UNITED STATES
SECURITIES AND EXCHANGE COMMISSION
Washington, D.C. 20549
FORM N-CSR
CERTIFIED SHAREHOLDER REPORT OF REGISTERED
MANAGEMENT INVESTMENT COMPANIES
Investment Company Act file number: 811-06241
Loomis Sayles Funds II
(Exact name of Registrant as specified in charter)
399 Boylston Street, Boston, Massachusetts 02116
(Address of principal executive offices) (Zip code)
Coleen Downs Dinneen, Esq.
Natixis Distributors, L.P.
399 Boylston Street
Boston, Massachusetts 02116
(Name and address of agent for service)
Registrant’s telephone number, including area code: (617) 449-2810
Date of fiscal year end: September 30
Date of reporting period: September 30, 2010
| Item 1. | Reports to Stockholders. |
The Registrant’s annual report transmitted to shareholders pursuant to Rule 30e-1 under the Investment Company Act of 1940 is as follows:
ANNUAL REPORT
September 30, 2010

Loomis Sayles Core Plus Bond Fund
Loomis Sayles High Income Fund
Loomis Sayles International Bond Fund
Loomis Sayles Limited Term Government and Agency Fund
Loomis Sayles Strategic Income Fund
Loomis, Sayles & Company, L.P.
TABLE OF CONTENTS
Management Discussion and Investment Results page 1
Portfolio of Investments page 18
Financial Statements page 53
LOOMIS SAYLES CORE PLUS BOND FUND
Management Discussion
Managers:
Peter W. Palfrey, CFA
Richard G. Raczkowski
Loomis, Sayles & Company, L.P.
Objective:
Seeks high total investment return through a combination of current income and capital appreciation
Strategy:
Invests primarily in bond investments
Fund Inception:
November 7, 1973
Symbols:
| | |
| Class A | | NEFRX |
| Class B | | NERBX |
| Class C | | NECRX |
| Class Y | | NERYX |
What You Should Know:
Fixed-income securities are subject to credit risk and interest rate risk; their value generally rises when prevailing interest rates fall and falls when rates rise.
The fund can invest a significant percentage of assets in debt securities that are rated below investment grade and the value of fund shares can be adversely affected by changes in economic conditions or other circumstances. Lower rated debt securities have speculative characteristics and may be subject to greater price volatility than higher rated investments. In addition, the secondary market for these securities may lack liquidity. The fund can also invest a significant percentage of assets in foreign securities and the value of the fund shares can be adversely affected by changes in currency exchange rates and by political and economic developments. In emerging markets, these risks can be significant. Fund shares should be viewed as a long-term investment.
Market Conditions
Investors’ overall willingness to accept risk continued to improve gradually over the past 12 months, and this was reflected in the solid performance of a wide range of non-Treasury sectors in the bond market. Concerns over debt problems in Greece and other peripheral eurozone countries, uncertainty surrounding the financial sector in Europe and pending financial legislation in the United States produced a major sell-off of riskier asset classes in May. However, as riskier asset classes settled down, the U.S. and global economies showed sustained signs of improvement over the period. And recently, mixed economic data have been met with growing confidence that the Federal Reserve Board (the Fed) will take action to keep the economy on track if there is any period of sustained weakness. Against this backdrop, a wide range of non-Treasury sectors delivered solid performance for the 12-month period ended September 30, 2010. The U.S. high-grade and high-yield markets, in particular, rebounded in the final quarter of the period. Heavy new corporate bond issuance was met with enthusiastic buying by investors seeking incremental yield. Treasuries also performed well, as investors embraced the prospects of a renewed round of quantitative easing by the Fed.
Performance Results
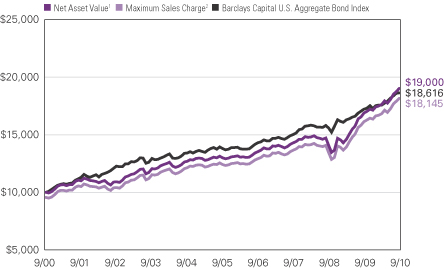
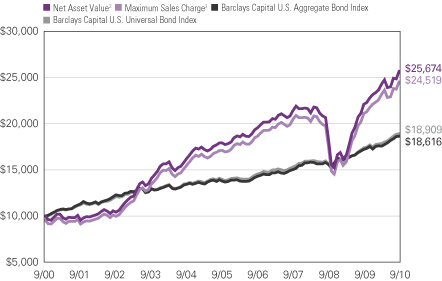
For the 12 months ended September 30, 2010, Class A shares of Loomis Sayles Core Plus Bond Fund returned 12.55% at net asset value. The fund outperformed its benchmark, the Barclays Capital U.S. Aggregate Bond Index, which returned 8.16%. It also outperformed Morningstar’s Intermediate-Term Bond category, which had an average return of 10.03%.
Explanation of Fund Performance
In an environment of declining interest rates and increasing risk tolerance, the fund benefited from its longer-than-market duration and an overweight allocation to non-Treasury sectors and non-U.S. dollar markets. Duration is a measure of interest rate sensitivity. We focused on investment-grade names with Baa and A quality ratings. In particular, we emphasized longer-duration investment grade industrial cyclicals, which we believed offered more value on a relative basis. Our emphasis on these types of bonds generated solid returns for the fund over the past 12 months. More recently we have harvested some gains and swapped the proceeds into longer-dated Treasuries.
We also maintained a near maximum allocation to high-yield corporate bonds, trimming out-performers that seemed to us to be nearing fair value and adding to issuers with solid balance sheets, leading market positions and proven access to capital. Our goal has been to generate significant incremental portfolio yield, while maintaining what we believe is an acceptable level of risk.
During the sovereign debt crisis in Europe, we opportunistically increased the fund’s exposure to bonds denominated in the Mexican peso and added to New Zealand and Canadian dollar-based issues. These three currencies subsequently rallied. We sold the positions and used the profits to purchase U.S. Treasuries and higher coupon agency mortgage-backed securities (MBS). The fund also retains a relatively large position in commercial mortgage-backed securities, which have provided significant excess return. The fund has a significant underweight in MBS, but has increased that allocation in recent weeks. A small cash position slightly detracted from overall returns.
Outlook
We believe the portfolio is well-positioned for a longer-term U.S. and global market recovery. However, we are aware that the potential for renewed investor concerns over the European sovereign debt crisis, tighter credit in China and India and slowing economic activity in the developed world pose risks to this outlook. We will monitor market conditions closely and may choose to become more defensive if the environment changes.
1 |
LOOMIS SAYLES CORE PLUS BOND FUND
Investment Results through September 30, 2010
The charts comparing the fund’s performance to an index provide you with a general sense of how it performed. The fund’s total return for the period shown below appears with and without sales charges and includes fund expenses and fees. An index measures the performance of a theoretical portfolio. Unlike a fund, an index is unmanaged and does not have expenses that affect the results. It is not possible to invest directly in an index. Investors would incur transaction costs and other expenses if they purchased the securities necessary to match the index.
Growth of a $10,000 Investment in Class A Shares4
September 30, 2000 through September 30, 2010
Average Annual Returns — September 30, 20104
| | | | | | | | | | | | |
| | | | |
| | | 1 Year | | | 5 Years | | | 10 Years | |
| | | | |
| Class A (Inception 11/7/73) | | | | | | | | | | | | |
| Net Asset Value1 | | | 12.55 | % | | | 7.89 | % | | | 6.63 | % |
| With Maximum Sales Charge2 | | | 7.50 | | | | 6.90 | | | | 6.14 | |
| | | | |
| Class B (Inception 9/13/93) | | | | | | | | | | | | |
| Net Asset Value1 | | | 11.64 | | | | 7.11 | | | | 5.84 | |
| With CDSC3 | | | 6.64 | | | | 6.80 | | | | 5.84 | |
| | | | |
| Class C (Inception 12/30/94) | | | | | | | | | | | | |
| Net Asset Value1 | | | 11.71 | | | | 7.10 | | | | 5.84 | |
| With CDSC3 | | | 10.71 | | | | 7.10 | | | | 5.84 | |
| | | | |
| Class Y (Inception 12/30/94) | | | | | | | | | | | | |
| Net Asset Value1 | | | 12.85 | | | | 8.18 | | | | 6.99 | |
| | | | |
| Comparative Performance | | | | | | | | | | | | |
| Barclays Capital U.S. Aggregate Bond Index | | | 8.16 | | | | 6.20 | | | | 6.41 | |
| Morningstar Int.-Term Bond Fund Avg. | | | 10.03 | | | | 5.41 | | | | 5.85 | |
All returns represent past performance and do not guarantee future results. Periods of less than one year are not annualized. Share price and return will vary and you may have a gain or loss when you sell your shares. All results include reinvestment of dividends and capital gains. Current returns may be higher or lower than those shown. For performance current to the most recent month-end, visit ga.natixis.com. Class Y shares are available to certain investors, as described in the prospectus. The table and graph do not reflect taxes shareholders might owe on any fund distributions or when they redeem their shares.
| | | | |
| Credit Quality | | % of Net
Assets as of
9/30/10* | |
| Aaa | | | 44.6 | |
| Aa | | | 4.6 | |
| A | | | 7.6 | |
| Baa | | | 19.2 | |
| Ba | | | 12.9 | |
| B | | | 4.1 | |
| Caa and lower | | | 0.1 | |
| Not Rated | | | 0.2 | |
| Short-term and other | | | 6.7 | |
| * | Credit quality at 9/30/2010 reflects the highest credit rating assigned to individual holdings of the fund among Moody’s, S&P or Fitch; ratings are subject to change. The fund’s shares are not rated by any rating agency and no credit rating for fund shares is implied. The Moody’s equivalent of the assigned rating is presented in the table. |
| | | | |
| Effective Duration | | % of Net
Assets as of
9/30/10 | |
| 1 year or less | | | 12.3 | |
| 1-5 years | | | 36.3 | |
| 5-10 years | | | 36.6 | |
| 10+ years | | | 14.8 | |
| Average Effective Duration | | | 6.0 | years |
Portfolio characteristics will vary.
Expense Ratios
as stated in the most recent prospectus
| | | | | | | | |
| Share Class | | Gross Expense Ratio5 | | | Net Expense Ratio6 | |
| A | | | 0.97 | % | | | 0.90 | % |
| B | | | 1.72 | | | | 1.65 | |
| C | | | 1.72 | | | | 1.65 | |
| Y | | | 0.68 | | | | 0.65 | |
NOTES TO CHARTS
See page 11 for a description of the indices.
| 1 | Does not include a sales charge. |
| 2 | Includes maximum sales charge of 4.50%. |
| 3 | Performance for Class B shares assumes a maximum 5% contingent deferred sales charge (“CDSC”) applied when you sell shares, which declines annually between years 1-6 according to the following schedule: 5, 4, 3, 3, 2, 1, 0%. Class C shares performance assumes a 1% CDSC applied when you sell shares within one year of purchase. |
| 4 | Fund performance has been increased by fee waivers and/or expense reimbursements, if any, without which performance would have been lower. |
| 5 | Before fee waivers and/or expense reimbursements. |
| 6 | After fee waivers and/or expense reimbursements. Waivers/reimbursements are contractual and are set to expire on 1/31/11. |
| 2
LOOMIS SAYLES HIGH INCOME FUND
Management Discussion
Managers:
Matthew J. Eagan, CFA
Kathleen C. Gaffney, CFA
Associate Manager:
Elaine M. Stokes
Loomis, Sayles & Company, L.P.
Objective:
Seeks high current income plus the opportunity for capital appreciation to produce a high total return
Strategy:
Invests primarily in lower-quality fixed-income securities
Fund Inception:
February 22, 1984
Symbols:
| | |
| Class A | | NEFHX |
| Class B | | NEHBX |
| Class C | | NEHCX |
| Class Y | | NEHYX |
What You Should Know:
Fixed-income securities are subject to credit risk and interest rate risk; their value generally rises when prevailing interest rates fall and falls when rates rise.
The fund can invest a significant percentage of assets in debt securities that are rated below investment grade and the value of fund shares can be adversely affected by changes in economic conditions or other circumstances. Lower rated debt securities have speculative characteristics and may be subject to greater price volatility than higher rated investments. In addition, the secondary market for these securities may lack liquidity. The fund can also invest a significant percentage of assets in foreign securities and the value of the fund shares can be adversely affected by changes in currency exchange rates and by political and economic developments. In emerging markets, these risks can be significant. Fund shares should be viewed as a long-term investment.
Market Conditions
As credit markets continued to recover from the worst financial crisis in recent history, investors grew more accepting of risk and sought higher yields in corporate issues. Demand for riskier asset classes and low interest rates helped companies refinance higher-cost debt while extending pending maturities. Credit fundamentals continued to improve, thanks to cost-cutting initiatives that boosted earnings and cautious managements that continued to stockpile cash. However, headwinds kept markets volatile as investors tried to gauge the impact of Europe’s sovereign debt problems and the slow pace of economic growth in the United States and abroad.
Performance Results
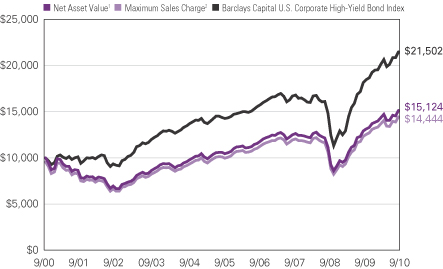
For the 12 months ended September 30, 2010, Class A shares of Loomis Sayles High Income Fund returned 17.05% at net asset value. The fund modestly underperformed its benchmark, the Barclays Capital U.S. Corporate High-Yield Bond Index, which returned 18.44% over the period. The fund outperformed Morningstar’s High Yield Bond category, which had an average return of 16.53%.
Explanation of Fund Performance
High-yield industrial holdings were the chief source of positive performance over the period. Investors seeking appreciation plus generous yields bought industrial issues in hopes that the sector would benefit from global economic recovery. This strategy was rewarded when strong earnings boosted prices for many issues. High-yield utilities rebounded when investors reassessed valuations in this beaten-down group. Selected out-of-benchmark positions in non-U.S.-dollar-denominated securities bolstered performance, as investors reached for yield. The Mexican peso, Uruguayan peso and Brazilian real made the greatest currency contributions. Convertible issues of some automotive and pharmaceutical holdings also added to performance, while Baa - Ba rated bonds delivered the best returns relative to the benchmark.
Below-benchmark exposure in two areas hampered relative results: high-yield financials and Caa - Ca quality issues. Successful security selection in the high-yield financials sector generated strong absolute performance, but an underweight position hurt relative performance. The sector rose based on favorable stress test outcomes for financial institutions in the United States and in Europe, notwithstanding the uncertain regulatory future. Investor appetite for yield and renewed acceptance of risk drove strong gains among Caa quality issues, but the fund’s results again were overshadowed by the benchmark’s larger commitment. Holdings tied to the Canadian dollar, South Korea’s won and the British pound also underperformed on a relative basis.
Outlook
We see a prolonged period of slow economic growth and low interest rates in the United States, Europe and Japan as the most influential and likely scenario for the remainder of 2010. Increased investor demand for yield should continue to benefit sectors of the market that offer substantial premiums over government bonds. The anticipation and investment positioning surrounding a second round of U.S. quantitative easing will continue to have wide-ranging ramifications for the markets.
Overall, our portfolio themes remain largely intact. Our assessment of the credit markets is consistent with previous quarters in 2010; selected relative value opportunities are still available in the current environment. Having the research expertise to identify the right securities for a portfolio is of utmost importance. The fund remains positioned to take advantage of the slowly improving global economy. We continue to see incremental fundamental improvement in the corporate space. Our global approach allows us to look beyond the domestic markets for security-specific opportunities as well. As relative value diminishes in certain names, we will continue to reduce position sizes selectively.
We expect market volatility to be a constant presence going forward. We plan to take advantage of this volatility by opportunistically adding securities across many of the markets available to us. We believe that a combination of improving corporate fundamentals, emerging market growth expectations that exceed those of the developed world and strong technical demand for yield have created an environment that could continue to benefit the fund in the future.
3 |
LOOMIS SAYLES HIGH INCOME FUND
Investment Results through September 30, 2010
The charts comparing the fund’s performance to an index provide you with a general sense of how it performed. The fund’s total return for the period shown below appears with and without sales charges and includes fund expenses and fees. An index measures the performance of a theoretical portfolio. Unlike a fund, the index is unmanaged and does not have expenses that affect the results. It is not possible to invest directly in an index. Investors would incur transaction costs and other expenses if they purchased the securities necessary to match the index.
Growth of a $10,000 Investment in Class A Shares4
September 30, 2000 through September 30, 2010
Average Annual Returns — September 30, 20104
| | | | | | | | | | | | | | | | |
| | | | | |
| | | 1 Year | | | 5 Years | | | 10 Years | | | Since
Class Y
Inception7 | |
| | | | | |
| Class A (Inception 2/22/84) | | | | | | | | | | | | | | | | |
| Net Asset Value1 | | | 17.05 | % | | | 7.40 | % | | | 4.22 | % | | | — | |
| With Maximum Sales Charge2 | | | 11.82 | | | | 6.44 | | | | 3.74 | | | | — | |
| | | | | |
| Class B (Inception 9/20/93) | | | | | | | | | | | | | | | | |
| Net Asset Value1 | | | 16.13 | | | | 6.61 | | | | 3.43 | | | | — | |
| With CDSC3 | | | 11.13 | | | | 6.30 | | | | 3.43 | | | | — | |
| | | | | |
| Class C (Inception 3/2/98) | | | | | | | | | | | | | | | | |
| Net Asset Value1 | | | 16.15 | | | | 6.63 | | | | 3.44 | | | | — | |
| With CDSC3 | | | 15.15 | | | | 6.63 | | | | 3.44 | | | | — | |
| | | | | |
| Class Y (Inception 2/29/08) | | | | | | | | | | | | | | | | |
| Net Asset Value1 | | | 17.11 | | | | — | | | | — | | | | 8.60 | |
| | | | | |
| Comparative Performance | | | | | | | | | | | | | | | | |
| Barclays Capital U.S. Corporate High-Yield Bond Index | | | 18.44 | | | | 8.37 | | | | 7.96 | | | | 11.96 | |
| Morningstar High Yield Bond Fund Avg. | | | 16.53 | | | | 6.01 | | | | 5.95 | | | | 8.23 | |
All returns represent past performance and do not guarantee future results. Periods of less than one year are not annualized. Share price and return will vary and you may have a gain or loss when you sell your shares. All results include reinvestment of dividends and capital gains. Current returns may be higher or lower than those shown. For performance current to the most recent month-end, visit ga.natixis.com. Performance history includes periods from a predecessor fund. Class Y shares are available to certain investors, as described in the prospectus. The table and graph do not reflect taxes shareholders might owe on any fund distributions or when they redeem their shares.
| | | | |
| Credit Quality | | % of Net
Assets as of
9/30/10* | |
| Aaa | | | 4.5 | |
| Aa | | | 4.2 | |
| A | | | 5.6 | |
| Baa | | | 3.6 | |
| Ba | | | 26.0 | |
| B | | | 33.8 | |
| Caa and lower | | | 8.4 | |
| Not Rated | | | 5.1 | |
| Short-term and other | | | 8.8 | |
| * | Credit quality at 9/30/2010 reflects the highest credit rating assigned to individual holdings of the fund among Moody’s, S&P and Fitch; ratings are subject to change. The fund’s shares are not rated by any rating agency and no credit rating for fund shares is implied. The Moody’s equivalent of the assigned rating is presented in the table. |
| | | | |
| Effective Maturity | | % of Net
Assets as of
9/30/10 | |
| 1 year or less | | | 12.6 | |
| 1-5 years | | | 31.3 | |
| 5-10 years | | | 26.1 | |
| 10+ years | | | 30.0 | |
| Average Effective Maturity | | | 8.7 | years |
Portfolio characteristics will vary.
Expense Ratios
as stated in the most recent prospectus
| | | | | | | | |
| Share Class | | Gross Expense Ratio5 | | | Net Expense Ratio6 | |
| A | | | 1.28 | % | | | 1.15 | % |
| B | | | 2.06 | | | | 1.90 | |
| C | | | 2.03 | | | | 1.90 | |
| Y | | | 0.92 | | | | 0.90 | |
NOTES TO CHARTS
| See | page 11 for a description of the indices. |
| 1 | Does not include a sales charge. |
| 2 | Includes maximum sales charge of 4.50%. |
| 3 | Performance for Class B shares assumes a maximum 5% contingent deferred sales charge (“CDSC”) applied when you sell shares, which declines annually between years 1-6 according to the following schedule: 5, 4, 3, 3, 2, 1, 0%. Class C shares performance assumes a 1% CDSC applied when you sell shares within one year of purchase. |
| 4 | Fund performance has been increased by fee waivers and/or expense reimbursements, if any, without which performance would have been lower. |
| 5 | Before fee waivers and/or expense reimbursements. |
| 6 | After fee waivers and/or expense reimbursements. Waivers/reimbursements are contractual and are set to expire on 1/31/11. |
| 7 | The since-inception comparative performance figures shown for Class Y shares are calculated from 3/1/08. |
| 4
LOOMIS SAYLES INTERNATIONAL BOND FUND
Management Discussion
Managers:
David W. Rolley, CFA
Kenneth M. Buntrock, CFA, CIC
Lynda L. Schweitzer, CFA
Loomis, Sayles & Company, L.P.
Objective:
Seeks high total return through a combination of high current income and capital appreciation
Strategy:
Invests primarily in fixed-income securities located outside the U.S.
Fund Inception:
February 1, 2008
Symbols:
| | |
| Class A | | LSIAX |
| Class C | | LSICX |
| Class Y | | LSIYX |
What You Should Know:
Fixed-income securities are subject to credit risk and interest rate risk; their value generally rises when prevailing interest rates fall and falls when rates rise. The fund may also invest in public or private debt obligations issued or guaranteed by U.S. or non-U.S. issuers. The fund can invest a significant percentage of assets in foreign securities and the value of the fund shares can be adversely affected by changes in currency exchange rates and by political and economic developments. In emerging markets these risks can be significant. The fund can invest a significant percentage of assets in debt securities that are rated below investment grade. Lower-rated debt securities have speculative characteristics and may be subject to greater price volatility than higher-rated investments. In addition, the secondary market for these securities may lack liquidity. Fund shares should be viewed as a long-term investment.
Market Conditions
Lower-rated corporate bonds, emerging market debt and other credit-sensitive securities outperformed government debt in a sometimes-volatile global bond market during the 12 months ended September 30, 2010. Throughout the period, fixed-income investors encountered a host of competing signals. While strong growth in emerging markets encouraged confidence in a global recovery, signs of weakness in other parts of the world engendered fears of a double-dip recession. Meanwhile, concerns about potential defaults by the sovereign debt of some European nations brought additional market instability, especially early in the period. At the same time, low interest rates persisted. Yields on most government bonds fell, and the spread (or difference in yields) between government-related bonds and corporate bonds narrowed. Currency markets remained choppy, with investors wary about signs that some nations might devalue their currencies to increase their competitiveness in global trade.
Performance Results
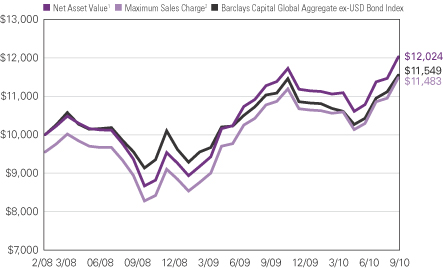
For the 12 months ended September 30, 2010, Class A shares of Loomis Sayles International Bond Fund returned 6.66% at net asset value. The fund outperformed its benchmark, the Barclays Capital Global Aggregate ex-USD Bond Index, which returned 4.72%. The fund underperformed Morningstar’s World Bond category, which had an average return of 8.30%.
Explanation of Fund Performance
A combination of favorable security selection and successful country allocations helped drive the fund’s outperformance relative to the index. Throughout the 12 months, the fund emphasized lower-rated corporate debt, which outperformed government securities. The fund also had less exposure than the index to euro-denominated bonds, which also helped performance, especially during the first half of the period when fears of a default in European sovereign debt spread through the market. The fund’s strong relative performance continued in the latter months of the period when confidence in a global economic rebound appeared to strengthen, providing support for performance of credit-sensitive securities and emerging market debt.
The fund’s consistent emphasis on lower-rated corporate securities, combined with an underweight relative to the benchmark in government debt and asset-backed securities, were the main drivers of performance. In particular, emphasis on the bonds of companies in consumer-sensitive industries, such as banking, food and beverage, retail and media, had positive influences. Those securities rallied on rising confidence about an economic recovery. Investments in the emerging-market nations of Brazil, Indonesia, Mexico and Uruguay also contributed positively to fund returns.
The fund’s underweight position in securities denominated in the Japanese yen held back performance when the yen appreciated by 7.5% relative to the U.S. dollar. Fortunately, the negative effects were limited by our decision to partially hedge the underweight position in the yen. Our emphasis on shorter-maturity securities in markets such as Korea and Singapore had a modestly negative impact on performance, as longer-maturity securities outperformed when they experienced greater price appreciation than shorter-maturity securities. An overweight position in the Norwegian krone also restricted results.
Outlook
We believe the Federal Reserve Board’s actions over the next several months are likely to have a major influence on the relative performance of different asset classes and currencies in the global fixed-income markets. The U.S. central bank’s options in monetary policy include expanding its balance sheet by buying more securities, which increases liquidity and expands the money supply. Outside the United States, the European Central Bank is passively reducing its balance sheet, which is sending the euro higher. Japan intervened in its currency markets, but we do not believe this action will hold down the yen. We are keeping the portfolio’s exposure to non-dollar currencies stable for now. At the same time, we have been slightly reducing the fund’s corporate credit holdings, and we may continue to reduce exposure in this area. We intend to maintain a conservative stance with regard to interest-rate risk, and we do not intend to extend duration, a measure of interest-rate sensitivity.
5 |
LOOMIS SAYLES INTERNATIONAL BOND FUND
Investment Results through September 30, 2010
The charts comparing the fund’s performance to an index provide you with a general sense of how it performed. The fund’s total return for the period shown below appears with and without sales charges and includes fund expenses and fees. An index measures the performance of a theoretical portfolio. Unlike a fund, an index is unmanaged and does not have expenses that affect the results. It is not possible to invest directly in an index. Investors would incur transaction costs and other expenses if they purchased the securities necessary to match the index.
Growth of $10,000 Investment in Class A Shares4
February 1, 2008 (inception) through September 30, 2010
Average Annual Returns — September 30, 20104
| | | | | | | | |
| | | |
| | | 1 Year | | | Since
Inception | |
| | | |
| Class A (Inception 2/1/08) | | | | | | | | |
| Net Asset Value1 | | | 6.66 | % | | | 7.17 | % |
| With Maximum Sales Charge2 | | | 1.87 | | | | 5.34 | |
| | | |
| Class C (Inception 2/1/08) | | | | | | | | |
| Net Asset Value1 | | | 5.86 | | | | 6.34 | |
| With CDSC3 | | | 4.86 | | | | 6.34 | |
| | | |
| Class Y (Inception 2/1/08) | | | | | | | | |
| Net Asset Value1 | | | 6.92 | | | | 7.37 | |
| | | |
| Comparative Performance | | | | | | | | |
| Barclays Capital Global Aggregate ex-USD Bond Index | | | 4.72 | | | | 5.55 | |
| Morningstar World Bond Fund Avg. | | | 8.30 | | | | 6.35 | |
All returns represent past performance and do not guarantee future results. Periods of less than one year are not annualized. Share price and return will vary and you may have a gain or loss when you sell your shares. All results include reinvestment of dividends and capital gains. Current returns may be higher or lower than those shown. For performance current to the most recent month-end, visit ga.natixis.com. Class Y shares are available to certain investors, as described in the prospectus. The table and graph do not reflect taxes shareholders might owe on any fund distributions or when they redeem their shares.
| | | | |
| Credit Quality | | % of Net
Assets as of
9/30/10* | |
| Aaa | | | 44.3 | |
| Aa | | | 24.0 | |
| A | | | 7.9 | |
| Baa | | | 12.0 | |
| Ba | | | 7.2 | |
| B | | | 1.3 | |
| Short-term and other | | | 3.3 | |
| * | Credit quality at 9/30/2010 reflects the highest credit rating assigned to individual holdings of the fund among Moody’s, S&P and Fitch, ratings are subject to change. The fund’s shares are not rated by any rating agency and no credit rating for fund shares is implied. The Moody’s equivalent of the assigned rating is presented in the table. |
| | | | |
| Effective Maturity | | % of Net
Assets as of
9/30/10 | |
| 1 year or less | | | 5.6 | |
| 1-5 years | | | 37.6 | |
| 5-10 years | | | 41.5 | |
| 10+ years | | | 15.3 | |
| Average Effective Maturity | | | 7.3 | years |
Portfolio characteristics will vary.
Expense Ratios
as stated in the most recent prospectus
| | | | | | | | |
| Share Class | | Gross Expense Ratio5 | | | Net Expense Ratio6 | |
| A | | | 2.11 | % | | | 1.10 | % |
| C | | | 2.93 | | | | 1.85 | |
| Y | | | 1.92 | | | | 0.85 | |
NOTES TO CHARTS
See page 11 for a description of the indices.
| 1 | Does not include a sales charge. |
| 2 | Includes maximum sales charge of 4.50%. |
| 3 | Class C shares performance assumes a 1% CDSC applied when you sell shares within one year of purchase. |
| 4 | Fund performance has been increased by fee waivers and/or expense reimbursements, if any, without which performance would have been lower. |
| 5 | Before fee waivers and/or expense reimbursements. |
| 6 | After fee waivers and/or expense reimbursements. Waivers/reimbursements are contractual and are set to expire on 1/31/11. |
| 6
LOOMIS SAYLES LIMITED TERM GOVERNMENT AND AGENCY FUND
Management Discussion
Managers:
John Hyll
Clifton V. Rowe, CFA
Loomis, Sayles & Company, L.P.
Objective:
Seeks a high current return consistent with preservation of capital
Strategy:
Invests primarily in securities issued or guaranteed by the U.S. government, its agencies or instrumentalities
Fund Inception:
January 3, 1989
Symbols:
| | |
| Class A | | NEFLX |
| Class B | | NELBX |
| Class C | | NECLX |
| Class Y | | NELYX |
What You Should Know:
Fixed-income securities are subject to credit risk and interest rate risk; their value generally rises when prevailing interest rates fall and falls when rates rise. Securities issued by the U.S. government are guaranteed by the U.S. government if held to maturity; mutual funds that invest in these securities are not guaranteed. Securities issued by U.S. government agencies may not be government guaranteed.
Market Conditions
Interest rates generally declined during the 12 months ended September 30, 2010, as the economic recovery was weaker than expected and the Federal Reserve Board (the Fed) remained committed to a low interest-rate policy. Yet, the probability of a lapse back into recession diminished during the period. As a result, the spread (or difference in yields) between government-related and non-government-related bonds declined significantly, and prices on non-government bonds rose strongly. Meanwhile, tighter standards made it difficult for many borrowers with high interest rates to refinance. This led to slower-than-expected pre-payments on premium government sponsored enterprise (GSE) mortgage-backed securities (MBS), which aided performance in this category.
Performance Results
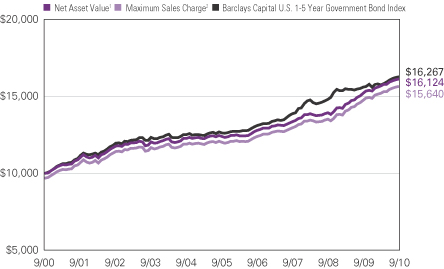
For the 12 months ended September 30, 2010, Class A shares of Loomis Sayles Limited Term Government and Agency Fund returned 6.03% at net asset value. The fund outperformed its benchmark, the Barclays Capital U.S. 1-5 Year Government Bond Index, which returned 4.19%. The fund also outperformed Morningstar’s Short Government category, which had an average return of 3.68%.
Explanation of Fund Performance
The fund’s positions in higher-yielding sectors – notably MBS and asset-backed securities (ABS) – were primarily responsible for the fund’s superior results relative to its benchmark. These sectors performed well during the year, except during the second quarter, when concerns over European sovereign bonds caused yield spreads to widen. (Sovereign bonds are foreign government bonds issued in local currencies.) However, as investors shifted their focus back toward yield opportunities in the domestic bond markets, the MBS and ABS sectors offered a compelling combination of high quality and attractive yields.
Commercial mortgage-backed securities (CMBS) were the greatest contributors to the fund’s strong relative performance, followed by MBS issued by GSEs and ABS. As interest rates generally remained low throughout the year, strong investor demand fueled gains for the fund’s holdings in these sectors. By contrast, U.S. Treasury securities and bonds issued by GSEs were underperformers. Longer-maturity securities experienced greater price appreciation than securities with shorter maturities. As a result, the fund’s emphasis on shorter maturities detracted from performance.
Outlook
We believe the Fed will continue its current interest-rate policy well into 2011. In the intermediate term, we anticipate a gradual rise in interest rates, as modest economic growth persists.
Provided interest rates remain relatively stable, we expect the fund’s holdings in MBS to benefit, and our focus will remain on income rather than appreciation potential. At the end of the period, the fund had more emphasis than the index on MBS issued by GSEs, CMBS and ABS. We believe these sectors continue to offer a modest yield advantage as well as strong credit quality.
Although we expect fundamental economic weakness to persist for some time in both the mortgage and consumer loan markets, we believe that the securities we selected for the fund are less vulnerable to credit risk because of certain credit enhancements that are in place to help absorb credit losses and protect senior securities. In addition, we believe these securities continue to offer compelling value.
7 |
LOOMIS SAYLES LIMITED TERM GOVERNMENT AND AGENCY FUND
Investment Results through September 30, 2010
The charts comparing the fund’s performance to an index provide you with a general sense of how it performed. The fund’s total return for the period shown below appears with and without sales charges and includes fund expenses and fees. An index measures the performance of a theoretical portfolio. Unlike a fund, the index is unmanaged and does not have expenses that affect the results. It is not possible to invest directly in an index. Investors would incur transaction costs and other expenses if they purchased the securities necessary to match the index.
Growth of a $10,000 Investment in Class A Shares4
September 30, 2000 through September 30, 2010
Average Annual Returns — September 30, 20104
| | | | | | | | | | | | |
| | | | |
| | | 1 Year | | | 5 Years | | | 10 Years | |
| | | | |
| Class A (Inception 1/3/89) | | | | | | | | | | | | |
| Net Asset Value1 | | | 6.03 | % | | | 5.39 | % | | | 4.89 | % |
| With Maximum Sales Charge2 | | | 2.84 | | | | 4.75 | | | | 4.57 | |
| | | | |
| Class B (Inception 9/27/93) | | | | | | | | | | | | |
| Net Asset Value1 | | | 5.16 | | | | 4.58 | | | | 4.14 | |
| With CDSC3 | | | 0.16 | | | | 4.24 | | | | 4.14 | |
| | | | |
| Class C (Inception 12/30/94) | | | | | | | | | | | | |
| Net Asset Value1 | | | 5.24 | | | | 4.62 | | | | 4.15 | |
| With CDSC3 | | | 4.24 | | | | 4.62 | | | | 4.15 | |
Class Y (Inception 3/31/94) Net Asset Value1 | | | 6.20 | | | | 5.65 | | | | 5.19 | |
| | | | |
| Comparative Performance | | | | | | | | | | | | |
| Barclays Capital U.S. 1-5 Year Government Bond Index | | | 4.19 | | | | 5.18 | | | | 4.99 | |
| Morningstar Short Government Fund Avg. | | | 3.68 | | | | 4.27 | | | | 4.12 | |
All returns represent past performance and do not guarantee future results. Periods of less than one year are not annualized. Share price and return will vary and you may have a gain or loss when you sell your shares. All results include reinvestment of dividends and capital gains. Current returns may be higher or lower than those shown. For performance current to the most recent month-end, visit ga.natixis.com. Performance history includes periods from a predecessor fund. Class Y shares are available to certain investors, as described in the prospectus. The table and graph do not reflect taxes shareholders might owe on any fund distributions or when they redeem their shares.
| | | | |
| Fund Composition | | % of Net
Assets as of
9/30/10 | |
| Treasuries | | | 30.9 | |
| Mortgage Related | | | 22.0 | |
| Government Owned - No Guarantee | | | 22.0 | |
| Commercial Mortgage-Backed Securities | | | 14.5 | |
| Government Sponsored | | | 4.9 | |
| ABS Car Loan | | | 2.0 | |
| Government Guaranteed | | | 1.2 | |
| ABS Credit Card | | | 0.9 | |
| ABS Home Equity | | | 0.5 | |
| Hybrid ARMs | | | 0.3 | |
| Collateralized Mortgage Obligations | | | 0.2 | |
| Short-term and Other | | | 0.6 | |
| |
| Effective Maturity | | % of Net
Assets as of
9/30/10 | |
| 1 year or less | | | 19.8 | |
| 1-5 years | | | 66.0 | |
| 5-10 years | | | 14.2 | |
| Average Effective Maturity | | | 2.6 | years |
Portfolio characteristics will vary.
Expense Ratios
as stated in the most recent prospectus
| | | | | | | | |
| Share Class | | Gross Expense Ratio5 | | | Net Expense Ratio6, 7 | |
| A | | | 0.99 | % | | | 0.85 | % |
| B | | | 1.74 | | | | 1.60 | |
| C | | | 1.74 | | | | 1.60 | |
| Y | | | 0.72 | | | | 0.60 | |
NOTES TO CHARTS
See page 11 for a description of the indices.
| 1 | Does not include a sales charge. |
| 2 | Includes maximum sales charge of 3.00%. |
| 3 | Performance for Class B shares assumes a maximum 5% contingent deferred sales charge (“CDSC”) applied when you sell shares, which declines annually between years 1-6 according to the following schedule: 5, 4, 3, 3, 2, 1, 0%. Class C shares performance assumes a 1% CDSC applied when you sell shares within one year of purchase. |
| 4 | Fund performance has been increased by fee waivers and/or expense reimbursements, if any, without which performance would have been lower. |
| 5 | Before fee waivers and/or expense reimbursements. |
| 6 | After fee waivers and/or expense reimbursements. Waivers/reimbursements are contractual and are set to expire on 1/31/11. |
| 7 | As of 7/1/10, the fund’s expenses were lowered; current expenses will be reflected in the annual update of the fund’s prospectus. |
| 8
LOOMIS SAYLES STRATEGIC INCOME FUND
Management Discussion
Managers:
Daniel J. Fuss, CFA, CIC
Kathleen C. Gaffney, CFA
Associate Managers:
Matthew J. Eagan, CFA
Elaine M. Stokes
Loomis, Sayles & Company, L.P.
Objective:
Seeks high current income, with a secondary objective of capital growth
Strategy:
Invests primarily in income-producing securities in the U.S. and around the world
Fund Inception:
May 1, 1995
Symbols:
| | |
| Class A | | NEFZX |
| Class B | | NEZBX |
| Class C | | NECZX |
| Class Y | | NEZYX |
| Admin Class | | NEZAX |
What You Should Know:
Fixed-income securities are subject to credit risk and interest rate risk; their value generally rises when prevailing interest rates fall and falls when rates rise.
The fund can invest a significant percentage of assets in debt securities that are rated below investment grade and the value of fund shares can be adversely affected by changes in economic conditions or other circumstances. Lower rated debt securities have speculative characteristics and may be subject to greater price volatility than higher rated investments. In addition, the secondary market for these securities may lack liquidity. The fund can also invest a significant percentage of assets in foreign securities and the value of the fund shares can be adversely affected by changes in currency exchange rates and by political and economic developments. In emerging markets, these risks can be significant. Fund shares should be viewed as a long-term investment.
Market Conditions
As the worst of the credit crisis receded, bond investors began to accept more risk in pursuit of yield and appreciation. Companies used the demand for riskier asset classes and low interest rates as an opportunity to refinance older, more costly debt, which benefited both high-yield and investment-grade issues. Encouraging results from the stress tests applied to European banks helped calm investor fears. Yet substantial challenges remained: the slow pace of recovery in the United States combined with the massive federal budget deficit, and China’s efforts to cool its economy, which sent waves of worry through global markets.
Performance Results
For the 12 months ended September 30, 2010, Class A shares of Loomis Sayles Strategic Income Fund returned 16.20% at net asset value. The fund outperformed its benchmark, the Barclays Capital U.S. Aggregate Bond Index, which returned 8.16% over the period. The fund also outdistanced Morningstar’s Multisector Bond category, which had an average return of 13.26%.
Explanation of Fund Performance
Exposure to high-yield bonds and bonds tied to selected foreign currencies, neither of which is included in the index, generally accounted for the fund’s outperformance relative to its benchmark. Major currencies rallied against the U.S. dollar, which translated into sizable contributions from the fund’s non-U.S.-dollar holdings. Bonds denominated in the Mexican peso and the Australian, New Zealand and Canadian dollars were the biggest winners. Smaller contributions came from bonds denominated in the South Korean won and Indonesian rupiah. The U.S. economic recovery fueled gains in the high-yield industrials sector, led by issues in the technology, consumer cyclical and telecommunications segments. High-yield financials also contributed positively to returns. Convertible bonds and preferred securities rose along with underlying equities in the stock market rally.
The high-yield utilities sector continued to sag under the weight of diminished growth prospects and languishing energy prices. Companies dependent on higher natural gas prices were especially affected. Investors fled government debt in Europe and the Middle East, fearing the risk of default on sovereign obligations. Fund holdings in affected countries declined as a result. Better returns among emerging market sovereign debt partially offset those declines, and sovereign bonds as a group were neutral. The fund had minimal exposure to commercial mortgage-backed securities, which hurt comparative results during a period of strong performance in that sector.
Outlook
We see a prolonged period of slow economic growth and low interest rates in the United States, Europe and Japan as the most influential and likely scenario for the remainder of 2010. Increased investor demand for yield should continue to benefit sectors of the market that offer substantial premiums over government bonds. The anticipation and investment positioning surrounding a second round of U.S. quantitative easing will continue to have wide-ranging ramifications for the markets.
Overall, our portfolio themes remain largely intact. Our assessment of the credit markets is consistent with previous quarters in 2010; selected relative value opportunities are still available in the current environment. Having the research expertise to identify the right securities for a portfolio is of utmost importance. The fund remains positioned to take advantage of the slowly improving global economy. We continue to see incremental fundamental improvement in the corporate space. Our global approach allows us to look beyond the domestic markets for security-specific opportunities as well. As relative value diminishes in certain names, we will continue to reduce position sizes selectively.
We expect market volatility to be a constant presence going forward. We plan to take advantage of this volatility by opportunistically adding securities across many of the markets available to us. We believe that a combination of improving corporate fundamentals, emerging market growth expectations that exceed those of the developed world and strong technical demand for yield have created an environment that could continue to benefit the fund in the future.
9 |
LOOMIS SAYLES STRATEGIC INCOME FUND
Investment Results through September 30, 2010
The charts comparing the fund’s performance to two indexes provide you with a general sense of how it performed. The fund’s total return for the period shown below appears with and without sales charges and includes fund expenses and fees. An index measures the performance of a theoretical portfolio. Unlike a fund, the index is unmanaged and does not have expenses that affect the results. It is not possible to invest directly in an index. Investors would incur transaction costs and other expenses if they purchased the securities necessary to match the index.
Growth of a $10,000 Investment in Class A Shares5
September 30, 2000 through September 30, 2010
Average Annual Returns — September 30, 20105
| | | | | | | | | | | | |
| | | | |
| | | 1 Year | | | 5 Years | | | 10 Years | |
| | | | |
| Class A (Inception 5/1/95) | | | | | | | | | | | | |
| Net Asset Value2 | | | 16.20 | % | | | 7.48 | % | | | 9.89 | % |
| With Maximum Sales Charge3 | | | 10.98 | | | | 6.50 | | | | 9.38 | |
| | | | |
| Class B (Inception 5/1/95) | | | | | | | | | | | | |
| Net Asset Value2 | | | 15.39 | | | | 6.68 | | | | 9.06 | |
| With CDSC4 | | | 10.39 | | | | 6.37 | | | | 9.06 | |
| | | | |
| Class C (Inception 5/1/95) | | | | | | | | | | | | |
| Net Asset Value2 | | | 15.40 | | | | 6.68 | | | | 9.07 | |
| With CDSC4 | | | 14.40 | | | | 6.68 | | | | 9.07 | |
| | | | |
| Class Y (Inception 12/1/99) | | | | | | | | | | | | |
| Net Asset Value2 | | | 16.50 | | | | 7.76 | | | | 10.21 | |
| | | | |
| Admin Class (Inception 2/1/10)1 | | | | | | | | | | | | |
| Net Asset Value2 | | | 15.70 | | | | 7.15 | | | | 9.51 | |
| | | | |
| Comparative Performance | | | | | | | | | | | | |
| Barclays Capital U.S. Aggregate Bond Index | | | 8.16 | | | | 6.20 | | | | 6.41 | |
| Barclays Capital U.S. Universal Bond Index | | | 8.92 | | | | 6.26 | | | | 6.58 | |
| Morningstar Multisector Bond Fund Avg. | | | 13.26 | | | | 6.14 | | | | 7.24 | |
All returns represent past performance and do not guarantee future results. Periods of less than one year are not annualized. Share price and return will vary and you may have a gain or loss when you sell your shares. All results include reinvestment of dividends and capital gains. Current returns may be higher or lower than those shown. Performance history includes periods from a predecessor fund. For performance current to the most recent month-end, visit ga.natixis.com. Class Y shares are available to certain investors, as described in the prospectus. The table and graph do not reflect taxes shareholders might owe on any fund distributions or when they redeem their shares.
| | | | |
| Credit Quality | | % of Net
Assets as of
9/30/10* | |
| Aaa | | | 17.9 | |
| Aa | | | 8.0 | |
| A | | | 10.2 | |
| Baa | | | 23.7 | |
| Ba | | | 10.8 | |
| B | | | 16.0 | |
| Caa and Lower | | | 4.7 | |
| Not Rated | | | 7.1 | |
| Short-term and Other | | | 1.6 | |
| * | Credit quality at 9/30/2010 reflects the highest credit rating assigned to individual holdings of the fund among Moody’s, S&P and Fitch; ratings are subject to change. The fund’s shares are not rated by any rating agency and no credit rating for fund shares is implied. The Moody’s equivalent of the assigned rating is presented in the table. |
| | | | |
| Effective Maturity | | % of Net
Assets as of
9/30/10 | |
| 1 year or less | | | 9.0 | |
| 1-5 years | | | 30.5 | |
| 5-10 years | | | 28.3 | |
| 10+ years | | | 32.2 | |
| Average Effective Maturity | | | 11.0 | years |
Portfolio characteristics will vary.
Expense Ratios
as stated in the most recent prospectus
| | | | | | | | |
| Share Class | | Gross Expense Ratio6 | | | Net Expense Ratio7 | |
| A | | | 0.99 | % | | | 0.99 | % |
| B | | | 1.75 | | | | 1.75 | |
| C | | | 1.74 | | | | 1.74 | |
| Y | | | 0.73 | | | | 0.73 | |
| Admin | | | 1.24 | | | | 1.24 | |
NOTES TO CHARTS
See page 11 for a description of the indices.
| 1 | Prior to the inception of Admin Class shares (2/1/10), performance is that of Class A shares, restated to reflect the higher net expenses of Admin Class shares. |
| 2 | Does not include a sales charge. |
| 3 | Includes maximum sales charge of 4.50%. |
| 4 | Performance for Class B shares assumes a maximum 5% contingent deferred sales charge (“CDSC”) applied when you sell shares, which declines annually between years 1-6 according to the following schedule: 5, 4, 3, 3, 2, 1, 0%. Class C share performance assumes a 1% CDSC applied when you sell shares within one year of purchase. |
| 5 | Fund performance has been increased by fee waivers and/or expense reimbursements, if any, without which performance would have been lower. |
| 6 | Before fee waivers and/or expense reimbursements. |
| 7 | After fee waivers and/or expense reimbursements. Waivers/reimbursements are contractual and are set to expire on 1/31/11. |
| 10
ADDITIONAL INFORMATION
The views expressed in this report reflect those of the portfolio managers as of the dates indicated. The managers’ views are subject to change at any time without notice based on changes in market or other conditions. References to specific securities or industries should not be regarded as investment advice. Because the funds are actively managed, there is no assurance that they will continue to invest in the securities or industries mentioned.
Before investing, consider the fund’s investment objectives, risks, charges and expenses. Visit ga.natixis.com or call 800-225-5478 for a prospectus and/or a summary prospectus, both of which contain this and other information. Read it carefully.
INDEX/AVERAGE DESCRIPTIONS
Barclays Capital Global Aggregate ex-USD Bond Index is an unmanaged index that provides a broad-based measure of the international investment-grade fixed-rate debt markets.
Barclays Capital U.S. 1-5 Year Government Bond Index is an unmanaged index that includes U.S. Treasury and agency securities with remaining maturities of one to five years.
Barclays Capital U.S. Aggregate Bond Index is an unmanaged index that covers the U.S.-dollar denominated, investment-grade, fixed-rate, taxable bond market of SEC-registered securities. The index includes bonds from the Treasury, government-related, corporate, mortgage-backed securities, asset-backed securities, and collateralized mortgage-backed securities sectors.
Barclays Capital U.S. Corporate High-Yield Bond Index is an unmanaged index that covers the U.S. dollar-denominated, non-investment grade, fixed-rate, taxable corporate bond market.
Barclays Capital U.S. Universal Bond Index is an unmanaged index that covers U.S. dollar-denominated taxable bonds, including U.S. government and investment grade debt, non-investment grade debt, asset-backed and mortgage-backed securities, Eurobonds, 144A securities and emerging market debt.
Morningstar Fund Averages are the average performance without sales charges of funds with similar investment objectives, as calculated by Morningstar, Inc.
PROXY VOTING INFORMATION
A description of the funds’ proxy voting policies and procedures is available without charge, upon request, by calling Natixis Funds at 800-225-5478; on the funds’ website at ga.natixis.com; and on the Securities and Exchange Commission’s (SEC’s) website at www.sec.gov. Information regarding how the funds voted proxies relating to portfolio securities during the 12-month period ended June 30, 2010 is available from the funds’ website and the SEC’s website.
QUARTERLY PORTFOLIO SCHEDULES
The funds file a complete schedule of portfolio holdings with the SEC for the first and third quarters of each fiscal year on Form N-Q. The funds’ Forms N-Q are available on the SEC’s website at www.sec.gov and may be reviewed and copied at the SEC’s Public Reference Room in Washington, DC. Information on the operation of the Public Reference Room may be obtained by calling
1-800-SEC-0330.
11 |
UNDERSTANDING FUND EXPENSES
As a mutual fund shareholder, you incur different costs: transaction costs, including sales charges (loads) on purchases and contingent deferred sales charges on redemptions, and ongoing costs, including management fees, distribution and/or service fees (12b-1 fees), and other fund expenses. In addition, each fund may assess a minimum balance fee of $20 on an annual basis for accounts that fall below the required minimum to establish an account. Certain exemptions may apply. These costs are described in more detail in the funds’ prospectuses. The examples below are intended to help you understand the ongoing costs of investing in the funds and help you compare these with the ongoing costs of investing in other mutual funds.
The first line in the table of each class of fund shares shows the actual account values and actual fund expenses you would have paid on a $1,000 investment in the fund from April 1, 2010 through September 30, 2010. To estimate the expenses you paid over the period, simply divide your account value by $1,000 (for example $8,600 account value divided by $1,000 = 8.60) and multiply the result by the number in the Expenses Paid During Period column as shown below for your class.
The second line in the table of each class of fund shares provides information about hypothetical account values and hypothetical expenses based on the fund’s actual expense ratios and an assumed rate of return of 5% per year before expenses, which is not the fund’s actual return. The hypothetical account values and expenses may not be used to estimate the actual ending account balance or expenses you paid on your investment for the period. You may use this information to compare the ongoing costs of investing in the fund and other funds. To do so, compare this 5% hypothetical example with the 5% hypothetical examples that appear in the shareholder reports of the other funds.
Please note that the expenses shown reflect ongoing costs only, and do not include any transaction costs such as sales charges redemption fees, or exchange fees. Therefore, the second line in the table of each fund is useful in comparing ongoing costs only, and will not help you determine the relative costs of owning different funds. If transaction costs were included, total costs would be higher.
| | | | | | | | | | | | |
| LOOMIS SAYLES CORE PLUS BOND FUND | | BEGINNING ACCOUNT VALUE
4/1/2010 | | | ENDING ACCOUNT VALUE
9/30/2010 | | | EXPENSES PAID DURING PERIOD*
4/1/2010 – 9/30/2010 | |
Class A | | | | | | | | | | | | |
Actual | | | $1,000.00 | | | | $1,079.00 | | | | $4.69 | |
Hypothetical (5% return before expenses) | | | $1,000.00 | | | | $1,020.56 | | | | $4.56 | |
Class B | | | | | | | | | | | | |
Actual | | | $1,000.00 | | | | $1,074.50 | | | | $8.58 | |
Hypothetical (5% return before expenses) | | | $1,000.00 | | | | $1,016.80 | | | | $8.34 | |
Class C | | | | | | | | | | | | |
Actual | | | $1,000.00 | | | | $1,074.90 | | | | $8.58 | |
Hypothetical (5% return before expenses) | | | $1,000.00 | | | | $1,016.80 | | | | $8.34 | |
Class Y | | | | | | | | | | | | |
Actual | | | $1,000.00 | | | | $1,080.70 | | | | $3.39 | |
Hypothetical (5% return before expenses) | | | $1,000.00 | | | | $1,021.81 | | | | $3.29 | |
| * | Expenses are equal to the Fund’s annualized expense ratio (after waiver/reimbursement): 0.90%, 1.65%, 1.65% and 0.65%, for Class A, B, C and Y, respectively, multiplied by the average account value over the period, multiplied by the number of days in the most recent fiscal half-year, divided by 365 (to reflect the half-year period). |
| 12
UNDERSTANDING FUND EXPENSES
| | | | | | | | | | | | |
| LOOMIS SAYLES HIGH INCOME FUND | | BEGINNING ACCOUNT VALUE
4/1/2010 | | | ENDING ACCOUNT VALUE
9/30/2010 | | | EXPENSES PAID DURING PERIOD*
4/1/2010 – 9/30/2010 | |
Class A | | | | | | | | | | | | |
Actual | | | $1,000.00 | | | | $1,052.10 | | | | $5.92 | |
Hypothetical (5% return before expenses) | | | $1,000.00 | | | | $1,019.30 | | | | $5.82 | |
Class B | | | | | | | | | | | | |
Actual | | | $1,000.00 | | | | $1,047.90 | | | | $9.75 | |
Hypothetical (5% return before expenses) | | | $1,000.00 | | | | $1,015.54 | | | | $9.60 | |
Class C | | | | | | | | | | | | |
Actual | | | $1,000.00 | | | | $1,050.20 | | | | $9.77 | |
Hypothetical (5% return before expenses) | | | $1,000.00 | | | | $1,015.54 | | | | $9.60 | |
Class Y | | | | | | | | | | | | |
Actual | | | $1,000.00 | | | | $1,053.40 | | | | $4.63 | |
Hypothetical (5% return before expenses) | | | $1,000.00 | | | | $1,020.56 | | | | $4.56 | |
| * | Expenses are equal to the Fund’s annualized expense ratio (after waiver/reimbursement): 1.15%, 1.90%, 1.90% and 0.90%, for Class A, B, C and Y, respectively, multiplied by the average account value over the period, multiplied by the number of days in the most recent fiscal half-year, divided by 365 (to reflect the half-year period). |
| | | | | | | | | | | | |
| LOOMIS SAYLES INTERNATIONAL BOND FUND | | BEGINNING ACCOUNT VALUE
4/1/2010 | | | ENDING ACCOUNT VALUE
9/30/2010 | | | EXPENSES PAID DURING PERIOD*
4/1/2010 – 9/30/2010 | |
Class A | | | | | | | | | | | | |
Actual | | | $1,000.00 | | | | $1,088.20 | | | | $5.76 | |
Hypothetical (5% return before expenses) | | | $1,000.00 | | | | $1,019.55 | | | | $5.57 | |
Class C | | | | | | | | | | | | |
Actual | | | $1,000.00 | | | | $1,083.70 | | | | $9.66 | |
Hypothetical (5% return before expenses) | | | $1,000.00 | | | | $1,015.79 | | | | $9.35 | |
Class Y | | | | | | | | | | | | |
Actual | | | $1,000.00 | | | | $1,089.50 | | | | $4.45 | |
Hypothetical (5% return before expenses) | | | $1,000.00 | | | | $1,020.81 | | | | $4.31 | |
| * | Expenses are equal to the Fund’s annualized expense ratio (after waiver/reimbursement): 1.10%, 1.85% and 0.85%, for Class A, C and Y, respectively, multiplied by the average account value over the period, multiplied by the number of days in the most recent fiscal half-year, divided by 365 (to reflect the half-year period). |
13 |
UNDERSTANDING FUND EXPENSES
| | | | | | | | | | | | |
LOOMIS SAYLES LIMITED TERM
GOVERNMENT AND AGENCY FUND | | BEGINNING ACCOUNT VALUE
4/1/2010 | | | ENDING ACCOUNT VALUE
9/30/2010 | | | EXPENSES PAID DURING PERIOD*
4/1/2010 – 9/30/2010 | |
Class A | | | | | | | | | | | | |
Actual | | | $1,000.00 | | | | $1,027.70 | | | | $4.42 | |
Hypothetical (5% return before expenses) | | | $1,000.00 | | | | $1,020.71 | | | | $4.41 | |
Class B | | | | | | | | | | | | |
Actual | | | $1,000.00 | | | | $1,023.00 | | | | $8.22 | |
Hypothetical (5% return before expenses) | | | $1,000.00 | | | | $1,016.95 | | | | $8.19 | |
Class C | | | | | | | | | | | | |
Actual | | | $1,000.00 | | | | $1,023.80 | | | | $8.22 | |
Hypothetical (5% return before expenses) | | | $1,000.00 | | | | $1,016.95 | | | | $8.19 | |
Class Y | | | | | | | | | | | | |
Actual | | | $1,000.00 | | | | $1,028.10 | | | | $3.15 | |
Hypothetical (5% return before expenses) | | | $1,000.00 | | | | $1,021.96 | | | | $3.14 | |
| * | Expenses are equal to the Fund’s annualized expense ratio (after waiver/reimbursement): 0.87%, 1.62%, 1.62% and 0.62%, for Class A, B, C and Y, respectively, multiplied by the average account value over the period, multiplied by the number of days in the most recent fiscal half-year, divided by 365 (to reflect the half-year period). |
| | | | | | | | | | | | |
| LOOMIS SAYLES STRATEGIC INCOME FUND | | BEGINNING ACCOUNT VALUE
4/1/2010 | | | ENDING ACCOUNT VALUE
9/30/2010 | | | EXPENSES PAID DURING PERIOD*
4/1/2010 – 9/30/2010 | |
Class A | | | | | | | | | | | | |
Actual | | | $1,000.00 | | | | $1,057.70 | | | | $5.00 | |
Hypothetical (5% return before expenses) | | | $1,000.00 | | | | $1,020.21 | | | | $4.91 | |
Class B | | | | | | | | | | | | |
Actual | | | $1,000.00 | | | | $1,053.40 | | | | $8.85 | |
Hypothetical (5% return before expenses) | | | $1,000.00 | | | | $1,016.44 | | | | $8.69 | |
Class C | | | | | | | | | | | | |
Actual | | | $1,000.00 | | | | $1,053.40 | | | | $8.85 | |
Hypothetical (5% return before expenses) | | | $1,000.00 | | | | $1,016.44 | | | | $8.69 | |
Class Y | | | | | | | | | | | | |
Actual | | | $1,000.00 | | | | $1,059.10 | | | | $3.72 | |
Hypothetical (5% return before expenses) | | | $1,000.00 | | | | $1,021.46 | | | | $3.65 | |
Admin Class | | | | | | | | | | | | |
Actual | | | $1,000.00 | | | | $1,055.70 | | | | $6.39 | |
Hypothetical (5% return before expenses) | | | $1,000.00 | | | | $1,018.85 | | �� | | $6.28 | |
| * | Expenses are equal to the Fund’s annualized expense ratio: 0.97%, 1.72%, 1.72%, 0.72% and 1.24%, for Class A, B, C, Y and Admin Class, respectively, multiplied by the average account value over the period, multiplied by the number of days in the most recent fiscal half-year, divided by 365 (to reflect the half-year period). |
| 14
BOARD APPROVAL OF THE EXISTING ADVISORY AGREEMENTS
The Board of Trustees, including the Independent Trustees, considers matters bearing on each Fund’s advisory agreement and, with respect to the Loomis Sayles Core Plus Bond Fund, its Advisory Administration Agreement (collectively, the “Agreements”) at most of its meetings throughout the year. Each year, usually in the spring, the Contract Review and Governance Committee of the Board meets to review the Agreements to determine whether to recommend that the full Board approve the continuation of the Agreements, typically for an additional one-year period. After the Committee has made its recommendation, the full Board, including the Independent Trustees, determines whether to approve the continuation of the Agreements.
In connection with these meetings, the Trustees receive materials that the Funds’ investment adviser (the “Adviser”) believes to be reasonably necessary for the Trustees to evaluate the Agreements. These materials generally include, among other items, (i) information on the investment performance of the Funds and the performance of peer groups of funds and the Funds’ performance benchmarks, (ii) information on the Funds’ advisory fees and other expenses, including information comparing the Funds’ expenses to the fees charged to institutional accounts with similar strategies managed by the Adviser and to those of peer groups of funds and information about any applicable expense caps and fee “breakpoints,” (iii) sales and redemption data in respect of the Funds, (iv) information about the profitability of the Agreements to the Adviser and (v) information obtained through the completion of a questionnaire by the Adviser (the Trustees are consulted as to the information requested through that questionnaire). The Board of Trustees, including the Independent Trustees, also consider other matters such as (i) the Adviser’s financial results and financial condition, (ii) each Fund’s investment objective and strategies and the size, education and experience of the Adviser’s investment staff and its use of technology, external research and trading cost measurement tools, (iii) arrangements in respect of the distribution of the Funds’ shares and the related costs, (iv) the procedures employed to determine the value of the Funds’ assets, (v) the allocation of the Funds’ brokerage, if any, including, if applicable, allocations to brokers affiliated with the Adviser and the use of “soft” commission dollars to pay Fund expenses and to pay for research and other similar services, (vi) the resources devoted to, and the record of compliance with, the Funds’ investment policies and restrictions, policies on personal securities transactions and other compliance policies, (vii) information about amounts invested by the Funds’ portfolio managers in the Funds or in similar accounts that they manage and (viii) the general economic outlook with particular emphasis on the mutual fund industry. Throughout the process, the Trustees are afforded the opportunity to ask questions of and request additional materials from the Adviser.
In addition to the materials requested by the Trustees in connection with their annual consideration of the continuation of the Agreements, the Trustees receive materials in advance of each regular quarterly meeting of the Board of Trustees that provide detailed information about the Funds’ investment performance and the fees charged to the Funds for advisory and other services. This information generally includes, among other things, an internal performance rating for each Fund based on agreed-upon criteria, graphs showing each Fund’s performance and fee differentials against each Fund’s peer group of funds, performance ratings provided by a third-party, total return information for various periods, and third-party performance rankings for various periods comparing a Fund against its peer group. The portfolio management team for each Fund or other representatives of the Adviser make periodic presentations to the Contract Review and Governance Committee and/or the full Board of Trustees, and Funds identified as presenting possible performance concerns may be subject to more frequent board presentations and reviews. In addition, each quarter the Trustees are provided with detailed statistical information about each Fund’s portfolio. The Trustees also receive periodic updates between meetings.
The Board of Trustees most recently approved the continuation of the Agreements at their meeting held in June 2010. The Agreements were continued for a one-year period for the Funds. In considering whether to approve the continuation of the Agreements, the Board of Trustees, including the Independent Trustees, did not identify any single factor as determinative. Individual Trustees may have evaluated the information presented differently from one another, giving different weights to various factors. Matters considered by the Trustees, including the Independent Trustees, in connection with their approval of the Agreements included, but were not limited to, the factors listed below.
The nature, extent and quality of the services provided to the Funds under the Agreements. The Trustees considered the nature, extent and quality of the services provided by the Adviser and its affiliates to the Funds and the resources dedicated to the Funds by the Adviser and its affiliates, including recent or planned investments by the Adviser in additional personnel or other resources.
For each Fund, the Trustees also considered the benefits to shareholders of investing in a mutual fund that is part of a family of funds that offers shareholders the right to exchange shares of one type of fund for shares of another type of fund, and provides a variety of fund and shareholder services.
After reviewing these and related factors, the Trustees concluded, within the context of their overall conclusions regarding each of the Agreements, that the nature, extent and quality of services provided supported the renewal of the Agreements.
Investment performance of the Funds and the Adviser. As noted above, the Trustees received information about the performance of the Funds over various time periods, including information which compared the performance of the Funds to the performance of peer groups
15 |
BOARD APPROVAL OF THE EXISTING ADVISORY AGREEMENTS
of funds and the Funds’ respective performance benchmarks. In addition, the Trustees also reviewed data prepared by an independent third party which analyzed the performance of the Funds using a variety of performance metrics, including metrics which also measured the performance of the Funds on a risk adjusted basis.
With respect to each Fund, the Board concluded that the Fund’s performance or other relevant factors supported the renewal of the Agreement relating to that Fund.
The Trustees also considered the Adviser’s performance and reputation generally, the Funds’ performance as a fund family generally (as noted by certain financial publications), and the historical responsiveness of the Adviser to Trustee concerns about performance and the willingness of the Adviser to take steps intended to improve performance.
After reviewing these and related factors, the Trustees concluded, within the context of their overall conclusions regarding each of the Agreements, that the performance of the Funds and the Adviser and/or other relevant factors supported the renewal of the Agreements.
The costs of the services to be provided and profits to be realized by the Adviser and its affiliates from their respective relationships with the Funds. The Trustees considered the fees charged to the Funds for advisory services as well as the total expense levels of the Funds. This information included comparisons (provided both by management and also by an independent third party) of the Funds’ advisory fees and total expense levels to those of their peer groups and information about the advisory fees charged by the Adviser to comparable accounts (such as institutional separate accounts), as well as information about differences in such fees. In considering the fees charged to comparable accounts, the Trustees considered, among other things, management’s representations about the differences between managing mutual funds as compared to other types of accounts, including the additional resources required to effectively manage and the greater regulatory costs associated with the management of mutual fund assets. In evaluating each Fund’s advisory fee, the Trustees also took into account the demands, complexity and quality of the investment management of such Fund, as well as the need for the Adviser to offer competitive compensation and to expend additional resources as the Funds grow in size. The Trustees considered that over the past several years, management had made recommendations regarding reductions in advisory fee rates, implementation of advisory fee breakpoints and the institution of advisory fee waivers and expense caps for various Funds in the Fund family. They noted that, as of December 31, 2009, all of the Natixis Funds in this report have expense caps in place, and the Trustees considered the amounts waived or reimbursed by the Adviser under these caps. The Trustees noted that certain Funds had advisory fee rates that were above the median of a peer group of funds. The Trustees considered the circumstances that accounted for such relatively higher expenses. These factors varied from Fund to Fund, but included one or more of the following: (1) although the Fund’s advisory fee rate was above its peer group median, it is subject to an expense cap which resulted in the reduction of the advisory fee; and (2) the Fund had not yet reached asset levels at which recently added breakpoints would have an impact on fees. The Trustees also noted that the Adviser has proposed the implementation of a breakpoint in the advisory fee and a reduction in the expense cap of the Loomis Sayles Limited Term Government and Agency Fund.
The Trustees also considered the compensation directly or indirectly received or to be received by the Adviser and its affiliates from their relationships with the Funds. The Trustees reviewed information provided by management as to the profitability of the Adviser’s and its affiliates’ relationships with the Funds, and information about the allocation of expenses used to calculate profitability. They also reviewed information provided by management about the effect of distribution costs and changes in asset levels on Adviser profitability, including information regarding resources spent on distribution activities. When reviewing profitability, the Trustees also considered information about court cases in which adviser profitability was an issue, the performance of the relevant Funds, the expense levels of the Funds, whether the Adviser had implemented breakpoints and/or expense caps with respect to such Funds and the overall profit margin of the Adviser compared to other investment managers.
After reviewing these and related factors, the Trustees concluded, within the context of their overall conclusions regarding each of the Agreements, that the advisory fee charged to each of the Funds was fair and reasonable, and that the costs of these services generally and the related profitability of the Adviser and its affiliates in respect of their relationships with the Funds supported the renewal of the Agreements.
Economies of Scale. The Trustees considered the existence of any economies of scale in the provision of services by the Adviser and whether those economies are shared with the Funds through breakpoints in their investment advisory fees or other means, such as expense waivers or caps. The Trustees noted that the Loomis Sayles Strategic Income Fund is subject to a breakpoint in its advisory fee, and that the Adviser has proposed to implement a breakpoint in the advisory fee of the Loomis Sayles Limited Term Government and Agency Fund. The Trustees further noted that each of the Funds was subject to an expense cap or waiver. In considering these issues, the Trustees also took note of the costs of the services provided (both on an absolute and a relative basis) and the profitability to the Adviser and its affiliates of their relationship with the Funds, as discussed above.
After reviewing these and related factors, the Trustees concluded, within the context of their overall conclusions regarding each of the Agreements, that the extent to which economies of scale were shared with the Funds supported the renewal of the Agreements.
| 16
BOARD APPROVAL OF THE EXISTING ADVISORY AGREEMENTS
The Trustees also considered other factors, which included but were not limited to the following:
| · | | the effect of recent market and economic turmoil on the performance, asset levels and expense ratios of each Fund. |
| · | | whether each Fund has operated in accordance with its investment objective and the Fund’s record of compliance with its investment restrictions, and the compliance programs of the Funds and the Adviser. They also considered the compliance-related resources the Adviser and its affiliates were providing to the Funds. |
| · | | the nature, quality, cost and extent of administrative and shareholder services performed by the Adviser and its affiliates, both under the Agreements and under separate agreements covering administrative services. |
| · | | so-called “fallout benefits” to the Adviser, such as the engagement of affiliates of the Adviser to provide distribution, administrative and brokerage services to the Funds, and the benefits of research made available to the Adviser by reason of brokerage commissions generated by the Funds’ securities transactions. The Trustees considered the possible conflicts of interest associated with these fallout and other benefits, and the reporting, disclosure and other processes in place to disclose and monitor such possible conflicts of interest. |
| · | | the Trustees’ review and discussion of the Funds’ advisory arrangements in prior years, and management’s record of responding to Trustee concerns raised during the year and in prior years. |
Based on their evaluation of all factors that they deemed to be material, including those factors described above, and assisted by the advice of independent counsel, the Trustees, including the Independent Trustees, concluded that each of the existing Agreements should be continued through June 30, 2011.
17 |
Portfolio of Investments – as of September 30, 2010
Loomis Sayles Core Plus Bond Fund
| | | | | | | | |
Principal
Amount (‡) | | | Description | | Value (†) | |
| | | | | | | | |
| | Bonds and Notes — 92.5% of Net Assets | | | | |
| | | | ABS Car Loan — 1.6% | | | | |
| $ | 1,140,000 | | | AESOP Funding II LLC, Series 2010-2A, Class A,
3.630%, 8/20/2014, 144A | | $ | 1,169,781 | |
| | 521,294 | | | Centre Point Funding LLC, Series 2010-1A, Class 1,
5.430%, 7/20/2016, 144A | | | 551,196 | |
| | 3,865,000 | | | Chrysler Financial Lease Trust,
Series 2010-A, Class B,
3.460%, 9/16/2013, 144A | | | 3,872,462 | |
| | 790,000 | | | Hertz Vehicle Financing LLC,
Series 2009-2A, Class A1,
4.260%, 3/25/2014, 144A | | | 828,810 | |
| | | | | | | | |
| | | | | | | 6,422,249 | |
| | | | | | | | |
| | | | ABS Credit Card — 0.8% | | | | |
| | 1,700,000 | | | GE Capital Credit Card Master Note Trust,
Series 2010-3, Class A,
2.210%, 6/15/2016 | | | 1,741,704 | |
| | 1,580,000 | | | World Financial Network Credit Card Master Trust, Series 2009-D, Class A,
4.660%, 5/15/2017 | | | 1,687,204 | |
| | | | | | | | |
| | | | | | | 3,428,908 | |
| | | | | | | | |
| | | | ABS Home Equity — 0.2% | | | | |
| | 772,530 | | | Countrywide Asset-Backed Certificates,
Series 2004-S1, Class A3,
4.615%, 2/25/2035 | | | 720,789 | |
| | | | | | | | |
| | | | Aerospace & Defense — 0.1% | | | | |
| | 470,000 | | | Oshkosh Corp.,
8.250%, 3/01/2017 | | | 505,250 | |
| | | | | | | | |
| | | | Automotive — 1.6% | | | | |
| | 285,000 | | | Ford Motor Credit Co. LLC,
6.625%, 8/15/2017 | | | 303,649 | |
| | 1,990,000 | | | Ford Motor Credit Co. LLC,
7.000%, 10/01/2013 | | | 2,135,023 | |
| | 1,830,000 | | | Ford Motor Credit Co. LLC,
7.000%, 4/15/2015 | | | 1,955,502 | |
| | 975,000 | | | Ford Motor Credit Co. LLC, 8.000%, 12/15/2016 | | | 1,102,112 | |
| | 830,000 | | | Lear Corp.,
7.875%, 3/15/2018 | | | 879,800 | |
| | | | | | | | |
| | | | | | | 6,376,086 | |
| | | | | | | | |
| | | | Banking — 4.9% | | | | |
| | 1,365,000 | | | Bear Stearns Cos., Inc. (The),
6.400%, 10/02/2017 | | | 1,589,910 | |
| | 605,000 | | | Citigroup, Inc.,
6.125%, 5/15/2018 | | | 660,062 | |
| | 2,135,000 | | | Citigroup, Inc.,
6.500%, 8/19/2013 | | | 2,358,898 | |
| | 795,000 | | | Citigroup, Inc.,
8.125%, 7/15/2039 | | | 1,004,231 | |
| | 625,000 | | | Goldman Sachs Group, Inc. (The),
5.300%, 2/14/2012 | | | 657,323 | |
| | 1,815,000 | | | Goldman Sachs Group, Inc. (The),
6.750%, 10/01/2037 | | | 1,886,556 | |
| | 1,090,000 | | | JPMorgan Chase & Co.,
6.000%, 1/15/2018 | | | 1,244,757 | |
| | 2,800,000 | | | Lloyds TSB Bank PLC, MTN,
4.375%, 1/12/2015, 144A | | | 2,867,533 | |
| | 2,530,000 | | | Merrill Lynch & Co., Inc., MTN, 6.875%, 4/25/2018 | | | 2,837,891 | |
| | 960,000 | | | Morgan Stanley,
4.750%, 4/01/2014 | | | 1,002,593 | |
| | | | | | | | |
Principal
Amount (‡) | | | Description | | Value (†) | |
| | | | | | | | |
| | | | Banking — continued | | | | |
| $ | 615,000 | | | Morgan Stanley,
5.375%, 10/15/2015 | | $ | 659,889 | |
| | 100,000 | | | Morgan Stanley,
6.750%, 4/15/2011 | | | 102,998 | |
| | 3,155,000 | | | Royal Bank of Scotland PLC (The),
4.875%, 3/16/2015 | | | 3,319,284 | |
| | | | | | | | |
| | | | | | | 20,191,925 | |
| | | | | | | | |
| | | | Building Materials — 1.2% | | | | |
| | 2,520,000 | | | Holcim Capital Corp. Ltd.,
6.875%, 9/29/2039, 144A | | | 2,803,266 | |
| | 1,420,000 | | | Owens Corning, Inc.,
7.000%, 12/01/2036 | | | 1,430,034 | |
| | 795,000 | | | USG Corp.,
6.300%, 11/15/2016 | | | 689,662 | |
| | | | | | | | |
| | | | | | | 4,922,962 | |
| | | | | | | | |
| | | | Chemicals — 1.2% | | | | |
| | 520,000 | | | CF Industries, Inc.,
6.875%, 5/01/2018 | | | 559,650 | |
| | 585,000 | | | CF Industries, Inc.,
7.125%, 5/01/2020 | | | 639,844 | |
| | 1,305,000 | | | Chevron Phillips Chemical Co. LLC,
8.250%, 6/15/2019, 144A | | | 1,651,627 | |
| | 740,000 | | | LBI Escrow Corp.,
8.000%, 11/01/2017, 144A | | | 808,450 | |
| | 1,330,000 | | | RPM International, Inc.,
6.125%, 10/15/2019 | | | 1,445,673 | |
| | | | | | | | |
| | | | | | | 5,105,244 | |
| | | | | | | | |
| | | | Commercial Mortgage-Backed Securities — 7.5% | |
| | 332,502 | | | Banc of America Commercial Mortgage, Inc., Series 2005-6, Class A2,
5.165%, 9/10/2047 | | | 333,416 | |
| | 1,305,000 | | | Banc of America Commercial Mortgage, Inc., Series 2007-2, Class A2,
5.634%, 4/10/2049 | | | 1,355,273 | |
| | 2,680,000 | | | Banc of America Commercial Mortgage, Inc., Series 2007-5, Class A4,
5.492%, 2/10/2051 | | | 2,805,846 | |
| | 850,000 | | | Banc of America Commercial Mortgage, Inc., Series 2006-1, Class A2,
5.334%, 9/10/2045 | | | 857,304 | |
| | 2,970,000 | | | Bear Stearns Commercial Mortgage Securities, Inc., Series 2007-PW15, Class A4,
5.331%, 2/11/2044 | | | 3,056,030 | |
| | 799,933 | | | Bear Stearns Commercial Mortgage Securities, Inc., Series 2005-PW10, Class A2,
5.270%, 12/11/2040 | | | 800,895 | |
| | 1,200,000 | | | Bear Stearns Commercial Mortgage Securities, Inc., Series 2007-PW16, Class A2,
5.665%, 6/11/2040(b) | | | 1,255,622 | |
| | 690,000 | | | Citigroup Commercial Mortgage Trust,
Series 2007-C6, Class A4,
5.698%, 12/10/2049(b) | | | 738,696 | |
| | 1,000,000 | | | Citigroup Commercial Mortgage Trust, Series 2008-C7, Class A4,
6.091%, 12/10/2049(b) | | | 1,073,109 | |
| | 428,247 | | | Citigroup/Deutsche Bank Commercial Mortgage Trust, Series 2006-CD2, Class A2,
5.408%, 1/15/2046 | | | 431,442 | |
| | 1,570,424 | | | Greenwich Capital Commercial Funding Corp., Series 2005-GG5, Class A2,
5.117%, 4/10/2037 | | | 1,588,171 | |
See accompanying notes to financial statements.
| 18
Portfolio of Investments – as of September 30, 2010
Loomis Sayles Core Plus Bond Fund – (continued)
| | | | | | | | |
Principal
Amount (‡) | | | Description | | Value (†) | |
| | | | | | | | |
| | | | Commercial Mortgage-Backed Securities — continued | |
| $ | 960,000 | | | Greenwich Capital Commercial Funding Corp., Series 2006-GG7, Class A4,
5.883%, 7/10/2038(b) | | $ | 1,051,837 | |
| | 2,839,000 | | | GS Mortgage Securities Corp. II,
Series 2006-GG6, Class A4,
5.553%, 4/10/2038 | | | 3,056,854 | |
| | 1,140,000 | | | GS Mortgage Securities Corp. II,
Series 2006-GG8, Class A4,
5.560%, 11/10/2039 | | | 1,214,225 | |
| | 1,375,000 | | | JPMorgan Chase Commercial Mortgage Securities Corp., Series 2006-LDP7, Class A4,
5.872%, 4/15/2045(b) | | | 1,524,321 | |
| | 2,650,000 | | | JPMorgan Chase Commercial Mortgage Securities Corp., Series 2007-CB18, Class A4,
5.440%, 6/12/2047 | | | 2,777,700 | |
| | 1,710,000 | | | LB-UBS Commercial Mortgage Trust,
Series 2005-C3, Class A3,
4.647%, 7/15/2030 | | | 1,751,839 | |
| | 540,000 | | | Merrill Lynch/Countrywide Commercial Mortgage Trust, Series 2007-6, Class A4,
5.485%, 3/12/2051 | | | 541,791 | |
| | 900,000 | | | Morgan Stanley Capital I,
Series 2007-T27, Class A4,
5.649%, 6/11/2042(b) | | | 998,286 | |
| | 1,175,000 | | | Morgan Stanley Capital I,
Series 2008-T29, Class A4,
6.280%, 1/11/2043(b) | | | 1,340,867 | |
| | 2,070,000 | | | Wachovia Bank Commercial Mortgage Trust, Series 2006-C29, Class A4,
5.308%, 11/15/2048 | | | 2,229,223 | |
| | | | | | | | |
| | | | | | | 30,782,747 | |
| | | | | | | | |
| | | | Construction Machinery — 0.3% | | | | |
| | 1,010,000 | | | Case New Holland, Inc.,
7.750%, 9/01/2013 | | | 1,097,113 | |
| | | | | | | | |
| | | | Consumer Cyclical Services — 0.4% | | | | |
| | 1,450,000 | | | Expedia, Inc.,
5.950%, 8/15/2020, 144A | | | 1,466,313 | |
| | | | | | | | |
| | | | Diversified Manufacturing — 0.3% | | | | |
| | 1,200,000 | | | Crane Co.,
6.550%, 11/15/2036(c) | | | 1,304,832 | |
| | | | | | | | |
| | | | Electric — 1.4% | | | | |
| | 290,000 | | | AES Corp. (The), 7.750%, 10/15/2015 | | | 310,300 | |
| | 570,000 | | | AES Corp. (The),
8.000%, 10/15/2017 | | | 615,600 | |
| | 1,765,000 | | | AES Corp. (The),
8.000%, 6/01/2020 | | | 1,915,025 | |
| | 110,000 | | | CMS Energy Corp.,
8.750%, 6/15/2019 | | | 131,342 | |
| | 915,000 | | | Dubai Electricity & Water Authority,
8.500%, 4/22/2015, 144A | | | 984,999 | |
| | 690,000 | | | IPALCO Enterprises, Inc.,
7.250%, 4/01/2016, 144A | | | 741,750 | |
| | 1,100,000 | | | TransAlta Corp.,
6.500%, 3/15/2040 | | | 1,193,576 | |
| | | | | | | | |
| | | | | | | 5,892,592 | |
| | | | | | | | |
| | | | Food & Beverage — 2.1% | | | | |
| | 760,000 | | | Anheuser-Busch Cos., Inc.,
4.500%, 4/01/2018 | | | 816,369 | |
| | 1,660,000 | | | Corn Products International, Inc.,
4.625%, 11/01/2020 | | | 1,698,112 | |
| | | | | | | | |
Principal
Amount (‡) | | | Description | | Value (†) | |
| | | | | | | | |
| | | | Food & Beverage — continued | | | | |
| $ | 2,235,000 | | | Del Monte Corp.,
7.500%, 10/15/2019 | | $ | 2,411,006 | |
| | 1,420,000 | | | Dr Pepper Snapple Group, Inc.,
6.820%, 5/01/2018 | | | 1,756,888 | |
| | 1,410,000 | | | Smithfield Foods, Inc.,
10.000%, 7/15/2014, 144A | | | 1,621,500 | |
| | 255,000 | | | TreeHouse Foods, Inc.,
7.750%, 3/01/2018 | | | 274,125 | |
| | | | | | | | |
| | | | | | | 8,578,000 | |
| | | | | | | | |
| | | | Government Owned — No Guarantee — 1.3% | | | | |
| | 2,535,000 | | | Petrobras International Finance Co.,
6.875%, 1/20/2040 | | | 2,901,921 | |
| | 1,375,000 | | | Qtel International Finance Ltd.,
7.875%, 6/10/2019, 144A | | | 1,663,768 | |
| | 545,000 | | | Taqa Abu Dhabi National Energy,
6.250%, 9/16/2019, 144A | | | 578,819 | |
| | | | | | | | |
| | | | | | | 5,144,508 | |
| | | | | | | | |
| | | | Healthcare — 0.7% | | | | |
| | 575,000 | | | HCA, Inc.,
7.500%, 12/15/2023 | | | 540,500 | |
| | 935,000 | | | HCA, Inc.,
9.125%, 11/15/2014 | | | 985,256 | |
| | 670,000 | | | Medco Health Solutions,
7.250%, 8/15/2013 | | | 773,957 | |
| | 590,000 | | | Omnicare, Inc.,
7.750%, 6/01/2020 | | | 603,275 | |
| | | | | | | | |
| | | | | | | 2,902,988 | |
| | | | | | | | |
| | | | Hybrid ARMs — 0.3% | | | | |
| | 744,506 | | | FHLMC,
5.971%, 11/01/2036(b) | | | 794,925 | |
| | 373,177 | | | FNMA,
6.000%, 2/01/2037(b) | | | 398,473 | |
| | | | | | | | |
| | | | | | | 1,193,398 | |
| | | | | | | | |
| | | | Independent Energy — 0.9% | | | | |
| | 2,520,000 | | | Anadarko Petroleum Corp.,
6.375%, 9/15/2017 | | | 2,776,926 | |
| | 280,000 | | | Williams Cos., Inc. (The),
7.750%, 6/15/2031 | | | 319,893 | |
| | 485,000 | | | Williams Cos., Inc. (The), Series A,
7.500%, 1/15/2031 | | | 548,759 | |
| | | | | | | | |
| | | | | | | 3,645,578 | |
| | | | | | | | |
| | | | Industrial Other — 0.6% | | | | |
| | 1,580,000 | | | Hutchison Whampoa International Ltd.,
5.750%, 9/11/2019, 144A | | | 1,754,963 | |
| | 760,000 | | | Timken Co. (The),
6.000%, 9/15/2014 | | | 845,061 | |
| | | | | | | | |
| | | | | | | 2,600,024 | |
| | | | | | | | |
| | | | Integrated Energy — 1.0% | | | | |
| | 300,000 | | | BP AMI Leasing, Inc.,
5.523%, 5/08/2019, 144A | | | 320,376 | |
| | 3,880,000 | | | BP Capital Markets PLC,
4.500%, 10/01/2020 | | | 3,967,746 | |
| | | | | | | | |
| | | | | | | 4,288,122 | |
| | | | | | | | |
| | | | Lodging — 0.3% | | | | |
| | 500,000 | | | Royal Caribbean Cruises Ltd.,
7.250%, 6/15/2016 | | | 520,000 | |
| | 510,000 | | | Royal Caribbean Cruises Ltd.,
11.875%, 7/15/2015 | | | 618,375 | |
| | | | | | | | |
| | | | | | | 1,138,375 | |
| | | | | | | | |
See accompanying notes to financial statements.
19 |
Portfolio of Investments – as of September 30, 2010
Loomis Sayles Core Plus Bond Fund – (continued)
| | | | | | | | |
Principal
Amount (‡) | | | Description | | Value (†) | |
| | | | | | | | |
| | | | Media Cable — 1.0% | | | | |
| $ | 900,000 | | | Cablevision Systems Corp.,
7.750%, 4/15/2018 | | $ | 951,750 | |
| | 610,000 | | | Cablevision Systems Corp.,
8.000%, 4/15/2020 | | | 656,513 | |
| | 410,000 | | | Cox Communications, Inc.,
5.450%, 12/15/2014 | | | 463,800 | |
| | 755,000 | | | Cox Communications, Inc.,
6.750%, 3/15/2011 | | | 775,117 | |
| | 1,050,000 | | | Time Warner Cable, Inc., 8.250%, 4/01/2019 | | | 1,355,631 | |
| | | | | | | | |
| | | | | | | 4,202,811 | |
| | | | | | | | |
| | | | Media Non-Cable — 0.6% | | | | |
| | 1,375,000 | | | Inmarsat Finance PLC,
7.375%, 12/01/2017, 144A | | | 1,436,875 | |
| | 310,000 | | | Lamar Media Corp.,
7.875%, 4/15/2018 | | | 325,500 | |
| | 600,000 | | | Myriad International Holding BV,
6.375%, 7/28/2017, 144A | | | 621,360 | |
| | | | | | | | |
| | | | | | | 2,383,735 | |
| | | | | | | | |
| | | | Metals & Mining — 1.9% | | | | |
| | 765,000 | | | AK Steel Corp.,
7.625%, 5/15/2020 | | | 774,562 | |
| | 2,655,000 | | | Alcoa, Inc.,
6.150%, 8/15/2020 | | | 2,729,725 | |
| | 1,615,000 | | | ArcelorMittal,
7.000%, 10/15/2039 | | | 1,649,839 | |
| | 915,000 | | | ArcelorMittal,
9.850%, 6/01/2019 | | | 1,176,055 | |
| | 710,000 | | | United States Steel Corp.,
6.650%, 6/01/2037 | | | 630,125 | |
| | 640,000 | | | United States Steel Corp.,
7.375%, 4/01/2020 | | | 667,200 | |
| | | | | | | | |
| | | | | | | 7,627,506 | |
| | | | | | | | |
| | | | Mortgage Related — 13.0% | | | | |
| | 554,934 | | | FHLMC,
4.000%, 7/01/2019 | | | 587,735 | |
| | 1,297,448 | | | FHLMC,
4.500%, 12/01/2034 | | | 1,363,754 | |
| | 5,463,974 | | | FHLMC,
5.000%, with various maturities from 2018 to 2040(d) | | | 5,748,130 | |
| | 7,083,980 | | | FHLMC,
5.500%, with various maturities from 2018 to 2038(d) | | | 7,531,424 | |
| | 108,295 | | | FHLMC,
6.000%, 6/01/2035 | | | 118,676 | |
| | 475,345 | | | FNMA,
4.000%, 6/01/2019 | | | 503,442 | |
| | 6,992,435 | | | FNMA,
4.500%, with various maturities from 2019 to 2039(d) | | | 7,354,739 | |
| | 10,764,770 | | | FNMA,
5.500%, with various maturities from 2018 to 2039(d) | | | 11,523,413 | |
| | 4,405,326 | | | FNMA,
6.000%, with various maturities from 2016 to 2039(d) | | | 4,785,298 | |
| | 253,644 | | | FNMA,
6.500%, with various maturities from 2029 to 2036(d) | | | 282,055 | |
| | 143,862 | | | FNMA,
7.000%, with various maturities in 2030(d) | | | 163,317 | |
| | | | | | | | |
Principal
Amount (‡) | | | Description | | Value (†) | |
| | | | | | | | |
| | | | Mortgage Related — continued | | | | |
| $ | 147,116 | | | FNMA,
7.500%, with various maturities from 2024 to 2032(d) | | $ | 167,913 | |
| | 3,705,004 | | | GNMA,
5.000%, with various maturities from 2035 to 2038(d) | | | 3,961,363 | |
| | 6,583,565 | | | GNMA,
5.500%, with various maturities from 2034 to 2039(d) | | | 7,091,218 | |
| | 1,449,680 | | | GNMA,
6.000%, with various maturities from 2029 to 2037(d) | | | 1,578,177 | |
| | 322,741 | | | GNMA,
6.500%, with various maturities from 2028 to 2032(d) | | | 361,327 | |
| | 255,181 | | | GNMA,
7.000%, with various maturities from 2025 to 2029(d) | | | 290,715 | |
| | 95,301 | | | GNMA,
7.500%, with various maturities from 2025 to 2030(d) | | | 108,792 | |
| | 43,168 | | | GNMA,
8.000%, 11/15/2029 | | | 51,024 | |
| | 85,193 | | | GNMA,
8.500%, with various maturities from 2017 to 2023(d) | | | 98,396 | |
| | 14,707 | | | GNMA,
9.000%, with various maturities in 2016(d) | | | 16,111 | |
| | 28,688 | | | GNMA,
11.500%, with various maturities from 2013 to 2015(d) | | | 28,977 | |
| | | | | | | | |
| | | | | | | 53,715,996 | |
| | | | | | | | |
| | | | Non-Captive Consumer — 0.8% | | | | |
| | 735,000 | | | HSBC Finance Corp.,
7.000%, 5/15/2012 | | | 794,799 | |
| | 325,000 | | | SLM Corp., MTN,
5.050%, 11/14/2014 | | | 309,491 | |
| | 350,000 | | | SLM Corp., Series A, MTN,
5.000%, 10/01/2013 | | | 342,994 | |
| | 30,000 | | | SLM Corp., Series A, MTN,
5.000%, 4/15/2015 | | | 28,760 | |
| | 120,000 | | | SLM Corp., Series A, MTN,
5.000%, 6/15/2018 | | | 95,701 | |
| | 55,000 | | | SLM Corp., Series A, MTN,
5.375%, 1/15/2013 | | | 55,449 | |
| | 35,000 | | | SLM Corp., Series A, MTN,
5.375%, 5/15/2014 | | | 34,057 | |
| | 420,000 | | | SLM Corp., Series A, MTN,
5.625%, 8/01/2033 | | | 322,968 | |
| | 1,135,000 | | | SLM Corp., Series A, MTN,
8.450%, 6/15/2018 | | | 1,146,423 | |
| | | | | | | | |
| | | | | | | 3,130,642 | |
| | | | | | | | |
| | | | Non-Captive Diversified — 2.7% | | | | |
| | 2,472,000 | | | Ally Financial, Inc.,
6.625%, 5/15/2012 | | | 2,558,520 | |
| | 1,211,000 | | | Ally Financial, Inc.,
8.000%, 11/01/2031 | | | 1,298,797 | |
| | 1,105,000 | | | Ally Financial, Inc.,
8.300%, 2/12/2015, 144A | | | 1,204,450 | |
| | 1,275,000 | | | GATX Corp.,
4.750%, 5/15/2015 | | | 1,363,226 | |
| | 3,580,000 | | | General Electric Capital Corp., Series A, GMTN,
6.150%, 8/07/2037 | | | 3,749,123 | |
See accompanying notes to financial statements.
| 20
Portfolio of Investments – as of September 30, 2010
Loomis Sayles Core Plus Bond Fund – (continued)
| | | | | | | | |
Principal
Amount (‡) | | | Description | | Value (†) | |
| | | | | | | | |
| | | | Non-Captive Diversified — continued | | | | |
| $ | 205,000 | | | International Lease Finance Corp.,
6.375%, 3/25/2013 | | $ | 206,025 | |
| | 120,000 | | | International Lease Finance Corp., Series R, MTN,
5.300%, 5/01/2012 | | | 120,300 | |
| | 40,000 | | | International Lease Finance Corp., Series R, MTN,
5.550%, 9/05/2012 | | | 40,050 | |
| | 200,000 | | | International Lease Finance Corp., Series R, MTN,
5.625%, 9/20/2013 | | | 196,250 | |
| | 285,000 | | | International Lease Finance Corp., Series R, MTN,
5.650%, 6/01/2014 | | | 276,450 | |
| | | | | | | | |
| | | | | | | 11,013,191 | |
| | | | | | | | |
| | | | Oil Field Services — 2.4% | | | | |
| | 2,270,000 | | | Pan American Energy LLC,
7.875%, 5/07/2021, 144A | | | 2,366,475 | |
| | 1,875,000 | | | Parker Drilling Co.,
9.125%, 4/01/2018, 144A | | | 1,903,125 | |
| | 1,420,000 | | | Rowan Cos., Inc.,
5.000%, 9/01/2017 | | | 1,467,028 | |
| | 3,845,000 | | | Transocean, Inc.,
4.950%, 11/15/2015 | | | 3,998,300 | |
| | | | | | | | |
| | | | | | | 9,734,928 | |
| | | | | | | | |
| | | | Paper — 1.1% | | | | |
| | 1,215,000 | | | Celulosa Arauco y Constitucion SA,
5.000%, 1/21/2021, 144A | | | 1,230,823 | |
| | 565,000 | | | Georgia-Pacific LLC,
7.375%, 12/01/2025 | | | 584,775 | |
| | 1,470,000 | | | Georgia-Pacific LLC,
7.750%, 11/15/2029 | | | 1,543,500 | |
| | 735,000 | | | Georgia-Pacific LLC,
8.000%, 1/15/2024 | | | 825,037 | |
| | 365,000 | | | Georgia-Pacific LLC,
8.875%, 5/15/2031 | | | 416,100 | |
| | | | | | | | |
| | | | | | | 4,600,235 | |
| | | | | | | | |
| | | | Pharmaceuticals — 1.0% | | | | |
| | 825,000 | | | Mylan, Inc.,
7.875%, 7/15/2020, 144A | | | 883,781 | |
| | 600,000 | | | Valeant Pharmaceuticals International,
6.750%, 10/01/2017, 144A | | | 612,000 | |
| | 2,165,000 | | | Valeant Pharmaceuticals International,
7.625%, 3/15/2020, 144A | | | 2,749,550 | |
| | | | | | | | |
| | | | | | | 4,245,331 | |
| | | | | | | | |
| | | | Pipelines — 0.6% | | | | |
| | 285,000 | | | Energy Transfer Partners LP,
6.625%, 10/15/2036 | | | 307,912 | |
| | 500,000 | | | Energy Transfer Partners LP,
7.500%, 7/01/2038 | | | 589,987 | |
| | 985,000 | | | ONEOK Partners LP,
8.625%, 3/01/2019 | | | 1,277,374 | |
| | 435,000 | | | Southern Natural Gas Co.,
7.350%, 2/15/2031 | | | 487,591 | |
| | | | | | | | |
| | | | | | | 2,662,864 | |
| | | | | | | | |
| | | | Property & Casualty Insurance — 0.3% | | | | |
| | 475,000 | | | Willis North America, Inc.,
6.200%, 3/28/2017 | | | 506,148 | |
| | 555,000 | | | Willis North America, Inc.,
7.000%, 9/29/2019 | | | 610,077 | |
| | | | | | | | |
| | | | | | | 1,116,225 | |
| | | | | | | | |
| | | | | | | | |
Principal
Amount (‡) | | | Description | | Value (†) | |
| | | | | | | | |
| | | | Refining — 0.9% | | | | |
| $ | 1,895,000 | | | Coffeyville Resources LLC/Coffeyville Finance, Inc.,
10.875%, 4/01/2017, 144A | | $ | 1,999,225 | |
| | 1,550,000 | | | Motiva Enterprises LLC,
6.850%, 1/15/2040, 144A | | | 1,857,734 | |
| | | | | | | | |
| | | | | | | 3,856,959 | |
| | | | | | | | |
| | | | Sovereigns — 1.8% | | | | |
| | 865,000(††) | | | Mexican Fixed Rate Bonds, Series M-10,
7.750%, 12/14/2017, (MXN) | | | 7,565,700 | |
| | | | | | | | |
| | | | Technology — 4.2% | | | | |
| | 965,000 | | | Amkor Technology, Inc.,
7.375%, 5/01/2018, 144A | | | 977,063 | |
| | 1,895,000 | | | Amphenol Corp.,
4.750%, 11/15/2014 | | | 2,055,918 | |
| | 905,000 | | | Brocade Communications Systems, Inc., 6.625%, 1/15/2018 | | | 941,200 | |
| | 290,000 | | | Brocade Communications Systems, Inc.,
6.875%, 1/15/2020 | | | 304,500 | |
| | 1,360,000 | | | Corning, Inc.,
7.250%, 8/15/2036 | | | 1,559,607 | |
| | 440,000 | | | Equifax, Inc.,
7.000%, 7/01/2037 | | | 498,983 | |
| | 2,050,000 | | | Fidelity National Information Services, Inc.,
7.625%, 7/15/2017, 144A | | | 2,188,375 | |
| | 445,000 | | | Fidelity National Information Services, Inc.,
7.875%, 7/15/2020, 144A | | | 479,488 | |
| | 2,230,000 | | | Fiserv, Inc.,
3.125%, 10/01/2015 | | | 2,263,423 | |
| | 1,180,000 | | | Fiserv, Inc.,
6.125%, 11/20/2012 | | | 1,287,725 | |
| | 700,000 | | | Jabil Circuit, Inc.,
7.750%, 7/15/2016 | | | 767,375 | |
| | 85,000 | | | Motorola, Inc.,
6.500%, 9/01/2025 | | | 92,505 | |
| | 535,000 | | | Motorola, Inc.,
6.500%, 11/15/2028 | | | 568,044 | |
| | 410,000 | | | Motorola, Inc.,
6.625%, 11/15/2037 | | | 438,445 | |
| | 340,000 | | | Motorola, Inc.,
7.500%, 5/15/2025 | | | 403,213 | |
| | 1,775,000 | | | National Semiconductor Corp.,
3.950%, 4/15/2015 | | | 1,861,996 | |
| | 290,000 | | | STATS ChipPAC Ltd.,
7.500%, 8/12/2015, 144A | | | 312,475 | |
| | 279,000 | | | Xerox Corp.,
5.500%, 5/15/2012 | | | 296,860 | |
| | | | | | | | |
| | | | | | | 17,297,195 | |
| | | | | | | | |
| | | | Textile — 0.4% | | | | |
| | 1,515,000 | | | Hanesbrands, Inc.,
8.000%, 12/15/2016 | | | 1,600,219 | |
| | | | | | | | |
| | | | Tobacco — 0.7% | | | | |
| | 2,600,000 | | | Reynolds American, Inc.,
7.250%, 6/15/2037 | | | 2,729,589 | |
| | | | | | | | |
| | | | Transportation Services — 0.6% | | | | |
| | 2,470,000 | | | Erac USA Finance Co.,
5.250%, 10/01/2020, 144A | | | 2,638,192 | |
| | | | | | | | |
| | | | Treasuries — 22.4% | | | | |
| | 3,980,000 | | | Canadian Government,
2.000%, 9/01/2012, (CAD) | | | 3,913,970 | |
| | 4,865,000 | | | New Zealand Government Bond,
6.000%, 12/15/2017, (NZD) | | | 3,838,801 | |
| | 3,680,000 | | | U. S. Treasury Bond,
0.875%, 4/30/2011 | | | 3,693,944 | |
See accompanying notes to financial statements.
21 |
Portfolio of Investments – as of September 30, 2010
Loomis Sayles Core Plus Bond Fund – (continued)
| | | | | | | | |
Principal
Amount (‡) | | | Description | | Value (†) | |
| | | | | | | | |
| | | | Treasuries — continued | | | | |
| $ | 16,340,000 | | | U.S. Treasury Bond,
4.375%, 5/15/2040 | | $ | 18,351,944 | |
| | 370,000 | | | U.S. Treasury Bond,
4.625%, 2/15/2040 | | | 432,322 | |
| | 5,710,000 | | | U.S. Treasury Note,
0.375%, 9/30/2012 | | | 5,703,753 | |
| | 3,555,000 | | | U.S. Treasury Note,
0.875%, 5/31/2011 | | | 3,570,553 | |
| | 3,310,000 | | | U.S. Treasury Note,
1.875%, 6/15/2012 | | | 3,394,948 | |
| | 11,810,000 | | | U.S. Treasury Note,
1.875%, 8/31/2017 | | | 11,799,855 | |
| | 1,000,000 | | | U.S. Treasury Note,
2.625%, 6/30/2014 | | | 1,064,609 | |
| | 2,420,000 | | | U.S. Treasury Note,
3.125%, 1/31/2017 | | | 2,622,297 | |
| | 13,855,000 | | | U.S. Treasury Note,
3.125%, 5/15/2019 | | | 14,722,018 | |
| | 6,295,000 | | | U.S. Treasury Note,
3.250%, 7/31/2016 | | | 6,889,582 | |
| | 5,450,000 | | | U.S. Treasury Note,
3.500%, 5/15/2020 | | | 5,915,812 | |
| | 1,345,000 | | | U.S. Treasury Note,
3.625%, 8/15/2019 | | | 1,479,080 | |
| | 1,060,000 | | | U.S. Treasury Note,
3.750%, 11/15/2018 | | | 1,184,219 | |
| | 2,160,000 | | | U.S. Treasury Note,
4.375%, 12/15/2010 | | | 2,178,479 | |
| | 1,355,000 | | | U.S. Treasury Note,
4.625%, 2/15/2017 | | | 1,592,761 | |
| | | | | | | | |
| | | | | | | 92,348,947 | |
| | | | | | | | |
| | | | Wireless — 3.1% | | | | |
| | 1,070,000 | | | American Tower Corp.,
4.625%, 4/01/2015 | | | 1,141,122 | |
| | 2,615,000 | | | CC Holdings GS V LLC/Crown Castle GS III Corp.,
7.750%, 5/01/2017, 144A | | | 2,889,575 | |
| | 200,000 | | | Indosat Palapa Co. BV,
7.375%, 7/29/2020, 144A | | | 220,500 | |
| | 10,000 | | | Nextel Communications, Inc., Series D,
7.375%, 8/01/2015 | | | 10,050 | |
| | 15,000 | | | Nextel Communications, Inc., Series F,
5.950%, 3/15/2014 | | | 14,925 | |
| | 1,385,000 | | | SK Telecom Co. Ltd.,
6.625%, 7/20/2027, 144A | | | 1,633,684 | |
| | 3,945,000 | | | Sprint Capital Corp.,
6.875%, 11/15/2028 | | | 3,609,675 | |
| | 1,424,000 | | | Telemar Norte Leste SA,
5.500%, 10/23/2020, 144A | | | 1,441,800 | |
| | 100,000 | | | True Move Co. Ltd.,
10.375%, 8/01/2014, 144A | | | 105,750 | |
| | 1,520,000 | | | True Move Co. Ltd.,
10.750%, 12/16/2013, 144A | | | 1,615,000 | |
| | | | | | | | |
| | | | | | | 12,682,081 | |
| | | | | | | | |
| | | | Wirelines — 4.3% | | | | |
| | 2,795,000 | | | Axtel SAB de CV,
9.000%, 9/22/2019, 144A | | | 2,578,387 | |
| | 4,653,000 | | | Embarq Corp.,
7.995%, 6/01/2036 | | | 4,947,205 | |
| | 2,055,000 | | | Equinix, Inc.,
8.125%, 3/01/2018 | | | 2,193,712 | |
| | 1,325,000 | | | Frontier Communications Corp.,
7.875%, 4/15/2015 | | | 1,431,000 | |
| | | | | | | | |
Principal
Amount (‡) | | | Description | | Value (†) | |
| | | | | | | | |
| | | | Wirelines — continued | | | | |
| $ | 1,575,000 | | | Frontier Communications Corp.,
7.875%, 1/15/2027 | | $ | 1,590,750 | |
| | 450,000 | | | Frontier Communications Corp.,
8.250%, 4/15/2017 | | | 492,188 | |
| | 775,000 | | | Qwest Corp.,
8.875%, 3/15/2012 | | | 850,562 | |
| | 590,000 | | | Telecom Italia Capital SA,
6.000%, 9/30/2034 | | | 556,575 | |
| | 2,435,000 | | | Telecom Italia Capital SA,
7.200%, 7/18/2036 | | | 2,618,334 | |
| | 515,000 | | | Windstream Corp.,
8.125%, 9/01/2018, 144A | | | 533,025 | |
| | | | | | | | |
| | | | | | | 17,791,738 | |
| | | | | | | | |
| | | | Total Bonds and Notes
(Identified Cost $354,398,541) | | | 380,652,087 | |
| | | | | | | | |
| | Bank Loans — 0.7% | | | | |
| | | | Non-Captive Consumer — 0.7% | | | | |
| | 2,700,000 | | | AGFS Funding Company, Term Loan B,
7.250%, 4/21/2015(e) (Identified Cost $2,662,972) | | | 2,711,637 | |
| | | | | | | | |
| Shares | | | | | | |
| | Preferred Stocks — 0.1% | | | | |
| | | | Banking — 0.1% | | | | |
| | 532 | | | Ally Financial, Inc., Series G, 7.000%, 144A (Identified Cost $125,943) | | | 478,883 | |
| | | | | | | | |
Principal
Amount (‡) | | | | | | |
| | Short-Term Investments — 3.5% | | | | |
| $ | 14,625,493 | | | Tri-Party Repurchase Agreement with Fixed Income Clearing Corporation, dated 9/30/2010 at 0.000% to be repurchased at $14,625,493 on 10/01/2010 collateralized by $14,960,000 Federal Home Loan Mortgage Corp. Discount Note due 08/29/2011 valued at $14,922,600 including accrued interest (Note 2 of Notes to Financial Statements)
(Identified Cost $14,625,493) | | | 14,625,493 | |
| | | | | | | | |
| | | | | | | | |
| | | | Total Investments — 96.8%
(Identified Cost $371,812,949)(a) | | | 398,468,100 | |
| | | | Other assets less liabilities — 3.2% | | | 13,189,331 | |
| | | | | | | | |
| | | | Net Assets — 100.0% | | $ | 411,657,431 | |
| | | | | | | | |
| | | | | | | | |
| | (‡) | | | Principal amount stated in U.S. dollars unless otherwise noted. | |
| | (†) | | | See Note 2 of Notes to Financial Statements. | | | | |
| | (††) | | | Amount shown represents units. One unit represents a principal amount of 100. | |
| | (a) | | | Federal Tax Information: | | | | |
| | | | At September 30, 2010, the net unrealized appreciation on investments based on a cost of $372,838,207 for federal income tax purposes was as follows: | |
| | | | Aggregate gross unrealized appreciation for all investments in which there is an excess of value over tax cost | | $ | 26,423,181 | |
| | | | Aggregate gross unrealized depreciation for all investments in which there is an excess of tax cost over value | | | (793,288 | ) |
| | | | | | | | |
| | | | Net unrealized appreciation | | $ | 25,629,893 | |
| | | | | | | | |
| | | | | | | | |
See accompanying notes to financial statements.
| 22
Portfolio of Investments – as of September 30, 2010
Loomis Sayles Core Plus Bond Fund – (continued)
| | | | | | | | |
| | | | | | | | |
| | (b) | | | Variable rate security. Rate as of September 30, 2010 is disclosed. | |
| | (c) | | | Illiquid security. At September 30, 2010, the value of this security amounted to $1,304,832 or 0.3% of net assets. | |
| | (d) | | | The Fund’s investment in mortgage related securities of the Federal Home Loan Mortgage Corporation, Federal National Mortgage Association and Government National Mortgage Association are interests in separate pools of mortgages. All separate investments in securities of each issuer which have the same coupon rate have been aggregated for the purpose of presentation in the Portfolio of Investments. | |
| | (e) | | | Variable rate security. Rate shown represents the weighted average rate at September 30, 2010. | |
| | | | | | | | |
| | 144A | | | Securities exempt from registration under Rule 144A of the Securities Act of 1933. These securities may be resold in transactions exempt from registration, normally to qualified institutional buyers. At September 30, 2010, the total value of these securities amounted to $58,643,208 or 14.2% of net assets. | |
| | | | | | | | |
| | ABS | | | Asset-Backed Securities | | | | |
| | ARMs | | | Adjustable Rate Mortgages | | | | |
| | FHLMC | | | Federal Home Loan Mortgage Corp. | | | | |
| | FNMA | | | Federal National Mortgage Association | | | | |
| | GMTN | | | Global Medium Term Note | | | | |
| | GNMA | | | Government National Mortgage Association | | | | |
| | MTN | | | Medium Term Note | | | | |
| | | | | | | | |
| | CAD | | | Canadian Dollar | | | | |
| | MXN | | | Mexican Peso | | | | |
| | NZD | | | New Zealand Dollar | | | | |
Industry Summary at September 30, 2010 (Unaudited)
| | | | |
| Treasuries | | | 22.4 | % |
| Mortgage Related | | | 13.0 | |
| Commercial Mortgage-Backed Securities | | | 7.5 | |
| Banking | | | 5.0 | |
| Wirelines | | | 4.3 | |
| Technology | | | 4.2 | |
| Wireless | | | 3.1 | |
| Non-Captive Diversified | | | 2.7 | |
| Oil Field Services | | | 2.4 | |
| Food & Beverage | | | 2.1 | |
| Other Investments, less than 2% each | | | 26.6 | |
| Short-Term Investments | | | 3.5 | |
| | | | |
| Total Investments | | | 96.8 | |
| Other assets less liabilities | | | 3.2 | |
| | | | |
| Net Assets | | | 100.0 | % |
| | | | |
See accompanying notes to financial statements.
23 |
Portfolio of Investments – as of September 30, 2010
Loomis Sayles High Income Fund
| | | | | | | | |
Principal
Amount (‡) | | | Description | | Value (†) | |
| | | | | | | | |
| | Bonds and Notes — 87.9% of Net Assets | | | | |
| | Non-Convertible Bonds — 69.0% | | | | |
| | | | ABS Home Equity — 1.9% | | | | |
| $ | 400,000 | | | Ameriquest Mortgage Securities, Inc., Series 2005-R5, Class M2,
0.716%, 7/25/2035(b) | | $ | 286,057 | |
| | 350,000 | | | Ameriquest Mortgage Securities, Inc., Series 2005-R7, Class M1,
0.736%, 9/25/2035(b) | | | 265,329 | |
| | 325,000 | | | Ameriquest Mortgage Securities, Inc., Series 2005-R7, Class M2,
0.756%, 9/25/2035(b) | | | 175,369 | |
| | 523,564 | | | Argent Securities, Inc.,
Series 2003-W3, Class M2,
2.056%, 9/25/2033(b) | | | 349,672 | |
| | 700,000 | | | Asset Backed Funding Certificates, Series 2006-HE1, Class A2B,
0.366%, 1/25/2037(b) | | | 397,451 | |
| | 725,000 | | | GSAMP Trust, Series 2006- HE5, Class A2C,
0.406%, 8/25/2036(b) | | | 318,535 | |
| | 200,000 | | | New Century Home Equity Loan Trust, Series 2005-1, Class M3,
0.776%, 3/25/2035(b) | | | 115,833 | |
| | 300,000 | | | New Century Home Equity Loan Trust, Series 2005-2, Class M2,
0.706%, 6/25/2035(b) | | | 207,190 | |
| | 400,000 | | | Park Place Securities, Inc., Series 2004-WCW2, Class M2,
0.906%, 10/25/2034(b) | | | 301,390 | |
| | 575,000 | | | Park Place Securities, Inc., Series 2005-WCW2, Class M1,
0.756%, 7/25/2035(b) | | | 409,499 | |
| | 266,352 | | | Saxon Asset Securities Trust,
Series 2004-3, Class M2,
0.906%, 12/26/2034(b) | | | 223,328 | |
| | | | | | | | |
| | | | | | | 3,049,653 | |
| | | | | | | | |
| | | | Aerospace & Defense — 0.0% | | | | |
| | 55,000 | | | Oshkosh Corp.,
8.250%, 3/01/2017 | | | 59,125 | |
| | | | | | | | |
| | | | Airlines — 1.2% | | | | |
| | 37,277 | | | Continental Airlines Pass Through Trust,
Series 1997-4, Class B,
6.900%, 7/02/2018 | | | 36,904 | |
| | 292,405 | | | Continental Airlines Pass Through Trust,
Series 2000-2, Class A-1,
7.707%, 10/02/2022 | | | 313,604 | |
| | 506,395 | | | Continental Airlines Pass Through Trust,
Series 2001-1, Class B,
7.373%, 6/15/2017 | | | 493,735 | |
| | 178,434 | | | Continental Airlines Pass Through Trust,
Series 2007-1, Class B,
6.903%, 4/19/2022 | | | 171,297 | |
| | 726,020 | | | UAL Pass Through Trust,
Series 2009-1,
10.400%, 5/01/2018 | | | 809,513 | |
| | | | | | | | |
| | | | | | | 1,825,053 | |
| | | | | | | | |
| | | | Automotive — 2.4% | | | | |
| | 40,000 | | | ArvinMeritor, Inc.,
8.125%, 9/15/2015 | | | 40,500 | |
| | 450,000 | | | FCE Bank PLC, EMTN,
7.875%, 2/15/2011, (GBP) | | | 714,893 | |
| | 420,000 | | | Ford Motor Co.,
6.375%, 2/01/2029 | | | 388,500 | |
| | | | | | | | |
Principal
Amount (‡) | | | Description | | Value (†) | |
| | | | | | | | |
| | | | Automotive — continued | | | | |
| $ | 65,000 | | | Ford Motor Co.,
6.625%, 2/15/2028 | | $ | 61,587 | |
| | 1,220,000 | | | Ford Motor Co.,
6.625%, 10/01/2028 | | | 1,155,950 | |
| | 40,000 | | | Ford Motor Co.,
7.500%, 8/01/2026 | | | 40,000 | |
| �� | 150,000 | | | Ford Motor Credit Co. LLC,
8.000%, 12/15/2016 | | | 169,556 | |
| | 635,000 | | | Goodyear Tire & Rubber Co. (The),
7.000%, 3/15/2028 | | | 584,200 | |
| | 565,000 | | | Goodyear Tire & Rubber Co. (The),
8.250%, 8/15/2020 | | | 594,662 | |
| | | | | | | | |
| | | | | | | 3,749,848 | |
| | | | | | | | |
| | | | Banking — 2.0% | | | | |
| | 2,210,000,000 | | | Barclays Bank PLC, EMTN,
3.680%, 8/20/2015, (KRW) | | | 1,948,450 | |
| | 12,176,250,000 | | | JPMorgan Chase Bank NA, EMTN,
Zero Coupon, 10/17/2011, 144A, (IDR) | | | 1,291,160 | |
| | | | | | | | |
| | | | | | | 3,239,610 | |
| | | | | | | | |
| | | | Building Materials — 0.9% | | | | |
| | 50,000 | | | Masco Corp.,
6.500%, 8/15/2032 | | | 42,911 | |
| | 345,000 | | | Masco Corp.,
7.750%, 8/01/2029 | | | 337,658 | |
| | 985,000 | | | USG Corp.,
6.300%, 11/15/2016 | | | 854,487 | |
| | 75,000 | | | USG Corp.,
9.500%, 1/15/2018 | | | 73,594 | |
| | 65,000 | | | USG Corp.,
9.750%, 8/01/2014, 144A | | | 67,763 | |
| | | | | | | | |
| | | | | | | 1,376,413 | |
| | | | | | | | |
| | | | Chemicals — 1.1% | | | | |
| | 855,000 | | | Hercules, Inc.,
6.500%, 6/30/2029 | | | 698,963 | |
| | 400,000 | | | Hexion US Finance Corp./Hexion
Nova Scotia Finance ULC,
8.875%, 2/01/2018 | | | 392,000 | |
| | 730,000 | | | Reichhold Industries, Inc.,
9.000%, 8/15/2014, 144A(c) | | | 629,625 | |
| | | | | | | | |
| | | | | | | 1,720,588 | |
| | | | | | | | |
| | | | Collateralized Mortgage Obligations — 1.5% | | | | |
| | 404,636 | | | Adjustable Rate Mortgage Trust,
Series 2005-10, Class 5A1,
0.516%, 1/25/2036(b) | | | 244,012 | |
| | 104,043 | | | American Home Mortgage Investment Trust,
Series 2004-3, Class 3A,
2.358%, 10/25/2034(b) | | | 76,433 | |
| | 303,989 | | | GSR Mortgage Loan Trust, Series 2005-AR7,
Class 2A1,
2.876%, 11/25/2035(b) | | | 264,784 | |
| | 517,450 | | | Impac CMB Trust, Series 2005-3, Class A1,
0.496%, 8/25/2035(b) | | | 345,573 | |
| | 201,083 | | | Indymac Index Mortgage Loan Trust,
Series 2005-AR3, Class 4A1,
5.170%, 4/25/2035(b) | | | 167,694 | |
| | 681,203 | | | Lehman Mortgage Trust, Series 2005-3, Class 1A6,
0.756%, 1/25/2036(b) | | | 454,963 | |
| | 811,454 | | | Lehman XS Trust, Series 2007-10H, Class 1A11,
0.376%, 7/25/2037(b)(d) | | | 337,146 | |
See accompanying notes to financial statements.
| 24
Portfolio of Investments – as of September 30, 2010
Loomis Sayles High Income Fund – (continued)
| | | | | | | | |
Principal
Amount (‡) | | | Description | | Value (†) | |
| | | | | | | | |
| | | | Collateralized Mortgage Obligations — continued | |
| $ | 307,473 | | | Master Adjustable Rate Mortgages Trust,
Series 2005-2, Class 5A1,
3.008%, 3/25/2035(b) | | $ | 265,825 | |
| | 188,955 | | | Sequoia Mortgage Trust, Series 2007-2, Class 1A1,
0.467%, 6/20/2036(b) | | | 134,623 | |
| | | | | | | | |
| | | | | | | 2,291,053 | |
| | | | | | | | |
| | | | Commercial Mortgage-Backed Securities — 0.1% | |
| | 100,000 | | | Credit Suisse Mortgage Capital Certificates,
Series 2007-C4, Class A4,
5.805%, 9/15/2039(b) | | | 99,397 | |
| | | | | | | | |
| | | | Construction Machinery — 0.7% | | | | |
| | 1,055,000 | | | RSC Equipment Rental, Inc./RSC Holdings III LLC,
9.500%, 12/01/2014 | | | 1,093,244 | |
| | 15,000 | | | United Rentals North America, Inc.,
7.750%, 11/15/2013 | | | 15,187 | |
| | | | | | | | |
| | | | | | | 1,108,431 | |
| | | | | | | | |
| | | | Consumer Cyclical Services — 0.5% | | | | |
| | 420,000 | | | ServiceMaster Co. (The),
7.450%, 8/15/2027 | | | 319,200 | |
| | 475,000 | | | West Corp.,
8.625%, 10/01/2018, 144A | | | 475,000 | |
| | | | | | | | |
| | | | | | | 794,200 | |
| | | | | | | | |
| | | | Consumer Products — 1.5% | | | | |
| | 1,970,000 | | | Acco Brands Corp.,
7.625%, 8/15/2015 | | | 1,891,200 | |
| | 145,000 | | | NBTY, Inc.,
9.000%, 10/01/2018, 144A | | | 152,250 | |
| | 275,000 | | | Visant Corp.,
10.000%, 10/01/2017, 144A | | | 287,375 | |
| | | | | | | | |
| | | | | | | 2,330,825 | |
| | | | | | | | |
| | | | Electric — 2.0% | | | | |
| | 35,000 | | | AES Corp. (The),
8.000%, 10/15/2017 | | | 37,800 | |
| | 21,813 | | | AES Red Oak LLC, Series A,
8.540%, 11/30/2019 | | | 22,413 | |
| | 375,000 | | | Dynegy Holdings, Inc.,
7.125%, 5/15/2018 | | | 255,938 | |
| | 180,000 | | | Dynegy Holdings, Inc.,
7.625%, 10/15/2026 | | | 108,450 | |
| | 815,000 | | | Dynegy Holdings, Inc.,
7.750%, 6/01/2019 | | | 558,275 | |
| | 2,230,000 | | | Edison Mission Energy,
7.625%, 5/15/2027 | | | 1,499,675 | |
| | 140,000 | | | NGC Corp. Capital Trust I, Series B,
8.316%, 6/01/2027(c) | | | 67,200 | |
| | 195,000 | | | TXU Corp., Series P,
5.550%, 11/15/2014 | | | 104,325 | |
| | 1,015,000 | | | TXU Corp., Series Q,
6.500%, 11/15/2024 | | | 388,237 | |
| | 370,000 | | | TXU Corp., Series R,
6.550%, 11/15/2034 | | | 140,600 | |
| | | | | | | | |
| | | | | | | 3,182,913 | |
| | | | | | | | |
| | | | Food and Beverage — 0.5% | | | | |
| | 700,000 | | | Marfrig Overseas Ltd.,
9.500%, 5/04/2020, 144A | | | 742,875 | |
| | | | | | | | |
| | | | | | | | |
Principal
Amount (‡) | | | Description | | Value (†) | |
| | | | | | | | |
| | | | Gaming — 1.5% | | | | |
| $ | 420,000 | | | Harrah’s Operating Co. Inc.,
10.000%, 12/15/2018 | | $ | 335,475 | |
| | 470,000 | | | MGM Resorts International,
5.875%, 2/27/2014 | | | 401,850 | |
| | 1,870,000 | | | MGM Resorts International,
7.500%, 6/01/2016 | | | 1,580,150 | |
| | | | | | | | |
| | | | | | | 2,317,475 | |
| | | | | | | | |
| | | | Government Owned — No Guarantee — 0.2% | | | | |
| | 400,000 | | | DP World Ltd.,
6.850%, 7/02/2037, 144A | | | 374,115 | |
| | | | | | | | |
| | | | Healthcare — 3.2% | | | | |
| | 270,000 | | | Gentiva Health Services, Inc.,
11.500%, 9/01/2018, 144A | | | 288,225 | |
| | 35,000 | | | HCA, Inc.,
7.050%, 12/01/2027 | | | 30,800 | |
| | 630,000 | | | HCA, Inc.,
7.500%, 12/15/2023 | | | 592,200 | |
| | 730,000 | | | HCA, Inc.,
7.500%, 11/06/2033 | | | 669,775 | |
| | 40,000 | | | HCA, Inc.,
7.690%, 6/15/2025 | | | 37,400 | |
| | 480,000 | | | HCA, Inc.,
8.360%, 4/15/2024 | | | 470,400 | |
| | 670,000 | | | HCA, Inc., MTN,
7.580%, 9/15/2025 | | | 623,100 | |
| | 1,685,000 | | | HCA, Inc., MTN,
7.750%, 7/15/2036 | | | 1,550,200 | |
| | 1,005,000 | | | Tenet Healthcare Corp.,
6.875%, 11/15/2031 | | | 814,050 | |
| | | | | | | | |
| | | | | | | 5,076,150 | |
| | | | | | | | |
| | | | Home Construction — 2.7% | | | | |
| | 400,000 | | | Corporcion GEO SAB de CV,
9.250%, 6/30/2020, 144A | | | 453,500 | |
| | 1,790,000 | | | KB Home,
7.250%, 6/15/2018 | | | 1,678,125 | |
| | 1,925,000 | | | Pulte Group, Inc.,
6.000%, 2/15/2035 | | | 1,443,750 | |
| | 495,000 | | | Pulte Group, Inc.,
6.375%, 5/15/2033 | | | 396,000 | |
| | 380,000 | | | Pulte Group, Inc.,
7.875%, 6/15/2032 | | | 342,475 | |
| | | | | | | | |
| | | | | | | 4,313,850 | |
| | | | | | | | |
| | | | Independent Energy — 2.0% | | | | |
| | 620,000 | | | Connacher Oil and Gas Ltd.,
10.250%, 12/15/2015, 144A | | | 629,300 | |
| | 1,505,000 | | | SandRidge Energy, Inc.,
8.000%, 6/01/2018, 144A | | | 1,467,375 | |
| | 1,065,000 | | | Swift Energy Co.,
7.125%, 6/01/2017 | | | 1,054,350 | |
| | | | | | | | |
| | | | | | | 3,151,025 | |
| | | | | | | | |
| | | | Industrial Other — 0.4% | | | | |
| | 530,000 | | | Corp. Pesquera Inca SAC,
9.000%, 2/10/2017, 144A | | | 548,550 | |
| | 140,000 | | | Ranhill Labuan Ltd.,
12.500%, 10/26/2011, 144A | | | 126,000 | |
| | | | | | | | |
| | | | | | | 674,550 | |
| | | | | | | | |
| | | | Lodging — 0.1% | | | | |
| | 170,000 | | | Felcor Lodging LP,
10.000%, 10/01/2014 | | | 184,663 | |
| | | | | | | | |
See accompanying notes to financial statements.
25 |
Portfolio of Investments – as of September 30, 2010
Loomis Sayles High Income Fund – (continued)
| | | | | | | | |
Principal
Amount (‡) | | | Description | | Value (†) | |
| | | | | | | | |
| | | | Media Cable — 0.5% | | | | |
| $ | 510,000 | | | CCO Holdings LLC/CCO Holdings Capital Corp.,
7.250%, 10/30/2017, 144A | | $ | 517,012 | |
| | 325,000 | | | CCO Holdings LLC/CCO Holdings Capital Corp.,
7.875%, 4/30/2018, 144A | | | 337,188 | |
| | | | | | | | |
| | | | | | | 854,200 | |
| | | | | | | | |
| | | | Media Non-Cable — 1.6% | | | | |
| | 240,000 | | | Clear Channel Communications, Inc.,
4.400%, 5/15/2011 | | | 233,700 | |
| | 1,195,000 | | | Clear Channel Communications, Inc.,
5.000%, 3/15/2012 | | | 1,129,275 | |
| | 595,000 | | | Clear Channel Communications, Inc.,
6.250%, 3/15/2011 | | | 590,537 | |
| | 320,000 | | | Intelsat Luxembourg SA,
11.250%, 2/04/2017 | | | 342,800 | |
| | 290,000 | | | Intelsat SA,
6.500%, 11/01/2013 | | | 287,463 | |
| | | | | | | | |
| | | | | | | 2,583,775 | |
| | | | | | | | |
| | | | Metals & Mining — 0.5% | | | | |
| | 360,000 | | | Algoma Acquisition Corp.,
9.875%, 6/15/2015, 144A | | | 320,850 | |
| | 125,000 | | | United States Steel Corp.,
7.000%, 2/01/2018 | | | 127,500 | |
| | 315,000 | | | United States Steel Corp.,
7.375%, 4/01/2020 | | | 328,388 | |
| | | | | | | | |
| | | | | | | 776,738 | |
| | | | | | | | |
| | | | Non-Captive Consumer — 2.3% | | | | |
| | 220,000 | | | American General Finance Corp., MTN,
5.750%, 9/15/2016 | | | 175,450 | |
| | 200,000 | | | American General Finance Corp.,
Series H, MTN,
5.375%, 10/01/2012 | | | 189,250 | |
| | 400,000 | | | American General Finance Corp.,
Series I, MTN,
4.875%, 7/15/2012 | | | 378,000 | |
| | 500,000 | | | American General Finance Corp.,
Series I, MTN,
5.850%, 6/01/2013 | | | 461,250 | |
| | 100,000 | | | American General Finance Corp.,
Series J, MTN,
5.900%, 9/15/2012 | | | 95,500 | |
| | 200,000 | | | American General Finance Corp.,
Series J, MTN,
6.500%, 9/15/2017 | | | 158,000 | |
| | 1,400,000 | | | American General Finance Corp.,
Series J, MTN,
6.900%, 12/15/2017 | | | 1,169,000 | |
| | 735,000 | | | Residential Capital LLC,
9.625%, 5/15/2015 | | | 740,512 | |
| | 10,000 | | | SLM Corp., Series A, MTN,
5.000%, 6/15/2018 | | | 7,975 | |
| | 5,000 | | | SLM Corp., Series A, MTN,
5.625%, 8/01/2033 | | | 3,845 | |
| | 245,000 | | | SLM Corp., Series A, MTN,
8.450%, 6/15/2018 | | | 247,466 | |
| | | | | | | | |
| | | | | | | 3,626,248 | |
| | | | | | | | |
| | | | Non-Captive Diversified — 6.5% | | | | |
| | 2,955,000 | | | Ally Financial, Inc.,
7.500%, 9/15/2020, 144A | | | 3,147,075 | |
| | 139,000 | | | Ally Financial, Inc.,
8.000%, 11/01/2031 | �� | | 149,077 | |
| | 20,000 | | | CIT Group, Inc.,
7.000%, 5/01/2015 | | | 19,850 | |
| | | | | | | | |
Principal
Amount (‡) | | | Description | | Value (†) | |
| | | | | | | | |
| | | | Non-Captive Diversified — continued | | | | |
| $ | 1,880,000 | | | CIT Group, Inc.,
7.000%, 5/01/2016 | | $ | 1,851,800 | |
| | 1,525,000 | | | CIT Group, Inc.,
7.000%, 5/01/2017 | | | 1,492,594 | |
| | 1,300,000 | | | General Electric Capital Corp.,
Series A, GMTN,
2.960%, 5/18/2012, (SGD) | | | 1,000,984 | |
| | 660,000 | | | General Motors Acceptance Corp. of Canada Ltd., EMTN,
7.125%, 9/13/2011, (AUD) | | | 620,699 | |
| | 175,000 | | | International Lease Finance Corp.,
5.875%, 5/01/2013 | | | 175,000 | |
| | 335,000 | | | International Lease Finance Corp.,
8.625%, 9/15/2015, 144A | | | 358,450 | |
| | 1,105,000 | | | International Lease Finance Corp.,
8.750%, 3/15/2017, 144A | | | 1,185,112 | |
| | 165,000 | | | International Lease Finance Corp., Series Q, MTN,
5.250%, 1/10/2013 | | | 162,731 | |
| | 110,000 | | | International Lease Finance Corp., Series R, MTN,
5.625%, 9/20/2013 | | | 107,938 | |
| | 80,000 | | | iStar Financial, Inc.,
5.850%, 3/15/2017 | | | 60,600 | |
| | 10,000 | | | iStar Financial, Inc.,
5.875%, 3/15/2016 | | | 7,563 | |
| | 15,000 | | | iStar Financial, Inc., Series B,
5.950%, 10/15/2013 | | | 11,888 | |
| | | | | | | | |
| | | | | | | 10,351,361 | |
| | | | | | | | |
| | | | Oil Field Services — 1.7% | | | | |
| | 320,000 | | | Allis-Chalmers Energy, Inc.,
8.500%, 3/01/2017 | | | 321,600 | |
| | 825,000 | | | Allis-Chalmers Energy, Inc.,
9.000%, 1/15/2014 | | | 833,250 | |
| | 490,000 | | | Basic Energy Services, Inc.,
7.125%, 4/15/2016 | | | 443,450 | |
| | 350,000 | | | Compagnie Generale de Geophysique-Veritas,
9.500%, 5/15/2016 | | | 378,000 | |
| | 265,000 | | | Parker Drilling Co.,
9.125%, 4/01/2018, 144A | | | 268,975 | |
| | 385,000 | | | Pioneer Drilling Co.,
9.875%, 3/15/2018, 144A | | | 393,663 | |
| | | | | | | | |
| | | | | | | 2,638,938 | |
| | | | | | | | |
| | | | Pharmaceuticals — 0.1% | | | | |
| | 100,000 | | | Valeant Pharmaceuticals International,
7.000%, 10/01/2020, 144A | | | 102,250 | |
| | | | | | | | |
| | | | Pipelines — 1.8% | | | | |
| | 2,285,000 | | | El Paso Corp.,
6.950%, 6/01/2028 | | | 2,154,709 | |
| | 405,000 | | | El Paso Corp.,
7.420%, 2/15/2037 | | | 386,190 | |
| | 110,000 | | | El Paso Corp., GMTN,
7.800%, 8/01/2031 | | | 114,165 | |
| | | | Pipelines — continued | | | | |
| | 235,000 | | | El Paso Corp., GMTN,
8.050%, 10/15/2030 | | | 244,842 | |
| | | | | | | | |
| | | | | | | 2,899,906 | |
| | | | | | | | |
| | | | Refining — 0.5% | | | | |
| | 150,000 | | | Petroplus Finance Ltd.,
6.750%, 5/01/2014, 144A | | | 137,250 | |
| | 745,000 | | | Petroplus Finance Ltd.,
7.000%, 5/01/2017, 144A | | | 648,150 | |
| | | | | | | | |
| | | | | | | 785,400 | |
| | | | | | | | |
See accompanying notes to financial statements.
| 26
Portfolio of Investments – as of September 30, 2010
Loomis Sayles High Income Fund – (continued)
| | | | | | | | |
Principal
Amount (‡) | | | Description | | Value (†) | |
| | | | | | | | |
| | | | Retailers — 1.1% | | | | |
| $ | 250,000 | | | Dillard’s, Inc.,
6.625%, 1/15/2018 | | $ | 241,250 | |
| | 105,000 | | | Dillard’s, Inc.,
7.130%, 8/01/2018 | | | 102,638 | |
| | 279,000 | | | J.C. Penney Corp., Inc.,
6.375%, 10/15/2036 | | | 269,235 | |
| | 140,000 | | | Macy’s Retail Holdings, Inc.,
6.375%, 3/15/2037 | | | 138,600 | |
| | 30,000 | | | Macy’s Retail Holdings, Inc.,
6.790%, 7/15/2027 | | | 28,950 | |
| | 210,000 | | | Macy’s Retail Holdings, Inc.,
6.900%, 4/01/2029 | | | 212,625 | |
| | 805,000 | | | Toys R Us, Inc.,
7.375%, 10/15/2018 | | | 768,775 | |
| | | | | | | | |
| | | | | | | 1,762,073 | |
| | | | | | | | |
| | | | Sovereigns — 5.0% | | | | |
| | 150,000 | | | Ireland Government Bond,
4.500%, 10/18/2018, (EUR) | | | 179,745 | |
| | 50,000 | | | Ireland Government Bond,
5.400%, 3/13/2025, (EUR) | | | 58,845 | |
| | 502,000(††) | | | Mexican Fixed Rate Bonds, Series M-20,
8.000%, 12/07/2023, (MXN) | | | 4,530,554 | |
| | 10,000,000 | | | Philippine Government International Bond,
4.950%, 1/15/2021, (PHP) | | | 233,307 | |
| | 50,000 | | | Portugal Obrigacoes do Tesouro OT,
3.850%, 4/15/2021, (EUR) | | | 55,355 | |
| | 3,000,000 | | | Republic of Brazil,
10.250%, 1/10/2028, (BRL) | | | 1,979,610 | |
| | 7,970,000 | | | Republic of Iceland,
8.000%, 7/22/2011, (ISK) | | | 40,614 | |
| | 5,275,000 | | | Republic of Iceland,
13.750%, 12/10/2010, (ISK) | | | 26,609 | |
| | 10,439,049 | | | Uruguay Government International Bond,
3.700%, 6/26/2037, (UYU) | | | 521,394 | |
| | 4,786,965 | | | Uruguay Government International Bond,
4.250%, 4/05/2027, (UYU) | | | 257,498 | |
| | | | | | | | |
| | | | | | | 7,883,531 | |
| | | | | | | | |
| | | | Supermarkets — 1.5% | | | | |
| | 315,000 | | | American Stores Co.,
8.000%, 6/01/2026 | | | 264,994 | |
| | 750,000 | | | New Albertson’s, Inc.,
7.450%, 8/01/2029 | | | 607,500 | |
| | 955,000 | | | New Albertson’s, Inc.,
7.750%, 6/15/2026 | | | 809,362 | |
| | 130,000 | | | New Albertson’s, Inc.,
8.000%, 5/01/2031 | | | 105,950 | |
| | 15,000 | | | New Albertson’s, Inc.,
8.700%, 5/01/2030 | | | 13,200 | |
| | 735,000 | | | New Albertson’s, Inc., Series C, MTN,
6.625%, 6/01/2028 | | | 537,469 | |
| | | | | | | | |
| | | | | | | 2,338,475 | |
| | | | | | | | |
| | | | Supranational — 4.5% | | | | |
| | 2,000,000 | | | European Bank for Reconstruction & Development, GMTN,
9.250%, 9/10/2012, (BRL) | | | 1,189,716 | |
| | 17,499,000,000 | | | European Investment Bank, EMTN,
Zero Coupon, 4/24/2013, 144A, (IDR) | | | 1,688,531 | |
| | 35,340,000,000 | | | Inter-American Development Bank, EMTN,
Zero Coupon, 8/20/2015, (IDR) | | | 2,877,092 | |
| | 1,500,000,000 | | | International Bank for Reconstruction & Development, EMTN,
2.300%, 2/26/2013, (KRW) | | | 1,334,970 | |
| | | | | | | | |
| | | | | | | 7,090,309 | |
| | | | | | | | |
| | | | | | | | |
Principal
Amount (‡) | | | Description | | Value (†) | |
| | | | | | | | |
| | | | Technology — 3.8% | | | | |
| $ | 225,000 | | | Advanced Micro Devices, Inc.,
7.750%, 8/01/2020, 144A | | $ | 232,313 | |
| | 85,000 | | | Advanced Micro Devices, Inc.,
8.125%, 12/15/2017 | | | 89,675 | |
| | 1,090,000 | | | Alcatel-Lucent USA, Inc.,
6.450%, 3/15/2029 | | | 792,975 | |
| | 1,930,000 | | | Alcatel-Lucent USA, Inc.,
6.500%, 1/15/2028 | | | 1,394,425 | |
| | 805,000 | | | Amkor Technology, Inc.,
7.375%, 5/01/2018, 144A | | | 815,062 | |
| | 160,000 | | | Fidelity National Information Services, Inc.,
7.875%, 7/15/2020, 144A | | | 172,400 | |
| | 1,580,000 | | | First Data Corp.,
9.875%, 9/24/2015 | | | 1,291,650 | |
| | 240,000 | | | Freescale Semiconductor, Inc.,
8.875%, 12/15/2014 | | | 239,700 | |
| | 340,000 | | | Nortel Networks Capital Corp.,
7.875%, 6/15/2026(e) | | | 221,000 | |
| | 560,000 | | | Nortel Networks Ltd.,
6.875%, 9/01/2023(e) | | | 154,000 | |
| | 300,000 | | | STATS ChipPAC Ltd.,
7.500%, 8/12/2015, 144A | | | 323,250 | |
| | 355,000 | | | Xerox Capital Trust I,
8.000%, 2/01/2027 | | | 361,200 | |
| | | | | | | | |
| | | | | | | 6,087,650 | |
| | | | | | | | |
| | | | Textile — 0.2% | | | | |
| | 375,000 | | | Jones Apparel Group, Inc.,
6.125%, 11/15/2034 | | | 305,625 | |
| | | | | | | | |
| | | | Transportation Services — 0.5% | | | | |
| | 275,000 | | | APL Ltd.,
8.000%, 1/15/2024(c) | | | 188,375 | |
| | 640,000 | | | Overseas Shipholding Group,
7.500%, 2/15/2024 | | | 553,600 | |
| | | | | | | | |
| | | | | | | 741,975 | |
| | | | | | | | |
| | | | Treasuries — 0.0% | | | | |
| | 58,737 | | | Hellenic Republic Government Bond,
2.300%, 7/25/2030, (EUR) | | | 39,061 | |
| | | | | | | | |
| | | | Wireless — 3.4% | | | | |
| | 1,443,000 | | | Nextel Communications, Inc., Series D,
7.375%, 8/01/2015 | | | 1,450,215 | |
| | 944,000 | | | Nextel Communications, Inc., Series E,
6.875%, 10/31/2013 | | | 949,900 | |
| | 1,080,000 | | | Nextel Communications, Inc., Series F,
5.950%, 3/15/2014 | | | 1,074,600 | |
| | 2,061,000 | | | Sprint Capital Corp.,
6.875%, 11/15/2028 | | | 1,885,815 | |
| | 55,000 | | | Sprint Capital Corp.,
6.900%, 5/01/2019 | | | 55,275 | |
| | 20,000 | | | Sprint Capital Corp.,
8.750%, 3/15/2032 | | | 21,000 | |
| | | | | | | | |
| | | | | | | 5,436,805 | |
| | | | | | | | |
| | | | Wirelines — 7.1% | | | | |
| | 100,000 | | | Axtel SAB de CV,
9.000%, 9/22/2019, 144A | | | 92,250 | |
| | 900,000 | | | Bakrie Telecom Pte Ltd.,
11.500%, 5/07/2015, 144A | | | 969,750 | |
| | 130,000 | | | Cincinnati Bell Telephone Co. LLC,
6.300%, 12/01/2028 | | | 98,800 | |
| | 530,000 | | | Cincinnati Bell, Inc.,
7.000%, 2/15/2015 | | | 530,000 | |
| | 370,000 | | | Cincinnati Bell, Inc.,
8.750%, 3/15/2018 | | | 360,750 | |
See accompanying notes to financial statements.
27 |
Portfolio of Investments – as of September 30, 2010
Loomis Sayles High Income Fund – (continued)
| | | | | | | | |
Principal
Amount (‡) | | | Description | | Value (†) | |
| | | | | | | | |
| | | | Wirelines — continued | | | | |
| $ | 1,611,153 | | | FairPoint Communications, Inc.,
13.125%, 4/02/2018(e) | | $ | 118,823 | |
| | 95,000 | | | Frontier Communications Corp.,
7.000%, 11/01/2025 | | | 87,400 | |
| | 30,000 | | | Frontier Communications Corp.,
7.125%, 3/15/2019 | | | 30,750 | |
| | 1,245,000 | | | Frontier Communications Corp.,
7.875%, 1/15/2027 | | | 1,257,450 | |
| | 605,000 | | | Frontier Communications Corp.,
9.000%, 8/15/2031 | | | 645,081 | |
| | 80,000 | | | Hawaiian Telcom Communications, Inc., Series B,
12.500%, 5/01/2015(e) | | | 8 | |
| | 770,000 | | | Level 3 Financing, Inc.,
8.750%, 2/15/2017 | | | 685,300 | |
| | 495,000 | | | Level 3 Financing, Inc.,
9.250%, 11/01/2014 | | | 465,300 | |
| | 425,000 | | | Qwest Capital Funding, Inc.,
6.500%, 11/15/2018 | | | 425,000 | |
| | 1,445,000 | | | Qwest Capital Funding, Inc.,
6.875%, 7/15/2028 | | | 1,358,300 | |
| | 275,000 | | | Qwest Capital Funding, Inc.,
7.625%, 8/03/2021 | | | 277,750 | |
| | 2,860,000 | | | Qwest Capital Funding, Inc.,
7.750%, 2/15/2031 | | | 2,888,600 | |
| | 10,000 | | | Qwest Corp.,
6.875%, 9/15/2033 | | | 9,875 | |
| | 975,000 | | | Windstream Corp.,
7.875%, 11/01/2017 | | | 1,016,437 | |
| | | | | | | | |
| | | | | | | 11,317,624 | |
| | | | | | | | |
| | | | Total Non-Convertible Bonds
(Identified Cost $100,389,782) | | | 109,283,756 | |
| | | | | | | | |
| | Convertible Bonds — 18.9% | | | | |
| | | | Airlines — 0.6% | | | | |
| | 980,000 | | | UAL Corp.,
4.500%, 6/30/2021 | | | 983,920 | |
| | | | | | | | |
| | | | Automotive — 1.9% | | | | |
| | 410,000 | | | ArvinMeritor, Inc., (Step to Zero Coupon on 2/15/2019),
4.000%, 2/15/2027(f) | | | 373,100 | |
| | 1,720,000 | | | Ford Motor Co.,
4.250%, 11/15/2016 | | | 2,567,100 | |
| | | | | | | | |
| | | | | | | 2,940,200 | |
| | | | | | | | |
| | | | Diversified Manufacturing — 1.2% | | | | |
| | 410,000 | | | Owens-Brockway Glass Container, Inc.,
3.000%, 6/01/2015, 144A | | | 401,800 | |
| | 1,720,000 | | | Trinity Industries, Inc.,
3.875%, 6/01/2036 | | | 1,556,600 | |
| | | | | | | | |
| | | | | | | 1,958,400 | |
| | | | | | | | |
| | | | Healthcare — 1.9% | | | | |
| | 1,555,000 | | | Hologic, Inc., (Step to Zero Coupon on 12/15/2013),
2.000%, 12/15/2037(f) | | | 1,438,375 | |
| | 1,803,000 | | | Omnicare, Inc.,
3.250%, 12/15/2035 | | | 1,550,580 | |
| | | | | | | | |
| | | | | | | 2,988,955 | |
| | | | | | | | |
| | | | Independent Energy — 0.7% | | | | |
| | 475,000 | | | Chesapeake Energy Corp.,
2.250%, 12/15/2038 | | | 365,156 | |
| | 785,000 | | | Penn Virginia Corp.,
4.500%, 11/15/2012 | | | 765,375 | |
| | | | | | | | |
| | | | | | | 1,130,531 | |
| | | | | | | | |
| | | | | | | | |
Principal
Amount (‡) | | | Description | | Value (†) | |
| | | | | | | | |
| | | | Metals & Mining — 0.4% | | | | |
| $ | 555,000 | | | Peabody Energy Corp.,
4.750%, 12/15/2066 | | $ | 618,825 | |
| | | | | | | | |
| | | | Pharmaceuticals — 3.7% | | | | |
| | 475,000 | | | Human Genome Sciences, Inc.,
2.250%, 10/15/2011 | | | 949,406 | |
| | 840,000 | | | Human Genome Sciences, Inc.,
2.250%, 8/15/2012 | | | 1,540,350 | |
| | 785,000 | | | Kendle International, Inc.,
3.375%, 7/15/2012 | | | 725,144 | |
| | 505,000 | | | Valeant Pharmaceuticals International,
4.000%, 11/15/2013 | | | 965,181 | |
| | 1,755,000 | | | Vertex Pharmaceuticals, Inc.,
3.350%, 10/01/2015 | | | 1,744,031 | |
| | | | | | | | |
| | | | | | | 5,924,112 | |
| | | | | | | | |
| | | | Technology — 5.9% | | | | |
| | 562,000 | | | Advanced Micro Devices, Inc.,
6.000%, 5/01/2015 | | | 552,868 | |
| | 1,580,000 | | | Alcatel-Lucent USA, Inc., Series B,
2.875%, 6/15/2025 | | | 1,431,875 | |
| | 15,000 | | | Ciena Corp.,
0.250%, 5/01/2013 | | | 13,388 | |
| | 1,890,000 | | | Ciena Corp.,
0.875%, 6/15/2017 | | | 1,377,337 | |
| | 40,000 | | | Ciena Corp.,
4.000%, 3/15/2015 | | | 42,950 | |
| | 3,705,000 | | | Intel Corp.,
2.950%, 12/15/2035 | | | 3,663,319 | |
| | 1,330,000 | | | Kulicke & Soffa Industries, Inc.,
0.875%, 6/01/2012 | | | 1,245,212 | |
| | 820,000 | | | Micron Technology, Inc.,
1.875%, 6/01/2014 | | | 728,775 | |
| | 280,000 | | | Nortel Networks Corp.,
2.125%, 4/15/2014(e) | | | 215,600 | |
| | | | | | | | |
| | | | | | | 9,271,324 | |
| | | | | | | | |
| | | | Textile — 0.1% | | | | |
| | 115,000 | | | Iconix Brand Group, Inc.,
1.875%, 6/30/2012 | | | 111,694 | |
| | | | | | | | |
| | | | Wireless — 0.9% | | | | |
| | 1,435,000 | | | NII Holdings, Inc.,
3.125%, 6/15/2012 | | | 1,391,950 | |
| | | | | | | | |
| | | | Wirelines — 1.6% | | | | |
| | 2,235,000 | | | Level 3 Communications, Inc.,
3.500%, 6/15/2012 | | | 2,114,869 | |
| | 459,000 | | | Level 3 Communications, Inc.,
5.250%, 12/15/2011 | | | 459,000 | |
| | | | | | | | |
| | | | | | | 2,573,869 | |
| | | | | | | | |
| | | | Total Convertible Bonds
(Identified Cost $24,870,557) | | | 29,893,780 | |
| | | | | | | | |
| | | | Total Bonds and Notes
(Identified Cost $125,260,339) | | | 139,177,536 | |
| | | | | | | | |
| | Bank Loans — 0.8% | | | | |
| | | | Media Non-Cable — 0.1% | | | | |
| | 224,012 | | | Tribune Company, Term Loan X,
5.000%, 6/04/2009(e)(g)(h) | | | 141,967 | |
| | | | | | | | |
| | | | Printing & Publishing — 0.2% | | | | |
| | 359,148 | | | SuperMedia, Inc., Exit Term Loan,
11.000%, 12/31/2015(g) | | | 279,956 | |
| | | | | | | | |
| | | | Technology — 0.0% | | | | |
| | 2,394 | | | Sungard Data Systems, Inc., Tranche A,
2.008%, 2/28/2014(g) | | | 2,315 | |
| | | | | | | | |
See accompanying notes to financial statements.
| 28
Portfolio of Investments – as of September 30, 2010
Loomis Sayles High Income Fund – (continued)
| | | | | | | | |
Principal
Amount (‡) | | | Description | | Value (†) | |
| | | | | | | | |
| | | | Wirelines — 0.5% | | | | |
| $ | 763,371 | | | FairPoint Communications, Inc., Initial Term Loan B,
5.000%, 3/31/2015(e)(g) | | $ | 492,199 | |
| | 36,338 | | | Hawaiian Telcom Communications, Inc., New Tranche C Term Loan,
4.750%, 5/30/2014(g)(i) | | | 27,707 | |
| | 250,000 | | | Level 3 Financing, Inc., Add on Term Loan,
11.500%, 3/13/2014(g) | | | 269,687 | |
| | 25,000 | | | Level 3 Financing, Inc., Tranche A Term Loan,
2.700%, 3/13/2014(g) | | | 22,777 | |
| | | | | | | | |
| | | | | | | 812,370 | |
| | | | | | | | |
| | | | Total Bank Loans
(Identified Cost $1,333,200) | | | 1,236,608 | |
| | | | | | | | |
| | | | | | | | |
| Shares | | | | | | |
| | Preferred Stocks — 1.8% | | | | |
| | Convertible Preferred Stocks — 1.7% | | | | |
| | | | Automotive — 0.0% | | | | |
| | 450 | | | Ford Motor Co. Capital Trust II,
6.500% | | | 21,559 | |
| | | | | | | | |
| | | | Capital Markets — 0.7% | | | | |
| | 26,890 | | | Newell Financial Trust I,
5.250% | | | 1,063,836 | |
| | | | | | | | |
| | | | Diversified Financial Services — 0.1% | | | | |
| | 3,732 | | | Sovereign Capital Trust IV,
4.375% | | | 138,084 | |
| | | | | | | | |
| | | | Electric Utilities — 0.2% | | | | |
| | 6,475 | | | AES Trust III,
6.750% | | | 316,061 | |
| | | | | | | | |
| | | | Machinery — 0.1% | | | | |
| | 2,550 | | | United Rentals Trust I,
6.500% | | | 85,425 | |
| | | | | | | | |
| | | | Oil, Gas & Consumable Fuels — 0.2% | | | | |
| | 9,500 | | | El Paso Energy Capital Trust I,
4.750% | | | 363,375 | |
| | | | | | | | |
| | | | Semiconductors & Semiconductor Equipment — 0.4% | | | | |
| | 799 | | | Lucent Technologies Capital Trust I,
7.750% | | | 647,190 | |
| | | | | | | | |
| | | | Total Convertible Preferred Stocks
(Identified Cost $2,195,579) | | | 2,635,530 | |
| | | | | | | | |
| | Non-Convertible Preferred Stock — 0.1% | | | | |
| | | | Banking — 0.1% | | | | |
| | 274 | | | Ally Financial, Inc., Series G,
7.000%, 144A
(Identified Cost $68,285) | | | 246,643 | |
| | | | | | | | |
| | | | Total Preferred Stocks
(Identified Cost $2,263,864) | | | 2,882,173 | |
| | | | | | | | |
| | Common Stocks — 0.7% | | | | |
| | | | Biotechnology — 0.2% | | | | |
| | 8,147 | | | Vertex Pharmaceuticals, Inc.(j) | | $ | 281,642 | |
| | | | | | | | |
| | | | Chemicals — 0.0% | | | | |
| | 1,087 | | | Ashland, Inc. | | | 53,013 | |
| | | | | | | | |
| | | | Household Durables — 0.0% | | | | |
| | 1,775 | | | KB Home | | | 20,111 | |
| | | | | | | | |
| | | | Media — 0.0% | | | | |
| | 388 | | | Dex One Corp.(j) | | | 4,764 | |
| | 1,835 | | | SuperMedia, Inc.(j) | | | 19,396 | |
| | | | | | | | |
| | | | | | | 24,160 | |
| | | | | | | | |
| | | | | | | | |
| | |
| Shares | | | Description | | Value (†) | |
| | | | | | | | |
| | | | Oil, Gas & Consumable Fuels — 0.3% | | | | |
| | 35,176 | | | El Paso Corp. | | $ | 435,479 | |
| | | | | | | | |
| | | | Pharmaceuticals — 0.2% | | | | |
| | 6,875 | | | Merck & Co., Inc. | | | 253,069 | |
| | | | | | | | |
| | | | Total Common Stocks
(Identified Cost $920,531) | | | 1,067,474 | |
| | | | | | | | |
| | Closed End Investment Companies — 0.0% | | | | |
| | 2,073 | | | Morgan Stanley Emerging Markets Debt Fund, Inc. | | | 23,425 | |
| | 1,772 | | | Western Asset High Income Opportunity Fund, Inc. | | | 11,110 | |
| | | | | | | | |
| | | | Total Closed End Investment Companies
(Identified Cost $28,644) | | | 34,535 | |
| | | | | | | | |
Principal
Amount (‡) | | | | | | |
| | Short-Term Investments — 8.7% | | | | |
| $ | 21,049 | | | Repurchase Agreement with State Street Corporation, dated 9/30/2010 at 0.000% to be repurchased at $21,049 on 10/01/2010 collateralized by $20,000 U.S. Treasury Note, 3.125% due 4/30/2017 valued at $21,902 including accrued interest (Note 2 of Notes to Financial Statements) | | | 21,049 | |
| | 13,827,775 | | | Tri-Party Repurchase Agreement with Fixed Income Clearing Corporation, dated 9/30/2010 at 0.000% to be repurchased at $13,827,775 on 10/01/2010 collateralized by $13,795,000 Federal Home Loan Bank, 4.375% due 10/22/2010 valued at $14,105,388 including accrued interest (Note 2 of Notes to Financial Statements) | | | 13,827,775 | |
| | | | | | | | |
| | | | Total Short-Term Investments
(Identified Cost $13,848,824) | | | 13,848,824 | |
| | | | | | | | |
| | | | | | | | |
| | | | Total Investments — 99.9%
(Identified Cost $143,655,402)(a) | | | 158,247,150 | |
| | | | Other assets less liabilities — 0.1% | | | 171,193 | |
| | | | | | | | |
| | | | Net Assets — 100.0% | | $ | 158,418,343 | |
| | | | | | | | |
| | | | | | | | |
| | (‡) | | | Principal amount stated in U.S. dollars unless otherwise noted. | |
| | (†) | | | See Note 2 of Notes to Financial Statements. | |
| | (††) | | | Amount shown represents units. One unit represents a principal amount of 100. | |
| | (a) | | | Federal Tax Information: | |
| | | | At September 30, 2010, the net unrealized appreciation on investments based on a cost of $144,056,645 for federal income tax purposes was as follows: | |
| | | | Aggregate gross unrealized appreciation for all investments in which there is an excess of value over tax cost | | $ | 17,434,500 | |
| | | | Aggregate gross unrealized depreciation for all investments in which there is an excess of tax cost over value | | | (3,243,995 | ) |
| | | | | | | | |
| | | | Net unrealized appreciation | | $ | 14,190,505 | |
| | | | | | | | |
| | | | | | | | |
| | (b) | | | Variable rate security. Rate as of September 30, 2010 is disclosed. | |
| | (c) | | | Illiquid security. At September 30, 2010, the value of these securities amounted to $885,200 or 0.6% of net assets. | |
| | (d) | | | The issuer has made partial payment with respect to interest and/or principal. Income is not being accrued. | |
See accompanying notes to financial statements.
29 |
Portfolio of Investments – as of September 30, 2010
Loomis Sayles High Income Fund – (continued)
| | | | | | | | |
| | | | | | | | |
| | (e) | | | The issuer is in default with respect to interest and/or principal payments. Income is not being accrued. | |
| | (f) | | | Coupon rate is a fixed rate for an initial period then resets at a specified date and rate. | |
| | (g) | | | Variable rate security. Rate shown represents the weighted average rate at September 30, 2010. | |
| | (h) | | | Issuer has filed for bankruptcy. | |
| | (i) | | | All or a portion of interest payment is paid-in-kind. | |
| | (j) | | | Non-income producing security. | |
| | | | | |
| | 144A | | | Securities exempt from registration under Rule 144A of the Securities Act of 1933. These securities may be resold in transactions exempt from registration, normally to qualified institutional buyers. At September 30, 2010, the total value of these securities amounted to $19,891,087 or 12.6% of net assets. | |
| | | | | |
| | ABS | | | Asset-Backed Securities | |
| | EMTN | | | Euro Medium Term Note | |
| | GMTN | | | Global Medium Term Note | |
| | MTN | | | Medium Term Note | |
| | | | | |
| | AUD | | | Australian Dollar | |
| | BRL | | | Brazilian Real | |
| | EUR | | | Euro | |
| | GBP | | | British Pound | |
| | IDR | | | Indonesian Rupiah | |
| | ISK | | | Icelandic Krona | |
| | KRW | | | South Korean Won | |
| | MXN | | | Mexican Peso | |
| | PHP | | | Philippine Peso | |
| | SGD | | | Singapore Dollar | |
| | UYU | | | Uruguayan Peso | |
Industry Summary at September 30, 2010 (Unaudited)
| | | | |
| Technology | | | 9.7 | % |
| Wirelines | | | 9.2 | |
| Non-Captive Diversified | | | 6.5 | |
| Healthcare | | | 5.1 | |
| Sovereigns | | | 5.0 | |
| Supranational | | | 4.5 | |
| Wireless | | | 4.3 | |
| Automotive | | | 4.3 | |
| Pharmaceuticals | | | 4.0 | |
| Home Construction | | | 2.7 | |
| Independent Energy | | | 2.7 | |
| Non-Captive Consumer | | | 2.3 | |
| Banking | | | 2.1 | |
| Electric | | | 2.0 | |
| Other Investments, less than 2% each | | | 26.8 | |
| Short-Term Investments | | | 8.7 | |
| | | | |
| Total Investments | | | 99.9 | |
| Other assets less liabilities | | | 0.1 | |
| | | | |
| Net Assets | | | 100.0 | % |
| | | | |
See accompanying notes to financial statements.
| 30
Portfolio of Investments – as of September 30, 2010
Loomis Sayles International Bond Fund
| | | | | | | | |
Principal
Amount (‡) | | | Description | | Value (†) | |
| | | | | | | | |
| | Bonds and Notes — 96.7% of Net Assets | | | | |
| | Non-Convertible Bonds — 96.3% | | | | |
| | | | Australia — 3.1% | | | | |
| | 200,000 | | | Australia & New Zealand Banking Group Ltd., EMTN,
2.625%, 11/16/2012, (EUR) | | $ | 277,415 | |
| | 200,000 | | | National Australia Bank Ltd., EMTN,
3.500%, 1/23/2015, (EUR) | | | 282,473 | |
| | 505,000 | | | New South Wales Treasury Corp.,
Series 10RG,
7.000%, 12/01/2010, (AUD) | | | 489,693 | |
| | | | | | | | |
| | | | | | | 1,049,581 | |
| | | | | | | | |
| | | | Belgium — 0.5% | | | | |
| | 100,000 | | | Anheuser-Busch InBev NV, EMTN,
6.500%, 6/23/2017, (GBP) | | | 182,604 | |
| | | | | | | | |
| | | | Brazil — 0.8% | | | | |
| | 193,211(††) | | | Brazil Notas do Tesouro Nacional,
Series B,
6.000%, 5/15/2015, (BRL) | | | 113,392 | |
| | 250,000 | | | Republic of Brazil,
10.250%, 1/10/2028, (BRL) | | | 164,968 | |
| | | | | | | | |
| | | | | | | 278,360 | |
| | | | | | | | |
| | | | Canada — 8.6% | | | | |
| | 225,000 | | | Bell Canada,
Series M-17,
6.100%, 3/16/2035, (CAD) | | | 228,394 | |
| | 1,105,000 | | | Canadian Government,
4.500%, 6/01/2015, (CAD)(b) | | | 1,198,123 | |
| | 165,000 | | | Corus Entertainment, Inc.,
7.250%, 2/10/2017, 144A, (CAD) | | | 170,023 | |
| | 200,000 | | | Province of Ontario, EMTN,
4.000%, 12/03/2019, (EUR) | | | 298,268 | |
| | 25,000,000 | | | Province of Quebec Canada,
1.600%, 5/09/2013, (JPY) | | | 304,064 | |
| | 150,000 | | | Province of Quebec Canada, EMTN,
3.375%, 6/20/2016, (EUR) | | | 215,346 | |
| | 200,000 | | | Province of Quebec Canada, EMTN,
3.625%, 2/10/2015, (EUR) | | | 290,156 | |
| | 200,000 | | | Shaw Communications, Inc.,
5.650%, 10/01/2019, (CAD) | | | 207,015 | |
| | | | | | | | |
| | | | | | | 2,911,389 | |
| | | | | | | | |
| | | | Cayman Islands — 1.7% | | | | |
| | 60,000 | | | DASA Finance Corp.,
8.750%, 5/29/2018, 144A | | | 67,410 | |
| | 119,000 | | | Fibria Overseas Finance Ltd.,
7.500%, 5/04/2020, 144A | | | 126,289 | |
| | 200,000 | | | Hutchison Whampoa Finance Ltd.,
4.625%, 9/21/2016, (EUR) | | | 284,428 | |
| | 100,000 | | | Odebrecht Finance Ltd.,
7.000%, 4/21/2020, 144A | | | 107,000 | |
| | | | | | | | |
| | | | | | | 585,127 | |
| | | | | | | | |
| | | | Finland — 4.2% | | | | |
| | 965,000 | | | Finland Government Bond,
3.125%, 9/15/2014, (EUR) | | | 1,403,809 | |
| | | | | | | | |
| | | | France — 1.0% | | | | |
| | 100,000 | | | Cie Financiere et Industrielle des Autoroutes,
5.250%, 4/30/2018, (EUR) | | | 153,306 | |
| | 50,000 | | | Lafarge SA, EMTN,
5.375%, 6/26/2017, (EUR) | | | 68,462 | |
| | 70,000 | | | Veolia Environnement, EMTN,
6.125%, 11/25/2033, (EUR) | | | 119,889 | |
| | | | | | | | |
| | | | | | | 341,657 | |
| | | | | | | | |
| | | | | | | | |
Principal
Amount (‡) | | | Description | | Value (†) | |
| | | | | | | | |
| | | | Germany — 11.4% | | | | |
| | 100,000 | | | Bertelsmann AG, EMTN,
3.625%, 10/06/2015, (EUR) | | $ | 140,611 | |
| | 835,000 | | | Bundesrepublik Deutschland,
3.000%, 7/04/2020, (EUR) | | | 1,210,517 | |
| | 1,040,000 | | | Bundesrepublik Deutschland,
3.250%, 1/04/2020, (EUR) | | | 1,538,008 | |
| | 110,000 | | | Landesbank Baden-Wuerttemberg,
3.750%, 2/12/2014, (EUR) | | | 160,006 | |
| | 105,000 | | | Muenchener Hypothekenbank eG,
5.000%, 1/16/2012, (EUR) | | | 149,879 | |
| | 460,000 | | | Republic of Germany,
4.000%, 4/13/2012, (EUR)(b) | | | 657,886 | |
| | | | | | | | |
| | | | | | | 3,856,907 | |
| | | | | | | | |
| | | | India — 0.6% | | | | |
| | 100,000 | | | Canara Bank Ltd., (fixed rate to 11/28/2016,
variable rate thereafter),
6.365%, 11/28/2021 | | | 99,730 | |
| | 100,000 | | | ICICI Bank Ltd., (fixed rate to 4/30/2017,
variable rate thereafter),
6.375%, 4/30/2022, 144A | | | 100,515 | |
| | | | | | | | |
| | | | | | | 200,245 | |
| | | | | | | | |
| | | | Indonesia — 0.3% | | | | |
| | 100,000 | | | Adaro Indonesia PT,
7.625%, 10/22/2019, 144A | | | 109,000 | |
| | | | | | | | |
| | | | Ireland — 0.3% | | | | |
| | 10,000,000 | | | Depfa ACS Bank,
Series 686, EMTN,
1.650%, 12/20/2016, (JPY) | | | 98,958 | |
| | | | | | | | |
| | | | Italy — 2.5% | | | | |
| | 150,000 | | | Finmeccanica SpA, EMTN,
4.875%, 3/24/2025, (EUR) | | | 208,254 | |
| | 470,000 | | | Italy Buoni Poliennali Del Tesoro,
4.000%, 9/01/2020, (EUR) | | | 650,467 | |
| | | | | | | | |
| | | | | | | 858,721 | |
| | | | | | | | |
| | | | Japan — 14.8% | | | | |
| | 83,000,000 | | | Japan Finance Organization for Municipal Enterprises,
1.350%, 11/26/2013, (JPY) | | | 1,031,130 | |
| | 122,000,000 | | | Japan Government,
0.700%, 6/20/2014, (JPY) | | | 1,488,904 | |
| | 197,000,000 | | | Japan Government,
1.300%, 3/20/2019, (JPY) | | | 2,482,214 | |
| | | | | | | | |
| | | | | | | 5,002,248 | |
| | | | | | | | |
| | | | Jersey — 0.5% | | | | |
| | 100,000 | | | WPP PLC,
6.000%, 4/04/2017, (GBP) | | | 171,602 | |
| | | | | | | | |
| | | | Luxembourg — 0.8% | | | | |
| | 150,000 | | | Enel Finance International SA, EMTN,
5.625%, 8/14/2024, (GBP) | | | 246,290 | |
| | 25,000 | | | Telecom Italia Finance SA, EMTN,
7.750%, 1/24/2033, (EUR) | | | 39,991 | |
| | | | | | | | |
| | | | | | | 286,281 | |
| | | | | | | | |
| | | | Mexico — 2.7% | | | | |
| | 160,000 | | | Axtel SAB de CV,
9.000%, 9/22/2019, 144A | | | 147,600 | |
| | 100,000 | | | BBVA Bancomer SA,
7.250%, 4/22/2020, 144A | | | 107,424 | |
| | 10,000(†††) | | | Mexican Fixed Rate Bonds,
Series M-10,
8.000%, 12/17/2015, (MXN) | | | 87,457 | |
See accompanying notes to financial statements.
31 |
Portfolio of Investments – as of September 30, 2010
Loomis Sayles International Bond Fund – (continued)
| | | | | | | | |
Principal
Amount (‡) | | | Description | | Value (†) | |
| | | | | | | | |
| | | | Mexico — continued | | | | |
| | 48,000(†††) | | | Mexican Fixed Rate Bonds,
Series M-10,
8.500%, 12/13/2018, (MXN) | | $ | 440,857 | |
| | 100,000 | | | Mexichem SAB de CV,
8.750%, 11/06/2019, 144A | | | 115,500 | |
| | | | | | | | |
| | | | | | | 898,838 | |
| | | | | | | | |
| | | | Netherlands — 5.4% | | | | |
| | 155,000 | | | Kingdom of Netherlands,
1.750%, 1/15/2013, (EUR) | | | 215,004 | |
| | 485,000 | | | Kingdom of Netherlands,
4.500%, 7/15/2017, (EUR) | | | 760,723 | |
| | 330,000 | | | Kingdom of Netherlands,
5.500%, 1/15/2028, (EUR) | | | 608,799 | |
| | 150,000 | | | RWE Finance BV, EMTN,
5.500%, 7/06/2022, (GBP) | | | 257,306 | |
| | | | | | | | |
| | | | | | | 1,841,832 | |
| | | | | | | | |
| | | | Norway — 1.0% | | | | |
| | 1,810,000 | | | Norwegian Government,
4.500%, 5/22/2019, (NOK) | | | 339,642 | |
| | | | | | | | |
| | | | Poland — 0.3% | | | | |
| | 80,000 | | | Poland Government International Bond,
3.000%, 9/23/2014, (CHF) | | | 84,099 | |
| | | | | | | | |
| | | | Singapore — 3.4% | | | | |
| | 425,000 | | | Singapore Government Bond,
1.625%, 4/01/2013, (SGD) | | | 331,899 | |
| | 810,000 | | | Singapore Government Bond,
2.250%, 7/01/2013, (SGD) | | | 645,081 | |
| | 150,000 | | | STATS ChipPAC Ltd.,
7.500%, 8/12/2015, 144A | | | 161,625 | |
| | | | | | | | |
| | | | | | | 1,138,605 | |
| | | | | | | | |
| | | | South Africa — 0.5% | | | | |
| | 150,000 | | | Edcon Proprietary Ltd.,
4.129%, 6/15/2014, 144A, (EUR)(c) | | | 171,770 | |
| | | | | | | | |
| | | | Supranationals — 7.3% | | | | |
| | 40,000,000 | | | Asian Development Bank, EMTN,
2.350%, 6/21/2027, (JPY) | | | 524,346 | |
| | 295,000 | | | European Bank for Reconstruction & Development, GMTN,
9.250%, 9/10/2012, (BRL) | | | 175,483 | |
| | 921,000,000 | | | European Investment Bank, EMTN,
Zero Coupon,
4/24/2013, 144A, (IDR) | | | 88,870 | |
| | 44,000,000 | | | European Investment Bank,
1.400%, 6/20/2017, (JPY) | | | 556,040 | |
| | 260,000 | | | European Investment Bank,
2.375%, 7/10/2020, (CHF) | | | 281,888 | |
| | 5,560,000,000 | | | Inter-American Development Bank, EMTN,
Zero Coupon,
8/20/2015, (IDR) | | | 452,649 | |
| | 30,000,000 | | | Nordic Investment Bank,
Series C, GMTN,
1.700%, 4/27/2017, (JPY) | | | 380,812 | |
| | | | | | | | |
| | | | | | | 2,460,088 | |
| | | | | | | | |
| | | | Sweden — 4.6% | | | | |
| | 2,540,000 | | | Sweden Government Bond,
5.000%, 12/01/2020, (SEK) | | | 457,892 | |
| | 5,100,000 | | | Sweden Government Bond,
5.500%, 10/08/2012, (SEK)(b) | | | 817,471 | |
| | 200,000 | | | Volvo Treasury AB,
Series 225, EMTN,
5.000%, 5/31/2017, (EUR) | | | 288,730 | |
| | | | | | | | |
| | | | | | | 1,564,093 | |
| | | | | | | | |
| | | | | | | | |
Principal
Amount (‡) | | | Description | | Value (†) | |
| | | | | | | | |
| | | | Switzerland — 0.5% | | | | |
| | 100,000 | | | Credit Suisse London, EMTN,
5.125%, 9/18/2017, (EUR) | | $ | 151,432 | |
| | | | | | | | |
| | | | United Arab Emirates — 0.3% | | | | |
| | 100,000 | | | DP World Ltd.,
6.850%, 7/02/2037, 144A | | | 93,529 | |
| | | | | | | | |
| | | | United Kingdom — 8.3% | | | | |
| | 200,000 | | | Anglo American Capital PLC,
4.375%, 12/02/2016, (EUR) | | | 286,485 | |
| | 50,000 | | | BAT International Finance PLC, EMTN,
5.375%, 6/29/2017, (EUR) | | | 77,922 | |
| | 100,000 | | | British Sky Broadcasting Group PLC, EMTN,
6.000%, 5/21/2027, (GBP) | | | 172,853 | |
| | 150,000 | | | British Telecommunications PLC,
5.750%, 12/07/2028, (GBP) | | | 225,126 | |
| | 50,000 | | | BSKYB Finance UK PLC,
5.750%, 10/20/2017, (GBP) | | | 88,255 | |
| | 25,000 | | | National Grid PLC, EMTN,
4.375%, 3/10/2020, (EUR) | | | 35,838 | |
| | 75,000 | | | National Grid PLC, EMTN,
5.000%, 7/02/2018, (EUR) | | | 111,726 | |
| | 100,000 | | | Rexam PLC, EMTN,
4.375%, 3/15/2013, (EUR) | | | 141,534 | |
| | 100,000 | | | Smiths Group PLC,
4.125%, 5/05/2017, (EUR) | | | 138,133 | |
| | 50,000 | | | Standard Chartered Bank,
Series 17, EMTN,
5.875%, 9/26/2017, (EUR) | | | 76,431 | |
| | 115,000 | | | United Kingdom Treasury,
4.000%, 3/07/2022, (GBP) | | | 193,695 | |
| | 60,000 | | | United Kingdom Treasury,
4.750%, 12/07/2038, (GBP) | | | 108,161 | |
| | 175,000 | | | United Kingdom Treasury,
5.000%, 3/07/2025, (GBP) | | | 322,510 | |
| | 290,000 | | | United Kingdom Treasury,
5.250%, 6/07/2012, (GBP) | | | 490,092 | |
| | 100,000 | | | Virgin Media Secured Finance PLC,
7.000%, 1/15/2018, (GBP) | | | 166,908 | |
| | 100,000 | | | Vodafone Group PLC,
Series 25, EMTN,
5.375%, 6/06/2022, (EUR) | | | 156,273 | |
| | | | | | | | |
| | | | | | | 2,791,942 | |
| | | | | | | | |
| | | | United States — 10.0% | | | | |
| | 80,000 | | | Ahold Finance USA, Inc., EMTN,
6.500%, 3/14/2017, (GBP) | | | 143,867 | |
| | 130,000 | | | Ally Financial, Inc.,
6.750%, 12/01/2014 | | | 135,444 | |
| | 100,000 | | | Anadarko Petroleum Corp.,
6.375%, 9/15/2017 | | | 110,195 | |
| | 100,000 | | | BA Credit Card Trust,
Series 04A1,
4.500%, 6/17/2016, (EUR) | | | 141,694 | |
| | 50,000 | | | Cargill, Inc., EMTN,
5.375%, 3/02/2037, (GBP) | | | 81,932 | |
| | 100,000 | | | Citibank Credit Card Issuance Trust,
Series 2001-A4, Class A4,
5.375%, 4/10/2013, (EUR) | | | 138,301 | |
| | 15,000,000 | | | Citigroup, Inc.,
2.400%, 10/31/2025, (JPY) | | | 159,855 | |
| | 100,000 | | | Crown Castle Towers LLC,
6.113%, 1/15/2040, 144A | | | 110,473 | |
| | 140,000 | | | DISH DBS Corp.,
6.625%, 10/01/2014 | | | 146,300 | |
See accompanying notes to financial statements.
| 32
Portfolio of Investments – as of September 30, 2010
Loomis Sayles International Bond Fund – (continued)
| | | | | | | | |
Principal
Amount (‡) | | | Description | | Value (†) | |
| | | | | | | | |
| | | | United States — continued | | | | |
| $ | 150,000 | | | Ford Motor Credit Co. LLC,
6.625%, 8/15/2017 | | $ | 159,815 | |
| | 150,000 | | | Frontier Communications Corp.,
9.000%, 8/15/2031 | | | 159,937 | |
| | 160,000 | | | Georgia-Pacific LLC,
7.250%, 6/01/2028 | | | 164,400 | |
| | 50,000 | | | Goldman Sachs Group, Inc. (The),
6.875%, 1/18/2038, (GBP) | | | 80,485 | |
| | 45,000 | | | HCA, Inc.,
8.360%, 4/15/2024 | | | 44,100 | |
| | 200,000 | | | HSBC Finance Corp., EMTN,
4.500%, 6/14/2016, (EUR) | | | 291,102 | |
| | 70,000 | | | IPALCO Enterprises, Inc.,
7.250%, 4/01/2016, 144A | | | 75,250 | |
| | 955,000,000 | | | JPMorgan Chase Bank NA, EMTN,
Zero Coupon,
10/17/2011, 144A, (IDR) | | | 101,267 | |
| | 100,000 | | | Merrill Lynch & Co., Inc., EMTN,
4.625%, 9/14/2018, (EUR) | | | 133,074 | |
| | 95,000 | | | Morgan Stanley,
5.375%, 11/14/2013, (GBP) | | | 157,260 | |
| | 55,000 | | | NRG Energy, Inc.,
8.250%, 9/01/2020, 144A | | | 56,719 | |
| | 100,000 | | | Owens Brockway Glass Container, Inc.,
6.750%, 12/01/2014, (EUR) | | | 139,733 | |
| | 150,000 | | | Qwest Corp.,
6.875%, 9/15/2033 | | | 148,125 | |
| | 100,000 | | | SLM Corp., Series 7, EMTN,
4.750%, 3/17/2014, (EUR) | | | 124,829 | |
| | 40,000 | | | SLM Corp., Series A, MTN,
5.000%, 10/01/2013 | | | 39,199 | |
| | 100,000 | | | Textron, Inc.,
3.875%, 3/11/2013, (EUR) | | | 135,322 | |
| | 50,000 | | | Wells Fargo & Co.,
4.625%, 11/02/2035, (GBP) | | | 73,430 | |
| | 100,000 | | | Zurich Finance USA, Inc., EMTN, (fixed rate
to 6/15/2015, variable rate thereafter),
4.500%, 6/15/2025, (EUR) | | | 137,468 | |
| | | | | | | | |
| | | | | | | 3,389,576 | |
| | | | | | | | |
| | | | Uruguay — 0.9% | | | | |
| | 2,763,647 | | | Uruguay Government International Bond,
3.700%, 6/26/2037, (UYU) | | | 138,034 | |
| | 3,077,233 | | | Uruguay Government International Bond,
5.000%, 9/14/2018, (UYU) | | | 173,344 | |
| | | | | | | | |
| | | | | | | 311,378 | |
| | | | | | | | |
| | | | Total Non-Convertible Bonds
(Identified Cost $30,295,597) | | | 32,573,313 | |
| | | | | | | | |
| | Convertible Bonds — 0.4% | | | | |
| | | | United States — 0.4% | | | | |
| | 91,000 | | | Advanced Micro Devices, Inc.,
6.000%, 5/01/2015 | | | 89,521 | |
| | | | United States — continued | | | | |
| | 50,000 | | | Hologic, Inc., (Step to
Zero Coupon on 12/15/2013),
2.000%, 12/15/2037(d) | | | 46,250 | |
| | | | | | | | |
| | | | Total Convertible Bonds
(Identified Cost $121,631) | | | 135,771 | |
| | | | | | | | |
| | | | Total Bonds and Notes
(Identified Cost $30,417,228) | | | 32,709,084 | |
| | | | | | | | |
| | | | | | | | |
Principal
Amount (‡) | | | Description | | Value (†) | |
| | | | | | | | |
| | Short-Term Investments — 1.7% | | | | |
| $ | 571,663 | | | Tri-Party Repurchase Agreement with Fixed Income Clearing Corporation, dated 9/30/2010 at 0.000% to be repurchased at $571,663 on 10/01/2010 collateralized by $580,000 Federal National Mortgage Association,
1.000% due 11/23/2011 valued at $587,250 including accrued interest (Note 2 of Notes to Financial Statements)
(Identified Cost $571,663) | | $ | 571,663 | |
| | | | | | | | |
| | | | | | | | |
| | | | Total Investments — 98.4%
(Identified Cost $30,988,891)(a) | | | 33,280,747 | |
| | | | Other assets less liabilities — 1.6% | | | 529,497 | |
| | | | | | | | |
| | | | Net Assets — 100.0% | | $ | 33,810,244 | |
| | | | | | | | |
| | | | | | | | |
| | (‡) | | | Principal amount stated in U.S. dollars unless otherwise noted. | |
| | (†) | | | See Note 2 of Notes to Financial Statements. | |
| | (††) | | | Security held in units. One unit represents a principal amount of 1,000. Amount shown represents principal amount including inflation adjustments. | |
| | (†††) | | | Amount shown represents units. One unit represents a principal amount of 100. | |
| | (a) | | | Federal Tax Information: | |
| | | | At September 30, 2010, the net unrealized appreciation on investments based on a cost of $31,096,877 for federal income tax purposes was as follows: | |
| | | | Aggregate gross unrealized appreciation for all investments in which there is an excess of value over tax cost | | $ | 2,353,496 | |
| | | | Aggregate gross unrealized depreciation for all investments in which there is an excess of tax cost over value | | | (169,626 | ) |
| | | | | | | | |
| | | | Net unrealized appreciation | | $ | 2,183,870 | |
| | | | | | | | |
| | | | | | | | |
| | (b) | | | All or a portion of this security is held as collateral for forward foreign currency contracts. | |
| | (c) | | | Variable rate security. Rate as of September 30, 2010 is disclosed. | |
| | (d) | | | Coupon rate is a fixed rate for an initial period then resets at a specified date and rate. | |
| | | | | | | | |
| | 144A | | | Securities exempt from registration under Rule 144A of the Securities Act of 1933. These securities may be resold in transactions exempt from registration, normally to qualified institutional buyers. At September 30, 2010, the total value of these securities amounted to $1,910,264 or 5.6% of net assets. | |
| | | | | | | | |
| | EMTN | | | Euro Medium Term Note | | | | |
| | GMTN | | | Global Medium Term Note | | | | |
| | MTN | | | Medium Term Note | | | | |
| | | | | | | | |
| | AUD | | | Australian Dollar | | | | |
| | BRL | | | Brazilian Real | | | | |
| | CAD | | | Canadian Dollar | | | | |
| | CHF | | | Swiss Franc | | | | |
| | EUR | | | Euro | | | | |
| | GBP | | | British Pound | | | | |
| | IDR | | | Indonesian Rupiah | | | | |
| | JPY | | | Japanese Yen | | | | |
| | MXN | | | Mexican Peso | | | | |
| | NOK | | | Norwegian Krone | | | | |
| | SEK | | | Swedish Krona | | | | |
| | SGD | | | Singapore Dollar | | | | |
| | UYU | | | Uruguayan Peso | | | | |
See accompanying notes to financial statements.
33 |
Portfolio of Investments – as of September 30, 2010
Loomis Sayles International Bond Fund – (continued)
At September 30, 2010, the Fund had the following open forward foreign currency contracts:
| | | | | | | | | | | | | | | | | | |
Contract
to Buy/
Sell | | Delivery
Date | | | Currency | | Units | | | Notional
Value | | | Unrealized
Appreciation
(Depreciation) | |
| Buy1 | | | 12/15/2010 | | | Canadian Dollar | | | 190,000 | | | $ | 184,342 | | | $ | 621 | |
| Buy2 | | | 11/16/2010 | | | Chinese Renminbi | | | 2,350,000 | | | | 351,313 | | | | (4,253 | ) |
| Sell2 | | | 11/16/2010 | | | Chinese Renminbi | | | 2,350,000 | | | | 351,313 | | | | (2,726 | ) |
| Buy3 | | | 12/15/2010 | | | Euro | | | 1,000,000 | | | | 1,362,497 | | | | 80,197 | |
| Buy1 | | | 12/15/2010 | | | Japanese Yen | | | 120,000,000 | | | | 1,438,541 | | | | 6,833 | |
| Buy1 | | | 10/22/2010 | | | Malaysian Ringgit | | | 1,100,000 | | | | 355,901 | | | | 3,247 | |
| Sell3 | | | 10/28/2010 | | | Mexican Peso | | | 4,600,000 | | | | 364,371 | | | | 1,108 | |
| Buy4 | | | 12/13/2010 | | | South Korean Won | | | 720,000,000 | | | | 629,584 | | | | 21,219 | |
| Buy3 | | | 12/13/2010 | | | South Korean Won | | | 587,000,000 | | | | 513,286 | | | | 17,718 | |
| Buy5 | | | 12/13/2010 | | | South Korean Won | | | 355,000,000 | | | | 310,420 | | | | 10,627 | |
| | | | | | | | | | | | | | | | | | |
| Total | | | | | | | | | | | | | | | | $ | 134,591 | |
| | | | | | | | | | | | | | | | | | |
1 Counterparty is JPMorgan Chase Bank.
2 Counterparty is Morgan Stanley & Co., Inc.
3 Counterparty is Credit Suisse.
4 Counterparty is Barclays Bank PLC.
5 Counterparty is UBS.
Industry Summary at September 30, 2010 (Unaudited)
| | | | |
| Treasuries | | | 47.1 | % |
| Supranational | | | 7.3 | |
| Banking | | | 6.5 | |
| Sovereigns | | | 5.0 | |
| Local Authorities | | | 3.3 | |
| Government Guaranteed | | | 3.0 | |
| Wirelines | | | 2.8 | |
| Other Investments, less than 2% each | | | 21.7 | |
| Short-Term Investments | | | 1.7 | |
| | | | |
| Total Investments | | | 98.4 | |
| Other assets less liabilities (including open forward foreign currency contracts) | | | 1.6 | |
| | | | |
| Net Assets | | | 100.0 | % |
| | | | |
Currency Exposure at September 30, 2010 as a Percentage of Net Assets (Unaudited)
| | | | |
| Euro | | | 37.3 | % |
| Japanese Yen | | | 20.8 | |
| United States Dollar | | | 9.7 | |
| British Pound | | | 9.4 | |
| Canadian Dollar | | | 5.3 | |
| Swedish Krona | | | 3.8 | |
| Singapore Dollar | | | 2.9 | |
| Other, less than 2% each | | | 9.2 | |
| | | | |
| Total Investments | | | 98.4 | |
| Other assets less liabilities (including open forward foreign currency contracts) | | | 1.6 | |
| | | | |
| Net Assets | | | 100.0 | % |
| | | | |
See accompanying notes to financial statements.
| 34
Portfolio of Investments – as of September 30, 2010
Loomis Sayles Limited Term Government and Agency Fund
| | | | | | | | |
Principal
Amount | | | Description | | Value (†) | |
| | | | | | | | |
| | Bonds and Notes — 99.4% of Net Assets | | | | |
| | | | ABS Car Loan — 2.0% | | | | |
| $ | 1,162,442 | | | ARI Fleet Lease Trust,
Series 2010-A, Class A,
1.707%, 8/15/2018, 144A(b) | | $ | 1,162,442 | |
| | 233,102 | | | Merrill Auto Trust Securitization,
Series 2008-1, Class 3A3,
5.500%, 3/15/2012 | | | 235,785 | |
| | 3,245,000 | | | Navistar Financial Dealer Note Master Trust,
Series 2010-1, Class A,
1.906%, 1/26/2015, 144A(b) | | | 3,253,584 | |
| | 1,810,000 | | | Nissan Master Owner Trust Receivables,
Series 2010-AA, Class A,
1.407%, 1/15/2015, 144A(b) | | | 1,837,138 | |
| | 177,265 | | | USAA Auto Owner Trust,
Series 2008-3, Class A3,
4.280%, 10/15/2012 | | | 179,360 | |
| | | | | | | | |
| | | | | | | 6,668,309 | |
| | | | | | | | |
| | | | ABS Credit Card — 0.9% | | | | |
| | 985,000 | | | American Express Credit Account Master,
Series 2004-2, Class A,
0.427%, 12/15/2016(b) | | | 980,343 | |
| | 2,100,000 | | | World Financial Network Credit Card Master Trust, Series 2010-A, Class A,
3.960%, 4/15/2019 | | | 2,179,178 | |
| | | | | | | | |
| | | | | | | 3,159,521 | |
| | | | | | | | |
| | | | ABS Home Equity — 0.5% | | | | |
| | 730,200 | | | Countrywide Asset-Backed Certificates,
Series 2004-S1, Class A3,
4.615%, 2/25/2035 | | | 681,293 | |
| | 543,170 | | | Residential Funding Mortgage Securities II,
Series 2002-HI5, Class A7,
5.700%, 1/25/2028 | | | 531,260 | |
| | 605,314 | | | Residential Funding Mortgage Securities II,
Series 2005-HI3, Class A4,
5.490%, 9/25/2035 | | | 590,949 | |
| | | | | | | | |
| | | | | | | 1,803,502 | |
| | | | | | | | |
| | | | Collateralized Mortgage Obligations — 0.2% | | | | |
| | 569,445 | | | Federal Home Loan Mortgage Corp.,
Series 2901, Class UA,
5.000%, 1/15/2030 | | | 588,199 | |
| | 34,450 | | | Federal Home Loan Mortgage Corp.,
Series 3145, Class KA,
5.000%, 8/15/2024 | | | 34,850 | |
| | | | | | | | |
| | | | | | | 623,049 | |
| | | | | | | | |
| | | | Commercial Mortgage-Backed Securities — 14.5% | |
| | 1,500,000 | | | Banc of America Commercial Mortgage, Inc.,
Series 2007-5, Class A4,
5.492%, 2/10/2051 | | | 1,570,436 | |
| | 2,000,000 | | | Bear Stearns Commercial Mortgage Securities,
Series 2007-PW15, Class A4,
5.331%, 2/11/2044 | | | 2,057,933 | |
| | 360,000 | | | Citigroup Commercial Mortgage Trust,
Series 2006-C5, Class A4,
5.431%, 10/15/2049 | | | 389,228 | |
| | 1,500,000 | | | Citigroup Commercial Mortgage Trust,
Series 2007-C6, Class A4,
5.698%, 12/10/2049(b) | | | 1,605,862 | |
| | 1,470,000 | | | Citigroup Commercial Mortgage Trust,
Series 2008-C7, Class A4,
6.091%, 12/10/2049(b) | | | 1,577,471 | |
| | | | | | | | |
Principal
Amount | | | Description | | Value (†) | |
| | | | | | | | |
| | | | Commercial Mortgage-Backed Securities — continued | |
| $ | 3,200,500 | | | Citigroup/Deutsche Bank Commercial Mortgage Trust, Series 2007-CD4, Class A4,
5.322%, 12/11/2049 | | $ | 3,317,012 | |
| | 1,400,000 | | | Commercial Mortgage Pass Through Certificates,
Series 2006-C7, Class A4,
5.767%, 6/10/2046(b) | | | 1,551,234 | |
| | 2,670,000 | | | Credit Suisse Mortgage Capital Certificates,
Series 2006-C3, Class A3,
5.826%, 6/15/2038(b) | | | 2,924,312 | |
| �� | 825,000 | | | Credit Suisse Mortgage Capital Certificates,
Series 2007-C2, Class A3,
5.542%, 1/15/2049 | | | 825,867 | |
| | 3,110,000 | | | Credit Suisse Mortgage Capital Certificates,
Series 2007-C3, Class A4,
5.721%, 6/15/2039(b) | | | 3,099,697 | |
| | 2,000,000 | | | Credit Suisse Mortgage Capital Certificates,
Series 2007-C4, Class A4,
5.805%, 9/15/2039(b) | | | 1,987,949 | |
| | 3,500,000 | | | Credit Suisse Mortgage Capital Certificates,
Series 2007-C5, Class A4,
5.695%, 9/15/2040 | | | 3,507,902 | |
| | 1,500,000 | | | Greenwich Capital Commercial Funding Corp.,
Series 2006-GG7, Class A4,
5.883%, 7/10/2038(b) | | | 1,643,495 | |
| | 3,000,000 | | | Greenwich Capital Commercial Funding Corp.,
Series 2007-GG9, Class A4,
5.444%, 3/10/2039 | | | 3,162,317 | |
| | 1,860,000 | | | GS Mortgage Securities Corp. II,
Series 2006-GG6, Class A4,
5.553%, 4/10/2038 | | | 2,002,729 | |
| | 1,140,000 | | | GS Mortgage Securities Corp. II,
Series 2006-GG8, Class A4,
5.560%, 11/10/2039 | | | 1,214,225 | |
| | 2,785,000 | | | JPMorgan Chase Commercial Mortgage Securities Corp.,
Series 2007-CB18, Class A4,
5.440%, 6/12/2047 | | | 2,919,205 | |
| | 3,000,000 | | | JPMorgan Chase Commercial Mortgage Securities Corp.,
Series 2007-LDPX, Class A3,
5.420%, 1/15/2049 | | | 3,121,250 | |
| | 3,914,000 | | | Merrill Lynch/Countrywide Commercial Mortgage Trust, Series 2007-6, Class A4,
5.485%, 3/12/2051 | | | 3,926,981 | |
| | 2,720,000 | | | Morgan Stanley Capital I,
Series 2007-IQ14, Class A4,
5.692%, 4/15/2049 | | | 2,823,492 | |
| | 1,500,000 | | | Morgan Stanley Capital I,
Series 2007-IQ15, Class A4,
5.880%, 6/11/2049(b) | | | 1,604,368 | |
| | 815,000 | | | Wachovia Bank Commercial Mortgage Trust,
Series 2006-C23, Class A4,
5.418%, 1/15/2045 | | | 879,808 | |
| | 1,410,000 | | | Wachovia Bank Commercial Mortgage Trust,
Series 2006-C28, Class A4,
5.572%, 10/15/2048 | | | 1,474,997 | |
| | | | | | | | |
| | | | | | | 49,187,770 | |
| | | | | | | | |
| | | | Government Guaranteed — 1.2% | | | | |
| | 1,800,000 | | | General Electric Capital Corp., MTN, (FDIC insured),
2.125%, 12/21/2012 | | | 1,857,314 | |
| | 2,340,000 | | | US Central Federal Credit Union, (FDIC insured),
1.900%, 10/19/2012 | | | 2,400,229 | |
| | | | | | | | |
| | | | | | | 4,257,543 | |
| | | | | | | | |
See accompanying notes to financial statements.
35 |
Portfolio of Investments – as of September 30, 2010
Loomis Sayles Limited Term Government and Agency Fund – (continued)
| | | | | | | | |
Principal
Amount | | | Description | | Value (†) | |
| | | | | | | | |
| | | | Government Owned - No Guarantee — 22.0% | | | | |
| $ | 5,100,000 | | | Federal Home Loan Mortgage Corp.,
0.178%, 2/02/2012(b) | | $ | 5,094,783 | |
| | 16,000,000 | | | Federal Home Loan Mortgage Corp.,
1.625%, 4/26/2011 | | | 16,122,192 | |
| | 11,920,000 | | | Federal Home Loan Mortgage Corp.,
2.125%, 3/23/2012 | | | 12,212,719 | |
| | 1,600,000 | | | Federal Home Loan Mortgage Corp.,
4.125%, 10/18/2010 | | | 1,602,955 | |
| | 17,760,000 | | | Federal Home Loan Mortgage Corp.,
4.125%, 12/21/2012 | | | 19,120,576 | |
| | 6,500,000 | | | Federal National Mortgage Association,
1.250%, 6/22/2012 | | | 6,583,610 | |
| | 5,000,000 | | | Federal National Mortgage Association,
1.750%, 3/23/2011 | | | 5,036,060 | |
| | 8,265,000 | | | Federal National Mortgage Association,
4.750%, 11/19/2012 | | | 8,989,634 | |
| | | | | | | | |
| | | | | | | 74,762,529 | |
| | | | | | | | |
| | | | Government Sponsored — 4.9% | | | | |
| | 6,800,000 | | | Federal Home Loan Bank,
1.125%, 6/03/2011 | | | 6,837,142 | |
| | 5,000,000 | | | Federal Home Loan Bank,
1.625%, 7/27/2011 | | | 5,052,700 | |
| | 3,000,000 | | | Federal Home Loan Bank,
3.375%, 10/20/2010 | | | 3,005,007 | |
| | 1,700,000 | | | Federal Home Loan Bank,
3.625%, 9/16/2011 | | | 1,754,961 | |
| | | | | | | | |
| | | | | | | 16,649,810 | |
| | | | | | | | |
| | | | Hybrid ARMs — 0.3% | | | | |
| | 851,274 | | | FNMA,
6.000%, 2/01/2037(b) | | | 908,976 | |
| | | | | | | | |
| | | | Mortgage Related — 22.0% | | | | |
| | 15,956,309 | | | FHLMC,
4.500%, with various maturities from 2025 to 2034(c) | | | 16,788,029 | |
| | 2,445,308 | | | FHLMC,
5.500%, 10/01/2023 | | | 2,631,898 | |
| | 3,467,129 | | | FHLMC,
6.000%, with various maturities from 2019 to 2021(c) | | | 3,763,810 | |
| | 5,092,036 | | | FHLMC,
6.500%, with various maturities from 2014 to 2034(c) | | | 5,600,698 | |
| | 137,445 | | | FHLMC,
7.000%, 2/01/2016 | | | 148,059 | |
| | 11,317 | | | FHLMC,
7.500%, with various maturities from 2012 to 2026(c) | | | 12,091 | |
| | 9,005 | | | FHLMC,
8.000%, 9/01/2015 | | | 9,788 | |
| | 3,909 | | | FHLMC,
10.000%, 7/01/2019 | | | 4,498 | |
| | 110,271 | | | FHLMC,
11.500%, with various maturities from 2015 to 2020(c) | | | 115,522 | |
| | 7,845,236 | | | FNMA,
4.000%, with various maturities from 2018 to 2019(c) | | | 8,314,251 | |
| | 9,547,383 | | | FNMA,
4.500%, with various maturities from 2019 to 2025(c) | | | 10,055,742 | |
| | 7,617,395 | | | FNMA,
5.500%, with various maturities from 2017 to 2033(c) | | | 8,203,761 | |
| | | | | | | | |
Principal
Amount | | | Description | | Value (†) | |
| | | | | | | | |
| | | | Mortgage Related — continued | | | | |
| $ | 13,191,568 | | | FNMA,
6.000%, with various maturities from 2017 to 2022(c) | | $ | 14,295,898 | |
| | 3,416,357 | | | FNMA,
6.500%, with various maturities from 2017 to 2037(c) | | | 3,752,770 | |
| | 177,938 | | | FNMA,
7.000%, 12/01/2022 | | | 194,499 | |
| | 331,710 | | | FNMA,
7.500%, with various maturities from 2015 to 2032(c) | | | 375,141 | |
| | 45,497 | | | FNMA,
8.000%, with various maturities from 2015 to 2016(c) | | | 49,481 | |
| | 78,723 | | | GNMA,
6.000%, 12/15/2031 | | | 86,386 | |
| | 268,158 | | | GNMA,
6.500%, 5/15/2031 | | | 301,035 | |
| | 261,599 | | | GNMA,
7.000%, 10/15/2028 | | | 298,523 | |
| | 1,903 | | | GNMA,
12.500%, 6/15/2014 | | | 1,920 | |
| | 20,604 | | | GNMA,
16.000%, with various maturities from 2011 to 2012(c) | | | 20,814 | |
| | 5,081 | | | GNMA,
17.000%, with various maturities in 2011(c) | | | 5,127 | |
| | | | | | | | |
| | | | | | | 75,029,741 | |
| | | | | | | | |
| | | | Treasuries — 30.9% | | | | |
| | 1,800,000 | | | U.S. Treasury Note,
0.625%, 6/30/2012 | | | 1,807,308 | |
| | 24,105,000 | | | U.S. Treasury Note,
0.875%, 5/31/2011 | | | 24,210,459 | |
| | 20,425,000 | | | U.S. Treasury Note,
1.000%, 9/30/2011 | | | 20,567,812 | |
| | 45,000,000 | | | U.S. Treasury Note,
1.375%, 9/15/2012 | | | 45,827,910 | |
| | 12,400,000 | | | U.S. Treasury Note,
1.875%, 6/30/2015 | | | 12,777,816 | |
| | | | | | | | |
| | | | | | | 105,191,305 | |
| | | | | | | | |
| | | | Total Bonds and Notes
(Identified Cost $325,863,102) | | | 338,242,055 | |
| | | | | | | | |
| | | | | | | | |
| | | | Total Investments — 99.4%
(Identified Cost $325,863,102)(a) | | | 338,242,055 | |
| | | | Other assets less liabilities — 0.6% | | | 1,902,294 | |
| | | | | | | | |
| | | | Net Assets — 100.0% | | $ | 340,144,349 | |
| | | | | | | | |
| | | | | | | | |
| | (†) | | | See Note 2 of Notes to Financial Statements. | |
| | (a) | | | Federal Tax Information: | |
| | | | At September 30, 2010, the net unrealized appreciation on investments based on a cost of $326,490,074 for federal income tax purposes was as follows: | |
| | | | Aggregate gross unrealized appreciation for all investments in which there is an excess of value over tax cost | | $ | 11,978,281 | |
| | | | Aggregate gross unrealized depreciation for all investments in which there is an excess of tax cost over value | | | (226,300 | ) |
| | | | | | | | |
| | | | Net unrealized appreciation | | $ | 11,751,981 | |
| | | | | | | | |
| | | | | | | | |
See accompanying notes to financial statements.
| 36
Portfolio of Investments – as of September 30, 2010
Loomis Sayles Limited Term Government and Agency Fund – (continued)
| | | | | | | | |
| | | | | | | | |
| | (b) | | | Variable rate security. Rate as of September 30, 2010 is disclosed. | |
| | (c) | | | The Fund’s investment in mortgage related securities of the Federal Home Loan Mortgage Corporation, Federal National Mortgage Association and Government National Mortgage Association are interests in separate pools of mortgages. All separate investments in securities of each issuer which have the same coupon rate have been aggregated for the purpose of presentation in the Portfolio of Investments. | |
| | | | | | | | |
| | 144A | | | Securities exempt from registration under Rule 144A of the Securities Act of 1933. These securities may be resold in transactions exempt from registration, normally to qualified institutional buyers. At September 30, 2010, the total value of these securities amounted to $6,253,164 or 1.8% of net assets. | |
| | | | | | | | |
| | ABS | | | Asset-Backed Securities | | | | |
| | ARMs | | | Adjustable Rate Mortgages | | | | |
| | FDIC | | | Federal Deposit Insurance Corporation | | | | |
| | FHLMC | | | Federal Home Loan Mortgage Corp. | | | | |
| | FNMA | | | Federal National Mortgage Association | | | | |
| | GNMA | | | Government National Mortgage Association | | | | |
| | MTN | | | Medium Term Note | | | | |
Industry Summary at September 30, 2010 (Unaudited)
| | | | |
| Treasuries | | | 30.9 | % |
| Mortgage Related | | | 22.0 | |
| Government Owned - No Guarantee | | | 22.0 | |
Commercial Mortgage-Backed
Securities | | | 14.5 | |
| Government Sponsored | | | 4.9 | |
| ABS Car Loan | | | 2.0 | |
| Other Investments, less than 2% each | | | 3.1 | |
| | | | |
| Total Investments | | | 99.4 | |
| Other assets less liabilities | | | 0.6 | |
| | | | |
| Net Assets | | | 100.0 | % |
| | | | |
See accompanying notes to financial statements.
37 |
Portfolio of Investments – as of September 30, 2010
Loomis Sayles Strategic Income Fund
| | | | | | | | |
Principal
Amount (‡) | | | Description | | Value (†) | |
| | | | | | | | |
| | Bonds and Notes — 90.4% of Net Assets | | | | |
| | Non-Convertible Bonds — 81.4% | | | | |
| | | | ABS Car Loan — 0.1% | | | | |
| $ | 11,305,000 | | | Avis Budget Rental Car Funding AESOP LLC,
Series 2007-2A, Class A,
0.397%, 8/20/2013, 144A(b) | | $ | 10,848,426 | |
| | | | | | | | |
| | | | ABS Home Equity — 0.0% | | | | |
| | 2,175,000 | | | New Century Home Equity Loan Trust,
Series 2005-2, Class M3,
0.746%, 6/25/2035(b) | | | 1,239,060 | |
| | | | | | | | |
| | | | Aerospace & Defense — 0.1% | | | | |
| | 620,000 | | | Bombardier, Inc.,
7.350%, 12/22/2026, (CAD) | | | 604,188 | |
| | 11,800,000 | | | Bombardier, Inc.,
7.450%, 5/01/2034, 144A | | | 11,210,000 | |
| | | | | | | | |
| | | | | | | 11,814,188 | |
| | | | | | | | |
| | | | Airlines — 2.2% | | | | |
| | 35,455,000 | | | Air Canada,
10.125%, 8/01/2015, 144A, (CAD) | | | 34,976,018 | |
| | 179,522 | | | American Airlines Pass Through Trust,
Series 1993-A6,
8.040%, 9/16/2011 | | | 179,522 | |
| | 3,200,380 | | | American Airlines Pass Through Trust,
Series 2009-1A,
10.375%, 1/02/2021 | | | 3,776,448 | |
| | 141,965 | | | Continental Airlines Pass Through Trust,
Series 1996-1, Class A,
6.940%, 4/15/2015 | | | 147,289 | |
| | 6,117,518 | | | Continental Airlines Pass Through Trust,
Series 1997-1, Class A,
7.461%, 10/01/2016 | | | 6,270,456 | |
| | 3,339,995 | | | Continental Airlines Pass Through Trust,
Series 1997-4, Class B,
6.900%, 7/02/2018 | | | 3,306,595 | |
| | 3,046,379 | | | Continental Airlines Pass Through Trust,
Series 1998-1, Class B,
6.748%, 9/15/2018 | | | 2,954,987 | |
| | 5,721,781 | | | Continental Airlines Pass Through Trust,
Series 1999-1, Class B,
6.795%, 2/02/2020 | | | 5,507,214 | |
| | 5,029,719 | | | Continental Airlines Pass Through Trust,
Series 1999-2, Class B,
7.566%, 9/15/2021 | | | 5,061,155 | |
| | 1,314,717 | | | Continental Airlines Pass Through Trust,
Series 2000-1, Class A-1,
8.048%, 5/01/2022 | | | 1,419,895 | |
| | 1,486,910 | | | Continental Airlines Pass Through Trust,
Series 2000-2, Class A-1,
7.707%, 10/02/2022 | | | 1,594,711 | |
| | 7,235,449 | | | Continental Airlines Pass Through Trust,
Series 2000-2, Class B,
8.307%, 10/02/2019 | | | 7,307,803 | |
| | 2,067,163 | | | Continental Airlines Pass Through Trust,
Series 2001-1, Class A-1,
6.703%, 12/15/2022 | | | 2,165,436 | |
| | 2,714,175 | | | Continental Airlines Pass Through Trust,
Series 2001-1, Class B,
7.373%, 6/15/2017 | | | 2,646,320 | |
| | 11,703,990 | | | Continental Airlines Pass Through Trust,
Series 2007-1, Class A,
5.983%, 10/19/2023 | | | 12,084,369 | |
| | | | | | | | |
Principal
Amount (‡) | | | Description | | Value (†) | |
| | | | | | | | |
| | | | Airlines — continued | | | | |
| $ | 19,476,090 | | | Continental Airlines Pass Through Trust,
Series 2007-1, Class B,
6.903%, 4/19/2022 | | $ | 18,697,046 | |
| | 19,191,567 | | | Continental Airlines Pass Through Trust,
Series 2009-1, Class A,
9.000%, 7/08/2016 | | | 21,878,387 | |
| | 17,425,000 | | | Continental Airlines Pass Through Trust,
Series 2009-2, Class A,
7.250%, 5/10/2021 | | | 18,993,250 | |
| | 2,825,000 | | | Delta Air Lines, Inc.,
9.500%, 9/15/2014, 144A | | | 3,065,125 | |
| | 2,450,000 | | | Delta Air Lines, Inc.,
Series 2001-1, Class A-2,
7.111%, 3/18/2013 | | | 2,560,250 | |
| | 1,472,356 | | | Delta Air Lines, Inc.,
Series 2007-1, Class A,
6.821%, 2/10/2024 | | | 1,544,060 | |
| | 8,142,151 | | | Delta Air Lines, Inc.,
Series 2007-1, Class B,
8.021%, 2/10/2024 | | | 8,182,862 | |
| | 25,800,820 | | | Delta Air Lines, Inc.,
Series 2007-1, Class C,
8.954%, 8/10/2014 | | | 26,252,334 | |
| | 7,126,790 | | | Delta Air Lines, Inc.,
Series B,
9.750%, 12/17/2016 | | | 7,625,665 | |
| | 2,185,205 | | | Northwest Airlines, Inc.,
Series 2002-1, Class G2, (MBIA Insured),
6.264%, 5/20/2023 | | | 2,196,132 | |
| | 21,099,455 | | | Northwest Airlines, Inc.,
Series 2007-1, Class B,
8.028%, 11/01/2017 | | | 21,327,118 | |
| | 1,500,000 | | | Qantas Airways Ltd.,
5.125%, 6/20/2013, 144A | | | 1,585,914 | |
| | 32,710,000 | | | Qantas Airways Ltd.,
6.050%, 4/15/2016, 144A | | | 35,981,654 | |
| | 20,244,097 | | | UAL Pass Through Trust,
Series 2007-1, Class A,
6.636%, 1/02/2024 | | | 20,193,486 | |
| | 11,036,483 | | | UAL Pass Through Trust,
Series 2009-1,
10.400%, 5/01/2018 | | | 12,305,679 | |
| | | | | | | | |
| | | | | | | 291,787,180 | |
| | | | | | | | |
| | | | Automotive — 2.8% | | | | |
| | 265,000 | | | ArvinMeritor, Inc.,
8.125%, 9/15/2015 | | | 268,313 | |
| | 1,853,000 | | | Cummins, Inc.,
6.750%, 2/15/2027 | | | 2,018,714 | |
| | 2,145,000 | | | Cummins, Inc.,
7.125%, 3/01/2028 | | | 2,418,262 | |
| | 3,100,000 | | | FCE Bank PLC, EMTN,
4.625%, 10/25/2010, (NOK) | | | 525,210 | |
| | 6,500,000 | | | FCE Bank PLC, EMTN,
7.125%, 1/16/2012, (EUR) | | | 9,149,114 | |
| | 4,500,000 | | | FCE Bank PLC, EMTN,
7.125%, 1/15/2013, (EUR) | | | 6,380,011 | |
| | 5,700,000 | | | FCE Bank PLC, EMTN,
7.875%, 2/15/2011, (GBP) | | | 9,055,308 | |
| | 19,011,000 | | | Ford Motor Co.,
6.375%, 2/01/2029 | | | 17,585,175 | |
| | 1,975,000 | | | Ford Motor Co.,
6.500%, 8/01/2018 | | | 2,009,563 | |
See accompanying notes to financial statements.
| 38
Portfolio of Investments – as of September 30, 2010
Loomis Sayles Strategic Income Fund – (continued)
| | | | | | | | |
Principal
Amount (‡) | | | Description | | Value (†) | |
| | | | | | | | |
| | | | Automotive — continued | | | | |
| $ | 1,220,000 | | | Ford Motor Co.,
6.625%, 2/15/2028 | | $ | 1,155,950 | |
| | 74,829,000 | | | Ford Motor Co.,
6.625%, 10/01/2028 | | | 70,900,477 | |
| | 2,365,000 | | | Ford Motor Co.,
7.125%, 11/15/2025 | | | 2,311,788 | |
| | 90,200,000 | | | Ford Motor Co.,
7.450%, 7/16/2031 | | | 94,033,500 | |
| | 1,345,000 | | | Ford Motor Co.,
7.500%, 8/01/2026 | | | 1,345,000 | |
| | 39,805,000 | | | Ford Motor Credit Co. LLC,
7.000%, 4/15/2015 | | | 42,534,827 | |
| | 22,640,000 | | | Ford Motor Credit Co. LLC,
8.000%, 6/01/2014 | | | 24,757,338 | |
| | 14,595,000 | | | Ford Motor Credit Co. LLC,
8.000%, 12/15/2016 | | | 16,497,765 | |
| | 47,600,000 | | | Ford Motor Credit Co. LLC,
8.700%, 10/01/2014 | | | 53,401,202 | |
| | 4,977,000 | | | Goodyear Tire & Rubber Co. (The),
7.000%, 3/15/2028 | | | 4,578,840 | |
| | 9,635,000 | | | Goodyear Tire & Rubber Co. (The),
10.500%, 5/15/2016 | | | 10,911,637 | |
| | 3,100,000 | | | TRW Automotive, Inc.,
7.250%, 3/15/2017, 144A | | | 3,293,750 | |
| | 5,300,000 | | | TRW Automotive, Inc.,
8.875%, 12/01/2017, 144A | | | 5,803,500 | |
| | | | | | | | |
| | | | | | | 380,935,244 | |
| | | | | | | | |
| | | | Banking — 6.5% | | | | |
| | 65,105,000 | | | AgriBank FCB,
9.125%, 7/15/2019, 144A(c) | | | 80,751,945 | |
| | 20,565,000 | | | Associates Corp. of North America,
6.950%, 11/01/2018 | | | 22,702,773 | |
| | 22,125,000 | | | BAC Capital Trust VI,
5.625%, 3/08/2035 | | | 20,798,031 | |
| | 1,675,000 | | | Bank of America Corp.,
5.420%, 3/15/2017 | | | 1,715,369 | |
| | 4,560,000 | | | Bank of America Corp.,
6.000%, 9/01/2017 | | | 4,937,185 | |
| | 8,020,000 | | | Bank of America NA,
5.300%, 3/15/2017 | | | 8,254,272 | |
| | 39,890,000,000 | | | Barclays Bank PLC, EMTN,
3.680%, 8/20/2015, (KRW) | | | 35,169,074 | |
| | 56,650,000,000 | | | Barclays Financial LLC,
4.470%, 12/04/2011, 144A, (KRW) | | | 50,238,527 | |
| | 224,520,000,000 | | | BNP Paribas SA,
EMTN, Zero Coupon,
6/13/2011, 144A, (IDR) | | | 24,150,050 | |
| | 47,120,000 | | | Citigroup, Inc.,
5.000%, 9/15/2014 | | | 48,940,717 | |
| | 985,000 | | | Citigroup, Inc.,
5.850%, 12/11/2034 | | | 992,544 | |
| | 22,790,000 | | | Citigroup, Inc.,
5.875%, 2/22/2033 | | | 21,818,713 | |
| | 10,819,000 | | | Citigroup, Inc.,
6.000%, 10/31/2033 | | | 10,436,927 | |
| | 6,060,000 | | | Citigroup, Inc.,
6.125%, 8/25/2036 | | | 5,902,343 | |
| | 45,862,000 | | | Citigroup, Inc.,
6.375%, 8/12/2014 | | | 50,928,650 | |
| | 3,350,000 | | | Citigroup, Inc.,
EMTN, (fixed rate to 11/30/2012, variable rate thereafter),
3.625%, 11/30/2017, (EUR) | | | 4,376,052 | |
| | | | | | | | |
Principal
Amount (‡) | | | Description | | Value (†) | |
| | | | | | | | |
| | | | Banking — continued | | | | |
| $ | 64,000,000 | | | Citigroup, Inc., MTN,
5.500%, 10/15/2014 | | $ | 69,444,416 | |
| | 9,905,000 | | | First Niagara Finance Group, Inc.,
6.750%, 3/19/2020 | | | 10,933,337 | |
| | 400,000 | | | Goldman Sachs Group, Inc. (The),
6.450%, 5/01/2036 | | | 401,180 | |
| | 30,375,000 | | | Goldman Sachs Group, Inc. (The),
6.750%, 10/01/2037 | | | 31,572,534 | |
| | 1,285,000 | | | Goldman Sachs Group, Inc. (The), GMTN,
5.375%, 3/15/2020 | | | 1,354,405 | |
| | 3,120,000 | | | HBOS PLC,
6.000%, 11/01/2033, 144A | | | 2,377,783 | |
| | 119,806,078 | | | HSBC Bank USA,
Zero Coupon, 11/28/2011, 144A | | | 110,664,874 | |
| | 9,090,000 | | | ICICI Bank Ltd., (fixed rate to 4/30/2017, variable rate thereafter),
6.375%, 4/30/2022, 144A | | | 9,136,823 | |
| | 109,312,000,000 | | | JPMorgan Chase & Co.,
Zero Coupon, 3/28/2011, 144A, (IDR) | | | 11,933,074 | |
| | 229,157,783,660 | | | JPMorgan Chase & Co.,
Zero Coupon, 4/12/2012, 144A, (IDR) | | | 23,485,784 | |
| | 599,726,100,000 | | | JPMorgan Chase & Co., EMTN,
Zero Coupon, 3/28/2011, 144A, (IDR) | | | 65,469,259 | |
| | 76,496,404,750 | | | JPMorgan Chase London, EMTN,
Zero Coupon, 10/21/2010, 144A, (IDR) | | | 8,529,885 | |
| | 27,555,000 | | | Lloyds TSB Bank PLC, MTN,
6.500%, 9/14/2020, 144A | | | 27,820,493 | |
| | 3,010,000 | | | Merrill Lynch & Co., Inc.,
5.700%, 5/02/2017 | | | 3,113,053 | |
| | 1,400,000 | | | Merrill Lynch & Co., Inc.,
6.110%, 1/29/2037 | | | 1,368,808 | |
| | 51,500,000 | | | Merrill Lynch & Co., Inc.,
10.710%, 3/08/2017, (BRL) | | | 29,219,858 | |
| | 3,450,000 | | | Merrill Lynch & Co., Inc., EMTN,
4.625%, 9/14/2018, (EUR) | | | 4,591,042 | |
| | 5,410,000 | | | Merrill Lynch & Co., Inc., MTN,
6.875%, 4/25/2018 | | | 6,068,375 | |
| | 800,000 | | | Merrill Lynch & Co., Inc.,
Series C, MTN,
6.050%, 6/01/2034 | | | 821,666 | |
| | 1,235,000 | | | Merrill Lynch & Co., Inc.,
Series C, MTN,
6.400%, 8/28/2017 | | | 1,351,467 | |
| | 26,665,000 | | | Morgan Stanley,
4.750%, 4/01/2014 | | | 27,848,073 | |
| | 10,500,000 | | | Morgan Stanley,
5.500%, 7/24/2020 | | | 10,817,289 | |
| | 5,050,000 | | | Morgan Stanley, GMTN,
5.125%, 11/30/2015, (GBP) | | | 8,189,644 | |
| | 7,900,000 | | | Morgan Stanley,
Series F, GMTN,
6.625%, 4/01/2018 | | | 8,758,375 | |
| | 2,900,000 | | | Morgan Stanley,
Series F, MTN,
5.550%, 4/27/2017 | | | 3,072,979 | |
| | 6,600,000 | | | Morgan Stanley,
Series F, MTN,
5.625%, 9/23/2019 | | | 6,871,597 | |
| | 5,210,000 | | | Morgan Stanley,
Series F, MTN,
5.950%, 12/28/2017 | | | 5,596,457 | |
| | | | | | | | |
| | | | | | | 882,925,702 | |
| | | | | | | | |
See accompanying notes to financial statements.
39 |
Portfolio of Investments – as of September 30, 2010
Loomis Sayles Strategic Income Fund – (continued)
| | | | | | | | |
Principal
Amount (‡) | | | Description | | Value (†) | |
| | | | | | | | |
| | | | Brokerage — 0.0% | | | | |
| $ | 880,000 | | | Jefferies Group, Inc.,
6.250%, 1/15/2036 | | $ | 807,988 | |
| | 3,285,000 | | | Jefferies Group, Inc.,
8.500%, 7/15/2019 | | | 3,814,243 | |
| | | | | | | | |
| | | | | | | 4,622,231 | |
| | | | | | | | |
| | | | Building Materials — 1.0% | | | | |
| | 3,255,000 | | | Masco Corp.,
4.800%, 6/15/2015 | | | 3,200,983 | |
| | 2,220,000 | | | Masco Corp.,
5.850%, 3/15/2017 | | | 2,171,984 | |
| | 13,440,000 | | | Masco Corp.,
6.125%, 10/03/2016 | | | 13,663,373 | |
| | 2,045,000 | | | Masco Corp.,
6.500%, 8/15/2032 | | | 1,755,076 | |
| | 18,935,000 | | | Owens Corning, Inc.,
6.500%, 12/01/2016 | | | 20,485,284 | |
| | 35,980,000 | | | Owens Corning, Inc.,
7.000%, 12/01/2036 | | | 36,234,235 | |
| | 46,412,000 | | | USG Corp.,
6.300%, 11/15/2016 | | | 40,262,410 | |
| | 14,155,000 | | | USG Corp.,
9.500%, 1/15/2018 | | | 13,889,594 | |
| | | | | | | | |
| | | | | | | 131,662,939 | |
| | | | | | | | |
| | | | Chemicals — 0.9% | | | | |
| | 23,584,000 | | | Borden, Inc.,
7.875%, 2/15/2023 | | | 17,923,840 | |
| | 6,920,000 | | | Borden, Inc.,
8.375%, 4/15/2016 | | | 5,882,000 | |
| | 8,757,000 | | | Borden, Inc.,
9.200%, 3/15/2021 | | | 7,268,310 | |
| | 36,355,000 | | | Chevron Phillips Chemical Co. LLC,
8.250%, 6/15/2019, 144A | | | 46,011,433 | |
| | 14,550,000 | | | Hercules, Inc.,
6.500%, 6/30/2029 | | | 11,894,625 | |
| | 5,200,000 | | | Hexion US Finance Corp./Hexion Nova Scotia Finance ULC,
8.875%, 2/01/2018 | | | 5,096,000 | |
| | 24,086,000 | | | Hexion US Finance Corp./Hexion Nova Scotia Finance ULC,
9.750%, 11/15/2014 | | | 25,049,440 | |
| | 5,350,000 | | | Methanex Corp., Senior Note,
6.000%, 8/15/2015 | | | 5,292,632 | |
| | 700,000 | | | Mosaic Global Holdings, Inc.,
7.375%, 8/01/2018 | | | 838,709 | |
| | | | | | | | |
| | | | | | | 125,256,989 | |
| | | | | | | | |
| | | | Collateralized Mortgage Obligations — 0.1% | |
| | 5,563,846 | | | Banc of America Funding Corp.,
Series 2007-8, Class 4A1,
6.000%, 8/25/2037 | | | 4,952,891 | |
| | 7,146,766 | | | WaMu Mortgage Pass Through Certificates,
Series 2007-OA6, Class 2A,
3.003%, 7/25/2047(b) | | | 4,353,938 | |
| | 6,470,016 | | | Wells Fargo Mortgage Backed Securities Trust, Series 2005-AR4, Class 2A2,
2.954%, 4/25/2035(b) | | | 6,177,365 | |
| | | | | | | | |
| | | | | | | 15,484,194 | |
| | | | | | | | |
| | | | | | | | |
Principal
Amount (‡) | | | Description | | Value (†) | |
| | | | | | | | |
| | | | Commercial Mortgage-Backed Securities — 0.1% | |
| $ | 5,583,502 | | | Banc of America Alternative Loan Trust,
Series 2007-1, Class 2A1,
5.791%, 4/25/2037(b) | | $ | 3,964,711 | |
| | 3,548,538 | | | GSR Mortgage Loan Trust,
Series 2005-AR2, Class 2A1,
3.097%, 4/25/2035(b) | | | 3,120,183 | |
| | | | | | | | |
| | | | | | | 7,084,894 | |
| | | | | | | | |
| | | | Construction Machinery — 0.9% | | | | |
| | 48,305,000 | | | Case New Holland, Inc.,
7.750%, 9/01/2013 | | | 52,471,306 | |
| | 1,425,000 | | | Joy Global, Inc.,
6.625%, 11/15/2036 | | | 1,413,503 | |
| | 1,645,000 | | | RSC Equipment Rental, Inc./RSC Holdings III LLC,
9.500%, 12/01/2014 | | | 1,704,631 | |
| | 10,790,000 | | | Terex Corp.,
8.000%, 11/15/2017 | | | 10,803,488 | |
| | 18,703,000 | | | United Rentals North America, Inc.,
7.000%, 2/15/2014 | | | 18,703,000 | |
| | 26,935,000 | | | United Rentals North America, Inc.,
10.875%, 6/15/2016 | | | 30,402,881 | |
| | | | | | | | |
| | | | | | | 115,498,809 | |
| | | | | | | | |
| | | | Consumer Cyclical Services — 0.7% | | | | |
| | 670,000 | | | ServiceMaster Co. (The),
7.100%, 3/01/2018 | | | 576,200 | |
| | 5,500,000 | | | ServiceMaster Co. (The),
7.450%, 8/15/2027 | | | 4,180,000 | |
| | 76,755,000 | | | Western Union Co. (The),
6.200%, 11/17/2036 | | | 82,918,350 | |
| | | | | | | | |
| | | | | | | 87,674,550 | |
| | | | | | | | |
| | | | Distributors — 0.0% | | | | |
| | 1,500,000 | | | EQT Corp.,
8.125%, 6/01/2019 | | | 1,859,703 | |
| | | | | | | | |
| | | | Diversified Manufacturing — 0.4% | | | | |
| | 1,441,000 | | | Textron Financial Corp.,
5.400%, 4/28/2013 | | | 1,513,037 | |
| | 550,000 | | | Textron Financial Corp.,
Series E, MTN,
5.125%, 8/15/2014 | | | 569,737 | |
| | 13,850,000 | | | Textron, Inc.,
3.875%, 3/11/2013, (EUR) | | | 18,742,071 | |
| | 5,020,000 | | | Textron, Inc.,
5.600%, 12/01/2017 | | | 5,423,518 | |
| | 16,040,000 | | | Textron, Inc., EMTN,
6.625%, 4/07/2020, (GBP) | | | 25,418,786 | |
| | | | | | | | |
| | | | | | | 51,667,149 | |
| | | | | | | | |
| | | | Electric — 3.5% | | | | |
| | 5,565,000 | | | AES Corp. (The),
8.375%, 3/01/2011, (GBP)(c) | | | 8,734,187 | |
| | 8,408,771 | | | AES Ironwood LLC,
8.857%, 11/30/2025 | | | 8,640,013 | |
| | 1,032,480 | | | AES Red Oak LLC,
Series A,
8.540%, 11/30/2019 | | | 1,060,873 | |
| | 52,100,000 | | | Alta Wind Holdings LLC,
7.000%, 6/30/2035, 144A | | | 55,136,388 | |
| | 70,050,991 | | | Bruce Mansfield Unit,
6.850%, 6/01/2034(c) | | | 78,069,132 | |
| | 3,254,784 | | | CE Generation LLC,
7.416%, 12/15/2018 | | | 3,339,024 | |
See accompanying notes to financial statements.
| 40
Portfolio of Investments – as of September 30, 2010
Loomis Sayles Strategic Income Fund – (continued)
| | | | | | | | |
Principal
Amount (‡) | | | Description | | Value (†) | |
| | | | | | | | |
| | | | Electric — continued | | | | |
| $ | 31,115,000 | | | Cleveland Electric Illuminating Co. (The),
5.950%, 12/15/2036 | | $ | 31,787,364 | |
| | 11,275,000 | | | Dynegy Holdings, Inc.,
7.125%, 5/15/2018 | | | 7,695,188 | |
| | 1,000,000 | | | Dynegy Holdings, Inc.,
7.500%, 6/01/2015 | | | 787,500 | |
| | 10,185,000 | | | Dynegy Holdings, Inc.,
7.625%, 10/15/2026 | | | 6,136,463 | |
| | 500,000 | | | Dynegy Holdings, Inc.,
7.750%, 6/01/2019 | | | 342,500 | |
| | 7,455,000 | | | Dynegy Holdings, Inc.,
8.375%, 5/01/2016 | | | 5,814,900 | |
| | 1,132,099 | | | Dynegy Roseton/Danskammer Pass Through Trust, Series A,
7.270%, 11/08/2010 | | | 1,132,099 | |
| | 95,200,000 | | | Edison Mission Energy,
7.625%, 5/15/2027 | | | 64,022,000 | |
| | 250,000 | | | Empresa Nacional de Electricidad SA (Endesa-Chile),
8.350%, 8/01/2013 | | | 288,829 | |
| | 4,875,000 | | | Endesa SA/Cayman Islands,
7.875%, 2/01/2027 | | | 5,602,501 | |
| | 5,940,000 | | | Energy Future Holdings Corp.,
10.000%, 1/15/2020, 144A | | | 5,896,994 | |
| | 555,000 | | | Enersis SA, Cayman Islands,
7.400%, 12/01/2016 | | | 655,791 | |
| | 5,310,000 | | | ITC Holdings Corp.,
6.375%, 9/30/2036, 144A | | | 5,863,637 | |
| | 31,735,000 | | | NGC Corp. Capital Trust I,
Series B,
8.316%, 6/01/2027(c) | | | 15,232,800 | |
| | 43,450,000 | | | NiSource Finance Corp.,
6.400%, 3/15/2018 | | | 50,391,007 | |
| | 2,500,000 | | | NRG Energy, Inc.,
7.250%, 2/01/2014 | | | 2,565,625 | |
| | 1,317,625 | | | Quezon Power Philippines Co.,
8.860%, 6/15/2017 | | | 1,363,742 | |
| | 25,230,000 | | | RRI Energy, Inc.,
7.875%, 6/15/2017 | | | 23,526,975 | |
| | 1,050,000 | | | SP PowerAssets Ltd., EMTN,
3.730%, 10/22/2010, (SGD) | | | 799,384 | |
| | 655,000 | | | Texas Competitive Electric Holdings Co. LLC,
Series A,
10.250%, 11/01/2015 | | | 429,025 | |
| | 50,270,000 | | | TXU Corp.,
Series P,
5.550%, 11/15/2014 | | | 26,894,450 | |
| | 101,735,000 | | | TXU Corp.,
Series Q,
6.500%, 11/15/2024 | | | 38,913,637 | |
| | 6,675,000 | | | TXU Corp.,
Series R,
6.550%, 11/15/2034 | | | 2,536,500 | |
| | 7,300,000 | | | White Pine Hydro LLC,
6.310%, 7/10/2017(c) | | | 7,671,351 | |
| | 10,935,000 | | | White Pine Hydro LLC,
6.960%, 7/10/2037(c) | | | 11,012,967 | |
| | 4,000,000 | | | White Pine Hydro Portfolio LLC,
7.260%, 7/20/2015(c) | | | 3,630,800 | |
| | | | | | | | |
| | | | | | | 475,973,646 | |
| | | | | | | | |
| | | | Financial Other — 0.2% | | | | |
| | 20,000,000 | | | National Life Insurance Co.,
10.500%, 9/15/2039, 144A | | | 24,311,200 | |
| | | | | | | | |
| | | | | | | | |
Principal
Amount (‡) | | | Description | | Value (†) | |
| | | | | | | | |
| | | | Food & Beverage — 0.2% | | | | |
| $ | 2,085,000 | | | ARAMARK Corp.,
5.000%, 6/01/2012 | | $ | 2,090,212 | |
| | 23,710,000 | | | Corn Products International, Inc.,
6.625%, 4/15/2037 | | | 25,898,552 | |
| | 965,000 | | | Smithfield Foods, Inc.,
7.750%, 7/01/2017 | | | 978,269 | |
| | | | | | | | |
| | | | | | | 28,967,033 | |
| | | | | | | | |
| | | | Government Owned — No Guarantee — 0.4% | |
| | 26,435,000 | | | Abu Dhabi National Energy Co.,
7.250%, 8/01/2018, 144A | | | 29,560,040 | |
| | 19,500,000 | | | DP World Ltd.,
6.850%, 7/02/2037, 144A | | | 18,238,116 | |
| | | | | | | | |
| | | | | | | 47,798,156 | |
| | | | | | | | |
| | | | Health Insurance — 0.2% | | | | |
| | 15,325,000 | | | CIGNA Corp.,
6.150%, 11/15/2036 | | | 16,874,235 | |
| | 2,000,000 | | | CIGNA Corp.,
6.350%, 3/15/2018 | | | 2,351,588 | |
| | | | | | | | |
| | | | | | | 19,225,823 | |
| | | | | | | | |
| | | | Healthcare — 2.4% | | | | |
| | 4,075,000 | | | Boston Scientific Corp.,
5.125%, 1/12/2017 | | | 4,116,443 | |
| | 2,765,000 | | | Boston Scientific Corp.,
5.450%, 6/15/2014 | | | 2,934,948 | |
| | 10,230,000 | | | Boston Scientific Corp.,
6.000%, 1/15/2020 | | | 10,910,694 | |
| | 4,155,000 | | | Boston Scientific Corp.,
6.400%, 6/15/2016 | | | 4,516,743 | |
| | 16,510,000 | | | Boston Scientific Corp.,
7.000%, 11/15/2035 | | | 16,684,279 | |
| | 17,785,000 | | | HCA, Inc.,
5.750%, 3/15/2014 | | | 17,540,456 | |
| | 3,800,000 | | | HCA, Inc.,
6.250%, 2/15/2013 | | | 3,866,500 | |
| | 17,035,000 | | | HCA, Inc.,
6.375%, 1/15/2015 | | | 16,992,412 | |
| | 49,350,000 | | | HCA, Inc.,
6.500%, 2/15/2016 | | | 49,350,000 | |
| | 2,074,000 | | | HCA, Inc.,
6.750%, 7/15/2013 | | | 2,115,480 | |
| | 14,620,000 | | | HCA, Inc.,
7.050%, 12/01/2027 | | | 12,865,600 | |
| | 11,104,000 | | | HCA, Inc.,
7.190%, 11/15/2015 | | | 10,881,920 | |
| | 20,447,000 | | | HCA, Inc.,
7.500%, 12/15/2023 | | | 19,220,180 | |
| | 22,250,000 | | | HCA, Inc.,
7.500%, 11/06/2033 | | | 20,414,375 | |
| | 46,148,000 | | | HCA, Inc.,
7.690%, 6/15/2025 | | | 43,148,380 | |
| | 32,745,000 | | | HCA, Inc.,
8.360%, 4/15/2024 | | | 32,090,100 | |
| | 15,815,000 | | | HCA, Inc., MTN,
7.580%, 9/15/2025 | | | 14,707,950 | |
| | 9,492,000 | | | HCA, Inc., MTN,
7.750%, 7/15/2036 | | | 8,732,640 | |
| | 3,260,000 | | | Owens & Minor, Inc.,
6.350%, 4/15/2016(c) | | | 3,327,642 | |
| | 32,559,000 | | | Tenet Healthcare Corp.,
6.875%, 11/15/2031 | | | 26,372,790 | |
| | 4,765,000 | | | Tenet Healthcare Corp.,
9.250%, 2/01/2015 | | | 5,116,419 | |
| | | | | | | | |
| | | | | | | 325,905,951 | |
| | | | | | | | |
See accompanying notes to financial statements.
41 |
Portfolio of Investments – as of September 30, 2010
Loomis Sayles Strategic Income Fund – (continued)
| | | | | | | | |
Principal
Amount (‡) | | | Description | | Value (†) | |
| | | | | | | | |
| | | | Home Construction — 0.9% | | | | |
| $ | 11,265,000 | | | Desarrolladora Homex SAB de CV,
7.500%, 9/28/2015 | | $ | 11,602,950 | |
| | 4,830,000 | | | K. Hovnanian Enterprises, Inc.,
6.250%, 1/15/2015 | | | 3,622,500 | |
| | 16,075,000 | | | K. Hovnanian Enterprises, Inc.,
6.250%, 1/15/2016 | | | 10,448,750 | |
| | 6,040,000 | | | K. Hovnanian Enterprises, Inc.,
6.375%, 12/15/2014 | | | 4,348,800 | |
| | 2,490,000 | | | K. Hovnanian Enterprises, Inc.,
6.500%, 1/15/2014 | | | 1,867,500 | |
| | 6,290,000 | | | K. Hovnanian Enterprises, Inc.,
7.500%, 5/15/2016 | | | 4,151,400 | |
| | 1,935,000 | | | K. Hovnanian Enterprises, Inc.,
7.750%, 5/15/2013 | | | 1,710,056 | |
| | 1,235,000 | | | K. Hovnanian Enterprises, Inc.,
8.875%, 4/01/2012 | | | 1,185,600 | |
| | 1,685,000 | | | KB Home,
5.750%, 2/01/2014 | | | 1,628,131 | |
| | 8,340,000 | | | KB Home,
5.875%, 1/15/2015 | | | 7,881,300 | |
| | 5,805,000 | | | KB Home,
6.250%, 6/15/2015 | | | 5,543,775 | |
| | 11,315,000 | | | KB Home,
7.250%, 6/15/2018 | | | 10,607,813 | |
| | 3,745,000 | | | Pulte Group, Inc.,
5.200%, 2/15/2015 | | | 3,623,288 | |
| | 47,260,000 | | | Pulte Group, Inc.,
6.000%, 2/15/2035 | | | 35,445,000 | |
| | 13,190,000 | | | Pulte Group, Inc.,
6.375%, 5/15/2033 | | | 10,552,000 | |
| | 4,245,000 | | | Toll Brothers Finance Corp.,
5.150%, 5/15/2015 | | | 4,289,844 | |
| | | | | | | | |
| | | | | | | 118,508,707 | |
| | | | | | | | |
| | | | Independent Energy — 1.1% | | | | |
| | 5,990,000 | | | Anadarko Petroleum Corp.,
6.375%, 9/15/2017 | | | 6,600,710 | |
| | 48,410,000 | | | Anadarko Petroleum Corp.,
6.450%, 9/15/2036 | | | 48,468,237 | |
| | 4,185,000 | | | Chesapeake Energy Corp.,
6.250%, 1/15/2017, (EUR) | | | 5,790,781 | |
| | 14,650,000 | | | Chesapeake Energy Corp.,
6.500%, 8/15/2017 | | | 15,199,375 | |
| | 22,690,000 | | | Chesapeake Energy Corp.,
6.875%, 11/15/2020 | | | 24,051,400 | |
| | 15,054,000 | | | Connacher Oil and Gas Ltd.,
10.250%, 12/15/2015, 144A | | | 15,279,810 | |
| | 3,000,000 | | | Connacher Oil and Gas Ltd.,
11.750%, 7/15/2014, 144A | | | 3,270,000 | |
| | 6,495,000 | | | Hilcorp Energy I LP,
7.750%, 11/01/2015, 144A | | | 6,559,950 | |
| | 4,798,000 | | | Pioneer Natural Resources Co.,
7.200%, 1/15/2028 | | | 4,947,160 | |
| | 13,570,000 | | | QEP Resources, Inc.,
6.875%, 3/01/2021 | | | 14,689,525 | |
| | 2,499,000 | | | Swift Energy Co.,
7.125%, 6/01/2017 | | | 2,474,010 | |
| | 715,000 | | | Williams Cos., Inc. (The),
7.750%, 6/15/2031 | | | 816,869 | |
| | 444,000 | | | Williams Cos., Inc. (The),
7.875%, 9/01/2021 | | | 539,107 | |
| | | | | | | | |
Principal
Amount (‡) | | | Description | | Value (†) | |
| | | | | | | | |
| | | | Independent Energy — continued | | | | |
| $ | 2,984,000 | | | Williams Cos., Inc. (The),
Series A,
7.500%, 1/15/2031 | | $ | 3,376,283 | |
| | | | | | | | |
| | | | | | | 152,063,217 | |
| | | | | | | | |
| | | | Industrial Other — 0.2% | | | | |
| | 350,000 | | | Great Lakes Dredge & Dock Corp.,
7.750%, 12/15/2013 | | | 351,750 | |
| | 20,000,000 | | | Ranhill Labuan Ltd.,
12.500%, 10/26/2011, 144A | | | 18,000,000 | |
| | 10,000,000 | | | Worthington Industries, Inc.,
6.500%, 4/15/2020 | | | 11,069,830 | |
| | | | | | | | |
| | | | | | | 29,421,580 | |
| | | | | | | | |
| | | | Life Insurance — 0.5% | | | | |
| | 2,185,000 | | | American International Group, Inc.,
Series G, MTN,
5.600%, 10/18/2016 | | | 2,228,700 | |
| | 19,625,000 | | | American International Group, Inc.,
Series G, MTN,
5.850%, 1/16/2018 | | | 20,311,875 | |
| | 4,815,000 | | | American International Group, Inc.,
Series MP, GMTN,
5.450%, 5/18/2017 | | | 4,899,262 | |
| | 2,855,000 | | | American International Group, Inc.,
Series MPLE,
4.900%, 6/02/2014, (CAD) | | | 2,677,690 | |
| | 15,930,000 | | | MetLife, Inc.,
6.400%, 12/15/2066 | | | 14,894,550 | |
| | 9,620,000 | | | MetLife, Inc.,
10.750%, 8/01/2069 | | | 12,481,950 | |
| | 4,385,000 | | | NLV Financial Corp.,
7.500%, 8/15/2033, 144A | | | 4,053,551 | |
| | 3,910,000 | | | Penn Mutual Life Insurance Co. (The),
6.650%, 6/15/2034, 144A | | | 3,544,341 | |
| | 6,700,000 | | | Unum Group,
7.125%, 9/30/2016 | | | 7,732,343 | |
| | | | | | | | |
| | | | | | | 72,824,262 | |
| | | | | | | | |
| | | | Local Authorities — 0.6% | | | | |
| | 72,695,000 | | | Queensland Treasury Corp.,
7.125%, 9/18/2017, 144A, (NZD) | | | 58,982,500 | |
| | 26,730,000 | | | Queensland Treasury Corp.,
Series 14,
5.750%, 11/21/2014, (AUD) | | | 26,371,011 | |
| | | | | | | | |
| | | | | | | 85,353,511 | |
| | | | | | | | |
| | | | Lodging — 0.0% | | | | |
| | 5,850,000 | | | Wyndham Worldwide Corp.,
5.750%, 2/01/2018 | | | 5,868,527 | |
| | | | | | | | |
| | | | Media Cable — 1.7% | | | | |
| | 11,140,000 | | | Comcast Corp.,
5.650%, 6/15/2035 | | | 11,245,807 | |
| | 1,265,000 | | | Comcast Corp.,
6.500%, 11/15/2035 | | | 1,414,098 | |
| | 161,264,000 | | | Comcast Corp.,
6.950%, 8/15/2037 | | | 189,096,554 | |
| | 400,000 | | | CSC Holdings LLC,
7.875%, 2/15/2018 | | | 436,500 | |
| | 25,270,000 | | | Shaw Communications, Inc.,
5.650%, 10/01/2019, (CAD) | | | 26,156,378 | |
| | | | | | | | |
| | | | | | | 228,349,337 | |
| | | | | | | | |
See accompanying notes to financial statements.
| 42
Portfolio of Investments – as of September 30, 2010
Loomis Sayles Strategic Income Fund – (continued)
| | | | | | | | |
Principal
Amount (‡) | | | Description | | Value (†) | |
| | | | | | | | |
| | | | Media Non-Cable — 0.5% | | | | |
| $ | 1,140,000 | | | Clear Channel Communications, Inc.,
4.400%, 5/15/2011 | | $ | 1,110,075 | |
| | 5,200,000 | | | Clear Channel Communications, Inc.,
5.000%, 3/15/2012 | | | 4,914,000 | |
| | 4,740,000 | | | Clear Channel Communications, Inc.,
6.250%, 3/15/2011 | | | 4,704,450 | |
| | 46,000,000 | | | News America, Inc.,
6.150%, 3/01/2037 | | | 49,530,546 | |
| | 10,385,000 | | | News America, Inc.,
6.400%, 12/15/2035 | | | 11,516,664 | |
| | | | | | | | |
| | | | | | | 71,775,735 | |
| | | | | | | | |
| | | | Metals & Mining — 0.4% | | | | |
| | 10,000,000 | | | Alcoa, Inc.,
5.720%, 2/23/2019 | | | 10,165,630 | |
| | 3,949,000 | | | Alcoa, Inc.,
5.870%, 2/23/2022 | | | 3,884,450 | |
| | 1,405,000 | | | Alcoa, Inc.,
5.950%, 2/01/2037 | | | 1,293,158 | |
| | 4,330,000 | | | Alcoa, Inc.,
6.750%, 1/15/2028 | | | 4,404,731 | |
| | 9,785,000 | | | Algoma Acquisition Corp.,
9.875%, 6/15/2015, 144A | | | 8,720,881 | |
| | 1,840,000 | | | Rio Tinto Alcan, Inc.,
5.750%, 6/01/2035 | | | 2,009,350 | |
| | 7,000,000 | | | United States Steel Corp.,
6.050%, 6/01/2017 | | | 6,938,750 | |
| | 6,779,000 | | | United States Steel Corp.,
6.650%, 6/01/2037 | | | 6,016,363 | |
| | 16,435,000 | | | United States Steel Corp.,
7.000%, 2/01/2018 | | | 16,763,700 | |
| | | | | | | | |
| | | | | | | 60,197,013 | |
| | | | | | | | |
| | | | Non-Captive Consumer — 4.4% | | | | |
| | 7,920,000 | | | American General Finance Corp., MTN,
5.750%, 9/15/2016 | | | 6,316,200 | |
| | 3,800,000 | | | American General Finance Corp.,
Series H, MTN,
5.375%, 10/01/2012 | | | 3,595,750 | |
| | 6,900,000 | | | American General Finance Corp.,
Series I, MTN,
4.875%, 7/15/2012 | | | 6,520,500 | |
| | 8,885,000 | | | American General Finance Corp.,
Series I, MTN,
5.850%, 6/01/2013 | | | 8,196,413 | |
| | 2,900,000 | | | American General Finance Corp.,
Series J, MTN,
5.900%, 9/15/2012 | | | 2,769,500 | |
| | 800,000 | | | American General Finance Corp.,
Series J, MTN,
6.500%, 9/15/2017 | | | 632,000 | |
| | 240,295,000 | | | American General Finance Corp.,
Series J, MTN,
6.900%, 12/15/2017 | | | 200,646,325 | |
| | 67,259,000 | | | Residential Capital LLC,
9.625%, 5/15/2015 | | | 67,763,442 | |
| | 995,000 | | | SLM Corp.,
6.000%, 5/10/2012, (AUD) | | | 894,620 | |
| | 109,950(††) | | | SLM Corp.,
6.000%, 12/15/2043 | | | 2,126,158 | |
| | 20,970,000 | | | SLM Corp., MTN,
5.050%, 11/14/2014 | | | 19,969,333 | |
| | 3,695,000 | | | SLM Corp., MTN,
5.125%, 8/27/2012 | | | 3,735,379 | |
| | | | | | | | |
Principal
Amount (‡) | | | Description | | Value (†) | |
| | | | | | | | |
| | | | Non-Captive Consumer — continued | | | | |
| $ | 2,160,000 | | | SLM Corp., MTN,
8.000%, 3/25/2020 | | $ | 2,143,428 | |
| | 4,700,000 | | | SLM Corp.,
Series 7, EMTN,
4.750%, 3/17/2014, (EUR) | | | 5,866,957 | |
| | 54,478,000 | | | SLM Corp.,
Series A, MTN,
5.000%, 10/01/2013 | | | 53,387,568 | |
| | 41,770,000 | | | SLM Corp.,
Series A, MTN,
5.000%, 4/15/2015 | | | 40,043,395 | |
| | 14,465,000 | | | SLM Corp.,
Series A, MTN,
5.000%, 6/15/2018 | | | 11,535,968 | |
| | 19,605,000 | | | SLM Corp.,
Series A, MTN,
5.375%, 1/15/2013 | | | 19,764,859 | |
| | 24,705,000 | | | SLM Corp.,
Series A, MTN,
5.375%, 5/15/2014 | | | 24,039,571 | |
| | 1,390,000 | | | SLM Corp.,
Series A, MTN,
5.400%, 10/25/2011 | | | 1,404,373 | |
| | 30,355,000 | | | SLM Corp.,
Series A, MTN,
5.625%, 8/01/2033 | | | 23,342,115 | |
| | 95,060,000 | | | SLM Corp.,
Series A, MTN,
8.450%, 6/15/2018 | | | 96,016,684 | |
| | | | | | | | |
| | | | | | | 600,710,538 | |
| | | | | | | | |
| | | | Non-Captive Diversified — 7.8% | | | | |
| | 311,000 | | | Ally Financial, Inc.,
6.625%, 12/17/2010 | | | 312,944 | |
| | 22,211,000 | | | Ally Financial, Inc.,
6.750%, 12/01/2014 | | | 23,141,086 | |
| | 2,947,000 | | | Ally Financial, Inc.,
6.875%, 8/28/2012 | | | 3,075,931 | |
| | 17,038,000 | | | Ally Financial, Inc.,
7.500%, 12/31/2013 | | | 18,102,875 | |
| | 35,400,000 | | | Ally Financial, Inc.,
7.500%, 9/15/2020, 144A | | | 37,701,000 | |
| | 32,711,000 | | | Ally Financial, Inc.,
8.000%, 12/31/2018 | | | 33,610,552 | |
| | 25,955,000 | | | Ally Financial, Inc.,
8.000%, 11/01/2031 | | | 27,836,737 | |
| | 49,800,000 | | | Ally Financial, Inc.,
8.300%, 2/12/2015, 144A | | | 54,282,000 | |
| | 18,096,402 | | | CIT Group, Inc.,
7.000%, 5/01/2013 | | | 18,186,884 | |
| | 27,144,615 | | | CIT Group, Inc.,
7.000%, 5/01/2014 | | | 27,076,753 | |
| | 27,144,615 | | | CIT Group, Inc.,
7.000%, 5/01/2015 | | | 26,941,030 | |
| | 67,386,037 | | | CIT Group, Inc.,
7.000%, 5/01/2016 | | | 66,375,246 | |
| | 70,757,457 | | | CIT Group, Inc.,
7.000%, 5/01/2017 | | | 69,253,861 | |
| | 3,100,000 | | | General Electric Capital Corp., EMTN,
6.125%, 5/17/2012, (GBP) | | | 5,166,548 | |
| | 6,610,000 | | | General Electric Capital Corp., EMTN,
9.000%, 1/04/2011, (NZD) | | | 4,903,933 | |
| | 79,035,000 | | | General Electric Capital Corp.,
Series A, EMTN,
6.750%, 9/26/2016, (NZD) | | | 60,353,884 | |
See accompanying notes to financial statements.
43 |
Portfolio of Investments – as of September 30, 2010
Loomis Sayles Strategic Income Fund – (continued)
| | | | | | | | |
Principal
Amount (‡) | | | Description | | Value (†) | |
| | | | | | | | |
| | | | Non-Captive Diversified — continued | | | | |
| | 65,300,000 | | | General Electric Capital Corp.,
Series A, GMTN,
2.960%, 5/18/2012, (SGD) | | $ | 50,280,206 | |
| | 115,000,000 | | | General Electric Capital Corp.,
Series A, GMTN,
3.485%, 3/08/2012, (SGD) | | | 89,082,458 | |
| | 58,490,000 | | | General Electric Capital Corp.,
Series A, GMTN,
7.625%, 12/10/2014, (NZD) | | | 45,774,378 | |
| | 15,305,000 | | | General Electric Capital Corp.,
Series A, MTN,
0.826%, 5/13/2024(b) | | | 12,691,579 | |
| | 243,057,000 | | | General Electric Capital Corp.,
Series A, MTN,
6.500%, 9/28/2015, (NZD) | | | 183,980,072 | |
| | 5,760,000 | | | General Motors Acceptance Corp. of Canada Ltd., EMTN,
7.125%, 9/13/2011, (AUD) | | | 5,417,014 | |
| | 360,000 | | | International Lease Finance Corp.,
5.875%, 5/01/2013 | | | 360,000 | |
| | 10,985,000 | | | International Lease Finance Corp.,
6.375%, 3/25/2013 | | | 11,039,925 | |
| | 20,610,000 | | | International Lease Finance Corp.,
7.125%, 9/01/2018, 144A | | | 22,207,275 | |
| | 24,750,000 | | | International Lease Finance Corp.,
8.625%, 9/15/2015, 144A | | | 26,482,500 | |
| | 415,000 | | | International Lease Finance Corp.,
Series Q, MTN,
5.250%, 1/10/2013 | | | 409,294 | |
| | 2,620,000 | | | International Lease Finance Corp.,
Series R, MTN,
5.625%, 9/20/2013 | | | 2,570,875 | |
| | 2,547,000 | | | International Lease Finance Corp.,
Series R, MTN,
5.650%, 6/01/2014 | | | 2,470,590 | |
| | 34,782,000 | | | iStar Financial, Inc.,
5.150%, 3/01/2012 | | | 29,564,700 | |
| | 3,010,000 | | | iStar Financial, Inc.,
5.500%, 6/15/2012 | | | 2,528,400 | |
| | 19,110,000 | | | iStar Financial, Inc.,
5.650%, 9/15/2011 | | | 17,294,550 | |
| | 4,040,000 | | | iStar Financial, Inc.,
5.800%, 3/15/2011 | | | 3,777,400 | |
| | 4,815,000 | | | iStar Financial, Inc.,
5.850%, 3/15/2017 | | | 3,647,363 | |
| | 8,815,000 | | | iStar Financial, Inc.,
5.875%, 3/15/2016 | | | 6,666,344 | |
| | 4,300,000 | | | iStar Financial, Inc.,
6.050%, 4/15/2015 | | | 3,268,000 | |
| | 35,130,000 | | | iStar Financial, Inc.,
8.625%, 6/01/2013 | | | 28,630,950 | |
| | 1,780,000 | | | iStar Financial, Inc.,
Series B,
5.125%, 4/01/2011 | | | 1,648,725 | |
| | 1,530,000 | | | iStar Financial, Inc.,
Series B,
5.700%, 3/01/2014 | | | 1,187,663 | |
| | 44,610,000 | | | iStar Financial, Inc.,
Series B,
5.950%, 10/15/2013 | | | 35,353,425 | |
| | | | | | | | |
| | | | | | | 1,062,654,950 | |
| | | | | | | | |
| | | | | | | | |
Principal
Amount (‡) | | | Description | | Value (†) | |
| | | | | | | | |
| | | | Oil Field Services — 1.3% | | | | |
| $ | 7,015,000 | | | Allis-Chalmers Energy, Inc.,
8.500%, 3/01/2017 | | $ | 7,050,075 | |
| | 8,060,000 | | | Allis-Chalmers Energy, Inc.,
9.000%, 1/15/2014 | | | 8,140,600 | |
| | 10,860,000 | | | Nabors Industries, Inc.,
6.150%, 2/15/2018 | | | 12,086,941 | |
| | 77,565,000 | | | Nabors Industries, Inc.,
9.250%, 1/15/2019 | | | 99,251,709 | |
| | 3,095,000 | | | Parker Drilling Co.,
9.125%, 4/01/2018, 144A | | | 3,141,425 | |
| | 16,035,000 | | | Rowan Cos., Inc.,
7.875%, 8/01/2019 | | | 19,137,821 | |
| | 15,520,000 | | | Weatherford International Ltd.,
6.500%, 8/01/2036 | | | 15,693,358 | |
| | 2,975,000 | | | Weatherford International Ltd.,
6.800%, 6/15/2037 | | | 3,118,115 | |
| | 9,580,000 | | | Weatherford International Ltd.,
7.000%, 3/15/2038 | | | 10,176,259 | |
| | | | | | | | |
| | | | | | | 177,796,303 | |
| | | | | | | | |
| | | | Packaging — 0.3% | | | | |
| | 2,450,000 | | | OI European Group BV,
6.875%, 3/31/2017, 144A, (EUR) | | | 3,473,562 | |
| | 1,750,000 | | | Owens-Brockway Glass Container, Inc.,
6.750%, 12/01/2014, (EUR) | | | 2,445,330 | |
| | 33,261,000 | | | Owens-Illinois, Inc.,
7.800%, 5/15/2018 | | | 35,672,422 | |
| | | | | | | | |
| | | | | | | 41,591,314 | |
| | | | | | | | |
| | | | Paper — 2.4% | | | | |
| | 34,800,000 | | | Fibria Overseas Finance Ltd.,
7.500%, 5/04/2020, 144A | | | 36,931,500 | |
| | 12,430,000 | | | Georgia-Pacific LLC,
7.250%, 6/01/2028 | | | 12,771,825 | |
| | 11,605,000 | | | Georgia-Pacific LLC,
7.375%, 12/01/2025 | | | 12,011,175 | |
| | 120,000 | | | Georgia-Pacific LLC,
7.700%, 6/15/2015 | | | 132,900 | |
| | 42,425,000 | | | Georgia-Pacific LLC,
7.750%, 11/15/2029 | | | 44,546,250 | |
| | 16,475,000 | | | Georgia-Pacific LLC,
8.000%, 1/15/2024 | | | 18,493,188 | |
| | 11,003,000 | | | Georgia-Pacific LLC,
8.875%, 5/15/2031 | | | 12,543,420 | |
| | 112,065,000 | | | International Paper Co.,
7.950%, 6/15/2018 | | | 135,906,717 | |
| | 14,520,000 | | | Westvaco Corp.,
7.950%, 2/15/2031 | | | 15,676,170 | |
| | 25,210,000 | | | Westvaco Corp.,
8.200%, 1/15/2030 | | | 27,572,353 | |
| | 2,840,000 | | | Weyerhaeuser Co.,
6.950%, 10/01/2027 | | | 2,801,052 | |
| | 1,020,000 | | | Weyerhaeuser Co.,
7.375%, 3/15/2032 | | | 1,038,775 | |
| | | | | | | | |
| | | | | | | 320,425,325 | |
| | | | | | | | |
| | | | Pharmaceuticals — 0.3% | | | | |
| | 37,975,000 | | | Elan Finance PLC/Elan Finance Corp.,
8.875%, 12/01/2013 | | | 38,924,375 | |
| | | | | | | | |
| | | | Pipelines — 2.2% | | | | |
| | 19,745,000 | | | DCP Midstream LP,
6.450%, 11/03/2036, 144A | | | 21,492,116 | |
| | 15,685,000 | | | El Paso Corp.,
6.950%, 6/01/2028 | | | 14,790,641 | |
| | 1,500,000 | | | El Paso Corp.,
7.420%, 2/15/2037 | | | 1,430,332 | |
See accompanying notes to financial statements.
| 44
Portfolio of Investments – as of September 30, 2010
Loomis Sayles Strategic Income Fund – (continued)
| | | | | | | | |
Principal
Amount (‡) | | | Description | | Value (†) | |
| | | | | | | | |
| | | | Pipelines — continued | | | | |
| $ | 1,000,000 | | | El Paso Corp.,
GMTN, 7.750%, 1/15/2032 | | $ | 1,038,359 | |
| | 750,000 | | | El Paso Corp., GMTN,
7.800%, 8/01/2031 | | | 778,402 | |
| | 5,255,000 | | | Energy Transfer Partners LP,
6.125%, 2/15/2017 | | | 5,829,724 | |
| | 9,115,000 | | | Energy Transfer Partners LP,
6.625%, 10/15/2036 | | | 9,847,782 | |
| | 13,175,000 | | | Enterprise Products Operating LLP,
6.300%, 9/15/2017 | | | 15,196,071 | |
| | 5,100,000 | | | Florida Gas Transmission Co.,
7.900%, 5/15/2019, 144A | | | 6,400,974 | |
| | 500,000 | | | Kinder Morgan Energy Partners LP,
5.800%, 3/15/2035 | | | 501,280 | |
| | 45,436,524 | | | Maritimes & Northeast Pipeline LLC,
7.500%, 5/31/2014, 144A(c) | | | 49,604,871 | |
| | 81,710,000 | | | NGPL PipeCo LLC,
7.119%, 12/15/2017, 144A | | | 88,655,350 | |
| | 3,425,000 | | | ONEOK Partners LP,
6.650%, 10/01/2036 | | | 3,844,203 | |
| | 20,770,000 | | | Plains All American Pipeline LP,
6.125%, 1/15/2017 | | | 23,203,102 | |
| | 44,730,000 | | | Plains All American Pipeline LP,
6.650%, 1/15/2037 | | | 48,482,892 | |
| | 4,168,000 | | | Transportadora de Gas del Sur SA,
7.875%, 5/14/2017, 144A | | | 4,074,220 | |
| | | | | | | | |
| | | | | | | 295,170,319 | |
| | | | | | | | |
| | | | Property & Casualty Insurance — 0.3% | | | | |
| | 3,405,000 | | | Hanover Insurance Group, Inc. (The),
7.500%, 3/01/2020 | | | 3,789,282 | |
| | 1,580,000 | | | Marsh & McLennan Cos., Inc.,
5.375%, 7/15/2014 | | | 1,706,441 | |
| | 11,075,000 | | | Marsh & McLennan Cos., Inc.,
5.875%, 8/01/2033 | | | 10,769,042 | |
| | 6,080,000 | | | MBIA Insurance Corp., (fixed rate to 1/15/2013, variable rate thereafter),
14.000%, 1/15/2033, 144A | | | 2,736,000 | |
| | 5,215,000 | | | White Mountains Re Group Ltd.,
6.375%, 3/20/2017, 144A | | | 5,271,880 | |
| | 5,985,000 | | | Willis North America, Inc.,
6.200%, 3/28/2017 | | | 6,377,460 | |
| | 4,445,000 | | | XL Group PLC,
6.250%, 5/15/2027 | | | 4,472,066 | |
| | 1,425,000 | | | XL Group PLC,
6.375%, 11/15/2024 | | | 1,480,787 | |
| | | | | | | | |
| | | | | | | 36,602,958 | |
| | | | | | | | |
| | | | Railroads — 0.0% | | | | |
| | 1,200,000 | | | Canadian Pacific Railway Co.,
5.750%, 3/15/2033 | | | 1,264,182 | |
| | 1,395,000 | | | CSX Corp., MTN, 6.000%, 10/01/2036 | | | 1,555,217 | |
| | 1,153,000 | | | Missouri Pacific Railroad Co., 5.000%, 1/01/2045(c) | | | 836,963 | |
| | | | | | | | |
| | | | | | | 3,656,362 | |
| | | | | | | | |
| | | | Refining — 0.0% | | | | |
| | 1,335,000 | | | Valero Energy Corp., 6.625%, 6/15/2037 | | | 1,340,664 | |
| | | | | | | | |
| | | | REITs — 0.4% | | | | |
| | 46,015,000 | | | WEA Finance LLC/WT Finance Australia Property Ltd., 6.750%, 9/02/2019, 144A | | | 54,518,940 | |
| | | | | | | | |
| | | | | | | | |
Principal
Amount (‡) | | | Description | | Value (†) | |
| | | | | | | | |
| | | | REITs — Apartments — 0.3% | | | | |
| $ | 2,025,000 | | | Camden Property Trust, 5.000%, 6/15/2015 | | $ | 2,178,892 | |
| | 27,950,000 | | | Camden Property Trust, 5.700%, 5/15/2017 | | | 29,674,962 | |
| | 3,300,000 | | | ERP Operating LP, 5.125%, 3/15/2016 | | | 3,613,348 | |
| | | | | | | | |
| | | | | | | 35,467,202 | |
| | | | | | | | |
| | | | REITs — Diversified — 0.0% | | | | |
| | 4,030,000 | | | Duke Realty LP, 5.950%, 2/15/2017 | | | 4,323,763 | |
| | | | | | | | |
| | | | REITs — Industrials — 0.1% | | | | |
| | 4,180,000 | | | ProLogis, 5.625%, 11/15/2015 | | | 4,089,348 | |
| | 3,915,000 | | | ProLogis, 5.625%, 11/15/2016 | | | 3,769,151 | |
| | 4,635,000 | | | ProLogis, 5.750%, 4/01/2016 | | | 4,575,797 | |
| | 1,662,000 | | | ProLogis, 6.625%, 5/15/2018 | | | 1,638,104 | |
| | 1,100,000 | | | ProLogis, 6.875%, 3/15/2020 | | | 1,081,423 | |
| | 2,080,000 | | | ProLogis, 7.375%, 10/30/2019 | | | 2,099,086 | |
| | | | | | | | |
| | | | | | | 17,252,909 | |
| | | | | | | | |
| | | | REITs — Office Property — 0.4% | | | | |
| | 47,305,000 | | | Highwoods Properties, Inc., 5.850%, 3/15/2017 | | | 48,654,943 | |
| | | | | | | | |
| | | | REITs — Regional Malls — 0.0% | | | | |
| | 4,900,000 | | | Simon Property Group LP, 5.750%, 12/01/2015 | | | 5,579,801 | |
| | 450,000 | | | Simon Property Group LP, 6.125%, 5/30/2018 | | | 522,197 | |
| | | | | | | | |
| | | | | | | 6,101,998 | |
| | | | | | | | |
| | | | Restaurants — 0.0% | | | | |
| | 1,250,000 | | | McDonald’s Corp., EMTN, 3.628%, 10/10/2010, (SGD) | | | 950,821 | |
| | | | | | | | |
| | | | Retailers — 1.1% | | | | |
| | 8,758,000 | | | Dillard’s, Inc., 6.625%, 1/15/2018 | | | 8,451,470 | |
| | 3,325,000 | | | Dillard’s, Inc., 7.000%, 12/01/2028 | | | 2,909,375 | |
| | 4,187,000 | | | Dillard’s, Inc., 7.130%, 8/01/2018 | | | 4,092,792 | |
| | 1,500,000 | | | Dillard’s, Inc., 7.750%, 7/15/2026 | | | 1,372,500 | |
| | 425,000 | | | Dillard’s, Inc., 7.875%, 1/01/2023 | | | 402,688 | |
| | 10,270,000 | | | Foot Locker, Inc., 8.500%, 1/15/2022 | | | 9,679,475 | |
| | 3,685,000 | | | J.C. Penney Corp., Inc., 5.750%, 2/15/2018 | | | 3,795,550 | |
| | 37,064,000 | | | J.C. Penney Corp., Inc., 6.375%, 10/15/2036 | | | 35,766,760 | |
| | 635,000 | | | J.C. Penney Corp., Inc., 7.125%, 11/15/2023 | | | 663,575 | |
| | 3,985,000 | | | J.C. Penney Corp., Inc., 7.625%, 3/01/2097 | | | 3,865,450 | |
| | 15,907,000 | | | Macy’s Retail Holdings, Inc., 6.375%, 3/15/2037 | | | 15,747,930 | |
| | 12,275,000 | | | Macy’s Retail Holdings, Inc., 6.790%, 7/15/2027 | | | 11,845,375 | |
See accompanying notes to financial statements.
45 |
Portfolio of Investments – as of September 30, 2010
Loomis Sayles Strategic Income Fund – (continued)
| | | | | | | | |
Principal
Amount (‡) | | | Description | | Value (†) | |
| | | | | | | | |
| | | | Retailers — continued | | | | |
| $ | 2,365,000 | | | Macy’s Retail Holdings, Inc., 6.900%, 4/01/2029 | | $ | 2,394,562 | |
| | 6,365,000 | | | Marks & Spencer PLC, 7.125%, 12/01/2037, 144A | | | 6,751,897 | |
| | 32,675,000 | | | Toys R Us, Inc., 7.375%, 10/15/2018 | | | 31,204,625 | |
| | 8,355,000 | | | Toys R Us, Inc., 7.875%, 4/15/2013 | | | 8,710,087 | |
| | | | | | | | |
| | | | | | | 147,654,111 | |
| | | | | | | | |
| | | | Sovereigns — 6.7% | | | | |
| | 104,626,000,000 | | | Indonesia Treasury Bond,
Series FR43, 10.250%, 7/15/2022, (IDR) | | | 13,801,125 | |
| | 10,000,000,000 | | | Indonesia Treasury Bond,
Series FR47, 10.000%, 2/15/2028, (IDR) | | | 1,282,731 | |
| | 272,460,000,000 | | | Indonesia Treasury Bond,
Series ZC3, Zero Coupon, 11/20/2012, (IDR) | | | 26,676,078 | |
| | 112,100,000 | | | Ireland Government Bond, 4.500%, 10/18/2018, (EUR) | | | 134,329,097 | |
| | 6,250,000 | | | Ireland Government Bond, 5.000%, 10/18/2020, (EUR) | | | 7,485,522 | |
| | 29,875,000 | | | Ireland Government Bond, 5.400%, 3/13/2025, (EUR) | | | 35,159,708 | |
| | 2,350,305(†††) | | | Mexican Fixed Rate Bonds,
Series M-10, 7.250%, 12/15/2016, (MXN) | | | 20,006,683 | |
| | 18,686,981(†††) | | | Mexican Fixed Rate Bonds,
Series M-20, 8.000%, 12/07/2023, (MXN) | | | 168,650,165 | |
| | 2,037,000(†††) | | | Mexican Fixed Rate Bonds,
Series MI-10, 9.000%, 12/20/2012, (MXN) | | | 17,432,497 | |
| | 79,755,000 | | | New South Wales Treasury Corp.,
Series 10RG,
7.000%, 12/01/2010, (AUD) | | | 77,337,624 | |
| | 10,530,000 | | | New South Wales Treasury Corp.,
Series 12RG, 6.000%, 5/01/2012, (AUD) | | | 10,327,747 | |
| | 66,305,000 | | | New South Wales Treasury Corp.,
Series 17RG, 5.500%, 3/01/2017, (AUD) | | | 64,671,420 | |
| | 24,800,000 | | | Portugal Obrigacoes do Tesouro OT, 3.850%, 4/15/2021, (EUR) | | | 27,455,970 | |
| | 6,225,000 | | | Portugal Obrigacoes do Tesouro OT, 4.800%, 6/15/2020, (EUR) | | | 7,570,815 | |
| | 56,700,000 | | | Republic of Brazil, 10.250%, 1/10/2028, (BRL) | | | 37,414,628 | |
| | 140,235,000 | | | Republic of Brazil, 12.500%, 1/05/2016, (BRL) | | | 95,520,590 | |
| | 107,840,000 | | | Republic of Brazil, 12.500%, 1/05/2022, (BRL) | | | 78,234,988 | |
| | 18,400,000 | | | Republic of Croatia, 6.750%, 11/05/2019, 144A | | | 20,102,000 | |
| | 3,178,700,000 | | | Republic of Iceland, 7.250%, 5/17/2013, (ISK) | | | 16,992,603 | |
| | 2,528,745,000 | | | Republic of Iceland, 8.000%, 7/22/2011, (ISK) | | | 12,886,157 | |
| | 5,387,208,000 | | | Republic of Iceland, 13.750%, 12/10/2010, (ISK) | | | 27,175,114 | |
| | 4,020,000 | | | Republic of Venezuela, 7.000%, 3/16/2015, (EUR) | | | 4,526,700 | |
| | | | | | | | |
| | | | | | | 905,039,962 | |
| | | | | | | | |
| | | | | | | | |
Principal
Amount (‡) | | | Description | | Value (†) | |
| | | | | | | | |
| | | | Supermarkets — 0.7% | | | | |
| $ | 2,000,000 | | | American Stores Co., 7.900%, 5/01/2017 | | $ | 1,935,000 | |
| | 72,681,000 | | | New Albertson’s, Inc., 7.450%, 8/01/2029 | | | 58,871,610 | |
| | 19,060,000 | | | New Albertson’s, Inc., 7.750%, 6/15/2026 | | | 16,153,350 | |
| | 4,895,000 | | | New Albertson’s, Inc., 8.000%, 5/01/2031 | | | 3,989,425 | |
| | 1,510,000 | | | New Albertson’s, Inc., 8.700%, 5/01/2030 | | | 1,328,800 | |
| | 13,242,000 | | | New Albertson’s, Inc.,
Series C, MTN, 6.625%, 6/01/2028 | | | 9,683,212 | |
| | | | | | | | |
| | | | | | | 91,961,397 | |
| | | | | | | | |
| | | | Supranational — 1.4% | | | | |
| | 20,250,000 | | | European Bank for Reconstruction & Development, GMTN, 9.250%, 9/10/2012, (BRL) | | | 12,045,878 | |
| | 16,375,000 | | | European Investment Bank, 11.250%, 2/14/2013, (BRL) | | | 10,209,212 | |
| | 460,500,000,000 | | | European Investment Bank,
EMTN, Zero Coupon, 4/24/2013, 144A, (IDR) | | | 44,435,025 | |
| | 24,398,000 | | | European Investment Bank, EMTN, 7.000%, 1/18/2012, (NZD) | | | 18,604,188 | |
| | 60,665,000 | | | European Investment Bank, MTN, 6.250%, 4/15/2015, (AUD) | | | 59,795,608 | |
| | 244,840,000,000 | | | Inter-American Development Bank,
EMTN, Zero Coupon, 5/20/2013, (IDR) | | | 22,528,023 | |
| | 24,450,000 | | | Inter-American Development Bank, EMTN, 6.000%, 12/15/2017, (NZD) | | | 19,123,079 | |
| | 8,300,000 | | | International Bank for Reconstruction & Development, 1.430%, 3/05/2014, (SGD) | | | 6,351,270 | |
| | | | | | | | |
| | | | | | | 193,092,283 | |
| | | | | | | | |
| | | | Technology — 2.2% | | | | |
| | 1,370,000 | | | Advanced Micro Devices, Inc., 7.750%, 8/01/2020, 144A | | | 1,414,525 | |
| | 41,705,000 | | | Agilent Technologies, Inc., 6.500%, 11/01/2017 | | | 48,039,823 | |
| | 832,000 | | | Alcatel-Lucent, EMTN, 6.375%, 4/07/2014, (EUR) | | | 1,139,895 | |
| | 47,625,000 | | | Alcatel-Lucent USA, Inc., 6.450%, 3/15/2029 | | | 34,647,188 | |
| | 5,065,000 | | | Alcatel-Lucent USA, Inc., 6.500%, 1/15/2028 | | | 3,659,463 | |
| | 2,435,000 | | | Arrow Electronics, Inc., 6.875%, 6/01/2018 | | | 2,779,114 | |
| | 21,490,000 | | | Avnet, Inc., 5.875%, 3/15/2014 | | | 23,440,798 | |
| | 35,630,000 | | | Avnet, Inc., 6.000%, 9/01/2015 | | | 39,290,983 | |
| | 11,345,000 | | | Avnet, Inc., 6.625%, 9/15/2016 | | | 13,011,989 | |
| | 6,150,000 | | | Corning, Inc., 6.850%, 3/01/2029 | | | 7,071,903 | |
| | 4,725,000 | | | Corning, Inc., 7.250%, 8/15/2036 | | | 5,418,488 | |
| | 3,640,000 | | | Eastman Kodak Co., 7.250%, 11/15/2013 | | | 3,494,400 | |
| | 11,626,000 | | | Equifax, Inc., 7.000%, 7/01/2037 | | | 13,184,500 | |
See accompanying notes to financial statements.
| 46
Portfolio of Investments – as of September 30, 2010
Loomis Sayles Strategic Income Fund – (continued)
| | | | | | | | |
Principal
Amount (‡) | | | Description | | Value (†) | |
| | | | | | | | |
| | | | Technology — continued | | | | |
| $ | 285,000 | | | Freescale Semiconductor, Inc., 8.875%, 12/15/2014 | | $ | 284,644 | |
| | 6,290,000 | | | Freescale Semiconductor, Inc., 10.125%, 12/15/2016 | | | 5,723,900 | |
| | 475,000 | | | Motorola, Inc., 6.000%, 11/15/2017 | | | 530,251 | |
| | 10,830,000 | | | Motorola, Inc., 6.500%, 9/01/2025 | | | 11,786,181 | |
| | 22,539,000 | | | Motorola, Inc., 6.500%, 11/15/2028 | | | 23,931,121 | |
| | 23,255,000 | | | Motorola, Inc., 6.625%, 11/15/2037 | | | 24,868,385 | |
| | 250,000 | | | Motorola, Inc., 7.500%, 5/15/2025 | | | 296,480 | |
| | 9,350,000 | | | Nortel Networks Capital Corp., 7.875%, 6/15/2026(d) | | | 6,077,500 | |
| | 11,770,000 | | | Nortel Networks Ltd., 6.875%, 9/01/2023(d) | | | 3,236,750 | |
| | 270,000 | | | Samsung Electronics Co. Ltd., 7.700%, 10/01/2027, 144A | | | 320,467 | |
| | 21,822,000 | | | Xerox Capital Trust I, 8.000%, 2/01/2027 | | | 22,203,099 | |
| | 1,730,000 | | | Xerox Corp., MTN, 7.200%, 4/01/2016 | | | 2,032,319 | |
| | | | | | | | |
| | | | | | | 297,884,166 | |
| | | | | | | | |
| | | | Tobacco — 0.5% | | | | |
| | 52,930,000 | | | Reynolds American, Inc., 6.750%, 6/15/2017 | | | 59,531,271 | |
| | 13,400,000 | | | Reynolds American, Inc., 7.250%, 6/15/2037 | | | 14,067,883 | |
| | | | | | | | |
| | | | | | | 73,599,154 | |
| | | | | | | | |
| | | | Transportation Services — 0.4% | | | | |
| | 10,503,000 | | | APL Ltd.,
8.000%, 1/15/2024(c) | | | 7,194,555 | |
| | 13,030,788 | | | Atlas Air Pass Through Trust,
Series 1998-1, Class B, 7.680%, 7/02/2015 | | | 12,379,249 | |
| | 6,862,758 | | | Atlas Air Pass Through Trust,
Series 1998-1, Class C, 8.010%, 7/02/2011(e) | | | 5,593,148 | |
| | 8,083,878 | | | Atlas Air Pass Through Trust,
Series 1999-1, Class A-1, 7.200%, 7/02/2020 | | | 8,164,716 | |
| | 181,285 | | | Atlas Air Pass Through Trust,
Series 1999-1, Class A-2,
6.880%, 1/02/2011 | | | 175,847 | |
| | 9,780,328 | | | Atlas Air Pass Through Trust,
Series 1999-1, Class B, 7.630%, 7/02/2016 | | | 8,411,082 | |
| | 4,744,556 | | | Atlas Air Pass Through Trust,
Series 1999-1, Class C, 8.770%, 7/02/2012(e) | | | 3,866,813 | |
| | 4,424,401 | | | Atlas Air Pass Through Trust,
Series 2000-1, Class B, 10.128%, 7/02/2017 | | | 4,335,913 | |
| | 3,970,000 | | | Erac USA Finance Co., 7.000%, 10/15/2037, 144A | | | 4,573,635 | |
| | | | | | | | |
| | | | | | | 54,694,958 | |
| | | | | | | | |
| | | | Treasuries — 15.2% | | | | |
| | 393,245,000 | | | Canadian Government, 1.000%, 9/01/2011, (CAD) | | | 381,293,624 | |
| | 177,160,000 | | | Canadian Government, 1.250%, 12/01/2011, (CAD) | | | 172,128,787 | |
| | | | | | | | |
Principal
Amount (‡) | | | Description | | Value (†) | |
| | | | | | | | |
| | | | Treasuries — continued | | | | |
| | 320,680,000 | | | Canadian Government, 2.000%, 9/01/2012, (CAD) | | $ | 315,359,748 | |
| | 130,000,000 | | | Canadian Government, 2.750%, 12/01/2010, (CAD) | | | 126,726,310 | |
| | 130,216,000 | | | Canadian Government, 3.500%, 6/01/2013, (CAD) | | | 133,135,704 | |
| | 101,755,000 | | | Canadian Government, 3.750%, 6/01/2012, (CAD) | | | 102,821,108 | |
| | 171,980,000 | | | Canadian Government, 3.750%, 6/01/2019, (CAD) | | | 181,129,757 | |
| | 25,445,000 | | | Canadian Government, 4.250%, 6/01/2018, (CAD) | | | 27,747,638 | |
| | 75,385,000 | | | Canadian Government, 5.250%, 6/01/2012, (CAD) | | | 77,977,206 | |
| | 4,074,191 | | | Hellenic Republic Government Bond, 2.300%, 7/25/2030, (EUR) | | | 2,709,447 | |
| | 22,670,000 | | | New Zealand Government Bond, 6.000%, 12/15/2017, (NZD) | | | 17,888,102 | |
| | 151,035,000 | | | New Zealand Government Bond, 6.500%, 4/15/2013, (NZD) | | | 117,910,922 | |
| | 457,420,000 | | | Norwegian Government, 4.250%, 5/19/2017, (NOK) | | | 84,124,478 | |
| | 221,050,000 | | | Norwegian Government, 5.000%, 5/15/2015, (NOK) | | | 41,458,315 | |
| | 366,200,000 | | | Norwegian Government, 6.000%, 5/16/2011, (NOK) | | | 63,592,579 | |
| | 1,180,775,000 | | | Norwegian Government, 6.500%, 5/15/2013, (NOK) | | | 221,335,959 | |
| | | | | | | | |
| | | | | | | 2,067,339,684 | |
| | | | | | | | |
| | | | Utility Other — 0.0% | | | | |
| | 3,300,000 | | | Listrindo Capital BV, 9.250%, 1/29/2015, 144A | | | 3,743,355 | |
| | | | | | | | |
| | | | Wireless — 1.2% | | | | |
| | 29,635,000 | | | Nextel Communications, Inc.,
Series D, 7.375%, 8/01/2015 | | | 29,783,175 | |
| | 4,748,000 | | | Nextel Communications, Inc.,
Series E, 6.875%, 10/31/2013 | | | 4,777,675 | |
| | 42,310,000 | | | Nextel Communications, Inc.,
Series F, 5.950%, 3/15/2014 | | | 42,098,450 | |
| | 21,186,000 | | | Sprint Capital Corp., 6.875%, 11/15/2028 | | | 19,385,190 | |
| | 29,252,000 | | | Sprint Capital Corp., 6.900%, 5/01/2019 | | | 29,398,260 | |
| | 6,260,000 | | | Sprint Capital Corp., 8.750%, 3/15/2032 | | | 6,573,000 | |
| | 11,309,000 | | | Sprint Nextel Corp., 6.000%, 12/01/2016 | | | 11,167,637 | |
| | 13,320,000 | | | True Move Co. Ltd., 10.750%, 12/16/2013, 144A | | | 14,152,500 | |
| | | | | | | | |
| | | | | | | 157,335,887 | |
| | | | | | | | |
| | | | Wirelines — 3.2% | | | | |
| | 8,900,000 | | | AT&T Corp., 6.500%, 3/15/2029 | | | 9,936,191 | |
| | 5,650,000 | | | Axtel SAB de CV, 9.000%, 9/22/2019, 144A | | | 5,212,125 | |
| | 4,370,000 | | | Bell Canada, MTN, 6.550%, 5/01/2029, 144A, (CAD) | | | 4,576,629 | |
| | 8,445,000 | | | Bell Canada, MTN, 7.300%, 2/23/2032, (CAD) | | | 9,561,096 | |
See accompanying notes to financial statements.
47 |
Portfolio of Investments – as of September 30, 2010
Loomis Sayles Strategic Income Fund – (continued)
| | | | | | | | |
Principal
Amount (‡) | | | Description | | Value (†) | |
| | | | | | | | |
| | | | Wirelines — continued | | | | |
| | 33,640,000 | | | Bell Canada,
Series M-17, 6.100%, 3/16/2035, (CAD) | | $ | 34,147,428 | |
| | 2,715,000 | | | BellSouth Telecommunications, Inc., 7.000%, 12/01/2095 | | | 3,068,971 | |
| | 350,000 | | | Cincinnati Bell Telephone Co. LLC, 6.300%, 12/01/2028 | | | 266,000 | |
| | 155,000 | | | Cincinnati Bell, Inc., 7.000%, 2/15/2015 | | | 155,000 | |
| | 5,330,000 | | | Embarq Corp., 7.995%, 6/01/2036 | | | 5,667,011 | |
| | 35,260,000 | | | Frontier Communications Corp., 7.875%, 1/15/2027 | | | 35,612,600 | |
| | 10,555,000 | | | GTE Corp., 6.940%, 4/15/2028 | | | 12,201,137 | |
| | 525,000 | | | Hawaiian Telcom Communications, Inc.,
Series B, 12.500%, 5/01/2015(d) | | | 52 | |
| | 1,120,000 | | | Koninklijke (Royal) KPN NV, EMTN, 5.750%, 3/18/2016, (GBP) | | | 1,947,893 | |
| | 1,800,000 | | | Koninklijke (Royal) KPN NV, GMTN, 4.000%, 6/22/2015, (EUR) | | | 2,593,990 | |
| | 32,435,000 | | | Level 3 Financing, Inc., 8.750%, 2/15/2017 | | | 28,867,150 | |
| | 13,010,000 | | | Level 3 Financing, Inc., 9.250%, 11/01/2014 | | | 12,229,400 | |
| | 16,335,000 | | | Qwest Capital Funding, Inc., 6.500%, 11/15/2018 | | | 16,335,000 | |
| | 42,460,000 | | | Qwest Capital Funding, Inc., 6.875%, 7/15/2028 | | | 39,912,400 | |
| | 12,463,000 | | | Qwest Capital Funding, Inc., 7.625%, 8/03/2021 | | | 12,587,630 | |
| | 32,395,000 | | | Qwest Capital Funding, Inc., 7.750%, 2/15/2031 | | | 32,718,950 | |
| | 33,130,000 | | | Qwest Corp., 6.875%, 9/15/2033 | | | 32,715,875 | |
| | 3,075,000 | | | Qwest Corp., 7.200%, 11/10/2026 | | | 3,075,000 | |
| | 3,999,000 | | | Qwest Corp., 7.250%, 9/15/2025 | | | 4,198,950 | |
| | 2,288,000 | | | Qwest Corp., 7.500%, 6/15/2023 | | | 2,299,440 | |
| | 5,470,000 | | | SK Broadband Co. Ltd., 7.000%, 2/01/2012, 144A | | | 5,798,200 | |
| | 23,000,000 | | | Telecom Italia Capital SA, 6.000%, 9/30/2034 | | | 21,697,004 | |
| | 19,635,000 | | | Telecom Italia Capital SA, 6.375%, 11/15/2033 | | | 19,369,476 | |
| | 31,690,000 | | | Telus Corp., 4.950%, 3/15/2017, (CAD) | | | 32,876,103 | |
| | 18,600,000 | | | Telus Corp.,
Series CG, 5.050%, 12/04/2019, (CAD) | | | 18,859,232 | |
| | 11,680,000 | | | Verizon Maryland, Inc., Series B,
5.125%, 6/15/2033 | | | 10,598,082 | |
| | 3,346,000 | | | Verizon New England, Inc., 7.875%, 11/15/2029 | | | 3,869,997 | |
| | 6,835,000 | | | Verizon New York, Inc., Series B, 7.375%, 4/01/2032 | | | 8,065,040 | |
| | 5,215,000 | | | Verizon Pennsylvania, Inc., 6.000%, 12/01/2028 | | | 5,232,856 | |
| | | | | | | | |
| | | | | | | 436,251,908 | |
| | | | | | | | |
| | | | Total Non-Convertible Bonds
(Identified Cost $10,233,848,915) | | | 11,041,645,505 | |
| | | | | | | | |
| | | | | | | | |
Principal
Amount (‡) | | | Description | | Value (†) | |
| | | | | | | | |
| | Convertible Bonds — 7.9% | | | | |
| | | | Airlines — 0.1% | | | | |
| $ | 10,655,000 | | | AMR Corp., 6.250%, 10/15/2014 | | $ | 10,361,988 | |
| | 1,255,000 | | | UAL Corp., 4.500%, 6/30/2021 | | | 1,260,020 | |
| | | | | | | | |
| | | | | | | 11,622,008 | |
| | | | | | | | |
| | | | Automotive — 1.4% | | | | |
| | 2,020,000 | | | ArvinMeritor, Inc.,
(Step to Zero Coupon on 2/15/2019), 4.000%, 2/15/2027(f) | | | 1,838,200 | |
| | 121,370,000 | | | Ford Motor Co., 4.250%, 11/15/2016 | | | 181,144,725 | |
| | 8,460,000 | | | Navistar International Corp., 3.000%, 10/15/2014 | | | 9,506,925 | |
| | | | | | | | |
| | | | | | | 192,489,850 | |
| | | | | | | | |
| | | | Diversified Manufacturing — 0.3% | | | | |
| | 30,570,000 | | | Owens-Brockway Glass Container, Inc., 3.000%, 6/01/2015, 144A | | | 29,958,600 | |
| | 16,727,000 | | | Trinity Industries, Inc., 3.875%, 6/01/2036 | | | 15,137,935 | |
| | | | | | | | |
| | | | | | | 45,096,535 | |
| | | | | | | | |
| | | | Electric — 0.0% | | | | |
| | 1,800,000 | | | CMS Energy Corp., 5.500%, 6/15/2029 | | | 2,414,250 | |
| | | | | | | | |
| | | | Healthcare — 0.3% | | | | |
| | 19,215,000 | | | Hologic, Inc., (Step to Zero Coupon on 12/15/2013), 2.000%, 12/15/2037(f) | | | 17,773,875 | |
| | 12,005,000 | | | Life Technologies Corp., 1.500%, 2/15/2024 | | | 13,550,644 | |
| | 190,000 | | | LifePoint Hospitals, Inc., 3.250%, 8/15/2025 | | | 185,487 | |
| | 2,380,000 | | | LifePoint Hospitals, Inc., 3.500%, 5/15/2014 | | | 2,368,100 | |
| | 5,445,000 | | | Omnicare, Inc., 3.250%, 12/15/2035 | | | 4,682,700 | |
| | | | | | | | |
| | | | | | | 38,560,806 | |
| | | | | | | | |
| | | | Independent Energy — 0.1% | | | | |
| | 1,860,000 | | | Chesapeake Energy Corp., 2.250%, 12/15/2038 | | | 1,429,875 | |
| | 4,120,000 | | | Chesapeake Energy Corp., 2.500%, 5/15/2037 | | | 3,584,400 | |
| | 3,795,000 | | | Penn Virginia Corp., 4.500%, 11/15/2012 | | | 3,700,125 | |
| | | | | | | | |
| | | | | | | 8,714,400 | |
| | | | | | | | |
| | | | Lodging — 0.2% | | | | |
| | 30,418,000 | | | Host Hotels & Resorts, Inc., 2.625%, 4/15/2027, 144A | | | 29,657,550 | |
| | | | | | | | |
| | | | Media Non-Cable — 0.0% | | | | |
| | 7,702,608 | | | Liberty Media LLC, 3.500%, 1/15/2031 | | | 4,101,639 | |
| | | | | | | | |
| | | | Metals & Mining — 0.1% | | | | |
| | 1,000,000 | | | Steel Dynamics, Inc., 5.125%, 6/15/2014 | | | 1,131,250 | |
| | 11,270,000 | | | United States Steel Corp., 4.000%, 5/15/2014 | | | 17,383,975 | |
| | | | | | | | |
| | | | | | | 18,515,225 | |
| | | | | | | | |
| | | | Non-Captive Diversified — 0.3% | | | | |
| | 44,035,000 | | | iStar Financial, Inc., 1.033%, 10/01/2012(b) | | | 33,576,687 | |
| | | | | | | | |
See accompanying notes to financial statements.
| 48
Portfolio of Investments – as of September 30, 2010
Loomis Sayles Strategic Income Fund – (continued)
| | | | | | | | |
Principal
Amount (‡) | | | Description | | Value (†) | |
| | | | | | | | |
| | | | Pharmaceuticals — 1.2% | | | | |
| $ | 635,000 | | | Human Genome Sciences, Inc., 2.250%, 10/15/2011 | | $ | 1,269,206 | |
| | 41,680,000 | | | Human Genome Sciences, Inc., 2.250%, 8/15/2012 | | | 76,430,700 | |
| | 2,240,000 | | | Kendle International, Inc., 3.375%, 7/15/2012 | | | 2,069,200 | |
| | 24,461,000 | | | Nektar Therapeutics, 3.250%, 9/28/2012 | | | 24,889,068 | |
| | 28,222,000 | | | Valeant Pharmaceuticals International, 4.000%, 11/15/2013 | | | 53,939,297 | |
| | | | | | | | |
| | | | | | | 158,597,471 | |
| | | | | | | | |
| | | | REITs — Industrials — 0.1% | | | | |
| | 19,445,000 | | | ProLogis, 3.250%, 3/15/2015 | | | 19,056,100 | |
| | | | | | | | |
| | | | Technology — 2.7% | | | | |
| | 15,470,000 | | | Advanced Micro Devices, Inc., 6.000%, 5/01/2015 | | | 15,218,613 | |
| | 2,560,000 | | | Alcatel-Lucent USA, Inc.,
Series B, 2.875%, 6/15/2025 | | | 2,320,000 | |
| | 220,000 | | | Ciena Corp., 0.250%, 5/01/2013 | | | 196,350 | |
| | 30,160,000 | | | Ciena Corp., 0.875%, 6/15/2017 | | | 21,979,100 | |
| | 6,075,000 | | | Ciena Corp., 4.000%, 3/15/2015 | | | 6,523,031 | |
| | 10,993,000 | | | Intel Corp., 2.950%, 12/15/2035 | | | 10,869,329 | |
| | 220,000,000 | | | Intel Corp., 3.250%, 8/01/2039 | | | 256,850,000 | |
| | 9,197,000 | | | Kulicke & Soffa Industries, Inc., 0.875%, 6/01/2012 | | | 8,610,691 | |
| | 15,555,000 | | | Micron Technology, Inc., 1.875%, 6/01/2014 | | | 13,824,506 | |
| | 745,000 | | | Nortel Networks Corp., 1.750%, 4/15/2012(d) | | | 573,650 | |
| | 30,767,000 | | | Nortel Networks Corp., 2.125%, 4/15/2014(d) | | | 23,690,590 | |
| | | | | | | | |
| | | | | | | 360,655,860 | |
| | | | | | | | |
| | | | Textile — 0.0% | | | | |
| | 85,000 | | | Dixie Yarns, Inc., 7.000%, 5/15/2012 | | | 79,900 | |
| | | | | | | | |
| | | | Wireless — 0.1% | | | | |
| | 16,157,000 | | | NII Holdings, Inc., 3.125%, 6/15/2012 | | | 15,672,290 | |
| | | | | | | | |
| | | | Wirelines — 1.0% | | | | |
| | 34,645,000 | | | Level 3 Communications, Inc., 3.500%, 6/15/2012 | | | 32,782,831 | |
| | 13,484,000 | | | Level 3 Communications, Inc., 5.250%, 12/15/2011 | | | 13,484,000 | |
| | 6,000,000 | | | Level 3 Communications, Inc., 6.500%, 10/01/2016 | | | 6,135,000 | |
| | 54,075,000 | | | Level 3 Communications, Inc., 7.000%, 3/15/2015, 144A(c) | | | 48,194,344 | |
| | 32,895,000 | | | Level 3 Communications, Inc., Series B, 7.000%, 3/15/2015(c) | | | 29,317,669 | |
| | 1,000,000 | | | Qwest Communications International, Inc., 3.500%, 11/15/2025 | | | 1,311,250 | |
| | | | | | | | |
| | | | | | | 131,225,094 | |
| | | | | | | | |
| | | | Total Convertible Bonds (Identified Cost $905,967,971) | | | 1,070,035,665 | |
| | | | | | | | |
| | | | | | | | |
Principal
Amount (‡) | | | Description | | Value (†) | |
| | | | | | | | |
| | Municipals — 1.1% | | | | |
| | | | California — 0.3% | | | | |
| $ | 4,170,000 | | | San Jose California Redevelopment Agency Tax Allocation (Merged Area Redevelopment),
Series C, (MBIA insured), 3.750%, 8/01/2028 | | $ | 3,667,557 | |
| | 1,530,000 | | | San Jose California Redevelopment Agency Tax Allocation (Merged Area Redevelopment),
Series C, (Registered), (MBIA insured), 3.750%, 8/01/2028 | | | 1,404,402 | |
| | 5,175,000 | | | State of California, (AMBAC insured), 4.500%, 8/01/2027 | | | 5,144,519 | |
| | 14,415,000 | | | State of California, 4.500%, 10/01/2029 | | | 14,197,766 | |
| | 4,190,000 | | | State of California, (AMBAC insured), 4.500%, 8/01/2030 | | | 4,108,924 | |
| | 3,620,000 | | | State of California, 4.500%, 8/01/2030 | | | 3,549,953 | |
| | 2,680,000 | | | State of California (Various Purpose), (MBIA insured), 3.250%, 12/01/2027 | | | 2,225,713 | |
| | 12,645,000 | | | State of California (Various Purpose), (AMBAC insured), 4.500%, 12/01/2033 | | | 12,324,576 | |
| | | | | | | | |
| | | | | | | 46,623,410 | |
| | | | | | | | |
| | | | District of Columbia — 0.0% | | | | |
| | 3,850,000 | | | Metropolitan Washington DC Airports Authority,
Series D, 8.000%, 10/01/2047 | | | 4,076,957 | |
| | | | | | | | |
| | | | Illinois — 0.0% | | | | |
| | 1,725,000 | | | Chicago O’Hare International Airport,
Series A, (AGMC insured), 4.500%, 1/01/2038 | | | 1,729,123 | |
| | | | | | | | |
| | | | Michigan — 0.1% | | | | |
| | 12,700,000 | | | Michigan Tobacco Settlement Finance Authority Taxable Turbo, Series A, 7.309%, 6/01/2034(c) | | | 10,084,816 | |
| | | | | | | | |
| | | | Virginia — 0.7% | | | | |
| | 128,820,000 | | | Virginia Tobacco Settlement Financing Corp.,
Series A-1, 6.706%, 6/01/2046(c) | | | 89,194,968 | |
| | | | | | | | |
| | | | Total Municipals (Identified Cost $189,948,670) | | | 151,709,274 | |
| | | | | | | | |
| | | | Total Bonds and Notes (Identified Cost $11,329,765,556) | | | 12,263,390,444 | |
| | | | | | | | |
| | | | | | | | |
| | Bank Loans — 0.5% | | | | |
| | | | Chemicals — 0.1% | | | | |
| | 4,216,858 | | | Hexion Specialty Chemicals, Inc., Extended Term Loan C1, 4.313%, 5/05/2015(g) | | | 4,025,750 | |
| | 809,920 | | | Hexion Specialty Chemicals, Inc., Extended Term Loan C2, 4.063%, 5/05/2015(g) | | | 773,214 | |
| | | | | | | | |
| | | | | | | 4,798,964 | |
| | | | | | | | |
| | | | Electric — 0.0% | | | | |
| | 4,993,651 | | | Texas Competitive Electric Holdings Company, LLC, Term Loan B2, 3.923%, 10/10/2014(g) | | | 3,877,670 | |
| | | | | | | | |
| | | | Media Non-Cable — 0.0% | | | | |
| | 2,797,946 | | | Tribune Company, Term Loan X, 5.000%, 6/04/2009(d)(g)(h) | | | 1,773,198 | |
| | | | | | | | |
See accompanying notes to financial statements.
49 |
Portfolio of Investments – as of September 30, 2010
Loomis Sayles Strategic Income Fund – (continued)
| | | | | | | | |
Principal
Amount (‡) | | | Description | | Value (†) | |
| | | | | | | | |
| | | | Oil Field Services — 0.0% | | | | |
| $ | 2,485,000 | | | Dresser, Inc., 2nd Lien Term Loan, 6.112%, 5/04/2015(g) | | $ | 2,394,397 | |
| | 1,220,433 | | | Dresser, Inc., Term Loan, 2.612%, 5/04/2014(g) | | | 1,171,871 | |
| | | | | | | | |
| | | | | | | 3,566,268 | |
| | | | | | | | |
| | | | Printing & Publishing — 0.2% | | | | |
| | 26,455,948 | | | SuperMedia, Inc., Exit Term Loan, 11.000%, 12/31/2015(g) | | | 20,622,411 | |
| | | | | | | | |
| | | | Wirelines — 0.2% | | | | |
| | 3,975,879 | | | FairPoint Communications, Inc., Initial Term
Loan A, 4.750%, 3/31/2014(d)(g) | | | 2,571,916 | |
| | 12,057,742 | | | FairPoint Communications, Inc., Initial Term
Loan B, 5.000%, 3/31/2015(d)(g) | | | 7,774,470 | |
| | 17,361,148 | | | Hawaiian Telcom Communications, Inc., New Tranche C Term Loan, 4.750%, 5/30/2014(g)(i) | | | 13,237,876 | |
| | 5,395,000 | | | Level 3 Financing, Inc., Tranche A Term Loan, 2.700%, 3/13/2014(g) | | | 4,915,223 | |
| | | | | | | | |
| | | | | | | 28,499,485 | |
| | | | | | | | |
| | | | Total Bank Loans (Identified Cost $69,696,266) | | | 63,137,996 | |
| | | | | | | | |
| | | | | | | | |
| Shares | | | | | | |
| | Common Stocks — 4.8% | | | | |
| | | | Biotechnology — 0.2% | | | | |
| | 867,059 | | | Vertex Pharmaceuticals, Inc.(e) | | | 29,974,230 | |
| | | | | | | | |
| | | | Containers & Packaging — 0.1% | | | | |
| | 460,656 | | | Owens-Illinois, Inc.(e) | | | 12,926,008 | |
| | 128,014 | | | Smurfit-Stone Container Corp.(e) | | | 2,351,617 | |
| | | | | | | | |
| | | | | | | 15,277,625 | |
| | | | | | | | |
| | | | Electric Utilities — 0.0% | | | | |
| | 282,500 | | | Duke Energy Corp. | | | 5,003,075 | |
| | | | | | | | |
| | | | Electronic Equipment, Instruments & Components — 0.0% | |
| | 41,343 | | | Corning, Inc. | | | 755,750 | |
| | | | | | | | |
| | | | Food Products — 0.4% | | | | |
| | 2,309,175 | | | ConAgra Foods, Inc. | | | 50,663,299 | |
| | | | | | | | |
| | | | Household Durables — 0.1% | | | | |
| | 477,725 | | | KB Home | | | 5,412,624 | |
| | 549,450 | | | Lennar Corp., Class A | | | 8,450,541 | |
| | | | | | | | |
| | | | | | | 13,863,165 | |
| | | | | | | | |
| | | | Media — 0.0% | | | | |
| | 4,701 | | | Dex One Corp.(e) | | | 57,728 | |
| | 56,625 | | | SuperMedia, Inc.(e) | | | 598,526 | |
| | | | | | | | |
| | | | | | | 656,254 | |
| | | | | | | | |
| | | | Oil, Gas & Consumable Fuels — 0.2% | | | | |
| | 846,398 | | | Chesapeake Energy Corp. | | | 19,170,915 | |
| | 216,429 | | | Repsol YPF SA, Sponsored ADR | | | 5,582,916 | |
| | 141,249 | | | Spectra Energy Corp. | | | 3,185,165 | |
| | | | | | | | |
| | | | | | | 27,938,996 | |
| | | | | | | | |
| | | | Pharmaceuticals — 1.7% | | | | |
| | 7,978,200 | | | Bristol-Myers Squibb Co. | | | 216,289,002 | |
| | 2,288 | | | Teva Pharmaceutical Industries, Ltd., Sponsored ADR | | | 120,692 | |
| | 459,757 | | | Valeant Pharmaceuticals International, Inc. | | | 11,516,916 | |
| | | | | | | | |
| | | | | | | 227,926,610 | |
| | | | | | | | |
| | | | | | | | |
Shares | | | Description | | Value (†) | |
| | | | | | | | |
| | | | REITs – Apartments — 0.3% | | | | |
| | 290,904 | | | Apartment Investment & Management Co., Class A | | $ | 6,219,528 | |
| | 889,730 | | | Associated Estates Realty Corp. | | | 12,438,425 | |
| | 460,000 | | | Equity Residential | | | 21,882,200 | |
| | | | | | | | |
| | | | | | | 40,540,153 | |
| | | | | | | | |
| | | | REITs – Regional Malls — 0.1% | | | | |
| | 123,159 | | | Simon Property Group, Inc. | | | 11,421,766 | |
| | | | | | | | |
| | | | REITs – Shopping Centers — 0.0% | | | | |
| | 201,557 | | | Developers Diversified Realty Corp. | | | 2,261,470 | |
| | | | | | | | |
| | | | Semiconductors & Semiconductor Equipment — 1.7% | |
| | 11,932,326 | | | Intel Corp. | | | 229,458,629 | |
| | | | | | | | |
| | | | Total Common Stocks (Identified Cost $647,274,087) | | | 655,741,022 | |
| | | | | | | | |
| | | | | | | | |
| | Preferred Stocks — 2.5% | | | | |
| | Convertible Preferred Stocks — 1.7% | | | | |
| | | | Automotive — 0.8% | | | | |
| | 2,378,821 | | | Ford Motor Co. Capital Trust II, 6.500% | | | 113,969,314 | |
| | | | | | | | |
| | | | Capital Markets — 0.1% | | | | |
| | 186,526 | | | Newell Financial Trust I, 5.250% | | | 7,379,435 | |
| | | | | | | | |
| | | | Commercial Banks — 0.1% | | | | |
| | 8,533 | | | Wells Fargo & Co., Series L, Class A, 7.500% | | | 8,584,198 | |
| | | | | | | | |
| | | | Diversified Financial Services — 0.2% | | | | |
| | 19,062 | | | Bank of America Corp., Series L, 7.250% | | | 18,704,587 | |
| | 203,258 | | | Sovereign Capital Trust IV, 4.375% | | | 7,520,546 | |
| | | | | | | | |
| | | | | | | 26,225,133 | |
| | | | | | | | |
| | | | Electric Utilities — 0.1% | | | | |
| | 380,577 | | | AES Trust III, 6.750% | | | 18,576,915 | |
| | 107,725 | | | CMS Energy Trust I, 7.750%(c)(j) | | | 3,770,375 | |
| | | | | | | | |
| | | | | | | 22,347,290 | |
| | | | | | | | |
| | | | Machinery — 0.1% | | | | |
| | 229,491 | | | United Rentals Trust I, 6.500% | | | 7,687,949 | |
| | | | | | | | |
| | | | Oil, Gas & Consumable Fuels — 0.1% | | | | |
| | 52,020 | | | Chesapeake Energy Corp., 4.500% | | | 4,473,720 | |
| | 159,977 | | | El Paso Energy Capital Trust I, 4.750% | | | 6,119,120 | |
| | | | | | | | |
| | | | | | | 10,592,840 | |
| | | | | | | | |
| | | | REITs - Hotels — 0.0% | | | | |
| | 42,700 | | | FelCor Lodging Trust, Inc., Series A, 1.950%(e) | | | 915,915 | |
| | | | | | | | |
| | | | Semiconductors & Semiconductor Equipment — 0.2% | |
| | 36,020 | | | Lucent Technologies Capital Trust I, 7.750% | | | 29,176,200 | |
| | | | | | | | |
| | | | Total Convertible Preferred Stocks (Identified Cost $204,225,482) | | | 226,878,274 | |
| | | | | | | | |
| | | | | | | | |
| | Non-Convertible Preferred Stocks — 0.8% | | | | |
| | | | Banking — 0.2% | | | | |
| | 36,916 | | | Ally Financial, Inc., Series G, 7.000%, 144A | | | 33,230,170 | |
| | | | | | | | |
See accompanying notes to financial statements.
| 50
Portfolio of Investments – as of September 30, 2010
Loomis Sayles Strategic Income Fund – (continued)
| | | | | | | | |
| Shares | | | Description | | Value (†) | |
| | | | | | | | |
| | | | Diversified Financial Services — 0.1% | | | | |
| | 35,000 | | | Bank of America Corp., 6.375% | | $ | 811,300 | |
| | 847,800 | | | Citigroup Capital XIII, (fixed rate to 10/30/2015, variable rate thereafter) 7.875% | | | 21,195,000 | |
| | | | | | | | |
| | | | | | | 22,006,300 | |
| | | | | | | | |
| | | | Electric Utilities — 0.0% | | | | |
| | 393 | | | Entergy New Orleans, Inc., 4.750% | | | 30,936 | |
| | | | | | | | |
| | | | Household Durables — 0.0% | | | | |
| | 49,411 | | | Hovnanian Enterprises, Inc., 7.625%(e) | | | 335,995 | |
| | | | | | | | |
| | | | Oil, Gas & Consumable Fuels — 0.1% | | | | |
| | 99,800 | | | SandRidge Energy, Inc., 8.500% | | | 10,414,350 | |
| | | | | | | | |
| | | | REITs — Industrials — 0.1% | | | | |
| | 1,596 | | | Highwoods Properties, Inc.,
Series A, 8.625% | | | 1,596,000 | |
| | 116,192 | | | ProLogis, Series C, 8.540% | | | 5,809,600 | |
| | | | | | | | |
| | | | | | | 7,405,600 | |
| | | | | | | | |
| | | | Software — 0.2% | | | | |
| | 26,000 | | | Falcons Funding Trust I, (Step to 10.875% on 3/15/2015, variable rate after 3/15/2020), 8.875%, 144A(f) | | | 27,421,875 | |
| | | | | | | | |
| | | | Thrifts & Mortgage Finance — 0.1% | | | | |
| | 389,800 | | | Countrywide Capital IV, 6.750% | | | 9,390,282 | |
| | | | | | | | |
| | | | Total Non-Convertible Preferred Stocks (Identified Cost $79,083,023) | | | 110,235,508 | |
| | | | | | | | |
| | | | Total Preferred Stocks (Identified Cost $283,308,505) | | | 337,113,782 | |
| | | | | | | | |
| | | | | | | | |
| | Closed End Investment Companies — 0.2% | | | | |
| | 392,579 | | | Dreyfus High Yield Strategies Fund | | | 1,754,828 | |
| | 88,955 | | | DWS High Income Trust | | | 898,446 | |
| | 860,000 | | | Highland Credit Strategies Fund | | | 6,303,800 | |
| | 104,115 | | | Morgan Stanley Emerging Markets Debt Fund, Inc. | | | 1,176,499 | |
| | 2,042,648 | | | Western Asset High Income Opportunity Fund, Inc. | | | 12,807,403 | |
| | 1,157,524 | | | Western Asset Managed High Income Fund, Inc. | | | 7,454,455 | |
| | | | | | | | |
| | | | Total Closed End Investment Companies (Identified Cost $35,971,891) | | | 30,395,431 | |
| | | | | | | | |
Principal
Amount (‡) | | | | | | |
| | Short-Term Investments — 0.3% | | | | |
| $ | 1,574,972 | | | Repurchase Agreement with State Street Corporation, dated 9/30/2010 at 0.000% to be repurchased at $1,574,972 on 10/01/2010 collateralized by $1,470,000 U.S. Treasury Note, 3.125% due 4/30/2017 valued at $1,609,799 including accrued interest (Note 2 of Notes to Financial Statements) | | | 1,574,972 | |
| | | | | | | | |
Principal
Amount (‡) | | | Description | | Value (†) | |
| | | | | | | | |
| | Short-Term Investments — continued | | | | |
| $ | 33,234,246 | | | Tri-Party Repurchase Agreement with Fixed Income Clearing Corporation, dated 9/30/2010 at 0.000% to be repurchased at $33,234,246 on 10/01/2010 collateralized by $32,565,000 Federal Home Loan Mortgage Corp. Discount Note, due 8/29/2011 valued at $32,483,588; $100,000 Federal Home Loan Bank, 0.580% due 6/01/2011 valued at $100,375; $1,300,000 Federal National Mortgage Association, 1.000% due 11/23/2011 valued at $1,316,250 including accrued interest (Note 2 of Notes to Financial Statements) | | $ | 33,234,246 | |
| | | | | | | | |
| | | | Total Short-Term Investments (Identified Cost $34,809,218) | | | 34,809,218 | |
| | | | | | | | |
| | | | | | | | |
| | | | Total Investments — 98.7% (Identified Cost $12,400,825,523)(a) | | | 13,384,587,893 | |
| | | | Other assets less liabilities — 1.3% | | | 182,630,501 | |
| | | | | | | | |
| | | | Net Assets — 100.0% | | $ | 13,567,218,394 | |
| | | | | | | | |
| | | | | | | | |
| | (‡) | | | Principal amount stated in U.S. dollars unless otherwise noted. | | | | |
| | (†) | | | See Note 2 of Notes to Financial Statements. | | | | |
| | (††) | | | Amount shown represents units. One unit represents a principal amount of 25. | | | | |
| | (†††) | | | Amount shown represents units. One unit represents a principal amount of 100. | | | | |
| | (a) | | | Federal Tax Information: | | | | |
| | | | At September 30, 2010, the net unrealized appreciation on investments based on a cost of $12,445,689,893 for federal income tax purposes was as follows: | | | | |
| | | | Aggregate gross unrealized appreciation for all investments in which there is an excess of value over tax cost | | $ | 1,366,741,392 | |
| | | | Aggregate gross unrealized depreciation for all investments in which there is an excess of tax cost over value | | | (427,843,392 | ) |
| | | | | | | | |
| | | | Net unrealized appreciation | | $ | 938,898,000 | |
| | | | | | | | |
| | | | | | | | |
| | (b) | | | Variable rate security. Rate as of September 30, 2010 is disclosed. | |
| | (c) | | | Illiquid security. At September 30, 2010, the value of these securities amounted to $446,629,385 or 3.3% of net assets. | |
| | (d) | | | The issuer is in default with respect to interest and/or principal payments. Income is not being accrued. | |
| | (e) | | | Non-income producing security. | |
| | (f) | | | Coupon rate is a fixed rate for an initial period then resets at a specified date and rate. | |
| | (g) | | | Variable rate security. Rate shown represents the weighted average rate at September 30, 2010. | |
| | (h) | | | Issuer has filed for bankruptcy. | |
| | (i) | | | All or a portion of interest payment is paid-in-kind. | |
| | (j) | | | Fair valued security by the Fund’s investment adviser. At September 30, 2010 the value of this security amounted to $3,770,375 or 0.0% of net assets. | |
| | | | | | | | |
| | 144A | | | Securities exempt from registration under Rule 144A of the Securities Act of 1933. These securities may be resold in transactions exempt from registration, normally to qualified institutional buyers. At September 30, 2010, the total value of these securities amounted to $1,521,268,235 or 11.2% of net assets. | |
See accompanying notes to financial statements.
51 |
Portfolio of Investments – as of September 30, 2010
Loomis Sayles Strategic Income Fund – (continued)
| | | | | | | | |
| | | | | | | | |
| | ADR | | | An American Depositary Receipt is a certificate issued by a custodian bank representing the right to receive securities of the foreign issuer described. The values of ADRs are significantly influenced by trading on exchanges not located in the United States. | |
| | | | | |
| | ABS | | | Asset-Backed Securities | |
| | AGMC | | | Assured Guaranty Municipal Corp. | |
| | AMBAC | | | American Municipal Bond Assurance Corp. | |
| | EMTN | | | Euro Medium Term Note | |
| | GMTN | | | Global Medium Term Note | |
| | MBIA | | | Municipal Bond Investors Assurance Corp. | |
| | MTN | | | Medium Term Note | |
| | REITs | | | Real Estate Investment Trusts | |
| | | | | | | | |
| | AUD | | | Australian Dollar | |
| | BRL | | | Brazilian Real | |
| | CAD | | | Canadian Dollar | |
| | EUR | | | Euro | |
| | GBP | | | British Pound | |
| | IDR | | | Indonesian Rupiah | |
| | ISK | | | Icelandic Krona | |
| | KRW | | | South Korean Won | |
| | MXN | | | Mexican Peso | |
| | NOK | | | Norwegian Krone | |
| | NZD | | | New Zealand Dollar | |
| | SGD | | | Singapore Dollar | |
Industry Summary at September 30, 2010 (Unaudited)
| | | | |
| Treasuries | | | 15.2 | % |
| Non-Captive Diversified | | | 8.1 | |
| Banking | | | 6.7 | |
| Sovereigns | | | 6.7 | |
| Automotive | | | 5.0 | |
| Technology | | | 4.9 | |
| Non-Captive Consumer | | | 4.4 | |
| Wirelines | | | 4.4 | |
| Electric | | | 3.5 | |
| Pharmaceuticals | | | 3.2 | |
| Healthcare | | | 2.7 | |
| Paper | | | 2.4 | |
| Airlines | | | 2.3 | |
| Pipelines | | | 2.2 | |
| Other Investments, less than 2% each | | | 26.7 | |
| Short-Term Investments | | | 0.3 | |
| | | | |
| Total Investments | | | 98.7 | |
| Other assets less liabilities | | | 1.3 | |
| | | | |
| Net Assets | | | 100.0 | % |
| | | | |
Currency Exposure at September 30, 2010 as a Percentage of Net Assets (Unaudited)
| | | | |
| United States Dollar | | | 67.6 | % |
| Canadian Dollar | | | 12.4 | |
| New Zealand Dollar | | | 3.9 | |
| Norwegian Krone | | | 3.0 | |
| Euro | | | 2.1 | |
| Other, less than 2% each | | | 9.7 | |
| | | | |
| Total Investments | | | 98.7 | |
| Other assets less liabilities | | | 1.3 | |
| | | | |
| Net Assets | | | 100.0 | % |
| | | | |
See accompanying notes to financial statements.
| 52
Statements of Assets and Liabilities
September 30, 2010
| | | | | | | | | | | | | | | | | | | | |
| | | Core Plus
Bond Fund | | | High Income
Fund | | | International
Bond Fund | | | Limited Term
Government
and Agency
Fund | | | Strategic
Income Fund | |
ASSETS | | | | | | | | | | | | | | | | | | | | |
Investments at cost | | $ | 371,812,949 | | | $ | 143,655,402 | | | $ | 30,988,891 | | | $ | 325,863,102 | | | $ | 12,400,825,523 | |
Net unrealized appreciation | | | 26,655,151 | | | | 14,591,748 | | | | 2,291,856 | | | | 12,378,953 | | | | 983,762,370 | |
| | | | | | | | | | | | | | | | | | | | |
Investments at value | | | 398,468,100 | | | | 158,247,150 | | | | 33,280,747 | | | | 338,242,055 | | | | 13,384,587,893 | |
Cash | | | — | | | | 290,518 | | | | — | | | | 71,834 | | | | 272,879 | |
Due from custodian (Note 2) | | | — | | | | — | | | | — | | | | — | | | | 3,020,723 | |
Foreign currency at value (identified cost $0, $4,192, $371,958, $0 and $10,075,783) | | | — | | | | 2,656 | | | | 385,030 | | | | — | | | | 9,568,127 | |
Receivable for Fund shares sold | | | 19,343,941 | | | | 352,652 | | | | 99,261 | | | | 1,644,608 | | | | 29,321,160 | |
Receivable for securities sold | | | 21,363,877 | | | | 212,249 | | | | — | | | | — | | | | 45,607,735 | |
Dividends and interest receivable | | | 4,444,230 | | | | 2,147,705 | | | | 459,108 | | | | 1,353,255 | | | | 198,600,861 | |
Unrealized appreciation on forward foreign currency contracts (Note 2) | | | — | | | | — | | | | 141,570 | | | | — | | | | — | |
Tax reclaims receivable | | | 8,042 | | | | 15,938 | | | | 3,596 | | | | — | | | | 1,047,034 | |
| | | | | | | | | | | | | | | | | | | | |
TOTAL ASSETS | | | 443,628,190 | | | | 161,268,868 | | | | 34,369,312 | | | | 341,311,752 | | | | 13,672,026,412 | |
| | | | | | | | | | | | | | | | | | | | |
LIABILITIES | | | | | | | | | | | | | | | | | | | | |
Payable for securities purchased | | | 31,103,587 | | | | 677,547 | | | | — | | | | — | | | | 61,772,288 | |
Payable for Fund shares redeemed | | | 405,945 | | | | 1,908,984 | | | | 468,268 | | | | 528,391 | | | | 31,290,541 | |
Unrealized depreciation on forward foreign currency contracts (Note 2) | | | — | | | | — | | | | 6,979 | | | | — | | | | — | |
Foreign taxes payable (Note 2) | | | — | | | | — | | | | — | | | | — | | | | 220,244 | |
Due to broker (Note 2) | | | — | | | | — | | | | — | | | | — | | | | 3,020,723 | |
Dividends payable | | | — | | | | — | | | | — | | | | 240,296 | | | | — | |
Management fees payable (Note 6) | | | 123,155 | | | | 73,777 | | | | 2,750 | | | | 84,097 | | | | 6,153,093 | |
Deferred Trustees’ fees (Note 6) | | | 229,443 | | | | 91,652 | | | | 27,104 | | | | 217,024 | | | | 583,600 | |
Administrative fees payable (Note 6) | | | 14,876 | | | | 6,030 | | | | 1,273 | | | | 13,306 | | | | 518,635 | |
Other accounts payable and accrued expenses | | | 93,753 | | | | 92,535 | | | | 52,694 | | | | 84,289 | | | | 1,248,894 | |
| | | | | | | | | | | | | | | | | | | | |
TOTAL LIABILITIES | | | 31,970,759 | | | | 2,850,525 | | | | 559,068 | | | | 1,167,403 | | | | 104,808,018 | |
| | | | | | | | | | | | | | | | | | | | |
NET ASSETS | | $ | 411,657,431 | | | $ | 158,418,343 | | | $ | 33,810,244 | | | $ | 340,144,349 | | | $ | 13,567,218,394 | |
| | | | | | | | | | | | | | | | | | | | |
NET ASSETS CONSIST OF: | | | | | | | | | | | | | | | | | | | | |
Paid-in capital | | $ | 385,946,991 | | | $ | 143,700,245 | | | $ | 31,374,119 | | | $ | 329,335,461 | | | $ | 13,321,639,728 | |
Undistributed net investment income (Distributions in excess of net investment income) | | | 249,369 | | | | 178,040 | | | | (163,380 | ) | | | (127,347 | ) | | | 4,843,087 | |
Accumulated net realized gain (loss) on investments, swap agreements and foreign currency transactions | | | (1,206,987 | ) | | | (56,713 | ) | | | 141,532 | | | | (1,442,718 | ) | | | (744,454,141 | ) |
Net unrealized appreciation on investments and foreign currency translations | | | 26,668,058 | | | | 14,596,771 | | | | 2,457,973 | | | | 12,378,953 | | | | 985,189,720 | |
| | | | | | | | | | | | | | | | | | | | |
NET ASSETS | | $ | 411,657,431 | | | $ | 158,418,343 | | | $ | 33,810,244 | | | $ | 340,144,349 | | | $ | 13,567,218,394 | |
| | | | | | | | | | | | | | | | | | | | |
COMPUTATION OF NET ASSET VALUE AND OFFERING PRICE: | | | | | | | | | | | | | | | | | | | | |
Class A shares: | | | | | | | | | | | | | | | | | | | | |
Net assets | | $ | 214,723,169 | | | $ | 68,010,828 | | | $ | 18,757,681 | | | $ | 164,264,914 | | | $ | 5,758,070,100 | |
| | | | | | | | | | | | | | | | | | | | |
Shares of beneficial interest | | | 16,843,359 | | | | 13,854,602 | | | | 1,678,915 | | | | 13,670,145 | | | | 391,961,353 | |
| | | | | | | | | | | | | | | | | | | | |
Net asset value and redemption price per share | | $ | 12.75 | | | $ | 4.91 | | | $ | 11.17 | | | $ | 12.02 | | | $ | 14.69 | |
| | | | | | | | | | | | | | | | | | | | |
Offering price per share (100/[100 - maximum sales charge] of net asset value) (Note 1) | | $ | 13.35 | | | $ | 5.14 | | | $ | 11.70 | | | $ | 12.39 | | | $ | 15.38 | |
| | | | | | | | | | | | | | | | | | | | |
Class B shares: (redemption price per share is equal to net asset value less any applicable contingent deferred sales charge) (Note 1) | | | | | | | | | | | | | | | | | | | | |
Net assets | | $ | 4,489,843 | | | $ | 1,208,596 | | | $ | — | | | $ | 4,049,367 | | | $ | 137,268,113 | |
| | | | | | | | | | | | | | | | | | | | |
Shares of beneficial interest | | | 350,962 | | | | 245,701 | | | | — | | | | 337,345 | | | | 9,287,909 | |
| | | | | | | | | | | | | | | | | | | | |
Net asset value and offering price per share | | $ | 12.79 | | | $ | 4.92 | | | $ | — | | | $ | 12.00 | | | $ | 14.78 | |
| | | | | | | | | | | | | | | | | | | | |
Class C shares: (redemption price per share is equal to net asset value less any applicable contingent deferred sales charge) (Note 1) | | | | | | | | | | | | | | | | | | | | |
Net assets | | $ | 123,122,504 | | | $ | 19,311,948 | | | $ | 6,145,057 | | | $ | 75,983,536 | | | $ | 5,146,163,761 | |
| | | | | | | | | | | | | | | | | | | | |
Shares of beneficial interest | | | 9,652,551 | | | | 3,927,775 | | | | 553,032 | | | | 6,318,739 | | | | 348,483,279 | |
| | | | | | | | | | | | | | | | | | | | |
Net asset value and offering price per share | | $ | 12.76 | | | $ | 4.92 | | | $ | 11.11 | | | $ | 12.03 | | | $ | 14.77 | |
| | | | | | | | | | | | | | | | | | | | |
Class Y shares: | | | | | | | | | | | | | | | | | | | | |
Net assets | | $ | 69,321,915 | | | $ | 69,886,971 | | | $ | 8,907,506 | | | $ | 95,846,532 | | | $ | 2,521,337,366 | |
| | | | | | | | | | | | | | | | | | | | |
Shares of beneficial interest | | | 5,407,085 | | | | 14,250,436 | | | | 797,815 | | | | 7,952,741 | | | | 171,748,268 | |
| | | | | | | | | | | | | | | | | | | | |
Net asset value, offering and redemption price per share | | $ | 12.82 | | | $ | 4.90 | | | $ | 11.16 | | | $ | 12.05 | | | $ | 14.68 | |
| | | | | | | | | | | | | | | | | | | | |
Admin Class shares: | | | | | | | | | | | | | | | | | | | | |
Net assets | | $ | — | | | $ | — | | | $ | — | | | $ | — | | | $ | 4,379,054 | |
| | | | | | | | | | | | | | | | | | | | |
Shares of beneficial interest | | | — | | | | — | | | | — | | | | — | | | | 298,635 | |
| | | | | | | | | | | | | | | | | | | | |
Net asset value, offering and redemption price per share | | $ | — | | | $ | — | | | $ | — | | | $ | — | | | $ | 14.66 | |
| | | | | | | | | | | | | | | | | | | | |
See accompanying notes to financial statements.
53 |
Statements of Operations
For the Year Ended September 30, 2010
| | | | | | | | | | | | | | | | | | | | |
| | | Core Plus
Bond Fund | | | High Income
Fund | | | International
Bond Fund | | | Limited Term
Government
and Agency
Fund | | | Strategic
Income Fund | |
INVESTMENT INCOME | | | | | | | | | | | | | | | | | | | | |
Interest | | $ | 17,226,091 | | | $ | 12,297,471 | | | $ | 1,013,899 | | | $ | 6,919,648 | | | $ | 820,873,584 | |
Dividends | | | 37,198 | | | | 230,967 | | | | — | | | | — | | | | 46,586,956 | |
Less net foreign taxes withheld | | | — | | | | — | | | | (2,662 | ) | | | — | | | | (140,831 | ) |
| | | | | | | | | | | | | | | | | | | | |
| | | 17,263,289 | | | | 12,528,438 | | | | 1,011,237 | | | | 6,919,648 | | | | 867,319,709 | |
| | | | | | | | | | | | | | | | | | | | |
Expenses | | | | | | | | | | | | | | | | | | | | |
Management fees (Note 6) | | | 1,344,800 | | | | 952,564 | | | | 186,831 | | | | 1,305,198 | | | | 73,019,120 | |
Service and distribution fees (Note 6) | | | 1,488,399 | | | | 372,974 | | | | 99,338 | | | | 1,028,107 | | | | 65,846,077 | |
Administrative fees (Note 6) | | | 156,159 | | | | 76,320 | | | | 14,960 | | | | 127,418 | | | | 6,282,952 | |
Trustees’ fees and expenses (Note 6) | | | 41,460 | | | | 26,056 | | | | 17,732 | | | | 39,295 | | | | 284,625 | |
Transfer agent fees and expenses (Note 6) | | | 342,098 | | | | 212,283 | | | | 16,163 | | | | 213,458 | | | | 10,452,878 | |
Audit and tax services fees | | | 46,485 | | | | 45,962 | | | | 46,558 | | | | 46,612 | | | | 60,675 | |
Custodian fees and expenses | | | 31,073 | | | | 50,725 | | | | 38,818 | | | | 27,113 | | | | 666,403 | |
Legal fees | | | 6,799 | | | | 3,276 | | | | 674 | | | | 5,336 | | | | 274,033 | |
Registration fees | | | 73,157 | | | | 66,493 | | | | 51,620 | | | | 86,540 | | | | 283,717 | |
Shareholder reporting expenses | | | 62,971 | | | | 44,487 | | | | 5,203 | | | | 32,425 | | | | 1,489,592 | |
Miscellaneous expenses | | | 14,976 | | | | 12,114 | | | | 7,084 | | | | 13,157 | | | | 402,729 | |
| | | | | | | | | | | | | | | | | | | | |
Total expenses | | | 3,608,377 | | | | 1,863,254 | | | | 484,981 | | | | 2,924,659 | | | | 159,062,801 | |
Less waiver and/or expense reimbursement (Note 6) | | | (5,687 | ) | | | (61,432 | ) | | | (120,967 | ) | | | (212,771 | ) | | | — | |
| | | | | | | | | | | | | | | | | | | | |
Net expenses | | | 3,602,690 | | | | 1,801,822 | | | | 364,014 | | | | 2,711,888 | | | | 159,062,801 | |
| | | | | | | | | | | | | | | | | | | | |
Net investment income | | | 13,660,599 | | | | 10,726,616 | | | | 647,223 | | | | 4,207,760 | | | | 708,256,908 | |
| | | | | | | | | | | | | | | | | | | | |
NET REALIZED AND UNREALIZED GAIN (LOSS) ON INVESTMENTS,
SWAP AGREEMENTS AND FOREIGN CURRENCY TRANSACTIONS | | | | | | | | | | | | | | | | | | | | |
Net realized gain (loss) on: | | | | | | | | | | | | | | | | | | | | |
Investments | | | 11,780,208 | | | | 15,061,649 | | | | (20,587 | ) | | | 5,299,478 | | | | (77,090,397 | ) |
Swap agreements | | | — | | | | — | | | | 5,412 | | | | — | | | | — | |
Foreign currency transactions | | | (92,152 | ) | | | 7,407 | | | | 96,325 | | | | — | | | | 2,149,629 | |
Net change in unrealized appreciation (depreciation) on: | | | | | | | | | | | | | | | | | | | | |
Investments | | | 13,887,953 | | | | (26,304 | ) | | | 1,027,962 | | | | 5,267,995 | | | | 1,297,401,687 | |
Foreign currency translations | | | 12,907 | | | | 14,375 | | | | 86,485 | | | | — | | | | (308,067 | ) |
| | | | | | | | | | | | | | | | | | | | |
Net realized and unrealized gain on investments, swap agreements and foreign currency transactions | | | 25,588,916 | | | | 15,057,127 | | | | 1,195,597 | | | | 10,567,473 | | | | 1,222,152,852 | |
| | | | | | | | | | | | | | | | | | | | |
NET INCREASE IN NET ASSETS RESULTING FROM OPERATIONS | | $ | 39,249,515 | | | $ | 25,783,743 | | | $ | 1,842,820 | | | $ | 14,775,233 | | | $ | 1,930,409,760 | |
| | | | | | | | | | | | | | | | | | | | |
See accompanying notes to financial statements.
| 54
Statements of Changes in Net Assets
| | | | | | | | | | | | | | | | | | | | | | | | |
| | | Core Plus Bond Fund | | | High Income Fund | | | International Bond Fund | |
| | | Year Ended
September 30,
2010 | | | Year Ended
September 30,
2009 | | | Year Ended
September 30,
2010 | | | Year Ended
September 30,
2009 | | | Year Ended
September 30,
2010 | | | Year Ended
September 30,
2009 | |
FROM OPERATIONS: | | | | | | | | | | | | | | | | | | | | | | | | |
Net investment income | | $ | 13,660,599 | | | $ | 10,726,024 | | | $ | 10,726,616 | | | $ | 7,929,754 | | | $ | 647,223 | | | $ | 501,191 | |
Net realized gain (loss) on investments, swap agreements and foreign currency transactions | | | 11,688,056 | | | | 1,047,585 | | | | 15,069,056 | | | | (2,943,074 | ) | | | 81,150 | | | | 246,125 | |
Net change in unrealized appreciation (depreciation) on investments and foreign currency translations | | | 13,900,860 | | | | 27,447,211 | | | | (11,929 | ) | | | 23,846,800 | | | | 1,114,447 | | | | 2,396,258 | |
| | | | | | | | | | | | | | | | | | | | | | | | |
Net increase in net assets resulting from operations | | | 39,249,515 | | | | 39,220,820 | | | | 25,783,743 | | | | 28,833,480 | | | | 1,842,820 | | | | 3,143,574 | |
| | | | | | | | | | | | | | | | | | | | | | | | |
FROM DISTRIBUTIONS TO SHAREHOLDERS: | | | | | | | | | | | | | | | | | | | | | | | | |
Net investment income | | | | | | | | | | | | | | | | | | | | | | | | |
Class A | | | (8,308,883 | ) | | | (7,509,410 | ) | | | (4,606,994 | ) | | | (3,638,806 | ) | | | (356,057 | ) | | | (80,043 | ) |
Class B | | | (232,826 | ) | | | (436,844 | ) | | | (84,337 | ) | | | (124,178 | ) | | | — | | | | — | |
Class C | | | (4,369,129 | ) | | | (2,761,267 | ) | | | (1,149,766 | ) | | | (969,430 | ) | | | (148,175 | ) | | | (13,441 | ) |
Class Y | | | (2,762,927 | ) | | | (1,308,176 | ) | | | (5,066,381 | ) | | | (3,008,116 | ) | | | (329,863 | ) | | | (240,546 | ) |
Net realized capital gains | | | | | | | | | | | | | | | | | | | | | | | | |
Class A | | | — | | | | — | | | | — | | | | — | | | | (81,934 | ) | | | — | |
Class C | | | — | | | | — | | | | — | | | | — | | | | (46,824 | ) | | | — | |
Class Y | | | — | | | | — | | | | — | | | | — | | | | (94,216 | ) | | | — | |
| | | | | | | | | | | | | | | | | | | | | | | | |
Total distributions | | | (15,673,765 | ) | | | (12,015,697 | ) | | | (10,907,478 | ) | | | (7,740,530 | ) | | | (1,057,069 | ) | | | (334,030 | ) |
| | | | | | | | | | | | | | | | | | | | | | | | |
NET INCREASE (DECREASE) IN NET ASSETS FROM CAPITAL SHARE TRANSACTIONS (NOTE 10) | | | 128,799,979 | | | | 58,618,493 | | | | (41,510,546 | ) | | | 109,311,312 | | | | 8,541,560 | | | | 9,056,042 | |
| | | | | | | | | | | | | | | | | | | | | | | | |
Redemption fees | | | | | | | | | | | | | | | | | | | | | | | | |
Class A | | | — | | | | — | | | | — | | | | 17,604 | | | | — | | | | — | |
Class B | | | — | | | | — | | | | — | | | | 697 | | | | — | | | | — | |
Class C | | | — | | | | — | | | | — | | | | 4,945 | | | | — | | | | — | |
Class Y | | | — | | | | — | | | | — | | | | 3,996 | | | | — | | | | — | |
| | | | | | | | | | | | | | | | | | | | | | | | |
Total redemption fees | | | — | | | | — | | | | — | | | | 27,242 | | | | — | | | | — | |
| | | | | | | | | | | | | | | | | | | | | | | | |
Net increase (decrease) in net assets | | | 152,375,729 | | | | 85,823,616 | | | | (26,634,281 | ) | | | 130,431,504 | | | | 9,327,311 | | | | 11,865,586 | |
NET ASSETS | | | | | | | | | | | | | | | | | | | | | | | | |
Beginning of the year | | | 259,281,702 | | | | 173,458,086 | | | | 185,052,624 | | | | 54,621,120 | | | | 24,482,933 | | | | 12,617,347 | |
| | | | | | | | | | | | | | | | | | | | | | | | |
End of the year | | $ | 411,657,431 | | | $ | 259,281,702 | | | $ | 158,418,343 | | | $ | 185,052,624 | | | $ | 33,810,244 | | | $ | 24,482,933 | |
| | | | | | | | | | | | | | | | | | | | | | | | |
UNDISTRIBUTED NET INVESTMENT INCOME (DISTRIBUTIONS IN EXCESS OF NET INVESTMENT INCOME) | | $ | 249,369 | | | $ | 1,162,716 | | | $ | 178,040 | | | $ | 8,540 | | | $ | (163,380 | ) | | $ | 180,612 | |
| | | | | | | | | | | | | | | | | | | | | | | | |
See accompanying notes to financial statements.
55 |
| | | | | | | | | | | | | | | | |
| | | Limited Term Government and
Agency Fund | | | Strategic Income Fund | |
| | | Year Ended
September 30,
2010 | | | Year Ended
September 30,
2009 | | | Year Ended
September 30,
2010 | | | Year Ended
September 30,
2009 | |
FROM OPERATIONS: | | | | | | | | | | | | | | | | |
Net investment income | | $ | 4,207,760 | | | $ | 5,607,171 | | | $ | 708,256,908 | | | $ | 729,275,012 | |
Net realized gain (loss) on investments, swap agreements and foreign currency transactions | | | 5,299,478 | | | | 2,955,994 | | | | (74,940,768 | ) | | | (765,289,471 | ) |
Net change in unrealized appreciation (depreciation) on investments and foreign currency translations | | | 5,267,995 | | | | 8,456,894 | | | | 1,297,093,620 | | | | 2,056,646,082 | |
| | | | | | | | | | | | | | | | |
Net increase in net assets resulting from operations | | | 14,775,233 | | | | 17,020,059 | | | | 1,930,409,760 | | | | 2,020,631,623 | |
| | | | | | | | | | | | | | | | |
FROM DISTRIBUTIONS TO SHAREHOLDERS: | | | | | | | | | | | | | | | | |
Net investment income | | | | | | | | | | | | | | | | |
Class A | | | (3,182,978 | ) | | | (3,913,002 | ) | | | (325,626,381 | ) | | | (356,540,265 | ) |
Class B | | | (65,117 | ) | | | (112,841 | ) | | | (7,060,015 | ) | | | (9,240,752 | ) |
Class C | | | (971,553 | ) | | | (1,292,557 | ) | | | (249,098,299 | ) | | | (258,397,380 | ) |
Class Y | | | (1,424,364 | ) | | | (471,487 | ) | | | (134,204,230 | ) | | | (89,955,755 | ) |
Admin Class | | | — | | | | — | | | | (41,765 | ) | | | — | |
Net realized capital gains | | | | | | | | | | | | | | | | |
Class A | | | — | | | | — | | | | — | | | | (33,148,981 | ) |
Class B | | | — | | | | — | | | | — | | | | (1,003,570 | ) |
Class C | | | — | | | | — | | | | — | | | | (25,254,965 | ) |
Class Y | | | — | | | | — | | | | — | | | | (5,262,204 | ) |
| | | | | | | | | | | | | | | | |
Total distributions | | | (5,644,012 | ) | | | (5,789,887 | ) | | | (716,030,690 | ) | | | (778,803,872 | ) |
| | | | | | | | | | �� | | | | | | |
NET INCREASE (DECREASE) IN NET ASSETS FROM CAPITAL SHARE TRANSACTIONS (NOTE 10) | | | 128,975,189 | | | | 51,940,484 | | | | (292,510,626 | ) | | | 923,443,021 | |
| | | | | | | | | | | | | | | | |
Net increase (decrease) in net assets | | | 138,106,410 | | | | 63,170,656 | | | | 921,868,444 | | | | 2,165,270,772 | |
NET ASSETS | | | | | | | | | | | | | | | | |
Beginning of the year | | | 202,037,939 | | | | 138,867,283 | | | | 12,645,349,950 | | | | 10,480,079,178 | |
| | | | | | | | | | | | | | | | |
End of the year | | $ | 340,144,349 | | | $ | 202,037,939 | | | $ | 13,567,218,394 | | | $ | 12,645,349,950 | |
| | | | | | | | | | | | | | | | |
UNDISTRIBUTED NET INVESTMENT INCOME (DISTRIBUTIONS IN EXCESS OF NET INVESTMENT INCOME) | | $ | (127,347 | ) | | $ | 40,900 | | | $ | 4,843,087 | | | $ | (3,333,964 | ) |
| | | | | | | | | | | | | | | | |
| 56
Financial Highlights
For a share outstanding throughout each period.
| | | | | | | | | | | | | | | | | | | | | | | | | | | | | | | | |
| | | | | | Income (Loss) from Investment
Operations: | | | Less Distributions: | | | | |
| | | | | | | | |
| | | Net asset
value,
beginning
of
the period | | | Net
investment
income (a) | | | Net realized
and unrealized
gain (loss) | | | Total from
investment
operations | | | Dividends
from
net investment
income | | | Distributions
from net
realized
capital gains | | | Total
distributions | | | Redemption
fees (b)(c) | |
| | | | | | | | | | | | | | | | | | | | | | | | | | | | | | | | |
CORE PLUS BOND FUND | | | | | | | | | | | | | | | | | | | | | | | | | | | | | | | | |
Class A | | | | | | | | | | | | | | | | | | | | | | | | | | | | | | | | |
9/30/2010 | | $ | 11.91 | | | $ | 0.54 | | | $ | 0.91 | | | $ | 1.45 | | | $ | (0.61 | ) | | $ | — | | | $ | (0.61 | ) | | $ | — | |
9/30/2009 | | | 10.54 | | | | 0.59 | | | | 1.44 | | | | 2.03 | | | | (0.66 | ) | | | — | | | | (0.66 | ) | | | — | |
9/30/2008 | | | 11.31 | | | | 0.55 | | | | (0.71 | ) | | | (0.16 | ) | | | (0.61 | ) | | | — | | | | (0.61 | ) | | | 0.00 | |
9/30/2007 | | | 11.23 | | | | 0.50 | | | | 0.14 | | | | 0.64 | | | | (0.56 | ) | | | — | | | | (0.56 | ) | | | 0.00 | |
9/30/2006 | | | 11.41 | | | | 0.50 | | | | (0.07 | ) | | | 0.43 | | | | (0.61 | ) | | | — | | | | (0.61 | ) | | | 0.00 | |
Class B | | | | | | | | | | | | | | | | | | | | | | | | | | | | | | | | |
9/30/2010 | | | 11.95 | | | | 0.44 | | | | 0.92 | | | | 1.36 | | | | (0.52 | ) | | | — | | | | (0.52 | ) | | | — | |
9/30/2009 | | | 10.57 | | | | 0.50 | | | | 1.45 | | | | 1.95 | | | | (0.57 | ) | | | — | | | | (0.57 | ) | | | — | |
9/30/2008 | | | 11.31 | | | | 0.44 | | | | (0.67 | ) | | | (0.23 | ) | | | (0.51 | ) | | | — | | | | (0.51 | ) | | | 0.00 | |
9/30/2007 | | | 11.24 | | | | 0.41 | | | | 0.13 | | | | 0.54 | | | | (0.47 | ) | | | — | | | | (0.47 | ) | | | 0.00 | |
9/30/2006 | | | 11.41 | | | | 0.41 | | | | (0.05 | ) | | | 0.36 | | | | (0.53 | ) | | | — | | | | (0.53 | ) | | | 0.00 | |
Class C | | | | | | | | | | | | | | | | | | | | | | | | | | | | | | | | |
9/30/2010 | | | 11.92 | | | | 0.45 | | | | 0.91 | | | | 1.36 | | | | (0.52 | ) | | | — | | | | (0.52 | ) | | | — | |
9/30/2009 | | | 10.55 | | | | 0.51 | | | | 1.44 | | | | 1.95 | | | | (0.58 | ) | | | — | | | | (0.58 | ) | | | — | |
9/30/2008 | | | 11.32 | | | | 0.47 | | | | (0.71 | ) | | | (0.24 | ) | | | (0.53 | ) | | | — | | | | (0.53 | ) | | | 0.00 | |
9/30/2007 | | | 11.25 | | | | 0.41 | | | | 0.13 | | | | 0.54 | | | | (0.47 | ) | | | — | | | | (0.47 | ) | | | 0.00 | |
9/30/2006 | | | 11.42 | | | | 0.41 | | | | (0.05 | ) | | | 0.36 | | | | (0.53 | ) | | | — | | | | (0.53 | ) | | | 0.00 | |
Class Y | | | | | | | | | | | | | | | | | | | | | | | | | | | | | | | | |
9/30/2010 | | | 11.97 | | | | 0.57 | | | | 0.92 | | | | 1.49 | | | | (0.64 | ) | | | — | | | | (0.64 | ) | | | — | |
9/30/2009 | | | 10.60 | | | | 0.62 | | | | 1.44 | | | | 2.06 | | | | (0.69 | ) | | | — | | | | (0.69 | ) | | | — | |
9/30/2008 | | | 11.36 | | | | 0.58 | | | | (0.70 | ) | | | (0.12 | ) | | | (0.64 | ) | | | — | | | | (0.64 | ) | | | 0.00 | |
9/30/2007 | | | 11.29 | | | | 0.54 | | | | 0.13 | | | | 0.67 | | | | (0.60 | ) | | | — | | | | (0.60 | ) | | | 0.00 | |
9/30/2006 | | | 11.46 | | | | 0.51 | | | | (0.04 | ) | | | 0.47 | | | | (0.64 | ) | | | — | | | | (0.64 | ) | | | 0.00 | |
| (a) | Per share net investment income has been calculated using the average shares outstanding during the period. |
| (b) | Amount rounds to less than $0.01 per share, if applicable. |
| (c) | Effective June 2, 2008, redemption fees were eliminated. |
| (d) | A sales charge for Class A shares and a contingent deferred sales charge for Class B and Class C shares are not reflected in total return calculations. Periods less than one year, if applicable, are not annualized. |
See accompanying notes to financial statements.
57 |
| | | | | | | | | | | | | | | | | | | | | | | | | | |
| | | | | | | | | |
Ratios to Average Net Assets: | | | | |
| | | | | | |
Net asset
value, end
of the period | | | Total
return
(%) (d)(e) | | |
Net assets,
end of
the period
(000’s) | | | Net
expenses
(%) (f)(g) | | | Gross
expenses
(%) (f) | | | Net investment
income
(%) (f) | | | Portfolio
turnover
rate (%) | |
| | | | | | | | | | | | | | | | | | | | | | | | | | |
| | | | | | | | | | | | | | | | | | | | | | | | | | |
| | | | | | | | | | | | | | | | | | | | | | | | | | |
| $ | 12.75 | | | | 12.55 | | | $ | 214,723 | | | | 0.90 | | | | 0.90 | | | | 4.41 | | | | 87 | |
| | 11.91 | | | | 20.07 | | | | 140,779 | | | | 0.90 | | | | 0.97 | | | | 5.43 | | | | 102 | |
| | 10.54 | | | | (1.61 | ) | | | 115,873 | | | | 0.93 | | | | 1.04 | | | | 4.86 | | | | 82 | |
| | 11.31 | | | | 5.70 | | | | 105,780 | | | | 1.04 | | | | 1.09 | | | | 4.41 | | | | 69 | |
| | 11.23 | | | | 4.03 | | | | 91,464 | | | | 1.05 | | | | 1.08 | | | | 4.46 | | | | 91 | |
| | | | | | | | | | | | | | | | | | | | | | | | | | |
| | 12.79 | | | | 11.64 | | | | 4,490 | | | | 1.65 | | | | 1.65 | | | | 3.64 | | | | 87 | |
| | 11.95 | | | | 19.19 | | | | 7,028 | | | | 1.65 | | | | 1.72 | | | | 4.66 | | | | 102 | |
| | 10.57 | | | | (2.21 | ) | | | 10,481 | | | | 1.70 | | | | 1.80 | | | | 3.92 | | | | 82 | |
| | 11.31 | | | | 4.90 | | | | 87,101 | | | | 1.79 | | | | 1.85 | | | | 3.64 | | | | 69 | |
| | 11.24 | | | | 3.26 | | | | 109,782 | | | | 1.80 | | | | 1.83 | | | | 3.72 | | | | 91 | |
| | | | | | | | | | | | | | | | | | | | | | | | | | |
| | 12.76 | | | | 11.71 | | | | 123,123 | | | | 1.65 | | | | 1.65 | | | | 3.66 | | | | 87 | |
| | 11.92 | | | | 19.20 | | | | 77,081 | | | | 1.65 | | | | 1.72 | | | | 4.69 | | | | 102 | |
| | 10.55 | | | | (2.32 | ) | | | 26,698 | | | | 1.68 | | | | 1.79 | | | | 4.17 | | | | 82 | |
| | 11.32 | | | | 4.91 | | | | 12,690 | | | | 1.78 | | | | 1.82 | | | | 3.66 | | | | 69 | |
| | 11.25 | | | | 3.26 | | | | 6,983 | | | | 1.80 | | | | 1.82 | | | | 3.63 | | | | 91 | |
| | | | | | | | | | | | | | | | | | | | | | | | | | |
| | 12.82 | | | | 12.85 | | | | 69,322 | | | | 0.65 | | | | 0.65 | | | | 4.66 | | | | 87 | |
| | 11.97 | | | | 20.37 | | | | 34,394 | | | | 0.65 | | | | 0.68 | | | | 5.67 | | | | 102 | |
| | 10.60 | | | | (1.36 | ) | | | 20,407 | | | | 0.68 | | | | 0.75 | | | | 5.14 | | | | 82 | |
| | 11.36 | | | | 6.06 | | | | 15,946 | | | | 0.70 | | | | 0.75 | | | | 4.75 | | | | 69 | |
| | 11.29 | | | | 4.28 | | | | 11,986 | | | | 0.80 | (h) | | | 0.80 | (h) | | | 4.58 | | | | 91 | |
| (e) | Had certain expenses not been waived/reimbursed during the period, if applicable, total returns would have been lower. |
| (f) | Computed on an annualized basis for periods less than one year, if applicable. |
| (g) | The investment adviser and/or administrator agreed to waive its fees and/or reimburse a portion of the Fund’s expenses during the period. Without this waiver/reimbursement, if applicable, expenses would have been higher. |
| (h) | Includes fee/expense recovery of 0.06%. |
| 58
Financial Highlights (continued)
For a share outstanding throughout each period.
| | | | | | | | | | | | | | | | | | | | | | | | | | | | | | | | |
| | | | | | Income (Loss) from Investment
Operations: | | | Less Distributions: | | | | |
| | | | | | | | |
| | | Net asset
value,
beginning
of
the period | | | Net
investment
income (a) | | | Net realized
and unrealized
gain (loss) | | | Total from
investment
operations | | | Dividends
from
net investment
income | | | Distributions
from net
realized
capital gains | | | Total
distributions | | | Redemption
fees (b) | |
| | | | | | | | | | | | | | | | | | | | | | | | | | | | | | | | |
HIGH INCOME FUND | | | | | | | | | | | | | | | | | | | | | | | | | | | | | | | | |
Class A | | | | | | | | | | | | | | | | | | | | | | | | | | | | | | | | |
9/30/2010 | | $ | 4.49 | | | $ | 0.32 | | | $ | 0.42 | | | $ | 0.74 | | | $ | (0.32 | ) | | $ | — | | | $ | (0.32 | ) | | $ | — | |
9/30/2009 | | | 4.24 | | | | 0.34 | | | | 0.24 | | | | 0.58 | | | | (0.33 | ) | | | — | | | | (0.33 | ) | | | 0.00 | (g) |
9/30/2008 | | | 5.12 | | | | 0.34 | | | | (0.87 | ) | | | (0.53 | ) | | | (0.35 | ) | | | — | | | | (0.35 | ) | | | 0.00 | |
9/30/2007 | | | 5.09 | | | | 0.33 | | | | 0.08 | | | | 0.41 | | | | (0.38 | ) | | | — | | | | (0.38 | ) | | | 0.00 | |
9/30/2006 | | | 4.98 | | | | 0.34 | | | | 0.11 | | | | 0.45 | | | | (0.34 | ) | | | — | | | | (0.34 | ) | | | 0.00 | |
Class B | | | | | | | | | | | | | | | | | | | | | | | | | | | | | | | | |
9/30/2010 | | | 4.50 | | | | 0.28 | | | | 0.42 | | | | 0.70 | | | | (0.28 | ) | | | — | | | | (0.28 | ) | | | — | |
9/30/2009 | | | 4.25 | | | | 0.31 | | | | 0.25 | | | | 0.56 | | | | (0.31 | ) | | | — | | | | (0.31 | ) | | | 0.00 | (g) |
9/30/2008 | | | 5.13 | | | | 0.30 | | | | (0.87 | ) | | | (0.57 | ) | | | (0.31 | ) | | | — | | | | (0.31 | ) | | | 0.00 | |
9/30/2007 | | | 5.10 | | | | 0.29 | | | | 0.07 | | | | 0.36 | | | | (0.33 | ) | | | — | | | | (0.33 | ) | | | 0.00 | |
9/30/2006 | | | 4.98 | | | | 0.30 | | | | 0.12 | | | | 0.42 | | | | (0.30 | ) | | | — | | | | (0.30 | ) | | | 0.00 | |
Class C | | | | | | | | | | | | | | | | | | | | | | | | | | | | | | | | |
9/30/2010 | | | 4.50 | | | | 0.28 | | | | 0.43 | | | | 0.71 | | | | (0.29 | ) | | | — | | | | (0.29 | ) | | | — | |
9/30/2009 | | | 4.24 | | | | 0.31 | | | | 0.26 | | | | 0.57 | | | | (0.31 | ) | | | — | | | | (0.31 | ) | | | 0.00 | (g) |
9/30/2008 | | | 5.12 | | | | 0.31 | | | | (0.87 | ) | | | (0.56 | ) | | | (0.32 | ) | | | — | | | | (0.32 | ) | | | 0.00 | |
9/30/2007 | | | 5.09 | | | | 0.29 | | | | 0.07 | | | | 0.36 | | | | (0.33 | ) | | | — | | | | (0.33 | ) | | | 0.00 | |
9/30/2006 | | | 4.98 | | | | 0.30 | | | | 0.11 | | | | 0.41 | | | | (0.30 | ) | | | — | | | | (0.30 | ) | | | 0.00 | |
Class Y | | | | | | | | | | | | | | | | | | | | | | | | | | | | | | | | |
9/30/2010 | | | 4.49 | | | | 0.33 | | | | 0.41 | | | | 0.74 | | | | (0.33 | ) | | | — | | | | (0.33 | ) | | | — | |
9/30/2009 | | | 4.24 | | | | 0.34 | | | | 0.25 | | | | 0.59 | | | | (0.34 | ) | | | — | | | | (0.34 | ) | | | 0.00 | (g) |
9/30/2008(h) | | | 4.87 | | | | 0.22 | | | | (0.65 | ) | | | (0.43 | ) | | | (0.21 | ) | | | — | | | | (0.21 | ) | | | 0.01 | |
INTERNATIONAL BOND FUND | | | | | | | | | | | | | | | | | | | | | | | | | | | | | | | | |
Class A | | | | | | | | | | | | | | | | | | | | | | | | | | | | | | | | |
9/30/2010 | | $ | 10.84 | | | $ | 0.22 | | | $ | 0.48 | | | $ | 0.70 | | | $ | (0.29 | ) | | $ | (0.08 | ) | | $ | (0.37 | ) | | $ | — | |
9/30/2009 | | | 9.19 | | | | 0.32 | | | | 1.53 | | | | 1.85 | | | | (0.20 | ) | | | — | | | | (0.20 | ) | | | — | |
9/30/2008(i) | | | 10.00 | | | | 0.17 | | | | (0.79 | ) | | | (0.62 | ) | | | (0.19 | ) | | | — | | | | (0.19 | ) | | | 0.00 | (j) |
Class C | | | | | | | | | | | | | | | | | | | | | | | | | | | | | | | | |
9/30/2010 | | | 10.82 | | | | 0.15 | | | | 0.46 | | | | 0.61 | | | | (0.24 | ) | | | (0.08 | ) | | | (0.32 | ) | | | — | |
9/30/2009 | | | 9.18 | | | | 0.24 | | | | 1.53 | | | | 1.77 | | | | (0.13 | ) | | | — | | | | (0.13 | ) | | | — | |
9/30/2008(i) | | | 10.00 | | | | 0.13 | | | | (0.81 | ) | | | (0.68 | ) | | | (0.15 | ) | | | — | | | | (0.15 | ) | | | 0.01 | (j) |
Class Y | | | | | | | | | | | | | | | | | | | | | | | | | | | | | | | | |
9/30/2010 | | | 10.82 | | | | 0.25 | | | | 0.47 | | | | 0.72 | | | | (0.30 | ) | | | (0.08 | ) | | | (0.38 | ) | | | — | |
9/30/2009 | | | 9.18 | | | | 0.33 | | | | 1.53 | | | | 1.86 | | | | (0.22 | ) | | | — | | | | (0.22 | ) | | | — | |
9/30/2008(i) | | | 10.00 | | | | 0.18 | | | | (0.81 | ) | | | (0.63 | ) | | | (0.20 | ) | | | — | | | | (0.20 | ) | | | 0.01 | (j) |
| (a) | Per share net investment income has been calculated using the average shares outstanding during the period. |
| (b) | Amount rounds to less than $0.01 per share, if applicable. |
| (c) | Had certain expenses not been waived/reimbursed during the period, if applicable, total returns would have been lower. |
| (d) | A sales charge for Class A shares and a contingent deferred sales charge for Class B and Class C shares are not reflected in total return calculations. Periods less than one year, if applicable, are not annualized. |
| (e) | The investment adviser and/or administrator agreed to waive its fees and/or reimburse a portion of the Fund’s expenses during the period. Without this waiver/reimbursement, if applicable, expenses would have been higher. |
See accompanying notes to financial statements.
59 |
| | | | | | | | | | | | | | | | | | | | | | | | | | |
| | | | | | | | | |
Ratios to Average Net Assets: | | | | |
| | | | | | |
Net asset
value, end
of the period | | | Total
return
(%) (c)(d) | | |
Net assets,
end of
the period
(000’s) | | | Net
expenses
(%) (e)(f) | | | Gross
expenses
(%) (f) | | | Net investment
income
(%) (f) | | | Portfolio
turnover
rate (%) | |
| | | | | | | | | | | | | | | | | | | | | | | | | | |
| | | | | | | | | | | | | | | | | | | | | | | | | | |
| | | | | | | | | | | | | | | | | | | | | | | | | | |
| $ | 4.91 | | | | 17.05 | | | $ | 68,011 | | | | 1.15 | | | | 1.20 | | | | 6.72 | | | | 56 | |
| | 4.49 | | | | 15.97 | | | | 59,944 | | | | 1.15 | | | | 1.28 | | | | 8.82 | | | | 30 | |
| | 4.24 | | | | (10.98 | ) | | | 38,577 | | | | 1.15 | | | | 1.40 | | | | 7.01 | | | | 27 | |
| | 5.12 | | | | 8.10 | | | | 32,603 | | | | 1.18 | | | | 1.43 | | | | 6.40 | | | | 41 | |
| | 5.09 | | | | 9.39 | | | | 29,069 | | | | 1.31 | | | | 1.48 | | | | 6.70 | | | | 41 | |
| | | | | | | | | | | | | | | | | | | | | | | | | | |
| | 4.92 | | | | 16.13 | | | | 1,209 | | | | 1.90 | | | | 1.94 | | | | 6.00 | | | | 56 | |
| | 4.50 | | | | 15.06 | | | | 1,569 | | | | 1.90 | | | | 2.06 | | | | 8.32 | | | | 30 | |
| | 4.25 | | | | (11.64 | ) | | | 2,267 | | | | 1.90 | | | | 2.15 | | | | 6.15 | | | | 27 | |
| | 5.13 | | | | 7.21 | | | | 4,201 | | | | 1.94 | | | | 2.18 | | | | 5.63 | | | | 41 | |
| | 5.10 | | | | 8.79 | | | | 7,283 | | | | 2.08 | | | | 2.25 | | | | 6.00 | | | | 41 | |
| | | | | | | | | | | | | | | | | | | | | | | | | | |
| | 4.92 | | | | 16.15 | | | | 19,312 | | | | 1.90 | | | | 1.95 | | | | 5.97 | | | | 56 | |
| | 4.50 | | | | 15.37 | | | | 17,827 | | | | 1.90 | | | | 2.03 | | | | 8.09 | | | | 30 | |
| | 4.24 | | | | (11.62 | ) | | | 9,945 | | | | 1.90 | | | | 2.15 | | | | 6.32 | | | | 27 | |
| | 5.12 | | | | 7.22 | | | | 5,275 | | | | 1.93 | | | | 2.17 | | | | 5.63 | | | | 41 | |
| | 5.09 | | | | 8.58 | | | | 3,457 | | | | 2.07 | | | | 2.23 | | | | 5.96 | | | | 41 | |
| | | | | | | | | | | | | | | | | | | | | | | | | | |
| | 4.90 | | | | 17.11 | | | | 69,887 | | | | 0.90 | | | | 0.93 | | | | 7.02 | | | | 56 | |
| | 4.49 | | | | 16.29 | | | | 105,713 | | | | 0.90 | | | | 0.92 | | | | 8.32 | | | | 30 | |
| | 4.24 | | | | (9.10 | ) | | | 3,833 | | | | 0.90 | | | | 1.15 | | | | 8.03 | | | | 27 | |
| | | | | | | | | | | | | | | | | | | | | | | | | | |
| | | | | | | | | | | | | | | | | | | | | | | | | | |
| $ | 11.17 | | | | 6.66 | | | $ | 18,758 | | | | 1.10 | | | | 1.49 | | | | 2.14 | | | | 128 | |
| | 10.84 | | | | 20.41 | | | | 8,479 | | | | 1.10 | | | | 2.11 | | | | 3.29 | | | | 91 | |
| | 9.19 | | | | (6.37 | ) | | | 1,953 | | | | 1.10 | | | | 2.95 | | | | 2.66 | | | | 60 | |
| | | | | | | | | | | | | | | | | | | | | | | | | | |
| | 11.11 | | | | 5.86 | | | | 6,145 | | | | 1.85 | | | | 2.24 | | | | 1.40 | | | | 128 | |
| | 10.82 | | | | 19.58 | | | | 2,955 | | | | 1.85 | | | | 2.93 | | | | 2.56 | | | | 91 | |
| | 9.18 | | | | (6.95 | ) | | | 683 | | | | 1.85 | | | | 3.70 | | | | 1.92 | | | | 60 | |
| | | | | | | | | | | | | | | | | | | | | | | | | | |
| | 11.16 | | | | 6.92 | | | | 8,908 | | | | 0.85 | | | | 1.23 | | | | 2.41 | | | | 128 | |
| | 10.82 | | | | 20.73 | | | | 13,049 | | | | 0.85 | | | | 1.92 | | | | 3.53 | | | | 91 | |
| | 9.18 | | | | (6.39 | ) | | | 9,981 | | | | 0.85 | | | | 2.48 | | | | 2.74 | | | | 60 | |
| (f) | Computed on an annualized basis for periods less than one year, if applicable. |
| (g) | Effective June 1, 2009, redemption fees were eliminated. |
| (h) | From commencement of class operations on February 29, 2008 through September 30, 2008. |
| (i) | For the period February 1, 2008 (inception) through September 30, 2008. |
| (j) | Effective June 2, 2008, redemption fees were eliminated. |
| 60
Financial Highlights (continued)
For a share outstanding throughout each period.
| | | | | | | | | | | | | | | | | | | | | | | | | | | | |
| | | | | | Income (Loss) from Investment
Operations: | | | Less Distributions: | |
| | | | | | | |
| | | Net asset
value,
beginning
of
the period | | | Net
investment
income (a) | | | Net realized
and unrealized
gain (loss) | | | Total from
investment
operations | | | Dividends
from
net investment
income | | | Distributions
from net
realized
capital gains | | | Total
distributions | |
| | | | | | | | | | | | | | | | | | | | | | | | | | | | |
LIMITED TERM GOVERNMENT AND AGENCY FUND | | | | | | | | | | | | | | | | | | | | | | | | | |
Class A | | | | | | | | | | | | | | | | | | | | | | | | | | | | |
9/30/2010 | | $ | 11.60 | | | $ | 0.20 | | | $ | 0.49 | | | $ | 0.69 | | | $ | (0.27 | ) | | $ | — | | | $ | (0.27 | ) |
9/30/2009 | | | 10.98 | | | | 0.35 | | | | 0.63 | | | | 0.98 | | | | (0.36 | ) | | | — | | | | (0.36 | ) |
9/30/2008 | | | 11.00 | | | | 0.45 | | | | 0.02 | | | | 0.47 | | | | (0.49 | ) | | | — | | | | (0.49 | ) |
9/30/2007 | | | 11.00 | | | | 0.45 | | | | 0.03 | | | | 0.48 | | | | (0.48 | ) | | | — | | | | (0.48 | ) |
9/30/2006 | | | 11.09 | | | | 0.39 | | | | (0.05 | ) | | | 0.34 | | | | (0.43 | ) | | | — | | | | (0.43 | ) |
Class B | | | | | | | | | | | | | | | | | | | | | | | | | | | | |
9/30/2010 | | | 11.59 | | | | 0.12 | | | | 0.47 | | | | 0.59 | | | | (0.18 | ) | | | — | | | | (0.18 | ) |
9/30/2009 | | | 10.97 | | | | 0.26 | | | | 0.63 | | | | 0.89 | | | | (0.27 | ) | | | — | | | | (0.27 | ) |
9/30/2008 | | | 10.99 | | | | 0.36 | | | | 0.02 | | | | 0.38 | | | | (0.40 | ) | | | — | | | | (0.40 | ) |
9/30/2007 | | | 10.98 | | | | 0.37 | | | | 0.03 | | | | 0.40 | | | | (0.39 | ) | | | — | | | | (0.39 | ) |
9/30/2006 | | | 11.07 | | | | 0.31 | | | | (0.05 | ) | | | 0.26 | | | | (0.35 | ) | | | — | | | | (0.35 | ) |
Class C | | | | | | | | | | | | | | | | | | | | | | | | | | | | |
9/30/2010 | | | 11.61 | | | | 0.12 | | | | 0.48 | | | | 0.60 | | | | (0.18 | ) | | | — | | | | (0.18 | ) |
9/30/2009 | | | 10.99 | | | | 0.26 | | | | 0.63 | | | | 0.89 | | | | (0.27 | ) | | | — | | | | (0.27 | ) |
9/30/2008 | | | 11.00 | | | | 0.36 | | | | 0.03 | | | | 0.39 | | | | (0.40 | ) | | | — | | | | (0.40 | ) |
9/30/2007 | | | 10.99 | | | | 0.37 | | | | 0.03 | | | | 0.40 | | | | (0.39 | ) | | | — | | | | (0.39 | ) |
9/30/2006 | | | 11.08 | | | | 0.31 | | | | (0.05 | ) | | | 0.26 | | | | (0.35 | ) | | | — | | | | (0.35 | ) |
Class Y | | | | | | | | | | | | | | | | | | | | | | | | | | | | |
9/30/2010 | | | 11.64 | | | | 0.23 | | | | 0.48 | | | | 0.71 | | | | (0.30 | ) | | | — | | | | (0.30 | ) |
9/30/2009 | | | 11.01 | | | | 0.39 | | | | 0.63 | | | | 1.02 | | | | (0.39 | ) | | | — | | | | (0.39 | ) |
9/30/2008 | | | 11.03 | | | | 0.47 | | | | 0.02 | | | | 0.49 | | | | (0.51 | ) | | | — | | | | (0.51 | ) |
9/30/2007 | | | 11.03 | | | | 0.49 | | | | 0.03 | | | | 0.52 | | | | (0.52 | ) | | | — | | | | (0.52 | ) |
9/30/2006 | | | 11.13 | | | | 0.43 | | | | (0.06 | ) | | | 0.37 | | | | (0.47 | ) | | | — | | | | (0.47 | ) |
| (a) | Per share net investment income has been calculated using the average shares outstanding during the period. |
| (b) | A sales charge for Class A shares and a contingent deferred sales charge for Class B and Class C shares are not reflected in total return calculations. Periods less than one year, if applicable, are not annualized. |
| (c) | Had certain expenses not been waived/reimbursed during the period, if applicable, total returns would have been lower. |
See accompanying notes to financial statements.
61 |
| | | | | | | | | | | | | | | | | | | | | | | | | | |
| | | | | | | | | |
Ratios to Average Net Assets: | | | | |
| | | | | | |
Net asset
value, end
of the period | | | Total
return
(%) (b)(c) | | |
Net assets,
end of
the period
(000’s) | | | Net
expenses
(%) (d)(e) | | | Gross
expenses
(%) (d) | | | Net investment
income
(%) (d) | | | Portfolio
turnover
rate (%) | |
| | | | | | | | | | | | | | | | | | | | | | | | | | |
| | | | | | | | | | | | | | | | | | | | | | | | | | |
| | | | | | | | | | | | | | | | | | | | | | | | | | |
| $ | 12.02 | | | | 6.03 | | | $ | 164,265 | | | | 0.89 | | | | 0.97 | | | | 1.73 | | | | 89 | |
| | 11.60 | | | | 9.05 | | | | 118,619 | | | | 0.90 | | | | 0.99 | | | | 3.10 | | | | 77 | |
| | 10.98 | | | | 4.29 | | | | 105,047 | | | | 0.92 | | | | 1.07 | | | | 4.04 | | | | 52 | |
| | 11.00 | | | | 4.46 | | | | 108,536 | | | | 0.99 | | | | 1.10 | | | | 4.13 | | | | 45 | |
| | 11.00 | | | | 3.20 | | | | 114,180 | | | | 1.04 | | | | 1.09 | | | | 3.57 | | | | 50 | |
| | | | | | | | | | | | | | | | | | | | | | | | | | |
| | 12.00 | | | | 5.16 | | | | 4,049 | | | | 1.64 | | | | 1.72 | | | | 1.00 | | | | 89 | |
| | 11.59 | | | | 8.24 | | | | 4,442 | | | | 1.65 | | | | 1.74 | | | | 2.32 | | | | 77 | |
| | 10.97 | | | | 3.52 | | | | 4,532 | | | | 1.67 | | | | 1.82 | | | | 3.29 | | | | 52 | |
| | 10.99 | | | | 3.72 | | | | 6,787 | | | | 1.74 | | | | 1.85 | | | | 3.37 | | | | 45 | |
| | 10.98 | | | | 2.36 | | | | 9,952 | | | | 1.79 | | | | 1.84 | | | | 2.79 | | | | 50 | |
| | | | | | | | | | | | | | | | | | | | | | | | | | |
| | 12.03 | | | | 5.24 | | | | 75,984 | | | | 1.64 | | | | 1.72 | | | | 0.98 | | | | 89 | |
| | 11.61 | | | | 8.24 | | | | 50,973 | | | | 1.65 | | | | 1.74 | | | | 2.32 | | | | 77 | |
| | 10.99 | | | | 3.62 | | | | 22,711 | | | | 1.66 | | | | 1.83 | | | | 3.29 | | | | 52 | |
| | 11.00 | | | | 3.62 | | | | 5,261 | | | | 1.74 | | | | 1.85 | | | | 3.38 | | | | 45 | |
| | 10.99 | | | | 2.46 | | | | 4,230 | | | | 1.79 | | | | 1.84 | | | | 2.81 | | | | 50 | |
| | | | | | | | | | | | | | | | | | | | | | | | | | |
| | 12.05 | | | | 6.20 | | | | 95,847 | | | | 0.63 | | | | 0.71 | | | | 1.94 | | | | 89 | |
| | 11.64 | | | | 9.40 | | | | 28,004 | | | | 0.65 | | | | 0.72 | | | | 3.42 | | | | 77 | |
| | 11.01 | | | | 4.55 | | | | 6,577 | | | | 0.67 | | | | 0.72 | | | | 4.28 | | | | 52 | |
| | 11.03 | | | | 4.79 | | | | 4,201 | | | | 0.71 | | | | 0.75 | | | | 4.43 | | | | 45 | |
| | 11.03 | | | | 3.43 | | | | 2,461 | | | | 0.74 | | | | 0.74 | | | | 3.89 | | | | 50 | |
| (d) | Computed on an annualized basis for periods less than one year, if applicable. |
| (e) | The investment adviser and/or administrator agreed to waive its fees and/or reimburse a portion of the Fund’s expenses during the period. Without this waiver/reimbursement, if applicable, expenses would have been higher. |
| 62
Financial Highlights (continued)
For a share outstanding throughout each period.
| | | | | | | | | | | | | | | | | | | | | | | | | | | | | | | | |
| | | | | | Income (Loss) from Investment
Operations: | | | Less Distributions: | | | | |
| | | | | | | | |
| | | Net asset
value,
beginning
of
the period | | | Net
investment
income (a) | | | Net realized
and unrealized
gain (loss) | | | Total from
investment
operations | | | Dividends
from
net investment
income | | | Distributions
from net
realized
capital gains | | | Total
distributions | | | Redemption
fees (b)(c) | |
| | | | | | | | | | | | | | | | | | | | | | | | | | | | | | | | |
STRATEGIC INCOME FUND | | | | | | | | | | | | | | | | | | | | | | | | | | | | | | | | |
Class A | | | | | | | | | | | | | | | | | | | | | | | | | | | | | | | | |
9/30/2010 | | $ | 13.39 | | | $ | 0.80 | | | $ | 1.31 | | | $ | 2.11 | | | $ | (0.81 | ) | | $ | — | | | $ | (0.81 | ) | | $ | — | |
9/30/2009 | | | 12.10 | | | | 0.87 | | | | 1.36 | | | | 2.23 | | | | (0.86 | ) | | | (0.08 | ) | | | (0.94 | ) | | | — | |
9/30/2008 | | | 15.18 | | | | 0.96 | | | | (3.02 | ) | | | (2.06 | ) | | | (1.01 | ) | | | (0.01 | ) | | | (1.02 | ) | | | 0.00 | |
9/30/2007 | | | 14.60 | | | | 0.80 | | | | 0.60 | | | | 1.40 | | | | (0.82 | ) | | | — | | | | (0.82 | ) | | | 0.00 | |
9/30/2006 | | | 14.17 | | | | 0.71 | | | | 0.53 | | | | 1.24 | | | | (0.81 | ) | | | — | | | | (0.81 | ) | | | 0.00 | |
Class B | | | | | | | | | | | | | | | | | | | | | | | | | | | | | | | | |
9/30/2010 | | | 13.46 | | | | 0.69 | | | | 1.33 | | | | 2.02 | | | | (0.70 | ) | | | — | | | | (0.70 | ) | | | — | |
9/30/2009 | | | 12.16 | | | | 0.79 | | | | 1.36 | | | | 2.15 | | | | (0.77 | ) | | | (0.08 | ) | | | (0.85 | ) | | | — | |
9/30/2008 | | | 15.25 | | | | 0.85 | | | | (3.04 | ) | | | (2.19 | ) | | | (0.89 | ) | | | (0.01 | ) | | | (0.90 | ) | | | 0.00 | |
9/30/2007 | | | 14.66 | | | | 0.69 | | | | 0.60 | | | | 1.29 | | | | (0.70 | ) | | | — | | | | (0.70 | ) | | | 0.00 | |
9/30/2006 | | | 14.22 | | | | 0.61 | | | | 0.52 | | | | 1.13 | | | | (0.69 | ) | | | — | | | | (0.69 | ) | | | 0.00 | |
Class C | | | | | | | | | | | | | | | | | | | | | | | | | | | | | | | | |
9/30/2010 | | | 13.45 | | | | 0.69 | | | | 1.33 | | | | 2.02 | | | | (0.70 | ) | | | — | | | | (0.70 | ) | | | — | |
9/30/2009 | | | 12.15 | | | | 0.79 | | | | 1.37 | | | | 2.16 | | | | (0.78 | ) | | | (0.08 | ) | | | (0.86 | ) | | | — | |
9/30/2008 | | | 15.24 | | | | 0.85 | | | | (3.03 | ) | | | (2.18 | ) | | | (0.90 | ) | | | (0.01 | ) | | | (0.91 | ) | | | 0.00 | |
9/30/2007 | | | 14.65 | | | | 0.69 | | | | 0.60 | | | | 1.29 | | | | (0.70 | ) | | | — | | | | (0.70 | ) | | | 0.00 | |
9/30/2006 | | | 14.22 | | | | 0.61 | | | | 0.51 | | | | 1.12 | | | | (0.69 | ) | | | — | | | | (0.69 | ) | | | 0.00 | |
Class Y | | | | | | | | | | | | | | | | | | | | | | | | | | | | | | | | |
9/30/2010 | | | 13.38 | | | | 0.83 | | | | 1.31 | | | | 2.14 | | | | (0.84 | ) | | | — | | | | (0.84 | ) | | | — | |
9/30/2009 | | | 12.09 | | | | 0.90 | | | | 1.36 | | | | 2.26 | | | | (0.89 | ) | | | (0.08 | ) | | | (0.97 | ) | | | — | |
9/30/2008 | | | 15.17 | | | | 1.00 | | | | (3.03 | ) | | | (2.03 | ) | | | (1.04 | ) | | | (0.01 | ) | | | (1.05 | ) | | | 0.00 | |
9/30/2007 | | | 14.59 | | | | 0.85 | | | | 0.59 | | | | 1.44 | | | | (0.86 | ) | | | — | | | | (0.86 | ) | | | 0.00 | |
9/30/2006 | | | 14.17 | | | | 0.76 | | | | 0.51 | | | | 1.27 | | | | (0.85 | ) | | | — | | | | (0.85 | ) | | | 0.00 | |
Admin Class | | | | | | | | | | | | | | | | | | | | | | | | | | | | | | | | |
9/30/2010* | | | 13.87 | | | | 0.52 | | | | 0.79 | | | | 1.31 | | | | (0.52 | ) | | | — | | | | (0.52 | ) | | | — | |
| * | From commencement of Class operations on February 1, 2010 through September 30, 2010. |
| (a) | Per share net investment income has been calculated using the average shares outstanding during the period. |
| (b) | Amount rounds to less than $0.01 per share, if applicable. |
| (c) | Effective June 2, 2008, redemption fees were eliminated. |
See accompanying notes to financial statements.
63 |
| | | | | | | | | | | | | | | | | | | | | | | | | | |
| | | | | | | | | |
Ratios to Average Net Assets: | | | | |
| | | | | | |
Net asset
value, end
of the period | | | Total
return
(%) (d)(e) | | |
Net assets,
end of
the period
(000’s) | | | Net
expenses
(%) (f)(g) | | | Gross
expenses
(%) (f) | | | Net investment
income
(%) (f) | | | Portfolio
turnover
rate (%) | |
| | | | | | | | | | | | | | | | | | | | | | | | | | |
| | | | | | | | | | | | | | | | | | | | | | | | | | |
| | | | | | | | | | | | | | | | | | | | | | | | | | |
| $ | 14.69 | | | | 16.20 | | | $ | 5,758,070 | | | | 0.96 | | | | 0.96 | | | | 5.67 | | | | 27 | |
| | 13.39 | | | | 20.56 | | | | 5,544,029 | | | | 0.99 | | | | 0.99 | | | | 7.74 | | | | 39 | |
| | 12.10 | | | | (14.54 | ) | | | 5,551,066 | | | | 0.97 | | | | 0.98 | | | | 6.59 | | | | 24 | |
| | 15.18 | | | | 9.90 | | | | 5,749,315 | | | | 1.00 | | | | 1.00 | | | | 5.39 | | | | 22 | |
| | 14.60 | | | | 9.04 | | | | 2,782,887 | | | | 1.05 | | | | 1.05 | | | | 5.01 | | | | 21 | |
| | | | | | | | | | | | | | | | | | | | | | | | | | |
| | 14.78 | | | | 15.39 | | | | 137,268 | | | | 1.71 | | | | 1.71 | | | | 4.92 | | | | 27 | |
| | 13.46 | | | | 19.62 | | | | 148,887 | | | | 1.74 | | | | 1.74 | | | | 7.02 | | | | 39 | |
| | 12.16 | | | | (15.19 | ) | | | 161,751 | | | | 1.72 | | | | 1.73 | | | | 5.78 | | | | 24 | |
| | 15.25 | | | | 9.08 | | | | 233,418 | | | | 1.76 | | | | 1.76 | | | | 4.61 | | | | 22 | |
| | 14.66 | | | | 8.22 | | | | 179,927 | | | | 1.79 | | | | 1.79 | | | | 4.26 | | | | 21 | |
| | | | | | | | | | | | | | | | | | | | | | | | | | |
| | 14.77 | | | | 15.40 | | | | 5,146,164 | | | | 1.71 | | | | 1.71 | | | | 4.92 | | | | 27 | |
| | 13.45 | | | | 19.66 | | | | 4,894,546 | | | | 1.74 | | | | 1.74 | | | | 6.95 | | | | 39 | |
| | 12.15 | | | | (15.19 | ) | | | 3,984,204 | | | | 1.72 | | | | 1.73 | | | | 5.85 | | | | 24 | |
| | 15.24 | | | | 9.08 | | | | 3,843,823 | | | | 1.75 | | | | 1.75 | | | | 4.63 | | | | 22 | |
| | 14.65 | | | | 8.14 | | | | 1,812,278 | | | | 1.79 | | | | 1.79 | | | | 4.24 | | | | 21 | |
| | | | | | | | | | | | | | | | | | | | | | | | | | |
| | 14.68 | | | | 16.50 | | | | 2,521,337 | | | | 0.71 | | | | 0.71 | | | | 5.92 | | | | 27 | |
| | 13.38 | | | | 20.91 | | | | 2,057,888 | | | | 0.72 | | | | 0.72 | | | | 7.76 | | | | 39 | |
| | 12.09 | | | | (14.34 | ) | | | 783,058 | | | | 0.72 | | | | 0.72 | | | | 6.88 | | | | 24 | |
| | 15.17 | | | | 10.22 | | | | 638,868 | | | | 0.74 | | | | 0.74 | | | | 5.67 | | | | 22 | |
| | 14.59 | | | | 9.28 | | | | 271,065 | | | | 0.78 | | | | 0.78 | | | | 5.30 | | | | 21 | |
| | | | | | | | | | | | | | | | | | | | | | | | | | |
| | 14.66 | | | | 9.61 | | | | 4,379 | | | | 1.24 | | | | 1.24 | | | | 5.52 | | | | 27 | |
| (d) | A sales charge for Class A shares and a contingent deferred sales charge for Class B and Class C shares are not reflected in total return calculations. Periods less than one year, if applicable, are not annualized. |
| (e) | Had certain expenses not been waived/reimbursed during the period, if applicable, total returns would have been lower. |
| (f) | Computed on an annualized basis for periods less than one year, if applicable. |
| (g) | The investment adviser and/or administrator agreed to waive its fees and/or reimburse a portion of the Fund’s expenses during the period. Without this waiver/reimbursement, if applicable, expenses would have been higher. |
| 64
Notes to Financial Statements
September 30, 2010
1. Organization. Natixis Funds Trust I and Loomis Sayles Funds II (the “Trusts” and each a “Trust”) are each organized as a Massachusetts business trust. Each Trust is registered under the Investment Company Act of 1940, as amended (“1940 Act”), as an open-end management investment company. Each Declaration of Trust permits the Board of Trustees to authorize the issuance of an unlimited number of shares of the Trust in multiple series. The financial statements for certain funds of the Trusts are presented in separate reports. The following funds (individually, a “Fund” and collectively, the “Funds”) are included in this report:
Natixis Funds Trust I:
Loomis Sayles Core Plus Bond Fund (the “Core Plus Bond Fund”)
Loomis Sayles Funds II:
Loomis Sayles High Income Fund (the “High Income Fund”)
Loomis Sayles International Bond Fund (the “International Bond Fund”)
Loomis Sayles Limited Term Government and Agency Fund (the “Limited Term Government and Agency Fund”)
Loomis Sayles Strategic Income Fund (the “Strategic Income Fund”)
The Funds each offer Class A, Class C and Class Y shares. Effective February 1, 2010, Strategic Income Fund began offering Admin Class shares. Effective October 12, 2007, Class B shares are no longer offered. Existing Class B shareholders may continue to reinvest dividends into Class B shares and exchange their Class B shares for Class B shares of other Natixis Funds subject to existing exchange privileges as described in the Prospectus.
Class A shares of all Funds except Limited Term Government and Agency Fund are sold with a maximum front-end sales charge of 4.50%. Class A shares of Limited Term Government and Agency Fund are sold with a maximum front-end sales charge of 3.00%. Class B shares do not pay a front-end sales charge; however, they are charged higher Rule 12b-1 fees, and are subject to a contingent deferred sales charge (“CDSC”) if such shares are redeemed within six years of purchase. After eight years of ownership, Class B shares convert to Class A shares. Class C shares do not pay a front-end sales charge, do not convert to any other class of shares, pay higher Rule 12b-1 fees than Class A shares and may be subject to a CDSC of 1.00% if those shares are redeemed within one year of acquisition, except for reinvested distributions. Class Y shares do not pay a front-end sales charge, a CDSC or Rule 12b-1 fees. Class Y shares are generally intended for institutional investors with a minimum initial investment of $100,000, though some categories of investors are exempted from the minimum investment amount as outlined in the Fund’s prospectus. Admin Class shares do not pay a front-end sales charge or a CDSC, but do pay a Rule 12b-1 fee. Admin Class shares are offered exclusively through intermediaries.
Most expenses of the Trusts can be directly attributed to a Fund. Expenses which cannot be directly attributed to a Fund are generally apportioned based on the relative net assets of each of the Funds in the Trusts. Expenses of a Fund are borne pro rata by the holders of each class of shares, except that each class bears expenses unique to that class (including the Rule 12b-1 service and distribution fees). In addition, each class votes as a class only with respect to its own Rule 12b-1 Plan. Shares of each class would receive their pro rata share of the net assets of a Fund if the Fund were liquidated. The Trustees approve separate distributions from net investment income on each class of shares.
2. Significant Accounting Policies. The following is a summary of significant accounting policies consistently followed by each Fund in the preparation of its financial statements. The Funds’ financial statements are prepared in accordance with accounting principles generally accepted in the United States of America which require the use of management estimates that affect the reported amounts and disclosures in the financial statements. Actual results could differ from those estimates. Management has evaluated the events and transactions subsequent to year-end through the date the financial statements were issued and has determined that there were no material events that would require disclosure in the Funds’ financial statements.
a. Valuation. Debt securities (other than short-term obligations purchased with an original or remaining maturity of sixty days or less) are generally valued on the basis of evaluated bids furnished to the Funds by a pricing service recommended by the investment adviser and approved by the Board of Trustees, which service determines valuations for normal, institutional-size trading units of such securities using market information, transactions for comparable securities and various relationships between securities which are generally recognized by institutional traders. Equity securities, including shares of closed-end investment companies and exchange-traded funds, for which market quotations are readily available are valued at market value, as reported by pricing services recommended by the investment adviser and approved by the Board of Trustees. Such pricing services generally use the security’s last sale price on the exchange or market where the security is primarily traded or, if there is no reported sale during the day, the closing bid price. Securities traded on the NASDAQ Global Select Market, NASDAQ Global Market and NASDAQ Capital Market are valued at the NASDAQ Official Closing Price (“NOCP”), or if lacking a NOCP, at the most recent bid quotation on the applicable NASDAQ Market.
65 |
Notes to Financial Statements (continued)
September 30, 2010
Broker-dealer bid quotations may also be used to value debt and equity securities where a pricing service does not price a security or where a pricing service does not provide a reliable price for the security. In instances where broker-dealer bid quotations are not available, certain securities held by the Funds may be valued on the basis of a price provided by a principal market maker. Forward foreign currency contracts are valued utilizing interpolated prices determined from information provided by an independent pricing service. Short-term obligations purchased with an original or remaining maturity of sixty days or less are valued at amortized cost, which approximates market value. Securities for which market quotations are not readily available are valued at fair value as determined in good faith by the Funds’ investment adviser using consistently applied procedures under the general supervision of the Board of Trustees. Investments in other open-end investment companies are valued at their net asset value each day.
Certain Funds may hold securities traded in foreign markets. Foreign securities are valued at the market price in the foreign market. However, if events occurring after the close of the foreign market (but before the close of regular trading on the New York Stock Exchange) are believed to materially affect the value of those securities, such securities are fair valued pursuant to procedures approved by the Board of Trustees. When fair valuing securities, the Funds may, among other things, use modeling tools or other processes that may take into account factors such as securities market activity and/or significant events that occur after the close of the foreign market and before the Funds calculate their net asset values.
b. Investment Transactions and Related Investment Income. Investment transactions are accounted for on a trade date plus one basis for daily net asset value calculation. However, for financial reporting purposes, investment transactions are reported on trade date. Dividend income is recorded on ex-dividend date, or in the case of certain foreign securities, as soon as a Fund is notified, and interest income is recorded on an accrual basis. Interest income is increased by the accretion of discount and decreased by the amortization of premium. Periodic principal adjustments for inflation-protected securities are recorded to interest income. Negative principal adjustments (in the event of deflation) are recorded as reductions of interest income to the extent of interest income earned, not to exceed the amount of positive principal adjustments on a cumulative basis. Distributions received from investments in securities that represent a return of capital or capital gain are recorded as a reduction of cost of investments or as a realized gain, respectively. The calendar year-end amounts of ordinary income, capital gains, and return of capital included in distributions received from the Funds’ investments in real estate investment trusts (“REITs”) are reported to the Funds after the end of the fiscal year; accordingly, the Funds estimate these amounts for accounting purposes until the characterization of REIT distributions is reported to the Funds after the end of the fiscal year. Estimates are based on the most recent REIT distribution information available. Investment income is recorded net of foreign taxes withheld when applicable. In determining net gain or loss on securities sold, the cost of securities has been determined on an identified cost basis. Investment income, non-class specific expenses and realized and unrealized gains and losses are allocated on a pro rata basis to each class based on the relative net assets of each class to the total net assets of the Fund.
c. Foreign Currency Translation. The books and records of the Funds are maintained in U.S. dollars. The value of securities, currencies and other assets and liabilities denominated in currencies other than U.S. dollars are translated into U.S. dollars based upon foreign exchange rates prevailing at the end of the period. Purchases and sales of investment securities, income and expenses are translated on the respective dates of such transactions.
Since the values of investment securities are presented at the foreign exchange rates prevailing at the end of the period, it is not practical to isolate that portion of the results of operations arising from changes in exchange rates from fluctuations which arise due to changes in market prices of investment securities. Such changes are included with the net realized and unrealized gain or loss on investments.
Net realized foreign exchange gains or losses arise from sales of foreign currency, currency gains or losses realized between the trade and settlement dates on securities transactions, and the difference between the amounts of dividends, interest and foreign withholding taxes recorded on the Funds’ books and the U.S. dollar equivalent of the amounts actually received or paid. Net unrealized foreign exchange gains and losses arise from changes in the value of assets and liabilities, other than investment securities, at the end of the fiscal period, resulting from changes in exchange rates.
Each Fund may use foreign currency exchange contracts to facilitate transactions in foreign-denominated investments. Losses may arise from changes in the value of the foreign currency or if the counterparties do not perform under the contracts’ terms.
d. Forward Foreign Currency Contracts. Each Fund may enter into forward foreign currency contracts. Contracts to buy generally are used to acquire exposure to foreign currencies, while contracts to sell generally are used to hedge a Fund’s investments against currency fluctuation. Also, a contract to buy or sell can offset a previous contract. These contracts involve market risk in excess of the unrealized gain or loss reflected in the Funds’ Statements of Assets and Liabilities. The U.S. dollar value of the currencies a Fund has committed to buy or sell represents the aggregate exposure to each currency the Fund has acquired or hedged through currency
| 66
Notes to Financial Statements (continued)
September 30, 2010
contracts outstanding at period end. Gains or losses are recorded for financial statement purposes as unrealized until settlement date. Risks may arise upon entering into these contracts from the potential inability of counterparties to meet the terms of their contracts and from unanticipated movements in the value of a foreign currency relative to the U.S. dollar. Certain contracts may require the movement of cash or securities to or from the counterparty as collateral for the Funds’ or counterparty’s net obligations under the contracts.
e. Swap Agreements. Each Fund may enter into credit default swaps. A credit default swap is an agreement between two parties (the “protection buyer” and “protection seller”) to exchange the credit risk of an issuer (“reference obligation”) for a specified time period. The reference obligation may be one or more debt securities or an index of such securities. The Funds may be either the protection buyer or the protection seller. The protection buyer is obligated to pay the protection seller a stream of payments (“fees”) over the term of the contract, provided that no credit event, such as a default or a downgrade in credit rating, occurs on the reference obligation. If a credit event occurs, the protection seller must pay the protection buyer the agreed upon notional value (“par value”) of the reference obligation in exchange for the reference obligation (or may pay the difference between the par value and market value of the reference obligation). The Funds may also make or receive upfront payments.
The notional amounts of credit default swaps are not recorded in the financial statements. Credit default swaps are marked-to-market daily. Fluctuations in the value of credit default swaps are recorded in the Statements of Operations as change in unrealized appreciation (depreciation) on swap agreements. Fees are accrued in accordance with the terms of the agreement and are recorded in the Statements of Operations as realized gain or loss when received or paid. Upfront fees received or paid by the Funds are amortized or accreted over the term of the agreement and recorded as realized gain or loss. Payments made or received by the Funds as a result of a credit event or termination of the agreement are recorded as realized gain or loss.
Credit default swaps are privately negotiated and traded between counterparties and, as such, are subject to the risk that a party to the agreement will not be able to meet its obligations. Counterparty risk is managed through the posting of collateral and, as a result, the risk of loss to a Fund from counterparty default should be limited to the extent a Fund is undercollateralized. In addition to collateral requirements, the Funds also require counterparties to meet minimum credit quality requirements. The Funds cover their net obligations under outstanding credit default swaps by segregating liquid assets in the form of collateral.
At September 30, 2010, there were no open credit default swaps.
f. Federal and Foreign Income Taxes. Each Trust treats each Fund as a separate entity for federal income tax purposes. Each Fund intends to meet the requirements of the Internal Revenue Code of 1986, as amended, applicable to regulated investment companies, and to distribute to its shareholders substantially all of its net investment income and any net realized capital gains at least annually. Management has performed an analysis of each Fund’s tax positions for the open tax years as of September 30, 2010 and has concluded that no provisions for income tax are required. The Funds’ federal tax returns for the prior three fiscal years, where applicable, remain subject to examination by the Internal Revenue Service. Management is not aware of any events that are reasonably possible to occur in the next twelve months that would result in the amounts of any unrecognized tax benefits significantly increasing or decreasing for the Funds. However, management’s conclusions regarding tax positions taken may be subject to review and adjustment at a later date based on factors including, but not limited to, new tax laws and accounting regulations and interpretations thereof.
A Fund may be subject to foreign taxes on income and gains on investments that are accrued based upon the Fund’s understanding of the tax rules and regulations that exist in the countries in which the Fund invests. Foreign governments may also impose taxes or other payments on investments with respect to foreign securities. Such taxes are accrued as applicable, and are reflected as foreign taxes payable on the Statements of Assets and Liabilities.
g. Dividends and Distributions to Shareholders. Dividends and distributions are recorded on ex-dividend date. The timing and characterization of certain income and capital gain distributions are determined annually in accordance with federal tax regulations, which may differ from accounting principles generally accepted in the United States of America. Permanent differences are primarily due to differing treatments for book and tax purposes for items such as foreign currency transactions, premium amortization, defaulted bond adjustments, paydown gains and losses, distribution redesignations, expired capital loss carryforwards and return of capital and capital gain distributions from REITs. Permanent book and tax basis differences relating to shareholder distributions will result in reclassifications to capital accounts. Temporary differences between book and tax distributable earnings are primarily due to deferred Trustees’ fees, wash sales, premium amortization accruals, forward contract mark to market, dividends payable, securities lending collateral gain/loss adjustment, REIT basis adjustments, contingent payment debt instruments and defaulted bond interest. Distributions from net investment income and short-term capital gains are considered to be distributed from ordinary income for tax purposes.
67 |
Notes to Financial Statements (continued)
September 30, 2010
The tax characterization of distributions is determined on an annual basis. The tax character of distributions paid to shareholders during the years ended September 30, 2010 and 2009 was as follows:
| | | | | | | | | | | | | | | | | | | | | | | | |
| | | 2010 Distributions Paid From: | | | 2009 Distributions Paid From: | |
Fund | | Ordinary Income | | | Long-Term Capital Gains | | | Total | | | Ordinary Income | | | Long-Term Capital Gains | | | Total | |
| | | | | | | | | | | | | | | | | | | | | | | | |
Core Plus Bond Fund | | $ | 15,673,765 | | | $ | — | | | $ | 15,673,765 | | | $ | 12,015,697 | | | $ | — | | | $ | 12,015,697 | |
High Income Fund | | | 10,907,478 | | | | — | | | | 10,907,478 | | | | 7,740,530 | | | | — | | | | 7,740,530 | |
International Bond Fund | | | 1,057,069 | | | | — | | | | 1,057,069 | | | | 334,030 | | | | — | | | | 334,030 | |
Limited Term Government and Agency Fund | | | 5,644,012 | | | | — | | | | 5,644,012 | | | | 5,789,887 | | | | — | | | | 5,789,887 | |
Strategic Income Fund | | | 716,030,690 | | | | — | | | | 716,030,690 | | | | 725,851,869 | | | | 52,952,003 | | | | 778,803,872 | |
Differences between these amounts and those reported in the Statements of Changes in Net Assets are primarily attributable to different book and tax treatment for short-term capital gains.
As of September 30, 2010, the components of distributable earnings on a tax basis were as follows:
| | | | | | | | | | | | | | | | | | | | |
| | | Core Plus
Bond Fund | | | High Income
Fund | | | International
Bond Fund | | | Limited Term
Government
and Agency
Fund | | | Strategic Income
Fund | |
| | | | | | | | | | | | | | | | | | | | |
Undistributed ordinary income | | $ | 470,834 | | | $ | 790,353 | | | $ | 91,685 | | | $ | 329,973 | | | $ | 13,103,747 | |
Undistributed long-term capital gains | | | — | | | | — | | | | 152,901 | | | | — | | | | — | |
| | | | | | | | | | | | | | | | | | | | |
Total undistributed earnings | | | 470,834 | | | | 790,353 | | | | 244,586 | | | | 329,973 | | | | 13,103,747 | |
| | | | | | | | | | | | | | | | | | | | |
Capital loss carryforward: | | | | | | | | | | | | | | | | | | | | |
Expires September 30, 2014 | | | (181,728 | ) | | | — | | | | — | | | | — | | | | — | |
Expires September 30, 2015 | | | — | | | | — | | | | — | | | | (715,432 | ) | | | — | |
Expires September 30, 2016 | | | — | | | | — | | | | — | | | | (100,316 | ) | | | — | |
Expires September 30, 2017 | | | — | | | | (33,112 | ) | | | — | | | | — | | | | (45,672,245 | ) |
Expires September 30, 2018 | | | — | | | | — | | | | — | | | | — | | | | (529,941,082 | ) |
| | | | | | | | | | | | | | | | | | | | |
Total capital loss carryforward | | | (181,728 | ) | | | (33,112 | ) | | | — | | | | (815,748 | ) | | | (575,613,327 | ) |
Deferred net capital losses (post-October 2009) | | | — | | | | — | | | | — | | | | — | | | | (126,545,807 | ) |
Unrealized appreciation (depreciation) | | | 25,650,778 | | | | 14,194,806 | | | | 2,218,644 | | | | 11,751,981 | | | | 939,966,602 | |
| | | | | | | | | | | | | | | | | | | | |
Total accumulated earnings (losses) | | $ | 25,939,884 | | | $ | 14,952,047 | | | $ | 2,463,230 | | | $ | 11,266,206 | | | $ | 250,911,215 | |
| | | | | | | | | | | | | | | | | | | | |
Capital loss carryforward utilized in the current year | | $ | 10,121,581 | | | $ | 11,956,905 | | | $ | — | | | $ | 4,384,047 | | | $ | — | |
| | | | | | | | | | | | | | | | | | | | |
Core Plus Bond Fund, High Income Fund, and Limited Term Government and Agency Fund had $9,272,152, $14,869,729 and $663,109, respectively, of capital loss carryforwards expire in the current year.
h. Repurchase Agreements. It is each Fund’s policy that the market value of the collateral for repurchase agreements be at least equal to 102% of the repurchase price, including interest. Certain repurchase agreements are tri-party arrangements whereby the collateral is held in a segregated account for the benefit of the Fund and on behalf of the counterparty. Repurchase agreements could involve certain risks in the event of default or insolvency of the counterparty including possible delays or restrictions upon a Fund’s ability to dispose of the underlying securities.
i. Securities Lending. The Funds have entered into an agreement with State Street Bank and Trust Company (“State Street Bank”), as agent of the Funds, to lend securities to certain designated borrowers. The loans are collateralized with cash or securities in an amount equal to at least 105% or 102% of the market value (including accrued interest) of the loaned international or domestic securities, respectively, when the loan is initiated. Thereafter, the value of the collateral must remain at least 102% of the market value (including accrued interest) of loaned securities for U.S. equities and U.S. corporate debt; at least 105% of the market value (including accrued interest) of loaned securities for non-U.S. equities; and at least 100% of the market value (including accrued interest) of loaned securities for U.S. Government securities, sovereign debt issued by non-U.S. Governments and non-U.S. corporate debt. In the event that the market value of the collateral falls below the required percentages described above, the borrower will deliver additional collateral on the next business day. As with other extensions of credit, the Funds may bear the risk of loss with respect to the
| 68
Notes to Financial Statements (continued)
September 30, 2010
investment of the collateral. The Funds invest cash collateral in short-term investments, a portion of the income from which is remitted to the borrowers and the remainder allocated between the Funds and State Street Bank as lending agent.
For the year ended September 30, 2010, none of the Funds loaned securities under this agreement. Excess collateral in the amount of $3,020,723 related to terminated loans with a bankrupt borrower is held by State Street Bank on behalf of Strategic Income Fund.
j. Delayed Delivery Commitments. The Funds may purchase securities, including those designated as TBAs in the Portfolio of Investments, for which delivery or payment will occur at a later date, beyond the normal settlement period. The price of the security and the date when the security will be delivered and paid for are fixed at the time the transaction is negotiated. The security and the obligation to pay for it are recorded by the Funds at the time the commitment is entered into. The actual security that will be delivered to fulfill a TBA trade is not designated at the time of the trade. The security is “to be announced” 48 hours prior to the established trade settlement date. The value of the security may vary with market fluctuations during the time before the Funds take delivery of the security. No interest accrues to the Funds until the transaction settles. When the Funds enter into such a transaction, collateral consisting of liquid securities or cash and cash equivalents is required to be segregated with the custodian and/or broker in an amount at least equal to the amount of the Funds’ commitment.
Purchases of delayed delivery securities may have a similar effect on the Funds’ net asset value as if the Funds had created a degree of leverage in its portfolio. Risks may arise upon entering into such transactions from the potential inability of counterparties to meet their obligations under the transactions. Additionally, losses may arise due to changes in the value of the underlying securities.
k. Indemnifications. Under the Trusts’ organizational documents, their officers and Trustees are indemnified against certain liabilities arising out of the performance of their duties to the Funds. Additionally, in the normal course of business, the Funds enter into contracts with service providers that contain general indemnification clauses. The Funds’ maximum exposure under these arrangements is unknown as this would involve future claims that may be made against the Funds that have not yet occurred. However, based on experience, the Funds expect the risk of loss to be remote.
3. Fair Value Measurements. In accordance with accounting standards related to fair value measurements and disclosures, the Funds have categorized the inputs utilized in determining the value of each Fund’s assets or liabilities. These inputs are summarized in the three broad levels listed below:
| | • | | Level 1 – quoted prices in active markets for identical assets or liabilities; |
| | • | | Level 2 – prices determined using other significant inputs that are observable either directly, or indirectly through corroboration with observable market data (which could include quoted prices for similar assets or liabilities, interest rates, credit risk, etc.); |
| | • | | Level 3 – prices determined using significant unobservable inputs when quoted prices or observable inputs are unavailable such as when there is little or no market activity for an asset or liability (unobservable inputs reflect each Fund’s own assumptions in determining the fair value of assets or liabilities and would be based on the best information available). |
The inputs or methodology used for valuing securities are not necessarily an indication of the risk associated with investing in those securities.
The following is a summary of the inputs used to value the Funds’ investments as of September 30, 2010, at value:
Core Plus Bond Fund
Asset Valuation Inputs
| | | | | | | | | | | | | | | | |
Description(a) | | Level 1 | | | Level 2 | | | Level 3 | | | Total | |
| | | | | | | | | | | | | | | | |
Bonds and Notes | | $ | — | | | $ | 380,652,087 | | | $ | — | | | $ | 380,652,087 | |
Bank Loans | | | — | | | | 2,711,637 | | | | — | | | | 2,711,637 | |
Preferred Stocks | | | — | | | | 478,883 | | | | — | | | | 478,883 | |
Short-Term Investments | | | — | | | | 14,625,493 | | | | — | | | | 14,625,493 | |
| | | | | | | | | | | | | | | | |
Total | | $ | — | | | $ | 398,468,100 | | | $ | — | | | $ | 398,468,100 | |
| | | | | | | | | | | | | | | | |
| (a) | Major categories of the Fund’s investments are included in the Portfolio of Investments. |
69 |
Notes to Financial Statements (continued)
September 30, 2010
High Income Fund
Asset Valuation Inputs
| | | | | | | | | | | | | | | | |
Description | | Level 1 | | | Level 2 | | | Level 3 | | | Total | |
| | | | | | | | | | | | | | | | |
Bonds and Notes(a) | | $ | — | | | $ | 139,177,536 | | | $ | — | | | $ | 139,177,536 | |
Bank Loans(a) | | | — | | | | 1,236,608 | | | | — | | | | 1,236,608 | |
Preferred Stocks | | | | | | | | | | | | | | | | |
Convertible Preferred Stocks | | | | | | | | | | | | | | | | |
Automotive | | | 21,559 | | | | — | | | | — | | | | 21,559 | |
Capital Markets | | | — | | | | 1,063,836 | | | | — | | | | 1,063,836 | |
Diversified Financial Services | | | — | | | | 138,084 | | | | — | | | | 138,084 | |
Electric Utilities | | | 316,061 | | | | — | | | | — | | | | 316,061 | |
Machinery | | | — | | | | 85,425 | | | | — | | | | 85,425 | |
Oil, Gas & Consumable Fuels | | | 363,375 | | | | — | | | | — | | | | 363,375 | |
Semiconductors & Semiconductor Equipment | | | — | | | | 647,190 | | | | — | | | | 647,190 | |
| | | | | | | | | | | | | | | | |
Total Convertible Preferred Stocks | | | 700,995 | | | | 1,934,535 | | | | — | | | | 2,635,530 | |
| | | | | | | | | | | | | | | | |
Non-Convertible Preferred Stocks(a) | | | — | | | | 246,643 | | | | — | | | | 246,643 | |
| | | | | | | | | | | | | | | | |
Total Preferred Stocks | | | 700,995 | | | | 2,181,178 | | | | — | | | | 2,882,173 | |
| | | | | | | | | | | | | | | | |
Common Stocks(a) | | | 1,067,474 | | | | — | | | | — | | | | 1,067,474 | |
Closed End Investment Companies | | | 34,535 | | | | — | | | | — | | | | 34,535 | |
Short-Term Investments | | | — | | | | 13,848,824 | | | | — | | | | 13,848,824 | |
| | | | | | | | | | | | | | | | |
Total | | $ | 1,803,004 | | | $ | 156,444,146 | | | $ | — | | | $ | 158,247,150 | |
| | | | | | | | | | | | | | | | |
| (a) | Major categories of the Fund’s investments are included in the Portfolio of Investments. |
International Bond Fund
Asset Valuation Inputs
| | | | | | | | | | | | | | | | |
Description(a) | | Level 1 | | | Level 2 | | | Level 3 | | | Total | |
| | | | | | | | | | | | | | | | |
Bonds and Notes | | $ | — | | | $ | 32,709,084 | | | $ | — | | | $ | 32,709,084 | |
Short-Term Investments | | | — | | | | 571,663 | | | | — | | | | 571,663 | |
| | | | | | | | | | | | | | | | |
Total Investments | | | — | | | | 33,280,747 | | | | — | | | | 33,280,747 | |
| | | | | | | | | | | | | | | | |
Forward Foreign Currency Contracts (unrealized appreciation) | | | — | | | | 141,570 | | | | — | | | | 141,570 | |
| | | | | | | | | | | | | | | | |
Total | | $ | — | | | $ | 33,422,317 | | | $ | — | | | $ | 33,422,317 | |
| | | | | | | | | | | | | | | | |
Liability Valuation Inputs
| | | | | | | | | | | | | | | | |
Description(a) | | Level 1 | | | Level 2 | | | Level 3 | | | Total | |
| | | | | | | | | | | | | | | | |
Forward Foreign Currency Contracts (unrealized depreciation) | | $ | — | | | $ | (6,979 | ) | | $ | — | | | $ | (6,979 | ) |
| | | | | | | | | | | | | | | | |
| (a) | Major categories of the Fund’s investments and forward foreign currency contracts are included in the Portfolio of Investments. |
Limited Term Government and Agency Fund
Asset Valuation Inputs
| | | | | | | | | | | | | | | | |
Description(a) | | Level 1 | | | Level 2 | | | Level 3 | | | Total | |
| | | | | | | | | | | | | | | | |
Bonds and Notes | | $ | — | | | $ | 338,242,055 | | | $ | — | | | $ | 338,242,055 | |
| | | | | | | | | | | | | | | | |
| (a) | Major categories of the Fund’s investments are included in the Portfolio of Investments. |
| 70
Notes to Financial Statements (continued)
September 30, 2010
Strategic Income Fund
Asset Valuation Inputs
| | | | | | | | | | | | | | | | |
Description | | Level 1 | | | Level 2 | | | Level 3 | | | Total | |
| | | | | | | | | | | | | | | | |
Bonds and Notes | | | | | | | | | | | | | | | | |
Non-Convertible Bonds | | | | | | | | | | | | | | | | |
Airlines | | $ | — | | | $ | 256,811,162 | | | $ | 34,976,018 | | | $ | 291,787,180 | |
Non-Captive Consumer | | | 2,126,158 | | | | — | | | | — | | | | 2,126,158 | |
All Other Non-Convertible Bonds(a) | | | — | | | | 10,747,732,167 | | | | — | | | | 10,747,732,167 | |
| | | | | | | | | | | | | | | | |
Total Non-Convertible Bonds | | | 2,126,158 | | | | 11,004,543,329 | | | | 34,976,018 | | | | 11,041,645,505 | |
| | | | | | | | | | | | | | | | |
Convertible Bonds(a) | | | — | | | | 1,070,035,665 | | | | — | | | | 1,070,035,665 | |
Municipals(a) | | | — | | | | 151,709,274 | | | | — | | | | 151,709,274 | |
| | | | | | | | | | | | | | | | |
Total Bonds and Notes | | | 2,126,158 | | | | 12,226,288,268 | | | | 34,976,018 | | | | 12,263,390,444 | |
| | | | | | | | | | | | | | | | |
Bank Loans(a) | | | — | | | | 63,137,996 | | | | — | | | | 63,137,996 | |
Common Stocks(a) | | | 655,741,022 | | | | — | | | | — | | | | 655,741,022 | |
Preferred Stocks | | | | | | | | | | | | | | | | |
Convertible Preferred Stocks | | | | | | | | | | | | | | | | |
Automotive | | | 113,969,314 | | | | — | | | | — | | | | 113,969,314 | |
Capital Markets | | | — | | | | 7,379,435 | | | | — | | | | 7,379,435 | |
Commercial Banks | | | 8,584,198 | | | | — | | | | — | | | | 8,584,198 | |
Diversified Financial Services | | | 18,704,587 | | | | 7,520,546 | | | | — | | | | 26,225,133 | |
Electric Utilities | | | 18,576,915 | | | | — | | | | 3,770,375 | | | | 22,347,290 | |
Machinery | | | — | | | | 7,687,949 | | | | — | | | | 7,687,949 | |
Oil, Gas & Consumable Fuels | | | 10,592,840 | | | | — | | | | — | | | | 10,592,840 | |
REITs - Hotels | | | 915,915 | | | | — | | | | — | | | | 915,915 | |
Semiconductors & Semiconductor Equipment | | | — | | | | 29,176,200 | | | | — | | | | 29,176,200 | |
| | | | | | | | | | | | | | | | |
Total Convertible Preferred Stocks | | | 171,343,769 | | | | 51,764,130 | | | | 3,770,375 | | | | 226,878,274 | |
| | | | | | | | | | | | | | | | |
Non-Convertible Preferred Stocks | | | | | | | | | | | | | | | | |
Banking | | | — | | | | 33,230,170 | | | | — | | | | 33,230,170 | |
Diversified Financial Services | | | 811,300 | | | | 21,195,000 | | | | — | | | | 22,006,300 | |
Electric Utilities | | | — | | | | 30,936 | | | | — | | | | 30,936 | |
Household Durables | | | 335,995 | | | | — | | | | — | | | | 335,995 | |
Oil, Gas & Consumable Fuels | | | — | | | | 10,414,350 | | | | — | | | | 10,414,350 | |
REITs - Industrials | | | 5,809,600 | | | | 1,596,000 | | | | — | | | | 7,405,600 | |
Software | | | — | | | | 27,421,875 | | | | — | | | | 27,421,875 | |
Thrifts & Mortgage Finance | | | 9,390,282 | | | | — | | | | — | | | | 9,390,282 | |
| | | | | | | | | | | | | | | | |
Total Non-Convertible Preferred Stocks | | | 16,347,177 | | | | 93,888,331 | | | | — | | | | 110,235,508 | |
| | | | | | | | | | | | | | | | |
Total Preferred Stocks | | | 187,690,946 | | | | 145,652,461 | | | | 3,770,375 | | | | 337,113,782 | |
| | | | | | | | | | | | | | | | |
Closed End Investment Companies | | | 30,395,431 | | | | — | | | | — | | | | 30,395,431 | |
Short-Term Investments | | | — | | | | 34,809,218 | | | | — | | | | 34,809,218 | |
| | | | | | | | | | | | | | | | |
Total | | $ | 875,953,557 | | | $ | 12,469,887,943 | | | $ | 38,746,393 | | | $ | 13,384,587,893 | |
| | | | | | | | | | | | | | | | |
| (a) | Major categories of the Fund’s investments are included in the Portfolio of Investments. |
71 |
Notes to Financial Statements (continued)
September 30, 2010
The following is a reconciliation of Level 3 investments for which significant unobservable inputs were used to determine fair value as of September 30, 2010:
High Income Fund
Asset Valuation Inputs
| | | | | | | | | | | | | | | | | | | | | | | | | | | | | | | | |
Investments in Securities | | Balance as of
September 30,
2009 | | | Accrued
Discounts
(Premiums) | | | Realized
Gain (Loss) | | | Change in
Unrealized
Appreciation
(Depreciation) | | | Net
Purchases
(Sales) | | | Transfers
into
Level 3 | | | Transfers
out of
Level 3 | | | Balance as of
September 30,
2010 | |
| | | | | | | | | | | | | | | | | | | | | | | | | | | | | | | | |
Bonds and Notes | | | | | | | | | | | | | | | | | | | | | | | | | | | | | | | | |
Non-Convertible Bonds | | | | | | | | | | | | | | | | | | | | | | | | | | | | | | | | |
Collateralized Mortgage Obligations | | $ | 389,767 | | | $ | — | | | $ | — | | | $ | — | | | $ | — | | | $ | — | | | $ | (389,767 | ) | | $ | — | |
Non-Captive Consumer | | | 497,545 | | | | 7,243 | | | | (19,550 | ) | | | 37,378 | | | | (522,616 | ) | | | — | | | | — | | | | — | |
Non-Captive Diversified | | | 478,858 | | | | — | | | | — | | | | — | | | | — | | | | — | | | | (478,858 | ) | | | — | |
Supranational | | | 678,290 | | | | — | | | | — | | | | — | | | | — | | | | — | | | | (678,290 | ) | | | — | |
Technology | | | 900,000 | | | | 4,241 | | | | 302,588 | | | | (140,839 | ) | | | (1,065,990 | ) | | | — | | | | — | | | | — | |
Wireless | | | 970,125 | | | | 504 | | | | — | | | | (9,448 | ) | | | (961,181 | ) | | | — | | | | — | | | | — | |
Convertible Bonds | | | | | | | | | | | | | | | | | | | | | | | | | | | | | | | | |
Technology | | | 196,560 | | | | 4,737 | | | | 12,025 | | | | 2,678 | | | | (216,000 | ) | | | — | | | | — | | | | — | |
Wirelines | | | 863,900 | | | | 1,973 | | | | (18,892 | ) | | | (64,581 | ) | | | (782,400 | ) | | | — | | | | — | | | | — | |
| | | | | | | | | | | | | | | | | | | | | | | | | | | | | | | | |
Total | | $ | 4,975,045 | | | $ | 18,698 | | | $ | 276,171 | | | $ | (174,812 | ) | | $ | (3,548,187 | ) | | $ | — | | | $ | (1,546,915 | ) | | $ | — | |
| | | | | | | | | | | | | | | | | | | | | | | | | | | | | | | | |
Debt securities valued at $1,546,915 were transferred from Level 3 to Level 2 during the year ended September 30, 2010. At September 30, 2009, these securities were valued using broker-dealer bid quotations based on inputs unobservable to the Fund; at September 30, 2010, securities valued at $868,625 were valued on the basis of evaluated bids furnished to the Fund by a pricing service where inputs are observable to the Fund and securities valued at $678,290 were valued using broker-dealer bid quotations based on inputs observable to the Fund.
All transfers are recognized as of the beginning of the reporting period.
International Bond Fund
Asset Valuation Inputs
| | | | | | | | | | | | | | | | | | | | | | | | | | | | | | | | |
Investments in Securities | | Balance as of
September 30,
2009 | | | Accrued
Discounts
(Premiums) | | | Realized
Gain (Loss) | | | Change in
Unrealized
Appreciation
(Depreciation) | | | Net
Purchases
(Sales) | | | Transfers
into
Level 3 | | | Transfers
out of
Level 3 | | | Balance as of
September 30,
2010 | |
| | | | | | | | | | | | | | | | | | | | | | | | | | | | | | | | |
Bonds and Notes | | | | | | | | | | | | | | | | | | | | | | | | | | | | | | | | |
Non-Convertible Bonds | | | | | | | | | | | | | | | | | | | | | | | | | | | | | | | | |
Ireland | | $ | 98,563 | | | $ | 57 | | | $ | (1,861 | ) | | $ | 147 | | | $ | (96,906 | ) | | $ | — | | | $ | — | | | $ | — | |
Supranational | | | 67,829 | | | | — | | | | — | | | | — | | | | — | | | | — | | | | (67,829 | ) | | | — | |
| | | | | | | | | | | | | | | | | | | | | | | | | | | | | | | | |
Total | | $ | 166,392 | | | $ | 57 | | | $ | (1,861 | ) | | $ | 147 | | | $ | (96,906 | ) | | $ | — | | | $ | (67,829 | ) | | $ | — | |
| | | | | | | | | | | | | | | | | | | | | | | | | | | | | | | | |
Debt securities valued at $67,829 were transferred from Level 3 to Level 2 during the year ended September 30, 2010. At September 30, 2009, these securities were valued using broker-dealer bid quotations based on inputs unobservable to the Fund; at September 30, 2010, these securities were valued using broker-dealer bid quotations based on inputs observable to the Fund.
| 72
Notes to Financial Statements (continued)
September 30, 2010
All transfers are recognized as of the beginning of the reporting period.
Limited Term Government and Agency Fund
Asset Valuation Inputs
| | | | | | | | | | | | | | | | | | | | | | | | | | | | | | | | |
Investments in Securities | | Balance as of
September 30,
2009 | | | Accrued
Discounts
(Premiums) | | | Realized
Gain (Loss) | | | Change in
Unrealized
Appreciation
(Depreciation) | | | Net
Purchases
(Sales) | | | Transfers
into
Level 3 | | | Transfers
out of
Level 3 | | | Balance as of
September 30,
2010 | |
| | | | | | | | | | | | | | | | | | | | | | | | | | | | | | | | |
Bonds and Notes | | | | | | | | | | | | | | | | | | | | | | | | | | | | | | | | |
ABS Home Equity | | $ | 538,786 | | | $ | — | | | $ | (141,943 | ) | | $ | 457,162 | | | $ | (854,005 | ) | | $ | — | | | $ | — | | | $ | — | |
| | | | | | | | | | | | | | | | | | | | | | | | | | | | | | | | |
Total | | $ | 538,786 | | | $ | — | | | $ | (141,943 | ) | | $ | 457,162 | | | $ | (854,005 | ) | | $ | — | | | $ | — | | | $ | — | |
| | | | | | | | | | | | | | | | | | | | | | | | | | | | | | | | |
Strategic Income Fund
Asset Valuation Inputs
| | | | | | | | | | | | | | | | | | | | | | | | | | | | | | | | |
Investments in Securities | | Balance as of
September 30,
2009 | | | Accrued
Discounts
(Premiums) | | | Realized
Gain (Loss) | | | Change in
Unrealized
Appreciation
(Depreciation) | | | Net
Purchases
(Sales) | | | Transfers
into
Level 3 | | | Transfers
out of
Level 3 | | | Balance as of
September 30,
2010 | |
| | | | | | | | | | | | | | | | | | | | | | | | | | | | | | | | |
Bonds and Notes | | | | | | | | | | | | | | | | | | | | | | | | | | | | | | | | |
Non-Convertible Bonds | | | | | | | | | | | | | | | | | | | | | | | | | | | | | | | | |
Airlines | | $ | 6,940,852 | | | $ | 8,242 | | | $ | — | | | $ | 1,068,018 | | | $ | 33,899,758 | | | $ | — | | | $ | (6,940,852 | ) | | $ | 34,976,018 | |
Automotive | | | 2,526,146 | | | | — | | | | — | | | | — | | | | — | | | | — | | | | (2,526,146 | ) | | | — | |
Chemicals | | | 23,203,580 | | | | — | | | | — | | | | — | | | | — | | | | — | | | | (23,203,580 | ) | | | — | |
Diversified Manufacturing | | | 20,732,656 | | | | — | | | | — | | | | — | | | | — | | | | — | | | | (20,732,656 | ) | | | — | |
Electric | | | 4,708,532 | | | | — | | | | — | | | | — | | | | — | | | | — | | | | (4,708,532 | ) | | | — | |
Non-Captive Consumer | | | 4,129,285 | | | | 2,638 | | | | 268 | | | | 205,168 | | | | (4,337,359 | ) | | | — | | | | — | | | | — | |
Non-Captive Diversified | | | 4,017,538 | | | | — | | | | — | | | | — | | | | — | | | | — | | | | (4,017,538 | ) | | | — | |
Supranational | | | 30,455,245 | | | | — | | | | — | | | | — | | | | — | | | | — | | | | (30,455,245 | ) | | | — | |
Technology | | | 225,000 | | | | — | | | | — | | | | — | | | | — | | | | — | | | | (225,000 | ) | | | — | |
Convertible Bonds | | | | | | | | | | | | | | | | | | | | | | | | | | | | | | | | |
Technology | | | 3,394,300 | | | | 54,845 | | | | 134,788 | | | | 146,067 | | | | (3,730,000 | ) | | | — | | | | — | | | | — | |
Wirelines | | | 57,319,500 | | | | — | | | | — | | | | — | | | | — | | | | — | | | | (57,319,500 | ) | | | — | |
Preferred Stocks | | | | | | | | | | | | | | | | | | | | | | | | | | | | | | | | |
Convertible Preferred Stocks | | | | | | | | | | | | | | | | | | | | | | | | | | | | | | | | |
Electric Utilities | | | 3,770,375 | | | | — | | | | — | | | | — | | | | — | | | | — | | | | — | | | | 3,770,375 | |
REITs - Hotels | | | 491,050 | | | | — | | | | — | | | | — | | | | — | | | | — | | | | (491,050 | ) | | | — | |
| | | | | | | | | | | | | | | | | | | | | | | | | | | | | | | | |
Total | | $ | 161,914,059 | | | $ | 65,725 | | | $ | 135,056 | | | $ | 1,419,253 | | | $ | 25,832,399 | | | $ | — | | | $ | (150,620,099 | ) | | $ | 38,746,393 | |
| | | | | | | | | | | | | | | | | | | | | | | | | | | | | | | | |
A preferred stock valued at $491,050 was transferred from Level 3 to Level 2 during the year ended September 30, 2010. At September 30, 2009, this security was valued using a broker-dealer bid quotation based on inputs unobservable to the Fund; at September 30, 2010, this security was valued at the market price in accordance with the Fund’s valuation policies.
Debt securities valued at $150,129,049 were transferred from Level 3 to Level 2 during the year ended September 30, 2010. At September 30, 2009, these securities were valued using broker-dealer bid quotations based on inputs unobservable to the Fund; at September 30, 2010, securities valued at $119,673,804 were valued on the basis of evaluated bids furnished to the Fund by a pricing service where inputs are observable to the Fund and securities valued at $30,455,245 were valued using broker-dealer bid quotations based on inputs observable to the Fund.
73 |
Notes to Financial Statements (continued)
September 30, 2010
All transfers are recognized as of the beginning of the reporting period.
4. Derivatives. Derivative instruments are defined as financial instruments whose value and performance are based on the value and performance of another security or financial instrument. Derivative instruments that the Funds currently use include forward foreign currency contracts and swaps (including credit default swaps).
The Funds are subject to the risk that changes in foreign currency exchange rates will have an unfavorable effect on the value of Fund assets denominated in foreign currencies. The Funds may enter into forward foreign currency contracts for hedging purposes to protect the value of the Funds’ holdings of foreign securities. The Funds may also use forward foreign currency contracts to gain exposure to foreign currencies, regardless of whether securities denominated in such currencies are held in the Funds. During the year ended September 30, 2010, High Income Fund engaged in forward foreign currency transactions for hedging purposes. During the same period, International Bond Fund engaged in forward foreign currency transactions for hedging purposes and to gain exposure to foreign currencies.
The Funds are subject to the risk that companies in which the Funds invest will fail financially or otherwise be unwilling or unable to meet their obligations to the Funds. The Funds may use credit default swaps to reduce their credit exposure to issuers of bonds they hold without having to sell the bonds. As a protection buyer, the Funds have the ability to hedge the downside risk of an issuer or group of issuers. As a protection seller, the Funds have the ability to gain exposure to an issuer or group of issuers whose bonds are unavailable or in short supply in the cash bond market, as well as realize additional income in the form of the fees paid by the protection buyer. During the year ended September 30, 2010, International Bond Fund engaged in credit default swap transactions as a protection buyer for hedging purposes.
Each Fund is party to agreements with counterparties that govern transactions in forward foreign currency contracts and swap transactions. These agreements contain contingent features that allow the counterparties to terminate open contracts early if the net asset value of a Fund declines beyond a certain threshold. If such contingent features were to be triggered, the counterparties could request immediate settlement of open contracts at current fair value.
Transactions in derivative instruments for High Income Fund during the year ended September 30, 2010 were as follows:
| | | | |
Statements of Operations Caption | | Foreign
Exchange
Contracts | |
| | | | |
Net Realized Gain (Loss) on: | | | | |
Foreign currency transactions* | | $ | (12,761 | ) |
Net Change in Unrealized Appreciation (Depreciation) on: | | | | |
Foreign currency translations* | | | 12,761 | |
| * | Represents realized gain (loss) and change in unrealized appreciation (depreciation), respectively, for forward foreign currency contracts during the period. |
The following is a summary of derivative instruments for International Bond Fund as of September 30, 2010:
| | | | |
Statements of Assets and Liabilities Caption | | Foreign
Exchange
Contracts | |
| | | | |
Assets | | | | |
Unrealized appreciation on forward foreign currency contracts | | $ | 141,570 | |
Liabilities | | | | |
Unrealized depreciation on forward foreign currency contracts | | | (6,979 | ) |
| 74
Notes to Financial Statements (continued)
September 30, 2010
Transactions in derivative instruments for International Bond Fund during the year ended September 30, 2010 were as follows:
| | | | | | | | |
Statements of Operations Caption | | Foreign
Exchange
Contracts | | | Credit
Contracts | |
| | | | | | | | |
Net Realized Gain (Loss) on: | | | | | | | | |
Swap agreements | | $ | — | | | $ | 5,412 | |
Foreign currency transactions* | | | 119,441 | | | | — | |
Net Change in Unrealized Appreciation (Depreciation) on: | | | | | | | | |
Foreign currency translations* | | | 69,385 | | | | — | |
| * | Represents realized gain (loss) and change in unrealized appreciation (depreciation), respectively, for forward foreign currency contracts during the period. |
As the Funds value their derivatives at fair value and recognize changes in fair value through the Statements of Operations, they do not qualify for hedge accounting under authoritative guidance for derivative instruments. The Funds’ investments in derivatives may represent an economic hedge; however, they are considered to be non-hedge transactions for the purpose of these disclosures.
Volume of derivative activity, as a percentage of net assets, for High Income Fund and International Bond Fund, based on month-end notional amounts outstanding during the period, at absolute value, was as follows for the year ended September 30, 2010:
| | | | |
High Income Fund | | Forwards | |
Average Notional Amount Outstanding | | | 0.08% | |
Highest Notional Amount Outstanding | | | 0.00% | |
Lowest Notional Amount Outstanding | | | 0.00% | |
Notional Amount Outstanding as of September 30, 2010 | | | 0.00% | |
| | | | | | | | |
International Bond Fund | | Forwards | | | Swaps | |
Average Notional Amount Outstanding | | | 17.98% | | | | 0.49% | |
Highest Notional Amount Outstanding | | | 27.79% | | | | 2.21% | |
Lowest Notional Amount Outstanding | | | 10.04% | | | | 0.00% | |
Notional Amount Outstanding as of September 30, 2010 | | | 17.34% | | | | 0.00% | |
Notional amounts outstanding at the end of the prior period are included in the average notional amount outstanding.
5. Purchases and Sales of Securities. For the year ended September 30, 2010, purchases and sales of securities (excluding short-term investments and including paydowns) were as follows:
| | | | | | | | | | | | | | | | |
| | | U.S. Government/ Agency Securities | | | Other Securities | |
Fund | | Purchases | | | Sales | | | Purchases | | | Sales | |
Core Plus Bond Fund | | $ | 149,804,323 | | | $ | 126,863,722 | | | $ | 234,005,525 | | | $ | 148,838,092 | |
High Income Fund | | | — | | | | 173,431 | | | | 81,575,432 | | | | 127,053,348 | |
International Bond Fund | | | 4,602,170 | | | | 4,611,391 | | | | 44,355,227 | | | | 33,273,986 | |
Limited Term Government and Agency Fund | | | 295,625,661 | | | | 178,948,726 | | | | 63,962,435 | | | | 52,122,606 | |
Strategic Income Fund | | | 162,676,309 | | | | 190,710,692 | | | | 3,284,296,010 | | | | 3,217,335,294 | |
75 |
Notes to Financial Statements (continued)
September 30, 2010
6. Management Fees and Other Transactions with Affiliates.
a. Management Fees. Loomis, Sayles & Company, L.P. (“Loomis Sayles”) serves as investment adviser to each Fund. Under the terms of the management agreements, each Fund pays a management fee at the following annual rates, calculated daily and payable monthly, based on each Fund’s average daily net assets:
| | | | | | | | | | | | | | | | | | | | | | | | |
| | | Percentage of Average Daily Net Assets | |
Fund | | First
$100 million | | | Next
$100 million | | | Next
$50 million | | | Next
$1.75 billion | | | Next
$13 billion | | | Over
$15 billion | |
Core Plus Bond Fund | | | 0.2500% | | | | 0.1875% | | | | 0.1875% | | | | 0.1875% | | | | 0.1875% | | | | 0.1875% | |
High Income Fund | | | 0.6000% | | | | 0.6000% | | | | 0.6000% | | | | 0.6000% | | | | 0.6000% | | | | 0.6000% | |
International Bond Fund | | | 0.6000% | | | | 0.6000% | | | | 0.6000% | | | | 0.6000% | | | | 0.6000% | | | | 0.6000% | |
Limited Term Government and Agency Fund | | | 0.5000% | | | | 0.5000% | | | | 0.5000% | | | | 0.4000% | | | | 0.4000% | | | | 0.4000% | |
Strategic Income Fund | | | 0.6500% | | | | 0.6500% | | | | 0.6000% | | | | 0.6000% | | | | 0.5500% | | | | 0.5400% | |
Prior to July 1, 2010, Limited Term Government and Agency Fund paid a management fee at an annual rate of 0.50%, calculated daily and payable monthly, based on the Fund’s average daily net assets.
Natixis Asset Management Advisors, L.P. (“Natixis Advisors”) serves as the advisory administrator to Core Plus Bond Fund. Under the terms of the advisory administration agreement, the Fund pays an advisory administration fee at the following annual rates, calculated daily and payable monthly, based on its average daily net assets:
| | | | |
| | | Percentage of Average Daily Net Assets |
Fund | | First $100 million | | Over $100 million |
Core Plus Bond Fund | | 0.2500% | | 0.1875% |
Management and advisory administration fees are presented in the Statements of Operations as management fees.
Loomis Sayles has given binding undertakings to the Funds to waive management fees and/or reimburse certain expenses to limit the Funds’ operating expenses, exclusive of acquired fund fees and expenses, brokerage expenses, interest expense, taxes and extraordinary expenses. These undertakings are in effect until January 31, 2011 and will be reevaluated on an annual basis. Management fees payable, as reflected on the Statements of Assets and Liabilities, is net of waivers and/or expense reimbursements, if any, pursuant to these undertakings.
For the year ended September 30, 2010, the expense limits as a percentage of average daily net assets under the expense limitation agreements were as follows:
| | | | | | | | | | | | | | | | | | | | |
| | | Expense Limit as a Percentage of
Average Daily Net Assets | |
Fund | | Class A | | | Class B | | | Class C | | | Class Y | | | Admin Class | |
Core Plus Bond Fund | | | 0.90% | | | | 1.65% | | | | 1.65% | | | | 0.65% | | | | — | |
High Income Fund | | | 1.15% | | | | 1.90% | | | | 1.90% | | | | 0.90% | | | | — | |
International Bond Fund | | | 1.10% | | | | — | | | | 1.85% | | | | 0.85% | | | | — | |
Limited Term Government and Agency Fund | | | 0.85% | | | | 1.60% | | | | 1.60% | | | | 0.60% | | | | — | |
Strategic Income Fund | | | 1.25% | | | | 2.00% | | | | 2.00% | | | | 1.00% | | | | 1.50% | |
Prior to July 1, 2010, the expense limits as a percentage of average daily net assets for the Limited Term Government and Agency Fund were as follows:
| | | | | | | | | | | | |
Expense Limit as a Percentage of Average
Daily Net Assets | |
Class A | | Class B | | | Class C | | | Class Y | |
| 0.90% | | | 1.65% | | | | 1.65% | | | | 0.65% | |
| 76
Notes to Financial Statements (continued)
September 30, 2010
Loomis Sayles and Natixis Advisors have agreed to equally bear the waivers and/or expense reimbursements for the Core Plus Bond Fund.
Loomis Sayles (and Natixis Advisors for Core Plus Bond Fund) shall be permitted to recover expenses borne under the expense limitation agreements (whether through waiver of its management fees or otherwise) on a class by class basis in later periods to the extent the expenses of a class fall below a class’ expense limits, provided, however, that a class is not obligated to pay such waived/reimbursed fees or expenses more than one year after the end of the fiscal year in which the fees or expenses were waived/reimbursed.
For the year ended September 30, 2010, the management fees and waivers of management fees for each Fund were as follows:
| | | | | | | | | | | | | | | | |
Fund | | Gross Management Fees | | | Waivers of Management Fees1 | | | Net Management Fees | | | Percentage of
Average
Daily Net Assets |
| | | | | Gross | | Net |
Core Plus Bond Fund | | $ | 672,400 | | | $ | 2,844 | | | $ | 669,556 | | | 0.207% | | 0.206% |
High Income Fund | | | 952,564 | | | | 61,432 | | | | 891,132 | | | 0.600% | | 0.561% |
International Bond Fund | | | 186,831 | | | | 120,967 | | | | 65,864 | | | 0.600% | | 0.212% |
Limited Term Government and Agency Fund | | | 1,305,198 | | | | 212,771 | | | | 1,092,427 | | | 0.491% | | 0.411% |
Strategic Income Fund | | | 73,019,120 | | | | — | | | | 73,019,120 | | | 0.558% | | 0.558% |
| 1 | Management fee waivers are subject to possible recovery until September 30, 2011. |
For the year ended September 30, 2010, the advisory administration fees for Core Plus Bond Fund were as follows:
| | | | | | | | | | | | | | | | |
Gross Advisory Administration Fee | | Waiver of Advisory Administration Fee | | | Net Advisory Administration Fee | | | Percentage of
Average
Daily Net Assets | |
| | | | Gross | | | Net | |
$672,400 | | $ | 2,843 | | | $ | 669,557 | | | | 0.207% | | | | 0.206% | |
No expenses were recovered during the year ended September 30, 2010 under the terms of the expense limitation agreement.
Certain officers and directors of Loomis Sayles and Natixis Advisors and its affiliates are also Trustees of the Funds. Loomis Sayles and Natixis Advisors are both limited partnerships indirectly owned by Natixis Global Asset Management, L.P. (“Natixis US”), which is part of Natixis Global Asset Management, an international asset management group based in Paris, France.
b. Service and Distribution Fees. Natixis Distributors, L.P. (“Natixis Distributors”), a wholly-owned subsidiary of Natixis US, has entered into a distribution agreement with the Trusts. Pursuant to this agreement, Natixis Distributors serves as principal underwriter of the Funds of the Trusts.
Pursuant to Rule 12b-1 under the 1940 Act, the Trusts have adopted a Service Plan relating to each Fund’s Class A shares (the “Class A Plans”), a Distribution and Service Plan relating to each Fund’s Class B (if applicable) and Class C shares (the “Class B and Class C Plans”), and Strategic Income Fund has adopted a Distribution Plan relating to its Admin Class shares (the “Admin Class Plan”).
Under the Class A Plans, each Fund pays Natixis Distributors a monthly service fee at an annual rate not to exceed 0.25% of the average daily net assets attributable to the Fund’s Class A shares, as reimbursement for expenses incurred by Natixis Distributors in providing personal services to investors in Class A shares and/or the maintenance of shareholder accounts.
Under the Class B (if applicable) and Class C Plans, each Fund pays Natixis Distributors a monthly service fee at an annual rate not to exceed 0.25% of the average daily net assets attributable to the Fund’s Class B (if applicable) and Class C shares, as compensation for services provided by Natixis Distributors in providing personal services to investors in Class B (if applicable) and Class C shares and/or the maintenance of shareholder accounts.
Also under the Class B (if applicable) and Class C Plans, each Fund pays Natixis Distributors a monthly distribution fee at the annual rate of 0.75% of the average daily net assets attributable to the Fund’s Class B (if applicable) and Class C shares, as compensation for
77 |
Notes to Financial Statements (continued)
September 30, 2010
services provided by Natixis Distributors in connection with the marketing or sale of Class B (if applicable) and Class C shares. Under the Admin Class Plan, the Strategic Income Fund pays Natixis Distributors a monthly distribution fee at an annual rate not to exceed 0.25% of the average daily net assets attributable to the Fund’s Admin Class shares, as compensation for services provided by Natixis Distributors in connection with the marketing or sale of Admin Class shares or for payments made by Natixis Distributors to securities dealers or other financial intermediaries as commissions, asset-based sales charges or other compensation with respect to the sale of Admin Class shares, or for providing personal services to investors and/or the maintenance of shareholder accounts.
In addition, the Admin Class shares of the Strategic Income Fund may pay Natixis Distributors an administrative service fee, at an annual rate not to exceed 0.25% of the average daily net assets attributable to Admin Class shares. These fees are subsequently paid to securities dealers or financial intermediaries for providing personal services and/or account maintenance for their customers who hold such shares.
For the year ended September 30, 2010, the Funds paid the following service and distribution fees:
| | | | | | | | | | | | | | | | | | | | | | | | | | | | |
| | | Service Fees | | | Distribution Fees | |
Fund | | Class A | | | Class B | | | Class C | | | Admin Class | | | Class B | | | Class C | | | Admin Class | |
Core Plus Bond Fund | | $ | 413,358 | | | $ | 13,758 | | | $ | 255,002 | | | $ | — | | | $ | 41,273 | | | $ | 765,008 | | | $ | — | |
High Income Fund | | | 168,724 | | | | 3,497 | | | | 47,566 | | | | — | | | | 10,491 | | | | 142,696 | | | | — | |
International Bond Fund | | | 38,382 | | | | — | | | | 15,239 | | | | — | | | | — | | | | 45,717 | | | | — | |
Limited Term Government and Agency Fund | | | 349,820 | | | | 10,373 | | | | 159,199 | | | | — | | | | 31,117 | | | | 477,598 | | | | — | |
Strategic Income Fund | | | 14,187,827 | | | | 357,146 | | | | 12,556,548 | | | | 1,740 | | | | 1,071,436 | | | | 37,669,640 | | | | 1,740 | |
c. Administrative Fees. Natixis Advisors provides certain administrative services for the Funds and contracts with State Street Bank to serve as sub-administrator. Natixis Advisors is a wholly-owned subsidiary of Natixis US. Pursuant to an agreement among Natixis Funds Trust I, Natixis Funds Trust II, Natixis Funds Trust IV, Natixis Cash Management Trust, Gateway Trust (“Natixis Funds Trusts”), Loomis Sayles Funds I, Loomis Sayles Funds II (“Loomis Sayles Funds Trusts”), Hansberger International Series and Natixis Advisors, each Fund pays Natixis Advisors monthly its pro rata portion of fees equal to an annual rate of 0.0575% of the first $15 billion of the average daily net assets of the Natixis Funds Trusts, Loomis Sayles Funds Trusts and Hansberger International Series, 0.0500% of the next $15 billion, 0.0400% of the next $30 billion and 0.0350% of such assets in excess of $60 billion, subject to an annual aggregate minimum fee for the Natixis Funds Trusts, Loomis Sayles Funds Trusts and Hansberger International Series of $10 million, which is reevaluated on an annual basis. New funds are subject to a fee for the first twelve months of operations of $75,000 plus $12,500 per additional class and an additional $75,000 if managed by multiple subadvisers.
Prior to July 1, 2010, each Fund paid Natixis Advisors monthly its pro rata portion of fees equal to an annual rate of 0.0575% of the first $15 billion of the average daily net assets of the Natixis Funds Trusts, Loomis Sayles Funds Trusts and Hansberger International Series, 0.0500% of the next $15 billion, 0.0425% of the next $30 billion and 0.0375% of such assets in excess of $60 billion, subject to an annual aggregate minimum fee for the Natixis Funds Trusts, Loomis Sayles Funds Trusts and Hansberger International Series of $10 million, which is reevaluated on an annual basis. New funds were subject to a fee for the first twelve months of operations of $75,000 plus $12,500 per additional class and an additional $75,000 if managed by multiple subadvisers.
For the year ended September 30, 2010, each Fund paid the following administrative fees to Natixis Advisors:
| | | | |
Fund | | Administrative
Fees | |
Core Plus Bond Fund | | $ | 156,159 | |
High Income Fund | | | 76,320 | |
International Bond Fund | | | 14,960 | |
Limited Term Government and Agency Fund | | | 127,418 | |
Strategic Income Fund | | | 6,282,952 | |
d. Sub-Transfer Agent Fees. Natixis Distributors has entered into agreements with financial intermediaries to provide certain recordkeeping, processing, shareholder communications and other services to customers of the intermediaries and has agreed to compensate the intermediaries for providing those services. Certain services would be provided by the Funds if the shares of those customers were registered directly with the Funds’ transfer agent. Accordingly, the Funds agreed to pay a portion of the intermediary fees
| 78
Notes to Financial Statements (continued)
September 30, 2010
attributable to shares of the Fund held by the intermediaries (which generally are a percentage of the value of shares held) not exceeding what the Funds would have paid their transfer agent had each customer’s shares been registered directly with the transfer agent instead of held through the intermediaries. Natixis Distributors pays the remainder of the fees.
For the year ended September 30, 2010, the Funds paid the following sub-transfer agent fees, which are reflected in transfer agent fees and expenses in the Statements of Operations.
| | | | |
Fund | | Sub-Transfer
Agent Fees | |
Core Plus Bond Fund | | $ | 223,807 | |
High Income Fund | | | 108,959 | |
International Bond Fund | | | 10,882 | |
Limited Term Government and Agency Fund | | | 116,345 | |
Strategic Income Fund | | | 8,068,633 | |
e. Commissions. Commissions (including CDSCs) on Fund shares retained by Natixis Distributors during the year ended September 30, 2010 were as follows:
| | | | |
Fund | | Commissions | |
Core Plus Bond Fund | | $ | 379,697 | |
High Income Fund | | | 79,786 | |
International Bond Fund | | | 65,871 | |
Limited Term Government and Agency Fund | | | 247,248 | |
Strategic Income Fund | | | 6,625,150 | |
f. Trustees Fees and Expenses. The Trusts do not pay any compensation directly to their officers or Trustees who are directors, officers or employees of Natixis Advisors, Natixis Distributors, Natixis US or their affiliates. Effective January 1, 2010, the Chairperson of the Board receives a retainer fee at the annual rate of $250,000. The Chairperson does not receive any meeting attendance fees for Board of Trustees meetings or committee meetings that she attends. Each Independent Trustee (other than the Chairperson) receives, in the aggregate, a retainer fee at the annual rate of $80,000. Each Independent Trustee also receives a meeting attendance fee of $10,000 for each meeting of the Board of Trustees that he or she attends in person and $5,000 for each meeting of the Board of Trustees that he or she attends telephonically. In addition, each committee chairman receives an additional retainer fee at an annual rate of $15,000. Each Contract Review and Governance Committee member is compensated $6,000 for each Committee meeting that he or she attends in person and $3,000 for each meeting that he or she attends telephonically. Each Audit Committee member is compensated $7,500 for each Committee meeting that he or she attends in person and $3,750 for each meeting that he or she attends telephonically. Each member of the ad hoc Committee on Alternative Investments received a one-time fee of $10,000. The ad hoc Committee on Alternative Investments is not a standing committee. These fees are allocated among the funds in the Natixis Funds Trusts, Loomis Sayles Funds Trusts and Hansberger International Series based on a formula that takes into account, among other factors, the relative net assets of each fund. Trustees are reimbursed for travel expenses in connection with attendance at meetings.
Prior to January 1, 2010, the Chairperson of the Board received a retainer fee at the annual rate of $200,000. The Chairperson did not receive any meeting attendance fees for Board of Trustees meetings or committee meetings that she attended. Each Independent Trustee (other than the Chairperson) received, in the aggregate, a retainer fee at the annual rate of $65,000. Each Independent Trustee also received a meeting attendance fee of $7,500 for each meeting of the Board of Trustees that he or she attended in person and $3,750 for each meeting of the Board of Trustees that he or she attended telephonically. In addition, each committee chairman received an additional retainer fee at an annual rate of $10,000. Each Contract Review and Governance Committee member was compensated $5,000 for each Committee meeting that he or she attended in person and $2,500 for each meeting that he or she attended telephonically. Each Audit Committee member was compensated $6,250 for each Committee meeting that he or she attended in person and $3,125 for each meeting that he or she attended telephonically.
A deferred compensation plan (the “Plan”) is available to the Trustees on a voluntary basis. Deferred amounts remain in the Funds until distributed in accordance with the provisions of the Plan. The value of a participating Trustee’s deferral account is based on theoretical investments of deferred amounts, on the normal payment dates, in certain funds of the Natixis Funds Trusts, Loomis Sayles Funds Trusts and Hansberger International Series as designated by the participating Trustees. Changes in the value of participants’ deferral accounts are allocated pro rata among the funds in the Natixis Funds Trusts, Loomis Sayles Funds Trusts, and Hansberger International
79 |
Notes to Financial Statements (continued)
September 30, 2010
Series, and are normally reflected as Trustees’ fees and expenses in the Statements of Operations. The portions of the accrued obligations allocated to the Funds under the Plan are reflected as Deferred Trustees’ fees in the Statements of Assets and Liabilities.
g. Payments by Affiliates. For the year ended September 30, 2010, Loomis Sayles reimbursed the Strategic Income Fund $76,238 and the Limited Term Government and Agency Fund $1,899 for losses incurred in connection with trading errors.
7. Line of Credit. Each Fund, together with certain other funds of Natixis Funds Trusts, Loomis Sayles Funds Trusts and Hansberger International Series, participates in a $200,000,000 committed unsecured line of credit provided by State Street Bank, with an individual limit of $125,000,000 for each fund that participates in the line of credit. Interest is charged to each participating fund based on its borrowings at a rate per annum equal to the greater of the Federal Funds rate or overnight LIBOR, plus 1.25%. In addition, a commitment fee of 0.15% per annum, payable at the end of each calendar quarter, is accrued and apportioned among the participating funds based on their average daily unused portion of the line of credit.
Prior to March 10, 2010, each Fund, together with certain other funds of Natixis Funds Trusts, Loomis Sayles Funds Trusts and Hansberger International Series, participated in a $200,000,000 committed unsecured line of credit provided by State Street Bank, with an individual limit of $125,000,000 for each fund that participated in the line of credit. Interest was charged to each participating fund based on its borrowings at a rate per annum equal to the greater of the Federal Funds rate or overnight LIBOR, plus 0.75%. In addition, a commitment fee of 0.125% per annum, payable at the end of each calendar quarter, was accrued and apportioned among the participating funds based on their average daily unused portion of the line of credit.
For the year ended September 30, 2010, none of the Funds had borrowings under these agreements.
8. Concentration of Risk. International Bond Fund is a non-diversified fund. Compared with diversified mutual funds, the International Bond Fund may invest a greater percentage of its assets in a particular country. Therefore, the International Bond Fund’s returns could be significantly affected by the performance of any one of the small number of countries in its portfolio.
Each Fund’s investments in foreign securities are subject to foreign currency fluctuations, higher volatility than U.S. securities, varying degrees of regulation and limited liquidity. Greater political, economic, credit and information risks are also associated with foreign securities.
9. Concentration of Ownership. At September 30, 2010, the Loomis Sayles Employees’ Profit Sharing Retirement Plan held 28,447 shares of beneficial interest of Limited Term Government and Agency Fund and Natixis US owned shares equating to 20.01% of International Bond Fund’s net assets.
| 80
Notes to Financial Statements (continued)
September 30, 2010
10. Capital Shares. Each Fund may issue an unlimited number of shares of beneficial interest, without par value. Transactions in capital shares were as follows:
| | | | | | | | | | | | | | | | |
| |
| Year Ended
September 30, 2010 |
| |
| Year Ended
September 30, 2009 |
|
Core Plus Bond Fund | | | Shares | | | | Amount | | | | Shares | | | | Amount | |
| | | | | | | | | | | | | | | | |
| Class A | | | | | | | | | | | | |
Issued from the sale of shares | | | 8,076,791 | | | $ | 99,281,285 | | | | 5,053,473 | | | $ | 54,649,921 | |
Issued in connection with the reinvestment of distributions | | | 503,145 | | | | 6,118,146 | | | | 515,393 | | | | 5,579,642 | |
Redeemed | | | (3,556,858 | ) | | | (43,324,928 | ) | | | (4,737,622 | ) | | | (51,103,206 | ) |
| | | | | | | | | | | | | | | | |
Net change | | | 5,023,078 | | | $ | 62,074,503 | | | | 831,244 | | | $ | 9,126,357 | |
| | | | | | | | | | | | | | | | |
| Class B | | | | | | | | | | | | |
Issued from the sale of shares | | | 46,593 | | | $ | 562,160 | | | | 72,713 | | | $ | 778,608 | |
Issued in connection with the reinvestment of distributions | | | 14,472 | | | | 175,787 | | | | 28,331 | | | | 305,872 | |
Redeemed | | | (298,342 | ) | | | (3,615,617 | ) | | | (504,102 | ) | | | (5,425,057 | ) |
| | | | | | | | | | | | | | | | |
Net change | | | (237,277 | ) | | $ | (2,877,670 | ) | | | (403,058 | ) | | $ | (4,340,577 | ) |
| | | | | | | | | | | | | | | | |
| Class C | | | | | | | | | | | | |
Issued from the sale of shares | | | 4,971,733 | | | $ | 60,338,041 | | | | 5,539,383 | | | $ | 59,909,721 | |
Issued in connection with the reinvestment of distributions | | | 143,826 | | | | 1,750,082 | | | | 82,284 | | | | 901,682 | |
Redeemed | | | (1,930,707 | ) | | | (23,457,007 | ) | | | (1,683,762 | ) | | | (18,156,728 | ) |
| | | | | | | | | | | | | | | | |
Net change | | | 3,184,852 | | | $ | 38,631,116 | | | | 3,937,905 | | | $ | 42,654,675 | |
| | | | | | | | | | | | | | | | |
| Class Y | | | | | | | | | | | | |
Issued from the sale of shares | | | 4,875,867 | | | $ | 59,587,010 | | | | 2,459,788 | | | $ | 27,430,717 | |
Issued in connection with the reinvestment of distributions | | | 102,891 | | | | 1,263,048 | | | | 63,520 | | | | 692,382 | |
Redeemed | | | (2,443,989 | ) | | | (29,878,028 | ) | | | (1,576,971 | ) | | | (16,945,061 | ) |
| | | | | | | | | | | | | | | | |
Net change | | | 2,534,769 | | | $ | 30,972,030 | | | | 946,337 | | | $ | 11,178,038 | |
| | | | | | | | | | | | | | | | |
Increase (decrease) from capital share transactions | | | 10,505,422 | | | $ | 128,799,979 | | | | 5,312,428 | | | $ | 58,618,493 | |
| | | | | | | | | | | | | | | | |
| | |
| |
| Year Ended
September 30, 2010 |
| |
| Year Ended
September 30, 2009 |
|
High Income Fund | | | Shares | | | | Amount | | | | Shares | | | | Amount | |
| | | | | | | | | | | | | | | | |
| Class A | | | | | | | | | | | | |
Issued from the sale of shares | | | 7,886,065 | | | $ | 37,432,096 | | | | 9,902,651 | | | $ | 37,553,280 | |
Issued in connection with the reinvestment of distributions | | | 740,661 | | | | 3,486,120 | | | | 702,667 | | | | 2,621,142 | |
Redeemed | | | (8,110,153 | ) | | | (38,368,078 | ) | | | (6,362,694 | ) | | | (24,378,951 | ) |
| | | | | | | | | | | | | | | | |
Net change | | | 516,573 | | | $ | 2,550,138 | | | | 4,242,624 | | | $ | 15,795,471 | |
| | | | | | | | | | | | | | | | |
| Class B | | | | | | | | | | | | |
Issued from the sale of shares | | | 27,891 | | | $ | 131,139 | | | | 22,526 | | | $ | 84,592 | |
Issued in connection with the reinvestment of distributions | | | 13,045 | | | | 61,362 | | | | 21,555 | | | | 78,355 | |
Redeemed | | | (143,704 | ) | | | (680,984 | ) | | | (229,184 | ) | | | (845,267 | ) |
| | | | | | | | | | | | | | | | |
Net change | | | (102,768 | ) | | $ | (488,483 | ) | | | (185,103 | ) | | $ | (682,320 | ) |
| | | | | | | | | | | | | | | | |
| Class C | | | | | | | | | | | | |
Issued from the sale of shares | | | 1,272,869 | | | $ | 6,002,594 | | | | 2,411,038 | | | $ | 9,092,790 | |
Issued in connection with the reinvestment of distributions | | | 138,274 | | | | 650,996 | | | | 155,802 | | | | 577,576 | |
Redeemed | | | (1,443,966 | ) | | | (6,801,815 | ) | | | (949,303 | ) | | | (3,508,124 | ) |
| | | | | | | | | | | | | | | | |
Net change | | | (32,823 | ) | | $ | (148,225 | ) | | | 1,617,537 | | | $ | 6,162,242 | |
| | | | | | | | | | | | | | | | |
| Class Y | | | | | | | | | | | | |
Issued from the sale of shares | | | 10,174,824 | | | $ | 47,942,376 | | | | 22,731,680 | | | $ | 88,407,570 | |
Issued in connection with the reinvestment of distributions | | | 940,961 | | | | 4,395,066 | | | | 650,415 | | | | 2,696,934 | |
Redeemed | | | (20,410,850 | ) | | | (95,761,418 | ) | | | (740,730 | ) | | | (3,068,585 | ) |
| | | | | | | | | | | | | | | | |
Net change | | | (9,295,065 | ) | | $ | (43,423,976 | ) | | | 22,641,365 | | | $ | 88,035,919 | |
| | | | | | | | | | | | | | | | |
Increase (decrease) from capital share transactions | | | (8,914,083 | ) | | $ | (41,510,546 | ) | | | 28,316,423 | | | $ | 109,311,312 | |
| | | | | | | | | | | | | | | | |
81 |
Notes to Financial Statements (continued)
September 30, 2010
10. Capital Shares (continued).
| | | | | | | | | | | | | | | | |
| |
| Year Ended
September 30, 2010 |
| |
| Year Ended
September 30, 2009 |
|
International Bond Fund | | | Shares | | | | Amount | | | | Shares | | | | Amount | |
| | | | | | | | | | | | | | | | |
| Class A | | | | | | | | | | | | | | | | |
Issued from the sale of shares | | | 1,454,026 | | | $ | 15,450,317 | | | | 672,013 | | | $ | 6,666,998 | |
Issued in connection with the reinvestment of distributions | | | 25,628 | | | | 268,292 | | | | 5,103 | | | | 49,865 | |
Redeemed | | | (582,821 | ) | | | (6,085,212 | ) | | | (107,505 | ) | | | (999,973 | ) |
| | | | | | | | | | | | | | | | |
Net change | | | 896,833 | | | $ | 9,633,397 | | | | 569,611 | | | $ | 5,716,890 | |
| | | | | | | | | | | | | | | | |
| Class C | | | | | | | | | | | | | | | | |
Issued from the sale of shares | | | 488,076 | | | $ | 5,290,541 | | | | 238,418 | | | $ | 2,461,614 | |
Issued in connection with the reinvestment of distributions | | | 4,722 | | | | 49,432 | | | | 670 | | | | 6,563 | |
Redeemed | | | (212,865 | ) | | | (2,176,537 | ) | | | (40,421 | ) | | | (390,729 | ) |
| | | | | | | | | | | | | | | | |
Net change | | | 279,933 | | | $ | 3,163,436 | | | | 198,667 | | | $ | 2,077,448 | |
| | | | | | | | | | | | | | | | |
| Class Y | | | | | | | | | | | | | | | | |
Issued from the sale of shares | | | 363,950 | | | $ | 3,901,435 | | | | 148,246 | | | $ | 1,536,076 | |
Issued in connection with the reinvestment of distributions | | | 34,152 | | | | 358,772 | | | | 24,645 | | | | 234,656 | |
Redeemed | | | (805,893 | ) | | | (8,515,480 | ) | | | (54,815 | ) | | | (509,028 | ) |
| | | | | | | | | | | | | | | | |
Net change | | | (407,791 | ) | | $ | (4,255,273 | ) | | | 118,076 | | | $ | 1,261,704 | |
| | | | | | | | | | | | | | | | |
Increase (decrease) from capital share transactions | | | 768,975 | | | $ | 8,541,560 | | | | 886,354 | | | $ | 9,056,042 | |
| | | | | | | | | | | | | | | | |
| | |
| |
| Year Ended
September 30, 2010 |
| |
| Year Ended
September 30, 2009 |
|
Limited Term Government and Agency Fund | | | Shares | | | | Amount | | | | Shares | | | | Amount | |
| | | | | | | | | | | | | | | | |
| Class A | | | | | | | | | | | | | | | | |
Issued from the sale of shares | | | 11,266,230 | | | $ | 133,267,058 | | | | 8,687,955 | | | $ | 97,183,574 | |
Issued in connection with the reinvestment of distributions | | | 199,254 | | | | 2,358,259 | | | | 242,614 | | | | 2,733,365 | |
Redeemed | | | (8,020,196 | ) | | | (94,867,976 | ) | | | (8,273,983 | ) | | | (93,400,549 | ) |
| | | | | | | | | | | | | | | | |
Net change | | | 3,445,288 | | | $ | 40,757,341 | | | | 656,586 | | | $ | 6,516,390 | |
| | | | | | | | | | | | | | | | |
| Class B | | | | | | | | | | | | | | | | |
Issued from the sale of shares | | | 74,327 | | | $ | 877,417 | | | | 130,399 | | | $ | 1,438,679 | |
Issued in connection with the reinvestment of distributions | | | 4,282 | | | | 50,516 | | | | 7,515 | | | | 84,528 | |
Redeemed | | | (124,533 | ) | | | (1,466,258 | ) | | | (167,898 | ) | | | (1,871,502 | ) |
| | | | | | | | | | | | | | | | |
Net change | | | (45,924 | ) | | $ | (538,325 | ) | | | (29,984 | ) | | $ | (348,295 | ) |
| | | | | | | | | | | | | | | | |
| Class C | | | | | | | | | | | | | | | | |
Issued from the sale of shares | | | 4,108,090 | | | $ | 48,568,618 | | | | 6,162,236 | | | $ | 68,267,485 | |
Issued in connection with the reinvestment of distributions | | | 41,123 | | | | 487,281 | | | | 42,444 | | | | 479,083 | |
Redeemed | | | (2,221,038 | ) | | | (26,267,537 | ) | | | (3,881,272 | ) | | | (43,578,196 | ) |
| | | | | | | | | | | | | | | | |
Net change | | | 1,928,175 | | | $ | 22,788,362 | | | | 2,323,408 | | | $ | 25,168,372 | |
| | | | | | | | | | | | | | | | |
| Class Y | | | | | | | | | | | | | | | | |
Issued from the sale of shares | | | 10,058,653 | | | $ | 119,749,282 | | | | 2,463,987 | | | $ | 28,003,881 | |
Issued in connection with the reinvestment of distributions | | | 40,673 | | | | 484,828 | | | | 14,127 | | | | 160,181 | |
Redeemed | | | (4,553,430 | ) | | | (54,266,299 | ) | | | (668,533 | ) | | | (7,560,045 | ) |
| | | | | | | | | | | | | | | | |
Net change | | | 5,545,896 | | | $ | 65,967,811 | | | | 1,809,581 | | | $ | 20,604,017 | |
| | | | | | | | | | | | | | | | |
Increase (decrease) from capital share transactions | | | 10,873,435 | | | $ | 128,975,189 | | | | 4,759,591 | | | $ | 51,940,484 | |
| | | | | | | | | | | | | | | | |
| 82
Notes to Financial Statements (continued)
September 30, 2010
10. Capital Shares (continued).
| | | | | | | | | | | | | | | | |
| |
| Year Ended
September 30, 2010 |
| |
| Year Ended
September 30, 2009 |
|
Strategic Income Fund | | | Shares | | | | Amount | | | | Shares | | | | Amount | |
| | | | | | | | | | | | | | | | |
| Class A | | | | | | | | | | | | | | | | |
Issued from the sale of shares | | | 102,095,738 | | | $ | 1,433,327,434 | | | | 197,022,094 | | | $ | 2,182,492,582 | |
Issued in connection with the reinvestment of distributions | | | 19,067,875 | | | | 267,178,534 | | | | 27,449,011 | | | | 301,119,073 | |
Redeemed | | | (143,344,700 | ) | | | (2,011,259,494 | ) | | | (269,140,105 | ) | | | (2,956,389,363 | ) |
| | | | | | | | | | | | | | | | |
Net change | | | (22,181,087 | ) | | $ | (310,753,526 | ) | | | (44,669,000 | ) | | $ | (472,777,708 | ) |
| | | | | | | | | | | | | | | | |
| Class B | | | | | | | | | | | | | | | | |
Issued from the sale of shares | | | 186,206 | | | $ | 2,622,085 | | | | 498,498 | | | $ | 5,392,143 | |
Issued in connection with the reinvestment of distributions | | | 248,193 | | | | 3,496,666 | | | | 443,741 | | | | 4,856,521 | |
Redeemed | | | (2,205,963 | ) | | | (31,123,182 | ) | | | (3,184,682 | ) | | | (35,016,126 | ) |
| | | | | | | | | | | | | | | | |
Net change | | | (1,771,564 | ) | | $ | (25,004,431 | ) | | | (2,242,443 | ) | | $ | (24,767,462 | ) |
| | | | | | | | | | | | | | | | |
| Class C | | | | | | | | | | | | | | | | |
Issued from the sale of shares | | | 56,633,554 | | | $ | 798,369,591 | | | | 123,246,746 | | | $ | 1,377,861,744 | |
Issued in connection with the reinvestment of distributions | | | 8,306,362 | | | | 117,036,115 | | | | 11,167,692 | | | | 123,558,637 | |
Redeemed | | | (80,289,909 | ) | | | (1,131,902,366 | ) | | | (98,406,847 | ) | | | (1,085,168,243 | ) |
| | | | | | | | | | | | | | | | |
Net change | | | (15,349,993 | ) | | $ | (216,496,660 | ) | | | 36,007,591 | | | $ | 416,252,138 | |
| | | | | | | | | | | | | | | | |
| Class Y | | | | | | | | | | | | | | | | |
Issued from the sale of shares | | | 71,382,373 | | | $ | 1,004,096,644 | | | | 132,053,741 | | | $ | 1,485,053,461 | |
Issued in connection with the reinvestment of distributions | | | 3,481,005 | | | | 48,849,457 | | | | 2,940,277 | | | | 33,107,757 | |
Redeemed | | | (56,938,380 | ) | | | (797,459,413 | ) | | | (45,930,609 | ) | | | (513,425,165 | ) |
| | | | | | | | | | | | | | | | |
Net change | | | 17,924,998 | | | $ | 255,486,688 | | | | 89,063,409 | | | $ | 1,004,736,053 | |
| | | | | | | | | | | | | | | | |
| Admin Class* | | | | | | | | | | | | | | | | |
Issued from the sale of shares | | | 309,466 | | | $ | 4,414,761 | | | | — | | | $ | — | |
Issued in connection with the reinvestment of distributions | | | 2,485 | | | | 35,684 | | | | — | | | | — | |
Redeemed | | | (13,316 | ) | | | (193,142 | ) | | | — | | | | — | |
| | | | | | | | | | | | | | | | |
Net change | | | 298,635 | | | $ | 4,257,303 | | | | — | | | $ | — | |
| | | | | | | | | | | | | | | | |
Increase (decrease) from capital share transactions | | | (21,079,011 | ) | | $ | (292,510,626 | ) | | | 78,159,557 | | | $ | 923,443,021 | |
| | | | | | | | | | | | | | | | |
| * | From commencement of Class operations on February 1, 2010 through September 30, 2010. |
83 |
Report of Independent Registered Public Accounting Firm
To the Trustees of Natixis Funds Trust I and Loomis Sayles Funds II and Shareholders of Loomis Sayles Core Plus Bond Fund, Loomis Sayles High Income Fund, Loomis Sayles International Bond Fund, Loomis Sayles Limited Term Government and Agency Fund, and Loomis Sayles Strategic Income Fund:
In our opinion, the accompanying statements of assets and liabilities, including the portfolios of investments, and the related statements of operations and of changes in net assets and the financial highlights present fairly, in all material respects, the financial position of Loomis Sayles Core Plus Bond Fund, a series of Natixis Funds Trust I, and Loomis Sayles High Income Fund, Loomis Sayles International Bond Fund, Loomis Sayles Limited Term Government and Agency Fund and Loomis Sayles Strategic Income Fund, each a series of Loomis Sayles Funds II (collectively, the “Funds”), at September 30, 2010, and the results of each of their operations, the changes in each of their net assets and the financial highlights for each of the periods indicated, in conformity with accounting principles generally accepted in the United States of America. These financial statements and financial highlights (hereafter referred to as “financial statements”) are the responsibility of the Funds’ management; our responsibility is to express an opinion on these financial statements based on our audits. We conducted our audits of these financial statements in accordance with the standards of the Public Company Accounting Oversight Board (United States). Those standards require that we plan and perform the audits to obtain reasonable assurance about whether the financial statements are free of material misstatement. An audit includes examining, on a test basis, evidence supporting the amounts and disclosures in the financial statements, assessing the accounting principles used and significant estimates made by management, and evaluating the overall financial statement presentation. We believe that our audits, which included confirmation of securities at September 30, 2010 by correspondence with the custodian and brokers, provide a reasonable basis for our opinion.
PricewaterhouseCoopers LLP
Boston, Massachusetts
November 22, 2010
| 84
Special Meeting of Shareholders (Unaudited)
A special meeting of shareholders of the Trusts was held on May 27, 2010 to consider a proposal to elect four Trustees to the Board of Trustees. The proposal was approved by shareholders of the Trusts. The results of the shareholder vote were as follows:
Natixis Funds Trust I
| | | | | | | | |
Nominee | | Voted “FOR”* | | | Withheld* | |
Kenneth A. Drucker | | | 134,327,075 | | | | 2,191,679 | |
Wendell J. Knox | | | 134,206,797 | | | | 2,311,957 | |
Erik R. Sirri | | | 134,310,617 | | | | 2,208,138 | |
Peter J. Smail | | | 134,368,549 | | | | 2,150,205 | |
| * | Trust-wide voting results. |
Loomis Sayles Funds II
| | | | | | | | |
Nominee | | Voted “FOR”* | | | Withheld* | |
Kenneth A. Drucker | | | 1,717,408,736 | | | | 24,631,425 | |
Wendell J. Knox | | | 1,717,302,502 | | | | 24,737,659 | |
Erik R. Sirri | | | 1,717,226,576 | | | | 24,813,585 | |
Peter J. Smail | | | 1,717,449,661 | | | | 24,590,500 | |
| * | Trust-wide voting results. |
In addition to the Trustees named above, the following also serve as Trustees of the Trusts: Graham T. Allison, Jr., Edward A. Benjamin, Daniel M. Cain, Sandra O. Moose, Cynthia L. Walker, Robert J. Blanding and John T. Hailer.
85 |
2010 U.S. Tax Distribution Information to Shareholders (Unaudited)
Corporate Dividends Received Deduction. For the fiscal year ended September 30, 2010, a percentage of dividends distributed by the Funds listed below qualify for the dividends received deduction for corporate shareholders. These percentages are as follows:
| | | | |
Fund | | Qualifying
Percentage | |
Core Plus Bond | | | 0.25 | % |
High Income | | | 0.32 | % |
Strategic Income | | | 3.25 | % |
Qualified Dividend Income. For the fiscal year ended September 30, 2010, the Funds below will designate up to the maximum amount allowable pursuant to the Internal Revenue Code as qualified dividend income eligible for reduced tax rates. These lower rates range from 0% to 15% depending on an individual’s tax bracket. If the Funds pay a distribution during calendar year 2010, complete information will be reported in conjunction with Form 1099-DIV.
| | | | |
Fund | | | |
Core Plus Bond | | | | |
High Income | | | | |
Strategic Income | | | | |
| 86
Trustee and Officer Information
The tables below provide certain information regarding the trustees and officers of Natixis Funds Trust I and Loomis Sayles Funds II (the “Trusts”). Unless otherwise indicated, the address of all persons below is 399 Boylston Street, Boston, MA 02116. The Trusts’ Statements of Additional Information include additional information about the trustees of the Trusts and are available by calling Natixis Funds at 800-225-5478.
| | | | | | | | |
Name and Year of Birth | | Position(s) Held with the
Trusts, Length of Time
Served and Term of Office* | | Principal Occupation(s)
During Past 5 Years | | Number of Portfolios
in Fund Complex
Overseen** and Other
Directorships Held
During Past 5 Years | | Experience,
Qualifications,
Attributes, Skills
for Board Membership |
| | | |
| INDEPENDENT TRUSTEES | | | | | | |
| | | | |
Graham T. Allison, Jr.
(1940) | | Trustee From 1984 to 1993 and since 1995 for Natixis Funds Trust I (including its predecessors); and since 2003 for Loomis Sayles Funds II Contract Review and Governance Committee Member | | Douglas Dillon Professor and Director of the Belfer Center for Science and International Affairs, John F. Kennedy School of Government, Harvard University | | 42 Director, Taubman Centers, Inc. (real estate investment trust) | | Significant experience on Board of Trustees of the Trusts and/or other business organizations; government experience (including as Assistant Secretary of Defense under President Clinton); academic experience |
| | | | |
| Edward A. Benjamin (1938) | | Trustee Since 2003 for Natixis Funds Trust I and since 2002 for Loomis Sayles Funds II Chairman of the Contract Review and Governance Committee | | Retired | | 42 Formerly, Director, Precision Optics Corporation (optics manufacturer) | | Significant experience on Board of Trustees of the Trusts and/or other business organizations; significant experience providing legal counsel to boards, funds, advisers and other financial institutions (former partner at Ropes & Gray LLP) |
| | | | |
Daniel M. Cain (1945) | | Trustee Since 1996 for Natixis Funds Trust I and since 2003 for Loomis Sayles Funds II Chairman of the Audit Committee | | Chairman (formerly, President and Chief Executive Officer) of Cain Brothers & Company, Incorporated (investment banking) | | 42 Director, Sheridan Healthcare Inc. (physician practice management) | | Significant experience on Board of Trustees of the Trusts and/or other business organizations; experience in the financial industry, including roles as chairman and former chief executive officer of an investment banking firm |
87 |
Trustee and Officer Information
| | | | | | | | |
Name and Year of Birth | | Position(s) Held with the
Trusts, Length of Time
Served and Term of Office* | | Principal Occupation(s)
During Past 5 Years | | Number of Portfolios
in Fund Complex
Overseen** and Other
Directorships Held
During Past 5 Years | | Experience,
Qualifications,
Attributes, Skills
for Board Membership |
| | | |
INDEPENDENT TRUSTEES
continued | | | | | | |
| | | | |
Kenneth A. Drucker (1945) | | Trustee Since 2008 Audit Committee Member | | Formerly, Vice President and Treasurer, Sequa Corp. (aerospace, automotive and metal manufacturing) | | 42 Formerly, Director, M Fund, Inc. (investment company); Director, Gateway Trust (investment company) | | Significant experience on Board of Trustees of the Trusts and/or other business organizations; executive experience including as treasurer of a corporation |
| | | | |
Wendell J. Knox (1948) | | Trustee Since 2009 Contract Review and Governance Committee Member | | Director (formerly, President and Chief Executive Officer) of Abt Associates Inc. (research and consulting) | | 42 Director, Eastern Bank (commercial bank); Director, The Hanover Insurance Group (property and casualty insurance) | | Significant experience on Board of Trustees of the Trusts and/or other business organizations; executive experience including roles as president and chief executive officer of a consulting company |
| | | | |
Sandra O. Moose (1942) | | Chairperson of the Board of Trustees since November 2005 Trustee since 1982 for Natixis Funds Trust I (including its predecessors) and since 2003 for Loomis Sayles Funds II Ex officio member of the Audit Committee and Contract Review and Governance Committee | | President, Strategic Advisory Services (management consulting); formerly, Senior Vice President and Director, The Boston Consulting Group, Inc. (management consulting) | | 42 Director, Verizon Communications; Director, AES Corporation (international power company); Formerly, Director, Rohm and Haas Company (specialty chemicals) | | Significant experience on Board of Trustees of the Trusts and/or other business organizations; executive experience at a management consulting company |
| | | | |
Erik R. Sirri1 (1958) | | Trustee Since 2009 Contract Review and Governance Committee Member | | Professor of Finance at Babson College; formerly, Director of the Division of Trading and Markets at the Securities and Exchange Commission | | 42 None | | Experience as Director of the Division of Trading and Markets at the Securities and Exchange Commission; academic experience and training as an economist |
| | | | |
Peter J. Smail1 (1952) | | Trustee Since 2009 Contract Review and Governance Committee Member | | Retired; formerly, President and Chief Executive Officer of Pyramis Global Advisors (investment management) | | 42 None | | Mutual fund industry and executive experience, including roles as president and chief executive officer for an investment adviser |
| 88
Trustee and Officer Information
| | | | | | | | |
Name and Year of Birth | | Position(s) Held with the
Trusts, Length of Time
Served and Term of Office* | | Principal Occupation(s)
During Past 5 Years | | Number of Portfolios
in Fund Complex
Overseen** and Other
Directorships Held
During Past 5 Years | | Experience,
Qualifications,
Attributes, Skills
for Board Membership |
| | | |
INDEPENDENT TRUSTEES
continued | | | | | | |
| | | | |
Cynthia L. Walker (1956) | | Trustee Since 2005 Audit Committee Member | | Deputy Dean for Finance and Administration, Yale University School of Medicine; formerly, Executive Dean for Administration, Harvard Medical School; and formerly, Dean for Finance and Chief Financial Officer, Harvard Medical School | | 42 None | | Significant experience on Board of Trustees of the Trusts and/or other business organizations; executive experience in a variety of academic organizations, including roles as dean for finance and administration |
|
| INTERESTED TRUSTEES |
| | | | |
Robert J. Blanding2 (1947) 555 California Street San Francisco, CA 94104 | | Trustee Since 2003 for Natixis Funds Trust I and since 2002 for Loomis Sayles Funds II Chief Executive Officer of Loomis Sayles Funds II since 2002 | | President, Chairman, Director and Chief Executive Officer, Loomis, Sayles & Company, L.P. | | 42 None | | Significant experience on Board of Trustees of the Trusts; continuing service as president, chairman, and Chief Executive Officer of Loomis, Sayles & Company, L.P. |
| | | | |
John T. Hailer3 (1960) | | Trustee Since 2000 for Natixis Funds Trust I and since 2003 for Loomis Sayles Funds II | | President and Chief Executive Officer — U.S. and Asia, Natixis Global Asset Management, L.P.; formerly, President and Chief Executive Officer, Natixis Distribution Corporation, Natixis Asset Management Advisors, L.P., Natixis Distributors, L.P. and Natixis Global Associates, Inc. | | 42 None | | Significant experience on Board of Trustees of the Trusts; continuing experience as Chief Executive Officer of Natixis Global Asset Management, L.P. |
| * | Each trustee serves until retirement, resignation or removal from the Board of Trustees. The current retirement age is 72; however, the trustees have designated 2010 as a transition period so that any trustees who are currently age 72 or older or who reach age 72 during the remainder of 2010 will not be required to retire until the end of calendar year 2011. The position of Chairperson of the Board is appointed for a two-year term. Ms. Moose was appointed to serve an additional two-year term as the Chairperson of the Board of Trustees on November 20, 2009. |
| ** | The trustees of the Trusts serve as trustees of a fund complex that includes all series of the Natixis Funds Trust I, Natixis Funds Trust II, Natixis Funds Trust IV, Gateway Trust and the Natixis Cash Management Trust (collectively, the “Natixis Funds Trusts”), Loomis Sayles Funds I and Loomis Sayles Funds II (collectively, the “Loomis Sayles Funds Trusts”), and Hansberger International Series (collectively, the “Fund Complex”). |
89 |
Trustee and Officer Information
| 1 | Mr. Sirri and Mr. Smail were appointed as trustees effective December 1, 2009. |
| 2 | Mr. Blanding is deemed an “interested person” of the Trusts because he holds the following positions with an affiliated person of the Trusts: President, Chairman, Director and Chief Executive Officer of Loomis Sayles. |
| 3 | Mr. Hailer is deemed an “interested person” of the Trusts because he holds the following positions with an affiliated person of the Trusts: President and Chief Executive Officer — U.S. and Asia, Natixis Global Asset Management, L.P. |
| | | | | | |
Name and Year of Birth | | Position(s) Held with the Trusts | | Term of Office* and Length of
Time Served | | Principal Occupation During
Past 5 Years** |
|
| OFFICERS OF THE TRUST |
| | | |
Coleen Downs Dinneen (1960) | | Secretary, Clerk and Chief Legal Officer | | Since September 2004 | | Executive Vice President, General Counsel, Secretary and Clerk (formerly, Senior Vice President, Deputy General Counsel, Assistant Secretary and Assistant Clerk), Natixis Distribution Corporation, Natixis Asset Management Advisors, L.P. and Natixis Distributors, L.P. |
| | | |
Daniel J. Fuss (1933) One Financial Center Boston, MA 02111 | | Executive Vice President of Loomis Sayles Funds II | | Since June 2003 | | Vice Chairman and Director, Loomis, Sayles & Company, L.P. |
| | | |
David Giunta (1965) | | President and Chief Executive Officer of Natixis Funds Trust I and President of Loomis Sayles Funds II | | Since March 2008 | | President and Chief Executive Officer, Natixis Distribution Corporation, Natixis Asset Management Advisors, L.P. and Natixis Distributors, L.P.; formerly, President, Fidelity Charitable Gift Fund; and formerly, Senior Vice President, Fidelity Brokerage Company |
| | | |
Russell L. Kane (1969) | | Chief Compliance Officer, Assistant Secretary and Anti-Money Laundering Officer | | Chief Compliance Officer since May 2006; Assistant Secretary since June 2004; and Anti-Money Laundering Officer since April 2007 | | Chief Compliance Officer for Mutual Funds, Senior Vice President, Deputy General Counsel, Assistant Secretary and Assistant Clerk, Natixis Distribution Corporation, Natixis Asset Management Advisors, L.P. and Natixis Distributors, L.P. |
| | | |
Michael C. Kardok (1959) | | Treasurer, Principal Financial and Accounting Officer | | Since October 2004 | | Senior Vice President, Natixis Asset Management Advisors, L.P. and Natixis Distributors, L.P. |
| * | Each officer of the Trusts serves for an indefinite term in accordance with the Trusts’ current By-laws until the date his or her successor is elected and qualified, or until he or she sooner dies, retires, is removed or becomes disqualified. |
| 90
Trustee and Officer Information
| ** | Each person listed above, except as noted, holds the same position(s) with the Fund Complex. Mr. Fuss is not an officer of the Natixis Funds Trusts or the Hansberger International Series. Previous positions during the past five years with the Distributor, Natixis Advisors or Loomis Sayles are omitted if not materially different from a trustee’s or officer’s current position with such entity. |
91 |
ANNUAL REPORT
September 30, 2010

Loomis Sayles Disciplined Equity Fund
Loomis Sayles Global Markets Fund
Loomis Sayles Growth Fund
Loomis Sayles Mid Cap Growth Fund
Loomis Sayles Value Fund
Loomis, Sayles & Company, L.P.
TABLE OF CONTENTS
Management Discussion and Performance page 1
Portfolio of Investments page 18
Financial Statements page 35
LOOMIS SAYLES DISCIPLINED EQUITY FUND
Management Discussion
Managers:
Maureen G. Depp, CFA
Brian James, CFA
Loomis, Sayles & Company, L.P.
Objective:
Long-term growth of capital
Strategy:
Invests primarily in equity securities, including common stocks, convertible securities, and warrants; focuses on stocks of large-capitalization companies, but may invest in companies of any size
Fund Inception:
July 31, 2000
Symbols:
| | |
| Class A | | LSRRX |
| Class B | | LSCBX |
| Class C | | LSCCX |
| Class Y | | LISRX |
What You Should Know:
Growth stocks are generally more sensitive to market movements than value stocks. The fund can invest a significant percentage of assets in foreign securities and the value of the fund shares can be adversely affected by changes in currency exchange rates and by political and economic developments. In emerging markets these risks can be significant. Fund shares should be viewed as a long-term investment.
Market Conditions
The domestic stock market moved both up and down during the 12 months ended September 30, 2010. While the dominant trend was up, stock prices dipped sharply in the spring of 2010 amid heightened economic concerns. Then, market sentiment shifted and equity values climbed higher late in the period. These changing trends affected stocks in sectors across the market, although those groups directly affected by changes in financial regulation, healthcare or energy policies tended to lag the market.
Performance Results
For the 12 months ended September 30, 2010, Class A shares of Loomis Sayles Disciplined Equity Fund returned 4.81% at net asset value. The fund underperformed its benchmark, the S&P 500 Index, which rose 10.16% and the average fund in its peer group, the Morningstar Large Growth category, which returned 10.34%.
Explanation of Fund Performance
The fund trailed its benchmark for most of the 12 months, primarily because of poor performance by healthcare and financials holdings. We underestimated the potential impact of political controversies on both groups. Both WellPoint, a healthcare benefits company, and Goldman Sachs, an investment bank, weakened performance and both were sold. In addition, dominant market trends did not favor our stock discipline, which seeks investments in corporations with lower stock valuations. When the equity markets rose, higher-priced stocks with recent positive earnings news tended to be performance leaders. Nevertheless, we retain confidence in our discipline, which relies heavily on fundamental company research. We believe our approach has been successful over the long term.
Goldman Sachs was not the only large financial company to be a major disappointment. Bank of America and JPMorgan Chase declined significantly because of weak loan demand and in reaction to the debate over financial regulation. We sold Bank of America shares but retained an investment in JPMorgan Chase because of its strong capital base and progress in dealing with credit problems. The fund’s relative performance also was held back by lack of exposure to Microsoft for most of the period. Even though increasing competition took its toll on Microsoft’s share price for much of the year, the stock performed well after Microsoft launched the Windows 7 operating system.
Despite the absence of Microsoft, stock selection in the information technology sector, combined with an overweight in the sector, boosted performance. We had a large position in Apple, which continued to profit from innovations in mobile devices such as the iPhone 4 and the iPad. More generally, we emphasized technology companies that could benefit from increasing corporate investments in technology, including data centers. Holdings that did particularly well in this environment included F5 Networks, which enjoyed strong revenue growth from data center spending, and software company Oracle, which benefitted from a rebound in corporate enterprise spending and from improving profit margins. The fund’s industrials holdings also helped, led by engine-maker Cummins, and transportation company CSX, which was sold.
During the year, we began to trade in call options – a form of equity derivatives – to manage risk and generate yield. This tactic had a modest positive influence on fund results.
Outlook
We have a positive view about the equity markets, despite the many potential obstacles that investors could face. Although the domestic economy is growing at a disappointing pace and employment remains a concern, the global economy appears to be expanding at a solid pace, particularly in Asia. We believe that many companies, either directly or indirectly linked to global economic developments, should benefit from this trend. We also believe that volatility in the equity markets has started to diminish. Meanwhile, corporate profits appear to be growing surprisingly well for a period of sluggish growth. Based on historical trends for equity price-to-earnings multiples, we continue to believe stock prices are low relative to earnings and represent an attractive opportunity.
1 |
LOOMIS SAYLES DISCIPLINED EQUITY FUND
Investment Results through September 30, 2010
The charts comparing the fund’s performance to an index provide you with a general sense of how it performed. The fund’s total return for the period shown below appears with and without sales charges and includes fund expenses and fees. An index measures the performance of a theoretical portfolio. Unlike a fund, the index is unmanaged and does not have expenses that affect the results. It is not possible to invest directly in an index. Investors would incur transaction costs and other expenses if they purchased the securities necessary to match the index.
Growth of a $10,000 Investment in Class A Shares1,5
September 30, 2000 through September 30, 2010
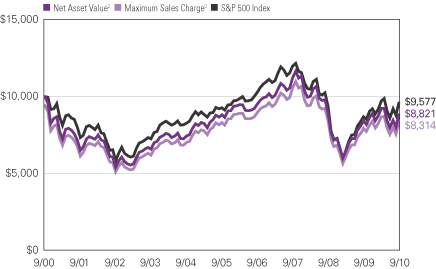
Average Annual Returns — September 30, 20105
| | | | | | | | | | | | |
| | | | |
| | | 1 Year | | | 5 Years | | | 10 Years | |
| | | | |
| Class A (Inception 11/30/01)1 | | | | | | | | | | | | |
| Net Asset Value2 | | | 4.81 | % | | | 0.00 | % | | | -1.25 | % |
| With Maximum Sales Charge3 | | | -1.24 | | | | -1.17 | | | | -1.83 | |
| | | | |
| Class B (Inception 9/12/03)1 | | | | | | | | | | | | |
| Net Asset Value2 | | | 4.09 | | | | -0.76 | | | | -2.03 | |
| With CDSC4 | | | -0.91 | | | | -1.06 | | | | -2.03 | |
| | | | |
| Class C (Inception 9/12/03)1 | | | | | | | | | | | | |
| Net Asset Value2 | | | 3.97 | | | | -0.78 | | | | -2.09 | |
| With CDSC4 | | | 2.97 | | | | -0.78 | | | | -2.09 | |
| | | | |
| Class Y (Inception 7/31/00) | | | | | | | | | | | | |
| Net Asset Value2 | | | 5.08 | | | | 0.31 | | | | -0.94 | |
| | | | |
| Comparative Performance | | | | | | | | | | | | |
| S&P 500 Index | | | 10.16 | | | | 0.64 | | | | -0.43 | |
| Morningstar Large Growth Fund Avg. | | | 10.34 | | | | 1.18 | | | | -2.22 | |
All returns represent past performance and do not guarantee future results. Periods of less than one year are not annualized. Share price and return will vary and you may have a gain or loss when you sell your shares. All results include reinvestment of dividends and capital gains. Current returns may be higher or lower than those shown. For performance current to the most recent month-end, visit ga.natixis.com.
Class Y shares are available to certain investors, as described in the prospectus.
The table and graph do not reflect taxes shareholders might owe on any fund distributions or when they redeem their shares.
| | | | |
| Fund Composition | | % of Net
Assets as of
9/30/10 | |
| Common Stocks | | | 98.9 | |
| Call Options Written | | | (0.3 | ) |
| Short-Term Investments and Other | | | 1.4 | |
| |
| Ten Largest Holdings | | % of Net
Assets as of
9/30/10 | |
| Chevron Corp. | | | 4.9 | |
| Oracle Corp. | | | 4.8 | |
| Apple, Inc. | | | 4.8 | |
| Coca-Cola Enterprises, Inc. | | | 3.7 | |
| JPMorgan Chase & Co. | | | 3.4 | |
| International Business Machines Corp. | | | 3.3 | |
| Cummins, Inc. | | | 3.3 | |
| American Express Co. | | | 3.1 | |
| Parker Hannifin Corp. | | | 3.0 | |
| DIRECTV, Class A | | | 2.8 | |
| |
| Five Largest Industries | | % of Net
Assets as of
9/30/10 | |
| Oil, Gas & Consumable Fuels | | | 7.4 | |
| Computers & Peripherals | | | 7.1 | |
| Pharmaceuticals | | | 7.1 | |
| Machinery | | | 6.3 | |
| Beverages | | | 6.1 | |
Portfolio holdings and asset allocations will vary.
Expense Ratios
as stated in the most recent prospectus
| | | | | | | | |
| Share Class | | Gross Expense Ratio6 | | | Net Expense Ratio7 | |
| A | | | 1.78 | % | | | 1.25 | % |
| B | | | 2.49 | | | | 2.00 | |
| C | | | 2.51 | | | | 2.00 | |
| Y | | | 1.38 | | | | 1.00 | |
NOTES TO CHARTS
| See | page 11 for a description of the indices. |
| 1 | Prior to 9/15/03, performance of Class A shares is that of Retail Class shares, which were redesignated as Class A shares, restated to reflect the sales load of Class A shares. Prior to the inception of Retail Class shares (11/30/01) performance is that of Institutional Class shares, restated to reflect the higher net expenses and sales loads of Class A shares. Prior to the inception of Class B and C shares (9/12/03), performance is that of Institutional Class shares, restated to reflect the higher net expenses and sales loads of Class B and C shares. The fund revised its investment strategies on 10/1/09; performance may have been different had the current investment strategies been in place for all periods shown. |
| 2 | Does not include a sales charge. |
| 3 | Includes maximum sales charge of 5.75%. |
| 4 | Performance for Class B shares assumes a maximum of 5% contingent deferred sales charge (“CDSC”) applied when you sell shares, which declines annually between years 1-6 according to the following schedule: 5, 4, 3, 3, 2, 1, 0%. Class C shares performance assumes a 1% CDSC applied when you sell shares within one year of purchase. |
| 5 | Fund performance has been increased by fee waivers and/or expense reimbursements, if any, without which performance would have been lower. |
| 6 | Before fee waivers and/or expense reimbursements. |
| 7 | After fee waivers and/or expense reimbursements. Waivers/reimbursements are contractual and are set to expire 1/31/11. |
| 2
LOOMIS SAYLES GLOBAL MARKETS FUND
Management Discussion
Managers:
Mark Baribeau, CFA
Dan Fuss, CFA, CIC
Warren Koontz, CFA, CIC
David Rolley, CFA
Loomis, Sayles & Company, L.P.
Objective:
Seeks high total return through a combination of capital appreciation and current income
Strategy:
Invests primarily in equity and fixed-income securities of U.S. and foreign issuers, including securities of issuers located in emerging markets
Fund Inception:
May 1, 1996
Symbols:
| | |
| Class A | | LGMAX |
| Class C | | LGMCX |
| Class Y | | LSWWX |
What You Should Know:
The fund can invest a significant percentage of assets in foreign securities and the value of the fund shares can be adversely affected by changes in currency exchange rates and by political and economic developments. In emerging markets these risks can be significant. The fund can invest a significant percentage of assets in debt securities that are rated below investment grade and the value of fund shares can be adversely affected by changes in economic conditions or other circumstances. In addition, the secondary market for these securities may lack liquidity. Fund shares should be viewed as a long-term investment.
Market Conditions
Early in the year, periodic flare-ups of concern over the possibility of a double-dip recession in the United States and a European sovereign debt crisis may have contributed to short-term volatility and periodic setbacks in both the stock and bond markets. Interest rates remained low. Yields fell on most government bonds, and yield spreads (the difference in yield between high- and low-quality bonds) continued to narrow. Strong growth in the emerging markets of Indonesia, Korea, Singapore and Thailand exceeded growth in developed nations. Currency markets in Japan, the United States and Europe remained choppy. September was a strong month for the global equity markets, capping off a strong quarter and putting to rest some of the uncertainties of the summer months.
Performance Results
For the 12 months ended September 30, 2010, Class A shares of Loomis Sayles Global Markets Fund returned 20.61% at net asset value. The fund outperformed both its primary benchmark, the Morgan Stanley Capital International (MSCI) World Index, which returned 7.31% for the period, and its secondary benchmark, the Citigroup World Government Bond Index, which returned 4.99%. The fund outperformed the average fund in Morningstar’s World Allocation category, which returned 8.40%.
Explanation of Fund Performance
During the first half of the fiscal year, concerns about European sovereign debt caused a widespread shift toward U.S. dollar-based assets and away from both European and Asian equivalents. This was followed by a rebound later in the year. A combination of good security selection, country allocation and a focus on high-yield issues benefited the fund during the complete cycle.
On the equity side of the fund, security selection was the leading driver of performance. Two technology stocks, Baidu and Apple, were among the largest individual contributors. Certain consumer stocks were also beneficial to performance, including Brazilian department store Lojas Renner, video rental company NetFlix and online shopping company Amazon.com. Some of the stocks we selected in the energy and financials sectors trailed the market and detracted from performance.
On the bond side, investments in relatively low-grade issues in the industrial and financial sectors aided results. Specifically, debt holdings of Georgia Pacific, Ally Financial (previously known as GMAC) and Ford Motor led to positive returns on both an absolute and relative basis. Country allocations to Brazil, Indonesia, Mexico and Uruguay also contributed to relative and absolute returns. From a currency perspective, the fund was able to outperform its secondary benchmark because of its relatively small exposure to eurobonds and its preference for U.S. dollar-denominated debt. An underweight in Japanese holdings detracted from returns relative to the fund’s secondary benchmark, as the Japanese yen appreciated versus the U.S. dollar. Also, the fund did not own any commercial mortgage-backed securities during the period, a sector that enjoyed strong gains during the year.
We maintained our focus on shorter maturity, high-yield corporate bonds in an effort to keep yields in the higher ranges until we believe that securities with longer maturities offer better value.
Outlook
We believe that the seesaw returns that have characterized the markets since the lows of March 2009 are likely to continue but with the potential for an overall upward trajectory.
On the equity side, we are currently maintaining the fund’s emphasis on technology, particularly on smart phones, e-commerce, the Internet, LED lighting technology and, more recently, software designed to enhance business productivity. We also continue to focus on the consumer discretionary sector.
On the bond side, we believe the European Central Bank is reducing its balance sheet, sending the euro higher. For the time being, we are maintaining the fund’s non-dollar exposures, and we have been making some reductions in the fund’s bond holdings.
3 |
LOOMIS SAYLES GLOBAL MARKETS FUND
Investment Results through September 30, 2010
The charts comparing the fund’s performance to two indexes provide you with a general sense of how it performed. The fund’s total return for the period shown below appears with and without sales charges and includes fund expenses and fees. An index measures the performance of a theoretical portfolio. Unlike a fund, the index is unmanaged and does not have expenses that affect the results. It is not possible to invest directly in an index. Investors would incur transaction costs and other expenses if they purchased the securities necessary to match the index.
Growth of a $10,000 Investment in Class A Shares1,5
September 30, 2000 through September 30, 2010
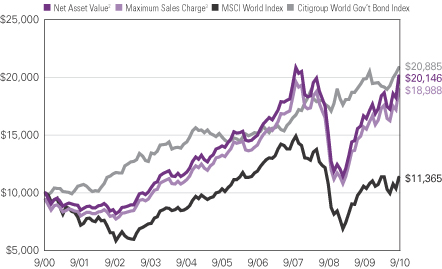
Average Annual Returns — September 30, 20105
| | | | | | | | | | | | |
| | | | |
| | | 1 Year | | | 5 Years | | | 10 Years | |
| | | | |
| Class A (Inception 2/1/06)1 | | | | | | | | | | | | |
| Net Asset Value2 | | | 20.61 | % | | | 7.45 | % | | | 7.25 | % |
| With Maximum Sales Charge3 | | | 13.69 | | | | 6.19 | | | | 6.62 | |
| | | | |
| Class C (Inception 2/1/06)1 | | | | | | | | | | | | |
| Net Asset Value2 | | | 19.79 | | | | 6.67 | | | | 6.46 | |
| With CDSC4 | | | 18.79 | | | | 6.67 | | | | 6.46 | |
| | | | |
| Class Y (Inception 5/1/96) | | | | | | | | | | | | |
| Net Asset Value2 | | | 21.02 | | | | 7.73 | | | | 7.53 | |
| | | | |
| Comparative Performance | | | | | | | | | | | | |
| MSCI World Index | | | 7.31 | | | | 1.85 | | | | 1.29 | |
| Citigroup World Government Bond Index | | | 4.99 | | | | 7.05 | | | | 7.64 | |
| Morningstar World Allocation Fund Avg. | | | 8.40 | | | | 4.20 | | | | 5.84 | |
All returns represent past performance and do not guarantee future results. Periods of less than one year are not annualized. Share price and return will vary and you may have a gain or loss when you sell your shares. All results include reinvestment of dividends and capital gains. Current returns may be higher or lower than those shown. For performance current to the most recent month-end, visit ga.natixis.com.
Class Y shares are available to certain investors, as described in the prospectus.
The table and graph do not reflect taxes shareholders might owe on any fund distributions or when they redeem their shares.
| | | | |
| Fund Composition | | % of Net
Assets as of 9/30/10 | |
| Common Stocks | | | 65.6 | |
| Bonds and Notes | | | 30.5 | |
| Preferred Stock | | | 0.4 | |
| Bank Loans | | | 0.1 | |
| Short-Term Investments and Other | | | 3.4 | |
| Ten Largest Holdings | | % of Net
Assets as of 9/30/10 | |
| Apple, Inc. | | | 4.0 | |
| Standard Chartered PLC | | | 2.5 | |
| Baidu, Inc., Sponsored ADR | | | 2.5 | |
| Daimler AG, (Registered) | | | 2.1 | |
| Siemens AG, (Registered) | | | 1.9 | |
| Natura Cosmeticos SA | | | 1.8 | |
| Lojas Renner SA | | | 1.8 | |
| Jones Lang LaSalle, Inc. | | | 1.7 | |
| Cognizant Technology Solutions Corp., Class A | | | 1.5 | |
| Cathay Pacific Airways Ltd. | | | 1.5 | |
| Five Largest Industries | | % of Net
Assets as of 9/30/10 | |
| Commercial Banks | | | 5.9 | |
| Machinery | | | 5.8 | |
| Computers & Peripherals | | | 5.3 | |
| Personal Products | | | 3.7 | |
| Automobiles | | | 3.4 | |
Portfolio holdings and asset allocations will vary.
Expense Ratios
as stated in the most recent prospectus
| | | | | | | | |
| Share Class | | Gross Expense Ratio6 | | | Net Expense Ratio7 | |
| A | | | 1.34 | % | | | 1.25 | % |
| C | | | 2.09 | | | | 2.00 | |
| Y | | | 1.01 | | | | 1.00 | |
NOTES TO CHARTS
| See | page 11 for a description of the indices. |
| 1 | Prior to the inception of Class A and C shares (2/1/06), performance is that of Institutional Class shares, restated to reflect the higher net expenses and sales loads of Class A and C shares. |
| 2 | Does not include a sales charge. |
| 3 | Includes the maximum sales charge of 5.75%. |
| 4 | Performance for Class C shares assumes a 1% contingent deferred sales charge (“CDSC”) applied when you sell shares within one year of purchase. |
| 5 | Fund performance has been increased by fee waivers and/or expense reimbursements, if any, without which performance would have been lower. |
| 6 | Before fee waivers and/or expense reimbursements. |
| 7 | After fee waivers and/or expense reimbursements. Waivers/reimbursements are contractual and are set to expire 1/31/11. |
| 4
LOOMIS SAYLES GROWTH FUND
Management Discussion
Manager:
Aziz Hamzaogullari, CFA
Loomis, Sayles & Company, L.P.
Objective:
Long-term growth of capital
Strategy:
Invests primarily in equity securities, including common stocks, convertible securities, and warrants; focuses on stocks of large-capitalization companies, but may invest in companies of any size
Fund Inception:
May 16, 1991
Symbols:
| | |
| Class A | | LGRRX |
| Class B | | LGRBX |
| Class C | | LGRCX |
| Class Y | | LSGRX |
What You Should Know:
Growth stocks are generally more sensitive to market movements because their stock prices are based on future expectations. Frequent portfolio turnover may result in increased tax liabilities that will reduce the fund’s overall return. The fund can invest a significant percentage of assets in foreign securities and the value of the fund shares can be adversely affected by changes in currency exchange rates and by political and economic developments. In emerging markets these risks can be significant. Fund shares should be viewed as a long-term investment.
Market Conditions
Stock prices moved higher over the 12 months ended September 30, 2010, despite lingering fears about the sustainability of an economic recovery. The market felt these fears most dramatically in the second quarter of 2010, when equity prices dipped sharply. However, equities recovered to resume their upward trend in the final month of the period. Over the 12-month period, large-cap growth stocks moderately outperformed large-cap value stocks and did better than the overall equity market, as well.
Performance Results
For the 12 months ended September 30, 2010, Class A shares of Loomis Sayles Growth Fund returned 14.73% at net asset value. The fund outperformed its benchmark, the Russell 1000 Growth Index, which rose 12.65%. It also outperformed the average fund in Morningstar’s Large Growth category, which returned 10.34%.
Explanation of Fund Performance
In May, Aziz V. Hamzaogullari, CFA, took over as portfolio manager of the fund. The manager and his team seek to identify attractive growth companies that are selling at significant discounts to intrinsic value, based on fundamental, bottom-up analysis of individual corporations. The fund’s primary focus and strategy remain unchanged: seeking long-term growth of capital through investments in high-quality, large-cap growth companies with competitive advantages and profitable growth.
Strong stock selection was the principal driver of fund results, notably in the information technology, consumer discretionary, industrials and healthcare sectors. Several large-cap technology companies made significant contributions to performance, including: technology innovator Apple, enterprise software provider Oracle, Internet search leader Google and semi-conductor producer Altera. The fund sold Apple during the period, while increasing positions in Oracle and Google and establishing a new position in Altera. In the consumer discretionary sector, Amazon.com and Priceline.com, two leaders in on-line commerce, were notable contributors. The fund sold Priceline.com but increased its investment in Amazon.com. Amazon.com’s brand, scale and cost structure are favorable. The company has a strong business model, is in a healthy financial position and is led by management with a long-term focus and a vested stake in the business. A relatively new position in Expeditors International, a transportation logistics company, also aided performance. Healthcare investments in Biogen, a biotechnology firm; Novartis, a pharmaceutical company and Express Scripts, a pharmacy benefits manager, all supported results. Biogen and Novartis were new positions added during the period, while Express Scripts was sold.
Despite the fund’s solid returns, several individual holdings from various industries held back returns. Notable detractors included: investment bank Goldman Sachs, medical technology corporation Medtronic, data center technology producer Brocade Communications, natural gas company Range Resources and Parker Hannifin, a manufacturer of heavy hydraulic equipment. Medtronic was a new holding, while Goldman Sachs, Brocade, Range Resources and Parker Hannifin were sold during the period. Cisco Systems, a technology investment, was prominent among detractors. Nevertheless the fund added to its position based on Cisco’s strong competitive position in the networking industry, its solid business model with strong financial attributes, growth prospects and its strong management team. We also added to the fund’s position in Microsoft, despite its lagging performance for the period.
Outlook
The fund’s fundamental bottom-up approach has led to overweight positions in healthcare and financials and underweights in the energy, industrials, materials and consumer sectors. Because the fund has a bottom-up focus, the portfolio manager and his team avoid making investment decisions based on other factors, such as the market or the economy. As a result, the fund’s positioning at the end of the period reflects bottom-up stock selection and sector weights that are a byproduct of that approach.
5 |
LOOMIS SAYLES GROWTH FUND
Investment Results through September 30, 2010
The charts comparing the fund’s performance to an index provide you with a general sense of how it performed. The fund’s total return for the period shown below appears with and without sales charges and includes fund expenses and fees. An index measures the performance of a theoretical portfolio. Unlike a fund, the index is unmanaged and does not have expenses that affect the results. It is not possible to invest directly in an index. Investors would incur transaction costs and other expenses if they purchased the securities necessary to match the index.
Growth of a $10,000 Investment in Class A Shares1,5
September 30, 2000 through September 30, 2010
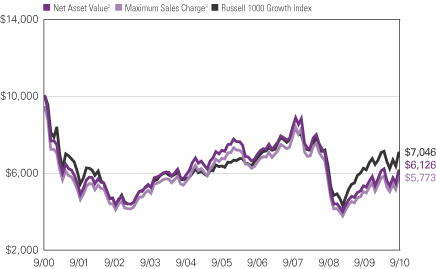
Average Annual Returns — September 30, 20105
| | | | | | | | | | | | |
| | | | |
| | | 1 Year | | | 5 Years | | | 10 Years | |
| | | | |
| Class A (Inception 12/31/96)1 | | | | | | | | | | | | |
| Net Asset Value2 | | | 14.73 | % | | | -3.14 | % | | | -4.78 | % |
| With Maximum Sales Charge3 | | | 8.21 | | | | -4.29 | | | | -5.34 | |
| | | | |
| Class B (Inception 9/12/03)1 | | | | | | | | | | | | |
| Net Asset Value2 | | | 13.79 | | | | -3.89 | | | | -5.51 | |
| With CDSC4 | | | 8.79 | | | | -4.28 | | | | -5.51 | |
| | | | |
| Class C (Inception 9/12/03)1 | | | | | | | | | | | | |
| Net Asset Value2 | | | 13.79 | | | | -3.89 | | | | -5.51 | |
| With CDSC4 | | | 12.79 | | | | -3.89 | | | | -5.51 | |
| | | | |
| Class Y (Inception 5/16/91) | | | | | | | | | | | | |
| Net Asset Value2 | | | 15.01 | | | | -2.77 | | | | -4.48 | |
| | | | |
| Comparative Performance | | | | | | | | | | | | |
| Russell 1000 Growth Index | | | 12.65 | | | | 2.06 | | | | -3.44 | |
| Morningstar Large Growth Fund Avg. | | | 10.34 | | | | 1.18 | | | | -2.22 | |
All returns represent past performance and do not guarantee future results. Periods of less than one year are not annualized. Share price and return will vary and you may have a gain or loss when you sell your shares. All results include reinvestment of dividends and capital gains. Current returns may be higher or lower than those shown. For performance current to the most recent month-end, visit ga.natixis.com.
Class Y shares are available to certain investors, as described in the prospectus.
The table and graph do not reflect taxes shareholders might owe on any fund distributions or when they redeem their shares.
| | | | |
| Fund Composition | | % of Net
Assets as of
9/30/10 | |
| Common Stocks | | | 99.5 | |
| Short-Term Investments and Other | | | 0.5 | |
| |
| Ten Largest Holdings | | % of Net
Assets as of
9/30/10 | |
| Amazon.com, Inc. | | | 7.2 | |
| Google, Inc., Class A | | | 6.6 | |
| Visa, Inc., Class A | | | 6.4 | |
| Oracle Corp. | | | 5.2 | |
| Biogen Idec, Inc. | | | 4.7 | |
| QUALCOMM, Inc. | | | 4.5 | |
| Cisco Systems, Inc. | | | 4.4 | |
| United Parcel Service, Inc., Class B | | | 4.2 | |
| American Express Co. | | | 4.1 | |
| SEI Investments Co. | | | 3.9 | |
| Five Largest Industries | | % of Net
Assets as of
9/30/10 | |
| Software | | | 10.4 | |
| Communications Equipment | | | 8.9 | |
| Internet & Catalog Retail | | | 8.8 | |
| Biotechnology | | | 8.5 | |
| IT Services | | | 7.9 | |
Portfolio holdings and asset allocations will vary.
Expense Ratios
as stated in the most recent prospectus
| | | | | | | | |
| Share Class | | Gross Expense Ratio6 | | | Net Expense Ratio7 | |
| A | | | 1.22 | % | | | 1.22 | % |
| B | | | 1.98 | | | | 1.98 | |
| C | | | 1.98 | | | | 1.98 | |
| Y | | | 0.99 | | | | 0.99 | |
NOTES TO CHARTS
| See | page 11 for a description of the indices. |
| 1 | Prior to 9/15/03, performance of Class A shares is that of Retail Class shares, which were redesignated as Class A shares, restated to reflect the sales load of Class A shares. Prior to the inception of Class B and C shares (9/12/03), performance is that of Institutional Class shares, restated to reflect the higher net expenses and sales loads of Class B and C shares. |
| 2 | Does not include a sales charge. |
| 3 | Includes maximum sales charge of 5.75%. |
| 4 | Performance for Class B shares assumes a maximum of 5% contingent deferred sales charge (“CDSC”) applied when you sell shares, which declines annually between years 1-6 according to the following schedule: 5, 4, 3, 3, 2, 1, 0%. Class C shares performance assumes a 1% CDSC applied when you sell shares within one year of purchase. |
| 5 | Fund performance has been increased by fee waivers and/or expense reimbursements, if any, without which performance would have been lower. |
| 6 | Before fee waivers and/or expense reimbursements. |
| 7 | After fee waivers and/or expense reimbursements. Waivers/reimbursements are contractual and are set to expire 1/31/11. |
| 6
LOOMIS SAYLES MID CAP GROWTH FUND
Management Discussion
Manager:
Philip C. Fine, CFA
Loomis, Sayles & Company, L.P.
Objective:
Long-term growth of capital
Strategy:
Invests primarily in common stocks or other equity securities; focuses on stocks of companies that fall within the capitalization range of the companies included in the Russell Midcap Growth Index.
Fund Inception:
December 31, 1996
Symbols:
| | |
| Class A | | LAGRX |
| Class C | | LSACX |
| Class Y | | LSAIX |
What You Should Know
Small- and mid-cap stocks may be more volatile than larger, more established companies. The secondary market for these stocks may be less liquid, which could adversely impact the fund’s value. Growth funds involve increased risks, in part, because the value of the underlying securities is based on future expectations that may or may not be met. The fund can invest a significant percentage of assets in foreign securities and the value of the fund shares can be adversely affected by changes in currency exchange rates and by political and economic developments. In emerging markets these risks can be significant. The fund is subject to currency decline. Fund shares should be viewed as a long-term investment.
Market Conditions
During the 12-month period ended September 30, 2010, market risk seemed to have been governed by an “on/off” switch. When the risk switch was “on,” money flowed into materials, industrials and other sectors that respond to economic recoveries. However, when it shifted to “off,” money diverted into U.S. Treasuries, staples and other, lower-risk market areas.
Performance Results
For the 12-month period ended September 30, 2010, Class A shares of Loomis Sayles Mid Cap Growth Fund returned 29.91% at net asset value. The fund outperformed its benchmark, the Russell Midcap Growth Index, which returned 18.27% and also the 15.98% return of the average fund in Morningstar’s Mid-Cap Growth category.
Explanation of Fund Performance
The fund outperformed both its benchmark and peer group of mutual funds, primarily as a result of strong stock selection. The technology and consumer discretionary stocks we selected made the largest positive contributions to the fund’s absolute and relative performance.
Strong performers included F5, NetFlix and Baidu. F5 provides networking products, such as switches, routers and security software. The leading provider of movie rentals in the United States, NetFlix offers DVDs by mail and through streaming video to other devices. Baidu, the leading Chinese language Internet search platform, continues to exceed analyst expectations as it consolidates market share gained after Google left the Chinese market.
Consumer staples and financial services were among the weakest sectors for the fund for the period. Weakness in staples was primarily due to two specific stocks: TreeHouse Foods, which reported a disappointing quarter, and Whole Foods, where concerns focused on decelerating earnings. Both stocks were sold. In financial services, the weakness was broader based.
Other disappointments included Marvell Technology Group, Brigham Exploration, and Alpha Natural Resources, all of which were sold during the period. In all three cases, losses occurred during the market sell-off in May and June. Semiconductor company Marvell declined due to concerns about weakness in the PC supply chain and an inventory glut in hard disk drives. Brigham is an exploration and production company with substantial acreage in the United States. Shortly after we purchased Brigham, oil prices corrected sharply, and our stop-loss discipline forced us to sell the stock. Alpha is one of America’s largest producers of metallurgical and thermal coal. Lower prices for both commodities caused the stock to sell off.
During the first quarter, we reduced the fund’s exposure to materials when we noted early indications of a tightening of monetary policy in China that could affect demand for commodities. Increased evidence of an impending global economic slowdown prompted us to further tone down risk in the second quarter. In the third quarter, we focused on “balancing” the portfolio so it could perform reasonably well in both up and down markets.
The fund used derivatives, primarily “put spreads” and “put spread collars,” to hedge against several stocks that were large positions in the fund, had run up fairly high and, as such, represented a risk to the fund. In most cases, these stocks continued to appreciate and the hedges were a drag on performance for the period.
Outlook
We have a positive view on the equity markets, despite the many potential obstacles that investors could face. Although the domestic economy is growing at a disappointing pace and employment remains a concern, the global economy appears to be expanding at a solid pace, particularly in Asia. We believe that many companies, either directly or indirectly linked to global economic developments, should benefit from this trend. We also believe that volatility in the equity markets has started to diminish. Meanwhile, corporate profits appear to be growing surprisingly well for a period of sluggish growth. Based on historical trends for equity price-to-earnings multiples, we continue to believe that stock prices are low relative to earnings and represent an attractive opportunity.
7 |
LOOMIS SAYLES MID CAP GROWTH FUND
Investment Results through September 30, 2010
The charts comparing the fund’s performance to an index provide you with a general sense of how it performed. The fund’s total return for the period shown below appears with and without sales charges and includes fund expenses and fees. An index measures the performance of a theoretical portfolio. Unlike a fund, the index is unmanaged and does not have expenses that affect the results. It is not possible to invest directly in an index. Investors would incur transaction costs and other expenses if they purchased the securities necessary to match the index.
Growth of a $10,000 Investment in Class A Shares1,5
September 30, 2000 through September 30, 2010
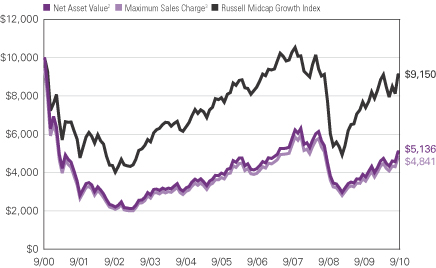
Average Annual Returns — September 30, 20105
| | | | | | | | | | | | |
| | | | |
| | | 1 Year | | | 5 Years | | | 10 Years | |
| | | | |
| Class A (Inception 12/31/96)1 | | | | | | | | | | | | |
| Net Asset Value2 | | | 29.91 | % | | | 4.98 | % | | | -6.45 | % |
| With Maximum Sales Charge3 | | | 22.41 | | | | 3.75 | | | | -7.00 | |
| | | | |
| Class C (Inception 2/2/09)1 | | | | | | | | | | | | |
| Net Asset Value2 | | | 28.96 | | | | 4.16 | | | | -7.19 | |
| With CDSC4 | | | 27.96 | | | | 4.16 | | | | -7.19 | |
| | | | |
| Class Y (Inception 12/31/96) | | | | | | | | | | | | |
| Net Asset Value2 | | | 30.20 | | | | 5.24 | | | | -6.20 | |
| | | | |
| Comparative Performance | | | | | | | | | | | | |
| Russell Midcap Growth Index | | | 18.27 | | | | 2.86 | | | | -0.88 | |
| Morningstar Mid-Cap Growth Avg. | | | 15.98 | | | | 2.50 | | | | 0.05 | |
All returns represent past performance and do not guarantee future results. Periods of less than one year are not annualized. Share price and return will vary and you may have a gain or loss when you sell your shares. All results include reinvestment of dividends and capital gains. Current returns may be higher or lower than those shown. For performance current to the most recent month-end, visit ga.natixis.com.
Class Y shares are available to certain investors, as described in the prospectus.
The table and graph do not reflect taxes shareholders might owe on any fund distributions or when they redeem their shares.
| | | | |
| Fund Composition | | % of Net
Assets as of
9/30/10 | |
| Common Stocks | | | 102.2 | |
| Put Options | | | 0.4 | |
| Call Options Written | | | (0.1 | ) |
| Put Options Written | | | (0.1 | ) |
| Short-Term Investments and Other | | | (2.4 | ) |
| |
| Ten Largest Holdings | | % of Net
Assets as of
9/30/10 | |
| NetFlix, Inc. | | | 3.9 | |
| F5 Networks, Inc. | | | 3.7 | |
| Baidu, Inc., Sponsored ADR | | | 3.7 | |
| Cummins, Inc. | | | 3.2 | |
| Salesforce.com, Inc. | | | 3.0 | |
| Ivanhoe Mines Ltd. | | | 2.8 | |
| Concho Resources, Inc. | | | 2.8 | |
| NetApp, Inc. | | | 2.7 | |
| Cognizant Technology Solutions Corp., Class A | | | 2.6 | |
| Eldorado Gold Corp. | | | 2.5 | |
| Five Largest Industries | | % of Net
Assets as of
9/30/10 | |
| Metals & Mining | | | 10.0 | |
| Software | | | 9.3 | |
| Internet Software & Services | | | 8.0 | |
| Communications Equipment | | | 7.5 | |
| Hotels, Restaurants & Leisure | | | 6.3 | |
Portfolio holdings and asset allocations will vary.
Expense Ratios
as stated in the most recent prospectus
| | | | | | | | |
| Share Class | | Gross Expense Ratio6 | | | Net Expense Ratio7 | |
| A | | | 1.49 | % | | | 1.25 | % |
| C | | | 2.31 | | | | 2.00 | |
| Y | | | 1.24 | | | | 1.00 | |
NOTES TO CHARTS
| See | page 11 for a description of the indices. |
| 1 | Prior to 2/1/09, performance of Class A shares is that of Retail Class shares, which were redesignated as Class A shares, restated to reflect the sales load of Class A shares. Prior to the inception of Class C shares (2/2/09), performance is that of Retail Class shares, restated to reflect the higher net expenses and sales loads of Class C shares. The fund revised its investment strategies on 2/1/07; performance may have been different had the current strategies been in place for all periods shown. |
| 2 | Does not include a sales charge. |
| 3 | Includes maximum sales charge of 5.75%. |
| 4 | Class C shares performance assumes a 1% CDSC applied when you sell shares within one year of purchase. |
| 5 | Fund performance has been increased by fee waivers and/or expense reimbursements, if any, without which performance would have been lower. |
| 6 | Before fee waivers and/or expense reimbursements. |
| 7 | After fee waivers and/or expense reimbursements. Waivers/reimbursements are contractual and are set to expire 1/31/11. |
| 8
LOOMIS SAYLES VALUE FUND
Management Discussion
Managers:
Arthur Barry, CFA
James L. Carroll, CFA
Warren N. Koontz, CFA, CIC
Loomis, Sayles & Company, L.P.
Objective:
Long-term growth of capital and income
Strategy:
Invests primarily in equity securities, including common stocks, convertible securities, and warrants.
Fund Inception:
May 13, 1991
Symbols:
| | |
| Class A | | LSVRX |
| Class B | | LSVBX |
| Class C | | LSCVX |
| Class Y | | LSGIX |
| Admin Class | | LSAVX |
What You Should Know:
While the fund offers potential for long-term capital growth, it invests in value stocks, which can fall out of favor with investors and may underperform growth stocks during certain market conditions. The fund can invest a significant percentage of assets in foreign securities and the value of the fund shares can be adversely affected by changes in currency exchange rates and by political and economic developments. In emerging markets these risks can be significant. Fund shares should be viewed as a long-term investment.
Market Conditions
After a long, spectacular rally dating back to last year, stocks weakened in the spring of 2010 amid troubling developments that included slowing growth in China, the Gulf oil spill, and the risk of debt defaults by some European nations. As these concerns began to abate, stocks rallied on prospects for continued corporate earnings growth in a stabilizing economy.
Performance Results
For the 12 months ended September 30, 2010, Class A shares of Loomis Sayles Value Fund returned 3.03% at net asset value. The fund’s return was lower than the return of its benchmark and peer group. The fund’s benchmark, the Russell 1000 Value Index, returned 8.90%. The average return of funds in Morningstar’s Large Value category was 8.02%.
Explanation of Fund Performance
The market’s focus on broad-based events caused equities to move in groups, diluting the impact of bottom-up stock analysis as stocks responded to market trends rather than company-specific factors. In addition, the securities that led the benchmark’s performance tended to be lower-quality companies that lie outside the fund’s primary focus. In this environment, many sectors underperformed the benchmark. Stock selection in healthcare and producer durables and an underweight in utilities hampered returns. We sold stent-maker Boston Scientific as it sought to overcome the effects of a major product recall. As international steelmaker ArcelorMittal shares turned volatile in response to a sovereign debt crisis in Europe, we also eliminated this holding. Finally, we sold the fund’s small stake in Anadarko Petroleum when prices rebounded from the Gulf oil spill, reducing exposure to the energy sector. We used proceeds from these sales to purchase stocks with greater appeal.
On a positive note, an underweight in the weak financial sector was a modest benefit to comparative returns. Contributors included Berkshire Hathaway and Ameriprise Financial. Ameriprise rose thanks to improved margins and an expanding client base. The absence of laggard Goldman Sachs from the portfolio also benefited relative results. In technology, Oracle moved higher as businesses displayed renewed willingness to invest in enterprise systems. Oracle has also experienced a positive impact from its acquisition of Sun Microsystems much sooner than it expected. DirectTV also moved sharply higher, thanks to strong earnings, rapid growth in Latin America and a financial restructuring that appears favorable to shareholders. Estee Lauder shares continued to reflect an improving top-line outlook along with the potential for expanding margins, while insurer UnitedHealth Group reported strong earnings and boosted its profit projections.
Outlook
We have a positive view on the equity markets, despite the many potential obstacles that investors could face. Although the domestic economy is growing at a disappointing pace and employment remains a concern, the global economy appears to be expanding at a solid pace, particularly in Asia. We believe that many companies, either directly or indirectly linked to global economic developments, should benefit from this trend. We also believe that volatility in the equity markets has started to diminish. Meanwhile, corporate profits appear to be growing surprisingly well for a period of sluggish growth. Based on historical trends for equity price-to-earnings multiples, we continue to believe that stock prices are low relative to earnings and represent an attractive opportunity.
9 |
LOOMIS SAYLES VALUE FUND
Investment Results through September 30, 2010
The charts comparing the fund’s performance to an index provide you with a general sense of how it performed. The fund’s total return for the period shown below appears with and without sales charges and includes fund expenses and fees. An index measures the performance of a theoretical portfolio. Unlike a fund, the index is unmanaged and does not have expenses that affect the results. It is not possible to invest directly in an index. Investors would incur transaction costs and other expenses if they purchased the securities necessary to match the index.
Growth of a $10,000 Investment in Class A Shares1,5
September 30, 2000 through September 30, 2010
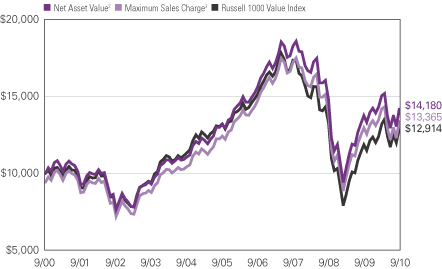
Average Annual Returns — September 30, 20105
| | | | | | | | | | | | |
| | | | |
| | | 1 Year | | | 5 Years | | | 10 Years | |
| | | | |
| Class A (Inception 6/30/06)1 | | | | | | | | | | | | |
| Net Asset Value2 | | | 3.03 | % | | | 1.47 | % | | | 3.56 | % |
| With Maximum Sales Charge3 | | | -2.88 | | | | 0.28 | | | | 2.94 | |
| | | | |
| Class B (Inception 6/1/07)1 | | | | | | | | | | | | |
| Net Asset Value2 | | | 2.26 | | | | 0.66 | | | | 2.66 | |
| With CDSC4 | | | -2.74 | | | | 0.32 | | | | 2.66 | |
| | | | |
| Class C (Inception 6/1/07)1 | | | | | | | | | | | | |
| Net Asset Value2 | | | 2.20 | | | | 0.67 | | | | 2.66 | |
| With CDSC4 | | | 1.20 | | | | 0.67 | | | | 2.66 | |
| | | | |
| Class Y (Inception 5/13/91) | | | | | | | | | | | | |
| Net Asset Value2 | | | 3.28 | | | | 1.80 | | | | 3.86 | |
| | | | |
| Admin Class (Inception 2/1/10)1 | | | | | | | | | | | | |
| Net Asset Value2 | | | 2.73 | | | | 1.17 | | | | 3.26 | |
| | | | |
| Comparative Performance | | | | | | | | | | | | |
| Russell 1000 Value Index | | | 8.90 | | | | -0.48 | | | | 2.59 | |
| Morningstar Large Value Fund Avg. | | | 8.02 | | | | -0.28 | | | | 2.47 | |
All returns represent past performance and do not guarantee future results. Periods of less than one year are not annualized. Share price and return will vary and you may have a gain or loss when you sell your shares. All results include reinvestment of dividends and capital gains. Current returns may be higher or lower than those shown. For performance current to the most recent month-end, visit ga.natixis.com.
Class Y shares are available to certain investors, as described in the prospectus.
The table and graph do not reflect taxes shareholders might owe on any fund distributions or when they redeem their shares.
| | | | |
| Fund Composition | | % of Net
Assets as of
9/30/10 | |
| Common Stocks | | | 97.4 | |
| Short-Term Investments and Other | | | 2.6 | |
| Ten Largest Holdings | | % of Net
Assets as of
9/30/10 | |
| General Electric Co. | | | 2.8 | |
| JPMorgan Chase & Co. | | | 2.7 | |
| ExxonMobil Corp. | | | 2.5 | |
| Oracle Corp. | | | 2.2 | |
| Total SA, Sponsored ADR | | | 2.1 | |
| Bank of America Corp. | | | 2.1 | |
| Schlumberger Ltd. | | | 1.9 | |
| Ameriprise Financial, Inc. | | | 1.8 | |
| Coca-Cola Enterprises, Inc. | | | 1.8 | |
| Wells Fargo & Co. | | | 1.8 | |
| Five Largest Industries | | % of Net
Assets as of
9/30/10 | |
| Oil, Gas & Consumable Fuels | | | 10.3 | |
| Pharmaceuticals | | | 7.2 | |
| Media | | | 6.5 | |
| Diversified Financial Services | | | 6.2 | |
| Capital Markets | | | 5.8 | |
Portfolio holdings and asset allocations will vary.
Expense Ratios
as stated in the most recent prospectus
| | | | | | | | |
| Share Class | | Gross Expense Ratio6 | | | Net Expense Ratio7 | |
| A | | | 1.06 | % | | | 1.06 | % |
| B | | | 1.81 | | | | 1.81 | |
| C | | | 1.81 | | | | 1.81 | |
| Y | | | 0.66 | | | | 0.66 | |
| Admin | | | 1.22 | | | | 1.22 | |
NOTES TO CHARTS
| See | page 11 for a description of the indices. |
| 1 | Prior to 6/1/07, performance of Class A shares is that of Retail Class shares, which were redesignated as Class A shares, restated to reflect the sales load of Class A shares. Prior to the inception of Retail Class shares (6/30/06), performance is that of Institutional Class shares, restated to reflect the higher net expenses and sales loads of Class A shares. Prior to the inception of Class B and C shares (6/1/07), performance is that of Institutional Class shares, restated to reflect the higher net expenses and sales loads of Class B and C shares. Prior to the inception of Admin Class shares (2/1/10), performance is that of Class A shares, restated to reflect the higher net expenses of Admin Class shares. |
| 2 | Does not include a sales charge. |
| 3 | Includes maximum sales charge of 5.75%. |
| 4 | Performance for Class B shares assumes a maximum of 5% contingent deferred sales charge (“CDSC”) applied when you sell shares, which declines annually between years 1-6 according to the following schedule: 5, 4, 3, 3, 2, 1, 0%. Class C shares performance assumes a 1% CDSC applied when you sell shares within one year of purchase. |
| 5 | Fund performance has been increased by fee waivers and/or expense reimbursements, if any, without which performance would have been lower. |
| 6 | Before fee waivers and/or expense reimbursements. |
| 7 | After fee waivers and/or expense reimbursements. Waivers/reimbursements are contractual and are set to expire 1/31/11. |
| 10
ADDITIONAL INFORMATION
The views expressed in this report reflect those of the portfolio managers as of the dates indicated. The managers’ views are subject to change at any time without notice based on changes in market or other conditions. References to specific securities or industries should not be regarded as investment advice. Because these funds are actively managed, there is no assurance that they will continue to invest in the securities or industries mentioned.
Before investing, consider the fund’s investment objectives, risks, charges and expenses. Visit ga.natixis.com or call 800-225-5478 for a prospectus and/or a summary prospectus, both of which contain this and other information. Read it carefully.
INDEX/AVERAGE DESCRIPTIONS:
Citigroup World Government Bond Index is an unmanaged index that includes the most significant and liquid government bond markets globally that carry at least an investment-grade rating.
MSCI World Index is an unmanaged index that is designed to measure the equity market performance of developed markets.
Russell 1000 Growth Index is an unmanaged index that measures the performance of the large-cap growth segment of the U.S. equity universe. It includes those Russell 1000 companies with higher price-to-book ratios and higher forecasted growth values.
Russell 1000 Value Index is an unmanaged index that measures the performance of the large-cap value segment of the U.S. equity universe. It includes those Russell 1000 companies with lower price-to-book ratios and lower expected growth values.
Russell Midcap Growth Index is an unmanaged index that measures the performance of the mid-cap growth segment of the U.S. equity universe. It includes those Russell Midcap Index companies with higher price-to-book ratios and higher forecasted growth values.
Standard & Poor’s 500 Index (“S&P 500”) is a widely recognized measure of U.S. stock market performance. It is an unmanaged index of 500 common stocks chosen for market size, liquidity, and industry group representation, among other factors.
Morningstar Fund Averages are the average performance without sales charges of funds with similar investment objectives, as calculated by Morningstar, Inc.
PROXY VOTING INFORMATION
A description of the funds’ proxy voting policies and procedures is available without charge, upon request, by calling Natixis Funds at 800-225-5478; on the funds’ website at ga.natixis.com; and on the Securities and Exchange Commission’s website at www.sec.gov. Information regarding how the funds voted proxies relating to portfolio securities during the 12-month period ended June 30, 2010 is available from the funds’ website and the SEC’s website.
QUARTERLY PORTFOLIO SCHEDULES
The funds will file a complete schedule of portfolio holdings with the SEC for the first and third quarters of each fiscal year on Form N-Q. The funds’ Forms N-Q are available on the SEC’s website at www.sec.gov and may be reviewed and copied at the SEC’s Public Reference Room in Washington, DC. Information on the operation of the Public Reference Room may be obtained by calling
1-800-SEC-0330.
11 |
UNDERSTANDING FUND EXPENSES
As a mutual fund shareholder, you incur different types of costs: transaction costs, including sales charges (loads) on purchases and contingent deferred sales charges on redemptions, and ongoing costs, including management fees, distribution and/or service fees (12b-1 fees), and other fund expenses. In addition, each fund may assess a minimum balance fee of $20 on an annual basis for accounts that fall below the required minimum to establish an account (certain exceptions may apply). These costs are described in more detail in the funds’ prospectus. The examples below are intended to help you understand the ongoing costs of investing in the funds and help you compare these with the ongoing costs of investing in other mutual funds.
The first line in the table for each class shows the actual amount of fund expenses you would have paid on a $1,000 investment in the fund from April 1, 2010 through September 30, 2010. It also shows how much a $1,000 investment would be worth at the close of the period, assuming actual fund returns and expenses. To estimate the expenses you paid over the period, simply divide your account value by $1,000 (for example, $8,600 account value divided by $1,000 = 8.6) and multiply the result by the number in the
Expenses Paid During the Period row as shown below for your class.
The second line in the table for each class provides information about hypothetical account values and hypothetical expenses based on the fund’s actual expense ratios and an assumed rate of return of 5% per year before expenses, which is not the fund’s actual return. The hypothetical account values and expenses may not be used to estimate the actual ending account balance or expenses you paid on your investment for the period. You may use this information to compare the ongoing costs of investing in the fund and other funds. To do so, compare this 5% hypothetical example with the 5% hypothetical examples that appear in the shareholder reports of the other funds.
Please note that the expenses shown reflect ongoing costs only, and do not include any transaction costs. Therefore, the second line in the table of each fund is useful in comparing ongoing costs only, and will not help you determine the relative costs of owning different funds. If transaction costs were included, total costs would be higher.
| | | | | | | | | | | | |
| LOOMIS SAYLES DISCIPLINED EQUITY FUND | | BEGINNING ACCOUNT VALUE
4/1/2010 | | | ENDING ACCOUNT VALUE
9/30/2010 | | | EXPENSES PAID DURING PERIOD*
4/1/2010 – 9/30/2010 | |
Class A | | | | | | | | | | | | |
Actual | | $ | 1,000.00 | | | $ | 956.50 | | | $ | 6.13 | |
Hypothetical (5% return before expenses) | | $ | 1,000.00 | | | $ | 1,018.80 | | | $ | 6.33 | |
Class B | | | | | | | | | | | | |
Actual | | $ | 1,000.00 | | | $ | 953.90 | | | $ | 9.80 | |
Hypothetical (5% return before expenses) | | $ | 1,000.00 | | | $ | 1,015.04 | | | $ | 10.10 | |
Class C | | | | | | | | | | | | |
Actual | | $ | 1,000.00 | | | $ | 953.40 | | | $ | 9.79 | |
Hypothetical (5% return before expenses) | | $ | 1,000.00 | | | $ | 1,015.04 | | | $ | 10.10 | |
Class Y | | | | | | | | | | | | |
Actual | | $ | 1,000.00 | | | $ | 956.80 | | | $ | 4.91 | |
Hypothetical (5% return before expenses) | | $ | 1,000.00 | | | $ | 1,020.05 | | | $ | 5.06 | |
| * | Expenses are equal to the Fund’s annualized expense ratio (after waiver/reimbursement): 1.25%, 2.00%, 2.00% and 1.00%, for Class A, B, C and Y, respectively, multiplied by the average account value over the period, multiplied by the number of days in the most recent fiscal half-year, divided by 365 (to reflect the half-year period). |
| 12
UNDERSTANDING FUND EXPENSES
| | | | | | | | | | | | |
| LOOMIS SAYLES GLOBAL MARKETS FUND | | BEGINNING ACCOUNT VALUE 4/1/2010 | | | ENDING ACCOUNT VALUE 9/30/2010 | | | EXPENSES PAID DURING PERIOD* 4/1/2010 – 9/30/2010 | |
Class A | | | | | | | | | | | | |
Actual | | $ | 1,000.00 | | | $ | 1,093.60 | | | $ | 6.56 | |
Hypothetical (5% return before expenses) | | $ | 1,000.00 | | | $ | 1,018.80 | | | $ | 6.33 | |
Class C | | | | | | | | | | | | |
Actual | | $ | 1,000.00 | | | $ | 1,089.60 | | | $ | 10.48 | |
Hypothetical (5% return before expenses) | | $ | 1,000.00 | | | $ | 1,015.04 | | | $ | 10.10 | |
Class Y | | | | | | | | | | | | |
Actual | | $ | 1,000.00 | | | $ | 1,095.60 | | | $ | 5.25 | |
Hypothetical (5% return before expenses) | | $ | 1,000.00 | | | $ | 1,020.05 | | | $ | 5.06 | |
| * | Expenses are equal to the Fund’s annualized expense ratio (after waiver/reimbursement): 1.25%, 2.00% and 1.00%, for Class A, C and Y, respectively, multiplied by the average account value over the period multiplied by the number of days in the most recent fiscal half-year, divided by 365 (to reflect the half-year period). |
| | | | | | | | | | | | |
| LOOMIS SAYLES GROWTH FUND | | BEGINNING ACCOUNT VALUE
4/1/2010 | | | ENDING ACCOUNT VALUE
9/30/2010 | | | EXPENSES PAID DURING PERIOD*
4/1/2010 – 9/30/2010 | |
Class A | | | | | | | | | | | | |
Actual | | $ | 1,000.00 | | | $ | 1,001.90 | | | $ | 6.17 | |
Hypothetical (5% return before expenses) | | $ | 1,000.00 | | | $ | 1,018.90 | | | $ | 6.23 | |
Class B | | | | | | | | | | | | |
Actual | | $ | 1,000.00 | | | $ | 998.00 | | | $ | 9.92 | |
Hypothetical (5% return before expenses) | | $ | 1,000.00 | | | $ | 1,015.14 | | | $ | 10.00 | |
Class C | | | | | | | | | | | | |
Actual | | $ | 1,000.00 | | | $ | 995.90 | | | $ | 9.86 | |
Hypothetical (5% return before expenses) | | $ | 1,000.00 | | | $ | 1,015.19 | | | $ | 9.95 | |
Class Y | | | | | | | | | | | | |
Actual | | $ | 1,000.00 | | | $ | 1,003.70 | | | $ | 4.92 | |
Hypothetical (5% return before expenses) | | $ | 1,000.00 | | | $ | 1,020.16 | | | $ | 4.96 | |
| * | Expenses are equal to the Fund’s annualized expense ratio: 1.23%, 1.98%, 1.97% and 0.98%, for Class A, B, C and Y, respectively, multiplied by the average account value over the period, multiplied by the number of days in the most recent fiscal half-year, divided by 365 (to reflect the half-year period). |
13 |
UNDERSTANDING FUND EXPENSES
| | | | | | | | | | | | |
| LOOMIS SAYLES MID CAP GROWTH FUND | | BEGINNING ACCOUNT VALUE
4/1/2010 | | | ENDING ACCOUNT VALUE
9/30/2010 | | | EXPENSES PAID DURING PERIOD*
4/1/2010 – 9/30/2010 | |
Class A | | | | | | | | | | | | |
Actual | | $ | 1,000.00 | | | $ | 1,102.00 | | | $ | 6.59 | |
Hypothetical (5% return before expenses) | | $ | 1,000.00 | | | $ | 1,018.80 | | | $ | 6.33 | |
Class C | | | | | | | | | | | | |
Actual | | $ | 1,000.00 | | | $ | 1,097.80 | | | $ | 10.52 | |
Hypothetical (5% return before expenses) | | $ | 1,000.00 | | | $ | 1,015.04 | | | $ | 10.10 | |
Class Y | | | | | | | | | | | | |
Actual | | $ | 1,000.00 | | | $ | 1,103.00 | | | $ | 5.27 | |
Hypothetical (5% return before expenses) | | $ | 1,000.00 | | | $ | 1,020.05 | | | $ | 5.06 | |
| * | Expenses are equal to the Fund’s annualized expense ratio (after waiver/reimbursement): 1.25%, 2.00% and 1.00%, for Class A, C and Y, respectively, multiplied by the average account value over the period, multiplied by the number of days in the most recent fiscal half-year, divided by 365 (to reflect the half-year period). |
| | | | | | | | | | | | |
| LOOMIS SAYLES VALUE FUND | | BEGINNING ACCOUNT VALUE
4/1/2010 | | | ENDING ACCOUNT VALUE
9/30/2010 | | | EXPENSES PAID DURING PERIOD*
4/1/2010 – 9/30/2010 | |
Class A | | | | | | | | | | | | |
Actual | | $ | 1,000.00 | | | $ | 941.60 | | | $ | 4.77 | |
Hypothetical (5% return before expenses) | | $ | 1,000.00 | | | $ | 1,020.16 | | | $ | 4.96 | |
Class B | | | | | | | | | | | | |
Actual | | $ | 1,000.00 | | | $ | 937.90 | | | $ | 8.40 | |
Hypothetical (5% return before expenses) | | $ | 1,000.00 | | | $ | 1,016.39 | | | $ | 8.74 | |
Class C | | | | | | | | | | | | |
Actual | | $ | 1,000.00 | | | $ | 937.80 | | | $ | 8.40 | |
Hypothetical (5% return before expenses) | | $ | 1,000.00 | | | $ | 1,016.39 | | | $ | 8.74 | |
Class Y | | | | | | | | | | | | |
Actual | | $ | 1,000.00 | | | $ | 942.80 | | | $ | 3.56 | |
Hypothetical (5% return before expenses) | | $ | 1,000.00 | | | $ | 1,021.41 | | | $ | 3.70 | |
Admin Class | | | | | | | | | | | | |
Actual | | $ | 1,000.00 | | | $ | 939.90 | | | $ | 6.18 | |
Hypothetical (5% return before expenses) | | $ | 1,000.00 | | | $ | 1,018.70 | | | $ | 6.43 | |
| * | Expenses are equal to the Fund’s annualized expense ratio: 0.98%, 1.73%, 1.73%, 0.73% and 1.27%, for Class A, B, C, Y and Admin Class, respectively, multiplied by the average account value over the period, multiplied by the number of days in the most recent fiscal half-year, divided by 365 (to reflect the half-year period). |
| 14
BOARD APPROVAL OF THE EXISTING ADVISORY AGREEMENTS
The Board of Trustees, including the Independent Trustees, considers matters bearing on each Fund’s advisory agreement (collectively, the “Agreements”) at most of its meetings throughout the year. Each year, usually in the spring, the Contract Review and Governance Committee of the Board meets to review the Agreements to determine whether to recommend that the full Board approve the continuation of the Agreements, typically for an additional one-year period. After the Committee has made its recommendation, the full Board, including the Independent Trustees, determines whether to approve the continuation of the Agreements.
In connection with these meetings, the Trustees receive materials that the Funds’ investment adviser (the “Adviser”) believes to be reasonably necessary for the Trustees to evaluate the Agreements. These materials generally include, among other items, (i) information on the investment performance of the Funds and the performance of peer groups of funds and the Funds’ performance benchmarks, (ii) information on the Funds’ advisory fees and other expenses, including information comparing the Funds’ expenses to the fees charged to institutional accounts with similar strategies managed by the Adviser and to those of peer groups of funds and information about any applicable expense caps and fee “breakpoints,” (iii) sales and redemption data in respect of the Funds, (iv) information about the profitability of the Agreements to the Adviser and (v) information obtained through the completion of a questionnaire by the Adviser (the Trustees are consulted as to the information requested through that questionnaire). The Board of Trustees, including the Independent Trustees, also consider other matters such as (i) the Adviser’s financial results and financial condition, (ii) each Fund’s investment objective and strategies and the size, education and experience of the Adviser’s investment staff and its use of technology, external research and trading cost measurement tools, (iii) arrangements in respect of the distribution of the Funds’ shares and the related costs, (iv) the procedures employed to determine the value of the Funds’ assets, (v) the allocation of the Funds’ brokerage, if any, including, if applicable, allocations to brokers affiliated with the Adviser and the use of “soft” commission dollars to pay Fund expenses and to pay for research and other similar services, (vi) the resources devoted to, and the record of compliance with, the Funds’ investment policies and restrictions, policies on personal securities transactions and other compliance policies, (vii) information about amounts invested by the Funds’ portfolio managers in the Funds or in similar accounts that they manage and (viii) the general economic outlook with particular emphasis on the mutual fund industry. Throughout the process, the Trustees are afforded the opportunity to ask questions of and request additional materials from the Adviser.
In addition to the materials requested by the Trustees in connection with their annual consideration of the continuation of the Agreements, the Trustees receive materials in advance of each regular quarterly meeting of the Board of Trustees that provide detailed information about the Funds’ investment performance and the fees charged to the Funds for advisory and other services. This information generally includes, among other things, an internal performance rating for each Fund based on agreed-upon criteria, graphs showing each Fund’s performance and fee differentials against each Fund’s peer group of funds, performance ratings provided by a third-party, total return information for various periods, and third-party performance rankings for various periods comparing a Fund against its peer group. The portfolio management team for each Fund or other representatives of the Adviser make periodic presentations to the Contract Review and Governance Committee and/or the full Board of Trustees, and Funds identified as presenting possible performance concerns may be subject to more frequent board presentations and reviews. In addition, each quarter the Trustees are provided with detailed statistical information about each Fund’s portfolio. The Trustees also receive periodic updates between meetings.
The Board of Trustees most recently approved the continuation of the Agreements at their meeting held in June 2010. The Agreements were continued for a one-year period for the Funds. In considering whether to approve the continuation of the Agreements, the Board of Trustees, including the Independent Trustees, did not identify any single factor as determinative. Individual Trustees may have evaluated the information presented differently from one another, giving different weights to various factors. Matters considered by the Trustees, including the Independent Trustees, in connection with their approval of the Agreements included, but were not limited to, the factors listed below.
The nature, extent and quality of the services provided to the Funds under the Agreements. The Trustees considered the nature, extent and quality of the services provided by the Adviser and its affiliates to the Funds and the resources dedicated to the Funds by the Adviser and its affiliates, including recent or planned investments by the Adviser in additional personnel or other resources.
For each Fund, the Trustees also considered the benefits to shareholders of investing in a mutual fund that is part of a family of funds that offers shareholders the right to exchange shares of one type of fund for shares of another type of fund, and provides a variety of fund and shareholder services.
After reviewing these and related factors, the Trustees concluded, within the context of their overall conclusions regarding each of the Agreements, that the nature, extent and quality of services provided supported the renewal of the Agreements.
Investment performance of the Funds and the Adviser. As noted above, the Trustees received information about the performance of the Funds over various time periods, including information which compared the performance of the Funds to the performance of peer groups of funds and the Funds’ respective performance benchmarks. In addition, the Trustees also reviewed data prepared by an independent
15 |
BOARD APPROVAL OF THE EXISTING ADVISORY AGREEMENTS
third party which analyzed the performance of the Funds using a variety of performance metrics, including metrics which also measured the performance of the Funds on a risk adjusted basis.
With respect to each Fund, the Board concluded that the Fund’s performance or other relevant factors supported the renewal of the Agreement relating to that Fund. In the case of each Fund that had performance that lagged that of a relevant peer group for certain (although not necessarily all) periods, the Board concluded that other factors relevant to performance supported renewal of the Agreements. These factors included one or more of the following: (1) that the underperformance was attributable, to a significant extent, to investment decisions (such as security selection or sector allocation) by the Adviser that were reasonable and consistent with the Funds’ investment objective and policies; (2) that the Fund’s more recent performance was competitive when compared to relevant performance benchmarks or peer groups; (3) that the Fund’s performance, although lagging in certain recent periods, was stronger over the longer term; and (4) that although the Fund’s performance lagged that of its relevant peer group for certain recent periods, performance was stronger when compared to the Fund’s relevant performance benchmark.
The Trustees also considered the Adviser’s performance and reputation generally, the Funds’ performance as a fund family generally (as noted by certain financial publications), and the historical responsiveness of the Adviser to Trustee concerns about performance and the willingness of the Adviser to take steps intended to improve performance.
After reviewing these and related factors, the Trustees concluded, within the context of their overall conclusions regarding each of the Agreements, that the performance of the Funds and the Adviser supported the renewal of the Agreements.
The costs of the services to be provided and profits to be realized by the Adviser and its affiliates from their respective relationships with the Funds. The Trustees considered the fees charged to the Funds for advisory services as well as the total expense levels of the Funds. This information included comparisons (provided both by management and also by an independent third party) of the Funds’ advisory fees and total expense levels to those of their peer groups and information about the advisory fees charged by the Adviser to comparable accounts (such as institutional separate accounts), as well as information about differences in such fees. In considering the fees charged to comparable accounts, the Trustees considered, among other things, management’s representations about the differences between managing mutual funds as compared to other types of accounts, including the additional resources required to effectively manage and the greater regulatory costs associated with the management of mutual fund assets. In evaluating each Fund’s advisory fee, the Trustees also took into account the demands, complexity and quality of the investment management of such Fund and the need for the Adviser to offer competitive compensation. The Trustees considered that over the past several years, management had made recommendations regarding reductions in advisory fee rates, implementation of advisory fee breakpoints and the institution of advisory fee waivers and expense caps for various Funds in the Fund family. They noted that, as of December 31, 2009, all five of the Natixis Equity Funds included in this report have expense caps in place, and the Trustees considered the amounts waived or reimbursed by the Adviser under these caps. The Trustees noted that the Loomis Sayles Global Markets Fund had an advisory fee rate that was above the median of a peer group of funds. The Trustees considered the circumstances that accounted for such relatively higher expenses and noted that the Fund’s total expense ratio was below the median of the Fund’s peer group of funds even though the advisory fee was above the median.
The Trustees also considered the compensation directly or indirectly received by the Adviser and its affiliates from their relationships with the Funds. The Trustees reviewed information provided by management as to the profitability of the Adviser’s and its affiliates’ relationships with the Funds, and information about the allocation of expenses used to calculate profitability. They also reviewed information provided by management about the effect of distribution costs and changes in asset levels on Adviser profitability, including information regarding resources spent on distribution activities. When reviewing profitability, the Trustees also considered information about court cases in which adviser profitability was an issue, the performance of the relevant Funds, the expense levels of the Funds, and whether the Adviser had implemented breakpoints and/or expense caps with respect to such Funds.
After reviewing these and related factors, the Trustees concluded, within the context of their overall conclusions regarding each of the Agreements, that the advisory fee charged to each of the Funds was fair and reasonable, and that the costs of these services generally and the related profitability of the Adviser and its affiliates in respect of their relationships with the Funds supported the renewal of the Agreements.
Economies of Scale. The Trustees considered the existence of any economies of scale in the provision of services by the Adviser and whether those economies are shared with the Funds through breakpoints in their investment advisory fees or other means, such as expense waivers or caps. The Trustees noted that each of the Funds was subject to an expense cap or waiver. In considering these issues, the Trustees also took note of the costs of the services provided (both on an absolute and a relative basis) and the profitability to the Adviser and its affiliates of their relationships with the Funds, as discussed above.
After reviewing these and related factors, the Trustees concluded, within the context of their overall conclusions regarding each of the Agreements, that the extent to which economies of scale were shared with the Funds supported the renewal of the Agreements.
| 16
BOARD APPROVAL OF THE EXISTING ADVISORY AGREEMENTS
The Trustees also considered other factors, which included but were not limited to the following:
| · | | the effect of recent market and economic turmoil on the performance, asset levels and expense ratios of each Fund. |
| · | | whether each Fund has operated in accordance with its investment objective and the Fund’s record of compliance with its investment restrictions, and the compliance programs of the Funds and the Adviser. They also considered the compliance-related resources the Adviser and its affiliates were providing to the Funds. |
| · | | the nature, quality, cost and extent of administrative and shareholder services performed by the Adviser and its affiliates, both under the Agreements and under separate agreements covering administrative services. |
| · | | so-called “fallout benefits” to the Adviser, such as the engagement of affiliates of the Adviser to provide distribution, administrative and brokerage services to the Funds, and the benefits of research made available to the Adviser by reason of brokerage commissions generated by the Funds’ securities transactions. The Trustees considered the possible conflicts of interest associated with these fallout and other benefits, and the reporting, disclosure and other processes in place to disclose and monitor such possible conflicts of interest. |
| · | | the Trustees’ review and discussion of the Funds’ advisory arrangements in prior years, and management’s record of responding to Trustee concerns raised during the year and in prior years. |
Based on their evaluation of all factors that they deemed to be material, including those factors described above, and assisted by the advice of independent counsel, the Trustees, including the Independent Trustees, concluded that each of the existing Agreements should be continued through June 30, 2011.
17 |
Portfolio of Investments – as of September 30, 2010
Loomis Sayles Disciplined Equity Fund
| | | | | | | | |
| Shares | | | Description | | Value (†) | |
| | | | | | | | |
| | Common Stocks — 98.9% of Net Assets | |
| | | | Aerospace & Defense — 1.7% | | | | |
| | 4,538 | | | Precision Castparts Corp. | | $ | 577,914 | |
| | | | | | | | |
| | | | Beverages — 6.1% | | | | |
| | 40,738 | | | Coca-Cola Enterprises, Inc. | | | 1,262,878 | |
| | 12,147 | | | PepsiCo, Inc. | | | 807,047 | |
| | | | | | | | |
| | | | | | | 2,069,925 | |
| | | | | | | | |
| | | | Biotechnology — 2.0% | | | | |
| | 12,525 | | | Amgen, Inc.(b) | | | 690,253 | |
| | | | | | | | |
| | | | Capital Markets — 1.5% | | | | |
| | 4,731 | | | Franklin Resources, Inc.(c) | | | 505,744 | |
| | | | | | | | |
| | | | Commercial Banks — 1.7% | | | | |
| | 23,489 | | | Wells Fargo & Co.(c) | | | 590,279 | |
| | | | | | | | |
| | | | Communications Equipment — 3.8% | | | | |
| | 5,687 | | | F5 Networks, Inc.(b) | | | 590,368 | |
| | 15,687 | | | QUALCOMM, Inc. | | | 707,797 | |
| | | | | | | | |
| | | | | | | 1,298,165 | |
| | | | | | | | |
| | | | Computers & Peripherals — 7.1% | | | | |
| | 5,786 | | | Apple, Inc.(b) | | | 1,641,777 | |
| | 15,886 | | | NetApp, Inc.(b)(c) | | | 790,964 | |
| | | | | | | | |
| | | | | | | 2,432,741 | |
| | | | | | | | |
| | | | Consumer Finance — 3.1% | | | | |
| | 25,181 | | | American Express Co.(c) | | | 1,058,357 | |
| | | | | | | | |
| | | | Diversified Financial Services — 3.4% | | | | |
| | 30,164 | | | JPMorgan Chase & Co.(c) | | | 1,148,343 | |
| | | | | | | | |
| | | | Diversified Telecommunication Services — 3.4% | | | | |
| | 19,285 | | | AT&T, Inc. | | | 551,551 | |
| | 97,974 | | | Qwest Communications International, Inc. | | | 614,297 | |
| | | | | | | | |
| | | | | | | 1,165,848 | |
| | | | | | | | |
| | | | Electric Utilities — 1.2% | | | | |
| | 15,428 | | | PPL Corp. | | | 420,104 | |
| | | | | | | | |
| | | | Energy Equipment & Services — 3.2% | | | | |
| | 8,391 | | | Cameron International Corp.(b)(c) | | | 360,478 | |
| | 22,504 | | | Halliburton Co.(c) | | | 744,207 | |
| | | | | | | | |
| | | | | | | 1,104,685 | |
| | | | | | | | |
| | | | Health Care Providers & Services — 1.7% | | | | |
| | 12,183 | | | Express Scripts, Inc.(b)(c) | | | 593,312 | |
| | | | | | | | |
| | | | Hotels, Restaurants & Leisure — 2.6% | | | | |
| | 16,951 | | | Starwood Hotels & Resorts Worldwide, Inc. | | | 890,775 | |
| | | | | | | | |
| | | | Household Products — 2.4% | | | | |
| | 5,165 | | | Clorox Co. (The) | | | 344,815 | |
| | 7,853 | | | Procter & Gamble Co. (The) | | | 470,945 | |
| | | | | | | | |
| | | | | | | 815,760 | |
| | | | | | | | |
| | | | Industrial Conglomerates — 2.6% | | | | |
| | 10,338 | | | 3M Co.(c) | | | 896,408 | |
| | | | | | | | |
| | | | Insurance — 5.2% | | | | |
| | 19,208 | | | Metlife, Inc. | | | 738,547 | |
| | 6,084 | | | Prudential Financial, Inc. | | | 329,631 | |
| | 32,658 | | | Unum Group | | | 723,375 | |
| | | | | | | | |
| | | | | | | 1,791,553 | |
| | | | | | | | |
| | | | Internet & Catalog Retail — 1.0% | | | | |
| | 994 | | | Priceline.com, Inc.(b) | | | 346,250 | |
| | | | | | | | |
| | | | IT Services — 3.3% | | | | |
| | 8,458 | | | International Business Machines Corp. | | | 1,134,556 | |
| | | | | | | | |
| | | | Machinery — 6.3% | | | | |
| | 12,342 | | | Cummins, Inc. | | | 1,117,939 | |
| | 14,804 | | | Parker Hannifin Corp.(c) | | | 1,037,168 | |
| | | | | | | | |
| | | | | | | 2,155,107 | |
| | | | | | | | |
| | | | | | | | |
| Shares | | | Description | | Value (†) | |
| | | | | | | | |
| | | | Media — 5.1% | | | | |
| | 23,292 | | | DIRECTV, Class A(b) | | $ | 969,646 | |
| | 17,655 | | | Discovery Communications, Inc., Class A(b) | | | 768,875 | |
| | | | | | | | |
| | | | | | | 1,738,521 | |
| | | | | | | | |
| | | | Metals & Mining — 1.4% | | | | |
| | 5,757 | | | Freeport-McMoRan Copper & Gold, Inc. | | | 491,590 | |
| | | | | | | | |
| | | | Multi-Utilities — 2.0% | | | | |
| | 38,672 | | | CMS Energy Corp. | | | 696,869 | |
| | | | | | | | |
| | | | Multiline Retail — 2.3% | | | | |
| | 15,873 | | | Dollar Tree, Inc.(b)(c) | | | 773,967 | |
| | | | | | | | |
| | | | Oil, Gas & Consumable Fuels — 7.4% | | | | |
| | 20,811 | | | Chevron Corp. | | | 1,686,732 | |
| | 69,690 | | | El Paso Corp. | | | 862,762 | |
| | | | | | | | |
| | | | | | | 2,549,494 | |
| | | | | | | | |
| | | | Paper & Forest Products — 1.9% | | | | |
| | 30,238 | | | International Paper Co.(c) | | | 657,677 | |
| | | | | | | | |
| | | | Personal Products — 2.4% | | | | |
| | 12,790 | | | Estee Lauder Cos., Inc. (The), Class A(c) | | | 808,712 | |
| | | | | | | | |
| | | | Pharmaceuticals — 7.1% | | | | |
| | 12,616 | | | Allergan, Inc. | | | 839,342 | |
| | 39,280 | | | Mylan, Inc.(b) | | | 738,857 | |
| | 13,198 | | | Perrigo Co. | | | 847,576 | |
| | | | | | | | |
| | | | | | | 2,425,775 | |
| | | | | | | | |
| | | | Semiconductors & Semiconductor Equipment — 1.2% | |
| | 21,704 | | | Intel Corp. | | | 417,368 | |
| | | | | | | | |
| | | | Software — 4.8% | |
| | 61,215 | | | Oracle Corp. | | | 1,643,623 | |
| | | | | | | | |
| | | | Total Common Stocks
(Identified Cost $31,210,986) | | | 33,889,675 | |
| | | | | | | | |
Principal
Amount | | | | | | |
| | Short-Term Investments — 1.8% | |
| $ | 624,405 | | | Tri-Party Repurchase Agreement, with Fixed Income Clearing Corporation, dated 9/30/2010 at 0.000% to be repurchased at $624,405 on 10/01/2010 collateralized by $630,000 Federal Home Loan Bank, 1.00% due 12/28/2011 valued at $637,088 including accrued interest (Note 2 of Notes to Financial Statements) (Identified Cost $624,405) | | | 624,405 | |
| | | | | | | | |
| | | | | | | | |
| | | | Total Investments — 100.7%
(Identified Cost $31,835,391)(a) | | | 34,514,080 | |
| | | | Other assets less liabilities — (0.7)% | | | (229,983 | ) |
| | | | | | | | |
| | | | Net Assets — 100.0% | | $ | 34,284,097 | |
| | | | | | | | |
| | | | | | | | |
See accompanying notes to financial statements.
| 18
Portfolio of Investments – as of September 30, 2010
Loomis Sayles Disciplined Equity Fund – (continued)
| | | | | | | | |
| Shares | | | Description | | Value (†) | |
| | | | | | | | |
| | Call Options Written — (0.3%) | |
| | 3,400 | | | 3M Co. expiring November 20, 2010 at 90 | | $ | (4,930 | ) |
| | 6,300 | | | American Express Co. expiring October 16, 2010 at 44 | | | (1,858 | ) |
| | 6,300 | | | American Express Co. expiring November 20, 2010 at 46 | | | (3,780 | ) |
| | 2,800 | | | Cameron International Corp. expiring November 20, 2010 at 45 | | | (4,130 | ) |
| | 2,800 | | | Cameron International Corp. expiring November 20, 2010 at 47.5 | | | (1,960 | ) |
| | 1,300 | | | Clorox Co. (The) expiring November 20, 2010 at 70 | | | (715 | ) |
| | 4,100 | | | Cummins, Inc. expiring November 20, 2010 at 100 | | | (8,405 | ) |
| | 10,400 | | | Dollar Tree, Inc. expiring November 20, 2010 at 50 | | | (13,780 | ) |
| | 3,000 | | | Express Scripts, Inc. expiring November 20, 2010 at 50 | | | (4,950 | ) |
| | 3,000 | | | Express Scripts, Inc. expiring November 20, 2010 at 52.5 | | | (2,355 | ) |
| | 1,400 | | | F5 Networks, Inc. expiring November 20, 2010 at 120 | | | (2,765 | ) |
| | 2,400 | | | Franklin Resources, Inc. expiring October 16, 2010 at 110 | | | (3,180 | ) |
| | 1,900 | | | Freeport-McMoRan Copper & Gold, Inc. expiring November 20, 2010 at 95 | | | (2,954 | ) |
| | 7,500 | | | Halliburton Co. expiring October 16, 2010 at 35 | | | (1,950 | ) |
| | 7,500 | | | Halliburton Co. expiring November 20, 2010 at 37 | | | (3,675 | ) |
| | 7,600 | | | International Paper Co. expiring October 16, 2010 at 26 | | | (304 | ) |
| | 7,600 | | | International Paper Co. expiring November 20, 2010 at 25 | | | (2,090 | ) |
| | 15,100 | | | JPMorgan Chase & Co. expiring November 20, 2010 at 43 | | | (4,153 | ) |
| | 7,900 | | | NetApp, Inc. expiring November 20, 2010 at 55 | | | (10,942 | ) |
| | 4,400 | | | Perrigo Co. expiring November 20, 2010 at 70 | | | (5,060 | ) |
| | 1,100 | | | Precision Castparts Corp. expiring November 20, 2010 at 140 | | | (1,375 | ) |
| | 7,800 | | | Wells Fargo Co. expiring November 20, 2010 at 28 | | | (2,808 | ) |
| | | | | | | | |
| | | | Total Call Options Written
(Premiums Received $87,891) | | $ | (88,119 | ) |
| | | | | | | | |
| | | | | | | | |
| | (†) | | | See Note 2 of Notes to Financial Statements. | | | | |
| | (a) | | | Federal Tax Information: | | | | |
| | | | At September 30, 2010, the net unrealized appreciation on investments based on a cost of $31,973,963 for federal income tax purposes was as follows: | |
| | | | Aggregate gross unrealized appreciation for all investments in which there is an excess of value over tax cost | | $ | 3,149,591 | |
| | | | Aggregate gross unrealized depreciation for all investments in which there is an excess of tax cost over value | | | (609,474 | ) |
| | | | | | | | |
| | | | Net unrealized appreciation | | $ | 2,540,117 | |
| | | | | | | | |
| | | | | | | | |
| | (b) | | | Non-income producing security. | | | | |
| | (c) | | | All or a portion of this security is held as collateral for outstanding call options. | |
Industry Summary at September 30, 2010 (Unaudited)
| | | | |
| Oil, Gas & Consumable Fuels | | | 7.4 | % |
| Computers & Peripherals | | | 7.1 | |
| Pharmaceuticals | | | 7.1 | |
| Machinery | | | 6.3 | |
| Beverages | | | 6.1 | |
| Insurance | | | 5.2 | |
| Media | | | 5.1 | |
| Software | | | 4.8 | |
| Communications Equipment | | | 3.8 | |
Diversified Telecommunication
Services | | | 3.4 | |
| Diversified Financial Services | | | 3.4 | |
| IT Services | | | 3.3 | |
| Energy Equipment & Services | | | 3.2 | |
| Consumer Finance | | | 3.1 | |
| Industrial Conglomerates | | | 2.6 | |
| Hotels, Restaurants & Leisure | | | 2.6 | |
| Household Products | | | 2.4 | |
| Personal Products | | | 2.4 | |
| Multiline Retail | | | 2.3 | |
| Multi-Utilities | | | 2.0 | |
| Biotechnology | | | 2.0 | |
Other Investments, less than 2% each | | | 13.3 | |
| Short-Term Investments | | | 1.8 | |
| | | | |
| Total Investments | | | 100.7 | |
| Other assets less liabilities (including call options written) | | | (0.7 | ) |
| | | | |
| Net Assets | | | 100.0 | % |
| | | | |
See accompanying notes to financial statements.
19 |
Portfolio of Investments – as of September 30, 2010
Loomis Sayles Global Markets Fund
| | | | | | | | |
| Shares | | | Description | | Value (†) | |
| | | | | | | | |
| | Common Stocks — 65.6% of Net Assets | |
| | | | Belgium — 1.3% | | | | |
| | 72,166 | | | Anheuser-Busch InBev NV | | $ | 4,248,358 | |
| | | | | | | | |
| | | | Bermuda — 1.0% | | | | |
| | 28,273 | | | Credicorp Ltd. | | | 3,220,295 | |
| | | | | | | | |
| | | | Brazil — 6.7% | | | | |
| | 252,200 | | | Cyrela Brazil Realty SA Empreendimentos e Participacoes | | | 3,569,852 | |
| | 215,800 | | | Hypermarcas SA(b) | | | 3,353,063 | |
| | 166,900 | | | Lojas Renner SA | | | 5,720,172 | |
| | 216,000 | | | Natura Cosmeticos SA | | | 5,808,510 | |
| | 224,400 | | | OGX Petroleo e Gas Participacoes SA(b) | | | 2,924,362 | |
| | | | | | | | |
| | | | | | | 21,375,959 | |
| | | | | | | | |
| | | | Canada — 1.1% | | | | |
| | 117,400 | | | Pacific Rubiales Energy Corp.(b) | | | 3,300,983 | |
| | 9,996 | | | Valeant Pharmaceuticals International, Inc. | | | 250,405 | |
| | | | | | | | |
| | | | | | | 3,551,388 | |
| | | | | | | | |
| | | | Cayman Islands — 2.5% | | | | |
| | 76,510 | | | Baidu, Inc., Sponsored ADR(b) | | | 7,851,456 | |
| | | | | | | | |
| | | | Chile — 2.1% | | | | |
| | 42,615 | | | Banco Santander Chile, ADR | | | 4,114,478 | |
| | 251,140 | | | S.A.C.I. Falabella | | | 2,443,637 | |
| | | | | | | | |
| | | | | | | 6,558,115 | |
| | | | | | | | |
| | | | Germany — 4.0% | | | | |
| | 104,873 | | | Daimler AG, (Registered)(b) | | | 6,637,013 | |
| | 57,575 | | | Siemens AG, (Registered) | | | 6,073,463 | |
| | | | | | | | |
| | | | | | | 12,710,476 | |
| | | | | | | | |
| | | | Hong Kong — 2.3% | | | | |
| | 1,755,000 | | | Cathay Pacific Airways Ltd. | | | 4,739,557 | |
| | 472,000 | | | Li & Fung Ltd. | | | 2,656,181 | |
| | | | | | | | |
| | | | | | | 7,395,738 | |
| | | | | | | | |
| | | | Indonesia — 1.0% | | | | |
| | 531,000 | | | Gudang Garam Tbk PT | | | 3,070,318 | |
| | | | | | | | |
| | | | Japan — 0.9% | | | | |
| | 23,400 | | | FANUC Ltd.(b) | | | 2,986,784 | |
| | | | | | | | |
| | | | Korea — 2.3% | | | | |
| | 30,965 | | | Hyundai Motor Co. | | | 4,156,285 | |
| | 11,373 | | | LG Chem Ltd. | | | 3,325,793 | |
| | | | | | | | |
| | | | | | | 7,482,078 | |
| | | | | | | | |
| | | | Mexico — 0.9% | | | | |
| | 1,453,200 | | | Genomma Lab Internacional SA de CV, Class B(b) | | | 2,790,701 | |
| | | | | | | | |
| | | | Netherlands Antilles — 0.5% | | | | |
| | 28,155 | | | Schlumberger Ltd. | | | 1,734,630 | |
| | | | | | | | |
| | | | Singapore — 0.8% | | | | |
| | 1,824,000 | | | Genting Singapore PLC(b) | | | 2,580,416 | |
| | | | | | | | |
| | | | Spain — 1.3% | | | | |
| | 52,892 | | | Industria de Diseno Textil SA (Inditex) | | | 4,204,695 | |
| | | | | | | | |
| | | | Sweden — 1.3% | | | | |
| | 208,211 | | | Atlas Copco AB, Class A | | | 4,026,934 | |
| | | | | | | | |
| | | | Switzerland — 1.2% | | | | |
| | 30,619 | | | Sonova Holding AG, (Registered) | | | 3,743,069 | |
| | | | | | | | |
| | | | Taiwan — 1.2% | | | | |
| | 170,000 | | | HTC Corp. | | | 3,861,292 | |
| | | | | | | | |
| | | | Turkey — 1.1% | | | | |
| | 980,659 | | | Yapi ve Kredi Bankasi AS(b) | | | 3,389,909 | |
| | | | | | | | |
| | | | | | | | |
| Shares | | | Description | | Value (†) | |
| | | | | | | | |
| | | | United Kingdom — 4.9% | | | | |
| | 155,813 | | | Antofagasta PLC | | $ | 3,028,930 | |
| | 743,302 | | | ARM Holdings PLC | | | 4,624,069 | |
| | 273,829 | | | Standard Chartered PLC | | | 7,862,858 | |
| | | | | | | | |
| | | | | | | 15,515,857 | |
| | | | | | | | |
| | | | United States — 27.2% | | | | |
| | 28,220 | | | Amazon.com, Inc.(b) | | | 4,432,233 | |
| | 96,922 | | | American Express Co. | | | 4,073,632 | |
| | 45,171 | | | Apple, Inc.(b) | | | 12,817,271 | |
| | 61,030 | | | Broadcom Corp., Class A | | | 2,159,852 | |
| | 54,863 | | | Caterpillar, Inc. | | | 4,316,621 | |
| | 76,319 | | | Cognizant Technology Solutions Corp., Class A(b) | | | 4,920,286 | |
| | 50,458 | | | Cree, Inc.(b) | | | 2,739,365 | |
| | 35,050 | | | Cummins, Inc. | | | 3,174,829 | |
| | 56,272 | | | Deere & Co. | | | 3,926,660 | |
| | 1,679 | | | Dex One Corp.(b) | | | 20,618 | |
| | 41,554 | | | Estee Lauder Cos., Inc. (The), Class A | | | 2,627,459 | |
| | 24,470 | | | F5 Networks, Inc.(b) | | | 2,540,231 | |
| | 66,550 | | | FMC Technologies, Inc.(b) | | | 4,544,700 | |
| | 61,708 | | | Jones Lang LaSalle, Inc. | | | 5,323,549 | |
| | 102,407 | | | Mylan, Inc.(b) | | | 1,926,276 | |
| | 85,174 | | | NetApp, Inc.(b) | | | 4,240,813 | |
| | 26,433 | | | NetFlix, Inc.(b) | | | 4,286,375 | |
| | 28,918 | | | Precision Castparts Corp. | | | 3,682,707 | |
| | 66,140 | | | QUALCOMM, Inc. | | | 2,984,237 | |
| | 30,868 | | | Salesforce.com, Inc.(b) | | | 3,451,042 | |
| | 66,661 | | | Starwood Hotels & Resorts Worldwide, Inc. | | | 3,503,036 | |
| | 299 | | | SuperMedia, Inc.(b) | | | 3,160 | |
| | 26,818 | | | Vertex Pharmaceuticals, Inc.(b) | | | 927,098 | |
| | 49,258 | | | VMware, Inc., Class A(b) | | | 4,183,975 | |
| | | | | | | | |
| | | | | | | 86,806,025 | |
| | | | | | | | |
| | | | Total Common Stocks
(Identified Cost $162,060,978) | | | 209,104,493 | |
| | | | | | | | |
Principal
Amount (‡) | | | | | | |
| | Bonds and Notes — 30.5% | |
| | Non-Convertible Bonds — 29.0% | |
| | | | Argentina — 0.2% | | | | |
| $ | 190,000 | | | Pan American Energy LLC,
7.875%, 5/07/2021, 144A | | | 198,075 | |
| | 570,000 | | | Transportadora de Gas del Sur SA,
7.875%, 5/14/2017, 144A | | | 557,175 | |
| | | | | | | | |
| | | | | | | 755,250 | |
| | | | | | | | |
| | | | Australia — 0.1% | | | | |
| | 230,000 | | | New South Wales Treasury Corp., Series 10RG,
7.000%, 12/01/2010, (AUD) | | | 223,029 | |
| | 155,000 | | | Sydney Airport Finance Co.,
5.125%, 2/22/2021, 144A | | | 154,848 | |
| | | | | | | | |
| | | | | | | 377,877 | |
| | | | | | | | |
| | | | Bermuda — 0.1% | | | | |
| | 100,000 | | | Noble Group Ltd.,
6.750%, 1/29/2020, 144A | | | 107,700 | |
| | 100,000 | | | Noble Group Ltd.,
8.500%, 5/30/2013, 144A | | | 112,770 | |
| | 200,000 | | | Qtel International Finance Ltd.,
7.875%, 6/10/2019, 144A | | | 242,003 | |
| | | | | | | | |
| | | | | | | 462,473 | |
| | | | | | | | |
| | | | Brazil — 1.1% | | | | |
| | 200,000 | | | Banco Nacional de Desenvolvimento Economico e Social,
6.500%, 6/10/2019, 144A | | | 230,750 | |
See accompanying notes to financial statements.
| 20
Portfolio of Investments – as of September 30, 2010
Loomis Sayles Global Markets Fund – (continued)
| | | | | | | | |
Principal
Amount (‡) | | | Description | | Value (†) | |
| | | | | | | | |
| | | | Brazil — continued | | | | |
| $ | 400,000 | | | Banco Santander Brasil,
4.500%, 4/06/2015, 144A | | $ | 411,038 | |
| | 1,545,685(††) | | | Brazil Notas do Tesouro Nacional, Series B,
6.000%, 8/15/2014, (BRL) | | | 908,256 | |
| | 463,706(††) | | | Brazil Notas do Tesouro Nacional, Series B,
6.000%, 5/15/2015, (BRL) | | | 272,141 | |
| | 200,000 | | | Gerdau Holdings, Inc.,
7.000%, 1/20/2020, 144A | | | 223,500 | |
| | 1,800,000 | | | Republic of Brazil,
10.250%, 1/10/2028, (BRL) | | | 1,187,766 | |
| | 129,000 | | | Telemar Norte Leste SA,
5.500%, 10/23/2020, 144A | | | 130,612 | |
| | | | | | | | |
| | | | | | | 3,364,063 | |
| | | | | | | | |
| | | | Canada — 0.8% | | | | |
| | 1,880,000 | | | Canadian Government,
4.500%, 6/01/2015, (CAD)(c) | | | 2,038,436 | |
| | 180,000 | | | Corus Entertainment, Inc.,
7.250%, 2/10/2017, 144A, (CAD) | | | 185,479 | |
| | 50,000 | | | Nortel Networks Ltd.,
6.875%, 9/01/2023(d) | | | 13,750 | |
| | 100,000 | | | Pacific Rubiales Energy Corp.,
8.750%, 11/10/2016, 144A | | | 112,500 | |
| | 100,000 | | | Shaw Communications, Inc.,
5.650%, 10/01/2019, (CAD) | | | 103,508 | |
| | | | | | | | |
| | | | | | | 2,453,673 | |
| | | | | | | | |
| | | | Cayman Islands — 1.1% | | | | |
| | 360,000 | | | DASA Finance Corp.,
8.750%, 5/29/2018, 144A | | | 404,460 | |
| | 200,000 | | | Embraer Overseas Ltd.,
6.375%, 1/24/2017 | | | 219,000 | |
| | 119,000 | | | Fibria Overseas Finance Ltd.,
7.500%, 5/04/2020, 144A | | | 126,289 | |
| | 100,000 | | | Hutchison Whampoa International Ltd.,
7.625%, 4/09/2019, 144A | | | 123,192 | |
| | 100,000 | | | LPG International, Inc.,
7.250%, 12/20/2015 | | | 112,250 | |
| | 700,000 | | | Marfrig Overseas Ltd.,
9.500%, 5/04/2020, 144A | | | 742,875 | |
| | 170,000 | | | Marfrig Overseas Ltd.,
9.625%, 11/16/2016, 144A | | | 182,325 | |
| | 200,000 | | | Odebrecht Finance Ltd.,
7.000%, 4/21/2020, 144A | | | 214,000 | |
| | 320,000 | | | Petrobras International Finance Co.,
5.875%, 3/01/2018 | | | 355,582 | |
| | 300,000 | | | Petrobras International Finance Co.,
6.875%, 1/20/2040 | | | 343,423 | |
| | 536,000 | | | Vale Overseas Ltd.,
6.875%, 11/21/2036 | | | 612,357 | |
| | 200,000 | | | Voto-Votorantim Ltd.,
6.750%, 4/05/2021, 144A | | | 211,000 | |
| | | | | | | | |
| | | | | | | 3,646,753 | |
| | | | | | | | |
| | | | Chile — 0.1% | | | | |
| | 185,000 | | | Celulosa Arauco y Constitucion SA,
5.000%, 1/21/2021, 144A | | | 187,409 | |
| | 100,000 | | | Celulosa Arauco y Constitucion SA,
7.250%, 7/29/2019 | | | 118,566 | |
| | | | | | | | |
| | | | | | | 305,975 | |
| | | | | | | | |
| | | | Colombia — 0.2% | | | | |
| | 200,000 | | | Ecopetrol SA,
7.625%, 7/23/2019 | | | 242,000 | |
| | | | | | | | |
Principal
Amount (‡) | | | Description | | Value (†) | |
| | | | | | | | |
| | | | Colombia — continued | | | | |
| $ | 100,000 | | | Empresas Publicas de Medellin ESP,
7.625%, 7/29/2019, 144A | | $ | 119,500 | |
| | 200,000,000 | | | Republic of Colombia,
7.750%, 4/14/2021, (COP) | | | 130,041 | |
| | 40,000 | | | Republic of Colombia,
8.125%, 5/21/2024 | | | 53,700 | |
| | | | | | | | |
| | | | | | | 545,241 | |
| | | | | | | | |
| | | | France — 0.2% | | | | |
| | 150,000 | | | Lafarge SA, EMTN,
5.375%, 6/26/2017, (EUR) | | | 205,386 | |
| | 240,000 | | | Veolia Environnement, EMTN,
4.000%, 2/12/2016, (EUR) | | | 348,511 | |
| | 25,000 | | | Veolia Environnement, EMTN,
5.125%, 5/24/2022, (EUR) | | | 38,125 | |
| | | | | | | | |
| | | | | | | 592,022 | |
| | | | | | | | |
| | | | Germany — 0.5% | | | | |
| | 200,000 | | | Bertelsmann AG,
4.750%, 9/26/2016, (EUR) | | | 294,536 | |
| | 975,000 | | | Bundesrepublik Deutschland,
3.000%, 7/04/2020, (EUR) | | | 1,413,478 | |
| | | | | | | | |
| | | | | | | 1,708,014 | |
| | | | | | | | |
| | | | India — 0.2% | | | | |
| | 500,000 | | | Canara Bank Ltd., (fixed rate to 11/28/2016, variable rate thereafter),
6.365%, 11/28/2021 | | | 498,651 | |
| | 100,000 | | | ICICI Bank Ltd., (fixed rate to 4/30/2017, variable rate thereafter),
6.375%, 4/30/2022, 144A | | | 100,515 | |
| | | | | | | | |
| | | | | | | 599,166 | |
| | | | | | | | |
| | | | Indonesia — 0.3% | | | | |
| | 200,000 | | | Adaro Indonesia PT,
7.625%, 10/22/2019, 144A | | | 218,000 | |
| | 3,500,000,000 | | | Indonesia Government International Bond,
9.500%, 7/15/2023, (IDR) | | | 438,921 | |
| | 1,500,000,000 | | | Indonesia Government International Bond,
11.500%, 9/15/2019, (IDR) | | | 210,082 | |
| | | | | | | | |
| | | | | | | 867,003 | |
| | | | | | | | |
| | | | Italy — 0.1% | | | | |
| | 250,000 | | | Finmeccanica SpA, EMTN,
4.875%, 3/24/2025, (EUR) | | | 347,090 | |
| | 100,000 | | | Telecom Italia SpA, EMTN,
5.375%, 1/29/2019, (EUR) | | | 141,642 | |
| | | | | | | | |
| | | | | | | 488,732 | |
| | | | | | | | |
| | | | Japan — 0.0% | | | | |
| | 40,000 | | | Nomura Holdings, Inc.,
6.700%, 3/04/2020 | | | 45,710 | |
| | | | | | | | |
| | | | Jersey — 0.1% | | | | |
| | 100,000 | | | WPP PLC,
6.000%, 4/04/2017, (GBP) | | | 171,602 | |
| | | | | | | | |
| | | | Korea — 0.3% | | | | |
| | 400,000,000 | | | Korea Treasury Bond,
5.000%, 9/10/2014, (KRW) | | | 368,686 | |
| | 460,000 | | | SK Broadband Co. Ltd.,
7.000%, 2/01/2012, 144A | | | 487,600 | |
| | 140,000 | | | SK Telecom Co. Ltd.,
6.625%, 7/20/2027, 144A | | | 165,138 | |
| | | | | | | | |
| | | | | | | 1,021,424 | |
| | | | | | | | |
See accompanying notes to financial statements.
21 |
Portfolio of Investments – as of September 30, 2010
Loomis Sayles Global Markets Fund – (continued)
| | | | | | | | |
Principal
Amount (‡) | | | Description | | Value (†) | |
| | | | | | | | |
| | | | Luxembourg — 0.1% | | | | |
| $ | 100,000 | | | CSN Resources SA,
6.500%, 7/21/2020, 144A | | $ | 106,625 | |
| | 125,000 | | | Telecom Italia Capital SA,
6.000%, 9/30/2034 | | | 117,918 | |
| | 10,000 | | | Telecom Italia Capital SA,
6.375%, 11/15/2033 | | | 9,865 | |
| | | | | | | | |
| | | | | | | 234,408 | |
| | | | | | | | |
| | | | Malaysia — 0.1% | | | | |
| | 200,000 | | | Ranhill Labuan Ltd.,
12.500%, 10/26/2011, 144A | | | 180,000 | |
| | | | | | | | |
| | | | Mexico — 1.1% | | | | |
| | 195,000 | | | Axtel SAB de CV,
7.625%, 2/01/2017, 144A | | | 178,425 | |
| | 145,000 | | | Axtel SAB de CV,
9.000%, 9/22/2019, 144A | | | 133,763 | |
| | 200,000 | | | BBVA Bancomer SA,
7.250%, 4/22/2020, 144A | | | 214,848 | |
| | 160,000 | | | Corporcion GEO SAB de CV,
8.875%, 9/25/2014, 144A | | | 177,600 | |
| | 200,000 | | | Corporcion GEO SAB de CV,
9.250%, 6/30/2020, 144A | | | 226,750 | |
| | 295,000 | | | Desarrolladora Homex SAB de CV,
7.500%, 9/28/2015 | | | 303,850 | |
| | 42,000(†††) | | | Mexican Fixed Rate Bonds, Series M-10,
8.000%, 12/17/2015, (MXN) | | | 367,319 | |
| | 116,000(†††) | | | Mexican Fixed Rate Bonds, Series M-10,
8.500%, 12/13/2018, (MXN) | | | 1,065,403 | |
| | 100,000 | | | Mexichem SAB de CV,
8.750%, 11/06/2019, 144A | | | 115,500 | |
| | 330,000 | | | Petroleos Mexicanos,
8.000%, 5/03/2019 | | | 409,200 | |
| | 200,000 | | | Urbi Desarrollos Urbanos SAB de CV,
9.500%, 1/21/2020, 144A | | | 227,500 | |
| | | | | | | | |
| | | | | | | 3,420,158 | |
| | | | | | | | |
| | | | Netherlands — 0.3% | | | | |
| | 50,000 | | | British American Tobacco Holdings BV,
4.000%, 7/07/2020, (EUR) | | | 71,233 | |
| | 200,000 | | | Indosat Palapa Co. BV,
7.375%, 7/29/2020, 144A | | | 220,500 | |
| | 200,000 | | | Listrindo Capital BV,
9.250%, 1/29/2015, 144A | | | 226,870 | |
| | 100,000 | | | Majapahit Holding BV,
7.250%, 6/28/2017, 144A | | | 115,250 | |
| | 100,000 | | | Majapahit Holding BV,
7.750%, 1/20/2020, 144A | | | 120,000 | |
| | 100,000 | | | Majapahit Holding BV,
8.000%, 8/07/2019, 144A | | | 121,000 | |
| | 100,000 | | | Myriad International Holding BV,
6.375%, 7/28/2017, 144A | | | 103,560 | |
| | 50,000 | | | OI European Group BV,
6.875%, 3/31/2017, 144A, (EUR) | | | 70,889 | |
| | | | | | | | |
| | | | | | | 1,049,302 | |
| | | | | | | | |
| | | | New Zealand — 0.3% | | | | |
| | 600,000 | | | New Zealand Government Bond,
6.000%, 12/15/2017, (NZD) | | | 473,439 | |
| | 500,000 | | | New Zealand Government Bond,
6.500%, 4/15/2013, (NZD) | | | 390,343 | |
| | | | | | | | |
| | | | | | | 863,782 | |
| | | | | | | | |
| | | | | | | | |
Principal
Amount (‡) | | | Description | | Value (†) | |
| | | | | | | | |
| | | | Norway — 0.4% | | | | |
| | 635,000 | | | Norwegian Government,
4.250%, 5/19/2017, (NOK) | | $ | 116,783 | |
| | 6,360,000 | | | Norwegian Government,
4.500%, 5/22/2019, (NOK) | | | 1,193,437 | |
| | | | | | | | |
| | | | | | | 1,310,220 | |
| | | | | | | | |
| | | | Poland — 0.2% | | | | |
| | 95,000 | | | Poland Government International Bond,
3.000%, 9/23/2014, (CHF) | | | 99,868 | |
| | 1,700,000 | | | Poland Government International Bond,
5.000%, 10/24/2013, (PLN) | | | 586,260 | |
| | | | | | | | |
| | | | | | | 686,128 | |
| | | | | | | | |
| | | | Qatar — 0.1% | | | | |
| | 100,000 | | | Qatar Government International Bond,
4.000%, 1/20/2015, 144A | | | 105,500 | |
| | 250,000 | | | Ras Laffan Liquefied Natural Gas Co. Ltd. III,
5.500%, 9/30/2014, 144A | | | 274,035 | |
| | | | | | | | |
| | | | | | | 379,535 | |
| | | | | | | | |
| | | | Singapore — 0.6% | | | | |
| | 200,000 | | | Prime Dig Pte Ltd.,
11.750%, 11/03/2014, 144A | | | 207,500 | |
| | 1,400,000 | | | Singapore Government Bond,
1.625%, 4/01/2013, (SGD) | | | 1,093,313 | |
| | 435,000 | | | Singapore Government Bond,
2.250%, 7/01/2013, (SGD) | | | 346,432 | |
| | 150,000 | | | STATS ChipPAC Ltd.,
7.500%, 8/12/2015, 144A | | | 161,625 | |
| | | | | | | | |
| | | | | | | 1,808,870 | |
| | | | | | | | |
| | | | South Africa — 0.5% | | | | |
| | 450,000 | | | Edcon Proprietary Ltd.,
4.129%, 6/15/2014, (EUR)(e) | | | 515,308 | |
| | 130,000 | | | Edcon Proprietary Ltd.,
4.129%, 6/15/2014, 144A, (EUR)(e) | | | 148,867 | |
| | 400,000 | | | Republic of South Africa,
5.500%, 3/09/2020 | | | 447,000 | |
| | 285,000 | | | Republic of South Africa, EMTN,
4.500%, 4/05/2016, (EUR) | | | 409,546 | |
| | | | | | | | |
| | | | | | | 1,520,721 | |
| | | | | | | | |
| | | | Supranationals — 0.1% | | | | |
| | 305,000 | | | European Investment Bank,
2.375%, 7/10/2020, (CHF) | | | 330,677 | |
| | | | | | | | |
| | | | Sweden — 0.3% | | | | |
| | 2,210,000 | | | Sweden Government Bond,
5.000%, 12/01/2020, (SEK) | | | 398,402 | |
| | 3,020,000 | | | Sweden Government Bond,
5.500%, 10/08/2012, (SEK)(c) | | | 484,071 | |
| | | | | | | | |
| | | | | | | 882,473 | |
| | | | | | | | |
| | | | Thailand — 0.1% | | | | |
| | 330,000 | | | True Move Co. Ltd.,
10.375%, 8/01/2014 | | | 348,975 | |
| | 100,000 | | | True Move Co. Ltd.,
10.375%, 8/01/2014, 144A | | | 105,750 | |
| | | | | | | | |
| | | | | | | 454,725 | |
| | | | | | | | |
| | | | Turkey — 0.2% | | | | |
| | 200,000 | | | Akbank TAS,
5.125%, 7/22/2015, 144A | | | 199,220 | |
| | 400,000 | | | Republic of Turkey,
5.625%, 3/30/2021 | | | 436,000 | |
| | | | | | | | |
| | | | | | | 635,220 | |
| | | | | | | | |
See accompanying notes to financial statements.
| 22
Portfolio of Investments – as of September 30, 2010
Loomis Sayles Global Markets Fund – (continued)
| | | | | | | | |
Principal
Amount (‡) | | | Description | | Value (†) | |
| | | | | | | | |
| | | | United Arab Emirates — 0.6% | | | | |
| $ | 400,000 | | | Abu Dhabi National Energy Co.,
6.500%, 10/27/2036, 144A | | $ | 409,223 | |
| | 400,000 | | | Abu Dhabi National Energy Co.,
7.250%, 8/01/2018, 144A | | | 447,287 | |
| | 500,000 | | | DP World Ltd.,
6.850%, 7/02/2037, 144A | | | 467,644 | |
| | 200,000 | | | Dubai Electricity & Water Authority,
8.500%, 4/22/2015, 144A | | | 215,300 | |
| | 150,000 | | | Emirate of Abu Dhabi,
5.500%, 4/08/2014, 144A | | | 167,232 | |
| | 250,000 | | | Mubadala Development Co., GMTN,
7.625%, 5/06/2019, 144A | | | 297,517 | |
| | | | | | | | |
| | | | | | | 2,004,203 | |
| | | | | | | | |
| | | | United Kingdom — 0.8% | | | | |
| | 410,000,000 | | | Barclays Bank PLC, EMTN,
3.680%, 8/20/2015, (KRW) | | | 361,477 | |
| | 100,000 | | | BAT International Finance PLC,
5.875%, 3/12/2015, (EUR) | | | 155,250 | |
| | 150,000 | | | British Telecommunications PLC,
5.750%, 12/07/2028, (GBP) | | | 225,126 | |
| | 60,000 | | | BSKYB Finance UK PLC,
5.750%, 10/20/2017, (GBP) | | | 105,906 | |
| | 200,000 | | | Imperial Tobacco Finance PLC, EMTN,
4.375%, 11/22/2013, (EUR) | | | 288,169 | |
| | 100,000 | | | Rexam PLC, EMTN,
4.375%, 3/15/2013, (EUR) | | | 141,534 | |
| | 150,000 | | | Smiths Group PLC,
4.125%, 5/05/2017, (EUR) | | | 207,200 | |
| | 250,000 | | | Standard Chartered Bank, Series 17, EMTN,
5.875%, 9/26/2017, (EUR) | | | 382,154 | |
| | 255,000 | | | United Kingdom Treasury,
4.000%, 3/07/2022, (GBP) | | | 429,497 | |
| | 100,000 | | | Virgin Media Secured Finance PLC,
7.000%, 1/15/2018, (GBP) | | | 166,908 | |
| | | | | | | | |
| | | | | | | 2,463,221 | |
| | | | | | | | |
| | | | United States — 17.7% | | | | |
| | 155,000 | | | Alcatel-Lucent USA, Inc.,
6.450%, 3/15/2029 | | | 112,763 | |
| | 288,000 | | | Ally Financial, Inc.,
6.000%, 12/15/2011 | | | 294,120 | |
| | 129,000 | | | Ally Financial, Inc.,
6.625%, 5/15/2012 | | | 133,515 | |
| | 257,000 | | | Ally Financial, Inc.,
6.750%, 12/01/2014 | | | 267,762 | |
| | 60,000 | | | Ally Financial, Inc.,
6.875%, 8/28/2012 | | | 62,625 | |
| | 63,000 | | | Ally Financial, Inc.,
7.000%, 2/01/2012 | | | 65,126 | |
| | 63,000 | | | Ally Financial, Inc.,
7.250%, 3/02/2011 | | | 64,103 | |
| | 55,000 | | | Ally Financial, Inc.,
7.500%, 12/31/2013 | | | 58,438 | |
| | 129,000 | | | Ally Financial, Inc.,
8.000%, 12/31/2018 | | | 132,548 | |
| | 1,946,000 | | | Ally Financial, Inc.,
8.000%, 11/01/2031 | | | 2,087,085 | |
| | 100,000 | | | American General Finance Corp., MTN,
5.750%, 9/15/2016 | | | 79,750 | |
| | 100,000 | | | American General Finance Corp., MTN,
5.900%, 9/15/2012 | | | 95,500 | |
| | | | | | | | |
Principal
Amount (‡) | | | Description | | Value (†) | |
| | | | | | | | |
| | | | United States — continued | | | | |
| $ | 100,000 | | | American General Finance Corp., Series H, MTN,
5.375%, 10/01/2012 | | $ | 94,625 | |
| | 300,000 | | | American General Finance Corp., Series I, MTN,
4.875%, 7/15/2012 | | | 283,500 | |
| | 200,000 | | | American General Finance Corp., Series I, MTN,
5.850%, 6/01/2013 | | | 184,500 | |
| | 400,000 | | | American General Finance Corp., Series J, MTN,
6.900%, 12/15/2017 | | | 334,000 | |
| | 35,000 | | | Anheuser-Busch Cos., Inc.,
6.500%, 5/01/2042 | | | 40,743 | |
| | 250,000 | | | Anheuser-Busch InBev Worldwide, Inc.,
7.750%, 1/15/2019, 144A | | | 324,303 | |
| | 60,000 | | | Arrow Electronics, Inc.,
6.875%, 7/01/2013 | | | 66,929 | |
| | 31,782 | | | Atlas Air Pass Through Trust, Series 1998-1, Class B,
7.680%, 7/02/2015 | | | 30,193 | |
| | 145,000 | | | Avnet, Inc.,
6.000%, 9/01/2015 | | | 159,899 | |
| | 200,000 | | | Bank of America Corp., (fixed rate to 5/06/2014, variable rate thereafter),
4.750%, 5/06/2019, (EUR) | | | 271,867 | |
| | 310,000 | | | Borden, Inc.,
7.875%, 2/15/2023 | | | 235,600 | |
| | 410,000 | | | Borden, Inc.,
8.375%, 4/15/2016 | | | 348,500 | |
| | 15,000 | | | Boston Scientific Corp.,
5.125%, 1/12/2017 | | | 15,153 | |
| | 5,000 | | | Boston Scientific Corp.,
5.450%, 6/15/2014 | | | 5,307 | |
| | 15,000 | | | Boston Scientific Corp.,
6.400%, 6/15/2016 | | | 16,306 | |
| | 60,000 | | | Boston Scientific Corp.,
7.000%, 11/15/2035 | | | 60,633 | |
| | 50,000 | | | Bristol-Myers Squibb Co.,
4.625%, 11/15/2021, (EUR) | | | 76,395 | |
| | 700,000 | | | Capital One Multi-Asset Execution Trust, Series 2005-A10, Class A,
0.337%, 9/15/2015(e) | | | 695,575 | |
| | 2,335,000 | | | Capital One Multi-Asset Execution Trust, Series 2006-A5, Class A5,
0.317%, 1/15/2016(e) | | | 2,312,998 | |
| | 15,000 | | | Chesapeake Energy Corp.,
6.500%, 8/15/2017 | | | 15,563 | |
| | 75,000 | | | Chesapeake Energy Corp.,
6.875%, 11/15/2020 | | | 79,500 | |
| | 79,617 | | | CIT Group, Inc.,
7.000%, 5/01/2013 | | | 80,015 | |
| | 119,429 | | | CIT Group, Inc.,
7.000%, 5/01/2014 | | | 119,130 | |
| | 119,429 | | | CIT Group, Inc.,
7.000%, 5/01/2015 | | | 118,533 | |
| | 199,049 | | | CIT Group, Inc.,
7.000%, 5/01/2016 | | | 196,063 | |
| | 278,673 | | | CIT Group, Inc.,
7.000%, 5/01/2017 | | | 272,751 | |
| | 120,000 | | | Citibank Credit Card Issuance Trust, Series 2001-A4, Class A4,
5.375%, 4/10/2013, (EUR) | | | 165,961 | |
| | 300,000 | | | Comcast Corp.,
5.650%, 6/15/2035 | | | 302,849 | |
| | 985,955 | | | Continental Airlines Pass Through Trust, Series 1999-1, Class B,
6.795%, 2/02/2020 | | | 948,982 | |
See accompanying notes to financial statements.
23 |
Portfolio of Investments – as of September 30, 2010
Loomis Sayles Global Markets Fund – (continued)
| | | | | | | | |
Principal
Amount (‡) | | | Description | | Value (†) | |
| | | | | | | | |
| | | | United States — continued | | | | |
| $ | 190,0 00 | | | CSX Corp.,
6.250%, 3/15/2018 | | $ | 225,566 | |
| | 265,000 | | | Cummins, Inc.,
5.650%, 3/01/2098 | | | 220,619 | |
| | 160,000 | | | Cummins, Inc.,
7.125%, 3/01/2028 | | | 180,383 | |
| | 309,402 | | | Delta Air Lines, Inc., Series 2007-1, Class B,
8.021%, 2/10/2024 | | | 310,949 | |
| | 292,535 | | | Delta Air Lines, Inc., Series 2007-1, Class C,
8.954%, 8/10/2014 | | | 297,654 | |
| | 42,000 | | | Dillard’s, Inc.,
6.625%, 1/15/2018 | | | 40,530 | |
| | 50,000 | | | Dillard’s, Inc.,
7.000%, 12/01/2028 | | | 43,750 | |
| | 8,000 | | | Dillard’s, Inc.,
7.750%, 7/15/2026 | | | 7,320 | |
| | 250,000 | | | Exelon Corp.,
4.900%, 6/15/2015 | | | 274,007 | |
| | 150,000 | | | Foot Locker, Inc.,
8.500%, 1/15/2022 | | | 141,375 | |
| | 25,000 | | | Ford Motor Co.,
6.375%, 2/01/2029 | | | 23,125 | |
| | 50,000 | | | Ford Motor Co.,
6.625%, 2/15/2028 | | | 47,375 | |
| | 2,105,000 | | | Ford Motor Co.,
6.625%, 10/01/2028 | | | 1,994,487 | |
| | 40,000 | | | Ford Motor Co.,
7.125%, 11/15/2025 | | | 39,100 | |
| | 835,000 | | | Ford Motor Co.,
7.450%, 7/16/2031 | | | 870,487 | |
| | 5,000 | | | Ford Motor Co.,
7.500%, 8/01/2026 | | | 5,000 | |
| | 2,250,000 | | | Ford Motor Credit Co. LLC,
7.000%, 10/01/2013 | | | 2,413,971 | |
| | 845,000 | | | Ford Motor Credit Co. LLC,
7.000%, 4/15/2015 | | | 902,950 | |
| | 905,000 | | | Ford Motor Credit Co. LLC,
8.000%, 12/15/2016 | | | 1,022,986 | |
| | 80,000 | | | Freescale Semiconductor, Inc.,
10.125%, 12/15/2016 | | | 72,800 | |
| | 45,000 | | | General Electric Capital Corp.,
5.625%, 5/01/2018 | | | 49,949 | |
| | 205,000 | | | General Electric Capital Corp., MTN,
5.875%, 1/14/2038 | | | 208,202 | |
| | 750,000 | | | General Electric Capital Corp., Series A, MTN,
4.875%, 3/04/2015 | | | 823,597 | |
| | 3,375,000 | | | Georgia-Pacific LLC,
7.250%, 6/01/2028 | | | 3,467,812 | |
| | 35,000 | | | Georgia-Pacific LLC,
7.750%, 11/15/2029 | | | 36,750 | |
| | 525,000 | | | Georgia-Pacific LLC,
8.000%, 1/15/2024 | | | 589,312 | |
| | 405,000 | | | Georgia-Pacific LLC,
8.875%, 5/15/2031 | | | 461,700 | |
| | 455,000 | | | Goldman Sachs Group, Inc. (The),
6.750%, 10/01/2037 | | | 472,938 | |
| | 50,000 | | | Goldman Sachs Group, Inc. (The),
6.875%, 1/18/2038, (GBP) | | | 80,485 | |
| | 165,000 | | | Goodyear Tire & Rubber Co. (The),
7.000%, 3/15/2028 | | | 151,800 | |
| | 25,000 | | | GTE Corp.,
6.940%, 4/15/2028 | | | 28,899 | |
| | | | | | | | |
Principal
Amount (‡) | | | Description | | Value (†) | |
| | | | | | | | |
| | | | United States — continued | | | | |
| $ | 20,000 | | | HCA, Inc.,
5.750%, 3/15/2014 | | $ | 19,725 | |
| | 55,000 | | | HCA, Inc.,
6.250%, 2/15/2013 | | | 55,963 | |
| | 90,000 | | | HCA, Inc.,
6.375%, 1/15/2015 | | | 89,775 | |
| | 15,000 | | | HCA, Inc.,
6.500%, 2/15/2016 | | | 15,000 | |
| | 40,000 | | | HCA, Inc.,
6.750%, 7/15/2013 | | | 40,800 | |
| | 225,000 | | | HCA, Inc.,
7.050%, 12/01/2027 | | | 198,000 | |
| | 245,000 | | | HCA, Inc.,
7.190%, 11/15/2015 | | | 240,100 | |
| | 90,000 | | | HCA, Inc.,
7.500%, 12/15/2023 | | | 84,600 | |
| | 250,000 | | | HCA, Inc.,
7.500%, 11/06/2033 | | | 229,375 | |
| | 1,295,000 | | | HCA, Inc.,
7.690%, 6/15/2025 | | | 1,210,825 | |
| | 395,000 | | | HCA, Inc.,
8.360%, 4/15/2024 | | | 387,100 | |
| | 125,000 | | | HCA, Inc.,
8.750%, 11/01/2010, (GBP) | | | 196,362 | |
| | 110,000 | | | HCA, Inc., MTN,
7.580%, 9/15/2025 | | | 102,300 | |
| | 75,000 | | | HCA, Inc., MTN,
7.750%, 7/15/2036 | | | 69,000 | |
| | 75,000 | | | Hexion US Finance Corp./Hexion Nova Scotia Finance ULC,
9.750%, 11/15/2014 | | | 78,000 | |
| | 470,000 | | | Highwoods Properties, Inc.,
5.850%, 3/15/2017 | | | 483,412 | |
| | 110,000 | | | Incitec Pivot Finance LLC,
6.000%, 12/10/2019, 144A | | | 116,622 | |
| | 250,000 | | | iStar Financial, Inc.,
5.150%, 3/01/2012 | | | 212,500 | |
| | 95,000 | | | iStar Financial, Inc.,
5.500%, 6/15/2012 | | | 79,800 | |
| | 105,000 | | | iStar Financial, Inc.,
5.650%, 9/15/2011 | | | 95,025 | |
| | 70,000 | | | iStar Financial, Inc.,
5.850%, 3/15/2017 | | | 53,025 | |
| | 300,000 | | | iStar Financial, Inc.,
5.875%, 3/15/2016 | | | 226,875 | |
| | 145,000 | | | iStar Financial, Inc.,
6.050%, 4/15/2015 | | | 110,200 | |
| | 985,000 | | | iStar Financial, Inc.,
8.625%, 6/01/2013 | | | 802,775 | |
| | 35,000 | | | iStar Financial, Inc., Series B,
5.700%, 3/01/2014 | | | 27,169 | |
| | 950,000 | | | iStar Financial, Inc., Series B,
5.950%, 10/15/2013 | | | 752,875 | |
| | 5,000 | | | J.C. Penney Corp., Inc.,
5.750%, 2/15/2018 | | | 5,150 | |
| | 64,000 | | | J.C. Penney Corp., Inc.,
6.375%, 10/15/2036 | | | 61,760 | |
| | 15,000 | | | J.C. Penney Corp., Inc.,
7.125%, 11/15/2023 | | | 15,675 | |
| | 5,000 | | | J.C. Penney Corp., Inc.,
7.625%, 3/01/2097 | | | 4,850 | |
| | 95,000 | | | Jefferies Group, Inc.,
6.250%, 1/15/2036 | | | 87,226 | |
See accompanying notes to financial statements.
| 24
Portfolio of Investments – as of September 30, 2010
Loomis Sayles Global Markets Fund – (continued)
| | | | | | | | |
Principal
Amount (‡) | | | Description | | Value (†) | |
| | | | | | | | |
| | | | United States — continued | | | | |
| $ | 375,000 | | | Jefferies Group, Inc.,
8.500%, 7/15/2019 | | $ | 435,416 | |
| | 260,000 | | | K. Hovnanian Enterprises, Inc.,
6.250%, 1/15/2016 | | | 169,000 | |
| | 15,000 | | | K. Hovnanian Enterprises, Inc.,
6.375%, 12/15/2014 | | | 10,800 | |
| | 15,000 | | | Lennar Corp., Series B,
5.500%, 9/01/2014 | | | 14,400 | |
| | 1,090,000 | | | Lennar Corp., Series B,
5.600%, 5/31/2015 | | | 1,027,325 | |
| | 55,000 | | | Lennar Corp., Series B,
6.500%, 4/15/2016 | | | 52,456 | |
| | 15,000 | | | Level 3 Financing, Inc.,
8.750%, 2/15/2017 | | | 13,350 | |
| | 10,000 | | | Level 3 Financing, Inc.,
9.250%, 11/01/2014 | | | 9,400 | |
| | 230,000 | | | Morgan Stanley,
5.375%, 11/14/2013, (GBP) | | | 380,735 | |
| | 500,000 | | | New Albertson’s, Inc.,
7.450%, 8/01/2029 | | | 405,000 | |
| | 50,000 | | | New Albertson’s, Inc., Series C, MTN,
6.625%, 6/01/2028 | | | 36,563 | |
| | 80,000 | | | News America, Inc., 6.150%, 3/01/2037 | | | 86,140 | |
| | 25,000 | | | News America, Inc.,
6.400%, 12/15/2035 | | | 27,724 | |
| | 925,000 | | | Nextel Communications, Inc., Series D,
7.375%, 8/01/2015 | | | 929,625 | |
| | 40,000 | | | Nextel Communications, Inc., Series E,
6.875%, 10/31/2013 | | | 40,250 | |
| | 230,000 | | | Nextel Communications, Inc., Series F,
5.950%, 3/15/2014 | | | 228,850 | |
| | 250,000 | | | NGC Corp. Capital Trust I, Series B,
8.316%, 6/01/2027(f) | | | 120,000 | |
| | 35,000 | | | Nortel Networks Capital Corp.,
7.875%, 6/15/2026(d) | | | 22,750 | |
| | 1,000,000 | | | NRG Energy, Inc.,
7.375%, 2/01/2016 | | | 1,028,750 | |
| | 50,000 | | | Ohio Edison Co.,
6.875%, 7/15/2036 | | | 58,348 | |
| | 150,000 | | | Owens Brockway Glass Container, Inc.,
6.750%, 12/01/2014, (EUR) | | | 209,600 | |
| | 565,000 | | | Owens Corning, Inc.,
6.500%, 12/01/2016 | | | 611,259 | |
| | 535,000 | | | Owens Corning, Inc.,
7.000%, 12/01/2036 | | | 538,780 | |
| | 40,000 | | | Owens-Illinois, Inc.,
7.800%, 5/15/2018 | | | 42,900 | |
| | 47,000 | | | Pulte Group, Inc.,
5.200%, 2/15/2015 | | | 45,473 | |
| | 540,000 | | | Pulte Group, Inc.,
6.000%, 2/15/2035 | | | 405,000 | |
| | 695,000 | | | Pulte Group, Inc.,
6.375%, 5/15/2033 | | | 556,000 | |
| | 1,335,000 | | | Qwest Capital Funding, Inc.,
6.500%, 11/15/2018 | | | 1,335,000 | |
| | 650,000 | | | Qwest Capital Funding, Inc.,
6.875%, 7/15/2028 | | | 611,000 | |
| | 400,000 | | | Qwest Capital Funding, Inc.,
7.625%, 8/03/2021 | | | 404,000 | |
| | 60,000 | | | Qwest Capital Funding, Inc.,
7.750%, 2/15/2031 | | | 60,600 | |
| | | | | | | | |
Principal
Amount (‡) | | | Description | | Value (†) | |
| | | | | | | | |
| | | | United States — continued | | | | |
| $ | 560,000 | | | Qwest Corp.,
6.875%, 9/15/2033 | | $ | 553,000 | |
| | 115,000 | | | Qwest Corp.,
7.250%, 9/15/2025 | | | 120,750 | |
| | 80,000 | | | Reynolds American, Inc.,
6.750%, 6/15/2017 | | | 89,977 | |
| | 20,000 | | | Reynolds American, Inc.,
7.250%, 6/15/2037 | | | 20,997 | |
| | 1,600(††††) | | | SLM Corp.,
6.000%, 12/15/2043 | | | 30,940 | |
| | 120,000 | | | SLM Corp., MTN,
5.050%, 11/14/2014 | | | 114,274 | |
| | 35,000 | | | SLM Corp., MTN,
5.125%, 8/27/2012 | | | 35,382 | |
| | 228,000 | | | SLM Corp., Series A, MTN,
5.000%, 10/01/2013 | | | 223,436 | |
| | 10,000 | | | SLM Corp., Series A, MTN,
5.000%, 6/15/2018 | | | 7,975 | |
| | 115,000 | | | SLM Corp., Series A, MTN,
5.375%, 1/15/2013 | | | 115,938 | |
| | 75,000 | | | SLM Corp., Series A, MTN,
5.375%, 5/15/2014 | | | 72,980 | |
| | 30,000 | | | SLM Corp., Series A, MTN,
5.400%, 10/25/2011 | | | 30,310 | |
| | 20,000 | | | SLM Corp., Series A, MTN,
5.625%, 8/01/2033 | | | 15,379 | |
| | 625,000 | | | SLM Corp., Series A, MTN,
8.450%, 6/15/2018 | | | 631,290 | |
| | 294,000 | | | Sprint Capital Corp.,
6.875%, 11/15/2028 | | | 269,010 | |
| | 420,000 | | | Sprint Capital Corp.,
6.900%, 5/01/2019 | | | 422,100 | |
| | 110,000 | | | Sprint Capital Corp.,
8.750%, 3/15/2032 | | | 115,500 | |
| | 26,000 | | | Sprint Nextel Corp.,
6.000%, 12/01/2016 | | | 25,675 | |
| | 265,000 | | | Tenet Healthcare Corp.,
6.875%, 11/15/2031 | | | 214,650 | |
| | 250,000 | | | Textron, Inc.,
3.875%, 3/11/2013, (EUR) | | | 338,305 | |
| | 395,000 | | | Time Warner, Inc.,
6.625%, 5/15/2029 | | | 447,426 | |
| | 105,000 | | | Toll Brothers Finance Corp.,
5.150%, 5/15/2015 | | | 106,109 | |
| | 375,000 | | | Toys R Us, Inc.,
7.375%, 10/15/2018 | | | 358,125 | |
| | 3,150,000 | | | TXU Corp., Series P,
5.550%, 11/15/2014 | | | 1,685,250 | |
| | 2,570,000 | | | TXU Corp., Series Q,
6.500%, 11/15/2024 | | | 983,025 | |
| | 30,000 | | | TXU Corp., Series R,
6.550%, 11/15/2034 | | | 11,400 | |
| | 700,000 | | | U.S. Treasury Note,
1.000%, 12/31/2011 | | | 705,907 | |
| | 477,517 | | | UAL Pass Through Trust, Series 2009-1,
10.400%, 5/01/2018 | | | 532,431 | |
| | 2,320,000 | | | United Rentals North America, Inc.,
7.000%, 2/15/2014 | | | 2,320,000 | |
| | 840,000 | | | United Rentals North America, Inc.,
7.750%, 11/15/2013 | | | 850,500 | |
| | 770,000 | | | United States Steel Corp.,
6.650%, 6/01/2037 | | | 683,375 | |
See accompanying notes to financial statements.
25 |
Portfolio of Investments – as of September 30, 2010
Loomis Sayles Global Markets Fund – (continued)
| | | | | | | | |
aPrincipal
Amount (‡) | | | Description | | Value (†) | |
| | | | | | | | |
| | | | United States — continued | | | | |
| $ | 50,000 | | | USG Corp.,
6.300%, 11/15/2016 | | $ | 43,375 | |
| | 230,000 | | | USG Corp.,
9.500%, 1/15/2018 | | | 225,687 | |
| | 5,000 | | | Verizon Maryland, Inc., Series B,
5.125%, 6/15/2033 | | | 4,537 | |
| | 140,000 | | | Verizon New York, Inc., Series B,
7.375%, 4/01/2032 | | | 165,195 | |
| | 110,000 | | | Verizon Pennsylvania, Inc.,
6.000%, 12/01/2028 | | | 110,377 | |
| | 185,000 | | | Wells Fargo & Co.,
4.625%, 11/02/2035, (GBP) | | | 271,693 | |
| | 230,000 | | | Williams Cos., Inc. (The),
7.875%, 9/01/2021 | | | 279,267 | |
| | 74,000 | | | Williams Cos., Inc. (The), Series A,
7.500%, 1/15/2031 | | | 83,728 | |
| | 24,000 | | | Xerox Capital Trust I,
8.000%, 2/01/2027 | | | 24,419 | |
| | 125,000 | | | Xerox Corp.,
6.750%, 2/01/2017 | | | 146,562 | |
| | 20,000 | | | Xerox Corp., MTN,
7.200%, 4/01/2016 | | | 23,495 | |
| | | | | | | | |
| | | | | | | 56,393,695 | |
| | | | | | | | |
| | | | Uruguay — 0.1% | | | | |
| | 3,642,989 | | | Uruguay Government International Bond,
3.700%, 6/26/2037, (UYU) | | | 181,955 | |
| | 4,147,575 | | | Uruguay Government International Bond,
5.000%, 9/14/2018, (UYU) | | | 233,638 | |
| | | | | | | | |
| | | | | | | 415,593 | |
| | | | | | | | |
| | | | Total Non-Convertible Bonds
(Identified Cost $84,795,489) | | | 92,437,909 | |
| | | | | | | | |
| | Convertible Bonds — 1.4% | |
| | | | United States — 1.4% | | | | |
| | 125,000 | | | Ford Motor Co.,
4.250%, 11/15/2016 | | | 186,563 | |
| | 745,000 | | | Hologic, Inc., (Step to Zero Coupon on 12/15/2013),
2.000%, 12/15/2037(g) | | | 689,125 | |
| | 1,125,000 | | | Intel Corp.,
3.250%, 8/01/2039 | | | 1,313,437 | |
| | 430,000 | | | iStar Financial, Inc.,
1.033%, 10/01/2012(e) | | | 327,875 | |
| | 365,000 | | | Kulicke & Soffa Industries, Inc.,
0.875%, 6/01/2012 | | | 341,731 | |
| | 440,000 | | | Level 3 Communications, Inc.,
3.500%, 6/15/2012 | | | 416,350 | |
| | 185,000 | | | Level 3 Communications, Inc.,
5.250%, 12/15/2011 | | | 185,000 | |
| | 215,000 | | | Level 3 Communications, Inc.,
7.000%, 3/15/2015, 144A(f) | | | 191,619 | |
| | 200,000 | | | NII Holdings, Inc.,
3.125%, 6/15/2012 | | | 194,000 | |
| | 550,000 | | | Owens-Brockway Glass Container, Inc.,
3.000%, 6/01/2015, 144A | | | 539,000 | |
| | 80,000 | | | Valeant Pharmaceuticals International,
4.000%, 11/15/2013 | | | 152,900 | |
| | | | | | | | |
| | | | Total Convertible Bonds
(Identified Cost $4,278,430) | | | 4,537,600 | |
| | | | | | | | |
| | | | | | | | |
Principal
Amount (‡) | | | Description | | Value (†) | |
| | | | | | | | |
| | Municipals — 0.1% | |
| | | | United States — 0.1% | | | | |
| $ | 135,000 | | | Virginia Tobacco Settlement Financing Corp., Series A-1,
6.706%, 6/01/2046(f)
(Identified Cost $134,987) | | $ | 93,474 | |
| | | | | | | | |
| | | | Total Bonds and Notes
(Identified Cost $89,208,906) | | | 97,068,983 | |
| | | | | | | | |
| | Bank Loans — 0.1% | |
| | | | United States — 0.1% | | | | |
| | 58,534 | | | Hawaiian Telcom Communications, Inc., New Tranche C Term Loan,
4.750%, 5/30/2014(h)(i) | | | 44,632 | |
| | 40,000 | | | Level 3 Financing, Inc., Tranche A Term Loan,
2.700%, 3/13/2014(h) | | | 36,443 | |
| | 2,737 | | | Sungard Data Systems, Inc., Tranche A,
2.008%, 2/28/2014(h) | | | 2,645 | |
| | 58,537 | | | SuperMedia, Inc., Exit Term Loan,
11.000%, 12/31/2015(h) | | | 45,630 | |
| | 7,314 | | | Tribune Company, Term Loan X,
5.000%, 6/04/2009(d)(h)(j) | | | 4,635 | |
| | | | | | | | |
| | | | Total Bank Loans
(Identified Cost $148,766) | | | 133,985 | |
| | | | | | | | |
| Shares | | | | | | |
| | Preferred Stocks — 0.4% | |
| | Convertible Preferred Stock — 0.2% | |
| | | | United States — 0.2% | | | | |
| | 820 | | | Lucent Technologies Capital Trust I,
7.750%
(Identified Cost $590,508) | | | 664,200 | |
| | | | | | | | |
| | Non-Convertible Preferred Stock — 0.2% | |
| | | | United States — 0.2% | | | | |
| | 682 | | | Ally Financial, Inc., Series G,
7.000%, 144A
(Identified Cost $145,366) | | | 613,907 | |
| | | | | | | | |
| | | | Total Preferred Stocks
(Identified Cost $735,874) | | | 1,278,107 | |
| | | | | | | | |
Principal
Amount (‡) | | | | | | |
| | Short-Term Investments — 2.7% | |
| $ | 3,507 | | | Repurchase Agreement with State Street Corporation dated 9/30/2010 at 0.000%, to be repurchased at $3,507 on 10/01/2010 collateralized by $5,000 U.S. Treasury Note, 3.125% due 4/30/2017 valued at $5,476 including accrued interest (Note 2 of Notes to Financial Statements) | | | 3,507 | |
| | 8,681,052 | | | Tri-Party Repurchase Agreement with Fixed Income Clearing Corporation, dated 9/30/2010 at 0.000% to be repurchased at $8,681,052 on 10/01/2010 collateralized by $8,825,000 Federal Home Loan Bank, 0.580% due 6/01/2011 valued at $8,858,094 including accrued interest (Note 2 of Notes to Financial Statements) | | | 8,681,052 | |
| | | | | | | | |
See accompanying notes to financial statements.
| 26
Portfolio of Investments – as of September 30, 2010
Loomis Sayles Global Markets Fund – (continued)
| | | | | | | | |
Principal
Amount (‡) | | | Description | | Value (†) | |
| | | | | | | | |
| | Short-Term Investments — continued | |
| | | | Total Short-Term Investments
(Identified Cost $8,684,559) | | $ | 8,684,559 | |
| | | | | | | | |
| | | | | | | | |
| | | | Total Investments — 99.3%
(Identified Cost $260,839,083)(a) | | | 316,270,127 | |
| | | | Other assets less liabilities — 0.7% | | | 2,332,928 | |
| | | | | | | | |
| | | | Net Assets — 100.0% | | $ | 318,603,055 | |
| | | | | | | | |
| | | | | | | | |
| | (‡) | | | Principal amount stated in U.S. dollars unless otherwise noted. | |
| | (†) | | | See Note 2 of Notes to Financial Statements. | | | | |
| | (††) | | | Security held in units. One unit represents a principal amount of 1,000. Amount shown represents principal amount including inflation adjustments. | |
| | (†††) | | | Amount shown represents units. One unit represents a principal amount of 100. | |
| | (††††) | | | Amount shown represents units. One unit represents a principal amount of 25. | |
| | (a) | | | Federal Tax Information: | | | | |
| | | | At September 30, 2010, the net unrealized appreciation on investments based on a cost of $263,343,191 for federal income tax purposes was as follows: | |
| | | | Aggregate gross unrealized appreciation for all investments in which there is an excess of value over tax cost | | $ | 57,606,110 | |
| | | | Aggregate gross unrealized depreciation for all investments in which there is an excess of tax cost over value | | | (4,679,174 | ) |
| | | | | | | | |
| | | | Net unrealized appreciation | | $ | 52,926,936 | |
| | | | | | | | |
| | | | | | | | |
| | (b) | | | Non-income producing security. | | | | |
| | (c) | | | All or a portion of this security is held as collateral for forward foreign currency contracts. | |
| | (d) | | | The issuer is in default with respect to interest and/or principal payments. Income is not being accrued. | |
| | (e) | | | Variable rate security. Rate as of September 30, 2010 is disclosed. | |
| | (f) | | | Illiquid security. At September 30, 2010, the value of these securities amounted to $405,093 or 0.1% of net assets. | |
| | (g) | | | Coupon rate is a fixed rate for an initial period then resets at a specified date and rate. | |
| | (h) | | | Variable rate security. Rate shown represents the weighted average rate at September 30, 2010. | |
| | (i) | | | All or a portion of interest payment is paid-in-kind. | |
| | (j) | | | Issuer has filed for bankruptcy. | |
| | | | | | | | |
| | 144A | | | Securities exempt from registration under Rule 144A of the Securities Act of 1933. These securities may be resold in transactions exempt from registration, normally to qualified institutional buyers. At September 30, 2010, the total value of these securities amounted to $13,479,984 or 4.2% of net assets. | |
| | ADR | | | An American Depositary Receipt is a certificate issued by a custodian bank representing the right to receive securities of the foreign issuer described. The values of ADRs are significantly influenced by trading on exchanges not located in the United States. | |
| | EMTN | | | Euro Medium Term Note | |
| | GMTN | | | Global Medium Term Note | |
| | MTN | | | Medium Term Note | |
| | | | | | | | |
| | | | | | | | |
| | AUD | | | Australian Dollar | |
| | BRL | | | Brazilian Real | |
| | CAD | | | Canadian Dollar | |
| | CHF | | | Swiss Franc | |
| | COP | | | Colombian Peso | |
| | EUR | | | Euro | |
| | GBP | | | British Pound | |
| | IDR | | | Indonesian Rupiah | |
| | KRW | | | South Korean Won | |
| | MXN | | | Mexican Peso | |
| | NOK | | | Norwegian Krone | |
| | NZD | | | New Zealand Dollar | |
| | PLN | | | Polish Zloty | |
| | SEK | | | Swedish Krona | |
| | SGD | | | Singapore Dollar | |
| | UYU | | | Uruguayan Peso | |
At September 30, 2010, the Fund had the following open forward foreign currency contracts:
| | | | | | | | | | | | | | | | | | |
Contract
to
Buy | | Delivery
Date | | | Currency | | Units | | | Notional
Value | | | Unrealized
Appreciation | |
| Buy1 | | | 08/23/2011 | | | Chinese Renminbi | | | 5,600,000 | | | $ | 844,246 | | | $ | 6,299 | |
| Buy2 | | | 10/22/2010 | | | Malaysian Ringgit | | | 1,250,000 | | | | 404,433 | | | | 3,690 | |
| Buy3 | | | 12/13/2010 | | | South Korean Won | | | 780,000,000 | | | | 682,050 | | | | 22,988 | |
| Buy4 | | | 12/13/2010 | | | South Korean Won | | | 870,000,000 | | | | 760,748 | | | | 26,260 | |
| | | | | | | | | | | | | | | | | | |
| Total | | | | | | | | | | | | | | | | $ | 59,237 | |
| | | | | | | | | | | | | | | | | | |
1Counterparty is Morgan Stanley & Co., Inc.
2Counterparty is JPMorgan Chase Bank.
3Counterparty is Barclays Bank PLC.
4Counterparty is Credit Suisse.
Industry Summary at September 30, 2010 (Unaudited)
| | | | |
| Commercial Banks | | | 5.9 | % |
| Machinery | | | 5.8 | |
| Computers & Peripherals | | | 5.3 | |
| Personal Products | | | 3.7 | |
| Automobiles | | | 3.4 | |
Semiconductors & Semiconductor Equipment | | | 3.3 | |
| Treasuries | | | 3.1 | |
| Communications Equipment | | | 2.9 | |
| Internet & Catalog Retail | | | 2.7 | |
| Multiline Retail | | | 2.6 | |
| Automotive | | | 2.5 | |
| Internet Software & Services | | | 2.5 | |
| Non-Captive Diversified | | | 2.5 | |
| Software | | | 2.4 | |
| Sovereigns | | | 2.2 | |
| Airlines | | | 2.2 | |
Other Investments, less than 2% each | | | 43.6 | |
| Short-Term Investments | | | 2.7 | |
| | | | |
| Total Investments | | | 99.3 | |
| Other assets less liabilities (including open forward foreign currency contracts) | | | 0.7 | |
| | | | |
| Net Assets | | | 100.0 | % |
| | | | |
See accompanying notes to financial statements.
27 |
Portfolio of Investments – as of September 30, 2010
Loomis Sayles Global Markets Fund – (continued)
Currency Exposure at September 30, 2010 as a Percentage of Net Assets (Unaudited)
| | | | |
| United States Dollar | | | 59.3 | % |
| Euro | | | 8.6 | |
| Brazilian Real | | | 7.5 | |
| British Pound | | | 5.5 | |
| South Korean Won | | | 2.6 | |
| Hong Kong Dollar | | | 2.3 | |
| Other, less than 2% each | | | 13.5 | |
| | | | |
| Total Investments | | | 99.3 | |
| Other assets less liabilities (including open forward foreign currency contracts) | | | 0.7 | |
| | | | |
| Net Assets | | | 100.0 | % |
| | | | |
See accompanying notes to financial statements.
| 28
Portfolio of Investments – as of September 30, 2010
Loomis Sayles Growth Fund
| | | | | | | | |
| Shares | | | Description | | Value (†) | |
| | | | | | | | |
| | Common Stocks — 99.5% of Net Assets | |
| | | | Air Freight & Logistics — 7.7% | | | | |
| | 76,201 | | | Expeditors International of Washington, Inc. | | $ | 3,522,772 | |
| | 62,443 | | | United Parcel Service, Inc., Class B | | | 4,164,324 | |
| | | | | | | | |
| | | | | | | 7,687,096 | |
| | | | | | | | |
| | | | Beverages — 3.9% | | | | |
| | 42,112 | | | Coca-Cola Co. (The) | | | 2,464,394 | |
| | 20,679 | | | Diageo PLC, Sponsored ADR | | | 1,427,058 | |
| | | | | | | | |
| | | | | | | 3,891,452 | |
| | | | | | | | |
| | | | Biotechnology — 8.5% | | | | |
| | 68,226 | | | Amgen, Inc.(b) | | | 3,759,935 | |
| | 83,167 | | | Biogen Idec, Inc.(b) | | | 4,667,332 | |
| | | | | | | | |
| | | | | | | 8,427,267 | |
| | | | | | | | |
| | | | Capital Markets — 7.8% | | | | |
| | 15,062 | | | Franklin Resources, Inc. | | | 1,610,128 | |
| | 73,865 | | | Legg Mason, Inc. | | | 2,238,848 | |
| | 191,130 | | | SEI Investments Co. | | | 3,887,584 | |
| | | | | | | | |
| | | | | | | 7,736,560 | |
| | | | | | | | |
| | | | Communications Equipment — 8.9% | | | | |
| | 202,191 | | | Cisco Systems, Inc.(b) | | | 4,427,983 | |
| | 99,105 | | | QUALCOMM, Inc. | | | 4,471,617 | |
| | | | | | | | |
| | | | | | | 8,899,600 | |
| | | | | | | | |
| | | | Consumer Finance — 4.1% | | | | |
| | 97,674 | | | American Express Co. | | | 4,105,238 | |
| | | | | | | | |
| | | | Energy Equipment & Services — 3.0% | | | | |
| | 39,996 | | | Schlumberger Ltd. | | | 2,464,153 | |
| | 30,727 | | | Weatherford International Ltd.(b) | | | 525,432 | |
| | | | | | | | |
| | | | | | | 2,989,585 | |
| | | | | | | | |
| | | | Health Care Equipment & Supplies — 4.1% | | | | |
| | 44,892 | | | Medtronic, Inc. | | | 1,507,473 | |
| | 48,341 | | | Zimmer Holdings, Inc.(b) | | | 2,529,685 | |
| | | | | | | | |
| | | | | | | 4,037,158 | |
| | | | | | | | |
| | | | Health Care Providers & Services — 0.4% | | | | |
| | 6,990 | | | WellPoint, Inc.(b) | | | 395,914 | |
| | | | | | | | |
| | | | Household Products — 3.2% | | | | |
| | 24,562 | | | Clorox Co. (The) | | | 1,639,759 | |
| | 25,498 | | | Procter & Gamble Co. (The) | | | 1,529,115 | |
| | | | | | | | |
| | | | | | | 3,168,874 | |
| | | | | | | | |
| | | | Internet & Catalog Retail — 8.8% | | | | |
| | 45,959 | | | Amazon.com, Inc.(b) | | | 7,218,320 | |
| | 34,395 | | | Blue Nile, Inc.(b) | | | 1,530,234 | |
| | | | | | | | |
| | | | | | | 8,748,554 | |
| | | | | | | | |
| | | | Internet Software & Services — 6.6% | | | | |
| | 12,578 | | | Google, Inc., Class A(b) | | | 6,613,387 | |
| | | | | | | | |
| | | | IT Services — 7.9% | | | | |
| | 33,436 | | | Automatic Data Processing, Inc. | | | 1,405,315 | |
| | 86,521 | | | Visa, Inc., Class A | | | 6,425,050 | |
| | | | | | | | |
| | | | | | | 7,830,365 | |
| | | | | | | | |
| | | | Media — 2.2% | | | | |
| | 55,940 | | | Omnicom Group, Inc. | | | 2,208,511 | |
| | | | | | | | |
| | | | Multiline Retail — 0.3% | | | | |
| | 6,296 | | | Target Corp. | | | 336,458 | |
| | | | | | | | |
| | | | Oil, Gas & Consumable Fuels — 0.4% | | | | |
| | 2,432 | | | Chevron Corp. | | | 197,114 | |
| | 3,772 | | | ConocoPhillips | | | 216,626 | |
| | | | | | | | |
| | | | | | | 413,740 | |
| | | | | | | | |
| | | | | | | | |
| Shares | | | Description | | Value (†) | |
| | | | | | | | |
| | | | Pharmaceuticals — 6.1% | | | | |
| | 64,295 | | | Merck & Co., Inc. | | $ | 2,366,699 | |
| | 64,690 | | | Novartis AG, ADR | | | 3,730,672 | |
| | | | | | | | |
| | | | | | | 6,097,371 | |
| | | | | | | | |
| | | | Semiconductors & Semiconductor Equipment — 3.1% | |
| | 71,296 | | | Altera Corp. | | | 2,150,287 | |
| | 31,000 | | | Analog Devices, Inc. | | | 972,780 | |
| | | | | | | | |
| | | | | | | 3,123,067 | |
| | | | | | | | |
| | | | Software — 10.4% | | | | |
| | 39,738 | | | FactSet Research Systems, Inc. | | | 3,223,944 | |
| | 82,297 | | | Microsoft Corp. | | | 2,015,453 | |
| | 193,049 | | | Oracle Corp. | | | 5,183,366 | |
| | | | | | | | |
| | | | | | | 10,422,763 | |
| | | | | | | | |
| | | | Specialty Retail — 2.1% | | | | |
| | 44,341 | | | Home Depot, Inc. (The) | | | 1,404,723 | |
| | 30,310 | | | Lowe’s Cos., Inc. | | | 675,610 | |
| | | | | | | | |
| | | | | | | 2,080,333 | |
| | | | | | | | |
| | | | Total Common Stocks
(Identified Cost $89,938,147) | | | 99,213,293 | |
| | | | | | | | |
Principal
Amount | | | | | | |
| | Short-Term Investments — 0.9% | |
| $ | 930,091 | | | Tri-Party Repurchase Agreement with Fixed Income Clearing Corporation, dated 9/30/2010 at 0.000% to be repurchased at $930,091 on 10/01/2010 collateralized by $945,000 Federal Home Loan Bank, 0.785% due 11/25/2011 valued at $952,088 including accrued interest (Note 2 of Notes to Financial Statements) (Identified Cost $930,091) | | | 930,091 | |
| | | | | | | | |
| | | | | | | | |
| | | | Total Investments — 100.4%
(Identified Cost $90,868,238)(a) | | | 100,143,384 | |
| | | | Other assets less liabilities — (0.4)% | | | (365,156 | ) |
| | | | | | | | |
| | | | Net Assets — 100.0% | | $ | 99,778,228 | |
| | | | | | | | |
| | | | | | | | |
| | (†) | | | See Note 2 of Notes to Financial Statements. | | | | |
| | (a) | | | Federal Tax Information: | | | | |
| | | | At September 30, 2010, the net unrealized appreciation on investments based on a cost of $92,016,124 for federal income tax purposes was as follows: | |
| | | | Aggregate gross unrealized appreciation for all investments in which there is an excess of value over tax cost | | $ | 9,339,180 | |
| | | | Aggregate gross unrealized depreciation for all investments in which there is an excess of tax cost over value | | | (1,211,920 | ) |
| | | | | | | | |
| | | | Net unrealized appreciation | | $ | 8,127,260 | |
| | | | | | | | |
| | | | | | | | |
| | (b) | | | Non-income producing security. | | | | |
| | | | | | | | |
| | ADR | | | An American Depositary Receipt is a certificate issued by a custodian bank representing the right to receive securities of the foreign issuer described. The values of ADRs are significantly influenced by trading on exchanges not located in the United States. | |
See accompanying notes to financial statements.
29 |
Portfolio of Investments – as of September 30, 2010
Loomis Sayles Growth Fund – (continued)
Industry Summary at September 30, 2010 (Unaudited)
| | | | |
| Software | | | 10.4 | % |
| Communications Equipment | | | 8.9 | |
| Internet & Catalog Retail | | | 8.8 | |
| Biotechnology | | | 8.5 | |
| IT Services | | | 7.9 | |
| Capital Markets | | | 7.8 | |
| Air Freight & Logistics | | | 7.7 | |
| Internet Software & Services | | | 6.6 | |
| Pharmaceuticals | | | 6.1 | |
| Consumer Finance | | | 4.1 | |
| Health Care Equipment & Supplies | | | 4.1 | |
| Beverages | | | 3.9 | |
| Household Products | | | 3.2 | |
Semiconductors & Semiconductor Equipment | | | 3.1 | |
| Energy Equipment & Services | | | 3.0 | |
| Media | | | 2.2 | |
| Specialty Retail | | | 2.1 | |
Other Investments, less than 2% each | | | 1.1 | |
| Short-Term Investments | | | 0.9 | |
| | | | |
| Total Investments | | | 100.4 | |
| Other assets less liabilities | | | (0.4 | ) |
| | | | |
| Net Assets | | | 100.0 | % |
| | | | |
See accompanying notes to financial statements.
| 30
Portfolio of Investments – as of September 30, 2010
Loomis Sayles Mid Cap Growth Fund
| | | | | | | | |
| Shares | | | Description | | Value (†) | |
| | | | | | | | |
| | Common Stocks — 102.2% of Net Assets | |
| | | | Biotechnology — 4.0% | | | | |
| | 28,034 | | | Alexion Pharmaceuticals, Inc.(b) | | $ | 1,804,268 | |
| | 37,578 | | | Human Genome Sciences, Inc.(b) | | | 1,119,449 | |
| | 70,412 | | | Incyte Corp.(b) | | | 1,125,888 | |
| | | | | | | | |
| | | | | | | 4,049,605 | |
| | | | | | | | |
| | | | Capital Markets — 2.8% | | | | |
| | 20,089 | | | Greenhill & Co., Inc. | | | 1,593,460 | |
| | 23,897 | | | T. Rowe Price Group, Inc. | | | 1,196,403 | |
| | | | | | | | |
| | | | | | | 2,789,863 | |
| | | | | | | | |
| | | | Chemicals — 1.0% | | | | |
| | 10,901 | | | CF Industries Holdings, Inc. | | | 1,041,045 | |
| | | | | | | | |
| | | | Commercial Services & Supplies — 1.8% | | | | |
| | 26,424 | | | Stericycle, Inc.(b) | | | 1,835,940 | |
| | | | | | | | |
| | | | Communications Equipment — 7.5% | | | | |
| | 43,242 | | | Acme Packet, Inc.(b) | | | 1,640,601 | |
| | 36,238 | | | F5 Networks, Inc.(b)(c) | | | 3,761,867 | |
| | 49,375 | | | Riverbed Technology, Inc.(b) | | | 2,250,513 | |
| | | | | | | | |
| | | | | | | 7,652,981 | |
| | | | | | | | |
| | | | Computers & Peripherals — 2.7% | | | | |
| | 55,249 | | | NetApp, Inc.(b) | | | 2,750,848 | |
| | | | | | | | |
| | | | Diversified Financial Services — 1.5% | | | | |
| | 14,206 | | | IntercontinentalExchange, Inc.(b) | | | 1,487,652 | |
| | | | | | | | |
| | | | Energy Equipment & Services — 1.7% | | | | |
| | 86,378 | | | Complete Production Services, Inc.(b) | | | 1,766,430 | |
| | | | | | | | |
| | | | Food Products — 2.2% | | | | |
| | 39,632 | | | Mead Johnson Nutrition Co., Class A | | | 2,255,457 | |
| | | | | | | | |
| | | | Health Care Equipment & Supplies — 2.3% | | | | |
| | 17,977 | | | Edwards Lifesciences Corp.(b) | | | 1,205,358 | |
| | 57,849 | | | NxStage Medical, Inc.(b) | | | 1,104,916 | |
| | | | | | | | |
| | | | | | | 2,310,274 | |
| | | | | | | | |
| | | | Health Care Providers & Services — 1.5% | | | | |
| | 25,918 | | | HMS Holdings Corp.(b) | | | 1,527,607 | |
| | | | | | | | |
| | | | Health Care Technology — 1.4% | | | | |
| | 40,333 | | | SXC Health Solutions Corp.(b) | | | 1,470,944 | |
| | | | | | | | |
| | | | Hotels, Restaurants & Leisure — 6.3% | | | | |
| | 12,682 | | | Chipotle Mexican Grill, Inc.(b) | | | 2,181,304 | |
| | 45,943 | | | Ctrip.com International Ltd., ADR(b) | | | 2,193,778 | |
| | 22,649 | | | Wynn Resorts Ltd. | | | 1,965,254 | |
| | | | | | | | |
| | | | | | | 6,340,336 | |
| | | | | | | | |
| | | | Household Products — 1.1% | | | | |
| | 16,269 | | | Clorox Co. (The) | | | 1,086,118 | |
| | | | | | | | |
| | | | Internet & Catalog Retail — 6.2% | | | | |
| | 24,123 | | | NetFlix, Inc.(b)(c) | | | 3,911,786 | |
| | 6,836 | | | Priceline.com, Inc.(b) | | | 2,381,252 | |
| | | | | | | | |
| | | | | | | 6,293,038 | |
| | | | | | | | |
| | | | Internet Software & Services — 8.0% | | | | |
| | 36,219 | | | Baidu, Inc., Sponsored ADR(b)(c) | | | 3,716,794 | |
| | 31,574 | | | MercadoLibre, Inc.(b) | | | 2,279,011 | |
| | 31,112 | | �� | OpenTable, Inc.(b) | | | 2,118,105 | |
| | | | | | | | |
| | | | | | | 8,113,910 | |
| | | | | | | | |
| | | | IT Services — 2.6% | | | | |
| | 41,501 | | | Cognizant Technology Solutions Corp., Class A(b) | | | 2,675,569 | |
| | | | | | | | |
| | | | Life Sciences Tools & Services — 1.9% | | | | |
| | 15,422 | | | Mettler-Toledo International, Inc.(b) | | | 1,919,114 | |
| | | | | | | | |
| | | | | | | | |
| Shares | | | Description | | Value (†) | |
| | | | | | | | |
| | | | Machinery — 5.5% | | | | |
| | 35,986 | | | Cummins, Inc. | | $ | 3,259,612 | |
| | 32,613 | | | Joy Global, Inc. | | | 2,293,346 | |
| | | | | | | | |
| | | | | | | 5,552,958 | |
| | | | | | | | |
| | | | Media — 1.7% | | | | |
| | 40,212 | | | Discovery Communications, Inc., Class A(b) | | | 1,751,233 | |
| | | | | | | | |
| | | | Metals & Mining — 10.0% | | | | |
| | 20,594 | | | Cliffs Natural Resources, Inc. | | | 1,316,368 | |
| | 138,426 | | | Eldorado Gold Corp. | | | 2,559,497 | |
| | 122,830 | | | Ivanhoe Mines Ltd.(b) | | | 2,875,450 | |
| | 15,644 | | | Randgold Resources Ltd., ADR | | | 1,587,240 | |
| | 22,495 | | | Walter Energy, Inc. | | | 1,828,619 | |
| | | | | | | | |
| | | | | | | 10,167,174 | |
| | | | | | | | |
| | | | Multiline Retail — 4.3% | | | | |
| | 48,272 | | | Dollar Tree, Inc.(b) | | | 2,353,743 | |
| | 44,728 | | | Family Dollar Stores, Inc. | | | 1,975,188 | |
| | | | | | | | |
| | | | | | | 4,328,931 | |
| | | | | | | | |
| | | | Oil, Gas & Consumable Fuels — 2.8% | | | | |
| | 42,911 | | | Concho Resources, Inc.(b) | | | 2,839,421 | |
| | | | | | | | |
| | | | Pharmaceuticals — 3.3% | | | | |
| | 33,704 | | | Perrigo Co. | | | 2,164,471 | |
| | 47,850 | | | Valeant Pharmaceuticals International, Inc. | | | 1,198,648 | |
| | | | | | | | |
| | | | | | | 3,363,119 | |
| | | | | | | | |
| | | | Real Estate Management & Development — 1.9% | |
| | 103,425 | | | CB Richard Ellis Group, Inc., Class A(b) | | | 1,890,609 | |
| | | | | | | | |
| | | | Semiconductors & Semiconductor Equipment — 1.6% | |
| | 85,241 | | | ARM Holdings PLC, Sponsored ADR | | | 1,599,121 | |
| | | | | | | | |
| | | | Software — 9.3% | | | | |
| | 25,703 | | | Citrix Systems, Inc.(b) | | | 1,753,973 | |
| | 25,458 | | | Concur Technologies, Inc.(b) | | | 1,258,643 | |
| | 33,682 | | | Rovi Corp.(b) | | | 1,697,910 | |
| | 27,265 | | | Salesforce.com, Inc.(b) | | | 3,048,227 | |
| | 19,960 | | | VMware, Inc., Class A(b) | | | 1,695,402 | |
| | | | | | | | |
| | | | | | | 9,454,155 | |
| | | | | | | | |
| | | | Specialty Retail — 2.1% | | | | |
| | 9,283 | | | AutoZone, Inc.(b) | | | 2,124,972 | |
| | | | | | | | |
| | | | Textiles, Apparel & Luxury Goods — 3.2% | | | | |
| | 31,778 | | | Fossil, Inc.(b) | | | 1,709,339 | |
| | 34,335 | | | Lululemon Athletica, Inc.(b) | | | 1,535,461 | |
| | | | | | | | |
| | | | | | | 3,244,800 | |
| | | | | | | | |
| | | | Total Common Stocks
(Identified Cost $80,874,822) | | | 103,683,224 | |
| | | | | | | | |
| | Put Options — 0.4% | |
| | 29,400 | | | Baidu, Inc., Sponsored ADR expiring December 18, 2010 at 80 | | | 70,707 | |
| | 26,900 | | | F5 Networks, Inc. expiring January 22, 2011 at 90 | | | 133,155 | |
| | 17,700 | | | NetFlix, Inc. expiring December 18, 2010 at 140 | | | 145,140 | |
| | 19,300 | | | Salesforce.com, Inc. expiring November 20, 2010 at 105 | | | 103,737 | |
| | | | | | | | |
| | | | Total Put Options
(Identified Cost $811,244) | | | 452,739 | |
| | | | | | | | |
See accompanying notes to financial statements.
31 |
Portfolio of Investments – as of September 30, 2010
Loomis Sayles Mid Cap Growth Fund – (continued)
| | | | | | | | |
Principal
Amount | | | Description | | Value (†) | |
| | | | | | | | |
| | Short-Term Investments — 11.5% | |
| $ | 11,632,824 | | | Tri-Party Repurchase Agreement with Fixed Income Clearing Corporation, dated 9/30/2010 at 0.000% to be repurchased at $11,632,824 on 10/01/2010 collateralized by $11,870,000 Federal Home Loan Bank, 0.250% due 1/28/2011 valued at $11,870,000, including accrued interest (Note 2 of Notes to Financial Statements) (Identified Cost $11,632,824) | | $ | 11,632,824 | |
| | | | | | | | |
| | | | | | | | |
| | | | Total Investments — 114.1%
(Identified Cost $93,318,890)(a) | | | 115,768,787 | |
| | | | Other assets less liabilities — (14.1)% | | | (14,339,363 | ) |
| | | | | | | | |
| | | | Net Assets — 100.0% | | $ | 101,429,424 | |
| | | | | | | | |
| Shares | | | | | | |
| | Call Options Written — (0.1%) | |
| | 10,700 | | | F5 Networks, Inc. expiring January 22, 2011 at 125 | | | (36,380 | ) |
| | 8,600 | | | NetFlix, Inc. expiring December 18, 2010 at 190 | | | (65,575 | ) |
| | | | | | | | |
| | | | Total Call Options Written
(Premiums Received $56,519) | | $ | (101,955 | ) |
| | | | | | | | |
| | Put Options Written — (0.1%) | |
| | 29,400 | | | Baidu, Inc., Sponsored ADR expiring December 18, 2010 at 66 | | | (23,373 | ) |
| | 26,900 | | | F5 Networks, Inc. expiring January 22, 2011 at 70 | | | (31,607 | ) |
| | 17,700 | | | NetFlix, Inc. expiring December 18, 2010 at 115 | | | (43,631 | ) |
| | 19,300 | | | Salesforce.com, Inc. expiring November 20, 2010 at 85 | | | (24,029 | ) |
| | | | | | | | |
| | | | Total Put Options Written
(Premiums Received $279,304) | | $ | (122,640 | ) |
| | | | | | | | |
| | | | | | | | |
| | (†) | | | See Note 2 of Notes to Financial Statements. | | | | |
| | (a) | | | Federal Tax Information: | | | | |
| | | | At September 30, 2010, the net unrealized appreciation on investments based on a cost of $93,391,288 for federal income tax purposes was as follows: | |
| | | | Aggregate gross unrealized appreciation for all investments in which there is an excess of value over tax cost | | $ | 23,437,355 | |
| | | | Aggregate gross unrealized depreciation for all investments in which there is an excess of tax cost over value | | | (1,059,856 | ) |
| | | | | | | | |
| | | | Net unrealized appreciation | | $ | 22,377,499 | |
| | | | | | | | |
| | | | | | | | |
| | (b) | | | Non-income producing security. | |
| | (c) | | | All or a portion of this security is held as collateral for outstanding options. | |
| | | | | | | | |
| | ADR | | | An American Depositary Receipt is a certificate issued by a custodian bank representing the right to receive securities of the foreign issuer described. The values of ADRs are significantly influenced by trading on exchanges not located in the United States. | |
Industry Summary at September 30, 2010 (Unaudited)
| | | | |
| Metals & Mining | | | 10.0 | % |
| Software | | | 9.3 | |
| Internet Software & Services | | | 8.0 | |
| Communications Equipment | | | 7.5 | |
| Hotels, Restaurants & Leisure | | | 6.3 | |
| Internet & Catalog Retail | | | 6.2 | |
| Machinery | | | 5.5 | |
| Multiline Retail | | | 4.3 | |
| Biotechnology | | | 4.0 | |
| Pharmaceuticals | | | 3.3 | |
| Textiles, Apparel & Luxury Goods | | | 3.2 | |
| Oil, Gas & Consumable Fuels | | | 2.8 | |
| Capital Markets | | | 2.8 | |
| Computers & Peripherals | | | 2.7 | |
| IT Services | | | 2.6 | |
| Health Care Equipment & Supplies | | | 2.3 | |
| Food Products | | | 2.2 | |
| Specialty Retail | | | 2.1 | |
Other Investments, less than 2% each | | | 17.5 | |
| Short-Term Investments | | | 11.5 | |
| | | | |
| Total Investments | | | 114.1 | |
| Other assets less liabilities (including options written) | | | (14.1 | ) |
| | | | |
| Net Assets | | | 100.0 | % |
| | | | |
See accompanying notes to financial statements.
| 32
Portfolio of Investments – as of September 30, 2010
Loomis Sayles Value Fund
| | | | | | | | |
| Shares | | | Description | | Value (†) | |
| | | | | | | | |
| | Common Stocks — 97.4% of Net Assets | |
| | | | Aerospace & Defense — 3.0% | | | | |
| | 283,439 | | | Honeywell International, Inc. | | $ | 12,454,310 | |
| | 264,867 | | | Northrop Grumman Corp. | | | 16,058,886 | |
| | | | | | | | |
| | | | | | | 28,513,196 | |
| | | | | | | | |
| | | | Auto Components — 1.8% | | | | |
| | 425,806 | | | Goodyear Tire & Rubber Co. (The)(b) | | | 4,577,415 | |
| | 389,812 | | | Johnson Controls, Inc. | | | 11,889,266 | |
| | | | | | | | |
| | | | | | | 16,466,681 | |
| | | | | | | | |
| | | | Beverages — 3.6% | | | | |
| | 543,115 | | | Coca-Cola Enterprises, Inc. | | | 16,836,565 | |
| | 246,863 | | | PepsiCo, Inc. | | | 16,401,578 | |
| | | | | | | | |
| | | | | | | 33,238,143 | |
| | | | | | | | |
| | | | Biotechnology — 1.1% | | | | |
| | 187,170 | | | Amgen, Inc.(b) | | | 10,314,939 | |
| | | | | | | | |
| | | | Capital Markets — 5.8% | | | | |
| | 362,288 | | | Ameriprise Financial, Inc. | | | 17,147,091 | |
| | 412,884 | | | Bank of New York Mellon Corp. | | | 10,788,659 | |
| | 412,384 | | | Legg Mason, Inc. | | | 12,499,359 | |
| | 364,332 | | | State Street Corp. | | | 13,720,743 | |
| | | | | | | | |
| | | | | | | 54,155,852 | |
| | | | | | | | |
| | | | Chemicals — 1.5% | | | | |
| | 173,618 | | | Air Products & Chemicals, Inc. | | | 14,379,043 | |
| | | | | | | | |
| | | | Commercial Banks — 5.5% | | | | |
| | 774,208 | | | Fifth Third Bancorp | | | 9,313,722 | |
| | 286,681 | | | PNC Financial Services Group, Inc. | | | 14,881,611 | |
| | 469,356 | | | U.S. Bancorp | | | 10,147,477 | |
| | 669,420 | | | Wells Fargo & Co. | | | 16,822,524 | |
| | | | | | | | |
| | | | | | | 51,165,334 | |
| | | | | | | | |
| | | | Computers & Peripherals — 1.3% | | | | |
| | 297,399 | | | Hewlett-Packard Co. | | | 12,511,576 | |
| | | | | | | | |
| | | | Construction & Engineering — 0.7% | | | | |
| | 256,728 | | | Foster Wheeler AG(b) | | | 6,279,567 | |
| | | | | | | | |
| | | | Consumer Finance — 1.3% | | | | |
| | 714,620 | | | Discover Financial Services | | | 11,919,862 | |
| | | | | | | | |
| | | | Containers & Packaging — 1.1% | | | | |
| | 381,390 | | | Owens-Illinois, Inc.(b) | | | 10,701,803 | |
| | | | | | | | |
| | | | Diversified Financial Services — 6.2% | | | | |
| | 1,500,804 | | | Bank of America Corp. | | | 19,675,540 | |
| | 3,431,907 | | | Citigroup, Inc.(b) | | | 13,384,437 | |
| | 655,082 | | | JPMorgan Chase & Co. | | | 24,938,972 | |
| | | | | | | | |
| | | | | | | 57,998,949 | |
| | | | | | | | |
| | | | Diversified Telecommunication Services — 3.1% | |
| | 520,482 | | | AT&T, Inc. | | | 14,885,785 | |
| | 358,249 | | | CenturyLink, Inc. | | | 14,136,506 | |
| | | | | | | | |
| | | | | | | 29,022,291 | |
| | | | | | | | |
| | | | Electric Utilities — 1.3% | | | | |
| | 434,253 | | | PPL Corp. | | | 11,824,709 | |
| | | | | | | | |
| | | | Electrical Equipment — 0.9% | | | | |
| | 390,569 | | | ABB Ltd., Sponosored ADR(b) | | | 8,248,817 | |
| | | | | | | | |
| | | | Energy Equipment & Services — 1.9% | | | | |
| | 294,127 | | | Schlumberger Ltd. | | | 18,121,164 | |
| | | | | | | | |
| | | | Food & Staples Retailing — 1.3% | | | | |
| | 392,612 | | | CVS Caremark Corp. | | | 12,355,500 | |
| | | | | | | | |
| | | | Food Products — 2.1% | | | | |
| | 487,172 | | | ConAgra Foods, Inc. | | | 10,688,554 | |
| | 177,357 | | | Kellogg Co. | | | 8,958,302 | |
| | | | | | | | |
| | | | | | | 19,646,856 | |
| | | | | | | | |
| | | | | | | | |
| Shares | | | Description | | Value (†) | |
| | | | | | | | |
| | | | Health Care Equipment & Supplies — 2.7% | | | | |
| | 368,952 | | | Covidien PLC | | $ | 14,828,181 | |
| | 303,568 | | | Medtronic, Inc. | | | 10,193,813 | |
| | | | | | | | |
| | | | | | | 25,021,994 | |
| | | | | | | | |
| | | | Health Care Providers & Services — 1.7% | | | | |
| | 454,900 | | | UnitedHealth Group, Inc. | | | 15,971,539 | |
| | | | | | | | |
| | | | Household Durables — 0.9% | | | | |
| | 251,145 | | | Harman International Industries, Inc.(b) | | | 8,390,754 | |
| | | | | | | | |
| | | | Household Products — 1.5% | | | | |
| | 81,719 | | | Energizer Holdings, Inc.(b) | | | 5,493,968 | |
| | 143,244 | | | Procter & Gamble Co. (The) | | | 8,590,343 | |
| | | | | | | | |
| | | | | | | 14,084,311 | |
| | | | | | | | |
| | | | Independent Power Producers & Energy Traders — 1.0% | |
| | 724,256 | | | Calpine Corp.(b) | | | 9,016,987 | |
| | | | | | | | |
| | | | Industrial Conglomerates — 4.5% | | | | |
| | 1,616,224 | | | General Electric Co. | | �� | 26,263,640 | |
| | 147,350 | | | Siemens AG, Sponsored ADR | | | 15,530,690 | |
| | | | | | | | |
| | | | | | | 41,794,330 | |
| | | | | | | | |
| | | | Insurance — 3.8% | | | | |
| | 153,313 | | | Berkshire Hathaway, Inc., Class B(b) | | | 12,675,919 | |
| | 228,834 | | | Travelers Cos., Inc. (The) | | | 11,922,251 | |
| | 472,952 | | | Unum Group | | | 10,475,887 | |
| | | | | | | | |
| | | | | | | 35,074,057 | |
| | | | | | | | |
| | | | Internet Software & Services — 2.3% | | | | |
| | 344,627 | | | AOL, Inc.(b) | | | 8,529,518 | |
| | 525,689 | | | eBay, Inc.(b) | | | 12,826,812 | |
| | | | | | | | |
| | | | | | | 21,356,330 | |
| | | | | | | | |
| | | | Media — 6.5% | | | | |
| | 491,545 | | | CBS Corp., Class B | | | 7,795,904 | |
| | 924,589 | | | Comcast Corp., Class A | | | 16,716,569 | |
| | 363,329 | | | DIRECTV, Class A(b) | | | 15,125,386 | |
| | 255,167 | | | Omnicom Group, Inc. | | | 10,073,993 | |
| | 299,446 | | | Viacom, Inc., Class B | | | 10,836,951 | |
| | | | | | | | |
| | | | | | | 60,548,803 | |
| | | | | | | | |
| | | | Multi-Utilities — 1.3% | | | | |
| | 354,064 | | | Public Service Enterprise Group, Inc. | | | 11,712,437 | |
| | | | | | | | |
| | | | Oil, Gas & Consumable Fuels — 10.3% | | | | |
| | 172,330 | | | Chevron Corp. | | | 13,967,346 | |
| | 242,054 | | | CONSOL Energy, Inc. | | | 8,946,316 | |
| | 1,222,933 | | | El Paso Corp. | | | 15,139,911 | |
| | 384,110 | | | ExxonMobil Corp. | | | 23,734,157 | |
| | 249,840 | | | Hess Corp. | | | 14,770,541 | |
| | 386,737 | | | Total SA, Sponsored ADR | | | 19,955,629 | |
| | | | | | | | |
| | | | | | | 96,513,900 | |
| | | | | | | | |
| | | | Paper & Forest Products — 0.9% | | | | |
| | 521,709 | | | Weyerhaeuser Co. | | | 8,222,134 | |
| | | | | | | | |
| | | | Personal Products — 0.8% | | | | |
| | 117,752 | | | Estee Lauder Cos., Inc. (The), Class A | | | 7,445,459 | |
| | | | | | | | |
| | | | Pharmaceuticals — 7.2% | | | | |
| | 470,332 | | | Bristol-Myers Squibb Co. | | | 12,750,701 | |
| | 163,770 | | | Johnson & Johnson | | | 10,147,189 | |
| | 425,331 | | | Merck & Co., Inc. | | | 15,656,434 | |
| | 807,426 | | | Pfizer, Inc. | | | 13,863,504 | |
| | 440,772 | | | Sanofi-Aventis SA, Sponsored ADR | | | 14,655,669 | |
| | | | | | | | |
| | | | | | | 67,073,497 | |
| | | | | | | | |
| | | | Road & Rail — 1.2% | | | | |
| | 186,956 | | | Norfolk Southern Corp. | | | 11,125,752 | |
| | | | | | | | |
See accompanying notes to financial statements.
33 |
Portfolio of Investments – as of September 30, 2010
Loomis Sayles Value Fund – (continued)
| | | | | | | | |
| Shares | | | Description | | Value (†) | |
| | | | | | | | |
| | | | Semiconductors & Semiconductor Equipment — 1.3% | |
| | 1,064,637 | | | Applied Materials, Inc. | | $ | 12,434,960 | |
| | | | | | | | |
| | | | Software — 2.2% | | | | |
| | 764,484 | | | Oracle Corp. | | | 20,526,395 | |
| | | | | | | | |
| | | | Specialty Retail — 2.1% | | | | |
| | 451,233 | | | Gap, Inc. (The) | | | 8,410,983 | |
| | 513,386 | | | Lowe’s Cos., Inc. | | | 11,443,374 | |
| | | | | | | | |
| | | | | | | 19,854,357 | |
| | | | | | | | |
| | | | Wireless Telecommunication Services — 1.7% | | | | |
| | 654,491 | | | Vodafone Group PLC, Sponsored ADR | | | 16,237,922 | |
| | | | | | | | |
| | | | Total Common Stocks
(Identified Cost $871,507,461) | | | 909,270,200 | |
| | | | | | | | |
Principal
Amount | | | | | | |
| | Short-Term Investments — 2.5% | |
| $ | 23,251,006 | | | Tri-Party Repurchase Agreement with Fixed Income Clearing Corporation, dated 9/30/2010 at 0.000% to be repurchased at $23,251,006 on 10/01/2010 collateralized by $23,455,000 Federal Home Loan Bank, 1.000% due 12/28/2011 valued at $23,718,869 including accrued interest (Note 2 of Notes to Financial Statements) (Identified Cost $23,251,006) | | | 23,251,006 | |
| | | | | | | | |
| | | | | | | | |
| | | | Total Investments — 99.9%
(Identified Cost $894,758,467)(a) | | | 932,521,206 | |
| | | | Other assets less liabilities — 0.1% | | | 864,210 | |
| | | | | | | | |
| | | | Net Assets — 100.0% | | $ | 933,385,416 | |
| | | | | | | | |
| | | | | | | | |
| | (†) | | | See Note 2 of Notes to Financial Statements. | | | | |
| | (a) | | | Federal Tax Information: | | | | |
| | | | At September 30, 2010, the net unrealized appreciation on investments based on a cost of $901,766,289 for federal income tax purposes was as follows: | |
| | | | Aggregate gross unrealized appreciation for all investments in which there is an excess of value over tax cost | | $ | 65,873,862 | |
| | | | Aggregate gross unrealized depreciation for all investments in which there is an excess of tax cost over value | | | (35,118,945 | ) |
| | | | | | | | |
| | | | Net unrealized appreciation | | $ | 30,754,917 | |
| | | | | | | | |
| | | | | | | | |
| | (b) | | | Non-income producing security. | | | | |
| | | | | | | | |
| | ADR | | | An American Depositary Receipt is a certificate issued by a custodian bank representing the right to receive securities of the foreign issuer described. The values of ADRs are significantly influenced by trading on exchanges not located in the United States. | |
Industry Summary at September 30, 2010 (Unaudited)
| | | | |
| Oil, Gas & Consumable Fuels | | | 10.3 | % |
| Pharmaceuticals | | | 7.2 | |
| Media | | | 6.5 | |
| Diversified Financial Services | | | 6.2 | |
| Capital Markets | | | 5.8 | |
| Commercial Banks | | | 5.5 | |
| Industrial Conglomerates | | | 4.5 | |
| Insurance | | | 3.8 | |
| Beverages | | | 3.6 | |
Diversified Telecommunication Services | | | 3.1 | |
| Aerospace & Defense | | | 3.0 | |
| Health Care Equipment & Supplies | | | 2.7 | |
| Internet Software & Services | | | 2.3 | |
| Software | | | 2.2 | |
| Specialty Retail | | | 2.1 | |
| Food Products | | | 2.1 | |
Other Investments, less than 2% each | | | 26.5 | |
| Short-Term Investments | | | 2.5 | |
| | | | |
| Total Investments | | | 99.9 | |
| Other assets less liabilities | | | 0.1 | |
| | | | |
| Net Assets | | | 100.0 | % |
| | | | |
See accompanying notes to financial statements.
| 34
Statements of Assets and Liabilities
September 30, 2010
| | | | | | | | | | | | | | | | | | | | |
| | | Disciplined
Equity Fund | | | Global
Markets Fund | | | Growth
Fund | | | Mid Cap
Growth Fund | | | Value Fund | |
ASSETS | | | | | | | | | | | | | | | | | | | | |
Investments at cost | | $ | 31,210,986 | | | $ | 252,154,524 | | | $ | 89,938,147 | | | $ | 81,686,066 | | | $ | 871,507,461 | |
Repurchase agreement(s) at cost | | | 624,405 | | | | 8,684,559 | | | | 930,091 | | | | 11,632,824 | | | | 23,251,006 | |
Net unrealized appreciation | | | 2,678,689 | | | | 55,431,044 | | | | 9,275,146 | | | | 22,449,897 | | | | 37,762,739 | |
| | | | | | | | | | | | | | | | | | | | |
Investments at value | | | 34,514,080 | | | | 316,270,127 | | | | 100,143,384 | | | | 115,768,787 | | | | 932,521,206 | |
Cash | | | — | | | | — | | | | — | | | | 127,391 | | | | — | |
Foreign currency at value (identified cost $0, $1,720,177, $0, $0 and $0) | | | — | | | | 1,771,343 | | | | — | | | | — | | | | — | |
Receivable for Fund shares sold | | | 9,684 | | | | 982,771 | | | | 28,872 | | | | 398,488 | | | | 828,040 | |
Receivable for securities sold | | | 612,989 | | | | 2,515,443 | | | | 709,789 | | | | 2,123,154 | | | | — | |
Dividends and interest receivable | | | 7,138 | | | | 2,067,738 | | | | 107,991 | | | | 78,851 | | | | 1,120,775 | |
Unrealized appreciation on forward foreign currency contracts (Note 2) | | | — | | | | 59,237 | | | | — | | | | — | | | | — | |
Tax reclaims receivable | | | — | | | | 21,447 | | | | — | | | | — | | | | 123,920 | |
| | | | | | | | | | | | | | | | | | | | |
TOTAL ASSETS | | | 35,143,891 | | | | 323,688,106 | | | | 100,990,036 | | | | 118,496,671 | | | | 934,593,941 | |
| | | | | | | | | | | | | | | | | | | | |
LIABILITIES | | | | | | | | | | | | | | | | | | | | |
Options written, at value (premiums received $87,891, $0, $0, $335,823 and $0) (Note 2) | | | 88,119 | | | | — | | | | — | | | | 224,595 | | | | — | |
Payable for securities purchased | | | 654,867 | | | | 4,323,254 | | | | 893,502 | | | | 10,272,570 | | | | — | |
Payable for Fund shares redeemed | | | 8,579 | | | | 411,735 | | | | 96,447 | | | | 6,402,694 | | | | 444,779 | |
Management fees payable (Note 6) | | | 5,884 | | | | 176,444 | | | | 39,664 | | | | 47,658 | | | | 375,873 | |
Deferred Trustees' fees (Note 6) | | | 51,446 | | | | 58,225 | | | | 88,874 | | | | 55,164 | | | | 232,756 | |
Administrative fees payable (Note 6) | | | 1,290 | | | | 11,744 | | | | 3,732 | | | | 3,471 | | | | 35,370 | |
Other accounts payable and accrued expenses | | | 49,609 | | | | 103,649 | | | | 89,589 | | | | 61,095 | | | | 119,747 | |
| | | | | | | | | | | | | | | | | | | | |
TOTAL LIABILITIES | | | 859,794 | | | | 5,085,051 | | | | 1,211,808 | | | | 17,067,247 | | | | 1,208,525 | |
| | | | | | | | | | | | | | | | | | | | |
NET ASSETS | | $ | 34,284,097 | | | $ | 318,603,055 | | | $ | 99,778,228 | | | $ | 101,429,424 | | | $ | 933,385,416 | |
| | | | | | | | | | | | | | | | | | | | |
NET ASSETS CONSIST OF: | | | | | | | | | | | | | | | | | | | | |
Paid-in capital | | $ | 37,085,067 | | | $ | 353,951,872 | | | $ | 189,757,664 | | | $ | 153,122,192 | | | $ | 970,841,796 | |
Accumulated net investment (loss)/Undistributed net investment income | | | 10,153 | | | | 3,780,052 | | | | (88,874 | ) | | | (55,164 | ) | | | 12,741,138 | |
Accumulated net realized loss on investments, options written and foreign currency transactions | | | (5,489,584 | ) | | | (94,687,571 | ) | | | (99,165,708 | ) | | | (74,198,729 | ) | | | (87,960,257 | ) |
Net unrealized appreciation on investments, options written and foreign currency translations | | | 2,678,461 | | | | 55,558,702 | | | | 9,275,146 | | | | 22,561,125 | | | | 37,762,739 | |
| | | | | | | | | | | | | | | | | | | | |
NET ASSETS | | $ | 34,284,097 | | | $ | 318,603,055 | | | $ | 99,778,228 | | | $ | 101,429,424 | | | $ | 933,385,416 | |
| | | | | | | | | | | | | | | | | | | | |
COMPUTATION OF NET ASSET VALUE AND OFFERING PRICE: | | | | | | | | | | | | | | | | | | | | |
Class A shares: | | | | | | | | | | | | | | | | | | | | |
Net assets | | $ | 2,024,846 | | | $ | 64,367,375 | | | $ | 29,900,606 | | | $ | 67,638,610 | | | $ | 130,922,361 | |
| | | | | | | | | | | | | | | | | | | | |
Shares of beneficial interest | | | 297,165 | | | | 4,372,252 | | | | 5,821,451 | | | | 2,847,060 | | | | 7,803,159 | |
| | | | | | | | | | | | | | | | | | | | |
Net asset value and redemption price per share | | $ | 6.81 | | | $ | 14.72 | | | $ | 5.14 | | | $ | 23.76 | | | $ | 16.78 | |
| | | | | | | | | | | | | | | | | | | | |
Offering price per share (100/94.25 of net asset value) (Note 1) | | $ | 7.23 | | | $ | 15.62 | | | $ | 5.45 | | | $ | 25.21 | | | $ | 17.80 | |
| | | | | | | | | | | | | | | | | | | | |
Class B shares: (redemption price per share is equal to net asset value less any applicable contingent deferred sales charge) (Note 1) | | | | | | | | | | | | | | | | | | | | |
Net assets | | $ | 137,727 | | | $ | — | | | $ | 4,085,803 | | | $ | — | | | $ | 3,299,033 | |
| | | | | | | | | | | | | | | | | | | | |
Shares of beneficial interest | | | 20,822 | | | | — | | | | 838,611 | | | | — | | | | 196,728 | |
| | | | | | | | | | | | | | | | | | | | |
Net asset value and offering price per share | | $ | 6.61 | | | $ | — | | | $ | 4.87 | | | $ | — | | | $ | 16.77 | |
| | | | | | | | | | | | | | | | | | | | |
Class C shares: (redemption price per share is equal to net asset value less any applicable contingent deferred sales charge) (Note 1) | | | | | | | | | | | | | | | | | | | | |
Net assets | | $ | 1,246,967 | | | $ | 109,455,439 | | | $ | 12,493,050 | | | $ | 34,119 | | | $ | 10,226,167 | |
| | | | | | | | | | | | | | | | | | | | |
Shares of beneficial interest | | | 190,430 | | | | 7,503,363 | | | | 2,562,858 | | | | 1,454 | | | | 616,629 | |
| | | | | | | | | | | | | | | | | | | | |
Net asset value and offering price per share | | $ | 6.55 | | | $ | 14.59 | | | $ | 4.87 | | | $ | 23.47 | | | $ | 16.58 | |
| | | | | | | | | | | | | | | | | | | | |
Class Y shares: | | | | | | | | | | | | | | | | | | | | |
Net assets | | $ | 30,874,557 | | | $ | 144,780,241 | | | $ | 53,298,769 | | | $ | 33,756,695 | | | $ | 788,936,851 | |
| | | | | | | | | | | | | | | | | | | | |
Shares of beneficial interest | | | 4,493,704 | | | | 9,798,139 | | | | 9,806,624 | | | | 1,376,044 | | | | 46,908,880 | |
| | | | | | | | | | | | | | | | | | | | |
Net asset value, offering and redemption price per share | | $ | 6.87 | | | $ | 14.78 | | | $ | 5.43 | | | $ | 24.53 | | | $ | 16.82 | |
| | | | | | | | | | | | | | | | | | | | |
Admin Class shares: | | | | | | | | | | | | | | | | | | | | |
Net assets | | $ | — | | | $ | — | | | $ | — | | | $ | — | | | $ | 1,004 | |
| | | | | | | | | | | | | | | | | | | | |
Shares of beneficial interest | | | — | | | | — | | | | — | | | | — | | | | 60 | |
| | | | | | | | | | | | | | | | | | | | |
Net asset value, offering and redemption price per share | | $ | — | | | $ | — | | | $ | — | | | $ | — | | | $ | 16.74 | |
| | | | | | | | | | | | | | | | | | | | |
See accompanying notes to financial statements.
35 |
Statements of Operations
For the Year Ended September 30, 2010
| | | | | | | | | | | | | | | | | | | | |
| | | Disciplined
Equity Fund | | | Global
Markets Fund | | | Growth Fund | | | Mid Cap
Growth Fund | | | Value Fund | |
INVESTMENT INCOME | | | | | | | | | | | | | | | | | | | | |
Dividends | | $ | 427,696 | | | $ | 2,135,140 | | | $ | 930,057 | | | $ | 602,812 | (a) | | $ | 22,464,019 | (b) |
Interest | | | — | | | | 6,772,175 | | | | — | | | | — | | | | — | |
Less net foreign taxes withheld | | | — | | | | (123,329 | ) | | | — | | | | (797 | ) | | | (264,095 | ) |
| | | | | | | | | | | | | | | | | | | | |
| | | 427,696 | | | | 8,783,986 | | | | 930,057 | | | | 602,015 | | | | 22,199,924 | |
| | | | | | | | | | | | | | | | | | | | |
Expenses | | | | | | | | | | | | | | | | | | | | |
Management fees (Note 6) | | | 162,088 | | | | 2,054,950 | | | | 527,810 | | | | 603,640 | | | | 4,320,687 | |
Service and distribution fees (Note 6) | | | 19,995 | | | | 1,148,060 | | | | 268,287 | | | | 125,780 | | | | 470,944 | |
Administrative fees (Note 6) | | | 15,571 | | | | 131,564 | | | | 50,741 | | | | 38,649 | | | | 414,996 | |
Trustees’ fees and expenses (Note 6) | | | 17,571 | | | | 21,797 | | | | 20,287 | | | | 18,476 | | | | 38,307 | |
Transfer agent fees and expenses (Note 6) | | | 25,882 | | | | 255,440 | | | | 213,666 | | | | 145,813 | | | | 988,511 | |
Audit and tax services fees | | | 43,049 | | | | 52,236 | | | | 41,045 | | | | 42,924 | | | | 34,294 | |
Custodian fees and expenses | | | 26,085 | | | | 161,364 | | | | 24,693 | | | | 24,158 | | | | 37,949 | |
Legal fees | | | 671 | | | | 5,651 | | | | 2,136 | | | | 1,553 | | | | 18,696 | |
Registration fees | | | 80,312 | | | | 67,272 | | | | 69,025 | | | | 63,660 | | | | 120,993 | |
Shareholder reporting expenses | | | 6,495 | | | | 41,887 | | | | 39,583 | | | | 22,080 | | | | 137,024 | |
Miscellaneous expenses | | | 12,113 | | | | 45,815 | | | | 11,948 | | | | 13,090 | | | | 30,450 | |
| | | | | | | | | | | | | | | | | | | | |
Total expenses | | | 409,832 | | | | 3,986,036 | | | | 1,269,221 | | | | 1,099,823 | | | | 6,612,851 | |
Less waiver and/or expense reimbursement (Note 6) | | | (81,384 | ) | | | (98,043 | ) | | | (15,201 | ) | | | (169,158 | ) | | | — | |
| | | | | | | | | | | | | | | | | | | | |
Net expenses | | | 328,448 | | | | 3,887,993 | | | | 1,254,020 | | | | 930,665 | | | | 6,612,851 | |
| | | | | | | | | | | | | | | | | | | | |
Net investment income (loss) | | | 99,248 | | | | 4,895,993 | | | | (323,963 | ) | | | (328,650 | ) | | | 15,587,073 | |
| | | | | | | | | | | | | | | | | | | | |
NET REALIZED AND UNREALIZED GAIN (LOSS) ON INVESTMENTS, OPTIONS WRITTEN AND FOREIGN CURRENCY TRANSACTIONS | | | | | | | | | | | | | | | | | | | | |
Net realized gain (loss) on: | | | | | | | | | | | | | | | | | | | | |
Investments | | | 2,282,241 | | | | 18,092,677 | | | | 24,201,174 | | | | 14,708,728 | | | | 10,776,100 | |
Options written | | | 146,797 | | | | — | | | | — | | | | (115,065 | ) | | | — | |
Foreign currency transactions | | | 740 | | | | (29,305 | ) | | | — | | | | 77 | | | | — | |
Net change in unrealized appreciation (depreciation) on: | | | | | | | | | | | | | | | | | | | | |
Investments | | | (1,084,023 | ) | | | 28,825,563 | | | | (9,534,757 | ) | | | 7,055,580 | | | | (6,736,757 | ) |
Options written | | | (228 | ) | | | — | | | | — | | | | 111,228 | | | | — | |
Foreign currency translations | | | — | | | | 83,179 | | | | — | | | | — | | | | — | |
| | | | | | | | | | | | | | | | | | | | |
Net realized and unrealized gain on investments, options written and foreign currency transactions | | | 1,345,527 | | | | 46,972,114 | | | | 14,666,417 | | | | 21,760,548 | | | | 4,039,343 | |
| | | | | | | | | | | | | | | | | | | | |
NET INCREASE IN NET ASSETS RESULTING FROM OPERATIONS | | $ | 1,444,775 | | | $ | 51,868,107 | | | $ | 14,342,454 | | | $ | 21,431,898 | | | $ | 19,626,416 | |
| | | | | | | | | | | | | | | | | | | | |
| (a) | Includes a non-recurring dividend of $411,787, the character of which has not yet been determined by the issuer. |
| (b) | Includes a non-recurring dividend of $6,716,255. |
See accompanying notes to financial statements.
| 36
Statements of Changes in Net Assets
| | | | | | | | | | | | | | | | | | | | | | | | |
| | | Disciplined Equity Fund | | | Global Markets Fund | | | Growth Fund | |
| | | Year Ended
September 30,
2010 | | | Year Ended
September 30,
2009 | | | Year Ended
September 30,
2010 | | | Year Ended
September 30,
2009 | | | Year Ended
September 30,
2010 | | | Year Ended
September 30,
2009 | |
FROM OPERATIONS: | | | | | | | | | | | | | | | | | | | | | | | | |
Net investment income (loss) | | $ | 99,248 | | | $ | 227,891 | | | $ | 4,895,993 | | | $ | 6,881,001 | | | $ | (323,963 | ) | | $ | (300,880 | ) |
Net realized gain (loss) on investments, options written and foreign currency transactions | | | 2,429,778 | | | | (6,612,204 | ) | | | 18,063,372 | | | | (80,934,410 | ) | | | 24,201,174 | | | | (84,916,365 | ) |
Net change in unrealized appreciation (depreciation) on investments, options written and foreign currency translations | | | (1,084,251 | ) | | | 5,341,200 | | | | 28,908,742 | | | | 77,383,636 | | | | (9,534,757 | ) | | | 36,216,597 | |
| | | | | | | | | | | | | | | | | | | | | | | | |
Net increase (decrease) in net assets resulting from operations | | | 1,444,775 | | | | (1,043,113 | ) | | | 51,868,107 | | | | 3,330,227 | | | | 14,342,454 | | | | (49,000,648 | ) |
| | | | | | | | | | | | | | | | | | | | | | | | |
FROM DISTRIBUTIONS TO SHAREHOLDERS: | | | | | | | | | | | | | | | | | | | | | | | | |
Net investment income | | | | | | | | | | | | | | | | | | | | | | | | |
Class A | | | (6,227 | ) | | | (16,599 | ) | | | (1,152,275 | ) | | | (1,215,467 | ) | | | — | | | | — | |
Class B | | | — | | | | — | | | | — | | | | — | | | | — | | | | — | |
Class C | | | — | | | | (6,028 | ) | | | (1,701,697 | ) | | | (1,365,584 | ) | | | — | | | | — | |
Class Y | | | (178,902 | ) | | | (193,935 | ) | | | (2,794,707 | ) | | | (2,348,859 | ) | | | — | | | | — | |
Net realized capital gains | | | | | | | | | | | | | | | | | | | | | | | | |
Class A | | | — | | | | — | | | | — | | | | (14,673 | ) | | | — | | | | — | |
Class C | | | — | | | | — | | | | — | | | | (28,430 | ) | | | — | | | | — | |
Class Y | | | — | | | | — | | | | — | | | | (24,786 | ) | | | — | | | | — | |
| | | | | | | | | | | | | | | | | | | | | | | | |
Total distributions | | | (185,129 | ) | | | (216,562 | ) | | | (5,648,679 | ) | | | (4,997,799 | ) | | | — | | | | — | |
| | | | | | | | | | | | | | | | | | | | | | | | |
NET INCREASE (DECREASE) IN NET ASSETS FROM CAPITAL SHARE TRANSACTIONS (NOTE 11) | | | 2,940,934 | | | | 5,893,459 | | | | 22,778,290 | | | | (60,874,359 | ) | | | (26,537,256 | ) | | | (108,551,663 | ) |
| | | | | | | | | | | | | | | | | | | | | | | | |
Net increase (decrease) in net assets | | | 4,200,580 | | | | 4,633,784 | | | | 68,997,718 | | | | (62,541,931 | ) | | | (12,194,802 | ) | | | (157,552,311 | ) |
NET ASSETS | | | | | | | | | | | | | | | | | | | | | | | | |
Beginning of the year | | | 30,083,517 | | | | 25,449,733 | | | | 249,605,337 | | | | 312,147,268 | | | | 111,973,030 | | | | 269,525,341 | |
| | | | | | | | | | | | | | | | | | | | | | | | |
End of the year | | $ | 34,284,097 | | | $ | 30,083,517 | | | $ | 318,603,055 | | | $ | 249,605,337 | | | $ | 99,778,228 | | | $ | 111,973,030 | |
| | | | | | | | | | | | | | | | | | | | | | | | |
ACCUMULATED NET INVESTMENT (LOSS)/UNDISTRIBUTED NET INVESTMENT INCOME | | $ | 10,153 | | | $ | 100,021 | | | $ | 3,780,052 | | | $ | 4,369,973 | | | $ | (88,874 | ) | | $ | (85,047 | ) |
| | | | | | | | | | | | | | | | | | | | | | | | |
See accompanying notes to financial statements.
37 |
Statements of Changes in Net Assets (continued)
| | | | | | | | | | | | | | | | |
| | | Mid Cap Growth Fund | | | Value Fund | |
| | | Year Ended
September 30,
2010 | | | Year Ended
September 30,
2009 | | | Year Ended
September 30,
2010 | | | Year Ended
September 30,
2009 | |
FROM OPERATIONS: | | | | | | | | | | | | | | | | |
Net investment income (loss) | | $ | (328,650 | ) | | $ | (350,178 | ) | | $ | 15,587,073 | | | $ | 7,832,048 | |
Net realized gain (loss) on investments, options written and foreign currency transactions | | | 14,593,740 | | | | (49,001,103 | ) | | | 10,776,100 | | | | (86,224,117 | ) |
Net change in unrealized appreciation (depreciation) on investments, options written and foreign currency translations | | | 7,166,808 | | | | 26,716,743 | | | | (6,736,757 | ) | | | 84,560,021 | |
| | | | | | | | | | | | | | | | |
Net increase (decrease) in net assets resulting from operations | | | 21,431,898 | | | | (22,634,538 | ) | | | 19,626,416 | | | | 6,167,952 | |
| | | | | | | | | | | | | | | | |
FROM DISTRIBUTIONS TO SHAREHOLDERS: | | | | | | | | | | | | | | | | |
Net investment income | | | | | | | | | | | | | | | | |
Class A | | | — | | | | — | | | | (1,044,591 | ) | | | (1,386,477 | ) |
Class B | | | — | | | | — | | | | — | | | | (12,760 | ) |
Class C | | | — | | | | — | | | | (22,715 | ) | | | (69,049 | ) |
Class Y | | | — | | | | — | | | | (6,810,651 | ) | | | (4,718,484 | ) |
Net realized capital gains | | | | | | | | | | | | | | | | |
Class A | | | — | | | | — | | | | — | | | | — | |
Class C | | | — | | | | — | | | | — | | | | — | |
Class Y | | | — | | | | — | | | | — | | | | — | |
| | | | | | | | | | | | | | | | |
Total distributions | | | — | | | | — | | | | (7,877,957 | ) | | | (6,186,770 | ) |
| | | | | | | | | | | | | | | | |
NET INCREASE (DECREASE) IN NET ASSETS FROM CAPITAL SHARE TRANSACTIONS (NOTE 11) | | | (2,011,419 | ) | | | (41,659,860 | ) | | | 211,104,442 | | | | 280,227,901 | |
| | | | | | | | | | | | | | | | |
Net increase (decrease) in net assets | | | 19,420,479 | | | | (64,294,398 | ) | | | 222,852,901 | | | | 280,209,083 | |
NET ASSETS | | | | | | | | | | | | | | | | |
Beginning of the year | | | 82,008,945 | | | | 146,303,343 | | | | 710,532,515 | | | | 430,323,432 | |
| | | | | | | | | | | | | | | | |
End of the year | | $ | 101,429,424 | | | $ | 82,008,945 | | | $ | 933,385,416 | | | $ | 710,532,515 | |
| | | | | | | | | | | | | | | | |
ACCUMULATED NET INVESTMENT (LOSS)/UNDISTRIBUTED NET INVESTMENT INCOME | | $ | (55,164 | ) | | $ | (49,188 | ) | | $ | 12,741,138 | | | $ | 5,032,022 | |
| | | | | | | | | | | | | | | | |
See accompanying notes to financial statements.
| 38
Financial Highlights
For a share outstanding throughout each period.
| | | | | | | | | | | | | | | | | | | | | | | | | | | | |
| | | | | | Income (Loss) from Investment
Operations: | | | Less Distributions: | |
| | | Net asset
value,
beginning
of
the period | | | Net
investment
income
(loss) (a)(b) | | | Net realized
and unrealized
gain (loss) | | | Total from
investment
operations | | | Dividends
from
net investment
income | | | Distributions
from net
realized
capital gains | | | Total
distributions | |
| | | | | | | | | | | | | | | | | | | | | | | | | | | | |
DISCIPLINED EQUITY FUND | | | | | | | | | | | | | | | | | | | | | |
Class A | | | | | | | | | | | | | | | | | | | | | | | | | | | | |
9/30/2010 | | $ | 6.53 | | | $ | 0.01 | | | $ | 0.29 | | | $ | 0.30 | | | $ | (0.02 | ) | | $ | — | | | $ | (0.02 | ) |
9/30/2009 | | | 6.98 | | | | 0.04 | | | | (0.44 | ) | | | (0.40 | ) | | | (0.05 | ) | | | — | | | | (0.05 | ) |
9/30/2008 | | | 9.77 | | | | 0.03 | | | | (1.80 | ) | | | (1.77 | ) | | | (0.05 | ) | | | (0.97 | ) | | | (1.02 | ) |
9/30/2007 | | | 9.42 | | | | 0.02 | | | | 1.53 | | | | 1.55 | | | | (0.07 | ) | | | (1.13 | ) | | | (1.20 | ) |
9/30/2006 | | | 9.22 | | | | 0.05 | | | | 0.64 | | | | 0.69 | | | | (0.03 | ) | | | (0.46 | ) | | | (0.49 | ) |
Class B | | | | | | | | | | | | | | | | | | | | | | | | | | | | |
9/30/2010 | | | 6.36 | | | | (0.04 | ) | | | 0.29 | | | | 0.25 | | | | — | | | | — | | | | — | |
9/30/2009 | | | 6.80 | | | | (0.00 | ) | | | (0.44 | ) | | | (0.44 | ) | | | — | | | | — | | | | — | |
9/30/2008 | | | 9.56 | | | | (0.03 | ) | | | (1.76 | ) | | | (1.79 | ) | | | — | | | | (0.97 | ) | | | (0.97 | ) |
9/30/2007 | | | 9.25 | | | | (0.05 | ) | | | 1.50 | | | | 1.45 | | | | (0.01 | ) | | | (1.13 | ) | | | (1.14 | ) |
9/30/2006 | | | 9.10 | | | | (0.02 | ) | | | 0.63 | | | | 0.61 | | | | — | | | | (0.46 | ) | | | (0.46 | ) |
Class C | | | | | | | | | | | | | | | | | | | | | | | | | | | | |
9/30/2010 | | | 6.30 | | | | (0.04 | ) | | | 0.29 | | | | 0.25 | | | | — | | | | — | | | | — | |
9/30/2009 | | | 6.76 | | | | (0.00 | ) | | | (0.44 | ) | | | (0.44 | ) | | | (0.02 | ) | | | — | | | | (0.02 | ) |
9/30/2008 | | | 9.52 | | | | (0.03 | ) | | | (1.76 | ) | | | (1.79 | ) | | | — | | | | (0.97 | ) | | | (0.97 | ) |
9/30/2007 | | | 9.22 | | | | (0.05 | ) | | | 1.50 | | | | 1.45 | | | | (0.02 | ) | | | (1.13 | ) | | | (1.15 | ) |
9/30/2006 | | | 9.08 | | | | (0.02 | ) | | | 0.63 | | | | 0.61 | | | | (0.01 | ) | | | (0.46 | ) | | | (0.47 | ) |
Class Y | | | | | | | | | | | | | | | | | | | | | | | | | | | | |
9/30/2010 | | | 6.58 | | | | 0.02 | | | | 0.31 | | | | 0.33 | | | | (0.04 | ) | | | — | | | | (0.04 | ) |
9/30/2009 | | | 7.03 | | | | 0.06 | | | | (0.45 | ) | | | (0.39 | ) | | | (0.06 | ) | | | — | | | | (0.06 | ) |
9/30/2008 | | | 9.85 | | | | 0.07 | | | | (1.82 | ) | | | (1.75 | ) | | | (0.10 | ) | | | (0.97 | ) | | | (1.07 | ) |
9/30/2007 | | | 9.49 | | | | 0.06 | | | | 1.53 | | | | 1.59 | | | | (0.10 | ) | | | (1.13 | ) | | | (1.23 | ) |
9/30/2006 | | | 9.27 | | | | 0.09 | | | | 0.64 | | | | 0.73 | | | | (0.05 | ) | | | (0.46 | ) | | | (0.51 | ) |
| (a) | Per share net investment income (loss) has been calculated using the average shares outstanding during the period. |
| (b) | Amount rounds to less than $0.01 per share, if applicable. |
| (c) | Had certain expenses not been waived/reimbursed during the period, if applicable, total returns would have been lower. |
| (d) | A sales charge for Class A shares and a contingent deferred sales charge for Class B and Class C shares are not reflected in total return calculations. Periods less than one year, if applicable, are not annualized. |
See accompanying notes to financial statements.
39 |
| | | | | | | | | | | | | | | | | | | | | | | | | | |
| | | | |
| | | | | | | | | | Ratios to Average Net Assets: | | | | |
| | | | | | |
Net asset
value, end
of the period | | | Total
return
(%) (c)(d) | | | Net assets,
end of
the period
(000’s) | | | Net
expenses
(%) (e)(f) | | | Gross
expenses
(%) (f) | | | Net investment
income (loss)
(%) (f) | | | Portfolio
turnover
rate (%) | |
| | | | | | | | | | | | | | | | | | | | | | | | | | |
| | | | | | | | | | | | | | | | | | | | | | | | | | |
| | | | | | | | | | | | | | | | | | | | | | | | | | |
| $ | 6.81 | | | | 4.81 | | | $ | 2,025 | | | | 1.20 | | | | 1.45 | | | | 0.12 | | | | 245 | |
| | 6.53 | | | | (5.64 | ) | | | 1,599 | | | | 1.25 | | | | 1.78 | | | | 0.78 | | | | 180 | |
| | 6.98 | | | | (20.40 | ) | | | 736 | | | | 1.25 | | | | 1.55 | | | | 0.38 | | | | 149 | |
| | 9.77 | | | | 17.98 | | | | 1,198 | | | | 1.25 | | | | 1.50 | | | | 0.22 | | | | 148 | |
| | 9.42 | | | | 7.69 | | | | 1,331 | | | | 1.25 | | | | 1.68 | | | | 0.56 | | | | 143 | |
| | | | | | | | | | | | | | | | | | | | | | | | | | |
| | 6.61 | | | | 4.09 | | | | 138 | | | | 1.94 | | | | 2.20 | | | | (0.61 | ) | | | 245 | |
| | 6.36 | | | | (6.47 | ) | | | 168 | | | | 2.00 | | | | 2.49 | | | | (0.03 | ) | | | 180 | |
| | 6.80 | | | | (21.01 | ) | | | 227 | | | | 2.00 | | | | 2.30 | | | | (0.37 | ) | | | 149 | |
| | 9.56 | | | | 17.11 | | | | 356 | | | | 2.00 | | | | 2.31 | | | | (0.51 | ) | | | 148 | |
| | 9.25 | | | | 6.90 | | | | 331 | | | | 2.00 | | | | 2.33 | | | | (0.19 | ) | | | 143 | |
| | | | | | | | | | | | | | | | | | | | | | | | | | |
| | 6.55 | | | | 3.97 | | | | 1,247 | | | | 1.94 | | | | 2.20 | | | | (0.61 | ) | | | 245 | |
| | 6.30 | | | | (6.41 | ) | | | 1,460 | | | | 2.00 | | | | 2.51 | | | | (0.06 | ) | | | 180 | |
| | 6.76 | | | | (21.10 | ) | | | 949 | | | | 2.00 | | | | 2.30 | | | | (0.39 | ) | | | 149 | |
| | 9.52 | | | | 17.17 | | | | 1,164 | | | | 2.00 | | | | 2.29 | | | | (0.54 | ) | | | 148 | |
| | 9.22 | | | | 6.92 | | | | 1,198 | | | | 2.00 | | | | 2.37 | | | | (0.18 | ) | | | 143 | |
| | | | | | | | | | | | | | | | | | | | | | | | | | |
| | 6.87 | | | | 5.08 | | | | 30,875 | | | | 0.95 | (g) | | | 1.20 | | | | 0.37 | | | | 245 | |
| | 6.58 | | | | (5.42 | ) | | | 26,857 | | | | 0.85 | | | | 1.38 | | | | 1.09 | | | | 180 | |
| | 7.03 | | | | (20.17 | ) | | | 23,538 | | | | 0.85 | | | | 1.15 | | | | 0.78 | | | | 149 | |
| | 9.85 | | | | 18.39 | | | | 27,400 | | | | 0.85 | | | | 1.11 | | | | 0.62 | | | | 148 | |
| | 9.49 | | | | 8.13 | | | | 23,096 | | | | 0.85 | | | | 1.26 | | | | 0.98 | | | | 143 | |
| (e) | The investment adviser and/or administrator agreed to waive its fees and/or reimburse a portion of the Fund’s expenses during the period. Without this waiver/reimbursement, if applicable, expenses would have been higher. |
| (f) | Computed on an annualized basis for periods less than one year, if applicable. |
| (g) | The expense limit changed during the period. See Note 6 of Notes to Financial Statements. |
| 40
Financial Highlights (continued)
For a share outstanding throughout each period.
| | | | | | | | | | | | | | | | | | | | | | | | | | | | | | | | |
| | | | | | Income (Loss) from Investment
Operations: | | | Less Distributions: | | | | |
| | | Net asset
value,
beginning
of
the period | | | Net
investment
income (a) | | | Net realized
and unrealized
gain (loss) | | | Total from
investment
operations | | | Dividends
from
net investment
income | | | Distributions
from net
realized
capital gains (b) | | | Total
distributions | | | Redemption
fees (b)(c) | |
| | | | | | | | | | | | | | | | | | | | | | | | | | | | | | | | |
GLOBAL MARKETS FUND | | | | | | | | | | | | | | | | | | | | | |
Class A | | | | | | | | | | | | | | | | | | | | | | | | | | | | | | | | |
9/30/2010 | | $ | 12.50 | | | $ | 0.26 | | | $ | 2.26 | | | $ | 2.52 | | | $ | (0.30 | ) | | $ | — | | | $ | (0.30 | ) | | $ | — | |
9/30/2009 | | | 11.65 | | | | 0.36 | | | | 0.74 | (h) | | | 1.10 | | | | (0.25 | ) | | | (0.00 | ) | | | (0.25 | ) | | | — | |
9/30/2008 | | | 15.83 | | | | 0.25 | | | | (3.46 | ) | | | (3.21 | ) | | | (0.53 | ) | | | (0.44 | ) | | | (0.97 | ) | | | 0.00 | |
9/30/2007 | | | 12.49 | | | | 0.20 | | | | 3.39 | | | | 3.59 | | | | (0.25 | ) | | | — | | | | (0.25 | ) | | | 0.00 | |
9/30/2006* | | | 12.71 | | | | 0.12 | | | | (0.34 | ) | | | (0.22 | ) | | | — | | | | — | | | | — | | | | — | |
Class C | | | | | | | | | | | | | | | | | | | | | | | | | | | | | | | | |
9/30/2010 | | | 12.39 | | | | 0.16 | | | | 2.26 | | | | 2.42 | | | | (0.22 | ) | | | — | | | | (0.22 | ) | | | — | |
9/30/2009 | | | 11.51 | | | | 0.28 | | | | 0.75 | (h) | | | 1.03 | | | | (0.15 | ) | | | (0.00 | ) | | | (0.15 | ) | | | — | |
9/30/2008 | | | 15.70 | | | | 0.15 | | | | (3.43 | ) | | | (3.28 | ) | | | (0.47 | ) | | | (0.44 | ) | | | (0.91 | ) | | | 0.00 | |
9/30/2007 | | | 12.43 | | | | 0.10 | | | | 3.36 | | | | 3.46 | | | | (0.19 | ) | | | — | | | | (0.19 | ) | | | 0.00 | |
9/30/2006* | | | 12.71 | | | | 0.06 | | | | (0.34 | ) | | | (0.28 | ) | | | — | | | | — | | | | — | | | | — | |
Class Y | | | | | | | | | | | | | | | | | | | | | | | | | | | | | | | | |
9/30/2010 | | | 12.54 | | | | 0.29 | | | | 2.28 | | | | 2.57 | | | | (0.33 | ) | | | — | | | | (0.33 | ) | | | — | |
9/30/2009 | | | 11.70 | | | | 0.38 | | | | 0.75 | (h) | | | 1.13 | | | | (0.29 | ) | | | (0.00 | ) | | | (0.29 | ) | | | — | |
9/30/2008 | | | 15.87 | | | | 0.30 | | | | (3.48 | ) | | | (3.18 | ) | | | (0.55 | ) | | | (0.44 | ) | | | (0.99 | ) | | | 0.00 | |
9/30/2007 | | | 12.51 | | | | 0.24 | | | | 3.39 | | | | 3.63 | | | | (0.27 | ) | | | — | | | | (0.27 | ) | | | 0.00 | |
9/30/2006** | | | 11.84 | | | | 0.19 | | | | 0.64 | | | | 0.83 | | | | (0.16 | ) | | | — | | | | (0.16 | ) | | | 0.00 | |
| * | From commencement of Class operations on February 1, 2006 through September 30, 2006. |
| ** | Prior to the close of business on February 1, 2006, the Fund offered Institutional Class shares, which were redesignated as Class Y shares on that date. |
| (a) | Per share net investment income has been calculated using the average shares outstanding during the period. |
| (b) | Amount rounds to less than $0.01 per share, if applicable. |
| (c) | Effective June 2, 2008, redemption fees were eliminated. |
| (d) | A sales charge for Class A shares and a contingent deferred sales charge for Class C shares are not reflected in total return calculations. Periods less than one year, if applicable, are not annualized. |
See accompanying notes to financial statements.
41 |
| | | | | | | | | | | | | | | | | | | | | | | | | | |
| | | | |
| | | | | | | | | | Ratios to Average Net Assets: | | | | |
| | | | | | |
Net asset
value, end
of the period | | | Total
return
(%) (d)(e) | | | Net assets,
end of
the period
(000’s) | | | Net
expenses
(%) (f)(g) | | | Gross
expenses
(%) (f) | | | Net investment
income
(%) (f) | | | Portfolio
turnover
rate (%) | |
| | | | | | | | | | | | | | | | | | | | | | | | | | |
| | | | | | | | | | | | | | | | | | | | | | | | | | |
| | | | | | | | | | | | | | | | | | | | | | | | | | |
| $ | 14.72 | | | | 20.61 | | | $ | 64,367 | | | | 1.25 | | | | 1.29 | | | | 1.96 | | | | 99 | |
| | 12.50 | | | | 10.27 | | | | 44,669 | | | | 1.25 | | | | 1.34 | | | | 3.56 | | | | 114 | |
| | 11.65 | | | | (21.87 | ) | | | 67,647 | | | | 1.25 | | | | 1.27 | | | | 1.74 | | | | 133 | |
| | 15.83 | | | | 29.05 | | | | 28,927 | | | | 1.25 | | | | 1.37 | | | | 1.44 | | | | 78 | |
| | 12.49 | | | | (1.73 | ) | | | 10,438 | | | | 1.25 | | | | 1.56 | | | | 1.52 | | | | 103 | |
| | | | | | | | | | | | | | | | | | | | | | | | | | |
| | 14.59 | | | | 19.79 | | | | 109,455 | | | | 2.00 | | | | 2.04 | | | | 1.21 | | | | 99 | |
| | 12.39 | | | | 9.40 | | | | 96,208 | | | | 2.00 | | | | 2.09 | | | | 2.82 | | | | 114 | |
| | 11.51 | | | | (22.42 | ) | | | 124,178 | | | | 2.00 | | | | 2.02 | | | | 1.04 | | | | 133 | |
| | 15.70 | | | | 27.99 | | | | 60,179 | | | | 2.00 | | | | 2.11 | | | | 0.69 | | | | 78 | |
| | 12.43 | | | | (2.12 | ) | | | 20,228 | | | | 2.00 | | | | 2.32 | | | | 0.78 | | | | 103 | |
| | | | | | | | | | | | | | | | | | | | | | | | | | |
| | 14.78 | | | | 21.02 | | | | 144,780 | | | | 1.00 | | | | 1.04 | | | | 2.20 | | | | 99 | |
| | 12.54 | | | | 10.49 | | | | 108,728 | | | | 1.00 | | | | 1.01 | | | | 3.79 | | | | 114 | |
| | 11.70 | | | | (21.66 | ) | | | 120,322 | | | | 0.99 | (i) | | | 0.99 | (i) | | | 2.06 | | | | 133 | |
| | 15.87 | | | | 29.36 | | | | 80,824 | | | | 1.00 | | | | 1.02 | | | | 1.70 | | | | 78 | |
| | 12.51 | | | | 7.07 | | | | 58,650 | | | | 1.00 | | | | 1.19 | | | | 1.58 | | | | 103 | |
| (e) | Had certain expenses not been waived/reimbursed during the period, if applicable, total returns would have been lower. |
| (f) | Computed on an annualized basis for periods less than one year, if applicable. |
| (g) | The investment adviser and/or administrator agreed to waive its fees and/or reimburse a portion of the Fund’s expenses during the period. Without this waiver/reimbursement, if applicable, expenses would have been higher. |
| (h) | The amount shown for a share outstanding does not correspond with the aggregate realized and unrealized gain (loss) on investments for the period due to the timing of sales and redemptions of fund shares in relation to fluctuating market values of investments of the Fund. |
| (i) | Includes fee/expense recovery of less than 0.01%. |
| 42
Financial Highlights (continued)
For a share outstanding throughout each period.
| | | | | | | | | | | | | | | | | | | | | | | | | | | | |
| | | | | | Income (Loss) from Investment
Operations: | | | Less Distributions: | |
| | | Net asset
value,
beginning
of
the period | | | Net
investment
income
(loss) (a)(b) | | | Net realized
and unrealized
gain (loss) | | | Total from
investment
operations | | | Dividends
from
net investment
income | | | Distributions
from net
realized
capital gains | | | Total
distributions | |
| | | | | | | | | | | | | | | | | | | | | | | | | | | | |
GROWTH FUND | | | | | | | | | | | | | | | | | | | | | | | | | | | | |
Class A | | | | | | | | | | | | | | | | | | | | | | | | | | | | |
9/30/2010 | | $ | 4.48 | | | $ | (0.01 | ) | | $ | 0.67 | | | $ | 0.66 | | | $ | — | | | $ | — | | | $ | — | |
9/30/2009 | | | 4.99 | | | | (0.01 | ) | | | (0.50 | ) | | | (0.51 | ) | | | — | | | | — | | | | — | |
9/30/2008 | | | 7.01 | | | | (0.02 | ) | | | (2.00 | ) | | | (2.02 | ) | | | — | | | | — | | | | — | |
9/30/2007 | | | 5.84 | | | | (0.03 | ) | | | 1.20 | | | | 1.17 | | | | — | | | | — | | | | — | |
9/30/2006 | | | 6.03 | | | | (0.00 | ) | | | (0.19 | ) | | | (0.19 | ) | | | — | | | | — | | | | — | |
Class B | | | | | | | | | | | | | | | | | | | | | | | | | | | | |
9/30/2010 | | | 4.28 | | | | (0.05 | ) | | | 0.64 | | | | 0.59 | | | | — | | | | — | | | | — | |
9/30/2009 | | | 4.81 | | | | (0.04 | ) | | | (0.49 | ) | | | (0.53 | ) | | | — | | | | — | | | | — | |
9/30/2008 | | | 6.79 | | | | (0.07 | ) | | | (1.91 | ) | | | (1.98 | ) | | | — | | | | — | | | | — | |
9/30/2007 | | | 5.70 | | | | (0.07 | ) | | | 1.16 | | | | 1.09 | | | | — | | | | — | | | | — | |
9/30/2006 | | | 5.94 | | | | (0.05 | ) | | | (0.19 | ) | | | (0.24 | ) | | | — | | | | — | | | | — | |
Class C | | | | | | | | | | | | | | | | | | | | | | | | | | | | |
9/30/2010 | | | 4.28 | | | | (0.05 | ) | | | 0.64 | | | | 0.59 | | | | — | | | | — | | | | — | |
9/30/2009 | | | 4.81 | | | | (0.04 | ) | | | (0.49 | ) | | | (0.53 | ) | | | — | | | | — | | | | — | |
9/30/2008 | | | 6.80 | | | | (0.07 | ) | | | (1.92 | ) | | | (1.99 | ) | | | — | | | | — | | | | — | |
9/30/2007 | | | 5.71 | | | | (0.08 | ) | | | 1.17 | | | | 1.09 | | | | — | | | | — | | | | — | |
9/30/2006 | | | 5.94 | | | | (0.04 | ) | | | (0.19 | ) | | | (0.23 | ) | | | — | | | | — | | | | — | |
Class Y | | | | | | | | | | | | | | | | | | | | | | | | | | | | |
9/30/2010 | | | 4.73 | | | | (0.00 | ) | | | 0.70 | | | | 0.70 | | | | — | | | | — | | | | — | |
9/30/2009 | | | 5.24 | | | | 0.01 | | | | (0.52 | ) | | | (0.51 | ) | | | — | | | | — | | | | — | |
9/30/2008 | | | 7.32 | | | | 0.01 | | | | (2.09 | ) | | | (2.08 | ) | | | — | | | | — | | | | — | |
9/30/2007 | | | 6.08 | | | | (0.00 | ) | | | 1.24 | | | | 1.24 | | | | — | | | | — | | | | — | |
9/30/2006 | | | 6.26 | | | | 0.02 | | | | (0.20 | ) | | | (0.18 | ) | | | — | | | | — | | | | — | |
| (a) | Per share net investment income (loss) has been calculated using the average shares outstanding during the period. |
| (b) | Amount rounds to less than $0.01 per share, if applicable. |
| (c) | Had certain expenses not been waived/reimbursed during the period, if applicable, total returns would have been lower. |
| (d) | A sales charge for Class A shares and a contingent deferred sales charge for Class B and Class C shares are not reflected in total return calculations. Periods less than one year, if applicable, are not annualized. |
| (e) | Computed on an annualized basis for periods less than one year, if applicable. |
See accompanying notes to financial statements.
43 |
| | | | | | | | | | | | | | | | | | | | | | | | | | |
| | | | |
| | | | | | | | | | Ratios to Average Net Assets: | | | | |
| | | | | | |
Net asset
value, end
of the period | | | Total
return
(%) (c)(d) | | | Net assets,
end of
the period
(000’s) | | | Net
expenses
(%) (e)(f) | | | Gross
expenses
(%) (e) | | | Net investment
income (loss)
(%) (e) | | | Portfolio
turnover
rate (%) | |
| | | | | | | | | | | | | | | | | | | | | | | | | | |
| | | | | | | | | | | | | | | | | | | | | | | | | | |
| | | | | | | | | | | | | | | | | | | | | | | | | | |
| $ | 5.14 | | | | 14.73 | | | $ | 29,901 | | | | 1.19 | | | | 1.20 | | | | (0.30 | ) | | | 163 | |
| | 4.48 | | | | (10.40 | ) | | | 33,207 | | | | 1.25 | | | | 1.31 | | | | (0.25 | ) | | | 191 | |
| | 4.99 | | | | (28.67 | ) | | | 156,841 | | | | 1.10 | | | | 1.10 | | | | (0.33 | ) | | | 179 | |
| | 7.01 | | | | 20.03 | | | | 228,629 | | | | 1.14 | (g) | | | 1.14 | (g) | | | (0.49 | ) | | | 134 | |
| | 5.84 | | | | (3.15 | ) | | | 225,729 | | | | 1.10 | | | | 1.17 | | | | (0.03 | ) | | | 174 | |
| | | | | | | | | | | | | | | | | | | | | | | | | | |
| | 4.87 | | | | 13.79 | | | | 4,086 | | | | 1.93 | | | | 1.95 | | | | (1.06 | ) | | | 163 | |
| | 4.28 | | | | (11.02 | ) | | | 5,397 | | | | 2.00 | | | | 2.12 | | | | (1.06 | ) | | | 191 | |
| | 4.81 | | | | (29.16 | ) | | | 9,553 | | | | 1.85 | | | | 1.85 | | | | (1.05 | ) | | | 179 | |
| | 6.79 | | | | 19.12 | | | | 28,258 | | | | 1.85 | (g) | | | 1.85 | (g) | | | (1.20 | ) | | | 134 | |
| | 5.70 | | | | (4.04 | ) | | | 32,160 | | | | 1.95 | | | | 2.11 | | | | (0.85 | ) | | | 174 | |
| | | | | | | | | | | | | | | | | | | | | | | | | | |
| | 4.87 | | | | 13.79 | | | | 12,493 | | | | 1.93 | | | | 1.95 | | | | (1.06 | ) | | | 163 | |
| | 4.28 | | | | (11.02 | ) | | | 16,336 | | | | 2.00 | | | | 2.12 | | | | (1.06 | ) | | | 191 | |
| | 4.81 | | | | (29.26 | ) | | | 27,743 | | | | 1.85 | | | | 1.85 | | | | (1.08 | ) | | | 179 | |
| | 6.80 | | | | 19.09 | | | | 39,157 | | | | 1.88 | | | | 1.88 | | | | (1.23 | ) | | | 134 | |
| | 5.71 | | | | (3.87 | ) | | | 43,415 | | | | 1.85 | | | | 1.95 | | | | (0.76 | ) | | | 174 | |
| | | | | | | | | | | | | | | | | | | | | | | | | | |
| | 5.43 | | | | 15.01 | | | | 53,299 | | | | 0.93 | (h) | | | 0.95 | | | | (0.05 | ) | | | 163 | |
| | 4.73 | | | | (9.73 | ) | | | 57,033 | | | | 0.75 | | | | 0.75 | | | | 0.18 | | | | 191 | |
| | 5.24 | | | | (28.42 | ) | | | 75,389 | | | | 0.66 | | | | 0.66 | | | | 0.11 | | | | 179 | |
| | 7.32 | | | | 20.39 | | | | 124,663 | | | | 0.67 | | | | 0.67 | | | | (0.02 | ) | | | 134 | |
| | 6.08 | | | | (2.88 | ) | | | 121,478 | | | | 0.80 | (i) | | | 0.80 | (i) | | | 0.31 | | | | 174 | |
| (f) | The investment adviser and/or administrator agreed to waive its fees and/or reimburse a portion of the Fund’s expenses during the period. Without this waiver/reimbursement, if applicable, expenses would have been higher. |
| (g) | Includes fee/expense recovery of less than 0.01% and 0.08% for Class A and Class B shares, respectively. |
| (h) | The expense limit changed during the period. See Note 6 of Notes to Financial Statements. |
| (i) | Includes fee/expense recovery of 0.07%. |
| 44
Financial Highlights (continued)
For a share outstanding throughout each period.
| | | | | | | | | | | | | | | | | | | | | | | | | | | | |
| | | | | | Income (Loss) from Investment
Operations: | | | Less Distributions: | |
| | | Net asset
value,
beginning
of
the period | | | Net
investment
loss (a) | | | Net realized
and unrealized
gain (loss) | | | Total from
investment
operations | | | Dividends
from
net investment
income | | | Distributions
from net
realized
capital gains | | | Total
distributions | |
| | | | | | | | | | | | | | | | | | | | | | | | | | | | |
MID CAP GROWTH FUND | | | | | | | | | | | | | | | | | | | | | |
Class A* | | | | | | | | | | | | | | | | | | | | | | | | | | | | |
9/30/2010 | | $ | 18.29 | | | $ | (0.09 | )(f) | | $ | 5.56 | | | $ | 5.47 | | | $ | — | | | $ | — | | | $ | — | |
9/30/2009 | | | 21.12 | | | | (0.07 | )(g) | | | (2.76 | ) | | | (2.83 | ) | | | — | | | | — | | | | — | |
9/30/2008 | | | 26.84 | | | | (0.15 | ) | | | (5.57 | ) | | | (5.72 | ) | | | — | | | | — | | | | — | |
9/30/2007 | | | 19.69 | | | | (0.16 | )(h) | | | 7.31 | | | | 7.15 | | | | — | | | | — | | | | — | |
9/30/2006 | | | 18.63 | | | | (0.15 | ) | | | 1.21 | | | | 1.06 | | | | — | | | | — | | | | — | |
Class C | | | | | | | | | | | | | | | | | | | | | | | | | | | | |
9/30/2010 | | | 18.20 | | | | (0.18 | )(f) | | | 5.45 | | | | 5.27 | | | | — | | | | — | | | | — | |
9/30/2009** | | | 15.13 | | | | (0.16 | ) | | | 3.23 | | | | 3.07 | | | | — | | | | — | | | | — | |
Class Y* | | | | | | | | | | | | | | | | | | | | | | | | | | | | |
9/30/2010 | | | 18.84 | | | | (0.07 | )(f) | | | 5.76 | | | | 5.69 | | | | — | | | | — | | | | — | |
9/30/2009 | | | 21.70 | | | | (0.05 | )(g) | | | (2.81 | ) | | | (2.86 | ) | | | — | | | | — | | | | — | |
9/30/2008 | | | 27.51 | | | | (0.10 | ) | | | (5.71 | ) | | | (5.81 | ) | | | — | | | | — | | | | — | |
9/30/2007 | | | 20.13 | | | | (0.11 | )(h) | | | 7.49 | | | | 7.38 | | | | — | | | | — | | | | — | |
9/30/2006 | | | 19.00 | | | | (0.10 | ) | | | 1.23 | | | | 1.13 | | | | — | | | | — | | | | — | |
| * | Prior to the close of business on February 2, 2009, the Fund offered Retail and Institutional Class shares, which were redesignated as Class A and Class Y shares, respectively, on that date. |
| ** | From commencement of Class operations on February 2, 2009 through September 30, 2009. |
| (a) | Per share net investment loss has been calculated using the average shares outstanding during the period. |
| (b) | Had certain expenses not been waived/reimbursed during the period, if applicable, total returns would have been lower. |
| (c) | A sales charge for Class A shares and a contingent deferred sales charge for Class C shares are not reflected in total return calculations. Periods less than one year, if applicable, are not annualized. |
| (d) | The investment adviser and/or administrator agreed to waive its fees and/or reimburse a portion of the Fund’s expenses during the period. Without this waiver/reimbursement, if applicable, expenses would have been higher. |
See accompanying notes to financial statements.
45 |
| | | | | | | | | | | | | | | | | | | | | | | | | | |
| | | | |
| | | | | | | | | | Ratios to Average Net Assets: | | | | |
| | | | | | |
Net asset
value, end
of the period | | | Total
return
(%) (b)(c) | | | Net assets,
end of
the period
(000’s) | | | Net
expenses
(%) (d)(e) | | | Gross
expenses
(%) (e) | | | Net investment
loss
(%) (e) | | | Portfolio
turnover
rate (%) | |
| | | | | | | | | | | | | | | | | | | | | | | | | | |
| | | | | | | | | | | | | | | | | | | | | | | | | | |
| | | | | | | | | | | | | | | | | | | | | | | | | | |
| $ | 23.76 | | | | 29.91 | | | $ | 67,639 | | | | 1.25 | | | | 1.46 | | | | (0.45 | )(f) | | | 191 | |
| | 18.29 | | | | (13.44 | ) | | | 54,951 | | | | 1.25 | | | | 1.52 | | | | (0.45 | )(g) | | | 292 | |
| | 21.12 | | | | (21.27 | ) | | | 120,524 | | | | 1.25 | | | | 1.32 | | | | (0.58 | ) | | | 299 | |
| | 26.84 | | | | 36.31 | | | | 30,654 | | | | 1.25 | | | | 1.43 | | | | (0.71 | ) | | | 194 | |
| | 19.69 | | | | 5.69 | | | | 26,668 | | | | 1.25 | | | | 1.52 | | | | (0.72 | ) | | | 211 | |
| | | | | | | | | | | | | | | | | | | | | | | | | | |
| | 23.47 | | | | 28.96 | | | | 34 | | | | 2.00 | | | | 2.24 | | | | (0.89 | )(f) | | | 191 | |
| | 18.20 | | | | 20.29 | | | | 1 | | | | 2.00 | | | | 2.24 | | | | (1.54 | ) | | | 292 | |
| | | | | | | | | | | | | | | | | | | | | | | | | | |
| | 24.53 | | | | 30.20 | | | | 33,757 | | | | 1.00 | | | | 1.22 | | | | (0.34 | )(f) | | | 191 | |
| | 18.84 | | | | (13.18 | ) | | | 27,057 | | | | 1.00 | | | | 1.12 | | | | (0.27 | )(g) | | | 292 | |
| | 21.70 | | | | (21.12 | ) | | | 25,779 | | | | 1.00 | (i) | | | 1.00 | (i) | | | (0.36 | ) | | | 299 | |
| | 27.51 | | | | 36.66 | | | | 24,143 | | | | 1.00 | | | | 1.10 | | | | (0.47 | ) | | | 194 | |
| | 20.13 | | | | 5.95 | | | | 17,467 | | | | 1.00 | | | | 1.12 | | | | (0.49 | ) | | | 211 | |
| (e) | Computed on an annualized basis for periods less than one year, if applicable. |
| (f) | Includes a non-recurring dividend, the character of which has not yet been determined by the issuer. Without this dividend, net investment loss per share would have been $(0.21), $(0.36) and $(0.16) for Class A, Class C and Class Y shares, respectively, and the ratio of net investment loss to average net assets would have been (1.02)%, (1.74)% and (0.76)% for Class A, Class C and Class Y shares, respectively. |
| (g) | Includes a non-recurring dividend of $0.03 per share. Without this dividend, net investment loss per share would have been $(0.10) and $(0.08) for Class A and Class Y shares, respectively, and the ratio of net investment loss to average net assets would have been (0.63)% and (0.46)% for Class A and Class Y shares, respectively. |
| (h) | Includes a non-recurring dividend of $0.02 per share. |
| (i) | Includes fee/expense recovery of less than 0.01%. |
| 46
Financial Highlights (continued)
For a share outstanding throughout each period.
| | | | | | | | | | | | | | | | | | | | | | | | | | | | |
| | | | | | Income (Loss) from Investment
Operations: | | | Less Distributions: | |
| | | Net asset
value,
beginning
of
the period | | | Net
investment
income (a)(b) | | | Net realized
and unrealized
gain (loss) | | | Total from
investment
operations | | | Dividends
from
net investment
income | | | Distributions
from net
realized
capital gains | | | Total
distributions | |
| | | | | | | | | | | | | | | | | | | | | | | | | | | | |
VALUE FUND | | | | | | | | | | | | | | | | | | | | | | | | | | | | |
Class A* | | | | | | | | | | | | | | | | | | | | | | | | | | | | |
9/30/2010 | | $ | 16.42 | | | $ | 0.27 | (g) | | $ | 0.23 | | | $ | 0.50 | | | $ | (0.14 | ) | | $ | — | | | $ | (0.14 | ) |
9/30/2009 | | | 17.93 | | | | 0.23 | | | | (1.53 | ) | | | (1.30 | ) | | | (0.21 | ) | | | — | | | | (0.21 | ) |
9/30/2008 | | | 23.46 | | | | 0.25 | | | | (4.45 | ) | | | (4.20 | ) | | | (0.18 | ) | | | (1.15 | ) | | | (1.33 | ) |
9/30/2007 | | | 21.04 | | | | 0.19 | | | | 3.27 | | | | 3.46 | | | | (0.13 | ) | | | (0.91 | ) | | | (1.04 | ) |
9/30/2006** | | | 19.69 | | | | 0.02 | | | | 1.33 | | | | 1.35 | | | | — | | | | — | | | | — | |
Class B | | | | | | | | | | | | | | | | | | | | | | | | | | | | |
9/30/2010 | | | 16.40 | | | | 0.12 | (g) | | | 0.25 | | | | 0.37 | | | | — | | | | — | | | | — | |
9/30/2009 | | | 17.80 | | | | 0.14 | | | | (1.51 | ) | | | (1.37 | ) | | | (0.03 | ) | | | — | | | | (0.03 | ) |
9/30/2008 | | | 23.46 | | | | 0.10 | | | | (4.45 | ) | | | (4.35 | ) | | | (0.16 | ) | | | (1.15 | ) | | | (1.31 | ) |
9/30/2007*** | | | 24.00 | | | | 0.00 | | | | (0.54 | ) | | | (0.54 | ) | | | — | | | | — | | | | — | |
Class C | | | | | | | | | | | | | | | | | | | | | | | | | | | | |
9/30/2010 | | | 16.26 | | | | 0.14 | (g) | | | 0.22 | | | | 0.36 | | | | (0.04 | ) | | | — | | | | (0.04 | ) |
9/30/2009 | | | 17.79 | | | | 0.12 | | | | (1.51 | ) | | | (1.39 | ) | | | (0.14 | ) | | | — | | | | (0.14 | ) |
9/30/2008 | | | 23.46 | | | | 0.09 | | | | (4.43 | ) | | | (4.34 | ) | | | (0.18 | ) | | | (1.15 | ) | | | (1.33 | ) |
9/30/2007*** | | | 24.00 | | | | 0.01 | | | | (0.55 | ) | | | (0.54 | ) | | | — | | | | — | | | | — | |
Class Y* | | | | | | | | | | | | | | | | | | | | | | | | | | | | |
9/30/2010 | | | 16.47 | | | | 0.31 | (g) | | | 0.23 | | | | 0.54 | | | | (0.19 | ) | | | — | | | | (0.19 | ) |
9/30/2009 | | | 18.01 | | | | 0.28 | | | | (1.54 | ) | | | (1.26 | ) | | | (0.28 | ) | | | — | | | | (0.28 | ) |
9/30/2008 | | | 23.54 | | | | 0.32 | | | | (4.45 | ) | | | (4.13 | ) | | | (0.25 | ) | | | (1.15 | ) | | | (1.40 | ) |
9/30/2007 | | | 21.05 | | | | 0.27 | | | | 3.27 | | | | 3.54 | | | | (0.14 | ) | | | (0.91 | ) | | | (1.05 | ) |
9/30/2006 | | | 18.72 | | | | 0.22 | | | | 3.17 | | | | 3.39 | | | | (0.27 | ) | | | (0.79 | ) | | | (1.06 | ) |
Admin Class | | | | | | | | | | | | | | | | | | | | | | | | | | | | |
9/30/2010**** | | | 16.72 | | | | 0.18 | (g) | | | (0.16 | ) | | | 0.02 | | | | — | | | | — | | | | — | |
| * | Prior to the close of business on June 1, 2007, the Fund offered Retail and Institutional Class shares, which were redesignated as Class A and Class Y shares, respectively, on that date. |
| ** | From commencement of Class operations on June 30, 2006, through September 30, 2006. |
| *** | From commencement of Class operations on June 1, 2007, through September 30, 2007. |
| **** | From commencement of Class operations on February 1, 2010 through September 30, 2010. |
| (a) | Amount rounds to less than $0.01 per share, if applicable. |
| (b) | Per share net investment income has been calculated using the average shares outstanding during the period. |
| (c) | A sales charge for Class A shares and a contingent deferred sales charge for Class B and Class C shares are not reflected in total return calculations. Periods less than one year, if applicable, are not annualized. |
| (d) | Had certain expenses not been waived/reimbursed during the period, if applicable, total returns would have been lower. |
See accompanying notes to financial statements.
47 |
| | | | | | | | | | | | | | | | | | | | | | | | | | |
| | | | |
| | | | | | | | | | Ratios to Average Net Assets: | | | | |
| | | | | | |
Net asset
value, end
of the period | | | Total
return
(%) (c)(d) | | | Net assets,
end of
the period
(000’s) | | | Net
expenses
(%) (e)(f) | | | Gross
expenses
(%) (f) | | | Net investment
income
(%) (f) | | | Portfolio
turnover
rate (%) | |
| | | | | | | | | | | | | | | | | | | | | | | | | | |
| | | | | | | | | | | | | | | | | | | | | | | | | | |
| | | | | | | | | | | | | | | | | | | | | | | | | | |
| $ | 16.78 | | | | 3.03 | | | $ | 130,922 | | | | 0.96 | | | | 0.96 | | | | 1.58 | (g) | | | 54 | |
| | 16.42 | | | | (6.97 | ) | | | 120,915 | | | | 1.06 | | | | 1.06 | | | | 1.67 | | | | 47 | |
| | 17.93 | | | | (19.01 | ) | | | 112,274 | | | | 1.05 | | | | 1.05 | | | | 1.24 | | | | 36 | (h) |
| | 23.46 | | | | 16.85 | | | | 17,500 | | | | 1.09 | (i) | | | 1.09 | (i) | | | 0.79 | | | | 41 | |
| | 21.04 | | | | 6.86 | | | | 466 | | | | 1.10 | | | | 8.65 | | | | 0.42 | | | | 36 | |
| | | | | | | | | | | | | | | | | | | | | | | | | | |
| | 16.77 | | | | 2.26 | | | | 3,299 | | | | 1.70 | | | | 1.70 | | | | 0.72 | (g) | | | 54 | |
| | 16.40 | | | | (7.62 | ) | | | 5,167 | | | | 1.81 | | | | 1.81 | | | | 1.03 | | | | 47 | |
| | 17.80 | | | | (19.65 | ) | | | 8,385 | | | | 1.80 | (j) | | | 1.80 | (j) | | | 0.51 | | | | 36 | (h) |
| | 23.46 | | | | (2.25 | ) | | | 108 | | | | 1.85 | | | | 1.89 | | | | 0.03 | | | | 41 | |
| | | | | | | | | | | | | | | | | | | | | | | | | | |
| | 16.58 | | | | 2.20 | | | | 10,226 | | | | 1.71 | | | | 1.71 | | | | 0.81 | (g) | | | 54 | |
| | 16.26 | | | | (7.60 | ) | | | 10,011 | | | | 1.81 | | | | 1.81 | | | | 0.89 | | | | 47 | |
| | 17.79 | | | | (19.62 | ) | | | 6,483 | | | | 1.80 | (j) | | | 1.80 | (j) | | | 0.46 | | | | 36 | (h) |
| | 23.46 | | | | (2.25 | ) | | | 1,390 | | | | 1.85 | | | | 1.94 | | | | 0.10 | | | | 41 | |
| | | | | | | | | | | | | | | | | | | | | | | | | | |
| | 16.82 | | | | 3.28 | | | | 788,937 | | | | 0.71 | | | | 0.71 | | | | 1.86 | (g) | | | 54 | |
| | 16.47 | | | | (6.66 | ) | | | 574,439 | | | | 0.66 | | | | 0.66 | | | | 1.97 | | | | 47 | |
| | 18.01 | | | | (18.67 | ) | | | 303,182 | | | | 0.65 | | | | 0.66 | | | | 1.58 | | | | 36 | (h) |
| | 23.54 | | | | 17.25 | | | | 182,002 | | | | 0.72 | (i) | | | 0.72 | (i) | | | 1.19 | | | | 41 | |
| | 21.05 | | | | 18.92 | | | | 71,147 | | | | 0.85 | | | | 0.91 | | | | 1.13 | | | | 36 | |
| | | | | | | | | | | | | | | | | | | | | | | | | | |
| | 16.74 | | | | 0.12 | | | | 1 | | | | 1.29 | | | | 1.29 | | | | 1.59 | (g) | | | 54 | |
| (e) | The investment adviser and/or administrator agreed to waive its fees and/or reimburse a portion of the Fund’s expenses during the period. Without this waiver/reimbursement, if applicable, expenses would have been higher. |
| (f) | Computed on an annualized basis for periods less than one year, if applicable. |
| (g) | Includes a non-recurring dividend. Without this dividend, net investment income per share would have been $0.14, $0.02, $0.01, $0.18 and $0.05 for Class A, Class B, Class C, Class Y and Admin Class shares, respectively, and the ratio of net investment income to average net assets would have been 0.84%, 0.10%, 0.09%, 1.08% and 0.50% for Class A, Class B, Class C, Class Y and Admin Class shares, respectively. |
| (h) | Portfolio turnover excludes the impact of assets resulting from a merger with another fund. |
| (i) | Includes fee/expense recovery of 0.02% and 0.01% for Class A and Class Y shares, respectively. |
| (j) | Includes fee/expense recovery of less than 0.01% for Class B and Class C shares. |
| 48
Notes to Financial Statements
September 30, 2010
1. Organization. Loomis Sayles Funds II (the “Trust”) is organized as a Massachusetts business trust. The Trust is registered under the Investment Company Act of 1940, as amended (the “1940 Act”), as an open-end management investment company. The Declaration of Trust permits the Board of Trustees to authorize the issuance of an unlimited number of shares of the Trust in multiple series. The financial statements for certain funds of the Trust are presented in separate reports. The following funds (individually, a “Fund” and collectively, the “Funds”) are included in this report:
Loomis Sayles Disciplined Equity Fund (the “Disciplined Equity Fund”)
Loomis Sayles Global Markets Fund (the “Global Markets Fund”)
Loomis Sayles Growth Fund (the “Growth Fund”)
Loomis Sayles Mid Cap Growth Fund (the “Mid Cap Growth Fund”)
Loomis Sayles Value Fund (the “Value Fund”)
Each Fund offers Class A, Class C and Class Y shares. Effective February 1, 2010, the Value Fund began offering Admin Class shares. Effective October 12, 2007, Class B shares are no longer offered. Existing Class B shareholders of Disciplined Equity Fund, Growth Fund and Value Fund may continue to reinvest dividends into Class B shares and exchange their Class B shares for Class B shares of other Natixis Funds subject to existing exchange privileges as described in the Prospectus.
Class A shares are sold with a maximum front-end sales charge of 5.75%. Class B shares do not pay a front-end sales charge; however, they are charged higher Rule 12b-1 fees, and are subject to a contingent deferred sales charge (“CDSC”) if such shares are redeemed within six years of purchase. After eight years of ownership, Class B shares convert to Class A shares. Class C shares do not pay a front-end sales charge, do not convert to any other class of shares, pay higher Rule 12b-1 fees than Class A shares and may be subject to a CDSC of 1.00% if those shares are redeemed within one year of acquisition, except for reinvested distributions. Class Y shares do not pay a front-end sales charge, a CDSC or Rule 12b-1 fees. Class Y shares are generally intended for institutional investors with a minimum initial investment of $100,000, though some categories of investors are exempted from the minimum investment amount as outlined in the Funds’ prospectus. Admin Class shares do not pay a front-end sales charge or a CDSC, but do pay a Rule 12b-1 fee. Admin Class shares are offered exclusively through intermediaries.
Most expenses of the Trust can be directly attributed to a Fund. Expenses which can not be directly attributed to a Fund are generally apportioned based on the relative net assets of each of the Funds in the Trust. Expenses of a Fund are borne pro rata by the holders of each class of shares, except that each class bears expenses unique to that class (including the Rule 12b-1 service and distribution fees). In addition, each class votes as a class only with respect to its own Rule 12b-1 Plan. Shares of each class would receive their pro rata share of the net assets of a Fund if the Fund were liquidated. The Trustees approve separate distributions from net investment income on each class of shares.
2. Significant Accounting Policies. The following is a summary of significant accounting policies consistently followed by each Fund in the preparation of its financial statements. The Funds’ financial statements are prepared in accordance with accounting principles generally accepted in the United States of America which require the use of management estimates that affect the reported amounts and disclosures in the financial statements. Actual results could differ from those estimates. Management has evaluated the events and transactions subsequent to year-end through the date the financial statements were issued and has determined that there were no material events that would require disclosure in the Funds’ financial statements.
a. Valuation. Equity securities, including shares of closed-end investment companies and exchange-traded funds, for which market quotations are readily available are valued at market value, as reported by pricing services recommended by the investment adviser and approved by the Board of Trustees. Such pricing services generally use the security’s last sale price on the exchange or market where the security is primarily traded or, if there is no reported sale during the day, the closing bid price. Securities traded on the NASDAQ Global Select Market, NASDAQ Global Market and NASDAQ Capital Market are valued at the NASDAQ Official Closing Price (“NOCP”), or if lacking a NOCP, at the most recent bid quotation on the applicable NASDAQ Market. Debt securities (other than short-term obligations purchased with an original or remaining maturity of sixty days or less) are generally valued on the basis of evaluated bids furnished to the Funds by a pricing service recommended by the investment adviser and approved by the Board of Trustees, which service determines valuations for normal, institutional-size trading units of such securities using market information, transactions for comparable securities and various relationships between securities which are generally recognized by institutional traders. Broker-dealer bid quotations may also be used to value debt and equity securities where a pricing service does not price a security or where a pricing service does not provide a reliable price for the security. In instances where broker-dealer bid quotations are not available, certain securities held by the Funds may be valued on the basis of a price provided by a principal market maker. Forward foreign currency contracts are valued utilizing interpolated prices determined from information provided by an independent pricing service. Domestic exchange-traded single equity option contracts are valued at the mean of the National Best Bid and offer quotations. Short-term
49 |
Notes to Financial Statements (continued)
September 30, 2010
obligations purchased with an original or remaining maturity of sixty days or less are valued at amortized cost, which approximates market value. Securities for which market quotations are not readily available are valued at fair value as determined in good faith by the Funds’ investment adviser using consistently applied procedures under the general supervision of the Board of Trustees. Investments in other open-end investment companies are valued at their net asset value each day.
The Funds may hold securities traded in foreign markets. Foreign securities are valued at the market price in the foreign market. However, if events occurring after the close of the foreign market (but before the close of regular trading on the New York Stock Exchange) are believed to materially affect the value of those securities, such securities are fair valued pursuant to procedures approved by the Board of Trustees. When fair valuing securities, the Funds may, among other things, use modeling tools or other processes that may take into account factors such as securities market activity and/or significant events that occur after the close of the foreign market and before the Funds calculate their net asset values. As of September 30, 2010, approximately 24% of the market value of the Global Markets Fund’s investments was fair valued pursuant to procedures approved by the Board of Trustees.
b. Investment Transactions and Related Investment Income. Investment transactions are accounted for on a trade date plus one basis for daily net asset value calculation. However, for financial reporting purposes, investment transactions are reported on trade date. Dividend income is recorded on ex-dividend date, or in the case of certain foreign securities, as soon as a Fund is notified, and interest income is recorded on an accrual basis. Interest income is increased by the accretion of discount and decreased by the amortization of premium. Periodic principal adjustments for inflation-protected securities are recorded to interest income. Investment income is recorded net of foreign taxes withheld when applicable. In determining net gain or loss on securities sold, the cost of securities has been determined on an identified cost basis. Investment income, non-class specific expenses and realized and unrealized gains and losses are allocated on a pro rata basis to each class based on the relative net assets of each class to the total net assets of the Fund.
c. Foreign Currency Translation. The books and records of the Funds are maintained in U.S. dollars. The value of securities, currencies and other assets and liabilities denominated in currencies other than U.S. dollars are translated into U.S. dollars based upon foreign exchange rates prevailing at the end of the period. Purchases and sales of investment securities, income and expenses are translated on the respective dates of such transactions.
Since the values of investment securities are presented at the foreign exchange rates prevailing at the end of the period, it is not practical to isolate that portion of the results of operations arising from changes in exchange rates from fluctuations which arise due to changes in market prices of investment securities. Such changes are included with the net realized and unrealized gain or loss on investments.
Net realized foreign exchange gains or losses arise from sales of foreign currency, currency gains or losses realized between the trade and settlement dates on securities transactions and the difference between the amounts of dividends, interest and foreign withholding taxes recorded on the Funds’ books and the U.S. dollar equivalent of the amounts actually received or paid. Net unrealized foreign exchange gains and losses arise from changes in the value of assets and liabilities, other than investment securities, at the end of the fiscal period, resulting from changes in exchange rates.
Each Fund may use foreign currency exchange contracts to facilitate transactions in foreign-denominated investments. Losses may arise from changes in the value of the foreign currency or if the counterparties do not perform under the contracts’ terms.
d. Forward Foreign Currency Contracts. Each Fund may enter into forward foreign currency contracts. Contracts to buy generally are used to acquire exposure to foreign currencies, while contracts to sell generally are used to hedge a Fund’s investments against currency fluctuation. Also, a contract to buy or sell can offset a previous contract. These contracts involve market risk in excess of the unrealized gain or loss reflected in the Funds’ Statements of Assets and Liabilities. The U.S. dollar value of the currencies a Fund has committed to buy or sell represents the aggregate exposure to each currency the Fund has acquired or hedged through currency contracts outstanding at period end. Gains or losses are recorded for financial statement purposes as unrealized until settlement date. Risks may arise upon entering into these contracts from the potential inability of counterparties to meet the terms of their contracts and from unanticipated movements in the value of a foreign currency relative to the U.S. dollar. Certain contracts may require the movement of cash or securities to or from the counterparty as collateral for the Funds’ or counterparty’s net obligations under the contracts.
e. Option Contracts. The Funds may enter into option contracts. When a Fund purchases an option, it pays a premium and the option is subsequently marked to market to reflect current value. Premiums paid for purchasing options which expire are treated as realized losses. Premiums paid for purchasing options which are exercised or closed are added to the cost or deducted from the proceeds on the underlying instrument to determine the realized gain or loss. The risk associated with purchasing options is limited to the premium paid.
| 50
Notes to Financial Statements (continued)
September 30, 2010
When a Fund writes an option, an amount equal to the net premium received (the premium less commission) is recorded as a liability and is subsequently adjusted to the current value until the option expires or the Fund enters into a closing purchase transaction. When a written option expires on its stipulated expiration date or the Fund enters into a closing purchase transaction, the difference between the net premium received and any amount paid at expiration or on effecting a closing purchase transaction, including commission, is treated as a realized gain or, if the net premium received is less than the amount paid, as a realized loss. The Fund, as writer of a written option, bears the risk of an unfavorable change in the market value of the equity underlying the written option.
Exchange-traded options have standardized contracts and are settled through a clearing house with fulfillment guaranteed by the credit of the exchange. Therefore, counterparty credit risks to the Funds are limited. Over-the-counter options are subject to the risk that the counterparty is unable or unwilling to meet its obligations under the option. For the year ended September 30, 2010, the Funds were not party to any over-the-counter options.
f. Federal and Foreign Income Taxes. The Trust treats each Fund as a separate entity for federal income tax purposes. Each Fund intends to meet the requirements of the Internal Revenue Code of 1986, as amended, applicable to regulated investment companies, and to distribute to its shareholders substantially all of its net investment income and any net realized capital gains at least annually. Management has performed an analysis of each Fund’s tax positions for the open tax years as of September 30, 2010 and has concluded that no provisions for income tax are required. The Funds’ federal tax returns for the prior three fiscal years remain subject to examination by the Internal Revenue Service. Management is not aware of any events that are reasonably possible to occur in the next six months that would result in the amounts of any unrecognized tax benefits significantly increasing or decreasing for the Funds. However, management’s conclusions regarding tax positions taken may be subject to review and adjustment at a later date based on factors including, but not limited to, new tax laws and accounting regulations and interpretations thereof.
A Fund may be subject to foreign taxes on income and gains on investments that are accrued based upon the Fund’s understanding of the tax rules and regulations that exist in the countries in which the Fund invests. Foreign governments may also impose taxes or other payments on investments with respect to foreign securities. Such taxes are accrued as applicable, and are reflected as foreign taxes payable on the Statements of Assets and Liabilities. In the event that realized gains on investments are subsequently offset by realized losses, taxes paid on realized gains may be returned to a Fund. Such amounts, if applicable, are reflected as foreign tax rebates receivable on the Statements of Assets and Liabilities.
g. Dividends and Distributions to Shareholders. Dividends and distributions are recorded on ex-dividend date. The timing and characterization of certain income and capital gain distributions are determined annually in accordance with federal tax regulations, which may differ from accounting principles generally accepted in the United States of America. Permanent differences are primarily due to differing treatments for book and tax purposes for items such as net operating losses, paydown gains and losses, foreign currency transactions, gains realized from passive foreign investment companies (“PFICs”), defaulted bonds, premium amortization accruals and expired capital loss carryforwards. Permanent book and tax basis differences relating to shareholder distributions will result in reclassifications to capital accounts. Temporary differences between book and tax distributable earnings are primarily due to deferred Trustees’ fees, forward contract mark to market, securities lending collateral gain/loss adjustment, straddle loss deferrals, wash sales, premium amortization accruals, contingent payment debt instruments, PFIC un-reversed inclusions and defaulted bond interest. Distributions from net investment income and short-term capital gains are considered to be distributed from ordinary income for tax purposes.
The tax characterization of distributions is determined on an annual basis. The tax character of distributions paid to shareholders during the years ended September 30, 2010 and 2009 was as follows:
| | | | | | | | | | | | | | | | | | | | | | | | |
| | | 2010 Distributions Paid From: | | | 2009 Distributions Paid From: | |
Fund | | Ordinary Income | | | Long-Term
Capital Gains | | | Total | | | Ordinary Income | | | Long-Term
Capital Gains | | | Total | |
Disciplined Equity Fund | | $ | 185,129 | | | $ | — | | | $ | 185,129 | | | $ | 216,562 | | | $ | — | | | $ | 216,562 | |
Global Markets Fund | | | 5,648,679 | | | | — | | | | 5,648,679 | | | | 4,997,799 | | | | — | | | | 4,997,799 | |
Growth Fund | | | — | | | | — | | | | — | | | | — | | | | — | | | | — | |
Mid Cap Growth Fund | | | — | | | | — | | | | — | | | | — | | | | — | | | | — | |
Value Fund | | | 7,877,957 | | | | — | | | | 7,877,957 | | | | 6,186,770 | | | | — | | | | 6,186,770 | |
Differences between these amounts for the year ended September 30, 2009 and those reported in the Statements of Changes in Net Assets for the same period are primarily attributable to different book and tax treatment for short-term capital gains.
51 |
Notes to Financial Statements (continued)
September 30, 2010
As of September 30, 2010, the components of distributable earnings were as follows:
| | | | | | | | | | | | | | | | | | | | |
| | | Disciplined Equity
Fund | | | Global Markets
Fund | | | Growth
Fund | | | Mid Cap
Growth Fund | | | Value Fund | |
Undistributed ordinary income | | $ | 61,598 | | | $ | 4,604,022 | | | $ | — | | | $ | — | | | $ | 12,973,893 | |
Undistributed long-term capital gains | | | — | | | | — | | | | — | | | | — | | | | — | |
| | | | | | | | | | | | | | | | | | | | |
Total undistributed earnings | | | 61,598 | | | | 4,604,022 | | | | — | | | | — | | | | 12,973,893 | |
| | | | | | | | | | | | | | | | | | | | |
Capital loss carryforward: | | | | | | | | | | | | | | | | | | | | |
Expires September 30, 2011 | | | — | | | | — | | | | (6,192,314 | ) | | | (21,142,388 | ) | | | — | |
Expires September 30, 2015 | | | — | | | | — | | | | — | | | | — | | | | — | |
Expires September 30, 2016 | | | — | | | | — | | | | (75,866 | ) | | | — | | | | — | |
Expires September 30, 2017 | | | (2,229,424 | ) | | | (54,290,711 | ) | | | (57,062,095 | ) | | | (33,667,761 | ) | | | (26,840,015 | ) |
Expires September 30, 2018 | | | (3,119,805 | ) | | | (38,601,700 | ) | | | (34,687,546 | ) | | | (18,653,312 | ) | | | (54,112,420 | ) |
| | | | | | | | | | | | | | | | | | | | |
Total capital loss carryforward | | | (5,349,229 | ) | | | (92,892,411 | ) | | | (98,017,821 | ) | | | (73,463,461 | ) | | | (80,952,435 | ) |
Unrealized appreciation (depreciation) | | | 2,538,106 | | | | 52,999,299 | | | | 8,127,260 | | | | 22,488,727 | | | | 30,754,917 | |
| | | | | | | | | | | | | | | | | | | | |
Total accumulated earnings (losses) | | $ | (2,749,525 | ) | | $ | (35,289,090 | ) | | $ | (89,890,561 | ) | | $ | (50,974,734 | ) | | $ | (37,223,625 | ) |
| | | | | | | | | | | | | | | | | | | | |
The Growth Fund and Mid Cap Growth Fund had $9,606,459 and $65,130,772 of capital loss carryforwards expire in the current year, respectively.
h. Repurchase Agreements. It is each Fund’s policy that the market value of the collateral for repurchase agreements be at least equal to 102% of the repurchase price, including interest. Certain repurchase agreements are tri-party arrangements whereby the collateral is held in a segregated account for the benefit of the Fund and on behalf of the counterparty. Repurchase agreements could involve certain risks in the event of default or insolvency of the counterparty including possible delays or restrictions upon a Fund’s ability to dispose of the underlying securities.
i. Securities Lending. The Funds have entered into an agreement with State Street Bank and Trust Company (“State Street Bank”), as agent of the Funds, to lend securities to certain designated borrowers. The loans are collateralized with cash or securities in an amount equal to at least 105% or 102% of the market value (including accrued interest) of the loaned international or domestic securities, respectively, when the loan is initiated. Thereafter, the value of the collateral must remain at least 102% of the market value (including accrued interest) of loaned securities for U.S. equities and U.S. corporate debt; at least 105% of the market value (including accrued interest) of loaned securities for non-U.S. equities; and at least 100% of the market value (including accrued interest) of loaned securities for U.S. Government securities, sovereign debt issued by non-U.S. Governments and non-U.S. corporate debt. In the event that the market value of the collateral falls below the required percentages described above, the borrower will deliver additional collateral on the next business day. As with other extensions of credit, the Funds may bear the risk of loss with respect to the investment of the collateral. The Funds invest cash collateral in short-term investments, a portion of the income from which is remitted to the borrowers and the remainder allocated between the Funds and State Street Bank as lending agent.
For the year ended September 30, 2010, none of the Funds had loaned securities under this agreement.
j. Indemnifications. Under the Trust’s organizational documents, its officers and Trustees are indemnified against certain liabilities arising out of the performance of their duties to the Funds. Additionally, in the normal course of business, the Funds enter into contracts with service providers that contain general indemnification clauses. The Funds’ maximum exposure under these arrangements is unknown as this would involve future claims that may be made against the Funds that have not yet occurred. However, based on experience, the Funds expect the risk of loss to be remote.
3. Fair Value Measurements. In accordance with accounting standards related to fair value measurements and disclosures, the Funds have categorized the inputs utilized in determining the value of each Fund’s assets or liabilities. These inputs are summarized in the three broad levels listed below:
| | • | | Level 1 – quoted prices in active markets for identical assets or liabilities; |
| 52
Notes to Financial Statements (continued)
September 30, 2010
| | • | | Level 2 – prices determined using other significant inputs that are observable either directly, or indirectly through corroboration with observable market data (which could include quoted prices for similar assets or liabilities, interest rates, credit risk, etc.); |
| | • | | Level 3 – prices determined using significant unobservable inputs when quoted prices or observable inputs are unavailable such as when there is little or no market activity for an asset or liability (unobservable inputs reflect each Fund’s own assumptions in determining the fair value of assets or liabilities and would be based on the best information available). |
The inputs or methodology used for valuing securities are not necessarily an indication of the risk associated with investing in those securities.
The following is a summary of the inputs used to value the Funds’ investments as of September 30, 2010, at value:
Disciplined Equity Fund
Asset Valuation Inputs
| | | | | | | | | | | | | | | | |
Description(a) | | Level 1 | | | Level 2 | | | Level 3 | | | Total | |
| | | | | | | | | | | | | | | | |
Common Stocks | | $ | 33,889,675 | | | $ | — | | | $ | — | | | $ | 33,889,675 | |
Short-Term Investments | | | — | | | | 624,405 | | | | — | | | | 624,405 | |
| | | | | | | | | | | | | | | | |
Total | | $ | 33,889,675 | | | $ | 624,405 | | | $ | — | | | $ | 34,514,080 | |
| | | | | | | | | | | | | | | | |
Liability Valuation Inputs
| | | | | | | | | | | | | | | | |
Description(a) | | Level 1 | | | Level 2 | | | Level 3 | | | Total | |
| | | | | | | | | | | | | | | | |
Call Options Written | | $ | (88,119 | ) | | $ | — | | | $ | — | | | $ | (88,119 | ) |
| | | | | | | | | | | | | | | | |
| (a) | Major categories of the Fund’s investments and option contracts are included in the Portfolio of Investments. |
53 |
Notes to Financial Statements (continued)
September 30, 2010
Global Markets Fund
Asset Valuation Inputs
| | | | | | | | | | | | | | | | |
Description | | Level 1 | | | Level 2 | | | Level 3 | | | Total | |
| | | | | | | | | | | | | | | | |
Common Stocks | | | | | | | | | | | | | | | | |
Belgium | | $ | — | | | $ | 4,248,358 | | | $ | — | | | $ | 4,248,358 | |
Bermuda | | | 3,220,295 | | | | — | | | | — | | | | 3,220,295 | |
Brazil | | | 21,375,959 | | | | — | | | | — | | | | 21,375,959 | |
Canada | | | 3,551,388 | | | | — | | | | — | | | | 3,551,388 | |
Cayman Islands | | | 7,851,456 | | | | — | | | | — | | | | 7,851,456 | |
Chile | | | 6,558,115 | | | | — | | | | — | | | | 6,558,115 | |
Germany | | | — | | | | 12,710,476 | | | | — | | | | 12,710,476 | |
Hong Kong | | | — | | | | 7,395,738 | | | | — | | | | 7,395,738 | |
Indonesia | | | — | | | | 3,070,318 | | | | — | | | | 3,070,318 | |
Japan | | | — | | | | 2,986,784 | | | | — | | | | 2,986,784 | |
Korea | | | — | | | | 7,482,078 | | | | — | | | | 7,482,078 | |
Mexico | | | 2,790,701 | | | | — | | | | — | | | | 2,790,701 | |
Netherlands Antilles | | | 1,734,630 | | | | — | | | | — | | | | 1,734,630 | |
Singapore | | | — | | | | 2,580,416 | | | | — | | | | 2,580,416 | |
Spain | | | — | | | | 4,204,695 | | | | — | | | | 4,204,695 | |
Sweden | | | — | | | | 4,026,934 | | | | — | | | | 4,026,934 | |
Switzerland | | | — | | | | 3,743,069 | | | | — | | | | 3,743,069 | |
Taiwan | | | — | | | | 3,861,292 | | | | — | | | | 3,861,292 | |
Turkey | | | — | | | | 3,389,909 | | | | — | | | | 3,389,909 | |
United Kingdom | | | — | | | | 15,515,857 | | | | — | | | | 15,515,857 | |
United States | | | 86,806,025 | | | | — | | | | — | | | | 86,806,025 | |
| | | | | | | | | | | | | | | | |
Total Common Stocks | | | 133,888,569 | | | | 75,215,924 | | | | — | | | | 209,104,493 | |
| | | | | | | | | | | | | | | | |
Bonds and Notes | | | | | | | | | | | | | | | | |
Non-Convertible Bonds | | | | | | | | | | | | | | | | |
Korea | | | — | | | | 652,738 | | | | 368,686 | | | | 1,021,424 | |
United States | | | 30,940 | | | | 56,362,755 | | | | | | | | 56,393,695 | |
All Other Non-Convertible Bonds(a) | | | — | | | | 35,022,790 | | | | — | | | | 35,022,790 | |
| | | | | | | | | | | | | | | | |
Total Non-Convertible Bonds | | | 30,940 | | | | 92,038,283 | | | | 368,686 | | | | 92,437,909 | |
| | | | | | | | | | | | | | | | |
Convertible Bonds(a) | | | — | | | | 4,537,600 | | | | — | | | | 4,537,600 | |
Municipals(a) | | | — | | | | 93,474 | | | | — | | | | 93,474 | |
| | | | | | | | | | | | | | | | |
Total Bonds and Notes | | | 30,940 | | | | 96,669,357 | | | | 368,686 | | | | 97,068,983 | |
| | | | | | | | | | | | | | | | |
Bank Loans(a) | | | — | | | | 133,985 | | | | — | | | | 133,985 | |
Preferred Stocks(a) | | | — | | | | 1,278,107 | | | | — | | | | 1,278,107 | |
Short-Term Investments | | | — | | | | 8,684,559 | | | | — | | | | 8,684,559 | |
| | | | | | | | | | | | | | | | |
Total Investments | | | 133,919,509 | | | | 181,981,932 | | | | 368,686 | | | | 316,270,127 | |
| | | | | | | | | | | | | | | | |
Forward Foreign Currency Contracts (unrealized appreciation)(a) | | | — | | | | 59,237 | | | | — | | | | 59,237 | |
| | | | | | | | | | | | | | | | |
Total | | $ | 133,919,509 | | | $ | 182,041,169 | | | $ | 368,686 | | | $ | 316,329,364 | |
| | | | | | | | | | | | | | | | |
| (a) | Major categories of the Fund’s investments and forward foreign currency contracts are included in the Portfolio of Investments. |
| 54
Notes to Financial Statements (continued)
September 30, 2010
Growth Fund
Asset Valuation Inputs
| | | | | | | | | | | | | | | | |
Description(a) | | Level 1 | | | Level 2 | | | Level 3 | | | Total | |
| | | | | | | | | | | | | | | | |
Common Stocks | | $ | 99,213,293 | | | $ | — | | | $ | — | | | $ | 99,213,293 | |
Short-Term Investments | | | — | | | | 930,091 | | | | — | | | | 930,091 | |
| | | | | | | | | | | | | | | | |
Total | | $ | 99,213,293 | | | $ | 930,091 | | | $ | — | | | $ | 100,143,384 | |
| | | | | | | | | | | | | | | | |
| (a) | Major categories of the Fund’s investments are included in the Portfolio of Investments. |
Mid Cap Growth Fund
Asset Valuation Inputs
| | | | | | | | | | | | | | | | |
Description(a) | | Level 1 | | | Level 2 | | | Level 3 | | | Total | |
| | | | | | | | | | | | | | | | |
Common Stocks | | $ | 103,683,224 | | | $ | — | | | $ | — | | | $ | 103,683,224 | |
Put Options | | | 452,739 | | | | — | | | | — | | | | 452,739 | |
Short-Term Investments | | | — | | | | 11,632,824 | | | | — | | | | 11,632,824 | |
| | | | | | | | | | | | | | | | |
Total | | $ | 104,135,963 | | | $ | 11,632,824 | | | $ | — | | | $ | 115,768,787 | |
| | | | | | | | | | | | | | | | |
Liability Valuation Inputs
| | | | | | | | | | | | | | | | |
Description(a) | | Level 1 | | | Level 2 | | | Level 3 | | | Total | |
| | | | | | | | | | | | | | | | |
Call Options Written | | $ | (101,955 | ) | | $ | — | | | $ | — | | | $ | (101,955 | ) |
Put Options Written | | | (122,640 | ) | | | — | | | | — | | | | (122,640 | ) |
| | | | | | | | | | | | | | | | |
Total | | $ | (224,595 | ) | | $ | — | | | $ | — | | | $ | (224,595) | |
| | | | | | | | | | | | | | | | |
| (a) | Major categories of the Fund’s investments and option contracts are included in the Portfolio of Investments. |
Value Fund
Asset Valuation Inputs
| | | | | | | | | | | | | | | | |
Description(a) | | Level 1 | | | Level 2 | | | Level 3 | | | Total | |
| | | | | | | | | | | | | | | | |
Common Stocks | | $ | 909,270,200 | | | $ | — | | | $ | — | | | $ | 909,270,200 | |
Short-Term Investments | | | — | | | | 23,251,006 | | | | — | | | | 23,251,006 | |
| | | | | | | | | | | | | | | | |
Total | | $ | 909,270,200 | | | $ | 23,251,006 | | | $ | — | | | $ | 932,521,206 | |
| | | | | | | | | | | | | | | | |
| (a) | Major categories of the Fund’s investments are included in the Portfolio of Investments. |
55 |
Notes to Financial Statements (continued)
September 30, 2010
The following is a reconciliation of Level 3 investments for which significant unobservable inputs were used to determine fair values as of September 30, 2010:
Global Markets Fund
Asset Valuation Inputs
| | | | | | | | | | | | | | | | | | | | | | | | | | | | | | | | |
Investments in Securities | | Balance as of
September 30,
2009 | | | Accrued
Discounts
(Premiums) | | | Realized
Gain (Loss) | | | Change in
Unrealized
Appreciation
(Depreciation) | | | Net
Purchases
(Sales) | | | Transfers
into Level 3 | | | Transfers
out of Level 3 | | | Balance as of
September 30,
2010 | |
| | | | | | | | | | | | | | | | | | | | | | | | | | | | | | | | |
Bonds and Notes | | | | | | | | | | | | | | | | | | | | | | | | | | | | | | | | |
Non-Convertible Bonds | | | | | | | | | | | | | | | | | | | | | | | | | | | | | | | | |
Korea | | $ | — | | | $ | — | | | $ | — | | | $ | 14,544 | | | $ | 354,142 | | | $ | — | | | $ | — | | | $ | 368,686 | |
United States | | | 859,552 | | | | — | | | | — | | | | — | | | | — | | | | — | | | | (859,552 | ) | | | — | |
Convertible Bonds | | | | | | | | | | | | | | | | | | | | | | | | | | | | | | | | |
United States | | | 227,900 | | | | — | | | | — | | | | — | | | | — | | | | — | | | | (227,900 | ) | | | — | |
| | | | | | | | | | | | | | | | | | | | | | | | | | | | | | | | |
Total | | $ | 1,087,452 | | | $ | — | | | $ | — | | | $ | 14,544 | | | $ | 354,142 | | | $ | — | | | $ | (1,087,452 | ) | | $ | 368,686 | |
| | | | | | | | | | | | | | | | | | | | | | | | | | | | | | | | |
Debt securities valued at $1,087,452 were transferred from Level 3 to Level 2 during the year ended September 30, 2010. At September 30, 2009, these securities were valued using broker-dealer bid quotations based on inputs unobservable to the Fund; at September 30, 2010, these securities were valued on the basis of evaluated bids furnished to the Fund by a pricing service, where inputs are observable to the Fund.
All transfers are recognized as of the beginning of the reporting period.
4. Derivatives. Derivative instruments are defined as financial instruments whose value and performance are based on the value and performance of another security or financial instrument. Derivative instruments that the Funds currently use are forward foreign currency contracts and option contracts.
The Funds are subject to the risk that changes in foreign currency exchange rates will have an unfavorable effect on the value of Fund assets denominated in foreign currencies. The Funds may enter into forward foreign currency contracts for hedging purposes to protect the value of the Funds’ holdings of foreign securities. The Funds may also use forward foreign currency contracts to gain exposure to foreign currencies, regardless of whether securities denominated in such currencies are held in the Funds. During the year ended September 30, 2010, Global Markets Fund engaged in forward foreign currency transactions for hedging purposes and to gain exposure to foreign currencies.
Disciplined Equity Fund, Global Markets Fund and Mid Cap Growth Fund are parties to agreements with counterparties that govern transactions in forward foreign currency contracts. These agreements contain contingent features that allow the counterparties to terminate open contracts early if the net asset value of a Fund declines beyond a certain threshold. If such contingent features were to be triggered, the counterparties could request immediate settlement of open contracts at current fair value.
The Funds are subject to the risk of unpredictable declines in the value of individual equity securities and periods of below-average performance in individual securities or in the equity market as a whole. Certain Funds may use purchased put options and written call options to hedge against a decline in value of an equity security that it owns. Certain Funds may also write put options to offset the cost of options used for hedging purposes. During the year ended September 30, 2010, Disciplined Equity Fund engaged in written call option transactions and Mid Cap Growth Fund engaged in written call option and purchased and written put option transaction in accordance with their objectives.
The following is a summary of derivative instruments for Disciplined Equity Fund as of September 30, 2010:
| | | | |
Statements of Assets and Liabilities Caption | | Equity
Contracts | |
Liabilities | | | | |
Options written, at value | | $ | (88,119 | ) |
| 56
Notes to Financial Statements (continued)
September 30, 2010
Transactions in derivative instruments for Disciplined Equity Fund during the year ended September 30, 2010, were as follows:
| | | | |
Statements of Assets and Liabilities Caption | | Equity
Contracts | |
Net Realized Gain (Loss) on: | | | | |
Options written | | $ | 146,797 | |
Net Change in Unrealized Appreciation (Depreciation) on: | | | | |
Options written | | | (228 | ) |
The following is a summary of derivative instruments for Global Markets Fund as of September 30, 2010:
| | | | |
Statements of Assets and Liabilities Caption | | Foreign
Exchange
Contracts | |
Assets | | | | |
Unrealized appreciation on forward foreign currency contracts | | $ | 59,237 | |
Transactions in derivative instruments for Global Markets Fund during the year ended September 30, 2010, were as follows:
| | | | |
Statements of Operations Caption | | Foreign
Exchange
Contracts | |
Net Realized Gain (Loss) on: | | | | |
Foreign currency transactions* | | $ | 48,738 | |
Net Change in Unrealized Appreciation (Depreciation) on: | | | | |
Foreign currency translations* | | | 36,928 | |
* Represents realized gain (loss) and change in unrealized appreciation (depreciation), respectively, for forward foreign currency contracts during the period.
The following is a summary of derivative instruments for Mid Cap Growth Fund as of September 30, 2010:
| | | | |
Statements of Assets and Liabilities Caption | | Equity
Contracts | |
Assets | | | | |
Investments at value* | | $ | 452,739 | |
Liabilities | | | | |
Options written, at value | | | (224,595 | ) |
* Represents purchased options, at value.
Transactions in derivative instruments for Mid Cap Growth Fund during the year ended September 30, 2010 were as follows:
| | | | |
Statements of Operations Caption | | Equity
Contracts | |
Net Realized Gain (Loss) on: | | | | |
Investments* | | $ | (713,825 | ) |
Options written | | | (115,065 | ) |
Net Change in Unrealized Appreciation (Depreciation) on: | | | | |
Investments* | | | (358,505 | ) |
Options written | | | 111,228 | |
* Represents realized gain (loss) and change in unrealized appreciation (depreciation), respectively, for purchased options during the period.
57 |
Notes to Financial Statements (continued)
September 30, 2010
As the Funds value their derivatives at fair value and recognize changes in fair value through the Statements of Operations, they do not qualify for hedge accounting under authoritative guidance for derivative instruments. The Funds’ investments in derivatives may represent an economic hedge; however, they are considered to be non-hedge transactions for the purpose of these disclosures.
Volume of derivative activity, as a percentage of net assets, for Disciplined Equity Fund and Mid Cap Growth Fund, based on the month-end market values of equity securities underlying purchased and written options, at absolute value, was as follows for the year ended September 30, 2010:
| | | | |
Disciplined Equity Fund* | | Call Options
Written | |
Average Market Value of Underlying Securities | | | 15.98% | |
Highest Market Value of Underlying Securities | | | 27.86% | |
Lowest Market Value of Underlying Securities | | | 9.99% | |
Market Value of Underlying Securities as of September 30, 2010 | | | 15.46% | |
| | | | | | | | | | | | |
Mid Cap Growth Fund* | | Call Options
Written | | | Put Options Written | | | Put Options Purchased | |
Average Market Value of Underlying Securities | | | 1.27% | | | | 3.02% | | | | 3.22% | |
Highest Market Value of Underlying Securities | | | 8.49% | | | | 10.68% | | | | 12.00% | |
Lowest Market Value of Underlying Securities | | | 0.00% | | | | 0.00% | | | | 0.00% | |
Market Value of Underlying Securities as of September 30, 2010 | | | 2.47% | | | | 10.68% | | | | 10.68% | |
* Market value of underlying securities is determined by multiplying option shares by the price of the option’s underlying security.
Volume of derivative activity, as a percentage of net assets, for Global Markets Fund, based on month-end notional amounts outstanding during the period, at absolute value, was as follows for the year ended September 30, 2010:
| | | | |
Global Markets Fund | | Forwards | |
Average Notional Amount Outstanding | | | 0.76% | |
Highest Notional Amount Outstanding | | | 1.68% | |
Lowest Notional Amount Outstanding | | | 0.25% | |
Notional Amount Outstanding as of September 30, 2010 | | | 0.84% | |
Market value of underlying securities and notional amounts outstanding at the end of the prior period are included in the averages above.
The following is a summary of Disciplined Equity Fund’s written option activity:
| | | | | | | | |
| | | Number of Contracts | | | Premiums | |
Outstanding at 9/30/2009 | | | — | | | $ | — | |
Options written | | | 20,142 | | | | 1,553,836 | |
Options terminated in closing purchase transactions | | | (17,820 | ) | | | (1,419,570 | ) |
Options exercised | | | (42 | ) | | | (2,058 | ) |
Options expired | | | (1,124 | ) | | | (44,317 | ) |
| | | | | | | | |
Outstanding at 9/30/2010 | | | 1,156 | | | $ | 87,891 | |
| | | | | | | | |
| 58
Notes to Financial Statements (continued)
September 30, 2010
The following is a summary of Mid Cap Growth Fund’s written option activity:
| | | | | | | | |
| | | Number of Contracts | | | Premiums | |
Outstanding at 9/30/2009 | | | — | | | $ | — | |
Options written | | | 6,325 | | | | 1,662,549 | |
Options terminated in closing purchase transactions | | | (5,199 | ) | | | (1,326,726 | ) |
Options expired | | | — | | | | — | |
| | | | | | | | |
Outstanding at 9/30/2010 | | | 1,126 | | | $ | 335,823 | |
| | | | | | | | |
5. Purchases and Sales of Securities. For the year ended September 30, 2010, purchases and sales of securities (excluding short-term investments and U.S. Government/agency securities and including paydowns) were as follows:
| | | | | | | | |
Fund | | Purchases | | | Sales | |
Disciplined Equity Fund | | $ | 80,499,371 | | | $ | 77,061,337 | |
Global Markets Fund | | | 270,931,446 | | | | 256,597,694 | |
Growth Fund | | | 168,224,429 | | | | 194,748,475 | |
Mid Cap Growth Fund | | | 150,095,906 | | | | 149,954,603 | |
Value Fund | | | 716,339,416 | | | | 437,388,693 | |
For the year ended September 30, 2010, purchases and sales of U.S. Government/agency securities by the Global Markets Fund were $4,415,265 and $3,732,368, respectively.
6. Management Fees and Other Transactions with Affiliates.
a. Management Fees. Loomis, Sayles & Company, L.P. (“Loomis Sayles”) serves as investment adviser to each Fund. Separate management agreements for each Fund in effect for the year ended September 30, 2010, provided for fees at the following annual percentage rates of each Fund’s average daily net assets:
| | | | |
Fund | | Percentage of
Average
Daily Net Assets | |
Disciplined Equity Fund | | | 0.50% | |
Global Markets Fund | | | 0.75% | |
Growth Fund | | | 0.50% | |
Mid Cap Growth Fund | | | 0.75% | |
Value Fund | | | 0.50% | |
Loomis Sayles has given binding undertakings to the Funds to waive management fees and/or reimburse certain expenses to limit the Funds’ operating expenses, exclusive of acquired fund fees and expenses, brokerage expenses, interest expense, taxes and extraordinary expenses. These undertakings are in effect until January 31, 2011 and will be reevaluated on an annual basis. Management fees payable, as reflected on the Statements of Assets and Liabilities, is net of waivers and/or expense reimbursements, if any, pursuant to these undertakings.
For the period from February 1, 2010 to September 30, 2010, the expense limits as a percentage of average daily net assets under the expense limitation agreements were as follows:
| | | | | | | | | | | | | | | | | | | | |
| | | Expense Limit as a Percentage of
Average Daily Net Assets | |
Fund | | Class A | | | Class B | | | Class C | | | Class Y | | | Admin Class | |
Disciplined Equity Fund | | | 1.25% | | | | 2.00% | | | | 2.00% | | | | 1.00% | | | | N/A | |
Global Markets Fund | | | 1.25% | | | | N/A | | | | 2.00% | | | | 1.00% | | | | N/A | |
Growth Fund | | | 1.25% | | | | 2.00% | | | | 2.00% | | | | 1.00% | | | | N/A | |
Mid Cap Growth Fund | | | 1.25% | | | | N/A | | | | 2.00% | | | | 1.00% | | | | N/A | |
Value Fund | | | 1.10% | | | | 1.85% | | | | 1.85% | | | | 0.85% | | | | 1.35% | |
59 |
Notes to Financial Statements (continued)
September 30, 2010
Prior to February 1, 2010, the expense limits as a percentage of average daily net assets were as follows:
| | | | | | | | | | | | | | | | |
| | | Expense Limit as a Percentage of
Average Daily Net Assets | |
Fund | | Class A | | | Class B | | | Class C | | | Class Y | |
Disciplined Equity Fund | | | 1.25% | | | | 2.00% | | | | 2.00% | | | | 0.85% | |
Global Markets Fund | | | 1.25% | | | | N/A | | | | 2.00% | | | | 1.00% | |
Growth Fund | | | 1.25% | | | | 2.00% | | | | 2.00% | | | | 0.85% | |
Mid Cap Growth Fund | | | 1.25% | | | | N/A | | | | 2.00% | | | | 1.00% | |
Value Fund | | | 1.10% | | | | 1.85% | | | | 1.85% | | | | 0.85% | |
For the period from October 1, 2009 to January 31, 2010, Loomis Sayles voluntarily agreed to further limit the operating expenses for Classes A, B and C of the Disciplined Equity Fund and the Growth Fund as follows:
| | | | | | | | | | | | |
| | | Expense Limit as a Percentage of
Average Daily Net Assets | |
Fund | | Class A | | | Class B | | | Class C | |
Disciplined Equity Fund | | | 1.10% | | | | 1.85% | | | | 1.85% | |
Growth Fund | | | 1.10% | | | | 1.85% | | | | 1.85% | |
Loomis Sayles shall be permitted to recover expenses it has borne under the expense limitation agreements (whether through waiver of its management fees or otherwise) on a class by class basis in later periods to the extent the expenses of a class fall below a class’ expense limits, provided, however, that a class is not obligated to pay such waived/reimbursed fees or expenses more than one year after the end of the fiscal year in which the fees or expenses were waived/reimbursed. Fees waived and/or expenses reimbursed pursuant to the voluntary agreement cannot be recovered by Loomis Sayles in later periods.
For the year ended September 30, 2010, the management fees and waivers of management fees for each Fund were as follows:
| | | | | | | | | | | | | | | | | | | | | | | | |
Fund | | Gross
Management
Fees | | | Contractual
Waivers of
Management
Fees1 | | | Voluntary
Waivers of
Management
Fees | | | Net
Management
Fees | | | Percentage of
Average
Daily Net Assets | |
| | | | | | Gross | | | Net | |
Disciplined Equity Fund | | $ | 162,088 | | | $ | 79,648 | | | $ | 1,736 | | | $ | 80,704 | | | | 0.50% | | | | 0.25% | |
Global Markets Fund | | | 2,054,950 | | | | 98,043 | | | | — | | | | 1,956,907 | | | | 0.75% | | | | 0.71% | |
Growth Fund | | | 527,810 | | | | 7,904 | | | | 7,297 | | | | 512,609 | | | | 0.50% | | | | 0.49% | |
Mid Cap Growth Fund | | | 603,640 | | | | 169,158 | | | | — | | | | 434,482 | | | | 0.75% | | | | 0.54% | |
Value Fund | | | 4,320,687 | | | | — | | | | — | | | | 4,320,687 | | | | 0.50% | | | | 0.50% | |
| 1 | Management fee waivers, with the exception of those for Growth Fund, are subject to possible recovery until September 30, 2011. |
No expenses were recovered during the year ended September 30, 2010 under the terms of the expense limitation agreement.
Certain officers and employees of Loomis Sayles are also officers or Trustees of the Trust. Loomis Sayles’ general partner is indirectly owned by Natixis Global Asset Management, L.P. (“Natixis US”), which is part of Natixis Global Asset Management, an international asset management group based in Paris, France.
b. Service and Distribution Fees. Natixis Distributors, L.P. (“Natixis Distributors”), a wholly-owned subsidiary of Natixis US, has entered into a distribution agreement with the Trust. Pursuant to this agreement, Natixis Distributors serves as principal underwriter of the Funds of the Trust.
Pursuant to Rule 12b-1 under the 1940 Act, the Trust has adopted a Service Plan relating to the Fund’s Class A shares (the “Class A Plans”), a Distribution and Service Plan relating to each Fund’s Class B (if applicable) and Class C shares (the “Class B and Class C Plans”), and Value Fund has adopted a Distribution Plan relating to its Admin Class shares (the “Admin Class Plan”).
Under the Class A Plans, each Fund pays Natixis Distributors a monthly service fee at an annual rate not to exceed 0.25% of the average daily net assets attributable to the Fund’s Class A shares, as reimbursement for expenses incurred by Natixis Distributors in providing personal services to investors in Class A shares and/or the maintenance of shareholder accounts.
| 60
Notes to Financial Statements (continued)
September 30, 2010
Under the Class B (if applicable) and Class C Plans, each Fund pays Natixis Distributors a monthly service fee at an annual rate not to exceed 0.25% of the average daily net assets attributable to the Fund’s Class B (if applicable) and Class C shares, as compensation for services provided by Natixis Distributors in providing personal services to investors in Class B (if applicable) and Class C shares and/or the maintenance of shareholder accounts.
Also under the Class B (if applicable) and Class C Plans, each Fund pays Natixis Distributors a monthly distribution fee at an annual rate of 0.75% of the average daily net assets attributable to the Fund’s Class B (if applicable) and Class C shares, as compensation for services provided by Natixis Distributors in connection with the marketing or sale of Class B (if applicable) and Class C shares.
Under the Admin Class Plan, the Value Fund pays Natixis Distributors a monthly distribution fee at an annual rate not to exceed 0.25% of the average daily net assets attributable to the Fund’s Admin Class shares, as compensation for services provided by Natixis Distributors in connection with the marketing or sale of Admin Class shares or for payments made by Natixis Distributors to securities dealers or other financial intermediaries as commissions, asset-based sales charges or other compensation with respect to the sale of Admin Class shares, or for providing personal services to investors and/or the maintenance of shareholder accounts.
In addition, the Admin Class shares of the Value Fund may pay Natixis Distributors an administrative service fee, at an annual rate not to exceed 0.25% of the average daily net assets attributable to Admin Class shares. These fees are subsequently paid to securities dealers or financial intermediaries for providing personal services and/or account maintenance for their customers who hold such shares.
For the year ended September 30, 2010, the Funds paid the following service and distribution fees:
| | | | | | | | | | | | | | | | | | | | | | | | | | | | |
| | | Service Fees | | | Distribution Fees | |
Fund | | Class A | | | Class B | | | Class C | | | Admin
Class | | | Class B | | | Class C | | | Admin
Class | |
Disciplined Equity Fund | | $ | 4,646 | | | $ | 372 | | | $ | 3,465 | | | $ | — | | | $ | 1,118 | | | $ | 10,394 | | | $ | — | |
Global Markets Fund | | | 127,900 | | | | — | | | | 255,040 | | | | — | | | | — | | | | 765,120 | | | | — | |
Growth Fund | | | 80,460 | | | | 11,911 | | | | 35,045 | | | | — | | | | 35,734 | | | | 105,137 | | | | — | |
Mid Cap Growth Fund | | | 125,627 | | | | — | | | | 38 | | | | — | | | | — | | | | 115 | | | | — | |
Value Fund | | | 323,829 | | | | 10,774 | | | | 26,004 | | | | 1 | | | | 32,323 | | | | 78,011 | | | | 2 | |
c. Administrative Fees. Natixis Asset Management Advisors, L.P. (“Natixis Advisors”) provides certain administrative services for the Funds and contracts with State Street Bank to serve as sub-administrator. Natixis Advisors is a wholly-owned subsidiary of Natixis US. Pursuant to an agreement among Natixis Funds Trust I, Natixis Funds Trust II, Natixis Funds Trust IV, Natixis Cash Management Trust, Gateway Trust (“Natixis Funds Trusts”), Loomis Sayles Funds I, Loomis Sayles Funds II (“Loomis Sayles Funds Trusts”), Hansberger International Series and Natixis Advisors, each Fund pays Natixis Advisors monthly its pro rata portion of fees equal to an annual rate of 0.0575% of the first $15 billion of the average daily net assets of the Natixis Funds Trusts, Loomis Sayles Funds Trusts and Hansberger International Series, 0.0500% of the next $15 billion, 0.0400% of the next $30 billion and 0.0350% of such assets in excess of $60 billion, subject to an annual aggregate minimum fee for the Natixis Funds Trusts, Loomis Sayles Funds Trusts and Hansberger International Series of $10 million, which is reevaluated on an annual basis. New funds are subject to a fee for the first twelve months of operations of $75,000 plus $12,500 per additional class and an additional $75,000 if managed by multiple subadvisers.
Prior to July 1, 2010, each Fund paid Natixis Advisors monthly its pro rata portion of fees equal to an annual rate of 0.0575% of the first $15 billion of the average daily net assets of the Natixis Funds Trusts, Loomis Sayles Funds Trusts and Hansberger International Series, 0.0500% of the next $15 billion, 0.0425% of the next $30 billion and 0.0375% of such assets in excess of $60 billion, subject to an annual aggregate minimum fee for the Natixis Funds Trusts, Loomis Sayles Funds Trusts and Hansberger International Series of $10 million, which is reevaluated on an annual basis. New funds were subject to a fee for the first twelve months of operations of $75,000 plus $12,500 per additional class and an additional $75,000 if managed by multiple subadvisers.
For the year ended September 30, 2010, each Fund paid the following administrative fees to Natixis Advisors:
| | | | |
Fund | | Administrative
Fees | |
Disciplined Equity Fund | | $ | 15,571 | |
Global Markets Fund | | | 131,564 | |
Growth Fund | | | 50,741 | |
Mid Cap Growth Fund | | | 38,649 | |
Value Fund | | | 414,996 | |
61 |
Notes to Financial Statements (continued)
September 30, 2010
d. Sub-Transfer Agent Fees. Natixis Distributors has entered into agreements with financial intermediaries to provide certain recordkeeping, processing, shareholder communications and other services to customers of the intermediaries and has agreed to compensate the intermediaries for providing those services. Certain services would be provided by the Funds if the shares of those customers were registered directly with the Funds’ transfer agent. Accordingly, the Funds agreed to pay a portion of the intermediary fees attributable to shares of the Fund held by the intermediaries (which generally is a percentage of the value of shares held) not exceeding what the Funds would have paid its transfer agent had each customer’s shares been registered directly with the transfer agent instead of held through the intermediaries. Natixis Distributors pays the remainder of the fees.
For the year ended September 30, 2010, the Funds paid the following sub-transfer agent fees, which are reflected in transfer agent fees and expenses in the Statements of Operations.
| | | | |
Fund | | Sub-Transfer
Agent Fees | |
Disciplined Equity Fund | | $ | 20,124 | |
Global Markets Fund | | | 194,048 | |
Growth Fund | | | 73,845 | |
Mid Cap Growth Fund | | | 107,813 | |
Value Fund | | | 768,106 | |
e. Commissions. Commissions (including CDSCs) on Fund shares retained by Natixis Distributors during the year ended September 30, 2010, were as follows:
| | | | |
Fund | | Commissions | |
Disciplined Equity Fund | | $ | 4,644 | |
Global Markets Fund | | | 224,935 | |
Growth Fund | | | 36,363 | |
Mid Cap Growth Fund | | | 8,045 | |
Value Fund | | | 47,956 | |
f. Trustees Fees and Expenses. The Trust does not pay any compensation directly to its officers or Trustees who are directors, officers or employees of Natixis Advisors, Natixis Distributors, Natixis US, or their affiliates. Effective January 1, 2010, the Chairperson of the Board receives a retainer fee at the annual rate of $250,000. The Chairperson does not receive any meeting attendance fees for Board of Trustees meetings or committee meetings that she attends. Each Independent Trustee (other than the Chairperson) receives, in the aggregate, a retainer fee at the annual rate of $80,000. Each Independent Trustee also receives a meeting attendance fee of $10,000 for each meeting of the Board of Trustees that he or she attends in person and $5,000 for each meeting of the Board of Trustees that he or she attends telephonically. In addition, each committee chairman receives an additional retainer fee at the annual rate of $15,000. Each Contract Review and Governance Committee member is compensated $6,000 for each Committee meeting that he or she attends in person and $3,000 for each meeting that he or she attends telephonically. Each Audit Committee member is compensated $7,500 for each Committee meeting that he or she attends in person and $3,750 for each meeting that he or she attends telephonically. Each member of the ad hoc Committee on Alternative Investments received a one-time fee of $10,000. The ad hoc Committee on Alternative Investments is not a standing committee. These fees are allocated among the funds in the Natixis Funds Trusts, Loomis Sayles Funds Trusts and the Hansberger International Series based on a formula that takes into account, among other factors, the relative net assets of each fund. Trustees are reimbursed for travel expenses in connection with attendance at meetings.
Prior to January 1, 2010, the Chairperson of the Board received a retainer fee at the annual rate of $200,000. The Chairperson did not receive any meeting attendance fees for Board of Trustees meetings or committee meetings that she attended. Each Independent Trustee (other than the Chairperson) received, in the aggregate, a retainer fee at the annual rate of $65,000. Each Independent Trustee also received a meeting attendance fee of $7,500 for each meeting of the Board of Trustees that he or she attended in person and $3,750 for each meeting of the Board of Trustees that he or she attended telephonically. In addition, each committee chairman received an additional retainer fee at an annual rate of $10,000. Each Contract Review and Governance Committee member was compensated $5,000 for each Committee meeting that he or she attended in person and $2,500 for each meeting that he or she attended telephonically. Each Audit Committee member was compensated $6,250 for each Committee meeting that he or she attended in person and $3,125 for each meeting that he or she attended telephonically.
A deferred compensation plan (the “Plan”) is available to the Trustees on a voluntary basis. Deferred amounts remain in the Funds until distributed in accordance with the provisions of the Plan. The value of a participating Trustee’s deferral account is based on theoretical
| 62
Notes to Financial Statements (continued)
September 30, 2010
investments of deferred amounts, on the normal payment dates, in certain funds of the Natixis Funds Trusts, Loomis Sayles Funds Trusts and Hansberger International Series as designated by the participating Trustees. Changes in the value of participants’ deferral accounts are allocated pro rata among the funds in the Natixis Funds Trusts, Loomis Sayles Funds Trusts, and Hansberger International Series, and are normally reflected as Trustees’ fees and expenses in the Statements of Operations. The portions of the accrued obligations allocated to the Funds under the Plan are reflected as Deferred Trustees’ fees on the Statements of Assets and Liabilities.
g. Payments by Affiliates. For the year ended September 30, 2010, Loomis Sayles reimbursed the Global Markets Fund and the Mid Cap Growth Fund $27,686 and $14,400, respectively, for losses incurred in connection with trading errors.
7. Line of Credit. Each Fund, together with certain other funds of Natixis Funds Trusts, Loomis Sayles Funds Trusts and Hansberger International Series, participates in a $200,000,000 committed unsecured line of credit provided by State Street Bank, with an individual limit of $125,000,000 for each fund that participates in the line of credit. Interest is charged to each participating fund based on its borrowings at a rate per annum equal to the greater of the Federal Funds rate or overnight LIBOR, plus 1.25%. In addition, a commitment fee of 0.15% per annum, payable at the end of each calendar quarter, is accrued and apportioned among the participating funds based on their average daily unused portion of the line of credit.
Prior to March 10, 2010, each Fund, together with certain other funds of Natixis Funds Trusts, Loomis Sayles Funds Trusts and Hansberger International Series, participated in a $200,000,000 committed unsecured line of credit provided by State Street Bank, with an individual limit of $125,000,000 for each fund that participated in the line of credit. Interest was charged to each participating fund based on its borrowings at a rate per annum equal to the greater of the Federal Funds rate or overnight LIBOR, plus 0.75%. In addition, a commitment fee of 0.125% per annum, payable at the end of each calendar quarter, was accrued and apportioned among the participating funds based on their average daily unused portion of the line of credit.
For the year ended September 30, 2010, none of the Funds had borrowings under these agreements.
8. Brokerage Commission Recapture. Each Fund has entered into agreements with certain brokers whereby the brokers will rebate a portion of brokerage commissions. All amounts rebated by the brokers are returned to the Funds under such agreements and are included in realized gains on the Statements of Operations. For the year ended September 30, 2010, amounts rebated under these agreements were as follows:
| | | | |
Fund | | Rebates | |
Disciplined Equity Fund | | $ | 13,274 | |
Global Markets Fund | | | 38,306 | |
Growth Fund | | | 31,710 | |
Mid Cap Growth Fund | | | 24,842 | |
Value Fund | | | 134,497 | |
9. Concentration of Risk. Each Fund’s investments in foreign securities are subject to foreign currency fluctuations, higher volatility than U.S. securities, varying degrees of regulation and limited liquidity. Greater political, economic, credit and information risks are also associated with foreign securities.
10. Concentration of Ownership. At September 30, 2010, Loomis Sayles Funded Pension Plan and Loomis Sayles Employees’ Profit Sharing Retirement Plan held shares of beneficial interest in the Funds as follows:
| | | | | | | | |
Fund | | Pension Plan | | | Profit Sharing
Retirement Plan | |
Disciplined Equity Fund | | | 1,049,783 | | | | 812,944 | |
Global Markets Fund | | | 968,050 | | | | 560,808 | |
Growth Fund | | | 1,250,210 | | | | 1,704,832 | |
Mid Cap Growth Fund | | | 298,360 | | | | 342,473 | |
Value Fund | | | 480,683 | | | | 679,644 | |
63 |
Notes to Financial Statements (continued)
September 30, 2010
From time to time, the Funds may have a concentration of several shareholders having a significant percentage of shares outstanding. Investment activities of these shareholders could have material impacts on the Funds. As of September 30, 2010, certain Funds had shareholders that held greater than 5% of the fund’s outstanding shares. Such ownership may be beneficially held by multiple individuals or entities other than the owner of record. The number of greater than 5% shareholders and the aggregate percentage of net assets represented by such ownership was as follows:
| | | | | | | | |
Fund | | Number of Greater
Than 5% Shareholders | | | Percentage of
Ownership | |
Disciplined Equity Fund | | | 1 | | | | 18.53% | |
Global Markets Fund | | | 1 | | | | 9.16% | |
Growth Fund | | | 1 | | | | 7.11% | |
Value Fund | | | 1 | | | | 5.57% | |
11. Capital Shares. Each Fund may issue an unlimited number of shares of beneficial interest, without par value. Transactions in capital shares were as follows:
| | | | | | | | | | | | | | | | |
| |
| Year Ended
September 30, 2010 |
| |
| Year Ended
September 30, 2009 |
|
Disciplined Equity Fund | | | Shares | | | | Amount | | | | Shares | | | | Amount | |
| | | | | | | | | | | | | | | | |
| Class A | | | | | | | | | | | | | | | | |
Issued from the sale of shares | | | 128,879 | | | $ | 877,104 | | | | 503,388 | | | $ | 2,877,536 | |
Issued in connection with the reinvestment of distributions | | | 878 | | | | 5,881 | | | | 2,476 | | | | 13,914 | |
Redeemed | | | (77,642 | ) | | | (516,404 | ) | | | (366,248 | ) | | | (1,808,856 | ) |
| | | | | | | | | | | | | | | | |
Net change | | | 52,115 | | | $ | 366,581 | | | | 139,616 | | | $ | 1,082,594 | |
| | | | | | | | | | | | | | | | |
| Class B | | | | | | | | | | | | | | | | |
Issued from the sale of shares | | | 307 | | | $ | 2,003 | | | | 12,584 | | | $ | 70,815 | |
Issued in connection with the reinvestment of distributions | | | — | | | | — | | | | — | | | | — | |
Redeemed | | | (5,901 | ) | | | (38,901 | ) | | | (19,550 | ) | | | (106,750 | ) |
| | | | | | | | | | | | | | | | |
Net change | | | (5,594 | ) | | $ | (36,898 | ) | | | (6,966 | ) | | $ | (35,935 | ) |
| | | | | | | | | | | | | | | | |
| Class C | | | | | | | | | | | | | | | | |
Issued from the sale of shares | | | 45,207 | | | $ | 298,621 | | | | 392,349 | | | $ | 2,090,452 | |
Issued in connection with the reinvestment of distributions | | | — | | | | — | | | | 300 | | | | 1,642 | |
Redeemed | | | (86,665 | ) | | | (557,736 | ) | | | (301,104 | ) | | | (1,542,203 | ) |
| | | | | | | | | | | | | | | | |
Net change | | | (41,458 | ) | | $ | (259,115 | ) | | | 91,545 | | | $ | 549,891 | |
| | | | | | | | | | | | | | | | |
| Class Y | | | | | | | | | | | | | | | | |
Issued from the sale of shares | | | 904,469 | | | $ | 6,207,958 | | | | 1,188,390 | | | $ | 6,823,853 | |
Issued in connection with the reinvestment of distributions | | | 25,763 | | | | 173,638 | | | | 34,089 | | | | 192,942 | |
Redeemed | | | (516,729 | ) | | | (3,511,230 | ) | | | (488,997 | ) | | | (2,719,886 | ) |
| | | | | | | | | | | | | | | | |
Net change | | | 413,503 | | | $ | 2,870,366 | | | | 733,482 | | | $ | 4,296,909 | |
| | | | | | | | | | | | | | | | |
Increase (decrease) from capital share transactions | | | 418,566 | | | $ | 2,940,934 | | | | 957,677 | | | $ | 5,893,459 | |
| | | | | | | | | | | | | | | | |
| 64
Notes to Financial Statements (continued)
September 30, 2010
| | | | | | | | | | | | | | | | |
| |
| Year Ended
September 30, 2010 |
| |
| Year Ended
September 30, 2009 |
|
Global Markets Fund | | | Shares | | | | Amount | | | | Shares | | | | Amount | |
| | | | | | | | | | | | | | | | |
| Class A | | | | | | | | | | | | | | | | |
Issued from the sale of shares | | | 2,185,512 | | | $ | 29,116,463 | | | | 1,705,833 | | | $ | 19,017,067 | |
Issued in connection with the reinvestment of distributions | | | 73,498 | | | | 923,132 | | | | 101,851 | | | | 922,775 | |
Redeemed | | | (1,460,708 | ) | | | (18,916,251 | ) | | | (4,038,918 | ) | | | (39,038,267 | ) |
| | | | | | | | | | | | | | | | |
Net change | | | 798,302 | | | $ | 11,123,344 | | | | (2,231,234 | ) | | $ | (19,098,425 | ) |
| | | | | | | | | | | | | | | | |
| Class C | | | | | | | | | | | | | | | | |
Issued from the sale of shares | | | 1,778,019 | | | $ | 23,110,162 | | | | 1,738,010 | | | $ | 17,537,139 | |
Issued in connection with the reinvestment of distributions | | | 53,353 | | | | 667,977 | | | | 53,943 | | | | 487,650 | |
Redeemed | | | (2,091,087 | ) | | | (27,231,329 | ) | | | (4,818,214 | ) | | | (46,175,227 | ) |
| | | | | | | | | | | | | | | | |
Net change | | | (259,715 | ) | | $ | (3,453,190 | ) | | | (3,026,261 | ) | | $ | (28,150,438 | ) |
| | | | | | | | | | | | | | | | |
| Class Y | | | | | | | | | | | | | | | | |
Issued from the sale of shares | | | 3,286,223 | | | $ | 43,183,799 | | | | 2,798,814 | | | $ | 29,261,743 | |
Issued in connection with the reinvestment of distributions | | | 145,986 | | | | 1,836,503 | | | | 162,878 | | | | 1,477,305 | |
Redeemed | | | (2,307,485 | ) | | | (29,912,166 | ) | | | (4,571,286 | ) | | | (44,364,544 | ) |
| | | | | | | | | | | | | | | | |
Net change | | | 1,124,724 | | | $ | 15,108,136 | | | | (1,609,594 | ) | | $ | (13,625,496 | ) |
| | | | | | | | | | | | | | | | |
Increase (decrease) from capital share transactions | | | 1,663,311 | | | $ | 22,778,290 | | | | (6,867,089 | ) | | $ | (60,874,359 | ) |
| | | | | | | | | | | | | | | | |
| | | | | | | | | | | | | | | | |
| |
| Year Ended
September 30, 2010 |
| |
| Year Ended
September 30, 2009 |
|
Growth Fund | | | Shares | | | | Amount | | | | Shares | | | | Amount | |
| | | | | | | | | | | | | | | | |
| Class A | | | | | | | | | | | | | | | | |
Issued from the sale of shares | | | 843,820 | | | $ | 4,085,570 | | | | 3,453,752 | | | $ | 13,194,701 | |
Issued in connection with the reinvestment of distributions | | | — | | | | — | | | | — | | | | — | |
Redeemed | | | (2,435,871 | ) | | | (11,723,591 | ) | | | (27,441,954 | ) | | | (101,923,299 | ) |
| | | | | | | | | | | | | | | | |
Net change | | | (1,592,051 | ) | | $ | (7,638,021 | ) | | | (23,988,202 | ) | | $ | (88,728,598 | ) |
| | | | | | | | | | | | | | | | |
| Class B | | | | | | | | | | | | | | | | |
Issued from the sale of shares | | | 26,879 | | | $ | 126,650 | | | | 41,478 | | | $ | 155,665 | |
Issued in connection with the reinvestment of distributions | | | — | | | | — | | | | — | | | | — | |
Redeemed | | | (449,262 | ) | | | (2,069,094 | ) | | | (768,098 | ) | | | (2,804,977 | ) |
| | | | | | | | | | | | | | | | |
Net change | | | (422,383 | ) | | $ | (1,942,444 | ) | | | (726,620 | ) | | $ | (2,649,312 | ) |
| | | | | | | | | | | | | | | | |
| Class C | | | | | | | | | | | | | | | | |
Issued from the sale of shares | | | 131,088 | | | $ | 596,834 | | | | 669,485 | | | $ | 2,490,747 | |
Issued in connection with the reinvestment of distributions | | | — | | | | — | | | | — | | | | — | |
Redeemed | | | (1,381,682 | ) | | | (6,253,716 | ) | | | (2,624,342 | ) | | | (9,647,623 | ) |
| | | | | | | | | | | | | | | | |
Net change | | | (1,250,594 | ) | | $ | (5,656,882 | ) | | | (1,954,857 | ) | | $ | (7,156,876 | ) |
| | | | | | | | | | | | | | | | |
| Class Y | | | | | | | | | | | | | | | | |
Issued from the sale of shares | | | 1,951,737 | | | $ | 9,949,238 | | | | 2,676,025 | | | $ | 11,399,448 | |
Issued in connection with the reinvestment of distributions | | | — | | | | — | | | | — | | | | — | |
Redeemed | | | (4,207,016 | ) | | | (21,249,147 | ) | | | (4,993,469 | ) | | | (21,416,325 | ) |
| | | | | | | | | | | | | | | | |
Net change | | | (2,255,279 | ) | | $ | (11,299,909 | ) | | | (2,317,444 | ) | | $ | (10,016,877 | ) |
| | | | | | | | | | | | | | | | |
Increase (decrease) from capital share transactions | | | (5,520,307 | ) | | $ | (26,537,256 | ) | | | (28,987,123 | ) | | $ | (108,551,663 | ) |
| | | | | | | | | | | | | | | | |
65 |
Notes to Financial Statements (continued)
September 30, 2010
| | | | | | | | | | | | | | | | |
| |
| Year Ended
September 30, 2010 |
| |
| Year Ended
September 30, 2009* |
|
Mid Cap Growth Fund | | | Shares | | | | Amount | | | | Shares | | | | Amount | |
| | | | | | | | | | | | | | | | |
| Class A** | | | | | | | | | | | | | | | | |
Issued from the sale of shares | | | 1,543,225 | | | $ | 34,666,538 | | | | 5,551,566 | | | $ | 85,146,527 | |
Issued in connection with the reinvestment of distributions | | | — | | | | — | | | | — | | | | — | |
Redeemed | | | (1,700,694 | ) | | | (35,573,122 | ) | | | (8,253,762 | ) | | | (130,696,008 | ) |
| | | | | | | | | | | | | | | | |
Net change | | | (157,469 | ) | | $ | (906,584 | ) | | | (2,702,196 | ) | | $ | (45,549,481 | ) |
| | | | | | | | | | | | | | | | |
| Class C | | | | | | | | | | | | | | | | |
Issued from the sale of shares | | | 2,038 | | | $ | 43,089 | | | | 66 | | | $ | 1,000 | |
Issued in connection with the reinvestment of distributions | | | — | | | | — | | | | — | | | | — | |
Redeemed | | | (650 | ) | | | (13,453 | ) | | | — | | | | — | |
| | | | | | | | | | | | | | | | |
Net change | | | 1,388 | | | $ | 29,636 | | | | 66 | | | $ | 1,000 | |
| | | | | | | | | | | | | | | | |
| Class Y** | | | | | | | | | | | | | | | | |
Issued from the sale of shares | | | 303,029 | | | $ | 6,515,222 | | | | 2,017,424 | | | $ | 31,974,020 | |
Issued in connection with the reinvestment of distributions | | | — | | | | — | | | | — | | | | — | |
Redeemed | | | (363,286 | ) | | | (7,649,693 | ) | | | (1,769,294 | ) | | | (28,085,399 | ) |
| | | | | | | | | | | | | | | | |
Net change | | | (60,257 | ) | | $ | (1,134,471 | ) | | | 248,130 | | | $ | 3,888,621 | |
| | | | | | | | | | | | | | | | |
Increase (decrease) from capital share transactions | | | (216,338 | ) | | $ | (2,011,419 | ) | | | (2,454,000 | ) | | $ | (41,659,860 | ) |
| | | | | | | | | | | | | | | | |
* From commencement of operations on February 2, 2009 through September 30, 2009 for Class C shares.
** Prior to the close of business on February 2, 2009 the Fund offered Retail and Institutional Class shares, which were redesignated as Class A and Class Y shares, respectively, on that date.
| | | | | | | | | | | | | | | | |
| |
| Year Ended
September 30, 2010 |
| |
| Year Ended
September 30, 2009 |
|
Value Fund | | | Shares | | | | Amount | | | | Shares | | | | Amount | |
| | | | | | | | | | | | | | | | |
| Class A | | | | | | | | | | | | | | | | |
Issued from the sale of shares | | | 2,979,169 | | | $ | 49,942,924 | | | | 3,255,896 | | | $ | 44,814,805 | |
Issued in connection with the reinvestment of distributions | | | 60,746 | | | | 1,001,699 | | | | 94,079 | | | | 1,308,638 | |
Redeemed | | | (2,599,420 | ) | | | (43,052,197 | ) | | | (2,248,215 | ) | | | (30,522,329 | ) |
| | | | | | | | | | | | | | | | |
Net change | | | 440,495 | | | $ | 7,892,426 | | | | 1,101,760 | | | $ | 15,601,114 | |
| | | | | | | | | | | | | | | | |
| Class B | | | | | | | | | | | | | | | | |
Issued from the sale of shares | | | 19,365 | | | $ | 325,859 | | | | 22,368 | | | $ | 308,302 | |
Issued in connection with the reinvestment of distributions | | | — | | | | — | | | | 888 | | | | 12,403 | |
Redeemed | | | (137,739 | ) | | | (2,333,285 | ) | | | (179,186 | ) | | | (2,417,234 | ) |
| | | | | | | | | | | | | | | | |
Net change | | | (118,374 | ) | | $ | (2,007,426 | ) | | | (155,930 | ) | | $ | (2,096,529 | ) |
| | | | | | | | | | | | | | | | |
| Class C | | | | | | | | | | | | | | | | |
Issued from the sale of shares | | | 202,556 | | | $ | 3,401,414 | | | | 382,900 | | | $ | 5,369,989 | |
Issued in connection with the reinvestment of distributions | | | 939 | | | | 15,401 | | | | 3,005 | | | | 41,620 | |
Redeemed | | | (202,655 | ) | | | (3,347,711 | ) | | | (134,455 | ) | | | (1,783,797 | ) |
| | | | | | | | | | | | | | | | |
Net change | | | 840 | | | $ | 69,104 | | | | 251,450 | | | $ | 3,627,812 | |
| | | | | | | | | | | | | | | | |
| Class Y | | | | | | | | | | | | | | | | |
Issued from the sale of shares | | | 24,167,438 | | | $ | 406,626,788 | | | | 26,551,540 | | | $ | 378,808,598 | |
Issued in connection with the reinvestment of distributions | | | 379,395 | | | | 6,260,027 | | | | 306,125 | | | | 4,258,197 | |
Redeemed | | | (12,514,723 | ) | | | (207,737,479 | ) | | | (8,813,838 | ) | | | (119,971,291 | ) |
| | | | | | | | | | | | | | | | |
Net change | | | 12,032,110 | | | $ | 205,149,336 | | | | 18,043,827 | | | $ | 263,095,504 | |
| | | | | | | | | | | | | | | | |
| Admin Class* | | | | | | | | | | | | | | | | |
Issued from the sale of shares | | | 60 | | | $ | 1,002 | | | | — | | | $ | — | |
Issued in connection with the reinvestment of distributions | | | — | | | | — | | | | — | | | | — | |
Redeemed | | | — | | | | — | | | | — | | | | — | |
| | | | | | | | | | | | | | | | |
Net change | | | 60 | | | $ | 1,002 | | | | — | | | $ | — | |
| | | | | | | | | | | | | | | | |
Increase (decrease) from capital share transactions | | | 12,355,131 | | | $ | 211,104,442 | | | | 19,241,107 | | | $ | 280,227,901 | |
| | | | | | | | | | | | | | | | |
* From commencement of Class operations on February 1, 2010 through September 30, 2010.
| 66
Report of Independent Registered Public Accounting Firm
To the Trustees of Loomis Sayles Funds II and Shareholders of Loomis Sayles Disciplined Equity Fund, Loomis Sayles Global Markets Fund, Loomis Sayles Growth Fund, Loomis Sayles Mid Cap Growth Fund and Loomis Sayles Value Fund:
In our opinion, the accompanying statements of assets and liabilities, including the portfolios of investments, and the related statements of operations and of changes in net assets and the financial highlights present fairly, in all material respects, the financial position of the Loomis Sayles Disciplined Equity Fund, Loomis Sayles Global Markets Fund, Loomis Sayles Growth Fund, Loomis Sayles Mid Cap Growth Fund and Loomis Sayles Value Fund, each a series of Loomis Sayles Funds II (collectively, the “Funds”), at September 30, 2010, and the results of each of their operations, the changes in each of their net assets and the financial highlights for each of the periods indicated, in conformity with accounting principles generally accepted in the United States of America. These financial statements and financial highlights (hereafter referred to as “financial statements”) are the responsibility of the Funds’ management; our responsibility is to express an opinion on these financial statements based on our audits. We conducted our audits of these financial statements in accordance with the standards of the Public Company Accounting Oversight Board (United States). Those standards require that we plan and perform the audits to obtain reasonable assurance about whether the financial statements are free of material misstatement. An audit includes examining, on a test basis, evidence supporting the amounts and disclosures in the financial statements, assessing the accounting principles used and significant estimates made by management, and evaluating the overall financial statement presentation. We believe that our audits, which included confirmation of securities at September 30, 2010 by correspondence with the custodian and brokers, provide a reasonable basis for our opinion.
PricewaterhouseCoopers LLP
Boston, Massachusetts
November 22, 2010
67 |
Special Meeting of Shareholders (Unaudited)
A special meeting of shareholders of the Trust was held on May 27, 2010 to consider a proposal to elect four Trustees to the Board of Trustees. The proposal was approved by shareholders of the Trust. The results of the shareholder vote were as follows:
| | | | | | | | |
Nominee | | Voted “FOR”* | | | Withheld* | |
Kenneth A. Drucker | | | 1,717,408,736 | | | | 24,631,425 | |
Wendell J. Knox | | | 1,717,302,502 | | | | 24,737,659 | |
Erik R. Sirri | | | 1,717,226,576 | | | | 24,813,585 | |
Peter J. Smail | | | 1,717,449,661 | | | | 24,590,500 | |
* Trust-wide voting results.
In addition to the Trustees named above, the following also serve as Trustees of the Trust: Graham T. Allison, Jr., Edward A. Benjamin, Daniel M. Cain, Sandra O. Moose, Cynthia L. Walker, Robert J. Blanding and John T. Hailer.
| 68
2010 U.S. Tax Distribution Information to Shareholders (Unaudited)
Corporate Dividends Received Deduction. For the fiscal year ended September 30, 2010, a percentage of dividends distributed by the Funds listed below qualify for the dividends received deduction for corporate shareholders. These percentages are as follows:
| | | | |
Fund | | Qualifying
Percentage | |
Disciplined Equity | | | 100.00 | % |
Global Markets | | | 11.78 | % |
Value | | | 100.00 | % |
Qualified Dividend Income. For the fiscal year ended September 30, 2010, the Funds below will designate up to the maximum amount allowable pursuant to the Internal Revenue Code as qualified dividend income eligible for reduced tax rates. These lower rates range from 0% to 15% depending on an individual’s tax bracket. If the Funds pay a distribution during calendar year 2010, complete information will be reported in conjunction with Form 1099-DIV.
| | | | |
Fund | | | |
Disciplined Equity | | | | |
Global Markets | | | | |
Value | | | | |
69 |
Trustee and Officer Information
The tables below provide certain information regarding the trustees and officers of Natixis Funds Trust I and Loomis Sayles Funds II (the “Trusts”). Unless otherwise indicated, the address of all persons below is 399 Boylston Street, Boston, MA 02116. The Trusts’ Statements of Additional Information include additional information about the trustees of the Trusts and are available by calling Natixis Funds at 800-225-5478.
| | | | | | | | |
Name and
Year of Birth | | Position(s) Held with the
Trusts, Length of Time
Served and Term of Office* | | Principal Occupation(s) During
Past 5 Years | | Number of
Portfolios in Fund
Complex Overseen** and Other
Directorships Held
During Past 5 Years | | Experience,
Qualifications,
Attributes, Skills
for Board Membership |
| | |
| INDEPENDENT TRUSTEES | | | | |
| | | | |
| Graham T. Allison, Jr. (1940) | | Trustee From 1984 to 1993 and since 1995 for Natixis Funds Trust I (including its predecessors); and since 2003 for Loomis Sayles Funds II Contract Review and Governance Committee Member | | Douglas Dillon Professor and Director of the Belfer Center for Science and International Affairs, John F. Kennedy School of Government, Harvard University | | 42 Director, Taubman Centers, Inc. (real estate investment trust) | | Significant experience on Board of Trustees of the Trusts and/or other business organizations; government experience (including as Assistant Secretary of Defense under President Clinton); academic experience |
| | | | |
Edward A. Benjamin (1938) | | Trustee Since 2003 for Natixis Funds Trust I and since 2002 for Loomis Sayles Funds II Chairman of the Contract Review and Governance Committee | | Retired | | 42 Formerly, Director, Precision Optics Corporation (optics manufacturer) | | Significant experience on Board of Trustees of the Trusts and/or other business organizations; significant experience providing legal counsel to boards, funds, advisers and other financial institutions (former partner at Ropes & Gray LLP) |
| | | | |
Daniel M. Cain (1945) | | Trustee Since 1996 for Natixis Funds Trust I and since 2003 for Loomis Sayles Funds II Chairman of the Audit Committee | | Chairman (formerly, President and Chief Executive Officer) of Cain Brothers & Company, Incorporated (investment banking) | | 42 Director, Sheridan Healthcare Inc. (physician practice management) | | Significant experience on Board of Trustees of the Trusts and/or other business organizations; experience in the financial industry, including roles as chairman and former chief executive officer of an investment banking firm |
| 70
Trustee and Officer Information
| | | | | | | | |
Name and
Year of Birth | | Position(s) Held with the
Trusts, Length of Time
Served and Term of Office* | | Principal Occupation(s) During
Past 5 Years | | Number of
Portfolios in Fund
Complex Overseen** and Other
Directorships Held
During Past 5 Years | | Experience,
Qualifications,
Attributes, Skills
for Board Membership |
| | |
INDEPENDENT TRUSTEES
continued | | | | |
| | | | |
Kenneth A. Drucker (1945) | | Trustee Since 2008 Audit Committee
Member | | Formerly, Vice President and Treasurer, Sequa Corp. (aerospace, automotive and metal manufacturing) | | 42 Formerly, Director, M Fund, Inc. (investment company); Director, Gateway Trust (investment company) | | Significant experience on Board of Trustees of the Trusts and/or other business organizations; executive experience including as treasurer of a corporation |
| | | | |
Wendell J. Knox (1948) | | Trustee Since 2009 Contract Review and Governance Committee Member | | Director (formerly, President and Chief Executive Officer) of Abt Associates Inc. (research and consulting) | | 42 Director, Eastern Bank (commercial bank); Director, The Hanover Insurance Group (property and casualty insurance) | | Significant experience on Board of Trustees of the Trusts and/or other business organizations; executive experience including roles as president and chief executive officer of a consulting company |
| | | | |
Sandra O. Moose (1942) | | Chairperson of the Board of Trustees since November 2005 Trustee since 1982 for Natixis Funds Trust I (including its predecessors) and since 2003 for Loomis Sayles Funds II Ex officio member of the Audit Committee and Contract Review and Governance Committee | | President, Strategic Advisory Services (management consulting); formerly, Senior Vice President and Director, The Boston Consulting Group, Inc. (management consulting) | | 42 Director, Verizon Communications; Director, AES Corporation (international power company); Formerly, Director, Rohm and Haas Company (specialty chemicals) | | Significant experience on Board of Trustees of the Trusts and/or other business organizations; executive experience at a management consulting company |
| | | | |
Erik R. Sirri1 (1958) | | Trustee Since 2009 Contract Review and Governance Committee Member | | Professor of Finance at Babson College; formerly, Director of the Division of Trading and Markets at the Securities and Exchange Commission | | 42 None | | Experience as Director of the Division of Trading and Markets at the Securities and Exchange Commission; academic experience and training as an economist |
71 |
Trustee and Officer Information
| | | | | | | | |
Name and
Year of Birth | | Position(s) Held with the
Trusts, Length of Time
Served and Term of Office* | | Principal Occupation(s) During
Past 5 Years | | Number of
Portfolios in Fund
Complex Overseen** and Other
Directorships Held
During Past 5 Years | | Experience,
Qualifications,
Attributes, Skills
for Board Membership |
| | |
INDEPENDENT TRUSTEES
continued | | | | |
| | | | |
Peter J. Smail1 (1952) | | Trustee Since 2009 Contract Review and Governance Committee Member | | Retired; formerly, President and Chief Executive Officer of Pyramis Global Advisors (investment management) | | 42 None | | Mutual fund industry and executive experience, including roles as president and chief executive officer for an investment adviser |
| | | | |
Cynthia L. Walker (1956) | | Trustee Since 2005 Audit Committee
Member | | Deputy Dean for Finance and Administration, Yale University School of Medicine; formerly, Executive Dean for Administration, Harvard Medical School; and formerly, Dean for Finance and Chief Financial Officer, Harvard Medical School | | 42 None | | Significant experience on Board of Trustees of the Trusts and/or other business organizations; executive experience in a variety of academic organizations, including roles as dean for finance and administration |
| | |
| INTERESTED TRUSTEES | | | | |
| | | | |
Robert J. Blanding2 (1947) 555 California Street San Francisco, CA 94104 | | Trustee Since 2003 for Natixis Funds Trust I and since 2002 for Loomis Sayles Funds II Chief Executive Officer of Loomis Sayles Funds II since 2002 | | President, Chairman, Director and Chief Executive Officer, Loomis, Sayles & Company, L.P. | | 42 None | | Significant experience on Board of Trustees of the Trusts; continuing service as president, chairman, and chief executive officer of Loomis, Sayles & Company, L.P. |
| | | | |
John T. Hailer3 (1960) | | Trustee Since 2000 for Natixis Funds Trust I and since 2003 for Loomis Sayles Funds II | | President and Chief Executive Officer — U.S. and Asia, Natixis Global Asset Management, L.P.; formerly, President and Chief Executive Officer, Natixis Distribution Corporation, Natixis Asset Management Advisors, L.P., Natixis Distributors, L.P. and Natixis Global Associates, Inc. | | 42 None | | Significant experience on Board of Trustees of the Trusts; continuing experience as Chief Executive Officer of Natixis Global Asset Management, L.P. |
| * | Each trustee serves until retirement, resignation or removal from the Board of Trustees. The current retirement age is 72; however, the trustees have designated 2010 as a transition period so that any trustees who are currently age 72 or older or who reach age 72 during the remainder of 2010 will not be required to retire until the end of calendar year 2011. The position of Chairperson of the Board is appointed for a two-year term. Ms. Moose was appointed to serve an additional two-year term as the Chairperson of the Board of Trustees on November 20, 2009. |
| 72
Trustee and Officer Information
| ** | The trustees of the Trusts serve as trustees of a fund complex that includes all series of the Natixis Funds Trust I, Natixis Funds Trust II, Natixis Funds Trust IV, Gateway Trust and the Natixis Cash Management Trust (collectively, the “Natixis Funds Trusts”), Loomis Sayles Funds I and Loomis Sayles Funds II (collectively, the “Loomis Sayles Funds Trusts”), and Hansberger International Series (collectively, the “Fund Complex”). |
| 1 | Mr. Sirri and Mr. Smail were appointed as trustees effective December 1, 2009. |
| 2 | Mr. Blanding is deemed an “interested person” of the Trusts because he holds the following positions with an affiliated person of the Trusts: President, Chairman, Director and Chief Executive Officer of Loomis Sayles. |
| 3 | Mr. Hailer is deemed an “interested person” of the Trusts because he holds the following positions with an affiliated person of the Trusts: President and Chief Executive Officer — U.S. and Asia, Natixis Global Asset Management, L.P. |
| | | | | | |
Name and Year of Birth | | Position(s) Held with the
Trusts | | Term of Office* and
Length of Time Served | | Principal Occupation During
Past 5 Years** |
| | |
| OFFICERS OF THE TRUST | | | | |
| | | |
Coleen Downs Dinneen (1960) | | Secretary, Clerk and Chief Legal Officer | | Since September 2004 | | Executive Vice President, General Counsel, Secretary and Clerk (formerly, Senior Vice President, Deputy General Counsel, Assistant Secretary and Assistant Clerk), Natixis Distribution Corporation, Natixis Asset Management Advisors, L.P. and Natixis Distributors, L.P. |
| | | |
Daniel J. Fuss (1933) One Financial Center Boston, MA 02111 | | Executive Vice President of Loomis Sayles Funds II | | Since June 2003 | | Vice Chairman and Director, Loomis, Sayles & Company, L.P. |
| | | |
David Giunta (1965) | | President and Chief Executive Officer of Natixis Funds Trust I and President of Loomis Sayles Funds II | | Since March 2008 | | President and Chief Executive Officer, Natixis Distribution Corporation, Natixis Asset Management Advisors, L.P. and Natixis Distributors, L.P.; formerly, President, Fidelity Charitable Gift Fund; and formerly, Senior Vice President, Fidelity Brokerage Company |
| | | |
Russell L. Kane (1969) | | Chief Compliance Officer, Assistant Secretary and Anti-Money Laundering Officer | | Chief Compliance Officer since May 2006; Assistant Secretary since June 2004; and Anti-Money Laundering Officer since April 2007 | | Chief Compliance Officer for Mutual Funds, Senior Vice President, Deputy General Counsel, Assistant Secretary and Assistant Clerk, Natixis Distribution Corporation, Natixis Asset Management Advisors, L.P. and Natixis Distributors, L.P. |
73 |
Trustee and Officer Information
| | | | | | |
Name and Year of Birth | | Position(s) Held with the
Trusts | | Term of Office* and
Length of Time Served | | Principal Occupation During
Past 5 Years** |
| | |
OFFICERS OF THE TRUST continued | | | | |
| | | |
Michael C. Kardok (1959) | | Treasurer, Principal Financial and Accounting Officer | | Since October 2004 | | Senior Vice President, Natixis Asset Management Advisors, L.P. and Natixis Distributors, L.P. |
| * | Each officer of the Trusts serves for an indefinite term in accordance with the Trusts’ current By-laws until the date his or her successor is elected and qualified, or until he or she sooner dies, retires, is removed or becomes disqualified. |
| ** | Each person listed above, except as noted, holds the same position(s) with the Fund Complex. Mr. Fuss is not an officer of the Natixis Funds Trusts or the Hansberger International Series. Previous positions during the past five years with the Distributor, Natixis Advisors or Loomis Sayles are omitted if not materially different from a trustee’s or officer’s current position with such entity. |
| 74

Loomis Sayles Small Cap Growth Fund
Loomis Sayles Small Cap Value Fund
ANNUAL REPORT
SEPTEMBER 30, 2010
LOOMIS SAYLES SMALL CAP GROWTH FUND
Fund and manager review
FUND FACTS
Managers:
Mark F. Burns, CFA
John Slavik, CFA
Symbols:
| | |
| Institutional Class | | LSSIX |
| Retail Class | | LCGRX |
Objective:
Long-term capital growth from investments in common stocks or other equity securities
Strategy:
Invests at least 80% of its net assets (plus any borrowings made for investment purposes) in equity securities of companies with market capitalizations that fall within the capitalization range of the Russell 2000 Index or is $3 billion or less at the time of investment. Unlike the Index, the Fund may invest in companies of any size.
The fund may invest any portion of its assets in Canadian securities and up to 20% of assets in other foreign securities, including emerging markets securities.
Fund Inception Date:
December 31, 1996
Net Assets:
$127.8 million
Market Conditions
The period began with the stocks of financially-sound companies returning to favor after a six-month period in which highly-leveraged companies dominated performance. Stock performance remained robust through the first quarter of 2010, as investors generally remained upbeat about the economic recovery. Beginning in April, widely-publicized issues involving sovereign credit in Southern Europe, a slowing economy in China, lackluster domestic employment growth and the Gulf of Mexico oil spill weighed heavily on investor sentiment. These concerns fed growing anticipation of an economic slowdown, and stocks sold off through the next several months. Late in the period, investor sentiment shifted once again, as economic data were not as dire as many expected. In addition, talk about renewed Federal Reserve Board action to boost economic growth sparked investor optimism, and stocks rallied to close out the period.
Performance Results
For the 12 months ended September 30, 2010, Institutional Class shares of Loomis Sayles Small Cap Growth Fund returned 21.16%. The fund outperformed its benchmark, the Russell 2000 Growth Index, which returned 14.79% for the period.
Explanation of Fund Performance
The fund’s strong performance relative to its benchmark was due primarily to stock selection in the healthcare and consumer discretionary sectors. In healthcare, shares of ev3, a medical device company focused on catheter-based technologies, rose in the first half of 2010 after the company announced it would be acquired by Covidien. In addition, Incyte, a biotechnology company developing treatments for breast cancer, arthritis and bone marrow diseases, advanced after reporting better-than-expected earnings due to improved cost management. In the consumer discretionary sector, shares of DSW, a footwear retailer, benefitted from stronger sales of seasonal products, while shares of
1 |
IMAX, a designer and manufacturer of projection and sound systems for theaters, advanced due to strong box office attendance at IMAX theatres and increased IMAX theater installations.
Utilities was the only sector in the fund with a negative impact on performance. One of the leading detractors from performance was Neutral Tandem, a telecommunication services company that fell in the first half of 2010 after reporting two consecutive quarters of disappointing growth. The company experienced a decline in pricing and lower-than-expected traffic, and the stock was sold.
Throughout the period, we reduced the fund’s weight in technology, but we still remain positive on the sector, and it remained one of the fund’s largest allocations. Some of the companies the fund owned were acquired by other companies, while we sold F5 Networks because it reached the fund’s maximum allowed market capitalization. We redeployed most of the assets from these sales into the producer durables, energy and consumer discretionary sectors. In producer durables, we added exposure to aerospace supply companies. In energy, we increased the fund’s allocation to exploration and production and energy service companies. Within consumer discretionary, we boosted exposure to auto parts companies.
Outlook
We have a positive view about the equity markets, despite the many potential obstacles that investors could face. Although the domestic economy is growing at a disappointing pace and employment remains a concern, the global economy appears to be expanding at a solid pace, particularly in Asia. We believe that many companies, either directly or indirectly linked to global economic developments, should benefit from this trend. We also believe that equity market volatility has started to diminish. Meanwhile, corporate profits appear to be growing surprisingly well for a period of sluggish growth. Based on historical trends for equity price-to-earnings multiples, we continue to believe that stock prices are low relative to earnings and represent an attractive opportunity.
What You Should Know:
Small- and mid-cap stocks may be more volatile than larger, more established companies. The secondary market for these stocks may be less liquid, which could adversely impact the fund’s value. Growth funds involve increased risks, in part, because the value of the underlying securities is based on future expectations that may or may not be met.
The fund can invest a significant percentage of assets in foreign securities and the value of fund shares can be adversely affected by changes in currency exchange rates and by political and economic developments. In emerging markets these risks can be significant. The fund is subject to currency risk, which is the risk that fluctuations in exchange rates between the U.S. dollar and foreign currencies may cause the value of a fund’s investments to decline. Fund shares should be viewed as a long-term investment.
| 2
LOOMIS SAYLES SMALL CAP GROWTH FUND
Average Annual Returns
September 30, 2010
| | | | | | | | | | | | | | | | |
| | | | | |
| | | | | | 1 year | | | 5 years | | | 10 years | |
| Institutional Class (Inception 12/31/96) | | | | | | | 21.16 | % | | | 4.83 | % | | | -5.74 | % |
| Retail Class (Inception 12/31/96) | | | | | | | 20.87 | | | | 4.56 | | | | -5.98 | |
| Comparative Performance | | | | | | | | | | | | | | | | |
| Russell 2000 Growth Index(c)(d) | | | | | | | 14.79 | | | | 2.35 | | | | -0.13 | |
| Russell 2000 Index(c) | | | | | | | 13.35 | | | | 1.60 | | | | 4.00 | |
| Lipper Small-Cap Growth Funds Index(c) | | | | | | | 14.86 | | | | 1.30 | | | | -0.70 | |
| Gross expense ratio (before fee waivers and/or expense reimbursements)* | | | | | |
| Institutional: 1.01% Retail: 1.43% | | | | | | | | | | | | | | | | |
| | | | |
| Net expense ratio (after fee waivers and/or expense reimbursements)* | | | | | | | | | | | | | |
| Institutional: 1.00% Retail: 1.25% | | | | | | | | | | | | | | | | |
| * | | As stated in the most recent prospectus. Waivers/reimbursements are contractual and are set to expire on 1/31/11. |
Cumulative Performance
September 30, 2000 to September 30, 2010(a)(b)
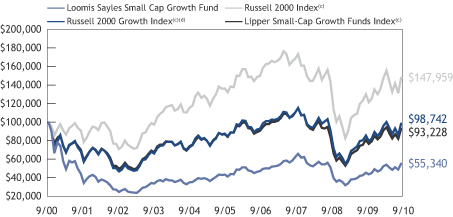
Data quoted reflects past performance and cannot guarantee future results. Average annual total returns assume reinvestment of dividends and capital gains distributions. Investment return and principal value will fluctuate so that shares, when redeemed, may be worth more or less than their original cost. For performance current to the most recent month end, please visit www.loomissayles.com. Current performance may be higher or lower than quoted.
Returns do not reflect the taxes that a shareholder would pay on fund distributions or the redemption of shares. Periods of less than one year are not annualized. Performance data reflects certain fee waivers and/or expense reimbursements, if any, without which performance would be lower.
| (a) | | Cumulative performance is shown for the Institutional Class. Performance of the Retail Class would be lower due to higher fees and expenses. |
| (b) | | The mountain chart is based on the initial investment minimum of $100,000 for the Institutional Class. |
| (c) | | See page 7 for a description of the indices. |
| (d) | | Effective August 20, 2010, the Russell 2000 Growth Index replaced the Russell 2000 Index as the fund’s primary benchmark. |
3 |
LOOMIS SAYLES SMALL CAP VALUE FUND
Fund and manager review
FUND FACTS
Managers:
Joseph Gatz, CFA
Daniel Thelen, CFA
Symbols:
| | |
| Institutional Class | | LSSCX |
| Retail Class | | LSCRX |
| Admin Class | | LSVAX |
Objective:
Long-term capital growth from investments in common stocks or other equity securities
Strategy:
Invests at least 80% of its net assets (plus any borrowings made for investment purposes) in equity securities of companies with market capitalizations that fall within the capitalization range of the Russell 2000 Index or is $3 billion or less at the time of investment. Unlike the Index, the Fund may invest in companies of any size.
The fund may invest up to 20% of its assets in securities of foreign issuers including emerging market securities.
Fund Inception Date:
May 13, 1991
Class Inception Date:
Institutional Class: May 13, 1991
Retail Class: December 31, 1996
Admin Class: January 2, 1998
Net Assets:
$912.2 million
Market Conditions
The equity markets were quite volatile during the period, trending higher, then lower, for weeks at a time. They ended on a positive note, with a double-digit rally during September. In general, mid-cap stocks outpaced small-cap stocks, and the growth style outperformed the value style, with banks and insurance stocks notable laggards. Real estate investment trusts (REITs) represented the top-performing segment of the Russell 2000 Value Index for the 12-month period, gaining more than 22%.
Performance Results
For the 12 months ended September 30, 2010, Institutional Class shares of Loomis Sayles Small Cap Value Fund returned 11.39%. The fund modestly underperformed its benchmark, the Russell 2000 Value Index, which returned 11.84% for the period.
Explanation of Fund Performance
After a strong start, the fund lagged during the market rally that occurred during the first four months of 2010. While our focus on more stable business models and better balance sheets was somewhat out of phase with the market during that January-April rally, the fund proved resilient during a more difficult market in May and June. During the late spring/early summer sell-off, the fund’s orientation toward more stable companies and attention to value proved defensive in a weaker market. From a sector perspective, the fund was most challenged by performance in the financial services, materials and processing and consumer staples sectors. Within financials, the fund’s underweight in the surging REIT area created an especially strong headwind to performance.
The consumer discretionary, producer durable and technology sectors made the most positive contributions to performance during the period. Despite generally disappointing unemployment and economic statistics, sectors and stocks sensitive to economic growth performed well. The consumer discretionary sector’s
| 4
What You Should Know:
Value stocks may fall out of favor with investors and underperform the overall equity market during any given period. Small- and mid-cap stocks may be more volatile than larger, more established companies. The secondary market for these stocks may be less liquid, which could adversely impact the Fund’s value.
The fund can invest a significant percentage of assets in foreign securities and the value of fund shares can be adversely affected by changes in currency exchange rates and by political and economic developments. In emerging markets these risks can be significant. The fund is subject to currency risk, which is the risk that fluctuations in exchange rates between the U.S. dollar and foreign currencies may cause the value of a fund’s investments to decline. Fund shares should be viewed as a long-term investment.
Fossil, a watch and accessories designer, was the fund’s top contributor. The company reported better-than-expected earnings, while expansion into new products and a shift toward higher price-point watches contributed to an improved outlook. Technology holding Sybase, an enterprise database and mobility software provider, also was among the top performers. The company’s stock rose sharply after SAP announced it would purchase Sybase for cash at a 55% premium.
Trading activity was modestly higher during the year, as we took profits in certain outperforming sectors and added to positions in lagging sectors. In the REIT segment, the additions of apartment owner UDR, data center operator DuPont Fabros Technology and healthcare facility manager BioMed Realty Trust reflected improving fundamentals. We also increased exposure to consumer discretionary, with the additions of auto supplier Tenneco and media and Internet content provider Liberty Media-Starz. We reduced the fund’s healthcare exposure by selling Almost Family and Medical Action Industries following company-specific disappointments. We also reduced the fund’s energy weight, selling Mariner Energy after the company agreed to be acquired by Apache. We also sold Penn Virginia and Hornbeck Offshore Services on deteriorating fundamentals.
Outlook
We have a positive view about the equity markets, despite the many potential obstacles that investors could face. Although the domestic economy is growing at a disappointing pace and employment remains a concern, the global economy appears to be expanding at a solid pace, particularly in Asia. We believe that many companies, either directly or indirectly linked to global economic developments, should benefit from this trend. We also believe that equity market volatility has started to diminish. Meanwhile, corporate profits appear to be growing surprisingly well for a period of sluggish growth. Based on historical trends for equity price-to-earnings multiples, we continue to believe that stock prices are low relative to earnings and represent an attractive opportunity.
5 |
LOOMIS SAYLES SMALL CAP VALUE FUND
Average Annual Returns
September 30, 2010
| | | | | | | | | | | | | | | | |
| | | | | |
| | | | | | 1 year | | | 5 years | | | 10 years | |
| Institutional Class (Inception 5/13/91) | | | | | | | 11.39 | % | | | 3.10 | % | | | 7.84 | % |
| Retail Class (Inception 12/31/96) | | | | | | | 11.10 | | | | 2.84 | | | | 7.57 | |
| Admin Class (Inception 1/2/98) | | | | | | | 10.89 | | | | 2.58 | | | | 7.29 | |
| Comparative Performance | | | | | | | | | | | | | | | | |
| Russell 2000 Value Index(c) | | | | | | | 11.84 | | | | 0.73 | | | | 7.72 | |
| Russell 2000 Index(c) | | | | | | | 13.35 | | | | 1.60 | | | | 4.00 | |
| Lipper Small-Cap Core Funds Index(c) | | | | | | | 13.83 | | | | 2.14 | | | | 4.98 | |
| Gross expense ratio (before fee waivers and/or expense reimbursements)* | | | | | | | | | | | | | |
| Institutional: 0.94% Retail: 1.31% Admin: 1.77% | | | | | | | | | | | | | | | | |
| Net expense ratio (after fee waivers and/or expense reimbursements)* | | | | | | | | | | | | | | | | |
| Institutional: 0.90% Retail: 1.15% Admin: 1.40% | | | | | | | | | | | | | | | | |
| * | | As stated in the most recent prospectus. Waivers/reimbursements are contractual and are set to expire on 1/31/11. |
Cumulative Performance
September 30, 2000 to September 30, 2010(a)(b)
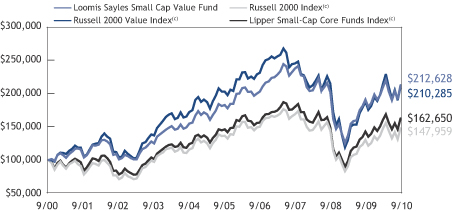
Data quoted reflects past performance and cannot guarantee future results. Average annual total returns assume reinvestment of dividends and capital gains distributions. Investment return and principal value will fluctuate so that shares, when redeemed, may be worth more or less than their original cost. For performance current to the most recent month end, please visit www.loomissayles.com. Current performance may be higher or lower than quoted.
Returns do not reflect the taxes that a shareholder would pay on fund distributions or the redemption of shares. Periods of less than one year are not annualized. Performance data reflects certain fee waivers and/or expense reimbursements, if any, without which performance would be lower.
| (a) | | Cumulative performance is shown for the Institutional Class. Performance of the Retail and Admin Classes would be lower due to higher fees and expenses. |
| (b) | | The mountain chart is based on the initial investment minimum of $100,000 for the Institutional Class. |
| (c) | | See page 7 for a description of the Indices. |
| 6
ADDITIONAL INFORMATION
Index Definitions
Indices are unmanaged and do not have expenses that affect results, unlike mutual funds. Index returns are adjusted for the reinvestment of capital gain distributions and income dividends. It is not possible to invest directly in an index.
Lipper Small-Cap Core Funds Index is an unmanaged index that tracks the average performance of the 30 largest small-cap core funds according to Lipper Inc.
Lipper Small-Cap Growth Funds Index is an unmanaged index that tracks the average performance of the 30 largest small-cap growth funds according to Lipper Inc.
Source: Lipper, Inc.
Russell 2000 Index is an unmanaged index that measures the performance of the small-cap segment of the U.S. equity universe.
Russell 2000 Growth Index is an unmanaged index that measures the performance of the small-cap growth segment of the U.S. equity universe. It includes those Russell 2000 companies with higher price-to-book ratios and higher forecasted growth values.
Russell 2000 Value Index is an unmanaged index that measures the performance of the small-cap value segment of the U.S. equity universe. It includes those Russell 2000 companies with lower price-to-book ratios and lower forecasted growth values.
Proxy Voting Information
A description of the funds’ proxy voting policies and procedures is available without charge, upon request, (i) by calling Loomis Sayles at 800-633-3330; (ii) on the funds’ website, www.loomissayles.com, and (iii) on the SEC’s website, www.sec.gov. Information about how the funds voted proxies relating to portfolio securities during the 12 months ended June 30, 2010 is available on (i) the funds’ website and (ii) the SEC’s website.
Quarterly Portfolio Schedules
The funds file a complete schedule of portfolio holdings with the SEC for the first and third quarters of each fiscal year on Form N-Q. The funds’ Forms N-Q are available on the SEC’s website at www.sec.gov and may be reviewed and copied at the SEC’s Public Reference Room in Washington, DC. Information on the operation of the Public Reference Room may be obtained by calling 800-SEC-0330.
UNDERSTANDING YOUR FUND’S EXPENSES
As a mutual fund shareholder you incur two types of costs: (1) transaction costs and (2) ongoing costs, including management fees, distribution and/or service fees (12b-1 fees), and other fund expenses. These costs are described in more detail in the funds’ prospectus. The examples below are intended to help you understand the ongoing costs of investing in the funds and help you compare these with the ongoing costs of investing in other mutual funds.
The first line in the table of each fund shows the actual amount of fund expenses you would have paid on a $1,000 investment in the fund from April 1, 2010 through September 30, 2010. It also shows how much a $1,000 investment would be worth at the close of the period, assuming actual fund returns and expenses. To estimate the expenses
7 |
you paid over the period, simply divide your account value by $1,000 (for example $8,600 account value divided by $1,000 = 8.6) and multiply the result by the number in the Expenses Paid During the Period column as shown below for your class.
The second line in the table of each fund provides information about hypothetical account values and hypothetical expenses based on the fund’s actual expense ratios and an assumed rate of return of 5% per year before expenses, which is not the fund’s actual return. The hypothetical account values and expenses may not be used to estimate the actual ending account balance or expenses you paid on your investment for the period. You may use this information to compare the ongoing costs of investing in the funds and other funds. To do so, compare this 5% hypothetical example with the 5% hypothetical examples that appear in the shareholder reports of other funds.
Please note that the expenses shown reflect ongoing costs only, and do not include any transaction costs. Therefore, the second line in the table is useful in comparing ongoing costs only, and will not help you determine the relative costs of owning different funds. If transaction costs were included, total costs would be higher.
Loomis Sayles Small Cap Growth Fund
| | | | | | | | | | | | |
Institutional Class | | Beginning
Account Value
4/1/2010 | | | Ending
Account Value
9/30/2010 | | | Expenses Paid
During Period*
4/1/2010 – 9/30/2010 | |
Actual | | | $1,000.00 | | | | $1,050.10 | | | | $5.14 | |
Hypothetical
(5% return before expenses) | | | $1,000.00 | | | | $1,020.05 | | | | $5.06 | |
| | | |
Retail Class | | | | | | | | | |
Actual | | | $1,000.00 | | | | $1,048.00 | | | | $6.42 | |
Hypothetical
(5% return before expenses) | | | $1,000.00 | | | | $1,018.80 | | | | $6.33 | |
*Expenses are equal to the Fund's annualized expense ratio (after waiver/reimbursement): 1.00% and 1.25%, for Institutional and Retail Class, respectively, multiplied by the average account value over the period multiplied by the number of days in the most recent fiscal half-year, divided by 365 (to reflect the half-year period). | |
| 8
Loomis Sayles Small Cap Value Fund
| | | | | | | | | | | | |
Institutional Class | | Beginning
Account Value
4/1/2010 | | | Ending
Account Value
9/30/2010 | | | Expenses Paid
During Period*
4/1/2010 – 9/30/2010 | |
Actual | | | $1,000.00 | | | | $1,015.10 | | | | $4.55 | |
Hypothetical
(5% return before expenses) | | | $1,000.00 | | | | $1,020.56 | | | | $4.56 | |
| | | |
Retail Class | | | | | | | | | |
Actual | | | $1,000.00 | | | | $1,014.30 | | | | $5.81 | |
Hypothetical
(5% return before expenses) | | | $1,000.00 | | | | $1,019.30 | | | | $5.82 | |
| | | |
Admin Class | | | | | | | | | |
Actual | | | $1,000.00 | | | | $1,013.20 | | | | $7.07 | |
Hypothetical
(5% return before expenses) | | | $1,000.00 | | | | $1,018.05 | | | | $7.08 | |
*Expenses are equal to the Fund's annualized expense ratio (after waiver/reimbursement): 0.90%, 1.15% and 1.40%, for Institutional, Retail and Admin Class, respectively, multiplied by the average account value over the period, multiplied by the number of days in the most recent fiscal half-year, divided by 365 (to reflect the half-year period). | |
9 |
BOARD APPROVAL OF THE EXISTING ADVISORY AGREEMENTS
The Board of Trustees, including the Independent Trustees, considers matters bearing on each Fund’s advisory agreement (collectively, the “Agreements”) at most of its meetings throughout the year. Each year, usually in the spring, the Contract Review and Governance Committee of the Board meets to review the Agreements to determine whether to recommend that the full Board approve the continuation of the Agreements, typically for an additional one-year period. After the Committee has made its recommendation, the full Board, including the Independent Trustees, determines whether to approve the continuation of the Agreements.
In connection with these meetings, the Trustees receive materials that the Funds’ investment adviser (the “Adviser”) believes to be reasonably necessary for the Trustees to evaluate the Agreements. These materials generally include, among other items, (i) information on the investment performance of the Funds and the performance of peer groups of funds and the Funds’ performance benchmarks, (ii) information on the Funds’ advisory fees and other expenses, including information comparing the Funds’ expenses to the fees charged to institutional accounts with similar strategies managed by the Adviser and to those of peer groups of funds and information about applicable expense caps and fee “breakpoints,” (iii) sales and redemption data in respect of the Funds, (iv) information about the profitability of the Agreements to the Adviser and (v) information obtained through the completion of a questionnaire by the Adviser (the Trustees are consulted as to the information requested through that questionnaire). The Board of Trustees, including the Independent Trustees, also consider other matters such as (i) the Adviser’s financial results and financial condition, (ii) each Fund’s investment objective and strategies and the size, education and experience of the Adviser’s respective investment staffs and their use of technology, external research and trading cost measurement tools, (iii) arrangements in respect of the distribution of the Funds’ shares and the related costs, (iv) the procedures employed to determine the value of the Funds’ assets, (v) the allocation of the Funds’ brokerage, if any, including, if applicable, allocations to brokers affiliated with the Adviser and the use of “soft” commission dollars to pay Fund expenses and to pay for research and other similar services, (vi) the resources devoted to, and the record of compliance with, the Funds’ investment policies and restrictions, policies on personal securities transactions and other compliance policies, (vii) information about amounts invested by the Funds’ portfolio managers in the Funds or in similar accounts that they manage and (viii) the general economic outlook with particular emphasis on the mutual fund industry. Throughout the process, the Trustees are afforded the opportunity to ask questions of and request additional materials from the Adviser.
In addition to the materials requested by the Trustees in connection with their annual consideration of the continuation of the Agreements, the Trustees receive materials in advance of each regular quarterly meeting of the Board of Trustees that provide detailed information about the Funds’ investment performance and the fees charged to the Funds for advisory and other services. This information generally includes, among other things, an internal performance rating for each Fund based on agreed-upon criteria, graphs
| 10
showing each Fund’s performance and fee differentials against each Fund’s peer group of funds, performance ratings provided by a third-party, total return information for various periods, and third-party performance rankings for various periods comparing a Fund against its peer group. The portfolio management team for each Fund or other representatives of the Adviser make periodic presentations to the Contract Review and Governance Committee and/or the full Board of Trustees, and Funds identified as presenting possible performance concerns may be subject to more frequent board presentations and reviews. In addition, each quarter the Trustees are provided with detailed statistical information about each Fund’s portfolio. The Trustees also receive periodic updates between meetings.
The Board of Trustees most recently approved the continuation of the Agreements at their meeting held in June 2010. The Agreements were continued for a one-year period for the Funds. In considering whether to approve the continuation of the Agreements, the Board of Trustees, including the Independent Trustees, did not identify any single factor as determinative. Individual Trustees may have evaluated the information presented differently from one another, giving different weights to various factors. Matters considered by the Trustees, including the Independent Trustees, in connection with their approval of the Agreements included, but were not limited to, the factors listed below.
The nature, extent and quality of the services provided to the Funds under the Agreements. The Trustees considered the nature, extent and quality of the services provided by the Adviser and its affiliates to the Funds and the resources dedicated to the Funds by the Adviser and its affiliates, including recent or planned investments by the Adviser in additional personnel or other resources. They also considered the administrative services provided by Natixis Advisors and its affiliates to the Funds.
For each Fund, the Trustees also considered the benefits to shareholders of investing in a mutual fund that is part of a family of funds that offers shareholders the right to exchange shares of one type of fund for shares of another type of fund, and provides a variety of fund and shareholder services.
After reviewing these and related factors, the Trustees concluded, within the context of their overall conclusions regarding each of the Agreements, that the nature, extent and quality of services provided supported the renewal of the Agreements.
Investment performance of the Funds and the Adviser. As noted above, the Trustees received information about the performance of the Funds over various time periods, including information which compared the performance of the Funds to the performance of peer groups of funds and the Funds’ respective performance benchmarks. In addition, the Trustees also reviewed data prepared by an independent third party which analyzed the performance of the Funds using a variety of performance metrics, including metrics which also measured the performance of the Funds on a risk adjusted basis.
With respect to each Fund, the Board concluded that the Fund’s performance or other relevant factors supported the renewal of the Agreement relating to that Fund. In the case of each Fund that had performance that lagged that of a relevant peer group of funds for certain (although not necessarily all) periods, the Board concluded that other factors
11 |
relevant to performance supported renewal of the relevant Agreement. These factors included one or more of the following: (1) that the underperformance was attributable, to a significant extent, to investment decisions (such as security selection or sector allocation) by the Adviser that were reasonable and consistent with the Fund’s investment objective and policies; (2) that the Fund’s performance, although lagging in certain recent periods, was stronger over the longer term; and (3) that although the Fund’s performance lagged that of its relevant peer group for certain recent periods, performance was stronger when compared to the Fund’s relevant performance benchmark.
The Trustees also considered the Adviser’s performance and reputation generally, the Funds’ performance as a fund family generally (as noted by certain financial publications), and the historical responsiveness of the Adviser to Trustee concerns about performance and the willingness of the Adviser to take steps intended to improve performance.
After reviewing these and related factors, the Trustees concluded, within the context of their overall conclusions regarding each of the Agreements, that the performance of the Funds and the Adviser supported the renewal of the Agreements.
The costs of the services to be provided and profits to be realized by the Adviser and its affiliates from their respective relationships with the Funds. The Trustees considered the fees charged to the Funds for advisory services as well as the total expense levels of the Funds. This information included comparisons (provided both by management and also by an independent third party) of the Funds’ advisory fees and total expense levels to those of their peer groups and information about the advisory fees charged by the Adviser to comparable accounts (such as institutional separate accounts), as well as information about differences in such fees. In considering the fees charged to comparable accounts, the Trustees considered, among other things, management’s representations about the differences between managing mutual funds as compared to other types of accounts, including the additional resources required to effectively manage and the greater regulatory costs associated with the management of mutual fund assets. In evaluating each Fund’s advisory fee, the Trustees also took into account the demands, complexity and quality of the investment management of such Fund and the need for the Adviser to offer competitive compensation. The Trustees considered that over the past several years, management had made recommendations regarding reductions in advisory fee rates, implementation of advisory fee breakpoints and the institution of advisory fee waivers and expense caps. They noted that all of the Loomis Sayles Funds in this report have expense caps in place, and they considered the amounts waived or reimbursed by the Adviser under these caps.
The Trustees also considered the compensation directly or indirectly received by the Adviser and its affiliates from their relationships with the Funds. The Trustees reviewed information provided by management as to the profitability of the Adviser and its affiliates’ relationships with the Funds, and information about the allocation of expenses used to calculate profitability. They also reviewed information provided by management about the effect of distribution costs and changes in asset levels on Adviser profitability, including information regarding resources spent on distribution activities. When reviewing profitability, the Trustees also considered information about court cases in which adviser
| 12
profitability was an issue, the performance of the relevant Funds, the expense levels of the Funds, and whether the Adviser had implemented breakpoints and/or expense caps with respect to such Funds.
After reviewing these and related factors, the Trustees concluded, within the context of their overall conclusions regarding each of the Agreements, that the advisory fee charged to each of the Funds was fair and reasonable, and that the costs of these services generally and the related profitability of the Adviser and its affiliates in respect of their relationships with the Funds supported the renewal of the Agreements.
Economies of Scale. The Trustees considered the existence of any economies of scale in the provision of services by the Adviser and whether those economies are shared with the Funds through breakpoints in their investment advisory fees or other means, such as expense waivers or caps. The Trustees noted that although each Fund’s management fee was not subject to breakpoints, each Fund’s management fee and overall net expense ratio was below the median fee for a peer group of funds and that each of the Funds was subject to an expense cap. In considering these issues, the Trustees also took note of the costs of the services provided (both on an absolute and a relative basis) and the profitability to the Adviser and its affiliates of their relationships with the Funds, as discussed above.
After reviewing these and related factors, the Trustees concluded, within the context of their overall conclusions regarding each of the Agreements, that the extent to which economies of scale were shared with the Funds supported the renewal of the Agreements.
The Trustees also considered other factors, which included but were not limited to the following:
| • | | the effect of recent market and economic turmoil on the performance, asset levels and expense ratios of each Fund. |
| • | | whether each Fund has operated in accordance with its investment objective and the Fund’s record of compliance with its investment restrictions, and the compliance programs of the Funds and the Adviser. They also considered the compliance-related resources the Adviser and its affiliates were providing to the Funds. |
| • | | the nature, quality, cost and extent of administrative and shareholder services performed by the Adviser and its affiliates, both under the Agreements and under separate agreements covering administrative services. |
| • | | so-called “fallout benefits” to the Adviser, such as the engagement of affiliates of the Adviser to provide distribution, administrative and brokerage services to the Funds, and the benefits of research made available to the Adviser by reason of brokerage commissions generated by the Funds’ securities transactions. The Trustees also considered the fact that Natixis Advisors’ parent company benefits from the retention of an affiliated Adviser. The Trustees considered the possible conflicts of interest associated with these fallout and other benefits, and the reporting, disclosure and other processes in place to disclose and monitor such possible conflicts of interest. |
13 |
| • | | the Trustees’ review and discussion of the Funds’ advisory arrangements in prior years, and management’s record of responding to Trustee concerns raised during the year and in prior years. |
Based on their evaluation of all factors that they deemed to be material, including those factors described above, and assisted by the advice of independent counsel, the Trustees, including the Independent Trustees, concluded that each of the existing Agreements should be continued through June 30, 2011.
| 14
Portfolio of Investments – as of September 30, 2010
Loomis Sayles Small Cap Growth Fund
| | | | | | | | | | | | |
| Shares | | | Description | | | | | Value (†) | |
| Common Stocks – 97.0% of Net Assets
| | | | | | | | |
| | | | Aerospace & Defense – 2.6% | | | | | | | | |
| | 32,053 | | | HEICO Corp. | | | | | | $ | 1,462,899 | |
| | 83,429 | | | Hexcel Corp.(b) | | | | | | | 1,484,202 | |
| | 12,230 | | | Ladish Co., Inc.(b) | | | | | | | 380,720 | |
| | | | | | | | | | | | |
| | | | | | | | | | | 3,327,821 | |
| | | | | | | | | | | | |
| | | | Air Freight & Logistics – 2.0% | | | | | | | | |
| | 26,385 | | | Atlas Air Worldwide Holdings, Inc.(b) | | | | | | | 1,327,166 | |
| | 40,117 | | | HUB Group, Inc., Class A(b) | | | | | | | 1,173,823 | |
| | | | | | | | | | | | |
| | | | | | | | | | | 2,500,989 | |
| | | | | | | | | | | | |
| | | | Auto Components – 2.0% | | | | | | | | |
| | 137,915 | | | Amerigon, Inc.(b) | | | | | | | 1,420,524 | |
| | 39,144 | | | Tenneco, Inc.(b) | | | | | | | 1,134,002 | |
| | | | | | | | | | | | |
| | | | | | | | | | | 2,554,526 | |
| | | | | | | | | | | | |
| | | | Biotechnology – 5.6% | | | | | | | | |
| | 16,413 | | | Alexion Pharmaceuticals, Inc.(b) | | | | | | | 1,056,341 | |
| | 72,990 | | | Alkermes, Inc.(b) | | | | | | | 1,069,303 | |
| | 72,991 | | | Cepheid, Inc.(b) | | | | | | | 1,365,661 | |
| | 48,809 | | | Clinical Data, Inc.(b) | | | | | | | 823,408 | |
| | 60,236 | | | Incyte Corp.(b) | | | | | | | 963,174 | |
| | 33,204 | | | Pharmasset, Inc.(b) | | | | | | | 979,518 | |
| | 34,932 | | | Regeneron Pharmaceuticals, Inc.(b) | | | | | | | 957,137 | |
| | | | | | | | | | | | |
| | | | | | | | | | | 7,214,542 | |
| | | | | | | | | | | | |
| | | | Building Products – 0.9% | | | | | | | | |
| | 63,325 | | | Trex Company, Inc.(b) | | | | | | | 1,207,608 | |
| | | | | | | | | | | | |
| | | | Capital Markets – 3.3% | | | | | | | | |
| | 48,549 | | | Evercore Partners, Inc., Class A | | | | | | | 1,388,987 | |
| | 17,114 | | | Greenhill & Co., Inc. | | | | | | | 1,357,482 | |
| | 30,669 | | | Stifel Financial Corp.(b) | | | | | | | 1,419,668 | |
| | | | | | | | | | | | |
| | | | | | | | | | | 4,166,137 | |
| | | | | | | | | | | | |
| | | | Commercial Banks – 2.0% | | | | | | | | |
| | 35,707 | | | Signature Bank(b) | | | | | | | 1,386,860 | |
| | 27,646 | | | SVB Financial Group(b) | | | | | | | 1,169,979 | |
| | | | | | | | | | | | |
| | | | | | | | | | | 2,556,839 | |
| | | | | | | | | | | | |
| | | | Commercial Services & Supplies – 2.0% | | | | | | | | |
| | 35,054 | | | EnerNOC, Inc.(b) | | | | | | | 1,101,046 | |
| | 37,897 | | | Waste Connections, Inc.(b) | | | | | | | 1,502,995 | |
| | | | | | | | | | | | |
| | | | | | | | | | | 2,604,041 | |
| | | | | | | | | | | | |
| | | | Communications Equipment – 1.6% | | | | | | | | |
| | 81,774 | | | Ciena Corp.(b) | | | | | | | 1,273,221 | |
| | 69,525 | | | Infinera Corp.(b) | | | | | | | 811,357 | |
| | | | | | | | | | | | |
| | | | | | | | | | | 2,084,578 | |
| | | | | | | | | | | | |
See accompanying notes to financial statements.
15 |
Portfolio of Investments – as of September 30, 2010
Loomis Sayles Small Cap Growth Fund – continued
| | | | | | | | | | | | |
| Shares | | | Description | | | | | Value (†) | |
| | Common Stocks – continued | | | | | | | | |
| | | | Computers & Peripherals – 0.9% | | | | | | | | |
| | 41,954 | | | Netezza Corp.(b) | | | | | | $ | 1,130,660 | |
| | | | | | | | | | | | |
| | | | Construction & Engineering – 0.8% | | | | | | | | |
| | 96,436 | | | MasTec, Inc.(b) | | | | | | | 995,219 | |
| | | | | | | | | | | | |
| | | | Diversified Consumer Services – 0.8% | | | | | | | | |
| | 35,222 | | | K12, Inc.(b) | | | | | | | 1,022,495 | |
| | | | | | | | | | | | |
| | | | Diversified Financial Services – 1.0% | | | | | | | | |
| | 39,103 | | | MSCI, Inc., Class A(b) | | | | | | | 1,298,611 | |
| | | | | | | | | | | | |
| | | | Electrical Equipment – 1.2% | | | | | | | | |
| | 51,016 | | | Polypore International, Inc.(b) | | | | | | | 1,538,642 | |
| | | | | | | | | | | | |
| | | | Electronic Equipment, Instruments & Components – 1.1% | | | | | | | | |
| | 58,890 | | | IPG Photonics Corp.(b) | | | | | | | 1,421,605 | |
| | | | | | | | | | | | |
| | | | Energy Equipment & Services – 2.6% | | | | | | | | |
| | 130,346 | | | Newpark Resources, Inc.(b) | | | | | | | 1,094,906 | |
| | 20,832 | | | Oceaneering International, Inc.(b) | | | | | | | 1,122,012 | |
| | 41,009 | | | T-3 Energy Services, Inc.(b) | | | | | | | 1,072,385 | |
| | | | | | | | | | | | |
| | | | | | | | | | | 3,289,303 | |
| | | | | | | | | | | | |
| | | | Food Products – 1.0% | | | | | | | | |
| | 31,790 | | | Diamond Foods, Inc. | | | | | | | 1,303,072 | |
| | | | | | | | | | | | |
| | | | Health Care Equipment & Supplies – 8.6% | | | | | | | | |
| | 76,849 | | | AGA Medical Holdings, Inc.(b) | | | | | | | 1,072,812 | |
| | 68,626 | | | Align Technology, Inc.(b) | | | | | | | 1,343,697 | |
| | 71,302 | | | DexCom, Inc.(b) | | | | | | | 942,613 | |
| | 61,702 | | | Insulet Corp.(b) | | | | | | | 872,466 | |
| | 74,240 | | | MELA Sciences, Inc.(b) | | | | | | | 484,045 | |
| | 49,213 | | | NxStage Medical, Inc.(b) | | | | | | | 939,968 | |
| | 36,637 | | | ResMed, Inc.(b) | | | | | | | 1,202,060 | |
| | 24,398 | | | Thoratec Corp.(b) | | | | | | | 902,238 | |
| | 57,981 | | | Volcano Corp.(b) | | | | | | | 1,506,346 | |
| | 51,746 | | | Zoll Medical Corp.(b) | | | | | | | 1,669,844 | |
| | | | | | | | | | | | |
| | | | | | | | | | | 10,936,089 | |
| | | | | | | | | | | | |
| | | | Health Care Providers & Services – 3.8% | | | | | | | | |
| | 56,585 | | | Bio-Reference Labs, Inc.(b) | | | | | | | 1,180,363 | |
| | 70,722 | | | Hanger Orthopedic Group, Inc.(b) | | | | | | | 1,028,298 | |
| | 21,844 | | | HMS Holdings Corp.(b) | | | | | | | 1,287,485 | |
| | 23,430 | | | MWI Veterinary Supply, Inc.(b) | | | | | | | 1,352,380 | |
| | | | | | | | | | | | |
| | | | | | | | | | | 4,848,526 | |
| | | | | | | | | | | | |
| | | | Health Care Technology – 2.0% | | | | | | | | |
| | 69,278 | | | MedAssets, Inc.(b) | | | | | | | 1,457,609 | |
| | 30,016 | | | SXC Health Solutions Corp.(b) | | | | | | | 1,094,684 | |
| | | | | | | | | | | | |
| | | | | | | | | | | 2,552,293 | |
| | | | | | | | | | | | |
See accompanying notes to financial statements.
| 16
Portfolio of Investments – as of September 30, 2010
Loomis Sayles Small Cap Growth Fund – continued
| | | | | | | | | | | | |
| Shares | | | Description | | | | | Value (†) | |
| | Common Stocks – continued | | | | | | | | |
| | | | Hotels, Restaurants & Leisure – 2.3% | | | | | | | | |
| | 38,468 | | | Life Time Fitness, Inc.(b) | | | | | | $ | 1,518,332 | |
| | 15,559 | | | Panera Bread Co., Class A(b) | | | | | | | 1,378,683 | |
| | | | | | | | | | | | |
| | | | | | | | | | | 2,897,015 | |
| | | | | | | | | | | | |
| | | | Household Durables – 1.0% | | | | | | | | |
| | 40,812 | | | Tempur-Pedic International, Inc.(b) | | | | | | | 1,265,172 | |
| | | | | | | | | | | | |
| | | | Internet Software & Services – 6.5% | | | | | | | | |
| | 41,692 | | | Ancestry.com, Inc.(b) | | | | | | | 948,910 | |
| | 50,443 | | | Constant Contact, Inc.(b) | | | | | | | 1,080,993 | |
| | 56,744 | | | GSI Commerce, Inc.(b) | | | | | | | 1,401,577 | |
| | 23,901 | | | MercadoLibre, Inc.(b) | | | | | | | 1,725,174 | |
| | 74,036 | | | Monster Worldwide, Inc.(b) | | | | | | | 959,507 | |
| | 47,341 | | | Vocus, Inc.(b) | | | | | | | 874,862 | |
| | 26,814 | | | WebMD Health Corp.(b) | | | | | | | 1,337,214 | |
| | | | | | | | | | | | |
| | | | | | | | | | | 8,328,237 | |
| | | | | | | | | | | | |
| | | | IT Services – 1.0% | | | | | | | | |
| | 107,119 | | | Sapient Corp. | | | | | | | 1,282,214 | |
| | | | | | | | | | | | |
| | | | Machinery – 1.1% | | | | | | | | |
| | 21,019 | | | Bucyrus International, Inc. | | | | | | | 1,457,668 | |
| | | | | | | | | | | | |
| | | | Media – 0.8% | | | | | | | | |
| | 58,368 | | | Imax Corp.(b) | | | | | | | 984,084 | |
| | | | | | | | | | | | |
| | | �� | Oil, Gas & Consumable Fuels – 5.3% | | | | | | | | |
| | 65,153 | | | Brigham Exploration Co.(b) | | | | | | | 1,221,619 | |
| | 41,437 | | | Comstock Resources, Inc.(b) | | | | | | | 931,918 | |
| | 22,646 | | | Concho Resources, Inc.(b) | | | | | | | 1,498,486 | |
| | 43,873 | | | Oasis Petroleum, Inc.(b) | | | | | | | 849,820 | |
| | 45,804 | | | Rosetta Resources, Inc.(b) | | | | | | | 1,075,936 | |
| | 47,439 | | | World Fuel Services Corp. | | | | | | | 1,233,888 | |
| | | | | | | | | | | | |
| | | | | | | | | | | 6,811,667 | |
| | | | | | | | | | | | |
| | | | Pharmaceuticals – 1.4% | | | | | | | | |
| | 137,379 | | | Inspire Pharmaceuticals, Inc.(b) | | | | | | | 817,405 | |
| | 67,423 | | | Nektar Therapeutics(b) | | | | | | | 995,838 | |
| | | | | | | | | | | | |
| | | | | | | | | | | 1,813,243 | |
| | | | | | | | | | | | |
| | | | Professional Services – 3.6% | | | | | | | | |
| | 32,530 | | | Advisory Board Co. (The)(b) | | | | | | | 1,436,199 | |
| | 59,009 | | | ICF International, Inc.(b) | | | | | | | 1,479,356 | |
| | 24,838 | | | IHS, Inc., Class A(b) | | | | | | | 1,688,984 | |
| | | | | | | | | | | | |
| | | | | | | | | | | 4,604,539 | |
| | | | | | | | | | | | |
| | | | Road & Rail – 0.7% | | | | | | | | |
| | 21,918 | | | Genesee & Wyoming, Inc., Class A(b) | | | | | | | 951,022 | |
| | | | | | | | | | | | |
See accompanying notes to financial statements.
17 |
Portfolio of Investments – as of September 30, 2010
Loomis Sayles Small Cap Growth Fund – continued
| | | | | | | | | | | | |
| Shares | | | Description | | | | | Value (†) | |
| | Common Stocks – continued | | | | | | | | |
| | | | Semiconductors & Semiconductor Equipment – 7.1% | | | | | | | | |
| | 79,779 | | | Advanced Energy Industries, Inc.(b) | | | | | | $ | 1,041,914 | |
| | 38,032 | | | Cavium Network, Inc.(b) | | | | | | | 1,093,800 | |
| | 31,710 | | | Cymer, Inc.(b) | | | | | | | 1,175,807 | |
| | 117,230 | | | GT Solar International, Inc.(b) | | | | | | | 981,215 | |
| | 23,727 | | | Hittite Microwave Corp.(b) | | | | | | | 1,130,592 | |
| | 36,723 | | | Netlogic Microsystems, Inc.(b) | | | | | | | 1,012,820 | |
| | 25,427 | | | Power Integrations, Inc. | | | | | | | 808,324 | |
| | 25,571 | | | Silicon Laboratories, Inc.(b) | | | | | | | 937,177 | |
| | 30,534 | | | Varian Semiconductor Equipment Associates, Inc.(b) | | | | | | | 878,769 | |
| | | | | | | | | | | | |
| | | | | | | | | | | 9,060,418 | |
| | | | | | | | | | | | |
| | | | Software – 9.9% | | | | | | | | |
| | 23,196 | | | ArcSight, Inc.(b) | | | | | | | 1,010,418 | |
| | 111,409 | | | Ariba, Inc.(b) | | | | | | | 2,105,630 | |
| | 34,667 | | | Blackboard, Inc.(b) | | | | | | | 1,249,399 | |
| | 31,768 | | | Concur Technologies, Inc.(b) | | | | | | | 1,570,610 | |
| | 56,428 | | | Informatica Corp.(b) | | | | | | | 2,167,399 | |
| | 54,837 | | | SuccessFactors, Inc.(b) | | | | | | | 1,376,957 | |
| | 40,341 | | | Ultimate Software Group, Inc. (The)(b) | | | | | | | 1,558,776 | |
| | 50,125 | | | VanceInfo Technologies, Inc., ADR(b) | | | | | | | 1,621,043 | |
| | | | | | | | | | | | |
| | | | | | | | | | | 12,660,232 | |
| | | | | | | | | | | | |
| | | | Specialty Retail – 6.9% | | | | | | | | |
| | 42,032 | | | DSW, Inc., Class A(b) | | | | | | | 1,206,318 | |
| | 44,064 | | | hhgregg, Inc.(b) | | | | | | | 1,091,025 | |
| | 48,302 | | | Hibbett Sports, Inc.(b) | | | | | | | 1,205,135 | |
| | 29,727 | | | J. Crew Group, Inc.(b) | | | | | | | 999,422 | |
| | 29,148 | | | Monro Muffler Brake, Inc. | | | | | | | 1,344,014 | |
| | 59,731 | | | Ulta Salon, Cosmetics & Fragrance, Inc.(b) | | | | | | | 1,744,145 | |
| | 44,052 | | | Vitamin Shoppe, Inc.(b) | | | | | | | 1,209,227 | |
| | | | | | | | | | | | |
| | | | | | | | | | | 8,799,286 | |
| | | | | | | | | | | | |
| | | | Textiles, Apparel & Luxury Goods – 3.6% | | | | | | | | |
| | 45,785 | | | Carter’s, Inc.(b) | | | | | | | 1,205,519 | |
| | 51,251 | | | Crocs, Inc.(b) | | | | | | | 666,776 | |
| | 24,043 | | | Phillips-Van Heusen Corp. | | | | | | | 1,446,427 | |
| | 68,232 | | | Volcom, Inc.(b) | | | | | | | 1,304,596 | |
| | | | | | | | | | | | |
| | | | | | | | | | | 4,623,318 | |
| | | | | | | | | | | | |
| | | | Total Common Stocks | | | | | | | | |
| | | | (Identified Cost $94,605,630) | | | | | | | 124,091,711 | |
| | | | | | | | | | | | |
See accompanying notes to financial statements.
| 18
Portfolio of Investments – as of September 30, 2010
Loomis Sayles Small Cap Growth Fund – continued
| | | | | | | | | | | | |
Principal
Amount | | | Description | | | | | Value (†) | |
| Short-Term Investments – 1.3%
| | | | | | | | |
| $ | 1,633,165 | | | Tri-Party Repurchase Agreement with Fixed Income Clearing Corporation, dated 9/30/2010 at 0.000% to be repurchased at $1,663,165 on 10/01/2010 collateralized by $1,665,000 Federal Home Loan Bank, 0.625% due 1/13/2012 valued at $1,669,163 including accrued interest (Note 2 of Notes to Financial Statements)
(Identified Cost $1,633,165) | | | | | | $ | 1,633,165 | |
| | | | | | | | | | | | |
| | | | Total Investments – 98.3% | | | | | | | | |
| | | | (Identified Cost $96,238,795)(a) | | | | | | | 125,724,876 | |
| | | | Other assets less liabilities—1.7% | | | | | | | 2,120,477 | |
| | | | | | | | | | | | |
| | | | Net Assets – 100.0% | | | | | | $ | 127,845,353 | |
| | | | | | | | | | | | |
| |
| (†)See Note 2 of Notes to Financial Statements. | | | | | |
| (a)Federal Tax Information: | | | | | |
| At September 30, 2010, the net unrealized appreciation on investments based on a cost
of $96,756,618 for federal income tax purposes was as follows: |
| | | | |
| Aggregate gross unrealized appreciation for all investments in which there is an excess
of value over tax cost |
| | $ | 30,505,784 | |
| Aggregate gross unrealized depreciation for all investments in which there is an excess of
tax cost over value |
| | | (1,537,526 | ) |
| | | | | | | | | | | | |
| Net unrealized appreciation | | | $ | 28,968,258 | |
| | | | | | | | | | | | |
| (b) | Non-income producing security. |
| ADR | An American Depositary Receipt is a certificate issued by a custodian bank representing the right to receive securities of the foreign issuer described. The values of ADRs are significantly influenced by trading on exchanges not located in the United States. |
See accompanying notes to financial statements.
19 |
Portfolio of Investments – as of September 30, 2010
Loomis Sayles Small Cap Growth Fund – continued
Industry Summary at September 30, 2010 (Unaudited)
| | | | |
Software | | | 9.9 | % |
Health Care Equipment & Supplies | | | 8.6 | |
Semiconductors & Semiconductor Equipment | | | 7.1 | |
Specialty Retail | | | 6.9 | |
Internet Software & Services | | | 6.5 | |
Biotechnology | | | 5.6 | |
Oil, Gas & Consumable Fuels | | | 5.3 | |
Health Care Providers & Services | | | 3.8 | |
Textiles, Apparel & Luxury Goods | | | 3.6 | |
Professional Services | | | 3.6 | |
Capital Markets | | | 3.3 | |
Aerospace & Defense | | | 2.6 | |
Energy Equipment & Services | | | 2.6 | |
Hotels, Restaurants & Leisure | | | 2.3 | |
Commercial Services & Supplies | | | 2.0 | |
Commercial Banks | | | 2.0 | |
Auto Components | | | 2.0 | |
Health Care Technology | | | 2.0 | |
Air Freight & Logistics | | | 2.0 | |
Other Investments, less than 2% each | | | 15.3 | |
Short-Term Investments | | | 1.3 | |
| | | | |
Total Investments | | | 98.3 | |
Other assets less liabilities | | | 1.7 | |
| | | | |
Net Assets | | | 100.0 | % |
| | | | |
See accompanying notes to financial statements.
| 20
Portfolio of Investments – as of September 30, 2010
Loomis Sayles Small Cap Value Fund
| | | | | | | | | | | | |
| Shares | | | Description | | | | | Value (†) | |
| | Common Stocks – 99.0% of Net Assets | | | | | | | | |
| | | | Air Freight & Logistics – 1.0% | | | | | | | | |
| | 187,245 | | | Atlas Air Worldwide Holdings, Inc.(b) | | | | | | $ | 9,418,424 | |
| | | | | | | | | | | | |
| | | | Auto Components – 1.8% | | | | | | | | |
| | 512,555 | | | Dana Holding Corp.(b) | | | | | | | 6,314,678 | |
| | 300,750 | | | Goodyear Tire & Rubber Co. (The)(b) | | | | | | | 3,233,062 | |
| | 225,991 | | | Tenneco, Inc.(b) | | | | | | | 6,546,959 | |
| | | | | | | | | | | | |
| | | | | | | | | | | 16,094,699 | |
| | | | | | | | | | | | |
| | | | Building Products – 1.1% | | | | | | | | |
| | 142,250 | | | Armstrong World Industries, Inc.(b) | | | | | | | 5,904,797 | |
| | 348,440 | | | Griffon Corp.(b) | | | | | | | 4,247,484 | |
| | | | | | | | | | | | |
| | | | | | | | | | | 10,152,281 | |
| | | | | | | | | | | | |
| | | | Capital Markets – 2.7% | | | | | | | | |
| | 555,653 | | | Ares Capital Corp. | | | | | | | 8,695,969 | |
| | 698,225 | | | Fifth Street Finance Corp. | | | | | | | 7,778,227 | |
| | 161,713 | | | JMP Group, Inc. | | | | | | | 986,449 | |
| | 162,890 | | | Stifel Financial Corp.(b) | | | | | | | 7,540,178 | |
| | | | | | | | | | | | |
| | | | | | | | | | | 25,000,823 | |
| | | | | | | | | | | | |
| | | | Chemicals – 4.2% | | | | | | | | |
| | 270,934 | | | Calgon Carbon Corp.(b) | | | | | | | 3,928,543 | |
| | 541,390 | | | Ferro Corp.(b) | | | | | | | 6,978,517 | |
| | 251,232 | | | Koppers Holdings, Inc. | | | | | | | 6,750,604 | |
| | 80,553 | | | Minerals Technologies, Inc. | | | | | | | 4,746,183 | |
| | 244,931 | | | Olin Corp. | | | | | | | 4,937,809 | |
| | 263,186 | | | WR Grace & Co.(b) | | | | | | | 7,353,417 | |
| | 233,915 | | | Zep, Inc. | | | | | | | 4,079,477 | |
| | | | | | | | | | | | |
| | | | | | | | | | | 38,774,550 | |
| | | | | | | | | | | | |
| | | | Commercial Banks – 7.2% | | | | | | | | |
| | 520,673 | | | Cathay General Bancorp | | | | | | | 6,190,802 | |
| | 83,912 | | | City National Corp. | | | | | | | 4,453,210 | |
| | 495,700 | | | CVB Financial Corp. | | | | | | | 3,722,707 | |
| | 482,716 | | | First Financial Bancorp | | | | | | | 8,051,703 | |
| | 552,161 | | | First Horizon National Corp.(b) | | | | | | | 6,300,152 | |
| | 417,314 | | | First Midwest Bancorp, Inc. | | | | | | | 4,811,630 | |
| | 161,834 | | | IBERIABANK Corp. | | | | | | | 8,088,463 | |
| | 2,273,275 | | | Popular, Inc.(b) | | | | | | | 6,592,498 | |
| | 183,036 | | | Prosperity Bancshares, Inc. | | | | | | | 5,943,179 | |
| | 228,219 | | | Signature Bank(b) | | | | | | | 8,864,026 | |
| | 423,986 | | | Sterling Bancshares, Inc. | | | | | | | 2,276,805 | |
| | | | | | | | | | | | |
| | | | | | | | | | | 65,295,175 | |
| | | | | | | | | | | | |
| | | | Commercial Services & Supplies – 4.1% | | | | | | | | |
| | 86,860 | | | Brink’s Co. (The) | | | | | | | 1,997,780 | |
| | 147,833 | | | McGrath Rentcorp | | | | | | | 3,540,600 | |
See accompanying notes to financial statements.
21 |
Portfolio of Investments – as of September 30, 2010
Loomis Sayles Small Cap Value Fund – continued
| | | | | | | | | | | | |
| Shares | | | Description | | | | | Value (†) | |
| | Common Stocks – continued | | | | | | | | |
| | | | Commercial Services & Supplies – continued | | | | | | | | |
| | 579,499 | | | Rollins, Inc. | | | | | | $ | 13,548,687 | |
| | 444,373 | | | Standard Parking Corp.(b) | | | | | | | 7,598,778 | |
| | 174,849 | | | Team, Inc.(b) | | | | | | | 3,009,151 | |
| | 191,730 | | | Waste Connections, Inc.(b) | | | | | | | 7,604,012 | |
| | | | | | | | | | | | |
| | | | | | | | | | | 37,299,008 | |
| | | | | | | | | | | | |
| | | | Communications Equipment – 1.1% | | | | | | | | |
| | 217,400 | | | ADTRAN, Inc. | | | | | | | 7,674,220 | |
| | 179,671 | | | Tekelec(b) | | | | | | | 2,328,536 | |
| | | | | | | | | | | | |
| | | | | | | | | | | 10,002,756 | |
| | | | | | | | | | | | |
| | | | Construction & Engineering – 0.4% | | | | | | | | |
| | 210,339 | | | MYR Group, Inc.(b) | | | | | | | 3,447,456 | |
| | | | | | | | | | | | |
| | | | Consumer Finance – 1.4% | | | | | | | | |
| | 150,355 | | | Cash America International, Inc. | | | | | | | 5,262,425 | |
| | 363,696 | | | Dollar Financial Corp.(b) | | | | | | | 7,590,336 | |
| | | | | | | | | | | | |
| | | | | | | | | | | 12,852,761 | |
| | | | | | | | | | | | |
| | | | Containers & Packaging – 0.5% | | | | | | | | |
| | 225,272 | | | Temple-Inland, Inc. | | | | | | | 4,203,576 | |
| | | | | | | | | | | | |
| | | | Distributors – 0.5% | | | | | | | | |
| | 134,464 | | | Core-Mark Holding Co., Inc.(b) | | | | | | | 4,163,006 | |
| | | | | | | | | | | | |
| | | | Diversified Financial Services – 1.3% | | | | | | | | |
| | 322,962 | | | MarketAxess Holdings, Inc. | | | | | | | 5,483,895 | |
| | 311,941 | | | PHH Corp.(b) | | | | | | | 6,569,477 | |
| | | | | | | | | | | | |
| | | | | | | | | | | 12,053,372 | |
| | | | | | | | | | | | |
| | | | Electric Utilities – 2.3% | | | | | | | | |
| | 178,898 | | | ALLETE, Inc. | | | | | | | 6,517,254 | |
| | 131,699 | | | ITC Holdings Corp. | | | | | | | 8,198,263 | |
| | 224,693 | | | UIL Holdings Corp. | | | | | | | 6,327,355 | |
| | | | | | | | | | | | |
| | | | | | | | | | | 21,042,872 | |
| | | | | | | | | | | | |
| | | | Electrical Equipment – 3.7% | | | | | | | | |
| | 64,937 | | | AZZ, Inc. | | | | | | | 2,781,901 | |
| | 223,929 | | | Baldor Electric Co. | | | | | | | 9,046,732 | |
| | 163,553 | | | Encore Wire Corp. | | | | | | | 3,354,472 | |
| | 266,554 | | | GrafTech International Ltd.(b) | | | | | | | 4,166,239 | |
| | 237,682 | | | II-VI, Inc.(b) | | | | | | | 8,872,669 | |
| | 10,651 | | | LaBarge, Inc.(b) | | | | | | | 133,031 | |
| | 123,425 | | | Thomas & Betts Corp.(b) | | | | | | | 5,062,893 | |
| | | | | | | | | | | | |
| | | | | | | | | | | 33,417,937 | |
| | | | | | | | | | | | |
| | | | Electronic Equipment, Instruments & Components – 3.4% | | | | | | | | |
| | 313,561 | | | Cognex Corp. | | | | | | | 8,409,706 | |
| | 131,288 | | | Littelfuse, Inc.(b) | | | | | | | 5,737,286 | |
See accompanying notes to financial statements.
| 22
Portfolio of Investments – as of September 30, 2010
Loomis Sayles Small Cap Value Fund – continued
| | | | | | | | | | | | |
| Shares | | | Description | | | | | Value (†) | |
| | Common Stocks – continued | | | | | | | | |
| | | | Electronic Equipment, Instruments & Components – continued | | | | | | | | |
| | 537,821 | | | Methode Electronics, Inc. | | | | | | $ | 4,883,415 | |
| | 75,054 | | | Rofin-Sinar Technologies, Inc.(b) | | | | | | | 1,904,870 | |
| | 241,876 | | | ScanSource, Inc.(b) | | | | | | | 6,709,640 | |
| | 328,375 | | | TTM Technologies, Inc.(b) | | | | | | | 3,214,791 | |
| | | | | | | | | | | | |
| | | | | | | | | | | 30,859,708 | |
| | | | | | | | | | | | |
| | | | Energy Equipment & Services – 2.6% | | | | | | | | |
| | 191,015 | | | Dresser-Rand Group, Inc.(b) | | | | | | | 7,046,543 | |
| | 157,568 | | | Lufkin Industries, Inc. | | | | | | | 6,917,235 | |
| | 282,687 | | | Newpark Resources, Inc.(b) | | | | | | | 2,374,571 | |
| | 133,752 | | | Oceaneering International, Inc.(b) | | | | | | | 7,203,883 | |
| | | | | | | | | | | | |
| | | | | | | | | | | 23,542,232 | |
| | | | | | | | | | | | |
| | | | Food & Staples Retailing – 1.0% | | | | | | | | |
| | 94,879 | | | BJ’s Wholesale Club, Inc.(b) | | | | | | | 3,937,479 | |
| | 375,547 | | | Spartan Stores, Inc. | | | | | | | 5,445,431 | |
| | | | | | | | | | | | |
| | | | | | | | | | | 9,382,910 | |
| | | | | | | | | | | | |
| | | | Food Products – 3.0% | | | | | | | | |
| | 136,464 | | | Corn Products International, Inc. | | | | | | | 5,117,400 | |
| | 634,943 | | | Darling International, Inc.(b) | | | | | | | 5,409,714 | |
| | 186,239 | | | Fresh Del Monte Produce, Inc.(b) | | | | | | | 4,041,386 | |
| | 168,066 | | | J & J Snack Foods Corp. | | | | | | | 7,047,008 | |
| | 124,041 | | | Lance, Inc. | | | | | | | 2,642,073 | |
| | 545,153 | | | Pilgrim’s Pride Corp.(b) | | | | | | | 3,063,760 | |
| | | | | | | | | | | | |
| | | | | | | | | | | 27,321,341 | |
| | | | | | | | | | | | |
| | | | Gas Utilities – 1.4% | | | | | | | | |
| | 432,671 | | | UGI Corp. | | | | | | | 12,378,717 | |
| | | | | | | | | | | | |
| | | | Health Care Equipment & Supplies – 2.0% | | | | | | | | |
| | 126,173 | | | Haemonetics Corp.(b) | | | | | | | 7,384,906 | |
| | 112,062 | | | Teleflex, Inc. | | | | | | | 6,362,880 | |
| | 124,562 | | | West Pharmaceutical Services, Inc. | | | | | | | 4,273,722 | |
| | | | | | | | | | | | |
| | | | | | | | | | | 18,021,508 | |
| | | | | | | | | | | | |
| | | | Health Care Providers & Services – 1.3% | | | | | | | | |
| | 103,792 | | | MEDNAX, Inc.(b) | | | | | | | 5,532,114 | |
| | 222,122 | | | WellCare Health Plans, Inc.(b) | | | | | | | 6,432,653 | |
| | | | | | | | | | | | |
| | | | | | | | | | | 11,964,767 | |
| | | | | | | | | | | | |
| | | | Hotels, Restaurants & Leisure – 2.1% | | | | | | | | |
| | 149,999 | | | Bob Evans Farms, Inc. | | | | | | | 4,210,472 | |
| | 205,689 | | | California Pizza Kitchen, Inc.(b) | | | | | | | 3,509,054 | |
| | 248,627 | | | Isle of Capri Casinos, Inc.(b) | | | | | | | 1,780,169 | |
| | 362,827 | | | Wyndham Worldwide Corp. | | | | | | | 9,966,858 | |
| | | | | | | | | | | | |
| | | | | | | | | | | 19,466,553 | |
| | | | | | | | | | | | |
See accompanying notes to financial statements.
23 |
Portfolio of Investments – as of September 30, 2010
Loomis Sayles Small Cap Value Fund – continued
| | | | | | | | | | | | |
| Shares | | | Description | | | | | Value (†) | |
| | Common Stocks – continued | | | | | | | | |
| | | | Household Durables – 1.4% | | | | | | | | |
| | 197,326 | | | Jarden Corp. | | | | | | $ | 6,142,759 | |
| | 308,949 | | | Leggett & Platt, Inc. | | | | | | | 7,031,679 | |
| | | | | | | | | | | | |
| | | | | | | | | | | 13,174,438 | |
| | | | | | | | | | | | |
| | | | Industrial Conglomerates – 0.7% | | | | | | | | |
| | 162,146 | | | Raven Industries, Inc. | | | | | | | 6,143,712 | |
| | | | | | | | | | | | |
| | | | Insurance – 5.3% | | | | | | | | |
| | 218,449 | | | Aspen Insurance Holdings Ltd. | | | | | | | 6,614,636 | |
| | 271,528 | | | Employers Holdings, Inc. | | | | | | | 4,281,996 | |
| | 104,597 | | | Hanover Insurance Group, Inc. (The) | | | | | | | 4,916,059 | |
| | 299,373 | | | HCC Insurance Holdings, Inc. | | | | | | | 7,810,642 | |
| | 496,165 | | | Old Republic International Corp. | | | | | | | 6,871,885 | |
| | 123,616 | | | ProAssurance Corp.(b) | | | | | | | 7,119,045 | |
| | 114,083 | | | Reinsurance Group of America, Inc. | | | | | | | 5,509,068 | |
| | 97,569 | | | RLI Corp. | | | | | | | 5,524,357 | |
| | | | | | | | | | | | |
| | | | | | | | | | | 48,647,688 | |
| | | | | | | | | | | | |
| | | | Internet & Catalog Retail – 0.5% | | | | | | | | |
| | 162,622 | | | HSN, Inc.(b) | | | | | | | 4,862,398 | |
| | | | | | | | | | | | |
| | | | Internet Software & Services – 0.6% | | | | | | | | |
| | 193,225 | | | IAC/InterActiveCorp(b) | | | | | | | 5,076,021 | |
| | | | | | | | | | | | |
| | | | IT Services – 3.0% | | | | | | | | |
| | 82,314 | | | Alliance Data Systems Corp.(b) | | | | | | | 5,371,812 | |
| | 277,971 | | | Broadridge Financial Solutions, Inc. | | | | | | | 6,357,197 | |
| | 141,530 | | | iGATE Corp. | | | | | | | 2,567,354 | |
| | 90,789 | | | Lender Processing Services, Inc. | | | | | | | 3,016,918 | |
| | 275,970 | | | Wright Express Corp.(b) | | | | | | | 9,854,889 | |
| | | | | | | | | | | | |
| | | | | | | | | | | 27,168,170 | |
| | | | | | | | | | | | |
| | | | Life Sciences Tools & Services – 0.8% | | | | | | | | |
| | 25,067 | | | Mettler-Toledo International, Inc.(b) | | | | | | | 3,119,337 | |
| | 157,729 | | | Pharmaceutical Product Development, Inc. | | | | | | | 3,910,102 | |
| | | | | | | | | | | | |
| | | | | | | | | | | 7,029,439 | |
| | | | | | | | | | | | |
| | | | Machinery – 5.5% | | | | | | | | |
| | 334,348 | | | Actuant Corp., Class A | | | | | | | 7,676,630 | |
| | 439,916 | | | Albany International Corp., Class A | | | | | | | 8,323,211 | |
| | 467,709 | | | Altra Holdings, Inc.(b) | | | | | | | 6,889,353 | |
| | 296,505 | | | Commercial Vehicle Group, Inc.(b) | | | | | | | 3,018,421 | |
| | 370,402 | | | John Bean Technologies Corp. | | | | | | | 5,967,176 | |
| | 42,038 | | | Middleby Corp. (The)(b) | | | | | | | 2,664,789 | |
| | 146,570 | | | RBC Bearings, Inc.(b) | | | | | | | 4,980,449 | |
| | 644,979 | | | Wabash National Corp.(b) | | | | | | | 5,217,880 | |
| | 117,284 | | | Wabtec Corp. | | | | | | | 5,605,002 | |
| | | | | | | | | | | | |
| | | | | | | | | | | 50,342,911 | |
| | | | | | | | | | | | |
See accompanying notes to financial statements.
| 24
Portfolio of Investments – as of September 30, 2010
Loomis Sayles Small Cap Value Fund – continued
| | | | | | | | | | | | |
| Shares | | | Description | | | | | Value (†) | |
| | COMMON STOCKS – continued | | | | | | | | |
| | | | Marine – 0.5% | | | | | | | | |
| | 113,347 | | | Kirby Corp.(b) | | | | | | $ | 4,540,681 | |
| | | | | | | | | | | | |
| | | | Media – 4.0% | | | | | | | | |
| | 163,892 | | | Arbitron, Inc. | | | | | | | 4,584,059 | |
| | 139,112 | | | Harte-Hanks, Inc. | | | | | | | 1,623,437 | |
| | 211,322 | | | John Wiley & Sons, Inc., Class A | | | | | | | 8,634,617 | |
| | 176,394 | | | Liberty Media-Starz, Series A(b) | | | | | | | 11,444,443 | |
| | 243,733 | | | Madison Square Garden, Inc., Class A(b) | | | | | | | 5,137,891 | |
| | 183,346 | | | Scholastic Corp. | | | | | | | 5,100,686 | |
| | | | | | | | | | | | |
| | | | | | | | | | | 36,525,133 | |
| | | | | | | | | | | | |
| | | | Metals & Mining – 1.9% | | | | | | | | |
| | 139,270 | | | Haynes International, Inc. | | | | | | | 4,863,308 | |
| | 560,885 | | | Horsehead Holding Corp.(b) | | | | | | | 5,535,935 | |
| | 166,083 | | | Reliance Steel & Aluminum Co. | | | | | | | 6,897,427 | |
| | | | | | | | | | | | |
| | | | | | | | | | | 17,296,670 | |
| | | | | | | | | | | | |
| | | | Multiline Retail – 0.6% | | | | | | | | |
| | 486,031 | | | Fred’s, Inc. Class A | | | | | | | 5,735,166 | |
| | | | | | | | | | | | |
| | | | Oil, Gas & Consumable Fuels – 2.4% | | | | | | | | |
| | 208,851 | | | Berry Petroleum Co., Class A | | | | | | | 6,626,842 | |
| | 263,059 | | | Cloud Peak Energy, Inc.(b) | | | | | | | 4,800,827 | |
| | 248,742 | | | Comstock Resources, Inc.(b) | | | | | | | 5,594,208 | |
| | 191,195 | | | Rosetta Resources, Inc.(b) | | | | | | | 4,491,170 | |
| | | | | | | | | | | | |
| | | | | | | | | | | 21,513,047 | |
| | | | | | | | | | | | |
| | | | Paper & Forest Products – 0.5% | | | | | | | | |
| | 94,118 | | | Deltic Timber Corp. | | | | | | | 4,216,486 | |
| | | | | | | | | | | | |
| | | | Pharmaceuticals – 0.7% | | | | | | | | |
| | 371,504 | | | Obagi Medical Products, Inc.(b) | | | | | | | 3,900,792 | |
| | 44,881 | | | Perrigo Co. | | | | | | | 2,882,258 | |
| | | | | | | | | | | | |
| | | | | | | | | | | 6,783,050 | |
| | | | | | | | | | | | |
| | | | Real Estate Management & Development – 0.4% | | | | | | | | |
| | 222,381 | | | Forestar Group, Inc.(b) | | | | | | | 3,791,596 | |
| | | | | | | | | | | | |
| | | | REITs – 0.9% | | | | | | | | |
| | 235,691 | | | Potlatch Corp. | | | | | | | 8,013,494 | |
| | | | | | | | | | | | |
| | | | REITs – Apartments – 2.5% | | | | | | | | |
| | 332,085 | | | American Campus Communities, Inc. | | | | | | | 10,108,668 | |
| | 108,261 | | | Mid-America Apartment Communities, Inc. | | | | | | | 6,309,451 | |
| | 309,208 | | | UDR, Inc. | | | | | | | 6,530,473 | |
| | | | | | | | | | | | |
| | | | | | | | | | | 22,948,592 | |
| | | | | | | | | | | | |
See accompanying notes to financial statements.
25 |
Portfolio of Investments – as of September 30, 2010
Loomis Sayles Small Cap Value Fund – continued
| | | | | | | | | | | | |
| Shares | | | Description | | | | | Value (†) | |
| | Common Stocks – continued | | | | | | | | |
| | | | REITs – Diversified – 1.1% | | | | | | | | |
| | 49,755 | | | Digital Realty Trust, Inc. | | | | | | $ | 3,069,883 | |
| | 268,619 | | | DuPont Fabros Technology, Inc. | | | | | | | 6,755,768 | |
| | | | | | | | | | | | |
| | | | | | | | | | | 9,825,651 | |
| | | | | | | | | | | | |
| | | | REITs – Healthcare – 0.9% | | | | | | | | |
| | 357,947 | | | Omega Healthcare Investors, Inc. | | | | | | | 8,035,910 | |
| | | | | | | | | | | | |
| | | | REITs – Mortgage – 0.8% | | | | | | | | |
| | 1,780,247 | | | Chimera Investment Corp. | | | | | | | 7,031,976 | |
| | | | | | | | | | | | |
| | | | REITs – Office Property – 0.8% | | | | | | | | |
| | 425,904 | | | BioMed Realty Trust, Inc. | | | | | | | 7,632,200 | |
| | | | | | | | | | | | |
| | | | REITs – Storage – 1.0% | | | | | | | | |
| | 101,476 | | | Sovran Self Storage, Inc. | | | | | | | 3,845,940 | |
| | 623,990 | | | U-Store-It Trust | | | | | | | 5,210,317 | |
| | | | | | | | | | | | |
| | | | | | | | | | | 9,056,257 | |
| | | | | | | | | | | | |
| | | | REITs – Triple Net Lease – 0.7% | | | | | | | | |
| | 268,632 | | | National Retail Properties, Inc. | | | | | | | 6,745,350 | |
| | | | | | | | | | | | |
| | | | Road & Rail – 1.7% | | | | | | | | |
| | 165,880 | | | Genesee & Wyoming, Inc., Class A(b) | | | | | | | 7,197,533 | |
| | 182,599 | | | Old Dominion Freight Line, Inc.(b) | | | | | | | 4,641,667 | |
| | 329,319 | | | Vitran Corp., Inc.(b) | | | | | | | 3,606,043 | |
| | | | | | | | | | | | |
| | | | | | | | | | | 15,445,243 | |
| | | | | | | | | | | | |
| | | | Semiconductors & Semiconductor Equipment – 2.6% | | | | | | | | |
| | 145,681 | | | Applied Micro Circuits Corp.(b) | | | | | | | 1,456,810 | |
| | 251,428 | | | Cohu, Inc. | | | | | | | 3,165,479 | |
| | 261,876 | | | Diodes, Inc.(b) | | | | | | | 4,475,461 | |
| | 341,235 | | | ON Semiconductor Corp.(b) | | | | | | | 2,460,304 | |
| | 665,150 | | | Teradyne, Inc.(b) | | | | | | | 7,409,771 | |
| | 509,153 | | | TriQuint Semiconductor, Inc.(b) | | | | | | | 4,887,869 | |
| | | | | | | | | | | | |
| | | | | | | | | | | 23,855,694 | |
| | | | | | | | | | | | |
| | | | Software – 0.9% | | | | | | | | |
| | 187,010 | | | Progress Software Corp.(b) | | | | | | | 6,190,031 | |
| | 115,527 | | | Radiant Systems, Inc.(b) | | | | | | | 1,975,512 | |
| | | | | | | | | | | | |
| | | | | | | | | | | 8,165,543 | |
| | | | | | | | | | | | |
| | | | Specialty Retail – 2.7% | | | | | | | | |
| | 194,583 | | | Genesco, Inc.(b) | | | | | | | 5,814,140 | |
| | 139,041 | | | Jo-Ann Stores, Inc.(b) | | | | | | | 6,194,277 | |
| | 305,125 | | | PEP Boys-Manny Moe & Jack | | | | | | | 3,228,222 | |
| | 864,336 | | | Sally Beauty Holdings, Inc.(b) | | | | | | | 9,680,563 | |
| | | | | | | | | | | | |
| | | | | | | | | | | 24,917,202 | |
| | | | | | | | | | | | |
See accompanying notes to financial statements.
| 26
Portfolio of Investments – as of September 30, 2010
Loomis Sayles Small Cap Value Fund – continued
| | | | | | | | | | | | |
| Shares | | | Description | | | | | Value (†) | |
| | Common Stocks – continued | | | | | | | | |
| | | | Textiles, Apparel & Luxury Goods – 1.6% | | | | | | | | |
| | 134,057 | | | Fossil, Inc.(b) | | | | | | $ | 7,210,926 | |
| | 222,164 | | | Kenneth Cole Productions, Inc., Class A(b) | | | | | | | 3,703,474 | |
| | 335,905 | | | Movado Group, Inc.(b) | | | | | | | 3,654,646 | |
| | | | | | | | | | | | |
| | | | | | | | | | | 14,569,046 | |
| | | | | | | | | | | | |
| | | | Thrifts & Mortgage Finance – 1.2% | | | | | | | | |
| | 516,533 | | | MGIC Investment Corp.(b) | | | | | | | 4,767,599 | |
| | 412,680 | | | Washington Federal, Inc. | | | | | | | 6,297,497 | |
| | | | | | | | | | | | |
| | | | | | | | | | | 11,065,096 | |
| | | | | | | | | | | | |
| | | | Trading Companies & Distributors – 0.2% | | | | | | | | |
| | 82,827 | | | Textainer Group Holdings Ltd. | | | | | | | 2,214,794 | |
| | | | | | | | | | | | |
| | | | Water Utilities – 0.5% | | | | | | | | |
| | 272,189 | | | Middlesex Water Co. | | | | | | | 4,583,663 | |
| | | | | | | | | | | | |
| | | | Total Common Stocks | | | | | | | | |
| | | | (Identified Cost $765,997,036) | | | | | | | 903,108,749 | |
| | | | | | | | | | | | |
| | | |
Principal
Amount | | | | | | | | | |
| | Short-Term Investments – 1.0% | | | | | | | | |
| $ | 8,982,191 | | | Tri-Party Repurchase Agreement with Fixed Income Clearing Corporation, dated 9/30/2010 at 0.000% to be repurchased at $8,982,191 on 10/01/2010 collateralized by $9,140,000 Federal Home Loan Bank, 0.625% due 1/13/2012 valued at $9,162,850 including accrued interest (Note 2 of Notes to Financial Statements)
(Identified Cost $8,982,191) | | | | | | | 8,982,191 | |
| | | | | | | | | | | | |
| | | | Total Investments – 100.0% | | | | | | | | |
| | | | (Identified Cost $774,979,227)(a) | | | | | | | 912,090,940 | |
| | | | Other assets less liabilities—0.0% | | | | | | | 139,445 | |
| | | | | | | | | | | | |
| | | | Net Assets – 100.0% | | | | | | $ | 912,230,385 | |
| | | | | | | | | | | | |
| | |
| (†)See Note 2 of Notes to Financial Statements. | | | | | | | | |
| (a)Federal Tax Information: | | | | | |
| At September 30, 2010, the net unrealized appreciation on investments based on a
cost of $777,579,088 for federal income tax purposes was as follows: |
| | | | |
| Aggregate gross unrealized appreciation for all investments in which there is an excess
of value over tax cost |
| | $ | 152,125,601 | |
| Aggregate gross unrealized depreciation for all investments in which there is an excess
of tax cost over value |
| | | (17,613,749 | ) |
| | | | | | | | | | | | |
| Net unrealized appreciation | | | $ | 134,511,852 | |
| | | | | | | | | | | | |
| (b) | Non-income producing security. |
| REITs | Real Estate Investment Trusts |
See accompanying notes to financial statements.
27 |
Portfolio of Investments – as of September 30, 2010
Loomis Sayles Small Cap Value Fund – continued
Industry Summary at September 30, 2010 (Unaudited)
| | | | |
Commercial Banks | | | 7.2 | % |
Machinery | | | 5.5 | |
Insurance | | | 5.3 | |
Chemicals | | | 4.2 | |
Commercial Services & Supplies | | | 4.1 | |
Media | | | 4.0 | |
Electrical Equipment | | | 3.7 | |
Electronic Equipment, Instruments & Components | | | 3.4 | |
Food Products | | | 3.0 | |
IT Services | | | 3.0 | |
Capital Markets | | | 2.7 | |
Specialty Retail | | | 2.7 | |
Semiconductors & Semiconductor Equipment | | | 2.6 | |
Energy Equipment & Services | | | 2.6 | |
REITs – Apartments | | | 2.5 | |
Oil, Gas & Consumable Fuels | | | 2.4 | |
Electric Utilities | | | 2.3 | |
Hotels, Restaurants & Leisure | | | 2.1 | |
Health Care Equipment & Supplies | | | 2.0 | |
Other Investments, less than 2% each | | | 33.7 | |
Short-Term Investments | | | 1.0 | |
| | | | |
Total Investments | | | 100.0 | |
Other assets less liabilities | | | 0.0 | |
| | | | |
Net Assets | | | 100.0 | % |
| | | | |
See accompanying notes to financial statements.
| 28
Statement of Assets and Liabilities
September 30, 2010
| | | | | | | | |
| | | Small Cap
Growth Fund | | | Small Cap
Value Fund | |
ASSETS | | | | | | | | |
Investments at cost | | $ | 96,238,795 | | | $ | 774,979,227 | |
Net unrealized appreciation | | | 29,486,081 | | | | 137,111,713 | |
| | | | | | | | |
Investments at value | | | 125,724,876 | | | | 912,090,940 | |
Receivable for Fund shares sold | | | 1,496,955 | | | | 516,825 | |
Receivable for securities sold | | | 2,240,853 | | | | 4,395,772 | |
Dividends receivable | | | 1,495 | | | | 1,334,300 | |
| | | | | | | | |
TOTAL ASSETS | | | 129,464,179 | | | | 918,337,837 | |
| | | | | | | | |
LIABILITIES | | | | | | | | |
Payable for securities purchased | | | 1,276,583 | | | | 4,482,251 | |
Payable for Fund shares redeemed | | | 142,927 | | | | 827,832 | |
Management fees payable (Note 5) | | | 54,250 | | | | 529,605 | |
Deferred Trustees’ fees (Note 5) | | | 53,431 | | | | 117,132 | |
Administrative fees payable (Note 5) | | | 4,726 | | | | 34,269 | |
Other accounts payable and accrued expenses | | | 86,909 | | | | 116,363 | |
| | | | | | | | |
TOTAL LIABILITIES | | | 1,618,826 | | | | 6,107,452 | |
| | | | | | | | |
NET ASSETS | | $ | 127,845,353 | | | $ | 912,230,385 | |
| | | | | | | | |
NET ASSETS CONSIST OF: | | | | | | | | |
Paid-in capital | | $ | 185,095,084 | | | $ | 922,036,619 | |
Accumulated net investment (loss)/undistributed net investment income | | | (53,431 | ) | | | 2,319,360 | |
Accumulated net realized loss on investments | | | (86,682,381 | ) | | | (149,237,307 | ) |
Net unrealized appreciation on investments | | | 29,486,081 | | | | 137,111,713 | |
| | | | | | | | |
NET ASSETS | | $ | 127,845,353 | | | $ | 912,230,385 | |
| | | | | | | | |
| | |
COMPUTATION OF NET ASSET VALUE AND OFFERING PRICE: | | | | | | | | |
Institutional Class: | | | | | | | | |
Net assets | | $ | 52,501,246 | | | $ | 454,852,942 | |
| | | | | | | | |
Shares of beneficial interest | | | 3,742,633 | | | | 19,834,078 | |
| | | | | | | | |
Net asset value, offering and redemption price per share | | $ | 14.03 | | | $ | 22.93 | |
| | | | | | | | |
Retail Class: | | | | | | | | |
Net assets | | $ | 75,344,107 | | | $ | 383,934,320 | |
| | | | | | | | |
Shares of beneficial interest | | | 5,558,722 | | | | 16,905,825 | |
| | | | | | | | |
Net asset value, offering and redemption price per share | | $ | 13.55 | | | $ | 22.71 | |
| | | | | | | | |
Admin Class: | | | | | | | | |
Net assets | | $ | — | | | $ | 73,443,123 | |
| | | | | | | | |
Shares of beneficial interest | | | — | | | | 3,294,130 | |
| | | | | | | | |
Net asset value, offering and redemption price per share | | $ | — | | | $ | 22.30 | |
| | | | | | | | |
See accompanying notes to financial statements.
29 |
Statements of Operations
For the Year Ended September 30, 2010
| | | | | | | | |
| | | Small Cap
Growth Fund | | | Small Cap
Value Fund | |
INVESTMENT INCOME | | | | | | | | |
Dividends | | $ | 184,163 | (a) | | $ | 13,271,322 | |
| | | | | | | | |
Expenses | | | | | | | | |
Management fees (Note 5) | | | 928,032 | | | | 7,073,643 | |
Service and distribution fees (Note 5) | | | 191,734 | | | | 1,318,692 | |
Administrative fees (Note 5) | | | 59,448 | | | | 453,231 | |
Trustees’ fees and expenses (Note 5) | | | 19,143 | | | | 35,220 | |
Transfer agent fees and expenses (Notes 5 and 6) | | | 201,445 | | | | 1,148,358 | |
Audit and tax services fees | | | 36,658 | | | | 41,924 | |
Custodian fees and expenses | | | 23,817 | | | | 42,019 | |
Legal fees | | | 2,580 | | | | 19,565 | |
Registration fees | | | 45,122 | | | | 69,178 | |
Shareholder reporting expenses | | | 50,406 | | | | 209,231 | |
Miscellaneous expenses | | | 10,371 | | | | 37,587 | |
| | | | | | | | |
Total expenses | | | 1,568,756 | | | | 10,448,648 | |
Less waiver and/or expense reimbursement (Note 5) | | | (139,511 | ) | | | (640,652 | ) |
| | | | | | | | |
Net expenses | | | 1,429,245 | | | | 9,807,996 | |
| | | | | | | | |
Net investment income (loss) | | | (1,245,082 | ) | | | 3,463,326 | |
| | | | | | | | |
| | |
NET REALIZED AND UNREALIZED GAIN ON INVESTMENTS | | | | | | | | |
Net Realized Gain on: | | | | | | | | |
Investments | | | 14,954,786 | | | | 58,619,537 | |
| | | | | | | | |
| | |
Net Change in Unrealized Appreciation (Depreciation) on: | | | | | | | | |
Investments | | | 10,136,058 | | | | 34,774,717 | |
| | | | | | | | |
Net realized and unrealized gain on investments | | | 25,090,844 | | | | 93,394,254 | |
| | | | | | | | |
| | |
NET INCREASE IN NET ASSETS RESULTING FROM OPERATIONS | | $ | 23,845,762 | | | $ | 96,857,580 | |
| | | | | | | | |
| (a) | Includes a non-recurring dividend of $89,040. |
See accompanying notes to financial statements.
| 30
Statements of Changes in Net Assets
| | | | | | | | | | | | | | | | |
| | | Small Cap Growth Fund | | | Small Cap Value Fund | |
| | | Year Ended
September 30,
2010 | | | Year Ended
September 30,
2009 | | | Year Ended
September 30,
2010 | | | Year Ended
September 30,
2009 | |
FROM OPERATIONS: | | | | | | | | | | | | | | | | |
Net investment income (loss) | | $ | (1,245,082 | ) | | $ | (794,013 | ) | | $ | 3,463,326 | | | $ | 3,004,380 | |
Net realized gain (loss) on investments | | | 14,954,786 | | | | (34,962,361 | ) | | | 58,619,537 | | | | (157,922,333 | ) |
Net change in unrealized appreciation (depreciation) on investments | | | 10,136,058 | | | | 21,890,105 | | | | 34,774,717 | | | | 76,497,968 | |
| | | | | | | | | | | | | | | | |
Net increase (decrease) in net assets resulting from operations | | | 23,845,762 | | | | (13,866,269 | ) | | | 96,857,580 | | | | (78,419,985 | ) |
| | | | | | | | | | | | | | | | |
FROM DISTRIBUTIONS
TO SHAREHOLDERS: | | | | | | | | | | | | | | | | |
Net Investment Income | | | | | | | | | | | | | | | | |
Institutional Class | | | — | | | | — | | | | (1,798,397 | ) | | | (2,585,541 | ) |
Retail Class | | | — | | | | — | | | | (522,660 | ) | | | (1,071,277 | ) |
Admin Class | | | — | | | | — | | | | — | | | | (9,660 | ) |
Net Realized Capital Gains | | | | | | | | | | | | | | | | |
Institutional Class | | | — | | | | — | | | | — | | | | (167,987 | ) |
Retail Class | | | — | | | | — | | | | — | | | | (141,335 | ) |
Admin Class | | | — | | | | — | | | | — | | | | (24,687 | ) |
| | | | | | | | | | | | | | | | |
Total distributions | | | — | | | | — | | | | (2,321,057 | ) | | | (4,000,487 | ) |
| | | | | | | | | | | | | | | | |
NET INCREASE (DECREASE) IN NET ASSETS FROM CAPITAL SHARE TRANSACTIONS (NOTE 10) | | | (17,035,340 | ) | | | 10,464,100 | | | | (150,208,179 | ) | | | (45,368,424 | ) |
| | | | | | | | | | | | | | | | |
Redemption fees | | | | | | | | | | | | | | | | |
Institutional Class | | | — | | | | — | | | | — | | | | 21,500 | |
Retail Class | | | — | | | | — | | | | — | | | | 17,487 | |
Admin Class | | | — | | | | — | | | | — | | | | 3,123 | |
| | | | | | | | | | | | | | | | |
Total redemption fees | | | — | | | | — | | | | — | | | | 42,110 | |
| | | | | | | | | | | | | | | | |
Net increase (decrease) in net assets | | | 6,810,422 | | | | (3,402,169 | ) | | | (55,671,656 | ) | | | (127,746,786 | ) |
NET ASSETS | | | | | | | | | | | | | | | | |
Beginning of the year | | | 121,034,931 | | | | 124,437,100 | | | | 967,902,041 | | | | 1,095,648,827 | |
| | | | | | | | | | | | | | | | |
End of the year | | $ | 127,845,353 | | | $ | 121,034,931 | | | $ | 912,230,385 | | | $ | 967,902,041 | |
| | | | | | | | | | | | | | | | |
ACCUMULATED NET INVESTMENT (LOSS)/UNDISTRIBUTED NET INVESTMENT INCOME | | $ | (53,431 | ) | | $ | (46,961 | ) | | $ | 2,319,360 | | | $ | 1,177,091 | |
| | | | | | | | | | | | | | | | |
See accompanying notes to financial statements.
31 |
This Page Intentionally Left Blank
| 32
Financial Highlights
For a share outstanding throughout each period.
| | | | | | | | | | | | | | | | | | | | | | | | | | | | | | | | |
| | | | | | Income (Loss) from
Investment Operations: | | | | | | Less Distributions: | |
| | | Net asset
value,
beginning
of the
period | | | Net
investment
income
(loss)(a)(b) | | | Net
realized
and
unrealized
gain (loss) | | | Total
from
investment
operations | | | | | | Dividends
from net
investment
income(b) | | | Distributions
from net
realized
capital
gains | | | Total
distributions | |
Small Cap Growth Fund | | | | | | | | | | | | | | | | | | | | | | | | | | | | | |
| | | | | | | |
| Institutional Class | | | | | | | | | | | | | | | | | | | | | | | | | | | | | |
9/30/2010 | | $ | 11.58 | | | $ | (0.11 | )(k) | | $ | 2.56 | | | $ | 2.45 | | | | | | | $ | — | | | $ | — | | | $ | — | |
9/30/2009 | | | 13.07 | | | | (0.07 | ) | | | (1.42 | ) | | | (1.49 | ) | | | | | | | — | | | | — | | | | — | |
9/30/2008 | | | 15.87 | | | | (0.07 | ) | | | (2.73 | ) | | | (2.80 | ) | | | | | | | — | | | | — | | | | — | |
9/30/2007 | | | 12.00 | | | | (0.06 | )(g) | | | 3.93 | | | | 3.87 | | | | | | | | — | | | | — | | | | — | |
9/30/2006 | | | 11.08 | | | | (0.08 | ) | | | 0.99 | | | | 0.91 | | | | | | | | — | | | | — | | | | — | |
| | | | | | | |
| Retail Class | | | | | | | | | | | | | | | | | | | | | | | | | | | | | |
9/30/2010 | | | 11.21 | | | | (0.13 | )(k) | | | 2.47 | | | | 2.34 | | | | | | | | — | | | | — | | | | — | |
9/30/2009 | | | 12.69 | | | | (0.09 | ) | | | (1.39 | ) | | | (1.48 | ) | | | | | | | — | | | | — | | | | — | |
9/30/2008 | | | 15.45 | | | | (0.10 | ) | | | (2.66 | ) | | | (2.76 | ) | | | | | | | — | | | | — | | | | — | |
9/30/2007 | | | 11.71 | | | | (0.09 | )(g) | | | 3.83 | | | | 3.74 | | | | | | | | — | | | | — | | | | — | |
9/30/2006 | | | 10.84 | | | | (0.11 | ) | | | 0.97 | | | | 0.86 | | | | | | | | — | | | | — | | | | — | |
| Small Cap Value Fund | | | | | | | | | | | | | | | | | | | | | | | | | | | | | |
| | | | | | | |
| Institutional Class | | | | | | | | | | | | | | | | | | | | | | | | | | | | | |
9/30/2010 | | $ | 20.66 | | | $ | 0.11 | | | $ | 2.23 | | | $ | 2.34 | | | | | | | $ | (0.07 | ) | | $ | — | | | $ | (0.07 | ) |
9/30/2009 | | | 22.01 | | | | 0.09 | | | | (1.32 | ) | | | (1.23 | ) | | | | | | | (0.11 | ) | | | (0.01 | ) | | | (0.12 | ) |
9/30/2008 | | | 28.77 | | | | 0.11 | (h) | | | (4.03 | ) | | | (3.92 | ) | | | | | | | (0.06 | ) | | | (2.78 | ) | | | (2.84 | ) |
9/30/2007 | | | 27.69 | | | | 0.12 | (g)(i) | | | 4.29 | | | | 4.41 | | | | | | | | (0.17 | ) | | | (3.16 | ) | | | (3.33 | ) |
9/30/2006 | | | 27.43 | | | | 0.13 | | | | 2.70 | | | | 2.83 | | | | | | | | (0.15 | ) | | | (2.42 | ) | | | (2.57 | ) |
| | | | | | | |
| Retail Class | | | | | | | | | | | | | | | | | | | | | | | | | | | | | |
9/30/2010 | | | 20.47 | | | | 0.06 | | | | 2.21 | | | | 2.27 | | | | | | | | (0.03 | ) | | | — | | | | (0.03 | ) |
9/30/2009 | | | 21.79 | | | | 0.04 | | | | (1.30 | ) | | | (1.26 | ) | | | | | | | (0.05 | ) | | | (0.01 | ) | | | (0.06 | ) |
9/30/2008 | | | 28.52 | | | | 0.05 | (h) | | | (4.00 | ) | | | (3.95 | ) | | | | | | | — | | | | (2.78 | ) | | | (2.78 | ) |
9/30/2007 | | | 27.46 | | | | 0.04 | (g)(i) | | | 4.28 | | | | 4.32 | | | | | | | | (0.10 | ) | | | (3.16 | ) | | | (3.26 | ) |
9/30/2006 | | | 27.23 | | | | 0.06 | | | | 2.67 | | | | 2.73 | | | | | | | | (0.08 | ) | | | (2.42 | ) | | | (2.50 | ) |
| | | | | | | |
| Admin Class | | | | | | | | | | | | | | | | | | | | | | | | | | | | | |
9/30/2010 | | | 20.11 | | | | 0.00 | | | | 2.19 | | | | 2.19 | | | | | | | | — | | | | — | | | | — | |
9/30/2009 | | | 21.40 | | | | 0.00 | | | | (1.28 | ) | | | (1.28 | ) | | | | | | | (0.00 | ) | | | (0.01 | ) | | | (0.01 | ) |
9/30/2008 | | | 28.13 | | | | (0.01 | )(h) | | | (3.94 | ) | | | (3.95 | ) | | | | | | | — | | | | (2.78 | ) | | | (2.78 | ) |
9/30/2007 | | | 27.14 | | | | (0.03 | )(g)(i) | | | 4.22 | | | | 4.19 | | | | | | | | (0.04 | ) | | | (3.16 | ) | | | (3.20 | ) |
9/30/2006 | | | 26.94 | | | | (0.01 | ) | | | 2.65 | | | | 2.64 | | | | | | | | (0.02 | ) | | | (2.42 | ) | | | (2.44 | ) |
(a) Per share net investment income (loss) has been calculated using the average shares outstanding during the period.
(b) Amount rounds to less than $0.01 per share, if applicable.
(c) Effective June 1, 2009, redemption fees were eliminated.
(d) Had certain expenses not been waived/reimbursed during the period, if applicable, total returns would have been lower. Periods less than one year, if applicable, are not annualized.
(e) Computed on an annualized basis for periods less than one year, if applicable.
See accompanying notes to financial statements.
33 |
| | | | | | | | | | | | | | | | | | | | | | | | | | | | | | |
| | | | | | | | | | | | | Ratios to Average Net Assets: | | | | |
Redemption
fees(b)(c) | | | Net asset
value,
end of
the
period | | | Total
return
(%)(d) | | | Net assets,
end of
the period
(000’s) | | | Net
expenses
(%)(e)(f) | | | Gross
expenses
(%)(e) | | | Net
investment
income
(loss)
(%)(e) | | | Portfolio
turnover
rate (%) | |
| | | | | | | | | | | | | | | | | | | | | | | | | | | | | | |
| | | | | | | |
| | | | | | | | | | | | | | | | | | | | | | | | | | | | | | |
| $ | — | | | $ | 14.03 | | | | 21.16 | | | $ | 52,501 | | | | 1.00 | | | | 1.06 | | | | (0.85 | )(k) | | | 69 | |
| | — | | | | 11.58 | | | | (11.40 | ) | | | 45,557 | | | | 1.00 | | | | 1.01 | | | | (0.68 | ) | | | 107 | |
| | 0.00 | | | | 13.07 | | | | (17.64 | ) | | | 44,540 | | | | 1.00 | | | | 1.01 | | | | (0.47 | ) | | | 92 | |
| | 0.00 | | | | 15.87 | | | | 32.25 | | | | 28,088 | | | | 1.00 | | | | 1.23 | | | | (0.47 | ) | | | 83 | |
| | 0.01 | | | | 12.00 | | | | 8.30 | | | | 20,414 | | | | 1.00 | | | | 1.38 | | | | (0.69 | ) | | | 100 | |
| | | | | | | |
| | | | | | | | | | | | | | | | | | | | | | | | | | | | | | |
| | — | | | | 13.55 | | | | 20.87 | | | | 75,344 | | | | 1.25 | | | | 1.39 | | | | (1.10 | )(k) | | | 69 | |
| | — | | | | 11.21 | | | | (11.66 | ) | | | 75,478 | | | | 1.25 | | | | 1.43 | | | | (0.93 | ) | | | 107 | |
| | 0.00 | | | | 12.69 | | | | (17.86 | ) | | | 79,897 | | | | 1.25 | | | | 1.42 | | | | (0.70 | ) | | | 92 | |
| | 0.00 | | | | 15.45 | | | | 31.94 | | | | 20,924 | | | | 1.25 | | | | 1.50 | | | | (0.66 | ) | | | 83 | |
| | 0.01 | | | | 11.71 | | | | 8.03 | | | | 2,981 | | | | 1.25 | | | | 1.92 | | | | (0.94 | ) | | | 100 | |
| | | | | | | | | | | | | | | | | | | | | | | | | | | | | | |
| | | | | | | |
| | | | | | | | | | | | | | | | | | | | | | | | | | | | | | |
| $ | — | | | $ | 22.93 | | | | 11.39 | | | $ | 454,853 | | | | 0.90 | | | | 0.94 | | | | 0.50 | | | | 52 | |
| | 0.00 | | | | 20.66 | | | | (5.42 | ) | | | 506,324 | | | | 0.90 | | | | 0.94 | | | | 0.52 | | | | 55 | |
| | 0.00 | | | | 22.01 | | | | (15.02 | ) | | | 553,268 | | | | 0.89 | | | | 0.89 | | | | 0.47 | | | | 61 | |
| | 0.00 | | | | 28.77 | | | | 17.02 | | | | 534,776 | | | | 0.89 | | | | 0.89 | | | | 0.43 | | | | 57 | |
| | 0.00 | | | | 27.69 | | | | 11.17 | | | | 442,714 | | | | 0.89 | (j) | | | 0.89 | (j) | | | 0.47 | | | | 62 | |
| | | | | | | |
| | | | | | | | | | | | | | | | | | | | | | | | | | | | | | |
| | — | | | | 22.71 | | | | 11.10 | | | | 383,934 | | | | 1.15 | | | | 1.24 | | | | 0.26 | | | | 52 | |
| | 0.00 | | | | 20.47 | | | | (5.66 | ) | | | 387,383 | | | | 1.15 | | | | 1.31 | | | | 0.26 | | | | 55 | |
| | 0.00 | | | | 21.79 | | | | (15.21 | ) | | | 464,525 | | | | 1.15 | | | | 1.27 | | | | 0.21 | | | | 61 | |
| | 0.00 | | | | 28.52 | | | | 16.74 | | | | 465,055 | | | | 1.15 | | | | 1.24 | | | | 0.15 | | | | 57 | |
| | 0.00 | | | | 27.46 | | | | 10.87 | | | | 291,690 | | | | 1.15 | | | | 1.20 | | | | 0.21 | | | | 62 | |
| | | | | | | |
| | | | | | | | | | | | | | | | | | | | | | | | | | | | | | |
| | — | | | | 22.30 | | | | 10.89 | | | | 73,443 | | | | 1.40 | | | | 1.56 | | | | 0.02 | | | | 52 | |
| | 0.00 | | | | 20.11 | | | | (5.93 | ) | | | 74,195 | | | | 1.40 | | | | 1.77 | | | | 0.02 | | | | 55 | |
| | 0.00 | | | | 21.40 | | | | (15.44 | ) | | | 77,855 | | | | 1.40 | | | | 1.68 | | | | (0.04 | ) | | | 61 | |
| | 0.00 | | | | 28.13 | | | | 16.41 | | | | 76,783 | | | | 1.40 | | | | 1.56 | | | | (0.10 | ) | | | 57 | |
| | 0.00 | | | | 27.14 | | | | 10.59 | | | | 64,367 | | | | 1.40 | | | | 1.46 | | | | (0.04 | ) | | | 62 | |
(f) The investment adviser and/or administrator agreed to waive its fees and/or reimburse a portion of the Fund’s expenses during the period. Without this waiver/reimbursement, if applicable, expenses would have been higher.
(g) Includes a non-recurring payment of $0.01 per share and $0.00 per share for Small Cap Growth Fund and Small Cap Value Fund, respectively.
(h) Includes a non-recurring dividend of $0.02 per share.
(i) Includes a non-recurring dividend of $0.05 per share.
(j) Includes fee/expense recovery of 0.02%.
(k) Includes a non-recurring dividend. Without this dividend, net investment loss per share would have been $(0.12) and $(0.14) for Institutional Class and Retail Class, respectively, and the ratio of net investment loss to average net assets would have been (0.92)% and (1.17)% for Institutional Class and Retail Class, respectively.
See accompanying notes to financial statements.
| 34
Notes to Financial Statements
September 30, 2010
1. Organization. Loomis Sayles Funds I and Loomis Sayles Funds II (the “Trusts” and each a “Trust”) are each organized as a Massachusetts business trust. Each Trust is registered under the Investment Company Act of 1940, as amended (the “1940 Act”), as an open-end management investment company. Each Declaration of Trust permits the Board of Trustees to authorize the issuance of an unlimited number of shares of the Trust in multiple series. The financial statements for certain funds of the Trusts are presented in separate reports. The following funds (individually, a “Fund” and collectively, the “Funds”) are included in this report:
Loomis Sayles Funds I:
Loomis Sayles Small Cap Value Fund (the “Small Cap Value Fund”)
Loomis Sayles Funds II:
Loomis Sayles Small Cap Growth Fund (the “Small Cap Growth Fund”)
Each Fund offers Institutional Class Shares and Retail Class Shares. In addition, Small Cap Value Fund offers Admin Class Shares.
Most expenses of the Trusts can be directly attributed to a Fund. Expenses which cannot be directly attributed to a Fund are generally apportioned based on the relative net assets of each of the Funds in the Trusts. Expenses of a Fund are borne pro rata by the holders of each class of shares, except that each class bears expenses unique to that class (including the Rule 12b-1 service and distribution fees and transfer agent fees). In addition, each class votes as a class only with respect to its own Rule 12b-1 Plan. Shares of each class would receive their pro rata share of the net assets of a Fund if the Fund were liquidated. The Trustees approve separate distributions from net investment income on each class of shares.
2. Significant Accounting Policies. The following is a summary of significant accounting policies consistently followed by each Fund in the preparation of its financial statements. The Funds’ financial statements are prepared in accordance with accounting principles generally accepted in the United States of America which require the use of management estimates that affect the reported amounts and disclosures in the financial statements. Actual results could differ from those estimates. Management has evaluated the events and transactions subsequent to year-end through the date the financial statements were issued and has determined that there were no material events that would require disclosure in the Funds’ financial statements.
a. Valuation. Equity securities, including shares of closed-end investment companies and exchange-traded funds, for which market quotations are readily available are valued at market value, as reported by pricing services recommended by the investment adviser and approved by the Board of Trustees. Such pricing services generally use the security’s last sale price on the exchange or market where the security is primarily traded or, if there is no reported sale during the day, the closing bid price. Securities traded on the NASDAQ Global Select Market, NASDAQ Global Market and NASDAQ Capital Market are valued at the NASDAQ Official Closing Price (“NOCP”), or if lacking a NOCP, at the most
35 |
Notes to Financial Statements – continued
September 30, 2010
recent bid quotation on the applicable NASDAQ Market. Debt securities (other than short-term obligations purchased with an original or remaining maturity of sixty days or less) are generally valued on the basis of evaluated bids furnished to the Funds by a pricing service recommended by the investment adviser and approved by the Board of Trustees, which service determines valuations for normal, institutional-size trading units of such securities using market information, transactions for comparable securities and various relationships between securities which are generally recognized by institutional traders. Broker-dealer bid quotations may also be used to value debt and equity securities where a pricing service does not price a security or where a pricing service does not provide a reliable price for the security. In instances where broker-dealer bid quotations are not available, certain securities held by the Funds may be valued on the basis of a price provided by a principal market maker. Forward foreign currency contracts are valued utilizing interpolated prices determined from information provided by an independent pricing service. Short-term obligations purchased with an original or remaining maturity of sixty days or less are valued at amortized cost, which approximates market value. Securities for which market quotations are not readily available are valued at fair value as determined in good faith by the Funds’ investment adviser using consistently applied procedures under the general supervision of the Board of Trustees. Investments in other open-end investment companies are valued at their net asset value each day.
The Funds may hold securities traded in foreign markets. Foreign securities are valued at the market price in the foreign market. However, if events occurring after the close of the foreign market (but before the close of regular trading on the New York Stock Exchange) are believed to materially affect the value of those securities, such securities are fair valued pursuant to procedures approved by the Board of Trustees. When fair valuing securities, the Funds may, among other things, use modeling tools or other processes that may take into account factors such as securities market activity and/or significant events that occur after the close of the foreign market and before the Funds calculate their net asset values.
b. Investment Transactions and Related Investment Income. Investment transactions are accounted for on a trade date plus one basis for daily net asset value calculation. However, for financial reporting purposes, investment transactions are reported on trade date. Dividend income is recorded on ex-dividend date, or in the case of certain foreign securities, as soon as a Fund is notified, and interest income is recorded on an accrual basis. Interest income is increased by the accretion of discount and decreased by the amortization of premium. Distributions received from investments in securities that represent a return of capital or capital gain are recorded as a reduction of cost of investments or as a realized gain, respectively. The calendar year-end amounts of ordinary income, capital gains, and return of capital included in distributions received from the Funds’ investments in real estate investment trusts (“REITs”) are reported to the Funds after the end of the fiscal year; accordingly, the Funds estimate these amounts for accounting purposes until the characterization of REIT distributions is reported to the Funds after the end of the fiscal year. Estimates are based on the most recent REIT
| 36
Notes to Financial Statements – continued
September 30, 2010
distribution information available. Investment income is recorded net of foreign taxes withheld when applicable. In determining net gain or loss on securities sold, the cost of securities has been determined on an identified cost basis. Investment income, non-class specific expenses and realized and unrealized gains and losses are allocated on a pro rata basis to each class based on the relative net assets of each class to the total net assets of the Fund.
c. Foreign Currency Translation. The books and records of the Funds are maintained in U.S. dollars. The value of securities, currencies and other assets and liabilities denominated in currencies other than U.S. dollars are translated into U.S. dollars based upon foreign exchange rates prevailing at the end of the period. Purchases and sales of investment securities, income and expenses are translated on the respective dates of such transactions.
Since the values of investment securities are presented at the foreign exchange rates prevailing at the end of the period, it is not practical to isolate that portion of the results of operations arising from changes in exchange rates from fluctuations which arise due to changes in market prices of investment securities. Such changes are included with the net realized and unrealized gain or loss on investments.
Net realized foreign exchange gains or losses arise from sales of foreign currency, currency gains or losses realized between the trade and settlement dates on securities transactions and the difference between the amounts of dividends, interest and foreign withholding taxes recorded on the Funds’ books and the U.S. dollar equivalent of the amounts actually received or paid. Net unrealized foreign exchange gains and losses arise from changes in the value of assets and liabilities, other than investment securities, at the end of the fiscal period, resulting from changes in exchange rates.
Each Fund may use foreign currency exchange contracts to facilitate transactions in foreign-denominated investments. Losses may arise from changes in the value of the foreign currency or if the counterparties do not perform under the contracts’ terms.
d. Federal and Foreign Income Taxes. Each Trust treats each Fund as a separate entity for federal income tax purposes. Each Fund intends to meet the requirements of the Internal Revenue Code of 1986, as amended, applicable to regulated investment companies, and to distribute to its shareholders substantially all of its net investment income and any net realized capital gains at least annually. Management has performed an analysis of each Fund’s tax positions for the open tax years as of September 30, 2010 and has concluded that no provisions for income tax are required. The Funds’ federal tax returns for the prior three fiscal years remain subject to examination by the Internal Revenue Service. Management is not aware of any events that are reasonably possible to occur in the next twelve months that would result in the amounts of any unrecognized tax benefits significantly increasing or decreasing for the Funds. However, management’s conclusions regarding tax positions taken may be subject to review and adjustment at a later date based on factors including, but not limited to, new tax laws and accounting regulations and interpretations thereof.
37 |
Notes to Financial Statements – continued
September 30, 2010
A Fund may be subject to foreign taxes on income and gains on investments that are accrued based upon the Fund’s understanding of the tax rules and regulations that exist in the countries in which the Fund invests. Foreign governments may also impose taxes or other payments on investments with respect to foreign securities. Such taxes are accrued as applicable.
e. Dividends and Distributions to Shareholders. Dividends and distributions are recorded on ex-dividend date. The timing and characterization of certain income and capital gain distributions are determined annually in accordance with federal tax regulations, which may differ from accounting principles generally accepted in the United States of America. Permanent differences are primarily due to differing treatments for book and tax purposes for items such as expired capital loss carryforwards, distribution redesignations and net operating losses. Permanent book and tax basis differences relating to shareholder distributions will result in reclassifications to capital accounts. Temporary differences between book and tax distributable earnings are primarily due to securities lending collateral gain/loss adjustments, deferred Trustees’ fees and wash sales. Distributions from net investment income and short-term capital gains are considered to be distributed from ordinary income for tax purposes.
The tax characterization of distributions is determined on an annual basis. The tax character of distributions paid to shareholders during the years ended September 30, 2010 and 2009 were as follows:
| | | | | | | | | | | | | | | | | | | | | | | | |
| | | 2010 Distributions Paid From: | | | 2009 Distributions Paid From: | |
Fund | | Ordinary
Income | | | Long-Term
Capital Gains | | | Total | �� | | Ordinary
Income | | | Long-Term
Capital Gains | | | Total | |
Small Cap Growth Fund | | $ | — | | | $ | — | | | $ | — | | | $ | — | | | $ | — | | | $ | — | |
Small Cap Value Fund | | | 2,321,057 | | | | — | | | | 2,321,057 | | | | 3,669,309 | | | | 331,178 | | | | 4,000,487 | |
Differences between these amounts for the year ended September 30, 2009 and those reported in the Statements of Changes in Net Assets for the same period are primarily attributable to different book and tax treatment for short-term capital gains.
| 38
Notes to Financial Statements – continued
September 30, 2010
As of September 30, 2010, the components of distributable earnings on a tax basis were as follows:
| | | | | | | | |
| | | Small Cap
Growth Fund | | | Small Cap
Value Fund | |
Undistributed ordinary income | | $ | — | | | $ | 2,436,492 | |
Undistributed long-term capital gains | | | — | | | | — | |
| | | | | | | | |
Total undistributed earnings | | | — | | | | 2,436,492 | |
| | | | | | | | |
Capital loss carryforward: | | | | | | | | |
Expires September 30, 2011 | | | (59,283,040 | ) | | | — | |
Expires September 30, 2017 | | | (14,995,800 | ) | | | (88,137,321 | ) |
Expires September 30, 2018 | | | (11,885,718 | ) | | | (58,500,125 | ) |
| | | | | | | | |
Total capital loss carryforward | | | (86,164,558 | ) | | | (146,637,446 | ) |
Deferred net capital losses (post-October 2009) | | | — | | | | — | |
Unrealized appreciation (depreciation) | | | 28,968,258 | | | | 134,511,852 | |
| | | | | | | | |
Total accumulated earnings (losses) | | $ | (57,196,300 | ) | | $ | (9,689,102 | ) |
| | | | | | | | |
The Small Cap Growth Fund had $138,314,515 of capital loss carryforwards expire in the current year.
f. Repurchase Agreements. It is each Fund’s policy that the market value of the collateral for repurchase agreements be at least equal to 102% of the repurchase price, including interest. Certain repurchase agreements are tri-party arrangements whereby the collateral is held in a segregated account for the benefit of the Fund and on behalf of the counterparty. Repurchase agreements could involve certain risks in the event of default or insolvency of the counterparty including possible delays or restrictions upon a Fund’s ability to dispose of the underlying securities.
g. Securities Lending. The Funds have entered into an agreement with State Street Bank and Trust Company (“State Street Bank”), as agent of the Funds, to lend securities to certain designated borrowers. The loans are collateralized with cash or securities in an amount equal to at least 105% or 102% of the market value (including accrued interest) of the loaned international or domestic securities, respectively, when the loan is initiated. Thereafter, the value of the collateral must remain at least 102% of the market value (including accrued interest) of loaned securities for U.S. equities and U.S. corporate debt; at least 105% of the market value (including accrued interest) of loaned securities for non-U.S. equities; and at least 100% of the market value (including accrued interest) of loaned securities for U.S. Government securities, sovereign debt issued by non-U.S. Governments and non-U.S. corporate debt. In the event that the market value of the collateral falls below the required percentages described above, the borrower will deliver additional collateral on the next business day. As with other extensions of credit, the Funds may bear the risk of loss with respect to the investment of the collateral. The Funds invest cash collateral in short-term investments, a portion of the income from which is remitted to the borrowers and the remainder allocated between the Funds and State Street Bank as lending agent.
39 |
Notes to Financial Statements – continued
September 30, 2010
For the year ended September 30, 2010, none of the Funds had loaned Securities under this agreement.
h. Indemnifications. Under the Trusts’ organizational documents, their officers and Trustees are indemnified against certain liabilities arising out of the performance of their duties to the Funds. Additionally, in the normal course of business, the Funds enter into contracts with service providers that contain general indemnification clauses. The Funds’ maximum exposure under these arrangements is unknown as this would involve future claims that may be made against the Funds that have not yet occurred. However, based on experience, the Funds expect the risk of loss to be remote.
3. Fair Value Measurements. In accordance with accounting standards related to fair value measurements and disclosures, the Funds have categorized the inputs utilized in determining the value of each Fund’s assets or liabilities. These inputs are summarized in the three broad levels listed below:
| | • | | Level 1—quoted prices in active markets for identical assets or liabilities; |
| | • | | Level 2—prices determined using other significant inputs that are observable either directly, or indirectly through corroboration with observable market data (which could include quoted prices for similar assets or liabilities, interest rates, credit risk, etc.); |
| | • | | Level 3—prices determined using significant unobservable inputs when quoted prices or observable inputs are unavailable such as when there is little or no market activity for an asset or liability (unobservable inputs reflect each Fund’s own assumptions in determining the fair value of assets or liabilities and would be based on the best information available). |
The inputs or methodology used for valuing securities are not necessarily an indication of the risk associated with investing in those securities.
The following is a summary of the inputs used to value the Funds’ investments as of September 30, 2010, at value:
Small Cap Growth Fund
Asset Valuation Inputs
| | | | | | | | | | | | | | | | |
Description(a) | | Level 1 | | | Level 2 | | | Level 3 | | | Total | |
Common Stocks | | $ | 124,091,711 | | | $ | — | | | $ | — | | | $ | 124,091,711 | |
Short-Term Investments | | | — | | | | 1,633,165 | | | | — | | | | 1,633,165 | |
| | | | | | | | | | | | | | | | |
Total | | $ | 124,091,711 | | | $ | 1,633,165 | | | $ | — | | | $ | 125,724,876 | |
| | | | | | | | | | | | | | | | |
(a) Major categories of the Fund’s investments are included in the Portfolio of Investments.
| 40
Notes to Financial Statements – continued
September 30, 2010
Small Cap Value Fund
Asset Valuation Inputs
| | | | | | | | | | | | | | | | |
Description(a) | | Level 1 | | | Level 2 | | | Level 3 | | | Total | |
Common Stocks | | $ | 903,108,749 | | | $ | — | | | $ | — | | | $ | 903,108,749 | |
Short-Term Investments | | | — | | | | 8,982,191 | | | | — | | | | 8,982,191 | |
| | | | | | | | | | | | | | | | |
Total | | $ | 903,108,749 | | | $ | 8,982,191 | | | $ | — | | | $ | 912,090,940 | |
| | | | | | | | | | | | | | | | |
(a) Major categories of the Fund’s investments are included in the Portfolio of Investments.
4. Purchases and Sales of Securities. For the year ended September 30, 2010, purchases and sales of securities (excluding short-term investments) were as follows:
| | | | | | | | |
Fund | | Purchases | | | Sales | |
Small Cap Growth Fund | | $ | 81,207,639 | | | $ | 100,003,395 | |
Small Cap Value Fund | | | 476,617,288 | | | | 589,137,329 | |
5. Management Fees and Other Transactions with Affiliates.
a. Management Fees. Loomis, Sayles & Company, L.P. (“Loomis Sayles”) serves as investment adviser to each Fund. Under the terms of the management agreements, each Fund pays a management fee at the following annual rates, calculated daily and payable monthly, based on each Fund’s average daily net assets:
| | | | |
Fund | | Percentage of Average
Daily Net Assets | |
Small Cap Growth Fund | | | 0.75% | |
Small Cap Value Fund | | | 0.75% | |
Loomis Sayles has given binding undertakings to the Funds to waive management fees and/or reimburse certain expenses to limit the Funds’ operating expenses, exclusive of acquired fund fees and expenses, brokerage expenses, interest expense, taxes and extraordinary expenses. These undertakings are in effect until January 31, 2011 and will be reevaluated on an annual basis. Management fees payable, as reflected on the Statements of Assets and Liabilities, is net of waivers and/or expense reimbursements, if any, pursuant to these undertakings.
For the year ended September 30, 2010, the expense limits as a percentage of average daily net assets under the expense limitation agreements were as follows:
| | | | | | | | | | | | |
| | | Expense Limit as a Percentage of
Average Daily Net Assets | |
Fund | | Institutional Class | | | Retail Class | | | Admin Class | |
Small Cap Growth Fund | | | 1.00% | | | | 1.25% | | | | — | |
Small Cap Value Fund | | | 0.90% | | | | 1.15% | | | | 1.40% | |
Loomis Sayles shall be permitted to recover expenses it has borne under the expense limitation agreements (whether through waiver of its management fees or otherwise) on a
41 |
Notes to Financial Statements – continued
September 30, 2010
class by class basis in later periods to the extent the expenses of a class fall below a class’ expense limits, provided, however, that a class is not obligated to pay such waived/reimbursed fees or expenses more than one year after the end of the fiscal year in which the fees or expenses were waived/reimbursed.
For the year ended September 30, 2010, the management fees for each Fund were as follows:
| | | | | | | | |
Fund | | Management
Fees | | | Percentage of
Average Daily Net Assets | |
Small Cap Growth Fund | | $ | 928,032 | | | | 0.75% | |
Small Cap Value Fund | | | 7,073,643 | | | | 0.75% | |
For the year ended September 30, 2010, class-specific expenses have been reimbursed as follows:
| | | | | | | | | | | | | | | | |
| | | Reimbursement1 | |
Fund | | Institutional
Class | | | Retail
Class | | | Admin
Class | | | Total | |
Small Cap Growth Fund | | $ | 29,470 | | | $ | 110,041 | | | $ | — | | | $ | 139,511 | |
Small Cap Value Fund | | | 189,503 | | | | 334,287 | | | | 116,862 | | | | 640,652 | |
1 Expense reimbursements are subject to possible recovery until September 30, 2011.
No expenses were recovered during the year ended September 30, 2010 under the terms of the expense limitation agreement.
Certain officers and employees of Loomis Sayles are also officers or Trustees of the Trust. Loomis Sayles’ general partner is indirectly owned by Natixis Global Asset Management, L.P. (“Natixis US”), which is part of Natixis Global Asset Management, an international asset management group based in Paris, France.
b. Service and Distribution Fees. Natixis Distributors, L.P. (“Natixis Distributors”), a wholly-owned subsidiary of Natixis US, has entered into a distribution agreement with the Trusts. Pursuant to this agreement, Natixis Distributors serves as principal underwriter of the funds of the Trusts.
Pursuant to Rule 12b-1 under the 1940 Act, the Small Cap Growth Fund and the Small Cap Value Fund have adopted a Distribution Plan relating to each Fund’s Retail Class shares (the “Retail Class Plan”) and the Small Cap Value Fund has adopted a Distribution Plan relating to its Admin Class shares (the “Admin Class Plan”).
Under the Retail Class Plan, each Fund pays Natixis Distributors a monthly distribution fee at an annual rate not to exceed 0.25% of the average daily net assets attributable to the Funds’ Retail Class shares, as compensation for services provided by Natixis Distributors in connection with the marketing or sale of Retail Class shares or for payments made by Natixis Distributors to securities dealers or other financial intermediaries as commissions, asset-based sales charges or other compensation with respect to the sale of Retail Class shares, or for providing personal services to investors and/or maintenance of shareholder accounts.
| 42
Notes to Financial Statements – continued
September 30, 2010
Under the Admin Class Plan, the Small Cap Value Fund pays Natixis Distributors a monthly distribution fee at an annual rate not to exceed 0.25% of the average daily net assets attributable to the Fund’s Admin Class shares, as compensation for services provided by Natixis Distributors in connection with the marketing or sale of Admin Class shares or for payments made by Natixis Distributors to securities dealers or other financial intermediaries as commissions, asset-based sales charges or other compensation with respect to the sale of Admin Class shares, or for providing personal services to investors and/or the maintenance of shareholder accounts.
In addition, the Admin Class shares of the Small Cap Value Fund may pay Natixis Distributors an administrative service fee, at an annual rate not to exceed 0.25% of the average daily net assets attributable to Admin Class shares. These fees are subsequently paid to securities dealers or financial intermediaries for providing personal services and/or account maintenance for their customers who hold such shares.
For the year ended September 30, 2010, the Funds paid the following service and distribution fees:
| | | | | | | | | | | | |
| | | Service Fees | | | Distribution Fees | |
Fund | | Admin Class | | | Retail Class | | | Admin Class | |
Small Cap Growth Fund | | $ | — | | | $ | 191,734 | | | $ | — | |
Small Cap Value Fund | | | 179,730 | | | | 959,232 | | | | 179,730 | |
c. Administrative Fees. Natixis Asset Management Advisors, L.P. (“Natixis Advisors”) provides certain administrative services for the Funds and contracts with State Street Bank to serve as sub-administrator. Natixis Advisors is a wholly-owned subsidiary of Natixis US. Pursuant to an agreement among Natixis Funds Trust I, Natixis Funds Trust II, Natixis Funds Trust IV, Natixis Cash Management Trust, Gateway Trust (“Natixis Funds Trusts”), Loomis Sayles Funds I, Loomis Sayles Funds II (“Loomis Sayles Funds Trusts”), Hansberger International Series and Natixis Advisors, each Fund pays Natixis Advisors monthly its pro rata portion of fees equal to an annual rate of 0.0575% of the first $15 billion of the average daily net assets of the Natixis Funds Trusts, Loomis Sayles Funds Trusts and Hansberger International Series, 0.0500% of the next $15 billion, 0.0400% of the next $30 billion and 0.0350% of such assets in excess of $60 billion, subject to an annual aggregate minimum fee for the Natixis Funds Trusts, Loomis Sayles Funds Trusts and Hansberger International Series of $10 million, which is reevaluated on an annual basis. New funds are subject to a fee for the first twelve months of operations of $75,000 plus $12,500 per additional class and an additional $75,000 if managed by multiple subadvisers.
Prior to July 1, 2010, each Fund paid Natixis Advisors monthly its pro rata portion of fees equal to an annual rate of 0.0575% of the first $15 billion of the average daily net assets of the Natixis Funds Trusts, Loomis Sayles Funds Trusts and Hansberger International Series, 0.0500% of the next $15 billion, 0.0425% of the next $30 billion and 0.0375% of such assets in excess of $60 billion, subject to an annual aggregate minimum fee for the
43 |
Notes to Financial Statements – continued
September 30, 2010
Natixis Funds Trusts, Loomis Sayles Funds Trusts and Hansberger International Series of $10 million, which is reevaluated on an annual basis. New funds were subject to a fee for the first twelve months of operations of $75,000 plus $12,500 per additional class and an additional $75,000 if managed by multiple subadvisers.
For the year ended September 30, 2010, each Fund paid the following administrative fees to Natixis Advisors:
| | | | |
Fund | | Administrative
Fees | |
Small Cap Growth Fund | | $ | 59,448 | |
Small Cap Value Fund | | | 453,231 | |
d. Sub-Transfer Agent Fees. Natixis Distributors has entered into agreements with financial intermediaries to provide certain recordkeeping, processing, shareholder communications and other services to customers of the intermediaries and has agreed to compensate the intermediaries for providing those services. Certain services would be provided by the Funds if the shares of those customers were registered directly with the Funds’ transfer agent. Accordingly, the Funds agreed to pay a portion of the intermediary fees attributable to shares of the Fund held by the intermediaries (which generally is a percentage of the value of shares held) not exceeding what the Funds would have paid its transfer agent had each customer’s shares been registered directly with the transfer agent instead of held through the intermediaries. Natixis Distributors pays the remainder of the fees.
For the year ended September 30, 2010, the Funds paid the following sub-transfer agent fees, which are reflected in transfer agent fees and expenses in the Statements of Operations:
| | | | | | | | | | | | |
| | | Sub-Transfer Agent Fees | |
Fund | | Institutional
Class | | | Retail Class | | | Admin
Class | |
Small Cap Growth Fund | | $ | 40,705 | | | $ | 40,633 | | | $ | — | |
Small Cap Value Fund | | | 405,782 | | | | 506,484 | | | | 150,273 | |
e. Trustees Fees and Expenses. The Trusts do not pay any compensation directly to their officers or Trustees who are directors, officers or employees of Natixis Advisors, Natixis Distributors, Natixis US or their affiliates. Effective January 1, 2010, the Chairperson of the Board receives a retainer fee at the annual rate of $250,000. The Chairperson does not receive any meeting attendance fees for Board of Trustees meetings or committee meetings that she attends. Each Independent Trustee (other than the Chairperson) receives, in the aggregate, a retainer fee at the annual rate of $80,000. Each Independent Trustee also receives a meeting attendance fee of $10,000 for each meeting of the Board of Trustees that he or she attends in person and $5,000 for each meeting of the Board of Trustees that he or she attends telephonically. In addition, each committee chairman receives an additional retainer fee at an annual rate of $15,000. Each Contract Review and Governance
| 44
Notes to Financial Statements – continued
September 30, 2010
Committee member is compensated $6,000 for each Committee meeting that he or she attends in person and $3,000 for each meeting that he or she attends telephonically. Each Audit Committee member is compensated $7,500 for each Committee meeting that he or she attends in person and $3,750 for each meeting that he or she attends telephonically. Each member of the ad hoc Committee on Alternative Investments received a one-time fee of $10,000. The ad hoc Committee on Alternative Investments is not a standing committee. These fees are allocated among the funds in the Natixis Funds Trusts, Loomis Sayles Funds Trusts and Hansberger International Series based on a formula that takes into account, among other factors, the relative net assets of each fund. Trustees are reimbursed for travel expenses in connection with attendance at meetings.
Prior to January 1, 2010, the Chairperson of the Board received a retainer fee at the annual rate of $200,000. The Chairperson did not receive any meeting attendance fees for Board of Trustees meetings or committee meetings that she attended. Each Independent Trustee (other than the Chairperson) received, in the aggregate, a retainer fee at the annual rate of $65,000. Each Independent Trustee also received a meeting attendance fee of $7,500 for each meeting of the Board of Trustees that he or she attended in person and $3,750 for each meeting of the Board of Trustees that he or she attended telephonically. In addition, each committee chairman received an additional retainer fee at the annual rate of $10,000. Each Contract Review and Governance Committee member was compensated $5,000 for each Committee meeting that he or she attended in person and $2,500 for each meeting that he or she attended telephonically. Each Audit Committee member was compensated $6,250 for each Committee meeting that he or she attended in person and $3,125 for each meeting that he or she attended telephonically.
A deferred compensation plan (the “Plan”) is available to the Trustees on a voluntary basis. Deferred amounts remain in the Funds until distributed in accordance with the provisions of the Plan. The value of a participating Trustee’s deferral account is based on theoretical investments of deferred amounts, on the normal payment dates, in certain funds of the Natixis Funds Trusts, Loomis Sayles Funds Trusts and Hansberger International Series as designated by the participating Trustees. Changes in the value of participants’ deferral accounts are allocated pro rata among the funds in the Natixis Funds Trusts, Loomis Sayles Funds Trusts, and Hansberger International Series, and are normally reflected as Trustees’ fees and expenses in the Statements of Operations. The portions of the accrued obligations allocated to the Funds under the Plan are reflected as Deferred Trustees’ fees in the Statements of Assets and Liabilities.
6. Class Specific Expenses. For the year ended September 30, 2010, the Funds paid the following class-specific transfer agent fees and expenses (including sub-transfer agent fees):
| | | | | | | | | | | | |
| | | Transfer Agent Fees and Expenses | |
Fund | | Institutional
Class | | | Retail Class | | | Admin
Class | |
Small Cap Growth Fund | | $ | 52,124 | | | $ | 149,321 | | | $ | — | |
Small Cap Value Fund | | | 453,425 | | | | 539,452 | | | | 155,481 | |
45 |
Notes to Financial Statements – continued
September 30, 2010
7. Line of Credit. Each Fund, together with certain other funds of Natixis Funds Trusts, Loomis Sayles Funds Trusts and Hansberger International Series, participates in a $200,000,000 committed unsecured line of credit provided by State Street Bank, with an individual limit of $125,000,000 for each fund that participates in the line of credit. Interest is charged to each participating fund based on its borrowings at a rate per annum equal to the greater of the Federal Funds rate or overnight LIBOR, plus 1.25%. In addition, a commitment fee of 0.15% per annum, payable at the end of each calendar quarter, is accrued and apportioned among the participating funds based on their average daily unused portion of the line of credit.
Prior to March 10, 2010, each Fund, together with certain other funds of Natixis Funds Trusts, Loomis Sayles Funds Trusts and Hansberger International Series, participated in a $200,000,000 committed unsecured line of credit provided by State Street Bank, with an individual limit of $125,000,000 for each fund that participated in the line of credit. Interest was charged to each participating fund based on its borrowings at a rate per annum equal to the greater of the Federal Funds rate or overnight LIBOR, plus 0.75%. In addition, a commitment fee of 0.125% per annum, payable at the end of each calendar quarter, was accrued and apportioned among the participating funds based on their average daily unused portion of the line of credit.
For the year ended September 30, 2010, none of the Funds had borrowings under these agreements.
8. Brokerage Commission Recapture. Each Fund has entered into agreements with certain brokers whereby the brokers will rebate a portion of brokerage commissions. All amounts rebated by the brokers are returned to the Funds under such agreements and are included in realized gains on investments in the Statements of Operations. For the year ended September 30, 2010, amounts rebated under these agreements were as follows:
| | | | |
Fund | | Rebates | |
Small Cap Growth Fund | | $ | 16,607 | |
Small Cap Value Fund | | | 109,979 | |
9. Concentration of Ownership. At September 30, 2010, Loomis Sayles Funded Pension Plan and Trust and Loomis Sayles Employees’ Profit Sharing Retirement Plan held shares of beneficial interest in the Funds as follows:
| | | | | | | | |
Fund | | Pension Plan | | | Profit Sharing
Retirement Plan | |
Small Cap Growth Fund | | | 359,940 | | | | 386,164 | |
Small Cap Value Fund | | | 355,203 | | | | 705,832 | |
From time to time, the Funds may have a concentration of several shareholders having a significant percentage of shares outstanding. Investment activities of these shareholders could have material impacts on the Funds. As of September 30, 2010, one shareholder account owned more than 5% of Small Cap Growth Fund’s total outstanding shares,
| 46
Notes to Financial Statements – continued
September 30, 2010
representing 7.52% of the Fund’s net assets. Such ownership may be beneficially held by multiple individuals or entities other than the owner of record.
10. Capital Shares. Each Fund may issue an unlimited number of shares of beneficial interest, without par value. Transactions in capital shares were as follows:
| | | | | | | | | | | | | | | | |
| | | Small Cap Growth Fund | |
| | | Year Ended
September 30, 2010 | | | Year Ended
September 30, 2009 | |
| Institutional Class | | Shares | | | Amount | | | Shares | | | Amount | |
Issued from the sale of shares | | | 942,038 | | | $ | 12,157,438 | | | | 1,974,319 | | | $ | 19,253,187 | |
Issued in connection with the reinvestment of distributions | | | — | | | | — | | | | — | | | | — | |
Redeemed | | | (1,134,399 | ) | | | (14,055,822 | ) | | | (1,447,130 | ) | | | (13,740,063 | ) |
| | | | | | | | | | | | | | | | |
Net change | | | (192,361 | ) | | $ | (1,898,384 | ) | | | 527,189 | | | $ | 5,513,124 | |
| | | | | | | | | | | | | | | | |
| | | | |
| Retail Class | | | | | | | | | | | | |
Issued from the sale of shares | | | 1,649,726 | | | $ | 20,206,682 | | | | 3,127,117 | | | $ | 30,016,606 | |
Issued in connection with the reinvestment of distributions | | | — | | | | — | | | | — | | | | — | |
Redeemed | | | (2,822,162 | ) | | | (35,343,638 | ) | | | (2,692,237 | ) | | | (25,065,630 | ) |
| | | | | | | | | | | | | | | | |
Net change | | | (1,172,436 | ) | | $ | (15,136,956 | ) | | | 434,880 | | | $ | 4,950,976 | |
| | | | | | | | | | | | | | | | |
Increase (decrease) from capital share transactions | | | (1,364,797 | ) | | $ | (17,035,340 | ) | | | 962,069 | | | $ | 10,464,100 | |
| | | | | | | | | | | | | | | | |
47 |
Notes to Financial Statements – continued
September 30, 2010
10. Capital Shares – continued.
| | | | | | | | | | | | | | | | |
| | | Small Cap Value Fund | |
| | | Year Ended
September 30, 2010 | | | Year Ended
September 30, 2009 | |
| Institutional Class | | Shares | | | Amount | | | Shares | | | Amount | |
Issued from the sale of shares | | | 2,602,888 | | | $ | 56,206,503 | | | | 5,487,523 | | | $ | 94,433,600 | |
Issued in connection with the reinvestment of distributions | | | 80,409 | | | | 1,643,559 | | | | 156,833 | | | | 2,488,947 | |
Redeemed | | | (7,355,313 | ) | | | (156,910,081 | ) | | | (6,270,554 | ) | | | (105,527,302 | ) |
| | | | | | | | | | | | | | | | |
Net change | | | (4,672,016 | ) | | $ | (99,060,019 | ) | | | (626,198 | ) | | $ | (8,604,755 | ) |
| | | | | | | | | | | | | | | | |
| | | | |
| Retail Class | | | | | | | | | | | | |
Issued from the sale of shares | | | 1,882,548 | | | $ | 40,646,183 | | | | 4,033,997 | | | $ | 70,124,577 | |
Issued in connection with the reinvestment of distributions | | | 25,691 | | | | 521,021 | | | | 76,628 | | | | 1,206,896 | |
Redeemed | | | (3,929,781 | ) | | | (84,156,249 | ) | | | (6,502,104 | ) | | | (108,566,266 | ) |
| | | | | | | | | | | | | | | | |
Net change | | | (2,021,542 | ) | | $ | (42,989,045 | ) | | | (2,391,479 | ) | | $ | (37,234,793 | ) |
| | | | | | | | | | | | | | | | |
| | | | |
| Admin Class | | | | | | | | | | | | |
Issued from the sale of shares | | | 995,292 | | | $ | 21,022,763 | | | | 1,211,062 | | | $ | 19,455,331 | |
Issued in connection with the reinvestment of distributions | | | — | | | | — | | | | 1,691 | | | | 26,231 | |
Redeemed | | | (1,389,922 | ) | | | (29,181,878 | ) | | | (1,162,021 | ) | | | (19,010,438 | ) |
| | | | | | | | | | | | | | | | |
Net change | | | (394,630 | ) | | $ | (8,159,115 | ) | | | 50,732 | | | $ | 471,124 | |
| | | | | | | | | | | | | | | | |
Increase (decrease) from capital share transactions | | | (7,088,188 | ) | | $ | (150,208,179 | ) | | | (2,966,945 | ) | | $ | (45,368,424 | ) |
| | | | | | | | | | | | | | | | |
| 48
Report of Independent Registered Public Accounting Firm
To the Trustees of Loomis Sayles Funds I and Loomis Sayles Funds II and Shareholders of Loomis Sayles Small Cap Value Fund and Loomis Sayles Small Cap Growth Fund:
In our opinion, the accompanying statements of assets and liabilities, including the portfolios of investments, and the related statements of operations and of changes in net assets and the financial highlights present fairly, in all material respects, the financial position of the Loomis Sayles Small Cap Value Fund, a series of Loomis Sayles Funds I, and the Loomis Sayles Small Cap Growth Fund, a series of Loomis Sayles Funds II (collectively, the “Funds”), at September 30, 2010, and the results of each of their operations, the changes in each of their net assets and the financial highlights for each of the periods indicated, in conformity with accounting principles generally accepted in the United States of America. These financial statements and financial highlights (hereafter referred to as “financial statements”) are the responsibility of the Funds’ management; our responsibility is to express an opinion on these financial statements based on our audits. We conducted our audits of these financial statements in accordance with the standards of the Public Company Accounting Oversight Board (United States). Those standards require that we plan and perform the audits to obtain reasonable assurance about whether the financial statements are free of material misstatement. An audit includes examining, on a test basis, evidence supporting the amounts and disclosures in the financial statements, assessing the accounting principles used and significant estimates made by management, and evaluating the overall financial statement presentation. We believe that our audits, which included confirmation of securities at September 30, 2010 by correspondence with the custodian and brokers, provide a reasonable basis for our opinion.
PricewaterhouseCoopers LLP
Boston, Massachusetts
November 22, 2010
49 |
Special Meeting of Shareholders (Unaudited)
A special meeting of shareholders of the Trusts was held on May 27, 2010 to consider a proposal to elect four Trustees to the Board of Trustees. The proposal was approved by shareholders of the Trusts. The results of the shareholder vote were as follows:
Loomis Sayles Funds I
| | | | | | | | |
Nominee | | Voted “FOR”* | | | Withheld* | |
Kenneth A. Drucker | | | 1,441,815,530 | | | | 17,903,098 | |
Wendell J. Knox | | | 1,441,546,136 | | | | 18,172,492 | |
Erik R. Sirri | | | 1,441,468,045 | | | | 18,250,582 | |
Peter J. Smail | | | 1,439,322,473 | | | | 20,396,155 | |
| * | Trust-wide voting results. |
Loomis Sayles Funds II
| | | | | | | | |
Nominee | | Voted “FOR”* | | | Withheld* | |
Kenneth A. Drucker | | | 1,717,408,736 | | | | 24,631,425 | |
Wendell J. Knox | | | 1,717,302,502 | | | | 24,737,659 | |
Erik R. Sirri | | | 1,717,226,576 | | | | 24,813,585 | |
Peter J. Smail | | | 1,717,449,661 | | | | 24,590,500 | |
| * | Trust-wide voting results. |
In addition to the Trustees named above, the following also serve as Trustees of the Trusts: Graham T. Allison, Jr., Edward A. Benjamin, Daniel M. Cain, Sandra O. Moose, Cynthia L. Walker, Robert J. Blanding and John T. Hailer.
| 50
2010 U.S. Tax Distribution Information to Shareholders (Unaudited)
Corporate Dividends Received Deduction. For the fiscal year ended September 30, 2010, a percentage of dividends distributed by the Fund listed below qualify for the dividends received deduction for corporate shareholders. These percentages are as follows:
| | | | |
Fund | | Qualifying Percentage | |
Small Cap Value | | | 100% | |
Qualified Dividend Income. For the fiscal year ended September 30, 2010, the Small Cap Value Fund will designate up to the maximum amount allowable pursuant to the Internal Revenue Code as qualified dividend income eligible for reduced tax rates. These lower rates range from 0% to 15% depending on an individual’s tax bracket. If the Small Cap Value Fund pays a distribution during calendar year 2010, complete information will be reported in conjunction with Form 1099-DIV.
51 |
Trustee and Officer Information
The tables below provide certain information regarding the trustees and officers of Loomis Sayles Funds I and Loomis Sayles Funds II (the “Trusts”). Unless otherwise indicated, the address of all persons below is 399 Boylston Street, Boston, MA 02116. The Trusts’ Statements of Additional Information include additional information about the trustees of the Trusts and are available by calling Loomis Sayles at 800-633-3330.
| | | | | | | | |
| Name and Year of Birth | | Position(s) Held
with the Trust(s),
Length of Time
Served and
Term of Office* | | Principal
Occupation(s)
During Past 5 Years | | Number of
Portfolios in
Fund Complex
Overseen** and
Other
Directorships Held
During Past 5 Years | | Experience,
Qualifications,
Attributes, Skills
for Board
Membership |
| | |
INDEPENDENT TRUSTEES | | | | |
| | | | |
Graham T. Allison, Jr.
(1940) | | Trustee Since 2003 Contract Review and Governance Committee Member | | Douglas Dillon Professor and Director of the Belfer Center for Science and International Affairs, John F. Kennedy School of Government, Harvard University | | 42
Director, Taubman Centers, Inc. (real estate investment trust) | | Significant experience on Board of Trustees of the Trusts and/or other business organizations; government experience (including as Assistant Secretary of Defense under President Clinton); academic experience |
| | | | |
Edward A. Benjamin
(1938) | | Trustee Since 2002 Chairman of the Contract Review and Governance Committee | | Retired | | 42
Formerly, Director, Precision Optics Corporation (optics manufacturer) | | Significant experience on Board of Trustees of the Trusts and/or other business organizations; significant experience providing legal counsel to boards, funds, advisers and other financial institutions (former partner at Ropes & Gray LLP) |
| 52
Trustee and Officer Information – continued
| | | | | | | | |
| Name and Year of Birth | | Position(s) Held
with the Trust(s),
Length of Time
Served and
Term of Office* | | Principal
Occupation(s)
During Past 5 Years | | Number of
Portfolios in
Fund Complex
Overseen** and
Other
Directorships Held
During Past 5 Years | | Experience,
Qualifications,
Attributes, Skills
for Board
Membership |
| | |
INDEPENDENT TRUSTEES – continued | | | | |
| | | | |
Daniel M. Cain
(1945) | | Trustee Since 2003 Chairman of the Audit Committee | | Chairman (formerly, President and Chief Executive Officer) of Cain Brothers & Company, Incorporated (investment banking) | | 42
Director, Sheridan Healthcare Inc. (physician practice management) | | Significant experience on Board of Trustees of the Trusts and/or other business organizations; experience in the financial industry, including roles as chairman and former chief executive officer of an investment banking firm |
| | | | |
Kenneth A. Drucker
(1945) | | Trustee Since 2008 Audit Committee Member | | Formerly, Vice President and Treasurer, Sequa Corp. (aerospace, automotive and metal manufacturing) | | 42
Formerly, Director, M Fund, Inc. (investment company); Director, Gateway Trust (investment company) | | Significant experience on Board of Trustees of the Trusts and/or other business organizations; executive experience including as treasurer of a corporation |
| | | | |
Wendell J. Knox
(1948) | | Trustee Since 2009 Contract Review and Governance Committee Member | | Director (formerly, President and Chief Executive Officer) of Abt Associates Inc. (research and consulting) | | 42
Director, Eastern Bank (commercial bank); Director, The Hanover Insurance Group (property and casualty insurance) | | Significant experience on Board of Trustees of the Trusts and/or other business organizations; executive experience including roles as president and chief executive officer of a consulting company |
| | | | |
Sandra O. Moose
(1942) | | Chairperson of the Board of Trustees since November 2005
Trustee Since 2003 Ex officio member of the Audit Committee and Contract Review and Governance Committee | | President, Strategic Advisory Services (management consulting); formerly, Senior Vice President and Director, The Boston Consulting Group, Inc. (management consulting) | | 42
Director, Verizon Communications; Director, AES Corporation (international power company); Formerly, Director, Rohm and Haas Company (specialty chemicals) | | Significant experience on Board of Trustees of the Trusts and/or other business organizations; executive experience at a management consulting company |
53 |
Trustee and Officer Information – continued
| | | | | | | | |
| Name and Year of Birth | | Position(s) Held
with the Trust(s),
Length of Time
Served and
Term of Office* | | Principal
Occupation(s)
During Past 5 Years | | Number of
Portfolios in
Fund Complex
Overseen** and
Other
Directorships Held
During Past 5 Years | | Experience,
Qualifications,
Attributes, Skills
for Board
Membership |
| | |
INDEPENDENT TRUSTEES – continued | | | | |
| | | | |
Erik R. Sirri1
(1958) | | Trustee Since 2009 Contract Review and Governance Committee Member | | Professor of Finance at Babson College; formerly, Director of the Division of Trading and Markets at the Securities and Exchange Commission | | 42
None | | Experience as Director of the Division of Trading and Markets at the Securities and Exchange Commission; academic experience and training as an economist |
| | | | |
Peter J. Smail1
(1952) | | Trustee Since 2009 Contract Review and Governance Committee Member | | Retired; formerly, President and Chief Executive Officer of Pyramis Global Advisors (investment management) | | 42
None | | Mutual fund industry and executive experience, including roles as president and chief executive officer for an investment adviser |
| | | | |
Cynthia L. Walker
(1956) | | Trustee Since 2005 Audit Committee Member | | Deputy Dean for Finance and Administration, Yale University School of Medicine; formerly, Executive Dean for Administration, Harvard Medical School; and formerly, Dean for Finance and Chief Financial Officer, Harvard Medical School | | 42
None | | Significant experience on Board of Trustees of the Trusts and/or other business organizations; executive experience in a variety of academic organizations, including roles as dean for finance and administration |
| 54
Trustee and Officer Information – continued
| | | | | | | | |
| Name and Year of Birth | | Position(s) Held
with the Trust(s),
Length of Time
Served and
Term of Office* | | Principal
Occupation(s)
During Past 5 Years | | Number of
Portfolios in
Fund Complex
Overseen** and
Other
Directorships Held
During Past 5 Years | | Experience,
Qualifications,
Attributes, Skills
for Board
Membership |
| | | |
INTERESTED TRUSTEES | | | | | | |
| | | | |
Robert J. Blanding2
(1947) 555 California Street San Francisco, CA 94104 | | Trustee Since 2002 President and Chief Executive Officer of Loomis Sayles Funds I since 2002 Chief Executive Officer of Loomis Sayles Funds II since 2002 | | President, Chairman, Director and Chief Executive Officer, Loomis, Sayles & Company, L.P. | | 42
None | | Significant experience on Board of Trustees of the Trusts; continuing service as president, chairman, and Chief Executive Officer of Loomis, Sayles & Company, L.P. |
| | | | |
John T. Hailer3
(1960) | | Trustee Since 2003 | | President and Chief Executive Officer –U.S. and Asia, Natixis Global Asset Management, L.P.; formerly, President and Chief Executive Officer, Natixis Distribution Corporation, Natixis Asset Management Advisors, L.P., Natixis Distributors, L.P. and Natixis Global Associates, Inc. | | 42
None | | Significant experience on Board of Trustees of the Trusts; continuing experience as Chief Executive Officer of Natixis Global Asset Management, L.P. |
| * | Each trustee serves until retirement, resignation or removal from the Board of Trustees. The current retirement age is 72; however, the trustees have designated 2010 as a transition period so that any trustees who are currently age 72 or older or who reach age 72 during the remainder of 2010 will not be required to retire until the end of calendar year 2011. The position of Chairperson of the Board is appointed for a two-year term. Ms. Moose was appointed to serve an additional two-year term as the Chairperson of the Board of Trustees on November 20, 2009. |
| ** | The trustees of the Trusts serve as trustees of a fund complex that includes all series of the Natixis Funds Trust I, Natixis Funds Trust II, Natixis Funds Trust IV, Gateway Trust and the Natixis Cash Management Trust (collectively, the “Natixis Funds Trusts”), Loomis Sayles Funds I and Loomis Sayles Funds II (collectively, the “Loomis Sayles Funds Trusts”), and Hansberger International Series (collectively, the “Fund Complex”). |
| 1 | Mr. Sirri and Mr. Smail were appointed as trustees effective December 1, 2009. |
| 2 | Mr. Blanding is deemed an “interested person” of the Trusts because he holds the following positions with an affiliated person of the Trusts: President, Chairman, Director and Chief Executive Officer of Loomis Sayles. |
| 3 | Mr. Hailer is deemed an “interested person” of the Trusts because he holds the following positions with an affiliated person of the Trusts: President and Chief Executive Officer – U.S. and Asia, Natixis Global Asset Management, L.P. |
55 |
Trustee and Officer Information – continued
| | | | | | |
| Name and Year of Birth | | Position(s) Held with
the Trusts | | Term of Office* and
Length of Time Served | | Principal Occupation
During Past 5 Years** |
|
OFFICERS OF THE TRUST |
| | | |
Coleen Downs Dinneen
(1960) | | Secretary, Clerk and Chief Legal Officer | | Since September 2004 | | Executive Vice President, General Counsel, Secretary and Clerk (formerly, Senior Vice President, Deputy General Counsel, Assistant Secretary and Assistant Clerk), Natixis Distribution Corporation, Natixis Asset Management Advisors, L.P. and Natixis Distributors, L.P. |
| | | |
Daniel J. Fuss
(1933)
One Financial Center Boston, MA 02111 | | Executive Vice President of Loomis Sayles Funds I and Loomis Sayles Funds II | | Since June 2003 | | Vice Chairman and Director, Loomis, Sayles & Company, L.P. |
| | | |
David Giunta
(1965) | | President of Loomis Sayles Funds II; and Executive Vice President of Loomis Sayles Funds I | | Since March 2008 | | President and Chief Executive Officer, Natixis Distribution Corporation, Natixis Asset Management Advisors, L.P. and Natixis Distributors, L.P.; formerly, President, Fidelity Charitable Gift Fund; and formerly, Senior Vice President, Fidelity Brokerage Company |
| | | |
Russell L. Kane
(1969) | | Chief Compliance Officer, Assistant Secretary and Anti-Money Laundering Officer | | Chief Compliance Officer since May 2006; Assistant Secretary since June 2004; and Anti-Money Laundering Officer since April 2007 | | Chief Compliance Officer for Mutual Funds, Senior Vice President, Deputy General Counsel, Assistant Secretary and Assistant Clerk, Natixis Distribution Corporation, Natixis Asset Management Advisors, L.P. and Natixis Distributors, L.P. |
| 56
Trustee and Officer Information – continued
| | | | | | |
| Name and Year of Birth | | Position(s) Held with
the Trusts | | Term of Office* and
Length of Time Served | | Principal Occupation
During Past 5 Years** |
|
OFFICERS OF THE TRUST – continued |
| | | |
Michael C. Kardok
(1959) | | Treasurer, Principal Financial and Accounting Officer | | Since October 2004 | | Senior Vice President, Natixis Asset Management Advisors, L.P. and Natixis Distributors, L.P. |
| * | Each officer of the Trusts serves for an indefinite term in accordance with the Trusts’ current By-laws until the date his or her successor is elected and qualified, or until he or she sooner dies, retires, is removed or becomes disqualified. |
| ** | Each person listed above, except as noted, holds the same position(s) with the Fund Complex. Mr. Fuss is not an officer of the Natixis Funds Trusts or the Hansberger International Series. Previous positions during the past five years with the Distributor, Natixis Advisors or Loomis Sayles are omitted if not materially different from a trustee’s or officer’s current position with such entity. |
57 |
ANNUAL REPORT
September 30, 2010

Loomis Sayles Investment Grade Bond Fund
Loomis, Sayles & Company, L.P.
TABLE OF CONTENTS
Management Discussion page 1
Investment Results page 3
Portfolio of Investments page 13
Financial Statements page 34
Loomis Sayles Investment Grade Bond Fund
Management Discussion
Managers:
Daniel Fuss, CFA, CIC
Associate Managers:
Matthew J. Eagan, CFA
Kathleen Gaffney, CFA
Elaine Stokes
Loomis, Sayles & Company, L.P.
Objective:
High total investment return through a combination of current income and capital appreciation
Strategy:
Invests primarily in investment-grade, fixed-income securities, although it may invest up to 10% of its assets in lower quality fixed-income securities. The fund may invest any portion of its assets in securities of Canadian issuers and up to 20% in other foreign securities, including emerging markets.
Fund Inception:
December 31, 1996
Symbols:
| | |
| Class A | | LIGRX |
| Class B | | LGBBX |
| Class C | | LGBCX |
| Class Y | | LSIIX |
| Admin Class | | LIGAX |
| Class J | | LIGJX |
Market Conditions
The fixed-income markets staged a robust rally over much of the 12-month period ended September 30, 2010. During the rally, investors turned to riskier asset classes in search of higher yields, which led to strong returns for corporate bonds, commercial mortgage-backed securities (CMBS) and equity-sensitive convertible and preferred securities. New-issue volume was high throughout the period, allowing companies to refinance debt at record-low interest rates. Corporations continued to find ways to cut costs and build cash reserves. Balance sheets continued to improve, as many companies avoided shareholder-friendly activities, such as share buybacks and mergers and acquisitions.
Performance Results
For the 12 months ended September 30, 2010, Class A shares of Loomis Sayles Investment Grade Bond Fund returned 13.41% at net asset value. The fund’s results substantially outdistanced the Barclays Capital U.S. Government/Credit Bond Index, which rose 8.73% over the same period. It also outperformed the 10.03% average return of funds in Morningstar’s Intermediate-Term Bond category.
Explanation of Fund Performance
The fund was well positioned to benefit from the strong credit rally that began in 2009 and continued into the second quarter of 2010. Investment-grade corporate bonds were the leading contributors to performance, led by investments in the industrials sector, notably in bonds of companies in the communications, basic industry, transportation and technology groups. In addition, the fund had exposure to high-yield corporate bonds and convertible bonds, two strong-performing sectors not represented in the Barclays index. Also helping support performance was the fund’s substantial allocation to securities denominated in currencies from commodity-rich nations, including Canada, Australia and New Zealand, all of which performed well as investors sought high yields in world markets. In addition, the fund’s position in CMBS helped performance, as did the decision to de-emphasize low-yielding U.S. Treasury and U.S. government agency debt.
1 |
The fund’s short-duration positions in asset-backed securities and in certain non-dollar-denominated securities hampered results, as prices of longer maturities appreciated more than prices of shorter maturities. (Duration is a measure of interest-rate sensitivity.) In addition, a small allocation to bank loans did not help the fund’s performance, as the sector produced poor returns compared to riskier alternatives.
Outlook
We see a prolonged period of slow economic growth and low interest rates in the United States, Europe and Japan as the most influential and likely scenario for the remainder of 2010. Increased investor demand for yield should continue to benefit sectors of the market that offer substantial premiums over government bonds. The anticipation and investment positioning surrounding a second round of U.S. quantitative easing will continue to have wide-ranging ramifications for the markets.
Overall, our portfolio themes remain largely intact. Our assessment of the credit markets is consistent with previous quarters in 2010; selected relative value opportunities are still available in the current environment. Having the research expertise to identify the right securities for a portfolio is of utmost importance. The fund remains positioned to take advantage of the slowly improving global economy. We continue to see incremental fundamental improvement in the corporate space. Our global approach allows us to look beyond the domestic markets for security-specific opportunities as well. As relative value diminishes in certain names, we will continue to reduce position sizes selectively.
We expect market volatility to be a constant presence going forward. We plan to take advantage of this volatility by opportunistically adding securities across many of the markets available to us. We believe that a combination of improving corporate fundamentals, emerging market growth expectations that exceed those of the developed world and strong technical demand for yield have created an environment that could continue to benefit the fund in the future.
What You Should Know:
This fund invests in fixed-income securities that are subject to credit risk, interest rate risk and liquidity risk. It may also invest in mortgage-related securities that are subject to prepayment risk. The fund can invest a significant percentage of assets in foreign securities and the value of fund shares can be adversely affected by changes in currency exchange rates and by political and economic developments. In emerging markets these risks can be significant. The fund is subject to currency risk, which is the risk that fluctuations in exchange rates between the U.S. dollar and foreign currencies may cause the value of a fund’s investments to decline. Lower rated debt securities have speculative characteristics and may be subject to greater price volatility than higher rated investments. In addition, the secondary market for these securities may lack liquidity. Fund shares should be viewed as a long-term investment.
| 2
Loomis Sayles Investment Grade Bond Fund
Investment Results through September 30, 2010
The charts comparing the fund’s performance to an index provide you with a general sense of how it performed. The fund’s total return for the period shown below appears with and without sales charges and includes fund expenses and fees. An index measures the performance of a theoretical portfolio. Unlike a fund, the index is unmanaged and does not have expenses that affect the results. It is not possible to invest directly in an index. Investors would incur transaction costs and other expenses if they purchased the securities necessary to match the index.
Growth of a $10,000 Investment in Class A Shares1,4
September 30, 2000 through September 30, 2010
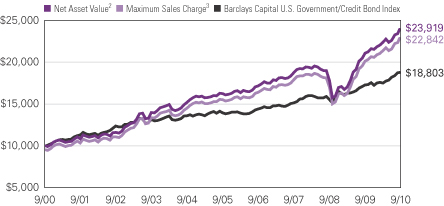
3 |
Average Annual Total Returns — September 30, 20104
| | | | | | | | | | | | |
| | | | |
| | | 1 Year | | | 5 Years | | | 10 Years | |
| | | | |
| Class A (Inception 12/31/96)1 | | | | | | | | | | | | |
| Net Asset Value2 | | | 13.41 | % | | | 8.04 | % | | | 9.11 | % |
| With Maximum Sales Charge3 | | | 8.29 | | | | 7.05 | | | | 8.61 | |
| | | | |
| Class B (Inception 9/12/03)1 | | | | | | | | | | | | |
| Net Asset Value2 | | | 12.43 | | | | 7.13 | | | | 8.17 | |
| With CDSC5 | | | 7.43 | | | | 6.82 | | | | 8.17 | |
| | | | |
| Class C (Inception 9/12/03)1 | | | | | | | | | | | | |
| Net Asset Value2 | | | 12.58 | | | | 7.24 | | | | 8.22 | |
| With CDSC5 | | | 11.58 | | | | 7.24 | | | | 8.22 | |
| | | | |
| Class Y (Inception 12/31/96) | | | | | | | | | | | | |
| Net Asset Value2 | | | 13.60 | | | | 8.33 | | | | 9.40 | |
| | | | |
| Admin Class (Inception 2/1/10)1 | | | | | | | | | | | | |
| Net Asset Value2 | | | 12.99 | | | | 7.55 | | | | 8.55 | |
| | | | |
| Class J (Inception 5/24/99) | | | | | | | | | | | | |
| Net Asset Value2 | | | 12.77 | | | | 7.53 | | | | 8.59 | |
| With Sales Charge5 | | | 8.84 | | | | 6.77 | | | | 8.21 | |
| | | | |
| Comparative Performance | | | | | | | | | | | | |
| Barclays Capital U.S. Government/Credit Bond Index | | | 8.73 | | | | 6.15 | | | | 6.52 | |
| Morningstar Intermediate-Term Bond Fund Avg. | | | 10.03 | | | | 5.41 | | | | 5.85 | |
All returns represent past performance and do not guarantee future results. Share price and return will vary and you may have a gain or loss when you sell your shares. All results include reinvestment of any dividends and capital gains. Current returns may be higher or lower than those shown. For performance current to the most recent month-end, visit ga.natixis.com. Class Y is only available to certain investors as described in the prospectus. Class J shares are not offered for sale in the United States and are not eligible for sale to U.S. investors. The table and graph do not reflect taxes shareholders might owe on any fund distributions or when they redeem their shares.
NOTES TO CHARTS
See page 6 for a description of the index/average.
| 1 | Prior to 9/15/03, performance of Class A shares is that of Retail Class shares, which were redesignated as Class A shares, restated to reflect the sales load of Class A shares. From 12/18/00 to 1/31/02, during which time Retail Class shares were not outstanding, performance is that of Institutional Class shares, restated to reflect the higher net expenses and sales loads of Class A shares. Prior to the inception of Class B and C shares (9/12/03), performance is that of Institutional Class shares, which were redesignated as Class Y shares, restated to reflect the higher net expenses and sales loads of Class B and C shares. Prior to the inception of Admin Class shares (2/1/10), performance is that of Class A shares, restated to reflect the higher net expenses of Admin Class shares. |
| 2 | Does not include a sales charge. |
| 3 | Includes maximum sales charge of 4.50%. |
| 4 | Fund performance has been increased by fee waivers and/or expense reimbursements, if any, without which performance would have been lower. |
| 5 | Performance for Class B shares assumes a maximum 5% contingent deferred sales charge (“CDSC”) applied when you sell shares, which declines annually between years 1-6 according to the following schedule: 5, 4, 3, 3, 2, 1, 0%. Class C shares performance assumes a 1% CDSC applied when you sell shares within one year of purchase. Performance for Class J assumes a 3.50% sales charge. |
| 4
| | | | |
| | | % of Net Assets as of | |
| CREDIT QUALITY | | 9/30/2010 | |
| Aaa | | | 28.8 | |
| Aa | | | 7.1 | |
| A | | | 21.5 | |
| Baa | | | 34.5 | |
| Ba | | | 3.2 | |
| B | | | 2.7 | |
| Caa & Lower | | | 0.1 | |
| Not Rated | | | 0.0 | |
| Short-term and other | | | 2.1 | |
Credit quality at 9/30/2010 reflects the highest credit rating assigned to individual holdings of the fund among Moody’s, S&P or Fitch; ratings are subject to change. The fund’s shares are not rated by any rating agency and no credit rating for the fund’s shares is implied. The Moody’s equivalent of the assigned rating is presented in the table.
| | | | |
| | | % of Net Assets as of | |
| EFFECTIVE MATURITY | | 9/30/2010 | |
| 1 year or less | | | 7.3 | |
| 1-5 years | | | 30.4 | |
| 5-10 years | | | 44.9 | |
| 10+ years | | | 17.4 | |
| Average Effective Maturity | | | 8.8 | |
Portfolio characteristics will vary.
Expense Ratios
as stated in the most recent prospectus
| | | | | | | | |
| Share Class | | Gross Expense Ratio1 | | | Net Expense Ratio2 | |
| A | | | 0.80 | % | | | 0.80 | % |
| B | | | 1.67 | | | | 1.67 | |
| C | | | 1.56 | | | | 1.56 | |
| Y | | | 0.54 | | | | 0.54 | |
| Admin | | | 1.33 | | | | 1.20 | |
| J | | | 1.31 | | | | 1.30 | |
| 1 | Before fee waivers and/or expense reimbursements. |
| 2 | After fee waivers and/or expense reimbursements. Waivers/reimbursements are contractual and are set to expire on 1/31/11. |
5 |
ADDITIONAL INFORMATION
The views expressed in this report reflect those of the portfolio managers as of the dates indicated. The managers’ views are subject to change at any time without notice based on changes in market or other conditions. References to specific securities or industries should not be regarded as investment advice. Because the fund is actively managed, there is no assurance that it will continue to invest in the securities, countries or industries mentioned.
Before investing, consider the fund’s investment objectives, risks, charges and other expenses. Visit ga.natixis.com or call 800-225-5478 for a prospectus and/or a summary prospectus, both of which contain this and other information. Read it carefully.
INDEX/AVERAGE DESCRIPTIONS:
Barclays Capital U.S. Government/Credit Bond Index is an unmanaged index that includes U.S. Treasuries, government-related issues, and investment grade U.S. corporate securities.
Morningstar Intermediate-Term Bond Fund Average is the average performance without sales charges of funds with similar investment objectives, as calculated by Morningstar, Inc.
PROXY VOTING INFORMATION
A description of the fund’s proxy voting policies and procedures is available without charge, upon request, by calling Natixis Funds at 800-225-5478; on the fund’s website at ga.natixis.com; and on the Securities and Exchange Commission’s (SEC’s) website at www.sec.gov. Information regarding how the fund voted proxies relating to portfolio securities during the 12-month period ended June 30, 2010 is available from the fund’s website and the SEC’s website.
QUARTERLY PORTFOLIO SCHEDULES
The fund files a complete schedule of portfolio holdings with the SEC for the first and third quarters of each fiscal year on Form N-Q. The fund’s Forms N-Q are available on the SEC’s website at www.sec.gov and may be reviewed and copied at the SEC’s Public Reference Room in Washington, DC. Information on the operation of the Public Reference Room may be obtained by calling 1-800-SEC-0330.
| 6
UNDERSTANDING YOUR FUND’S EXPENSES
As a mutual fund shareholder, you incur different types of costs: transaction costs, including sales charges (loads) on purchases and contingent deferred sales charges on redemptions; and ongoing costs, including management fees, distribution fees (12b-1 fees) and/or service fees, and other fund expenses. In addition, the fund may assess a minimum balance fee of $20 on an annual basis for accounts that fall below the required minimum to establish an account (certain exceptions may apply). These costs are described in more detail in the fund’s prospectus. The examples below are intended to help you understand the ongoing costs of investing in the fund and help you compare these with the ongoing costs of investing in other mutual funds.
The first line in the table for each class shows the actual amount of fund expenses you would have paid on a $1,000 investment in the fund from April 1, 2010 through September 30, 2010. It also shows how much a $1,000 investment would be worth at the close of the period, assuming actual fund returns and expenses. To estimate the expenses you paid over the period, simply divide your account value by $1,000 (for example $8,600 account value divided by $1,000 =8.6) and multiply the result by the number in the Expenses Paid During the Period row as shown below for your class.
The second line in the table for each class provides information about hypothetical account values and hypothetical expenses based on the fund’s actual expense ratios and an assumed rate of return of 5% per year before expenses, which is not the fund’s actual return. The hypothetical account values and expenses may not be used to estimate the actual ending account balance or expenses you paid on your investment for the period. You may use this information to compare the ongoing costs of investing in the fund and other funds. To do so, compare this 5% hypothetical example with the 5% hypothetical examples that appear in the shareholder reports of the other funds.
Please note that the expenses shown reflect ongoing costs only, and do not include any transaction costs. Therefore, the second line in the table of the fund is useful in comparing ongoing costs only, and will not help you determine the relative costs of owning different funds. If transaction costs were included, total costs would be higher.
7 |
| | | | | | | | | | | | |
LOOMIS SAYLES INVESTMENT GRADE
BOND FUND | | BEGINNING
ACCOUNT VALUE
4/1/2010 | | | ENDING
ACCOUNT VALUE
9/30/2010 | | | EXPENSES PAID
DURING PERIOD*
4/1/2010 – 9/30/2010 | |
Class A | | | | | | | | | | | | |
Actual | | | $1,000.00 | | | | $1,067.50 | | | | $4.30 | |
Hypothetical (5% return before expenses) | | | $1,000.00 | | | | $1,020.91 | | | | $4.20 | |
Class B | | | | | | | | | | | | |
Actual | | | $1,000.00 | | | | $1,063.30 | | | | $8.53 | |
Hypothetical (5% return before expenses) | | | $1,000.00 | | | | $1,016.80 | | | | $8.34 | |
Class C | | | | | | | | | | | | |
Actual | | | $1,000.00 | | | | $1,063.10 | | | | $8.12 | |
Hypothetical (5% return before expenses) | | | $1,000.00 | | | | $1,017.20 | | | | $7.94 | |
Class Y | | | | | | | | | | | | |
Actual | | | $1,000.00 | | | | $1,067.90 | | | | $2.95 | |
Hypothetical (5% return before expenses) | | | $1,000.00 | | | | $1,022.21 | | | | $2.89 | |
Admin Class | | | | | | | | | | | | |
Actual | | | $1,000.00 | | | | $1,065.60 | | | | $5.59 | |
Hypothetical (5% return before expenses) | | | $1,000.00 | | | | $1,019.65 | | | | $5.47 | |
Class J | | | | | | | | | | | | |
Actual | | | $1,000.00 | | | | $1,064.10 | | | | $6.73 | |
Hypothetical (5% return before expenses) | | | $1,000.00 | | | | $1,018.55 | | | | $6.58 | |
| * | Expenses are equal to the Fund's annualized expense ratio (after waiver/reimbursement): 0.83%, 1.65%, 1.57%, 0.57%, 1.08% and 1.30%, for Class A, B, C, Y, Admin Class and Class J, respectively, multiplied by the average account value over the period, multiplied by the number of days in the most recent fiscal half-year, divided by 365 (to reflect the half-year period). |
| 8
BOARD APPROVAL OF THE EXISTING ADVISORY AGREEMENT
The Board of Trustees, including the Independent Trustees, considers matters bearing on the Fund’s advisory agreement (the “Agreement”) at most of its meetings throughout the year. Each year, usually in the spring, the Contract Review and Governance Committee of the Board meets to review the Agreement to determine whether to recommend that the full Board approve the continuation of the Agreement, typically for an additional one-year period. After the Committee has made its recommendation, the full Board, including the Independent Trustees, determines whether to approve the continuation of the Agreement.
In connection with these meetings, the Trustees receive materials that the Fund’s investment adviser (the “Adviser”) believes to be reasonably necessary for the Trustees to evaluate the Agreement. These materials generally include, among other items, (i) information on the investment performance of the Fund and the performance of a peer group of funds and the Fund’s performance benchmarks, (ii) information on the Fund’s advisory fee and other expenses, including information comparing the Fund’s expenses to the fees charged to institutional accounts with similar strategies managed by the Adviser and to those of a peer group of funds and information about any applicable expense caps and fee “breakpoints,” (iii) sales and redemption data in respect of the Fund, (iv) information about the profitability of the Agreement to the Adviser and (v) information obtained through the completion of a questionnaire by the Adviser (the Trustees are consulted as to the information requested through that questionnaire). The Board of Trustees, including the Independent Trustees, also consider other matters such as (i) the Adviser’s financial results and financial condition, (ii) the Fund’s investment objective and strategies and the size, education and experience of the Adviser’s investment staff and their use of technology, external research and trading cost measurement tools, (iii) arrangements in respect of the distribution of the Fund’s shares and the related costs, (iv) the procedures employed to determine the value of the Fund’s assets, (v) the allocation of the Fund’s brokerage, if any, including, if applicable, allocations to brokers affiliated with the Adviser and the use of “soft” commission dollars to pay Fund expenses and to pay for research and other similar services, (vi) the resources devoted to, and the record of compliance with, the Fund’s investment policies and restrictions, policies on personal securities transactions and other compliance policies, (vii) information about amounts invested by the Fund’s portfolio managers in the Fund or in similar accounts that they manage and (viii) the general economic outlook with particular emphasis on the mutual fund industry. Throughout the process, the Trustees are afforded the opportunity to ask questions of and request additional materials from the Adviser.
In addition to the materials requested by the Trustees in connection with their annual consideration of the continuation of the Agreement, the Trustees receive materials in advance of each regular quarterly meeting of the Board of Trustees that provide detailed information about the Fund’s investment performance and the fees charged to the Fund for advisory and other services. This information generally includes, among other things, an internal performance rating for the Fund based on agreed-upon criteria, graphs showing performance and fee differentials against the Fund’s peer group of funds, performance
9 |
ratings provided by a third-party, total return information for various periods, and third-party performance rankings for various periods comparing the Fund against its peer group. The portfolio management team for the Fund or other representatives of the Adviser make periodic presentations to the Contract Review and Governance Committee and/or the full Board of Trustees, and if the Fund is identified as presenting possible performance concerns it may be subject to more frequent board presentations and reviews. In addition, each quarter the Trustees are provided with detailed statistical information about the Fund’s portfolio. The Trustees also receive periodic updates between meetings.
The Board of Trustees most recently approved the continuation of the Agreement at their meeting held in June 2010. The Agreement was continued for a one-year period. In considering whether to approve the continuation of the Agreement, the Board of Trustees, including the Independent Trustees, did not identify any single factor as determinative. Individual Trustees may have evaluated the information presented differently from one another, giving different weights to various factors. Matters considered by the Trustees, including the Independent Trustees, in connection with their approval of the Agreement included, but were not limited to, the factors listed below.
The nature, extent and quality of the services provided to the Fund under the Agreement. The Trustees considered the nature, extent and quality of the services provided by the Adviser and its affiliates to the Fund and the resources dedicated to the Fund by the Adviser and its affiliates, including recent or planned investments by the Adviser in additional personnel or other resources.
The Trustees also considered the benefits to shareholders of investing in a mutual fund that is part of a family of funds that offers shareholders the right to exchange shares of one type of fund for shares of another type of fund, and provides a variety of fund and shareholder services.
After reviewing these and related factors, the Trustees concluded, within the context of their overall conclusions regarding the Agreement, that the nature, extent and quality of services provided supported the renewal of the Agreement.
Investment performance of the Fund and the Adviser. As noted above, the Trustees received information about the performance of the Fund over various time periods, including information which compared the performance of the Fund to the performance of a peer group of funds and the Fund’s performance benchmark. In addition, the Trustees also reviewed data prepared by an independent third party which analyzed the performance of the Fund using a variety of performance metrics, including metrics which also measured the performance of the Fund on a risk adjusted basis.
With respect to the Fund, the Board concluded that the Fund’s performance or other relevant factors supported the renewal of the Fund’s Agreement. The Trustees also considered the Adviser’s performance and reputation generally, the performance of the fund family generally (as noted by certain financial publications), and the historical responsiveness of the Adviser to Trustee concerns about performance and the willingness of the Adviser to take steps intended to improve performance.
After reviewing these and related factors, the Trustees concluded, within the context of their overall conclusions regarding the Agreement, that the performance of the Fund and the Adviser supported the renewal of the Agreement.
| 10
The costs of the services to be provided and profits to be realized by the Adviser and its affiliates from their respective relationships with the Fund. The Trustees considered the fees charged to the Fund for advisory services as well as the total expense level of the Fund. This information included comparisons (provided both by management and also by an independent third party) of the Fund’s advisory fee and total expense level to those of its peer group and information about the advisory fees charged by the Adviser to comparable accounts (such as institutional separate accounts), as well as information about differences in such fees. In considering the fees charged to comparable accounts, the Trustees considered, among other things, management’s representations about the differences between managing mutual funds as compared to other types of accounts, including the additional resources required to effectively manage and the greater regulatory costs associated with the management of mutual fund assets. In evaluating the Fund’s advisory fee, the Trustees also took into account the demands, complexity and quality of the investment management of the Fund, as well as the need for the Adviser to offer competitive compensation in order to attract and retain capable personnel and the need for the Adviser to expend additional resources as the Fund grows in size. The Trustees considered that over the past several years, management had made recommendations regarding the institution of advisory fee waivers and expense caps. They noted that the Fund currently has an expense cap in place, and they considered the amounts waived or reimbursed by the Adviser under the cap.
The Trustees also considered the compensation directly or indirectly received by the Adviser and its affiliates from their relationships with the Fund. The Trustees reviewed information provided by management as to the profitability of the Adviser’s and its affiliates’ relationships with the Fund, and information about the allocation of expenses used to calculate profitability. They also reviewed information provided by management about the effect of distribution costs and changes in asset levels on Adviser profitability, including information regarding resources spent on distribution activities. When reviewing profitability, the Trustees also considered information about court cases in which adviser profitability was an issue, the performance of the Fund, the expense levels of the Fund, whether the Adviser had implemented breakpoints and/or expense caps with respect to the Fund and the overall profit margin of the Adviser compared to other investment managers.
After reviewing these and related factors, the Trustees concluded, within the context of their overall conclusions regarding the Agreement, that the advisory fee charged to the Fund was fair and reasonable, and that the costs of these services generally and the related profitability of the Adviser and its affiliates in respect of their relationships with the Fund supported the renewal of the Agreement.
Economies of Scale. The Trustees considered the existence of any economies of scale in the provision of services by the Adviser and whether those economies are shared with the Fund through breakpoints in its investment advisory fee or other means, such as expense waivers or caps. The Trustees noted that although the Fund’s advisory fee was not subject to breakpoints, the Fund was subject to an expense cap, and the Fund’s overall net expense ratio was below the median compared to a peer group of funds. In considering the issues, the Trustees also took note of the costs of the services provided (both on an absolute and a relative basis) and the profitability to the Adviser and its affiliates of their relationships with the Fund, as discussed above.
11 |
After reviewing these and related factors, the Trustees concluded, within the context of their overall conclusions regarding the Agreement, that the extent to which economies of scale were shared with the Fund supported the renewal of the Agreement.
The Trustees also considered other factors, which included but were not limited to the following:
| · | | the effect of recent market and economic turmoil on the performance, asset levels and expense ratios of the Fund. |
| · | | whether the Fund has operated in accordance with its investment objective and the Fund’s record of compliance with its investment restrictions, and the compliance programs of the Fund and the Adviser. They also considered the compliance-related resources the Adviser and its affiliates were providing to the Fund. |
| · | | the nature, quality, cost and extent of administrative and shareholder services performed by the Adviser and its affiliates, both under the Agreement and under a separate agreement covering administrative services. |
| · | | so-called “fallout benefits” to the Adviser, such as the engagement of affiliates of the Adviser to provide distribution, administrative and brokerage services to the Fund. The Trustees considered the possible conflicts of interest associated with these fallout and other benefits, and the reporting, disclosure and other processes in place to disclose and monitor such possible conflicts of interest. |
| · | | the Trustees’ review and discussion of the Fund’s advisory arrangements in prior years, and management’s record of responding to Trustee concerns raised during the year and in prior years. |
Based on their evaluation of all factors that they deemed to be material, including those factors described above, and assisted by the advice of independent counsel, the Trustees, including the Independent Trustees, concluded that the existing Agreement should be continued through June 30, 2011.
| 12
Portfolio of Investments – as of September 30, 2010
Loomis Sayles Investment Grade Bond Fund
| | | | | | | | |
Principal
Amount (‡) | | | Description | | Value (†) | |
| | | | | | | | |
| | Bonds and Notes — 97.7% of Net Assets | | | | |
| | Non-Convertible Bonds — 94.5% | | | | |
| | | | ABS Car Loan — 1.2% | | | | |
| $ | 8,255,000 | | | Avis Budget Rental Car Funding AESOP LLC, Series 2007-2A, Class A,
0.397%, 8/20/2013, 144A(b) | | $ | 7,921,606 | |
| | 831,000 | | | Avis Budget Rental Car Funding AESOP LLC, Series 2010-2A, Class B,
5.740%, 8/20/2014, 144A | | | 852,561 | |
| | 4,690,000 | | | Avis Budget Rental Car Funding AESOP LLC, Series 2010-3A, Class B,
6.740%, 5/20/2016, 144A | | | 4,962,093 | |
| | 19,025,000 | | | Chesapeake Funding LLC, Series 2009-2A, Class B,
2.007%, 9/15/2021, 144A(b) | | | 18,030,287 | |
| | 17,100,000 | | | Chesapeake Funding LLC, Series 2009-2A, Class C,
2.007%, 9/15/2021, 144A(b) | | | 15,711,424 | |
| | 43,060,000 | | | Chrysler Financial Lease Trust, Series 2010-A, Class B,
3.460%, 9/16/2013, 144A | | | 43,143,136 | |
| | 20,000,000 | | | Ford Auto Securitization Trust, Series 2010-R3A, Class A3,
2.714%, 9/15/2015, 144A, (CAD) | | | 19,438,235 | |
| | 5,600,000 | | | Ford Auto Securitization Trust, Series 2010-R3A, Class D,
4.526%, 3/15/2017, 144A, (CAD) | | | 5,442,706 | |
| | 8,514,000 | | | Merrill Auto Trust Securitization Asset, Series 2008-1, Class B,
6.750%, 4/15/2015 | | | 9,163,324 | |
| | | | | | | | |
| | | | | | | 124,665,372 | |
| | | | | | | | |
| | | | ABS Credit Card — 0.9% | | | | |
| | 2,550,000 | | | Capital One Multi-Asset Execution Trust, Series 2006-C2, Class C,
0.557%, 6/16/2014(b) | | | 2,518,665 | |
| | 29,215,000 | | | Chase Issuance Trust, Series 2007-B1, Class B1, 0.507%, 4/15/2019(b) | | | 28,031,357 | |
| | 12,035,000 | | | Citibank Credit Card Issuance Trust, Series 2008-C6, Class C6,
6.300%, 6/20/2014 | | | 12,803,781 | |
| | 19,600,000 | | | GE Capital Credit Card Master Note Trust, Series 2009-4, Class B,
5.390%, 11/15/2017, 144A | | | 21,527,984 | |
| | 10,000,000 | | | MBNA Credit Card Master Note Trust, Series 2002-C1, Class C1,
6.800%, 7/15/2014 | | | 10,635,783 | |
| | 14,780,000 | | | MBNA Credit Card Master Note Trust, Series 2004-B1, Class B1,
4.450%, 8/15/2016 | | | 16,016,297 | |
| | 2,375,000 | | | World Financial Network Credit Card Master Trust, Series 2010-A, Class B, 6.750%, 4/15/2019 | | | 2,493,450 | |
| | | | | | | | |
| | | | | | | 94,027,317 | |
| | | | | | | | |
| | | | ABS Home Equity — 0.0% | | | | |
| | 1,650,000 | | | New Century Home Equity Loan Trust, Series 2005-2, Class M3,
0.746%, 6/25/2035(b) | | | 939,977 | |
| | | | | | | | |
| | | | ABS Other — 2.0% | | | | |
| | 10,224,845 | | | CIT Equipment Collateral, Series 2008-VT1, Class A3, 6.590%, 12/22/2014 | | | 10,543,742 | |
| | 1,700,000 | | | Community Program Loan Trust, Series 1987-A, Class A5,
4.500%, 4/01/2029 | | | 1,635,891 | |
| | 59,884,409 | | | Marriott Vacation Club Owner Trust, Series 2009-2A, Class A,
4.809%, 7/20/2031, 144A | | | 62,147,998 | |
See accompanying notes to financial statements.
13 |
Portfolio of Investments – as of September 30, 2010
Loomis Sayles Investment Grade Bond Fund – (continued)
| | | | | | | | |
Principal
Amount (‡) | | | Description | | Value (†) | |
| | | | | | | | |
| | | | ABS Other — continued | | | | |
| $ | 18,606,194 | | | Sierra Receivables Funding Co., Series 2009-3A, Class A1,
7.620%, 7/20/2026, 144A | | $ | 18,860,798 | |
| | 57,515,908 | | | SVO VOI Mortgage Corp., Series 2009-BA, Class NT,
5.810%, 12/20/2028, 144A | | | 60,233,380 | |
| | 44,819,160 | | | Trinity Rail Leasing LP, Series 2009-1A, Class A, 6.657%, 11/16/2039, 144A | | | 48,162,844 | |
| | | | | | | | |
| | | | | | | 201,584,653 | |
| | | | | | | | |
| | | | Airlines — 3.1% | | | | |
| | 17,106,499 | | | American Airlines Pass Through Trust, Series 2009-1A,
10.375%, 1/02/2021 | | | 20,185,669 | |
| | 562,841 | | | Continental Airlines Pass Through Trust, Series 1997-1, Class A,
7.461%, 10/01/2016 | | | 576,912 | |
| | 990,361 | | | Continental Airlines Pass Through Trust, Series 1998-1, Class A,
6.648%, 3/15/2019 | | | 1,012,644 | |
| | 1,006,555 | | | Continental Airlines Pass Through Trust, Series 1999-1, Class A,
6.545%, 8/02/2020 | | | 1,049,334 | |
| | 9,111,684 | | | Continental Airlines Pass Through Trust, Series 2000-1, Class A-1,
8.048%, 5/01/2022 | | | 9,840,618 | |
| | 1,794,869 | | | Continental Airlines Pass Through Trust, Series 2000-2, Class A-1,
7.707%, 10/02/2022 | | | 1,924,997 | |
| | 3,544,703 | | | Continental Airlines Pass Through Trust, Series 2001-1, Class A-1,
6.703%, 12/15/2022 | | | 3,713,218 | |
| | 60,175,107 | | | Continental Airlines Pass Through Trust, Series 2007-1, Class A,
5.983%, 10/19/2023 | | | 62,130,798 | |
| | 12,101,802 | | | Continental Airlines Pass Through Trust, Series 2007-1, Class B,
6.903%, 4/19/2022 | | | 11,617,730 | |
| | 28,787,351 | | | Continental Airlines Pass Through Trust, Series 2009-1, Class A,
9.000%, 7/08/2016 | | | 32,817,580 | |
| | 22,105,000 | | | Continental Airlines Pass Through Trust, Series 2009-2, Class A,
7.250%, 5/10/2021 | | | 24,094,450 | |
| | 22,950,000 | | | Delta Air Lines, Inc., 6.200%, 7/02/2018 | | | 23,868,000 | |
| | 4,300,000 | | | Delta Air Lines, Inc., Series 2001-1, Class A-2, 7.111%, 3/18/2013 | | | 4,493,500 | |
| | 2,093,963 | | | Delta Air Lines, Inc., Series 2007-1, Class A, 6.821%, 2/10/2024 | | | 2,195,939 | |
| | 16,630,343 | | | Delta Air Lines, Inc., Series 2007-1, Class B, 8.021%, 2/10/2024 | | | 16,713,494 | |
| | 40,849,316 | | | Delta Air Lines, Inc., Series A, 7.750%, 6/17/2021 | | | 45,342,741 | |
| | 4,751,193 | | | Delta Air Lines, Inc., Series B, 9.750%, 12/17/2016 | | | 5,083,777 | |
| | 8,923,686 | | | Northwest Airlines, Inc., Series 2007-1, Class B, 8.028%, 11/01/2017 | | | 9,019,972 | |
| | 8,115,000 | | | Qantas Airways Ltd., 6.050%, 4/15/2016, 144A | | | 8,926,662 | |
| | 27,420,759 | | | UAL Pass Through Trust, Series 2007-1, Class A, 6.636%, 1/02/2024 | | | 27,352,207 | |
| | 8,020,332 | | | UAL Pass Through Trust, Series 2009-1, 10.400%, 5/01/2018 | | | 8,942,670 | |
| | | | | | | | |
| | | | | | | 320,902,912 | |
| | | | | | | | |
| | | | Automotive — 1.1% | | | | |
| | 41,885,000 | | | Cummins, Inc., 5.650%, 3/01/2098 | | | 34,870,268 | |
| | 5,389,000 | | | Cummins, Inc., 6.750%, 2/15/2027 | | | 5,870,938 | |
| | 665,000 | | | Cummins, Inc., 7.125%, 3/01/2028 | | | 749,718 | |
| | 1,990,000 | | | Ford Motor Co., 6.375%, 2/01/2029 | | | 1,840,750 | |
| | 130,000 | | | Ford Motor Co., 6.500%, 8/01/2018 | | | 132,275 | |
See accompanying notes to financial statements.
| 14
Portfolio of Investments – as of September 30, 2010
Loomis Sayles Investment Grade Bond Fund – (continued)
| | | | | | | | |
Principal
Amount (‡) | | | Description | | Value (†) | |
| | | | | | | | |
| | | | Automotive — continued | | | | |
| $ | 260,000 | | | Ford Motor Co., 6.625%, 2/15/2028 | | $ | 246,350 | |
| | 5,185,000 | | | Ford Motor Co., 6.625%, 10/01/2028 | | | 4,912,788 | |
| | 8,730,000 | | | Ford Motor Co., 7.450%, 7/16/2031 | | | 9,101,025 | |
| | 245,000 | | | Ford Motor Co., 7.500%, 8/01/2026 | | | 245,000 | |
| | 41,000,000 | | | Ford Motor Credit Co. LLC, 6.625%, 8/15/2017 | | | 43,682,876 | |
| | 345,000 | | | Ford Motor Credit Co. LLC, 7.000%, 10/01/2013 | | | 370,142 | |
| | 5,435,000 | | | Ford Motor Credit Co. LLC, 7.000%, 4/15/2015 | | | 5,807,732 | |
| | 4,640,000 | | | Ford Motor Credit Co. LLC, 8.000%, 12/15/2016 | | | 5,244,921 | |
| | | | | | | | |
| | | | | | | 113,074,783 | |
| | | | | | | | |
| | | | Banking — 10.1% | | | | |
| | 47,100,000 | | | AgriBank FCB, 9.125%, 7/15/2019, 144A(c) | | | 58,419,731 | |
| | 7,450,000 | | | American Express Centurion Bank, Series BKN1, 6.000%, 9/13/2017 | | | 8,497,604 | |
| | 36,659,000 | | | Associates Corp. of North America, 6.950%, 11/01/2018 | | | 40,469,776 | |
| | 2,595,000 | | | BAC Capital Trust VI, 5.625%, 3/08/2035 | | | 2,439,362 | |
| | 3,690,000 | | | Bank of America Corp., 5.420%, 3/15/2017 | | | 3,778,933 | |
| | 10,020,000 | | | Bank of America Corp., 6.000%, 9/01/2017 | | | 10,848,814 | |
| | 17,625,000 | | | Bank of America NA, 5.300%, 3/15/2017 | | | 18,139,844 | |
| | 7,260,000,000 | | | Barclays Bank PLC, EMTN, 3.680%, 8/20/2015, (KRW) | | | 6,400,789 | |
| | 2,220,000 | | | Bear Stearns Cos., Inc. (The), 4.650%, 7/02/2018 | | | 2,337,121 | |
| | 975,000 | | | Bear Stearns Cos., Inc. (The), 5.300%, 10/30/2015 | | | 1,087,712 | |
| | 16,371,250,000 | | | BNP Paribas SA, EMTN, Zero Coupon, 6/13/2011, 144A, (IDR) | | | 1,760,941 | |
| | 9,190,000 | | | Capital One Financial Corp., 6.150%, 9/01/2016 | | | 10,075,475 | |
| | 10,400,000 | | | Citigroup, Inc., 5.000%, 9/15/2014 | | | 10,801,856 | |
| | 15,000,000 | | | Citigroup, Inc., 5.500%, 2/15/2017 | | | 15,488,700 | |
| | 1,325,000 | | | Citigroup, Inc., 5.850%, 12/11/2034 | | | 1,335,148 | |
| | 2,800,000 | | | Citigroup, Inc., 5.875%, 2/22/2033 | | | 2,680,667 | |
| | 20,308,000 | | | Citigroup, Inc., 6.125%, 5/15/2018 | | | 22,156,272 | |
| | 8,895,000 | | | Citigroup, Inc., 6.125%, 8/25/2036 | | | 8,663,588 | |
| | 74,265,000 | | | Citigroup, Inc., 6.375%, 8/12/2014 | | | 82,469,500 | |
| | 2,450,000 | | | Citigroup, Inc., EMTN, (fixed rate to 11/30/2012, variable rate thereafter),
3.625%, 11/30/2017, (EUR) | | | 3,200,396 | |
| | 65,235,000 | | | Citigroup, Inc., MTN, 5.500%, 10/15/2014 | | | 70,784,476 | |
| | 7,110,000 | | | First Niagara Finance Group, Inc., 6.750%, 3/19/2020 | | | 7,848,160 | |
| | 1,200,000 | | | Goldman Sachs Group, Inc. (The), 6.450%, 5/01/2036 | | | 1,203,539 | |
| | 99,020,000 | | | Goldman Sachs Group, Inc. (The), 6.750%, 10/01/2037 | | | 102,923,863 | |
| | 6,790,000 | | | Goldman Sachs Group, Inc. (The), GMTN, 5.375%, 3/15/2020 | | | 7,156,741 | |
| | 1,560,000 | | | HBOS PLC, 6.000%, 11/01/2033, 144A | | | 1,188,892 | |
| | 700,000 | | | ICICI Bank Ltd., (fixed rate to 4/30/2017, variable rate thereafter),
6.375%, 4/30/2022, 144A | | | 703,606 | |
| | 17,920,000,000 | | | JPMorgan Chase & Co., Zero Coupon, 3/28/2011, 144A, (IDR) | | | 1,956,242 | |
| | 68,827,366,920 | | | JPMorgan Chase & Co., Zero Coupon, 4/12/2012, 144A, (IDR) | | | 7,053,938 | |
| | 22,683,264,000 | | | JPMorgan Chase & Co., EMTN, Zero Coupon, 3/28/2011, 144A, (IDR) | | | 2,476,225 | |
| | 344,497,150,000 | | | JPMorgan Chase Bank NA, EMTN, Zero Coupon, 10/17/2011, 144A, (IDR) | | | 36,530,208 | |
| | 24,124,936,500 | | | JPMorgan Chase London, EMTN, Zero Coupon, 10/21/2010, 144A, (IDR) | | | 2,690,099 | |
| | 100,000 | | | Keybank NA, 6.950%, 2/01/2028 | | | 108,446 | |
| | 10,000,000 | | | Lloyds TSB Bank PLC, EMTN, 4.570%, 10/13/2015, (CAD) | | | 9,716,202 | |
| | 83,400,000 | | | Lloyds TSB Bank PLC, MTN, 6.500%, 9/14/2020, 144A | | | 84,203,559 | |
See accompanying notes to financial statements.
15 |
Portfolio of Investments – as of September 30, 2010
Loomis Sayles Investment Grade Bond Fund – (continued)
| | | | | | | | |
Principal
Amount (‡) | | | Description | | Value (†) | |
| | | | | | | | |
| | | | Banking — continued | | | | |
| $ | 6,620,000 | | | Merrill Lynch & Co., Inc., 5.700%, 5/02/2017 | | $ | 6,846,649 | |
| | 70,800,000 | | | Merrill Lynch & Co., Inc., 6.110%, 1/29/2037 | | | 69,222,576 | |
| | 10,000,000 | | | Merrill Lynch & Co., Inc., 10.710%, 3/08/2017, (BRL) | | | 5,673,759 | |
| | 3,200,000 | | | Merrill Lynch & Co., Inc., EMTN, 4.625%, 9/14/2018, (EUR) | | | 4,258,358 | |
| | 11,895,000 | | | Merrill Lynch & Co., Inc., MTN, 6.875%, 4/25/2018 | | | 13,342,574 | |
| | 41,000,000 | | | Merrill Lynch & Co., Inc., Series C, MTN, 6.050%, 6/01/2034 | | | 42,110,362 | |
| | 2,710,000 | | | Merrill Lynch & Co., Inc., Series C, MTN, 6.400%, 8/28/2017 | | | 2,965,567 | |
| | 51,525,000 | | | Morgan Stanley, 4.750%, 4/01/2014 | | | 53,811,061 | |
| | 78,300,000 | | | Morgan Stanley, 5.500%, 7/24/2020 | | | 80,666,069 | |
| | 1,510,000 | | | Morgan Stanley, EMTN, 5.450%, 1/09/2017 | | | 1,592,455 | |
| | 2,850,000 | | | Morgan Stanley, GMTN, 5.125%, 11/30/2015, (GBP) | | | 4,621,878 | |
| | 5,300,000 | | | Morgan Stanley, Series F, GMTN, 6.625%, 4/01/2018 | | | 5,875,871 | |
| | 17,500,000 | | | Morgan Stanley, Series F, MTN, 5.550%, 4/27/2017 | | | 18,543,840 | |
| | 30,200,000 | | | Morgan Stanley, Series F, MTN, 5.625%, 9/23/2019 | | | 31,442,760 | |
| | 9,910,000 | | | Morgan Stanley, Series F, MTN, 5.950%, 12/28/2017 | | | 10,645,084 | |
| | 2,875,000 | | | National City Bank of Indiana, 4.250%, 7/01/2018 | | | 2,915,561 | |
| | 8,826,000 | | | National City Corp., 6.875%, 5/15/2019 | | | 10,353,075 | |
| | 3,400,000 | | | Standard Chartered Bank, 6.400%, 9/26/2017, 144A | | | 3,800,904 | |
| | 18,250,000 | | | Standard Chartered PLC, 5.500%, 11/18/2014, 144A | | | 20,148,748 | |
| | | | | | | | |
| | | | | | | 1,036,433,576 | |
| | | | | | | | |
| | | | Brokerage — 0.6% | | | | |
| | 12,070,000 | | | Jefferies Group, Inc., 6.250%, 1/15/2036 | | | 11,082,288 | |
| | 45,150,000 | | | Jefferies Group, Inc., 8.500%, 7/15/2019 | | | 52,424,071 | |
| | | | | | | | |
| | | | | | | 63,506,359 | |
| | | | | | | | |
| | | | Building Materials — 1.3% | | | | |
| | 6,785,000 | | | Masco Corp., 4.800%, 6/15/2015 | | | 6,672,403 | |
| | 11,180,000 | | | Masco Corp., 5.850%, 3/15/2017 | | | 10,938,188 | |
| | 6,760,000 | | | Masco Corp., 6.125%, 10/03/2016 | | | 6,872,351 | |
| | 4,913,000 | | | Masco Corp., 6.500%, 8/15/2032 | | | 4,216,474 | |
| | 29,980,000 | | | Masco Corp., 7.125%, 3/15/2020 | | | 30,712,052 | |
| | 5,030,000 | | | Masco Corp., 7.750%, 8/01/2029 | | | 4,922,957 | |
| | 24,925,000 | | | Owens Corning, Inc., 6.500%, 12/01/2016 | | | 26,965,709 | |
| | 42,280,000 | | | Owens Corning, Inc., 7.000%, 12/01/2036 | | | 42,578,750 | |
| | 1,060,000 | | | USG Corp., 6.300%, 11/15/2016 | | | 919,550 | |
| | | | | | | | |
| | | | | | | 134,798,434 | |
| | | | | | | | |
| | | | Chemicals — 1.1% | | | | |
| | 35,520,000 | | | Chevron Phillips Chemical Co. LLC, 8.250%, 6/15/2019, 144A | | | 44,954,645 | |
| | 3,545,000 | | | Cytec Industries, Inc., 6.000%, 10/01/2015 | | | 3,985,296 | |
| | 2,400,000 | | | Methanex Corp., Senior Note, 6.000%, 8/15/2015 | | | 2,374,265 | |
| | 53,725,000 | | | PPG Industries, Inc., 6.650%, 3/15/2018 | | | 65,092,619 | |
| | | | | | | | |
| | | | | | | 116,406,825 | |
| | | | | | | | |
| | | | Collateralized Mortgage Obligations — 0.0% | | | | |
| | 2,818,937 | | | WaMu Mortgage Pass Through Certificates, Series 2007-OA6,
Class 2A, 3.003%, 7/25/2047(b) | | | 1,717,347 | |
| | 106,131 | | | Wells Fargo Mortgage Backed Securities Trust, Series 2006-AR12,
Class 1A1, 5.837%, 9/25/2036(b) | | | 88,065 | |
| | | | | | | | |
| | | | | | | 1,805,412 | |
| | | | | | | | |
See accompanying notes to financial statements.
| 16
Portfolio of Investments – as of September 30, 2010
Loomis Sayles Investment Grade Bond Fund – (continued)
| | | | | | | | |
Principal
Amount (‡) | | | Description | | Value (†) | |
| | | | | | | | |
| | | | Commercial Mortgage-Backed Securities — 3.7% | | | | |
| $ | 2,877,732 | | | Bank of America-First Union NB Commercial Mortgage, Series 2001-3, Class A2, 5.464%, 4/11/2037 | | $ | 2,945,042 | |
| | 8,100,000 | | | Bear Stearns Commercial Mortgage Securities, Inc., Series 2007-PW15, Class A4, 5.331%, 2/11/2044 | | | 8,334,629 | |
| | 33,890,000 | | | Citigroup/Deutsche Bank Commercial Mortgage Trust, Series 2007-CD4, Class A4, 5.322%, 12/11/2049 | | | 35,123,738 | |
| | 62,975,000 | | | Credit Suisse Mortgage Capital Certificates, Series 2007-C3, Class A4,
5.721%, 6/15/2039(b) | | | 62,766,376 | |
| | 35,130,000 | | | Credit Suisse Mortgage Capital Certificates, Series 2007-C4, Class A4,
5.805%, 9/15/2039(b) | | | 34,918,317 | |
| | 5,110,000 | | | Credit Suisse Mortgage Capital Certificates, Series 2007-C5, Class A4, 5.695%, 9/15/2040 | | | 5,121,537 | |
| | 58,950,000 | | | Crown Castle Towers LLC, 6.113%, 1/15/2040, 144A | | | 65,123,834 | |
| | 24,057,000 | | | Greenwich Capital Commercial Funding Corp., Series 2007-GG11,
Class A4, 5.736%, 12/10/2049 | | | 25,176,302 | |
| | 1,396,318 | | | GSR Mortgage Loan Trust, Series 2005-AR2, Class 2A1,
3.097%, 4/25/2035(b) | | | 1,227,765 | |
| | 20,220,000 | | | JPMorgan Chase Commercial Mortgage Securities Corp., Series 2006-LDP6, Class A4, 5.475%, 4/15/2043 | | | 22,077,852 | |
| | 8,930,000 | | | JPMorgan Chase Commercial Mortgage Securities Corp.,
Series 2006-LDP7, Class A4, 5.872%, 4/15/2045(b) | | | 9,899,769 | |
| | 60,634,099 | | | JPMorgan Chase Commercial Mortgage Securities Corp.,
Series 2007-LD11, Class A4, 5.817%, 6/15/2049(b) | | | 62,650,953 | |
| | 21,993,000 | | | JPMorgan Chase Commercial Mortgage Securities Corp.,
Series 2007-LDPX, Class A3, 5.420%, 1/15/2049 | | | 22,881,882 | |
| | 3,200,000 | | | LB-UBS Commercial Mortgage Trust, Series 2006-C4, Class A4,
5.881%, 6/15/2038(b) | | | 3,525,783 | |
| | 1,340,000 | | | Merrill Lynch/Countrywide Commercial Mortgage Trust, Series 2007-6, Class A4, 5.485%, 3/12/2051 | | | 1,344,444 | |
| | 10,000,000 | | | Morgan Stanley Re-REMIC Trust, Series 2009-GG10, Class A4B,
5.808%, 8/12/2045, 144A(b) | | | 9,222,218 | |
| | 7,000,000 | | | Vornado DP LLC, Series 2010-VNO, Class D, 6.356%, 9/13/2028, 144A | | | 7,215,100 | |
| | 3,700,000 | | | Wachovia Bank Commercial Mortgage Trust, Series 2006-C29, Class A4,
5.308%, 11/15/2048 | | | 3,984,601 | |
| | | | | | | | |
| | | | | | | 383,540,142 | |
| | | | | | | | |
| | | | Construction Machinery — 0.3% | | | | |
| | 24,153,000 | | | Case New Holland, Inc., 7.750%, 9/01/2013 | | | 26,236,196 | |
| | 6,935,000 | | | Toro Co., 6.625%, 5/01/2037(c) | | | 6,878,875 | |
| | | | | | | | |
| | | | | | | 33,115,071 | |
| | | | | | | | |
| | | | Consumer Cyclical Services — 0.2% | | | | |
| | 14,545,000 | | | Western Union. (The), 6.200%, 11/17/2036 | | | 15,712,949 | |
| | | | | | | | |
| | | | Consumer Products — 0.2% | | | | |
| | 7,620,000 | | | Hasbro, Inc., 6.600%, 7/15/2028 | | | 8,054,599 | |
| | 12,010,000 | | | Snap-on, Inc., 6.700%, 3/01/2019 | | | 14,476,302 | |
| | | | | | | | |
| | | | | | | 22,530,901 | |
| | | | | | | | |
See accompanying notes to financial statements.
17 |
Portfolio of Investments – as of September 30, 2010
Loomis Sayles Investment Grade Bond Fund – (continued)
| | | | | | | | |
Principal
Amount (‡) | | | Description | | Value (†) | |
| | | | | | | | |
| | | | Distributors — 0.9% | | | | |
| $ | 10,000,000 | | | EQT Corp., 8.125%, 6/01/2019 | | $ | 12,398,020 | |
| | 61,345,000 | | | Equitable Resources, Inc., 6.500%, 4/01/2018 | | | 69,417,266 | |
| | 5,865,000 | | | ONEOK, Inc., 6.000%, 6/15/2035 | | | 6,065,970 | |
| | | | | | | | |
| | | | | | | 87,881,256 | |
| | | | | | | | |
| | | | Diversified Manufacturing — 0.5% | | | | |
| | 1,425,000 | | | Ingersoll-Rand Global Holding Co. Ltd., 6.875%, 8/15/2018 | | | 1,730,335 | |
| | 2,875,000 | | | Textron Financial Corp., 5.400%, 4/28/2013 | | | 3,018,724 | |
| | 1,207,000 | | | Textron Financial Corp., Series E, MTN, 5.125%, 8/15/2014 | | | 1,250,314 | |
| | 19,200,000 | | | Textron, Inc., 3.875%, 3/11/2013, (EUR) | | | 25,981,789 | |
| | 11,280,000 | | | Textron, Inc., EMTN, 6.625%, 4/07/2020, (GBP) | | | 17,875,555 | |
| | | | | | | | |
| | | | | | | 49,856,717 | |
| | | | | | | | |
| | | | Electric — 3.5% | | | | |
| | 38,900,000 | | | Alta Wind Holdings LLC, 7.000%, 6/30/2035, 144A | | | 41,167,092 | |
| | 47,570,000 | | | Ameren Illinois Co., 6.250%, 4/01/2018 | | | 54,381,168 | |
| | 40,400,000 | | | AmerenEnergy Generating Co., Series H, 7.000%, 4/15/2018 | | | 40,592,950 | |
| | 500,000 | | | Baltimore Gas & Electric Co., 5.200%, 6/15/2033 | | | 504,087 | |
| | 11,891,990 | | | Bruce Mansfield Unit, 6.850%, 6/01/2034(c) | | | 13,253,165 | |
| | 17,815,000 | | | Cleveland Electric Illuminating Co. (The), 5.700%, 4/01/2017 | | | 19,780,992 | |
| | 25,465,000 | | | Cleveland Electric Illuminating Co. (The), 5.950%, 12/15/2036 | | | 26,015,273 | |
| | 895,000 | | | Commonwealth Edison Co., 4.700%, 4/15/2015 | | | 1,000,874 | |
| | 5,500,000 | | | Empresa Nacional de Electricidad SA (Endesa-Chile), 7.875%, 2/01/2027 | | | 6,320,770 | |
| | 1,000,000 | | | Empresa Nacional de Electricidad SA (Endesa-Chile), 8.350%, 8/01/2013 | | | 1,155,315 | |
| | 3,681,000 | | | Exelon Corp., 4.900%, 6/15/2015 | | | 4,034,483 | |
| | 1,905,000 | | | ITC Holdings Corp., 5.875%, 9/30/2016, 144A | | | 2,118,410 | |
| | 2,830,000 | | | ITC Holdings Corp., 6.375%, 9/30/2036, 144A | | | 3,125,064 | |
| | 9,132,440 | | | Mackinaw Power LLC, 6.296%, 10/31/2023, 144A | | | 9,876,277 | |
| | 14,090,000 | | | NiSource Finance Corp., 6.125%, 3/01/2022 | | | 15,952,938 | |
| | 24,635,000 | | | NiSource Finance Corp., 6.400%, 3/15/2018 | | | 28,570,367 | |
| | 22,085,000 | | | NiSource Finance Corp., 6.800%, 1/15/2019 | | | 26,196,101 | |
| | 1,565,000 | | | Ohio Edison Co., 6.875%, 7/15/2036 | | | 1,826,278 | |
| | 31,750 | | | Quezon Power Philippines Co., 8.860%, 6/15/2017 | | | 32,861 | |
| | 51,115,000 | | | Southwestern Electric Power Co., 6.450%, 1/15/2019 | | | 58,250,245 | |
| | 500,000 | | | SP Powerassets Ltd., EMTN, 3.730%, 10/22/2010, (SGD) | | | 380,659 | |
| | 1,075,000 | | | White Pine Hydro LLC, 6.310%, 7/10/2017(c) | | | 1,129,685 | |
| | 1,600,000 | | | White Pine Hydro LLC, 6.960%, 7/10/2037(c) | | | 1,611,408 | |
| | | | | | | | |
| | | | | | | 357,276,462 | |
| | | | | | | | |
| | | | Entertainment — 0.1% | | | | |
| | 505,000 | | | Time Warner, Inc., 7.625%, 4/15/2031 | | | 626,119 | |
| | 330,000 | | | Time Warner, Inc., 7.700%, 5/01/2032 | | | 412,375 | |
| | 3,695,000 | | | Viacom, Inc., 6.125%, 10/05/2017 | | | 4,315,797 | |
| | 2,655,000 | | | Viacom, Inc., 6.250%, 4/30/2016 | | | 3,114,246 | |
| | | | | | | | |
| | | | | | | 8,468,537 | |
| | | | | | | | |
See accompanying notes to financial statements.
| 18
Portfolio of Investments – as of September 30, 2010
Loomis Sayles Investment Grade Bond Fund – (continued)
| | | | | | | | |
Principal
Amount (‡) | | | Description | | Value (†) | |
| | | | | | | | |
| | | | Financial Other — 1.4% | | | | |
| $ | 60,745,000 | | | Cantor Fitzgerald LP, 6.375%, 6/26/2015, 144A | | $ | 62,434,744 | |
| | 45,970,000 | | | Cantor Fitzgerald LP, 7.875%, 10/15/2019, 144A(c) | | | 48,260,685 | |
| | 27,500,000 | | | National Life Insurance Co., 10.500%, 9/15/2039, 144A | | | 33,427,900 | |
| | | | | | | | |
| | | | | | | 144,123,329 | |
| | | | | | | | |
| | | | Food & Beverage — 0.1% | | | | |
| | 2,500,000 | | | Cargill, Inc., EMTN, 5.375%, 3/02/2037, (GBP) | | | 4,096,576 | |
| | 8,630,000 | | | Corn Products International, Inc., 6.625%, 4/15/2037 | | | 9,426,592 | |
| | | | | | | | |
| | | | | | | 13,523,168 | |
| | | | | | | | |
| | | | Government Guaranteed — 0.1% | | | | |
| | 10,500,000 | | | Instituto de Credito Oficial, MTN, 6.125%, 2/27/2014, (AUD) | | | 9,666,674 | |
| | | | | | | | |
| | | | Government Owned — No Guarantee — 3.9% | | | | |
| | 3,820,000 | | | Abu Dhabi National Energy Co., 6.500%, 10/27/2036, 144A | | | 3,908,078 | |
| | 37,780,000 | | | Abu Dhabi National Energy Co., 7.250%, 8/01/2018, 144A | | | 42,246,201 | |
| | 59,320,000 | | | DP World Ltd., 6.850%, 7/02/2037, 144A | | | 55,481,284 | �� |
| | 101,460,000 | | | Federal Home Loan Mortgage Corp., 2.125%, 9/21/2012 | | | 104,619,870 | |
| | 111,280,000 | | | Federal National Mortgage Association, 1.375%, 4/28/2011 | | | 111,982,733 | |
| | 67,635,000 | | | Federal National Mortgage Association, 1.625%, 4/15/2013 | | | 69,168,285 | |
| | 15,500,000 | | | Korea Gas Corp., 6.000%, 7/15/2014, 144A | | | 17,202,706 | |
| | 1,000,000 | | | Telekom Malaysia Berhad, 7.875%, 8/01/2025, 144A | | | 1,382,444 | |
| | | | | | | | |
| | | | | | | 405,991,601 | |
| | | | | | | | |
| | | | Government Sponsored — 0.7% | | | | |
| | 67,640,000 | | | Federal Home Loan Bank, 1.875%, 6/21/2013 | | | 69,697,879 | |
| | | | | | | | |
| | | | Health Insurance — 0.5% | | | | |
| | 5,455,000 | | | CIGNA Corp., 6.150%, 11/15/2036 | | | 6,006,457 | |
| | 1,355,000 | | | CIGNA Corp., 6.350%, 3/15/2018 | | | 1,593,201 | |
| | 1,603,000 | | | CIGNA Corp., 7.875%, 5/15/2027 | | | 1,939,750 | |
| | 3,650,000 | | | CIGNA Corp., 8.500%, 5/01/2019 | | | 4,710,409 | |
| | 1,200,000 | | | CIGNA Corp., (Step to 8.080% on 1/15/2023), 8.300%, 1/15/2033(d) | | | 1,517,875 | |
| | 24,830,000 | | | UnitedHealth Group, Inc., 5.800%, 3/15/2036 | | | 25,982,584 | |
| | 565,000 | | | UnitedHealth Group, Inc., 6.500%, 6/15/2037 | | | 647,885 | |
| | 4,556,000 | | | UnitedHealth Group, Inc., 6.625%, 11/15/2037 | | | 5,309,284 | |
| | 2,567,000 | | | UnitedHealth Group, Inc., 6.875%, 2/15/2038 | | | 3,071,354 | |
| | | | | | | | |
| | | | | | | 50,778,799 | |
| | | | | | | | |
| | | | Healthcare — 0.9% | | | | |
| | 7,860,000 | | | Boston Scientific Corp., 6.000%, 1/15/2020 | | | 8,382,997 | |
| | 7,535,000 | | | Covidien International Finance SA, 6.000%, 10/15/2017 | | | 8,959,258 | |
| | 17,795,000 | | | Express Scripts, Inc., 6.250%, 6/15/2014 | | | 20,430,493 | |
| | 10,730,000 | | | Express Scripts, Inc., 7.250%, 6/15/2019 | | | 13,493,619 | |
| | 9,480,000 | | | HCA, Inc., 5.750%, 3/15/2014 | | | 9,349,650 | |
| | 1,950,000 | | | HCA, Inc., 6.250%, 2/15/2013 | | | 1,984,125 | |
| | 3,810,000 | | | HCA, Inc., 6.375%, 1/15/2015 | | | 3,800,475 | |
| | 4,015,000 | | | HCA, Inc., 6.500%, 2/15/2016 | | | 4,015,000 | |
| | 365,000 | | | HCA, Inc., 6.750%, 7/15/2013 | | | 372,300 | |
| | 3,000,000 | | | HCA, Inc., 7.050%, 12/01/2027 | | | 2,640,000 | |
See accompanying notes to financial statements.
19 |
Portfolio of Investments – as of September 30, 2010
Loomis Sayles Investment Grade Bond Fund – (continued)
| | | | | | | | |
Principal
Amount (‡) | | | Description | | Value (†) | |
| | | | | | | | |
| | | | Healthcare — continued | | | | |
| $ | 2,290,000 | | | HCA, Inc., 7.190%, 11/15/2015 | | $ | 2,244,200 | |
| | 2,155,000 | | | HCA, Inc., 7.500%, 12/15/2023 | | | 2,025,700 | |
| | 1,310,000 | | | HCA, Inc., 7.500%, 11/06/2033 | | | 1,201,925 | |
| | 3,890,000 | | | HCA, Inc., 7.690%, 6/15/2025 | | | 3,637,150 | |
| | 4,255,000 | | | HCA, Inc., 8.360%, 4/15/2024 | | | 4,169,900 | |
| | 1,225,000 | | | HCA, Inc., MTN, 7.580%, 9/15/2025 | | | 1,139,250 | |
| | 3,135,000 | | | HCA, Inc., MTN, 7.750%, 7/15/2036 | | | 2,884,200 | |
| | 2,305,000 | | | Owens & Minor, Inc., 6.350%, 4/15/2016(c) | | | 2,352,826 | |
| | | | | | | | |
| | | | | | | 93,083,068 | |
| | | | | | | | |
| | | | Home Construction — 0.2% | | | | |
| | 2,050,000 | | | Desarrolladora Homex SAB de CV, 7.500%, 9/28/2015 | | | 2,111,500 | |
| | 2,601,000 | | | Pulte Group, Inc., 5.200%, 2/15/2015 | | | 2,516,468 | |
| | 9,400,000 | | | Pulte Group, Inc., 6.000%, 2/15/2035 | | | 7,050,000 | |
| | 3,645,000 | | | Pulte Group, Inc., 6.375%, 5/15/2033 | | | 2,916,000 | |
| | 3,605,000 | | | Toll Brothers Finance Corp., 5.150%, 5/15/2015 | | | 3,643,083 | |
| | | | | | | | |
| | | | | | | 18,237,051 | |
| | | | | | | | |
| | | | Independent Energy — 0.3% | | | | |
| | 12,190,000 | | | Anadarko Petroleum Corp., 6.375%, 9/15/2017 | | | 13,432,832 | |
| | 15,680,000 | | | Anadarko Petroleum Corp., 6.450%, 9/15/2036 | | | 15,698,863 | |
| | 1,940,000 | | | Chesapeake Energy Corp., 6.250%, 1/15/2017, (EUR) | | | 2,684,376 | |
| | | | | | | | |
| | | | | | | 31,816,071 | |
| | | | | | | | |
| | | | Industrial Other — 0.1% | | | | |
| | 5,000,000 | | | Worthington Industries, Inc., 6.500%, 4/15/2020 | | | 5,534,915 | |
| | | | | | | | |
| | | | Integrated Energy — 0.1% | | | | |
| | 7,196,000 | | | Marathon Oil Corp., 7.500%, 2/15/2019 | | | 9,183,967 | |
| | 1,073,240 | | | PF Export Receivables Master Trust, Series A, 6.436%, 6/01/2015, 144A | | | 1,148,367 | |
| | | | | | | | |
| | | | | | | 10,332,334 | |
| | | | | | | | |
| | | | Life Insurance — 0.6% | | | | |
| | 7,060,000 | | | American International Group, Inc., Series G, MTN, 5.850%, 1/16/2018 | | | 7,307,100 | |
| | 2,080,000 | | | American International Group, Inc., Series MP, GMTN, 5.450%, 5/18/2017 | | | 2,116,400 | |
| | 9,990,000 | | | ASIF III Jersey Ltd., Series 2003-G, EMTN, 4.750%, 9/11/2013, (EUR) | | | 14,049,949 | |
| | 11,210,000 | | | MetLife, Inc., 6.400%, 12/15/2066 | | | 10,481,350 | |
| | 9,260,000 | | | Mutual of Omaha Insurance Co., 6.800%, 6/15/2036, 144A | | | 8,838,188 | |
| | 3,135,000 | | | NLV Financial Corp., 7.500%, 8/15/2033, 144A | | | 2,898,035 | |
| | 2,935,000 | | | Penn Mutual Life Insurance Co. (The), 6.650%, 6/15/2034, 144A | | | 2,660,522 | |
| | 14,805,000 | | | Penn Mutual Life Insurance Co. (The), 7.625%, 6/15/2040, 144A | | | 14,881,468 | |
| | 4,835,000 | | | Unum Group, 7.125%, 9/30/2016 | | | 5,579,981 | |
| | | | | | | | |
| | | | | | | 68,812,993 | |
| | | | | | | | |
| | | | Local Authorities — 0.9% | | | | |
| | 220,000 | | | Alberta Municipal Funding Corp., 5.700%, 9/01/2011, (CAD) | | | 222,123 | |
| | 7,070,000 | | | Manitoba (Province of), GMTN, 6.375%, 9/01/2015, (NZD) | | | 5,517,894 | |
| | 21,729 | | | Province of Alberta, 5.930%, 9/16/2016, (CAD) | | | 24,092 | |
| | 500,000 | | | Province of Nova Scotia, 6.600%, 6/01/2027, (CAD) | | | 627,860 | |
See accompanying notes to financial statements.
| 20
Portfolio of Investments – as of September 30, 2010
Loomis Sayles Investment Grade Bond Fund – (continued)
| | | | | | | | |
Principal
Amount (‡) | | | Description | | Value (†) | |
| | | | | | | | |
| | | | Local Authorities — continued | | | | |
| $ | 30,440,000 | | | Quebec Province, Series QC, 6.750%, 11/09/2015, (NZD) | | $ | 24,138,779 | |
| | 31,820,000 | | | Queensland Treasury Corp., 7.125%, 9/18/2017, 144A, (NZD) | | | 25,817,775 | |
| | 19,325,000 | | | Queensland Treasury Corp., Series 11G, 6.000%, 6/14/2011, (AUD) | | | 18,826,880 | |
| | 19,580,000 | | | Queensland Treasury Corp., Series 14, 5.750%, 11/21/2014, (AUD) | | | 19,317,037 | |
| | | | | | | | |
| | | | | | | 94,492,440 | |
| | | | | | | | |
| | | | Lodging — 1.0% | | | | |
| | 53,660,000 | | | Choice Hotels International, Inc., 5.700%, 8/28/2020 | | | 54,181,253 | |
| | 4,620,000 | | | Wyndham Worldwide Corp., 5.750%, 2/01/2018 | | | 4,634,632 | |
| | 13,575,000 | | | Wyndham Worldwide Corp., 6.000%, 12/01/2016 | | | 14,161,766 | |
| | 24,030,000 | | | Wyndham Worldwide Corp., 7.375%, 3/01/2020 | | | 25,682,014 | |
| | | | | | | | |
| | | | | | | 98,659,665 | |
| | | | | | | | |
| | | | Media Cable — 1.6% | | | | |
| | 4,316,000 | | | Comcast Corp., 5.650%, 6/15/2035 | | | 4,356,993 | |
| | 32,715,000 | | | Comcast Corp., 6.950%, 8/15/2037 | | | 38,361,282 | |
| | 18,220,000 | | | Shaw Communications, Inc., 5.650%, 10/01/2019, (CAD) | | | 18,859,090 | |
| | 4,190,000 | | | Time Warner Cable, Inc., 5.850%, 5/01/2017 | | | 4,777,497 | |
| | 79,880,000 | | | Time Warner Cable, Inc., 6.750%, 7/01/2018 | | | 95,267,844 | |
| | | | | | | | |
| | | | | | | 161,622,706 | |
| | | | | | | | |
| | | | Media Non-Cable — 0.2% | | | | |
| | 4,580,000 | | | News America Holdings, 8.150%, 10/17/2036 | | | 5,768,583 | |
| | 7,700,000 | | | News America, Inc., 6.150%, 3/01/2037 | | | 8,290,983 | |
| | 7,060,000 | | | News America, Inc., 6.400%, 12/15/2035 | | | 7,829,335 | |
| | | | | | | | |
| | | | | | | 21,888,901 | |
| | | | | | | | |
| | | | Metals & Mining — 1.3% | | | | |
| | 5,170,000 | | | Alcoa, Inc., 5.870%, 2/23/2022 | | | 5,085,491 | |
| | 5,625,000 | | | Alcoa, Inc., 5.950%, 2/01/2037 | | | 5,177,233 | |
| | 66,250,000 | | | Alcoa, Inc., 6.150%, 8/15/2020 | | | 68,114,606 | |
| | 5,930,000 | | | Alcoa, Inc., 6.750%, 1/15/2028 | | | 6,032,346 | |
| | 3,250,000 | | | Rio Tinto Alcan, Inc., 5.750%, 6/01/2035 | | | 3,549,124 | |
| | 1,985,000 | | | United States Steel Corp., 6.050%, 6/01/2017 | | | 1,967,631 | |
| | 4,712,000 | | | United States Steel Corp., 6.650%, 6/01/2037 | | | 4,181,900 | |
| | 31,890,000 | | | United States Steel Corp., 7.000%, 2/01/2018 | | | 32,527,800 | |
| | 3,735,000 | | | Vale Overseas Ltd., 6.875%, 11/21/2036 | | | 4,267,081 | |
| | | | | | | | |
| | | | | | | 130,903,212 | |
| | | | | | | | |
| | | | Mortgage Related — 0.0% | | | | |
| | 137,084 | | | FHLMC, 5.000%, 12/01/2031 | | | 145,284 | |
| | 20,939 | | | FNMA, 6.000%, 7/01/2029 | | | 23,106 | |
| | | | | | | | |
| | | | | | | 168,390 | |
| | | | | | | | |
| | | | Non-Captive Consumer — 1.7% | | | | |
| | 5,000,000 | | | American General Finance Corp., Series I, MTN, 5.400%, 12/01/2015 | | | 4,025,000 | |
| | 89,585,000 | | | American General Finance Corp., Series J, MTN, 6.900%, 12/15/2017 | | | 74,803,475 | |
| | 63,775(††) | | | SLM Corp., 6.000%, 12/15/2043 | | | 1,233,249 | |
| | 6,480,000 | | | SLM Corp., MTN, 5.050%, 11/14/2014 | | | 6,170,781 | |
| | 355,000 | | | SLM Corp., MTN, 5.125%, 8/27/2012 | | | 358,879 | |
See accompanying notes to financial statements.
21 |
Portfolio of Investments – as of September 30, 2010
Loomis Sayles Investment Grade Bond Fund – (continued)
| | | | | | | | |
Principal
Amount (‡) | | | Description | | Value (†) | |
| | | | | | | | |
| | | | Non-Captive Consumer — continued | | | | |
| $ | 655,000 | | | SLM Corp., MTN, 8.000%, 3/25/2020 | | $ | 649,975 | |
| | 6,200,000 | | | SLM Corp., Series 7, EMTN, 4.750%, 3/17/2014, (EUR) | | | 7,739,391 | |
| | 4,900,000 | | | SLM Corp., Series A, MTN, 0.798%, 1/27/2014(b) | | | 4,232,561 | |
| | 9,425,000 | | | SLM Corp., Series A, MTN, 5.000%, 10/01/2013 | | | 9,236,349 | |
| | 6,690,000 | | | SLM Corp., Series A, MTN, 5.000%, 4/15/2015 | | | 6,413,462 | |
| | 2,000,000 | | | SLM Corp., Series A, MTN, 5.000%, 6/15/2018 | | | 1,595,018 | |
| | 6,275,000 | | | SLM Corp., Series A, MTN, 5.375%, 1/15/2013 | | | 6,326,166 | |
| | 5,485,000 | | | SLM Corp., Series A, MTN, 5.375%, 5/15/2014 | | | 5,337,262 | |
| | 300,000 | | | SLM Corp., Series A, MTN, 5.400%, 10/25/2011 | | | 303,102 | |
| | 19,921,000 | | | SLM Corp., Series A, MTN, 5.625%, 8/01/2033 | | | 15,318,671 | |
| | 31,335,000 | | | SLM Corp., Series A, MTN, 8.450%, 6/15/2018 | | | 31,650,356 | |
| | | | | | | | |
| | | | | | | 175,393,697 | |
| | | | | | | | |
| | | | Non-Captive Diversified — 3.2% | | | | |
| | 1,345,000 | | | Ally Financial, Inc., 6.000%, 12/15/2011 | | | 1,368,680 | |
| | 1,310,000 | | | Ally Financial, Inc., 6.625%, 5/15/2012 | | | 1,348,638 | |
| | 1,670,000 | | | Ally Financial, Inc., 6.750%, 12/01/2014 | | | 1,723,188 | |
| | 1,500,000 | | | Ally Financial, Inc., 6.875%, 9/15/2011 | | | 1,538,271 | |
| | 400,000 | | | Ally Financial, Inc., 6.875%, 8/28/2012 | | | 416,650 | |
| | 1,210,000 | | | Ally Financial, Inc., 7.000%, 2/01/2012 | | | 1,252,144 | |
| | 3,142,000 | | | Ally Financial, Inc., 7.500%, 12/31/2013 | | | 3,338,375 | |
| | 5,664,000 | | | Ally Financial, Inc., 8.000%, 12/31/2018 | | | 5,819,760 | |
| | 2,335,000 | | | Ally Financial, Inc., 8.000%, 11/01/2031 | | | 2,457,464 | |
| | 5,045,000 | | | Ally Financial, Inc., EMTN, 5.375%, 6/06/2011, (EUR) | | | 6,911,986 | |
| | 4,602,472 | | | CIT Group, Inc., 7.000%, 5/01/2013 | | | 4,625,484 | |
| | 6,903,711 | | | CIT Group, Inc., 7.000%, 5/01/2014 | | | 6,886,452 | |
| | 6,903,710 | | | CIT Group, Inc., 7.000%, 5/01/2015 | | | 6,851,932 | |
| | 11,506,193 | | | CIT Group, Inc., 7.000%, 5/01/2016 | | | 11,333,600 | |
| | 16,108,672 | | | CIT Group, Inc., 7.000%, 5/01/2017 | | | 15,766,363 | |
| | 36,465,000 | | | GATX Corp., 4.750%, 10/01/2012 | | | 38,330,513 | |
| | 7,515,000 | | | General Electric Capital Australia Funding Pty Ltd., EMTN,
8.000%, 2/13/2012, (AUD) | | | 7,443,708 | |
| | 7,730,000 | | | General Electric Capital Australia Funding Pty Ltd., MTN,
6.000%, 5/15/2013, (AUD) | | | 7,298,473 | |
| | 1,915,000 | | | General Electric Capital Australia Funding Pty Ltd., MTN,
6.000%, 3/15/2019, (AUD) | | | 1,722,665 | |
| | 990,000 | | | General Electric Capital Corp., 5.625%, 5/01/2018 | | | 1,098,876 | |
| | 915,000 | | | General Electric Capital Corp., EMTN, 9.000%, 1/04/2011, (NZD) | | | 678,835 | |
| | 4,775,000 | | | General Electric Capital Corp., MTN, 5.875%, 1/14/2038 | | | 4,849,585 | |
| | 14,535,000 | | | General Electric Capital Corp., Series A, EMTN, 6.750%, 9/26/2016, (NZD) | | | 11,099,433 | |
| | 6,200,000 | | | General Electric Capital Corp., Series A, GMTN, 2.960%, 5/18/2012, (SGD) | | | 4,773,925 | |
| | 13,400,000 | | | General Electric Capital Corp., Series A, GMTN, 3.485%, 3/08/2012, (SGD) | | | 10,380,043 | |
| | 37,650,000 | | | General Electric Capital Corp., Series A, GMTN, 7.625%, 12/10/2014, (NZD) | | | 29,464,957 | |
| | 10,470,000 | | | General Electric Capital Corp., Series A, MTN, 0.826%, 5/13/2024(b) | | | 8,682,185 | |
| | 17,060,000 | | | General Electric Capital Corp., Series A, MTN, 4.875%, 3/04/2015 | | | 18,734,081 | |
| | 27,137,000 | | | General Electric Capital Corp., Series A, MTN, 6.500%, 9/28/2015, (NZD) | | | 20,541,137 | |
| | 2,285,000 | | | International Lease Finance Corp., 5.000%, 9/15/2012 | | | 2,273,575 | |
See accompanying notes to financial statements.
| 22
Portfolio of Investments – as of September 30, 2010
Loomis Sayles Investment Grade Bond Fund – (continued)
| | | | | | | | |
Principal
Amount (‡) | | | Description | | Value (†) | |
| | | | | | | | |
| | | | Non-Captive Diversified — continued | | | | |
| $ | 6,660,000 | | | International Lease Finance Corp., 5.125%, 11/01/2010 | | $ | 6,660,000 | |
| | 16,795,000 | | | International Lease Finance Corp., 6.375%, 3/25/2013 | | | 16,878,975 | |
| | 61,735,000 | | | International Lease Finance Corp., 7.125%, 9/01/2018, 144A | | | 66,519,462 | |
| | 560,000 | | | International Lease Finance Corp., 8.625%, 9/15/2015, 144A | | | 599,200 | |
| | 655,000 | | | International Lease Finance Corp., Series R, MTN, 5.550%, 9/05/2012 | | | 655,819 | |
| | 1,505,000 | | | International Lease Finance Corp., Series R, MTN, 5.625%, 9/20/2013 | | | 1,476,781 | |
| | 1,660,000 | | | International Lease Finance Corp., Series R, MTN, 5.650%, 6/01/2014 | | | 1,610,200 | |
| | | | | | | | |
| | | | | | | 333,411,415 | |
| | | | | | | | |
| | | | Oil Field Services — 0.8% | | | | |
| | 6,095,000 | | | Nabors Industries, Inc., 6.150%, 2/15/2018 | | | 6,783,601 | |
| | 23,075,000 | | | Nabors Industries, Inc., 9.250%, 1/15/2019 | | | 29,526,632 | |
| | 23,846,000 | | | Rowan Cos., Inc., 7.875%, 8/01/2019 | | | 28,460,272 | |
| | 600,000 | | | Transocean Ltd., 7.375%, 4/15/2018 | | | 664,014 | |
| | 5,905,000 | | | Weatherford International Ltd., 6.500%, 8/01/2036 | | | 5,970,959 | |
| | 1,680,000 | | | Weatherford International Ltd., 6.800%, 6/15/2037 | | | 1,760,818 | |
| | 5,405,000 | | | Weatherford International Ltd., 7.000%, 3/15/2038 | | | 5,741,407 | |
| | | | | | | | |
| | | | | | | 78,907,703 | |
| | | | | | | | |
| | | | Paper — 1.0% | | | | |
| | 4,460,000 | | | Celulosa Arauco y Constitucion SA, 7.250%, 7/29/2019 | | | 5,288,035 | |
| | 575,000 | | | Georgia-Pacific LLC, 7.250%, 6/01/2028 | | | 590,813 | |
| | 2,460,000 | | | Georgia-Pacific LLC, 7.375%, 12/01/2025 | | | 2,546,100 | |
| | 285,000 | | | Georgia-Pacific LLC, 7.750%, 11/15/2029 | | | 299,250 | |
| | 1,340,000 | | | Georgia-Pacific LLC, 8.000%, 1/15/2024 | | | 1,504,150 | |
| | 1,365,000 | | | Georgia-Pacific LLC, 8.875%, 5/15/2031 | | | 1,556,100 | |
| | 6,295,000 | | | International Paper Co., 5.250%, 4/01/2016 | | | 6,814,300 | |
| | 15,087,000 | | | International Paper Co., 7.950%, 6/15/2018 | | | 18,296,744 | |
| | 7,777,000 | | | International Paper Co., 8.700%, 6/15/2038 | | | 9,936,113 | |
| | 5,385,000 | | | Mead Corp. (The), 7.550%, 3/01/2047 | | | 5,080,812 | |
| | 5,890,000 | | | Westvaco Corp., 8.200%, 1/15/2030 | | | 6,441,934 | |
| | 24,530,000 | | | Weyerhaeuser Co., 6.875%, 12/15/2033 | | | 23,416,117 | |
| | 7,535,000 | | | Weyerhaeuser Co., 7.375%, 10/01/2019 | | | 8,241,225 | |
| | 17,660,000 | | | Weyerhaeuser Co., 7.375%, 3/15/2032 | | | 17,985,068 | |
| | | | | | | | |
| | | | | | | 107,996,761 | |
| | | | | | | | |
| | | | Pharmaceuticals — 1.0% | | | | |
| | 2,280,000 | | | Elan Finance PLC/Elan Finance Corp., 8.875%, 12/01/2013 | | | 2,337,000 | |
| | 90,000,000 | | | Roche Holdings, Inc., 5.000%, 3/01/2014, 144A | | | 100,625,490 | |
| | 500,000 | | | Schering-Plough Corp., 5.300%, 12/01/2013 | | | 563,318 | |
| | | | | | | | |
| | | | | | | 103,525,808 | |
| | | | | | | | |
| | | | Pipelines — 3.2% | | | | |
| | 5,350,000 | | | CenterPoint Energy Resources Corp., 6.250%, 2/01/2037 | | | 6,035,116 | |
| | 2,010,000 | | | DCP Midstream LP, 6.450%, 11/03/2036, 144A | | | 2,187,853 | |
| | 2,470,000 | | | El Paso Corp., 6.950%, 6/01/2028 | | | 2,329,160 | |
| | 540,000 | | | Energy Transfer Partners LP, 6.125%, 2/15/2017 | | | 599,058 | |
| | 1,605,000 | | | Energy Transfer Partners LP, 6.625%, 10/15/2036 | | | 1,734,031 | |
| | 9,455,000 | | | Enterprise Products Operating LLP, 6.300%, 9/15/2017 | | | 10,905,416 | |
See accompanying notes to financial statements.
23 |
Portfolio of Investments – as of September 30, 2010
Loomis Sayles Investment Grade Bond Fund – (continued)
| | | | | | | | |
Principal
Amount (‡) | | | Description | | Value (†) | |
| | | | | | | | |
| | | | Pipelines — continued | | | | |
| $ | 3,400,000 | | | Florida Gas Transmission Co., 7.900%, 5/15/2019, 144A | | $ | 4,267,316 | |
| | 4,390,000 | | | Kinder Morgan Energy Partners LP, 5.800%, 3/15/2035 | | | 4,401,238 | |
| | 82,600,000 | | | Kinder Morgan Energy Partners LP, 5.950%, 2/15/2018 | | | 93,286,292 | |
| | 310,000 | | | Kinder Morgan Finance Co., 5.700%, 1/05/2016 | | | 319,687 | |
| | 31,770,032 | | | Maritimes & Northeast Pipeline LLC, 7.500%, 5/31/2014, 144A(c) | | | 34,684,615 | |
| | 9,080,000 | | | NGPL PipeCo LLC, 6.514%, 12/15/2012, 144A | | | 9,656,017 | |
| | 31,430,000 | | | NGPL PipeCo LLC, 7.119%, 12/15/2017, 144A | | | 34,101,550 | |
| | 4,665,000 | | | ONEOK Partners LP, 6.650%, 10/01/2036 | | | 5,235,973 | |
| | 10,115,000 | | | Panhandle Eastern Pipeline Co., 6.200%, 11/01/2017 | | | 11,232,293 | |
| | 48,630,000 | | | Panhandle Eastern Pipeline Co., 7.000%, 6/15/2018 | | | 56,572,203 | |
| | 1,435,000 | | | Panhandle Eastern Pipeline Co., 8.125%, 6/01/2019 | | | 1,739,269 | |
| | 2,130,000 | | | Plains All American Pipeline LP, 6.125%, 1/15/2017 | | | 2,379,519 | |
| | 16,025,000 | | | Plains All American Pipeline LP, 6.500%, 5/01/2018 | | | 18,496,568 | |
| | 4,595,000 | | | Plains All American Pipeline LP, 6.650%, 1/15/2037 | | | 4,980,525 | |
| | 4,215,000 | | | Southern Natural Gas Co., 5.900%, 4/01/2017, 144A | | | 4,626,561 | |
| | 20,000,000 | | | Texas Eastern Transmission LP, 6.000%, 9/15/2017, 144A | | | 23,137,400 | |
| | | | | | | | |
| | | | | | | 332,907,660 | |
| | | | | | | | |
| | | | Property & Casualty Insurance — 0.8% | | | | |
| | 3,150,000 | | | Hanover Insurance Group, Inc. (The), 7.500%, 3/01/2020 | | | 3,505,503 | |
| | 8,355,000 | | | Liberty Mutual Group, Inc., 6.500%, 3/15/2035, 144A | | | 7,650,673 | |
| | 3,460,000 | | | Marsh & McLennan Cos., Inc., 5.375%, 7/15/2014 | | | 3,736,890 | |
| | 12,652,000 | | | Marsh & McLennan Cos., Inc., 5.750%, 9/15/2015 | | | 13,994,415 | |
| | 31,010,000 | | | Marsh & McLennan Cos., Inc., 5.875%, 8/01/2033 | | | 30,153,318 | |
| | 965,000 | | | MBIA Insurance Corp., (fixed rate to 1/15/2013, variable rate thereafter),
14.000%, 1/15/2033, 144A | | | 434,250 | |
| | 5,195,000 | | | White Mountains Re Group Ltd., 6.375%, 3/20/2017, 144A | | | 5,251,662 | |
| | 2,580,000 | | | Willis North America, Inc., 6.200%, 3/28/2017 | | | 2,749,181 | |
| | 13,815,000 | | | Willis North America, Inc., 7.000%, 9/29/2019 | | | 15,185,973 | |
| | 2,260,000 | | | XL Group PLC, 6.250%, 5/15/2027 | | | 2,273,761 | |
| | 1,495,000 | | | XL Group PLC, 6.375%, 11/15/2024 | | | 1,553,528 | |
| | | | | | | | |
| | | | | | | 86,489,154 | |
| | | | | | | | |
| | | | Railroads — 0.2% | | | | |
| | 2,390,000 | | | Canadian Pacific Railway Co., 5.750%, 3/15/2033 | | | 2,517,829 | |
| | 10,000,000 | | | Canadian Pacific Railway Co., 7.250%, 5/15/2019 | | | 12,374,440 | |
| | 1,648,000 | | | CSX Corp., MTN, 6.000%, 10/01/2036 | | | 1,837,274 | |
| | 243,000 | | | Missouri Pacific Railroad Co., 4.750%, 1/01/2030(c) | | | 219,308 | |
| | 1,738,000 | | | Missouri Pacific Railroad Co., 5.000%, 1/01/2045(c) | | | 1,261,614 | |
| | 195,000 | | | Missouri Pacific Railroad Co., Series A, 4.750%, 1/01/2020(c) | | | 193,050 | |
| | | | | | | | |
| | | | | | | 18,403,515 | |
| | | | | | | | |
| | | | Refining — 0.0% | | | | |
| | 3,740,000 | | | Valero Energy Corp., 6.625%, 6/15/2037 | | | 3,755,869 | |
| | | | | | | | |
| | | | REITs — 0.4% | | | | |
| | 36,980,000 | | | WEA Finance LLC/WT Finance Australia Property Ltd.,
6.750%, 9/02/2019, 144A | | | 43,814,200 | |
| | | | | | | | |
See accompanying notes to financial statements.
| 24
Portfolio of Investments – as of September 30, 2010
Loomis Sayles Investment Grade Bond Fund – (continued)
| | | | | | | | |
Principal
Amount (‡) | | | Description | | Value (†) | |
| | | | | | | | |
| | | | REITs — Apartments — 0.4% | | | | |
| $ | 12,510,000 | | | Camden Property Trust, 5.000%, 6/15/2015 | | $ | 13,460,710 | |
| | 16,850,000 | | | Camden Property Trust, 5.700%, 5/15/2017 | | | 17,889,915 | |
| | 1,153,000 | | | Colonial Realty LP, 4.800%, 4/01/2011 | | | 1,145,207 | |
| | 1,010,000 | | | ERP Operating LP, 5.125%, 3/15/2016 | | | 1,105,903 | |
| | 1,800,000 | | | ERP Operating LP, 5.375%, 8/01/2016 | | | 1,986,961 | |
| | 2,420,000 | | | ERP Operating LP, 5.750%, 6/15/2017 | | | 2,725,060 | |
| | | | | | | | |
| | | | | | | 38,313,756 | |
| | | | | | | | |
| | | | REITs — Diversified — 0.3% | | | | |
| | 4,230,000 | | | Duke Realty LP, 5.950%, 2/15/2017 | | | 4,538,342 | |
| | 20,000,000 | | | Duke Realty LP, 6.500%, 1/15/2018 | | | 21,970,660 | |
| | | | | | | | |
| | | | | | | 26,509,002 | |
| | | | | | | | |
| | | | REITs — Industrials — 0.6% | | | | |
| | 10,500,000 | | | First Industrial LP, 5.950%, 5/15/2017 | | | 8,944,803 | |
| | 3,957,000 | | | ProLogis, 5.625%, 11/15/2015 | | | 3,871,185 | |
| | 11,422,000 | | | ProLogis, 5.625%, 11/15/2016 | | | 10,996,485 | |
| | 11,126,000 | | | ProLogis, 5.750%, 4/01/2016 | | | 10,983,888 | |
| | 9,909,000 | | | ProLogis, 6.625%, 5/15/2018 | | | 9,766,528 | |
| | 19,280,000 | | | ProLogis, 7.375%, 10/30/2019 | | | 19,456,913 | |
| | | | | | | | |
| | | | | | | 64,019,802 | |
| | | | | | | | |
| | | | REITs — Office — 0.3% | | | | |
| | 21,270,000 | | | Highwoods Properties, Inc., 5.850%, 3/15/2017 | | | 21,876,982 | |
| | 11,552,000 | | | Highwoods Properties, Inc., 7.500%, 4/15/2018 | | | 12,936,218 | |
| | | | | | | | |
| | | | | | | 34,813,200 | |
| | | | | | | | |
| | | | REITs — Regional Malls — 0.2% | | | | |
| | 2,480,000 | | | Simon Property Group LP, 5.250%, 12/01/2016 | | | 2,772,246 | |
| | 12,475,000 | | | Simon Property Group LP, 5.750%, 12/01/2015 | | | 14,205,719 | |
| | 1,930,000 | | | Simon Property Group LP, 5.875%, 3/01/2017 | | | 2,217,041 | |
| | 4,155,000 | | | Simon Property Group LP, 6.100%, 5/01/2016 | | | 4,827,753 | |
| | | | | | | | |
| | | | | | | 24,022,759 | |
| | | | | | | | |
| | | | REITs — Shopping Centers — 0.1% | | | | |
| | 5,000,000 | | | Equity One, Inc., 6.000%, 9/15/2017 | | | 5,164,190 | |
| | 1,960,000 | | | Federal Realty Investment Trust, 5.650%, 6/01/2016 | | | 2,173,932 | |
| | | | | | | | |
| | | | | | | 7,338,122 | |
| | | | | | | | |
| | | | REITs — Triple Net Lease — 0.4% | | | | |
| | 5,990,000 | | | Realty Income Corp., 5.750%, 1/15/2021 | | | 6,349,873 | |
| | 26,085,000 | | | Realty Income Corp., 6.750%, 8/15/2019 | | | 29,901,888 | |
| | | | | | | | |
| | | | | | | 36,251,761 | |
| | | | | | | | |
| | | | Restaurants — 0.1% | | | | |
| | 10,545,000 | | | Darden Restaurants, Inc., 6.000%, 8/15/2035 | | | 10,557,612 | |
| | 1,000,000 | | | McDonald’s Corp., EMTN, 3.628%, 10/10/2010, (SGD) | | | 760,657 | |
| | | | | | | | |
| | | | | | | 11,318,269 | |
| | | | | | | | |
See accompanying notes to financial statements.
25 |
Portfolio of Investments – as of September 30, 2010
Loomis Sayles Investment Grade Bond Fund – (continued)
| | | | | | | | |
Principal
Amount (‡) | | | Description | | Value (†) | |
| | | | | | | | |
| | | | Retailers — 0.6% | | | | |
| $ | 8,170,000 | | | J.C. Penney Corp., Inc., 5.750%, 2/15/2018 | | $ | 8,415,100 | |
| | 8,316,000 | | | J.C. Penney Corp., Inc., 6.375%, 10/15/2036 | | | 8,024,940 | |
| | 12,000 | | | J.C. Penney Corp., Inc., 7.125%, 11/15/2023 | | | 12,540 | |
| | 8,845,000 | | | J.C. Penney Corp., Inc., 7.625%, 3/01/2097 | | | 8,579,650 | |
| | 13,717,000 | | | Macy’s Retail Holdings, Inc., 6.375%, 3/15/2037 | | | 13,579,830 | |
| | 10,695,000 | | | Macy’s Retail Holdings, Inc., 6.790%, 7/15/2027 | | | 10,320,675 | |
| | 2,750,000 | | | Macy’s Retail Holdings, Inc., 6.900%, 4/01/2029 | | | 2,784,375 | |
| | 8,240,000 | | | Marks & Spencer PLC, 7.125%, 12/01/2037, 144A | | | 8,740,868 | |
| | | | | | | | |
| | | | | | | 60,457,978 | |
| | | | | | | | |
| | | | Sovereigns — 3.7% | | | | |
| | 84,525,000 | | | Ireland Government Bond, 4.500%, 10/18/2018, (EUR) | | | 101,286,056 | |
| | 4,725,000 | | | Ireland Government Bond, 5.000%, 10/18/2020, (EUR) | | | 5,659,055 | |
| | 22,550,000 | | | Ireland Government Bond, 5.400%, 3/13/2025, (EUR) | | | 26,538,960 | |
| | 438,500(†††) | | | Mexican Fixed Rate Bonds, Series M-10, 7.250%, 12/15/2016, (MXN) | | | 3,732,677 | |
| | 4,200,900(†††) | | | Mexican Fixed Rate Bonds, Series M-20, 8.000%, 12/07/2023, (MXN) | | | 37,913,159 | |
| | 380,000(†††) | | | Mexican Fixed Rate Bonds, Series MI-10, 9.000%, 12/20/2012, (MXN) | | | 3,252,012 | |
| | 29,165,000 | | | New South Wales Treasury Corp., Series 10RG,
7.000%, 12/01/2010, (AUD) | | | 28,281,008 | |
| | 31,140,000 | | | New South Wales Treasury Corp., Series 12RG, 6.000%, 5/01/2012, (AUD) | | | 30,541,885 | |
| | 18,320,000 | | | New South Wales Treasury Corp., Series 17RG, 5.500%, 3/01/2017, (AUD) | | | 17,868,644 | |
| | 18,700,000 | | | Portugal Obrigacoes do Tesouro OT, 3.850%, 4/15/2021, (EUR) | | | 20,702,687 | |
| | 4,700,000 | | | Portugal Obrigacoes do Tesouro OT, 4.800%, 6/15/2020, (EUR) | | | 5,716,117 | |
| | 24,705,000 | | | Republic of Brazil, 10.250%, 1/10/2028, (BRL) | | | 16,302,088 | |
| | 6,285,000 | | | Republic of Brazil, 12.500%, 1/05/2022, (BRL) | | | 4,559,597 | |
| | 53,700,000 | | | Republic of Croatia, 6.750%, 11/05/2019, 144A | | | 58,667,250 | |
| | 793,200,000 | | | Republic of Iceland, 7.250%, 5/17/2013, (ISK) | | | 4,240,266 | |
| | 680,815,000 | | | Republic of Iceland, 8.000%, 7/22/2011, (ISK) | | | 3,469,345 | |
| | 1,512,832,000 | | | Republic of Iceland, 13.750%, 12/10/2010, (ISK) | | | 7,631,297 | |
| | | | | | | | |
| | | | | | | 376,362,103 | |
| | | | | | | | |
| | | | Supermarkets — 0.2% | | | | |
| | 4,220,000 | | | American Stores Co., Series B, MTN, 7.100%, 3/20/2028 | | | 3,249,400 | |
| | 3,340,000 | | | Kroger Co., 6.400%, 8/15/2017 | | | 3,992,726 | |
| | 1,900,000 | | | New Albertson’s, Inc., 7.450%, 8/01/2029 | | | 1,539,000 | |
| | 1,000,000 | | | New Albertson’s, Inc., Series C, MTN, 6.625%, 6/01/2028 | | | 731,250 | |
| | 11,100,000 | | | Safeway, Inc., 6.350%, 8/15/2017 | | | 13,117,236 | |
| | | | | | | | |
| | | | | | | 22,629,612 | |
| | | | | | | | |
| | | | Supranational — 1.3% | | | | |
| | 12,000,000 | | | European Bank for Reconstruction & Development, GMTN,
9.250%, 9/10/2012, (BRL) | | | 7,138,298 | |
| | 196,541,400,000 | | | European Investment Bank, EMTN, Zero Coupon, 4/24/2013, 144A, (IDR) | | | 18,964,869 | |
| | 28,694,000 | | | European Investment Bank, EMTN, 7.000%, 1/18/2012, (NZD) | | | 21,880,013 | |
| | 336,380,000,000 | | | Inter-American Development Bank, EMTN, Zero Coupon,
5/20/2013, (IDR) | | | 30,950,729 | |
| | 418,960,000,000 | | | Inter-American Development Bank, EMTN, Zero Coupon,
9/23/2013, (IDR) | | | 37,492,812 | |
See accompanying notes to financial statements.
| 26
Portfolio of Investments – as of September 30, 2010
Loomis Sayles Investment Grade Bond Fund – (continued)
| | | | | | | | |
Principal
Amount (‡) | | | Description | | Value (†) | |
| | | | | | | | |
| | | | Supranational — continued | | | | |
| | 13,265,000 | | | Inter-American Development Bank, EMTN, 6.000%, 12/15/2017, (NZD) | | $ | 10,374,954 | |
| | 15,400,000 | | | International Bank for Reconstruction & Development,
1.430%, 3/05/2014, (SGD) | | | 11,784,285 | |
| | | | | | | | |
| | | | | | | 138,585,960 | |
| | | | | | | | |
| | | | Technology — 3.8% | | | | |
| | 8,895,000 | | | Agilent Technologies, Inc., 6.500%, 11/01/2017 | | | 10,246,115 | |
| | 4,700,000 | | | Alcatel-Lucent USA, Inc., 6.450%, 3/15/2029 | | | 3,419,250 | |
| | 2,035,000 | | | Arrow Electronics, Inc., 6.875%, 7/01/2013 | | | 2,270,006 | |
| | 1,050,000 | | | Arrow Electronics, Inc., 6.875%, 6/01/2018 | | | 1,198,386 | |
| | 6,100,000 | | | Avnet, Inc., 5.875%, 3/15/2014 | | | 6,653,740 | |
| | 6,230,000 | | | Avnet, Inc., 6.000%, 9/01/2015 | | | 6,870,133 | |
| | 1,540,000 | | | Avnet, Inc., 6.625%, 9/15/2016 | | | 1,766,281 | |
| | 12,715,000 | | | BMC Software, Inc., 7.250%, 6/01/2018(c) | | | 15,352,803 | |
| | 13,750,000 | | | Corning, Inc., 6.750%, 9/15/2013 | | | 15,601,107 | |
| | 1,480,000 | | | Corning, Inc., 6.850%, 3/01/2029 | | | 1,701,856 | |
| | 58,825,000 | | | Corning, Inc., 7.000%, 5/15/2024 | | | 72,512,989 | |
| | 7,650,000 | | | Corning, Inc., 7.250%, 8/15/2036 | | | 8,772,790 | |
| | 56,440,000 | | | Dun & Bradstreet Corp. (The), 6.000%, 4/01/2013 | | | 61,922,751 | |
| | 7,205,000 | | | Equifax, Inc., 7.000%, 7/01/2037 | | | 8,170,852 | |
| | 330,000 | | | Freescale Semiconductor, Inc., 10.125%, 12/15/2016 | | | 300,300 | |
| | 72,515,000 | | | Ingram Micro, Inc., 5.250%, 9/01/2017 | | | 75,109,804 | |
| | 7,965,000 | | | Intuit, Inc., 5.750%, 3/15/2017 | | | 9,024,050 | |
| | 26,770,000 | | | KLA-Tencor Corp., 6.900%, 5/01/2018 | | | 30,707,653 | |
| | 7,559,000 | | | Motorola, Inc., 6.500%, 9/01/2025 | | | 8,226,384 | |
| | 6,355,000 | | | Motorola, Inc., 6.500%, 11/15/2028 | | | 6,747,517 | |
| | 11,650,000 | | | Motorola, Inc., 6.625%, 11/15/2037 | | | 12,458,254 | |
| | 1,625,000 | | | Motorola, Inc., 8.000%, 11/01/2011 | | | 1,725,833 | |
| | 2,628,000 | | | Samsung Electronics Co. Ltd., 7.700%, 10/01/2027, 144A | | | 3,119,210 | |
| | 5,725,000 | | | Tyco Electronics Group SA, 6.550%, 10/01/2017 | | | 6,695,989 | |
| | 11,189,000 | | | Xerox Capital Trust I, 8.000%, 2/01/2027 | | | 11,384,405 | |
| | 573,000 | | | Xerox Corp., 6.350%, 5/15/2018 | | | 664,777 | |
| | 7,265,000 | | | Xerox Corp., 6.750%, 2/01/2017 | | | 8,518,198 | |
| | | | | | | | |
| | | | | | | 391,141,433 | |
| | | | | | | | |
| | | | Textile — 0.2% | | | | |
| | 3,837,000 | | | Phillips-Van Heusen Corp., 7.750%, 11/15/2023 | | | 4,251,907 | |
| | 15,228,000 | | | VF Corp., 6.450%, 11/01/2037 | | | 18,509,451 | |
| | | | | | | | |
| | | | | | | 22,761,358 | |
| | | | | | | | |
| | | | Tobacco — 0.1% | | | | |
| | 8,305,000 | | | Reynolds American, Inc., 6.750%, 6/15/2017 | | | 9,340,775 | |
| | 2,035,000 | | | Reynolds American, Inc., 7.250%, 6/15/2037 | | | 2,136,428 | |
| | | | | | | | |
| | | | | | | 11,477,203 | |
| | | | | | | | |
| | | | Transportation Services — 0.7% | | | | |
| | 8,620,000 | | | Erac USA Finance Co., 6.375%, 10/15/2017, 144A | | | 10,021,138 | |
| | 2,885,000 | | | Erac USA Finance Co., 6.700%, 6/01/2034, 144A | | | 3,203,319 | |
| | 52,626,000 | | | Erac USA Finance Co., 7.000%, 10/15/2037, 144A | | | 60,627,731 | |
| | | | | | | | |
| | | | | | | 73,852,188 | |
| | | | | | | | |
See accompanying notes to financial statements.
27 |
Portfolio of Investments – as of September 30, 2010
Loomis Sayles Investment Grade Bond Fund – (continued)
| | | | | | | | |
Principal
Amount (‡) | | | Description | | Value (†) | |
| | | | | | | | |
| | | | Treasuries — 19.8% | | | | |
| | 154,833,000 | | | Canadian Government, 1.000%, 9/01/2011, (CAD) | | $ | 150,127,365 | |
| | 10,865,000 | | | Canadian Government, 1.250%, 12/01/2011, (CAD) | | | 10,556,442 | |
| | 367,850,000 | | | Canadian Government, 2.000%, 9/01/2012, (CAD) | | | 361,747,172 | |
| | 26,235,000 | | | Canadian Government, 2.750%, 12/01/2010, (CAD) | | | 25,574,344 | |
| | 39,109,000 | | | Canadian Government, 3.500%, 6/01/2013, (CAD) | | | 39,985,902 | |
| | 229,170,000 | | | Canadian Government, 3.750%, 6/01/2012, (CAD) | | | 231,571,062 | |
| | 198,720,000 | | | Canadian Government, 3.750%, 6/01/2019, (CAD) | | | 209,292,391 | |
| | 4,250,000 | | | Canadian Government, 4.000%, 6/01/2016, (CAD) | | | 4,542,902 | |
| | 187,955,000 | | | Canadian Government, 4.250%, 6/01/2018, (CAD) | | | 204,963,932 | |
| | 310,490,000 | | | Canadian Government, 5.250%, 6/01/2012, (CAD) | | | 321,166,583 | |
| | 2,947,514 | | | Hellenic Republic Government Bond, 2.300%, 7/25/2030, (EUR) | | | 1,960,177 | |
| | 12,530,000 | | | New Zealand Government Bond, 6.000%, 12/15/2017, (NZD) | | | 9,886,984 | |
| | 211,235,000 | | | New Zealand Government Bond, 6.500%, 4/15/2013, (NZD) | | | 164,908,225 | |
| | 742,220,000 | | | Norwegian Government, 4.250%, 5/19/2017, (NOK) | | | 136,502,274 | |
| | 120,965,000 | | | Norwegian Government, 5.000%, 5/15/2015, (NOK) | | | 22,687,198 | |
| | 199,940,000 | | | Norwegian Government, 6.000%, 5/16/2011, (NOK) | | | 34,720,645 | |
| | 600,385,000 | | | Norwegian Government, 6.500%, 5/15/2013, (NOK) | | | 112,542,008 | |
| | | | | | | | |
| | | | | | | 2,042,735,606 | |
| | | | | | | | |
| | | | Wireless — 0.8% | | | | |
| | 32,100,000 | | | Cellco Partnership/Verizon Wireless Capital LLC, 8.500%, 11/15/2018 | | | 43,708,323 | |
| | 8,650,000 | | | Nextel Communications, Inc., Series D, 7.375%, 8/01/2015 | | | 8,693,250 | |
| | 370,000 | | | Nextel Communications, Inc., Series E, 6.875%, 10/31/2013 | | | 372,312 | |
| | 15,710,000 | | | Nextel Communications, Inc., Series F, 5.950%, 3/15/2014 | | | 15,631,450 | |
| | 6,512,000 | | | Sprint Capital Corp., 6.875%, 11/15/2028 | | | 5,958,480 | |
| | 2,650,000 | | | Sprint Capital Corp., 6.900%, 5/01/2019 | | | 2,663,250 | |
| | 625,000 | | | Sprint Capital Corp., 8.750%, 3/15/2032 | | | 656,250 | |
| | 93,000 | | | Sprint Nextel Corp., 6.000%, 12/01/2016 | | | 91,838 | |
| | 500,000 | | | True Move Co. Ltd., 10.750%, 12/16/2013, 144A | | | 531,250 | |
| | 1,654,000 | | | Vodafone Group PLC, 5.000%, 9/15/2015 | | | 1,860,991 | |
| | | | | | | | |
| | | | | | | 80,167,394 | |
| | | | | | | | |
| | | | Wirelines — 3.9% | | | | |
| | 19,610,000 | | | AT&T Corp., 6.500%, 3/15/2029 | | | 21,893,114 | |
| | 415,000 | | | Bell Canada, MTN, 7.300%, 2/23/2032, (CAD) | | | 469,847 | |
| | 3,250,000 | | | Bell Canada, Series M-17, 6.100%, 3/16/2035, (CAD) | | | 3,299,023 | |
| | 1,915,000 | | | BellSouth Corp., 6.000%, 11/15/2034 | | | 2,031,821 | |
| | 3,000,000 | | | BellSouth Telecommunications, Inc., 5.850%, 11/15/2045 | | | 2,917,935 | |
| | 6,810,000 | | | BellSouth Telecommunications, Inc., 7.000%, 12/01/2095 | | | 7,697,861 | |
| | 2,460,000 | | | CenturyLink, Inc., Series P, 7.600%, 9/15/2039 | | | 2,406,945 | |
| | 134,165,000 | | | Deutsche Telekom International Finance BV, 6.000%, 7/08/2019 | | | 159,637,835 | |
| | 3,350,000 | | | GTE Corp., 6.940%, 4/15/2028 | | | 3,872,459 | |
| | 65,000 | | | Level 3 Financing, Inc., 8.750%, 2/15/2017 | | | 57,850 | |
| | 560,000 | | | Level 3 Financing, Inc., 9.250%, 11/01/2014 | | | 526,400 | |
| | 1,735,000 | | | Qwest Capital Funding, Inc., 6.500%, 11/15/2018 | | | 1,735,000 | |
| | 2,815,000 | | | Qwest Capital Funding, Inc., 6.875%, 7/15/2028 | | | 2,646,100 | |
| | 4,465,000 | | | Qwest Capital Funding, Inc., 7.625%, 8/03/2021 | | | 4,509,650 | |
| | 970,000 | | | Qwest Capital Funding, Inc., 7.750%, 2/15/2031 | | | 979,700 | |
See accompanying notes to financial statements.
| 28
Portfolio of Investments – as of September 30, 2010
Loomis Sayles Investment Grade Bond Fund – (continued)
| | | | | | | | |
Principal
Amount (‡) | | | Description | | Value (†) | |
| | | | | | | | |
| | | | Wirelines — continued | | | | |
| $ | 340,000 | | | Qwest Corp., 6.500%, 6/01/2017 | | $ | 371,450 | |
| | 14,795,000 | | | Qwest Corp., 6.875%, 9/15/2033 | | | 14,610,062 | |
| | 890,000 | | | Qwest Corp., 7.200%, 11/10/2026 | | | 890,000 | |
| | 9,275,000 | | | Qwest Corp., 7.250%, 9/15/2025 | | | 9,738,750 | |
| | 9,680,000 | | | Qwest Corp., 7.250%, 10/15/2035 | | | 9,583,200 | |
| | 1,600,000 | | | Qwest Corp., 7.500%, 6/15/2023 | | | 1,608,000 | |
| | 17,170,000 | | | Telecom Italia Capital SA, 4.875%, 10/01/2010 | | | 17,170,000 | |
| | 11,215,000 | | | Telecom Italia Capital SA, 6.000%, 9/30/2034 | | | 10,579,648 | |
| | 4,180,000 | | | Telecom Italia Capital SA, 6.375%, 11/15/2033 | | | 4,123,474 | |
| | 14,445,000 | | | Telus Corp., 4.950%, 3/15/2017, (CAD) | | | 14,985,652 | |
| | 55,855,000 | | | Telus Corp., Series CG, 5.050%, 12/04/2019, (CAD) | | | 56,633,463 | |
| | 3,676,000 | | | Verizon Communications, Inc., 6.100%, 4/15/2018 | | | 4,371,385 | |
| | 7,449,000 | | | Verizon Maryland, Inc., Series B, 5.125%, 6/15/2033 | | | 6,758,999 | |
| | 14,540,000 | | | Verizon New England, Inc., 6.500%, 9/15/2011 | | | 15,287,749 | |
| | 2,700,000 | | | Verizon New England, Inc., 7.875%, 11/15/2029 | | | 3,122,831 | |
| | 7,047,000 | | | Verizon New York, Inc., Series B, 7.375%, 4/01/2032 | | | 8,315,192 | |
| | 5,375,000 | | | Verizon Pennsylvania, Inc., 6.000%, 12/01/2028 | | | 5,393,404 | |
| | | | | | | | |
| | | | | | | 398,224,799 | |
| | | | | | | | |
| | | | Total Non-Convertible Bonds (Identified Cost $8,654,142,184) | | | 9,741,448,938 | |
| | | | | | | | |
| | | | | | | | |
| | Convertible Bonds — 2.8% | | | | |
| | | | Automotive — 0.5% | | | | |
| | 35,585,000 | | | Ford Motor Co., 4.250%, 11/15/2016 | | | 53,110,612 | |
| | | | | | | | |
| | | | Media Non-Cable — 0.0% | | | | |
| | 530,651 | | | Liberty Media LLC, 3.500%, 1/15/2031 | | | 282,572 | |
| | | | | | | | |
| | | | REITs — Apartments — 0.0% | | | | |
| | 1,400,000 | | | ERP Operating LP, 3.850%, 8/15/2026 | | | 1,441,440 | |
| | | | | | | | |
| | | | REITs — Industrials — 0.4% | | | | |
| | 10,673,000 | | | ProLogis, 1.875%, 11/15/2037 | | | 10,005,938 | |
| | 27,955,000 | | | ProLogis, 3.250%, 3/15/2015 | | | 27,395,900 | |
| | | | | | | | |
| | | | | | | 37,401,838 | |
| | | | | | | | |
| | | | Technology — 1.8% | | | | |
| | 24,645,000 | | | Intel Corp., 2.950%, 12/15/2035 | | | 24,367,744 | |
| | 140,000,000 | | | Intel Corp., 3.250%, 8/01/2039 | | | 163,450,000 | |
| | | | | | | | |
| | | | | | | 187,817,744 | |
| | | | | | | | |
| | | | Wireless — 0.0% | | | | |
| | 5,200,000 | | | NII Holdings, Inc., 3.125%, 6/15/2012 | | | 5,044,000 | |
| | | | | | | | |
| | | | Wirelines — 0.1% | | | | |
| | 2,735,000 | | | Level 3 Communications, Inc., 3.500%, 6/15/2012 | | | 2,587,994 | |
| | 230,000 | | | Level 3 Communications, Inc., 5.250%, 12/15/2011 | | | 230,000 | |
| | 2,990,000 | | | Level 3 Communications, Inc., 7.000%, 3/15/2015, 144A(c) | | | 2,664,837 | |
| | | | | | | | |
| | | | | | | 5,482,831 | |
| | | | | | | | |
| | | | Total Convertible Bonds (Identified Cost $248,287,691) | | | 290,581,037 | |
| | | | | | | | |
| | | | | | | | |
See accompanying notes to financial statements.
29 |
Portfolio of Investments – as of September 30, 2010
Loomis Sayles Investment Grade Bond Fund – (continued)
| | | | | | | | |
Principal
Amount (‡) | | | Description | | Value (†) | |
| | | | | | | | |
| | Municipals — 0.4% | | | | |
| | | | California — 0.1% | | | | |
| $ | 1,305,000 | | | San Jose California Redevelopment Agency Tax Allocation (Merged Area Redevelopment), Series C, (MBIA insured), 3.750%, 8/01/2028 | | $ | 1,147,760 | |
| | 480,000 | | | San Jose California Redevelopment Agency Tax Allocation (Merged Area Redevelopment), Series C, (Registered), (MBIA insured),
3.750%, 8/01/2028 | | | 440,597 | |
| | 1,620,000 | | | State of California, (AMBAC insured), 4.500%, 8/01/2027 | | | 1,610,458 | |
| | 4,515,000 | | | State of California, 4.500%, 10/01/2029 | | | 4,446,959 | |
| | 1,315,000 | | | State of California, (AMBAC insured), 4.500%, 8/01/2030 | | | 1,289,555 | |
| | 1,135,000 | | | State of California, 4.500%, 8/01/2030 | | | 1,113,038 | |
| | 840,000 | | | State of California (Various Purpose), (MBIA insured), 3.250%, 12/01/2027 | | | 697,611 | |
| | 3,965,000 | | | State of California (Various Purpose), (AMBAC insured),
4.500%, 12/01/2033 | | | 3,864,527 | |
| | | | | | | | |
| | | | | | | 14,610,505 | |
| | | | | | | | |
| | | | District of Columbia — 0.2% | | | | |
| | 15,000,000 | | | Metropolitan Washington Airports Authority, 7.462%, 10/01/2046 | | | 16,100,250 | |
| | | | | | | | |
| | | | Illinois — 0.0% | | | | |
| | 540,000 | | | Chicago O’Hare International Airport, Series A, (AGMC insured),
4.500%, 1/01/2038 | | | 541,291 | |
| | | | | | | | |
| | | | Michigan — 0.0% | | | | |
| | 2,585,000 | | | Michigan Tobacco Settlement Finance Authority Taxable Turbo, Series A, 7.309%, 6/01/2034(c) | | | 2,052,697 | |
| | | | | | | | |
| | | | Ohio — 0.0% | | | | |
| | 6,570,000 | | | Buckeye Tobacco Settlement Financing Authority, Series A-2,
5.875%, 6/01/2047(c) | | | 4,798,465 | |
| | | | | | | | |
| | | | Virginia — 0.1% | | | | |
| | 14,550,000 | | | Virginia Tobacco Settlement Financing Corp., Series A-1,
6.706%, 6/01/2046(c) | | | 10,074,420 | |
| | | | | | | | |
| | | | Total Municipals (Identified Cost $52,282,985) | | | 48,177,628 | |
| | | | | | | | |
| | | | Total Bonds and Notes (Identified Cost $8,954,712,860) | | | 10,080,207,603 | |
| | | | | | | | |
| | | | | | | | |
| | Bank Loans — 0.2% | | | | |
| | | | Airlines — 0.2% | | | | |
| | 18,000,000 | | | AWAS Capital, Inc., New 1st Lien Term Loan, 7.750%, 6/10/2016(e)
(Identified Cost $17,486,430) | | | 18,275,580 | |
| | | | | | | | |
| | | | | | | | |
See accompanying notes to financial statements.
| 30
Portfolio of Investments – as of September 30, 2010
Loomis Sayles Investment Grade Bond Fund – (continued)
| | | | | | | | |
Principal
Amount (‡) | | | Description | | Value (†) | |
| | | | | | | | |
| | Short-Term Investments — 0.9% | | | | |
| $ | 92,300,701 | | | Tri-Party Repurchase Agreement with Fixed Income Clearing Corporation, dated 9/30/2010 at 0.000% to be repurchased at $92,300,701 on 10/01/2010 collateralized by $150,000 Federal Home Loan Bank, 0.625% due 1/13/2012 valued at $150,375; $43,670,000 Federal Home Loan Bank, 0.250% due 1/28/2011 valued at $43,670,000; $11,780,000 Federal Home Loan Mortgage Corp. Discount Note, due 8/29/2011 valued at $11,750,550; $3,510,000 Federal Home Loan Bank, 1.000% due 12/28/2011 valued at $3,549,488; $33,560,000 Federal Home Loan Bank, 0.785% due 11/25/2011 valued at $33,811,700; $1,205,000 Federal Home Loan Mortgage Corp., 3.000% due 8/11/2017 valued at $1,218,556 including accrued interest (Note 2 of Notes to Financial Statements) (Identified Cost $92,300,701) | | $ | 92,300,701 | |
| | | | | | | | |
| | | | | | | | |
| | | | Total Investments — 98.8% (Identified Cost $9,064,499,991)(a) | | | 10,190,783,884 | |
| | | | Other assets less liabilities — 1.2% | | | 119,522,859 | |
| | | | | | | | |
| | | | Net Assets — 100.0% | | $ | 10,310,306,743 | |
| | | | | | | | |
| | | | | | | | |
| | (‡) | | | Principal amount stated in U.S. dollars unless otherwise noted. | | | | |
| | (†) | | | See Note 2 of Notes to Financial Statements. | | | | |
| | (††) | | | Amount shown represents units. One unit represents a principal amount of 25. | |
| | (†††) | | | Amount shown represents units. One unit represents a principal amount of 100. | |
| | (a) | | | Federal Tax Information: | | | | |
| | | | At September 30, 2010, the net unrealized appreciation on investments based on a cost of $9,099,261,730 for federal income tax purposes was as follows: | |
| | | | Aggregate gross unrealized appreciation for all investments in which there is an excess of value over tax cost | | $ | 1,131,147,592 | |
| | | | Aggregate gross unrealized depreciation for all investments in which there is an excess of tax cost over value | | | (39,625,438 | ) |
| | | | | | | | |
| | | | Net unrealized appreciation | | $ | 1,091,522,154 | |
| | | | | | | | |
| | | | | | | | |
| | (b) | | | Variable rate security. Rate as of September 30, 2010 is disclosed. | | | | |
| | (c) | | | Illiquid security. At September 30, 2010, the value of these securities amounted to $203,208,184 or 2.0% of net assets. | |
| | (d) | | | Coupon rate is a fixed rate for an initial period then resets at a specified date and rate. | |
| | (e) | | | Variable rate security. Rate shown represents the weighted average rate at September 30, 2010. | |
| | | | | | | | |
| | 144A | | | Securities exempt from registration under Rule 144A of the Securities Act of 1933. These securities may be resold in transactions exempt from registration, normally to qualified institutional buyers. At September 30, 2010, the total value of these securities amounted to $1,563,782,565 or 15.2% of net assets. | |
| | | | | | | | |
| | ABS | | | Asset-Backed Securities | | | | |
| | AGMC | | | Assured Guaranty Municipal Corp. | | | | |
| | AMBAC | | | American Municipal Bond Assurance Corp. | | | | |
| | EMTN | | | Euro Medium Term Note | | | | |
| | FHLMC | | | Federal Home Loan Mortgage Corp. | | | | |
See accompanying notes to financial statements.
31 |
Portfolio of Investments – as of September 30, 2010
Loomis Sayles Investment Grade Bond Fund – (continued)
| | | | | | | | |
| | FNMA | | | Federal National Mortgage Association | | | | |
| | GMTN | | | Global Medium Term Note | | | | |
| | MBIA | | | Municipal Bond Investors Assurance Corp. | | | | |
| | MTN | | | Medium Term Note | | | | |
| | REITs | | | Real Estate Investment Trusts | | | | |
| | | | | | | | |
| | AUD | | | Australian Dollar | | | | |
| | BRL | | | Brazilian Real | | | | |
| | CAD | | | Canadian Dollar | | | | |
| | EUR | | | Euro | | | | |
| | GBP | | | British Pound | | | | |
| | IDR | | | Indonesian Rupiah | | | | |
| | ISK | | | Icelandic Krona | | | | |
| | KRW | | | South Korean Won | | | | |
| | MXN | | | Mexican Peso | | | | |
| | NOK | | | Norwegian Krone | | | | |
| | NZD | | | New Zealand Dollar | | | | |
| | SGD | | | Singapore Dollar | | | | |
Industry Summary at September 30, 2010 (Unaudited)
| | | | |
| Treasuries | | | 19.8 | % |
| Banking | | | 10.1 | |
| Technology | | | 5.6 | |
| Wirelines | | | 4.0 | |
| Government Owned—No Guarantee | | | 3.9 | |
Commercial Mortgage-Backed
Securities | | | 3.7 | |
| Sovereigns | | | 3.7 | |
| Electric | | | 3.5 | |
| Airlines | | | 3.3 | |
| Non-Captive Diversified | | | 3.2 | |
| Pipelines | | | 3.2 | |
| ABS Other | | | 2.0 | |
| Other Investments, less than 2% each | | | 31.9 | |
| Short-Term Investments | | | 0.9 | |
| | | | |
| Total Investments | | | 98.8 | |
| Other assets less liabilities | | | 1.2 | |
| | | | |
| Net Assets | | | 100.0 | % |
| | | | |
See accompanying notes to financial statements.
| 32
Portfolio of Investments – as of September 30, 2010
Loomis Sayles Investment Grade Bond Fund – (continued)
Currency Exposure at September 30, 2010 as a Percentage of Net Assets (Unaudited)
| | | | |
| United States Dollar | | | 69.9 | % |
| Canadian Dollar | | | 16.4 | |
| New Zealand Dollar | | | 3.1 | |
| Norwegian Krone | | | 3.0 | |
| Euro | | | 2.2 | |
| Other, less than 2% each | | | 4.2 | |
| | | | |
| Total Investments | | | 98.8 | |
| Other assets less liabilities | | | 1.2 | |
| | | | |
| Net Assets | | | 100.0 | % |
| | | | |
See accompanying notes to financial statements.
33 |
Statement of Assets and Liabilities
September 30, 2010
| | | | |
ASSETS | | | | |
Investments at cost | | $ | 9,064,499,991 | |
Net unrealized appreciation | | | 1,126,283,893 | |
| | | | |
Investments at value | | | 10,190,783,884 | |
Foreign currency at value (identified cost $2,506,587) | | | 2,250,618 | |
Receivable for Fund shares sold | | | 38,039,285 | |
Receivable for securities sold | | | 7,090,446 | |
Interest receivable | | | 136,471,644 | |
Tax reclaims receivable | | | 536,764 | |
| | | | |
TOTAL ASSETS | | | 10,375,172,641 | |
| | | | |
LIABILITIES | | | | |
Payable for securities purchased | | | 40,705,700 | |
Payable for Fund shares redeemed | | | 19,190,854 | |
Foreign taxes payable (Note 2) | | | 54,960 | |
Management fees payable (Note 5) | | | 3,351,164 | |
Deferred Trustees’ fees (Note 5) | | | 226,882 | |
Administrative fees payable (Note 5) | | | 392,514 | |
Other accounts payable and accrued expenses | | | 943,824 | |
| | | | |
TOTAL LIABILITIES | | | 64,865,898 | |
| | | | |
NET ASSETS | | $ | 10,310,306,743 | |
| | | | |
NET ASSETS CONSIST OF: | | | | |
Paid-in capital | | $ | 8,981,532,559 | |
Undistributed net investment income | | | 39,402,955 | |
Accumulated net realized gain on investments and foreign currency transactions | | | 161,964,765 | |
Net unrealized appreciation on investments and foreign currency translations | | | 1,127,406,464 | |
| | | | |
NET ASSETS | | $ | 10,310,306,743 | |
| | | | |
See accompanying notes to financial statements.
| 34
Statement of Assets and Liabilities (continued)
September 30, 2010
| | | | |
COMPUTATION OF NET ASSET VALUE AND OFFERING PRICE: | | | | |
Class A shares: | | | | |
Net assets | | $ | 3,092,955,849 | |
| | | | |
Shares of beneficial interest | | | 246,320,092 | |
| | | | |
Net asset value and redemption price per share | | $ | 12.56 | |
| | | | |
Offering price per share (100/95.50) (Note 1) | | $ | 13.15 | |
| | | | |
Class B shares: (redemption price per share is equal to net asset value less any applicable contingent deferred sales charge) (Note 1) | | | | |
Net assets | | $ | 17,113,165 | |
| | | | |
Shares of beneficial interest | | | 1,369,324 | |
| | | | |
Net asset value and offering price per share | | $ | 12.50 | |
| | | | |
Class C shares: (redemption price per share is equal to net asset value less any applicable contingent deferred sales charge) (Note 1) | | | | |
Net assets | | $ | 2,593,323,848 | |
| | | | |
Shares of beneficial interest | | | 208,046,324 | |
| | | | |
Net asset value and offering price per share | | $ | 12.47 | |
| | | | |
Class Y shares: | | | | |
Net assets | | $ | 4,473,000,897 | |
| | | | |
Shares of beneficial interest | | | 355,991,826 | |
| | | | |
Net asset value, offering and redemption price per share | | $ | 12.56 | |
| | | | |
Admin Class shares: | | | | |
Net assets | | $ | 878,549 | |
| | | | |
Shares of beneficial interest | | | 70,031 | |
| | | | |
Net asset value, offering and redemption price per share | | $ | 12.55 | |
| | | | |
Class J shares: | | | | |
Net assets | | $ | 133,034,435 | |
| | | | |
Shares of beneficial interest | | | 10,606,840 | |
| | | | |
Net asset value and redemption price per share | | $ | 12.54 | |
| | | | |
Offering price per share (100/96.50 of net asset value) (Note 1) | | $ | 12.99 | |
| | | | |
See accompanying notes to financial statements.
35 |
Statement of Operations
For the Year Ended September 30, 2010
| | | | |
INVESTMENT INCOME | | | | |
Interest | | $ | 516,277,594 | |
| | | | |
Expenses | | | | |
Management fees (Note 5) | | | 38,345,729 | |
Service and distribution fees (Note 5) | | | 34,074,213 | |
Administrative fees (Note 5) | | | 4,603,645 | |
Trustees’ fees and expenses (Note 5) | | | 183,570 | |
Transfer agent fees and expenses (Notes 5 and 6) | | | 8,257,435 | |
Audit and tax services fees | | | 58,565 | |
Custodian fees and expenses | | | 424,322 | |
Legal fees (Note 6) | | | 217,699 | |
Registration fees (Note 6) | | | 345,975 | |
Shareholder reporting expenses (Note 6) | | | 1,141,740 | |
Fee/expense recovery (Note 5) | | | 8,509 | |
Miscellaneous expenses | | | 293,295 | |
| | | | |
Total expenses | | | 87,954,697 | |
Less waiver and/or expense reimbursement (Note 5) | | | (42,738 | ) |
| | | | |
Net expenses | | | 87,911,959 | |
| | | | |
Net investment income | | | 428,365,635 | |
| | | | |
NET REALIZED AND UNREALIZED GAIN (LOSS) ON INVESTMENTS AND FOREIGN CURRENCY TRANSACTIONS | | | | |
Net realized gain on: | | | | |
Investments | | | 220,400,551 | |
Foreign currency transactions | | | 1,144,712 | |
Net change in unrealized appreciation (depreciation) on: | | | | |
Investments | | | 549,472,362 | |
Foreign currency translations | | | (325,273 | ) |
| | | | |
Net realized and unrealized gain on investments and foreign currency transactions | | | 770,692,352 | |
| | | | |
NET INCREASE IN NET ASSETS RESULTING FROM OPERATIONS | | $ | 1,199,057,987 | |
| | | | |
See accompanying notes to financial statements.
| 36
Statement of Changes in Net Assets
| | | | | | | | |
| | | Year Ended
September 30,
2010 | | | Year Ended
September 30,
2009 | |
FROM OPERATIONS: | | | | | | | | |
Net investment income | | $ | 428,365,635 | | | $ | 350,121,874 | |
Net realized gain (loss) on investments and foreign currency transactions | | | 221,545,263 | | | | (23,240,057 | ) |
Net change in unrealized appreciation (depreciation) on investments and foreign currency translations | | | 549,147,089 | | | | 1,086,052,060 | |
| | | | | | | | |
Net increase in net assets resulting from operations | | | 1,199,057,987 | | | | 1,412,933,877 | |
| | | | | | | | |
FROM DISTRIBUTIONS TO SHAREHOLDERS: | | | | | | | | |
Net investment income | | | | | | | | |
Class A | | | (141,582,997 | ) | | | (126,482,744 | ) |
Class B | | | (676,565 | ) | | | (778,099 | ) |
Class C | | | (102,299,334 | ) | | | (86,396,910 | ) |
Class Y | | | (192,755,479 | ) | | | (111,617,170 | ) |
Admin Class | | | (9,090 | ) | | | — | |
Class J | | | (5,898,638 | ) | | | (8,135,019 | ) |
Net realized capital gains | | | | | | | | |
Class A | | | (6,651,489 | ) | | | (24,679,708 | ) |
Class B | | | (39,640 | ) | | | (203,042 | ) |
Class C | | | (5,758,632 | ) | | | (18,444,267 | ) |
Class Y | | | (8,463,329 | ) | | | (16,568,771 | ) |
Admin Class | | | — | | | | — | |
Class J | | | (320,597 | ) | | | (2,097,657 | ) |
| | | | | | | | |
Total distributions | | | (464,455,790 | ) | | | (395,403,387 | ) |
| | | | | | | | |
NET INCREASE IN NET ASSETS FROM CAPITAL SHARE TRANSACTIONS (NOTE 10) | | | 433,617,282 | | | | 3,695,970,881 | |
| | | | | | | | |
Net increase in net assets | | | 1,168,219,479 | | | | 4,713,501,371 | |
NET ASSETS | | | | | | | | |
Beginning of the year | | | 9,142,087,264 | | | | 4,428,585,893 | |
| | | | | | | | |
End of the year | | $ | 10,310,306,743 | | | $ | 9,142,087,264 | |
| | | | | | | | |
UNDISTRIBUTED NET INVESTMENT INCOME | | $ | 39,402,955 | | | $ | 35,750,437 | |
| | | | | | | | |
See accompanying notes to financial statements.
37 |
This Page Intentionally Left Blank
| 38
Financial Highlights
For a share outstanding throughout each period.
| | | | | | | | | | | | | | | | | | | | | | | | | | | | |
| | | | | | Income (Loss) From Investment
Operations: | | | Less Distributions: | |
| | | Net asset
value,
beginning
of the
period | | | Net
investment
income (a) | | | Net realized
and
unrealized
gain (loss) | | | Total from
investment
operations | | | Dividends
from net
investment
income | | | Distributions
from net
realized
capital
gains | | | Total
distributions | |
INVESTMENT GRADE BOND FUND | | | | | | | | | | | | | | | | | | | | | |
Class A | | | | | | | | | | | | | | | | | | | | | | | | | | | | |
9/30/2010 | | $ | 11.64 | | | $ | 0.55 | | | $ | 0.96 | | | $ | 1.51 | | | $ | (0.56 | ) | | $ | (0.03 | ) | | $ | (0.59 | ) |
9/30/2009 | | | 10.54 | | | | 0.60 | | | | 1.22 | | | | 1.82 | | | | (0.59 | ) | | | (0.13 | ) | | | (0.72 | ) |
9/30/2008 | | | 11.73 | | | | 0.60 | | | | (1.15 | ) | | | (0.55 | ) | | | (0.64 | ) | | | — | | | | (0.64 | ) |
9/30/2007 | | | 11.35 | | | | 0.58 | | | | 0.42 | | | | 1.00 | | | | (0.62 | ) | | | — | | | | (0.62 | ) |
9/30/2006 | | | 11.71 | | | | 0.51 | | | | 0.10 | | | | 0.61 | | | | (0.75 | ) | | | (0.22 | ) | | | (0.97 | ) |
Class B | | | | | | | | | | | | | | | | | | | | | | | | | | | | |
9/30/2010 | | | 11.59 | | | | 0.45 | | | | 0.95 | | | | 1.40 | | | | (0.46 | ) | | | (0.03 | ) | | | (0.49 | ) |
9/30/2009 | | | 10.50 | | | | 0.51 | | | | 1.21 | | | | 1.72 | | | | (0.50 | ) | | | (0.13 | ) | | | (0.63 | ) |
9/30/2008 | | | 11.68 | | | | 0.50 | | | | (1.14 | ) | | | (0.64 | ) | | | (0.54 | ) | | | — | | | | (0.54 | ) |
9/30/2007 | | | 11.31 | | | | 0.47 | | | | 0.43 | | | | 0.90 | | | | (0.53 | ) | | | — | | | | (0.53 | ) |
9/30/2006 | | | 11.67 | | | | 0.42 | | | | 0.10 | | | | 0.52 | | | | (0.66 | ) | | | (0.22 | ) | | | (0.88 | ) |
Class C | | | | | | | | | | | | | | | | | | | | | | | | | | | | |
9/30/2010 | | | 11.56 | | | | 0.46 | | | | 0.96 | | | | 1.42 | | | | (0.48 | ) | | | (0.03 | ) | | | (0.51 | ) |
9/30/2009 | | | 10.47 | | | | 0.52 | | | | 1.22 | | | | 1.74 | | | | (0.52 | ) | | | (0.13 | ) | | | (0.65 | ) |
9/30/2008 | | | 11.66 | | | | 0.51 | | | | (1.15 | ) | | | (0.64 | ) | | | (0.55 | ) | | | — | | | | (0.55 | ) |
9/30/2007 | | | 11.30 | | | | 0.49 | | | | 0.42 | | | | 0.91 | | | | (0.55 | ) | | | — | | | | (0.55 | ) |
9/30/2006 | | | 11.66 | | | | 0.42 | | | | 0.11 | | | | 0.53 | | | | (0.67 | ) | | | (0.22 | ) | | | (0.89 | ) |
Class Y | | | | | | | | | | | | | | | | | | | | | | | | | | | | |
9/30/2010 | | | 11.65 | | | | 0.58 | | | | 0.95 | | | | 1.53 | | | | (0.59 | ) | | | (0.03 | ) | | | (0.62 | ) |
9/30/2009 | | | 10.55 | | | | 0.62 | | | | 1.23 | | | | 1.85 | | | | (0.62 | ) | | | (0.13 | ) | | | (0.75 | ) |
9/30/2008 | | | 11.73 | | | | 0.64 | | | | (1.15 | ) | | | (0.51 | ) | | | (0.67 | ) | | | — | | | | (0.67 | ) |
9/30/2007 | | | 11.36 | | | | 0.61 | | | | 0.41 | | | | 1.02 | | | | (0.65 | ) | | | — | | | | (0.65 | ) |
9/30/2006 | | | 11.71 | | | | 0.55 | | | | 0.11 | | | | 0.66 | | | | (0.79 | ) | | | (0.22 | ) | | | (1.01 | ) |
Admin Class | | | | | | | | | | | | | | | | | | | | | | | | | | | | |
9/30/2010* | | | 11.80 | | | | 0.33 | | | | 0.73 | | | | 1.06 | | | | (0.31 | ) | | | — | | | | (0.31 | ) |
Class J | | | | | | | | | | | | | | | | | | | | | | | | | | | | |
9/30/2010 | | | 11.63 | | | | 0.49 | | | | 0.95 | | | | 1.44 | | | | (0.50 | ) | | | (0.03 | ) | | | (0.53 | ) |
9/30/2009 | | | 10.53 | | | | 0.55 | | | | 1.22 | | | | 1.77 | | | | (0.54 | ) | | | (0.13 | ) | | | (0.67 | ) |
9/30/2008 | | | 11.71 | | | | 0.54 | | | | (1.14 | ) | | | (0.60 | ) | | | (0.58 | ) | | | — | | | | (0.58 | ) |
9/30/2007 | | | 11.34 | | | | 0.52 | | | | 0.42 | | | | 0.94 | | | | (0.57 | ) | | | — | | | | (0.57 | ) |
9/30/2006 | | | 11.69 | | | | 0.46 | | | | 0.11 | | | | 0.57 | | | | (0.70 | ) | | | (0.22 | ) | | | (0.92 | ) |
| * | From commencement of Class operations on February 1, 2010 through September 30, 2010. |
| (a) | Per share net investment income has been calculated using the average shares outstanding during the period. |
| (b) | Had certain expenses not been waived/reimbursed during the period, if applicable, total returns would have been lower. |
| (c) | A sales charge for Class A and Class J shares and a contingent deferred sales charge for Class B and Class C shares are not reflected in total return calculations. Periods less than one year, if applicable, are not annualized. |
See accompanying notes to financial statements.
39 |
| | | | | | | | | | | | | | | | | | | | | | | | | | |
| | | | | | | | | | Ratios to Average Net Assets: | | | | |
| | | | | | |
Net asset
value,
end of
the period | | | Total
return
(%) (b)(c) | | | Net assets,
end of
the period
(000’s) | | | Net
expenses
(%) (d)(e) | | | Gross
expenses
(%) (e) | | | Net investment
income
(%) (e) | | | Portfolio
turnover
rate (%) | |
| | | | | | | | | | | | | | | | | | | | | | | | | | |
| | | | | | | | | | | | | | | | | | | | | | | | | | |
| $ | 12.56 | | | | 13.41 | | | $ | 3,092,956 | | | | 0.81 | | | | 0.81 | | | | 4.58 | | | | 25 | |
| | 11.64 | | | | 18.64 | | | | 2,946,489 | | | | 0.80 | | | | 0.80 | | | | 5.87 | | | | 30 | |
| | 10.54 | | | | (5.12 | ) | | | 1,867,335 | | | | 0.80 | | | | 0.80 | | | | 5.20 | | | | 35 | |
| | 11.73 | | | | 9.14 | | | | 834,736 | | | | 0.83 | | | | 0.83 | | | | 5.05 | | | | 35 | |
| | 11.35 | | | | 5.63 | | | | 152,054 | | | | 0.92 | (f) | | | 0.92 | (f) | | | 4.59 | | | | 35 | |
| | | | | | | | | | | | | | | | | | | | | | | | | | |
| | 12.50 | | | | 12.43 | | | | 17,113 | | | | 1.65 | | | | 1.65 | | | | 3.74 | | | | 25 | |
| | 11.59 | | | | 17.59 | | | | 17,489 | | | | 1.67 | | | | 1.67 | | | | 5.07 | | | | 30 | |
| | 10.50 | | | | (5.88 | ) | | | 16,009 | | | | 1.65 | (g) | | | 1.65 | (g) | | | 4.29 | | | | 35 | |
| | 11.68 | | | | 8.17 | | | | 17,082 | | | | 1.70 | | | | 1.71 | | | | 4.16 | | | | 35 | |
| | 11.31 | | | | 4.83 | | | | 5,525 | | | | 1.70 | | | | 1.89 | | | | 3.75 | | | | 35 | |
| | | | | | | | | | | | | | | | | | | | | | | | | | |
| | 12.47 | | | | 12.58 | | | | 2,593,324 | | | | 1.56 | | | | 1.56 | | | | 3.83 | | | | 25 | |
| | 11.56 | | | | 17.80 | | | | 2,495,305 | | | | 1.56 | | | | 1.56 | | | | 5.09 | | | | 30 | |
| | 10.47 | | | | (5.84 | ) | | | 1,333,421 | | | | 1.55 | | | | 1.55 | | | | 4.45 | | | | 35 | |
| | 11.66 | | | | 8.28 | | | | 605,934 | | | | 1.57 | | | | 1.57 | | | | 4.30 | | | | 35 | |
| | 11.30 | | | | 4.87 | | | | 82,863 | | | | 1.70 | (f) | | | 1.70 | (f) | | | 3.79 | | | | 35 | |
| | | | | | | | | | | | | | | | | | | | | | | | | | |
| | 12.56 | | | | 13.60 | | | | 4,473,001 | | | | 0.56 | | | | 0.56 | | | | 4.82 | | | | 25 | |
| | 11.65 | | | | 18.94 | | | | 3,531,187 | | | | 0.54 | | | | 0.54 | | | | 6.01 | | | | 30 | |
| | 10.55 | | | | (4.79 | ) | | | 1,044,046 | | | | 0.53 | | | | 0.53 | | | | 5.48 | | | | 35 | |
| | 11.73 | | | | 9.32 | | | | 448,873 | | | | 0.55 | (g) | | | 0.55 | (g) | | | 5.33 | | | | 35 | |
| | 11.36 | | | | 6.09 | | | | 76,548 | | | | 0.55 | | | | 0.63 | | | | 4.94 | | | | 35 | |
| | | | | | | | | | | | | | | | | | | | | | | | | | |
| | 12.55 | | | | 9.13 | | | | 879 | | | | 1.08 | | | | 7.68 | | | | 4.06 | | | | 25 | |
| | | | | | | | | | | | | | | | | | | | | | | | | | |
| | 12.54 | | | | 12.77 | | | | 133,034 | | | | 1.30 | (h) | | | 1.30 | (h) | | | 4.09 | | | | 25 | |
| | 11.63 | | | | 18.05 | | | | 151,617 | | | | 1.30 | | | | 1.31 | | | | 5.48 | | | | 30 | |
| | 10.53 | | | | (5.50 | ) | | | 167,775 | | | | 1.28 | | | | 1.28 | | | | 4.66 | | | | 35 | |
| | 11.71 | | | | 8.52 | | | | 180,453 | | | | 1.28 | | | | 1.28 | | | | 4.57 | | | | 35 | |
| | 11.34 | | | | 5.29 | | | | 214,894 | | | | 1.30 | (f) | | | 1.30 | (f) | | | 4.09 | | | | 35 | |
| (d) | The investment adviser and/or administrator agreed to waive its fees and/or reimburse a portion of the Fund’s expenses during the period. Without this waiver/reimbursement, if applicable, expenses would have been higher. |
| (e) | Computed on an annualized basis for periods less than one year, if applicable. |
| (f) | Includes fee/expense recovery of 0.06%, 0.09% and 0.03% for Class A, Class C and Class J shares, respectively. |
| (g) | Includes fee/expense recovery of less than 0.01%. |
| (h) | Includes fee/expense recovery of 0.01% for Class J shares. |
See accompanying notes to financial statements.
| 40
Notes to Financial Statements
September 30, 2010
1. Organization. Loomis Sayles Funds II (the “Trust”) is organized as a Massachusetts business trust. The Trust is registered under the Investment Company Act of 1940, as amended (the “1940 Act”), as an open-end management investment company. The Declaration of Trust permits the Board of Trustees to authorize the issuance of an unlimited number of shares of the Trust in multiple series. The financial statements for certain funds of the Trust are presented in separate reports. Information presented in these financial statements pertains to Loomis Sayles Investment Grade Bond Fund (the “Fund” or the “Investment Grade Bond Fund”).
The Fund offers Class A, Class C, Class Y, Admin Class and Class J shares. The Fund began offering Admin Class shares effective February 1, 2010. Effective October 12, 2007, Class B shares are no longer offered. Existing Class B shareholders may continue to reinvest dividends into Class B shares and exchange their Class B shares for Class B shares of other Natixis Funds subject to existing exchange privileges as described in the Fund’s prospectus.
Class A shares are sold with a maximum front-end sales charge of 4.50%. Class B shares do not pay a front-end sales charge; however, they are charged higher Rule 12b-1 fees, and are subject to a contingent deferred sales charge (“CDSC”) if such shares are redeemed within six years of purchase. After eight years of ownership, Class B shares convert to Class A shares. Class C shares do not pay a front-end sales charge, do not convert to any other class of shares, pay higher Rule 12b-1 fees than Class A shares and may be subject to a CDSC of 1.00% if those shares are redeemed within one year of acquisition, except for reinvested distributions. Class Y shares do not pay a front-end sales charge, a CDSC or Rule 12b-1 fees. Class Y shares are generally intended for institutional investors with a minimum initial investment of $100,000, though some categories of investors are exempted from the minimum investment amount as outlined in the Fund’s prospectus. Admin Class shares do not pay a front-end sales charge or a CDSC, but do pay a Rule 12b-1 fee. Admin Class shares are offered exclusively through intermediaries. Class J shares are only offered to non-U.S. investors and are sold with a maximum front-end sales charge of 3.50%.
Most expenses of the Trust can be directly attributed to a Fund. Expenses which can not be directly attributed to a Fund are generally apportioned based on the relative net assets of each of the Funds in the Trust. Expenses of the Fund are borne pro rata by the holders of each class of shares, except that each class bears expenses unique to that class (Rule 12b-1 service and distribution fees for Class A, Class B, Class C, Admin Class and Class J, and registration, legal, shareholder reporting and transfer agent fees for Class J). In addition, each class votes as a class only with respect to its own Rule 12b-1 Plan. Shares of each class would receive their pro rata share of the net assets of the Fund if the Fund were liquidated. The Trustees approve separate distributions from net investment income on each class of shares.
2. Significant Accounting Policies. The following is a summary of significant accounting policies consistently followed by the Fund in the preparation of its financial
41 |
Notes to Financial Statements (continued)
September 30, 2010
statements. The Fund’s financial statements are prepared in accordance with accounting principles generally accepted in the United States of America which require the use of management estimates that affect the reported amounts and disclosures in the financial statements. Actual results could differ from those estimates. Management has evaluated the events and transactions subsequent to year-end through the date the financial statements were issued and has determined that there were no material events that would require disclosure in the Fund’s financial statements.
a. Valuation. Debt securities (other than short-term obligations purchased with an original or remaining maturity of sixty days or less) are generally valued on the basis of evaluated bids furnished to the Fund by a pricing service recommended by the investment adviser and approved by the Board of Trustees, which service determines valuations for normal, institutional-size trading units of such securities using market information, transactions for comparable securities and various relationships between securities which are generally recognized by institutional traders. Broker-dealer bid quotations may also be used to value debt and equity securities where a pricing service does not price a security or where a pricing service does not provide a reliable price for the security. In instances where broker-dealer bid quotations are not available, certain securities held by the Fund may be valued on the basis of a price provided by a principal market maker. Forward foreign currency contracts are valued utilizing interpolated prices determined from information provided by an independent pricing service. Short-term obligations purchased with an original or remaining maturity of sixty days or less are valued at amortized cost, which approximates market value. Securities for which market quotations are not readily available are valued at fair value as determined in good faith by the Fund’s investment adviser using consistently applied procedures under the general supervision of the Board of Trustees. Investments in other open-end investment companies are valued at their net asset value each day.
The Fund may hold securities traded in foreign markets. Foreign securities are valued at the market price in the foreign market. However, if events occurring after the close of the foreign market (but before the close of regular trading on the New York Stock Exchange) are believed to materially affect the value of those securities, such securities are fair valued pursuant to procedures approved by the Board of Trustees. When fair valuing securities, the Fund may, among other things, use modeling tools or other processes that may take into account factors such as securities market activity and/or significant events that occur after the close of the foreign market and before the Fund calculates its net asset value.
b. Investment Transactions and Related Investment Income. Investment transactions are accounted for on a trade date plus one basis for daily net asset value calculation. However, for financial reporting purposes, investment transactions are reported on trade date. Interest income is recorded on an accrual basis. Interest income is increased by the accretion of discount and decreased by the amortization of premium.
| 42
Notes to Financial Statements (continued)
September 30, 2010
Investment income is recorded net of foreign taxes withheld when applicable. In determining net gain or loss on securities sold, the cost of securities has been determined on an identified cost basis. Investment income, non-class specific expenses and realized and unrealized gains and losses are allocated on a pro rata basis to each class based on the relative net assets of each class to the total net assets of the Fund.
c. Foreign Currency Translation. The books and records of the Fund are maintained in U.S. dollars. The value of securities, currencies and other assets and liabilities denominated in currencies other than U.S. dollars are translated into U.S. dollars based upon foreign exchange rates prevailing at the end of the period. Purchases and sales of investment securities, income and expenses are translated on the respective dates of such transactions.
Since the values of investment securities are presented at the foreign exchange rates prevailing at the end of the period, it is not practical to isolate that portion of the results of operations arising from changes in exchange rates from fluctuations which arise due to changes in market prices of investment securities. Such changes are included with the net realized and unrealized gain or loss on investments.
Net realized foreign exchange gains or losses arise from sales of foreign currency, currency gains or losses realized between the trade and settlement dates on securities transactions and the difference between the amounts of interest and foreign withholding taxes recorded on the Fund’s books and the U.S. dollar equivalent of the amounts actually received or paid. Net unrealized foreign exchange gains and losses arise from changes in the value of assets and liabilities, other than investment securities, at the end of the fiscal period, resulting from changes in exchange rates.
The Fund may use foreign currency exchange contracts to facilitate transactions in foreign-denominated investments. Losses may arise from changes in the value of the foreign currency or if the counterparties do not perform under the contracts’ terms.
d. Forward Foreign Currency Contracts. The Fund may enter into forward foreign currency contracts. Contracts to buy generally are used to acquire exposure to foreign currencies, while contracts to sell generally are used to hedge the Fund’s investments against currency fluctuation. Also, a contract to buy or sell can offset a previous contract. These contracts involve market risk in excess of the unrealized gain or loss reflected in the Fund’s Statement of Assets and Liabilities. The U.S. dollar value of the currencies the Fund has committed to buy or sell represents the aggregate exposure to each currency the Fund has acquired or hedged through currency contracts outstanding at period end. Gains or losses are recorded for financial statement purposes as unrealized until settlement date. Risks may arise upon entering into these contracts from the potential inability of counterparties to meet the terms of their contracts and from unanticipated movements in the value of a foreign currency relative to the U.S. dollar. Certain contracts may require the movement of cash or securities to or from the counterparty as collateral for the Fund’s or counterparty’s net obligations under the contracts.
43 |
Notes to Financial Statements (continued)
September 30, 2010
At September 30, 2010, there were no open forward foreign currency contracts.
e. Federal and Foreign Income Taxes. The Trust treats each Fund as a separate entity for federal income tax purposes. The Fund intends to meet the requirements of the Internal Revenue Code of 1986, as amended, applicable to regulated investment companies, and to distribute to its shareholders substantially all of its net investment income and any net realized capital gains at least annually. Management has performed an analysis of the Fund’s tax positions for the open tax years as of September 30, 2010 and has concluded that no provisions for income tax are required. The Fund’s federal tax returns for the prior three fiscal years remain subject to examination by the Internal Revenue Service. Management is not aware of any events that are reasonably possible to occur in the next twelve months that would result in the amounts of any unrecognized tax benefits significantly increasing or decreasing for the Fund. However, management’s conclusions regarding tax positions taken may be subject to review and adjustment at a later date based on factors including, but not limited to, new tax laws and accounting regulations and interpretations thereof.
The Fund may be subject to foreign taxes on income and gains on investments that are accrued based upon the Fund’s understanding of the tax rules and regulations that exist in the countries in which the Fund invests. Foreign governments may also impose taxes or other payments on investments with respect to foreign securities. Such taxes are accrued as applicable, and are reflected as foreign taxes payable on the Statement of Assets and Liabilities.
f. Dividends and Distributions to Shareholders. Dividends and distributions are recorded on ex-dividend date. The timing and characterization of certain income and capital gain distributions are determined annually in accordance with federal tax regulations, which may differ from accounting principles generally accepted in the United States of America. Permanent differences are primarily due to differing treatments for book and tax purposes for items such as defaulted bonds, reclassification of realized capital gain to ordinary income, foreign currency transactions, paydown adjustments and premium amortization accruals. Permanent book and tax basis differences relating to shareholder distributions will result in reclassifications to capital accounts. Temporary differences between book and tax distributable earnings are primarily due to premium amortization accruals, deferred Trustees’ fees, defaulted bond accruals, securities lending collateral gain/loss adjustments, forward contract mark to market, contingent payment debt instruments and wash sales. Distributions from net investment income and short-term capital gains are considered to be distributed from ordinary income for tax purposes.
| 44
Notes to Financial Statements (continued)
September 30, 2010
The tax characterization of distributions is determined on an annual basis. The tax character of distributions paid to shareholders during the years ended September 30, 2010 and 2009 were as follows:
| | | | | | | | | | | | | | | | | | | | | | |
| 2010 Distributions Paid From: | | | 2009 Distributions Paid From: | |
Ordinary
Income | | | Long-Term
Capital Gains | | | Total | | | Ordinary
Income | | | Long-Term
Capital Gains | | | Total | |
| | $464,455,790 | | | $ | — | | | $ | 464,455,790 | | | $ | 386,232,314 | | | $ | 9,171,073 | | | $ | 395,403,387 | |
Differences between these amounts and those reported in the Statement of Changes in Net Assets are primarily attributable to different book and tax treatment for short-term capital gains.
As of September 30, 2010, the components of distributable earnings on a tax basis were as follows:
| | | | |
Undistributed ordinary income | | $ | 137,731,112 | |
Undistributed long-term capital gains | | | 98,983,081 | |
| | | | |
Total undistributed earnings | | | 236,714,193 | |
Unrealized appreciation | | | 1,092,340,427 | |
| | | | |
Total accumulated earnings | | $ | 1,329,054,620 | |
| | | | |
Capital loss carryforward utilized in the current year | | $ | 1,891,321 | |
| | | | |
g. Repurchase Agreements. It is the Fund’s policy that the market value of the collateral for repurchase agreements be at least equal to 102% of the repurchase price, including interest. Certain repurchase agreements are tri-party arrangements whereby the collateral is held in a segregated account for the benefit of the Fund and on behalf of the counterparty. Repurchase agreements could involve certain risks in the event of default or insolvency of the counterparty including possible delays or restrictions upon the Fund’s ability to dispose of the underlying securities.
h. Securities Lending. The Fund has entered into an agreement with State Street Bank and Trust Company (“State Street Bank”), as agent of the Fund, to lend securities to certain designated borrowers. The loans are collateralized with cash or securities in an amount equal to at least 105% or 102% of the market value (including accrued interest) of the loaned international or domestic securities, respectively, when the loan is initiated. Thereafter, the value of the collateral must remain at least 102% of the market value (including accrued interest) of loaned securities for U.S. equities and U.S. corporate debt; at least 105% of the market value (including accrued interest) of loaned securities for non-U.S. equities; and at least 100% of the market value (including accrued interest) of loaned securities for U.S. Government securities, sovereign debt issued by non-U.S. Governments and non-U.S. corporate debt. In the event that the market value of the collateral falls below the required percentages described above, the borrower
45 |
Notes to Financial Statements (continued)
September 30, 2010
will deliver additional collateral on the next business day. As with other extensions of credit, the Fund may bear the risk of loss with respect to the investment of the collateral. The Fund invests cash collateral in short-term investments, a portion of the income from which is remitted to the borrowers and the remainder allocated between the Fund and State Street Bank as lending agent.
For the year ended September 30, 2010, the Fund did not loan securities under this agreement.
i. Indemnifications. Under the Trust’s organizational documents, its officers and Trustees are indemnified against certain liabilities arising out of the performance of their duties to the Fund. Additionally, in the normal course of business, the Fund enters into contracts with service providers that contain general indemnification clauses. The Fund’s maximum exposure under these arrangements is unknown as this would involve future claims that may be made against the Fund that have not yet occurred. However, based on experience, the Fund expects the risk of loss to be remote.
3. Fair Value Measurements. In accordance with accounting standards related to fair value measurements and disclosures, the Fund has categorized the inputs utilized in determining the value of the Fund’s assets or liabilities. These inputs are summarized in the three broad levels listed below:
| | • | | Level 1 – quoted prices in active markets for identical assets or liabilities; |
| | • | | Level 2 – prices determined using other significant inputs that are observable either directly, or indirectly through corroboration with observable market data (which could include quoted prices for similar assets or liabilities, interest rates, credit risk, etc.); |
| | • | | Level 3 – prices determined using significant unobservable inputs when quoted prices or observable inputs are unavailable such as when there is little or no market activity for an asset or liability (unobservable inputs reflect the Fund’s own assumptions in determining the fair value of assets or liabilities and would be based on the best information available). |
The inputs or methodology used for valuing securities are not necessarily an indication of the risk associated with investing in those securities.
| 46
Notes to Financial Statements (continued)
September 30, 2010
The following is a summary of the inputs used to value the Fund’s investments as of September 30, 2010, at value:
Asset Valuation Inputs
| | | | | | | | | | | | | | | | |
Description | | Level 1 | | | Level 2 | | | Level 3 | | | Total | |
Bonds and Notes | | | | | | | | | | | | | | | | |
Non-Convertible Bonds | | | | | | | | | | | | | | | | |
ABS Car Loan | | $ | — | | | $ | 99,784,431 | | | $ | 24,880,941 | | | $ | 124,665,372 | |
Banking | | | — | | | | 1,026,717,374 | | | | 9,716,202 | | | | 1,036,433,576 | |
Non-Captive Consumer | | | 1,233,249 | | | | 174,160,448 | | | | — | | | | 175,393,697 | |
All Other Non-Convertible Bonds(a) | | | — | | | | 8,404,956,293 | | | | — | | | | 8,404,956,293 | |
| | | | | | | | | | | | | | | | |
Total Non-Convertible Bonds | | | 1,233,249 | | | | 9,705,618,546 | | | | 34,597,143 | | | | 9,741,448,938 | |
| | | | | | | | | | | | | | | | |
Convertible Bonds(a) | | | — | | | | 290,581,037 | | | | — | | | | 290,581,037 | |
Municipals(a) | | | — | | | | 48,177,628 | | | | — | | | | 48,177,628 | |
| | | | | | | | | | | | | | | | |
Total Bonds and Notes | | | 1,233,249 | | | | 10,044,377,211 | | | | 34,597,143 | | | | 10,080,207,603 | |
| | | | | | | | | | | | | | | | |
Bank Loans(a) | | | — | | | | 18,275,580 | | | | — | | | | 18,275,580 | |
Short-Term Investments | | | — | | | | 92,300,701 | | | | — | | | | 92,300,701 | |
| | | | | | | | | | | | | | | | |
Total | | $ | 1,233,249 | | | $ | 10,154,953,492 | | | $ | 34,597,143 | | | $ | 10,190,783,884 | |
| | | | | | | | | | | | | | | | |
| (a) | Major categories of the Fund’s investments are included in the Portfolio of Investments. |
The following is a reconciliation of Level 3 investments for which significant unobservable inputs were used to determine fair value as of September 30, 2010:
Asset Valuation Inputs
| | | | | | | | | | | | | | | | | | | | | | | | | | | | | | | | |
Investments
in Securities | | Balance
as of
September 30,
2009 | | | Accrued
Discounts
(Premiums) | | | Realized
Gain
(Loss) | | | Change in
Unrealized
Appreciation
(Depreciation) | | | Net
Purchases
(Sales) | | | Transfers
into
Level 3 | | | Transfers
out of
Level 3 | | | Balance
as of
September 30,
2010 | |
Bonds and Notes | | | | | | | | | | | | | | | | | | | | | | | | | | | | | | | | |
Non-Convertible Bonds | | | | | | | | | | | | | | | | | | | | | | | | | | | | | | | | |
ABS Car Loan | | $ | — | | | $ | — | | | $ | — | | | $ | (46,031 | ) | | $ | 24,926,972 | | | $ | — | | | $ | — | | | $ | 24,880,941 | |
ABS Other | | | 39,800,000 | | | | — | | | | — | | | | — | | | | — | | | | — | | | | (39,800,000 | ) | | | — | |
Airlines | | | 14,176,691 | | | | — | | | | — | | | | — | | | | — | | | | — | | | | (14,176,691 | ) | | | — | |
Automotive | | | 630,087 | | | | — | | | | — | | | | — | | | | — | | | | — | | | | (630,087 | ) | | | — | |
Banking | | | — | | | | — | | | | — | | | | 44,554 | | | | 9,671,648 | | | | — | | | | — | | | | 9,716,202 | |
Diversified Manufacturing | | | 14,557,959 | | | | — | | | | — | | | | — | | | | — | | | | — | | | | (14,557,959 | ) | | | — | |
Integrated Energy | | | 1,351,142 | | | | — | | | | — | | | | — | | | | — | | | | — | | | | (1,351,142 | ) | | | — | |
Non-Captive Consumer | | | 5,137,913 | | | | 78,375 | | | | 35,844 | | | | 144,681 | | | | (5,396,813 | ) | | | — | | | | — | | | | — | |
Supranational | | | 8,370,105 | | | | — | | | | — | | | | — | | | | — | | | | — | | | | (8,370,105 | ) | | | — | |
Convertible Bonds | | | | | | | | | | | | | | | | | | | | | | | | | | | | | | | | |
Wirelines | | | 3,169,400 | | | | — | | | | — | | | | — | | | | — | | | | — | | | | (3,169,400 | ) | | | — | |
| | | | | | | | | | | | | | | | | | | | | | | | | | | | | | | | |
Total | | $ | 87,193,297 | | | $ | 78,375 | | | $ | 35,844 | | | $ | 143,204 | | | $ | 29,201,807 | | | $ | — | | | $ | (82,055,384 | ) | | $ | 34,597,143 | |
| | | | | | | | | | | | | | | | | | | | | | | | | | | | | | | | |
47 |
Notes to Financial Statements (continued)
September 30, 2010
Debt securities valued at $82,055,384 were transferred from Level 3 to Level 2 during the year ended September 30, 2010. At September 30, 2009, these securities were valued using broker-dealer bid quotations based on inputs unobservable to the Fund; at September 30, 2010, securities valued at $73,685,279 were valued on the basis of evaluated bids furnished to the Fund by a pricing service where inputs are observable to the Fund and securities valued at $8,370,105 were valued using broker-dealer bid quotations based on inputs observable to the Fund.
All transfers are recognized as of the beginning of the reporting period.
4. Purchases and Sales of Securities. For the year ended September 30, 2010, purchases and sales of securities (excluding short-term investments and U.S. Government/agency securities and including paydowns) were $2,739,924,730 and $1,880,223,294, respectively. Purchases and sales of U.S. Government/agency securities (excluding short-term investments and including paydowns) were $160,703,619 and $408,781,205, respectively.
5. Management Fees and Other Transactions with Affiliates.
a. Management Fees. Loomis, Sayles & Company, L.P. (“Loomis Sayles”) serves as investment adviser to the Fund. Under the terms of the management agreement, the Fund pays a management fee at the annual rate of 0.40% of average daily net assets, calculated daily and payable monthly.
Loomis Sayles has given a binding undertaking to the Fund to waive management fees and/or reimburse certain expenses to limit the Fund’s operating expenses, exclusive of acquired fund fees and expenses, brokerage expenses, interest expense, taxes and extraordinary expenses. This undertaking is in effect until January 31, 2011 and will be reevaluated on an annual basis. Management fees payable, as reflected on the Statement of Assets and Liabilities, is net of waivers and/or expense reimbursements, if any, pursuant to this undertaking.
For the period from February 1, 2010 to September 30, 2010, the expense limits as a percentage of average daily net assets under the expense limitation agreement were as follows:
| | | | | | | | | | | | | | | | | | | | | | |
| Expense Limit as a Percentage of Average Daily Net Assets | |
Class A | | | Class B | | | Class C | | | Class Y | | | Admin Class | | | Class J | |
| | 0.95% | | | | 1.70 | % | | | 1.70 | % | | | 0.70 | % | | | 1.20 | % | | | 1.30 | % |
| 48
Notes to Financial Statements (continued)
September 30, 2010
Prior to February 1, 2010, the expense limits as a percentage of average daily net assets under the expense limitation agreement were as follows:
| | | | | | | | | | | | | | | | | | |
| Expense Limit as a Percentage of Average Daily Net Assets | |
Class A | | | Class B | | | Class C | | | Class Y | | | Class J | |
| | 0.95% | | | | 1.70 | % | | | 1.70 | % | | | 0.55 | % | | | 1.30 | % |
Loomis Sayles shall be permitted to recover expenses it has borne under the expense limitation agreement (whether through waiver of its management fees or otherwise) on a class by class basis in later periods to the extent the expenses of a class fall below a class’ expense limits, provided, however, that a class is not obligated to pay such waived/reimbursed fees or expenses more than one year after the end of the fiscal year in which the fees or expenses were waived/reimbursed.
For the year ended September 30, 2010, the management fees for the Fund were $38,345,729 (0.40% of average daily net assets).
For the year ended September 30, 2010, class-specific expenses have been reimbursed as follows:
| | | | | | | | | | | | | | | | | | | | | | | | | | |
| Reimbursement1 | |
Class A | | | Class B | | | Class C | | | Class Y | | | Admin Class | | | Class J | | | Total | |
| $ | — | | | $ | — | | | $ | — | | | $ | 26,680 | | | $ | 16,058 | | | $ | — | | | $ | 42,738 | |
| 1 | Expense reimbursements are not subject to recovery. |
For the year ended September 30, 2010, expense reimbursements related to the prior fiscal year were recovered as follows:
| | | | | | | | | | | | | | | | | | | | | | | | | | |
| Recovered Expenses | |
Class A | | | Class B | | | Class C | | | Class Y | | | Admin Class | | | Class J | | | Total | |
| $ | — | | | $ | — | | | $ | — | | | $ | — | | | $ | — | | | $ | 8,509 | | | $ | 8,509 | |
Certain officers and employees of Loomis Sayles are also officers or Trustees of the Trust. Loomis Sayles’ general partner is indirectly owned by Natixis Global Asset Management, L.P. (“Natixis US”), which is part of Natixis Global Asset Management, an international asset management group based in Paris, France.
b. Service and Distribution Fees. Natixis Distributors, L.P. (“Natixis Distributors”), a wholly-owned subsidiary of Natixis US, has entered into a distribution agreement with the Trust. Pursuant to this agreement, Natixis Distributors serves as principal underwriter of the Funds of the Trust, except Class J shares of the Fund. The Fund has entered into a distribution agreement relating to Class J shares with Loomis Sayles Distributors, L.P. (“Loomis Sayles Distributors”), a wholly-owned subsidiary of Natixis US.
Pursuant to Rule 12b-1 under the 1940 Act, the Trust has adopted a Service Plan relating to the Fund’s Class A shares (the “Class A Plan”), a Distribution and Service Plan
49 |
Notes to Financial Statements (continued)
September 30, 2010
relating to the Fund’s Class B and Class C shares (the “Class B and Class C Plans”), and a Distribution Plan relating to its Admin Class shares (the “Admin Class Plan”).
Under the Class A Plan, the Fund pays Natixis Distributors a monthly service fee at an annual rate not to exceed 0.25% of the average daily net assets attributable to the Fund’s Class A shares, as reimbursement for expenses incurred by Natixis Distributors in providing personal services to investors in Class A shares and/or the maintenance of shareholder accounts.
Under the Class B and Class C Plans, the Fund pays Natixis Distributors a monthly service fee at an annual rate not to exceed 0.25% of the average daily net assets attributable to the Fund’s Class B and Class C shares, as compensation for services provided by Natixis Distributors in providing personal services to investors in Class B and Class C shares and/or the maintenance of shareholder accounts.
Also under the Class B and Class C Plans, the Fund pays Natixis Distributors a monthly distribution fee at an annual rate of 0.75% of the average daily net assets attributable to the Fund’s Class B and Class C shares, as compensation for services provided by Natixis Distributors in connection with the marketing or sale of Class B and Class C shares.
Under the Admin Class Plan, the Fund pays Natixis Distributors a monthly distribution fee at an annual rate not to exceed 0.25% of the average daily net assets attributable to the Fund’s Admin Class shares, as compensation for services provided by Natixis Distributors in connection with the marketing or sale of Admin Class shares or for payments made by Natixis Distributors to securities dealers or other financial intermediaries as commissions, asset-based sales charges or other compensation with respect to the sale of Admin Class shares, or for providing personal services to investors and/or the maintenance of shareholder accounts.
In addition, the Admin Class shares of the Fund may pay Natixis Distributors an administrative service fee, at an annual rate not to exceed 0.25% of the average daily net assets attributable to Admin Class shares. These fees are subsequently paid to securities dealers or financial intermediaries for providing personal services and/or account maintenance for their customers who hold such shares.
Class J shares are subject to a monthly shareholder service fee at an annual rate of 0.25% and a monthly distribution fee, at an annual rate of 0.50% of the average daily net assets attributable to the Fund’s Class J shares, both payable to Loomis Sayles Distributors, pursuant to a shareholder service and distribution plan adopted under Rule 12b-1.
For the year ended September 30, 2010 the Fund paid the following service and distribution fees:
| | | | | | | | | | | | | | | | | | | | | | | | | | | | | | | | | | |
| Service Fees | | | Distribution Fees | |
Class A | | | Class B | | | Class C | | | Admin
Class | | | Class J | | | Class B | | | Class C | | | Admin
Class | | | Class J | |
| $ | 7,481,784 | | | $ | 43,035 | | | $ | 6,346,852 | | | $ | 608 | | | $ | 343,888 | | | $ | 129,105 | | | $ | 19,040,556 | | | $ | 608 | | | $ | 687,777 | |
| 50
Notes to Financial Statements (continued)
September 30, 2010
c. Administrative Fees. Natixis Asset Management Advisors, L.P. (“Natixis Advisors”) provides certain administrative services for the Fund and contracts with State Street Bank to serve as sub-administrator. Natixis Advisors is a wholly-owned subsidiary of Natixis US. Pursuant to an agreement among Natixis Funds Trust I, Natixis Funds Trust II, Natixis Funds Trust IV, Natixis Cash Management Trust, Gateway Trust (“Natixis Funds Trusts”), Loomis Sayles Funds I, Loomis Sayles Funds II (“Loomis Sayles Funds Trusts”), Hansberger International Series and Natixis Advisors, the Fund pays Natixis Advisors monthly its pro rata portion of fees equal to an annual rate of 0.0575% of the first $15 billion of the average daily net assets of the Natixis Funds Trusts, Loomis Sayles Funds Trusts and Hansberger International Series, 0.0500% of the next $15 billion, 0.0400% of the next $30 billion and 0.0350% of such assets in excess of $60 billion, subject to an annual aggregate minimum fee for the Natixis Funds Trusts, Loomis Sayles Funds Trusts and Hansberger International Series of $10 million, which is reevaluated on an annual basis. New funds are subject to a fee for the first twelve months of operations of $75,000 plus $12,500 per additional class and an additional $75,000 if managed by multiple subadvisers.
Prior to July 1, 2010, the Fund paid Natixis Advisors monthly its pro rata portion of fees equal to an annual rate of 0.0575% of the first $15 billion of the average daily net assets of the Natixis Funds Trusts, Loomis Sayles Funds Trusts and Hansberger International Series, 0.0500% of the next $15 billion, 0.0425% of the next $30 billion and 0.0375% of such assets in excess of $60 billion, subject to an annual aggregate minimum fee for the Natixis Funds Trusts, Loomis Sayles Funds Trusts and Hansberger International Series of $10 million, which is reevaluated on an annual basis. New funds were subject to a fee for the first twelve months of operations of $75,000 plus $12,500 per additional class and an additional $75,000 if managed by multiple subadvisers.
For the year ended September 30, 2010, the Fund paid $4,603,645 in administrative fees to Natixis Advisors.
d. Sub-Transfer Agent Fees. Natixis Distributors has entered into agreements with financial intermediaries to provide certain recordkeeping, processing, shareholder communications and other services to customers of the intermediaries and has agreed to compensate the intermediaries for providing those services. Certain services would be provided by the Fund if the shares of those customers were registered directly with the Fund’s transfer agent. Accordingly, the Fund agreed to pay a portion of the intermediary fees attributable to shares of the Fund held by intermediaries (which generally are a percentage of the value of shares held) not exceeding what the Fund would have paid its transfer agent had each customer’s shares been registered directly with the transfer agent instead of held through the intermediaries. Natixis Distributors pays the remainder of the fees.
51 |
Notes to Financial Statements (continued)
September 30, 2010
For the year ended September 30, 2010, the Fund paid the following sub-transfer agent fees which are reflected in transfer agent fees and expenses in the Statement of Operations.
| | | | | | | | | | | | | | | | | | | | | | |
| Sub-Transfer Agent Fees | |
Class A | | | Class B | | | Class C | | | Class Y | | | Admin Class | | | Class J | |
| | $2,087,814 | | | $ | 12,067 | | | $ | 1,771,673 | | | $ | 2,689,519 | | | $ | 131 | | | $ | — | |
e. Commissions. Commissions (including CDSCs) on Fund shares retained by Natixis Distributors were $4,902,197 and commissions on Class J shares of the Fund retained by Loomis Sayles Distributors were $71,436 for the year ended September 30, 2010.
f. Trustees Fees and Expenses. The Trust does not pay any compensation directly to its officers or Trustees who are directors, officers or employees of Natixis Advisors, Natixis Distributors, Natixis US or their affiliates. Effective January 1, 2010, the Chairperson of the Board receives a retainer fee at the annual rate of $250,000. The Chairperson does not receive any meeting attendance fees for Board of Trustees meetings or committee meetings that she attends. Each Independent Trustee (other than the Chairperson) receives, in the aggregate, a retainer fee at the annual rate of $80,000. Each Independent Trustee also receives a meeting attendance fee of $10,000 for each meeting of the Board of Trustees that he or she attends in person and $5,000 for each meeting of the Board of Trustees that he or she attends telephonically. In addition, each committee chairman receives an additional retainer fee at an annual rate of $15,000. Each Contract Review and Governance Committee member is compensated $6,000 for each Committee meeting that he or she attends in person and $3,000 for each meeting that he or she attends telephonically. Each Audit Committee member is compensated $7,500 for each Committee meeting that he or she attends in person and $3,750 for each meeting that he or she attends telephonically. Each member of the ad hoc Committee on Alternative Investments received a one-time fee of $10,000. The ad hoc Committee on Alternative Investments is not a standing committee. These fees are allocated among the funds in the Natixis Funds Trusts, Loomis Sayles Funds Trusts and Hansberger International Series based on a formula that takes into account, among other factors, the relative net assets of each fund. Trustees are reimbursed for travel expenses in connection with attendance at meetings.
Prior to January 1, 2010, the Chairperson of the Board received a retainer fee at the annual rate of $200,000. The Chairperson did not receive any meeting attendance fees for Board of Trustees meetings or committee meetings that she attended. Each Independent Trustee (other than the Chairperson) received, in the aggregate, a retainer fee at the annual rate of $65,000. Each Independent Trustee also received a meeting attendance fee of $7,500 for each meeting of the Board of Trustees that he or she attended in person and $3,750 for each meeting of the Board of Trustees that he or she attended telephonically. In addition, each committee chairman received an additional retainer fee at an annual rate of $10,000. Each Contract Review and Governance
| 52
Notes to Financial Statements (continued)
September 30, 2010
Committee member was compensated $5,000 for each Committee meeting that he or she attended in person and $2,500 for each meeting that he or she attended telephonically. Each Audit Committee member was compensated $6,250 for each Committee meeting that he or she attended in person and $3,125 for each meeting that he or she attended telephonically.
A deferred compensation plan (the “Plan”) is available to the Trustees on a voluntary basis. Deferred amounts remain in the Funds until distributed in accordance with the provisions of the Plan. The value of a participating Trustee’s deferral account is based on theoretical investments of deferred amounts, on the normal payment dates, in certain funds of the Natixis Funds Trusts, Loomis Sayles Funds Trusts and Hansberger International Series as designated by the participating Trustees. Changes in the value of participants’ deferral accounts are allocated pro rata among the funds in the Natixis Funds Trusts, Loomis Sayles Funds Trusts, and Hansberger International Series, and are normally reflected as Trustees’ fees and expenses in the Statement of Operations. The portions of the accrued obligations allocated to the Fund under the Plan are reflected as Deferred Trustees’ fees on the Statement of Assets and Liabilities.
6. Class-Specific Expenses. For the year ended September 30, 2010, the Fund paid the following class-specific expenses:
| | | | | | | | | | | | | | | | | | | | | | | | |
| | | Class A | | | Class B | | | Class C | | | Class Y | | | Admin Class | | | Class J | |
Transfer Agent Fees and Expenses | | $ | 2,609,318 | | | $ | 14,992 | | | $ | 2,213,170 | | | $ | 3,410,967 | | | $ | 223 | | | $ | 8,765 | |
Registration Fees | | | 109,768 | | | | 15,453 | | | | 63,368 | | | | 137,849 | | | | 16,092 | | | | 3,445 | |
Legal Fees | | | 61,873 | | | | 347 | | | | 52,433 | | | | 81,537 | | | | 4 | | | | 21,505 | |
Shareholding Reporting Expenses | | | 337,015 | | | | 2,297 | | | | 229,082 | | | | 488,312 | | | | 36 | | | | 84,998 | |
Transfer agent, registration, legal, and shareholder reporting fees and expenses attributable to Class A, Class B, Class C, Class Y, and Admin Class are allocated on a pro rata basis to each class based on the relative net assets of each class to the total net assets of those classes. Prior to July 1, 2010, registration, legal, and shareholder reporting fees and expenses were borne by each class individually.
7. Line of Credit. The Fund, together with certain other funds of Natixis Funds Trusts, Loomis Sayles Funds Trusts and Hansberger International Series, participates in a $200,000,000 committed unsecured line of credit provided by State Street Bank, with an individual limit of $125,000,000 for each fund that participates in the line of credit. Interest is charged to each participating fund based on its borrowings at a rate per annum equal to the greater of the Federal Funds rate or overnight LIBOR, plus 1.25%. In addition, a commitment fee of 0.15% per annum, payable at the end of each calendar quarter, is accrued and apportioned among the participating funds based on their average daily unused portion of the line of credit.
53 |
Notes to Financial Statements (continued)
September 30, 2010
Prior to March 10, 2010, the Fund, together with certain other funds of Natixis Funds Trusts, Loomis Sayles Funds Trusts and Hansberger International Series, participated in a $200,000,000 committed unsecured line of credit provided by State Street Bank, with an individual limit of $125,000,000 for each Fund that participated in the line of credit. Interest was charged to each participating fund based on its borrowings at a rate per annum equal to the greater of the Federal Funds rate or overnight LIBOR, plus 0.75%. In addition, a commitment fee of 0.125% per annum, payable at the end of each calendar quarter, was accrued and apportioned among the participating funds based on their average daily unused portion of the line of credit.
For the year ended September 30, 2010, the Fund had no borrowings under these agreements.
8. Concentration of Risk. The Fund’s investments in foreign securities are subject to foreign currency fluctuations, higher volatility than U.S. securities, varying degrees of regulation and limited liquidity. Greater political, economic, credit and information risks are also associated with foreign securities.
9. Concentration of Ownership. At September 30, 2010, the Loomis Sayles Employees’ Profit Sharing Retirement Plan held 503,665 shares of beneficial interest of Class Y shares.
10. Capital Shares. The Fund may issue an unlimited number of shares of beneficial interest, without par value. Transactions in capital shares were as follows:
| | | | | | | | | | | | | | | | |
| |
| Year Ended
September 30, 2010 |
| |
| Year Ended
September 30, 2009 |
|
| | | Shares | | | | Amount | | | | Shares | | | | Amount | |
| Class A | | | | | | | | | | | | | | | | |
Issued from the sale of shares | | | 91,844,109 | | | $ | 1,096,753,290 | | | | 200,269,071 | | | $ | 2,017,489,461 | |
Issued in connection with the reinvestment of distributions | | | 10,182,612 | | | | 121,128,395 | | | | 11,250,899 | | | | 113,354,829 | |
Redeemed | | | (108,792,537 | ) | | | (1,299,578,958 | ) | | | (135,581,311 | ) | | | (1,374,597,415 | ) |
| | | | | | | | | | | | | | | | |
Net change | | | (6,765,816 | ) | | $ | (81,697,273 | ) | | | 75,938,659 | | | $ | 756,246,875 | |
| | | | | | | | | | | | | | | | |
| Class B | | | | | | | | | | | | | | | | |
Issued from the sale of shares | | | 105,865 | | | $ | 1,259,480 | | | | 342,411 | | | $ | 3,353,183 | |
Issued in connection with the reinvestment of distributions | | | 30,442 | | | | 360,482 | | | | 47,761 | | | | 475,214 | |
Redeemed | | | (276,089 | ) | | | (3,290,669 | ) | | | (406,153 | ) | | | (4,093,030 | ) |
| | | | | | | | | | | | | | | | |
Net change | | | (139,782 | ) | | $ | (1,670,707 | ) | | | (15,981 | ) | | $ | (264,633 | ) |
| | | | | | | | | | | | | | | | |
| Class C | | | | | | | | | | | | | | | | |
Issued from the sale of shares | | | 43,761,421 | | | $ | 518,776,270 | | | | 125,777,319 | | | $ | 1,258,454,707 | |
Issued in connection with the reinvestment of distributions | | | 4,398,460 | | | | 51,955,271 | | | | 4,814,937 | | | | 48,253,057 | |
Redeemed | | | (55,937,893 | ) | | | (664,795,170 | ) | | | (42,064,857 | ) | | | (423,168,232 | ) |
| | | | | | | | | | | | | | | | |
Net change | | | (7,778,012 | ) | | $ | (94,063,629 | ) | | | 88,527,399 | | | $ | 883,539,532 | |
| | | | | | | | | | | | | | | | |
| 54
Notes to Financial Statements (continued)
September 30, 2010
| | | | | | | | | | | | | | | | |
| |
| Year Ended
September 30, 2010 |
| |
| Year Ended
September 30, 2009 |
|
| | | Shares | | | | Amount | | | | Shares | | | | Amount | |
| Class Y | | | | | | | | | | | | | | | | |
Issued from the sale of shares | | | 174,435,982 | | | $ | 2,089,695,869 | | | | 271,785,951 | | | $ | 2,773,164,198 | |
Issued in connection with the reinvestment of distributions | | | 11,822,258 | | | | 140,840,248 | | | | 8,469,829 | | | | 85,983,440 | |
Redeemed | | | (133,376,609 | ) | | | (1,591,510,831 | ) | | | (76,132,184 | ) | | | (772,285,683 | ) |
| | | | | | | | | | | | | | | | |
Net change | | | 52,881,631 | | | $ | 639,025,286 | | | | 204,123,596 | | | $ | 2,086,861,955 | |
| | | | | | | | | | | | | | | | |
| Admin Class* | | | | | | | | | | | | | | | | |
Issued from the sale of shares | | | 78,071 | | | $ | 948,013 | | | | — | | | $ | — | |
Issued in connection with the reinvestment of distributions | | | 719 | | | | 8,728 | | | | — | | | | — | |
Redeemed | | | (8,759 | ) | | | (107,600 | ) | | | — | | | | — | |
| | | | | | | | | | | | | | | | |
Net change | | | 70,031 | | | $ | 849,141 | | | | — | | | $ | — | |
| | | | | | | | | | | | | | | | |
| Class J | | | | | | | | | | | | | | | | |
Issued from the sale of shares | | | 1,179,600 | | | $ | 14,218,250 | | | | 1,250,300 | | | $ | 12,326,154 | |
Issued in connection with the reinvestment of distributions | | | — | | | | — | | | | — | | | | — | |
Redeemed | | | (3,610,670 | ) | | | (43,043,786 | ) | | | (4,148,420 | ) | | | (42,739,002 | ) |
| | | | | | | | | | | | | | | | |
Net change | | | (2,431,070 | ) | | $ | (28,825,536 | ) | | | (2,898,120 | ) | | $ | (30,412,848 | ) |
| | | | | | | | | | | | | | | | |
Increase (decrease) from capital share transactions | | | 35,836,982 | | | $ | 433,617,282 | | | | 365,675,553 | | | $ | 3,695,970,881 | |
| | | | | | | | | | | | | | | | |
| * | From commencement of Class operations on February 1, 2010 through September 30, 2010. |
55 |
Report of Independent Registered Public
Accounting Firm
To the Trustees of Loomis Sayles Funds II and Shareholders of Loomis Sayles Investment Grade Bond Fund:
In our opinion, the accompanying statement of assets and liabilities, including the portfolio of investments, and the related statements of operations and of changes in net assets and the financial highlights present fairly, in all material respects, the financial position of the Loomis Sayles Investment Grade Bond Fund, a series of Loomis Sayles Funds II (the “Fund”), at September 30, 2010, and the results of its operations, the changes in its net assets and the financial highlights for each of the periods indicated, in conformity with accounting principles generally accepted in the United States of America. These financial statements and financial highlights (hereafter referred to as “financial statements”) are the responsibility of the Fund’s management; our responsibility is to express an opinion on these financial statements based on our audits. We conducted our audits of these financial statements in accordance with the standards of the Public Company Accounting Oversight Board (United States). Those standards require that we plan and perform the audits to obtain reasonable assurance about whether the financial statements are free of material misstatement. An audit includes examining, on a test basis, evidence supporting the amounts and disclosures in the financial statements, assessing the accounting principles used and significant estimates made by management, and evaluating the overall financial statement presentation. We believe that our audits, which included confirmation of securities at September 30, 2010 by correspondence with the custodian and brokers, provide a reasonable basis for our opinion.
PricewaterhouseCoopers LLP
Boston, Massachusetts
November 22, 2010
| 56
Special Meeting Of Shareholders (Unaudited)
A special meeting of shareholders of the Trust was held on May 27, 2010 to consider a proposal to elect four Trustees to the Board of Trustees. The proposal was approved by shareholders of the Trust. The results of the shareholder vote were as follows:
| | | | | | | | |
Nominee | | Voted “FOR”* | | | Withheld* | |
Kenneth A. Drucker | | | 1,717,408,736 | | | | 24,631,425 | |
Wendell J. Knox | | | 1,717,302,502 | | | | 24,737,659 | |
Erik R. Sirri | | | 1,717,226,576 | | | | 24,813,585 | |
Peter J. Smail | | | 1,717,449,661 | | | | 24,590,500 | |
| * | Trust-wide voting results. |
In addition to the Trustees named above, the following also serve as Trustees of the Trust: Graham T. Allison, Jr., Edward A. Benjamin, Daniel M. Cain, Sandra O. Moose, Cynthia L. Walker, Robert J. Blanding and John T. Hailer.
57 |
2010 U.S. Tax Distribution Information to Shareholders (Unaudited)
Corporate Dividends Received Deduction. For the fiscal year ended September 30, 2010, 0.02% of dividends distributed by Investment Grade Bond Fund qualify for the dividends received deduction for corporate shareholders.
Qualified Dividend Income. For the fiscal year ended September 30, 2010, the Investment Grade Bond Fund will designate up to the maximum amount allowable pursuant to the Internal Revenue Code as qualified dividend income eligible for reduced tax rates. These lower rates range from 0% to 15% depending on an individual’s tax bracket. If the Fund pays a distribution during calendar year 2010, complete information will be reported in conjunction with Form 1099-DIV.
Qualified Interest Income/Short-Term Capital Gain. For the fiscal year ending September 30, 2010, the Investment Grade Bond Fund will designate up to the maximum amount allowable pursuant to the Internal Revenue Code as qualified interest income and qualified short-term capital gains eligible for reduced tax withholding rates for foreign shareholders. Complete information will be reported in conjunction with dividend information provided to foreign shareholders.
| 58
Trustee and Officer Information
The tables below provide certain information regarding the trustees and officers of Loomis Sayles Funds II (the “Trust”). Unless otherwise indicated, the address of all persons below is 399 Boylston Street, Boston, MA 02116. The Trust’s Statements of Additional Information include additional information about the trustees of the Trust and are available by calling Natixis Funds at 800-225-5478.
| | | | | | | | |
Name and Year of
Birth | | Position(s) Held with the Trust, Length of Time
Served and Term
of Office* | | Principal
Occupation(s)
During Past 5
Years | | Number of
Portfolios in Fund
Complex
Overseen** and Other
Directorships
Held During Past
5 Years | | Experience,
Qualifications,
Attributes, Skills
for Board
Membership |
| | | |
| INDEPENDENT TRUSTEES | | | | | | |
| | | | |
| Graham T. Allison, Jr. (1940) | | Trustee Since 2003 Contract Review and Governance Committee Member | | Douglas Dillon Professor and Director of the Belfer Center for Science and International Affairs, John F. Kennedy School of Government, Harvard University | | 42 Director, Taubman Centers, Inc. (real estate investment trust) | | Significant experience on Board of Trustees of the Trust and/or other business organizations; government experience (including as Assistant Secretary of Defense under President Clinton); academic experience |
| | | | |
Edward A. Benjamin
(1938) | | Trustee Since 2002 Chairman of the Contract Review and Governance Committee | | Retired | | 42 Formerly, Director, Precision Optics Corporation (optics manufacturer) | | Significant experience on Board of Trustees of the Trust and/or other business organizations; significant experience providing legal counsel to boards, funds, advisers and other financial institutions (former partner at Ropes & Gray LLP) |
59 |
Trustee and Officer Information
| | | | | | | | |
Name and Year of
Birth | | Position(s) Held with the Trust, Length of Time
Served and Term
of Office* | | Principal
Occupation(s)
During Past 5
Years | | Number of
Portfolios in Fund
Complex
Overseen** and Other
Directorships
Held During Past
5 Years | | Experience,
Qualifications,
Attributes, Skills
for Board
Membership |
| | | |
INDEPENDENT TRUSTEES continued | | | | | | |
| | | | |
Daniel M. Cain
(1945) | | Trustee Since 2003 Chairman of the Audit Committee | | Chairman (formerly, President and Chief Executive Officer) of Cain Brothers & Company, Incorporated (investment banking) | | 42 Director, Sheridan Healthcare Inc. (physician practice management) | | Significant experience on Board of Trustees of the Trust and/or other business organizations; experience in the financial industry, including roles as chairman and former chief executive officer of an investment banking firm |
| | | | |
Kenneth A. Drucker
(1945) | | Trustee Since 2008 Audit Committee Member | | Formerly, Vice President and Treasurer, Sequa Corp. (aerospace, automotive and metal manufacturing) | | 42 Formerly, Director, M Fund, Inc. (investment company); Director, Gateway Trust (investment company) | | Significant experience on Board of Trustees of the Trust and/or other business organizations; executive experience including as treasurer of a corporation |
| | | | |
Wendell J. Knox
(1948) | | Trustee Since 2009 Contract Review and Governance Committee Member | | Director (formerly, President and Chief Executive Officer) of Abt Associates Inc. (research and consulting) | | 42 Director, Eastern Bank (commercial bank); Director, The Hanover Insurance Group (property and casualty insurance) | | Significant experience on Board of Trustees of the Trust and/or other business organizations; executive experience including roles as president and chief executive officer of a consulting company |
| 60
Trustee and Officer Information
| | | | | | | | |
Name and Year of
Birth | | Position(s) Held with the Trust, Length of Time
Served and Term
of Office* | | Principal
Occupation(s)
During Past 5
Years | | Number of
Portfolios in Fund
Complex
Overseen** and Other
Directorships
Held During Past
5 Years | | Experience,
Qualifications,
Attributes, Skills
for Board
Membership |
| | | |
INDEPENDENT TRUSTEES continued | | | | | | |
| | | | |
Sandra O. Moose
(1942) | | Chairperson of the Board of Trustees since November 2005 Trustee since 2003 Ex officio member of the Audit Committee and Contract Review and Governance Committee | | President, Strategic Advisory Services (management consulting); formerly, Senior Vice President and Director, The Boston Consulting Group, Inc. (management consulting) | | 42 Director, Verizon Communications; Director, AES Corporation (international power company); Formerly, Director, Rohm and Haas Company (specialty chemicals) | | Significant experience on Board of Trustees of the Trust and/or other business organizations; executive experience at a management consulting company |
| | | | |
Erik R. Sirri1
(1958) | | Trustee Since 2009 Contract Review and Governance Committee Member | | Professor of Finance at Babson College; formerly, Director of the Division of Trading and Markets at the Securities and Exchange Commission | | 42 None | | Experience as Director of the Division of Trading and Markets at the Securities and Exchange Commission; academic experience and training as an economist |
| | | | |
Peter J. Smail1
(1952) | | Trustee Since 2009 Contract Review and Governance Committee Member | | Retired; formerly, President and Chief Executive Officer of Pyramis Global Advisors (investment management) | | 42 None | | Mutual fund industry and executive experience, including roles as president and chief executive officer for an investment adviser |
61 |
Trustee and Officer Information
| | | | | | | | |
Name and Year of
Birth | | Position(s) Held with the Trust, Length of Time
Served and Term
of Office* | | Principal
Occupation(s)
During Past 5
Years | | Number of
Portfolios in Fund
Complex
Overseen** and Other
Directorships
Held During Past
5 Years | | Experience,
Qualifications,
Attributes, Skills
for Board
Membership |
| | | |
INDEPENDENT TRUSTEES continued | | | | | | |
| | | | |
Cynthia L. Walker
(1956) | | Trustee Since 2005 Audit Committee Member | | Deputy Dean for Finance and Administration, Yale University School of Medicine; formerly, Executive Dean for Administration, Harvard Medical School; and formerly, Dean for Finance and Chief Financial Officer, Harvard Medical School | | 42 None | | Significant experience on Board of Trustees of the Trust and/or other business organizations; executive experience in a variety of academic organizations, including roles as dean for finance and administration |
| | | |
| INTERESTED TRUSTEES | | | | | | |
| | | | |
Robert J. Blanding2
(1947) 555 California Street San Francisco, CA 94104 | | Trustee and Chief Executive Officer Since 2002 | | President, Chairman, Director and Chief Executive Officer, Loomis, Sayles & Company, L.P. | | 42 None | | Significant experience on Board of Trustees of the Trust; continuing service as president, chairman, and chief executive officer of Loomis, Sayles & Company, L.P. |
| 62
Trustee and Officer Information
| | | | | | | | |
Name and Year of
Birth | | Position(s) Held with the Trust, Length of Time
Served and Term
of Office* | | Principal
Occupation(s)
During Past 5
Years | | Number of
Portfolios in Fund
Complex
Overseen** and Other
Directorships
Held During Past
5 Years | | Experience,
Qualifications,
Attributes, Skills
for Board
Membership |
| | | |
INTERESTED TRUSTEES continued | | | | | | |
| | | | |
John T. Hailer3
(1960) | | Trustee Since 2003 | | President and Chief Executive Officer –U.S. and Asia, Natixis Global Asset Management, L.P.; formerly, President and Chief Executive Officer, Natixis Distribution Corporation, Natixis Asset Management Advisors, L.P., Natixis Distributors, L.P. and Natixis Global Associates, Inc. | | 42 None | | Significant experience on Board of Trustees of the Trust; continuing experience as Chief Executive Officer of Natixis Global Asset Management, L.P. |
| * | Each trustee serves until retirement, resignation or removal from the Board of Trustees. The current retirement age is 72; however, the trustees have designated 2010 as a transition period so that any trustees who are currently age 72 or older or who reach age 72 during the remainder of 2010 will not be required to retire until the end of calendar year 2011. The position of Chairperson of the Board is appointed for a two-year term. Ms. Moose was appointed to serve an additional two-year term as the Chairperson of the Board of Trustees on November 20, 2009. |
| ** | The trustees of the Trust serve as trustees of a fund complex that includes all series of the Natixis Funds Trust I, Natixis Funds Trust II, Natixis Funds Trust IV, Gateway Trust and the Natixis Cash Management Trust (collectively, the “Natixis Funds Trusts”), Loomis Sayles Funds I and Loomis Sayles Funds II (collectively, the “Loomis Sayles Funds Trusts”), and Hansberger International Series (collectively, the “Fund Complex”). |
| 1 | Mr. Sirri and Mr. Smail were appointed as trustees effective December 1, 2009. |
| 2 | Mr. Blanding is deemed an “interested person” of the Trust because he holds the following positions with an affiliated person of the Trust: President, Chairman, Director and Chief Executive Officer of Loomis Sayles. |
| 3 | Mr. Hailer is deemed an “interested person” of the Trust because he holds the following positions with an affiliated person of the Trust: President and Chief Executive Officer–U.S. and Asia, Natixis Global Asset Management, L.P. |
63 |
Trustee and Officer Information
| | | | | | |
Name and Year of Birth | | Position(s) Held with the
Trust | | Term of Office* and
Length of Time Served | | Principal Occupation
During Past 5 Years** |
| | |
| OFFICERS OF THE TRUST | | | | |
| | | |
Coleen Downs Dinneen
(1960) | | Secretary, Clerk and Chief Legal Officer | | Since September 2004 | | Executive Vice President, General Counsel, Secretary and Clerk (formerly, Senior Vice President, Deputy General Counsel, Assistant Secretary and Assistant Clerk), Natixis Distribution Corporation, Natixis Asset Management Advisors, L.P. and Natixis Distributors, L.P. |
| | | |
Daniel J. Fuss
(1933) One Financial Center Boston, MA 02111 | | Executive Vice President | | Since June 2003 | | Vice Chairman and Director, Loomis, Sayles & Company, L.P. |
| | | |
David Giunta
(1965) | | President | | Since March 2008 | | President and Chief Executive Officer, Natixis Distribution Corporation, Natixis Asset Management Advisors, L.P. and Natixis Distributors, L.P.; formerly, President, Fidelity Charitable Gift Fund; and formerly, Senior Vice President, Fidelity Brokerage Company |
| | | |
Russell L. Kane
(1969) | | Chief Compliance Officer, Assistant Secretary and Anti-Money Laundering Officer | | Chief Compliance Officer since May 2006; Assistant Secretary since June 2004; and Anti-Money Laundering Officer since April 2007 | | Chief Compliance Officer for Mutual Funds, Senior Vice President, Deputy General Counsel, Assistant Secretary and Assistant Clerk, Natixis Distribution Corporation, Natixis Asset Management Advisors, L.P. and Natixis Distributors, L.P. |
| 64
Trustee and Officer Information
| | | | | | |
Name and Year of Birth | | Position(s) Held with the
Trust | | Term of Office* and
Length of Time Served | | Principal Occupation
During Past 5 Years** |
| | |
OFFICERS OF THE TRUST continued | | | | |
| | | |
Michael C. Kardok
(1959) | | Treasurer, Principal Financial and Accounting Officer | | Since October 2004 | | Senior Vice President, Natixis Asset Management Advisors, L.P. and Natixis Distributors, L.P. |
| * | Each officer of the Trust serves for an indefinite term in accordance with the Trust’s current By-laws until the date his or her successor is elected and qualified, or until he or she sooner dies, retires, is removed or becomes disqualified. |
| ** | Each person listed above, except as noted, holds the same position(s) with the Fund Complex. Mr. Fuss is not an officer of the Natixis Funds Trusts or the Hansberger International Series. Previous positions during the past five years with the Distributor, Natixis Advisors or Loomis Sayles are omitted if not materially different from a trustee’s or officer’s current position with such entity. |
65 |
The Registrant has adopted a code of ethics that applies to the Registrant’s principal executive officer, principal financial officer and persons performing similar functions.
| Item 3. | Audit Committee Financial Expert. |
The Board of Trustees of the Registrant has established an audit committee. Ms. Cynthia L. Walker, Mr. Daniel M. Cain and Mr. Kenneth A. Drucker are members of the audit committee and have been designated as “audit committee financial experts” by the Board of Trustees. Each of these individuals is also an Independent Trustee of the Registrant.
| Item 4. | Principal Accountant Fees and Services. |
Fees billed by the Principal Accountant for services rendered to the Registrant.
The table below sets forth fees billed by the principal accountant, PricewaterhouseCoopers LLP, for the past two fiscal years for professional services rendered in connection with a) the audit of the Registrant’s annual financial statements and services provided in connection with regulatory filings; b) audit-related services (including services that are reasonably related to the performance of the audit of the Registrant’s financial statements and but not reported under “Audit Fees”); c) tax compliance, tax advice and tax planning and d) all other fees billed for professional services rendered by the principal accountant to the Registrant, other than the services reported as a part of (a) through (c) of this Item.
| | | | | | | | | | | | | | | | | | | | | | | | | | | | | | | | |
| | | Audit fees | | | Audit-related fees1 | | | Tax fees2 | | | All other fees3 | |
| | | 10/1/08-
9/30/09 | | | 10/01/09-
9/30/10 | | | 10/1/08-
9/30/09 | | | 10/01/09-
9/30/10 | | | 10/1/08-
9/30/09 | | | 10/01/09-
9/30/10 | | | 10/1/08-
9/30/09 | | | 10/01/09-
9/30/10 | |
Loomis Sayles Funds II | | $ | 418,399 | | | $ | 408,090 | | | $ | 4,266 | | | $ | 5,955 | | | $ | 105,143 | | | $ | 104,056 | | | $ | 25,795 | | | $ | 27,842 | |
| 1. | Audit-related fees consist of: |
2009 - performance of agreed-upon procedures related to the Registrant’s deferred compensation plan.
2010 - performance of agreed-upon procedures related to the Registrant’s deferred compensation plan and consulting services with respect to regulatory advice.
2009 - review of Registrant’s tax returns and consulting services with respect to new security types.
2010 - review of Registrant’s tax returns, consulting services with respect to new security types, and consulting services related to new Massachusetts filing requirements.
| 3. | All other fees consist of: |
2009 - filing and translation services with respect to Japanese shareholders in Loomis Sayles Investment Grade Bond Fund.
2010 - filing and translation services with respect to Japanese shareholders in Loomis Sayles Investment Grand Bond Fund.
Aggregate fees billed to the Registrant for non-audit services during 2009 and 2010 were $135,204 and $137,853, respectively.
Fees billed by the Principal Accountant for services rendered to the Adviser and Control Affiliates.
The following table sets forth the fees billed by the Registrant’s principal accountant for non-audit services rendered to Loomis, Sayles & Company, L.P. and entities controlling, controlled by or under common control with Loomis, Sayles & Company, L.P. Registrant (“Control Affiliates”) that provide ongoing services to the Registrant, for engagements that related directly to the operations and financial reporting of the Registrant for the last two fiscal years.
| | | | | | | | | | | | | | | | | | | | | | | | |
| | | Audit-related fees | | | Tax fees | | | All other fees | |
| | | 10/1/08-
9/30/09 | | | 10/01/09-
9/30/10 | | | 10/1/08-
9/30/09 | | | 10/01/09-
9/30/10 | | | 10/1/08-
9/30/09 | | | 10/01/09-
9/30/10 | |
Control Affiliates | | $ | 12,000 | | | $ | 12,000 | | | $ | — | | | $ | — | | | $ | — | | | $ | — | |
The following table sets forth the aggregate fees billed by the Registrant’s principal accountant for non-audit services rendered to Loomis, Sayles & Company, L.P. and Control Affiliates that provide ongoing services to the Registrant, for the last two fiscal years, including the fees disclosed in the table above.
| | | | | | | | |
| | | Aggregate Non-Audit Fees | |
| | | 10/1/08-
9/30/09 | | | 10/01/09-
9/30/10 | |
Control Affiliates | | $ | 18,500 | | | $ | 174,242 | |
None of the services described above were approved pursuant to (c)(7)(i)(C) of Regulation S-X.
Audit Committee Pre Approval Policies.
Annually, the Registrant’s Audit Committee reviews the audit, audit-related, tax and other non-audit services together with the projected fees, for services proposed to be rendered to the Trust and/or other entities for which pre-approval is required during the upcoming year. Any subsequent revisions to already pre-approved services or fees (including fee increases) and requests for pre-approval of new services would be presented for consideration quarterly as needed.
If, in the opinion of management, a proposed engagement by the Registrant’s independent accountants needs to commence before the next regularly scheduled Audit Committee meeting, any member of the Audit Committee who is an independent Board member is authorized to pre-approve the engagement, but only for engagements to provide audit, audit related and tax services. This approval is subject to review of the full Audit Committee at its next quarterly meeting. All other engagements require the approval of all the members of the Audit Committee.
| Item 5. | Audit Committee of Listed Registrants. |
Not applicable.
| Item 6. | Schedule of Investments. |
Included as part of the Report to Shareholders filed as Item 1 herewith.
| Item 7. | Disclosure of Proxy Voting Policies and Procedures for Closed-End Management Investment Companies. |
Not applicable.
| Item 8. | Portfolio Managers of Closed-End Management Investment Companies |
Not applicable.
| Item 9. | Purchases of Equity Securities by Closed-End Management Investment Companies and Affiliated Purchasers. |
Not applicable.
| Item 10. | Submission of Matters to a Vote of Securities Holders. |
There were no material changes to the procedures by which shareholders may recommend nominees to the Registrant’s Board of Trustees.
| Item 11. | Controls and Procedures. |
The Registrant’s principal executive officer and principal financial officer have concluded that the Registrant’s disclosure controls and procedures are sufficient to ensure that information required to be disclosed by the Registrant in this Form N-CSR was recorded, processed, summarized and reported within the time periods specified in the Securities and Exchange Commission’s rules and forms, based upon such officers’ evaluation of these controls and procedures as of a date within 90 days of the filing date of the report.
There were no changes in the Registrant’s internal control over financial reporting that occurred during the Registrant’s last fiscal quarter of the period covered by the report that has materially affected, or is reasonably likely to materially affect, the Registrant’s internal control over financial reporting.
| | |
| (a) (1) | | Code of Ethics required by Item 2 hereof, filed herewith as Exhibit (a)(1). |
| |
| (a) (2) | | Certifications of Principal Executive Officer and Principal Financial Officer pursuant to Rule 30a-2(a) under the Investment Company Act of 1940 (17 CFR 270.30a-2(a)), filed herewith as Exhibits (a)(2)(1) and (a)(2)(2), respectively. |
| |
| (a) (3) | | Not applicable. |
| |
| (b) | | Certification of Principal Executive Officer and Principal Financial Officer pursuant to Section 906 of Sarbanes-Oxley Act of 2002 are filed herewith as Exhibit (b). |
SIGNATURES
Pursuant to the requirements of the Securities Exchange Act of 1934 and the Investment Company Act of 1940, the Registrant has duly caused this report to be signed on its behalf by the undersigned, thereunto duly authorized.
| | |
| Loomis Sayles Funds II |
| |
| By: | | /s/ ROBERT J. BLANDING |
| Name: | | Robert J. Blanding |
| Title: | | Chief Executive Officer |
| |
| Date: | | November 22, 2010 |
Pursuant to the requirements of the Securities Exchange Act of 1934 and the Investment Company Act of 1940, this report has been signed by the following persons on behalf of the Registrant and in the capacities and on the dates indicated.
| | |
| By: | | /s/ ROBERT J. BLANDING |
| Name: | | Robert J. Blanding |
| Title: | | Chief Executive Officer |
| |
| Date: | | November 22, 2010 |
| | |
| By: | | /s/ MICHAEL C. KARDOK |
| Name: | | Michael C. Kardok |
| Title: | | Treasurer |
| |
| Date: | | November 22, 2010 |