UNITED STATES
SECURITIES AND EXCHANGE COMMISSION
Washington, D.C. 20549
FORM N-CSR
CERTIFIED SHAREHOLDER REPORT OF REGISTERED
MANAGEMENT INVESTMENT COMPANIES
Investment Company Act file number: 811-06241
Loomis Sayles Funds II
(Exact name of Registrant as specified in charter)
399 Boylston Street, Boston, Massachusetts 02116
(Address of principal executive offices) (Zip code)
Coleen Downs Dinneen, Esq.
Natixis Distributors, L.P.
399 Boylston Street
Boston, Massachusetts 02116
(Name and address of agent for service)
Registrant’s telephone number, including area code: (617) 449-2810
Date of fiscal year end: September 30
Date of reporting period: September 30, 2009
| Item 1. | Reports to Stockholders. |
The Registrant’s annual report transmitted to shareholders pursuant to Rule 30e-1 under the Investment Company Act of 1940 is as follows:

INCOME FUNDS
ANNUAL REPORT
September 30, 2009
Loomis Sayles Core Plus Bond Fund
Loomis Sayles High Income Fund
Loomis Sayles International Bond Fund
Loomis Sayles Limited Term Government and Agency Fund
Loomis Sayles Strategic Income Fund


TABLE OF CONTENTS
Management Discussion and Performancepage 1
Portfolio of Investmentspage 18
Financial Statementspage 55
LOOMIS SAYLES CORE PLUS BOND FUND
PORTFOLIO PROFILE
Objective:
Seeks a high level of current income consistent with what the fund considers reasonable risk
Strategy:
Invests primarily in U.S. corporate and U.S. government bonds
Fund Inception:
November 7, 1973
Managers:
Peter W. Palfrey, CFA
Richard G. Raczkowski
Loomis, Sayles & Company, L.P.
Symbols:
| | |
| Class A | | NEFRX |
| Class B | | NERBX |
| Class C | | NECRX |
| Class Y | | NERYX |
What You Should Know:
Fixed-income securities are subject to credit risk and interest rate risk; their value generally rises when prevailing interest rates fall and falls when rates rise.
The fund can invest a significant percentage of assets in debt securities that are rated below investment grade and the value of fund shares can be adversely affected by changes in economic conditions or other circumstances. Lower rated debt securities have speculative characteristics and may be subject to greater price volatility than higher rated investments. In addition, the secondary market for these securities may lack liquidity. The fund can also invest a significant percentage of assets in foreign securities and the value of the fund shares can be adversely affected by changes in currency exchange rates, political, and economic developments. In emerging markets, these risks can be significant. Fund shares should be viewed as a long-term investment.
Management Discussion
In the extremely difficult market environment that characterized the end of 2008 and early 2009, widespread concern about the world’s financial markets triggered a massive flight to safety. This hurt risk markets and drove yields on U.S. Treasury securities to record lows. As the risk markets neared a bottom, Loomis Sayles Core Plus Bond Fund moved aggressively back into credit and securitized markets as well as into Treasury Inflation Protected Securities (TIPS) at attractive valuations. These moves worked well for the fund.
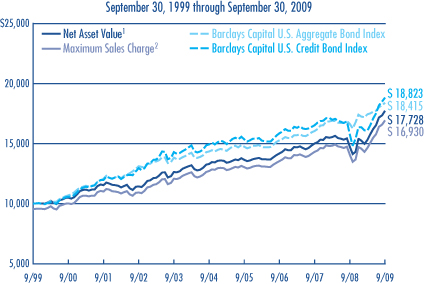
For the fiscal year ended September 30, 2009, the total return on Class A shares of the fund was 20.07% based on the net asset value and $0.66 in reinvested dividends. By comparison, the fund’s benchmark, Barclays Capital U.S. Aggregate Bond Index, returned 10.56% for the fiscal period, while Morningstar’s Intermediate-Term Bond peer group returned 11.81%.
WHICH OF THE TACTICS YOU USED WAS MOST HELPFUL TO THE FUND?
Our move from a very defensive positioning in the fall of 2008 to a much more aggressive positioning late in 2008 and in 2009 as risk markets recovered was key to protecting capital through the worst of the financial crisis and participating in the upturn. Our increased allocation to higher-yielding securities was also strongly positive. Corporate bonds performed well, particularly industrials, which were the largest contributor. Strong security selection and our overweight positions in investment-grade financial and utility companies were also positive.
The recovery in the high-yield market began late in December of 2008 and continued through September of 2009. We doubled the fund’s exposure to high-yield securities during the year and began harvesting gains in earnest in the second quarter of 2009 as evidence mounted that economic conditions were stabilizing. An increasing number of companies issued new debt and some of our holdings in previously distressed companies — including Ford and GMAC — came back into favor.
DID THE DECLINE IN THE U.S. DOLLAR IMPACT THE FUND?
The fund’s significant allocation to the Japanese yen was an effective defensive measure during the closing quarter of 2008, and we sold most of the fund’s yen-denominated holdings late in 2008 at substantial gains. We opportunistically added positions in Australian and Canadian dollars to capture the anticipated rebound in commodity currencies as risk markets began to stabilize. During the summer of 2009, we shifted the fund’s remaining non-U.S.-dollar position back into Treasuries due to concerns mounting that the depreciating U.S. dollar might be overdue for a correction.
WHAT ABOUT OTHER POSITIONS? HOW DID THEY IMPACT PERFORMANCE?
Commercial mortgage-backed securities (CMBS) detracted from performance in the final quarter of 2008 and early in 2009, but this sector was very positive throughout the remainder of the fiscal year. This reflected improving investor confidence in higher-rated CMBS and support from government stimulus programs. Following a significant rally, we trimmed holdings in CMBS at a profit in the third quarter or 2009.
WHAT’S YOUR OUTLOOK?
The significant rebound from such distressed price levels and the sharp contraction in yield spreads has helped normalize most markets, but we believe there is still good value to be found should the U.S. and global economies continue to recover as expected. Going forward, the timing of the government’s exit strategy from its current levels of monetary and fiscal support, as well as investor risk preferences, will likely drive the markets over the next 12 months. Portfolio yield in the shorter maturity sectors should become increasingly important as Treasury yields start to normalize and inflation fears become more prevalent. We plan to maintain a high degree of liquidity in the fund in anticipation of what we expect to be a bumpy recovery and to take advantage of volatility we see ahead for the markets in the coming year.
1
LOOMIS SAYLES CORE PLUS BOND FUND
Investment Results through September 30, 2009
PERFORMANCE IN PERSPECTIVE
The charts comparing the fund’s performance to two indexes provide you with a general sense of how it performed. The fund’s total return for the period shown below appears with and without sales charges and includes fund expenses and fees. An index measures the performance of a theoretical portfolio. Unlike a fund, the index is unmanaged and does not have expenses that affect the results. It is not possible to invest directly in an index. Investors would incur transaction costs and other expenses if they purchased the securities necessary to match the index.
Growth of a $10,000 Investment in Class A Shares4
Average Annual Total Returns — September 30, 20094
| | | | | | | | | |
| | | | |
| | | 1 YEAR | | | 5 YEARS | | | 10 YEARS | |
CLASS A (Inception 11/7/73) | | | | | | | | | |
Net Asset Value1 | | 20.07 | % | | 5.88 | % | | 5.89 | % |
With Maximum Sales Charge2 | | 14.63 | | | 4.91 | | | 5.41 | |
| | | | |
CLASS B (Inception 9/13/93) | | | | | | | | | |
Net Asset Value1 | | 19.19 | | | 5.10 | | | 5.12 | |
With CDSC3 | | 14.19 | | | 4.77 | | | 5.12 | |
| | | | |
CLASS C (Inception 12/30/94) | | | | | | | | | |
Net Asset Value1 | | 19.20 | | | 5.08 | | | 5.11 | |
With CDSC3 | | 18.20 | | | 5.08 | | | 5.11 | |
| | | | |
CLASS Y (Inception 12/30/94) | | | | | | | | | |
Net Asset Value1 | | 20.37 | | | 6.16 | | | 6.26 | |
| | | | |
| COMPARATIVE PERFORMANCE | | 1 YEAR | | | 5 YEARS | | | 10 YEARS | |
Barclays Capital U.S. Aggregate Bond Index | | 10.56 | % | | 5.13 | % | | 6.30 | % |
Barclays Capital U.S. Credit Bond Index | | 19.49 | | | 4.72 | | | 6.53 | |
Morningstar Int.-Term Bond Fund Avg. | | 11.81 | | | 3.82 | | | 5.38 | |
See page 11 for a description of the indices.
All returns represent past performance and do not guarantee future results. Periods of less than one year are not annualized. Share price and return will vary and you may have a gain or loss when you sell your shares. All results include reinvestment of any dividends and capital gains. Current returns may be higher or lower than those shown. For performance current to the most recent month-end, visit www.funds.natixis.com. Class Y shares are available to certain investors, as described in the prospectus.
The table and graph do not reflect taxes shareholders might owe on any fund distributions or when they redeem their shares.
PORTFOLIO FACTS
| | | | |
| |
| | | % of Net Assets as of |
| CREDIT QUALITY | | 9/30/09 | | 9/30/08 |
Aaa | | 51.5 | | 59.1 |
Aa | | 4.7 | | 5.6 |
A | | 9.0 | | 4.8 |
Baa | | 19.6 | | 14.6 |
Ba | | 5.9 | | 4.8 |
B | | 3.3 | | 5.7 |
Caa | | 1.3 | | 0.5 |
Ca | | 1.0 | | 0.3 |
Not Rated* | | 1.9 | | 3.8 |
Short-term and other | | 1.8 | | 0.8 |
Credit quality is based on ratings from Moody’s Investors Service.
* Securities that are not rated by Moody’s may be rated by another rating agency or by Loomis Sayles.
| | | | | | |
| |
| | | % of Net Assets as of | |
| EFFECTIVE DURATION | | 9/30/09 | | | 9/30/08 | |
1 year or less | | 6.7 | | | 8.8 | |
1-5 years | | 36.6 | | | 39.7 | |
5-10 years | | 43.9 | | | 40.0 | |
10+ years | | 12.8 | | | 11.5 | |
Average Effective Duration | | 5.9 | years | | 5.7 | years |
Portfolio characteristics will vary.
EXPENSE RATIOS AS STATED IN THE MOST RECENT PROSPECTUS
| | | | | | |
| Share Class | | Gross Expense Ratio5 | | | Net Expense Ratio6 | |
A | | 1.04 | % | | 0.90 | % |
B | | 1.80 | | | 1.65 | |
C | | 1.79 | | | 1.65 | |
Y | | 0.75 | | | 0.65 | |
NOTES TO CHARTS
| 1 | Does not include a sales charge. |
| 2 | Includes maximum sales charge of 4.50%. |
| 3 | Performance for Class B shares assumes a maximum 5% contingent deferred sales charge (“CDSC”) applied when you sell shares, which declines annually between years 1-6 according to the following schedule: 5, 4, 3, 3, 2, 1, 0%. Class C shares performance assumes a 1% CDSC applied when you sell shares within one year of purchase. |
| 4 | Fund performance has been increased by expense reductions and reimbursements, if any, without which performance would have been lower. |
| 5 | Before reductions and reimbursements. |
| 6 | After reductions and reimbursements. Expense reductions are contractual and are set to expire on 1/31/10. |
2
LOOMIS SAYLES HIGH INCOME FUND
PORTFOLIO PROFILE
Objective:
Seeks high current income plus the opportunity for capital appreciation to produce a high total return
Strategy:
Invests primarily in lower-quality fixed-income securities
Fund Inception:
February 22, 1984
Managers:
Matthew J. Eagan, CFA
Kathleen C. Gaffney, CFA
Elaine M. Stokes
Loomis, Sayles & Company, L.P.
Symbols:
| | |
| Class A | | NEFHX |
| Class B | | NEHBX |
| Class C | | NEHCX |
| Class Y | | NEHYX |
What You Should Know:
Fixed-income securities are subject to credit risk and interest rate risk; their value generally rises when prevailing interest rates fall and falls when rates rise.
The fund can invest a significant percentage of assets in debt securities that are rated below investment grade and the value of fund shares can be adversely affected by changes in economic conditions or other circumstances. Lower rated debt securities have speculative characteristics and may be subject to greater price volatility than higher rated investments. In addition, the secondary market for these securities may lack liquidity. The fund can also invest a significant percentage of assets in foreign securities and the value of the fund shares can be adversely affected by changes in currency exchange rates, political, and economic developments. In emerging markets, these risks can be significant. Fund shares should be viewed as a long-term investment.
Management Discussion
As the credit crisis eased last spring, investors turned away from low-yielding, government-backed issues in search of better returns in other sectors. High-yield bonds in particular benefited from this renewed risk appetite. Increased demand and stronger market liquidity pushed prices of lower-rated issues sharply higher and their yields plunged. By the end of the period, spreads – the yield advantage high-yield issues have over Treasury issues of similar maturity – had narrowed dramatically from the exceptionally wide levels that had prevailed at the height of the financial crisis.
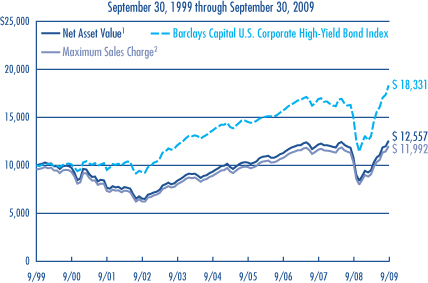
For the fiscal year ended September 30, 2009, Class A shares of Loomis Sayles High Income Fund provided a total return at net asset value of 15.97%, including $0.33 in dividends reinvested during the period. The fund underperformed its benchmark, Barclays Capital U.S. Corporate High-Yield Bond Index, which returned 22.34% for the period. However, its performance was above the 13.16% average of the funds in Morningstar’s High Yield Bond category.
WHAT WERE THE BEST PERFORMING MARKET AREAS?
As capital returned to the credit markets in the latter part of fiscal 2009, lower-rated industrial bonds made the strongest contribution to results. The ability of lower-rated companies to refinance pending maturities brought default assumptions down significantly and enticed investors to reach for higher returns in the lower-rated portions of the market.
Improving conditions in the world financial system also spurred merger talks, notably in the consolidating pharmaceutical industry. This trend, combined with the broader debate over universal healthcare, spurred demand in the healthcare sector. As a result, consumer non-cyclicals led sector performance for the period. In terms of quality, the fund’s strongest returns came from securities rated B by Moody’s Investors Service.
WHAT CAUSED THE FUND TO LAG ITS BENCHMARK DURING THE YEAR?
In general, the fund underperformed its benchmark because its portfolio included more higher-quality issues during a period when the lower-quality sector provided the best results. Specifically, the fund was underweight in high-yield financials, where government guarantees of certain issues increased investor confidence. Subsequent infusions of capital as part of the government’s stimulus programs also enhanced performance in this area, but the fund’s participation was limited. The fund’s underweight in bonds rated CCC by Moody’s also hindered performance, as this sector recorded some of the period’s better gains. Moreover, our commitment to bank loans and Treasury securities – which are not part of the benchmark – also handicapped results, as higher-rated holdings lost favor in the second half of the year.
WHAT’S YOUR OUTLOOK?
Looking ahead, we continue to believe there is select value in corporate bonds. Despite their recent tightening, spreads remain wide relative to long-term averages. A vast majority of the spread tightening that has taken place this year is due to the re-emergence of liquidity in the markets. Over the long term, further spread tightening from these levels will most likely be generated by an improvement in global and U.S. economic fundamentals. Our view is that maintaining specific risk in the portfolio will present the best opportunity for long-term performance.
Global risk appetite has weakened the U.S. dollar, and we expect this may continue. Currencies from developed and emerging markets may offer more long-term upside potential, particularly the European peripheral currencies and Asian currencies tied to China and its global-growth story.
3
LOOMIS SAYLES HIGH INCOME FUND
Investment Results through September 30, 2009
PERFORMANCE IN PERSPECTIVE
The charts comparing the fund’s performance to an index provide you with a general sense of how it performed. The fund’s total return for the period shown below appears with and without sales charges and includes fund expenses and fees. An index measures the performance of a theoretical portfolio. Unlike a fund, the index is unmanaged and does not have expenses that affect the results. It is not possible to invest directly in an index. Investors would incur transaction costs and other expenses if they purchased the securities necessary to match the index.
Growth of a $10,000 Investment in Class A Shares4
Average Annual Total Returns — September 30, 20094
| | | | | | | | | | | | |
| | | | | |
| | | 1 YEAR | | | 5 YEARS | | | 10 YEARS | | | SINCE
INCEPTION | |
CLASS A (Inception 2/22/84) | | | | | | | | | | | | |
Net Asset Value1 | | 15.97 | % | | 6.14 | % | | 2.31 | % | | — | |
With Maximum Sales Charge2 | | 10.75 | | | 5.15 | | | 1.84 | | | — | |
| | | | | |
CLASS B (Inception 9/20/93) | | | | | | | | | | | | |
Net Asset Value1 | | 15.06 | | | 5.32 | | | 1.55 | | | — | |
With CDSC3 | | 10.06 | | | 5.02 | | | 1.55 | | | — | |
| | | | | |
CLASS C (Inception 3/2/98) | | | | | | | | | | | | |
Net Asset Value1 | | 15.37 | | | 5.34 | | | 1.56 | | | — | |
With CDSC3 | | 14.37 | | | 5.34 | | | 1.56 | | | — | |
| | | | | |
CLASS Y (Inception 2/29/08) | | | | | | | | | | | | |
Net Asset Value1 | | 16.29 | | | — | | | — | | | 3.56 | % |
| | | | | |
| COMPARATIVE PERFORMANCE | | 1 YEAR | | | 5 YEARS | | | 10 YEARS | | | SINCE
CLASS Y
INCEPTION7 | |
Barclays Capital U.S. Corporate High-Yield Bond Index | | 22.34 | % | | 6.13 | % | | 6.25 | % | | 8.05 | % |
Morningstar High Yield Bond Fund Avg. | | 13.16 | | | 4.11 | | | 4.47 | | | 3.47 | |
See page 11 for a description of the indices.
All returns represent past performance and do not guarantee future results. Periods of less than one year are not annualized. Share price and return will vary and you may have a gain or loss when you sell your shares. All results include reinvestment of dividends and capital gains. Current returns may be higher or lower than those shown. For performance current to the most recent month-end, visit www.funds.natixis.com. Performance history includes periods from a predecessor fund. Class Y shares are available to certain investors, as described in the prospectus.
The table and graph do not reflect taxes shareholders might owe on any fund distributions or when they redeem their shares.
PORTFOLIO FACTS
| | | | |
| |
| | | % of Net Assets as of |
| CREDIT QUALITY | | 9/30/09 | | 9/30/08 |
Aaa | | 10.0 | | 17.3 |
Aa | | 0.5 | | 2.0 |
A | | 0.2 | | 1.0 |
Baa | | 5.3 | | 7.6 |
Ba | | 28.5 | | 14.9 |
B | | 28.2 | | 28.9 |
Caa | | 12.9 | | 16.4 |
Ca | | 1.9 | | 0.5 |
C | | — | | 0.0 |
Not Rated* | | 5.6 | | 10.1 |
Short-term and other | | 6.9 | | 1.3 |
Credit quality is based on ratings from Moody’s Investors Service.
* Securities that are not rated by Moody’s may be rated by another rating agency or by Loomis Sayles.
| | | | | | |
| |
| | | % of Net Assets as of | |
| EFFECTIVE MATURITY | | 9/30/09 | | | 9/30/08 | |
1 year or less | | 6.8 | | | 16.0 | |
1-5 years | | 32.1 | | | 25.7 | |
5-10 years | | 34.2 | | | 28.5 | |
10+ years | | 26.9 | | | 29.8 | |
Average Effective Maturity | | 8.6 | years | | 8.8 | years |
Portfolio characteristics will vary.
EXPENSE RATIOS AS STATED IN THE MOST RECENT PROSPECTUS
| | | | | | |
| Share Class | | Gross Expense Ratio5 | | | Net Expense Ratio6 | |
A | | 1.40 | % | | 1.15 | % |
B | | 2.15 | | | 1.90 | |
C | | 2.15 | | | 1.90 | |
Y | | 1.15 | | | 0.90 | |
NOTES TO CHARTS
| 1 | Does not include a sales charge. |
| 2 | Includes maximum sales charge of 4.50%. |
| 3 | Performance for Class B shares assumes a maximum 5% contingent deferred sales charge (“CDSC”) applied when you sell shares, which declines annually between years 1-6 according to the following schedule: 5, 4, 3, 3, 2, 1, 0%. Class C shares performance assumes a 1% CDSC applied when you sell shares within one year of purchase. |
| 4 | Fund performance has been increased by expense reductions and reimbursements, if any, without which performance would have been lower. |
| 5 | Before reductions and reimbursements. |
| 6 | After reductions and reimbursements. Expense reductions are contractual and are set to expire on 1/31/10. |
| 7 | The since-inception comparative performance figures shown for Class Y shares are calculated from 3/1/08. |
4
LOOMIS SAYLES INTERNATIONAL BOND FUND
PORTFOLIO PROFILE
Objective:
Seeks high total return through a combination of high current income and capital appreciation
Strategy:
Invests primarily in fixed-income securities located outside the U.S.
Fund Inception:
February 1, 2008
Managers:
Lynda L. Schweitzer, CFA
Kenneth M. Buntrock, CFA, CIC
David W. Rolley, CFA
Loomis, Sayles & Company, L.P.
Symbols:
| | |
| Class A | | LSIAX |
| Class C | | LSICX |
| Class Y | | LSIYX |
What You Should Know:
Fixed-income securities are subject to credit risk and interest rate risk; their value generally rises when prevailing interest rates fall and falls when rates rise. The fund may also invest in public or private debt obligations issued or guaranteed by U.S. or non-U.S. issuers. The fund can invest a significant percentage of assets in foreign securities and the value of the fund shares can be adversely affected by changes in currency exchange rates, political, and economic developments. In emerging markets these risks can be significant. The fund can invest a significant percentage of assets in debt securities that are rated below investment grade. Lower-rated debt securities have speculative characteristics and may be subject to greater price volatility than higher-rated investments. In addition, the secondary market for these securities may lack liquidity. Fund shares should be viewed as a long-term investment.
Management Discussion
Trends in global fixed-income markets reversed course in the spring of 2009, as rising optimism about an economic recovery replaced fears of a protracted worldwide recession. The changing market sentiment helped investment-grade corporate bonds, high-yield debt and emerging market securities stage strong comebacks over the second half of the 12-month period ended September 30, 2009. The robust rally offset many of the losses incurred during the previous six months.
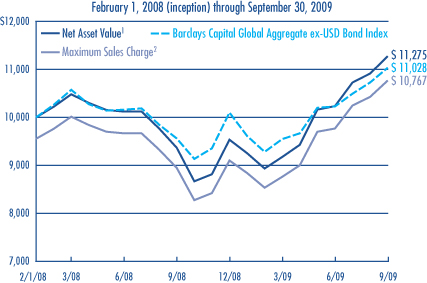
The fund’s positioning for a global economic recovery helped drive Loomis Sayles International Bond Fund’s strong relative performance for the fiscal year ended September 30, 2009. Based on the net asset value of Class A Shares, the fund produced a total return of 20.41%, including $0.20 in dividends reinvested during the period. The fund outpaced the 15.41% return on its benchmark, Barclays Capital Global Aggregate ex-USD Bond Index and the 14.82% average return of the funds in Morningstar’s World Bond category.
WHAT FACTORS CONTRIBUTED TO THE FUND’S STRONG PERFORMANCE?
The fund’s emphasis on the U.S., U.K. and European corporate bond markets, as well as strong security selection, was primarily responsible for its outperformance. Our focus on corporate bonds had held back results during the first half of the fiscal year, but the fund was positioned well when credit markets began a recovery about halfway through the period. As investors became less risk-averse and more interested in the yield advantage that corporate bonds have over government debt, money poured into the higher-yield sectors of the fixed-income markets.
In addition to investment-grade corporate debt, holdings in high-yield corporate bonds and emerging-market securities helped propel the fund’s solid return. The fund’s overall currency strategy also helped, as our overweight position in the Norwegian krone and tactical positioning in the South Korean won also contributed to strongly positive returns.
WHICH STRATEGIES DETRACTED FROM THE FUND’S RESULTS?
While our exposure to U.S. corporate securities supported performance, the financial institutions represented in the portfolio generally detracted in the closing quarter of 2008 and early 2009 as a result of the rapid deterioration in the international financial markets.
Despite the overall success of our Scandinavian currency strategy, the fund’s performance was negatively impacted by its underweight relative to its benchmark in the Icelandic krona. The fund was also underweight in the Japanese yen, which was a drag on performance when the yen strengthened against the U.S. dollar during the latter part of the year.
WHAT’S YOUR OUTLOOK?
Despite strong performance this past quarter, we still see attractive opportunities in corporate bonds, the high-yield sectors of the securitized market and selected currencies. Yield spreads – the difference in yield between corporate bonds and Treasury securities – are still wide relative to their long-term averages and may tighten further as the economy recovers.
Market trends and conditions vary from country to country, but we believe the overall global economy is moving toward a gradual recovery. In the United States, however, we think the recovery is likely to be weak, hampered by high unemployment and sluggish consumer and investment spending. Accordingly, we limited the fund’s exposure to U.S. high-yield corporate debt. We also added to the fund’s holdings in non-U.S. dollar currencies. We also plan to reduce the duration of our U.S. dollar-based investments in anticipation of higher yields in 2010.
5
LOOMIS SAYLES INTERNATIONAL BOND FUND
Investment Results through September 30, 2009
PERFORMANCE IN PERSPECTIVE
The charts comparing the fund’s performance to an index provide you with general sense of how it performed. The fund’s total return for the period shown below appears with and without sales charges and includes fund expenses and fees. An index measures the performance of a theoretical portfolio. Unlike a fund, an index is unmanaged and does not have expenses that affect the results. It is not possible to invest directly in an index. Investors would incur transaction costs and other expenses if they purchased the securities necessary to match the index.
Growth of $10,000 Investment in Class A Shares4
Average Annual Total Returns — September 30, 20094
| | | | | | |
| | | |
| | | 1 YEAR | | | SINCE
INCEPTION | |
CLASS A (Inception 2/1/08) | | | | | | |
Net Asset Value1 | | 20.41 | % | | 7.48 | % |
With Maximum Sales Charge2 | | 15.03 | | | 4.55 | |
| | | |
CLASS C (Inception 2/1/08) | | | | | | |
Net Asset Value1 | | 19.58 | | | 6.63 | |
With CDSC3 | | 18.58 | | | 6.63 | |
| | | |
CLASS Y (Inception 2/1/08) | | | | | | |
Net Asset Value1 | | 20.73 | | | 7.63 | |
| | | |
| COMPARATIVE PERFORMANCE | | 1 YEAR | | | SINCE
INCEPTION | |
Barclays Capital Global Aggregate ex-USD Bond Index | | 15.41 | % | | 6.05 | % |
Morningstar World Bond Fund Avg. | | 14.82 | | | 4.92 | |
See page 11 for a description of the indices.
All returns represent past performance and do not guarantee future results. Periods of less than one year are not annualized. Share price and return will vary and you may have a gain or loss when you sell your shares. All results include reinvestment of dividends and capital gains. Current returns may be higher or lower than those shown. For performance current to the most recent month-end, visit www.funds.natixis.com. Class Y shares are available to certain investors, as described in the prospectus.
The table does not reflect taxes shareholders might owe on any fund distributions or when they redeem their shares.
PORTFOLIO FACTS
| | | | |
| |
| | | % of Net Assets as of |
| CREDIT QUALITY | | 9/30/09 | | 9/30/08 |
Aaa | | 52.5 | | 54.2 |
Aa | | 19.1 | | 18.7 |
A | | 7.0 | | 8.3 |
Baa | | 10.7 | | 10.5 |
Ba | | 2.7 | | 3.1 |
B | | 1.2 | | 0.5 |
Caa | | 0.4 | | 0.7 |
Not Rated* | | 3.3 | | 2.3 |
Short-term and other | | 3.1 | | 1.7 |
Credit quality is based on ratings from Moody’s Investors Service.
* Securities that are not rated by Moody’s may be rated by another rating agency or by Loomis Sayles.
| | | | | | |
| |
| | | % of Net Assets as of | |
| EFFECTIVE MATURITY | | 9/30/09 | | | 9/30/08 | |
1 year or less | | 17.3 | | | 12.5 | |
1-5 years | | 35.9 | | | 18.4 | |
5-10 years | | 29.2 | | | 55.2 | |
10+ years | | 17.6 | | | 13.9 | |
Average Effective Maturity | | 6.7 | years | | 8.1 | years |
Portfolio characteristics will vary.
EXPENSE RATIOS AS STATED IN THE MOST RECENT PROSPECTUS
| | | | | | |
| Share Class | | Gross Expense Ratio5 | | | Net Expense Ratio6 | |
A | | 2.20 | % | | 1.10 | % |
C | | 2.93 | | | 1.85 | |
Y | | 1.83 | | | 0.85 | |
NOTES TO CHARTS
| 1 | Does not include a sales charge. |
| 2 | Includes maximum sales charge of 4.50%. |
| 3 | Class C shares performance assumes a 1% CDSC applied when you sell shares within one year of purchase. |
| 4 | Fund performance has been increased by expense reductions and reimbursements, if any, without which performance would have been lower. |
| 5 | Before reductions and reimbursements. |
| 6 | After reductions and reimbursements. Expense reductions are contractual and are set to expire on 1/31/10. |
6
LOOMIS SAYLES LIMITED TERM GOVERNMENTAND AGENCY FUND
PORTFOLIO PROFILE
Objective:
Seeks a high current return consistent with preservation of capital
Strategy:
Invests primarily in securities issued or guaranteed by the U.S. government, its agencies or instrumentalities
Fund Inception:
January 3, 1989
Managers:
John Hyll
Clifton V. Rowe, CFA
Loomis, Sayles & Company, L.P.
Symbols:
| | |
| Class A | | NEFLX |
| Class B | | NELBX |
| Class C | | NECLX |
| Class Y | | NELYX |
What You Should Know:
Fixed-income securities are subject to credit risk and interest rate risk; their value generally rises when prevailing interest rates fall and falls when rates rise. Securities issued by the U.S. government are guaranteed by the U.S. government if held to maturity; mutual funds that invest in these securities are not guaranteed. Securities issued by U.S. government agencies may not be government guaranteed.
Management Discussion
After a difficult start to the fiscal year last fall, Loomis Sayles Limited Term Government and Agency Fund experienced strong performance during the balance of the year, outperforming both its benchmark and the average return of its Morningstar peer group. The massive flight to quality, which was triggered by the financial meltdown during the closing quarter of 2008, gave way to an increasing willingness on the part of investors to accept greater risk. Price recovery in the fund’s position in mortgage-related securities was primarily responsible for the fund’s outperformance.
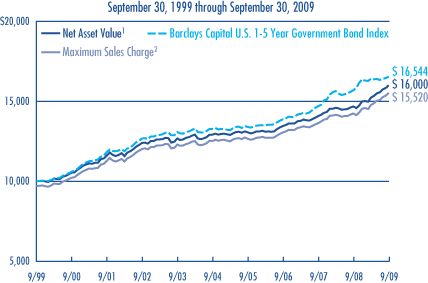
For the fiscal year ended September 30, 2009, the fund’s total return based on the net asset value of Class A shares was 9.05% including $0.36 in reinvested dividends. For the same period, Barclays Capital U.S. 1-5 Year Government Bond Index returned 5.43%, while Morningstar’s Short Government category returned 5.48%.
WHICH SECTORS HAD THE MOST POSITIVE IMPACT ON FUND PERFORMANCE?
Although mortgage-related and asset-backed securities offer a yield advantage over U.S. Treasury securities, they had become significantly undervalued in the latter part of 2008, as concerns surrounding the real estate and mortgage markets mounted. However, beginning in the second quarter of 2009 and continuing into the third quarter, confidence began to return to the markets and investors recognized the compelling values offered by higher-quality mortgage securities. As a result, investors’ appetite for risk led to a shift away from safety and toward securities with a combination of better income and capital appreciation potential.
Treasury inflation protected securities (TIPS) also performed well, reflecting the modest improvement in the economic outlook during the second and third quarter of 2009. Concerns about deflation eased, resulting in strengthened TIPS valuations.
WHICH SECTORS HAD A NEGATIVE IMPACT DURING THE YEAR?
The same sectors that had provided the most support for the fund in the turbulent period at the end of 2008 and early 2009 were relative underperformers during the market recovery in the second and third quarters of 2009. Investors turned their attention from Treasuries and securities issued by government sponsored entities (GSEs) toward higher-yielding, lower-quality sectors. Performance in the top-quality arena fell behind. As interest rates declined, securities with shorter maturities also lagged relative to longer-term securities with higher yields, so the fund’s relatively short maturity detracted from overall performance.
WHICH OF THE TACTICS YOU USED WAS MOST HELPFUL DURING THE PERIOD?
This fund’s mandate is to seek a high current return consistent with preservation of capital, primarily by investing in short-term government securities. However, within that framework, we strive to provide shareholders with attractive returns with as little risk as possible in any given market environment. Early in the fund’s fiscal year, we increased its holdings in TIPS because they appeared to be attractively valued. This move gave the fund yields similar to non-inflation-protected securities at a lower cost. As the year progressed, we turned our attention to securities offering even higher income potential, primarily in the mortgage-related market.
WHAT IS YOUR OUTLOOK?
For the intermediate term, we look for a gradual rise in interest rates and we believe our mortgage positions will benefit from the relatively stable interest-rate environment we see ahead. We believe the Federal Reserve Board will hold off on raising interest rates longer than the majority of investors expect, and we do not anticipate any significant shifts in the yield curve.
Despite the market’s positive performance in the latter part of 2009, we still see attractive opportunities for conservative bond investors, but we think the “rising tide lifts all boats” phenomenon may be nearing an end. Good results are likely to become harder to find.
7
LOOMIS SAYLES LIMITED TERM GOVERNMENTAND AGENCY FUND
Investment Results through September 30, 2009
PERFORMANCE IN PERSPECTIVE
The charts comparing the fund’s performance to an index provide you with a general sense of how it performed. The fund’s total return for the period shown below appears with and without sales charges and includes fund expenses and fees. An index measures the performance of a theoretical portfolio. Unlike a fund, the index is unmanaged and does not have expenses that affect the results. It is not possible to invest directly in an index. Investors would incur transaction costs and other expenses if they purchased the securities necessary to match the index.
Growth of a $10,000 Investment in Class A Shares4
Average Annual Total Returns — September 30, 20094
| | | | | | | | | |
| | | | |
| | | 1 YEAR | | | 5 YEARS | | | 10 YEARS | |
CLASS A (Inception 1/3/89) | | | | | | | | | |
Net Asset Value1 | | 9.05 | % | | 4.38 | % | | 4.81 | % |
With Maximum Sales Charge2 | | 5.77 | | | 3.74 | | | 4.49 | |
| | | | |
CLASS B (Inception 9/27/93) | | | | | | | | | |
Net Asset Value1 | | 8.24 | | | 3.59 | | | 4.08 | |
With CDSC3 | | 3.24 | | | 3.24 | | | 4.08 | |
| | | | |
CLASS C (Inception 12/30/94) | | | | | | | | | |
Net Asset Value1 | | 8.24 | | | 3.60 | | | 4.08 | |
With CDSC3 | | 7.24 | | | 3.60 | | | 4.08 | |
| | | | |
CLASS Y (Inception 3/31/94) | | | | | | | | | |
Net Asset Value1 | | 9.40 | | | 4.65 | | | 5.15 | |
| | | | |
| COMPARATIVE PERFORMANCE | | 1 YEAR | | | 5 YEARS | | | 10 YEARS | |
Barclays Capital U.S. 1-5 Year Government Bond Index | | 5.43 | % | | 4.51 | % | | 5.16 | % |
Morningstar Short Gov’t Fund Avg. | | 5.48 | | | 3.79 | | | 4.38 | |
See page 11 for a description of the indices.
All returns represent past performance and do not guarantee future results. Periods of less than one year are not annualized. Share price and return will vary and you may have a gain or loss when you sell your shares. All results include reinvestment of dividends and capital gains. Current returns may be higher or lower than those shown. For performance current to the most recent month-end, visit www.funds.natixis.com. Performance history includes periods from a predecessor fund. Class Y shares are available to certain investors, as described in the prospectus.
The table and graph do not reflect taxes shareholders might owe on any fund distributions or when they redeem their shares.
PORTFOLIO FACTS
| | | | |
| |
| | | % of Net Assets as of |
| FUND COMPOSITION* | | 9/30/09 | | 9/30/08 |
Mortgage Related | | 42.4 | | 70.6 |
Treasuries | | 14.6 | | 4.6 |
Commercial Mortgage-Backed Securities | | 10.9 | | — |
Government Owned - No Guarantee | | 10.0 | | — |
Government Sponsored | | 8.3 | | — |
Government Guaranteed | | 3.5 | | — |
ABS Credit Card | | 3.4 | | 2.7 |
ABS Car Loan | | 2.1 | | — |
Automotive | | — | | 1.8 |
Hybrid ARMs | | 2.0 | | 1.6 |
ABS Home Equity | | 1.2 | | — |
Collateralized Mortgage Obligations | | 0.4 | | 0.1 |
ABS Other | | 0.3 | | — |
Asset-Backed Securities | | — | | 3.5 |
Mortgage Backed Securities | | — | | 2.0 |
Short-Term Investments & Other | | 0.9 | | 13.1 |
| | | | |
* Security classification changes made by Barclays Capital during the year ended 9/30/09 are not reflected in Fund Composition as of 9/30/08. | | | | |
| | | | | | |
| |
| | | % of Net Assets as of | |
| EFFECTIVE MATURITY | | 9/30/09 | | | 9/30/08 | |
1 year or less | | 1.9 | | | 19.0 | |
1-5 years | | 83.5 | | | 74.5 | |
5-10 years | | 14.6 | | | 6.5 | |
10+ years | | n/a | | | n/a | |
Average Effective Maturity | | 3.5 | years | | 3.0 | years |
Portfolio characteristics will vary.
EXPENSE RATIOS AS STATED IN THE MOST RECENT PROSPECTUS
| | | | | | |
| Share Class | | Gross Expense Ratio5 | | | Net Expense Ratio6 | |
A | | 1.07 | % | | 0.90 | % |
B | | 1.82 | | | 1.65 | |
C | | 1.83 | | | 1.65 | |
Y | | 0.72 | | | 0.65 | |
NOTES TO CHARTS
| 1 | Does not include a sales charge. |
| 2 | Includes maximum sales charge of 3.00%. |
| 3 | Performance for Class B shares assumes a maximum 5% contingent deferred sales charge (“CDSC”) applied when you sell shares, which declines annually between years 1-6 according to the following schedule: 5, 4, 3, 3, 2, 1, 0%. Class C shares performance assumes a 1% CDSC applied when you sell shares within one year of purchase. |
| 4 | Fund performance has been increased by expense reductions and reimbursements, if any, without which performance would have been lower. |
| 5 | Before reductions and reimbursements. |
| 6 | After reductions and reimbursements. Expense reductions are contractual and are set to expire on 1/31/10. |
8
LOOMIS SAYLES STRATEGIC INCOME FUND
PORTFOLIO PROFILE
Objective:
Seeks high current income, with a secondary objective of capital growth
Strategy:
Invests primarily in income-producing securities in the U.S. and around the world
Fund Inception:
May 1, 1995
Managers:
Daniel J. Fuss, CFA, CIC
Kathleen C. Gaffney, CFA
Associate Managers:
Matthew J. Eagan, CFA
Elaine M. Stokes
Loomis, Sayles & Company, L.P.
Symbols:
| | |
| Class A | | NEFZX |
| Class B | | NEZBX |
| Class C | | NECZX |
| Class Y | | NEZYX |
What You Should Know:
Fixed-income securities are subject to credit risk and interest rate risk; their value generally rises when prevailing interest rates fall and falls when rates rise.
The fund can invest a significant percentage of assets in debt securities that are rated below investment grade and the value of fund shares can be adversely affected by changes in economic conditions or other circumstances. Lower rated debt securities have speculative characteristics and may be subject to greater price volatility than higher rated investments. In addition, the secondary market for these securities may lack liquidity. The fund can also invest a significant percentage of assets in foreign securities and the value of the fund shares can be adversely affected by changes in currency exchange rates, political, and economic developments. In emerging markets, these risks can be significant. Fund shares should be viewed as a long-term investment.
Management Discussion
Beginning in March of 2009, signs that the recession was easing and the global economy was righting itself drew investors away from top-quality issues to seek higher returns. As a result of rigorous rallies following last winter’s severely depressed market, bond prices rose in a variety of corporate sectors and ratings categories. Resulting higher prices narrowed the extraordinarily wide spreads, or yield advantage, that had prevailed between Treasury and corporate issues during the economic crisis.
For the fiscal year ended September 30, 2009, Class A shares of Loomis Sayles Strategic Income Fund provided a total return at net asset value of 20.56%, including $0.86 in dividends and $0.08 in capital gains reinvested during the year. The fund outperformed its benchmark, Barclays Capital U.S. Aggregate Bond Index, which returned 10.56% over the period. It also outdistanced Morningstar’s Multisector Bond category, which had an average return of 13.15%.
WHAT WAS RESPONSIBLE FOR THE FUND’S STRONG PERFORMANCE?
Investment-grade corporate issues were among the best performers, with industrial bonds rated BBB by Moody’s Investor Services leading results. In addition, our emphasis on investment-grade industrials aided returns relative to the benchmark. Notable strength came from cable, wireline communications and oil field services companies. Consumer-related sectors, including healthcare and tobacco, also delivered strong performance, as did retail issues and others expected to benefit from an anticipated economic upturn. Financials were another source of positive performance, as surviving banks and other financial firms recovered from a period of exceptional stress. Real estate investment trusts and select utility companies also contributed. The high-yield sector as a whole gained the greatest impetus from investors’ renewed risk appetite, with financial securities rated CC by Moody’s Investors Service leading the way. Among high-yield industrial issues, automotive, pharmaceutical, and residential construction, as well as wireless telecommunications all boosted portfolio returns.
As currencies of commodity-rich countries rallied amid improving global growth prospects, the fund gained positive momentum from holdings denominated in the Brazilian real, the Norwegian krone, the New Zealand dollar and Indonesia’s rupiah. Although Canada’s dollar also strengthened, weak local market conditions diluted the contributions of the fund’s Canadian holdings. In contrast, strong regional markets amplified the positive impact of the fund’s euro-denominated investments.
Among convertibles, security-specific gains in the technology, wireline telecommunications and automotive industries added to results. Asset-backed obligations, especially credit-card issues, also moved higher. In addition, the fund’s relatively small positions in U.S. Treasury and government agency securities, as well as its underweight in mortgage-backed securities, proved helpful as improving risk tolerance caused investors to turn toward riskier assets in search of higher returns.
WHAT WERE THE PERIOD’S DISAPPOINTMENTS?
The fund experienced few areas of underperformance amid the widespread bullish sentiment in the past several months. High-yield electric utilities were a relative underperformer. In terms of quality categories, industrial bonds rated CCC by Moody’s detracted from the fund’s relative performance.
WHAT’S YOUR OUTLOOK?
Looking ahead, we continue to believe there is select value in corporate bonds. Despite their recent tightening, spreads remain wide relative to long-term averages. A vast majority of the spread tightening that has taken place this year is due to the re-emergence of liquidity in the markets. Over the long term, further spread tightening from these levels will most likely be generated by an improvement in global and U.S. economic fundamentals. Our view is that maintaining specific risk in the portfolio will present the best opportunity for long-term performance.
Global risk appetite has weakened the U.S. dollar, and we expect this may continue. Currencies from developed and emerging markets may offer more long-term upside potential, particularly the European peripheral currencies and Asian currencies tied to China and its global-growth story.
9
LOOMIS SAYLES STRATEGIC INCOME FUND
Investment Results through September 30, 2009
PERFORMANCE IN PERSPECTIVE
The charts comparing the fund’s performance to two indexes provide you with a general sense of how it performed. The fund’s total return for the period shown below appears with and without sales charges and includes fund expenses and fees. An index measures the performance of a theoretical portfolio. Unlike a fund, the index is unmanaged and does not have expenses that affect the results. It is not possible to invest directly in an index. Investors would incur transaction costs and other expenses if they purchased the securities necessary to match the index.
Growth of a $10,000 Investment in Class A Shares4
Average Annual Total Returns — September 30, 20094
| | | | | | | | | | | | |
| | | | | |
| | | 1 YEAR | | | 5 YEARS | | | 10 YEARS | | | SINCE
INCEPTION | |
CLASS A (Inception 5/1/95) | | | | | | | | | | | | |
Net Asset Value1 | | 20.56 | % | | 6.35 | % | | 9.03 | % | | — | |
With Maximum Sales Charge2 | | 15.14 | | | 5.38 | | | 8.53 | | | — | |
| | | | | |
CLASS B (Inception 5/1/95) | | | | | | | | | | | | |
Net Asset Value1 | | 19.62 | | | 5.56 | | | 8.21 | | | — | |
With CDSC3 | | 14.62 | | | 5.24 | | | 8.21 | | | — | |
| | | | | |
CLASS C (Inception 5/1/95) | | | | | | | | | | | | |
Net Asset Value1 | | 19.66 | | | 5.55 | | | 8.21 | | | — | |
With CDSC3 | | 18.66 | | | 5.55 | | | 8.21 | | | — | |
| | | | | |
CLASS Y (Inception 12/1/99) | | | | | | | | | | | | |
Net Asset Value1 | | 20.91 | | | 6.63 | | | — | | | 9.22 | % |
| COMPARATIVE PERFORMANCE | | 1 YEAR | | | 5 YEARS | | | 10 YEARS | | | SINCE
CLASS Y
INCEPTION | |
Barclays Capital U.S. Aggregate Bond Index | | 10.56 | % | | 5.13 | % | | 6.30 | % | | 6.37 | % |
Barclays Capital U.S. Universal Bond Index | | 10.91 | | | 5.15 | | | 6.42 | | | 6.47 | |
Morningstar Multisector Bond Fund Avg. | | 13.15 | | | 4.99 | | | 6.21 | | | 6.16 | |
See page 11 for a description of the indices.
All returns represent past performance and do not guarantee future results. Periods of less than one year are not annualized. Share price and return will vary and you may have a gain or loss when you sell your shares. All results include reinvestment of dividends and capital gains. Current returns may be higher or lower than those shown. Performance history includes periods from a predecessor fund. For performance current to the most recent month-end, visit www.funds.natixis.com. Class Y shares are available to certain investors, as described in the prospectus.
The table and graph do not reflect taxes shareholders might owe on any fund distributions or when they redeem their shares.
PORTFOLIO FACTS
| | | | |
| |
| | | % of Net Assets as of |
| CREDIT QUALITY | | 9/30/09 | | 9/30/08 |
Aaa | | 15.6 | | 18.3 |
Aa | | 6.1 | | 4.1 |
A | | 7.4 | | 8.1 |
Baa | | 30.8 | | 32.0 |
Ba | | 10.5 | | 10.0 |
B | | 6.9 | | 10.3 |
Caa | | 8.1 | | 7.4 |
Ca | | 3.9 | | 0.8 |
C | | 0.0 | | 0.0 |
Not Rated* | | 6.7 | | 8.8 |
Short-term and other | | 4.0 | | 0.2 |
Credit quality is based on ratings from Moody’s Investors Service.
* Securities that are not rated by Moody’s may be rated by another rating agency or by Loomis Sayles.
| | | | | | |
| |
| | | % of Net Assets as of | |
| EFFECTIVE MATURITY | | 9/30/09 | | | 9/30/08 | |
1 year or less | | 5.7 | | | 8.6 | |
1-5 years | | 25.8 | | | 20.6 | |
5-10 years | | 33.1 | | | 28.2 | |
10+ years | | 35.4 | | | 42.6 | |
Average Effective Maturity | | 12.3 | years | | 13.8 | years |
Portfolio characteristics will vary.
EXPENSE RATIOS AS STATED IN THE MOST RECENT PROSPECTUS
| | | | | | |
| Share Class | | Gross Expense Ratio5 | | | Net Expense Ratio6 | |
A | | 0.98 | % | | 0.98 | % |
B | | 1.73 | | | 1.73 | |
C | | 1.73 | | | 1.73 | |
Y | | 0.73 | | | 0.73 | |
NOTES TO CHARTS
| 1 | Does not include a sales charge. |
| 2 | Includes maximum sales charge of 4.50%. |
| 3 | Performance for Class B shares assumes a maximum 5% contingent deferred sales charge (“CDSC”) applied when you sell shares, which declines annually between years 1-6 according to the following schedule: 5, 4, 3, 3, 2, 1, 0%. Class C share performance assumes a 1.00% CDSC applied when you sell shares within one year of purchase. |
| 4 | Fund performance has been increased by expense reductions and reimbursements, if any, without which performance would have been lower. |
| 5 | Before reductions and reimbursements. |
| 6 | After reductions and reimbursements. Expense reductions are contractual and are set to expire on 1/31/10. |
10
ADDITIONAL INFORMATION
The views expressed in this report reflect those of the portfolio managers as of the dates indicated. The managers’ views are subject to change at any time without notice based on changes in market or other conditions. References to specific securities or industries should not be regarded as investment advice. Because the funds are actively managed, there is no assurance that they will continue to invest in the securities or industries mentioned.
For more complete information on any Natixis Fund, contact your financial professional, visit the funds website at www.funds.natixis.com or call Natixis Funds at 800-225-5478 and ask for a free prospectus, which contains more complete information including charges and other ongoing expenses. Investors should consider a fund’s objective, risks and expenses carefully before investing. This and other fund information can be found in the prospectus. Please read the prospectus carefully before investing.
INDEX/AVERAGE DESCRIPTIONS
Barclays Capital U.S. Aggregate Bond Index is an unmanaged index of investment-grade bonds with one- to ten-year maturities issued by the U.S. government, its agencies and U.S. corporations.
Barclays Capital Global Aggregate ex-USD Bond Index is an unmanaged index which provides a broad-based measure of the international investment-grade bond market.
Barclays Capital U.S. Corporate High-Yield Bond Index is a market-weighted, unmanaged index of fixed-rate, non-investment grade debt.
Barclays Capital U.S. 1-5 Year Government Bond Index is an unmanaged, market-weighted index of bonds issued by the U.S. government and its agencies, with maturities between one and five years.
Barclays Capital U.S. Credit Bond Index is an unmanaged index that includes all publicly issued, fixed-rate, nonconvertible, dollar-denominated, SEC-registered, U.S. investment-grade corporate debt, and foreign debt that meets specific maturity, liquidity and quality requirements.
Barclays Capital U.S. Universal Bond Index is an unmanaged index representing a blend of the Lehman Aggregate Bond Index, the High Yield Index, and the Emerging Market Index, among other indexes.
Morningstar Fund Averages are the average performance without sales charge of funds with similar investment objectives, as calculated by Morningstar, Inc.
PROXY VOTING INFORMATION
A description of the funds’ proxy voting policies and procedures is available without charge, upon request, by calling Natixis Funds at 800-225-5478; on the funds’ website at www.funds.natixis.com; and on the Securities and Exchange Commission’s (SEC’s) website at www.sec.gov. Information regarding how the funds voted proxies relating to portfolio securities during the 12-month period ended June 30, 2009 is available from the funds’ website and the SEC’s website.
QUARTERLY PORTFOLIO SCHEDULES
The funds file a complete schedule of portfolio holdings with the SEC for the first and third quarters of each fiscal year on Form N-Q. The funds’ Forms N-Q are available on the SEC’s website at www.sec.gov and may be reviewed and copied at the SEC’s Public Reference Room in Washington, DC. Information on the operation of the Public Reference Room may be obtained by calling
1-800-SEC-0330.
| | | | |
| NOT FDIC INSURED | | MAY LOSE VALUE | | NO BANK GUARANTEE |
11
UNDERSTANDING FUND EXPENSES
As a mutual fund shareholder, you incur different costs: transaction costs, including sales charges (loads) on purchases, redemption fees and contingent deferred sales charges on redemptions; certain exchange fees; and ongoing costs, including management fees, distribution and/or service fees (12b-1 fees), and other fund expenses. In addition, each fund may assess a minimum balance fee of $20 on an annual basis for accounts that fall below the required minimum to establish an account. Certain exemptions may apply. These costs are described in more detail in the funds’ prospectuses. The examples below are intended to help you understand the ongoing costs of investing in the funds and help you compare these with the ongoing costs of investing in other mutual funds.
The first line in the table of each Class of fund shares shows the actual account values and actual fund expenses you would have paid on a $1,000 investment in the fund from April 1, 2009 through September 30, 2009. To estimate the expenses you paid over the period, simply divide your account value by $1,000 (for example $8,600 account value divided by $1,000 = 8.60) and multiply the result by the number in the Expenses Paid During Period column as shown below for your Class.
The second line in the table of each Class of fund shares provides information about hypothetical account values and hypothetical expenses based on the fund’s actual expense ratios and an assumed rate of return of 5% per year before expenses, which is not the fund’s actual return. The hypothetical account values and expenses may not be used to estimate the actual ending account balance or expenses you paid on your investment for the period. You may use this information to compare the ongoing costs of investing in the fund and other funds. To do so, compare this 5% hypothetical example with the 5% hypothetical examples that appear in the shareholder reports of the other funds.
Please note that the expenses shown reflect ongoing costs only, and do not include any transaction costs such as sales charges, redemption fees, or exchange fees. Therefore, the second line in the table of each fund is useful in comparing ongoing costs only, and will not help you determine the relative costs of owning different funds. If transaction costs were included, total costs would be higher.
| | | | | | |
| LOOMIS SAYLES CORE PLUS BOND FUND | | BEGINNING ACCOUNT VALUE
4/1/2009 | | ENDING ACCOUNT VALUE
9/30/2009 | | EXPENSES PAID DURING PERIOD*
4/1/2009 – 9/30/2009 |
CLASS A | | | | | | |
Actual | | $1,000.00 | | $1,156.70 | | $4.87 |
Hypothetical (5% return before expenses) | | $1,000.00 | | $1,020.56 | | $4.56 |
CLASS B | | | | | | |
Actual | | $1,000.00 | | $1,152.70 | | $8.90 |
Hypothetical (5% return before expenses) | | $1,000.00 | | $1,016.80 | | $8.34 |
CLASS C | | | | | | |
Actual | | $1,000.00 | | $1,152.30 | | $8.90 |
Hypothetical (5% return before expenses) | | $1,000.00 | | $1,016.80 | | $8.34 |
CLASS Y | | | | | | |
Actual | | $1,000.00 | | $1,158.40 | | $3.52 |
Hypothetical (5% return before expenses) | | $1,000.00 | | $1,021.81 | | $3.29 |
| * | Expenses are equal to the Fund’s annualized expense ratio (after fee reduction/reimbursement): 0.90%, 1.65%, 1.65% and 0.65% for Class A, B, C and Y, respectively, multiplied by the average account value over the period, multiplied by the number of days in the most recent fiscal half-year, divided by 365 (to reflect the half-year period). |
12
UNDERSTANDING FUND EXPENSES
| | | | | | |
| LOOMIS SAYLES HIGH INCOME FUND | | BEGINNING ACCOUNT VALUE
4/1/2009 | | ENDING ACCOUNT VALUE
9/30/2009 | | EXPENSES PAID DURING PERIOD*
4/1/2009 – 9/30/2009 |
CLASS A | | | | | | |
Actual | | $1,000.00 | | $1,321.70 | | $6.69 |
Hypothetical (5% return before expenses) | | $1,000.00 | | $1,019.30 | | $5.82 |
CLASS B | | | | | | |
Actual | | $1,000.00 | | $1,319.60 | | $11.05 |
Hypothetical (5% return before expenses) | | $1,000.00 | | $1,015.54 | | $9.60 |
CLASS C | | | | | | |
Actual | | $1,000.00 | | $1,319.80 | | $11.05 |
Hypothetical (5% return before expenses) | | $1,000.00 | | $1,015.54 | | $9.60 |
CLASS Y | | | | | | |
Actual | | $1,000.00 | | $1,323.60 | | $5.24 |
Hypothetical (5% return before expenses) | | $1,000.00 | | $1,020.56 | | $4.56 |
| * | Expenses are equal to the Fund’s annualized expense ratio (after fee reduction/reimbursement): 1.15%, 1.90%, 1.90% and 0.90% for Class A, B, C and Y, respectively, multiplied by the average account value over the period, multiplied by the number of days in the most recent fiscal half-year, divided by 365 (to reflect the half-year period). |
| | | | | | |
| LOOMIS SAYLES INTERNATIONAL BOND FUND | | BEGINNING ACCOUNT VALUE
4/1/2009 | | ENDING ACCOUNT VALUE
9/30/2009 | | EXPENSES PAID DURING PERIOD*
4/1/2009 – 9/30/2009 |
CLASS A | | | | | | |
Actual | | $1,000.00 | | $1,229.20 | | $6.15 |
Hypothetical (5% return before expenses) | | $1,000.00 | | $1,019.55 | | $5.57 |
CLASS C | | | | | | |
Actual | | $1,000.00 | | $1,225.30 | | $10.32 |
Hypothetical (5% return before expenses) | | $1,000.00 | | $1,015.79 | | $9.35 |
CLASS Y | | | | | | |
Actual | | $1,000.00 | | $1,229.70 | | $4.75 |
Hypothetical (5% return before expenses) | | $1,000.00 | | $1,020.81 | | $4.31 |
| * | Expenses are equal to the Fund’s annualized expense ratio (after fee reduction/reimbursement): 1.10%, 1.85% and 0.85%, for Class A, C and Y, respectively, multiplied by the average account value over the period, multiplied by the number of days in the most recent fiscal half-year, divided by 365 (to reflect the half-year period). |
13
UNDERSTANDING FUND EXPENSES
| | | | | | |
LOOMIS SAYLES LIMITED TERM GOVERNMENT AND
AGENCY FUND | | BEGINNING ACCOUNT VALUE
4/1/2009 | | ENDING ACCOUNT VALUE
9/30/2009 | | EXPENSES PAID DURING PERIOD*
4/1/2009 – 9/30/2009 |
CLASS A | | | | | | |
Actual | | $1,000.00 | | $1,050.60 | | $4.63 |
Hypothetical (5% return before expenses) | | $1,000.00 | | $1,020.56 | | $4.56 |
CLASS B | | | | | | |
Actual | | $1,000.00 | | $1,047.70 | | $8.47 |
Hypothetical (5% return before expenses) | | $1,000.00 | | $1,016.80 | | $8.34 |
CLASS C | | | | | | |
Actual | | $1,000.00 | | $1,047.70 | | $8.47 |
Hypothetical (5% return before expenses) | | $1,000.00 | | $1,016.80 | | $8.34 |
CLASS Y | | | | | | |
Actual | | $1,000.00 | | $1,052.80 | | $3.34 |
Hypothetical (5% return before expenses) | | $1,000.00 | | $1,021.81 | | $3.29 |
| * | Expenses are equal to the Fund’s annualized expense ratio (after fee reduction/reimbursement): 0.90%, 1.65%, 1.65% and 0.65%, for Class A, B, C and Y, respectively, multiplied by the average account value over the period multiplied by the number of days in the most recent fiscal half-year, divided by 365 (to reflect the half-year period). |
| | | | | | |
| LOOMIS SAYLES STRATEGIC INCOME FUND | | BEGINNING ACCOUNT VALUE
4/1/2009 | | ENDING ACCOUNT VALUE
9/30/2009 | | EXPENSES PAID DURING PERIOD*
4/1/2009 – 9/30/2009 |
CLASS A | | | | | | |
Actual | | $1,000.00 | | $1,331.70 | | $5.73 |
Hypothetical (5% return before expenses) | | $1,000.00 | | $1,020.16 | | $4.96 |
CLASS B | | | | | | |
Actual | | $1,000.00 | | $1,327.00 | | $10.09 |
Hypothetical (5% return before expenses) | | $1,000.00 | | $1,016.39 | | $8.74 |
CLASS C | | | | | | |
Actual | | $1,000.00 | | $1,326.20 | | $10.09 |
Hypothetical (5% return before expenses) | | $1,000.00 | | $1,016.39 | | $8.74 |
CLASS Y | | | | | | |
Actual | | $1,000.00 | | $1,333.90 | | $4.15 |
Hypothetical (5% return before expenses) | | $1,000.00 | | $1,021.51 | | $3.60 |
| * | Expenses are equal to the Fund’s annualized expense ratio: 0.98%, 1.73%, 1.73% and 0.71% for Class A, B, C and Y, respectively, multiplied by the average account value over the period, multiplied by the number of days in the most recent fiscal half-year, divided by 365 (to reflect the half-year period). |
14
BOARD APPROVALOFTHE EXISTING ADVISORYAND SUB-ADVISORY AGREEMENTS
The Board of Trustees, including the Independent Trustees, considers matters bearing on each Fund’s advisory agreement and, with respect to the Loomis Sayles Core Plus Bond Fund, its Advisory Administration Agreement (collectively, the “Agreements”) at most of its meetings throughout the year. Each year, usually in the spring, the Contract Review and Governance Committee of the Board meets to review the Agreements to determine whether to recommend that the full Board approve the continuation of the Agreements, typically for an additional one-year period. After the Committee has made its recommendation, the full Board, including the Independent Trustees, determines whether to approve the continuation of the Agreements.
In connection with these meetings, the Trustees receive materials that the Funds’ investment adviser ( the “Adviser”) believes to be reasonably necessary for the Trustees to evaluate the Agreements. These materials generally include, among other items, (i) information on the investment performance of the Funds and the performance of peer groups of funds and the Funds’ performance benchmarks, (ii) information on the Funds’ advisory fees and other expenses, including information comparing the Funds’ expenses to those of peer groups of funds and information about any applicable expense caps and fee “breakpoints,” (iii) sales and redemption data in respect of the Funds, (iv) information about the profitability of the Agreements to the Funds’ Adviser and (v) information obtained through the completion of a questionnaire by the Adviser (the Trustees are consulted as to the information requested through that questionnaire). The Board of Trustees, including the Independent Trustees, also consider other matters such as (i) the Adviser’s financial results and financial condition, (ii) each Fund’s investment objective and strategies and the size, education and experience of the Adviser’s investment staff and its use of technology, external research and trading cost measurement tools, (iii) arrangements in respect of the distribution of the Funds’ shares and the related costs, (iv) the procedures employed to determine the value of the Funds’ assets, (v) the allocation of the Funds’ brokerage, if any, including, if applicable, allocations to brokers affiliated with the Adviser and the use of “soft” commission dollars to pay Fund expenses and to pay for research and other similar services, (vi) the resources devoted to, and the record of compliance with, the Funds’ investment policies and restrictions, policies on personal securities transactions and other compliance policies, (vii) information about amounts invested by the Funds’ portfolio managers in the Funds or in similar accounts that they manage and (viii) the general economic outlook with particular emphasis on the mutual fund industry. Throughout the process, the Trustees are afforded the opportunity to ask questions of and request additional materials from the Adviser.
In addition to the materials requested by the Trustees in connection with their annual consideration of the continuation of the Agreements, the Trustees receive materials in advance of each regular quarterly meeting of the Board of Trustees that provide detailed information about the Funds’ investment performance and the fees charged to the Funds for advisory and other services. This information generally includes, among other things, an internal performance rating for each Fund based on agreed-upon criteria, graphs showing each Fund’s performance and fee differentials against each Fund’s peer group of funds, performance ratings provided by a third-party, total return information for various periods, and third-party performance rankings for various periods comparing a Fund against its peer group. The portfolio management team for each Fund or other representatives of the Adviser make periodic presentations to the Contract Review and Governance Committee and/or the full Board of Trustees, and Funds identified as presenting possible performance concerns may be subject to more frequent board presentations and reviews. In addition, each quarter the Trustees are provided with detailed statistical information about each Fund’s portfolio.
The Board of Trustees most recently approved the continuation of the Agreements at their meeting held in June 2009. The Agreements were continued for a one-year period for the Funds. In considering whether to approve the continuation of the Agreements, the Board of Trustees, including the Independent Trustees, did not identify any single factor as determinative. Individual Trustees may have evaluated the information presented differently from one another, giving different weights to various factors. Matters considered by the Trustees, including the Independent Trustees, in connection with their approval of the Agreements included the factors listed below.
The nature, extent and quality of the services provided to the Funds under the Agreements. The Trustees considered the nature, extent and quality of the services provided by the Adviser and its affiliates to the Funds and the resources dedicated to the Funds by the Adviser and its affiliates, including recent or planned investments by the Adviser in additional personnel or other resources. They considered the need for the Adviser to offer competitive compensation in order to attract and retain capable personnel and the need for the Adviser to expend additional resources as the Funds grew in size.
For each Fund, the Trustees also considered the benefits to shareholders of investing in a mutual fund that is part of a family of funds that offers shareholders the right to exchange shares of one type of fund for shares of another type of fund, and provides a variety of fund and shareholder services.
15
BOARD APPROVALOFTHE EXISTING ADVISORYAND SUB-ADVISORY AGREEMENTS
After reviewing these and related factors, the Trustees concluded, within the context of their overall conclusions regarding each of the Agreements, that the nature, extent and quality of services provided supported the renewal of the Agreements.
Investment performance of the Funds and the Adviser. As noted above, the Trustees received information about the performance of the Funds over various time periods, including information which compared the performance of the Funds to the performance of peer groups of funds and the Funds’ respective performance benchmarks. In addition, the Trustees also reviewed data prepared by an independent third party which analyzed the performance of the Funds using a variety of performance metrics, including metrics which also measured the performance of the Funds on a risk adjusted basis.
With respect to each Fund, the Board concluded that the Fund’s performance or other relevant factors supported the renewal of the Agreement relating to that Fund. In the case of each Fund that had performance that lagged that of a relevant peer group for certain (although not necessarily all) periods, the Board concluded that other factors relevant to performance supported renewal of the Funds’ Agreements. These factors varied from Fund to Fund, but included one or more of the following: (1) that the Fund had a limited operating history, (2) that the underperformance was attributable, to a significant extent, to investment decisions (such as security selection or sector allocation) by the Fund’s Adviser that were reasonable and consistent with the Fund’s investment objective and policies (3) that the Fund’s performance, although lagging in certain recent periods, was stronger over the longer term (4) that the Fund’s more recent performance was competitive when compared to relevant performance benchmarks or peer groups, and (5) reductions in the Fund’s expense levels resulting from decreased expenses were not yet fully reflected in the Fund’s performance results.
The Trustees also considered the Adviser’s performance and reputation generally, the Funds’ performance as a fund family generally (as noted by certain financial publications), and the historical responsiveness of the Adviser to Trustee concerns about performance and the willingness of the Adviser to take steps intended to improve performance.
After reviewing these and related factors, the Trustees concluded, within the context of their overall conclusions regarding each of the Agreements, that the performance of the Funds and the Adviser and/or other relevant factors supported the renewal of the Agreements.
The costs of the services to be provided and profits to be realized by the Adviser and its affiliates from their respective relationships with the Funds. The Trustees considered the fees charged to the Funds for advisory services as well as the total expense levels of the Funds. This information included comparisons (provided both by management and also by an independent third party) of the Funds’ advisory fees and total expense levels to those of their peer groups and information about the advisory fees charged by the Adviser to comparable accounts. In considering the fees charged to comparable accounts, the Trustees considered, among other things, management’s representations about the differences between managing mutual funds as compared to other types of accounts, including the additional resources required to effectively manage and the greater regulatory costs associated with the management of mutual fund assets. In evaluating each Fund’s advisory fee, the Trustees also took into account the demands, complexity and quality of the investment management of such Fund. The Trustees considered that over the past several years, management had made recommendations regarding reductions in advisory fee rates, implementation of advisory fee breakpoints and the institution of advisory fee waivers and expense caps for various Funds in the Fund family. They noted that, as of December 31, 2008, all of the Natixis Funds in this report have expense caps in place, and the Trustees considered the amounts waived or reimbursed by the Adviser under these caps. The Trustees noted that the Loomis Sayles Strategic Income Fund had an advisory fee rate that was above the median of a peer group of funds. The Trustees considered the circumstances that accounted for such relatively higher expenses. The Trustees noted that for the Loomis Sayles Strategic Income Fund, the Fund’s total expense ratio was below the median even though the advisory fee was above the median and they noted that they had recently implemented an additional breakpoint in the Fund’s advisory fee schedule. The Trustees also noted that while the Loomis Sayles Limited Term Government and Agency Fund’s advisory fee was above the median for its peer group of funds, after the application of the Fund’s expense cap, it was below the median.
The Trustees also considered the compensation directly or indirectly received or to be received by the Adviser and its affiliates from their relationships with the Funds. The Trustees reviewed information provided by management as to the profitability of the Adviser’s and its affiliates’ relationships with the Funds, and information about the allocation of expenses used to calculate profitability. They also reviewed information provided by management about the effect of distribution costs and changes in asset levels on Adviser profitability, including information regarding resources spent on distribution activities. When reviewing profitability, the Trustees also considered information about court cases in which adviser profitability was an issue, the performance of the relevant Funds, the expense levels of the Funds, and whether the Adviser had implemented breakpoints and/or expense caps with respect to such Funds.
16
BOARD APPROVALOFTHE EXISTING ADVISORYAND SUB-ADVISORY AGREEMENTS
After reviewing these and related factors, the Trustees concluded, within the context of their overall conclusions regarding each of the Agreements, that the advisory fee charged to each of the Funds was fair and reasonable, and that the costs of these services generally and the related profitability of the Adviser and its affiliates in respect of their relationships with the Funds supported the renewal of the Agreements.
Economies of Scale. The Trustees considered the existence of any economies of scale in the provision of services by the Adviser and whether those economies are shared with the Funds through breakpoints in their investment advisory fees or other means, such as expense waivers or caps. The Trustees noted that each of the Funds was subject to an expense cap or waiver. For Loomis Sayles Strategic Income Fund, the Trustees noted that they had recently implemented an additional breakpoint in response to the growth of assets in the Fund. The Trustees further considered the effect of recent market volatility on all of the Fund’s assets and possible effect on the Fund’s future profitability. In considering these issues, the Trustees also took note of the costs of the services provided (both on an absolute and a relative basis) and the profitability to the Adviser and its affiliates of their relationships with the Funds, as discussed above.
After reviewing these and related factors, the Trustees considered, within the context of their overall conclusions regarding each of the Agreements, that the extent to which economies of scale were shared with the Funds supported the renewal of the Agreements.
The Trustees also considered other factors, which included but were not limited to the following:
| · | | the effect of recent market and economic turmoil on the performance, asset levels and expense ratios of each Fund. |
| · | | whether each Fund has operated in accordance with its investment objective and the Fund’s record of compliance with its investment restrictions, and the compliance programs of the Funds and the Adviser. They also considered the compliance-related resources the Adviser and its affiliates were providing to the Funds. |
| · | | the nature, quality, cost and extent of administrative and shareholder services performed by the Adviser and its affiliates, both under the Agreements and under separate agreements covering administrative services. |
| · | | so-called “fallout benefits” to the Adviser, such as the engagement of affiliates of the Adviser to provide distribution, administrative and brokerage services to the Funds, and the benefits of research made available to the Adviser by reason of brokerage commissions generated by the Funds’ securities transactions. The Trustees considered the possible conflicts of interest associated with these fallout and other benefits, and the reporting, disclosure and other processes in place to disclose and monitor such possible conflicts of interest. |
| · | | the Trustees’ review and discussion of the Funds’ advisory arrangements in prior years, and management’s record of responding to Trustee concerns raised during the year and in prior years. |
Based on their evaluation of all factors that they deemed to be material, including those factors described above, and assisted by the advice of independent counsel, the Trustees, including the Independent Trustees, concluded that each of the existing Agreements should be continued through June 30, 2010.
17
LOOMIS SAYLES CORE PLUS BOND FUND — PORTFOLIOOF INVESTMENTS
Investments as of September 30, 2009
| | | | | | |
Principal
Amount | | Description | | Value (†) |
| | | | | | |
| | Bonds and Notes — 96.3% of Net Assets | | | |
| | | ABS Home Equity — 0.6% | | | |
| $ | 1,017,940 | | Countrywide Asset-Backed Certificates, Series 2004-S1, Class A3, 4.615%, 2/25/2035 | | $ | 765,387 |
| | 836,743 | | Residential Asset Securities Corp., Series 2003-KS10, Class AI4, 4.470%, 3/25/2032 | | | 699,644 |
| | | | | | |
| | | | | | 1,465,031 |
| | | | | | |
| | | Automotive — 0.9% | | | |
| | 1,640,000 | | Ford Motor Credit Co. LLC, 7.000%, 10/01/2013 | | | 1,539,327 |
| | 810,000 | | Ford Motor Credit Co. LLC, 8.000%, 12/15/2016 | | | 751,490 |
| | | | | | |
| | | | | | 2,290,817 |
| | | | | | |
| | | Banking — 6.1% | | | |
| | 2,105,000 | | Barclays Bank PLC, 6.750%, 5/22/2019 | | | 2,354,306 |
| | 1,365,000 | | Bear Stearns Cos., Inc. (The), 6.400%, 10/02/2017 | | | 1,484,941 |
| | 2,135,000 | | Citigroup, Inc., 6.500%, 8/19/2013 | | | 2,241,214 |
| | 1,115,000 | | Citigroup, Inc., 8.125%, 7/15/2039 | | | 1,248,119 |
| | 625,000 | | Goldman Sachs Group, Inc. (The), 5.300%, 2/14/2012 | | | 660,291 |
| | 1,040,000 | | Goldman Sachs Group, Inc. (The), 6.150%, 4/01/2018 | | | 1,093,990 |
| | 1,560,000 | | JPMorgan Chase & Co., 6.000%, 1/15/2018 | | | 1,674,387 |
| | 1,670,000 | | Merrill Lynch & Co., Inc., MTN, 6.875%, 4/25/2018 | | | 1,756,334 |
| | 800,000 | | Morgan Stanley, 4.000%, 1/15/2010 | | | 806,230 |
| | 615,000 | | Morgan Stanley, 5.375%, 10/15/2015 | | | 634,822 |
| | 100,000 | | Morgan Stanley, 6.750%, 4/15/2011 | | | 106,627 |
| | 835,000 | | Morgan Stanley, Series F, GMTN, 6.625%, 4/01/2018 | | | 882,948 |
| | 835,000 | | Morgan Stanley, Series F, MTN, 5.550%, 4/27/2017 | | | 831,834 |
| | | | | | |
| | | | | | 15,776,043 |
| | | | | | |
| | | Building Materials — 1.5% | | | |
| | 2,520,000 | | Holcim Capital Corp. Ltd., 144A, 6.875%, 9/29/2039 | | | 2,596,895 |
| | 815,000 | | Owens Corning, Inc., 7.000%, 12/01/2036 | | | 667,798 |
| | 795,000 | | USG Corp., 6.300%, 11/15/2016 | | | 675,750 |
| | | | | | |
| | | | | | 3,940,443 |
| | | | | | |
| | | Chemicals — 0.5% | | | |
| | 1,000,000 | | Chevron Phillips Chemical Co. LLC, 144A, 8.250%, 6/15/2019 | | | 1,207,713 |
| | | | | | |
| | | Commercial Mortgage-Backed Securities — 7.2% | | | |
| | 795,000 | | Banc of America Commercial Mortgage, Inc., Series 2005-6, Class A2, 5.165%, 9/10/2047 | | | 803,235 |
| | | | | | |
Principal
Amount | | Description | | Value (†) |
| | | | | | |
| | | Commercial Mortgage-Backed Securities — continued | | | |
| $ | 850,000 | | Banc of America Commercial Mortgage, Inc., Series 2006-1, Class A2, 5.334%, 9/10/2045 | | $ | 859,204 |
| | 1,305,000 | | Banc of America Commercial Mortgage, Inc., Series 2007-2, Class A2, 5.634%, 4/10/2049 | | | 1,295,483 |
| | 1,245,000 | | Bear Stearns Commercial Mortgage Securities, Inc., Series 2005-PW10, Class A2, 5.270%, 12/11/2040 | | | 1,247,215 |
| | 1,200,000 | | Bear Stearns Commercial Mortgage Securities, Inc., Series 2007-PW16, Class A2, 5.667%, 6/11/2040(b) | | | 1,183,159 |
| | 145,000 | | Bear Stearns Commercial Mortgage Securities, Series 2007-PW15, Class A4, 5.331%, 2/11/2044 | | | 130,526 |
| | 1,000,000 | | Citigroup Commercial Mortgage Trust, Series 2008-C7, Class A4, 6.095%, 12/10/2049(b) | | | 900,310 |
| | 710,000 | | Citigroup/Deutsche Bank Commercial Mortgage Trust, Series 2006-CD2, Class A2, 5.408%, 1/15/2046 | | | 714,745 |
| | 1,800,000 | | Greenwich Capital Commercial Funding Corp., Series 2005-GG5, Class A2, 5.117%, 4/10/2037 | | | 1,795,601 |
| | 960,000 | | Greenwich Capital Commercial Funding Corp., Series 2006-GG7, Class A4, 5.918%, 7/10/2038(b) | | | 878,303 |
| | 274,000 | | GS Mortgage Securities Corp. II, Series 2006-GG6, Class A4, 5.553%, 4/10/2038 | | | 247,456 |
| | 1,140,000 | | GS Mortgage Securities Corp. II, Series 2006-GG8, Class A4, 5.560%, 11/10/2039 | | | 1,001,888 |
| | 1,375,000 | | JP Morgan Chase Commercial Mortgage Securities Corp., Series 2006-LDP7, Class A4, 5.875%, 4/15/2045(b) | | | 1,278,701 |
| | 850,000 | | JP Morgan Chase Commercial Mortgage Securities Corp., Series 2007-CB18, Class A4, 5.440%, 6/12/2047 | | | 730,316 |
| | 1,710,000 | | LB-UBS Commercial Mortgage Trust, Series 2005-C3, Class A3, 4.647%, 7/15/2030 | | | 1,712,618 |
| | 900,000 | | Morgan Stanley Capital I, Series 2007-T27, Class A4, 5.650%, 6/11/2042(b) | | | 849,315 |
| | 1,175,000 | | Morgan Stanley Capital I, Series 2008-T29, Class A4, 6.280%, 1/11/2043(b) | | | 1,139,794 |
| | 2,070,000 | | Wachovia Bank Commercial Mortgage Trust, Series 2006-C29, Class A4, 5.308%, 11/15/2048 | | | 1,863,884 |
| | | | | | |
| | | | | | 18,631,753 |
| | | | | | |
| | | Consumer Products — 0.2% | | | |
| | 255,000 | | Whirlpool Corp., 8.000%, 5/01/2012 | | | 275,248 |
| | 250,000 | | Whirlpool Corp., MTN, 8.600%, 5/01/2014 | | | 279,656 |
| | | | | | |
| | | | | | 554,904 |
| | | | | | |
| | | Distributors — 0.3% | | | |
| | 605,000 | | EQT Corp., 8.125%, 6/01/2019 | | | 690,529 |
| | | | | | |
| | | Diversified Manufacturing — 2.7% | | | |
| | 1,200,000 | | Crane Co., 6.550%, 11/15/2036(c) | | | 1,177,523 |
See accompanying notes to financial statements.
18
LOOMIS SAYLES CORE PLUS BOND FUND — PORTFOLIOOF INVESTMENTS (continued)
Investments as of September 30, 2009
| | | | | | |
Principal
Amount | | Description | | Value (†) |
| | | | | | |
| | | Diversified Manufacturing — continued | | | |
| $ | 2,145,000 | | General Electric Co., 5.250%, 12/06/2017 | | $ | 2,201,306 |
| | 2,790,000 | | Hutchison Whampoa International Ltd., 144A, 5.750%, 9/11/2019 | | | 2,806,857 |
| | 760,000 | | Timken Co. (The), 6.000%, 9/15/2014 | | | 789,532 |
| | | | | | |
| | | | | | 6,975,218 |
| | | | | | |
| | | Electric — 2.4% | | | |
| | 290,000 | | AES Corp. (The), 7.750%, 10/15/2015 | | | 291,450 |
| | 570,000 | | AES Corp. (The), 8.000%, 10/15/2017 | | | 573,563 |
| | 715,000 | | AES Corp. (The), 8.000%, 6/01/2020 | | | 709,637 |
| | 110,000 | | CMS Energy Corp., 8.750%, 6/15/2019 | | | 119,657 |
| | 950,000 | | Enersis SA, Chile, 7.375%, 1/15/2014 | | | 1,048,121 |
| | 630,000 | | Exelon Generation Co. LLC, 5.200%, 10/01/2019 | | | 636,894 |
| | 1,535,000 | | Exelon Generation Co. LLC, 6.250%, 10/01/2039 | | | 1,566,716 |
| | 690,000 | | Ipalco Enterprises, Inc., 144A, 7.250%, 4/01/2016 | | | 691,725 |
| | 590,000 | | Southern California Edison Co., 7.625%, 1/15/2010 | | | 601,083 |
| | | | | | |
| | | | | | 6,238,846 |
| | | | | | |
| | | Environmental — 0.2% | | | |
| | 545,000 | | Waste Management, Inc., 7.375%, 3/11/2019 | | | 634,240 |
| | | | | | |
| | | Financial Other — 0.6% | | | |
| | 1,430,000 | | HKCG Finance Ltd., 144A, 6.250%, 8/07/2018 | | | 1,570,367 |
| | | | | | |
| | | Food & Beverage — 2.6% | | | |
| | 560,000 | | Anheuser-Busch Cos., Inc., 4.500%, 4/01/2018 | | | 543,080 |
| | 605,000 | | Bunge Ltd. Finance Co., 8.500%, 6/15/2019 | | | 697,462 |
| | 2,235,000 | | Del Monte Corp., 144A, 7.500%, 10/15/2019 | | | 2,257,350 |
| | 1,015,000 | | Dr Pepper Snapple Group, Inc., 6.820%, 5/01/2018 | | | 1,153,835 |
| | 915,000 | | Kraft Foods, Inc., 6.125%, 8/23/2018 | | | 970,532 |
| | 1,040,000 | | Smithfield Foods, Inc., 144A, 10.000%, 7/15/2014 | | | 1,092,000 |
| | | | | | |
| | | | | | 6,714,259 |
| | | | | | |
| | | Government Guaranteed — 0.4% | | | |
| | 910,000 | | JPMorgan Chase & Co., 2.125%, 6/22/2012, (FDIC insured) | | | 923,341 |
| | | | | | |
| | | Government Owned — No Guarantee — 0.9% | | | |
| | 1,280,000 | | Export-Import Bank of Korea, 8.125%, 1/21/2014 | | | 1,466,217 |
| | 750,000 | | Qtel International Finance Ltd., 144A, 7.875%, 6/10/2019 | | | 857,431 |
| | | | | | |
| | | | | | 2,323,648 |
| | | | | | |
| | | | | | |
Principal
Amount | | Description | | Value (†) |
| | | | | | |
| | | Health Insurance — 0.6% | | | |
| $ | 1,470,000 | | WellPoint, Inc., 7.000%, 2/15/2019 | | $ | 1,671,033 |
| | | | | | |
| | | Healthcare — 1.0% | | | |
| | 190,000 | | Express Scripts, Inc., 7.250%, 6/15/2019 | | | 223,146 |
| | 575,000 | | HCA, Inc., 7.500%, 12/15/2023 | | | 464,179 |
| | 685,000 | | HCA, Inc., 9.125%, 11/15/2014 | | | 707,262 |
| | 485,000 | | Hospira, Inc., 6.050%, 3/30/2017 | | | 507,880 |
| | 670,000 | | Medco Health Solutions, 7.250%, 8/15/2013 | | | 749,723 |
| | | | | | |
| | | | | | 2,652,190 |
| | | | | | |
| | | Hybrid ARMs — 0.9% | | | |
| | 1,117,659 | | FHLMC, 5.980%, 11/01/2036(b) | | | 1,174,939 |
| | 1,104,898 | | FNMA, 6.026%, 2/01/2037(b) | | | 1,174,915 |
| | 120,903 | | JPMorgan Mortgage Trust, Series 2006-A7, Class 1A3, 4.552%, 1/25/2037(b) | | | 112,760 |
| | | | | | |
| | | | | | 2,462,614 |
| | | | | | |
| | | Independent Energy — 1.6% | | | |
| | 1,710,000 | | Anadarko Petroleum Corp., 6.950%, 6/15/2019 | | | 1,906,450 |
| | 2,000,000 | | XTO Energy, Inc., 6.375%, 6/15/2038 | | | 2,127,554 |
| | | | | | |
| | | | | | 4,034,004 |
| | | | | | |
| | | Lodging — 0.6% | | | |
| | 1,390,000 | | Royal Caribbean Cruises Ltd., 11.875%, 7/15/2015 | | | 1,563,750 |
| | | | | | |
| | | Media Cable — 2.1% | | | |
| | 590,000 | | Comcast Corp., 6.450%, 3/15/2037 | | | 624,745 |
| | 1,770,000 | | Comcast Corp., 6.950%, 8/15/2037 | | | 1,975,607 |
| | 755,000 | | Cox Communications, Inc., 6.750%, 3/15/2011 | | | 799,553 |
| | 1,760,000 | | Time Warner Cable, Inc., 8.250%, 4/01/2019 | | | 2,127,305 |
| | | | | | |
| | | | | | 5,527,210 |
| | | | | | |
| | | Metals & Mining — 1.1% | | | |
| | 1,010,000 | | ArcelorMittal, 9.850%, 6/01/2019 | | | 1,194,632 |
| | 790,000 | | Rio Tinto Finance (USA) Ltd., 9.000%, 5/01/2019 | | | 969,783 |
| | 710,000 | | United States Steel Corp., 6.650%, 6/01/2037 | | | 579,103 |
| | | | | | |
| | | | | | 2,743,518 |
| | | | | | |
| | | Mortgage Related — 16.9% | | | |
| | 721,470 | | FHLMC, 4.000%, 7/01/2019 | | | 750,406 |
| | 1,499,037 | | FHLMC, 4.500%, 12/01/2034 | | | 1,524,646 |
| | 349,803 | | FHLMC, 5.000%, 11/01/2018 | | | 371,941 |
See accompanying notes to financial statements.
19
LOOMIS SAYLES CORE PLUS BOND FUND — PORTFOLIOOF INVESTMENTS (continued)
Investments as of September 30, 2009
| | | | | | |
Principal
Amount | | Description | | Value (†) |
| | | | | | |
| | | Mortgage Related — continued | | | |
| $ | 983,685 | | FHLMC 5.500%, with various maturities in 2018(d) | | $ | 1,054,747 |
| | 142,523 | | FHLMC, 6.000%, 6/01/2035 | | | 151,573 |
| | 577,436 | | FNMA, 4.000%, 6/01/2019 | | | 600,596 |
| | 5,769,643 | | FNMA 4.500%, with various maturities from 2019 to 2035(d) | | | 5,964,505 |
| | 782,549 | | FNMA, 5.500%, 5/01/2018 | | | 837,510 |
| | 7,225,983 | | FNMA 6.000%, with various maturities from 2016 to 2039(d) | | | 7,650,895 |
| | 3,295,592 | | FNMA 6.500%, with various maturities from 2029 to 2037(d) | | | 3,531,964 |
| | 151,800 | | FNMA 7.000%, with various maturities in 2030(d) | | | 167,567 |
| | 174,950 | | FNMA 7.500%, with various maturities from 2024 to 2032(d) | | | 195,964 |
| | 5,049,511 | | GNMA 5.000%, with various maturities from 2035 to 2038(d) | | | 5,241,610 |
| | 11,465,903 | | GNMA 5.500%, with various maturities from 2034 to 2039(d) | | | 12,060,450 |
| | 2,376,967 | | GNMA 6.000%, with various maturities from 2029 to 2037(d) | | | 2,517,115 |
| | 456,462 | | GNMA 6.500%, with various maturities from 2028 to 2032(d) | | | 492,236 |
| | 293,761 | | GNMA 7.000%, with various maturities from 2025 to 2029(d) | | | 323,799 |
| | 107,647 | | GNMA, 7.500%, with various maturities from 2025 to 2030(d) | | | 120,422 |
| | 58,955 | | GNMA, 8.000%, 11/15/2029 | | | 67,026 |
| | 94,983 | | GNMA 8.500%, with various maturities from 2017 to 2023(d) | | | 107,601 |
| | 17,021 | | GNMA 9.000%, with various maturities in 2016(d) | | | 18,599 |
| | 35,492 | | GNMA 11.500%, with various maturities from 2013 to 2015(d) | | | 39,752 |
| | | | | | |
| | | | | | 43,790,924 |
| | | | | | |
| | | Non-Captive Consumer — 0.9% | | | |
| | 735,000 | | HSBC Finance Corp., 7.000%, 5/15/2012 | | | 793,993 |
| | 245,000 | | SLM Corp., MTN, 5.050%, 11/14/2014 | | | 180,098 |
| | 215,000 | | SLM Corp., Series A, MTN, 5.000%, 10/01/2013 | | | 171,153 |
| | 120,000 | | SLM Corp., Series A, MTN, 5.000%, 6/15/2018 | | | 75,255 |
| | 35,000 | | SLM Corp., Series A, MTN, 5.375%, 5/15/2014 | | | 26,788 |
| | 420,000 | | SLM Corp., Series A, MTN, 5.625%, 8/01/2033 | | | 263,606 |
| | 1,135,000 | | SLM Corp., Series A, MTN, 8.450%, 6/15/2018 | | | 905,162 |
| | | | | | |
| | | | | | 2,416,055 |
| | | | | | |
| | | Non-Captive Diversified — 2.0% | | | |
| | 745,000 | | General Electric Capital Corp., 5.875%, 1/14/2038 | | | 683,225 |
| | 1,180,000 | | General Electric Capital Corp., Series A, MTN, 5.625%, 9/15/2017 | | | 1,194,790 |
| | | | | | |
Principal
Amount | | Description | | Value (†) |
| | | | | | |
| | | Non-Captive Diversified — continued | | | |
| $ | 1,842,000 | | GMAC, Inc., 144A, 6.625%, 5/15/2012 | | $ | 1,694,640 |
| | 571,000 | | GMAC, Inc., 144A, 8.000%, 11/01/2031 | | | 459,655 |
| | 465,000 | | International Lease Finance Corp., 5.000%, 4/15/2010 | | | 451,595 |
| | 205,000 | | International Lease Finance Corp., 6.375%, 3/25/2013 | | | 164,401 |
| | 120,000 | | International Lease Finance Corp., Series R, MTN, 5.300%, 5/01/2012 | | | 100,859 |
| | 40,000 | | International Lease Finance Corp., Series R, MTN, 5.550%, 9/05/2012 | | | 32,683 |
| | 200,000 | | International Lease Finance Corp., Series R, MTN, 5.625%, 9/20/2013 | | | 152,378 |
| | 285,000 | | International Lease Finance Corp., Series R, MTN, 5.650%, 6/01/2014 | | | 218,747 |
| | | | | | |
| | | | | | 5,152,973 |
| | | | | | |
| | | Oil Field Services — 0.4% | | | |
| | 190,000 | | Nabors Industries, Inc., 6.150%, 2/15/2018 | | | 190,474 |
| | 730,000 | | Nabors Industries, Inc., 9.250%, 1/15/2019 | | | 867,541 |
| | | | | | |
| | | | | | 1,058,015 |
| | | | | | |
| | | Paper — 1.7% | | | |
| | 565,000 | | Georgia-Pacific Corp., 7.375%, 12/01/2025 | | | 508,500 |
| | 755,000 | | Georgia-Pacific Corp., 7.750%, 11/15/2029 | | | 694,600 |
| | 735,000 | | Georgia-Pacific Corp., 8.000%, 1/15/2024 | | | 727,650 |
| | 365,000 | | Georgia-Pacific Corp., 8.875%, 5/15/2031 | | | 368,650 |
| | 1,730,000 | | International Paper Co., 9.375%, 5/15/2019 | | | 2,025,650 |
| | | | | | |
| | | | | | 4,325,050 |
| | | | | | |
| | | Pipelines — 1.2% | | | |
| | 1,150,000 | | NGPL Pipeco LLC, 144A, 6.514%, 12/15/2012 | | | 1,261,669 |
| | 705,000 | | ONEOK Partners LP, 8.625%, 3/01/2019 | | | 841,593 |
| | 830,000 | | TEPPCO Partners LP, 7.550%, 4/15/2038 | | | 979,038 |
| | | | | | |
| | | | | | 3,082,300 |
| | | | | | |
| | | Property & Casualty Insurance — 0.6% | | | |
| | 760,000 | | Marsh & McLennan Cos., Inc., 9.250%, 4/15/2019 | | | 952,386 |
| | 475,000 | | Willis North America, Inc., 6.200%, 3/28/2017 | | | 464,970 |
| | 245,000 | | Willis North America, Inc., 7.000%, 9/29/2019 | | | 251,914 |
| | | | | | |
| | | | | | 1,669,270 |
| | | | | | |
| | | Refining — 0.4% | | | |
| | 965,000 | | Valero Energy Corp., 9.375%, 3/15/2019 | | | 1,124,489 |
| | | | | | |
| | | Sovereigns — 1.7% | | | |
| | 1,065,000 | | Emirate of Abu Dhabi, 144A, 6.750%, 4/08/2019 | | | 1,189,377 |
See accompanying notes to financial statements.
20
LOOMIS SAYLES CORE PLUS BOND FUND — PORTFOLIOOF INVESTMENTS (continued)
Investments as of September 30, 2009
| | | | | | |
Principal
Amount | | Description | | Value (†) |
| | | | | | |
| | | Sovereigns — continued | | | |
| $ | 1,155,000 | | Indonesia Government International Bond, 144A, 7.750%, 1/17/2038 | | $ | 1,276,275 |
| | 1,125,000 | | Republic of Korea, 7.125%, 4/16/2019 | | | 1,319,483 |
| | 545,000 | | Taqa Abu Dhabi National Energy, 144A, 6.250%, 9/16/2019 | | | 549,027 |
| | | | | | |
| | | | | | 4,334,162 |
| | | | | | |
| | | Technology — 2.1% | | | |
| | 745,000 | | Corning, Inc., 7.250%, 8/15/2036 | | | 786,031 |
| | 440,000 | | Equifax, Inc., 7.000%, 7/01/2037 | | | 432,276 |
| | 1,180,000 | | Fiserv, Inc., 6.125%, 11/20/2012 | | | 1,278,928 |
| | 215,000 | | Jabil Circuit, Inc., 7.750%, 7/15/2016 | | | 218,225 |
| | 85,000 | | Motorola, Inc., 6.500%, 9/01/2025 | | | 71,832 |
| | 115,000 | | Motorola, Inc., 6.500%, 11/15/2028 | | | 94,853 |
| | 185,000 | | Motorola, Inc., 6.625%, 11/15/2037 | | | 154,937 |
| | 279,000 | | Xerox Corp., 5.500%, 5/15/2012 | | | 292,549 |
| | 1,435,000 | | Xerox Corp., 6.350%, 5/15/2018 | | | 1,491,835 |
| | 683,000 | | Xerox Corp., 6.400%, 3/15/2016 | | | 715,610 |
| | | | | | |
| | | | | | 5,537,076 |
| | | | | | |
| | | Tobacco — 0.6% | | | |
| | 1,590,000 | | Reynolds American, Inc., 7.250%, 6/15/2037 | | | 1,574,763 |
| | | | | | |
| | | Treasuries — 26.1% | | | |
| | 6,555,000 | | U.S. Treasury Bond, 3.500%, 2/15/2039 | | | 5,938,423 |
| | 5,617,000 | | U.S. Treasury Note, 0.875%, 12/31/2010 | | | 5,641,136 |
| | 5,430,000 | | U.S. Treasury Note, 0.875%, 5/31/2011 | | | 5,442,940 |
| | 2,325,000 | | U.S. Treasury Note, 1.000%, 7/31/2011 | | | 2,331,631 |
| | 4,885,000 | | U.S. Treasury Note, 2.375%, 8/31/2010 | | | 4,973,160 |
| | 1,000,000 | | U.S. Treasury Note, 2.625%, 6/30/2014 | | | 1,017,812 |
| | 2,670,000 | | U.S. Treasury Note, 2.625%, 7/31/2014 | | | 2,714,640 |
| | 3,810,000 | | U.S. Treasury Note, 2.750%, 2/15/2019 | | | 3,635,871 |
| | 22,870,000 | | U.S. Treasury Note, 3.125%, 5/15/2019 | | | 22,503,714 |
| | 3,545,000 | | U.S. Treasury Note, 3.250%, 7/31/2016 | | | 3,628,088 |
| | 2,205,000 | | U.S. Treasury Note, 3.625%, 1/15/2010 | | | 2,227,050 |
| | 3,105,000 | | U.S. Treasury Note, 3.625%, 8/15/2019 | | | 3,186,991 |
| | | | | | |
Principal
Amount | | Description | | Value (†) |
| | | | | | |
| | | Treasuries — continued | | | |
| $ | 1,060,000 | | U.S. Treasury Note, 3.750%, 11/15/2018 | | $ | 1,096,852 |
| | 3,005,000 | | U.S. Treasury Note, 4.625%, 2/15/2017 | | | 3,326,862 |
| | | | | | |
| | | | | | 67,665,170 |
| | | | | | |
| | | Wireless — 2.0% | | | |
| | 10,000 | | Nextel Communications, Inc., Series D, 7.375%, 8/01/2015 | | | 8,975 |
| | 15,000 | | Nextel Communications, Inc., Series F, 5.950%, 3/15/2014 | | | 13,275 |
| | 1,385,000 | | SK Telecom Co., Ltd., 144A, 6.625%, 7/20/2027 | | | 1,467,921 |
| | 2,695,000 | | Sprint Capital Corp., 6.875%, 11/15/2028 | | | 2,250,325 |
| | 1,420,000 | | True Move Co. Ltd., 144A, 10.750%, 12/16/2013 | | | 1,363,200 |
| | | | | | |
| | | | | | 5,103,696 |
| | | | | | |
| | | Wirelines — 4.7% | | | |
| | 1,095,000 | | Axtel SAB de CV, 144A, 9.000%, 9/22/2019 | | | 1,111,425 |
| | 3,428,000 | | Embarq Corp., 7.995%, 6/01/2036 | | | 3,581,622 |
| | 1,275,000 | | Frontier Communications Corp., 7.875%, 1/15/2027 | | | 1,163,437 |
| | 210,000 | | Qwest Capital Funding, Inc., 6.500%, 11/15/2018 | | | 172,725 |
| | 460,000 | | Qwest Corp., 6.875%, 9/15/2033 | | | 372,600 |
| | 850,000 | | Qwest Corp., 7.250%, 9/15/2025 | | | 733,125 |
| | 255,000 | | Qwest Corp., 7.250%, 10/15/2035 | | | 205,275 |
| | 1,790,000 | | Qwest Corp., 7.500%, 6/15/2023 | | | 1,628,900 |
| | 590,000 | | Telecom Italia Capital SA, 6.000%, 9/30/2034 | | | 575,173 |
| | 1,700,000 | | Telecom Italia Capital SA, 7.200%, 7/18/2036 | | | 1,920,781 |
| | 600,000 | | Telemar Norte Leste SA, 144A, 9.500%, 4/23/2019 | | | 717,000 |
| | | | | | |
| | | | | | 12,182,063 |
| | | | | | |
| | | Total Bonds and Notes (Identified Cost $235,840,892) | | | 249,607,477 |
| | | | | | |
Shares | | | | |
| | Preferred Stocks — 0.3% |
| | | Diversified Financial Services — 0.1% | | | |
| | 532 | | Preferred Blocker, Inc., 7.000%, 144A | | | 309,375 |
| | | | | | |
| | | Thrifts & Mortgage Finance — 0.2% | | | |
| | 256,000 | | Federal National Mortgage Association, 6.750%(e)(f) | | | 401,920 |
| | 4,200 | | Federal National Mortgage Association,
(fixed rate to 12/13/2010, variable rate thereafter), 8.250%(e)(f) | | | 6,762 |
| | | | | | |
| | | | | | 408,682 |
| | | | | | |
| | | Total Preferred Stocks (Identified Cost $1,717,444) | | | 718,057 |
| | | | | | |
See accompanying notes to financial statements.
21
LOOMIS SAYLES CORE PLUS BOND FUND — PORTFOLIOOF INVESTMENTS (continued)
Investments as of September 30, 2009
| | | | | | | |
Principal
Amount (‡) | | Description | | Value (†) | |
| | | | | | | |
| | Short-Term Investments — 4.5% | | | | |
| $ | 11,737,039 | | Tri-Party Repurchase Agreement with Fixed Income Clearing Corporation, dated 9/30/2009 at 0.000% to be repurchased at $11,737,039 on 10/01/2009, collateralized by $11,870,000 Federal Home Loan Bank, 2.900% due 7/02/2013 valued at $11,973,863, including accrued interest (Note 2g of Notes to Financial Statements) (Identified Cost $11,737,039) | | $ | 11,737,039 | |
| | | | | | | |
| | | | | | | |
| | | Total Investments — 101.1% (Identified Cost $249,295,375)(a) | | | 262,062,573 | |
| | | Other assets less liabilities — (1.1)% | | | (2,780,871 | ) |
| | | | | | | |
| | | Net Assets — 100.0% | | $ | 259,281,702 | |
| | | | | | | |
| | | | | | | |
| | (†) | | See Note 2a of Notes to Financial Statements. | | | | |
| | (a) | | Federal Tax Information: At September 30, 2009, the net unrealized appreciation on investments based on a cost of $250,658,047 for federal income tax purposes was as follows: | | | | |
| | | Aggregate gross unrealized appreciation for all investments in which there is an excess of value over tax cost | | $ | 14,511,656 | |
| | | Aggregate gross unrealized depreciation for all investments in which there is an excess of tax cost over value | | | (3,107,130 | ) |
| | | | | | | |
| | | Net unrealized appreciation | | $ | 11,404,526 | |
| | | | | | | |
| | | | | | | |
| | (b) | | Variable rate security. Rate as of September 30, 2009 is disclosed. | |
| | (c) | | Illiquid security. At September 30, 2009, the value of this security amounted to $1,177,523 or 0.5% of net assets. | |
| | (d) | | The Fund’s investment in mortgage related securities of the Federal Home Loan Mortgage Corporation, Federal National Mortgage Association and Government National Mortgage Association are interests in separate pools of mortgages. All separate investments in securities of each issuer which have the same coupon rate have been aggregated for the purpose of presentation in the Portfolio of Investments. | |
| | (e) | | Non-income producing security. | |
| | (f) | | Future dividend payments have been eliminated as the issuer has been placed in conservatorship. | |
| | | | |
| | 144A | | Securities exempt from registration under Rule 144A of the Securities Act of 1933. These securities may be resold in transactions exempt from registration, normally to qualified institutional buyers. At September 30, 2009, the value of these securities amounted to $24,479,902 or 9.4% of net assets. | |
| | | | | | | |
| | ABS | | Asset-Backed Securities | |
| | ARM | | Adjustable Rate Mortgage | |
| | FDIC | | Federal Deposit Insurance Corporation | |
| | FHLMC | | Federal Home Loan Mortgage Corporation | |
| | FNMA | | Federal National Mortgage Association | |
| | GMTN | | Global Medium Term Note | |
| | GNMA | | Government National Mortgage Association | |
| | MTN | | Medium Term Note | |
Industry Summary at September 30, 2009 (Unaudited)
| | | |
| Treasuries | | 26.1 | % |
| Mortgage Related | | 16.9 | |
| Commercial Mortgage-Backed Securities | | 7.2 | |
| Banking | | 6.1 | |
| Wirelines | | 4.7 | |
| Diversified Manufacturing | | 2.7 | |
| Food & Beverage | | 2.6 | |
| Electric | | 2.4 | |
| Technology | | 2.1 | |
| Media Cable | | 2.1 | |
| Non-Captive Diversified | | 2.0 | |
| Wireless | | 2.0 | |
| Other Investments, less than 2% each | | 19.7 | |
| Short-Term Investments | | 4.5 | |
| | | |
| Total Investments | | 101.1 | |
| Other assets less liabilities | | (1.1 | ) |
| | | |
| Net Assets | | 100.0 | % |
| | | |
See accompanying notes to financial statements.
22
LOOMIS SAYLES HIGH INCOME FUND — PORTFOLIOOF INVESTMENTS
Investments as of September 30, 2009
| | | | | | |
Principal
Amount (‡) | | Description | | Value (†) |
| | | | | | |
| | Bonds and Notes — 89.9% of Net Assets | | | |
| | | ABS Car Loan — 0.1% | | | |
| $ | 85,000 | | Capital One Auto Finance Trust, Series 2006-C, Class A4, 0.273%, 5/15/2013(b) | | $ | 83,382 |
| | 100,000 | | Capital One Auto Finance Trust, Series 2007-C, Class A4, 5.230%, 7/15/2014 | | | 97,803 |
| | | | | | |
| | | | | | 181,185 |
| | | | | | |
| | | ABS Credit Card — 0.1% | | | |
| | 100,000 | | HSBC Private Label Credit Card Master Note Trust, Series 2007-1, Class B, 0.353%, 12/16/2013(b) | | | 96,345 |
| | | | | | |
| | | ABS Home Equity — 1.3% | | | |
| | 117,055 | | Citigroup Mortgage Loan Trust, Inc., Series 2006-NC1, Class A2B, 0.356%, 8/25/2036(b) | | | 96,860 |
| | 606,666 | | Citigroup Mortgage Loan Trust, Inc., Series 2006-WFH2, Class A2A, 0.396%, 8/25/2036(b) | | | 398,231 |
| | 351,975 | | HSI Asset Securitization Corp. Trust, Series 2006-HE2, Class 2A1, 0.296%, 12/25/2036(b) | | | 237,652 |
| | 528,673 | | Long Beach Mortgage Loan Trust, Series 2006-WL2, Class 2A3, 0.446%, 1/25/2036(b) | | | 353,210 |
| | 188,570 | | Residential Asset Mortgage Products, Inc. Series 2006-RZ3, Class A2, 0.406%, 8/25/2036(b) | | | 149,117 |
| | 2,000,000 | | Residential Asset Mortgage Products, Inc., Series 2006-RZ5, Class A2, 0.426%, 8/25/2046(b) | | | 1,195,356 |
| | | | | | |
| | | | | | 2,430,426 |
| | | | | | |
| | | Aerospace & Defense — 2.6% | | | |
| | 1,590,000 | | BE Aerospace, Inc., 8.500%, 7/01/2018 | | | 1,629,750 |
| | 600,000 | | Bombardier, Inc., 144A, 6.300%, 5/01/2014 | | | 579,000 |
| | 2,900,000 | | Bombardier, Inc., 144A, 7.450%, 5/01/2034 | | | 2,530,250 |
| | | | | | |
| | | | | | 4,739,000 |
| | | | | | |
| | | Airlines — 0.3% | | | |
| | 49,894 | | Continental Airlines, Inc., Series 1997-4, Class 4B, 6.900%, 7/02/2018 | | | 43,907 |
| | 310,216 | | Continental Airlines, Inc., Series 2000-2, Class A-1, 7.707%, 10/02/2022 | | | 288,501 |
| | 180,000 | | Continental Airlines, Inc., Series 2007-1, Class B, 6.903%, 4/19/2022 | | | 154,800 |
| | | | | | |
| | | | | | 487,208 |
| | | | | | |
| | | Automotive — 2.5% | | | |
| | 450,000 | | FCE Bank PLC, EMTN, 7.875%, 2/15/2011 (GBP) | | | 704,784 |
| | 420,000 | | Ford Motor Co., 6.375%, 2/01/2029 | | | 302,400 |
| | 65,000 | | Ford Motor Co., 6.625%, 2/15/2028 | | | 46,800 |
| | 1,220,000 | | Ford Motor Co., 6.625%, 10/01/2028 | | | 878,400 |
| | 40,000 | | Ford Motor Co., 7.500%, 8/01/2026 | | | 29,200 |
| | 130,000 | | Ford Motor Credit Co. LLC, 7.000%, 10/01/2013 | | | 122,020 |
| | 105,000 | | Ford Motor Credit Co. LLC, 7.250%, 10/25/2011 | | | 101,977 |
| | | | | | |
Principal
Amount (‡) | | Description | | Value (†) |
| | | | | | |
| | | Automotive — continued | | | |
| $ | 310,000 | | Ford Motor Credit Co. LLC, 7.500%, 8/01/2012 | | $ | 297,652 |
| | 1,320,000 | | Ford Motor Credit Co. LLC, 8.000%, 6/01/2014 | | | 1,268,516 |
| | 150,000 | | Ford Motor Credit Co. LLC, 8.000%, 12/15/2016 | | | 139,165 |
| | 635,000 | | Goodyear Tire & Rubber Co. (The), 7.000%, 3/15/2028 | | | 552,450 |
| | 225,000 | | Goodyear Tire & Rubber Co. (The), 10.500%, 5/15/2016 | | | 244,125 |
| | | | | | |
| | | | | | 4,687,489 |
| | | | | | |
| | | Banking — 0.3% | | | |
| | 290,000 | | Citigroup, Inc., 5.000%, 9/15/2014 | | | 275,959 |
| | 200,000 | | Merrill Lynch & Co., Inc., 7.750%, 5/14/2038 | | | 225,384 |
| | | | | | |
| | | | | | 501,343 |
| | | | | | |
| | | Building Materials — 0.9% | | | |
| | 750,000 | | Masco Corp., 4.800%, 6/15/2015 | | | 688,259 |
| | 50,000 | | Masco Corp., 6.500%, 8/15/2032 | | | 40,456 |
| | 345,000 | | Masco Corp., 7.750%, 8/01/2029 | | | 311,932 |
| | 625,000 | | USG Corp., 6.300%, 11/15/2016 | | | 531,250 |
| | 65,000 | | USG Corp., 144A, 9.750%, 8/01/2014 | | | 67,925 |
| | | | | | |
| | | | | | 1,639,822 |
| | | | | | |
| | | Chemicals — 0.3% | | | |
| | 855,000 | | Hercules, Inc., Subordinated Note, 6.500%, 6/30/2029 | | | 475,594 |
| | | | | | |
| | | Collateralized Mortgage Obligations — 0.6% | | | |
| | 636,066 | | Lehman Mortgage Trust, Series 2006-6, Class 5A1, 0.746%, 12/25/2036(b) | | | 458,308 |
| | 561,254 | | Residential Accredit Loans, Inc., Series 2005-QA13, Class 2A1, 5.813%, 12/25/2035(b) | | | 249,690 |
| | 226,043 | | Structured Adjustable Rate Mortgage Loan Trust, Series 2007-7, Class 1A1, 0.546%, 8/25/2037(b) | | | 125,726 |
| | 498,224 | | WaMu Mortgage Pass Through Certificates, Series 2006-AR10, Class 1A1, 5.922%, 9/25/2036(b) | | | 371,967 |
| | | | | | |
| | | | | | 1,205,691 |
| | | | | | |
| | | Commercial Mortgage-Backed Securities — 3.1% | | | |
| | 100,000 | | Bear Stearns Commercial Mortgage Securities, Series 2006-PW13, Class A4, 5.540%, 9/11/2041 | | | 95,450 |
| | 100,000 | | Bear Stearns Commercial Mortgage Securities, Series 2007-PW15, Class A4, 5.331%, 2/11/2044 | | | 90,018 |
| | 550,000 | | Citigroup Commercial Mortgage Trust, Series 2006-C5, Class A4, 5.431%, 10/15/2049 | | | 497,045 |
| | 800,000 | | Commercial Mortgage Pass Through Certificates, Series 2007-C9, Class A4, 5.816%, 12/10/2049(b) | | | 720,892 |
See accompanying notes to financial statements.
23
LOOMIS SAYLES HIGH INCOME FUND — PORTFOLIOOF INVESTMENTS (continued)
Investments as of September 30, 2009
| | | | | | |
Principal
Amount (‡) | | Description | | Value (†) |
| | | | | | |
| | | Commercial Mortgage-Backed Securities — continued | | | |
| $ | 100,000 | | Credit Suisse Mortgage Capital Certificates, Series 2007-C4, Class A4, 5.809%, 9/15/2039(b) | | $ | 79,223 |
| | 650,000 | | Greenwich Capital Commercial Funding Corp., Series 2007-GG11, Class A4, 5.736%, 12/10/2049 | | | 585,283 |
| | 1,375,000 | | Greenwich Capital Commercial Funding Corp., Series 2007-GG9, Class A4, 5.444%, 3/10/2039 | | | 1,218,543 |
| | 520,000 | | JPMorgan Chase Commercial Mortgage Securities Corp., Series 2007-LD11, Class A4, 5.818%, 6/15/2049(b) | | | 454,517 |
| | 100,000 | | JPMorgan Chase Commercial Mortgage Securities Corp., Series 2007-LDPX, Class A3, 5.420%, 1/15/2049 | | | 84,295 |
| | 866,149 | | Lehman XS Trust, Series 2007-10H, Class 1A11, 0.366%, 7/25/2037(b) | | | 389,767 |
| | 300,000 | | Morgan Stanley Capital I, Series 2007-T27, Class A4, 5.650%, 6/11/2042(b) | | | 283,105 |
| | 400,000 | | Morgan Stanley Capital I, Series 2008-T29, Class A4, 6.280%, 1/11/2043(b) | | | 388,015 |
| | 300,000 | | Wachovia Bank Commercial Mortgage Trust, Series 2006-C23, Class A4, 5.418%, 1/15/2045(b) | | | 273,121 |
| | 645,000 | | Wachovia Bank Commercial Mortgage Trust, Series 2006-C29, Class A4, 5.308%, 11/15/2048 | | | 580,775 |
| | | | | | |
| | | | | | 5,740,049 |
| | | | | | |
| | | Construction Machinery — 1.4% | | | |
| | 40,000 | | Joy Global, Inc., 6.625%, 11/15/2036 | | | 37,271 |
| | 350,000 | | RSC Equipment Rental, Inc., 9.500%, 12/01/2014 | | | 337,750 |
| | 165,000 | | United Rentals North America, Inc., Convertible, 1.875%, 10/15/2023 | | | 155,925 |
| | 2,245,000 | | United Rentals North America, Inc., 7.000%, 2/15/2014 | | | 1,953,150 |
| | 15,000 | | United Rentals North America, Inc., 7.750%, 11/15/2013 | | | 13,500 |
| | 150,000 | | United Rentals North America, Inc., 144A, 10.875%, 6/15/2016 | | | 160,500 |
| | | | | | |
| | | | | | 2,658,096 |
| | | | | | |
| | | Consumer Products — 0.1% | | | |
| | 260,000 | | Acco Brands Corp., 7.625%, 8/15/2015 | | | 215,800 |
| | | | | | |
| | | Diversified Manufacturing — 0.1% | | | |
| | 150,000 | | Trinity Industries, Inc., Convertible, 3.875%, 6/01/2036 | | | 110,625 |
| | | | | | |
| | | Electric — 4.4% | | | |
| | 35,000 | | AES Corp. (The), 8.000%, 10/15/2017 | | | 35,219 |
| | 2,740,000 | | AES Corp. (The), 8.000%, 6/01/2020 | | | 2,719,450 |
| | 213,669 | | AES Ironwood LLC, 8.857%, 11/30/2025 | | | 196,041 |
| | 23,517 | | AES Red Oak LLC, Series A, 8.540%, 11/30/2019 | | | 22,165 |
| | | | | | |
Principal
Amount (‡) | | Description | | Value (†) |
| | | | | | |
| | | Electric — continued | | | |
| $ | 555,000 | | CMS Energy Corp., Convertible, 5.500%, 6/15/2029 | | $ | 634,781 |
| | 220,000 | | CMS Energy Corp., 8.750%, 6/15/2019 | | | 239,314 |
| | 375,000 | | Dynegy Holdings, Inc., 7.125%, 5/15/2018 | | | 288,750 |
| | 180,000 | | Dynegy Holdings, Inc., 7.625%, 10/15/2026 | | | 123,300 |
| | 815,000 | | Dynegy Holdings, Inc., 7.750%, 6/01/2019 | | | 694,788 |
| | 2,230,000 | | Edison Mission Energy, 7.625%, 5/15/2027 | | | 1,594,450 |
| | 140,000 | | NGC Corp. Capital Trust I, Series B, 8.316%, 6/01/2027 | | | 63,000 |
| | 775,000 | | NRG Energy, Inc., 7.375%, 1/15/2017 | | | 749,812 |
| | 195,000 | | TXU Corp., Series P, 5.550%, 11/15/2014 | | | 133,077 |
| | 1,015,000 | | TXU Corp., Series Q, 6.500%, 11/15/2024 | | | 469,458 |
| | 370,000 | | TXU Corp., Series R, 6.550%, 11/15/2034 | | | 166,430 |
| | | | | | |
| | | | | | 8,130,035 |
| | | | | | |
| | | Food & Beverage — 1.5% | | | |
| | 845,000 | | ARAMARK Corp., 8.500%, 2/01/2015 | | | 852,394 |
| | 710,000 | | Aramark Services, Inc., 5.000%, 6/01/2012 | | | 670,950 |
| | 600,000 | | CCL Finance Ltd., 144A, 9.500%, 8/15/2014 | | | 637,500 |
| | 570,000 | | Tyson Foods, Inc., 7.850%, 4/01/2016 | | | 581,400 |
| | | | | | |
| | | | | | 2,742,244 |
| | | | | | |
| | | Government Guaranteed — 0.1% | | | |
| | 275,000 | | Canada Housing Trust, 3.550%, 9/15/2013 (CAD) | | | 267,127 |
| | | | | | |
| | | Government Owned — No Guarantee — 0.1% | | | |
| | 160,000 | | Federal Home Loan Mortgage Corp., 4.625%, 10/25/2012(g) | | | 173,888 |
| | | | | | |
| | | Healthcare — 6.4% | | | |
| | 660,000 | | Affymetrix, Inc., Convertible, 3.500%, 1/15/2038 | | | 531,300 |
| | 105,000 | | Boston Scientific Corp., 6.400%, 6/15/2016 | | | 106,444 |
| | 95,000 | | Boston Scientific Corp., 7.000%, 11/15/2035 | | | 87,044 |
| | 385,000 | | CHS/Community Health Systems, Inc., 8.875%, 7/15/2015 | | | 394,625 |
| | 495,000 | | HCA, Inc., 5.750%, 3/15/2014 | | | 436,837 |
| | 155,000 | | HCA, Inc., 6.250%, 2/15/2013 | | | 148,025 |
| | 10,000 | | HCA, Inc., 6.300%, 10/01/2012 | | | 9,600 |
| | 50,000 | | HCA, Inc., 6.375%, 1/15/2015 | | | 44,500 |
| | 205,000 | | HCA, Inc., 6.500%, 2/15/2016 | | | 181,937 |
See accompanying notes to financial statements.
24
LOOMIS SAYLES HIGH INCOME FUND — PORTFOLIOOF INVESTMENTS (continued)
Investments as of September 30, 2009
| | | | | | |
Principal
Amount (‡) | | Description | | Value (†) |
| | | | | | |
| | | Healthcare — continued | | | |
| $ | 35,000 | | HCA, Inc., 7.050%, 12/01/2027 | | $ | 26,545 |
| | 1,070,000 | | HCA, Inc., 7.190%, 11/15/2015 | | | 991,080 |
| | 630,000 | | HCA, Inc., 7.500%, 12/15/2023 | | | 508,579 |
| | 700,000 | | HCA, Inc., 7.500%, 11/06/2033 | | | 541,644 |
| | 40,000 | | HCA, Inc., 7.690%, 6/15/2025 | | | 32,482 |
| | 480,000 | | HCA, Inc., 8.360%, 4/15/2024 | | | 390,594 |
| | 670,000 | | HCA, Inc., MTN, 7.580%, 9/15/2025 | | | 542,057 |
| | 1,685,000 | | HCA, Inc., MTN, 7.750%, 7/15/2036 | | | 1,320,695 |
| | 1,520,000 | | Hologic, Inc., Convertible, (Step to Zero Coupon on 12/15/2013), 2.000%, 12/15/2037(c) | | | 1,242,600 |
| | 40,000 | | Life Technologies Corp., Convertible, 1.500%, 2/15/2024 | | | 43,700 |
| | 1,368,000 | | Omnicare, Inc., Convertible, 3.250%, 12/15/2035 | | | 1,049,940 |
| | 380,000 | | Psychiatric Solutions, Inc., 144A, 7.750%, 7/15/2015 | | | 357,200 |
| | 435,000 | | Psychiatric Solutions, Inc., 7.750%, 7/15/2015 | | | 419,775 |
| | 255,000 | | Tenet Healthcare Corp., 6.875%, 11/15/2031 | | | 198,900 |
| | 190,000 | | Tenet Healthcare Corp., 7.375%, 2/01/2013 | | | 188,100 |
| | 1,833,000 | | Tenet Healthcare Corp., 9.250%, 2/01/2015 | | | 1,913,194 |
| | 60,000 | | Tenet Healthcare Corp., 9.875%, 7/01/2014 | | | 61,650 |
| | | | | | |
| | | | | | 11,769,047 |
| | | | | | |
| | | Home Construction — 3.9% | | | |
| | 755,000 | | D.R. Horton, Inc., 6.500%, 4/15/2016 | | | 742,731 |
| | 620,000 | | D.R. Horton, Inc., Guaranteed Note, 5.625%, 1/15/2016 | | | 579,700 |
| | 410,000 | | Desarrolladora Homex SAB de CV, 7.500%, 9/28/2015 | | | 402,825 |
| | 315,000 | | KB Home, 5.750%, 2/01/2014 | | | 302,400 |
| | 360,000 | | KB Home, Guaranteed Note, 5.875%, 1/15/2015 | | | 339,300 |
| | 1,790,000 | | KB Home, Guaranteed Note, 7.250%, 6/15/2018 | | | 1,745,250 |
| | 580,000 | | Lennar Corp., Series B, 5.600%, 5/31/2015 | | | 535,050 |
| | 830,000 | | Lennar Corp., Series B, 6.500%, 4/15/2016 | | | 780,200 |
| | 1,325,000 | | Pulte Homes, Inc., 6.000%, 2/15/2035 | | | 1,000,375 |
| | 495,000 | | Pulte Homes, Inc., 6.375%, 5/15/2033 | | | 381,150 |
| | 380,000 | | Pulte Homes, Inc., 7.875%, 6/15/2032 | | | 334,400 |
| | | | | | |
| | | | | | 7,143,381 |
| | | | | | |
| | | | | | |
Principal
Amount (‡) | | Description | | Value (†) |
| | | | | | |
| | | Independent Energy — 6.7% | | | |
| $ | 475,000 | | Chesapeake Energy Corp., Convertible, 2.250%, 12/15/2038 | | $ | 355,063 |
| | 40,000 | | Chesapeake Energy Corp., 6.375%, 6/15/2015 | | | 37,150 |
| | 3,295,000 | | Chesapeake Energy Corp., 6.500%, 8/15/2017 | | | 3,023,162 |
| | 790,000 | | Chesapeake Energy Corp., 6.875%, 11/15/2020 | | | 703,100 |
| | 620,000 | | Connacher Oil and Gas Ltd., 144A, 10.250%, 12/15/2015 | | | 505,300 |
| | 500,000 | | Connacher Oil and Gas Ltd., 144A, 11.750%, 7/15/2014 | | | 532,500 |
| | 825,000 | | Hilcorp Energy I LP, 144A, 7.750%, 11/01/2015 | | | 779,625 |
| | 435,000 | | Penn Virginia Corp., Convertible, 4.500%, 11/15/2012 | | | 391,500 |
| | 790,000 | | PetroHawk Energy Corp., 7.875%, 6/01/2015 | | | 778,150 |
| | 355,000 | | Pioneer Natural Resources Co., 5.875%, 7/15/2016 | | | 328,121 |
| | 200,000 | | Pioneer Natural Resources Co., 6.875%, 5/01/2018 | | | 190,863 |
| | 3,127,000 | | Pioneer Natural Resources Co., 7.200%, 1/15/2028 | | | 2,713,992 |
| | 1,260,000 | | SandRidge Energy, Inc., 144A, 8.000%, 6/01/2018 | | | 1,212,750 |
| | 1,065,000 | | Swift Energy Co., 7.125%, 6/01/2017 | | | 926,550 |
| | | | | | |
| | | | | | 12,477,826 |
| | | | | | |
| | | Industrial Other — 0.2% | | | |
| | 245,000 | | Incyte Corp., Convertible, 3.500%, 2/15/2011 | | | 238,875 |
| | 140,000 | | Ranhill Labuan Ltd., 144A, 12.500%, 10/26/2011 | | | 112,000 |
| | | | | | |
| | | | | | 350,875 |
| | | | | | |
| | | Lodging — 4.1% | | | |
| | 170,000 | | Felcor Lodging Trust, Inc., 144A, 10.000%, 10/01/2014 | | | 164,475 |
| | 615,000 | | Host Hotels & Resorts LP, 6.375%, 3/15/2015 | | | 582,713 |
| | 55,000 | | Host Hotels & Resorts LP, 6.750%, 6/01/2016 | | | 52,250 |
| | 80,000 | | Host Hotels & Resorts LP, 6.875%, 11/01/2014 | | | 78,200 |
| | 105,000 | | Host Hotels & Resorts LP, Convertible, 144A, 3.250%, 4/15/2024 | | | 105,000 |
| | 1,690,000 | | Host Hotels & Resorts, Inc., Convertible, 144A, 2.625%, 4/15/2027 | | | 1,552,687 |
| | 135,000 | | Royal Caribbean Cruises Ltd., 6.875%, 12/01/2013 | | | 125,888 |
| | 2,000,000 | | Royal Caribbean Cruises Ltd., 7.000%, 6/15/2013 | | | 1,905,000 |
| | 670,000 | | Royal Caribbean Cruises Ltd., 7.250%, 6/15/2016 | | | 619,750 |
| | 2,590,000 | | Starwood Hotels & Resorts Worldwide, Inc., 6.750%, 5/15/2018 | | | 2,444,312 |
| | | | | | |
| | | | | | 7,630,275 |
| | | | | | |
See accompanying notes to financial statements.
25
LOOMIS SAYLES HIGH INCOME FUND — PORTFOLIOOF INVESTMENTS (continued)
Investments as of September 30, 2009
| | | | | | |
Principal
Amount (‡) | | Description | | Value (†) |
| | | | | | |
| | | Media Cable — 2.1% | | | |
| $ | 1,114,000 | | CSC Holdings, Inc., Senior Note, 7.625%, 7/15/2018 | | $ | 1,130,710 |
| | 250,000 | | CSC Holdings, Inc., 7.875%, 2/15/2018 | | | 255,000 |
| | 180,000 | | CSC Holdings, Inc., 144A, 8.625%, 2/15/2019 | | | 190,350 |
| | 1,570,000 | | Virgin Media Finance PLC, 8.750%, 4/15/2014 | | | 1,601,400 |
| | 670,000 | | Virgin Media Finance PLC, 9.500%, 8/15/2016 | | | 705,175 |
| | | | | | |
| | | | | | 3,882,635 |
| | | | | | |
| | | Media Non-Cable — 1.2% | | | |
| | 175,000 | | Intelsat Corp., 6.875%, 1/15/2028 | | | 145,250 |
| | 1,765,000 | | Intelsat Subsidiary Holding Co. Ltd., 8.500%, 1/15/2013 | | | 1,787,062 |
| | 160,000 | | Intelsat Subsidiary Holding Co. Ltd., 144A, 8.875%, 1/15/2015 | | | 162,000 |
| | 85,000 | | R.H. Donnelley Corp., 6.875%, 1/15/2013(d) | | | 4,888 |
| | 25,000 | | R.H. Donnelley Corp., Series A-1, 6.875%, 1/15/2013(d) | | | 1,438 |
| | 160,000 | | R.H. Donnelley Corp., Series A-2, 6.875%, 1/15/2013(d) | | | 9,200 |
| | 615,000 | | R.H. Donnelley Corp., Series A-3, 8.875%, 1/15/2016(d) | | | 35,362 |
| | 155,000 | | R.H. Donnelley Corp., Series A-4, 8.875%, 10/15/2017(d) | | | 8,913 |
| | | | | | |
| | | | | | 2,154,113 |
| | | | | | |
| | | Metals & Mining — 1.8% | | | |
| | 355,000 | | ArcelorMittal, 9.850%, 6/01/2019 | | | 419,895 |
| | 245,000 | | Steel Dynamics, Inc., Convertible, 5.125%, 6/15/2014 | | | 289,100 |
| | 410,000 | | Steel Dynamics, Inc., 6.750%, 4/01/2015 | | | 392,575 |
| | 580,000 | | Steel Dynamics, Inc., 7.375%, 11/01/2012 | | | 585,800 |
| | 1,145,000 | | Steel Dynamics, Inc., 144A, 8.250%, 4/15/2016 | | | 1,150,725 |
| | 355,000 | | United States Steel Corp., 6.050%, 6/01/2017 | | | 331,567 |
| | 125,000 | | United States Steel Corp., 7.000%, 2/01/2018 | | | 120,047 |
| | | | | | |
| | | | | | 3,289,709 |
| | | | | | |
| | | Non-Captive Consumer — 2.2% | | | |
| | 60,000 | | SLM Corp., MTN, 5.050%, 11/14/2014 | | | 44,106 |
| | 40,000 | | SLM Corp., Series A, MTN, 4.500%, 7/26/2010 | | | 38,867 |
| | 20,000 | | SLM Corp., Series A, MTN, 5.000%, 10/01/2013 | | | 15,921 |
| | 10,000 | | SLM Corp., Series A, MTN, 5.000%, 6/15/2018 | | | 6,271 |
| | 4,260,000 | | SLM Corp., Series A, MTN, 5.375%, 5/15/2014 | | | 3,260,510 |
| | 5,000 | | SLM Corp., Series A, MTN, 5.625%, 8/01/2033 | | | 3,138 |
| | | | | |
Principal
Amount (‡) | | Description | | Value (†) |
| | | | | |
| | Non-Captive Consumer — continued | | | |
| 735,000 | | SLM Corp., Series A, MTN, 6.500%, 6/15/2010 (NZD)(e)(f) | | $ | 497,545 |
| 245,000 | | SLM Corp., Series A, MTN, 8.450%, 6/15/2018 | | | 195,387 |
| | | | | |
| | | | | 4,061,745 |
| | | | | |
| | Non-Captive Diversified — 2.3% | | | |
| 1,300,000 | | General Electric Capital Corp., Series A, GMTN, 2.960%, 5/18/2012 (SGD) | | | 877,120 |
| 66,000 | | GMAC, Inc., 144A, 5.375%, 6/06/2011 | | | 60,885 |
| 172,000 | | GMAC, Inc., 144A, 5.750%, 9/27/2010 | | | 165,980 |
| 412,000 | | GMAC, Inc., 144A, 6.000%, 4/01/2011 | | | 386,250 |
| 398,000 | | GMAC, Inc., 144A, 6.000%, 12/15/2011 | | | 368,150 |
| 208,000 | | GMAC, Inc., 144A, 6.625%, 5/15/2012 | | | 191,360 |
| 2,041,000 | | GMAC, Inc., 144A, 6.750%, 12/01/2014 | | | 1,734,850 |
| 24,000 | | GMAC, Inc., 144A, 8.000%, 11/01/2031 | | | 19,320 |
| 590,000 | | General Motors Acceptance Corp. of Canada, EMTN, 7.125%, 9/13/2011 (AUD) | | | 478,858 |
| 80,000 | | iStar Financial, Inc., 5.850%, 3/15/2017 | | | 41,800 |
| 10,000 | | iStar Financial, Inc., 5.875%, 3/15/2016 | | | 5,500 |
| 15,000 | | iStar Financial, Inc., Series B, 5.950%, 10/15/2013 | | | 8,550 |
| | | | | |
| | | | | 4,338,623 |
| | | | | |
| | Oil Field Services — 1.3% | | | |
| 490,000 | | Basic Energy Services, Inc., 7.125%, 4/15/2016 | | | 384,650 |
| 380,000 | | Basic Energy Services, Inc., 144A, 11.625%, 8/01/2014 | | | 402,800 |
| 350,000 | | Compagnie Generale de Geophysique-Veritas, 144A, 9.500%, 5/15/2016 | | | 370,125 |
| 170,000 | | Complete Production Services, Inc., 8.000%, 12/15/2016 | | | 154,700 |
| 30,000 | | Key Energy Services, Inc., 8.375%, 12/01/2014 | | | 28,500 |
| 1,052,000 | | North American Energy Partners, Inc., 8.750%, 12/01/2011 | | | 1,030,960 |
| | | | | |
| | | | | 2,371,735 |
| | | | | |
| | Packaging — 0.1% | | | |
| 175,000 | | Owens-Illinois, Inc., Senior Note, 7.800%, 5/15/2018 | | | 175,438 |
| | | | | |
| | Paper — 2.9% | | | |
| 340,000 | | Georgia-Pacific Corp., 7.250%, 6/01/2028 | | | 302,600 |
| 160,000 | | Georgia-Pacific Corp., 7.375%, 12/01/2025 | | | 144,000 |
| 1,071,000 | | Georgia-Pacific Corp., 7.750%, 11/15/2029 | | | 985,320 |
| 815,000 | | Georgia-Pacific Corp., 8.000%, 1/15/2024 | | | 806,850 |
See accompanying notes to financial statements.
26
LOOMIS SAYLES HIGH INCOME FUND — PORTFOLIOOF INVESTMENTS (continued)
Investments as of September 30, 2009
| | | | | | |
Principal
Amount (‡) | | Description | | Value (†) |
| | | | | | |
| | | Paper — continued | | | |
| $ | 2,305,000 | | Georgia-Pacific Corp., 8.875%, 5/15/2031 | | $ | 2,328,050 |
| | 35,000 | | Georgia-Pacific LLC, 144A, 7.125%, 1/15/2017 | | | 34,212 |
| | 200,000 | | Georgia-Pacific LLC, 9.500%, 12/01/2011 | | | 213,000 |
| | 485,000 | | International Paper Co., 5.250%, 4/01/2016 | | | 485,239 |
| | | | | | |
| | | | | | 5,299,271 |
| | | | | | |
| | | Pharmaceuticals — 5.0% | | | |
| | 2,340,000 | | Elan Finance PLC, 8.875%, 12/01/2013 | | | 2,357,550 |
| | 1,865,000 | | Elan Finance PLC, Senior Note, 7.750%, 11/15/2011 | | | 1,899,969 |
| | 950,000 | | Human Genome Sciences, Inc., Convertible, 2.250%, 10/15/2011 | | | 1,314,563 |
| | 840,000 | | Human Genome Sciences, Inc., Convertible, 2.250%, 8/15/2012 | | | 1,046,850 |
| | 785,000 | | Kendle International, Inc., Convertible, 3.375%, 7/15/2012 | | | 692,763 |
| | 1,521,000 | | Nektar Therapeutics, Convertible, 3.250%, 9/28/2012 | | | 1,380,307 |
| | 505,000 | | Valeant Pharmaceuticals International, Subordinated Note, Convertible, 4.000%, 11/15/2013 | | | 543,506 |
| | | | | | |
| | | | | | 9,235,508 |
| | | | | | |
| | | Pipelines — 1.7% | | | |
| | 2,285,000 | | El Paso Corp., 6.950%, 6/01/2028 | | | 1,900,791 |
| | 225,000 | | El Paso Corp., 7.000%, 6/15/2017 | | | 220,500 |
| | 405,000 | | El Paso Corp., 7.420%, 2/15/2037 | | | 347,818 |
| | 110,000 | | El Paso Corp., GMTN, 7.800%, 8/01/2031 | | | 100,883 |
| | 235,000 | | El Paso Corp., GMTN, 8.050%, 10/15/2030 | | | 217,206 |
| | 130,000 | | El Paso Natural Gas Co., 8.375%, 6/15/2032 | | | 156,077 |
| | 175,000 | | Kinder Morgan, Inc., 6.500%, 9/01/2012 | | | 179,813 |
| | | | | | |
| | | | | | 3,123,088 |
| | | | | | |
| | | Refining — 0.4% | | | |
| | 150,000 | | Petroplus Finance Ltd., 144A, 6.750%, 5/01/2014 | | | 140,438 |
| | 745,000 | | Petroplus Finance Ltd., 144A, 7.000%, 5/01/2017 | | | 677,950 |
| | | | | | |
| | | | | | 818,388 |
| | | | | | |
| | | REITs — 0.3% | | | |
| | 195,000 | | ProLogis, Convertible, 1.875%, 11/15/2037 | | | 166,481 |
| | 170,000 | | ProLogis, Convertible, 2.250%, 4/01/2037 | | | 153,213 |
| | 100,000 | | ProLogis, 5.625%, 11/15/2015 | | | 90,871 |
| | 45,000 | | ProLogis, 5.750%, 4/01/2016 | | | 40,252 |
| | | | | | |
Principal
Amount (‡) | | Description | | Value (†) |
| | | | | | |
| | | REITs — continued | | | |
| $ | 80,000 | | ProLogis, 6.625%, 5/15/2018 | | $ | 73,871 |
| | | | | | |
| | | | | | 524,688 |
| | | | | | |
| | | Retailers — 2.5% | | | |
| | 250,000 | | Dillard’s, Inc., 6.625%, 1/15/2018 | | | 190,000 |
| | 105,000 | | Dillard’s, Inc., 7.130%, 8/01/2018 | | | 81,637 |
| | 545,000 | | J.C. Penney Corp., Inc., Senior Note, 6.375%, 10/15/2036 | | | 449,625 |
| | 765,000 | | Macy’s Retail Holdings, Inc., 5.900%, 12/01/2016 | | | 700,887 |
| | 510,000 | | Macy’s Retail Holdings, Inc., 6.375%, 3/15/2037 | | | 401,800 |
| | 30,000 | | Macy’s Retail Holdings, Inc., 6.790%, 7/15/2027 | | | 21,870 |
| | 210,000 | | Macy’s Retail Holdings, Inc., 6.900%, 4/01/2029 | | | 165,662 |
| | 1,115,000 | | Toys R Us Property Co. I LLC, 144A, 10.750%, 7/15/2017 | | | 1,198,625 |
| | 1,600,000 | | Toys R Us, Inc., 7.375%, 10/15/2018 | | | 1,392,000 |
| | 20,000 | | Toys R Us, Inc., 7.875%, 4/15/2013 | | | 19,200 |
| | | | | | |
| | | | | | 4,621,306 |
| | | | | | |
| | | Sovereigns — 1.9% | | | |
| | 423,500(††) | | Mexican Fixed Rate Bonds, Series M-20, 8.000%, 12/07/2023 (MXN) | | | 3,076,862 |
| | 350,000 | | New South Wales Treasury Corp., Series 10RG, 7.000%, 12/01/2010 (AUD)(g) | | | 318,070 |
| | 4,504,661 | | Republic of Uruguay, 4.250%, 4/05/2027 (UYU) | | | 193,324 |
| | | | | | |
| | | | | | 3,588,256 |
| | | | | | |
| | | Supermarkets — 0.9% | | | |
| | 300,000 | | American Stores Co., 8.000%, 6/01/2026 | | | 270,000 |
| | 750,000 | | New Albertson’s, Inc., 7.450%, 8/01/2029 | | | 645,000 |
| | 190,000 | | New Albertson’s, Inc., 7.750%, 6/15/2026 | | | 169,100 |
| | 130,000 | | New Albertson’s, Inc., 8.000%, 5/01/2031 | | | 116,675 |
| | 735,000 | | New Albertson’s, Inc., Series C, MTN, 6.625%, 6/01/2028 | | | 567,788 |
| | | | | | |
| | | | | | 1,768,563 |
| | | | | | |
| | | Supranational — 0.4% | | | |
| | 9,210,000,000 | | European Investment Bank, EMTN, 144A, Zero Coupon, 4/24/2013 (IDR) | | | 678,290 |
| | 13,400,000 | | International Bank for Reconstruction & Development, 9.500%, 5/27/2010 (ISK) | | | 87,375 |
| | | | | | |
| | | | | | 765,665 |
| | | | | | |
| | | Technology — 8.3% | | | |
| | 300,000 | | Affiliated Computer Services, Inc., 5.200%, 6/01/2015 | | | 294,750 |
| | 1,090,000 | | Alcatel-Lucent USA, Inc., 6.450%, 3/15/2029 | | | 829,763 |
See accompanying notes to financial statements.
27
LOOMIS SAYLES HIGH INCOME FUND — PORTFOLIOOF INVESTMENTS (continued)
Investments as of September 30, 2009
| | | | | | |
Principal
Amount (‡) | | Description | | Value (†) |
| | | | | | |
| | | Technology — continued | | | |
| $ | 1,930,000 | | Alcatel-Lucent USA, Inc., 6.500%, 1/15/2028 | | $ | 1,469,212 |
| | 50,000 | | Alcatel-Lucent USA, Inc., Series A, Convertible, 2.875%, 6/15/2023 | | | 49,188 |
| | 1,580,000 | | Alcatel-Lucent USA, Inc., Series B, Convertible, 2.875%, 6/15/2025 | | | 1,319,300 |
| | 2,165,000 | | Amkor Technology, Inc., 7.750%, 5/15/2013 | | | 2,165,000 |
| | 290,000 | | Amkor Technology, Inc., 9.250%, 6/01/2016 | | | 298,700 |
| | 15,000 | | Ciena Corp., Convertible, 0.250%, 5/01/2013 | | | 11,981 |
| | 535,000 | | Ciena Corp., Convertible, 0.875%, 6/15/2017 | | | 368,481 |
| | 30,000 | | Intel Corp., Convertible, 2.950%, 12/15/2035 | | | 26,775 |
| | 1,220,000 | | Jabil Circuit, Inc., 8.250%, 3/15/2018 | | | 1,238,300 |
| | 345,000 | | JDS Uniphase Corp., Convertible, 1.000%, 5/15/2026 | | | 289,800 |
| | 1,330,000 | | Kulicke & Soffa Industries, Inc., Convertible, 0.875%, 6/01/2012 | | | 1,088,938 |
| | 285,000 | | Kulicke & Soffa Industries, Inc., Convertible, 1.000%, 6/30/2010 | | | 270,394 |
| | 216,000 | | Maxtor Corp., Subordinated Note, Convertible, 5.750%, 3/01/2012(f) | | | 196,560 |
| | 580,000 | | Motorola, Inc., 6.500%, 9/01/2025 | | | 490,149 |
| | 1,000,000 | | Motorola, Inc., 7.500%, 5/15/2025 | | | 900,000 |
| | 340,000 | | Nortel Networks Capital Corp., 7.875%, 6/15/2026(d) | | | 190,400 |
| | 280,000 | | Nortel Networks Corp., Convertible, 2.125%, 4/15/2014(d) | | | 154,000 |
| | 560,000 | | Nortel Networks Ltd., 6.875%, 9/01/2023(d) | | | 156,800 |
| | 255,000 | | Seagate Technology HDD Holdings, 6.375%, 10/01/2011 | | | 255,000 |
| | 1,805,000 | | Seagate Technology HDD Holdings, 6.800%, 10/01/2016 | | | 1,656,087 |
| | 390,000 | | Seagate Technology International, 144A, 10.000%, 5/01/2014 | | | 426,075 |
| | 820,000 | | SunGard Data Systems, Inc., 9.125%, 8/15/2013 | | | 828,200 |
| | 355,000 | | Xerox Capital Trust I, 8.000%, 2/01/2027 | | | 347,013 |
| | | | | | |
| | | | | | 15,320,866 |
| | | | | | |
| | | Textile — 0.1% | | | |
| | 375,000 | | Jones Apparel Group, Inc., 6.125%, 11/15/2034 | | | 277,500 |
| | | | | | |
| | | Transportation Services — 0.4% | | | |
| | 275,000 | | APL Ltd., Senior Note, 8.000%, 1/15/2024(f) | | | 224,813 |
| | 640,000 | | Overseas Shipholding Group, Senior Note, 7.500%, 2/15/2024 | | | 536,000 |
| | | | | | |
| | | | | | 760,813 |
| | | | | | |
| | | Treasuries — 1.9% | | | |
| | 3,360,000 | | Canadian Government, 4.500%, 6/01/2015 (CAD) | | | 3,440,277 |
| | | | | | |
| | | | | | |
Principal
Amount (‡) | | Description | | Value (†) |
| | | | | | |
| | | Wireless — 3.7% | | | |
| $ | 130,000 | | Crown Castle International Corp., 9.000%, 1/15/2015 | | $ | 136,175 |
| | 1,443,000 | | Nextel Communications, Inc., Series D, 7.375%, 8/01/2015 | | | 1,295,092 |
| | 944,000 | | Nextel Communications, Inc., Series E, 6.875%, 10/31/2013 | | | 875,560 |
| | 1,080,000 | | Nextel Communications, Inc., Series F, 5.950%, 3/15/2014 | | | 955,800 |
| | 80,000 | | NII Holdings, Inc., 2.750%, 8/15/2025 | | | 78,500 |
| | 850,000 | | NII Holdings, Inc., 3.125%, 6/15/2012 | | | 742,688 |
| | 2,061,000 | | Sprint Capital Corp., 6.875%, 11/15/2028 | | | 1,720,935 |
| | 55,000 | | Sprint Capital Corp., 6.900%, 5/01/2019 | | | 49,225 |
| | 20,000 | | Sprint Capital Corp., 8.750%, 3/15/2032 | | | 18,900 |
| | 500,000 | | True Move Co. Ltd., 144A, 10.375%, 8/01/2014 | | | 467,500 |
| | 600,000 | | True Move Co. Ltd., 144A, 10.750%, 12/16/2013 | | | 576,000 |
| | | | | | |
| | | | | | 6,916,375 |
| | | | | | |
| | | Wirelines — 7.4% | | | |
| | 255,000 | | Bell Canada, Series M-17, 6.100%, 3/16/2035 (CAD) | | | 222,420 |
| | 65,000 | | Cincinnati Bell Telephone Co., 6.300%, 12/01/2028 | | | 48,425 |
| | 530,000 | | Cincinnati Bell, Inc., 7.000%, 2/15/2015 | | | 514,100 |
| | 955,000 | | Cincinnati Bell, Inc., 8.375%, 1/15/2014 | | | 959,775 |
| | 460,000 | | Embarq Corp., 7.995%, 6/01/2036 | | | 480,614 |
| | 1,611,153 | | FairPoint Communications, Inc., 13.125%, 4/02/2018(j) | | | 197,366 |
| | 95,000 | | Frontier Communications Corp., 7.000%, 11/01/2025 | | | 80,988 |
| | 30,000 | | Frontier Communications Corp., 7.125%, 3/15/2019 | | | 28,275 |
| | 1,245,000 | | Frontier Communications Corp., 7.875%, 1/15/2027 | | | 1,136,062 |
| | 605,000 | | Frontier Communications Corp., 9.000%, 8/15/2031 | | | 592,900 |
| | 80,000 | | Hawaiian Telcom Communications, Inc., Series B, 12.500%, 5/01/2015(d) | | | 100 |
| | 2,235,000 | | Level 3 Communications, Inc., Convertible, 3.500%, 6/15/2012 | | | 1,776,825 |
| | 459,000 | | Level 3 Communications, Inc., Convertible, 5.250%, 12/15/2011 | | | 408,510 |
| | 815,000 | | Level 3 Communications, Inc., Convertible, 144A 7.000%, 3/15/2015(f) | | | 863,900 |
| | 400,000 | | Level 3 Communications, Inc., Convertible, 10.000%, 5/01/2011 | | | 395,000 |
| | 770,000 | | Level 3 Financing, Inc., 8.750%, 2/15/2017 | | | 639,100 |
| | 495,000 | | Level 3 Financing, Inc., 9.250%, 11/01/2014 | | | 436,219 |
See accompanying notes to financial statements.
28
LOOMIS SAYLES HIGH INCOME FUND — PORTFOLIOOF INVESTMENTS (continued)
Investments as of September 30, 2009
| | | | | | |
Principal
Amount (‡) | | Description | | Value (†) |
| | | | | | |
| | | Wirelines — continued | | | |
| $ | 425,000 | | Qwest Capital Funding, Inc., 6.500%, 11/15/2018 | | $ | 349,563 |
| | 2,860,000 | | Qwest Capital Funding, Inc., 7.750%, 2/15/2031 | | | 2,280,850 |
| | 1,445,000 | | Qwest Capital Funding, Inc., Guaranteed Note, 6.875%, 7/15/2028 | | | 1,090,975 |
| | 275,000 | | Qwest Capital Funding, Inc., Guaranteed Note, 7.625%, 8/03/2021 | | | 232,375 |
| | 10,000 | | Qwest Corp., 6.875%, 9/15/2033 | | | 8,100 |
| | 975,000 | | Windstream Corp., 144A, 7.875%, 11/01/2017 | | | 970,125 |
| | | | | | |
| | | | | | 13,712,567 |
| | | | | | |
| | | Total Bonds and Notes (Identified Cost $151,485,604) | | | 166,300,500 |
| | | | | | |
| | Bank Loans — 1.5% | | | |
| | | Chemicals — 0.1% | | | |
| | 140,441 | | Ashland Chemicals, Term Loan B, 7.650%, 5/13/2014(h) | | | 143,338 |
| | | | | | |
| | | Diversified Manufacturing — 0.2% | | | |
| | 325,057 | | CommScope, Inc., Term Loan B, 2.783%, 12/26/2014(h) | | | 317,437 |
| | | | | | |
| | | Food & Beverage — 0.0% | | | |
| | 1,306 | | Dole Food Co., Inc., Credit Link Deposit, 7.495%, 4/12/2013(h) | | | 1,320 |
| | 838 | | Dole Food Co., Inc., Tranche B Term Loan, 8.000%, 4/12/2013(h) | | | 847 |
| | 4,108 | | Dole Food Co., Inc., Tranche C Term Loan, 8.000%, 4/12/2013(h) | | | 4,153 |
| | | | | | |
| | | | | | 6,320 |
| | | | | | |
| | | Media Non-Cable — 0.3% | | | |
| | 975,889 | | Idearc, Inc., Term Loan B, 6.250%, 11/17/2014(d)(h) | | | 412,723 |
| | 224,012 | | Tribune Co., Term Loan X, 5.000%, 6/04/2009(d)(h)(l) | | | 108,787 |
| | | | | | |
| | | | | | 521,510 |
| | | | | | |
| | | Technology — 0.2% | | | |
| | 417,835 | | Nuance Communications, Inc., Term Loan, 2.250%, 3/31/2013(h) | | | 399,158 |
| | 2,419 | | Sungard Data Systems, Inc., Tranche A, 2.004%, 2/28/2014(h) | | | 2,261 |
| | 67,045 | | Sungard Data Systems, Inc., Tranche B, 4.079%, 2/26/2016(h) | | | 65,268 |
| | | | | | |
| | | | | | 466,687 |
| | | | | | |
| | | Wirelines — 0.7% | | | |
| | 763,371 | | Fairpoint Communications, Inc., Initial Term Loan B, 5.000%, 3/31/2015(h) | | | 573,719 |
| | 35,482 | | Hawaiian Telcom Communications, Inc., Tranche C Term Loan, 4.750%, 6/01/2014(h)(i) | | | 21,892 |
| | 250,000 | | Level 3 Financing, Inc., Add on Term Loan, 11.500%, 3/13/2014(h) | | | 264,610 |
| | 25,000 | | Level 3 Financing, Inc., Tranche A Term Loan, 2.683%, 3/13/2014(h) | | | 22,094 |
| | 365,343 | | Transaction Network Services, Inc., Term Loan A, 9.500%, 3/28/2014(h) | | | 368,540 |
| | | | | | |
| | | | | | 1,250,855 |
| | | | | | |
| | | Total Bank Loans (Identified Cost $2,613,743) | | | 2,706,147 |
| | | | | | |
| | | | | |
| | |
| Shares | | Description | | Value (†) |
| | | | | |
| Preferred Stocks — 1.3% | | | |
| Convertible Preferred Stocks — 1.2% | | | |
| | Capital Markets — 0.5% | | | |
| 24,190 | | Newell Financial Trust I, 5.250% | | $ | 855,721 |
| | | | | |
| | Diversified Financial Services — 0.1% | | | |
| 3,732 | | Sovereign Capital Trust IV, 4.375% | | | 112,893 |
| | | | | |
| | Electric Utilities — 0.1% | | | |
| 6,475 | | AES Trust III, 6.750% | | | 285,305 |
| | | | | |
| | Machinery — 0.0% | | | |
| 2,550 | | United Rentals Trust I, 6.500% | | | 63,431 |
| | | | | |
| | Oil, Gas & Consumable Fuels — 0.2% | | | |
| 9,500 | | El Paso Energy Capital Trust I, 4.750% | | | 317,656 |
| | | | | |
| | Semiconductors & Semiconductor Equipment — 0.3% | | | |
| 799 | | Lucent Technologies Capital Trust I, 7.750% | | | 611,235 |
| | | | | |
| | Total Convertible Preferred Stocks (Identified Cost $2,078,890) | | | 2,246,241 |
| | | | | |
| Non-Convertible Preferred Stocks — 0.1% | | | |
| | Diversified Financial Services — 0.1% | | | |
| 274 | | Preferred Blocker, Inc., 144A, 7.000% | | | 159,340 |
| | | | | |
| | Thrifts & Mortgage Finance — 0.0% | | | |
| 300 | | Federal Home Loan Mortgage Corp., 5.000%(j)(k) | | | 795 |
| 7,900 | | Federal Home Loan Mortgage Corp., 5.570%(j)(k) | | | 12,640 |
| 2,850 | | Federal Home Loan Mortgage Corp., 5.660%(j)(k) | | | 4,702 |
| 1,000 | | Federal Home Loan Mortgage Corp., 5.700%(j)(k) | | | 2,570 |
| 1,800 | | Federal Home Loan Mortgage Corp., 5.790%(j)(k) | | | 4,788 |
| 650 | | Federal Home Loan Mortgage Corp., 5.810%(j)(k) | | | 1,774 |
| 1,400 | | Federal Home Loan Mortgage Corp., 5.900%(j)(k) | | | 2,380 |
| 350 | | Federal Home Loan Mortgage Corp., 6.000%(j)(k) | | | 1,033 |
| 600 | | Federal Home Loan Mortgage Corp., 6.420%(j)(k) | | | 1,800 |
| 1,350 | | Federal Home Loan Mortgage Corp., 6.550%(j)(k) | | | 2,457 |
| 7,400 | | Federal Home Loan Mortgage Corp.,
(fixed rate to 12/31/2012, variable rate thereafter), 8.375%(j)(k) | | | 13,394 |
| 1,200 | | Federal National Mortgage Association, 4.750%(j)(k) | | | 3,060 |
| 200 | | Federal National Mortgage Association, 5.125%(j)(k) | | | 532 |
| 400 | | Federal National Mortgage Association, 5.375%(j)(k) | | | 1,136 |
| 350 | | Federal National Mortgage Association, 5.810%(j)(k) | | | 977 |
| 550 | | Federal National Mortgage Association, 6.750%(j)(k) | | | 864 |
See accompanying notes to financial statements.
29
LOOMIS SAYLES HIGH INCOME FUND — PORTFOLIOOF INVESTMENTS (continued)
Investments as of September 30, 2009
| | | | | | |
Shares | | Description | | Value (†) |
| | | | | | |
| | | Thrifts & Mortgage Finance — continued | | | |
| | 10,250 | | Federal National Mortgage Association,
(fixed rate to 12/13/2010, variable rate thereafter), 8.250%(j)(k) | | $ | 16,502 |
| | | | | | |
| | | | | | 71,404 |
| | | | | | |
| | | Total Non-Convertible Preferred Stocks
(Identified Cost $634,132) | | | 230,744 |
| | | | | | |
| | | Total Preferred Stocks (Identified Cost $2,713,022) | | | 2,476,985 |
| | | | | | |
| | Common Stocks — 0.3% | | | |
| | | Biotechnology — 0.2% | | | |
| | 43,053 | | EPIX Pharmaceuticals, Inc.(j) | | | 603 |
| | 127 | | EPIX Pharmaceuticals, Inc., Contingent Value Rights(j) | | | — |
| | 8,147 | | Vertex Pharmaceuticals, Inc.(j) | | | 308,771 |
| | | | | | |
| | | | | | 309,374 |
| | | | | | |
| | | Chemicals — 0.0% | | | |
| | 1,087 | | Ashland, Inc. | | | 46,980 |
| | | | | | |
| | | Household Durables — 0.0% | | | |
| | 1,775 | | KB Home | | | 29,483 |
| | | | | | |
| | | Pharmaceuticals — 0.1% | | | |
| | 6,875 | | Merck & Co., Inc. | | | 217,456 |
| | | | | | |
| | | Thrifts & Mortgage Finance — 0.0% | | | |
| | 5,500 | | Federal Home Loan Mortgage Corp.(j)(k) | | | 9,900 |
| | | | | | |
| | | Total Common Stocks (Identified Cost $670,137) | | | 613,193 |
| | | | | | |
| | Closed-End Investment Companies — 0.0% | | | |
| | 3,835 | | Morgan Stanley Emerging Markets Debt Fund, Inc. | | | 36,701 |
| | 2,175 | | Western Asset High Income Opportunity Fund, Inc. | | | 12,659 |
| | | | | | |
| | | Total Closed-End Investment Companies
(Identified Cost $45,443) | | | 49,360 |
| | | | | | |
Principal
Amount (‡) | | | | |
| | Short-Term Investments — 6.9% |
| $ | 15,199 | | Repurchase Agreement with State Street Corporation, dated 9/30/2009 at 0.000% to be repurchased at $15,199 on 10/01/2009, collateralized by $20,000 U.S. Treasury Bill, due 11/05/2009 valued at $19,999 including accrued interest (Note 2g of Notes to Financial Statements) | | | 15,199 |
| | 12,654,163 | | Tri-Party Repurchase Agreement with Fixed Income Clearing Corporation, dated 9/30/2009 at 0.000% to be repurchased at $12,654,163 on 10/01/2009, collateralized by $12,915,000 Federal Home Loan Mortgage Corp. Discount Note, due 12/31/2009 valued at $12,908,543 including accrued interest (Note 2g of Notes to Financial Statements) | | | 12,654,163 |
| | | | | | |
| | | Total Short-Term Investments (Identified Cost $12,669,362) | | | 12,669,362 |
| | | | | | |
| | | | | | |
| | | Total Investments — 99.9% (Identified Cost $170,197,311)(a) | | | 184,815,547 |
| | | Other assets less liabilities — 0.1% | | | 237,077 |
| | | | | | |
| | | Net Assets — 100.0% | | $ | 185,052,624 |
| | �� | | | | |
| | | | | | |
| | (‡) | | Principal amount stated in U.S. dollars unless otherwise noted. | | | |
| | (†) | | See Note 2a of Notes to Financial Statements. | | | |
| | (††) | | Amount shown represents units. One unit represents a principal amount of 100. |
| | | | | | |
| | | | | | |
| (a) | | Federal Tax Information: At September 30, 2009, the net unrealized appreciation on investments based on a cost of $170,660,593 for federal income tax purposes was as follows: | | | | |
| | Aggregate gross unrealized appreciation for all investments in which there is an excess of value over tax cost | | $ | 18,505,499 | |
| | Aggregate gross unrealized depreciation for all investments in which there is an excess of tax cost over value | | | (4,350,545 | ) |
| | | | | | |
| | Net unrealized appreciation | | $ | 14,154,954 | |
| | | | | | |
| | | | | | |
| (b) | | Variable rate security. Rate as of September 30, 2009 is disclosed. | | | | |
| (c) | | Step Bond: Coupon rate is a fixed rate for an initial period then resets at a specified date and rate. | |
| (d) | | The issuer is in default with respect to interest and/or principal payments. Income is not being accrued. | |
| (e) | | Fair valued security by the Fund’s investment adviser. At September 30, 2009, the value of this security amounted to $497,545 or 0.3% of net assets. | |
| (f) | | Illiquid security. At September 30, 2009, the value of these securities amounted to $1,782,818 or 1.0% of net assets. | |
| (g) | | All or a portion of this security is held as collateral for open forward foreign currency contracts. | |
| (h) | | Variable rate security. Rate shown represents the weighted average rate at September 30, 2009. | |
| (i) | | All or a portion of interest payment is paid-in-kind. | |
| (j) | | Non-income producing security. | |
| (k) | | Future dividend payments have been eliminated as the issuer has been placed in conservatorship. | |
| (l) | | Issuer has filed for bankruptcy. | |
| | | | | | |
| 144A | | Securities exempt from registration under Rule 144A of the Securities Act of 1933. These securities may be resold in transactions exempt from registration, normally to qualified institutional buyers. At September 30, 2009, the value of these securities amounted to $20,691,962 or 11.2% of net assets. | |
| | | | | | |
| ABS | | Asset-Backed Securities | | | | |
| EMTN | | Euro Medium Term Note | | | | |
| GMTN | | Global Medium Term Note | | | | |
| MTN | | Medium Term Note | | | | |
| REITs | | Real Estate Investment Trusts | | | | |
| | | | | | |
| AUD | | Australian Dollar | | | | |
| CAD | | Canadian Dollar | | | | |
| GBP | | British Pound | | | | |
| IDR | | Indonesian Rupiah | | | | |
| ISK | | Icelandic Krona | | | | |
| MXN | | Mexican Peso | | | | |
| NZD | | New Zealand Dollar | | | | |
| SGD | | Singapore Dollar | | | | |
| UYU | | Uruguayan Peso | | | | |
At September 30, 2009, the Fund had the following open forward foreign currency contracts:
| | | | | | | | | | | | | |
Contract to Buy/Sell | | Delivery Date | | Currency | | Units | | Notional Value | | Unrealized Appreciation (Depreciation) | |
Buy1 | | 10/30/2009 | | Singapore Dollar | | 1,140,000 | | $ | 809,109 | | $ | 4,791 | |
Sell1 | | 10/30/2009 | | Singapore Dollar | | 1,140,000 | | | 809,109 | | | (17,552 | ) |
| | | | | | | | | | | | | |
Total | | | | | | | | | | | $ | (12,761 | ) |
| | | | | | | | | | | | | |
| 1 | Counterparty is Barclays Bank PLC. |
See accompanying notes to financial statements.
30
LOOMIS SAYLES HIGH INCOME FUND — PORTFOLIOOF INVESTMENTS (continued)
Investments as of September 30, 2009
Industry Summary at September 30, 2009 (Unaudited)
| | | |
| Technology | | 8.5 | % |
| Wirelines | | 8.1 | |
| Independent Energy | | 6.7 | |
| Healthcare | | 6.4 | |
| Pharmaceuticals | | 5.1 | |
| Electric | | 4.4 | |
| Lodging | | 4.1 | |
| Home Construction | | 3.9 | |
| Wireless | | 3.7 | |
| Commercial Mortgage-Backed Securities | | 3.1 | |
| Paper | | 2.9 | |
| Aerospace & Defense | | 2.6 | |
| Automotive | | 2.5 | |
| Retailers | | 2.5 | |
| Non-Captive Diversified | | 2.3 | |
| Non-Captive Consumer | | 2.2 | |
| Media Cable | | 2.1 | |
| Other Investments, less than 2% each | | 21.9 | |
| Short-Term Investments | | 6.9 | |
| | | |
| Total Investments | | 99.9 | |
| Other assets less liabilities (including open Forward Foreign Currency Contracts) | | 0.1 | |
| | | |
| Net Assets | | 100.0 | % |
| | | |
See accompanying notes to financial statements.
31
LOOMIS SAYLES INTERNATIONAL BOND FUND — PORTFOLIOOF INVESTMENTS
Investments as of September 30, 2009
| | | | | |
Principal
Amount (‡) | | Description | | Value (†) |
| | | | | |
| Bonds and Notes — 84.8% of Net Assets |
| Non-Convertible Bonds — 84.7% |
| | Australia — 1.2% | | | |
| 100,000 | | National Australia Bank Ltd., GMTN, 4.750%, 7/15/2016, (EUR) | | $ | 151,476 |
| 165,000 | | New South Wales Treasury Corp., Series 10RG, 7.000%, 12/01/2010, (AUD) | | | 149,947 |
| | | | | |
| | | | | 301,423 |
| | | | | |
| | Austria — 0.8% | | | |
| 17,000,000 | | Oesterreichische Kontrollbank AG, 1.800%, 3/22/2010, (JPY) | | | 190,037 |
| | | | | |
| | Belgium — 7.6% | | | |
| 100,000 | | Anheuser-Busch InBev NV, EMTN, 6.500%, 6/23/2017, (GBP) | | | 172,466 |
| 625,000 | | Kingdom of Belgium, 5.500%, 9/28/2017, (EUR) | | | 1,046,981 |
| 415,000 | | Kingdom of Belgium, Series 50, 4.000%, 3/28/2013, (EUR) | | | 643,551 |
| | | | | |
| | | | | 1,862,998 |
| | | | | |
| | Brazil — 0.4% | | | |
| 200(†††) | | Brazil Notas do Tesouro Nacional, Series F, 10.000%, 1/01/2017, (BRL) | | | 98,999 |
| 5,000 | | Republic of Brazil, 7.125%, 1/20/2037 | | | 5,962 |
| | | | | |
| | | | | 104,961 |
| | | | | |
| | Canada — 4.4% | | | |
| 110,000 | | Bell Canada, Series M-17, 6.100%, 3/16/2035, (CAD) | | | 95,946 |
| 255,000 | | Canadian Government, 2.000%, 9/01/2012, (CAD) | | | 238,818 |
| 715,000 | | Canadian Government, 4.500%, 6/01/2015, (CAD)(b) | | | 732,083 |
| | | | | |
| | | | | 1,066,847 |
| | | | | |
| | Cayman Islands — 1.2% | | | |
| 60,000 | | DASA Finance Corp., 144A, 8.750%, 5/29/2018 | | | 63,600 |
| 75,000 | | DASA Finance Corp., 8.750%, 5/29/2018 | | | 79,500 |
| 100,000 | | Hutchison Whampoa Finance Ltd., 4.625%, 9/21/2016, (EUR) | | | 143,847 |
| | | | | |
| | | | | 286,947 |
| | | | | |
| | France — 3.2% | | | |
| 50,000 | | Credit Agricole SA, EMTN, 5.971%, 2/01/2018, (EUR) | | | 80,960 |
| 100,000 | | Electricite de France, EMTN, 5.875%, 7/18/2031, (GBP) | | | 173,062 |
| 40,000 | | Lafarge SA, EMTN, 4.750%, 3/23/2020, (EUR) | | | 51,556 |
| 50,000 | | Lafarge SA, EMTN, 5.375%, 6/26/2017, (EUR) | | | 70,889 |
| 85,000 | | PPR, EMTN, 4.000%, 1/29/2013, (EUR) | | | 124,277 |
| 35,000 | | Veolia Environnement, EMTN, 5.125%, 5/24/2022, (EUR) | | | 51,124 |
| 70,000 | | Veolia Environnement, EMTN, 6.125%, 11/25/2033, (EUR) | | | 106,952 |
| | | | | |
Principal
Amount (‡) | | Description | | Value (†) |
| | | | | |
| | France — continued | | | |
| 50,000 | | Vivendi, 4.500%, 10/03/2013, (EUR) | | $ | 74,760 |
| 50,000 | | Wendel, 4.875%, 5/26/2016, (EUR) | | | 56,705 |
| | | | | |
| | | | | 790,285 |
| | | | | |
| | Germany — 21.9% | | | |
| 50,000 | | Bertelsmann AG, EMTN, 3.625%, 10/06/2015, (EUR) | | | 66,407 |
| 21,000,000 | | Kreditanstalt fuer Wiederaufbau, 1.350%, 1/20/2014, (JPY) | | | 238,015 |
| 16,000,000 | | Kreditanstalt fuer Wiederaufbau, 1.750%, 3/23/2010, (JPY) | | | 179,396 |
| 36,000,000 | | Kreditanstalt fuer Wiederaufbau, 2.050%, 2/16/2026, (JPY) | | | 391,559 |
| 185,000 | | Kreditanstalt fuer Wiederaufbau, 2.500%, 10/11/2010, (EUR) | | | 275,848 |
| 5,000,000 | | Kreditanstalt fuer Wiederaufbau, 2.600%, 6/20/2037, (JPY) | | | 55,727 |
| 105,000 | | Muenchener Hypothekenbank eG, 5.000%, 1/16/2012, (EUR) | | | 164,369 |
| 130,000 | | Republic of Germany, 1.250%, 9/16/2011, (EUR) | | | 190,176 |
| 540,000 | | Republic of Germany, 3.750%, 7/04/2013, (EUR) | | | 836,309 |
| 665,000 | | Republic of Germany, 3.750%, 1/04/2017, (EUR) | | | 1,027,087 |
| 400,000 | | Republic of Germany, 4.000%, 12/11/2009, (EUR) | | | 589,162 |
| 330,000 | | Republic of Germany, 4.000%, 4/13/2012, (EUR) | | | 512,020 |
| 100,000 | | Republic of Germany, 4.000%, 1/04/2037, (EUR) | | | 146,901 |
| 100,000 | | Republic of Germany, 4.500%, 1/04/2013, (EUR) | | | 158,021 |
| 280,000 | | Republic of Germany, 6.500%, 7/04/2027, (EUR) | | | 541,034 |
| | | | | |
| | | | | 5,372,031 |
| | | | | |
| | India — 0.7% | | | |
| 100,000 | | Canara Bank Ltd., (fixed rate to 11/28/2016, variable rate thereafter), 6.365%, 11/28/2021 | | | 92,273 |
| 100,000 | | ICICI Bank Ltd., (fixed rate to 4/30/2017, variable rate thereafter), 144A, 6.375%, 4/30/2022 | | | 81,801 |
| | | | | |
| | | | | 174,074 |
| | | | | |
| | Ireland — 1.5% | | | |
| 30,000,000 | | Depfa ACS Bank, Series 686, EMTN, 1.650%, 12/20/2016, (JPY) | | | 270,956 |
| 100,000 | | Elan Corp. PLC, 144A, 8.750%, 10/15/2016 | | | 98,563 |
| | | | | |
| | | | | 369,519 |
| | | | | |
| | Italy — 0.8% | | | |
| 150,000 | | Finmeccanica SpA, EMTN, 4.875%, 3/24/2025, (EUR) | | | 207,457 |
| | | | | |
| | Japan — 8.4% | | | |
| 18,000,000 | | Development Bank of Japan, 1.750%, 6/21/2010, (JPY) | | | 202,476 |
See accompanying notes to financial statements.
32
LOOMIS SAYLES INTERNATIONAL BOND FUND — PORTFOLIOOF INVESTMENTS (continued)
Investments as of September 30, 2009
| | | | | |
Principal
Amount (‡) | | Description | | Value (†) |
| | | | | |
| | Japan — continued | | | |
| 63,000,000 | | Japan Finance Organization for Municipal Enterprises, 1.350%, 11/26/2013, (JPY) | | $ | 721,499 |
| 39,000,000 | | Japan Government , 0.700%, 6/20/2014, (JPY) | | | 437,308 |
| 20,000,000 | | Japan Government, 1.300%, 3/20/2019, (JPY) | | | 224,783 |
| 41,000,000 | | Japan Government, 1.400%, 6/20/2011, (JPY) | | | 465,962 |
| | | | | |
| | | | | 2,052,028 |
| | | | | |
| | Jersey — 0.3% | | | |
| 50,000 | | WPP PLC, 6.000%, 4/04/2017, (GBP) | | | 76,530 |
| | | | | |
| | Luxembourg — 0.5% | | | |
| 50,000 | | Enel Finance International SA, EMTN, 5.625%, 8/14/2024, (GBP) | | | 79,972 |
| 25,000 | | Telecom Italia Finance SA, EMTN, 7.750%, 1/24/2033, (EUR) | | | 41,051 |
| | | | | |
| | | | | 121,023 |
| | | | | |
| | Mexico — 1.2% | | | |
| 85,000 | | Desarrolladora Homex SAB de CV, 7.500%, 9/28/2015 | | | 83,512 |
| 17,000(††) | | Mexican Fixed Rate Bonds, Series M-10, 8.500%, 12/13/2018, (MXN) | | | 130,471 |
| 10,000(††) | | Mexican Fixed Rate Bonds, Series M-20, 8.000%, 12/07/2023, (MXN) | | | 72,653 |
| | | | | |
| | | | | 286,636 |
| | | | | |
| | Netherlands — 3.6% | | | |
| 245,000 | | Kingdom of Netherlands, 5.000%, 7/15/2011, (EUR)(b) | | | 382,394 |
| 50,000 | | Koninklijke (Royal) KPN NV, GMTN, 4.750%, 1/17/2017, (EUR) | | | 74,580 |
| 100,000 | | Linde Finance BV, EMTN, 4.750%, 4/24/2017, (EUR) | | | 151,712 |
| 100,000 | | RWE Finance BV, EMTN, 5.500%, 7/06/2022, (GBP) | | | 164,170 |
| 10,000 | | Wolters Kluwer NV, 5.125%, 1/27/2014, (EUR) | | | 15,325 |
| 50,000 | | Wolters Kluwer NV, 6.375%, 4/10/2018, (EUR) | | | 80,613 |
| | | | | |
| | | | | 868,794 |
| | | | | |
| | Norway — 3.3% | | | |
| 275,000 | | Norwegian Government, 4.250%, 5/19/2017, (NOK) | | | 48,404 |
| 2,125,000 | | Norwegian Government, 5.000%, 5/15/2015, (NOK) | | | 390,960 |
| 775,000 | | Norwegian Government, 6.000%, 5/16/2011, (NOK) | | | 140,992 |
| 1,235,000 | | Norwegian Government, 6.500%, 5/15/2013, (NOK) | | | 235,518 |
| | | | | |
| | | | | 815,874 |
| | | | | |
| | Singapore — 0.8% | | | |
| 265,000 | | Republic of Singapore, 2.250%, 7/01/2013, (SGD) | | | 196,434 |
| | | | | |
| | South Africa — 0.4% | | | |
| 100,000 | | Edcon Proprietary Ltd., 144A, 4.023%, 6/15/2014, (EUR)(c) | | | 104,629 |
| | | | | |
| | | | | |
Principal
Amount (‡) | | Description | | Value (†) |
| | | | | |
| | Spain — 0.6% | | | |
| 100,000 | | Santander Issurance SA, EMTN, (fixed rate to 5/29/2014, variable rate thereafter), 4.750%, 5/29/2019, (EUR) | | $ | 146,016 |
| | | | | |
| | Supranational — 4.9% | | | |
| 40,000,000 | | Asian Development Bank, EMTN, 2.350%, 6/21/2027, (JPY) | | | 457,635 |
| 25,000,000 | | European Investment Bank, 1.250%, 9/20/2012, (JPY) | | | 284,895 |
| 4,000,000 | | European Investment Bank, 1.400%, 6/20/2017, (JPY) | | | 45,250 |
| 921,000,000 | | European Investment Bank, EMTN, 144A, Zero Coupon, 4/24/2013, (IDR) | | | 67,829 |
| 30,000,000 | | Nordic Investment Bank, Series C, GMTN, 1.700%, 4/27/2017, (JPY) | | | 347,197 |
| | | | | |
| | | | | 1,202,806 |
| | | | | |
| | Sweden — 2.2% | | | |
| 2,490,000 | | Sweden Government Bond, 5.500%, 10/08/2012, (SEK) | | | 392,501 |
| 100,000 | | Telefonaktiebolaget LM Ericsson, EMTN, 5.375%, 6/27/2017, (EUR) | | | 150,380 |
| | | | | |
| | | | | 542,881 |
| | | | | |
| | United Arab Emirates — 0.8% | | | |
| 100,000 | | Abu Dhabi National Energy Co., 144A, 6.500%, 10/27/2036 | | | 96,556 |
| 100,000 | | DP World Ltd., 144A, 6.850%, 7/02/2037 | | | 87,949 |
| | | | | |
| | | | | 184,505 |
| | | | | |
| | United Kingdom — 5.7% | | | |
| 50,000 | | BAT International Finance PLC, EMTN, 5.375%, 6/29/2017, (EUR) | | | 76,797 |
| 50,000 | | British Sky Broadcasting Group PLC, EMTN, 6.000%, 5/21/2027, (GBP) | | | 81,066 |
| 50,000 | | BSKYB Finance UK PLC, 5.750%, 10/20/2017, (GBP) | | | 84,457 |
| 94,000 | | Lloyds TSB Group PLC, 5.875%, 7/08/2014, (EUR) | | | 140,466 |
| 50,000 | | Standard Chartered Bank, Series 17, EMTN, 5.875%, 9/26/2017, (EUR) | | | 75,663 |
| 70,000 | | United Kingdom Gilt, 4.250%, 6/07/2032, (GBP) | | | 115,646 |
| 30,000 | | United Kingdom Treasury, 4.000%, 9/07/2016, (GBP) | | | 50,872 |
| 350,000 | | United Kingdom Treasury, 5.250%, 6/07/2012, (GBP) | | | 608,889 |
| 100,000 | | Vodafone Group PLC, EMTN, 5.375%, 6/06/2022, (EUR) | | | 151,530 |
| | | | | |
| | | | | 1,385,386 |
| | | | | |
| | United States — 8.3% | | | |
| 25,000 | | Ahold Finance USA, Inc., EMTN, 6.500%, 3/14/2017, (GBP) | | | 42,351 |
| 50,000 | | Alcoa, Inc., 6.750%, 1/15/2028 | | | 43,611 |
| 100,000 | | Bristol-Myers Squibb Co., 4.625%, 11/15/2021, (EUR) | | | 150,738 |
| 50,000 | | Cargill, Inc., EMTN, 5.375%, 3/02/2037, (GBP) | | | 69,846 |
See accompanying notes to financial statements.
33
LOOMIS SAYLES INTERNATIONAL BOND FUND — PORTFOLIOOF INVESTMENTS (continued)
Investments as of September 30, 2009
| | | | | | |
Principal
Amount (‡) | | Description | | Value (†) |
| | | | | | |
| | | United States — continued | | | |
| $ | 20,000 | | Chesapeake Energy Corp., 6.375%, 6/15/2015 | | $ | 18,575 |
| | 60,000 | | Chesapeake Energy Corp., 6.500%, 8/15/2017 | | | 55,050 |
| | 50,000 | | Couche-Tard US/Finance, 7.500%, 12/15/2013 | | | 50,563 |
| | 50,000 | | Countrywide Financial Corp., EMTN, 5.125%, 2/17/2011, (GBP) | | | 80,144 |
| | 60,000 | | Frontier Communications Corp., 6.250%, 1/15/2013 | | | 58,800 |
| | 100,000 | | Georgia-Pacific Corp., 8.000%, 1/15/2024 | | | 99,000 |
| | 50,000 | | Goldman Sachs Group, Inc. (The), 6.875%, 1/18/2038, (GBP) | | | 79,526 |
| | 50,000 | | Goldman Sachs Group, Inc. (The), 7.125%, 8/07/2025, (GBP) | | | 92,141 |
| | 55,000 | | HCA, Inc., 5.750%, 3/15/2014 | | | 48,538 |
| | 45,000 | | HCA, Inc., 8.360%, 4/15/2024 | | | 36,618 |
| | 90,000 | | International Paper Co., 8.700%, 6/15/2038 | | | 99,770 |
| | 50,000 | | Kraft Foods, Inc., 6.250%, 3/20/2015, (EUR) | | | 79,059 |
| | 100,000 | | Merrill Lynch & Co., Inc., EMTN, 4.625%, 9/14/2018, (EUR) | | | 126,510 |
| | 25,000 | | Morgan Stanley, 5.375%, 11/14/2013, (GBP) | | | 40,475 |
| | 50,000 | | Morgan Stanley, EMTN, 3.750%, 3/01/2013, (EUR) | | | 72,484 |
| | 75,000 | | Motorola, Inc., 6.625%, 11/15/2037 | | | 62,813 |
| | 5,000 | | New Albertson’s, Inc., 7.450%, 8/01/2029 | | | 4,300 |
| | 5,000 | | New Albertson’s, Inc., 7.750%, 6/15/2026 | | | 4,450 |
| | 95,000 | | New Albertson’s, Inc., 8.000%, 5/01/2031 | | | 85,262 |
| | 5,000 | | New Albertson’s, Inc., 8.700%, 5/01/2030 | | | 4,550 |
| | 50,000 | | Owens Brockway Glass Container, Inc., 6.750%, 12/01/2014, (EUR) | | | 72,436 |
| | 95,000 | | Qwest Corp., 6.875%, 9/15/2033 | | | 76,950 |
| | 70,000 | | SLM Corp., Series A, MTN, 4.500%, 7/26/2010 | | | 68,016 |
| | 100,000 | | Sprint Nextel Corp., 6.000%, 12/01/2016 | | | 89,250 |
| | 100,000 | | Textron, Inc., 3.875%, 3/11/2013, (EUR) | | | 135,121 |
| | 50,000 | | Wells Fargo & Co., 4.625%, 11/02/2035, (GBP) | | | 72,356 |
| | | | | | |
| | | | | | 2,019,303 |
| | | | | | |
| | | Total Non-Convertible Bonds (Identified Cost $19,471,627) | | | 20,729,424 |
| | | | | | |
| | | | | | | |
Principal
Amount (‡) | | Description | | Value (†) | |
| | | | | | | |
| | Convertible Bonds — 0.1% | | | | |
| | | United States — 0.1% | | | | |
| $ | 50,000 | | Hologic, Inc., (Step to Zero Coupon on 12/15/2013), 2.000%, 12/15/2037(d) (Identified Cost $34,778) | | $ | 40,875 | |
| | | | | | | |
| | | Total Bonds and Notes (Identified Cost $19,506,405) | | | 20,770,299 | |
| | | | | | | |
| | Short-Term Investments — 7.3% | | | | |
| | 1,782,795 | | Tri-Party Repurchase Agreement with Fixed Income Clearing Corporation, dated 9/30/2009 at 0.000% to be repurchased at $1,782,795 on 10/01/2009, collateralized by $1,740,000 Federal Home Loan Mortgage Corp., 5.625% due 11/23/2035 valued at $1,818,474 including accrued interest (Note 2g of Notes to Financial Statements) (Identified Cost $1,782,795) | | | 1,782,795 | |
| | | | | | | |
| | | | | | | |
| | | Total Investments — 92.1%
(Identified Cost $21,289,200)(a) | | | 22,553,094 | |
| | | Other assets less liabilities—7.9% | | | 1,929,839 | |
| | | | | | | |
| | | Net Assets — 100.0% | | $ | 24,482,933 | |
| | | | | | | |
| | | | | | | |
| | (‡) | | Principal amount stated in U.S. dollars unless otherwise noted. | | | | |
| | (†) | | See Note 2a of Notes to Financial Statements. | | | | |
| | (††) | | Amount shown represents units. One unit represents a principal amount of 100. | | | | |
| | (†††) | | Amount shown represents units. One unit represents a principal amount of 1,000. | | | | |
| | (a) | | Federal Tax Information: | | | | |
| | | At September 30, 2009, the net unrealized appreciation on investments based on a cost of $21,335,124 for federal income tax purposes was as follows: | | | | |
| | | Aggregate gross unrealized appreciation for all investments in which there is an excess of value over tax cost | | $ | 1,346,393 | |
| | | Aggregate gross unrealized depreciation for all investments in which there is an excess of tax cost over value | | | (128,423 | ) |
| | | | | | | |
| | | Net unrealized appreciation | | $ | 1,217,970 | |
| | | | | | | |
| | | | | | | |
| | (b) | | All or a portion of this security is held as collateral for open forward foreign currency contracts. | |
| | (c) | | Variable rate security. Rate as of September 30, 2009 is disclosed. | | | | |
| | (d) | | Step Bond: Coupon rate is a fixed rate for an initial period then resets at a specified date and rate. | |
| | | | | | | |
| | 144A | | Securities exempt from registration under Rule 144A of the Securities Act of 1933. These securities may be resold in transactions exempt from registration, normally to qualified institutional buyers. At September 30, 2009, the value of these securities amounted to $600,927 or 2.5% of net assets. | |
| | EMTN | | Euro Medium Term Note | | | | |
| | GMTN | | Global Medium Term Note | | | | |
| | MTN | | Medium Term Note | | | | |
| | | | | | | |
| | AUD | | Australian Dollar | | | | |
| | BRL | | Brazilian Real | | | | |
| | CAD | | Canadian Dollar | | | | |
| | EUR | | Euro | | | | |
| | GBP | | British Pound | | | | |
| | IDR | | Indonesian Rupiah | | | | |
| | JPY | | Japanese Yen | | | | |
| | MXN | | Mexican Peso | | | | |
| | NOK | | Norwegian Krone | | | | |
| | SEK | | Swedish Krona | | | | |
| | SGD | | Singapore Dollar | | | | |
See accompanying notes to financial statements.
34
LOOMIS SAYLES INTERNATIONAL BOND FUND — PORTFOLIOOF INVESTMENTS (continued)
Investments as of September 30, 2009
At September 30, 2009, the Fund had the following open forward foreign currency contracts:
| | | | | | | | | | | | |
Contract to
Buy/Sell | | Delivery
Date | | Currency | | Units | | Notional
Value | | Unrealized Appreciation |
Buy1 | | 12/16/2009 | | Euro | | 372,000 | | $ | 544,322 | | $ | 15,156 |
Buy2 | | 12/16/2009 | | Japanese Yen | | 94,250,000 | | | 1,050,483 | | | 23,591 |
Sell2 | | 12/16/2009 | | Japanese Yen | | 36,300,000 | | | 404,589 | | | 1,790 |
Buy3 | | 12/14/2009 | | South Korean Won | | 248,000,000 | | | 210,288 | | | 7,508 |
Buy4 | | 12/14/2009 | | South Korean Won | | 600,000,000 | | | 508,762 | | | 17,161 |
| | | | | | | | | | | | |
Total | | | | | | | | | | | $ | 65,206 |
| | | | | | | | | | | | |
| 1 | Counterparty is Credit Suisse. |
| 2 | Counterparty is JP Morgan Chase. |
| 4 | Counterparty is Barclays Bank PLC. |
Industry Summary at September 30, 2009 (Unaudited)
| | | |
| Treasuries | | 41.5 | % |
| Banking | | 7.2 | |
| Government Guaranteed | | 5.5 | |
| Supranational | | 4.9 | |
| Government Agencies | | 2.9 | |
| Sovereigns | | 2.7 | |
| Other Investments, less than 2% each | | 20.1 | |
| Short-Term Investments | | 7.3 | |
| | | |
| Total Investments | | 92.1 | |
| Other assets less liabilities (including open Forward Foreign Currency Contracts) | | 7.9 | |
| | | |
| Net Assets | | 100.0 | % |
| | | |
Currency Exposure at September 30, 2009 as a Percentage of Net Assets (Unaudited)
| | | |
| Euro | | 39.0 | % |
| Japanese Yen | | 18.4 | |
| United States Dollar | | 14.0 | |
| British Pound | | 8.5 | |
| Canadian Dollar | | 4.4 | |
| Norwegian Krone | | 3.3 | |
| Other, less than 2% each | | 4.5 | |
| | | |
| Total Investments | | 92.1 | |
| Other assets less liabilities (including open Forward Foreign Currency Contracts) | | 7.9 | |
| | | |
| Net Assets | | 100.0 | % |
| | | |
See accompanying notes to financial statements.
35
LOOMIS SAYLES LIMITED TERM GOVERNMENTAND AGENCY FUND
PORTFOLIOOF INVESTMENTS
Investments as of September 30, 2009
| | | | | | |
Principal
Amount | | Description | | Value (†) |
| | | | | | |
| | Bonds and Notes — 99.1% of Net Assets | | | |
| | | ABS Car Loan — 2.1% | | | |
| $ | 91,578 | | Honda Auto Receivables Owner Trust, Series 2008-1, Class A2, 3.770%, 9/20/2010 | | $ | 91,928 |
| | 1,025,000 | | Honda Auto Receivables Owner Trust, Series 2009-2, Class A3, 2.790%, 1/15/2013 | | | 1,048,989 |
| | 785,000 | | Honda Auto Receivables Owner Trust, Series 2009-3, Class A3, 2.310%, 5/15/2013 | | | 797,050 |
| | 565,000 | | Merrill Auto Trust Securitization, Series 2008-1, Class 3A3, 5.500%, 3/15/2012 | | | 585,507 |
| | 425,000 | | Nissan Auto Receivables Owner Trust, Series 2008-B, Class A3, 4.460%, 4/16/2012 | | | 439,341 |
| | 915,000 | | Nissan Master Owner Trust Receivables, Series 2007-A, Class A, 0.243%, 5/15/2012(b) | | | 908,862 |
| | 429,000 | | USAA Auto Owner Trust, Series 2008-3, Class A3, 4.280%, 10/15/2012 | | | 443,936 |
| | | | | | |
| | | | | | 4,315,613 |
| | | | | | |
| | | ABS Credit Card — 3.4% | | | |
| | 985,000 | | American Express Credit Account Master Trust, Series 2004-2 Class A, 0.413%, 12/15/2016(b) | | | 947,809 |
| | 1,150,000 | | Capital One Multi-Asset Execution Trust, Series 2008-A6, Class A6, 1.343%, 3/17/2014(b) | | | 1,158,227 |
| | 3,000,000 | | Citibank Credit Card Issuance Trust, Series 2006-A8, Class A8, 0.549%, 12/17/2018(b) | | | 2,767,474 |
| | 1,400,000 | | Discover Card Master Trust I, Series 2007-3, Class A2, 0.293%, 10/16/2014(b) | | | 1,362,604 |
| | 600,000 | | Discover Card Master Trust, Series 2008-A3, Class A3, 5.100%, 10/15/2013 | | | 630,348 |
| | | | | | |
| | | | | | 6,866,462 |
| | | | | | |
| | | ABS Home Equity — 1.2% | | | |
| | 962,163 | | Countrywide Asset-Backed Certificates, Series 2004-S1, Class A3, 4.615%, 2/25/2035 | | | 723,448 |
| | 1,017,154 | | Countrywide Asset-Backed Certificates, Series 2006-S1, Class A2, 5.549%, 8/25/2021 | | | 538,786 |
| | 669,276 | | Residential Funding Mortgage Securities II, Series 2002-HI5, Class A7, 5.700%, 1/25/2028 | | | 547,966 |
| | 660,000 | | Residential Funding Mortgage Securities II, Series 2005-HI3, Class A4, 5.490%, 9/25/2035 | | | 549,655 |
| | | | | | |
| | | | | | 2,359,855 |
| | | | | | |
| | | ABS Other — 0.3% | | | |
| | 700,000 | | John Deere Owner Trust, Series 2009-A, Class A3, 2.590%, 10/15/2013 | | | 711,857 |
| | | | | | |
| | | Collateralized Mortgage Obligations — 0.4% | | | |
| | 87,991 | | Federal Home Loan Mortgage Corp., Series 3145, Class KA, 5.000%, 8/15/2024 | | | 91,409 |
| | 770,851 | | Federal Home Loan Mortgage Corp., Series 2901, Class UA, 5.000%, 1/15/2030 | | | 808,517 |
| | | | | | |
| | | | | | 899,926 |
| | | | | | |
| | | Commercial Mortgage-Backed Securities — 10.9% | | | |
| | 1,005,000 | | Banc of America Commercial Mortgage, Inc., Series 2007-2, Class A2, 5.634%, 4/10/2049 | | | 997,671 |
| | 1,050,000 | | Bear Stearns Commercial Mortgage Securities, Inc.,
Series 2007-PW16, Class A2, 5.667%, 6/11/2040(b) | | | 1,035,264 |
| | | | | | |
Principal
Amount | | Description | | Value (†) |
| | | | | | |
| | | Commercial Mortgage-Backed Securities — continued | | | |
| $ | 360,000 | | Citigroup Commercial Mortgage Trust, Series 2006-C5, Class A4, 5.431%, 10/15/2049 | | $ | 325,339 |
| | 790,000 | | Citigroup/Deutsche Bank Commercial Mortgage Trust, Series 2007-CD4, Class A2B, 5.205%, 12/11/2049 | | | 786,282 |
| | 1,400,000 | | Commercial Mortgage Pass Through Certificates, Series 2006-C7, Class A4, 5.768%, 6/10/2046(b) | | | 1,339,263 |
| | 2,670,000 | | Credit Suisse Mortgage Capital Certificates, Series 2006-C3, Class A3, 5.826%, 6/15/2038(b) | | | 2,264,532 |
| | 1,610,000 | | Credit Suisse Mortgage Capital Certificates, Series 2007-C3, Class A4, 5.773%, 6/15/2039(b) | | | 1,271,035 |
| | 2,000,000 | | Credit Suisse Mortgage Capital Certificates, Series 2007-C4, Class A4, 5.809%, 9/15/2039(b) | | | 1,584,465 |
| | 1,500,000 | | Greenwich Capital Commercial Funding Corp., Series 2006-GG7, Class A4, 5.918%, 7/10/2038(b) | | | 1,372,349 |
| | 1,850,000 | | Greenwich Capital Commercial Funding Corp., Series 2007-GG9, Class A2, 5.381%, 3/10/2039 | | | 1,837,215 |
| | 1,860,000 | | GS Mortgage Securities Corp. II, Series 2006-GG6, Class A4, 5.553%, 4/10/2038 | | | 1,679,809 |
| | 500,000 | | GS Mortgage Securities Corp. II, Series 2006-GG8, Class A4, 5.560%, 11/10/2039 | | | 439,425 |
| | 1,720,000 | | Morgan Stanley Capital I, Series 2007-IQ14, Class A4, 5.692%, 4/15/2049 | | | 1,406,798 |
| | 905,000 | | Morgan Stanley Capital I, Series 2006-T23, Series A2, 5.741%, 8/12/2041(b) | | | 915,228 |
| | 530,000 | | Wachovia Bank Commercial Mortgage Trust, Series 2006-C28, Class A4, 5.572%, 10/15/2048 | | | 464,579 |
| | 4,675,000 | | Wachovia Bank Commercial Mortgage Trust, Series 2006-C29, Class A4, 5.308%, 11/15/2048 | | | 4,209,497 |
| | | | | | |
| | | | | | 21,928,751 |
| | | | | | |
| | | Government Guaranteed — 3.5% | | | |
| | 7,000,000 | | Citigroup Funding, Inc., 0.730%, 7/12/2012 (FDIC insured)(b) | | | 7,012,005 |
| | | | | | |
| | | Government Owned — No Guarantee — 10.0% | | | |
| | 6,000,000 | | Federal Home Loan Mortgage Corp., 2.125%, 3/23/2012 | | | 6,111,132 |
| | 1,600,000 | | Federal Home Loan Mortgage Corp., 4.125%, 10/18/2010 | | | 1,659,171 |
| | 5,000,000 | | Federal National Mortgage Association, 1.750%, 3/23/2011 | | | 5,074,620 |
| | 3,420,000 | | Federal National Mortgage Association, 2.000%, 1/09/2012 | | | 3,478,793 |
| | 3,500,000 | | Federal National Mortgage Association, 5.000%, 10/15/2011 | | | 3,791,351 |
| | | | | | |
| | | | | | 20,115,067 |
| | | | | | |
| | | Government Sponsored — 8.3% | | | |
| | 6,800,000 | | Federal Home Loan Bank, 1.125%, 6/03/2011 | | | 6,835,584 |
| | 5,000,000 | | Federal Home Loan Bank, 1.625%, 7/27/2011 | | | 5,057,330 |
See accompanying notes to financial statements.
36
LOOMIS SAYLES LIMITED TERM GOVERNMENTAND AGENCY FUND
PORTFOLIOOF INVESTMENTS (continued)
Investments as of September 30, 2009
| | | | | | |
Principal
Amount | | Description | | Value (†) |
| | | | | | |
| | | Government Sponsored — continued | | | |
| $ | 3,000,000 | | Federal Home Loan Bank, 3.375%, 10/20/2010 | | $ | 3,087,903 |
| | 1,700,000 | | Federal Home Loan Bank, 3.625%, 9/16/2011 | | | 1,789,580 |
| | | | | | |
| | | | | | 16,770,397 |
| | | | | | |
| | | Hybrid ARMs — 2.0% | | | |
| | 2,520,438 | | FNMA, 6.026%, 2/01/2037(b) | | | 2,680,158 |
| | 155,447 | | JPMorgan Mortgage Trust, Series 2006-A7, Class 1A3, 4.552%, 1/25/2037(b) | | | 144,977 |
| | 1,635,729 | | Morgan Stanley Mortgage Loan Trust, Series 2005-3AR, Class 5A, 5.585%, 7/25/2035(b) | | | 1,295,131 |
| | | | | | |
| | | | | | 4,120,266 |
| | | | | | |
| | | Mortgage Related — 42.4% | | | |
| | 7,641,202 | | FHLMC 4.500%, with various maturities from 2024 to 2034(c) | | | 7,905,107 |
| | 4,963,789 | | FHLMC 5.000%, with various maturities from 2022 to 2023(c) | | | 5,219,169 |
| | 16,554,608 | | FHLMC 5.500%, with various maturities from 2011 to 2023(c) | | | 17,657,952 |
| | 4,567,515 | | FHLMC 6.000%, with various maturities from 2019 to 2021(c) | | | 4,875,793 |
| | 6,823,443 | | FHLMC 6.500%, with various maturities from 2014 to 2034(c) | | | 7,305,738 |
| | 170,340 | | FHLMC, 7.000%, 2/01/2016 | | | 183,190 |
| | 18,922 | | FHLMC 7.500%, with various maturities from 2012 to 2026(c) | | | 20,195 |
| | 12,106 | | FHLMC, 8.000%, 9/01/2015 | | | 13,126 |
| | 4,458 | | FHLMC, 10.000%, 7/01/2019 | | | 5,008 |
| | 135,785 | | FHLMC 11.500%, with various maturities from 2015 to 2020(c) | | | 147,665 |
| | 9,529,069 | | FNMA 4.000%, with various maturities from 2018 to 2019(c) | | | 9,920,956 |
| | 852,857 | | FNMA, 4.500%, 9/01/2019 | | | 898,257 |
| | 2,022,877 | | FNMA 5.500%, with various maturities from 2017 to 2036(c) | | | 2,135,215 |
| | 20,858,677 | | FNMA 6.000%, with various maturities from 2017 to 2034(c) | | | 22,278,823 |
| | 5,110,573 | | FNMA 6.500%, with various maturities from 2017 to 2037(c) | | | 5,482,237 |
| | 190,599 | | FNMA, 7.000%, 12/01/2022 | | | 206,674 |
| | 408,201 | | FNMA 7.500%, with various maturities from 2015 to 2032(c) | | | 453,493 |
| | 59,846 | | FNMA 8.000%, with various maturities from 2015 to 2016(c) | | | 65,044 |
| | 94,838 | | GNMA, 6.000%, 12/15/2031 | | | 101,209 |
| | 335,525 | | GNMA, 6.500%, 5/15/2031 | | | 362,574 |
| | 289,911 | | GNMA, 7.000%, 10/15/2028 | | | 319,625 |
| | 2,384 | | GNMA, 12.500%, 6/15/2014 | | | 2,707 |
| | | | | | | |
Principal
Amount | | Description | | Value (†) | |
| | | | | | | |
| | | Mortgage Related — continued | | | | |
| $ | 43,467 | | GNMA 16.000%, with various maturities from 2011 to 2012(c) | | $ | 48,854 | |
| | 18,611 | | GNMA 17.000%, with various maturities in 2011(c) | | | 20,765 | |
| | | | | | | |
| | | | | | 85,629,376 | |
| | | | | | | |
| | | Treasuries — 14.6% | | | | |
| | 4,693,937 | | U.S. Treasury Inflation Indexed Bond, 1.375%, 7/15/2018 | | | 4,646,998 | |
| | 15,782,916 | | U.S. Treasury Inflation Indexed Note, 0.625%, 4/15/2013 | | | 15,748,383 | |
| | 8,600,000 | | U.S. Treasury Note, 3.625%, 12/31/2012 | | | 9,172,433 | |
| | | | | | | |
| | | | | | 29,567,814 | |
| | | | | | | |
| | | Total Bonds and Notes (Identified Cost $193,186,431) | | | 200,297,389 | |
| | | | | | | |
Principal
Amount | | | | | |
| | Short-Term Investments — 0.5% | |
| | 998,373 | | Tri-Party Repurchase Agreement with Fixed Income Clearing Corporation, dated 9/30/2009 at 0.000% to be repurchased at $998,373 on 10/01/2009, collateralized by $1,010,000 Federal Home Loan Bank, 2.900% due 7/02/2013 valued at $1,018,838 including accrued interest (Note 2g of Notes to Financial Statements) (Identified Cost $998,373) | | | 998,373 | |
| | | | | | | |
| | | | | | | |
| | | Total Investments — 99.6% (Identified Cost $194,184,804)(a) | | | 201,295,762 | |
| | | Other assets less liabilities—0.4% | | | 742,177 | |
| | | | | | | |
| | | Net Assets — 100.0% | | $ | 202,037,939 | |
| | | | | | | |
| | | | | | | |
| | (†) | | See Note 2a Notes to Financial Statements. | | | | |
| | (a) | | Federal Tax Information: | | | | |
| | | At September 30, 2009, the net unrealized appreciation on investments based on a cost of $194,375,623 for federal income tax purposes was as follows: | | | | |
| | | Aggregate gross unrealized appreciation for all investments in which there is an excess of value over tax cost | | $ | 8,255,713 | |
| | | Aggregate gross unrealized depreciation for all investments in which there is an excess of tax cost over value | | | (1,335,574 | ) |
| | | | | | | |
| | | Net unrealized appreciation | | $ | 6,920,139 | |
| | | | | | | |
| | | | | | | |
| | (b) | | Variable rate security. Rate as of September 30, 2009 is disclosed. | | | | |
| | (c) | | The Fund’s investment in mortgage related securities of the Federal Home Loan Mortgage Corporation, Federal National Mortgage Association and Government National Mortgage Association are interests in separate pools of mortgages. All separate investments in securities of each issuer which have the same coupon rate have been aggregated for the purpose of presentation in the Portfolio of Investments. | |
| | | | | | | |
| | ABS | | Asset-Backed Securities | | | | |
| | ARM | | Adjustable Rate Mortgage | | | | |
| | FDIC | | Federal Deposit Insurance Corporation | | | | |
| | FHLMC | | Federal Home Loan Mortgage Corporation | | | | |
| | FNMA | | Federal National Mortgage Association | | | | |
| | GNMA | | Government National Mortgage Association | | | | |
See accompanying notes to financial statements.
37
LOOMIS SAYLES LIMITED TERM GOVERNMENTAND AGENCY FUND
PORTFOLIOOF INVESTMENTS (continued)
Investments as of September 30, 2009
Industry Summary at September 30, 2009 (Unaudited)
| | | |
| Mortgage Related | | 42.4 | % |
| Treasuries | | 14.6 | |
| Commercial Mortgage-Backed Securities | | 10.9 | |
| Government Owned — No Guarantee | | 10.0 | |
| Government Sponsored | | 8.3 | |
| Government Guaranteed | | 3.5 | |
| ABS Credit Card | | 3.4 | |
| ABS Car Loan | | 2.1 | |
| Hybrid ARMs | | 2.0 | |
| Other Investments, less than 2% each | | 1.9 | |
| Short-Term Investments | | 0.5 | |
| | | |
| Total Investments | | 99.6 | |
| Other assets less liabilities | | 0.4 | |
| | | |
| Net Assets | | 100.0 | % |
| | | |
See accompanying notes to financial statements.
38
LOOMIS SAYLES STRATEGIC INCOME FUND — PORTFOLIOOF INVESTMENTS
Investments as of September 30, 2009
| | | | | | |
Principal Amount (‡) | | Description | | Value (†) |
| | | | | | |
| | Bonds and Notes — 89.2% of Net Assets | | | |
| | Non-Convertible Bonds — 83.3% | | | |
| | | ABS Credit Card — 0.7% | | | |
| $ | 80,700,000 | | Citibank Credit Card Issuance Trust, Series 2008-C6, Class C6, 6.300%, 6/20/2014 | | $ | 83,481,495 |
| | | | | | |
| | | Aerospace & Defense — 0.1% | | | |
| | 1,380,000 | | Bombardier, Inc., 144A, 6.300%, 5/01/2014 | | | 1,331,700 |
| | 2,795,000 | | Bombardier, Inc., 7.350%, 12/22/2026, (CAD) | | | 2,346,140 |
| | 11,700,000 | | Bombardier, Inc., 144A, 7.450%, 5/01/2034 | | | 10,208,250 |
| | | | | | |
| | | | | | 13,886,090 |
| | | | | | |
| | | Airlines — 1.5% | | | |
| | 825,000 | | American Airlines Pass Through Trust, Series 1999-1, Class B, 7.324%, 4/15/2011 | | | 822,938 |
| | 3,245,000 | | American Airlines Pass Through Trust, Series 2009-1A, 10.375%, 7/02/2019 | | | 3,431,360 |
| | 432,651 | | American Airlines Pass Through Trust, Series 93A6, 8.040%, 9/16/2011 | | | 283,927 |
| | 20,000,000 | | Continental Airlines, Inc., 9.000%, 7/08/2016 | | | 21,177,200 |
| | 178,186 | | Continental Airlines, Inc., Series 1996-1, Class A, 6.940%, 4/15/2015 | | | 167,494 |
| | 4,470,543 | | Continental Airlines, Inc., Series 1997-4, Class 4B, 6.900%, 7/02/2018 | | | 3,934,078 |
| | 4,100,843 | | Continental Airlines, Inc., Series 1998-1, Class 1B, 6.748%, 9/15/2018 | | | 3,526,725 |
| | 6,639,043 | | Continental Airlines, Inc., Series 1999-1, Class B, 6.795%, 2/02/2020 | | | 5,742,772 |
| | 2,928,724 | | Continental Airlines, Inc., Series 1999-2, Class B, 7.566%, 9/15/2021 | | | 2,547,990 |
| | 1,577,483 | | Continental Airlines, Inc., Series 2000-2, Class A-1, 7.707%, 10/02/2022 | | | 1,467,060 |
| | 7,140,073 | | Continental Airlines, Inc., Series 2000-2, Class B, 8.307%, 10/02/2019 | | | 6,283,264 |
| | 1,800,933 | | Continental Airlines, Inc., Series 2001-1, Class A-1, 6.703%, 12/15/2022 | | | 1,663,360 |
| | 2,336,738 | | Continental Airlines, Inc., Series 2001-1, Class B, 7.373%, 6/15/2017 | | | 1,939,492 |
| | 11,915,000 | | Continental Airlines, Inc., Series 2007-1, Class A, 5.983%, 4/19/2022 | | | 11,259,675 |
| | 16,802,000 | | Continental Airlines, Inc., Series 2007-1, Class B, 6.903%, 4/19/2022 | | | 14,449,720 |
| | 7,230,366 | | Continental Airlines, Inc., Series 971A, 7.461%, 10/01/2016 | | | 6,742,316 |
| | 3,145,000 | | Delta Air Lines, Inc., 144A, 9.500%, 9/15/2014 | | | 3,145,000 |
| | 1,586,138 | | Delta Air Lines, Inc., Series 2007-1, Class A, 6.821%, 2/10/2024 | | | 1,467,177 |
| | 8,785,889 | | Delta Air Lines, Inc., Series 2007-1, Class B, 8.021%, 2/10/2024 | | | 6,940,852 |
| | 29,025,486 | | Delta Air Lines, Inc., Series 2007-1, Class C, 8.954%, 8/10/2014 | | | 23,641,258 |
| | 25,391,757 | | Northwest Airlines, Inc., Series 07-1, Class B, 8.028%, 11/01/2017 | | | 18,838,398 |
| | 1,500,000 | | Qantas Airways Ltd., 144A, 5.125%, 6/20/2013 | | | 1,499,738 |
| | | | | | |
Principal
Amount (‡) | | Description | | Value (†) |
| | | | | | |
| | | Airlines — continued | | | |
| $ | 32,710,000 | | Qantas Airways Ltd., 144A, 6.050%, 4/15/2016 | | $ | 32,167,734 |
| | 18,286,946 | | United Air Lines, Inc., Series 2007-1, Class A, 6.636%, 1/02/2024 | | | 15,178,165 |
| | | | | | |
| | | | | | 188,317,693 |
| | | | | | |
| | | Automotive — 2.8% | | | |
| | 1,853,000 | | Cummins, Inc., 6.750%, 2/15/2027 | | | 1,637,400 |
| | 2,145,000 | | Cummins, Inc., 7.125%, 3/01/2028 | | | 2,032,387 |
| | 3,100,000 | | FCE Bank PLC, EMTN, 4.625%, 10/25/2010, (NOK) | | | 493,759 |
| | 6,500,000 | | FCE Bank PLC, EMTN, 7.125%, 1/16/2012, (EUR) | | | 9,036,180 |
| | 4,500,000 | | FCE Bank PLC, EMTN, 7.125%, 1/15/2013, (EUR) | | | 6,091,190 |
| | 5,700,000 | | FCE Bank PLC, EMTN, 7.875%, 2/15/2011, (GBP) | | | 8,927,273 |
| | 17,816,000 | | Ford Motor Co., 6.375%, 2/01/2029 | | | 12,827,520 |
| | 1,705,000 | | Ford Motor Co., 6.500%, 8/01/2018 | | | 1,357,606 |
| | 500,000 | | Ford Motor Co., 6.625%, 2/15/2028 | | | 360,000 |
| | 73,114,000 | | Ford Motor Co., 6.625%, 10/01/2028 | | | 52,642,080 |
| | 1,940,000 | | Ford Motor Co., 7.125%, 11/15/2025 | | | 1,455,000 |
| | 86,090,000 | | Ford Motor Co., 7.450%, 7/16/2031 | | | 69,732,900 |
| | 800,000 | | Ford Motor Co., 7.500%, 8/01/2026 | | | 584,000 |
| | 10,685,000 | | Ford Motor Credit Co. LLC, 7.000%, 10/01/2013 | | | 10,029,091 |
| | 24,235,000 | | Ford Motor Credit Co. LLC, 7.250%, 10/25/2011 | | | 23,537,250 |
| | 5,940,000 | | Ford Motor Credit Co. LLC, 7.500%, 8/01/2012 | | | 5,703,392 |
| | 1,030,000 | | Ford Motor Credit Co. LLC, 7.875%, 6/15/2010 | | | 1,034,513 |
| | 47,810,000 | | Ford Motor Credit Co. LLC, 8.000%, 6/01/2014 | | | 45,945,267 |
| | 14,595,000 | | Ford Motor Credit Co. LLC, 8.000%, 12/15/2016 | | | 13,540,745 |
| | 10,625,000 | | Ford Motor Credit Co. LLC, 8.625%, 11/01/2010 | | | 10,748,144 |
| | 50,000,000 | | Ford Motor Credit Co. LLC, 8.700%, 10/01/2014 | | | 48,977,550 |
| | 1,645,000 | | Ford Motor Credit Co. LLC, 9.750%, 9/15/2010 | | | 1,681,007 |
| | 7,640,000 | | Ford Motor Credit Co. LLC, EMTN, 4.875%, 1/15/2010, (EUR) | | | 11,096,136 |
| | 4,977,000 | | Goodyear Tire & Rubber Co. (The), 7.000%, 3/15/2028 | | | 4,329,990 |
| | 9,635,000 | | Goodyear Tire & Rubber Co. (The), 10.500%, 5/15/2016 | | | 10,453,975 |
| | | | | | |
| | | | | | 354,254,355 |
| | | | | | |
See accompanying notes to financial statements.
39
LOOMIS SAYLES STRATEGIC INCOME FUND — PORTFOLIOOF INVESTMENTS (continued)
Investments as of September 30, 2009
| | | | | | |
Principal
Amount (‡) | | Description | | Value (†) |
| | | | | | |
| | | Banking — 6.7% | | | |
| $ | 67,925,000 | | AgriBank FCB, 9.125%, 7/15/2019(b) | | $ | 73,461,839 |
| | 20,565,000 | | Associates Corp. of North America, 6.950%, 11/01/2018 | | | 20,120,220 |
| | 22,125,000 | | BAC Capital Trust VI, 5.625%, 3/08/2035 | | | 17,155,504 |
| | 11,685,000 | | Bank of America Corp., 5.750%, 12/01/2017 | | | 11,663,698 |
| | 4,560,000 | | Bank of America Corp., 6.000%, 9/01/2017 | | | 4,613,503 |
| | 1,006,000,000 | | Barclays Financial LLC, 144A, 4.160%, 2/22/2010, (THB) | | | 30,547,351 |
| | 56,650,000,000 | | Barclays Financial LLC, 144A, 4.470%, 12/04/2011, (KRW) | | | 48,079,779 |
| | 17,310,000,000 | | Barclays Financial LLC, EMTN, 144A, 4.060%, 9/16/2010, (KRW) | | | 14,832,316 |
| | 135,000,000 | | Barclays Financial LLC, EMTN, 144A, 4.100%, 3/22/2010, (THB) | | | 4,107,782 |
| | 21,340,000,000 | | Barclays Financial LLC, EMTN, 144A, 4.460%, 9/23/2010, (KRW) | | | 18,350,679 |
| | 224,520,000,000 | | BNP Paribas SA, EMTN, 144A, Zero Coupon, 6/13/2011, (IDR) | | | 19,592,361 |
| | 2,165,000 | | Capital One Financial Corp., 6.150%, 9/01/2016 | | | 2,126,017 |
| | 18,650,000 | | Citibank NA, 144A, 15.000%, 7/02/2010, (BRL) | | | 10,966,613 |
| | 47,120,000 | | Citigroup, Inc., 5.000%, 9/15/2014 | | | 44,838,685 |
| | 3,060,000 | | Citigroup, Inc., 5.850%, 12/11/2034 | | | 2,626,576 |
| | 20,715,000 | | Citigroup, Inc., 5.875%, 2/22/2033 | | | 17,169,193 |
| | 4,210,000 | | Citigroup, Inc., 5.875%, 5/29/2037 | | | 3,670,712 |
| | 10,819,000 | | Citigroup, Inc., 6.000%, 10/31/2033 | | | 9,053,631 |
| | 1,850,000 | | Citigroup, Inc., 6.125%, 8/25/2036 | | | 1,587,674 |
| | 45,862,000 | | Citigroup, Inc., 6.375%, 8/12/2014 | | | 47,416,263 |
| | 64,000,000 | | Citigroup, Inc., MTN, 5.500%, 10/15/2014 | | | 63,907,520 |
| | 1,285,000 | | Goldman Sachs Group, Inc. (The), 6.150%, 4/01/2018 | | | 1,351,708 |
| | 30,775,000 | | Goldman Sachs Group, Inc. (The), 6.750%, 10/01/2037 | | | 31,760,754 |
| | 119,806,078 | | HSBC Bank USA, 144A, Zero Coupon, 11/28/2011 | | | 93,532,605 |
| | 9,090,000 | | ICICI Bank Ltd., (fixed rate to 4/30/2017, variable rate thereafter), 144A, 6.375%, 4/30/2022 | | | 7,435,720 |
| | 109,312,000,000 | | JPMorgan Chase & Co., 144A, Zero Coupon, 3/28/2011, (IDR) | | | 9,820,549 |
| | 229,157,783,660 | | JPMorgan Chase & Co., 144A, Zero Coupon, 4/12/2012, (IDR) | | | 18,538,900 |
| | 599,726,100,000 | | JPMorgan Chase & Co., EMTN, Zero Coupon, 3/28/2011, (IDR) | | | 53,879,169 |
| | 92,000,000 | | JPMorgan Chase Bank, 144A, Zero Coupon, 5/17/2010, (BRL) | | | 48,908,106 |
| | | | | |
Principal
Amount (‡) | | Description | | Value (†) |
| | | | | |
| | Banking — continued | | | |
| 76,496,404,750 | | JPMorgan Chase Bank, EMTN, 144A, Zero Coupon, 10/21/2010, (IDR) | | $ | 7,272,105 |
| 60,000,000 | | Kreditanstalt fuer Wiederaufbau, EMTN, 10.750%, 2/01/2010, (ISK) | | | 394,065 |
| 800,000 | | Merrill Lynch & Co., Inc., Series C, 6.050%, 6/01/2034 | | | 747,001 |
| 1,400,000 | | Merrill Lynch & Co., Inc., 6.110%, 1/29/2037 | | | 1,331,621 |
| 51,500,000 | | Merrill Lynch & Co., Inc., 10.710%, 3/08/2017, (BRL) | | | 28,398,256 |
| 3,450,000 | | Merrill Lynch & Co., Inc., EMTN, 4.625%, 9/14/2018, (EUR) | | | 4,364,596 |
| 5,410,000 | | Merrill Lynch & Co., Inc., MTN, 6.875%, 4/25/2018 | | | 5,689,681 |
| 2,255,000 | | Merrill Lynch & Co., Inc., Series C, MTN, 6.400%, 8/28/2017 | | | 2,283,783 |
| 26,665,000 | | Morgan Stanley, 4.750%, 4/01/2014 | | | 26,468,212 |
| 5,050,000 | | Morgan Stanley, 5.125%, 11/30/2015, (GBP) | | | 7,944,834 |
| 6,600,000 | | Morgan Stanley, 7.300%, 5/13/2019 | | | 7,261,808 |
| 7,900,000 | | Morgan Stanley, Series F, GMTN, 6.625%, 4/01/2018 | | | 8,353,642 |
| 2,900,000 | | Morgan Stanley, Series F, MTN, 5.550%, 4/27/2017 | | | 2,889,003 |
| 5,210,000 | | Morgan Stanley, Series F, MTN, 5.950%, 12/28/2017 | | | 5,304,530 |
| | | | | |
| | | | | 839,818,564 |
| | | | | |
| | Brokerage — 0.0% | | | |
| 4,000,000 | | Jefferies Group, Inc., 8.500%, 7/15/2019 | | | 4,233,472 |
| | | | | |
| | Building Materials — 1.0% | | | |
| 6,345,000 | | Masco Corp., 0.600%, 3/12/2010(c) | | | 6,244,210 |
| 3,255,000 | | Masco Corp., 4.800%, 6/15/2015 | | | 2,987,045 |
| 2,220,000 | | Masco Corp., 5.850%, 3/15/2017 | | | 2,047,389 |
| 13,440,000 | | Masco Corp., 6.125%, 10/03/2016 | | | 12,739,628 |
| 1,795,000 | | Masco Corp., 6.500%, 8/15/2032 | | | 1,452,365 |
| 18,935,000 | | Owens Corning, Inc., 6.500%, 12/01/2016 | | | 18,474,728 |
| 35,980,000 | | Owens Corning, Inc., 7.000%, 12/01/2036 | | | 29,481,436 |
| 44,212,000 | | USG Corp., 6.300%, 11/15/2016 | | | 37,580,200 |
| 14,155,000 | | USG Corp., 9.500%, 1/15/2018 | | | 13,659,575 |
| | | | | |
| | | | | 124,666,576 |
| | | | | |
| | Chemicals — 0.8% | | | |
| 23,584,000 | | Borden, Inc., 7.875%, 2/15/2023 | | | 13,207,040 |
| 6,920,000 | | Borden, Inc., 8.375%, 4/15/2016 | | | 4,567,200 |
| 8,757,000 | | Borden, Inc., 9.200%, 3/15/2021 | | | 5,429,340 |
See accompanying notes to financial statements.
40
LOOMIS SAYLES STRATEGIC INCOME FUND — PORTFOLIOOF INVESTMENTS (continued)
Investments as of September 30, 2009
| | | | | | |
Principal
Amount (‡) | | Description | | Value (†) |
| | | | | | |
| | | Chemicals — continued | | | |
| $ | 38,140,000 | | Chevron Phillips Chemical Co. LLC, 144A, 8.250%, 6/15/2019 | | $ | 46,062,174 |
| | 14,550,000 | | Hercules, Inc., Subordinated Note, 6.500%, 6/30/2029 | | | 8,093,437 |
| | 1,575,000 | | Hexion US Finance Corp./Hexion Nova Scotia Finance ULC, 9.750%, 11/15/2014 | | | 1,354,500 |
| | 1,650,000 | | Koppers Holdings, Inc., (Step to 9.875% on 11/15/2009), Zero Coupon, 11/15/2014(d) | | | 1,654,125 |
| | 5,350,000 | | Methanex Corp., Senior Note, 6.000%, 8/15/2015 | | | 4,546,018 |
| | 6,465,000 | | Mosaic Global Holdings, Inc., 7.300%, 1/15/2028 | | | 6,465,899 |
| | 5,820,000 | | Mosaic Global Holdings, Inc., 7.375%, 8/01/2018 | | | 6,274,926 |
| | | | | | |
| | | | | | 97,654,659 |
| | | | | | |
| | | Construction Machinery — 0.9% | | | |
| | 50,000,000 | | Case New Holland, Inc., 144A, 7.750%, 9/01/2013 | | | 49,750,000 |
| | 7,965,000 | | Caterpillar Financial Services Corp., MTN, 6.125%, 2/17/2014 | | | 8,732,165 |
| | 1,425,000 | | Joy Global, Inc., 6.625%, 11/15/2036 | | | 1,327,777 |
| | 1,645,000 | | RSC Equipment Rental, Inc., 9.500%, 12/01/2014 | | | 1,587,425 |
| | 3,225,000 | | Terex Corp., 8.000%, 11/15/2017 | | | 2,958,937 |
| | 18,243,000 | | United Rentals North America, Inc., 7.000%, 2/15/2014 | | | 15,871,410 |
| | 1,630,000 | | United Rentals North America, Inc., 7.750%, 11/15/2013 | | | 1,467,000 |
| | 26,935,000 | | United Rentals North America, Inc., 144A, 10.875%, 6/15/2016 | | | 28,820,450 |
| | | | | | |
| | | | | | 110,515,164 |
| | | | | | |
| | | Consumer Cyclical Services — 0.8% | | | |
| | 101,985,000 | | Western Union Co. (The), 6.200%, 11/17/2036 | | | 102,376,826 |
| | | | | | |
| | | Consumer Products — 0.1% | | | |
| | 9,860,000 | | Whirlpool Corp., 8.000%, 5/01/2012 | | | 10,642,904 |
| | 5,915,000 | | Whirlpool Corp., MTN, 8.600%, 5/01/2014 | | | 6,616,667 |
| | | | | | |
| | | | | | 17,259,571 |
| | | | | | |
| | | Distributors — 0.0% | | | |
| | 1,500,000 | | EQT Corp., 8.125%, 6/01/2019 | | | 1,712,055 |
| | | | | | |
| | | Diversified Manufacturing — 0.7% | | | |
| | 1,441,000 | | Textron Financial Corp., 5.400%, 4/28/2013 | | | 1,414,915 |
| | 550,000 | | Textron Financial Corp., Series E, MTN, 5.125%, 8/15/2014 | | | 512,143 |
| | 9,950,000 | | Textron, Inc., 3.875%, 3/11/2013, (EUR) | | | 13,444,565 |
| | 4,250,000 | | Textron, Inc., 5.600%, 12/01/2017 | | | 3,957,370 |
| | 30,350,000 | | Textron, Inc., 6.200%, 3/15/2015 | | | 30,470,156 |
| | 20,485,000 | | Textron, Inc., 7.250%, 10/01/2019 | | | 20,758,229 |
| | | | | |
Principal
Amount (‡) | | Description | | Value (†) |
| | | | | |
| | Diversified Manufacturing — continued | | | |
| 15,630,000 | | Textron, Inc., EMTN, 6.625%, 4/07/2020, (GBP) | | $ | 20,732,656 |
| | | | | |
| | | | | 91,290,034 |
| | | | | |
| | Electric — 3.5% | | | |
| 4,020,000 | | AES Corp. (The), 7.750%, 3/01/2014 | | | 4,050,150 |
| 5,565,000 | | AES Corp. (The), 8.375%, 3/01/2011, (GBP)(b) | | | 8,982,649 |
| 8,752,194 | | AES Ironwood LLC, 8.857%, 11/30/2025 | | | 8,030,138 |
| 1,113,141 | | AES Red Oak LLC, Series A, 8.540%, 11/30/2019 | | | 1,049,135 |
| 70,811,970 | | Bruce Mansfield Unit, 6.850%, 6/01/2034(b) | | | 69,153,554 |
| 3,552,768 | | CE Generation LLC, 7.416%, 12/15/2018 | | | 3,453,756 |
| 32,125,000 | | Cleveland Electric Illuminating Co., 5.950%, 12/15/2036 | | | 31,076,440 |
| 11,275,000 | | Dynegy Holdings, Inc., 7.125%, 5/15/2018 | | | 8,681,750 |
| 1,000,000 | | Dynegy Holdings, Inc., 7.500%, 6/01/2015 | | | 925,000 |
| 10,185,000 | | Dynegy Holdings, Inc., 7.625%, 10/15/2026 | | | 6,976,725 |
| 500,000 | | Dynegy Holdings, Inc., 7.750%, 6/01/2019 | | | 426,250 |
| 7,455,000 | | Dynegy Holdings, Inc., 8.375%, 5/01/2016 | | | 6,970,425 |
| 4,744,113 | | Dynegy Roseton/Danskammer Pass Through Trust, Series A, 7.270%, 11/08/2010 | | | 4,708,532 |
| 95,200,000 | | Edison Mission Energy, 7.625%, 5/15/2027 | | | 68,068,000 |
| 250,000 | | Empresa Nacional de Electricidad SA, (Endesa-Chile), 8.350%, 8/01/2013 | | | 288,553 |
| 4,875,000 | | Empresa-Chile Overseas Co., 7.875%, 2/01/2027 | | | 5,403,474 |
| 555,000 | | Enersis SA, Cayman Islands, 7.400%, 12/01/2016 | | | 619,791 |
| 5,310,000 | | ITC Holdings Corp., 144A, 6.375%, 9/30/2036 | | | 5,064,736 |
| 31,735,000 | | NGC Corp. Capital Trust I, Series B, 8.316%, 6/01/2027 | | | 14,280,750 |
| 955,000 | | NiSource Finance Corp., 5.400%, 7/15/2014 | | | 970,488 |
| 43,450,000 | | NiSource Finance Corp., 6.400%, 3/15/2018 | | | 43,369,009 |
| 2,500,000 | | NRG Energy, Inc., 7.250%, 2/01/2014 | | | 2,456,250 |
| 5,000,000 | | NRG Energy, Inc., 7.375%, 2/01/2016 | | | 4,837,500 |
| 1,442,125 | | Quezon Power (Philippines) Ltd., Senior Secured Note, 8.860%, 6/15/2017 | | | 1,348,387 |
| 25,230,000 | | RRI Energy, Inc., 7.875%, 6/15/2017 | | | 24,630,787 |
| 1,050,000 | | SP PowerAssets Ltd., EMTN, 3.730%, 10/22/2010, (SGD) | | | 757,756 |
| 655,000 | | Texas Competitive Electric Holdings Co. LLC, Series A, 10.250%, 11/01/2015 | | | 471,600 |
See accompanying notes to financial statements.
41
LOOMIS SAYLES STRATEGIC INCOME FUND — PORTFOLIOOF INVESTMENTS (continued)
Investments as of September 30, 2009
| | | | | | |
Principal
Amount (‡) | | Description | | Value (†) |
| | | | | | |
| | | Electric — continued | | | |
| $ | 8,785,000 | | Toledo Edison Co., 6.150%, 5/15/2037 | | $ | 9,169,107 |
| | 46,215,000 | | TXU Corp., Series P, 5.550%, 11/15/2014 | | | 31,539,288 |
| | 101,030,000 | | TXU Corp., Series Q, 6.500%, 11/15/2024 | | | 46,728,396 |
| | 6,245,000 | | TXU Corp., Series R, 6.550%, 11/15/2034 | | | 2,809,076 |
| | 7,300,000 | | White Pine Hydro LLC, 6.310%, 7/10/2017(b) | | | 6,295,688 |
| | 10,935,000 | | White Pine Hydro LLC, 6.960%, 7/10/2037(b) | | | 7,979,138 |
| | 4,000,000 | | White Pine Hydro LLC, 7.260%, 7/20/2015(b) | | | 3,522,932 |
| | | | | | |
| | | | | | 435,095,210 |
| | | | | | |
| | | Entertainment — 0.2% | | | |
| | 25,544,000 | | Viacom, Inc., Class B, 6.875%, 4/30/2036 | | | 26,984,554 |
| | | | | | |
| | | Financial Other — 0.2% | | | |
| | 20,000,000 | | National Life Insurance Co., 144A, 10.500%, 9/15/2039 | | | 20,368,400 |
| | | | | | |
| | | Food & Beverage — 1.1% | | | |
| | 48,729,000 | | Anheuser-Busch Inbev Worldwide, Inc., 144A, 5.375%, 11/15/2014 | | | 51,993,356 |
| | 2,085,000 | | Aramark Services, Inc., 5.000%, 6/01/2012 | | | 1,970,325 |
| | 23,710,000 | | Corn Products International, Inc., 6.625%, 4/15/2037 | | | 23,934,771 |
| | 9,916,000 | | Kraft Foods, Inc., 6.500%, 8/11/2017 | | | 10,726,613 |
| | 27,245,000 | | Kraft Foods, Inc., 7.000%, 8/11/2037 | | | 30,349,867 |
| | 14,120,000 | | Sara Lee Corp., 6.125%, 11/01/2032 | | | 14,373,666 |
| | 965,000 | | Smithfield Foods, Inc., 7.750%, 7/01/2017 | | | 793,712 |
| | | | | | |
| | | | | | 134,142,310 |
| | | | | | |
| | | Government Owned — No Guarantee — 0.3% | | | |
| | 26,435,000 | | Abu Dhabi National Energy Co., 144A, 7.250%, 8/01/2018 | | | 28,316,564 |
| | 12,100,000 | | DP World Ltd., 144A, 6.850%, 7/02/2037 | | | 10,641,817 |
| | | | | | |
| | | | | | 38,958,381 |
| | | | | | |
| | | Government Sponsored — 0.4% | | | |
| | 66,595,000 | | Queensland Treasury Corp., 144A, 7.125%, 9/18/2017, (NZD) | | | 49,644,479 |
| | | | | | |
| | | Health Insurance — 0.6% | | | |
| | 15,325,000 | | CIGNA Corp., 6.150%, 11/15/2036 | | | 13,580,249 |
| | 2,000,000 | | CIGNA Corp., 6.350%, 3/15/2018 | | | 2,005,432 |
| | 6,700,000 | | Unum Group, 7.125%, 9/30/2016 | | | 6,779,033 |
| | 50,000,000 | | WellPoint, Inc., 6.375%, 6/15/2037 | | | 54,298,700 |
| | | | | | |
| | | | | | 76,663,414 |
| | | | | | |
| | | | | | |
Principal
Amount (‡) | | Description | | Value (†) |
| | | | | | |
| | | Healthcare — 3.8% | | | |
| $ | 2,765,000 | | Boston Scientific Corp., 5.450%, 6/15/2014 | | $ | 2,771,913 |
| | 8,230,000 | | Boston Scientific Corp., 6.400%, 6/15/2016 | | | 8,343,163 |
| | 16,510,000 | | Boston Scientific Corp., 7.000%, 11/15/2035 | | | 15,127,287 |
| | 17,785,000 | | HCA, Inc., 5.750%, 3/15/2014 | | | 15,695,262 |
| | 3,800,000 | | HCA, Inc., 6.250%, 2/15/2013 | | | 3,629,000 |
| | 17,035,000 | | HCA, Inc., 6.375%, 1/15/2015 | | | 15,161,150 |
| | 49,350,000 | | HCA, Inc., 6.500%, 2/15/2016 | | | 43,798,125 |
| | 2,074,000 | | HCA, Inc., 6.750%, 7/15/2013 | | | 1,985,855 |
| | 14,405,000 | | HCA, Inc., 7.050%, 12/01/2027 | | | 10,925,055 |
| | 10,944,000 | | HCA, Inc., 7.190%, 11/15/2015 | | | 10,136,803 |
| | 20,077,000 | | HCA, Inc., 7.500%, 12/15/2023 | | | 16,207,520 |
| | 18,780,000 | | HCA, Inc., 7.500%, 11/06/2033 | | | 14,531,532 |
| | 43,278,000 | | HCA, Inc., 7.690%, 6/15/2025 | | | 35,144,116 |
| | 30,985,000 | | HCA, Inc., 8.360%, 4/15/2024 | | | 25,213,672 |
| | 13,545,000 | | HCA, Inc., MTN, 7.580%, 9/15/2025 | | | 10,958,460 |
| | 9,277,000 | | HCA, Inc., MTN, 7.750%, 7/15/2036 | | | 7,271,266 |
| | 11,370,000 | | Hospira, Inc., 6.050%, 3/30/2017 | | | 11,906,380 |
| | 176,070,000 | | Medco Health Solutions, Inc., 7.125%, 3/15/2018 | | | 199,504,565 |
| | 3,260,000 | | Owens & Minor, Inc., 6.350%, 4/15/2016(b) | | | 2,939,271 |
| | 31,009,000 | | Tenet Healthcare Corp., 6.875%, 11/15/2031 | | | 24,187,020 |
| | 1,570,000 | | Tenet Healthcare Corp., 7.375%, 2/01/2013 | | | 1,554,300 |
| | 4,765,000 | | Tenet Healthcare Corp., 9.250%, 2/01/2015 | | | 4,973,469 |
| | | | | | |
| | | | | | 481,965,184 |
| | | | | | |
| | | Home Construction — 1.8% | | | |
| | 2,840,000 | | Centex Corp., 5.250%, 6/15/2015 | | | 2,804,500 |
| | 43,470,000 | | D.R. Horton, Inc., 5.250%, 2/15/2015 | | | 40,535,775 |
| | 4,335,000 | | D.R. Horton, Inc., 5.625%, 9/15/2014 | | | 4,183,275 |
| | 1,625,000 | | D.R. Horton, Inc., 6.500%, 4/15/2016 | | | 1,598,594 |
| | 16,160,000 | | D.R. Horton, Inc., Guaranteed Note, 5.625%, 1/15/2016 | | | 15,109,600 |
| | 11,265,000 | | Desarrolladora Homex SAB de CV, 7.500%, 9/28/2015 | | | 11,067,862 |
See accompanying notes to financial statements.
42
LOOMIS SAYLES STRATEGIC INCOME FUND — PORTFOLIOOF INVESTMENTS (continued)
Investments as of September 30, 2009
| | | | | | |
Principal
Amount (‡) | | Description | | Value (†) |
| | | | | | |
| | | Home Construction — continued | | | |
| $ | 6,290,000 | | K. Hovnanian Enterprises, Inc., 7.500%, 5/15/2016 | | $ | 4,780,400 |
| | 1,935,000 | | K. Hovnanian Enterprises, Inc., 7.750%, 5/15/2013 | | | 1,489,950 |
| | 1,235,000 | | K. Hovnanian Enterprises, Inc., 8.875%, 4/01/2012 | | | 1,037,400 |
| | 4,830,000 | | K. Hovnanian Enterprises, Inc., Guaranteed Note, 6.250%, 1/15/2015 | | | 3,670,800 |
| | 16,075,000 | | K. Hovnanian Enterprises, Inc., Guaranteed Note, 6.250%, 1/15/2016 | | | 12,056,250 |
| | 6,040,000 | | K. Hovnanian Enterprises, Inc., Guaranteed Note, 6.375%, 12/15/2014 | | | 4,590,400 |
| | 2,490,000 | | K. Hovnanian Enterprises, Inc., Guaranteed Note, 6.500%, 1/15/2014 | | | 1,942,200 |
| | 1,685,000 | | KB Home, 5.750%, 2/01/2014 | | | 1,617,600 |
| | 8,340,000 | | KB Home, Guaranteed Note, 5.875%, 1/15/2015 | | | 7,860,450 |
| | 5,805,000 | | KB Home, Guaranteed Note, 6.250%, 6/15/2015 | | | 5,543,775 |
| | 11,315,000 | | KB Home, Guaranteed Note, 7.250%, 6/15/2018 | | | 11,032,125 |
| | 2,720,000 | | Lennar Corp., Series B, 5.125%, 10/01/2010 | | | 2,713,200 |
| | 16,755,000 | | Lennar Corp., Series B, 5.500%, 9/01/2014 | | | 15,665,925 |
| | 5,970,000 | | Lennar Corp., Series B, 5.600%, 5/31/2015 | | | 5,507,325 |
| | 23,885,000 | | Lennar Corp., Series B, 6.500%, 4/15/2016 | | | 22,451,900 |
| | 4,240,000 | | Pulte Homes, Inc., 5.200%, 2/15/2015 | | | 4,028,000 |
| | 46,260,000 | | Pulte Homes, Inc., 6.000%, 2/15/2035 | | | 34,926,300 |
| | 13,190,000 | | Pulte Homes, Inc., 6.375%, 5/15/2033 | | | 10,156,300 |
| | 4,245,000 | | Toll Brothers Financial Corp., 5.150%, 5/15/2015 | | | 4,082,009 |
| | 1,749,000 | | Toll Corp., 8.250%, 12/01/2011 | | | 1,783,980 |
| | | | | | |
| | | | | | 232,235,895 |
| | | | | | |
| | | Independent Energy — 1.3% | | | |
| | 48,410,000 | | Anadarko Petroleum Corp., 6.450%, 9/15/2036 | | | 49,982,986 |
| | 4,185,000 | | Chesapeake Energy Corp., 6.250%, 1/15/2017, (EUR) | | | 5,634,186 |
| | 14,650,000 | | Chesapeake Energy Corp., 6.500%, 8/15/2017 | | | 13,441,375 |
| | 22,690,000 | | Chesapeake Energy Corp., 6.875%, 11/15/2020 | | | 20,194,100 |
| | 15,054,000 | | Connacher Oil and Gas Ltd., 144A, 10.250%, 12/15/2015 | | | 12,269,010 |
| | 3,000,000 | | Connacher Oil and Gas Ltd., 144A, 11.750%, 7/15/2014 | | | 3,195,000 |
| | 6,495,000 | | Hilcorp Energy I LP, 144A, 7.750%, 11/01/2015 | | | 6,137,775 |
| | 1,805,000 | | Penn Virginia Corp., 10.375%, 6/15/2016 | | | 1,949,400 |
| | | | | | |
Principal
Amount (‡) | | Description | | Value (†) |
| | | | | | |
| | | Independent Energy — continued | | | |
| $ | 7,175,000 | | Pioneer Natural Resources Co., 5.875%, 7/15/2016 | | $ | 6,631,738 |
| | 1,760,000 | | Pioneer Natural Resources Co., 6.875%, 5/01/2018 | | | 1,679,591 |
| | 4,798,000 | | Pioneer Natural Resources Co., 7.200%, 1/15/2028 | | | 4,164,290 |
| | 2,499,000 | | Swift Energy Co., 7.125%, 6/01/2017 | | | 2,174,130 |
| | 9,170,000 | | Talisman Energy, Inc., 5.850%, 2/01/2037 | | | 8,820,118 |
| | 24,260,000 | | Talisman Energy, Inc., 6.250%, 2/01/2038 | | | 24,748,475 |
| | | | | | |
| | | | | | 161,022,174 |
| | | | | | |
| | | Industrial Other — 0.2% | | | |
| | 2,590,000 | | Great Lakes Dredge & Dock Corp., Senior Subordinated Note, 7.750%, 12/15/2013 | | | 2,541,438 |
| | 20,000,000 | | Ranhill Labuan Ltd., 144A, 12.500%, 10/26/2011 | | | 16,000,000 |
| | | | | | |
| | | | | | 18,541,438 |
| | | | | | |
| | | Life Insurance — 0.2% | | | |
| | 2,455,000 | | American International Group, Inc., MTN, 5.450%, 5/18/2017 | | | 1,779,605 |
| | 2,185,000 | | American International Group, Inc., Series G, MTN, 5.600%, 10/18/2016 | | | 1,603,228 |
| | 13,750,000 | | American International Group, Inc., Series G, MTN, 5.850%, 1/16/2018 | | | 9,955,110 |
| | 1,500,000 | | MetLife, Inc., 6.400%, 12/15/2066 | | | 1,267,500 |
| | 9,620,000 | | MetLife, Inc., 10.750%, 8/01/2069 | | | 11,592,100 |
| | | | | | |
| | | | | | 26,197,543 |
| | | | | | |
| | | Local Authorities — 0.7% | | | |
| | 128,820,000 | | Virginia Tobacco Settlement Financing Corp., Series A-1, 6.706%, 6/01/2046(b) | | | 92,012,261 |
| | | | | | |
| | | Media Cable — 2.4% | | | |
| | 47,035,000 | | Comcast Corp., 5.650%, 6/15/2035 | | | 45,490,794 |
| | 12,560,000 | | Comcast Corp., 6.500%, 11/15/2035 | | | 13,383,773 |
| | 161,264,000 | | Comcast Corp., 6.950%, 8/15/2037 | | | 179,996,749 |
| | 400,000 | | CSC Holdings, Inc., 7.875%, 2/15/2018 | | | 408,000 |
| | 2,540,000 | | CSC Holdings, Inc., 144A, 8.500%, 4/15/2014 | | | 2,667,000 |
| | 25,270,000 | | Shaw Communications, Inc., 5.650%, 10/01/2019, (CAD) | | | 23,969,503 |
| | 10,000,000 | | Shaw Communications, Inc., 5.700%, 3/02/2017, (CAD) | | | 9,743,800 |
| | 17,959,000 | | Time Warner Cable, Inc., 6.750%, 7/01/2018 | | | 19,840,385 |
| | 2,720,000 | | Virgin Media Finance PLC, 9.125%, 8/15/2016 | | | 2,794,800 |
| | 5,070,000 | | Virgin Media Finance PLC, 9.750%, 4/15/2014, (GBP) | | | 8,386,219 |
| | | | | | |
| | | | | | 306,681,023 |
| | | | | | |
See accompanying notes to financial statements.
43
LOOMIS SAYLES STRATEGIC INCOME FUND — PORTFOLIOOF INVESTMENTS (continued)
Investments as of September 30, 2009
| | | | | | |
Principal
Amount (‡) | | Description | | Value (†) |
| | | | | | |
| | | Media Non-Cable — 0.6% | | | |
| $ | 225,000 | | Intelsat Corp., 6.875%, 1/15/2028 | | $ | 186,750 |
| | 46,000,000 | | News America, Inc., 6.150%, 3/01/2037 | | | 45,008,562 |
| | 11,140,000 | | News America, Inc., 6.200%, 12/15/2034 | | | 10,960,390 |
| | 14,360,000 | | News America, Inc., 6.400%, 12/15/2035 | | | 14,486,052 |
| | 4,335,000 | | R.H. Donnelley Corp., Series A-1, 6.875%, 1/15/2013(e) | | | 249,263 |
| | 1,910,000 | | R.H. Donnelley Corp., Series A-2, 6.875%, 1/15/2013(e) | | | 109,825 |
| | 470,000 | | R.H. Donnelley Corp., Series A-3, 8.875%, 1/15/2016(e) | | | 27,025 |
| | 4,845,000 | | R.H. Donnelley Corp., Series A-4, 8.875%, 10/15/2017(e) | | | 278,587 |
| | | | | | |
| | | | | | 71,306,454 |
| | | | | | |
| | | Metals & Mining — 0.8% | | | |
| | 400,000 | | Alcoa, Inc., 5.550%, 2/01/2017 | | | 388,297 |
| | 10,000,000 | | Alcoa, Inc., 5.720%, 2/23/2019 | | | 9,052,680 |
| | 3,949,000 | | Alcoa, Inc., 5.870%, 2/23/2022 | | | 3,423,743 |
| | 4,330,000 | | Alcoa, Inc., 6.750%, 1/15/2028 | | | 3,776,678 |
| | 9,785,000 | | Algoma Acquistion Corp., 144A, 9.875%, 6/15/2015 | | | 8,219,400 |
| | 65,000 | | ArcelorMittal, 6.125%, 6/01/2018 | | | 64,035 |
| | 10,850,000 | | ArcelorMittal USA Partnership, 9.750%, 4/01/2014 | | | 11,365,375 |
| | 1,840,000 | | Rio Tinto Alcan, Inc., 5.750%, 6/01/2035 | | | 1,773,000 |
| | 29,436,000 | | Rio Tinto Finance (USA) Ltd., 8.950%, 5/01/2014 | | | 34,739,985 |
| | 1,730,000 | | Teck Resources Ltd., 10.250%, 5/15/2016 | | | 1,954,900 |
| | 1,000,000 | | Teck Resources Ltd., 10.750%, 5/15/2019 | | | 1,162,500 |
| | 7,000,000 | | United States Steel Corp., 6.050%, 6/01/2017 | | | 6,537,944 |
| | 6,779,000 | | United States Steel Corp., 6.650%, 6/01/2037 | | | 5,529,210 |
| | 16,435,000 | | United States Steel Corp., 7.000%, 2/01/2018 | | | 15,783,714 |
| | | | | | |
| | | | | | 103,771,461 |
| | | | | | |
| | | Non-Captive Consumer — 3.2% | | | |
| | 4,900,000 | | American General Finance Corp., MTN, 5.750%, 9/15/2016 | | | 3,401,712 |
| | 229,130,000 | | American General Finance Corp., Series J, MTN, 6.900%, 12/15/2017 | | | 160,249,168 |
| | 109,950(†††) | | SLM Corp., 6.000%, 12/15/2043 | | | 1,553,318 |
| | 20,590,000 | | SLM Corp., MTN, 5.050%, 11/14/2014 | | | 15,135,565 |
| | 2,160,000 | | SLM Corp., MTN, 5.125%, 8/27/2012 | | | 1,848,256 |
| | | | | |
Principal
Amount (‡) | | Description | | Value (†) |
| | | | | |
| | Non-Captive Consumer — continued | | | |
| 4,700,000 | | SLM Corp., Series 7, EMTN, 4.750%, 3/17/2014, (EUR) | | $ | 5,055,139 |
| 7,160,000 | | SLM Corp., Series A, MTN, 4.500%, 7/26/2010 | | | 6,957,114 |
| 52,268,000 | | SLM Corp., Series A, MTN, 5.000%, 10/01/2013 | | | 41,608,412 |
| 37,670,000 | | SLM Corp., Series A, MTN, 5.000%, 4/15/2015 | | | 28,068,407 |
| 14,075,000 | | SLM Corp., Series A, MTN, 5.000%, 6/15/2018 | | | 8,826,784 |
| 19,605,000 | | SLM Corp., Series A, MTN, 5.375%, 1/15/2013 | | | 16,345,826 |
| 23,420,000 | | SLM Corp., Series A, MTN, 5.375%, 5/15/2014 | | | 17,925,153 |
| 1,390,000 | | SLM Corp., Series A, MTN, 5.400%, 10/25/2011 | | | 1,282,581 |
| 28,150,000 | | SLM Corp., Series A, MTN, 5.625%, 8/01/2033 | | | 17,667,869 |
| 6,100,000 | | SLM Corp., Series A, MTN, 6.500%, 6/15/2010, (NZD)(b)(f) | | | 4,129,285 |
| 95,060,000 | | SLM Corp., Series A, MTN, 8.450%, 6/15/2018 | | | 75,810,350 |
| | | | | |
| | | | | 405,864,939 |
| | | | | |
| | Non-Captive Diversified — 6.7% | | | |
| 90,000 | | CIT Group, Inc., 4.750%, 12/15/2010 | | | 62,174 |
| 599,000 | | CIT Group, Inc., 5.400%, 2/13/2012 | | | 393,140 |
| 365,000 | | CIT Group, Inc., 5.400%, 1/30/2016 | | | 230,098 |
| 1,381,000 | | CIT Group, Inc., 5.600%, 4/27/2011 | | | 940,322 |
| 3,581,000 | | CIT Group, Inc., 5.800%, 10/01/2036 | | | 2,147,490 |
| 7,000 | | CIT Group, Inc., 5.850%, 9/15/2016 | | | 4,412 |
| 15,060,000 | | CIT Group, Inc., EMTN, 3.800%, 11/14/2012, (EUR) | | | 13,773,772 |
| 15,150,000 | | CIT Group, Inc., EMTN, 4.650%, 9/19/2016, (EUR) | | | 12,747,599 |
| 10,500,000 | | CIT Group, Inc., EMTN, 5.500%, 12/20/2016, (GBP) | | | 9,564,935 |
| 60,000 | | CIT Group, Inc., GMTN, 4.250%, 2/01/2010 | | | 43,258 |
| 18,360,000 | | CIT Group, Inc., GMTN, 4.250%, 9/22/2011, (EUR) | | | 17,060,600 |
| 2,533,000 | | CIT Group, Inc., GMTN, 5.000%, 2/13/2014 | | | 1,618,025 |
| 4,855,000 | | CIT Group, Inc., GMTN, 5.000%, 5/13/2014, (EUR) | | | 4,191,690 |
| 341,000 | | CIT Group, Inc., GMTN, 5.000%, 2/01/2015 | | | 218,397 |
| 20,730,000 | | CIT Group, Inc., MTN, 4.250%, 3/17/2015, (EUR) | | | 17,594,430 |
| 3,065,000 | | CIT Group, Inc., MTN, 5.125%, 9/30/2014 | | | 1,963,491 |
| 20,350,000 | | CIT Group, Inc., MTN, 5.500%, 12/01/2014, (GBP) | | | 19,188,203 |
| 934,000 | | CIT Group, Inc., Series A, GMTN, 6.000%, 4/01/2036 | | | 539,609 |
See accompanying notes to financial statements.
44
LOOMIS SAYLES STRATEGIC INCOME FUND — PORTFOLIOOF INVESTMENTS (continued)
Investments as of September 30, 2009
| | | | | | |
Principal
Amount (‡) | | Description | | Value (†) |
| | | | | | |
| | | Non-Captive Diversified — continued | | | |
| $ | 586,000 | | CIT Group, Inc., Series A, MTN, 5.650%, 2/13/2017 | | $ | 366,430 |
| | 75,990,000 | | CIT Group, Inc., Series A, MTN, 7.625%, 11/30/2012 | | | 49,493,123 |
| | 12,860,000 | | GATX Corp., 8.750%, 5/15/2014 | | | 14,470,779 |
| | 3,100,000 | | General Electric Capital Corp., EMTN, 6.125%, 5/17/2012, (GBP) | | | 5,204,489 |
| | 79,035,000 | | General Electric Capital Corp., Series A, EMTN, 6.750%, 9/26/2016, (NZD) | | | 54,759,040 |
| | 65,300,000 | | General Electric Capital Corp., Series A, GMTN, 2.960%, 5/18/2012, (SGD) | | | 44,058,413 |
| | 30,350,000 | | General Electric Capital Corp., Series A, GMTN, 6.625%, 2/04/2010, (NZD) | | | 22,042,764 |
| | 2,000,000 | | General Electric Capital Corp., Series A, GMTN, 7.625%, 12/10/2014, (NZD) | | | 1,465,160 |
| | 15,305,000 | | General Electric Capital Corp., Series A, MTN, 0.809%, 5/13/2024(c) | | | 10,674,136 |
| | 115,000,000 | | General Electric Capital Corp., Series A, MTN, 3.485%, 3/08/2012, (SGD) | | | 78,965,605 |
| | 243,057,000 | | General Electric Capital Corp., Series A, MTN, 6.500%, 9/28/2015, (NZD) | | | 167,851,159 |
| | 43,074,000 | | GMAC, Inc., 144A, 5.375%, 6/06/2011 | | | 39,735,765 |
| | 3,390,000 | | GMAC, Inc., 144A, 5.750%, 9/27/2010 | | | 3,271,350 |
| | 34,490,000 | | GMAC, Inc., 144A, 6.000%, 12/15/2011 | | | 31,903,250 |
| | 311,000 | | GMAC, Inc., 144A, 6.625%, 12/17/2010 | | | 298,560 |
| | 15,206,000 | | GMAC, Inc., 144A, 6.625%, 5/15/2012 | | | 13,989,520 |
| | 22,211,000 | | GMAC, Inc., 144A, 6.750%, 12/01/2014 | | | 18,879,350 |
| | 4,169,000 | | GMAC, Inc., 144A, 6.875%, 9/15/2011 | | | 3,939,705 |
| | 2,947,000 | | GMAC, Inc., 144A, 6.875%, 8/28/2012 | | | 2,711,240 |
| | 7,702,000 | | GMAC, Inc., 144A, 7.000%, 2/01/2012 | | | 7,162,860 |
| | 17,038,000 | | GMAC, Inc., 144A, 7.500%, 12/31/2013 | | | 14,908,250 |
| | 32,711,000 | | GMAC, Inc., 144A, 8.000%, 12/31/2018 | | | 24,696,805 |
| | 25,955,000 | | GMAC, Inc., 144A, 8.000%, 11/01/2031 | | | 20,893,775 |
| | 4,950,000 | | General Motors Acceptance Corp. of Canada Ltd., EMTN, 7.125%, 9/13/2011, (AUD) | | | 4,017,538 |
| | 34,782,000 | | iStar Financial, Inc., 5.150%, 3/01/2012 | | | 20,695,290 |
| | 5,255,000 | | iStar Financial, Inc., 5.375%, 4/15/2010 | | | 4,841,169 |
| | 3,010,000 | | iStar Financial, Inc., 5.500%, 6/15/2012 | | | 1,836,100 |
| | 19,110,000 | | iStar Financial, Inc., 5.650%, 9/15/2011 | | | 13,185,900 |
| | 1,530,000 | | iStar Financial, Inc., 5.700%, 3/01/2014 | | | 826,200 |
| | 4,040,000 | | iStar Financial, Inc., 5.800%, 3/15/2011 | | | 2,868,400 |
| | | | | | |
Principal
Amount (‡) | | Description | | Value (†) |
| | | | | | |
| | | Non-Captive Diversified — continued | | | |
| $ | 4,815,000 | | iStar Financial, Inc., 5.850%, 3/15/2017 | | $ | 2,515,838 |
| | 8,815,000 | | iStar Financial, Inc., 5.875%, 3/15/2016 | | | 4,848,250 |
| | 4,300,000 | | iStar Financial, Inc., 6.050%, 4/15/2015 | | | 2,246,750 |
| | 35,130,000 | | iStar Financial, Inc., 8.625%, 6/01/2013 | | | 22,131,900 |
| | 1,780,000 | | iStar Financial, Inc., Series B, 5.125%, 4/01/2011 | | | 1,210,400 |
| | 44,610,000 | | iStar Financial, Inc., Series B, 5.950%, 10/15/2013 | | | 25,427,700 |
| | | | | | |
| | | | | | 840,674,608 |
| | | | | | |
| | | Oil Field Services — 2.4% | | | |
| | 10,860,000 | | Nabors Industries, Inc., 6.150%, 2/15/2018 | | | 10,887,107 |
| | 127,565,000 | | Nabors Industries, Inc., 9.250%, 1/15/2019 | | | 151,599,777 |
| | 22,930,000 | | North American Energy Partners, Inc., 8.750%, 12/01/2011 | | | 22,471,400 |
| | 3,003,000 | | Rowan Cos., Inc., 7.875%, 8/01/2019 | | | 3,228,765 |
| | 15,520,000 | | Weatherford International Ltd., 6.500%, 8/01/2036 | | | 15,816,261 |
| | 2,975,000 | | Weatherford International Ltd., 6.800%, 6/15/2037 | | | 3,128,076 |
| | 9,580,000 | | Weatherford International Ltd., 7.000%, 3/15/2038 | | | 10,327,939 |
| | 71,937,000 | | Weatherford International Ltd., 9.625%, 3/01/2019 | | | 90,052,823 |
| | | | | | |
| | | | | | 307,512,148 |
| | | | | | |
| | | Packaging — 0.3% | | | |
| | 2,450,000 | | OI European Group BV, 144A, 6.875%, 3/31/2017, (EUR) | | | 3,477,649 |
| | 1,750,000 | | Owens Brockway Glass Container, Inc., 6.750%, 12/01/2014, (EUR) | | | 2,535,252 |
| | 33,261,000 | | Owens-Illinois, Inc., Senior Note, 7.800%, 5/15/2018 | | | 33,344,152 |
| | | | | | |
| | | | | | 39,357,053 |
| | | | | | |
| | | Packaging & Containers — 0.0% | | | |
| | 4,445,000 | | XL Capital Ltd., 6.250%, 5/15/2027 | | | 3,929,993 |
| | 1,425,000 | | XL Capital Ltd., 6.375%, 11/15/2024 | | | 1,150,706 |
| | | | | | |
| | | | | | 5,080,699 |
| | | | | | |
| | | Paper — 2.4% | | | |
| | 7,955,000 | | Domtar Corp., 5.375%, 12/01/2013 | | | 7,656,687 |
| | 12,430,000 | | Georgia-Pacific Corp., 7.250%, 6/01/2028 | | | 11,062,700 |
| | 11,605,000 | | Georgia-Pacific Corp., 7.375%, 12/01/2025 | | | 10,444,500 |
| | 120,000 | | Georgia-Pacific Corp., 7.700%, 6/15/2015 | | | 121,200 |
| | 42,425,000 | | Georgia-Pacific Corp., 7.750%, 11/15/2029 | | | 39,031,000 |
See accompanying notes to financial statements.
45
LOOMIS SAYLES STRATEGIC INCOME FUND — PORTFOLIOOF INVESTMENTS (continued)
Investments as of September 30, 2009
| | | | | | |
Principal
Amount (‡) | | Description | | Value (†) |
| | | | | | |
| | | Paper — continued | | | |
| $ | 16,475,000 | | Georgia-Pacific Corp., 8.000%, 1/15/2024 | | $ | 16,310,250 |
| | 18,378,000 | | Georgia-Pacific Corp., 8.875%, 5/15/2031 | | | 18,561,780 |
| | 154,533,000 | | International Paper Co., 7.950%, 6/15/2018 | | | 167,507,282 |
| | 3,100,000 | | International Paper Co., 9.375%, 5/15/2019 | | | 3,629,778 |
| | 3,995,000 | | Jefferson Smurfit Corp., 7.500%, 6/01/2013(e) | | | 2,831,456 |
| | 100,000 | | Smurfit-Stone Container Enterprises, Inc., 8.000%, 3/15/2017(e) | | | 71,000 |
| | 14,520,000 | | Westvaco Corp., 7.950%, 2/15/2031 | | | 14,220,641 |
| | 17,355,000 | | Westvaco Corp., 8.200%, 1/15/2030 | | | 17,022,912 |
| | | | | | |
| | | | | | 308,471,186 |
| | | | | | |
| | | Pharmaceuticals — 0.7% | | | |
| | 41,300,000 | | Elan Finance PLC, 8.875%, 12/01/2013 | | | 41,609,750 |
| | 50,820,000 | | Elan Finance PLC, Senior Note, 7.750%, 11/15/2011 | | | 51,772,875 |
| | | | | | |
| | | | | | 93,382,625 |
| | | | | | |
| | | Pipelines — 2.3% | | | |
| | 19,745,000 | | DCP Midstream LP, 144A, 6.450%, 11/03/2036 | | | 17,883,659 |
| | 15,685,000 | | El Paso Corp., 6.950%, 6/01/2028 | | | 13,047,661 |
| | 1,500,000 | | El Paso Corp., 7.420%, 2/15/2037 | | | 1,288,215 |
| | 750,000 | | El Paso Corp., GMTN, 7.800%, 8/01/2031 | | | 687,839 |
| | 1,000,000 | | El Paso Energy Corp., GMTN, 7.750%, 1/15/2032 | | | 916,198 |
| | 5,255,000 | | Energy Transfer Partners LP, 6.125%, 2/15/2017 | | | 5,470,176 |
| | 9,115,000 | | Energy Transfer Partners LP, 6.625%, 10/15/2036 | | | 9,460,714 |
| | 13,175,000 | | Enterprise Products Operating LLP, 6.300%, 9/15/2017 | | | 14,190,568 |
| | 5,100,000 | | Florida Gas Transmission Co., 144A, 7.900%, 5/15/2019 | | | 6,083,887 |
| | 500,000 | | Kinder Morgan Energy Partners LP, 5.800%, 3/15/2035 | | | 471,498 |
| | 47,310,000 | | Maritimes & Northeast Pipeline LLC, 144A 7.500%, 5/31/2014(b) | | | 49,759,712 |
| | 81,710,000 | | NGPL Pipeco LLC, 144A, 7.119%, 12/15/2017 | | | 91,425,401 |
| | 3,425,000 | | ONEOK Partners LP, 6.650%, 10/01/2036 | | | 3,649,591 |
| | 20,770,000 | | Plains All American Pipeline LP, 6.125%, 1/15/2017 | | | 21,558,076 |
| | 44,730,000 | | Plains All American Pipeline LP, 6.650%, 1/15/2037 | | | 47,113,483 |
| | 250,000 | | Transportadora de Gas del Sur SA, 144A, 7.875%, 5/14/2017 | | | 215,000 |
| | 600,000 | | Williams Cos., Inc., 7.875%, 9/01/2021 | | | 648,997 |
| | 965,000 | | Williams Cos., Inc., Senior Note, 7.750%, 6/15/2031 | | | 1,011,878 |
| | | | | | |
Principal
Amount (‡) | | Description | | Value (†) |
| | | | | | |
| | | Pipelines — continued | | | |
| $ | 4,030,000 | | Williams Cos., Inc., Series A, 7.500%, 1/15/2031 | | $ | 4,116,169 |
| | | | | | |
| | | | | | 288,998,722 |
| | | | | | |
| | | Property & Casualty Insurance — 0.4% | | | |
| | 4,785,000 | | Allstate Corp., 5.950%, 4/01/2036 | | | 5,076,478 |
| | 2,660,000 | | Marsh & McLennan Cos., Inc., 5.375%, 7/15/2014 | | | 2,768,148 |
| | 11,710,000 | | Marsh & McLennan Cos., Inc., 5.750%, 9/15/2015 | | | 12,348,265 |
| | 11,075,000 | | Marsh & McLennan Cos., Inc., 5.875%, 8/01/2033 | | | 10,178,302 |
| | 666,000 | | Marsh & McLennan Cos., Inc., 9.250%, 4/15/2019 | | | 834,591 |
| | 6,080,000 | | MBIA Insurance Corp., (fixed rate to 1/15/2013, variable rate thereafter), 144A, 14.000%, 1/15/2033 | | | 2,675,200 |
| | 11,205,000 | | Willis North America, Inc., 6.200%, 3/28/2017 | | | 10,968,395 |
| | | | | | |
| | | | | | 44,849,379 |
| | | | | | |
| | | Railroads — 0.4% | | | |
| | 2,700,000 | | Canadian Pacific Railway Co., 5.750%, 3/15/2033 | | | 2,599,431 |
| | 16,410,000 | | Canadian Pacific Railway Co., 5.950%, 5/15/2037 | | | 16,191,977 |
| | 25,430,000 | | CSX Corp., MTN, 6.000%, 10/01/2036 | | | 26,225,094 |
| | 1,153,000 | | Missouri Pacific Railroad Co., 5.000%, 1/01/2045(b) | | | 784,040 |
| | | | | | |
| | | | | | 45,800,542 |
| | | | | | |
| | | Refining — 0.0% | | | |
| | 1,335,000 | | Valero Energy Corp., 6.625%, 6/15/2037 | | | 1,192,250 |
| | | | | | |
| | | REITs — 1.1% | | | |
| | 2,025,000 | | Camden Property Trust, 5.000%, 6/15/2015 | | | 1,927,203 |
| | 27,950,000 | | Camden Property Trust, 5.700%, 5/15/2017 | | | 26,444,836 |
| | 4,030,000 | | Duke Realty LP, 5.950%, 2/15/2017 | | | 3,714,737 |
| | 3,300,000 | | ERP Operating LP, 5.125%, 3/15/2016 | | | 3,220,051 |
| | 47,305,000 | | Highwoods Properties, Inc., 5.850%, 3/15/2017 | | | 41,663,122 |
| | 4,135,000 | | ProLogis, 5.625%, 11/15/2015 | | | 3,757,520 |
| | 1,000,000 | | ProLogis, 5.625%, 11/15/2016 | | | 897,268 |
| | 1,967,000 | | ProLogis, 5.750%, 4/01/2016 | | | 1,759,440 |
| | 1,002,000 | | ProLogis, 6.625%, 5/15/2018 | | | 925,239 |
| | 1,500,000 | | Simon Property Group LP, 5.250%, 12/01/2016 | | | 1,478,551 |
| | 4,900,000 | | Simon Property Group LP, 5.750%, 12/01/2015 | | | 5,012,269 |
| | 550,000 | | Simon Property Group LP, 5.875%, 3/01/2017 | | | 560,894 |
See accompanying notes to financial statements.
46
LOOMIS SAYLES STRATEGIC INCOME FUND — PORTFOLIOOF INVESTMENTS (continued)
Investments as of September 30, 2009
| | | | | | |
Principal
Amount (‡) | | Description | | Value (†) |
| | | | | | |
| | | REITs — continued | | | |
| $ | 1,890,000 | | Simon Property Group LP, 6.100%, 5/01/2016 | | $ | 1,942,446 |
| | 450,000 | | Simon Property Group LP, 6.125%, 5/30/2018 | | | 453,409 |
| | 46,015,000 | | WEA Finance LLC/WT Finance Australia Pty Ltd., 144A, 6.750%, 9/02/2019 | | | 46,544,126 |
| | | | | | |
| | | | | | 140,301,111 |
| | | | | | |
| | | Restaurants — 0.0% | | | |
| | 1,250,000 | | McDonald’s Corp., EMTN, 3.628%, 10/10/2010, (SGD) | | | 902,678 |
| | | | | | |
| | | Retailers — 2.6% | | | |
| | 8,758,000 | | Dillard’s, Inc., 6.625%, 1/15/2018 | | | 6,656,080 |
| | 4,187,000 | | Dillard’s, Inc., 7.130%, 8/01/2018 | | | 3,255,392 |
| | 1,500,000 | | Dillard’s, Inc., 7.750%, 7/15/2026 | | | 1,057,500 |
| | 425,000 | | Dillard’s, Inc., 7.875%, 1/01/2023 | | | 310,250 |
| | 3,325,000 | | Dillard’s, Inc., Class A, 7.000%, 12/01/2028 | | | 2,211,125 |
| | 123,940,000 | | Home Depot, Inc., 5.875%, 12/16/2036 | | | 120,247,332 |
| | 3,685,000 | | J.C. Penney Corp., Inc., 5.750%, 2/15/2018 | | | 3,427,050 |
| | 635,000 | | J.C. Penney Corp., Inc., 7.125%, 11/15/2023 | | | 584,200 |
| | 3,330,000 | | J.C. Penney Corp., Inc., 7.400%, 4/01/2037 | | | 2,963,700 |
| | 3,985,000 | | J.C. Penney Corp., Inc., 7.625%, 3/01/2097 | | | 3,188,000 |
| | 72,470,000 | | J.C. Penney Corp., Inc., Senior Note, 6.375%, 10/15/2036 | | | 59,787,750 |
| | 13,935,000 | | Lowe’s Cos., Inc., 6.650%, 9/15/2037 | | | 16,186,227 |
| | 20,564,000 | | Macy’s Retail Holdings, Inc., 6.375%, 3/15/2037 | | | 16,201,224 |
| | 12,275,000 | | Macy’s Retail Holdings, Inc., 6.790%, 7/15/2027 | | | 8,948,340 |
| | 2,365,000 | | Macy’s Retail Holdings, Inc., 6.900%, 4/01/2029 | | | 1,865,666 |
| | 6,365,000 | | Marks & Spencer PLC, 144A, 7.125%, 12/01/2037 | | | 5,946,100 |
| | 25,856,000 | | Target Corp., 7.000%, 1/15/2038 | | | 30,261,242 |
| | 32,675,000 | | Toys R Us, Inc., 7.375%, 10/15/2018 | | | 28,427,250 |
| | 8,355,000 | | Toys R Us, Inc., 7.875%, 4/15/2013 | | | 8,020,800 |
| | 10,270,000 | | Woolworth Corp., 8.500%, 1/15/2022 | | | 9,705,150 |
| | | | | | |
| | | | | | 329,250,378 |
| | | | | | |
| | | Sovereigns — 4.8% | | | |
| | 104,626,000,000 | | Indonesia Treasury Bond, Series FR43, 10.250%, 7/15/2022, (IDR) | | | 10,668,096 |
| | 10,000,000,000 | | Indonesia Treasury Bond, Series FR47, 10.000%, 2/15/2028, (IDR) | | | 968,368 |
| | | | | |
Principal
Amount (‡) | | Description | | Value (†) |
| | | | | |
| | Sovereigns — continued | | | |
| 272,460,000,000 | | Indonesia Treasury Bond, Series ZC3, Zero Coupon, 11/20/2012, (IDR) | | $ | 21,692,777 |
| 2,350,305(††) | | Mexican Fixed Rate Bonds, Series M-10, 7.250%, 12/15/2016, (MXN) | | | 16,941,629 |
| 2,037,000(††) | | Mexican Fixed Rate Bonds, Series M-10, 9.000%, 12/20/2012, (MXN) | | | 16,086,822 |
| 18,686,981(††) | | Mexican Fixed Rate Bonds, Series M-20, 8.000%, 12/07/2023, (MXN) | | | 135,766,863 |
| 79,755,000 | | New South Wales Treasury Corp., Series 10RG, 7.000%, 12/01/2010, (AUD) | | | 72,479,088 |
| 10,530,000 | | New South Wales Treasury Corp., Series 12RG, 6.000%, 5/01/2012, (AUD) | | | 9,472,392 |
| 66,305,000 | | New South Wales Treasury Corp., Series 17RG, 5.500%, 3/01/2017, (AUD) | | | 57,282,904 |
| 56,700,000 | | Republic of Brazil, 10.250%, 1/10/2028, (BRL) | | | 30,724,769 |
| 140,235,000 | | Republic of Brazil, 12.500%, 1/05/2016, (BRL) | | | 86,954,249 |
| 107,840,000 | | Republic of Brazil, 12.500%, 1/05/2022, (BRL) | | | 66,958,681 |
| 1,400,000,000 | | Republic of Iceland, Zero Coupon, 11/16/2009, (ISK) | | | 8,948,981 |
| 2,981,242,000 | | Republic of Iceland, 7.000%, 3/17/2010, (ISK) | | | 19,220,356 |
| 3,178,700,000 | | Republic of Iceland, 7.250%, 5/17/2013, (ISK) | | | 20,374,442 |
| 1,700,700,000 | | Republic of Iceland, 8.000%, 7/22/2011, (ISK) | | | 11,108,753 |
| 3,090,910,000 | | Republic of Iceland, 13.750%, 12/10/2010, (ISK) | | | 21,417,015 |
| 4,020,000 | | Republic of Venezuela, 7.000%, 3/16/2015, (EUR) | | | 4,967,203 |
| | | | | |
| | | | | 612,033,388 |
| | | | | |
| | Supermarkets — 0.8% | | | |
| 2,000,000 | | American Stores Co., 7.900%, 5/01/2017 | | | 1,880,000 |
| 72,681,000 | | New Albertson’s, Inc., 7.450%, 8/01/2029 | | | 62,505,660 |
| 19,060,000 | | New Albertson’s, Inc., 7.750%, 6/15/2026 | | | 16,963,400 |
| 4,895,000 | | New Albertson’s, Inc., 8.000%, 5/01/2031 | | | 4,393,263 |
| 1,510,000 | | New Albertson’s, Inc., 8.700%, 5/01/2030 | | | 1,374,100 |
| 13,242,000 | | New Albertson’s, Inc., Series C, MTN, 6.625%, 6/01/2028 | | | 10,229,445 |
| | | | | |
| | | | | 97,345,868 |
| | | | | |
| | Supranational — 2.1% | | | |
| 175,000,000 | | Eurofima, EMTN, 11.000%, 2/05/2010, (ISK) | | | 1,143,981 |
| 128,250,000 | | European Investment Bank, Zero Coupon, 3/10/2021, (AUD) | | | 57,324,818 |
| 16,375,000 | | European Investment Bank, 11.250%, 2/14/2013, (BRL) | | | 9,683,951 |
| 413,529,000,000 | | European Investment Bank, EMTN, 144A, Zero Coupon, 4/24/2013, (IDR) | | | 30,455,245 |
| 134,330,000 | | European Investment Bank, EMTN, 144A, 4.600%, 1/30/2037, (CAD) | | | 110,510,311 |
See accompanying notes to financial statements.
47
LOOMIS SAYLES STRATEGIC INCOME FUND — PORTFOLIOOF INVESTMENTS (continued)
Investments as of September 30, 2009
| | | | | |
Principal
Amount (‡) | | Description | | Value (†) |
| | | | | |
| | Supranational — continued | | | |
| 11,330,000 | | European Investment Bank, EMTN, 7.000%, 1/18/2012, (NZD) | | $ | 8,568,406 |
| 244,840,000,000 | | Inter-American Development Bank, EMTN, Zero Coupon, 5/20/2013, (IDR) | | | 17,459,258 |
| 24,450,000 | | Inter-American Development Bank, EMTN, 6.000%, 12/15/2017, (NZD) | | | 17,580,802 |
| 8,300,000 | | International Bank for Reconstruction & Development, 1.430%, 3/05/2014, (SGD) | | | 5,662,242 |
| 1,385,900,000 | | International Bank for Reconstruction & Development, 9.500%, 5/27/2010, (ISK) | | | 9,036,783 |
| | | | | |
| | | | | 267,425,797 |
| | | | | |
| | Technology — 2.4% | | | |
| 41,705,000 | | Agilent Technologies, Inc., 6.500%, 11/01/2017 | | | 43,399,891 |
| 41,104,000 | | Alcatel-Lucent USA, Inc., 6.450%, 3/15/2029 | | | 31,290,420 |
| 5,040,000 | | Alcatel-Lucent USA, Inc., 6.500%, 1/15/2028 | | | 3,836,700 |
| 832,000 | | Alcatel-Lucent, EMTN, 6.375%, 4/07/2014, (EUR) | | | 1,156,631 |
| 10,725,000 | | Amkor Technology, Inc., 7.750%, 5/15/2013 | | | 10,725,000 |
| 1,225,000 | | Amkor Technology, Inc., 9.250%, 6/01/2016 | | | 1,261,750 |
| 2,435,000 | | Arrow Electronics, Inc., 6.875%, 6/01/2018 | | | 2,592,172 |
| 30,125,000 | | Avnet, Inc., 5.875%, 3/15/2014 | | | 31,320,872 |
| 35,630,000 | | Avnet, Inc., 6.000%, 9/01/2015 | | | 36,683,223 |
| 11,345,000 | | Avnet, Inc., 6.625%, 9/15/2016 | | | 11,921,995 |
| 6,225,000 | | Corning, Inc., 5.900%, 3/15/2014 | | | 6,644,615 |
| 6,220,000 | | Corning, Inc., 6.200%, 3/15/2016 | | | 6,356,965 |
| 6,150,000 | | Corning, Inc., 6.850%, 3/01/2029 | | | 6,275,712 |
| 4,725,000 | | Corning, Inc., 7.250%, 8/15/2036 | | | 4,985,229 |
| 2,900,000 | | Eastman Kodak Co., 7.250%, 11/15/2013 | | | 2,378,000 |
| 11,626,000 | | Equifax, Inc., 7.000%, 7/01/2037 | | | 11,421,917 |
| 6,290,000 | | Freescale Semiconductor, Inc., 10.125%, 12/15/2016 | | | 4,182,850 |
| 9,739,000 | | Motorola, Inc., 5.220%, 10/01/2097 | | | 5,347,373 |
| 475,000 | | Motorola, Inc., 6.000%, 11/15/2017 | | | 455,012 |
| 9,345,000 | | Motorola, Inc., 6.500%, 9/01/2025 | | | 7,897,319 |
| 21,299,000 | | Motorola, Inc., 6.500%, 11/15/2028 | | | 17,567,650 |
| 18,715,000 | | Motorola, Inc., 6.625%, 11/15/2037 | | | 15,673,813 |
| 250,000 | | Motorola, Inc., 7.500%, 5/15/2025 | | | 225,000 |
| 9,350,000 | | Nortel Networks Capital Corp., 7.875%, 6/15/2026(e) | | | 5,236,000 |
| | | | | | |
Principal
Amount (‡) | | Description | | Value (†) |
| | | | | | |
| | | Technology — continued | | | |
| $ | 11,770,000 | | Nortel Networks Ltd., 6.875%, 9/01/2023(e) | | $ | 3,295,600 |
| | 285,000 | | Samsung Electronics Co. Ltd., 144A, 7.700%, 10/01/2027 | | | 316,156 |
| | 21,822,000 | | Xerox Capital Trust I, 8.000%, 2/01/2027 | | | 21,331,005 |
| | 4,795,000 | | Xerox Corp., 5.500%, 5/15/2012 | | | 5,027,850 |
| | 1,730,000 | | Xerox Corp., MTN, 7.200%, 4/01/2016 | | | 1,877,977 |
| | | | | | |
| | | | | | 300,684,697 |
| | | | | | |
| | | Tobacco — 1.4% | | | |
| | 29,189,000 | | Altria Group, Inc., 8.500%, 11/10/2013 | | | 33,854,570 |
| | 59,268,000 | | Altria Group, Inc., 9.250%, 8/06/2019 | | | 72,422,888 |
| | 1,375,000 | | Altria Group, Inc., 9.700%, 11/10/2018 | | | 1,707,828 |
| | 52,930,000 | | Reynolds American, Inc., 6.750%, 6/15/2017 | | | 55,023,858 |
| | 13,400,000 | | Reynolds American, Inc., 7.250%, 6/15/2037 | | | 13,271,588 |
| | | | | | |
| | | | | | 176,280,732 |
| | | | | | |
| | | Transportation Services — 0.4% | | | |
| | 10,503,000 | | APL Ltd., Senior Note, 8.000%, 1/15/2024(b) | | | 8,586,202 |
| | 16,030,016 | | Atlas Air, Inc., Series 1998-1, Class 1B, 7.680%, 1/02/2014 | | | 13,625,513 |
| | 8,904,345 | | Atlas Air, Inc., Series 1999-1, Class A1, 7.200%, 7/02/2020 | | | 6,945,389 |
| | 265,928 | | Atlas Air, Inc., Series 1999-1, Class A2, 6.880%, 1/02/2011 | | | 244,654 |
| | 11,454,101 | | Atlas Air, Inc., Series 1999-1, Class B, 7.630%, 7/02/2016 | | | 8,590,576 |
| | 4,744,556 | | Atlas Air, Inc., Series 1999-1, Class C, 8.770%, 7/02/2012(g) | | | 3,321,189 |
| | 4,917,945 | | Atlas Air, Inc., Series 2000-1, Class B, 9.057%, 7/02/2017 | | | 4,376,971 |
| | 6,862,758 | | Atlas Air, Inc., Series C, 8.010%, 1/02/2010(g) | | | 4,803,931 |
| | 3,970,000 | | Erac USA Finance Co., 144A, 7.000%, 10/15/2037 | | | 3,716,357 |
| | | | | | |
| | | | | | 54,210,782 |
| | | | | | |
| | | Treasuries — 8.8% | | | |
| | 297,140,000 | | Canadian Government, 2.000%, 9/01/2012, (CAD) | | | 278,284,453 |
| | 130,000,000 | | Canadian Government, 2.750%, 12/01/2010, (CAD) | | | 124,378,182 |
| | 65,260,000 | | Canadian Government, 3.500%, 6/01/2013, (CAD) | | | 63,766,636 |
| | 101,755,000 | | Canadian Government, 3.750%, 6/01/2012, (CAD) | | | 100,015,761 |
| | 171,980,000 | | Canadian Government, 3.750%, 6/01/2019, (CAD) | | | 166,444,642 |
| | 25,445,000 | | Canadian Government, 4.250%, 6/01/2018, (CAD) | | | 25,728,290 |
| | 75,385,000 | | Canadian Government, 5.250%, 6/01/2012, (CAD) | | | 76,842,497 |
See accompanying notes to financial statements.
48
LOOMIS SAYLES STRATEGIC INCOME FUND — PORTFOLIOOF INVESTMENTS (continued)
Investments as of September 30, 2009
| | | | | |
Principal
Amount (‡) | | Description | | Value (†) |
| | | | | |
| | Treasuries — continued | | | |
| 22,670,000 | | New Zealand Government Bond, 6.000%, 12/15/2017, (NZD) | | $ | 16,764,390 |
| 457,420,000 | | Norwegian Government, 4.250%, 5/19/2017, (NOK) | | | 80,513,554 |
| 221,050,000 | | Norwegian Government, 5.000%, 5/15/2015, (NOK) | | | 40,669,013 |
| 366,200,000 | | Norwegian Government, 6.000%, 5/16/2011, (NOK) | | | 66,620,872 |
| 262,545,000 | | Norwegian Government, 6.500%, 5/15/2013, (NOK) | | | 50,068,092 |
| 25,000,000 | | U.S. Treasury Note, 3.125%, 5/15/2019 | | | 24,599,600 |
| | | | | |
| | | | | 1,114,695,982 |
| | | | | |
| | Wireless — 1.6% | | | |
| 8,524,000 | | ALLTEL Corp., 6.800%, 5/01/2029 | | | 9,355,721 |
| 29,102,000 | | ALLTEL Corp., Senior Note, 7.875%, 7/01/2032 | | | 35,825,144 |
| 29,635,000 | | Nextel Communications, Inc., Series D, 7.375%, 8/01/2015 | | | 26,597,412 |
| 15,931,000 | | Nextel Communications, Inc., Series E, 6.875%, 10/31/2013 | | | 14,776,003 |
| 42,310,000 | | Nextel Communications, Inc., Series F, 5.950%, 3/15/2014 | | | 37,444,350 |
| 2,085,000 | | Rogers Wireless, Inc., 7.625%, 12/15/2011, (CAD) | | | 2,152,127 |
| 2,525,000 | | Rogers Wireless, Inc., Senior Secured Note, 6.375%, 3/01/2014 | | | 2,787,438 |
| 21,186,000 | | Sprint Capital Corp., 6.875%, 11/15/2028 | | | 17,690,310 |
| 18,070,000 | | Sprint Capital Corp., 6.900%, 5/01/2019 | | | 16,172,650 |
| 6,260,000 | | Sprint Capital Corp., 8.750%, 3/15/2032 | | | 5,915,700 |
| 11,309,000 | | Sprint Nextel Corp., 6.000%, 12/01/2016 | | | 10,093,283 |
| 400,000 | | True Move Co. Ltd., 144A, 10.375%, 8/01/2014 | | | 374,000 |
| 29,435,000 | | True Move Co. Ltd., 144A, 10.750%, 12/16/2013 | | | 28,257,600 |
| | | | | |
| | | | | 207,441,738 |
| | | | | |
| | Wirelines — 4.3% | | | |
| 10,245,000 | | AT&T Corp., 6.500%, 3/15/2029 | | | 10,649,186 |
| 101,060,000 | | AT&T, Inc., 6.500%, 9/01/2037 | | | 108,589,677 |
| 5,650,000 | | Axtel SAB de CV, 144A, 9.000%, 9/22/2019 | | | 5,734,750 |
| 4,370,000 | | Bell Canada, MTN, 144A, 6.550%, 5/01/2029, (CAD) | | | 4,018,776 |
| 8,445,000 | | Bell Canada, MTN, 7.300%, 2/23/2032, (CAD) | | | 8,439,636 |
| 33,640,000 | | Bell Canada, Series M-17, 6.100%, 3/16/2035, (CAD) | | | 29,342,036 |
| 860,000 | | BellSouth Corp., 6.550%, 6/15/2034 | | | 920,540 |
| 2,715,000 | | BellSouth Telecommunications, Inc., 7.000%, 12/01/2095 | | | 2,695,821 |
| 155,000 | | Cincinnati Bell, Inc., 7.000%, 2/15/2015 | | | 150,350 |
| | | | | | |
Principal
Amount (‡) | | Description | | Value (†) |
| | | | | | |
| | | Wirelines — continued | | | |
| $ | 270,000 | | Cincinnati Bell, Inc., 8.375%, 1/15/2014 | | $ | 271,350 |
| | 5,330,000 | | Embarq Corp., 7.995%, 6/01/2036 | | | 5,568,859 |
| | 35,260,000 | | Frontier Communications Corp., 7.875%, 1/15/2027 | | | 32,174,750 |
| | 10,555,000 | | GTE Corp., 6.940%, 4/15/2028 | | | 11,348,609 |
| | 525,000 | | Hawaiian Telcom Communications, Inc., Series B, 12.500%, 5/01/2015(e) | | | 656 |
| | 1,120,000 | | Koninklijke (Royal) KPN NV, EMTN, 5.750%, 3/18/2016, (GBP) | | | 1,874,110 |
| | 1,800,000 | | Koninklijke (Royal) KPN NV, GMTN, 4.000%, 6/22/2015, (EUR) | | | 2,649,543 |
| | 32,435,000 | | Level 3 Financing, Inc., 8.750%, 2/15/2017 | | | 26,921,050 |
| | 13,010,000 | | Level 3 Financing, Inc., 9.250%, 11/01/2014 | | | 11,465,063 |
| | 3,346,000 | | New England Telephone & Telegraph Co., 7.875%, 11/15/2029 | | | 3,797,024 |
| | 16,335,000 | | Qwest Capital Funding, Inc., 6.500%, 11/15/2018 | | | 13,435,537 |
| | 32,395,000 | | Qwest Capital Funding, Inc., 7.750%, 2/15/2031 | | | 25,835,012 |
| | 42,460,000 | | Qwest Capital Funding, Inc., Guaranteed Note, 6.875%, 7/15/2028 | | | 32,057,300 |
| | 12,463,000 | | Qwest Capital Funding, Inc., Guaranteed Note, 7.625%, 8/03/2021 | | | 10,531,235 |
| | 33,130,000 | | Qwest Corp., 6.875%, 9/15/2033 | | | 26,835,300 |
| | 3,075,000 | | Qwest Corp., 7.200%, 11/10/2026 | | | 2,567,625 |
| | 3,999,000 | | Qwest Corp., 7.250%, 9/15/2025 | | | 3,449,138 |
| | 2,288,000 | | Qwest Corp., 7.500%, 6/15/2023 | | | 2,082,080 |
| | 5,470,000 | | SK Broadband Co. Ltd., 144A, 7.000%, 2/01/2012 | | | 5,634,100 |
| | 23,000,000 | | Telecom Italia Capital SA, 6.000%, 9/30/2034 | | | 22,421,987 |
| | 19,635,000 | | Telecom Italia Capital SA, 6.375%, 11/15/2033 | | | 20,062,886 |
| | 6,030,000 | | Telefonica Emisiones SAU, 5.877%, 7/15/2019 | | | 6,551,691 |
| | 20,895,000 | | Telefonica Emisiones SAU, Guaranteed Note, 7.045%, 6/20/2036 | | | 24,727,268 |
| | 31,690,000 | | Telus Corp., 4.950%, 3/15/2017, (CAD) | | | 30,282,279 |
| | 37,101,000 | | Verizon Global Funding Corp., Senior Note, 5.850%, 9/15/2035 | | | 37,351,729 |
| | 6,230,000 | | Verizon Maryland, Inc., Series B, 5.125%, 6/15/2033 | | | 5,301,487 |
| | 6,835,000 | | Verizon New York, Inc., Series A, 7.375%, 4/01/2032 | | | 7,494,605 |
| | 5,215,000 | | Verizon Pennsylvania, Inc., 6.000%, 12/01/2028 | | | 4,861,501 |
| | | | | | |
| | | | | | 548,094,546 |
| | | | | | |
| | | Total Non-Convertible Bonds
(Identified Cost $10,495,755,268) | | | 10,534,908,583 |
| | | | | | |
See accompanying notes to financial statements.
49
LOOMIS SAYLES STRATEGIC INCOME FUND — PORTFOLIOOF INVESTMENTS (continued)
Investments as of September 30, 2009
| | | | | | |
Principal
Amount (‡) | | Description | | Value (†) |
| | | | | | |
| | Convertible Bonds — 5.4% | | | |
| | | Airlines — 0.0% | | | |
| $ | 2,800,000 | | AMR Corp., 6.250%, 10/15/2014 | | $ | 2,957,500 |
| | | | | | |
| | | Diversified Manufacturing — 0.0% | | | |
| | 3,520,000 | | Trinity Industries, Inc., 3.875%, 6/01/2036 | | | 2,596,000 |
| | | | | | |
| | | Electric — 0.0% | | | |
| | 1,800,000 | | CMS Energy Corp., 5.500%, 6/15/2029 | | | 2,058,750 |
| | | | | | |
| | | Healthcare — 0.3% | | | |
| | 26,280,000 | | Affymetrix, Inc., 3.500%, 1/15/2038 | | | 21,155,400 |
| | 1,135,000 | | Hologic, Inc., (Step to Zero Coupon on 12/15/2013), 2.000%, 12/15/2037(d) | | | 927,862 |
| | 12,005,000 | | Life Technologies Corp., 1.500%, 2/15/2024 | | | 13,115,462 |
| | 190,000 | | LifePoint Hospitals, Inc., 3.250%, 8/15/2025 | | | 166,250 |
| | 250,000 | | LifePoint Hospitals, Inc., 3.500%, 5/15/2014 | | | 212,188 |
| | 3,650,000 | | Omnicare, Inc., 3.250%, 12/15/2035 | | | 2,801,375 |
| | | | | | |
| | | | | | 38,378,537 |
| | | | | | |
| | | Independent Energy — 0.0% | | | |
| | 860,000 | | Chesapeake Energy Corp., 2.250%, 12/15/2038 | | | 642,850 |
| | 3,130,000 | | Penn Virginia Corp., 4.500%, 11/15/2012 | | | 2,817,000 |
| | | | | | |
| | | | | | 3,459,850 |
| | | | | | |
| | | Industrial Other — 0.3% | | | |
| | 30,860,000 | | Incyte Corp., 3.500%, 2/15/2011 | | | 30,088,500 |
| | | | | | |
| | | Lodging — 0.2% | | | |
| | 30,418,000 | | Host Hotels & Resorts, Inc., 144A, 2.625%, 4/15/2027 | | | 27,946,537 |
| | | | | | |
| | | Media Non-Cable — 0.0% | | | |
| | 7,761,687 | | Liberty Media LLC, 3.500%, 1/15/2031 | | | 4,763,735 |
| | | | | | |
| | | Metals & Mining — 0.2% | | | |
| | 2,250,000 | | ArcelorMittal, 5.000%, 5/15/2014 | | | 3,248,438 |
| | 1,000,000 | | Steel Dynamics, Inc., 5.125%, 6/15/2014 | | | 1,180,000 |
| | 11,270,000 | | United States Steel Corp., 4.000%, 5/15/2014 | | | 17,919,300 |
| | | | | | |
| | | | | | 22,347,738 |
| | | | | | |
| | | Non-Captive Diversified — 0.2% | | | |
| | 44,035,000 | | iStar Financial, Inc., 1.097%, 10/01/2012(c) | | | 22,017,500 |
| | | | | | |
| | | Oil Field Services — 0.0% | | | |
| | 1,300,000 | | Transocean, Inc., Series B, 1.500%, 12/15/2037 | | | 1,254,500 |
| | 535,000 | | Transocean, Inc., Series C, 1.500%, 12/15/2037 | | | 509,588 |
| | | | | | |
| | | | | | 1,764,088 |
| | | | | | |
| | | | | | |
Principal
Amount (‡) | | Description | | Value (†) |
| | | | | | |
| | | Pharmaceuticals — 0.9% | | | |
| $ | 635,000 | | Human Genome Sciences, Inc., 2.250%, 10/15/2011 | | $ | 878,681 |
| | 41,680,000 | | Human Genome Sciences, Inc., 2.250%, 8/15/2012 | | | 51,943,700 |
| | 1,600,000 | | Kendle International, Inc., 3.375%, 7/15/2012 | | | 1,412,000 |
| | 24,461,000 | | Nektar Therapeutics, 3.250%, 9/28/2012 | | | 22,198,358 |
| | 28,222,000 | | Valeant Pharmaceuticals International, Subordinated Note, 4.000%, 11/15/2013 | | | 30,373,927 |
| | | | | | |
| | | | | | 106,806,666 |
| | | | | | |
| | | REITs — 0.1% | | | |
| | 6,469,000 | | ProLogis, 1.875%, 11/15/2037 | | | 5,522,909 |
| | 5,920,000 | | ProLogis, 2.250%, 4/01/2037 | | | 5,335,400 |
| | | | | | |
| | | | | | 10,858,309 |
| | | | | | |
| | | Technology — 2.3% | | | |
| | 14,075,000 | | Advanced Micro Devices, Inc., 5.750%, 8/15/2012 | | | 11,805,406 |
| | 850,000 | | Advanced Micro Devices, Inc., 6.000%, 5/01/2015 | | | 636,438 |
| | 1,100,000 | | Alcatel-Lucent USA, Inc., Series B, 2.875%, 6/15/2025 | | | 918,500 |
| | 220,000 | | Ciena Corp., 0.250%, 5/01/2013 | | | 175,725 |
| | 8,970,000 | | Ciena Corp., 0.875%, 6/15/2017 | | | 6,178,087 |
| | 2,050,000 | | Intel Corp., 2.950%, 12/15/2035 | | | 1,829,625 |
| | 220,000,000 | | Intel Corp., 144A, 3.250%, 8/01/2039 | | | 235,125,000 |
| | 9,197,000 | | Kulicke & Soffa Industries, Inc., 0.875%, 6/01/2012 | | | 7,530,044 |
| | 3,880,000 | | Kulicke & Soffa Industries, Inc., 1.000%, 6/30/2010 | | | 3,681,150 |
| | 3,730,000 | | Maxtor Corp., Subordinated Note, 5.750%, 3/01/2012(b) | | | 3,394,300 |
| | 745,000 | | Nortel Networks Corp., 1.750%, 4/15/2012(e) | | | 409,750 |
| | 30,767,000 | | Nortel Networks Corp., 2.125%, 4/15/2014(e) | | | 16,921,850 |
| | 311,000 | | Richardson Electronics Ltd., 7.750%, 12/15/2011 | | | 276,790 |
| | | | | | |
| | | | | | 288,882,665 |
| | | | | | |
| | | Textile — 0.0% | | | |
| | 103,000 | | Dixie Group, Inc., Subordinated Note, 7.000%, 5/15/2012 | | | 84,460 |
| | | | | | |
| | | Wireless — 0.1% | | | |
| | 16,157,000 | | NII Holdings, Inc., 3.125%, 6/15/2012 | | | 14,117,179 |
| | | | | | |
| | | Wirelines — 0.8% | | | |
| | 34,645,000 | | Level 3 Communications, Inc., 3.500%, 6/15/2012 | | | 27,542,775 |
| | 13,484,000 | | Level 3 Communications, Inc., 5.250%, 12/15/2011 | | | 12,000,760 |
See accompanying notes to financial statements.
50
LOOMIS SAYLES STRATEGIC INCOME FUND — PORTFOLIOOF INVESTMENTS (continued)
Investments as of September 30, 2009
| | | | | | |
Principal
Amount (‡) | | Description | | Value (†) |
| | | | | | |
| | | Wirelines — continued | | | |
| $ | 54,075,000 | | Level 3 Communications, Inc., 144A 7.000%, 3/15/2015(b) | | $ | 57,319,500 |
| | 2,470,000 | | Level 3 Communications, Inc., 10.000%, 5/01/2011 | | | 2,439,125 |
| | 1,000,000 | | Qwest Communications International, Inc., 3.500%, 11/15/2025 | | | 1,008,750 |
| | | | | | |
| | | | | | 100,310,910 |
| | | | | | |
| | | Total Convertible Bonds (Identified Cost $661,125,834) | | | 679,438,924 |
| | | | | | |
| | Municipals — 0.5% | | | |
| | | California — 0.3% | | | |
| | 1,530,000 | | San Jose California Redevelopment Agency Tax Allocation (Merged Area), Series C, (Registered), (MBIA insured), 3.750%, 8/01/2028 | | | 1,358,456 |
| | 4,170,000 | | San Jose California Redevelopment Agency Tax Allocation (Merged Area Redevelopment), Series C, 3.750%, 8/01/2028 | | | 3,489,831 |
| | 5,175,000 | | State of California, (AMBAC insured), 4.500%, 8/01/2027 | | | 5,038,484 |
| | 14,415,000 | | State of California, 4.500%, 10/01/2029 | | | 13,720,629 |
| | 4,190,000 | | State of California, (AMBAC insured), 4.500%, 8/01/2030 | | | 3,967,302 |
| | 3,620,000 | | State of California, 4.500%, 8/01/2030 | | | 3,427,597 |
| | 2,680,000 | | State of California (Various Purpose), (MBIA insured), 3.250%, 12/01/2027 | | | 2,183,101 |
| | 12,645,000 | | State of California (Various Purpose), (AMBAC insured), 4.500%, 12/01/2033 | | | 11,540,839 |
| | | | | | |
| | | | | | 44,726,239 |
| | | | | | |
| | | Illinois — 0.0% | | | |
| | 1,725,000 | | Chicago O’Hare International Airport, Series A, (FSA insured), 4.500%, 1/01/2038 | | | 1,711,252 |
| | | | | | |
| | | Michigan — 0.1% | | | |
| | 12,850,000 | | Michigan Tobacco Settlement Finance Authority, Taxable Turbo Series A, 7.309%, 6/01/2034(b) | | | 10,273,061 |
| | | | | | |
| | | Nebraska — 0.1% | | | |
| | 6,230,000 | | Omaha Public Power District, Series AA, (FGIC insured), 4.500%, 2/01/2034 | | | 6,341,766 |
| | | | | | |
| | | Wisconsin — 0.0% | | | |
| | 835,000 | | Wisconsin Housing & Economic Development Authority, Series E, 4.900%, 11/01/2035 | | | 835,376 |
| | | | | | |
| | | Total Municipals (Identified Cost $63,889,351) | | | 63,887,694 |
| | | | | | |
| | | Total Bonds and Notes (Identified Cost $11,220,770,453) | | | 11,278,235,201 |
| | | | | | |
| | Bank Loans — 0.7% | | | |
| | | Airlines — 0.1% | | | |
| | 5,645,000 | | Delta Air Lines, Inc., Secured Term Loan, 9/27/2013(h) | | | 5,602,662 |
| | | | | | |
| | | Energy — 0.1% | | | |
| | 12,839,630 | | ATP Oil & Gas Corp., Tranche B-1 Term Loan, 8.500%, 7/15/2014(i) | | | 11,767,521 |
| | | | | | |
Principal
Amount (‡) | | Description | | Value (†) |
| | | | | | |
| | | Energy — continued | | | |
| $ | 3,384,895 | | ATP Oil & Gas Corp., Tranche B2 Term Loan, 9.000%, 1/15/2011(i) | | $ | 3,102,256 |
| | | | | | |
| | | | | | 14,869,777 |
| | | | | | |
| | | Media Non-Cable — 0.1% | | | |
| | 30,120,849 | | Idearc, Inc., Term Loan B, 6.250%, 11/17/2014(e)(i) | | | 12,738,710 |
| | 2,797,946 | | Tribune Co., Term Loan X, 5.000%, 6/04/2009(e)(i)(l) | | | 1,358,766 |
| | | | | | |
| | | | | | 14,097,476 |
| | | | | | |
| | | Oil Field Services — 0.0% | | | |
| | 2,485,000 | | Dresser, Inc., Second Lien Term Loan, 5.994%, 5/04/2015(i) | | | 2,149,525 |
| | 1,230,373 | | Dresser, Inc., Term Loan, 2.679%, 5/04/2014(i) | | | 1,150,399 |
| | | | | | |
| | | | | | 3,299,924 |
| | | | | | |
| | | Retailers — 0.0% | | | |
| | 1,520,647 | | Harbor Freight Tools USA, Inc., Tranche C Term Loan, 9.750%, 2/12/2013(i) | | | 1,528,250 |
| | | | | | |
| | | Technology — 0.2% | | | |
| | 6,799,473 | | Nuance Communications, Inc., Incremental Term Loan, 2.250%, 3/29/2013(i) | | | 6,495,536 |
| | 512,748 | | Nuance Communications, Inc., Term Loan, 2.250%, 3/31/2013(i) | | | 489,829 |
| | 433,064 | | Sungard Data Systems, Inc., Tranche A, 2.004%, 2/28/2014(i) | | | 404,806 |
| | 12,001,044 | | Sungard Data Systems, Inc., Tranche B, 4.079%, 2/26/2016(i) | | | 11,683,016 |
| | | | | | |
| | | | | | 19,073,187 |
| | | | | | |
| | | Wirelines — 0.2% | | | |
| | 1,985,000 | | Fairpoint Communications, Inc., Initial Term Loan A, 3/31/2014(h) | | | 1,493,713 |
| | 1,990,879 | | Fairpoint Communications, Inc., Initial Term Loan A, 4.750%, 3/31/2014(i) | | | 1,498,136 |
| | 3,970,000 | | Fairpoint Communications, Inc., Initial Term Loan B, 3/31/2015(h) | | | 2,983,693 |
| | 8,087,742 | | Fairpoint Communications, Inc., Initial Term Loan B, 5.000%, 3/31/2015(i) | | | 6,078,423 |
| | 16,952,315 | | Hawaiian Telcom Communications, Inc., Tranche C Term Loan, 4.750%, 6/01/2014(i)(j) | | | 10,459,579 |
| | 5,395,000 | | Level 3 Financing, Inc., Tranche A Term Loan, 2.683%, 3/13/2014(i) | | | 4,767,831 |
| | | | | | |
| | | | | | 27,281,375 |
| | | | | | |
| | | Total Bank Loans (Identified Cost $97,112,789) | | | 85,752,651 |
| | | | | | |
Shares | | | | |
| | Common Stocks — 2.8% | | | |
| | | Biotechnology — 0.3% | | | |
| | 1,732,629 | | EPIX Pharmaceuticals, Inc.(g) | | | 24,257 |
| | 5,111 | | EPIX Pharmaceuticals, Inc., Contingent Value Rights(g) | | | — |
| | 867,059 | | Vertex Pharmaceuticals, Inc.(g) | | | 32,861,536 |
| | | | | | |
| | | | | | 32,885,793 |
| | | | | | |
| | | Containers & Packaging — 0.1% | | | |
| | 460,656 | | Owens-Illinois, Inc.(g) | | | 16,998,207 |
| | | | | | |
| | | Electric Utilities — 0.0% | | | |
| | 282,500 | | Duke Energy Corp. | | | 4,446,550 |
| | | | | | |
See accompanying notes to financial statements.
51
LOOMIS SAYLES STRATEGIC INCOME FUND — PORTFOLIOOF INVESTMENTS (continued)
Investments as of September 30, 2009
| | | | | |
Shares | | Description | | Value (†) |
| | | | | |
| | Electronic Equipment, Instruments & Components — 0.0% | | | |
| 41,343 | | Corning, Inc. | | $ | 632,961 |
| | | | | |
| | Food Products — 0.4% | | | |
| 2,309,175 | | ConAgra Foods, Inc. | | | 50,062,914 |
| | | | | |
| | Household Durables — 0.1% | | | |
| 477,725 | | KB Home | | | 7,935,012 |
| 549,450 | | Lennar Corp., Class A | | | 7,829,663 |
| | | | | |
| | | | | 15,764,675 |
| | | | | |
| | Oil, Gas & Consumable Fuels — 0.2% | | | |
| 846,398 | | Chesapeake Energy Corp. | | | 24,037,703 |
| 141,249 | | Spectra Energy Corp. | | | 2,675,256 |
| | | | | |
| | | | | 26,712,959 |
| | | | | |
| | Pharmaceuticals — 1.3% | | | |
| 7,238,800 | | Bristol-Myers Squibb Co. | | | 163,017,776 |
| 2,288 | | Teva Pharmaceutical Industries Ltd., Sponsored ADR | | | 115,681 |
| | | | | |
| | | | | 163,133,457 |
| | | | | |
| | REITs — 0.3% | | | |
| 290,904 | | Apartment Investment & Management Co., Class A | | | 4,290,834 |
| 889,730 | | Associated Estates Realty Corp. | | | 8,559,202 |
| 201,557 | | Developers Diversified Realty Corp. | | | 1,862,387 |
| 460,000 | | Equity Residential | | | 14,122,000 |
| 122,402 | | Simon Property Group, Inc. | | | 8,498,371 |
| | | | | |
| | | | | 37,332,794 |
| | | | | |
| | Thrifts & Mortgage Finance — 0.1% | | | |
| 4,794,025 | | Federal Home Loan Mortgage Corp.(g)(k) | | | 8,629,245 |
| | | | | |
| | Total Common Stocks (Identified Cost $448,488,257) | | | 356,599,555 |
| | | | | |
| Preferred Stocks — 1.5% | | | |
| Convertible Preferred Stocks — 1.1% | | | |
| | Automotive — 0.3% | | | |
| 1,458,359 | | Ford Motor Co. Capital Trust II, 6.500% | | | 43,925,773 |
| | | | | |
| | Capital Markets — 0.1% | | | |
| 183,851 | | Newell Financial Trust I, 5.250% | | | 6,503,729 |
| | | | | |
| | Commercial Banks — 0.0% | | | |
| 5,933 | | Wells Fargo & Co., Series L, Class A, 7.500% | | | 5,298,169 |
| | | | | |
| | Diversified Consumer Services — 0.0% |
| 6 | | Six Flags, Inc., 7.250%(g) | | | 3 |
| | | | | |
| | Diversified Financial Services — 0.2% |
| 16,622 | | Bank of America Corp., Series L, 7.250% | | | 14,128,700 |
| 2,144 | | CIT Group, Inc., 8.750% | | | 13,272 |
| 161,133 | | Sovereign Capital Trust IV, 4.375% | | | 4,874,273 |
| | | | | |
| | | | | 19,016,245 |
| | | | | |
| | Electric Utilities — 0.2% | | | |
| 380,577 | | AES Trust III, 6.750% | | | 16,769,174 |
| | | | | |
Shares | | Description | | Value (†) |
| | | | | |
| | Electric Utilities — continued | | | |
| 107,725 | | CMS Energy Trust I, 7.750%(b)(f) | | $ | 3,770,375 |
| | | | | |
| | | | | 20,539,549 |
| | | | | |
| | Machinery — 0.0% | | | |
| 171,240 | | United Rentals Trust I, 6.500% | | | 4,259,595 |
| | | | | |
| | Oil, Gas & Consumable Fuels — 0.1% |
| 52,020 | | Chesapeake Energy Corp., 4.500% | | | 4,333,266 |
| 158,777 | | El Paso Energy Capital Trust I, 4.750% | | | 5,309,106 |
| | | | | |
| | | | | 9,642,372 |
| | | | | |
| | REITs — 0.0% | | | |
| 42,700 | | FelCor Lodging Trust, Inc., Series A, 7.800% | | | 491,050 |
| | | | | |
| | Semiconductors & Semiconductor Equipment — 0.2% |
| 32,320 | | Lucent Technologies Capital Trust I, 7.750% | | | 24,724,800 |
| | | | | |
| | Total Convertible Preferred Stocks
(Identified Cost $149,943,789) | | | 134,401,285 |
| | | | | |
| Non-Convertible Preferred Stocks — 0.4% |
| | Diversified Financial Services — 0.2% |
| 35,000 | | Bank of America Corp., 6.375% | | | 628,250 |
| 250,146 | | CIT Group, Inc., 6.350% | | | 637,872 |
| 36,916 | | Preferred Blocker, Inc., 144A, 7.000% | | | 21,467,810 |
| | | | | |
| | | | | 22,733,932 |
| | | | | |
| | Electric Utilities — 0.0% | | | |
| 393 | | Entergy New Orleans, Inc., 4.750% | | | 28,357 |
| | | | | |
| | Thrifts & Mortgage Finance — 0.2% |
| 389,800 | | Countrywide Capital IV, 6.750% | | | 7,862,266 |
| 75,100 | | Federal Home Loan Mortgage Corp., 5.000%(g)(k) | | | 199,015 |
| 1,741,500 | | Federal Home Loan Mortgage Corp., 5.570%(g)(k) | | | 2,786,400 |
| 444,350 | | Federal Home Loan Mortgage Corp., 5.660%(g)(k) | | | 733,178 |
| 120,695 | | Federal Home Loan Mortgage Corp., 5.700%(g)(k) | | | 310,186 |
| 283,000 | | Federal Home Loan Mortgage Corp., 5.790%(g)(k) | | | 752,780 |
| 81,450 | | Federal Home Loan Mortgage Corp., 5.810%(g)(k) | | | 222,359 |
| 219,750 | | Federal Home Loan Mortgage Corp., 5.900%(g)(k) | | | 373,575 |
| 96,600 | | Federal Home Loan Mortgage Corp., 6.000%(g)(k) | | | 284,970 |
| 89,300 | | Federal Home Loan Mortgage Corp., 6.420%(g)(k) | | | 267,900 |
| 392,116 | | Federal Home Loan Mortgage Corp., 6.550%(g)(k) | | | 713,651 |
See accompanying notes to financial statements.
52
LOOMIS SAYLES STRATEGIC INCOME FUND — PORTFOLIOOF INVESTMENTS (continued)
Investments as of September 30, 2009
| | | | | | |
Shares | | Description | | Value (†) |
| | | | | | |
| | | Thrifts & Mortgage Finance — continued |
| | 3,856,103 | | Federal Home Loan Mortgage Corp., (fixed rate to 12/31/2012, variable rate thereafter), 8.375%(g)(k) | | $ | 6,979,546 |
| | 192,100 | | Federal National Mortgage Association, 4.750%(g)(k) | | | 489,855 |
| | 144,900 | | Federal National Mortgage Association, 5.125%(g)(k) | | | 385,434 |
| | 104,850 | | Federal National Mortgage Association, 5.375%(g)(k) | | | 297,774 |
| | 56,600 | | Federal National Mortgage Association, 5.810%(g)(k) | | | 157,914 |
| | 87,300 | | Federal National Mortgage Association, 6.750%(g)(k) | | | 137,061 |
| | 250,000 | | Federal National Mortgage Association, 8.250%(g)(k) | | | 395,000 |
| | 6,747,525 | | Federal National Mortgage Association, (fixed rate to 12/13/2010, variable rate thereafter), 8.250%(g)(k) | | | 10,863,515 |
| | | | | | |
| | | | | | 34,212,379 |
| | | | | | |
| | | Total Non-Convertible Preferred Stocks
(Identified Cost $304,384,624) | | | 56,974,668 |
| | | | | | |
| | | Total Preferred Stocks (Identified Cost $454,328,413) | | | 191,375,953 |
| | | | | | |
| | Closed-End Investment Companies — 0.2% |
| | 191,930 | | BlackRock Senior High Income Fund, Inc. | | | 658,320 |
| | 1,033,275 | | Dreyfus High Yield Strategies | | | 3,668,126 |
| | 88,955 | | DWS High Income Trust | | | 730,321 |
| | 860,000 | | Highland Credit Strategies Fund | | | 5,461,000 |
| | 110,211 | | Morgan Stanley Emerging Markets Debt Fund, Inc. | | | 1,054,719 |
| | 28,322 | | Van Kampen High Income Trust II | | | 391,693 |
| | 2,055,800 | | Western Asset High Income Opportunity Fund, Inc. | | | 11,964,756 |
| | 1,217,820 | | Western Asset Managed High Income Fund, Inc. | | | 7,355,633 |
| | | | | | |
| | | Total Closed-End Investment Companies
(Identified Cost $40,372,606) | | | 31,284,568 |
| | | | | | |
| | Exchange Traded Funds — 0.5% |
| | 292,043 | | iShares iBoxx $ High Yield Corporate Bond Fund | | | 25,217,913 |
| | 837,667 | | SPDR Barclays Capital High Yield Bond Fund | | | 32,241,803 |
| | | | | | |
| | | Total Exchange Traded Funds (Identified Cost $53,154,775) | | | 57,459,716 |
| | | | | | |
| | Warrants — 0.0% |
| | | Pharmaceuticals — 0.0% | | | |
| | 574,624 | | Valeant Pharmaceuticals International(f)(g)
(Identified Cost $0) | | | — |
| | | | | | |
Principal
Amount (‡) | | | | |
| | Short-Term Investments — 4.1% |
| $ | 84,269 | | Repurchase Agreement with State Street Corporation, dated 9/30/2009 at 0.000% to be repurchased at $84,269 on 10/01/2009, collateralized by $90,000 U.S. Treasury Bill, due 11/05/2009 valued at $89,996 including accrued interest (Note 2g of Notes to Financial Statements) | | | 84,269 |
| | | | | | | |
Principal
Amount (‡) | | Description | | Value (†) | |
| | | | | | | |
| $ | 514,789,236 | | Tri-Party Repurchase Agreement with Fixed Income Clearing Corporation, dated 9/30/2009 at 0.000% to be repurchased at $514,789,236 on 10/01/2009, collateralized by $36,475,000 Federal Home Loan Mortgage Corp. Discount Note, due 12/31/2009 valued at $36,456,763; $300,000,000 Federal Home Loan Bank, 1.620% due 12/30/2009 valued at $304,590,000; $100,000,000 Federal National Mortgage Association Discount Note, due 12/30/2009 valued at $100,000,000; $82,495,000 Federal National Mortgage Association, 3.875% due 12/10/2009 valued at $84,041,781 including accrued interest (Note 2g of Notes to Financial Statements) | | $ | 514,789,236 | |
| | | | | | | |
| | | Total Short-Term Investments
(Identified Cost $514,873,505) | | | 514,873,505 | |
| | | | | | | |
| | | | | | | |
| | | Total Investments — 99.0% (Identified Cost $12,829,100,798)(a) | | | 12,515,581,149 | |
| | | Other assets less liabilities — 1.0% | | | 129,768,801 | |
| | | | | | | |
| | | Net Assets — 100.0% | | $ | 12,645,349,950 | |
| | | | | | | |
| | | | | | | |
| | (‡) | | Principal amount stated in U.S. dollars unless otherwise noted. | | | | |
| | (†) | | See Note 2a of Notes to Financial Statements. | | | | |
| | (††) | | Amount shown represents units. One unit represents a principal amount of 100. | | | | |
| | (†††) | | Amount shown represents units. One unit represents a principal amount of 25. | | | | |
| | (a) | | Federal Tax Information: | | | | |
| | | At September 30, 2009, the net unrealized depreciation on investments based on a cost of $12,884,137,592 for federal income tax purposes was as follows: | | | | |
| | | Aggregate gross unrealized appreciation for all investments in which there is an excess of value over tax cost | | $ | 763,092,378 | |
| | | Aggregate gross unrealized depreciation for all investments in which there is an excess of tax cost over value | | | (1,131,648,821 | ) |
| | | | | | | |
| | | Net unrealized depreciation | | $ | (368,556,443 | ) |
| | | | | | | |
| | | | | | | |
| | (b) | | Illiquid security. At September 30, 2009, the value of these securities amounted to $402,363,807 or 3.2% of net assets. | |
| | (c) | | Variable rate security. Rate as of September 30, 2009 is disclosed. | |
| | (d) | | Step Bond: Coupon rate is a fixed rate for an initial period then resets at a specified date and rate. | |
| | (e) | | The issuer is in default with respect to interest and/or principal payments. Income is not being accrued. | |
| | (f) | | Fair valued security by the Fund’s investment adviser. At September 30, 2009 the value of these securities amounted to $7,899,660 or 0.1% of net assets. | |
| | (g) | | Non-income producing security. | |
| | (h) | | All or a portion of this security has not settled. Contract rates are not determined and do not take effect until settlement date. | |
| | (i) | | Variable rate security. Rate shown represents the weighted average rate at September 30, 2009. | |
| | (j) | | All or a portion of interest payment is paid-in-kind. | |
| | (k) | | Future dividend payments have been eliminated as the issuer has been placed in conservatorship. | |
| | (l) | | Issuer has filed for bankruptcy. | |
| | | | | | | |
See accompanying notes to financial statements.
53
LOOMIS SAYLES STRATEGIC INCOME FUND — PORTFOLIOOF INVESTMENTS (continued)
Investments as of September 30, 2009
| | | | |
| | | | |
| 144A | | Securities exempt from registration under Rule 144A of the Securities Act of 1933. These securities may be resold in transactions exempt from registration, normally to qualified institutional buyers. At September 30, 2009, the value of these securities amounted to $1,656,764,755 or 13.1% of net assets. |
| ADR | | An American Depositary Receipt is a certificate issued by a custodian bank representing the right to receive securities of the foreign issuer described. The values of ADRs are significantly influenced by trading on exchanges not located in the United States. |
| ABS | | Asset-Backed Securities |
| AMBAC | | American Municipal Bond Assurance Corp. |
| EMTN | | Euro Medium Term Note |
| FGIC | | Financial Guaranty Insurance Company |
| FSA | | Financial Security Assurance, Inc. |
| GMTN | | Global Medium Term Note |
| MBIA | | Municipal Bond Investors Assurance Corp. |
| MTN | | Medium Term Note |
| REITs | | Real Estate Investment Trusts |
| | |
| AUD | | Australian Dollar |
| BRL | | Brazilian Real |
| CAD | | Canadian Dollar |
| EUR | | Euro |
| GBP | | British Pound |
| IDR | | Indonesian Rupiah |
| ISK | | Icelandic Krona |
| KRW | | South Korean Won |
| MXN | | Mexican Peso |
| NOK | | Norwegian Krone |
| NZD | | New Zealand Dollar |
| SGD | | Singapore Dollar |
| THB | | Thai Baht |
Industry Summary at September 30, 2009 (Unaudited)
| | | |
| Treasuries | | 8.8 | % |
| Non-Captive Diversified | | 6.9 | |
| Banking | | 6.7 | |
| Wirelines | | 5.3 | |
| Technology | | 4.9 | |
| Sovereigns | | 4.8 | |
| Healthcare | | 4.1 | |
| Electric | | 3.5 | |
| Non-Captive Consumer | | 3.2 | |
| Automotive | | 3.1 | |
| Pharmaceuticals | | 2.9 | |
| Retailers | | 2.6 | |
| Oil Field Services | | 2.4 | |
| Paper | | 2.4 | |
| Media Cable | | 2.4 | |
| Pipelines | | 2.3 | |
| Supranational | | 2.1 | |
| Other Investments, less than 2% each | | 26.5 | |
| Short-Term Investments | | 4.1 | |
| | | |
| Total Investments | | 99.0 | |
| Other assets less liabilities | | 1.0 | |
| | | |
| Net Assets | | 100.0 | % |
| | | |
Currency Exposure at September 30, 2009 as a Percentage of Net Assets (Unaudited)
| | | |
| United States Dollar | | 74.9 | % |
| Canadian Dollar | | 8.3 | |
| New Zealand Dollar | | 2.6 | |
| Brazilian Real | | 2.2 | |
| Other, less than 2% each | | 11.0 | |
| | | |
| Total Investments | | 99.0 | |
| Other assets less liabilities | | 1.0 | |
| | | |
| Net Assets | | 100.0 | % |
| | | |
See accompanying notes to financial statements.
54
STATEMENTSOF ASSETSAND LIABILITIES
September 30, 2009
| | | | | | | | | | | |
| | | Core Plus Bond Fund | | | High Income Fund | | | International
Bond Fund |
| | | | | | | | | | | |
ASSETS | | | | | | | | | | | |
Investments at cost | | $ | 249,295,375 | | | $ | 170,197,311 | | | $ | 21,289,200 |
Net unrealized appreciation (depreciation) | | | 12,767,198 | | | | 14,618,236 | | | | 1,263,894 |
| | | | | | | | | | | |
Investments at value | | | 262,062,573 | | | | 184,815,547 | | | | 22,553,094 |
Cash | | | — | | | | 6,106 | | | | — |
Foreign currency at value (identified cost $0, $7,780, $874,981, $0 and $8,799,207) | | | — | | | | 8,213 | | | | 880,281 |
Receivable for Fund shares sold | | | 2,547,574 | | | | 744,136 | | | | 512,878 |
Receivable for securities sold | | | 8,288,869 | | | | — | | | | 1,721,244 |
Receivable from investment advisor (Note 6) | | | 21,692 | | | | 12,111 | | | | 13,486 |
Dividends and interest receivable | | | 2,914,685 | | | | 3,335,736 | | | | 318,442 |
Unrealized appreciation on forward foreign currency contracts (Note 2) | | | — | | | | 4,791 | | | | 65,206 |
Tax reclaims receivable | | | 10,183 | | | | — | | | | 439 |
Due from broker | | | — | | | | 5,028 | | | | — |
| | | | | | | | | | | |
TOTAL ASSETS | | | 275,845,576 | | | | 188,931,668 | | | | 26,065,070 |
| | | | | | | | | | | |
LIABILITIES | | | | | | | | | | | |
Payable for securities purchased | | | 15,890,070 | | | | 3,216,971 | | | | 1,517,811 |
Payable for Fund shares redeemed | | | 287,373 | | | | 402,363 | | | | — |
Unrealized depreciation on forward foreign currency contracts (Note 2) | | | — | | | | 17,552 | | | | — |
Dividends payable | | | — | | | | — | | | | — |
Foreign taxes payable (Note 2) | | | — | | | | 184 | | | | — |
Management fees payable (Note 6) | | | 86,710 | | | | 88,560 | | | | 10,657 |
Deferred Trustees’ fees (Note 6) | | | 212,359 | | | | 80,543 | | | | 16,727 |
Administrative fees payable (Note 6) | | | 9,956 | | | | 7,209 | | | | 868 |
Other accounts payable and accrued expenses | | | 77,406 | | | | 65,662 | | | | 36,074 |
| | | | | | | | | | | |
TOTAL LIABILITIES | | | 16,563,874 | | | | 3,879,044 | | | | 1,582,137 |
| | | | | | | | | | | |
NET ASSETS | | $ | 259,281,702 | | | $ | 185,052,624 | | | $ | 24,482,933 |
| | | | | | | | | | | |
NET ASSETS CONSIST OF: | | | | | | | | | | | |
Paid-in capital | | $ | 266,419,164 | | | $ | 200,080,520 | | | $ | 22,832,559 |
Undistributed net investment income (Distributions in excess of net investment income) | | | 1,162,716 | | | | 8,540 | | | | 180,612 |
Accumulated net realized gain (loss) on investments and foreign currency transactions | | | (21,067,376 | ) | | | (29,645,136 | ) | | | 126,236 |
Net unrealized appreciation (depreciation) on investments and foreign currency translations | | | 12,767,198 | | | | 14,608,700 | | | | 1,343,526 |
| | | | | | | | | | | |
NET ASSETS | | $ | 259,281,702 | | | $ | 185,052,624 | | | $ | 24,482,933 |
| | | | | | | | | | | |
COMPUTATION OF NET ASSET VALUE AND OFFERING PRICE: | | | | | | | | | | | |
Class A shares: | | | | | | | | | | | |
Net assets | | $ | 140,779,380 | | | $ | 59,944,387 | | | $ | 8,478,817 |
| | | | | | | | | | | |
Shares of beneficial interest | | | 11,820,281 | | | | 13,338,029 | | | | 782,082 |
| | | | | | | | | | | |
Net asset value and redemption price per share | | $ | 11.91 | | | $ | 4.49 | | | $ | 10.84 |
| | | | | | | | | | | |
Offering price per share (100/[100-maximum sales charge] of net asset value) (Note 1) | | $ | 12.47 | | | $ | 4.70 | | | $ | 11.35 |
| | | | | | | | | | | |
Class B shares: (redemption price per share is equal to net asset value less any applicable contingent deferred sales charge) (Note 1) | | | | | | | | | | | |
Net assets | | $ | 7,027,907 | | | $ | 1,568,722 | | | $ | — |
| | | | | | | | | | | |
Shares of beneficial interest | | | 588,239 | | | | 348,469 | | | | — |
| | | | | | | | | | | |
Net asset value and offering price per share | | $ | 11.95 | | | $ | 4.50 | | | $ | — |
| | | | | | | | | | | |
Class C shares: (redemption price per share is equal to net asset value less any applicable contingent deferred sales charge) (Note 1) | | | | | | | | | | | |
Net assets | | $ | 77,080,859 | | | $ | 17,826,637 | | | $ | 2,954,887 |
| | | | | | | | | | | |
Shares of beneficial interest | | | 6,467,699 | | | | 3,960,598 | | | | 273,099 |
| | | | | | | | | | | |
Net asset value and offering price per share | | $ | 11.92 | | | $ | 4.50 | | | $ | 10.82 |
| | | | | | | | | | | |
Class Y shares: | | | | | | | | | | | |
Net assets | | $ | 34,393,556 | | | $ | 105,712,878 | | | $ | 13,049,229 |
| | | | | | | | | | | |
Shares of beneficial interest | | | 2,872,316 | | | | 23,545,501 | | | | 1,205,606 |
| | | | | | | | | | | |
Net asset value, offering and redemption price per share | | $ | 11.97 | | | $ | 4.49 | | | $ | 10.82 |
| | | | | | | | | | | |
See accompanying notes to financial statements.
55
| | | | | | |
Limited Term Government
and Agency Fund | | | Strategic
Income Fund | |
| | | | | | |
| | | | | | |
| $ | 194,184,804 | | | $ | 12,829,100,798 | |
| | 7,110,958 | | | | (313,519,649 | ) |
| | | | | | | |
| | 201,295,762 | | | | 12,515,581,149 | |
| | — | | | | 28,329 | |
| | — | | | | 8,687,510 | |
| | 1,426,211 | | | | 37,774,087 | |
| | — | | | | 32,240,848 | |
| | 42,507 | | | | — | |
| | 902,024 | | | | 193,384,207 | |
| | — | | | | — | |
| | — | | | | 52,563 | |
| | — | | | | — | |
| | | | | | | |
| | 203,666,504 | | | | 12,787,748,693 | |
| | | | | | | |
| | | | | | |
| | 446,484 | | | | 101,755,128 | |
| | 635,633 | | | | 32,506,294 | |
| | — | | | | — | |
| | 185,399 | | | | — | |
| | — | | | | 339,912 | |
| | 80,898 | | | | 5,667,057 | |
| | 201,782 | | | | 489,310 | |
| | 7,903 | | | | 495,206 | |
| | 70,466 | | | | 1,145,836 | |
| | | | | | | |
| | 1,628,565 | | | | 142,398,743 | |
| | | | | | | |
| $ | 202,037,939 | | | $ | 12,645,349,950 | |
| | | | | | | |
| | | | | | |
| $ | 201,023,381 | | | $ | 13,614,150,354 | |
| | 40,900 | | | | (3,333,964 | ) |
| | (6,137,300 | ) | | | (653,562,540 | ) |
| | 7,110,958 | | | | (311,903,900 | ) |
| | | | | | | |
| $ | 202,037,939 | | | $ | 12,645,349,950 | |
| | | | | | | |
| | | | | | |
| | | | | | |
| $ | 118,619,186 | | | $ | 5,544,029,232 | |
| | | | | | | |
| | 10,224,857 | | | | 414,142,440 | |
| | | | | | | |
| $ | 11.60 | | | $ | 13.39 | |
| | | | | | | |
| $ | 11.95 | | | $ | 14.02 | |
| | | | | | | |
| | | | | | |
| $ | 4,441,690 | | | $ | 148,886,834 | |
| | | | | | | |
| | 383,269 | | | | 11,059,473 | |
| | | | | | | |
| $ | 11.59 | | | $ | 13.46 | |
| | | | | | | |
| | | | | | |
| $ | 50,972,980 | | | $ | 4,894,545,621 | |
| | | | | | | |
| | 4,390,564 | | | | 363,833,272 | |
| | | | | | | |
| $ | 11.61 | | | $ | 13.45 | |
| | | | | | | |
| | | | | | |
| $ | 28,004,083 | | | $ | 2,057,888,263 | |
| | | | | | | |
| | 2,406,845 | | | | 153,823,270 | |
| | | | | | | |
| $ | 11.64 | | | $ | 13.38 | |
| | | | | | | |
56
STATEMENTSOF OPERATIONS
For the Year Ended September 30, 2009
| | | | | | | | | | | | |
| | | Core Plus Bond Fund | | | High Income Fund | | | International
Bond Fund | |
| | | | | | | | | | | | |
INVESTMENT INCOME | | | | | | | | | | | | |
Dividends | | $ | 23,956 | | | $ | 162,845 | | | $ | — | |
Interest | | | 12,954,595 | | | | 8,858,726 | | | | 644,915 | |
Securities lending income (Note 2) | | | 3,323 | | | | 648 | | | | — | |
Less net foreign taxes withheld | | | (11,979 | ) | | | (13,149 | ) | | | — | |
| | | | | | | | | | | | |
| | | 12,969,895 | | | | 9,009,070 | | | | 644,915 | |
| | | | | | | | | | | | |
Expenses | | | | | | | | | | | | |
Management fees (Note 6) | | | 893,730 | | | | 558,817 | | | | 88,309 | |
Service fees - Class A (Note 6) | | | 310,233 | | | | 104,938 | | | | 8,741 | |
Service and distribution fees - Class B (Note 6) | | | 82,185 | | | | 15,269 | | | | — | |
Service and distribution fees - Class C (Note 6) | | | 518,988 | | | | 120,884 | | | | 9,880 | |
Trustees’ fees and expenses (Note 6) | | | 15,673 | | | | 13,412 | | | | 12,992 | |
Administrative fees (Note 6) | | | 101,792 | | | | 46,013 | | | | 38,718 | |
Custodian fees and expenses | | | 27,123 | | | | 47,382 | | | | 31,393 | |
Transfer agent fees and expenses - Class A (Note 6) | | | 177,912 | | | | 51,925 | | | | 2,294 | |
Transfer agent fees and expenses - Class B (Note 6) | | | 11,813 | | | | 1,923 | | | | — | |
Transfer agent fees and expenses - Class C (Note 6) | | | 74,201 | | | | 14,979 | | | | 720 | |
Transfer agent fees and expenses - Class Y (Note 6) | | | 20,708 | | | | 29,083 | | | | 477 | |
Audit and tax services fees | | | 46,320 | | | | 47,344 | | | | 48,521 | |
Legal fees | | | 6,893 | | | | 3,769 | | | | 481 | |
Shareholder reporting expenses | | | 46,257 | | | | 23,342 | | | | 4,683 | |
Registration fees | | | 66,531 | | | | 84,690 | | | | 47,360 | |
Miscellaneous expenses (Note 6) | | | (22,662 | ) | | | (3,631 | ) | | | 4,103 | |
| | | | | | | | | | | | |
Total expenses | | | 2,377,697 | | | | 1,160,139 | | | | 298,672 | |
Less fee reduction and/or expense reimbursement (Note 6) | | | (133,826 | ) | | | (80,823 | ) | | | (154,948 | ) |
| | | | | | | | | | | | |
Net expenses | | | 2,243,871 | | | | 1,079,316 | | | | 143,724 | |
| | | | | | | | | | | | |
Net investment income | | | 10,726,024 | | | | 7,929,754 | | | | 501,191 | |
| | | | | | | | | | | | |
NET REALIZED AND UNREALIZED GAIN (LOSS) ON INVESTMENTS
AND FOREIGN CURRENCY TRANSACTIONS | | | | | | | | | | | | |
Net realized gain (loss) on: | | | | | | | | | | | | |
Investments | | | 1,026,647 | | | | (2,866,469 | ) | | | 191,068 | |
Foreign currency transactions | | | 20,938 | | | | (76,605 | ) | | | 55,057 | |
Net change in unrealized appreciation (depreciation) on: | | | | | | | | | | | | |
Investments | | | 27,447,282 | | | | 23,851,440 | | | | 2,269,558 | |
Foreign currency translations | | | (71 | ) | | | (4,640 | ) | | | 126,700 | |
| | | | | | | | | | | | |
Net realized and unrealized gain on investments and foreign currency transactions | | | 28,494,796 | | | | 20,903,726 | | | | 2,642,383 | |
| | | | | | | | | | | | |
NET INCREASE IN NET ASSETS RESULTING FROM OPERATIONS | | $ | 39,220,820 | | | $ | 28,833,480 | | | $ | 3,143,574 | |
| | | | | | | | | | | | |
See accompanying notes to financial statements.
57
| | | | | | |
Limited Term Government
and Agency Fund | | | Strategic
Income Fund | |
| | | | | | |
| | | | | | |
| $ | — | | | $ | 33,603,271 | |
| | 7,756,448 | | | | 820,316,083 | |
| | 291 | | | | 107,283 | |
| | — | | | | (1,165,114 | ) |
| | | | | | | |
| | 7,756,739 | | | | 852,861,523 | |
| | | | | | | |
| | | | | | |
| | 970,393 | | | | 55,117,195 | |
| | 306,180 | | | | 11,730,368 | |
| | 46,672 | | | | 1,343,664 | |
| | 535,208 | | | | 38,124,862 | |
| | 15,612 | | | | 182,149 | |
| | 97,102 | | | | 4,879,685 | |
| | 25,247 | | | | 439,790 | |
| | 116,220 | | | | 4,738,807 | |
| | 4,499 | | | | 135,666 | |
| | 51,317 | | | | 3,829,237 | |
| | 8,372 | | | | 965,876 | |
| | 48,112 | | | | 61,539 | |
| | 6,622 | | | | 329,555 | |
| | 18,186 | | | | 1,099,511 | |
| | 92,483 | | | | 276,658 | |
| | (21,652 | ) | | | 331,949 | |
| | | | | | | |
| | 2,320,573 | | | | 123,586,511 | |
| | (171,005 | ) | | | — | |
| | | | | | | |
| | 2,149,568 | | | | 123,586,511 | |
| | | | | | | |
| | 5,607,171 | | | | 729,275,012 | |
| | | | | | | |
| | | | | | |
| | | | | | |
| | 2,955,994 | | | | (769,749,888 | ) |
| | — | | | | 4,460,417 | |
| | | | | | |
| | 8,456,894 | | | | 2,047,826,732 | |
| | — | | | | 8,819,350 | |
| | | | | | | |
| | 11,412,888 | | | | 1,291,356,611 | |
| | | | | | | |
| $ | 17,020,059 | | | $ | 2,020,631,623 | |
| | | | | | | |
58
STATEMENTSOF CHANGESIN NET ASSETS
| | | | | | | | | | | | | | | | | | | | | | | | |
| | | Core Plus Bond Fund | | | High Income Fund | | | International Bond Fund | |
| | | Year Ended
September 30,
2009 | | | Year Ended
September 30,
2008 | | | Year Ended
September 30,
2009 | | | Year Ended
September 30,
2008 | | | Year Ended
September 30,
2009 | | | Period Ended
September 30,
2008 (a) | |
| | | | | | | | | | | | | | | | | | | | | | | | |
FROM OPERATIONS: | | | | | | | | | | | | | | | | | | | | | | | | |
Net investment income | | $ | 10,726,024 | | | $ | 7,889,395 | | | $ | 7,929,754 | | | $ | 3,149,292 | | | $ | 501,191 | | | $ | 212,713 | |
Net realized gain (loss) on investments and foreign currency transactions | | | 1,047,585 | | | | 1,986,851 | | | | (2,943,074 | ) | | | 555,245 | | | | 246,125 | | | | (76,409 | ) |
Net change in unrealized appreciation (depreciation) on investments and foreign currency translations | | | 27,447,211 | | | | (13,469,246 | ) | | | 23,846,800 | | | | (10,381,633 | ) | | | 2,396,258 | | | | (1,052,732 | ) |
| | | | | | | | | | | | | | | | | | | | | | | | |
Net increase (decrease) in net assets resulting from operations | | | 39,220,820 | | | | (3,593,000 | ) | | | 28,833,480 | | | | (6,677,096 | ) | | | 3,143,574 | | | | (916,428 | ) |
| | | | | | | | | | | | | | | | | | | | | | | | |
FROM DISTRIBUTIONS TO SHAREHOLDERS: | | | | | | | | | | | | | | | | | | | | | | | | |
Net investment income | | | | | | | | | | | | | | | | | | | | | | | | |
Class A | | | (7,509,410 | ) | | | (6,214,311 | ) | | | (3,638,806 | ) | | | (2,552,225 | ) | | | (80,043 | ) | | | (20,706 | ) |
Class B | | | (436,844 | ) | | | (690,101 | ) | | | (124,178 | ) | | | (205,884 | ) | | | — | | | | — | |
Class C | | | (2,761,267 | ) | | | (812,461 | ) | | | (969,430 | ) | | | (471,489 | ) | | | (13,441 | ) | | | (5,728 | ) |
Class Y | | | (1,308,176 | ) | | | (1,030,857 | ) | | | (3,008,116 | ) | | | (54,867 | ) | | | (240,546 | ) | | | (217,001 | ) |
Net realized capital gain | | | | | | | | | | | | | | | | | | | | | | | | |
Class A | | | — | | | | — | | | | — | | | | — | | | | — | | | | — | |
Class B | | | — | | | | — | | | | — | | | | — | | | | — | | | | — | |
Class C | | | — | | | | — | | | | — | | | | — | | | | — | | | | — | |
Class Y | | | — | | | | — | | | | — | | | | — | | | | — | | | | — | |
| | | | | | | | | | | | | | | | | | | | | | | | |
Total distributions | | | (12,015,697 | ) | | | (8,747,730 | ) | | | (7,740,530 | ) | | | (3,284,465 | ) | | | (334,030 | ) | | | (243,435 | ) |
| | | | | | | | | | | | | | | | | | | | | | | | |
NET INCREASE (DECREASE) IN NET ASSETS FROM CAPITAL SHARE TRANSACTIONS (NOTE 10) | | | 58,618,493 | | | | (35,735,068 | ) | | | 109,311,312 | | | | 22,486,017 | | | | 9,056,042 | | | | 13,763,336 | |
| | | | | | | | | | | | | | | | | | | | | | | | |
Redemption fees | | | | | | | | | | | | | | | | | | | | | | | | |
Class A | | | — | | | | 10,657 | | | | 17,604 | | | | 12,665 | | | | — | | | | 259 | |
Class B | | | — | | | | 1,520 | | | | 697 | | | | 782 | | | | — | | | | — | |
Class C | | | — | | | | 1,489 | | | | 4,945 | | | | 3,312 | | | | — | | | | 275 | |
Class Y | | | — | | | | 1,652 | | | | 3,996 | | | | 1,025 | | | | — | | | | 13,340 | |
| | | | | | | | | | | | | | | | | | | | | | | | |
Total redemption fees | | | — | | | | 15,318 | | | | 27,242 | | | | 17,784 | | | | — | | | | 13,874 | |
| | | | | | | | | | | | | | | | | | | | | | | | |
Net increase (decrease) in net assets | | | 85,823,616 | | | | (48,060,480 | ) | | | 130,431,504 | | | | 12,542,240 | | | | 11,865,586 | | | | 12,617,347 | |
NET ASSETS | | | | | | | | | | | | | | | | | | | | | | | | |
Beginning of the year | | | 173,458,086 | | | | 221,518,566 | | | | 54,621,120 | | | | 42,078,880 | | | | 12,617,347 | | | | — | |
| | | | | | | | | | | | | | | | | | | | | | | | |
End of the year | | $ | 259,281,702 | | | $ | 173,458,086 | | | $ | 185,052,624 | | | $ | 54,621,120 | | | $ | 24,482,933 | | | $ | 12,617,347 | |
| | | | | | | | | | | | | | | | | | | | | | | | |
UNDISTRIBUTED NET INVESTMENT INCOME (DISTRIBUTIONS IN EXCESS OF NET INVESTMENT INCOME) | | $ | 1,162,716 | | | $ | 371,177 | | | $ | 8,540 | | | $ | (14,090 | ) | | $ | 180,612 | | | $ | (22,126 | ) |
| | | | | | | | | | | | | | | | | | | | | | | | |
| (a) | From commencement of operations on February 1, 2008 through September 30, 2008. |
See accompanying notes to financial statements.
59
| | | | | | | | | | | | | | |
| Limited Term Government and Agency Fund | | | Strategic Income Fund | |
Year Ended
September 30,
2009 | | | Year Ended
September 30,
2008 | | | Year Ended
September 30,
2009 | | | Year Ended
September 30,
2008 | |
| | | | | | | | | | | | | | |
| | | | | | | | | | | | | | |
| $ | 5,607,171 | | | $ | 4,755,700 | | | $ | 729,275,012 | | | $ | 754,292,599 | |
| | | |
| | 2,955,994 | | | | 498,940 | | | | (765,289,471 | ) | | | 183,690,261 | |
| | | |
| | 8,456,894 | | | | (407,128 | ) | | | 2,056,646,082 | | | | (2,817,298,752 | ) |
| | | | | | | | | | | | | | | |
| | | |
| | 17,020,059 | | | | 4,847,512 | | | | 2,020,631,623 | | | | (1,879,315,892 | ) |
| | | | | | | | | | | | | | | |
| | | |
| | | | | | | | | | | | | | |
| | | | | | | | | | | | | | |
| | (3,913,002 | ) | | | (4,474,145 | ) | | | (356,540,265 | ) | | | (448,782,373 | ) |
| | (112,841 | ) | | | (205,652 | ) | | | (9,240,752 | ) | | | (12,700,249 | ) |
| | (1,292,557 | ) | | | (262,151 | ) | | | (258,397,380 | ) | | | (272,297,986 | ) |
| | (471,487 | ) | | | (244,165 | ) | | | (89,955,755 | ) | | | (61,058,261 | ) |
| | | | | | | | | | | | | | |
| | — | | | | — | | | | (33,148,981 | ) | | | (5,233,811 | ) |
| | — | | | | — | | | | (1,003,570 | ) | | | (183,665 | ) |
| | — | | | | — | | | | (25,254,965 | ) | | | (3,481,864 | ) |
| | — | | | | — | | | | (5,262,204 | ) | | | (634,289 | ) |
| | | | | | | | | | | | | | | |
| | (5,789,887 | ) | | | (5,186,113 | ) | | | (778,803,872 | ) | | | (804,372,498 | ) |
| | | | | | | | | | | | | | | |
| | | |
| | 51,940,484 | | | | 14,420,990 | | | | 923,443,021 | | | | 2,697,961,138 | |
| | | | | | | | | | | | | | | |
| | | | | | | | | | | | | | |
| | — | | | | — | | | | — | | | | 209,238 | |
| | — | | | | — | | | | — | | | | 7,216 | |
| | — | | | | — | | | | — | | | | 140,777 | |
| | — | | | | — | | | | — | | | | 25,844 | |
| | | | | | | | | | | | | | | |
| | — | | | | — | | | | — | | | | 383,075 | |
| | | | | | | | | | | | | | | |
| | 63,170,656 | | | | 14,082,389 | | | | 2,165,270,772 | | | | 14,655,823 | |
| | | | | | | | | | | | | | |
| | 138,867,283 | | | | 124,784,894 | | | | 10,480,079,178 | | | | 10,465,423,355 | |
| | | | | | | | | | | | | | | |
| $ | 202,037,939 | | | $ | 138,867,283 | | | $ | 12,645,349,950 | | | $ | 10,480,079,178 | |
| | | | | | | | | | | | | | | |
| | | |
| $ | 40,900 | | | $ | (287,351 | ) | | $ | (3,333,964 | ) | | $ | 97,385,788 | |
| | | | | | | | | | | | | | | |
60
FINANCIAL HIGHLIGHTS
For a share outstanding throughout each period.
| | | | | | | | | | | | | | | | | | | | | | | | | |
| | | | | Income (Loss) from Investment Operations: | | | Less Distributions: | | | |
| | | | | | | |
| | | Net asset
value,
beginning
of
the period | | Net
investment
income (a) | | Net realized
and unrealized
gain (loss) | | | Total from
investment
operations | | | Dividends
from
net investment
income | | | Total
distributions | | | Redemption
fees (b)(c) |
| | | | | | | | | | | | | | | | | | | | | | | | | |
CORE PLUS BOND FUND | | | | | | | | | | | | | | | | | | | | | | | | | |
Class A | | | | | | | | | | | | | | | | | | | | | | | | | |
9/30/2009 | | $ | 10.54 | | $ | 0.59 | | $ | 1.44 | | | $ | 2.03 | | | $ | (0.66 | ) | | $ | (0.66 | ) | | $ | — |
9/30/2008 | | | 11.31 | | | 0.55 | | | (0.71 | ) | | | (0.16 | ) | | | (0.61 | ) | | | (0.61 | ) | | | 0.00 |
9/30/2007 | | | 11.23 | | | 0.50 | | | 0.14 | | | | 0.64 | | | | (0.56 | ) | | | (0.56 | ) | | | 0.00 |
9/30/2006 | | | 11.41 | | | 0.50 | | | (0.07 | ) | | | 0.43 | | | | (0.61 | ) | | | (0.61 | ) | | | 0.00 |
9/30/2005 | | | 11.69 | | | 0.46 | | | (0.18 | ) | | | 0.28 | | | | (0.56 | ) | | | (0.56 | ) | | | 0.00 |
Class B | | | | | | | | | | | | | | | | | | | | | | | | | |
9/30/2009 | | | 10.57 | | | 0.50 | | | 1.45 | | | | 1.95 | | | | (0.57 | ) | | | (0.57 | ) | | | — |
9/30/2008 | | | 11.31 | | | 0.44 | | | (0.67 | ) | | | (0.23 | ) | | | (0.51 | ) | | | (0.51 | ) | | | 0.00 |
9/30/2007 | | | 11.24 | | | 0.41 | | | 0.13 | | | | 0.54 | | | | (0.47 | ) | | | (0.47 | ) | | | 0.00 |
9/30/2006 | | | 11.41 | | | 0.41 | | | (0.05 | ) | | | 0.36 | | | | (0.53 | ) | | | (0.53 | ) | | | 0.00 |
9/30/2005 | | | 11.70 | | | 0.37 | | | (0.18 | ) | | | 0.19 | | | | (0.48 | ) | | | (0.48 | ) | | | 0.00 |
Class C | | | | | | | | | | | | | | | | | | | | | | | | | |
9/30/2009 | | | 10.55 | | | 0.51 | | | 1.44 | | | | 1.95 | | | | (0.58 | ) | | | (0.58 | ) | | | — |
9/30/2008 | | | 11.32 | | | 0.47 | | | (0.71 | ) | | | (0.24 | ) | | | (0.53 | ) | | | (0.53 | ) | | | 0.00 |
9/30/2007 | | | 11.25 | | | 0.41 | | | 0.13 | | | | 0.54 | | | | (0.47 | ) | | | (0.47 | ) | | | 0.00 |
9/30/2006 | | | 11.42 | | | 0.41 | | | (0.05 | ) | | | 0.36 | | | | (0.53 | ) | | | (0.53 | ) | | | 0.00 |
9/30/2005 | | | 11.71 | | | 0.37 | | | (0.18 | ) | | | 0.19 | | | | (0.48 | ) | | | (0.48 | ) | | | 0.00 |
Class Y | | | | | | | | | | | | | | | | | | | | | | | | | |
9/30/2009 | | | 10.60 | | | 0.62 | | | 1.44 | | | | 2.06 | | | | (0.69 | ) | | | (0.69 | ) | | | — |
9/30/2008 | | | 11.36 | | | 0.58 | | | (0.70 | ) | | | (0.12 | ) | | | (0.64 | ) | | | (0.64 | ) | | | 0.00 |
9/30/2007 | | | 11.29 | | | 0.54 | | | 0.13 | | | | 0.67 | | | | (0.60 | ) | | | (0.60 | ) | | | 0.00 |
9/30/2006 | | | 11.46 | | | 0.51 | | | (0.04 | ) | | | 0.47 | | | | (0.64 | ) | | | (0.64 | ) | | | 0.00 |
9/30/2005 | | | 11.74 | | | 0.49 | | | (0.18 | ) | | | 0.31 | | | | (0.59 | ) | | | (0.59 | ) | | | 0.00 |
| (a) | Per share net investment income has been calculated using the average shares outstanding during the period. |
| (b) | Amount rounds to less than $0.01 per share, if applicable. |
| (c) | Effective June 2, 2008, redemption fees were eliminated. |
| (d) | A sales charge for Class A shares and a contingent deferred sales charge for Class B and Class C shares are not reflected in total return calculations. Periods less than one year, if applicable, are not annualized. |
See accompanying notes to financial statements.
61
| | | | | | | | | | | | | | | | | |
| | | | | | | | Ratios to Average Net Assets: | | |
| | | | | | |
Net asset
value,
end of
the period | | Total
return
(%) (d)(e) | | | Net assets,
end of
the period
(000’s) | | Net
expenses
(%) (f)(g) | | | Gross
expenses
(%) (g) | | | Net investment
income (loss)
(%) (g) | | Portfolio
turnover
rate (%) |
| | | | | | | | | | | | | | | | | |
| | | | | | | | | | | | | | | | | |
| | | | | | | | | | | | | | | | | |
| $ | 11.91 | | 20.07 | | | $ | 140,779 | | 0.90 | | | 0.97 | | | 5.43 | | 102 |
| | 10.54 | | (1.61 | ) | | | 115,873 | | 0.93 | | | 1.04 | | | 4.86 | | 82 |
| | 11.31 | | 5.70 | | | | 105,780 | | 1.04 | | | 1.09 | | | 4.41 | | 69 |
| | 11.23 | | 4.03 | | | | 91,464 | | 1.05 | | | 1.08 | | | 4.46 | | 91 |
| | 11.41 | | 2.43 | | | | 105,111 | | 1.13 | | | 1.18 | | | 3.93 | | 64 |
| | | | | | | | | | | | | | | | | |
| | 11.95 | | 19.19 | | | | 7,028 | | 1.65 | | | 1.72 | | | 4.66 | | 102 |
| | 10.57 | | (2.21 | ) | | | 10,481 | | 1.70 | | | 1.80 | | | 3.92 | | 82 |
| | 11.31 | | 4.90 | | | | 87,101 | | 1.79 | | | 1.85 | | | 3.64 | | 69 |
| | 11.24 | | 3.26 | | | | 109,782 | | 1.80 | | | 1.83 | | | 3.72 | | 91 |
| | 11.41 | | 1.58 | | | | 132,221 | | 1.88 | | | 1.93 | | | 3.18 | | 64 |
| | | | | | | | | | | | | | | | | |
| | 11.92 | | 19.20 | | | | 77,081 | | 1.65 | | | 1.72 | | | 4.69 | | 102 |
| | 10.55 | | (2.32 | ) | | | 26,698 | | 1.68 | | | 1.79 | | | 4.17 | | 82 |
| | 11.32 | | 4.91 | | | | 12,690 | | 1.78 | | | 1.82 | | | 3.66 | | 69 |
| | 11.25 | | 3.26 | | | | 6,983 | | 1.80 | | | 1.82 | | | 3.63 | | 91 |
| | 11.42 | | 1.59 | | | | 6,065 | | 1.88 | | | 1.93 | | | 3.17 | | 64 |
| | | | | | | | | | | | | | | | | |
| | 11.97 | | 20.37 | | | | 34,394 | | 0.65 | | | 0.68 | | | 5.67 | | 102 |
| | 10.60 | | (1.36 | ) | | | 20,407 | | 0.68 | | | 0.75 | | | 5.14 | | 82 |
| | 11.36 | | 6.06 | | | | 15,946 | | 0.70 | | | 0.75 | | | 4.75 | | 69 |
| | 11.29 | | 4.28 | | | | 11,986 | | 0.80 | (h) | | 0.80 | (h) | | 4.58 | | 91 |
| | 11.46 | | 2.68 | | | | 9,060 | | 0.88 | | | 0.99 | | | 4.18 | | 64 |
| (e) | Had certain expenses not been reduced during the period, if applicable, total return would have been lower. |
| (f) | The investment adviser and/or administrator agreed to reimburse a portion of the Fund’s expenses and/or reduce its fee during the period. Without this reimbursement/fee reduction, if applicable, expenses would have been higher. |
| (g) | Computed on an annualized basis for periods less than one year, if applicable. |
| (h) | Includes fee/expense recovery of 0.06%. |
62
FINANCIAL HIGHLIGHTS (continued)
For a share outstanding throughout each period.
| | | | | | | | | | | | | | | | | | | | | | |
| | | | | Income (Loss) from Investment Operations: | | | Less Distributions: | |
| | | | | | |
| | | Net asset
value,
beginning
of
the period | | Net
investment
income (a) | | Net realized
and unrealized
gain (loss) | | | Total from
investment
operations | | | Dividends
from
net investment
income | | | Total
distributions | |
| | | | | | | | | | | | | | | | | | | | | | |
HIGH INCOME FUND | | | | | | | | | | | | | | | | | | | | | | |
Class A | | | | | | | | | | | | | | | | | | | | | | |
9/30/2009 | | $ | 4.24 | | $ | 0.34 | | $ | 0.24 | | | $ | 0.58 | | | $ | (0.33 | ) | | $ | (0.33 | ) |
9/30/2008 | | | 5.12 | | | 0.34 | | | (0.87 | ) | | | (0.53 | ) | | | (0.35 | ) | | | (0.35 | ) |
9/30/2007 | | | 5.09 | | | 0.33 | | | 0.08 | | | | 0.41 | | | | (0.38 | ) | | | (0.38 | ) |
9/30/2006 | | | 4.98 | | | 0.34 | | | 0.11 | | | | 0.45 | | | | (0.34 | ) | | | (0.34 | ) |
9/30/2005 | | | 4.82 | | | 0.33 | | | 0.16 | | | | 0.49 | | | | (0.33 | ) | | | (0.33 | ) |
Class B | | | | | | | | | | | | | | | | | | | | | | |
9/30/2009 | | | 4.25 | | | 0.31 | | | 0.25 | | | | 0.56 | | | | (0.31 | ) | | | (0.31 | ) |
9/30/2008 | | | 5.13 | | | 0.30 | | | (0.87 | ) | | | (0.57 | ) | | | (0.31 | ) | | | (0.31 | ) |
9/30/2007 | | | 5.10 | | | 0.29 | | | 0.07 | | | | 0.36 | | | | (0.33 | ) | | | (0.33 | ) |
9/30/2006 | | | 4.98 | | | 0.30 | | | 0.12 | | | | 0.42 | | | | (0.30 | ) | | | (0.30 | ) |
9/30/2005 | | | 4.83 | | | 0.29 | | | 0.15 | | | | 0.44 | | | | (0.29 | ) | | | (0.29 | ) |
Class C | | | | | | | | | | | | | | | | | | | | | | |
9/30/2009 | | | 4.24 | | | 0.31 | | | 0.26 | | | | 0.57 | | | | (0.31 | ) | | | (0.31 | ) |
9/30/2008 | | | 5.12 | | | 0.31 | | | (0.87 | ) | | | (0.56 | ) | | | (0.32 | ) | | | (0.32 | ) |
9/30/2007 | | | 5.09 | | | 0.29 | | | 0.07 | | | | 0.36 | | | | (0.33 | ) | | | (0.33 | ) |
9/30/2006 | | | 4.98 | | | 0.30 | | | 0.11 | | | | 0.41 | | | | (0.30 | ) | | | (0.30 | ) |
9/30/2005 | | | 4.83 | | | 0.29 | | | 0.15 | | | | 0.44 | | | | (0.29 | ) | | | (0.29 | ) |
Class Y | | | | | | | | | | | | | | | | | | | | | | |
9/30/2009 | | | 4.24 | | | 0.34 | | | 0.25 | | | | 0.59 | | | | (0.34 | ) | | | (0.34 | ) |
9/30/2008(h) | | | 4.87 | | | 0.22 | | | (0.65 | ) | | | (0.43 | ) | | | (0.21 | ) | | | (0.21 | ) |
INTERNATIONAL BOND FUND | | | | | | | | | | | | | | | | | | | | | | |
Class A | | | | | | | | | | | | | | | | | | | | | | |
9/30/2009 | | $ | 9.19 | | $ | 0.32 | | $ | 1.53 | | | $ | 1.85 | | | $ | (0.20 | ) | | $ | (0.20 | ) |
9/30/2008(j) | | | 10.00 | | | 0.17 | | | (0.79 | ) | | | (0.62 | ) | | | (0.19 | ) | | | (0.19 | ) |
Class C | | | | | | | | | | | | | | | | | | | | | | |
9/30/2009 | | | 9.18 | | | 0.24 | | | 1.53 | | | | 1.77 | | | | (0.13 | ) | | | (0.13 | ) |
9/30/2008(j) | | | 10.00 | | | 0.13 | | | (0.81 | ) | | | (0.68 | ) | | | (0.15 | ) | | | (0.15 | ) |
Class Y | | | | | | | | | | | | | | | | | | | | | | |
9/30/2009 | | | 9.18 | | | 0.33 | | | 1.53 | | | | 1.86 | | | | (0.22 | ) | | | (0.22 | ) |
9/30/2008(j) | | | 10.00 | | | 0.18 | | | (0.81 | ) | | | (0.63 | ) | | | (0.20 | ) | | | (0.20 | ) |
| (a) | Per share net investment income has been calculated using the average shares outstanding during the period. |
| (b) | Amount rounds to less than $0.01 per share, if applicable. |
| (c) | A sales charge for Class A shares and a contingent deferred sales charge for Class B and Class C shares are not reflected in total return calculations. Periods less than one year, if applicable, are not annualized. |
| (d) | Had certain expenses not been reduced during the period, if applicable, total returns would have been lower. |
See accompanying notes to financial statements.
63
| | | | | | | | | | | | | | | | | | | |
| | | | | | | | | | | Ratios to Average Net Assets: | | |
| | | | | | | |
Redemption
fees (b) | | | Net asset
value,
end of
the period | | Total
return
(%) (c)(d) | | | Net assets,
end of
the period
(000’s) | | Net
expenses
(%) (e)(f) | | Gross
expenses
(%) (f) | | Net investment
income
(loss) (%) (f) | | Portfolio
turnover
rate (%) |
| | | | | | | | | | | | | | | | | | | |
| | | | | | | | | | | | | | | | | | | |
| | | | | | | | | | | | | | | | | | | |
| | | | | | | | | | | | | | | | | | | |
| $ | 0.00 | (g) | | $ | 4.49 | | 15.97 | | | $ | 59,944 | | 1.15 | | 1.28 | | 8.82 | | 30 |
| | 0.00 | | | | 4.24 | | (10.98 | ) | | | 38,577 | | 1.15 | | 1.40 | | 7.01 | | 27 |
| | 0.00 | | | | 5.12 | | 8.10 | | | | 32,603 | | 1.18 | | 1.43 | | 6.40 | | 41 |
| | 0.00 | | | | 5.09 | | 9.39 | | | | 29,069 | | 1.31 | | 1.48 | | 6.70 | | 41 |
| | 0.00 | | | | 4.98 | | 10.34 | | | | 25,817 | | 1.58 | | 1.72 | | 6.60 | | 42 |
| | | | | | | | | | | | | | | | | | | |
| | 0.00 | (g) | | | 4.50 | | 15.06 | | | | 1,569 | | 1.90 | | 2.06 | | 8.32 | | 30 |
| | 0.00 | | | | 4.25 | | (11.64 | ) | | | 2,267 | | 1.90 | | 2.15 | | 6.15 | | 27 |
| | 0.00 | | | | 5.13 | | 7.21 | | | | 4,201 | | 1.94 | | 2.18 | | 5.63 | | 41 |
| | 0.00 | | | | 5.10 | | 8.79 | | | | 7,283 | | 2.08 | | 2.25 | | 6.00 | | 41 |
| | 0.00 | | | | 4.98 | | 9.29 | | | | 12,034 | | 2.33 | | 2.47 | | 5.85 | | 42 |
| | | | | | | | | | | | | | | | | | | |
| | 0.00 | (g) | | | 4.50 | | 15.37 | | | | 17,827 | | 1.90 | | 2.03 | | 8.09 | | 30 |
| | 0.00 | | | | 4.24 | | (11.62 | ) | | | 9,945 | | 1.90 | | 2.15 | | 6.32 | | 27 |
| | 0.00 | | | | 5.12 | | 7.22 | | | | 5,275 | | 1.93 | | 2.17 | | 5.63 | | 41 |
| | 0.00 | | | | 5.09 | | 8.58 | | | | 3,457 | | 2.07 | | 2.23 | | 5.96 | | 41 |
| | 0.00 | | | | 4.98 | | 9.29 | | | | 3,554 | | 2.33 | | 2.47 | | 5.82 | | 42 |
| | | | | | | | | | | | | | | | | | | |
| | 0.00 | (g) | | | 4.49 | | 16.29 | | | | 105,713 | | 0.90 | | 0.92 | | 8.32 | | 30 |
| | 0.01 | | | | 4.24 | | (9.10 | ) | | | 3,833 | | 0.90 | | 1.15 | | 8.03 | | 27 |
| | | | | | | | | | | | | | | | | | | |
| | | | | | | | | | | | | | | | | | | |
| $ | — | | | $ | 10.84 | | 20.41 | | | $ | 8,479 | | 1.10 | | 2.11 | | 3.29 | | 91 |
| | 0.00 | (i) | | | 9.19 | | (6.37 | ) | | | 1,953 | | 1.10 | | 2.95 | | 2.66 | | 60 |
| | | | | | | | | | | | | | | | | | | |
| | — | | | | 10.82 | | 19.58 | | | | 2,955 | | 1.85 | | 2.93 | | 2.56 | | 91 |
| | 0.01 | (i) | | | 9.18 | | (6.95 | ) | | | 683 | | 1.85 | | 3.70 | | 1.92 | | 60 |
| | | | | | | | | | | | | | | | | | | |
| | — | | | | 10.82 | | 20.73 | | | | 13,049 | | 0.85 | | 1.92 | | 3.53 | | 91 |
| | 0.01 | (i) | | | 9.18 | | (6.39 | ) | | | 9,981 | | 0.85 | | 2.48 | | 2.74 | | 60 |
| (e) | The investment adviser and/or administrator agreed to reimburse a portion of the Fund’s expenses and/or reduce its fee during the period. Without this reimbursement/fee reduction, if applicable, expenses would have been higher. |
| (f) | Computed on an annualized basis for periods less than one year, if applicable. |
| (g) | Effective June 1, 2009, redemption fees were eliminated. |
| (h) | From commencement of class operations on February 29, 2008 through September 30, 2008. |
| (i) | Effective June 2, 2008, redemption fees were eliminated. |
| (j) | For the period February 1, 2008 (inception) through September 30, 2008. |
64
FINANCIAL HIGHLIGHTS (continued)
For a share outstanding throughout each period.
| | | | | | | | | | | | | | | | | | | | | |
| | | | | Income (Loss) from Investment Operations: | | Less Distributions: | |
| | | | | | |
| | | Net asset
value,
beginning
of
the period | | Net
investment
income (a) | | Net realized
and unrealized
gain (loss) | | | Total from
investment
operations | | Dividends
from
net investment
income | | | Total
distributions | |
| | | | | | | | | | | | | | | | | | | | | |
LIMITED TERM GOVERNMENT AND AGENCY FUND | | | | | | | | | | | | | | | | | | | | | |
Class A | | | | | | | | | | | | | | | | | | | | | |
9/30/2009 | | $ | 10.98 | | $ | 0.35 | | $ | 0.63 | | | $ | 0.98 | | $ | (0.36 | ) | | $ | (0.36 | ) |
9/30/2008 | | | 11.00 | | | 0.45 | | | 0.02 | | | | 0.47 | | | (0.49 | ) | | | (0.49 | ) |
9/30/2007 | | | 11.00 | | | 0.45 | | | 0.03 | | | | 0.48 | | | (0.48 | ) | | | (0.48 | ) |
9/30/2006 | | | 11.09 | | | 0.39 | | | (0.05 | ) | | | 0.34 | | | (0.43 | ) | | | (0.43 | ) |
9/30/2005 | | | 11.30 | | | 0.28 | | | (0.16 | ) | | | 0.12 | | | (0.33 | ) | | | (0.33 | ) |
Class B | | | | | | | | | | | | | | | | | | | | | |
9/30/2009 | | | 10.97 | | | 0.26 | | | 0.63 | | | | 0.89 | | | (0.27 | ) | | | (0.27 | ) |
9/30/2008 | | | 10.99 | | | 0.36 | | | 0.02 | | | | 0.38 | | | (0.40 | ) | | | (0.40 | ) |
9/30/2007 | | | 10.98 | | | 0.37 | | | 0.03 | | | | 0.40 | | | (0.39 | ) | | | (0.39 | ) |
9/30/2006 | | | 11.07 | | | 0.31 | | | (0.05 | ) | | | 0.26 | | | (0.35 | ) | | | (0.35 | ) |
9/30/2005 | | | 11.28 | | | 0.20 | | | (0.17 | ) | | | 0.03 | | | (0.24 | ) | | | (0.24 | ) |
Class C | | | | | | | | | | | | | | | | | | | | | |
9/30/2009 | | | 10.99 | | | 0.26 | | | 0.63 | | | | 0.89 | | | (0.27 | ) | | | (0.27 | ) |
9/30/2008 | | | 11.00 | | | 0.36 | | | 0.03 | | | | 0.39 | | | (0.40 | ) | | | (0.40 | ) |
9/30/2007 | | | 10.99 | | | 0.37 | | | 0.03 | | | | 0.40 | | | (0.39 | ) | | | (0.39 | ) |
9/30/2006 | | | 11.08 | | | 0.31 | | | (0.05 | ) | | | 0.26 | | | (0.35 | ) | | | (0.35 | ) |
9/30/2005 | | | 11.30 | | | 0.20 | | | (0.18 | ) | | | 0.02 | | | (0.24 | ) | | | (0.24 | ) |
Class Y | | | | | | | | | | | | | | | | | | | | | |
9/30/2009 | | | 11.01 | | | 0.39 | | | 0.63 | | | | 1.02 | | | (0.39 | ) | | | (0.39 | ) |
9/30/2008 | | | 11.03 | | | 0.47 | | | 0.02 | | | | 0.49 | | | (0.51 | ) | | | (0.51 | ) |
9/30/2007 | | | 11.03 | | | 0.49 | | | 0.03 | | | | 0.52 | | | (0.52 | ) | | | (0.52 | ) |
9/30/2006 | | | 11.13 | | | 0.43 | | | (0.06 | ) | | | 0.37 | | | (0.47 | ) | | | (0.47 | ) |
9/30/2005 | | | 11.34 | | | 0.31 | | | (0.17 | ) | | | 0.14 | | | (0.35 | ) | | | (0.35 | ) |
| (a) | Per share net investment income has been calculated using the average shares outstanding during the period. |
| (b) | A sales charge for Class A shares and a contingent deferred sales charge for Class B and Class C shares are not reflected in total return calculations. Periods less than one year, if applicable, are not annualized. |
| (c) | Had certain expenses not been reduced during the period, if applicable, total returns would have been lower. |
See accompanying notes to financial statements.
65
| | | | | | | | | | | | | | | |
| | | | | | | Ratios to Average Net Assets: | | |
| | | | | | |
Net asset
value,
end of
the period | | Total
return
(%) (b)(c) | | Net assets,
end of
the period
(000’s) | | Net
expenses
(%) (d)(e) | | Gross
expenses
(%) (d) | | | Net investment
income (loss)
(%) (d) | | Portfolio
turnover
rate (%) |
| | | | | | | | | | | | | | | |
| | | | | | | | | | | | | | | |
| | | | | | | | | | | | | | | |
| $ | 11.60 | | 9.05 | | $ | 118,619 | | 0.90 | | 0.99 | | | 3.10 | | 77 |
| | 10.98 | | 4.29 | | | 105,047 | | 0.92 | | 1.07 | | | 4.04 | | 52 |
| | 11.00 | | 4.46 | | | 108,536 | | 0.99 | | 1.10 | | | 4.13 | | 45 |
| | 11.00 | | 3.20 | | | 114,180 | | 1.04 | | 1.09 | | | 3.57 | | 50 |
| | 11.09 | | 1.05 | | | 141,417 | | 1.24 | | 1.24 | | | 2.50 | | 93 |
| | | | | | | | | | | | | | | |
| | 11.59 | | 8.24 | | | 4,442 | | 1.65 | | 1.74 | | | 2.32 | | 77 |
| | 10.97 | | 3.52 | | | 4,532 | | 1.67 | | 1.82 | | | 3.29 | | 52 |
| | 10.99 | | 3.72 | | | 6,787 | | 1.74 | | 1.85 | | | 3.37 | | 45 |
| | 10.98 | | 2.36 | | | 9,952 | | 1.79 | | 1.84 | | | 2.79 | | 50 |
| | 11.07 | | 0.29 | | | 15,114 | | 1.99 | | 1.99 | | | 1.75 | | 93 |
| | | | | | | | | | | | | | | |
| | 11.61 | | 8.24 | | | 50,973 | | 1.65 | | 1.74 | | | 2.32 | | 77 |
| | 10.99 | | 3.62 | | | 22,711 | | 1.66 | | 1.83 | | | 3.29 | | 52 |
| | 11.00 | | 3.62 | | | 5,261 | | 1.74 | | 1.85 | | | 3.38 | | 45 |
| | 10.99 | | 2.46 | | | 4,230 | | 1.79 | | 1.84 | | | 2.81 | | 50 |
| | 11.08 | | 0.21 | | | 5,715 | | 1.99 | | 1.99 | | | 1.75 | | 93 |
| | | | | | | | | | | | | | | |
| | 11.64 | | 9.40 | | | 28,004 | | 0.65 | | 0.72 | | | 3.42 | | 77 |
| | 11.01 | | 4.55 | | | 6,577 | | 0.67 | | 0.72 | | | 4.28 | | 52 |
| | 11.03 | | 4.79 | | | 4,201 | | 0.71 | | 0.75 | | | 4.43 | | 45 |
| | 11.03 | | 3.43 | | | 2,461 | | 0.74 | | 0.74 | | | 3.89 | | 50 |
| | 11.13 | | 1.24 | | | 2,533 | | 1.02 | | 1.59 | (f) | | 2.77 | | 93 |
| (d) | Computed on an annualized basis for periods less than one year, if applicable. |
| (e) | The investment adviser and/or administrator agreed to reimburse a portion of the Fund’s expenses and/or reduce its fee during the period. Without this reimbursement/fee reduction, if applicable, expenses would have been higher. |
| (f) | Represents the total expenses prior to reduction of a portion of the class’s transfer agent expenses. |
66
FINANCIAL HIGHLIGHTS (continued)
For a share outstanding throughout each period.
| | | | | | | | | | | | | | | | | | | | | | | | | | |
| | | | | Income (Loss) from Investment Operations: | | | Less Distributions: | |
| | | | | | | |
| | | Net asset
value,
beginning
of
the period | | Net
investment
income (a) | | Net realized
and unrealized
gain (loss) | | | Total from
investment
operations | | | Dividends
from
net investment
income | | | Distributions
from net
realized
capital gains | | | Total
distributions | |
| | | | | | | | | | | | | | | | | | | | | | | | | | |
STRATEGIC INCOME FUND | | | | | | | | | | | | | | | | | | | | | | | | | | |
Class A | | | | | | | | | | | | | | | | | | | | | | | | | | |
9/30/2009 | | $ | 12.10 | | $ | 0.87 | | $ | 1.36 | | | $ | 2.23 | | | $ | (0.86 | ) | | $ | (0.08 | ) | | $ | (0.94 | ) |
9/30/2008 | | | 15.18 | | | 0.96 | | | (3.02 | ) | | | (2.06 | ) | | | (1.01 | ) | | | (0.01 | ) | | | (1.02 | ) |
9/30/2007 | | | 14.60 | | | 0.80 | | | 0.60 | | | | 1.40 | | | | (0.82 | ) | | | — | | | | (0.82 | ) |
9/30/2006 | | | 14.17 | | | 0.71 | | | 0.53 | | | | 1.24 | | | | (0.81 | ) | | | — | | | | (0.81 | ) |
9/30/2005 | | | 13.57 | | | 0.66 | | | 0.70 | | | | 1.36 | | | | (0.76 | ) | | | — | | | | (0.76 | ) |
Class B | | | | | | | | | | | | | | | | | | | | | | | | | | |
9/30/2009 | | | 12.16 | | | 0.79 | | | 1.36 | | | | 2.15 | | | | (0.77 | ) | | | (0.08 | ) | | | (0.85 | ) |
9/30/2008 | | | 15.25 | | | 0.85 | | | (3.04 | ) | | | (2.19 | ) | | | (0.89 | ) | | | (0.01 | ) | | | (0.90 | ) |
9/30/2007 | | | 14.66 | | | 0.69 | | | 0.60 | | | | 1.29 | | | | (0.70 | ) | | | — | | | | (0.70 | ) |
9/30/2006 | | | 14.22 | | | 0.61 | | | 0.52 | | | | 1.13 | | | | (0.69 | ) | | | — | | | | (0.69 | ) |
9/30/2005 | | | 13.60 | | | 0.56 | | | 0.71 | | | | 1.27 | | | | (0.65 | ) | | | — | | | | (0.65 | ) |
Class C | | | | | | | | | | | | | | | | | | | | | | | | | | |
9/30/2009 | | | 12.15 | | | 0.79 | | | 1.37 | | | | 2.16 | | | | (0.78 | ) | | | (0.08 | ) | | | (0.86 | ) |
9/30/2008 | | | 15.24 | | | 0.85 | | | (3.03 | ) | | | (2.18 | ) | | | (0.90 | ) | | | (0.01 | ) | | | (0.91 | ) |
9/30/2007 | | | 14.65 | | | 0.69 | | | 0.60 | | | | 1.29 | | | | (0.70 | ) | | | — | | | | (0.70 | ) |
9/30/2006 | | | 14.22 | | | 0.61 | | | 0.51 | | | | 1.12 | | | | (0.69 | ) | | | — | | | | (0.69 | ) |
9/30/2005 | | | 13.60 | | | 0.55 | | | 0.72 | | | | 1.27 | | | | (0.65 | ) | | | — | | | | (0.65 | ) |
Class Y | | | | | | | | | | | | | | | | | | | | | | | | | | |
9/30/2009 | | | 12.09 | | | 0.90 | | | 1.36 | | | | 2.26 | | | | (0.89 | ) | | | (0.08 | ) | | | (0.97 | ) |
9/30/2008 | | | 15.17 | | | 1.00 | | | (3.03 | ) | | | (2.03 | ) | | | (1.04 | ) | | | (0.01 | ) | | | (1.05 | ) |
9/30/2007 | | | 14.59 | | | 0.85 | | | 0.59 | | | | 1.44 | | | | (0.86 | ) | | | — | | | | (0.86 | ) |
9/30/2006 | | | 14.17 | | | 0.76 | | | 0.51 | | | | 1.27 | | | | (0.85 | ) | | | — | | | | (0.85 | ) |
9/30/2005 | | | 13.57 | | | 0.70 | | | 0.70 | | | | 1.40 | | | | (0.80 | ) | | | — | | | | (0.80 | ) |
| (a) | Per share net investment income has been calculated using the average shares outstanding during the period. |
| (b) | Amount rounds to less than $0.01 per share, if applicable. |
| (c) | Effective June 2, 2008, redemption fees were eliminated. |
| (d) | A sales charge for Class A shares and a contingent deferred sales charge for Class B and Class C shares are not reflected in total return calculations. Periods less than one year, if applicable, are not annualized. |
See accompanying notes to financial statements.
67
| | | | | | | | | | | | | | | | | | |
| | | | | | | | | | Ratios to Average Net Assets: | | |
| | | | | | | |
Redemption
fees (b)(c) | | Net asset
value,
end of
the period | | Total
return
(%) (d)(e) | | | Net assets,
end of
the period
(000’s) | | Net
expenses
(%) (f)(g) | | Gross
expenses
(%) (f) | | Net investment
income
(%) (f) | | Portfolio
turnover
rate (%) |
| | | | | | | | | | | | | | | | | | |
| | | | | | | | | | | | | | | | | | |
| | | | | | | | | | | | | | | | | | |
| $ | — | | $ | 13.39 | | 20.56 | | | $ | 5,544,029 | | 0.99 | | 0.99 | | 7.74 | | 39 |
| | 0.00 | | | 12.10 | | (14.54 | ) | | | 5,551,066 | | 0.97 | | 0.98 | | 6.59 | | 24 |
| | 0.00 | | | 15.18 | | 9.90 | | | | 5,749,315 | | 1.00 | | 1.00 | | 5.39 | | 22 |
| | 0.00 | | | 14.60 | | 9.04 | | | | 2,782,887 | | 1.05 | | 1.05 | | 5.01 | | 21 |
| | 0.00 | | | 14.17 | | 10.20 | | | | 977,198 | | 1.18 | | 1.18 | | 4.71 | | 14 |
| | | | | | | | | | | | | | | | | | |
| | — | | | 13.46 | | 19.62 | | | | 148,887 | | 1.74 | | 1.74 | | 7.02 | | 39 |
| | 0.00 | | | 12.16 | | (15.19 | ) | | | 161,751 | | 1.72 | | 1.73 | | 5.78 | | 24 |
| | 0.00 | | | 15.25 | | 9.08 | | | | 233,418 | | 1.76 | | 1.76 | | 4.61 | | 22 |
| | 0.00 | | | 14.66 | | 8.22 | | | | 179,927 | | 1.79 | | 1.79 | | 4.26 | | 21 |
| | 0.00 | | | 14.22 | | 9.46 | | | | 144,081 | | 1.93 | | 1.93 | | 3.98 | | 14 |
| | | | | | | | | | | | | | | | | | |
| | — | | | 13.45 | | 19.66 | | | | 4,894,546 | | 1.74 | | 1.74 | | 6.95 | | 39 |
| | 0.00 | | | 12.15 | | (15.19 | ) | | | 3,984,204 | | 1.72 | | 1.73 | | 5.85 | | 24 |
| | 0.00 | | | 15.24 | | 9.08 | | | | 3,843,823 | | 1.75 | | 1.75 | | 4.63 | | 22 |
| | 0.00 | | | 14.65 | | 8.14 | | | | 1,812,278 | | 1.79 | | 1.79 | | 4.24 | | 21 |
| | 0.00 | | | 14.22 | | 9.45 | | | | 765,200 | | 1.93 | | 1.93 | | 3.93 | | 14 |
| | | | | | | | | | | | | | | | | | |
| | — | | | 13.38 | | 20.91 | | | | 2,057,888 | | 0.72 | | 0.72 | | 7.76 | | 39 |
| | 0.00 | | | 12.09 | | (14.34 | ) | | | 783,058 | | 0.72 | | 0.72 | | 6.88 | | 24 |
| | 0.00 | | | 15.17 | | 10.22 | | | | 638,868 | | 0.74 | | 0.74 | | 5.67 | | 22 |
| | 0.00 | | | 14.59 | | 9.28 | | | | 271,065 | | 0.78 | | 0.78 | | 5.30 | | 21 |
| | 0.00 | | | 14.17 | | 10.51 | | | | 50,369 | | 0.91 | | 0.91 | | 4.98 | | 14 |
| (e) | Had certain expenses not been reduced during the period, if applicable, total returns would have been lower. |
| (f) | Computed on an annualized basis for periods less than one year, if applicable. |
| (g) | The investment adviser and/or administrator agreed to reimburse a portion of the Fund’s expenses and/or reduce its fee during the period. Without this reimbursement/fee reduction, if applicable, expenses would have been higher. |
68
NOTESTO FINANCIAL STATEMENTS
September 30, 2009
1. Organization. Natixis Funds Trust I and Loomis Sayles Funds II (the “Trusts” and each a “Trust”) are each organized as a Massachusetts business trust. Each Trust is registered under the Investment Company Act of 1940, as amended (“1940 Act”), as an open-end management investment company. Each Declaration of Trust permits the Board of Trustees to authorize the issuance of an unlimited number of shares of the Trust in multiple series. The financial statements for certain funds of the Trust are presented in separate reports. The following funds (individually, a “Fund” and collectively, the “Funds”) are included in this report:
Natixis Funds Trust I:
Loomis Sayles Core Plus Bond Fund (the “Core Plus Bond Fund”)
Loomis Sayles Funds II:
Loomis Sayles High Income Fund (the “High Income Fund”)
Loomis Sayles International Bond Fund (the “International Bond Fund”)
Loomis Sayles Limited Term Government and Agency Fund (the “Limited Term Government and Agency Fund”)
Loomis Sayles Strategic Income Fund (the “Strategic Income Fund”)
The Funds each offer Class A, Class C and Class Y shares. Effective October 12, 2007, Class B shares are no longer offered. Existing Class B shareholders may continue to reinvest dividends into Class B shares and exchange their Class B shares for Class B shares of other Natixis Funds subject to existing exchange privileges as described in the Prospectus.
Class A shares of all Funds except Limited Term Government and Agency Fund are sold with a maximum front-end sales charge of 4.50%. Class A shares of Limited Term Government and Agency Fund are sold with a maximum front-end sales charge of 3.00%. Class B shares do not pay a front-end sales charge, but pay higher Rule 12b-1 fees than Class A shares for eight years (at which point they automatically convert to Class A shares), and are subject to a contingent deferred sales charge (“CDSC”) if those shares are redeemed within six years of purchase. Class C shares do not pay a front-end sales charge, do not convert to any other Class of shares and pay higher Rule 12b-1 fees than Class A shares and may be subject to a CDSC of 1.00% if those shares are redeemed within one year of acquisition except for reinvested distributions. Class Y shares do not pay a front-end sales charge, a CDSC or Rule 12b-1 fees. Class Y shares are generally intended for institutional investors with a minimum initial investment of $100,000, though some categories of investors are excepted from the minimum investment amount as outlined in the Fund’s Prospectus.
Most expenses of the Trusts can be directly attributed to a Fund. Expenses which cannot be directly attributed to a Fund are generally apportioned based on the relative net assets of each of the Funds in the Trusts. Expenses of a Fund are borne pro rata by the holders of each class of shares, except that each class bears expenses unique to that class (including the Rule 12b-1 service and distribution fees and transfer agent fees applicable to such class). In addition, each class votes as a class only with respect to its own Rule 12b-1 Plan. Shares of each class would receive their pro rata share of the net assets of a Fund if the Fund were liquidated. The Trustees approve separate dividends from net investment income on each class of shares.
2. Significant Accounting Policies. The following is a summary of significant accounting policies consistently followed by each Fund in the preparation of its financial statements. The Funds’ financial statements are prepared in accordance with accounting principles generally accepted in the United States of America which require the use of management estimates that affect the reported amounts and disclosures in the financial statements. Actual results could differ from those estimates. Management has evaluated the events and transactions that have occurred through November 23, 2009, the date the financial statements were issued, and noted no items requiring recognition in the financial statements or additional disclosure in the Notes to Financial Statements.
a. Valuation. Debt securities (other than short-term obligations purchased with an original or remaining maturity of sixty days or less) are generally valued on the basis of evaluated bids furnished to the Funds by a pricing service recommended by the investment adviser and approved by the Board of Trustees, which service determines valuations for normal, institutional-size trading units of such securities using market information, transactions for comparable securities and various relationships between securities which are generally recognized by institutional traders. Equity securities, including closed-end investment companies and exchange-traded funds, for which market quotations are readily available are valued at market value, as reported by pricing services recommended by the investment adviser and approved by the Board of Trustees. Such pricing services generally use the security’s last sale price on the exchange or market where the security is primarily traded or, if there is no reported sale during the day, the closing bid price. Securities traded on the NASDAQ Global Select Market, NASDAQ Global Market and NASDAQ Capital Market are valued at the NASDAQ Official Closing Price (“NOCP”), or if lacking a NOCP, at the most recent bid quotation on the applicable NASDAQ market. Broker-dealer bid quotations may also be used to value debt and equity securities where a pricing service does not price a security or where a pricing service does not provide a reliable price for the security. In instances where broker-dealer bid quotations are not available, certain securities held by the Funds may be valued on the basis of a price provided by a principal market maker. Forward foreign currency contracts are valued using interpolated prices determined from information provided by an independent pricing service. Short-term obligations purchased with an original or remaining maturity of sixty days or less are valued at amortized cost, which approximates market value. Securities for which market quotations are not readily available are valued at fair value as determined in good faith by the Funds’ investment adviser using consistently applied procedures under the general supervision of the Board of Trustees. Investments in other open-end investment companies are valued at their net asset value each day.
Certain Funds may hold securities traded in foreign markets. Foreign securities are valued at the market price in the foreign market. However, if events occurring after the close of the foreign market (but before the close of regular trading on the New York Stock Exchange) are believed to materially affect the value of those securities, such securities
69
NOTESTO FINANCIAL STATEMENTS (continued)
September 30, 2009
are fair valued pursuant to procedures approved by the Board of Trustees. When fair valuing securities, the Funds may, among other things, use modeling tools or other processes that may take into account factors such as securities market activity and/or significant events that occur after the close of the foreign market and before the Funds calculate their net asset values.
b. Security Transactions and Related Investment Income. Security transactions are accounted for on trade date. Dividend income is recorded on ex-dividend date, or in the case of certain foreign securities, as soon as a Fund is notified, and interest income is recorded on an accrual basis. Interest income is increased by the accretion of discount and decreased by the amortization of premium. Periodic principal adjustments for inflation-protected securities are recorded to interest income. Negative principal adjustments (in the event of deflation) are recorded as reductions of interest income to the extent of interest income earned. The amount by which negative principal adjustments exceed interest income earned or positive principal adjustments on a cumulative basis is recorded as an increase to the cost basis of the security. Distributions received from investments in securities that represent a return of capital or capital gain are recorded as a reduction of cost of investments or as a realized gain, respectively. The calendar year-end amounts of ordinary income, capital gains, and return of capital included in distributions received from the Funds’ investments in real estate investment trusts (“REITs”) are reported to the Funds after the end of the fiscal year; accordingly, the Funds estimate these amounts for accounting purposes until the characterization of REIT distributions is reported to the Funds after the end of the fiscal year. Estimates are based on the most recent REIT distribution information available. Investment income is recorded net of foreign taxes withheld when applicable. In determining net gain or loss on securities sold, the cost of securities has been determined on an identified cost basis. Investment income, non-class specific expenses and realized and unrealized gains and losses are allocated on a pro rata basis to each class based on the relative net assets of each class to the total net assets of the Fund.
c. Foreign Currency Translation. The books and records of the Funds are maintained in U.S. dollars. The value of securities, currencies and other assets and liabilities denominated in currencies other than U.S. dollars are translated into U.S. dollars based upon foreign exchange rates prevailing at the end of the period. Purchases and sales of investment securities, income and expenses are translated on the respective dates of such transactions.
Since the values of investment securities are presented at the foreign exchange rates prevailing at the end of the period, it is not practical to isolate that portion of the results of operations arising from changes in exchange rates from fluctuations which arise due to changes in market prices of investment securities. Such changes are included with the net realized and unrealized gain or loss on investments.
Net realized foreign exchange gains or losses arise from sales of foreign currency, currency gains or losses realized between the trade and settlement dates on securities transactions, and the difference between the amounts of dividends, interest and foreign withholding taxes recorded on the Funds’ books and the U.S. dollar equivalent of the amounts actually received or paid. Net unrealized foreign exchange gains and losses arise from changes in the value of assets and liabilities, other than investment securities, at the end of the fiscal period, resulting from changes in exchange rates.
Each Fund may use foreign currency exchange contracts to facilitate transactions in foreign-denominated investments. Losses may arise from changes in the value of the foreign currency or if the counterparties do not perform under the contracts’ terms.
d. Forward Foreign Currency Contracts. Each Fund may enter into forward foreign currency contracts. Contracts to buy generally are used to acquire exposure to foreign currencies, while contracts to sell generally are used to hedge a Fund’s investments against currency fluctuation. Also, a contract to buy or sell can offset a previous contract. These contracts involve market risk in excess of the unrealized gain or loss reflected in the Funds’ Statements of Assets and Liabilities. The U.S. dollar value of the currencies a Fund has committed to buy or sell represents the aggregate exposure to each currency the Fund has acquired or hedged through currency contracts outstanding at period end. Gains or losses are recorded for financial statement purposes as unrealized until settlement date. Risks may arise upon entering into these contracts from the potential inability of counterparties to meet the terms of their contracts and from unanticipated movements in the value of a foreign currency relative to the U.S. dollar.
e. Federal and Foreign Income Taxes. Each Trust treats each Fund as a separate entity for federal income tax purposes. Each Fund intends to meet the requirements of the Internal Revenue Code applicable to regulated investment companies, and to distribute to its shareholders substantially all of its net investment income and any net realized capital gains at least annually. Management has performed an analysis of each Fund’s tax positions for the open tax years as of September 30, 2009 and has concluded that no provisions for income tax are required. The Funds’ federal tax returns for the prior three fiscal years, where applicable, remain subject to examination by the Internal Revenue Service. Management is not aware of any events that are reasonably possible to occur in the next twelve months that would result in the amounts of any unrecognized tax benefits significantly increasing or decreasing for the Funds. However, management’s conclusions regarding tax positions taken may be subject to review and adjustment at a later date based on factors including, but not limited to, new tax laws and accounting regulations and interpretations thereof.
A Fund may be subject to foreign taxes on income and gains on investments that are accrued based upon the Fund’s understanding of the tax rules and regulations that exist in the countries in which the Fund invests. Foreign governments may also impose taxes or other payments on investments with respect to foreign securities. Such taxes are accrued as applicable, and are reflected as foreign taxes payable on the Statements of Assets and Liabilities.
f. Dividends and Distributions to Shareholders. Dividends and distributions are recorded on ex-dividend date. The timing and characterization of certain income and capital gain distributions are determined annually in accordance with federal tax regulations, which may differ from accounting principles generally accepted in the United
70
NOTESTO FINANCIAL STATEMENTS (continued)
September 30, 2009
States of America. Permanent differences are primarily due to differing treatments for book and tax purposes for items such as foreign currency transactions, treasury inflation protected bond adjustments, premium amortization, defaulted bond adjustments, paydown gains and losses, distribution redesignations, expired capital loss carryforwards and return of capital and capital gains distributions from REITS. Permanent book and tax basis differences relating to shareholder distributions will result in reclassifications to capital accounts. Temporary differences between book and tax distributable earnings are primarily due to deferred Trustees’ fees, wash sales, premium amortization accruals, forward contracts mark to market, dividends payable, securities lending collateral gain/loss adjustment, REIT basis adjustments, discount accretion on inflation-protected securities and defaulted bond interest. Distributions from net investment income and short-term capital gains are considered to be distributed from ordinary income for tax purposes.
The tax characterization of distributions is determined on an annual basis. The tax character of distributions paid to shareholders during the years ended September 30, 2009 and 2008 was as follows:
| | | | | | | | | | | | | | | | | | |
| | | 2009 Distributions Paid From: | | 2008 Distributions Paid From: |
Fund | | Ordinary Income | | Long-Term Capital Gains | | Total | | Ordinary Income | | Long-Term Capital Gains | | Total |
Core Plus Bond Fund | | $ | 12,015,697 | | $ | — | | $ | 12,015,697 | | $ | 8,747,730 | | $ | — | | $ | 8,747,730 |
High Income Fund | | | 7,740,530 | | | — | | | 7,740,530 | | | 3,284,465 | | | — | | | 3,284,465 |
International Bond Fund | | | 334,030 | | | — | | | 334,030 | | | 243,435 | | | — | | | 243,435 |
Limited Term Government and Agency Fund | | | 5,789,887 | | | — | | | 5,789,887 | | | 5,186,113 | | | — | | | 5,186,113 |
Strategic Income Fund | | | 725,851,869 | | | 52,952,003 | | | 778,803,872 | | | 794,838,869 | | | 9,533,629 | | | 804,372,498 |
Differences between these amounts and those reported in the Statements of Changes in Net Assets, if any, are primarily attributable to different book and tax treatment for short-term capital gains.
As of September 30, 2009, the components of distributable earnings on a tax basis were as follows:
| | | | | | | | | | | | | | | | | | | | |
| | | Core Plus Bond Fund | | | High Income Fund | | | International Bond Fund | | | Limited Term Government and Agency Fund | | | Strategic Income Fund | |
Undistributed ordinary income | | $ | 1,375,074 | | | $ | 143,101 | | | $ | 416,092 | | | $ | 428,081 | | | $ | 3,010,647 | |
Undistributed long-term capital gains | | | — | | | | — | | | | — | | | | — | | | | — | |
| | | | | | | | | | | | | | | | | | | | |
Total undistributed earnings | | | 1,375,074 | | | | 143,101 | | | | 416,092 | | | | 428,081 | | | | 3,010,647 | |
| | | | | | | | | | | | | | | | | | | | |
Capital loss carryforward: | | | | | | | | | | | | | | | | | | | | |
Expires September 30, 2010 | | | (19,393,733 | ) | | | (26,826,634 | ) | | | — | | | | — | | | | — | |
Expires September 30, 2014 | | | (181,728 | ) | | | — | | | | — | | | | (1,425,832 | ) | | | — | |
Expires September 30, 2015 | | | — | | | | — | | | | — | | | | (4,336,746 | ) | | | — | |
Expires September 30, 2016 | | | — | | | | — | | | | — | | | | (100,316 | ) | | | — | |
Expires September 30, 2017 | | | — | | | | (33,112 | ) | | | — | | | | — | | | | (45,672,245 | ) |
| | | | | | | | | | | | | | | | | | | | |
Total capital loss carryforward | | | (19,575,461 | ) | | | (26,859,746 | ) | | | — | | | | (5,862,894 | ) | | | (45,672,245 | ) |
Deferred net capital losses (post-October 2008) | | | (129,243 | ) | | | (2,276,152 | ) | | | (45,041 | ) | | | (83,587 | ) | | | (552,853,501 | ) |
Unrealized appreciation (depreciation) | | | 11,404,526 | | | | 14,099,463 | | | | 1,297,602 | | | | 6,920,139 | | | | (366,940,694 | ) |
| | | | | | | | | | | | | | | | | | | | |
Total accumulated earnings (losses) | | | (6,925,104 | ) | | | (14,893,334 | ) | | | 1,668,653 | | | | 1,401,739 | | | | (962,455,793 | ) |
| | | | | | | | | | | | | | | | | | | | |
Capital loss carryforward utilized in the current year | | $ | 123,810 | | | $ | — | | | $ | — | | | $ | 2,626,828 | | | $ | — | |
| | | | | | | | | | | | | | | | | | | | |
The High Income Fund had carry forward losses expire in the current year in the amount of $43,374,722.
The Limited Term Government and Agency Fund had carry forward losses expire in the current year in the amount of $4,128,091.
g. Repurchase Agreements. It is each Fund’s policy that the market value of the collateral for repurchase agreements be at least equal to 100% of the repurchase price, including interest. Certain repurchase agreements are tri-party arrangements whereby the collateral is held in a segregated account for the benefit of the Fund and on behalf of the counterparty. It is each Fund’s policy, regarding tri-party arrangements, that the market value of the collateral be at least equal to 102% of the repurchase price, including interest. Repurchase agreements could involve certain risks in the event of default or insolvency of the counterparty including possible delays or restrictions upon a Fund’s ability to dispose of the underlying securities.
71
NOTESTO FINANCIAL STATEMENTS (continued)
September 30, 2009
h. Securities Lending. The Funds have entered into an agreement with State Street Bank and Trust Company (“State Street Bank”), as agent of the Funds, to lend securities to certain designated borrowers. The loans are collateralized with cash or securities in an amount equal to at least 105% or 102% of the market value (including accrued interest) of the loaned international or domestic securities, respectively, when the loan is initiated. Thereafter, the value of the collateral must remain at least 102% of the market value (including accrued interest) of loaned securities for U.S. equities and U.S. corporate debt; at least 105% of the market value (including accrued interest) of loaned securities for non-U.S. equities; and at least 100% of the market value (including accrued interest) of loaned securities for U.S. government securities, sovereign debt issued by non-U.S. governments and non-U.S. corporate debt. In the event that the market value of the collateral falls below the required percentages described above, the borrower will deliver additional collateral on the next business day. As with other extensions of credit, the Funds bear the risk of loss with respect to the investment of the collateral. The Funds invest cash collateral in short-term investments, a portion of the income from which is remitted to the borrowers and the remainder allocated between the Funds and State Street Bank as lending agent.
As of September 30, 2009, there were no securities on loan.
i. Delayed Delivery Commitments. Purchases of when-issued or delayed delivery instruments (identified in the Portfolio of Investments as TBA investments) may have a similar effect on a Fund’s net asset value as if the Fund had created a degree of leverage in its portfolio. The price of the underlying instruments and the date when they will be paid for are fixed at the time the transaction is negotiated. If a Fund enters into such a transaction, collateral consisting of liquid securities or cash and cash equivalents will be maintained in an amount at least equal to the commitment with the custodian and/ or broker. Losses may arise due to changes in the market value of the underlying instruments or if the counterparty does not perform under the contract.
j. Indemnifications. Under the Trusts’ organizational documents, their officers and Trustees are indemnified against certain liabilities arising out of the performance of their duties to the Funds. Additionally, in the normal course of business, the Funds enter into contracts with service providers that contain general indemnification clauses. The Funds’ maximum exposure under these arrangements is unknown as this would involve future claims that may be made against the Funds that have not yet occurred. However, based on experience, the Funds expect the risk of loss to be remote.
3. Fair Value Measurements. Effective October 1, 2008, the Funds adopted accounting standards related to fair value measurements and disclosures which establish a hierarchy for which various inputs are used in determining the value of each Fund’s assets or liabilities. These inputs are summarized in the three broad levels listed below:
| | • | | Level 1 – quoted prices in active markets for identical assets or liabilities; |
| | • | | Level 2 – prices determined using other significant inputs that are observable either directly, or indirectly through corroboration with observable market data (which could include quoted prices for similar assets or liabilities, interest rates, credit risk, etc.); |
| | • | | Level 3 – prices determined using significant unobservable inputs for situations where quoted prices or observable inputs are unavailable such as when there is little or no market activity for an asset or liability (unobservable inputs reflect each Fund’s own assumptions in determining the fair value of assets or liabilities and would be based on the best information available). |
The inputs or methodology used for valuing securities are not necessarily an indication of the risk associated with investing in those securities.
The following is a summary of the inputs used to value the Funds’ investments as of September 30, 2009, at value:
Core Plus Bond Fund
Asset Valuation Inputs
| | | | | | | | | | | | |
Description | | Level 1 | | Level 2 | | Level 3 | | Total |
| | | | | | | | | | | | |
Bonds and Notes (a) | | $ | — | | $ | 249,607,477 | | $ | — | | $ | 249,607,477 |
| | | | | | | | | | | | |
Preferred Stocks | | | | | | | | | | | | |
Diversified Financial Services | | | — | | | 309,375 | | | — | | | 309,375 |
Thrifts & Mortgage Finance | | | 401,920 | | | 6,762 | | | — | | | 408,682 |
| | | | | | | | | | | | |
Total Preferred Stocks | | | 401,920 | | | 316,137 | | | — | | | 718,057 |
| | | | | | | | | | | | |
Short-Term Investments | | | 11,737,039 | | | — | | | — | | | 11,737,039 |
| | | | | | | | | | | | |
Total | | $ | 12,138,959 | | $ | 249,923,614 | | $ | — | | $ | 262,062,573 |
| | | | | | | | | | | | |
(a) Major categories of the Fund’s investments are included in the Portfolio of Investments.
72
NOTESTO FINANCIAL STATEMENTS (continued)
September 30, 2009
High Income Fund
Asset Valuation Inputs
| | | | | | | | | | | | |
Description | | Level 1 | | Level 2 | | Level 3 | | Total |
| | | | | | | | | | | | |
Bonds and Notes | | | | | | | | | | | | |
ABS Car Loan | | $ | — | | $ | 181,185 | | $ | — | | $ | 181,185 |
ABS Credit Card | | | — | | | 96,345 | | | — | | | 96,345 |
ABS Home Equity | | | — | | | 2,430,426 | | | — | | | 2,430,426 |
Aerospace & Defense | | | — | | | 4,739,000 | | | — | | | 4,739,000 |
Airlines | | | — | | | 487,208 | | | — | | | 487,208 |
Automotive | | | — | | | 4,687,489 | | | — | | | 4,687,489 |
Banking | | | — | | | 501,343 | | | — | | | 501,343 |
Building Materials | | | — | | | 1,639,822 | | | — | | | 1,639,822 |
Chemicals | | | — | | | 475,594 | | | — | | | 475,594 |
Collateralized Mortgage Obligations | | | — | | | 1,205,691 | | | — | | | 1,205,691 |
Commercial Mortgage-Backed Securities | | | — | | | 5,350,282 | | | 389,767 | | | 5,740,049 |
Construction Machinery | | | — | | | 2,658,096 | | | — | | | 2,658,096 |
Consumer Products | | | — | | | 215,800 | | | — | | | 215,800 |
Diversified Manufacturing | | | — | | | 110,625 | | | — | | | 110,625 |
Electric | | | — | | | 8,130,035 | | | — | | | 8,130,035 |
Food & Beverage | | | — | | | 2,742,244 | | | — | | | 2,742,244 |
Government Guaranteed | | | — | | | 267,127 | | | — | | | 267,127 |
Government Owned - No Guarantee | | | — | | | 173,888 | | | — | | | 173,888 |
Healthcare | | | — | | | 11,769,047 | | | — | | | 11,769,047 |
Home Construction | | | — | | | 7,143,381 | | | — | | | 7,143,381 |
Independent Energy | | | — | | | 12,477,826 | | | — | | | 12,477,826 |
Industrial Other | | | — | | | 350,875 | | | — | | | 350,875 |
Lodging | | | — | | | 7,630,275 | | | — | | | 7,630,275 |
Media Cable | | | — | | | 3,882,635 | | | — | | | 3,882,635 |
Media Non-Cable | | | — | | | 2,154,113 | | | — | | | 2,154,113 |
Metals & Mining | | | — | | | 3,289,709 | | | — | | | 3,289,709 |
Non-Captive Consumer | | | — | | | 3,564,200 | | | 497,545 | | | 4,061,745 |
Non-Captive Diversified | | | — | | | 3,859,765 | | | 478,858 | | | 4,338,623 |
Oil Field Services | | | — | | | 2,371,735 | | | — | | | 2,371,735 |
Packaging | | | — | | | 175,438 | | | — | | | 175,438 |
Paper | | | — | | | 5,299,271 | | | — | | | 5,299,271 |
Pharmaceuticals | | | — | | | 9,235,508 | | | — | | | 9,235,508 |
Pipelines | | | — | | | 3,123,088 | | | — | | | 3,123,088 |
Refining | | | — | | | 818,388 | | | — | | | 818,388 |
REITs | | | — | | | 524,688 | | | — | | | 524,688 |
Retailers | | | — | | | 4,621,306 | | | — | | | 4,621,306 |
Sovereigns | | | — | | | 3,588,256 | | | — | | | 3,588,256 |
Supermarkets | | | — | | | 1,768,563 | | | — | | | 1,768,563 |
Supranational | | | — | | | 87,375 | | | 678,290 | | | 765,665 |
Technology | | | — | | | 14,224,306 | | | 1,096,560 | | | 15,320,866 |
Textile | | | — | | | 277,500 | | | — | | | 277,500 |
Transportation Services | | | — | | | 760,813 | | | — | | | 760,813 |
Treasuries | | | — | | | 3,440,277 | | | — | | | 3,440,277 |
Wireless | | | — | | | 6,916,375 | | | — | | | 6,916,375 |
Wirelines | | | — | | | 11,878,542 | | | 1,834,025 | | | 13,712,567 |
| | | | | | | | | | | | |
Total Bonds and Notes | | | — | | | 161,325,455 | | | 4,975,045 | | | 166,300,500 |
| | | | | | | | | | | | |
Bank Loans (a) | | | — | | | 2,706,147 | | | — | | | 2,706,147 |
| | | | | | | | | | | | |
73
NOTESTO FINANCIAL STATEMENTS (continued)
September 30, 2009
High Income Fund
Asset Valuation Inputs (continued)
| | | | | | | | | | | | |
Description | | Level 1 | | Level 2 | | Level 3 | | Total |
| | | | | | | | | | | | |
Preferred Stocks
Convertible Preferred Stocks (a) | | $ | — | | $ | 2,246,241 | | $ | — | | $ | 2,246,241 |
| | | | | | | | | | | | |
Non-Convertible Preferred Stocks | | | | | | | | | | | | |
Diversified Financial Services | | | — | | | 159,340 | | | — | | | 159,340 |
Thrifts & Mortgage Finance | | | 32,723 | | | 38,681 | | | — | | | 71,404 |
| | | | | | | | | | | | |
Total Non-Convertible Preferred Stocks | | | 32,723 | | | 198,021 | | | — | | | 230,744 |
| | | | | | | | | | | | |
Total Preferred Stocks | | | 32,723 | | | 2,444,262 | | | — | | | 2,476,985 |
| | | | | | | | | | | | |
Common Stocks (a) | | | 613,193 | | | — | | | — | | | 613,193 |
Closed-End Investment Companies | | | 49,360 | | | — | | | — | | | 49,360 |
Short-Term Investments | | | 12,669,362 | | | — | | | — | | | 12,669,362 |
| | | | | | | | | | | | |
Total Investments | | | 13,364,638 | | | 166,475,864 | | | 4,975,045 | | | 184,815,547 |
| | | | | | | | | | | | |
Forward Foreign Currency Contracts (unrealized appreciation) | | | — | | | 4,791 | | | — | | | 4,791 |
| | | | | | | | | | | | |
Total | | $ | 13,364,638 | | $ | 166,480,655 | | $ | 4,975,045 | | $ | 184,820,338 |
| | | | | | | | | | | | |
(a) Major categories of the Fund’s investments are included in the Portfolio of Investments.
Liability Valuation Inputs
| | | | | | | | | | | | | | |
Description | | Level 1 | | Level 2 | | | Level 3 | | Total | |
| | | | | | | | | | | | | | |
Forward Foreign Currency Contracts (unrealized depreciation) | | $ | — | | $ | (17,552 | ) | | $ | — | | $ | (17,552 | ) |
| | | | | | | | | | | | | | |
International Bond Fund
Asset Valuation Inputs
| | | | | | | | | | | | |
Description | | Level 1 | | Level 2 | | Level 3 | | Total |
| | | | | | | | | | | | |
Bonds and Notes | | | | | | | | | | | | |
Non-Convertible Bonds | | | | | | | | | | | | |
Australia | | $ | — | | $ | 301,423 | | $ | — | | $ | 301,423 |
Austria | | | — | | | 190,037 | | | — | | | 190,037 |
Belgium | | | — | | | 1,862,998 | | | — | | | 1,862,998 |
Brazil | | | — | | | 104,961 | | | — | | | 104,961 |
Canada | | | — | | | 1,066,847 | | | — | | | 1,066,847 |
Cayman Islands | | | — | | | 286,947 | | | — | | | 286,947 |
France | | | — | | | 790,285 | | | — | | | 790,285 |
Germany | | | — | | | 5,372,031 | | | — | | | 5,372,031 |
India | | | — | | | 174,074 | | | — | | | 174,074 |
Ireland | | | — | | | 270,956 | | | 98,563 | | | 369,519 |
Italy | | | — | | | 207,457 | | | — | | | 207,457 |
Japan | | | — | | | 2,052,028 | | | — | | | 2,052,028 |
Jersey | | | — | | | 76,530 | | | — | | | 76,530 |
Luxembourg | | | — | | | 121,023 | | | — | | | 121,023 |
Mexico | | | — | | | 286,636 | | | — | | | 286,636 |
Netherlands | | | — | | | 868,794 | | | — | | | 868,794 |
Norway | | | — | | | 815,874 | | | — | | | 815,874 |
Singapore | | | — | | | 196,434 | | | — | | | 196,434 |
South Africa | | | — | | | 104,629 | | | — | | | 104,629 |
74
NOTESTO FINANCIAL STATEMENTS (continued)
September 30, 2009
International Bond Fund
Asset Valuation Inputs (continued)
| | | | | | | | | | | | |
Description | | Level 1 | | Level 2 | | Level 3 | | Total |
| | | | | | | | | | | | |
Bonds and Notes (continued) | | | | | | | | | | | | |
Non-Convertible Bonds (continued) | | | | | | | | | | | | |
Spain | | $ | — | | $ | 146,016 | | $ | — | | $ | 146,016 |
Supranational | | | — | | | 1,134,977 | | | 67,829 | | | 1,202,806 |
Sweden | | | — | | | 542,881 | | | — | | | 542,881 |
United Arab Emirates | | | — | | | 184,505 | | | — | | | 184,505 |
United Kingdom | | | — | | | 1,385,386 | | | — | | | 1,385,386 |
United States | | | — | | | 2,019,303 | | | — | | | 2,019,303 |
| | | | | | | | | | | | |
Total Non-Convertible Bonds | | | — | | | 20,563,032 | | | 166,392 | | | 20,729,424 |
| | | | | | | | | | | | |
Convertible Bonds (a) | | | — | | | 40,875 | | | — | | | 40,875 |
| | | | | | | | | | | | |
Total Bonds and Notes | | | — | | | 20,603,907 | | | 166,392 | | | 20,770,299 |
| | | | | | | | | | | | |
Short-Term Investments | | | 1,782,795 | | | — | | | — | | | 1,782,795 |
| | | | | | | | | | | | |
Total Investments | | | 1,782,795 | | | 20,603,907 | | | 166,392 | | | 22,553,094 |
| | | | | | | | | | | | |
Forward Foreign Currency Contracts (unrealized appreciation) | | | — | | | 65,206 | | | — | | | 65,206 |
| | | | | | | | | | | | |
Total | | $ | 1,782,795 | | $ | 20,669,113 | | $ | 166,392 | | $ | 22,618,300 |
| | | | | | | | | | | | |
(a) Major categories of the Fund’s investments are included in the Portfolio of Investments.
Limited Term Government and Agency Fund
Asset Valuation Inputs
| | | | | | | | | | | | |
Description | | Level 1 | | Level 2 | | Level 3 | | Total |
| | | | | | | | | | | | |
| | | | | | | | | | | | |
Bonds and Notes | | | | | | | | | | | | |
ABS Car Loan | | $ | — | | $ | 4,315,613 | | $ | — | | $ | 4,315,613 |
ABS Credit Card | | | — | | | 6,866,462 | | | — | | | 6,866,462 |
ABS Home Equity | | | — | | | 1,821,069 | | | 538,786 | | | 2,359,855 |
ABS Other | | | — | | | 711,857 | | | — | | | 711,857 |
Collateralized Mortgage Obligations | | | — | | | 899,926 | | | — | | | 899,926 |
Commercial Mortgage-Backed Securities | | | — | | | 21,928,751 | | | — | | | 21,928,751 |
Government Guaranteed | | | — | | | 7,012,005 | | | — | | | 7,012,005 |
Government Owned — No Guarantee | | | — | | | 20,115,067 | | | — | | | 20,115,067 |
Government Sponsored | | | — | | | 16,770,397 | | | — | | | 16,770,397 |
Hybrid ARMs | | | — | | | 4,120,266 | | | — | | | 4,120,266 |
Mortgage Related | | | — | | | 85,629,376 | | | — | | | 85,629,376 |
Treasuries | | | — | �� | | 29,567,814 | | | — | | | 29,567,814 |
| | | | | | | | | | | | |
Total Bonds and Notes | | | — | | | 199,758,603 | | | 538,786 | | | 200,297,389 |
| | | | | | | | | | | | |
Short-Term Investments | | | 998,373 | | | — | | | — | | | 998,373 |
| | | | | | | | | | | | |
Total | | $ | 998,373 | | $ | 199,758,603 | | $ | 538,786 | | $ | 201,295,762 |
| | | | | | | | | | | | |
75
NOTESTO FINANCIAL STATEMENTS (continued)
September 30, 2009
Strategic Income Fund
Asset Valuation Inputs
| | | | | | | | | | | | |
Description | | Level 1 | | Level 2 | | Level 3 | | Total |
| | | | | | | | | | | | |
| | | | | | | | | | | | |
Bonds and Notes | | | | | | | | | | | | |
Non-Convertible Bonds | | | | | | | | | | | | |
ABS Credit Card | | $ | — | | $ | 83,481,495 | | $ | — | | $ | 83,481,495 |
Aerospace & Defense | | | — | | | 13,886,090 | | | — | | | 13,886,090 |
Airlines | | | — | | | 181,376,841 | | | 6,940,852 | | | 188,317,693 |
Automotive | | | — | | | 351,728,209 | | | 2,526,146 | | | 354,254,355 |
Banking | | | — | | | 839,818,564 | | | — | | | 839,818,564 |
Brokerage | | | — | | | 4,233,472 | | | — | | | 4,233,472 |
Building Materials | | | — | | | 124,666,576 | | | — | | | 124,666,576 |
Chemicals | | | — | | | 74,451,079 | | | 23,203,580 | | | 97,654,659 |
Construction Machinery | | | — | | | 110,515,164 | | | — | | | 110,515,164 |
Consumer Cyclical Services | | | — | | | 102,376,826 | | | — | | | 102,376,826 |
Consumer Products | | | — | | | 17,259,571 | | | — | | | 17,259,571 |
Distributors | | | — | | | 1,712,055 | | | — | | | 1,712,055 |
Diversified Manufacturing | | | — | | | 70,557,378 | | | 20,732,656 | | | 91,290,034 |
Electric | | | — | | | 430,386,678 | | | 4,708,532 | | | 435,095,210 |
Entertainment | | | — | | | 26,984,554 | | | — | | | 26,984,554 |
Financial Other | | | — | | | 20,368,400 | | | — | | | 20,368,400 |
Food & Beverage | | | — | | | 134,142,310 | | | — | | | 134,142,310 |
Government Owned - No Guarantee | | | — | | | 38,958,381 | | | — | | | 38,958,381 |
Government Sponsored | | | — | | | 49,644,479 | | | — | | | 49,644,479 |
Health Insurance | | | — | | | 76,663,414 | | | — | | | 76,663,414 |
Healthcare | | | — | | | 481,965,184 | | | — | | | 481,965,184 |
Home Construction | | | — | | | 232,235,895 | | | — | | | 232,235,895 |
Independent Energy | | | — | | | 161,022,174 | | | — | | | 161,022,174 |
Industrial Other | | | — | | | 18,541,438 | | | — | | | 18,541,438 |
Life Insurance | | | — | | | 26,197,543 | | | — | | | 26,197,543 |
Local Authorities | | | — | | | 92,012,261 | | | — | | | 92,012,261 |
Media Cable | | | — | | | 306,681,023 | | | — | | | 306,681,023 |
Media Non-Cable | | | — | | | 71,306,454 | | | — | | | 71,306,454 |
Metals & Mining | | | — | | | 103,771,461 | | | — | | | 103,771,461 |
Non-Captive Consumer | | | — | | | 401,735,654 | | | 4,129,285 | | | 405,864,939 |
Non-Captive Diversified | | | — | | | 836,657,070 | | | 4,017,538 | | | 840,674,608 |
Oil Field Services | | | — | | | 307,512,148 | | | — | | | 307,512,148 |
Packaging | | | — | | | 39,357,053 | | | — | | | 39,357,053 |
Packaging & Containers | | | — | | | 5,080,699 | | | — | | | 5,080,699 |
Paper | | | — | | | 308,471,186 | | | — | | | 308,471,186 |
Pharmaceuticals | | | — | | | 93,382,625 | | | — | | | 93,382,625 |
Pipelines | | | — | | | 288,998,722 | | | — | | | 288,998,722 |
Property & Casualty Insurance | | | — | | | 44,849,379 | | | — | | | 44,849,379 |
Railroads | | | — | | | 45,800,542 | | | — | | | 45,800,542 |
Refining | | | — | | | 1,192,250 | | | — | | | 1,192,250 |
REITs | | | — | | | 140,301,111 | | | — | | | 140,301,111 |
Restaurants | | | — | | | 902,678 | | | — | | | 902,678 |
Retailers | | | — | | | 329,250,378 | | | — | | | 329,250,378 |
Sovereigns | | | — | | | 612,033,388 | | | — | | | 612,033,388 |
Supermarkets | | | — | | | 97,345,868 | | | — | | | 97,345,868 |
Supranational | | | — | | | 236,970,552 | | | 30,455,245 | | | 267,425,797 |
Technology | | | — | | | 300,459,697 | | | 225,000 | | | 300,684,697 |
76
NOTESTO FINANCIAL STATEMENTS (continued)
September 30, 2009
Strategic Income Fund
Asset Valuation Inputs (continued)
| | | | | | | | | | | | |
Description | | Level 1 | | Level 2 | | Level 3 | | Total |
| | | | | | | | | | | | |
Bonds and Notes (continued) | | | | | | | | | | | | |
Non-Convertible Bonds (continued) | | | | | | | | | | | | |
Tobacco | | $ | — | | $ | 176,280,732 | | $ | — | | $ | 176,280,732 |
Transportation Services | | | — | | | 54,210,782 | | | — | | | 54,210,782 |
Treasuries | | | — | | | 1,114,695,982 | | | — | | | 1,114,695,982 |
Wireless | | | — | | | 207,441,738 | | | — | | | 207,441,738 |
Wirelines | | | — | | | 548,094,546 | | | — | | | 548,094,546 |
| | | | | | | | | | | | |
Total Non-Convertible Bonds | | | — | | | 10,437,969,749 | | | 96,938,834 | | | 10,534,908,583 |
| | | | | | | | | | | | |
Convertible Bonds | | | | | | | | | | | | |
Airlines | | | — | | | 2,957,500 | | | — | | | 2,957,500 |
Diversified Manufacturing | | | — | | | 2,596,000 | | | — | | | 2,596,000 |
Electric | | | — | | | 2,058,750 | | | — | | | 2,058,750 |
Healthcare | | | — | | | 38,378,537 | | | — | | | 38,378,537 |
Independent Energy | | | — | | | 3,459,850 | | | — | | | 3,459,850 |
Industrial Other | | | — | | | 30,088,500 | | | — | | | 30,088,500 |
Lodging | | | — | | | 27,946,537 | | | — | | | 27,946,537 |
Media Non-Cable | | | — | | | 4,763,735 | | | — | | | 4,763,735 |
Metals & Mining | | | — | | | 22,347,738 | | | — | | | 22,347,738 |
Non-Captive Diversified | | | — | | | 22,017,500 | | | — | | | 22,017,500 |
Oil Field Services | | | — | | | 1,764,088 | | | — | | | 1,764,088 |
Pharmaceuticals | | | — | | | 106,806,666 | | | — | | | 106,806,666 |
REITs | | | — | | | 10,858,309 | | | — | | | 10,858,309 |
Technology | | | — | | | 285,488,365 | | | 3,394,300 | | | 288,882,665 |
Textile | | | — | | | 84,460 | | | — | | | 84,460 |
Wireless | | | — | | | 14,117,179 | | | — | | | 14,117,179 |
Wirelines | | | — | | | 42,991,410 | | | 57,319,500 | | | 100,310,910 |
| | | | | | | | | | | | |
Total Convertible Bonds | | | — | | | 618,725,124 | | | 60,713,800 | | | 679,438,924 |
| | | | | | | | | | | | |
Municipals (a) | | | — | | | 63,887,694 | | | — | | | 63,887,694 |
| | | | | | | | | | | | |
Total Bonds and Notes | | | — | | | 11,120,582,567 | | | 157,652,634 | | | 11,278,235,201 |
| | | | | | | | | | | | |
Bank Loans (a) | | | — | | | 85,752,651 | | | — | | | 85,752,651 |
| | | | | | | | | | | | |
Common Stocks (a) | | | 356,599,555 | | | — | | | — | | | 356,599,555 |
| | | | | | | | | | | | |
Preferred Stocks | | | | | | | | | | | | |
Convertible Preferred Stocks | | | | | | | | | | | | |
Automotive | | | 43,925,773 | | | — | | | — | | | 43,925,773 |
Capital Markets | | | — | | | 6,503,729 | | | — | | | 6,503,729 |
Commercial Banks | | | 5,298,169 | | | — | | | — | | | 5,298,169 |
Diversified Consumer Services | | | 3 | | | — | | | — | | | 3 |
Diversified Financial Services | | | — | | | 19,016,245 | | | — | | | 19,016,245 |
Electric Utilities | | | — | | | 16,769,174 | | | 3,770,375 | | | 20,539,549 |
Machinery | | | — | | | 4,259,595 | | | — | | | 4,259,595 |
Oil, Gas & Consumable Fuels | | | 4,333,266 | | | 5,309,106 | | | — | | | 9,642,372 |
REITs | | | — | | | — | | | 491,050 | | | 491,050 |
Semiconductors & Semiconductor Equipment | | | — | | | 24,724,800 | | | — | | | 24,724,800 |
| | | | | | | | | | | | |
Total Convertible Preferred Stocks | | | 53,557,211 | | | 76,582,649 | | | 4,261,425 | | | 134,401,285 |
| | | | | | | | | | | | |
77
NOTESTO FINANCIAL STATEMENTS (continued)
September 30, 2009
Strategic Income Fund
Asset Valuation Inputs (continued)
| | | | | | | | | | | | |
Description | | Level 1 | | Level 2 | | Level 3 | | Total |
| | | | | | | | | | | | |
Preferred Stocks (continued) | | | | | | | | | | | | |
Non-Convertible Preferred Stocks | | | | | | | | | | | | |
Diversified Financial Services | | $ | 1,266,122 | | $ | 21,467,810 | | $ | — | | $ | 22,733,932 |
Electric Utilities | | | — | | | 28,357 | | | — | | | 28,357 |
Thrifts & Mortgage Finance | | | 18,347,060 | | | 15,865,319 | | | — | | | 34,212,379 |
| | | | | | | | | | | | |
Total Non-Convertible Preferred Stocks | | | 19,613,182 | | | 37,361,486 | | | — | �� | | 56,974,668 |
| | | | | | | | | | | | |
Total Preferred Stocks | | | 73,170,393 | | | 113,944,135 | | | 4,261,425 | | | 191,375,953 |
| | | | | | | | | | | | |
Closed-End Investment Companies | | | 31,284,568 | | | — | | | — | | | 31,284,568 |
Exchange Traded Funds | | | 57,459,716 | | | — | | | — | | | 57,459,716 |
Short-Term Investments | | | 514,873,505 | | | — | | | — | | | 514,873,505 |
| | | | | | | | | | | | |
Total | | $ | 1,033,387,737 | | $ | 11,320,279,353 | | $ | 161,914,059 | | $ | 12,515,581,149 |
| | | | | | | | | | | | |
(a) Major categories of the Fund’s investments are included in the Portfolio of Investments.
The following is a reconciliation of Level 3 investments for which significant unobservable inputs were used to determine fair value as of September 30, 2009:
Core Plus Bond Fund
Asset Valuation Inputs
| | | | | | | | | | | | | | | | | | | | | | | | |
Investments in
Securities | | Balance
as of September 30, 2008 | | Accrued Discounts (Premiums) | | Realized Gain
(Loss) | | | Change in Unrealized Appreciation (Depreciation) | | Net Purchases (Sales) | | | Net
Transfers in/(out)
Level 3 | | | Balance
as of September 30, 2009 |
| | | | | | | | | | | | | | | | | | | | | | | | |
| | | | | | | | | | | | | | | | | | | | | | | | |
Bonds and Notes | | | | | | | | | | | | | | | | | | | | | | | | |
ABS Home Equity | | $ | 2,940,801 | | $ | — | | $ | (1,585,344 | ) | | $ | 811,247 | | $ | (1,401,317 | ) | | $ | (765,387 | ) | | $ | — |
Financial Other | | | 1,406,692 | | | 730 | | | — | | | | 162,945 | | | — | | | | (1,570,367 | ) | | | — |
Technology | | | 522,800 | | | 786 | | | (1,029,551 | ) | | | 605,240 | | | (99,275 | ) | | | — | | | | — |
Wireless | | | 2,216,254 | | | 2,538 | | | — | | | | 612,329 | | | — | | | | (2,831,121 | ) | | | — |
| | | | | | | | | | | | | | | | | | | | | | | | |
Total | | $ | 7,086,547 | | $ | 4,054 | | $ | (2,614,895 | ) | | $ | 2,191,761 | | $ | (1,500,592 | ) | | $ | (5,166,875 | ) | | $ | — |
| | | | | | | | | | | | | | | | | | | | | | | | |
High Income Fund
Asset Valuation Inputs
| | | | | | | | | | | | | | | | | | | | | | | | | |
Investments in
Securities | | Balance
as of September 30, 2008 | | Accrued Discounts (Premiums) | | Realized Gain
(Loss) | | | Change in Unrealized Appreciation (Depreciation) | | | Net Purchases (Sales) | | | Net
Transfers in/(out)
Level 3 | | | Balance
as of September 30, 2009 |
| | | | | | | | | | | | | | | | | | | | | | | | | |
| | | | | | | | | | | | | | | | | | | | | | | | | |
| | | | | | | | | | | | | | | | | | | | | | | | | |
Bonds and Notes | | | | | | | | | | | | | | | | | | | | | | | | | |
Banking | | $ | 320,000 | | $ | 4,358 | | $ | (406,726 | ) | | $ | 118,618 | | | $ | (36,250 | ) | | $ | — | | | $ | — |
Chemicals | | | 254,600 | | | 1,994 | | | — | | | | (42,187 | ) | | | 261,187 | | | | (475,594 | ) | | | — |
Commercial Mortgage-Backed Securities | | | — | | | — | | | 44,500 | | | | 21,654 | | | | 323,613 | | | | — | | | | 389,767 |
Healthcare | | | 63,500 | | | 668 | | | — | | | | 37,624 | | | | (101,792 | ) | | | — | | | | — |
Industrial Other | | | 67,200 | | | — | | | — | | | | 44,800 | | | | — | | | | (112,000 | ) | | | — |
Media Non-Cable | | | 159,375 | | | 6,496 | | | (266,237 | ) | | | 180,741 | | | | (80,375 | ) | | | — | | | | — |
Non-Captive Consumer | | | 408,215 | | | 9,753 | | | — | | | | 79,577 | | | | — | | | | — | | | | 497,545 |
Non-Captive Diversified | | | — | | | 125 | | | — | | | | 7,244 | | | | 471,489 | | | | — | | | | 478,858 |
78
NOTESTO FINANCIAL STATEMENTS (continued)
September 30, 2009
High Income Fund
Asset Valuation Inputs (continued)
| | | | | | | | | | | | | | | | | | | | | | | | |
Investments in Securities | | Balance
as of September 30, 2008 | | Accrued Discounts (Premiums) | | Realized Gain
(Loss) | | | Change in Unrealized Appreciation (Depreciation) | | Net Purchases (Sales) | | | Net
Transfers in/(out)
Level 3 | | | Balance as of September 30, 2009 |
| | | | | | | | | | | | | | | | | | | | | | | | |
Bonds and Notes (continued) | | | | | | | | | | | | | | | | | | | | | | | | |
Property & Casualty Insurance | | $ | 15,900 | | $ | — | | $ | (1,302 | ) | | $ | 402 | | $ | (15,000 | ) | | $ | — | | | $ | — |
Supranational | | | 583,267 | | | 50,343 | | | — | | | | 44,680 | | | — | | | | — | | | | 678,290 |
Technology | | | 381,600 | | | 12,433 | | | (8,795 | ) | | | 106,662 | | | 728,300 | | | | (123,640 | ) | | | 1,096,560 |
Wireless | | | 133,460 | | | 860 | | | — | | | | 57,305 | | | 275,875 | | | | (467,500 | ) | | | — |
Wirelines | | | — | | | 619 | | | — | | | | 74,029 | | | 1,759,377 | | | | — | | | | 1,834,025 |
Preferred Stocks | | | — | | | — | | | — | | | | — | | | — | | | | — | | | | — |
Convertible Preferred Stocks
Semiconductors & Semiconductor Equipment | | | 371,256 | | | — | | | — | | | | 239,979 | | | — | | | | (611,235 | ) | | | — |
| | | | | | | | | | | | | | | | | | | | | | | | |
Total | | $ | 2,758,373 | | $ | 87,649 | | $ | (638,560 | ) | | $ | 971,128 | | $ | 3,586,424 | | | $ | (1,789,969 | ) | | $ | 4,975,045 |
| | | | | | | | | | | | | | | | | | | | | | | | |
International Bond Fund
Asset Valuation Inputs
| | | | | | | | | | | | | | | | | | | | | | | |
Investments in Securities | | Balance
as of September 30, 2008 | | Accrued Discounts (Premiums) | | Realized Gain
(Loss) | | Change in Unrealized Appreciation (Depreciation) | | | Net Purchases (Sales) | | | Net
Transfers in/(out)
Level 3 | | Balance as of September 30, 2009 |
| | | | | | | | | | | | | | | | | | | | | | | |
| | | | | | | | | | | | | | | | | | | | | | | |
Bonds and Notes | | | | | | | | | | | | | | | | | | | | | | | |
Non-Convertible Bonds | | | | | | | | | | | | | | | | | | | | | | | |
Ireland | | $ | — | | $ | — | | $ | — | | $ | (147 | ) | | $ | 98,710 | | | $ | — | | $ | 98,563 |
Supranational | | | 58,327 | | | 5,034 | | | — | | | 4,468 | | | | — | | | | — | | | 67,829 |
United States | | | 68,665 | | | 48 | | | 4,952 | | | 4,322 | | | | (77,987 | ) | | | — | | | — |
| | | | | | | | | | | | | | | | | | | | | | | |
Total | | $ | 126,992 | | $ | 5,082 | | $ | 4,952 | | $ | 8,643 | | | $ | 20,723 | | | $ | — | | $ | 166,392 |
| | | | | | | | | | | | | | | | | | | | | | | |
Limited Term Government and Agency Fund
Asset Valuation Inputs
| | | | | | | | | | | | | | | | | | | | | | | |
Investments in Securities | | Balance
as of September 30, 2008 | | Accrued Discounts (Premiums) | | Realized Gain
(Loss) | | Change in Unrealized Appreciation (Depreciation) | | | Net Purchases (Sales) | | | Net
Transfers in/(out)
Level 3 | | Balance as of September 30, 2009 |
| | | | | | | | | | | | | | | | | | | | | | | |
| | | | | | | | | | | | | | | | | | | | | | | |
Bonds and Notes | | | | | | | | | | | | | | | | | | | | | | | |
ABS Home Equity | | $ | 743,234 | | $ | — | | $ | 13,224 | | $ | (287,671 | ) | | $ | (707,002 | ) | | $ | 777,001 | | $ | 538,786 |
| | | | | | | | | | | | | | | | | | | | | | | |
Total | | $ | 743,234 | | $ | — | | $ | 13,224 | | $ | (287,671 | ) | | $ | (707,002 | ) | | $ | 777,001 | | $ | 538,786 |
| | | | | | | | | | | | | | | | | | | | | | | |
79
NOTESTO FINANCIAL STATEMENTS (continued)
September 30, 2009
Strategic Income Fund
Asset Valuation Inputs
| | | | | | | | | | | | | | | | | | | | | | | | | |
Investments in Securities | | Balance as of
September 30,
2008 | | Accrued
Discounts
(Premiums) | | Realized
Gain
(Loss) | | | Change in
Unrealized
Appreciation
(Depreciation) | | | Net
Purchases
(Sales) | | | Net Transfers
in/(out) Level 3 | | | Balance as of
September 30,
2009 |
| | | | | | | | | | | | | | | | | | | | | | | | | |
Bonds and Notes | | | | | | | | | | | | | | | | | | | | | | | | | |
Non-Convertible Bonds | | | | | | | | | | | | | | | | | | | | | | | | | |
Airlines | | $ | 16,733,800 | | $ | — | | $ | 128,579 | | | $ | 4,797,869 | | | $ | (2,401,865 | ) | | $ | (12,317,531 | ) | | $ | 6,940,852 |
Automotive | | | — | | | 3,949 | | | — | | | | (24,731 | ) | | | 494,230 | | | | 2,052,698 | | | | 2,526,146 |
Banking | | | 49,326,408 | | | 1,800,522 | | | (34,140,022 | ) | | | 20,069,348 | | | | (8,658,000 | ) | | | (28,398,256 | ) | | | — |
Chemicals | | | 9,748,500 | | | 220,718 | | | — | | | | 3,747,860 | | | | — | | | | 9,486,502 | | | | 23,203,580 |
Diversified Manufacturing | | | — | | | 98,826 | | | — | | | | 1,626,310 | | | | 19,007,520 | | | | — | | | | 20,732,656 |
Electric | | | — | | | 82,267 | | | — | | | | 71,916 | | | | 4,554,349 | | | | — | | | | 4,708,532 |
Independent Energy | | | 4,890,065 | | | 56,028 | | | — | | | | 688,093 | | | | — | | | | (5,634,186 | ) | | | — |
Industrial Other | | | 9,600,000 | | | — | | | — | | | | 6,400,000 | | | | — | | | | (16,000,000 | ) | | | — |
Life Insurance | | | 2,828,966 | | | — | | | 403,808 | | | | 1,967,772 | | | | (5,200,546 | ) | | | — | | | | — |
Media Non-Cable | | | 5,251,125 | | | 246,750 | | | (10,728,408 | ) | | | 8,055,958 | | | | (2,825,425 | ) | | | — | | | | — |
Non-Captive Consumer | | | 7,027,071 | | | 186,834 | | | — | | | | 1,970,519 | | | | — | | | | (5,055,139 | ) | | | 4,129,285 |
Non-Captive Diversified | | | 17,213,700 | | | 38,142 | | | — | | | | 4,942,232 | | | | 3,955,364 | | | | (22,131,900 | ) | | | 4,017,538 |
Property & Casualty Insurance | | | 3,662,300 | | | 2,971 | | | (120,488 | ) | | | (446,283 | ) | | | (423,300 | ) | | | (2,675,200 | ) | | | — |
Supranational | | | 40,912,861 | | | — | | | — | | | | 7,001,642 | | | | — | | | | (17,459,258 | ) | | | 30,455,245 |
Technology | | | 8,828,600 | | | 64,549 | | | (6,933 | ) | | | (314,266 | ) | | | 184,650 | | | | (8,531,600 | ) | | | 225,000 |
Wireless | | | 19,281,400 | | | 55,587 | | | — | | | | 8,147,063 | | | | 773,550 | | | | (28,257,600 | ) | | | — |
Convertible Bonds | | | | | | | | | | | | | | | | | | | | | | | | | |
Healthcare | | | 2,555,500 | | | 27,551 | | | — | | | | 1,480,595 | | | | (4,063,646 | ) | | | — | | | | — |
Technology | | | — | | | 73,071 | | | 39,962 | | | | (113,053 | ) | | | (466,000 | ) | | | 3,860,320 | | | | 3,394,300 |
Transportation Services | | | 358,670 | | | 4,616 | | | 27,920 | | | | 11,794 | | | | (403,000 | ) | | | — | | | | — |
Wirelines | | | — | | | 41,099 | | | — | | | | 4,284,901 | | | | 52,993,500 | | | | — | | | | 57,319,500 |
Preferred Stocks | | | | | | | | | | | | | | | | | | | | | | | | | |
Convertible Preferred Stocks | | | | | | | | | | | | | | | | | | | | | | | | | |
Electric Utilities | | | 4,309,000 | | | — | | | — | | | | (538,625 | ) | | | — | | | | — | | | | 3,770,375 |
REITs | | | — | | | — | | | — | | | | (32,025 | ) | | | — | | | | 523,075 | | | | 491,050 |
Semiconductors & Semiconductor Equipment | | | 15,017,488 | | | — | | | — | | | | 9,707,312 | | | | — | | | | (24,724,800 | ) | | | — |
| | | | | | | | | | | | | | | | | | | | | | | | | |
Total | | $ | 217,545,454 | | $ | 3,003,480 | | $ | (44,395,582 | ) | | $ | 83,502,201 | | | $ | 57,521,381 | | | $ | (155,262,875 | ) | | $ | 161,914,059 |
| | | | | | | | | | | | | | | | | | | | | | | | | |
4. Derivatives. Effective April 1, 2009, the Funds adopted accounting standards related to derivative instruments and hedging activities which require enhanced disclosures. Derivative instruments are defined as financial instruments whose value and performance are based on the value and performance of another security or financial instrument. Derivative instruments that the Funds currently use are forward foreign currency contracts.
The Funds are subject to the risk that changes in foreign currency exchange rates will have an unfavorable effect on the value of Fund assets denominated in foreign currencies. The Funds may enter into forward foreign currency contracts for hedging purposes to protect the value of the Funds’ holdings of foreign securities. The Funds may also use forward foreign currency contracts to gain exposure to foreign currencies, regardless of whether securities denominated in such currencies are held in the funds. High Income Fund and International Bond Fund engaged in forward foreign currency contract transactions during the year ended September 30, 2009.
The following is a summary of derivative instruments for High Income Fund, as of September 30, 2009:
| | |
Asset Derivatives | | Forwards |
Foreign exchange contracts | | $ 4,791 |
Statement of Assets and Liabilities Location | | Unrealized appreciation on forward foreign currency contracts |
80
NOTESTO FINANCIAL STATEMENTS (continued)
September 30, 2009
| | |
Liability Derivatives | | Forwards |
Foreign exchange contracts | | $ (17,552) |
Statement of Assets and Liabilities Location | | Unrealized depreciation on forward foreign currency contracts |
Transactions in derivative instruments during the period April 1, 2009 to September 30, 2009, were as follows:
| | |
Realized Gain (Loss) | | Forwards |
Foreign exchange contracts | | $ (36,465) |
Statement of Operations Location | | Net realized gain (loss) on foreign currency transactions |
Change in Unrealized Appreciation (Depreciation) | | Forwards |
Foreign exchange contracts | | $ (19,476) |
Statement of Operations Location | | Net change in unrealized appreciation/(depreciation) on foreign currency translations |
The following is a summary of derivative instruments for International Bond Fund, as of September 30, 2009:
| | |
Asset Derivatives | | Forwards |
Foreign exchange contracts | | $ 65,206 |
Statement of Assets and Liabilities Location | | Unrealized appreciation on forward foreign currency contracts |
Transactions in derivative instruments during the period April 1, 2009 to September 30, 2009, were as follows:
| | |
Realized Gain (Loss) | | Forwards |
Foreign exchange contracts | | $ 195,162 |
Statement of Operations Location | | Net realized gain (loss) on foreign currency transactions |
Change in Unrealized Appreciation (Depreciation) | | Forwards |
Foreign exchange contracts | | $ 22,227 |
Statement of Operations Location | | Net change in unrealized appreciation/(depreciation) on foreign currency translations |
Volume of derivative activity for High Income Fund and International Bond Fund, based on month-end notional amounts outstanding during the period April 1, 2009 to September 30, 2009, were as follows:
| | |
| | | Percentage of Net Assets |
| |
High Income Fund | | Forwards |
Average Notional Amount Outstanding | | 0.44% |
Highest Notional Amount Outstanding | | 0.79% |
Lowest Notional Amount Outstanding | | 0.00% |
Notional Amount Outstanding as of September 30, 2009 | | 0.00% |
| |
International Bond Fund | | Forwards |
Average Notional Amount Outstanding | | 10.93% |
Highest Notional Amount Outstanding | | 15.51% |
Lowest Notional Amount Outstanding | | 6.87% |
Notional Amount Outstanding as of September 30, 2009 | | 7.80% |
Notional amounts outstanding are at absolute value and are determined, when applicable, by netting notional amounts of contracts to buy and sell the same underlying instrument.
81
NOTESTO FINANCIAL STATEMENTS (continued)
September 30, 2009
5. Purchases and Sales of Securities. For the year ended September 30, 2009, purchases and sales of securities (excluding short-term investments and including paydowns) were as follows:
| | | | | | | | | | | | |
| | | U.S. Government and
Agency Securities | | Other Securities |
Fund | | Purchases | | Sales | | Purchases | | Sales |
Core Plus Bond Fund | | $ | 146,443,561 | | $ | 114,266,435 | | $ | 112,488,661 | | $ | 91,084,725 |
High Income Fund | | | — | | | — | | | 127,878,005 | | | 25,832,335 |
International Bond Fund | | | 1,169,577 | | | 1,171,276 | | | 17,667,867 | | | 11,600,919 |
Limited Term Government and Agency Fund | | | 164,053,899 | | | 121,528,615 | | | 43,725,944 | | | 17,645,403 |
Strategic Income Fund | | | 163,575,904 | | | 191,548,045 | | | 3,870,713,357 | | | 3,499,805,852 |
6. Management Fees and Other Transactions with Affiliates.
a. Management Fees. Loomis, Sayles & Company, L.P. (“Loomis Sayles”) serves as investment adviser to each Fund. Under the terms of the management agreements, each Fund pays a management fee at the following annual rates, calculated daily and payable monthly, based on each Fund’s average daily net assets:
| | | | | | | | | | | | | | | |
| | | Percentage of Average Daily Net Assets | |
Fund | | First $100 million | | | Next $100 million | | | Next $1.8 billion | | | Next $13 billion | | | Over $15 billion | |
Core Plus Bond Fund | | 0.2500 | % | | 0.1875 | % | | 0.1875 | % | | 0.1875 | % | | 0.1875 | % |
High Income Fund | | 0.6000 | % | | 0.6000 | % | | 0.6000 | % | | 0.6000 | % | | 0.6000 | % |
International Bond Fund | | 0.6000 | % | | 0.6000 | % | | 0.6000 | % | | 0.6000 | % | | 0.6000 | % |
Limited Term Government and Agency Fund | | 0.5000 | % | | 0.5000 | % | | 0.5000 | % | | 0.5000 | % | | 0.5000 | % |
Strategic Income Fund | | 0.6500 | % | | 0.6500 | % | | 0.6000 | % | | 0.5500 | % | | 0.5400 | % |
Natixis Asset Management Advisors, L.P. (“Natixis Advisors”), serves as the advisory administrator to Core Plus Bond Fund. Under the terms of the advisory administration agreement, the Fund pays an advisory administration fee at the following annual rates, calculated daily and payable monthly, based on its average daily net assets:
| | | | | | |
| | | Percentage of Average Daily Net Assets | |
Fund | | First $100 million | | | Over $100 million | |
Core Plus Bond Fund | | 0.2500 | % | | 0.1875 | % |
Management and advisory administration fees are presented in the Statements of Operations as management fees.
Loomis Sayles has given binding undertakings to the Funds to reduce management fees and/or reimburse certain expenses associated with these Funds to limit their operating expenses, exclusive of acquired fund fees and expenses, brokerage expenses, interest expense, taxes and extraordinary expenses. These undertakings are in effect until January 31, 2010 and will be reevaluated on an annual basis. For the year ended September 30, 2009, the expense limits as a percentage of average daily net assets under the expense limitation agreements were as follows:
| | | | | | | | |
| | | Expense Limit as a Percentage of
Average Daily Net Assets |
Fund | | Class A | | Class B | | Class C | | Class Y |
Core Plus Bond Fund | | 0.90% | | 1.65% | | 1.65% | | 0.65% |
High Income Fund | | 1.15% | | 1.90% | | 1.90% | | 0.90% |
International Bond Fund | | 1.10% | | — | | 1.85% | | 0.85% |
Limited Term Government and Agency Fund | | 0.90% | | 1.65% | | 1.65% | | 0.65% |
Strategic Income Fund | | 1.25% | | 2.00% | | 2.00% | | 1.00% |
Loomis Sayles and Natixis Advisors have agreed to equally bear the fee reductions and/or expense reimbursements for the Core Plus Bond Fund.
82
NOTESTO FINANCIAL STATEMENTS (continued)
September 30, 2009
Loomis Sayles (and Natixis Advisors for Core Plus Bond Fund) shall be permitted to recover expenses borne under the expense limitation agreement (whether through reduction of its management fees or otherwise) on a class by class basis in later periods to the extent the expenses of a class fall below a class’ expense limits, provided, however, that a class is not obligated to pay such reduced fees/expenses more than one year after the end of the fiscal year in which the fee/expense was reduced.
For the year ended September 30, 2009, the management fees and reductions of management fees for each Fund were as follows:
| | | | | | | | | | | | | |
Fund | | Gross
Management
Fee | | Reduction of
Management
Fee1 | | Net
Management
Fee | | Percentage of
Average
Daily Net Assets |
| | | | | Gross | | Net |
| | | | | | | | | | | | | |
Core Plus Bond Fund | | $ | 446,865 | | $ | — | | $ | 446,865 | | 0.218% | | 0.218% |
High Income Fund | | | 558,817 | | | 16,356 | | | 542,461 | | 0.600% | | 0.580% |
International Bond Fund | | | 88,309 | | | 88,309 | | | — | | 0.600% | | — |
Limited Term Government and Agency Fund | | | 970,393 | | | 12,931 | | | 957,462 | | 0.500% | | 0.493% |
Strategic Income Fund | | | 55,117,195 | | | — | | | 55,117,195 | | 0.561% | | 0.561% |
1 Management fee reductions are subject to possible recovery until September 30, 2010.
For the year ended September 30, 2009, the advisory administration fees for Core Plus Bond Fund were as follows:
| | |
Advisory
Administration
Fee | | Percentage of
Average
Daily Net Assets |
$446,865 | | 0.218% |
For the year ended September 30, 2009, expenses have been reimbursed as follows:
| | | | | | | | | | | | | | | |
| | | Reimbursement2 |
Fund | | Class A | | Class B | | Class C | | Class Y | | Total |
Core Plus Bond Fund | | $ | 86,191 | | $ | 5,790 | | $ | 35,428 | | $ | 6,417 | | $ | 133,826 |
High Income Fund | | | 48,409 | | | 1,923 | | | 14,135 | | | — | | | 64,467 |
International Bond Fund | | | 14,225 | | | — | | | 4,716 | | | 47,698 | | | 66,639 |
Limited Term Government and Agency Fund | | | 100,205 | | | 3,973 | | | 45,524 | | | 8,372 | | | 158,074 |
2 Expense reimbursements are subject to possible recovery until September 30, 2010.
There were no expenses recovered during the year ended September 30, 2009 as permitted under the expense limitation agreement.
Certain officers and directors of Loomis Sayles and Natixis Advisors are also Trustees of the Funds. Loomis Sayles and Natixis Advisors are both limited partnerships indirectly owned by Natixis Global Asset Management, L.P. (“Natixis US”), which is part of Natixis Global Asset Management, an international asset management group based in Paris, France.
b. Administrative Fees. Natixis Advisors provides certain administrative services for the Funds and contracts with State Street Bank to serve as sub-administrator. Natixis Advisors is a wholly-owned subsidiary of Natixis US. Pursuant to an agreement among Natixis Funds Trust I, Natixis Funds Trust II, Natixis Funds Trust III, Natixis Funds Trust IV, Natixis Cash Management Trust, Gateway Trust (“Natixis Funds Trusts”), Loomis Sayles Funds I, Loomis Sayles Funds II (“Loomis Sayles Funds Trusts”), Hansberger International Series and Natixis Advisors, each Fund pays Natixis Advisors monthly its pro rata portion of fees equal to an annual rate of 0.0575% of the first $15 billion of the average daily net assets of the Natixis Funds Trusts, Loomis Sayles Funds Trusts and the Hansberger International Series, 0.0500% of the next $15 billion, 0.0425% of the next $30 billion and 0.0375% of such assets in excess of $60 billion, subject to an annual aggregate minimum fee for the Natixis Funds Trusts, Loomis Sayles Funds Trusts and the Hansberger International Series of $10 million, which is reevaluated on an annual basis. New funds are subject to a fee for the first twelve months of operations of $75,000 plus $12,500 per class and an additional $75,000 if managed by multiple subadvisors.
83
NOTESTO FINANCIAL STATEMENTS (continued)
September 30, 2009
For the year ended September 30, 2009, each Fund paid the following for administrative fees to Natixis Advisors:
| | | |
Fund | | Administrative
Fees |
Core Plus Bond Fund | | $ | 101,792 |
High Income Fund | | | 46,013 |
International Bond Fund | | | 38,718 |
Limited Term Government and Agency Fund | | | 97,102 |
Strategic Income Fund | | | 4,879,685 |
c. Service and Distribution Fees. Natixis Distributors, L.P. (“Natixis Distributors”), a wholly-owned subsidiary of Natixis US, has entered into a distribution agreement with the Trusts. Pursuant to this agreement, Natixis Distributors serves as principal underwriter of each Fund.
Pursuant to Rule 12b-1 under the 1940 Act, the Trusts have adopted a Service Plan relating to each Fund’s Class A shares (the “Class A Plans”) and a Distribution and Service Plan relating to each Fund’s Class B and Class C shares (the “Class B and Class C Plans”).
Under the Class A Plans, each Fund pays Natixis Distributors a monthly service fee at an annual rate not to exceed 0.25% of the average daily net assets attributable to the Fund’s Class A shares, as reimbursement for expenses incurred by Natixis Distributors in providing personal services to investors in Class A shares and/or the maintenance of shareholder accounts.
Under the Class B, if applicable, and Class C Plans, each Fund pays Natixis Distributors a monthly service fee at an annual rate not to exceed 0.25% of the average daily net assets attributable to the Fund’s Class B and Class C shares, as compensation for services provided and expenses incurred by Natixis Distributors in providing personal services to investors in Class B and Class C shares and/or the maintenance of shareholder accounts.
Also under the Class B, if applicable, and Class C Plans, each Fund pays Natixis Distributors a monthly distribution fee at the annual rate of 0.75% of the average daily net assets attributable to the Fund’s Class B and Class C shares, as compensation for services provided and expenses incurred by Natixis Distributors in connection with the marketing or sale of Class B and Class C shares.
For the year ended September 30, 2009, the Funds paid the following service and distribution fees:
| | | | | | | | | | | | | | | |
| | | Service Fee | | Distribution Fee |
Fund | | Class A | | Class B | | Class C | | Class B | | Class C |
| | | | | | | | | | | | | | | |
Core Plus Bond Fund | | $ | 310,233 | | $ | 20,546 | | $ | 129,747 | | $ | 61,639 | | $ | 389,241 |
High Income Fund | | | 104,938 | | | 3,817 | | | 30,221 | | | 11,452 | | | 90,663 |
International Bond Fund | | | 8,741 | | | — | | | 2,470 | | | — | | | 7,410 |
Limited Term Government and Agency Fund | | | 306,180 | | | 11,668 | | | 133,802 | | | 35,004 | | | 401,406 |
Strategic Income Fund | | | 11,730,368 | | | 335,916 | | | 9,531,216 | | | 1,007,748 | | | 28,593,646 |
d. Sub-Transfer Agent Fees. Natixis Distributors has entered into agreements with financial intermediaries to provide certain recordkeeping, processing, shareholder communications and other services to customers of the intermediaries and has agreed to compensate the intermediaries for providing those services. Certain services would be provided by the Funds if the shares of those customers were registered directly with the Funds’ transfer agent. Accordingly, the Funds agreed to pay a portion of the intermediary fees attributable to shares of the Fund held by the intermediaries (which generally are a percentage of the value of shares held) not exceeding what the Funds would have paid its transfer agent had each customer’s shares been registered directly with the transfer agent instead of held through the intermediaries. Natixis Distributors pays the remainder of the fees.
84
NOTESTO FINANCIAL STATEMENTS (continued)
September 30, 2009
For the year ended September 30, 2009, the Funds paid the following sub-transfer agent fees, which are reflected in transfer agent fees and expenses in the Statements of Operations.
| | | | | | | | | | | | |
| | | Sub-Transfer Agent Fees |
Fund | | Class A | | Class B | | Class C | | Class Y |
Core Plus Bond Fund | | $ | 93,297 | | $ | 6,378 | | $ | 37,859 | | $ | 18,255 |
High Income Fund | | | 21,685 | | | 851 | | | 3,099 | | | 23,847 |
International Bond Fund | | | 1,475 | | | — | | | 172 | | | 187 |
Limited Term Government and Agency Fund | | | 50,842 | | | 1,944 | | | 11,911 | | | 7,994 |
Strategic Income Fund | | | 3,503,843 | | | 100,896 | | | 1,259,866 | | | 861,698 |
e. Commissions. The Funds have been informed that commissions (including CDSCs) on Fund shares retained by Natixis Distributors during the year ended September 30, 2009 were as follows:
| | | |
Fund | | Commission |
Core Plus Bond Fund | | $ | 298,698 |
High Income Fund | | | 104,449 |
International Bond Fund | | | 25,048 |
Limited Term Government and Agency Fund | | | 184,190 |
Strategic Income Fund | | | 8,326,656 |
f. Trustees Fees and Expenses. The Funds do not pay any compensation directly to their officers or Trustees who are directors, officers or employees of Natixis Advisors, Natixis Distributors, Natixis US, or their affiliates. The Chairperson of the Board receives a retainer fee at the annual rate of $200,000. The Chairperson does not receive any meeting attendance fees for Board of Trustees meetings or committee meetings that she attends. Each Independent Trustee (other than the Chairperson) receives, in the aggregate, a retainer fee at the annual rate of $65,000. Each Independent Trustee also receives a meeting attendance fee of $7,500 for each meeting of the Board of Trustees that he or she attends in person and $3,750 for each meeting of the Board of Trustees that he or she attends telephonically. In addition, each committee chair receives an additional retainer fee at the annual rate of $10,000. Each Contract Review and Governance Committee member is compensated $5,000 for each Committee meeting that he or she attends in person and $2,500 for each meeting that he or she attends telephonically. Each Audit Committee member is compensated $6,250 for each Committee meeting that he or she attends in person and $3,125 for each meeting that he or she attends telephonically. These fees are allocated among the funds in the Natixis Funds Trusts, Loomis Sayles Funds Trusts and the Hansberger International Series based on a formula that takes into account, among other factors, the relative net assets of each Fund. Trustees are reimbursed for travel expenses in connection with attendance at meetings.
A deferred compensation plan (the “Plan”) is available to the Trustees on a voluntary basis. Deferred amounts remain in the Funds until distributed in accordance with the provisions of the Plan. The value of a participating Trustee’s deferral account is based on theoretical investments of deferred amounts, on the normal payment dates, in certain funds of the Natixis Funds Trusts, Loomis Sayles Funds Trusts and Hansberger International Series as designated by the participating Trustees. Changes in the value of participants’ deferral accounts are allocated pro rata among the funds in the Natixis Funds Trusts, Loomis Sayles Funds Trusts, and Hansberger International Series, and are normally reflected as Trustees’ fees and expenses in the Statements of Operations. The portions of the accrued obligations allocated to the Funds under the Plan are reflected as Deferred Trustees’ fees on the Statements of Assets and Liabilities.
For the year ended September 30, 2009, net depreciation in the value of participants’ deferral accounts has been included as a reduction of miscellaneous expenses on the Statements of Operations, as follows:
| | | |
Fund | | Amount |
Core Plus Bond Fund | | $ | 33,926 |
High Income Fund | | | 8,622 |
Limited Term Government and Agency Fund | | | 32,163 |
Strategic Income Fund | | | 49,800 |
g. Redemption Fees. Effective June 1, 2009, the redemption fee imposed on Class A shares of High Income Fund was eliminated. Prior to June 1, 2009, shareholders of Class A shares of High Income Fund were charged a 2% redemption fee if they redeemed, including redeeming by exchange within 60 days of acquisition (including acquisition by exchange). The redemption fee was deducted from the shareholder’s redemption or exchange proceeds and was paid to the Fund. These fees were accounted for as an addition to paid-in capital and are presented on the Statements of Changes in Net Assets.
85
NOTESTO FINANCIAL STATEMENTS (continued)
September 30, 2009
7. Line of Credit. Each Fund, together with certain other funds of Natixis Funds Trusts, Loomis Sayles Funds Trusts and the Hansberger International Series, participates in a $200,000,000 committed unsecured line of credit provided by State Street Bank, with an individual limit of $125,000,000 for each Fund that participates in the line of credit. Interest is charged to each participating fund based on its borrowings at a rate per annum equal to the greater of the Federal Funds rate or overnight LIBOR, plus 0.75%. In addition, a commitment fee of 0.125% per annum, payable at the end of each calendar quarter, is accrued and apportioned among the participating funds based on their average daily unused portion of the line of credit.
Prior to March 11, 2009, each Fund, together with certain other funds of Natixis Funds Trusts, Loomis Sayles Funds Trusts and Hansberger International Series, participated in a $200,000,000 committed unsecured line of credit provided by State Street Bank, with an individual limit of $125,000,000 for each Fund that participated in the line of credit. Interest was charged to each participating fund based on its borrowings at a rate per annum equal to the greater of the Federal Funds rate plus 0.50%. In addition, a commitment fee of 0.09% per annum, payable at the end of each calendar quarter, was accrued and apportioned among the participating funds based on their average daily unused portion of the line of credit.
For the year ended September 30, 2009, the Funds had no borrowings under these agreements.
8. Concentration of Risk. International Bond Fund is a non-diversified fund. Compared with diversified mutual funds, the International Bond Fund may invest a greater percentage of its assets in a particular country. Therefore, the International Bond Fund’s returns could be significantly affected by the performance of any one of the small number of countries in its portfolio.
Each Fund may purchase investments of foreign issuers. Investing in securities of foreign issuers involves special risks and considerations not typically associated with investing in U.S. companies and securities of the U.S. government. These risks include revaluation of currencies and the risk of expropriation. Moreover, the markets for securities of many foreign issuers may be less liquid and the prices of such securities may be more volatile than those of comparable U.S. companies and the U.S. government.
9. Shareholders. At September 30, 2009, the Loomis Sayles Employees’ Profit Sharing Retirement Plan held 19,053 shares of beneficial interest of Limited Term Government and Agency Fund. At September 30, 2009, Natixis US owned shares equating to 46.46% of International Bond Fund’s net assets. At September 30, 2009, three shareholders individually owned more than 5% of the High Income Fund’s total outstanding shares, representing in aggregate, 21.90% of the Fund.
10. Capital Shares. Each Fund may issue an unlimited number of shares of beneficial interest, without par value. Transactions in capital shares were as follows:
| | | | | | | | | | | | | | |
| | Year Ended
September 30, 2009 | | | Year Ended
September 30, 2008 | |
Core Plus Bond Fund | | Shares | | | | Amount | | | Shares | | | | Amount | |
| | | | | | | | | | | | | | |
| Class A | | | | | | | | | | | | | | |
Issued from the sale of shares | | 5,053,473 | | | $ | 54,649,921 | | | 3,961,377 | | | $ | 44,610,104 | |
Issued in connection with the reinvestment of distributions | | 515,393 | | | | 5,579,642 | | | 416,060 | | | | 4,674,418 | |
Redeemed | | (4,737,622 | ) | | | (51,103,206 | ) | | (2,742,021 | ) | | | (30,840,053 | ) |
| | | | | | | | | | | | | | |
Net change | | 831,244 | | | $ | 9,126,357 | | | 1,635,416 | | | $ | 18,444,469 | |
| | | | | | | | | | | | | | |
| Class B | | | | | | | | | | | | | | |
Issued from the sale of shares | | 72,713 | | | $ | 778,608 | | | 81,830 | | | $ | 928,726 | |
Issued in connection with the reinvestment of distributions | | 28,331 | | | | 305,872 | | | 43,582 | | | | 492,099 | |
Redeemed | | (504,102 | ) | | | (5,425,057 | ) | | (6,832,567 | ) | | | (77,200,182 | ) |
| | | | | | | | | | | | | | |
Net change | | (403,058 | ) | | $ | (4,340,577 | ) | | (6,707,155 | ) | | $ | (75,779,357 | ) |
| | | | | | | | | | | | | | |
| Class C | | | | | | | | | | | | | | |
Issued from the sale of shares | | 5,539,383 | | | $ | 59,909,721 | | | 1,866,796 | | | $ | 20,868,873 | |
Issued in connection with the reinvestment of distributions | | 82,284 | | | | 901,682 | | | 25,095 | | | | 281,730 | |
Redeemed | | (1,683,762 | ) | | | (18,156,728 | ) | | (483,069 | ) | | | (5,447,710 | ) |
| | | | | | | | | | | | | | |
Net change | | 3,937,905 | | | $ | 42,654,675 | | | 1,408,822 | | | $ | 15,702,893 | |
| | | | | | | | | | | | | | |
| Class Y | | | | | | | | | | | | | | |
Issued from the sale of shares | | 2,459,788 | | | $ | 27,430,717 | | | 1,132,575 | | | $ | 12,755,055 | |
Issued in connection with the reinvestment of distributions | | 63,520 | | | | 692,382 | | | 44,572 | | | | 502,262 | |
Redeemed | | (1,576,971 | ) | | | (16,945,061 | ) | | (654,873 | ) | | | (7,360,390 | ) |
| | | | | | | | | | | | | | |
Net change | | 946,337 | | | $ | 11,178,038 | | | 522,274 | | | $ | 5,896,927 | |
| | | | | | | | | | | | | | |
Increase (decrease) from capital share transactions | | 5,312,428 | | | $ | 58,618,493 | | | (3,140,643 | ) | | $ | (35,735,068 | ) |
| | | | | | | | | | | | | | |
86
NOTESTO FINANCIAL STATEMENTS (continued)
September 30, 2009
10. Capital Shares (continued).
| | | | | | | | | | | | | | |
| | Year Ended September 30, 2009 | | | Period Ended September 30, 2008* | |
High Income Fund | | Shares | | | | Amount | | | Shares | | | | Amount | |
| | | | | | | | | | | | | | |
| Class A | | | | | | | | | | | | | | |
Issued from the sale of shares | | 9,902,651 | | | $ | 37,553,280 | | | 4,904,752 | | | $ | 23,822,307 | |
Issued in connection with the reinvestment of distributions | | 702,667 | | | | 2,621,142 | | | 378,438 | | | | 1,831,932 | |
Redeemed | | (6,362,694 | ) | | | (24,378,951 | ) | | (2,555,411 | ) | | | (12,401,358 | ) |
| | | | | | | | | | | | | | |
Net change | | 4,242,624 | | | $ | 15,795,471 | | | 2,727,779 | | | $ | 13,252,881 | |
| | | | | | | | | | | | | | |
| Class B | | | | | | | | | | | | | | |
Issued from the sale of shares | | 22,526 | | | $ | 84,592 | | | 44,248 | | | $ | 206,339 | |
Issued in connection with the reinvestment of distributions | | 21,555 | | | | 78,355 | | | 26,234 | | | | 128,112 | |
Redeemed | | (229,184 | ) | | | (845,267 | ) | | (356,172 | ) | | | (1,746,563 | ) |
| | | | | | | | | | | | | | |
Net change | | (185,103 | ) | | $ | (682,320 | ) | | (285,690 | ) | | $ | (1,412,112 | ) |
| | | | | | | | | | | | | | |
| Class C | | | | | | | | | | | | | | |
Issued from the sale of shares | | 2,411,038 | | | $ | 9,092,790 | | | 1,607,159 | | | $ | 7,812,971 | |
Issued in connection with the reinvestment of distributions | | 155,802 | | | | 577,576 | | | 53,048 | | | | 255,350 | |
Redeemed | | (949,303 | ) | | | (3,508,124 | ) | | (346,620 | ) | | | (1,670,004 | ) |
| | | | | | | | | | | | | | |
Net change | | 1,617,537 | | | $ | 6,162,242 | | | 1,313,587 | | | $ | 6,398,317 | |
| | | | | | | | | | | | | | |
| Class Y | | | | | | | | | | | | | | |
Issued from the sale of shares | | 22,731,680 | | | $ | 88,407,570 | | | 922,271 | | | $ | 4,329,547 | |
Issued in connection with the reinvestment of distributions | | 650,415 | | | | 2,696,934 | | | 9,401 | | | | 42,724 | |
Redeemed | | (740,730 | ) | | | (3,068,585 | ) | | (27,536 | ) | | | (125,340 | ) |
| | | | | | | | | | | | | | |
Net change | | 22,641,365 | | | $ | 88,035,919 | | | 904,136 | | | $ | 4,246,931 | |
| | | | | | | | | | | | | | |
Increase (decrease) from capital share transactions | | 28,316,423 | | | $ | 109,311,312 | | | 4,659,812 | | | $ | 22,486,017 | |
| | | | | | | | | | | | | | |
| * | From February 29, 2008 (commencement of operations) through September 30, 2008 for Class Y shares. |
| | | | | | | | | | | | | | |
| | Year Ended September 30, 2009 | | | Period Ended September 30, 2008** | |
International Bond Fund | | Shares | | | | Amount | | | Shares | | | | Amount | |
| | | | | | | | | | | | | | |
| Class A | | | | | | | | | | | | | | |
Issued from the sale of shares | | 672,013 | | | $ | 6,666,998 | | | 327,200 | | | $ | 3,256,979 | |
Issued in connection with the reinvestment of distributions | | 5,103 | | | | 49,865 | | | 1,505 | | | | 14,727 | |
Redeemed | | (107,505 | ) | | | (999,973 | ) | | (116,234 | ) | | | (1,149,151 | ) |
| | | | | | | | | | | | | | |
Net change | | 569,611 | | | $ | 5,716,890 | | | 212,471 | | | $ | 2,122,555 | |
| | | | | | | | | | | | | | |
| Class C | | | | | | | | | | | | | | |
Issued from the sale of shares | | 238,418 | | | $ | 2,461,614 | | | 101,736 | | | $ | 1,017,705 | |
Issued in connection with the reinvestment of distributions | | 670 | | | | 6,563 | | | 284 | | | | 2,804 | |
Redeemed | | (40,421 | ) | | | (390,729 | ) | | (27,588 | ) | | | (272,845 | ) |
| | | | | | | | | | | | | | |
Net change | | 198,667 | | | $ | 2,077,448 | | | 74,432 | | | $ | 747,664 | |
| | | | | | | | | | | | | | |
| Class Y | | | | | | | | | | | | | | |
Issued from the sale of shares | | 148,246 | | | $ | 1,536,076 | | | 1,079,358 | | | $ | 10,809,876 | |
Issued in connection with the reinvestment of distributions | | 24,645 | | | | 234,656 | | | 21,719 | | | | 215,650 | |
Redeemed | | (54,815 | ) | | | (509,028 | ) | | (13,547 | ) | | | (132,409 | ) |
| | | | | | | | | | | | | | |
Net change | | 118,076 | | | $ | 1,261,704 | | | 1,087,530 | | | $ | 10,893,117 | |
| | | | | | | | | | | | | | |
Increase (decrease) from capital share transactions | | 886,354 | | | $ | 9,056,042 | | | 1,374,433 | | | $ | 13,763,336 | |
| | | | | | | | | | | | | | |
| | | | |
** From February 1, 2008 (commencement of operations) through September 30, 2008. | | | | | | | | | | | | | | |
87
NOTESTO FINANCIAL STATEMENTS (continued)
September 30, 2009
10. Capital Shares (continued).
| | | | | | | | | | | | | | |
| | Year Ended September 30, 2009 | | | Year Ended September 30, 2008 | |
Limited Term Government and Agency Fund | | Shares | | | | Amount | | | Shares | | | | Amount | |
| | | | | | | | | | | | | | |
| Class A | | | | | | | | | | | | | | |
Issued from the sale of shares | | 8,687,955 | | | $ | 97,183,574 | | | 2,035,015 | | | $ | 22,451,140 | |
Issued in connection with the reinvestment of distributions | | 242,614 | | | | 2,733,365 | | | 269,896 | | | | 2,982,151 | |
Redeemed | | (8,273,983 | ) | | | (93,400,549 | ) | | (2,604,784 | ) | | | (28,704,540 | ) |
| | | | | | | | | | | | | | |
Net change | | 656,586 | | | $ | 6,516,390 | | | (299,873 | ) | | $ | (3,271,249 | ) |
| | | | | | | | | | | | | | |
| Class B | | | | | | | | | | | | | | |
Issued from the sale of shares | | 130,399 | | | $ | 1,438,679 | | | 67,405 | | | $ | 747,264 | |
Issued in connection with the reinvestment of distributions | | 7,515 | | | | 84,528 | | | 16,247 | | | | 179,371 | |
Redeemed | | (167,898 | ) | | | (1,871,502 | ) | | (288,166 | ) | | | (3,175,026 | ) |
| | | | | | | | | | | | | | |
Net change | | (29,984 | ) | | $ | (348,295 | ) | | (204,514 | ) | | $ | (2,248,391 | ) |
| | | | | | | | | | | | | | |
| Class C | | | | | | | | | | | | | | |
Issued from the sale of shares | | 6,162,236 | | | $ | 68,267,485 | | | 1,833,502 | | | $ | 20,260,185 | |
Issued in connection with the reinvestment of distributions | | 42,444 | | | | 479,083 | | | 13,505 | | | | 149,095 | |
Redeemed | | (3,881,272 | ) | | | (43,578,196 | ) | | (257,963 | ) | | | (2,855,031 | ) |
| | | | | | | | | | | | | | |
Net change | | 2,323,408 | | | $ | 25,168,372 | | | 1,589,044 | | | $ | 17,554,249 | |
| | | | | | | | | | | | | | |
| Class Y | | | | | | | | | | | | | | |
Issued from the sale of shares | | 2,463,987 | | | $ | 28,003,881 | | | 367,309 | | | $ | 4,065,238 | |
Issued in connection with the reinvestment of distributions | | 14,127 | | | | 160,181 | | | 13,550 | | | | 150,194 | |
Redeemed | | (668,533 | ) | | | (7,560,045 | ) | | (164,425 | ) | | | (1,829,051 | ) |
| | | | | | | | | | | | | | |
Net change | | 1,809,581 | | | $ | 20,604,017 | | | 216,434 | | | $ | 2,386,381 | |
| | | | | | | | | | | | | | |
Increase (decrease) from capital share transactions | | 4,759,591 | | | $ | 51,940,484 | | | 1,301,091 | | | $ | 14,420,990 | |
| | | | | | | | | | | | | | |
| | |
| | Year Ended September 30, 2009 | | | Year Ended September 30, 2008 | |
Strategic Income Fund | | Shares | | | | Amount | | | Shares | | | | Amount | |
| | | | | | | | | | | | | | |
| Class A | | | | | | | | | | | | | | |
Issued from the sale of shares | | 197,022,094 | | | $ | 2,182,492,582 | | | 197,552,720 | | | $ | 2,901,194,415 | |
Issued in connection with the reinvestment of distributions | | 27,449,011 | | | | 301,119,073 | | | 22,956,546 | | | | 331,016,205 | |
Redeemed | | (269,140,105 | ) | | | (2,956,389,363 | ) | | (140,438,578 | ) | | | (1,990,731,186 | ) |
| | | | | | | | | | | | | | |
Net change | | (44,669,000 | ) | | $ | (472,777,708 | ) | | 80,070,688 | | | $ | 1,241,479,434 | |
| | | | | | | | | | | | | | |
| Class B | | | | | | | | | | | | | | |
Issued from the sale of shares | | 498,498 | | | $ | 5,392,143 | | | 410,099 | | | $ | 6,009,632 | |
Issued in connection with the reinvestment of distributions | | 443,741 | | | | 4,856,521 | | | 401,421 | | | | 5,839,477 | |
Redeemed | | (3,184,682 | ) | | | (35,016,126 | ) | | (2,816,244 | ) | | | (41,124,244 | ) |
| | | | | | | | | | | | | | |
Net change | | (2,242,443 | ) | | $ | (24,767,462 | ) | | (2,004,724 | ) | | $ | (29,275,135 | ) |
| | | | | | | | | | | | | | |
| Class C | | | | | | | | | | | | | | |
Issued from the sale of shares | | 123,246,746 | | | $ | 1,377,861,744 | | | 118,265,590 | | | $ | 1,746,293,697 | |
Issued in connection with the reinvestment of distributions | | 11,167,692 | | | | 123,558,637 | | | 7,195,646 | | | | 104,006,617 | |
Redeemed | | (98,406,847 | ) | | | (1,085,168,243 | ) | | (49,785,407 | ) | | | (709,035,285 | ) |
| | | | | | | | | | | | | | |
Net change | | 36,007,591 | | | $ | 416,252,138 | | | 75,675,829 | | | $ | 1,141,265,029 | |
| | | | | | | | | | | | | | |
| Class Y | | | | | | | | | | | | | | |
Issued from the sale of shares | | 132,053,741 | | | $ | 1,485,053,461 | | | 47,274,736 | | | $ | 690,204,820 | |
Issued in connection with the reinvestment of distributions | | 2,940,277 | | | | 33,107,757 | | | 1,084,519 | | | | 15,512,730 | |
Redeemed | | (45,930,609 | ) | | | (513,425,165 | ) | | (25,704,216 | ) | | | (361,225,740 | ) |
| | | | | | | | | | | | | | |
Net change | | 89,063,409 | | | $ | 1,004,736,053 | | | 22,655,039 | | | $ | 344,491,810 | |
| | | | | | | | | | | | | | |
Increase (decrease) from capital share transactions | | 78,159,557 | | | $ | 923,443,021 | | | 176,396,832 | | | $ | 2,697,961,138 | |
| | | | | | | | | | | | | | |
88
REPORTOF INDEPENDENT REGISTERED PUBLIC ACCOUNTING FIRM
To the Trustees of Natixis Funds Trust I and Loomis Sayles Funds II and Shareholders of Loomis Sayles Core Plus Bond Fund, Loomis Sayles High Income Fund, Loomis Sayles International Bond Fund, Loomis Sayles Limited Term Government and Agency Fund, and Loomis Sayles Strategic Income Fund:
In our opinion, the accompanying statements of assets and liabilities, including the portfolios of investments, and the related statements of operations and of changes in net assets and the financial highlights present fairly, in all material respects, the financial position of Loomis Sayles Core Plus Bond Fund, a series of Natixis Funds Trust I, and Loomis Sayles High Income Fund, Loomis Sayles International Bond Fund, Loomis Sayles Limited Term Government and Agency Fund and Loomis Sayles Strategic Income Fund, each a series of Loomis Sayles Funds II (collectively, the “Funds”), at September 30, 2009, and the results of each of their operations, the changes in each of their net assets and the financial highlights for each of the periods indicated, in conformity with accounting principles generally accepted in the United States of America. These financial statements and financial highlights (hereafter referred to as “financial statements”) are the responsibility of the Funds’ management; our responsibility is to express an opinion on these financial statements based on our audits. We conducted our audits of these financial statements in accordance with the standards of the Public Company Accounting Oversight Board (United States). Those standards require that we plan and perform the audits to obtain reasonable assurance about whether the financial statements are free of material misstatement. An audit includes examining, on a test basis, evidence supporting the amounts and disclosures in the financial statements, assessing the accounting principles used and significant estimates made by management, and evaluating the overall financial statement presentation. We believe that our audits, which included confirmation of securities at September 30, 2009 by correspondence with the custodian and brokers, provide a reasonable basis for our opinion.
PricewaterhouseCoopers LLP
Boston, Massachusetts
November 23, 2009
89
2009 U.S. TAX DISTRIBUTION INFORMATIONTO SHAREHOLDERS (unaudited)
Corporate Dividends Received Deduction. For the fiscal year ended September 30, 2009, a percentage of dividends distributed by the Funds listed below qualify for the dividends received deduction for corporate shareholders. These percentages are as follows:
| | | |
Fund | | Qualifying
Percentage | |
Core Plus Bond | | 0.18 | % |
High Income | | 2.08 | % |
Strategic Income | | 4.62 | % |
Capital Gains Distributions. Pursuant to Internal Revenue Section 852(b), the following Fund paid distributions, which have been designated as capital gains distributions for the fiscal year ended September 30, 2009, unless subsequently determined to be different.
| | | |
Fund | | Amount |
Strategic Income | | $ | 52,952,003 |
Qualified Dividend Income. For the fiscal year ended September 30, 2009, the Funds below will designate up to the maximum amount allowable pursuant to the Internal Revenue Code as qualified dividend income eligible for reduced tax rates. These lower rates range from 0% to 15% depending on an individual’s tax bracket. If the Funds pay a distribution during calendar year 2009, complete information will be reported in conjunction with Form 1099-DIV.
| | |
Fund | | |
Core Plus Bond | | |
High Income | | |
Strategic Income | | |
90
TRUSTEEAND OFFICER INFORMATION
The tables below provide certain information regarding the Trustees and officers of Natixis Funds Trust I and Loomis Sayles Funds II (the “Trusts”). Unless otherwise indicated, the address of all persons below is 399 Boylston Street, Boston, MA 02116. The Trusts’ Statements of Additional Information include additional information about the Trustees of the Trusts and are available by calling Natixis Funds at 800-225-5478.
| | | | | | |
Name and Year of Birth | | Position(s) Held with the
Trusts, Length of Time
Served and Term of Office* | | Principal Occupation(s)
During Past 5 Years** | | Number of Portfolios in
Fund Complex Overseen*** and Other Directorships Held |
| | | |
| INDEPENDENT TRUSTEES | | | | | | |
| | | |
Graham T. Allison, Jr.
(1940) | | Trustee Since 1984 for Natixis Funds Trust I (including its predecessors) and since 2003 for Loomis Sayles Funds II Contract Review and Governance Committee Member | | Douglas Dillon Professor and Director of the Belfer Center for Science and International Affairs, John F. Kennedy School of Government, Harvard University | | 39 Director, Taubman Centers, Inc. (real estate investment trust) |
| | | |
Charles D. Baker
(1956) | | Trustee Since 2005 Contract Review and Governance Committee Member | | Formerly, President and Chief Executive Officer, Harvard Pilgrim Health Care (health plan) | | 39 None |
| | | |
Edward A. Benjamin
(1938) | | Trustee Since 2003 for Natixis Funds Trust I and since 2002 for Loomis Sayles Funds II Chairman of the Contract Review and Governance Committee | | Retired | | 39 None |
| | | |
Daniel M. Cain
(1945) | | Trustee Since 1996 for Natixis Funds Trust I and since 2003 for Loomis Sayles Funds II Chairman of the Audit Committee | | Chairman (formerly, President and Chief Executive Officer), Cain Brothers & Company, Incorporated (investment banking) | | 39 Director, Sheridan Healthcare Inc. (physician practice management) |
| | | |
Kenneth A. Drucker
(1945) | | Trustee Since 2008 Audit Committee Member | | Formerly, Treasurer, Sequa Corp. (manufacturing) | | 39 None |
| | | |
Wendell J. Knox****
(1948) | | Trustee Since 2009 Contract Review and Governance Committee Member | | Director (formerly, President and Chief Executive Officer) of Abt Associates Inc. (research and consulting) | | 39 Director, Eastern Bank (commercial bank); Director, The Hanover Insurance Group (property and casualty insurance) |
91
TRUSTEEAND OFFICER INFORMATION
| | | | | | |
Name and Year of Birth | | Position(s) Held with the
Trusts, Length of Time
Served and Term of Office* | | Principal Occupation(s)
During Past 5 Years** | | Number of Portfolios in
Fund Complex Overseen*** and Other Directorships Held |
| | | |
INDEPENDENT TRUSTEES continued | | | | | | |
| | | |
Sandra O. Moose
(1942) | | Chairperson of the Board of Trustees since November 2005 Trustee since 1982 for Natixis Funds Trust I (including its predecessors) and since 2003 for Loomis Sayles Funds II Ex officio member of the Audit Committee and Contract Review and Governance Committee | | President, Strategic Advisory Services (management consulting); formerly, Senior Vice President and Director, The Boston Consulting Group, Inc. (management consulting) | | 39 Director, Verizon Communications; Director, AES Corporation (international power company) |
| | | |
Cynthia L. Walker
(1956) | | Trustee Since 2005 Audit Committee Member | | Deputy Dean for Finance and Administration, Yale University School of Medicine; formerly, Executive Dean for Administration, Harvard Medical School; and formerly, Dean for Finance and Chief Financial Officer, Harvard Medical School | | 39 None |
92
TRUSTEEAND OFFICER INFORMATION
| | | | | | |
Name and Year of Birth | | Position(s) Held with the
Trusts, Length of Time
Served and Term of Office* | | Principal Occupation(s)
During Past 5 Years** | | Number of Portfolios in
Fund Complex Overseen*** and Other Directorships Held |
| | | |
| INTERESTED TRUSTEES | | | | | | |
| | | |
Robert J. Blanding1 (1947) 555 California Street San Francisco, CA 94104 | | Trustee Since 2003 for Natixis Funds Trust I and since 2002 for Loomis Sayles Funds II Chief Executive Officer of Loomis Sayles Funds II since 2002 | | President, Chairman, Director and Chief Executive Officer, Loomis, Sayles & Company, L.P. | | 39 None |
| | | |
John T. Hailer2
(1960) | | Trustee Since 2000 for Natixis Funds Trust I and since 2003 for Loomis Sayles Funds II | | President and Chief Executive Officer-U.S. and Asia, Natixis Global Asset Management, L.P.; formerly, President and Chief Executive Officer, Natixis Distribution Corporation, Natixis Asset Management Advisors, L.P., Natixis Distributors, L.P. and Natixis Global Associates, Inc. | | 39 None |
| * | Each Trustee serves until retirement, resignation or removal from the Board of Trustees. The current retirement age is 72. The position of Chairperson of the Board is appointed for a two-year term. Ms. Moose was appointed to serve an additional two-year term as the Chairperson of the Board of Trustees on September 14, 2007. |
| ** | Each person listed above, except as noted, holds the same position(s) with the Natixis Funds Trust I, Natixis Funds Trust II, Natixis Funds Trust III, Natixis Funds Trust IV, Gateway Trust and the Natixis Cash Management Trust (collectively, the “Natixis Funds Trusts”), Loomis Sayles Funds I and Loomis Sayles Funds II (collectively, the “Loomis Sayles Funds Trusts”), and Hansberger International Series. Previous positions during the past five years with Natixis Distributors, L.P. (the “Distributor”), Natixis Asset Management Advisors, L.P. (“Natixis Advisors”), or Loomis, Sayles & Company, L.P. (“Loomis Sayles”) are omitted if not materially different from a Trustee’s or officer’s current position with such entity. |
| *** | The Trustees of the Trusts serve as trustees of a fund complex that includes all series of the Natixis Funds Trusts, the Loomis Sayles Funds Trusts and Hansberger International Series (collectively, the “Fund Complex”). |
| **** | Mr. Knox was appointed as trustee effective July 1, 2009. |
| 1 | Mr. Blanding is deemed an “interested person” of the Trusts because he holds the following positions with an affiliated person of the Trusts: President, Chairman, Director and Chief Executive Officer of Loomis Sayles. |
| 2 | Mr. Hailer is deemed an “interested person” of the Trusts because he holds the following positions with an affiliated person of the Trusts: President and Chief Executive Officer-U.S. and Asia, Natixis Global Asset Management, L.P. |
93
TRUSTEEAND OFFICER INFORMATION
| | | | | | |
Name and Year of Birth | | Position(s) Held
with the Trusts | | Term of Office* and
Length of Time Served | | Principal Occupation
During Past 5 Years** |
|
| OFFICERS OF THE TRUSTS |
| | | |
Coleen Downs Dinneen
(1960) | | Secretary, Clerk and Chief Legal Officer | | Since September 2004 | | Executive Vice President, General Counsel, Secretary and Clerk (formerly, Senior Vice President, Deputy General Counsel, Assistant Secretary and Assistant Clerk), Natixis Distribution Corporation, Natixis Asset Management Advisors, L.P. and Natixis Distributors, L.P. |
| | | |
Daniel J. Fuss
(1933) One Financial Center Boston, MA 02111 | | Executive Vice President of Loomis Sayles Funds II | | Since June 2003 | | Vice Chairman and Director, Loomis, Sayles & Company, L.P. |
| | | |
David Giunta
(1965) | | President and Chief Executive Officer of Natixis Funds Trust I and President of Loomis Sayles Funds II | | Since March 2008 | | President and Chief Executive Officer, Natixis Distribution Corporation, Natixis Asset Management Advisors, L.P. and Natixis Distributors, L.P.; formerly, President, Fidelity Charitable Gift Fund; and formerly, Senior Vice President, Fidelity Brokerage Company |
| | | |
Russell L. Kane
(1969) | | Chief Compliance Officer, Assistant Secretary and Anti-Money Laundering Officer | | Chief Compliance Officer since May 2006; Assistant Secretary since June 2004; and Anti-Money Laundering Officer since April 2007 | | Chief Compliance Officer for Mutual Funds, Senior Vice President, Deputy General Counsel, Assistant Secretary and Assistant Clerk, Natixis Distribution Corporation, Natixis Asset Management Advisors, L.P. and Natixis Distributors, L.P. |
94
TRUSTEEAND OFFICER INFORMATION
| | | | | | |
Name and Year of Birth | | Position(s) Held
with the Trusts | | Term of Office* and
Length of Time Served | | Principal Occupation
During Past 5 Years** |
|
OFFICERS OF THE TRUSTS continued |
| | | |
Michael C. Kardok
(1959) | | Treasurer, Principal Financial and Accounting Officer | | Since October 2004 | | Senior Vice President, Natixis Asset Management Advisors, L.P. and Natixis Distributors, L.P. |
| * | Each officer of the Trusts serves for an indefinite term in accordance with the Trusts’ current By-laws until the date his or her successor is elected and qualified, or until he or she sooner dies, retires, is removed or becomes disqualified. |
| ** | Each person listed above, except as noted, holds the same position(s) with the Fund Complex. Mr. Fuss is not an officer of the Natixis Funds Trusts or the Hansberger International Series. Previous positions during the past five years with the Distributor, Natixis Advisors or Loomis Sayles are omitted if not materially different from a Trustee’s or officer’s current position with such entity. |
95

EQUITY FUNDS
ANNUAL REPORT
September 30, 2009
Loomis Sayles Disciplined Equity Fund
(Formerly Loomis Sayles Research Fund)
Loomis Sayles Global Markets Fund
Loomis Sayles Growth Fund
Loomis Sayles Mid Cap Growth Fund
Loomis Sayles Value Fund


TABLE OF CONTENTS
Management Discussion and Performance page 1
Portfolio of Investments page 18
Financial Statements page 35
LOOMIS SAYLES DISCIPLINED EQUITY FUND
PORTFOLIO PROFILE
Objective:
Long-term growth of capital
Strategy:
Invests primarily in equity securities, including common stocks, convertible securities, and warrants; focuses on stocks of large-capitalization companies, but may invest in companies of any size
Fund Inception:
July 31, 2000
Managers:
Maureen G. Depp, CFA
Brian James, CFA
Loomis, Sayles & Company, L.P.
Symbols:
| | |
| Class A | | LSRRX |
| Class B | | LSCBX |
| Class C | | LSCCX |
| Class Y | | LISRX |
What You Should Know:
Growth stocks are generally more sensitive to market movements than value stocks. The fund can invest a significant percentage of assets in foreign securities and the value of the fund shares can be adversely affected by changes in currency exchange rates, political, and economic developments. In emerging markets these risks can be significant. Fund shares should be viewed as a long-term investment.
Management Discussion
Effective October 1, 2009, Loomis Sayles Research Fund changed its name to Loomis Sayles Disciplined Equity Fund to reflect changes in its investment strategies designed to give the fund more flexibility in pursuit of its objective, long-term growth of capital. These changes are described in detail in the prospectus supplement dated July 9, 2009.
During the 12 months ended September 30, 2009 the securities markets experienced abrupt, dramatic changes in the dominant forces influencing equity values. Fears of a major economic recession sent stock valuations tumbling in the early months. However, investor sentiment changed, starting in March of 2009, and stock prices staged a robust rally that extended through the end of the period.
Despite the volatile equity market, Loomis Sayles Disciplined Equity Fund provided a total return of -5.64% for the fiscal year ended September 30, 2009, based on the net asset value of Class A shares and $0.05 in reinvested dividends. The fund outperformed the -6.91% return on its benchmark, S&P 500 Index and lagged the -2.69% return on the funds in Morningstar’s Large Growth category.
WHICH STRATEGIES CONTRIBUTED MOST TO THE FUND’S PERFORMANCE?
Our bias in favor of above-average quality in our security selections played a major role in the fund’s performance, even after the late-period rally began extending to lower-quality stocks in the final weeks of the fiscal year. By focusing on financially solid companies with strong earnings histories and relatively low debt, we were able to avoid many of the negatives in the large-cap market. Throughout the 12-month period, we maintained our long-term strategy of focusing on what we believe to be the best individual stock ideas generated through bottom-up analysis of industries and competitive dynamics.
WHAT SECTORS AND STOCKS WERE POSITIVE CONTRIBUTORS?
Strong selections in energy and information technology boosted performance. Within the energy sector, stock selection in the integrated oil company group was generally positive, notably Occidental Petroleum. At the same time, not owning weaker performers like Hess proved advantageous. Investments in exploration and production company Petrohawk provided additional support. In information technology, the most influential contributors were Apple and Google. Apple benefited from strong sales of its iPhone and iPod Touch products, while Google showed solid earnings growth. Among financial holdings, Goldman Sachs’ smart risk control and superior revenue growth helped propel results.
WHICH SECTORS AND STOCKS WERE NEGATIVE?
With the exception of Goldman Sachs, fund investments in the financial and consumer staples sectors tended to hold back results. The financial group was “ground zero” in the turmoil that roiled the market in the fall of 2008, and a subsequent rally in the group in 2009 failed to overcome the losses. Poor performers included Bank of America and State Street Corp., both of which were sold early in 2009, although we bought back Bank of America later in the year. Unfortunately, we missed out on the price rally these stocks experienced in the spring and early summer. Weak stock selection in the consumer staples group also held back results. Procter & Gamble was a major detractor, as it faced stiff competition from competitors with lower-priced products.
WHAT’S YOUR OUTLOOK?
As fears about the economy receded, investors became more confident about investing in stocks, creating a robust market recovery that has lifted prices of many stocks from distressed levels. In our opinion, stock valuations are more reasonable now than at the start of fiscal 2009 and we anticipate that any further gains in the equity market will depend on the pace and pattern of an economic recovery. In this environment, we think valuation analysis of individual stocks becomes especially important in making buy and sell decisions.
1
LOOMIS SAYLES DISCIPLINED EQUITY FUND
Investment Results through September 30, 2009
PERFORMANCE IN PERSPECTIVE
The charts comparing the fund’s performance to an index provide you with a general sense of how it performed. The fund’s total return for the period shown below appears with and without sales charges and includes fund expenses and fees. An index measures the performance of a theoretical portfolio. Unlike a fund, the index is unmanaged and does not have expenses that affect the results. It is not possible to invest directly in an index. Investors would incur transaction costs and other expenses if they purchased the securities necessary to match the index.
Growth of a $10,000 Investment in Class A Shares1,6
Average Annual Total Returns — September 30, 20096
| | | | | | | | | |
| | | | |
| | | 1 YEAR | | | 5 YEARS | | | SINCE FUND
INCEPTION | |
Class A (Inception 11/30/01)1 | | | | | | | | | |
Net Asset Value2 | | -5.64 | % | | 2.48 | % | | -1.30 | % |
With Maximum Sales Charge3 | | -11.11 | | | 1.26 | | | -1.93 | |
| | | | |
Class B (Inception 9/12/03)1 | | | | | | | | | |
Net Asset Value2 | | -6.47 | | | 1.72 | | | -2.10 | |
With CDSC4 | | -11.15 | | | 1.41 | | | -2.10 | |
| | | | |
Class C (Inception 9/12/03)1 | | | | | | | | | |
Net Asset Value2 | | -6.41 | | | 1.68 | | | -2.15 | |
With CDSC4 | | -7.34 | | | 1.68 | | | -2.15 | |
| | | | |
Class Y (Inception 7/31/00)1 | | | | | | | | | |
Net Asset Value2 | | -5.42 | | | 2.84 | | | -0.99 | |
| | | | |
| COMPARATIVE PERFORMANCE | | 1 YEAR | | | 5 YEARS | | | SINCE FUND
INCEPTION5 | |
S&P 500 Index | | -6.91 | % | | 1.02 | % | | -1.45 | % |
Morningstar Large Growth Fund Avg. | | -2.69 | | | 1.77 | | | -3.42 | |
All returns represent past performance and do not guarantee future results. Periods of less than one year are not annualized. Share price and return will vary and you may have a gain or loss when you sell your shares. All results include reinvestment of dividends and capital gains. Current returns may be higher or lower than those shown. For performance current to the most recent month-end, visit www.funds.natixis.com.
Class Y shares are available to certain investors, as described in the prospectus.
The table and graph do not reflect taxes shareholders might owe on any fund distributions or when they redeem their shares.
PORTFOLIO FACTS
| | | | |
| | | % of Net Assets as of |
| FUND COMPOSITION | | 9/30/09 | | 9/30/08 |
Common Stocks | | 97.4 | | 100.0 |
Short-Term Investments and Other | | 2.6 | | 0.0 |
| | | % of Net Assets as of |
| TEN LARGEST HOLDINGS | | 9/30/09 | | 9/30/08 |
Apple, Inc. | | 3.2 | | 2.6 |
Procter & Gamble Co. (The) | | 2.7 | | 4.0 |
ExxonMobil Corp. | | 2.6 | | 3.9 |
JPMorgan Chase & Co. | | 2.6 | | 3.1 |
Oracle Corp. | | 2.5 | | 2.8 |
Pfizer, Inc. | | 2.4 | | — |
Cisco Systems, Inc. | | 2.4 | | — |
AT&T, Inc. | | 2.2 | | 2.0 |
Hewlett-Packard Co. | | 2.2 | | 2.8 |
Wells Fargo & Co. | | 2.2 | | 2.2 |
| | | % of Net Assets as of |
| FIVE LARGEST INDUSTRIES | | 9/30/09 | | 9/30/08 |
Oil, Gas & Consumable Fuels | | 10.1 | | 10.8 |
Computers & Peripherals | | 7.1 | | 6.4 |
Pharmaceuticals | | 5.7 | | 4.4 |
Diversified Financial Services | | 4.3 | | 5.7 |
Capital Markets | | 4.2 | | 2.2 |
| | | Portfolio holdings and asset allocations will vary. |
EXPENSE RATIOS AS STATED IN THE MOST RECENT PROSPECTUS
| | | | |
| Share Class | | Gross Expense Ratio7 | | Net Expense Ratio8 |
A | | 1.55% | | 1.25% |
B | | 2.30 | | 2.00 |
C | | 2.30 | | 2.00 |
Y | | 1.15 | | 0.85 |
NOTES TO CHARTS
See page 11 for a description of the indices.
| 1 | Returns shown in the chart include performance of the fund’s Retail Class shares, which were converted to Class A shares on 9/12/03. The prior Retail Class performance has been restated to reflect expenses and sales loads of Class A shares. For periods before the inception of Retail Class shares (11/30/01), performance shown for Class A has been based on the performance of the fund’s Institutional Class shares, adjusted to reflect the higher expenses and sales load paid by Class A shares. For periods prior to the inception of Class B and Class C shares (9/12/03), performance is based on prior Institutional Class performance, restated to reflect the sales loads and expenses of Class B and Class C shares. The restatement of the fund’s performance to reflect Class A, Class B, and Class C expenses is based on the net expenses of the Class after taking into effect the fund’s then current expense cap arrangements. Class Y performance includes performance of the prior Institutional Class shares, which were redesignated as Class Y shares on 9/12/03. Institutional Class performance has been restated to reflect the net expenses of Class Y after taking into account the fund’s then current expense cap arrangements. The growth of $10,000 chart compares the performance of Class A shares, at net asset value, to the performance of Class A shares including the maximum sales charge of 5.75%. This chart reflects the performance of Class A shares rather than Class Y shares because Class A shares have the highest sales charge. Prior to 9/12/03, the fund was offered without a sales charge. |
| 2 | Does not include a sales charge. |
| 3 | Includes maximum sales charge of 5.75%. |
| 4 | Performance for Class B shares assumes a maximum of 5% contingent deferred sales charge (“CDSC”) applied when you sell shares, which declines annually between years 1-6 according to the following schedule: 5, 4, 3, 3, 2, 1, 0%. Class C shares performance assumes a 1% CDSC applied when you sell shares within one year of purchase. |
| 5 | The since-inception performance comparisons shown are calculated from 8/1/00. |
| 6 | Fund performance has been increased by expense reductions and reimbursements, if any, without which performance would have been lower. |
| 7 | Before reductions and reimbursements. |
| 8 | After reductions and reimbursements. Expense reductions are contractual and are set to expire 1/31/10. |
2
LOOMIS SAYLES GLOBAL MARKETS FUND
PORTFOLIO PROFILE
Objective:
Seeks high total return through a combination of capital appreciation and current income
Strategy:
Invests primarily in equity and fixed-income securities of U.S. and foreign issuers, including securities of issuers located in emerging markets
Fund Inception:
May 1, 1996
Managers:
Mark Baribeau, CFA
Dan Fuss, CFA, CIC
Warren Koontz, CFA, CIC
David Rolley, CFA
Loomis, Sayles & Company, L.P.
Symbols:
| | |
| Class A | | LGMAX |
| Class C | | LGMCX |
| Class Y | | LSWWX |
What You Should Know:
The fund can invest a significant percentage of assets in foreign securities and the value of the fund shares can be adversely affected by changes in currency exchange rates, political, and economic developments. In emerging markets these risks can be significant. The fund can invest a significant percentage of assets in debt securities that are rated below investment grade and the value of fund shares can be adversely affected by changes in economic conditions or other circumstances. In addition, the secondary market for these securities may lack liquidity. Fund shares should be viewed as a long-term investment.
Management Discussion
During the 12 months ended September 30, 2009, the securities markets experienced dramatic changes in the dominant forces influencing both equity and bond values. Fears of a major economic recession sent stock valuations tumbling in the early months. However, investor sentiment changed in March 2009, and stock prices staged a robust rally that extended through the end of the period. Similarly, bond markets rallied in the second half of the reporting period, reversing losses sustained earlier.
Loomis Sayles Global Markets Fund’s combined equity and bond portfolios outperformed its primary benchmark and its Morningstar peer group for the fiscal year ended September 30, 2009. However, the fund lagged its secondary benchmark, which is composed of government bonds. Based on the net asset value of Class A shares, the fund’s total return was 10.27%, including $0.25 in dividends and less than $0.01 in capital gains reinvested during the period. The fund’s primary benchmark, the MSCI World Index, returned -1.64%, while its secondary benchmark, Citigroup World Government Bond Index, returned 13.78%. The average return on the funds in Morningstar’s World Allocation category was 4.20% for the 12-month period.
On the equity side, strong stock selection in the information technology sector helped performance. On the bond side, the fund’s security selection within the U.S. high-yield bond market and its emphasis on emerging markets were positive factors.
WHICH STOCKS OR SECTORS HAD THE MOST IMPACT ON THE EQUITY SIDE?
Apple was one of the best individual contributors, as it benefited from brisk sales of iPhones, iPods and Mac personal computers, while the company continued to enhance its total product line. Among financial stocks, Goldman Sachs fared better in the financial sector’s recovery than its peers due to its smarter risk management on the way down and superior revenue growth on the way up. The fund also benefited from being underweight relative to the benchmark in consumer staples, as investors rotated out of this relatively defensive sector during the past few months.
Disappointing sectors included healthcare and industrials. Healthcare holding Myriad Genetics detracted from performance amid concern about operating margins and expenses in the diagnostic division of this Utah-based company. We sold the stock. Within industrials, Gamesa was another negative, even though its profits tripled. This Spanish company manufactures wind turbines and builds wind farms. However, investors became concerned about customers’ financing availability. The fund’s worst-performing equity was JPMorgan, which fell on renewed concerns over the breadth of toxic assets across the financial sector.
WHAT ABOUT THE FUND’S BOND PORTFOLIO?
On the bond side, security selection and weightings within the corporate sector contributed to the fund’s strong results. The fund’s emerging markets exposure also contributed positively as investors’ risk appetite improved during the year. However, the fund’s country allocation detracted from returns as most government bond markets posted negative returns for the 12-month period. The fund’s underweight position in the Japanese yen also detracted from results when that currency rallied recently.
WHAT WAS YOUR STRATEGY FOR THE YEAR?
We focused on what we believed to be attractive, earnings-driven opportunities around the world. As the markets continued to stabilize, we reduced the portfolio’s defensive bias and decreased our healthcare allocation, as we became concerned that political headwinds in the United States might add to uncertainties. We also significantly increased the fund’s weight in the consumer discretionary sector. As the visibility of the economic recovery increases, a number of consumer-oriented companies should start to benefit. On the bond side, we reduced the fund’s credit spread positions while adding to its exposure to non-U.S. dollar currencies.
WHAT’S YOUR OUTLOOK?
With economic clouds parting, investors worldwide have grown more confident and risk appetites have improved. Much of what had been oversold at the end of last year has sprung back. We expect the U.S. economy to stage a weak recovery, hindered by high unemployment and sluggish consumer and investment spending.
3
LOOMIS SAYLES GLOBAL MARKETS FUND
Investment Results through September 30, 2009
PERFORMANCE IN PERSPECTIVE
The charts comparing the fund’s performance to two indexes provide you with a general sense of how it performed. The fund’s total return for the period shown below appears with and without sales charges and includes fund expenses and fees. An index measures the performance of a theoretical portfolio. Unlike a fund, the index is unmanaged and does not have expenses that affect the results. It is not possible to invest directly in an index. Investors would incur transaction costs and other expenses if they purchased the securities necessary to match the index.
Growth of a $10,000 Investment in Class A Shares1,5
Average Annual Total Returns — September 30, 20095
| | | | | | | | | |
| | | | |
| | | 1 YEAR | | | 5 YEARS | | | 10 YEARS | |
Class A (Inception 2/1/06)1 | | | | | | | | | |
Net Asset Value2 | | 10.27 | % | | 7.14 | % | | 9.33 | % |
With Maximum Sales Charge3 | | 3.94 | | | 5.88 | | | 8.69 | |
| | | | |
Class C (Inception 2/1/06)1 | | | | | | | | | |
Net Asset Value2 | | 9.40 | | | 6.34 | | | 8.52 | |
With CDSC4 | | 8.40 | | | 6.34 | | | 8.52 | |
| | | | |
Class Y (Inception 5/1/96)1 | | | | | | | | | |
Net Asset Value2 | | 10.49 | | | 7.39 | | | 9.60 | |
| | | | |
| COMPARATIVE PERFORMANCE | | 1 YEAR | | | 5 YEARS | | | 10 YEARS | |
MSCI World Index | | -1.64 | % | | 4.07 | % | | 1.40 | % |
Citigroup World Government Bond Index | | 13.78 | | | 6.65 | | | 6.69 | |
Morningstar World Allocation Fund Avg. | | 4.20 | | | 6.22 | | | 6.22 | |
All returns represent past performance and do not guarantee future results. Periods of less than one year are not annualized. Share price and return will vary and you may have a gain or loss when you sell your shares. All results include reinvestment of dividends and capital gains. Current returns may be higher or lower than those shown. For performance current to the most recent month-end, visit www.funds.natixis.com.
Class Y shares are available to certain investors, as described in the prospectus.
The table and graph do not reflect taxes shareholders might owe on any fund distributions or when they redeem their shares.
PORTFOLIO FACTS
| | | | |
| |
| | | % of Net Assets as of |
| FUND COMPOSITION | | 9/30/09 | | 9/30/08 |
Common Stocks | | 60.6 | | 65.5 |
Bonds & Notes | | 37.0 | | 26.6 |
Bank Loans | | 0.1 | | 0.0 |
Preferred Stock | | 0.4 | | 0.1 |
Short-Term Investments and Other | | 1.9 | | 7.8 |
| |
| | | % of Net Assets as of |
| TEN LARGEST HOLDINGS | | 9/30/09 | | 9/30/08 |
Apple, Inc. | | 3.4 | | 2.1 |
Standard Chartered PLC | | 2.7 | | 1.9 |
Goldman Sachs Group, Inc. (The) | | 1.8 | | — |
ABB Ltd. (Registered) | | 1.7 | | 1.6 |
Wells Fargo & Co. | | 1.7 | | 1.0 |
JPMorgan Chase & Co. | | 1.6 | | 2.7 |
Priceline.com, Inc. | | 1.6 | | — |
QUALCOMM, Inc. | | 1.5 | | 2.3 |
Google, Inc., Class A | | 1.5 | | 1.0 |
Southwestern Energy Co. | | 1.5 | | 1.3 |
| |
| | | % of Net Assets as of |
| FIVE LARGEST INDUSTRIES | | 9/30/09 | | 9/30/08 |
Commercial Banks | | 5.4 | | 4.7 |
Internet Software & Services | | 5.1 | | 1.0 |
Diversified Financial Services | | 4.2 | | 2.7 |
Semiconductors & Semiconductor Equipment | | 3.9 | | 0.1 |
Banking | | 3.8 | | 0.6 |
Portfolio holdings and asset allocations will vary.
EXPENSE RATIOS AS STATED IN THE MOST RECENT PROSPECTUS
| | | | |
| Share Class | | Gross Expense Ratio6 | | Net Expense Ratio7 |
A | | 1.27% | | 1.25% |
C | | 2.02 | | 2.00 |
Y | | 0.99 | | 0.99 |
NOTES TO CHARTS
See page 11 for a description of the indices.
| 1 | Returns shown in the chart include performance of the fund’s Institutional Class shares, which were redesignated as Class Y shares on 2/1/06. For periods prior to the inception of Class A and Class C shares (2/1/06), the prior Institutional Class performance has been restated to reflect the sales loads and expenses of Class A and Class C shares. The restatement of the fund’s performance to reflect Class A and Class C expenses is based on the net expenses of the Class after taking into account the fund’s then current expense cap arrangements. The growth of $10,000 chart compares the performance of Class A shares, at net asset value, to the performance of Class A shares including the maximum sales charge of 5.75%. This chart reflects the performance of Class A Shares rather than Class Y shares because Class A shares have the highest sales charge. Prior to 2/1/06, the fund was offered without a sales charge. |
| 2 | Does not include a sales charge. |
| 3 | Includes the maximum sales charge of 5.75%. |
| 4 | Performance for Class C shares assumes a 1% contingent deferred sales charge (“CDSC”) applied when you sell shares within one year of purchase. |
| 5 | Fund performance has been increased by expense reductions and reimbursements, if any, without which performance would have been lower. |
| 6 | Before reductions and reimbursements. |
| 7 | After reductions and reimbursements. Expense reductions are contractual and are set to expire 1/31/10. |
4
LOOMIS SAYLES GROWTH FUND
PORTFOLIO PROFILE
Objective:
Long-term growth of capital
Strategy:
Invests primarily in equity securities, including common stocks, convertible securities, and warrants; focuses on stocks of large-capitalization companies, but may invest in companies of any size
Fund Inception:
May 16, 1991
Managers:
Mark Baribeau, CFA
Pamela Czekanski, CFA
Richard Skaggs, CFA
Loomis, Sayles &
Company, L.P.
Symbols:
| | |
| Class A | | LGRRX |
| Class B | | LGRBX |
| Class C | | LGRCX |
| Class Y | | LSGRX |
What You Should Know:
Growth stocks are generally more sensitive to market movements because their stock prices are based on future expectations. Frequent portfolio turnover may result in increased tax liabilities that will reduce the fund’s overall return. The fund can invest a significant percentage of assets in foreign securities and the value of the fund shares can be adversely affected by changes in currency exchange rates, political, and economic developments. In emerging markets these risks can be significant. Fund shares should be viewed as a long-term investment.
Management Discussion
Investors in U.S. equities experienced a sharp reversal in market forces during the 12 months ended September 30, 2009. Evidence of a seriously deteriorating economy sent stock valuations into a dramatic slide during the first half of the period. However, sentiment started changing in March 2009 as investors grew more confident about a potential recovery and stock prices began a steep, if uneven, recovery.
Loomis Sayles Growth Fund Class A shares produced a total return of -10.40% at net asset value for the fiscal year ended September 30, 2009. The fund underperformed the -1.85% return on its benchmark, the Russell 1000 Growth Index, and came in below the -2.69% average return on the funds in Morningstar’s Large Growth category.
WHICH SECTOR AND STOCK SELECTIONS PROVED DISAPPOINTING?
Weak stock selection in the healthcare and financial sectors were the primary factors in the fund’s underperformance relative to its benchmark. In healthcare, investments in Celgene, St. Jude Medical and Illumina performed particularly poorly. Celgene’s share price was a victim both of investors’ concerns over biotechnology stocks in general and disappointing sales projections for its Revlimid product. Medical equipment producer St. Jude reported strong quarterly results during the year, but its share price declined amid growing concerns about the sales prospects of its cardiac rhythm management devices in an economic slowdown. Illumina designs and produces technology used in genetic research. It declined when investors became concerned that the company’s customers might lose government research grants and be unable to afford its products. We sold St. Jude and Illumina.
In the volatile financial sector, investments in discount broker Charles Schwab and investment manager T. Rowe Price both fell in value as slumping capital markets and asset levels slowed revenues. We sold both positions. Outside the healthcare and financial groups, investments in CSX and First Solar had the most negative impact on performance and were sold. Railroad and transportation services giant CSX declined on mounting concerns that freight volumes would slip as commodity prices fell and factory orders dropped. The share price of First Solar, a producer of modules used in solar energy systems, performed poorly as investors worried about increased competition from Chinese solar manufacturers.
WHICH STOCKS WERE POSITIVE FOR PERFORMANCE?
Among consumer discretionary stocks, two internet-related companies were positive. On-line retailer Amazon.com showed strong results, as both its sales and its profits exceeded expectations, despite a slowdown in consumer spending generally. At the same time, web-based travel services company Priceline.com reported an increase in profits when it gained market share in both the U.S. and in foreign markets as travelers hunted for low-cost fares. Other investments that provided noteworthy support included Apple and Goldman Sachs. Apple continued to benefit from brisk sales of iPhones, iPods and Mac personal computers, while the company continued to enhance its total product line. Investment bank Goldman Sachs reported solid earnings from its operations in fixed-income, currency and commodity markets.
WHAT WAS YOUR STRATEGY FOR THE YEAR?
Throughout the year, we held to our strategy to identify and select large-cap growth companies exhibiting strong fundamentals with leadership products in the marketplace.
WHAT’S YOUR OUTLOOK?
Dramatic market gains in recent months have brought stock valuations back to levels that we believe are reasonable given current economic conditions. Much of what had been oversold has now recovered. We think continued improvement in the economy should support further price gains, but the pace and pattern of any recovery is likely to be bumpy. In this environment, we believe valuation analysis will be an important component of decisions about buying or selling stocks, and individual stock picking is likely to have the greatest impact on results.
5
LOOMIS SAYLES GROWTH FUND
Investment Results through September 30, 2009
PERFORMANCE IN PERSPECTIVE
The charts comparing the fund’s performance to an index provide you with a general sense of how it performed. The fund’s total return for the period shown below appears with and without sales charges and includes fund expenses and fees. An index measures the performance of a theoretical portfolio. Unlike a fund, the index is unmanaged and does not have expenses that affect the results. It is not possible to invest directly in an index. Investors would incur transaction costs and other expenses if they purchased the securities necessary to match the index.
Growth of a $10,000 Investment in Class A Shares1,5
Average Annual Total Returns — September 30, 20095
| | | | | | | | | |
| | | | |
| | | 1 YEAR | | | 5 YEARS | | | 10 YEARS | |
Class A (Inception 12/31/96)1 | | | | | | | | | |
Net Asset Value2 | | -10.40 | % | | -2.09 | % | | -2.51 | % |
With Maximum Sales Charge3 | | -15.63 | | | -3.23 | | | -3.08 | |
| | | | |
Class B (Inception 9/12/03)1 | | | | | | | | | |
Net Asset Value2 | | -11.02 | | | -2.83 | | | -3.25 | |
With CDSC4 | | -15.47 | | | -3.22 | | | -3.25 | |
| | | | |
Class C (Inception 9/12/03)1 | | | | | | | | | |
Net Asset Value2 | | -11.02 | | | -2.83 | | | -3.25 | |
With CDSC4 | | -11.91 | | | -2.83 | | | -3.25 | |
| | | | |
Class Y (Inception 5/16/91)1 | | | | | | | | | |
Net Asset Value2 | | -9.73 | | | -1.69 | | | -2.20 | |
| | | | |
| COMPARATIVE PERFORMANCE | | 1 YEAR | | | 5 YEARS | | | 10 YEARS | |
Russell 1000 Growth Index | | -1.85 | % | | 1.86 | % | | -2.56 | % |
Morningstar Large Growth Fund Avg. | | -2.69 | | | 1.77 | | | -0.64 | |
All returns represent past performance and do not guarantee future results. Periods of less than one year are not annualized. Share price and return will vary and you may have a gain or loss when you sell your shares. All results include reinvestment of dividends and capital gains. Current returns may be higher or lower than those shown. For performance current to the most recent month-end, visit www.funds.natixis.com.
Class Y shares are available to certain investors, as described in the prospectus.
The table and graph do not reflect taxes shareholders might owe on any fund distributions or when they redeem their shares.
PORTFOLIO FACTS
| | | | |
| |
| | | % of Net Assets as of |
| FUND COMPOSITION | | 9/30/09 | | 9/30/08 |
Common Stocks | | 99.2 | | 96.0 |
Short-Term Investments and Other | | 0.8 | | 4.0 |
| |
| | | % of Net Assets as of |
| TEN LARGEST HOLDINGS | | 9/30/09 | | 9/30/08 |
Apple, Inc. | | 4.9 | | 3.5 |
Google, Inc., Class A | | 4.5 | | 3.2 |
QUALCOMM, Inc. | | 3.9 | | 4.1 |
International Business Machines Corp. | | 3.7 | | 3.5 |
Goldman Sachs Group, Inc. (The) | | 3.3 | | — |
Priceline.com, Inc. | | 3.2 | | 0.8 |
Franklin Resources, Inc. | | 3.1 | | — |
Oracle Corp. | | 3.0 | | 2.9 |
Amazon.com, Inc. | | 3.0 | | 2.7 |
Broadcom Corp., Class A | | 2.9 | | — |
| |
| | | % of Net Assets as of |
| FIVE LARGEST INDUSTRIES | | 9/30/09 | | 9/30/08 |
Computers & Peripherals | | 10.5 | | 9.1 |
Communications Equipment | | 9.1 | | 4.1 |
Capital Markets | | 8.2 | | 8.5 |
Internet Software & Services | | 7.1 | | 3.2 |
Internet & Catalog Retail | | 6.2 | | 3.5 |
Portfolio holdings and asset allocations will vary.
EXPENSE RATIOS AS STATED IN THE MOST RECENT PROSPECTUS
| | | | |
| Share Class | | Gross Expense Ratio6 | | Net Expense Ratio7 |
A | | 1.10% | | 1.10% |
B | | 1.85 | | 1.85 |
C | | 1.85 | | 1.85 |
Y | | 0.88 | | 0.85 |
NOTES TO CHARTS
See page 11 for a description of the indices.
| 1 | Returns shown in the chart include performance of the fund’s Retail Class shares, which were converted to Class A shares on 9/12/03. The prior Retail Class performance has been restated to reflect expenses and sales loads of Class A shares. For periods prior to the inception of Class B and Class C shares (9/12/03), performance is based on prior Institutional Class performance, restated to reflect the loads and expenses of Class B and Class C shares. The restatement of the fund’s performance to reflect Class A expenses is based on the net expenses of the Class after taking into effect the fund’s then current expense cap arrangements. Class Y performance includes performance of the prior Institutional Class, which was redesignated as Class Y shares on 9/12/03, Institutional Class performance has been restated to reflect the net expenses of Class Y after taking into effect the fund’s then current expense cap arrangements. The growth of $10,000 chart compares the performance of Class A shares, at net asset value, to the performance of Class A shares including the maximum sales charge of 5.75%. This chart reflects the performance of Class A Shares rather than Class Y shares because Class A shares have the highest sales charge. Prior to 9/12/03, the fund was offered without a sales charge. |
| 2 | Does not include a sales charge. |
| 3 | Includes maximum sales charge of 5.75%. |
| 4 | Performance for Class B shares assumes a maximum of 5% contingent deferred sales charge (“CDSC”) applied when you sell shares, which declines annually between years 1-6 according to the following schedule: 5, 4, 3, 3, 2, 1, 0%. Class C shares performance assumes a 1% CDSC applied when you sell shares within one year of purchase. |
| 5 | Fund performance has been increased by expense reductions and reimbursements, if any, without which performance would have been lower. |
| 6 | Before reductions and reimbursements. |
| 7 | After reductions and reimbursements. Expense reductions are contractual and are set to expire 1/31/10. |
6
LOOMIS SAYLES MID CAP GROWTH FUND
PORTFOLIO PROFILE
Objective:
Long-term growth of capital
Strategy:
Invests primarily in common stocks or other equity securities; focuses on stocks of companies that fall within the capitalization range of the companies included in the Russell Midcap Growth Index.
Fund Inception:
December 31, 1996
Manager:
Philip C. Fine, CFA
Symbols:
| | |
| Class A | | LAGRX |
| Class C | | LSACX |
| Class Y | | LSAIX |
What You Should Know
Small- and mid-cap stocks may be more volatile than larger, more established companies. The secondary market for these stocks may be less liquid, which could adversely impact the fund’s value. Growth funds involve increased risks, in part, because the value of the underlying securities is based on future expectations that may or may not be met. The fund can invest a significant percentage of assets in foreign securities and the value of the fund shares can be adversely affected by changes in currency exchange rates, political, and economic developments. In emerging markets these risks can be significant. The fund is subject to currency decline. Fund shares should be viewed as a long-term investment.
Management Discussion
From the outset of fiscal 2009, Loomis Sayles Mid Cap Growth Fund was defensively positioned, reflecting concerns about the deteriorating world economic climate. The fund performed relatively well during the downturn in the fourth quarter of 2008, but remained defensively positioned during the rally that began early in March 2009. With the wisdom of hindsight, much of the fund’s underperformance can be attributed to the fact that we stayed too long with some defensive stocks that had been good relative performers in the worst days of the bear market. These included sectors that had been our biggest winners in the first half of the year – notably healthcare and value retailers.
For the fiscal year ended September 30, 2009, the fund’s return was -13.44% based on the net asset value of Class A shares. For the same period, the fund’s benchmark, the Russell Midcap Growth Index, was -0.40%, while the average return on the funds in Morningstar’s Mid-Cap Growth category was -3.10%.
WHICH SECTORS AND STOCKS HURT PERFORMANCE THE MOST?
Our materials selections were lackluster with the notable exception of Freeport-McMoRan Copper & Gold, a mining concern headquartered in Arizona with operations in Indonesia and other countries. We also owned two gold stocks, Kinross Gold and Agnico-Eagle Mines, that were good defensive picks in the final three months of 2008 and the first quarter of 2009, but they were a drag on performance during the subsequent rally. Results from our financial stocks were disappointing. We were late moving into asset managers, which rebounded sharply when the market turned, and too early with our buys in regional banks. Technology also proved negative. Our semiconductor stocks were generally positive, but we did not own some of the stronger performers in networking and software.
Two of our worst performers were financial companies: NASDAQ and T. Rowe Price and we sold both positions. Exchange operator NASDAQ is highly sensitive to market activity and it experienced increasing pricing pressure from emerging electronic trading platforms. T. Rowe Price, a leading asset manager, was hit hard during the market’s meltdown. Continental Resources, an oil exploration and production company, curtailed its drilling program in the second half of 2008 when oil prices fell off steeply, which resulted in lowered production estimates and, by extension, lower earnings estimates. We sold the stock.
WHICH SECTORS AND STOCKS HAD A POSITIVE IMPACT?
With the exception of Continental, our energy selections were positive both in the fourth quarter of 2008, when commodity prices fell, and during most of 2009 when oil prices generally rose. Two issues drove strong performance in consumer staples: Green Mountain Coffee Roasters and NBTY. Green Mountain is highly regarded for its organic, gourmet coffees and for its corporate citizenship initiatives. NBTY, formerly known as Nature’s Bounty, manufactures vitamins and nutritional supplements. Other strong performers included semiconductor company Broadcom, and Priceline.com, a leading online travel company that continues to post strong earnings growth despite the lagging economy. As mentioned previously, Freeport-McMoRan was also a strong performer.
HOW DID YOU ADJUST THE FUND’S SECTOR WEIGHTINGS DURING THE YEAR?
The biggest change we made in sector weightings was to tilt the portfolio away from defensive sectors like healthcare, and toward more cyclical issues, like technology, specialty retail and producer durables. The fund’s emphasis on energy and materials remained constant.
WHAT’S YOUR OUTLOOK?
Much of what had been oversold now has recovered and valuation levels seem to us to be reasonable relative to current economic conditions. We believe continued economic improvement, if it occurs, will support higher stock prices, but the pace of the recovery is apt to be bumpy. In this type of market, we think it will be increasingly important to focus on careful stock selection.
7
LOOMIS SAYLES MID CAP GROWTH FUND
Investment Results through September 30, 2009
PERFORMANCE IN PERSPECTIVE
The charts comparing the fund’s performance to an index provide you with a general sense of how it performed. The fund’s total return for the period shown below appears with and without sales charges and includes fund expenses and fees. An index measures the performance of a theoretical portfolio. Unlike a fund, the index is unmanaged and does not have expenses that affect the results. It is not possible to invest directly in an index. Investors would incur transaction costs and other expenses if they purchased the securities necessary to match the index.
Growth of a $10,000 Investment in Class A Shares1,5
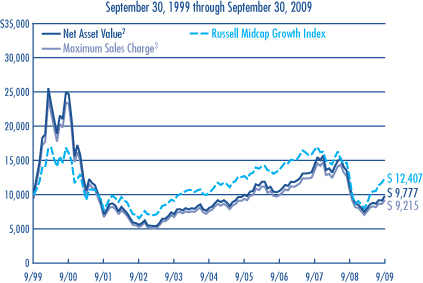
Average Annual Total Returns — September 30, 20095
| | | | | | | | | |
| | | | |
| | | 1 YEAR | | | 5 YEARS | | | 10 YEARS | |
Class A (Inception 12/31/96)1 | | | | | | | | | |
Net Asset Value2 | | -13.44 | % | | 3.94 | % | | -0.23 | % |
With Maximum Sales Charge3 | | -18.42 | | | 2.71 | | | -0.82 | |
| | | | |
Class C (Inception 2/2/09)1 | | | | | | | | | |
Net Asset Value2 | | -14.11 | | | 3.09 | | | -1.05 | |
With CDSC4 | | -14.97 | | | 3.09 | | | -1.05 | |
| | | | |
Class Y (Inception 12/31/96)1 | | | | | | | | | |
Net Asset Value2 | | -13.18 | | | 4.19 | | | 0.04 | |
| | | | |
| COMPARATIVE PERFORMANCE | | 1 YEAR | | | 5 YEARS | | | 10 YEARS | |
Russell Midcap Growth Index | | -0.40 | % | | 3.75 | % | | 2.18 | % |
Morningstar Mid-Cap Growth Avg. | | -3.10 | | | 3.14 | | | 2.88 | |
All returns represent past performance and do not guarantee future results. Periods of less than one year are not annualized. Share price and return will vary and you may have a gain or loss when you sell your shares. All results include reinvestment of dividends and capital gains. Current returns may be higher or lower than those shown. For performance current to the most recent month-end, visit www.funds.natixis.com.
Class Y shares are available to certain investors, as described in the prospectus.
The table and graph do not reflect taxes shareholders might owe on any fund distributions or when they redeem their shares.
PORTFOLIO FACTS
| | | | |
| |
| | | % of Net Assets as of |
| FUND COMPOSITION | | 9/30/09 | | 9/30/08 |
Common Stocks | | 98.5 | | 93.6 |
Short-Term Investments and Other | | 1.5 | | 6.4 |
| |
| | | % of Net Assets as of |
| TEN LARGEST HOLDINGS | | 9/30/09 | | 9/30/08 |
Freeport-McMoRan Copper & Gold, Inc. | | 3.2 | | — |
Priceline.com, Inc. | | 2.7 | | — |
Walter Energy, Inc. | | 2.4 | | — |
Marvell Technology Group Ltd. | | 2.3 | | — |
Teck Resources Ltd., Class B | | 2.3 | | — |
Cognizant Technology Solutions Corp., Class A | | 2.1 | | — |
Nabors Industries Ltd. | | 2.1 | | — |
Life Technologies Corp. | | 2.1 | | — |
Broadcom Corp., Class A | | 2.1 | | — |
Silicon Laboratories, Inc. | | 2.1 | | — |
| |
| | | % of Net Assets as of |
| FIVE LARGEST INDUSTRIES | | 9/30/09 | | 9/30/08 |
Semiconductors & Semiconductor Equipment | | 9.5 | | — |
Metals & Mining | | 7.9 | | — |
Specialty Retail | | 5.6 | | 11.7 |
Software | | 5.5 | | 7.1 |
Life Sciences Tools & Services | | 5.4 | | 4.7 |
Portfolio holdings and asset allocations will vary.
EXPENSE RATIOS AS STATED IN THE MOST RECENT PROSPECTUS
| | | | |
| Share Class | | Gross Expense Ratio6 | | Net Expense Ratio7 |
A | | 1.32% | | 1.25% |
C | | 2.19 | | 2.00 |
Y | | 1.00 | | 1.00 |
NOTES TO CHARTS
See page 11 for a description of the indices.
| 1 | Returns shown in the chart include performance of the fund’s Retail Class shares, which were redesignated to Class A shares on 2/2/09. Performance has been restated to reflect the current sales load of Class A shares. For the periods prior to the inception of Class C shares (2/2/09), performance is based on prior Retail Class performance, restated to reflect the sales loads and expenses of Class C shares. The restatement of the fund’s performance to reflect Class C expenses is based on the net expenses of the Class after taking into effect the fund’s then current expense cap arrangements. Class Y performance includes performance of the prior Institutional Class shares, which were redesignated as Class Y shares on 2/2/09. |
| 2 | Does not include a sales charge. |
| 3 | Includes maximum sales charge of 5.75%. |
| 4 | Class C shares performance assumes a 1% CDSC applied when you sell shares within one year of purchase. |
| 5 | Fund performance has been increased by expense reductions and reimbursements, if any, without which performance would have been lower. |
| 6 | Before reductions and reimbursements. |
| 7 | After reductions and reimbursements. Expense reductions are contractual and are set to expire 1/31/10. |
8
LOOMIS SAYLES VALUE FUND
PORTFOLIO PROFILE
Objective:
Long-term growth of capital and income
Strategy:
Invests primarily in equity securities, including common stocks, convertible securities, and warrants.
Fund Inception:
May 13, 1991
Managers:
Arthur Barry, CFA
James L. Carroll, CFA
Warren N. Koontz, CFA, CIC
Loomis, Sayles & Company, L.P.
Symbols:
| | |
| Class A | | LSVRX |
| Class B | | LSVBX |
| Class C | | LSCVX |
| Class Y | | LSGIX |
What You Should Know:
While the fund offers potential for long-term capital growth, it invests in value stocks, which can fall out of favor with investors and may underperform growth stocks during certain market conditions. The fund can invest a significant percentage of assets in foreign securities and the value of the fund shares can be adversely affected by changes in currency exchange rates, political, and economic developments. In emerging markets these risks can be significant. Fund shares should be viewed as a long-term investment.
Management Discussion
Battered equity prices shot higher in March of 2009 when intensely negative sentiment dissipated amid signs that the recession might soon be contained. With the pace of economic decline slowing and the global economy beginning to stabilize, investors’ risk appetite increased, sending them in pursuit of greater returns. Stocks moved up in the ensuing months, although the rally regained only part of the ground that had been lost during the worst of the credit crisis.
Successful stock selection in a number of sectors helped Loomis Sayles Value Fund outperform its benchmark and hold up better than its Morningstar peer group for the 12 months ended September 30, 2009. Nevertheless, results were negative. For fiscal 2009, Class A shares of the fund provided a total return of -6.97% at net asset value, including $0.21 in reinvested dividends. The Russell 1000 Value Index returned -10.62% for the period, while the average return on the funds in Morningstar’s Large Value category was -7.18%.
WHICH INVESTMENTS DELIVERED THE BEST RETURNS?
Results in the healthcare sector benefited from buyouts of two major pharmaceutical companies. Shares of Schering-Plough rose sharply in response to Merck’s offer to buy the company at an attractive premium. Wyeth, a long-standing fund holding, was the target of a buyout offer from Pfizer. In producer durables, Goodrich and Siemens, both heavily involved in aerospace and defense systems, performed well despite fears of Pentagon cutbacks. The fund owned both Pepsi Bottling Co. stock and PepsiCo. Both stocks moved higher when PepsiCo bought the remaining shares of Pepsi Bottling Group. The fund also enjoyed good results in energy when oil and gas prices rebounded.
WHICH STRATEGIES OR STOCKS PROVED DISAPPOINTING?
Our strategy of underweighting financial stocks has been beneficial to performance for some time. However, our emphasis on higher-quality issues was a negative during the second quarter of 2009, because lower-quality, more speculative companies led the rally among financial shares. Fears of nationalization and weak operating results drove down shares of Bank of America and Citigroup. We sold Citigroup. A sharp rally in consumer discretionary stocks also featured lower-quality issues, leaving behind the higher-quality companies that the fund holds. In technology, cell phone maker Nokia declined when earnings fell far short of expectations. General Electric also suffered a sharp decline as deteriorating conditions eroded earnings in the industrial and financial segments of its business.
WHAT STRATEGIC ADJUSTMENTS HAVE YOU MADE?
Reflecting our improving view of the economy, we reduced the portfolio’s defensive bias and increased exposure to economically sensitive areas like energy. Within this sector we concentrated in exploration and production companies as well as energy services, rather than in the larger integrated oil companies. We also increased holdings in consumer staples, including Dr. Pepper Snapple and ConAgra.
WHAT’S YOUR OUTLOOK?
The improving economic tone has encouraged investors, and their new-found risk appetite has led to soaring markets since March of 2009. Many stocks that had been oversold during the worst of the decline have recovered, and we believe valuations in general seem reasonable given current conditions. If the outlook continues to brighten, higher equity prices could follow. However, the recovery is unlikely to affect all sectors equally. Restoring economic health will take time, and the pace will not be even, so periods of volatility are likely along the way.
That scenario could bode well for bottom-up, value-focused investors like us who emphasize stock picking over trend following. We continue to follow our established approach, seeking out attractive stocks while avoiding excess risk, a process that requires time and discipline. Nevertheless, we believe this strategy is well-suited to current conditions, and we are identifying what appear to us to be excellent investment opportunities that fit our approach.
9
LOOMIS SAYLES VALUE FUND
Investment Results through September 30, 2009
PERFORMANCE IN PERSPECTIVE
The charts comparing the fund’s performance to an index provide you with a general sense of how it performed. The fund’s total return for the period shown below appears with and without sales charges and includes fund expenses and fees. An index measures the performance of a theoretical portfolio. Unlike a fund, the index is unmanaged and does not have expenses that affect the results. It is not possible to invest directly in an index. Investors would incur transaction costs and other expenses if they purchased the securities necessary to match the index.
Growth of a $10,000 Investment in Class A Shares1,5
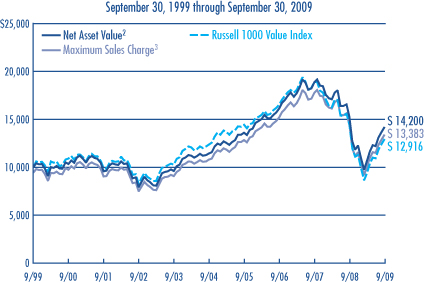
Average Annual Total Returns — September 30, 20095
| | | | | | | | | |
| | | | |
| | | 1 YEAR | | | 5 YEARS | | | 10 YEARS | |
Class A (Inception 6/30/06)1 | | | | | | | | | |
Net Asset Value2 | | -6.97 | % | | 4.43 | % | | 3.57 | % |
With Maximum Sales Charge3 | | -12.30 | | | 3.19 | | | 2.96 | |
| | | | |
Class B (Inception 6/1/07)1 | | | | | | | | | |
Net Asset Value2 | | -7.62 | | | 3.56 | | | 2.58 | |
With CDSC4 | | -12.23 | | | 3.21 | | | 2.58 | |
| | | | |
Class C (Inception 6/1/07)1 | | | | | | | | | |
Net Asset Value2 | | -7.60 | | | 3.57 | | | 2.58 | |
With CDSC4 | | -8.51 | | | 3.57 | | | 2.58 | |
| | | | |
Class Y (Inception 5/13/91)1 | | | | | | | | | |
Net Asset Value2 | | -6.66 | | | 4.76 | | | 3.89 | |
| | | | |
| COMPARATIVE PERFORMANCE | | 1 YEAR | | | 5 YEARS | | | 10 YEARS | |
Russell 1000 Value Index | | -10.62 | % | | 0.90 | % | | 2.59 | % |
Morningstar Large Value Fund Avg. | | -7.18 | | | 0.85 | | | 2.51 | |
All returns represent past performance and do not guarantee future results. Periods of less than one year are not annualized. Share price and return will vary and you may have a gain or loss when you sell your shares. All results include reinvestment of dividends and capital gains. Current returns may be higher or lower than those shown. For performance current to the most recent month-end, visit www.funds.natixis.com.
Class Y shares are available to certain investors, as described in the prospectus.
The table and graph do not reflect taxes shareholders might owe on any fund distributions or when they redeem their shares.
PORTFOLIO FACTS
| | | | |
| |
| | | % of Net Assets as of |
| FUND COMPOSITION | | 9/30/09 | | 9/30/08 |
Common Stocks | | 88.2 | | 97.3 |
Short-Term Investments and Other | | 11.8 | | 2.7 |
| |
| | | % of Net Assets as of |
| TEN LARGEST HOLDINGS | | 9/30/09 | | 9/30/08 |
JPMorgan Chase & Co. | | 2.8 | | 3.1 |
Total SA, Sponsored ADR | | 2.2 | | 2.2 |
Schering-Plough Corp. | | 1.9 | | 2.1 |
Hewlett-Packard Co. | | 1.9 | | 2.0 |
Bank of America Corp. | | 1.9 | | 2.4 |
Northrop Grumman Corp. | | 1.9 | | 1.9 |
ExxonMobil Corp. | | 1.8 | | 4.3 |
Owens-Illinois, Inc. | | 1.7 | | 1.3 |
DIRECTV Group, Inc. (The) | | 1.7 | | 1.8 |
Ameriprise Financial, Inc. | | 1.6 | | 1.4 |
| |
| | | % of Net Assets as of |
| FIVE LARGEST INDUSTRIES | | 9/30/09 | | 9/30/08 |
Oil, Gas & Consumable Fuels | | 11.3 | | 7.9 |
Pharmaceuticals | | 6.9 | | 9.8 |
Capital Markets | | 5.2 | | 3.0 |
Diversified Financial Services | | 4.6 | | 8.3 |
Insurance | | 3.9 | | 7.4 |
Portfolio holdings and asset allocations will vary.
EXPENSE RATIOS AS STATED IN THE MOST RECENT PROSPECTUS
| | | | |
| Share Class | | Gross Expense Ratio6 | | Net Expense Ratio7 |
A | | 1.05% | | 1.05% |
B | | 1.80 | | 1.80 |
C | | 1.80 | | 1.80 |
Y | | 0.66 | | 0.66 |
NOTES TO CHARTS
See page 11 for a description of the indices.
| 1 | Returns shown in the chart include performance of the fund’s Retail Class shares, which were redesignated to Class A shares on 6/1/07. Performance has been restated to reflect the current sales load of Class A shares. For periods before the inception of Retail Class shares (6/30/06), performance shown for Class A has been based on the performance of the fund’s Institutional Class shares, adjusted to reflect the higher fees and expenses paid by Class A shares. The restatement of the fund’s performance to reflect Class A expenses is based on the net expenses of the Class after taking into effect the fund’s then current expense cap arrangements. For periods prior to the inception of Class B and Class C shares (6/1/07), performance is based on prior Institutional Class performance, restated to reflect the sales loads and expenses of Class B and Class C shares, respectively. The growth of $10,000 chart compares the performance of Class A shares, at net asset value, to the performance of Class A shares including the maximum sales charge of 5.75%. This chart reflects the performance of Class A Shares rather than Class Y shares because Class A shares have the highest sales charge. Prior to 6/1/07, the fund was offered without a sales charge. |
| 2 | Does not include a sales charge. |
| 3 | Includes maximum sales charge of 5.75%. |
| 4 | Performance for Class B shares assumes a maximum of 5% contingent deferred sales charge (“CDSC”) applied when you sell shares, which declines annually between years 1-6 according to the following schedule: 5, 4, 3, 3, 2, 1, 0%. Class C shares performance assumes a 1% CDSC applied when you sell shares within one year of purchase. |
| 5 | Fund performance has been increased by expense reductions and reimbursements, if any, without which performance would have been lower. |
| 6 | Before reductions and reimbursements. |
| 7 | After reductions and reimbursements. Expense reductions are contractual and are set to expire 1/31/10. |
10
ADDITIONAL INFORMATION
The views expressed in this report reflect those of the portfolio managers as of the dates indicated. The managers’ views are subject to change at any time without notice based on changes in market or other conditions. References to specific securities or industries should not be regarded as investment advice. Because these funds are actively managed, there is no assurance that they will continue to invest in the securities or industries mentioned.
For more complete information on any Natixis Fund, contact your financial professional, visit the funds website at www.funds.natixis.com or call Natixis Funds at 800-225-5478 and ask for a free prospectus, which contains more complete information including charges and other ongoing expenses. Investors should consider a fund’s objective, risks and expenses carefully before investing. This and other fund information can be found in the prospectus. Please read the prospectus carefully before investing.
INDEX/AVERAGE DESCRIPTIONS:
Citigroup World Government Bond Index (“Citigroup WGBI”) is an unmanaged index that measures the most significant and liquid government bond indices located around the world with a rating of at least investment grade.
Morgan Stanley Capital International World Index (“MSCI World”) is an unmanaged index that measures global developed market equity performance.
Russell 1000 Growth Index is an unmanaged index that measures the performance of those Russell 1000 companies with higher price-to-book ratios and higher forecasted growth values.
Russell 1000 Value Index is an unmanaged index that measures the performance of those Russell 1000 companies with lower price-to-book ratios and lower forecasted growth values.
Russell Midcap Growth Index is an unmanaged index that measures the performance of those Russell Midcap Index companies with higher price-to-book ratios and higher forecasted growth values.
Standard & Poor’s 500 Index (“S&P 500”) is an unmanaged index of U.S. common stock performance.
Morningstar Fund Averages are the average performance without sales charges of funds with similar investment objectives, as calculated by Morningstar, Inc.
PROXY VOTING INFORMATION
A description of the funds’ proxy voting policies and procedures is available without charge, upon request, by calling Natixis Funds at 800-225-5478; on the funds’ website at www.funds.natixis.com; and on the Securities and Exchange Commission’s website at www.sec.gov. Information regarding how the funds voted proxies relating to portfolio securities during the 12-month period ended June 30, 2009 is available from the funds’ website and the SEC’s website.
QUARTERLY PORTFOLIO SCHEDULES
The funds will file a complete schedule of portfolio holdings with the SEC for the first and third quarters of each fiscal year on Form N-Q. The funds’ Forms N-Q are available on the SEC’s website at www.sec.gov and may be reviewed and copied at the SEC’s Public Reference Room in Washington, DC. Information on the operation of the Public Reference Room may be obtained by calling
1-800-SEC-0330.
| | | | |
| NOT FDIC INSURED | | MAY LOSE VALUE | | NO BANK GUARANTEE |
11
UNDERSTANDING FUND EXPENSES
As a mutual fund shareholder, you incur different types of costs: transaction costs, including sales charges (loads) on purchases and contingent deferred sales charges on redemptions, certain exchange fees and ongoing costs, including management fees, distribution and/or service fees (12b-1 fees), and other fund expenses. In addition, each fund may assess a minimum balance fee of $20 on an annual basis for accounts that fall below the required minimum to establish an account (certain exceptions may apply). These costs are described in more detail in the funds’ prospectus. The examples below are intended to help you understand the ongoing costs of investing in the funds and help you compare these with the ongoing costs of investing in other mutual funds.
The first line in the table for each class shows the actual amount of fund expenses you would have paid on a $1,000 investment in the fund from April 1, 2009 through September 30, 2009. It also shows how much a $1,000 investment would be worth at the close of the period, assuming actual fund returns and expenses. To estimate the expenses you paid over the period, simply divide your account value by $1,000 (for example, $8,600 account value divided by $1,000 = 8.6) and multiply the result by the number in the Expenses Paid During the Period row as shown below for your class.
The second line in the table for each class provides information about hypothetical account values and hypothetical expenses based on the fund’s actual expense ratios and an assumed rate of return of 5% per year before expenses, which is not the fund’s actual return. The hypothetical account values and expenses may not be used to estimate the actual ending account balance or expenses you paid on your investment for the period. You may use this information to compare the ongoing costs of investing in the fund and other funds. To do so, compare this 5% hypothetical example with the 5% hypothetical examples that appear in the shareholder reports of the other funds.
Please note that the expenses shown reflect ongoing costs only, and do not include any transaction costs. Therefore, the second line in the table of each fund is useful in comparing ongoing costs only, and will not help you determine the relative costs of owning different funds. If transaction costs were included, total costs would be higher.
| | | | | | |
| LOOMIS SAYLES DISCIPLINED EQUITY FUND** | | BEGINNING ACCOUNT VALUE
4/1/2009 | | ENDING ACCOUNT VALUE
9/30/2009 | | EXPENSES PAID DURING PERIOD*
4/1/2009 – 9/30/2009 |
CLASS A | | | | | | |
Actual | | $1,000.00 | | $1,300.80 | | $7.21 |
Hypothetical (5% return before expenses) | | $1,000.00 | | $1,018.80 | | $6.33 |
CLASS B | | | | | | |
Actual | | $1,000.00 | | $1,295.30 | | $11.51 |
Hypothetical (5% return before expenses) | | $1,000.00 | | $1,015.04 | | $10.10 |
CLASS C | | | | | | |
Actual | | $1,000.00 | | $1,296.30 | | $11.51 |
Hypothetical (5% return before expenses) | | $1,000.00 | | $1,015.04 | | $10.10 |
CLASS Y | | | | | | |
Actual | | $1,000.00 | | $1,300.40 | | $4.90 |
Hypothetical (5% return before expenses) | | $1,000.00 | | $1,020.81 | | $4.31 |
| * | Expenses are equal to the Fund’s annualized expense ratio (after fee reduction/reimbursement): 1.25%, 2.00%, 2.00% and 0.85%, for Class A, B, C and Y, respectively, multiplied by the average account value over the period, multiplied by the number of days in the most recent fiscal half-year, divided by 365 (to reflect the half-year period). |
| ** | Formerly Loomis Sayles Research Fund. |
12
UNDERSTANDING FUND EXPENSES
| | | | | | |
| LOOMIS SAYLES GLOBAL MARKETS FUND | | BEGINNING ACCOUNT VALUE
4/1/2009 | | ENDING ACCOUNT VALUE
9/30/2009 | | EXPENSES PAID DURING PERIOD*
4/1/2009 – 9/30/2009 |
CLASS A | | | | | | |
Actual | | $1,000.00 | | $1,376.70 | | $7.45 |
Hypothetical (5% return before expenses) | | $1,000.00 | | $1,018.80 | | $6.33 |
CLASS C | | | | | | |
Actual | | $1,000.00 | | $1,370.60 | | $11.89 |
Hypothetical (5% return before expenses) | | $1,000.00 | | $1,015.04 | | $10.10 |
CLASS Y | | | | | | |
Actual | | $1,000.00 | | $1,378.40 | | $5.96 |
Hypothetical (5% return before expenses) | | $1,000.00 | | $1,020.05 | | $5.06 |
| * | Expenses are equal to the Fund’s annualized expense ratio (after fee reduction/reimbursement): 1.25%, 2.00% and 1.00%, for Class A, C and Y, respectively, multiplied by the average account value over the period multiplied by the number of days in the most recent fiscal half-year, divided by 365 (to reflect the half-year period). |
| | | | | | |
| LOOMIS SAYLES GROWTH FUND | | BEGINNING ACCOUNT VALUE
4/1/2009 | | ENDING ACCOUNT VALUE
9/30/2009 | | EXPENSES PAID DURING PERIOD*
4/1/2009 – 9/30/2009 |
CLASS A | | | | | | |
Actual | | $1,000.00 | | $1,230.80 | | $6.99 |
Hypothetical (5% return before expenses) | | $1,000.00 | | $1,018.80 | | $6.33 |
CLASS B | | | | | | |
Actual | | $1,000.00 | | $1,226.40 | | $11.16 |
Hypothetical (5% return before expenses) | | $1,000.00 | | $1,015.04 | | $10.10 |
CLASS C | | | | | | |
Actual | | $1,000.00 | | $1,226.40 | | $11.16 |
Hypothetical (5% return before expenses) | | $1,000.00 | | $1,015.04 | | $10.10 |
CLASS Y | | | | | | |
Actual | | $1,000.00 | | $1,235.00 | | $4.43 |
Hypothetical (5% return before expenses) | | $1,000.00 | | $1,021.11 | | $4.00 |
| * | Expenses are equal to the Fund’s annualized expense ratio (after fee reduction/reimbursement): 1.25%, 2.00%, 2.00% and 0.79% for Class A, B, C, and Y, respectively, multiplied by the average account value over the period, multiplied by the number of days in the most recent fiscal half-year, divided by 365 (to reflect the half-year period). |
13
UNDERSTANDING FUND EXPENSES
| | | | | | |
| LOOMIS SAYLES MID CAP GROWTH FUND | | BEGINNING ACCOUNT VALUE
4/1/2009 | | ENDING ACCOUNT VALUE
9/30/2009 | | EXPENSES PAID DURING PERIOD*
4/1/2009 – 9/30/2009 |
CLASS A | | | | | | |
Actual | | $1,000.00 | | $1,222.60 | | $6.96 |
Hypothetical (5% return before expenses) | | $1,000.00 | | $1,018.80 | | $6.33 |
CLASS C | | | | | | |
Actual | | $1,000.00 | | $1,218.20 | | $11.12 |
Hypothetical (5% return before expenses) | | $1,000.00 | | $1,015.04 | | $10.10 |
CLASS Y | | | | | | |
Actual | | $1,000.00 | | $1,224.20 | | $5.58 |
Hypothetical (5% return before expenses) | | $1,000.00 | | $1,020.05 | | $5.06 |
| * | Expenses are equal to the Fund’s annualized expense ratio (after fee reduction/reimbursement): 1.25%, 2.00% and 1.00%, for Class A, C and Y, respectively, multiplied by the average account value over the period, multiplied by the number of days in the most recent fiscal half-year, divided by 365 (to reflect the half-year period). |
| | | | | | |
| LOOMIS SAYLES VALUE FUND | | BEGINNING ACCOUNT VALUE
4/1/2009 | | ENDING ACCOUNT VALUE
9/30/2009 | | EXPENSES PAID DURING PERIOD*
4/1/2009 – 9/30/2009 |
CLASS A | | | | | | |
Actual | | $1,000.00 | | $1,331.70 | | $6.31 |
Hypothetical (5% return before expenses) | | $1,000.00 | | $1,019.65 | | $5.47 |
CLASS B | | | | | | |
Actual | | $1,000.00 | | $1,326.90 | | $10.73 |
Hypothetical (5% return before expenses) | | $1,000.00 | | $1,015.84 | | $9.30 |
CLASS C | | | | | | |
Actual | | $1,000.00 | | $1,327.30 | | $10.68 |
Hypothetical (5% return before expenses) | | $1,000.00 | | $1,015.89 | | $9.25 |
CLASS Y | | | | | | |
Actual | | $1,000.00 | | $1,334.70 | | $3.98 |
Hypothetical (5% return before expenses) | | $1,000.00 | | $1,021.66 | | $3.45 |
| * | Expenses are equal to the Fund’s annualized expense ratio: 1.08%, 1.84%, 1.83% and 0.68%, for Class A, B, C, and Y, respectively, multiplied by the average account value over the period, multiplied by the number of days in the most recent fiscal half-year, divided by 365 (to reflect the half-year period). |
14
BOARD APPROVALOFTHE EXISTING ADVISORY AGREEMENTS
The Board of Trustees, including the Independent Trustees, considers matters bearing on each Fund’s advisory agreement (collectively, the “Agreements”) at most of its meetings throughout the year. Each year, usually in the spring, the Contract Review and Governance Committee of the Board meets to review the Agreements to determine whether to recommend that the full Board approve the continuation of the Agreements, typically for an additional one-year period. After the Committee has made its recommendation, the full Board, including the Independent Trustees, determines whether to approve the continuation of the Agreements.
In connection with these meetings, the Trustees receive materials that the Funds’ investment adviser (the “Adviser”) believes to be reasonably necessary for the Trustees to evaluate the Agreements. These materials generally include, among other items, (i) information on the investment performance of the Funds and the performance of peer groups of funds and the Funds’ performance benchmarks, (ii) information on the Funds’ advisory fees and other expenses, including information comparing the Funds’ expenses to those of peer groups of funds and information about any applicable expense caps and fee “breakpoints,” (iii) sales and redemption data in respect of the Funds, (iv) information about the profitability of the Agreements to the Funds’ Adviser and (v) information obtained through the completion of a questionnaire by the Adviser (the Trustees are consulted as to the information requested through that questionnaire). The Board of Trustees, including the Independent Trustees, also consider other matters such as (i) the Adviser’s financial results and financial condition, (ii) each Fund’s investment objective and strategies and the size, education and experience of the Adviser’s investment staff and its use of technology, external research and trading cost measurement tools, (iii) arrangements in respect of the distribution of the Funds’ shares and the related costs, (iv) the procedures employed to determine the value of the Funds’ assets, (v) the allocation of the Funds’ brokerage, if any, including, if applicable, allocations to brokers affiliated with the Adviser and the use of “soft” commission dollars to pay Fund expenses and to pay for research and other similar services, (vi) the resources devoted to, and the record of compliance with, the Funds’ investment policies and restrictions, policies on personal securities transactions and other compliance policies, (vii) information about amounts invested by the Funds’ portfolio managers in the Funds or in similar accounts that they manage and (viii) the general economic outlook with particular emphasis on the mutual fund industry. Throughout the process, the Trustees are afforded the opportunity to ask questions of and request additional materials from the Adviser.
In addition to the materials requested by the Trustees in connection with their annual consideration of the continuation of the Agreements, the Trustees receive materials in advance of each regular quarterly meeting of the Board of Trustees that provide detailed information about the Funds’ investment performance and the fees charged to the Funds for advisory and other services. This information generally includes, among other things, an internal performance rating for each Fund based on agreed-upon criteria, graphs showing each Fund’s performance and fee differentials against each Fund’s peer group of funds, performance ratings provided by a third-party, total return information for various periods, and third-party performance rankings for various periods comparing a Fund against its peer group. The portfolio management team for each Fund or other representatives of the Adviser make periodic presentations to the Contract Review and Governance Committee and/or the full Board of Trustees, and Funds identified as presenting possible performance concerns may be subject to more frequent board presentations and reviews. In addition, each quarter the Trustees are provided with detailed statistical information about each Fund’s portfolio.
The Board of Trustees most recently approved the continuation of the Agreements at their meeting held in June 2009. The Agreements were continued for a one-year period for the Funds. In considering whether to approve the continuation of the Agreements, the Board of Trustees, including the Independent Trustees, did not identify any single factor as determinative. Individual Trustees may have evaluated the information presented differently from one another, giving different weights to various factors. Matters considered by the Trustees, including the Independent Trustees, in connection with their approval of the Agreements included the factors listed below.
The nature, extent and quality of the services provided to the Funds under the Agreements. The Trustees considered the nature, extent and quality of the services provided by the Adviser and its affiliates to the Funds and the resources dedicated to the Funds by the Adviser and its affiliates, including recent or planned investments by the Adviser in additional personnel or other resources. They considered the need for the Adviser to offer competitive compensation in order to attract and retain capable personnel.
For each Fund, the Trustees also considered the benefits to shareholders of investing in a mutual fund that is part of a family of funds that offers shareholders the right to exchange shares of one type of fund for shares of another type of fund, and provides a variety of fund and shareholder services.
After reviewing these and related factors, the Trustees concluded, within the context of their overall conclusions regarding each of the Agreements, that the nature, extent and quality of services provided supported the renewal of the Agreements.
15
BOARD APPROVALOFTHE EXISTING ADVISORY AGREEMENTS
Investment performance of the Funds and the Adviser. As noted above, the Trustees received information about the performance of the Funds over various time periods, including information which compared the performance of the Funds to the performance of peer groups of funds and the Funds’ respective performance benchmarks. In addition, the Trustees also reviewed data prepared by an independent third party which analyzed the performance of the Funds using a variety of performance metrics, including metrics which also measured the performance of the Funds on a risk adjusted basis.
With respect to each Fund, the Board concluded that the Fund’s performance or other relevant factors supported the renewal of the Agreement relating to that Fund. In the case of each Fund that had performance that lagged that of a relevant peer group for certain (although not necessarily all) periods, the Board concluded that other factors relevant to performance supported renewal of the Funds’ Agreements. These factors included one or more of the following: (1) that the underperformance was attributable, to a significant extent, to investment decisions (such as security selection or sector allocation) by the Fund’s Adviser that were reasonable and consistent with the Funds’ investment objective and policies; (2) that the Fund’s more recent performance was competitive when compared to relevant performance benchmarks or peer groups and (3) that the Fund’s performance, although lagging in certain recent periods, was stronger over the longer term.
The Trustees also considered the Adviser’s performance and reputation generally, the Funds’ performance as a fund family generally (as noted by certain financial publications), and the historical responsiveness of the Adviser to Trustee concerns about performance and the willingness of the Adviser to take steps intended to improve performance.
After reviewing these and related factors, the Trustees concluded, within the context of their overall conclusions regarding each of the Agreements, that the performance of the Funds and the Adviser supported the renewal of the Agreements.
The costs of the services to be provided and profits to be realized by the Adviser and its affiliates from their respective relationships with the Funds. The Trustees considered the fees charged to the Funds for advisory services as well as the total expense levels of the Funds. This information included comparisons (provided both by management and also by an independent third party) of the Funds’ advisory fees and total expense levels to those of their peer groups and information about the advisory fees charged by the Adviser to comparable accounts. In considering the fees charged to comparable accounts, the Trustees considered, among other things, management’s representations about the differences between managing mutual funds as compared to other types of accounts, including the additional resources required to effectively manage and the greater regulatory costs associated with the management of mutual fund assets. In evaluating each Fund’s advisory fee, the Trustees also took into account the demands, complexity and quality of the investment management of such Fund. The Trustees considered that over the past several years, management had made recommendations regarding reductions in advisory fee rates, implementation of advisory fee breakpoints and the institution of advisory fee waivers and expense caps for various Funds in the Fund family. They noted that, as of December 31, 2008, all five of the Natixis Equity Funds included in this report have expense caps in place, and the Trustees considered the amounts waived or reimbursed by the Adviser under these caps. The Trustees noted that the Loomis Sayles Global Markets Fund had an advisory fee rate that was above the median of a peer group of funds. The Trustees considered the circumstances that accounted for such relatively higher expenses and noted that the Fund’s total expense ratio was equal to the median of the Fund’s peer group of funds even though the advisory fee was above the median.
The Trustees also considered the compensation directly or indirectly received by the Adviser and its affiliates from their relationships with the Funds. The Trustees reviewed information provided by management as to the profitability of the Adviser’s and its affiliates’ relationships with the Funds, and information about the allocation of expenses used to calculate profitability. They also reviewed information provided by management about the effect of distribution costs and changes in asset levels on Adviser profitability, including information regarding resources spent on distribution activities. When reviewing profitability, the Trustees also considered information about court cases in which adviser profitability was an issue, the performance of the relevant Funds, the expense levels of the Funds, and whether the Adviser had implemented breakpoints and/or expense caps with respect to such Funds.
After reviewing these and related factors, the Trustees concluded, within the context of their overall conclusions regarding each of the Agreements, that the advisory fee charged to each of the Funds was fair and reasonable, and that the costs of these services generally and the related profitability of the Adviser and its affiliates in respect of their relationships with the Funds supported the renewal of the Agreements.
Economies of Scale. The Trustees considered the existence of any economies of scale in the provision of services by the Adviser and whether those economies are shared with the Funds through breakpoints in their investment advisory fees or other means, such as
16
BOARD APPROVALOFTHE EXISTING ADVISORY AGREEMENTS
expense waivers or caps. The Trustees noted that each of the Funds was subject to an expense cap or waiver. In considering these issues, the Trustees also took note of the costs of the services provided (both on an absolute and a relative basis) and the profitability to the Adviser and its affiliates of their relationships with the Funds, as discussed above.
After reviewing these and related factors, the Trustees considered, within the context of their overall conclusions regarding each of the Agreements, that the extent to which economies of scale were shared with the Funds supported the renewal of the Agreements.
The Trustees also considered other factors, which included but were not limited to the following:
| · | | the effect of recent market and economic turmoil on the performance, asset levels and expense ratios of each Fund. |
| · | | whether each Fund has operated in accordance with its investment objective and the Fund’s record of compliance with its investment restrictions, and the compliance programs of the Funds and the Adviser. They also considered the compliance-related resources the Adviser and its affiliates were providing to the Funds. |
| · | | the nature, quality, cost and extent of administrative and shareholder services performed by the Adviser and its affiliates, both under the Agreements and under separate agreements covering administrative services. |
| · | | so-called “fallout benefits” to the Adviser, such as the engagement of affiliates of the Adviser to provide distribution, administrative and brokerage services to the Funds, and the benefits of research made available to the Adviser by reason of brokerage commissions generated by the Funds’ securities transactions. The Trustees considered the possible conflicts of interest associated with these fallout and other benefits, and the reporting, disclosure and other processes in place to disclose and monitor such possible conflicts of interest. |
| · | | the Trustees’ review and discussion of the Funds’ advisory arrangements in prior years, and management’s record of responding to Trustee concerns raised during the year and in prior years. |
Based on their evaluation of all factors that they deemed to be material, including those factors described above, and assisted by the advice of independent counsel, the Trustees, including the Independent Trustees, concluded that each of the existing Agreements should be continued through June 30, 2010.
17
LOOMIS SAYLES DISCIPLINED EQUITY FUND* — PORTFOLIOOF INVESTMENTS
Investments as of September 30, 2009
| | | | | |
| | |
| Shares | | Description | | Value (†) |
| | | | | |
| Common Stocks — 97.4% of Net Assets | | | |
| | Aerospace & Defense — 2.6% | | | |
| 3,971 | | General Dynamics Corp. | | $ | 256,526 |
| 3,454 | | ITT Corp. | | | 180,126 |
| 3,939 | | Raytheon Co. | | | 188,954 |
| 2,601 | | United Technologies Corp. | | | 158,479 |
| | | | | |
| | | | | 784,085 |
| | | | | |
| | Air Freight & Logistics — 0.7% | | | |
| 3,844 | | United Parcel Service, Inc., Class B | | | 217,071 |
| | | | | |
| | Beverages — 2.6% | | | |
| 18,153 | | Coca-Cola Enterprises, Inc. | | | 388,655 |
| 13,561 | | Dr Pepper Snapple Group, Inc.(b) | | | 389,879 |
| | | | | |
| | | | | 778,534 |
| | | | | |
| | Biotechnology — 1.9% | | | |
| 5,729 | | Amgen, Inc.(b) | | | 345,058 |
| 3,799 | | Celgene Corp.(b) | | | 212,364 |
| | | | | |
| | | | | 557,422 |
| | | | | |
| | Building Products — 1.0% | | | |
| 22,873 | | Masco Corp. | | | 295,519 |
| | | | | |
| | Capital Markets — 4.2% | | | |
| 3,349 | | Franklin Resources, Inc. | | | 336,909 |
| 2,859 | | Goldman Sachs Group, Inc. (The) | | | 527,057 |
| 17,613 | | Invesco Ltd. | | | 400,872 |
| | | | | |
| | | | | 1,264,838 |
| | | | | |
| | Chemicals — 0.9% | | | |
| 3,200 | | Praxair, Inc. | | | 261,408 |
| | | | | |
| | Commercial Banks — 3.2% | | | |
| 6,389 | | PNC Financial Services Group, Inc. | | | 310,441 |
| 23,331 | | Wells Fargo & Co. | | | 657,468 |
| | | | | |
| | | | | 967,909 |
| | | | | |
| | Communications Equipment — 4.2% | | | |
| 26,367 | | Brocade Communications Systems, Inc.(b) | | | 207,244 |
| 30,918 | | Cisco Systems, Inc.(b) | | | 727,810 |
| 8,717 | | Harris Corp. | | | 327,759 |
| | | | | |
| | | | | 1,262,813 |
| | | | | |
| | Computers & Peripherals — 7.1% | | | |
| 5,220 | | Apple, Inc.(b) | | | 967,631 |
| 28,937 | | EMC Corp.(b) | | | 493,087 |
| 14,052 | | Hewlett-Packard Co. | | | 663,395 |
| | | | | |
| | | | | 2,124,113 |
| | | | | |
| | Containers & Packaging — 1.5% | | | |
| 6,518 | | Owens-Illinois, Inc.(b) | | | 240,514 |
| 7,807 | | Pactiv Corp.(b) | | | 203,373 |
| | | | | |
| | | | | 443,887 |
| | | | | |
| | Diversified Financial Services — 4.3% | | | |
| 29,816 | | Bank of America Corp. | | | 504,487 |
| 17,782 | | JPMorgan Chase & Co. | | | 779,207 |
| | | | | |
| | | | | 1,283,694 |
| | | | | |
| | Diversified Telecommunication Services — 2.9% | | | |
| 24,584 | | AT&T, Inc. | | | 664,014 |
| 6,399 | | CenturyTel, Inc. | | | 215,006 |
| | | | | |
| | | | | 879,020 |
| | | | | |
| | | | | |
| | |
| Shares | | Description | | Value (†) |
| | | | | |
| | Electric Utilities — 2.1% | | | |
| 13,068 | | American Electric Power Co., Inc. | | $ | 404,977 |
| 2,837 | | Entergy Corp. | | | 226,563 |
| | | | | |
| | | | | 631,540 |
| | | | | |
| | Energy Equipment & Services — 1.5% | | | |
| 5,201 | | Halliburton Co. | | | 141,051 |
| 5,381 | | Schlumberger Ltd. | | | 320,708 |
| | | | | |
| | | | | 461,759 |
| | | | | |
| | Food & Staples Retailing — 2.2% | | | |
| 15,040 | | SUPERVALU, Inc. | | | 226,502 |
| 11,587 | | Walgreen Co. | | | 434,165 |
| | | | | |
| | | | | 660,667 |
| | | | | |
| | Health Care Equipment & Supplies — 0.8% | | | |
| 10,790 | | CareFusion Corp.(b) | | | 235,222 |
| | | | | |
| | Health Care Providers & Services — 3.2% | | | |
| 7,739 | | Aetna, Inc. | | | 215,377 |
| 6,012 | | Express Scripts, Inc.(b) | | | 466,411 |
| 4,857 | | McKesson Corp. | | | 289,234 |
| | | | | |
| | | | | 971,022 |
| | | | | |
| | Hotels, Restaurants & Leisure — 3.3% | | | |
| 13,360 | | International Game Technology | | | 286,973 |
| 19,413 | | Starbucks Corp.(b) | | | 400,878 |
| 9,209 | | Starwood Hotels & Resorts Worldwide, Inc. | | | 304,173 |
| | | | | |
| | | | | 992,024 |
| | | | | |
| | Household Products — 2.7% | | | |
| 14,099 | | Procter & Gamble Co. (The) | | | 816,614 |
| | | | | |
| | Independent Power Producers & Energy Traders — 0.8% | | | |
| 6,867 | | Constellation Energy Group, Inc. | | | 222,285 |
| | | | | |
| | Industrial Conglomerates — 0.3% | | | |
| 6,165 | | General Electric Co. | | | 101,229 |
| | | | | |
| | Insurance — 2.4% | | | |
| 10,351 | | Metlife, Inc. | | | 394,063 |
| 6,555 | | Prudential Financial, Inc. | | | 327,160 |
| | | | | |
| | | | | 721,223 |
| | | | | |
| | Internet Software & Services — 1.7% | | | |
| 1,051 | | Google, Inc., Class A(b) | | | 521,138 |
| | | | | |
| | IT Services — 1.2% | | | |
| 9,506 | | Cognizant Technology Solutions Corp., Class A(b) | | | 367,502 |
| | | | | |
| | Life Sciences Tools & Services — 1.9% | | | |
| 5,892 | | Life Technologies Corp.(b) | | | 274,273 |
| 5,263 | | Waters Corp.(b) | | | 293,991 |
| | | | | |
| | | | | 568,264 |
| | | | | |
| | Machinery — 2.1% | | | |
| 4,724 | | Cummins, Inc. | | | 211,682 |
| 4,149 | | Flowserve Corp. | | | 408,843 |
| | | | | |
| | | | | 620,525 |
| | | | | |
| | Media — 1.5% | | | |
| 16,031 | | Time Warner, Inc. | | | 461,372 |
| | | | | |
| | Metals & Mining — 0.8% | | | |
| 3,640 | | Freeport-McMoRan Copper & Gold, Inc. | | | 249,740 |
| | | | | |
| | Multi-Utilities & Unregulated Power — 0.5% | | | |
| 4,915 | | Public Service Enterprise Group, Inc. | | | 154,528 |
| | | | | |
See accompanying notes to financial statements.
18
LOOMIS SAYLES DISCIPLINED EQUITY FUND* — PORTFOLIOOF INVESTMENTS (continued)
Investments as of September 30, 2009
| | | | | |
| | |
| Shares | | Description | | Value (†) |
| | | | | |
| | Multiline Retail — 1.3% | | | |
| 6,614 | | Kohl’s Corp.(b) | | $ | 377,329 |
| | | | | |
| | Oil, Gas & Consumable Fuels — 10.1% | | | |
| 5,443 | | Anadarko Petroleum Corp. | | | 341,439 |
| 3,856 | | Apache Corp. | | | 354,097 |
| 8,007 | | Chevron Corp. | | | 563,933 |
| 11,392 | | ExxonMobil Corp. | | | 781,605 |
| 4,462 | | Kinder Morgan Management LLC(b) | | | 211,276 |
| 6,068 | | Marathon Oil Corp. | | | 193,569 |
| 3,780 | | Occidental Petroleum Corp. | | | 296,352 |
| 11,995 | | Petrohawk Energy Corp.(b) | | | 290,399 |
| | | | | |
| | | | | 3,032,670 |
| | | | | |
| | Personal Products — 1.4% | | | |
| 12,153 | | Avon Products, Inc. | | | 412,716 |
| | | | | |
| | Pharmaceuticals — 5.7% | | | |
| 5,069 | | Allergan, Inc. | | | 287,717 |
| 11,549 | | Merck & Co., Inc. | | | 365,295 |
| 21,103 | | Mylan, Inc.(b) | | | 337,859 |
| 44,035 | | Pfizer, Inc. | | | 728,779 |
| | | | | |
| | | | | 1,719,650 |
| | | | | |
| | Road & Rail — 1.8% | | | |
| 5,577 | | CSX Corp. | | | 233,453 |
| 5,449 | | Union Pacific Corp. | | | 317,949 |
| | | | | |
| | | | | 551,402 |
| | | | | |
| | Semiconductors & Semiconductor Equipment — 1.4% | | | |
| 7,230 | | Analog Devices, Inc. | | | 199,404 |
| 15,853 | | Applied Materials, Inc. | | | 212,430 |
| | | | | |
| | | | | 411,834 |
| | | | | |
| | Software — 3.5% | | | |
| 24,448 | | Activision Blizzard, Inc.(b) | | | 302,911 |
| 36,035 | | Oracle Corp. | | | 750,969 |
| | | | | |
| | | | | 1,053,880 |
| | | | | |
| | Specialty Retail — 3.2% | | | |
| 10,636 | | Abercrombie & Fitch Co. | | | 349,712 |
| 16,062 | | Limited Brands, Inc. | | | 272,893 |
| 6,967 | | Ross Stores, Inc. | | | 332,814 |
| | | | | |
| | | | | 955,419 |
| | | | | |
| | Tobacco — 2.0% | | | |
| 12,530 | | Philip Morris International, Inc. | | | 610,712 |
| | | | | |
| | Trading Companies & Distributors — 0.9% | | | |
| 3,148 | | W.W. Grainger, Inc. | | | 281,305 |
| | | | | |
| | Total Common Stocks (Identified Cost $25,521,172) | | | 29,283,884 |
| | | | | |
| | | | | | | |
Principal
Amount | | Description | | Value (†) | |
| | | | | | | |
| | Short-Term Investments — 3.8% | |
| $ | 1,152,860 | | Tri-Party Repurchase Agreement with Fixed Income Clearing Corporation, dated 9/30/2009 at 0.000% to be repurchased at $1,152,860 on 10/01/2009 collateralized by $1,170,000 Federal Home Loan Mortgage Corp., 3.030% due 5/05/2014 valued at $1,180,238 including accrued interest (Note 2h of Notes to Financial Statements) (Identified Cost $1,152,860) | | $ | 1,152,860 | |
| | | | | | | |
| | | Total Investments — 101.2%
(Identified Cost $26,674,032)(a) | | | 30,436,744 | |
| | | Other assets less liabilities — (1.2)% | | | (353,227 | ) |
| | | | | | | |
| | | Net Assets — 100.0% | | $ | 30,083,517 | |
| | | | | | | |
| | | | | | | |
| | * | | Formerly Loomis Sayles Research Fund. | | | | |
| | (†) | | See Note 2a of Notes to Financial Statements. | | | | |
| | (a) | | Federal Tax Information: At September 30, 2009, the net unrealized appreciation on investments based on a cost of $27,549,786 for federal income tax purposes was as follows: | | | | |
| | | Aggregate gross unrealized appreciation for all investments in which there is an excess of value over tax cost | | $ | 3,275,478 | |
| | | Aggregate gross unrealized depreciation for all investments in which there is an excess of tax cost over value | | | (388,520 | ) |
| | | | | | | |
| | | Net unrealized appreciation | | $ | 2,886,958 | |
| | | | | | | |
| | (b) | | Non-income producing security. | | | | |
Industry Summary at September 30, 2009 (Unaudited)
| | | |
| Oil, Gas & Consumable Fuels | | 10.1 | % |
| Computers & Peripherals | | 7.1 | |
| Pharmaceuticals | | 5.7 | |
| Diversified Financial Services | | 4.3 | |
| Capital Markets | | 4.2 | |
| Communications Equipment | | 4.2 | |
| Software | | 3.5 | |
| Hotels, Restaurants & Leisure | | 3.3 | |
| Health Care Providers & Services | | 3.2 | |
| Commercial Banks | | 3.2 | |
| Specialty Retail | | 3.2 | |
| Diversified Telecommunication Services | | 2.9 | |
| Household Products | | 2.7 | |
| Aerospace & Defense | | 2.6 | |
| Beverages | | 2.6 | |
| Insurance | | 2.4 | |
| Food & Staples Retailing | | 2.2 | |
| Electric Utilities | | 2.1 | |
| Machinery | | 2.1 | |
| Tobacco | | 2.0 | |
| Other Investments, less than 2% each | | 23.8 | |
| Short-Term Investments | | 3.8 | |
| | | |
| Total Investments | | 101.2 | |
| Other assets less liabilities | | (1.2 | ) |
| | | |
| Net Assets | | 100.0 | % |
| | | |
See accompanying notes to financial statements.
19
LOOMIS SAYLES GLOBAL MARKETS FUND — PORTFOLIOOF INVESTMENTS
Investments as of September 30, 2009
| | | | | |
| | |
| Shares | | Description | | Value (†) |
| | | | | |
| Common Stocks — 60.6% of Net Assets | | | |
| | Brazil — 4.9% | | | |
| 68,100 | | B2W Companhiaia Global do Varejo | | $ | 1,914,303 |
| 349,200 | | BM&F BOVESPA SA | | | 2,574,256 |
| 138,500 | | Lojas Renner SA | | | 2,428,206 |
| 187,600 | | Natura Cosmeticos SA | | | 3,383,281 |
| 83,298 | | Vale SA, Sponsored ADR | | | 1,926,683 |
| | | | | |
| | | | | 12,226,729 |
| | | | | |
| | Cayman Islands — 1.2% | | | |
| 7,807 | | Baidu.com, Sponsored ADR(e) | | | 3,052,927 |
| | | | | |
| | Chile — 0.6% | | | |
| 37,998 | | Sociedad Quimica y Minera de Chile SA, Sponsored ADR | | | 1,486,862 |
| | | | | |
| | China — 2.1% | | | |
| 1,858,000 | | Dongfeng Motor Group Co. Ltd., Class H | | | 1,955,759 |
| 201,900 | | Tencent Holdings Ltd. | | | 3,256,014 |
| | | | | |
| | | | | 5,211,773 |
| | | | | |
| | France — 0.7% | | | |
| 46,471 | | ArcelorMittal | | | 1,725,933 |
| | | | | |
| | Germany — 1.2% | | | |
| 33,349 | | Siemens AG (Registered) | | | 3,070,783 |
| | | | | |
| | Greece — 1.0% | | | |
| 135,872 | | Piraeus Bank SA(e) | | | 2,532,713 |
| | | | | |
| | Japan — 1.8% | | | |
| 84,900 | | Honda Motor Co. Ltd. | | | 2,578,392 |
| 64,700 | | Toyoda Gosei Co. Ltd. | | | 1,886,788 |
| | | | | |
| | | | | 4,465,180 |
| | | | | |
| | Korea — 2.4% | | | |
| 38,790 | | Samsung Electro-Mechanics Co. Ltd. | | | 3,332,678 |
| 3,976 | | Samsung Electronics Co. Ltd. | | | 2,744,989 |
| | | | | |
| | | | | 6,077,667 |
| | | | | |
| | Mexico — 0.7% | | | |
| 48,145 | | Desarrolladora Homex SAB de CV, ADR(e) | | | 1,813,420 |
| | | | | |
| | Netherlands — 0.9% | | | |
| 51,064 | | Randstad Holding NV(e) | | | 2,212,102 |
| | | | | |
| | Russia — 0.8% | | | |
| 100,347 | | Vimpel-Communications, Sponsored ADR(e) | | | 1,876,489 |
| | | | | |
| | Spain — 2.0% | | | |
| 106,784 | | Gamesa Corp Tecnologica SA | | | 2,402,686 |
| 43,149 | | Industria de Diseno Textil SA | | | 2,481,222 |
| | | | | |
| | | | | 4,883,908 |
| | | | | |
| | Sweden — 0.9% | | | |
| 227,373 | | Volvo AB, Class B | | | 2,108,606 |
| | | | | |
| | Switzerland — 2.8% | | | |
| 206,301 | | ABB Ltd. (Registered)(e) | | | 4,142,365 |
| 51,567 | | Credit Suisse Group AG | | | 2,869,076 |
| | | | | |
| | | | | 7,011,441 |
| | | | | |
| | Taiwan — 0.7% | | | |
| 104,194 | | MediaTek, Inc. | | | 1,731,809 |
| | | | | |
| | Turkey — 0.6% | | | |
| 39,163 | | BIM Birlesik Magazalar A/S | | | 1,601,993 |
| | | | | |
| | United Kingdom — 5.2% | | | |
| 106,865 | | BG Group PLC | | | 1,862,547 |
| 272,379 | | Standard Chartered PLC | | | 6,728,130 |
| | | | | | |
| | |
| Shares | | Description | | Value (†) |
| | | | | | |
| | | United Kingdom — continued | | | |
| | 190,911 | | Xstrata PLC(e) | | $ | 2,815,474 |
| | 66,606 | | Vodafone Group PLC, Sponsored ADR | | | 1,498,635 |
| | | | | | |
| | | | | | 12,904,786 |
| | | | | | |
| | | United States — 30.1% | | | |
| | 38,094 | | Amazon.com, Inc.(e) | | | 3,556,456 |
| | 49,715 | | Amgen, Inc.(e) | | | 2,994,334 |
| | 45,942 | | Apple, Inc.(e) | | | 8,516,268 |
| | 201,505 | | Bank of America Corp. | | | 3,409,465 |
| | 74,637 | | Broadcom Corp., Class A(e) | | | 2,290,609 |
| | 99,153 | | Cisco Systems, Inc.(e) | | | 2,334,062 |
| | 108,813 | | eBay, Inc.(e) | | | 2,569,075 |
| | 54,583 | | FMC Technologies, Inc.(e) | | | 2,851,416 |
| | 24,779 | | Goldman Sachs Group, Inc. (The) | | | 4,568,009 |
| | 36,851 | | Goodrich Corp. | | | 2,002,483 |
| | 7,655 | | Google, Inc., Class A(e) | | | 3,795,732 |
| | 61,490 | | Guess?, Inc. | | | 2,277,590 |
| | 93,226 | | International Game Technology | | | 2,002,494 |
| | 91,308 | | JPMorgan Chase & Co. | | | 4,001,117 |
| | 149,069 | | Marvell Technology Group Ltd.(e) | | | 2,413,427 |
| | 24,033 | | Priceline.com, Inc.(e) | | | 3,985,152 |
| | 85,206 | | QUALCOMM, Inc. | | | 3,832,566 |
| | 88,237 | | Southwestern Energy Co.(e) | | | 3,765,955 |
| | 52,139 | | Tiffany & Co. | | | 2,008,916 |
| | 46,735 | | Union Pacific Corp. | | | 2,726,987 |
| | 75,015 | | Urban Outfitters, Inc.(e) | | | 2,263,203 |
| | 26,818 | | Vertex Pharmaceuticals, Inc.(e) | | | 1,016,402 |
| | 27,840 | | Visa, Inc., Class A | | | 1,924,022 |
| | 146,527 | | Wells Fargo & Co. | | | 4,129,131 |
| | | | | | |
| | | | | | 75,234,871 |
| | | | | | |
| | | Total Common Stocks
(Identified Cost $126,994,688) | | | 151,229,992 |
| | | | | | |
Principal
Amount (‡) | | | | |
| | Bonds and Notes — 37.0% | | | |
| | Non-Convertible Bonds — 35.9% | | | |
| | | Argentina — 0.2% | | | |
| $ | 570,000 | | Transportadora de Gas del Sur SA,
7.875%, 5/14/2017, 144A | | | 490,200 |
| | | | | | |
| | | Australia — 0.1% | | | |
| | 230,000 | | New South Wales Treasury Corp., Series 10RG,
7.000%, 12/01/2010, (AUD) | | | 209,018 |
| | | | | | |
| | | Bermuda — 0.1% | | | |
| | 100,000 | | Noble Group Ltd.,
8.500%, 5/30/2013, 144A | | | 108,250 |
| | 200,000 | | Qtel International Finance Ltd.,
7.875%, 6/10/2019, 144A | | | 228,648 |
| | | | | | |
| | | | | | 336,898 |
| | | | | | |
| | | Brazil — 0.7% | | | |
| | 200,000 | | Banco Nacional de Desenvolvimento Economico e Social,
6.500%, 6/10/2019, 144A | | | 212,500 |
| | 1,477,709(††††) | | Brazil Notas do Tesouro Nacional, Series B,
6.000%, 8/15/2010, (BRL) | | | 841,878 |
| | 450(†††††) | | Brazil Notas do Tesouro Nacional, Series F,
10.000%, 1/01/2014, (BRL) | | | 235,597 |
| | 170,000 | | Marfrig Overseas Ltd.,
9.625%, 11/16/2016, 144A | | | 168,725 |
See accompanying notes to financial statements.
20
LOOMIS SAYLES GLOBAL MARKETS FUND — PORTFOLIOOF INVESTMENTS (continued)
Investments as of September 30, 2009
| | | | | | |
Principal
Amount (‡) | | Description | | Value (†) |
| | | | | | |
| | | Brazil — continued | | | |
| $ | 36,000 | | Republic of Brazil,
7.125%, 1/20/2037 | | $ | 42,930 |
| | 100,000 | | Telemar Norte Leste SA,
9.500%, 4/23/2019, 144A | | | 119,500 |
| | | | | | |
| | | | | | 1,621,130 |
| | | | | | |
| | | Canada — 0.6% | | | |
| | 343,000 | | ArcelorMittal USA Partnership,
9.750%, 4/01/2014 | | | 359,292 |
| | 855,000 | | Canadian Government,
4.500%, 6/01/2015, (CAD)(b) | | | 875,428 |
| | 25,000 | | Canadian Pacific Railway Ltd., MTN,
4.900%, 6/15/2010, (CAD), 144A | | | 23,912 |
| | 50,000 | | Nortel Networks Ltd.,
6.875%, 9/01/2023(g) | | | 14,000 |
| | 100,000 | | Shaw Communications, Inc.,
5.650%, 10/01/2019, (CAD) | | | 94,854 |
| | | | | | |
| | | | | | 1,367,486 |
| | | | | | |
| | | Cayman Islands — 0.9% | | | |
| | 360,000 | | DASA Finance Corp.,
8.750%, 5/29/2018, 144A | | | 381,600 |
| | 200,000 | | Embraer Overseas Ltd.,
6.375%, 1/24/2017 | | | 201,000 |
| | 100,000 | | Hutchison Whampoa International 09 Ltd.,
7.625%, 4/09/2019, 144A | | | 113,127 |
| | 100,000 | | LPG International, Inc.,
7.250%, 12/20/2015 | | | 105,750 |
| | 950,000 | | Petrobras International Finance Co.,
5.875%, 3/01/2018 | | | 985,372 |
| | 536,000 | | Vale Overseas Ltd.,
6.875%, 11/21/2036 | | | 554,509 |
| | | | | | |
| | | | | | 2,341,358 |
| | | | | | |
| | | Chile — 0.0% | | | |
| | 100,000 | | Celulosa Arauco y Constitucion SA,
7.250%, 7/29/2019, 144A | | | 110,104 |
| | | | | | |
| | | Colombia — 0.2% | | | |
| | 200,000 | | Ecopetrol SA,
7.625%, 7/23/2019, 144A | | | 219,000 |
| | 100,000 | | Empresas Publicas de Medellin ESP,
7.625%, 7/29/2019, 144A | | | 108,250 |
| | 40,000 | | Republic of Colombia,
8.125%, 5/21/2024 | | | 48,000 |
| | | | | | |
| | | | | | 375,250 |
| | | | | | |
| | | France — 0.5% | | | |
| | 35,000 | | Lafarge SA, EMTN,
4.750%, 3/23/2020, (EUR) | | | 45,112 |
| | 250,000 | | Lafarge SA, EMTN,
5.375%, 6/26/2017, (EUR) | | | 354,445 |
| | 70,000 | | PPR SA, EMTN,
4.000%, 1/29/2013, (EUR) | | | 102,345 |
| | 240,000 | | Veolia Environnement, EMTN,
4.000%, 2/12/2016, (EUR) | | | 350,133 |
| | 25,000 | | Veolia Environnement, EMTN,
5.125%, 5/24/2022, (EUR) | | | 36,517 |
| | 100,000 | | Wendel,
4.375%, 8/09/2017, (EUR) | | | 103,898 |
| | 200,000 | | Wendel,
4.875%, 5/26/2016, (EUR) | | | 226,819 |
| | | | | | |
| | | | | | 1,219,269 |
| | | | | | |
| | | | | |
Principal
Amount (‡) | | Description | | Value (†) |
| | | | | |
| | Germany — 0.4% | | | |
| 200,000 | | Bertelsmann AG,
4.750%, 9/26/2016, (EUR) | | $ | 275,628 |
| 30,000,000 | | Kreditanstalt fuer Wiederaufbau,
1.850%, 9/20/2010, (JPY) | | | 338,391 |
| 305,000 | | Republic of Germany,
3.750%, 7/04/2013, (EUR) | | | 472,360 |
| | | | | |
| | | | | 1,086,379 |
| | | | | |
| | India — 0.2% | | | |
| 500,000 | | Canara Bank Ltd., (fixed rate to 11/28/2016, variable rate thereafter),
6.365%, 11/28/2021 | | | 461,366 |
| 100,000 | | ICICI Bank Ltd., (fixed rate to 4/30/2017, variable rate thereafter),
6.375%, 4/30/2022, 144A | | | 81,801 |
| | | | | |
| | | | | 543,167 |
| | | | | |
| | Indonesia — 0.6% | | | |
| 400,000 | | Indonesia Government International Bond,
6.875%, 1/17/2018 | | | 430,000 |
| 700,000 | | Indonesia Government International Bond,
7.750%, 1/17/2038, 144A | | | 773,500 |
| 1,500,000,000 | | Indonesia Government International Bond,
11.500%, 9/15/2019, (IDR) | | | 169,077 |
| 100,000 | | Indonesia Government International Bond,
11.625%, 3/04/2019, 144A | | | 140,750 |
| | | | | |
| | | | | 1,513,327 |
| | | | | |
| | Ireland — 0.2% | | | |
| 555,000 | | Elan Financial PLC,
7.750%, 11/15/2011 | | | 565,406 |
| | | | | |
| | Italy — 0.2% | | | |
| 250,000 | | Finmeccanica SpA, EMTN,
4.875%, 3/24/2025, (EUR) | | | 345,762 |
| 100,000 | | Telecom Italia SpA, EMTN,
5.375%, 1/29/2019, (EUR) | | | 148,091 |
| | | | | |
| | | | | 493,853 |
| | | | | |
| | Japan — 0.6% | | | |
| 10,000,000 | | Japan Finance Corp. for Small and Medium Enterprises,
1.100%, 9/20/2011, (JPY) | | | 112,368 |
| 120,000,000 | | Japan Government,
1.400%, 6/20/2011, (JPY) | | | 1,363,790 |
| | | | | |
| | | | | 1,476,158 |
| | | | | |
| | Korea — 0.6% | | | |
| 400,000 | | Export-Import Bank of Korea,
8.125%, 1/21/2014 | | | 458,193 |
| 200,000 | | Korea Gas Corp.,
6.000%, 7/15/2014, 144A | | | 210,819 |
| 300,000 | | Korea Hydro & Nuclear Power Co. Ltd.,
6.250%, 6/17/2014, 144A | | | 319,120 |
| 460,000 | | SK Broadband Co. Ltd.,
7.000%, 2/01/2012, 144A | | | 473,800 |
| 140,000 | | SK Telecom Co. Ltd.,
6.625%, 7/20/2027, 144A | | | 148,382 |
| | | | | |
| | | | | 1,610,314 |
| | | | | |
| | Luxembourg — 0.2% | | | |
| 200,000 | | Enel Finance International SA, EMTN,
5.000%, 9/14/2022, (EUR) | | | 292,790 |
See accompanying notes to financial statements.
21
LOOMIS SAYLES GLOBAL MARKETS FUND — PORTFOLIOOF INVESTMENTS (continued)
Investments as of September 30, 2009
| | | | | | |
Principal
Amount (‡) | | Description | | Value (†) |
| | | | | | |
| | | Luxembourg — continued | | | |
| $ | 125,000 | | Telecom Italia Capital SA,
6.000%, 9/30/2034 | | $ | 121,859 |
| | 10,000 | | Telecom Italia Capital SA,
6.375%, 11/15/2033 | | | 10,218 |
| | | | | | |
| | | | | | 424,867 |
| | | | | | |
| | | Malaysia — 0.1% | | | |
| | 200,000 | | Ranhill Labuan Ltd.,
12.500%, 10/26/2011, 144A | | | 160,000 |
| | | | | | |
| | | Mexico — 0.6% | | | |
| | 340,000 | | Axtel SAB de CV,
7.625%, 2/01/2017, 144A | | | 326,400 |
| | 160,000 | | Corporacion GEO SAB de CV,
8.875%, 9/25/2014, 144A | | | 168,000 |
| | 295,000 | | Desarrolladora Homex SAB de CV,
7.500%, 9/28/2015 | | | 289,837 |
| | 44,000(††) | | Mexican Bonos, Series M-10,
8.500%, 12/13/2018, (MXN) | | | 337,689 |
| | 330,000 | | Petroleos Mexicanos,
8.000%, 5/03/2019 | | | 376,860 |
| | | | | | |
| | | | | | 1,498,786 |
| | | | | | |
| | | Netherlands — 0.3% | | | |
| | 150,000 | | Koninklijke KPN NV, EMTN,
4.750%, 1/17/2017, (EUR) | | | 223,739 |
| | 100,000 | | Majapahit Holding BV,
7.250%, 6/28/2017, 144A | | | 102,000 |
| | 100,000 | | Majapahit Holding BV,
8.000%, 8/07/2019, 144A | | | 106,750 |
| | 50,000 | | OI European Group BV,
6.875%, 3/31/2017, (EUR), 144A | | | 70,972 |
| | 125,000 | | Wolters Kluwer NV,
6.375%, 4/10/2018, (EUR) | | | 201,533 |
| | | | | | |
| | | | | | 704,994 |
| | | | | | |
| | | Norway — 0.5% | | | |
| | 635,000 | | Norwegian Government,
4.250%, 5/19/2017, (NOK) | | | 111,771 |
| | 1,765,000 | | Norwegian Government,
5.000%, 5/15/2015, (NOK) | | | 324,727 |
| | 1,885,000 | | Norwegian Government,
6.000%, 5/16/2011, (NOK) | | | 342,928 |
| | 2,860,000 | | Norwegian Government,
6.500%, 5/15/2013, (NOK) | | | 545,410 |
| | | | | | |
| | | | | | 1,324,836 |
| | | | | | |
| | | Peru — 0.1% | | | |
| | 200,000 | | Peruvian Government International Bond,
7.350%, 7/21/2025 | | | 233,500 |
| | | | | | |
| | | Qatar — 0.1% | | | |
| | 250,000 | | Ras Laffan Liquefied Natural Gas Co. Ltd. III,
5.500%, 9/30/2014, 144A | | | 265,406 |
| | | | | | |
| | | Singapore — 0.1% | | | |
| | 435,000 | | Government of Singapore,
2.250%, 7/01/2013, (SGD) | | | 322,448 |
| | | | | | |
| | | South Africa — 0.4% | | | |
| | 130,000 | | Edcon Proprietary Ltd.,
4.023%, 6/15/2014, (EUR), 144A(d) | | | 136,018 |
| | 450,000 | | Edcon Proprietary Ltd.,
4.023%, 6/15/2014, (EUR)(d) | | | 470,833 |
| | | | | |
Principal
Amount (‡) | | Description | | Value (†) |
| | | | | |
| | South Africa — continued | | | |
| 285,000 | | Republic of South Africa, EMTN,
4.500%, 4/05/2016, (EUR) | | $ | 406,628 |
| | | | | |
| | | | | 1,013,479 |
| | | | | |
| | Spain — 0.2% | | | |
| 100,000 | | Santander Issuances SA Unipersonal,
(fixed rate to 9/30/2014, variable rate thereafter),
4.500%, 9/30/2019, (EUR) | | | 143,750 |
| 150,000 | | Santander Issuances SA Unipersonal, EMTN,
(fixed rate to 5/29/2014, variable rate thereafter),
4.750%, 5/29/2019, (EUR) | | | 219,024 |
| | | | | |
| | | | | 362,774 |
| | | | | |
| | Supranational — 0.2% | | | |
| 42,000,000 | | European Investment Bank,
1.250%, 9/20/2012, (JPY) | | | 478,624 |
| | | | | |
| | Sweden — 0.2% | | | |
| 3,020,000 | | Sweden Government Bond,
5.500%, 10/08/2012, (SEK) | | | 476,045 |
| | | | | |
| | Thailand — 0.2% | | | |
| 330,000 | | True Move Co. Ltd.,
10.375%, 8/01/2014 | | | 308,550 |
| 100,000 | | True Move Co. Ltd.,
10.375%, 8/01/2014, 144A | | | 93,500 |
| | | | | |
| | | | | 402,050 |
| | | | | |
| | United Arab Emirates — 0.7% | | | |
| 400,000 | | Abu Dhabi National Energy Co.,
6.500%, 10/27/2036, 144A | | | 386,224 |
| 400,000 | | Abu Dhabi National Energy Co.,
7.250%, 8/01/2018, 144A | | | 428,471 |
| 500,000 | | DP World Ltd.,
6.850%, 7/02/2037, 144A | | | 439,745 |
| 150,000 | | Emirate of Abu Dhabi,
5.500%, 4/08/2014, 144A | | | 159,643 |
| 250,000 | | Mubadala Development Co., GMTN,
7.625%, 5/06/2019, 144A | | | 283,750 |
| | | | | |
| | | | | 1,697,833 |
| | | | | |
| | United Kingdom — 0.5% | | | |
| 100,000 | | BAT International Finance PLC,
5.875%, 3/12/2015, (EUR) | | | 159,913 |
| 60,000 | | BSKYB Finance UK PLC,
5.750%, 10/20/2017, (GBP) | | | 101,348 |
| 200,000 | | Imperial Tobacco Finance PLC, EMTN,
4.375%, 11/22/2013, (EUR) | | | 295,730 |
| 250,000 | | Standard Chartered Bank, EMTN,
5.875%, 9/26/2017, (EUR) | | | 378,315 |
| 100,000 | | United Kingdom Treasury,
4.000%, 9/07/2016, (GBP) | | | 169,572 |
| 100,000 | | WPP PLC,
6.000%, 4/04/2017, (GBP) | | | 153,060 |
| | | | | |
| | | | | 1,257,938 |
| | | | | |
| | United States — 25.4% | | | |
| 155,000 | | Alcatel-Lucent USA, Inc.,
6.450%, 3/15/2029 | | | 117,994 |
| 15,000 | | Amkor Technology, Inc.,
7.750%, 5/15/2013 | | | 15,000 |
| 100,000 | | Anadarko Petroleum Corp.,
5.950%, 9/15/2016 | | | 105,956 |
See accompanying notes to financial statements.
22
LOOMIS SAYLES GLOBAL MARKETS FUND — PORTFOLIOOF INVESTMENTS (continued)
Investments as of September 30, 2009
| | | | | | |
Principal
Amount (‡) | | Description | | Value (†) |
| | | | | | |
| | | United States — continued | | | |
| $ | 780,000 | | Anadarko Petroleum Corp.,
6.450%, 9/15/2036 | | $ | 805,345 |
| | 610,000 | �� | Anheuser-Busch Cos., Inc.,
4.950%, 1/15/2014 | | | 630,844 |
| | 105,000 | | Anheuser-Busch Cos., Inc.,
6.450%, 9/01/2037 | | | 114,373 |
| | 35,000 | | Anheuser-Busch Cos., Inc.,
6.500%, 5/01/2042 | | | 37,861 |
| | 250,000 | | Anheuser-Busch InBev Worldwide, Inc.,
7.750%, 1/15/2019, 144A | | | 295,815 |
| | 60,000 | | Arrow Electronics, Inc.,
6.875%, 7/01/2013 | | | 64,824 |
| | 260,000 | | AT&T, Inc.,
6.500%, 9/01/2037 | | | 279,372 |
| | 39,098 | | Atlas Air, Inc., Series B,
7.680%, 1/02/2014 | | | 33,233 |
| | 145,000 | | Avnet, Inc.,
6.000%, 9/01/2015 | | | 149,286 |
| | 200,000 | | Bank of America Corp.,
(fixed rate to 5/06/2014, variable rate thereafter),
4.750%, 5/06/2019, (EUR) | | | 258,342 |
| | 400,000,000 | | Barclays Financial LLC,
4.060%, 9/16/2010, (KRW), 144A | | | 342,746 |
| | 310,000 | | Borden, Inc.,
7.875%, 2/15/2023 | | | 173,600 |
| | 410,000 | | Borden, Inc.,
8.375%, 4/15/2016 | | | 270,600 |
| | 5,000 | | Boston Scientific Corp.,
5.450%, 6/15/2014 | | | 5,013 |
| | 30,000 | | Boston Scientific Corp.,
6.400%, 6/15/2016 | | | 30,413 |
| | 60,000 | | Boston Scientific Corp.,
7.000%, 11/15/2035 | | | 54,975 |
| | 50,000 | | Bristol-Myers Squibb Co.,
4.625%, 11/15/2021, (EUR) | | | 75,369 |
| | 150,000 | | Bunge Ltd. Finance Corp.,
8.500%, 6/15/2019 | | | 172,924 |
| | 700,000 | | Capital One Multi-Asset Execution Trust, Series 2005-A10, Class A,
0.323%, 9/15/2015(d) | | | 684,024 |
| | 2,335,000 | | Capital One Multi-Asset Execution Trust, Series 2006-A5, Class A5,
0.303%, 1/15/2016(d) | | | 2,271,968 |
| | 30,000 | | Caterpillar Financial Services Corp., MTN,
6.125%, 2/17/2014 | | | 32,890 |
| | 15,000 | | Chesapeake Energy Corp.,
6.500%, 8/15/2017 | | | 13,763 |
| | 70,000 | | Chesapeake Energy Corp.,
6.875%, 1/15/2016 | | | 66,325 |
| | 75,000 | | Chesapeake Energy Corp.,
6.875%, 11/15/2020 | | | 66,750 |
| | 22,000 | | CIT Group, Inc.,
5.400%, 2/13/2012 | | | 14,439 |
| | 112,000 | | CIT Group, Inc.,
5.400%, 3/07/2013 | | | 71,812 |
| | 7,000 | | CIT Group, Inc.,
5.400%, 1/30/2016 | | | 4,413 |
| | 17,000 | | CIT Group, Inc.,
5.600%, 4/27/2011 | | | 11,575 |
| | 153,000 | | CIT Group, Inc.,
5.800%, 10/01/2036 | | | 91,753 |
| | | | | | |
Principal
Amount (‡) | | Description | | Value (†) |
| | | | | | |
| | | United States — continued | | | |
| $ | 60,000 | | CIT Group, Inc., GMTN,
5.000%, 2/13/2014 | | $ | 38,327 |
| | 7,000 | | CIT Group, Inc., GMTN,
5.000%, 2/01/2015 | | | 4,483 |
| | 28,000 | | CIT Group, Inc., MTN,
5.125%, 9/30/2014 | | | 17,937 |
| | 706,000 | | CIT Group, Inc., Series A, MTN,
7.625%, 11/30/2012 | | | 459,826 |
| | 120,000 | | Citi Credit Card Issuance Trust, Series 2001-A4, Class A4,
5.375%, 4/10/2013, (EUR) | | | 172,440 |
| | 1,000,000 | | Comcast Corp.,
5.650%, 6/15/2035 | | | 967,169 |
| | 90,000 | | Countrywide Home Loans, Inc., Series L, MTN,
4.000%, 3/22/2011 | | | 91,470 |
| | 190,000 | | CSX Corp.,
6.250%, 3/15/2018 | | | 206,054 |
| | 265,000 | | Cummins, Inc.,
5.650%, 3/01/2098 | | | 160,656 |
| | 160,000 | | Cummins, Inc.,
7.125%, 3/01/2028 | | | 151,600 |
| | 10,000 | | D.R. Horton, Inc.,
5.250%, 2/15/2015 | | | 9,325 |
| | 333,864 | | Delta Air Lines, Inc., Series 2007-1, Class B,
8.021%, 8/10/2022 | | | 263,752 |
| | 329,097 | | Delta Air Lines, Inc., Series 2007-1, Class C,
8.954%, 8/10/2014 | | | 268,049 |
| | 50,000 | | Dillard’s, Inc.,
6.625%, 1/15/2018 | | | 38,000 |
| | 50,000 | | Dillard’s, Inc.,
7.000%, 12/01/2028 | | | 33,250 |
| | 13,000 | | ESI Tractebel Acquisition Corp., Series B,
7.990%, 12/30/2011 | | | 12,933 |
| | 250,000 | | Exelon Corp.,
4.900%, 6/15/2015 | | | 259,151 |
| | 150,000 | | Foot Locker, Inc.,
8.500%, 1/15/2022 | | | 141,750 |
| | 10,000 | | Ford Motor Co.,
6.625%, 2/15/2028 | | | 7,200 |
| | 1,750,000 | | Ford Motor Co.,
6.625%, 10/01/2028 | | | 1,260,000 |
| | 15,000 | | Ford Motor Co.,
7.125%, 11/15/2025 | | | 11,250 |
| | 595,000 | | Ford Motor Co.,
7.450%, 7/16/2031 | | | 481,950 |
| | 2,250,000 | | Ford Motor Credit Co. LLC,
7.000%, 10/01/2013 | | | 2,111,881 |
| | 260,000 | | Ford Motor Credit Co. LLC,
7.250%, 10/25/2011 | | | 252,514 |
| | 345,000 | | Ford Motor Credit Co. LLC,
7.500%, 8/01/2012 | | | 331,258 |
| | 905,000 | | Ford Motor Credit Co. LLC,
8.000%, 12/15/2016 | | | 839,628 |
| | 170,000 | | Ford Motor Credit Co. LLC,
8.625%, 11/01/2010 | | | 171,970 |
| | 390,000 | | Ford Motor Credit Co. LLC,
9.750%, 9/15/2010 | | | 398,537 |
| | 80,000 | | Freescale Semiconductor, Inc.,
10.125%, 12/15/2016 | | | 53,200 |
| | 45,000 | | General Electric Capital Corp.,
5.625%, 5/01/2018 | | | 44,784 |
See accompanying notes to financial statements.
23
LOOMIS SAYLES GLOBAL MARKETS FUND — PORTFOLIOOF INVESTMENTS (continued)
Investments as of September 30, 2009
| | | | | | |
Principal
Amount (‡) | | Description | | Value (†) |
| | | | | | |
| | | United States — continued | | | |
| $ | 205,000 | | General Electric Capital Corp., MTN,
5.875%, 1/14/2038 | | $ | 188,001 |
| | 750,000 | | General Electric Capital Corp., Series A, MTN,
4.875%, 3/04/2015 | | | 773,014 |
| | 3,375,000 | | Georgia-Pacific LLC,
7.250%, 6/01/2028 | | | 3,003,750 |
| | 35,000 | | Georgia-Pacific LLC,
7.750%, 11/15/2029 | | | 32,200 |
| | 525,000 | | Georgia-Pacific LLC,
8.000%, 1/15/2024 | | | 519,750 |
| | 505,000 | | Georgia-Pacific LLC,
8.875%, 5/15/2031 | | | 510,050 |
| | 288,000 | | GMAC, Inc.,
6.000%, 12/15/2011, 144A | | | 266,400 |
| | 129,000 | | GMAC, Inc.,
6.625%, 5/15/2012, 144A | | | 118,680 |
| | 257,000 | | GMAC, Inc.,
6.750%, 12/01/2014, 144A | | | 218,450 |
| | 28,000 | | GMAC, Inc.,
6.875%, 9/15/2011, 144A | | | 26,460 |
| | 60,000 | | GMAC, Inc.,
6.875%, 8/28/2012, 144A | | | 55,200 |
| | 63,000 | | GMAC, Inc.,
7.000%, 2/01/2012, 144A | | | 58,590 |
| | 63,000 | | GMAC, Inc.,
7.250%, 3/02/2011, 144A | | | 60,638 |
| | 55,000 | | GMAC, Inc.,
7.500%, 12/31/2013, 144A | | | 48,125 |
| | 129,000 | | GMAC, Inc.,
8.000%, 12/31/2018, 144A | | | 97,395 |
| | 1,946,000 | | GMAC, Inc.,
8.000%, 11/01/2031, 144A | | | 1,566,530 |
| | 150,000 | | Goldman Sachs Group, Inc. (The),
1.201%, 5/23/2016, (EUR)(d) | | | 196,149 |
| | 150,000 | | Goldman Sachs Group, Inc. (The),
4.750%, 1/28/2014, (EUR) | | | 224,690 |
| | 1,190,000 | | Goldman Sachs Group, Inc. (The),
5.000%, 10/01/2014 | | | 1,252,626 |
| | 605,000 | | Goldman Sachs Group, Inc. (The),
6.150%, 4/01/2018 | | | 636,407 |
| | 455,000 | | Goldman Sachs Group, Inc. (The),
6.750%, 10/01/2037 | | | 469,574 |
| | 400,000 | | Goldman Sachs Group, Inc. (The),
6.875%, 1/18/2038, (GBP) | | | 636,205 |
| | 165,000 | | Goodyear Tire & Rubber Co. (The),
7.000%, 3/15/2028 | | | 143,550 |
| | 25,000 | | GTE Corp.,
6.940%, 4/15/2028 | | | 26,880 |
| | 20,000 | | HCA, Inc.,
5.750%, 3/15/2014 | | | 17,650 |
| | 55,000 | | HCA, Inc.,
6.250%, 2/15/2013 | | | 52,525 |
| | 90,000 | | HCA, Inc.,
6.375%, 1/15/2015 | | | 80,100 |
| | 15,000 | | HCA, Inc.,
6.500%, 2/15/2016 | | | 13,313 |
| | 40,000 | | HCA, Inc.,
6.750%, 7/15/2013 | | | 38,300 |
| | 225,000 | | HCA, Inc.,
7.050%, 12/01/2027 | | | 170,645 |
| | | | | | |
Principal
Amount (‡) | | Description | | Value (†) |
| | | | | | |
| | | United States — continued | | | |
| $ | 245,000 | | HCA, Inc.,
7.190%, 11/15/2015 | | $ | 226,930 |
| | 90,000 | | HCA, Inc.,
7.500%, 12/15/2023 | | | 72,654 |
| | 250,000 | | HCA, Inc.,
7.500%, 11/06/2033 | | | 193,444 |
| | 1,295,000 | | HCA, Inc.,
7.690%, 6/15/2025 | | | 1,051,611 |
| | 395,000 | | HCA, Inc.,
8.360%, 4/15/2024 | | | 321,427 |
| | 125,000 | | HCA, Inc.,
8.750%, 11/01/2010, (GBP) | | | 197,771 |
| | 110,000 | | HCA, Inc., MTN,
7.580%, 9/15/2025 | | | 88,995 |
| | 75,000 | | HCA, Inc., MTN,
7.750%, 7/15/2036 | | | 58,785 |
| | 470,000 | | Highwoods Properties, Inc.,
5.850%, 3/15/2017 | | | 413,945 |
| | 260,000 | | Hilcorp Energy I LP,
7.750%, 11/01/2015, 144A | | | 245,700 |
| | 1,715,000 | | Home Depot, Inc. (The),
5.875%, 12/16/2036 | | | 1,663,903 |
| | 250,000 | | iStar Financial, Inc.,
5.150%, 3/01/2012 | | | 148,750 |
| | 95,000 | | iStar Financial, Inc.,
5.500%, 6/15/2012 | | | 57,950 |
| | 105,000 | | iStar Financial, Inc.,
5.650%, 9/15/2011 | | | 72,450 |
| | 70,000 | | iStar Financial, Inc.,
5.850%, 3/15/2017 | | | 36,575 |
| | 300,000 | | iStar Financial, Inc.,
5.875%, 3/15/2016 | | | 165,000 |
| | 145,000 | | iStar Financial, Inc.,
6.050%, 4/15/2015 | | | 75,763 |
| | 985,000 | | iStar Financial, Inc.,
8.625%, 6/01/2013 | | | 620,550 |
| | 35,000 | | iStar Financial, Inc., Series B,
5.700%, 3/01/2014 | | | 18,900 |
| | 950,000 | | iStar Financial, Inc., Series B,
5.950%, 10/15/2013 | | | 541,500 |
| | 5,000 | | J.C. Penney Corp., Inc.,
5.750%, 2/15/2018 | | | 4,650 |
| | 125,000 | | J.C. Penney Corp., Inc.,
6.375%, 10/15/2036 | | | 103,125 |
| | 15,000 | | J.C. Penney Corp., Inc.,
7.125%, 11/15/2023 | | | 13,800 |
| | 5,000 | | J.C. Penney Corp., Inc.,
7.400%, 4/01/2037 | | | 4,450 |
| | 5,000 | | J.C. Penney Corp., Inc.,
7.625%, 3/01/2097 | | | 4,000 |
| | 450,000 | | Jefferies Group, Inc.,
8.500%, 7/15/2019 | | | 476,266 |
| | 260,000 | | K. Hovnanian Enterprises, Inc.,
6.250%, 1/15/2016 | | | 195,000 |
| | 15,000 | | K. Hovnanian Enterprises, Inc.,
6.375%, 12/15/2014 | | | 11,400 |
| | 150,000 | | Kraft Foods, Inc.,
6.250%, 3/20/2015, (EUR) | | | 237,177 |
| | 30,000 | | Lennar Corp., Series B,
5.125%, 10/01/2010 | | | 29,925 |
See accompanying notes to financial statements.
24
LOOMIS SAYLES GLOBAL MARKETS FUND — PORTFOLIOOF INVESTMENTS (continued)
Investments as of September 30, 2009
| | | | | | |
Principal
Amount (‡) | | Description | | Value (†) |
| | | | | | |
| | | United States — continued | | | |
| $ | 15,000 | | Lennar Corp., Series B,
5.500%, 9/01/2014 | | $ | 14,025 |
| | 1,090,000 | | Lennar Corp., Series B,
5.600%, 5/31/2015 | | | 1,005,525 |
| | 55,000 | | Lennar Corp., Series B,
6.500%, 4/15/2016 | | | 51,700 |
| | 15,000 | | Level 3 Financing, Inc.,
8.750%, 2/15/2017 | | | 12,450 |
| | 10,000 | | Level 3 Financing, Inc.,
9.250%, 11/01/2014 | | | 8,813 |
| | 1,000,000 | | Lubrizol Corp.,
6.500%, 10/01/2034 | | | 1,044,374 |
| | 130,000 | | MBNA Credit Card Master Note Trust, Series 03A5,
4.150%, 4/19/2010, (EUR) | | | 191,259 |
| | 150,000 | | Merrill Lynch & Co., Inc., EMTN,
4.625%, 9/14/2018, (EUR) | | | 189,765 |
| | 610,000 | | Morgan Stanley,
4.750%, 4/01/2014 | | | 605,498 |
| | 230,000 | | Morgan Stanley,
5.375%, 11/14/2013, (GBP) | | | 372,367 |
| | 1,400,000 | | Morgan Stanley,
5.375%, 10/15/2015 | | | 1,445,123 |
| | 300,000 | | Morgan Stanley, EMTN,
5.450%, 1/09/2017 | | | 300,419 |
| | 300,000 | | Morgan Stanley, Series F, MTN,
5.550%, 4/27/2017 | | | 298,862 |
| | 650,000 | | Morgan Stanley, Series F, MTN,
5.950%, 12/28/2017 | | | 661,794 |
| | 100,000 | | Mosaic Global Holdings, Inc.,
7.375%, 8/01/2018 | | | 107,817 |
| | 500,000 | | New Albertson’s, Inc.,
7.450%, 8/01/2029 | | | 430,000 |
| | 50,000 | | New Albertson’s, Inc., Series C, MTN,
6.625%, 6/01/2028 | | | 38,625 |
| | 80,000 | | News America, Inc.,
6.150%, 3/01/2037 | | | 78,276 |
| | 25,000 | | News America, Inc.,
6.400%, 12/15/2035 | | | 25,219 |
| | 925,000 | | Nextel Communications, Inc., Series D,
7.375%, 8/01/2015 | | | 830,187 |
| | 140,000 | | Nextel Communications, Inc., Series E,
6.875%, 10/31/2013 | | | 129,850 |
| | 230,000 | | Nextel Communications, Inc., Series F,
5.950%, 3/15/2014 | | | 203,550 |
| | 250,000 | | NGC Corp. Capital Trust I, Series B,
8.316%, 6/01/2027 | | | 112,500 |
| | 35,000 | | Nortel Networks Capital Corp.,
7.875%, 6/15/2026(g) | | | 19,600 |
| | 1,000,000 | | NRG Energy, Inc.,
7.375%, 2/01/2016 | | | 967,500 |
| | 50,000 | | Ohio Edison Co.,
6.875%, 7/15/2036 | | | 57,264 |
| | 150,000 | | Owens Brockway Glass Container, Inc.,
6.750%, 12/01/2014, (EUR) | | | 217,307 |
| | 565,000 | | Owens Corning, Inc.,
6.500%, 12/01/2016 | | | 551,266 |
| | 535,000 | | Owens Corning, Inc.,
7.000%, 12/01/2036 | | | 438,370 |
| | 40,000 | | Owens-Illinois, Inc.,
7.800%, 5/15/2018 | | | 40,100 |
| | | | | | |
Principal
Amount (‡) | | Description | | Value (†) |
| | | | | | |
| | | United States — continued | | | |
| $ | 200,000 | | Philip Morris International, Inc.,
5.875%, 9/04/2015, (EUR) | | $ | 325,020 |
| | 50,000 | | Pulte Homes, Inc.,
5.200%, 2/15/2015 | | | 47,500 |
| | 540,000 | | Pulte Homes, Inc.,
6.000%, 2/15/2035 | | | 407,700 |
| | 695,000 | | Pulte Homes, Inc.,
6.375%, 5/15/2033 | | | 535,150 |
| | 1,335,000 | | Qwest Capital Funding, Inc.,
6.500%, 11/15/2018 | | | 1,098,037 |
| | 650,000 | | Qwest Capital Funding, Inc.,
6.875%, 7/15/2028 | | | 490,750 |
| | 400,000 | | Qwest Capital Funding, Inc.,
7.625%, 8/03/2021 | | | 338,000 |
| | 60,000 | | Qwest Capital Funding, Inc.,
7.750%, 2/15/2031 | | | 47,850 |
| | 560,000 | | Qwest Corp.,
6.875%, 9/15/2033 | | | 453,600 |
| | 115,000 | | Qwest Corp.,
7.250%, 9/15/2025 | | | 99,187 |
| | 58,000 | | R.H. Donnelley Corp.,
6.875%, 1/15/2013(g) | | | 3,335 |
| | 50,000 | | R.H. Donnelley Corp., Series A-1,
6.875%, 1/15/2013(g) | | | 2,875 |
| | 60,000 | | R.H. Donnelley Corp., Series A-2,
6.875%, 1/15/2013(g) | | | 3,450 |
| | 18,000 | | R.H. Donnelley Corp., Series A-3,
8.875%, 1/15/2016(g) | | | 1,035 |
| | 735,000 | | R.H. Donnelley Corp., Series A-4,
8.875%, 10/15/2017(g) | | | 42,263 |
| | 305,000 | | R.H. Donnelley, Inc.,
11.750%, 5/15/2015, 144A(g) | | | 172,325 |
| | 80,000 | | Reynolds American, Inc.,
6.750%, 6/15/2017 | | | 83,165 |
| | 20,000 | | Reynolds American, Inc.,
7.250%, 6/15/2037 | | | 19,808 |
| | 1,600(†††) | | SLM Corp.,
6.000%, 12/15/2043 | | | 22,604 |
| | 120,000 | | SLM Corp., MTN,
5.050%, 11/14/2014 | | | 88,211 |
| | 30,000 | | SLM Corp., MTN,
5.125%, 8/27/2012 | | | 25,670 |
| | 20,000 | | SLM Corp., Series A, MTN,
4.500%, 7/26/2010 | | | 19,433 |
| | 228,000 | | SLM Corp., Series A, MTN,
5.000%, 10/01/2013 | | | 181,501 |
| | 10,000 | | SLM Corp., Series A, MTN,
5.000%, 6/15/2018 | | | 6,271 |
| | 115,000 | | SLM Corp., Series A, MTN,
5.375%, 1/15/2013 | | | 95,882 |
| | 75,000 | | SLM Corp., Series A, MTN,
5.375%, 5/15/2014 | | | 57,403 |
| | 30,000 | | SLM Corp., Series A, MTN,
5.400%, 10/25/2011 | | | 27,682 |
| | 20,000 | | SLM Corp., Series A, MTN,
5.625%, 8/01/2033 | | | 12,553 |
| | 625,000 | | SLM Corp., Series A, MTN,
8.450%, 6/15/2018 | | | 498,437 |
| | 294,000 | | Sprint Capital Corp.,
6.875%, 11/15/2028 | | | 245,490 |
See accompanying notes to financial statements.
25
LOOMIS SAYLES GLOBAL MARKETS FUND — PORTFOLIOOF INVESTMENTS (continued)
Investments as of September 30, 2009
| | | | | | |
Principal
Amount (‡) | | Description | | Value (†) |
| | | | | | |
| | | United States — continued | | | |
| $ | 320,000 | | Sprint Capital Corp.,
6.900%, 5/01/2019 | | $ | 286,400 |
| | 110,000 | | Sprint Capital Corp.,
8.750%, 3/15/2032 | | | 103,950 |
| | 26,000 | | Sprint Nextel Corp.,
6.000%, 12/01/2016 | | | 23,205 |
| | 265,000 | | Tenet Healthcare Corp.,
6.875%, 11/15/2031 | | | 206,700 |
| | 23,000 | | Tenet Healthcare Corp.,
7.375%, 2/01/2013 | | | 22,770 |
| | 250,000 | | Textron, Inc.,
3.875%, 3/11/2013, (EUR) | | | 337,803 |
| | 395,000 | | Time Warner, Inc.,
6.625%, 5/15/2029 | | | 405,305 |
| | 160,000 | | Time Warner, Inc.,
6.950%, 1/15/2028 | | | 168,689 |
| | 115,000 | | Time Warner, Inc.,
7.625%, 4/15/2031 | | | 128,885 |
| | 75,000 | | Time Warner, Inc.,
7.700%, 5/01/2032 | | | 84,809 |
| | 105,000 | | Toll Brothers Finance Corp.,
5.150%, 5/15/2015 | | | 100,968 |
| | 375,000 | | Toys R Us, Inc.,
7.375%, 10/15/2018 | | | 326,250 |
| | 200,000 | | Transcontinental Gas Pipe Line Corp.,
6.400%, 4/15/2016 | | | 221,440 |
| | 3,150,000 | | TXU Corp., Series P,
5.550%, 11/15/2014 | | | 2,149,708 |
| | 2,570,000 | | TXU Corp., Series Q,
6.500%, 11/15/2024 | | | 1,188,676 |
| | 30,000 | | TXU Corp., Series R,
6.550%, 11/15/2034 | | | 13,494 |
| | 2,320,000 | | United Rentals North America, Inc.,
7.000%, 2/15/2014 | | | 2,018,400 |
| | 840,000 | | United Rentals North America, Inc.,
7.750%, 11/15/2013 | | | 756,000 |
| | 770,000 | | United States Steel Corp.,
6.650%, 6/01/2037 | | | 628,041 |
| | 50,000 | | USG Corp.,
6.300%, 11/15/2016 | | | 42,500 |
| | 230,000 | | USG Corp.,
9.500%, 1/15/2018 | | | 221,950 |
| | 221,000 | | Verizon Communications, Inc.,
5.850%, 9/15/2035 | | | 222,494 |
| | 5,000 | | Verizon Maryland, Inc.,
5.125%, 6/15/2033 | | | 4,255 |
| | 140,000 | | Verizon New York, Inc., Series B,
7.375%, 4/01/2032 | | | 153,511 |
| | 110,000 | | Verizon Pennsylvania, Inc.,
6.000%, 12/01/2028 | | | 102,544 |
| | 775,000 | | Viacom, Inc., Class B,
6.875%, 4/30/2036 | | | 818,706 |
| | 135,000 | | Virginia Tobacco Settlement Financing Corp., Series A-1,
6.706%, 6/01/2046(f) | | | 96,426 |
| | 185,000 | | Wells Fargo & Co.,
4.625%, 11/02/2035, (GBP) | | | 267,717 |
| | 100,000 | | Williams Cos., Inc. (The),
7.500%, 1/15/2031 | | | 102,138 |
| | 310,000 | | Williams Cos., Inc. (The),
7.875%, 9/01/2021 | | | 335,315 |
| | | | | | |
Principal
Amount (‡) | | Description | | Value (†) |
| | | | | | |
| | | United States — continued | | | |
| $ | 420,000 | | Xerox Corp.,
6.350%, 5/15/2018 | | $ | 436,635 |
| | 125,000 | | Xerox Corp.,
6.750%, 2/01/2017 | | | 132,303 |
| | 20,000 | | Xerox Corp., MTN,
7.200%, 4/01/2016 | | | 21,711 |
| | | | | | |
| | | | | | 63,509,474 |
| | | | | | |
| | | Total Non-Convertible Bonds (Identified Cost $86,595,857) | | | 89,492,371 |
| | | | | | |
| | Convertible Bonds — 1.1% | | | |
| | | United States — 1.1% | | | |
| | 1,125,000 | | Intel Corp.,
3.250%, 8/01/2039, 144A | | | 1,202,343 |
| | 430,000 | | iStar Financial, Inc.,
1.097%, 10/01/2012(d) | | | 215,000 |
| | 365,000 | | Kulicke & Soffa Industries, Inc.,
0.875%, 6/01/2012 | | | 298,844 |
| | 440,000 | | Level 3 Communications, Inc.,
3.500%, 6/15/2012 | | | 349,800 |
| | 185,000 | | Level 3 Communications, Inc.,
5.250%, 12/15/2011 | | | 164,650 |
| | 215,000 | | Level 3 Communications, Inc.,
7.000%, 3/15/2015, 144A(f) | | | 227,900 |
| | 200,000 | | NII Holdings, Inc.,
3.125%, 6/15/2012 | | | 174,750 |
| | 80,000 | | Valeant Pharmaceuticals International,
4.000%, 11/15/2013 | | | 86,100 |
| | | | | | |
| | | Total Convertible Bonds (Identified Cost $2,860,123) | | | 2,719,387 |
| | | | | | |
| | | Total Bonds and Notes (Identified Cost $89,455,980) | | | 92,211,758 |
| | | | | | |
| | Bank Loans — 0.1% | | | |
| | | United States — 0.1% | | | |
| | 1,958 | | Dole Food Co., Inc., Credit Link Deposit,
7.495%, 4/12/2013(h) | | | 1,979 |
| | 1,259 | | Dole Food Co., Inc., Tranche B Term Loan,
8.000%, 4/12/2013(h) | | | 1,272 |
| | 6,176 | | Dole Food Co., Inc., Tranche C Term Loan,
8.000%, 4/12/2013(h) | | | 6,243 |
| | 57,156 | | Hawaiian Telcom Communications, Inc., Tranche C Term Loan,
4.750%, 6/01/2014(c)(h) | | | 35,265 |
| | 159,059 | | Idearc, Inc., Term Loan B,
6.250%, 11/17/2014(g)(h) | | | 67,269 |
| | 40,000 | | Level 3 Financing, Inc., Tranche A Term Loan,
2.683%, 3/13/2014(h) | | | 35,350 |
| | 2,765 | | Sungard Data Systems, Inc., Tranche A,
2.004%, 2/28/2014(h) | | | 2,585 |
| | 76,623 | | Sungard Data Systems, Inc., Tranche B,
4.079%, 2/26/2016(h) | | | 74,592 |
| | 7,314 | | Tribune Co., Term Loan X,
5.000%, 6/04/2009(h)(g)(k) | | | 3,552 |
| | | | | | |
| | | | | | 228,107 |
| | | | | | |
| | | Total Bank Loans (Identified Cost $302,461) | | | 228,107 |
| | | | | | |
| | |
| Shares | | | | |
| | Preferred Stocks — 0.4% | | | |
| | | United States — 0.4% | | | |
| | 12,940 | | Federal Home Loan Mortgage Corp., (fixed rate to 12/31/2012, variable rate thereafter), 8.375%(e)(i) | | | 23,422 |
See accompanying notes to financial statements.
26
LOOMIS SAYLES GLOBAL MARKETS FUND — PORTFOLIOOF INVESTMENTS (continued)
Investments as of September 30, 2009
| | | | | | | |
| | |
| Shares | | Description | | Value (†) | |
| | | | | | | |
| | | United States — continued | | | | |
| | 17,500 | | Federal National Mortgage Association, (fixed rate to 12/13/2010, variable rate thereafter), 8.250%(e)(i) | | $ | 28,175 | |
| | 820 | | Lucent Technologies Capital Trust, 7.750% | | | 627,300 | |
| | 682 | | Preferred Blocker, Inc., 7.000%, 144A | | | 396,604 | |
| | | | | | | |
| | | Total Preferred Stocks (Identified Cost $1,389,779) | | | 1,075,501 | |
| | | | | | | |
| | Warrants — 0.0% | | | | |
| | | United States — 0.0% | | | | |
| | 12,495 | | Valeant Pharmaceuticals International, Expiration 8/16/2010(e)(j) (Identified Cost $0) | | | — | |
| | | | | | | |
Principal
Amount (‡) | | | | | |
| | Short-Term Investments — 2.8% | | | | |
| $ | 355 | | Repurchase Agreement with State Street Corp., dated 9/30/2009 at 0.000%, to be repurchased at $355 on 10/1/2009 collateralized by $5,000 U.S. Treasury Bill, due 11/05/2009 valued at $5,000 including accrued interest (Note 2h of Notes to Financial Statements) | | | 355 | |
| | 6,973,791 | | Tri-Party Repurchase Agreement with Fixed Income Clearing Corp., dated 9/30/2009 at 0.000% to be repurchased at $6,973,791 on 10/01/2009 collateralized by $7,055,000 Federal Home Loan Bank, 2.900% due 7/02/2013 valued at $7,116,731 including accrued interest (Note 2h of Notes to Financial Statements) | | | 6,973,791 | |
| | | | | | | |
| | | Total Short-Term Investments (Identified Cost $6,974,146) | | | 6,974,146 | |
| | | | | | | |
| | | Total Investments - 100.9% (Identified Cost $225,117,054)(a) | | | 251,719,504 | |
| | | Other assets less liabilities — (0.9)% | | | (2,114,167 | ) |
| | | | | | | |
| | | Net Assets — 100.0% | | $ | 249,605,337 | |
| | | | | | | |
| | (‡) | | Principal amount stated in U.S. dollars unless otherwise noted. | | | | |
| | (†) | | See Note 2a of Notes to Financial Statements. | | | | |
| | (††) | | Amount shown represents units. One unit represents a principal amount of 100. | | | | |
| | (†††) | | Amount shown represents units. One unit represents a principal amount of 25. | | | | |
| | (††††) | | Security held in units. One unit represents a principal amount of 1,000. Amount shown represents principal amount including inflation adjustments. | | | | |
| | (†††††) | | Amount shown represents units. One unit represents a principal amount of 1,000. | | | | |
| | (a) | | Federal Tax Information: | | | | |
| | | At September 30, 2009, the net unrealized appreciation on investments based on a cost of $227,124,926 for federal income tax purposes was as follows: | | | | |
| | | Aggregate gross unrealized appreciation for all investments in which there is an excess of value over tax cost | | $ | 32,199,705 | |
| | | Aggregate gross unrealized depreciation for all investments in which there is an excess of tax cost over value | | | (7,605,127 | ) |
| | | | | | | |
| | | Net unrealized appreciation | | $ | 24,594,578 | |
| | | | | | | |
| | | | | | | |
| | (b) | | All or a portion of this security is held as collateral for open forward contracts. | |
| | (c) | | All or a portion of interest payment is paid-in-kind. | |
| | (d) | | Variable rate security. Rate as of September 30, 2009 is disclosed. | |
| | (e) | | Non-income producing security. | |
| | (f) | | Illiquid security. At September 30, 2009, the value of these securities amounted to $324,326 or 0.1% of net assets. | |
| | (g) | | The issuer is in default with respect to interest and/or principal payments. Income is not being accrued. | |
| | (h) | | Variable rate security. Rate shown represents the weighted average rate at September 30, 2009. | |
| | (i) | | Future dividend payments have been eliminated as the issuer has been placed in conservatorship. | |
| | | | |
| (j) | | Fair valued security by the Fund’s investment adviser. At September 30, 2009 the value of this security amounted to $0 or 0.0% of net assets. |
| (k) | | Issuer has filed for bankruptcy. |
| | |
| 144A | | Securities exempt from registration under Rule 144A of the Securities Act of 1933. These securities may be resold in transactions exempt from registration, normally to qualified institutional buyers. At September 30, 2009, the total value of these securities amounted to $12,958,768 or 5.2% of net assets. |
| ADR | | An American Depositary Receipt (ADR) is a certificate issued by a custodian bank representing the right to receive securities of the foreign issuer described. The values of ADRs are significantly influenced by trading on exchanges not located in the United States. |
| EMTN | | Euro Medium Term Note |
| GMTN | | Global Medium Term Note |
| MTN | | Medium Term Note |
| | | | |
| AUD | | Australian Dollar |
| BRL | | Brazilian Real |
| CAD | | Canadian Dollar |
| EUR | | Euro |
| GBP | | British Pound |
| IDR | | Indonesian Rupiah |
| JPY | | Japanese Yen |
| KRW | | South Korean Won |
| MXN | | Mexican Peso |
| NOK | | Norwegian Krone |
| SEK | | Swedish Krona |
| SGD | | Singapore Dollar |
At September 30, 2009, the Fund had the following open forward foreign currency contracts:
| | | | | | | | | | | | |
Contract
to Buy | | Delivery
Date | | Currency | | Units | | Notional
Value | | Unrealized
Appreciation |
| Buy1 | | 12/14/2009 | | South Korean Won | | 780,000,000 | | $ | 661,391 | | $ | 22,309 |
| | | | | | | | | | | | |
| 1 | Counterparty is Barclays Bank PLC. |
Industry Summary at September 30, 2009 (Unaudited)
| | | |
| Commercial Banks | | 5.4 | % |
| Internet Software & Services | | 5.1 | |
| Diversified Financial Services | | 4.2 | |
| Semiconductors & Semiconductor Equipment | | 3.9 | |
| Banking | | 3.8 | |
| Internet & Catalog Retail | | 3.8 | |
| Specialty Retail | | 3.6 | |
| Computers & Peripherals | | 3.4 | |
| Metals & Mining | | 3.2 | |
| Capital Markets | | 3.0 | |
| Electrical Equipment | | 2.6 | |
| Automotive | | 2.5 | |
| Non-Captive Diversified | | 2.5 | |
| Communications Equipment | | 2.5 | |
| Oil, Gas & Consumable Fuels | | 2.3 | |
| Electric | | 2.2 | |
| Wirelines | | 2.2 | |
| Treasuries | | 2.0 | |
| Other Investments, less than 2% each | | 39.9 | |
| Short-Term Investments | | 2.8 | |
| | | |
| Total Investments | | 100.9 | |
| Other assets less liabilities (including open Forward Foreign Currency Contracts) | | (0.9 | ) |
| | | |
| Net Assets | | 100.0 | % |
| | | |
See accompanying notes to financial statements.
27
LOOMIS SAYLES GLOBAL MARKETS FUND — PORTFOLIOOF INVESTMENTS (continued)
Investments as of September 30, 2009
Currency Exposure at September 30, 2009 as Percentage of Net Assets (Unaudited)
| | | |
| United States Dollar | | 68.8 | % |
| Euro | | 8.3 | |
| British Pound | | 5.3 | |
| Brazilian Real | | 4.6 | |
| Japanese Yen | | 2.7 | |
| Swedish Krona | | 2.7 | |
| South Korean Won | | 2.6 | |
| Hong Kong Dollar | | 2.1 | |
| Other, less than 2% each | | 3.8 | |
| | | |
| Total Investments | | 100.9 | |
| Other assets less liabilities (including open Forward Foreign Currency Contracts) | | (0.9 | ) |
| | | |
| Net Assets | | 100.0 | % |
| | | |
See accompanying notes to financial statements.
28
LOOMIS SAYLES GROWTH FUND — PORTFOLIOOF INVESTMENTS
Investments as of September 30, 2009
| | | | | |
| Shares | | Description | | Value (†) |
| | | | | |
| Common Stocks — 99.2% of Net Assets | | | |
| | Biotechnology — 2.7% | | | |
| 24,427 | | Amgen, Inc.(b) | | $ | 1,471,238 |
| 27,379 | | Celgene Corp.(b) | | | 1,530,486 |
| | | | | |
| | | | | 3,001,724 |
| | | | | |
| | Capital Markets — 8.2% | | | |
| 9,470 | | BlackRock, Inc. | | | 2,053,285 |
| 34,280 | | Franklin Resources, Inc. | | | 3,448,568 |
| 19,756 | | Goldman Sachs Group, Inc. (The) | | | 3,642,019 |
| | | | | |
| | | | | 9,143,872 |
| | | | | |
| | Chemicals — 2.2% | | | |
| 30,893 | | Praxair, Inc. | | | 2,523,649 |
| | | | | |
| | Commercial Banks — 1.7% | | | |
| 69,435 | | Wells Fargo & Co. | | | 1,956,678 |
| | | | | |
| | Communications Equipment — 9.1% | | | |
| 117,628 | | Brocade Communications Systems, Inc.(b) | | | 924,556 |
| 136,817 | | Cisco Systems, Inc.(b) | | | 3,220,672 |
| 65,634 | | Juniper Networks, Inc.(b) | | | 1,773,431 |
| 95,719 | | QUALCOMM, Inc. | | | 4,305,441 |
| | | | | |
| | | | | 10,224,100 |
| | | | | |
| | Computers & Peripherals — 10.5% | | | |
| 29,443 | | Apple, Inc.(b) | | | 5,457,849 |
| 130,944 | | EMC Corp.(b) | | | 2,231,286 |
| 34,348 | | International Business Machines Corp. | | | 4,108,364 |
| | | | | |
| | | | | 11,797,499 |
| | | | | |
| | Construction & Engineering — 1.0% | | | |
| 22,297 | | Fluor Corp. | | | 1,133,803 |
| | | | | |
| | Diversified Financial Services — 5.0% | | | |
| 92,293 | | Bank of America Corp. | | | 1,561,597 |
| 12,300 | | IntercontinentalExchange, Inc.(b) | | | 1,195,437 |
| 65,107 | | JPMorgan Chase & Co. | | | 2,852,989 |
| | | | | |
| | | | | 5,610,023 |
| | | | | |
| | Energy Equipment & Services — 1.5% | | | |
| 32,203 | | FMC Technologies, Inc.(b) | | | 1,682,285 |
| | | | | |
| | Food & Staples Retailing — 1.5% | | | |
| 55,627 | | Whole Foods Market, Inc.(b) | | | 1,696,067 |
| | | | | |
| | Health Care Providers & Services — 4.1% | | | |
| 31,147 | | Express Scripts, Inc.(b) | | | 2,416,384 |
| 38,523 | | Medco Health Solutions, Inc.(b) | | | 2,130,707 |
| | | | | |
| | | | | 4,547,091 |
| | | | | |
| | Hotels, Restaurants & Leisure — 4.4% | | | |
| 100,444 | | International Game Technology | | | 2,157,537 |
| 133,862 | | Starbucks Corp.(b) | | | 2,764,250 |
| | | | | |
| | | | | 4,921,787 |
| | | | | |
| | Industrial Conglomerates — 1.6% | | | |
| 23,776 | | 3M Co. | | | 1,754,669 |
| | | | | |
| | Internet & Catalog Retail — 6.2% | | | |
| 36,012 | | Amazon.com, Inc.(b) | | | 3,362,081 |
| 21,360 | | Priceline.com, Inc.(b) | | | 3,541,915 |
| | | | | |
| | | | | 6,903,996 |
| | | | | |
| | Internet Software & Services — 7.1% | | | |
| 122,201 | | eBay, Inc.(b) | | | 2,885,166 |
| 10,223 | | Google, Inc., Class A(b) | | | 5,069,074 |
| | | | | |
| | | | | 7,954,240 |
| | | | | |
| | | | | | | |
| Shares | | Description | | Value (†) | |
| | | | | | | |
| | | IT Services — 4.1% | | | | |
| | 61,216 | | Cognizant Technology Solutions Corp., Class A(b) | | $ | 2,366,611 | |
| | 32,277 | | Visa, Inc., Class A | | | 2,230,663 | |
| | | | | | | |
| | | | | | 4,597,274 | |
| | | | | | | |
| | | Machinery — 2.5% | | | | |
| | 28,946 | | Flowserve Corp. | | | 2,852,339 | |
| | | | | | | |
| | | Metals & Mining — 2.1% | | | | |
| | 33,729 | | Freeport-McMoRan Copper & Gold, Inc. | | | 2,314,147 | |
| | | | | | | |
| | | Oil, Gas & Consumable Fuels — 4.4% | | | | |
| | 19,185 | | Anadarko Petroleum Corp. | | | 1,203,475 | |
| | 51,196 | | Southwestern Energy Co.(b) | | | 2,185,045 | |
| | 37,209 | | XTO Energy, Inc. | | | 1,537,476 | |
| | | | | | | |
| | | | | | 4,925,996 | |
| | | | | | | |
| | | Pharmaceuticals — 2.0% | | | | |
| | 141,725 | | Mylan, Inc.(b) | | | 2,269,017 | |
| | | | | | | |
| | | Road & Rail — 2.2% | | | | |
| | 41,880 | | Union Pacific Corp. | | | 2,443,698 | |
| | | | | | | |
| | | Semiconductors & Semiconductor Equipment — 5.5% | | | | |
| | 39,816 | | Analog Devices, Inc. | | | 1,098,125 | |
| | 106,587 | | Broadcom Corp., Class A(b) | | | 3,271,155 | |
| | 110,684 | | Marvell Technology Group Ltd.(b) | | | 1,791,974 | |
| | | | | | | |
| | | | | | 6,161,254 | |
| | | | | | | |
| | | Software — 4.4% | | | | |
| | 162,771 | | Oracle Corp. | | | 3,392,148 | |
| | 26,278 | | Salesforce.com, Inc.(b) | | | 1,496,006 | |
| | | | | | | |
| | | | | | 4,888,154 | |
| | | | | | | |
| | | Specialty Retail — 5.2% | | | | |
| | 40,076 | | Ross Stores, Inc. | | | 1,914,431 | |
| | 43,101 | | Tiffany & Co. | | | 1,660,682 | |
| | 74,285 | | Urban Outfitters, Inc.(b) | | | 2,241,178 | |
| | | | | | | |
| | | | | | 5,816,291 | |
| | | | | | | |
| | | Total Common Stocks (Identified Cost $92,309,750) | | | 111,119,653 | |
| | | | | | | |
Principal
Amount | | | | | |
| | Short-Term Investments — 0.6% | | | | |
| $ | 682,469 | | Tri-Party Repurchase Agreement with Fixed Income Clearing Corporation, dated 9/30/2009 at 0.000% to be repurchased at $682,469 on 10/01/2009 collateralized by $695,000 Federal National Mortgage Association, 3.000% due 1/13/2014 valued at $698,475 including accrued interest (Note 2h of Notes to Financial Statements) (Identified Cost $682,469) | | | 682,469 | |
| | | | | | | |
| | | | | | | |
| | | Total Investments — 99.8% (Identified Cost $92,992,219)(a) | | | 111,802,122 | |
| | | Other assets less liabilities — 0.2% | | | 170,908 | |
| | | | | | | |
| | | Net Assets — 100.0% | | $ | 111,973,030 | |
| | | | | | | |
| | (†) | | See Note 2a of Notes to Financial Statements. | | | | |
| | (a) | | Federal Tax Information: | | | | |
| | | At September 30, 2009, the net unrealized appreciation on investments based on a cost of $95,359,225 for federal income tax purposes was as follows: | | | | |
| | | Aggregate gross unrealized appreciation for all investments in which there is an excess of value over tax cost | | $ | 16,546,675 | |
| | | Aggregate gross unrealized depreciation for all investments in which there is an excess of tax cost over value | | | (103,778 | ) |
| | | | | | | |
| | | Net unrealized appreciation | | $ | 16,442,897 | |
| | | | | | | |
| | (b) | | Non-income producing security. | | | | |
See accompanying notes to financial statements.
29
LOOMIS SAYLES GROWTH FUND — PORTFOLIOOF INVESTMENTS (continued)
Investments as of September 30, 2009
Industry Summary at September 30, 2009 (Unaudited)
| | | |
| Computers & Peripherals | | 10.5 | % |
| Communications Equipment | | 9.1 | |
| Capital Markets | | 8.2 | |
| Internet Software & Services | | 7.1 | |
| Internet & Catalog Retail | | 6.2 | |
| Semiconductors & Semiconductor Equipment | | 5.5 | |
| Specialty Retail | | 5.2 | |
| Diversified Financial Services | | 5.0 | |
| Oil, Gas & Consumable Fuels | | 4.4 | |
| Hotels, Restaurants & Leisure | | 4.4 | |
| Software | | 4.4 | |
| IT Services | | 4.1 | |
| Health Care Providers & Services | | 4.1 | |
| Biotechnology | | 2.7 | |
| Machinery | | 2.5 | |
| Chemicals | | 2.2 | |
| Road & Rail | | 2.2 | |
| Metals & Mining | | 2.1 | |
| Pharmaceuticals | | 2.0 | |
| Other Investments, less than 2% each | | 7.3 | |
| Short-Term Investments | | 0.6 | |
| | | |
| Total Investments | | 99.8 | |
| Other assets less liabilities | | 0.2 | |
| | | |
| Net Assets | | 100.0 | % |
| | | |
See accompanying notes to financial statements.
30
LOOMIS SAYLES MID CAP GROWTH FUND — PORTFOLIOOF INVESTMENTS
Investments as of September 30, 2009
| | | | | |
| Shares | | Description | | Value (†) |
| | | | | |
| Common Stocks — 98.5% of Net Assets | | | |
| | Biotechnology — 1.5% | | | |
| 27,087 | | Alexion Pharmaceuticals, Inc.(b) | | $ | 1,206,455 |
| | | | | |
| | Capital Markets — 3.1% | | | |
| 18,742 | | Affiliated Managers Group, Inc.(b) | | | 1,218,418 |
| 95,624 | | Janus Capital Group, Inc. | | | 1,355,948 |
| | | | | |
| | | | | 2,574,366 |
| | | | | |
| | Commercial Banks — 1.6% | | | |
| 30,703 | | SVB Financial Group(b) | | | 1,328,519 |
| | | | | |
| | Communications Equipment — 3.0% | | | |
| 151,251 | | Brocade Communications Systems, Inc.(b) | | | 1,188,833 |
| 32,404 | | F5 Networks, Inc.(b) | | | 1,284,170 |
| | | | | |
| | | | | 2,473,003 |
| | | | | |
| | Computers & Peripherals — 1.6% | | | |
| 47,592 | | NetApp, Inc.(b) | | | 1,269,755 |
| | | | | |
| | Diversified Consumer Services — 1.7% | | | |
| 17,330 | | New Oriental Education & Technology Group, Inc.,
Sponsored ADR(b) | | | 1,394,198 |
| | | | | |
| | Energy Equipment & Services — 3.2% | | | |
| 17,475 | | Dril-Quip, Inc.(b) | | | 867,459 |
| 83,335 | | Nabors Industries Ltd.(b) | | | 1,741,701 |
| | | | | |
| | | | | 2,609,160 |
| | | | | |
| | Food Products — 1.9% | | | |
| 21,483 | | Green Mountain Coffee Roasters, Inc.(b) | | | 1,586,305 |
| | | | | |
| | Health Care Equipment & Supplies — 2.1% | | | |
| 39,176 | | CareFusion Corp.(b) | | | 854,037 |
| 12,656 | | Edwards Lifesciences Corp.(b) | | | 884,781 |
| | | | | |
| | | | | 1,738,818 |
| | | | | |
| | Health Care Providers & Services — 1.0% | | | |
| 21,785 | | HMS Holdings Corp.(b) | | | 832,840 |
| | | | | |
| | Health Care Technology — 1.6% | | | |
| 18,045 | | Cerner Corp.(b) | | | 1,349,766 |
| | | | | |
| | Hotels, Restaurants & Leisure — 4.8% | | | |
| 22,446 | | Ctrip.com International Ltd., ADR(b) | | | 1,319,600 |
| 61,751 | | International Game Technology | | | 1,326,412 |
| 63,480 | | Starbucks Corp.(b) | | | 1,310,862 |
| | | | | |
| | | | | 3,956,874 |
| | | | | |
| | Household Durables — 4.4% | | | |
| 93,704 | | D.R. Horton, Inc. | | | 1,069,163 |
| 44,044 | | Gafisa SA, ADR | | | 1,337,176 |
| 1,823 | | NVR, Inc.(b) | | | 1,161,925 |
| | | | | |
| | | | | 3,568,264 |
| | | | | |
| | Internet & Catalog Retail — 4.4% | | | |
| 21,991 | | Blue Nile, Inc.(b) | | | 1,366,081 |
| 13,525 | | Priceline.com, Inc.(b) | | | 2,242,715 |
| | | | | |
| | | | | 3,608,796 |
| | | | | |
| | Internet Software & Services — 2.7% | | | |
| 23,117 | | MercadoLibre, Inc.(b) | | | 889,080 |
| 28,693 | | NetEase.com, Inc., ADR(b) | | | 1,310,696 |
| | | | | |
| | | | | 2,199,776 |
| | | | | |
| | IT Services — 2.1% | | | |
| 45,357 | | Cognizant Technology Solutions Corp., Class A(b) | | | 1,753,502 |
| | | | | |
| | | | | |
| Shares | | Description | | Value (†) |
| | | | | |
| | Life Sciences Tools & Services — 5.4% | | | |
| 30,154 | | Illumina, Inc.(b) | | $ | 1,281,545 |
| 37,370 | | Life Technologies Corp.(b) | | | 1,739,574 |
| 15,482 | | Mettler-Toledo International, Inc.(b) | | | 1,402,514 |
| | | | | |
| | | | | 4,423,633 |
| | | | | |
| | Machinery — 4.9% | | | |
| 46,262 | | Bucyrus International, Inc. | | | 1,647,853 |
| 28,041 | | Cummins, Inc. | | | 1,256,517 |
| 11,395 | | Flowserve Corp. | | | 1,122,863 |
| | | | | |
| | | | | 4,027,233 |
| | | | | |
| | Media — 1.5% | | | |
| 43,054 | | Discovery Communications, Inc. Class A(b) | | | 1,243,830 |
| | | | | |
| | Metals & Mining — 7.9% | | | |
| 38,323 | | Freeport-McMoRan Copper & Gold, Inc. | | | 2,629,341 |
| 67,278 | | Teck Resources Ltd., Class B Class B(b) | | | 1,854,855 |
| 33,156 | | Walter Energy, Inc. | | | 1,991,349 |
| | | | | |
| | | | | 6,475,545 |
| | | | | |
| | Oil, Gas & Consumable Fuels — 3.7% | | | |
| 41,930 | | Concho Resources, Inc.(b) | | | 1,522,898 |
| 61,883 | | Petrohawk Energy Corp.(b) | | | 1,498,187 |
| | | | | |
| | | | | 3,021,085 |
| | | | | |
| | Paper & Forest Products — 3.0% | | | |
| 54,064 | | International Paper Co. | | | 1,201,843 |
| 76,830 | | Votorantim Celulose e Papel SA, Sponsored ADR(b) | | | 1,260,780 |
| | | | | |
| | | | | 2,462,623 |
| | | | | |
| | Personal Products — 5.0% | | | |
| 37,674 | | Avon Products, Inc. | | | 1,279,409 |
| 29,786 | | Mead Johnson Nutrition Co., Class A | | | 1,343,646 |
| 38,063 | | NBTY, Inc.(b) | | | 1,506,534 |
| | | | | |
| | | | | 4,129,589 |
| | | | | |
| | Semiconductors & Semiconductor Equipment — 9.5% | | | |
| 56,126 | | Broadcom Corp., Class A(b) | | | 1,722,507 |
| 35,639 | | Lam Research Corp.(b) | | | 1,217,428 |
| 117,782 | | Marvell Technology Group Ltd.(b) | | | 1,906,891 |
| 36,639 | | Silicon Laboratories, Inc.(b) | | | 1,698,584 |
| 37,436 | | Varian Semiconductor Equipment Associates, Inc.(b) | | | 1,229,398 |
| | | | | |
| | | | | 7,774,808 |
| | | | | |
| | Software — 5.5% | | | |
| 25,426 | | ANSYS, Inc.(b) | | | 952,712 |
| 24,766 | | Concur Technologies, Inc.(b) | | | 984,696 |
| 19,313 | | Perfect World Co. Ltd., Sponsored ADR(b) | | | 928,955 |
| 28,476 | | Salesforce.com, Inc.(b) | | | 1,621,139 |
| | | | | |
| | | | | 4,487,502 |
| | | | | |
| | Specialty Retail — 5.6% | | | |
| 42,232 | | Guess?, Inc. | | | 1,564,274 |
| 40,401 | | TJX Cos., Inc. (The) | | | 1,500,897 |
| 49,448 | | Urban Outfitters, Inc.(b) | | | 1,491,846 |
| | | | | |
| | | | | 4,557,017 |
| | | | | |
| | Textiles, Apparel & Luxury Goods — 2.6% | | | |
| 27,434 | | Fuqi International, Inc.(b) | | | 803,268 |
| 57,307 | | Lululemon Athletica, Inc.(b) | | | 1,303,734 |
| | | | | |
| | | | | 2,107,002 |
| | | | | |
See accompanying notes to financial statements.
31
LOOMIS SAYLES MID CAP GROWTH FUND — PORTFOLIOOF INVESTMENTS (continued)
Investments as of September 30, 2009
| | | | | | | |
| Shares | | Description | | Value (†) | |
| | | | | | | |
| | | Wireless Telecommunication Services — 3.2% | | | | |
| | 38,818 | | Crown Castle International Corp.(b) | | $ | 1,217,333 | |
| | 18,968 | | Millicom International Cellular SA(b) | | | 1,379,732 | |
| | | | | | | |
| | | | | | 2,597,065 | |
| | | | | | | |
| | | Total Common Stocks (Identified Cost $65,363,012) | | | 80,757,329 | |
| | | | | | | |
Principal
Amount | | | | | |
| | Short-Term Investments — 1.6% | | | | |
| $ | 1,320,554 | | Tri-Party Repurchase Agreement with Fixed Income Clearing Corporation, dated 9/30/2009 at 0.000% to be repurchased at $1,320,554 on 10/01/2009 collateralized by $1,350,000 Federal Home Loan Mortgage Corp., 2.100% due 9/24/2012 valued at $1,350,000, including accrued interest (Note 2h of Notes to Financial Statements) (Identified Cost $1,320,554) | | | 1,320,554 | |
| | | | | | | |
| | | | | | | |
| | | Total Investments — 100.1% (Identified Cost $66,683,566)(a) | | | 82,077,883 | |
| | | | | | | |
| | | Other assets less liabilities — (0.1)% | | | (68,938 | ) |
| | | | | | | |
| | | Net Assets — 100.0% | | $ | 82,008,945 | |
| | | | | | | |
| | | | | | | |
| | (†) | | See Note 2a of Notes to Financial Statements. | | | | |
| | (a) | | Federal Tax Information: At September 30, 2009, the net unrealized appreciation on investments based on a cost of $67,511,494 for federal income tax purposes was as follows: | | | | |
| | | Aggregate gross unrealized appreciation for all investments in which there is an excess of value over tax cost | | $ | 14,979,309 | |
| | | Aggregate gross unrealized depreciation for all investments in which there is an excess of tax cost over value | | | (412,920 | ) |
| | | | | | | |
| | | Net unrealized appreciation | | $ | 14,566,389 | |
| | | | | | | |
| | (b) | | Non-income producing security. | | | | |
Industry Summary at September 30, 2009 (Unaudited)
| | | |
| Semiconductors & Semiconductor Equipment | | 9.5 | % |
| Metals & Mining | | 7.9 | |
| Specialty Retail | | 5.6 | |
| Software | | 5.5 | |
| Life Sciences Tools & Services | | 5.4 | |
| Personal Products | | 5.0 | |
| Machinery | | 4.9 | |
| Hotels, Restaurants & Leisure | | 4.8 | |
| Internet & Catalog Retail | | 4.4 | |
| Household Durables | | 4.4 | |
| Oil, Gas & Consumable Fuels | | 3.7 | |
| Energy Equipment & Services | | 3.2 | |
| Wireless Telecommunication Services | | 3.2 | |
| Capital Markets | | 3.1 | |
| Communications Equipment | | 3.0 | |
| Paper & Forest Products | | 3.0 | |
| Internet Software & Services | | 2.7 | |
| Textiles, Apparel & Luxury Goods | | 2.6 | |
| IT Services | | 2.1 | |
| Health Care Equipment & Supplies | | 2.1 | |
| Other Investments, less than 2% each | | 12.4 | |
| Short-Term Investments | | 1.6 | |
| | | |
| Total Investments | | 100.1 | |
| Other assets less liabilities | | (0.1 | ) |
| | | |
| Net Assets | | 100.0 | % |
| | | |
See accompanying notes to financial statements.
32
LOOMIS SAYLES VALUE FUND — PORTFOLIOOF INVESTMENTS
Investments as of September 30, 2009
| | | | | |
| Shares | | Description | | Value (†) |
| | | | | |
| Common Stocks — 88.2% of Net Assets | | | |
| | Aerospace & Defense — 3.6% | | | |
| 103,038 | | Goodrich Corp. | | $ | 5,599,085 |
| 182,154 | | Honeywell International, Inc. | | | 6,767,021 |
| 255,363 | | Northrop Grumman Corp. | | | 13,215,035 |
| | | | | |
| | | | | 25,581,141 |
| | | | | |
| | Beverages — 3.5% | | | |
| 301,563 | | Dr Pepper Snapple Group, Inc.(b) | | | 8,669,936 |
| 181,324 | | Molson Coors Brewing Co., Class B | | | 8,826,852 |
| 125,828 | | PepsiCo, Inc. | | | 7,381,071 |
| | | | | |
| | | | | 24,877,859 |
| | | | | |
| | Biotechnology — 0.8% | | | |
| 93,417 | | Amgen, Inc.(b) | | | 5,626,506 |
| | | | | |
| | Capital Markets — 5.2% | | | |
| 315,912 | | Ameriprise Financial, Inc. | | | 11,477,083 |
| 270,589 | | Bank of New York Mellon Corp. | | | 7,844,375 |
| 227,822 | | Legg Mason, Inc. | | | 7,069,317 |
| 194,251 | | State Street Corp. | | | 10,217,602 |
| | | | | |
| | | | | 36,608,377 |
| | | | | |
| | Chemicals — 1.1% | | | |
| 92,073 | | Praxair, Inc. | | | 7,521,443 |
| | | | | |
| | Commercial Banks — 3.5% | | | |
| 178,816 | | PNC Financial Services Group, Inc. | | | 8,688,669 |
| 331,088 | | U.S. Bancorp | | | 7,237,584 |
| 322,647 | | Wells Fargo & Co. | | | 9,092,193 |
| | | | | |
| | | | | 25,018,446 |
| | | | | |
| | Communications Equipment — 1.6% | | | |
| 288,682 | | Cisco Systems, Inc.(b) | | | 6,795,574 |
| 318,561 | | Nokia Oyj, Sponsored ADR | | | 4,657,362 |
| | | | | |
| | | | | 11,452,936 |
| | | | | |
| | Computers & Peripherals — 3.0% | | | |
| 283,202 | | Hewlett-Packard Co. | | | 13,369,966 |
| 68,741 | | International Business Machines Corp. | | | 8,222,111 |
| | | | | |
| | | | | 21,592,077 |
| | | | | |
| | Construction & Engineering — 1.2% | | | |
| 274,109 | | Foster Wheeler AG(b) | | | 8,746,818 |
| | | | | |
| | Consumer Finance — 1.0% | | | |
| 416,078 | | Discover Financial Services | | | 6,752,946 |
| | | | | |
| | Containers & Packaging — 1.7% | | | |
| 332,100 | | Owens-Illinois, Inc.(b) | | | 12,254,490 |
| | | | | |
| | Diversified Consumer Services — 1.0% | | | |
| 367,878 | | H&R Block, Inc. | | | 6,761,598 |
| | | | | |
| | Diversified Financial Services — 4.6% | | | |
| 786,233 | | Bank of America Corp. | | | 13,303,062 |
| 445,646 | | JPMorgan Chase & Co. | | | 19,528,208 |
| | | | | |
| | | | | 32,831,270 |
| | | | | |
| | Diversified Telecommunication Services — 2.3% | | | |
| 309,025 | | AT&T, Inc. | | | 8,346,766 |
| 244,357 | | CenturyTel, Inc. | | | 8,210,395 |
| | | | | |
| | | | | 16,557,161 |
| | | | | |
| | Electric Utilities — 2.3% | | | |
| 299,904 | | Allegheny Energy, Inc. | | | 7,953,454 |
| 278,231 | | American Electric Power Co., Inc. | | | 8,622,379 |
| | | | | |
| | | | | 16,575,833 |
| | | | | |
| | | | | |
| Shares | | Description | | Value (†) |
| | | | | |
| | Electrical Equipment — 1.0% | | | |
| 355,264 | | ABB Ltd., Sponsored ADR(b) | | $ | 7,119,491 |
| | | | | |
| | Energy Equipment & Services — 2.1% | | | |
| 328,081 | | Smith International, Inc. | | | 9,415,925 |
| 117,989 | | Tidewater, Inc. | | | 5,556,102 |
| | | | | |
| | | | | 14,972,027 |
| | | | | |
| | Food & Staples Retailing — 2.3% | | | |
| 193,767 | | CVS Caremark Corp. | | | 6,925,233 |
| 271,938 | | SUPERVALU, Inc. | | | 4,095,386 |
| 111,479 | | Wal-Mart Stores, Inc. | | | 5,472,504 |
| | | | | |
| | | | | 16,493,123 |
| | | | | |
| | Food Products — 1.5% | | | |
| 484,624 | | ConAgra Foods, Inc. | | | 10,506,648 |
| | | | | |
| | Gas Utilities — 1.3% | | | |
| 221,872 | | EQT Corp. | | | 9,451,747 |
| | | | | |
| | Health Care Equipment & Supplies — 2.6% | | | |
| 715,829 | | Boston Scientific Corp.(b) | | | 7,580,629 |
| 249,326 | | Covidien PLC | | | 10,785,843 |
| | | | | |
| | | | | 18,366,472 |
| | | | | |
| | Health Care Providers & Services — 2.3% | | | |
| 137,665 | | McKesson Corp. | | | 8,197,951 |
| 320,878 | | UnitedHealth Group, Inc. | | | 8,034,785 |
| | | | | |
| | | | | 16,232,736 |
| | | | | |
| | Hotels, Restaurants & Leisure — 0.9% | | | |
| 183,573 | | Carnival Corp. | | | 6,109,309 |
| | | | | |
| | Industrial Conglomerates — 2.7% | | | |
| 577,719 | | General Electric Co. | | | 9,486,146 |
| 103,928 | | Siemens AG, Sponsored ADR | | | 9,661,147 |
| | | | | |
| | | | | 19,147,293 |
| | | | | |
| | Insurance — 3.9% | | | |
| 2,225 | | Berkshire Hathaway, Inc., Class B(b) | | | 7,393,675 |
| 284,468 | | Metlife, Inc. | | | 10,829,697 |
| 192,846 | | Travelers Cos., Inc. (The) | | | 9,493,808 |
| | | | | |
| | | | | 27,717,180 |
| | | | | |
| | Internet Software & Services — 0.9% | | | |
| 263,898 | | eBay, Inc.(b) | | | 6,230,632 |
| | | | | |
| | Media — 3.5% | | | |
| 440,093 | | DIRECTV Group, Inc. (The)(b) | | | 12,137,765 |
| 153,543 | | Time Warner Cable, Inc. | | | 6,616,168 |
| 222,234 | | Time Warner, Inc. | | | 6,395,894 |
| | | | | |
| | | | | 25,149,827 |
| | | | | |
| | Metals & Mining — 0.7% | | | |
| 125,756 | | ArcelorMittal | | | 4,670,578 |
| | | | | |
| | Multi-Utilities & Unregulated Power — 1.1% | | | |
| 256,618 | | Public Service Enterprise Group, Inc. | | | 8,068,070 |
| | | | | |
| | Oil, Gas & Consumable Fuels — 11.3% | | | |
| 117,565 | | Anadarko Petroleum Corp. | | | 7,374,852 |
| 117,913 | | Chevron Corp. | | | 8,304,613 |
| 141,146 | | CONSOL Energy, Inc. | | | 6,367,096 |
| 186,450 | | ExxonMobil Corp. | | | 12,792,335 |
| 149,766 | | Hess Corp. | | | 8,006,490 |
| 264,382 | | Marathon Oil Corp. | | | 8,433,786 |
| 257,209 | | Total SA, Sponsored ADR | | | 15,242,205 |
| 406,035 | | Valero Energy Corp. | | | 7,873,019 |
| 147,722 | | XTO Energy, Inc. | | | 6,103,873 |
| | | | | |
| | | | | 80,498,269 |
| | | | | |
See accompanying notes to financial statements.
33
LOOMIS SAYLES VALUE FUND — PORTFOLIOOF INVESTMENTS (continued)
Investments as of September 30, 2009
| | | | | | | |
| Shares | | Description | | Value (†) | |
| | | | | | | |
| | | Paper & Forest Products — 0.9% | | | | |
| | 178,712 | | Weyerhaeuser Co. | | $ | 6,549,795 | |
| | | | | | | |
| | | Personal Products — 0.8% | | | | |
| | 161,752 | | Estee Lauder Cos., Inc. (The), Class A | | | 5,997,764 | |
| | | | | | | |
| | | Pharmaceuticals — 6.9% | | | | |
| | 329,124 | | Bristol-Myers Squibb Co. | | | 7,411,873 | |
| | 157,328 | | Johnson & Johnson | | | 9,579,702 | |
| | 609,482 | | Pfizer, Inc. | | | 10,086,927 | |
| | 481,396 | | Schering-Plough Corp. | | | 13,599,437 | |
| | 174,604 | | Wyeth | | | 8,482,262 | |
| | | | | | | |
| | | | | | 49,160,201 | |
| | | | | | | |
| | | Semiconductors & Semiconductor Equipment — 1.1% | | | | |
| | 558,078 | | Applied Materials, Inc. | | | 7,478,245 | |
| | | | | | | |
| | | Software — 1.0% | | | | |
| | 267,524 | | Microsoft Corp. | | | 6,926,196 | |
| | | | | | | |
| | | Specialty Retail — 0.9% | | | | |
| | 294,737 | | Gap, Inc. (The) | | | 6,307,372 | |
| | | | | | | |
| | | Textiles, Apparel & Luxury Goods — 1.0% | | | | |
| | 104,606 | | Nike, Inc., Class B | | | 6,768,008 | |
| | | | | | | |
| | | Wireless Telecommunication Services — 1.1% | | | | |
| | 347,883 | | Vodafone Group PLC, Sponsored ADR | | | 7,827,368 | |
| | | | | | | |
| | | Total Common Stocks (Identified Cost $582,007,756) | | | 626,507,252 | |
| | | | | | | |
Principal
Amount | | | | | |
| | Short-Term Investments — 3.1% | | | | |
| $ | 22,366,685 | | Tri-Party Repurchase Agreement with Fixed Income Clearing Corporation, dated 9/30/2009 at 0.000% to be repurchased at $22,366,685 on 10/01/2009 collateralized by $22,620,000 Federal Home Loan Bank, 2.900% due 7/02/2013 with a value of $22,817,925 including accrued interest (Note 2h of Notes to Financial Statements) (Identified Cost $22,366,685) | | | 22,366,685 | |
| | | | | | | |
| | | | | | | |
| | | Total Investments - 91.3% (Identified Cost $604,374,441)(a) | | | 648,873,937 | |
| | | Other assets less liabilities — 8.7% | | | 61,658,578 | |
| | | | | | | |
| | | Net Assets — 100.0% | | $ | 710,532,515 | |
| | | | | | | |
| | | | | | | |
| | (†) | | See Note 2a of Notes to Financial Statements. | | | | |
| | (a) | | Federal Tax Information: | | | | |
| | | At September 30, 2009, the net unrealized appreciation on investments based on a cost of $609,773,146 for federal income tax purposes was as follows: | | | | |
| | | Aggregate gross unrealized appreciation for all investments in which there is an excess of value over tax cost | | $ | 59,947,334 | |
| | | Aggregate gross unrealized depreciation for all investments in which there is an excess of tax cost over value | | | (20,846,543 | ) |
| | | | | | | |
| | | Net unrealized appreciation | | $ | 39,100,791 | |
| | | | | | | |
| | (b) | | Non-income producing security. | | | | |
| | | | | | | |
| | ADR | | An American Depositary Receipt is a certificate issued by a custodian bank representing the right to receive securities of the foreign issuer described. The values of ADRs are significantly influenced by trading on exchanges not located in the United States. | | | | |
Industry Summary at September 30, 2009 (Unaudited)
| | | |
| Oil, Gas & Consumable Fuels | | 11.3 | % |
| Pharmaceuticals | | 6.9 | |
| Capital Markets | | 5.2 | |
| Diversified Financial Services | | 4.6 | |
| Insurance | | 3.9 | |
| Aerospace & Defense | | 3.6 | |
| Media | | 3.5 | |
| Commercial Banks | | 3.5 | |
| Beverages | | 3.5 | |
| Computers & Peripherals | | 3.0 | |
| Industrial Conglomerates | | 2.7 | |
| Health Care Equipment & Supplies | | 2.6 | |
| Electrical Utilities | | 2.3 | |
| Diversified Telecommunication Services | | 2.3 | |
| Food & Staples Retailing | | 2.3 | |
| Health Care Providers & Services | | 2.3 | |
| Energy Equipment & Services | | 2.1 | |
| Other Investments, less than 2% each | | 22.6 | |
| Short-Term Investments | | 3.1 | |
| | | |
| Total Investments | | 91.3 | |
| Other assets less liabilities | | 8.7 | |
| | | |
| Net Assets | | 100.0 | % |
| | | |
See accompanying notes to financial statements.
34
STATEMENTSOF ASSETSAND LIABILITIES
September 30, 2009
| | | | | | | | | | | | |
| | | Disciplined
Equity Fund* | | | Global
Markets Fund | | | Growth Fund | |
| | | | | | | | | | | | |
ASSETS | | | | | | | | | | | | |
Investments at cost | | $ | 26,674,032 | | | $ | 225,117,054 | | | $ | 92,992,219 | |
Net unrealized appreciation | | | 3,762,712 | | | | 26,602,450 | | | | 18,809,903 | |
| | | | | | | | | | | | |
Investments at value | | | 30,436,744 | | | | 251,719,504 | | | | 111,802,122 | |
Cash | | | — | | | | 27 | | | | — | |
Foreign currency at value (identified cost $0, $810,596, $0, $0 and $0) | | | — | | | | 825,552 | | | | — | |
Receivable for Fund shares sold | | | 579 | | | | 708,401 | | | | 58,247 | |
Receivable for securities sold | | | — | | | | 830,484 | | | | 793,413 | |
Dividends and interest receivable | | | 22,194 | | | | 2,029,026 | | | | 40,928 | |
Unrealized appreciation on forward foreign currency contracts (Note 2) | | | — | | | | 22,309 | | | | — | |
Receivable from investment adviser (Note 6) | | | 11,490 | | | | — | | | | — | |
Tax reclaims receivable | | | — | | | | 13,485 | | | | — | |
Foreign tax rebates receivable (Note 2) | | | — | | | | 3,031 | | | | — | |
| | | | | | | | | | | | |
TOTAL ASSETS | | | 30,471,007 | | | | 256,151,819 | | | | 112,694,710 | |
| | | | | | | | | | | | |
LIABILITIES | | | | | | | | | | | | |
Payable for securities purchased | | | 303,718 | | | | 5,378,833 | | | | — | |
Payable for Fund shares redeemed | | | 147 | | | | 890,642 | | | | 476,812 | |
Management fees payable (Note 6) | | | 11,653 | | | | 147,779 | | | | 49,668 | |
Administrative fees payable (Note 6) | | | 1,144 | | | | 9,542 | | | | 4,490 | |
Deferred Trustees’ fees (Note 6) | | | 45,466 | | | | 51,078 | | | | 85,046 | |
Service and distribution fees payable (Note 6) | | | 55 | | | | 2,948 | | | | 827 | |
Other accounts payable and accrued expenses | | | 25,307 | | | | 65,660 | | | | 104,837 | |
| | | | | | | | | | | | |
TOTAL LIABILITIES | | | 387,490 | | | | 6,546,482 | | | | 721,680 | |
| | | | | | | | | | | | |
NET ASSETS | | $ | 30,083,517 | | | $ | 249,605,337 | | | $ | 111,973,030 | |
| | | | | | | | | | | | |
NET ASSETS CONSIST OF: | | | | | | | | | | | | |
Paid-in capital | | $ | 34,139,408 | | | $ | 331,099,821 | | | $ | 226,221,515 | |
Accumulated net investment (loss)/undistributed net investment income | | | 100,021 | | | | 4,369,973 | | | | (85,047 | ) |
Accumulated net realized loss on investments, options written and foreign currency transactions | | | (7,918,624 | ) | | | (112,514,417 | ) | | | (132,973,341 | ) |
Net unrealized appreciation on investments and foreign currency translations | | | 3,762,712 | | | | 26,649,960 | | | | 18,809,903 | |
| | | | | | | | | | | | |
NET ASSETS | | $ | 30,083,517 | | | $ | 249,605,337 | | | $ | 111,973,030 | |
| | | | | | | | | | | | |
COMPUTATION OF NET ASSET VALUE AND OFFERING PRICE: | | | | | | | | | | | | |
Class A shares: | | | | | | | | | | | | |
Net assets | | $ | 1,599,086 | | | $ | 44,669,370 | | | $ | 33,206,573 | |
| | | | | | | | | | | | |
Shares of beneficial interest | | | 245,050 | | | | 3,573,950 | | | | 7,413,502 | |
| | | | | | | | | | | | |
Net asset value and redemption price per share | | $ | 6.53 | | | $ | 12.50 | | | $ | 4.48 | |
| | | | | | | | | | | | |
Offering price per share (100/94.25 of net asset value) (Note 1) | | $ | 6.93 | | | $ | 13.26 | | | $ | 4.75 | |
| | | | | | | | | | | | |
Class B shares: (redemption price per share is equal to net asset value less any applicable contingent deferred sales charge) (Note 1) | | | | | | | | | | | | |
Net assets | | $ | 167,980 | | | $ | — | | | $ | 5,397,375 | |
| | | | | | | | | | | | |
Shares of beneficial interest | | | 26,416 | | | | — | | | | 1,260,994 | |
| | | | | | | | | | | | |
Net asset value and offering price per share | | $ | 6.36 | | | $ | — | | | $ | 4.28 | |
| | | | | | | | | | | | |
Class C shares: (redemption price per share is equal to net asset value less any applicable contingent deferred sales charge) (Note 1) | | | | | | | | | | | | |
Net assets | | $ | 1,459,833 | | | $ | 96,207,846 | | | $ | 16,336,035 | |
| | | | | | | | | | | | |
Shares of beneficial interest | | | 231,888 | | | | 7,763,078 | | | | 3,813,452 | |
| | | | | | | | | | | | |
Net asset value and offering price per share | | $ | 6.30 | | | $ | 12.39 | | | $ | 4.28 | |
| | | | | | | | | | | | |
Class Y shares: | | | | | | | | | | | | |
Net assets | | $ | 26,856,618 | | | $ | 108,728,121 | | | $ | 57,033,047 | |
| | | | | | | | | | | | |
Shares of beneficial interest | | | 4,080,201 | | | | 8,673,415 | | | | 12,061,903 | |
| | | | | | | | | | | | |
Net asset value, offering and redemption price per share | | $ | 6.58 | | | $ | 12.54 | | | $ | 4.73 | |
| | | | | | | | | | | | |
See accompanying notes to financial statements.
35
| | | | | | |
Mid Cap
Growth Fund | | | Value Fund | |
| | | | | | |
| | | | | | |
| $ | 66,683,566 | | | $ | 604,374,441 | |
| | 15,394,317 | | | | 44,499,496 | |
| | | | | | | |
| | 82,077,883 | | | | 648,873,937 | |
| | — | | | | — | |
| | — | | | | — | |
| | 110,655 | | | | 63,845,236 | |
| | 1,483,778 | | | | — | |
| | 19,514 | | | | 365,841 | |
| | — | | | | — | |
| | 4,093 | | | | — | |
| | — | | | | 53,844 | |
| | — | | | | — | |
| | | | | | | |
| | 83,695,923 | | | | 713,138,858 | |
| | | | | | | |
| | | | | | |
| | 1,221,599 | | | | — | |
| | 316,163 | | | | 2,001,175 | |
| | 50,364 | | | | 261,028 | |
| | 3,297 | | | | 25,616 | |
| | 49,188 | | | | 227,497 | |
| | 377 | | | | 1,255 | |
| | 45,990 | | | | 89,772 | |
| | | | | | | |
| | 1,686,978 | | | | 2,606,343 | |
| | | | | | | |
| $ | 82,008,945 | | | $ | 710,532,515 | |
| | | | | | | |
| | | | | | |
| $ | 220,586,980 | | | $ | 759,737,354 | |
| | (49,188 | ) | | | 5,032,022 | |
| | (153,923,164 | ) | | | (98,736,357 | ) |
| | 15,394,317 | | | | 44,499,496 | |
| | | | | | | |
| $ | 82,008,945 | | | $ | 710,532,515 | |
| | | | | | | |
| | | | | | |
| | | | | | |
| $ | 54,951,137 | | | $ | 120,914,601 | |
| | | | | | | |
| | 3,004,529 | | | | 7,362,664 | |
| | | | | | | |
| $ | 18.29 | | | $ | 16.42 | |
| | | | | | | |
| $ | 19.41 | | | $ | 17.42 | |
| | | | | | | |
| | | | | | |
| $ | — | | | $ | 5,167,456 | |
| | | | | | | |
| | — | | | | 315,102 | |
| | | | | | | |
| $ | — | | | $ | 16.40 | |
| | | | | | | |
| | | | | | |
| $ | 1,203 | | | $ | 10,011,185 | |
| | | | | | | |
| | 66 | | | | 615,789 | |
| | | | | | | |
| $ | 18.20 | | | $ | 16.26 | |
| | | | | | | |
| | | | | | |
| $ | 27,056,605 | | | $ | 574,439,273 | |
| | | | | | | |
| | 1,436,301 | | | | 34,876,770 | |
| | | | | | | |
| $ | 18.84 | | | $ | 16.47 | |
| | | | | | | |
36
STATEMENTSOF OPERATIONS
For the Year Ended September 30, 2009
| | | | | | | | | | | | |
| | | Disciplined
Equity Fund* | | | Global
Markets Fund | | | Growth Fund | |
| | | | | | | | | | | | |
INVESTMENT INCOME | | | | | | | | | | | | |
Dividends | | $ | 444,193 | | | $ | 1,793,763 | | | $ | 1,323,632 | |
Interest | | | 170 | | | | 8,158,192 | | | | 1,225 | |
Securities lending income (Note 2) | | | 1,793 | | | | 5,876 | | | | 3,137 | |
Less net foreign taxes withheld | | | — | | | | (73,658 | ) | | | — | |
| | | | | | | | | | | | |
| | | 446,156 | | | | 9,884,173 | | | | 1,327,994 | |
| | | | | | | | | | | | |
Expenses | | | | | | | | | | | | |
Management fees (Note 6) | | | 114,531 | | | | 1,541,941 | | | | 688,816 | |
Service fees - Class A (Note 6) | | | 4,227 | | | | 92,953 | | | | 155,864 | |
Service and distribution fees - Class B (Note 6) | | | 1,354 | | | | — | | | | 57,052 | |
Service and distribution fees - Class C (Note 6) | | | 12,902 | | | | 854,298 | | | | 171,806 | |
Trustees’ fees and expenses (Note 6) | | | 12,377 | | | | 15,449 | | | | 14,345 | |
Administrative fees (Note 6) | | | 11,530 | | | | 103,647 | | | | 69,768 | |
Custodian fees and expenses | | | 40,757 | | | | 101,881 | | | | 28,914 | |
Transfer agent fees and expenses - Class A (Note 6) | | | 3,050 | | | | 52,132 | | | | 220,803 | |
Transfer agent fees and expenses - Class B (Note 6) | | | 263 | | | | — | | | | 22,716 | |
Transfer agent fees and expenses - Class C (Note 6) | | | 2,458 | | | | 117,578 | | | | 68,852 | |
Transfer agent fees and expenses - Class Y (Note 6) | | | 18,328 | | | | 53,503 | | | | 12,047 | |
Audit and tax services fees | | | 42,532 | | | | 59,319 | | | | 46,670 | |
Legal fees | | | 828 | | | | 7,854 | | | | 5,796 | |
Shareholder reporting expenses | | | 6,388 | | | | 42,345 | | | | 60,990 | |
Registration fees | | | 63,117 | | | | 60,950 | | | | 63,232 | |
Miscellaneous expenses (Note 6) | | | 4,248 | | | | 13,571 | | | | 5,474 | |
| | | | | | | | | | | | |
Total expenses | | | 338,890 | | | | 3,117,421 | | | | 1,693,145 | |
Less fee reduction and/or expense reimbursement (Note 6) | | | (120,625 | ) | | | (114,249 | ) | | | (64,271 | ) |
| | | | | | | | | | | | |
Net expenses | | | 218,265 | | | | 3,003,172 | | | | 1,628,874 | |
| | | | | | | | | | | | |
Net investment income (loss) | | | 227,891 | | | | 6,881,001 | | | | (300,880 | ) |
| | | | | | | | | | | | |
NET REALIZED AND UNREALIZED GAIN (LOSS) ON INVESTMENTS,
OPTIONS WRITTEN AND FOREIGN CURRENCY TRANSACTIONS | | | | | | | | | | | | |
Net realized gain (loss) on: | | | | | | | | | | | | |
Investments | | | (6,612,204 | ) | | | (80,980,194 | ) | | | (84,916,365 | ) |
Options written | | | — | | | | — | | | | — | |
Foreign currency transactions | | | — | | | | 45,784 | | | | — | |
Net change in unrealized appreciation (depreciation) on: | | | | | | | | | | | | |
Investments | | | 5,341,200 | | | | 77,267,062 | | | | 36,216,597 | |
Foreign currency translations | | | — | | | | 116,574 | | | | — | |
| | | | | | | | | | | | |
Net realized and unrealized loss on investments, options written and foreign currency transactions | | | (1,271,004 | ) | | | (3,550,774 | ) | | | (48,699,768 | ) |
| | | | | | | | | | | | |
NET INCREASE (DECREASE) IN NET ASSETS RESULTING FROM OPERATIONS | | $ | (1,043,113 | ) | | $ | 3,330,227 | | | $ | (49,000,648 | ) |
| | | | | | | | | | | | |
| ** | Includes a non-recurring dividend of $159,432. |
See accompanying notes to financial statements.
37
| | | | | | |
Mid Cap
Growth Fund | | | Value Fund | |
| | | | | | |
| | | | | | |
| $ | 685,449 | ** | | $ | 11,347,392 | |
| | 5,356 | | | | 11,820 | |
| | 4,168 | | | | 9,583 | |
| | (7,618 | ) | | | (223,670 | ) |
| | | | | | | |
| | 687,355 | | | | 11,145,125 | |
| | | | | | | |
| | | | | | |
| | 657,857 | | | | 2,096,555 | |
| | 160,386 | | | | 242,062 | |
| | — | | | | 53,822 | |
| | 7 | | | | 71,337 | |
| | 13,557 | | | | 19,162 | |
| | 44,293 | | | | 210,587 | |
| | 22,668 | | | | 28,629 | |
| | 159,790 | | | | 206,161 | |
| | — | | | | 11,568 | |
| | 2 | | | | 15,230 | |
| | 24,382 | | | | 192,972 | |
| | 44,141 | | | | 46,594 | |
| | 3,494 | | | | 14,150 | |
| | 25,997 | | | | 30,793 | |
| | 69,971 | | | | 88,473 | |
| | 10,660 | | | | (15,018 | ) |
| | | | | | | |
| | 1,237,205 | | | | 3,313,077 | |
| | (199,672 | ) | | | — | |
| | | | | | | |
| | 1,037,533 | | | | 3,313,077 | |
| | | | | | | |
| | (350,178 | ) | | | 7,832,048 | |
| | | | | | | |
| | | | | | |
| | | | | | |
| | (48,258,879 | ) | | | (86,224,117 | ) |
| | (742,224 | ) | | | — | |
| | — | | | | — | |
| | | | | | |
| | 26,716,743 | | | | 84,560,021 | |
| | — | | | | — | |
| | | | | | | |
| | (22,284,360 | ) | | | (1,664,096 | ) |
| | | | | | | |
| $ | (22,634,538 | ) | | $ | 6,167,952 | |
| | | | | | | |
38
STATEMENTSOF CHANGESIN NET ASSETS
| | | | | | | | | | | | | | | | |
| | | Disciplined Equity Fund* | | | Global Markets Fund | |
| | | Year Ended
September 30, 2009 | | | Year Ended
September 30, 2008 | | | Year Ended
September 30, 2009 | | | Year Ended
September 30, 2008 | |
| | | | | | | | | | | | | | | | |
FROM OPERATIONS: | | | | | | | | | | | | | | | | |
Net investment income (loss) | | $ | 227,891 | | | $ | 204,565 | | | $ | 6,881,001 | | | $ | 5,317,926 | |
Net realized loss on investments, options written and foreign currency transactions | | | (6,612,204 | ) | | | (1,114,622 | ) | | | (80,934,410 | ) | | | (25,759,987 | ) |
Net change in unrealized appreciation (depreciation) on investments and foreign currency translations | | | 5,341,200 | | | | (5,382,213 | ) | | | 77,383,636 | | | | (77,734,683 | ) |
| | | | | | | | | | | | | | | | |
Net increase (decrease) in net assets resulting from operations | | | (1,043,113 | ) | | | (6,292,270 | ) | | | 3,330,227 | | | | (98,176,744 | ) |
| | | | | | | | | | | | | | | | |
FROM DISTRIBUTIONS TO SHAREHOLDERS: | | | | | | | | | | | | | | | | |
Net investment income | | | | | | | | | | | | | | | | |
Class A | | | (16,599 | ) | | | (6,624 | ) | | | (1,215,467 | ) | | | (1,576,341 | ) |
Class B | | | — | | | | — | | | | — | | | | — | |
Class C | | | (6,028 | ) | | | — | | | | (1,365,584 | ) | | | (2,867,382 | ) |
Class Y | | | (193,935 | ) | | | (277,956 | ) | | | (2,348,859 | ) | | | (3,658,690 | ) |
Net realized capital gains | | | | | | | | | | | | | | | | |
Class A | | | — | | | | (123,072 | ) | | | (14,673 | ) | | | (1,305,191 | ) |
Class B | | | — | | | | (37,858 | ) | | | — | | | | — | |
Class C | | | — | | | | (97,901 | ) | | | (28,430 | ) | | | (2,671,987 | ) |
Class Y | | | — | | | | (2,801,426 | ) | | | (24,786 | ) | | | (2,927,617 | ) |
| | | | | | | | | | | | | | | | |
Total distributions | | | (216,562 | ) | | | (3,344,837 | ) | | | (4,997,799 | ) | | | (15,007,208 | ) |
| | | | | | | | | | | | | | | | |
NET INCREASE (DECREASE) IN NET ASSETS FROM CAPITAL SHARE TRANSACTIONS (NOTE 10) | | | 5,893,459 | | | | 4,968,748 | | | | (60,874,359 | ) | | | 255,345,464 | |
| | | | | | | | | | | | | | | | |
Redemption fees | | | | | | | | | | | | | | | | |
Class A | | | — | | | | — | | | | — | | | | 12,818 | |
Class C | | | — | | | | — | | | | — | | | | 21,877 | |
Class Y | | | — | | | | — | | | | — | | | | 21,783 | |
| | | | | | | | | | | | | | | | |
Total redemption fees | | | — | | | | — | | | | — | | | | 56,478 | |
| | | | | | | | | | | | | | | | |
Net increase (decrease) in net assets | | | 4,633,784 | | | | (4,668,359 | ) | | | (62,541,931 | ) | | | 142,217,990 | |
NET ASSETS | | | | | | | | | | | | | | | | |
Beginning of year | | | 25,449,733 | | | | 30,118,092 | | | | 312,147,268 | | | | 169,929,278 | |
| | | | | | | | | | | | | | | | |
End of year | | $ | 30,083,517 | | | $ | 25,449,733 | | | $ | 249,605,337 | | | $ | 312,147,268 | |
| | | | | | | | | | | | | | | | |
ACCUMULATED NET INVESTMENT (LOSS)/UNDISTRIBUTED NET INVESTMENT INCOME | | $ | 100,021 | | | $ | 34,370 | | | $ | 4,369,973 | | | $ | 2,572,401 | |
| | | | | | | | | | | | | | | | |
See accompanying notes to financial statements.
39
| | | | | | | | | | | | | | | | | | | | | | |
| Growth Fund | | | Mid Cap Growth Fund | | | Value Fund | |
Year Ended
September 30, 2009 | | | Year Ended
September 30, 2008 | | | Year Ended
September 30, 2009 | | | Year Ended
September 30, 2008 | | | Year Ended
September 30, 2009 | | | Year Ended
September 30, 2008 | |
| | | | | | | | | | | | | | | | | | | | | | |
| | | | | | | | | | | | | | | | | | | | | | |
| $ | (300,880 | ) | | $ | (1,167,160 | ) | | $ | (350,178 | ) | | $ | (637,739 | ) | | $ | 7,832,048 | | | $ | 4,768,470 | |
| | (84,916,365 | ) | | | (32,148,656 | ) | | | (49,001,103 | ) | | | (16,800,881 | ) | | | (86,224,117 | ) | | | (11,245,452 | ) |
|
36,216,597 |
| | | (81,622,240 | ) | | | 26,716,743 | | | | (24,348,831 | ) | | | 84,560,021 | | | | (72,620,410 | ) |
| | | | | | | | | | | | | | | | | | | | | | | |
| | (49,000,648 | ) | | | (114,938,056 | ) | | | (22,634,538 | ) | | | (41,787,451 | ) | | | 6,167,952 | | | | (79,097,392 | ) |
| | | | | | | | | | | | | | | | | | | | | | | |
| | | | | | | | | | | | | | | | | | | | | | |
| | | | | | | | | | | | | | | | | | | | | | |
| | — | | | | — | | | | — | | | | — | | | | (1,386,477 | ) | | | (444,319 | ) |
| | — | | | | — | | | | — | | | | — | | | | (12,760 | ) | | | (25,511 | ) |
| | — | | | | — | | | | — | | | | — | | | | (69,049 | ) | | | (19,019 | ) |
| | — | | | | — | | | | — | | | | — | | | | (4,718,484 | ) | | | (1,991,889 | ) |
| | | | | | | | | | | | | | | | | | | | | | |
| | — | | | | — | | | | — | | | | — | | | | — | | | | (1,119,214 | ) |
| | — | | | | — | | | | — | | | | — | | | | — | | | | (44,036 | ) |
| | — | | | | — | | | | — | | | | — | | | | — | | | | (96,784 | ) |
| | — | | | | — | | | | — | | | | — | | | | — | | | | (8,863,000 | ) |
| | | | | | | | | | | | | | | | | | | | | | | |
| | — | | | | — | | | | — | | | | — | | | | (6,186,770 | ) | | | (12,603,772 | ) |
| | | | | | | | | | | | | | | | | | | | | | | |
| | | | | |
| | (108,551,663 | ) | | | (36,244,496 | ) | | | (41,659,860 | ) | | | 133,294,170 | | | | 280,227,901 | | | | 321,024,510 | |
| | | | | | | | | | | | | | | | | | | | | | | |
| | | | | | | | | | | | | | | | | | | | | | |
| | — | | | | — | | | | — | | | | — | | | | — | | | | — | |
| | — | | | | — | | | | — | | | | — | | | | — | | | | — | |
| | — | | | | — | | | | — | | | | — | | | | — | | | | — | |
| | | | | | | | | | | | | | | | | | | | | | | |
| | — | | | | — | | | | — | | | | — | | | | — | | | | — | |
| | | | | | | | | | | | | | | | | | | | | | | |
| | (157,552,311 | ) | | | (151,182,552 | ) | | | (64,294,398 | ) | | | 91,506,719 | | | | 280,209,083 | | | | 229,323,346 | |
| | | | | | | | | | | | | | | | | | | | | | |
| | 269,525,341 | | | | 420,707,893 | | | | 146,303,343 | | | | 54,796,624 | | | | 430,323,432 | | | | 201,000,086 | |
| | | | | | | | | | | | | | | | | | | | | | | |
| $ | 111,973,030 | | | $ | 269,525,341 | | | $ | 82,008,945 | | | $ | 146,303,343 | | | $ | 710,532,515 | | | $ | 430,323,432 | |
| | | | | | | | | | | | | | | | | | | | | | | |
| $ | (85,047 | ) | | $ | (81,654 | ) | | $ | (49,188 | ) | | $ | (42,576 | ) | | $ | 5,032,022 | | | $ | 3,386,746 | |
| | | | | | | | | | | | | | | | | | | | | | | |
40
FINANCIAL HIGHLIGHTS
For a share outstanding throughout each period.
| | | | | | | | | | | | | | | | | | | | | | | | | | | |
| | | | | Income (Loss) from Investment Operations: | | | Less Distributions: | |
| | | | | | | |
| | | Net asset
value,
beginning
of
the period | | Net
investment
income
(loss) (a)(b) | | | Net realized
and unrealized
gain (loss) | | | Total from
investment
operations | | | Dividends
from
net investment
income (b) | | | Distributions
from net
realized
capital gains | | | Total
distributions (b) | |
| | | | | | | | | | | | | | | | | | | | | | | | | | | |
DISCIPLINED EQUITY FUND* | | | | | | | | | | | | | |
Class A | | | | | | | | | | | | | | | | | | | | | | | | | | | |
9/30/2009 | | $ | 6.98 | | $ | 0.04 | | | $ | (0.44 | ) | | $ | (0.40 | ) | | $ | (0.05 | ) | | $ | — | | | $ | (0.05 | ) |
9/30/2008 | | | 9.77 | | | 0.03 | | | | (1.80 | ) | | | (1.77 | ) | | | (0.05 | ) | | | (0.97 | ) | | | (1.02 | ) |
9/30/2007 | | | 9.42 | | | 0.02 | | | | 1.53 | | | | 1.55 | | | | (0.07 | ) | | | (1.13 | ) | | | (1.20 | ) |
9/30/2006 | | | 9.22 | | | 0.05 | | | | 0.64 | | | | 0.69 | | | | (0.03 | ) | | | (0.46 | ) | | | (0.49 | ) |
9/30/2005 | | | 7.79 | | | 0.00 | | | | 1.43 | | | | 1.43 | | | | (0.00 | ) | | | — | | | | (0.00 | ) |
Class B | | | | | | | | | | | | | | | | | | | | | | | | | | | |
9/30/2009 | | | 6.80 | | | (0.00 | ) | | | (0.44 | ) | | | (0.44 | ) | | | — | | | | — | | | | — | |
9/30/2008 | | | 9.56 | | | (0.03 | ) | | | (1.76 | ) | | | (1.79 | ) | | | — | | | | (0.97 | ) | | | (0.97 | ) |
9/30/2007 | | | 9.25 | | | (0.05 | ) | | | 1.50 | | | | 1.45 | | | | (0.01 | ) | | | (1.13 | ) | | | (1.14 | ) |
9/30/2006 | | | 9.10 | | | (0.02 | ) | | | 0.63 | | | | 0.61 | | | | — | | | | (0.46 | ) | | | (0.46 | ) |
9/30/2005 | | | 7.73 | | | (0.06 | ) | | | 1.43 | | | | 1.37 | | | | (0.00 | ) | | | — | | | | (0.00 | ) |
Class C | | | | | | | | | | | | | | | | | | | | | | | | | | | |
9/30/2009 | | | 6.76 | | | (0.00 | ) | | | (0.44 | ) | | | (0.44 | ) | | | (0.02 | ) | | | — | | | | (0.02 | ) |
9/30/2008 | | | 9.52 | | | (0.03 | ) | | | (1.76 | ) | | | (1.79 | ) | | | — | | | | (0.97 | ) | | | (0.97 | ) |
9/30/2007 | | | 9.22 | | | (0.05 | ) | | | 1.50 | | | | 1.45 | | | | (0.02 | ) | | | (1.13 | ) | | | (1.15 | ) |
9/30/2006 | | | 9.08 | | | (0.02 | ) | | | 0.63 | | | | 0.61 | | | | (0.01 | ) | | | (0.46 | ) | | | (0.47 | ) |
9/30/2005 | | | 7.73 | | | (0.07 | ) | | | 1.42 | | | | 1.35 | | | | (0.00 | ) | | | — | | | | (0.00 | ) |
Class Y | | | | | | | | | | | | | | | | | | | | | | | | | | | |
9/30/2009 | | | 7.03 | | | 0.06 | | | | (0.45 | ) | | | (0.39 | ) | | | (0.06 | ) | | | — | | | | (0.06 | ) |
9/30/2008 | | | 9.85 | | | 0.07 | | | | (1.82 | ) | | | (1.75 | ) | | | (0.10 | ) | | | (0.97 | ) | | | (1.07 | ) |
9/30/2007 | | | 9.49 | | | 0.06 | | | | 1.53 | | | | 1.59 | | | | (0.10 | ) | | | (1.13 | ) | | | (1.23 | ) |
9/30/2006 | | | 9.27 | | | 0.09 | | | | 0.64 | | | | 0.73 | | | | (0.05 | ) | | | (0.46 | ) | | | (0.51 | ) |
9/30/2005 | | | 7.82 | | | 0.04 | | | | 1.44 | | | | 1.48 | | | | (0.03 | ) | | | — | | | | (0.03 | ) |
| (a) | Per share net investment income (loss) has been calculated using the average shares outstanding during the period. |
| (b) | Amount rounds to less than $0.01 per share, if applicable. |
| (c) | Had certain expenses not been reduced during the period, if applicable, total returns would have been lower. |
See accompanying notes to financial statements.
41
| | | | | | | | | | | | | | | | |
| | | | | | | | Ratios to Average Net Assets: | | | |
| | | | | | |
Net asset
value,
end of
the period | | Total
return
(%) (c)(d) | | | Net assets,
end of
the period
(000’s) | | Net
expenses
(%) (e)(f) | | Gross
expenses
(%) (f) | | Net investment
income (loss)
(%) (f) | | | Portfolio
turnover
rate (%) |
| | | | | | | | | | | | | | | | |
| | | | | | | | | | | | | | | | |
| | | | | | | | | | | | | | | | |
| $ | 6.53 | | (5.64 | ) | | $ | 1,599 | | 1.25 | | 1.78 | | 0.78 | | | 180 |
| | 6.98 | | (20.40 | ) | | | 736 | | 1.25 | | 1.55 | | 0.38 | | | 149 |
| | 9.77 | | 17.98 | | | | 1,198 | | 1.25 | | 1.50 | | 0.22 | | | 148 |
| | 9.42 | | 7.69 | | | | 1,331 | | 1.25 | | 1.68 | | 0.56 | | | 143 |
| | 9.22 | | 18.42 | | | | 344 | | 1.25 | | 34.73 | | 0.03 | | | 133 |
| | | | | | | | | | | | | | | | |
| | 6.36 | | (6.47 | ) | | | 168 | | 2.00 | | 2.49 | | (0.03 | ) | | 180 |
| | 6.80 | | (21.01 | ) | | | 227 | | 2.00 | | 2.30 | | (0.37 | ) | | 149 |
| | 9.56 | | 17.11 | | | | 356 | | 2.00 | | 2.31 | | (0.51 | ) | | 148 |
| | 9.25 | | 6.90 | | | | 331 | | 2.00 | | 2.33 | | (0.19 | ) | | 143 |
| | 9.10 | | 17.77 | | | | 210 | | 2.00 | | 41.40 | | (0.71 | ) | | 133 |
| | | | | | | | | | | | | | | | |
| | 6.30 | | (6.41 | ) | | | 1,460 | | 2.00 | | 2.51 | | (0.06 | ) | | 180 |
| | 6.76 | | (21.10 | ) | | | 949 | | 2.00 | | 2.30 | | (0.39 | ) | | 149 |
| | 9.52 | | 17.17 | | | | 1,164 | | 2.00 | | 2.29 | | (0.54 | ) | | 148 |
| | 9.22 | | 6.92 | | | | 1,198 | | 2.00 | | 2.37 | | (0.18 | ) | | 143 |
| | 9.08 | | 17.51 | | | | 140 | | 2.00 | | 37.60 | | (0.76 | ) | | 133 |
| | | | | | | | | | | | | | | | |
| | 6.58 | | (5.42 | ) | | | 26,857 | | 0.85 | | 1.38 | | 1.09 | | | 180 |
| | 7.03 | | (20.17 | ) | | | 23,538 | | 0.85 | | 1.15 | | 0.78 | | | 149 |
| | 9.85 | | 18.39 | | | | 27,400 | | 0.85 | | 1.11 | | 0.62 | | | 148 |
| | 9.49 | | 8.13 | | | | 23,096 | | 0.85 | | 1.26 | | 0.98 | | | 143 |
| | 9.27 | | 18.99 | | | | 24,651 | | 0.85 | | 1.31 | | 0.43 | | | 133 |
| (d) | A sales charge for Class A shares and a contingent deferred sales charge for Class B and Class C shares are not reflected in total return calculations. Periods less than one year, if applicable, are not annualized. |
| (e) | The investment adviser and/or administrator agreed to reimburse a portion of the Fund’s expenses and/or reduce its fees during the period. Without this reimbursement/fee reduction, if applicable, expenses would have been higher. |
| (f) | Computed on an annualized basis for periods less than one year, if applicable. |
42
FINANCIAL HIGHLIGHTS (continued)
For a share outstanding throughout each period.
| | | | | | | | | | | | | | | | | | | | | | | | | | | | | |
| | | | | Income (Loss) from Investment Operations: | | | Less Distributions: | | | |
| | | | | | | | |
| | | Net asset
value,
beginning
of
the period | | Net
investment
income (a) | | Net realized
and unrealized
gain (loss) | | | Total from
investment
operations | | | Dividends
from
net investment
income | | | Distributions
from net
realized
capital gains (b) | | | Total
distributions | | | Redemption
fees (b)(c) |
| | | | | | | | | | | | | | | | | | | | | | | | | | | | | |
GLOBAL MARKETS FUND | | | | | | | | | | | | |
Class A | | | | | | | | | | | | | | | | | | | | | | | | | | | | | |
9/30/2009 | | $ | 11.65 | | $ | 0.36 | | $ | 0.74 | (h) | | $ | 1.10 | | | $ | (0.25 | ) | | $ | (0.00 | ) | | $ | (0.25 | ) | | $ | — |
9/30/2008 | | | 15.83 | | | 0.25 | | | (3.46 | ) | | | (3.21 | ) | | | (0.53 | ) | | | (0.44 | ) | | | (0.97 | ) | | | 0.00 |
9/30/2007 | | | 12.49 | | | 0.20 | | | 3.39 | | | | 3.59 | | | | (0.25 | ) | | | — | | | | (0.25 | ) | | | 0.00 |
9/30/2006* | | | 12.71 | | | 0.12 | | | (0.34 | ) | | | (0.22 | ) | | | — | | | | — | | | | — | | | | — |
Class C | | | | | | | | | | | | | | | | | | | | | | | | | | | | | |
9/30/2009 | | | 11.51 | | | 0.28 | | | 0.75 | (h) | | | 1.03 | | | | (0.15 | ) | | | (0.00 | ) | | | (0.15 | ) | | | — |
9/30/2008 | | | 15.70 | | | 0.15 | | | (3.43 | ) | | | (3.28 | ) | | | (0.47 | ) | | | (0.44 | ) | | | (0.91 | ) | | | 0.00 |
9/30/2007 | | | 12.43 | | | 0.10 | | | 3.36 | | | | 3.46 | | | | (0.19 | ) | | | — | | | | (0.19 | ) | | | 0.00 |
9/30/2006* | | | 12.71 | | | 0.06 | | | (0.34 | ) | | | (0.28 | ) | | | — | | | | — | | | | — | | | | — |
Class Y | | | | | | | | | | | | | | | | | | | | | | | | | | | | | |
9/30/2009 | | | 11.70 | | | 0.38 | | | 0.75 | (h) | | | 1.13 | | | | (0.29 | ) | | | (0.00 | ) | | | (0.29 | ) | | | — |
9/30/2008 | | | 15.87 | | | 0.30 | | | (3.48 | ) | | | (3.18 | ) | | | (0.55 | ) | | | (0.44 | ) | | | (0.99 | ) | | | 0.00 |
9/30/2007 | | | 12.51 | | | 0.24 | | | 3.39 | | | | 3.63 | | | | (0.27 | ) | | | — | | | | (0.27 | ) | | | 0.00 |
9/30/2006** | | | 11.84 | | | 0.19 | | | 0.64 | | | | 0.83 | | | | (0.16 | ) | | | — | | | | (0.16 | ) | | | 0.00 |
9/30/2005 | | | 10.19 | | | 0.19 | | | 1.73 | | | | 1.92 | | | | (0.27 | ) | | | — | | | | (0.27 | ) | | | — |
| * | From commencement of Class operations on February 1, 2006 through September 30, 2006. |
| ** | Prior to the close of business on February 1, 2006, the Fund offered Institutional Class shares, which were redesignated as Class Y shares on that date. |
| (a) | Per share net investment income has been calculated using the average shares outstanding during the period. |
| (b) | Amount rounds to less than $0.01 per share, if applicable. |
| (c) | Effective June 2, 2008, redemption fees were eliminated. |
| (d) | A sales charge for Class A shares and a contingent deferred sales charge for Class C shares are not reflected in total return calculations. Periods less than one year, if applicable, are not annualized. |
| (e) | Had certain expenses not been reduced during the period, if applicable, total returns would have been lower. |
See accompanying notes to financial statements.
43
| | | | | | | | | | | | | | | | | |
| | | | | | | | Ratios to Average Net Assets: | | |
| | | | | | |
Net asset
value,
end of
the period | | Total
return
(%) (d)(e) | | | Net assets,
end of
the period
(000’s) | | Net
expenses
(%) (f)(g) | | | Gross
expenses
(%) (f) | | | Net investment
income
(%) (f) | | Portfolio
turnover
rate (%) |
| | | | | | | | | | | | | | | | | |
| | | | | | | | | | | | | | | | | |
| | | | | | | | | | | | | | | | | |
| $ | 12.50 | | 10.27 | | | $ | 44,669 | | 1.25 | | | 1.34 | | | 3.56 | | 114 |
| | 11.65 | | (21.87 | ) | | | 67,647 | | 1.25 | | | 1.27 | | | 1.74 | | 133 |
| | 15.83 | | 29.05 | | | | 28,927 | | 1.25 | | | 1.37 | | | 1.44 | | 78 |
| | 12.49 | | (1.73 | ) | | | 10,438 | | 1.25 | | | 1.56 | | | 1.52 | | 103 |
| | | | | | | | | | | | | | | | | |
| | 12.39 | | 9.40 | | | | 96,208 | | 2.00 | | | 2.09 | | | 2.82 | | 114 |
| | 11.51 | | (22.42 | ) | | | 124,178 | | 2.00 | | | 2.02 | | | 1.04 | | 133 |
| | 15.70 | | 27.99 | | | | 60,179 | | 2.00 | | | 2.11 | | | 0.69 | | 78 |
| | 12.43 | | (2.12 | ) | | | 20,228 | | 2.00 | | | 2.32 | | | 0.78 | | 103 |
| | | | | | | | | | | | | | | | | |
| | 12.54 | | 10.49 | | | | 108,728 | | 1.00 | | | 1.01 | | | 3.79 | | 114 |
| | 11.70 | | (21.66 | ) | | | 120,322 | | 0.99 | (i) | | 0.99 | (i) | | 2.06 | | 133 |
| | 15.87 | | 29.36 | | | | 80,824 | | 1.00 | | | 1.02 | | | 1.70 | | 78 |
| | 12.51 | | 7.07 | | | | 58,650 | | 1.00 | | | 1.19 | | | 1.58 | | 103 |
| | 11.84 | | 19.11 | | | | 47,712 | | 1.00 | | | 1.46 | | | 1.72 | | 78 |
| (f) | Computed on an annualized basis for periods less than one year, if applicable. |
| (g) | The investment adviser and/or administrator agreed to reimburse a portion of the Fund’s expenses and/or reduce its fees during the period. Without this reimbursement/fee reduction, if applicable, expenses would have been higher. |
| (h) | The amount shown for a share outstanding does not correspond with the aggregate realized and unrealized gain (loss) for the period due to the timing of sales and redemptions of fund shares in relation to fluctuating market values of investments of the fund. |
| (i) | Includes fee/expense recovery of less than 0.01%. |
44
FINANCIAL HIGHLIGHTS (continued)
For a share outstanding throughout each period.
| | | | | | | | | | | | | | | | | | | | | | | | |
| | | | | Income (Loss) from Investment Operations: | | | Less Distributions: |
| | | | | | | |
| | | Net asset
value,
beginning
of
the period | | Net
investment
income
(loss) (a)(b) | | | Net realized
and unrealized
gain (loss) | | | Total from
investment
operations | | | Dividends
from
net investment
income | | Distributions
from net
realized
capital gains | | Total
distributions |
| | | | | | | | | | | | | | | | | | | | | | | | |
GROWTH FUND | | | | | | | | | | | | | | | | | | | | | | | | |
Class A | | | | | | | | | | | | | | | | | | | | | | | | |
9/30/2009 | | $ | 4.99 | | $ | (0.01 | ) | | $ | (0.50 | ) | | $ | (0.51 | ) | | $ | — | | $ | — | | $ | — |
9/30/2008 | | | 7.01 | | | (0.02 | ) | | | (2.00 | ) | | | (2.02 | ) | | | — | | | — | | | — |
9/30/2007 | | | 5.84 | | | (0.03 | ) | | | 1.20 | | | | 1.17 | | | | — | | | — | | | — |
9/30/2006 | | | 6.03 | | | (0.00 | ) | | | (0.19 | ) | | | (0.19 | ) | | | — | | | — | | | — |
9/30/2005 | | | 4.98 | | | (0.02 | ) | | | 1.07 | | | | 1.05 | | | | — | | | — | | | — |
Class B | | | | | | | | | | | | | | | | | | | | | | | | |
9/30/2009 | | | 4.81 | | | (0.04 | ) | | | (0.49 | ) | | | (0.53 | ) | | | — | | | — | | | — |
9/30/2008 | | | 6.79 | | | (0.07 | ) | | | (1.91 | ) | | | (1.98 | ) | | | — | | | — | | | — |
9/30/2007 | | | 5.70 | | | (0.07 | ) | | | 1.16 | | | | 1.09 | | | | — | | | — | | | — |
9/30/2006 | | | 5.94 | | | (0.05 | ) | | | (0.19 | ) | | | (0.24 | ) | | | — | | | — | | | — |
9/30/2005 | | | 4.94 | | | (0.06 | ) | | | 1.06 | | | | 1.00 | | | | — | | | — | | | — |
Class C | | | | | | | | | | | | | | | | | | | | | | | | |
9/30/2009 | | | 4.81 | | | (0.04 | ) | | | (0.49 | ) | | | (0.53 | ) | | | — | | | — | | | — |
9/30/2008 | | | 6.80 | | | (0.07 | ) | | | (1.92 | ) | | | (1.99 | ) | | | — | | | — | | | — |
9/30/2007 | | | 5.71 | | | (0.08 | ) | | | 1.17 | | | | 1.09 | | | | — | | | — | | | — |
9/30/2006 | | | 5.94 | | | (0.04 | ) | | | (0.19 | ) | | | (0.23 | ) | | | — | | | — | | | — |
9/30/2005 | | | 4.94 | | | (0.06 | ) | | | 1.06 | | | | 1.00 | | | | — | | | — | | | — |
Class Y | | | | | | | | | | | | | | | | | | | | | | | | |
9/30/2009 | | | 5.24 | | | 0.01 | | | | (0.52 | ) | | | (0.51 | ) | | | — | | | — | | | — |
9/30/2008 | | | 7.32 | | | 0.01 | | | | (2.09 | ) | | | (2.08 | ) | | | — | | | — | | | — |
9/30/2007 | | | 6.08 | | | (0.00 | ) | | | 1.24 | | | | 1.24 | | | | — | | | — | | | — |
9/30/2006 | | | 6.26 | | | 0.02 | | | | (0.20 | ) | | | (0.18 | ) | | | — | | | — | | | — |
9/30/2005 | | | 5.15 | | | (0.00 | ) | | | 1.11 | | | | 1.11 | | | | — | | | — | | | — |
| (a) | Per share net investment income (loss) has been calculated using the average shares outstanding during the period. |
| (b) | Amount rounds to less than $0.01 per share, if applicable. |
| (c) | Had certain expenses not been reduced during the period, if applicable, total returns would have been lower. |
| (d) | A sales charge for Class A shares and a contingent deferred sales charge for Class B and Class C shares are not reflected in total return calculations. Periods less than one year, if applicable, are not annualized. |
| (e) | Computed on an annualized basis for periods less than one year, if applicable. |
See accompanying notes to financial statements.
45
| | | | | | | | | | | | | | | | | | |
| | | | | | | | Ratios to Average Net Assets: | | | |
| | | | | | |
Net asset
value,
end of
the period | | Total
return
(%) (c)(d) | | | Net assets,
end of
the period
(000’s) | | Net
expenses
(%) (e)(f) | | | Gross
expenses
(%) (e) | | | Net investment
income (loss)
(%) (e) | | | Portfolio
turnover
rate (%) |
| | | | | | | | | | | | | | | | | | |
| | | | | | | | | | | | | | | | | | |
| | | | | | | | | | | | | | | | | | |
| $ | 4.48 | | (10.40 | ) | | $ | 33,207 | | 1.25 | | | 1.31 | | | (0.25 | ) | | 191 |
| | 4.99 | | (28.67 | ) | | | 156,841 | | 1.10 | | | 1.10 | | | (0.33 | ) | | 179 |
| | 7.01 | | 20.03 | | | | 228,629 | | 1.14 | (g) | | 1.14 | (g) | | (0.49 | ) | | 134 |
| | 5.84 | | (3.15 | ) | | | 225,729 | | 1.10 | | | 1.17 | | | (0.03 | ) | | 174 |
| | 6.03 | | 21.08 | | | | 51,248 | | 1.10 | | | 1.60 | | | (0.38 | ) | | 164 |
| | | | | | | | | | | | | | | | | | |
| | 4.28 | | (11.02 | ) | | | 5,397 | | 2.00 | | | 2.12 | | | (1.06 | ) | | 191 |
| | 4.81 | | (29.16 | ) | | | 9,553 | | 1.85 | | | 1.85 | | | (1.05 | ) | | 179 |
| | 6.79 | | 19.12 | | | | 28,258 | | 1.85 | (g) | | 1.85 | (g) | | (1.20 | ) | | 134 |
| | 5.70 | | (4.04 | ) | | | 32,160 | | 1.95 | | | 2.11 | | | (0.85 | ) | | 174 |
| | 5.94 | | 20.24 | | | | 38,538 | | 1.85 | | | 2.33 | | | (1.14 | ) | | 164 |
| | | | | | | | | | | | | | | | | | |
| | 4.28 | | (11.02 | ) | | | 16,336 | | 2.00 | | | 2.12 | | | (1.06 | ) | | 191 |
| | 4.81 | | (29.26 | ) | | | 27,743 | | 1.85 | | | 1.85 | | | (1.08 | ) | | 179 |
| | 6.80 | | 19.09 | | | | 39,157 | | 1.88 | | | 1.88 | | | (1.23 | ) | | 134 |
| | 5.71 | | (3.87 | ) | | | 43,415 | | 1.85 | | | 1.95 | | | (0.76 | ) | | 174 |
| | 5.94 | | 20.24 | | | | 25,734 | | 1.85 | | | 2.35 | | | (1.10 | ) | | 164 |
| | | | | | | | | | | | | | | | | | |
| | 4.73 | | (9.73 | ) | | | 57,033 | | 0.75 | | | 0.75 | | | 0.18 | | | 191 |
| | 5.24 | | (28.42 | ) | | | 75,389 | | 0.66 | | | 0.66 | | | 0.11 | | | 179 |
| | 7.32 | | 20.39 | | | | 124,663 | | 0.67 | | | 0.67 | | | (0.02 | ) | | 134 |
| | 6.08 | | (2.88 | ) | | | 121,478 | | 0.80 | (h) | | 0.80 | (h) | | 0.31 | | | 174 |
| | 6.26 | | 21.55 | | | | 95,534 | | 0.85 | | | 0.97 | | | (0.05 | ) | | 164 |
| (f) | The investment adviser and/or administrator agreed to reimburse a portion of the Fund’s expenses and/or reduce its fees during the period. Without this reimbursement/fee reduction, if applicable, expenses would have been higher. |
| (g) | Includes fee/expense recovery of less than 0.01% and 0.08% for Class A and Class B shares, respectively. |
| (h) | Includes fee/expense recovery of 0.07%. |
46
FINANCIAL HIGHLIGHTS (continued)
For a share outstanding throughout each period.
| | | | | | | | | | | | | | | | | | | | | | | | | | |
| | | | | Income (Loss) from Investment Operations: | | | Less Distributions: | |
| | | | | | | |
| | | Net asset
value,
beginning
of
the period | | Net
investment
loss (a) | | | Net realized
and unrealized
gain (loss) | | | Total from
investment
operations | | | Dividends
from
net investment
income | | | Distributions
from net
realized
capital gains | | Total
distributions | |
| | | | | | | | | | | | | | | | | | | | | | | | | | |
MID CAP GROWTH FUND | | | | | | | | | | | | | | | | | | | | | | | | | | |
Class A** | | | | | | | | | | | | | | | | | | | | | | | | | | |
9/30/2009 | | $ | 21.12 | | $ | (0.07 | )(f) | | $ | (2.76 | ) | | $ | (2.83 | ) | | $ | — | | | $ | — | | $ | — | |
9/30/2008 | | | 26.84 | | | (0.15 | ) | | | (5.57 | ) | | | (5.72 | ) | | | — | | | | — | | | — | |
9/30/2007 | | | 19.69 | | | (0.16 | )(g) | | | 7.31 | | | | 7.15 | | | | — | | | | — | | | — | |
9/30/2006 | | | 18.63 | | | (0.15 | ) | | | 1.21 | | | | 1.06 | | | | — | | | | — | | | — | |
9/30/2005 | | | 15.20 | | | (0.14 | ) | | | 3.70 | | | | 3.56 | | | | (0.13 | ) | | | — | | | (0.13 | ) |
Class C | | | | | | | | | | | | | | | | | | | | | | | | | | |
9/30/2009* | | | 15.13 | | | (0.16 | ) | | | 3.23 | | | | 3.07 | | | | — | | | | — | | | — | |
Class Y** | | | | | | | | | | | | | | | | | | | | | | | | | | |
9/30/2009 | | | 21.70 | | | (0.05 | )(f) | | | (2.81 | ) | | | (2.86 | ) | | | — | | | | — | | | — | |
9/30/2008 | | | 27.51 | | | (0.10 | ) | | | (5.71 | ) | | | (5.81 | ) | | | — | | | | — | | | — | |
9/30/2007 | | | 20.13 | | | (0.11 | )(g) | | | 7.49 | | | | 7.38 | | | | — | | | | — | | | — | |
9/30/2006 | | | 19.00 | | | (0.10 | ) | | | 1.23 | | | | 1.13 | | | | — | | | | — | | | — | |
9/30/2005 | | | 15.50 | | | (0.10 | ) | | | 3.78 | | | | 3.68 | | | | (0.18 | ) | | | — | | | (0.18 | ) |
| * | From commencement of Class operations on February 2, 2009 through September 30, 2009. |
| ** | Prior to the close of business on February 2, 2009, the Fund offered Retail and Institutional Class shares, which were redesignated as Class A and Class Y shares, respectively on that date. |
| (a) | Per share net investment loss has been calculated using the average shares outstanding during the period. |
| (b) | Had certain expenses not been reduced during the period, if applicable, total returns would have been lower. |
| (c) | A sales charge for Class A shares and a contingent deferred sales charge for Class C shares are not reflected in total return calculations. Periods less than one year, if applicable, are not annualized. |
| (d) | The investment adviser and/or administrator agreed to reimburse a portion of the Fund’s expenses and/or reduce its fees during the period. Without this reimbursement/fee reduction, if applicable, expenses would have been higher. |
See accompanying notes to financial statements.
47
| | | | | | | | | | | | | | | | | | |
| | | | | | | | Ratios to Average Net Assets: | | | |
| | | | | | |
Net asset
value,
end of
the period | | Total
return
(%) (b)(c) | | | Net assets,
end of
the period
(000’s) | | Net
expenses
(%) (d)(e) | | | Gross
expenses
(%) (e) | | | Net investment
income (loss)
(%) (e) | | | Portfolio
turnover
rate (%) |
| | | | | | | | | | | | | | | | | | |
| | | | | | | | | | | | | | | | | | |
| | | | | | | | | | | | | | | | | | |
| $ | 18.29 | | (13.44 | ) | | $ | 54,951 | | 1.25 | | | 1.52 | | | (0.45 | )(f) | | 292 |
| | 21.12 | | (21.27 | ) | | | 120,524 | | 1.25 | | | 1.32 | | | (0.58 | ) | | 299 |
| | 26.84 | | 36.31 | | | | 30,654 | | 1.25 | | | 1.43 | | | (0.71 | ) | | 194 |
| | 19.69 | | 5.69 | | | | 26,668 | | 1.25 | | | 1.52 | | | (0.72 | ) | | 211 |
| | 18.63 | | 23.55 | | | | 25,802 | | 1.25 | | | 1.50 | | | (0.85 | ) | | 280 |
| | | | | | | | | | | | | | | | | | |
| | 18.20 | | 20.29 | | | | 1 | | 2.00 | | | 2.24 | | | (1.54 | ) | | 292 |
| | | | | | | | | | | | | | | | | | |
| | 18.84 | | (13.18 | ) | | | 27,057 | | 1.00 | | | 1.12 | | | (0.27 | )(f) | | 292 |
| | 21.70 | | (21.12 | ) | | | 25,779 | | 1.00 | (h) | | 1.00 | (h) | | (0.36 | ) | | 299 |
| | 27.51 | | 36.66 | | | | 24,143 | | 1.00 | | | 1.10 | | | (0.47 | ) | | 194 |
| | 20.13 | | 5.95 | | | | 17,467 | | 1.00 | | | 1.12 | | | (0.49 | ) | | 211 |
| | 19.00 | | 23.85 | | | | 26,159 | | 1.00 | | | 1.21 | | | (0.60 | ) | | 280 |
| (e) | Computed on an annualized basis for periods less than one year, if applicable. |
| (f) | Includes a non-recurring dividend of $0.03 per share. Without this dividend, net investment loss per share would have been $(0.10) and $(0.08) for Class A and Class Y shares, respectively, and the ratio of net investment (loss) to average net assets would have been (0.63)% and (0.46)% for Class A and Class Y shares, respectively. |
| (g) | Includes a non-recurring payment of $0.02 per share. |
| (h) | Includes fee/expense recovery of less than 0.01%. |
48
FINANCIAL HIGHLIGHTS (continued)
For a share outstanding throughout each period.
| | | | | | | | | | | | | | | | | | | | | | | | | | |
| | | | | Income (Loss) from Investment Operations: | | | Less Distributions: | |
| | | | | | | |
| | | Net asset
value,
beginning
of
the period | | Net
investment
income (a)(b) | | Net realized
and unrealized
gain (loss) | | | Total from
investment
operations | | | Dividends
from
net investment
income | | | Distributions
from net
realized
capital gains | | | Total
distributions | |
| | | | | | | | | | | | | | | | | | | | | | | | | | |
VALUE FUND | | | | | | | | | | | | | | | | | | | | | | | | | | |
Class A*** | | | | | | | | | | | | | | | | | | | | | | | | | | |
9/30/2009 | | $ | 17.93 | | $ | 0.23 | | $ | (1.53 | ) | | $ | (1.30 | ) | | $ | (0.21 | ) | | $ | — | | | $ | (0.21 | ) |
9/30/2008 | | | 23.46 | | | 0.25 | | | (4.45 | ) | | | (4.20 | ) | | | (0.18 | ) | | | (1.15 | ) | | | (1.33 | ) |
9/30/2007 | | | 21.04 | | | 0.19 | | | 3.27 | | | | 3.46 | | | | (0.13 | ) | | | (0.91 | ) | | | (1.04 | ) |
9/30/2006* | | | 19.69 | | | 0.02 | | | 1.33 | | | | 1.35 | | | | — | | | | — | | | | — | |
Class B | | | | | | | | | | | | | | | | | | | | | | | | | | |
9/30/2009 | | | 17.80 | | | 0.14 | | | (1.51 | ) | | | (1.37 | ) | | | (0.03 | ) | | | — | | | | (0.03 | ) |
9/30/2008 | | | 23.46 | | | 0.10 | | | (4.45 | ) | | | (4.35 | ) | | | (0.16 | ) | | | (1.15 | ) | | | (1.31 | ) |
9/30/2007** | | | 24.00 | | | 0.00 | | | (0.54 | ) | | | (0.54 | ) | | | — | | | | — | | | | — | |
Class C | | | | | | | | | | | | | | | | | | | | | | | | | | |
9/30/2009 | | | 17.79 | | | 0.12 | | | (1.51 | ) | | | (1.39 | ) | | | (0.14 | ) | | | — | | | | (0.14 | ) |
9/30/2008 | | | 23.46 | | | 0.09 | | | (4.43 | ) | | | (4.34 | ) | | | (0.18 | ) | | | (1.15 | ) | | | (1.33 | ) |
9/30/2007** | | | 24.00 | | | 0.01 | | | (0.55 | ) | | | (0.54 | ) | | | — | | | | — | | | | — | |
Class Y*** | | | | | | | | | | | | | | | | | | | | | | | | | | |
9/30/2009 | | | 18.01 | | | 0.28 | | | (1.54 | ) | | | (1.26 | ) | | | (0.28 | ) | | | — | | | | (0.28 | ) |
9/30/2008 | | | 23.54 | | | 0.32 | | | (4.45 | ) | | | (4.13 | ) | | | (0.25 | ) | | | (1.15 | ) | | | (1.40 | ) |
9/30/2007 | | | 21.05 | | | 0.27 | | | 3.27 | | | | 3.54 | | | | (0.14 | ) | | | (0.91 | ) | | | (1.05 | ) |
9/30/2006 | | | 18.72 | | | 0.22 | | | 3.17 | | | | 3.39 | | | | (0.27 | ) | | | (0.79 | ) | | | (1.06 | ) |
9/30/2005 | | | 15.95 | | | 0.20 | | | 2.83 | | | | 3.03 | | | | (0.26 | ) | | | — | | | | (0.26 | ) |
| * | From commencement of Class operations on June 30, 2006, through September 30, 2006. |
| ** | From commencement of Class operations on June 1, 2007, through September 30, 2007. |
| *** | Prior to the close of business on June 1, 2007, the Fund offered Retail and Institutional Class shares, which were redesignated as Class A and Class Y shares, respectively, on that date. |
| (a) | Amount rounds to less than $0.01 per share, if applicable. |
| (b) | Per share net investment income has been calculated using the average shares outstanding during the period. |
| (c) | A sales charge for Class A shares and a contingent deferred sales charge for Class B and Class C shares are not reflected in total return calculations. Periods less than one year, if applicable, are not annualized. |
| (d) | Had certain expenses not been reduced during the period, if applicable, total returns would have been lower. |
See accompanying notes to financial statements.
49
| | | | | | | | | | | | | | | | | | |
| | | | | | | | Ratios to Average Net Assets: | | | |
| | | | | | |
Net asset
value,
end of
the period | | Total
return
(%) (c)(d) | | | Net assets,
end of
the period
(000’s) | | Net
expenses
(%) (e)(f) | | | Gross
expenses
(%) (f) | | | Net investment
income (%) (f) | | Portfolio
turnover
rate (%) | |
| | | | | | | | | | | | | | | | | | |
| | | | | | | | | | | | | | | | | | |
| | | | | | | | | | | | | | | | | | |
| $ | 16.42 | | (6.97 | ) | | $ | 120,915 | | 1.06 | | | 1.06 | | | 1.67 | | 47 | |
| | 17.93 | | (19.01 | ) | | | 112,274 | | 1.05 | | | 1.05 | | | 1.24 | | 36 | (g) |
| | 23.46 | | 16.85 | | | | 17,500 | | 1.09 | (h) | | 1.09 | (h) | | 0.79 | | 41 | |
| | 21.04 | | 6.86 | | | | 466 | | 1.10 | | | 8.65 | | | 0.42 | | 36 | |
| | | | | | | | | | | | | | | | | | |
| | 16.40 | | (7.62 | ) | | | 5,167 | | 1.81 | | | 1.81 | | | 1.03 | | 47 | |
| | 17.80 | | (19.65 | ) | | | 8,385 | | 1.80 | (i) | | 1.80 | (i) | | 0.51 | | 36 | (g) |
| | 23.46 | | (2.25 | ) | | | 108 | | 1.85 | | | 1.89 | | | 0.03 | | 41 | |
| | | | | | | | | | | | | | | | | | |
| | 16.26 | | (7.60 | ) | | | 10,011 | | 1.81 | | | 1.81 | | | 0.89 | | 47 | |
| | 17.79 | | (19.62 | ) | | | 6,483 | | 1.80 | (i) | | 1.80 | (i) | | 0.46 | | 36 | (g) |
| | 23.46 | | (2.25 | ) | | | 1,390 | | 1.85 | | | 1.94 | | | 0.10 | | 41 | |
| | | | | | | | | | | | | | | | | | |
| | 16.47 | | (6.66 | ) | | | 574,439 | | 0.66 | | | 0.66 | | | 1.97 | | 47 | |
| | 18.01 | | (18.67 | ) | | | 303,182 | | 0.65 | | | 0.66 | | | 1.58 | | 36 | (g) |
| | 23.54 | | 17.25 | | | | 182,002 | | 0.72 | (h) | | 0.72 | (h) | | 1.19 | | 41 | |
| | 21.05 | | 18.92 | | | | 71,147 | | 0.85 | | | 0.91 | | | 1.13 | | 36 | |
| | 18.72 | | 19.19 | | | | 37,255 | | 0.85 | | | 0.92 | | | 1.13 | | 34 | |
| (e) | The investment adviser and/or administrator agreed to reimburse a portion of the Fund’s expenses and/or reduce its fees during the period. Without this reimbursement/fee reduction, if applicable, expenses would have been higher. |
| (f) | Computed on an annualized basis for periods less than one year, if applicable. |
| (g) | Portfolio turnover excludes the impact of assets resulting from a merger with another fund. (See Note 11 of Notes to Financial Statements) |
| (h) | Includes fee/expense recovery of 0.02% and 0.01% for Class A and Class Y shares, respectively. |
| (i) | Includes fee/expense recovery of less than 0.01% for Class B and Class C shares, respectively. |
50
NOTESTO FINANCIAL STATEMENTS
September 30, 2009
1. Organization. Loomis Sayles Funds II (the “Trust”) is organized as a Massachusetts business trust. The Trust is registered under the Investment Company Act of 1940, as amended (the “1940 Act”), as an open-end management investment company. The Declaration of Trust permits the Board of Trustees to authorize the issuance of an unlimited number of shares of the Trust in multiple series. The financial statements for certain funds of the Trust are presented in separate reports. The following funds (individually, a “Fund” and collectively, the “Funds”) are included in this report:
Loomis Sayles Disciplined Equity Fund (formerly Loomis Sayles Research Fund) (the “Disciplined Equity Fund”)
Loomis Sayles Global Markets Fund (the “Global Markets Fund”)
Loomis Sayles Growth Fund (the “Growth Fund”)
Loomis Sayles Mid Cap Growth Fund (the “Mid Cap Growth Fund”)
Loomis Sayles Value Fund (the “Value Fund”)
Effective October 1, 2009, Loomis Sayles Research Fund changed its name to Loomis Sayles Disciplined Equity Fund to reflect changes in its investment strategies designed to give the Fund more flexibility in pursuit of its objective, long-term growth of capital.
Each Fund offers Class A, Class C and Class Y shares. Effective October 12, 2007, Class B shares are no longer offered. Existing Class B shareholders may continue to reinvest dividends into Class B shares and exchange their Class B shares for Class B shares of other Natixis Funds subject to existing exchange privileges as described in the Prospectus.
Effective February 2, 2009, the Mid Cap Growth Fund redesignated its Retail Class and Institutional Class shares as Class A and Class Y shares, respectively. In addition, on February 2, 2009, the Mid Cap Growth Fund began offering Class C shares.
Class A shares are sold with a maximum front-end sales charge of 5.75%. Class B shares do not pay a front-end sales charge, but pay higher Rule 12b-1 fees than Class A shares for eight years (at which point they automatically convert to Class A shares), and are subject to a contingent deferred sales charge (“CDSC”) if those shares are redeemed within six years of purchase. Class C shares do not pay a front-end sales charge, do not convert to any other class of shares and pay higher Rule 12b-1 fees than Class A shares and may be subject to a CDSC of 1.00% if those shares are redeemed within one year of acquisition, except for reinvested distributions. Class Y shares do not pay a front-end sales charge, a CDSC or distribution fees. Class Y shares are generally intended for institutional investors with a minimum initial investment of $100,000, though some categories of investors are exempted from the minimum investment amount as outlined in the Funds’ Prospectus.
Most expenses of the Trust can be directly attributed to a Fund. Expenses which can not be directly attributed to a Fund are generally apportioned based on the relative net assets of each of the Funds in the Trust. Expenses of a Fund are borne pro rata by the holders of each class of shares, except that each class bears expenses unique to that class (including the Rule 12b-1 service and distribution fees and transfer agent fees applicable to such class). In addition, each class votes as a class only with respect to its own Rule 12b-1 Plan. Shares of each class would receive their pro rata share of the net assets of a Fund if the Fund were liquidated. The Trustees approve separate dividends from net investment income on each class of shares.
2. Significant Accounting Policies. The following is a summary of significant accounting policies consistently followed by each Fund in the preparation of its financial statements. The Funds’ financial statements are prepared in accordance with accounting principles generally accepted in the United States of America which require the use of management estimates that affect the reported amounts and disclosures in the financial statements. Actual results could differ from those estimates. Management has evaluated the events and transactions that have occurred through November 23, 2009, the date the financial statements were issued, and noted no items requiring recognition in the financial statements or additional disclosures in the Notes to Financial Statements.
a. Valuation. Equity securities, including closed-end investment companies and exchange-traded funds, for which market quotations are readily available are valued at market value, as reported by pricing services recommended by the investment adviser and approved by the Board of Trustees. Such pricing services generally use the security’s last sale price on the exchange or market where the security is primarily traded or, if there is no reported sale during the day, the closing bid price. Securities traded on the NASDAQ Global Select Market, NASDAQ Global Market and NASDAQ Capital Market are valued at the NASDAQ Official Closing Price (“NOCP”), or if lacking a NOCP, at the most recent bid quotation on the applicable NASDAQ Market. Debt securities (other than short-term obligations purchased with an original or remaining maturity of sixty days or less) are generally valued on the basis of evaluated bids furnished to the Funds by a pricing service recommended by the investment adviser and approved by the Board of Trustees, which service determines valuations for normal, institutional-size trading units of such securities using market information, transactions for comparable securities and various relationships between securities which are generally recognized by institutional traders. Broker-dealer bid quotations may also be used to value debt and equity securities where a pricing service does not price a security or where a pricing service does not provide a reliable price for the security. In instances where broker-dealer bid quotations are not available, certain securities held by the Funds may be valued on the basis of a price provided by a principal market maker. Forward foreign currency contracts are valued utilizing interpolated prices determined from information provided by an independent pricing service. Domestic exchange-traded single equity option contracts are valued at the mean of the National Best Bid and offer quotations. Short-term obligations purchased with an original or remaining maturity of sixty days or less are valued at amortized cost, which approximates market value. Securities for which market quotations are not readily available are valued at fair value as determined in good faith by the Funds’ investment adviser using consistently applied procedures under the general supervision of the Board of Trustees. Investments in other open-end investment companies are valued at their net asset value each day.
51
NOTESTO FINANCIAL STATEMENTS (continued)
September 30, 2009
The Funds may hold securities traded in foreign markets. Foreign securities are valued at the market price in the foreign market. However, if events occurring after the close of the foreign market (but before the close of regular trading on the New York Stock Exchange) are believed to materially affect the value of those securities, such securities are fair valued pursuant to procedures approved by the Board of Trustees. When fair valuing securities, the Funds may, among other things, use modeling tools or other processes that may take into account factors such as securities market activity and/or significant events that occur after the close of the foreign market and before the Funds calculate their net asset values. As of September 30, 2009, approximately 21% of the market value of the Global Markets Fund’s investments was fair valued pursuant to procedures approved by the Board of Trustees.
b. Security Transactions and Related Investment Income. Security transactions are accounted for on trade date. Dividend income is recorded on ex-dividend date, or in the case of certain foreign securities, as soon as a Fund is notified, and interest income is recorded on an accrual basis. Interest income is increased by the accretion of discount and decreased by the amortization of premium. Periodic principal adjustments for inflation-protected securities are recorded to interest income. Investment income is recorded net of foreign taxes withheld when applicable. In determining net gain or loss on securities sold, the cost of securities has been determined on an identified cost basis. Investment income, non-class specific expenses and realized and unrealized gains and losses are allocated on a pro rata basis to each class based on the relative net assets of each class to the total net assets of the Fund.
c. Foreign Currency Translation. The books and records of the Funds are maintained in U.S. dollars. The value of securities, currencies and other assets and liabilities denominated in currencies other than U.S. dollars are translated into U.S. dollars based upon foreign exchange rates prevailing at the end of the period. Purchases and sales of investment securities, income and expenses are translated on the respective dates of such transactions.
Since the values of investment securities are presented at the foreign exchange rates prevailing at the end of the period, it is not practical to isolate that portion of the results of operations arising from changes in exchange rates from fluctuations which arise due to changes in market prices of investment securities. Such changes are included with the net realized and unrealized gain or loss on investments.
Net realized foreign exchange gains or losses arise from sales of foreign currency, currency gains or losses realized between the trade and settlement dates on securities transactions and the difference between the amounts of dividends, interest and foreign withholding taxes recorded on the Funds’ books and the U.S. dollar equivalent of the amounts actually received or paid. Net unrealized foreign exchange gains and losses arise from changes in the value of assets and liabilities, other than investment securities, at the end of the fiscal period, resulting from changes in exchange rates.
Each Fund may use foreign currency exchange contracts to facilitate transactions in foreign-denominated investments. Losses may arise from changes in the value of the foreign currency or if the counterparties do not perform under the contracts’ terms.
d. Forward Foreign Currency Contracts. Each Fund may enter into forward foreign currency contracts. Contracts to buy generally are used to acquire exposure to foreign currencies, while contracts to sell generally are used to hedge a Fund’s investments against currency fluctuation. Also, a contract to buy or sell can offset a previous contract. These contracts involve market risk in excess of the unrealized gain or loss reflected in the Funds’ Statements of Assets and Liabilities. The U.S. dollar value of the currencies a Fund has committed to buy or sell represents the aggregate exposure to each currency the Fund has acquired or hedged through currency contracts outstanding at period end. Gains or losses are recorded for financial statement purposes as unrealized until settlement date. Risks may arise upon entering into these contracts from the potential inability of counterparties to meet the terms of their contracts and from unanticipated movements in the value of a foreign currency relative to the U.S. dollar.
e. Option Contracts. The Funds may enter into option contracts. When a Fund purchases an option, it pays a premium and the option is subsequently marked to market to reflect current value. Premiums paid for purchasing options which expire are treated as realized losses. Premiums paid for purchasing options which are exercised or closed are added to the cost or deducted from the proceeds on the underlying instrument to determine the realized gain or loss. The risk associated with purchasing options is limited to the premium paid.
The following is a summary of Mid Cap Growth Fund’s purchased option activity:
| | | | | | | |
Contracts | | Number of
Contracts | | | Premiums | |
Outstanding at 9/30/2008 | | — | | | $ | — | |
Options purchased | | 6,569 | | | | 2,383,230 | |
Options terminated in closing sale transactions | | (6,406 | ) | | | (2,290,646 | ) |
Options expired unexercised | | (163 | ) | | | (92,584 | ) |
| | | | | | | |
Outstanding at 9/30/2009 | | — | | | $ | — | |
| | | | | | | |
52
NOTESTO FINANCIAL STATEMENTS (continued)
September 30, 2009
When the Fund writes an option, an amount equal to the net premium received (the premium less commission) is recorded as a liability and is subsequently adjusted to the current value until the option expires or the Fund enters into a closing purchase transaction. When a written option expires on its stipulated expiration date or the Fund enters into a closing purchase transaction, the difference between the net premium received and any amount paid at expiration or on effecting a closing purchase transaction, including commission, is treated as a realized gain or, if the net premium received is less than the amount paid, as a realized loss. The Fund, as writer of a written option, bears the risk of an unfavorable change in the market value of the equity underlying the written option.
The following is a summary of Mid Cap Growth Fund’s written option activity:
| | | | | | | |
| | | Number of Contracts | | | Premiums | |
Outstanding at 9/30/2008 | | — | | | $ | — | |
Options written | | 22,673 | | | | 2,877,525 | |
Options terminated in closing purchase transactions | | (22,673 | ) | | | (2,877,525 | ) |
Options expired unexercised | | — | | | | — | |
| | | | | | | |
Outstanding at 9/30/2009 | | — | | | $ | — | |
| | | | | | | |
Exchange-traded options have standardized contracts and are settled through a clearing house with fulfillment guaranteed by the credit of the exchange. Therefore, counterparty credit risks to the Funds are limited. Over-the-counter options are subject to the risk that the counterparty is unable or unwilling to meet its obligations under the option.
f. Federal and Foreign Income Taxes. The Trust treats each Fund as a separate entity for federal income tax purposes. Each Fund intends to meet the requirements of the Internal Revenue Code applicable to regulated investment companies, and to distribute to its shareholders substantially all of its net investment income and any net realized capital gains at least annually. Management has performed an analysis of each Fund’s tax positions for the open tax years as of September 30, 2009 and has concluded that no provisions for income tax are required. The Funds’ federal tax returns for the prior three fiscal years remain subject to examination by the Internal Revenue Service. Management is not aware of any events that are reasonably possible to occur in the next twelve months that would result in the amounts of any unrecognized tax benefits significantly increasing or decreasing for the Funds. However, management’s conclusions regarding tax positions taken may be subject to review and adjustment at a later date based on factors including, but not limited to, new tax laws and accounting regulations and interpretations thereof.
A Fund may be subject to foreign taxes on income and gains on investments that are accrued based upon the Fund’s understanding of the tax rules and regulations that exist in the countries in which the Fund invests. Foreign governments may also impose taxes or other payments on investments with respect to foreign securities. Such taxes are accrued as applicable, and are reflected as foreign taxes payable on the Statements of Assets and Liabilities. In the event that realized gains on investments are subsequently offset by realized losses, taxes paid on realized gains may be returned to a Fund. Such amounts, if applicable, are reflected as foreign tax rebates receivable on the Statements of Assets and Liabilities.
g. Dividends and Distributions to Shareholders. Dividends and distributions are recorded on ex-dividend date. The timing and characterization of certain income and capital gain distributions are determined annually in accordance with federal tax regulations, which may differ from accounting principles generally accepted in the United States of America. Permanent differences are primarily due to differing treatments for book and tax purposes for items such as net operating losses, distribution redesignations, paydown adjustments, foreign currency transactions, gains realized from passive foreign investment companies (“PFICs”), defaulted bonds and premium amortization accruals. Permanent book and tax basis differences relating to shareholder distributions will result in reclassifications to capital accounts. Temporary differences between book and tax distributable earnings are primarily due to deferred Trustees’ fees, forward contracts mark to market, securities lending collateral gain/loss adjustment, straddle loss deferrals, wash sales, premium amortization accruals and defaulted bond interest. Distributions from net investment income and short-term capital gains are considered to be distributed from ordinary income for tax purposes.
The tax characterization of distributions is determined on an annual basis. The tax character of distributions paid to shareholders during the years ended September 30, 2009 and 2008 was as follows:
| | | | | | | | | | | | | | | | | |
| | | 2009 Distributions Paid From: | | 2008 Distributions Paid From: |
Fund | | Ordinary Income | | Long-Term Capital Gains | | Total | | Ordinary Income | | Long-Term Capital Gains | | Total |
Disciplined Equity Fund | | $ | 216,562 | | — | | $ | 216,562 | | $ | 1,651,307 | | $ | 1,693,530 | | $ | 3,344,837 |
Global Markets Fund | | | 4,997,799 | | — | | | 4,997,799 | | | 9,975,891 | | | 5,031,317 | | | 15,007,208 |
Growth Fund | | | — | | — | | | — | | | — | | | — | | | — |
Mid Cap Growth Fund | | | — | | — | | | — | | | — | | | — | | | — |
Value Fund | | | 6,186,770 | | — | | | 6,186,770 | | | 6,455,247 | | | 6,148,525 | | | 12,603,772 |
53
NOTESTO FINANCIAL STATEMENTS (continued)
September 30, 2009
Differences between these amounts and those reported in the Statements of Changes in Net Assets, if any, are primarily attributable to different book and tax treatment for short-term capital gains.
As of September 30, 2009, the components of distributable earnings were as follows:
| | | | | | | | | | | | | | | | | | | | |
| | | Disciplined
Equity Fund | | | Global
Markets Fund | | | Growth
Fund | | | Mid Cap
Growth Fund | | | Value
Fund | |
Undistributed ordinary income | | $ | 145,487 | | | $ | 4,511,402 | | | $ | — | | | $ | — | | | $ | 5,259,519 | |
Undistributed long-term capital gains | | | — | | | | — | | | | — | | | | — | | | | — | |
| | | | | | | | | | | | | | | | | | | | |
Total undistributed earnings | | | 145,487 | | | | 4,511,402 | | | | — | | | | — | | | | 5,259,519 | |
| | | | | | | | | | | | | | | | | | | | |
Capital loss carryforward: | | | | | | | | | | | | | | | | | | | | |
Expires September 30, 2010 | | | — | | | | — | | | | (9,606,459 | )* | | | (65,130,772 | ) | | | — | |
Expires September 30, 2011 | | | — | | | | — | | | | (6,192,314 | )* | | | (21,142,388 | ) | | | — | |
Expires September 30, 2016 | | | — | | | | — | | | | (75,866 | ) | | | — | | | | — | |
Expires September 30, 2017 | | | (2,229,424 | ) | | | (54,290,711 | ) | | | (57,062,095 | ) | | | (33,667,761 | ) | | | (26,840,015 | ) |
| | | | | | | | | | | | | | | | | | | | |
Total capital loss carryforward | | | (2,229,424 | ) | | | (54,290,711 | ) | | | (72,936,734 | ) | | | (119,940,921 | ) | | | (26,840,015 | ) |
Deferred net capital losses (post-October 2008) | | | (4,813,445 | ) | | | (56,215,833 | ) | | | (57,669,601 | ) | | | (32,805,392 | ) | | | (66,497,637 | ) |
Unrealized appreciation (depreciation) | | | 2,886,958 | | | | 24,618,034 | | | | 16,442,897 | | | | 14,566,389 | | | | 39,100,791 | |
| | | | | | | | | | | | | | | | | | | | |
Total accumulated earnings (losses) | | $ | (4,010,424 | ) | | $ | (81,377,108 | ) | | $ | (114,163,438 | ) | | $ | (138,179,924 | ) | | $ | (48,977,342 | ) |
| | | | | | | | | | | | | | | | | | | | |
* A significant portion of the Loomis Sayles Growth Fund’s carryforward losses are a result of prior year mergers; therefore, utilization of these losses has been limited under section 382 of the Internal Revenue Code.
h. Repurchase Agreements. It is each Fund’s policy that the market value of the collateral for repurchase agreements be at least equal to 100% of the repurchase price, including interest. Certain repurchase agreements are tri-party arrangements whereby the collateral is held in a segregated account for the benefit of the Fund and on behalf of the counterparty. It is each Fund’s policy, regarding tri-party arrangements, that the market value of the collateral be at least equal to 102% of the repurchase price, including interest. Repurchase agreements could involve certain risks in the event of default or insolvency of the counterparty including possible delays or restrictions upon a Fund’s ability to dispose of the underlying securities.
i. Securities Lending. The Funds have entered into an agreement with State Street Bank and Trust Company (“State Street Bank”), as agent of the Funds, to lend securities to certain designated borrowers. The loans are collateralized with cash or securities in an amount equal to at least 105% or 102% of the market value (including accrued interest) of the loaned international or domestic securities, respectively, when the loan is initiated. Thereafter, the value of the collateral must remain at least 102% of the market value (including accrued interest) of loaned securities for U.S. equities and U.S. corporate debt; at least 105% of the market value (including accrued interest) of loaned securities for non-U.S. equities; and at least 100% of the market value (including accrued interest) of loaned securities for U.S. government securities, sovereign debt issued by non-U.S. governments and non-U.S. corporate debt. In the event that the market value of the collateral falls below the required percentages described above, the borrower will deliver additional collateral on the next business day. As with other extensions of credit, the Funds bear the risk of loss with respect to the investment of the collateral. The Funds invest cash collateral in short-term investments, a portion of the income from which is remitted to the borrowers and the remainder allocated between the Funds and State Street Bank as lending agent.
As of September 30, 2009, there were no securities on loan.
j. Indemnifications. Under the Trust’s organizational documents, its officers and Trustees are indemnified against certain liabilities arising out of the performance of their duties to the Funds. Additionally, in the normal course of business, the Funds enter into contracts with service providers that contain general indemnification clauses. The Funds’ maximum exposure under these arrangements is unknown as this would involve future claims that may be made against the Funds that have not yet occurred. However, based on experience, the Funds expect the risk of loss to be remote.
3. Fair Value Measurements. Effective October 1, 2008, the Funds adopted accounting standards related to fair value measurements and disclosures which establish a hierarchy for which various inputs are used in determining the value of each Fund’s assets or liabilities. These inputs are summarized in the three broad levels listed below:
| | • | | Level 1 — quoted prices in active markets for identical assets or liabilities; |
| | • | | Level 2 — prices determined using other significant inputs that are observable either directly, or indirectly through corroboration with observable market data (which could include quoted prices for similar assets or liabilities, interest rates, credit risk, etc.); |
54
NOTESTO FINANCIAL STATEMENTS (continued)
September 30, 2009
| | • | | Level 3 — prices determined using significant unobservable inputs for situations where quoted prices or observable inputs are unavailable such as when there is little or no market activity for an asset or liability (unobservable inputs reflect each Fund’s own assumptions in determining the fair value of assets or liabilities and would be based on the best information available). |
The inputs or methodology used for valuing securities are not necessarily an indication of the risk associated with investing in those securities.
The following is a summary of the inputs used to value the Funds’ investments as of September 30, 2009, at value:
Disciplined Equity Fund
Asset Valuation Inputs
| | | | | | | | | | | | |
Description | | Level 1 | | Level 2 | | Level 3 | | Total |
Common Stock(a) | | $ | 29,283,884 | | $ | — | | $ | — | | $ | 29,283,884 |
Short-Term Investments | | | 1,152,860 | | | — | | | — | | | 1,152,860 |
| | | | | | | | | | | | |
Total | | $ | 30,436,744 | | $ | — | | $ | — | | $ | 30,436,744 |
| | | | | | | | | | | | |
(a) Major categories of the Fund’s investments are included in the Portfolio of Investments.
Global Markets Fund
Asset Valuation Inputs
| | | | | | | | | | | | |
Description | | Level 1 | | Level 2 | | Level 3 | | Total |
Common Stocks | | | | | | | | | | | | |
Brazil | | $ | 12,226,729 | | $ | — | | $ | — | | $ | 12,226,729 |
Cayman Islands | | | 3,052,927 | | | — | | | — | | | 3,052,927 |
Chile | | | 1,486,862 | | | — | | | — | | | 1,486,862 |
China | | | — | | | 5,211,773 | | | — | | | 5,211,773 |
France | | | 1,725,933 | | | — | | | — | | | 1,725,933 |
Germany | | | — | | | 3,070,783 | | | — | | | 3,070,783 |
Greece | | | — | | | 2,532,713 | | | — | | | 2,532,713 |
Japan | | | — | | | 4,465,180 | | | — | | | 4,465,180 |
Korea | | | — | | | 6,077,667 | | | — | | | 6,077,667 |
Mexico | | | — | | | 1,813,420 | | | — | | | 1,813,420 |
Netherlands | | | — | | | 2,212,102 | | | — | | | 2,212,102 |
Russia | | | — | | | 1,876,489 | | | — | | | 1,876,489 |
Spain | | | — | | | 4,883,908 | | | — | | | 4,883,908 |
Sweden | | | — | | | 2,108,606 | | | — | | | 2,108,606 |
Switzerland | | | — | | | 7,011,441 | | | — | | | 7,011,441 |
Taiwan | | | — | | | 1,731,809 | | | — | | | 1,731,809 |
Turkey | | | — | | | 1,601,993 | | | — | | | 1,601,993 |
United Kingdom | | | 1,498,635 | | | 11,406,151 | | | — | | | 12,904,786 |
United States | | | 75,234,871 | | | — | | | — | | | 75,234,871 |
| | | | | | | | | | | | |
Total Common Stocks | | | 95,225,957 | | | 56,004,035 | | | — | | | 151,229,992 |
| | | | | | | | | | | | |
Bonds and Notes | | | | | | | | | | | | |
Non-Convertible Bonds | | | | | | | | | | | | |
Argentina | | | — | | | 490,200 | | | — | | | 490,200 |
Australia | | | — | | | 209,018 | | | — | | | 209,018 |
Bermuda | | | — | | | 336,898 | | | — | | | 336,898 |
Brazil | | | — | | | 1,621,130 | | | — | | | 1,621,130 |
Canada | | | — | | | 1,367,486 | | | — | | | 1,367,486 |
Cayman Islands | | | — | | | 2,341,358 | | | — | | | 2,341,358 |
Chile | | | — | | | 110,104 | | | — | | | 110,104 |
55
NOTESTO FINANCIAL STATEMENTS (continued)
September 30, 2009
Global Markets Fund
Asset Valuation Inputs (continued)
| | | | | | | | | | | | |
Description | | Level 1 | | Level 2 | | Level 3 | | Total |
Bonds and Notes (continued) | | | | | | | | | | | | |
Non-Convertible Bonds (continued) | | | | | | | | | | | | |
Colombia | | $ | — | | $ | 375,250 | | $ | — | | $ | 375,250 |
France | | | — | | | 1,219,269 | | | — | | | 1,219,269 |
Germany | | | — | | | 1,086,379 | | | — | | | 1,086,379 |
India | | | — | | | 543,167 | | | — | | | 543,167 |
Indonesia | | | — | | | 1,513,327 | | | — | | | 1,513,327 |
Ireland | | | — | | | 565,406 | | | — | | | 565,406 |
Italy | | | — | | | 493,853 | | | — | | | 493,853 |
Japan | | | — | | | 1,476,158 | | | — | | | 1,476,158 |
Korea | | | — | | | 1,610,314 | | | — | | | 1,610,314 |
Luxembourg | | | — | | | 424,867 | | | — | | | 424,867 |
Malaysia | | | — | | | 160,000 | | | — | | | 160,000 |
Mexico | | | — | | | 1,498,786 | | | — | | | 1,498,786 |
Netherlands | | | — | | | 704,994 | | | — | | | 704,994 |
Norway | | | — | | | 1,324,836 | | | — | | | 1,324,836 |
Peru | | | — | | | 233,500 | | | — | | | 233,500 |
Qatar | | | — | | | 265,406 | | | — | | | 265,406 |
Singapore | | | — | | | 322,448 | | | — | | | 322,448 |
South Africa | | | — | | | 1,013,479 | | | — | | | 1,013,479 |
Spain | | | — | | | 362,774 | | | — | | | 362,774 |
Supranational | | | — | | | 478,624 | | | — | | | 478,624 |
Sweden | | | — | | | 476,045 | | | — | | | 476,045 |
Thailand | | | — | | | 402,050 | | | — | | | 402,050 |
United Arab Emirates | | | — | | | 1,697,833 | | | — | | | 1,697,833 |
United Kingdom | | | — | | | 1,257,938 | | | — | | | 1,257,938 |
United States | | | — | | | 62,649,922 | | | 859,552 | | | 63,509,474 |
| | | | | | | | | | | | |
Total Non-Convertible Bonds | | | — | | | 88,632,819 | | | 859,552 | | | 89,492,371 |
| | | | | | | | | | | | |
Convertible Bonds | | | | | | | | | | | | |
United States | | | — | | | 2,491,487 | | | 227,900 | | | 2,719,387 |
| | | | | | | | | | | | |
Total Bonds and Notes | | | — | | | 91,124,306 | | | 1,087,452 | | | 92,211,758 |
| | | | | | | | | | | | |
Bank Loans(a) | | | — | | | 228,107 | | | — | | | 228,107 |
Preferred Stocks | | | | | | | | | | | | |
United States | | | 23,422 | | | 1,052,079 | | | — | | | 1,075,501 |
Short-Term Investments | | | 6,974,146 | | | — | | | — | | | 6,974,146 |
| | | | | | | | | | | | |
Total Investments | | | 102,223,525 | | | 148,408,527 | | | 1,087,452 | | | 251,719,504 |
| | | | | | | | | | | | |
Forward Foreign Currency Contracts (unrealized appreciation) | | | — | | | 22,309 | | | — | | | 22,309 |
| | | | | | | | | | | | |
Total | | $ | 102,223,525 | | $ | 148,430,836 | | $ | 1,087,452 | | $ | 251,741,813 |
| | | | | | | | | | | | |
(a) Major categories of the Fund’s investments are included in the Portfolio of Investments.
Growth Fund
Asset Valuation Inputs
| | | | | | | | | | | | |
Description | | Level 1 | | Level 2 | | Level 3 | | Total |
Common Stock(a) | | $ | 111,119,653 | | $ | — | | $ | — | | $ | 111,119,653 |
Short-Term Investments | | | 682,469 | | | — | | | — | | | 682,469 |
| | | | | | | | | | | | |
Total | | $ | 111,802,122 | | $ | — | | $ | — | | $ | 111,802,122 |
| | | | | | | | | | | | |
(a) Major categories of the Fund’s investments are included in the Portfolio of Investments.
56
NOTESTO FINANCIAL STATEMENTS (continued)
September 30, 2009
Mid Cap Growth Fund
Asset Valuation Inputs
| | | | | | | | | | | | |
Description | | Level 1 | | Level 2 | | Level 3 | | Total |
Common Stock(a) | | $ | 80,757,329 | | $ | — | | $ | — | | $ | 80,757,329 |
Short-Term Investments | | | 1,320,554 | | | — | | | — | | | 1,320,554 |
| | | | | | | | | | | | |
Total | | $ | 82,077,883 | | $ | — | | $ | — | | $ | 82,077,883 |
| | | | | | | | | | | | |
(a) Major categories of the Fund’s investments are included in the Portfolio of Investments.
Value Fund
Asset Valuation Inputs
| | | | | | | | | | | | |
Description | | Level 1 | | Level 2 | | Level 3 | | Total |
Common Stocks(a) | | $ | 626,507,252 | | $ | — | | $ | — | | $ | 626,507,252 |
Short-Term Investments | | | 22,366,685 | | | — | | | — | | | 22,366,685 |
| | | | | | | | | | | | |
Total | | $ | 648,873,937 | | $ | — | | $ | — | | $ | 648,873,937 |
| | | | | | | | | | | | |
(a) Major categories of the Fund’s investments are included in the Portfolio of Investments.
The following is a reconciliation of Level 3 investments for which significant unobservable inputs were used to determine fair values as of September 30, 2009:
Global Markets Fund
Asset Valuation Inputs
| | | | | | | | | | | | | | | | | | | | | | | | | |
Investments in Securities | | Balance as of
September 30,
2008 | | Accrued
Discounts
(Premiums) | | Realized
Gain
(Loss) | | | Change in
Unrealized
Appreciation
(Depreciation) | | | Net
Purchases
(Sales) | | | Net Transfers
in/(out)
Level 3 | | | Balance as of
September 30,
2009 |
Bonds and Notes | | | | | | | | | | | | | | | | | | | | | | | | | |
Non-Convertible Bonds | | | | | | | | | | | | | | | | | | | | | | | | | |
Canada | | $ | 20,000 | | $ | 164 | | $ | — | | | $ | (6,164 | ) | | $ | — | | | $ | (14,000 | ) | | $ | — |
Colombia | | | 18,333 | | | — | | | (2,570 | ) | | | 5,050 | | | | (20,813 | ) | | | — | | | | — |
Hong Kong | | | 403,317 | | | 66 | | | 18,328 | | | | 3,921 | | | | (425,632 | ) | | | — | | | | — |
Korea | | | 126,420 | | | 45 | | | — | | | | 21,917 | | | | — | | | | (148,382 | ) | | | — |
Malaysia | | | 96,000 | | | 212 | | | — | | | | 63,788 | | | | — | | | | (160,000 | ) | | | — |
Thailand | | | 286,939 | | | 508 | | | — | | | | 114,603 | | | | — | | | | (402,050 | ) | | | — |
United States | | | 1,610,948 | | | 21,355 | | | (728,896 | ) | | | 995,662 | | | | (757,255 | ) | | | (282,262 | ) | | | 859,552 |
Convertible Bonds | | | | | | | | | | | | | | | | | | | | | | | | | |
United States | | | — | | | 163 | | | — | | | | 17,037 | | | | 210,700 | | | | — | | | | 227,900 |
Preferred Stocks | | | | | | | | | | | | | | | | | | | | | | | | | |
United States | | | 381,013 | | | — | | | — | | | | 246,287 | | | | — | | | | (627,300 | ) | | | — |
| | | | | | | | | | | | | | | | | | | | | | | | | |
Total | | $ | 2,942,970 | | $ | 22,513 | | $ | (713,138 | ) | | $ | 1,462,101 | | | $ | (993,000 | ) | | $ | (1,633,994 | ) | | $ | 1,087,452 |
| | | | | | | | | | | | | | | | | | | | | | | | | |
4. Derivatives. Effective April 1, 2009, the Funds adopted accounting standards related to derivative instruments and hedging activities which require enhanced disclosures. Derivative instruments are defined as financial instruments whose value and performance are based on the value and performance of another security or financial instrument. Derivative instruments that the Funds currently use are forward foreign currency contracts and option contracts.
The Funds are subject to the risk that changes in foreign currency exchange rates will have an unfavorable effect on the value of Fund assets denominated in foreign currencies. The Funds may enter into forward foreign currency contracts for hedging purposes to protect the value of the Funds’ holdings of foreign securities. The Funds may also use forward foreign currency contracts to gain exposure to foreign currencies, regardless of whether securities denominated in such currencies are held in the Funds. Global Markets Fund engaged in forward foreign currency contract transactions during the year ended September 30, 2009.
57
NOTESTO FINANCIAL STATEMENTS (continued)
September 30, 2009
The following is a summary of derivative instruments for Global Markets Fund as of September 30, 2009:
| | |
Asset Derivatives | | Forwards |
Foreign exchange contracts | | $ 22,309 |
Statement of Assets and Liabilities Location | | Unrealized appreciation on forward foreign currency contracts |
Transactions in derivative instruments during the period April 1, 2009 to September 30, 2009 were as follows:
| | |
Realized Gain (Loss) | | Forwards |
Foreign exchange contracts | | $ (21,981) |
Statement of Operations Location | | Net realized gain (loss) on foreign currency transactions |
| | |
Change in Unrealized Appreciation
(Depreciation) | | Forwards |
Foreign exchange contracts | | $ 32,258 |
Statement of Operations Location | | Net change in unrealized appreciation/depreciation on foreign currency translations |
The Funds are subject to the risk of unpredictable declines in the value of individual equity securities and periods of below-average performance in individual securities or in the equity market as a whole. Certain Funds may use purchased put options and written call options to hedge against a decline in value of an equity security that it owns. Certain Funds may also write put options to offset the cost of options used for hedging purposes. Mid Cap Growth Fund engaged in option transactions during the year ended September 30, 2009.
Transactions in derivative instruments for Mid Cap Growth Fund during the period April 1, 2009 to September 30, 2009 were as follows:
| | | | |
Realized Gain (Loss) | | Purchased Options | | Written Options |
Equity contracts | | $ (628,176) | | $ (368,125) |
Statement of Operations Location | | Net realized gain (loss) on investments | | Net realized gain (loss) on options written |
| | |
Change in Unrealized Appreciation (Depreciation) | | Purchased Options | | Written Options |
Equity contracts | | $ (23,112) | | $ 476,252 |
Statement of Operations Location | | Net change in unrealized appreciation/depreciation on investments | | Net change in unrealized
appreciation/depreciation on
options written* |
* For the year ended September 30, 2009, net change in unrealized appreciation/(depreciation) on options written was $0.
Volume of derivative activity for Global Markets Fund, based on month-end notional amounts outstanding during the period April 1, 2009 to September 30, 2009 was as follows:
| | | |
| | | Percentage of Net Assets | |
Global Markets Fund | | Forwards | |
Average Notional Amount Outstanding | | 0.12 | % |
Highest Notional Amount Outstanding | | 0.45 | % |
Lowest Notional Amount Outstanding | | 0.00 | % |
Notional Amount Outstanding as of September 30, 2009 | | 0.26 | % |
Notional amounts outstanding are at absolute value and are determined, when applicable, by netting notional amounts of contracts to buy and sell the same underlying instrument.
See Note 2e for summaries of Mid Cap Growth Fund’s purchased and written option activity.
58
NOTESTO FINANCIAL STATEMENTS (continued)
September 30, 2009
5. Purchases and Sales of Securities. For the year ended September 30, 2009, purchases and sales of securities (excluding short-term investments and U.S. government/agency securities and including paydowns) were as follows:
| | | | | | |
Fund | | Purchases | | Sales |
Disciplined Equity Fund | | $ | 47,376,365 | | $ | 42,248,452 |
Global Markets Fund | | | 232,387,021 | | | 270,384,569 |
Growth Fund | | | 273,443,016 | | | 372,074,843 |
Mid Cap Growth Fund | | �� | 258,654,470 | | | 293,266,399 |
Value Fund | | | 405,003,802 | | | 195,279,510 |
For the year ended September 30, 2009, purchases and sales of U.S. government/agency securities by the Global Markets Fund were $1,970,166 and $4,753,729, respectively.
6. Management Fees and Other Transactions with Affiliates.
a. Management Fees. Loomis, Sayles & Company, L.P. (“Loomis Sayles”) serves as investment adviser to each Fund. Separate management agreements for each Fund in effect for the year ended September 30, 2009, provided for fees at the following annual percentage rates of each Fund’s average daily net assets:
| | | |
Fund | | Percentage of
Average
Daily Net Assets | |
Disciplined Equity Fund | | 0.50 | % |
Global Markets Fund | | 0.75 | % |
Growth Fund | | 0.50 | % |
Mid Cap Growth Fund | | 0.75 | % |
Value Fund | | 0.50 | % |
Loomis Sayles has given binding undertakings to the Funds to reduce management fees and/or reimburse certain expenses associated with the Funds to limit their operating expenses, exclusive of acquired fund fees and expenses, brokerage expenses, interest expense, taxes and extraordinary expenses. These undertakings are in effect until January 31, 2010 and will be reevaluated on an annual basis. For the year ended September 30, 2009, the expense limits as a percentage of average daily net assets under the expense limitation agreements were as follows:
| | | | | | | | | | | | |
| | | Expense Limit as a Percentage of Average
Daily Net Assets | |
Fund | | Class A | | | Class B | | | Class C | | | Class Y | |
Disciplined Equity Fund | | 1.25 | % | | 2.00 | % | | 2.00 | % | | 0.85 | % |
Global Markets Fund | | 1.25 | % | | N/A | | | 2.00 | % | | 1.00 | % |
Growth Fund | | 1.25 | % | | 2.00 | % | | 2.00 | % | | 0.85 | % |
Mid Cap Growth Fund | | 1.25 | % | | N/A | | | 2.00 | % | | 1.00 | % |
Value Fund | | 1.10 | % | | 1.85 | % | | 1.85 | % | | 0.85 | % |
Loomis Sayles shall be permitted to recover expenses it has borne under the expense limitation agreement (whether through reduction of its management fees or otherwise) on a class by class basis in later periods to the extent a class’ expenses fall below a class’ expense limits, provided, however, that a class is not obligated to pay such reduced fees/expenses more than one year after the end of the fiscal year in which the fee/expense was reduced.
59
NOTESTO FINANCIAL STATEMENTS (continued)
September 30, 2009
For the year ended September 30, 2009, the management fees for each Fund were as follows:
| | | | | | | | | | | | | | | |
| | | Gross
Management
Fee | | Reduction of
Management
Fee1 | | Net
Management
Fee | | Percentage of
Average
Daily Net Assets | |
Fund | | | | | Gross | | | Net | |
Disciplined Equity Fund | | $ | 114,531 | | $ | 99,717 | | $ | 14,814 | | 0.50 | % | | 0.06 | % |
Global Markets Fund | | | 1,541,941 | | | — | | | 1,541,941 | | 0.75 | % | | 0.75 | % |
Growth Fund | | | 688,816 | | | — | | | 688,816 | | 0.50 | % | | 0.50 | % |
Mid Cap Growth Fund | | | 657,857 | | | 16,542 | | | 641,315 | | 0.75 | % | | 0.73 | % |
Value Fund | | | 2,096,555 | | | — | | | 2,096,555 | | 0.50 | % | | 0.50 | % |
1 Management fee reductions are subject to possible recovery until September 30, 2010.
For the year ended September 30, 2009, expenses have been reimbursed as follows:
| | | | | | | | | | | | | | | |
| | | Reimbursement2 |
Fund | | Class A | | Class B | | Class C | | Class Y | | Total |
Disciplined Equity Fund | | $ | 1,626 | | $ | 70 | | $ | 884 | | $ | 18,328 | | $ | 20,908 |
Global Markets Fund | | | 32,609 | | | — | | | 72,934 | | | 8,706 | | | 114,249 |
Growth Fund | | | 36,724 | | | 6,736 | | | 20,811 | | | — | | | 64,271 |
Mid Cap Growth Fund | | | 158,746 | | | — | | | 2 | | | 24,382 | | | 183,130 |
Value Fund | | | — | | | — | | | — | | | — | | | — |
2 Expense reimbursements are subject to possible recovery until September 30, 2010.
There were no expenses recovered during the year ended September 30, 2009 as permitted under the expense limitation agreement.
Certain officers and employees of Loomis Sayles are also officers or Trustees of the Trust. Loomis Sayles’ general partner is indirectly owned by Natixis Global Asset Management, L.P. (“Natixis US”), which is part of Natixis Global Asset Management, an international asset management group based in Paris, France.
For the year ended September 30, 2009, Loomis Sayles reimbursed the Disciplined Equity Fund $420 for losses incurred in connection with a trading error.
b. Administrative Fees. Natixis Asset Management Advisors, L.P. (“Natixis Advisors”) provides certain administrative services for the Funds and contracts with State Street Bank to serve as sub-administrator. Natixis Advisors is a wholly-owned subsidiary of Natixis US. Pursuant to an agreement among Natixis Funds Trust I, Natixis Funds Trust II, Natixis Funds Trust III, Natixis Funds Trust IV, Natixis Cash Management Trust, Gateway Trust (“Natixis Funds Trusts”), Loomis Sayles Funds I, Loomis Sayles Funds II (“Loomis Sayles Funds Trusts”), Hansberger International Series and Natixis Advisors, each Fund pays Natixis Advisors monthly its pro rata portion of fees equal to an annual rate of 0.0575% of the first $15 billion of the average daily net assets of the Natixis Funds Trusts, Loomis Sayles Funds Trusts and the Hansberger International Series, 0.0500% of the next $15 billion, 0.0425% of the next $30 billion and 0.0375% of such assets in excess of $60 billion, subject to an annual aggregate minimum fee for the Natixis Funds Trusts , Loomis Sayles Funds Trusts and the Hansberger International Series of $10 million, which is reevaluated on an annual basis. New funds are subject to a fee for the first twelve months of operations of $75,000 plus $12,500 per class and an additional $75,000 if managed by multiple subadvisors.
For the year ended September 30, 2009, each Fund paid the following for administrative fees to Natixis Advisors:
| | | |
Fund | | Administrative
Fees |
Disciplined Equity Fund | | $ | 11,530 |
Global Markets Fund | | | 103,647 |
Growth Fund | | | 69,768 |
Mid Cap Growth Fund | | | 44,293 |
Value Fund | | | 210,587 |
60
NOTESTO FINANCIAL STATEMENTS (continued)
September 30, 2009
c. Service and Distribution Fees. Natixis Distributors, L.P. (“Natixis Distributors”) a wholly owned subsidiary of Natixis US, has entered into a distribution agreement with the Trust. Pursuant to this agreement, Natixis Distributors serves as principal underwriter of the funds of the Trust.
Pursuant to Rule 12b-1 under the 1940 Act, the Trust has adopted a Service Plan relating to each Fund’s Class A shares (the “Class A Plans”); Distribution and Service Plan relating to the Disciplined Equity Fund’s, Growth Fund’s and Value Fund’s Class B shares (the “Class B Plans”), and a Distribution and Service Plan relating to each Fund’s Class C shares (the “Class C Plans”).
Under the Class A Plans, each Fund pays Natixis Distributors a monthly service fee at an annual rate not to exceed 0.25% of the average daily net assets attributable to the Fund’s Class A shares, as reimbursement for expenses incurred by Natixis Distributors in providing personal services to investors in Class A shares and/or the maintenance of shareholder accounts.
Under the Class B, if applicable, and Class C Plans, each applicable Fund pays Natixis Distributors a monthly service fee at an annual rate not to exceed 0.25% of the average daily net assets attributable to the Fund’s Class B and Class C shares, as compensation for services provided and expenses incurred by Natixis Distributors in providing personal services to investors in Class B and Class C shares and/or the maintenance of shareholder accounts.
Also under the Class B, if applicable, and Class C Plans, each applicable Fund pays Natixis Distributors a monthly distribution fee at an annual rate of 0.75% of the average daily net assets attributable to the Fund’s Class B and Class C shares, as compensation for services provided and expenses incurred by Natixis Distributors in connection with the marketing or sale of Class B and Class C shares.
For the year ended September 30, 2009, the Funds paid the following service and distribution fees:
| | | | | | | | | | | | | | | |
| | | Service Fee | | Distribution Fee |
Fund | | Class A | | Class B | | Class C | | Class B | | Class C |
| | | | | | | | | | | | | | | |
Disciplined Equity Fund | | $ | 4,227 | | $ | 338 | | $ | 3,225 | | $ | 1,016 | | $ | 9,677 |
Global Markets Fund | | | 92,953 | | | — | | | 213,574 | | | — | | | 640,724 |
Growth Fund | | | 155,864 | | | 14,263 | | | 42,952 | | | 42,789 | | | 128,854 |
Mid Cap Growth Fund | | | 160,386 | | | — | | | 2 | | | — | | | 5 |
Value Fund | | | 242,062 | | | 13,456 | | | 17,834 | | | 40,366 | | | 53,503 |
d. Sub-Transfer Agent Fees. Natixis Distributors has entered into agreements with financial intermediaries to provide certain recordkeeping, processing, shareholder communications and other services to customers of the intermediaries and has agreed to compensate the intermediaries for providing those services. Certain services would be provided by the Funds if the shares of those customers were registered directly with the Funds’ transfer agent. Accordingly, the Funds agreed to pay a portion of the intermediary fees attributable to shares of the Fund held by the intermediaries (which generally is a percentage of the value of shares held) not exceeding what the Funds would have paid its transfer agent had each customer’s shares been registered directly with the transfer agent instead of held through the intermediaries. Natixis Distributors pays the remainder of the fees.
For the year ended September 30, 2009, the Funds paid the following sub-transfer agent fees, which are reflected in transfer agent fees and expenses in the Statements of Operations.
| | | | | | | | | | | | |
| | | Sub-Transfer Agent Fees |
Fund | | Class A | | Class B | | Class C | | Class Y |
Disciplined Equity Fund | | $ | 1,240 | | $ | 111 | | $ | 577 | | $ | 16,411 |
Global Markets Fund | | | 34,303 | | | — | | | 46,095 | | | 45,855 |
Growth Fund | | | 109,791 | | | 7,972 | | | 19,726 | | | 3,877 |
Mid Cap Growth Fund | | | 107,475 | | | — | | | 1 | | | 16,241 |
Value Fund | | | 48,287 | | | 2,745 | | | 2,302 | | | 183,465 |
61
NOTESTO FINANCIAL STATEMENTS (continued)
September 30, 2009
e. Commissions. The Funds have been informed that commissions (including CDSCs) on Fund shares retained by Natixis Distributors during the year ended September 30, 2009, were as follows:
| | | |
Fund | | Commissions |
Disciplined Equity Fund | | $ | 25,979 |
Global Markets Fund | | | 126,483 |
Growth Fund | | | 45,006 |
Mid Cap Growth Fund | | | 11,010 |
Value Fund | | | 70.303 |
f. Trustees Fees and Expenses. The Funds do not pay any compensation directly to their officers or Trustees who are directors, officers or employees of Natixis Advisors, Natixis Distributors, Natixis US, or their affiliates. The Chairperson of the Board receives a retainer fee at the annual rate of $200,000. The Chairperson does not receive any meeting attendance fees for Board of Trustees meetings or committee meetings that she attends. Each Independent Trustee (other than the Chairperson) receives, in the aggregate, a retainer fee at the annual rate of $65,000. Each Independent Trustee also receives a meeting attendance fee of $7,500 for each meeting of the Board of Trustees that he or she attends in person and $3,750 for each meeting of the Board of Trustees that he or she attends telephonically. In addition, each committee chair receives an additional retainer fee at the annual rate of $10,000. Each Contract Review and Governance Committee member is compensated $5,000 for each Committee meeting that he or she attends in person and $2,500 for each meeting that he or she attends telephonically. Each Audit Committee member is compensated $6,250 for each Committee meeting that he or she attends in person and $3,125 for each meeting that he or she attends telephonically. These fees are allocated among the funds in the Natixis Funds Trusts, Loomis Sayles Funds Trusts and the Hansberger International Series based on a formula that takes into account, among other factors, the relative net assets of each Fund. Trustees are reimbursed for travel expenses in connection with attendance at meetings.
A deferred compensation plan (the “Plan”) is available to the Trustees on a voluntary basis. Deferred amounts remain in the Funds until distributed in accordance with the provisions of the Plan. The value of a participating Trustee’s deferral account is based on theoretical investments of deferred amounts, on the normal payment dates, in certain funds of the Natixis Funds Trusts, Loomis Sayles Funds Trusts and Hansberger International Series as designated by the participating Trustees. Changes in the value of participants’ deferral accounts are allocated pro rata among the funds in the Natixis Funds Trusts, Loomis Sayles Funds Trusts, and Hansberger International Series, and are normally reflected as Trustees’ fees and expenses in the Statements of Operations. The portions of the accrued obligations allocated to the Funds under the Plan are reflected as Deferred Trustees’ fees on the Statements of Assets and Liabilities.
For the year ended September 30, 2009, net depreciation in the value of participants’ deferral accounts has been included as a reduction of miscellaneous expenses on the Statements of Operations as follows:
| | | |
Fund | | Amount |
Disciplined Equity Fund | | $ | 4,239 |
Global Markets Fund | | | 4,680 |
Growth Fund | | | 10,163 |
Mid Cap Growth Fund | | | 4,596 |
Value Fund | | | 37,432 |
7. Line of Credit. Each Fund, together with certain other funds of Natixis Funds Trusts, Loomis Sayles Funds Trusts and the Hansberger International Series, participates in a $200,000,000 committed unsecured line of credit provided by State Street Bank, with an individual limit of $125,000,000 for each fund that participates in the line of credit. Interest is charged to each participating fund based on its borrowings at a rate per annum equal to the greater of the Federal Funds rate or overnight LIBOR, plus 0.75%. In addition, a commitment fee of 0.125% per annum, payable at the end of each calendar quarter, is accrued and apportioned among the participating funds based on their average daily unused portion of the line of credit.
Prior to March 11, 2009, each Fund, together with certain other funds of Natixis Funds Trusts, Loomis Sayles Funds Trusts and Hansberger International Series, participated in a $200,000,000 committed unsecured line of credit provided by State Street Bank, with an individual limit of $125,000,000 for each fund that participated in the line of credit. Interest was charged to each participating fund based on its borrowings at a rate per annum equal to the Federal Funds rate plus 0.50%. In addition, a commitment fee of 0.09% per annum, payable at the end of each calendar quarter, was accrued and apportioned among the participating funds based on their average daily unused portion of the line of credit.
For the year ended September 30, 2009, the Funds had no borrowings under these agreements.
62
NOTESTO FINANCIAL STATEMENTS (continued)
September 30, 2009
8. Brokerage Commission Recapture. Each Fund has entered into agreements with certain brokers whereby the brokers will rebate a portion of brokerage commissions. All amounts rebated by the brokers are returned to the Funds under such agreements and are included in realized gains on the Statements of Operations. For the year ended September 30, 2009, amounts rebated under these agreements were as follows:
| | | |
Fund | | Rebates |
Disciplined Equity Fund | | $ | 15,677 |
Global Markets Fund | | | 36,127 |
Growth Fund | | | 83,845 |
Mid Cap Growth Fund | | | 59,028 |
Value Fund | | | 70,489 |
9. Shareholders. At September 30, 2009, Loomis Sayles Funded Pension Plan and Loomis Sayles Employees’ Profit Sharing Retirement Plan held shares of beneficial interest in the Funds as follows:
| | | | |
Fund | | Pension Plan | | Profit Sharing
Retirement Plan |
Disciplined Equity Fund | | 1,069,387 | | 847,161 |
Global Markets Fund | | 966,530 | | 491,718 |
Growth Fund | | 1,281,668 | | 1,812,209 |
Mid Cap Growth Fund | | 305,472 | | 337,725 |
Value Fund | | 486,920 | | 663,084 |
At September 30, 2009, two shareholders individually owned more than 5% of the Disciplined Equity Fund’s total outstanding shares, representing, in aggregate, 22.56% of the Fund; one shareholder individually owned more than 5% of the Global Markets Fund’s total outstanding shares, representing 9.60% of the Fund; and one shareholder individually owned more than 5% of the Mid Cap Growth Fund’s total outstanding shares, representing 5.96% of the Fund.
10. Capital Shares. Each Fund may issue an unlimited number of shares of beneficial interest, without par value. Transactions in capital shares were as follows:
| | | | | | | | | | | | | | |
| | Year Ended
September 30, 2009 | | | Year Ended
September 30, 2008 | |
Disciplined Equity Fund | | Shares | | | | Amount | | | Shares | | | | Amount | |
| | | | | | | | | | | | | | |
| Class A | | | | | | | | | | | | | | |
Issued from the sale of shares | | 503,388 | | | $ | 2,877,536 | | | 41,128 | | | $ | 353,240 | |
Issued in connection with the reinvestment of distributions | | 2,476 | | | | 13,914 | | | 5,586 | | | | 50,215 | |
Redeemed | | (366,248 | ) | | | (1,808,856 | ) | | (63,879 | ) | | | (518,171 | ) |
| | | | | | | | | | | | | | |
Net change | | 139,616 | | | $ | 1,082,594 | | | (17,165 | ) | | $ | (114,716 | ) |
| | | | | | | | | | | | | | |
| Class B | | | | | | | | | | | | | | |
Issued from the sale of shares | | 12,584 | | | $ | 70,815 | | | 4,050 | | | $ | 37,443 | |
Issued in connection with the reinvestment of distributions | | — | | | | — | | | 2,116 | | | | 18,641 | |
Redeemed | | (19,550 | ) | | | (106,750 | ) | | (10,015 | ) | | | (79,179 | ) |
| | | | | | | | | | | | | | |
Net change | | (6,966 | ) | | $ | (35,935 | ) | | (3,849 | ) | | $ | (23,095 | ) |
| | | | | | | | | | | | | | |
| Class C | | | | | | | | | | | | | | |
Issued from the sale of shares | | 392,349 | | | $ | 2,090,452 | | | 122,016 | | | $ | 929,529 | |
Issued in connection with the reinvestment of distributions | | 300 | | | | 1,642 | | | 625 | | | | 5,472 | |
Redeemed | | (301,104 | ) | | | (1,542,203 | ) | | (104,640 | ) | | | (837,295 | ) |
| | | | | | | | | | | | | | |
Net change | | 91,545 | | | $ | 549,891 | | | 18,001 | | | $ | 97,706 | |
| | | | | | | | | | | | | | |
| Class Y | | | | | | | | | | | | | | |
Issued from the sale of shares | | 1,188,390 | | | $ | 6,823,853 | | | 445,607 | | | $ | 3,756,330 | |
Issued in connection with the reinvestment of distributions | | 34,089 | | | | 192,942 | | | 340,294 | | | | 3,072,854 | |
Redeemed | | (488,997 | ) | | | (2,719,886 | ) | | (220,905 | ) | | | (1,820,331 | ) |
| | | | | | | | | | | | | | |
Net change | | 733,482 | | | $ | 4,296,909 | | | 564,996 | | | $ | 5,008,853 | |
| | | | | | | | | | | | | | |
Increase (decrease) from capital share transactions | | 957,677 | | | $ | 5,893,459 | | | 561,983 | | | $ | 4,968,748 | |
| | | | | | | | | | | | | | |
63
NOTESTO FINANCIAL STATEMENTS (continued)
September 30, 2009
10. Capital Shares (continued).
| | | | | | | | | | | | | | |
| | Year Ended
September 30, 2009 | | | Year Ended
September 30, 2008 | |
Global Markets Fund | | Shares | | | | Amount | | | Shares | | | | Amount | |
| | | | | | | | | | | | | | |
| Class A | | | | | | | | | | | | | | |
Issued from the sale of shares | | 1,705,833 | | | $ | 19,017,067 | | | 7,795,589 | | | $ | 116,072,629 | |
Issued in connection with the reinvestment of distributions | | 101,851 | | | | 922,775 | | | 131,139 | | | | 2,095,597 | |
Redeemed | | (4,038,918 | ) | | | (39,038,267 | ) | | (3,949,026 | ) | | | (54,699,917 | ) |
| | | | | | | | | | | | | | |
Net change | | (2,231,234 | ) | | $ | (19,098,425 | ) | | 3,977,702 | | | $ | 63,468,309 | |
| | | | | | | | | | | | | | |
| Class C | | | | | | | | | | | | | | |
Issued from the sale of shares | | 1,738,010 | | | $ | 17,537,139 | | | 9,661,731 | | | $ | 145,592,794 | |
Issued in connection with the reinvestment of distributions | | 53,943 | | | | 487,650 | | | 105,649 | | | | 1,677,700 | |
Redeemed | | (4,818,214 | ) | | | (46,175,227 | ) | | (2,810,388 | ) | | | (38,148,474 | ) |
| | | | | | | | | | | | | | |
Net change | | (3,026,261 | ) | | $ | (28,150,438 | ) | | 6,956,992 | | | $ | 109,122,020 | |
| | | | | | | | | | | | | | |
| Class Y | | | | | | | | | | | | | | |
Issued from the sale of shares | | 2,798,814 | | | $ | 29,261,743 | | | 8,797,937 | | | $ | 131,551,316 | |
Issued in connection with the reinvestment of distributions | | 162,878 | | | | 1,477,305 | | | 307,774 | | | | 4,927,469 | |
Redeemed | | (4,571,286 | ) | | | (44,364,544 | ) | | (3,916,604 | ) | | | (53,723,650 | ) |
| | | | | | | | | | | | | | |
Net change | | (1,609,594 | ) | | $ | (13,625,496 | ) | | 5,189,107 | | | $ | 82,755,135 | |
| | | | | | | | | | | | | | |
Increase (decrease) from capital share transactions | | (6,867,089 | ) | | $ | (60,874,359 | ) | | 16,123,801 | | | $ | 255,345,464 | |
| | | | | | | | | | | | | | |
| | |
| | Year Ended
September 30, 2009 | | | Year Ended
September 30, 2008 | |
Growth Fund | | Shares | | | | Amount | | | Shares | | | | Amount | |
| | | | | | | | | | | | | | |
| Class A | | | | | | | | | | | | | | |
Issued from the sale of shares | | 3,453,752 | | | $ | 13,194,701 | | | 7,680,209 | | | $ | 49,883,063 | |
Issued in connection with the reinvestment of distributions | | — | | | | — | | | — | | | | — | |
Redeemed | | (27,441,954 | ) | | | (101,923,299 | ) | | (8,908,360 | ) | | | (57,264,265 | ) |
| | | | | | | | | | | | | | |
Net change | | (23,988,202 | ) | | $ | (88,728,598 | ) | | (1,228,151 | ) | | $ | (7,381,202 | ) |
| | | | | | | | | | | | | | |
| Class B | | | | | | | | | | | | | | |
Issued from the sale of shares | | 41,478 | | | $ | 155,665 | | | 63,680 | | | $ | 406,401 | |
Issued in connection with the reinvestment of distributions | | — | | | | — | | | — | | | | — | |
Redeemed | | (768,098 | ) | | | (2,804,977 | ) | | (2,236,178 | ) | | | (13,949,200 | ) |
| | | | | | | | | | | | | | |
Net change | | (726,620 | ) | | $ | (2,649,312 | ) | | (2,172,498 | ) | | $ | (13,542,799 | ) |
| | | | | | | | | | | | | | |
| Class C | | | | | | | | | | | | | | |
Issued from the sale of shares | | 669,485 | | | $ | 2,490,747 | | | 1,220,476 | | | $ | 7,692,403 | |
Issued in connection with the reinvestment of distributions | | — | | | | — | | | — | | | | — | |
Redeemed | | (2,624,342 | ) | | | (9,647,623 | ) | | (1,212,293 | ) | | | (7,365,990 | ) |
| | | | | | | | | | | | | | |
Net change | | (1,954,857 | ) | | $ | (7,156,876 | ) | | 8,183 | | | $ | 326,413 | |
| | | | | | | | | | | | | | |
| Class Y | | | | | | | | | | | | | | |
Issued from the sale of shares | | 2,676,025 | | | $ | 11,399,448 | | | 4,435,371 | | | $ | 30,672,809 | |
Issued in connection with the reinvestment of distributions | | — | | | | — | | | — | | | | — | |
Redeemed | | (4,993,469 | ) | | | (21,416,325 | ) | | (7,080,124 | ) | | | (46,319,717 | ) |
| | | | | | | | | | | | | | |
Net change | | (2,317,444 | ) | | $ | (10,016,877 | ) | | (2,644,753 | ) | | $ | (15,646,908 | ) |
| | | | | | | | | | | | | | |
Increase (decrease) from capital share transactions | | (28,987,123 | ) | | $ | (108,551,663 | ) | | (6,037,219 | ) | | $ | (36,244,496 | ) |
| | | | | | | | | | | | | | |
64
NOTESTO FINANCIAL STATEMENTS (continued)
September 30, 2009
10. Capital Shares (continued).
| | | | | | | | | | | | | | |
| | Year Ended
September 30, 2009 | | | Year Ended
September 30, 2008 | |
Mid Cap Growth Fund | | Shares | | | | Amount | | | Shares | | | | Amount | |
| | | | | | | | | | | | | | |
| Class A** | | | | | | | | | | | | | | |
Issued from the sale of shares | | 5,551,566 | | | $ | 85,146,527 | | | 7,376,061 | | | $ | 191,485,150 | |
Issued in connection with the reinvestment of distributions | | — | | | | — | | | — | | | | — | |
Redeemed | | (8,253,762 | ) | | | (130,696,008 | ) | | (2,811,222 | ) | | | (67,626,524 | ) |
| | | | | | | | | | | | | | |
Net change | | (2,702,196 | ) | | $ | (45,549,481 | ) | | 4,564,839 | | | $ | 123,858,626 | |
| | | | | | | | | | | | | | |
| Class C* | | | | | | | | | | | | | | |
Issued from the sale of shares | | 66 | | | $ | 1,000 | | | — | | | $ | — | |
Issued in connection with the reinvestment of distributions | | — | | | | — | | | — | | | | — | |
Redeemed | | — | | | | — | | | — | | | | — | |
| | | | | | | | | | | | | | |
Net change | | 66 | | | $ | 1,000 | | | — | | | $ | — | |
| | | | | | | | | | | | | | |
| Class Y** | | | | | | | | | | | | | | |
Issued from the sale of shares | | 2,017,424 | | | $ | 31,974,020 | | | 835,746 | | | $ | 23,099,020 | |
Issued in connection with the reinvestment of distributions | | — | | | | — | | | — | | | | — | |
Redeemed | | (1,769,294 | ) | | | (28,085,399 | ) | | (525,115 | ) | | | (13,663,476 | ) |
| | | | | | | | | | | | | | |
Net change | | 248,130 | | | $ | 3,888,621 | | | 310,631 | | | $ | 9,435,544 | |
| | | | | | | | | | | | | | |
Increase (decrease) from capital share transactions | | (2,454,000 | ) | | $ | (41,659,860 | ) | | 4,875,470 | | | $ | 133,294,170 | |
| | | | | | | | | | | | | | |
* From commencement of Class operations on February 2, 2009 through September 30, 2009.
** Prior to the close of business on February 2, 2009 the Fund offered Retail and Institutional Class shares, which were redesignated as Class A and Class Y shares, respectively on that date.
| | | | | | | | | | | | | | |
| | Year Ended
September 30, 2009 | | | Year Ended
September 30, 2008 | |
Value Fund | | Shares | | | | Amount | | | Shares | | | | Amount | |
| | | | | | | | | | | | | | |
| Class A | | | | | | | | | | | | | | |
Issued from the sale of shares | | 3,255,896 | | | $ | 44,814,805 | | | 2,540,370 | | | $ | 50,973,973 | |
Issued in connection with the acquisition of assets from Natixis Value Fund (Note 11) | | — | | | | — | | | 4,677,827 | | | | 105,017,209 | |
Issued in connection with the reinvestment of distributions | | 94,079 | | | | 1,308,638 | | | 66,481 | | | | 1,479,502 | |
Redeemed | | (2,248,215 | ) | | | (30,522,329 | ) | | (1,769,731 | ) | | | (35,781,927 | ) |
| | | | | | | | | | | | | | |
Net change | | 1,101,760 | | | $ | 15,601,114 | | | 5,514,947 | | | $ | 121,688,757 | |
| | | | | | | | | | | | | | |
| Class B | | | | | | | | | | | | | | |
Issued from the sale of shares | | 22,368 | | | $ | 308,302 | | | 15,504 | | | $ | 318,803 | |
Issued in connection with the acquisition of assets from Natixis Value Fund (Note 11) | | — | | | | — | | | 653,035 | | | | 14,641,036 | |
Issued in connection with the reinvestment of distributions | | 888 | | | | 12,403 | | | 3,039 | | | | 67,865 | |
Redeemed | | (179,186 | ) | | | (2,417,234 | ) | | (205,132 | ) | | | (4,185,244 | ) |
| | | | | | | | | | | | | | |
Net change | | (155,930 | ) | | $ | (2,096,529 | ) | | 466,446 | | | $ | 10,842,460 | |
| | | | | | | | | | | | | | |
| Class C | | | | | | | | | | | | | | |
Issued from the sale of shares | | 382,900 | | | $ | 5,369,989 | | | 237,371 | | | $ | 4,858,951 | |
Issued in connection with the acquisition of assets from Natixis Value Fund (Note 11) | | — | | | | — | | | 127,550 | | | | 2,857,122 | |
Issued in connection with the reinvestment of distributions | | 3,005 | | | | 41,620 | | | 1,900 | | | | 42,151 | |
Redeemed | | (134,455 | ) | | | (1,783,797 | ) | | (61,760 | ) | | | (1,258,832 | ) |
| | | | | | | | | | | | | | |
Net change | | 251,450 | | | $ | 3,627,812 | | | 305,061 | | | $ | 6,499,392 | |
| | | | | | | | | | | | | | |
| Class Y | | | | | | | | | | | | | | |
Issued from the sale of shares | | 26,551,540 | | | $ | 378,808,598 | | | 11,928,797 | | | $ | 239,360,963 | |
Issued in connection with the reinvestment of distributions | | 306,125 | | | | 4,258,197 | | | 436,948 | | | | 9,702,013 | |
Redeemed | | (8,813,838 | ) | | | (119,971,291 | ) | | (3,265,447 | ) | | | (67,069,075 | ) |
| | | | | | | | | | | | | | |
Net change | | 18,043,827 | | | $ | 263,095,504 | | | 9,100,298 | | | $ | 181,993,901 | |
| | | | | | | | | | | | | | |
Increase (decrease) from capital share transactions | | 19,241,107 | | | $ | 280,227,901 | | | 15,386,752 | | | $ | 321,024,510 | |
| | | | | | | | | | | | | | |
65
NOTESTO FINANCIAL STATEMENTS (continued)
September 30, 2009
11. Acquisition of Assets. After the close of business on October 26, 2007, the Value Fund acquired all assets and liabilities of Natixis Value Fund, pursuant to a plan of reorganization approved by Natixis Value Fund shareholders on October 12, 2007. The acquisition was accomplished by a tax-free exchange of 4,677,827 Class A shares of the Value Fund for 14,004,395 shares of the Natixis Value Fund Class A, 653,035 Class B shares of the Value Fund for 2,297,374 shares of the Natixis Value Fund Class B; and 127,550 Class C shares of the Value Fund for 448,235 shares of the Natixis Value Fund Class C. Natixis Value Fund net assets at that date of $122,515,367, including $13,382,872 of net unrealized appreciation, were combined with those of the Value Fund. The aggregate net assets of the Value Fund immediately before the acquisition were $200,528,438. The combined net assets of the Value Fund immediately following the acquisition were $323,043,805.
12. Concentration of Risk. Each Fund may purchase investments of foreign issuers. Investing in securities of foreign issuers involves special risks and considerations not typically associated with investing in U.S. companies and securities of the U.S. government. These risks include revaluation of currencies and the risk of expropriation. Moreover, the markets for securities of many foreign issuers may be less liquid and the prices of such securities may be more volatile than those of comparable U.S. companies and the U.S. government.
66
REPORTOF INDEPENDENT REGISTERED PUBLIC ACCOUNTING FIRM
To the Trustees of Loomis Sayles Funds II and Shareholders of Loomis Sayles Disciplined Equity Fund (formerly Loomis Sayles Research Fund), Loomis Sayles Global Markets Fund, Loomis Sayles Growth Fund, Loomis Sayles Mid Cap Growth Fund and Loomis Sayles Value Fund:
In our opinion, the accompanying statements of assets and liabilities, including the portfolios of investments, and the related statements of operations and of changes in net assets and the financial highlights present fairly, in all material respects, the financial position of the Loomis Sayles Disciplined Equity Fund (formerly Loomis Sayles Research Fund), Loomis Sayles Global Markets Fund, Loomis Sayles Growth Fund, Loomis Sayles Mid Cap Growth Fund and Loomis Sayles Value Fund, each a series of Loomis Sayles Funds II (collectively, the “Funds"), at September 30, 2009, and the results of each of their operations, the changes in each of their net assets and the financial highlights for each of the periods indicated, in conformity with accounting principles generally accepted in the United States of America. These financial statements and financial highlights (hereafter referred to as "financial statements") are the responsibility of the Funds' management; our responsibility is to express an opinion on these financial statements based on our audits. We conducted our audits of these financial statements in accordance with the standards of the Public Company Accounting Oversight Board (United States). Those standards require that we plan and perform the audits to obtain reasonable assurance about whether the financial statements are free of material misstatement. An audit includes examining, on a test basis, evidence supporting the amounts and disclosures in the financial statements, assessing the accounting principles used and significant estimates made by management, and evaluating the overall financial statement presentation. We believe that our audits, which included confirmation of securities at September 30, 2009 by correspondence with the custodian and brokers, provide a reasonable basis for our opinion.
PricewaterhouseCoopers LLP
Boston, Massachusetts
November 23, 2009
67
2009 U.S. TAX DISTRIBUTION INFORMATIONTO SHAREHOLDERS (Unaudited)
Corporate Dividends Received Deduction. For the fiscal year ended September 30, 2009, a percentage of dividends distributed by the Funds listed below qualify for the dividends received deduction for corporate shareholders. These percentages are as follows:
| | | |
Fund | | Qualifying
Percentage | |
Disciplined Equity | | 100.00 | % |
Global Markets | | 12.47 | % |
Value | | 100.00 | % |
Qualified Dividend Income. For the fiscal year ended September 30, 2009, the Funds below will designate up to the maximum amount allowable pursuant to the Internal Revenue Code as qualified dividend income eligible for reduced tax rates. These lower rates range from 0% to 15% depending on an individual’s tax bracket. If the Funds pay a distribution during calendar year 2009, complete information will be reported in conjunction with Form 1099-DIV.
| | |
Fund | | |
Disciplined Equity | | |
Global Markets | | |
Value | | |
68
TRUSTEEAND OFFICER INFORMATION
The tables below provide certain information regarding the Trustees and officers of Loomis Sayles Funds II (the “Trust”). Unless otherwise indicated, the address of all persons below is 399 Boylston Street, Boston, MA 02116. The Trust’s Statements of Additional Information include additional information about the Trustees of the Trust and are available by calling Natixis Funds at 800-225-5478.
| | | | | | |
Name and Year of Birth | | Position(s) Held with the
Trust, Length of Time
Served and Term of Office* | | Principal Occupation(s)
During Past 5 Years** | | Number of Portfolios in
Fund Complex Overseen*** and Other Directorships Held |
| | | |
| INDEPENDENT TRUSTEES | | | | | | |
| | | |
Graham T. Allison, Jr.
(1940) | | Trustee Since 2003 Contract Review and Governance Committee Member | | Douglas Dillon Professor and Director of the Belfer Center for Science and International Affairs, John F. Kennedy School of Government, Harvard University | | 39 Director, Taubman Centers, Inc. (real estate investment trust) |
| | | |
Charles D. Baker (1956) | | Trustee Since 2005 Contract Review and Governance Committee Member | | Formerly, President and Chief Executive Officer, Harvard Pilgrim Health Care (health plan) | | 39 None |
| | | |
Edward A. Benjamin
(1938) | | Trustee Since 2002 Chairman of the Contract Review and Governance Committee | | Retired | | 39 None |
| | | |
Daniel M. Cain (1945) | | Trustee Since 2003 Chairman of the Audit Committee | | Chairman (formerly, President and Chief Executive Officer), Cain Brothers & Company, Incorporated (investment banking); | | 39 Director, Sheridan Healthcare Inc. (physician practice management) |
| | | |
Kenneth A. Drucker (1945) | | Trustee Since 2008 Audit Committee Member | | Formerly, Treasurer, Sequa Corp. (manufacturing) | | 39 None |
| | | |
Wendell J. Knox**** (1948) | | Trustee Since 2009 Contract Review and Governance Committee Member | | Director (formerly, President and Chief Executive Officer) of Abt Associates Inc. (research and consulting) | | 39 Director, Eastern Bank (commercial bank); Director, The Hanover Insurance Group (property and casualty insurance) |
| | | |
Sandra O. Moose (1942) | | Chairperson of the Board of Trustees since November 2005 Trustee since 2003 Ex officio member of the Audit Committee and Contract Review and Governance Committee | | President, Strategic Advisory Services (management consulting); formerly, Senior Vice President and Director, The Boston Consulting Group, Inc. (management consulting) | | 39 Director, Verizon Communications; Director, AES Corporation (international power company) |
69
TRUSTEEAND OFFICER INFORMATION
| | | | | | |
Name and Year of Birth | | Position(s) Held with the
Trust, Length of Time
Served and Term of Office* | | Principal Occupation(s)
During Past 5 Years** | | Number of Portfolios in
Fund Complex Overseen*** and Other Directorships Held |
| | | |
INDEPENDENT TRUSTEES continued | | | | | | |
| | | |
Cynthia L. Walker
(1956) | | Trustee Since 2005 Audit Committee Member | | Deputy Dean for Finance and Administration, Yale University School of Medicine; formerly, Executive Dean for Administration, Harvard Medical School; and formerly, Dean for Finance and Chief Financial Officer, Harvard Medical School | | 39 None |
| | | |
| INTERESTED TRUSTEES | | | | | | |
| | | |
Robert J. Blanding1 (1947) 555 California Street San Francisco, CA 94104 | | Chief Executive Officer and Trustee since 2002 | | President, Chairman, Director and Chief Executive Officer, Loomis, Sayles & Company, L.P. | | 39 None |
| | | |
John T. Hailer2 (1960) | | Trustee Since 2003 | | President and Chief Executive Officer-U.S. and Asia, Natixis Global Asset Management, L.P.; formerly, President and Chief Executive Officer, Natixis Distribution Corporation, Natixis Asset Management Advisors, L.P., Natixis Distributors, L.P. and Natixis Global Associates, Inc. | | 39 None |
| * | Each Trustee serves until retirement, resignation or removal from the Board of Trustees. The current retirement age is 72. The position of Chairperson of the Board is appointed for a two-year term. Ms. Moose was appointed to serve an additional two-year term as the Chairperson of the Board of Trustees on September 14, 2007. |
| ** | Each person listed above, except as noted, holds the same position(s) with the Natixis Funds Trust I, Natixis Funds Trust II, Natixis Funds Trust III, Natixis Funds Trust IV, Gateway Trust and the Natixis Cash Management Trust (collectively, the “Natixis Funds Trusts”), Loomis Sayles Funds I and Loomis Sayles Funds II (collectively, the “Loomis Sayles Funds Trusts”), and Hansberger International Series. Previous positions during the past five years with Natixis Distributors, L.P. (the “Distributor”), Natixis Asset Management Advisors, L.P. (“Natixis Advisors”), or Loomis, Sayles & Company, L.P. (“Loomis Sayles”) are omitted if not materially different from a Trustee’s or officer’s current position with such entity. |
| *** | The Trustees of the Trust serve as trustees of a fund complex that includes all series of the Natixis Funds Trusts, the Loomis Sayles Funds Trusts and Hansberger International Series (collectively, the “Fund Complex”). |
| **** | Mr. Knox was appointed as trustee effective July 1, 2009. |
| 1 | Mr. Blanding is deemed an “interested person” of the Trust because he holds the following positions with an affiliated person of the Trust: President, Chairman, Director and Chief Executive Officer of Loomis Sayles. |
| 2 | Mr. Hailer is deemed an “interested person” of the Trust because he holds the following positions with an affiliated person of the Trust: President and Chief Executive Officer-U.S. and Asia, Natixis Global Asset Management, L.P. |
70
TRUSTEEAND OFFICER INFORMATION
| | | | | | |
Name and Year of Birth | | Position(s) Held with the
Trust | | Term of Office* and Length of Time Served | | Principal Occupation
During Past 5 Years** |
| | | |
| OFFICERS OF THE TRUST | | | | | | |
| | | |
Coleen Downs Dinneen (1960) | | Secretary, Clerk and Chief Legal Officer | | Since September 2004 | | Executive Vice President, General Counsel, Secretary and Clerk (formerly, Senior Vice President, Deputy General Counsel, Assistant Secretary and Assistant Clerk), Natixis Distribution Corporation, Natixis Asset Management Advisors, L.P. and Natixis Distributors, L.P. |
| | | |
Daniel J. Fuss (1933) One Financial Center Boston, MA 02111 | | Executive Vice President | | Since June 2003 | | Vice Chairman and Director, Loomis, Sayles & Company, L.P. |
| | | |
David Giunta (1965) | | President | | Since March 2008 | | President and Chief Executive Officer, Natixis Distribution Corporation, Natixis Asset Management Advisors, L.P. and Natixis Distributors, L.P.; formerly, President, Fidelity Charitable Gift Fund; and formerly, Senior Vice President, Fidelity Brokerage Company |
| | | |
Russell L. Kane (1969) | | Chief Compliance Officer, Assistant Secretary and Anti-Money Laundering Officer | | Chief Compliance Officer since May 2006; Assistant Secretary since June 2004; and Anti-Money Laundering Officer since April 2007 | | Chief Compliance Officer for Mutual Funds, Senior Vice President, Deputy General Counsel, Assistant Secretary and Assistant Clerk, Natixis Distribution Corporation, Natixis Asset Management Advisors, L.P. and Natixis Distributors, L.P. |
| | | |
Michael C. Kardok (1959) | | Treasurer, Principal Financial and Accounting Officer | | Since October 2004 | | Senior Vice President, Natixis Asset Management Advisors, L.P. and Natixis Distributors, L.P. |
| * | Each officer of the Trust serves for an indefinite term in accordance with the Trust’ current By-laws until the date his or her successor is elected and qualified, or until he or she sooner dies, retires, is removed or becomes disqualified. |
| ** | Each person listed above, except as noted, holds the same position(s) with the Fund Complex. Mr. Fuss is not an officer of the Natixis Funds Trusts or the Hansberger International Series. Previous positions during the past five years with the Distributor, Natixis Advisors or Loomis Sayles are omitted if not materially different from a Trustee’s or officer’s current position with such entity. |
71

Loomis Sayles Small Cap Growth Fund
Loomis Sayles Small Cap Value Fund
ANNUAL REPORT
SEPTEMBER 30, 2009
FUND AND MANAGER REVIEW
Loomis Sayles Small Cap Growth Fund

Mark F. Burns, CFA
Manager since January 2005

John Slavik, CFA
Manager since April 2005
PORTFOLIO REVIEW
The Fund underperformed its Benchmark, the Russell 2000 Growth Index, during the 12-month period ending September 30, 2009. The majority of the underperformance took place during the second quarter 2009 as the equity markets rebounded off the lows in March. Although the rapid rebound of stocks is positive, quick moves like the one just witnessed often come with a price. That price was a low quality rally that propelled the smallest of the small caps and companies with the most troubled balance sheets and profitability profiles.
Stock selection, which has been a consistent driver of returns for the product, was a detractor in the second quarter and, hence, the 12-month period. From a sector standpoint, the healthcare and consumer discretionary sectors were the most problematic. Partially offsetting this were overweight positions in the energy and technology sectors, with each showing a positive impact from stock selection as well.
Healthcare was the largest detractor to the Fund’s performance, primarily due to the negative macro economic impact on hospital and pharmaceutical budgets. Natus Medical, a medical device company, and ICON Plc., a clinical research provider for pharma companies, were each impacted by this trend. RTI Biologics, a biomedical company, was hurt by discretionary spending on elective surgeries as well as a slower than expected product launch. Each of these holdings were sold from the portfolio as the spending environment remained in question.
Within the consumer discretionary sector, VistaPrint and Gildan Activewear represented the largest performance detractors. VistaPrint, an online supplier of graphic design products for small businesses, fell in the fourth quarter of 2008 after reducing its full-year earnings and revenue forecasts. Gildan Activewear, an apparel manufacturing company, fell in the fourth quarter of 2008, as economic activity contracted and consumer spending plunged. Both stocks were sold.
The technology, consumer staples and energy sectors were among the most positive performers. Within technology, Riverbed Technology and Brocade Communications were among the portfolio’s top performers. Riverbed, which produces appliances to connect computers in wide area networks, advanced late in the period on better-than-expected earnings. Brocade, a company that provides switching solutions for storage area networks, rose dramatically in the second quarter 2009, after the equity markets bottomed in March. Consumer staples holding Green Mountain Coffee Roasters, the company behind the Keurig one-cup coffee brewers, was the largest individual contributor to the Fund’s performance, benefiting from a distribution partnership with Wal-Mart. We sold Riverbed and Green Mountain at a profit. And within the energy sector, the top contributors to performance were Oceaneering and Concho Resources. Oceaneering, an energy service company that supplies the oil and gas industry, rose steadily in the first three quarters of 2009 as demand picked up in-line with the increase in oil prices. Concho, an oil and gas exploration and production company rose in the third quarter of 2009 as commodity prices recovered.
The only significant change we made to the portfolio’s positioning was to substantially increase the technology weighting, in anticipation of an improving economy in the closing quarter of 2009. Technology represented our
FUND FACTS
Symbol | Institutional: LSSIX;
Retail: LCGRX
Objective | Long-term capital growth from investments in common stocks or other equity securities
Strategy | Invests at least 80% of its net assets (plus any borrowings made for investment purposes) in equity securities of companies with market capitalizations that fall within the capitalization range of the Russell 2000 Index or is $3 billion or less at the time of investment. Unlike the Index, the Fund may invest in companies of any size.
Fund Inception Date | 12/31/96
Total Net Assets | $121.0 million
1
largest overweight, and stock selection within this sector became more fruitful due to falling intra-sector correlations. In addition, the sector’s inventory replenishment cycle helped promote strong company fundamentals.
OUTLOOK
As the economic clouds parted this year, investors have grown more confident, leading to improved risk appetites and a dramatic rise in the market. The panic lows of March have been corrected and valuation levels seem to more accurately reflect current improving economic conditions. We believe continued economic improvement will lead to improved, yet bumpy, corporate profit growth, supportive of higher stock prices. The focus now centers on stock selection, as companies with the best business fundamentals and balance sheets are likely to provide the greatest returns.
AVERAGE ANNUAL TOTAL RETURNS
Periods Ended September 30, 2009
| | | | | | | | | | |
| 1 Year | | | 5 Years | | | 10 Years | | | Since
Inception | |
Loomis Sayles Small Cap Growth: Institutional | |
| -11.40 | % | | 5.26 | % | | -3.01 | % | | 2.08 | % |
Loomis Sayles Small Cap Growth: Retail | |
| -11.66 | �� | | 5.01 | | | -3.27 | | | 1.82 | |
Russell 2000 Growth Index(c) | |
| -6.32 | | | 2.91 | | | 1.10 | | | 2.49 | |
Russell 2000 Index(c) | |
| -9.55 | | | 2.41 | | | 4.88 | | | 5.45 | |
Lipper Small-Cap Growth Funds Index(c) | |
| -3.75 | | | 2.01 | | | 2.47 | | | 3.82 | |
| | | | | | | | |
Gross expense ratio (before reductions and reimbursements)* |
| Institutional: 1.01% | | Retail: 1.42% |
Net expense ratio (after reductions and reimbursements)* |
| Institutional: 1.00% | | Retail: 1.25% |
* As stated in the most recent prospectus
CUMULATIVE PERFORMANCE
Inception to September 30, 2009(a)(b)
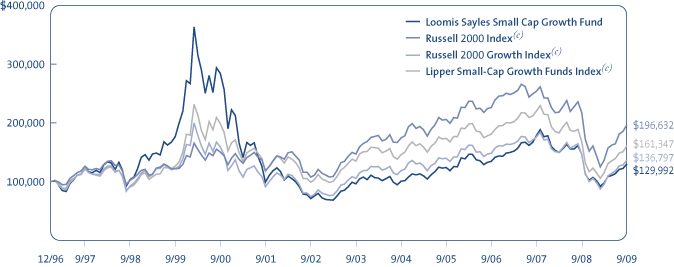
Data quoted reflects past performance and cannot guarantee future results. Average annual total returns assume reinvestment of dividends and capital gains distributions. Investment return and principal value will fluctuate so that shares, when redeemed, may be worth more or less than their original cost. For performance current to the most recent month end, please visit www.loomissayles.com. Current performance may be higher or lower than quoted.
Returns do not reflect the taxes that a shareholder would pay on fund distributions or the redemption of shares. Periods of less than one year are not annualized. Performance data reflects certain fee reductions and reimbursements, if any, without which performance would be lower.
(a) Cumulative performance is shown for the Institutional Class of Shares. Performance of the Retail Class would be lower due to higher fees. (b) The mountain chart is based on the initial investment minimum of $100,000 for the Institutional Class. (c) See page 5 for a description of the Indices.
WHAT YOU SHOULD KNOW
Small- and mid-cap stocks may be more volatile than larger, more established companies. The secondary market for these stocks may be less liquid, which could adversely impact the Fund’s value. Growth funds involve increased risks, in part, because the value of the underlying securities is based on future expectations that may or may not be met.
The Fund can invest a significant percentage of assets in foreign securities and the value of the fund shares can be adversely affected by changes in currency exchange rates, political, and economic developments. In emerging markets these risks can be significant. The Fund is subject to currency risk, which is the risk that fluctuations in exchange rates between the US dollar and foreign currencies may cause the value of a Fund’s investments to decline. Fund shares should be viewed as a long-term investment.
2
FUND AND MANAGER REVIEW
Loomis Sayles Small Cap Value Fund

Joseph Gatz, CFA
Manager since January 2000

Daniel Thelen, CFA
Manager since April 2000
PORTFOLIO REVIEW
The Fund outperformed its Benchmark, the Russell 2000 Value Index, for the fiscal year ended September 30, 2009, primarily due to strong stock selection in the financial services sector.
The Fund’s higher quality orientation proved to be fairly defensive during the dramatic stock market selloff late in 2008 and early in 2009, and stock selection was favorable. Our cautious view on the fundamentals of bank stocks, which we underweighted, and our significant weighting in non-credit-sensitive financial data service companies, resulted in solid relative performance in financial services. PHH Corp., a provider of outsourced mortgage and fleet management services, was the Fund’s top contributor for the year. Twelve months ago, the stock was severely depressed due to PHH’s dependence on the capital markets to fund its business. As financing concerns slowly lifted, the high-quality, lower-risk nature of PHH’s business showed through. Three consecutive positive earnings surprises and a management change driven by activist shareholders also inspired investors.
Our holdings in consumer stocks were heavily weighted toward less-economically sensitive business services and media companies, which held up reasonably well versus the retail, apparel and restaurant segments.
Consumer staples, technology, materials and processing detracted slightly, but no individual sector had a large negative impact on the Fund’s relative performance. In the consumer staples sector, Spartan Stores, a Midwest grocery retailer, was among the largest detractors, declining on concerns about reduced economic activity in key states. The technology and materials sectors performed exceptionally well during the market rally. Overall, our stock selection in technology lagged, but an above-average weighting helped, while our underweight in materials detracted while our stock selection was positive.
As the market rebounded from its low in March of 2009, leadership was concentrated among the smallest market cap, higher-risk stocks. These stocks were the hardest hit during the market downturn, but they were among the first to reverse course on early signs of an economic bottom. The low-quality nature of the rally resulted in our portfolio being somewhat out of phase with the market. Nevertheless, several changes we made, including the addition of attractively valued basic materials, technology and industrial stocks in the spring of 2009, helped the Fund maintain its lead on the index.
OUTLOOK
As the economic clouds parted, investors have grown more confident, risk appetites have improved, and the market has risen dramatically. Much of what had been oversold has recovered, and valuation levels seem reasonable relative to current economic conditions. We believe continued economic improvement will support higher prices, but the recovery pace and pattern is apt to be bumpy. We believe determining appropriate valuations will be instrumental, while a focus on individual stock selection is likely to be especially important in this market environment.
FUND FACTS
Symbol | Institutional: LSSCX;
Retail: LSCRX; Admin: LSVAX
Objective | Long-term capital growth from investments in common stocks or other equity securities
Strategy | Invests at least 80% of its net assets (plus any borrowings made for investment purposes) in equity securities of companies with market capitalizations that fall within the capitalization range of the Russell 2000 Index or is $3 billion or less at the time of investment. Unlike the Index, the Fund may invest in companies of any size.
Fund Inception Date | 5/13/91
Class Inception Date | Institutional: 5/13/91
Retail: 12/31/96
Admin: 1/2/98
Total Net Assets | $967.9 million
3
AVERAGE ANNUAL TOTAL RETURNS
Periods Ended September 30, 2009
| | | | | | | | | | |
| 1 Year | | | 5 Years | | | 10 Years | | | Since Fund
Inception(a)(b) | |
Loomis Sayles Small Cap Value: Institutional | |
| -5.42 | % | | 4.29 | % | | 8.70 | % | | 11.95 | % |
Loomis Sayles Small Cap Value: Retail | |
| -5.66 | | | 4.03 | | | 8.44 | | | 11.76 | |
Loomis Sayles Small Cap Value: Admin | |
| -5.93 | | | 3.75 | | | 8.15 | | | 11.41 | |
Russell 2000 Value Index(c) | |
| -12.61 | | | 1.78 | | | 8.05 | | | 10.97 | |
Russell 2000 Index(c) | |
| -9.55 | | | 2.41 | | | 4.88 | | | 8.63 | |
Lipper Small-Cap Core Funds Index(c) | |
| -4.09 | | | 2.86 | | | 6.61 | | | N/A | |
| | | | | | | | |
Gross expense ratio (before reductions and reimbursements)* |
| Institutional: 0.90% | | Retail: 1.27% | | Admin: 1.69% |
Net expense ratio (after reductions and reimbursements)* |
| Institutional: 0.90% | | Retail: 1.15% | | Admin: 1.41% |
* As stated in the most recent prospectus
CUMULATIVE PERFORMANCE
Inception to September 30, 2009(d)(e)
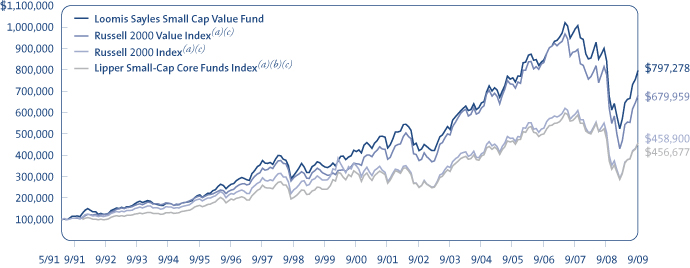
Data quoted reflects past performance and cannot guarantee future results. Average annual total returns assume reinvestment of dividends and capital gains distributions. Investment return and principal value will fluctuate so that shares, when redeemed, may be worth more or less than their original cost. For performance current to the most recent month end, please visit www.loomissayles.com. Current performance may be higher or lower than quoted.
Returns do not reflect the taxes that a shareholder would pay on fund distributions or the redemption of shares. Periods of less than one year are not annualized. Performance data reflects certain fee reductions and reimbursements, if any, without which performance would be lower.
(a) Performance shown for periods prior to the inception date of the Retail Class (12/31/96) and Admin Class (1/02/98) represents the performance of the Institutional Class of shares during the periods shown, adjusted to reflect current levels of 12b-1 fees payable by the respective Classes. Since index performance data is not available coincident with the Fund’s inception date, the beginning value of the index is the value as of the month end closest to the Fund’s inception date. (b) The Lipper Small-Cap Core Funds Index performance data is not available prior to January 1, 1992. (c) See page 5 for a description of the Indices. (d) Cumulative performance is shown for the Institutional Class of Shares. Performance of the Retail and Admin Classes would be lower due to higher fees and expenses. (e) The mountain chart is based on the initial investment minimum of $100,000 for the Institutional Class.
WHAT YOU SHOULD KNOW
Value stocks may fall out of favor with investors and underperform the overall equity market during any given period. Small- and mid-cap stocks may be more volatile than larger, more established companies. The secondary market for these stocks may be less liquid, which could adversely impact the Fund’s value.
The Fund can invest a significant percentage of assets in foreign securities and the value of the fund shares can be adversely affected by changes in currency exchange rates, political, and economic developments. In emerging markets these risks can be significant. The Fund is subject to currency risk, which is the risk that fluctuations in exchange rates between the US dollar and foreign currencies may cause the value of a Fund’s investments to decline. Fund shares should be viewed as a long-term investment.
4
ADDITIONAL INFORMATION
Index Definitions
Indexes are unmanaged and do not have expenses that affect results, unlike mutual funds. Index returns are adjusted for the reinvestment of capital gain distributions and income dividends. It is not possible to invest directly in an index.
Lipper Small-Cap Core Funds Index is an equally weighted index of typically the 30 largest mutual funds within the small-cap core funds investment objective.
Lipper Small-Cap Growth Funds Index is an equally weighted index of typically the 30 largest mutual funds within the small-cap growth funds investment objective.
Source: Lipper, Inc.
Russell 2000 Growth Index is an index comprised of those Russell 2000 companies with higher price-to-book ratios and higher forecasted growth values.
Russell 2000 Index is an index comprised of the 2,000 smallest companies in the Russell 3000 Index (a broad market index), representing approximately 10% of the Russell 3000 total market capitalization.
Russell 2000 Value Index is an index comprised of those Russell 2000 companies with lower price-to-book ratios and lower forecasted growth values.
Proxy Voting Information
A description of the Funds’ proxy voting policies and procedures is available without charge, upon request, (i) by calling Loomis Sayles at 800-633-3330; (ii) on the Funds’ website, www.loomissayles.com, and (iii) on the SEC’s website, www.sec.gov. Information about how the Funds voted proxies relating to portfolio securities during the 12 months ended June 30, 2009 is available on (i) the Funds’ website and (ii) the SEC’s website.
Quarterly Portfolio Schedules
The Funds file a complete schedule of portfolio holdings with the SEC for the first and third quarters of each fiscal year on Form N-Q. The Funds’ Forms N-Q are available on the SEC’s website at www.sec.gov and may be reviewed and copied at the SEC’s Public Reference Room in Washington, DC. Information on the operation of the Public Reference Room may be obtained by calling 800-SEC-0330.
UNDERSTANDING YOUR FUND’S EXPENSES
As a mutual fund shareholder you incur two types of costs: (1) transaction costs, including redemption fees and certain exchange fees; and (2) ongoing costs, including management fees, distribution and/or service fees (12b-1 fees), and other Fund expenses. These costs are described in more detail in the Funds’ prospectus. The examples below are intended to help you understand the ongoing costs of investing in the Funds and help you compare these with the ongoing costs of investing in other mutual funds.
The first line in the table of each Fund shows the actual amount of Fund expenses you would have paid on a $1,000 investment in the Fund from April 1, 2009 through September 30, 2009. It also shows how much a $1,000 investment would be worth at the close of the period, assuming actual fund returns and expenses. To estimate the expenses you paid over the period, simply divide your account value by $1,000 (for example $8,600 account value divided by $1,000 = 8.6) and multiply the result by the number in the Expenses Paid During the Period column as shown below for your class.
The second line in the table of each Fund provides information about hypothetical account values and hypothetical expenses based on the Fund’s actual expense ratios and an assumed rate of return of 5% per year before expenses, which is not the Fund’s actual return. The hypothetical account values and expenses may not be used to estimate the actual ending account balance or expenses you paid on your investment for the period. You may use this information to compare the ongoing costs of investing in the Funds and other funds. To do so, compare this 5% hypothetical example with the 5% hypothetical examples that appear in the shareholder reports of other funds.
5
Please note that the expenses shown reflect ongoing costs only, and do not include any transaction costs. Therefore, the second line in the table is useful in comparing ongoing costs only, and will not help you determine the relative costs of owning different funds. If transaction costs were included, total costs would be higher.
Loomis Sayles Small Cap Growth Fund
| | | | | | |
Institutional Class | | Beginning
Account Value
4/1/2009 | | Ending
Account Value
9/30/2009 | | Expenses Paid
During Period*
4/1/2009 – 9/30/2009 |
Actual | | $1,000.00 | | $1,323.40 | | $5.82 |
Hypothetical (5% return before expenses) | | $1,000.00 | | $1,020.05 | | $5.06 |
| | | |
Retail Class | | | | | | |
Actual | | $1,000.00 | | $1,321.90 | | $7.28 |
Hypothetical (5% return before expenses) | | $1,000.00 | | $1,018.80 | | $6.33 |
* Expenses are equal to the Fund’s annualized expense ratio (after fee reduction/reimbursement): 1.00%, and 1.25% for Institutional and Retail Class, respectively, multiplied by the average account value over the period multiplied by the number of days in the most recent fiscal half-year, divided by 365 (to reflect the half-year period). |
Loomis Sayles Small Cap Value Fund
| | | | | | |
Institutional Class | | Beginning
Account Value
4/1/2009 | | Ending
Account Value
9/30/2009 | | Expenses Paid
During Period*
4/1/2009 – 9/30/2009 |
Actual | | $1,000.00 | | $1,396.90 | | $5.41 |
Hypothetical (5% return before expenses) | | $1,000.00 | | $1,020.56 | | $4.56 |
| | | |
Retail Class | | | | | | |
Actual | | $1,000.00 | | $1,395.40 | | $6.91 |
Hypothetical (5% return before expenses) | | $1,000.00 | | $1,019.30 | | $5.82 |
| | | |
Admin Class | | | | | | |
Actual | | $1,000.00 | | $1,392.70 | | $8.40 |
Hypothetical (5% return before expenses) | | $1,000.00 | | $1,018.05 | | $7.08 |
* Expenses are equal to the Fund’s annualized expense ratio (after fee reduction/reimbursement): 0.90%, 1.15% and 1.40% for Institutional, Retail and Admin Class, respectively, multiplied by the average account value over the period, multiplied by the number of days in the most recent fiscal half-year, divided by 365 (to reflect the half-year period). |
6
BOARD APPROVAL OF THE EXISTING ADVISORY AGREEMENTS
The Board of Trustees, including the Independent Trustees, considers matters bearing on each Fund’s advisory agreement (collectively, the “Agreements”) at most of its meetings throughout the year. Each year, usually in the spring, the Contract Review and Governance Committee of the Board meets to review the Agreements to determine whether to recommend that the full Board approve the continuation of the Agreements, typically for an additional one-year period. After the Committee has made its recommendation, the full Board, including the Independent Trustees, determines whether to approve the continuation of the Agreements.
In connection with these meetings, the Trustees receive materials that the Funds’ investment adviser (the “Adviser”) believes to be reasonably necessary for the Trustees to evaluate the Agreements. These materials generally include, among other items, (i) information on the investment performance of the Funds and the performance of peer groups of funds and the Funds’ performance benchmarks, (ii) information on the Funds’ advisory fees, and other expenses, including information comparing the Funds’ expenses to those of peer groups of funds and information about applicable expense caps and fee “breakpoints,” (iii) sales and redemption data in respect of the Funds, (iv) information about the profitability of the Agreements to the Funds’ Adviser and (v) information obtained through the completion of a questionnaire by the Adviser (the Trustees are consulted as to the information requested through that questionnaire). The Board of Trustees, including the Independent Trustees, also consider other matters such as (i) the Adviser’s financial results and financial condition, (ii) each Fund’s investment objective and strategies and the size, education and experience of the Adviser’s respective investment staffs and their use of technology, external research and trading cost measurement tools, (iii) arrangements in respect of the distribution of the Funds’ shares and the related costs, (iv) the procedures employed to determine the value of the Funds’ assets, (v) the allocation of the Funds’ brokerage, if any, including, if applicable, allocations to brokers affiliated with the Adviser and the use of “soft” commission dollars to pay Fund expenses and to pay for research and other similar services, (vi) the resources devoted to, and the record of compliance with, the Funds’ investment policies and restrictions, policies on personal securities transactions and other compliance policies, (vii) information about amounts invested by the Funds’ portfolio managers in the Funds or in similar accounts that they manage and (viii) the general economic outlook with particular emphasis on the mutual fund industry. Throughout the process, the Trustees are afforded the opportunity to ask questions of and request additional materials from the Adviser.
In addition to the materials requested by the Trustees in connection with their annual consideration of the continuation of the Agreements, the Trustees receive materials in advance of each regular quarterly meeting of the Board of Trustees that provide detailed information about the Funds’ investment performance and the fees charged to the Funds for advisory and other services. This information generally includes, among other things, an internal performance rating for each Fund based on agreed-upon criteria, graphs showing each Fund’s performance and fee differentials against each Fund’s peer group of funds, performance ratings provided by a third-party, total return information for various periods, and third-party performance rankings for various periods comparing a Fund against its peer group. The portfolio management team for each Fund or other representatives of the Adviser make periodic presentations to the Contract Review and Governance Committee and/or the full Board of Trustees, and Funds identified as presenting possible performance concerns may be subject to more frequent board presentations and reviews. In addition, each quarter the Trustees are provided with detailed statistical information about each Fund’s portfolio.
The Board of Trustees most recently approved the continuation of the Agreements at their meeting held in June, 2009. The Agreements were continued for a one-year period for the Funds. In considering whether to approve the continuation of the Agreements, the Board of Trustees, including the Independent Trustees, did not identify any single factor as determinative. Individual Trustees may have evaluated the information presented differently from one another, giving different weights to various factors. Matters considered by the Trustees, including the Independent Trustees, in connection with their approval of the Agreements included the factors listed below.
The nature, extent and quality of the services provided to the Funds under the Agreements. The Trustees considered the nature, extent and quality of the services provided by the Adviser and its affiliates to the Funds and the resources dedicated to the Funds by the Adviser and its affiliates, including recent or planned investments by the Adviser in additional personnel or other resources. They considered the need for the Adviser to offer competitive compensation in order to attract and retain capable personnel. They also considered the administrative services provided by Natixis Advisors and its affiliates to the Funds.
For each Fund, the Trustees also considered the benefits to shareholders of investing in a mutual fund that is part of a family of funds that offers shareholders the right to exchange shares of one type of fund for shares of another type of fund, and provides a variety of fund and shareholder services.
After reviewing these and related factors, the Trustees concluded, within the context of their overall conclusions regarding each of the Agreements, that the nature, extent and quality of services provided supported the renewal of the Agreements.
Investment performance of the Funds and the Adviser. As noted above, the Trustees received information about the performance of the Funds over various time periods, including information which compared the performance of the Funds to the performance of peer
7
groups of funds and the Funds’ respective performance benchmarks. In addition, the Trustees also reviewed data prepared by an independent third party which analyzed the performance of the Funds using a variety of performance metrics, including metrics which also measured the performance of the Funds on a risk adjusted basis.
With respect to each Fund, the Board concluded that the Fund’s performance or other relevant factors supported the renewal of the Agreement relating to that Fund.
The Trustees also considered the Adviser’s performance and reputation generally, the Funds’ performance as a fund family generally (as noted by certain financial publications), and the historical responsiveness of the Adviser to Trustee concerns about performance and the willingness of the Adviser to take steps intended to improve performance.
After reviewing these and related factors, the Trustees concluded, within the context of their overall conclusions regarding each of the Agreements, that the performance of the Funds and the Adviser supported the renewal of the Agreements.
The costs of the services to be provided and profits to be realized by the Adviser and its affiliates from their respective relationships with the Funds. The Trustees considered the fees charged to the Funds for advisory services as well as the total expense levels of the Funds. This information included comparisons (provided both by management and also by an independent third party) of the Funds’ advisory fees and total expense levels to those of their peer groups and information about the advisory fees charged by the Adviser to comparable accounts. In considering the fees charged to comparable accounts, the Trustees considered, among other things, management’s representations about the differences between managing mutual funds as compared to other types of accounts, including the additional resources required to effectively manage and the greater regulatory costs associated with the management of mutual fund assets. In evaluating each Fund’s advisory fee, the Trustees also took into account the demands, complexity and quality of the investment management of such Fund. The Trustees considered that over the past several years, management had made recommendations regarding the institution of expense caps. They noted that all of the Loomis Sayles Funds in this report have expense caps in place, and they considered the amounts waived or reimbursed by the Adviser under these caps.
The Trustees also considered the compensation directly or indirectly received by the Adviser and its affiliates from their relationships with the Funds. The Trustees reviewed information provided by management as to the profitability of the Adviser and its affiliates’ relationships with the Funds, and information about the allocation of expenses used to calculate profitability. They also reviewed information provided by management about the effect of distribution costs and changes in asset levels on Adviser profitability, including information regarding resources spent on distribution activities. When reviewing profitability, the Trustees also considered information about court cases in which adviser profitability was an issue, the performance of the relevant Funds, the expense levels of the Funds, and whether the Adviser had implemented breakpoints and/or expense caps with respect to such Funds.
After reviewing these and related factors, the Trustees concluded, within the context of their overall conclusions regarding each of the Agreements, that the advisory fee charged to each of the Funds were fair and reasonable, and that the costs of these services generally and the related profitability of the Adviser and its affiliates in respect of their relationships with the Funds supported the renewal of the Agreements.
Economies of Scale. The Trustees considered the existence of any economies of scale in the provision of services by the Adviser and whether those economies are shared with the Funds through breakpoints in their investment advisory fees or other means, such as expense waivers or caps. The Trustees noted that although each Fund’s management fee was not subject to breakpoints, each Fund’s management fee was below the median fee for a peer group of funds and that each of the Funds was subject to an expense cap. In considering these issues, the Trustees also took note of the costs of the services provided (both on an absolute and a relative basis) and the profitability to the Adviser and its affiliates of their relationships with the Funds, as discussed above.
After reviewing these and related factors, the Trustees considered, within the context of their overall conclusions regarding each of the Agreements, that the extent to which economies of scale were shared with the Funds supported the renewal of the Agreements.
The Trustees also considered other factors, which included but were not limited to the following:
| • | | the effect of recent market and economic turmoil on the performance, asset levels and expense ratios of each Fund. |
| • | | whether each Fund has operated in accordance with its investment objective and the Fund’s record of compliance with its investment restrictions, and the compliance programs of the Funds and the Adviser. They also considered the compliance-related resources the Adviser and its affiliates were providing to the Funds. |
| • | | the nature, quality, cost and extent of administrative and shareholder services performed by the Adviser and its affiliates, both under the Agreements and under separate agreements covering administrative services. |
| • | | so-called “fallout benefits” to the Adviser, such as the engagement of affiliates of the Adviser to provide distribution, administrative and brokerage services to the Funds, and the benefits of research made available to the Adviser by reason of brokerage commissions |
8
| | generated by the Funds’ securities transactions. The Trustees also considered the fact that Natixis Advisors’ parent company benefits from the retention of an affiliated Adviser. The Trustees considered the possible conflicts of interest associated with these fallout and other benefits, and the reporting, disclosure and other processes in place to disclose and monitor such possible conflicts of interest. |
| • | | the Trustees’ review and discussion of the Funds’ advisory arrangements in prior years, and management’s record of responding to Trustee concerns raised during the year and in prior years. |
Based on their evaluation of all factors that they deemed to be material, including those factors described above, and assisted by the advice of independent counsel, the Trustees, including the Independent Trustees, concluded that each of the existing Agreements should be continued through June 30, 2010.
9
PORTFOLIO OF INVESTMENTS – as of September 30, 2009
Loomis Sayles Small Cap Growth Fund
| | | | | | | |
| | | | | Shares | | Value (†) |
| | | | | | | |
| | | |
| COMMON STOCKS – 97.4% of Net Assets | | | | | | | |
| | | |
| Aerospace & Defense – 2.0% | | | | | | | |
Applied Signal Technology, Inc. | | | | 49,537 | | $ | 1,152,726 |
Hexcel Corp.(b) | | | | 105,827 | | | 1,210,661 |
| | | | | | | |
| | | | | | | 2,363,387 |
| | | | | | | |
| Biotechnology – 4.8% | | | | | | | |
Alexion Pharmaceuticals, Inc.(b) | | | | 24,335 | | | 1,083,881 |
AMAG Pharmaceuticals, Inc.(b) | | | | 18,395 | | | 803,494 |
Incyte Corp. Ltd.(b) | | | | 134,691 | | | 909,164 |
Isis Pharmaceuticals, Inc.(b) | | | | 48,621 | | | 708,408 |
Onyx Pharmaceuticals, Inc.(b) | | | | 26,280 | | | 787,612 |
Regeneron Pharmaceuticals, Inc.(b) | | | | 38,595 | | | 744,883 |
Theravance, Inc.(b) | | | | 49,374 | | | 722,835 |
| | | | | | | |
| | | | | | | 5,760,277 |
| | | | | | | |
| Building Products – 0.6% | | | | | | | |
Trex Company, Inc.(b) | | | | 43,079 | | | 784,038 |
| | | | | | | |
| Capital Markets – 4.0% | | | | | | | |
Evercore Partners, Inc., Class A | | | | 39,517 | | | 1,154,687 |
Greenhill & Co., Inc. | | | | 15,206 | | | 1,362,153 |
Penson Worldwide, Inc.(b) | | | | 101,355 | | | 987,198 |
Stifel Financial Corp.(b) | | | | 24,809 | | | 1,362,014 |
| | | | | | | |
| | | | | | | 4,866,052 |
| | | | | | | |
| Commercial Banks – 0.9% | | | | | | | |
Signature Bank(b) | | | | 39,300 | | | 1,139,700 |
| | | | | | | |
| Commercial Services & Supplies – 2.7% | | | | | | | |
EnerNOC, Inc.(b) | | | | 33,665 | | | 1,116,331 |
Tetra Tech, Inc.(b) | | | | 34,066 | | | 903,771 |
Waste Connections, Inc.(b) | | | | 41,807 | | | 1,206,550 |
| | | | | | | |
| | | | | | | 3,226,652 |
| | | | | | | |
| Communications Equipment – 6.1% | | | | | | | |
Brocade Communications Systems, Inc.(b) | | | | 136,465 | | | 1,072,615 |
Ciena Corp.(b) | | | | 76,816 | | | 1,250,565 |
DG FastChannel, Inc.(b) | | | | 57,594 | | | 1,206,018 |
F5 Networks, Inc.(b) | | | | 30,599 | | | 1,212,638 |
Harris Stratex Networks, Inc., Class A(b) | | | | 133,587 | | | 935,109 |
Starent Networks Corp.(b) | | | | 24,485 | | | 622,409 |
Tellabs, Inc.(b) | | | | 152,621 | | | 1,056,137 |
| | | | | | | |
| | | | | | | 7,355,491 |
| | | | | | | |
| Construction & Engineering – 3.2% | | | | | | | |
Dycom Industries, Inc.(b) | | | | 48,292 | | | 593,992 |
MasTec, Inc.(b) | | | | 88,794 | | | 1,078,847 |
Northwest Pipe Co.(b) | | | | 32,778 | | | 1,099,046 |
Orion Marine Group, Inc.(b) | | | | 53,846 | | | 1,105,997 |
| | | | | | | |
| | | | | | | 3,877,882 |
| | | | | | | |
| Diversified Consumer Services – 2.6% | | | | | | | |
Grand Canyon Education, Inc.(b) | | | | 54,021 | | | 963,194 |
Lincoln Educational Services Corp.(b) | | | | 43,145 | | | 987,158 |
New Oriental Education & Technology Group, Inc., Sponsored ADR(b) | | | | 15,413 | | | 1,239,976 |
| | | | | | | |
| | | | | | | 3,190,328 |
| | | | | | | |
See accompanying notes to financial statements.
10
PORTFOLIO OF INVESTMENTS – as of September 30, 2009
Loomis Sayles Small Cap Growth Fund – continued
| | | | | | | |
| | | | | Shares | | Value (†) |
| | | | | | | |
| | | |
| COMMON STOCKS – continued | | | | | | | |
| | | |
| Diversified Financial Services – 1.1% | | | | | | | |
MSCI, Inc.(b) | | | | 43,457 | | $ | 1,287,196 |
| | | | | | | |
| Diversified Telecommunication Services – 0.7% | | | | | | | |
Neutral Tandem, Inc.(b) | | | | 39,069 | | | 889,210 |
| | | | | | | |
| Electric Utilities – 0.9% | | | | | | | |
ITC Holdings Corp. | | | | 23,444 | | | 1,065,530 |
| | | | | | | |
| Electronic Equipment Instruments & Components – 1.7% | | | | | | | |
Cogent, Inc.(b) | | | | 75,903 | | | 766,620 |
IPG Photonics Corp.(b) | | | | 84,502 | | | 1,284,431 |
| | | | | | | |
| | | | | | | 2,051,051 |
| | | | | | | |
| Energy Equipment & Services – 1.8% | | | | | | | |
Oceaneering International, Inc.(b) | | | | 22,494 | | | 1,276,535 |
Tesco Corp.(b) | | | | 118,041 | | | 941,967 |
| | | | | | | |
| | | | | | | 2,218,502 |
| | | | | | | |
| Food Products – 1.0% | | | | | | | |
Diamond Foods, Inc. | | | | 36,383 | | | 1,154,069 |
| | | | | | | |
| Health Care Equipment & Supplies – 5.7% | | | | | | | |
DexCom, Inc.(b) | | | | 111,199 | | | 881,808 |
Electro-Optical Sciences, Inc.(b) | | | | 83,497 | | | 799,901 |
ev3, Inc.(b) | | | | 98,341 | | | 1,210,578 |
Insulet Corp.(b) | | | | 70,731 | | | 794,309 |
Masimo Corp.(b) | | | | 27,525 | | | 721,155 |
ResMed, Inc.(b) | | | | 27,301 | | | 1,234,005 |
Volcano Corp.(b) | | | | 71,493 | | | 1,202,513 |
| | | | | | | |
| | | | | | | 6,844,269 |
| | | | | | | |
| Health Care Providers & Services – 3.9% | | | | | | | |
Bio-Reference Labs, Inc.(b) | | | | 30,245 | | | 1,040,428 |
Catalyst Health Solutions, Inc.(b) | | | | 39,449 | | | 1,149,939 |
Genoptix, Inc.(b) | | | | 31,013 | | | 1,078,632 |
IPC The Hospitalist Co.(b) | | | | 47,249 | | | 1,485,981 |
| | | | | | | |
| | | | | | | 4,754,980 |
| | | | | | | |
| Health Care Technology – 4.6% | | | | | | | |
athenahealth, Inc.(b) | | | | 33,504 | | | 1,285,548 |
MedAssets, Inc.(b) | | | | 87,426 | | | 1,973,205 |
Phase Forward, Inc.(b) | | | | 69,545 | | | 976,412 |
SXC Health Solutions Corp.(b) | | | | 29,522 | | | 1,381,334 |
| | | | | | | |
| | | | | | | 5,616,499 |
| | | | | | | |
| Hotels, Restaurants & Leisure – 3.4% | | | | | | | |
Bally Technologies, Inc.(b) | | | | 22,083 | | | 847,325 |
BJ’s Restaurants, Inc.(b) | | | | 66,567 | | | 997,839 |
Buffalo Wild Wings, Inc.(b) | | | | 26,996 | | | 1,123,304 |
Panera Bread Co., Class A(b) | | | | 21,618 | | | 1,188,990 |
| | | | | | | |
| | | | | | | 4,157,458 |
| | | | | | | |
| Household Durables – 0.7% | | | | | | | |
Tempur-Pedic International, Inc.(b) | | | | 41,834 | | | 792,336 |
| | | | | | | |
| Internet Software & Services – 2.9% | | | | | | | |
Constant Contact, Inc.(b) | | | | 55,782 | | | 1,073,804 |
DealerTrack Holdings, Inc.(b) | | | | 64,691 | | | 1,223,307 |
GSI Commerce, Inc.(b) | | | | 65,172 | | | 1,258,471 |
| | | | | | | |
| | | | | | | 3,555,582 |
| | | | | | | |
See accompanying notes to financial statements.
11
| | | | | | | |
| | | | | Shares | | Value (†) |
| | | | | | | |
| | | |
| COMMON STOCKS – continued | | | | | | | |
| | | |
| IT Services – 1.0% | | | | | | | |
CyberSource Corp.(b) | | | | 72,744 | | $ | 1,212,642 |
| | | | | | | |
| Machinery – 2.4% | | | | | | | |
Bucyrus International, Inc. | | | | 37,170 | | | 1,323,995 |
Energy Recovery, Inc.(b) | | | | 113,226 | | | 658,975 |
Wabtec Corp. | | | | 24,156 | | | 906,575 |
| | | | | | | |
| | | | | | | 2,889,545 |
| | | | | | | |
| Media – 0.8% | | | | | | | |
Imax Corp.(b) | | | | 109,125 | | | 1,026,866 |
| | | | | | | |
| Oil, Gas & Consumable Fuels – 3.6% | | | | | | | |
Arena Resources, Inc.(b) | | | | 34,249 | | | 1,215,840 |
Comstock Resources, Inc.(b) | | | | 40,734 | | | 1,632,619 |
Concho Resources, Inc.(b) | | | | 39,901 | | | 1,449,204 |
| | | | | | | |
| | | | | | | 4,297,663 |
| | | | | | | |
| Pharmaceuticals – 2.8% | | | | | | | |
Cypress Bioscience, Inc.(b) | | | | 89,420 | | | 730,561 |
Eurand NV(b) | | | | 61,004 | | | 923,601 |
Inspire Pharmaceuticals, Inc.(b) | | | | 132,042 | | | 689,259 |
Nektar Therapeutics(b) | | | | 107,520 | | | 1,047,245 |
| | | | | | | |
| | | | | | | 3,390,666 |
| | | | | | | |
| Professional Services – 3.4% | | | | | | | |
ICF International, Inc.(b) | | | | 49,755 | | | 1,508,572 |
IHS, Inc., Class A(b) | | | | 26,827 | | | 1,371,664 |
Monster Worldwide, Inc.(b) | | | | 69,059 | | | 1,207,151 |
| | | | | | | |
| | | | | | | 4,087,387 |
| | | | | | | |
| Semiconductors & Semiconductor Equipment – 8.0% | | | | | | | |
Cavium Network, Inc.(b) | | | | 51,068 | | | 1,096,430 |
Cymer, Inc.(b) | | | | 27,488 | | | 1,068,184 |
Hittite Microwave Corp.(b) | | | | 29,990 | | | 1,103,032 |
Lam Research Corp.(b) | | | | 39,276 | | | 1,341,668 |
Netlogic Microsystems, Inc.(b) | | | | 26,610 | | | 1,197,450 |
Power Integrations, Inc. | | | | 31,450 | | | 1,048,229 |
Silicon Laboratories, Inc.(b) | | | | 30,373 | | | 1,408,092 |
Varian Semiconductor Equipment Associates, Inc.(b) | | | | 42,555 | | | 1,397,506 |
| | | | | | | |
| | | | | | | 9,660,591 |
| | | | | | | |
| Software – 10.4% | | | | | | | |
ArcSight, Inc.(b) | | | | 26,049 | | | 627,000 |
Ariba, Inc.(b) | | | | 106,804 | | | 1,238,927 |
Blackboard, Inc.(b) | | | | 37,436 | | | 1,414,332 |
Concur Technologies, Inc.(b) | | | | 30,254 | | | 1,202,899 |
DemandTec, Inc.(b) | | | | 99,033 | | | 874,461 |
Informatica Corp.(b) | | | | 71,552 | | | 1,615,644 |
Nice Systems Ltd., ADR(b) | | | | 36,344 | | | 1,106,311 |
Sourcefire, Inc.(b) | | | | 31,449 | | | 675,210 |
Tyler Technologies, Inc.(b) | | | | 71,400 | | | 1,220,226 |
Ultimate Software Group, Inc.(The)(b) | | | | 44,226 | | | 1,270,171 |
VanceInfo Technologies, Inc., ADR(b) | | | | 70,084 | | | 1,362,433 |
| | | | | | | |
| | | | | | | 12,607,614 |
| | | | | | | |
See accompanying notes to financial statements.
12
PORTFOLIO OF INVESTMENTS – as of September 30, 2009
Loomis Sayles Small Cap Growth Fund – continued
| | | | | | | | |
| | | | | Shares | | Value (†) |
| | | | | | | | |
| | | |
| COMMON STOCKS – continued | | | | | | | | |
| | | |
| Specialty Retail – 5.5% | | | | | | | | |
DSW, Inc., Class A(b) | | | | | 79,768 | | $ | 1,273,895 |
hhgregg, Inc.(b) | | | | | 50,874 | | | 861,806 |
Hibbett Sports, Inc.(b) | | | | | 48,253 | | | 879,652 |
Lumber Liquidators, Inc.(b) | | | | | 60,874 | | | 1,320,357 |
Monro Muffler Brake, Inc. | | | | | 38,606 | | | 1,227,285 |
Ulta Salon, Cosmetics & Fragrance, Inc.(b) | | | | | 65,485 | | | 1,081,157 |
| | | | | | | | |
| | | | | | | | 6,644,152 |
| | | | | | | | |
| Textiles, Apparel & Luxury Goods – 4.2% | | | | | | | | |
Fuqi International, Inc.(b) | | | | | 28,478 | | | 833,836 |
Lululemon Athletica, Inc.(b) | | | | | 37,268 | | | 847,847 |
Phillips-Van Heusen Corp. | | | | | 33,081 | | | 1,415,536 |
Under Armour, Inc., Class A(b) | | | | | 44,737 | | | 1,245,030 |
Volcom, Inc.(b) | | | | | 43,410 | | | 715,397 |
| | | | | | | | |
| | | | | | | | 5,057,646 |
| | | | | | | | |
| | | |
| TOTAL COMMON STOCKS | | | | | | | | |
(Identified Cost $98,475,238) | | | | | | | | 117,825,261 |
| | | | | | | | |
| | | |
| | | | | Principal Amount | | |
| | | |
| SHORT-TERM INVESTMENTS – 1.5% | | | | | | | | |
| Tri-Party Repurchase Agreement with Fixed Income Clearing Corporation, dated 9/30/09 at 0.000% to be repurchased at $1,818,320 on 10/01/09 collateralized by $1,840,000 Federal Home Loan Bank, 3.030% due 5/05/14 valued at $1,856,100 including accrued interest (Note 2f of Notes to Financial Statements) (Identified Cost $1,818,320) | | | | $ | 1,818,320 | | | 1,818,320 |
| | | | | | | | |
| | | |
| TOTAL INVESTMENTS – 98.9% | | | | | | | | |
(Identified Cost $100,293,558)(a) | | | | | | | | 119,643,581 |
Other assets less liabilities—1.1% | | | | | | | | 1,391,350 |
| �� | | | | | | | |
| | | |
| NET ASSETS – 100.0% | | | | | | | $ | 121,034,931 |
| | | | | | | | |
| | |
(†) See Note 2a of Notes to Financial Statements. | | | | | | |
(a) Federal Tax Information: | | | | | | |
At September 30, 2009, the net unrealized appreciation on investments based on a cost of $101,035,882 for federal income tax purposes was as follows: | | | |
Aggregate gross unrealized appreciation for all investments in which there is an excess of value over tax cost | | $ | 21,141,029 |
Aggregate gross unrealized depreciation for all investments in which there is an excess of tax cost over value | | | (2,533,330) |
| | | | | | | | |
Net unrealized appreciation | | $ | 18,607,699 |
| | | | | | | | |
| (b) | Non-income producing security. |
| ADR | An American Depositary Receipt (ADR) is a certificate issued by a custodian bank representing the right to receive securities of the foreign issuer described. The values of ADRs are significantly influenced by trading on exchanges not located in the United States. |
See accompanying notes to financial statements.
13
INDUSTRY SUMMARY AT SEPTEMBER 30, 2009 (Unaudited)
| | | |
Software | | 10.4 | % |
Semiconductors & Semiconductor Equipment | | 8.0 | |
Communications Equipment | | 6.1 | |
Health Care Equipment & Supplies | | 5.7 | |
Specialty Retail | | 5.5 | |
Biotechnology | | 4.8 | |
Health Care Technology | | 4.6 | |
Textiles, Apparel & Luxury Goods | | 4.2 | |
Capital Markets | | 4.0 | |
Health Care Providers & Services | | 3.9 | |
Oil, Gas & Consumable Fuels | | 3.6 | |
Hotels, Restaurants & Leisure | | 3.4 | |
Professional Services | | 3.4 | |
Construction & Engineering | | 3.2 | |
Internet Software & Services | | 2.9 | |
Pharmaceuticals | | 2.8 | |
Commercial Services & Supplies | | 2.7 | |
Diversified Consumer Services | | 2.6 | |
Machinery | | 2.4 | |
Aerospace & Defense | | 2.0 | |
Other Investments, less than 2% each | | 11.2 | |
Short-Term Investments | | 1.5 | |
| | | |
Total Investments | | 98.9 | |
Other assets less liabilities | | 1.1 | |
| | | |
Net Assets | | 100.0 | % |
| | | |
See accompanying notes to financial statements.
14
PORTFOLIO OF INVESTMENTS – as of September 30, 2009
Loomis Sayles Small Cap Value Fund
| | | | | | | |
| | | | | Shares | | Value (†) |
| | | | | | | |
| | | |
| COMMON STOCKS – 95.4% of Net Assets | | | | | | | |
| | | |
| Aerospace & Defense – 1.1% | | | | | | | |
Ducommun, Inc. | | | | 209,460 | | $ | 3,960,889 |
Teledyne Technologies, Inc.(b) | | | | 195,386 | | | 7,031,942 |
| | | | | | | |
| | | | | | | 10,992,831 |
| | | | | | | |
| Air Freight & Logistics – 0.8% | | | | | | | |
Atlas Air Worldwide Holdings, Inc.(b) | | | | 236,556 | | | 7,562,695 |
| | | | | | | |
| Auto Components – 0.5% | | | | | | | |
Goodyear Tire & Rubber Co. (The)(b) | | | | 298,466 | | | 5,082,876 |
| | | | | | | |
| Building Products – 0.8% | | | | | | | |
Armstrong World Industries, Inc.(b) | | | | 220,314 | | | 7,592,020 |
| | | | | | | |
| Capital Markets – 2.9% | | | | | | | |
Fifth Street Finance Corp. | | | | 349,872 | | | 3,824,101 |
Investment Technology Group, Inc.(b) | | | | 217,478 | | | 6,071,986 |
JMP Group, Inc. | | | | 161,713 | | | 1,562,148 |
Legg Mason, Inc. | | | | 160,379 | | | 4,976,560 |
Stifel Financial Corp.(b) | | | | 214,727 | | | 11,788,512 |
| | | | | | | |
| | | | | | | 28,223,307 |
| | | | | | | |
| Chemicals – 3.0% | | | | | | | |
Calgon Carbon Corp.(b) | | | | 270,934 | | | 4,017,951 |
Ferro Corp. | | | | 613,965 | | | 5,464,288 |
Koppers Holdings, Inc. | | | | 195,239 | | | 5,788,836 |
LSB Industries, Inc.(b) | | | | 187,459 | | | 2,918,737 |
Minerals Technologies, Inc. | | | | 42,169 | | | 2,005,558 |
Olin Corp. | | | | 244,931 | | | 4,271,597 |
RPM International, Inc. | | | | 243,744 | | | 4,506,827 |
| | | | | | | |
| | | | | | | 28,973,794 |
| | | | | | | |
| Commercial Banks – 5.8% | | | | | | | |
Bank of the Ozarks, Inc. | | | | 246,487 | | | 6,539,300 |
First Horizon National Corp.(b) | | | | 417,991 | | | 5,530,027 |
Glacier Bancorp, Inc. | | | | 228,082 | | | 3,407,545 |
Hancock Holding Co. | | | | 85,415 | | | 3,209,042 |
IBERIABANK Corp. | | | | 188,834 | | | 8,603,277 |
Metro Bancorp, Inc.(b) | | | | 119,404 | | | 1,453,147 |
Prosperity Bancshares, Inc. | | | | 228,423 | | | 7,946,836 |
Signature Bank(b) | | | | 292,081 | | | 8,470,349 |
Southwest Bancorp, Inc. | | | | 261,402 | | | 3,670,084 |
Sterling Bancshares, Inc. | | | | 941,772 | | | 6,884,353 |
| | | | | | | |
| | | | | | | 55,713,960 |
| | | | | | | |
| Commercial Services & Supplies – 5.5% | | | | | | | |
ABM Industries, Inc. | | | | 391,160 | | | 8,230,006 |
American Ecology Corp. | | | | 150,555 | | | 2,815,378 |
Brink’s Co. (The) | | | | 181,717 | | | 4,890,004 |
McGrath Rentcorp | | | | 147,833 | | | 3,144,408 |
Rollins, Inc. | | | | 833,861 | | | 15,718,280 |
Standard Parking Corp.(b) | | | | 497,373 | | | 8,699,054 |
Team, Inc.(b) | | | | 164,327 | | | 2,785,343 |
Waste Connections, Inc.(b) | | | | 248,909 | | | 7,183,514 |
| | | | | | | |
| | | | | | | 53,465,987 |
| | | | | | | |
See accompanying notes to financial statements.
15
| | | | | | | |
| | | | | Shares | | Value (†) |
| | | | | | | |
| | | |
| COMMON STOCKS – continued | | | | | | | |
| | | |
| Communications Equipment – 3.5% | | | | | | | |
ADC Telecommunications, Inc.(b) | | | | 447,285 | | $ | 3,730,357 |
ADTRAN, Inc. | | | | 236,180 | | | 5,798,219 |
Anaren, Inc.(b) | | | | 169,713 | | | 2,885,121 |
Avocent Corp.(b) | | | | 234,036 | | | 4,743,910 |
Brocade Communications Systems, Inc.(b) | | | | 336,187 | | | 2,642,430 |
CommScope, Inc.(b) | | | | 198,099 | | | 5,929,103 |
Harris Stratex Networks, Inc., Class A(b) | | | | 369,589 | | | 2,587,123 |
Tekelec(b) | | | | 343,013 | | | 5,635,703 |
| | | | | | | |
| | | | | | | 33,951,966 |
| | | | | | | |
| Computers & Peripherals – 0.3% | | | | | | | |
Intevac, Inc.(b) | | | | 197,385 | | | 2,652,854 |
| | | | | | | |
| Construction & Engineering – 0.4% | | | | | | | |
MYR Group, Inc.(b) | | | | 173,109 | | | 3,650,869 |
| | | | | | | |
| Construction Materials – 0.4% | | | | | | | |
Eagle Materials, Inc. | | | | 126,011 | | | 3,601,394 |
| | | | | | | |
| Consumer Finance – 0.9% | | | | | | | |
Dollar Financial Corp.(b) | | | | 519,036 | | | 8,314,957 |
| | | | | | | |
| Containers & Packaging – 1.2% | | | | | | | |
Myers Industries, Inc. | | | | 209,271 | | | 2,253,849 |
Rock-Tenn Co., Class A | | | | 191,835 | | | 9,037,347 |
| | | | | | | |
| | | | | | | 11,291,196 |
| | | | | | | |
| Distributors – 0.2% | | | | | | | |
Core-Mark Holding Co., Inc.(b) | | | | 61,813 | | | 1,767,852 |
| | | | | | | |
| Diversified Consumer Services – 0.4% | | | | | | | |
Hillenbrand, Inc. | | | | 215,015 | | | 4,379,856 |
| | | | | | | |
| Diversified Financial Services – 1.1% | | | | | | | |
PHH Corp.(b) | | | | 520,467 | | | 10,326,065 |
| | | | | | | |
| Electric Utilities – 2.7% | | | | | | | |
ALLETE, Inc. | | | | 242,848 | | | 8,152,407 |
ITC Holdings Corp. | | | | 147,590 | | | 6,707,965 |
Portland General Electric Co. | | | | 211,598 | | | 4,172,713 |
UIL Holdings Corp. | | | | 257,628 | | | 6,798,803 |
| | | | | | | |
| | | | | | | 25,831,888 |
| | | | | | | |
| Electrical Equipment – 1.9% | | | | | | | |
Baldor Electric Co. | | | | 146,966 | | | 4,018,051 |
Encore Wire Corp. | | | | 163,553 | | | 3,653,774 |
GrafTech International Ltd.(b) | | | | 257,042 | | | 3,778,517 |
II-VI, Inc.(b) | | | | 272,341 | | | 6,928,355 |
| | | | | | | |
| | | | | | | 18,378,697 |
| | | | | | | |
| Electronic Equipment Instruments & Components – 1.3% | | | | | | | |
Littelfuse, Inc.(b) | | | | 137,304 | | | 3,602,857 |
Methode Electronics, Inc. | | | | 270,494 | | | 2,345,183 |
TTM Technologies, Inc.(b) | | | | 321,945 | | | 3,692,709 |
Vishay Intertechnology, Inc.(b) | | | | 412,997 | | | 3,262,676 |
| | | | | | | |
| | | | | | | 12,903,425 |
| | | | | | | |
See accompanying notes to financial statements.
16
PORTFOLIO OF INVESTMENTS – as of September 30, 2009
Loomis Sayles Small Cap Value Fund – continued
| | | | | | | |
| | | | | Shares | | Value (†) |
| | | | | | | |
| | | |
| COMMON STOCKS – continued | | | | | | | |
| | | |
| Energy Equipment & Services – 2.1% | | | | | | | |
Hornbeck Offshore Services, Inc.(b) | | | | 182,127 | | $ | 5,019,420 |
Lufkin Industries, Inc. | | | | 58,027 | | | 3,085,876 |
Oceaneering International, Inc.(b) | | | | 158,835 | | | 9,013,886 |
Seahawk Drilling, Inc.(b) | | | | 106,646 | | | 3,315,624 |
| | | | | | | |
| | | | | | | 20,434,806 |
| | | | | | | |
| Food & Staples Retailing – 0.5% | | | | | | | |
Spartan Stores, Inc. | | | | 359,274 | | | 5,076,542 |
| | | | | | | |
| Food Products – 2.5% | | | | | | | |
Darling International, Inc.(b) | | | | 506,580 | | | 3,723,363 |
Flowers Foods, Inc. | | | | 231,281 | | | 6,080,377 |
J & J Snack Foods Corp. | | | | 201,646 | | | 8,709,091 |
Ralcorp Holdings, Inc.(b) | | | | 99,353 | | | 5,809,170 |
| | | | | | | |
| | | | | | | 24,322,001 |
| | | | | | | |
| Gas Utilities – 1.1% | | | | | | | |
UGI Corp. | | | | 424,507 | | | 10,638,145 |
| | | | | | | |
| Health Care Equipment & Supplies – 1.7% | | | | | | | |
Medical Action Industries, Inc.(b) | | | | 261,297 | | | 3,153,855 |
Teleflex, Inc. | | | | 156,254 | | | 7,548,630 |
West Pharmaceutical Services, Inc. | | | | 144,562 | | | 5,870,663 |
| | | | | | | |
| | | | | | | 16,573,148 |
| | | | | | | |
| Health Care Providers & Services – 1.4% | | | | | | | |
CorVel Corp.(b) | | | | 93,798 | | | 2,663,863 |
MEDNAX, Inc.(b) | | | | 119,792 | | | 6,578,977 |
MWI Veterinary Supply, Inc.(b) | | | | 109,983 | | | 4,393,821 |
| | | | | | | |
| | | | | | | 13,636,661 |
| | | | | | | |
| Hotels, Restaurants & Leisure – 2.4% | | | | | | | |
Bob Evans Farms, Inc. | | | | 181,897 | | | 5,285,927 |
California Pizza Kitchen, Inc.(b) | | | | 251,170 | | | 3,923,276 |
Dover Downs Gaming & Entertainment, Inc. | | | | 301,983 | | | 1,721,303 |
Isle of Capri Casinos, Inc.(b) | | | | 347,414 | | | 4,096,011 |
Penn National Gaming, Inc.(b) | | | | 122,555 | | | 3,389,871 |
Wyndham Worldwide Corp. | | | | 286,963 | | | 4,683,236 |
| | | | | | | |
| | | | | | | 23,099,624 |
| | | | | | | |
| Household Durables – 1.3% | | | | | | | |
Jarden Corp. | | | | 197,326 | | | 5,538,941 |
Leggett & Platt, Inc. | | | | 374,547 | | | 7,266,212 |
| | | | | | | |
| | | | | | | 12,805,153 |
| | | | | | | |
| Industrial Conglomerates – 0.3% | | | | | | | |
Raven Industries, Inc. | | | | 123,702 | | | 3,306,554 |
| | | | | | | |
| Insurance – 6.5% | | | | | | | |
American Physicians Capital, Inc. | | | | 107,020 | | | 3,083,246 |
Aspen Insurance Holdings Ltd. | | | | 256,449 | | | 6,788,205 |
Hanover Insurance Group, Inc. (The) | | | | 134,037 | | | 5,539,749 |
HCC Insurance Holdings, Inc. | | | | 334,373 | | | 9,145,102 |
Navigators Group, Inc.(b) | | | | 116,894 | | | 6,429,170 |
ProAssurance Corp.(b) | | | | 102,409 | | | 5,344,726 |
See accompanying notes to financial statements.
17
| | | | | | | |
| | | | | Shares | | Value (†) |
| | | | | | | |
| | | |
| COMMON STOCKS – continued | | | | | | | |
| | | |
| Insurance – continued | | | | | | | |
Reinsurance Group of America, Inc. | | | | 139,456 | | $ | 6,219,738 |
RLI Corp. | | | | 113,569 | | | 5,994,172 |
W.R. Berkley Corp. | | | | 272,454 | | | 6,887,637 |
Zenith National Insurance Corp. | | | | 235,235 | | | 7,268,761 |
| | | | | | | |
| | | | | | | 62,700,506 |
| | | �� | | | | |
| Internet & Catalog Retail – 0.7% | | | | | | | |
HSN, Inc.(b) | | | | 434,171 | | | 7,068,304 |
| | | | | | | |
| Internet Software & Services – 0.3% | | | | | | | |
United Online, Inc. | | | | 395,892 | | | 3,182,972 |
| | | | | | | |
| IT Services – 3.5% | | | | | | | |
Broadridge Financial Solutions, Inc. | | | | 465,213 | | | 9,350,781 |
Global Payments, Inc. | | | | 124,931 | | | 5,834,278 |
Lender Processing Services, Inc. | | | | 217,332 | | | 8,295,563 |
SRA International, Inc., Class A(b) | | | | 200,139 | | | 4,321,001 |
Wright Express Corp.(b) | | | | 214,667 | | | 6,334,823 |
| | | | | | | |
| | | | | | | 34,136,446 |
| | | | | | | |
| Life Sciences Tools & Services – 0.6% | | | | | | | |
Mettler-Toledo International, Inc.(b) | | | | 61,157 | | | 5,540,213 |
| | | | | | | |
| Machinery – 4.3% | | | | | | | |
Actuant Corp., Class A | | | | 476,590 | | | 7,654,036 |
Albany International Corp., Class A | | | | 342,706 | | | 6,648,496 |
Altra Holdings, Inc.(b) | | | | 333,302 | | | 3,729,649 |
Colfax Corp.(b) | | | | 165,357 | | | 1,757,745 |
Dynamic Materials Corp. | | | | 183,577 | | | 3,664,197 |
John Bean Technologies Corp. | | | | 370,402 | | | 6,730,204 |
Middleby Corp. (The)(b) | | | | 36,509 | | | 2,008,360 |
Tennant Co. | | | | 103,930 | | | 3,020,206 |
Wabtec Corp. | | | | 169,822 | | | 6,373,420 |
| | | | | | | |
| | | | | | | 41,586,313 |
| | | | | | | |
| Marine – 0.2% | | | | | | | |
Kirby Corp.(b) | | | | 63,554 | | | 2,340,058 |
| | | | | | | |
| Media – 3.4% | | | | | | | |
Alloy, Inc.(b) | | | | 244,628 | | | 1,656,131 |
Arbitron, Inc. | | | | 192,310 | | | 3,992,356 |
Dolan Media Co.(b) | | | | 293,924 | | | 3,524,149 |
John Wiley & Sons, Inc. Class A | | | | 249,879 | | | 8,690,792 |
Live Nation, Inc.(b) | | | | 922,972 | | | 7,559,141 |
Scholastic Corp. | | | | 293,584 | | | 7,145,834 |
| | | | | | | |
| | | | | | | 32,568,403 |
| | | | | | | |
| Metals & Mining – 1.3% | | | | | | | |
Horsehead Holding Corp.(b) | | | | 356,270 | | | 4,175,484 |
Reliance Steel & Aluminum Co. | | | | 190,083 | | | 8,089,933 |
| | | | | | | |
| | | | | | | 12,265,417 |
| | | | | | | |
| Multi-Utilities & Unregulated Power – 0.5% | | | | | | | |
NorthWestern Corp. | | | | 193,268 | | | 4,721,537 |
| | | | | | | |
See accompanying notes to financial statements.
18
PORTFOLIO OF INVESTMENTS – as of September 30, 2009
Loomis Sayles Small Cap Value Fund – continued
| | | | | | | |
| | | | | Shares | | Value (†) |
| | | | | | | |
| | | |
| COMMON STOCKS – continued | | | | | | | |
| | | |
| Oil, Gas & Consumable Fuels – 3.6% | | | | | | | |
Arena Resources, Inc.(b) | | | | 169,513 | | $ | 6,017,712 |
Berry Petroleum Co., Class A | | | | 187,881 | | | 5,031,453 |
Comstock Resources, Inc.(b) | | | | 196,822 | | | 7,888,626 |
Mariner Energy, Inc.(b) | | | | 360,308 | | | 5,109,167 |
Penn Virginia Corp. | | | | 485,007 | | | 11,111,510 |
| | | | | | | |
| | | | | | | 35,158,468 |
| | | | | | | |
| Paper & Forest Products – 0.6% | | | | | | | |
Clearwater Paper Corp.(b) | | | | 80,429 | | | 3,324,130 |
Deltic Timber Corp. | | | | 45,984 | | | 2,104,688 |
| | | | | | | |
| | | | | | | 5,428,818 |
| | | | | | | |
| Personal Products – 0.5% | | | | | | | |
Alberto-Culver Co. | | | | 182,486 | | | 5,051,212 |
| | | | | | | |
| Pharmaceuticals – 2.3% | | | | | | | |
Endo Pharmaceuticals Holdings, Inc.(b) | | | | 270,162 | | | 6,113,766 |
Obagi Medical Products, Inc.(b) | | | | 385,567 | | | 4,472,577 |
Perrigo Co. | | | | 358,879 | | | 12,198,297 |
| | | | | | | |
| | | | | | | 22,784,640 |
| | | | | | | |
| Real Estate Management & Development – 1.0% | | | | | | | |
Forestar Group, Inc.(b) | | | | 548,186 | | | 9,417,836 |
| | | | | | | |
| REITs – 4.7% | | | | | | | |
American Campus Communities, Inc. | | | | 363,085 | | | 9,748,832 |
Capstead Mortgage Corp. | | | | 673,066 | | | 9,362,348 |
Chimera Investment Corp. | | | | 1,535,216 | | | 5,864,525 |
Digital Realty Trust, Inc. | | | | 174,840 | | | 7,991,937 |
National Retail Properties, Inc. | | | | 219,320 | | | 4,708,800 |
Potlatch Corp. | | | | 268,691 | | | 7,644,259 |
| | | | | | | |
| | | | | | | 45,320,701 |
| | | | | | | |
| Road & Rail – 1.1% | | | | | | | |
Con-way, Inc. | | | | 101,024 | | | 3,871,240 |
Genesee & Wyoming, Inc., Class A(b) | | | | 187,345 | | | 5,680,300 |
Saia, Inc.(b) | | | | 75,742 | | | 1,217,931 |
| | | | | | | |
| | | | | | | 10,769,471 |
| | | | | | | |
| Semiconductors & Semiconductor Equipment – 3.8% | | | | | | | |
Applied Micro Circuits Corp.(b) | | | | 203,481 | | | 2,032,775 |
Atmel Corp.(b) | | | | 902,712 | | | 3,782,363 |
Cohu, Inc. | | | | 251,428 | | | 3,409,364 |
Entegris, Inc.(b) | | | | 1,061,734 | | | 5,255,584 |
ON Semiconductor Corp.(b) | | | | 740,740 | | | 6,111,105 |
Semtech Corp.(b) | | | | 229,275 | | | 3,899,968 |
Teradyne, Inc.(b) | | | | 584,253 | | | 5,404,340 |
TriQuint Semiconductor, Inc.(b) | | | | 942,042 | | | 7,272,564 |
| | | | | | | |
| | | | | | | 37,168,063 |
| | | | | | | |
| Software – 2.2% | | | | | | | |
Informatica Corp.(b) | | | | 132,523 | | | 2,992,369 |
MicroStrategy, Inc., Class A(b) | | | | 43,617 | | | 3,120,360 |
Progress Software Corp.(b) | | | | 156,761 | | | 3,550,637 |
See accompanying notes to financial statements.
19
| | | | | | | | |
| | | | | Shares | | Value (†) |
| | | | | | | | |
| | | |
| COMMON STOCKS – continued | | | | | | | | |
| | | |
| Software – continued | | | | | | | | |
Quest Software, Inc.(b) | | | | | 272,667 | | $ | 4,594,439 |
Sybase, Inc.(b) | | | | | 174,940 | | | 6,805,166 |
| | | | | | | | |
| | | | | | | | 21,062,971 |
| | | | | | | | |
| | | |
| Specialty Retail – 2.3% | | | | | | | | |
Genesco, Inc.(b) | | | | | 166,373 | | | 4,004,598 |
Jo-Ann Stores, Inc.(b) | | | | | 200,926 | | | 5,390,845 |
Sally Beauty Holdings, Inc.(b) | | | | | 1,127,717 | | | 8,018,068 |
Sonic Automotive, Inc., Class A | | | | | 471,078 | | | 4,946,319 |
| | | | | | | | |
| | | | | | | | 22,359,830 |
| | | | | | | | |
| Textiles, Apparel & Luxury Goods – 2.7% | | | | | | | | |
Carter’s, Inc.(b) | | | | | 388,247 | | | 10,366,195 |
FGX International Holdings Ltd.(b) | | | | | 275,446 | | | 3,842,472 |
Fossil, Inc.(b) | | | | | 248,694 | | | 7,075,344 |
Movado Group, Inc. | | | | | 320,326 | | | 4,654,337 |
| | | | | | | | |
| | | | | | | | 25,938,348 |
| | | | | | | | |
| Thrifts & Mortgage Finance – 0.9% | | | | | | | | |
Washington Federal, Inc. | | | | | 286,005 | | | 4,822,044 |
Westfield Financial, Inc. | | | | | 407,901 | | | 3,454,922 |
| | | | | | | | |
| | | | | | | | 8,276,966 |
| | | | | | | | |
| Water Utilities – 0.4% | | | | | | | | |
Middlesex Water Co. | | | | | 272,189 | | | 4,104,610 |
| | | | | | | | |
| | | |
| TOTAL COMMON STOCKS | | | | | | | | |
(Identified Cost $821,166,230) | | | | | | | | 923,503,226 |
| | | | | | | | |
| | | |
| | | | | Principal Amount | | |
| | | |
| SHORT-TERM INVESTMENTS – 4.0% | | | | | | | | |
| Tri-Party Repurchase Agreement with Fixed Income Clearing Corporation, dated 9/30/2009 at 0.000% to be repurchased at $38,153,199 on 10/01/2009 collateralized by $38,725,000 Federal National Mortgage Association, 3.000% due 1/13/2014 with a value of $38,918,625 including accrued interest (Note 2f of Notes to Financial Statements) (Identified Cost $38,153,198) | | | | $ | 38,153,198 | | | 38,153,198 |
| | | | | | | | |
| | | |
| TOTAL INVESTMENTS – 99.4% | | | | | | | | |
(Identified Cost $859,319,428)(a) | | | | | | | | 961,656,424 |
Other assets less liabilities—0.6% | | | | | | | | 6,245,617 |
| | | | | | | | |
| | | |
| NET ASSETS – 100.0% | | | | | | | $ | 967,902,041 |
| | | | | | | | |
| |
(†) See Note 2a of Notes to Financial Statements. | | | |
(a) Federal Tax Information:
At September 30, 2009, the net unrealized appreciation on investments based on a cost of $868,593,394 for federal income tax purposes was as follows: | | | |
Aggregate gross unrealized appreciation for all investments in which there is an excess of value over tax cost | | $ | 136,082,101 |
Aggregate gross unrealized depreciation for all investments in which there is an excess of tax cost over value | | | (43,019,071) |
| | | | | | | | |
Net unrealized appreciation | | $ | 93,063,030 |
| | | | | | | | |
| (b) | Non-income producing security. |
| REITs | Real Estate Investment Trusts |
See accompanying notes to financial statements.
20
PORTFOLIO OF INVESTMENTS – as of September 30, 2009
Loomis Sayles Small Cap Value Fund – continued
INDUSTRY SUMMARY AT SEPTEMBER 30, 2009 (Unaudited)
| | | |
Insurance | | 6.5 | % |
Commercial Banks | | 5.8 | |
Commercial Services & Supplies | | 5.5 | |
REITs | | 4.7 | |
Machinery | | 4.3 | |
Semiconductors & Semiconductor Equipment | | 3.8 | |
Oil, Gas & Consumable Fuels | | 3.6 | |
IT Services | | 3.5 | |
Communications Equipment | | 3.5 | |
Media | | 3.4 | |
Chemicals | | 3.0 | |
Capital Markets | | 2.9 | |
Textiles, Apparel & Luxury Goods | | 2.7 | |
Electric Utilities | | 2.7 | |
Food Products | | 2.5 | |
Hotels, Restaurants & Leisure | | 2.4 | |
Pharmaceuticals | | 2.3 | |
Specialty Retail | | 2.3 | |
Software | | 2.2 | |
Energy Equipment & Services | | 2.1 | |
Other Investments, less than 2% each | | 25.7 | |
Short-Term Investments | | 4.0 | |
| | | |
Total Investments | | 99.4 | |
Other assets less liabilities | | 0.6 | |
| | | |
Net Assets | | 100.0 | % |
| | | |
See accompanying notes to financial statements.
21
STATEMENTS OF ASSETS AND LIABILITIES
September 30, 2009
| | | | | | | | |
| | | Small Cap
Growth Fund | | | Small Cap
Value Fund | |
| | | | | | | | |
Assets | | | | | | | | |
Investments at cost | | $ | 100,293,558 | | | $ | 859,319,428 | |
Net unrealized appreciation | | | 19,350,023 | | | | 102,336,996 | |
| | | | | | | | |
Investments at value | | | 119,643,581 | | | | 961,656,424 | |
Receivable for Fund shares sold | | | 223,084 | | | | 923,560 | |
Receivable for securities sold | | | 3,006,329 | | | | 9,038,272 | |
Dividends and interest receivable | | | — | | | | 1,397,261 | |
Receivable from investment adviser (Note 5) | | | 7,976 | | | | 14,259 | |
| | | | | | | | |
Total Assets | | | 122,880,970 | | | | 973,029,776 | |
| | | | | | | | |
| | |
| Liabilities | | | | | | | | |
Payable for securities purchased | | | 1,588,658 | | | | 3,865,585 | |
Payable for Fund shares redeemed | | | 88,698 | | | | 416,831 | |
Management fees payable (Note 5) | | | 73,145 | | | | 584,910 | |
Administrative fees payable (Note 5) | | | 4,787 | | | | 38,275 | |
Deferred Trustees’ fees (Note 5) | | | 46,961 | | | | 110,532 | |
Service and distribution fees payable (Note 5) | | | 519 | | | | 3,693 | |
Other accounts payable and accrued expenses | | | 43,271 | | | | 107,909 | |
| | | | | | | | |
Total Liabilities | | | 1,846,039 | | | | 5,127,735 | |
| | | | | | | | |
Net Assets | | $ | 121,034,931 | | | $ | 967,902,041 | |
| | | | | | | | |
Net Assets consist of: | | | | | | | | |
Paid-in capital | | $ | 341,683,551 | | | $ | 1,072,244,798 | |
Accumulated net investment income (loss)/Undistributed net investment income | | | (46,961 | ) | | | 1,177,091 | |
Accumulated net realized loss on investments | | | (239,951,682 | ) | | | (207,856,844 | ) |
Net unrealized appreciation on investments | | | 19,350,023 | | | | 102,336,996 | |
| | | | | | | | |
Net Assets | | $ | 121,034,931 | | | $ | 967,902,041 | |
| | | | | | | | |
| | |
| Net Asset Value and Offering Price | | | | | | | | |
Institutional Class | | | | | | | | |
Net assets | | $ | 45,556,734 | | | $ | 506,323,696 | |
| | | | | | | | |
Shares of beneficial interest | | | 3,934,994 | | | | 24,506,094 | |
| | | | | | | | |
Net asset value, offering and redemption price per share | | $ | 11.58 | | | $ | 20.66 | |
| | | | | | | | |
Retail Class | | | | | | | | |
Net assets | | $ | 75,478,197 | | | $ | 387,383,082 | |
| | | | | | | | |
Shares of beneficial interest | | | 6,731,158 | | | | 18,927,367 | |
| | | | | | | | |
Net asset value, offering and redemption price per share | | $ | 11.21 | | | $ | 20.47 | |
| | | | | | | | |
Admin Class | | | | | | | | |
Net assets | | $ | — | | | $ | 74,195,263 | |
| | | | | | | | |
Shares of beneficial interest | | | — | | | | 3,688,760 | |
| | | | | | | | |
Net asset value, offering and redemption price per share | | $ | — | | | $ | 20.11 | |
| | | | | | | | |
See accompanying notes to financial statements.
22
STATEMENTS OF OPERATIONS
For the Year Ended September 30, 2009
| | | | | | | | |
| | | Small Cap
Growth Fund | | | Small Cap
Value Fund | |
| | | | | | | | |
Investment Income | | | | | | | | |
Dividends | | $ | 295,838 | | | $ | 11,236,026 | |
Interest | | | 2,346 | | | | 21,623 | |
Securities lending income (Note 2) | | | 7,998 | | | | 49,006 | |
| | | | | | | | |
| | | 306,182 | | | | 11,306,655 | |
| | | | | | | | |
| | |
| Expenses | | | | | | | | |
Management fees (Note 5) | | | 713,999 | | | | 5,985,483 | |
Distribution fees—Retail Class (Note 5) | | | 148,197 | | | | 820,762 | |
Service and distribution fees—Admin Class (Note 5) | | | — | | | | 298,932 | |
Trustees’ fees and expenses (Note 5) | | | 8,260 | | | | 14,692 | |
Administrative fees (Note 5) | | | 47,922 | | | | 402,025 | |
Custodian fees and expenses | | | 23,264 | | | | 38,599 | |
Transfer agent fees and expenses—Institutional Class (Note 5) | | | 20,269 | | | | 350,319 | |
Transfer agent fees and expenses—Retail Class (Note 5) | | | 132,724 | | | | 677,633 | |
Transfer agent fees and expenses—Admin Class (Note 5) | | | — | | | | 250,517 | |
Audit and tax services fees | | | 39,839 | | | | 68,062 | |
Registration fees | | | 42,142 | | | | 91,928 | |
Shareholder reporting expenses | | | 20,466 | | | | 151,299 | |
Legal fees | | | 3,439 | | | | 29,518 | |
Miscellaneous expenses | | | 10,376 | | | | 43,289 | |
| | | | | | | | |
Total expenses | | | 1,210,897 | | | | 9,223,058 | |
Less fee reduction and/or expense reimbursement (Note 5) | | | (110,702 | ) | | | (920,783 | ) |
| | | | | | | | |
Net expenses | | | 1,100,195 | | | | 8,302,275 | |
| | | | | | | | |
Net investment income (loss) | | | (794,013 | ) | | | 3,004,380 | |
| | | | | | | | |
| | |
| Net Realized and Unrealized Gain (Loss) on Investments | | | | | | | | |
Net Realized Loss on: | | | | | | | | |
Investments | | | (34,962,361 | ) | | | (157,922,333 | ) |
| Net Change in Unrealized Appreciation (Depreciation) on: | | | | | | | | |
Investments | | | 21,890,105 | | | | 76,497,968 | |
| | | | | | | | |
Net realized and unrealized loss on investments | | | (13,072,256 | ) | | | (81,424,365 | ) |
| | | | | | | | |
| | |
| Net Decrease in Net Assets Resulting from Operations | | $ | (13,866,269 | ) | | $ | (78,419,985 | ) |
| | | | | | | | |
See accompanying notes to financial statements.
23
STATEMENTS OF CHANGES IN NET ASSETS
Small Cap Growth Fund
| | | | | | | | |
| | | Year Ended
September 30, 2009 | | | Year Ended
September 30, 2008 | |
From Operations: | | | | | | | | |
Net investment loss | | $ | (794,013 | ) | | $ | (584,280 | ) |
Net realized loss on investments | | | (34,962,361 | ) | | | (6,171,517 | ) |
Net change in unrealized appreciation (depreciation) on investments | | | 21,890,105 | | | | (10,322,096 | ) |
| | | | | | | | |
Net decrease in net assets resulting from operations | | | (13,866,269 | ) | | | (17,077,893 | ) |
| | | | | | | | |
From Distributions to Shareholders: | | | | | | | | |
Net Investment Income: | | | | | | | | |
Institutional Class | | | — | | | | — | |
Retail Class | | | — | | | | — | |
Capital Gains: | | | | | | | | |
Institutional Class | | | — | | | | — | |
Retail Class | | | — | | | | — | |
| | | | | | | | |
Total distributions | | | — | | | | — | |
| | | | | | | | |
Increase in Net Assets Derived from Capital Share Transactions (Note 9) | | | 10,464,100 | | | | 92,473,941 | |
| | | | | | | | |
Redemption Fees: | | | | | | | | |
Institutional Class | | | — | | | | 11,629 | |
Retail Class | | | — | | | | 17,229 | |
| | | | | | | | |
Total redemption fees | | | — | | | | 28,858 | |
| | | | | | | | |
Net increase (decrease) in net assets | | | (3,402,169 | ) | | | 75,424,906 | |
Net Assets | | | | | | | | |
Beginning of year | | | 124,437,100 | | | | 49,012,194 | |
| | | | | | | | |
End of year | | $ | 121,034,931 | | | $ | 124,437,100 | |
| | | | | | | | |
Accumulated Net Investment Loss | | $ | (46,961 | ) | | $ | (40,103 | ) |
| | | | | | | | |
See accompanying notes to financial statements.
24
STATEMENTS OF CHANGES IN NET ASSETS
Small Cap Value Fund
| | | | | | | | |
| | | Year Ended
September 30, 2009 | | | Year Ended
September 30, 2008 | |
From Operations: | | | | | | | | |
Net investment income | | $ | 3,004,380 | | | $ | 3,447,311 | |
Net realized loss on investments | | | (157,922,333 | ) | | | (37,271,375 | ) |
Net change in unrealized appreciation (depreciation) on investments | | | 76,497,968 | | | | (141,209,963 | ) |
| | | | | | | | |
Net decrease in net assets resulting from operations | | | (78,419,985 | ) | | | (175,034,027 | ) |
| | | | | | | | |
From Distributions to Shareholders: | | | | | | | | |
Net Investment Income: | | | | | | | | |
Institutional Class | | | (2,585,541 | ) | | | (1,132,960 | ) |
Retail Class | | | (1,071,277 | ) | | | — | |
Admin Class | | | (9,660 | ) | | | — | |
Capital Gains: | | | | | | | | |
Institutional Class | | | (167,987 | ) | | | (51,944,175 | ) |
Retail Class | | | (141,335 | ) | | | (47,065,282 | ) |
Admin Class | | | (24,687 | ) | | | (8,031,853 | ) |
| | | | | | | | |
Total distributions | | | (4,000,487 | ) | | | (108,174,270 | ) |
| | | | | | | | |
Increase (Decrease) in Net Assets Derived from Capital Share Transactions (Note 9) | | | (45,368,424 | ) | | | 302,201,210 | |
| | | | | | | | |
Redemption Fees: | | | | | | | | |
Institutional Class | | | 21,500 | | | | 20,568 | |
Retail Class | | | 17,487 | | | | 18,348 | |
Admin Class | | | 3,123 | | | | 3,084 | |
| | | | | | | | |
Total redemption fees | | | 42,110 | | | | 42,000 | |
| | | | | | | | |
Net increase (decrease) in net assets | | | (127,746,786 | ) | | | 19,034,913 | |
Net Assets | | | | | | | | |
Beginning of year | | | 1,095,648,827 | | | | 1,076,613,914 | |
| | | | | | | | |
End of year | | $ | 967,902,041 | | | $ | 1,095,648,827 | |
| | | | | | | | |
Undistributed Net Investment Income | | $ | 1,177,091 | | | $ | 1,842,018 | |
| | | | | | | | |
See accompanying notes to financial statements.
25
THIS PAGE INTENTIONALLY LEFT BLANK
26
FINANCIAL HIGHLIGHTS
For a share outstanding throughout each period.
| | | | | | | | | | | | | | | | | | | | | | | | | | | | | |
| | | | | Income (Loss) from Investment Operations: | | | | | Less Distributions: | |
| | | Net asset
value,
beginning of
the period | | Net
investment
income
(loss)(a)(b) | | | Net realized
and unrealized
gain (loss) | | | Total from
investment
operations | | | | | Dividends
from
net investment
income | | | Distributions
from net
realized
capital gains | | | Total
distributions | |
| Small Cap Growth Fund | | | | | | | | | | | | | | | | | | | | | | | |
| | | | | | | |
| Institutional Class | | | | | | | | | | | | | | | | | | | | | | | | | | |
9/30/2009 | | $ | 13.07 | | $ | (0.07 | ) | | $ | (1.42 | ) | | $ | (1.49 | ) | | | | $ | — | | | $ | — | | | $ | — | |
9/30/2008 | | | 15.87 | | | (0.07 | ) | | | (2.73 | ) | | | (2.80 | ) | | | | | — | | | | — | | | | — | |
9/30/2007 | | | 12.00 | | | (0.06 | )(g) | | | 3.93 | | | | 3.87 | | | | | | — | | | | — | | | | — | |
9/30/2006 | | | 11.08 | | | (0.08 | ) | | | 0.99 | | | | 0.91 | | | | | | — | | | | — | | | | — | |
9/30/2005 | | | 8.96 | | | (0.08 | ) | | | 2.20 | | | | 2.12 | | | | | | — | | | | — | | | | — | |
| | | | | | | |
| Retail Class | | | | | | | | | | | | | | | | | | | | | | | | | | |
9/30/2009 | | | 12.69 | | | (0.09 | ) | | | (1.39 | ) | | | (1.48 | ) | | | | | — | | | | — | | | | — | |
9/30/2008 | | | 15.45 | | | (0.10 | ) | | | (2.66 | ) | | | (2.76 | ) | | | | | — | | | | — | | | | — | |
9/30/2007 | | | 11.71 | | | (0.09 | )(g) | | | 3.83 | | | | 3.74 | | | | | | — | | | | — | | | | — | |
9/30/2006 | | | 10.84 | | | (0.11 | ) | | | 0.97 | | | | 0.86 | | | | | | — | | | | — | | | | — | |
9/30/2005 | | | 8.78 | | | (0.11 | ) | | | 2.17 | | | | 2.06 | | | | | | — | | | | — | | | | — | |
| | | | | | |
| Small Cap Value Fund | | | | | | | | | | | | | | | | | | | | | | | |
| | | | | | | |
| Institutional Class | | | | | | | | | | | | | | | | | | | | | | | | | | |
9/30/2009 | | $ | 22.01 | | $ | 0.09 | | | $ | (1.32 | ) | | $ | (1.23 | ) | | | | $ | (0.11 | ) | | $ | (0.01 | ) | | $ | (0.12 | ) |
9/30/2008 | | | 28.77 | | | 0.11 | (h) | | | (4.03 | ) | | | (3.92 | ) | | | | | (0.06 | ) | | | (2.78 | ) | | | (2.84 | ) |
9/30/2007 | | | 27.69 | | | 0.12 | (g)(i) | | | 4.29 | | | | 4.41 | | | | | | (0.17 | ) | | | (3.16 | ) | | | (3.33 | ) |
9/30/2006 | | | 27.43 | | | 0.13 | | | | 2.70 | | | | 2.83 | | | | | | (0.15 | ) | | | (2.42 | ) | | | (2.57 | ) |
9/30/2005 | | | 25.75 | | | 0.13 | | | | 4.22 | | | | 4.35 | | | | | | (0.02 | ) | | | (2.65 | ) | | | (2.67 | ) |
| | | | | | | |
| Retail Class | | | | | | | | | | | | | | | | | | | | | | | | | | |
9/30/2009 | | | 21.79 | | | 0.04 | | | | (1.30 | ) | | | (1.26 | ) | | | | | (0.05 | ) | | | (0.01 | ) | | | (0.06 | ) |
9/30/2008 | | | 28.52 | | | 0.05 | (h) | | | (4.00 | ) | | | (3.95 | ) | | | | | — | | | | (2.78 | ) | | | (2.78 | ) |
9/30/2007 | | | 27.46 | | | 0.04 | (g)(i) | | | 4.28 | | | | 4.32 | | | | | | (0.10 | ) | | | (3.16 | ) | | | (3.26 | ) |
9/30/2006 | | | 27.23 | | | 0.06 | | | | 2.67 | | | | 2.73 | | | | | | (0.08 | ) | | | (2.42 | ) | | | (2.50 | ) |
9/30/2005 | | | 25.62 | | | 0.06 | | | | 4.20 | | | | 4.26 | | | | | | — | | | | (2.65 | ) | | | (2.65 | ) |
| | | | | | | |
| Admin Class | | | | | | | | | | | | | | | | | | | | | | | | | | |
9/30/2009 | | | 21.40 | | | 0.00 | | | | (1.28 | ) | | | (1.28 | ) | | | | | (0.00 | ) | | | (0.01 | ) | | | (0.01 | ) |
9/30/2008 | | | 28.13 | | | (0.01 | )(h) | | | (3.94 | ) | | | (3.95 | ) | | | | | — | | | | (2.78 | ) | | | (2.78 | ) |
9/30/2007 | | | 27.14 | | | (0.03 | )(g)(i) | | | 4.22 | | | | 4.19 | | | | | | (0.04 | ) | | | (3.16 | ) | | | (3.20 | ) |
9/30/2006 | | | 26.94 | | | (0.01 | ) | | | 2.65 | | | | 2.64 | | | | | | (0.02 | ) | | | (2.42 | ) | | | (2.44 | ) |
9/30/2005 | | | 25.43 | | | (0.00 | ) | | | 4.16 | | | | 4.16 | | | | | | — | | | | (2.65 | ) | | | (2.65 | ) |
(a) Per share net investment income (loss) has been calculated using the average shares outstanding during the period.
(b) Amount rounds to less than $0.01 per share, if applicable.
(c) Effective June 1, 2009, redemption fees were eliminated.
(d) Had certain expenses not been reduced during the period, if applicable, total returns would have been lower. Periods less than one year, if applicable, are not annualized.
(e) Computed on an annualized basis for periods less than one year, if applicable.
(f) The investment adviser and/or administrator agreed to reimburse a portion of the Fund’s expenses and/or reduce its fees during the period. Without this reimbursement/fee reduction, if applicable, expenses would have been higher.
(g) Includes a non-recurring payment of $0.01 per share and $0.00 per share for Small Cap Growth Fund and Small Cap Value Fund, respectively.
(h) Includes a non-recurring dividend of $0.02 per share.
(i) Includes a non-recurring dividend of $0.05 per share.
(j) Includes fee/expense recovery of 0.02%.
See accompanying notes to financial statements.
27
| | | | | | | | | | | | | | | | | | | | | |
| | | | | | | | | | Ratio to Average Net Assets: | | | |
Redemption
fees(b)(c) | | Net asset
value,
end of
the period | | Total
return (%)(d) | | | Net assets,
end of
the period
(000’s) | | Net
expenses (%)(e)(f) | | | Gross
expenses (%)(e) | | | Net
investment
income (loss) (%)(e) | | | Portfolio
turnover
rate (%) |
| | | | | | | | | | | | | | | | | | | | | |
| | | | | | | |
| | | | | | | | | | | | | | | | | | | | | |
| $ | — | | $ | 11.58 | | (11.40 | ) | | $ | 45,557 | | 1.00 | | | 1.01 | | | (0.68 | ) | | 107 |
| | 0.00 | | | 13.07 | | (17.64 | ) | | | 44,540 | | 1.00 | | | 1.01 | | | (0.47 | ) | | 92 |
| | 0.00 | | | 15.87 | | 32.25 | | | | 28,088 | | 1.00 | | | 1.23 | | | (0.47 | ) | | 83 |
| | 0.01 | | | 12.00 | | 8.30 | | | | 20,414 | | 1.00 | | | 1.38 | | | (0.69 | ) | | 100 |
| | 0.00 | | | 11.08 | | 23.66 | | | | 15,785 | | 1.00 | | | 1.70 | | | (0.85 | ) | | 227 |
| | | | | | | |
| | | | | | | | | | | | | | | | | | | | | |
| | — | | | 11.21 | | (11.66 | ) | | | 75,478 | | 1.25 | | | 1.43 | | | (0.93 | ) | | 107 |
| | 0.00 | | | 12.69 | | (17.86 | ) | | | 79,897 | | 1.25 | | | 1.42 | | | (0.70 | ) | | 92 |
| | 0.00 | | | 15.45 | | 31.94 | | | | 20,924 | | 1.25 | | | 1.50 | | | (0.66 | ) | | 83 |
| | 0.01 | | | 11.71 | | 8.03 | | | | 2,981 | | 1.25 | | | 1.92 | | | (0.94 | ) | | 100 |
| | 0.00 | | | 10.84 | | 23.46 | | | | 3,592 | | 1.25 | | | 1.87 | | | (1.14 | ) | | 227 |
| | | | | | | |
| | | | | | | | | | | | | | | | | | | | | |
| | | | | | | |
| | | | | | | | | | | | | | | | | | | | | |
| $ | 0.00 | | $ | 20.66 | | (5.42 | ) | | $ | 506,324 | | 0.90 | | | 0.94 | | | 0.52 | | | 55 |
| | 0.00 | | | 22.01 | | (15.02 | ) | | | 553,268 | | 0.89 | | | 0.89 | | | 0.47 | | | 61 |
| | 0.00 | | | 28.77 | | 17.02 | | | | 534,776 | | 0.89 | | | 0.89 | | | 0.43 | | | 57 |
| | 0.00 | | | 27.69 | | 11.17 | | | | 442,714 | | 0.89 | (j) | | 0.89 | (j) | | 0.47 | | | 62 |
| | 0.00 | | | 27.43 | | 17.99 | | | | 403,110 | | 0.90 | | | 0.93 | | | 0.48 | | | 59 |
| | | | | | | |
| | | | | | | | | | | | | | | | | | | | | |
| | 0.00 | | | 20.47 | | (5.66 | ) | | | 387,383 | | 1.15 | | | 1.31 | | | 0.26 | | | 55 |
| | 0.00 | | | 21.79 | | (15.21 | ) | | | 464,525 | | 1.15 | | | 1.27 | | | 0.21 | | | 61 |
| | 0.00 | | | 28.52 | | 16.74 | | | | 465,055 | | 1.15 | | | 1.24 | | | 0.15 | | | 57 |
| | 0.00 | | | 27.46 | | 10.87 | | | | 291,690 | | 1.15 | | | 1.20 | | | 0.21 | | | 62 |
| | 0.00 | | | 27.23 | | 17.69 | | | | 235,948 | | 1.15 | | | 1.20 | | | 0.24 | | | 59 |
| | | | | | | |
| | | | | | | | | | | | | | | | | | | | | |
| | 0.00 | | | 20.11 | | (5.93 | ) | | | 74,195 | | 1.40 | | | 1.77 | | | 0.02 | | | 55 |
| | 0.00 | | | 21.40 | | (15.44 | ) | | | 77,855 | | 1.40 | | | 1.68 | | | (0.04 | ) | | 61 |
| | 0.00 | | | 28.13 | | 16.41 | | | | 76,783 | | 1.40 | | | 1.56 | | | (0.10 | ) | | 57 |
| | 0.00 | | | 27.14 | | 10.59 | | | | 64,367 | | 1.40 | | | 1.46 | | | (0.04 | ) | | 62 |
| | 0.00 | | | 26.94 | | 17.40 | | | | 67,505 | | 1.40 | | | 1.43 | | | (0.01 | ) | | 59 |
See accompanying notes to financial statements.
28
NOTES TO FINANCIAL STATEMENTS
September 30, 2009
1. Organization. Loomis Sayles Funds I and Loomis Sayles Funds II (the “Trusts” and each a “Trust”) are each organized as a Massachusetts business trust. Each Trust is registered under the Investment Company Act of 1940, as amended (the “1940 Act”), as an open-end management investment company. Each Declaration of Trust permits the Board of Trustees to authorize the issuance of an unlimited number of shares of the Trusts in multiple series. The financial statements for certain funds of the Trusts are presented in separate reports. The following funds (individually, a “Fund” and collectively, the “Funds”) are included in this report:
Loomis Sayles Funds I:
Loomis Sayles Small Cap Value Fund (the “Small Cap Value Fund”)
Loomis Sayles Funds II:
Loomis Sayles Small Cap Growth Fund (the “Small Cap Growth Fund”)
Each Fund offers Institutional Class Shares and Retail Class Shares. In addition, Small Cap Value Fund offers Admin Class Shares.
Most expenses of the Trusts can be directly attributed to a Fund. Expenses which cannot be directly attributed to a Fund are generally apportioned based on the relative net assets of each of the Funds in the Trusts. Expenses of a Fund are borne pro rata by the holders of each class of shares, except that each class bears expenses unique to that class (including the Rule 12b-1 service and distribution fees and transfer agent fees applicable to such class). In addition, each class votes as a class only with respect to its own Rule 12b-1 Plan. Shares of each class would receive their pro rata share of the net assets of a Fund if the Fund were liquidated. The Trustees approve separate dividends from net investment income on each class of shares.
2. Significant Accounting Policies. The following is a summary of significant accounting policies consistently followed by each Fund in the preparation of its financial statements. The Funds’ financial statements are prepared in accordance with accounting principles generally accepted in the United States of America which require the use of management estimates that affect the reported amounts and disclosures in the financial statements. Actual results could differ from those estimates. Management has evaluated the events and transactions that have occurred through November 23, 2009, the date the financial statements were issued, and noted no items requiring recognition in the financial statements or additional disclosure in the Notes to Financial Statements.
a. Valuation. Equity securities, including closed-end investment companies and exchange-traded funds, for which market quotations are readily available are valued at market value, as reported by pricing services recommended by the investment adviser and approved by the Board of Trustees. Such pricing services generally use the security’s last sale price on the exchange or market where the security is primarily traded or, if there is no reported sale during the day, the closing bid price. Securities traded on the NASDAQ Global Select Market, NASDAQ Global Market and NASDAQ Capital Market are valued at the NASDAQ Official Closing Price (“NOCP”), or if lacking a NOCP, at the most recent bid quotation on the applicable NASDAQ Market. Debt securities (other than short-term obligations purchased with an original or remaining maturity of sixty days or less) are generally valued on the basis of evaluated bids furnished to the Funds by a pricing service recommended by the investment adviser and approved by the Board of Trustees, which service determines valuations for normal, institutional-size trading units of such securities using market information, transactions for comparable securities and various relationships between securities which are generally recognized by institutional traders. Broker-dealer bid quotations may also be used to value debt and equity securities where a pricing service does not price a security or where a pricing service does not provide a reliable price for the security. In instances where broker-dealer bid quotations are not available, certain securities held by the Funds may be valued on the basis of a price provided by a principal market maker. Forward foreign currency contracts are valued utilizing interpolated prices determined from information provided by an independent pricing service. Short-term obligations purchased with an original or remaining maturity of sixty days or less are valued at amortized cost, which approximates market value. Securities for which market quotations are not readily available are valued at fair value as determined in good faith by the Funds’ investment adviser using consistently applied procedures under the general supervision of the Board of Trustees. Investments in other open-end investment companies are valued at their net asset value each day.
The Funds may hold securities traded in foreign markets. Foreign securities are valued at the market price in the foreign market. However, if events occurring after the close of the foreign market (but before the close of regular trading on the New York Stock Exchange) are believed to materially affect the value of those securities, such securities are fair valued pursuant to procedures approved by the Board of Trustees. When fair valuing securities, the Funds may, among other things, use modeling tools or other processes that may take into account factors such as securities market activity and/or significant events that occur after the close of the foreign market and before the Funds calculate their net asset values.
29
b. Security Transactions and Related Investment Income. Security transactions are accounted for on trade date. Dividend income is recorded on ex-dividend date, or in the case of certain foreign securities, as soon as a Fund is notified, and interest income is recorded on an accrual basis. Interest income is increased by the accretion of discount and decreased by the amortization of premium. Distributions received from investments in securities that represent a return of capital or capital gain are recorded as reduction of cost of investments or as a realized gain, respectively. The calendar year-end amounts of ordinary income, capital gains, and return of capital included in distributions received from the Funds’ investments in real estate investment trusts (“REITs”) are reported to the Funds after the end of the fiscal year; accordingly, the Funds estimate these amounts for accounting purposes until the characterization of REIT distributions is reported to the Funds after the end of the fiscal year. Estimates are based on the most recent REIT distribution information available. Investment income is recorded net of foreign taxes withheld when applicable. In determining net gain or loss on securities sold, the cost of securities has been determined on an identified cost basis. Investment income, non-class specific expenses and realized and unrealized gains and losses are allocated on a pro rata basis to each class based on the relative net assets of each class to the total net assets of the Fund.
c. Foreign Currency Translation. The books and records of the Funds are maintained in U.S. dollars. The value of securities, currencies and other assets and liabilities denominated in currencies other than U.S. dollars are translated into U.S. dollars based upon foreign exchange rates prevailing at the end of the period. Purchases and sales of investment securities, income and expenses are translated on the respective dates of such transactions.
Since the values of investment securities are presented at the foreign exchange rates prevailing at the end of the period, it is not practical to isolate that portion of the results of operations arising from changes in exchange rates from fluctuations which arise due to changes in market prices of investment securities. Such changes are included with the net realized and unrealized gain or loss on investments.
Net realized foreign exchange gains or losses arise from sales of foreign currency, currency gains or losses realized between the trade and settlement dates on securities transactions and the difference between the amounts of dividends, interest and foreign withholding taxes recorded on the Funds’ books and the U.S. dollar equivalent of the amounts actually received or paid. Net unrealized foreign exchange gains and losses arise from changes in the value of assets and liabilities, other than investment securities, at the end of the fiscal period, resulting from changes in exchange rates.
Each Fund may use foreign currency exchange contracts to facilitate transactions in foreign-denominated investments. Losses may arise from changes in the value of the foreign currency or if the counterparties do not perform under the contracts’ terms.
d. Federal and Foreign Income Taxes. Each Trust treats each Fund as a separate entity for federal income tax purposes. Each Fund intends to meet the requirements of the Internal Revenue Code applicable to regulated investment companies, and to distribute to its shareholders substantially all of its net investment income and any net realized capital gains at least annually. Management has performed an analysis of each Fund’s tax positions for the open tax years as of September 30, 2009 and has concluded that no provisions for income tax are required. The Funds’ federal tax returns for the prior three fiscal years remain subject to examination by the Internal Revenue Service. Management is not aware of any events that are reasonably possible to occur in the next twelve months that would result in the amounts of any unrecognized tax benefits significantly increasing or decreasing for the Funds. However, management’s conclusions regarding tax positions taken may be subject to review and adjustment at a later date based on factors including, but not limited to, new tax laws and accounting regulations and interpretations thereof.
A Fund may be subject to foreign taxes on income and gains on investments that are accrued based upon the Fund’s understanding of the tax rules and regulations that exist in the countries in which the Fund invests. Foreign governments may also impose taxes or other payments on investments with respect to foreign securities. Such taxes are accrued as applicable.
e. Dividends and Distributions to Shareholders. Dividends and distributions are recorded on ex-dividend date. The timing and characterization of certain income and capital gain distributions are determined annually in accordance with federal tax regulations, which may differ from accounting principles generally accepted in the United States of America. Permanent differences are primarily due to differing treatments for book and tax purposes for items such as distribution redesignation and net operating losses. Permanent book and tax basis differences relating to shareholder distributions will result in reclassifications to capital accounts. Temporary differences between book and tax distributable earnings are primarily due to securities lending collateral gain/loss adjustment, deferred Trustees’ fees and wash sales. Distributions from net investment income and short-term capital gains are considered to be distributed from ordinary income for tax purposes.
30
NOTES TO FINANCIAL STATEMENTS – continued
September 30, 2009
The tax characterization of distributions is determined on an annual basis. The tax character of distributions paid to shareholders during the years ended September 30, 2009 and 2008 were as follows:
| | | | | | | | | | | | | | | | | | |
| | | 2009 Distributions Paid From: | | 2008 Distributions Paid From: |
Fund | | Ordinary
Income | | Long-Term
Capital Gains | | Total | | Ordinary
Income | | Long-Term
Capital Gains | | Total |
Small Cap Growth Fund | | $ | — | | $ | — | | $ | — | | $ | — | | $ | — | | $ | — |
Small Cap Value Fund | | | 3,669,309 | | | 331,178 | | | 4,000,487 | | | 16,873,484 | | | 91,300,786 | | | 108,174,270 |
Differences between these amounts and those reported in the Statements of Changes in Net Assets, if any, are primarily attributable to different book and tax treatment for short-term capital gains.
As of September 30, 2009, the components of distributable earnings on a tax basis were as follows:
| | | | | | | | |
| | | Small Cap
Growth Fund | | | Small Cap
Value Fund | |
Undistributed ordinary income | | $ | — | | | $ | 1,287,623 | |
Undistributed long-term capital gains | | | — | | | | — | |
| | | | | | | | |
Total undistributed earnings | | | — | | | | 1,287,623 | |
| | | | | | | | |
Capital loss carryforward: | | | | | | | | |
Expires September 30, 2010 | | | (138,314,515 | ) | | | — | |
Expires September 30, 2011 | | | (59,283,040 | ) | | | — | |
Expires September 30, 2017 | | | (14,995,800 | ) | | | (88,137,321 | ) |
| | | | | | | | |
Total capital loss carryforward | | | (212,593,355 | ) | | | (88,137,321 | ) |
Deferred net capital losses (post-October 2008) | | | (26,616,006 | ) | | | (110,445,559 | ) |
Unrealized appreciation (depreciation) | | | 18,607,699 | | | | 93,063,030 | |
| | | | | | | | |
Total accumulated earnings (losses) | | $ | (220,601,662 | ) | | $ | (104,232,227 | ) |
| | | | | | | | |
f. Repurchase Agreements. It is each Fund’s policy that the market value of the collateral for repurchase agreements be at least equal to 102% of the repurchase price, including interest. The repurchase agreements are tri-party arrangements whereby the collateral is held in a segregated account for the benefit of the Fund and on behalf of the counterparty. Repurchase agreements could involve certain risks in the event of default or insolvency of the counterparty including possible delays or restrictions upon a Fund’s ability to dispose of the underlying securities.
g. Securities Lending. The Funds have entered into an agreement with State Street Bank and Trust Company (“State Street Bank”), as agent of the Funds, to lend securities to certain designated borrowers. The loans are collateralized with cash or securities in an amount equal to at least 105% or 102% of the market value (including accrued interest) of the loaned international or domestic securities, respectively, when the loan is initiated. Thereafter, the value of the collateral must remain at least 102% of the market value (including accrued interest) of loaned securities for U.S. equities and U.S. corporate debt; at least 105% of the market value (including accrued interest) of loaned securities for non-U.S. equities; and at least 100% of the market value (including accrued interest) of loaned securities for U.S. government securities, sovereign debt issued by non-U.S. governments and non-U.S. corporate debt. In the event that the market value of the collateral falls below the required percentages described above, the borrower will deliver additional collateral on the next business day. As with other extensions of credit, the Funds bear the risk of loss with respect to the investment of the collateral. The Funds invest cash collateral in short-term investments, a portion of the income from which is remitted to the borrowers and the remainder allocated between the Funds and State Street Bank as lending agent.
As of September 30, 2009, there were no securities on loan.
h. Indemnifications. Under the Trusts’ organizational documents, their officers and Trustees are indemnified against certain liabilities arising out of the performance of their duties to the Funds. Additionally, in the normal course of business, the Funds enter into contracts with service providers that contain general indemnification clauses. The Funds’ maximum exposure under these arrangements is unknown as this would involve future claims that may be made against the Funds that have not yet occurred. However, based on experience, the Funds expect the risk of loss to be remote.
31
3. Fair Value Measurements. Effective October 1, 2008, the Funds adopted accounting standards related to fair value measurements and disclosures which establish a hierarchy in which various inputs are used in determining the value of each Fund’s assets or liabilities. These inputs are summarized in the three broad levels listed below:
| | • | | Level 1—quoted prices in active markets for identical assets or liabilities; |
| | • | | Level 2—prices determined using other significant inputs that are observable either directly, or indirectly through corroboration with observable market data (which could include quoted prices for similar assets or liabilities, interest rates, credit risk, etc.); |
| | • | | Level 3—prices determined using significant unobservable inputs for situations where quoted prices or observable inputs are unavailable such as when there is little or no market activity for an asset or liability (unobservable inputs reflect each Fund’s own assumptions in determining the fair value of assets or liabilities and would be based on the best information available). |
The inputs or methodology used for valuing securities are not necessarily an indication of the risk associated with investing in those securities.
The following is a summary of the inputs used to value the Funds’ investments as of September 30, 2009, at value:
Small Cap Growth Fund
Asset Valuation Inputs
| | | | | | | | | | | | |
Description | | Level 1 | | Level 2 | | Level 3 | | Total |
Common Stocks(a) | | $ | 117,825,261 | | $ | — | | $ | — | | $ | 117,825,261 |
Short-Term Investments | | | 1,818,320 | | | — | | | — | | | 1,818,320 |
| | | | | | | | | | | | |
Total | | $ | 119,643,581 | | $ | — | | $ | — | | $ | 119,643,581 |
| | | | | | | | | | | | |
(a) Major categories of the Fund’s investments are included in the Portfolio of Investments.
Small Cap Value Fund
Asset Valuation Inputs
| | | | | | | | | | | | |
Description | | Level 1 | | Level 2 | | Level 3 | | Total |
Common Stocks(a) | | $ | 923,503,226 | | $ | — | | $ | — | | $ | 923,503,226 |
Short-Term Investments | | | 38,153,198 | | | — | | | — | | | 38,153,198 |
| | | | | | | | | | | | |
Total | | $ | 961,656,424 | | $ | — | | $ | — | | $ | 961,656,424 |
| | | | | | | | | | | | |
(a) Major categories of the Fund’s investments are included in the Portfolio of Investments.
4. Purchases and Sales of Securities. For the year ended September 30, 2009, purchases and sales of securities (excluding short-term investments) were as follows:
| | | | | | |
Fund | | Purchases | | Sales |
Small Cap Growth Fund | | $ | 111,737,304 | | $ | 102,415,951 |
Small Cap Value Fund | | | 440,690,957 | | | 505,156,733 |
5. Management Fees and Other Transactions with Affiliates.
a. Management Fees. Loomis, Sayles & Company, L.P. (“Loomis Sayles”) serves as investment adviser to each Fund. Under the terms of the management agreements, each Fund pays a management fee at the following annual rates, calculated daily and payable monthly, based on each Fund’s average daily net assets:
| | |
Fund | | Percentage of
Average Daily
Net Assets |
Small Cap Growth Fund | | 0.75% |
Small Cap Value Fund | | 0.75% |
Loomis Sayles has given binding undertakings to the Funds to reduce management fees and/or reimburse certain expenses associated with the Funds to limit their operating expenses, exclusive of acquired fund fees and expenses, brokerage expenses, interest expense, taxes and extraordinary expenses. These undertakings are in effect until January 31, 2010 and will be reevaluated
32
NOTES TO FINANCIAL STATEMENTS –��continued
September 30, 2009
on an annual basis. For the year ended September 30, 2009, the expense limits as a percentage of average daily net assets under the expense limitation agreements were as follows:
| | | | | | |
| | | Expense Limit as a Percentage of
Average Daily Net Assets |
Fund | | Institutional Class | | Retail Class | | Admin Class |
Small Cap Growth Fund | | 1.00% | | 1.25% | | — |
Small Cap Value Fund | | 0.90% | | 1.15% | | 1.40% |
Loomis Sayles shall be permitted to recover expenses it has borne under the expense limitation agreement (whether through reduction of its management fees or otherwise) on a class by class basis in later periods to the extent the expenses of a class fall below a class’ expense limits, provided, however, that a class is not obligated to pay such reduced fees/expenses more than one year after the end of the fiscal year in which the fee/expense was reduced.
For the year ended September 30, 2009, the management fees for each Fund were as follows:
| | | | | |
Fund | | Management
Fee | | Percentage of
Average Daily
Net Assets |
Small Cap Growth Fund | | $ | 713,999 | | 0.75% |
Small Cap Value Fund | | | 5,985,483 | | 0.75% |
For the year ended September 30, 2009, expenses have been reimbursed as follows:
| | | | | | | | | | | | |
| | | Reimbursement1 |
Fund | | Institutional Class | | Retail Class | | Admin Class | | Total |
Small Cap Growth Fund | | $ | 4,255 | | $ | 106,447 | | $ | — | | $ | 110,702 |
Small Cap Value Fund | | | 167,311 | | | 529,638 | | | 223,834 | | | 920,783 |
1 Expense reimbursements are subject to possible recovery until September 30, 2010.
There were no expenses recovered during the year ended September 30, 2009 as permitted under the expense limitation agreement.
Certain officers and employees of Loomis Sayles are also officers or Trustees of the Trust. Loomis Sayles’ general partner is indirectly owned by Natixis Global Asset Management, L.P. (“Natixis US”), which is part of Natixis Global Asset Management, an international asset management group based in Paris, France.
b. Administrative Fees. Natixis Asset Management Advisors, L.P. (“Natixis Advisors”) provides certain administrative services for the Funds and contracts with State Street Bank to serve as sub-administrator. Natixis Advisors is a wholly-owned subsidiary of Natixis US. Pursuant to an agreement among Natixis Funds Trust I, Natixis Funds Trust II, Natixis Funds Trust III, Natixis Funds Trust IV, Natixis Cash Management Trust, Gateway Trust (“Natixis Funds Trusts”), Loomis Sayles Funds I, Loomis Sayles Funds II (“Loomis Sayles Funds Trusts”), Hansberger International Series and Natixis Advisors, each Fund pays Natixis Advisors monthly its pro rata portion of fees equal to an annual rate of 0.0575% of the first $15 billion of the average daily net assets of the Natixis Funds Trusts, Loomis Sayles Funds Trusts and the Hansberger International Series, 0.0500% of the next $15 billion, 0.0425% of the next $30 billion and 0.0375% of such assets in excess of $60 billion, subject to an annual aggregate minimum fee for the Natixis Funds Trusts, Loomis Sayles Funds Trusts and the Hansberger International Series of $10 million, which is reevaluated on an annual basis. New funds are subject to a fee for the first twelve months of operations of $75,000 plus $12,500 per class and an additional $75,000 if managed by multiple subadvisors.
For the year ended September 30, 2009, each Fund paid the following for administrative fees to Natixis Advisors:
| | | |
Fund | | Administrative
Fees |
Small Cap Growth Fund | | $ | 47,922 |
Small Cap Value Fund | | | 402,025 |
c. Service and Distribution Fees. Natixis Distributors, L.P. (“Natixis Distributors”), a wholly owned subsidiary of Natixis US, has entered into a distribution agreement with the Trusts. Pursuant to this agreement, Natixis Distributors serves as principal underwriter of each Fund.
33
Pursuant to Rule 12b-1 under the 1940 Act, the Small Cap Growth Fund and the Small Cap Value Fund have adopted a Distribution Plan relating to their Retail Class shares (the “Retail Class Plans”) and the Small Cap Value Fund has adopted a separate Distribution Plan relating to its Admin Class shares (the “Admin Class Plan”).
Under the respective Retail Class and Admin Class Plans, each Fund pays Natixis Distributors a monthly distribution fee at an annual rate not to exceed 0.25% of the average daily net assets attributable to the Fund’s Retail Class and Admin Class Shares, as reimbursement for expenses incurred by Natixis Distributors in providing personal services to investors in Retail Class and Admin Class Shares and/or maintenance of shareholder accounts. In addition, the Admin Class shares of the Small Cap Value Fund may pay an administrative service fee, at an annual rate not to exceed 0.25% of the average daily net assets attributable to Admin Class shares, to securities dealers or financial intermediaries for providing personal service and account maintenance for their customers who hold such shares.
For the year ended September 30, 2009, the Funds paid the following service and distribution fees:
| | | | | | | | | |
| | | Service Fees | | Distribution Fees |
Fund | | Admin
Class | | Retail
Class | | Admin
Class |
Small Cap Growth Fund | | $ | — | | $ | 148,197 | | $ | — |
Small Cap Value Fund | | | 149,466 | | | 820,762 | | | 149,466 |
d. Sub-Transfer Agent Fees. Natixis Distributors has entered into agreements with financial intermediaries to provide certain recordkeeping, processing, shareholder communications and other services to customers of the intermediaries and has agreed to compensate the intermediaries for providing those services. Certain services would be provided by the Funds if the shares of those customers were registered directly with the Funds’ transfer agent. Accordingly, the Funds agreed to pay a portion of the intermediary fees attributable to shares of the Fund held by the intermediaries (which generally is a percentage of the value of shares held) not exceeding what the Funds would have paid its transfer agent had each customer’s shares been registered directly with the transfer agent instead of held through the intermediaries. Natixis Distributors pays the remainder of the fees.
For the year ended September 30, 2009, the Funds paid the following sub-transfer agent fees, which are reflected in transfer agent fees and expenses in the Statements of Operations:
| | | | | | | | | |
| | | Sub-Transfer Agent Fees |
Fund | | Institutional
Class | | Retail
Class | | Admin
Class |
Small Cap Growth Fund | | $ | 17,234 | | $ | 47,223 | | $ | — |
Small Cap Value Fund | | | 299,213 | | | 626,381 | | | 246,077 |
e. Trustees Fees and Expenses. The Funds do not pay any compensation directly to their officers or Trustees who are directors, officers or employees of Natixis Advisors, Natixis Distributors, Natixis US, or their affiliates. The Chairperson of the Board receives a retainer fee at the annual rate of $200,000. The Chairperson does not receive any meeting attendance fees for Board of Trustees meetings or committee meetings that she attends. Each Independent Trustee (other than the Chairperson) receives, in the aggregate, a retainer fee at the annual rate of $65,000. Each Independent Trustee also receives a meeting attendance fee of $7,500 for each meeting of the Board of Trustees that he or she attends in person and $3,750 for each meeting of the Board of Trustees that he or she attends telephonically. In addition, each committee chair receives an additional retainer fee at the annual rate of $10,000. Each Contract Review and Governance Committee member is compensated $5,000 for each Committee meeting that he or she attends in person and $2,500 for each meeting that he or she attends telephonically. Each Audit Committee member is compensated $6,250 for each Committee meeting that he or she attends in person and $3,125 for each meeting that he or she attends telephonically. These fees are allocated among the funds in the Natixis Funds Trusts, Loomis Sayles Funds Trusts and the Hansberger International Series based on a formula that takes into account, among other factors, the relative net assets of each Fund. Trustees are reimbursed for travel expenses in connection with attendance at meetings.
A deferred compensation plan (the “Plan”) is available to the Trustees on a voluntary basis. Deferred amounts remain in the Funds until distributed in accordance with the provisions of the Plan. The value of a participating Trustee’s deferral account is based on theoretical investments of deferred amounts, on the normal payment dates, in certain funds of the Natixis Funds Trusts, Loomis Sayles Funds Trusts and Hansberger International Series as designated by the participating Trustees. Changes in the value of participants’ deferral accounts are allocated pro rata among the funds in the Natixis Funds Trusts, Loomis Sayles Funds Trusts, and Hansberger International Series, and are normally reflected as Trustees’ fees and expenses in the Statements of Operations.
34
NOTES TO FINANCIAL STATEMENTS – continued
September 30, 2009
The portions of the accrued obligations allocated to the Funds under the Plan are reflected as Deferred Trustees’ fees on the Statements of Assets and Liabilities.
f. Redemption Fees. Effective June 1, 2009, the redemption fee imposed on Small Cap Growth Fund and Small Cap Value Fund was eliminated. Prior to June 1, 2009, shareholders of Small Cap Growth Fund and Small Cap Value Fund were charged a 2% redemption fee if they redeemed, including redeeming by exchange within 60 days of acquisition (including acquisition by exchange). The redemption fee was deducted from the shareholder’s redemption or exchange proceeds and was paid to the Fund. These fees were accounted for as an addition to paid-in capital and are presented on the Statements of Changes in Net Assets.
6. Line of Credit. Each Fund, together with certain other funds of Natixis Funds Trusts, Loomis Sayles Funds Trusts and the Hansberger International Series, participates in a $200,000,000 committed unsecured line of credit provided by State Street Bank, with an individual limit of $125,000,000 for each Fund that participates in the line of credit. Interest is charged to each participating fund based on its borrowings at a rate per annum equal to the greater of the Federal Funds rate or overnight LIBOR, plus 0.75%. In addition, a commitment fee of 0.125% per annum, payable at the end of each calendar quarter, is accrued and apportioned among the participating funds based on their average daily unused portion of the line of credit.
Prior to March 11, 2009, each Fund, together with certain other funds of Natixis Funds Trusts, Loomis Sayles Funds Trusts and Hansberger International Series, participated in a $200,000,000 committed unsecured line of credit provided by State Street Bank, with an individual limit of $125,000,000 for each Fund that participated in the line of credit. Interest was charged to each participating fund based on its borrowings at a rate per annum equal to the Federal Funds rate plus 0.50%. In addition, a commitment fee of 0.09% per annum, payable at the end of each calendar quarter, was accrued and apportioned among the participating funds based on their average daily unused portion of the line of credit.
For the year ended September 30, 2009, the Funds had no borrowings under these agreements.
7. Brokerage Commission Recapture. Each Fund has entered into agreements with certain brokers whereby the brokers will rebate a portion of brokerage commissions. All amounts rebated by the brokers are returned to the Funds under such agreements and are included in realized gains in the Statements of Operations. For the year ended September 30, 2009, amounts rebated under these agreements were as follows:
| | | |
Fund | | Rebates |
Small Cap Growth Fund | | $ | 21,646 |
Small Cap Value Fund | | | 82,819 |
8. Shareholders. At September 30, 2009, the Loomis Sayles Funded Pension Plan and the Loomis Sayles Employees’ Profit Sharing Retirement Plan held Institutional Class shares of beneficial interest in the Funds as follows:
| | | | |
Fund | | Pension Plan | | Profit Sharing
Retirement Plan |
Small Cap Growth Fund | | 368,786 | | 363,748 |
Small Cap Value Fund | | 362,408 | | 754,730 |
35
9. Capital Shares. Each Fund may issue an unlimited number of shares of beneficial interest, without par value. Transactions in capital shares were as follows:
| | | | | | | | | | | | | | |
| | | Small Cap Growth Fund | |
| | |
| | | Year Ended September 30, 2009 | | | Year Ended September 30, 2008 | |
| | | | |
| Institutional Class | | Shares | | | Amount | | | Shares | | | Amount | |
Issued from the sale of shares | | 1,974,319 | | | $ | 19,253,187 | | | 2,094,507 | | | $ | 30,602,699 | |
Issued in connection with the reinvestment of distributions | | — | | | | — | | | — | | | | — | |
Redeemed | | (1,447,130 | ) | | | (13,740,063 | ) | | (456,742 | ) | | | (6,441,388 | ) |
| | | | | | | | | | | | | | |
Net change | | 527,189 | | | $ | 5,513,124 | | | 1,637,765 | | | $ | 24,161,311 | |
| | | | | | | | | | | | | | |
| | | | |
| Retail Class | | Shares | | | Amount | | | Shares | | | Amount | |
Issued from the sale of shares | | 3,127,117 | | | $ | 30,016,606 | | | 6,898,095 | | | $ | 94,809,730 | |
Issued in connection with the reinvestment of distributions | | — | | | | — | | | — | | | | — | |
Redeemed | | (2,692,237 | ) | | | (25,065,630 | ) | | (1,956,386 | ) | | | (26,497,100 | ) |
| | | | | | | | | | | | | | |
Net change | | 434,880 | | | $ | 4,950,976 | | | 4,941,709 | | | $ | 68,312,630 | |
| | | | | | | | | | | | | | |
Increase (decrease) from capital share transactions | | 962,069 | | | $ | 10,464,100 | | | 6,579,474 | | | $ | 92,473,941 | |
| | | | | | | | | | | | | | |
| |
| | | Small Cap Value Fund | |
| | |
| | | Year Ended September 30, 2009 | | | Year Ended September 30, 2008 | |
| | | | |
| Institutional Class | | Shares | | | Amount | | | Shares | | | Amount | |
Issued from the sale of shares | | 5,487,523 | | | $ | 94,433,600 | | | 9,681,674 | | | $ | 228,728,526 | |
Issued in connection with the reinvestment of distributions | | 156,833 | | | | 2,488,947 | | | 1,942,239 | | | | 49,352,283 | |
Redeemed | | (6,270,554 | ) | | | (105,527,302 | ) | | (5,076,716 | ) | | | (120,789,687 | ) |
| | | | | | | | | | | | | | |
Net change | | (626,198 | ) | | $ | (8,604,755 | ) | | 6,547,197 | | | $ | 157,291,122 | |
| | | | | | | | | | | | | | |
| | | | |
| Retail Class | | Shares | | | Amount | | | Shares | | | Amount | |
Issued from the sale of shares | | 4,033,997 | | | $ | 70,124,577 | | | 10,268,147 | | | $ | 242,357,595 | |
Issued in connection with the reinvestment of distributions | | 76,628 | | | | 1,206,896 | | | 1,850,508 | | | | 46,632,804 | |
Redeemed | | (6,502,104 | ) | | | (108,566,266 | ) | | (7,108,230 | ) | | | (166,486,060 | ) |
| | | | | | | | | | | | | | |
Net change | | (2,391,479 | ) | | $ | (37,234,793 | ) | | 5,010,425 | | | $ | 122,504,339 | |
| | | | | | | | | | | | | | |
| | | | |
| Admin Class | | Shares | | | Amount | | | Shares | | | Amount | |
Issued from the sale of shares | | 1,211,062 | | | $ | 19,455,331 | | | 2,168,929 | | | $ | 51,105,918 | |
Issued in connection with the reinvestment of distributions | | 1,691 | | | | 26,231 | | | 271,955 | | | | 6,747,215 | |
Redeemed | | (1,162,021 | ) | | | (19,010,438 | ) | | (1,532,487 | ) | | | (35,447,384 | ) |
| | | | | | | | | | | | | | |
Net change | | 50,732 | | | $ | 471,124 | | | 908,397 | | | $ | 22,405,749 | |
| | | | | | | | | | | | | | |
Increase (decrease) from capital share transactions | | (2,966,945 | ) | | $ | (45,368,424 | ) | | 12,466,019 | | | $ | 302,201,210 | |
| | | | | | | | | | | | | | |
36
REPORT OF INDEPENDENT REGISTERED PUBLIC ACCOUNTING FIRM
To the Trustees of Loomis Sayles Funds I and Loomis Sayles Funds II and Shareholders of Loomis Sayles Small Cap Value Fund and Loomis Sayles Small Cap Growth Fund:
In our opinion, the accompanying statements of assets and liabilities, including the portfolios of investments, and the related statements of operations and of changes in net assets and the financial highlights present fairly, in all material respects, the financial position of the Loomis Sayles Small Cap Value Fund, a series of Loomis Sayles Funds I and the Loomis Sayles Small Cap Growth Fund, a series of Loomis Sayles Funds II (collectively, the “Funds”), at September 30, 2009, and the results of each of their operations, the changes in each of their net assets and the financial highlights for each of the periods indicated, in conformity with accounting principles generally accepted in the United States of America. These financial statements and financial highlights (hereafter referred to as “financial statements”) are the responsibility of the Funds’ management; our responsibility is to express an opinion on these financial statements based on our audits. We conducted our audits of these financial statements in accordance with the standards of the Public Company Accounting Oversight Board (United States). Those standards require that we plan and perform the audits to obtain reasonable assurance about whether the financial statements are free of material misstatement. An audit includes examining, on a test basis, evidence supporting the amounts and disclosures in the financial statements, assessing the accounting principles used and significant estimates made by management, and evaluating the overall financial statement presentation. We believe that our audits, which included confirmation of securities at September 30, 2009 by correspondence with the custodian and brokers, provide a reasonable basis for our opinion.
PricewaterhouseCoopers LLP
Boston, Massachusetts
November 23, 2009
37
2009 U.S. TAX DISTRIBUTION INFORMATION TO SHAREHOLDERS (Unaudited)
Corporate Dividends Received Deduction. For the fiscal year ended September 30, 2009, a percentage of dividends distributed by the Funds listed below qualify for the dividends received deduction for corporate shareholders. These percentages are as follows:
| | |
Fund | | Qualifying Percentage |
| Small Cap Value | | 100% |
Capital Gains Distributions. Pursuant to Internal Revenue Section 852(b), the following Funds paid distributions, which have been designated as capital gains distributions for the fiscal year ended September 30, 2009, unless subsequently determined to be different.
| | |
Fund | | Amount |
| Small Cap Value | | $331,178 |
Qualified Dividend Income. For the fiscal year ended September 30, 2009, the Funds below will designate up to the maximum amount allowable pursuant to the Internal Revenue Code as qualified dividend income eligible for reduced tax rates. These lower rates range from 0% to 15% depending on an individual’s tax bracket. If the Funds pay a distribution during calendar year 2009, complete information will be reported in conjunction with Form 1099-DIV.
38
TRUSTEE AND OFFICER INFORMATION
The tables below provide certain information regarding the Trustees and officers of Loomis Sayles Funds I and Loomis Sayles Funds II (the “Trusts”). Unless otherwise indicated, the address of all persons below is 399 Boylston Street, Boston, MA 02116. The Trusts’ Statements of Additional Information include additional information about the Trustees of the Trusts and are available by calling Loomis Sayles at 800-633-3330.
| | | | | | |
| Name and Year of Birth | | Position(s)
Held with
the Trusts, Length
of Time Served and
Term of Office* | | Principal Occupation(s) During Past 5 Years** | | Number of Portfolios in Fund
Complex Overseen*** and
Other Directorships Held |
| | | |
Independent Trustees | | | | | | |
Graham T. Allison, Jr.
(1940) | | Trustee Since 2003 Contract Review and Governance Committee Member | | Douglas Dillon Professor and Director of the Belfer Center for Science and International Affairs, John F. Kennedy School of Government, Harvard University | | 39 Director, Taubman Centers, Inc. (real estate investment trust) |
| | | |
Charles D. Baker (1956) | | Trustee Since 2005 Contract Review and Governance Committee Member | | Formerly, President and Chief Executive Officer, Harvard Pilgrim Health Care (health plan) | | 39 None |
| | | |
Edward A. Benjamin
(1938) | | Trustee Since 2002 Chairman of the Contract Review and Governance Committee | | Retired | | 39 None |
| | | |
Daniel M. Cain (1945) | | Trustee Since 2003 Chairman of the Audit Committee | | Chairman (formerly, President and Chief Executive Officer), Cain Brothers & Company, Incorporated (investment banking) | | 39 Director, Sheridan Healthcare Inc. (physician practice management) |
| | | |
Kenneth A. Drucker (1945) | | Trustee Since 2008 Audit Committee Member | | Formerly, Treasurer, Sequa Corp. (manufacturing) | | 39 None |
| | | |
Wendell J. Knox**** (1948) | | Trustee Since 2009 Contract Review and Governance Committee Member | | Director (formerly, President and Chief Executive Officer) of Abt Associates Inc. (research and consulting) | | 39 Director, Eastern Bank (commercial bank); Director, The Hanover Insurance Group (property and casualty insurance) |
| | | |
Sandra O. Moose (1942) | | Chairperson of the Board of Trustees since November 2005 Trustee Since 2003 Ex officio member of the Audit Committee and Contract Review and Governance Committee | | President, Strategic Advisory Services (management consulting); formerly, Senior Vice President and Director, The Boston Consulting Group, Inc. (management consulting) | | 39 Director, Verizon Communications; Director, AES Corporation (international power company) |
39
| | | | | | |
| Name and Year of Birth | | Position(s)
Held with
the Trusts, Length
of Time Served and
Term of Office* | | Principal Occupation(s) During Past 5 Years** | | Number of Portfolios in Fund
Complex Overseen*** and
Other Directorships Held |
Cynthia L. Walker (1956) | | Trustee Since 2005 Audit Committee Member | | Deputy Dean for Finance and Administration, Yale University School of Medicine; formerly, Executive Dean for Administration, Harvard Medical School; and formerly, Dean for Finance and Chief Financial Officer, Harvard Medical School | | 39 None |
| | | |
Interested Trustees | | | | | | |
Robert J. Blanding1 (1947) 555 California Street San Francisco, CA 94104 | | Trustee Since 2002 President and Chief Executive Officer of Loomis Sayles Funds I since 2002 Chief Executive Officer of Loomis Sayles Funds II since 2002 | | President, Chairman, Director and Chief Executive Officer, Loomis, Sayles & Company, L.P. | | 39 None |
| | | |
John T. Hailer2 (1960) | | Trustee Since 2003 | | President and Chief Executive Officer-U.S. and Asia, Natixis Global Asset Management, L.P.; formerly, President and Chief Executive Officer, Natixis Distribution Corporation, Natixis Asset Management Advisors, L.P., Natixis Distributors, L.P. and Natixis Global Associates, Inc. | | 39 None |
| * | Each Trustee serves until retirement, resignation or removal from the Board of Trustees. The current retirement age is 72. The position of Chairperson of the Board is appointed for a two-year term. Ms. Moose was appointed to serve an additional two-year term as the Chairperson of the Board of Trustees on September 14, 2007. |
| ** | Each person listed above, except as noted, holds the same position(s) with the Natixis Funds Trust I, Natixis Funds Trust II, Natixis Funds Trust III, Natixis Funds Trust IV, Gateway Trust and the Natixis Cash Management Trust (collectively, the “Natixis Funds Trusts”), Loomis Sayles Funds I and Loomis Sayles Funds II (collectively, the “Loomis Sayles Funds Trusts”), and Hansberger International Series. Previous positions during the past five years with Natixis Distributors, L.P. (the “Distributor”), Natixis Asset Management Advisors, L.P. (“Natixis Advisors”), or Loomis, Sayles & Company, L.P. (“Loomis Sayles”) are omitted if not materially different from a Trustee’s or officer’s current position with such entity. |
| *** | The Trustees of the Trusts serve as trustees of a fund complex that includes all series of the Natixis Funds Trusts, the Loomis Sayles Funds Trusts and Hansberger International Series (collectively, the “Fund Complex”). |
| **** | Mr. Knox was appointed as trustee effective July 1, 2009. |
| 1 | Mr. Blanding is deemed an “interested person” of the Trusts because he holds the following positions with an affiliated person of the Trusts: President, Chairman, Director and Chief Executive Officer of Loomis Sayles. |
| 2 | Mr. Hailer is deemed an “interested person” of the Trusts because he holds the following positions with an affiliated person of the Trusts: President and Chief Executive Officer-U.S. and Asia, Natixis Global Asset Management, L.P. |
40
| | | | | | |
| Name and Year of Birth | | Position(s)
Held with the Trusts | | Term of Office* and
Length of Time Served | | Principal Occupation During
Past 5 Years** |
|
Officers of the Trusts |
Coleen Downs Dinneen (1960) | | Secretary, Clerk and Chief Legal Officer | | Since September 2004 | | Executive Vice President, General Counsel, Secretary and Clerk (formerly, Senior Vice President, Deputy General Counsel, Assistant Secretary and Assistant Clerk), Natixis Distribution Corporation, Natixis Asset Management Advisors, L.P. and Natixis Distributors, L.P. |
Daniel J. Fuss (1933) One Financial Center Boston, MA 02111 | | Executive Vice President | | Since June 2003 | | Vice Chairman and Director, Loomis, Sayles & Company, L.P. |
| | | |
David Giunta (1965) | | President of Loomis Sayles Funds II and Executive Vice President of Loomis Sayles Funds I | | Since March 2008 | | President and Chief Executive Officer, Natixis Distribution Corporation, Natixis Asset Management Advisors, L.P. and Natixis Distributors, L.P.; formerly, President, Fidelity Charitable Gift Fund; and formerly, Senior Vice President, Fidelity Brokerage Company |
| | | |
Russell L. Kane (1969) | | Chief Compliance Officer, Assistant Secretary and Anti-Money Laundering Officer | | Chief Compliance Officer since May 2006; Assistant Secretary since June 2004; and Anti-Money Laundering Officer since April 2007 | | Chief Compliance Officer for Mutual Funds, Senior Vice President, Deputy General Counsel, Assistant Secretary and Assistant Clerk, Natixis Distribution Corporation, Natixis Asset Management Advisors, L.P. and Natixis Distributors, L.P. |
| | | |
Michael C. Kardok (1959) | | Treasurer, Principal Financial and Accounting Officer | | Since October 2004 | | Senior Vice President, Natixis Asset Management Advisors, L.P. and Natixis Distributors, L.P. |
| * | Each officer of the Trusts serves for an indefinite term in accordance with the Trusts’ current By-laws until the date his or her successor is elected and qualified, or until he or she sooner dies, retires, is removed or becomes disqualified. |
| ** | Each person listed above, except as noted, holds the same position(s) with the Fund Complex. Mr. Fuss is not an officer of the Natixis Funds Trusts or the Hansberger International Series. Previous positions during the past five years with the Distributor, Natixis Advisors or Loomis Sayles are omitted if not materially different from a Trustee’s or officer’s current position with such entity. |
41
ANNUAL REPORT
September 30, 2009
Loomis Sayles Investment Grade Bond Fund


TABLE OF CONTENTS
Management Discussion and Performance page 1
Portfolio of Investments page 8
Financial Statements page 21
LOOMIS SAYLES INVESTMENT GRADE BOND FUND
PORTFOLIO PROFILE
Objective:
High total investment return through a combination of current income and capital appreciation
Strategy:
Invests primarily in investment-grade, fixed-income securities, although it may invest up to 10% of its assets in lower quality fixed-income securities. The fund may invest any portion of its assets in securities of Canadian issuers and up to 20% in other foreign securities, including emerging markets.
Fund Inception:
December 31, 1996
Managers:
Daniel Fuss, CFA, CIC
Associate Managers:
Matthew J. Eagan, CFA
Kathleen Gaffney, CFA
Elaine Stokes
Loomis, Sayles & Company, L.P.
Symbols:
| | |
| Class A | | LIGRX |
| Class B | | LGBBX |
| Class C | | LGBCX |
| Class Y | | LSIIX |
| Class J | | LIGJX |
What You Should Know:
This fund invests in fixed-income securities that are subject to credit risk, interest rate risk and liquidity risk. It may also invest in mortgage-related securities that are subject to prepayment risk. The fund can invest a significant percentage of assets in foreign securities and the value of fund shares can be adversely affected by changes in currency exchange rates, political, and economic developments. In emerging markets these risks can be significant. The fund is subject to currency risk, which is the risk that fluctuations in exchange rates between the U.S. dollar and foreign currencies may cause the value of a fund’s investments to decline. Lower rated debt securities have speculative characteristics and may be subject to greater price volatility than higher rated investments. In addition, the secondary market for these securities may lack liquidity. Fund shares should be viewed as a long-term investment.
Management Discussion
After the extremely difficult market environment that characterized the end of 2008 and early 2009, fears of a debilitating global economic recession began to subside. The widespread flight to quality that had driven up the price of U.S. Treasury securities dissipated and fixed-income investors once again began to seek out higher yields. As a result, investment-grade bonds, high-yielding corporate debt and other securities exposed to credit risk staged a strong comeback, erasing many of the losses sustained early in the period.
Based on the net asset value of Class A shares, Loomis Sayles Investment Grade Bond Fund produced a total return of 18.64% for the fiscal year ended September 30, 2009. The fund outperformed the 11.46% return of its benchmark, Barclays Capital U.S. Government/Credit Bond Index, and the 11.81% average return of the funds in Morningstar’s Intermediate-Term Bond category.
WHAT WERE THE PRIMARY REASONS FOR THE FUND’S GOOD PERFORMANCE?
For the fiscal year as a whole, investment-grade bonds were the leading contributors to performance. The fund’s emphasis on industrial bonds in particular helped it outperform its benchmark and Morningstar peer group. Security selection played an important role; issues within telecommunications, consumer non-cyclical and energy were among the top performers in the investment-grade arena. The fund also had a longer duration than the benchmark as a result of our emphasis on longer-term issues that offer higher yields. This positioning was particularly helpful in the latter part of the fiscal year when yields on longer-term corporate bonds declined as their prices rose.
Solid security selection in the financials group also contributed to performance, as government aid programs buoyed returns on bonds issued by financial-services companies. In this sector, select financial company and bank holdings turned in superior relative performance. Investments in commercial mortgage-backed securities also contributed to the fund’s results when their prices rallied following announcements related to U.S. government rescue programs.
Investments in high-yield corporate bonds posted particularly robust returns after risk appetites began to return early in 2009 and liquidity improved in that market, giving a further lift to the fund’s returns. The fund’s underweight position in U.S. Treasuries and government agency debt also proved advantageous as the risk-aversion mentality that had characterized the fourth quarter of 2008 faded and yield came back into favor.
WHICH SECURITIES OR SECTORS UNDERPERFORMED WITHIN THE FUND?
The past 12 months were a rare instance in which every sector of the fund produced a positive absolute return. However, some allocations did not perform as well as others. Despite positive total returns, the fund’s exposure to short-duration, asset-backed securities and residential mortgage-backed securities lagged the performance of our other risky asset sectors. In addition, our allocation to non-U.S. dollar-denominated securities did not perform as well as our top-performing U.S. corporate holdings, as short-duration positioning and currency volatility hampered returns.
WHAT’S YOUR OUTLOOK?
Looking ahead, we continue to believe there is select value in corporate bonds. Despite their recent tightening, spreads remain wide relative to long-term averages. A vast majority of the spread tightening that has taken place this year is due to the re-emergence of liquidity in the markets. Over the long term, further spread tightening from these levels will most likely be generated by an improvement in global and U.S. economic fundamentals. Our view is that maintaining specific risk in the portfolio will present the best opportunity for long-term performance.
Global risk appetite has weakened the U.S. dollar, and we expect this may continue. Currencies from developed and emerging markets may offer more long-term upside potential, particularly the European peripheral currencies and Asian currencies tied to China and its global-growth story.
1
LOOMIS SAYLES INVESTMENT GRADE BOND FUND
Investment Results through September 30, 2009
PERFORMANCE IN PERSPECTIVE
The charts comparing the fund’s performance to an index provide you with a general sense of how it performed. The fund’s total return for the period shown below appears with and without sales charges and includes fund expenses and fees. An index measures the performance of a theoretical portfolio. Unlike a fund, the index is unmanaged and does not have expenses that affect the results. It is not possible to invest directly in an index. Investors would incur transaction costs and other expenses if they purchased the securities necessary to match the index.
Growth of a $10,000 Investment in Class A Shares1,4
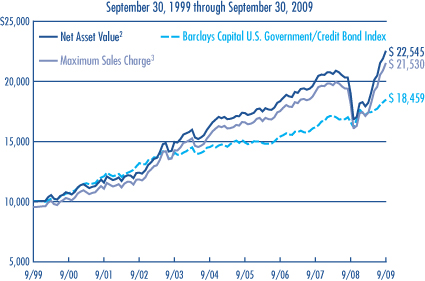
Average Annual Total Returns — September 30, 20094
| | | | | | | | | |
| | | | |
| | | 1 YEAR | | | 5 YEARS | | | 10 YEARS | |
Class A (Inception 12/31/96)1 | | | | | | | | | |
Net Asset Value2 | | 18.64 | % | | 6.75 | % | | 8.47 | % |
With Maximum Sales Charge3 | | 13.27 | | | 5.77 | | | 7.97 | |
| | | | |
Class B (Inception 9/12/03)1 | | | | | | | | | |
Net Asset Value2 | | 17.59 | | | 5.85 | | | 7.52 | |
With CDSC5 | | 12.59 | | | 5.54 | | | 7.52 | |
| | | | |
Class C (Inception 9/12/03)1 | | | | | | | | | |
Net Asset Value2 | | 17.80 | | | 5.93 | | | 7.56 | |
With CDSC5 | | 16.80 | | | 5.93 | | | 7.56 | |
| | | | |
Class Y (Inception 12/31/96)1 | | | | | | | | | |
Net Asset Value2 | | 18.94 | | | 7.07 | | | 8.76 | |
| | | | |
CLASS J (Inception 5/24/99)1 | | | | | | | | | |
Net Asset Value2 | | 18.05 | | | 6.27 | | | 7.96 | |
With Sales Charge5 | | 13.94 | | | 5.52 | | | 7.58 | |
| | | | |
| COMPARATIVE PERFORMANCE | | 1 YEAR | | | 5 YEARS | | | 10 YEARS | |
Barclays Capital U.S. Government/Credit Bond Index | | 11.46 | % | | 4.92 | % | | 6.32 | % |
Morningstar Intermediate-Term Bond Fund Avg. | | 11.81 | | | 3.82 | | | 5.38 | |
See page 3 for a description of the index/average.
All returns represent past performance and do not guarantee future results. Share price and return will vary and you may have a gain or loss when you sell your shares. All results include reinvestment of any dividends and capital gains. Current returns may be higher or lower than those shown. For performance current to the most recent month-end, visit www.funds.natixis.com. Class Y is only available to certain investors as described in the prospectus. Class J shares are not offered for sale in the United States and are not eligible for sale to U.S. investors.
PORTFOLIO FACTS
| | | | |
| |
| | | % of Net Assets as of |
| CREDIT QUALITY | | 9/30/2009 | | 9/30/2008 |
Aaa | | 31.8 | | 28.6 |
Aa | | 2.9 | | 4.5 |
A | | 16.0 | | 14.6 |
Baa | | 37.8 | | 41.3 |
Ba | | 4.6 | | 3.7 |
B | | 0.4 | | 1.0 |
Caa | | 0.7 | | 1.2 |
Ca | | 0.9 | | 0.1 |
C | | — | | — |
Not Rated* | | 1.2 | | 3.0 |
Short-term and other | | 3.7 | | 2.0 |
Credit quality is based on ratings from Moody’s Investors Service.
| | * | Securities that are not rated by Moody’s may be rated by another rating agency or by Loomis Sayles. Portfolio characteristics will vary. | |
| | | | | | |
| |
| | | % of Net Assets as of | |
| EFFECTIVE MATURITY | | 9/30/09 | | | 9/30/08 | |
1 year or less | | 6.0 | | | 14.6 | |
1-5 years | | 31.3 | | | 24.1 | |
5-10 years | | 43.5 | | | 33.1 | |
10+ years | | 19.2 | | | 28.2 | |
Average Effective Maturity | | 9.7 | years | | 11.1 | years |
Portfolio characteristics will vary.
EXPENSE RATIOS AS STATED IN THE MOST RECENT PROSPECTUS
| | | | |
| Share Class | | Gross Expense Ratio6 | | Net Expense Ratio7 |
A | | 0.80% | | 0.80% |
B | | 1.65 | | 1.65 |
C | | 1.55 | | 1.55 |
Y | | 0.53 | | 0.53 |
J | | 1.28 | | 1.28 |
NOTES TO CHARTS
The table and graph do not reflect taxes shareholders might owe on any fund distributions or when they redeem their shares.
| 1 | Returns shown in the chart include performance of the fund’s Retail Class shares, which were converted to Class A shares on 9/12/03. The prior Retail Class performance has been restated to reflect the expenses and sales loads of Class A shares. Retail Class was closed on 12/18/00 and recommenced operations on 1/31/02; Institutional Class performance is shown for the intervening period, adjusted to reflect the expenses and sales loads paid by Class A shares. The restatement of the fund’s performance to reflect Class A expenses is based on the net expenses of the Class after taking into effect the fund’s then current expense cap arrangements. For periods prior to the inception of Class B and Class C shares (9/12/03), performance is based on prior Institutional Class performance, restated to reflect the sales loads and expenses of Class B and Class C shares. Institutional Class became Class Y on 9/12/03. Institutional Class performance has been restated to reflect the expenses of Class Y shares after taking into effect Class Y’s then current expense cap arrangements. For periods prior to the inception of Class J Shares (5/24/99), performance is based on prior Institutional Class performance, restated to reflect the sales loads and expenses of Class J shares. The growth of $10,000 chart compares the performance of Class A shares at net asset value, to the performance of Class A shares including the maximum sales charge of 4.50%. This chart reflects the performance of Class A shares rather than Class Y shares because Class A shares have the highest sales charge. Prior to 9/12/03, the fund (except Class J) was offered without a sales charge. |
| 2 | Does not include a sales charge. |
| 3 | Includes maximum sales charge of 4.50%. |
| 4 | Fund performance has been increased by expense reductions and reimbursements, if any, without which performance would have been lower. |
| 5 | Performance for Class B shares assumes a maximum 5% contingent deferred sales charge (“CDSC”) applied when you sell shares, which declines annually between years 1-6 according to the following schedule: 5, 4, 3, 3, 2, 1, 0%. Class C shares performance assumes a 1% CDSC applied when you sell shares within one year of purchase. Performance for Class J assumes a 3.50% sales charge. |
| 6 | Before reductions and reimbursements. |
| 7 | After reductions and reimbursements. Expense reductions are contractual and are set to expire on 1/31/10. |
2
ADDITIONAL INFORMATION
The views expressed in this report reflect those of the portfolio managers as of the dates indicated. The managers’ views are subject to change at any time without notice based on changes in market or other conditions. References to specific securities or industries should not be regarded as investment advice. Because the fund is actively managed, there is no assurance that it will continue to invest in the securities, countries or industries mentioned.
For more complete information on any Natixis Fund, contact your financial professional, visit the funds website at www.funds.natixis.com, or call Natixis Funds at 800-225-5478 and ask for a free prospectus, which contains more complete information including charges and other ongoing expenses. Investors should consider a fund’s objective, risks and expenses carefully before investing. This and other fund information can be found in the prospectus. Please read the prospectus carefully before investing.
INDEX/AVERAGE DESCRIPTIONS:
Barclays Capital U.S. Government/Credit Bond Index is an unmanaged index of publicly traded bonds, including U.S. government bonds, U.S. Treasury securities and corporate bonds.
Morningstar Intermediate-Term Bond Fund Average is the average performance without sales charges of funds with similar investment objectives, as calculated by Morningstar, Inc.
PROXY VOTING INFORMATION
A description of the fund’s proxy voting policies and procedures is available without charge, upon request, by calling Natixis Funds at 800-225-5478; on the fund’s website at www.funds.natixis.com; and on the Securities and Exchange Commission’s (SEC’s) website at www.sec.gov. Information regarding how the fund voted proxies relating to portfolio securities during the 12-month period ended June 30, 2009 is available from the fund’s website and the SEC’s website.
QUARTERLY PORTFOLIO SCHEDULES
The fund files a complete schedule of portfolio holdings with the SEC for the first and third quarters of each fiscal year on Form N-Q. The fund’s Forms N-Q are available on the SEC’s website at www.sec.gov and may be reviewed and copied at the SEC’s Public Reference Room in Washington, DC. Information on the operation of the Public Reference Room may be obtained by calling 1-800-SEC-0330.
| | | | |
| NOT FDIC INSURED | | MAY LOSE VALUE | | NO BANK GUARANTEE |
3
UNDERSTANDING YOUR FUND’S EXPENSES
As a mutual fund shareholder, you incur different types of costs: transaction costs, including sales charges (loads) on purchases and contingent deferred sales charges on redemptions; certain exchange fees; and ongoing costs, including management fees, distribution fees (12b-1 fees) and/or service fees, and other fund expenses. In addition, the fund may assess a minimum balance fee of $20 on an annual basis for accounts that fall below the required minimum to establish an account (certain exceptions may apply). These costs are described in more detail in the fund’s prospectus. The examples below are intended to help you understand the ongoing costs of investing in the fund and help you compare these with the ongoing costs of investing in other mutual funds.
The first line in the table for each Class shows the actual amount of fund expenses you would have paid on a $1,000 investment in the fund from April 1, 2009 through September 30, 2009. It also shows how much a $1,000 investment would be worth at the close of the period, assuming actual fund returns and expenses. To estimate the expenses you paid over the period, simply divide your account value by $1,000 (for example $8,600 account value divided by $1,000 =8.6) and multiply the result by the number in the Expenses Paid During the Period row as shown below for your class.
The second line in the table for each Class provides information about hypothetical account values and hypothetical expenses based on the fund’s actual expense ratios and an assumed rate of return of 5% per year before expenses, which is not the fund’s actual return. The hypothetical account values and expenses may not be used to estimate the actual ending account balance or expenses you paid on your investment for the period. You may use this information to compare the ongoing costs of investing in the fund and other funds. To do so, compare this 5% hypothetical example with the 5% hypothetical examples that appear in the shareholder reports of the other funds.
Please note that the expenses shown reflect ongoing costs only, and do not include any transaction costs. Therefore, the second line in the table of the fund is useful in comparing ongoing costs only, and will not help you determine the relative costs of owning different funds. If transaction costs were included, total costs would be higher.
| | | | | | |
| LOOMIS SAYLES INVESTMENT GRADE BOND FUND | | BEGINNING ACCOUNT VALUE 4/1/2009 | | ENDING ACCOUNT VALUE 9/30/2009 | | EXPENSES PAID DURING PERIOD* 4/1/2009 – 9/30/2009 |
Class A | | | | | | |
Actual | | $1,000.00 | | $1,237.90 | | $4.49 |
Hypothetical (5% return before expenses) | | $1,000.00 | | $1,021.06 | | $4.05 |
Class B | | | | | | |
Actual | | $1,000.00 | | $1,232.60 | | $9.23 |
Hypothetical (5% return before expenses) | | $1,000.00 | | $1,016.80 | | $8.34 |
Class C | | | | | | |
Actual | | $1,000.00 | | $1,232.80 | | $8.68 |
Hypothetical (5% return before expenses) | | $1,000.00 | | $1,017.30 | | $7.84 |
Class Y | | | | | | |
Actual | | $1,000.00 | | $1,240.60 | | $3.03 |
Hypothetical (5% return before expenses) | | $1,000.00 | | $1,022.36 | | $2.74 |
Class J | | | | | | |
Actual | | $1,000.00 | | $1,235.00 | | $7.34 |
Hypothetical (5% return before expenses) | | $1,000.00 | | $1,018.50 | | $6.63 |
| * | Expenses are equal to the Fund’s annualized expense ratio (after fee reduction/reimbursement): 0.80%, 1.65%, 1.55%, 0.54% and 1.31% for Class A, B, C, Y and J, respectively, multiplied by the average account value over the period, multiplied by the number of days in the most recent fiscal half-year, divided by 365 (to reflect the half-year period). |
4
BOARD APPROVALOFTHE EXISTING ADVISORY AGREEMENT
The Board of Trustees, including the Independent Trustees, considers matters bearing on the Fund’s advisory agreement (the “Agreement”) at most of its meetings throughout the year. Each year, usually in the spring, the Contract Review and Governance Committee of the Board meets to review the Agreement to determine whether to recommend that the full Board approve the continuation of the Agreement, typically for an additional one-year period. After the Committee has made its recommendation, the full Board, including the Independent Trustees, determines whether to approve the continuation of the Agreement.
In connection with these meetings, the Trustees receive materials that the Fund’s investment adviser (the “Adviser”) believes to be reasonably necessary for the Trustees to evaluate the Agreement. These materials generally include, among other items, (i) information on the investment performance of the Fund and the performance of a peer group of funds and the Fund’s performance benchmarks, (ii) information on the Fund’s advisory fee and other expenses, including information comparing the Fund’s expenses to those of a peer group of funds and information about any applicable expense caps and fee “breakpoints,” (iii) sales and redemption data in respect of the Fund, (iv) information about the profitability of the Agreement to the Fund’s Adviser and (v) information obtained through the completion of a questionnaire by the Adviser (the Trustees are consulted as to the information requested through that questionnaire). The Board of Trustees, including the Independent Trustees, also consider other matters such as (i) the Adviser’s financial results and financial condition, (ii) the Fund’s investment objective and strategies and the size, education and experience of the Adviser’s investment staff and their use of technology, external research and trading cost measurement tools, (iii) arrangements in respect of the distribution of the Fund’s shares and the related costs, (iv) the procedures employed to determine the value of the Fund’s assets, (v) the allocation of the Fund’s brokerage, if any, including, if applicable, allocations to brokers affiliated with the Adviser and the use of “soft” commission dollars to pay Fund expenses and to pay for research and other similar services, (vi) the resources devoted to, and the record of compliance with, the Fund’s investment policies and restrictions, policies on personal securities transactions and other compliance policies, (vii) information about amounts invested by the Fund’s portfolio managers in the Fund or in similar accounts that they manage and (viii) the general economic outlook with particular emphasis on the mutual fund industry. Throughout the process, the Trustees are afforded the opportunity to ask questions of and request additional materials from the Adviser.
In addition to the materials requested by the Trustees in connection with their annual consideration of the continuation of the Agreement, the Trustees receive materials in advance of each regular quarterly meeting of the Board of Trustees that provide detailed information about the Fund’s investment performance and the fees charged to the Fund for advisory and other services. This information generally includes, among other things, an internal performance rating for the Fund based on agreed-upon criteria, graphs showing performance and fee differentials against the Fund’s peer group of funds, performance ratings provided by a third-party, total return information for various periods, and third-party performance rankings for various periods comparing the Fund against its peer group. The portfolio management team for the Fund or other representatives of the Adviser makes periodic presentations to the Contract Review and Governance Committee and/or the full Board of Trustees, and if the Fund is identified as presenting possible performance concerns it may be subject to more frequent board presentations and reviews. In addition, each quarter the Trustees are provided with detailed statistical information about the Fund’s portfolio.
The Board of Trustees most recently approved the continuation of the Agreement at their meeting held in June, 2009. The Agreement was continued for a one-year period. In considering whether to approve the continuation of the Agreement, the Board of Trustees, including the Independent Trustees, did not identify any single factor as determinative. Individual Trustees may have evaluated the information presented differently from one another, giving different weights to various factors. Matters considered by the Trustees, including the Independent Trustees, in connection with their approval of the Agreement included the factors listed below.
The nature, extent and quality of the services provided to the Fund under the Agreement. The Trustees considered the nature, extent and quality of the services provided by the Adviser and its affiliates to the Fund and the resources dedicated to the Fund by the Adviser and its affiliates, including recent or planned investments by the Adviser in additional personnel or other resources. They considered the need for the Adviser to offer competitive compensation in order to attract and retain capable personnel.
The Trustees also considered the benefits to shareholders of investing in a mutual fund that is part of a family of funds that offers shareholders the right to exchange shares of one type of fund for shares of another type of fund, and provides a variety of fund and shareholder services.
After reviewing these and related factors, the Trustees concluded, within the context of their overall conclusions regarding the Agreement, that the nature, extent and quality of services provided supported the renewal of the Agreement.
5
BOARD APPROVALOFTHE EXISTING ADVISORY AGREEMENT
Investment performance of the Fund and the Adviser. As noted above, the Trustees received information about the performance of the Fund over various time periods, including information which compared the performance of the Fund to the performance of a peer group of funds and the Fund’s performance benchmark. In addition, the Trustees also reviewed data prepared by an independent third party which analyzed the performance of the Fund using a variety of performance metrics, including metrics which also measured the performance of the Fund on a risk adjusted basis.
With respect to the Fund, the Board concluded that the Fund’s performance or other relevant factors supported the renewal of the Fund’s Agreement. The Fund had performance that lagged that of a relevant peer group for certain (although not necessarily all) periods, the Board concluded that other factors relevant to performance supported renewal of the Fund’s Agreement. These factors included the following: (1) that the Fund’s performance, although lagging in certain recent periods, was strong over the longer term and (2) that the Fund’s more recent performance was competitive when compared to relevant performance benchmarks or peer groups.
The Board concluded that the Fund’s performance and other relevant factors supported the renewal of the Agreement. The Trustees also considered the Adviser’s performance and reputation generally, the performance of the fund family generally (as noted by certain financial publications), and the historical responsiveness of the Adviser to Trustee concerns about performance and the willingness of the Adviser to take steps intended to improve performance.
After reviewing these and related factors, the Trustees concluded, within the context of their overall conclusions regarding the Agreement, that the performance of the Fund and the Adviser supported the renewal of the Agreement.
The costs of the services to be provided and profits to be realized by the Adviser and its affiliates from their respective relationships with the Fund. The Trustees considered the fees charged to the Fund for advisory services as well as the total expense level of the Fund. This information included comparisons (provided both by management and also by an independent third party) of the Fund’s advisory fee and total expense level to those of its peer group and information about the advisory fees charged by the Adviser to comparable accounts. In considering the fees charged to comparable accounts, the Trustees considered, among other things, management’s representations about the differences between managing mutual funds as compared to other types of accounts, including the additional resources required to effectively manage and the greater regulatory costs associated with the management of mutual fund assets. In evaluating the Fund’s advisory fee, the Trustees also took into account the demands, complexity and quality of the investment management of the Fund. The Trustees considered that over the past several years, management had made recommendations regarding the institution of advisory fee waivers and expense caps. They noted that the Fund currently has an expense cap in place, and they considered the amounts waived or reimbursed by the Adviser under the cap.
The Trustees also considered the compensation directly or indirectly received by the Adviser and its affiliates from their relationships with the Fund. The Trustees reviewed information provided by management as to the profitability of the Adviser’s and its affiliates’ relationships with the Fund, and information about the allocation of expenses used to calculate profitability. They also reviewed information provided by management about the effect of distribution costs and changes in asset levels on Adviser profitability, including information regarding resources spent on distribution activities. When reviewing profitability, the Trustees also considered information about court cases in which adviser profitability was an issue, the performance of the Fund, the expense levels of the Fund, and whether the Adviser had implemented breakpoints and/or expense caps with respect to the Fund.
After reviewing these and related factors, the Trustees concluded, within the context of their overall conclusions regarding the Agreement, that the advisory fee charged to the Fund was fair and reasonable, and that the costs of these services generally and the related profitability of the Adviser and its affiliates in respect of their relationships with the Fund supported the renewal of the Agreement.
Economies of Scale. The Trustees considered the existence of any economies of scale in the provision of services by the Adviser and whether those economies are shared with the Fund through breakpoints in its investment advisory fee or other means, such as expense waivers or caps. The Trustees noted that although the Fund’s advisory fee was not subject to breakpoints, the Fund was subject to an expense cap. In considering the issues, the Trustees also took note of the costs of the services provided (both on an absolute and a relative basis) and the profitability to the Adviser and its affiliates of their relationships with the Fund, as discussed above.
After reviewing these and related factors, the Trustees considered, within the context of their overall conclusions regarding the Agreement, that the extent to which economies of scale were shared with the Fund supported the renewal of the Agreement.
6
BOARD APPROVALOFTHE EXISTING ADVISORY AGREEMENT
The Trustees also considered other factors, which included but were not limited to the following:
| · | | the effect of recent market and economic turmoil on the performance, asset levels and expense ratios of the Fund. |
| · | | whether the Fund has operated in accordance with its investment objective and the Fund’s record of compliance with its investment restrictions, and the compliance programs of the Fund and the Adviser. They also considered the compliance-related resources the Adviser and its affiliates were providing to the Fund. |
| · | | the nature, quality, cost and extent of administrative and shareholder services performed by the Adviser and its affiliates, both under the Agreement and under a separate agreement covering administrative services. |
| · | | so-called “fallout benefits” to the Adviser, such as the engagement of affiliates of the Adviser to provide distribution, administrative and brokerage services to the Fund. The Trustees considered the possible conflicts of interest associated with these fallout and other benefits, and the reporting, disclosure and other processes in place to disclose and monitor such possible conflicts of interest. |
| · | | the Trustees’ review and discussion of the Fund’s advisory arrangements in prior years, and management’s record of responding to Trustee concerns raised during the year and in prior years. |
Based on their evaluation of all factors that they deemed to be material, including those factors described above, and assisted by the advice of independent counsel, the Trustees, including the Independent Trustees, concluded that the existing Agreement should be continued through June 30, 2010.
7
LOOMIS SAYLES INVESTMENT GRADE BOND FUND — PORTFOLIOOF INVESTMENTS
Investments as of September 30, 2009
| | | | | | |
Principal
Amount (‡) | | Description | | Value (†) |
| | | | | | |
| | Bonds and Notes — 95.2% of Net Assets | | | |
| | Non-Convertible Bonds — 92.6% | | | |
| | | ABS Car Loan — 1.5% | | | |
| $ | 69,327,000 | | ARG Funding Corp., Series 2005-2A, Class A5,
0.406%, 5/20/2011, 144A(b) | | $ | 69,327,187 |
| | 26,520,000 | | Capital One Auto Finance Trust, Series 2006-C, Class A4,
0.273%, 5/15/2013(b) | | | 26,015,248 |
| | 19,025,000 | | Chesapeake Funding LLC, Series 2009-2A, Class B,
2.004%, 4/15/2013, 144A(b) | | | 16,618,185 |
| | 17,100,000 | | Chesapeake Funding LLC, Series 2009-2A, Class C,
2.004%, 4/15/2013, 144A(b) | | | 14,146,693 |
| | 500,000 | | Daimler Chrysler Auto Trust, Series 2008-B, Class A4A,
5.320%, 11/10/2014 | | | 521,698 |
| | 7,199,000 | | Merrill Auto Trust Securitization Asset, Series 2008-1, Class B,
6.750%, 4/15/2015 | | | 6,642,461 |
| | | | | | |
| | | | | | 133,271,472 |
| | | | | | |
| | | ABS Credit Card — 1.4% | | | |
| | 9,995,000 | | American Express Issuance Trust, Series 2005-2, Class A,
0.313%, 8/15/2013(b) | | | 9,794,875 |
| | 24,955,000 | | Capital One Multi-Asset Execution Trust, Series 2005-A10, Class A,
0.323%, 9/15/2015(b) | | | 24,385,455 |
| | 2,550,000 | | Capital One Multi-Asset Execution Trust, Series 2006-C2, Class C,
0.543%, 6/16/2014(b) | | | 2,409,663 |
| | 29,215,000 | | Chase Issuance Trust, Series 2007-B1, Class B1,
0.493%, 4/15/2019(b) | | | 25,046,087 |
| | 4,000,000 | | Citibank Credit Card Issuance Trust, Series 2008-A1, Class A1,
5.350%, 2/07/2020 | | | 4,329,551 |
| | 29,395,000 | | Citibank Credit Card Issuance Trust, Series 2008-C6, Class C6,
6.300%, 6/20/2014 | | | 30,408,160 |
| | 10,000,000 | | MBNA Credit Card Master Note Trust, Series 2002-C1, Class C1,
6.800%, 7/15/2014 | | | 10,440,003 |
| | 19,060,000 | | MBNA Credit Card Master Note Trust, Series 2005-B2, Class B,
0.423%, 12/17/2012(b) | | | 18,805,160 |
| | 5,000,000 | | World Financial Network Credit Card, Series 2008-B, Class M,
7.800%, 10/15/2013 | | | 4,988,302 |
| | | | | | |
| | | | | | 130,607,256 |
| | | | | | |
| | | ABS Other — 0.6% | | | |
| | 16,965,000 | | CIT Equipment Collateral, Series 2008-VT1, Class A3,
6.590%, 12/22/2014 | | | 17,319,452 |
| | 375,416 | | Community Program Loan Trust, Series 1987-A, Class A4,
4.500%, 10/01/2018 | | | 377,117 |
| | 1,700,000 | | Community Program Loan Trust, Series 1987-A, Class A5,
4.500%, 4/01/2029 | | | 1,531,993 |
| | 39,800,000 | | Sierra Receivables Funding Co., Series 2009-3A, Class A1,
7.620%, 7/20/2026, 144A | | | 39,800,000 |
| | | | | | |
| | | | | | 59,028,562 |
| | | | | | |
| | | Airlines — 1.7% | | | |
| | 17,345,000 | | American Airlines, Inc., Pass Through Trust, Series 2009-1A,
10.375%, 7/02/2019 | | | 18,341,123 |
| | 30,000,000 | | Continental Airlines, Inc.,
9.000%, 7/08/2016 | | | 31,765,800 |
| | 3,180,883 | | Continental Airlines, Inc., Series 2000-1, Class A-1,
8.048%, 5/01/2022 | | | 3,021,839 |
| | 1,904,201 | | Continental Airlines, Inc., Series 2000-2, Class A-1,
7.707%, 10/02/2022 | | | 1,770,907 |
| | 2,576,944 | | Continental Airlines, Inc., Series 2001-1, Class A-1,
6.703%, 12/15/2022 | | | 2,380,092 |
| | | | | | |
Principal
Amount (‡) | | Description | | Value (†) |
| | | | | | |
| | | Airlines — continued | | | |
| $ | 37,300,000 | | Continental Airlines, Inc., Series 2007-1, Class A,
5.983%, 4/19/2022 | | $ | 35,248,500 |
| | 12,208,000 | | Continental Airlines, Inc., Series 2007-1, Class B,
6.903%, 4/19/2022 | | | 10,498,880 |
| | 665,228 | | Continental Airlines, Inc., Series 971A,
7.461%, 10/01/2016 | | | 620,325 |
| | 1,268,346 | | Continental Airlines, Inc., Series 991A, Class B,
6.545%, 8/02/2020 | | | 1,198,587 |
| | 805,324 | | Delta Air Lines, Inc., Series 2007-1, Class A,
6.821%, 2/10/2024 | | | 744,924 |
| | 17,945,178 | | Delta Air Lines, Inc., Series 2007-1, Class B,
8.021%, 2/10/2024 | | | 14,176,691 |
| | 10,739,048 | | Northwest Airlines, Inc., Series 07-1, Class B,
8.028%, 11/01/2017 | | | 7,967,407 |
| | 8,115,000 | | Qantas Airways Ltd.,
6.050%, 4/15/2016, 144A | | | 7,980,469 |
| | 28,727,526 | | United Air Lines, Inc., Series 2007-1, Class A,
6.636%, 1/02/2024 | | | 23,843,847 |
| | | | | | |
| | | | | | 159,559,391 |
| | | | | | |
| | | Automotive — 0.5% | | | |
| | 33,635,000 | | Cummins, Inc.,
5.650%, 3/01/2098 | | | 20,391,219 |
| | 3,389,000 | | Cummins, Inc.,
6.750%, 2/15/2027 | | | 2,994,683 |
| | 665,000 | | Cummins, Inc.,
7.125%, 3/01/2028 | | | 630,087 |
| | 1,990,000 | | Ford Motor Co.,
6.375%, 2/01/2029 | | | 1,432,800 |
| | 130,000 | | Ford Motor Co.,
6.500%, 8/01/2018 | | | 103,512 |
| | 260,000 | | Ford Motor Co.,
6.625%, 2/15/2028 | | | 187,200 |
| | 5,185,000 | | Ford Motor Co.,
6.625%, 10/01/2028 | | | 3,733,200 |
| | 8,730,000 | | Ford Motor Co., 7.450%, 7/16/2031 | | | 7,071,300 |
| | 245,000 | | Ford Motor Co., 7.500%, 8/01/2026 | | | 178,850 |
| | 345,000 | | Ford Motor Credit Co. LLC, 7.000%, 10/01/2013 | | | 323,822 |
| | 2,215,000 | | Ford Motor Credit Co. LLC, 7.250%, 10/25/2011 | | | 2,151,228 |
| | 2,240,000 | | Ford Motor Credit Co. LLC, 8.000%, 12/15/2016 | | | 2,078,196 |
| | 935,000 | | Ford Motor Credit Co. LLC, 8.625%, 11/01/2010 | | | 945,837 |
| | 2,135,000 | | Ford Motor Credit Co. LLC, 9.750%, 9/15/2010 | | | 2,181,733 |
| | | | | | |
| | | | | | 44,403,667 |
| | | | | | |
| | | Banking — 8.7% | | | |
| | 47,100,000 | | AgriBank FCB, 9.125%, 7/15/2019(c) | | | 50,939,309 |
| | 7,450,000 | | American Express Centurion Bank, Series BKN1, 6.000%, 9/13/2017 | | | 7,706,630 |
| | 36,659,000 | | Associates Corp. of North America, 6.950%, 11/01/2018 | | | 35,866,139 |
| | 2,595,000 | | BAC Capital Trust VI, 5.625%, 3/08/2035 | | | 2,012,137 |
See accompanying notes to financial statements.
8
LOOMIS SAYLES INVESTMENT GRADE BOND FUND — PORTFOLIOOF INVESTMENTS (continued)
Investments as of September 30, 2009
| | | | | | |
Principal
Amount (‡) | | Description | | Value (†) |
| | | | | | |
| | | Banking — continued | | | |
| $ | 25,690,000 | | Bank of America Corp., 5.750%, 12/01/2017 | | $ | 25,643,167 |
| | 10,020,000 | | Bank of America Corp., 6.000%, 9/01/2017 | | | 10,137,565 |
| | 3,120,000,000 | | Barclays Financial LLC, 4.060%, 9/16/2010, (KRW), 144A | | | 2,673,416 |
| | 180,000,000 | | Barclays Financial LLC, 4.160%, 2/22/2010, (THB), 144A | | | 5,465,729 |
| | 3,500,000,000 | | Barclays Financial LLC, 4.460%, 9/23/2010, (KRW), 144A | | | 3,009,718 |
| | 52,000,000 | | Barclays Financial LLC, EMTN, 4.100%, 3/22/2010, (THB), 144A | | | 1,582,257 |
| | 2,220,000 | | Bear Stearns Cos., Inc. (The), 4.650%, 7/02/2018 | | | 2,118,417 |
| | 975,000 | | Bear Stearns Cos., Inc. (The), 5.300%, 10/30/2015 | | | 1,029,470 |
| | 2,150,000 | | Bear Stearns Cos., Inc. (The), 6.400%, 10/02/2017 | | | 2,338,918 |
| | 12,745,000 | | Bear Stearns Cos., Inc. (The), 7.250%, 2/01/2018 | | | 14,555,325 |
| | 16,371,250,000 | | BNP Paribas SA, EMTN, Zero Coupon, 6/13/2011, (IDR), 144A | | | 1,428,610 |
| | 19,200,000 | | Capital One Financial Corp., 6.150%, 9/01/2016 | | | 18,854,285 |
| | 9,860,000 | | Citibank NA, 15.000%, 7/02/2010, (BRL), 144A | | | 5,797,898 |
| | 10,400,000 | | Citigroup, Inc., 5.000%, 9/15/2014 | | | 9,896,484 |
| | 4,125,000 | | Citigroup, Inc., 5.850%, 12/11/2034 | | | 3,540,727 |
| | 5,670,000 | | Citigroup, Inc., 5.875%, 5/29/2037 | | | 4,943,690 |
| | 20,308,000 | | Citigroup, Inc., 6.125%, 5/15/2018 | | | 19,996,130 |
| | 2,225,000 | | Citigroup, Inc., 6.125%, 8/25/2036 | | | 1,909,499 |
| | 74,265,000 | | Citigroup, Inc., 6.375%, 8/12/2014 | | | 76,781,841 |
| | 80,235,000 | | Citigroup, Inc., MTN, 5.500%, 10/15/2014 | | | 80,119,060 |
| | 6,790,000 | | Goldman Sachs Group, Inc. (The), 6.150%, 4/01/2018 | | | 7,142,489 |
| | 100,220,000 | | Goldman Sachs Group, Inc. (The), 6.750%, 10/01/2037 | | | 103,430,147 |
| | 700,000 | | ICICI Bank Ltd., (fixed rate to 4/30/2017, variable rate thereafter), 6.375%, 4/30/2022, 144A | | | 572,608 |
| | 18,000,000 | | JPMorgan Chase & Co., Zero Coupon, 5/17/2010, (BRL), 144A | | | 9,568,977 |
| | 22,683,264,000 | | JPMorgan Chase & Co., EMTN, Zero Coupon, 3/28/2011, (IDR) | | | 2,037,856 |
| | 17,920,000,000 | | JPMorgan Chase & Co., Zero Coupon, 3/28/2011, (IDR), 144A | | | 1,609,926 |
| | 68,827,366,920 | | JPMorgan Chase & Co., Zero Coupon, 4/12/2012, (IDR), 144A | | | 5,568,145 |
| | 24,124,936,500 | | JPMorgan Chase London, EMTN, Zero Coupon, 10/21/2010, (IDR), 144A | | | 2,293,429 |
| | 100,000 | | Keybank NA, 6.950%, 2/01/2028 | | | 88,958 |
| | | | | |
Principal
Amount (‡) | | Description | | Value (†) |
| | | | | |
| | Banking — continued | | | |
| 30,000,000 | | Kreditanstalt fuer Wiederaufbau, EMTN, 10.750%, 2/01/2010, (ISK) | | $ | 197,032 |
| 70,600,000 | | Merrill Lynch & Co., Inc., 6.110%, 1/29/2037 | | | 67,151,755 |
| 200,000 | | Merrill Lynch & Co., Inc., 7.750%, 5/14/2038 | | | 225,384 |
| 10,000,000 | | Merrill Lynch & Co., Inc., 10.710%, 3/08/2017, (BRL) | | | 5,514,224 |
| 3,200,000 | | Merrill Lynch & Co., Inc., EMTN, 4.625%, 9/14/2018, (EUR) | | | 4,048,321 |
| 11,895,000 | | Merrill Lynch & Co., Inc., MTN, 6.875%, 4/25/2018 | | | 12,509,936 |
| 41,000,000 | | Merrill Lynch & Co., Inc., Series C, MTN, 6.050%, 6/01/2034 | | | 38,283,791 |
| 4,955,000 | | Merrill Lynch & Co., Inc., Series C, MTN, 6.400%, 8/28/2017 | | | 5,018,246 |
| 12,975,000 | | Morgan Stanley, 4.000%, 1/15/2010 | | | 13,076,049 |
| 51,525,000 | | Morgan Stanley, 4.750%, 4/01/2014 | | | 51,144,746 |
| 4,400,000 | | Morgan Stanley, 7.300%, 5/13/2019 | | | 4,841,206 |
| 1,510,000 | | Morgan Stanley, EMTN, 5.450%, 1/09/2017 | | | 1,512,108 |
| 2,850,000 | | Morgan Stanley, GMTN, 5.125%, 11/30/2015, (GBP) | | | 4,483,718 |
| 5,300,000 | | Morgan Stanley, Series F, GMTN, 6.625%, 4/01/2018 | | | 5,604,342 |
| 17,500,000 | | Morgan Stanley, Series F, MTN, 5.550%, 4/27/2017 | | | 17,433,640 |
| 9,910,000 | | Morgan Stanley, Series F, MTN, 5.950%, 12/28/2017 | | | 10,089,807 |
| 2,875,000 | | National City Bank of Indiana, 4.250%, 7/01/2018 | | | 2,527,602 |
| 1,325,000 | | National City Bank, MTN, 5.800%, 6/07/2017 | | | 1,322,925 |
| 9,826,000 | | National City Corp.,
6.875%, 5/15/2019 | | | 10,667,921 |
| 3,400,000 | | Standard Chartered Bank,
6.400%, 9/26/2017, 144A | | | 3,537,734 |
| 18,250,000 | | Standard Chartered PLC,
5.500%, 11/18/2014, 144A | | | 19,505,089 |
| | | | | |
| | | | | 799,354,532 |
| | | | | |
| | Brokerage — 0.6% | | | |
| 54,955,000 | | Jefferies Group, Inc.,
8.500%, 7/15/2019 | | | 58,162,613 |
| | | | | |
| | Building Materials — 0.7% | | | |
| 4,335,000 | | Masco Corp.,
0.600%, 3/12/2010(b) | | | 4,266,139 |
| 2,225,000 | | Masco Corp.,
4.800%, 6/15/2015 | | | 2,041,836 |
| 10,625,000 | | Masco Corp.,
5.850%, 3/15/2017 | | | 9,798,874 |
| 6,760,000 | | Masco Corp.,
6.125%, 10/03/2016 | | | 6,407,730 |
| 790,000 | | Masco Corp.,
6.500%, 8/15/2032 | | | 639,202 |
| 1,505,000 | | Masco Corp.,
7.750%, 8/01/2029 | | | 1,360,746 |
See accompanying notes to financial statements.
9
LOOMIS SAYLES INVESTMENT GRADE BOND FUND — PORTFOLIOOF INVESTMENTS (continued)
Investments as of September 30, 2009
| | | | | | |
Principal
Amount (‡) | | Description | | Value (†) |
| | | | | | |
| | | Building Materials — continued | | | |
| $ | 16,315,000 | | Owens Corning, Inc.,
6.500%, 12/01/2016 | | $ | 15,918,415 |
| | 23,003,000 | | Owens Corning, Inc.,
7.000%, 12/01/2036 | | | 18,848,290 |
| | 1,060,000 | | USG Corp.,
6.300%, 11/15/2016 | | | 901,000 |
| | | | | | |
| | | | | | 60,182,232 |
| | | | | | |
| | | Chemicals — 1.9% | | | |
| | 35,520,000 | | Chevron Phillips Chemical Co. LLC,
8.250%, 6/15/2019, 144A | | | 42,897,966 |
| | 3,545,000 | | Cytec Industries, Inc.,
6.000%, 10/01/2015 | | | 3,468,378 |
| | 17,625,000 | | Cytec Industries, Inc.,
8.950%, 7/01/2017 | | | 19,482,446 |
| | 25,165,000 | | Lubrizol Corp.,
6.500%, 10/01/2034 | | | 26,281,672 |
| | 2,400,000 | | Methanex Corp.,
6.000%, 8/15/2015 | | | 2,039,335 |
| | 68,560,000 | | PPG Industries, Inc.,
6.650%, 3/15/2018 | | | 74,748,500 |
| | | | | | |
| | | | | | 168,918,297 |
| | | | | | |
| | | Collateralized Mortgage Obligations — 0.0% | | | |
| | 1,601,377 | | CS First Boston Mortgage Securities Corp., Series 2005-7, Class 3A1,
5.000%, 8/25/2020 | | | 1,374,683 |
| | 125,077 | | Wells Fargo Mortgage Backed Securities Trust, Series 2006-AR12, Class 1A1,
6.027%, 9/25/2036(b) | | | 94,039 |
| | | | | | |
| | | | | | 1,468,722 |
| | | | | | |
| | | Commercial Mortgage-Backed Securities — 2.7% | | | |
| | 3,000,000 | | Bank of America-First Union NB Commercial Mortgage, Series 2001-3, Class A2,
5.464%, 4/11/2037 | | | 3,125,981 |
| | 8,100,000 | | Bear Stearns Commercial Mortgage Securities, Series 2007-PW15, Class A4,
5.331%, 2/11/2044 | | | 7,291,427 |
| | 62,975,000 | | Credit Suisse Mortgage Capital Certificates, Series 2007-C3, Class A4,
5.723%, 6/15/2039(b) | | | 49,716,426 |
| | 35,130,000 | | Credit Suisse Mortgage Capital Certificates, Series 2007-C4, Class A4,
5.809%, 9/15/2039(b) | | | 27,831,131 |
| | 5,110,000 | | Credit Suisse Mortgage Capital Certificates, Series 2007-C5, Class A4,
5.695%, 9/15/2040 | | | 4,027,212 |
| | 24,057,000 | | Greenwich Capital Commercial Funding Corp., Series 2007-GG11, Class A4,
5.736%, 12/10/2049 | | | 21,661,791 |
| | 15,360,000 | | Greenwich Capital Commercial Funding Corp., Series 2007-GG9, Class A4,
5.444%, 3/10/2039 | | | 13,612,238 |
| | 20,220,000 | | JPMorgan Chase Commercial Mortgage Securities Corp., Series 2006-LDP6, Class A4,
5.475%, 4/15/2043 | | | 18,918,135 |
| | 8,930,000 | | JPMorgan Chase Commercial Mortgage Securities Corp., Series 2006-LDP7, Class A4,
5.875%, 4/15/2045(b) | | | 8,304,580 |
| | | | | | |
Principal
Amount (‡) | | Description | | Value (†) |
| | | | | | |
| | | Commercial Mortgage-Backed Securities — continued | | | |
| $ | 60,634,099 | | JPMorgan Chase Commercial Mortgage Securities Corp., Series 2007-LD11, Class A4,
5.818%, 6/15/2049(b) | | $ | 52,998,459 |
| | 21,993,000 | | JPMorgan Chase Commercial Mortgage Securities Corp., Series 2007-LDPX, Class A3,
5.420%, 1/15/2049 | | | 18,538,971 |
| | 3,200,000 | | LB-UBS Commercial Mortgage Trust, Series 2006-C4, Class A4,
5.882%, 6/15/2038(b) | | | 3,029,917 |
| | 1,340,000 | | Merrill Lynch/Countrywide Commercial Mortgage Trust, Series 2007-6, Class A4,
5.485%, 3/12/2051 | | | 1,043,463 |
| | 12,700,000 | | Morgan Stanley Capital I, Series 2008-T29, Class A4,
6.280%, 1/11/2043(b) | | | 12,319,473 |
| | 3,700,000 | | Wachovia Bank Commercial Mortgage Trust, Series 2006-C29, Class A4,
5.308%, 11/15/2048 | | | 3,331,580 |
| | | | | | |
| | | | | | 245,750,784 |
| | | | | | |
| | | Construction Machinery — 0.4% | | | |
| | 25,000,000 | | Case New Holland, Inc.,
7.750%, 9/01/2013, 144A | | | 24,875,000 |
| | 4,770,000 | | Caterpillar Financial Services Corp., MTN,
6.125%, 2/17/2014 | | | 5,229,432 |
| | 6,935,000 | | Toro Co.,
6.625%, 5/01/2037(c) | | | 5,528,242 |
| | | | | | |
| | | | | | 35,632,674 |
| | | | | | |
| | | Consumer Cyclical Services — 0.9% | | | |
| | 15,350,000 | | Western Union Co. (The),
5.930%, 10/01/2016 | | | 16,633,551 |
| | 19,330,000 | | Western Union Co. (The),
6.200%, 11/17/2036 | | | 19,404,266 |
| | 40,000,000 | | Western Union Co. (The),
6.500%, 2/26/2014 | | | 43,686,000 |
| | | | | | |
| | | | | | 79,723,817 |
| | | | | | |
| | | Consumer Products — 0.6% | | | |
| | 7,620,000 | | Hasbro, Inc.,
6.600%, 7/15/2028 | | | 7,249,767 |
| | 27,427,000 | | Koninklijke (Royal) Philips Electronics N.V.,
6.875%, 3/11/2038 | | | 32,069,705 |
| | 12,010,000 | | Snap-on, Inc.,
6.700%, 3/01/2019 | | | 13,251,366 |
| | 1,335,000 | | Whirlpool Corp., MTN,
8.000%, 5/01/2012 | | | 1,441,002 |
| | 800,000 | | Whirlpool Corp., MTN,
8.600%, 5/01/2014 | | | 894,900 |
| | | | | | |
| | | | | | 54,906,740 |
| | | | | | |
| | | Distributors — 0.9% | | | |
| | 10,000,000 | | EQT Corp.,
8.125%, 6/01/2019 | | | 11,413,700 |
| | 61,345,000 | | Equitable Resources, Inc.,
6.500%, 4/01/2018 | | | 62,711,276 |
| | 5,865,000 | | ONEOK, Inc.,
6.000%, 6/15/2035 | | | 5,789,506 |
| | | | | | |
| | | | | | 79,914,482 |
| | | | | | |
| | | Diversified Manufacturing — 0.9% | | | |
| | 1,425,000 | | Ingersoll-Rand Global Holding Co. Ltd.,
6.875%, 8/15/2018 | | | 1,528,820 |
See accompanying notes to financial statements.
10
LOOMIS SAYLES INVESTMENT GRADE BOND FUND — PORTFOLIOOF INVESTMENTS (continued)
Investments as of September 30, 2009
| | | | | | |
Principal
Amount (‡) | | Description | | Value (†) |
| | | | | | |
| | | Diversified Manufacturing — continued | | | |
| $ | 2,875,000 | | Textron Financial Corp.,
5.400%, 4/28/2013 | | $ | 2,822,957 |
| | 1,207,000 | | Textron Financial Corp., Series E, MTN,
5.125%, 8/15/2014 | | | 1,123,921 |
| | 19,200,000 | | Textron, Inc.,
3.875%, 3/11/2013, (EUR) | | | 25,943,280 |
| | 22,055,000 | | Textron, Inc.,
6.200%, 3/15/2015 | | | 22,142,316 |
| | 14,885,000 | | Textron, Inc.,
7.250%, 10/01/2019 | | | 15,083,536 |
| | 10,975,000 | | Textron, Inc., EMTN,
6.625%, 4/07/2020, (GBP) | | | 14,557,959 |
| | | | | | |
| | | | | | 83,202,789 |
| | | | | | |
| | | Electric — 3.2% | | | |
| | 40,400,000 | | AmerenEnergy Generating Co.,
Series H, 7.000%, 4/15/2018 | | | 40,891,749 |
| | 500,000 | | Baltimore Gas & Electric Co.,
5.200%, 6/15/2033 | | | 452,698 |
| | 12,021,175 | | Bruce Mansfield Unit,
6.850%, 6/01/2034(c) | | | 11,739,639 |
| | 17,815,000 | | Cleveland Electric Illuminating Co. (The),
5.700%, 4/01/2017 | | | 18,746,065 |
| | 26,290,000 | | Cleveland Electric Illuminating Co. (The),
5.950%, 12/15/2036 | | | 25,431,894 |
| | 895,000 | | Commonwealth Edison Co.,
4.700%, 4/15/2015 | | | 933,904 |
| | 5,500,000 | | Empresa Nacional de Electricidad SA (Endesa-Chile), 7.875%, 2/01/2027 | | | 6,096,228 |
| | 1,000,000 | | Empresa Nacional de Electricidad SA (Endesa-Chile), 8.350%, 8/01/2013 | | | 1,154,210 |
| | 3,681,000 | | Exelon Corp.,
4.900%, 6/15/2015 | | | 3,815,743 |
| | 47,570,000 | | Illinois Power Co.,
6.250%, 4/01/2018 | | | 51,101,026 |
| | 1,905,000 | | ITC Holdings Corp.,
5.875%, 9/30/2016, 144A | | | 1,944,961 |
| | 2,830,000 | | ITC Holdings Corp.,
6.375%, 9/30/2036, 144A | | | 2,699,285 |
| | 9,615,564 | | Mackinaw Power LLC,
6.296%, 10/31/2023, 144A | | | 9,087,766 |
| | 1,500,000 | | MidAmerican Energy Holdings Co.,
5.875%, 10/01/2012 | | | 1,634,291 |
| | 24,635,000 | | NiSource Finance Corp.,
6.400%, 3/15/2018 | | | 24,589,080 |
| | 22,085,000 | | NiSource Finance Corp.,
6.800%, 1/15/2019 | | | 22,610,954 |
| | 1,565,000 | | Ohio Edison Co.,
6.875%, 7/15/2036 | | | 1,792,363 |
| | 34,750 | | Quezon Power Philippines Co.,
8.860%, 6/15/2017 | | | 32,491 |
| | 51,115,000 | | Southwestern Electric Power Co.,
6.450%, 1/15/2019 | | | 55,730,173 |
| | 500,000 | | SP Powerassets Ltd., EMTN,
3.730%, 10/22/2010, (SGD) | | | 360,836 |
| | 8,785,000 | | Toledo Edison Co.,
6.150%, 5/15/2037 | | | 9,169,107 |
| | 1,075,000 | | White Pine Hydro LLC,
6.310%, 7/10/2017(c) | | | 927,105 |
| | | | | | |
Principal
Amount (‡) | | Description | | Value (†) |
| | | | | | |
| | | Electric — continued | | | |
| $ | 1,600,000 | | White Pine Hydro LLC,
6.960%, 7/10/2037(c) | | $ | 1,167,501 |
| | | | | | |
| | | | | | 292,109,069 |
| | | | | | |
| | | Entertainment — 0.2% | | | |
| | 4,300,000 | | Time Warner, Inc.,
6.625%, 5/15/2029 | | | 4,412,178 |
| | 755,000 | | Time Warner, Inc.,
6.950%, 1/15/2028 | | | 796,000 |
| | 505,000 | | Time Warner, Inc.,
7.625%, 4/15/2031 | | | 565,974 |
| | 330,000 | | Time Warner, Inc.,
7.700%, 5/01/2032 | | | 373,160 |
| | 3,695,000 | | Viacom, Inc.,
6.125%, 10/05/2017 | | | 3,956,536 |
| | 2,655,000 | | Viacom, Inc.,
6.250%, 4/30/2016 | | | 2,863,569 |
| | 4,182,000 | | Viacom, Inc., Class B,
6.875%, 4/30/2036 | | | 4,417,844 |
| | | | | | |
| | | | | | 17,385,261 |
| | | | | | |
| | | Financial Other — 0.3% | | | |
| | 27,500,000 | | National Life Insurance Co.,
10.500%, 9/15/2039, 144A | | | 28,006,550 |
| | | | | | |
| | | Food & Beverage — 1.2% | | | |
| | 43,520,000 | | Anheuser-Busch Cos., Inc.,
5.375%, 11/15/2014, 144A | | | 46,435,405 |
| | 6,845,000 | | Anheuser-Busch Cos., Inc.,
5.950%, 1/15/2033 | | | 7,001,011 |
| | 8,760,000 | | Anheuser-Busch Cos., Inc.,
6.450%, 9/01/2037 | | | 9,542,005 |
| | 2,500,000 | | Cargill, Inc., EMTN,
5.375%, 3/02/2037, (GBP) | | | 3,492,320 |
| | 1,525,000 | | Cia Brasileira de Bebidas,
8.750%, 9/15/2013 | | | 1,784,250 |
| | 8,630,000 | | Corn Products International, Inc.,
6.625%, 4/15/2037 | | | 8,711,813 |
| | 2,777,000 | | Kraft Foods, Inc.,
6.500%, 8/11/2017 | | | 3,004,014 |
| | 21,385,000 | | Kraft Foods, Inc.,
6.500%, 11/01/2031 | | | 22,254,707 |
| | 7,175,000 | | Kraft Foods, Inc.,
7.000%, 8/11/2037 | | | 7,992,670 |
| | | | | | |
| | | | | | 110,218,195 |
| | | | | | |
| | | Government Owned - No Guarantee — 5.0% | | | |
| | 3,820,000 | | Abu Dhabi National Energy Co.,
6.500%, 10/27/2036, 144A | | | 3,688,443 |
| | 37,780,000 | | Abu Dhabi National Energy Co.,
7.250%, 8/01/2018, 144A | | | 40,469,067 |
| | 52,220,000 | | DP World Ltd.,
6.850%, 7/02/2037, 144A | | | 45,926,915 |
| | 101,460,000 | | Federal Home Loan Mortgage Corp.,
2.125%, 9/21/2012 | | | 102,753,209 |
| | 135,280,000 | | Federal National Mortgage Association,
1.375%, 4/28/2011 | | | 136,459,236 |
| | 67,635,000 | | Federal National Mortgage Association,
1.750%, 8/10/2012 | | | 67,943,213 |
| | 42,085,000 | | Federal National Mortgage Association,
1.875%, 4/20/2012 | | | 42,653,779 |
See accompanying notes to financial statements.
11
LOOMIS SAYLES INVESTMENT GRADE BOND FUND — PORTFOLIOOF INVESTMENTS (continued)
Investments as of September 30, 2009
| | | | | | |
Principal
Amount (‡) | | Description | | Value (†) |
| | | | | | |
| | | Government Owned - No Guarantee — continued | | | |
| $ | 15,500,000 | | Korea Gas Corp.,
6.000%, 7/15/2014, 144A | | $ | 16,338,488 |
| | 1,000,000 | | Telekom Malaysia Berhad,
7.875%, 8/01/2025, 144A | | | 1,178,508 |
| | | | | | |
| | | | | | 457,410,858 |
| | | | | | |
| | | Government Sponsored — 0.9% | | | |
| | 67,635,000 | | Federal Home Loan Bank,
1.625%, 9/26/2012 | | | 67,463,613 |
| | 24,230,000 | | Queensland Treasury Corp.,
7.125%, 9/18/2017, (NZD), 144A | | | 18,062,703 |
| | | | | | |
| | | | | | 85,526,316 |
| | | | | | |
| | | Health Insurance — 0.9% | | | |
| | 5,455,000 | | CIGNA Corp.,
6.150%, 11/15/2036 | | | 4,833,948 |
| | 1,355,000 | | CIGNA Corp.,
6.350%, 3/15/2018 | | | 1,358,680 |
| | 1,603,000 | | CIGNA Corp.,
7.875%, 5/15/2027 | | | 1,548,007 |
| | 1,200,000 | | CIGNA Corp., (Step to 8.080% on 1/15/2023)
8.300%, 1/15/2033(d) | | | 1,169,419 |
| | 3,650,000 | | CIGNA Corp.,
8.500%, 5/01/2019 | | | 4,189,036 |
| | 24,830,000 | | UnitedHealth Group, Inc.,
5.800%, 3/15/2036 | | | 24,078,694 |
| | 565,000 | | UnitedHealth Group, Inc.,
6.500%, 6/15/2037 | | | 587,232 |
| | 4,556,000 | | UnitedHealth Group, Inc.,
6.625%, 11/15/2037 | | | 4,868,897 |
| | 2,567,000 | | UnitedHealth Group, Inc.,
6.875%, 2/15/2038 | | | 2,862,770 |
| | 4,835,000 | | Unum Group,
7.125%, 9/30/2016 | | | 4,892,034 |
| | 27,070,000 | | WellPoint, Inc.,
6.375%, 6/15/2037 | | | 29,397,316 |
| | | | | | |
| | | | | | 79,786,033 |
| | | | | | |
| | | Healthcare — 1.6% | | | |
| | 7,535,000 | | Covidien International Finance SA,
6.000%, 10/15/2017 | | | 8,359,517 |
| | 17,795,000 | | Express Scripts, Inc.,
6.250%, 6/15/2014 | | | 19,555,726 |
| | 10,730,000 | | Express Scripts, Inc.,
7.250%, 6/15/2019 | | | 12,601,849 |
| | 9,480,000 | | HCA, Inc.,
5.750%, 3/15/2014 | | | 8,366,100 |
| | 1,950,000 | | HCA, Inc.,
6.250%, 2/15/2013 | | | 1,862,250 |
| | 3,930,000 | | HCA, Inc.,
6.300%, 10/01/2012 | | | 3,772,800 |
| | 3,810,000 | | HCA, Inc.,
6.375%, 1/15/2015 | | | 3,390,900 |
| | 4,015,000 | | HCA, Inc.,
6.500%, 2/15/2016 | | | 3,563,313 |
| | 365,000 | | HCA, Inc.,
6.750%, 7/15/2013 | | | 349,488 |
| | 3,000,000 | | HCA, Inc.,
7.050%, 12/01/2027 | | | 2,275,263 |
| | 2,290,000 | | HCA, Inc.,
7.190%, 11/15/2015 | | | 2,121,096 |
| | | | | | |
Principal
Amount (‡) | | Description | | Value (†) |
| | | | | | |
| | | Healthcare — continued | | | |
| $ | 2,155,000 | | HCA, Inc.,
7.500%, 12/15/2023 | | $ | 1,739,663 |
| | 1,310,000 | | HCA, Inc.,
7.500%, 11/06/2033 | | | 1,013,648 |
| | 3,890,000 | | HCA, Inc.,
7.690%, 6/15/2025 | | | 3,158,894 |
| | 4,255,000 | | HCA, Inc.,
8.360%, 4/15/2024 | | | 3,462,455 |
| | 1,225,000 | | HCA, Inc., MTN,
7.580%, 9/15/2025 | | | 991,075 |
| | 3,135,000 | | HCA, Inc., MTN,
7.750%, 7/15/2036 | | | 2,457,197 |
| | 2,865,000 | | Hospira, Inc.,
6.050%, 3/30/2017 | | | 3,000,156 |
| | 57,190,000 | | Medco Health Solutions, Inc.,
7.125%, 3/15/2018 | | | 64,801,875 |
| | 530,000 | | Owens & Minor, Inc.,
6.350%, 4/15/2016(c) | | | 477,857 |
| | | | | | |
| | | | | | 147,321,122 |
| | | | | | |
| | | Home Construction — 0.3% | | | |
| | 850,000 | | Centex Corp.,
5.250%, 6/15/2015 | | | 839,375 |
| | 3,685,000 | | D.R. Horton, Inc.,
5.250%, 2/15/2015 | | | 3,436,262 |
| | 2,050,000 | | Desarrolladora Homex SAB de CV,
7.500%, 9/28/2015 | | | 2,014,125 |
| | 2,605,000 | | Lennar Corp., Series B,
5.600%, 5/31/2015 | | | 2,403,113 |
| | 1,870,000 | | Lennar Corp., Series B,
6.500%, 4/15/2016 | | | 1,757,800 |
| | 2,945,000 | | Pulte Homes, Inc.,
5.200%, 2/15/2015 | | | 2,797,750 |
| | 250,000 | | Pulte Homes, Inc.,
5.250%, 1/15/2014 | | | 242,500 |
| | 9,400,000 | | Pulte Homes, Inc.,
6.000%, 2/15/2035 | | | 7,097,000 |
| | 3,645,000 | | Pulte Homes, Inc.,
6.375%, 5/15/2033 | | | 2,806,650 |
| | 3,605,000 | | Toll Brothers Finance Corp.,
5.150%, 5/15/2015 | | | 3,466,582 |
| | | | | | |
| | | | | | 26,861,157 |
| | | | | | |
| | | Independent Energy — 0.9% | | | |
| | 15,680,000 | | Anadarko Petroleum Corp.,
6.450%, 9/15/2036 | | | 16,189,490 |
| | 1,940,000 | | Chesapeake Energy Corp.,
6.250%, 1/15/2017, (EUR) | | | 2,611,785 |
| | 600,000 | | Questar Market Resources, Inc.,
6.050%, 9/01/2016 | | | 604,219 |
| | 48,640,000 | | Questar Market Resources, Inc.,
6.800%, 4/01/2018 | | | 49,865,339 |
| | 3,585,000 | | Talisman Energy, Inc.,
5.850%, 2/01/2037 | | | 3,448,215 |
| | 10,865,000 | | Talisman Energy, Inc.,
6.250%, 2/01/2038 | | | 11,083,767 |
| | | | | | |
| | | | | | 83,802,815 |
| | | | | | |
| | | Integrated Energy — 0.3% | | | |
| | 21,450,000 | | Marathon Oil Corp.,
7.500%, 2/15/2019 | | | 24,741,009 |
See accompanying notes to financial statements.
12
LOOMIS SAYLES INVESTMENT GRADE BOND FUND — PORTFOLIOOF INVESTMENTS (continued)
Investments as of September 30, 2009
| | | | | | |
Principal
Amount (‡) | | Description | | Value (†) |
| | | | | | |
| | | Integrated Energy — continued | | | |
| $ | 1,299,175 | | PF Export Receivables Master Trust, Series A,
6.436%, 6/01/2015, 144A | | $ | 1,351,142 |
| | | | | | |
| | | | | | 26,092,151 |
| | | | | | |
| | | Life Insurance — 0.1% | | | |
| | 9,260,000 | | Mutual of Omaha Insurance Co.,
6.800%, 6/15/2036, 144A | | | 7,575,421 |
| | | | | | |
| | | Local Authorities — 0.6% | | | |
| | 220,000 | | Alberta Municipal Funding Corp.,
5.700%, 9/01/2011, (CAD) | | | 222,143 |
| | 7,070,000 | | Manitoba (Province of), GMTN,
6.375%, 9/01/2015, (NZD) | | | 5,035,364 |
| | 24,666 | | Province of Alberta,
5.930%, 9/16/2016, (CAD) | | | 25,752 |
| | 500,000 | | Province of Nova Scotia,
6.600%, 6/01/2027, (CAD) | | | 569,009 |
| | 30,440,000 | | Quebec Province, Series QC,
6.750%, 11/09/2015, (NZD) | | | 22,151,702 |
| | 19,325,000 | | Queensland Treasury Corp., Series 11G,
6.000%, 6/14/2011, (AUD) | | | 17,428,029 |
| | 14,550,000 | | Virginia Tobacco Settlement Financing Corp., Series A-1,
6.706%, 6/01/2046(c) | | | 10,392,629 |
| | | | | | |
| | | | | | 55,824,628 |
| | | | | | |
| | | Media Cable — 1.9% | | | |
| | 16,251,000 | | Comcast Corp.,
5.650%, 6/15/2035 | | | 15,717,463 |
| | 890,000 | | Comcast Corp.,
6.450%, 3/15/2037 | | | 942,411 |
| | 4,610,000 | | Comcast Corp.,
6.500%, 11/15/2035 | | | 4,912,356 |
| | 32,715,000 | | Comcast Corp.,
6.950%, 8/15/2037 | | | 36,515,240 |
| | 4,100,000 | | Cox Communications, Inc., Class A,
6.250%, 6/01/2018, 144A | | | 4,349,719 |
| | 3,750,000 | | Cox Communications, Inc., Class A,
6.750%, 3/15/2011 | | | 3,971,291 |
| | 18,220,000 | | Shaw Communications, Inc.,
5.650%, 10/01/2019, (CAD) | | | 17,282,325 |
| | 4,190,000 | | Time Warner Cable, Inc.,
5.850%, 5/01/2017 | | | 4,417,714 |
| | 79,880,000 | | Time Warner Cable, Inc.,
6.750%, 7/01/2018 | | | 88,248,229 |
| | 350,000 | | Virgin Media Finance PLC,
9.750%, 4/15/2014, (GBP) | | | 578,930 |
| | | | | | |
| | | | | | 176,935,678 |
| | | | | | |
| | | Media Non-Cable — 0.3% | | | |
| | 4,580,000 | | News America Holdings,
8.150%, 10/17/2036 | | | 5,059,856 |
| | 7,700,000 | | News America, Inc.,
6.150%, 3/01/2037 | | | 7,534,042 |
| | 4,095,000 | | News America, Inc.,
6.200%, 12/15/2034 | | | 4,028,976 |
| | 9,760,000 | | News America, Inc.,
6.400%, 12/15/2035 | | | 9,845,673 |
| | | | | | |
| | | | | | 26,468,547 |
| | | | | | |
| | | Metals & Mining — 1.2% | | | |
| | 5,170,000 | | Alcoa, Inc.,
5.870%, 2/23/2022 | | | 4,482,339 |
| | | | | | |
Principal
Amount (‡) | | Description | | Value (†) |
| | | | | | |
| | | | | | |
| | | Metals & Mining — continued | | | |
| $ | 5,930,000 | | Alcoa, Inc.,
6.750%, 1/15/2028 | | $ | 5,172,217 |
| | 5,000,000 | | ArcelorMittal,
9.850%, 6/01/2019 | | | 5,914,020 |
| | 2,415,000 | | ArcelorMittal USA Partnership,
9.750%, 4/01/2014 | | | 2,529,713 |
| | 10,775,000 | | Newmont Mining Corp.,
5.875%, 4/01/2035 | | | 10,551,979 |
| | 3,250,000 | | Rio Tinto Alcan, Inc.,
5.750%, 6/01/2035 | | | 3,131,658 |
| | 29,798,000 | | Rio Tinto Finance (USA) Ltd.,
8.950%, 5/01/2014 | | | 35,167,212 |
| | 1,500,000 | | Teck Cominco Ltd.,
7.000%, 9/15/2012 | | | 1,541,250 |
| | 1,985,000 | | United States Steel Corp.,
6.050%, 6/01/2017 | | | 1,853,974 |
| | 4,712,000 | | United States Steel Corp.,
6.650%, 6/01/2037 | | | 3,843,286 |
| | 31,890,000 | | United States Steel Corp.,
7.000%, 2/01/2018 | | | 30,626,263 |
| | 3,735,000 | | Vale Overseas Ltd.,
6.875%, 11/21/2036 | | | 3,863,973 |
| | | | | | |
| | | | | | 108,677,884 |
| | | | | | |
| | | Mortgage Related — 0.0% | | | |
| | 145,808 | | FHLMC,
5.000%, 12/01/2031 | | | 151,621 |
| | 26,561 | | FNMA,
6.000%, 7/01/2029 | | | 28,355 |
| | | | | | |
| | | | | | 179,976 |
| | | | | | |
| | | Non-Captive Consumer — 1.5% | | | |
| | 5,000,000 | | American General Finance Corp., Series I, MTN,
5.400%, 12/01/2015 | | | 3,506,270 |
| | 88,895,000 | | American General Finance Corp., Series J, MTN, 6.900%, 12/15/2017 | | | 62,171,474 |
| | 25,000,000 | | HSBC Finance Corp., 6.375%, 11/27/2012 | | | 26,989,000 |
| | 63,775(†††) | | SLM Corp., 6.000%, 12/15/2043 | | | 900,981 |
| | 6,200,000 | | SLM Corp., EMTN, 4.750%, 3/17/2014, (EUR) | | | 6,668,481 |
| | 630,000 | | SLM Corp., MTN, 5.050%, 11/14/2014 | | | 463,109 |
| | 310,000 | | SLM Corp., MTN, 5.125%, 8/27/2012 | | | 265,259 |
| | 200,000 | | SLM Corp., Series A, MTN, 4.500%, 7/26/2010 | | | 194,333 |
| | 3,190,000 | | SLM Corp., Series A, MTN, 5.000%, 10/01/2013 | | | 2,539,428 |
| | 2,120,000 | | SLM Corp., Series A, MTN, 5.000%, 4/15/2015 | | | 1,579,640 |
| | 960,000 | | SLM Corp., Series A, MTN, 5.000%, 6/15/2018 | | | 602,040 |
| | 1,680,000 | | SLM Corp., Series A, MTN, 5.375%, 1/15/2013 | | | 1,400,713 |
| | 1,470,000 | | SLM Corp., Series A, MTN, 5.375%, 5/15/2014 | | | 1,125,106 |
| | 300,000 | | SLM Corp., Series A, MTN, 5.400%, 10/25/2011 | | | 276,816 |
See accompanying notes to financial statements.
13
LOOMIS SAYLES INVESTMENT GRADE BOND FUND — PORTFOLIOOF INVESTMENTS (continued)
Investments as of September 30, 2009
| | | | | | |
Principal
Amount (‡) | | Description | | Value (†) |
| | | | | | |
| | | Non-Captive Consumer — continued | | | |
| $ | 690,000 | | SLM Corp., Series A, MTN, 5.625%, 8/01/2033 | | $ | 433,067 |
| | 7,590,000 | | SLM Corp., Series A, MTN, 6.500%, 6/15/2010, (NZD)(c)(e) | | | 5,137,913 |
| | 31,335,000 | | SLM Corp., Series A, MTN, 8.450%, 6/15/2018 | | | 24,989,662 |
| | | | | | |
| | | | | | 139,243,292 |
| | | | | | |
| | | Non-Captive Diversified — 2.8% | | | |
| | 4,152,000 | | CIT Group, Inc., 5.400%, 2/13/2012 | | | 2,725,070 |
| | 7,550,000 | | CIT Group, Inc., 5.500%, 12/01/2014, (GBP) | | | 7,118,965 |
| | 1,750,000 | | CIT Group, Inc., EMTN, 3.800%, 11/14/2012, (EUR) | | | 1,600,538 |
| | 350,000 | | CIT Group, Inc., EMTN, 4.650%, 9/19/2016, (EUR) | | | 294,499 |
| | 2,050,000 | | CIT Group, Inc., EMTN, 5.000%, 5/13/2014, (EUR) | | | 1,769,920 |
| | 4,250,000 | | CIT Group, Inc., EMTN, 5.500%, 12/20/2016, (GBP) | | | 3,871,521 |
| | 5,450,000 | | CIT Group, Inc., GMTN, 4.250%, 9/22/2011, (EUR) | | | 5,064,285 |
| | 137,000 | | CIT Group, Inc., GMTN, 5.000%, 2/13/2014 | | | 87,513 |
| | 1,450,000 | | CIT Group, Inc., MTN, 4.250%, 3/17/2015, (EUR) | | | 1,230,676 |
| | 236,000 | | CIT Group, Inc., MTN, 5.125%, 9/30/2014 | | | 151,186 |
| | 717,000 | | CIT Group, Inc., Series A, GMTN, 6.000%, 4/01/2036 | | | 414,240 |
| | 22,522,000 | | CIT Group, Inc., Series A, MTN, 7.625%, 11/30/2012 | | | 14,668,826 |
| | 36,465,000 | | GATX Corp., 4.750%, 10/01/2012 | | | 36,686,598 |
| | 7,515,000 | | General Electric Capital Australia Funding, EMTN, 8.000%, 2/13/2012, (AUD) | | | 6,820,357 |
| | 990,000 | | General Electric Capital Corp., 5.625%, 5/01/2018 | | | 985,250 |
| | 4,775,000 | | General Electric Capital Corp., MTN, 5.875%, 1/14/2038 | | | 4,379,057 |
| | 14,535,000 | | General Electric Capital Corp., Series A, EMTN, 6.750%, 9/26/2016, (NZD) | | | 10,070,509 |
| | 6,200,000 | | General Electric Capital Corp., Series A, GMTN, 2.960%, 5/18/2012, (SGD) | | | 4,183,188 |
| | 13,400,000 | | General Electric Capital Corp., Series A, GMTN, 3.485%, 3/08/2012, (SGD) | | | 9,201,210 |
| | 4,200,000 | | General Electric Capital Corp., Series A, GMTN, 6.625%, 2/04/2010, (NZD) | | | 3,050,399 |
| | 24,270,000 | | General Electric Capital Corp., Series A, GMTN, 7.625%, 12/10/2014, (NZD) | | | 17,779,721 |
| | 10,470,000 | | General Electric Capital Corp., Series A, MTN, 0.809%, 5/13/2024(b) | | | 7,302,071 |
| | 17,060,000 | | General Electric Capital Corp., Series A, MTN, 4.875%, 3/04/2015 | | | 17,583,503 |
| | 27,137,000 | | General Electric Capital Corp., Series A, MTN, 6.500%, 9/28/2015, (NZD) | | | 18,740,365 |
| | 1,345,000 | | GMAC, Inc., 6.000%, 12/15/2011 | | | 1,232,815 |
| | | | | | |
Principal
Amount (‡) | | Description | | Value (†) |
| | | | | | |
| | | Non-Captive Diversified — continued | | | |
| $ | 1,310,000 | | GMAC, Inc., 6.625%, 5/15/2012 | | $ | 1,193,579 |
| | 1,670,000 | | GMAC, Inc., 6.750%, 12/01/2014 | | | 1,406,995 |
| | 1,500,000 | | GMAC, Inc., 6.875%, 9/15/2011 | | | 1,411,635 |
| | 400,000 | | GMAC, Inc., 6.875%, 8/28/2012 | | | 364,501 |
| | 1,210,000 | | GMAC, Inc., 7.000%, 2/01/2012 | | | 1,114,867 |
| | 3,142,000 | | GMAC, Inc., 7.500%, 12/31/2013, 144A | | | 2,749,250 |
| | 5,664,000 | | GMAC, Inc., 8.000%, 12/31/2018, 144A | | | 4,276,320 |
| | 2,335,000 | | GMAC, Inc., 8.000%, 11/01/2031 | | | 1,866,739 |
| | 5,045,000 | | GMAC, Inc., EMTN, 5.375%, 6/06/2011, (EUR) | | | 6,791,988 |
| | 380,000 | | GMAC, Inc., EMTN, 5.750%, 9/27/2010, (EUR) | | | 536,610 |
| | 2,930,000 | | International Lease Finance Corp., 5.000%, 4/15/2010 | | | 2,845,534 |
| | 2,285,000 | | International Lease Finance Corp., 5.000%, 9/15/2012 | | | 1,833,237 |
| | 6,660,000 | | International Lease Finance Corp., 5.125%, 11/01/2010 | | | 6,236,284 |
| | 3,280,000 | | International Lease Finance Corp., 6.375%, 3/25/2013 | | | 2,630,422 |
| | 16,000,000 | | International Lease Finance Corp., EMTN, 6.625%, 12/07/2009, (GBP) | | | 25,328,422 |
| | 655,000 | | International Lease Finance Corp., Series R, MTN, 5.550%, 9/05/2012 | | | 535,192 |
| | 2,755,000 | | International Lease Finance Corp., Series R, MTN, 5.625%, 9/15/2010 | | | 2,629,033 |
| | 5,225,000 | | iStar Financial, Inc., 5.150%, 3/01/2012 | | | 3,108,875 |
| | 1,000,000 | | iStar Financial, Inc., 5.375%, 4/15/2010 | | | 921,250 |
| | 330,000 | | iStar Financial, Inc., 5.500%, 6/15/2012 | | | 201,300 |
| | 3,700,000 | | iStar Financial, Inc., 5.650%, 9/15/2011 | | | 2,553,000 |
| | 765,000 | | iStar Financial, Inc., 5.800%, 3/15/2011 | | | 543,150 |
| | 385,000 | | iStar Financial, Inc., 5.850%, 3/15/2017 | | | 201,162 |
| | 1,605,000 | | iStar Financial, Inc., 5.875%, 3/15/2016 | | | 882,750 |
| | 745,000 | | iStar Financial, Inc., 6.050%, 4/15/2015 | | | 389,262 |
| | 535,000 | | iStar Financial, Inc., 8.625%, 6/01/2013 | | | 337,050 |
| | 335,000 | | iStar Financial, Inc., Series B, 5.125%, 4/01/2011 | | | 227,800 |
| | 254,000 | | iStar Financial, Inc., Series B, 5.700%, 3/01/2014 | | | 137,160 |
| | 5,680,000 | | iStar Financial, Inc., Series B, 5.950%, 10/15/2013 | | | 3,237,600 |
| | | | | | |
| | | | | | 253,503,249 |
| | | | | | |
See accompanying notes to financial statements.
14
LOOMIS SAYLES INVESTMENT GRADE BOND FUND — PORTFOLIOOF INVESTMENTS (continued)
Investments as of September 30, 2009
| | | | | | |
Principal
Amount (‡) | | Description | | Value (†) |
| | | | | | |
| | | Oil Field Services — 1.9% | | | |
| $ | 6,095,000 | | Nabors Industries, Inc., 6.150%, 2/15/2018 | | $ | 6,110,213 |
| | 73,075,000 | | Nabors Industries, Inc., 9.250%, 1/15/2019 | | | 86,843,207 |
| | 16,665,000 | | Rowan Cos., Inc., 7.875%, 8/01/2019 | | | 17,917,875 |
| | 600,000 | | Transocean Ltd., 7.375%, 4/15/2018 | | | 704,666 |
| | 5,905,000 | | Weatherford International Ltd., 6.500%, 8/01/2036 | | | 6,017,720 |
| | 1,680,000 | | Weatherford International Ltd., 6.800%, 6/15/2037 | | | 1,766,443 |
| | 5,405,000 | | Weatherford International Ltd., 7.000%, 3/15/2038 | | | 5,826,985 |
| | 40,400,000 | | Weatherford International Ltd., 9.625%, 3/01/2019 | | | 50,573,892 |
| | | | | | |
| | | | | | 175,761,001 |
| | | | | | |
| | | Paper — 1.7% | | | |
| | 4,460,000 | | Celulosa Arauco y Constitucion SA, 7.250%, 7/29/2019, 144A | | | 4,910,643 |
| | 575,000 | | Georgia-Pacific LLC, 7.250%, 6/01/2028 | | | 511,750 |
| | 2,460,000 | | Georgia-Pacific LLC, 7.375%, 12/01/2025 | | | 2,214,000 |
| | 285,000 | | Georgia-Pacific LLC, 7.750%, 11/15/2029 | | | 262,200 |
| | 1,340,000 | | Georgia-Pacific LLC, 8.000%, 1/15/2024 | | | 1,326,600 |
| | 2,280,000 | | Georgia-Pacific LLC, 8.875%, 5/15/2031 | | | 2,302,800 |
| | 6,295,000 | | International Paper Co., 5.250%, 4/01/2016 | | | 6,298,097 |
| | 92,495,000 | | International Paper Co., 7.950%, 6/15/2018 | | | 100,260,695 |
| | 7,777,000 | | International Paper Co., 8.700%, 6/15/2038 | | | 8,621,209 |
| | 4,210,000 | | International Paper Co., 9.375%, 5/15/2019 | | | 4,929,472 |
| | 22,860,000 | | Weyerhaeuser Co., 6.875%, 12/15/2033 | | | 19,044,643 |
| | 5,055,000 | | Weyerhaeuser Co., 7.375%, 3/15/2032 | | | 4,477,618 |
| | | | | | |
| | | | | | 155,159,727 |
| | | | | | |
| | | Pharmaceuticals — 1.1% | | | |
| | 800,000 | | Elan Financial PLC, 7.750%, 11/15/2011 | | | 815,000 |
| | 2,280,000 | | Elan Financial PLC, 8.875%, 12/01/2013 | | | 2,297,100 |
| | 90,000,000 | | Roche Holdings, Inc., 5.000%, 3/01/2014, 144A | | | 97,296,840 |
| | 500,000 | | Schering-Plough Corp., 5.550%, 12/01/2013 | | | 547,396 |
| | | | | | |
| | | | | | 100,956,336 |
| | | | | | |
| | | Pipelines — 3.6% | | | |
| | 5,350,000 | | CenterPoint Energy Resources Corp., 6.250%, 2/01/2037 | | | 5,147,123 |
| | 2,010,000 | | DCP Midstream LP, 6.450%, 11/03/2036, 144A | | | 1,820,519 |
| | | | | | |
Principal
Amount (‡) | | Description | | Value (†) |
| | | | | | |
| | | Pipelines — continued | | | |
| $ | 2,470,000 | | El Paso Corp., 6.950%, 6/01/2028 | | $ | 2,054,684 |
| | 1,000,000 | | El Paso Corp., 12.000%, 12/12/2013 | | | 1,140,000 |
| | 540,000 | | Energy Transfer Partners LP, 6.125%, 2/15/2017 | | | 562,111 |
| | 1,605,000 | | Energy Transfer Partners LP, 6.625%, 10/15/2036 | | | 1,665,875 |
| | 9,455,000 | | Enterprise Products Operating LLP, 6.300%, 9/15/2017 | | | 10,183,820 |
| | 3,400,000 | | Florida Gas Transmission Co., 7.900%, 5/15/2019, 144A | | | 4,055,925 |
| | 4,390,000 | | Kinder Morgan Energy Partners LP, 5.800%, 3/15/2035 | | | 4,139,753 |
| | 82,600,000 | | Kinder Morgan Energy Partners LP, 5.950%, 2/15/2018 | | | 86,409,347 |
| | 310,000 | | Kinder Morgan Finance Co., 5.700%, 1/05/2016 | | | 295,275 |
| | 33,080,000 | | Maritimes & Northeast Pipeline LLC, 7.500%, 5/31/2014, 144A(c) | | | 34,792,882 |
| | 9,080,000 | | NGPL PipeCo LLC, 6.514%, 12/15/2012, 144A | | | 9,961,695 |
| | 31,430,000 | | NGPL PipeCo LLC, 7.119%, 12/15/2017, 144A | | | 35,167,058 |
| | 5,430,000 | | NGPL PipeCo LLC, 7.768%, 12/15/2037, 144A | | | 6,591,298 |
| | 4,665,000 | | ONEOK Partners LP, 6.650%, 10/01/2036 | | | 4,970,903 |
| | 10,115,000 | | Panhandle Eastern Pipe Line Co., 6.200%, 11/01/2017 | | | 10,666,045 |
| | 48,630,000 | | Panhandle Eastern Pipe Line Co., 7.000%, 6/15/2018 | | | 54,113,422 |
| | 1,435,000 | | Panhandle Eastern Pipe Line Co., 8.125%, 6/01/2019 | | | 1,672,030 |
| | 2,130,000 | | Plains All American Pipeline LP, 6.125%, 1/15/2017 | | | 2,210,819 |
| | 16,025,000 | | Plains All American Pipeline LP, 6.500%, 5/01/2018 | | | 17,164,313 |
| | 4,595,000 | | Plains All American Pipeline LP, 6.650%, 1/15/2037 | | | 4,839,849 |
| | 4,215,000 | | Southern Natural Gas Co., 5.900%, 4/01/2017, 144A | | | 4,341,024 |
| | 20,000,000 | | Texas Eastern Transmission LP, 6.000%, 9/15/2017, 144A | | | 21,261,400 |
| | | | | | |
| | | | | | 325,227,170 |
| | | | | | |
| | | Property & Casualty Insurance — 1.3% | | | |
| | 3,460,000 | | Marsh & McLennan Cos., Inc., 5.375%, 7/15/2014 | | | 3,600,673 |
| | 12,652,000 | | Marsh & McLennan Cos., Inc., 5.750%, 9/15/2015 | | | 13,341,610 |
| | 31,010,000 | | Marsh & McLennan Cos., Inc., 5.875%, 8/01/2033 | | | 28,499,244 |
| | 40,534,000 | | Marsh & McLennan Cos., Inc., 9.250%, 4/15/2019 | | | 50,794,777 |
| | 965,000 | | MBIA Insurance Corp., (fixed rate to 1/15/2013,
variable rate thereafter), 14.000%, 1/15/2033, 144A | | | 424,600 |
| | 2,950,000 | | White Mountains RE Group, 6.375%, 3/20/2017, 144A | | | 2,637,359 |
See accompanying notes to financial statements.
15
LOOMIS SAYLES INVESTMENT GRADE BOND FUND — PORTFOLIOOF INVESTMENTS (continued)
Investments as of September 30, 2009
| | | | | | |
Principal
Amount (‡) | | Description | | Value (†) |
| | | | | | |
| | | Property & Casualty Insurance — continued | | | |
| $ | 4,830,000 | | Willis North America, Inc., 6.200%, 3/28/2017 | | $ | 4,728,010 |
| | 13,815,000 | | Willis North America, Inc., 7.000%, 9/29/2019 | | | 14,204,845 |
| | 625,000 | | XL Capital Ltd., 6.250%, 5/15/2027 | | | 552,586 |
| | 200,000 | | XL Capital Ltd., 6.375%, 11/15/2024 | | | 161,503 |
| | | | | | |
| | | | | | 118,945,207 |
| | | | | | |
| | | Railroads — 0.5% | | | |
| | 2,390,000 | | Canadian Pacific Railway Co., 5.750%, 3/15/2033 | | | 2,300,977 |
| | 15,830,000 | | Canadian Pacific Railway Co., 5.950%, 5/15/2037 | | | 15,619,683 |
| | 10,000,000 | | Canadian Pacific Railway Co., 7.250%, 5/15/2019 | | | 11,601,080 |
| | 5,000,000 | | Canadian Pacific Railway Ltd., MTN, 4.900%, 6/15/2010, (CAD), 144A | | | 4,782,375 |
| | 1,550,000 | | CSX Corp., 6.150%, 5/01/2037 | | | 1,641,830 |
| | 7,814,000 | | CSX Corp., MTN, 6.000%, 10/01/2036 | | | 8,058,313 |
| | 195,000 | | Missouri Pacific Railroad Co., Series A, 4.750%, 1/01/2020(c) | | | 172,087 |
| | 243,000 | | Missouri Pacific Railroad Co., 4.750%, 1/01/2030(c) | | | 208,980 |
| | 1,738,000 | | Missouri Pacific Railroad Co., 5.000%, 1/01/2045(c) | | | 1,181,840 |
| | | | | | |
| | | | | | 45,567,165 |
| | | | | | |
| | | Refining — 0.0% | | | |
| | 3,740,000 | | Valero Energy Corp., 6.625%, 6/15/2037 | | | 3,340,086 |
| | | | | | |
| | | REITs — 1.9% | | | |
| | 2,845,000 | | Camden Property Trust, 5.000%, 6/15/2015 | | | 2,707,601 |
| | 12,015,000 | | Camden Property Trust, 5.700%, 5/15/2017 | | | 11,367,968 |
| | 1,153,000 | | Colonial Realty LP, 4.800%, 4/01/2011 | | | 1,119,275 |
| | 4,230,000 | | Duke Realty LP, 5.950%, 2/15/2017 | | | 3,899,091 |
| | 20,000,000 | | Duke Realty LP, 6.500%, 1/15/2018 | | | 18,794,040 |
| | 5,000,000 | | Equity One, Inc., 6.000%, 9/15/2017 | | | 4,476,565 |
| | 1,010,000 | | ERP Operating LP, 5.125%, 3/15/2016 | | | 985,531 |
| | 1,800,000 | | ERP Operating LP, 5.375%, 8/01/2016 | | | 1,773,646 |
| | 2,420,000 | | ERP Operating LP, 5.750%, 6/15/2017 | | | 2,397,083 |
| | 1,960,000 | | Federal Realty Investment Trust, 5.650%, 6/01/2016 | | | 1,863,066 |
| | 10,500,000 | | First Industrial LP, 5.950%, 5/15/2017 | | | 7,153,440 |
| | 14,130,000 | | Highwoods Properties, Inc., 5.850%, 3/15/2017 | | | 12,444,771 |
| | 2,195,000 | | Highwoods Properties, Inc., 7.500%, 4/15/2018 | | | 2,100,466 |
| | | | | | |
Principal
Amount (‡) | | Description | | Value (†) |
| | | | | | |
| | | REITs — continued | | | |
| $ | 3,777,000 | | ProLogis, 5.625%, 11/15/2015 | | $ | 3,432,202 |
| | 1,500,000 | | ProLogis, 5.625%, 11/15/2016 | | | 1,345,902 |
| | 1,865,000 | | ProLogis, 5.750%, 4/01/2016 | | | 1,668,203 |
| | 9,909,000 | | ProLogis, 6.625%, 5/15/2018 | | | 9,149,891 |
| | 7,075,000 | | Realty Income Corp., 6.750%, 8/15/2019 | | | 6,890,930 |
| | 2,480,000 | | Simon Property Group LP, 5.250%, 12/01/2016 | | | 2,444,539 |
| | 2,040,000 | | Simon Property Group LP, 5.300%, 5/30/2013 | | | 2,085,659 |
| | 12,475,000 | | Simon Property Group LP, 5.750%, 12/01/2015 | | | 12,760,827 |
| | 1,930,000 | | Simon Property Group LP, 5.875%, 3/01/2017 | | | 1,968,228 |
| | 4,155,000 | | Simon Property Group LP, 6.100%, 5/01/2016 | | | 4,270,297 |
| | 19,525,000 | | Simon Property Group LP, 10.350%, 4/01/2019 | | | 24,297,925 |
| | 34,655,000 | | WEA Finance LLC/WT Finance Australia Pty Ltd., 6.750%, 9/02/2019, 144A | | | 35,053,498 |
| | | | | | |
| | | | | | 176,450,644 |
| | | | | | |
| | | Restaurants — 0.1% | | | |
| | 10,545,000 | | Darden Restaurants, Inc., 6.000%, 8/15/2035 | | | 9,558,958 |
| | 1,000,000 | | McDonald’s Corp., EMTN, 3.628%, 10/10/2010, (SGD) | | | 722,143 |
| | | | | | |
| | | | | | 10,281,101 |
| | | | | | |
| | | Retailers — 1.2% | | | |
| | 33,062,000 | | Home Depot, Inc. (The), 5.875%, 12/16/2036 | | | 32,076,951 |
| | 8,170,000 | | J.C. Penney Corp., Inc.,
5.750%, 2/15/2018 | | | 7,598,100 |
| | 16,260,000 | | J.C. Penney Corp., Inc.,
6.375%, 10/15/2036 | | | 13,414,500 |
| | 12,000 | | J.C. Penney Corp., Inc.,
7.125%, 11/15/2023 | | | 11,040 |
| | 7,385,000 | | J.C. Penney Corp., Inc.,
7.400%, 4/01/2037 | | | 6,572,650 |
| | 8,845,000 | | J.C. Penney Corp., Inc.,
7.625%, 3/01/2097 | | | 7,076,000 |
| | 1,645,000 | | Lowe’s Cos., Inc.,
6.650%, 9/15/2037 | | | 1,910,753 |
| | 17,730,000 | | Macy’s Retail Holdings, Inc.,
6.375%, 3/15/2037 | | | 13,968,474 |
| | 10,695,000 | | Macy’s Retail Holdings, Inc.,
6.790%, 7/15/2027 | | | 7,796,537 |
| | 2,750,000 | | Macy’s Retail Holdings, Inc.,
6.900%, 4/01/2029 | | | 2,169,379 |
| | 8,240,000 | | Marks & Spencer PLC,
7.125%, 12/01/2037, 144A | | | 7,697,701 |
| | 7,266,000 | | Target Corp.,
7.000%, 1/15/2038 | | | 8,503,952 |
| | | | | | |
| | | | | | 108,796,037 |
| | | | | | |
See accompanying notes to financial statements.
16
LOOMIS SAYLES INVESTMENT GRADE BOND FUND — PORTFOLIOOF INVESTMENTS (continued)
Investments as of September 30, 2009
| | | | | |
Principal
Amount (‡) | | Description | | Value (†) |
| | | | | |
| | Sovereigns — 1.6% | | | |
| 438,500(††) | | Mexican Fixed Rate Bonds, Series M-10,
7.250%, 12/15/2016, (MXN) | | $ | 3,160,826 |
| 4,200,900(††) | | Mexican Fixed Rate Bonds, Series M-20,
8.000%, 12/07/2023, (MXN) | | | 30,520,875 |
| 380,000(††) | | Mexican Fixed Rate Bonds, Series MI-10,
9.000%, 12/20/2012, (MXN) | | | 3,000,978 |
| 29,165,000 | | New South Wales Treasury Corp., Series 10RG,
7.000%, 12/01/2010, (AUD) | | | 26,504,327 |
| 31,140,000 | | New South Wales Treasury Corp., Series 12RG,
6.000%, 5/01/2012, (AUD) | | | 28,012,374 |
| 20,000,000 | | New South Wales Treasury Corp., Series 17RG,
5.500%, 3/01/2017, (AUD) | | | 17,278,607 |
| 24,705,000 | | Republic of Brazil,
10.250%, 1/10/2028, (BRL) | | | 13,387,221 |
| 6,285,000 | | Republic of Brazil,
12.500%, 1/05/2022, (BRL) | | | 3,902,405 |
| 350,000,000 | | Republic of Iceland, Zero Coupon,
11/16/2009, (ISK) | | | 2,237,245 |
| 234,380,000 | | Republic of Iceland,
7.000%, 3/17/2010, (ISK) | | | 1,511,071 |
| 793,200,000 | | Republic of Iceland,
7.250%, 5/17/2013, (ISK) | | | 5,084,156 |
| 424,400,000 | | Republic of Iceland,
8.000%, 7/22/2011, (ISK) | | | 2,772,126 |
| 999,327,000 | | Republic of Iceland,
13.750%, 12/10/2010, (ISK) | | | 6,924,369 |
| | | | | |
| | | | | 144,296,580 |
| | | | | |
| | Supermarkets — 0.2% | | | |
| 4,220,000 | | American Stores Co., Series B, MTN,
7.100%, 3/20/2028 | | | 3,333,800 |
| 3,340,000 | | Kroger Co.,
6.400%, 8/15/2017 | | | 3,695,553 |
| 1,900,000 | | New Albertson’s, Inc.,
7.450%, 8/01/2029 | | | 1,634,000 |
| 1,000,000 | | New Albertson’s, Inc., Series C, MTN,
6.625%, 6/01/2028 | | | 772,500 |
| 11,100,000 | | Safeway, Inc.,
6.350%, 8/15/2017 | | | 12,321,888 |
| | | | | |
| | | | | 21,757,741 |
| | | | | |
| | Supranational — 1.3% | | | |
| 90,000,000 | | Eurofima, EMTN,
11.000%, 2/05/2010, (ISK) | | | 588,333 |
| 113,651,400,000 | | European Investment Bank, EMTN,
Zero Coupon, 4/24/2013, (IDR), 144A | | | 8,370,105 |
| 15,500,000 | | European Investment Bank, EMTN,
4.600%, 1/30/2037, (CAD), 144A | | | 12,751,506 |
| 26,194,000 | | European Investment Bank, EMTN,
7.000%, 1/18/2012, (NZD) | | | 19,809,428 |
| 336,380,000,000 | | Inter-American Development Bank, EMTN,
Zero Coupon, 5/20/2013, (IDR) | | | 23,986,870 |
| 418,960,000,000 | | Inter-American Development Bank, EMTN,
Zero Coupon, 9/23/2013, (IDR) | | | 28,796,185 |
| 13,265,000 | | Inter-American Development Bank, EMTN,
6.000%, 12/15/2017, (NZD) | | | 9,538,214 |
| 15,400,000 | | International Bank for Reconstruction & Development,
1.430%, 3/05/2014, (SGD) | | | 10,505,847 |
| 429,100,000 | | International Bank for Reconstruction & Development,
9.500%, 5/27/2010, (ISK) | | | 2,797,953 |
| | | | | |
| | | | | 117,144,441 |
| | | | | |
| | | | | | |
Principal
Amount (‡) | | Description | | Value (†) |
| | | | | | |
| | | Technology — 3.4% | | | |
| $ | 8,895,000 | | Agilent Technologies, Inc.,
6.500%, 11/01/2017 | | $ | 9,256,493 |
| | 4,700,000 | | Alcatel-Lucent USA, Inc.,
6.450%, 3/15/2029 | | | 3,577,875 |
| | 2,035,000 | | Arrow Electronics, Inc.,
6.875%, 7/01/2013 | | | 2,198,616 |
| | 1,050,000 | | Arrow Electronics, Inc.,
6.875%, 6/01/2018 | | | 1,117,774 |
| | 9,000,000 | | Avnet, Inc.,
5.875%, 3/15/2014 | | | 9,357,273 |
| | 6,230,000 | | Avnet, Inc.,
6.000%, 9/01/2015 | | | 6,414,159 |
| | 1,540,000 | | Avnet, Inc.,
6.625%, 9/15/2016 | | | 1,618,323 |
| | 13,695,000 | | BMC Software, Inc.,
7.250%, 6/01/2018(c) | | | 14,826,549 |
| | 13,750,000 | | Corning, Inc.,
6.750%, 9/15/2013 | | | 14,980,185 |
| | 1,480,000 | | Corning, Inc.,
6.850%, 3/01/2029 | | | 1,510,253 |
| | 58,825,000 | | Corning, Inc.,
7.000%, 5/15/2024 | | | 63,358,113 |
| | 7,650,000 | | Corning, Inc.,
7.250%, 8/15/2036 | | | 8,071,324 |
| | 56,440,000 | | Dun & Bradstreet Corp. (The),
6.000%, 4/01/2013 | | | 58,495,488 |
| | 7,205,000 | | Equifax, Inc., 7.000%, 7/01/2037 | | | 7,078,523 |
| | 330,000 | | Freescale Semiconductor, Inc.,
10.125%, 12/15/2016 | | | 219,450 |
| | 7,965,000 | | Intuit, Inc.,
5.750%, 3/15/2017 | | | 8,329,423 |
| | 55,000,000 | | KLA-Tencor Corp.,
6.900%, 5/01/2018 | | | 57,489,685 |
| | 4,680,000 | | Motorola, Inc.,
5.220%, 10/01/2097 | | | 2,569,638 |
| | 1,730,000 | | Motorola, Inc.,
6.500%, 9/01/2025 | | | 1,461,997 |
| | 4,150,000 | | Motorola, Inc.,
6.500%, 11/15/2028 | | | 3,422,966 |
| | 6,145,000 | | Motorola, Inc.,
6.625%, 11/15/2037 | | | 5,146,437 |
| | 1,625,000 | | Motorola, Inc.,
8.000%, 11/01/2011 | | | 1,732,269 |
| | 2,774,000 | | Samsung Electronics Co. Ltd.,
7.700%, 10/01/2027, 144A | | | 3,077,254 |
| | 5,725,000 | | Tyco Electronics Group SA,
6.550%, 10/01/2017 | | | 5,993,039 |
| | 782,000 | | Xerox Corp.,
5.500%, 5/15/2012 | | | 819,975 |
| | 11,067,000 | | Xerox Corp.,
6.350%, 5/15/2018 | | | 11,505,320 |
| | 7,265,000 | | Xerox Corp.,
6.750%, 2/01/2017 | | | 7,689,429 |
| | | | | | |
| | | | | | 311,317,830 |
| | | | | | |
| | | Textile — 0.2% | | | |
| | 15,228,000 | | VF Corp.,
6.450%, 11/01/2037 | | | 17,024,858 |
| | | | | | |
See accompanying notes to financial statements.
17
LOOMIS SAYLES INVESTMENT GRADE BOND FUND — PORTFOLIOOF INVESTMENTS (continued)
Investments as of September 30, 2009
| | | | | | |
Principal
Amount (‡) | | Description | | Value (†) |
| | | | | | |
| | | Tobacco — 0.9% | | | |
| $ | 46,086,000 | | Altria Group, Inc.,
8.500%, 11/10/2013 | | $ | 53,452,386 |
| | 14,604,000 | | Altria Group, Inc.,
9.250%, 8/06/2019 | | | 17,845,445 |
| | 2,175,000 | | Altria Group, Inc.,
9.700%, 11/10/2018 | | | 2,701,474 |
| | 8,305,000 | | Reynolds American, Inc.,
6.750%, 6/15/2017 | | | 8,633,538 |
| | 2,035,000 | | Reynolds American, Inc.,
7.250%, 6/15/2037 | | | 2,015,499 |
| | | | | | |
| | | | | | 84,648,342 |
| | | | | | |
| | | Transportation Services — 0.6% | | | |
| | 8,620,000 | | Erac USA Finance Co.,
6.375%, 10/15/2017, 144A | | | 8,654,058 |
| | 2,885,000 | | Erac USA Finance Co.,
6.700%, 6/01/2034, 144A | | | 2,561,349 |
| | 49,956,000 | | Erac USA Finance Co.,
7.000%, 10/15/2037, 144A | | | 46,764,311 |
| | | | | | |
| | | | | | 57,979,718 |
| | | | | | |
| | | Treasuries — 19.1% | | | |
| | 365,135,000 | | Canadian Government,
2.000%, 9/01/2012, (CAD) | | | 341,964,709 |
| | 26,235,000 | | Canadian Government,
2.750%, 12/01/2010, (CAD) | | | 25,100,474 |
| | 31,610,000 | | Canadian Government,
3.500%, 6/01/2013, (CAD) | | | 30,886,659 |
| | 229,170,000 | | Canadian Government,
3.750%, 6/01/2012, (CAD) | | | 225,252,930 |
| | 198,720,000 | | Canadian Government,
3.750%, 6/01/2019, (CAD) | | | 192,323,987 |
| | 4,250,000 | | Canadian Government,
4.000%, 6/01/2016, (CAD) | | | 4,250,715 |
| | 187,955,000 | | Canadian Government,
4.250%, 6/01/2018, (CAD) | | | 190,047,583 |
| | 310,490,000 | | Canadian Government,
5.250%, 6/01/2012, (CAD) | | | 316,493,029 |
| | 9,600,000 | | Canadian Government,
5.500%, 6/01/2010, (CAD) | | | 9,265,818 |
| | 3,430,000 | | Canadian Government,
5.750%, 6/01/2033, (CAD) | | | 4,085,437 |
| | 12,530,000 | | New Zealand Government,
6.000%, 12/15/2017, (NZD) | | | 9,265,893 |
| | 742,220,000 | | Norwegian Government,
4.250%, 5/19/2017, (NOK) | | | 130,643,107 |
| | 120,965,000 | | Norwegian Government,
5.000%, 5/15/2015, (NOK) | | | 22,255,269 |
| | 199,940,000 | | Norwegian Government,
6.000%, 5/16/2011, (NOK) | | | 36,374,050 |
| | 142,485,000 | | Norwegian Government,
6.500%, 5/15/2013, (NOK) | | | 27,172,302 |
| | 100,000,000 | | U.S. Treasury Note,
1.000%, 8/31/2011 | | | 100,175,800 |
| | 80,000,000 | | U.S. Treasury Note,
3.125%, 5/15/2019 | | | 78,718,720 |
| | | | | | |
| | | | | | 1,744,276,482 |
| | | | | | |
| | | Wireless — 0.9% | | | |
| | 5,255,000 | | ALLTEL Corp.,
7.875%, 7/01/2032 | | | 6,469,010 |
| | | | | | |
Principal
Amount (‡) | | Description | | Value (†) |
| | | | | | |
| | | Wireless — continued | | | |
| $ | 8,650,000 | | Nextel Communications, Inc., Series D,
7.375%, 8/01/2015 | | $ | 7,763,375 |
| | 1,220,000 | | Nextel Communications, Inc., Series E,
6.875%, 10/31/2013 | | | 1,131,550 |
| | 15,710,000 | | Nextel Communications, Inc., Series F,
5.950%, 3/15/2014 | | | 13,903,350 |
| | 6,512,000 | | Sprint Capital Corp.,
6.875%, 11/15/2028 | | | 5,437,520 |
| | 1,800,000 | | Sprint Capital Corp.,
6.900%, 5/01/2019 | | | 1,611,000 |
| | 625,000 | | Sprint Capital Corp.,
8.750%, 3/15/2032 | | | 590,625 |
| | 93,000 | | Sprint Nextel Corp.,
6.000%, 12/01/2016 | | | 83,003 |
| | 32,100,000 | | Verizon Wireless Capital LLC,
8.500%, 11/15/2018, 144A | | | 40,081,087 |
| | 1,654,000 | | Vodafone Group PLC,
5.000%, 9/15/2015 | | | 1,747,868 |
| | | | | | |
| | | | | | 78,818,388 |
| | | | | | |
| | | Wirelines — 3.9% | | | |
| | 19,610,000 | | AT&T Corp.,
6.500%, 3/15/2029 | | | 20,383,654 |
| | 11,980,000 | | AT&T, Inc.,
6.500%, 9/01/2037 | | | 12,872,594 |
| | 415,000 | | Bell Canada, MTN,
7.300%, 2/23/2032, (CAD) | | | 414,736 |
| | 3,250,000 | | Bell Canada, Series M-17,
6.100%, 3/16/2035, (CAD) | | | 2,834,769 |
| | 1,915,000 | | BellSouth Corp.,
6.000%, 11/15/2034 | | | 1,940,027 |
| | 1,710,000 | | BellSouth Corp.,
6.550%, 6/15/2034 | | | 1,830,375 |
| | 3,000,000 | | BellSouth Telecommunications, Inc.,
5.850%, 11/15/2045 | | | 2,710,800 |
| | 6,810,000 | | BellSouth Telecommunications, Inc., 7.000%, 12/01/2095 | | | 6,761,894 |
| | 134,165,000 | | Deutsche Telekom International Finance BV, 6.000%, 7/08/2019 | | | 143,781,813 |
| | 3,350,000 | | GTE Corp., 6.940%, 4/15/2028 | | | 3,601,880 |
| | 65,000 | | Level 3 Financing, Inc., 8.750%, 2/15/2017 | | | 53,950 |
| | 560,000 | | Level 3 Financing, Inc., 9.250%, 11/01/2014 | | | 493,500 |
| | 2,700,000 | | New England Telephone & Telegraph, 7.875%, 11/15/2029 | | | 3,063,946 |
| | 1,735,000 | | Qwest Capital Funding, Inc., 6.500%, 11/15/2018 | | | 1,427,037 |
| | 2,815,000 | | Qwest Capital Funding, Inc., 6.875%, 7/15/2028 | | | 2,125,325 |
| | 4,465,000 | | Qwest Capital Funding, Inc., 7.625%, 8/03/2021 | | | 3,772,925 |
| | 970,000 | | Qwest Capital Funding, Inc., 7.750%, 2/15/2031 | | | 773,575 |
| | 340,000 | | Qwest Corp., 6.500%, 6/01/2017 | | | 319,600 |
| | 10,720,000 | | Qwest Corp., 6.875%, 9/15/2033 | | | 8,683,200 |
| | 890,000 | | Qwest Corp., 7.200%, 11/10/2026 | | | 743,150 |
See accompanying notes to financial statements.
18
LOOMIS SAYLES INVESTMENT GRADE BOND FUND — PORTFOLIOOF INVESTMENTS (continued)
Investments as of September 30, 2009
| | | | | | |
Principal
Amount (‡) | | Description | | Value (†) |
| | | | | | |
| | | Wirelines — continued | | | |
| $ | 1,265,000 | | Qwest Corp., 7.250%, 9/15/2025 | | $ | 1,091,062 |
| | 4,295,000 | | Qwest Corp., 7.250%, 10/15/2035 | | | 3,457,475 |
| | 1,600,000 | | Qwest Corp., 7.500%, 6/15/2023 | | | 1,456,000 |
| | 17,170,000 | | Telecom Italia Capital SA, 4.875%, 10/01/2010 | | | 17,649,232 |
| | 11,215,000 | | Telecom Italia Capital SA, 6.000%, 9/30/2034 | | | 10,933,156 |
| | 4,180,000 | | Telecom Italia Capital SA, 6.375%, 11/15/2033 | | | 4,271,091 |
| | 785,000 | | Telefonica Emisiones SAU, 5.877%, 7/15/2019 | | | 852,915 |
| | 3,536,000 | | Telefonica Emisiones SAU, 7.045%, 6/20/2036 | | | 4,184,524 |
| | 4,265,000 | | Telefonica Europe BV, 7.750%, 9/15/2010 | | | 4,511,491 |
| | 14,445,000 | | Telus Corp., 4.950%, 3/15/2017, (CAD) | | | 13,803,330 |
| | 8,375,000 | | Verizon Communications, Inc., 5.850%, 9/15/2035 | | | 8,431,598 |
| | 3,676,000 | | Verizon Communications, Inc., 6.100%, 4/15/2018 | | | 3,970,043 |
| | 18,485,000 | | Verizon Communications, Inc., 8.950%, 3/01/2039 | | | 25,323,803 |
| | 5,674,000 | | Verizon Maryland, Inc., 5.125%, 6/15/2033 | | | 4,828,353 |
| | 14,540,000 | | Verizon New England, Inc., 6.500%, 9/15/2011 | | | 15,634,004 |
| | 7,047,000 | | Verizon New York, Inc., Series B, 7.375%, 4/01/2032 | | | 7,727,064 |
| | 5,375,000 | | Verizon Pennsylvania, Inc., 6.000%, 12/01/2028 | | | 5,010,656 |
| | | | | | |
| | | | | | 351,724,547 |
| | | | | | |
| | | Total Non-Convertible Bonds (Identified Cost $7,899,208,240) | | | 8,466,489,633 |
| | | | | | |
| | Convertible Bonds — 2.1% |
| | | Media Non-Cable — 0.0% | | | |
| | 534,721 | | Liberty Media LLC, 3.500%, 1/15/2031 | | | 328,185 |
| | | | | | |
| | | Non-Captive Diversified — 0.1% | | | |
| | 9,920,000 | | iStar Financial, Inc., 1.097%, 10/01/2012(b) | | | 4,960,000 |
| | | | | | |
| | | Oil Field Services — 0.1% | | | |
| | 505,000 | | Transocean, Inc., 1.500%, 12/15/2037 | | | 487,325 |
| | 7,050,000 | | Transocean, Inc., Series C, 1.500%, 12/15/2037 | | | 6,715,125 |
| | | | | | |
| | | | | | 7,202,450 |
| | | | | | |
| | | Pharmaceuticals — 0.1% | | | |
| | 3,997,000 | | Vertex Pharmaceuticals, Inc., 4.750%, 2/15/2013 | | | 6,630,024 |
| | | | | | |
| | | REITs — 0.1% | | | |
| | 1,400,000 | | ERP Operating LP, 3.850%, 8/15/2026 | | | 1,386,924 |
| | 10,673,000 | | ProLogis, 1.875%, 11/15/2037 | | | 9,112,074 |
| | | | | | |
Principal
Amount (‡) | | Description | | Value (†) |
| | | | | | |
| | | REITs — continued | | | |
| $ | 4,070,000 | | ProLogis, 2.250%, 4/01/2037 | | $ | 3,668,087 |
| | | | | | |
| | | | | | 14,167,085 |
| | | | | | |
| | | Technology — 1.6% | | | |
| | 1,405,000 | | Intel Corp., 2.950%, 12/15/2035 | | | 1,253,963 |
| | 140,000,000 | | Intel Corp., 3.250%, 8/01/2039, 144A | | | 149,625,000 |
| | | | | | |
| | | | | | 150,878,963 |
| | | | | | |
| | | Wireless — 0.0% | | | |
| | 5,200,000 | | NII Holdings, Inc., 3.125%, 6/15/2012 | | | 4,543,500 |
| | | | | | |
| | | Wirelines — 0.1% | | | |
| | 2,735,000 | | Level 3 Communications, Inc., 3.500%, 6/15/2012 | | | 2,174,325 |
| | 230,000 | | Level 3 Communications, Inc., 5.250%, 12/15/2011 | | | 204,700 |
| | 2,990,000 | | Level 3 Communications, Inc., 7.000%, 3/15/2015, 144A(c) | | | 3,169,400 |
| | | | | | |
| | | | | | 5,548,425 |
| | | | | | |
| | | Total Convertible Bonds (Identified Cost $185,180,028) | | | 194,258,632 |
| | | | | | |
| | Municipals — 0.5% |
| | | California — 0.2% | | | |
| | 1,305,000 | | San Jose California Redevelopment Agency Tax Allocation (Merged Area Redevelopment), 3.750%, 8/01/2028, Series C | | | 1,092,141 |
| | 480,000 | | San Jose California Redevelopment Agency Tax Allocation (Merged Area), 3.750%, 8/01/2028, Series C, (Registered), (MBIA insured) | | | 426,182 |
| | 1,620,000 | | State of California,
4.500%, 8/01/2027, (AMBAC insured) | | | 1,577,264 |
| | 4,515,000 | | State of California,
4.500%, 10/01/2029 | | | 4,297,513 |
| | 1,315,000 | | State of California,
4.500%, 8/01/2030, (AMBAC insured) | | | 1,245,108 |
| | 1,135,000 | | State of California,
4.500%, 8/01/2030 | | | 1,074,675 |
| | 840,000 | | State of California (Various Purpose),
3.250%, 12/01/2027 | | | 684,256 |
| | 3,965,000 | | State of California (Various Purpose),
4.500%, 12/01/2033, (AMBAC insured) | | | 3,618,776 |
| | | | | | |
| | | | | | 14,015,915 |
| | | | | | |
| | | District Of Columbia — 0.2% | | | |
| | 15,000,000 | | Metropolitan Washington Airports Authority,
7.462%, 10/01/2046 | | | 16,228,950 |
| | | | | | |
| | | Illinois — 0.0% | | | |
| | 540,000 | | Chicago O’Hare International Airport,
4.500%, 1/01/2038,
Series A, (FSA insured) | | | 535,696 |
| | | | | | |
| | | Michigan — 0.0% | | | |
| | 2,615,000 | | Michigan Tobacco Settlement Finance Authority,
7.309%, 6/01/2034(c) | | | 2,090,588 |
| | | | | | |
| | | Nebraska — 0.0% | | | |
| | 1,950,000 | | Omaha Public Power District,
4.500%, 2/01/2034,
Series AA, (FGIC insured) | | | 1,984,983 |
| | | | | | |
See accompanying notes to financial statements.
19
LOOMIS SAYLES INVESTMENT GRADE BOND FUND — PORTFOLIOOF INVESTMENTS (continued)
Investments as of September 30, 2009
| | | | | | | |
Principal
Amount (‡) | | Description | | Value (†) | |
| | | | | | | |
| | | Ohio — 0.1% | | | | |
| $ | 6,570,000 | | Buckeye Tobacco Settlement Financing Authority, Series A-2,
5.875%, 6/01/2047(c) | | $ | 5,329,584 | |
| | | | | | | |
| | | Wisconsin — 0.0% | | | | |
| | 260,000 | | Wisconsin Housing & Economic Development Authority,
4.900%, 11/01/2035, Series E | | | 260,117 | |
| | | | | | | |
| | | Total Municipals (Identified Cost $39,997,085) | | | 40,445,833 | |
| | | | | | | |
| | | Total Bonds and Notes (Identified Cost $8,124,385,353) | | | 8,701,194,098 | |
| | | | | | | |
| | Short-Term Investments — 3.7% | | | | |
| | 342,620,918 | | Tri-Party Repurchase Agreement with Fixed Income Clearing Corporation, dated 9/30/2009 at 0.000% to be repurchased at $342,620,918 on 10/01/2009 collateralized by $281,275,000 Federal Home Loan Mortgage Corp. Discount Note, due 12/31/2009 valued at $281,134,363; $68,375,000 Federal National Mortgage Association Discount Note, due 12/31/2009 valued at $68,340,813 including accrued interest (Note 2g of Notes to Financial Statements) (Identified Cost $342,620,918) | | | 342,620,918 | |
| | | | | | | |
| | | | | | | |
| | | Total Investments — 98.9%
(Identified Cost $8,467,006,271)(a) | | | 9,043,815,016 | |
| | | Other assets less liabilities — 1.1% | | | 98,272,248 | |
| | | | | | | |
| | | Net Assets — 100.0% | | $ | 9,142,087,264 | |
| | | | | | | |
| | | | | | | |
| | (‡) | | Principal amount stated in U.S. dollars unless otherwise noted. | |
| | (†) | | See Note 2a of Notes to Financial Statements. | |
| | (††) | | Amount shown represents units. One unit represents a principal amount of 100. | |
| | (†††) | | Amount shown represents units. One unit represents a principal amount of 25. | |
| | (a) | | Federal Tax Information: | |
| | | At September 30, 2009, the net unrealized appreciation on investments based on a cost of $8,481,242,709 for federal income tax purposes was as follows: | |
| | | Aggregate gross unrealized appreciation for all investments in which there is an excess of value over tax cost | | $ | 713,055,274 | |
| | | Aggregate gross unrealized depreciation for all investments in which there is an excess of tax cost over value | | | (150,482,967 | ) |
| | | | | | | |
| | | Net unrealized appreciation | | $ | 562,572,307 | |
| | | | | | | |
| | | | | | | |
| | (b) | | Variable rate security. Rate as of September 30, 2009 is disclosed. | |
| | (c) | | Illiquid security. At September 30, 2009, the value of these securities amounted to $148,082,105 or 1.6% of net assets. | |
| | (d) | | Step Bond: Coupon is a fixed rate for an initial period then resets at a specified date and rate. | |
| | (e) | | Fair valued security by the Fund’s investment adviser. At September 30, 2009 the value of this security amounted to $5,137,913 or 0.1% of net assets. | |
| | | | | | | |
| | 144A | | Securities exempt from registration under Rule 144A of the Securities Act of 1933. These securities may be resold in transactions exempt from registration, normally to qualified institutional buyers. At September 30, 2009, the total value of these securities amounted to $1,058,247,866 or 11.6% of net assets. | |
| | | | | | | |
| | | | |
| ABS | | Asset-Backed Securities | | |
| AMBAC | | American Municipal Bond Assurance Corp. | | |
| EMTN | | Euro Medium Term Note | | |
| FGIC | | Financial Guaranty Insurance Company | | |
| FHLMC | | Federal Home Loan Mortgage Corp. | | |
| FNMA | | Federal National Mortgage Association | | |
| FSA | | Financial Security Assurance, Inc. | | |
| GMTN | | Global Medium Term Note | | |
| MBIA | | Municipal Bond Investor Assurance Corp. | | |
| MTN | | Medium Term Note | | |
| REITs | | Real Estate Investment Trusts | | |
| | | | |
| AUD | | Australian Dollar | | |
| BRL | | Brazilian Real | | |
| CAD | | Canadian Dollar | | |
| EUR | | Euro | | |
| GBP | | British Pound | | |
| IDR | | Indonesian Rupiah | | |
| ISK | | Icelandic Krona | | |
| KRW | | South Korean Won | | |
| MXN | | Mexican Peso | | |
| NOK | | Norwegian Krone | | |
| NZD | | New Zealand Dollar | | |
| SGD | | Singapore Dollar | | |
| THB | | Thai Baht | | |
Industry Summary at September 30, 2009 (Unaudited)
| | | |
| Treasuries | | 19.1 | % |
| Banking | | 8.7 | |
| Technology | | 5.0 | |
| Government Owned—No Guarantee | | 5.0 | |
| Wirelines | | 4.0 | |
| Pipelines | | 3.6 | |
| Electric | | 3.2 | |
| Non-Captive Diversified | | 2.9 | |
| Commercial Mortgage-Backed Securities | | 2.7 | |
| REITs | | 2.0 | |
| Oil Field Services | | 2.0 | |
| Other Investments, less than 2% each | | 37.0 | |
| Short-Term Investments | | 3.7 | |
| | | |
| Total Investments | | 98.9 | |
| Other assets less liabilities | | 1.1 | |
| | | |
| Net Assets | | 100.0 | % |
| | | |
Currency Exposure at September 30, 2009 as a Percentage of Net Assets (Unaudited)
| | | |
| United States Dollar | | 75.2 | % |
| Canadian Dollar | | 15.2 | |
| Norwegian Krone | | 2.4 | |
| Other, less than 2% each | | 6.1 | |
| | | |
| Total Investments | | 98.9 | |
| Other assets less liabilities | | 1.1 | |
| | | |
| Net Assets | | 100.0 | % |
| | | |
See accompanying notes to financial statements.
20
STATEMENTOF ASSETSAND LIABILITIES
September 30, 2009
| | | | |
| | | | |
ASSETS | | | | |
Investments at cost | | $ | 8,467,006,271 | |
Net unrealized appreciation | | | 576,808,745 | |
| | | | |
Investments at value | | | 9,043,815,016 | |
Foreign currency at value (identified cost $1,260,352) | | | 1,286,197 | |
Receivable for Fund shares sold | | | 53,035,884 | |
Receivable for securities sold | | | 34,458,891 | |
Interest receivable | | | 125,090,356 | |
Receivable from investment adviser (Note 5) | | | 4,377 | |
Tax reclaims receivable | | | 139,316 | |
| | | | |
TOTAL ASSETS | | | 9,257,830,037 | |
| | | | |
LIABILITIES | | | | |
Payable for securities purchased | | | 78,771,192 | |
Payable for Fund shares redeemed | | | 32,662,929 | |
Foreign taxes payable | | | 52,174 | |
Management fees payable (Note 5) | | | 2,931,003 | |
Administrative fees payable (Note 5) | | | 359,589 | |
Deferred Trustees’ fees (Note 5) | | | 165,322 | |
Service and distribution fees payable (Note 5) | | | 91,924 | |
Other accounts payable and accrued expenses | | | 708,640 | |
| | | | |
TOTAL LIABILITIES | | | 115,742,773 | |
| | | | |
NET ASSETS | | $ | 9,142,087,264 | |
| | | | |
NET ASSETS CONSIST OF: | | | | |
Paid-in capital | | $ | 8,547,915,277 | |
Undistributed net investment income | | | 35,750,437 | |
Accumulated net realized loss on investments and foreign currency transactions | | | (19,837,825 | ) |
Net unrealized appreciation on investments and foreign currency translations | | | 578,259,375 | |
| | | | |
NET ASSETS | | $ | 9,142,087,264 | |
| | | | |
COMPUTATION OF NET ASSET VALUE AND OFFERING PRICE: | | | | |
Class A shares: | | | | |
Net assets | | $ | 2,946,488,549 | |
| | | | |
Shares of beneficial interest | | | 253,085,908 | |
| | | | |
Net asset value and redemption price per share | | $ | 11.64 | |
| | | | |
Offering price per share (100/95.50 of $11.64) (Note 1) | | $ | 12.19 | |
| | | | |
Class B shares: (redemption price per share is equal to net asset value less any applicable contingent deferred sales charge) (Note 1) | | | | |
Net assets | | $ | 17,489,394 | |
| | | | |
Shares of beneficial interest | | | 1,509,106 | |
| | | | |
Net asset value and offering price per share | | $ | 11.59 | |
| | | | |
Class C shares: (redemption price per share is equal to net asset value less any applicable contingent deferred sales charge) (Note 1) | | | | |
Net assets | | $ | 2,495,304,950 | |
| | | | |
Shares of beneficial interest | | | 215,824,336 | |
| | | | |
Net asset value and offering price per share | | $ | 11.56 | |
| | | | |
Class Y shares: | | | | |
Net assets | | $ | 3,531,187,154 | |
| | | | |
Shares of beneficial interest | | | 303,110,195 | |
| | | | |
Net asset value, offering and redemption price per share | | $ | 11.65 | |
| | | | |
Class J shares: (redemption price per share is equal to net asset value less any applicable contingent deferred sales charge) (Note 1) | | | | |
Net assets | | $ | 151,617,217 | |
| | | | |
Shares of beneficial interest | | | 13,037,910 | |
| | | | |
Net asset value and redemption price per share | | $ | 11.63 | |
| | | | |
Offering price per share (100/96.50 of $11.63) (Note 1) | | $ | 12.05 | |
| | | | |
See accompanying notes to financial statements.
21
STATEMENTOF OPERATIONS
For the Year Ended September 30, 2009
| | | | |
| | | | |
INVESTMENT INCOME | | | | |
Interest | | $ | 408,973,544 | |
Securities lending income (Note 2) | | | 12,173 | |
Less net foreign taxes withheld | | | (285,986 | ) |
| | | | |
| | | 408,699,731 | |
| | | | |
Expenses | | | | |
Management fees (Note 5) | | | 24,655,556 | |
Service fees - Class A (Note 5) | | | 5,625,303 | |
Service and distribution fees - Class B (Note 5) | | | 157,899 | |
Service and distribution fees - Class C (Note 5) | | | 17,661,984 | |
Service and distribution fees - Class J (Note 5) | | | 1,144,720 | |
Trustees’ fees and expenses (Note 5) | | | 107,614 | |
Administrative fees (Note 5) | | | 3,093,302 | |
Custodian fees and expenses | | | 263,224 | |
Transfer agent fees and expenses - Class A (Note 5) | | | 1,713,601 | |
Transfer agent fees and expenses - Class B (Note 5) | | | 13,270 | |
Transfer agent fees and expenses - Class C (Note 5) | | | 1,357,208 | |
Transfer agent fees and expenses - Class Y (Note 5) | | | 1,172,654 | |
Transfer agent fees and expenses - Class J (Note 5) | | | 9,100 | |
Audit and tax services fees | | | 56,693 | |
Legal fees - Class A | | | 79,809 | |
Legal fees - Class B | | | 590 | |
Legal fees - Class C | | | 61,304 | |
Legal fees - Class Y | | | 63,907 | |
Legal fees - Class J | | | 25,747 | |
Shareholder reporting expenses - Class A | | | 209,403 | |
Shareholder reporting expenses - Class B | | | 2,682 | |
Shareholder reporting expenses - Class C | | | 179,077 | |
Shareholder reporting expenses - Class Y | | | 119,108 | |
Shareholder reporting expenses - Class J | | | 110,648 | |
Registration fees - Class A | | | 120,621 | |
Registration fees - Class B | | | 17,205 | |
Registration fees - Class C | | | 96,496 | |
Registration fees - Class Y | | | 280,567 | |
Registration fees - Class J | | | 2,326 | |
Miscellaneous expenses | | | 184,748 | |
| | | | |
Total expenses | | | 58,586,366 | |
Less fee reduction and/or expense reimbursement (Note 5) | | | (8,509 | ) |
| | | | |
Net expenses | | | 58,577,857 | |
| | | | |
Net investment income | | | 350,121,874 | |
| | | | |
NET REALIZED AND UNREALIZED GAIN (LOSS) ON INVESTMENTS AND FOREIGN CURRENCY TRANSACTIONS | | | | |
Net realized gain (loss) on: | | | | |
Investments | | | (23,503,094 | ) |
Foreign currency transactions | | | 263,037 | |
Net change in unrealized appreciation (depreciation) on: | | | | |
Investments | | | 1,083,089,296 | |
Foreign currency translations | | | 2,962,764 | |
| | | | |
Net realized and unrealized gain on investments and foreign currency transactions | | | 1,062,812,003 | |
| | | | |
NET INCREASE IN NET ASSETS RESULTING FROM OPERATIONS | | $ | 1,412,933,877 | |
| | | | |
See accompanying notes to financial statements.
22
STATEMENTOF CHANGESIN NET ASSETS
| | | | | | | | |
| | | Year Ended
September 30,
2009 | | | Year Ended
September 30,
2008 | |
FROM OPERATIONS: | | | | | | | | |
Net investment income | | $ | 350,121,874 | | | $ | 187,092,207 | |
Net realized gain (loss) on investments and foreign currency transactions | | | (23,240,057 | ) | | | 70,516,187 | |
Net change in unrealized appreciation (depreciation) on investments and foreign currency translations | | | 1,086,052,060 | | | | (568,566,913 | ) |
| | | | | | | | |
Net increase (decrease) in net assets resulting from operations | | | 1,412,933,877 | | | | (310,958,519 | ) |
| | | | | | | | |
FROM DISTRIBUTIONS TO SHAREHOLDERS: | | | | | | | | |
Net investment income | | | | | | | | |
Class A | | | (126,482,744 | ) | | | (83,130,555 | ) |
Class B | | | (778,099 | ) | | | (806,347 | ) |
Class C | | | (86,396,910 | ) | | | (50,818,767 | ) |
Class Y | | | (111,617,170 | ) | | | (47,348,532 | ) |
Class J | | | (8,135,019 | ) | | | (8,734,457 | ) |
Net realized capital gains | | | | | | | | |
Class A | | | (24,679,708 | ) | | | — | |
Class B | | | (203,042 | ) | | | — | |
Class C | | | (18,444,267 | ) | | | — | |
Class Y | | | (16,568,771 | ) | | | — | |
Class J | | | (2,097,657 | ) | | | — | |
| | | | | | | | |
Total distributions | | | (395,403,387 | ) | | | (190,838,658 | ) |
| | | | | | | | |
INCREASE IN NET ASSETS FROM CAPITAL SHARE TRANSACTIONS (NOTE 8) | | | 3,695,970,881 | | | | 2,843,305,497 | |
| | | | | | | | |
Net increase in net assets | | | 4,713,501,371 | | | | 2,341,508,320 | |
NET ASSETS | | | | | | | | |
Beginning of year | | | 4,428,585,893 | | | | 2,087,077,573 | |
| | | | | | | | |
End of year | | $ | 9,142,087,264 | | | $ | 4,428,585,893 | |
| | | | | | | | |
UNDISTRIBUTED NET INVESTMENT INCOME | | $ | 35,750,437 | | | $ | 25,666,898 | |
| | | | | | | | |
See accompanying notes to financial statements.
23
This Page Intentionally Left Blank
24
FINANCIAL HIGHLIGHTS
For a share outstanding throughout each period.
| | | | | | | | | | | | | | | | | | | | | | | | | | |
| | | | | Income (Loss) from Investment Operations: | | | Less Distributions: | |
| | | Net asset
value,
beginning
of
the period | | Net
investment
income (a) | | Net realized
and unrealized
gain (loss) | | | Total from
investment
operations | | | Dividends
from
net investment
income | | | Distributions
from net
realized
capital gains | | | Total
distributions | |
INVESTMENT GRADE BOND FUND | | | | | | | | | | | | | | | | | | | | | | | | | | |
Class A | | | | | | | | | | | | | | | | | | | | | | | | | | |
9/30/2009 | | $ | 10.54 | | $ | 0.60 | | $ | 1.22 | | | $ | 1.82 | | | $ | (0.59 | ) | | $ | (0.13 | ) | | $ | (0.72 | ) |
9/30/2008 | | | 11.73 | | | 0.60 | | | (1.15 | ) | | | (0.55 | ) | | | (0.64 | ) | | | — | | | | (0.64 | ) |
9/30/2007 | | | 11.35 | | | 0.58 | | | 0.42 | | | | 1.00 | | | | (0.62 | ) | | | — | | | | (0.62 | ) |
9/30/2006 | | | 11.71 | | | 0.51 | | | 0.10 | | | | 0.61 | | | | (0.75 | ) | | | (0.22 | ) | | | (0.97 | ) |
9/30/2005 | | | 11.84 | | | 0.49 | | | 0.29 | | | | 0.78 | | | | (0.74 | ) | | | (0.17 | ) | | | (0.91 | ) |
Class B | | | | | | | | | | | | | | | | | | | | | | | | | | |
9/30/2009 | | | 10.50 | | | 0.51 | | | 1.21 | | | | 1.72 | | | | (0.50 | ) | | | (0.13 | ) | | | (0.63 | ) |
9/30/2008 | | | 11.68 | | | 0.50 | | | (1.14 | ) | | | (0.64 | ) | | | (0.54 | ) | | | — | | | | (0.54 | ) |
9/30/2007 | | | 11.31 | | | 0.47 | | | 0.43 | | | | 0.90 | | | | (0.53 | ) | | | — | | | | (0.53 | ) |
9/30/2006 | | | 11.67 | | | 0.42 | | | 0.10 | | | | 0.52 | | | | (0.66 | ) | | | (0.22 | ) | | | (0.88 | ) |
9/30/2005 | | | 11.82 | | | 0.41 | | | 0.27 | | | | 0.68 | | | | (0.66 | ) | | | (0.17 | ) | | | (0.83 | ) |
Class C | | | | | | | | | | | | | | | | | | | | | | | | | | |
9/30/2009 | | | 10.47 | | | 0.52 | | | 1.22 | | | | 1.74 | | | | (0.52 | ) | | | (0.13 | ) | | | (0.65 | ) |
9/30/2008 | | | 11.66 | | | 0.51 | | | (1.15 | ) | | | (0.64 | ) | | | (0.55 | ) | | | — | | | | (0.55 | ) |
9/30/2007 | | | 11.30 | | | 0.49 | | | 0.42 | | | | 0.91 | | | | (0.55 | ) | | | — | | | | (0.55 | ) |
9/30/2006 | | | 11.66 | | | 0.42 | | | 0.11 | | | | 0.53 | | | | (0.67 | ) | | | (0.22 | ) | | | (0.89 | ) |
9/30/2005 | | | 11.81 | | | 0.40 | | | 0.28 | | | | 0.68 | | | | (0.66 | ) | | | (0.17 | ) | | | (0.83 | ) |
Class Y | | | | | | | | | | | | | | | | | | | | | | | | | | |
9/30/2009 | | | 10.55 | | | 0.62 | | | 1.23 | | | | 1.85 | | | | (0.62 | ) | | | (0.13 | ) | | | (0.75 | ) |
9/30/2008 | | | 11.73 | | | 0.64 | | | (1.15 | ) | | | (0.51 | ) | | | (0.67 | ) | | | — | | | | (0.67 | ) |
9/30/2007 | | | 11.36 | | | 0.61 | | | 0.41 | | | | 1.02 | | | | (0.65 | ) | | | — | | | | (0.65 | ) |
9/30/2006 | | | 11.71 | | | 0.55 | | | 0.11 | | | | 0.66 | | | | (0.79 | ) | | | (0.22 | ) | | | (1.01 | ) |
9/30/2005 | | | 11.85 | | | 0.54 | | | 0.28 | | | | 0.82 | | | | (0.79 | ) | | | (0.17 | ) | | | (0.96 | ) |
Class J | | | | | | | | | | | | | | | | | | | | | | | | | | |
9/30/2009 | | | 10.53 | | | 0.55 | | | 1.22 | | | | 1.77 | | | | (0.54 | ) | | | (0.13 | ) | | | (0.67 | ) |
9/30/2008 | | | 11.71 | | | 0.54 | | | (1.14 | ) | | | (0.60 | ) | | | (0.58 | ) | | | — | | | | (0.58 | ) |
9/30/2007 | | | 11.34 | | | 0.52 | | | 0.42 | | | | 0.94 | | | | (0.57 | ) | | | — | | | | (0.57 | ) |
9/30/2006 | | | 11.69 | | | 0.46 | | | 0.11 | | | | 0.57 | | | | (0.70 | ) | | | (0.22 | ) | | | (0.92 | ) |
9/30/2005 | | | 11.83 | | | 0.46 | | | 0.27 | | | | 0.73 | | | | (0.70 | ) | | | (0.17 | ) | | | (0.87 | ) |
| (a) | Per share net investment income has been calculated using the average shares outstanding during the period. |
| (b) | Had certain expenses not been reduced during the period, if applicable, total returns would have been lower. |
| (c) | A sales charge for Class A and Class J and a contingent deferred sales charge for Class B and Class C shares are not reflected in total return calculations. Periods less than one year, if applicable, are not annualized. |
| (d) | The investment adviser and/or administrator agreed to reimburse a portion of the Fund’s expenses and/or reduce its fees during the period. Without this reimbursement/fee reduction, if applicable, expenses would have been higher. |
See accompanying notes to financial statements.
25
| | | | | | | | | | | | | | | | | |
| | | | | | | | Ratios to Average Net Assets: | | |
| | | | | | |
Net asset
value,
end of
the period | | Total
return
(%) (b)(c) | | | Net assets,
end of
the period
(000’s) | | Net
expenses
(%) (d)(e) | | | Gross
expenses
(%) (e) | | | Net investment
income
(%) (e) | | Portfolio
turnover
rate (%) |
| | | | | | | | | | | | | | | | | |
| | | | | | | | | | | | | | | | | |
| | | | | | | | | | | | | | | | | |
| $ | 11.64 | | 18.64 | | | $ | 2,946,489 | | 0.80 | | | 0.80 | | | 5.87 | | 30 |
| | 10.54 | | (5.12 | ) | | | 1,867,335 | | 0.80 | | | 0.80 | | | 5.20 | | 35 |
| | 11.73 | | 9.14 | | | | 834,736 | | 0.83 | | | 0.83 | | | 5.05 | | 35 |
| | 11.35 | | 5.63 | | | | 152,054 | | 0.92 | (f) | | 0.92 | (f) | | 4.59 | | 35 |
| | 11.71 | | 6.83 | | | | 39,168 | | 0.95 | | | 1.14 | | | 4.21 | | 28 |
| | | | | | | | | | | | | | | | | |
| $ | 11.59 | | 17.59 | | | | 17,489 | | 1.67 | | | 1.67 | | | 5.07 | | 30 |
| | 10.50 | | (5.88 | ) | | | 16,009 | | 1.65 | (g) | | 1.65 | (g) | | 4.29 | | 35 |
| | 11.68 | | 8.17 | | | | 17,082 | | 1.70 | | | 1.71 | | | 4.16 | | 35 |
| | 11.31 | | 4.83 | | | | 5,525 | | 1.70 | | | 1.89 | | | 3.75 | | 35 |
| | 11.67 | | 5.89 | | | | 3,443 | | 1.70 | | | 2.18 | | | 3.47 | | 28 |
| | | | | | | | | | | | | | | | | |
| $ | 11.56 | | 17.80 | | | | 2,495,305 | | 1.56 | | | 1.56 | | | 5.09 | | 30 |
| | 10.47 | | (5.84 | ) | | | 1,333,421 | | 1.55 | | | 1.55 | | | 4.45 | | 35 |
| | 11.66 | | 8.28 | | | | 605,934 | | 1.57 | | | 1.57 | | | 4.30 | | 35 |
| | 11.30 | | 4.87 | | | | 82,863 | | 1.70 | (f) | | 1.70 | (f) | | 3.79 | | 35 |
| | 11.66 | | 5.91 | | | | 27,992 | | 1.70 | | | 1.97 | | | 3.45 | | 28 |
| | | | | | | | | | | | | | | | | |
| $ | 11.65 | | 18.94 | | | | 3,531,187 | | 0.54 | | | 0.54 | | | 6.01 | | 30 |
| | 10.55 | | (4.79 | ) | | | 1,044,046 | | 0.53 | | | 0.53 | | | 5.48 | | 35 |
| | 11.73 | | 9.32 | | | | 448,873 | | 0.55 | (g) | | 0.55 | (g) | | 5.33 | | 35 |
| | 11.36 | | 6.09 | | | | 76,548 | | 0.55 | | | 0.63 | | | 4.94 | | 35 |
| | 11.71 | | 7.13 | | | | 26,012 | | 0.55 | | | 0.82 | | | 4.61 | | 28 |
| | | | | | | | | | | | | | | | | |
| $ | 11.63 | | 18.05 | | | | 151,617 | | 1.30 | | | 1.31 | | | 5.48 | | 30 |
| | 10.53 | | (5.50 | ) | | | 167,775 | | 1.28 | | | 1.28 | | | 4.66 | | 35 |
| | 11.71 | | 8.52 | | | | 180,453 | | 1.28 | | | 1.28 | | | 4.57 | | 35 |
| | 11.34 | | 5.29 | | | | 214,894 | | 1.30 | (f) | | 1.30 | (f) | | 4.09 | | 35 |
| | 11.69 | | 6.36 | | | | 314,418 | | 1.30 | | | 1.35 | | | 3.89 | | 28 |
| (e) | Computed on an annualized basis for periods less than one year, if applicable. |
| (f) | Includes fee/expense recovery of 0.06%, 0.09% and 0.03% for Class A, Class C and Class J, respectively. |
| (g) | Includes fee/expense recovery of less than 0.01% for Class B and Class Y, respectively. |
26
NOTESTO FINANCIAL STATEMENTS
September 30, 2009
1. Organization. Loomis Sayles Funds II (the “Trust”) is organized as a Massachusetts business trust. The Trust is registered under the Investment Company Act of 1940, as amended (the “1940 Act”), as an open-end management investment company. The Declaration of Trust permits the Board of Trustees to authorize the issuance of an unlimited number of shares of the Trust in multiple series. The financial statements for certain funds of the Trust are presented in separate reports. Information presented in these financial statements pertains to Loomis Sayles Investment Grade Bond Fund (the “Fund” or the “Investment Grade Bond Fund”).
The Fund offers Class A, Class C, Class Y and Class J shares. Effective October 12, 2007, Class B shares are no longer offered. Existing Class B shareholders may continue to reinvest dividends into Class B shares and exchange their Class B shares for Class B shares of other Natixis Funds subject to existing exchange privileges as described in the Fund’s Prospectus.
Class A shares are sold with a maximum front-end sales charge of 4.50%. Class B shares do not pay a front-end sales charge, but pay higher Rule 12b-1 fees than Class A shares for eight years (at which point they automatically convert to Class A shares) and are subject to a contingent deferred sales charge (“CDSC”) if those shares are redeemed within six years of purchase. Class C shares do not pay a front-end sales charge, do not convert to any other class of shares, pay higher Rule 12b-1 fees than Class A shares and may be subject to a CDSC of 1.00% if those shares are redeemed within one year of acquisition except for reinvested distributions. Class Y shares do not pay a front-end sales charge, a CDSC or Rule 12b-1 fees. Class Y shares are generally intended for institutional investors with a minimum initial investment of $100,000, though some categories of investors are exempted from the minimum investment amount as outlined in the Fund’s Prospectus. Class J shares are only offered to non-U.S. investors and are sold with a maximum front-end sales charge of 3.50%.
Most expenses of the Trust can be directly attributed to a Fund. Expenses which can not be directly attributed to a Fund are generally apportioned based on the relative net assets of each of the Funds in the Trust. Expenses of the Fund are borne pro rata by the holders of each class of shares, except that each class bears expenses unique to that class (including the Rule 12b-1 service and distribution fees, registration, legal, shareholder reporting and transfer agent fees applicable to such class). In addition, each class votes as a class only with respect to its own Rule 12b-1 Plan. Shares of each class would receive their pro rata share of the net assets of the Fund if the Fund were liquidated. The Trustees approve separate dividends from net investment income on each class of shares.
2. Significant Accounting Policies. The following is a summary of significant accounting policies consistently followed by the Fund in the preparation of its financial statements. The Fund’s financial statements are prepared in accordance with accounting principles generally accepted in the United States of America which require the use of management estimates that affect the reported amounts and disclosures in the financial statements. Actual results could differ from those estimates. Management has evaluated the events and transactions that have occurred through November 23, 2009, the date the financial statements were issued, and noted no items requiring recognition in the financial statements or additional disclosure in the Notes to Financial Statements.
a. Valuation. Debt securities (other than short-term obligations purchased with an original or remaining maturity of sixty days or less) are generally valued on the basis of evaluated bids furnished to the Fund by a pricing service recommended by the investment adviser and approved by the Board of Trustees, which service determines valuations for normal, institutional-size trading units of such securities using market information, transactions for comparable securities and various relationships between securities which are generally recognized by institutional traders. Broker-dealer bid quotations may also be used to value debt securities where a pricing service does not price a security or where a pricing service does not provide a reliable price for the security. In instances where broker-dealer bid quotations are not available, certain securities held by the Fund may be valued on the basis of a price provided by a principal market maker. Forward foreign currency contracts are valued utilizing interpolated prices determined from information provided by an independent pricing service. Short-term obligations purchased with an original or remaining maturity of sixty days or less are valued at amortized cost, which approximates market value. Securities for which market quotations are not readily available are valued at fair value as determined in good faith by the Fund’s investment adviser using consistently applied procedures under the general supervision of the Board of Trustees. Investments in other open-end investment companies are valued at their net asset value each day.
The Fund may hold securities traded in foreign markets. Foreign securities are valued at the market price in the foreign market. However, if events occurring after the close of the foreign market (but before the close of regular trading on the New York Stock Exchange) are believed to materially affect the value of those securities, such securities are fair valued pursuant to procedures approved by the Board of Trustees. When fair valuing securities, the Fund may, among other things, use modeling tools or other processes that may take into account factors such as securities market activity and/or significant events that occur after the close of the foreign market and before the Fund calculates its net asset value.
b. Security Transactions and Related Investment Income. Security transactions are accounted for on trade date. Interest income is recorded on an accrual basis. Interest income is increased by the accretion of discount and decreased by the amortization of premium. Investment income is recorded net of foreign taxes withheld when applicable. In determining net gain or loss on securities sold, the cost of securities has been determined on an identified cost basis. Investment income, non-class specific expenses and realized and unrealized gains and losses are allocated on a pro rata basis to each class based on the relative net assets of each class to the total net assets of the Fund.
c. Foreign Currency Translation. The books and records of the Fund are maintained in U.S. dollars. The value of securities, currencies and other assets and liabilities denominated in currencies other than U.S. dollars are translated into U.S. dollars based upon foreign exchange rates prevailing at the end of the period. Purchases and sales of investment securities, income and expenses are translated on the respective dates of such transactions.
27
NOTESTO FINANCIAL STATEMENTS (continued)
September 30, 2009
Since the values of investment securities are presented at the foreign exchange rates prevailing at the end of the period, it is not practical to isolate that portion of the results of operations arising from changes in exchange rates from fluctuations which arise due to changes in market prices of investment securities. Such changes are included with the net realized and unrealized gain or loss on investments.
Net realized foreign exchange gains or losses arise from sales of foreign currency, currency gains or losses realized between the trade and settlement dates on securities transactions and the difference between the amounts of interest and foreign withholding taxes recorded on the Fund’s books and the U.S. dollar equivalent of the amounts actually received or paid. Net unrealized foreign exchange gains and losses arise from changes in the value of assets and liabilities, other than investment securities, at the end of the fiscal period, resulting from changes in exchange rates.
The Fund may use foreign currency exchange contracts to facilitate transactions in foreign-denominated investments. Losses may arise from changes in the value of the foreign currency or if the counterparties do not perform under the contracts’ terms.
d. Forward Foreign Currency Contracts. The Fund may enter into forward foreign currency contracts. Contracts to buy generally are used to acquire exposure to foreign currencies, while contracts to sell generally are used to hedge the Fund’s investments against currency fluctuation. Also, a contract to buy or sell can offset a previous contract. These contracts involve market risk in excess of the unrealized gain or loss reflected in the Fund’s Statement of Assets and Liabilities. The U.S. dollar value of the currencies the Fund has committed to buy or sell represents the aggregate exposure to each currency the Fund has acquired or hedged through currency contracts outstanding at period end. Gains or losses are recorded for financial statement purposes as unrealized until settlement date. Risks may arise upon entering into these contracts from the potential inability of counterparties to meet the terms of their contracts and from unanticipated movements in the value of a foreign currency relative to the U.S. dollar. At September 30, 2009, there were no open forward foreign currency contracts.
e. Federal and Foreign Income Taxes. The Trust treats each Fund as a separate entity for federal income tax purposes. The Fund intends to meet the requirements of the Internal Revenue Code applicable to regulated investment companies, and to distribute to its shareholders substantially all of its net investment income and any net realized capital gains at least annually. Management has performed an analysis of the Fund’s tax positions for the open tax years as of September 30, 2009 and has concluded that no provisions for income tax are required. The Fund’s federal tax returns for the prior three fiscal years remain subject to examination by the Internal Revenue Service. Management is not aware of any events that are reasonably possible to occur in the next twelve months that would result in the amounts of any unrecognized tax benefits significantly increasing or decreasing for the Fund. However, management’s conclusions regarding tax positions taken may be subject to review and adjustment at a later date based on factors including, but not limited to, new tax laws and accounting regulations and interpretations thereof.
The Fund may be subject to foreign taxes on income and gains on investments that are accrued based upon the Fund’s understanding of the tax rules and regulations that exist in the countries in which the Fund invests. Foreign governments may also impose taxes or other payments on investments with respect to foreign securities. Such taxes are accrued as applicable, and are reflected as foreign taxes payable on the Statement of Assets and Liabilities.
f. Dividends and Distributions to Shareholders. Dividends and distributions are recorded on ex-dividend date. The timing and characterization of certain income and capital gain distributions are determined annually in accordance with federal tax regulations, which may differ from accounting principles generally accepted in the United States of America. Permanent differences are primarily due to differing treatments for book and tax purposes for items such as defaulted bonds, distribution redesignations, foreign currency transactions, paydown adjustments and premium amortization accruals. Permanent book and tax basis differences relating to shareholder distributions will result in reclassifications to capital accounts. Temporary differences between book and tax distributable earnings are primarily due to premium amortization accruals, deferred Trustees’ fees, defaulted bond accruals, securities lending collateral gain/loss adjustments and wash sales. Distributions from net investment income and short-term capital gains are considered to be distributed from ordinary income for tax purposes.
The tax characterization of distributions is determined on an annual basis. The tax character of distributions paid to shareholders during the years ended September 30, 2009 and 2008 were as follows:
| | | | | | | | | | |
2009 Distributions Paid From: | | 2008 Distributions Paid From: |
Ordinary
Income | | Long-Term
Capital Gains | | Total | | Ordinary
Income | | Long-Term
Capital Gains | | Total |
$ 386,232,314 | | $9,171,073 | | $395,403,387 | | $190,838,658 | | $— | | $190,838,658 |
Differences between these amounts and those reported in the Statement of Changes in Net Assets, if any, are primarily attributable to different book and tax treatment for short-term capital gains.
28
NOTESTO FINANCIAL STATEMENTS (continued)
September 30, 2009
As of September 30, 2009, the components of distributable earnings on a tax basis were as follows:
| | | | |
Undistributed ordinary income | | $ | 35,968,831 | |
Undistributed long-term capital gains | | | — | |
| | | | |
Total undistributed earnings | | | 35,968,831 | |
Capital loss carryforward: | | | | |
Expires September 30, 2017 | | | (1,891,321 | ) |
Deferred net capital losses (post- October 2008) | | | (3,774,568 | ) |
Unrealized appreciation | | | 564,087,439 | |
| | | | |
Total accumulated earnings | | $ | 594,390,381 | |
| | | | |
g. Repurchase Agreements. It is the Fund’s policy that the market value of the collateral for repurchase agreements be at least equal to 100% of the repurchase price, including interest. Certain repurchase agreements are tri-party arrangements whereby the collateral is held in a segregated account for the benefit of the Fund and on behalf of the counterparty. It is the Fund’s policy, regarding tri-party arrangements, that the market value of the collateral be at least equal to 102% of the repurchase price, including interest. Repurchase agreements could involve certain risks in the event of default or insolvency of the counterparty including possible delays or restrictions upon a Fund’s ability to dispose of the underlying securities.
h. Securities Lending. The Fund has entered into an agreement with State Street Bank and Trust Company (“State Street Bank”), as agent of the Fund, to lend securities to certain designated borrowers. The loans are collateralized with cash or securities in an amount equal to at least 105% or 102% of the market value (including accrued interest) of the loaned international or domestic securities, respectively, when the loan is initiated. Thereafter, the value of the collateral must remain at least 102% of the market value (including accrued interest) of loaned securities for U.S. equities and U.S. corporate debt; at least 105% of the market value (including accrued interest) of loaned securities for non-U.S. equities; and at least 100% of the market value (including accrued interest) of loaned securities for U.S. government securities, sovereign debt issued by non-U.S. governments and non-U.S. corporate debt. In the event that the market value of the collateral falls below the required percentages described above, the borrower will deliver additional collateral on the next business day. As with other extensions of credit, the Fund bears the risk of loss with respect to the investment of the collateral. The Fund invests cash collateral in short-term investments, a portion of the income from which is remitted to the borrowers and the remainder allocated between the Fund and State Street Bank as lending agent.
As of September 30, 2009 there were no securities on loan.
i. Indemnifications. Under the Trust’s organizational documents, its officers and Trustees are indemnified against certain liabilities arising out of the performance of their duties to the Fund. Additionally, in the normal course of business, the Fund enters into contracts with service providers that contain general indemnification clauses. The Fund’s maximum exposure under these arrangements is unknown as this would involve future claims that may be made against the Fund that have not yet occurred. However, based on experience, the Fund expects the risk of loss to be remote.
3. Fair Value Measurements. Effective October 1, 2008, the Fund adopted accounting standards related to fair value measurements and disclosures which establish a hierarchy for which various inputs are used in determining the value of the Fund’s assets or liabilities. These inputs are summarized in the three broad levels listed below:
| | • | | Level 1 – quoted prices in active markets for identical assets or liabilities; |
| | • | | Level 2 – prices determined using other significant inputs that are observable either directly, or indirectly through corroboration with observable market data (which could include quoted prices for similar assets or liabilities, interest rates, credit risk, etc.); |
| | • | | Level 3 – prices determined using significant inputs for situations where quoted prices or observable inputs are unavailable such as when there is little or no market activity for an asset or liability (unobservable inputs reflect the Fund’s own assumptions in determining the fair value of assets or liabilities and would be based on the best information available). |
The inputs or methodology used for valuing securities are not necessarily an indication of the risk associated with investing in those securities.
29
NOTESTO FINANCIAL STATEMENTS (continued)
September 30, 2009
The following is a summary of the inputs used to value the Fund’s investments as of September 30, 2009, at value:
Asset Valuation Inputs
| | | | | | | | | | | | |
Description | | Level 1 | | Level 2 | | Level 3 | | Total |
| | | | | | | | | | | | |
Bonds and Notes | | | | | | | | | | | | |
Non-Convertible Bonds | | | | | | | | | | | | |
ABS Car Loan | | $ | — | | $ | 133,271,472 | | $ | — | | $ | 133,271,472 |
ABS Credit Card | | | — | | | 130,607,256 | | | — | | | 130,607,256 |
ABS Other | | | — | | | 19,228,562 | | | 39,800,000 | | | 59,028,562 |
Airlines | | | — | | | 145,382,700 | | | 14,176,691 | | | 159,559,391 |
Automotive | | | — | | | 43,773,580 | | | 630,087 | | | 44,403,667 |
Banking | | | — | | | 799,354,532 | | | — | | | 799,354,532 |
Brokerage | | | — | | | 58,162,613 | | | — | | | 58,162,613 |
Building Materials | | | — | | | 60,182,232 | | | — | | | 60,182,232 |
Chemicals | | | — | | | 168,918,297 | | | — | | | 168,918,297 |
Collateralized Mortgage Obligations | | | — | | | 1,468,722 | | | — | | | 1,468,722 |
Commercial Mortgage-Backed Securities | | | — | | | 245,750,784 | | | — | | | 245,750,784 |
Construction Machinery | | | — | | | 35,632,674 | | | — | | | 35,632,674 |
Consumer Cyclical Services | | | — | | | 79,723,817 | | | — | | | 79,723,817 |
Consumer Products | | | — | | | 54,906,740 | | | — | | | 54,906,740 |
Distributors | | | — | | | 79,914,482 | | | — | | | 79,914,482 |
Diversified Manufacturing | | | — | | | 68,644,830 | | | 14,557,959 | | | 83,202,789 |
Electric | | | — | | | 292,109,069 | | | — | | | 292,109,069 |
Entertainment | | | — | | | 17,385,261 | | | — | | | 17,385,261 |
Financial Other | | | — | | | 28,006,550 | | | — | | | 28,006,550 |
Food & Beverage | | | — | | | 110,218,195 | | | — | | | 110,218,195 |
Government Owned – No Guarantee | | | — | | | 457,410,858 | | | — | | | 457,410,858 |
Government Sponsored | | | — | | | 85,526,316 | | | — | | | 85,526,316 |
Health Insurance | | | — | | | 79,786,033 | | | — | | | 79,786,033 |
Healthcare | | | — | | | 147,321,122 | | | — | | | 147,321,122 |
Home Construction | | | — | | | 26,861,157 | | | — | | | 26,861,157 |
Independent Energy | | | — | | | 83,802,815 | | | — | | | 83,802,815 |
Integrated Energy | | | — | | | 24,741,009 | | | 1,351,142 | | | 26,092,151 |
Life Insurance | | | — | | | 7,575,421 | | | — | | | 7,575,421 |
Local Authorities | | | — | | | 55,824,628 | | | — | | | 55,824,628 |
Media Cable | | | — | | | 176,935,678 | | | — | | | 176,935,678 |
Media Non-Cable | | | — | | | 26,468,547 | | | — | | | 26,468,547 |
Metals & Mining | | | — | | | 108,677,884 | | | — | | | 108,677,884 |
Mortgage Related | | | — | | | 179,976 | | | — | | | 179,976 |
Non-Captive Consumer | | | — | | | 134,105,379 | | | 5,137,913 | | | 139,243,292 |
Non-Captive Diversified | | | — | | | 253,503,249 | | | — | | | 253,503,249 |
Oil Field Services | | | — | | | 175,761,001 | | | — | | | 175,761,001 |
Paper | | | — | | | 155,159,727 | | | — | | | 155,159,727 |
Pharmaceuticals | | | — | | | 100,956,336 | | | — | | | 100,956,336 |
Pipelines | | | — | | | 325,227,170 | | | — | | | 325,227,170 |
Property & Casualty Insurance | | | — | | | 118,945,207 | | | — | | | 118,945,207 |
Railroads | | | — | | | 45,567,165 | | | — | | | 45,567,165 |
Refining | | | — | | | 3,340,086 | | | — | | | 3,340,086 |
REITs | | | — | | | 176,450,644 | | | — | | | 176,450,644 |
Restaurants | | | — | | | 10,281,101 | | | — | | | 10,281,101 |
Retailers | | | — | | | 108,796,037 | | | — | | | 108,796,037 |
Sovereigns | | | — | | | 144,296,580 | | | — | | | 144,296,580 |
Supermarkets | | | — | | | 21,757,741 | | | — | | | 21,757,741 |
Supranational | | | — | | | 108,774,336 | | | 8,370,105 | | | 117,144,441 |
Technology | | | — | | | 311,317,830 | | | — | | | 311,317,830 |
Textile | | | — | | | 17,024,858 | | | — | | | 17,024,858 |
30
NOTESTO FINANCIAL STATEMENTS (continued)
September 30, 2009
Asset Valuation Inputs (continued)
| | | | | | | | | | | | |
Description | | Level 1 | | Level 2 | | Level 3 | | Total |
| | | | | | | | | | | | |
Bonds and Notes (continued) | | | | | | | | | | | | |
Non-Convertible Bonds (continued) | | | | | | | | | | | | |
Tobacco | | $ | — | | $ | 84,648,342 | | $ | — | | $ | 84,648,342 |
Transportation Services | | | — | | | 57,979,718 | | | — | | | 57,979,718 |
Treasuries | | | — | | | 1,744,276,482 | | | — | | | 1,744,276,482 |
Wireless | | | — | | | 78,818,388 | | | — | | | 78,818,388 |
Wirelines | | | — | | | 351,724,547 | | | — | | | 351,724,547 |
| | | | | | | | | | | | |
Total Non-Convertible Bonds | | | — | | | 8,382,465,736 | | | 84,023,897 | | | 8,466,489,633 |
| | | | | | | | | | | | |
Convertible Bonds | | | | | | | | | | | | |
Media Non-Cable | | | — | | | 328,185 | | | — | | | 328,185 |
Non-Captive Diversified | | | — | | | 4,960,000 | | | — | | | 4,960,000 |
Oil Field Services | | | — | | | 7,202,450 | | | — | | | 7,202,450 |
Pharmaceuticals | | | — | | | 6,630,024 | | | — | | | 6,630,024 |
REITs | | | — | | | 14,167,085 | | | — | | | 14,167,085 |
Technology | | | — | | | 150,878,963 | | | — | | | 150,878,963 |
Wireless | | | — | | | 4,543,500 | | | — | | | 4,543,500 |
Wirelines | | | — | | | 2,379,025 | | | 3,169,400 | | | 5,548,425 |
| | | | | | | | | | | | |
Total Convertible Bonds | | | — | | | 191,089,232 | | | 3,169,400 | | | 194,258,632 |
| | | | | | | | | | | | |
Municipals (a) | | | — | | | 40,445,833 | | | — | | | 40,445,833 |
| | | | | | | | | | | | |
Total Bonds and Notes | | | — | | | 8,614,000,801 | | | 87,193,297 | | | 8,701,194,098 |
| | | | | | | | | | | | |
Short-Term Investments | | | 342,620,918 | | | — | | | — | | | 342,620,918 |
| | | | | | | | | | | | |
Total | | $ | 342,620,918 | | $ | 8,614,000,801 | | $ | 87,193,297 | | $ | 9,043,815,016 |
| | | | | | | | | | | | |
(a) Major categories of the Fund’s investments are included in the Portfolio of Investments.
The following is a reconciliation of Level 3 investments for which significant unobservable inputs were used to determine fair value as of September 30, 2009:
Asset Valuation Inputs
| | | | | | | | | | | | | | | | | | | | | | | | | |
Investments in Securities | | Balance as of
September 30,
2008 | | Accrued
Discounts
(Premiums) | | Realized
Gain (Loss) | | | Change in
Unrealized
Appreciation
(Depreciation) | | | Net
Purchases
(Sales) | | | Net Transfers
in/(out) Level 3 | | | Balance as of
September 30,
2009 |
| | | | | | | | | | | | | | | | | | | | | | | | | |
Bonds and Notes | | | | | | | | | | | | | | | | | | | | | | | | | |
Non-Convertible Bonds | | | | | | | | | | | | | | | | | | | | | | | | | |
ABS Other | | $ | — | | $ | — | | $ | — | | | $ | 5,110 | | | $ | 39,794,890 | | | $ | — | | | $ | 39,800,000 |
Airlines | | | 7,077,300 | | | — | | | — | | | | 4,065,275 | | | | (2,317,349 | ) | | | 5,351,465 | | | | 14,176,691 |
Automotive | | | — | | | 1,134 | | | — | | | | (7,431 | ) | | | — | | | | 636,384 | | | | 630,087 |
Banking | | | 30,706,384 | | | 2,642,505 | | | (17,458,194 | ) | | | 7,047,991 | | | | (17,335,504 | ) | | | (5,603,182 | ) | | | — |
Collateralized Mortgage Obligations | | | 107,273 | | | — | | | 2,361 | | | | 8,319 | | | | (23,914 | ) | | | (94,039 | ) | | | — |
Diversified Manufacturing | | | — | | | 68,079 | | | — | | | | 1,084,571 | | | | 13,405,309 | | | | — | | | | 14,557,959 |
Independent Energy | | | 1,390,484 | | | 39,442 | | | — | | | | 561,271 | | | | 620,588 | | | | (2,611,785 | ) | | | — |
Integrated Energy | | | 1,570,862 | | | — | | | — | | | | 6,215 | | | | (225,935 | ) | | | — | | | | 1,351,142 |
Life Insurance | | | 5,445,760 | | | 8,720 | | | 567,288 | | | | 3,989,283 | | | | (10,011,051 | ) | | | — | | | | — |
Media Non-Cable | | | 360,000 | | | 537 | | | (828,763 | ) | | | 635,726 | | | | (167,500 | ) | | | — | | | | — |
Non-Captive Consumer | | | 9,016,044 | | | 346,651 | | | — | | | | 2,443,699 | | | | — | | | | (6,668,481 | ) | | | 5,137,913 |
Non-Captive Diversified | | | 262,150 | | | 570 | | | — | | | | 74,330 | | | | — | | | | (337,050 | ) | | | — |
Property & Casualty Insurance | | | 511,450 | | | 521 | | | — | | | | (87,371 | ) | | | — | | | | (424,600 | ) | | | — |
Supranational | | | 52,476,860 | | | 2,560,753 | | | — | | | | 5,806,261 | | | | 309,286 | | | | (52,783,055 | ) | | | 8,370,105 |
Convertible Bonds | | | | | | | | | | | | | | | | | — | | | | — | | | | |
Wirelines | | | — | | | 2,272 | | | — | | | | 236,928 | | | | 2,930,200 | | | | — | | | | 3,169,400 |
| | | | | | | | | | | | | | | | | | | | | | | | | |
Total | | $ | 108,924,567 | | $ | 5,671,184 | | $ | (17,717,308 | ) | | $ | 25,870,177 | | | $ | 26,979,020 | | | $ | (62,534,343 | ) | | $ | 87,193,297 |
| | | | | | | | | | | | | | | | | | | | | | | | | |
31
NOTESTO FINANCIAL STATEMENTS (continued)
September 30, 2009
4. Purchases and Sales of Securities. For the year ended September 30, 2009, purchases and sales of securities (excluding short-term investments and U.S. government/agency securities and including paydowns) were $4,551,512,516 and $1,405,648,274, respectively. Purchases and sales of U.S. government/agency securities (excluding short-term investments and including paydowns) were $907,238,462 and $320,971,662, respectively.
5. Management Fees and Other Transactions with Affiliates.
a. Management Fees. Loomis, Sayles & Company, L.P. (“Loomis Sayles”) serves as investment adviser to the Fund. Under the terms of the management agreement, the Fund pays a management fee at the annual rate of 0.40% of average daily net assets, calculated daily and payable monthly.
Loomis Sayles has given a binding undertaking to the Fund to reduce management fees and/or reimburse certain expenses associated with the Fund to limit its operating expenses, exclusive of acquired fund fees and expenses, brokerage expenses, interest expense, taxes and extraordinary expenses. This undertaking is in effect until January 31, 2010 and will be reevaluated on an annual basis. For the year ended September 30, 2009, the expense limits as a percentage of average daily net assets under the expense limitation agreement were as follows:
| | | | | | | | | | | | |
| Expense Limit as a Percentage of Average Daily Net Assets | |
Class A | | Class B | | | Class C | | | Class Y | | | Class J | |
| 0.95% | | 1.70 | % | | 1.70 | % | | 0.55 | % | | 1.30 | % |
Loomis Sayles shall be permitted to recover expenses it has borne under the expense limitation agreement (whether through reduction of its management fees or otherwise) on a class by class basis in later periods to the extent the expenses of a class fall below a class’ expense limits, provided, however, that a class is not obligated to pay such reduced fees/expenses more than one year after the end of the fiscal year in which the fee/expense was reduced.
For the year ended September 30, 2009, the management fees for the Fund were $24,655,556 (0.40% of average daily net assets).
For the year ended September 30, 2009, expenses have been reimbursed as follows:
| | | | | | | | | | | | | | | | |
| Reimbursement1 |
Class A | | Class B | | Class C | | Class Y | | Class J | | Total |
| $ | — | | $ | — | | $ | — | | $ | — | | $ | 8,509 | | $ | 8,509 |
1Expense reimbursements are subject to possible recovery until September 30, 2010.
There were no expenses recovered during the year ended September 30, 2009 as permitted under the expense limitation agreement.
Certain officers and employees of Loomis Sayles are also officers or Trustees of the Trust. Loomis Sayles’ general partner is indirectly owned by Natixis Global Asset Management, L.P. (“Natixis US”), which is part of Natixis Global Asset Management, an international asset management group based in Paris, France.
b. Administrative Fees. Natixis Asset Management Advisors, L.P. (“Natixis Advisors”) provides certain administrative services for the Fund and contracts with State Street Bank to serve as sub-administrator. Natixis Advisors is a wholly-owned subsidiary of Natixis US. Pursuant to an agreement among Natixis Funds Trust I, Natixis Funds Trust II, Natixis Funds Trust III, Natixis Funds Trust IV, Natixis Cash Management Trust, Gateway Trust (“Natixis Funds Trusts”), Loomis Sayles Funds I, Loomis Sayles Funds II (“Loomis Sayles Funds Trusts”), Hansberger International Series and Natixis Advisors, the Fund pays Natixis Advisors monthly its pro rata portion of fees equal to an annual rate of 0.0575% of the first $15 billion of the average daily net assets of the Natixis Funds Trusts, Loomis Sayles Funds Trusts and the Hansberger International Series, 0.0500% of the next $15 billion, 0.0425% of the next $30 billion and 0.0375% of such assets in excess of $60 billion, subject to an annual aggregate minimum fee for the Natixis Funds Trusts, Loomis Sayles Funds Trusts and the Hansberger International Series of $10 million, which is reevaluated on an annual basis. New funds are subject to a fee for the first twelve months of operations of $75,000 plus $12,500 per class and an additional $75,000 if managed by multiple subadvisors.
For the year ended September 30, 2009, the Fund paid $3,093,302 in administrative fees to Natixis Advisors.
c. Service and Distribution Fees. Natixis Distributors, L.P. (“Natixis Distributors”), a wholly-owned subsidiary of Natixis US, has entered into a distribution agreement with the Trust. Pursuant to this agreement, Natixis Distributors serves as principal underwriter of the Fund, except Class J shares of the Fund. The Fund has entered into a distribution agreement relating to Class J shares with Loomis Sayles Distributors, L.P. (“Loomis Sayles Distributors”), a wholly-owned subsidiary of Natixis US.
Pursuant to Rule 12b-1 under the 1940 Act, the Fund has adopted a Service Plan relating to the Fund’s Class A shares (the “Class A Plan”) and a Distribution and Service Plan relating to the Fund’s Class B and Class C shares (the “Class B and Class C Plans”).
32
NOTESTO FINANCIAL STATEMENTS (continued)
September 30, 2009
Under the Class A Plan, the Fund pays Natixis Distributors a monthly service fee at an annual rate not to exceed 0.25% of the average daily net assets attributable to the Fund’s Class A shares, as reimbursement for expenses incurred by Natixis Distributors in providing personal services to investors in Class A shares and/or the maintenance of shareholder accounts.
Under the Class B and Class C Plans, the Fund pays Natixis Distributors a monthly service fee at an annual rate not to exceed 0.25% of the average daily net assets attributable to the Fund’s Class B and Class C shares, as compensation for services provided and expenses incurred by Natixis Distributors in providing personal services to investors in Class B and Class C shares and/or the maintenance of shareholder accounts.
Also under the Class B and Class C Plans, the Fund pays Natixis Distributors a monthly distribution fee at an annual rate of 0.75% of the average daily net assets attributable to the Fund’s Class B and Class C shares, as compensation for services provided and expenses incurred by Natixis Distributors in connection with the marketing or sale of Class B and Class C shares.
Class J shares are subject to a monthly shareholder service fee at an annual rate of 0.25% and a monthly distribution fee, at an annual rate of 0.50% of the average daily net assets attributable to the Fund’s Class J shares, both payable to Loomis Sayles Distributors, pursuant to a shareholder service and distribution plan adopted under Rule 12b-1.
For the year ended September 30, 2009 the Fund paid the following service and distribution fees:
| | | | | | | | | | | | | | | | | | |
| Service Fees | | Distribution Fees |
Class A | | Class B | | Class C | | Class J | | Class B | | Class C | | Class J |
| $5,625,303 | | $ | 39,475 | | $ | 4,415,496 | | $ | 381,573 | | $ | 118,424 | | $ | 13,246,488 | | $ | 763,147 |
d. Sub-Transfer Agent Fees. Natixis Distributors has entered into agreements with financial intermediaries to provide certain recordkeeping, processing, shareholder communications and other services to customers of the intermediaries and has agreed to compensate the intermediaries for providing those services. Certain services would be provided by the Fund if the shares of those customers were registered directly with the Fund’s transfer agent. Accordingly, the Fund agreed to pay a portion of the intermediary fees attributable to shares of the Fund held by intermediaries (which generally are a percentage of the value of shares held) not exceeding what the Fund would have paid its transfer agent had each customer’s shares been registered directly with the transfer agent instead of held through the intermediaries. Natixis Distributors pays the remainder of the fees.
For the year ended September 30, 2009, the Fund paid the following sub-transfer agent fees which are reflected in transfer agent fees and expenses in the Statement of Operations.
| | | | | | | | | | | | |
| Sub-Transfer Agent Fees |
Class A | | Class B | | Class C | | Class Y | | Class J |
| $1,269,911 | | $ | 9,095 | | $ | 531,893 | | $ | 1,062,678 | | $ | — |
e. Commissions. The Fund has been informed that commissions (including CDSCs) on Fund shares retained by Natixis Distributors were $6,889,980 and commissions on Fund shares retained by Loomis Sayles Distributors by investors in Class J shares of the Fund were $61,983 for the year ended September 30, 2009.
f. Trustees Fees and Expenses. The Fund does not pay any compensation directly to its officers or Trustees who are directors, officers or employees of Natixis Advisors, Natixis Distributors, Natixis US, or their affiliates. The Chairperson of the Board receives a retainer fee at the annual rate of $200,000. The Chairperson does not receive any meeting attendance fees for Board of Trustees meetings or committee meetings that she attends. Each Independent Trustee (other than the Chairperson) receives, in the aggregate, a retainer fee at the annual rate of $65,000. Each Independent Trustee also receives a meeting attendance fee of $7,500 for each meeting of the Board of Trustees that he or she attends in person and $3,750 for each meeting of the Board of Trustees that he or she attends telephonically. In addition, each committee chair receives an additional retainer fee at the annual rate of $10,000. Each Contract Review and Governance Committee member is compensated $5,000 for each Committee meeting that he or she attends in person and $2,500 for each meeting that he or she attends telephonically. Each Audit Committee member is compensated $6,250 for each Committee meeting that he or she attends in person and $3,125 for each meeting that he or she attends telephonically. These fees are allocated among the funds in the Natixis Funds Trusts, Loomis Sayles Funds Trusts and the Hansberger International Series based on a formula that takes into account, among other factors, the relative net assets of each fund. Trustees are reimbursed for travel expenses in connection with attendance at meetings.
A deferred compensation plan (the “Plan”) is available to the Trustees on a voluntary basis. Deferred amounts remain in the Funds until distributed in accordance with the provisions of the Plan. The value of a participating Trustee’s deferral account is based on theoretical investments of deferred amounts, on the normal payment dates, in certain funds of the Natixis Funds Trusts, Loomis Sayles Funds Trusts and Hansberger International Series as designated by the participating Trustees. Changes in the value of participants’ deferral accounts are allocated pro rata among the funds in the Natixis Funds Trusts, Loomis Sayles Funds Trusts, and Hansberger International Series, and are normally reflected as Trustees’ fees and expenses in the Statement of Operations. The portions of the accrued obligations allocated to the Funds under the Plan are reflected as Deferred Trustees’ fees on the Statement of Assets and Liabilities.
33
NOTESTO FINANCIAL STATEMENTS (continued)
September 30, 2009
6. Line of Credit. The Fund, together with certain other funds of Natixis Funds Trusts, Loomis Sayles Funds Trusts and the Hansberger International Series, participates in a $200,000,000 committed unsecured line of credit provided by State Street Bank, with an individual limit of $125,000,000 for each fund that participates in the line of credit. Interest is charged to each participating fund based on its borrowings at a rate per annum equal to the greater of the Federal Funds rate or overnight LIBOR, plus 0.75%. In addition, a commitment fee of 0.125% per annum, payable at the end of each calendar quarter, is accrued and apportioned among the participating funds based on their average daily unused portion of the line of credit.
Prior to March 11, 2009, the Fund, together with certain other funds of Natixis Funds Trusts, Loomis Sayles Funds Trusts and Hansberger International Series, participated in a $200,000,000 committed unsecured line of credit provided by State Street Bank, with an individual limit of $125,000,000 for each fund that participated in the line of credit. Interest was charged to each participating fund based on its borrowings at a rate per annum equal to the Federal Funds rate plus 0.50%. In addition, a commitment fee of 0.09% per annum, payable at the end of each calendar quarter, was accrued and apportioned among the participating funds based on their average daily unused portion of the line of credit.
For the year ended September 30, 2009, the Fund had no borrowings under these agreements.
7. Shareholders. At September 30, 2009, the Loomis Sayles Employees’ Profit Sharing Retirement Plan held 448,355 shares of beneficial interest of Class Y shares.
8. Capital Shares. The Fund may issue an unlimited number of shares of beneficial interest, without par value. Transactions in capital shares were as follows:
| | | | | | | | | | | | | | |
| | Year Ended
September 30, 2009 | | | Year Ended
September 30, 2008 | |
| | Shares | | | | Amount | | | Shares | | | | Amount | |
| | | | | | | | | | | | | | |
| Class A | | | | | | | | | | | | | | |
Issued from the sale of shares | | 200,269,071 | | | $ | 2,017,489,461 | | | 141,854,364 | | | $ | 1,656,977,467 | |
Issued in connection with the reinvestment of distributions | | 11,250,899 | | | | 113,354,829 | | | 5,123,079 | | | | 59,622,406 | |
Redeemed | | (135,581,311 | ) | | | (1,374,597,415 | ) | | (41,000,347 | ) | | | (471,380,105 | ) |
| | | | | | | | | | | | | | |
Net change | | 75,938,659 | | | $ | 756,246,875 | | | 105,977,096 | | | $ | 1,245,219,768 | |
| | | | | | | | | | | | | | |
| Class B | | | | | | | | | | | | | | |
Issued from the sale of shares | | 342,411 | | | $ | 3,353,183 | | | 238,331 | | | $ | 2,759,530 | |
Issued in connection with the reinvestment of distributions | | 47,761 | | | | 475,214 | | | 32,911 | | | | 382,852 | |
Redeemed | | (406,153 | ) | | | (4,093,030 | ) | | (208,730 | ) | | | (2,405,675 | ) |
| | | | | | | | | | | | | | |
Net change | | (15,981 | ) | | $ | (264,633 | ) | | 62,512 | | | $ | 736,707 | |
| | | | | | | | | | | | | | |
| Class C | | | | | | | | | | | | | | |
Issued from the sale of shares | | 125,777,319 | | | $ | 1,258,454,707 | | | 86,193,536 | | | $ | 1,001,609,060 | |
Issued in connection with the reinvestment of distributions | | 4,814,937 | | | | 48,253,057 | | | 1,861,389 | | | | 21,543,304 | |
Redeemed | | (42,064,857 | ) | | | (423,168,232 | ) | | (12,717,963 | ) | | | (145,036,821 | ) |
| | | | | | | | | | | | | | |
Net change | | 88,527,399 | | | $ | 883,539,532 | | | 75,336,962 | | | $ | 878,115,543 | |
| | | | | | | | | | | | | | |
| Class Y | | | | | | | | | | | | | | |
Issued from the sale of shares | | 271,785,951 | | | $ | 2,773,164,198 | | | 84,132,384 | | | $ | 980,528,103 | |
Issued in connection with the reinvestment of distributions | | 8,469,829 | | | | 85,983,440 | | | 2,701,331 | | | | 31,421,337 | |
Redeemed | | (76,132,184 | ) | | | (772,285,683 | ) | | (26,105,415 | ) | | | (298,275,048 | ) |
| | | | | | | | | | | | | | |
Net change | | 204,123,596 | | | $ | 2,086,861,955 | | | 60,728,300 | | | $ | 713,674,392 | |
| | | | | | | | | | | | | | |
| Class J | | | | | | | | | | | | | | |
Issued from the sale of shares | | 1,250,300 | | | $ | 12,326,154 | | | 2,839,200 | | | $ | 32,261,445 | |
Issued in connection with the reinvestment of distributions | | — | | | | — | | | — | | | | — | |
Redeemed | | (4,148,420 | ) | | | (42,739,002 | ) | | (2,306,870 | ) | | | (26,702,358 | ) |
| | | | | | | | | | | | | | |
Net change | | (2,898,120 | ) | | $ | (30,412,848 | ) | | 532,330 | | | $ | 5,559,087 | |
| | | | | | | | | | | | | | |
Increase (decrease) from capital share transactions | | 365,675,553 | | | $ | 3,695,970,881 | | | 242,637,200 | | | $ | 2,843,305,497 | |
| | | | | | | | | | | | | | |
9. Concentration of Risk. The Fund may purchase investments of foreign issuers. Investing in securities of foreign issuers involves special risks and considerations not typically associated with investing in U.S. companies and securities of the U.S. government. These risks include revaluation of currencies and the risk of expropriation. Moreover, the markets for securities of many foreign issuers may be less liquid and the prices of such securities may be more volatile than those of comparable U.S. companies and the U.S. government.
34
REPORTOF INDEPENDENT REGISTERED PUBLIC ACCOUNTING FIRM
To the Trustees of Loomis Sayles Funds II and Shareholders of Loomis Sayles Investment Grade Bond Fund:
In our opinion, the accompanying statement of assets and liabilities, including the portfolio of investments, and the related statements of operations and of changes in net assets and the financial highlights present fairly, in all material respects, the financial position of the Loomis Sayles Investment Grade Bond Fund, a series of Loomis Sayles Funds II (the “Fund”), at September 30, 2009, and the results of its operations, the changes in its net assets and the financial highlights for each of the periods indicated, in conformity with accounting principles generally accepted in the United States of America. These financial statements and financial highlights (hereafter referred to as “financial statements”) are the responsibility of the Fund’s management; our responsibility is to express an opinion on these financial statements based on our audits. We conducted our audits of these financial statements in accordance with the standards of the Public Company Accounting Oversight Board (United States). Those standards require that we plan and perform the audits to obtain reasonable assurance about whether the financial statements are free of material misstatement. An audit includes examining, on a test basis, evidence supporting the amounts and disclosures in the financial statements, assessing the accounting principles used and significant estimates made by management, and evaluating the overall financial statement presentation. We believe that our audits, which included confirmation of securities at September 30, 2009 by correspondence with the custodian and brokers, provide a reasonable basis for our opinion.
PricewaterhouseCoopers LLP
Boston, Massachusetts
November 23, 2009
35
2009 U.S. TAX DISTRIBUTION INFORMATIONTO SHAREHOLDERS (Unaudited)
Capital Gains Distributions. Pursuant to Internal Revenue Section 852(b), the Fund designated $9,171,073 as capital gains dividends paid during the year ended September 30, 2009, unless subsequently determined to be different.
Qualified Dividend Income. For the fiscal year ended September 30, 2009, the Investment Grade Bond Fund will designate up to the maximum amount allowable pursuant to the Internal Revenue Code as qualified dividend income eligible for reduced tax rates. These lower rates range from 0% to 15% depending on an individual’s tax bracket. If the Fund pays a distribution during calendar year 2009, complete information will be reported in conjunction with Form 1099-DIV.
Qualified Interest Income. For the fiscal year ending September 30, 2009, the Investment Grade Bond Fund will designate up to the maximum amount allowable pursuant to the Internal Revenue Code as qualified interest income eligible for reduced tax with holding rates for foreign shareholders. Complete information will be reported in conjunction with dividend information provided to foreign shareholders.
36
TRUSTEEAND OFFICER INFORMATION
The tables below provide certain information regarding the Trustees and officers of Loomis Sayles Funds II (the “Trust”). Unless otherwise indicated, the address of all persons below is 399 Boylston Street, Boston, MA 02116. The Trust’s Statements of Additional Information include additional information about the Trustees of the Trust and are available by calling Natixis Funds at 800-225-5478.
| | | | | | |
Name and Year of Birth | | Position(s) Held with the
Trust, Length of Time
Served and Term of Office* | | Principal Occupation(s)
During Past 5 Years** | | Number of Portfolios in
Fund Complex Overseen*** and Other Directorships Held |
| |
| INDEPENDENT TRUSTEES | | |
| | | |
Graham T. Allison, Jr.
(1940) | | Trustee Since 2003 Contract Review and Governance Committee Member | | Douglas Dillon Professor and Director of the Belfer Center for Science and International Affairs, John F. Kennedy School of Government, Harvard University | | 39 Director, Taubman Centers, Inc. (real estate investment trust) |
| | | |
Charles D. Baker
(1956) | | Trustee Since 2005 Contract Review and Governance Committee Member | | Formerly, President and Chief Executive Officer, Harvard Pilgrim Health Care (health plan) | | 39 None |
| | | |
Edward A. Benjamin
(1938) | | Trustee Since 2002 Chairman of the Contract Review and Governance Committee | | Retired | | 39 None |
| | | |
Daniel M. Cain
(1945) | | Trustee Since 2003 Chairman of the Audit Committee | | Chairman, (formerly, President and Chief Executive Officer) Cain Brothers & Company, Incorporated (investment banking) | | 39 Director, Sheridan Healthcare Inc. (physician practice management) |
| | | |
Kenneth A. Drucker
(1945) | | Trustee Since 2008 Audit Committee Member | | Formerly, Treasurer, Sequa Corp. (manufacturing) | | 39 None |
| | | |
Wendell J. Knox****
(1948) | | Trustee Since 2009 Contract Review and Governance Committee Member | | Director (formerly, President and Chief Executive Officer) of Abt Associates Inc. (research and consulting) | | 39 Director, Eastern Bank (commercial bank); Director, The Hanover Insurance Group (property and casualty insurance) |
| | | |
Sandra O. Moose
(1942) | | Chairperson of the Board of Trustees since November 2005 Trustee Since 2003 Ex officio member of the Audit Committee and Contract Review and Governance Committee | | President, Strategic Advisory Services (management consulting); formerly, Senior Vice President and Director, The Boston Consulting Group, Inc. (management consulting) | | 39 Director, Verizon Communications; Director, AES Corporation (international power company) |
37
TRUSTEEAND OFFICER INFORMATION
| | | | | | |
Name and Year of Birth | | Position(s) Held with the
Trust, Length of Time
Served and Term of Office* | | Principal Occupation(s)
During Past 5 Years** | | Number of Portfolios in
Fund Complex Overseen*** and Other Directorships Held |
| |
INDEPENDENT TRUSTEES continued | | |
| | | |
Cynthia L. Walker (1956) | | Trustee Since 2005 Audit Committee Member | | Deputy Dean for Finance and Administration, Yale University School of Medicine; formerly, Executive Dean for Administration, Harvard Medical School; and formerly, Dean for Finance and Chief Financial Officer, Harvard Medical School | | 39 None |
| |
| INTERESTED TRUSTEES | | |
| | | |
Robert J. Blanding1 (1947) 555 California Street San Francisco, CA 94104 | | Trustee and Chief Executive Officer since 2002 | | President, Chairman, Director and Chief Executive Officer, Loomis, Sayles & Company, L.P. | | 39 None |
| | | |
John T. Hailer2 (1960) | | Trustee Since 2003 | | President and Chief Executive Officer-U.S. and Asia, Natixis Global Asset Management, L.P.; formerly, President and Chief Executive Officer, Natixis Distribution Corporation, Natixis Asset Management Advisors, L.P., Natixis Distributors, L.P. and Natixis Global Associates, Inc. | | 39 None |
| * | Each Trustee serves until retirement, resignation or removal from the Board of Trustees. The current retirement age is 72. The position of Chairperson of the Board is appointed for a two-year term. Ms. Moose was appointed to serve an additional two-year term as the Chairperson of the Board of Trustees on September 14, 2007. |
| ** | Each person listed above, except as noted, holds the same position(s) with the Natixis Funds Trust I, Natixis Funds Trust II, Natixis Funds Trust III, Natixis Funds Trust IV, Gateway Trust and the Natixis Cash Management Trust (collectively, the “Natixis Funds Trusts”), Loomis Sayles Funds I and Loomis Sayles Funds II (collectively, the “Loomis Sayles Funds Trusts”), and Hansberger International Series. Previous positions during the past five years with Natixis Distributors, L.P. (the “Distributor”), Natixis Asset Management Advisors, L.P. (“Natixis Advisors”), or Loomis, Sayles & Company, L.P. (“Loomis Sayles”) are omitted if not materially different from a Trustee’s or officer’s current position with such entity. |
| *** | The Trustees of the Trusts serve as trustees of a fund complex that includes all series of the Natixis Funds Trusts, the Loomis Sayles Funds Trusts and Hansberger International Series (collectively, the “Fund Complex”). |
| **** | Mr. Knox was appointed as trustee effective July 1, 2009. |
| 1 | Mr. Blanding is deemed an “interested person” of the Trusts because he holds the following positions with an affiliated person of the Trusts: President, Chairman, Director and Chief Executive Officer of Loomis Sayles. |
| 2 | Mr. Hailer is deemed an “interested person” of the Trusts because he holds the following positions with an affiliated person of the Trusts: President and Chief Executive Officer-U.S. and Asia, Natixis Global Asset Management, L.P. |
38
TRUSTEEAND OFFICER INFORMATION
| | | | | | |
Name and Year of Birth | | Position(s) Held with the
Trust | | Term of Office* and
Length of Time Served | | Principal Occupation During
Past 5 Years** |
| |
| OFFICERS OF THE TRUST | | |
| | | |
Coleen Downs Dinneen
(1960) | | Secretary, Clerk and Chief Legal Officer | | Since September 2004 | | Executive Vice President, General Counsel, Secretary and Clerk (formerly, Senior Vice President, Deputy General Counsel, Assistant Secretary and Assistant Clerk), Natixis Distribution Corporation, Natixis Asset Management Advisors, L.P. and Natixis Distributors, L.P. |
| | | |
Daniel J. Fuss
(1933) One Financial Center Boston, MA 02111 | | Executive Vice President | | Since June 2003 | | Vice Chairman and Director, Loomis, Sayles & Company, L.P. |
| | | |
David Giunta (1965) | | President | | Since March 2008 | | President and Chief Executive Officer, Natixis Distribution Corporation, Natixis Asset Management Advisors, L.P. and Natixis Distributors, L.P.; formerly, President, Fidelity Charitable Gift Fund; and formerly, Senior Vice President, Fidelity Brokerage Company |
| | | |
Russell L. Kane (1969) | | Chief Compliance Officer, Assistant Secretary and Anti-Money Laundering Officer | | Chief Compliance Officer since May 2006; Assistant Secretary since June 2004; and Anti-Money Laundering Officer since April 2007 | | Chief Compliance Officer for Mutual Funds, Senior Vice President, Deputy General Counsel, Assistant Secretary and Assistant Clerk, Natixis Distribution Corporation, Natixis Asset Management Advisors, L.P. and Natixis Distributors, L.P. |
| | | |
Michael C. Kardok (1959) | | Treasurer, Principal Financial and Accounting Officer | | Since October 2004 | | Senior Vice President, Natixis Asset Management Advisors, L.P. and Natixis Distributors, L.P. |
| * | Each officer of the Trusts serves for an indefinite term in accordance with the Trust’s current By-laws until the date his or her successor is elected and qualified, or until he or she sooner dies, retires, is removed or becomes disqualified. |
| ** | Each person listed above, except as noted, holds the same position(s) with the Fund Complex. Mr. Fuss is not an officer of the Natixis Funds Trusts or the Hansberger International Series. Previous positions during the past five years with the Distributor, Natixis Advisors or Loomis Sayles are omitted if not materially different from a Trustee’s or officer’s current position with such entity. |
39
The Registrant has adopted a code of ethics that applies to the Registrant’s principal executive officer, principal financial officer and persons performing similar functions.
| Item 3. | Audit Committee Financial Expert. |
The Board of Trustees of the Registrant has established an audit committee. Ms. Cynthia L. Walker, Mr. Daniel M. Cain and Mr. Kenneth A. Drucker are members of the audit committee and have been designated as “audit committee financial experts” by the Board of Trustees. Each of these individuals is also an Independent Trustee of the Registrant.
| Item 4. | Principal Accountant Fees and Services. |
Fees billed by the Principal Accountant for services rendered to the Registrant.
The table below sets forth fees billed by the principal accountant, PricewaterhouseCoopers LLP, for the past two fiscal years for professional services rendered in connection with a) the audit of the Registrant’s annual financial statements and services provided in connection with regulatory filings; b) audit-related services (including services that are reasonably related to the performance of the audit of the Registrant’s financial statements and but not reported under “Audit Fees”); c) tax compliance, tax advice and tax planning and d) all other fees billed for professional services rendered by the principal accountant to the Registrant, other than the services reported as a part of (a) through (c) of this Item.
| | | | | | | | | | | | | | | | | | | | | | | | |
| | | Audit fees | | Audit-related fees1 | | Tax fees2 | | All other fees3 |
| | | 2008 | | 2009 | | 2008 | | 2009 | | 2008 | | 2009 | | 2008 | | 2009 |
Loomis Sayles Funds II | | $ | 419,167 | | $ | 418,399 | | $ | 29,851 | | $ | 4,266 | | $ | 131,205 | | $ | 105,143 | | $ | 29,562 | | $ | 25,795 |
| 1. | Audit-related fees consist of: |
2008 – a) performance of agreed-upon procedures related to the Registrant’s deferred compensation plan, b) services related to the implementation of a new accounting standard, c) performance of agreed upon procedures related to a fund merger with the Loomis Sayles Value Fund and d) consulting services with respect to potential derivative investments for the Loomis Sayles Mid Cap Growth Fund.
2009 - performance of agreed-upon procedures related to the Registrant’s deferred compensation plan.
2008 - review of year-end shareholder reporting and the Registrant’s tax returns and consulting services with respect to potential derivative investments for the Loomis Sayles Mid Cap Growth Fund.
2009 - review of Registrant’s tax returns and consulting services with respect to new security types.
| 3. | All other fees consist of: |
2008 - filing and translation services with respect to Japanese shareholders in Loomis Sayles Investment Grade Bond Fund.
2009 - filing and translation services with respect to Japanese shareholders in Loomis Sayles Investment Grade Bond Fund.
Aggregate fees billed to the Registrant for non-audit services during 2008 and 2009 were $190,618 and $135,204, respectively.
Fees billed by the Principal Accountant for services rendered to the Adviser and Control Affiliates.
The following table sets forth the non-audit services provided by the Registrant’s principal accountant to Loomis, Sayles & Company, L.P. and entities controlling, controlled by or under common control with Loomis, Sayles & Company, L.P. that provide ongoing services to the Registrant (“Control Affiliates”) for the last two fiscal years.
| | | | | | | | | | | | | | | | | | |
| | | Audit-related fees | | Tax fees | | All other fees |
| | | 2008 | | 2009 | | 2008 | | 2009 | | 2008 | | 2009 |
Control Affiliates | | $ | 12,000 | | $ | 12,000 | | $ | — | | $ | 6,500 | | $ | — | | $ | — |
Aggregate fees billed to Control Affiliates for non-audit services during 2008 and 2009 were $12,000 and $18,500, respectively.
None of the audit-related, tax and other services provided by the Registrant’s principal accountant were approved by the Audit Committee pursuant to paragraph (c)(7)(i)(C) of Rule 2-01 of Regulation S-X.
Audit Committee Pre Approval Policies.
Annually, the Registrant’s Audit Committee reviews the audit, audit-related, tax and other non-audit services together with the projected fees, for services proposed to be rendered to the Trust and/or other entities for which pre-approval is required during the upcoming year. Any subsequent revisions to already pre-approved services or fees (including fee increases) and requests for pre-approval of new services would be presented for consideration quarterly as needed.
If, in the opinion of management, a proposed engagement by the Registrant’s independent accountants needs to commence before the next regularly scheduled Audit Committee meeting, any member of the Audit Committee who is an independent Board member is authorized to pre-approve the engagement, but only for engagements to provide audit, audit related and tax services. This approval is subject to review of the full Audit Committee at its next quarterly meeting. All other engagements require the approval of all the members of the Audit Committee.
| Item 5. | Audit Committee of Listed Registrants. |
Not applicable.
| Item 6. | Schedule of Investments. |
Included as part of the Report to Shareholders filed as Item 1 herewith.
| Item 7. | Disclosure of Proxy Voting Policies and Procedures for Closed-End Management Investment Companies. |
Not applicable.
| Item 8. | Portfolio Managers of Closed-End Management Investment Companies |
Not applicable.
| Item 9. | Purchases of Equity Securities by Closed-End Management Investment Companies and Affiliated Purchasers. |
Not applicable.
| Item 10. | Submission of Matters to a Vote of Securities Holders. |
There were no material changes to the procedures by which shareholders may recommend nominees to the Registrant’s Board of Trustees.
| Item 11. | Controls and Procedures. |
The Registrant’s principal executive officer and principal financial officer have concluded that the Registrant’s disclosure controls and procedures are sufficient to ensure that information required to be disclosed by the Registrant in this Form N-CSR was recorded, processed, summarized and reported within the time periods specified in the Securities and Exchange Commission’s rules and forms, based upon such officers’ evaluation of these controls and procedures as of a date within 90 days of the filing date of the report.
There were no changes in the Registrant’s internal control over financial reporting that occurred during the Registrant’s last fiscal quarter of the period covered by the report that has materially affected, or is reasonably likely to materially affect, the Registrant’s internal control over financial reporting.
| | | | |
| (a) | | (1) | | Code of Ethics required by Item 2 hereof, filed herewith as Exhibit (a)(1). |
| | |
| (a) | | (2) | | Certifications of Principal Executive Officer and Principal Financial Officer pursuant to Rule 30a-2(a) under the Investment Company Act of 1940 (17 CFR 270.30a-2(a)), filed herewith as Exhibits (a)(2)(1) and (a)(2)(2), respectively. |
| | |
| (a) | | (3) | | Not applicable. |
| | |
| (b) | | | | Certification of Principal Executive Officer and Principal Financial Officer pursuant to Section 906 of Sarbanes-Oxley Act of 2002 are filed herewith as Exhibit (b). |
SIGNATURES
Pursuant to the requirements of the Securities Exchange Act of 1934 and the Investment Company Act of 1940, the Registrant has duly caused this report to be signed on its behalf by the undersigned, thereunto duly authorized.
| | |
| Loomis Sayles Funds II |
| |
| By: | | /s/ ROBERT J. BLANDING |
| Name: | | Robert J. Blanding |
| Title: | | Chief Executive Officer |
| Date: | | November 23, 2009 |
Pursuant to the requirements of the Securities Exchange Act of 1934 and the Investment Company Act of 1940, this report has been signed by the following persons on behalf of the Registrant and in the capacities and on the dates indicated.
| | |
| By: | | /s/ ROBERT J. BLANDING |
| Name: | | Robert J. Blanding |
| Title: | | Chief Executive Officer |
| Date: | | November 23, 2009 |
| |
| By: | | /s/ MICHAEL C. KARDOK |
| Name: | | Michael C. Kardok |
| Title: | | Treasurer |
| Date: | | November 23, 2009 |