UNITED STATES
SECURITIES AND EXCHANGE COMMISSION
Washington, D.C. 20549
FORM N-CSR
CERTIFIED SHAREHOLDER REPORT OF REGISTERED
MANAGEMENT INVESTMENT COMPANIES
Investment Company Act file number: 811-06241
Loomis Sayles Funds II
(Exact name of Registrant as specified in charter)
| | |
| 399 Boylston Street, Boston, Massachusetts | | 02116 |
| (Address of principal executive offices) | | (Zip code) |
Coleen Downs Dinneen, Esq.
NGAM Distribution, L.P.
399 Boylston Street
Boston, Massachusetts 02116
(Name and address of agent for service)
Registrant’s telephone number, including area code: (617) 449-2810
Date of fiscal year end: September 30
Date of reporting period: September 30, 2014
| Item 1. | Reports to Stockholders. |
The Registrant’s annual report transmitted to shareholders pursuant to Rule 30e-1 under the Investment Company Act of 1940 is as follows:
ANNUAL REPORT
September 30, 2014

Loomis Sayles Global Equity and Income Fund
Loomis Sayles Growth Fund
Loomis Sayles Value Fund

TABLE OF CONTENTS
Portfolio Review page 1
Portfolio of Investments page 21
Financial Statements page 46
Notes to Financial Statements page 65
Barron’s/Lipper 2013 one-year ranking is based on 64 qualifying U.S. fund companies. Award recipient must have at least three funds in Lipper’s general U.S.-stock category (including at least one world and one mixed asset/balanced), two taxable bond and one tax-exempt bond fund. Natixis was not ranked for the 5- and 10-year periods. Past performance is no guarantee of future results.
For more details visit ngam.natixis.com/TopFundFamily
LOOMIS SAYLES GLOBAL EQUITY AND INCOME FUND
| | |
| Managers | | Symbols |
| Daniel J. Fuss, CFA®, CIC | | Class A LGMAX |
| Eileen N. Riley, CFA® | | Class C LGMCX |
| David W. Rolley, CFA® | | Class Y LSWWX |
| Lee M. Rosenbaum | | |
| Loomis, Sayles & Company, L.P. | | |
Objective
Seeks high total investment return through a combination of capital appreciation and current income
Market Conditions
Developed equity markets posted relatively strong gains during the 12-month period ending September 30, 2014 in U.S. dollar terms. The S&P 500® Index was one of the best performing markets globally due to improving economic data including rising consumer confidence and lower unemployment. In Europe, the mixed pace of economic recovery resulted in muted, albeit positive, returns. Emerging market stocks delivered gains in aggregate terms following their lows in January, demonstrating some resilience to recent challenging macroeconomic events. Weakness in Russia and other Eastern European markets was offset by strength in India and several other Southeast Asian markets and in Mexico and Peru.
Bond market themes included general spread tightening, significant central bank involvement and rising geopolitical tensions. U.S. rates initially trended higher before declining through the first half of 2014 as expectations surrounding the timing of interest rate hikes changed.
In terms of global macroeconomic drivers, softer economic data at the beginning of 2014, harsh winter weather in the United States, and lingering concerns across Asia and several emerging market economies contributed to moderate but uneven global growth. The euro zone recovery has been timid overall, and progress has varied considerably across the region. In Japan, economic data were mixed while the country’s commitment to the prime minister’s reform agenda remained strong. Finally, emerging markets performed well for most of the period, as valuations improved following last year’s selloff.
Performance Results
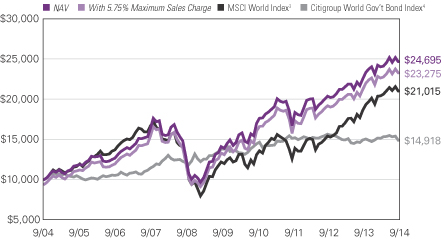
For the 12 months ended September 30, 2014, Class A shares of Loomis Sayles Global Equity and Income Fund returned 9.62% at net asset value. The Fund underperformed its primary benchmark, the Morgan Stanley Capital International (MSCI) World Index, which returned 12.80%. The Fund outpaced its secondary benchmark, the Citigroup World Government Bond Index, which returned -0.07%.
1 |
Explanation of Fund Performance
Although the Fund delivered a strong absolute return, it underperformed its primary, all-equity benchmark due to its blended equity and fixed-income exposure in what were ultimately strong prevailing equity market conditions.
Within the Fund’s equity component, individual stocks in the consumer staples, information technology and financials sectors detracted from performance, as did the energy sector in general. Hengan International, a China-based manufacturer of paper products, was a prominent detractor. The stock lagged as competitive intensity increased; however, proactive steps to expand internationally and reduce capital spending are underway. Adidas, a global sport apparel company, underperformed as conditions in Russia deteriorated, competition increased, and the company’s golf business disappointed, which led to below-forecast operating margins. A position in a Turkey-based bank, Turkiye Garanti Bankasi, launched last year on expectations for stabilization in the Turkish economy, deteriorated when the currency devalued sharply in January prompting us to exit the position.
Within the fixed-income component, a position in shorter-maturity U.S. Treasury notes weighed on performance. These holdings did not perform as well as longer-maturity Treasury bonds, nor did they keep pace with corporate bonds and euro zone government securities. Elsewhere, holdings in sovereign bonds backed by the governments of Canada, South Africa and Japan underperformed broader markets due to currency weakness. In addition, our strategy of managing currency risk via forwards detracted from results.
The equity component performed well due largely to strong stock selection in the healthcare, consumer discretionary and materials sectors. From a regional perspective, strong stock selection in European stocks, combined with a large underweight to developed Asia, aided performance. On a security level, Shire, Transdigm Group and Google were among the strongest contributors to absolute return. Under a new CEO, Shire, a global pharmaceutical company, streamlined its existing businesses and used its strong balance sheet to augment internal growth via acquisitions. Transdigm Group, a U.S. aircraft parts manufacturer, benefited from a combination of strong end-market demand in commercial aerospace, two acquisitions, and a sizable special dividend that helped drive shares higher. Google, a U.S. based Internet company, showed strong stock performance driven by a reacceleration in its advertising revenue, an increase in mobile search revenue, and a more effective monetization of its YouTube video site.
Within the Fund’s fixed-income component, exposure to global corporate bonds drove the majority of the positive performance. Corporate bond spreads (the difference in yields between corporate bonds and government bonds of similar maturity) touched and remained near historically low levels, with the exception of below-investment-grade bonds, which experienced some weakness late in the period. Positioning in the banking, metals and mining, and wireless industries was particularly advantageous. Government bonds from Spain, Italy and other peripheral euro zone countries posted strong returns, as yield-starved investors were willing to move lower on the quality spectrum to increase return potential. Elsewhere, selected positions in emerging market bonds aided results, including hard currency bonds issued by government-related enterprises in Brazil, Turkey and Hungary.
| 2
LOOMIS SAYLES GLOBAL EQUITY AND INCOME FUND
Outlook
U.S. economic data continues to outpace data from other economies around the world, so much so that the Federal Reserve (the Fed) remains on a path to raise its federal funds rate target sometime in 2015, for the first time since before the financial crisis began. At the same time, with other central banks moving toward further stimulus, the relative outperformance of the U.S. dollar versus many global currencies may continue for the near term. This currency advantage, on top of the arguably superior relative fundamental prospects for large U.S. companies, has supported U.S. equities in recent months. While third-quarter results may have disappointed, we should keep in mind that U.S. equities have posted strong longer-term, multi-year returns across all market capitalizations.
In the fixed-income market, we believe the U.S. remains the best poised of the industrialized economies to expand in the near term, lead the global recovery forward and raise short-term interest rates in 2015. Growth, in tandem with the Fed’s decision to end quantitative easing in October, should lead to higher U.S. yields, all else being equal. As U.S. growth increases, selected countries may benefit due to their close trading ties with the U.S.
Geopolitical stress and lackluster growth have generated concerns about Europe’s short-term prospects. We believe an accommodative European Central Bank should support local bond markets and likely cap yields in the near and medium term. Meanwhile, in Japan we believe there is an inflection point at which yen weakness will start having an adverse effect on Japan’s import pricing and profitability. In emerging markets, we believe country and currency selections will remain crucial in coming quarters, as certain economies may face slower growth. We will closely monitor China’s growth, but we do not anticipate any major financial incidents.
Growth of $10,000 Investment in Class A Shares1,5
September 30, 2004 through September 30, 2014
3 |
Average Annual Total Returns — September 30, 20145
| | | | | | | | | | | | |
| | | | |
| | | 1 Year | | | 5 Years | | | 10 Years | |
| | | | |
| Class A (Inception 2/1/06)1 | | | | | | | | | | | | |
| NAV | | | 9.62 | % | | | 11.84 | % | | | 9.46 | % |
| With 5.75% Maximum Sales Charge | | | 3.33 | | | | 10.53 | | | | 8.82 | |
| | | | |
| Class C (Inception 2/1/06)1 | | | | | | | | | | | | |
| NAV | | | 8.72 | | | | 11.01 | | | | 8.65 | |
| With CDSC2 | | | 7.72 | | | | 11.01 | | | | 8.65 | |
| | | | |
| Class Y (Inception 5/1/96) | | | | | | | | | | | | |
| NAV | | | 9.87 | | | | 12.13 | | | | 9.73 | |
| | | | |
| Comparative Performance | | | | | | | | | | | | |
| MSCI World Index3 | | | 12.80 | | | | 11.47 | | | | 7.71 | |
| Citigroup World Government Bond Index4 | | | -0.07 | | | | 1.58 | | | | 4.08 | |
Past performance does not guarantee future results. The table(s) do not reflect taxes shareholders might owe on any Fund distributions or when they redeem their shares. Performance for periods less than one year is cumulative, not annualized. Returns reflect changes in share price and reinvestment of dividends and capital gains, if any. Unlike a fund, an index is not managed and does not reflect fees and expenses.
| 1 | Prior to the inception of Class A and C shares (2/1/06), performance is that of Institutional Class shares, which were redesignated as Class Y shares, and restated to reflect the higher net expenses and sales loads of Class A and C shares. |
| 2 | Performance for Class C shares assumes a 1% contingent deferred sales charge (“CDSC”) applied when you sell shares within one year of purchase. |
| 3 | MSCI World Index is an unmanaged index that is designed to measure the equity market performance of developed markets. |
| 4 | Citigroup World Government Bond Index is an unmanaged index that includes the most significant and liquid government bond markets globally that carry at least an investment-grade rating. |
| 5 | Fund performance has been increased by fee waivers and/or expense reimbursements, if any, without which performance would have been lower. |
| 4
LOOMIS SAYLES GROWTH FUND
| | |
| Manager | | Symbols |
| Aziz V. Hamzaogullari, CFA® | | Class A LGRRX |
| Loomis, Sayles & Company, L.P. | | Class B LGRBX |
| | Class C LGRCX |
| | Class N LGRNX |
| | Class Y LSGRX |
Objective
Long-term growth of capital
Market Conditions
Following strong performance in 2013, equity market returns were modest overall for the first quarter of 2014. U.S. large-cap stocks moved higher with few interruptions in the second quarter, supported by the U.S. economic recovery. U.S. corporate earnings growth remained positive, and domestic companies continued to return capital to shareholders in the form of stock repurchases and dividends. Equity returns closed the period with mixed results. Large-cap stocks sustained their constructive, lower-volatility uptrend, posting modest third-quarter returns. By contrast, results were generally negative for the small- and mid-cap segments of the market.
Performance Results
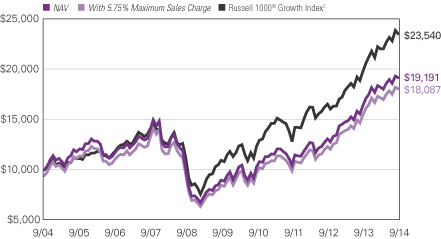
For the 12 months ended September 30, 2014, Class A shares of Loomis Sayles Growth Fund returned 17.23% at net asset value. The Fund underperformed its benchmark, the Russell 1000® Growth Index, which returned 19.15%.
Explanation of Fund Performance
The Fund returned strong absolute performance due primarily to contributions from its holdings in Facebook, Google, and Monster Beverage. The Fund’s positions in Danone, ARM Holdings, and Expeditors International of Washington detracted slightly from return. Stock selection in the healthcare, industrials, information technology, and consumer discretionary sectors detracted from relative performance. Stock selection in the consumer staples and financials sectors as well as our allocation to the information technology, consumer discretionary, and energy sectors contributed to relative performance.
Social media company Facebook was a top contributor, with advertising revenue again accelerating growth for all key metrics. In particular, mobile advertising represented more than 57% of advertising revenue and a $5.1 billion business for Facebook. Facebook grew much faster than the overall advertising industry. More importantly, the company grew much faster than the online advertising segment, gaining significant market share during the period. We continue to see attractive upside potential in this large, growing and underpenetrated market. We believe Facebook is well-positioned for strong, sustained growth and shares remain priced significantly below intrinsic value, offering an attractive, long-term reward-to-risk opportunity.
5 |
Global online search and advertising leader Google reported robust organic growth above that of the overall online advertising industry. Increased advertising in mobile, video and online channels continued to drive fundamentally strong revenue growth. The company is focusing on helping clients build their digital brand by providing trustworthy ad technology to publishers and advertisers and continuing to roll out digital content on a global basis through Google Play. YouTube continues to gain traction with users and advertisers and will play a major role in helping clients build their brand. We believe the market continues to underestimate Google’s long-term sustainable growth rate.
Monster Beverage, an energy drink company, reported solid results during the period. In the most recent quarter, sales growth in the U.S. was just below its recent double-digit run rate and in line with growth in the energy drink category. Gross and operating margins improved in North America due to positive product mix, selective pricing strategies and reduced ingredient costs. International gross and operating margins improved as a result of cost benefits associated with local production, right-sizing of international operations, particularly in Europe, and scale. In mid-August, Monster and Coca-Cola entered into a long-term strategic partnership that we believe will benefit both parties and accelerate growth. As part of the deal, Monster becomes Coca-Cola’s exclusive energy drink partner and Coca-Cola will become Monster’s preferred global distributor.
Danone, a food company based in France, posted a slight increase in revenue but a decline in net operating income year-over-year due to record milk price inflation, softness in North American and European fresh dairy markets, and mixed performance in China’s early nutrition business. We believe the company has taken the necessary actions to address the issue of milk price inflation, and we anticipate continued improvements in Europe and China. With market expectations for revenue and profit growth well below our estimates, we believe the company’s shares are trading at a significant discount to our estimate of intrinsic value, offering an attractive reward-to-risk profile.
Although U.K.-based semiconductor designer ARM Holdings reported mixed results, it has continued to gain market share across all its markets. Licensing revenue was strong, but the company reported ongoing weakness in royalty revenues caused by an inventory correction in the mobile industry early in 2014 and continued rapid growth in lower-valued non-mobile chips—ARM’s fastest-growing segment. We believe the royalty revenues will improve with continued rapid adoption of 4G technology in China and the ongoing replacement of entry-level phones with smartphones. Furthermore, we recognize the uptick in licensing as an important driver of longer-term growth in higher-margin royalty revenue. Going forward, we believe the company should benefit from higher royalty fees associated with the licensing of its new technologies. ARM is beginning to see traction in the enterprise server and networking business where the combined total addressable market is similar to that of smartphones. We believe ARM remains well-positioned to benefit from the long-term growth in mobile devices and the shift to outsourcing of chip architecture design. Company shares currently sell at a discount to our estimate of intrinsic value, and therefore, we believe ARM offers a compelling reward-to-risk opportunity.
| 6
LOOMIS SAYLES GROWTH FUND
Logistics company Expeditors International of Washington reported strong volume growth in its air and ocean freight forwarding operations and its customs services business. However, ongoing near-term pricing weakness and an uptick in certain costs led to some margin pressure year-over-year. Geographically, Europe and the US saw strong growth in net revenues, while Asia reported negative net revenue growth due to pricing pressure. While ocean freight volume growth was stronger than airfreight volume growth, both segments performed well compared to competitors, and allowed the company to gain market share. The pricing environment remained challenging, as pricing power lagged the cyclical recovery in volumes. Based on our analysis, we expect pricing to improve over time and drive margin expansion. We believe Expeditors will continue to gain share and benefit from the cyclical rebound in international trade and structural tailwinds in the industry. Expeditors’ shares are trading at a significant discount to our estimate of its intrinsic value, and we believe they offer a compelling reward-to-risk opportunity.
Outlook
Our investment process is characterized by bottom-up, fundamental research and a long-term investment time horizon. The nature of the process leads to a lower-turnover portfolio in which sector positioning is the result of stock selection. The Fund ended the period with overweight positions in the information technology, consumer staples, healthcare and financials sectors and underweight positions in the consumer discretionary, industrials, energy, materials, telecommunication services, and utilities sectors.
Growth of $10,000 Investment in Class A Shares3
September 30, 2004 through September 30, 2014
7 |
Average Annual Total Returns — September 30, 20143
| | | | | | | | | | | | | | | | |
| | | | | |
| | | 1 Year | | | 5 Years | | | 10 Years | | | Life of
Class N | |
| | | | | |
| Class A (Inception 12/31/96) | | | | | | | | | | | | | | | | |
| NAV | | | 17.23 | % | | | 16.36 | % | | | 6.73 | % | | | — | % |
| With 5.75% Maximum Sales Charge | | | 10.52 | | | | 15.01 | | | | 6.11 | | | | — | |
| | | | | |
| Class B (Inception 9/12/03) | | | | | | | | | | | | | | | | |
| NAV | | | 16.27 | | | | 15.48 | | | | 5.93 | | | | — | |
| With CDSC1 | | | 11.27 | | | | 15.25 | | | | 5.93 | | | | — | |
| | | | | |
| Class C (Inception 9/12/03) | | | | | | | | | | | | | | | | |
| NAV | | | 16.42 | | | | 15.53 | | | | 5.95 | | | | — | |
| With CDSC1 | | | 15.42 | | | | 15.53 | | | | 5.95 | | | | — | |
| | | | | |
| Class N (Inception 2/1/13) | | | | | | | | | | | | | | | | |
| NAV | | | 17.21 | | | | — | | | | — | | | | 18.40 | |
| | | | | |
| Class Y (Inception 5/16/91) | | | | | | | | | | | | | | | | |
| NAV | | | 17.51 | | | | 16.65 | | | | 7.09 | | | | — | |
| | | | | |
| Comparative Performance | | | | | | | | | | | | | | | | |
| Russell 1000® Growth Index2 | | | 19.15 | | | | 16.50 | | | | 8.94 | | | | 20.79 | |
Past performance does not guarantee future results. The table(s) do not reflect taxes shareholders might owe on any Fund distributions or when they redeem their shares. Performance for periods less than one year is cumulative, not annualized. Returns reflect changes in share price and reinvestment of dividends and capital gains, if any. Unlike a fund, an index is not managed and does not reflect fees and expenses.
| 1 | Performance for Class B shares assumes a maximum of 5% contingent deferred sales charge (“CDSC”) applied when you sell shares, which declines annually between years 1-6 according to the following schedule: 5, 4, 3, 3, 2, 1, 0%. Class C shares performance assumes a 1% CDSC applied when you sell shares within one year of purchase. |
| 2 | Russell 1000® Growth Index is an unmanaged index that measures the performance of the large-cap growth segment of the U.S. equity universe. It includes those Russell 1000 companies with higher price-to-book ratios and higher forecasted growth values. |
| 3 | Fund performance has been increased by fee waivers and/or expense reimbursements, if any, without which performance would have been lower. |
| 8
LOOMIS SAYLES VALUE FUND
| | | | |
| Managers | | Symbols | | |
| Arthur J. Barry, CFA® | | Class A | | LSVRX |
Adam C. Liebhoff* | | Class B | | LSVBX |
| Warren N. Koontz, CFA®, CIC** | | Class C | | LSCVX |
| Loomis, Sayles & Company, L.P. | | Class N | | LSVNX |
| | Class Y | | LSGIX |
| | Admin Class | | LSAVX |
| * | Adam C. Liebhoff became a co-portfolio manager of the Fund effective September 12, 2014. |
| ** | Effective August 25, 2014 Warren Koontz no longer serves as co-portfolio manager of the Fund. |
Objective
Long-term growth of capital and income
Market Conditions
The U.S. equity markets performed well during the 12 months ended September 30, 2014, but the period was not without its ups and downs. After a strong end to 2013, the historical tendency for the market to outperform in January was instead replaced by a period of profit taking. A substantial rebound followed in February and March. However, the markets fell again in early April on news of the Ukrainian crisis and Russia’s annexation of the Crimean peninsula. From mid-April through the end of the second quarter, stocks generally rallied, partly due to the U.S. economy showing signs of a strong rebound from the weather-ravaged first quarter. Throughout the third quarter, stocks oscillated around a flat return, as economic data showed mixed signs. Improving consumer sentiment and a recent uptick in household income were encouraging, but the price of oil declined sharply in the third quarter on a strong dollar and robust U.S. supply.
Performance Results
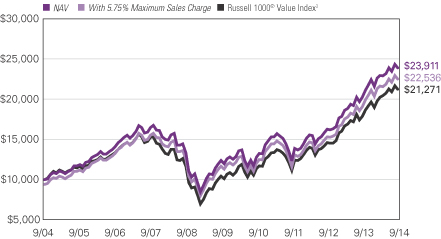
For the 12 months ended September 30, 2014, Class A shares of Loomis Sayles Value Fund returned 17.97% at net asset value. The Fund underperformed its benchmark, the Russell 1000® Value Index, which returned 18.89%.
Explanation of Fund Performance
Although the Fund delivered a strong absolute return, it slightly underperformed due to stock selection in the information technology sector on a relative basis. Every sector contributed positively to total return over the past year. Stock selection, particularly in the financial and healthcare sectors, aided Fund performance. Underweight positions in the financial and energy sectors also boosted return. Other sectors that underperformed compared with the Benchmark included the consumer discretionary, industrials and utilities sectors.
9 |
Among the largest detractors to Fund performance was General Motors, the vehicle manufacturer, which lagged for several reasons. The company announced weaker-than-expected fourth quarter 2013 earnings and disappointing guidance for the first quarter of 2014. Severe winter weather in the first quarter of 2014 hampered vehicle sales. In addition, a highly publicized recall weighed on stock performance. Initially the recall focused on faulty ignition switches on several older models, but GM soon expanded it to include other issues. A position in First Energy, a public utility company, was also a prominent detractor, underperforming due to pressure on power markets caused by low regional natural gas prices. The company attempted to offset this headwind with a shift to more regulated growth, but the move was insufficient and caused the company to reduce its dividend to help fund the regulated growth investments. Finally, Knowles Corp, a designer and manufacturer of advanced acoustic components, underperformed due to an industry practice called a “teardown,” which resulted in an in-depth look at how the iPhone was made. The teardown insinuates that the company lost market share for its microphones used in the phone, causing a drag on performance.
In terms of individual contributors, Forest Laboratories, a pharmaceutical company, was the Fund’s best-performing stock for the period. The company’s new CEO announced in late 2013 a thorough review of business operations followed by an updated strategy. The new strategy included a $500 million cost savings program, the acquisition of Saphris, a schizophrenia and bipolar disorder drug from Merck, an accelerated share repurchase program and the issuance of $1.2 billion in debt. Forest’s strong balance sheet and decent pipeline led to an acquisition agreement with Actavis in February. Actavis’s acquisition of Forest, which was finalized in July, should generate significant benefits, including approximately $1 billion in operating and tax synergies to be realized within three years following the close of the deal.
Two financial sector companies, Wells Fargo and Ameriprise Financial, were also among the Fund’s top contributors. Wells Fargo, a diversified financial services company, benefited from superior revenue growth compared to its more challenged industry. Despite losing a big tailwind from mortgage refinancing in mid-2013, the company’s broad diversification in commercial lending, retail brokerage, investment banking/trading, commercial finance and insurance brokerage fueled top line growth. In addition, Wells Fargo passed regulatory stress tests while many peers failed, allowing the company to raise its dividend payout more than 30% and reduce share count via buybacks. Ameriprise Financial, a financial planning and services firm, outperformed due to continued strong results in its financial planning unit and improvements in its asset management subsidiary. The company also boosted its dividend and reduced its share base through stock repurchases.
Outlook
While valuations are on the high side compared with recent years, we believe they are reasonably in line with our market view given historically low inflation and interest rates.
Although the lower unemployment rate remains encouraging, the declining labor force participation rate is concerning, and housing affordability is deteriorating. Despite these issues, we feel a boost in consumer spending is likely to occur. Household balance sheets are strong,
| 10
LOOMIS SAYLES VALUE FUND
and household income is showing a slight improvement. A stronger dollar and lower commodity costs may aid consumption if imports become cheaper and inflation stays muted.
We believe the market is long overdue for a correction, and we will view any such occurrence as a buying opportunity. Valuations are such that any market correction should yield an attractive entry point. As always, we will focus on individual stock selection during these buying opportunities.
Growth of $10,000 Investment in Class A Shares1,4
September 30, 2004 through September 30, 2014
11 |
Average Annual Total Returns — September 30, 20144
| | | | | | | | | | | | | | | | |
| | | | | |
| | | 1 Year | | | 5 Years | | | 10 Years | | | Life of
Class N | |
| | | | | |
| Class A (Inception 6/30/06)1 | | | | | | | | | | | | | | | | |
| NAV | | | 17.97 | % | | | 14.00 | % | | | 9.11 | % | | | — | % |
| With 5.75% Maximum Sales Charge | | | 11.19 | | | | 12.66 | | | | 8.46 | | | | — | |
| | | | | |
| Class B (Inception 6/1/07)1 | | | | | | | | | | | | | | | | |
| NAV | | | 17.08 | | | | 13.15 | | | | 8.25 | | | | — | |
| With CDSC2 | | | 12.08 | | | | 12.90 | | | | 8.25 | | | | — | |
| | | | | |
| Class C (Inception 6/1/07)1 | | | | | | | | | | | | | | | | |
| NAV | | | 17.07 | | | | 13.14 | | | | 8.25 | | | | — | |
| With CDSC2 | | | 16.07 | | | | 13.14 | | | | 8.25 | | | | — | |
| | | | | |
| Class N (Inception 2/1/13) | | | | | | | | | | | | | | | | |
| NAV | | | 18.43 | | | | — | | | | — | | | | 19.53 | |
| | | | | |
| Class Y (Inception 5/13/91) | | | | | | | | | | | | | | | | |
| NAV | | | 18.27 | | | | 14.28 | | | | 9.42 | | | | — | |
| | | | | |
| Admin Class (Inception 2/1/10)1 | | | | | | | | | | | | | | | | |
| NAV | | | 17.68 | | | | 13.73 | | | | 8.82 | | | | — | |
| | | | | |
| Comparative Performance | | | | | | | | | | | | | | | | |
| Russell 1000® Value Index3 | | | 18.89 | | | | 15.26 | | | | 7.84 | | | | 18.95 | |
Past performance does not guarantee future results. The table(s) do not reflect taxes shareholders might owe on any Fund distributions or when they redeem their shares. Performance for periods less than one year is cumulative, not annualized. Returns reflect changes in share price and reinvestment of dividends and capital gains, if any. Unlike a fund, an index is not managed and does not reflect fees and expenses.
| 1 | Prior to 6/1/07, performance of Class A shares is that of Retail Class shares, which were redesignated as Class A shares, restated to reflect the sales load of Class A shares. Prior to the inception of Retail Class shares (6/30/06), performance is that of Institutional Class shares, which were redesignated as Class Y shares, restated to reflect the higher net expenses and sales loads of Class A shares. Prior to the inception of Class B and C shares (6/1/07), performance is that of Institutional Class shares, restated to reflect the higher net expenses and sales loads of Class B and C shares. Prior to the inception of Admin Class shares (2/1/10), performance is that of Class A shares, restated to reflect the higher net expenses of Admin Class shares. |
| 2 | Performance for Class B shares assumes a maximum of 5% contingent deferred sales charge (“CDSC”) applied when you sell shares, which declines annually between years 1-6 according to the following schedule: 5, 4, 3, 3, 2, 1, 0%. Class C shares performance assumes a 1% CDSC applied when you sell shares within one year of purchase. |
| 3 | Russell 1000® Value Index is an unmanaged index that measures the performance of the large-cap value segment of the U.S. equity universe. It includes those Russell 1000 companies with lower price-to-book ratios and higher forecasted growth values. |
| 4 | Fund performance has been increased by fee waivers and/or expense reimbursements, if any, without which performance would have been lower. |
| 12
ADDITIONAL INFORMATION
The views expressed in this report reflect those of the portfolio managers as of the dates indicated. The managers’ views are subject to change at any time without notice based on changes in market or other conditions. References to specific securities or industries should not be regarded as investment advice. Because the fund is actively managed, there is no assurance that it will continue to invest in the securities or industries mentioned.
ADDITIONAL INDEX INFORMATION
This document may contain references to third party copyrights, indexes, and trademarks, each of which is the property of its respective owner. Such owner is not affiliated with Natixis Global Asset Management or any of its related or affiliated companies (collectively “NGAM”) and does not sponsor, endorse or participate in the provision of any NGAM services, funds or other financial products.
The index information contained herein is derived from third parties and is provided on an “as is” basis. The user of this information assumes the entire risk of use of this information. Each of the third party entities involved in compiling, computing or creating index information disclaims all warranties (including, without limitation, any warranties of originality, accuracy, completeness, timeliness, non-infringement, merchantability and fitness for a particular purpose) with respect to such information.
PROXY VOTING INFORMATION
A description of the funds’ proxy voting policies and procedures is available without charge, upon request, by calling Natixis Funds at 800-225-5478; on the funds’ website at ngam.natixis.com; and on the Securities and Exchange Commission’s (“SEC’s”) website at www.sec.gov. Information regarding how the funds voted proxies relating to portfolio securities during the 12 months ended June 30, 2014 is available from the funds’ website and the SEC’s website.
QUARTERLY PORTFOLIO SCHEDULES
The funds file a complete schedule of portfolio holdings with the SEC for the first and third quarters of each fiscal year on Form N-Q. The funds’ Forms N-Q are available on the SEC’s website at www.sec.gov and may be reviewed and copied at the SEC’s Public Reference Room in Washington, DC. Information on the operation of the Public Reference Room may be obtained by calling 800-SEC-0330.
13 |
UNDERSTANDING FUND EXPENSES
As a mutual fund shareholder, you incur different types of costs: transaction costs, including sales charges (loads) on purchases and contingent deferred sales charges on redemptions, and ongoing costs, including management fees, distribution and/or service fees (12b-1 fees), and other fund expenses. Certain exemptions may apply. These costs are described in more detail in the Fund’s prospectus. The examples below are intended to help you understand the ongoing costs of investing in the Funds and help you compare these with the ongoing costs of investing in other mutual funds.
The first line in the table for each class of Fund shares shows the actual account values and actual fund expenses you would have paid on a $1,000 investment in the Fund from April 1, 2014 through September 30, 2014. To estimate the expenses you paid over the period, simply divide your account value by $1,000 (for example, $8,600 account value divided by $1,000 = 8.6) and multiply the result by the number in the Expenses Paid During Period row as shown below for your class.
The second line in the table for each class of Fund shares provides information about hypothetical account values and hypothetical expenses based on the Fund’s actual expense ratios and an assumed rate of return of 5% per year before expenses, which is not the Fund’s actual return. The hypothetical account values and expenses may not be used to estimate the actual ending account balance or expenses you paid on your investment for the period. You may use this information to compare the ongoing costs of investing in the Funds to other funds. To do so, compare this 5% hypothetical example with the 5% hypothetical examples that appear in the shareholder reports of the other funds.
Please note that the expenses shown reflect ongoing costs only, and do not include any transaction costs, such as sales charges. Therefore, the second line in the table of each fund is useful in comparing ongoing costs only, and will not help you determine the relative costs of owning different funds. If transaction costs were included, total costs would be higher.
| | | | | | | | | | | | |
LOOMIS SAYLES GLOBAL EQUITY AND
INCOME FUND | | BEGINNING
ACCOUNT VALUE
4/1/2014 | | | ENDING
ACCOUNT VALUE
9/30/2014 | | | EXPENSES PAID
DURING PERIOD*
4/1/2014 – 9/30/2014 | |
| Class A | | | | | | | | | | | | |
| Actual | | $ | 1,000.00 | | | $ | 1,027.00 | | | $ | 5.95 | |
| Hypothetical (5% return before expenses) | | $ | 1,000.00 | | | $ | 1,019.20 | | | $ | 5.92 | |
| Class C | | | | | | | | | | | | |
| Actual | | $ | 1,000.00 | | | $ | 1,023.10 | | | $ | 9.74 | |
| Hypothetical (5% return before expenses) | | $ | 1,000.00 | | | $ | 1,015.44 | | | $ | 9.70 | |
| Class Y | | | | | | | | | | | | |
| Actual | | $ | 1,000.00 | | | $ | 1,028.40 | | | $ | 4.68 | |
| Hypothetical (5% return before expenses) | | $ | 1,000.00 | | | $ | 1,020.46 | | | $ | 4.66 | |
| * | Expenses are equal to the Fund's annualized expense ratio: 1.17%, 1.92% and 0.92% for Class A, C and Y, respectively, multiplied by the average account value over the period, multiplied by the number of days in the most recent fiscal half-year (183), divided by 365 (to reflect the half-year period). |
| 14
| | | | | | | | | | | | |
| LOOMIS SAYLES GROWTH FUND | | BEGINNING
ACCOUNT VALUE
4/1/2014 | | | ENDING
ACCOUNT VALUE
9/30/2014 | | | EXPENSES PAID
DURING PERIOD*
4/1/2014 – 9/30/2014 | |
| Class A | | | | | | | | | | | | |
| Actual | | | $1,000.00 | | | | $1,052.30 | | | | $4.78 | |
| Hypothetical (5% return before expenses) | | | $1,000.00 | | | | $1,020.41 | | | | $4.71 | |
| Class B | | | | | | | | | | | | |
| Actual | | | $1,000.00 | | | | $1,048.90 | | | | $8.63 | |
| Hypothetical (5% return before expenses) | | | $1,000.00 | | | | $1,016.65 | | | | $8.49 | |
| Class C | | | | | | | | | | | | |
| Actual | | | $1,000.00 | | | | $1,048.90 | | | | $8.63 | |
| Hypothetical (5% return before expenses) | | | $1,000.00 | | | | $1,016.65 | | | | $8.49 | |
| Class N | | | | | | | | | | | | |
| Actual | | | $1,000.00 | | | | $1,053.70 | | | | $4.89 | |
| Hypothetical (5% return before expenses) | | | $1,000.00 | | | | $1,020.31 | | | | $4.81 | |
| Class Y | | | | | | | | | | | | |
| Actual | | | $1,000.00 | | | | $1,054.60 | | | | $3.50 | |
| Hypothetical (5% return before expenses) | | | $1,000.00 | | | | $1,021.66 | | | | $3.45 | |
| * | Expenses are equal to the Fund's annualized expense ratio (after waiver/reimbursement): 0.93%, 1.68%, 1.68%, 0.95% and 0.68% for Class A, B, C, N and Y, respectively, multiplied by the average account value over the period, multiplied by the number of days in the most recent fiscal half-year (183), divided by 365 (to reflect the half-year period). |
15 |
| | | | | | | | | | | | |
| LOOMIS SAYLES VALUE FUND | | BEGINNING
ACCOUNT VALUE
4/1/2014 | | | ENDING
ACCOUNT VALUE
9/30/2014 | | | EXPENSES PAID
DURING PERIOD*
4/1/2014 – 9/30/2014 | |
| Class A | | | | | | | | | | | | |
| Actual | | $ | 1,000.00 | | | $ | 1,040.20 | | | $ | 4.91 | |
| Hypothetical (5% return before expenses) | | $ | 1,000.00 | | | $ | 1,020.26 | | | $ | 4.86 | |
| Class B | | | | | | | | | | | | |
| Actual | | $ | 1,000.00 | | | $ | 1,036.00 | | | $ | 8.73 | |
| Hypothetical (5% return before expenses) | | $ | 1,000.00 | | | $ | 1,016.50 | | | $ | 8.64 | |
| Class C | | | | | | | | | | | | |
| Actual | | $ | 1,000.00 | | | $ | 1,036.10 | | | $ | 8.73 | |
| Hypothetical (5% return before expenses) | | $ | 1,000.00 | | | $ | 1,016.50 | | | $ | 8.64 | |
| Class N | | | | | | | | | | | | |
| Actual | | $ | 1,000.00 | | | $ | 1,041.90 | | | $ | 2.92 | |
| Hypothetical (5% return before expenses) | | $ | 1,000.00 | | | $ | 1,022.21 | | | $ | 2.89 | |
| Class Y | | | | | | | | | | | | |
| Actual | | $ | 1,000.00 | | | $ | 1,041.20 | | | $ | 3.63 | |
| Hypothetical (5% return before expenses) | | $ | 1,000.00 | | | $ | 1,021.51 | | | $ | 3.60 | |
| Admin Class | | | | | | | | | | | | |
| Actual | | $ | 1,000.00 | | | $ | 1,038.90 | | | $ | 6.18 | |
| Hypothetical (5% return before expenses) | | $ | 1,000.00 | | | $ | 1,019.00 | | | $ | 6.12 | |
| * | Expenses are equal to the Fund's annualized expense ratio: 0.96%, 1.71%, 1.71%, 0.57%, 0.71% and 1.21% for Class A, B, C, N, Y and Admin Class, respectively, multiplied by the average account value over the period, multiplied by the number of days in the most recent fiscal half-year (183), divided by 365 (to reflect the half-year period). |
| 16
BOARD APPROVAL OF THE EXISTING ADVISORY AGREEMENTS
The Board of Trustees of the Trust (the “Board”), including the Independent Trustees, considers matters bearing on each Fund’s advisory agreement (collectively, the “Agreements”) at most of its meetings throughout the year. Each year, usually in the spring, the Contract Review Committee of the Board meets to review the Agreements to determine whether to recommend that the full Board approve the continuation of the Agreements, typically for an additional one-year period. After the Committee has made its recommendation, the full Board, including the Independent Trustees, determines whether to approve the continuation of the Agreements.
In connection with these meetings, the Trustees receive materials that the Funds’ investment adviser (the “Adviser”) believes to be reasonably necessary for the Trustees to evaluate the Agreements. These materials generally include, among other items, (i) information on the investment performance of the Funds and the performance of peer groups of funds and the Funds’ performance benchmarks, (ii) information on the Funds’ advisory fees and other expenses, including information comparing the Funds’ expenses to the fees charged to institutional accounts with similar strategies managed by the Adviser, if any, and to those of peer groups of funds and information about any applicable expense caps and fee “breakpoints,” (iii) sales and redemption data in respect of the Funds, (iv) information about the profitability of the Agreements to the Adviser and (v) information obtained through the completion by the Adviser of a questionnaire distributed on behalf of the Trustees. The Board, including the Independent Trustees, also considers other matters such as (i) the Adviser’s financial results and financial condition, (ii) each Fund’s investment objective and strategies and the size, education and experience of the Adviser’s investment staff and its use of technology, external research and trading cost measurement tools, (iii) arrangements in respect of the distribution of the Funds’ shares and the related costs, (iv) the procedures employed to determine the value of the Funds’ assets, (v) the allocation of the Funds’ brokerage, if any, including, if applicable, allocations to brokers affiliated with the Adviser and the use of “soft” commission dollars to pay Fund expenses and to pay for research and other similar services, (vi) the resources devoted to, and the record of compliance with, the Funds’ investment policies and restrictions, policies on personal securities transactions and other compliance policies, (vii) information about amounts invested by the Funds’ portfolio managers in the Funds or in similar accounts that they manage and (viii) the general economic outlook with particular emphasis on the mutual fund industry. Throughout the process, the Trustees are afforded the opportunity to ask questions of and request additional materials from the Adviser.
In addition to the materials requested by the Trustees in connection with their annual consideration of the continuation of the Agreements, the Trustees receive materials in advance of each regular quarterly meeting of the Board that provide detailed information about the Funds’ investment performance and the fees charged to the Funds for advisory and other services. This information generally includes, among other things, an internal performance rating for each Fund based on agreed-upon criteria, graphs showing each Fund’s performance and fee differentials against each Fund’s peer group/category, performance ratings provided by a third-party, total return information for various periods,
17 |
and third-party performance rankings for various periods comparing a Fund against similarly categorized funds. The portfolio management team for each Fund or other representatives of the Adviser make periodic presentations to the Contract Review Committee and/or the full Board, and Funds identified as presenting possible performance concerns may be subject to more frequent board presentations and reviews. In addition, each quarter the Trustees are provided with detailed statistical information about each Fund’s portfolio. The Trustees also receive periodic updates between meetings.
The Board most recently approved the continuation of the Agreements at its meeting held in June 2014. The Agreements were continued for a one-year period for the Funds. In considering whether to approve the continuation of the Agreements, the Board, including the Independent Trustees, did not identify any single factor as determinative. Individual Trustees may have evaluated the information presented differently from one another, giving different weights to various factors. Matters considered by the Trustees, including the Independent Trustees, in connection with their approval of the Agreements included, but were not limited to, the factors listed below.
The nature, extent and quality of the services provided to the Funds under the Agreements. The Trustees considered the nature, extent and quality of the services provided by the Adviser and its affiliates to the Funds and the resources dedicated to the Funds by the Adviser and its affiliates.
The Trustees considered not only the advisory services provided by the Adviser to the Funds, but also the administrative services provided by NGAM Advisors, L.P. (“NGAM Advisors”) and its affiliates to the Funds. For each Fund, the Trustees also considered the benefits to shareholders of investing in a mutual fund that is part of a family of funds that offers shareholders the right to exchange shares of one type of fund for shares of another type of fund, and provides a variety of fund and shareholder services.
After reviewing these and related factors, the Trustees concluded, within the context of their overall conclusions regarding each of the Agreements, that the nature, extent and quality of services provided supported the renewal of the Agreements.
Investment performance of the Funds and the Adviser. As noted above, the Trustees received information about the performance of the Funds over various time periods, including information that compared the performance of the Funds to the performance of peer groups and categories of funds and the Funds’ respective performance benchmarks. In addition, the Trustees also reviewed data prepared by an independent third party that analyzed the performance of the Funds using a variety of performance metrics, including metrics that also measured the performance of the Funds on a risk adjusted basis. With respect to each Fund, the Board concluded that the Fund’s performance or other relevant factors supported the renewal of the Agreement relating to that Fund.
The Trustees also considered the Adviser’s performance and reputation generally, the performance of the fund family generally, and the historical responsiveness of the Adviser to Trustee concerns about performance and the willingness of the Adviser to take steps intended to improve performance.
After reviewing these and related factors, the Trustees concluded, within the context of their overall conclusions regarding each of the Agreements, that the performance of the Funds and the Adviser supported the renewal of the Agreements.
| 18
The costs of the services to be provided and profits to be realized by the Adviser and its affiliates from their respective relationships with the Funds. The Trustees considered the fees charged to the Funds for advisory services as well as the total expense levels of the Funds. This information included comparisons (provided both by management and also by an independent third party) of the Funds’ advisory fees and total expense levels to those of their peer groups and information about the advisory fees charged by the Adviser to comparable accounts (such as institutional separate accounts), as well as information about differences in such fees and the reasons for any such differences. In considering the fees charged to comparable accounts, the Trustees considered, among other things, management’s representations about the differences between managing mutual funds as compared to other types of accounts, including the additional resources required to effectively manage mutual fund assets and the greater regulatory costs associated with the management of such assets. In evaluating each Fund’s advisory fee, the Trustees also took into account the demands, complexity and quality of the investment management of such Fund and the need for the Adviser to offer competitive compensation. The Trustees considered that over the past several years, management had made recommendations regarding reductions in advisory fee rates, implementation of advisory fee breakpoints and the institution of advisory fee waivers and expense caps for various funds in the fund family. They noted that the Funds in this report have expense caps in place and the Trustees considered that the Funds’ current expenses are below their respective caps. The Trustees also considered management’s proposal to add a breakpoint to the advisory fee for the Loomis Sayles Global Equity and Income Fund.
The Trustees also considered the compensation directly or indirectly received by the Adviser and its affiliates from their relationships with the Funds. The Trustees reviewed information provided by management as to the profitability of the Adviser’s and its affiliates’ relationships with the Funds, and information about the allocation of expenses used to calculate profitability. They also reviewed information provided by management about the effect of distribution costs and changes in asset levels on Adviser profitability, including information regarding resources spent on distribution activities. When reviewing profitability, the Trustees also considered information about court cases in which adviser compensation or profitability were issues, the performance of the relevant Funds, the expense levels of the Funds, and whether the Adviser had implemented breakpoints and/or expense caps with respect to such Funds.
After reviewing these and related factors, the Trustees concluded, within the context of their overall conclusions regarding each of the Agreements, that the advisory fee charged to each of the Funds was fair and reasonable, and that the costs of these services generally and the related profitability of the Adviser and its affiliates in respect of their relationships with the Funds supported the renewal of the Agreements.
Economies of Scale. The Trustees considered the existence of any economies of scale in the provision of services by the Adviser and whether those economies are shared with the Funds through breakpoints in their investment advisory fees or other means, such as expense waivers or caps. The Trustees also discussed with management the factors considered with respect to the implementation of breakpoints in investment advisory fees or expense waivers or caps for certain funds. Management explained that a number of factors are taken into account in considering the possible implementation of breakpoints or an expense cap for a
19 |
fund, including, among other things, factors such as a fund’s assets, the projected growth of a fund, projected profitability and a fund’s fees and performance. With respect to economies of scale, the Trustees noted that each of the Funds was subject to an expense cap or waiver. The Trustees also noted that management had proposed the implementation of a breakpoint for the Loomis Sayles Global Equity and Income Fund. In considering these issues, the Trustees also took note of the costs of the services provided (both on an absolute and a relative basis) and the profitability to the Adviser and its affiliates of their relationships with the Funds, as discussed above.
After reviewing these and related factors, the Trustees concluded, within the context of their overall conclusions regarding each of the Agreements, that the extent to which economies of scale were shared with the Funds supported the renewal of the Agreements.
The Trustees also considered other factors, which included but were not limited to the following:
| · | | The effect of recent market and economic events on the performance, asset levels and expense ratios of each Fund. |
| · | | Whether each Fund has operated in accordance with its investment objective and the Fund’s record of compliance with its investment restrictions, and the compliance programs of the Funds and the Adviser. They also considered the compliance-related resources the Adviser and its affiliates were providing to the Funds. |
| · | | The nature, quality, cost and extent of administrative and shareholder services performed by the Adviser and its affiliates, both under the Agreements and under separate agreements covering administrative services. |
| · | | So-called “fallout benefits” to the Adviser, such as the engagement of affiliates of the Adviser to provide distribution, administrative and brokerage services to the Funds, and the benefits of research made available to the Adviser by reason of brokerage commissions (if any) generated by the Funds’ securities transactions. The Trustees also considered the benefits to the parent company of NGAM Advisors from the retention of the Adviser. The Trustees considered the possible conflicts of interest associated with these fallout and other benefits, and the reporting, disclosure and other processes in place to disclose and monitor such possible conflicts of interest. |
| · | | The Trustees’ review and discussion of the Funds’ advisory arrangements in prior years, and management’s record of responding to Trustee concerns raised during the year and in prior years. |
Based on their evaluation of all factors that they deemed to be material, including those factors described above, and assisted by the advice of independent counsel, the Trustees, including the Independent Trustees, concluded that each of the existing Agreements, with the addition of the breakpoint with respect to the Loomis Sayles Global Equity and Income Fund described above, should be continued through June 30, 2015.
| 20
Portfolio of Investments – as of September 30, 2014
Loomis Sayles Global Equity and Income Fund
| | | | | | | | |
Shares | | | Description | | Value (†) | |
| | Common Stocks — 68.6% of Net Assets | |
| | | | Belgium — 1.5% | | | | |
| | 167,680 | | | Anheuser-Busch InBev NV | | $ | 18,595,356 | |
| | | | | | | | |
| | | | Canada — 1.7% | | | | |
| | 617,200 | | | CGI Group, Inc., Class A(b) | | | 20,853,474 | |
| | | | | | | | |
| | | | China — 2.6% | | | | |
| | 195,836 | | | Alibaba Group Holding Ltd., Sponsored ADR(b) | | | 17,400,028 | |
| | 1,572,000 | | | Hengan International Group Co. Ltd. | | | 15,465,001 | |
| | | | | | | | |
| | | | | | | 32,865,029 | |
| | | | | | | | |
| | | | Denmark — 1.4% | | | | |
| | 362,698 | | | Novo Nordisk AS, Class B | | | 17,268,698 | |
| | | | | | | | |
| | | | Germany — 2.4% | | | | |
| | 118,194 | | | Bayer AG, (Registered) | | | 16,445,311 | |
| | 272,253 | | | Brenntag AG | | | 13,325,203 | |
| | | | | | | | |
| | | | | | | 29,770,514 | |
| | | | | | | | |
| | | | India — 2.3% | | | | |
| | 486,464 | | | HCL Technologies Ltd. | | | 13,493,078 | |
| | 714,030 | | | HDFC Bank Ltd. | | | 10,617,022 | |
| | 718,916 | | | Motherson Sumi Systems Ltd. | | | 4,592,812 | |
| | | | | | | | |
| | | | | | | 28,702,912 | |
| | | | | | | | |
| | | | Italy — 1.1% | | | | |
| | 277,845 | | | Luxottica Group S.p.A. | | | 14,441,791 | |
| | | | | | | | |
| | | | Japan — 3.7% | | | | |
| | 399,500 | | | Asahi Group Holdings Ltd. | | | 11,556,001 | |
| | 2,461,800 | | | Mitsubishi UFJ Financial Group, Inc. | | | 13,874,000 | |
| | 433,900 | | | Nomura Research Institute Ltd. | | | 14,032,354 | |
| | 197,300 | | | Suzuki Motor Corp. | | | 6,543,495 | |
| | | | | | | | |
| | | | | | | 46,005,850 | |
| | | | | | | | |
| | | | Mexico — 1.2% | | | | |
| | 6,492,732 | | | Genomma Lab Internacional S.A. de CV, Class B(b) | | | 15,600,347 | |
| | | | | | | | |
| | | | Sweden — 1.4% | | | | |
| | 609,499 | | | Atlas Copco AB, Class A | | | 17,391,261 | |
| | | | | | | | |
| | | | Switzerland — 2.4% | | | | |
| | 99,604 | | | Roche Holding AG | | | 29,413,352 | |
| | | | | | | | |
| | | | Thailand — 1.1% | | | | |
| | 1,230,700 | | | Bangkok Bank PCL | | | 7,959,148 | |
| | 397,000 | | | Siam Cement PCL (The) | | | 5,501,070 | |
| | | | | | | | |
| | | | | | | 13,460,218 | |
| | | | | | | | |
| | | | United Kingdom — 4.7% | | | | |
| | 434,270 | | | Diageo PLC | | | 12,525,269 | |
| | 7,457,754 | | | Legal & General Group PLC | | | 27,596,081 | |
| | 598,716 | | | London Stock Exchange Group PLC | | | 18,067,654 | |
| | | | | | | | |
| | | | | | | 58,189,004 | |
| | | | | | | | |
See accompanying notes to financial statements.
21 |
Portfolio of Investments – as of September 30, 2014
Loomis Sayles Global Equity and Income Fund – (continued)
| | | | | | | | |
Shares | | | Description | | Value (†) | |
| | | | United States — 41.1% | | | | |
| | 136,119 | | | ACE Ltd. | | $ | 14,274,800 | |
| | 47,893 | | | Amazon.com, Inc.(b) | | | 15,442,619 | |
| | 193,145 | | | American Express Co. | | | 16,907,913 | |
| | 45,899 | | | AutoZone, Inc.(b) | | | 23,392,884 | |
| | 424,680 | | | Citigroup, Inc. | | | 22,006,918 | |
| | 73,617 | | | Core Laboratories NV | | | 10,773,848 | |
| | 152,555 | | | Facebook, Inc., Class A(b) | | | 12,057,947 | |
| | 100,644 | | | FactSet Research Systems, Inc. | | | 12,231,265 | |
| | 182,039 | | | Genesee & Wyoming, Inc., Class A(b) | | | 17,350,137 | |
| | 164,748 | | | Gilead Sciences, Inc.(b) | | | 17,537,425 | |
| | 131,215 | | | Goldman Sachs Group, Inc. (The) | | | 24,087,138 | |
| | 26,035 | | | Google, Inc., Class A(b) | | | 15,319,254 | |
| | 26,035 | | | Google, Inc., Class C(b) | | | 15,031,568 | |
| | 162,030 | | | Gulfport Energy Corp.(b) | | | 8,652,402 | |
| | 955 | | | Hawaiian Telcom Holdco, Inc.(b) | | | 24,534 | |
| | 181,348 | | | Lowe’s Cos., Inc. | | | 9,596,936 | |
| | 114,060 | | | M&T Bank Corp. | | | 14,062,457 | |
| | 119,591 | | | National Oilwell Varco, Inc. | | | 9,100,875 | |
| | 277,440 | | | Noble Energy, Inc. | | | 18,965,798 | |
| | 205,906 | | | Oceaneering International, Inc. | | | 13,418,894 | |
| | 102,816 | | | Praxair, Inc. | | | 13,263,264 | |
| | 92,162 | | | Precision Castparts Corp. | | | 21,831,335 | |
| | 25,346 | | | Priceline Group, Inc. (The)(b) | | | 29,365,369 | |
| | 93,340 | | | QUALCOMM, Inc. | | | 6,979,032 | |
| | 199,034 | | | Schlumberger Ltd. | | | 20,239,767 | |
| | 80,430 | | | Signet Jewelers Ltd. | | | 9,161,781 | |
| | 211,309 | | | Texas Instruments, Inc. | | | 10,077,326 | |
| | 147,300 | | | TransDigm Group, Inc. | | | 27,151,809 | |
| | 200,867 | | | UnitedHealth Group, Inc. | | | 17,324,779 | |
| | 174,094 | | | Valeant Pharmaceuticals International, Inc.(b) | | | 22,841,133 | |
| | 147,490 | | | Valspar Corp. (The) | | | 11,650,235 | |
| | 66,010 | | | W.W. Grainger, Inc. | | | 16,611,416 | |
| | 203,776 | | | Wyndham Worldwide Corp. | | | 16,558,838 | |
| | | | | | | | |
| | | | | | | 513,291,696 | |
| | | | | | | | |
| | | | Total Common Stocks
(Identified Cost $723,409,467) | | | 855,849,502 | |
| | | | | | | | |
| | | | | | | | |
Principal
Amount (‡) | | | | | | |
| | Bonds and Notes — 28.3% | |
| | Non-Convertible Bonds — 27.6% | |
| | | | Argentina — 0.1% | | | | |
| $ | 382,136 | | | Transportadora de Gas del Sur S.A., 9.625%, 5/14/2020, 144A | | | 378,315 | |
| | 1,180,000 | | | YPF S.A., 8.750%, 4/04/2024, 144A(c) | | | 1,203,600 | |
| | | | | | | | |
| | | | | | | 1,581,915 | |
| | | | | | | | |
| | | | Australia — 0.3% | | | | |
| | 110,000 | | | Incitec Pivot Finance LLC, 6.000%, 12/10/2019, 144A | | | 123,679 | |
| | 1,200,000 | | | Macquarie Bank Ltd., 5.000%, 2/22/2017, 144A(c) | | | 1,293,176 | |
See accompanying notes to financial statements.
| 22
Portfolio of Investments – as of September 30, 2014
Loomis Sayles Global Equity and Income Fund – (continued)
| | | | | | | | |
Principal
Amount (‡) | | | Description | | Value (†) | |
| | | | Australia — continued | | | | |
| $ | 500,000 | | | Macquarie Bank Ltd., 6.625%, 4/07/2021, 144A | | $ | 569,735 | |
| | 2,185,000 | | | New South Wales Treasury Corp., 6.000%, 2/01/2018, (AUD)(c) | | | 2,094,293 | |
| | 155,000 | | | Sydney Airport Finance Co., 5.125%, 2/22/2021, 144A | | | 172,505 | |
| | | | | | | | |
| | | | | | | 4,253,388 | |
| | | | | | | | |
| | | | Barbados — 0.0% | | | | |
| | 200,000 | | | Columbus International, Inc., 7.375%, 3/30/2021, 144A | | | 208,000 | |
| | | | | | | | |
| | | | Belgium — 0.1% | | | | |
| | 350,000 | | | Anheuser-Busch InBev NV, EMTN, 6.500%, 6/23/2017, (GBP) | | | 635,079 | |
| | | | | | | | |
| | | | Brazil — 1.9% | | | | |
| | 800,000 | | | Banco do Brasil S.A., 3.875%, 10/10/2022 | | | 742,000 | |
| | 1,100,000 | | | Banco Nacional de Desenvolvimento Economico e Social,
5.750%, 9/26/2023, 144A | | | 1,174,580 | |
| | 400,000 | | | Banco Santander Brasil S.A., 4.500%, 4/06/2015, 144A | | | 404,500 | |
| | 600,000 | | | Banco Santander Brasil S.A., 4.625%, 2/13/2017, 144A | | | 626,250 | |
| | 2,045,017 | | | Banco Votorantim S.A., 6.250%, 5/16/2016, 144A, (BRL) | | | 799,799 | |
| | 800,000 | | | Braskem Finance Ltd., 5.750%, 4/15/2021, 144A | | | 818,400 | |
| | 6,600(††) | | | Brazil Letras do Tesouro Nacional, Zero Coupon, 7/01/2016, (BRL)(c) | | | 2,200,643 | |
| | 591,287(†††) | | | Brazil Notas do Tesouro Nacional, Series B, 6.000%, 5/15/2015, (BRL) | | | 246,245 | |
| | 2,250(††) | | | Brazil Notas do Tesouro Nacional, Series F, 10.000%, 1/01/2019, (BRL) | | | 850,487 | |
| | 1,115(††) | | | Brazil Notas do Tesouro Nacional, Series F, 10.000%, 1/01/2021, (BRL) | | | 411,182 | |
| | 2,250,000 | | | Brazilian Government International Bond, 10.250%, 1/10/2028, (BRL) | | | 910,019 | |
| | 1,700,000 | | | BRF S.A., 3.950%, 5/22/2023, 144A(c) | | | 1,599,615 | |
| | 600,000 | | | BRF S.A., 5.875%, 6/06/2022, 144A | | | 648,000 | |
| | 2,300,000 | | | BRF S.A., 7.750%, 5/22/2018, 144A, (BRL) | | | 822,184 | |
| | 1,255,000 | | | Cielo S.A./Cielo USA, Inc., 3.750%, 11/16/2022, 144A | | | 1,164,013 | |
| | 1,000,000 | | | CIMPOR Financial Operations BV, 5.750%, 7/17/2024, 144A | | | 967,500 | |
| | 400,000 | | | Cosan Luxembourg S.A., 5.000%, 3/14/2023, 144A | | | 384,000 | |
| | 400,000 | | | CSN Resources S.A., 6.500%, 7/21/2020, 144A | | | 408,800 | |
| | 800,000 | | | Gerdau Trade, Inc., 5.750%, 1/30/2021, 144A | | | 825,000 | |
| | 226,000 | | | GTL Trade Finance, Inc., 5.893%, 4/29/2024, 144A | | | 228,511 | |
| | 300,000 | | | Itau Unibanco Holding S.A., 6.200%, 12/21/2021, 144A | | | 312,750 | |
| | 100,000 | | | LPG International, Inc., 7.250%, 12/20/2015 | | | 106,223 | |
| | 175,000 | | | Odebrecht Drilling Norbe VIII/IX Ltd., 6.350%, 6/30/2021, 144A | | | 180,075 | |
| | 858,330 | | | Odebrecht Offshore Drilling Finance Ltd., 6.750%, 10/01/2022, 144A | | | 890,517 | |
| | 2,400,000 | | | Oi S.A., 9.750%, 9/15/2016, 144A, (BRL) | | | 893,032 | |
| | 1,750,000 | | | Petrobras Global Finance BV, 4.375%, 5/20/2023(c) | | | 1,639,802 | |
| | 320,000 | | | Petrobras International Finance Co., 5.375%, 1/27/2021 | | | 323,462 | |
| | 775,000 | | | Petrobras International Finance Co., 5.750%, 1/20/2020 | | | 815,463 | |
| | 300,000 | | | Petrobras International Finance Co., 6.875%, 1/20/2040 | | | 309,852 | |
| | 800,000 | | | Samarco Mineracao S.A., 4.125%, 11/01/2022, 144A | | | 744,960 | |
| | 500,000 | | | Tupy Overseas S.A., 6.625%, 7/17/2024, 144A | | | 508,750 | |
| | 1,106,000 | | | Vale Overseas Ltd., 6.875%, 11/21/2036(c) | | | 1,247,015 | |
| | | | | | | | |
| | | | | | | 24,203,629 | |
| | | | | | | | |
| | | | Canada — 0.8% | | | | |
| | 1,085,000 | | | Air Canada, 7.625%, 10/01/2019, 144A, (CAD) | | | 1,036,338 | |
| | 1,570,000 | | | Bank of Nova Scotia, 1.450%, 4/25/2018(c) | | | 1,548,026 | |
See accompanying notes to financial statements.
23 |
Portfolio of Investments – as of September 30, 2014
Loomis Sayles Global Equity and Income Fund – (continued)
| | | | | | | | |
Principal
Amount (‡) | | | Description | | Value (†) | |
| | | | Canada — continued | | | | |
| | 650,000 | | | Canadian Government, 1.000%, 8/01/2016, (CAD) | | $ | 579,002 | |
| | 3,000,000 | | | Canadian Government, 1.250%, 9/01/2018, (CAD)(c) | | | 2,655,601 | |
| | 70,000 | | | Canadian Government, 1.750%, 9/01/2019, (CAD) | | | 62,853 | |
| | 2,065,000 | | | Canadian Government, 3.000%, 12/01/2015, (CAD)(c) | | | 1,886,093 | |
| | 1,335,000 | | | Institutional Mortgage Securities Canada, Inc., Series 2014-5A, Class A2,
2.616%, 1/12/2024, 144A, (CAD) | | | 1,191,719 | |
| | 600,000 | | | Telus Corp., Series CG, 5.050%, 12/04/2019, (CAD) | | | 594,171 | |
| | | | | | | | |
| | | | | | | 9,553,803 | |
| | | | | | | | |
| | | | Chile — 0.5% | | | | |
| | 1,450,000 | | | Banco de Credito e Inversiones, 3.000%, 9/13/2017, 144A(c) | | | 1,488,425 | |
| | 200,000 | | | Celulosa Arauco y Constitucion S.A., 4.750%, 1/11/2022 | | | 202,321 | |
| | 300,000,000 | | | Chile Government International Bond, 5.500%, 8/05/2020, (CLP)(c) | | | 529,210 | |
| | 1,135,000 | | | Corpbanca S.A., 3.125%, 1/15/2018 | | | 1,137,329 | |
| | 250,000 | | | E.CL S.A., 5.625%, 1/15/2021, 144A | | | 273,763 | |
| | 800,000 | | | Inversiones CMPC S.A., 4.375%, 5/15/2023, 144A | | | 776,647 | |
| | 1,120,000 | | | Transelec S.A., 4.250%, 1/14/2025, 144A | | | 1,111,517 | |
| | 400,000 | | | VTR Finance BV, 6.875%, 1/15/2024, 144A | | | 414,000 | |
| | | | | | | | |
| | | | | | | 5,933,212 | |
| | | | | | | | |
| | | | China — 0.3% | | | | |
| | 800,000 | | | Baidu, Inc., 2.250%, 11/28/2017 | | | 804,839 | |
| | 700,000 | | | Baidu, Inc., 3.250%, 8/06/2018 | | | 720,712 | |
| | 400,000 | | | China Resources Gas Group Ltd., 4.500%, 4/05/2022, 144A | | | 412,694 | |
| | 1,200,000 | | | CNOOC Finance 2013 Ltd., 3.000%, 5/09/2023 | | | 1,115,063 | |
| | 1,000,000 | | | Parkson Retail Group Ltd., 4.500%, 5/03/2018 | | | 929,920 | |
| | | | | | | | |
| | | | | | | 3,983,228 | |
| | | | | | | | |
| | | | Colombia — 0.6% | | | | |
| | 555,000 | | | Colombia Telecomunicaciones S.A. E.S.P., 5.375%, 9/27/2022, 144A | | | 557,775 | |
| | 610,000 | | | Ecopetrol S.A., 4.125%, 1/16/2025 | | | 590,175 | |
| | 1,180,000 | | | Ecopetrol S.A., 5.875%, 9/18/2023(c) | | | 1,302,425 | |
| | 435,000,000 | | | Emgesa S.A. E.S.P., 8.750%, 1/25/2021, (COP) | | | 232,495 | |
| | 830,000,000 | | | Emgesa S.A. E.S.P., 8.750%, 1/25/2021, 144A, (COP) | | | 443,610 | |
| | 2,140,000,000 | | | Empresas Publicas de Medellin E.S.P., 8.375%, 2/01/2021, 144A, (COP) | | | 1,112,908 | |
| | 875,000 | | | Pacific Rubiales Energy Corp., 5.125%, 3/28/2023, 144A | | | 835,888 | |
| | 580,000 | | | Pacific Rubiales Energy Corp., 5.625%, 1/19/2025, 144A | | | 557,351 | |
| | 200,000,000 | | | Republic of Colombia, 7.750%, 4/14/2021, (COP) | | | 106,963 | |
| | 1,150,000 | | | SUAM Finance BV, 4.875%, 4/17/2024, 144A | | | 1,170,125 | |
| | | | | | | | |
| | | | | | | 6,909,715 | |
| | | | | | | | |
| | | | Czech Republic — 0.0% | | | | |
| | 400,000 | | | CEZ AS, 4.250%, 4/03/2022, 144A | | | 420,494 | |
| | | | | | | | |
| | | | Dominican Republic — 0.0% | | | | |
| | 425,000 | | | Dominican Republic International Bond, 8.625%, 4/20/2027, 144A | | | 514,250 | |
| | | | | | | | |
| | | | Finland — 0.1% | | | | |
| | 1,015,000 | | | Finland Government Bond, 1.500%, 4/15/2023, 144A, (EUR)(c) | | | 1,345,455 | |
| | | | | | | | |
See accompanying notes to financial statements.
| 24
Portfolio of Investments – as of September 30, 2014
Loomis Sayles Global Equity and Income Fund – (continued)
| | | | | | | | |
Principal
Amount (‡) | | | Description | | Value (†) | |
| | | | France — 0.2% | | | | |
| $ | 425,000 | | | Alcatel-Lucent USA, Inc., 6.450%, 3/15/2029 | | $ | 400,562 | |
| | 15,000 | | | Alcatel-Lucent USA, Inc., 6.500%, 1/15/2028 | | | 14,138 | |
| | 200,000 | | | AXA S.A., 7.125%, 12/15/2020, (GBP) | | | 382,855 | |
| | 1,130,000 | | | Societe Generale S.A., 5.000%, 1/17/2024, 144A | | | 1,137,615 | |
| | | | | | | | |
| | | | | | | 1,935,170 | |
| | | | | | | | |
| | | | Hong Kong — 0.1% | | | | |
| | 400,000 | | | Hutchison Whampoa International 11 Ltd., 3.500%, 1/13/2017, 144A | | | 418,736 | |
| | 400,000 | | | Noble Group Ltd., 6.750%, 1/29/2020, 144A | | | 446,000 | |
| | | | | | | | |
| | | | | | | 864,736 | |
| | | | | | | | |
| | | | Hungary — 0.2% | | | | |
| | 1,330,000 | | | Hungary Government International Bond, 5.375%, 3/25/2024 | | | 1,403,150 | |
| | 980,000 | | | Hungary Government International Bond, 5.750%, 11/22/2023 | | | 1,062,075 | |
| | 520,000 | | | Hungary Government International Bond, 7.625%, 3/29/2041 | | | 663,000 | |
| | | | | | | | |
| | | | | | | 3,128,225 | |
| | | | | | | | |
| | | | Iceland — 0.1% | | | | |
| | 1,000,000 | | | Republic of Iceland, 5.875%, 5/11/2022, 144A | | | 1,126,424 | |
| | | | | | | | |
| | | | India — 0.5% | | | | |
| | 1,155,000 | | | Bharti Airtel International Netherlands BV, 5.125%, 3/11/2023, 144A | | | 1,214,321 | |
| | 990,000 | | | Bharti Airtel International Netherlands BV, 5.350%, 5/20/2024, 144A | | | 1,054,934 | |
| | 200,000 | | | Canara Bank Ltd., (fixed rate to 11/28/2016, variable rate thereafter),
6.365%, 11/28/2021 | | | 204,766 | |
| | 780,000 | | | ICICI Bank Ltd., 3.500%, 3/18/2020, 144A | | | 780,906 | |
| | 1,400,000 | | | ICICI Bank Ltd., (fixed rate to 4/30/2017, variable rate thereafter),
6.375%, 4/30/2022, 144A(c) | | | 1,460,200 | |
| | 750,000 | | | Reliance Holdings USA, Inc., 5.400%, 2/14/2022, 144A | | | 818,724 | |
| | 700,000 | | | State Bank of India/London, 4.125%, 8/01/2017, 144A | | | 729,667 | |
| | | | | | | | |
| | | | | | | 6,263,518 | |
| | | | | | | | |
| | | | Indonesia — 0.6% | | | | |
| | 200,000 | | | Adaro Indonesia PT, 7.625%, 10/22/2019, 144A | | | 208,200 | |
| | 800,000 | | | Gajah Tunggal Tbk PT, 7.750%, 2/06/2018, 144A | | | 804,000 | |
| | 3,500,000,000 | | | Indonesia Government International Bond, 9.500%, 7/15/2023, (IDR) | | | 303,324 | |
| | 781,000,000 | | | Indonesia Government International Bond, 11.500%, 9/15/2019, (IDR) | | | 72,728 | |
| | 12,100,000,000 | | | Indonesia Treasury Bond, 6.125%, 5/15/2028, (IDR) | | | 797,100 | |
| | 14,000,000,000 | | | Indonesia Treasury Bond, 8.375%, 3/15/2024, (IDR) | | | 1,140,336 | |
| | 200,000 | | | Indosat Palapa Co. BV, 7.375%, 7/29/2020, 144A | | | 212,000 | |
| | 400,000 | | | Listrindo Capital BV, 6.950%, 2/21/2019, 144A | | | 423,000 | |
| | 2,800,000 | | | Pertamina Persero PT, 4.300%, 5/20/2023, 144A(c) | | | 2,653,000 | |
| | 545,000 | | | Republic of Indonesia, 2.875%, 7/08/2021, 144A, (EUR) | | | 695,246 | |
| | 500,000 | | | TBG Global Pte Ltd., 4.625%, 4/03/2018, 144A | | | 496,250 | |
| | | | | | | | |
| | | | | | | 7,805,184 | |
| | | | | | | | |
| | | | Ireland — 0.2% | | | | |
| | 1,600,000 | | | AIB Mortgage Bank, EMTN, 4.875%, 6/29/2017, (EUR)(c) | | | 2,268,564 | |
| | | | | | | | |
| | | | Italy — 1.0% | | | | |
| | 2,860,000 | | | Italy Buoni Poliennali Del Tesoro, 4.500%, 8/01/2018, (EUR)(c) | | | 4,111,338 | |
| | 2,295,000 | | | Italy Buoni Poliennali Del Tesoro, 4.750%, 8/01/2023, 144A, (EUR)(c) | | | 3,509,092 | |
See accompanying notes to financial statements.
25 |
Portfolio of Investments – as of September 30, 2014
Loomis Sayles Global Equity and Income Fund – (continued)
| | | | | | | | |
Principal
Amount (‡) | | | Description | | Value (†) | |
| | | | Italy — continued | | | | |
| | 1,925,000 | | | Italy Buoni Poliennali Del Tesoro, 5.000%, 3/01/2022, (EUR) | | $ | 2,962,286 | |
| | 125,000 | | | Telecom Italia Capital S.A., 6.000%, 9/30/2034 | | | 122,344 | |
| | 10,000 | | | Telecom Italia Capital S.A., 6.375%, 11/15/2033 | | | 9,950 | |
| | 725,000 | | | UniCredit SpA, EMTN, 6.950%, 10/31/2022, (EUR) | | | 1,076,820 | |
| | 870,000 | | | Wind Acquisition Finance S.A., 7.375%, 4/23/2021, 144A | | | 874,350 | |
| | | | | | | | |
| | | | 12,666,180 | |
| | | | | | | | |
| | | | Japan — 0.2% | | | | |
| | 1,165,000 | | | Nomura Holdings, Inc., GMTN, 2.750%, 3/19/2019 | | | 1,167,041 | |
| | 850,000 | | | Softbank Corp., 4.500%, 4/15/2020, 144A(c) | | | 847,875 | |
| | | | | | | | |
| | | | 2,014,916 | |
| | | | | | | | |
| | | | Korea — 0.8% | | | | |
| | 3,700,000 | | | Export-Import Bank of Korea, 3.000%, 5/22/2018, 144A, (NOK) | | | 586,379 | |
| | 400,000 | | | Hana Bank, 4.000%, 11/03/2016, 144A | | | 420,588 | |
| | 600,000 | | | Hyundai Capital Services, Inc., 3.500%, 9/13/2017, 144A | | | 626,064 | |
| | 600,000 | | | Hyundai Steel Co., 4.625%, 4/21/2016, 144A | | | 624,741 | |
| | 600,000 | | | Industrial Bank of Korea, 2.375%, 7/17/2017, 144A | | | 609,652 | |
| | 400,000 | | | Kia Motors Corp., 3.625%, 6/14/2016, 144A(c) | | | 415,194 | |
| | 400,000 | | | Korea Finance Corp., 4.625%, 11/16/2021 | | | 435,017 | |
| | 400,000 | | | Korea National Oil Corp., 3.125%, 4/03/2017, 144A | | | 413,240 | |
| | 3,784,140,000 | | | Korea Treasury Bond, 2.750%, 9/10/2017, (KRW)(c) | | | 3,626,250 | |
| | 970,000,000 | | | Korea Treasury Bond, 4.000%, 3/10/2016, (KRW) | | | 941,744 | |
| | 250,000 | | | Lotte Shopping Co. Ltd., 3.375%, 5/09/2017, 144A | | | 258,320 | |
| | 1,125,000 | | | Minera y Metalurgica del Boleo S.A. de CV, 2.875%, 5/07/2019, 144A | | | 1,136,293 | |
| | 140,000 | | | SK Telecom Co. Ltd., 6.625%, 7/20/2027, 144A | | | 175,678 | |
| | 200,000 | | | Woori Bank, 5.875%, 4/13/2021, 144A | | | 226,534 | |
| | | | | | | | |
| | | | 10,495,694 | |
| | | | | | | | |
| | | | Luxembourg — 0.2% | | | | |
| | 400,000 | | | Altice Financing S.A., 7.875%, 12/15/2019, 144A | | | 426,500 | |
| | 500,000 | | | Altice S.A., 7.750%, 5/15/2022, 144A | | | 516,250 | |
| | 970,000 | | | ArcelorMittal, 7.250%, 3/01/2041 | | | 972,425 | |
| | 500,000 | | | Millicom International Cellular S.A., 4.750%, 5/22/2020, 144A | | | 476,250 | |
| | | | | | | | |
| | | | | | | 2,391,425 | |
| | | | | | | | |
| | | | Mexico — 1.2% | | | | |
| | 1,020,000 | | | Alfa SAB de CV, 5.250%, 3/25/2024, 144A | | | 1,087,830 | |
| | 10,000,000 | | | America Movil SAB de CV, 6.450%, 12/05/2022, (MXN) | | | 720,665 | |
| | 300,000 | | | Banco Santander Mexico S.A. Institucion de Banca Multiple Grupo Financiero Santander, 4.125%, 11/09/2022, 144A | | | 301,500 | |
| | 640,000 | | | Cemex Finance LLC, 6.000%, 4/01/2024, 144A | | | 638,208 | |
| | 10,000,000 | | | Grupo Televisa SAB, EMTN, 7.250%, 5/14/2043, (MXN) | | | 626,493 | |
| | 364,500(††††) | | | Mexican Fixed Rate Bonds, Series M, 6.500%, 6/10/2021, (MXN)(c) | | | 2,829,864 | |
| | 186,200(††††) | | | Mexican Fixed Rate Bonds, Series M, 6.500%, 6/09/2022, (MXN)(c) | | | 1,435,287 | |
| | 395,000(††††) | | | Mexican Fixed Rate Bonds, Series M-10, 8.500%, 12/13/2018, (MXN)(c) | | | 3,319,512 | |
| | 265,000(††††) | | | Mexican Fixed Rate Bonds, Series M-20, 8.000%, 12/07/2023, (MXN)(c) | | | 2,234,739 | |
| | 480,000 | | | Petroleos Mexicanos, 3.500%, 7/18/2018 | | | 497,760 | |
| | 925,000 | | | Unifin Financiera S.A.P.I. de CV SOFOM ENR, 6.250%, 7/22/2019, 144A | | | 901,875 | |
| | | | | | | | |
| | | | | | | 14,593,733 | |
| | | | | | | | |
See accompanying notes to financial statements.
| 26
Portfolio of Investments – as of September 30, 2014
Loomis Sayles Global Equity and Income Fund – (continued)
| | | | | | | | |
Principal
Amount (‡) | | | Description | | Value (†) | |
| | | | Morocco — 0.1% | | | | |
| $ | 1,190,000 | | | OCP S.A., 6.875%, 4/25/2044, 144A(c) | | $ | 1,279,488 | |
| | | | | | | | |
| | | | New Zealand — 0.5% | | | | |
| | 2,877,545 | | | New Zealand Government Bond, 3.000%, 9/20/2030, (NZD)(c) | | | 2,355,077 | |
| | 2,340,000 | | | New Zealand Government Bond, 5.000%, 3/15/2019, (NZD)(c) | | | 1,901,744 | |
| | 2,590,000 | | | New Zealand Government Bond, 5.500%, 4/15/2023, (NZD) | | | 2,215,701 | |
| | | | | | | | |
| | | | | | | 6,472,522 | |
| | | | | | | | |
| | | | Nigeria — 0.0% | | | | |
| | 550,000 | | | GTB Finance BV, 6.000%, 11/08/2018, 144A | | | 550,000 | |
| | | | | | | | |
| | | | Norway — 0.2% | | | | |
| | 13,760,000 | | | Norway Government Bond, 4.500%, 5/22/2019, (NOK)(c) | | | 2,404,699 | |
| | | | | | | | |
| | | | Panama — 0.0% | | | | |
| | 300,000 | | | Banco Latinoamericano de Comercio Exterior S.A., 3.750%, 4/04/2017, 144A | | | 311,250 | |
| | | | | | | | |
| | | | Peru — 0.1% | | | | |
| | 1,050,000 | | | Transportadora de Gas del Peru S.A., 4.250%, 4/30/2028, 144A | | | 994,875 | |
| | | | | | | | |
| | | | Philippines — 0.1% | | | | |
| | 40,000,000 | | | Philippine Government International Bond, 3.900%, 11/26/2022, (PHP) | | | 876,831 | |
| | 30,000,000 | | | Philippine Government International Bond, 4.950%, 1/15/2021, (PHP) | | | 697,733 | |
| | 175,000 | | | Philippine Long Distance Telephone Co., EMTN, 8.350%, 3/06/2017 | | | 200,375 | |
| | | | | | | | |
| | | | | | | 1,774,939 | |
| | | | | | | | |
| | | | Poland — 0.7% | | | | |
| | 1,000,000 | | | PKO Finance AB, 4.630%, 9/26/2022, 144A | | | 1,038,750 | |
| | 17,080,000 | | | Poland Government Bond, 4.000%, 10/25/2023, (PLN)(c) | | | 5,568,909 | |
| | 2,200,000 | | | Poland Government Bond, 4.750%, 4/25/2017, (PLN) | | | 708,867 | |
| | 3,210,000 | | | Poland Government Bond, 5.500%, 10/25/2019, (PLN) | | | 1,112,066 | |
| | | | | | | | |
| | | | | | | 8,428,592 | |
| | | | | | | | |
| | | | Singapore — 0.2% | | | | |
| | 2,000,000 | | | DBS Bank Ltd., (fixed rate to 9/21/2017, variable rate thereafter),
3.625%, 9/21/2022, 144A(c) | | | 2,062,734 | |
| | | | | | | | |
| | | | South Africa — 0.3% | | | | |
| | 500,000 | | | Myriad International Holdings BV, 6.000%, 7/18/2020, 144A | | | 542,500 | |
| | 285,000 | | | Republic of South Africa, EMTN, 4.500%, 4/05/2016, (EUR) | | | 379,365 | |
| | 11,500,000 | | | South Africa Government Bond, 7.750%, 2/28/2023, (ZAR) | | | 995,608 | |
| | 600,000 | | | South Africa Government International Bond, 5.875%, 9/16/2025 | | | 660,000 | |
| | 700,000 | | | Transnet SOC Ltd., 4.000%, 7/26/2022, 144A | | | 659,015 | |
| | | | | | | | |
| | | | | | | 3,236,488 | |
| | | | | | | | |
| | | | Spain — 0.3% | | | | |
| | 2,115,000 | | | Spain Government Bond, 4.300%, 10/31/2019, (EUR)(c) | | | 3,116,746 | |
| | 800,000 | | | Spain Government Bond, 4.400%, 10/31/2023, 144A, (EUR) | | | 1,215,489 | |
| | | | | | | | |
| | | | | | | 4,332,235 | |
| | | | | | | | |
| | | | Supranationals — 0.7% | | | | |
| | 840,000 | | | Central American Bank for Economic Integration, 3.875%, 2/09/2017, 144A | | | 863,024 | |
| | 1,115,000 | | | Corporacion Andina de Fomento, 4.375%, 6/15/2022 | | | 1,191,638 | |
See accompanying notes to financial statements.
27 |
Portfolio of Investments – as of September 30, 2014
Loomis Sayles Global Equity and Income Fund – (continued)
| | | | | | | | |
Principal
Amount (‡) | | | Description | | Value (†) | |
| | | | Supranationals — continued | | | | |
| | 3,680,000 | | | European Financial Stability Facility, 1.625%, 7/17/2020, (EUR)(c) | | $ | 4,958,151 | |
| | 70,000,000 | | | International Finance Corp., 7.800%, 6/03/2019, (INR) | | | 1,207,097 | |
| | | | | | | | |
| | | | | | | 8,219,910 | |
| | | | | | | | |
| | | | Sweden — 0.1% | | | | |
| | 9,195,000 | | | Sweden Government Bond, 4.500%, 8/12/2015, (SEK)(c) | | | 1,321,496 | |
| | 2,450,000 | | | Sweden Government Bond, 5.000%, 12/01/2020, (SEK) | | | 422,204 | |
| | | | | | | | |
| | | | | | | 1,743,700 | |
| | | | | | | | |
| | | | Switzerland — 0.0% | | | | |
| | 250,000 | | | Zurich Finance USA, Inc., EMTN, (fixed rate to 6/15/2015, variable rate thereafter), 4.500%, 6/15/2025, (EUR) | | | 321,683 | |
| | | | | | | | |
| | | | Thailand — 0.2% | | | | |
| | 1,010,000 | | | Siam Commercial Bank PCL (The), 3.500%, 4/07/2019, 144A | | | 1,029,696 | |
| | 950,000 | | | Thai Oil PCL, 3.625%, 1/23/2023, 144A | | | 916,011 | |
| | | | | | | | |
| | | | | | | 1,945,707 | |
| | | | | | | | |
| | | | Turkey — 0.8% | | | | |
| | 800,000 | | | Arcelik AS, 5.000%, 4/03/2023, 144A | | | 752,000 | |
| | 545,000 | | | Export Credit Bank of Turkey, 5.000%, 9/23/2021, 144A | | | 541,730 | |
| | 920,000 | | | TC Ziraat Bankasi AS, 4.250%, 7/03/2019, 144A | | | 900,680 | |
| | 1,195,000 | | | Turk Telekomunikasyon AS, 3.750%, 6/19/2019, 144A | | | 1,165,137 | |
| | 1,600,000 | | | Turkey Government International Bond, 3.250%, 3/23/2023(c) | | | 1,440,000 | |
| | 1,200,000 | | | Turkey Government International Bond, 5.125%, 3/25/2022 | | | 1,234,800 | |
| | 1,125,000 | | | Turkey Government International Bond, 5.750%, 3/22/2024 | | | 1,194,412 | |
| | 600,000 | | | Turkiye Garanti Bankasi AS, 4.000%, 9/13/2017, 144A | | | 603,864 | |
| | 800,000 | | | Turkiye Is Bankasi, 3.875%, 11/07/2017, 144A | | | 798,400 | |
| | 875,000 | | | Yapi ve Kredi Bankasi, 5.250%, 12/03/2018, 144A | | | 891,188 | |
| | | | | | | | |
| | | | | | | 9,522,211 | |
| | | | | | | | |
| | | | United Arab Emirates — 0.1% | | | | |
| | 600,000 | | | Dubai Electricity & Water Authority, 6.375%, 10/21/2016, 144A | | | 659,850 | |
| | 200,000 | | | Dubai Electricity & Water Authority, 8.500%, 4/22/2015, 144A | | | 208,246 | |
| | | | | | | | |
| | | | | | | 868,096 | |
| | | | | | | | |
| | | | United Kingdom — 0.8% | | | | |
| | 600,000 | | | Anglo American Capital PLC, 2.625%, 9/27/2017, 144A | | | 610,430 | |
| | 410,000,000 | | | Barclays Bank PLC, EMTN, 3.680%, 8/20/2015, (KRW) | | | 393,810 | |
| | 470,000 | | | British Telecommunications PLC, 5.750%, 12/07/2028, (GBP) | | | 898,838 | |
| | 150,000 | | | Imperial Tobacco Finance PLC, EMTN, 6.250%, 12/04/2018, (GBP) | | | 277,008 | |
| | 400,000 | | | Old Mutual PLC, EMTN, 8.000%, 6/03/2021, (GBP) | | | 737,276 | |
| | 1,130,000 | | | Royal Bank of Scotland Group PLC, 6.000%, 12/19/2023 | | | 1,184,623 | |
| | 250,000 | | | Standard Chartered PLC, EMTN, 3.625%, 11/23/2022, (EUR) | | | 337,863 | |
| | 345,000 | | | United Kingdom Gilt, 2.000%, 1/22/2016, (GBP) | | | 568,911 | |
| | 305,000 | | | United Kingdom Gilt, 3.750%, 9/07/2019, (GBP) | | | 541,038 | |
| | 705,000 | | | United Kingdom Treasury, 1.750%, 1/22/2017, (GBP) | | | 1,162,066 | |
| | 250,000 | | | United Kingdom Treasury, 4.250%, 3/07/2036, (GBP) | | | 487,841 | |
| | 1,055,000 | | | United Kingdom Treasury, 5.000%, 3/07/2025, (GBP)(c) | | | 2,114,888 | |
| | 115,000 | | | Virgin Media Finance PLC, 6.375%, 10/15/2024, 144A, (GBP) | | | 185,644 | |
| | 100,000 | | | WPP PLC, 6.000%, 4/04/2017, (GBP) | | | 177,900 | |
| | | | | | | | |
| | | | | | | 9,678,136 | |
| | | | | | | | |
See accompanying notes to financial statements.
| 28
Portfolio of Investments – as of September 30, 2014
Loomis Sayles Global Equity and Income Fund – (continued)
| | | | | | | | |
Principal
Amount (‡) | | | Description | | Value (†) | |
| | | | United States — 12.4% | | | | |
| $ | 15,000 | | | 21st Century Fox America, Inc., 6.400%, 12/15/2035 | | $ | 18,597 | |
| | 45,000 | | | AECOM Technology Corp., 5.750%, 10/15/2022, 144A | | | 45,169 | |
| | 45,000 | | | AECOM Technology Corp., 5.875%, 10/15/2024, 144A | | | 45,281 | |
| | 240,000 | | | AES Corp. (The), 4.875%, 5/15/2023 | | | 228,000 | |
| | 975,000 | | | Alcoa, Inc., 5.900%, 2/01/2027 | | | 1,021,270 | |
| | 745,000 | | | Ally Financial, Inc., 5.125%, 9/30/2024 | | | 730,100 | |
| | 129,000 | | | Ally Financial, Inc., 8.000%, 12/31/2018 | | | 146,415 | |
| | 1,728,000 | | | Ally Financial, Inc., 8.000%, 11/01/2031 | | | 2,155,680 | |
| | 189,745 | | | American Airlines Pass Through Trust, Series 2013-1, Class A,
4.000%, 1/15/2027 | | | 193,187 | |
| | 51,000 | | | American International Group, Inc., (fixed rate to 5/15/2038, variable rate thereafter), 8.175%, 5/15/2068 | | | 68,723 | |
| | 12,046 | | | Atlas Air Pass Through Trust, Series 1998-1, Class B, 7.680%, 1/02/2016(d) | | | 12,257 | |
| | 495,000 | | | Atrium Windows & Doors, Inc., 7.750%, 5/01/2019, 144A | | | 480,150 | |
| | 925,000 | | | Aviation Capital Group Corp., 6.750%, 4/06/2021, 144A | | | 1,049,875 | |
| | 145,000 | | | Avnet, Inc., 6.000%, 9/01/2015 | | | 151,500 | |
| | 200,000 | | | Bank of America Corp., 5.490%, 3/15/2019 | | | 220,792 | |
| | 500,000 | | | Bank of America Corp., EMTN, 4.625%, 8/07/2017, (EUR) | | | 703,990 | |
| | 115,000 | | | Bank of America Corp., MTN, 4.000%, 4/01/2024 | | | 116,198 | |
| | 50,000 | | | Beazer Homes USA, Inc., 7.250%, 2/01/2023 | | | 49,750 | |
| | 15,000 | | | Boston Scientific Corp., 5.125%, 1/12/2017 | | | 16,142 | |
| | 15,000 | | | Boston Scientific Corp., 6.400%, 6/15/2016 | | | 16,309 | |
| | 40,000 | | | California Resources Corp., 5.000%, 1/15/2020, 144A | | | 40,600 | |
| | 670,000 | | | California Resources Corp., 5.500%, 9/15/2021, 144A | | | 680,050 | |
| | 90,000 | | | California Resources Corp., 6.000%, 11/15/2024, 144A | | | 92,475 | |
| | 875,000 | | | Cantor Fitzgerald LP, 6.375%, 6/26/2015, 144A | | | 901,250 | |
| | 55,000 | | | CBS Outdoor Americas Capital LLC/CBS Outdoor Americas Capital Corp.,
5.250%, 2/15/2022, 144A | | | 54,931 | |
| | 140,000 | | | CBS Outdoor Americas Capital LLC/CBS Outdoor Americas Capital Corp.,
5.875%, 3/15/2025, 144A | | | 140,700 | |
| | 1,995,000 | | | CenturyLink, Inc., 6.450%, 6/15/2021 | | | 2,134,650 | |
| | 510,000 | | | CenturyLink, Inc., 7.650%, 3/15/2042 | | | 502,350 | |
| | 55,000 | | | CenturyLink, Inc., Series G, 6.875%, 1/15/2028 | | | 54,725 | |
| | 605,000 | | | CenturyLink, Inc., Series P, 7.600%, 9/15/2039 | | | 597,437 | |
| | 20,000 | | | Chesapeake Energy Corp., 6.625%, 8/15/2020 | | | 22,060 | |
| | 95,000 | | | Chesapeake Energy Corp., 6.875%, 11/15/2020 | | | 105,925 | |
| | 1,470,000 | | | Clear Channel Worldwide Holdings, Inc., 7.625%, 3/15/2020 | | | 1,525,125 | |
| | 155,000 | | | Cleaver-Brooks, Inc., 8.750%, 12/15/2019, 144A | | | 167,787 | |
| | 1,005,000 | | | Continental Airlines Pass Through Certificates, Series 2012-3, Class C,
6.125%, 4/29/2018 | | | 1,065,300 | |
| | 276,728 | | | Continental Airlines Pass Through Trust, Series 1999-1, Class B,
6.795%, 2/02/2020 | | | 290,910 | |
| | 235,000 | | | Crestview DS Merger Sub II, Inc., 10.000%, 9/01/2021 | | | 259,675 | |
| | 155,000 | | | Cummins, Inc., 5.650%, 3/01/2098 | | | 175,358 | |
| | 202,347 | | | Delta Air Lines Pass Through Trust, Series 2007-1, Class B,
8.021%, 2/10/2024 | | | 236,240 | |
| | 42,000 | | | Dillard’s, Inc., 6.625%, 1/15/2018 | | | 45,885 | |
| | 50,000 | | | Dillard’s, Inc., 7.000%, 12/01/2028 | | | 51,750 | |
See accompanying notes to financial statements.
29 |
Portfolio of Investments – as of September 30, 2014
Loomis Sayles Global Equity and Income Fund – (continued)
| | | | | | | | |
Principal
Amount (‡) | | | Description | | Value (†) | |
| | | | United States — continued | | | | |
| $ | 8,000 | | | Dillard’s, Inc., 7.750%, 7/15/2026 | | $ | 8,760 | |
| | 315,000 | | | DPL, Inc., 6.750%, 10/01/2019, 144A | | | 320,512 | |
| | 310,000 | | | DR Horton, Inc., 4.375%, 9/15/2022 | | | 298,375 | |
| | 1,121,000 | | | First Data Corp., 10.625%, 6/15/2021 | | | 1,275,137 | |
| | 150,000 | | | Foot Locker, Inc., 8.500%, 1/15/2022(d) | | | 164,051 | |
| | 25,000 | | | Ford Motor Co., 6.375%, 2/01/2029 | | | 29,769 | |
| | 50,000 | | | Ford Motor Co., 6.625%, 2/15/2028 | | | 58,340 | |
| | 2,105,000 | | | Ford Motor Co., 6.625%, 10/01/2028 | | | 2,588,605 | |
| | 40,000 | | | Ford Motor Co., 7.125%, 11/15/2025 | | | 49,270 | |
| | 835,000 | | | Ford Motor Co., 7.400%, 11/01/2046 | | | 1,139,305 | |
| | 5,000 | | | Ford Motor Co., 7.500%, 8/01/2026 | | | 6,307 | |
| | 1,000,000 | | | Ford Motor Credit Co. LLC, 5.000%, 5/15/2018 | | | 1,092,146 | |
| | 905,000 | | | Forethought Financial Group, Inc., 8.625%, 4/15/2021, 144A | | | 1,028,795 | |
| | 50,000 | | | General Electric Capital Corp., GMTN, 3.100%, 1/09/2023 | | | 49,484 | |
| | 600,000 | | | General Electric Capital Corp., Series A, (fixed rate to 6/15/2022, variable rate thereafter), 7.125%(e) | | | 694,500 | |
| | 240,000 | | | General Motors Financial Co., Inc., 4.375%, 9/25/2021 | | | 245,400 | |
| | 3,435,000 | | | Georgia-Pacific LLC, 7.250%, 6/01/2028 | | | 4,482,713 | |
| | 105,000 | | | Georgia-Pacific LLC, 7.375%, 12/01/2025 | | | 136,447 | |
| | 180,000 | | | Georgia-Pacific LLC, 7.750%, 11/15/2029 | | | 247,567 | |
| | 315,000 | | | Georgia-Pacific LLC, 8.875%, 5/15/2031 | | | 471,456 | |
| | 800,000 | | | Goldman Sachs Group, Inc. (The), 3.375%, 2/01/2018, (CAD) | | | 734,511 | |
| | 2,295,000 | | | Goldman Sachs Group, Inc. (The), 6.750%, 10/01/2037 | | | 2,739,741 | |
| | 3,045,000 | | | Goodyear Tire & Rubber Co. (The), 7.000%, 5/15/2022 | | | 3,261,956 | |
| | 165,000 | | | Goodyear Tire & Rubber Co. (The), 7.000%, 3/15/2028 | | | 174,075 | |
| | 70,000 | | | GS Mortgage Securities Corp. II, Series 2007-GG10, Class AM,
5.991%, 8/10/2045(f) | | | 72,577 | |
| | 425,000 | | | Halcon Resources Corp., 8.875%, 5/15/2021 | | | 418,625 | |
| | 410,000 | | | Hanover Insurance Group, Inc. (The), 6.375%, 6/15/2021 | | | 470,395 | |
| | 1,000,000 | | | HCA Holdings, Inc., 6.250%, 2/15/2021 | | | 1,045,000 | |
| | 20,000 | | | HCA, Inc., 4.750%, 5/01/2023 | | | 19,550 | |
| | 90,000 | | | HCA, Inc., 6.375%, 1/15/2015 | | | 90,788 | |
| | 225,000 | | | HCA, Inc., 7.050%, 12/01/2027 | | | 226,125 | |
| | 245,000 | | | HCA, Inc., 7.190%, 11/15/2015 | | | 256,025 | �� |
| | 90,000 | | | HCA, Inc., 7.500%, 12/15/2023 | | | 98,100 | |
| | 820,000 | | | HCA, Inc., 7.500%, 11/06/2033 | | | 861,000 | |
| | 1,500,000 | | | HCA, Inc., 7.690%, 6/15/2025 | | | 1,650,000 | |
| | 395,000 | | | HCA, Inc., 8.360%, 4/15/2024 | | | 454,250 | |
| | 195,000 | | | HCA, Inc., MTN, 7.580%, 9/15/2025 | | | 212,550 | |
| | 75,000 | | | HCA, Inc., MTN, 7.750%, 7/15/2036 | | | 81,375 | |
| | 855,000 | | | Hecla Mining Co., 6.875%, 5/01/2021 | | | 803,700 | |
| | 585,000 | | | Hercules, Inc., 6.500%, 6/30/2029 | | | 520,650 | |
| | 470,000 | | | Highwoods Properties, Inc., 5.850%, 3/15/2017 | | | 515,966 | |
| | 450,000 | | | International Lease Finance Corp., 4.625%, 4/15/2021 | | | 446,625 | |
| | 1,250,000 | | | International Lease Finance Corp., 6.250%, 5/15/2019 | | | 1,339,375 | |
| | 45,000 | | | iStar Financial, Inc., 3.875%, 7/01/2016 | | | 45,000 | |
| | 145,000 | | | iStar Financial, Inc., 4.875%, 7/01/2018 | | | 141,013 | |
| | 70,000 | | | iStar Financial, Inc., 5.850%, 3/15/2017 | | | 72,625 | |
See accompanying notes to financial statements.
| 30
Portfolio of Investments – as of September 30, 2014
Loomis Sayles Global Equity and Income Fund – (continued)
| | | | | | | | |
Principal
Amount (‡) | | | Description | | Value (†) | |
| | | | United States — continued | | | | |
| $ | 60,000 | | | iStar Financial, Inc., 6.050%, 4/15/2015 | | $ | 61,200 | |
| | 200,000 | | | iStar Financial, Inc., 7.125%, 2/15/2018 | | | 207,000 | |
| | 48,000 | | | J.C. Penney Corp., Inc., 6.375%, 10/15/2036 | | | 37,200 | |
| | 5,000 | | | J.C. Penney Corp., Inc., 7.625%, 3/01/2097 | | | 4,100 | |
| | 2,995,000 | | | Jack Cooper Holdings Corp., 9.250%, 6/01/2020, 144A | | | 3,219,625 | |
| | 115,000 | | | Jarden Corp., 3.750%, 10/01/2021, 144A, (EUR) | | | 147,066 | |
| | 665,000 | | | Jefferies Group LLC, 5.125%, 4/13/2018 | | | 724,295 | |
| | 30,000 | | | Jefferies Group LLC, 5.125%, 1/20/2023 | | | 31,887 | |
| | 1,070,000 | | | Jefferies Group LLC, 6.250%, 1/15/2036 | | | 1,126,285 | |
| | 685,000 | | | Jefferies Group LLC, 6.450%, 6/08/2027 | | | 767,488 | |
| | 1,410,000 | | | Jefferies Group LLC, 6.875%, 4/15/2021 | | | 1,643,066 | |
| | 15,000 | | | K. Hovnanian Enterprises, Inc., 5.000%, 11/01/2021 | | | 13,050 | |
| | 245,000 | | | KB Home, 4.750%, 5/15/2019 | | | 238,262 | |
| | 1,665,000 | | | KB Home, 8.000%, 3/15/2020 | | | 1,831,500 | |
| | 190,000 | | | Ladder Capital Finance Holdings LLLP/Ladder Capital Finance Corp.,
7.375%, 10/01/2017 | | | 200,925 | |
| | 55,000 | | | Lennar Corp., Series B, 6.500%, 4/15/2016 | | | 57,888 | |
| | 135,000 | | | Level 3 Financing, Inc., 7.000%, 6/01/2020 | | | 142,256 | |
| | 1,435,000 | | | Level 3 Financing, Inc., 8.625%, 7/15/2020 | | | 1,553,387 | |
| | 30,000 | | | Level 3 Financing, Inc., 9.375%, 4/01/2019 | | | 32,063 | |
| | 165,000 | | | Masco Corp., 6.500%, 8/15/2032 | | | 165,000 | |
| | 865,000 | | | Masco Corp., 7.750%, 8/01/2029 | | | 991,107 | |
| | 2,700,000 | | | Merrill Lynch & Co., Inc., 6.110%, 1/29/2037 | | | 3,090,539 | |
| | 310,000 | | | Momentive Specialty Chemicals, Inc., 7.875%, 2/15/2023(d)(g) | | | 278,225 | |
| | 265,000 | | | Momentive Specialty Chemicals, Inc., 8.375%, 4/15/2016(d)(g) | | | 259,037 | |
| | 825,000 | | | Morgan Stanley, 2.125%, 4/25/2018 | | | 824,913 | |
| | 220,000 | | | Morgan Stanley, 2.500%, 1/24/2019 | | | 220,015 | |
| | 450,000 | | | Morgan Stanley, 3.750%, 2/25/2023 | | | 449,415 | |
| | 725,000 | | | Morgan Stanley, 5.750%, 1/25/2021 | | | 823,744 | |
| | 250,000 | | | Morgan Stanley, EMTN, 5.750%, 2/14/2017, (GBP) | | | 440,230 | |
| | 500,000 | | | Morgan Stanley, GMTN, 7.625%, 3/03/2016, (AUD) | | | 462,014 | |
| | 3,150,000 | | | Morgan Stanley, MTN, 4.100%, 5/22/2023 | | | 3,141,300 | |
| | 600,000 | | | Morgan Stanley, MTN, 6.250%, 8/09/2026 | | | 721,478 | |
| | 100,000 | | | Morgan Stanley, Series F, MTN, 0.684%, 10/18/2016(f) | | | 100,266 | |
| | 175,000 | | | Navient LLC, 4.875%, 6/17/2019 | | | 175,000 | |
| | 915,000 | | | Navient LLC, 5.500%, 1/25/2023 | | | 879,544 | |
| | 1,600(†††††) | | | Navient LLC, 6.000%, 12/15/2043 | | | 34,580 | |
| | 141,000 | | | Navient LLC, MTN, 3.875%, 9/10/2015 | | | 142,763 | |
| | 40,000 | | | Navient LLC, MTN, 4.625%, 9/25/2017 | | | 40,450 | |
| | 60,000 | | | Navient LLC, MTN, 5.500%, 1/15/2019 | | | 61,200 | |
| | 1,130,000 | | | Navient LLC, MTN, 7.250%, 1/25/2022 | | | 1,226,050 | |
| | 10,000 | | | Navient LLC, Series A, MTN, 5.000%, 6/15/2018 | | | 9,925 | |
| | 2,560,000 | | | Navient LLC, Series A, MTN, 5.625%, 8/01/2033 | | | 2,156,800 | |
| | 360,000 | | | Navient LLC, Series A, MTN, 8.450%, 6/15/2018 | | | 405,000 | |
| | 1,552,000 | | | New Albertson’s, Inc., 7.450%, 8/01/2029 | | | 1,412,320 | |
| | 245,000 | | | New Albertson’s, Inc., 7.750%, 6/15/2026 | | | 231,525 | |
| | 3,605,000 | | | New Albertson’s, Inc., 8.000%, 5/01/2031 | | | 3,424,750 | |
| | 2,110,000 | | | New Albertson’s, Inc., 8.700%, 5/01/2030 | | | 2,078,350 | |
See accompanying notes to financial statements.
31 |
Portfolio of Investments – as of September 30, 2014
Loomis Sayles Global Equity and Income Fund – (continued)
| | | | | | | | |
Principal
Amount (‡) | | | Description | | Value (†) | |
| | | | United States — continued | | | | |
| $ | 315,000 | | | New Albertson’s, Inc., Series C, MTN, 6.625%, 6/01/2028 | | $ | 256,725 | |
| | 80,000 | | | NGPL PipeCo LLC, 7.768%, 12/15/2037, 144A | | | 82,600 | |
| | 420,000 | | | Old Republic International Corp., 4.875%, 10/01/2024 | | | 420,558 | |
| | 115,000 | | | Owens Corning, Inc., 6.500%, 12/01/2016 | | | 126,689 | |
| | 535,000 | | | Owens Corning, Inc., 7.000%, 12/01/2036 | | | 648,408 | |
| | 540,000 | | | Pulte Group, Inc., 6.000%, 2/15/2035 | | | 513,000 | |
| | 785,000 | | | Pulte Group, Inc., 6.375%, 5/15/2033 | | | 783,037 | |
| | 220,000 | | | Pulte Group, Inc., 7.875%, 6/15/2032 | | | 247,500 | |
| | 1,335,000 | | | Qwest Capital Funding, Inc., 6.500%, 11/15/2018 | | | 1,468,500 | |
| | 650,000 | | | Qwest Capital Funding, Inc., 6.875%, 7/15/2028 | | | 643,532 | |
| | 400,000 | | | Qwest Capital Funding, Inc., 7.625%, 8/03/2021 | | | 445,000 | |
| | 60,000 | | | Qwest Capital Funding, Inc., 7.750%, 2/15/2031 | | | 61,350 | |
| | 560,000 | | | Qwest Corp., 6.875%, 9/15/2033 | | | 558,845 | |
| | 115,000 | | | Qwest Corp., 7.250%, 9/15/2025 | | | 134,127 | |
| | 480,000 | | | R.R. Donnelley & Sons Co., 7.000%, 2/15/2022 | | | 506,400 | |
| | 200,000 | | | Rain CII Carbon LLC/CII Carbon Corp., 8.250%, 1/15/2021, 144A | | | 208,000 | |
| | 500,000 | | | Range Resources Corp., 5.000%, 8/15/2022 | | | 511,250 | |
| | 80,000 | | | Reynolds American, Inc., 6.750%, 6/15/2017 | | | 90,289 | |
| | 400,000 | | | Reynolds Group Issuer, Inc./Reynolds Group Issuer LLC/Reynolds Group Issuer (Luxembourg) S.A., 9.875%, 8/15/2019 | | | 430,500 | |
| | 655,000 | | | Rockies Express Pipeline LLC, 3.900%, 4/15/2015, 144A | | | 653,362 | |
| | 1,970,000 | | | Rosetta Resources, Inc., 5.625%, 5/01/2021 | | | 1,920,750 | |
| | 760,000 | | | Shearer’s Foods LLC/Chip Finance Corp., 9.000%, 11/01/2019, 144A | | | 826,500 | |
| | 330,000 | | | Springleaf Finance Corp., 7.750%, 10/01/2021 | | | 369,600 | |
| | 130,000 | | | Springleaf Finance Corp., 8.250%, 10/01/2023 | | | 146,250 | |
| | 400,000 | | | Springleaf Finance Corp., MTN, 5.750%, 9/15/2016 | | | 415,000 | |
| | 300,000 | | | Springleaf Finance Corp., Series I, MTN, 5.400%, 12/01/2015 | | | 306,750 | |
| | 135,000 | | | Springleaf Finance Corp., Series J, MTN, 6.900%, 12/15/2017 | | | 143,438 | |
| | 294,000 | | | Sprint Capital Corp., 6.875%, 11/15/2028 | | | 280,770 | |
| | 240,000 | | | Sprint Capital Corp., 6.900%, 5/01/2019 | | | 252,300 | |
| | 110,000 | | | Sprint Capital Corp., 8.750%, 3/15/2032 | | | 120,038 | |
| | 26,000 | | | Sprint Communications, Inc., 6.000%, 12/01/2016 | | | 27,349 | |
| | 180,000 | | | Sprint Communications, Inc., 6.000%, 11/15/2022 | | | 174,600 | |
| | 2,910,000 | | | SUPERVALU, Inc., 6.750%, 6/01/2021 | | | 2,866,350 | |
| | 1,360,000 | | | Tenet Healthcare Corp., 6.875%, 11/15/2031 | | | 1,312,400 | |
| | 820,000 | | | Textron, Inc., 5.950%, 9/21/2021 | | | 944,537 | |
| | 960,000 | | | Toys R Us, Inc., 7.375%, 10/15/2018 | | | 662,400 | |
| | 171,000 | | | TransDigm, Inc., 6.500%, 7/15/2024, 144A | | | 170,359 | |
| | 7,940,000 | | | U.S. Treasury Note, 0.250%, 1/15/2015 | | | 7,944,653 | |
| | 4,760,000 | | | U.S. Treasury Note, 0.250%, 1/31/2015 | | | 4,763,161 | |
| | 15,210,000 | | | U.S. Treasury Note, 0.250%, 2/15/2015 | | | 15,221,879 | |
| | 5,000,000 | | | U.S. Treasury Note, 0.250%, 2/29/2016 | | | 4,995,900 | |
| | 5,140,000 | | | U.S. Treasury Note, 0.250%, 4/15/2016 | | | 5,129,761 | |
| | 7,500,000 | | | U.S. Treasury Note, 0.375%, 3/31/2016 | | | 7,501,755 | |
| | 24,004 | | | UAL Pass Through Trust, Series 2009-1, 10.400%, 5/01/2018 | | | 26,585 | |
| | 630,000 | | | United Continental Holdings, Inc., 6.375%, 6/01/2018 | | | 659,925 | |
| | 295,000 | | | United Rentals North America, Inc., 7.625%, 4/15/2022 | | | 320,812 | |
| | 1,735,000 | | | United States Steel Corp., 6.650%, 6/01/2037 | | | 1,643,912 | |
| | 770,000 | | | United States Steel Corp., 7.500%, 3/15/2022 | | | 827,750 | |
See accompanying notes to financial statements.
| 32
Portfolio of Investments – as of September 30, 2014
Loomis Sayles Global Equity and Income Fund – (continued)
| | | | | | | | |
Principal
Amount (‡) | | | Description | | Value (†) | |
| | | | United States — continued | | | | |
| $ | 129,794 | | | US Airways Pass Through Trust, Series 2012-1A, Class A,
5.900%, 4/01/2026 | | $ | 145,369 | |
| | 69,497 | | | US Airways Pass Through Trust, Series 2012-1B, Class B,
8.000%, 4/01/2021 | | | 77,837 | |
| | 506,632 | | | US Airways Pass Through Trust, Series 2012-2A, Class A,
4.625%, 12/03/2026 | | | 528,164 | |
| | 230,000 | | | USG Corp., 9.750%, 1/15/2018 | | | 266,800 | |
| | 330,000 | | | Valeant Pharmaceuticals International, 6.375%, 10/15/2020, 144A | | | 339,075 | |
| | 110,000 | | | Verizon Pennsylvania, Inc., 6.000%, 12/01/2028 | | | 119,569 | |
| | 260,000 | | | Visant Corp., 10.000%, 10/01/2017 | | | 232,050 | |
| | 60,000 | | | Weyerhaeuser Co., 6.950%, 10/01/2027 | | | 74,093 | |
| | 315,000 | | | Weyerhaeuser Co., 7.375%, 3/15/2032 | | | 417,533 | |
| | 55,000 | | | Weyerhaeuser Real Estate Co., 4.375%, 6/15/2019, 144A | | | 53,763 | |
| | 125,000 | | | Xerox Corp., 6.750%, 2/01/2017 | | | 139,895 | |
| | 20,000 | | | Xerox Corp., MTN, 7.200%, 4/01/2016 | | | 21,779 | |
| | | | | | | | |
| | | | | | | 155,218,270 | |
| | | | | | | | |
| | | | Total Non-Convertible Bonds
(Identified Cost $332,515,874) | | | 344,461,472 | |
| | | | | | | | |
| | | | | | | | |
| | Convertible Bonds — 0.7% | |
| | | | United States — 0.7% | | | | |
| | 390,000 | | | Chesapeake Energy Corp., 2.500%, 5/15/2037 | | | 393,169 | |
| | 175,000 | | | Chesapeake Energy Corp., 2.750%, 11/15/2035 | | | 177,188 | |
| | 185,000 | | | Ciena Corp., 3.750%, 10/15/2018, 144A | | | 215,525 | |
| | 125,000 | | | Ford Motor Co., 4.250%, 11/15/2016 | | | 214,219 | |
| | 530,000 | | | Hologic, Inc., (accretes to principal after 3/01/2018), 2.000%, 3/01/2042(h) | | | 558,156 | |
| | 1,125,000 | | | Intel Corp., 3.250%, 8/01/2039 | | | 1,886,484 | |
| | 160,000 | | | KB Home, 1.375%, 2/01/2019 | | | 154,000 | |
| | 215,000 | | | Level 3 Communications, Inc., 7.000%, 3/15/2015, 144A(d)(g) | | | 366,709 | |
| | 83,000 | | | Macquarie Infrastructure Co. LLC, 2.875%, 7/15/2019 | | | 92,026 | |
| | 2,200,000 | | | Old Republic International Corp., 3.750%, 3/15/2018 | | | 2,575,375 | |
| | 375,000 | | | Omnicare, Inc., 3.750%, 12/15/2025 | | | 894,141 | |
| | 610,000 | | | Owens-Brockway Glass Container, Inc., 3.000%, 6/01/2015, 144A | | | 613,812 | |
| | 40,000 | | | RPM International, Inc., 2.250%, 12/15/2020 | | | 44,900 | |
| | 90,000 | | | Trinity Industries, Inc., 3.875%, 6/01/2036 | | | 174,713 | |
| | | | | | | | |
| | | | Total Convertible Bonds
(Identified Cost $6,200,027) | | | 8,360,417 | |
| | | | | | | | |
| | | | | | | | |
| | Municipals — 0.0% | |
| | | | United States — 0.0% | | | | |
| | 415,000 | | | State of Illinois, 5.100%, 6/01/2033 | | | 402,986 | |
| | 130,000 | | | Virginia Tobacco Settlement Financing Corp., Series A-1,
6.706%, 6/01/2046 | | | 95,153 | |
| | | | | | | | |
| | | | Total Municipals
(Identified Cost $449,959) | | | 498,139 | |
| | | | | | | | |
| | | | Total Bonds and Notes
(Identified Cost $339,165,860) | | | 353,320,028 | |
| | | | | | | | |
See accompanying notes to financial statements.
33 |
Portfolio of Investments – as of September 30, 2014
Loomis Sayles Global Equity and Income Fund – (continued)
| | | | | | | | |
Principal
Amount (‡) | | | Description | | Value (†) | |
| | Senior Loans — 0.4% | |
| | | | United States — 0.4% | | | | |
| $ | 1,846,875 | | | Fairpoint Communications, Inc., Refi Term Loan, 7.500%, 2/14/2019(f) | | $ | 1,871,124 | |
| | 1,065,000 | | | Flying Fortress, Inc., New Term Loan, 3.500%, 6/30/2017(f) | | | 1,053,690 | |
| | 23,142 | | | PowerTeam Services LLC, Delayed Draw Term Loan, 4.250%, 5/06/2020(f) | | | 22,621 | |
| | 429,563 | | | PowerTeam Services LLC, 1st Lien Term Loan, 4.250%, 5/06/2020(f) | | | 419,897 | |
| | 120,000 | | | PowerTeam Services LLC, 2nd Lien Term Loan, 8.250%, 11/06/2020(f) | | | 116,400 | |
| | 15,958 | | | SuperMedia, Inc., Exit Term Loan, 11.600%, 12/30/2016(f) | | | 12,974 | |
| | 908,435 | | | Supervalu, Inc., Refi Term Loan B, 4.500%, 3/21/2019(f) | | | 890,775 | |
| | | | | | | | |
| | | | Total Senior Loans
(Identified Cost $4,401,547) | | | 4,387,481 | |
| | | | | | | | |
| | | | | | | | |
| Shares | | | | | | |
| | Preferred Stocks — 0.1% | |
| | Non-Convertible Preferred Stock — 0.1% | |
| | | | United States — 0.1% | | | | |
| | 682 | | | Ally Financial, Inc., Series G, 7.000% 144A
(Identified Cost $145,366) | | | 682,639 | |
| | | | | | | | |
| | | | | | | | |
| | Convertible Preferred Stocks — 0.0% | |
| | | | United States — 0.0% | | | | |
| | 460 | | | Chesapeake Energy Corp., 5.000% | | | 45,080 | |
| | 100 | | | Chesapeake Energy Corp., Series A, 5.750% 144A | | | 110,938 | |
| | | | | | | | |
| | | | Total Convertible Preferred Stocks
(Identified Cost $135,343) | | | 156,018 | |
| | | | | | | | |
| | | | Total Preferred Stocks
(Identified Cost $280,709) | | | 838,657 | |
| | | | | | | | |
| | | | | | | | |
Principal
Amount (‡) | | | | | | |
| | Short-Term Investments — 1.9% | |
| $ | 10,684 | | | Repurchase Agreement with State Street Bank and Trust Company, dated 9/30/2014 at 0.000% to be repurchased at $10,684 on 10/01/2014 collateralized by $10,900 U.S. Treasury Note, 1.500% due 8/31/2018 valued at $10,908 including accrued interest (Note 2 of Notes to Financial Statements) | | | 10,684 | |
| | 9,918,910 | | | Tri-Party Repurchase Agreement with Fixed Income Clearing Corporation, dated 9/30/2014 at 0.000% to be repurchased at $9,918,910 on 10/01/2014 collateralized by $10,250,000 U.S. Treasury Note, 1.750% due 10/31/2020 valued at $10,121,875 including accrued interest (Note 2 of Notes to Financial Statements) | | | 9,918,910 | |
| | 13,865,000 | | | U.S. Treasury Bills, 0.024%-0.045%, 1/02/2015(i)(j) | | | 13,864,279 | |
| | | | | | | | |
| | | | Total Short-Term Investments
(Identified Cost $23,793,287) | | | 23,793,873 | |
| | | | | | | | |
| | | | | | | | |
| | | | Total Investments — 99.3%
(Identified Cost $1,091,050,870)(a) | | | 1,238,189,541 | |
| | | | Other assets less liabilities — 0.7% | | | 9,035,033 | |
| | | | | | | | |
| | | | Net Assets — 100.0% | | $ | 1,247,224,574 | |
| | | | | | | | |
See accompanying notes to financial statements.
| 34
Portfolio of Investments – as of September 30, 2014
Loomis Sayles Global Equity and Income Fund – (continued)
| | | | | | | | |
| | | | | | | | |
| | (‡) | | | Principal Amount stated in U.S. dollars unless otherwise noted. | |
| | (†) | | | See Note 2 of Notes to Financial Statements. | |
| | (††) | | | Amount shown represents units. One unit represents a principal amount of 1,000. | |
| | (†††) | | | Security held in units. One unit represents a principal amount of 1,000. Amount shown represents principal amount including inflation adjustments. | |
| | (††††) | | | Amount shown represents units. One unit represents a principal amount of 100. | |
| | (†††††) | | | Amount shown represents units. One unit represents a principal amount of 25. | |
| | (a) | | | Federal Tax Information: | |
| | | | At September 30, 2014, the net unrealized appreciation on investments based on a cost of $1,090,976,768 for federal income tax purposes was as follows: | |
| | | | Aggregate gross unrealized appreciation for all investments in which there is an excess of value over tax cost | | $ | 161,905,651 | |
| | | | Aggregate gross unrealized depreciation for all investments in which there is an excess of tax cost over value | | | (14,692,878 | ) |
| | | | | | | | |
| | | | Net unrealized appreciation | | $ | 147,212,773 | |
| | | | | | | | |
| | | | | | | | |
| | (b) | | | Non-income producing security. | |
| | (c) | | | All of this security has been designated to cover the Fund’s obligations under open forward foreign currency contracts. | |
| | (d) | | | Fair valued by the Fund’s adviser or deemed to be fair valued pursuant to the Fund’s pricing policies and procedures. At September 30, 2014, the value of these securities amounted to $1,080,279 or 0.1% of net assets. | |
| | (e) | | | Perpetual bond with no specified maturity date. | |
| | (f) | | | Variable rate security. Rate as of September 30, 2014 is disclosed. | |
| | (g) | | | Illiquid security. At September 30, 2014, the value of these securities amounted to $903,971 or 0.1% of net assets. | |
| | (h) | | | Coupon rate is a fixed rate for an initial period then resets at a specified date and rate. | |
| | (i) | | | The Fund’s investment in U.S. Treasury Bills is comprised of various lots with differing discount rates. These separate investments, which have the same maturity date, have been aggregated for the purpose of presentation in the Portfolio of Investments. | |
| | (j) | | | Interest rate represents discount rate at time of purchase; not a coupon rate. | |
| | | | | | | | |
| | 144A | | | All or a portion of these securities are exempt from registration under Rule 144A of the Securities Act of 1933. These securities may be resold in transactions exempt from registration, normally to qualified institutional buyers. At September 30, 2014, the value of Rule 144A holdings amounted to $93,282,390 or 7.5% of net assets. | |
| | ADR | | | An American Depositary Receipt is a certificate issued by a custodian bank representing the right to receive securities of the foreign issuer described. The values of ADRs may be significantly influenced by trading on exchanges not located in the United States. | |
| | EMTN | | | Euro Medium Term Note | |
| | GMTN | | | Global Medium Term Note | |
| | MTN | | | Medium Term Note | |
| | | | | | | | |
| | AUD | | | Australian Dollar | |
| | BRL | | | Brazilian Real | |
| | CAD | | | Canadian Dollar | |
| | CLP | | | Chilean Peso | |
| | COP | | | Colombian Peso | |
| | EUR | | | Euro | |
| | GBP | | | British Pound | |
See accompanying notes to financial statements.
35 |
Portfolio of Investments – as of September 30, 2014
Loomis Sayles Global Equity and Income Fund – (continued)
| | | | | | |
| | | | | | |
| | IDR | | | Indonesian Rupiah | | |
| | INR | | | Indian Rupee | | |
| | KRW | | | South Korean Won | | |
| | MXN | | | Mexican Peso | | |
| | NOK | | | Norwegian Krone | | |
| | NZD | | | New Zealand Dollar | | |
| | PHP | | | Philippine Peso | | |
| | PLN | | | Polish Zloty | | |
| | SEK | | | Swedish Krona | | |
| | ZAR | | | South African Rand | | |
At September 30, 2014, the Fund had the following open forward foreign currency contracts:
| | | | | | | | | | | | | | | | | | |
Contract
to
Buy/Sell | | Delivery
Date | | | Currency | | Units of
Currency | | | Notional
Value | | | Unrealized
Appreciation
(Depreciation) | |
| Sell1 | | | 12/17/2014 | | | Australian Dollar | | | 2,870,000 | | | $ | 2,499,268 | | | $ | 164,292 | |
| Buy1 | | | 10/07/2014 | | | Brazilian Real | | | 2,900,000 | | | | 1,183,164 | | | | 1,901 | |
| Sell1 | | | 10/07/2014 | | | Brazilian Real | | | 17,985,000 | | | | 7,337,658 | | | | 504,083 | |
| Buy1 | | | 12/17/2014 | | | British Pound | | | 1,370,000 | | | | 2,219,499 | | | | 6,696 | |
| Sell1 | | | 12/05/2014 | | | Canadian Dollar | | | 2,895,000 | | | | 2,580,984 | | | | 84,172 | |
| Sell2 | | | 12/22/2014 | | | Colombian Peso | | | 3,980,000,000 | | | | 1,949,649 | | | | 41,596 | |
| Buy3 | | | 12/17/2014 | | | Euro | | | 8,270,000 | | | | 10,451,094 | | | | (255,083 | ) |
| Buy1 | | | 12/17/2014 | | | Japanese Yen | | | 2,245,000,000 | | | | 20,483,677 | | | | (581,241 | ) |
| Buy3 | | | 12/17/2014 | | | Mexican Peso | | | 17,000,000 | | | | 1,259,246 | | | | 6,150 | |
| Sell3 | | | 12/17/2014 | | | Mexican Peso | | | 61,000,000 | | | | 4,518,471 | | | | 118,196 | |
| Sell3 | | | 12/17/2014 | | | New Zealand Dollar | | | 8,162,000 | | | | 6,324,068 | | | | 290,009 | |
| Sell4 | | | 12/17/2014 | | | Norwegian Krone | | | 19,500,000 | | | | 3,027,022 | | | | 106,314 | |
| Sell2 | | | 12/17/2014 | | | Polish Zloty | | | 24,720,000 | | | | 7,439,311 | | | | 195,974 | |
| | | | | | | | | | | | | | | | | | |
| Total | | | | | | | | | | | | | | | | $ | 683,059 | |
| | | | | | | | | | | | | | | | | | |
1 Counterparty is Credit Suisse International.
2 Counterparty is Citibank N.A.
3 Counterparty is Barclays Bank PLC.
4 Counterparty is UBS AG.
See accompanying notes to financial statements.
| 36
Portfolio of Investments – as of September 30, 2014
Loomis Sayles Global Equity and Income Fund – (continued)
Industry Summary at September 30, 2014
| | | | |
Treasuries | | | 8.9 | % |
Pharmaceuticals | | | 8.1 | |
Banks | | | 5.4 | |
Internet Software & Services | | | 4.8 | |
Energy Equipment & Services | | | 4.3 | |
Aerospace & Defense | | | 4.0 | |
IT Services | | | 3.9 | |
Internet & Catalog Retail | | | 3.6 | |
Banking | | | 3.6 | |
Beverages | | | 3.5 | |
Specialty Retail | | | 3.4 | |
Insurance | | | 3.3 | |
Trading Companies & Distributors | | | 2.4 | |
Oil, Gas & Consumable Fuels | | | 2.2 | |
Chemicals | | | 2.2 | |
Other Investments, less than 2% each | | | 33.8 | |
Short-Term Investments | | | 1.9 | |
| | | | |
Total Investments | | | 99.3 | |
Other assets less liabilities (including open forward foreign currency contracts) | | | 0.7 | |
| | | | |
Net Assets | | | 100.0 | % |
| | | | |
Currency Exposure Summary at September 30, 2014
| | | | |
United States Dollar | | | 65.4 | % |
Euro | | | 7.1 | |
British Pound | | | 5.4 | |
Japanese Yen | | | 3.7 | |
Canadian Dollar | | | 2.5 | |
Indian Rupee | | | 2.4 | |
Swiss Franc | | | 2.4 | |
Mexican Peso | | | 2.1 | |
Other, less than 2% each | | | 8.3 | |
| | | | |
Total Investments | | | 99.3 | |
Other assets less liabilities (including open forward foreign currency contracts) | | | 0.7 | |
| | | | |
Net Assets | | | 100.0 | % |
| | | | |
See accompanying notes to financial statements.
37 |
Portfolio of Investments – as of September 30, 2014
Loomis Sayles Growth Fund
| | | | | | | | |
Shares | | | Description | | Value (†) | |
| | Common Stocks — 98.3% of Net Assets | | | | |
| | | | Air Freight & Logistics — 6.2% | | | | |
| | 817,647 | | | Expeditors International of Washington, Inc. | | $ | 33,180,115 | |
| | 349,497 | | | United Parcel Service, Inc., Class B | | | 34,352,060 | |
| | | | | | | | |
| | | | | | | 67,532,175 | |
| | | | | | | | |
| | | | Beverages — 9.4% | | | | |
| | 927,620 | | | Coca-Cola Co. (The) | | | 39,572,269 | |
| | 436,822 | | | Monster Beverage Corp.(b) | | | 40,043,473 | |
| | 428,049 | | | SABMiller PLC, Sponsored ADR | | | 23,782,402 | |
| | | | | | | | |
| | | | | | | 103,398,144 | |
| | | | | | | | |
| | | | Biotechnology — 2.7% | | | | |
| | 213,491 | | | Amgen, Inc. | | | 29,986,946 | |
| | | | | | | | |
| | | | Capital Markets — 3.5% | | | | |
| | 168,721 | | | Greenhill & Co., Inc. | | | 7,843,840 | |
| | 857,758 | | | SEI Investments Co. | | | 31,016,529 | |
| | | | | | | | |
| | | | | | | 38,860,369 | |
| | | | | | | | |
| | | | Communications Equipment — 9.2% | | | | |
| | 2,303,284 | | | Cisco Systems, Inc. | | | 57,973,658 | |
| | 571,054 | | | QUALCOMM, Inc. | | | 42,697,708 | |
| | | | | | | | |
| | | | | | | 100,671,366 | |
| | | | | | | | |
| | | | Consumer Finance — 2.2% | | | | |
| | 272,529 | | | American Express Co. | | | 23,857,189 | |
| | | | | | | | |
| | | | Energy Equipment & Services — 3.3% | | | | |
| | 356,296 | | | Schlumberger Ltd. | | | 36,231,740 | |
| | | | | | | | |
| | | | Food Products — 3.5% | | | | |
| | 2,893,497 | | | Danone, Sponsored ADR | | | 38,772,860 | |
| | | | | | | | |
| | | | Health Care Equipment & Supplies — 4.5% | | | | |
| | 369,880 | | | Varian Medical Systems, Inc.(b) | | | 29,634,786 | |
| | 192,893 | | | Zimmer Holdings, Inc. | | | 19,395,391 | |
| | | | | | | | |
| | | | | | | 49,030,177 | |
| | | | | | | | |
| | | | Hotels, Restaurants & Leisure — 2.2% | | | | |
| | 335,071 | | | Yum! Brands, Inc. | | | 24,118,411 | |
| | | | | | | | |
| | | | Household Products — 3.5% | | | | |
| | 457,114 | | | Procter & Gamble Co. (The) | | | 38,278,726 | |
| | | | | | | | |
| | | | Internet & Catalog Retail — 4.8% | | | | |
| | 164,094 | | | Amazon.com, Inc.(b) | | | 52,910,469 | |
| | | | | | | | |
| | | | Internet Software & Services — 12.7% | | | | |
| | 248,132 | | | Alibaba Group Holding Ltd., Sponsored ADR(b) | | | 22,046,528 | |
| | 769,548 | | | Facebook, Inc., Class A(b) | | | 60,825,074 | |
| | 48,934 | | | Google, Inc., Class A(b) | | | 28,793,255 | |
| | 48,929 | | | Google, Inc., Class C(b) | | | 28,249,647 | |
| | | | | | | | |
| | | | | | | 139,914,504 | |
| | | | | | | | |
See accompanying notes to financial statements.
| 38
Portfolio of Investments – as of September 30, 2014
Loomis Sayles Growth Fund – (continued)
| | | | | | | | |
Shares | | | Description | | Value (†) | |
| | | | IT Services — 5.3% | | | | |
| | 132,907 | | | Automatic Data Processing, Inc. | | $ | 11,041,914 | |
| | 221,542 | | | Visa, Inc., Class A | | | 47,270,416 | |
| | | | | | | | |
| | | | | | | 58,312,330 | |
| | | | | | | | |
| | | | Pharmaceuticals — 7.5% | | | | |
| | 321,957 | | | Merck & Co., Inc. | | | 19,085,611 | |
| | 399,322 | | | Novartis AG, ADR | | | 37,588,180 | |
| | 529,576 | | | Novo Nordisk AS, Sponsored ADR | | | 25,218,409 | |
| | | | | | �� | | |
| | | | | | | 81,892,200 | |
| | | | | | | | |
| | | | Semiconductors & Semiconductor Equipment — 3.1% | | | | |
| | 76,943 | | | Altera Corp. | | | 2,753,021 | |
| | 92,009 | | | Analog Devices, Inc. | | | 4,553,525 | |
| | 599,667 | | | ARM Holdings PLC, Sponsored ADR | | | 26,199,451 | |
| | | | | | | | |
| | | | | | | 33,505,997 | |
| | | | | | | | |
| | | | Software — 12.0% | | | | |
| | 597,663 | | | Autodesk, Inc.(b) | | | 32,931,231 | |
| | 190,053 | | | FactSet Research Systems, Inc. | | | 23,097,141 | |
| | 623,139 | | | Microsoft Corp. | | | 28,888,724 | |
| | 1,218,034 | | | Oracle Corp. | | | 46,626,342 | |
| | | | | | | | |
| | | | | | | 131,543,438 | |
| | | | | | | | |
| | | | Specialty Retail — 2.7% | | | | |
| | 565,616 | | | Lowe’s Cos., Inc. | | | 29,932,399 | |
| | | | | | | | |
| | | | Total Common Stocks
(Identified Cost $929,150,360) | | | 1,078,749,440 | |
| | | | | | | | |
| | | | | | | | |
Principal
Amount | | | | | | |
| | Short-Term Investments — 2.2% | | | | |
| $ | 24,425,042 | | | Tri-Party Repurchase Agreement with Fixed Income Clearing Corporation, dated 9/30/2014 at 0.000% to be repurchased at $24,425,042 on 10/01/2014 collateralized by $25,075,000 U.S. Treasury Note, 1.500% due 5/31/2019 valued at $24,918,281 including accrued interest (Note 2 of Notes to Financial Statements)
(Identified Cost $24,425,042) | | | 24,425,042 | |
| | | | | | | | |
| | | | | | | | |
| | | | Total Investments — 100.5%
(Identified Cost $953,575,402)(a) | | | 1,103,174,482 | |
| | | | Other assets less liabilities — (0.5)% | | | (5,070,601 | ) |
| | | | | | | | |
| | | | Net Assets — 100.0% | | $ | 1,098,103,881 | |
| | | | | | | | |
See accompanying notes to financial statements.
39 |
Portfolio of Investments – as of September 30, 2014
Loomis Sayles Growth Fund – (continued)
| | | | | | | | |
| | | | | | | | |
| | (†) | | | See Note 2 of Notes to Financial Statements. | | | | |
| | (a) | | | Federal Tax Information: | | | | |
| | | | At September 30, 2014, the net unrealized appreciation on investments based on a cost of $953,830,012 for federal income tax purposes was as follows: | |
| | | | Aggregate gross unrealized appreciation for all investments in which there is an excess of value over tax cost | | $ | 155,349,304 | |
| | | | Aggregate gross unrealized depreciation for all investments in which there is an excess of tax cost over value | | | (6,004,834 | ) |
| | | | | | | | |
| | | | Net unrealized appreciation | | $ | 149,344,470 | |
| | | | | | | | |
| | | | | | | | |
| | (b) | | | Non-income producing security. | | | | |
| | | | | | | | |
| | ADR | | | An American Depositary Receipt is a certificate issued by a custodian bank representing the right to receive securities of the foreign issuer described. The values of ADRs may be significantly influenced by trading on exchanges not located in the United States. | |
Industry Summary at September 30, 2014
| | | | |
Internet Software & Services | | | 12.7 | % |
Software | | | 12.0 | |
Beverages | | | 9.4 | |
Communications Equipment | | | 9.2 | |
Pharmaceuticals | | | 7.5 | |
Air Freight & Logistics | | | 6.2 | |
IT Services | | | 5.3 | |
Internet & Catalog Retail | | | 4.8 | |
Health Care Equipment & Supplies | | | 4.5 | |
Capital Markets | | | 3.5 | |
Food Products | | | 3.5 | |
Household Products | | | 3.5 | |
Energy Equipment & Services | | | 3.3 | |
Semiconductors & Semiconductor Equipment | | | 3.1 | |
Biotechnology | | | 2.7 | |
Specialty Retail | | | 2.7 | |
Hotels, Restaurants & Leisure | | | 2.2 | |
Consumer Finance | | | 2.2 | |
Short-Term Investments | | | 2.2 | |
| | | | |
Total Investments | | | 100.5 | |
Other assets less liabilities | | | (0.5 | ) |
| | | | |
Net Assets | | | 100.0 | % |
| | | | |
See accompanying notes to financial statements.
| 40
Portfolio of Investments – as of September 30, 2014
Loomis Sayles Value Fund
| | | | | | | | |
Shares | | | Description | | Value (†) | |
| | Common Stocks — 97.8% of Net Assets | |
| | | | Aerospace & Defense — 2.7% | | | | |
| | 301,101 | | | Honeywell International, Inc. | | $ | 28,038,525 | |
| | 259,267 | | | Northrop Grumman Corp. | | | 34,161,020 | |
| | | | | | | | |
| | | | | | | 62,199,545 | |
| | | | | | | | |
| | | | Automobiles — 1.1% | | | | |
| | 811,070 | | | General Motors Co. | | | 25,905,576 | |
| | | | | | | | |
| | | | Banks — 11.5% | | | | |
| | 2,882,719 | | | Bank of America Corp. | | | 49,150,359 | |
| | 857,450 | | | Citigroup, Inc. | | | 44,433,059 | |
| | 1,585,159 | | | Fifth Third Bancorp | | | 31,734,883 | |
| | 966,750 | | | JPMorgan Chase & Co. | | | 58,237,020 | |
| | 399,831 | | | PNC Financial Services Group, Inc. (The) | | | 34,217,537 | |
| | 869,217 | | | Wells Fargo & Co. | | | 45,086,286 | |
| | | | | | | | |
| | | | | | | 262,859,144 | |
| | | | | | | | |
| | | | Beverages — 1.3% | | | | |
| | 323,704 | | | PepsiCo, Inc. | | | 30,133,605 | |
| | | | | | | | |
| | | | Capital Markets — 4.4% | | | | |
| | 270,022 | | | Ameriprise Financial, Inc. | | | 33,315,314 | |
| | 484,333 | | | Legg Mason, Inc. | | | 24,778,476 | |
| | 575,142 | | | State Street Corp. | | | 42,336,203 | |
| | | | | | | | |
| | | | | | | 100,429,993 | |
| | | | | | | | |
| | | | Chemicals — 1.4% | | | | |
| | 456,295 | | | E.I. du Pont de Nemours & Co. | | | 32,743,729 | |
| | | | | | | | |
| | | | Communications Equipment — 2.4% | | | | |
| | 1,097,774 | | | Cisco Systems, Inc. | | | 27,630,971 | |
| | 440,488 | | | Motorola Solutions, Inc. | | | 27,874,081 | |
| | | | | | | | |
| | | | | | | 55,505,052 | |
| | | | | | | | |
| | | | Construction Materials — 1.1% | | | | |
| | 409,162 | | | Vulcan Materials Co. | | | 24,643,827 | |
| | | | | | | | |
| | | | Consumer Finance — 1.5% | | | | |
| | 545,000 | | | Discover Financial Services | | | 35,092,550 | |
| | | | | | | | |
| | | | Containers & Packaging — 1.4% | | | | |
| | 915,908 | | | Sealed Air Corp. | | | 31,946,871 | |
| | | | | | | | |
| | | | Diversified Telecommunication Services — 1.3% | | | | |
| | 611,418 | | | Verizon Communications, Inc. | | | 30,564,786 | |
| | | | | | | | |
| | | | Electric Utilities — 2.1% | | | | |
| | 274,448 | | | NextEra Energy, Inc. | | | 25,765,178 | |
| | 493,433 | | | Northeast Utilities | | | 21,859,082 | |
| | | | | | | | |
| | | | | | | 47,624,260 | |
| | | | | | | | |
| | | | Electrical Equipment — 2.4% | | | | |
| | 1,129,030 | | | ABB Ltd., Sponsored ADR | | | 25,301,562 | |
| | 460,090 | | | Eaton Corp. PLC | | | 29,155,904 | |
| | | | | | | | |
| | | | | | | 54,457,466 | |
| | | | | | | | |
See accompanying notes to financial statements.
41 |
Portfolio of Investments – as of September 30, 2014
Loomis Sayles Value Fund – (continued)
| | | | | | | | |
Shares | | | Description | | Value (†) | |
| | | | Electronic Equipment, Instruments & Components — 0.8% | | | | |
| | 681,013 | | | Knowles Corp.(b) | | $ | 18,046,845 | |
| | | | | | | | |
| | | | Energy Equipment & Services — 2.3% | | | | |
| | 403,945 | | | National Oilwell Varco, Inc. | | | 30,740,215 | |
| | 224,392 | | | Schlumberger Ltd. | | | 22,818,422 | |
| | | | | | | | |
| | | | | | | 53,558,637 | |
| | | | | | | | |
| | | | Food & Staples Retailing — 1.3% | | | | |
| | 369,624 | | | CVS Health | | | 29,418,374 | |
| | | | | | | | |
| | | | Food Products — 1.2% | | | | |
| | 821,330 | | | Mondelez International, Inc., Class A | | | 28,142,872 | |
| | | | | | | | |
| | | | Health Care Equipment & Supplies — 1.4% | | | | |
| | 367,464 | | | Covidien PLC | | | 31,789,311 | |
| | | | | | | | |
| | | | Health Care Providers & Services — 3.1% | | | | |
| | 435,949 | | | HCA Holdings, Inc.(b) | | | 30,743,123 | |
| | 475,566 | | | UnitedHealth Group, Inc. | | | 41,017,568 | |
| | | | | | | | |
| | | | | | | 71,760,691 | |
| | | | | | | | |
| | | | Independent Power & Renewable Electricity Producers — 0.9% | | | | |
| | 995,623 | | | Calpine Corp.(b) | | | 21,605,019 | |
| | | | | | | | |
| | | | Insurance — 6.3% | | | | |
| | 662,597 | | | American International Group, Inc. | | | 35,793,490 | |
| | 759,445 | | | FNF Group | | | 21,067,005 | |
| | 670,510 | | | MetLife, Inc. | | | 36,019,797 | |
| | 246,496 | | | Travelers Cos., Inc. (The) | | | 23,155,834 | |
| | 839,147 | | | Unum Group | | | 28,849,874 | |
| | | | | | | | |
| | | | | | | 144,886,000 | |
| | | | | | | | |
| | | | Internet & Catalog Retail — 1.2% | | | | |
| | 966,850 | | | Liberty Interactive Corp., Class A(b) | | | 27,574,562 | |
| | | | | | | | |
| | | | Internet Software & Services — 1.2% | | | | |
| | 595,236 | | | AOL, Inc.(b) | | | 26,755,858 | |
| | | | | | | | |
| | | | Machinery — 3.9% | | | | |
| | 231,973 | | | Deere & Co. | | | 19,019,466 | |
| | 402,978 | | | Illinois Tool Works, Inc. | | | 34,019,403 | |
| | 374,208 | | | Ingersoll-Rand PLC | | | 21,090,363 | |
| | 512,664 | | | Terex Corp. | | | 16,287,335 | |
| | | | | | | | |
| | | | | | | 90,416,567 | |
| | | | | | | | |
| | | | Media — 5.1% | | | | |
| | 636,645 | | | Comcast Corp., Class A | | | 34,238,768 | |
| | 503,061 | | | Liberty Global PLC, Class A(b) | | | 21,400,215 | |
| | 448,573 | | | Omnicom Group, Inc. | | | 30,888,737 | |
| | 385,229 | | | Viacom, Inc., Class B | | | 29,639,519 | |
| | | | | | | | |
| | | | | | | 116,167,239 | |
| | | | | | | | |
| | | | Multiline Retail — 1.3% | | | | |
| | 371,689 | | | Family Dollar Stores, Inc. | | | 28,709,258 | |
| | | | | | | | |
See accompanying notes to financial statements.
| 42
Portfolio of Investments – as of September 30, 2014
Loomis Sayles Value Fund – (continued)
| | | | | | | | |
Shares | | | Description | | Value (†) | |
| | | | Oil, Gas & Consumable Fuels — 8.5% | | | | |
| | 387,421 | | | Chevron Corp. | | $ | 46,227,074 | |
| | 810,149 | | | Cobalt International Energy, Inc.(b) | | | 11,018,026 | |
| | 288,841 | | | Hess Corp. | | | 27,243,483 | |
| | 909,188 | | | Marathon Oil Corp. | | | 34,176,377 | |
| | 431,363 | | | Noble Energy, Inc. | | | 29,487,975 | |
| | 388,402 | | | Royal Dutch Shell PLC, ADR | | | 29,569,044 | |
| | 380,136 | | | Valero Energy Corp. | | | 17,588,893 | |
| | | | | | | | |
| | | | | | | 195,310,872 | |
| | | | | | | | |
| | | | Pharmaceuticals — 11.1% | | | | |
| | 104,853 | | | Actavis PLC(b) | | | 25,298,932 | |
| | 614,440 | | | Bristol-Myers Squibb Co. | | | 31,447,039 | |
| | 646,721 | | | Eli Lilly & Co. | | | 41,939,857 | |
| | 608,826 | | | Merck & Co., Inc. | | | 36,091,206 | |
| | 1,686,625 | | | Pfizer, Inc. | | | 49,873,501 | |
| | 751,391 | | | Sanofi, ADR | | | 42,400,994 | |
| | 517,583 | | | Teva Pharmaceutical Industries Ltd., Sponsored ADR | | | 27,820,086 | |
| | | | | | | | |
| | | | | | | 254,871,615 | |
| | | | | | | | |
| | | | REITs – Diversified — 1.5% | | | | |
| | 140,643 | | | CBS Outdoor Americas, Inc. | | | 4,210,851 | |
| | 908,017 | | | Weyerhaeuser Co. | | | 28,929,422 | |
| | | | | | | | |
| | | | | | | 33,140,273 | |
| | | | | | | | |
| | | | Road & Rail — 1.5% | | | | |
| | 308,365 | | | Norfolk Southern Corp. | | | 34,413,534 | |
| | | | | | | | |
| | | | Software — 3.5% | | | | |
| | 964,806 | | | Microsoft Corp. | | | 44,728,406 | |
| | 1,502,172 | | | Symantec Corp. | | | 35,316,064 | |
| | | | | | | | |
| | | | | | | 80,044,470 | |
| | | | | | | | |
| | | | Specialty Retail — 2.1% | | | | |
| | 312,359 | | | AutoNation, Inc.(b) | | | 15,714,781 | |
| | 610,811 | | | Lowe’s Cos., Inc. | | | 32,324,118 | |
| | | | | | | | |
| | | | | | | 48,038,899 | |
| | | | | | | | |
| | | | Technology Hardware, Storage & Peripherals — 2.7% | | | | |
| | 282,928 | | | Apple, Inc. | | | 28,504,996 | |
| | 1,115,229 | | | EMC Corp. | | | 32,631,601 | |
| | | | | | | | |
| | | | | | | 61,136,597 | |
| | | | | | | | |
| | | | Tobacco — 1.2% | | | | |
| | 328,325 | | | Philip Morris International, Inc. | | | 27,382,305 | |
| | | | | | | | |
| | | | Wireless Telecommunication Services — 1.1% | | | | |
| | 760,092 | | | Vodafone Group PLC, Sponsored ADR | | | 24,999,426 | |
| | | | | | | | |
| | | | Total Common Stocks
(Identified Cost $1,671,780,189) | | | 2,242,275,628 | |
| | | | | | | | |
See accompanying notes to financial statements.
43 |
Portfolio of Investments – as of September 30, 2014
Loomis Sayles Value Fund – (continued)
| | | | | | | | |
Principal
Amount | | | Description | | Value (†) | |
| | Short-Term Investments — 2.2% | |
| $ | 51,061,716 | | | Tri-Party Repurchase Agreement with Fixed Income Clearing Corporation, dated 9/30/2014 at 0.000% to be repurchased at $51,061,716 on 10/01/2014 collateralized by $47,730,000 U.S. Treasury Note, 3.625% due 8/15/2019 valued at $52,085,363 including accrued interest (Note 2 of Notes to Financial Statements)
(Identified Cost $51,061,716) | | $ | 51,061,716 | |
| | | | | | | | |
| | | | Total Investments — 100.0%
(Identified Cost $1,722,841,905)(a) | | | 2,293,337,344 | |
| | | | Other assets less liabilities — 0.0% | | | 954,419 | |
| | | | | | | | |
| | | | Net Assets — 100.0% | | $ | 2,294,291,763 | |
| | | | | | | | |
| | | | | | | | |
| | (†) | | | See Note 2 of Notes to Financial Statements. | | | | |
| | (a) | | | Federal Tax Information: | | | | |
| | | | At September 30, 2014, the net unrealized appreciation on investments based on a cost of $1,726,358,670 for federal income tax purposes was as follows: | |
| | | | Aggregate gross unrealized appreciation for all investments in which there is an excess of value over tax cost | | $ | 591,252,797 | |
| | | | Aggregate gross unrealized depreciation for all investments in which there is an excess of tax cost over value | | | (24,274,123 | ) |
| | | | | | | | |
| | | | Net unrealized appreciation | | $ | 566,978,674 | |
| | | | | | | | |
| | | | | | | | |
| | (b) | | | Non-income producing security. | | | | |
| | | | | | | | |
| | ADR | | | An American Depositary Receipt is a certificate issued by a custodian bank representing the right to receive securities of the foreign issuer described. The values of ADRs may be significantly influenced by trading on exchanges not located in the United States. | |
| | REITs | | | Real Estate Investment Trusts | | | | |
See accompanying notes to financial statements.
| 44
Portfolio of Investments – as of September 30, 2014
Loomis Sayles Value Fund – (continued)
Industry Summary at September 30, 2014
| | | | |
Banks | | | 11.5 | % |
Pharmaceuticals | | | 11.1 | |
Oil, Gas & Consumable Fuels | | | 8.5 | |
Insurance | | | 6.3 | |
Media | | | 5.1 | |
Capital Markets | | | 4.4 | |
Machinery | | | 3.9 | |
Software | | | 3.5 | |
Health Care Providers & Services | | | 3.1 | |
Aerospace & Defense | | | 2.7 | |
Technology Hardware, Storage & Peripherals | | | 2.7 | |
Communications Equipment | | | 2.4 | |
Electrical Equipment | | | 2.4 | |
Energy Equipment & Services | | | 2.3 | |
Specialty Retail | | | 2.1 | |
Electric Utilities | | | 2.1 | |
Other Investments, less than 2% each | | | 23.7 | |
Short-Term Investments | | | 2.2 | |
| | | | |
Total Investments | | | 100.0 | |
Other assets less liabilities | | | 0.0 | |
| | | | |
Net Assets | | | 100.0 | % |
| | | | |
See accompanying notes to financial statements.
45 |
Statements of Assets and Liabilities
September 30, 2014
| | | | | | | | | | | | |
| | | Global Equity
and
Income Fund | | | Growth Fund | | | Value Fund | |
ASSETS | | | | | | | | | | | | |
Investments at cost | | $ | 1,091,050,870 | | | $ | 953,575,402 | | | $ | 1,722,841,905 | |
Net unrealized appreciation | | | 147,138,671 | | | | 149,599,080 | | | | 570,495,439 | |
| | | | | | | | | | | | |
Investments at value | | | 1,238,189,541 | | | | 1,103,174,482 | | | | 2,293,337,344 | |
Cash | | | 53,394 | | | | — | | | | — | |
Foreign currency at value (identified cost $2,060,017, $0 and $0, respectively) | | | 2,034,013 | | | | — | | | | — | |
Receivable for Fund shares sold | | | 3,753,583 | | | | 1,151,330 | | | | 1,443,610 | |
Receivable for securities sold | | | 4,290,434 | | | | — | | | | 1,826,527 | |
Collateral received for open forward foreign currency contracts (Notes 2 and 4) | | | 260,000 | | | | — | | | | — | |
Dividends and interest receivable | | | 5,917,478 | | | | 1,216,844 | | | | 2,631,858 | |
Unrealized appreciation on forward foreign currency contracts (Note 2) | | | 1,519,383 | | | | — | | | | — | |
Tax reclaims receivable | | | 249,723 | | | | — | | | | — | |
| | | | | | | | | | | | |
TOTAL ASSETS | | | 1,256,267,549 | | | | 1,105,542,656 | | | | 2,299,239,339 | |
| | | | | | | | | | | | |
LIABILITIES | | | | | | | | | | | | |
Payable for securities purchased | | | 5,281,114 | | | | 5,935,017 | | | | 2,031,408 | |
Payable for Fund shares redeemed | | | 1,392,379 | | | | 723,521 | | | | 1,298,378 | |
Unrealized depreciation on forward foreign currency contracts (Note 2) | | | 836,324 | | | | — | | | | — | |
Foreign taxes payable (Note 2) | | | 172,157 | | | | — | | | | — | |
Due to brokers (Note 2) | | | 260,000 | | | | — | | | | — | |
Management fees payable (Note 6) | | | 778,092 | | | | 453,451 | | | | 961,741 | |
Deferred Trustees’ fees (Note 6) | | | 137,243 | | | | 164,167 | | | | 392,695 | |
Administrative fees payable (Note 6) | | | 44,566 | | | | 38,947 | | | | 82,623 | |
Payable to distributor (Note 6d) | | | 11,180 | | | | 10,104 | | | | 31,043 | |
Other accounts payable and accrued expenses | | | 129,920 | | | | 113,568 | | | | 149,688 | |
| | | | | | | | | | | | |
TOTAL LIABILITIES | | | 9,042,975 | | | | 7,438,775 | | | | 4,947,576 | |
| | | | | | | | | | | | |
NET ASSETS | | $ | 1,247,224,574 | | | $ | 1,098,103,881 | | | $ | 2,294,291,763 | |
| | | | | | | | | | | | |
NET ASSETS CONSIST OF: | | | | | | | | | | | | |
Paid-in capital | | $ | 1,034,889,137 | | | $ | 990,098,321 | | | $ | 1,501,923,855 | |
Undistributed net investment income | | | 9,047,574 | | | | 4,934,562 | | | | 38,569,726 | |
Accumulated net realized gain (loss) on investments and foreign currency transactions | | | 55,768,181 | | | | (46,528,082 | ) | | | 183,302,743 | |
Net unrealized appreciation on investments and foreign currency translations | | | 147,519,682 | | | | 149,599,080 | | | | 570,495,439 | |
| | | | | | | | | | | | |
NET ASSETS | | $ | 1,247,224,574 | | | $ | 1,098,103,881 | | | $ | 2,294,291,763 | |
| | | | | | | | | | | | |
See accompanying notes to financial statements.
| 46
Statements of Assets and Liabilities (continued)
September 30, 2014
| | | | | | | | | | | | |
| | | Global Equity
and
Income Fund | | | Growth Fund | | | Value Fund | |
COMPUTATION OF NET ASSET VALUE AND
OFFERING PRICE: | | | | | | | | | | | | |
Class A shares: | | | | | | | | | | | | |
Net assets | | $ | 237,166,929 | | | $ | 63,681,682 | | | $ | 580,091,520 | |
| | | | | | | | | | | | |
Shares of beneficial interest | | | 11,996,739 | | | | 6,736,527 | | | | 20,377,453 | |
| | | | | | | | | | | | |
Net asset value and redemption price per share | | $ | 19.77 | | | $ | 9.45 | | | $ | 28.47 | |
| | | | | | | | | | | | |
Offering price per share (100/94.25 of net asset value) (Note 1) | | $ | 20.98 | | | $ | 10.03 | | | $ | 30.21 | |
| | | | | | | | | | | | |
Class B shares: (redemption price per share is equal to net asset value less any applicable contingent deferred sales charge) (Note 1) | | | | | | | | | | | | |
Net assets | | $ | — | | | $ | 427,651 | | | $ | 672,112 | |
| | | | | | | | | | | | |
Shares of beneficial interest | | | — | | | | 48,628 | | | | 23,370 | |
| | | | | | | | | | | | |
Net asset value and offering price per share | | $ | — | | | $ | 8.79 | | | $ | 28.76 | |
| | | | | | | | | | | | |
Class C shares: (redemption price per share is equal to net asset value less any applicable contingent deferred sales charge) (Note 1) | | | | | | | | | | | | |
Net assets | | $ | 377,000,583 | | | $ | 29,836,650 | | | $ | 16,957,649 | |
| | | | | | | | | | | | |
Shares of beneficial interest | | | 19,319,833 | | | | 3,395,226 | | | | 602,573 | |
| | | | | | | | | | | | |
Net asset value and offering price per share | | $ | 19.51 | | | $ | 8.79 | | | $ | 28.14 | |
| | | | | | | | | | | | |
Class N shares: | | | | | | | | | | | | |
Net assets | | $ | — | | | $ | 1,325 | | | $ | 392,811,027 | |
| | | | | | | | | | | | |
Shares of beneficial interest | | | — | | | | 132 | | | | 13,743,580 | |
| | | | | | | | | | | | |
Net asset value, offering and redemption price per share | | $ | — | | | $ | 10.01 | * | | $ | 28.58 | |
| | | | | | | | | | | | |
Class Y shares: | | | | | | | | | | | | |
Net assets | | $ | 633,057,062 | | | $ | 1,004,156,573 | | | $ | 1,303,491,944 | |
| | | | | | | | | | | | |
Shares of beneficial interest | | | 31,833,961 | | | | 99,990,208 | | | | 45,611,704 | |
| | | | | | | | | | | | |
Net asset value, offering and redemption price per share | | $ | 19.89 | | | $ | 10.04 | | | $ | 28.58 | |
| | | | | | | | | | | | |
Admin Class shares: | | | | | | | | | | | | |
Net assets | | $ | — | | | $ | — | | | $ | 267,511 | |
| | | | | | | | | | | | |
Shares of beneficial interest | | | — | | | | — | | | | 9,439 | |
| | | | | | | | | | | | |
Net asset value, offering and redemption price per share | | $ | — | | | $ | — | | | $ | 28.34 | |
| | | | | | | | | | | | |
| * | Net asset value calculations reflect fractional share and dollar amounts. |
See accompanying notes to financial statements.
47 |
Statements of Operations
For the Year Ended September 30, 2014
| | | | | | | | | | | | |
| | | Global Equity
and
Income Fund | | | Growth
Fund | | | Value
Fund | |
INVESTMENT INCOME | | | | | | | | | | | | |
Dividends | | $ | 16,120,059 | | | $ | 12,182,495 | | | $ | 62,763,636 | (a) |
Interest | | | 17,044,019 | | | | 231 | | | | 724 | |
Less net foreign taxes withheld | | | (672,816 | ) | | | (327,285 | ) | | | (292,124 | ) |
| | | | | | | | | | | | |
| | | 32,491,262 | | | | 11,855,441 | | | | 62,472,236 | |
| | | | | | | | | | | | |
Expenses | | | | | | | | | | | | |
Management fees (Note 6) | | | 9,290,151 | | | | 4,018,726 | | | | 11,022,110 | |
Service and distribution fees (Note 6) | | | 4,394,595 | | | | 423,526 | | | | 1,199,186 | |
Administrative fees (Note 6) | | | 539,025 | | | | 349,269 | | | | 958,953 | |
Trustees’ fees and expenses (Note 6) | | | 55,240 | | | | 52,648 | | | | 106,676 | |
Transfer agent fees and expenses (Notes 6 and 7) | | | 976,837 | | | | 799,743 | | | | 2,561,949 | |
Audit and tax services fees | | | 54,966 | | | | 39,996 | | | | 40,376 | |
Custodian fees and expenses | | | 292,215 | | | | 35,590 | | | | 57,565 | |
Legal fees | | | 11,048 | | | | 7,074 | | | | 19,589 | |
Registration fees | | | 104,688 | | | | 158,803 | | | | 164,763 | |
Shareholder reporting expenses | | | 59,819 | | | | 17,339 | | | | 125,110 | |
Miscellaneous expenses | | | 58,045 | | | | 27,161 | | | | 56,915 | |
| | | | | | | | | | | | |
Total expenses | | | 15,836,629 | | | | 5,929,875 | | | | 16,313,192 | |
Less waiver and/or expense reimbursement (Note 6) | | | — | | | | (31 | ) | | | — | |
| | | | | | | | | | | | |
Net expenses | | | 15,836,629 | | | | 5,929,844 | | | | 16,313,192 | |
| | | | | | | | | | | | |
Net investment income | | | 16,654,633 | | | | 5,925,597 | | | | 46,159,044 | |
| | | | | | | | | | | | |
NET REALIZED AND UNREALIZED GAIN (LOSS) ON INVESTMENTS AND FOREIGN CURRENCY TRANSACTIONS | | | | | | | | | | | | |
Net realized gain (loss) on: | | | | | | | | | | | | |
Investments | | | 65,771,569 | | | | 37,751,773 | | | | 193,094,685 | |
Foreign currency transactions | | | (2,737,540 | ) | | | — | | | | — | |
Net change in unrealized appreciation (depreciation) on: | | | | | | | | | | | | |
Investments | | | 30,111,706 | | | | 73,439,555 | | | | 118,580,388 | |
Foreign currency translations | | | 609,421 | | | | — | | | | — | |
| | | | | | | | | | | | |
Net realized and unrealized gain on investments and foreign currency transactions | | | 93,755,156 | | | | 111,191,328 | | | | 311,675,073 | |
| | | | | | | | | | | | |
NET INCREASE IN NET ASSETS RESULTING FROM OPERATIONS | | $ | 110,409,789 | | | $ | 117,116,925 | | | $ | 357,834,117 | |
| | | | | | | | | | | | |
| (a) | Includes non-recurring dividends of $18,542,329. |
See accompanying notes to financial statements.
| 48
Statements of Changes in Net Assets
| | | | | | | | | | | | | | | | |
| | | Global Equity and Income Fund | | | Growth Fund | |
| | | Year Ended
September 30,
2014 | | | Year Ended
September 30,
2013 | | | Year Ended
September 30,
2014 | | | Year Ended
September 30,
2013 | |
FROM OPERATIONS: | | | | | | | | | | | | | | | | |
Net investment income | | $ | 16,654,633 | | | $ | 18,882,904 | | | $ | 5,925,597 | | | $ | 1,530,832 | |
Net realized gain on investments and foreign currency transactions | | | 63,034,029 | | | | 31,642,395 | | | | 37,751,773 | | | | 4,017,895 | |
Net change in unrealized appreciation (depreciation) on investments and foreign currency translations | | | 30,721,127 | | | | 58,003,890 | | | | 73,439,555 | | | | 49,693,475 | |
| | | | | | | | | | | | | | | | |
Net increase in net assets resulting from operations | | | 110,409,789 | | | | 108,529,189 | | | | 117,116,925 | | | | 55,242,202 | |
| | | | | | | | | | | | | | | | |
FROM DISTRIBUTIONS TO SHAREHOLDERS: | | | | | | | | | | | | | | | | |
Net investment income | | | | | | | | | | | | | | | | |
Class A | | | (4,662,019 | ) | | | (3,564,600 | ) | | | (62,431 | ) | | | (294,078 | ) |
Class C | | | (3,777,946 | ) | | | (2,862,934 | ) | | | — | | | | (20,215 | ) |
Class N | | | — | | | | — | | | | (3 | ) | | | — | |
Class Y | | | (11,208,754 | ) | | | (9,012,867 | ) | | | (1,861,749 | ) | | | (1,088,093 | ) |
Net realized capital gains | | | | | | | | | | | | | | | | |
Class A | | | (3,414,741 | ) | | | — | | | | — | | | | — | |
Class C | | | (4,537,332 | ) | | | — | | | | — | | | | — | |
Class Y | | | (7,216,843 | ) | | | — | | | | — | | | | — | |
| | | | | | | | | | | | | | | | |
Total distributions | | | (34,817,635 | ) | | | (15,440,401 | ) | | | (1,924,183 | ) | | | (1,402,386 | ) |
| | | | | | | | | | | | | | | | |
NET INCREASE IN NET ASSETS FROM CAPITAL SHARE TRANSACTIONS (NOTE 12) | | | 9,166,416 | | | | 141,699,087 | | | | 369,196,723 | | | | 411,126,304 | |
| | | | | | | | | | | | | | | | |
Net increase in net assets | | | 84,758,570 | | | | 234,787,875 | | | | 484,389,465 | | | | 464,966,120 | |
NET ASSETS | | | | | | | | | | | | | | | | |
Beginning of the year | | | 1,162,466,004 | | | | 927,678,129 | | | | 613,714,416 | | | | 148,748,296 | |
| | | | | | | | | | | | | | | | |
End of the year | | $ | 1,247,224,574 | | | $ | 1,162,466,004 | | | $ | 1,098,103,881 | | | $ | 613,714,416 | |
| | | | | | | | | | | | | | | | |
UNDISTRIBUTED NET INVESTMENT INCOME | | $ | 9,047,574 | | | $ | 16,224,238 | | | $ | 4,934,562 | | | $ | 938,277 | |
| | | | | | | | | | | | | | | | |
See accompanying notes to financial statements.
49 |
Statements of Changes in Net Assets (continued)
| | | | | | | | |
| | | Value Fund | |
| | | Year Ended
September 30,
2014 | | | Year Ended
September 30,
2013 | |
FROM OPERATIONS: | | | | | | | | |
Net investment income | | $ | 46,159,044 | | | $ | 25,179,744 | |
Net realized gain on investments and foreign currency transactions | | | 193,094,685 | | | | 103,312,153 | |
Net change in unrealized appreciation (depreciation) on investments and foreign currency translations | | | 118,580,388 | | | | 226,865,373 | |
| | | | | | | | |
Net increase in net assets resulting from operations | | | 357,834,117 | | | | 355,357,270 | |
| | | | | | | | |
FROM DISTRIBUTIONS TO SHAREHOLDERS: | | | | | | | | |
Net investment income | | | | | | | | |
Class A | | | (2,696,217 | ) | | | (1,732,857 | ) |
Class B | | | — | | | | (4,549 | ) |
Class C | | | (56,045 | ) | | | (55,400 | ) |
Class N | | | (3,689,697 | ) | | | — | |
Class Y | | | (16,821,147 | ) | | | (20,425,746 | ) |
Admin Class | | | (119 | ) | | | (23 | ) |
Net realized capital gains | | | | | | | | |
Class A | | | (12,795,968 | ) | | | — | |
Class B | | | (52,578 | ) | | | — | |
Class C | | | (776,082 | ) | | | — | |
Class N | | | (14,085,769 | ) | | | — | |
Class Y | | | (71,586,232 | ) | | | — | |
Admin Class | | | (641 | ) | | | — | |
| | | | | | | | |
Total distributions | | | (122,560,495 | ) | | | (22,218,575 | ) |
| | | | | | | | |
NET INCREASE IN NET ASSETS FROM CAPITAL SHARE TRANSACTIONS (NOTE 12) | | | 96,928,660 | | | | 248,645,802 | |
| | | | | | | | |
Net increase in net assets | | | 332,202,282 | | | | 581,784,497 | |
NET ASSETS | | | | | | | | |
Beginning of the year | | | 1,962,089,481 | | | | 1,380,304,984 | |
| | | | | | | | |
End of the year | | $ | 2,294,291,763 | | | $ | 1,962,089,481 | |
| | | | | | | | |
UNDISTRIBUTED NET INVESTMENT INCOME | | $ | 38,569,726 | | | $ | 16,777,729 | |
| | | | | | | | |
See accompanying notes to financial statements.
| 50
Financial Highlights
For a share outstanding throughout each period.
| | | | | | | | | | | | | | | | | | | | |
| | | Global Equity and Income Fund—Class A | |
| | | Year Ended
September 30,
2014 | | | Year Ended
September 30,
2013 | | | Year Ended
September 30,
2012 | | | Year Ended
September 30,
2011 | | | Year Ended
September 30,
2010 | |
Net asset value, beginning of the period | | $ | 18.57 | | | $ | 17.07 | | | $ | 14.24 | | | $ | 14.72 | | | $ | 12.50 | |
| | | | | | | | | | | | | | | | | | | | |
INCOME (LOSS) FROM INVESTMENT OPERATIONS: | | | | | | | | | | | | | | | | | | | | |
Net investment
income(a) | | | 0.28 | | | | 0.32 | (b) | | | 0.35 | (c) | | | 0.22 | | | | 0.26 | |
Net realized and unrealized gain (loss) | | | 1.49 | | | | 1.45 | | | | 2.71 | | | | (0.45 | ) | | | 2.26 | |
| | | | | | | | | | | | | | | | | | | | |
Total from Investment Operations | | | 1.77 | | | | 1.77 | | | | 3.06 | | | | (0.23 | ) | | | 2.52 | |
| | | | | | | | | | | | | | | | | | | | |
LESS DISTRIBUTIONS FROM: | | | | | | | | | | | | | | | | | | | | |
Net investment income | | | (0.33 | ) | | | (0.27 | ) | | | (0.23 | ) | | | (0.25 | ) | | | (0.30 | ) |
Net realized capital gains | | | (0.24 | ) | | | — | | | | — | | | | — | | | | — | |
| | | | | | | | | | | | | | | | | | | | |
Total Distributions | | | (0.57 | ) | | | (0.27 | ) | | | (0.23 | ) | | | (0.25 | ) | | | (0.30 | ) |
| | | | | | | | | | | | | | | | | | | | |
Net asset value, end of the period | | $ | 19.77 | | | $ | 18.57 | | | $ | 17.07 | | | $ | 14.24 | | | $ | 14.72 | |
| | | | | | | | | | | | | | | | | | | | |
Total return(e) | | | 9.62 | % | | | 10.54 | %(b) | | | 21.75 | %(c) | | | (1.67 | )% | | | 20.61 | %(d) |
RATIOS TO AVERAGE NET ASSETS: | | | | | | | | | | | | | | | | | | | | |
Net assets, end of the period (000’s) | | $ | 237,167 | | | $ | 251,211 | | | $ | 216,209 | | | $ | 111,589 | | | $ | 64,367 | |
Net expenses | | | 1.17 | % | | | 1.18 | % | | | 1.21 | % | | | 1.24 | %(g) | | | 1.25 | %(f) |
Gross expenses | | | 1.17 | % | | | 1.18 | % | | | 1.21 | % | | | 1.24 | %(g) | | | 1.29 | % |
Net investment
income | | | 1.46 | % | | | 1.82 | %(b) | | | 2.16 | %(c) | | | 1.41 | % | | | 1.96 | % |
Portfolio turnover rate | | | 49 | % | | | 58 | % | | | 29 | % | | | 65 | % | | | 99 | % |
| (a) | Per share net investment income has been calculated using the average shares outstanding during the period. |
| (b) | Includes non-recurring dividends. Without these dividends, net investment income per share would have been $0.27, total return would have been 10.25% and the ratio of net investment income to average net assets would have been 1.51%. |
| (c) | Includes a non-recurring dividend. Without this dividend, net investment income per share would have been $0.31, total return would have been 21.46% and the ratio of net investment income to average net assets would have been 1.93%. |
| (d) | Had certain expenses not been waived/reimbursed during the period, total returns would have been lower. |
| (e) | A sales charge for Class A shares is not reflected in total return calculations. |
| (f) | The investment adviser agreed to waive its fees and/or reimburse a portion of the Fund’s expenses during the period. Without this waiver/reimbursement, expenses would have been higher. |
| (g) | Includes fee/expense recovery of 0.02%. |
See accompanying notes to financial statements.
51 |
Financial Highlights (continued)
For a share outstanding throughout each period.
| | | | | | | | | | | | | | | | | | | | |
| | | Global Equity and Income Fund—Class C | |
| | | Year Ended
September 30,
2014 | | | Year Ended
September 30,
2013 | | | Year Ended
September 30,
2012 | | | Year Ended
September 30,
2011 | | | Year Ended
September 30,
2010 | |
Net asset value, beginning of the period | | $ | 18.36 | | | $ | 16.90 | | | $ | 14.10 | | | $ | 14.59 | | | $ | 12.39 | |
| | | | | | | | | | | | | | | | | | | | |
INCOME (LOSS) FROM INVESTMENT OPERATIONS: | | | | | | | | | | | | | | | | | | | | |
Net investment income(a) | | | 0.14 | | | | 0.19 | (b) | | | 0.22 | (c) | | | 0.10 | | | | 0.16 | |
Net realized and unrealized gain (loss) | | | 1.45 | | | | 1.45 | | | | 2.70 | | | | (0.44 | ) | | | 2.26 | |
| | | | | | | | | | | | | | | | | | | | |
Total from Investment Operations | | | 1.59 | | | | 1.64 | | | | 2.92 | | | | (0.34 | ) | | | 2.42 | |
| | | | | | | | | | | | | | | | | | | | |
LESS DISTRIBUTIONS FROM: | | | | | | | | | | | | | | | | | | | | |
Net investment income | | | (0.20 | ) | | | (0.18 | ) | | | (0.12 | ) | | | (0.15 | ) | | | (0.22 | ) |
Net realized capital gains | | | (0.24 | ) | | | — | | | | — | | | | — | | | | — | |
| | | | | | | | | | | | | | | | | | | | |
Total Distributions | | | (0.44 | ) | | | (0.18 | ) | | | (0.12 | ) | | | (0.15 | ) | | | (0.22 | ) |
| | | | | | | | | | | | | | | | | | | | |
Net asset value, end of the period | | $ | 19.51 | | | $ | 18.36 | | | $ | 16.90 | | | $ | 14.10 | | | $ | 14.59 | |
| | | | | | | | | | | | | | | | | | | | |
Total return(e) | | | 8.72 | % | | | 9.77 | %(b) | | | 20.83 | %(c) | | | (2.42 | )% | | | 19.79 | %(d) |
RATIOS TO AVERAGE NET ASSETS: | | | | | | | | | | | | | | | | | | | | |
Net assets, end of the period (000’s) | | $ | 377,001 | | | $ | 340,561 | | | $ | 251,366 | | | $ | 145,369 | | | $ | 109,455 | |
Net expenses | | | 1.92 | % | | | 1.93 | % | | | 1.96 | % | | | 1.99 | %(g) | | | 2.00 | %(f) |
Gross expenses | | | 1.92 | % | | | 1.93 | % | | | 1.96 | % | | | 1.99 | %(g) | | | 2.04 | % |
Net investment income | | | 0.71 | % | | | 1.07 | %(b) | | | 1.40 | %(c) | | | 0.64 | % | | | 1.21 | % |
Portfolio turnover rate | | | 49 | % | | | 58 | % | | | 29 | % | | | 65 | % | | | 99 | % |
| (a) | Per share net investment income has been calculated using the average shares outstanding during the period. |
| (b) | Includes non-recurring dividends. Without these dividends, net investment income per share would have been $0.13, total return would have been 9.41% and the ratio of net investment income to average net assets would have been 0.76%. |
| (c) | Includes a non-recurring dividend. Without this dividend, net investment income per share would have been $0.19, total return would have been 20.55% and the ratio of net investment income to average net assets would have been 1.18%. |
| (d) | Had certain expenses not been waived/reimbursed during the period, total returns would have been lower. |
| (e) | A contingent deferred sales charge for Class C shares is not reflected in total return calculations. |
| (f) | The investment adviser agreed to waive its fees and/or reimburse a portion of the Fund’s expenses during the period. Without this waiver/reimbursement, expenses would have been higher. |
| (g) | Includes fee/expense recovery of 0.02%. |
See accompanying notes to financial statements.
| 52
Financial Highlights (continued)
For a share outstanding throughout each period.
| | | | | | | | | | | | | | | | | | | | |
| | | Global Equity and Income Fund—Class Y | |
| | | Year Ended
September 30,
2014 | | | Year Ended
September 30,
2013 | | | Year Ended
September 30,
2012 | | | Year Ended
September 30,
2011 | | | Year Ended
September 30,
2010 | |
Net asset value, beginning of the period | | $ | 18.68 | | | $ | 17.15 | | | $ | 14.31 | | | $ | 14.78 | | | $ | 12.54 | |
| | | | | | | | | | | | | | | | | | | | |
INCOME (LOSS) FROM INVESTMENT OPERATIONS: | | | | | | | | | | | | | | | | | | | | |
Net investment income(a) | | | 0.33 | | | | 0.37 | (b) | | | 0.40 | (c) | | | 0.26 | | | | 0.29 | |
Net realized and unrealized gain (loss) | | | 1.49 | | | | 1.47 | | | | 2.71 | | | | (0.45 | ) | | | 2.28 | |
| | | | | | | | | | | | | | | | | | | | |
Total from Investment Operations | | | 1.82 | | | | 1.84 | | | | 3.11 | | | | (0.19 | ) | | | 2.57 | |
| | | | | | | | | | | | | | | | | | | | |
LESS DISTRIBUTIONS FROM: | | | | | | | | | | | | | | | | | | | | |
Net investment income | | | (0.37 | ) | | | (0.31 | ) | | | (0.27 | ) | | | (0.28 | ) | | | (0.33 | ) |
Net realized capital gains | | | (0.24 | ) | | | — | | | | — | | | | — | | | | — | |
| | | | | | | | | | | | | | | | | | | | |
Total Distributions | | | (0.61 | ) | | | (0.31 | ) | | | (0.27 | ) | | | (0.28 | ) | | | (0.33 | ) |
| | | | | | | | | | | | | | | | | | | | |
Net asset value, end of the period | | $ | 19.89 | | | $ | 18.68 | | | $ | 17.15 | | | $ | 14.31 | | | $ | 14.78 | |
| | | | | | | | | | | | | | | | | | | | |
Total return | | | 9.87 | % | | | 10.90 | %(b) | | | 21.96 | %(c) | | | (1.42 | )% | | | 21.02 | %(d) |
RATIOS TO AVERAGE NET ASSETS: | | | | | | | | | | | | | | | | | | | | |
Net assets, end of the period (000’s) | | $ | 633,057 | | | $ | 570,694 | | | $ | 460,103 | | | $ | 216,136 | | | $ | 144,780 | |
Net expenses | | | 0.92 | % | | | 0.93 | % | | | 0.96 | % | | | 0.99 | %(f) | | | 1.00 | %(e) |
Gross expenses | | | 0.92 | % | | | 0.93 | % | | | 0.96 | % | | | 0.99 | %(f) | | | 1.04 | % |
Net investment income | | | 1.69 | % | | | 2.07 | %(b) | | | 2.44 | %(c) | | | 1.65 | % | | | 2.20 | % |
Portfolio turnover rate | | | 49 | % | | | 58 | % | | | 29 | % | | | 65 | % | | | 99 | % |
| (a) | Per share net investment income has been calculated using the average shares outstanding during the period. |
| (b) | Includes non-recurring dividends. Without these dividends, net investment income per share would have been $0.31, total return would have been 10.60% and the ratio of net investment income to average net assets would have been 1.76%. |
| (c) | Includes a non-recurring dividend. Without this dividend, net investment income per share would have been $0.36, total return would have been 21.75% and the ratio of net investment income to average net assets would have been 2.20%. |
| (d) | Had certain expenses not been waived/reimbursed during the period, total returns would have been lower. |
| (e) | The investment adviser agreed to waive its fees and/or reimburse a portion of the Fund’s expenses during the period. Without this waiver/reimbursement, expenses would have been higher. |
| (f) | Includes fee/expense recovery of 0.02%. |
See accompanying notes to financial statements.
53 |
Financial Highlights (continued)
For a share outstanding throughout each period.
| | | | | | | | | | | | | | | | | | | | |
| | | Growth Fund—Class A | |
| | | Year Ended
September 30,
2014 | | | Year Ended
September 30,
2013 | | | Year Ended
September 30,
2012 | | | Year Ended
September 30,
2011 | | | Year Ended
September 30,
2010 | |
Net asset value, beginning of the period | | $ | 8.07 | | | $ | 6.50 | | | $ | 5.24 | | | $ | 5.14 | | | $ | 4.48 | |
| | | | | | | | | | | | | | | | | | | | |
INCOME (LOSS) FROM INVESTMENT OPERATIONS: | | | | | | | | | | | | | | | | | | | | |
Net investment income (loss)(a) | | | 0.05 | | | | 0.04 | | | | 0.04 | | | | 0.01 | | | | (0.01 | ) |
Net realized and unrealized gain (loss) | | | 1.34 | | | | 1.59 | | | | 1.23 | | | | 0.09 | | | | 0.67 | |
| | | | | | | | | | | | | | | | | | | | |
Total from Investment Operations | | | 1.39 | | | | 1.63 | | | | 1.27 | | | | 0.10 | | | | 0.66 | |
| | | | | | | | | | | | | | | | | | | | |
LESS DISTRIBUTIONS FROM: | | | | | | | | | | | | | | | | | | | | |
Net investment income | | | (0.01 | ) | | | (0.06 | ) | | | (0.01 | ) | | | — | | | | — | |
Net realized capital gains | | | — | | | | — | | | | — | | | | — | | | | — | |
| | | | | | | | | | | | | | | | | | | | |
Total Distributions | | | (0.01 | ) | | | (0.06 | ) | | | (0.01 | ) | | | — | | | | — | |
| | | | | | | | | | | | | | | | | | | | |
Net asset value, end of the period | | $ | 9.45 | | | $ | 8.07 | | | $ | 6.50 | | | $ | 5.24 | | | $ | 5.14 | |
| | | | | | | | | | | | | | | | | | | | |
Total return(c) | | | 17.23 | % | | | 25.23 | % | | | 24.22 | % | | | 1.95 | % | | | 14.73 | %(b) |
RATIOS TO AVERAGE NET ASSETS: | | | | | | | | | | | | | | | | | | | | |
Net assets, end of the period (000’s) | | $ | 63,682 | | | $ | 50,248 | | | $ | 33,663 | | | $ | 26,716 | | | $ | 29,901 | |
Net expenses | | | 0.94 | % | | | 1.03 | % | | | 1.07 | % | | | 1.14 | % | | | 1.19 | %(d) |
Gross expenses | | | 0.94 | % | | | 1.03 | % | | | 1.07 | % | | | 1.14 | % | | | 1.20 | % |
Net investment income | | | 0.55 | % | | | 0.57 | % | | | 0.61 | % | | | 0.23 | % | | | (0.30 | )% |
Portfolio turnover rate | | | 14 | % | | | 6 | % | | | 16 | % | | | 16 | % | | | 163 | % |
| (a) | Per share net investment income has been calculated using the average shares outstanding during the period. |
| (b) | Had certain expenses not been waived/reimbursed during the period, total returns would have been lower. |
| (c) | A sales charge for Class A shares is not reflected in total return calculations. |
| (d) | The investment adviser agreed to waive its fees and/or reimburse a portion of the Fund’s expenses during the period. Without this waiver/reimbursement, expenses would have been higher. |
See accompanying notes to financial statements.
| 54
Financial Highlights (continued)
For a share outstanding throughout each period.
| | | | | | | | | | | | | | | | | | | | |
| | | Growth Fund—Class B | |
| | | Year Ended
September 30,
2014 | | | Year Ended
September 30,
2013 | | | Year Ended
September 30,
2012 | | | Year Ended
September 30,
2011 | | | Year Ended
September 30,
2010 | |
Net asset value, beginning of the period | | $ | 7.56 | | | $ | 6.09 | | | $ | 4.94 | | | $ | 4.87 | | | $ | 4.28 | |
| | | | | | | | | | | | | | | | | | | | |
INCOME (LOSS) FROM INVESTMENT OPERATIONS: | | | | | | | | | | | | | | | | | | | | |
Net investment loss(a) | | | (0.02 | ) | | | (0.01 | ) | | | (0.01 | ) | | | (0.03 | ) | | | (0.05 | ) |
Net realized and unrealized gain (loss) | | | 1.25 | | | | 1.48 | | | | 1.16 | | | | 0.10 | | | | 0.64 | |
| | | | | | | | | | | | | | | | | | | | |
Total from Investment Operations | | | 1.23 | | | | 1.47 | | | | 1.15 | | | | 0.07 | | | | 0.59 | |
| | | | | | | | | | | | | | | | | | | | |
LESS DISTRIBUTIONS FROM: | | | | | | | | | | | | | | | | | | | | |
Net investment income | | | — | | | | — | | | | — | | | | — | | | | — | |
Net realized capital gains | | | — | | | | — | | | | — | | | | — | | | | — | |
| | | | | | | | | | | | | | | | | | | | |
Total Distributions | | | — | | | | — | | | | — | | | | — | | | | — | |
| | | | | | | | | | | | | | | | | | | | |
Net asset value, end of the period | | $ | 8.79 | | | $ | 7.56 | | | $ | 6.09 | | | $ | 4.94 | | | $ | 4.87 | |
| | | | | | | | | | | | | | | | | | | | |
Total return(c) | | | 16.27 | % | | | 24.14 | % | | | 23.28 | % | | | 1.44 | % | | | 13.79 | %(b) |
RATIOS TO AVERAGE NET ASSETS: | | | | | | | | | | | | | | | | | | | | |
Net assets, end of the period (000’s) | | $ | 428 | | | $ | 1,422 | | | $ | 1,908 | | | $ | 2,609 | | | $ | 4,086 | |
Net expenses | | | 1.69 | % | | | 1.78 | % | | | 1.82 | % | | | 1.89 | % | | | 1.93 | %(d) |
Gross expenses | | | 1.69 | % | | | 1.78 | % | | | 1.82 | % | | | 1.89 | % | | | 1.95 | % |
Net investment loss | | | (0.25 | )% | | | (0.14 | )% | | | (0.12 | )% | | | (0.54 | )% | | | (1.06 | )% |
Portfolio turnover rate | | | 14 | % | | | 6 | % | | | 16 | % | | | 16 | % | | | 163 | % |
| (a) | Per share net investment loss has been calculated using the average shares outstanding during the period. |
| (b) | Had certain expenses not been waived/reimbursed during the period, total returns would have been lower. |
| (c) | A contingent deferred sales charge for Class B shares is not reflected in total return calculations. |
| (d) | The investment adviser agreed to waive its fees and/or reimburse a portion of the Fund’s expenses during the period. Without this waiver/reimbursement, expenses would have been higher. |
See accompanying notes to financial statements.
55 |
Financial Highlights (continued)
For a share outstanding throughout each period.
| | | | | | | | | | | | | | | | | | | | |
| | | Growth Fund—Class C | |
| | | Year Ended
September 30,
2014 | | | Year Ended
September 30,
2013 | | | Year Ended
September 30,
2012 | | | Year Ended
September 30,
2011 | | | Year Ended
September 30,
2010 | |
Net asset value, beginning of the period | | $ | 7.55 | | | $ | 6.09 | | | $ | 4.94 | | | $ | 4.87 | | | $ | 4.28 | |
| | | | | | | | | | | | | | | | | | | | |
INCOME (LOSS) FROM INVESTMENT OPERATIONS: | | | | | | | | | | | | | | | | | | | | |
Net investment loss(a) | | | (0.02 | ) | | | (0.01 | ) | | | (0.01 | ) | | | (0.03 | ) | | | (0.05 | ) |
Net realized and unrealized gain (loss) | | | 1.26 | | | | 1.48 | | | | 1.16 | | | | 0.10 | | | | 0.64 | |
| | | | | | | | | | | | | | | | | | | | |
Total from Investment Operations | | | 1.24 | | | | 1.47 | | | | 1.15 | | | | 0.07 | | | | 0.59 | |
| | | | | | | | | | | | | | | | | | | | |
LESS DISTRIBUTIONS FROM: | | | | | | | | | | | | | | | | | | | | |
Net investment income | | | — | | | | (0.01 | ) | | | — | | | | — | | | | — | |
Net realized capital gains | | | — | | | | — | | | | — | | | | — | | | | — | |
| | | | | | | | | | | | | | | | | | | | |
Total Distributions | | | — | | | | (0.01 | ) | | | — | | | | — | | | | — | |
| | | | | | | | | | | | | | | | | | | | |
Net asset value, end of the period | | $ | 8.79 | | | $ | 7.55 | | | $ | 6.09 | | | $ | 4.94 | | | $ | 4.87 | |
| | | | | | | | | | | | | | | | | | | | |
Total return(c) | | | 16.42 | % | | | 24.21 | % | | | 23.28 | % | | | 1.44 | % | | | 13.79 | %(b) |
RATIOS TO AVERAGE NET ASSETS: | | | | | | | | | | | | | | | | | | | | |
Net assets, end of the period (000’s) | | $ | 29,837 | | | $ | 20,798 | | | $ | 10,489 | | | $ | 10,262 | | | $ | 12,493 | |
Net expenses | | | 1.69 | % | | | 1.78 | % | | | 1.82 | % | | | 1.89 | % | | | 1.93 | %(d) |
Gross expenses | | | 1.69 | % | | | 1.78 | % | | | 1.82 | % | | | 1.89 | % | | | 1.95 | % |
Net investment income (loss) | | | (0.20 | )% | | | (0.20 | )% | | | (0.13 | )% | | | (0.53 | )% | | | (1.06 | )% |
Portfolio turnover rate | | | 14 | % | | | 6 | % | | | 16 | % | | | 16 | % | | | 163 | % |
| (a) | Per share net investment loss has been calculated using the average shares outstanding during the period. |
| (b) | Had certain expenses not been waived/reimbursed during the period, total returns would have been lower. |
| (c) | A contingent deferred sales charge for Class C shares is not reflected in total return calculations. |
| (d) | The investment adviser agreed to waive its fees and/or reimburse a portion of the Fund’s expenses during the period. Without this waiver/reimbursement, expenses would have been higher. |
See accompanying notes to financial statements.
| 56
Financial Highlights (continued)
For a share outstanding throughout each period.
| | | | | | | | |
| | | Growth Fund—Class N | |
| | | Year Ended
September 30,
2014 | | | Period Ended
September 30,
2013* | |
Net asset value, beginning of the period | | $ | 8.56 | | | $ | 7.58 | |
| | | | | | | | |
INCOME (LOSS) FROM INVESTMENT OPERATIONS: | | | | | | | | |
Net investment income(a) | | | 0.05 | | | | 0.03 | |
Net realized and unrealized gain (loss) | | | 1.42 | | | | 0.95 | |
| | | | | | | | |
Total from Investment Operations | | | 1.47 | | | | 0.98 | |
| | | | | | | | |
LESS DISTRIBUTIONS FROM: | | | | | | | | |
Net investment income | | | (0.02 | ) | | | — | |
Net realized capital gains | | | — | | | | — | |
| | | | | | | | |
Total Distributions | | | (0.02 | ) | | | — | |
| | | | | | | | |
Net asset value, end of the period | | $ | 10.01 | | | $ | 8.56 | |
| | | | | | | | |
Total return(b) | | | 17.21 | % | | | 12.93 | % |
RATIOS TO AVERAGE NET ASSETS: | | | | | | | | |
Net assets, end of the period (000’s) | | $ | 1 | | | $ | 1 | |
Net expenses(c) | | | 0.95 | % | | | 0.95 | %(d) |
Gross expenses | | | 3.45 | % | | | 3.50 | %(d) |
Net investment income | | | 0.52 | % | | | 0.60 | %(d) |
Portfolio turnover rate | | | 14 | % | | | 6 | % |
| * | From commencement of Class operations on February 1, 2013 through September 30, 2013. |
| (a) | Per share net investment income has been calculated using the average shares outstanding during the period. |
| (b) | Had certain expenses not been waived/reimbursed during the period, total returns would have been lower. Periods less than one year, if applicable, are not annualized. |
| (c) | The investment adviser agreed to waive its fees and/or reimburse a portion of the Fund’s expenses during the period. Without this waiver/reimbursement, expenses would have been higher. |
| (d) | Computed on an annualized basis for periods less than one year. |
See accompanying notes to financial statements.
57 |
Financial Highlights (continued)
For a share outstanding throughout each period.
| | | | | | | | | | | | | | | | | | | | |
| | | Growth Fund—Class Y | |
| | | Year Ended
September 30,
2014 | | | Year Ended
September 30,
2013 | | | Year Ended
September 30,
2012 | | | Year Ended
September 30,
2011 | | | Year Ended
September 30,
2010 | |
Net asset value, beginning of the period | | $ | 8.57 | | | $ | 6.90 | | | $ | 5.56 | | | $ | 5.43 | | | $ | 4.73 | |
| | | | | | | | | | | | | | | | | | | | |
INCOME (LOSS) FROM INVESTMENT OPERATIONS: | | | | | | | | | | | | | | | | | | | | |
Net investment income (loss)(a) | | | 0.08 | | | | 0.05 | | | | 0.06 | | | | 0.03 | | | | (0.00 | )(b) |
Net realized and unrealized gain (loss) | | | 1.42 | | | | 1.69 | | | | 1.30 | | | | 0.10 | | | | 0.70 | |
| | | | | | | | | | | | | | | | | | | | |
Total from Investment Operations | | | 1.50 | | | | 1.74 | | | | 1.36 | | | | 0.13 | | | | 0.70 | |
| | | | | | | | | | | | | | | | | | | | |
LESS DISTRIBUTIONS FROM: | | | | | | | | | | | | | | | | | | | | |
Net investment income | | | (0.03 | ) | | | (0.07 | ) | | | (0.02 | ) | | | — | | | | — | |
Net realized capital gains | | | — | | | | — | | | | — | | | | — | | | | — | |
| | | | | | | | | | | | | | | | | | | | |
Total Distributions | | | (0.03 | ) | | | (0.07 | ) | | | (0.02 | ) | | | — | | | | — | |
| | | | | | | | | | | | | | | | | | | | |
Net asset value, end of the period | | $ | 10.04 | | | $ | 8.57 | | | $ | 6.90 | | | $ | 5.56 | | | $ | 5.43 | |
| | | | | | | | | | | | | | | | | | | | |
Total return | | | 17.51 | % | | | 25.49 | % | | | 24.57 | % | | | 2.21 | % | | | 15.01 | %(c) |
RATIOS TO AVERAGE NET ASSETS: | | | | | | | | | | | | | | | | | | | | |
Net assets, end of the period (000’s) | | $ | 1,004,157 | | | $ | 541,245 | | | $ | 102,688 | | | $ | 70,177 | | | $ | 53,299 | |
Net expenses | | | 0.69 | % | | | 0.77 | % | | | 0.82 | % | | | 0.89 | % | | | 0.93 | %(d)(e) |
Gross expenses | | | 0.69 | % | | | 0.77 | % | | | 0.82 | % | | | 0.89 | % | | | 0.95 | % |
Net investment income (loss) | | | 0.79 | % | | | 0.68 | % | | | 0.87 | % | | | 0.49 | % | | | (0.05 | )% |
Portfolio turnover rate | | | 14 | % | | | 6 | % | | | 16 | % | | | 16 | % | | | 163 | % |
| (a) | Per share net investment income (loss) has been calculated using the average shares outstanding during the period. |
| (b) | Amount rounds to less than $0.01 per share. |
| (c) | Had certain expenses not been waived/reimbursed during the period, total returns would have been lower. |
| (d) | The investment adviser agreed to waive its fees and/or reimburse a portion of the Fund’s expenses during the period. Without this waiver/reimbursement, expenses would have been higher. |
| (e) | Effective February 1, 2010, the expense limit increased from 0.85% to 1.00%. |
See accompanying notes to financial statements.
| 58
Financial Highlights (continued)
For a share outstanding throughout each period.
| | | | | | | | | | | | | | | | | | | | |
| | | Value Fund—Class A | |
| | | Year Ended
September 30,
2014 | | | Year Ended
September 30,
2013 | | | Year Ended
September 30,
2012 | | | Year Ended
September 30,
2011 | | | Year Ended
September 30,
2010 | |
Net asset value, beginning of the period | | $ | 25.59 | | | $ | 20.86 | | | $ | 16.04 | | | $ | 16.78 | | | $ | 16.42 | |
| | | | | | | | | | | | | | | | | | | | |
INCOME (LOSS) FROM INVESTMENT OPERATIONS: | | | | | | | | | | | | | | | | | | | | |
Net investment income(a) | | | 0.45 | (b) | | | 0.31 | | | | 0.27 | | | | 0.20 | | | | 0.27 | (c) |
Net realized and unrealized gain (loss) | | | 4.00 | | | | 4.70 | | | | 4.78 | | | | (0.72 | ) | | | 0.23 | |
| | | | | | | | | | | | | | | | | | | | |
Total from Investment Operations | | | 4.45 | | | | 5.01 | | | | 5.05 | | | | (0.52 | ) | | | 0.50 | |
| | | | | | | | | | | | | | | | | | | | |
LESS DISTRIBUTIONS FROM: | | | | | | | | | | | | | | | | | | | | |
Net investment income | | | (0.27 | ) | | | (0.28 | ) | | | (0.23 | ) | | | (0.22 | ) | | | (0.14 | ) |
Net realized capital gains | | | (1.30 | ) | | | — | | | | — | | | | — | | | | — | |
| | | | | | | | | | | | | | | | | | | | |
Total Distributions | | | (1.57 | ) | | | (0.28 | ) | | | (0.23 | ) | | | (0.22 | ) | | | (0.14 | ) |
| | | | | | | | | | | | | | | | | | | | |
Net asset value, end of the period | | $ | 28.47 | | | $ | 25.59 | | | $ | 20.86 | | | $ | 16.04 | | | $ | 16.78 | |
| | | | | | | | | | | | | | | | | | | | |
Total return(d) | | | 17.97 | %(b) | | | 24.35 | % | | | 31.71 | % | | | (3.28 | )% | | | 3.03 | % |
RATIOS TO AVERAGE NET ASSETS: | | | | | | | | | | | | | | | | | | | | |
Net assets, end of the period (000’s) | | $ | 580,092 | | | $ | 171,327 | | | $ | 129,572 | | | $ | 126,789 | | | $ | 130,922 | |
Net expenses | | | 0.96 | % | | | 0.97 | % | | | 0.98 | % | | | 0.98 | % | | | 0.96 | % |
Gross expenses | | | 0.96 | % | | | 0.97 | % | | | 0.98 | % | | | 0.98 | % | | | 0.96 | % |
Net investment income | | | 1.63 | %(b) | | | 1.31 | % | | | 1.45 | % | | | 1.09 | % | | | 1.58 | %(c) |
Portfolio turnover rate | | | 28 | % | | | 24 | % | | | 25 | % | | | 29 | % | | | 54 | % |
| (a) | Per share net investment income has been calculated using the average shares outstanding during the period. |
| (b) | Includes non-recurring dividends. Without these dividends, net investment income per share would have been $0.29, total return would have been 17.02% and the ratio of net investment income to average net assets would have been 1.05%. |
| (c) | Includes a non-recurring dividend. Without this dividend, net investment income per share would have been $0.14 and the ratio of net investment income to average net assets would have been 0.84%. |
| (d) | A sales charge for Class A shares is not reflected in total return calculations. |
See accompanying notes to financial statements.
59 |
Financial Highlights (continued)
For a share outstanding throughout each period.
| | | | | | | | | | | | | | | | | | | | |
| | | Value Fund—Class B | |
| | | Year Ended
September 30,
2014 | | | Year Ended
September 30,
2013 | | | Year Ended
September 30,
2012 | | | Year Ended
September 30,
2011 | | | Year Ended
September 30,
2010 | |
Net asset value, beginning of the period | | $ | 25.77 | | | $ | 20.95 | | | $ | 16.05 | | | $ | 16.77 | | | $ | 16.40 | |
| | | | | | | | | | | | | | | | | | | | |
INCOME (LOSS) FROM INVESTMENT OPERATIONS: | | | | | | | | | | | | | | | | | | | | |
Net investment
income(a) | | | 0.32 | (b) | | | 0.14 | | | | 0.13 | | | | 0.06 | | | | 0.12 | (c) |
Net realized and unrealized gain (loss) | | | 3.97 | | | | 4.75 | | | | 4.81 | | | | (0.73 | ) | | | 0.25 | |
| | | | | | | | | | | | | | | | | | | | |
Total from Investment Operations | | | 4.29 | | | | 4.89 | | | | 4.94 | | | | (0.67 | ) | | | 0.37 | |
| | | | | | | | | | | | | | | | | | | | |
LESS DISTRIBUTIONS FROM: | | | | | | | | | | | | | | | | | | | | |
Net investment income | | | — | | | | (0.07 | ) | | | (0.04 | ) | | | (0.05 | ) | | | — | |
Net realized capital gains | | | (1.30 | ) | | | — | | | | — | | | | — | | | | — | |
| | | | | | | | | | | | | | | | | | | | |
Total Distributions | | | (1.30 | ) | | | (0.07 | ) | | | (0.04 | ) | | | (0.05 | ) | | | — | |
| | | | | | | | | | | | | | | | | | | | |
Net asset value, end of the period | | $ | 28.76 | | | $ | 25.77 | | | $ | 20.95 | | | $ | 16.05 | | | $ | 16.77 | |
| | | | | | | | | | | | | | | | | | | | |
Total return(d) | | | 17.08 | %(b) | | | 23.42 | % | | | 30.79 | % | | | (4.05 | )% | | | 2.26 | % |
RATIOS TO AVERAGE NET ASSETS: | | | | | | | | | | | | | | | | | | | | |
Net assets, end of the period (000’s) | | $ | 672 | | | $ | 1,143 | | | $ | 1,534 | | | $ | 2,037 | | | $ | 3,299 | |
Net expenses | | | 1.71 | % | | | 1.72 | % | | | 1.73 | % | | | 1.73 | % | | | 1.70 | % |
Gross expenses | | | 1.71 | % | | | 1.72 | % | | | 1.73 | % | | | 1.73 | % | | | 1.70 | % |
Net investment
income | | | 1.16 | %(b) | | | 0.59 | % | | | 0.71 | % | | | 0.32 | % | | | 0.72 | %(c) |
Portfolio turnover rate | | | 28 | % | | | 24 | % | | | 25 | % | | | 29 | % | | | 54 | % |
| (a) | Per share net investment income has been calculated using the average shares outstanding during the period. |
| (b) | Includes non-recurring dividends. Without these dividends, net investment income per share would have been $0.07, total return would have been 16.14% and the ratio of net investment income to average net assets would have been 0.26%. |
| (c) | Includes a non-recurring dividend. Without this dividend, net investment income per share would have been $0.02 and the ratio of net investment income to average net assets would have been 0.10%. |
| (d) | A contingent deferred sales charge for Class B shares is not reflected in total return calculations. |
See accompanying notes to financial statements.
| 60
Financial Highlights (continued)
For a share outstanding throughout each period.
| | | | | | | | | | | | | | | | | | | | |
| | | Value Fund—Class C | |
| | | Year Ended
September 30,
2014 | | | Year Ended
September 30,
2013 | | | Year Ended
September 30,
2012 | | | Year Ended
September 30,
2011 | | | Year Ended
September 30,
2010 | |
Net asset value, beginning of the period | | $ | 25.33 | | | $ | 20.65 | | | $ | 15.85 | | | $ | 16.58 | | | $ | 16.26 | |
| | | | | | | | | | | | | | | | | | | | |
INCOME (LOSS) FROM INVESTMENT OPERATIONS: | | | | | | | | | | | | | | | | | | | | |
Net investment income(a) | | | 0.31 | (b) | | | 0.13 | | | | 0.13 | | | | 0.06 | | | | 0.14 | (c) |
Net realized and unrealized gain (loss) | | | 3.89 | | | | 4.68 | | | | 4.74 | | | | (0.71 | ) | | | 0.22 | |
| | | | | | | | | | | | | | | | | | | | |
Total from Investment Operations | | | 4.20 | | | | 4.81 | | | | 4.87 | | | | (0.65 | ) | | | 0.36 | |
| | | | | | | | | | | | | | | | | | | | |
LESS DISTRIBUTIONS FROM: | | | | | | | | | | | | | | | | | | | | |
Net investment income | | | (0.09 | ) | | | (0.13 | ) | | | (0.07 | ) | | | (0.08 | ) | | | (0.04 | ) |
Net realized capital gains | | | (1.30 | ) | | | — | | | | — | | | | — | | | | — | |
| | | | | | | | | | | | | | | | | | | | |
Total Distributions | | | (1.39 | ) | | | (0.13 | ) | | | (0.07 | ) | | | (0.08 | ) | | | (0.04 | ) |
| | | | | | | | | | | | | | | | | | | | |
Net asset value, end of the period | | $ | 28.14 | | | $ | 25.33 | | | $ | 20.65 | | | $ | 15.85 | | | $ | 16.58 | |
| | | | | | | | | | | | | | | | | | | | |
Total return(d) | | | 17.07 | %(b) | | | 23.41 | % | | | 30.78 | % | | | (4.00 | )% | | | 2.20 | % |
RATIOS TO AVERAGE NET ASSETS: | | | | | | | | | | | | | | | | | | | | |
Net assets, end of the period (000’s) | | $ | 16,958 | | | $ | 15,158 | | | $ | 9,104 | | | $ | 8,996 | | | $ | 10,226 | |
Net expenses | | | 1.71 | % | | | 1.72 | % | | | 1.73 | % | | | 1.73 | % | | | 1.71 | % |
Gross expenses | | | 1.71 | % | | | 1.72 | % | | | 1.73 | % | | | 1.73 | % | | | 1.71 | % |
Net investment income | | | 1.15 | %(b) | | | 0.55 | % | | | 0.70 | % | | | 0.33 | % | | | 0.81 | %(c) |
Portfolio turnover rate | | | 28 | % | | | 24 | % | | | 25 | % | | | 29 | % | | | 54 | % |
| (a) | Per share net investment income has been calculated using the average shares outstanding during the period. |
| (b) | Includes non-recurring dividends. Without these dividends, net investment income per share would have been $0.08, total return would have been 16.11% and the ratio of net investment income to average net assets would have been 0.28%. |
| (c) | Includes a non-recurring dividend. Without this dividend, net investment income per share would have been $0.01 and the ratio of net investment income to average net assets would have been 0.09%. |
| (d) | A contingent deferred sales charge for Class C shares is not reflected in total return calculations. |
See accompanying notes to financial statements.
61 |
Financial Highlights (continued)
For a share outstanding throughout each period.
| | | | | | | | |
| | | Value Fund—Class N | |
| | | Year Ended
September 30,
2014 | | | Period Ended
September 30,
2013* | |
Net asset value, beginning of the period | | $ | 25.65 | | | $ | 22.59 | |
| | | | | | | | |
INCOME (LOSS) FROM INVESTMENT OPERATIONS: | | | | | | | | |
Net investment income(a) | | | 0.63 | (b) | | | 0.25 | |
Net realized and unrealized gain (loss) | | | 3.94 | | | | 2.81 | |
| | | | | | | | |
Total from Investment Operations | | | 4.57 | | | | 3.06 | |
| | | | | | | | |
LESS DISTRIBUTIONS FROM: | | | | | | | | |
Net investment income | | | (0.34 | ) | | | — | |
Net realized capital gains | | | (1.30 | ) | | | — | |
| | | | | | | | |
Total Distributions | | | (1.64 | ) | | | — | |
| | | | | | | | |
Net asset value, end of the period | | $ | 28.58 | | | $ | 25.65 | |
| | | | | | | | |
Total return | | | 18.43 | %(b) | | | 13.55 | % |
RATIOS TO AVERAGE NET ASSETS: | | | | | | | | |
Net assets, end of the period (000’s) | | $ | 392,811 | | | $ | 260,643 | |
Net expenses | | | 0.57 | % | | | 0.57 | %(c) |
Gross expenses | | | 0.57 | % | | | 0.57 | %(c) |
Net investment income | | | 2.28 | %(b) | | | 1.50 | %(c) |
Portfolio turnover rate | | | 28 | % | | | 24 | % |
| * | From commencement of Class operations on February 1, 2013 through September 30, 2013. |
| (a) | Per share net investment income has been calculated using the average shares outstanding during the period. |
| (b) | Includes non-recurring dividends. Without these dividends, net investment income per share would have been $0.39, total return would have been 17.48% and the ratio of net investment income to average net assets would have been 1.43%. |
| (c) | Computed on an annualized basis for periods less than one year. |
See accompanying notes to financial statements.
| 62
Financial Highlights (continued)
For a share outstanding throughout each period.
| | | | | | | | | | | | | | | | | | | | |
| | | Value Fund—Class Y | |
| | | Year Ended
September 30,
2014 | | | Year Ended
September 30,
2013 | | | Year Ended
September 30,
2012 | | | Year Ended
September 30,
2011 | | | Year Ended
September 30,
2010 | |
Net asset value, beginning of the period | | $ | 25.65 | | | $ | 20.91 | | | $ | 16.08 | | | $ | 16.82 | | | $ | 16.47 | |
| | | | | | | | | | | | | | | | | | | | |
INCOME (LOSS) FROM INVESTMENT OPERATIONS: | | | | | | | | | | | | | | | | | | | | |
Net investment income(a) | | | 0.60 | (b) | | | 0.36 | | | | 0.32 | | | | 0.25 | | | | 0.31 | (c) |
Net realized and unrealized gain (loss) | | | 3.94 | | | | 4.72 | | | | 4.78 | | | | (0.73 | ) | | | 0.23 | |
| | | | | | | | | | | | | | | | | | | | |
Total from Investment Operations | | | 4.54 | | | | 5.08 | | | | 5.10 | | | | (0.48 | ) | | | 0.54 | |
| | | | | | | | | | | | | | | | | | | | |
LESS DISTRIBUTIONS FROM: | | | | | | | | | | | | | | | | | | | | |
Net investment income | | | (0.31 | ) | | | (0.34 | ) | | | (0.27 | ) | | | (0.26 | ) | | | (0.19 | ) |
Net realized capital gains | | | (1.30 | ) | | | — | | | | — | | | | — | | | | — | |
| | | | | | | | | | | | | | | | | | | | |
Total Distributions | | | (1.61 | ) | | | (0.34 | ) | | | (0.27 | ) | | | (0.26 | ) | | | (0.19 | ) |
| | | | | | | | | | | | | | | | | | | | |
Net asset value, end of the period | | $ | 28.58 | | | $ | 25.65 | | | $ | 20.91 | | | $ | 16.08 | | | $ | 16.82 | |
| | | | | | | | | | | | | | | | | | | | |
Total return | | | 18.27 | %(b) | | | 24.65 | % | | | 32.05 | % | | | (3.05 | )% | | | 3.28 | % |
RATIOS TO AVERAGE NET ASSETS: | | | | | | | | | | | | | | | | | | | | |
Net assets, end of the period (000’s) | | $ | 1,303,492 | | | $ | 1,513,807 | | | $ | 1,240,093 | | | $ | 957,584 | | | $ | 788,937 | |
Net expenses | | | 0.71 | % | | | 0.72 | % | | | 0.73 | % | | | 0.74 | % | | | 0.71 | % |
Gross expenses | | | 0.71 | % | | | 0.72 | % | | | 0.73 | % | | | 0.74 | % | | | 0.71 | % |
Net investment income | | | 2.19 | %(b) | | | 1.56 | % | | | 1.68 | % | | | 1.34 | % | | | 1.86 | %(c) |
Portfolio turnover rate | | | 28 | % | | | 24 | % | | | 25 | % | | | 29 | % | | | 54 | % |
| (a) | Per share net investment income has been calculated using the average shares outstanding during the period. |
| (b) | Includes non-recurring dividends. Without these dividends, net investment income per share would have been $0.35, total return would have been 17.32% and the ratio of net investment income to average net assets would have been 1.28%. |
| (c) | Includes a non-recurring dividend. Without this dividend, net investment income per share would have been $0.18 and the ratio of net investment income to average net assets would have been 1.08%. |
See accompanying notes to financial statements.
63 |
Financial Highlights (continued)
For a share outstanding throughout each period.
| | | | | | | | | | | | | | | | | | | | |
| | | Value Fund—Admin Class | |
| | | Year Ended
September 30,
2014 | | | Year Ended
September 30,
2013 | | | Year Ended
September 30,
2012 | | | Year Ended
September 30,
2011 | | | Period Ended
September 30,
2010* | |
Net asset value, beginning of the period | | $ | 25.51 | | | $ | 20.79 | | | $ | 16.00 | | | $ | 16.74 | | | $ | 16.72 | |
| | | | | | | | | | | | | | | | | | | | |
INCOME (LOSS) FROM INVESTMENT OPERATIONS: | | | | | | | | | | | | | | | | | | | | |
Net investment income(a) | | | 0.30 | (b) | | | 0.24 | | | | 0.22 | | | | 0.17 | | | | 0.18 | (c) |
Net realized and unrealized gain (loss) | | | 4.07 | | | | 4.71 | | | | 4.77 | | | | (0.73 | ) | | | (0.16 | ) |
| | | | | | | | | | | | | | | | | | | | |
Total from Investment Operations | | | 4.37 | | | | 4.95 | | | | 4.99 | | | | (0.56 | ) | | | 0.02 | |
| | | | | | | | | | | | | | | | | | | | |
LESS DISTRIBUTIONS FROM: | | | | | | | | | | | | | | | | | | | | |
Net investment income | | | (0.24 | ) | | | (0.23 | ) | | | (0.20 | ) | | | (0.18 | ) | | | — | |
Net realized capital gains | | | (1.30 | ) | | | — | | | | — | | | | — | | | | — | |
| | | | | | | | | | | | | | | | | | | | |
Total Distributions | | | (1.54 | ) | | | (0.23 | ) | | | (0.20 | ) | | | (0.18 | ) | | | — | |
| | | | | | | | | | | | | | | | | | | | |
Net asset value, end of the period | | $ | 28.34 | | | $ | 25.51 | | | $ | 20.79 | | | $ | 16.00 | | | $ | 16.74 | |
| | | | | | | | | | | | | | | | | | | | |
Total return | | | 17.68 | %(b) | | | 24.08 | % | | | 31.43 | % | | | (3.48 | )% | | | 0.12 | % |
RATIOS TO AVERAGE NET ASSETS: | | | | | | | | | | | | | | | | | | | | |
Net assets, end of the period (000’s) | | $ | 268 | | | $ | 12 | | | $ | 2 | | | $ | 1 | | | $ | 1 | |
Net expenses | | | 1.21 | % | | | 1.19 | % | | | 1.24 | % | | | 1.17 | % | | | 1.29 | %(d) |
Gross expenses | | | 1.21 | % | | | 1.19 | % | | | 1.24 | % | | | 1.17 | % | | | 1.29 | %(d) |
Net investment income | | | 1.07 | %(b) | | | 1.01 | % | | | 1.17 | % | | | 0.90 | % | | | 1.59 | %(c)(d) |
Portfolio turnover rate | | | 28 | % | | | 24 | % | | | 25 | % | | | 29 | % | | | 54 | % |
| * | From commencement of Class operations on February 1, 2010 through September 30, 2010. |
| (a) | Per share net investment income has been calculated using the average shares outstanding during the period. |
| (b) | Includes non-recurring dividends. Without these dividends, net investment income per share would have been $0.27, total return would have been 16.73% and the ratio of net investment income to average net assets would have been 0.96%. |
| (c) | Includes a non-recurring dividend. Without this dividend, net investment income per share would have been $0.05 and the ratio of net investment income to average net assets would have been 0.50%. |
| (d) | Computed on an annualized basis for periods less than one year. |
See accompanying notes to financial statements.
| 64
Notes to Financial Statements
September 30, 2014
1. Organization. Loomis Sayles Funds II (the “Trust”) is organized as a Massachusetts business trust. The Trust is registered under the Investment Company Act of 1940, as amended (the “1940 Act”), as an open-end management investment company. The Declaration of Trust permits the Board of Trustees to authorize the issuance of an unlimited number of shares of the Trust in multiple series. The financial statements for certain funds of the Trust are presented in separate reports. The following funds (individually, a “Fund” and collectively, the “Funds”) are included in this report:
Loomis Sayles Global Equity and Income Fund (the “Global Equity and Income Fund”)
Loomis Sayles Growth Fund (the “Growth Fund”)
Loomis Sayles Value Fund (the “Value Fund”)
Each Fund is a diversified investment company.
Each Fund offers Class A, Class C and Class Y shares. In addition, Growth Fund and Value Fund offer Class N shares and Value Fund offers Admin Class shares. Effective October 12, 2007, Class B shares are no longer offered. Existing Class B shareholders of Growth Fund and Value Fund may continue to reinvest dividends into Class B shares and exchange their Class B shares for Class B shares of other Natixis Funds subject to existing exchange privileges as described in the prospectus.
Class A shares are sold with a maximum front-end sales charge of 5.75%. Class B shares do not pay a front-end sales charge; however, they are charged higher Rule 12b-1 fees, and are subject to a contingent deferred sales charge (“CDSC”) if such shares are redeemed within six years of purchase. After eight years of ownership, Class B shares convert to Class A shares. Class C shares do not pay a front-end sales charge, do not convert to any other class of shares, pay higher Rule 12b-1 fees than Class A shares and may be subject to a CDSC of 1.00% if those shares are redeemed within one year of acquisition, except for reinvested distributions. Class N and Class Y shares do not pay a front-end sales charge, a CDSC or Rule 12b-1 fees. Class N shares are primarily intended for employer-sponsored retirement plans. Class Y shares are intended for institutional investors with a minimum initial investment of $100,000, though some categories of investors are exempted from the minimum investment amount as outlined in the Funds’ prospectus. Admin Class shares do not pay a front-end sales charge or a CDSC, but do pay a Rule 12b-1 fee. Class N and Admin Class shares are offered exclusively through intermediaries.
Most expenses can be directly attributed to a fund. Expenses which cannot be directly attributed to a fund are generally apportioned based on the relative net assets of each of the funds in Natixis Funds Trust I, Natixis Funds Trust II, Natixis Funds Trust IV, Gateway Trust (“Natixis Funds Trusts”), Loomis Sayles Funds I, Loomis Sayles Funds II (“Loomis Sayles Funds Trusts”) and Hansberger International Series. Expenses of a Fund are borne pro rata by the holders of each class of shares, except that each class bears expenses unique to that class (including the Rule 12b-1 service and distribution
65 |
Notes to Financial Statements (continued)
September 30, 2014
fees and, for Growth Fund and Value Fund, transfer agent fees). In addition, each class votes as a class only with respect to its own Rule 12b-1 Plan. Shares of each class would receive their pro rata share of the net assets of a Fund if the Fund were liquidated. The Trustees approve separate distributions from net investment income on each class of shares.
2. Significant Accounting Policies. The following is a summary of significant accounting policies consistently followed by each Fund in the preparation of its financial statements. The Funds’ financial statements follow the accounting and reporting guidelines provided for investment companies and are prepared in accordance with accounting principles generally accepted in the United States of America which require the use of management estimates that affect the reported amounts and disclosures in the financial statements. Actual results could differ from those estimates. Management has evaluated the events and transactions subsequent to year-end through the date the financial statements were issued and has determined that there were no material events that would require disclosure in the Funds’ financial statements.
a. Valuation. Fund securities and other investments are valued at market value based on market quotations obtained or determined by independent pricing services recommended by the adviser and approved by the Board of Trustees. Fund securities and other investments for which market quotations are not readily available are valued at fair value as determined in good faith by the adviser pursuant to procedures approved by the Board of Trustees, as described below. Market value is determined as follows:
Equity securities (including closed-end investment companies and exchange-traded funds) are valued at the last sale price quoted on the exchange or market where traded most extensively or, if there is no reported sale during the day, the closing bid quotation as reported by an independent pricing service. Securities traded on the NASDAQ Global Select Market, NASDAQ Global Market and NASDAQ Capital Market are valued at the NASDAQ Official Closing Price (“NOCP”), or if lacking an NOCP, at the most recent bid quotations on the applicable NASDAQ Market. In some foreign markets, an official close price and a last sale price may be available from the foreign exchange or market. In those cases, the official close price is used. Debt securities (other than short-term obligations purchased with an original or remaining maturity of sixty days or less) and unlisted equity securities are valued based on evaluated bids furnished to the Fund by an independent pricing service using market information, transactions for comparable securities and various relationships between securities, if available, or bid prices obtained from broker-dealers. Senior loans are valued at bid prices supplied by an independent pricing service, if available. Broker-dealer bid prices may be used to value debt and equity securities and senior loans where an independent pricing service is unable to price a security or where an independent pricing service does not provide a
| 66
Notes to Financial Statements (continued)
September 30, 2014
reliable price for the security. Forward foreign currency contracts are valued utilizing interpolated rates determined based on information provided by an independent pricing service. Short-term obligations (purchased with an original or remaining maturity of sixty days or less) are valued at amortized cost (which approximates market value).
Fund securities and other investments for which market quotations are not readily available are valued at fair value as determined in good faith by the adviser pursuant to procedures approved by the Board of Trustees. The Funds may also value securities and other investments at fair value in other circumstances such as when extraordinary events occur after the close of a foreign market but prior to the close of the New York Stock Exchange (“NYSE”). This may include situations relating to a single issuer (such as a declaration of bankruptcy or a delisting of the issuer’s security from the primary market on which it has traded) as well as events affecting the securities markets in general (such as market disruptions or closings and significant fluctuations in U.S. and/or foreign markets). When fair valuing its securities or other investments, the Funds may, among other things, use modeling tools or other processes that may take into account factors such as securities or other market activity and/or significant events that occur after the close of the foreign market and before the time the Fund’s net asset value (“NAV”) is calculated. Fair value pricing may require subjective determinations about the value of a security, and fair values used to determine a Fund’s NAV may differ from quoted or published prices, or from prices that are used by others, for the same securities. In addition, the use of fair value pricing may not always result in adjustments to the prices of securities held by a Fund.
As September 30, 2014, approximately 22% of the market value of Global Equity and Income Fund’s investments was fair valued pursuant to procedures approved by the Board of Trustees as events occurring after the close of the foreign market were believed to materially affect the value of those securities. Additionally, multiple securities held by the Fund for which market quotations were not readily available as of September 30, 2014, were fair valued pursuant to procedures approved by the Board of Trustees, amounting to less than 0.1% of net assets.
b. Investment Transactions and Related Investment Income. Investment transactions are accounted for on a trade date plus one day basis for daily NAV calculation. However, for financial reporting purposes, investment transactions are reported on trade date. Dividend income is recorded on ex-dividend date, or in the case of certain foreign securities, as soon as a Fund is notified, and interest income is recorded on an accrual basis. Interest income is increased by the accretion of discount and decreased by the amortization of premium. Periodic principal adjustments for inflation-protected securities are recorded to interest income. In determining net gain or loss on securities sold, the cost of securities has been determined on an identified cost basis. Investment income, non-class specific expenses and realized and unrealized gains and losses are allocated on a pro rata basis to each class based on the relative net assets of each class to the total net assets of the Fund.
67 |
Notes to Financial Statements (continued)
September 30, 2014
c. Foreign Currency Translation. The books and records of the Funds are maintained in U.S. dollars. The values of securities, currencies and other assets and liabilities denominated in currencies other than U.S. dollars are translated into U.S. dollars based upon foreign exchange rates prevailing at the end of the period. Purchases and sales of investment securities, income and expenses are translated on the respective dates of such transactions.
Since the values of investment securities are presented at the foreign exchange rates prevailing at the end of the period, it is not practical to isolate that portion of the results of operations arising from changes in exchange rates from fluctuations which arise due to changes in market prices of investment securities. Such changes are included with the net realized and unrealized gain or loss on investments.
Net realized foreign exchange gains or losses arise from sales of foreign currency, currency gains or losses realized between the trade and settlement dates on securities transactions and the difference between the amounts of dividends, interest and foreign withholding taxes recorded on the Funds’ books and the U.S. dollar equivalent of the amounts actually received or paid. Net unrealized foreign exchange gains and losses arise from changes in the value of assets and liabilities, other than investment securities, at the end of the fiscal period, resulting from changes in exchange rates.
Each Fund may use foreign currency exchange contracts to facilitate transactions in foreign-denominated investments. Losses may arise from changes in the value of the foreign currency or if the counterparties do not perform under the contracts’ terms.
d. Forward Foreign Currency Contracts. The Funds may enter into forward foreign currency contracts, including forward foreign cross currency contracts to acquire exposure to foreign currencies or to hedge the Funds’ investments against currency fluctuation. A contract can also be used to offset a previous contract. These contracts involve market risk in excess of the unrealized gain or loss reflected in the Funds’ Statements of Assets and Liabilities. The U.S. dollar value of the currencies a Fund has committed to buy or sell represents the aggregate exposure to each currency the Fund has acquired or hedged through currency contracts outstanding at period end. Gains or losses are recorded for financial statement purposes as unrealized until settlement date. Contracts are traded over-the-counter directly with a counterparty. Risks may arise upon entering into these contracts from the potential inability of counterparties to meet the terms of their contracts and from unanticipated movements in the value of a foreign currency relative to the U.S. dollar. Certain contracts may require the movement of cash and/or securities as collateral for the Funds’ or counterparty’s net obligations under the contracts.
e. Due to Brokers. Transactions and positions in certain forward foreign currency contracts are maintained and cleared by registered U.S. broker/dealers pursuant to customer agreements between the Fund and the various broker/dealers. The due to
| 68
Notes to Financial Statements (continued)
September 30, 2014
brokers balance in the Statement of Assets and Liabilities for Global Equity and Income Fund represents cash received as collateral for forward foreign currency contracts. In certain circumstances the Fund’s use of cash held at brokers is restricted by regulation or broker mandated limits.
f. Federal and Foreign Income Taxes. The Trust treats each Fund as a separate entity for federal income tax purposes. Each Fund intends to meet the requirements of the Internal Revenue Code of 1986, as amended, applicable to regulated investment companies, and to distribute to its shareholders substantially all of its net investment income and any net realized capital gains at least annually. Management has performed an analysis of each Fund’s tax positions for the open tax years as of September 30, 2014 and has concluded that no provisions for income tax are required. The Funds’ federal tax returns for the prior three fiscal years remain subject to examination by the Internal Revenue Service. Management is not aware of any events that are reasonably possible to occur in the next twelve months that would result in the amounts of any unrecognized tax benefits significantly increasing or decreasing for the Funds. However, management’s conclusions regarding tax positions taken may be subject to review and adjustment at a later date based on factors including, but not limited to, new tax laws and accounting regulations and interpretations thereof.
A Fund may be subject to foreign withholding taxes on investment income and taxes on capital gains on investments that are accrued and paid based upon the Fund’s understanding of the tax rules and regulations that exist in the countries in which the Fund invests. Foreign withholding taxes on dividend and interest income are reflected on the Statements of Operations as a reduction of investment income, net of amounts eligible to be reclaimed. Dividends and interest receivable on the Statements of Assets and Liabilities are net of foreign withholding taxes. Foreign withholding taxes eligible to be reclaimed are reflected on the Statements of Assets and Liabilities as tax reclaims receivable. Capital gains taxes paid are included in net realized gain (loss) on investments in the Statements of Operations. Accrued but unpaid capital gains taxes are reflected as foreign taxes payable on the Statements of Assets and Liabilities, if applicable, and reduce unrealized gains on investments. In the event that realized gains on investments are subsequently offset by realized losses, taxes paid on realized gains may be returned to a Fund. Such amounts, if applicable, are reflected as foreign tax rebates receivable on the Statements of Assets and Liabilities and are recorded as a realized gain when received.
g. Dividends and Distributions to Shareholders. Dividends and distributions are recorded on ex-dividend date. The timing and characterization of certain income and capital gain distributions are determined annually in accordance with federal tax regulations, which may differ from accounting principles generally accepted in the United States of America. Permanent differences are primarily due to differing treatments for book and tax purposes of items such as capital gains tax reclass, foreign
69 |
Notes to Financial Statements (continued)
September 30, 2014
currency gains and losses, paydown gains and losses, contingent payment debt instruments, return of capital and capital gain distributions received, deferred Trustees’ fees, trust preferred securities and premium amortization. Permanent book and tax basis differences relating to shareholder distributions will result in reclassifications to capital accounts. Temporary differences between book and tax distributable earnings are primarily due to deferred Trustees’ fees, forward foreign currency contract mark to market, wash sales, premium amortization, contingent payment debt instruments and return of capital distributions received. Distributions from net investment income and short-term capital gains are considered to be distributed from ordinary income for tax purposes.
The tax characterization of distributions is determined on an annual basis. The tax character of distributions paid to shareholders during the periods ended September 30, 2014 and 2013 were as follows:
| | | | | | | | | | | | | | | | | | | | | | | | |
| | | 2014 Distributions Paid From: | | | 2013 Distributions Paid From: | |
Fund | | Ordinary Income | | | Long-Term
Capital Gains | | | Total | | | Ordinary Income | | | Long-Term
Capital Gains | | | Total | |
Global Equity and Income Fund | | $ | 23,348,919 | | | $ | 11,468,716 | | | $ | 34,817,635 | | | $ | 15,440,401 | | | $ | — | | | $ | 15,440,401 | |
Growth Fund | | | 1,924,183 | | | | — | | | | 1,924,183 | | | | 1,402,386 | | | | — | | | | 1,402,386 | |
Value Fund | | | 23,545,450 | | | | 99,015,045 | | | | 122,560,495 | | | | 22,218,575 | | | | — | | | | 22,218,575 | |
Differences between these amounts and those reported in the Statements of Changes in Net Assets are primarily attributable to different book and tax treatment for short-term capital gains.
As of September 30, 2014, the components of distributable earnings on a tax basis were as follows:
| | | | | | | | | | | | |
| | | Global
Equity and
Income Fund | | | Growth
Fund | | | Value
Fund | |
Undistributed ordinary income | | $ | 27,961,419 | | | $ | 5,098,729 | | | $ | 49,196,790 | |
Undistributed long-term capital gain | | | 37,565,142 | | | | — | | | | 176,585,139 | |
| | | | | | | | | | | | |
Total undistributed earnings | | | 65,526,561 | | | | 5,098,729 | | | | 225,781,929 | |
| | | | | | | | | | | | |
Capital loss carryforward: | | | | | | | | | | | | |
Expires: | | | | | | | | | | | | |
September 30, 2017 | | | — | | | | (11,593,528 | ) | | | — | |
September 30, 2018 | | | — | | | | (34,679,944 | ) | | | — | |
| | | | | | | | | | | | |
Total capital loss carryforward | | | — | | | | (46,273,472 | ) | | | — | |
Unrealized appreciation | | | 146,946,118 | | | | 149,344,470 | | | | 566,978,674 | |
| | | | | | | | | | | | |
Total accumulated earnings | | $ | 212,472,679 | | | $ | 108,169,727 | | | $ | 792,760,603 | |
| | | | | | | | | | | | |
Capital loss carryforward
utilized in the current year | | $ | — | | | $ | 37,528,363 | | | $ | — | |
| | | | | | | | | | | | |
| 70
Notes to Financial Statements (continued)
September 30, 2014
h. Repurchase Agreements. Each Fund may enter into repurchase agreements, under the terms of a Master Repurchase Agreement, under which each Fund acquires securities as collateral and agrees to resell the securities at an agreed upon time and at an agreed upon price. It is each Fund’s policy that the market value of the collateral for repurchase agreements be at least equal to 102% of the repurchase price, including interest. Certain repurchase agreements are tri-party arrangements whereby the collateral is held in a segregated account for the benefit of the Fund and on behalf of the counterparty. Repurchase agreements could involve certain risks in the event of default or insolvency of the counterparty, including possible delays or restrictions upon a Fund’s ability to dispose of the underlying securities. As of September 30, 2014, each Fund, as applicable, had investments in repurchase agreements for which the value of the related collateral exceeded the value of the repurchase agreement. The gross value of repurchase agreements is included in the Statements of Assets and Liabilities for financial reporting purposes.
i. Securities Lending. The Funds have entered into an agreement with State Street Bank and Trust Company (“State Street Bank”), as agent of the Funds, to lend securities to certain designated borrowers. The loans are collateralized with cash or securities in an amount equal to at least 105% or 102% of the market value (including accrued interest) of the loaned international or domestic securities, respectively, when the loan is initiated. Thereafter, the value of the collateral must remain at least 102% of the market value (including accrued interest) of loaned securities for U.S. equities and U.S. corporate debt; at least 105% of the market value (including accrued interest) of loaned securities for non-U.S. equities; and at least 100% of the market value (including accrued interest) of loaned securities for U.S. Government securities, sovereign debt issued by non-U.S. Governments and non-U.S. corporate debt. In the event that the market value of the collateral falls below the required percentages described above, the borrower will deliver additional collateral on the next business day. As with other extensions of credit, the Funds may bear the risk of loss with respect to the investment of the collateral. The Funds invest cash collateral in short-term investments, a portion of the income from which is remitted to the borrowers and the remainder allocated between the Funds and State Street Bank as lending agent.
For the year ended September 30, 2014, none of the Funds had loaned securities under this agreement.
j. Indemnifications. Under the Trust’s organizational documents, its officers and Trustees are indemnified against certain liabilities arising out of the performance of their duties to the Funds. Additionally, in the normal course of business, the Funds enter into contracts with service providers that contain general indemnification clauses. The Funds’ maximum exposure under these arrangements is unknown as this would involve future claims that may be made against the Funds that have not yet occurred. However, based on experience, the Funds expect the risk of loss to be remote.
71 |
Notes to Financial Statements (continued)
September 30, 2014
3. Fair Value Measurements. In accordance with accounting standards related to fair value measurements and disclosures, the Funds have categorized the inputs utilized in determining the value of each Fund’s assets or liabilities. These inputs are summarized in the three broad levels listed below:
| | • | | Level 1 – quoted prices in active markets for identical assets or liabilities; |
| | • | | Level 2 – prices determined using other significant inputs that are observable either directly, or indirectly through corroboration with observable market data (which could include quoted prices for similar assets or liabilities, interest rates, credit risk, etc.); and |
| | • | | Level 3 – prices determined using significant unobservable inputs when quoted prices or observable inputs are unavailable such as when there is little or no market activity for an asset or liability (unobservable inputs reflect each Fund’s own assumptions in determining the fair value of assets or liabilities and would be based on the best information available). |
The inputs or methodology used for valuing securities are not necessarily an indication of the risk associated with investing in those securities.
The following is a summary of the inputs used to value the Funds’ investments as of September 30, 2014, at value:
Global Equity and Income Fund
Asset Valuation Inputs
| | | | | | | | | | | | | | | | |
Description | | Level 1 | | | Level 2 | | | Level 3 | | | Total | |
Common Stocks(a) | | | | | | | | | | | | | | | | |
Belgium | | $ | — | | | $ | 18,595,356 | | | $ | — | | | $ | 18,595,356 | |
China | | | 17,400,028 | | | | 15,465,001 | | | | — | | | | 32,865,029 | |
Denmark | | | — | | | | 17,268,698 | | | | — | | | | 17,268,698 | |
Germany | | | — | | | | 29,770,514 | | | | — | | | | 29,770,514 | |
India | | | 10,617,022 | | | | 18,085,890 | | | | — | | | | 28,702,912 | |
Italy | | | — | | | | 14,441,791 | | | | — | | | | 14,441,791 | |
Japan | | | — | | | | 46,005,850 | | | | — | | | | 46,005,850 | |
Sweden | | | — | | | | 17,391,261 | | | | — | | | | 17,391,261 | |
Switzerland | | | — | | | | 29,413,352 | | | | — | | | | 29,413,352 | |
Thailand | | | — | | | | 13,460,218 | | | | — | | | | 13,460,218 | |
United Kingdom | | | — | | | | 58,189,004 | | | | — | | | | 58,189,004 | |
All Other Common Stocks(a) | | | 549,745,517 | | | | — | | | | — | | | | 549,745,517 | |
| | | | | | | | | | | | | | | | |
Total Common Stocks | | | 577,762,567 | | | | 278,086,935 | | | | — | | | | 855,849,502 | |
| | | | | | | | | | | | | | | | |
| 72
Notes to Financial Statements (continued)
September 30, 2014
Global Equity and Income Fund (continued)
Asset Valuation Inputs (continued)
| | | | | | | | | | | | | | | | |
Description | | Level 1 | | | Level 2 | | | Level 3 | | | Total | |
Bonds and Notes | | | | | | | | | | | | | | | | |
Non-Convertible Bonds | | | | | | | | | | | | | | | | |
Korea | | $ | — | | | $ | 5,927,700 | | | $ | 4,567,994 | | | $ | 10,495,694 | |
United States | | | 34,580 | | | | 152,636,977 | | | | 2,546,713 | | | | 155,218,270 | |
All Other Non-Convertible Bonds(a) | | | — | | | | 178,747,508 | | | | — | | | | 178,747,508 | |
| | | | | | | | | | | | | | | | |
Total Non-Convertible Bonds | | | 34,580 | | | | 337,312,185 | | | | 7,114,707 | | | | 344,461,472 | |
| | | | | | | | | | | | | | | | |
Convertible Bonds(a) | | | — | | | | 8,360,417 | | | | — | | | | 8,360,417 | |
Municipals(a) | | | — | | | | 498,139 | | | | — | | | | 498,139 | |
| | | | | | | | | | | | | | | | |
Total Bonds and Notes | | | 34,580 | | | | 346,170,741 | | | | 7,114,707 | | | | 353,320,028 | |
| | | | | | | | | | | | | | | | |
Senior Loans(a) | | | — | | | | 4,387,481 | | | | — | | | | 4,387,481 | |
Preferred Stocks | | | | | | | | | | | | | | | | |
Non-Convertible Preferred Stock(a) | | | 682,639 | | | | — | | | | — | | | | 682,639 | |
Convertible Preferred Stocks | | | | | | | | | | | | | | | | |
United States | | | 45,080 | | | | 110,938 | | | | — | | | | 156,018 | |
| | | | | | | | | | | | | | | | |
Total Preferred Stocks | | | 727,719 | | | | 110,938 | | | | — | | | | 838,657 | |
| | | | | | | | | | | | | | | | |
Short-Term Investments | | | — | | | | 23,793,873 | | | | — | | | | 23,793,873 | |
| | | | | | | | | | | | | | | | |
Total Investments | | | 578,524,866 | | | | 652,549,968 | | | | 7,114,707 | | | | 1,238,189,541 | |
| | | | | | | | | | | | | | | | |
Forward Foreign Currency Contracts (unrealized appreciation) | | | — | | | | 1,519,383 | | | | — | | | | 1,519,383 | |
| | | | | | | | | | | | | | | | |
Total | | $ | 578,524,866 | | | $ | 654,069,351 | | | $ | 7,114,707 | | | $ | 1,239,708,924 | |
| | | | | | | | | | | | | | | | |
| | | | |
| Liability Valuation Inputs | | | | | | | | | | | | | | | | |
Description | | Level 1 | | | Level 2 | | | Level 3 | | | Total | |
Forward Foreign Currency Contracts (unrealized depreciation) | | $ | — | | | $ | (836,324 | ) | | $ | — | | | $ | (836,324 | ) |
| | | | | | | | | | | | | | | | |
| (a) | Details of the major categories of the Fund’s investments are reflected within the Portfolio of Investments. |
A preferred stock valued at $110,312 was transferred from Level 1 to Level 2 during the period ended September 30, 2014. At September 30, 2013, this security was valued at the last sale price in accordance with the Fund’s valuation policies. At September 30, 2014, this security was valued on the basis of evaluated bids furnished to the Fund by an independent pricing service as a market price was not available.
73 |
Notes to Financial Statements (continued)
September 30, 2014
All transfers are recognized as of the beginning of the reporting period.
Growth Fund
Asset Valuation Inputs
| | | | | | | | | | | | | | | | |
Description | | Level 1 | | | Level 2 | | | Level 3 | | | Total | |
Common Stocks(a) | | $ | 1,078,749,440 | | | $ | — | | | $ | — | | | $ | 1,078,749,440 | |
Short-Term Investments | | | — | | | | 24,425,042 | | | | — | | | | 24,425,042 | |
| | | | | | | | | | | | | | | | |
Total | | $ | 1,078,749,440 | | | $ | 24,425,042 | | | $ | — | | | $ | 1,103,174,482 | |
| | | | | | | | | | | | | | | | |
| (a) | Details of the major categories of the Fund’s investments are reflected within the Portfolio of Investments. |
For the year ended September 30, 2014, there were no transfers among Levels 1, 2 and 3.
Value Fund
Asset Valuation Inputs
| | | | | | | | | | | | | | | | |
Description | | Level 1 | | | Level 2 | | | Level 3 | | | Total | |
Common Stocks(a) | | $ | 2,242,275,628 | | | $ | — | | | $ | — | | | $ | 2,242,275,628 | |
Short-Term Investments | | | — | | | | 51,061,716 | | | | — | | | | 51,061,716 | |
| | | | | | | | | | | | | | | | |
Total | | $ | 2,242,275,628 | | | $ | 51,061,716 | | | $ | — | | | $ | 2,293,337,344 | |
| | | | | | | | | | | | | | | | |
| (a) | Details of the major categories of the Fund’s investments are reflected within the Portfolio of Investments. |
For the year ended September 30, 2014, there were no transfers among Levels 1, 2 and 3.
The following is a reconciliation of Level 3 investments for which significant unobservable inputs were used to determine fair value as of September 30, 2013 and/or September 30, 2014:
Global Equity and Income Fund
Asset Valuation Inputs
| | | | | | | | | | | | | | | | | | | | |
Investments in Securities | | Balance as of
September 30, 2013 | | | Accrued
Discounts (Premiums) | | | Realized
Gain (Loss) | | | Change in
Unrealized
Appreciation (Depreciation) | | | Purchases | |
Bonds and Notes | | | | | | | | | | | | | | | | | | | | |
Non-Convertible Bonds | | | | | | | | | | | | | | | | | | | | |
Brazil | | $ | 1,065,325 | | | $ | 415 | | | $ | (6,682 | ) | | $ | 2,505 | | | $ | — | |
Korea | | | 4,410,510 | | | | (4,450 | ) | | | — | | | | 161,934 | | | | — | |
United States | | | 3,019,090 | | | | 1,778 | | | | 6,876 | | | | 106,333 | | | | — | |
| | | | | | | | | | | | | | | | | | | | |
Total | | $ | 8,494,925 | | | $ | (2,257 | ) | | $ | 194 | | | $ | 270,772 | | | $ | — | |
| | | | | | | | | | | | | | | | | | | | |
| 74
Notes to Financial Statements (continued)
September 30, 2014
Global Equity and Income Fund (continued)
Asset Valuation Inputs (continued)
| | | | | | | | | | | | | | | | | | | | |
Investments in Securities | | Sales | | | Transfers into Level 3 | | | Transfers
out of Level 3 | | | Balance as of
September 30, 2014 | | | Change in
Unrealized
Appreciation
(Depreciation)
from
Investments
Still Held at
September 30, 2014 | |
Bonds and Notes | | | | | | | | | | | | | | | | | | | | |
Non-Convertible Bonds | | | | | | | | | | | | | | | | | | | | |
Brazil | | $ | (1,061,563 | ) | | $ | — | | | $ | — | | | $ | — | | | $ | — | |
Korea | | | — | | | | — | | | | — | | | | 4,567,994 | | | | 161,934 | |
United States | | | (587,364 | ) | | | — | | | | — | | | | 2,546,713 | | | | 111,209 | |
| | | | | | | | | | | | | | | | | | | | |
Total | | $ | (1,648,927 | ) | | $ | — | | | $ | — | | | $ | 7,114,707 | | | $ | 273,143 | |
| | | | | | | | | | | | | | | | | | | | |
4. Derivatives. Derivative instruments are defined as financial instruments whose value and performance are based on the value and performance of another security or financial instrument. Derivative instruments that Global Equity and Income Fund used during the period include forward foreign currency contracts.
Global Equity and Income Fund is subject to the risk that changes in foreign currency exchange rates will have an unfavorable effect on the value of Fund assets denominated in foreign currencies. The Fund may enter into forward foreign currency contracts for hedging purposes to protect the value of the Fund’s holdings of foreign securities. The Fund may also use forward foreign currency contracts to gain exposure to foreign currencies, regardless of whether securities denominated in such currencies are held in the Fund. During the year ended September 30, 2014, the Fund engaged in forward foreign currency transactions for hedging purposes and to gain exposure to foreign currencies.
75 |
Notes to Financial Statements (continued)
September 30, 2014
The following is a summary of derivative instruments for Global Equity and Income Fund as of September 30, 2014, as reflected within the Statements of Assets and Liabilities
| | | | |
Assets | | Unrealized
appreciation on
forward foreign
currency contracts | |
Over-the-counter asset derivatives | | | | |
Foreign exchange contracts | | $ | 1,519,383 | |
| |
Liabilities | | Unrealized
depreciation on
forward foreign
currency contracts | |
Over-the-counter liability derivatives | | | | |
Foreign exchange contracts | | $ | 836,324 | |
Transactions in derivative instruments for Global Equity and Income Fund during the year ended September 30, 2014 as reflected within the Statements of Operations were as follows:
| | | | |
Net Realized Gain (Loss) on: | | Foreign currency transactions1 | |
Foreign exchange contracts | | $ | (2,700,029 | ) |
| |
Net Change in Unrealized Appreciation (Depreciation) on: | | Foreign currency transactions1 | |
Foreign exchange contracts | | $ | 910,551 | |
| 1 | Represents realized loss and change in unrealized appreciation (depreciation), respectively, for forward foreign currency contracts during the period. Does not include other foreign currency gains or losses included in the Statements of Operations. |
As the Fund values its derivatives at fair value and recognizes changes in fair value through the Statement of Operations, it does not qualify for hedge accounting under authoritative guidance for derivative instruments. The Fund’s investments in derivatives may represent an economic hedge; however, they are considered to be non-hedge transactions for the purpose of these disclosures.
| 76
Notes to Financial Statements (continued)
September 30, 2014
The volume of forward foreign currency contract activity, as a percentage of net assets, for Global Equity and Income Fund, based on gross month-end notional amounts outstanding during the period, including long and short positions at absolute value, was as follows for the year ended September 30, 2014:
| | | | |
Global Equity and Income Fund | | Forwards | |
Average Notional Amount Outstanding | | | 6.62 | % |
Highest Notional Amount Outstanding | | | 11.39 | % |
Lowest Notional Amount Outstanding | | | 4.99 | % |
Notional Amount Outstanding as of September 30, 2014 | | | 5.71 | % |
Notional amounts outstanding at the end of the prior period are included in the average notional amount outstanding.
Unrealized gain and/or loss on open forwards is recorded in the Statements of Assets and Liabilities. The aggregate notional values of forward contracts are not recorded in the Statements of Assets and Liabilities, and therefore are not included in the Fund’s net assets.
Global Equity and Income Fund enters into over-the-counter derivatives, including forward foreign currency contracts, pursuant to International Swaps and Derivatives Association, Inc. (“ISDA”) agreements negotiated between the Fund and its counterparties. ISDA agreements typically contain, among other things, terms for posting of collateral and master netting provisions in the event of a default or other termination event. Collateral is posted by the Fund or the counterparty to the extent of the net mark-to-market exposure to the other party of all open contracts under the agreement, subject to minimum transfer requirements. Master netting provisions allow the Fund and the counterparty, in the event of a default or other termination event, to offset amounts owed by each related to derivative contracts, including any posted collateral, to one net amount payable by either the Fund or the counterparty. The Fund’s ISDA agreements typically contain provisions that allow a counterparty to terminate open contracts early if the net asset value of the Fund declines beyond a certain threshold. For financial reporting purposes, the Fund does not offset derivative assets and liabilities, and any related collateral received or pledged, on the Statements of Assets and Liabilities.
77 |
Notes to Financial Statements (continued)
September 30, 2014
As of September 30, 2014, gross amounts of over-the-counter derivative assets and liabilities not offset in the Statements of Assets and Liabilities and the related net amounts after taking into account master netting arrangements for Global Equity and Income Fund, by counterparty, are as follows:
| | | | | | | | | | | | | | | | | | | | |
Counterparty | | Gross
Amounts of Assets | | | Offset Amount | | | Net
Asset Balance | | | Collateral
(Received)/ Pledged | | | Net Amount | |
Barclays Bank plc | | $ | 414,355 | | | $ | (255,083 | ) | | $ | 159,272 | | | $ | — | | | $ | 159,272 | |
Citibank N.A. | | | 237,570 | | | | — | | | | 237,570 | | | | (237,570 | ) | | | — | |
Credit Suisse International | | | 761,144 | | | | (581,241 | ) | | | 179,903 | | | | — | | | | 179,903 | |
UBS AG | | | 106,314 | | | | — | | | | 106,314 | | | | — | | | | 106,314 | |
| | | | | | | | | | | | | | | | | | | | |
| | $ | 1,519,383 | | | $ | (836,324 | ) | | $ | 683,059 | | | $ | (237,570 | ) | | $ | 445,489 | |
| | | | | | | | | | | | | | | | | | | | |
| | | | | |
Counterparty | | Gross
Amounts of Liabilities | | | Offset Amount | | | Net
Liability Balance | | | Collateral
(Received)/ Pledged | | | Net Amount | |
Barclays Bank plc | | $ | (255,083 | ) | | $ | 255,083 | | | $ | — | | | $ | — | | | $ | — | |
Credit Suisse International | | | (581,241 | ) | | | 581,241 | | | | — | | | | — | | | | — | |
| | | | | | | | | | | | | | | | | | | | |
| | $ | (836,324 | ) | | $ | 836,324 | | | $ | — | | | $ | — | | | $ | — | |
| | | | | | | | | | | | | | | | | | | | |
The actual collateral received or pledged, if any, may exceed the amounts shown in the table due to overcollateralization. Timing differences may exist between when contracts under the ISDA agreement are marked-to-market and when collateral moves. The ISDA agreements include tri-party control agreements under which collateral is held for the benefit of the secured party at a third party custodian, State Street Bank.
Counterparty risk is managed based on policies and procedures established by the Fund’s adviser. Such policies and procedures may include, but are not limited to, minimum counterparty credit rating requirements, monitoring of counterparty credit default swap spreads and posting of collateral. The Fund’s risk of loss from counterparty credit risk on over-the-counter derivatives is generally limited to the Fund’s aggregated unrealized gains and the amount of any collateral pledged to the counterparty, which may be offset by any collateral posted to the Fund by the counterparty. ISDA master agreements can help to manage counterparty risk by specifying collateral posting arrangements at pre-arranged exposure levels. Under these ISDA agreements, collateral is routinely transferred if the total net exposure in respect of certain transactions, net of existing collateral already in place, exceeds a specified amount (typically $250,000, depending on the counterparty). With exchange traded derivatives, there is minimal counterparty credit risk to the Fund because the exchange’s clearinghouse, as counterparty to these instruments, stands between the buyer and the seller of the contract. Credit risk still exists in exchange traded
| 78
Notes to Financial Statements (continued)
September 30, 2014
derivatives with respect to initial and variation margin that is held in a broker’s customer accounts. While brokers are required to segregate customer margin from their own assets, in the event that a broker becomes insolvent or goes into bankruptcy and at that time there is a shortfall in the aggregate amount of margin held by the broker for all its clients, U.S. bankruptcy laws will typically allocate that shortfall on a pro rata basis across all of the broker’s customers, potentially resulting in losses to the Fund. Based on balances reflected on the Fund’s Statement of Assets and Liabilities, the following table shows (i) the maximum amount of loss due to credit risk that, based on the gross fair value of the financial instrument, the Fund would incur if parties to the relevant financial instruments failed completely to perform according to the terms of the contracts and the collateral or other security, if any, for the amount due proved to be of no value to the Fund, and (ii) the amount of loss that the Fund would incur after taking into account master netting provisions pursuant to ISDA agreements, as of September 30, 2014:
| | | | |
Maximum Amount of Loss - Gross | | Maximum Amount of Loss - Net | |
$1,519,383 | | $ | 445,489 | |
These amounts include cash received as collateral of $260,000.
5. Purchases and Sales of Securities. For the year ended September 30, 2014, purchases and sales of securities (excluding short-term investments and U.S. Government/Agency securities and including paydowns) were as follows:
| | | | | | | | |
Fund | | Purchases | | | Sales | |
Global Equity and Income Fund | | $ | 532,751,637 | | | $ | 545,903,843 | |
Growth Fund | | | 473,519,153 | | | | 107,395,812 | |
Value Fund | | | 623,898,934 | | | | 584,555,844 | |
For the year ended September 30, 2014, purchases and sales of U.S. Government/Agency securities by the Global Equity and Income Fund were $55,985,566 and $47,935,932, respectively.
79 |
Notes to Financial Statements (continued)
September 30, 2014
6. Management Fees and Other Transactions with Affiliates.
a. Management Fees. Loomis, Sayles & Company, L.P. (“Loomis Sayles”) serves as investment adviser to each Fund. Separate management agreements for each Fund in effect for the year ended September 30, 2014, provided for fees at the following annual percentage rates of each Fund’s average daily net assets:
| | | | | | | | |
| | | Percentage of
Average
Daily Net Assets | |
Fund | | First $2 billion | | | Over $2 billion | |
Global Equity and Income Fund | | | 0.75 | % | | | 0.73 | % |
Growth Fund | | | 0.50 | % | | | 0.50 | % |
Value Fund | | | 0.50 | % | | | 0.50 | % |
Prior to July 1, 2014, Global Equity and Income Fund paid a management fee at the following annual rates, calculated daily and payable monthly, based on the Fund’s average daily net assets:
| | | | |
Fund | | Percentage of
Average Daily Net Assets | |
Global Equity and Income Fund | | | 0.75 | % |
Loomis Sayles has given binding undertakings to the Funds to waive management fees and/or reimburse certain expenses to limit the Funds’ operating expenses, exclusive of acquired fund fees and expenses, brokerage expenses, interest expense, taxes and extraordinary expenses. These undertakings are in effect until January 31, 2015 and are reevaluated on an annual basis. Management fees payable, as reflected on the Statements of Assets and Liabilities, is net of waivers and/or expense reimbursements, if any, pursuant to these undertakings.
For the year ended September 30, 2014, the expense limits as a percentage of average daily net assets under the expense limitation agreements were as follows:
| | | | | | | | | | | | | | | | | | | | | | | | |
| | | Expense Limit as a Percentage of
Average Daily Net Assets | |
Fund | | Class A | | | Class B | | | Class C | | | Class N | | | Class Y | | | Admin
Class | |
Global Equity and Income Fund | | | 1.25 | % | | | — | | | | 2.00 | % | | | — | | | | 1.00 | % | | | — | |
Growth Fund | | | 1.25 | % | | | 2.00 | % | | | 2.00 | % | | | 0.95 | % | | | 1.00 | % | | | — | |
Value Fund | | | 1.10 | % | | | 1.85 | % | | | 1.85 | % | | | 0.80 | % | | | 0.85 | % | | | 1.35 | % |
Loomis Sayles shall be permitted to recover expenses it has borne under the expense limitation agreements (whether through waiver of its management fees or otherwise) on
| 80
Notes to Financial Statements (continued)
September 30, 2014
a class by class basis in later periods to the extent the annual operating expenses of a class fall below a class’ expense limits, provided, however, that a class is not obligated to pay such waived/reimbursed fees or expenses more than one year after the end of the fiscal year in which the fees or expenses were waived/reimbursed.
For the year ended September 30, 2014, the management fees and waivers of management fees for each Fund were as follows:
| | | | | | | | | | | | | | | | | | | | |
| | | Gross
Management Fees | | | Waivers of
Management Fees | | | Net
Management Fees | | | Percentage of
Average Daily Net Assets | |
Fund | | | | | Gross | | | Net | |
Global Equity and Income Fund | | $ | 9,290,151 | | | $ | — | | | $ | 9,290,151 | | | | 0.75 | % | | | 0.75 | % |
Growth Fund | | | 4,018,726 | | | | — | | | | 4,018,726 | | | | 0.50 | % | | | 0.50 | % |
Value Fund | | | 11,022,110 | | | | — | | | | 11,022,110 | | | | 0.50 | % | | | 0.50 | % |
For the year ended September 30, 2014 class specific expenses have been reimbursed as follows:
| | | | |
| | | Reimbursement1 | |
Fund | | Class N | |
Growth Fund | | $ | 31 | |
| 1 | Expense reimbursements of $15 are subject to possible recovery until September 30, 2015. See note 6h. |
No expenses were recovered for any of the Funds during the year ended September 30, 2014 under the terms of the expense agreements.
Certain officers and employees of Loomis Sayles are also officers or Trustees of the Trust. Loomis Sayles’ general partner is indirectly owned by Natixis Global Asset Management, L.P. (“Natixis US”), which is part of Natixis Global Asset Management, an international asset management group based in Paris, France.
b. Service and Distribution Fees. NGAM Distribution, L.P. (“NGAM Distribution”), which is a wholly-owned subsidiary of Natixis US, has entered into a distribution agreement with the Trust. Pursuant to this agreement, NGAM Distribution serves as principal underwriter of the Funds of the Trust.
Pursuant to Rule 12b-1 under the 1940 Act, the Trust has adopted a Service Plan relating to each Fund’s Class A shares (the “Class A Plans”), a Distribution and Service Plan relating to each Fund’s Class B (if applicable) and Class C shares (the “Class B and Class C Plans”), and Value Fund has adopted a Distribution Plan relating to its Admin Class shares (the “Admin Class Plan”).
Under the Class A Plans, each Fund pays NGAM Distribution a monthly service fee at an annual rate not to exceed 0.25% of the average daily net assets attributable to the
81 |
Notes to Financial Statements (continued)
September 30, 2014
Fund’s Class A shares, as reimbursement for expenses incurred by NGAM Distribution in providing personal services to investors in Class A shares and/or the maintenance of shareholder accounts.
Under the Class B (if applicable) and Class C Plans, each Fund pays NGAM Distribution a monthly service fee at an annual rate not to exceed 0.25% of the average daily net assets attributable to the Fund’s Class B (if applicable) and Class C shares, as compensation for services provided by NGAM Distribution in providing personal services to investors in Class B (if applicable) and Class C shares and/or the maintenance of shareholder accounts.
Also under the Class B (if applicable) and Class C Plans, each Fund pays NGAM Distribution a monthly distribution fee at an annual rate of 0.75% of the average daily net assets attributable to the Funds’ Class B (if applicable) and Class C shares, as compensation for services provided by NGAM Distribution in connection with the marketing or sale of Class B (if applicable) and Class C shares.
Under the Admin Class Plan, Value Fund pays NGAM Distribution a monthly distribution fee at an annual rate not to exceed 0.25% of the average daily net assets attributable to the Fund’s Admin Class shares, as compensation for services provided by NGAM Distribution in connection with the marketing or sale of Admin Class shares or for payments made by NGAM Distribution to securities dealers or other financial intermediaries as commissions, asset-based sales charges or other compensation with respect to the sale of Admin Class shares, or for providing personal services to investors and/or the maintenance of shareholder accounts.
In addition, the Admin Class shares of Value Fund may pay NGAM Distribution an administrative service fee, at an annual rate not to exceed 0.25% of the average daily net assets attributable to Admin Class shares. These fees are subsequently paid to securities dealers or financial intermediaries for providing personal services and/or account maintenance for their customers who hold such shares.
For the year ended September 30, 2014, the service and distribution fees for each Fund were as follows:
| | | | | | | | | | | | | | | | | | | | | | | | | | | | |
| | | Service Fees | | | Distribution Fees | |
Fund | | Class A | | | Class B | | | Class C | | | Admin
Class | | | Class B | | | Class C | | | Admin
Class | |
Global Equity and Income Fund | | $ | 675,152 | | | $ | — | | | $ | 929,861 | | | $ | — | | | $ | — | | | $ | 2,789,582 | | | $ | — | |
Growth Fund | | | 149,585 | | | | 1,952 | | | | 66,533 | | | | — | | | | 5,855 | | | | 199,600 | | | | — | |
Value Fund | | | 1,018,847 | | | | 2,301 | | | | 42,636 | | | | 294 | | | | 6,906 | | | | 127,908 | | | | 294 | |
c. Administrative Fees. NGAM Advisors, L.P. (“NGAM Advisors”), provides certain administrative services for the Funds and contracts with State Street Bank to serve as
| 82
Notes to Financial Statements (continued)
September 30, 2014
sub-administrator. NGAM Advisors is a wholly-owned subsidiary of Natixis US. Pursuant to an agreement among Natixis Funds Trusts, Loomis Sayles Funds Trusts, Hansberger International Series and NGAM Advisors, each Fund pays NGAM Advisors monthly its pro rata portion of fees equal to an annual rate of 0.0575% of the first $15 billion of the average daily net assets of the Natixis Funds Trusts, Loomis Sayles Funds Trusts and Hansberger International Series, 0.0500% of the next $15 billion, 0.0400% of the next $30 billion, 0.0350% of the next $30 billion and 0.0325% of such assets in excess of $90 billion, subject to an annual aggregate minimum fee for the Natixis Funds Trusts, Loomis Sayles Funds Trusts and Hansberger International Series of $10 million, which is reevaluated on an annual basis.
For the year ended September 30, 2014, the administrative fees for each Fund were as follows:
| | | | |
Fund | | Administrative Fees | |
Global Equity and Income Fund | | $ | 539,025 | |
Growth Fund | | | 349,269 | |
Value Fund | | | 958,953 | |
Prior to July 1, 2014, each Fund paid NGAM Advisors monthly its pro rata portion of fees equal to an annual rate of 0.0575% of the first $15 billion of the average daily net assets of the Natixis Funds Trusts, Loomis Sayles Funds Trusts and Hansberger International Series, 0.0500% of the next $15 billion, 0.0400% of the next $30 billion and 0.0350% of such assets in excess of $60 billion, subject to an annual aggregate minimum fee for the Natixis Funds Trusts, Loomis Sayles Funds Trusts and Hansberger International Series of $10 million.
d. Sub-Transfer Agent Fees. NGAM Distribution has entered into agreements, which include servicing agreements, with financial intermediaries that provide recordkeeping, processing, shareholder communications and other services to customers of the intermediaries that hold positions in the Funds and has agreed to compensate the intermediaries for providing those services. Intermediaries transact with the Funds primarily through the use of omnibus accounts on behalf of their customers who hold positions in the Funds. These services would have been provided by the Funds’ transfer agent and other service providers if the shareholders’ accounts were maintained directly at the Funds’ transfer agent. Accordingly, the Funds have agreed to reimburse NGAM Distribution for all or a portion of the servicing fees paid to these intermediaries. The reimbursement amounts (sub-transfer agent fees) paid to NGAM Distribution are subject to a current per-account equivalent fee limit approved by the Funds’ Board, which is based on fees for similar services paid to the Funds’ transfer agent and other service providers. Class N shares do not bear such expenses.
83 |
Notes to Financial Statements (continued)
September 30, 2014
For the year ended September 30, 2014, the sub-transfer agent fees (which are reflected in transfer agent fees and expenses in the Statements of Operations) for each Fund were as follows:
| | | | |
Fund | | Sub-Transfer
Agent Fees | |
Global Equity and Income Fund | | $ | 905,750 | |
Growth Fund | | | 701,402 | |
Value Fund | | | 2,457,876 | |
As of September 30, 2014, the Funds owe NGAM Distribution the following reimbursements for sub-transfer agent fees (which are reflected in the Statements of Assets and Liabilities as payable to distributor):
| | | | |
Fund | | Reimbursements
of Sub-Transfer
Agent Fees | |
Global Equity and Income Fund | | $ | 11,180 | |
Growth Fund | | | 10,104 | |
Value Fund | | | 31,043 | |
Sub-transfer agent fees attributable to Class A, Class B, Class C, Class Y, and Admin Class are allocated on a pro rata basis to each class based on the relative net assets of each class to the total net assets of those classes.
e. Commissions. Commissions (including CDSCs) on Fund shares retained by NGAM Distribution during the year ended September 30, 2014, were as follows:
| | | | |
Fund | | Commissions | |
Global Equity and Income Fund | | $ | 568,871 | |
Growth Fund | | | 123,483 | |
Value Fund | | | 104,049 | |
f. Trustees Fees and Expenses. The Trust does not pay any compensation directly to its officers or Trustees who are directors, officers or employees of NGAM Advisors, NGAM Distribution, Natixis US or their affiliates. Effective January 1, 2014, the Chairperson of the Board receives a retainer fee at the annual rate of $300,000. The Chairperson does not receive any meeting attendance fees for Board of Trustees meetings or committee meetings that she attends. Each Independent Trustee (other than the Chairperson) receives, in the aggregate, a retainer fee at the annual rate of $130,000. Each Independent Trustee also receives a meeting attendance fee of $10,000 for each meeting of the Board of Trustees that he or she attends in person and $5,000 for each meeting of the Board of Trustees that he or she attends telephonically. In addition, each committee chairperson (except for the Chairperson of the Governance Committee) receives an additional retainer fee at an annual rate of $17,500. Each
| 84
Notes to Financial Statements (continued)
September 30, 2014
Contract Review Committee member is compensated $6,000 for each Committee meeting that he or she attends in person and $3,000 for each meeting that he or she attends telephonically. Each Audit Committee member is compensated $6,000 for each Committee meeting that he or she attends in person and $3,000 for each meeting that he or she attends telephonically. These fees are allocated among the funds in the Natixis Funds Trusts, Loomis Sayles Funds Trusts and Hansberger International Series based on a formula that takes into account, among other factors, the relative net assets of each Fund. Trustees are reimbursed for travel expenses in connection with attendance at meetings.
Prior to January 1, 2014, the Chairperson of the Board received a retainer fee at the annual rate of $285,000 and each Independent Trustee (other than the Chairperson) received, in the aggregate, a retainer fee at the annual rate of $115,000. All other Trustee fees remained unchanged.
A deferred compensation plan (the “Plan”) is available to the Trustees on a voluntary basis. Deferred amounts remain in the Funds until distributed in accordance with the provisions of the Plan. The value of a participating Trustee’s deferral account is based on theoretical investments of deferred amounts, on the normal payment dates, in certain funds of the Natixis Funds Trusts, Loomis Sayles Funds Trusts and Hansberger International Series as designated by the participating Trustees. Changes in the value of participants’ deferral accounts are allocated pro rata among the funds in the Natixis Funds Trusts, Loomis Sayles Funds Trusts, and Hansberger International Series, and are normally reflected as Trustees’ fees and expenses in the Statements of Operations. The portions of the accrued obligations allocated to the Funds under the Plan are reflected as Deferred Trustees’ fees on the Statements of Assets and Liabilities.
g. Affiliated Ownership. As of September 30, 2014, Loomis Sayles Funded Pension Plan and Trust (“Pension Plan”) and Loomis Sayles Employees’ Profit Sharing Retirement Plan (“Retirement Plan”) held shares of the Funds representing the following percentages of net assets:
| | | | | | | | | | | | |
Fund | | Pension
Plan | | | Retirement
Plan | | | Total | |
Global Equity and Income Fund | | | 1.53 | % | | | 1.13 | % | | | 2.66 | % |
Growth Fund | | | 1.20 | % | | | 2.21 | % | | | 3.41 | % |
Value Fund | | | 0.71 | % | | | 1.13 | % | | | 1.84 | % |
Additionally, as of September 30, 2014, NGAM Advisors held shares of Growth Fund representing less than 1% of the Fund’s net assets.
Investment activities of affiliated shareholders could have material impacts on the Funds.
h. Reimbursement of Transfer Agent Fees and Expenses. Effective July 1, 2014, NGAM Advisors has given a binding contractual undertaking to the Growth Fund to reimburse
85 |
Notes to Financial Statements (continued)
September 30, 2014
any and all transfer agency expenses for the Fund’s Class N shares. This undertaking is in effect through January 31, 2016 and is not subject to recovery under the expense limitation agreement described above.
For the period July 1, 2014 to September 30, 2014, NGAM Advisors reimbursed the Fund $16 for transfer agency expenses related to Class N shares.
7. Class-Specific Transfer Agent Fees and Expenses. For the year ended September 30, 2014, the Funds incurred the following class-specific transfer agent fees and expenses (including sub-transfer agent fees, where applicable):
| | | | | | | | | | | | | | | | | | | | | | | | |
| | | Transfer Agent Fees and Expenses | |
Fund | | Class A | | | Class B | | | Class C | | | Class N | | | Class Y | | | Admin
Class | |
Growth Fund | | $ | 60,221 | | | $ | 807 | | | $ | 26,713 | | | $ | 36 | | | $ | 711,966 | | | $ | — | |
Value Fund | | | 558,010 | | | | 1,266 | | | | 23,414 | | | | 224 | | | | 1,978,877 | | | | 158 | |
Transfer agent fees and expenses attributable to Class A, Class B, Class C, Class Y and Admin Class are allocated on a pro rata basis to each class based on the relative net assets of each class to the total net assets of those classes. Transfer agent fees and expenses attributable to Class N are allocated to Class N.
The Global Equity and Income Fund allocates transfer agent fees and expenses on a pro rata basis based on the relative net assets of each class to the total net assets of those classes.
8. Line of Credit. Each Fund, together with certain other funds of Natixis Funds Trusts, Loomis Sayles Funds Trusts and Hansberger International Series, participates in a $200,000,000 committed unsecured line of credit provided by State Street Bank, with an individual limit of $125,000,000 for each Fund that participates in the line of credit. Interest is charged to each participating Fund based on its borrowings at a rate per annum equal to the greater of the Federal Funds rate or overnight LIBOR, plus 1.25%. In addition, a commitment fee of 0.10% per annum, payable at the end of each calendar quarter, is accrued and apportioned among the participating funds based on their average daily unused portion of the line of credit.
For the year ended September 30, 2014, none of the Funds had borrowings under this agreement.
9. Brokerage Commission Recapture. Each Fund has entered into agreements with certain brokers whereby the brokers will rebate a portion of brokerage commissions. All amounts rebated by the brokers are returned to the Funds under such agreements and
| 86
Notes to Financial Statements (continued)
September 30, 2014
are included in realized gains on investments on the Statements of Operations. For the year ended September 30, 2014, amounts rebated under these agreements were as follows:
| | | | |
Fund | | Rebates | |
Global Equity and Income Fund | | $ | 32,791 | |
Growth Fund | | | 14,529 | |
Value Fund | | | 88,226 | |
10. Concentration of Risk. Each Fund’s investments in foreign securities are subject to foreign currency fluctuations, higher volatility than U.S. securities, varying degrees of regulation and limited liquidity. Greater political, economic, credit and information risks are also associated with foreign securities.
11. Concentration of Ownership. From time to time, a fund may have a concentration of one or more accounts constituting a significant percentage of shares outstanding. Investment activities by holders of such accounts could have material impacts on the Funds. As of September 30, 2014, based on management’s evaluation of the shareholder account base, the Funds had accounts representing controlling ownership of more than 5% of the Fund’s total outstanding shares. The number of such accounts, based on accounts that represent more than 5% of an individual class of shares, and the aggregate percentage of net assets represented by such holdings were as follows:
| | | | | | | | | | | | | | | | |
Fund | | Number of 5%
Non-Affiliated
Account Holders | | | Percentage of Non-Affiliated
Ownership | | | Percentage of
Affiliated Ownership (Note 6) | | | Total Percentage of
Ownership | |
Global Equity and
Income Fund | | | — | | | | — | | | | 2.66 | % | | | 2.66 | % |
Growth Fund | | | 2 | | | | 54.05 | % | | | 3.41 | % | | | 57.46 | % |
Value Fund | | | 3 | | | | 39.13 | % | | | 1.84 | % | | | 40.97 | % |
Omnibus shareholder accounts for which NGAM Advisors understands that the intermediary has discretion over the underlying shareholder accounts or investment models where a shareholder account may be invested for a non-discretionary customer are included in the table above. For other omnibus accounts, the Funds do not have information on the individual shareholder accounts underlying omnibus accounts; therefore, there could be other 5% shareholders in addition to those disclosed in the table above.
87 |
Notes to Financial Statements (continued)
September 30, 2014
12. Capital Shares. Each Fund may issue an unlimited number of shares of beneficial interest, without par value. Transactions in capital shares were as follows:
| | | | | | | | | | | | | | | | |
| |
| Year Ended
September 30, 2014 |
| |
| Year Ended
September 30, 2013 |
|
Global Equity and Income Fund | | | Shares | | | | Amount | | | | Shares | | | | Amount | |
| Class A | | | | | | | | | | | | | | | | |
Issued from the sale of shares | | | 4,685,713 | | | $ | 90,264,674 | | | | 6,403,257 | | | $ | 112,444,744 | |
Issued in connection with the reinvestment of distributions | | | 320,675 | | | | 6,115,265 | | | | 158,735 | | | | 2,698,497 | |
Redeemed | | | (6,534,023 | ) | | | (128,000,618 | ) | | | (5,705,750 | ) | | | (101,062,656 | ) |
| | | | | | | | | | | | | | | | |
Net change | | | (1,527,635 | ) | | $ | (31,620,679 | ) | | | 856,242 | | | $ | 14,080,585 | |
| | | | | | | | | | | | | | | | |
| Class C | | | | | | | | | | | | | | | | |
Issued from the sale of shares | | | 4,201,270 | | | $ | 80,327,199 | | | | 6,477,950 | | | $ | 112,781,235 | |
Issued in connection with the reinvestment of distributions | | | 215,331 | | | | 4,076,209 | | | | 79,749 | | | | 1,347,760 | |
Redeemed | | | (3,650,704 | ) | | | (70,124,476 | ) | | | (2,880,607 | ) | | | (50,645,807 | ) |
| | | | | | | | | | | | | | | | |
Net change | | | 765,897 | | | $ | 14,278,932 | | | | 3,677,092 | | | $ | 63,483,188 | |
| | | | | | | | | | | | | | | | |
| Class Y | | | | | | | | | | | | | | | | |
Issued from the sale of shares | | | 9,211,425 | | | $ | 180,672,006 | | | | 13,693,457 | | | $ | 242,081,042 | |
Issued in connection with the reinvestment of distributions | | | 680,676 | | | | 13,034,936 | | | | 372,584 | | | | 6,360,002 | |
Redeemed | | | (8,613,247 | ) | | | (167,198,779 | ) | | | (10,334,286 | ) | | | (184,305,730 | ) |
| | | | | | | | | | | | | | | | |
Net change | | | 1,278,854 | | | $ | 26,508,163 | | | | 3,731,755 | | | $ | 64,135,314 | |
| | | | | | | | | | | | | | | | |
Increase (decrease) from capital share transactions | | | 517,116 | | | $ | 9,166,416 | | | | 8,265,089 | | | $ | 141,699,087 | |
| | | | | | | | | | | | | | | | |
| 88
Notes to Financial Statements (continued)
September 30, 2014
12. Capital Shares (continued).
| | | | | | | | | | | | | | | | |
| |
| Year Ended
September 30, 2014 |
| |
| Year Ended
September 30, 2013* |
|
Growth Fund | | | Shares | | | | Amount | | | | Shares | | | | Amount | |
| Class A | | | | | | | | | | | | | | | | |
Issued from the sale of shares | | | 3,007,220 | | | $ | 27,233,233 | | | | 2,079,530 | | | $ | 15,522,796 | |
Issued in connection with the reinvestment of distributions | | | 6,400 | | | | 55,872 | | | | 42,088 | | | | 279,039 | |
Redeemed | | | (2,503,981 | ) | | | (22,914,837 | ) | | | (1,072,705 | ) | | | (7,766,746 | ) |
| | | | | | | | | | | | | | | | |
Net change | | | 509,639 | | | $ | 4,374,268 | | | | 1,048,913 | | | $ | 8,035,089 | |
| | | | | | | | | | | | | | | | |
| Class B | | | | | | | | | | | | | | | | |
Issued from the sale of shares | | | 2,541 | | | $ | 20,382 | | | | 5,381 | | | $ | 35,874 | |
Redeemed | | | (141,955 | ) | | | (1,161,919 | ) | | | (130,908 | ) | | | (871,942 | ) |
| | | | | | | | | | | | | | | | |
Net change | | | (139,414 | ) | | $ | (1,141,537 | ) | | | (125,527 | ) | | $ | (836,068 | ) |
| | | | | | | | | | | | | | | | |
| Class C | | | | | | | | | | | | | | | | |
Issued from the sale of shares | | | 1,212,100 | | | $ | 10,078,324 | | | | 1,396,477 | | | $ | 9,907,201 | |
Issued in connection with the reinvestment of distributions | | | — | | | | — | | | | 1,981 | | | | 12,359 | |
Redeemed | | | (571,652 | ) | | | (4,797,966 | ) | | | (366,836 | ) | | | (2,445,099 | ) |
| | | | | | | | | | | | | | | | |
Net change | | | 640,448 | | | $ | 5,280,358 | | | | 1,031,622 | | | $ | 7,474,461 | |
| | | | | | | | | | | | | | | | |
| Class N | | | | | | | | | | | | | | | | |
Issued from the sale of shares | | | 0 | ** | | $ | 1 | | | | 132 | | | $ | 1,000 | |
Issued in connection with the reinvestment of distributions | | | 0 | ** | | | 3 | | | | — | | | | — | |
Redeemed | | | — | | | | — | | | | — | | | | — | |
| | | | | | | | | | | | | | | | |
Net change | | | 0 | ** | | $ | 4 | | | | 132 | | | $ | 1,000 | |
| | | | | | | | | | | | | | | | |
| Class Y | | | | | | | | | | | | | | | | |
Issued from the sale of shares | | | 49,660,184 | | | $ | 483,150,619 | | | | 51,555,859 | | | $ | 422,574,020 | |
Issued in connection with the reinvestment of distributions | | | 174,623 | | | | 1,617,014 | | | | 142,021 | | | | 998,409 | |
Redeemed | | | (13,014,287 | ) | | | (124,084,003 | ) | | | (3,414,873 | ) | | | (27,120,607 | ) |
| | | | | | | | | | | | | | | | |
Net change | | | 36,820,520 | | | $ | 360,683,630 | | | | 48,283,007 | | | $ | 396,451,822 | |
| | | | | | | | | | | | | | | | |
Increase (decrease) from capital share transactions | | | 37,831,193 | | | $ | 369,196,723 | | | | 50,238,147 | | | $ | 411,126,304 | |
| | | | | | | | | | | | | | | | |
| * | From commencement of operations on February 1, 2013 through September 30, 2013 for Class N shares. |
| ** | Amount rounds to less than one share. |
89 |
Notes to Financial Statements (continued)
September 30, 2014
12. Capital Shares (continued).
| | | | | | | | | | | | | | | | |
| |
| Year Ended
September 30, 2014 |
| |
| Year Ended
September 30, 2013* |
|
Value Fund | | | Shares | | | | Amount | | | | Shares | | | | Amount | |
| Class A | | | | | | | | | | | | | | | | |
Issued from the sale of shares | | | 15,747,402 | | | $ | 429,600,872 | | | | 1,852,296 | | | $ | 43,861,390 | |
Issued in connection with the reinvestment of distributions | | | 579,679 | | | | 15,129,608 | | | | 80,241 | | | | 1,677,029 | |
Redeemed | | | (2,644,187 | ) | | | (72,446,851 | ) | | | (1,449,094 | ) | | | (33,882,046 | ) |
| | | | | | | | | | | | | | | | |
Net change | | | 13,682,894 | | | $ | 372,283,629 | | | | 483,443 | | | $ | 11,656,373 | |
| | | | | | | | | | | | | | | | |
| Class B | | | | | | | | | | | | | | | | |
Issued from the sale of shares | | | 1,447 | | | $ | 38,410 | | | | 5,265 | | | $ | 129,542 | |
Issued in connection with the reinvestment of distributions | | | 1,686 | | | | 44,736 | | | | 192 | | | | 4,059 | |
Redeemed | | | (24,118 | ) | | | (659,371 | ) | | | (34,307 | ) | | | (800,771 | ) |
| | | | | | | | | | | | | | | | |
Net change | | | (20,985 | ) | | $ | (576,225 | ) | | | (28,850 | ) | | $ | (667,170 | ) |
| | | | | | | | | | | | | | | | |
| Class C | | | | | | | | | | | | | | | | |
Issued from the sale of shares | | | 116,820 | | | $ | 3,134,859 | | | | 247,166 | | | $ | 5,937,119 | |
Issued in connection with the reinvestment of distributions | | | 21,199 | | | | 550,342 | | | | 1,685 | | | | 35,039 | |
Redeemed | | | (133,849 | ) | | | (3,668,131 | ) | | | (91,366 | ) | | | (2,113,440 | ) |
| | | | | | | | | | | | | | | | |
Net change | | | 4,170 | | | $ | 17,070 | | | | 157,485 | | | $ | 3,858,718 | |
| | | | | | | | | | | | | | | | |
| Class N | | | | | | | | | | | | | | | | |
Issued from the sale of shares | | | 4,027,342 | | | $ | 109,873,134 | | | | 10,454,022 | | | $ | 258,496,210 | |
Issued in connection with the reinvestment of distributions | | | 680,270 | | | | 17,775,466 | | | | — | | | | — | |
Redeemed | | | (1,123,644 | ) | | | (30,658,707 | ) | | | (294,410 | ) | | | (7,559,202 | ) |
| | | | | | | | | | | | | | | | |
Net change | | | 3,583,968 | | | $ | 96,989,893 | | | | 10,159,612 | | | $ | 250,937,008 | |
| | | | | | | | | | | | | | | | |
| Class Y | | | | | | | | | | | | | | | | |
Issued from the sale of shares | | | 9,269,260 | | | $ | 253,687,659 | | | | 19,403,642 | | | $ | 451,188,543 | |
Issued in connection with the reinvestment of distributions | | | 3,181,533 | | | | 83,197,088 | | | | 927,685 | | | | 19,397,907 | |
Redeemed | | | (25,850,524 | ) | | | (708,914,565 | ) | | | (20,622,336 | ) | | | (487,734,421 | ) |
| | | | | | | | | | | | | | | | |
Net change | | | (13,399,731 | ) | | $ | (372,029,818 | ) | | | (291,009 | ) | | $ | (17,147,971 | ) |
| | | | | | | | | | | | | | | | |
| Admin Class | | | | | | | | | | | | | | | | |
Issued from the sale of shares | | | 10,291 | | | $ | 280,894 | | | | 420 | | | $ | 10,224 | |
Issued in connection with the reinvestment of distributions | | | 4 | | | | 96 | | | | 1 | | | | 14 | |
Redeemed | | | (1,317 | ) | | | (36,879 | ) | | | (51 | ) | | | (1,394 | ) |
| | | | | | | | | | | | | | | | |
Net change | | | 8,978 | | | $ | 244,111 | | | | 370 | | | $ | 8,844 | |
| | | | | | | | | | | | | | | | |
Increase (decrease) from capital share transactions | | | 3,859,294 | | | $ | 96,928,660 | | | | 10,481,051 | | | $ | 248,645,802 | |
| | | | | | | | | | | | | | | | |
| * | From commencement of operations on February 1, 2013 through September 30, 2013 for Class N shares. |
| 90
Report of Independent Registered Public Accounting Firm
To the Trustees of Loomis Sayles Funds II and Shareholders of Loomis Sayles Global Equity and Income Fund, Loomis Sayles Growth Fund and Loomis Sayles Value Fund:
In our opinion, the accompanying statements of assets and liabilities, including the portfolios of investments, and the related statements of operations and of changes in net assets and the financial highlights present fairly, in all material respects, the financial position of the Loomis Sayles Global Equity and Income Fund, Loomis Sayles Growth Fund and Loomis Sayles Value Fund, each a series of Loomis Sayles Funds II (collectively, the “Funds”), at September 30, 2014, and the results of each of their operations, the changes in each of their net assets and the financial highlights for each of the periods indicated, in conformity with accounting principles generally accepted in the United States of America. These financial statements and financial highlights (hereafter referred to as “financial statements”) are the responsibility of the Funds’ management. Our responsibility is to express an opinion on these financial statements based on our audits. We conducted our audits of these financial statements in accordance with the standards of the Public Company Accounting Oversight Board (United States). Those standards require that we plan and perform the audits to obtain reasonable assurance about whether the financial statements are free of material misstatement. An audit includes examining, on a test basis, evidence supporting the amounts and disclosures in the financial statements, assessing the accounting principles used and significant estimates made by management, and evaluating the overall financial statement presentation. We believe that our audits, which included confirmation of securities at September 30, 2014 by correspondence with the custodian and the application of alternative auditing procedures where securities purchased had not been received, provide a reasonable basis for the opinion expressed above.
PricewaterhouseCoopers LLP
Boston, Massachusetts
November 21, 2014
91 |
2014 U.S. Tax Distribution Information to Shareholders (Unaudited)
Corporate Dividends Received Deduction. For the fiscal year ended September 30, 2014, a percentage of dividends distributed by the Funds listed below qualify for the dividends received deduction for corporate shareholders. These percentages are as follows:
| | | | |
Fund | | Qualifying
Percentage | |
Global Equity and Income | | | 30.38 | % |
Growth | | | 100.00 | % |
Value | | | 91.34 | % |
Capital Gains Distributions. Pursuant to Internal Revenue Section 852(b), the following Funds paid distributions, which have been designated as capital gains distributions for the fiscal year ended September 30, 2014, unless subsequently determined to be different.
| | | | |
Fund | | Amount | |
Global Equity and Income | | $ | 11,468,716 | |
Value | | | 99,015,045 | |
Qualified Dividend Income. For the fiscal year ended September 30, 2014, the Funds below will designate up to the maximum amount allowable pursuant to the Internal Revenue Code as qualified dividend income eligible for reduced tax rates. These lower rates range from 0% to 20% depending on an individual’s tax bracket. If the Funds pay a distribution during calendar year 2014, complete information will be reported in conjunction with Form 1099-DIV.
| | |
Fund | | |
Global Equity and Income | | |
Growth | | |
Value | | |
| 92
Trustee and Officer Information
The tables below provide certain information regarding the trustees and officers of Loomis Sayles Funds II (the “Trust”). Unless otherwise indicated, the address of all persons below is 399 Boylston Street, Boston, MA 02116. The Funds’ Statement of Additional Information includes additional information about the trustees of the Trust and is available by calling Natixis Funds at 800-225-5478.
| | | | | | | | |
Name and Year of
Birth | | Position(s) Held
with the Trust,
Length of Time
Served and Term
of Office1 | | Principal
Occupation(s)
During Past
5 Years | | Number of
Portfolios in
Fund Complex
Overseen2 and Other
Directorships Held
During Past
5 Years | | Experience,
Qualifications,
Attributes, Skills
for Board
Membership |
| | | |
| INDEPENDENT TRUSTEES | | | | | | |
| | | | |
Kenneth A. Drucker (1945) | | Trustee since 2008 Chairman of the Audit Committee and Governance Committee Member | | Retired | | 42 None | | Significant experience on the Board and on the board of other business organizations (including at investment companies); executive experience (including as treasurer of an aerospace, automotive, and metal manufacturing corporation) |
| | | | |
| Edmond J. English (1953) | | Trustee since 2013 Contract Review Committee Member | | Chief Executive Officer of Bob’s Discount Furniture (retail) | | 42 Formerly, Director, BJ’s Wholesale Club (retail); formerly, Director, Citizens Financial Group (bank) | | Experience on the Board and significant experience on the board of other business organizations (including at a retail company and a bank); executive experience (including at a retail company) |
93 |
Trustee and Officer Information
| | | | | | | | |
Name and Year of
Birth | | Position(s) Held
with the Trust,
Length of Time
Served and Term
of Office1 | | Principal
Occupation(s)
During Past
5 Years | | Number of
Portfolios in
Fund Complex
Overseen2 and Other
Directorships Held
During Past
5 Years | | Experience,
Qualifications,
Attributes, Skills
for Board
Membership |
| | | |
INDEPENDENT TRUSTEES
(continued) | | | | | | |
| | | | |
Wendell J. Knox (1948) | | Trustee since 2009 Audit Committee Member and Governance Committee Member | | Director of Abt Associates Inc. (research and consulting) | | 42 Director, Eastern Bank (bank); Director, The Hanover Insurance Group (property and casualty insurance) | | Significant experience on the Board and on the board of other business organizations (including at a bank and at a property and casualty insurance firm); executive experience (including roles as president and chief executive officer of a research and consulting company) |
| | | | |
Martin T. Meehan
(1956) | | Trustee since 2012 Contract Review Committee Member | | Chancellor and faculty member, University of Massachusetts Lowell | | 42 None | | Experience on the Board and on the board of other business organizations; experience as Chancellor of the University of Massachusetts Lowell; government experience (including as a member of the U.S. House of Representatives); academic experience |
| 94
Trustee and Officer Information
| | | | | | | | |
Name and Year of
Birth | | Position(s) Held
with the Trust,
Length of Time
Served and Term
of Office1 | | Principal
Occupation(s)
During Past
5 Years | | Number of
Portfolios in
Fund Complex
Overseen2 and Other
Directorships Held
During Past
5 Years | | Experience,
Qualifications,
Attributes, Skills
for Board
Membership |
| | | |
INDEPENDENT TRUSTEES
(continued) | | | | | | |
| | | | |
Sandra O. Moose (1942) | | Chairperson of the Board of Trustees since November 2005 Trustee since 2003 Ex Officio member of the Audit Committee, the Contract Review Committee and the Governance Committee | | President, Strategic Advisory Services (management consulting) | | 42 Director, AES Corporation (international power company); formerly, Director, Rohm and Haas Company (specialty chemicals); formerly, Director, Verizon Communications (telecommunications company) | | Significant experience on the Board and on the board of other business organizations (including at a telecommunications company, an international power company and a specialty chemicals corporation); executive experience (including at a management consulting company) |
| | | | |
Erik R. Sirri (1958) | | Trustee since 2009 Audit Committee Member | | Professor of Finance at Babson College | | 42 None | | Significant experience on the Board; experience as Director of the Division of Trading and Markets at the Securities and Exchange Commission; academic experience; training as an economist |
| | | | |
Peter J. Smail (1952) | | Trustee since 2009 Chairman of the Contract Review Committee and Governance Committee Member | | Retired | | 42 None | | Significant experience on the Board; mutual fund industry and executive experience (including roles as president and chief executive officer for an investment adviser) |
95 |
Trustee and Officer Information
| | | | | | | | |
Name and Year of
Birth | | Position(s) Held
with the Trust,
Length of Time
Served and Term
of Office1 | | Principal
Occupation(s)
During Past
5 Years | | Number of
Portfolios in
Fund Complex
Overseen2 and Other
Directorships Held
During Past
5 Years | | Experience,
Qualifications,
Attributes, Skills
for Board
Membership |
| | | |
INDEPENDENT TRUSTEES
(continued) | | | | | | |
| | | | |
Cynthia L. Walker (1956) | | Trustee since 2005 Chairperson of the Governance Committee and Contract Review Committee Member | | Deputy Dean for Finance and Administration, Yale University School of Medicine | | 42 None | | Significant experience on the Board; executive experience in a variety of academic organizations (including roles as dean for finance and administration) |
| | | |
| INTERESTED TRUSTEES | | | | | | |
| | | | |
Robert J. Blanding3 (1947) 555 California Street San Francisco, CA 94104 | | Trustee since 2002 Chief Executive Officer since 2002 | | Chairman, Director and Chief Executive Officer (formerly, President), Loomis, Sayles & Company, L.P. | | 42 None | | Significant experience on the Board; continuing service as Chairman and Chief Executive Officer of Loomis, Sayles & Company, L.P. |
| | | | |
| David L. Giunta4 (1965) | | Trustee since 2011 President since 2008 | | President and Chief Executive Officer, NGAM Distribution Corporation, NGAM Advisors, L.P. and NGAM Distribution, L.P. | | 42 None | | Experience on the Board; continuing experience as President and Chief Executive Officer of NGAM Advisors, L.P. |
| 96
Trustee and Officer Information
| | | | | | | | |
Name and Year of
Birth | | Position(s) Held
with the Trust,
Length of Time
Served and Term
of Office1 | | Principal
Occupation(s)
During Past
5 Years | | Number of
Portfolios in
Fund Complex
Overseen2 and Other
Directorships Held
During Past
5 Years | | Experience,
Qualifications,
Attributes, Skills
for Board
Membership |
| | | |
INTERESTED TRUSTEES (continued) | | | | | | |
| | | | |
John T. Hailer5 (1960) | | Trustee since 2003 | | President and Chief Executive Officer – U.S. and Asia, Natixis Global Asset Management, L.P. | | 42 None | | Significant experience on the Board; continuing experience as President and Chief Executive Officer – U.S. and Asia, Natixis Global Asset Management, L.P. |
| 1 | Each trustee serves until retirement, resignation or removal from the Board. The current retirement age is 75. The position of Chairperson of the Board is appointed for a three-year term. Ms. Moose was appointed to serve an additional three-year term as the Chairperson of the Board on December 13, 2013. |
| 2 | The trustees of the Trust serve as trustees of a fund complex that includes all series of the Natixis Funds Trust I, Natixis Funds Trust II, Natixis Funds Trust IV and Gateway Trust (collectively, the “Natixis Funds Trusts”), Loomis Sayles Funds I and Loomis Sayles Funds II (collectively, the “Loomis Sayles Funds Trusts”). |
| 3 | Mr. Blanding is deemed an “interested person” of the Trust because he holds the following positions with an affiliated person of the Trust: Chairman, Director and Chief Executive Officer of Loomis, Sayles & Company, L.P. and Director of Loomis Sayles Investment Asia Pte., Ltd. |
| 4 | Mr. Giunta is deemed an “interested person” of the Trust because he holds the following positions with an affiliated person of the Trust: President and Chief Executive Officer of NGAM Distribution Corporation, NGAM Advisors, L.P. and NGAM Distribution, L.P. |
| 5 | Mr. Hailer is deemed an “interested person” of the Trust because he holds the following positions with an affiliated person of the Trust: President and Chief Executive Officer – U.S. and Asia, Natixis Global Asset Management, L.P. |
97 |
Trustee and Officer Information
| | | | | | |
Name and Year of Birth | | Position(s) Held
with the Trust | | Term of Office1 and
Length of Time Served | | Principal Occupation(s)
During Past 5 Years2 |
|
| OFFICERS OF THE TRUST |
| | | |
Coleen Downs Dinneen (1960) | | Secretary, Clerk and Chief Legal Officer | | Since September 2004 | | Executive Vice President, General Counsel, Secretary and Clerk, NGAM Distribution Corporation, NGAM Advisors, L.P. and NGAM Distribution, L.P. |
| | | |
Daniel J. Fuss (1933) One Financial Center Boston, MA 02111 | | Executive Vice President | | Since June 2003 | | Vice Chairman and Director, Loomis, Sayles & Company, L.P. |
| | | |
Russell L. Kane (1969) | | Chief Compliance Officer, Assistant Secretary and Anti-Money Laundering Officer | | Chief Compliance Officer since May 2006; Assistant Secretary since June 2004; and Anti-Money Laundering Officer since April 2007 | | Chief Compliance Officer for Mutual Funds, Senior Vice President, Deputy General Counsel, Assistant Secretary and Assistant Clerk, NGAM Distribution Corporation, NGAM Advisors, L.P. and NGAM Distribution, L.P. |
| | | |
Michael C. Kardok (1959) | | Treasurer, Principal Financial and Accounting Officer | | Since October 2004 | | Senior Vice President, NGAM Advisors, L.P. and NGAM Distribution, L.P. |
| 1 | Each officer of the Trust serves for an indefinite term in accordance with the Trust’s current by-laws until the date his or her successor is elected and qualified, or until he or she sooner dies, retires, is removed or becomes disqualified. |
| 2 | Each person listed above, except as noted, holds the same position(s) with the Fund Complex. Mr. Fuss is not an officer of the Natixis Funds Trusts. Previous positions during the past five years with NGAM Distribution, L.P., NGAM Advisors, L.P. or Loomis, Sayles & Company, L.P. are omitted, if not materially different from a trustee’s or officer’s current position with such entity. |
| 98

Loomis Sayles Small Cap Growth Fund
Loomis Sayles Small Cap Value Fund
Annual Report
September 30, 2014
LOOMIS SAYLES SMALL CAP GROWTH FUND
| | | | |
| Managers | | Symbols | | |
| Mark F. Burns, CFA® | | Institutional Class | | LSSIX |
| John J. Slavik, CFA® | | Retail Class | | LCGRX |
| | Class N | | LSSNX |
Objective
Long-term capital growth from investments in common stocks or other equity securities
Market Conditions
Equity markets were generally positive for the one-year period ended September 30, 2014. Nevertheless, there was divergence among returns, with large-cap stocks leading the way in the United States. After a strong 2013, during which valuations trended higher, small-cap companies began to give back those returns in 2014. The small-cap market saw a quick yet significant rotation out of growth and into value for a portion of the period, creating headwinds for many small-cap growth managers.
Performance Results
For the 12 months ended September 30, 2014, Institutional Class shares of Loomis Sayles Small Cap Growth Fund returned -1.31%. The Fund underperformed its benchmark, the Russell 2000® Growth Index, which returned 3.79%.
Explanation of Fund Performance
The majority of the Fund’s relative underperformance can be attributed to stock selection. Our investments in the information technology, healthcare and energy sectors detracted the most from relative performance. Stock selection in the consumer staples and industrials sectors contributed positively to relative performance.
Tile Shop Holdings, a specialty retailer of manufactured and natural stone, was the Fund’s most significant performance detractor. The company’s shares declined following negative news reports surrounding independent lab test results on Tile Shop’s products, and ineffective senior management compounded the problem. These factors prompted us to sell the Fund’s position. A position in 8X8, a provider of Voice over Internet Protocol (VoIP), also detracted from performance. Despite reporting positive results, the company announced plans to make strategic investments in its business, which ultimately pressured margins and triggered negative investor reaction. Our investment in Noodles & Co., a casual restaurant chain, also had an impact on fund performance. We exited the position as shares declined following disappointing earnings results driven by sales weakness in the Mid-Atlantic region and an increasingly negative macroeconomic outlook for middle-income families.
1 |
A position in Spirit Airlines, a low-fare airline, was among the Fund’s top contributors. The company reported strong results during the year driven by increasing traffic and capacity, along with expanded routes. XPO Logistics was also a top-performing stock. The logistics company reported robust results due to better-than-expected organic growth from its freight brokerage business. XPO also announced attractive acquisitions during the year. Another top contributor was Measurement Specialties, a developer and manufacturer of sensors. The company announced it would be acquired by TE Connectivity at an attractive premium.
Outlook
We believe volatility in the small-cap market may persist into early next year. Although small-cap valuations have trended toward more normal levels relative to large-cap companies, investors remain cautious, pending the upcoming earnings season. In this environment, we want to continue to focus on differentiated growth companies that are executing to plan fundamentally, and that have been mispriced in the marketplace. We have uncovered stocks that fit this description that we believe will reward the portfolio and are confident that our process will enable us to continue discovering these types of opportunities.
| 2
LOOMIS SAYLES SMALL CAP GROWTH FUND
Cumulative Performance — September 30, 2004 through September 30, 2014(b)(c)
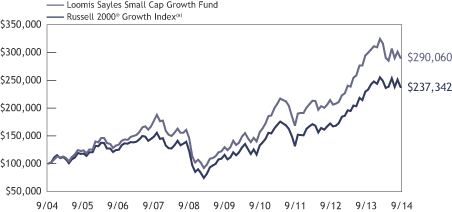
Average Annual Total Returns — September 30, 2014(b)
| | | | | | | | | | | | | | | | |
| | | | | |
| | | 1 Year | | | 5 Years | | | 10 Years | | | Life of
Class N | |
| | | | | |
| Institutional Class (Inception 12/31/96) | | | -1.31 | % | | | 17.56 | % | | | 11.24 | % | | | — | % |
| Retail Class (Inception 12/31/96) | | | -1.58 | | | | 17.24 | | | | 10.96 | | | | — | |
| Class N (Inception 2/1/13) | | | -1.27 | | | | — | | | | — | | | | 16.42 | |
| | | | | |
| Comparative Performance | | | | | | | | | | | | | | | | |
| Russell 2000® Growth Index(a) | | | 3.79 | | | | 15.51 | | | | 9.03 | | | | 15.96 | |
Past performance does not guarantee future results. The table(s) do not reflect taxes shareholders might owe on any Fund distributions or when they redeem their shares. Performance for periods less than one year is cumulative, not annualized. Returns reflect changes in share price and reinvestment of dividends and capital gains, if any. Unlike a fund, an index is not managed and does not reflect fees and expenses.
| (a) | | See page 7 for a description of the index. |
| (b) | | Fund performance has been increased by fee waivers and/or expense reimbursements, if any, without which performance would have been lower. |
| (c) | | The mountain chart is based on the initial minimum of $100,000 for the Institutional Class. |
3 |
LOOMIS SAYLES SMALL CAP VALUE FUND
| | | | |
| Managers | | Symbols | | |
| Joseph R. Gatz, CFA® | | Institutional Class | | LSSCX |
| Jeffrey Schwartz, CFA® | | Retail Class | | LSCRX |
| | Admin Class | | LSVAX |
| | Class N | | LSCNX |
Objective
Long-term capital growth from investments in common stocks or other equity securities
Market Conditions
Equity markets began the fiscal year with gains broadly distributed across investment styles, market capitalization ranges and economic sectors, capping off a strong calendar 2013. Markets retrenched to begin calendar year 2014, mostly due to the Federal Reserve’s (the Fed’s) decision to taper its monthly securities purchases over the course of 2014. The subsequent recovery in stock prices resulted in most large- and small-cap indices reaching new all-time highs. Restored confidence in monetary conditions, low real interest rates and the lack of significant inflation pressures continued to support most financial assets. Markets ended the fiscal year on a weaker note, reflecting concerns about geopolitical events and global economic growth.
Distinct trends between large- and small-cap stocks and growth and value stocks emerged during 2014. These crosscurrents reflected investors’ changing risk postures, which were driven by concerns about the U.S. economy and geopolitical fears. Against this backdrop, large-cap stocks gained 19.01% (as measured by the Russell 1000® Index), outperforming mid- and small-cap stocks, which returned 15.83% and 3.93%, respectively (as measured by the Russell Midcap® Index and Russell 2000® Index). With the exception of large-cap stocks, value stocks outperformed growth stocks.
Performance Results
For the 12 months ended September 30, 2014, Institutional Class shares of Loomis Sayles Small Cap Value Fund returned 6.17% at net asset value. The Fund outperformed its benchmark, the Russell 2000® Value Index, which returned 4.13%.
Explanation of Fund Performance
Stock selection was a strong contributor to Fund performance, particularly in the consumer discretionary, industrials and materials sectors. Top individual contributors included Avis Budget Group, Old Dominion Freight Line and Liberty Ventures. Rental car company Avis Budget Group continued to show solid earnings growth. The company’s stock price increased more than 90% during the 12-month period, as consolidation within the car rental industry relieved pricing pressure. Old Dominion Freight Lines, a provider of “less-than-truck-load” services on a regional, inter-regional and long-haul basis in the United States, continued to report solid growth. The company’s growth and terminal
| 4
LOOMIS SAYLES SMALL CAP VALUE FUND
expansion allowed Old Dominion to capture market share through better on-time delivery and lower claim rates than its competitors. Based on the stock’s strong performance, we have been reducing our position since the beginning of 2014. Liberty Ventures, a tracking stock of Liberty Interactive whose main assets include public and private investments in a variety of e-commerce, media, and other businesses, also performed well. The stock’s strength was partly due to the entity’s spinoff of its holdings in TripAdvisor into a new security, which simplified the valuation of the parent company, along with a narrowing of the stock’s prior discount to its net asset value.
Stock selection in the consumer staples and healthcare sectors detracted from Fund performance. Employers Holdings, Post Holdings and TriMas Corporation were among the most significant detractors. Shares of Employers Holdings, a workers’ compensation insurance provider, declined on rising concerns regarding increased workers’ compensation claims. With the stock selling well-below book value and early signs of pricing improvement, we added to our position earlier in the year. Cereal and specialty food company, Post Holdings, reduced earnings expectations, which drove down its stock price. Weak food trends, coupled with poor initial results from the company’s recent food-related acquisitions outside of the cereal category, led to the earnings warning. Although these short-term results and the downturn in the stock were disappointing, we believe our assessment confirmed the merits of the company’s strategy, and we modestly increased exposure on the price weakness. Meanwhile, the stock price of TriMas, a diversified manufacturer, declined on revised earnings expectations. This “mini-conglomerate” has some strong businesses and some weak ones, but we believe the stock is valued below its true intrinsic value, and we continue to hold the shares.
Outlook
Signals continue to point to the Fed moving to raise the federal funds rate during the next year. If the Fed can engineer a measured increase in U.S. interest rates, we believe it is highly probable that rates will remain well within a band that allows businesses to function smoothly in the year ahead. We expect that a rate increase will not derail an economic recovery or materially hurt the equity market.
Dividends are on track to grow more than 10% this year compared to 2013, and we expect double-digit dividend growth next year as well. In addition to dividend growth, equity fundamentals remain firmly supported by share repurchases and a pickup in mergers and acquisitions. We anticipate earnings will continue to grow in the mid-to-upper single digits as the economic expansion continues. As a result, moderate stock price corrections could provide selective buying opportunities, just as they have during the better part of the past five years.
5 |
Cumulative Performance — September 30, 2004 through September 30, 2014(b)(c)
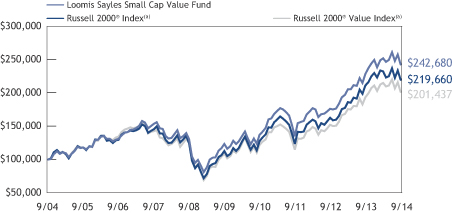
Average Annual Total Returns — September 30, 2014(b)
| | | | | | | | | | | | | | | | | | |
| | | | | | |
| | | | | 1 Year | | | 5 Years | | | 10 Years | | | Life of
Class N | |
| | | | | | |
| Institutional Class (Inception 5/13/91) | | | | | 6.17 | % | | | 14.49 | % | | | 9.27 | % | | | — | % |
| Retail Class (Inception 12/31/96) | | | | | 5.90 | | | | 14.20 | | | | 9.00 | | | | — | |
| Admin Class (Inception 1/2/98) | | | | | 5.63 | | | | 13.92 | | | | 8.72 | | | | — | |
| Class N (Inception 2/1/13) | | | | | 6.25 | | | | — | | | | — | | | | 13.83 | |
| | | | |
| Comparative Performance | | | | | | | | | | | | | |
| Russell 2000® Value Index(a) | | | | | 4.13 | | | | 13.02 | | | | 7.25 | | | | 11.49 | |
| Russell 2000® Index(a) | | | | | 3.93 | | | | 14.29 | | | | 8.19 | | | | 13.69 | |
Past performance does not guarantee future results. The table(s) do not reflect taxes shareholders might owe on any Fund distributions or when they redeem their shares. Performance for periods less than one year is cumulative, not annualized. Returns reflect changes in share price and reinvestment of dividends and capital gains, if any. Unlike a fund, an index is not managed and does not reflect fees and expenses.
| (a) | | See page 7 for a description of the index. |
| (b) | | Fund performance has been increased by fee waivers and/or expense reimbursements, if any, without which performance would have been lower. |
| (c) | | The mountain chart is based on the initial minimum of $100,000 for the Institutional Class. |
| 6
ADDITIONAL INFORMATION
The views expressed in this report reflect those of the portfolio managers as of the dates indicated. The managers’ views are subject to change at any time without notice based on changes in market or other conditions. References to specific securities or industries should not be regarded as investment advice. Because the fund is actively managed, there is no assurance that it will continue to invest in the securities or industries mentioned.
Index Definitions
Indices are unmanaged and do not have expenses that affect results, unlike mutual funds. Index returns are adjusted for the reinvestment of capital gain distributions and income dividends. It is not possible to invest directly in an index.
Russell 2000® Index is an unmanaged index that measures the performance of the small-cap segment of the U.S. equity universe.
Russell 2000® Growth Index is an unmanaged index that measures the performance of the small-cap growth segment of the U.S. equity universe. It includes those Russell 2000® companies with higher price-to-book ratios and higher forecasted growth values.
Russell 2000® Value Index is an unmanaged index that measures the performance of the small-cap value segment of the U.S. equity universe. It includes those Russell 2000® companies with lower price-to-book ratios and lower forecasted growth values.
Additional Index Information
This document may contain references to third party copyrights, indexes, and trademarks, each of which is the property of its respective owner. Such owner is not affiliated with Natixis Global Asset Management or any of its related or affiliated companies (collectively “NGAM”) and does not sponsor, endorse or participate in the provision of any NGAM services, funds or other financial products.
The index information contained herein is derived from third parties and is provided on an “as is” basis. The user of this information assumes the entire risk of use of this information. Each of the third party entities involved in compiling, computing or creating index information disclaims all warranties (including, without limitation, any warranties of originality, accuracy, completeness, timeliness, non-infringement, merchantability and fitness for a particular purpose) with respect to such information.
Proxy Voting Information
A description of the Funds’ proxy voting policies and procedures is available without charge, upon request, (i) by calling Loomis Sayles at 800-633-3330; (ii) on the Funds’ website, www.loomissayles.com, and (iii) on the Securities and Exchange Commission’s (“SEC’s”) website at www.sec.gov. Information about how the Funds voted proxies relating to portfolio securities during the 12 months ended June 30, 2014 is available on (i) the Funds’ website and (ii) the SEC’s website.
Quarterly Portfolio Schedules
The Funds file a complete schedule of portfolio holdings with the SEC for the first and third quarters of each fiscal year on Form N-Q. The Funds’ Forms N-Q are available on the SEC’s website at www.sec.gov and may be reviewed and copied at the SEC’s Public Reference Room in Washington, DC. Information on the operation of the Public Reference Room may be obtained by calling 800-SEC-0330.
7 |
UNDERSTANDING YOUR FUND’S EXPENSES
As a mutual fund shareholder you incur two types of costs: (1) transaction costs and (2) ongoing costs, including management fees, distribution and/or service fees (12b-1 fees), and other fund expenses. Certain exemptions may apply. These costs are described in more detail in the Funds’ prospectus. The following examples are intended to help you understand the ongoing costs of investing in the Funds and help you compare these with the ongoing costs of investing in other mutual funds.
The first line in the table of each fund shows the actual amount of Fund expenses you would have paid on a $1,000 investment in the Fund from April 1, 2014 through September 30, 2014. To estimate the expenses you paid over the period, simply divide your account value by $1,000 (for example $8,600 account value divided by $1,000 = 8.6) and multiply the result by the number in the Expenses Paid During Period column as shown below for your class.
The second line in the table of each Fund provides information about hypothetical account values and hypothetical expenses based on the Fund’s actual expense ratios and an assumed rate of return of 5% per year before expenses, which is not the Fund’s actual return. The hypothetical account values and expenses may not be used to estimate the actual ending account balance or expenses you paid on your investment for the period. You may use this information to compare the ongoing costs of investing in the Funds to other funds. To do so, compare this 5% hypothetical example with the 5% hypothetical examples that appear in the shareholder reports of other funds.
Please note that the expenses shown reflect ongoing costs only, and do not include any transaction costs. Therefore, the second line in the table is useful in comparing ongoing costs only, and will not help you determine the relative costs of owning different funds. If transaction costs were included, total costs would be higher.
Loomis Sayles Small Cap Growth Fund
| | | | | | | | | | |
| Institutional Class | | Beginning
Account Value
4/1/2014 | | | Ending
Account Value
9/30/2014 | | | Expenses Paid
During Period*
4/1/2014 – 9/30/2014 |
Actual | | | $1,000.00 | | | | $919.00 | | | $4.57 |
Hypothetical (5% return before expenses) | | | $1,000.00 | | | | $1,020.31 | | | $4.81 |
| | | |
Retail Class | | | | | | | | |
Actual | | | $1,000.00 | | | | $917.40 | | | $5.82 |
Hypothetical (5% return before expenses) | | | $1,000.00 | | | | $1,019.00 | | | $6.12 |
| | | |
Class N | | | | | | | | |
Actual | | | $1,000.00 | | | | $919.40 | | | $4.04 |
Hypothetical (5% return before expenses) | | | $1,000.00 | | | | $1,020.86 | | | $4.26 |
* Expenses are equal to the Fund's annualized expense ratio: 0.95%, 1.21% and 0.84% for Institutional Class, Retail Class and Class N, respectively, multiplied by the average account value over the period, multiplied by the number of days in the most recent fiscal half-year (183), divided by 365 (to reflect the half-year period). |
| 8
Loomis Sayles Small Cap Value Fund
| | | | | | | | | | | | |
Institutional Class | | Beginning
Account Value
4/1/2014 | | | Ending
Account Value
9/30/2014 | | | Expenses Paid
During Period*
4/1/2014 – 9/30/2014 | |
Actual | | | $1,000.00 | | | | $963.20 | | | | $4.43 | |
Hypothetical (5% return before expenses) | | | $1,000.00 | | | | $1,020.56 | | | | $4.56 | |
| | | |
Retail Class | | | | | | | | | |
Actual | | | $1,000.00 | | | | $962.00 | | | | $5.66 | |
Hypothetical (5% return before expenses) | | | $1,000.00 | | | | $1,019.30 | | | | $5.82 | |
| | | |
Admin Class | | | | | | | | | |
Actual | | | $1,000.00 | | | | $960.80 | | | | $6.88 | |
Hypothetical (5% return before expenses) | | | $1,000.00 | | | | $1,018.05 | | | | $7.08 | |
| | | |
Class N | | | | | | | | | |
Actual | | | $1,000.00 | | | | $963.50 | | | | $4.18 | |
Hypothetical (5% return before expenses) | | | $1,000.00 | | | | $1,020.81 | | | | $4.31 | |
* Expenses are equal to the Fund’s annualized expense ratio (after waiver/reimbursement): 0.90%, 1.15%, 1.40% and 0.85% for Institutional Class, Retail Class, Admin Class and Class N, respectively, multiplied by the average account value over the period, multiplied by the number of days in the most recent fiscal half-year (183), divided by 365 (to reflect the half-year period). | |
9 |
BOARD APPROVAL OF THE EXISTING ADVISORY AGREEMENTS
The Board of Trustees of the Trusts (the “Board”), including the Independent Trustees, considers matters bearing on each Fund’s advisory agreement (collectively, the “Agreements”) at most of its meetings throughout the year. Each year, usually in the spring, the Contract Review Committee of the Board meets to review the Agreements to determine whether to recommend that the full Board approve the continuation of the Agreements, typically for an additional one-year period. After the Committee has made its recommendation, the full Board, including the Independent Trustees, determines whether to approve the continuation of the Agreements.
In connection with these meetings, the Trustees receive materials that the Funds’ investment adviser (the “Adviser”) believes to be reasonably necessary for the Trustees to evaluate the Agreements. These materials generally include, among other items, (i) information on the investment performance of the Funds and the performance of peer groups and categories of funds and the Funds’ performance benchmarks, (ii) information on the Funds’ advisory fees and other expenses, including information comparing the Funds’ expenses to the fees charged to institutional accounts with similar strategies managed by the Adviser, if any, and to those of peer groups of funds and information about applicable expense caps and fee “breakpoints,” (iii) sales and redemption data in respect of the Funds, (iv) information about the profitability of the Agreements to the Adviser and (v) information obtained through the completion by the Adviser of a questionnaire distributed on behalf of the Trustees. The Board, including the Independent Trustees, also considers other matters such as (i) the Adviser’s financial results and/or financial condition, (ii) each Fund’s investment objective and strategies and the size, education and experience of the Adviser’s investment staff and its use of technology, external research and trading cost measurement tools, (iii) arrangements in respect of the distribution of the Funds’ shares and the related costs, (iv) the procedures employed to determine the value of the Funds’ assets, (v) the allocation of the Funds’ brokerage, if any, including, if applicable, allocations to brokers affiliated with the Adviser and the use of “soft” commission dollars to pay Fund expenses and to pay for research and other similar services, (vi) the resources devoted to, and the record of compliance with, the Funds’ investment policies and restrictions, policies on personal securities transactions and other compliance policies, (vii) information about amounts invested by the Funds’ portfolio managers in the Funds or in similar accounts that they manage and (viii) the general economic outlook with particular emphasis on the mutual fund industry. Throughout the process, the Trustees are afforded the opportunity to ask questions of and request additional materials from the Adviser.
In addition to the materials requested by the Trustees in connection with their annual consideration of the continuation of the Agreements, the Trustees receive materials in advance of each regular quarterly meeting of the Board that provide detailed information about the Funds’ investment performance and the fees charged to the Funds for advisory and other services. This information generally includes, among other things, an internal performance rating for each Fund based on agreed-upon criteria, graphs showing each
| 10
Fund’s performance and fee differentials against each Fund’s peer group/category, performance ratings provided by a third-party, total return information for various periods, and third-party performance rankings for various periods comparing a Fund against similarly categorized funds. The portfolio management team for each Fund or other representatives of the Adviser make periodic presentations to the Contract Review Committee and/or the full Board, and Funds identified as presenting possible performance concerns may be subject to more frequent board presentations and reviews. In addition, each quarter the Trustees are provided with detailed statistical information about each Fund’s portfolio. The Trustees also receive periodic updates between meetings.
The Board most recently approved the continuation of the Agreements at its meeting held in June 2014. The Agreements were continued for a one-year period for the Funds. In considering whether to approve the continuation of the Agreements, the Board, including the Independent Trustees, did not identify any single factor as determinative. Individual Trustees may have evaluated the information presented differently from one another, giving different weights to various factors. Matters considered by the Trustees, including the Independent Trustees, in connection with their approval of the Agreements included, but were not limited to, the factors listed below.
The nature, extent and quality of the services provided to the Funds under the Agreements. The Trustees considered the nature, extent and quality of the services provided by the Adviser and its affiliates to the Funds and the resources dedicated to the Funds by the Adviser and its affiliates.
The Trustees considered not only the advisory services provided by the Adviser to the Funds, but also the administrative services provided by NGAM Advisors, L.P. (“NGAM Advisors”) and its affiliates to the Funds. For each Fund, the Trustees also considered the benefits to shareholders of investing in a mutual fund that is part of a family of funds that offers shareholders the right to exchange shares of one type of fund for shares of another type of fund, and provides a variety of fund and shareholder services.
After reviewing these and related factors, the Trustees concluded, within the context of their overall conclusions regarding each of the Agreements, that the nature, extent and quality of services provided supported the renewal of the Agreements.
Investment performance of the Funds and the Adviser. As noted above, the Trustees received information about the performance of the Funds over various time periods, including information that compared the performance of the Funds to the performance of peer groups and categories of funds and the Funds’ respective performance benchmarks. In addition, the Trustees also reviewed data prepared by an independent third party that analyzed the performance of the Funds using a variety of performance metrics, including metrics that also measured the performance of the Funds on a risk adjusted basis. With respect to each Fund, the Board concluded that the Fund’s performance or other relevant factors supported the renewal of the Agreement relating to that Fund. In the case of the Loomis Sayles Small Cap Value Fund, the performance of which lagged that of a relevant peer group median and/or category median of funds for certain (although not necessarily all) periods, the Board concluded that other factors relevant to performance supported renewal of the relevant Agreement, including (1) that the underperformance was
11 |
attributable, to a significant extent, to investment decisions (such as security selection or sector allocation) by the Adviser that were reasonable and consistent with the Fund’s investment objective and policies; and (2) that the Fund’s performance was stronger over the long term.
The Trustees also considered the Adviser’s performance and reputation generally, the performance of the fund family generally, and the historical responsiveness of the Adviser to Trustee concerns about performance and the willingness of the Adviser to take steps intended to improve performance.
After reviewing these and related factors, the Trustees concluded, within the context of their overall conclusions regarding each of the Agreements, that the performance of the Funds and the Adviser supported the renewal of the Agreements.
The costs of the services to be provided and profits to be realized by the Adviser and its affiliates from their respective relationships with the Funds. The Trustees considered the fees charged to the Funds for advisory services as well as the total expense levels of the Funds. This information included comparisons (provided both by management and also by an independent third party) of the Funds’ advisory fees and total expense levels to those of their peer groups and information about the advisory fees charged by the Adviser to comparable accounts (such as institutional separate accounts), as well as information about differences in such fees and the reasons for any such differences. In considering the fees charged to comparable accounts, the Trustees considered, among other things, management’s representations about the differences between managing mutual funds as compared to other types of accounts, including the additional resources required to effectively manage mutual fund assets and the greater regulatory costs associated with the management of such assets. In evaluating each Fund’s advisory fee, the Trustees also took into account the demands, complexity and quality of the investment management of such Fund and the need for the Adviser to offer competitive compensation. The Trustees considered that over the past several years, management had made recommendations regarding reductions in advisory fee rates, implementation of advisory fee breakpoints and the institution of advisory fee waivers and expense caps for various funds in the fund family. They noted that the Funds in this report have expense caps in place, and they considered the amounts waived or reimbursed by the Adviser for the Loomis Sayles Small Cap Value Fund. The Loomis Sayles Small Cap Growth Fund’s current expenses are below the cap.
The Trustees also considered the compensation directly or indirectly received by the Adviser and its affiliates from their relationships with the Funds. The Trustees reviewed information provided by management as to the profitability of the Adviser and its affiliates’ relationships with the Funds, and information about the allocation of expenses used to calculate profitability. They also reviewed information provided by management about the effect of distribution costs and changes in asset levels on Adviser profitability, including information regarding resources spent on distribution activities. When reviewing profitability, the Trustees also considered information about court cases in which adviser compensation or profitability were issues, the performance of the relevant Funds, the
| 12
expense levels of the Funds, and whether the Adviser had implemented breakpoints and/or expense caps with respect to such Funds.
After reviewing these and related factors, the Trustees concluded, within the context of their overall conclusions regarding each of the Agreements, that the advisory fee charged to each of the Funds was fair and reasonable, and that the costs of these services generally and the related profitability of the Adviser and its affiliates in respect of their relationships with the Funds supported the renewal of the Agreements.
Economies of Scale. The Trustees considered the existence of any economies of scale in the provision of services by the Adviser and whether those economies are shared with the Funds through breakpoints in their investment advisory fees or other means, such as expense waivers or caps. The Trustees also discussed with management the factors considered with respect to the implementation of breakpoints in investment advisory fees or expense waivers or caps for certain funds. Management explained that a number of factors are taken into account in considering the implementation of breakpoints or an expense cap for a fund, including, among other things, factors such as a fund’s assets, the projected growth of a fund, projected profitability and a fund’s fees and performance. With respect to economies of scale, the Trustees noted that although neither Fund’s management fee was subject to breakpoints, each Fund’s management fee and overall net expense ratio was at or below the median fee for a peer group of funds and that each Fund was subject to an expense cap. In considering these issues, the Trustees also took note of the costs of the services provided (both on an absolute and a relative basis) and the profitability to the Adviser and its affiliates of their relationships with the Funds, as discussed above.
After reviewing these and related factors, the Trustees concluded, within the context of their overall conclusions regarding each of the Agreements, that the extent to which economies of scale were shared with the Funds supported the renewal of the Agreements.
The Trustees also considered other factors, which included but were not limited to the following:
| • | | the effect of recent market and economic events on the performance, asset levels and expense ratios of each Fund. |
| • | | whether each Fund has operated in accordance with its investment objective and the Fund’s record of compliance with its investment restrictions, and the compliance programs of the Funds and the Adviser. They also considered the compliance-related resources the Adviser and its affiliates were providing to the Funds. |
| • | | the nature, quality, cost and extent of administrative and shareholder services performed by the Adviser and its affiliates, both under the Agreements and under separate agreements covering administrative services. |
| • | | so-called “fallout benefits” to the Adviser, such as the engagement of affiliates of the Adviser to provide distribution, administrative and brokerage services to the Funds, and the benefits of research made available to the Adviser by reason of brokerage commissions (if any) generated by the Funds’ securities transactions. The Trustees also |
13 |
| | considered the benefits to the parent company of NGAM Advisors from the retention of the Adviser. The Trustees considered the possible conflicts of interest associated with these fallout and other benefits, and the reporting, disclosure and other processes in place to disclose and monitor such possible conflicts of interest. |
| • | | the Trustees’ review and discussion of the Funds’ advisory arrangements in prior years, and management’s record of responding to Trustee concerns raised during the year and in prior years. |
Based on their evaluation of all factors that they deemed to be material, including those factors described above, and assisted by the advice of independent counsel, the Trustees, including the Independent Trustees, concluded that each of the existing Agreements should be continued through June 30, 2015.
| 14
Portfolio of Investments – as of September 30, 2014
Loomis Sayles Small Cap Growth Fund
| | | | | | | | |
| Shares | | | Description | | Value (†) | |
|
| | Common Stocks – 98.2% of Net Assets | |
| | |
| | | | Aerospace & Defense – 0.8% | | | | |
| | 218,769 | | | Hexcel Corp.(b) | | $ | 8,685,129 | |
| | | | | | | | |
| | | | Air Freight & Logistics – 1.9% | | | | |
| | 518,158 | | | XPO Logistics, Inc.(b) | | | 19,519,012 | |
| | | | | | | | |
| | | | Airlines – 1.1% | | | | |
| | 159,990 | | | Spirit Airlines, Inc.(b) | | | 11,061,709 | |
| | | | | | | | |
| | | | Banks – 4.0% | | | | |
| | 377,904 | | | Bank of the Ozarks, Inc. | | | 11,911,534 | |
| | 659,771 | | | Boston Private Financial Holdings, Inc. | | | 8,174,563 | |
| | 265,226 | | | Pinnacle Financial Partners, Inc. | | | 9,574,659 | |
| | 399,707 | | | PrivateBancorp, Inc. | | | 11,955,236 | |
| | | | | | | | |
| | | | | | | 41,615,992 | |
| | | | | | | | |
| | | | Biotechnology – 7.1% | | | | |
| | 202,943 | | | Acceleron Pharma, Inc.(b) | | | 6,136,996 | |
| | 180,105 | | | Acorda Therapeutics, Inc.(b) | | | 6,101,958 | |
| | 408,061 | | | Anacor Pharmaceuticals, Inc.(b) | | | 9,985,253 | |
| | 292,258 | | | Chimerix, Inc.(b) | | | 8,072,166 | |
| | 448,541 | | | Emergent Biosolutions, Inc.(b) | | | 9,558,409 | |
| | 387,593 | | | Exact Sciences Corp.(b) | | | 7,511,552 | |
| | 523,252 | | | Neurocrine Biosciences, Inc.(b) | | | 8,199,359 | |
| | 117,390 | | | PTC Therapeutics, Inc.(b) | | | 5,166,334 | |
| | 107,648 | | | Receptos, Inc.(b) | | | 6,686,017 | |
| | 239,824 | | | TESARO, Inc.(b) | | | 6,456,062 | |
| | | | | | | | |
| | | | | | | 73,874,106 | |
| | | | | | | | |
| | | | Building Products – 1.9% | | | | |
| | 325,267 | | | Apogee Enterprises, Inc. | | | 12,945,627 | |
| | 347,523 | | | NCI Building Systems, Inc.(b) | | | 6,741,946 | |
| | | | | | | | |
| | | | | | | 19,687,573 | |
| | | | | | | | |
| | | | Capital Markets – 1.5% | | | | |
| | 178,764 | | | Artisan Partners Asset Management, Inc. | | | 9,304,666 | |
| | 233,236 | | | HFF, Inc., Class A | | | 6,752,182 | |
| | | | | | | | |
| | | | | | | 16,056,848 | |
| | | | | | | | |
| | | | Chemicals – 1.0% | | | | |
| | 396,243 | | | Flotek Industries, Inc.(b) | | | 10,330,055 | |
| | | | | | | | |
| | | | Commercial Services & Supplies – 1.6% | | | | |
| | 282,066 | | | Healthcare Services Group, Inc. | | | 8,069,908 | |
| | 531,403 | | | Interface, Inc. | | | 8,576,845 | |
| | | | | | | | |
| | | | | | | 16,646,753 | |
| | | | | | | | |
| | |
| | | | Communications Equipment – 0.7% | | | | |
| | 417,977 | | | Ciena Corp.(b) | | | 6,988,575 | |
| | | | | | | | |
See accompanying notes to financial statements.
15 |
Portfolio of Investments – as of September 30, 2014
Loomis Sayles Small Cap Growth Fund – continued
| | | | | | | | |
| Shares | | | Description | | Value (†) | |
|
| | Common Stocks – continued | |
| | |
| | | | Consumer Finance – 1.0% | | | | |
| | 236,767 | | | Encore Capital Group, Inc.(b) | | $ | 10,491,146 | |
| | | | | | | | |
| | | | Distributors – 1.0% | | | | |
| | 201,110 | | | Pool Corp. | | | 10,843,851 | |
| | | | | | | | |
| | | | Diversified Consumer Services – 3.5% | | | | |
| | 340,277 | | | Bright Horizons Family Solutions, Inc.(b) | | | 14,312,050 | |
| | 305,162 | | | Grand Canyon Education, Inc.(b) | | | 12,441,455 | |
| | 568,487 | | | Nord Anglia Education, Inc.(b) | | | 9,664,279 | |
| | | | | | | | |
| | | | | | | 36,417,784 | |
| | | | | | | | |
| | | | Diversified Financial Services – 1.0% | | | | |
| | 163,007 | | | MarketAxess Holdings, Inc. | | | 10,083,613 | |
| | | | | | | | |
| | | | Electrical Equipment – 0.8% | | | | |
| | 334,232 | | | Thermon Group Holdings, Inc.(b) | | | 8,161,945 | |
| | | | | | | | |
| | | | Electronic Equipment, Instruments & Components – 2.6% | | | | |
| | 131,832 | | | FEI Co. | | | 9,942,770 | |
| | 141,001 | | | IPG Photonics Corp.(b) | | | 9,698,049 | |
| | 91,963 | | �� | Measurement Specialties, Inc.(b) | | | 7,872,952 | |
| | | | | | | | |
| | | | | | | 27,513,771 | |
| | | | | | | | |
| | | | Energy Equipment & Services – 3.5% | | | | |
| | 100,249 | | | Dril-Quip, Inc.(b) | | | 8,962,261 | |
| | 358,004 | | | Forum Energy Technologies, Inc.(b) | | | 10,958,502 | |
| | 487,866 | | | Helix Energy Solutions Group, Inc.(b) | | | 10,762,324 | |
| | 145,008 | | | RigNet, Inc.(b) | | | 5,865,574 | |
| | | | | | | | |
| | | | | | | 36,548,661 | |
| | | | | | | | |
| | | | Food Products – 1.0% | | | | |
| | 128,295 | | | TreeHouse Foods, Inc.(b) | | | 10,327,748 | |
| | | | | | | | |
| | | | Health Care Equipment & Supplies – 6.5% | | | | |
| | 271,542 | | | Cardiovascular Systems, Inc.(b) | | | 6,416,538 | |
| | 117,976 | | | Cyberonics, Inc.(b) | | | 6,035,652 | |
| | 337,696 | | | Cynosure, Inc., Class A(b) | | | 7,091,616 | |
| | 230,858 | | | Insulet Corp.(b) | | | 8,507,117 | |
| | 631,380 | | | Novadaq Technologies, Inc.(b) | | | 8,012,212 | |
| | 332,670 | | | Quidel Corp.(b) | | | 8,938,843 | |
| | 527,395 | | | Spectranetics Corp.(b) | | | 14,012,885 | |
| | 307,268 | | | Wright Medical Group, Inc.(b) | | | 9,310,221 | |
| | | | | | | | |
| | | | | | | 68,325,084 | |
| | | | | | | | |
| | | | Health Care Providers & Services – 5.8% | | | | |
| | 293,344 | | | Acadia Healthcare Co., Inc.(b) | | | 14,227,184 | |
| | 233,847 | | | Amsurg Corp.(b) | | | 11,704,042 | |
| | 210,958 | | | IPC The Hospitalist Co.(b) | | | 9,448,809 | |
See accompanying notes to financial statements.
| 16
Portfolio of Investments – as of September 30, 2014
Loomis Sayles Small Cap Growth Fund – continued
| | | | | | | | |
| Shares | | | Description | | Value (†) | |
|
| | Common Stocks – continued | |
| | |
| | | | Health Care Providers & Services – continued | | | | |
| | 175,191 | | | Magellan Health, Inc.(b) | | $ | 9,588,203 | |
| | 271,542 | | | Team Health Holdings, Inc.(b) | | | 15,746,721 | |
| | | | | | | | |
| | | | | | | 60,714,959 | |
| | | | | | | | |
| | | | Health Care Technology – 0.9% | | | | |
| | 488,274 | | | HMS Holdings Corp.(b) | | | 9,203,965 | |
| | | | | | | | |
| | |
| | | | Hotels, Restaurants & Leisure – 3.0% | | | | |
| | 234,254 | | | Multimedia Games Holding Co., Inc.(b) | | | 8,435,487 | |
| | 256,668 | | | Popeyes Louisiana Kitchen, Inc.(b) | | | 10,395,054 | |
| | 147,861 | | | Vail Resorts, Inc. | | | 12,828,420 | |
| | | | | | | | |
| | | | | | | 31,658,961 | |
| | | | | | | | |
| | | | Internet & Catalog Retail – 1.1% | | | | |
| | 312,702 | | | HomeAway, Inc.(b) | | | 11,100,921 | |
| | | | | | | | |
| | | | Internet Software & Services – 5.4% | | | | |
| | 257,610 | | | comScore, Inc.(b) | | | 9,379,580 | |
| | 48,222 | | | CoStar Group, Inc.(b) | | | 7,500,450 | |
| | 274,463 | | | Dealertrack Technologies, Inc.(b) | | | 11,914,439 | |
| | 247,227 | | | Envestnet, Inc.(b) | | | 11,125,215 | |
| | 514,941 | | | Everyday Health, Inc.(b) | | | 7,193,726 | |
| | 128,300 | | | Shutterstock, Inc.(b) | | | 9,158,054 | |
| | | | | | | | |
| | | | | | | 56,271,464 | |
| | | | | | | | |
| | | | IT Services – 3.2% | | | | |
| | 279,421 | | | Cardtronics, Inc.(b) | | | 9,835,619 | |
| | 209,599 | | | Euronet Worldwide, Inc.(b) | | | 10,016,736 | |
| | 479,920 | | | InterXion Holding NV(b) | | | 13,288,985 | |
| | | | | | | | |
| | | | | | | 33,141,340 | |
| | | | | | | | |
| | | | Life Sciences Tools & Services – 0.8% | | | | |
| | 435,520 | | | Cambrex Corp.(b) | | | 8,135,514 | |
| | | | | | | | |
| | | | Machinery – 3.3% | | | | |
| | 333,755 | | | Manitowoc Co., Inc. (The) | | | 7,826,555 | |
| | 120,013 | | | Middleby Corp. (The)(b) | | | 10,576,745 | |
| | 139,982 | | | Proto Labs, Inc.(b) | | | 9,658,758 | |
| | 105,781 | | | RBC Bearings, Inc. | | | 5,997,783 | |
| | | | | | | | |
| | | | | | | 34,059,841 | |
| | | | | | | | |
| | | | Oil, Gas & Consumable Fuels – 3.6% | | | | |
| | 136,722 | | | Diamondback Energy, Inc.(b) | | | 10,224,071 | |
| | 187,050 | | | Gulfport Energy Corp.(b) | | | 9,988,470 | |
| | 222,910 | | | Oasis Petroleum, Inc.(b) | | | 9,319,867 | |
| | 190,039 | | | Rosetta Resources, Inc.(b) | | | 8,468,138 | |
| | | | | | | | |
| | | | | | | 38,000,546 | |
| | | | | | | | |
See accompanying notes to financial statements.
17 |
Portfolio of Investments – as of September 30, 2014
Loomis Sayles Small Cap Growth Fund – continued
| | | | | | | | |
| Shares | | | Description | | Value (†) | |
|
| | Common Stocks – continued | |
| | |
| | | | Pharmaceuticals – 2.1% | | | | |
| | 275,074 | | | Akorn, Inc.(b) | | $ | 9,976,934 | |
| | 229,840 | | | Impax Laboratories, Inc.(b) | | | 5,449,506 | |
| | 70,903 | | | Pacira Pharmaceuticals, Inc.(b) | | | 6,871,919 | |
| | | | | | | | |
| | | | | | | 22,298,359 | |
| | | | | | | | |
| | | | Professional Services – 5.4% | | | | |
| | 210,754 | | | Advisory Board Co. (The)(b) | | | 9,819,029 | |
| | 162,194 | | | Corporate Executive Board Co. (The) | | | 9,742,994 | |
| | 182,092 | | | Huron Consulting Group, Inc.(b) | | | 11,102,149 | |
| | 311,207 | | | On Assignment, Inc.(b) | | | 8,355,908 | |
| | 258,128 | | | TriNet Group, Inc.(b) | | | 6,646,796 | |
| | 223,482 | | | WageWorks, Inc.(b) | | | 10,175,135 | |
| | | | | | | | |
| | | | | | | 55,842,011 | |
| | | | | | | | |
| | | | Road & Rail – 1.4% | | | | |
| | 157,098 | | | Genesee & Wyoming, Inc., Class A(b) | | | 14,973,010 | |
| | | | | | | | |
| | | | Semiconductors & Semiconductor Equipment – 7.0% | | | | |
| | 235,816 | | | Cavium, Inc.(b) | | | 11,727,130 | |
| | 721,849 | | | Intersil Corp. | | | 10,257,474 | |
| | 252,091 | | | MKS Instruments, Inc. | | | 8,414,798 | |
| | 309,985 | | | Monolithic Power Systems, Inc. | | | 13,654,839 | |
| | 155,040 | | | Power Integrations, Inc. | | | 8,358,207 | |
| | 372,742 | | | Semtech Corp.(b) | | | 10,119,945 | |
| | 247,363 | | | Silicon Laboratories, Inc.(b) | | | 10,052,832 | |
| | | | | | | | |
| | | | | | | 72,585,225 | |
| | | | | | | | |
| | | | Software – 6.8% | | | | |
| | 357,528 | | | Aspen Technology, Inc.(b) | | | 13,485,956 | |
| | 315,215 | | | FleetMatics Group PLC(b) | | | 9,614,057 | |
| | 340,209 | | | Guidewire Software, Inc.(b) | | | 15,084,867 | |
| | 238,021 | | | NetScout Systems, Inc.(b) | | | 10,901,362 | |
| | 247,469 | | | Proofpoint, Inc.(b) | | | 9,190,999 | |
| | 88,567 | | | Ultimate Software Group, Inc. (The)(b) | | | 12,533,116 | |
| | | | | | | | |
| | | | | | | 70,810,357 | |
| | | | | | | | |
| | | | Specialty Retail – 1.5% | | | | |
| | 115,582 | | | Asbury Automotive Group, Inc.(b) | | | 7,445,792 | |
| | 103,509 | | | Restoration Hardware Holdings, Inc.(b) | | | 8,234,141 | |
| | | | | | | | |
| | | | | | | 15,679,933 | |
| | | | | | | | |
| | | | Textiles, Apparel & Luxury Goods – 3.8% | | | | |
| | 130,269 | | | Deckers Outdoor Corp.(b) | | | 12,659,541 | |
| | 183,965 | | | Oxford Industries, Inc. | | | 11,220,025 | |
| | 459,000 | | | Tumi Holdings, Inc.(b) | | | 9,340,650 | |
| | 213,056 | | | Vince Holding Corp.(b) | | | 6,447,075 | |
| | | | | | | | |
| | | | | | | 39,667,291 | |
| | | | | | | | |
See accompanying notes to financial statements.
| 18
Portfolio of Investments – as of September 30, 2014
Loomis Sayles Small Cap Growth Fund – continued
| | | | | | | | |
| Shares | | | Description | | Value (†) | |
|
| | Common Stocks – continued | |
| | |
| | | | Transportation Infrastructure – 0.6% | | | | |
| | 391,951 | | | Wesco Aircraft Holdings, Inc.(b) | | $ | 6,819,947 | |
| | | | | | | | |
| | |
| | | | Total Common Stocks
(Identified Cost $860,897,786) | | | 1,024,142,999 | |
| | | | | | | | |
| | |
| Principal
Amount |
| | | | | | |
|
| | Short-Term Investments – 1.8% | |
| $ | 18,494,039 | | | Tri-Party Repurchase Agreement with Fixed Income Clearing Corporation, dated 9/30/2014 at 0.000% to be repurchased at $18,494,039 on 10/01/2014 collateralized by $19,105,000 U.S. Treasury Note, 1.750% due 10/31/2020 valued at $18,866,188 including accrued interest (Note 2 of Notes to Financial Statements) (Identified Cost $18,494,039) | | | 18,494,039 | |
| | | | | | | | |
| | |
| | | | Total Investments – 100.0%
(Identified Cost $879,391,825)(a) | | | 1,042,637,038 | |
| | | | Other assets less liabilities – (0.0)% | | | (32,473 | ) |
| | | | | | | | |
| | | | Net Assets – 100.0% | | $ | 1,042,604,565 | |
| | | | | | | | |
| | |
| | (†) | | | See Note 2 of Notes to Financial Statements. | | | | |
| | (a) | | | Federal Tax Information: | | | | |
| | | | At September 30, 2014, the net unrealized appreciation on investments based on a cost of $879,807,494 for federal income tax purposes was as follows: | |
| | | | Aggregate gross unrealized appreciation for all investments in which there is an excess of value over tax cost | | $ | 198,825,229 | |
| | | | Aggregate gross unrealized depreciation for all investments in which there is an excess of tax cost over value | | | (35,995,685 | ) |
| | | | | | | | |
| | | | Net unrealized appreciation | | $ | 162,829,544 | |
| | | | | | | | |
| | (b) | | | Non-income producing security. | | | | |
See accompanying notes to financial statements.
19 |
Portfolio of Investments – as of September 30, 2014
Loomis Sayles Small Cap Growth Fund – continued
Industry Summary at September 30, 2014
| | | | |
Biotechnology | | | 7.1 | % |
Semiconductors & Semiconductor Equipment | | | 7.0 | |
Software | | | 6.8 | |
Health Care Equipment & Supplies | | | 6.5 | |
Health Care Providers & Services | | | 5.8 | |
Internet Software & Services | | | 5.4 | |
Professional Services | | | 5.4 | |
Banks | | | 4.0 | |
Textiles, Apparel & Luxury Goods | | | 3.8 | |
Oil, Gas & Consumable Fuels | | | 3.6 | |
Energy Equipment & Services | | | 3.5 | |
Diversified Consumer Services | | | 3.5 | |
Machinery | | | 3.3 | |
IT Services | | | 3.2 | |
Hotels, Restaurants & Leisure | | | 3.0 | |
Electronic Equipment, Instruments & Components | | | 2.6 | |
Pharmaceuticals | | | 2.1 | |
Other Investments, less than 2% each | | | 21.6 | |
Short-Term Investments | | | 1.8 | |
| | | | |
Total Investments | | | 100.0 | |
Other assets less liabilities | | | (0.0 | ) |
| | | | |
Net Assets | | | 100.0 | % |
| | | | |
See accompanying notes to financial statements.
| 20
Portfolio of Investments – as of September 30, 2014
Loomis Sayles Small Cap Value Fund
| | | | | | | | |
| Shares | | | Description | | Value (†) | |
| |
| | Common Stocks – 97.3% of Net Assets | | | | |
| | |
| | | | Aerospace & Defense – 0.3% | | | | |
| | 170,506 | | | Exelis, Inc. | | $ | 2,820,169 | |
| | 9,473 | | | Vectrus, Inc.(b) | | | 184,999 | |
| | | | | | | | |
| | | | | | | 3,005,168 | |
| | | | | | | | |
| | | | Auto Components – 2.1% | | | | |
| | 374,253 | | | Dana Holding Corp. | | | 7,174,430 | |
| | 455,867 | | | Fox Factory Holding Corp.(b) | | | 7,065,938 | |
| | 266,658 | | | Remy International, Inc. | | | 5,474,489 | |
| | 87,906 | | | Tenneco, Inc.(b) | | | 4,598,363 | |
| | | | | | | | |
| | | | | | | 24,313,220 | |
| | | | | | | | |
| | | | Banks – 12.6% | | | | |
| | 478,291 | | | BancorpSouth, Inc. | | | 9,632,781 | |
| | 567,676 | | | Cathay General Bancorp | | | 14,095,395 | |
| | 137,903 | | | City National Corp. | | | 10,435,120 | |
| | 502,601 | | | CVB Financial Corp. | | | 7,212,324 | |
| | 511,015 | | | First Financial Bancorp | | | 8,089,367 | |
| | 201,962 | | | First Financial Bankshares, Inc. | | | 5,612,524 | |
| | 133,723 | | | IBERIABANK Corp. | | | 8,359,025 | |
| | 293,141 | | | PacWest Bancorp | | | 12,086,203 | |
| | 221,496 | | | Pinnacle Financial Partners, Inc. | | | 7,996,006 | |
| | 218,717 | | | Popular, Inc.(b) | | | 6,437,935 | |
| | 198,069 | | | Prosperity Bancshares, Inc. | | | 11,323,605 | |
| | 120,043 | | | Signature Bank(b) | | | 13,452,019 | |
| | 576,740 | | | Talmer Bancorp, Inc., Class A | | | 7,976,314 | |
| | 158,640 | | | Texas Capital Bancshares, Inc.(b) | | | 9,150,355 | |
| | 326,295 | | | Tristate Capital Holdings, Inc.(b) | | | 2,959,496 | |
| | 240,808 | | | Wintrust Financial Corp. | | | 10,756,893 | |
| | | | | | | | |
| | | | | | | 145,575,362 | |
| | | | | | | | |
| | | | Building Products – 1.3% | | | | |
| | 141,358 | | | Armstrong World Industries, Inc.(b) | | | 7,916,048 | |
| | 137,286 | | | Masonite International Corp.(b) | | | 7,602,899 | |
| | | | | | | | |
| | | | | �� | | 15,518,947 | |
| | | | | | | | |
| | | | Capital Markets – 1.2% | | | | |
| | 179,476 | | | Safeguard Scientifics, Inc.(b) | | | 3,302,359 | |
| | 230,480 | | | Stifel Financial Corp.(b) | | | 10,807,207 | |
| | | | | | | | |
| | | | | | | 14,109,566 | |
| | | | | | | | |
| | | | Chemicals – 2.2% | | | | |
| | 184,875 | | | Cabot Corp. | | | 9,386,104 | |
| | 145,011 | | | Minerals Technologies, Inc. | | | 8,948,629 | |
| | 211,708 | | | Tronox Ltd., Class A | | | 5,514,993 | |
| | 93,823 | | | Zep, Inc. | | | 1,315,398 | |
| | | | | | | | |
| | | | | | | 25,165,124 | |
| | | | | | | | |
See accompanying notes to financial statements.
21 |
Portfolio of Investments – as of September 30, 2014
Loomis Sayles Small Cap Value Fund – continued
| | | | | | | | |
| Shares | | | Description | | Value (†) | |
| |
| | Common Stocks – continued | | | | |
| | |
| | | | Commercial Services & Supplies – 3.9% | | | | |
| | 392,733 | | | KAR Auction Services, Inc. | | $ | 11,243,946 | |
| | 409,597 | | | Knoll, Inc. | | | 7,090,124 | |
| | 140,089 | | | McGrath Rentcorp | | | 4,791,044 | |
| | 212,302 | | | Rollins, Inc. | | | 6,216,203 | |
| | 234,651 | | | Viad Corp. | | | 4,845,543 | |
| | 131,683 | | | Waste Connections, Inc. | | | 6,389,259 | |
| | 164,051 | | | West Corp. | | | 4,832,942 | |
| | | | | | | | |
| | | | | | | 45,409,061 | |
| | | | | | | | |
| | | | Communications Equipment – 0.6% | | | | |
| | 682,195 | | | Calix, Inc.(b) | | | 6,528,606 | |
| | | | | | | | |
| | | | Construction & Engineering – 1.4% | | | | |
| | 278,084 | | | MYR Group, Inc.(b) | | | 6,696,263 | |
| | 340,653 | | | Primoris Services Corp. | | | 9,143,126 | |
| | | | | | | | |
| | | | | | | 15,839,389 | |
| | | | | | | | |
| | | | Consumer Finance – 0.3% | | | | |
| | 26,965 | | | Credit Acceptance Corp.(b) | | | 3,399,478 | |
| | | | | | | | |
| | | | Distributors – 0.7% | | | | |
| | 145,018 | | | Core-Mark Holding Co., Inc. | | | 7,691,755 | |
| | | | | | | | |
| | | | Diversified Financial Services – 1.3% | | | | |
| | 575,103 | | | FNFV Group(b) | | | 7,913,418 | |
| | 116,777 | | | MarketAxess Holdings, Inc. | | | 7,223,825 | |
| | | | | | | | |
| | | | | | | 15,137,243 | |
| | | | | | | | |
| | | | Diversified Telecommunication Services – 0.2% | | | | |
| | 227,592 | | | Premiere Global Services, Inc.(b) | | | 2,724,276 | |
| | | | | | | | |
| | | | Electric Utilities – 2.1% | | | | |
| | 245,550 | | | ALLETE, Inc. | | | 10,899,964 | |
| | 89,427 | | | ITC Holdings Corp. | | | 3,186,284 | |
| | 279,172 | | | UIL Holdings Corp. | | | 9,882,689 | |
| | | | | | | | |
| | | | | | | 23,968,937 | |
| | | | | | | | |
| | | | Electrical Equipment – 1.7% | | | | |
| | 94,828 | | | AZZ, Inc. | | | 3,960,965 | |
| | 296,510 | | | Babcock & Wilcox Co. | | | 8,210,362 | |
| | 124,700 | | | EnerSys | | | 7,312,408 | |
| | | | | | | | |
| | | | | | | 19,483,735 | |
| | | | | | | | |
| | | | Electronic Equipment, Instruments & Components – 4.8% | | | | |
| | 150,705 | | | Belden, Inc. | | | 9,648,134 | |
| | 372,437 | | | Checkpoint Systems, Inc.(b) | | | 4,554,904 | |
| | 157,537 | | | Littelfuse, Inc. | | | 13,419,002 | |
| | 169,323 | | | Methode Electronics, Inc. | | | 6,242,939 | |
| | 161,095 | | | Rogers Corp.(b) | | | 8,821,562 | |
See accompanying notes to financial statements.
| 22
Portfolio of Investments – as of September 30, 2014
Loomis Sayles Small Cap Value Fund – continued
| | | | | | | | |
| Shares | | | Description | | Value (†) | |
| |
| | Common Stocks – continued | | | | |
| | |
| | | | Electronic Equipment, Instruments & Components – continued | | | | |
| | 364,412 | | | TTM Technologies, Inc.(b) | | $ | 2,481,646 | |
| | 674,195 | | | Vishay Intertechnology, Inc. | | | 9,634,247 | |
| | | | | | | | |
| | | | | | | 54,802,434 | |
| | | | | | | | |
| | | | Energy Equipment & Services – 2.4% | | | | |
| | 135,944 | | | Bristow Group, Inc. | | | 9,135,437 | |
| | 512,806 | | | Helix Energy Solutions Group, Inc.(b) | | | 11,312,500 | |
| | 1,400,777 | | | Parker Drilling Co.(b) | | | 6,919,839 | |
| | | | | | | | |
| | | | | | | 27,367,776 | |
| | | | | | | | |
| | | | Food & Staples Retailing – 0.7% | | | | |
| | 404,895 | | | SpartanNash Co. | | | 7,875,208 | |
| | | | | | | | |
| | | | Food Products – 1.3% | | | | |
| | 183,424 | | | Darling Ingredients, Inc.(b) | | | 3,360,328 | |
| | 28,766 | | | J & J Snack Foods Corp. | | | 2,691,347 | |
| | 258,919 | | | Post Holdings, Inc.(b) | | | 8,590,932 | |
| | | | | | | | |
| | | | | | | 14,642,607 | |
| | | | | | | | |
| | | | Health Care Equipment & Supplies – 1.2% | | | | |
| | 154,998 | | | Cynosure, Inc., Class A(b) | | | 3,254,958 | |
| | 172,624 | | | SurModics, Inc.(b) | | | 3,134,852 | |
| | 69,851 | | | Teleflex, Inc. | | | 7,337,149 | |
| | | | | | | | |
| | | | | | | 13,726,959 | |
| | | | | | | | |
| | | | Health Care Providers & Services – 1.6% | | | | |
| | 171,483 | | | Bio-Reference Laboratories, Inc.(b) | | | 4,811,813 | |
| | 856,553 | | | BioScrip, Inc.(b) | | | 5,918,781 | |
| | 121,290 | | | Hanger Orthopedic Group, Inc.(b) | | | 2,488,871 | |
| | 78,515 | | | WellCare Health Plans, Inc.(b) | | | 4,737,595 | |
| | | | | | | | |
| | | | | | | 17,957,060 | |
| | | | | | | | |
| | | | Health Care Technology – 0.4% | | | | |
| | 236,746 | | | MedAssets, Inc.(b) | | | 4,905,377 | |
| | | | | | | | |
| | | | Hotels, Restaurants & Leisure – 4.3% | | | | |
| | 122,206 | | | Churchill Downs, Inc. | | | 11,915,085 | |
| | 52,123 | | | Cracker Barrel Old Country Store, Inc. | | | 5,378,572 | |
| | 467,403 | | | Diamond Resorts International, Inc.(b) | | | 10,638,092 | |
| | 206,868 | | | Marriott Vacations Worldwide Corp.(b) | | | 13,117,500 | |
| | 260,561 | | | Six Flags Entertainment Corp. | | | 8,960,693 | |
| | | | | | | | |
| | | | | | | 50,009,942 | |
| | | | | | | | |
| | | | Household Durables – 1.5% | | | | |
| | 166,677 | | | Jarden Corp.(b) | | | 10,018,954 | |
| | 146,650 | | | La-Z-Boy, Inc. | | | 2,902,204 | |
| | 183,476 | | | Libbey, Inc.(b) | | | 4,818,080 | |
| | | | | | | | |
| | | | | | | 17,739,238 | |
| | | | | | | | |
See accompanying notes to financial statements.
23 |
Portfolio of Investments – as of September 30, 2014
Loomis Sayles Small Cap Value Fund – continued
| | | | | | | | |
| Shares | | | Description | | Value (†) | |
| |
| | Common Stocks – continued | | | | |
| | |
| | | | Industrial Conglomerates – 0.6% | | | | |
| | 304,445 | | | Raven Industries, Inc. | | $ | 7,428,458 | |
| | | | | | | | |
| | | | Insurance – 3.4% | | | | |
| | 476,929 | | | Employers Holdings, Inc. | | | 9,180,883 | |
| | 278,340 | | | HCC Insurance Holdings, Inc. | | | 13,441,039 | |
| | 183,001 | | | ProAssurance Corp. | | | 8,064,854 | |
| | 112,655 | | | Reinsurance Group of America, Inc., Class A | | | 9,027,045 | |
| | | | | | | | |
| | | | | | | 39,713,821 | |
| | | | | | | | |
| | | | Internet & Catalog Retail – 1.2% | | | | |
| | 148,154 | | | HSN, Inc. | | | 9,092,211 | |
| | 131,743 | | | Liberty Ventures, Series A(b) | | | 5,000,964 | |
| | | | | | | | |
| | | | | | | 14,093,175 | |
| | | | | | | | |
| | | | Internet Software & Services – 0.7% | | | | |
| | 179,548 | | | Blucora, Inc.(b) | | | 2,736,312 | |
| | 344,072 | | | Perficient, Inc.(b) | | | 5,157,639 | |
| | | | | | | | |
| | | | | | | 7,893,951 | |
| | | | | | | | |
| | | | IT Services – 3.5% | | | | |
| | 444,951 | | | Convergys Corp. | | | 7,929,027 | |
| | 71,306 | | | DST Systems, Inc. | | | 5,984,000 | |
| | 279,713 | | | Euronet Worldwide, Inc.(b) | | | 13,367,484 | |
| | 114,923 | | | WEX, Inc.(b) | | | 12,678,305 | |
| | | | | | | | |
| | | | | | | 39,958,816 | |
| | | | | | | | |
| | | | Machinery – 5.5% | | | | |
| | 76,947 | | | Alamo Group, Inc. | | | 3,154,827 | |
| | 196,720 | | | Albany International Corp., Class A | | | 6,696,349 | |
| | 357,860 | | | Altra Industrial Motion Corp. | | | 10,435,198 | |
| | 80,582 | | | Graham Corp. | | | 2,316,732 | |
| | 436,753 | | | John Bean Technologies Corp. | | | 12,285,862 | |
| | 174,087 | | | RBC Bearings, Inc. | | | 9,870,733 | |
| | 271,346 | | | TriMas Corp.(b) | | | 6,601,848 | |
| | 122,128 | | | Twin Disc, Inc. | | | 3,292,571 | |
| | 108,803 | | | Wabtec Corp. | | | 8,817,395 | |
| | | | | | | | |
| | | | | | | 63,471,515 | |
| | | | | | | | |
| | | | Marine – 0.9% | �� | | | |
| | 88,833 | | | Kirby Corp.(b) | | | 10,468,969 | |
| | | | | | | | |
| | | | Media – 4.0% | | | | |
| | 300,021 | | | Carmike Cinemas, Inc.(b) | | | 9,294,651 | |
| | 367,319 | | | E.W. Scripps Co. (The), Class A(b) | | | 5,990,973 | |
| | 160,410 | | | John Wiley & Sons, Inc., Class A | | | 9,000,605 | |
| | 501,841 | | | National CineMedia, Inc. | | | 7,281,713 | |
| | 434,097 | | | New Media Investment Group, Inc. | | | 7,219,033 | |
| | 309,685 | | | Time, Inc.(b) | | | 7,255,919 | |
| | | | | | | | |
| | | | | | | 46,042,894 | |
| | | | | | | | |
See accompanying notes to financial statements.
| 24
Portfolio of Investments – as of September 30, 2014
Loomis Sayles Small Cap Value Fund – continued
| | | | | | | | |
| Shares | | | Description | | Value (†) | |
| |
| | Common Stocks – continued | | | | |
| | |
| | | | Metals & Mining – 2.9% | | | | |
| | 211,397 | | | Globe Specialty Metals, Inc. | | $ | 3,845,312 | |
| | 173,984 | | | Haynes International, Inc. | | | 8,001,524 | |
| | 410,714 | | | Horsehead Holding Corp.(b) | | | 6,789,102 | |
| | 228,468 | | | RTI International Metals, Inc.(b) | | | 5,634,021 | |
| | 425,027 | | | SunCoke Energy, Inc.(b) | | | 9,541,856 | |
| | | | | | | | |
| | | | | | | 33,811,815 | |
| | | | | | | | |
| | | | Multi-Utilities – 0.9% | | | | |
| | 226,340 | | | NorthWestern Corp. | | | 10,266,782 | |
| | | | | | | | |
| | | | Oil, Gas & Consumable Fuels – 0.9% | | | | |
| | 48,421 | | | Clayton Williams Energy, Inc.(b) | | | 4,670,205 | |
| | 197,842 | | | QEP Resources, Inc. | | | 6,089,577 | |
| | | | | | | | |
| | | | | | | 10,759,782 | |
| | | | | | | | |
| | | | Paper & Forest Products – 0.4% | | | | |
| | 216,520 | | | PH Glatfelter Co. | | | 4,752,614 | |
| | | | | | | | |
| | | | Pharmaceuticals – 0.3% | | | | |
| | 37,132 | | | Mallinckrodt PLC(b) | | | 3,347,450 | |
| | | | | | | | |
| | | | Professional Services – 0.7% | | | | |
| | 119,514 | | | Insperity, Inc. | | | 3,267,513 | |
| | 373,784 | | | RPX Corp.(b) | | | 5,132,054 | |
| | | | | | | | |
| | | | | | | 8,399,567 | |
| | | | | | | | |
| | | | REITs – Apartments – 1.9% | | | | |
| | 211,947 | | | American Campus Communities, Inc. | | | 7,725,468 | |
| | 101,769 | | | Home Properties, Inc. | | | 5,927,027 | |
| | 131,990 | | | Mid-America Apartment Communities, Inc. | | | 8,665,143 | |
| | | | | | | | |
| | | | | | | 22,317,638 | |
| | | | | | | | |
| | | | REITs – Diversified – 0.8% | | | | |
| | 219,944 | | | Potlatch Corp. | | | 8,843,948 | |
| | | | | | | | |
| | | | REITs – Health Care – 0.8% | | | | |
| | 276,487 | | | Omega Healthcare Investors, Inc. | | | 9,453,091 | |
| | | | | | | | |
| | | | REITs – Hotels – 0.9% | | | | |
| | 1,619,221 | | | Hersha Hospitality Trust | | | 10,314,438 | |
| | | | | | | | |
| | | | REITs – Office Property – 0.8% | | | | |
| | 460,289 | | | BioMed Realty Trust, Inc. | | | 9,297,838 | |
| | | | | | | | |
| | | | REITs – Shopping Centers – 1.0% | | | | |
| | 795,565 | | | Retail Opportunity Investments Corp. | | | 11,694,806 | |
| | | | | | | | |
| | | | REITs – Single Tenant – 0.5% | | | | |
| | 169,580 | | | National Retail Properties, Inc. | | | 5,862,381 | |
| | | | | | | | |
See accompanying notes to financial statements.
25 |
Portfolio of Investments – as of September 30, 2014
Loomis Sayles Small Cap Value Fund – continued
| | | | | | | | |
| Shares | | | Description | | Value (†) | |
| |
| | Common Stocks – continued | | | | |
| | |
| | | | REITs – Storage – 2.0% | | | | |
| | 612,529 | | | CubeSmart | | $ | 11,013,271 | |
| | 161,388 | | | Sovran Self Storage, Inc. | | | 12,000,812 | |
| | | | | | | | |
| | | | | | | 23,014,083 | |
| | | | | | | | |
| | | | Road & Rail – 1.8% | | | | |
| | 83,875 | | | Avis Budget Group, Inc.(b) | | | 4,603,899 | |
| | 60,650 | | | Genesee & Wyoming, Inc., Class A(b) | | | 5,780,551 | |
| | 155,039 | | | Old Dominion Freight Line, Inc.(b) | | | 10,951,955 | |
| | | | | | | | |
| | | | | | | 21,336,405 | |
| | | | | | | | |
| | | | Semiconductors & Semiconductor Equipment – 1.7% | | | | |
| | 274,974 | | | Semtech Corp.(b) | | | 7,465,544 | |
| | 617,170 | | | Teradyne, Inc. | | | 11,966,926 | |
| | | | | | | | |
| | | | | | | 19,432,470 | |
| | | | | | | | |
| | | | Software – 2.8% | | | | |
| | 147,890 | | | Monotype Imaging Holdings, Inc. | | | 4,188,245 | |
| | 119,923 | | | SS&C Technologies Holdings, Inc.(b) | | | 5,263,420 | |
| | 228,929 | | | Synchronoss Technologies, Inc.(b) | | | 10,480,370 | |
| | 219,246 | | | Verint Systems, Inc.(b) | | | 12,192,270 | |
| | | | | | | | |
| | | | | | | 32,124,305 | |
| | | | | | | | |
| | | | Specialty Retail – 2.7% | | | | |
| | 273,727 | | | Barnes & Noble, Inc.(b) | | | 5,403,371 | |
| | 287,482 | | | Christopher & Banks Corp.(b) | | | 2,843,197 | |
| | 154,500 | | | Genesco, Inc.(b) | | | 11,548,875 | |
| | 474,546 | | | MarineMax, Inc.(b) | | | 7,996,100 | |
| | 121,130 | | | Sally Beauty Holdings, Inc.(b) | | | 3,315,328 | |
| | | | | | | | |
| | | | | | | 31,106,871 | |
| | | | | | | | |
| | | | Technology Hardware, Storage & Peripherals – 0.2% | | | | |
| | 98,520 | | | Eastman Kodak Co.(b) | | | 2,164,484 | |
| | | | | | | | |
| | | | Thrifts & Mortgage Finance – 0.9% | | | | |
| | 469,332 | | | Capitol Federal Financial, Inc. | | | 5,547,504 | |
| | 139,883 | | | Federal Agricultural Mortgage Corp., Class C | | | 4,495,840 | |
| | | | | | | | |
| | | | | | | 10,043,344 | |
| | | | | | | | |
| | | | Trading Companies & Distributors – 1.8% | | | | |
| | 102,309 | | | DXP Enterprises, Inc.(b) | | | 7,538,127 | |
| | 151,214 | | | H&E Equipment Services, Inc. | | | 6,090,900 | |
| | 205,934 | | | Rush Enterprises, Inc., Class A(b) | | | 6,888,492 | |
| | | | | | | | |
| | | | | | | 20,517,519 | |
| | | | | | | | |
| | | | Transportation Infrastructure – 0.5% | | | | |
| | 88,516 | | | Macquarie Infrastructure Co. LLC | | | 5,904,017 | |
| | | | | | | | |
See accompanying notes to financial statements.
| 26
Portfolio of Investments – as of September 30, 2014
Loomis Sayles Small Cap Value Fund – continued
| | | | | | | | |
| Shares | | | Description | | Value (†) | |
| |
| | Common Stocks – continued | | | | |
| | |
| | | | Water Utilities – 0.2% | | | | |
| | 109,040 | | | Middlesex Water Co. | | $ | 2,137,184 | |
| | | | | | | | |
| | | | Total Common Stocks
(Identified Cost $793,014,183) | | | 1,122,870,899 | |
| | | | | | | | |
| |
| | Closed-End Investment Companies – 1.0% | | | | |
| | 404,250 | | | Ares Capital Corp. | | | 6,532,680 | |
| | 362,797 | | | Hercules Technology Growth Capital, Inc. | | | 5,246,045 | |
| | | | | | | | |
| | | | Total Closed-End Investment Companies
(Identified Cost $10,036,806) | | | 11,778,725 | |
| | | | | | | | |
| | |
| Principal
Amount |
| | | | | | |
| |
| | Short-Term Investments – 1.7% | | | | |
| $ | 18,850,346 | | | Tri-Party Repurchase Agreement with Fixed Income Clearing Corporation, dated 9/30/2014 at 0.000% to be repurchased at $18,850,346 on 10/01/2014 collateralized by $19,160,000 U.S. Treasury Note, 1.625% due 4/30/2019 valued at $19,231,850 including accrued interest (Note 2 of Notes to Financial Statements) (Identified Cost $18,850,346) | | | 18,850,346 | |
| | | | | | | | |
| | | | Total Investments – 100.0%
(Identified Cost $821,901,335)(a) | | | 1,153,499,970 | |
| | | | Other assets less liabilities – 0.0% | | | 457,290 | |
| | | | | | | | |
| | | | Net Assets – 100.0% | | $ | 1,153,957,260 | |
| | | | | | | | |
| | |
| | (†) | | | See Note 2 of Notes to Financial Statements. | | | | |
| | (a) | | | Federal Tax Information: | | | | |
| | | | At September 30, 2014, the net unrealized appreciation on investments based on a cost of $821,704,202 for federal income tax purposes was as follows: | |
| | | | Aggregate gross unrealized appreciation for all investments in which there is an excess of value over tax cost | | $ | 353,104,889 | |
| | | | Aggregate gross unrealized depreciation for all investments in which there is an excess of tax cost over value | | | (21,309,121 | ) |
| | | | | | | | |
| | | | Net unrealized appreciation | | $ | 331,795,768 | |
| | | | | | | | |
| | (b) | | | Non-income producing security. | | | | |
| REITs | | | Real Estate Investment Trusts | | | | |
See accompanying notes to financial statements.
27 |
Portfolio of Investments – as of September 30, 2014
Loomis Sayles Small Cap Value Fund – continued
Industry Summary at September 30, 2014
| | | | |
Banks | | | 12.6 | % |
Machinery | | | 5.5 | |
Electronic Equipment, Instruments & Components | | | 4.8 | |
Hotels, Restaurants & Leisure | | | 4.3 | |
Media | | | 4.0 | |
Commercial Services & Supplies | | | 3.9 | |
IT Services | | | 3.5 | |
Insurance | | | 3.4 | |
Metals & Mining | | | 2.9 | |
Software | | | 2.8 | |
Specialty Retail | | | 2.7 | |
Energy Equipment & Services | | | 2.4 | |
Chemicals | | | 2.2 | |
Auto Components | | | 2.1 | |
Electric Utilities | | | 2.1 | |
REITs – Storage | | | 2.0 | |
Other Investments, less than 2% each | | | 37.1 | |
Short-Term Investments | | | 1.7 | |
| | | | |
Total Investments | | | 100.0 | |
Other assets less liabilities | | | 0.0 | |
| | | | |
Net Assets | | | 100.0 | % |
| | | | |
See accompanying notes to financial statements.
| 28
Statements of Assets and Liabilities
September 30, 2014
| | | | | | | | |
| | | Small Cap
Growth Fund | | | Small Cap
Value Fund | |
ASSETS | | | | | | | | |
Investments at cost | | $ | 879,391,825 | | | $ | 821,901,335 | |
Net unrealized appreciation | | | 163,245,213 | | | | 331,598,635 | |
| | | | | | | | |
Investments at value | | | 1,042,637,038 | | | | 1,153,499,970 | |
Receivable for Fund shares sold | | | 942,418 | | | | 410,804 | |
Receivable for securities sold | | | 7,611,906 | | | | 2,908,094 | |
Dividends receivable | | | 46,498 | | | | 1,136,263 | |
| | | | | | | | |
TOTAL ASSETS | | | 1,051,237,860 | | | | 1,157,955,131 | |
| | | | | | | | |
LIABILITIES | | | | | | | | |
Payable for securities purchased | | | 6,354,231 | | | | 407,312 | |
Payable for Fund shares redeemed | | | 1,346,536 | | | | 2,515,301 | |
Management fees payable (Note 5) | | | 665,813 | | | | 723,146 | |
Deferred Trustees’ fees (Note 5) | | | 126,603 | | | | 205,028 | |
Administrative fees payable (Note 5) | | | 38,136 | | | | 42,857 | |
Payable to distributor (Note 5d) | | | 15,744 | | | | 13,664 | |
Other accounts payable and accrued expenses | | | 86,232 | | | | 90,563 | |
| | | | | | | | |
TOTAL LIABILITIES | | | 8,633,295 | | | | 3,997,871 | |
| | | | | | | | |
NET ASSETS | | $ | 1,042,604,565 | | | $ | 1,153,957,260 | |
| | | | | | | | |
NET ASSETS CONSIST OF: | | | | | | | | |
Paid-in capital | | $ | 746,991,371 | | | $ | 685,510,200 | |
Accumulated net investment (loss)/Undistributed net investment income | | | (6,062,036 | ) | | | 2,845,587 | |
Accumulated net realized gain on investments | | | 138,430,017 | | | | 134,002,838 | |
Net unrealized appreciation on investments | | | 163,245,213 | | | | 331,598,635 | |
| | | | | | | | |
NET ASSETS | | $ | 1,042,604,565 | | | $ | 1,153,957,260 | |
| | | | | | | | |
| | |
COMPUTATION OF NET ASSET VALUE AND OFFERING PRICE: | | | | | | | | |
Institutional Class: | | | | | | | | |
Net assets | | $ | 852,131,488 | | | $ | 730,900,594 | |
| | | | | | | | |
Shares of beneficial interest | | | 35,114,166 | | | | 20,080,368 | |
| | | | | | | | |
Net asset value, offering and redemption price per share | | $ | 24.27 | | | $ | 36.40 | |
| | | | | | | | |
Retail Class: | | | | | | | | |
Net assets | | $ | 175,392,583 | | | $ | 358,697,741 | |
| | | | | | | | |
Shares of beneficial interest | | | 7,591,556 | | | | 9,969,596 | |
| | | | | | | | |
Net asset value, offering and redemption price per share | | $ | 23.10 | | | $ | 35.98 | |
| | | | | | | | |
Admin Class: | | | | | | | | |
Net assets | | $ | — | | | $ | 61,790,690 | |
| | | | | | | | |
Shares of beneficial interest | | | — | | | | 1,762,371 | |
| | | | | | | | |
Net asset value, offering and redemption price per share | | $ | — | | | $ | 35.06 | |
| | | | | | | | |
Class N: | | | | | | | | |
Net assets | | $ | 15,080,494 | | | $ | 2,568,235 | |
| | | | | | | | |
Shares of beneficial interest | | | 620,837 | | | | 70,485 | |
| | | | | | | | |
Net asset value, offering and redemption price per share | | $ | 24.29 | | | $ | 36.44 | |
| | | | | | | | |
See accompanying notes to financial statements.
29 |
Statements of Operations
For the Year Ended September 30, 2014
| | | | | | | | |
| | | Small Cap
Growth Fund | | | Small Cap
Value Fund | |
INVESTMENT INCOME | | | | | | | | |
Dividends | | $ | 3,645,048 | (a) | | $ | 17,851,701 | |
Interest | | | 453 | | | | 204 | |
| | | | | | | | |
| | | 3,645,501 | | | | 17,851,905 | |
| | | | | | | | |
Expenses | | | | | | | | |
Management fees (Note 5) | | | 8,707,416 | | | | 9,389,148 | |
Service and distribution fees (Note 5) | | | 512,998 | | | | 1,393,698 | |
Administrative fees (Note 5) | | | 505,429 | | | | 544,872 | |
Trustees’ fees and expenses (Note 5) | | | 52,458 | | | | 65,315 | |
Transfer agent fees and expenses (Notes 5 and 6) | | | 1,457,705 | | | | 1,349,343 | |
Audit and tax services fees | | | 40,124 | | | | 41,017 | |
Custodian fees and expenses | | | 44,156 | | | | 42,486 | |
Legal fees | | | 10,376 | | | | 11,153 | |
Registration fees | | | 68,290 | | | | 78,810 | |
Shareholder reporting expenses | | | 55,693 | | | | 67,625 | |
Miscellaneous expenses | | | 36,408 | | | | 39,073 | |
| | | | | | | | |
Total expenses | | | 11,491,053 | | | | 13,022,540 | |
Less waiver and/or expense reimbursement (Note 5) | | | — | | | | (362,170 | ) |
| | | | | | | | |
Net expenses | | | 11,491,053 | | | | 12,660,370 | |
| | | | | | | | |
Net investment income (loss) | | | (7,845,552 | ) | | | 5,191,535 | |
| | | | | | | | |
| | |
NET REALIZED AND UNREALIZED GAIN (LOSS) ON INVESTMENTS | | | | | | | | |
Net realized gain on: | | | | | | | | |
Investments | | | 146,827,349 | | | | 145,244,540 | |
Net change in unrealized appreciation (depreciation) on: | | | | | | | | |
Investments | | | (156,740,215 | ) | | | (73,587,700 | ) |
| | | | | | | | |
Net realized and unrealized gain (loss) on investments | | | (9,912,866 | ) | | | 71,656,840 | |
| | | | | | | | |
| | |
NET INCREASE (DECREASE) IN NET ASSETS RESULTING FROM OPERATIONS | | $ | (17,758,418 | ) | | $ | 76,848,375 | |
| | | | | | | | |
| (a) | Includes a non-recurring dividend of $366,102. |
See accompanying notes to financial statements.
| 30
Statements of Changes in Net Assets
| | | | | | | | | | | | | | | | |
| | | Small Cap Growth Fund | | | Small Cap Value Fund | |
| | | Year Ended
September 30,
2014 | | | Year Ended
September 30,
2013 | | | Year Ended
September 30,
2014 | | | Year Ended
September 30,
2013 | |
FROM OPERATIONS: | | | | | | | | | | | | | | | | |
Net investment income (loss) | | $ | (7,845,552 | ) | | $ | (6,960,368 | ) | | $ | 5,191,535 | | | $ | 5,356,482 | |
Net realized gain on investments | | | 146,827,349 | | | | 87,223,584 | | | | 145,244,540 | | | | 101,532,511 | |
Net change in unrealized appreciation (depreciation) on investments | | | (156,740,215 | ) | | | 222,061,214 | | | | (73,587,700 | ) | | | 174,751,306 | |
| | | | | | | | | | | | | | | | |
Net increase (decrease) in net assets resulting from operations | | | (17,758,418 | ) | | | 302,324,430 | | | | 76,848,375 | | | | 281,640,299 | |
| | | | | | | | | | | | | | | | |
FROM DISTRIBUTIONS TO SHAREHOLDERS: | | | | | | | | | | | | | | | | |
Net investment income | | | | | | | | | | | | | | | | |
Institutional Class | | | — | | | | — | | | | (1,957,501 | ) | | | (5,790,803 | ) |
Retail Class | | | — | | | | — | | | | (74,356 | ) | | | (2,562,409 | ) |
Admin Class | | | — | | | | — | | | | — | | | | (317,577 | ) |
Class N | | | — | | | | — | | | | (3 | ) | | | — | |
Net realized capital gains | | | | | | | | | | | | | | | | |
Institutional Class | | | (64,424,433 | ) | | | — | | | | (64,817,421 | ) | | | (501,108 | ) |
Retail Class | | | (15,631,057 | ) | | | — | | | | (35,067,106 | ) | | | (299,758 | ) |
Admin Class | | | — | | | | — | | | | (6,651,623 | ) | | | (57,681 | ) |
Class N | | | (529,097 | ) | | | — | | | | (103 | ) | | | — | |
| | | | | | | | | | | | | | | | |
Total distributions | | | (80,584,587 | ) | | | — | | | | (108,568,113 | ) | | | (9,529,336 | ) |
| | | | | | | | | | | | | | | | |
NET INCREASE (DECREASE) IN NET ASSETS FROM CAPITAL SHARE TRANSACTIONS (NOTE 10) | | | 7,643,805 | | | | 1,689,164 | | | | (26,204,128 | ) | | | (44,339,129 | ) |
| | | | | | | | | | | | | | | | |
Net increase (decrease) in net assets | | | (90,699,200 | ) | | | 304,013,594 | | | | (57,923,866 | ) | | | 227,771,834 | |
NET ASSETS | | | | | | | | | | | | | | | | |
Beginning of the year | | | 1,133,303,765 | | | | 829,290,171 | | | | 1,211,881,126 | | | | 984,109,292 | |
| | | | | | | | | | | | | | | | |
End of the year | | $ | 1,042,604,565 | | | $ | 1,133,303,765 | | | $ | 1,153,957,260 | | | $ | 1,211,881,126 | |
| | | | | | | | | | | | | | | | |
ACCUMULATED NET INVESTMENT (LOSS)/UNDISTRIBUTED NET INVESTMENT INCOME | | $ | (6,062,036 | ) | | $ | (6,100,899 | ) | | $ | 2,845,587 | | | $ | 192,931 | |
| | | | | | | | | | | | | | | | |
See accompanying notes to financial statements.
31 |
Financial Highlights
For a share outstanding throughout each period.
| | | | | | | | | | | | | | | | | | | | |
| | | Small Cap Growth Fund—Institutional Class | |
| | | Year Ended
September 30,
2014 | | | Year Ended
September 30,
2013 | | | Year Ended
September 30,
2012 | | | Year Ended
September 30,
2011 | | | Year Ended
September 30,
2010 | |
Net asset value, beginning of the period | | $ | 26.35 | | | $ | 19.17 | | | $ | 15.06 | | | $ | 14.03 | | | $ | 11.58 | |
| | | | | | | | | | | | | | | | | | | | |
INCOME (LOSS) FROM INVESTMENT OPERATIONS: | | | | | | | | | | | | | | | | | | | | |
Net investment loss(a) | | | (0.16 | )(b) | | | (0.15 | )(c) | | | (0.14 | ) | | | (0.13 | ) | | | (0.11 | )(d) |
Net realized and unrealized gain (loss) | | | (0.09 | ) | | | 7.33 | | | | 4.25 | | | | 1.16 | (e) | | | 2.56 | |
| | | | | | | | | | | | | | | | | | | | |
Total from Investment Operations | | | (0.25 | ) | | | 7.18 | | | | 4.11 | | | | 1.03 | | | | 2.45 | |
| | | | | | | | | | | | | | | | | | | | |
LESS DISTRIBUTIONS FROM: | | | | | | | | | | | | | | | | | | | | |
Net investment income | | | — | | | | — | | | | — | | | | — | | | | — | |
Net realized capital gains | | | (1.83 | ) | | | — | | | | — | | | | — | | | | — | |
| | | | | | | | | | | | | | | | | | | | |
Total Distributions | | | (1.83 | ) | | | — | | | | — | | | | — | | | | — | |
| | | | | | | | | | | | | | | | | | | | |
Net asset value, end of the period | | $ | 24.27 | | | $ | 26.35 | | | $ | 19.17 | | | $ | 15.06 | | | $ | 14.03 | |
| | | | | | | | | | | | | | | | | | | | |
Total return | | | (1.31 | )%(b) | | | 37.45 | %(c) | | | 27.29 | % | | | 7.34 | % | | | 21.16 | %(f) |
RATIOS TO AVERAGE NET ASSETS: | | | | | | | | | | | | | | | | | | | | |
Net assets, end of the period (000’s) | | $ | 852,131 | | | $ | 914,000 | | | $ | 599,469 | | | $ | 154,313 | | | $ | 52,501 | |
Net expenses | | | 0.94 | % | | | 0.94 | % | | | 0.95 | % | | | 0.98 | %(h) | | | 1.00 | %(g) |
Gross expenses | | | 0.94 | % | | | 0.94 | % | | | 0.95 | % | | | 0.98 | %(h) | | | 1.06 | % |
Net investment loss | | | (0.63 | )%(b) | | | (0.70 | )%(c) | | | (0.79 | )% | | | (0.78 | )% | | | (0.85 | )%(d) |
Portfolio turnover rate | | | 63 | % | | | 56 | % | | | 77 | % | | | 76 | % | | | 69 | % |
| (a) | Per share net investment loss has been calculated using the average shares outstanding during the period. |
| (b) | Includes a non-recurring dividend. Without this dividend, net investment loss per share would have been $(0.17), total return would have been (1.35)% and the ratio of net investment loss to average net assets would have been (0.66)%. |
| (c) | Includes non-recurring dividends. Without these dividends, net investment loss per share would have been $(0.16), total return would have been 37.40% and the ratio of net investment loss to average net assets would have been (0.75)%. |
| (d) | Includes a non-recurring dividend. Without this dividend, net investment loss per share would have been $(0.12) and the ratio of net investment loss to average net assets would have been (0.92)%. |
| (e) | The amount shown for a share outstanding does not correspond with the aggregate realized and unrealized gain (loss) on investments for the period due to the timing of sales and redemptions of fund shares in relation to fluctuating market values of investments of the Fund. |
| (f) | Had certain expenses not been waived/reimbursed during the period, total returns would have been lower. |
| (g) | The investment adviser agreed to waive its fees and/or reimburse a portion of the Fund’s expenses during the period. Without this waiver/reimbursement, expenses would have been higher. |
| (h) | Includes fee/expense recovery of 0.03%. |
See accompanying notes to financial statements.
| 32
Financial Highlights – continued
For a share outstanding throughout each period.
| | | | | | | | | | | | | | | | | | | | |
| | | Small Cap Growth Fund—Retail Class | |
| | | Year Ended
September 30,
2014 | | | Year Ended
September 30,
2013 | | | Year Ended
September 30,
2012 | | | Year Ended
September 30,
2011 | | | Year Ended
September 30,
2010 | |
Net asset value, beginning of the period | | $ | 25.23 | | | $ | 18.41 | | | $ | 14.52 | | | $ | 13.55 | | | $ | 11.21 | |
| | | | | | | | | | | | | | | | | | | | |
INCOME (LOSS) FROM INVESTMENT OPERATIONS: | | | | | | | | | | | | | | | | | | | | |
Net investment loss(a) | | | (0.22 | )(b) | | | (0.20 | )(c) | | | (0.19 | ) | | | (0.18 | ) | | | (0.13 | )(d) |
Net realized and unrealized gain (loss) | | | (0.08 | ) | | | 7.02 | | | | 4.08 | | | | 1.15 | (e) | | | 2.47 | |
| | | | | | | | | | | | | | | | | | | | |
Total from Investment Operations | | | (0.30 | ) | | | 6.82 | | | | 3.89 | | | | 0.97 | | | | 2.34 | |
| | | | | | | | | | | | | | | | | | | | |
LESS DISTRIBUTIONS FROM: | | | | | | | | | | | | | | | | | | | | |
Net investment income | | | — | | | | — | | | | — | | | | — | | | | — | |
Net realized capital gains | | | (1.83 | ) | | | — | | | | — | | | | — | | | | — | |
| | | | | | | | | | | | | | | | | | | | |
Total Distributions | | | (1.83 | ) | | | — | | | | — | | | | — | | | | — | |
| | | | | | | | | | | | | | | | | | | | |
Net asset value, end of the period | | $ | 23.10 | | | $ | 25.23 | | | $ | 18.41 | | | $ | 14.52 | | | $ | 13.55 | |
| | | | | | | | | | | | | | | | | | | | |
Total return | | | (1.58 | )%(b) | | | 37.05 | %(c) | | | 26.79 | %(f) | | | 7.16 | %(f) | | | 20.87 | %(f) |
RATIOS TO AVERAGE NET ASSETS: | | | | | | | | | | | | | | | | | | | | |
Net assets, end of the period (000’s) | | $ | 175,393 | | | $ | 211,724 | | | $ | 229,822 | | | $ | 113,110 | | | $ | 75,344 | |
Net expenses | | | 1.21 | % | | | 1.25 | %(h) | | | 1.25 | %(g) | | | 1.25 | %(g) | | | 1.25 | %(g) |
Gross expenses | | | 1.21 | % | | | 1.25 | %(h) | | | 1.28 | % | | | 1.27 | % | | | 1.39 | % |
Net investment loss | | | (0.90 | )%(b) | | | (0.99 | )%(c) | | | (1.09 | )% | | | (1.07 | )% | | | (1.10 | )%(d) |
Portfolio turnover rate | | | 63 | % | | | 56 | % | | | 77 | % | | | 76 | % | | | 69 | % |
| (a) | Per share net investment loss has been calculated using the average shares outstanding during the period. |
| (b) | Includes a non-recurring dividend. Without this dividend, net investment loss per share would have been $(0.23), total return would have been (1.58)% and the ratio of net investment loss to average net assets would have been (0.93)%. |
| (c) | Includes non-recurring dividends. Without these dividends, net investment loss per share would have been $(0.21), total return would have been 36.99% and the ratio of net investment loss to average net assets would have been (1.05)%. |
| (d) | Includes a non-recurring dividend. Without this dividend, net investment loss per share would have been $(0.14) and the ratio of net investment loss to average net assets would have been (1.17)%. |
| (e) | The amount shown for a share outstanding does not correspond with the aggregate realized and unrealized gain (loss) on investments for the period due to the timing of sales and redemptions of fund shares in relation to fluctuating market values of investments of the Fund. |
| (f) | Had certain expenses not been waived/reimbursed during the period, total returns would have been lower. |
| (g) | The investment adviser agreed to waive its fees and/or reimburse a portion of the Fund’s expenses during the period. Without this waiver/reimbursement, expenses would have been higher. |
| (h) | Includes fee/expense recovery of 0.01%. |
See accompanying notes to financial statements.
33 |
Financial Highlights – continued
For a share outstanding throughout each period.
| | | | | | | | |
| | | Small Cap Growth Fund—
Class N | |
| | | Year Ended
September 30,
2014 | | | Period Ended
September 30,
2013* | |
Net asset value, beginning of the period | | $ | 26.36 | | | $ | 20.22 | |
| | | | | | | | |
INCOME (LOSS) FROM INVESTMENT OPERATIONS: | | | | | | | | |
Net investment loss(a) | | | (0.14 | )(b) | | | (0.11 | ) |
Net realized and unrealized gain (loss) | | | (0.10 | ) | | | 6.25 | |
| | | | | | | | |
Total from Investment Operations | | | (0.24 | ) | | | 6.14 | |
| | | | | | | | |
LESS DISTRIBUTIONS FROM: | | | | | | | | |
Net investment income | | | — | | | | — | |
Net realized capital gains | | | (1.83 | ) | | | — | |
| | | | | | | | |
Total Distributions | | | (1.83 | ) | | | — | |
| | | | | | | | |
Net asset value, end of the period | | $ | 24.29 | | | $ | 26.36 | |
| | | | | | | | |
Total return | | | (1.27 | )%(b) | | | 30.37 | % |
RATIOS TO AVERAGE NET ASSETS: | | | | | | | | |
Net assets, end of the period (000’s) | | $ | 15,080 | | | $ | 7,580 | |
Net expenses | | | 0.83 | % | | | 0.83 | %(c) |
Gross expenses | | | 0.83 | % | | | 0.83 | %(c) |
Net investment loss | | | (0.53 | )%(b) | | | (0.63 | )%(c) |
Portfolio turnover rate | | | 63 | % | | | 56 | % |
| * | From commencement of Class operations on February 1, 2013 through September 30, 2013. |
| (a) | Per share net investment loss has been calculated using the average shares outstanding during the period. |
| (b) | Includes a non-recurring dividend. Without this dividend, net investment loss per share would have been $(0.14), total return would have been (1.31)% and the ratio of net investment loss to average net assets would have been (0.56)%. |
| (c) | Computed on an annualized basis for periods less than one year. |
See accompanying notes to financial statements.
| 34
Financial Highlights – continued
For a share outstanding throughout each period.
| | | | | | | | | | | | | | | | | | | | |
| | | Small Cap Value Fund—Institutional Class | |
| | | Year Ended
September 30,
2014 | | | Year Ended
September 30,
2013 | | | Year Ended
September 30,
2012 | | | Year Ended
September 30,
2011 | | | Year Ended
September 30,
2010 | |
Net asset value, beginning of the period | | $ | 37.42 | | | $ | 29.14 | | | $ | 22.36 | | | $ | 22.93 | | | $ | 20.66 | |
| | | | | | | | | | | | | | | | | | | | |
INCOME (LOSS) FROM INVESTMENT OPERATIONS: | | | | | | | | | | | | | | | | | | | | |
Net investment income(a) | | | 0.20 | | | | 0.20 | | | | 0.21 | | | | 0.09 | (b) | | | 0.11 | |
Net realized and unrealized gain (loss) | | | 2.18 | | | | 8.41 | | | | 6.62 | | | | (0.50 | ) | | | 2.23 | |
| | | | | | | | | | | | | | | | | | | | |
Total from Investment Operations | | | 2.38 | | | | 8.61 | | | | 6.83 | | | | (0.41 | ) | | | 2.34 | |
| | | | | | | | | | | | | | | | | | | | |
LESS DISTRIBUTIONS FROM: | | | | | | | | | | | | | | | | | | | | |
Net investment income | | | (0.10 | ) | | | (0.30 | ) | | | (0.05 | ) | | | (0.16 | ) | | | (0.07 | ) |
Net realized capital gains | | | (3.30 | ) | | | (0.03 | ) | | | — | | | | — | | | | — | |
| | | | | | | | | | | | | | | | | | | | |
Total Distributions | | | (3.40 | ) | | | (0.33 | ) | | | (0.05 | ) | | | (0.16 | ) | | | (0.07 | ) |
| | | | | | | | | | | | | | | | | | | | |
Net asset value, end of the period | | $ | 36.40 | | | $ | 37.42 | | | $ | 29.14 | | | $ | 22.36 | | | $ | 22.93 | |
| | | | | | | | | | | | | | | | | | | | |
Total return | | | 6.17 | %(c) | | | 29.82 | %(c) | | | 30.59 | % | | | (1.88 | )%(b)(c) | | | 11.39 | %(c) |
RATIOS TO AVERAGE NET ASSETS: | | | | | | | | | | | | | | | | | | | | |
Net assets, end of the period (000’s) | | $ | 730,901 | | | $ | 733,512 | | | $ | 572,776 | | | $ | 431,761 | | | $ | 454,853 | |
Net expenses | | | 0.90 | %(d) | | | 0.90 | %(d) | | | 0.90 | %(e) | | | 0.90 | %(d) | | | 0.90 | %(d) |
Gross expenses | | | 0.91 | % | | | 0.91 | % | | | 0.90 | %(e) | | | 0.93 | % | | | 0.94 | % |
Net investment income | | | 0.53 | % | | | 0.61 | % | | | 0.76 | % | | | 0.33 | %(b) | | | 0.50 | % |
Portfolio turnover rate | | | 23 | % | | | 22 | % | | | 19 | % | | | 42 | % | | | 52 | % |
| (a) | Per share net investment income has been calculated using the average shares outstanding during the period. |
| (b) | Includes a non-recurring dividend. Without this dividend, net investment income per share would have been $0.07, total return would have been (1.93)% and the ratio of net investment income to average net assets would have been 0.28%. |
| (c) | Had certain expenses not been waived/reimbursed during the period, total returns would have been lower. |
| (d) | The investment adviser agreed to waive its fees and/or reimburse a portion of the Fund’s expenses during the period. Without this waiver/reimbursement, expenses would have been higher. |
| (e) | Includes fee/expense recovery of less than 0.01%. |
See accompanying notes to financial statements.
35 |
Financial Highlights – continued
For a share outstanding throughout each period.
| | | | | | | | | | | | | | | | | | | | |
| | | Small Cap Value Fund—Retail Class | |
| | | Year Ended
September 30,
2014 | | | Year Ended
September 30,
2013 | | | Year Ended
September 30,
2012 | | | Year Ended
September 30,
2011 | | | Year Ended
September 30,
2010 | |
Net asset value, beginning of the period | | $ | 37.03 | | | $ | 28.84 | | | $ | 22.14 | | | $ | 22.71 | | | $ | 20.47 | |
| | | | | | | | | | | | | | | | | | | | |
INCOME (LOSS) FROM INVESTMENT OPERATIONS: | | | | | | | | | | | | | | | | | | | | |
Net investment income(a) | | | 0.10 | | | | 0.12 | | | | 0.13 | | | | 0.02 | (b) | | | 0.06 | |
Net realized and unrealized gain (loss) | | | 2.16 | | | | 8.32 | | | | 6.57 | | | | (0.48 | ) | | | 2.21 | |
| | | | | | | | | | | | | | | | | | | | |
Total from Investment Operations | | | 2.26 | | | | 8.44 | | | | 6.70 | | | | (0.46 | ) | | | 2.27 | |
| | | | | | | | | | | | | | | | | | | | |
LESS DISTRIBUTIONS FROM: | | | | | | | | | | | | | | | | | | | | |
Net investment income | | | (0.01 | ) | | | (0.22 | ) | | | — | | | | (0.11 | ) | | | (0.03 | ) |
Net realized capital gains | | | (3.30 | ) | | | (0.03 | ) | | | — | | | | — | | | | — | |
| | | | | | | | | | | | | | | | | | | | |
Total Distributions | | | (3.31 | ) | | | (0.25 | ) | | | — | | | | (0.11 | ) | | | (0.03 | ) |
| | | | | | | | | | | | | | | | | | | | |
Net asset value, end of the period | | $ | 35.98 | | | $ | 37.03 | | | $ | 28.84 | | | $ | 22.14 | | | $ | 22.71 | |
| | | | | | | | | | | | | | | | | | | | |
Total return(c) | | | 5.90 | % | | | 29.48 | % | | | 30.26 | % | | | (2.12 | )%(b) | | | 11.10 | % |
RATIOS TO AVERAGE NET ASSETS: | | | | | | | | | | | | | | | | | | | | |
Net assets, end of the period (000’s) | | $ | 358,698 | | | $ | 403,475 | | | $ | 343,480 | | | $ | 347,759 | | | $ | 383,934 | |
Net expenses(d) | | | 1.15 | % | | | 1.15 | % | | | 1.15 | % | | | 1.15 | % | | | 1.15 | % |
Gross expenses | | | 1.20 | % | | | 1.22 | % | | | 1.22 | % | | | 1.22 | % | | | 1.24 | % |
Net investment income | | | 0.28 | % | | | 0.37 | % | | | 0.49 | % | | | 0.08 | %(b) | | | 0.26 | % |
Portfolio turnover rate | | | 23 | % | | | 22 | % | | | 19 | % | | | 42 | % | | | 52 | % |
| (a) | Per share net investment income has been calculated using the average shares outstanding during the period. |
| (b) | Includes a non-recurring dividend. Without this dividend, net investment income per share would have been $0.01, total return would have been (2.16)% and the ratio of net investment income to average net assets would have been 0.03%. |
| (c) | Had certain expenses not been waived/reimbursed during the period, total returns would have been lower. |
| (d) | The investment adviser agreed to waive its fees and/or reimburse a portion of the Fund’s expenses during the period. Without this waiver/reimbursement, expenses would have been higher. |
See accompanying notes to financial statements.
| 36
Financial Highlights – continued
For a share outstanding throughout each period.
| | | | | | | | | | | | | | | | | | | | |
| | | Small Cap Value Fund—Admin Class | |
| | | Year Ended
September 30,
2014 | | | Year Ended
September 30,
2013 | | | Year Ended
September 30,
2012 | | | Year Ended
September 30,
2011 | | | Year Ended
September 30,
2010 | |
Net asset value, beginning of the period | | $ | 36.24 | | | $ | 28.22 | | | $ | 21.72 | | | $ | 22.30 | | | $ | 20.11 | |
| | | | | | | | | | | | | | | | | | | | |
INCOME (LOSS) FROM INVESTMENT OPERATIONS: | | | | | | | | | | | | | | | | | | | | |
Net investment income (loss)(a) | | | 0.01 | | | | 0.04 | | | | 0.06 | | | | (0.04 | )(c) | | | 0.00 | (b) |
Net realized and unrealized gain (loss) | | | 2.11 | | | | 8.15 | | | | 6.44 | | | | (0.49 | ) | | | 2.19 | |
| | | | | | | | | | | | | | | | | | | | |
Total from Investment Operations | | | 2.12 | | | | 8.19 | | | | 6.50 | | | | (0.53 | ) | | | 2.19 | |
| | | | | | | | | | | | | | | | | | | | |
LESS DISTRIBUTIONS FROM: | | | | | | | | | | | | | | | | | | | | |
Net investment income | | | — | | | | (0.14 | ) | | | — | | | | (0.05 | ) | | | — | |
Net realized capital gains | | | (3.30 | ) | | | (0.03 | ) | | | — | | | | — | | | | — | |
| | | | | | | | | | | | | | | | | | | | |
Total Distributions | | | (3.30 | ) | | | (0.17 | ) | | | — | | | | (0.05 | ) | | | — | |
| | | | | | | | | | | | | | | | | | | | |
Net asset value, end of the period | | $ | 35.06 | | | $ | 36.24 | | | $ | 28.22 | | | $ | 21.72 | | | $ | 22.30 | |
| | | | | | | | | | | | | | | | | | | | |
Total return(d) | | | 5.63 | % | | | 29.17 | % | | | 29.93 | % | | | (2.40 | )%(c) | | | 10.89 | % |
RATIOS TO AVERAGE NET ASSETS: | | | | | | | | | | | | | | | | | | | | |
Net assets, end of the period (000’s) | | $ | 61,791 | | | $ | 74,892 | | | $ | 67,853 | | | $ | 65,500 | | | $ | 73,443 | |
Net expenses(e) | | | 1.40 | % | | | 1.40 | % | | | 1.40 | % | | | 1.40 | % | | | 1.40 | % |
Gross expenses | | | 1.51 | % | | | 1.52 | % | | | 1.52 | % | | | 1.52 | % | | | 1.56 | % |
Net investment income (loss) | | | 0.02 | % | | | 0.11 | % | | | 0.24 | % | | | (0.17 | )%(c) | | | 0.02 | % |
Portfolio turnover rate | | | 23 | % | | | 22 | % | | | 19 | % | | | 42 | % | | | 52 | % |
| (a) | Per share net investment income (loss) has been calculated using the average shares outstanding during the period. |
| (b) | Amount rounds to less than $0.01 per share. |
| (c) | Includes a non-recurring dividend. Without this dividend, net investment loss per share would have been $(0.06), total return would have been (2.44)% and the ratio of net investment loss to average net assets would have been (0.22)%. |
| (d) | Had certain expenses not been waived/reimbursed during the period, total returns would have been lower. |
| (e) | The investment adviser agreed to waive its fees and/or reimburse a portion of the Fund’s expenses during the period. Without this waiver/reimbursement, expenses would have been higher. |
See accompanying notes to financial statements.
37 |
Financial Highlights – continued
For a share outstanding throughout each period.
| | | | | | | | |
| | | Small Cap Value Fund—
Class N | |
| | | Year Ended
September 30,
2014 | | | Period Ended
September 30,
2013* | |
Net asset value, beginning of the period | | $ | 37.44 | | | $ | 32.08 | |
| | | | | | | | |
INCOME (LOSS) FROM INVESTMENT OPERATIONS: | | | | | | | | |
Net investment income(a) | | | 0.23 | | | | 0.06 | |
Net realized and unrealized gain (loss) | | | 2.18 | | | | 5.30 | |
| | | | | | | | |
Total from Investment Operations | | | 2.41 | | | | 5.36 | |
| | | | | | | | |
LESS DISTRIBUTIONS FROM: | | | | | | | | |
Net investment income | | | (0.11 | ) | | | — | |
Net realized capital gains | | | (3.30 | ) | | | — | |
| | | | | | | | |
Total Distributions | | | (3.41 | ) | | | — | |
| | | | | | | | |
Net asset value, end of the period | | $ | 36.44 | | | $ | 37.44 | |
| | | | | | | | |
Total return(b) | | | 6.25 | % | | | 16.71 | % |
RATIOS TO AVERAGE NET ASSETS: | | | | | | | | |
Net assets, end of the period (000’s) | | $ | 2,568 | | | $ | 1 | |
Net expenses(c) | | | 0.85 | % | | | 0.85 | %(d) |
Gross expenses | | | 0.89 | % | | | 14.45 | %(d) |
Net investment income | | | 0.60 | % | | | 0.27 | %(d) |
Portfolio turnover rate | | | 23 | % | | | 22 | % |
| * | From commencement of Class operations on February 1, 2013 through September 30, 2013. |
| (a) | Per share net investment income has been calculated using the average shares outstanding during the period. |
| (b) | Had certain expenses not been waived/reimbursed during the period, total returns would have been lower. Periods less than one year, if applicable, are not annualized. |
| (c) | The investment adviser agreed to waive its fees and/or reimburse a portion of the Fund’s expenses during the period. Without this waiver/reimbursement, expenses would have been higher. |
| (d) | Computed on an annualized basis for periods less than one year. |
See accompanying notes to financial statements.
| 38
Notes to Financial Statements
September 30, 2014
1. Organization. Loomis Sayles Funds I and Loomis Sayles Funds II (the “Trusts” and each a “Trust”) are each organized as a Massachusetts business trust. Each Trust is registered under the Investment Company Act of 1940, as amended (the “1940 Act”), as an open-end management investment company. Each Declaration of Trust permits the Board of Trustees to authorize the issuance of an unlimited number of shares of the Trust in multiple series. The financial statements for certain funds of the Trusts are presented in separate reports. The following funds (individually, a “Fund” and collectively, the “Funds”) are included in this report:
Loomis Sayles Funds I:
Loomis Sayles Small Cap Value Fund (the “Small Cap Value Fund”)
Loomis Sayles Funds II:
Loomis Sayles Small Cap Growth Fund (the “Small Cap Growth Fund”)
Each Fund is a diversified investment company.
Small Cap Growth Fund and Small Cap Value Fund were closed to new investors effective September 14, 2012 and September 15, 2008, respectively. The Funds continue to offer Institutional Class, Retail Class and Class N shares to existing investors and Small Cap Value Fund continues to offer Admin Class shares to existing investors.
Most expenses can be directly attributed to a fund. Expenses which cannot be directly attributed to a fund are generally apportioned based on the relative net assets of each of the Funds in Natixis Funds Trust I, Natixis Funds Trust II, Natixis Funds Trust IV, Gateway Trust (“Natixis Funds Trusts”), Loomis Sayles Funds I, Loomis Sayles Funds II (“Loomis Sayles Funds Trusts”) and Hansberger International Series. Expenses of a Fund are borne pro rata by the holders of each class of shares, except that each class bears expenses unique to that class (including the Rule 12b-1 service and distribution fees and transfer agent fees). In addition, each class votes as a class only with respect to its own Rule 12b-1 Plan. Shares of each class would receive their pro rata share of the net assets of a Fund if the Fund were liquidated. The Trustees approve separate distributions from net investment income on each class of shares.
2. Significant Accounting Policies. The following is a summary of significant accounting policies consistently followed by each Fund in the preparation of its financial statements. The Funds’ financial statements follow the accounting and reporting guidelines provided for investment companies and are prepared in accordance with accounting principles generally accepted in the United States of America which require the use of management estimates that affect the reported amounts and disclosures in the financial statements. Actual results could differ from those estimates. Management has evaluated the events and transactions subsequent to year-end through the date the financial statements were issued and has determined that there were no material events that would require disclosure in the Funds’ financial statements.
39 |
Notes to Financial Statements – continued
September 30, 2014
a. Valuation. Fund securities and other investments are valued at market value based on market quotations obtained or determined by independent pricing services recommended by the adviser and approved by the Board of Trustees. Fund securities and other investments for which market quotations are not readily available are valued at fair value as determined in good faith by the adviser pursuant to procedures approved by the Board of Trustees, as described below. Market value is determined as follows:
Equity securities (including closed-end investment companies and exchange-traded funds) are valued at the last sale price quoted on the exchange or market where traded most extensively or, if there is no reported sale during the day, the closing bid quotation as reported by an independent pricing service. Securities traded on the NASDAQ Global Select Market, NASDAQ Global Market and NASDAQ Capital Market are valued at the NASDAQ Official Closing Price (“NOCP”), or if lacking an NOCP, at the most recent bid quotations on the applicable NASDAQ Market. In some foreign markets, an official close price and a last sale price may be available from the foreign exchange or market. In those cases, the official close price is used. Debt securities (other than short-term obligations purchased with an original or remaining maturity of sixty days or less) and unlisted equity securities are valued based on evaluated bids furnished to the Fund by an independent pricing service using market information, transactions for comparable securities and various relationships between securities, if available, or bid prices obtained from broker-dealers. Broker-dealer bid prices may be used to value debt and equity securities where an independent pricing service is unable to price a security or where an independent pricing service does not provide a reliable price for the security. Short-term obligations (purchased with an original or remaining maturity of sixty days or less) are valued at amortized cost (which approximates market value.)
Fund securities and other investments for which market quotations are not readily available are valued at fair value as determined in good faith by the adviser pursuant to procedures approved by the Board of Trustees. The Funds may also value securities and other investments at fair value in other circumstances such as when extraordinary events occur after the close of a foreign market but prior to the close of the New York Stock Exchange (“NYSE”). This may include situations relating to a single issuer (such as a declaration of bankruptcy or a delisting of the issuer’s security from the primary market on which it has traded) as well as events affecting the securities markets in general (such as market disruptions or closings and significant fluctuations in U.S. and/or foreign markets). When fair valuing its securities or other investments, the Funds may, among other things, use modeling tools or other processes that may take into account factors such as securities or other market activity and/or significant events that occur after the close of the foreign market and before the time the Fund’s net asset value (“NAV”) is calculated. Fair value pricing may require subjective determinations about the value of a security, and fair values used to determine a Fund’s NAV may differ from quoted or published prices, or from prices that are used by others, for the same securities. In addition, the use of fair value pricing may not always result in adjustments to the prices of securities held by a Fund.
| 40
Notes to Financial Statements – continued
September 30, 2014
b. Investment Transactions and Related Investment Income. Investment transactions are accounted for on a trade date plus one day basis for daily NAV calculation. However, for financial reporting purposes, investment transactions are reported on trade date. Dividend income is recorded on ex-dividend date, or in the case of certain foreign securities, as soon as a Fund is notified, and interest income is recorded on an accrual basis. Interest income is increased by the accretion of discount and decreased by the amortization of premium. Distributions received from investments in securities that represent a return of capital or capital gain are recorded as a reduction of cost of the investments or as a realized gain, respectively. The calendar year-end amounts of ordinary income, capital gains and return of capital included in distributions received from the Funds’ investments in real estate investment trusts (“REITs”) are reported to the Funds after the end of the fiscal year; accordingly, the Funds estimate these amounts for accounting purposes until the characterization of REIT distributions is reported to the Funds after the end of the fiscal year. Estimates are based on the most recent REIT distribution information available. In determining net gain or loss on securities sold, the cost of securities has been determined on an identified cost basis. Investment income, non-class specific expenses and realized and unrealized gains and losses are allocated on a pro rata basis to each class based on the relative net assets of each class to the total net assets of the Fund.
c. Foreign Currency Translation. The books and records of the Funds are maintained in U.S. dollars. The values of securities, currencies and other assets and liabilities denominated in currencies other than U.S. dollars are translated into U.S. dollars based upon foreign exchange rates prevailing at the end of the period. Purchases and sales of investment securities, income and expenses are translated on the respective dates of such transactions.
Since the values of investment securities are presented at the foreign exchange rates prevailing at the end of the period, it is not practical to isolate that portion of the results of operations arising from changes in exchange rates from fluctuations which arise due to changes in market prices of investment securities. Such changes are included with the net realized and unrealized gain or loss on investments.
Net realized foreign exchange gains or losses arise from sales of foreign currency, currency gains or losses realized between the trade and settlement dates on securities transactions and the difference between the amounts of dividends, interest and foreign withholding taxes recorded on the Funds’ books and the U.S. dollar equivalent of the amounts actually received or paid. Net unrealized foreign exchange gains and losses arise from changes in the value of assets and liabilities, other than investment securities, at the end of the fiscal period, resulting from changes in exchange rates.
Each Fund may use foreign currency exchange contracts to facilitate transactions in foreign-denominated investments. Losses may arise from changes in the value of the foreign currency or if the counterparties do not perform under the contracts’ terms.
d. Federal and Foreign Income Taxes. Each Trust treats each Fund as a separate entity for federal income tax purposes. Each Fund intends to meet the requirements of the Internal
41 |
Notes to Financial Statements – continued
September 30, 2014
Revenue Code of 1986, as amended, applicable to regulated investment companies, and to distribute to its shareholders substantially all of its net investment income and any net realized capital gains at least annually. Management has performed an analysis of each Fund’s tax positions for the open tax years as of September 30, 2014 and has concluded that no provisions for income tax are required. The Funds’ federal tax returns for the prior three fiscal years remain subject to examination by the Internal Revenue Service. Management is not aware of any events that are reasonably possible to occur in the next twelve months that would result in the amounts of any unrecognized tax benefits significantly increasing or decreasing for the Funds. However, management’s conclusions regarding tax positions taken may be subject to review and adjustment at a later date based on factors including, but not limited to, new tax laws and accounting regulations and interpretations thereof.
A Fund may be subject to foreign withholding taxes on investment income and taxes on capital gains on investments that are accrued and paid based upon the Fund’s understanding of the tax rules and regulations that exist in the countries in which the Fund invests. Foreign withholding taxes on dividend and interest income are reflected on the Statements of Operations as a reduction of investment income, net of amounts eligible to be reclaimed. Dividends and interest receivable on the Statements of Assets and Liabilities are net of foreign withholding taxes. Foreign withholding taxes eligible to be reclaimed are reflected on the Statements of Assets and Liabilities as tax reclaims receivable. Capital gains taxes paid are included in net realized gain (loss) on investments in the Statements of Operations. Accrued but unpaid capital gains taxes are reflected as foreign taxes payable on the Statements of Assets and Liabilities, if applicable, and reduce unrealized gains on investments. In the event that realized gains on investments are subsequently offset by realized losses, taxes paid on realized gains may be returned to a Fund. Such amounts, if applicable, are reflected as foreign tax rebates receivable on the Statements of Assets and Liabilities and are recorded as a realized gain when received.
e. Dividends and Distributions to Shareholders. Dividends and distributions are recorded on ex-dividend date. The timing and characterization of certain income and capital gain distributions are determined annually in accordance with federal tax regulations, which may differ from accounting principles generally accepted in the United States of America. Permanent differences are primarily due to differing treatments for book and tax purposes of items such as return of capital and capital gain distributions received, deferred Trustees’ fees and net operating losses. Permanent book and tax basis differences relating to shareholder distributions will result in reclassifications to capital accounts. Temporary differences between book and tax distributable earnings are primarily due to return of capital distributions received, deferred Trustees’ fees and wash sales. Distributions from net investment income and short-term capital gains are considered to be distributed from ordinary income for tax purposes.
| 42
Notes to Financial Statements – continued
September 30, 2014
The tax characterization of distributions is determined on an annual basis. The tax character of distributions paid to shareholders during the periods ended September 30, 2014 and 2013 were as follows:
| | | | | | | | | | | | | | | | | | | | | | | | |
| | | 2014 Distributions Paid From: | | | 2013 Distributions Paid From: | |
Fund | | Ordinary
Income | | | Long-Term
Capital Gains | | | Total | | | Ordinary
Income | | | Long-Term
Capital Gains | | | Total | |
Small Cap Growth Fund | | $ | — | | | $ | 80,584,587 | | | $ | 80,584,587 | | | $ | — | | | $ | — | | | $ | — | |
Small Cap Value Fund | | | 2,574,013 | | | | 105,994,100 | | | | 108,568,113 | | | | 8,670,789 | | | | 858,547 | | | | 9,529,336 | |
As of September 30, 2014, the components of distributable earnings on a tax basis were as follows:
| | | | | | | | |
| | | Small Cap
Growth Fund | | | Small Cap
Value Fund | |
Undistributed ordinary income | | $ | — | | | $ | 8,163,440 | |
Undistributed long-term capital gain | | | 138,845,686 | | | | 128,692,880 | |
| | | | | | | | |
Total undistributed earnings | | | 138,845,686 | | | | 136,856,320 | |
| | | | | | | | |
Late-year ordinary and post-October capital loss deferrals* | | | (5,935,433 | ) | | | — | |
Unrealized appreciation | | | 162,829,544 | | | | 331,795,768 | |
| | | | | | | | |
Total accumulated earnings | | $ | 295,739,797 | | | $ | 468,652,088 | |
| | | | | | | | |
| * | Under current tax law, capital losses, foreign currency losses, and losses on passive foreign investment companies and contingent payment debt instruments after October 31 or December 31, as applicable, may be deferred and treated as occurring on the first day of the following taxable year. |
f. Repurchase Agreements. Each Fund may enter into repurchase agreements, under the terms of a Master Repurchase Agreement, under which each Fund acquires securities as collateral and agrees to resell the securities at an agreed upon time and at an agreed upon price. It is each Fund’s policy that the market value of the collateral for repurchase agreements be at least equal to 102% of the repurchase price, including interest. Certain repurchase agreements are tri-party arrangements whereby the collateral is held in a segregated account for the benefit of the Fund and on behalf of the counterparty. Repurchase agreements could involve certain risks in the event of default or insolvency of the counterparty, including possible delays or restrictions upon a Fund’s ability to dispose of the underlying securities. As of September 30, 2014, each Fund, as applicable, had investments in repurchase agreements for which the value of the related collateral exceeded the value of the repurchase agreement. The gross value of repurchase agreements is included in the Statements of Assets and Liabilities for financial reporting purposes.
g. Securities Lending. The Funds have entered into an agreement with State Street Bank and Trust Company (“State Street Bank”), as agent of the Funds, to lend securities to certain designated borrowers. The loans are collateralized with cash or securities in an amount equal to at least 105% or 102% of the market value (including accrued interest) of
43 |
Notes to Financial Statements – continued
September 30, 2014
the loaned international or domestic securities, respectively, when the loan is initiated. Thereafter, the value of the collateral must remain at least 102% of the market value (including accrued interest) of loaned securities for U.S. equities and U.S. corporate debt; at least 105% of the market value (including accrued interest) of loaned securities for non-U.S. equities; and at least 100% of the market value (including accrued interest) of loaned securities for U.S. Government securities, sovereign debt issued by non-U.S. Governments and non-U.S. corporate debt. In the event that the market value of the collateral falls below the required percentages described above, the borrower will deliver additional collateral on the next business day. As with other extensions of credit, the Funds may bear the risk of loss with respect to the investment of the collateral. The Funds invest cash collateral in short-term investments, a portion of the income from which is remitted to the borrowers and the remainder allocated between the Funds and State Street Bank as lending agent.
For the year ended September 30, 2014, neither Fund had loaned securities under this agreement.
h. Indemnifications. Under the Trusts’ organizational documents, their officers and Trustees are indemnified against certain liabilities arising out of the performance of their duties to the Funds. Additionally, in the normal course of business, the Funds enter into contracts with service providers that contain general indemnification clauses. The Funds’ maximum exposure under these arrangements is unknown as this would involve future claims that may be made against the Funds that have not yet occurred. However, based on experience, the Funds expect the risk of loss to be remote.
3. Fair Value Measurements. In accordance with accounting standards related to fair value measurements and disclosures, the Funds have categorized the inputs utilized in determining the value of each Fund’s assets or liabilities. These inputs are summarized in the three broad levels listed below:
| | • | | Level 1—quoted prices in active markets for identical assets or liabilities; |
| | • | | Level 2—prices determined using other significant inputs that are observable either directly, or indirectly through corroboration with observable market data (which could include quoted prices for similar assets or liabilities, interest rates, credit risk, etc.); and |
| | • | | Level 3—prices determined using significant unobservable inputs when quoted prices or observable inputs are unavailable such as when there is little or no market activity for an asset or liability (unobservable inputs reflect each Fund’s own assumptions in determining the fair value of assets or liabilities and would be based on the best information available). |
The inputs or methodology used for valuing securities are not necessarily an indication of the risk associated with investing in those securities.
| 44
Notes to Financial Statements – continued
September 30, 2014
The following is a summary of the inputs used to value the Funds’ investments as of September 30, 2014, at value:
Small Cap Growth Fund
Asset Valuation Inputs
| | | | | | | | | | | | | | | | |
Description | | Level 1 | | | Level 2 | | | Level 3 | | | Total | |
Common Stocks(a) | | $ | 1,024,142,999 | | | $ | — | | | $ | — | | | $ | 1,024,142,999 | |
Short-Term Investments | | | — | | | | 18,494,039 | | | | — | | | | 18,494,039 | |
| | | | | | | | | | | | | | | | |
Total | | $ | 1,024,142,999 | | | $ | 18,494,039 | | | $ | — | | | $ | 1,042,637,038 | |
| | | | | | | | | | | | | | | | |
(a) Details of the major categories of the Fund’s investments are reflected within the Portfolio of Investments.
For the year ended September 30, 2014, there were no transfers among Levels 1, 2 and 3.
Small Cap Value Fund
Asset Valuation Inputs
| | | | | | | | | | | | | | | | |
Description | | Level 1 | | | Level 2 | | | Level 3 | | | Total | |
Common Stocks(a) | | $ | 1,122,870,899 | | | $ | — | | | $ | — | | | $ | 1,122,870,899 | |
Closed-End Investment Companies | | | 11,778,725 | | | | — | | | | — | | | | 11,778,725 | |
Short-Term Investments | | | — | | | | 18,850,346 | | | | — | | | | 18,850,346 | |
| | | | | | | | | | | | | | | | |
Total | | $ | 1,134,649,624 | | | $ | 18,850,346 | | | $ | — | | | $ | 1,153,499,970 | |
| | | | | | | | | | | | | | | | |
(a) Details of the major categories of the Fund’s investments are reflected within the Portfolio of Investments.
For the year ended September 30, 2014, there were no transfers among Levels 1, 2 and 3.
4. Purchases and Sales of Securities. For the year ended September 30, 2014, purchases and sales of securities (excluding short-term investments) were as follows:
| | | | | | | | |
Fund | | Purchases | | | Sales | |
Small Cap Growth Fund | | $ | 706,879,677 | | | $ | 756,396,269 | |
Small Cap Value Fund | | | 285,836,483 | | | | 404,979,169 | |
5. Management Fees and Other Transactions with Affiliates.
a. Management Fees. Loomis, Sayles & Company, L.P. (“Loomis Sayles”) serves as investment adviser to each Fund. Under the terms of the management agreements, each Fund pays a management fee at the following annual rates, calculated daily and payable monthly, based on each Fund’s average daily net assets:
| | |
Fund | | Percentage of
Average Daily Net Assets |
Small Cap Growth Fund | | 0.75% |
Small Cap Value Fund | | 0.75% |
45 |
Notes to Financial Statements – continued
September 30, 2014
Loomis Sayles has given binding undertakings to the Funds to waive management fees and/or reimburse certain expenses to limit the Funds’ operating expenses, exclusive of acquired fund fees and expenses, brokerage expenses, interest expense, taxes and extraordinary expenses. These undertakings are in effect until January 31, 2015 and are reevaluated on an annual basis. Management fees payable, as reflected on the Statements of Assets and Liabilities, is net of waivers and/or expense reimbursements, if any, pursuant to these undertakings.
For the year ended September 30, 2014, the expense limits as a percentage of average daily net assets under the expense limitation agreements were as follows:
| | | | | | | | | | | | | | | | |
| | | Expense Limit as a Percentage of
Average Daily Net Assets | |
Fund | | Institutional Class | | | Retail Class | | | Admin Class | | | Class N | |
Small Cap Growth Fund | | | 1.00% | | | | 1.25% | | | | — | | | | 0.95% | |
Small Cap Value Fund | | | 0.90% | | | | 1.15% | | | | 1.40% | | | | 0.85% | |
Loomis Sayles shall be permitted to recover expenses they have borne under the expense limitation agreements (whether through waiver of its management fees or otherwise) on a class by class basis in later periods to the extent the annual operating expenses of a class fall below a class’ expense limits, provided, however, that a class is not obligated to pay such waived/reimbursed fees or expenses more than one year after the end of the fiscal year in which the fees or expenses were waived/reimbursed.
For the year ended September 30, 2014, the management fees for each Fund were as follows:
| | | | | | | | |
Fund | | Management
Fees | | | Percentage of
Average Daily Net Assets | |
Small Cap Growth Fund | | $ | 8,707,416 | | | | 0.75% | |
Small Cap Value Fund | | | 9,389,148 | | | | 0.75% | |
For the year ended September 30, 2014, class-specific expenses have been reimbursed as follows:
| | | | | | | | | | | | | | | | | | | | |
| | | Reimbursement1 | |
Fund | | Institutional
Class | | | Retail
Class | | | Admin
Class | | | Class N | | | Total | |
Small Cap Value Fund | | $ | 64,496 | | | $ | 212,203 | | | $ | 84,894 | | | $ | 577 | | | $ | 362,170 | |
1 Expense reimbursements are subject to possible recovery until September 30, 2015.
Certain officers and employees of Loomis Sayles are also officers or Trustees of the Trusts. Loomis Sayles’ general partner is indirectly owned by Natixis Global Asset Management, L.P. (“Natixis US”), which is part of Natixis Global Asset Management, an international asset management group based in Paris, France.
b. Service and Distribution Fees. NGAM Distribution, L.P. (“NGAM Distribution”), which is a wholly-owned subsidiary of Natixis US, has entered into a distribution agreement with the Trusts. Pursuant to this agreement, NGAM Distribution serves as principal underwriter of the Funds of the Trusts.
| 46
Notes to Financial Statements – continued
September 30, 2014
Pursuant to Rule 12b-1 under the 1940 Act, Small Cap Growth Fund and Small Cap Value Fund have adopted a Distribution Plan relating to each Fund’s Retail Class shares (the “Retail Class Plans”) and Small Cap Value Fund has adopted a Distribution Plan relating to its Admin Class shares (the “Admin Class Plan”).
Under the Retail Class Plans, each Fund pays NGAM Distribution a monthly distribution fee at an annual rate not to exceed 0.25% of the average daily net assets attributable to the Funds’ Retail Class shares, as compensation for services provided by NGAM Distribution in connection with the marketing or sale of Retail Class shares or for payments made by NGAM Distribution to securities dealers or other financial intermediaries as commissions, asset-based sales charges or other compensation with respect to the sale of Retail Class shares, or for providing personal services to investors and/or maintenance of shareholder accounts.
Under the Admin Class Plan, Small Cap Value Fund pays NGAM Distribution a monthly distribution fee at an annual rate not to exceed 0.25% of the average daily net assets attributable to the Fund’s Admin Class shares, as compensation for services provided by NGAM Distribution in connection with the marketing or sale of Admin Class shares or for payments made by NGAM Distribution to securities dealers or other financial intermediaries as commissions, asset-based sales charges or other compensation with respect to the sale of Admin Class shares, or for providing personal services to investors and/or the maintenance of shareholder accounts.
In addition, the Admin Class shares of Small Cap Value Fund may pay NGAM Distribution an administrative service fee, at an annual rate not to exceed 0.25% of the average daily net assets attributable to Admin Class shares. These fees are subsequently paid to securities dealers or financial intermediaries for providing personal services and/or account maintenance for their customers who hold such shares.
For the year ended September 30, 2014, the service and distribution fees for each Fund were as follows:
| | | | | | | | | | | | |
| | | Service Fees | | | Distribution Fees | |
Fund | | Admin
Class | | | Retail
Class | | | Admin
Class | |
Small Cap Growth Fund | | $ | — | | | $ | 512,998 | | | $ | — | |
Small Cap Value Fund | | | 187,149 | | | | 1,019,400 | | | | 187,149 | |
c. Administrative Fees. NGAM Advisors, L.P. (“NGAM Advisors”) provides certain administrative services for the Funds and contracts with State Street Bank to serve as sub-administrator. NGAM Advisors is a wholly-owned subsidiary of Natixis US. Pursuant to an agreement among Natixis Funds Trusts, Loomis Sayles Funds Trusts, Hansberger International Series and NGAM Advisors, each Fund pays NGAM Advisors monthly its pro rata portion of fees equal to an annual rate of 0.0575% of the first $15 billion of the average daily net assets of the Natixis Funds Trusts, Loomis Sayles Funds Trusts and Hansberger International Series, 0.0500% of the next $15 billion, 0.0400% of the next $30 billion, 0.0350% of the next $30 billion and 0.0325% of such assets in excess of
47 |
Notes to Financial Statements – continued
September 30, 2014
$90 billion, subject to an annual aggregate minimum fee for the Natixis Funds Trusts, Loomis Sayles Funds Trusts and Hansberger International Series of $10 million, which is reevaluated on an annual basis.
For the year ended September 30, 2014, the administrative fees for each Fund were as follows:
| | | | |
Fund | | Administrative
Fees | |
Small Cap Growth Fund | | $ | 505,429 | |
Small Cap Value Fund | | | 544,872 | |
Prior to July 1, 2014, each Fund paid NGAM Advisors monthly its pro rata portion of fees equal to an annual rate of 0.0575% of the first $15 billion of the average daily net assets of the Natixis Funds Trusts, Loomis Sayles Funds Trusts and Hansberger International Series, 0.0500% of the next $15 billion, 0.0400% of the next $30 billion and 0.0350% of such assets in excess of $60 billion, subject to an annual aggregate minimum fee for the Natixis Funds Trusts, Loomis Sayles Funds Trusts and Hansberger International Series of $10 million.
d. Sub-Transfer Agent Fees. NGAM Distribution has entered into agreements, which include servicing agreements, with financial intermediaries that provide recordkeeping, processing, shareholder communications and other services to customers of the intermediaries that hold positions in the Funds and has agreed to compensate the intermediaries for providing those services. Intermediaries transact with the Funds primarily through the use of omnibus accounts on behalf of their customers who hold positions in the Funds. These services would have been provided by the Funds’ transfer agent and other service providers if the shareholders’ accounts were maintained directly at the Funds’ transfer agent. Accordingly, the Funds have agreed to reimburse NGAM Distribution for all or a portion of the servicing fees paid to these intermediaries. The reimbursement amounts (sub-transfer agent fees) paid to NGAM Distribution are subject to a current per-account equivalent fee limit approved by the Funds’ Board, which is based on fees for similar services paid to the Funds’ transfer agent and other service providers. Class N shares do not bear such expenses.
For the year ended September 30, 2014, the sub-transfer agent fees (which are reflected in transfer agent fees and expenses in the Statements of Operations) for each Fund were as follows:
| | | | |
Fund | | Sub-Transfer
Agent Fees | |
Small Cap Growth Fund | | $ | 1,406,824 | |
Small Cap Value Fund | | | 1,298,055 | |
| 48
Notes to Financial Statements – continued
September 30, 2014
As of September 30, 2014, the Funds owe NGAM Distribution the following reimbursements for sub-transfer agent fees (which are reflected in the Statements of Assets and Liabilities as payable to distributor):
| | | | |
Fund | | Reimbursements
of Sub-Transfer
Agent Fees | |
Small Cap Growth Fund | | $ | 15,744 | |
Small Cap Value Fund | | | 13,664 | |
Effective July 1, 2014, sub-transfer agent fees attributable to Institutional Class, Retail Class and Admin Class are allocated on a pro rata basis to each class based on the relative net assets of each class to the total net assets of those classes. Prior to July 1, 2014, sub-transfer agent fees attributable to Institutional Class, Retail Class and Admin Class were allocated to each individual class.
e. Trustees Fees and Expenses. The Trusts do not pay any compensation directly to their officers or Trustees who are directors, officers or employees of NGAM Advisors, NGAM Distribution, Natixis US or their affiliates. Effective January 1, 2014, the Chairperson of the Board receives a retainer fee at the annual rate of $300,000. The Chairperson does not receive any meeting attendance fees for Board of Trustees meetings or committee meetings that she attends. Each Independent Trustee (other than the Chairperson) receives, in the aggregate, a retainer fee at the annual rate of $130,000. Each Independent Trustee also receives a meeting attendance fee of $10,000 for each meeting of the Board of Trustees that he or she attends in person and $5,000 for each meeting of the Board of Trustees that he or she attends telephonically. In addition, each committee chairperson (except for the Chairperson of the Governance Committee) receives an additional retainer fee at an annual rate of $17,500. Each Contract Review Committee member is compensated $6,000 for each Committee meeting that he or she attends in person and $3,000 for each meeting that he or she attends telephonically. Each Audit Committee member is compensated $6,000 for each Committee meeting that he or she attends in person and $3,000 for each meeting that he or she attends telephonically. These fees are allocated among the funds in the Natixis Funds Trusts, Loomis Sayles Funds Trusts and Hansberger International Series based on a formula that takes into account, among other factors, the relative net assets of each Fund. Trustees are reimbursed for travel expenses in connection with attendance at meetings.
Prior to January 1, 2014, the Chairperson of the Board received a retainer fee at the annual rate of $285,000 and each Independent Trustee (other than the Chairperson) received, in the aggregate, a retainer fee at the annual rate of $115,000. All other Trustee fees remained unchanged.
A deferred compensation plan (the “Plan”) is available to the Trustees on a voluntary basis. Deferred amounts remain in the Funds until distributed in accordance with the provisions of the Plan. The value of a participating Trustee’s deferral account is based on theoretical investments of deferred amounts, on the normal payment dates, in certain funds of the
49 |
Notes to Financial Statements – continued
September 30, 2014
Natixis Funds Trusts, Loomis Sayles Funds Trusts and Hansberger International Series as designated by the participating Trustees. Changes in the value of participants’ deferral accounts are allocated pro rata among the funds in the Natixis Funds Trusts, Loomis Sayles Funds Trusts, and Hansberger International Series, and are normally reflected as Trustees’ fees and expenses in the Statements of Operations. The portions of the accrued obligations allocated to the Funds under the Plan are reflected as Deferred Trustees’ fees in the Statements of Assets and Liabilities.
f. Affiliated Ownership. As of September 30, 2014, Loomis Sayles Funded Pension Plan and Trust (“Pension Plan”) and Loomis Sayles Employees’ Profit Sharing Retirement Plan (“Retirement Plan”) held shares of the Funds representing the following percentages of net assets:
| | | | | | | | | | | | |
Fund | | Pension Plan | | | Retirement Plan | | | Total
Affiliated
Ownership | |
Small Cap Growth Fund | | | 1.07% | | | | 1.37% | | | | 2.44% | |
Small Cap Value Fund | | | 1.66% | | | | 2.22% | | | | 3.88% | |
6. Class-Specific Transfer Agent Fees and Expenses. For the year ended September 30, 2014, the Funds incurred the following class-specific transfer agent fees and expenses (including sub-transfer agent fees, where applicable):
| | | | | | | | | | | | | | | | |
| | | Transfer Agent Fees and Expenses | |
Fund | | Institutional
Class | | | Retail
Class | | | Admin
Class | | | Class N | |
Small Cap Growth Fund | | $ | 1,158,246 | | | $ | 298,262 | | | $ | — | | | $ | 1,197 | |
Small Cap Value Fund | | | 669,401 | | | | 534,514 | | | | 144,432 | | | | 996 | |
Effective July 1, 2014, transfer agent fees and expenses attributable to Institutional Class, Retail Class and Admin Class are allocated on a pro rata basis to each class based on relative net assets of each class to the total net assets of those classes. Prior to July 1, 2014, transfer agent fees and expenses attributable to Institutional Class, Retail Class and Admin Class were allocated to each individual class.
Transfer agent fees and expenses attributable to Class N are allocated to Class N.
7. Line of Credit. Each Fund, together with certain other funds of Natixis Funds Trusts, Loomis Sayles Funds Trusts and Hansberger International Series, participates in a $200,000,000 committed unsecured line of credit provided by State Street Bank, with an individual limit of $125,000,000 for each Fund that participates in the line of credit. Interest is charged to each participating Fund based on its borrowings at a rate per annum equal to the greater of the Federal Funds rate or overnight LIBOR, plus 1.25%. In addition, a commitment fee of 0.10% per annum, payable at the end of each calendar quarter, is accrued and apportioned among the participating funds based on their average daily unused portion of the line of credit.
For the year ended September 30, 2014, neither Fund had borrowings under this agreement.
| 50
Notes to Financial Statements – continued
September 30, 2014
8. Brokerage Commission Recapture. Each Fund has entered into agreements with certain brokers whereby the brokers will rebate a portion of brokerage commissions. All amounts rebated by the brokers are returned to the Funds under such agreements and are included in realized gains on investments in the Statements of Operations. For the year ended September 30, 2014, amounts rebated under these agreements were as follows:
| | | | |
Fund | | Rebates | |
Small Cap Growth Fund | | $ | 82,809 | |
Small Cap Value Fund | | | 53,786 | |
9. Concentration of Ownership. From time to time, a fund may have a concentration of one or more accounts constituting a significant percentage of shares outstanding. Investment activities by holders of such accounts could have material impacts on the Funds. As of September 30, 2014, based on management’s evaluation of the shareholder account base, the Funds had accounts representing controlling ownership of more than 5% of the Fund’s total outstanding shares. The number of such accounts, based on accounts that represent more than 5% of an individual class of shares, and the aggregate percentage of net assets represented by such holdings were as follows:
| | | | | | | | | | | | | | | | |
Fund | | Number of 5%
Non-Affiliated
Account Holders | | | Percentage of
Non-Affiliated
Ownership | | | Percentage of
Affiliated
Ownership
(Note 5) | | | Total
Percentage of
Ownership | |
Small Cap Growth Fund | | | 2 | | | | 25.78% | | | | 2.44% | | | | 28.22% | |
Small Cap Value Fund | | | 3 | | | | 24.91% | | | | 3.88% | | | | 28.79% | |
Omnibus shareholder accounts for which NGAM Advisors understands that the intermediary has discretion over the underlying shareholder accounts or investment models where a shareholder account may be invested for a non-discretionary customer are included in the table above. For other omnibus accounts, the Funds do not have information on the individual shareholder accounts underlying omnibus accounts; therefore, there could be other 5% shareholders in addition to those disclosed in the table above.
51 |
Notes to Financial Statements – continued
September 30, 2014
10. Capital Shares. Each Fund may issue an unlimited number of shares of beneficial interest, without par value. Transactions in capital shares were as follows:
| | | | | | | | | | | | | | | | |
| | | Small Cap Growth Fund | |
| | | Year Ended
September 30, 2014 | | | Year Ended
September 30, 2013* | |
| Institutional Class | | Shares | | | Amount | | | Shares | | | Amount | |
Issued from the sale of shares | | | 8,265,332 | | | $ | 214,034,486 | | | | 11,813,357 | | | $ | 252,532,051 | |
Issued in connection with the reinvestment of distributions | | | 2,386,288 | | | | 61,256,020 | | | | — | | | | — | |
Redeemed | | | (10,228,143 | ) | | | (257,989,269 | ) | | | (8,396,592 | ) | | | (176,478,451 | ) |
| | | | | | | | | | | | | | | | |
Net change | | | 423,477 | | | $ | 17,301,237 | | | | 3,416,765 | | | $ | 76,053,600 | |
| | | | | | | | | | | | | | | | |
| Retail Class | | | | | | | | | | | | |
Issued from the sale of shares | | | 1,803,527 | | | $ | 44,732,574 | | | | 2,620,258 | | | $ | 53,469,074 | |
Issued in connection with the reinvestment of distributions | | | 637,221 | | | | 15,605,531 | | | | — | | | | — | |
Redeemed | | | (3,240,173 | ) | | | (78,525,108 | ) | | | (6,709,873 | ) | | | (135,077,555 | ) |
| | | | | | | | | | | | | | | | |
Net change | | | (799,425 | ) | | $ | (18,187,003 | ) | | | (4,089,615 | ) | | $ | (81,608,481 | ) |
| | | | | | | | | | | | | | | | |
| Class N | | | | | | | | | | | | |
Issued from the sale of shares | | | 426,210 | | | $ | 10,866,912 | | | | 291,609 | | | $ | 7,346,195 | |
Issued in connection with the reinvestment of distributions | | | 20,604 | | | | 529,097 | | | | — | | | | — | |
Redeemed | | | (113,573 | ) | | | (2,866,438 | ) | | | (4,013 | ) | | | (102,150 | ) |
| | | | | | | | | | | | | | | | |
Net change | | | 333,241 | | | $ | 8,529,571 | | | | 287,596 | | | $ | 7,244,045 | |
| | | | | | | | | | | | | | | | |
Increase (decrease) from capital share transactions | | | (42,707 | ) | | $ | 7,643,805 | | | | (385,254 | ) | | $ | 1,689,164 | |
| | | | | | | | | | | | | | | | |
* From commencement of operations on February 1, 2013 through September 30, 2013 for Class N shares.
| 52
Notes to Financial Statements – continued
September 30, 2014
10. Capital Shares – continued.
| | | | | | | | | | | | | | | | |
| | | Small Cap Value Fund | |
| | | Year Ended
September 30, 2014 | | | Year Ended
September 30, 2013* | |
| Institutional Class | | Shares | | | Amount | | | Shares | | | Amount | |
Issued from the sale of shares | | | 3,763,242 | | | $ | 142,391,032 | | | | 3,209,013 | | | $ | 105,799,055 | |
Issued in connection with the reinvestment of distributions | | | 1,733,383 | | | | 64,429,846 | | | | 204,464 | | | | 6,072,591 | |
Redeemed | | | (5,018,897 | ) | | | (188,920,687 | ) | | | (3,464,461 | ) | | | (112,934,799 | ) |
| | | | | | | | | | | | | | | | |
Net change | | | 477,728 | | | $ | 17,900,191 | | | | (50,984 | ) | | $ | (1,063,153 | ) |
| | | | | | | | | | | | | | | | |
| Retail Class | | | | | | | | | | | | |
Issued from the sale of shares | | | 981,833 | | | $ | 36,703,146 | | | | 1,284,622 | | | $ | 42,022,941 | |
Issued in connection with the reinvestment of distributions | | | 952,559 | | | | 35,063,705 | | | | 96,978 | | | | 2,855,026 | |
Redeemed | | | (2,862,025 | ) | | | (107,131,359 | ) | | | (2,396,051 | ) | | | (77,723,740 | ) |
| | | | | | | | | | | | | | | | |
Net change | | | (927,633 | ) | | $ | (35,364,508 | ) | | | (1,014,451 | ) | | $ | (32,845,773 | ) |
| | | | | | | | | | | | | | | | |
| Admin Class | | | | | | | | | | | | |
Issued from the sale of shares | | | 613,122 | | | $ | 22,321,084 | | | | 474,991 | | | $ | 15,185,040 | |
Issued in connection with the reinvestment of distributions | | | 143,514 | | | | 5,157,882 | | | | 9,613 | | | | 277,512 | |
Redeemed | | | (1,060,940 | ) | | | (38,817,639 | ) | | | (822,273 | ) | | | (25,893,755 | ) |
| | | | | | | | | | | | | | | | |
Net change | | | (304,304 | ) | | $ | (11,338,673 | ) | | | (337,669 | ) | | $ | (10,431,203 | ) |
| | | | | | | | | | | | | | | | |
| Class N | | | | | | | | | | | | |
Issued from the sale of shares | | | 95,239 | | | $ | 3,550,943 | | | | 31 | | | $ | 1,000 | |
Issued in connection with the reinvestment of distributions | | | 3 | | | | 106 | | | | — | | | | — | |
Redeemed | | | (24,788 | ) | | | (952,187 | ) | | | — | | | | — | |
| | | | | | | | | | | | | | | | |
Net change | | | 70,454 | | | $ | 2,598,862 | | | | 31 | | | $ | 1,000 | |
| | | | | | | | | | | | | | | | |
Increase (decrease) from capital share transactions | | | (683,755 | ) | | $ | (26,204,128 | ) | | | (1,403,073 | ) | | $ | (44,339,129 | ) |
| | | | | | | | | | | | | | | | |
* From commencement of operations on February 1, 2013 through September 30, 2013 for Class N shares.
53 |
Report of Independent Registered Public Accounting Firm
To the Trustees of Loomis Sayles Funds I and Loomis Sayles Funds II and Shareholders of Loomis Sayles Small Cap Value Fund and Loomis Sayles Small Cap Growth Fund:
In our opinion, the accompanying statements of assets and liabilities, including the portfolios of investments, and the related statements of operations and of changes in net assets and the financial highlights present fairly, in all material respects, the financial position of the Loomis Sayles Small Cap Value Fund, a series of Loomis Sayles Funds I, and the Loomis Sayles Small Cap Growth Fund, a series of Loomis Sayles Funds II (collectively, the “Funds”), at September 30, 2014, and the results of each of their operations, the changes in each of their net assets and the financial highlights for each of the periods indicated, in conformity with accounting principles generally accepted in the United States of America. These financial statements and financial highlights (hereafter referred to as “financial statements”) are the responsibility of the Funds’ management. Our responsibility is to express an opinion on these financial statements based on our audits. We conducted our audits of these financial statements in accordance with the standards of the Public Company Accounting Oversight Board (United States). Those standards require that we plan and perform the audits to obtain reasonable assurance about whether the financial statements are free of material misstatement. An audit includes examining, on a test basis, evidence supporting the amounts and disclosures in the financial statements, assessing the accounting principles used and significant estimates made by management, and evaluating the overall financial statement presentation. We believe that our audits, which included confirmation of securities at September 30, 2014 by correspondence with the custodian and the application of alternative auditing procedures where securities purchased had not been received, provide a reasonable basis for the opinion expressed above.
PricewaterhouseCoopers LLP
Boston, Massachusetts
November 21, 2014
| 54
2014 U.S. Tax Distribution Information to Shareholders (Unaudited)
Corporate Dividends Received Deduction. For the fiscal year ended September 30, 2014, a percentage of dividends distributed by the Funds listed below qualify for the dividends received deduction for corporate shareholders. These percentages are as follows:
| | | | |
Fund | | Qualifying Percentage | |
Small Cap Value Fund | | | 100.00% | |
Capital Gains Distributions. Pursuant to Internal Revenue Section 852(b), the following Funds paid distributions, which have been designated as capital gains distributions for the fiscal year ended September 30, 2014, unless subsequently determined to be different.
| | | | |
Fund | | Amount | |
Small Cap Growth Fund | | $ | 80,584,587 | |
Small Cap Value Fund | | | 105,994,100 | |
Qualified Dividend Income. For the fiscal year ended September 30, 2014, the Funds below will designate up to the maximum amount allowable pursuant to the Internal Revenue Code as qualified dividend income eligible for reduced tax rates. These lower rates range from 0% to 20% depending on an individual’s tax bracket. If the Funds pay a distribution during calendar year 2014, complete information will be reported in conjunction with Form 1099-DIV.
55 |
Trustee and Officer Information
As of 9/30/14
The tables below provide certain information regarding the trustees and officers of Loomis Sayles Funds I and Loomis Sayles Funds II (the “Trusts”). Unless otherwise indicated, the address of all persons below is 399 Boylston Street, Boston, MA 02116. The Funds’ Statements of Additional Information include additional information about the trustees of the Trusts and are available by calling Natixis Funds at 800-225-5478.
| | | | | | | | |
| Name and Year of Birth | | Position(s) Held
with the Trust(s),
Length of Time
Served and
Term of Office1 | | Principal
Occupation(s)
During Past 5 Years | | Number of
Portfolios in
Fund Complex
Overseen2 and
Other
Directorships Held
During Past 5 Years | | Experience,
Qualifications,
Attributes, Skills
for Board
Membership |
| | |
| INDEPENDENT TRUSTEES | | | | |
| | | | |
Kenneth A. Drucker (1945) | | Trustee since 2008 Chairman of the Audit Committee and Governance Committee Member | | Retired | | 42 None | | Significant experience on the Board and on the board of other business organizations (including at investment companies); executive experience (including as treasurer of an aerospace, automotive, and metal manufacturing corporation) |
| | | | |
| Edmond J. English (1953) | | Trustee since 2013 Contract Review Committee Member | | Chief Executive Officer of Bob’s Discount Furniture (retail) | | 42 Formerly, Director, BJ’s Wholesale Club (retail); formerly, Director, Citizens Financial Group (bank) | | Experience on the board and significant experience on the board of other business organizations (including at a retail company and a bank); executive experience (including at a retail company) |
| 56
Trustee and Officer Information – continued
| | | | | | | | |
| Name and Year of Birth | | Position(s) Held
with the Trust(s),
Length of Time
Served and
Term of Office1 | | Principal
Occupation(s)
During Past 5 Years | | Number of
Portfolios in
Fund Complex
Overseen2 and
Other
Directorships Held
During Past 5 Years | | Experience,
Qualifications,
Attributes, Skills for
Board Membership |
| | |
| INDEPENDENT TRUSTEES – continued | | | | |
| | | | |
Wendell J. Knox (1948) | | Trustee since 2009 Audit Committee Member and Governance Committee Member | | Director of Abt Associates Inc. (research and consulting) | | 42 Director, Eastern Bank (bank); Director, The Hanover Insurance Group (property and casualty insurance) | | Significant experience on the Board and on the board of other business organizations (including at a bank and at a property and casualty insurance firm); executive experience (including roles as president and chief executive officer of a research and consulting company) |
| | | | |
| Martin T. Meehan (1956) | | Trustee since 2012 Contract Review Committee Member | | Chancellor and faculty member, University of Massachusetts Lowell | | 42 None | | Experience on the Board and on the board of other business organizations; experience as Chancellor of the University of Massachusetts Lowell; government experience (including as a member of the U.S. House of Representatives); academic experience |
| | | | |
Sandra O. Moose (1942) | | Chairperson of the Board of Trustees since November 2005 Trustee since 2003 Ex Officio member of the Audit Committee, the Contract Review Committee and the Governance Committee | | President, Strategic Advisory Services (management consulting) | | 42 Director, AES Corporation (international power company); formerly, Director, Rohm and Haas Company (specialty chemicals); formerly, Director, Verizon Communications (telecommunications company); | | Significant experience on the Board and on the board of other business organizations (including at a telecommunications company, an international power company and a specialty chemicals corporation); executive experience (including at a management consulting company) |
57 |
Trustee and Officer Information – continued
| | | | | | | | |
| Name and Year of Birth | | Position(s) Held
with the Trust(s),
Length of Time
Served and
Term of Office1 | | Principal
Occupation(s)
During Past 5 Years | | Number of
Portfolios in
Fund Complex
Overseen2 and
Other
Directorships Held
During Past 5 Years | | Experience,
Qualifications,
Attributes, Skills
for Board
Membership |
| | |
| INDEPENDENT TRUSTEES – continued | | | | |
| | | | |
Erik R. Sirri (1958) | | Trustee since 2009 Audit Committee Member | | Professor of Finance at Babson College | | 42 None | | Significant experience on the Board; experience as Director of the Division of Trading and Markets at the Securities and Exchange Commission; academic experience; training as an economist |
| | | | |
Peter J. Smail (1952) | | Trustee since 2009 Chairman of the Contract Review Committee and Governance Committee Member | | Retired | | 42 None | | Significant experience on the Board; mutual fund industry and executive experience (including roles as president and chief executive officer for an investment adviser) |
| | | | |
Cynthia L. Walker (1956) | | Trustee since 2005 Chairperson of the Governance Committee and Contract Review Committee Member | | Deputy Dean for Finance and Administration, Yale University School of Medicine | | 42 None | | Significant experience on the Board; executive experience in a variety of academic organizations (including roles as dean for finance and administration) |
| | | |
| INTERESTED TRUSTEES | | | | | | |
| | | | |
Robert J. Blanding3 (1947) 555 California Street San Francisco, CA 94104 | | Trustee since 2002 President and Chief Executive Officer of Loomis Sayles Funds I since 2002 Chief Executive Officer of Loomis Sayles Funds II since 2002 | | Chairman, Director and Chief Executive Officer (formerly, President), Loomis, Sayles & Company, L.P. | | 42 None | | Significant experience on the Board; continuing service as Chairman and Chief Executive Officer of Loomis, Sayles & Company, L.P. |
| 58
Trustee and Officer Information – continued
| | | | | | | | |
| Name and Year of Birth | | Position(s) Held
with the Trust(s),
Length of Time
Served and
Term of Office1 | | Principal
Occupation(s)
During Past 5 Years | | Number of
Portfolios in
Fund Complex
Overseen2 and
Other
Directorships Held
During Past 5 Years | | Experience,
Qualifications,
Attributes, Skills
for Board
Membership |
| | | |
| INTERESTED TRUSTEES – continued | | | | | | |
| | | | |
David L. Giunta4 (1965) | | Trustee since 2011 President of Loomis Sayles Funds II since 2008 Executive Vice President of Loomis Sayles Funds I since 2008 | | President and Chief Executive Officer, NGAM Distribution Corporation, NGAM Advisors, L.P. and NGAM Distribution, L.P. | | 42 None | | Experience on the Board; continuing experience as President and Chief Executive Officer of NGAM Advisors, L.P. |
| | | | |
John T. Hailer5 (1960) | | Trustee since 2003 | | President and Chief Executive Officer – U.S. and Asia, Natixis Global Asset Management, L.P. | | 42 None | | Significant experience on the Board; continuing experience as President and Chief Executive Officer – U.S. and Asia, Natixis Global Asset Management, L.P. |
| 1 | Each trustee serves until retirement, resignation or removal from the Board. The current retirement age is 75. The position of Chairperson of the Board is appointed for a three-year term. Ms. Moose was appointed to serve an additional three-year term as the Chairperson of the Board on December 13, 2013. |
| 2 | The trustees of the Trusts serve as trustees of a fund complex that includes all series of the Natixis Funds Trust I, Natixis Funds Trust II, Natixis Funds Trust IV and Gateway Trust (collectively, the “Natixis Funds Trusts”), Loomis Sayles Funds I and Loomis Sayles Funds II (collectively, the “Loomis Sayles Funds Trusts”). |
| 3 | Mr. Blanding is deemed an “interested person” of the Trusts because he holds the following positions with an affiliated person of the Trusts: Chairman, Director and Chief Executive Officer of Loomis, Sayles & Company, L.P. and Director of Loomis Sayles Investment Asia Pte., Ltd. |
| 4 | Mr. Giunta is deemed an “interested person” of the Trusts because he holds the following positions with an affiliated person of the Trusts: President and Chief Executive Officer of NGAM Distribution Corporation, NGAM Advisors, L.P. and NGAM Distribution, L.P. |
| 5 | Mr. Hailer is deemed an “interested person” of the Trusts because he holds the following positions with an affiliated person of the Trusts: President and Chief Executive Officer – U.S. and Asia, Natixis Global Asset Management, L.P. |
59 |
Trustee and Officer Information – continued
| | | | | | |
| Name and Year of Birth | | Position(s) Held with
the Trust(s) | | Term of Office1 and
Length of Time Served | | Principal Occupation(s)
During Past 5 Years2 |
|
| OFFICERS OF THE TRUST |
| | | |
Coleen Downs Dinneen (1960) | | Secretary, Clerk and Chief Legal Officer | | Since September 2004 | | Executive Vice President, General Counsel, Secretary and Clerk, NGAM Distribution Corporation, NGAM Advisors, L.P. and NGAM Distribution, L.P. |
| | | |
Daniel J. Fuss (1933) One Financial Center Boston, MA 02111 | | Executive Vice President | | Since June 2003 | | Vice Chairman and Director, Loomis, Sayles & Company, L.P. |
| | | |
Russell L. Kane (1969) | | Chief Compliance Officer, Assistant Secretary and Anti-Money Laundering Officer | | Chief Compliance Officer since May 2006; Assistant Secretary since June 2004; and Anti-Money Laundering Officer since April 2007 | | Chief Compliance Officer for Mutual Funds, Senior Vice President, Deputy General Counsel, Assistant Secretary and Assistant Clerk, NGAM Distribution Corporation, NGAM Advisors, L.P. and NGAM Distribution, L.P. |
| | | |
Michael C. Kardok (1959) | | Treasurer, Principal Financial and
Accounting Officer | | Since October 2004 | | Senior Vice President, NGAM Advisors, L.P. and NGAM Distribution, L.P. |
| 1 | Each officer of the Trusts serves for an indefinite term in accordance with the Trusts’ current by-laws until the date his or her successor is elected and qualified, or until he or she sooner dies, retires, is removed or becomes disqualified. |
| 2 | Each person listed above, except as noted, holds the same position(s) with the Fund Complex. Mr. Fuss is not an officer of the Natixis Funds Trusts. Previous positions during the past five years with NGAM Distribution, L.P., NGAM Advisors, L.P. or Loomis, Sayles & Company, L.P. are omitted, if not materially different from a trustee’s or officer’s current position with such entity. |
| 60
ANNUAL REPORT
September 30, 2014

Loomis Sayles Core Plus Bond Fund
Loomis Sayles High Income Fund
Loomis Sayles International Bond Fund
Loomis Sayles Limited Term Government
and Agency Fund

TABLE OF CONTENTS
Portfolio Review page 1
Portfolio of Investments page 25
Financial Statements page 68
Notes to Financial Statements page 89
Barron’s/Lipper 2013 one-year ranking is based on 64 qualifying U.S. fund companies. Award recipient must have at least three funds in Lipper’s general U.S.-stock category (including at least one world and one mixed-asset/balanced), two taxable bond and one tax-exempt bond fund. Natixis was not ranked for the 5- and 10-year periods. Past performance is no guarantee of future results.
For more details visit ngam.natixis.com/TopFundFamily
LOOMIS SAYLES CORE PLUS BOND FUND
| | | | |
| Managers | | Symbols | | |
| Peter W. Palfrey, CFA® | | Class A | | NEFRX |
| Richard G. Raczkowski | | Class B | | NERBX |
| Loomis, Sayles & Company, L.P. | | Class C | | NECRX |
| | Class N | | NERNX |
| | Class Y | | NERYX |
Objective
Seeks high total investment return through a combination of current income and capital appreciation
Market Conditions
In January 2014, the U.S. Federal Reserve (the Fed) began tapering its quantitative easing (QE) program. The Fed reduced its monthly bond purchases by $10 billion per policy meeting, with the goal of concluding the program in October 2014. Despite the reduced Fed bond buying, the fixed income market remained resilient. By the third quarter of 2014, global unrest in the Middle East and Eastern Europe triggered market volatility. Additionally, more hawkish announcements from the Fed created uncertainty surrounding future rate policy.
Against a backdrop of a rallying U.S. dollar, foreign currencies struggled during 2014. In particular, the New Zealand and Australian dollars sagged due to concerns about slower economic growth in China and waning demand for commodities. During the third quarter of 2014, the Central Bank of New Zealand stated its intention to weaken the local currency, prompting an immediate selloff. In general, U.S. Treasuries benefited from recent market conditions. Yields on short-maturity securities rose, but yields on 10- and 30-year Treasuries fell.
Portfolio Review
For the 12 months ended September 30, 2014, Class A shares of the Loomis Sayles Core Plus Bond Fund returned 7.43%. The fund outperformed its benchmark, the Barclays U.S. Aggregate Bond Index, which returned 3.96%.
Explanation of Fund Performance
An overweight position in investment-grade securities, with an emphasis on securities with BBB ratings and a focus on strong relative value, aided Fund performance. Security selection among the investment-grade securities of companies in the industrials sector was a strong contributor to the Fund’s outperformance. Selected companies in the energy, communications and capital goods sectors also drove results. Investment-grade securities in the financial and utilities sectors also contributed to returns, primarily due to the performance of selected banking and electric companies. Exposure to out-of-benchmark (securities not held by the benchmark) high-yield bonds significantly contributed to performance, as investors’ demand for yield lifted the market. Bonds with BB and B ratings
1 |
were the largest contributors on a relative basis. Strong security selection within high-yield industrials bolstered fund performance, as selected companies within the communications and basic industrial sectors also performed well. High-yield securities in the financials and utilities sectors also generated positive results. In addition, we opportunistically increased the fund’s out-of-benchmark, non-U.S.-dollar holdings. Securities denominated in the euro aided fund performance, as selected peripheral European bonds performed well. Underweight allocations to U.S. Treasuries and Agencies also contributed to performance.
The fund continued to hold a significantly lower position in mortgage-backed securities relative to the benchmark. This positioning detracted from performance. In addition, holdings denominated in the Brazilian real and Philippine peso weighed on performance. Security selection and the dislocation experienced in emerging markets in January and July limited performance in non-U.S. dollar markets. Meanwhile, we shortened the fund’s duration (price sensitivity to interest rate changes) during the period, and this positioning detracted from performance.
Outlook
We expect some volatility in non-government sectors once the Fed finally moves away from calendar-based guidance to its stated goal of economic data-based guidance, meaning that economic data will drive Fed guidance rather than a specific timeline. By the end of the reporting period, the Fed’s expected transition to monetary policy “normalization” pressured the riskier market sectors. Non-Treasury sectors, including investment grade, high yield, emerging markets and credit structured products, experienced wider spreads (the yield differences between Treasury and non-Treasury securities of similar maturity) as investors prepared for an eventual hike in short-term interest rates. It’s important to note that when this policy shift occurs, it will be because the Fed believes the U.S. economic growth outlook has improved enough to justify a less accommodative monetary policy. In considering this shift, the Fed is examining a number of factors, including improved labor markets, stronger hiring, a modest firming in incomes and higher asset prices (also indicative of improved consumer and business sentiment). That being said, we expect a measured pace of Fed tightening due to the fact that global economic growth remains uneven, U.S. economic growth potential remains lower than in previous economic cycles and inflation remains benign.
We believe market technical factors may continue to be subject to pressure in the near term. Investors likely will remain cautious ahead of any Fed action, with a tug of war between investors’ desire to avoid disruptive markets and the significant opportunity cost of staying sidelined in an extraordinarily low-yielding market, with few attractive investment alternatives.
We recently began redeploying liquid assets (generated from gains realized by selling securities issued by European peripheral countries and other fully priced securities) into riskier markets including high-yield bonds, structured products, emerging-markets debt and emerging non-U.S.-dollar denominated securities. Although U.S. high-yield valuations appear fairly full, we are still finding opportunities in selected higher-growth industries in the United States, such as energy.
| 2
LOOMIS SAYLES CORE PLUS BOND FUND
Growth of $10,000 Investment in Class A Shares3
September 30, 2004 through September 30, 2014
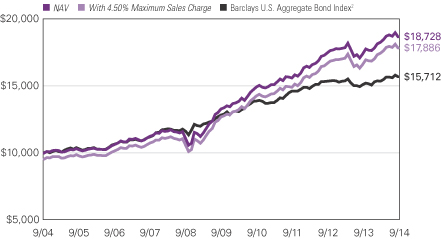
3 |
Average Annual Total Returns — September 30, 20143
| | | | | | | | | | | | | | | | |
| | | | | |
| | | 1 Year | | | 5 Years | | | 10 Years | | | Life of
Class N | |
| | | | | |
| Class A (Inception 11/7/73) | | | | | | | | | | | | | | | | |
| NAV | | | 7.43 | % | | | 7.08 | % | | | 6.48 | % | | | — | % |
| With 4.50% Maximum Sales Charge | | | 2.59 | | | | 6.10 | | | | 5.99 | | | | — | |
| | | | | |
| Class B (Inception 9/13/93) | | | | | | | | | | | | | | | | |
| NAV | | | 6.56 | | | | 6.26 | | | | 5.68 | | | | — | |
| With CDSC1 | | | 1.56 | | | | 5.94 | | | | 5.68 | | | | — | |
| | | | | |
| Class C (Inception 12/30/94) | | | | | | | | | | | | | | | | |
| NAV | | | 6.54 | | | | 6.27 | | | | 5.67 | | | | — | |
| With CDSC1 | | | 5.54 | | | | 6.27 | | | | 5.67 | | | | | |
| | | | | |
| Class N (Inception 2/1/13) | | | | | | | | | | | | | | | | |
| NAV | | | 7.81 | | | | — | | | | — | | | | 3.36 | |
| | | | | |
| Class Y (Inception 12/30/94) | | | | | | | | | | | | | | | | |
| NAV | | | 7.65 | | | | 7.35 | | | | 6.75 | | | | — | |
| | | | | |
| Comparative Performance | | | | | | | | | | | | | | | | |
| Barclays U.S. Aggregate Bond Index2 | | | 3.96 | | | | 4.12 | | | | 4.62 | | | | 1.68 | |
Past performance does not guarantee future results. The table(s) do not reflect taxes shareholders might owe on any Fund distributions or when they redeem their shares. Performance for periods less than one year is cumulative, not annualized. Returns reflect changes in share price and reinvestment of dividends and capital gains, if any. Unlike a fund, an index is not managed and does not reflect fees and expenses.
| 1 | Performance for Class B shares assumes a maximum 5% contingent deferred sales charge (“CDSC”) applied when you sell shares, which declines annually between years 1-6 according to the following schedule: 5, 4, 3, 3, 2, 1, 0%. Class C shares performance assumes a 1% CDSC applied when you sell shares within one year of purchase. |
| 2 | Barclays U.S. Aggregate Bond Index is an unmanaged index that covers the U.S.-dollar denominated, investment-grade, fixed-rate, taxable bond market of SEC-registered securities. The index includes bonds from the Treasury, government-related, corporate, mortgage-backed securities, asset-backed securities, and collateralized mortgage-backed securities sectors. |
| 3 | Fund performance has been increased by fee waivers and/or expense reimbursements, if any, without which performance would have been lower. |
| 4
LOOMIS SAYLES HIGH INCOME FUND
| | | | |
| Managers | | Symbols | | |
| Matthew J. Eagan, CFA® | | Class A | | NEFHX |
| Elaine M. Stokes | | Class B | | NEHBX |
| Loomis, Sayles & Company, L.P. | | Class C | | NEHCX |
| | Class Y | | NEHYX |
Objective
Seeks high current income plus the opportunity for capital appreciation to produce a high total return
Market Conditions
Early in the reporting period, U.S. yields increased due to strong payroll data, but then generally declined for the remainder of the period. In addition, the Federal Reserve (the Fed) announced it would begin tapering quantitative easing (QE) in January 2014. The program is set to conclude in October 2014. Meanwhile, the European Central Bank (ECB) considered launching QE programs as euro zone inflation headed toward zero and growth remained anemic. Japan remained in the midst of a QE program, and many investors expected the Bank of England would be the first central bank to raise rates in 2015.
Although volatility remained consistently low for most of the period, the market experienced less stability as the reporting period drew to a close. High-yield securities generally performed well in the low volatility market, but investors responded to heightened volatility by moving out of low-credit-quality securities and into investment-grade positions, especially in Europe.
The U.S. dollar rally, which resulted in the currency peaking at a four-year high at the end of the reporting period, hampered foreign currency performance as those currencies lost value relative to the dollar. In addition, concerns about slower growth in China, and resulting lower demand for commodities, hurt the New Zealand and Australian dollars. Additionally, the Central Bank of New Zealand stated its local dollar was too strong, prompting an immediate selloff. The euro also weakened, particularly during the Scottish independence campaign. In general, U.S. Treasuries benefited from the dollar’s strength.
Performance Results
For the 12 months ended September 30, 2014, Class A shares of Loomis Sayles High Income Fund returned 8.42%. The fund outperformed its benchmark, the Barclays U.S. Corporate High-Yield Bond Index, which returned 7.20%.
5 |
Explanation of Fund Performance
The Fund’s outperformance primarily resulted from security selection within the investment-grade, high-yield, convertible and securitized segments. Positioning along the yield curve (a curve that shows the relationship among bond yields across the maturity spectrum) also aided results.
Investment-grade and high-yield securities in the industrial and financial sectors were among the leading contributors to relative performance. Specifically, securities in the communication, consumer cyclical and technology industries dominated returns. In addition, holdings in out-of-benchmark convertible securities (securities not held by the benchmark), including selections within the technology, consumer non-cyclical and basic industrial sectors, were strong contributors to the fund’s performance. Out-of-benchmark positions in securitized investments also aided fund performance.
Meanwhile, out-of-benchmark positions in common stock weighed on performance. Consumer cyclical securities, specifically those in the automotive industry, were the main detractors. A slight overweight position in emerging markets also dragged down performance. Consumer cyclical securities once again were prominent detractors, as exposure to homebuilders in Mexico hampered relative return. Additionally, positions in U.S. Treasuries detracted from absolute and relative performance, primarily due to yield curve positioning.
Outlook
A healthier U.S. economy and accommodative monetary policies abroad should help global growth in 2015. U.S. core inflation remains well below the 2.0% target set by the Fed, giving policy makers time to evaluate potential shifts away from historically low rates. We do not believe the Fed will raise rates until the third quarter of 2015, and the pace of hikes may be slow and gradual.
We believe corporate bonds have the potential to outperform if rates rise slowly on the back of stronger U.S. economic fundamentals. A number of factors are supportive of this forecast, including the fact that corporate credit fundamentals remain sound, corporate profits are growing and companies that are issuing new debt are primarily using the proceeds to refinance. Market liquidity remains good despite recent volatility in the bond markets. We find that opportunities in the high-income market have increased as yields have risen. While we do not foresee a large liquidity drain in fixed-income markets, we constantly monitor these markets for indications of the direction of future flows.
We continue to pursue a lower sensitivity to rising U.S. Treasury yields through lower nominal durations and diversification across multiple market sectors. We believe current markets will reward solid security selection, and our objective is to drive returns through capital appreciation and attractive income.
| 6
LOOMIS SAYLES HIGH INCOME FUND
Growth of $10,000 Investment in Class A Shares4
September 30, 2004 through September 30, 2014
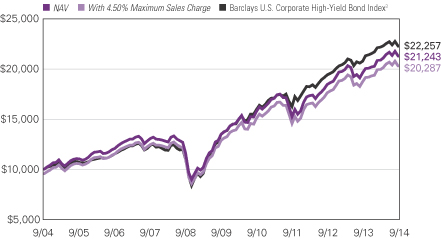
7 |
Average Annual Total Returns — September 30, 20144
| | | | | | | | | | | | |
| | | | |
| | | 1 Year | | | 5 Years | | | 10 Years | |
| | | | |
| Class A (Inception 2/22/84) | | | | | | | | | | | | |
| NAV | | | 8.42 | % | | | 9.53 | % | | | 7.82 | % |
| With 4.50% Maximum Sales Charge | | | 3.47 | | | | 8.54 | | | | 7.32 | |
| | | | |
| Class B (Inception 9/20/93) | | | | | | | | | | | | |
| NAV | | | 7.51 | | | | 8.71 | | | | 7.00 | |
| With CDSC2 | | | 2.63 | | | | 8.42 | | | | 7.00 | |
| | | | |
| Class C (Inception 3/2/98) | | | | | | | | | | | | |
| NAV | | | 7.60 | | | | 8.70 | | | | 7.01 | |
| With CDSC2 | | | 6.62 | | | | 8.70 | | | | 7.01 | |
| | | | |
| Class Y (Inception 2/29/08)1 | | | | | | | | | | | | |
| NAV | | | 8.72 | | | | 9.77 | | | | 7.99 | |
| | | | |
| Comparative Performance | | | | | | | | | | | | |
| Barclays U.S. Corporate High-Yield Bond Index3 | | | 7.20 | | | | 10.57 | | | | 8.33 | |
Past performance does not guarantee future results. The table(s) do not reflect taxes shareholders might owe on any Fund distributions or when they redeem their shares. Performance for periods less than one year is cumulative, not annualized. Returns reflect changes in share price and reinvestment of dividends and capital gains, if any. Unlike a fund, an index is not managed and does not reflect fees and expenses.
| 1 | Prior to the inception of Class Y shares (2/29/08), performance is that of Class A shares and reflects the higher net expenses of that share class. |
| 2 | Performance for Class B shares assumes a maximum 5% contingent deferred sales charge (“CDSC”) applied when you sell shares, which declines annually between years 1-6 according to the following schedule: 5, 4, 3, 3, 2, 1, 0%. Class C shares performance assumes a 1% CDSC applied when you sell shares within one year of purchase. |
| 3 | Barclays U.S. Corporate High-Yield Bond Index is an unmanaged index that covers the U.S. dollar-denominated, non-investment grade, fixed-rate, taxable corporate bond market. |
| 4 | Fund performance has been increased by fee waivers and/or expense reimbursements, if any, without which performance would have been lower. |
| 8
LOOMIS SAYLES INTERNATIONAL BOND FUND
| | | | |
| Managers | | Symbols | | |
| Kenneth M. Buntrock, CFA®, CIC | | Class A | | LSIAX |
| David W. Rolley, CFA® | | Class C | | LSICX |
| Lynda L. Schweitzer, CFA® | | Class Y | | LSIYX |
| Loomis, Sayles & Company, L.P. | | |
Objective
Seeks high total investment return through a combination of high current income and capital appreciation
Market Conditions
The main themes of the 12-month period included low volatility, significant central bank involvement in the markets and rising geopolitical tensions. U.S. interest rates initially traded higher before falling through the first half of 2014 as expectations for short-term rate hikes changed. Softer economic data at the beginning of the year, harsh winter weather and lingering concerns about Asia and several emerging market economies were the driving forces behind moderate and uneven global growth.
The euro zone recovery has been timid overall, and progress has been uneven across the region. The European Central Bank (ECB) became increasingly more accommodative, and yields in core and peripheral countries trended to historically low levels. Indicators of future economic activity suggest continued recovery in coming months, but events such as the Scottish independence referendum and a disinflationary environment heightened concerns. The Bank of Japan maintained its policy stance and asset purchase program. It appeared that April’s consumption tax hike took a larger bite out of economic activity than previously expected.
Emerging markets performed well for most of the period, as valuations were more attractive following last year’s selloff. Despite conflicts between Russia and Ukraine and in the Middle East, many markets remained relatively stable. In addition, it appears China’s policymakers currently are content with marginally slower growth and are not willing to provide much stimulus to accelerate the country’s economy.
Performance Results
For the 12 months ended September 30, 2014, Class A shares of the Loomis Sayles International Bond Fund returned -1.29%. The fund underperformed its benchmark, the Barclays Global Aggregate ex-USD Bond Index, which returned -0.81%.
Explanation of Fund Performance
Issue selection among global Treasuries was the primary detractor from performance during the period. The Fund’s preference for German government bonds over the better-performing government bonds of several peripheral European countries, such as Spain and Italy, weighed on results. Our out-of-benchmark (securities not held by the Fund’s
9 |
benchmark) exposure in short duration (less price sensitivity to interest rate changes) U.S. Treasuries also dragged down performance. Within the corporate space, selected U.S. and European holdings hindered performance. In particular, our issue selection in the U.S. energy and auto loan sectors and the European capital goods, banking and consumer cyclical sectors mitigated returns. Although currency positioning was positive overall, our overweight exposure to the Norwegian krone weighed on results as the currency weakened. Currency forwards, which were used to manage currency risk, also detracted from performance.
Yield curve (a curve that shows the relationship among bond yields across the maturity spectrum) positioning was a strong contributor to performance during the period. Specifically, our euro issues in the “belly” of the curve (intermediate maturity range) proved beneficial, as euro yields plummeted due to geopolitical concerns and economic weakness across Europe. Positioning along the U.S. yield curve also contributed to fund performance. From a currency perspective, the fund’s underweight positions in the yen and euro contributed positively. These currencies depreciated versus the U.S. dollar during the 12-month period. Our underweight exposure to the Australian dollar and Canadian dollar also generated positive results. Sector allocation also enhanced performance, with an overweight allocation to the corporate space leading the way. In particular, the fund’s allocations in the U.K. banking, communication and electric sectors were positive. Additionally, an underweight position in government-related sectors aided performance. Interest rate futures, which were used for duration management, also contributed positively to results.
Outlook
We believe the United States will remain the best positioned of the industrialized economies to expand in the near term, lead the global recovery forward and raise interest rates in 2015. Growth, in tandem with the Federal Reserve’s (the Fed’s) decision to end its monthly bond-buying program, known as quantitative easing, in October, should lead to higher U.S. yields, all else being equal. As U.S. growth increases, certain countries may benefit due to their close trading ties with the United States.
Geopolitical stress and lackluster growth have generated concerns about Europe’s short-term prospects. We believe an accommodative ECB should be supportive for local bond markets, and yields likely will remain capped in the near and medium term. The Bank of Japan signaled that monetary easing would be increased following weak growth impacted by April’s tax hike. There may be an inflection point at which yen weakness will start having an adverse effect on Japan’s import pricing and profitability.
In emerging markets, we believe country and currency selections will remain crucial in coming quarters. Selected economies may face slower growth as economic indicators remain anemic and have not yet rebounded to pre-2008 rates. We will closely monitor China’s growth, but we do not anticipate any major financial incidents.
| 10
LOOMIS SAYLES INTERNATIONAL BOND FUND
Growth of $10,000 Investment in Class A Shares3
February 1, 2008 (inception) through September 30, 2014
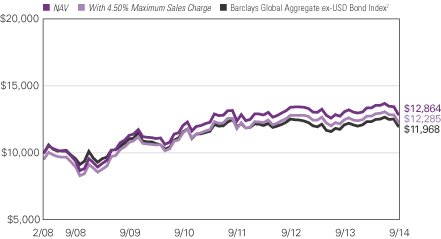
Average Annual Total Returns — September 30, 20143
| | | | | | | | | | | | |
| | | | |
| | | 1 Year | | | 5 Years | | | Life of
Fund | |
| | | | |
| Class A (Inception 2/1/08) | | | | | | | | | | | | |
| NAV | | | -1.29 | % | | | 2.68 | % | | | 3.86 | % |
| With 4.50% Maximum Sales Charge | | | -5.71 | | | | 1.74 | | | | 3.14 | |
| | | | |
| Class C (Inception 2/1/08) | | | | | | | | | | | | |
| NAV | | | -2.11 | | | | 1.91 | | | | 3.07 | |
| With CDSC1 | | | -3.06 | | | | 1.91 | | | | 3.07 | |
| | | | |
| Class Y (Inception 2/1/08) | | | | | | | | | | | | |
| NAV | | | -1.05 | | | | 2.96 | | | | 4.11 | |
| | | | |
| Comparative Performance | | | | | | | | | | | | |
| Barclays Global Aggregate ex-USD Bond Index2 | | | -0.81 | | | | 1.68 | | | | 2.74 | |
Past performance does not guarantee future results. The table(s) do not reflect taxes shareholders might owe on any Fund distributions or when they redeem their shares. Performance for periods less than one year is cumulative, not annualized. Returns reflect changes in share price and reinvestment of dividends and capital gains, if any. Unlike a fund, an index is not managed and does not reflect fees and expenses.
| 1 | Class C shares performance assumes a 1% CDSC applied when you sell shares within one year of purchase. |
| 2 | Barclays Global Aggregate ex-USD Bond Index is an unmanaged index that provides a broad-based measure of the international investment-grade fixed-rate debt markets. |
| 3 | Fund performance has been increased by fee waivers and/or expense reimbursements, if any, without which performance would have been lower. |
11 |
LOOMIS SAYLES LIMITED TERM GOVERNMENT AND AGENCY FUND
| | | | |
| Managers | | Symbols | | |
| Christopher T. Harms | | Class A | | NEFLX |
| Clifton V. Rowe, CFA® | | Class B | | NELBX |
| Kurt L. Wagner, CFA®, CIC | | Class C | | NECLX |
| Loomis, Sayles & Company, L.P. | | Class Y | | NELYX |
Objective
Seeks a high current return consistent with preservation of capital
Market Conditions
Weaker-than-expected U.S. growth, geopolitical concerns in Russia/Ukraine and Syria, and central bank actions, including the Federal Reserve’s (the Fed’s) tapering of quantitative easing (QE) and the European Central Bank’s easing of monetary policy, remained in the spotlight during the period. The yield curve (a curve that shows the relationship among bond yields across the maturity spectrum) flattened during the period. This occurred because rates on short- and intermediate-maturity securities increased and rates on long-maturity securities declined. Spreads (the difference in yield between Treasury and non-Treasury securities of similar maturity) compressed across most market sectors, including corporate bonds, asset-backed securities (ABS) and commercial mortgage-backed securities (CMBS).
Performance Results
For the 12 months ended September 30, 2014, Class A shares of the Loomis Sayles Limited Term Government and Agency Fund returned 1.44%. The fund outperformed its benchmark, the Barclays U.S. 1-5 Year Government Bond Index, which returned 0.67%.
Explanation of Fund Performance
The Fund’s preference for credit and agency mortgage-backed securities (MBS) over U.S. Treasuries and agency securities primarily accounted for it’s relative outperformance. A large MBS allocation significantly outperformed Treasuries and agencies on a duration-adjusted basis (duration refers to a security’s price sensitivity to interest rate changes), providing strong results for the Fund. As the commercial real estate market improved during the period, the Fund’s non-agency CMBS allocation was a primary contributor to relative performance. Our CMBS focus remained on senior issues within the top tranche (a portion of a specific class of bonds within an offering of fixed income securities), as we continued to find opportunities among seasoned and new issue securities. Agency CMBS also helped buoy performance as they outperformed Treasuries of a similar duration. In addition, the Fund’s agency collateralized mortgage obligations (CMOs) advanced as credit spreads (the yield difference between Treasuries and non-Treasury securities of a similar maturity) tightened.
| 12
LOOMIS SAYLES LIMITED TERM GOVERNMENT AND AGENCY FUND
Yield curve positioning was the primary detractor to performance, as we maintained an overweight to the shorter end of the curve, where yields rose, and an underweight to the longer end, where interest rates were flat to slightly negative. In addition, an underweight position in government agencies slightly weighed on gains, as these securities were among the stronger contributors for the benchmark during the period.
Outlook
For agency MBS, we believe Fed buying should absorb most of the net supply for the fourth quarter, and net negative supply should support spreads. However, spreads are narrow on a historical basis, and therefore we would tend to favor an underweight position to the MBS sector for the long-term provided this trend continues. Within the commercial real estate segment, top-tier assets and markets generally have recovered and ended the period at or above prior peak levels. We believe the investment grade CMBS sector remains attractive. Elsewhere, we believe senior AAA-rated ABS currently offer an attractive combination of strong credit quality and enhanced yield. We favor buying subordinated bonds (bonds that rank lower in priority than other bonds in the event the issuing entity experiences financial distress) and bonds that have subsequently been reissued with the same maturities (“off-the-run”), as we believe the impact of credit risk on the price of these bonds creates attractive opportunities to capture additional yield.
Growth of $10,000 Investment in Class A Shares3
September 30, 2004 through September 30, 2014
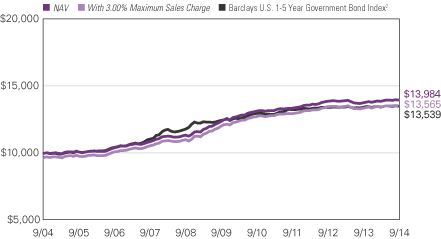
13 |
Average Annual Total Returns — September 30, 20143
| | | | | | | | | | | | |
| | | | |
| | | 1 Year | | | 5 Years | | | 10 Years | |
| | | | |
| Class A (Inception 1/3/89) | | | | | | | | | | | | |
| NAV | | | 1.44 | % | | | 2.44 | % | | | 3.40 | % |
| With 3.00% Maximum Sales Charge | | | -1.59 | | | | 1.81 | | | | 3.09 | |
| | | | |
| Class B (Inception 9/27/93) | | | | | | | | | | | | |
| NAV | | | 0.69 | | | | 1.67 | | | | 2.63 | |
| With CDSC1 | | | -4.28 | | | | 1.30 | | | | 2.63 | |
| | | | |
| Class C (Inception 12/30/94) | | | | | | | | | | | | |
| NAV | | | 0.69 | | | | 1.67 | | | | 2.63 | |
| With CDSC1 | | | -0.31 | | | | 1.67 | | | | 2.63 | |
| | | | |
| Class Y (Inception 3/31/94) | | | | | | | | | | | | |
| NAV | | | 1.70 | | | | 2.69 | | | | 3.67 | |
| | | | |
| Comparative Performance | | | | | | | | | | | | |
| Barclays U.S. 1-5 Year Government Bond Index2 | | | 0.67 | | | | 1.66 | | | | 3.08 | |
Past performance does not guarantee future results. The table(s) do not reflect taxes shareholders might owe on any Fund distributions or when they redeem their shares. Performance for periods less than one year is cumulative, not annualized. Returns reflect changes in share price and reinvestment of dividends and capital gains, if any. Unlike a fund, an index is not managed and does not reflect fees and expenses.
| 1 | Performance for Class B shares assumes a maximum 5% contingent deferred sales charge (“CDSC”) applied when you sell shares, which declines annually between years 1-6 according to the following schedule: 5, 4, 3, 3, 2, 1, 0%. Class C shares performance assumes a 1% CDSC applied when you sell shares within one year of purchase. |
| 2 | Barclays U.S. 1-5 Year Government Bond Index is an unmanaged index that includes U.S. Treasury and agency securities with remaining maturities of one to five years. |
| 3 | Fund performance has been increased by fee waivers and/or expense reimbursements, if any, without which performance would have been lower. |
| 14
ADDITIONAL INFORMATION
The views expressed in this report reflect those of the portfolio managers as of the dates indicated. The managers’ views are subject to change at any time without notice based on changes in market or other conditions. References to specific securities or industries should not be regarded as investment advice. Because the fund is actively managed, there is no assurance that it will continue to invest in the securities or industries mentioned.
ADDITIONAL INDEX INFORMATION
This document may contain references to third party copyrights, indexes, and trademarks, each of which is the property of its respective owner. Such owner is not affiliated with Natixis Global Asset Management or any of its related or affiliated companies (collectively “NGAM”) and does not sponsor, endorse or participate in the provision of any NGAM services, funds or other financial products.
The index information contained herein is derived from third parties and is provided on an “as is” basis. The user of this information assumes the entire risk of use of this information. Each of the third party entities involved in compiling, computing or creating index information disclaims all warranties (including, without limitation, any warranties of originality, accuracy, completeness, timeliness, non-infringement, merchantability and fitness for a particular purpose) with respect to such information.
PROXY VOTING INFORMATION
A description of the fund’s proxy voting policies and procedures is available without charge, upon request, by calling Natixis Funds at 800-225-5478; on the fund’s website at ngam.natixis.com; and on the Securities and Exchange Commission’s (“SEC’s”) website at www.sec.gov. Information regarding how the fund voted proxies relating to portfolio securities during the 12-months ended June 30, 2014 is available from the fund’s website and the SEC’s website.
QUARTERLY PORTFOLIO SCHEDULES
The fund files a complete schedule of portfolio holdings with the SEC for the first and third quarters of each fiscal year on Form N-Q. The fund’s Forms N-Q are available on the SEC’s website at www.sec.gov and may be reviewed and copied at the SEC’s Public Reference Room in Washington, DC. Information on the operation of the Public Reference Room may be obtained by calling 800-SEC-0330.
15 |
UNDERSTANDING FUND EXPENSES
As a mutual fund shareholder, you incur different costs: transaction costs, including sales charges (loads) on purchases and contingent deferred sales charges on redemptions, and ongoing costs, including management fees, distribution and/or service fees (12b-1 fees), and other fund expenses. Certain exemptions may apply. Certain exemptions may apply. These costs are described in more detail in the Fund’s prospectuses. The following examples are intended to help you understand the ongoing costs of investing in the Funds and help you compare these with the ongoing costs of investing in other mutual funds.
The first line in the table of each class of Fund shares shows the actual account values and actual fund expenses you would have paid on a $1,000 investment in the Fund from April 1, 2014 through September 30, 2014. To estimate the expenses you paid over the period, simply divide your account value by $1,000 (for example $8,600 account value divided by $1,000 = 8.60) and multiply the result by the number in the Expenses Paid During Period column as shown below for your class.
The second line in the table of each class of fund shares provides information about hypothetical account values and hypothetical expenses based on the Fund’s actual expense ratios and an assumed rate of return of 5% per year before expenses, which is not the Fund’s actual return. The hypothetical account values and expenses may not be used to estimate the actual ending account balance or expenses you paid on your investment for the period. You may use this information to compare the ongoing costs of investing in the Fund to other funds. To do so, compare this 5% hypothetical example with the 5% hypothetical examples that appear in the shareholder reports of the other funds.
Please note that the expenses shown reflect ongoing costs only, and do not include any transaction costs such as sales charges. Therefore, the second line in the table of each fund is useful in comparing ongoing costs only, and will not help you determine the relative costs of owning different funds. If transaction costs were included, total costs would be higher.
| 16
| | | | | | | | | | | | |
| LOOMIS SAYLES CORE PLUS BOND FUND | | BEGINNING
ACCOUNT VALUE
4/1/2014 | | | ENDING
ACCOUNT VALUE
9/30/2014 | | | EXPENSES PAID
DURING PERIOD*
4/1/2014 – 9/30/2014 | |
| Class A | | | | | | | | | | | | |
| Actual | | | $1,000.00 | | | | $1,022.10 | | | | $4.00 | |
| Hypothetical (5% return before expenses) | | | $1,000.00 | | | | $1,021.11 | | | | $4.00 | |
| Class B | | | | | | | | | | | | |
| Actual | | | $1,000.00 | | | | $1,017.90 | | | | $7.79 | |
| Hypothetical (5% return before expenses) | | | $1,000.00 | | | | $1,017.35 | | | | $7.79 | |
| Class C | | | | | | | | | | | | |
| Actual | | | $1,000.00 | | | | $1,017.60 | | | | $7.79 | |
| Hypothetical (5% return before expenses) | | | $1,000.00 | | | | $1,017.35 | | | | $7.79 | |
| Class N | | | | | | | | | | | | |
| Actual | | | $1,000.00 | | | | $1,023.60 | | | | $2.38 | |
| Hypothetical (5% return before expenses) | | | $1,000.00 | | | | $1,022.71 | | | | $2.38 | |
| Class Y | | | | | | | | | | | | |
| Actual | | | $1,000.00 | | | | $1,023.20 | | | | $2.74 | |
| Hypothetical (5% return before expenses) | | | $1,000.00 | | | | $1,022.36 | | | | $2.74 | |
| * | Expenses are equal to the Fund's annualized expense ratio: 0.79%, 1.54%, 1.54%, 0.47% and 0.54% for Class A, B, C, N and Y, respectively, multiplied by the average account value over the period, multiplied by the number of days in the most recent fiscal half-year (183), divided by 365 (to reflect the half-year period). |
17 |
| | | | | | | | | | | | |
| LOOMIS SAYLES HIGH INCOME FUND | | BEGINNING
ACCOUNT VALUE
4/1/2014 | | | ENDING
ACCOUNT VALUE
9/30/2014 | | | EXPENSES PAID
DURING PERIOD*
4/1/2014 – 9/30/2014 | |
| Class A | | | | | | | | | | | | |
| Actual | | | $1,000.00 | | | | $1,018.40 | | | | $5.72 | |
| Hypothetical (5% return before expenses) | | | $1,000.00 | | | | $1,019.40 | | | | $5.72 | |
| Class B | | | | | | | | | | | | |
| Actual | | | $1,000.00 | | | | $1,014.30 | | | | $9.59 | |
| Hypothetical (5% return before expenses) | | | $1,000.00 | | | | $1,015.54 | | | | $9.60 | |
| Class C | | | | | | | | | | | | |
| Actual | | | $1,000.00 | | | | $1,014.60 | | | | $9.55 | |
| Hypothetical (5% return before expenses) | | | $1,000.00 | | | | $1,015.59 | | | | $9.55 | |
| Class Y | | | | | | | | | | | | |
| Actual | | | $1,000.00 | | | | $1,019.80 | | | | $4.46 | |
| Hypothetical (5% return before expenses) | | | $1,000.00 | | | | $1,020.66 | | | | $4.46 | |
| * | Expenses are equal to the Fund's annualized expense ratio (after waiver/reimbursement): 1.13%, 1.90%, 1.89% and 0.88% for Class A, B, C and Y, respectively, multiplied by the average account value over the period, multiplied by the number of days in the most recent fiscal half-year (183), divided by 365 (to reflect the half-year period). |
| | | | | | | | | | | | |
LOOMIS SAYLES INTERNATIONAL
BOND FUND | | BEGINNING
ACCOUNT VALUE
4/1/2014 | | | ENDING
ACCOUNT VALUE
9/30/2014 | | | EXPENSES PAID
DURING PERIOD*
4/1/2014 – 9/30/2014 | |
| Class A | | | | | | | | | | | | |
| Actual | | | $1,000.00 | | | | $965.80 | | | | $5.22 | |
| Hypothetical (5% return before expenses) | | | $1,000.00 | | | | $1,019.75 | | | | $5.37 | |
| Class C | | | | | | | | | | | | |
| Actual | | | $1,000.00 | | | | $962.20 | | | | $8.90 | |
| Hypothetical (5% return before expenses) | | | $1,000.00 | | | | $1,015.99 | | | | $9.15 | |
| Class Y | | | | | | | | | | | | |
| Actual | | | $1,000.00 | | | | $967.90 | | | | $4.00 | |
| Hypothetical (5% return before expenses) | | | $1,000.00 | | | | $1,021.01 | | | | $4.10 | |
| * | Expenses are equal to the Fund's annualized expense ratio (after waiver/reimbursement): 1.06%, 1.81% and 0.81% for Class A, C and Y, respectively, multiplied by the average account value over the period, multiplied by the number of days in the most recent fiscal half-year (183), divided by 365 (to reflect the half-year period). |
| 18
| | | | | | | | | | | | |
LOOMIS SAYLES LIMITED TERM
GOVERNMENT AND AGENCY FUND | | BEGINNING
ACCOUNT VALUE
4/1/2014 | | | ENDING
ACCOUNT VALUE
9/30/2014 | | | EXPENSES PAID
DURING PERIOD*
4/1/2014 – 9/30/2014 | |
| Class A | | | | | | | | | | | | |
| Actual | | | $1,000.00 | | | | $1,006.10 | | | | $4.02 | |
| Hypothetical (5% return before expenses) | | | $1,000.00 | | | | $1,021.06 | | | | $4.05 | |
| Class B | | | | | | | | | | | | |
| Actual | | | $1,000.00 | | | | $1,002.30 | | | | $7.78 | |
| Hypothetical (5% return before expenses) | | | $1,000.00 | | | | $1,017.30 | | | | $7.84 | |
| Class C | | | | | | | | | | | | |
| Actual | | | $1,000.00 | | | | $1,002.30 | | | | $7.78 | |
| Hypothetical (5% return before expenses) | | | $1,000.00 | | | | $1,017.30 | | | | $7.84 | |
| Class Y | | | | | | | | | | | | |
| Actual | | | $1,000.00 | | | | $1,007.30 | | | | $2.77 | |
| Hypothetical (5% return before expenses) | | | $1,000.00 | | | | $1,022.31 | | | | $2.79 | |
| * | Expenses are equal to the Fund's annualized expense ratio: 0.80%, 1.55%, 1.55% and 0.55% for Class A, B, C and Y, respectively, multiplied by the average account value over the period, multiplied by the number of days in the most recent fiscal half-year (183), divided by 365 (to reflect the half-year period). |
19 |
BOARD APPROVAL OF THE EXISTING ADVISORY AGREEMENTS
The Board of Trustees of the Trusts (the “Board”), including the Independent Trustees, considers matters bearing on each Fund’s advisory agreement and, with respect to the Loomis Sayles Core Plus Bond Fund, its Advisory Administration Agreement (collectively, the “Agreements”) at most of its meetings throughout the year. Each year, usually in the spring, the Contract Review Committee of the Board meets to review the Agreements to determine whether to recommend that the full Board approve the continuation of the Agreements, typically for an additional one-year period. After the Committee has made its recommendation, the full Board, including the Independent Trustees, determines whether to approve the continuation of the Agreements.
In connection with these meetings, the Trustees receive materials that the Funds’ investment adviser (the “Adviser”) believes to be reasonably necessary for the Trustees to evaluate the Agreements. These materials generally include, among other items, (i) information on the investment performance of the Funds and the performance of peer groups of funds and the Funds’ performance benchmarks, (ii) information on the Funds’ advisory fees and other expenses, including information comparing the Funds’ expenses to the fees charged to institutional accounts with similar strategies managed by the Adviser, if any, and to those of peer groups of funds and information about any applicable expense caps and fee “breakpoints,” (iii) sales and redemption data in respect of the Funds, (iv) information about the profitability of the Agreements to the Adviser and (v) information obtained through the completion by the Adviser of a questionnaire distributed on behalf of the Trustees. The Board, including the Independent Trustees, also considers other matters such as (i) the Adviser’s financial results and financial condition, (ii) each Fund’s investment objective and strategies and the size, education and experience of the Adviser’s investment staff and its use of technology, external research and trading cost measurement tools, (iii) arrangements in respect of the distribution of the Funds’ shares and the related costs, (iv) the procedures employed to determine the value of the Funds’ assets, (v) the allocation of the Funds’ brokerage, if any, including, if applicable, allocations to brokers affiliated with the Adviser and the use of “soft” commission dollars to pay Fund expenses and to pay for research and other similar services, (vi) the resources devoted to, and the record of compliance with, the Funds’ investment policies and restrictions, policies on personal securities transactions and other compliance policies, (vii) information about amounts invested by the Funds’ portfolio managers in the Funds or in similar accounts that they manage and (viii) the general economic outlook with particular emphasis on the mutual fund industry. Throughout the process, the Trustees are afforded the opportunity to ask questions of and request additional materials from the Adviser.
In addition to the materials requested by the Trustees in connection with their annual consideration of the continuation of the Agreements, the Trustees receive materials in advance of each regular quarterly meeting of the Board that provide detailed information about the Funds’ investment performance and the fees charged to the Funds for advisory and other services. This information generally includes, among other things, an internal performance rating for each Fund based on agreed-upon criteria, graphs showing each Fund’s performance and fee differentials against each Fund’s peer group/category,
| 20
performance ratings provided by a third-party, total return information for various periods, and third-party performance rankings for various periods comparing a Fund against similarly categorized funds. The portfolio management team for each Fund or other representatives of the Adviser make periodic presentations to the Contract Review Committee and/or the full Board, and Funds identified as presenting possible performance concerns may be subject to more frequent board presentations and reviews. In addition, each quarter the Trustees are provided with detailed statistical information about each Fund’s portfolio. The Trustees also receive periodic updates between meetings.
The Board most recently approved the continuation of the Agreements at its meeting held in June 2014. The Agreements were continued for a one-year period for the Funds. In considering whether to approve the continuation of the Agreements, the Board, including the Independent Trustees, did not identify any single factor as determinative. Individual Trustees may have evaluated the information presented differently from one another, giving different weights to various factors. Matters considered by the Trustees, including the Independent Trustees, in connection with their approval of the Agreements included, but were not limited to, the factors listed below.
The nature, extent and quality of the services provided to the Funds under the Agreements. The Trustees considered the nature, extent and quality of the services provided by the Adviser and its affiliates to the Funds and the resources dedicated to the Funds by the Adviser and its affiliates.
The Trustees considered not only the advisory services provided by the Adviser to the Funds, but also the administrative services provided by NGAM Advisors, L.P. (“NGAM Advisors”) and its affiliates to the Funds. For each Fund, the Trustees also considered the benefits to shareholders of investing in a mutual fund that is part of a family of funds that offers shareholders the right to exchange shares of one type of fund for shares of another type of fund, and provides a variety of fund and shareholder services.
After reviewing these and related factors, the Trustees concluded, within the context of their overall conclusions regarding each of the Agreements, that the nature, extent and quality of services provided supported the renewal of the Agreements.
Investment performance of the Funds and the Adviser. As noted above, the Trustees received information about the performance of the Funds over various time periods, including information that compared the performance of the Funds to the performance of peer groups and categories of funds and the Funds’ respective performance benchmarks. In addition, the Trustees also reviewed data prepared by an independent third party that analyzed the performance of the Funds using a variety of performance metrics, including metrics that also measured the performance of the Funds on a risk adjusted basis.
With respect to each Fund, the Board concluded that the Fund’s performance or other relevant factors supported the renewal of the Agreement relating to that Fund. In the case of the Loomis Sayles High Income Fund, the Loomis Sayles International Bond Fund and the Loomis Sayles Limited Term Government and Agency Fund, each of which had performance that lagged that of a relevant peer group median and/or category median for certain (although not necessarily all) periods, the Board concluded that other factors relevant to performance supported renewal of the Agreements. These factors included the
21 |
following: (1) that the underperformance was attributable, to a significant extent, to investment decisions (such as security selection or sector allocation) by the Adviser that was reasonable and consistent with the Fund’s investment objective and policies; (2) that the Fund has performed largely in line with its benchmark over the longer term; (3) that the Fund’s more recent performance, although lagging in certain periods, was competitive when compared to relevant performance benchmarks or categories; (4) that the Fund’s more recent performance, although lagging in certain periods, had shown improvement relative to its category; and (5) that the Fund’s long-term performance was competitive when compared to relevant performance benchmarks or peer groups.
The Trustees also considered the Adviser’s performance and reputation generally, the performance of the fund family generally, and the historical responsiveness of the Adviser to Trustee concerns about performance and the willingness of the Adviser to take steps intended to improve performance.
After reviewing these and related factors, the Trustees concluded, within the context of their overall conclusions regarding each of the Agreements, that the performance of the Funds and the Adviser and/or other relevant factors supported the renewal of the Agreements.
The costs of the services to be provided and profits to be realized by the Adviser and its affiliates from their respective relationships with the Funds. The Trustees considered the fees charged to the Funds for advisory services as well as the total expense levels of the Funds. This information included comparisons (provided both by management and also by an independent third party) of the Funds’ advisory fees and total expense levels to those of their peer groups and information about the advisory fees charged by the Adviser to comparable accounts (such as institutional separate accounts), as well as information about differences in such fees and the reasons for any such differences. In considering the fees charged to comparable accounts, the Trustees considered, among other things, management’s representations about the differences between managing mutual funds as compared to other types of accounts, including the additional resources required to effectively manage mutual fund assets and the greater regulatory costs associated with the management of such assets. In evaluating each fund’s advisory fee, the Trustees also took into account the demands, complexity and quality of the investment management of such Fund, as well as the need for the Adviser to offer competitive compensation and to expend additional resources as the Funds grow in size. The Trustees considered that over the past several years, management had made recommendations regarding reductions in advisory fee rates, implementation of advisory fee breakpoints and the institution of advisory fee waivers and expense caps for various funds in the fund family. They noted that the Funds in this report have expense caps in place, and they considered the amounts waived or reimbursed by the Adviser under these caps for each Fund whose current expenses are above the cap.
The Trustees also considered the compensation directly or indirectly received or to be received by the Adviser and its affiliates from their relationships with the Funds. The Trustees reviewed information provided by management as to the profitability of the Adviser’s and its affiliates’ relationships with the Funds, and information about the allocation of expenses used to calculate profitability. They also reviewed information provided by management about the effect of distribution costs and changes in asset levels on
| 22
Adviser profitability, including information regarding resources spent on distribution activities. When reviewing profitability, the Trustees also considered information about court cases in which adviser compensation or profitability were issues and the performance of the relevant Funds, the expense levels of the Funds, whether the Adviser had implemented breakpoints and/or expense caps with respect to such Funds.
After reviewing these and related factors, the Trustees concluded, within the context of their overall conclusions regarding each of the Agreements, that the advisory fee charged to each of the Funds was fair and reasonable, and that the costs of these services generally and the related profitability of the Adviser and its affiliates in respect of their relationships with the Funds supported the renewal of the Agreements.
Economies of Scale. The Trustees considered the existence of any economies of scale in the provision of services by the Adviser and whether those economies are shared with the Funds through breakpoints in their investment advisory fees or other means, such as expense waivers or caps. The Trustees also discussed with management the factors considered with respect to the implementation of breakpoints in investment advisory fees or expense waivers or caps for certain funds. Management explained that a number of factors are taken into account in considering the possible implementation of breakpoints or an expense cap for a fund, including, among other things, factors such as a fund’s assets, the projected growth of a fund, projected profitability and a fund’s fees and performance. With respect to economies of scale, the Trustees noted that each of the Funds was subject to an expense cap or waiver. In considering these issues, the Trustees also took note of the costs of the services provided (both on an absolute and a relative basis) and the profitability to the Adviser and its affiliates of their relationships with the Funds, as discussed above.
After reviewing these and related factors, the Trustees concluded, within the context of their overall conclusions regarding each of the Agreements, that the extent to which economies of scale were shared with the Funds supported the renewal of the Agreements.
The Trustees also considered other factors, which included but were not limited to the following:
| · | | The effect of recent market and economic events on the performance, asset levels and expense ratios of each Fund. |
| · | | Whether each Fund has operated in accordance with its investment objective and the Fund’s record of compliance with its investment restrictions, and the compliance programs of the Funds and the Adviser. They also considered the compliance-related resources the Adviser and its affiliates were providing to the Funds. |
| · | | The nature, quality, cost and extent of administrative and shareholder services performed by the Adviser and its affiliates, both under the Agreements and under separate agreements covering administrative services. |
| · | | So-called “fallout benefits” to the Adviser, such as the engagement of affiliates of the Adviser to provide distribution, administrative and brokerage services to the Funds, and the benefits of research made available to the Adviser by reason of brokerage commissions (if any) generated by the Funds’ securities transactions. The Trustees also considered the benefits to the parent company of NGAM Advisors from the retention |
23 |
| | of the Adviser. The Trustees considered the possible conflicts of interest associated with these fallout and other benefits, and the reporting, disclosure and other processes in place to disclose and monitor such possible conflicts of interest. |
| · | | The Trustees’ review and discussion of the Funds’ advisory arrangements in prior years, and management’s record of responding to Trustee concerns raised during the year and in prior years. |
Based on their evaluation of all factors that they deemed to be material, including those factors described above, and assisted by the advice of independent counsel, the Trustees, including the Independent Trustees, concluded that each of the existing Agreements should be continued through June 30, 2015.
| 24
Portfolio of Investments – as of September 30, 2014
Loomis Sayles Core Plus Bond Fund
| | | | | | | | |
Principal
Amount (‡) | | | Description | | Value (†) | |
| | Bonds and Notes — 88.2% of Net Assets | |
| | Non-Convertible Bonds — 88.2% | |
| | | | ABS Car Loan — 1.9% | |
| $ | 8,905,000 | | | Ally Master Owner Trust, Series 2014-4, Class A2, 1.430%, 6/17/2019 | | $ | 8,872,932 | |
| | 1,430,000 | | | AmeriCredit Automobile Receivables Trust, Series 2011-2, Class D, 4.000%, 5/08/2017 | | | 1,462,199 | |
| | 2,355,000 | | | AmeriCredit Automobile Receivables Trust, Series 2013-2, Class B, 1.190%, 5/08/2018 | | | 2,355,134 | |
| | 1,860,000 | | | AmeriCredit Automobile Receivables Trust, Series 2013-2, Class C, 1.790%, 3/08/2019 | | | 1,862,894 | |
| | 3,170,000 | | | AmeriCredit Automobile Receivables Trust, Series 2014-2, Class C, 2.180%, 6/08/2020 | | | 3,138,731 | |
| | 2,040,000 | | | AmeriCredit Automobile Receivables Trust, Series 2014-3, Class B, 1.920%, 11/08/2019 | | | 2,034,714 | |
| | 2,345,000 | | | AmeriCredit Automobile Receivables Trust, Series 2014-3, Class C, 2.580%, 9/08/2020 | | | 2,341,724 | |
| | 1,950,000 | | | Avis Budget Rental Car Funding AESOP LLC, Series 2012-3A, Class A, 2.100%, 3/20/2019, 144A | | | 1,951,812 | |
| | 1,535,000 | | | Avis Budget Rental Car Funding AESOP LLC, Series 2013-1A, Class B, 2.620%, 9/20/2019, 144A | | | 1,520,126 | |
| | 133,309 | | | Centre Point Funding LLC, Series 2010-1A, Class 1, 5.430%, 7/20/2016, 144A | | | 135,391 | |
| | 6,445,000 | | | Santander Drive Auto Receivables Trust, Series 2012-3, Class C, 3.010%, 4/16/2018 | | | 6,575,950 | |
| | 3,385,000 | | | Santander Drive Auto Receivables Trust, Series 2012-4, Class C, 2.940%, 12/15/2017 | | | 3,453,672 | |
| | 2,090,000 | | | Santander Drive Auto Receivables Trust, Series 2012-5, Class C, 2.700%, 8/15/2018 | | | 2,134,778 | |
| | 2,875,000 | | | Santander Drive Auto Receivables Trust, Series 2012-6, Class C, 1.940%, 3/15/2018 | | | 2,896,939 | |
| | 3,185,000 | | | Santander Drive Auto Receivables Trust, Series 2014-3, Class C, 2.130%, 8/17/2020 | | | 3,158,443 | |
| | | | | | | | |
| | | | | | | 43,895,439 | |
| | | | | | | | |
| | | | ABS Home Equity — 0.5% | |
| | 4,661,975 | | | Colony American Homes, Series 2014-1A, Class A, 1.400%, 5/17/2031, 144A | | | 4,668,413 | |
| | 282,763 | | | Countrywide Asset-Backed Certificates, Series 2004-S1, Class A3, 5.115%, 2/25/2035 | | | 288,482 | |
| | 6,330,246 | | | Sequoia Mortgage Trust, Series 2013-5, Class A1, 2.500%, 5/25/2043, 144A | | | 5,907,158 | |
| | | | | | | | |
| | | | | | | 10,864,053 | |
| | | | | | | | |
| | | | ABS Other — 0.5% | |
| | 3,800,000 | | | OneMain Financial Issuance Trust, Series 2014-2A, Class A, 2.470%, 9/18/2024, 144A | | | 3,801,189 | |
| | 8,615,000 | | | Springleaf Funding Trust, Series 2013-BA, Class A, 3.920%, 1/16/2023, 144A | | | 8,822,363 | |
| | | | | | | | |
| | | | | | | 12,623,552 | |
| | | | | | | | |
| | | | Aerospace & Defense — 0.2% | |
| | 3,110,000 | | | Bombardier, Inc., 5.750%, 3/15/2022, 144A | | | 3,094,450 | |
| | 1,480,000 | | | Bombardier, Inc., 7.500%, 3/15/2018, 144A | | | 1,616,900 | |
| | | | | | | | |
| | | | | | | 4,711,350 | |
| | | | | | | | |
See accompanying notes to financial statements.
25 |
Portfolio of Investments – as of September 30, 2014
Loomis Sayles Core Plus Bond Fund – (continued)
| | | | | | | | |
Principal
Amount (‡) | | | Description | | Value (†) | |
| | | | Airlines — 0.2% | |
| $ | 3,191,832 | | | Continental Airlines Pass Through Certificates, Series 2012-2, Class A, 4.000%, 4/29/2026 | | $ | 3,263,648 | |
| | 1,024,776 | | | Continental Airlines Pass Through Trust, Series 2010-1, Class A, 4.750%, 7/12/2022 | | | 1,099,072 | |
| | | | | | | | |
| | | | | | | 4,362,720 | |
| | | | | | | | |
| | | | Automotive — 1.9% | |
| | 665,000 | | | American Axle & Manufacturing, Inc., 5.125%, 2/15/2019 | | | 661,675 | |
| | 1,285,000 | | | Ford Motor Credit Co. LLC, 2.375%, 1/16/2018 | | | 1,296,844 | |
| | 2,070,000 | | | Ford Motor Credit Co. LLC, 2.375%, 3/12/2019 | | | 2,049,031 | |
| | 7,885,000 | | | Ford Motor Credit Co. LLC, 5.000%, 5/15/2018 | | | 8,611,571 | |
| | 12,025,000 | | | Ford Motor Credit Co. LLC, 5.750%, 2/01/2021 | | | 13,659,354 | |
| | 5,585,000 | | | Ford Motor Credit Co. LLC, 6.625%, 8/15/2017(c) | | | 6,313,725 | |
| | 6,900,000 | | | General Motors Financial Co., Inc., 6.750%, 6/01/2018 | | | 7,697,812 | |
| | 4,290,000 | | | Hyundai Capital Services, Inc., 3.500%, 9/13/2017, 144A | | | 4,476,362 | |
| | | | | | | | |
| | | | | | | 44,766,374 | |
| | | | | | | | |
| | | | Banking — 6.5% | |
| | 6,405,000 | | | Ally Financial, Inc., 3.500%, 1/27/2019 | | | 6,228,862 | |
| | 5,000,000 | | | Ally Financial, Inc., 4.750%, 9/10/2018 | | | 5,125,000 | |
| | 2,330,000 | | | Ally Financial, Inc., 6.250%, 12/01/2017 | | | 2,498,925 | |
| | 9,160,000 | | | Banco Santander Brasil S.A., 4.625%, 2/13/2017, 144A | | | 9,560,750 | |
| | 6,105,000 | | | Banco Santander Chile, 3.875%, 9/20/2022, 144A | | | 6,013,791 | |
| | 13,070,000 | | | Bangkok Bank PCL, 3.300%, 10/03/2018, 144A | | | 13,388,777 | |
| | 3,190,000 | | | Bank of America Corp., 2.650%, 4/01/2019 | | | 3,180,223 | |
| | 14,245,000 | | | Bank of America Corp., MTN, 5.000%, 5/13/2021(c) | | | 15,643,261 | |
| | 7,385,000 | | | BBVA Banco Continental S.A., 3.250%, 4/08/2018, 144A | | | 7,503,160 | |
| | 12,480,000 | | | Citigroup, Inc., 4.050%, 7/30/2022 | | | 12,640,156 | |
| | 7,020,000 | | | Goldman Sachs Group, Inc. (The), 5.750%, 1/24/2022 | | | 7,982,968 | |
| | 1,355,000 | | | Goldman Sachs Group, Inc. (The), 6.000%, 6/15/2020 | | | 1,556,665 | |
| | 4,440,000 | | | Goldman Sachs Group, Inc. (The), 6.750%, 10/01/2037 | | | 5,300,414 | |
| | 3,035,000 | | | Goldman Sachs Group, Inc. (The), 7.500%, 2/15/2019 | | | 3,619,001 | |
| | 1,985,000 | | | Hana Bank, 4.250%, 6/14/2017, 144A | | | 2,110,190 | |
| | 13,735,000 | | | JPMorgan Chase & Co., 4.500%, 1/24/2022 | | | 14,716,050 | |
| | 2,890,000 | | | Merrill Lynch & Co., Inc., MTN, 6.875%, 4/25/2018 | | | 3,333,338 | |
| | 9,615,000 | | | Morgan Stanley, 5.750%, 1/25/2021 | | | 10,924,544 | |
| | 630,000 | | | Morgan Stanley, GMTN, 5.500%, 1/26/2020 | | | 706,389 | |
| | 5,595,000 | | | Morgan Stanley, GMTN, 5.500%, 7/28/2021 | | | 6,301,676 | |
| | 3,535,000 | | | Morgan Stanley, Series F, GMTN, 6.625%, 4/01/2018 | | | 4,048,367 | |
| | 6,700,000 | | | PKO Finance AB, 4.630%, 9/26/2022, 144A | | | 6,959,625 | |
| | | | | | | | |
| | | | | | | 149,342,132 | |
| | | | | | | | |
| | | | Cable Satellite — 1.2% | |
| | 3,935,000 | | | CCO Holdings LLC/CCO Holdings Capital Corp., 5.250%, 3/15/2021 | | | 3,856,300 | |
| | 5,030,000 | | | CCO Holdings LLC/CCO Holdings Capital Corp., 5.250%, 9/30/2022 | | | 4,923,112 | |
| | 2,965,000 | | | CCO Holdings LLC/CCO Holdings Capital Corp., 6.500%, 4/30/2021 | | | 3,091,013 | |
| | 499,000 | | | Cox Communications, Inc., 5.450%, 12/15/2014 | | | 503,902 | |
| | 2,775,000 | | | Time Warner Cable, Inc., 4.500%, 9/15/2042 | | | 2,738,345 | |
| | 4,080,000 | | | Time Warner Cable, Inc., 5.500%, 9/01/2041 | | | 4,592,774 | |
See accompanying notes to financial statements.
| 26
Portfolio of Investments – as of September 30, 2014
Loomis Sayles Core Plus Bond Fund – (continued)
| | | | | | | | |
Principal
Amount (‡) | | | Description | | Value (†) | |
| | | | Cable Satellite — continued | |
| $ | 1,758,000 | | | Time Warner Cable, Inc., 5.875%, 11/15/2040 | | $ | 2,068,491 | |
| | 2,215,000 | | | Time Warner Cable, Inc., 6.550%, 5/01/2037 | | | 2,794,231 | |
| | 2,825,000 | | | Virgin Media Finance PLC, 6.375%, 4/15/2023, 144A | | | 2,916,813 | |
| | | | | | | | |
| | | | | | | 27,484,981 | |
| | | | | | | | |
| | | | Chemicals — 1.8% | |
| | 3,195,000 | | | Ashland, Inc., 3.875%, 4/15/2018 | | | 3,202,988 | |
| | 10,820,000 | | | Braskem America Finance Co., 7.125%, 7/22/2041, 144A | | | 10,711,800 | |
| | 4,375,000 | | | Methanex Corp., 3.250%, 12/15/2019 | | | 4,441,596 | |
| | 1,460,000 | | | Methanex Corp., 5.250%, 3/01/2022 | | | 1,604,693 | |
| | 7,310,000 | | | Mexichem SAB de CV, 6.750%, 9/19/2042, 144A | | | 7,825,355 | |
| | 2,230,000 | | | Olin Corp., 5.500%, 8/15/2022 | | | 2,296,900 | |
| | 5,650,000 | | | PolyOne Corp., 5.250%, 3/15/2023 | | | 5,480,500 | |
| | 2,290,000 | | | RPM International, Inc., 3.450%, 11/15/2022 | | | 2,228,502 | |
| | 3,685,000 | | | RPM International, Inc., 6.125%, 10/15/2019 | | | 4,207,131 | |
| | | | | | | | |
| | | | | | | 41,999,465 | |
| | | | | | | | |
| | | | Consumer Cyclical Services — 0.4% | |
| | 2,165,000 | | | Service Corp. International, 5.375%, 1/15/2022 | | | 2,186,650 | |
| | 5,995,000 | | | Service Corp. International, 5.375%, 5/15/2024, 144A | | | 6,009,988 | |
| | | | | | | | |
| | | | | | | 8,196,638 | |
| | | | | | | | |
| | | | Consumer Products — 0.2% | |
| | 1,110,000 | | | Avon Products, Inc., 4.600%, 3/15/2020 | | | 1,133,760 | |
| | 3,620,000 | | | Whirlpool Corp., MTN, 4.850%, 6/15/2021 | | | 3,967,089 | |
| | | | | | | | |
| | | | | | | 5,100,849 | |
| | | | | | | | |
| | | | Diversified Manufacturing — 0.6% | |
| | 1,200,000 | | | Crane Co., 6.550%, 11/15/2036 | | | 1,410,619 | |
| | 12,235,000 | | | Votorantim Cimentos S.A., 7.250%, 4/05/2041, 144A | | | 12,632,638 | |
| | | | | | | | |
| | | | | | | 14,043,257 | |
| | | | | | | | |
| | | | Electric — 1.2% | |
| | 3,295,000 | | | AES Corp. (The), 3.234%, 6/01/2019(b) | | | 3,245,575 | |
| | 2,200,000 | | | AES Corp. (The), 7.375%, 7/01/2021 | | | 2,464,000 | |
| | 6,090,000 | | | EDP Finance BV, 5.250%, 1/14/2021, 144A | | | 6,329,763 | |
| | 1,085,000 | | | Empresa Nacional de Electricidad S.A., 4.250%, 4/15/2024 | | | 1,085,993 | |
| | 4,270,000 | | | FirstEnergy Corp., 2.750%, 3/15/2018 | | | 4,287,003 | |
| | 1,010,000 | | | Ipalco Enterprises, Inc., 5.000%, 5/01/2018 | | | 1,064,288 | |
| | 4,435,000 | | | National Rural Utilities Cooperative Finance Corp., (fixed rate to 4/30/2023, variable rate thereafter), 4.750%, 4/30/2043 | | | 4,385,106 | |
| | 3,740,000 | | | Transelec S.A., 4.625%, 7/26/2023, 144A | | | 3,855,469 | |
| | | | | | | | |
| | | | | | | 26,717,197 | |
| | | | | | | | |
| | | | Finance Companies — 3.4% | |
| | 8,060,000 | | | CIT Group, Inc., 5.375%, 5/15/2020 | | | 8,321,950 | |
| | 7,435,000 | | | CIT Group, Inc., 5.500%, 2/15/2019, 144A | | | 7,778,869 | |
| | 8,510,000 | | | International Lease Finance Corp., 3.875%, 4/15/2018 | | | 8,446,175 | |
| | 2,750,000 | | | International Lease Finance Corp., 5.750%, 5/15/2016 | | | 2,873,750 | |
| | 4,380,000 | | | International Lease Finance Corp., 5.875%, 4/01/2019 | | | 4,664,700 | |
See accompanying notes to financial statements.
27 |
Portfolio of Investments – as of September 30, 2014
Loomis Sayles Core Plus Bond Fund – (continued)
| | | | | | | | |
Principal
Amount (‡) | | | Description | | Value (†) | |
| | | | Finance Companies — continued | |
| $ | 2,450,000 | | | International Lease Finance Corp., 5.875%, 8/15/2022 | | $ | 2,560,250 | |
| | 11,320,000 | | | International Lease Finance Corp., 6.250%, 5/15/2019 | | | 12,129,380 | |
| | 10,790,000 | | | Navient LLC, 4.875%, 6/17/2019 | | | 10,790,000 | |
| | 1,100,000 | | | Navient LLC, MTN, 6.000%, 1/25/2017 | | | 1,150,875 | |
| | 9,010,000 | | | Navient LLC, MTN, 6.125%, 3/25/2024 | | | 8,784,750 | |
| | 6,560,000 | | | Navient LLC, MTN, 6.250%, 1/25/2016 | | | 6,809,280 | |
| | 2,940,000 | | | Navient LLC, MTN, 8.000%, 3/25/2020 | | | 3,296,475 | |
| | 120,000 | | | Navient LLC, Series A, MTN, 5.000%, 6/15/2018 | | | 119,100 | |
| | | | | | | | |
| | | | | | | 77,725,554 | |
| | | | | | | | |
| | | | Financial Other — 0.4% | |
| | 10,465,000 | | | Cielo S.A./Cielo USA, Inc., 3.750%, 11/16/2022, 144A | | | 9,706,288 | |
| | | | | | | | |
| | | | Food & Beverage — 0.7% | |
| | 4,920,000 | | | Alicorp SAA, 3.875%, 3/20/2023, 144A | | | 4,772,400 | |
| | 1,340,000 | | | Cosan Luxembourg S.A., 5.000%, 3/14/2023, 144A | | | 1,286,400 | |
| | 4,455,000 | | | Sigma Alimentos S.A. de CV, 5.625%, 4/14/2018, 144A | | | 4,900,500 | |
| | 2,635,000 | | | Sysco Corp., 4.350%, 10/02/2034 | | | 2,673,305 | |
| | 1,770,000 | | | WhiteWave Foods Co. (The), 5.375%, 10/01/2022 | | | 1,787,700 | |
| | | | | | | | |
| | | | | | | 15,420,305 | |
| | | | | | | | |
| | | | Government Owned – No Guarantee — 8.4% | |
| | 2,355,000 | | | Abu Dhabi National Energy Co., 2.500%, 1/12/2018, 144A | | | 2,375,465 | |
| | 6,745,000 | | | CEZ AS, 5.625%, 4/03/2042, 144A | | | 7,530,793 | |
| | 6,200,000 | | | China Resources Gas Group Ltd., 4.500%, 4/05/2022, 144A | | | 6,396,757 | |
| | 5,990,000 | | | CNPC General Capital Ltd., 3.950%, 4/19/2022, 144A | | | 6,006,293 | |
| | 5,910,000 | | | Dolphin Energy Ltd., 5.500%, 12/15/2021, 144A | | | 6,604,425 | |
| | 1,665,000 | | | Dubai Electricity & Water Authority, 6.375%, 10/21/2016, 144A | | | 1,831,084 | |
| | 1,600,000 | | | Federal Home Loan Mortgage Corp., 6.250%, 7/15/2032 | | | 2,228,301 | |
| | 13,410,000 | | | Federal National Mortgage Association, 2.625%, 9/06/2024 | | | 13,191,068 | |
| | 27,425,000 | | | Federal National Mortgage Association, 6.625%, 11/15/2030 | | | 38,969,526 | |
| | 5,345,000 | | | Federal National Mortgage Association, 7.250%, 5/15/2030 | | | 7,950,067 | |
| | 4,370,000 | | | IPIC GMTN Ltd., 6.875%, 11/01/2041, 144A | | | 5,681,000 | |
| | 16,295,000 | | | OCP S.A., 5.625%, 4/25/2024, 144A | | | 16,950,059 | |
| | 6,280,000 | | | OCP S.A., 6.875%, 4/25/2044, 144A | | | 6,752,256 | |
| | 1,290,000 | | | Ooredoo International Finance Ltd., 3.875%, 1/31/2028, 144A | | | 1,212,600 | |
| | 2,895,000 | | | Ooredoo International Finance Ltd., 4.750%, 2/16/2021, 144A | | | 3,094,176 | |
| | 2,965,000 | | | Ooredoo International Finance Ltd., 7.875%, 6/10/2019, 144A | | | 3,628,419 | |
| | 20,235,000 | | | Pertamina Persero PT, 5.625%, 5/20/2043, 144A(d) | | | 18,413,850 | |
| | 9,610,000 | | | Petrobras Global Finance BV, 5.625%, 5/20/2043 | | | 8,512,192 | |
| | 7,260,000 | | | Petrobras International Finance Co., 6.750%, 1/27/2041 | | | 7,456,020 | |
| | 1,350,000 | | | Petroleos Mexicanos, 3.125%, 1/23/2019, 144A | | | 1,383,750 | |
| | 1,210,000 | | | Petroleos Mexicanos, 3.500%, 7/18/2018 | | | 1,254,770 | |
| | 12,620,000 | | | Rio Oil Finance Trust, Series 2014-1, 6.250%, 7/06/2024, 144A | | | 13,018,817 | |
| | 15,460,000 | | | Tennessee Valley Authority, 3.500%, 12/15/2042 | | | 14,398,841 | |
| | | | | | | | |
| | | | | | | 194,840,529 | |
| | | | | | | | |
| | | | Healthcare — 1.1% | |
| | 1,580,000 | | | HCA Holdings, Inc., 6.250%, 2/15/2021 | | | 1,651,100 | |
| | 11,560,000 | | | HCA, Inc., 7.500%, 2/15/2022 | | | 13,005,000 | |
See accompanying notes to financial statements.
| 28
Portfolio of Investments – as of September 30, 2014
Loomis Sayles Core Plus Bond Fund – (continued)
| | | | | | | | |
Principal
Amount (‡) | | | Description | | Value (†) | |
| | | | Healthcare — continued | |
| $ | 575,000 | | | HCA, Inc., 7.500%, 12/15/2023 | | $ | 626,750 | |
| | 3,200,000 | | | PerkinElmer, Inc., 5.000%, 11/15/2021 | | | 3,446,698 | |
| | 3,385,000 | | | Universal Health Services, Inc., 3.750%, 8/01/2019, 144A | | | 3,376,537 | |
| | 2,845,000 | | | Universal Health Services, Inc., 4.750%, 8/01/2022, 144A | | | 2,841,444 | |
| | | | | | | | |
| | | | | | | 24,947,529 | |
| | | | | | | | |
| | | | Home Construction — 0.2% | |
| | 5,675,000 | | | KB Home, 4.750%, 5/15/2019 | | | 5,518,938 | |
| | | | | | | | |
| | | | Hybrid ARMs — 0.0% | |
| | 128,619 | | | FNMA, 1.909%, 2/01/2037 | | | 135,732 | |
| | | | | | | | |
| | | | Independent Energy — 1.0% | |
| | 2,840,000 | | | MEG Energy Corp., 7.000%, 3/31/2024, 144A | | | 2,939,400 | |
| | 6,505,000 | | | Newfield Exploration Co., 5.750%, 1/30/2022 | | | 6,976,612 | |
| | 6,350,000 | | | QEP Resources, Inc., 5.250%, 5/01/2023 | | | 6,159,500 | |
| | 3,855,000 | | | Range Resources Corp., 5.000%, 8/15/2022 | | | 3,941,738 | |
| | 3,360,000 | | | SM Energy Co., 6.500%, 1/01/2023 | | | 3,494,400 | |
| | | | | | | | |
| | | | | | | 23,511,650 | |
| | | | | | | | |
| | | | Industrial Other — 0.8% | |
| | 575,000 | | | AECOM Technology Corp., 5.750%, 10/15/2022, 144A | | | 577,156 | |
| | 575,000 | | | AECOM Technology Corp., 5.875%, 10/15/2024, 144A | | | 578,594 | |
| | 1,360,000 | | | Briggs & Stratton Corp., 6.875%, 12/15/2020 | | | 1,504,500 | |
| | 1,650,000 | | | CBRE Services, Inc., 5.000%, 3/15/2023 | | | 1,633,335 | |
| | 9,170,000 | | | Deluxe Corp., 6.000%, 11/15/2020 | | | 9,536,800 | |
| | 5,645,000 | | | Ferreycorp SAA, 4.875%, 4/26/2020, 144A | | | 5,588,550 | |
| | | | | | | | |
| | | | | | | 19,418,935 | |
| | | | | | | | |
| | | | Integrated Energy — 0.4% | |
| | 8,540,000 | | | Pacific Rubiales Energy Corp., 5.375%, 1/26/2019, 144A | | | 8,668,100 | |
| | | | | | | | |
| | | | Leisure — 0.2% | |
| | 3,620,000 | | | Regal Entertainment Group, 5.750%, 3/15/2022 | | | 3,629,050 | |
| | | | | | | | |
| | | | Media Entertainment — 0.7% | |
| | 66,000,000 | | | Grupo Televisa SAB, EMTN, 7.250%, 5/14/2043, (MXN) | | | 4,134,857 | |
| | 7,210,000 | | | Myriad International Holdings BV, 6.000%, 7/18/2020, 144A | | | 7,822,850 | |
| | 4,284,000 | | | Myriad International Holdings BV, 6.375%, 7/28/2017, 144A | | | 4,648,140 | |
| | | | | | | | |
| | | | | | | 16,605,847 | |
| | | | | | | | |
| | | | Metals & Mining — 1.8% | |
| | 5,605,000 | | | Alcoa, Inc., 6.150%, 8/15/2020 | | | 6,177,607 | |
| | 1,335,000 | | | APERAM, 7.375%, 4/01/2016, 144A | | | 1,359,617 | |
| | 1,280,000 | | | APERAM, 7.750%, 4/01/2018, 144A | | | 1,331,200 | |
| | 9,170,000 | | | ArcelorMittal, 7.250%, 3/01/2041 | | | 9,192,925 | |
| | 485,000 | | | ArcelorMittal, 7.500%, 10/15/2039 | | | 499,550 | |
| | 5,580,000 | | | Freeport-McMoRan, Inc., 2.375%, 3/15/2018 | | | 5,594,162 | |
| | 4,250,000 | | | Goldcorp, Inc., 2.125%, 3/15/2018 | | | 4,238,708 | |
| | 5,280,000 | | | Plains Exploration & Production Co., 6.875%, 2/15/2023 | | | 5,992,800 | |
| | 6,090,000 | | | Samarco Mineracao S.A., 5.750%, 10/24/2023, 144A | | | 6,260,520 | |
| | 1,445,000 | | | Steel Dynamics, Inc., 5.250%, 4/15/2023 | | | 1,455,837 | |
| | | | | | | | |
| | | | | | | 42,102,926 | |
| | | | | | | | |
See accompanying notes to financial statements.
29 |
Portfolio of Investments – as of September 30, 2014
Loomis Sayles Core Plus Bond Fund – (continued)
| | | | | | | | |
Principal
Amount (‡) | | | Description | | Value (†) | |
| | | | Midstream — 1.9% | |
| $ | 12,340,000 | | | Energy Transfer Partners LP, 6.050%, 6/01/2041 | | $ | 13,439,334 | |
| | 600,000 | | | Energy Transfer Partners LP, 6.500%, 2/01/2042 | | | 683,201 | |
| | 3,565,000 | | | Kinder Morgan Finance Co. LLC, 6.000%, 1/15/2018, 144A | | | 3,881,394 | |
| | 5,035,000 | | | Kinder Morgan, Inc., 5.000%, 2/15/2021, 144A | | | 5,248,988 | |
| | 3,280,000 | | | Kinder Morgan, Inc., 5.625%, 11/15/2023, 144A | | | 3,485,000 | |
| | 2,720,000 | | | Regency Energy Partners LP/Regency Energy Finance Corp., 5.000%, 10/01/2022 | | | 2,679,200 | |
| | 5,195,000 | | | Regency Energy Partners LP/Regency Energy Finance Corp., 5.875%, 3/01/2022 | | | 5,402,800 | |
| | 10,215,000 | | | Transportadora de Gas del Peru S.A., 4.250%, 4/30/2028, 144A | | | 9,678,712 | |
| | | | | | | | |
| | | | | | | 44,498,629 | |
| | | | | | | | |
| | | | Mortgage Related — 10.0% | |
| | 4,001,081 | | | FHLMC, 3.000%, 11/01/2042 | | | 3,969,507 | |
| | 15,341,414 | | | FHLMC, 3.500%, with various maturities in 2043(e) | | | 15,704,785 | |
| | 2,636,118 | | | FHLMC, 4.000%, 8/01/2043 | | | 2,779,112 | |
| | 296,237 | | | FHLMC, 5.000%, 8/01/2035 | | | 327,548 | |
| | 360,942 | | | FHLMC, 5.500%, with various maturities from 2018 to 2040(e) | | | 393,228 | |
| | 29,520 | | | FHLMC, 6.000%, 6/01/2035 | | | 33,702 | |
| | 21,044,428 | | | FNMA, 3.500%, with various maturities from 2042 to 2043(e) | | | 21,499,357 | |
| | 2,821,455 | | | FNMA, 4.500%, with various maturities from 2039 to 2041(e) | | | 3,055,838 | |
| | 1,050,996 | | | FNMA, 6.000%, with various maturities from 2016 to 2039(e) | | | 1,194,050 | |
| | 43,881 | | | FNMA, 6.500%, with various maturities from 2029 to 2036(e) | | | 49,788 | |
| | 60,027 | | | FNMA, 7.000%, with various maturities in 2030(e) | | | 67,712 | |
| | 59,613 | | | FNMA, 7.500%, with various maturities from 2024 to 2032(e) | | | 68,912 | |
| | 2,900,000 | | | FNMA (TBA), 2.500%, 11/01/2029(f) | | | 2,909,402 | |
| | 14,255,000 | | | FNMA (TBA), 3.000%, 11/01/2029(f) | | | 14,649,797 | |
| | 33,375,000 | | | FNMA (TBA), 3.500%, 11/01/2044(f) | | | 34,013,819 | |
| | 76,415,000 | | | FNMA (TBA), 4.000%, 11/01/2044(f) | | | 80,288,285 | |
| | 24,650,000 | | | FNMA (TBA), 4.500%, 11/01/2044(f) | | | 26,526,673 | |
| | 752,618 | | | GNMA, 2.106%, 9/20/2063(b) | | | 807,745 | |
| | 181,502 | | | GNMA, 4.144%, 1/20/2063 | | | 195,385 | |
| | 158,642 | | | GNMA, 4.323%, 5/20/2063 | | | 172,010 | |
| | 209,946 | | | GNMA, 4.423%, 7/20/2063 | | | 229,094 | |
| | 1,044,034 | | | GNMA, 4.499%, 12/20/2062 | | | 1,137,351 | |
| | 653,135 | | | GNMA, 4.515%, 7/20/2063 | | | 714,287 | |
| | 1,164,960 | | | GNMA, 4.522%, 8/20/2062 | | | 1,266,857 | |
| | 632,180 | | | GNMA, 4.524%, 5/20/2063 | | | 691,855 | |
| | 1,110,786 | | | GNMA, 4.538%, 11/20/2062 | | | 1,211,058 | |
| | 2,259,018 | | | GNMA, 4.616%, with various maturities from 2061 to 2062(e) | | | 2,456,827 | |
| | 3,296,817 | | | GNMA, 4.627%, with various maturities from 2061 to 2064(e) | | | 3,584,622 | |
| | 933,087 | | | GNMA, 4.668%, 5/20/2062 | | | 1,013,280 | |
| | 363,694 | | | GNMA, 4.673%, 3/20/2062 | | | 394,939 | |
| | 3,753,121 | | | GNMA, 4.676%, 4/20/2062 | | | 4,086,443 | |
| | 1,025,117 | | | GNMA, 4.698%, 7/20/2061 | | | 1,106,884 | |
| | 735,744 | | | GNMA, 4.700%, 10/20/2061 | | | 796,698 | |
| | 759,688 | | | GNMA, 5.500%, 4/15/2038 | | | 844,346 | |
| | 167,486 | | | GNMA, 6.000%, with various maturities from 2029 to 2038(e) | | | 191,333 | |
See accompanying notes to financial statements.
| 30
Portfolio of Investments – as of September 30, 2014
Loomis Sayles Core Plus Bond Fund – (continued)
| | | | | | | | |
Principal
Amount (‡) | | | Description | | Value (†) | |
| | | | Mortgage Related — continued | |
| $ | 129,133 | | | GNMA, 6.500%, with various maturities from 2028 to 2032(e) | | $ | 147,872 | |
| | 109,336 | | | GNMA, 7.000%, with various maturities from 2025 to 2029(e) | | | 117,634 | |
| | 42,523 | | | GNMA, 7.500%, with various maturities from 2025 to 2030(e) | | | 48,092 | |
| | 11,700 | | | GNMA, 8.000%, 11/15/2029 | | | 11,927 | |
| | 42,525 | | | GNMA, 8.500%, with various maturities from 2017 to 2023(e) | | | 43,154 | |
| | 1,702 | | | GNMA, 9.000%, with various maturities in 2016(e) | | | 1,709 | |
| | 1,881 | | | GNMA, 11.500%, with various maturities in 2015(e) | | | 1,890 | |
| | 2,374,985 | | | Government National Mortgage Association, 4.631%, 10/20/2062 | | | 2,590,222 | |
| | | | | | | | |
| | | | | | | 231,395,029 | |
| | | | | | | | |
| | | | Non-Agency Commercial Mortgage-Backed Securities — 5.6% | |
| | 3,680,000 | | | A10 Securitization LLC, Series 2014-1, Class A1, 1.720%, 4/15/2033, 144A | | | 3,676,335 | |
| | 81,341 | | | Banc of America Merrill Lynch Commercial Mortgage, Inc., Series 2007-2, Class A2, 5.634%, 4/10/2049(b) | | | 81,298 | |
| | 1,670,000 | | | Banc of America Merrill Lynch Commercial Mortgage, Inc., Series 2007-2, Class A4, 5.781%, 4/10/2049(b) | | | 1,812,242 | |
| | 117,225 | | | Bear Stearns Commercial Mortgage Securities, Series 2007-PW16, Class A2, 5.845%, 6/11/2040(b) | | | 116,681 | |
| | 1,000,000 | | | Citigroup Commercial Mortgage Trust, Series 2008-C7, Class A4, 6.339%, 12/10/2049(b) | | | 1,102,007 | |
| | 8,236,000 | | | Commercial Mortgage Pass Through Certificates, Series 2014-KYO, Class D, 2.154%, 6/11/2027, 144A(b) | | | 8,238,718 | |
| | 8,965,000 | | | Commercial Mortgage Trust, Series 2014-SAVA, Class C, 2.554%, 6/15/2034, 144A(b) | | | 8,956,851 | |
| | 6,010,000 | | | Credit Suisse Mortgage Capital Certificates, Series 2007-C2, Class A3, 5.542%, 1/15/2049 | | | 6,489,724 | |
| | 2,913,925 | | | Credit Suisse Mortgage Capital Certificates, Series 2007-C4, Class A4, 6.097%, 9/15/2039(b) | | | 3,167,937 | |
| | 1,865,000 | | | Credit Suisse Mortgage Capital Certificates, Series 2007-C5, Class A4, 5.695%, 9/15/2040 | | | 2,025,778 | |
| | 5,790,000 | | | Credit Suisse Mortgage Capital Certificates, Series 2008-C1, Class A3, 6.173%, 2/15/2041(b) | | | 6,404,574 | |
| | 1,500,000 | | | GP Portfolio Trust, Series 2014-GPP, Class A, 1.104%, 2/15/2027, 144A(b) | | | 1,501,663 | |
| | 3,295,000 | | | GP Portfolio Trust, Series 2014-GPP, Class D, 2.904%, 2/15/2027, 144A(b) | | | 3,300,404 | |
| | 411,053 | | | Greenwich Capital Commercial Funding Corp., Series 2006-GG7, Class A4, 6.014%, 7/10/2038(b) | | | 436,259 | |
| | 2,900,130 | | | Greenwich Capital Commercial Funding Corp., Series 2007-GG11, Class A4, 5.736%, 12/10/2049 | | | 3,176,411 | |
| | 13,235,000 | | | Greenwich Capital Commercial Funding Corp., Series 2007-GG9, Class A4, 5.444%, 3/10/2039 | | | 14,256,358 | |
| | 10,103,640 | | | GS Mortgage Securities Corp. II, Series 2007-GG10, Class A4, 5.991%, 8/10/2045(b) | | | 11,034,195 | |
| | 7,893,259 | | | JPMorgan Chase Commercial Mortgage Securities Trust, Series 2006-LDP9, Class A3, 5.336%, 5/15/2047 | | | 8,457,185 | |
| | 2,300,000 | | | JPMorgan Chase Commercial Mortgage Securities Trust, Series 2007-C1, Class A4, 5.716%, 2/15/2051 | | | 2,499,329 | |
| | 6,492,000 | | | JPMorgan Chase Commercial Mortgage Securities Trust, Series 2007-LD11, Class A4, 5.981%, 6/15/2049(b) | | | 7,032,829 | |
See accompanying notes to financial statements.
31 |
Portfolio of Investments – as of September 30, 2014
Loomis Sayles Core Plus Bond Fund – (continued)
| | | | | | | | |
Principal
Amount (‡) | | | Description | | Value (†) | |
| | | | Non-Agency Commercial Mortgage-Backed Securities — continued | |
| $ | 378,456 | | | JPMorgan Chase Commercial Mortgage Securities Trust, Series 2007-LDPX, Class A3, 5.420%, 1/15/2049 | | $ | 407,748 | |
| | 4,110,000 | | | JPMorgan Chase Commercial Mortgage Securities Trust, Series 2014-FL5, Class B, 1.502%, 7/15/2031, 144A(b) | | | 4,110,000 | |
| | 2,205,000 | | | JPMorgan Chase Commercial Mortgage Securities Trust, Series 2014-FL5, Class C, 2.252%, 7/15/2031, 144A(b) | | | 2,205,000 | |
| | 5,045,000 | | | Merrill Lynch/Countrywide Commercial Mortgage Trust, Series 2007-6, Class A4, 5.485%, 3/12/2051 | | | 5,469,249 | |
| | 5,000,000 | | | Merrill Lynch/Countrywide Commercial Mortgage Trust, Series 2007-9, Class A4, 5.700%, 9/12/2049 | | | 5,480,230 | |
| | 1,092,000 | | | Morgan Stanley Capital I, Series 2007-HQ12, Class A5, 5.773%, 4/12/2049(b) | | | 1,170,944 | |
| | 1,900,000 | | | Morgan Stanley Capital I, Series 2007-HQ13, Class A3, 5.569%, 12/15/2044 | | | 2,027,416 | |
| | 2,930,000 | | | Morgan Stanley Capital I, Series 2007-IQ14, Class A4, 5.692%, 4/15/2049 | | | 3,182,648 | |
| | 305,000 | | | Morgan Stanley Capital I, Series 2007-T27, Class A4, 5.831%, 6/11/2042(b) | | | 334,957 | |
| | 1,175,000 | | | Morgan Stanley Capital I, Series 2008-T29, Class A4, 6.455%, 1/11/2043(b) | | | 1,323,944 | |
| | 2,735,000 | | | SCG Trust, Series 2013-SRP1, Class B, 2.654%, 11/15/2026, 144A(b) | | | 2,741,928 | |
| | 934,910 | | | Wachovia Bank Commercial Mortgage Trust, Series 2006-C28, Class A4, 5.572%, 10/15/2048 | | | 999,279 | |
| | 3,350,000 | | | Wachovia Bank Commercial Mortgage Trust, Series 2007-C30, Class A5, 5.342%, 12/15/2043 | | | 3,611,451 | |
| | 2,345,000 | | | Wachovia Bank Commercial Mortgage Trust, Series 2007-C31, Class A5, 5.500%, 4/15/2047 | | | 2,550,488 | |
| | | | | | | | |
| | | | | | | 129,382,060 | |
| | | | | | | | |
| | | | Oil Field Services — 2.3% | |
| | 2,535,000 | | | Nabors Industries, Inc., 4.625%, 9/15/2021 | | | 2,724,476 | |
| | 3,557,000 | | | Nabors Industries, Inc., 5.000%, 9/15/2020 | | | 3,895,054 | |
| | 5,705,000 | | | Nabors Industries, Inc., 5.100%, 9/15/2023 | | | 6,180,814 | |
| | 6,950,000 | | | Pan American Energy LLC/Argentine Branch, 7.875%, 5/07/2021, 144A | | | 7,262,750 | |
| | 3,445,000 | | | Paragon Offshore Ltd., 6.750%, 7/15/2022, 144A | | | 2,911,025 | |
| | 7,150,000 | | | Paragon Offshore Ltd., 7.250%, 8/15/2024, 144A | | | 6,041,750 | |
| | 5,950,000 | | | Rowan Cos., Inc., 4.875%, 6/01/2022 | | | 6,181,265 | |
| | 1,330,000 | | | Rowan Cos., Inc., 7.875%, 8/01/2019 | | | 1,608,024 | |
| | 2,430,000 | | | Sidewinder Drilling, Inc., 9.750%, 11/15/2019, 144A | | | 2,430,000 | |
| | 13,140,000 | | | Transocean, Inc., 6.500%, 11/15/2020 | | | 13,962,183 | |
| | | | | | | | |
| | | | | | | 53,197,341 | |
| | | | | | | | |
| | | | Packaging — 0.3% | |
| | 3,275,000 | | | Sealed Air Corp., 5.250%, 4/01/2023, 144A | | | 3,209,500 | |
| | 2,515,000 | | | Sealed Air Corp., 6.500%, 12/01/2020, 144A | | | 2,681,619 | |
| | | | | | | | |
| | | | | | | 5,891,119 | |
| | | | | | | | |
| | | | Paper — 0.5% | |
| | 2,965,000 | | | Celulosa Arauco y Constitucion S.A., 4.750%, 1/11/2022 | | | 2,999,415 | |
| | 3,755,000 | | | Celulosa Arauco y Constitucion S.A., 5.000%, 1/21/2021 | | | 3,870,098 | |
| | 4,015,000 | | | Rock-Tenn Co., 4.000%, 3/01/2023 | | | 4,075,775 | |
| | | | | | | | |
| | | | | | | 10,945,288 | |
| | | | | | | | |
See accompanying notes to financial statements.
| 32
Portfolio of Investments – as of September 30, 2014
Loomis Sayles Core Plus Bond Fund – (continued)
| | | | | | | | |
Principal
Amount (‡) | | | Description | | Value (†) | |
| | | | Pharmaceuticals — 0.9% | |
| $ | 11,450,000 | | | Valeant Pharmaceuticals International, 6.375%, 10/15/2020, 144A | | $ | 11,764,875 | |
| | 760,000 | | | Valeant Pharmaceuticals International, 6.750%, 8/15/2021, 144A | | | 788,500 | |
| | 3,170,000 | | | Valeant Pharmaceuticals International, 6.875%, 12/01/2018, 144A | | | 3,273,025 | |
| | 5,510,000 | | | Valeant Pharmaceuticals International, Inc., 5.625%, 12/01/2021, 144A | | | 5,489,337 | |
| | | | | | | | |
| | | | | | | 21,315,737 | |
| | | | | | | | |
| | | | Property & Casualty Insurance — 0.2% | |
| | 3,285,000 | | | Willis Group Holdings PLC, 5.750%, 3/15/2021 | | | 3,674,647 | |
| | | | | | | | |
| | | | Refining — 0.7% | |
| | 5,030,000 | | | Phillips 66, 5.875%, 5/01/2042 | | | 5,960,651 | |
| | 10,730,000 | | | Thai Oil PCL, 4.875%, 1/23/2043, 144A | | | 10,073,817 | |
| | | | | | | | |
| | | | | | | 16,034,468 | |
| | | | | | | | |
| | | | Retailers — 1.1% | |
| | 4,440,000 | | | GameStop Corp., 5.500%, 10/01/2019, 144A | | | 4,384,500 | |
| | 14,280,000 | | | Lotte Shopping Co. Ltd., 3.375%, 5/09/2017, 144A | | | 14,755,238 | |
| | 5,330,000 | | | SACI Falabella, 3.750%, 4/30/2023, 144A | | | 5,122,157 | |
| | 1,125,000 | | | Wolverine World Wide, Inc., 6.125%, 10/15/2020 | | | 1,175,625 | |
| | | | | | | | |
| | | | | | | 25,437,520 | |
| | | | | | | | |
| | | | Sovereigns — 1.8% | |
| | 9,495,000 | | | Indonesia Government International Bond, 6.750%, 1/15/2044, 144A | | | 11,109,150 | |
| | 1,261,000 | | | Mexico Government International Bond, 5.550%, 1/21/2045 | | | 1,400,971 | |
| | 4,454,000 | | | Mexico Government International Bond, Series A, MTN, 6.050%, 1/11/2040 | | | 5,255,720 | |
| | 5,995,000 | | | Panama Government International Bond, 4.000%, 9/22/2024 | | | 5,980,012 | |
| | 5,355,000 | | | Philippine Government International Bond, 4.200%, 1/21/2024 | | | 5,649,525 | |
| | 11,835,000 | | | Republic of Portugal, 5.125%, 10/15/2024, 144A | | | 12,261,297 | |
| | | | | | | | |
| | | | | | | 41,656,675 | |
| | | | | | | | |
| | | | Supranational — 2.4% | |
| | 42,720,000 | | | International Finance Corp., GMTN, 10.000%, 6/12/2017, (BRL) | | | 17,300,924 | |
| | 94,905,000 | | | International Finance Corp., GMTN, 10.500%, 4/17/2018, (BRL) | | | 39,020,485 | |
| | | | | | | | |
| | | | | | | 56,321,409 | |
| | | | | | | | |
| | | | Technology — 1.5% | |
| | 1,160,000 | | | Brocade Communications Systems, Inc., 6.875%, 1/15/2020 | | | 1,206,400 | |
| | 3,145,000 | | | Dun & Bradstreet Corp. (The), 3.250%, 12/01/2017 | | | 3,251,697 | |
| | 3,156,000 | | | Equifax, Inc., 7.000%, 7/01/2037 | | | 4,030,752 | |
| | 5,465,000 | | | Hewlett-Packard Co., 2.750%, 1/14/2019 | | | 5,550,538 | |
| | 69,000 | | | Motorola Solutions, Inc., 6.625%, 11/15/2037 | | | 75,749 | |
| | 340,000 | | | Motorola Solutions, Inc., 7.500%, 5/15/2025 | | | 428,189 | |
| | 6,105,000 | | | Tencent Holdings Ltd., 2.000%, 5/02/2017, 144A | | | 6,107,894 | |
| | 14,695,000 | | | Tencent Holdings Ltd., 3.375%, 5/02/2019, 144A | | | 14,853,853 | |
| | | | | | | | |
| | | | | | | 35,505,072 | |
| | | | | | | | |
| | | | Tobacco — 0.6% | |
| | 11,225,000 | | | Reynolds American, Inc., 7.250%, 6/15/2037 | | | 14,104,168 | |
| | | | | | | | |
See accompanying notes to financial statements.
33 |
Portfolio of Investments – as of September 30, 2014
Loomis Sayles Core Plus Bond Fund – (continued)
| | | | | | | | |
Principal
Amount (‡) | | | Description | | Value (†) | |
| | | | Treasuries — 16.4% | |
| | 10,580,000(††) | | | Mexican Fixed Rate Bonds, Series M, 6.500%, 6/10/2021, (MXN) | | $ | 82,139,810 | |
| | 336,000,000 | | | Philippine Government International Bond, 3.900%, 11/26/2022, (PHP) | | | 7,365,384 | |
| | 365,000,000 | | | Philippine Government International Bond, 6.250%, 1/14/2036, (PHP) | | | 8,712,746 | |
| | 1,350,000 | | | U.S. Treasury Bond, 3.375%, 5/15/2044 | | | 1,393,875 | |
| | 9,780,000 | | | U.S. Treasury Bond, 3.625%, 2/15/2044 | | | 10,568,512 | |
| | 18,135,000 | | | U.S. Treasury Bond, 3.750%, 11/15/2043 | | | 20,044,833 | |
| | 3,875,000 | | | U.S. Treasury Bond, 3.875%, 8/15/2040 | | | 4,386,620 | |
| | 13,876,884 | | | U.S. Treasury Inflation Indexed Bond, 0.125%, 7/15/2024(g) | | | 13,322,891 | |
| | 42,330,000 | | | U.S. Treasury Note, 0.375%, 6/30/2015 | | | 42,427,571 | |
| | 141,445,000 | | | U.S. Treasury Note, 0.375%, 3/31/2016(c) | | | 141,478,098 | |
| | 13,030,000 | | | U.S. Treasury Note, 0.375%, 5/31/2016 | | | 13,016,761 | |
| | 6,610,000 | | | U.S. Treasury Note, 1.250%, 10/31/2018 | | | 6,527,375 | |
| | 7,240,000 | | | U.S. Treasury Note, 1.250%, 4/30/2019 | | | 7,095,200 | |
| | 12,950,000 | | | U.S. Treasury Note, 2.500%, 5/15/2024 | | | 12,958,094 | |
| | 8,830,000 | | | U.S. Treasury Note, 2.750%, 2/15/2024 | | | 9,037,646 | |
| | | | | | | | |
| | | | | | | 380,475,416 | |
| | | | | | | | |
| | | | Wireless — 2.0% | |
| | 1,475,000 | | | American Tower Corp., 4.700%, 3/15/2022 | | | 1,544,042 | |
| | 6,810,000 | | | Bharti Airtel International Netherlands BV, 5.125%, 3/11/2023, 144A | | | 7,159,761 | |
| | 300,000 | | | Bharti Airtel International Netherlands BV, 5.350%, 5/20/2024, 144A | | | 319,677 | |
| | 5,960,000 | | | SK Telecom Co. Ltd., 2.125%, 5/01/2018, 144A | | | 5,929,497 | |
| | 3,165,000 | | | SK Telecom Co. Ltd., 6.625%, 7/20/2027, 144A | | | 3,971,569 | |
| | 10,330,000 | | | Softbank Corp., 4.500%, 4/15/2020, 144A | | | 10,304,175 | |
| | 11,020,000 | | | Sprint Capital Corp., 6.875%, 11/15/2028 | | | 10,524,100 | |
| | 6,225,000 | | | Ymobile Corp., 8.250%, 4/01/2018, 144A | | | 6,567,375 | |
| | | | | | | | |
| | | | | | | 46,320,196 | |
| | | | | | | | |
| | | | Wirelines — 3.8% | |
| | 5,757,000 | | | Axtel SAB de CV, (Step to 9.000% on 1/31/2015), 8.000%, 1/31/2020, 144A(h) | | | 5,699,430 | |
| | 2,650,000 | | | CenturyLink, Inc., 5.625%, 4/01/2020 | | | 2,733,475 | |
| | 7,175,000 | | | Colombia Telecomunicaciones S.A. E.S.P., 5.375%, 9/27/2022, 144A | | | 7,210,875 | |
| | 14,723,000 | | | Embarq Corp., 7.995%, 6/01/2036 | | | 15,914,091 | |
| | 1,575,000 | | | Frontier Communications Corp., 7.875%, 1/15/2027 | | | 1,582,875 | |
| | 5,050,000 | | | Frontier Communications Corp., 8.500%, 4/15/2020 | | | 5,605,500 | |
| | 5,935,000 | | | Frontier Communications Corp., 8.750%, 4/15/2022 | | | 6,676,875 | |
| | 415,000 | | | Frontier Communications Corp., 9.000%, 8/15/2031 | | | 430,562 | |
| | 1,975,000 | | | Qwest Corp., 6.750%, 12/01/2021 | | | 2,264,118 | |
| | 5,000,000 | | | Telefonica Celular del Paraguay S.A., 6.750%, 12/13/2022, 144A | | | 5,190,000 | |
| | 4,029,000 | | | Telefonica Emisiones SAU, 5.134%, 4/27/2020 | | | 4,428,528 | |
| | 5,541,000 | | | Telefonica Emisiones SAU, 5.462%, 2/16/2021 | | | 6,170,768 | |
| | 6,344,000 | | | Telemar Norte Leste S.A., 5.500%, 10/23/2020, 144A | | | 6,161,927 | |
| | 5,178,000 | | | Verizon Communications, Inc., 2.625%, 2/21/2020, 144A | | | 5,113,042 | |
| | 4,025,000 | | | Verizon Communications, Inc., 5.050%, 3/15/2034 | | | 4,264,528 | |
| | 9,440,000 | | | Windstream Corp., 7.500%, 4/01/2023 | | | 9,676,000 | |
| | | | | | | | |
| | | | 89,122,594 | |
| | | | | | | | |
| | | | Total Non-Convertible Bonds
(Identified Cost $2,033,568,889) | | | 2,041,616,758 | |
| | | | | | | | |
See accompanying notes to financial statements.
| 34
Portfolio of Investments – as of September 30, 2014
Loomis Sayles Core Plus Bond Fund – (continued)
| | | | | | | | |
Principal
Amount (‡) | | | Description | | Value (†) | |
| | Convertible Bonds — 0.0% | |
| | | | Wirelines — 0.0% | |
| | 2,257,000 | | | Axtel SAB de CV, (Step to 9.000% on 1/31/2015), 8.000%, 1/31/2020, 144A (MXN)(h)(i)(j)(k)
(Identified Cost $346,907) | | $ | 265,482 | |
| | | | | | | | |
| | | | Total Bonds and Notes
(Identified Cost $2,033,915,796) | | | 2,041,882,240 | |
| | | | | | | | |
| | | | | | | | |
| | Senior Loans — 2.7% | |
| | | | Automotive — 0.2% | |
| | 278,355 | | | KAR Auction Services, Inc., Term Loan B2, 3.500%, 3/11/2021(b) | | | 273,832 | |
| | 5,544,105 | | | Visteon Corp., Delayed Draw Term Loan B, 3.500%, 4/09/2021(b) | | | 5,445,365 | |
| | | | | | | | |
| | | | 5,719,197 | |
| | | | | | | | |
| | | | Building Materials — 0.1% | |
| | 2,970,000 | | | ABC Supply Co., Inc., Term Loan, 3.500%, 4/16/2020(b) | | | 2,909,679 | |
| | | | | | | | |
| | | | Cable Satellite — 0.2% | |
| | 3,631,038 | | | Charter Communications Operating LLC, Term Loan E, 3.000%, 7/01/2020(b) | | | 3,520,799 | |
| | | | | | | | |
| | | | Chemicals — 0.1% | |
| | 3,592,207 | | | Axalta Coating Systems U.S. Holdings, Inc., USD Term Loan, 3.750%, 2/01/2020(b) | | | 3,516,627 | |
| | | | | | | | |
| | | | Diversified Manufacturing — 0.1% | |
| | 3,002,825 | | | Ameriforge Group, Inc., 1st Lien Term Loan, 5.000%, 12/19/2019(b) | | | 2,991,564 | |
| | | | | | | | |
| | | | Electric — 0.2% | |
| | 5,415,007 | | | NRG Energy, Inc., Refi Term Loan B, 2.750%, 7/02/2018(b) | | | 5,306,707 | |
| | | | | | | | |
| | | | Food & Beverage — 0.5% | |
| | 11,741,000 | | | Aramark Corp., USD Term Loan F, 3.250%, 2/24/2021(b) | | | 11,498,901 | |
| | | | | | | | |
| | | | Healthcare — 0.2% | |
| | 4,089,750 | | | DaVita HealthCare Partners, Inc., Term Loan B, 3.500%, 6/24/2021(b) | | | 4,038,137 | |
| | | | | | | | |
| | | | Leisure — 0.2% | |
| | 4,017,150 | | | Activision Blizzard, Inc., Term Loan B, 3.250%, 10/12/2020(b) | | | 4,003,893 | |
| | | | | | | | |
| | | | Media Entertainment — 0.3% | |
| | 7,035,000 | | | Intelsat Jackson Holdings S.A., Term Loan B2, 3.750%, 6/30/2019(b) | | | 6,911,887 | |
| | | | | | | | |
| | | | Metals & Mining — 0.1% | |
| | 3,613,173 | | | Arch Coal, Inc., Term Loan B, 6.250%, 5/16/2018(b) | | | 3,302,657 | |
| | | | | | | | |
| | | | Midstream — 0.3% | |
| | 6,263,000 | | | Energy Transfer Equity LP, New Term Loan, 3.250%, 12/02/2019(b) | | | 6,096,843 | |
| | | | | | | | |
| | | | Pharmaceuticals — 0.2% | |
| | 3,898,373 | | | Grifols Worldwide Operations USA, Inc., USD Term Loan B, 3.154%, 2/27/2021(b) | | | 3,822,862 | |
| | | | | | | | |
| | | | Total Senior Loans
(Identified Cost $64,824,701) | | | 63,639,753 | |
| | | | | | | | |
See accompanying notes to financial statements.
35 |
Portfolio of Investments – as of September 30, 2014
Loomis Sayles Core Plus Bond Fund – (continued)
| | | | | | | | |
Shares | | | Description | | Value (†) | |
| | Preferred Stocks — 0.5% | |
| | | | Banking — 0.1% | |
| | 68,182 | | | Ally Financial, Inc., Series A, (fixed rate to 5/15/2016, variable rate thereafter), 8.500% | | $ | 1,836,141 | |
| | 532 | | | Ally Financial, Inc., Series G, 7.000%, 144A | | | 532,499 | |
| | | | | | | | |
| | | | | | | 2,368,640 | |
| | | | | | | | |
| | | | Cable Satellite — 0.4% | |
| | 8,945,000 | | | NBCUniversal Enterprise, Inc., 5.250%, 144A | | | 9,302,800 | |
| | | | | | | | |
| | | | Finance Companies — 0.0% | |
| | 5,510 | | | SLM Corp., Series A, 6.970% | | | 271,533 | |
| | | | | | | | |
| | | | Total Preferred Stocks
(Identified Cost $11,013,801) | | | 11,942,973 | |
| | | | | | | | |
| | | | | | | | |
Principal
Amount (‡) | | | | | | |
| | Short-Term Investments — 10.9% | |
| $ | 208,242 | | | Repurchase Agreement with State Street Bank and Trust Company, dated 9/30/2014 at 0.000% to be repurchased at $208,242 on 10/01/2014 collateralized by $212,300 U.S. Treasury Note, 1.500% due 8/31/2018 valued at $212,464 including accrued interest (Note 2 of Notes to Financial Statements) | | | 208,242 | |
| | 251,096,543 | | | Tri-Party Repurchase Agreement with Fixed Income Clearing Corporation, dated 9/30/2014 at 0.000% to be repurchased at $251,096,543 on 10/01/2014 collateralized by $255,800,000 U.S. Treasury Note, 0.375% due 1/15/2016 valued at $256,119,750 including accrued interest (Note 2 of Notes to Financial Statements) | | | 251,096,543 | |
| | | | | | | | |
| | | | Total Short-Term Investments
(Identified Cost $251,304,785) | | | 251,304,785 | |
| | | | | | | | |
| | | | | | | | |
| | | | Total Investments — 102.3%
(Identified Cost $2,361,059,083)(a) | | | 2,368,769,751 | |
| | | | Other assets less liabilities — (2.3)% | | | (52,662,117 | ) |
| | | | | | | | |
| | | | Net Assets — 100.0% | | $ | 2,316,107,634 | |
| | | | | | | | |
| | | | | | | | |
| | (‡) | | | Principal Amount stated in U.S. dollars unless otherwise noted. | |
| | (†) | | | See Note 2 of Notes to Financial Statements. | |
| | (††) | | | Amount shown represents units. One unit represents a principal amount of 100. | |
| | (a) | | | Federal Tax Information: | |
| | | | At September 30, 2014, the net unrealized appreciation on investments based on a cost of $2,367,009,316 for federal income tax purposes was as follows: | |
| | | | Aggregate gross unrealized appreciation for all investments in which there is an excess of value over tax cost | | $ | 31,037,905 | |
| | | | Aggregate gross unrealized depreciation for all investments in which there is an excess of tax cost over value | | | (29,277,470 | ) |
| | | | | | | | |
| | | | Net unrealized appreciation | | $ | 1,760,435 | |
| | | | | | | | |
See accompanying notes to financial statements.
| 36
Portfolio of Investments – as of September 30, 2014
Loomis Sayles Core Plus Bond Fund – (continued)
| | | | | | |
| | | | | | |
| | (b) | | | Variable rate security. Rate as of September 30, 2014 is disclosed. |
| | (c) | | | All of this security has been designated to cover the Fund’s obligations under open TBA transactions. |
| | (d) | | | A portion of this security has been designated to cover the Fund’s obligations under open TBA transactions. |
| | (e) | | | The Fund’s investment in mortgage related securities of Federal Home Loan Mortgage Corporation, Federal National Mortgage Association and Government National Mortgage Association are interests in separate pools of mortgages. All separate investments in securities of each issuer which have the same coupon rate have been aggregated for the purpose of presentation in the Portfolio of Investments. |
| | (f) | | | Delayed delivery. See Note 2 of Notes to Financial Statements. |
| | (g) | | | Treasury Inflation Protected Security (TIPS). |
| | (h) | | | Coupon rate is a fixed rate for an initial period then resets at a specified date and rate. |
| | (i) | | | Illiquid security. At September 30, 2014, the value of this security amounted to $265,482 or less than 0.1% of net assets. |
| | (j) | | | Fair valued by the Fund’s adviser. At September 30, 2014, the value of this security amounted to $265,482 or less than 0.1% of net assets. |
| | (k) | | | Convertible dollar-indexed note. Coupon rate is based on MXN denominated par value and is payable in USD. |
| | | | | | |
| | 144A | | | All or a portion of these securities are exempt from registration under Rule 144A of the Securities Act of 1933. These securities may be resold in transactions exempt from registration, normally to qualified institutional buyers. At September 30, 2014, the value of Rule 144A holdings amounted to $562,401,981 or 24.3% of net assets. |
| | ABS | | | Asset-Backed Securities |
| | ARMs | | | Adjustable Rate Mortgages |
| | EMTN | | | Euro Medium Term Note |
| | FHLMC | | | Federal Home Loan Mortgage Corp. |
| | FNMA | | | Federal National Mortgage Association |
| | GMTN | | | Global Medium Term Note |
| | GNMA | | | Government National Mortgage Association |
| | MTN | | | Medium Term Note |
| | TBA | | | To Be Announced |
| | | | | | |
| | BRL | | | Brazilian Real |
| | MXN | | | Mexican Peso |
| | PHP | | | Philippine Peso |
| | USD | | | U.S. Dollar |
See accompanying notes to financial statements.
37 |
Portfolio of Investments – as of September 30, 2014
Loomis Sayles Core Plus Bond Fund – (continued)
Industry Summary at September 30, 2014
| | | | |
Treasuries | | | 16.4 | % |
Mortgage Related | | | 10.0 | |
Government Owned – No Guarantee | | | 8.4 | |
Banking | | | 6.6 | |
Non-Agency Commercial Mortgage-Backed Securities | | | 5.6 | |
Wirelines | | | 3.8 | |
Finance Companies | | | 3.4 | |
Supranational | | | 2.4 | |
Oil Field Services | | | 2.3 | |
Midstream | | | 2.2 | |
Automotive | | | 2.1 | |
Wireless | | | 2.0 | |
Other Investments, less than 2% each | | | 26.2 | |
Short-Term Investments | | | 10.9 | |
| | | | |
Total Investments | | | 102.3 | |
Other assets less liabilities | | | (2.3 | ) |
| | | | |
Net Assets | | | 100.0 | % |
| | | | |
See accompanying notes to financial statements.
| 38
Portfolio of Investments – as of September 30, 2014
Loomis Sayles High Income Fund
| | | | | | | | |
Principal
Amount (‡) | | | Description | | Value (†) | |
| | Bonds and Notes — 88.8% of Net Assets | | | | |
| | Non-Convertible Bonds — 78.4% | | | | |
| | | | ABS Home Equity — 4.6% | | | | |
| $ | 248,974 | | | American Home Mortgage Investment Trust, Series 2005-2, Class 4A1,
1.832%, 9/25/2045(b) | | $ | 240,645 | |
| | 189,447 | | | Banc of America Alternative Loan Trust, Series 2003-8, Class 1CB1,
5.500%, 10/25/2033 | | | 195,197 | |
| | 285,875 | | | Banc of America Alternative Loan Trust, Series 2003-10, Class 3A1,
5.500%, 12/25/2033 | | | 293,300 | |
| | 311,056 | | | Banc of America Funding Corp., Series 2008-R4, Class 1A4,
0.605%, 7/25/2037, 144A(b) | | | 238,844 | |
| | 226,282 | | | Banc of America Funding Trust, Series 2005-7, Class 3A1, 5.750%, 11/25/2035 | | | 232,134 | |
| | 50,289 | | | Banc of America Mortgage Securities, Inc., Series 2005-A, Class 2A1,
2.705%, 2/25/2035(b) | | | 49,557 | |
| | 103,624 | | | Bear Stearns Adjustable Rate Mortgage Trust, Series 2004-9, Class 12A3,
2.822%, 11/25/2034(b) | | | 102,849 | |
| | 114,132 | | | Citicorp Mortgage Securities Trust, Series 2006-4, Class 1A2,
6.000%, 8/25/2036 | | | 116,754 | |
| | 96,526 | | | Citigroup Mortgage Loan Trust, Inc., Series 2005-2, Class 1A4,
2.612%, 5/25/2035(b) | | | 95,517 | |
| | 87,395 | | | CitiMortgage Alternative Loan Trust, Series 2006-A3, Class 1A7,
6.000%, 7/25/2036 | | | 78,360 | |
| | 543,402 | | | Countrywide Alternative Loan Trust, Series 2004-27CB, Class A1,
6.000%, 12/25/2034 | | | 544,138 | |
| | 267,455 | | | Countrywide Alternative Loan Trust, Series 2006-J4, Class 1A3,
6.250%, 7/25/2036 | | | 183,170 | |
| | 332,037 | | | Countrywide Home Loan Mortgage Pass Through Trust, Series 2005-11,
Class 4A1, 0.425%, 4/25/2035(b) | | | 288,543 | |
| | 434,311 | | | Countrywide Home Loan Mortgage Pass Through Trust, Series 2005-HYB7, Class 2A, 2.596%, 11/20/2035(b) | | | 414,292 | |
| | 338,412 | | | Countrywide Home Loan Mortgage Pass Through Trust, Series 2006-20,
Class 1A35, 6.000%, 2/25/2037 | | | 317,218 | |
| | 73,788 | | | GMAC Mortgage Corp. Loan Trust, Series 2003-J7, Class A7,
5.000%, 11/25/2033 | | | 76,158 | |
| | 402,860 | | | GMAC Mortgage Corp. Loan Trust, Series 2005-AR3, Class 2A1,
2.738%, 6/19/2035(b) | | | 403,460 | |
| | 316,111 | | | GMAC Mortgage Corp. Loan Trust, Series 2005-AR4, Class 3A1,
2.959%, 7/19/2035(b) | | | 296,542 | |
| | 77,709 | | | GSR Mortgage Loan Trust, Series 2004-14, Class 3A1, 2.814%, 12/25/2034(b) | | | 74,922 | |
| | 548,931 | | | GSR Mortgage Loan Trust, Series 2005-AR6, Class 4A5, 2.682%, 9/25/2035(b) | | | 554,416 | |
| | 179,862 | | | GSR Mortgage Loan Trust, Series 2006-8F, Class 4A17, 6.000%, 9/25/2036 | | | 147,867 | |
| | 97,491 | | | JPMorgan Alternative Loan Trust, Series 2006-A1, Class 5A1,
4.591%, 3/25/2036(b) | | | 79,053 | |
| | 393,005 | | | Lehman Mortgage Trust, Series 2005-3, Class 1A6, 0.655%, 1/25/2036(b)(c) | | | 284,158 | |
| | 155,434 | | | Lehman Mortgage Trust, Series 2006-1, Class 3A5, 5.500%, 2/25/2036 | | | 156,057 | |
| | 497,819 | | | MASTR Adjustable Rate Mortgages Trust, Series 2005-2, Class 3A1,
2.686%, 3/25/2035(b) | | | 444,714 | |
See accompanying notes to financial statements.
39 |
Portfolio of Investments – as of September 30, 2014
Loomis Sayles High Income Fund – (continued)
| | | | | | | | |
Principal
Amount (‡) | | | Description | | Value (†) | |
| | | | ABS Home Equity — continued | | | | |
| $ | 535,989 | | | MASTR Adjustable Rate Mortgages Trust, Series 2007-1, Class I2A1,
0.315%, 1/25/2047(b) | | $ | 408,187 | |
| | 474,679 | | | Merrill Lynch Alternative Note Asset Trust, Series 2007-F1, Class 2A7,
6.000%, 3/25/2037 | | | 358,548 | |
| | 101,199 | | | New York Mortgage Trust, Series 2006-1, Class 2A2, 2.633%, 5/25/2036(b) | | | 92,075 | |
| | 419,748 | | | Residential Accredit Loans, Inc., Series 2006-QS6, Class 1A16,
6.000%, 6/25/2036 | | | 339,440 | |
| | 335,099 | | | Residential Funding Mortgage Securities, Series 2006-S1, Class 1A3,
5.750%, 1/25/2036 | | | 344,664 | |
| | 572,251 | | | WaMu Mortgage Pass Through Certificates, Series 2006-AR19, Class 2A,
1.926%, 1/25/2047(b) | | | 549,154 | |
| | 108,539 | | | WaMu Mortgage Pass Through Certificates, Series 2007-OA3, Class 2A1A, 0.875%, 4/25/2047(b) | | | 97,949 | |
| | 552,500 | | | Washington Mutual Mortgage Pass Through Certificates, Series 2006-AR6, Class 2A, 1.075%, 8/25/2046(b) | | | 380,795 | |
| | | | | | | | |
| | | | | | | 8,478,677 | |
| | | | | | | | |
| | | | ABS Other — 0.4% | |
| | 172,168 | | | Sierra Receivables Funding Co. LLC, Series 2011-3A, Class C,
9.310%, 7/20/2028, 144A | | | 185,379 | |
| | 450,000 | | | Springleaf Funding Trust, Series 2014-AA, Class C,
4.450%, 12/15/2022, 144A | | | 447,739 | |
| | | | | | | | |
| | | | | | | 633,118 | |
| | | | | | | | |
| | | | Aerospace & Defense — 1.7% | |
| | 1,500,000 | | | Meccanica Holdings USA, Inc., 6.250%, 1/15/2040, 144A | | | 1,417,500 | |
| | 900,000 | | | Meccanica Holdings USA, Inc., 7.375%, 7/15/2039, 144A | | | 940,500 | |
| | 200,000 | | | Oshkosh Corp., 5.375%, 3/01/2022 | | | 201,000 | |
| | 620,000 | | | TransDigm, Inc., 6.000%, 7/15/2022, 144A | | | 612,250 | |
| | | | | | | | |
| | | | | | | 3,171,250 | |
| | | | | | | | |
| | | | Airlines — 0.2% | |
| | 4,753 | | | Continental Airlines Pass Through Trust, Series 1997-4, Class B,
6.900%, 7/02/2018 | | | 4,985 | |
| | 137,903 | | | Virgin Australia Pass Through Trust, Series 2013-1B, 6.000%, 4/23/2022, 144A | | | 141,626 | |
| | 216,879 | | | Virgin Australia Pass Through Trust, Series 2013-1C, 7.125%, 10/23/2018, 144A | | | 218,627 | |
| | | | | | | | |
| | | | | | | 365,238 | |
| | | | | | | | |
| | | | Automotive — 0.6% | | | | |
| | 835,000 | | | General Motors Co., 4.875%, 10/02/2023 | | | 883,012 | |
| | 185,000 | | | Midas Intermediate Holdco II LLC/Midas Intermediate Holdco II Finance, Inc., 7.875%, 10/01/2022, 144A | | | 184,538 | |
| | | | | | | | |
| | | | | | | 1,067,550 | |
| | | | | | | | |
| | | | Banking — 2.4% | | | | |
| | 2,100,000 | | | Banco Santander Brasil S.A., 8.000%, 3/18/2016, 144A, (BRL) | | | 819,324 | |
| | 820,000 | | | HBOS PLC, 6.000%, 11/01/2033, 144A | | | 910,200 | |
| | 900,000 | | | Morgan Stanley, GMTN, 7.625%, 3/03/2016, (AUD) | | | 831,626 | |
| | 65,000 | | | Royal Bank of Scotland Group PLC, 5.250%, (EUR)(d) | | | 78,199 | |
See accompanying notes to financial statements.
| 40
Portfolio of Investments – as of September 30, 2014
Loomis Sayles High Income Fund – (continued)
| | | | | | | | |
Principal
Amount (‡) | | | Description | | Value (†) | |
| | | | Banking — continued | | | | |
| | 740,000 | | | Royal Bank of Scotland Group PLC, 5.500%, (EUR)(d) | | $ | 900,075 | |
| | 800,000 | | | Royal Bank of Scotland Group PLC, 6.125%, 12/15/2022 | | | 846,750 | |
| | | | | | | | |
| | | | | | | 4,386,174 | |
| | | | | | | | |
| | | | Brokerage — 0.4% | |
| | 650,000 | | | Jefferies Finance LLC/JFIN Co-Issuer Corp., 6.875%, 4/15/2022, 144A | | | 640,250 | |
| | | | | | | | |
| | | | Building Materials — 2.8% | |
| | 880,000 | | | Atrium Windows & Doors, Inc., 7.750%, 5/01/2019, 144A | | | 853,600 | |
| | 395,000 | | | Building Materials Holding Corp., 9.000%, 9/15/2018, 144A | | | 428,575 | |
| | 451,000 | | | CPG Merger Sub LLC, 8.000%, 10/01/2021, 144A | | | 457,765 | |
| | 1,280,000 | | | HD Supply, Inc., 7.500%, 7/15/2020 | | | 1,328,000 | |
| | 50,000 | | | Masco Corp., 6.500%, 8/15/2032 | | | 50,000 | |
| | 345,000 | | | Masco Corp., 7.750%, 8/01/2029 | | | 395,297 | |
| | 1,000,000 | | | Odebrecht Finance Ltd., 4.375%, 4/25/2025, 144A | | | 940,000 | |
| | 900,000 | | | Odebrecht Finance Ltd., 8.250%, 4/25/2018, 144A, (BRL) | | | 331,835 | |
| | 240,000 | | | USG Corp., 5.875%, 11/01/2021, 144A | | | 244,800 | |
| | | | | | | | |
| | | | | | | 5,029,872 | |
| | | | | | | | |
| | | | Cable Satellite — 1.7% | |
| | 475,000 | | | CCO Holdings LLC/CCO Holdings Capital Corp., 5.125%, 2/15/2023 | | | 456,000 | |
| | 430,000 | | | CCO Holdings LLC/CCO Holdings Capital Corp., 5.250%, 9/30/2022 | | | 420,863 | |
| | 15,000 | | | CCO Holdings LLC/CCO Holdings Capital Corp., 5.750%, 1/15/2024 | | | 14,925 | |
| | 50,000 | | | Intelsat Luxembourg S.A., 6.750%, 6/01/2018 | | | 51,375 | |
| | 995,000 | | | Intelsat Luxembourg S.A., 7.750%, 6/01/2021 | | | 1,013,656 | |
| | 230,000 | | | Intelsat Luxembourg S.A., 8.125%, 6/01/2023 | | | 239,775 | |
| | 155,000 | | | Numericable Group S.A., 5.375%, 5/15/2022, 144A, (EUR) | | | 202,296 | |
| | 265,000 | | | Virgin Media Finance PLC, 6.000%, 10/15/2024, 144A | | | 265,331 | |
| | 375,000 | | | Virgin Media Secured Finance PLC, 5.500%, 1/15/2025, 144A | | | 373,125 | |
| | 130,000 | | | Wave Holdco LLC/Wave Holdco Corp.,
8.250%, (9.000% PIK), 7/15/2019, 144A(e) | | | 133,250 | |
| | | | | | | | |
| | | | | | | 3,170,596 | |
| | | | | | | | |
| | | | Chemicals — 2.3% | |
| | 600,000 | | | Axalta Coating Systems U.S. Holdings, Inc./Axalta Coating Systems Dutch Holding B BV, 7.375%, 5/01/2021, 144A | | | 643,500 | |
| | 265,000 | | | Braskem Finance Ltd., 6.450%, 2/03/2024 | | | 275,600 | |
| | 1,510,000 | | | Hercules, Inc., 6.500%, 6/30/2029 | | | 1,343,900 | |
| | 850,000 | | | Hexion U.S. Finance Corp./Hexion Nova Scotia Finance ULC, 8.875%, 2/01/2018 | | | 865,937 | |
| | 445,000 | | | Perstorp Holding AB, 11.000%, 8/15/2017, 144A | | | 458,350 | |
| | 635,000 | | | TPC Group, Inc., 8.750%, 12/15/2020, 144A | | | 674,688 | |
| | | | | | | | |
| | | | | | | 4,261,975 | |
| | | | | | | | |
| | | | Construction Machinery — 0.4% | |
| | 650,000 | | | Ashtead Capital, Inc., 5.625%, 10/01/2024, 144A | | | 653,250 | |
| | | | | | | | |
| | | | Consumer Cyclical Services — 1.0% | |
| | 732,000 | | | ServiceMaster Co. (The), 7.000%, 8/15/2020 | | | 761,280 | |
| | 1,095,000 | | | ServiceMaster Co. (The), 7.450%, 8/15/2027 | | | 1,105,950 | |
| | | | | | | | |
| | | | | | | 1,867,230 | |
| | | | | | | | |
See accompanying notes to financial statements.
41 |
Portfolio of Investments – as of September 30, 2014
Loomis Sayles High Income Fund – (continued)
| | | | | | | | |
Principal
Amount (‡) | | | Description | | Value (†) | |
| | | | Electric — 1.7% | |
| $ | 355,000 | | | AES Corp. (The), 3.234%, 6/01/2019(b) | | $ | 349,675 | |
| | 500,000 | | | Calpine Corp., 5.375%, 1/15/2023 | | | 483,750 | |
| | 415,000 | | | Calpine Corp., 6.000%, 1/15/2022, 144A | | | 438,862 | |
| | 1,502,000 | | | Enel SpA, (fixed rate to 9/24/2023, variable rate thereafter),
8.750%, 9/24/2073, 144A | | | 1,740,518 | |
| | 13,839 | | | Red Oak Power LLC, Series A, 8.540%, 11/30/2019 | | | 14,946 | |
| | | | | | | | |
| | | | | | | 3,027,751 | |
| | | | | | | | |
| | | | Finance Companies — 4.9% | |
| | 945,000 | | | AerCap Ireland Capital Ltd./AerCap Global Aviation Trust,
5.000%, 10/01/2021, 144A | | | 940,275 | |
| | 340,000 | | | CIT Group, Inc., 3.875%, 2/19/2019 | | | 334,050 | |
| | 65,000 | | | CIT Group, Inc., 5.000%, 8/15/2022 | | | 65,163 | |
| | 545,000 | | | CIT Group, Inc., 5.000%, 8/01/2023 | | | 540,912 | |
| | 600,000 | | | iStar Financial, Inc., 4.000%, 11/01/2017 | | | 582,000 | |
| | 505,000 | | | iStar Financial, Inc., 5.000%, 7/01/2019 | | | 486,063 | |
| | 1,015,000 | | | Ladder Capital Finance Holdings LLLP/Ladder Capital Finance Corp.,
5.875%, 8/01/2021, 144A | | | 1,004,850 | |
| | 585,000 | | | Ladder Capital Finance Holdings LLLP/Ladder Capital Finance Corp.,
7.375%, 10/01/2017 | | | 618,637 | |
| | 1,230,000 | | | Navient LLC, 5.500%, 1/25/2023 | | | 1,182,337 | |
| | 435,000 | | | Oxford Finance LLC/Oxford Finance Co-Issuer, Inc., 7.250%, 1/15/2018, 144A | | | 452,400 | |
| | 540,000 | | | Provident Funding Associates LP/PFG Finance Corp., 6.750%, 6/15/2021, 144A | | | 534,600 | |
| | 1,110,000 | | | Springleaf Finance Corp., 7.750%, 10/01/2021 | | | 1,243,200 | |
| | 445,000 | | | Springleaf Finance Corp., 8.250%, 10/01/2023 | | | 500,625 | |
| | 445,000 | | | Springleaf Finance Corp., Series J, MTN, 6.900%, 12/15/2017 | | | 472,813 | |
| | | | | | | | |
| | | | | | | 8,957,925 | |
| | | | | | | | |
| | | | Financial Other — 0.9% | |
| | 695,000 | | | Icahn Enterprises LP/Icahn Enterprises Finance Corp., 4.875%, 3/15/2019 | | | 684,575 | |
| | 180,000 | | | Icahn Enterprises LP/Icahn Enterprises Finance Corp., 5.875%, 2/01/2022 | | | 180,000 | |
| | 804,000 | | | Rialto Holdings LLC/Rialto Corp., 7.000%, 12/01/2018, 144A | | | 820,080 | |
| | | | | | | | |
| | | | | | | 1,684,655 | |
| | | | | | | | |
| | | | Food & Beverage — 1.2% | |
| | 1,800,000 | | | BRF S.A., 7.750%, 5/22/2018, 144A, (BRL) | | | 643,448 | |
| | 600,000 | | | Cosan Luxembourg S.A., 9.500%, 3/14/2018, 144A, (BRL) | | | 219,385 | |
| | 605,000 | | | Crestview DS Merger Sub II, Inc., 10.000%, 9/01/2021 | | | 668,525 | |
| | 250,000 | | | TreeHouse Foods, Inc., 4.875%, 3/15/2022 | | | 246,250 | |
| | 480,000 | | | WhiteWave Foods Co. (The), 5.375%, 10/01/2022 | | | 484,800 | |
| | | | | | | | |
| | | | | | | 2,262,408 | |
| | | | | | | | |
| | | | Gaming — 0.7% | |
| | 100,000 | | | GLP Capital LP/GLP Financing II, Inc., 4.375%, 11/01/2018 | | | 101,500 | |
| | 285,000 | | | GLP Capital LP/GLP Financing II, Inc., 4.875%, 11/01/2020 | | | 290,612 | |
| | 740,000 | | | MGM Resorts International, 6.750%, 10/01/2020 | | | 788,100 | |
| | | | | | | | |
| | | | | | | 1,180,212 | |
| | | | | | | | |
See accompanying notes to financial statements.
| 42
Portfolio of Investments – as of September 30, 2014
Loomis Sayles High Income Fund – (continued)
| | | | | | | | |
Principal
Amount (‡) | | | Description | | Value (†) | |
| | | | Government Owned – No Guarantee — 0.6% | |
| $ | 530,000 | | | Petrobras Global Finance BV, 6.250%, 3/17/2024 | | $ | 555,244 | |
| | 465,000 | | | Rio Oil Finance Trust, Series 2014-1, 6.250%, 7/06/2024, 144A | | | 479,695 | |
| | | | | | | | |
| | | | | | | 1,034,939 | |
| | | | | | | | |
| | | | Healthcare — 4.5% | |
| | 360,000 | | | Amsurg Corp., 5.625%, 7/15/2022, 144A | | | 356,400 | |
| | 305,000 | | | BioScrip, Inc., 8.875%, 2/15/2021, 144A | | | 312,244 | |
| | 240,000 | | | Catamaran Corp., 4.750%, 3/15/2021 | | | 230,850 | |
| | 1,330,000 | | | CHS/Community Health Systems, Inc., 6.875%, 2/01/2022, 144A | | | 1,383,200 | |
| | 170,000 | | | HCA, Inc., 7.050%, 12/01/2027 | | | 170,850 | |
| | 655,000 | | | HCA, Inc., 7.500%, 12/15/2023 | | | 713,950 | |
| | 145,000 | | | HCA, Inc., 7.500%, 11/06/2033 | | | 152,250 | |
| | 590,000 | | | HCA, Inc., 7.690%, 6/15/2025 | | | 649,000 | |
| | 480,000 | | | HCA, Inc., 8.360%, 4/15/2024 | | | 552,000 | |
| | 820,000 | | | HCA, Inc., MTN, 7.580%, 9/15/2025 | | | 893,800 | |
| | 515,000 | | | HCA, Inc., MTN, 7.750%, 7/15/2036 | | | 558,775 | |
| | 305,000 | | | LifePoint Hospitals, Inc., 5.500%, 12/01/2021 | | | 308,813 | |
| | 310,000 | | | Tenet Healthcare Corp., 5.000%, 3/01/2019, 144A | | | 306,125 | |
| | 635,000 | | | Tenet Healthcare Corp., 6.875%, 11/15/2031 | | | 612,775 | |
| | 375,000 | | | Universal Health Services, Inc., 3.750%, 8/01/2019, 144A | | | 374,062 | |
| | 720,000 | | | Universal Health Services, Inc., 4.750%, 8/01/2022, 144A | | | 719,100 | |
| | | | | | | | |
| | | | | | | 8,294,194 | |
| | | | | | | | |
| | | | Home Construction — 4.0% | |
| | 1,200,000 | | | Corporacion GEO SAB de CV, 8.875%, 3/27/2022, 144A(f) | | | 109,500 | |
| | 750,000 | | | K. Hovnanian Enterprises, Inc., 5.000%, 11/01/2021 | | | 652,500 | |
| | 500,000 | | | K. Hovnanian Enterprises, Inc., 9.125%, 11/15/2020, 144A | | | 541,250 | |
| | 345,000 | | | KB Home, 7.000%, 12/15/2021 | | | 359,663 | |
| | 880,000 | | | KB Home, 7.250%, 6/15/2018 | | | 941,600 | |
| | 3,135,000 | | | Pulte Group, Inc., 6.000%, 2/15/2035(g) | | | 2,978,250 | |
| | 495,000 | | | Pulte Group, Inc., 6.375%, 5/15/2033 | | | 493,762 | |
| | 70,000 | | | Standard Pacific Corp., 8.375%, 1/15/2021 | | | 80,150 | |
| | 200,000 | | | Urbi Desarrollos Urbanos SAB de CV, 9.500%, 1/21/2020, 144A(f) | | | 26,092 | |
| | 1,100,000 | | | Urbi Desarrollos Urbanos SAB de CV, 9.750%, 2/03/2022, 144A(f) | | | 142,230 | |
| | 915,000 | | | Weyerhaeuser Real Estate Co., 4.375%, 6/15/2019, 144A | | | 894,412 | |
| | | | | | | | |
| | | | | | | 7,219,409 | |
| | | | | | | | |
| | | | Independent Energy — 4.9% | |
| | 90,000 | | | Baytex Energy Corp., 5.125%, 6/01/2021, 144A | | | 87,750 | |
| | 840,000 | | | Baytex Energy Corp., 5.625%, 6/01/2024, 144A | | | 806,400 | |
| | 280,000 | | | Chesapeake Energy Corp., 6.625%, 8/15/2020 | | | 308,840 | |
| | 115,000 | | | Halcon Resources Corp., 8.875%, 5/15/2021 | | | 113,275 | |
| | 400,000 | | | Halcon Resources Corp., 9.750%, 7/15/2020 | | | 407,000 | |
| | 180,000 | | | Jones Energy Holdings LLC/Jones Energy Finance Corp.,
6.750%, 4/01/2022, 144A | | | 180,000 | |
| | 220,000 | | | MEG Energy Corp., 6.375%, 1/30/2023, 144A | | | 221,925 | |
| | 135,000 | | | MEG Energy Corp., 7.000%, 3/31/2024, 144A | | | 139,725 | |
| | 4,400,000 | | | OGX Austria GmbH, 8.375%, 4/01/2022, 144A(f) | | | 145,200 | |
| | 595,000 | | | OGX Austria GmbH, 8.500%, 6/01/2018, 144A(f) | | | 23,800 | |
See accompanying notes to financial statements.
43 |
Portfolio of Investments – as of September 30, 2014
Loomis Sayles High Income Fund – (continued)
| | | | | | | | |
Principal
Amount (‡) | | | Description | | Value (†) | |
| | | | Independent Energy — continued | |
| $ | 400,000 | | | QEP Resources, Inc., 5.250%, 5/01/2023 | | $ | 388,000 | |
| | 520,000 | | | QEP Resources, Inc., 5.375%, 10/01/2022 | | | 509,600 | |
| | 955,000 | | | Rex Energy Corp., 6.250%, 8/01/2022, 144A | | | 921,575 | |
| | 890,000 | | | Rice Energy, Inc., 6.250%, 5/01/2022, 144A | | | 867,750 | |
| | 1,435,000 | | | Rosetta Resources, Inc., 5.875%, 6/01/2022 | | | 1,429,619 | |
| | 305,000 | | | RSP Permian, Inc., 6.625%, 10/01/2022, 144A | | | 306,906 | |
| | 245,000 | | | Sanchez Energy Corp., 6.125%, 1/15/2023, 144A | | | 242,623 | |
| | 810,000 | | | SandRidge Energy, Inc., 7.500%, 3/15/2021 | | | 789,750 | |
| | 920,000 | | | SM Energy Co., 5.000%, 1/15/2024 | | | 878,600 | |
| | 115,000 | | | Ultra Petroleum Corp., 5.750%, 12/15/2018, 144A | | | 115,575 | |
| | | | | | | | |
| | | | | | | 8,883,913 | |
| | | | | | | | |
| | | | Industrial Other — 0.9% | |
| | 265,000 | | | AECOM Technology Corp., 5.750%, 10/15/2022, 144A | | | 265,994 | |
| | 955,000 | | | CBRE Services, Inc., 5.250%, 3/15/2025 | | | 949,031 | |
| | 330,000 | | | Transfield Services Ltd., 8.375%, 5/15/2020, 144A | | | 343,200 | |
| | | | | | | | |
| | | | | | | 1,558,225 | |
| | | | | | | | |
| | | | Integrated Energy — 1.0% | |
| | 75,000 | | | California Resources Corp., 5.000%, 1/15/2020, 144A | | | 76,125 | |
| | 800,000 | | | California Resources Corp., 5.500%, 9/15/2021, 144A | | | 812,000 | |
| | 125,000 | | | California Resources Corp., 6.000%, 11/15/2024, 144A | | | 128,438 | |
| | 800,000 | | | Pacific Rubiales Energy Corp., 5.375%, 1/26/2019, 144A | | | 812,000 | |
| | | | | | | | |
| | | | | | | 1,828,563 | |
| | | | | | | | |
| | | | Leisure — 0.3% | |
| | 655,000 | | | 24 Hour Holdings III LLC, 8.000%, 6/01/2022, 144A | | | 605,875 | |
| | | | | | | | |
| | | | Lodging — 0.3% | |
| | 605,000 | | | Hilton Worldwide Finance LLC/Hilton Worldwide Finance Corp.,
5.625%, 10/15/2021, 144A | | | 623,150 | |
| | | | | | | | |
| | | | Media Entertainment — 0.1% | |
| | 151,000 | | | DreamWorks Animation SKG, Inc., 6.875%, 8/15/2020, 144A | | | 157,795 | |
| | | | | | | | |
| | | | Metals & Mining — 2.5% | |
| | 2,395,000 | | | ArcelorMittal, 7.250%, 3/01/2041(g) | | | 2,400,987 | |
| | 795,000 | | | CONSOL Energy, Inc., 5.875%, 4/15/2022, 144A | | | 783,075 | |
| | 180,000 | | | Constellium NV, 4.625%, 5/15/2021, 144A, (EUR) | | | 231,896 | |
| | 200,000 | | | Emeco Pty Ltd., 9.875%, 3/15/2019, 144A | | | 199,000 | |
| | 515,000 | | | Essar Steel Algoma, Inc., 9.375%, 3/15/2015, 144A | | | 513,713 | |
| | 175,000 | | | First Quantum Minerals Ltd., 7.000%, 2/15/2021, 144A | | | 177,406 | |
| | 270,000 | | | First Quantum Minerals Ltd., 7.250%, 5/15/2022, 144A | | | 276,075 | |
| | | | | | | | |
| | | | | | | 4,582,152 | |
| | | | | | | | |
| | | | Midstream — 1.8% | |
| | 85,000 | | | Gibson Energy, Inc., 6.750%, 7/15/2021, 144A | | | 90,100 | |
| | 275,000 | | | NGL Energy Partners LP/NGL Energy Finance Corp., 5.125%, 7/15/2019, 144A | | | 269,500 | |
| | 445,000 | | | Regency Energy Partners LP/Regency Energy Finance Corp.,
4.500%, 11/01/2023 | | | 430,538 | |
See accompanying notes to financial statements.
| 44
Portfolio of Investments – as of September 30, 2014
Loomis Sayles High Income Fund – (continued)
| | | | | | | | |
Principal
Amount (‡) | | | Description | | Value (†) | |
| | | | Midstream — continued | |
| $ | 405,000 | | | Regency Energy Partners LP/Regency Energy Finance Corp.,
5.750%, 9/01/2020 | | $ | 421,200 | |
| | 295,000 | | | Regency Energy Partners LP/Regency Energy Finance Corp.,
5.875%, 3/01/2022 | | | 306,800 | |
| | 385,000 | | | Rose Rock Midstream LP/Rose Rock Finance Corp., 5.625%, 7/15/2022, 144A | | | 381,150 | |
| | 425,000 | | | Sabine Pass Liquefaction LLC, 6.250%, 3/15/2022, 144A | | | 447,312 | |
| | 935,000 | | | Summit Midstream Holdings LLC/Summit Midstream Finance Corp.,
5.500%, 8/15/2022 | | | 916,300 | |
| | | | | | | | |
| | | | | | | 3,262,900 | |
| | | | | | | | |
| | | | Non-Agency Commercial Mortgage-Backed Securities — 1.8% | |
| | 1,690,000 | | | GS Mortgage Securities Corp. II, Series 2007-GG10, Class AM,
5.991%, 8/10/2045(b) | | | 1,752,205 | |
| | 805,000 | | | Hilton USA Trust, Series 2013-HLT, Class EFX, 5.609%, 11/05/2030, 144A(b) | | | 817,481 | |
| | 125,000 | | | JPMorgan Chase Commercial Mortgage Securities Trust, Series 2007-LDPX, Class AM, 5.464%, 1/15/2049 | | | 130,732 | |
| | 525,000 | | | Morgan Stanley Capital I Trust, Series 2007-HQ12, Class AM,
5.773%, 4/12/2049(b) | | | 563,714 | |
| | | | | | | | |
| | | | | | | 3,264,132 | |
| | | | | | | | |
| | | | Oil Field Services — 1.0% | |
| | 655,000 | | | Hercules Offshore, Inc., 8.750%, 7/15/2021, 144A | | | 569,850 | |
| | 435,000 | | | Paragon Offshore Ltd., 6.750%, 7/15/2022, 144A | | | 367,575 | |
| | 905,000 | | | Paragon Offshore Ltd., 7.250%, 8/15/2024, 144A | | | 764,725 | |
| | 35,000 | | | Parker Drilling Co., 6.750%, 7/15/2022, 144A | | | 35,175 | |
| | 155,000 | | | Pioneer Energy Services Corp., 6.125%, 3/15/2022, 144A | | | 153,450 | |
| | | | | | | | |
| | | | | | | 1,890,775 | |
| | | | | | | | |
| | | | Packaging — 1.2% | |
| | 200,000 | | | Ardagh Packaging Finance PLC/Ardagh Holdings USA, Inc.,
6.000%, 6/30/2021, 144A | | | 192,000 | |
| | 625,000 | | | Berry Plastics Corp., 5.500%, 5/15/2022 | | | 601,563 | |
| | 755,000 | | | Sealed Air Corp., 6.875%, 7/15/2033, 144A | | | 735,181 | |
| | 775,000 | | | Signode Industrial Group Lux S.A./Signode Industrial Group U.S., Inc.,
6.375%, 5/01/2022, 144A | | | 744,000 | |
| | | | | | | | |
| | | | | | | 2,272,744 | |
| | | | | | | | |
| | | | Pharmaceuticals — 1.5% | |
| | 250,000 | | | Salix Pharmaceuticals Ltd., 6.000%, 1/15/2021, 144A | | | 270,625 | |
| | 1,540,000 | | | Valeant Pharmaceuticals International, 6.375%, 10/15/2020, 144A | | | 1,582,350 | |
| | 530,000 | | | Valeant Pharmaceuticals International, 7.250%, 7/15/2022, 144A | | | 559,150 | |
| | 145,000 | | | Valeant Pharmaceuticals International, Inc., 6.750%, 8/15/2018, 144A | | | 152,975 | |
| | 70,000 | | | Valeant Pharmaceuticals International, Inc., 7.500%, 7/15/2021, 144A | | | 74,900 | |
| | | | | | | | |
| | | | | | | 2,640,000 | |
| | | | | | | | |
| | | | Property & Casualty Insurance — 0.4% | |
| | 786,000 | | | Hockey Merger Sub 2, Inc., 7.875%, 10/01/2021, 144A | | | 804,668 | |
| | | | | | | | |
See accompanying notes to financial statements.
45 |
Portfolio of Investments – as of September 30, 2014
Loomis Sayles High Income Fund – (continued)
| | | | | | | | |
Principal
Amount (‡) | | | Description | | Value (†) | |
| | | | Refining — 0.0% | |
| $ | 45,000 | | | Calumet Specialty Products Partners LP/Calumet Finance Corp.,
7.625%, 1/15/2022 | | $ | 45,675 | |
| | | | | | | | |
| | | | Retailers — 1.2% | |
| | 40,000 | | | Dillard’s, Inc., 7.000%, 12/01/2028 | | | 41,400 | |
| | 435,000 | | | Dillard’s, Inc., 7.750%, 7/15/2026 | | | 476,325 | |
| | 205,000 | | | Dillard’s, Inc., 7.750%, 5/15/2027 | | | 224,475 | |
| | 35,000 | | | Dillard’s, Inc., 7.875%, 1/01/2023 | | | 39,725 | |
| | 445,000 | | | GameStop Corp., 5.500%, 10/01/2019, 144A | | | 439,438 | |
| | 280,000 | | | Group 1 Automotive, Inc., 5.000%, 6/01/2022, 144A | | | 270,900 | |
| | 55,000 | | | J.C. Penney Corp., Inc., 5.750%, 2/15/2018 | | | 51,425 | |
| | 220,000 | | | J.C. Penney Corp., Inc., 8.125%, 10/01/2019 | | | 214,500 | |
| | 520,000 | | | Nine West Holdings, Inc., 6.125%, 11/15/2034 | | | 362,700 | |
| | 135,000 | | | Toys R Us, Inc., 7.375%, 10/15/2018 | | | 93,150 | |
| | | | | | | | |
| | | | | | | 2,214,038 | |
| | | | | | | | |
| | | | Sovereigns — 0.3% | |
| | 565,000 | | | Republic of Portugal, 5.125%, 10/15/2024, 144A | | | 585,351 | |
| | | | | | | | |
| | | | Supermarkets — 0.5% | |
| | 205,000 | | | New Albertson’s, Inc., 7.450%, 8/01/2029 | | | 186,550 | |
| | 935,000 | | | New Albertson’s, Inc., Series C, MTN, 6.625%, 6/01/2028 | | | 762,025 | |
| | | | | | | | |
| | | | | | | 948,575 | |
| | | | | | | | |
| | | | Supranational — 1.8% | |
| | 458,000,000 | | | International Bank for Reconstruction & Development, EMTN,
4.250%, 2/05/2016, (CLP) | | | 773,855 | |
| | 88,390,000 | | | International Finance Corp., 7.800%, 6/03/2019, (INR) | | | 1,524,218 | |
| | 2,175,000 | | | International Finance Corp., GMTN, 10.500%, 4/17/2018, (BRL) | | | 894,258 | |
| | | | | | | | |
| | | | | | | 3,192,331 | |
| | | | | | | | |
| | | | Technology — 4.4% | |
| | 490,000 | | | Advanced Micro Devices, Inc., 7.000%, 7/01/2024 | | | 467,950 | |
| | 2,500,000 | | | Alcatel-Lucent USA, Inc., 6.450%, 3/15/2029 | | | 2,356,250 | |
| | 1,930,000 | | | Alcatel-Lucent USA, Inc., 6.500%, 1/15/2028 | | | 1,819,025 | |
| | 160,000 | | | Amkor Technology, Inc., 6.375%, 10/01/2022 | | | 165,600 | |
| | 140,000 | | | Amkor Technology, Inc., 6.625%, 6/01/2021 | | | 145,950 | |
| | 260,000 | | | Audatex North America, Inc., 6.125%, 11/01/2023, 144A | | | 266,500 | |
| | 660,000 | | | Blackboard, Inc., 7.750%, 11/15/2019, 144A | | | 653,400 | |
| | 445,000 | | | BMC Software Finance, Inc., 8.125%, 7/15/2021, 144A | | | 427,200 | |
| | 330,000 | | | CommScope, Inc., 5.000%, 6/15/2021, 144A | | | 323,400 | |
| | 430,000 | | | Equinix, Inc., 4.875%, 4/01/2020 | | | 425,700 | |
| | 260,000 | | | First Data Corp., 10.625%, 6/15/2021 | | | 295,750 | |
| | 187,000 | | | iGATE Corp., 4.750%, 4/15/2019, 144A | | | 181,390 | |
| | 440,000 | | | Rolta Americas LLC, 8.875%, 7/24/2019, 144A | | | 451,550 | |
| | | | | | | | |
| | | | | | | 7,979,665 | |
| | | | | | | | |
See accompanying notes to financial statements.
| 46
Portfolio of Investments – as of September 30, 2014
Loomis Sayles High Income Fund – (continued)
| | | | | | | | |
Principal
Amount (‡) | | | Description | | Value (†) | |
| | | | Transportation Services — 0.4% | |
| $ | 275,000 | | | APL Ltd., 8.000%, 1/15/2024(h)(j) | | $ | 253,000 | |
| | 550,000 | | | Avis Budget Car Rental LLC/Avis Budget Finance, Inc.,
5.125%, 6/01/2022, 144A | | | 540,375 | |
| | | | | | | | |
| | | | | | | 793,375 | |
| | | | | | | | |
| | | | Treasuries — 8.9% | |
| | 165,000(††) | | | Mexican Fixed Rate Bonds, Series M, 4.750%, 6/14/2018, (MXN) | | | 1,220,264 | |
| | 131,500(††) | | | Mexican Fixed Rate Bonds, Series M, 6.500%, 6/10/2021, (MXN) | | | 1,020,925 | |
| | 116,500(††) | | | Mexican Fixed Rate Bonds, Series M-20, 8.000%, 12/07/2023, (MXN) | | | 982,442 | |
| | 184,000(††) | | | Mexican Fixed Rate Bonds, Series M-20, 10.000%, 12/05/2024, (MXN) | | | 1,768,984 | |
| | 99,000(††) | | | Mexican Fixed Rate Bonds, Series M-30, 8.500%, 11/18/2038, (MXN) | | | 870,755 | |
| | 10,000,000 | | | Philippine Government International Bond, 4.950%, 1/15/2021, (PHP) | | | 232,578 | |
| | 120,000,000 | | | Philippine Government International Bond, 6.250%, 1/14/2036, (PHP)(g) | | | 2,864,464 | |
| | 1,050,000 | | | Republic of Brazil, 8.500%, 1/05/2024, (BRL) | | | 388,214 | |
| | 2,250,000 | | | Republic of Brazil, 10.250%, 1/10/2028, (BRL) | | | 910,019 | |
| | 6,000,000 | | | U.S. Treasury Note, 0.875%, 8/15/2017 | | | 5,971,404 | |
| | | | | | | | |
| | | | | | | 16,230,049 | |
| | | | | | | | |
| | | | Wireless — 2.4% | |
| | 100,000 | | | Altice S.A., 7.250%, 5/15/2022, 144A, (EUR) | | | 130,726 | |
| | 6,000,000 | | | America Movil SAB de CV, 6.450%, 12/05/2022, (MXN) | | | 432,399 | |
| | 6,100,000 | | | America Movil SAB de CV, 8.460%, 12/18/2036, (MXN) | | | 442,149 | |
| | 800,000 | | | Bakrie Telecom Pte Ltd., 11.500%, 5/07/2015, 144A(f) | | | 72,800 | |
| | 2,711,000 | | | Sprint Capital Corp., 6.875%, 11/15/2028 | | | 2,589,005 | |
| | 370,000 | | | T-Mobile USA, Inc., 6.125%, 1/15/2022 | | | 371,850 | |
| | 180,000 | | | Wind Acquisition Finance S.A., 4.203%, 7/15/2020, 144A, (EUR)(b) | | | 226,496 | |
| | 200,000 | | | Wind Acquisition Finance S.A., 4.750%, 7/15/2020, 144A | | | 192,000 | |
| | | | | | | | |
| | | | | | | 4,457,425 | |
| | | | | | | | |
| | | | Wirelines — 3.8% | |
| | 332,000 | | | Axtel SAB de CV, (Step to 9.000% on 1/31/2015), 8.000%, 1/31/2020, 144A(i) | | | 328,680 | |
| | 705,000 | | | CenturyLink, Inc., 7.650%, 3/15/2042 | | | 694,425 | |
| | 130,000 | | | Cincinnati Bell Telephone Co. LLC, 6.300%, 12/01/2028 | | | 124,150 | |
| | 60,000,000 | | | Empresa de Telecomunicaniones de Bogota, 7.000%, 1/17/2023, 144A, (COP) | | | 27,701 | |
| | 405,000 | | | Frontier Communications Corp., 9.000%, 8/15/2031 | | | 420,188 | |
| | 605,000 | | | Level 3 Communications, Inc., 8.875%, 6/01/2019 | | | 645,837 | |
| | 1,090,000 | | | Level 3 Financing, Inc., 7.000%, 6/01/2020 | | | 1,148,587 | |
| | 1,460,000 | | | Oi S.A., 5.750%, 2/10/2022 | | | 1,365,246 | |
| | 345,000 | | | Telecom Italia Capital S.A., 6.375%, 11/15/2033 | | | 343,275 | |
| | 35,000 | | | Telecom Italia Capital S.A., 7.200%, 7/18/2036 | | | 37,450 | |
| | 85,000 | | | Telecom Italia Capital S.A., 7.721%, 6/04/2038 | | | 95,625 | |
| | 450,000 | | | Telecom Italia SpA, 5.303%, 5/30/2024, 144A | | | 441,000 | |
| | 1,030,000 | | | Telefonica Emisiones SAU, 7.045%, 6/20/2036 | | | 1,304,731 | |
| | | | | | | | |
| | | | | | | 6,976,895 | |
| | | | | | | | |
| | | | Total Non-Convertible Bonds (Identified Cost $145,045,472) | | | 143,184,944 | |
| | | | | | | | |
See accompanying notes to financial statements.
47 |
Portfolio of Investments – as of September 30, 2014
Loomis Sayles High Income Fund – (continued)
| | | | | | | | |
Principal
Amount (‡) | | | Description | | Value (†) | |
| | Convertible Bonds — 10.4% | | | | |
| | | | Automotive — 0.2% | |
| $ | 240,000 | | | Ford Motor Co., 4.250%, 11/15/2016 | | $ | 411,300 | |
| | | | | | | | |
| | | | Construction Machinery — 1.5% | |
| | 640,000 | | | Ryland Group, Inc. (The), 1.625%, 5/15/2018 | | | 788,400 | |
| | 1,055,000 | | | Trinity Industries, Inc., 3.875%, 6/01/2036 | | | 2,048,019 | |
| | | | | | | | |
| | | | | | | 2,836,419 | |
| | | | | | | | |
| | | | Consumer Products — 0.2% | |
| | 350,000 | | | Jarden Corp., 1.125%, 3/15/2034, 144A | | | 348,906 | |
| | | | | | | | |
| | | | Energy — 1.1% | |
| | 420,000 | | | Chesapeake Energy Corp., 2.500%, 5/15/2037 | | | 423,412 | |
| | 945,000 | | | Hornbeck Offshore Services, Inc., 1.500%, 9/01/2019 | | | 924,919 | |
| | 990,000 | | | Peabody Energy Corp., 4.750%, 12/15/2066 | | | 678,150 | |
| | | | | | | | |
| | | | | | | 2,026,481 | |
| | | | | | | | |
| | | | Home Construction — 2.0% | |
| | 565,000 | | | KB Home, 1.375%, 2/01/2019 | | | 543,813 | |
| | 530,000 | | | Lennar Corp., 2.750%, 12/15/2020, 144A | | | 938,100 | |
| | 600,000 | | | Lennar Corp., 3.250%, 11/15/2021, 144A | | | 1,029,000 | |
| | 945,000 | | | Standard Pacific Corp., 1.250%, 8/01/2032 | | | 1,064,306 | |
| | | | | | | | |
| | | | | | | 3,575,219 | |
| | | | | | | | |
| | | | Pharmaceuticals — 1.9% | |
| | 58,000 | | | BioMarin Pharmaceutical, Inc., 0.750%, 10/15/2018 | | | 61,408 | |
| | 239,000 | | | BioMarin Pharmaceutical, Inc., 1.500%, 10/15/2020 | | | 261,705 | |
| | 699,000 | | | Emergent Biosolutions, Inc., 2.875%, 1/15/2021, 144A | | | 702,495 | |
| | 315,000 | | | Gilead Sciences, Inc., Series D, 1.625%, 5/01/2016 | | | 1,470,853 | |
| | 285,000 | | | Mylan, Inc., 3.750%, 9/15/2015 | | | 973,631 | |
| | | | | | | | |
| | | | | | | 3,470,092 | |
| | | | | | | | |
| | | | REITs – Mortgage — 0.2% | |
| | 310,000 | | | iStar Financial, Inc., 3.000%, 11/15/2016 | | | 390,988 | |
| | | | | | | | |
| | | | Retailers — 0.6% | |
| | 658,000 | | | Priceline Group, Inc. (The), 0.350%, 6/15/2020 | | | 732,436 | |
| | 235,000 | | | Priceline Group, Inc. (The), 1.000%, 3/15/2018 | | | 316,222 | |
| | | | | | | | |
| | | | | | | 1,048,658 | |
| | | | | | | | |
| | | | Technology — 2.6% | |
| | 900,000 | | | Ciena Corp., 3.750%, 10/15/2018, 144A | | | 1,048,500 | |
| | 215,000 | | | JDS Uniphase Corp., 0.625%, 8/15/2033 | | | 214,866 | |
| | 465,000 | | | MercadoLibre, Inc., 2.250%, 7/01/2019, 144A | | | 503,653 | |
| | 370,000 | | | Micron Technology, Inc., Series C, 2.375%, 5/01/2032(g) | | | 1,318,587 | |
| | 224,000 | | | Micron Technology, Inc., Series G, 3.000%, 11/15/2043 | | | 294,560 | |
| | 115,000 | | | Novellus Systems, Inc., 2.625%, 5/15/2041 | | | 250,628 | |
| | 475,000 | | | Palo Alto Networks, Inc., Zero Coupon, 7/01/2019, 144A | | | 527,250 | |
| | 355,000 | | | Xilinx, Inc., 2.625%, 6/15/2017 | | | 525,622 | |
| | | | | | | | |
| | | | | | | 4,683,666 | |
| | | | | | | | |
See accompanying notes to financial statements.
| 48
Portfolio of Investments – as of September 30, 2014
Loomis Sayles High Income Fund – (continued)
| | | | | | | | |
Principal
Amount (‡) | | | Description | | Value (†) | |
| | | | Transportation Services — 0.1% | |
| $ | 115,000 | | | Macquarie Infrastructure Co. LLC, 2.875%, 7/15/2019 | | $ | 127,506 | |
| | | | | | | | |
| | | | Wirelines — 0.0% | |
| | 48,800 | | | Axtel SAB de CV, (Step to 9.000% on 1/31/2015), 8.000%, 1/31/2020, 144A, (MXN)(h)(i)(j)(k) | | | 5,740 | |
| | | | | | | | |
| | | | Total Convertible Bonds (Identified Cost $15,181,431) | | | 18,924,975 | |
| | | | | | | | |
| | | | Total Bonds and Notes (Identified Cost $160,226,903) | | | 162,109,919 | |
| | | | | | | | |
| | | | | | | | |
| | Senior Loans — 1.5% | | | | |
| | | | Construction Machinery — 0.0% | |
| | 75,000 | | | Neff Rental LLC, 2nd Lien Term Loan, 7.250%, 6/09/2021(b) | | | 75,094 | |
| | | | | | | | |
| | | | Media Entertainment — 0.0% | |
| | 97,907 | | | SuperMedia, Inc., Exit Term Loan, 11.600%, 12/30/2016(b) | | | 79,598 | |
| | | | | | | | |
| | | | Oil Field Services — 0.1% | |
| | 122,182 | | | FTS International, Inc., New Term Loan B, 5.750%, 4/16/2021(b) | | | 122,160 | |
| | | | | | | | |
| | | | Other Utility — 0.2% | |
| | 232,063 | | | PowerTeam Services LLC, 1st Lien Term Loan, 4.250%, 5/06/2020(b) | | | 226,841 | |
| | 12,623 | | | PowerTeam Services LLC, Delayed Draw Term Loan, 4.250%, 5/06/2020(b) | | | 12,339 | |
| | 95,000 | | | PowerTeam Services LLC, 2nd Lien Term Loan, 8.250%, 11/06/2020(b) | | | 92,150 | |
| | | | | | | | |
| | | | | | | 331,330 | |
| | | | | | | | |
| | | | Supermarkets — 0.4% | |
| | 550,000 | | | Albertson’s Holdings LLC, Term Loan B4, 4.500%, 8/25/2021(b) | | | 547,019 | |
| | 284,000 | | | New Albertson’s, Inc., Term Loan, 4.750%, 6/27/2021(b) | | | 278,854 | |
| | | | | | | | |
| | | | | | | 825,873 | |
| | | | | | | | |
| | | | Transportation Services — 0.1% | |
| | 99,750 | | | OSG Bulk Ships, Inc., Exit Term Loan, 5.250%, 8/05/2019(b) | | | 99,044 | |
| | | | | | | | |
| | | | Wirelines — 0.7% | |
| | 1,231,250 | | | Fairpoint Communications, Inc., Refi Term Loan, 7.500%, 2/14/2019(b) | | | 1,247,416 | |
| | 25,000 | | | Integra Telecom, Inc., 2nd Lien Term Loan, 9.750%, 2/22/2020(b) | | | 24,958 | |
| | | | | | | | |
| | | | | | | 1,272,374 | |
| | | | | | | | |
| | | | Total Senior Loans (Identified Cost $2,809,004) | | | 2,805,473 | |
| | | | | | | | |
| | | | | | | | |
| Shares | | | | | | |
| | Preferred Stocks — 4.5% | | | | |
| | Convertible Preferred Stocks — 2.5% | | | | |
| | | | Banking — 0.1% | |
| | 94 | | | Bank of America Corp., Series L, 7.250% | | | 107,771 | |
| | | | | | | | |
| | | | Electric — 0.2% | |
| | 7,189 | | | NextEra Energy, Inc., 5.889% | | | 430,693 | |
| | | | | | | | |
See accompanying notes to financial statements.
49 |
Portfolio of Investments – as of September 30, 2014
Loomis Sayles High Income Fund – (continued)
| | | | | | | | |
| Shares | | | Description | | Value (†) | |
| | | | Food & Beverage — 0.5% | |
| | 18,721 | | | Tyson Foods, Inc., 4.750% | | $ | 941,666 | |
| | | | | | | | |
| | | | Metals & Mining — 0.2% | |
| | 21,500 | | | ArcelorMittal, 6.000% | | | 454,295 | |
| | | | | | | | |
| | | | REITs – Diversified — 0.8% | |
| | 7,337 | | | Crown Castle International Corp., Series A, 4.500% | | | 771,705 | |
| | 12,356 | | | Weyerhaeuser Co., Series A, 6.375% | | | 667,595 | |
| | | | | | | | |
| | | | 1,439,300 | |
| | | | | | | | |
| | | | REITs – Mortgage — 0.3% | |
| | 8,025 | | | iStar Financial, Inc., Series J, 4.500% | | | 477,488 | |
| | | | | | | | |
| | | | Utility Other — 0.4% | |
| | 1,424 | | | Dominion Resources, Inc., 6.375% | | | 71,058 | |
| | 7,126 | | | Dominion Resources, Inc., Series A, 6.125% | | | 399,483 | |
| | 5,356 | | | Dominion Resources, Inc., Series B, 6.000% | | | 301,275 | |
| | | | | | | | |
| | | | | | | 771,816 | |
| | | | | | | | |
| | | | Total Convertible Preferred Stocks (Identified Cost $4,492,412) | | | 4,623,029 | |
| | | | | | | | |
| | | | | | | | |
| | Non-Convertible Preferred Stocks — 2.0% | | | | |
| | | | Banking — 1.7% | |
| | 78,785 | | | Ally Financial, Inc., Series A, (fixed rate to 5/15/2016,
variable rate thereafter), 8.500% | | | 2,121,680 | |
| | 965 | | | Ally Financial, Inc., Series G, 7.000%, 144A | | | 965,905 | |
| | | | | | | | |
| | | | | | | 3,087,585 | |
| | | | | | | | |
| | | | Finance Companies — 0.3% | |
| | 12,925 | | | iStar Financial, Inc., Series E, 7.875% | | | 319,247 | |
| | 7,500 | | | iStar Financial, Inc., Series F, 7.800% | | | 184,350 | |
| | 550 | | | iStar Financial, Inc., Series G, 7.650% | | | 13,299 | |
| | | | | | | | |
| | | | | | | 516,896 | |
| | | | | | | | |
| | | | Total Non-Convertible Preferred Stocks (Identified Cost $3,279,860) | | | 3,604,481 | |
| | | | | | | | |
| | | | Total Preferred Stocks (Identified Cost $7,772,272) | | | 8,227,510 | |
| | | | | | | | |
| | | | | | | | |
| | Common Stocks — 1.4% | | | | |
| | | | Automobiles — 0.9% | |
| | 50,658 | | | General Motors Co. | | | 1,618,016 | |
| | | | | | | | |
| | | | Oil, Gas & Consumable Fuels — 0.3% | |
| | 14,882 | | | Kinder Morgan, Inc. | | | 570,576 | |
| | | | | | | | |
| | | | Trading Companies & Distributors — 0.2% | |
| | 2,696 | | | United Rentals, Inc.(l) | | | 299,526 | |
| | | | | | | | |
| | | | Total Common Stocks (Identified Cost $2,413,285) | | | 2,488,118 | |
| | | | | | | | |
See accompanying notes to financial statements.
| 50
Portfolio of Investments – as of September 30, 2014
Loomis Sayles High Income Fund – (continued)
| | | | | | | | |
| Shares | | | Description | | Value (†) | |
| | Warrants — 0.1% | | | | |
| | 10,360 | | | FairPoint Communications, Inc., Expiration on 1/24/2018 at $48.81(h)(j)(l) | | $ | — | |
| | 22,512 | | | Kinder Morgan, Inc., Expiration on 5/25/2017 at $40.00(l) | | | 81,944 | |
| | | | | | | | |
| | | | Total Warrants (Identified Cost $29,892) | | | 81,944 | |
| | | | | | | | |
| | | | | | | | |
Principal
Amount (‡) | | | | | | |
| | Short-Term Investments — 7.6% | | | | |
| $ | 37,620 | | | Repurchase Agreement with State Street Bank and Trust Company, dated 9/30/2014 at 0.000% to be repurchased at $37,620 on 10/01/2014 collateralized by $38,400 U.S. Treasury Note, 1.500% due 8/31/2018 valued at $38,430 including accrued interest (Note 2 of Notes to Financial Statements) | | | 37,620 | |
| | 13,311,362 | | | Tri-Party Repurchase Agreement with Fixed Income Clearing Corporation, dated 9/30/2014 at 0.000% to be repurchased at $13,311,362 on 10/01/2014 collateralized by $13,665,000 U.S. Treasury Note, 1.500% due 5/31/2019 valued at $13,579,594 including accrued interest (Note 2 of Notes to Financial Statements) | | | 13,311,362 | |
| | 475,000 | | | U.S. Treasury Bills, 0.041%, 2/05/2015(m)(n) | | | 474,963 | |
| | | | | | | | |
| | | | Total Short-Term Investments (Identified Cost $13,823,914) | | | 13,823,945 | |
| | | | | | | | |
| | | | | | | | |
| | | | Total Investments — 103.9% (Identified Cost $187,075,270)(a) | | | 189,536,909 | |
| | | | Other assets less liabilities — (3.9)% | | | (7,044,814 | ) |
| | | | | | | | |
| | | | Net Assets — 100.0% | | $ | 182,492,095 | |
| | | | | | | | |
| | | | | | | | |
| | (‡) | | | Principal Amount stated in U.S. dollars unless otherwise noted. | |
| | (†) | | | See Note 2 of Notes to Financial Statements. | |
| | (††) | | | Amount shown represents units. One unit represents a principal amount of 100. | |
| | (a) | | | Federal Tax Information: | |
| | | | At September 30, 2014, the net unrealized appreciation on investments based on a cost of $187,229,403 for federal income tax purposes was as follows: | |
| | | | Aggregate gross unrealized appreciation for all investments in which there is an excess of value over tax cost | | $ | 13,559,970 | |
| | | | Aggregate gross unrealized depreciation for all investments in which there is an excess of tax cost over value | | | (11,252,464 | ) |
| | | | | | | | |
| | | | Net unrealized appreciation | | $ | 2,307,506 | |
| | | | | | | | |
| | | | | | | | |
| | (b) | | | Variable rate security. Rate as of September 30, 2014 is disclosed. | |
| | (c) | | | The issuer is making partial payments with respect to principal. | |
| | (d) | | | Perpetual bond with no specified maturity date. | |
| | (e) | | | Payment-in-kind security for which the issuer has the option at each interest payment date of making interest payments in cash or additional debt securities. For the period ended September 30, 2014, the issuer has not paid out any interest payments. | |
| | (f) | | | The issuer is in default with respect to interest and/or principal payments. Income is not being accrued. | |
See accompanying notes to financial statements.
51 |
Portfolio of Investments – as of September 30, 2014
Loomis Sayles High Income Fund – (continued)
| | | | | | |
| | | | | | |
| | (g) | | | All of this security has been designated to cover the Fund’s obligations under open forward foreign currency and futures contracts. |
| | (h) | | | Illiquid security. At September 30, 2014, the value of these securities amounted to $258,740 or 0.1% of net assets. |
| | (i) | | | Coupon rate is a fixed rate for an initial period then resets at a specified date and rate. |
| | (j) | | | Fair valued by the Fund’s adviser or deemed to be fair valued pursuant to the Fund’s pricing policies and procedures. At September 30, 2014, the value of these securities amounted to $258,740 or 0.1% of net assets. |
| | (k) | | | Convertible dollar-indexed note. Coupon rate is based on MXN denominated par value and is payable in USD. |
| | (l) | | | Non-income producing security. |
| | (m) | | | A portion of this security has been pledged as initial margin for open futures contracts. |
| | (n) | | | Interest rate represents discount rate at time of purchase; not a coupon rate. |
| | | | | | |
| | 144A | | | All or a portion of these securities are exempt from registration under Rule 144A of the Securities Act of 1933. These securities may be resold in transactions exempt from registration, normally to qualified institutional buyers. At September 30, 2014, the value of Rule 144A holdings amounted to $56,561,464 or 31.0% of net assets. |
| | | | | | |
| | ABS | | | Asset-Backed Securities | | |
| | EMTN | | | Euro Medium Term Note | | |
| | GMTN | | | Global Medium Term Note | | |
| | MTN | | | Medium Term Note | | |
| | PIK | | | Payment-in-Kind | | |
| | REITs | | | Real Estate Investment Trusts | | |
| | | | | | |
| | AUD | | | Australian Dollar | | |
| | BRL | | | Brazilian Real | | |
| | CLP | | | Chilean Peso | | |
| | COP | | | Colombian Peso | | |
| | EUR | | | Euro | | |
| | INR | | | Indian Rupee | | |
| | MXN | | | Mexican Peso | | |
| | PHP | | | Philippine Peso | | |
| | USD | | | U.S. Dollar | | |
At September 30, 2014, the Fund had the following open forward foreign currency contracts:
| | | | | | | | | | | | | | | | | | |
Contract
to
Buy/Sell1 | | Delivery
Date | | | Currency | | Units
of
Currency | | | Notional
Value | | | Unrealized
Appreciation
(Depreciation) | |
| Buy | | | 10/31/2014 | | | Euro | | | 1,170,000 | | | $ | 1,478,045 | | | $ | (98,261 | ) |
| Sell | | | 10/31/2014 | | | Euro | | | 2,470,000 | | | | 3,120,317 | | | | 220,346 | |
| | | | | | | | | | | | | | | | | | |
| Total | | | $ | 122,085 | |
| | | | | | | | | | | | | | | | | | |
1 Counterparty is Barclays Bank PLC.
See accompanying notes to financial statements.
| 52
Portfolio of Investments – as of September 30, 2014
Loomis Sayles High Income Fund – (continued)
At September 30, 2014, open short futures contracts were as follows:
| | | | | | | | | | | | | | | | |
| Financial Futures | | Expiration
Date | | | Contracts | | | Notional
Value | | | Unrealized
Appreciation
(Depreciation) | |
30 Year U.S. Treasury Bond | | | 12/19/2014 | | | | 43 | | | $ | 5,929,969 | | | $ | 51,042 | |
| | | | | | | | | | | | | | | | |
Industry Summary at September 30, 2014
| | | | |
Treasuries | | | 8.9 | % |
Technology | | | 7.0 | |
Home Construction | | | 6.0 | |
Finance Companies | | | 5.2 | |
Independent Energy | | | 4.9 | |
ABS Home Equity | | | 4.6 | |
Healthcare | | | 4.5 | |
Wirelines | | | 4.5 | |
Banking | | | 4.2 | |
Pharmaceuticals | | | 3.4 | |
Building Materials | | | 2.8 | |
Metals & Mining | | | 2.7 | |
Wireless | | | 2.4 | |
Chemicals | | | 2.3 | |
Other Investments, less than 2% each | | | 32.9 | |
Short-Term Investments | | | 7.6 | |
| | | | |
Total Investments | | | 103.9 | |
Other assets less liabilities (including forward foreign currency contracts and futures contracts) | | | (3.9 | ) |
| | | | |
Net Assets | | | 100.0 | % |
| | | | |
See accompanying notes to financial statements.
53 |
Portfolio of Investments – as of September 30, 2014
Loomis Sayles International Bond Fund
| | | | | | | | |
Principal
Amount (‡) | | | Description | | Value (†) | |
| | Bonds and Notes — 98.9% of Net Assets | |
| | Non-Convertible Bonds — 98.8% | |
| | | | Australia — 2.1% | |
| | 185,000 | | | New South Wales Treasury Corp., 6.000%, 5/01/2020, (AUD)(b) | | $ | 183,654 | |
| | | | | | | | |
| | | | Belgium — 3.5% | |
| | 100,000 | | | Anheuser-Busch InBev NV, EMTN, 1.250%, 3/24/2017, (EUR) | | | 128,561 | |
| | 130,000 | | | Belgium Government Bond, 2.250%, 6/22/2023, (EUR)(b) | | | 180,784 | |
| | | | | | | | |
| | | | | | | 309,345 | |
| | | | | | | | |
| | | | Brazil — 0.8% | |
| | 35,000 | | | CSN Islands IX Corp., 10.000%, 1/15/2015 | | | 35,837 | |
| | 30,000 | | | Petrobras Global Finance BV, 3.115%, 3/17/2020(c) | | | 30,561 | |
| | | | | | | | |
| | | | | | | 66,398 | |
| | | | | | | | |
| | | | Canada — 1.6% | |
| | 30,000 | | | Bombardier, Inc., 4.750%, 4/15/2019, 144A | | | 29,925 | |
| | 25,000 | | | Canadian Government, 1.750%, 9/01/2019, (CAD) | | | 22,447 | |
| | 61,044 | | | Ford Auto Securitization Trust, Series 2013-R1A, Class A2, 1.676 %, 9/15/2016, 144A, (CAD) | | | 54,587 | |
| | 30,000 | | | Videotron Ltd., 5.375%, 6/15/2024, 144A | | | 29,700 | |
| | | | | | | | |
| | | | | | | 136,659 | |
| | | | | | | | |
| | | | Colombia — 0.2% | |
| | 15,000 | | | Ecopetrol S.A., 4.125%, 1/16/2025 | | | 14,512 | |
| | | | | | | | |
| | | | Denmark — 1.0% | |
| | 445,000 | | | Denmark Government Bond, 4.000%, 11/15/2019, (DKK) | | | 89,922 | |
| | | | | | | | |
| | | | Finland — 3.4% | |
| | 40,000 | | | Finland Government Bond, 1.500%, 4/15/2023, 144A, (EUR) | | | 53,023 | |
| | 150,000 | | | Finland Government Bond, 4.000%, 7/04/2025, 144A, (EUR)(b) | | | 242,846 | |
| | | | | | | | |
| | | | | | | 295,869 | |
| | | | | | | | |
| | | | France — 5.6% | |
| | 50,000 | | | AXA S.A., EMTN, (fixed rate to 4/16/2020, variable rate thereafter), 5.250%, 4/16/2040, (EUR) | | | 70,639 | |
| | 220,000 | | | French Treasury Note BTAN, 1.750%, 2/25/2017, (EUR)(b) | | | 289,560 | |
| | 100,000 | | | Sanofi, EMTN, 1.875%, 9/04/2020, (EUR) | | | 133,980 | |
| | | | | | | | |
| | | | | | | 494,179 | |
| | | | | | | | |
| | | | Germany — 9.3% | |
| | 30,000 | | | BMW Finance NV, 2.375%, 1/24/2023, (EUR) | | | 41,277 | |
| | 140,000 | | | Bundesrepublik Deutschland, 1.750%, 7/04/2022, (EUR)(b) | | | 192,598 | |
| | 105,000 | | | Bundesrepublik Deutschland, 3.750%, 1/04/2017, (EUR) | | | 144,031 | |
| | 45,000 | | | Bundesrepublik Deutschland, 4.000%, 1/04/2037, (EUR) | | | 80,202 | |
| | 165,000 | | | Bundesrepublik Deutschland, 4.250%, 7/04/2017, (EUR)(b) | | | 233,141 | |
| | 40,000 | | | Bundesrepublik Deutschland, 4.750%, 7/04/2034, (EUR) | | | 76,438 | |
| | 40,000 | | | Volkswagen International Finance NV, EMTN, 1.875%, 5/15/2017, (EUR) | | | 52,463 | |
| | | | | | | | |
| | | | | | | 820,150 | |
| | | | | | | | |
| | | | Hungary — 0.0% | |
| | 4,000 | | | Hungary Government International Bond, 5.375%, 3/25/2024 | | | 4,220 | |
| | | | | | | | |
See accompanying notes to financial statements.
| 54
Portfolio of Investments – as of September 30, 2014
Loomis Sayles International Bond Fund – (continued)
| | | | | | | | |
Principal
Amount (‡) | | | Description | | Value (†) | |
| | | | Ireland — 1.0% | |
| | 60,000 | | | AIB Mortgage Bank, EMTN, 4.875%, 6/29/2017, (EUR) | | $ | 85,071 | |
| | | | | | | | |
| | | | Italy — 6.3% | |
| | 50,000 | | | Enel Finance International S.A., EMTN, 5.625%, 8/14/2024, (GBP) | | | 92,487 | |
| | 45,000 | | | Italy Buoni Poliennali Del Tesoro, 4.000%, 2/01/2037, (EUR) | | | 62,414 | |
| | 75,000 | | | Italy Buoni Poliennali Del Tesoro, 4.750%, 5/01/2017, (EUR) | | | 104,863 | |
| | 190,000 | | | Italy Buoni Poliennali Del Tesoro, 5.000%, 3/01/2022, (EUR)(b) | | | 292,382 | |
| | | | | | | | |
| | | | | | | 552,146 | |
| | | | | | | | |
| | | | Japan — 25.0% | |
| | 80,000,000 | | | Japan Finance Organization for Municipalities, 1.900%, 6/22/2018, (JPY) | | | 778,101 | |
| | 17,400,000 | | | Japan Government Ten Year Bond, 1.700%, 12/20/2016, (JPY) | | | 164,327 | |
| | 39,100,000 | | | Japan Government Ten Year Bond, 1.700%, 9/20/2017, (JPY) | | | 373,407 | |
| | 3,750,000 | | | Japan Government Thirty Year Bond, 1.700%, 12/20/2043, (JPY) | | | 34,885 | |
| | 9,500,000 | | | Japan Government Thirty Year Bond, 2.000%, 12/20/2033, (JPY) | | | 96,963 | |
| | 13,000,000 | | | Japan Government Thirty Year Bond, 2.000%, 9/20/2040, (JPY) | | | 130,072 | |
| | 59,300,000 | | | Japan Government Twenty Year Bond, 1.900%, 12/20/2028, (JPY) | | | 615,253 | |
| | | | | | | | |
| | | | | | | 2,193,008 | |
| | | | | | | | |
| | | | Luxembourg — 0.3% | |
| | 25,000 | | | ArcelorMittal, 6.000%, 3/01/2021 | | | 26,281 | |
| | | | | | | | |
| | | | Mexico — 3.3% | |
| | 37,000(††) | | | Mexican Fixed Rate Bonds, Series M, 6.500%, 6/10/2021, (MXN)(b) | | | 287,256 | |
| | | | | | | | |
| | | | Netherlands — 1.7% | |
| | 15,000 | | | Netherlands Government Bond, 2.250%, 7/15/2022, 144A, (EUR)(b) | | | 21,070 | |
| | 90,000 | | | Netherlands Government Bond, 4.500%, 7/15/2017, 144A, (EUR)(b) | | | 127,908 | |
| | | | | | | | |
| | | | | | | 148,978 | |
| | | | | | | | |
| | | | New Zealand — 2.2% | |
| | 200,000 | | | New Zealand Government Bond, 5.000%, 3/15/2019, (NZD) | | | 162,542 | |
| | 35,000 | | | New Zealand Government Bond, 6.000%, 4/15/2015, (NZD) | | | 27,679 | |
| | | | | | | | |
| | | | | | | 190,221 | |
| | | | | | | | |
| | | | Norway — 2.0% | |
| | 1,075,000 | | | Norway Government Bond, 4.250%, 5/19/2017, (NOK) | | | 178,959 | |
| | | | | | | | |
| | | | Philippines — 1.3% | |
| | 5,000,000 | | | Philippine Government International Bond, 4.950%, 1/15/2021, (PHP) | | | 116,289 | |
| | | | | | | | |
| | | | Poland — 2.0% | |
| | 145,000 | | | Poland Government Bond, 3.250%, 7/25/2019, (PLN) | | | 45,538 | |
| | 130,000 | | | Poland Government Bond, 4.750%, 4/25/2017, (PLN) | | | 41,888 | |
| | 80,000 | | | Poland Government International Bond, EMTN, 2.625%, 5/12/2015, (CHF)(b) | | | 84,994 | |
| | | | | | | | |
| | | | | | | 172,420 | |
| | | | | | | | |
| | | | Singapore — 0.2% | |
| | 20,000 | | | Singapore Government Bond, 2.500%, 6/01/2019, (SGD) | | | 16,334 | |
| | | | | | | | |
| | | | South Africa — 0.6% | |
| | 595,000 | | | South Africa Government Bond, 7.750%, 2/28/2023, (ZAR) | | | 51,512 | |
| | | | | | | | |
See accompanying notes to financial statements.
55 |
Portfolio of Investments – as of September 30, 2014
Loomis Sayles International Bond Fund – (continued)
| | | | | | | | |
Principal
Amount (‡) | | | Description | | Value (†) | |
| | | | Spain — 4.4% | |
| | 50,000 | | | Iberdrola Finanzas SAU, EMTN, 6.000%, 7/01/2022, (GBP) | | $ | 94,908 | |
| | 25,000 | | | Spain Government Bond, 4.200%, 1/31/2037, (EUR) | | | 36,293 | |
| | 130,000 | | | Spain Government Bond, 5.850%, 1/31/2022, (EUR) | | | 213,459 | |
| | 40,000 | | | Telefonica Emisiones SAU, 5.462%, 2/16/2021 | | | 44,546 | |
| | | | | | | | |
| | | | | | | 389,206 | |
| | | | | | | | |
| | | | Sweden — 1.0% | |
| | 545,000 | | | Sweden Government Bond, Series 1052, 4.250%, 3/12/2019, (SEK) | | | 87,667 | |
| | | | | | | | |
| | | | Switzerland — 0.7% | |
| | 50,000 | | | Zurich Finance USA, Inc., EMTN, (fixed rate to 6/15/2015, variable rate thereafter), 4.500%, 6/15/2025, (EUR) | | | 64,337 | |
| | | | | | | | |
| | | | United Kingdom — 7.5% | |
| | 50,000 | | | Barclays Bank PLC, EMTN, 5.750%, 9/14/2026, (GBP) | | | 89,202 | |
| | 45,000 | | | British Telecommunications PLC, 5.750%, 12/07/2028, (GBP) | | | 86,059 | |
| | 50,000 | | | Heathrow Funding Ltd., MTN, 5.225%, 2/15/2025, (GBP) | | | 91,405 | |
| | 15,000 | | | United Kingdom Gilt, 1.000%, 9/07/2017, (GBP) | | | 24,125 | |
| | 15,000 | | | United Kingdom Gilt, 4.250%, 12/07/2027, (GBP) | | | 28,691 | |
| | 80,000 | | | United Kingdom Treasury, 1.750%, 1/22/2017, (GBP) | | | 131,866 | |
| | 70,000 | | | United Kingdom Treasury, 4.250%, 3/07/2036, (GBP)(b) | | | 136,596 | |
| | 15,000 | | | United Kingdom Treasury, 4.750%, 12/07/2038, (GBP) | | | 31,727 | |
| | 20,000 | | | United Kingdom Treasury, 5.000%, 3/07/2025, (GBP) | | | 40,093 | |
| | | | | | | | |
| | | | | | | 659,764 | |
| | | | | | | | |
| | | | United States — 11.8% | |
| | 25,000 | | | Ally Financial, Inc., 3.500%, 7/18/2016 | | | 25,281 | |
| | 65,000 | | | AmeriCredit Automobile Receivables Trust, Series 2013-3, Class C, 2.380%, 6/10/2019 | | | 65,578 | |
| | 50,000 | | | Bank of America Corp., EMTN, 4.625%, 9/14/2018, (EUR) | | | 71,222 | |
| | 50,000 | | | Capital One Multi-Asset Execution Trust, Series 2004-B7, Class B7, 0.692%, 8/17/2017, (EUR)(c) | | | 63,150 | |
| | 50,000 | | | Cargill, Inc., EMTN, 5.375%, 3/02/2037, (GBP) | | | 95,984 | |
| | 95,000 | | | HSBC Finance Corp., EMTN, 4.500%, 6/14/2016, (EUR)(b) | | | 128,360 | |
| | 50,000 | | | JPMorgan Chase & Co., EMTN, 3.875%, 9/23/2020, (EUR) | | | 73,501 | |
| | 15,000 | | | KB Home, 4.750%, 5/15/2019 | | | 14,588 | |
| | 15,000 | | | Paragon Offshore Ltd., 6.750%, 7/15/2022, 144A | | | 12,675 | |
| | 35,000 | | | Paragon Offshore Ltd., 7.250%, 8/15/2024, 144A | | | 29,575 | |
| | 10,000 | | | Sprint Communications, Inc., 6.000%, 11/15/2022 | | | 9,700 | |
| | 15,000 | | | Time Warner Cable, Inc., 6.750%, 6/15/2039 | | | 19,271 | |
| | 280,000 | | | U.S. Treasury Note, 0.125%, 12/31/2014(d) | | | 280,044 | |
| | 45,000 | | | United Continental Holdings, Inc., 6.375%, 6/01/2018 | | | 47,137 | |
| | 45,000 | | | US Airways Pass Through Trust, Series 2013-1, Class A, 3.950%, 5/15/2027 | | | 45,337 | |
| | 25,000 | | | Verizon Communications, Inc., 5.050%, 3/15/2034 | | | 26,488 | |
| | 30,000 | | | Whiting Petroleum Corp., 5.000%, 3/15/2019 | | | 30,825 | |
| | | | | | | | |
| | | | | | | 1,038,716 | |
| | | | | | | | |
| | | | Total Non-Convertible Bonds
(Identified Cost $9,329,513) | | | 8,673,073 | |
| | | | | | | | |
See accompanying notes to financial statements.
| 56
Portfolio of Investments – as of September 30, 2014
Loomis Sayles International Bond Fund – (continued)
| | | | | | | | |
Principal
Amount (‡) | | | Description | | Value (†) | |
| | Convertible Bonds — 0.1% | | | | |
| | | | United States — 0.1% | | | | |
| $ | 5,000 | | | Macquarie Infrastructure Co. LLC, 2.875%, 7/15/2019
(Identified Cost $5,000) | | $ | 5,544 | |
| | | | | | | | |
| | | | Total Bonds and Notes
(Identified Cost $9,334,513) | | | 8,678,617 | |
| | | | | | | | |
| | | | | | | | |
| Shares | | | | | | |
| | Preferred Stocks — 0.2% | | | | |
| | | | United States — 0.2% | | | | |
| | 164 | | | Dominion Resources, Inc., Series A, 6.125%, 4/01/2016 | | | 9,194 | |
| | 64 | | | Dominion Resources, Inc., Series B, 6.000%, 7/01/2016 | | | 3,600 | |
| | 115 | | | Weyerhaeuser Co., Series A, 6.375%, 7/01/2016 | | | 6,213 | |
| | | | | | | | |
| | | | Total Preferred Stocks
(Identified Cost $18,020) | | | 19,007 | |
| | | | | | | | |
| | | | | | | | |
| | | | Total Investments — 99.1%
(Identified Cost $9,352,533)(a) | | | 8,697,624 | |
| | | | Other assets less liabilities — 0.9% | | | 83,063 | |
| | | | | | | | |
| | | | Net Assets — 100.0% | | $ | 8,780,687 | |
| | | | | | | | |
| | | | | | | | |
| | (‡) | | | Principal Amount stated in U.S. dollars unless otherwise noted. | |
| | (†) | | | See Note 2 of Notes to Financial Statements. | |
| | (††) | | | Amount shown represents units. One unit represents a principal amount of 100. | |
| | (a) | | | Federal Tax Information: | |
| | | | At September 30, 2014, the net unrealized depreciation on investments based on a cost of $9,547,442 for federal income tax purposes was as follows: | |
| | | | Aggregate gross unrealized appreciation for all investments in which there is an excess of value over tax cost | | $ | 163,539 | |
| | | | Aggregate gross unrealized depreciation for all investments in which there is an excess of tax cost over value | | | (1,013,357 | ) |
| | | | | | | | |
| | | | Net unrealized depreciation | | $ | (849,818 | ) |
| | | | | | | | |
| | | | | | | | |
| | (b) | | | All of this security has been designated to cover the Fund’s obligations under open forward foreign currency and futures contracts. | |
| | (c) | | | Variable rate security. Rate as of September 30, 2014 is disclosed. | |
| | (d) | | | A portion of this security has been pledged as initial margin for open futures contracts. | |
| | | | | | | | |
| | 144A | | | All or a portion of these securities are exempt from registration under Rule 144A of the Securities Act of 1933. These securities may be resold in transactions exempt from registration, normally to qualified institutional buyers. At September 30, 2014, the value of Rule 144A holdings amounted to $601,309 or 6.8% of net assets. | |
| | EMTN | | | Euro Medium Term Note | |
| | MTN | | | Medium Term Note | |
See accompanying notes to financial statements.
57 |
Portfolio of Investments – as of September 30, 2014
Loomis Sayles International Bond Fund – (continued)
| | | | | | |
| | | | | | |
| | AUD | | | Australian Dollar |
| | CAD | | | Canadian Dollar |
| | CHF | | | Swiss Franc |
| | DKK | | | Danish Krone |
| | EUR | | | Euro |
| | GBP | | | British Pound |
| | JPY | | | Japanese Yen |
| | MXN | | | Mexican Peso |
| | NOK | | | Norwegian Krone |
| | NZD | | | New Zealand Dollar |
| | PHP | | | Philippine Peso |
| | PLN | | | Polish Zloty |
| | SEK | | | Swedish Krona |
| | SGD | | | Singapore Dollar |
| | ZAR | | | South African Rand |
At September 30, 2014, the Fund had the following open forward foreign currency contracts:
| | | | | | | | | | | | | | | | | | |
Contract
to
Buy/Sell | | Delivery
Date | | | Currency | | Units
of
Currency | | | Notional
Value | | | Unrealized
Appreciation
(Depreciation) | |
| Buy1 | | | 12/24/2014 | | | British Pound | | | 37,000 | | | $ | 59,939 | | | $ | (490 | ) |
| Sell1 | | | 12/24/2014 | | | British Pound | | | 37,000 | | | | 59,939 | | | | 359 | |
| Buy2 | | | 12/17/2014 | | | Canadian Dollar | | | 336,000 | | | | 299,470 | | | | (9,782 | ) |
| Buy1 | | | 12/17/2014 | | | Euro | | | 155,000 | | | | 195,879 | | | | (4,781 | ) |
| Sell1 | | | 12/29/2014 | | | Euro | | | 47,000 | | | | 59,401 | | | | 701 | |
| Buy3 | | | 11/18/2014 | | | Japanese Yen | | | 8,900,000 | | | | 81,175 | | | | (5,995 | ) |
| Sell1 | | | 12/17/2014 | | | Mexican Peso | | | 360,000 | | | | 26,666 | | | | 698 | |
| Buy1 | | | 12/11/2014 | | | South Korean Won | | | 192,100,000 | | | | 181,493 | | | | (6,233 | ) |
| | | | | | | | | | | | | | | | | | |
| Total | | | $ | (25,523 | ) |
| | | | | | | | | | | | | | | | | | |
At September 30, 2014, the Fund had the following open forward cross currency contracts:
| | | | | | | | | | | | | | | | |
| Settlement Date | | Deliver/Units of Currency | | | Receive/Units of Currency | | | Unrealized
Appreciation
(Depreciation) | |
| 12/22/2014 | | Japanese Yen | | | 9,785,346 | | | South Korean Won4 | | | 94,000,000 | | | $ | (521 | ) |
| 12/17/2014 | | New Zealand Dollar | | | 246,500 | | | Euro3 | | | 156,149 | | | | 6,338 | |
| | | | | | | | | | | | | | | | |
| Total | | | $ | 5,817 | |
| | | | | | | | | | | | | | | | |
1 Counterparty is Barclays Bank PLC.
2 Counterparty is UBS AG.
3 Counterparty is Bank of America, N.A.
4 Counterparty is Credit Suisse International.
See accompanying notes to financial statements.
| 58
Portfolio of Investments – as of September 30, 2014
Loomis Sayles International Bond Fund – (continued)
At September 30, 2014, open long futures contracts were as follows:
| | | | | | | | | | | | | | | | |
| Financial Futures | | Expiration
Date | | | Contracts | | | Notional
Value | | | Unrealized
Appreciation
(Depreciation) | |
German Euro BOBL | | | 12/08/2014 | | | | 5 | | | $ | 807,847 | | | $ | 2,644 | |
| | | | | | | | | | | | | | | | |
Industry Summary at September 30, 2014
| | | | |
Treasuries | | | 63.3 | % |
Government Guaranteed | | | 8.9 | |
Banking | | | 3.9 | |
Food & Beverage | | | 2.6 | |
Electric | | | 2.2 | |
Local Authorities | | | 2.1 | |
Other Investments, less than 2% each | | | 16.1 | |
| | | | |
Total Investments | | | 99.1 | |
Other assets less liabilities (including forward foreign currency contracts and futures contracts) | | | 0.9 | |
| | | | |
Net Assets | | | 100.0 | % |
| | | | |
Currency Exposure Summary at September 30, 2014
| | | | |
Euro | | | 37.0 | % |
Japanese Yen | | | 25.0 | |
British Pound | | | 10.8 | |
United States Dollar | | | 9.7 | |
Mexican Peso | | | 3.3 | |
New Zealand Dollar | | | 2.2 | |
Australian Dollar | | | 2.1 | |
Norwegian Krone | | | 2.0 | |
Other, less than 2% each | | | 7.0 | |
| | | | |
Total Investments | | | 99.1 | |
Other assets less liabilities (including forward foreign currency contracts and futures contracts) | | | 0.9 | |
| | | | |
Net Assets | | | 100.0 | % |
| | | | |
See accompanying notes to financial statements.
59 |
Portfolio of Investments – as of September 30, 2014
Loomis Sayles Limited Term Government and Agency Fund
| | | | | | | | |
Principal
Amount | | | Description | | Value (†) | |
| | Bonds and Notes — 94.4% of Net Assets | |
| | | | ABS Car Loan — 2.0% | |
| $ | 2,200,000 | | | Avis Budget Rental Car Funding AESOP LLC, Series 2012-3A, Class A, 2.100%, 3/20/2019, 144A | | $ | 2,202,044 | |
| | 1,640,000 | | | Capital Auto Receivables Asset Trust, Series 2014-2, Class A3, 1.260%, 5/21/2018 | | | 1,638,611 | |
| | 1,165,000 | | | Credit Acceptance Auto Loan Trust, Series 2013-2A, Class A, 1.500%, 4/15/2021, 144A | | | 1,170,291 | |
| | 2,695,000 | | | Credit Acceptance Auto Loan Trust, Series 2014-2A, Class A, 1.880%, 3/15/2022, 144A | | | 2,694,542 | |
| | 2,350,000 | | | First Investors Auto Owner Trust, Series 2013-3A, Class A3, 1.440%, 10/15/2019, 144A | | | 2,348,531 | |
| | 1,045,000 | | | First Investors Auto Owner Trust, Series 2014-1A, Class A3, 1.490%, 1/15/2020, 144A | | | 1,046,274 | |
| | 625,000 | | | Ford Credit Auto Owner Trust, Series 2014-1, Class A, 2.260%, 11/15/2025, 144A | | | 624,510 | |
| | 2,120,000 | | | Tidewater Auto Receivables Trust, Series 2014-AA, Class A3, 1.400%, 7/15/2018, 144A | | | 2,116,125 | |
| | | | | | | | |
| | | | | | | 13,840,928 | |
| | | | | | | | |
| | | | ABS Credit Card — 0.9% | |
| | 3,220,000 | | | GE Capital Credit Card Master Note Trust, Series 2012-7, Class A, 1.760%, 9/15/2022 | | | 3,113,978 | |
| | 3,400,000 | | | World Financial Network Credit Card Master Trust, Series 2012-A, Class A, 3.140%, 1/17/2023 | | | 3,511,694 | |
| | | | | | | | |
| | | | | | | 6,625,672 | |
| | | | | | | | |
| | | | ABS Home Equity — 0.1% | |
| | 267,269 | | | Countrywide Asset-Backed Certificates, Series 2004-S1, Class A3, 5.115%, 2/25/2035 | | | 272,675 | |
| | 160,491 | | | Residential Funding Mortgage Securities II, Series 2002-HI5, Class A7, 6.200%, 1/25/2028(b) | | | 160,459 | |
| | | | | | | | |
| | | | | | | 433,134 | |
| | | | | | | | |
| | | | ABS Other — 0.4% | |
| | 3,000,000 | | | Ally Master Owner Trust, Series 2012-5, Class A, 1.540%, 9/15/2019 | | | 2,982,288 | |
| | | | | | | | |
| | | | Agency Commercial Mortgage-Backed Securities — 11.5% | |
| | 6,000,000 | | | FHLMC Multifamily Structured Pass Through Certificates, Series K006, Class A2, 4.251%, 1/25/2020 | | | 6,561,618 | |
| | 4,305,000 | | | FHLMC Multifamily Structured Pass Through Certificates, Series K014, Class A2, 3.871%, 4/25/2021 | | | 4,633,071 | |
| | 3,535,000 | | | FHLMC Multifamily Structured Pass Through Certificates, Series K703, Class A2, 2.699%, 5/25/2018 | | | 3,651,234 | |
| | 700,000 | | | FHLMC Multifamily Structured Pass Through Certificates, Series K704, Class A2, 2.412%, 8/25/2018 | | | 714,806 | |
| | 2,590,000 | | | FHLMC Multifamily Structured Pass Through Certificates, Series K706, Class A2, 2.323%, 10/25/2018 | | | 2,629,055 | |
| | 7,910,000 | | | FHLMC Multifamily Structured Pass Through Certificates, Series K708, Class A2, 2.130%, 1/25/2019 | | | 7,968,067 | |
See accompanying notes to financial statements.
| 60
Portfolio of Investments – as of September 30, 2014
Loomis Sayles Limited Term Government and Agency Fund – (continued)
| | | | | | | | |
Principal
Amount | | | Description | | Value (†) | |
| | | | Agency Commercial Mortgage-Backed Securities — continued | |
| $ | 34,370,000 | | | FHLMC Multifamily Structured Pass Through Certificates, Series K711, Class A2, 1.730%, 7/25/2019 | | $ | 33,820,389 | |
| | 6,334,422 | | | FHLMC Multifamily Structured Pass Through Certificates, Series KF01, Class A, 0.505%, 4/25/2019(c) | | | 6,338,190 | |
| | 292,184 | | | Government National Mortgage Association, Series 2003-72, Class Z, 5.377%, 11/16/2045(c) | | | 315,115 | |
| | 296,726 | | | Government National Mortgage Association, Series 2003-88, Class Z, 5.106%, 3/16/2046(c) | | | 317,689 | |
| | 13,260,000 | | | Government National Mortgage Association, Series 2013-52, Class KX, 4.443%, 8/16/2051(c) | | | 14,488,062 | |
| | | | | | | | |
| | | | | | | 81,437,296 | |
| | | | | | | | |
| | | | Collateralized Mortgage Obligations — 13.2% | |
| | 165,997 | | | Federal Home Loan Mortgage Corp., REMIC, Series 1500, Class FD, 1.870%, 5/15/2023(c) | | | 170,036 | |
| | 107,411 | | | Federal Home Loan Mortgage Corp., REMIC, Series 1552, Class I, 1.760%, 8/15/2023(c) | | | 109,395 | |
| | 398,581 | | | Federal Home Loan Mortgage Corp., REMIC, Series 2131, Class ZB, 6.000%, 3/15/2029 | | | 440,694 | |
| | 516,396 | | | Federal Home Loan Mortgage Corp., REMIC, Series 2646, Class FM, 0.554%, 11/15/2032(c) | | | 518,692 | |
| | 2,679,041 | | | Federal Home Loan Mortgage Corp., REMIC, Series 2874, Class BC, 5.000%, 10/15/2019 | | | 2,858,401 | |
| | 4,054,957 | | | Federal Home Loan Mortgage Corp., REMIC, Series 2931, Class DE, 4.000%, 2/15/2020 | | | 4,254,798 | |
| | 3,618,554 | | | Federal Home Loan Mortgage Corp., REMIC, Series 2978, Class JG, 5.500%, 5/15/2035 | | | 4,017,380 | |
| | 3,510,000 | | | Federal Home Loan Mortgage Corp., REMIC, Series 3036, Class NE, 5.000%, 9/15/2035 | | | 3,813,955 | |
| | 3,653,540 | | | Federal Home Loan Mortgage Corp., REMIC, Series 3057, Class PE, 5.500%, 11/15/2034 | | | 3,820,459 | |
| | 6,249,309 | | | Federal Home Loan Mortgage Corp., REMIC, Series 3412, Class AY, 5.500%, 2/15/2038 | | | 6,764,896 | |
| | 3,110,845 | | | Federal Home Loan Mortgage Corp., REMIC, Series 3561, Class W, 4.252%, 6/15/2048(c) | | | 3,237,637 | |
| | 3,990,558 | | | Federal Home Loan Mortgage Corp., REMIC, Series 3620, Class AT, 4.309%, 12/15/2036(c) | | | 4,160,863 | |
| | 237,239 | | | Federal Home Loan Mortgage Corp., REMIC, Series 3802, Class BA, 4.500%, 11/15/2028 | | | 244,957 | |
| | 127,803 | | | Federal National Mortgage Association, REMIC, Series 1992-162, Class FB, 2.230%, 9/25/2022(c) | | | 131,734 | |
| | 103,776 | | | Federal National Mortgage Association, REMIC, Series 1994-42, Class FD, 1.910%, 4/25/2024(c) | | | 106,098 | |
| | 23,965 | | | Federal National Mortgage Association, REMIC, Series 2002-W10, Class A7, 3.755%, 8/25/2042(c) | | | 23,875 | |
| | 1,986,592 | | | Federal National Mortgage Association, REMIC, Series 2005-33, Class QD, 5.000%, 1/25/2034 | | | 2,078,872 | |
See accompanying notes to financial statements.
61 |
Portfolio of Investments – as of September 30, 2014
Loomis Sayles Limited Term Government and Agency Fund – (continued)
| | | | | | | | |
Principal
Amount | | | Description | | Value (†) | |
| | | | Collateralized Mortgage Obligations — continued | |
| $ | 1,809,338 | | | Federal National Mortgage Association, REMIC, Series 2005-100, Class BQ, 5.500%, 11/25/2025 | | $ | 1,989,261 | |
| | 3,881,000 | | | Federal National Mortgage Association, REMIC, Series 2008-86, Class LA, 3.831%, 8/25/2038(c) | | | 3,940,527 | |
| | 91,373 | | | Federal National Mortgage Association, REMIC, Series G93-19, Class FD, 1.960%, 4/25/2023(c) | | | 93,299 | |
| | 14,009 | | | FHLMC Structured Pass Through Securities, Series T-60, Class 2A1, 3.304%, 3/25/2044(c) | | | 14,229 | |
| | 713,603 | | | Government National Mortgage Association, Series 1998-19, Class ZB, 6.500%, 7/20/2028 | | | 807,351 | |
| | 3,071,900 | | | Government National Mortgage Association, Series 2012-124, Class HT, 7.215%, 7/20/2032(c) | | | 3,497,724 | |
| | 7,999,656 | | | Government National Mortgage Association, Series 2012-H29, Class HF, 0.656%, 10/20/2062(c) | | | 8,030,246 | |
| | 7,702,757 | | | Government National Mortgage Association, Series 2013-H02, Class GF, 0.656%, 12/20/2062(c) | | | 7,735,509 | |
| | 5,554,613 | | | Government National Mortgage Association, Series 2013-H08, Class FA, 0.506%, 3/20/2063(c) | | | 5,530,295 | |
| | 4,645,176 | | | Government National Mortgage Association, Series 2013-H10, Class FA, 0.556%, 3/20/2063(c) | | | 4,636,272 | |
| | 14,407,030 | | | Government National Mortgage Association, Series 2013-H22, Class FT, 0.770%, 4/20/2063(c) | | | 14,489,006 | |
| | 579,591 | | | NCUA Guaranteed Notes, Series 2010-A1, Class A, 0.504%, 12/07/2020(c) | | | 580,241 | |
| | 1,603,000 | | | NCUA Guaranteed Notes, Series 2010-C1, Class A2, 2.900%, 10/29/2020 | | | 1,650,689 | |
| | 1,266,525 | | | NCUA Guaranteed Notes, Series 2010-R1, Class 1A, 0.606%, 10/07/2020(c) | | | 1,273,053 | |
| | 1,815,848 | | | NCUA Guaranteed Notes, Series 2010-R3, Class 1A, 0.716%, 12/08/2020(c) | | | 1,829,899 | |
| | 112,148 | | | NCUA Guaranteed Notes, Series 2010-R3, Class 2A, 0.716%, 12/08/2020(c) | | | 112,957 | |
| | | | | | | | |
| | | | | | | 92,963,300 | |
| | | | | | | | |
| | | | Hybrid ARMs — 21.5% | |
| | 1,714,263 | | | FHLMC, 2.088%, 6/01/2037(c) | | | 1,816,751 | |
| | 1,718,020 | | | FHLMC, 2.290%, 4/01/2036(c) | | | 1,793,692 | |
| | 4,343,261 | | | FHLMC, 2.297%, 9/01/2035(c) | | | 4,645,509 | |
| | 1,201,310 | | | FHLMC, 2.339%, 11/01/2038(c) | | | 1,285,533 | |
| | 3,300,447 | | | FHLMC, 2.345%, 7/01/2033 | | | 3,505,986 | |
| | 2,491,404 | | | FHLMC, 2.370%, 3/01/2036(c) | | | 2,663,491 | |
| | 8,477,095 | | | FHLMC, 2.374%, 3/01/2037(c) | | | 9,066,094 | |
| | 2,249,833 | | | FHLMC, 2.374%, 9/01/2038(c) | | | 2,394,432 | |
| | 814,740 | | | FHLMC, 2.375%, 2/01/2035(c) | | | 873,059 | |
| | 5,643,713 | | | FHLMC, 2.377%, 2/01/2036(c) | | | 6,040,273 | |
| | 434,305 | | | FHLMC, 2.385%, 9/01/2038(c) | | | 467,620 | |
| | 1,055,818 | | | FHLMC, 2.401%, 4/01/2037(c) | | | 1,131,776 | |
| | 2,816,426 | | | FHLMC, 2.416%, 2/01/2036(c) | | | 3,016,513 | |
| | 1,899,561 | | | FHLMC, 2.455%, 3/01/2038(c) | | | 2,043,291 | |
| | 3,429,019 | | | FHLMC, 2.486%, 4/01/2037(c) | | | 3,687,918 | |
| | 1,006,830 | | | FHLMC, 2.514%, 12/01/2034(c) | | | 1,080,061 | |
| | 788,034 | | | FHLMC, 2.805%, 3/01/2037(c) | | | 850,137 | |
| | 1,067,747 | | | FHLMC, 3.097%, 11/01/2038(c) | | | 1,135,353 | |
See accompanying notes to financial statements.
| 62
Portfolio of Investments – as of September 30, 2014
Loomis Sayles Limited Term Government and Agency Fund – (continued)
| | | | | | | | |
Principal
Amount | | | Description | | Value (†) | |
| | | | Hybrid ARMs — continued | |
| $ | 1,928,555 | | | FHLMC, 4.072%, 9/01/2038(c) | | $ | 2,041,731 | |
| | 253,930 | | | FHLMC, 5.276%, 12/01/2037(c) | | | 266,165 | |
| | 293,398 | | | FNMA, 1.909%, 2/01/2037(c) | | | 309,624 | |
| | 3,437,673 | | | FNMA, 1.923%, 7/01/2035(c) | | | 3,655,733 | |
| | 6,605,647 | | | FNMA, 2.037%, 9/01/2037(c) | | | 7,074,485 | |
| | 5,397,963 | | | FNMA, 2.105%, 4/01/2037(c) | | | 5,710,086 | |
| | 4,964,583 | | | FNMA, 2.149%, 7/01/2035(c) | | | 5,281,926 | |
| | 552,839 | | | FNMA, 2.158%, 8/01/2035(c) | | | 591,090 | |
| | 1,451,436 | | | FNMA, 2.169%, 8/01/2034(c) | | | 1,577,048 | |
| | 997,260 | | | FNMA, 2.256%, 9/01/2034(c) | | | 1,070,898 | |
| | 1,010,435 | | | FNMA, 2.263%, 10/01/2033(c) | | | 1,083,275 | |
| | 1,687,566 | | | FNMA, 2.270%, 9/01/2036 | | | 1,797,476 | |
| | 2,372,861 | | | FNMA, 2.276%, 4/01/2037(c) | | | 2,551,656 | |
| | 4,269,336 | | | FNMA, 2.287%, 11/01/2033(c) | | | 4,540,092 | |
| | 818,789 | | | FNMA, 2.310%, 12/01/2034(c) | | | 828,522 | |
| | 1,608,567 | | | FNMA, 2.310%, 1/01/2036 | | | 1,719,198 | |
| | 2,078,911 | | | FNMA, 2.320%, 4/01/2034(c) | | | 2,218,728 | |
| | 569,679 | | | FNMA, 2.334%, 4/01/2033(c) | | | 612,054 | |
| | 2,580,358 | | | FNMA, 2.334%, 6/01/2036(c) | | | 2,750,847 | |
| | 8,848,342 | | | FNMA, 2.339%, 10/01/2034(c) | | | 9,505,762 | |
| | 6,435,489 | | | FNMA, 2.345%, 4/01/2034(c) | | | 6,900,561 | |
| | 4,072,003 | | | FNMA, 2.348%, 8/01/2035(c) | | | 4,305,391 | |
| | 4,854,008 | | | FNMA, 2.373%, 9/01/2037(c) | | | 5,177,770 | |
| | 5,206,148 | | | FNMA, 2.405%, 6/01/2037 | | | 5,597,802 | |
| | 2,348,784 | | | FNMA, 2.412%, 6/01/2033 | | | 2,478,865 | |
| | 2,962,822 | | | FNMA, 2.412%, 10/01/2033 | | | 3,173,586 | |
| | 5,585,155 | | | FNMA, 2.424%, 3/01/2037(c) | | | 6,010,883 | |
| | 1,892,063 | | | FNMA, 2.445%, 2/01/2047(c) | | | 2,031,353 | |
| | 533,047 | | | FNMA, 2.554%, 8/01/2033(c) | | | 569,385 | |
| | 5,313,350 | | | FNMA, 2.562%, 7/01/2037(c) | | | 5,705,759 | |
| | 618,422 | | | FNMA, 2.625%, 8/01/2036 | | | 665,209 | |
| | 1,733,606 | | | FNMA, 2.656%, 5/01/2035(c) | | | 1,866,630 | |
| | 3,219,191 | | | FNMA, 2.973%, 6/01/2035(c) | | | 3,432,417 | |
| | 1,238,284 | | | FNMA, 4.709%, 8/01/2038(c) | | | 1,331,145 | |
| | | | | | | | |
| | | | | | | 151,930,641 | |
| | | | | | | | |
| | | | Mortgage Related — 17.4% | |
| | 177,563 | | | FHLMC, 3.000%, 10/01/2026 | | | 182,842 | |
| | 1,345,245 | | | FHLMC, 4.000%, with various maturities from 2024 to 2042(d) | | | 1,421,084 | |
| | 1,128,258 | | | FHLMC, 4.500%, with various maturities from 2025 to 2034(d) | | | 1,211,437 | |
| | 497,330 | | | FHLMC, 5.500%, 10/01/2023 | | | 544,187 | |
| | 42,381 | | | FHLMC, 6.000%, 11/01/2019 | | | 45,280 | |
| | 1,358,909 | | | FHLMC, 6.500%, with various maturities from 2017 to 2034(d) | | | 1,576,351 | |
| | 14,458 | | | FHLMC, 7.000%, 2/01/2016 | | | 14,582 | |
| | 657 | | | FHLMC, 7.500%, with various maturities from 2014 to 2026(d) | | | 745 | |
| | 1,036 | | | FHLMC, 8.000%, 9/01/2015 | | | 1,058 | |
| | 2,133 | | | FHLMC, 10.000%, 7/01/2019 | | | 2,361 | |
| | 31,937 | | | FHLMC, 11.500%, with various maturities from 2015 to 2020(d) | | | 33,084 | |
See accompanying notes to financial statements.
63 |
Portfolio of Investments – as of September 30, 2014
Loomis Sayles Limited Term Government and Agency Fund – (continued)
| | | | | | | | |
Principal
Amount | | | Description | | Value (†) | |
| | | | Mortgage Related — continued | | | | |
| $ | 233,819 | | | FNMA, 3.000%, 3/01/2042 | | $ | 231,920 | |
| | 2,534,744 | | | FNMA, 4.500%, 1/01/2025 | | | 2,706,206 | |
| | 3,741,047 | | | FNMA, 5.000%, with various maturities from 2037 to 2038(d) | | | 4,138,319 | |
| | 1,821,634 | | | FNMA, 5.500%, with various maturities from 2018 to 2033(d) | | | 2,008,869 | |
| | 3,009,764 | | | FNMA, 6.000%, with various maturities from 2017 to 2022(d) | | | 3,286,755 | |
| | 473,603 | | | FNMA, 6.500%, with various maturities from 2017 to 2037(d) | | | 533,443 | |
| | 24,479 | | | FNMA, 7.000%, 12/01/2022 | | | 24,558 | |
| | 143,741 | | | FNMA, 7.500%, with various maturities from 2015 to 2032(d) | | | 162,362 | |
| | 3,942 | | | FNMA, 8.000%, with various maturities from 2015 to 2016(d) | | | 4,039 | |
| | 5,321,954 | | | GNMA, 1.857%, 2/20/2061(c) | | | 5,602,133 | |
| | 4,170,758 | | | GNMA, 2.042%, 2/20/2063(c) | | | 4,421,258 | |
| | 4,931,266 | | | GNMA, 2.316%, 3/20/2063(c) | | | 5,299,790 | |
| | 3,012,740 | | | GNMA, 2.527%, 2/20/2063(c) | | | 3,251,837 | |
| | 4,759,684 | | | GNMA, 4.479%, 2/20/2062 | | | 5,152,229 | |
| | 4,864,431 | | | GNMA, 4.521%, 12/20/2061 | | | 5,258,902 | |
| | 7,334,944 | | | GNMA, 4.532%, 12/20/2062 | | | 7,994,612 | |
| | 2,452,287 | | | GNMA, 4.560%, 3/20/2062 | | | 2,654,510 | |
| | 12,232,942 | | | GNMA, 4.583%, 11/20/2062 | | | 13,350,874 | |
| | 1,575,974 | | | GNMA, 4.599%, 4/20/2063 | | | 1,724,084 | |
| | 4,465,749 | | | GNMA, 4.604%, 6/20/2062 | | | 4,859,155 | |
| | 1,512,976 | | | GNMA, 4.616%, 8/20/2061 | | | 1,634,216 | |
| | 1,904,672 | | | GNMA, 4.639%, 3/20/2062 | | | 2,068,194 | |
| | 8,443,158 | | | GNMA, 4.659%, 2/20/2062 | | | 9,171,541 | |
| | 2,019,934 | | | GNMA, 4.698%, 7/20/2061 | | | 2,181,052 | |
| | 8,683,584 | | | GNMA, 4.700%, with various maturities in 2061(d) | | | 9,387,492 | |
| | 1,997,749 | | | GNMA, 4.717%, 3/20/2061 | | | 2,149,796 | |
| | 1,621,808 | | | GNMA, 4.808%, 8/20/2062 | | | 1,762,284 | |
| | 904,905 | | | GNMA, 5.167%, 4/20/2061 | | | 980,366 | |
| | 25,754 | | | GNMA, 6.000%, 12/15/2031 | | | 29,833 | |
| | 114,913 | | | GNMA, 6.500%, 5/15/2031 | | | 134,004 | |
| | 105,498 | | | GNMA, 7.000%, 10/15/2028 | | | 121,436 | |
| | 8,684,227 | | | Government National Mortgage Association, Series 2014-H14, Class FA, 0.656%, 7/20/2064(c) | | | 8,710,167 | |
| | 6,350,941 | | | Government National Mortgage Association, Series 2014-H15, Class FA, 0.656%, 7/20/2064(c) | | | 6,357,247 | |
| | | | | | | | |
| | | | | | | 122,386,494 | |
| | | | | | | | |
| | | | Non-Agency Commercial Mortgage-Backed Securities — 15.2% | |
| | 1,290,000 | | | A10 Securitization LLC, Series 2014-1, Class A1, 1.720%, 4/15/2033, 144A | | | 1,288,715 | |
| | 1,780,000 | | | Banc of America Merrill Lynch Commercial Mortgage, Inc., Series 2007-2, Class A4, 5.781%, 4/10/2049(c) | | | 1,931,611 | |
| | 375,000 | | | Banc of America Merrill Lynch Commercial Mortgage, Inc., Series 2007-5, Class A4, 5.492%, 2/10/2051 | | | 403,714 | |
| | 1,294,904 | | | Bear Stearns Commercial Mortgage Securities, Series 2007-PW15, Class A4, 5.331%, 2/11/2044 | | | 1,380,176 | |
| | 3,215,000 | | | CG-CCRE Commercial Mortgage Trust, Series 2014-FL1, Class A, 1.104%, 6/15/2031, 144A(c) | | | 3,209,332 | |
See accompanying notes to financial statements.
| 64
Portfolio of Investments – as of September 30, 2014
Loomis Sayles Limited Term Government and Agency Fund – (continued)
| | | | | | | | |
Principal
Amount | | | Description | | Value (†) | |
| | | | Non-Agency Commercial Mortgage-Backed Securities — continued | | | | |
| $ | 3,490,000 | | | CGBAM Commercial Mortgage Trust, Series 2013-BREH, Class A2, 1.254%, 5/15/2030, 144A(c) | | $ | 3,493,490 | |
| | 1,470,000 | | | Citigroup Commercial Mortgage Trust, Series 2008-C7, Class A4,
6.339%, 12/10/2049(c) | | | 1,619,950 | |
| | 3,200,500 | | | Citigroup/Deutsche Bank Commercial Mortgage Trust, Series 2007-CD4, Class A4, 5.322%, 12/11/2049 | | | 3,419,036 | |
| | 885,000 | | | Commercial Mortgage Pass Through Certificates, Series 2014-BBG, Class A, 0.954%, 3/15/2029, 144A(c) | | | 885,556 | |
| | 2,625,000 | | | Credit Suisse Mortgage Capital Certificates, Series 2007-C2, Class A3, 5.542%, 1/15/2049 | | | 2,834,530 | |
| | 5,270,000 | | | Credit Suisse Mortgage Capital Certificates, Series 2007-C5, Class A4, 5.695%, 9/15/2040 | | | 5,724,316 | |
| | 3,000,000 | | | Credit Suisse Mortgage Capital Certificates, Series 2008-C1, Class A3, 6.173%, 2/15/2041(c) | | | 3,318,432 | |
| | 1,000,000 | | | Del Coronado Trust, Series 2013-HDC, Class A, 0.954%, 3/15/2026, 144A(c) | | | 998,834 | |
| | 1,200,000 | | | Extended Stay America Trust, Series 2013-ESFL, Class A2FL,
0.856%, 12/05/2031, 144A(c) | | | 1,197,461 | |
| | 3,350,000 | | | GP Portfolio Trust, Series 2014-GPP, Class A, 1.104%, 2/15/2027, 144A(c) | | | 3,353,715 | |
| | 5,000,000 | | | Greenwich Capital Commercial Funding Corp., Series 2007-GG9, Class A4, 5.444%, 3/10/2039 | | | 5,385,855 | |
| | 7,778,000 | | | Greenwich Capital Commercial Funding Corp., Series 2007-GG11, Class A4, 5.736%, 12/10/2049 | | | 8,518,971 | |
| | 3,555,000 | | | GS Mortgage Securities Corp. Trust, Series 2013-PEMB, Class A,
3.668%, 3/05/2033, 144A(c) | | | 3,447,003 | |
| | 253,598 | | | JPMorgan Chase Commercial Mortgage Securities Trust, Series 2006-CB15, Class A4, 5.814%, 6/12/2043 | | | 269,516 | |
| | 2,692,804 | | | JPMorgan Chase Commercial Mortgage Securities Trust, Series 2007-CB18, Class A4, 5.440%, 6/12/2047 | | | 2,900,592 | |
| | 4,730,695 | | | JPMorgan Chase Commercial Mortgage Securities Trust, Series 2007-LDPX, Class A3, 5.420%, 1/15/2049 | | | 5,096,851 | |
| | 3,500,000 | | | JPMorgan Chase Commercial Mortgage Securities Trust, Series 2013-JWRZ, Class A, 0.934%, 4/15/2030, 144A(c) | | | 3,497,753 | |
| | 975,000 | | | JPMorgan Chase Commercial Mortgage Securities Trust, Series 2014-C19, Class ASB, 3.584%, 4/15/2047 | | | 1,009,450 | |
| | 2,380,000 | | | JPMorgan Chase Commercial Mortgage Securities Trust, Series 2014-FL5, Class A, 1.132%, 7/15/2031, 144A(c) | | | 2,380,000 | |
| | 1,637,286 | | | LB-UBS Commercial Mortgage Trust, Series 2007-C2, Class A3, 5.430%, 2/15/2040 | | | 1,773,058 | |
| | 1,882,058 | | | LB-UBS Commercial Mortgage Trust, Series 2007-C7, Class A3, 5.866%, 9/15/2045 | | | 2,082,488 | |
| | 1,137,971 | | | Merrill Lynch/Countrywide Commercial Mortgage Trust, Series 2007-5, Class A4, 5.378%, 8/12/2048 | | | 1,216,556 | |
| | 5,364,000 | | | Merrill Lynch/Countrywide Commercial Mortgage Trust, Series 2007-6, Class A4, 5.485%, 3/12/2051 | | | 5,815,075 | |
| | 3,620,000 | | | Morgan Stanley Bank of America Merrill Lynch Trust, Series 2013-C11, Class A2, 3.085%, 8/15/2046 | | | 3,743,963 | |
| | 3,485,000 | | | Morgan Stanley Capital I, Series 2007-HQ12, Class A5, 5.773%, 4/12/2049(c) | | | 3,736,941 | |
See accompanying notes to financial statements.
65 |
Portfolio of Investments – as of September 30, 2014
Loomis Sayles Limited Term Government and Agency Fund – (continued)
| | | | | | | | |
Principal
Amount | | | Description | | Value (†) | |
| | | | Non-Agency Commercial Mortgage-Backed Securities — continued | | | | |
| $ | 1,459,481 | | | Morgan Stanley Capital I, Series 2007-IQ15, Class A4, 6.105%, 6/11/2049(c) | | $ | 1,603,049 | |
| | 2,220,181 | | | Motel 6 Trust, Series 2012-MTL6, Class A1, 1.500%, 10/05/2025, 144A | | | 2,203,041 | |
| | 2,273,011 | | | PFP III Ltd., Series 2014-1, Class A, 1.324%, 6/14/2031, 144A(c) | | | 2,277,502 | |
| | 3,420,000 | | | Resource Capital Corp. Ltd., Series 2014-CRE2, Class A, 1.204%, 4/15/2032, 144A(c) | | | 3,420,000 | |
| | 1,520,000 | | | SCG Trust, Series 2013-SRP1, Class A, 1.554%, 11/15/2026, 144A(c) | | | 1,524,416 | |
| | 4,122,954 | | | Wachovia Bank Commercial Mortgage Trust, Series 2006-C28, Class A4, 5.572%, 10/15/2048 | | | 4,406,819 | |
| | 3,775,000 | | | Wachovia Bank Commercial Mortgage Trust, Series 2007-C30, Class A5, 5.342%, 12/15/2043 | | | 4,069,620 | |
| | 1,515,000 | | | WFRBS Commercial Mortgage Trust, Series 2014-C20, Class ABS, 3.638%, 5/15/2047 | | | 1,571,735 | |
| | | | | | | | |
| | | | | | | 107,009,122 | |
| | | | | | | | |
| | | | Treasuries — 12.2% | |
| | 7,000,000 | | | U.S. Treasury Note, 0.084%, 4/30/2016(c) | | | 7,003,591 | |
| | 21,610,000 | | | U.S. Treasury Note, 0.625%, 9/30/2017 | | | 21,292,592 | |
| | 10,000,000 | | | U.S. Treasury Note, 0.875%, 11/30/2016 | | | 10,036,720 | |
| | 23,890,000 | | | U.S. Treasury Note, 0.875%, 5/15/2017 | | | 23,860,138 | |
| | 21,810,000 | | | U.S. Treasury Note, 1.625%, 3/31/2019 | | | 21,748,670 | |
| | 2,385,000 | | | U.S. Treasury Note, 1.625%, 8/31/2019 | | | 2,368,603 | |
| | | | | | | | |
| | | | | | | 86,310,314 | |
| | | | | | | | |
| | | | Total Bonds and Notes (Identified Cost $662,014,201) | | | 665,919,189 | |
| | | | | | | | |
| | | | | | | | |
| | Short-Term Investments — 2.9% | |
| | 2,819,113 | | | Tri-Party Repurchase Agreement with Fixed Income Clearing Corporation, dated 9/30/2014 at 0.000% to be repurchased at $2,819,113 on 10/01/2014 collateralized by $2,895,000 U.S. Treasury Note, 1.500% due 5/31/2019 valued at $2,876,906 including accrued interest (Note 2 of Notes to Financial Statements) | �� | | 2,819,113 | |
| | 14,355,000 | | | U.S. Treasury Bills, 0.000%-0.073%, 10/16/2014(e)(f) | | | 14,354,943 | |
| | 2,400,000 | | | U.S. Treasury Bills, 0.025%-0.030%,10/30/2014(e)(f) | | | 2,399,967 | |
| | 1,300,000 | | | U.S. Treasury Bills, 0.019%, 12/26/2014(e) | | | 1,299,953 | |
| | | | | | | | |
| | | | Total Short-Term Investments
(Identified Cost $20,873,699) | | | 20,873,976 | |
| | | | | | | | |
| | | | | | | | |
| | | | Total Investments — 97.3%
(Identified Cost $682,887,900)(a) | | | 686,793,165 | |
| | | | Other assets less liabilities — 2.7% | | | 18,929,757 | |
| | | | | | | | |
| | | | Net Assets — 100.0% | | $ | 705,722,922 | |
| | | | | | | | |
| | | | | | | | |
See accompanying notes to financial statements.
| 66
Portfolio of Investments – as of September 30, 2014
Loomis Sayles Limited Term Government and Agency Fund – (continued)
| | | | | | | | |
| | (†) | | | See Note 2 of Notes to Financial Statements. | |
| | (a) | | | Federal Tax Information: | |
| | | | At September 30, 2014, the net unrealized appreciation on investments based on a cost of $682,896,702 for federal income tax purposes was as follows: | |
| | | | Aggregate gross unrealized appreciation for all investments in which there is an excess of value over tax cost | | $ | 10,769,133 | |
| | | | Aggregate gross unrealized depreciation for all investments in which there is an excess of tax cost over value | | | (6,872,670 | ) |
| | | | | | | | |
| | | | Net unrealized appreciation | | $ | 3,896,463 | |
| | | | | | | | |
| | | | | | | | |
| | (b) | | | Fair valued by the Fund’s adviser. At September 30, 2014, the value of this security amounted to $160,459 or less than 0.1% of net assets. | |
| | (c) | | | Variable rate security. Rate as of September 30, 2014 is disclosed. | |
| | (d) | | | The Fund’s investment in mortgage related securities of Federal Home Loan Mortgage Corporation, Federal National Mortgage Association and Government National Mortgage Association are interests in separate pools of mortgages. All separate investments in securities of each issuer which have the same coupon rate have been aggregated for the purpose of presentation in the Portfolio of Investments. | |
| | (e) | | | Interest rate represents discount rate at time of purchase; not a coupon rate. | |
| | (f) | | | The Fund’s investment in U.S. Treasury Bills is comprised of various lots with differing discount rates. These separate investments, which have the same maturity date, have been aggregated for the purpose of presentation in the Portfolio of Investments. | |
| | | | | | | | |
| | 144A | | | All or a portion of these securities are exempt from registration under Rule 144A of the Securities Act of 1933. These securities may be resold in transactions exempt from registration, normally to qualified institutional buyers. At September 30, 2014, the value of Rule 144A holdings amounted to $45,379,135 or 6.4% of net assets. | |
| | ABS | | | Asset-Backed Securities | |
| | ARMs | | | Adjustable Rate Mortgages | |
| | FHLMC | | | Federal Home Loan Mortgage Corp. | |
| | FNMA | | | Federal National Mortgage Association | |
| | GNMA | | | Government National Mortgage Association | |
| | REMIC | | | Real Estate Mortgage Investment Conduit | |
Industry Summary at September 30, 2014
| | | | |
Hybrid ARMs | | | 21.5 | % |
Mortgage Related | | | 17.4 | |
Non-Agency Commercial Mortgage-Backed Securities | | | 15.2 | |
Collateralized Mortgage Obligations | | | 13.2 | |
Treasuries | | | 12.2 | |
Agency Commercial Mortgage-Backed Securities | | | 11.5 | |
ABS Car Loan | | | 2.0 | |
Other Investments, less than 2% each | | | 1.4 | |
Short-Term Investments | | | 2.9 | |
| | | | |
Total Investments | | | 97.3 | |
Other assets less liabilities | | | 2.7 | |
| | | | |
Net Assets | | | 100.0 | % |
| | | | |
See accompanying notes to financial statements.
67 |
Statements of Assets and Liabilities
September 30, 2014
| | | | | | | | | | | | | | | | |
| | | Core Plus
Bond Fund | | | High Income
Fund | | | International
Bond Fund | | | Limited Term
Government
and Agency
Fund | |
ASSETS | | | | | | | | | | | | | | | | |
Investments at cost | | $ | 2,361,059,083 | | | $ | 187,075,270 | | | $ | 9,352,533 | | | $ | 682,887,900 | |
Net unrealized appreciation (depreciation) | | | 7,710,668 | | | | 2,461,639 | | | | (654,909 | ) | | | 3,905,265 | |
| | | | | | | | | | | | | | | | |
Investments at value | | | 2,368,769,751 | | | | 189,536,909 | | | | 8,697,624 | | | | 686,793,165 | |
Cash | | | 9,794 | | | | — | | | | 89,509 | | | | — | |
Foreign currency at value (identified cost $0, $0, $55,555 and $0) | | | — | | | | — | | | | 53,777 | | | | — | |
Receivable for Fund shares sold | | | 134,802,912 | | | | 238,272 | | | | 508 | | | | 18,458,859 | |
Receivable from investment adviser (Note 6) | | | — | | | | — | | | | 11,334 | | | | — | |
Receivable for securities sold | | | 9,455,741 | | | | — | | | | 4,940 | | | | — | |
Receivable for delayed delivery securities
sold (Note 2) | | | 158,357,597 | | | | — | | | | — | | | | — | |
Collateral received for delayed delivery
securities (Note 2) | | | 120,000 | | | | — | | | | — | | | | — | |
Dividends and interest receivable | | | 23,772,360 | | | | 2,241,109 | | | | 81,828 | | | | 2,325,627 | |
Unrealized appreciation on forward foreign currency contracts (Note 2) | | | — | | | | 220,346 | | | | 8,096 | | | | — | |
Tax reclaims receivable | | | — | | | | 183 | | | | — | | | | — | |
Receivable for variation margin on futures contracts (Note 2) | | | — | | | | 17,469 | | | | 646 | | | | — | |
| | | | | | | | | | | | | | | | |
TOTAL ASSETS | | | 2,695,288,155 | | | | 192,254,288 | | | | 8,948,262 | | | | 707,577,651 | |
| | | | | | | | | | | | | | | | |
LIABILITIES | | | | | | | | | | | | | | | | |
Payable for securities purchased | | | 59,149,549 | | | | 3,489,647 | | | | 4,028 | | | | — | |
Payable for delayed delivery securities
purchased (Note 2) | | | 316,890,042 | | | | — | | | | — | | | | — | |
Payable for Fund shares redeemed | | | 1,670,567 | | | | 5,827,673 | | | | 34 | | | | 801,059 | |
Unrealized depreciation on forward foreign currency contracts (Note 2) | | | — | | | | 98,261 | | | | 27,802 | | | | — | |
Due to broker (Note 2) | | | 120,000 | | | | — | | | | — | | | | — | |
Distributions payable | | | — | | | | — | | | | — | | | | 361,137 | |
Management fees payable (Note 6) | | | 661,933 | | | | 94,927 | | | | — | | | | 205,618 | |
Deferred Trustees’ fees (Note 6) | | | 367,910 | | | | 156,607 | | | | 70,004 | | | | 327,279 | |
Administrative fees payable (Note 6) | | | 75,647 | | | | 6,795 | | | | 316 | | | | 23,980 | |
Payable to distributor (Note 6d) | | | 16,133 | | | | 1,144 | | | | 82 | | | | 3,535 | |
Other accounts payable and accrued expenses | | | 228,740 | | | | 87,139 | | | | 65,309 | | | | 132,121 | |
| | | | | | | | | | | | | | | | |
TOTAL LIABILITIES | | | 379,180,521 | | | | 9,762,193 | | | | 167,575 | | | | 1,854,729 | |
| | | | | | | | | | | | | | | | |
NET ASSETS | | $ | 2,316,107,634 | | | $ | 182,492,095 | | | $ | 8,780,687 | | | $ | 705,722,922 | |
| | | | | | | | | | | | | | | | |
NET ASSETS CONSIST OF: | | | | | | | | | | | | | | | | |
Paid-in capital | | $ | 2,291,939,003 | | | $ | 176,135,286 | | | $ | 9,815,180 | | | $ | 714,134,950 | |
Undistributed (Distributions in excess of) net investment income | | | 2,265,864 | | | | (990,073 | ) | | | (290,213 | ) | | | (509,665 | ) |
Accumulated net realized gain (loss) on investments, futures contracts and foreign currency transactions | | | 14,438,981 | | | | 4,730,965 | | | | (66,677 | ) | | | (11,807,628 | ) |
Net unrealized appreciation (depreciation) on investments, futures contracts and foreign currency translations | | | 7,463,786 | | | | 2,615,917 | | | | (677,603 | ) | | | 3,905,265 | |
| | | | | | | | | | | | | | | | |
NET ASSETS | | $ | 2,316,107,634 | | | $ | 182,492,095 | | | $ | 8,780,687 | | | $ | 705,722,922 | |
| | | | | | | | | | | | | | | | |
See accompanying notes to financial statements.
| 68
Statements of Assets and Liabilities (continued)
September 30, 2014
| | | | | | | | | | | | | | | | |
| | | Core Plus
Bond Fund | | | High Income
Fund | | | International
Bond Fund | | | Limited Term
Government
and Agency
Fund | |
COMPUTATION OF NET ASSET VALUE AND OFFERING PRICE: | | | | | | | | | | | | | | | | |
Class A shares: | | | | | | | | | | | | | | | | |
Net assets | | $ | 642,784,269 | | | $ | 42,630,035 | | | $ | 3,292,495 | | | $ | 314,359,555 | |
| | | | | | | | | | | | | | | | |
Shares of beneficial interest | | | 48,779,934 | | | | 9,504,582 | | | | 353,262 | | | | 27,067,694 | |
| | | | | | | | | | | | | | | | |
Net asset value and redemption price per
share | | $ | 13.18 | | | $ | 4.49 | | | $ | 9.32 | | | $ | 11.61 | |
| | | | | | | | | | | | | | | | |
Offering price per share (100/[100-maximum sales charge] of net asset value) (Note 1) | | $ | 13.80 | | | $ | 4.70 | | | $ | 9.76 | | | $ | 11.97 | |
| | | | | | | | | | | | | | | | |
Class B shares: (redemption price per share is equal to net asset value less any applicable contingent deferred sales charge) (Note 1) | | | | | | | | | | | | | | | | |
Net assets | | $ | 678,389 | | | $ | 121,762 | | | $ | — | | | $ | 4,202,930 | |
| | | | | | | | | | | | | | | | |
Shares of beneficial interest | | | 51,222 | | | | 27,022 | | | | — | | | | 362,327 | |
| | | | | | | | | | | | | | | | |
Net asset value and offering price per share | | $ | 13.24 | | | $ | 4.51 | | | $ | — | | | $ | 11.60 | |
| | | | | | | | | | | | | | | | |
Class C shares: (redemption price per share is equal to net asset value less any applicable contingent deferred sales charge) (Note 1) | | | | | | | | | | | | | | | | |
Net assets | | $ | 256,306,524 | | | $ | 14,555,269 | | | $ | 2,285,115 | | | $ | 56,936,404 | |
| | | | | | | | | | | | | | | | |
Shares of beneficial interest | | | 19,442,455 | | | | 3,237,663 | | | | 249,161 | | | | 4,898,352 | |
| | | | | | | | | | | | | | | | |
Net asset value and offering price per share | | $ | 13.18 | | | $ | 4.50 | | | $ | 9.17 | | | $ | 11.62 | |
| | | | | | | | | | | | | | | | |
Class N shares: | | | | | | | | | | | | | | | | |
Net assets | | $ | 105,514,200 | | | $ | — | | | $ | — | | | $ | — | |
| | | | | | | | | | | | | | | | |
Shares of beneficial interest | | | 7,948,021 | | | | — | | | | — | | | | — | |
| | | | | | | | | | | | | | | | |
Net asset value, offering and redemption price per share | | $ | 13.28 | | | $ | — | | | $ | — | | | $ | — | |
| | | | | | | | | | | | | | | | |
Class Y shares: | | | | | | | | | | | | | | | | |
Net assets | | $ | 1,310,824,252 | | | $ | 125,185,029 | | | $ | 3,203,077 | | | $ | 330,224,033 | |
| | | | | | | | | | | | | | | | |
Shares of beneficial interest | | | 98,776,082 | | | | 27,960,180 | | | | 342,508 | | | | 28,345,451 | |
| | | | | | | | | | | | | | | | |
Net asset value, offering and redemption price per share | | $ | 13.27 | | | $ | 4.48 | | | $ | 9.35 | | | $ | 11.65 | |
| | | | | | | | | | | | | | | | |
See accompanying notes to financial statements.
69 |
Statements of Operations
For the Year Ended September 30, 2014
| | | | | | | | | | | | | | | | |
| | | Core Plus Bond
Fund | | | High Income
Fund | | | International Bond
Fund | | | Limited Term
Government
and Agency
Fund | |
INVESTMENT INCOME | | | | | | | | | | | | | | | | |
Interest | | $ | 62,112,508 | | | $ | 9,527,589 | | | $ | 278,674 | | | $ | 14,325,885 | |
Dividends | | | 201,331 | | | | 614,015 | | | | 1,550 | | | | — | |
| | | | | | | | | | | | | | | | |
| | | 62,313,839 | | | | 10,141,604 | | | | 280,224 | | | | 14,325,885 | |
| | | | | | | | | | | | | | | | |
Expenses | | | | | | | | | | | | | | | | |
Management fees (Note 6) | | | 5,892,030 | | | | 1,064,303 | | | | 73,102 | | | | 2,469,783 | |
Service and distribution fees (Note 6) | | | 3,351,631 | | | | 272,839 | | | | 45,704 | | | | 1,561,246 | |
Administrative fees (Note 6) | | | 681,061 | | | | 77,171 | | | | 5,309 | | | | 291,541 | |
Trustees’ fees and expenses (Note 6) | | | 96,998 | | | | 41,975 | | | | 27,019 | | | | 73,910 | |
Transfer agent fees and expenses (Notes 6 and 7) | | | 1,271,491 | | | | 177,403 | | | | 10,049 | | | | 554,550 | |
Audit and tax services fees | | | 51,830 | | | | 51,529 | | | | 54,014 | | | | 55,662 | |
Custodian fees and expenses | | | 115,233 | | | | 63,912 | | | | 34,817 | | | | 38,824 | |
Legal fees | | | 14,078 | | | | 1,617 | | | | 108 | | | | 5,981 | |
Registration fees | | | 241,664 | | | | 72,562 | | | | 52,001 | | | | 113,402 | |
Shareholder reporting expenses | | | 85,146 | | | | 12,547 | | | | 2,728 | | | | 41,358 | |
Miscellaneous expenses | | | 42,481 | | | | 17,590 | | | | 13,568 | | | | 26,194 | |
| | | | | | | | | | | | | | | | |
Total expenses | | | 11,843,643 | | | | 1,853,448 | | | | 318,419 | | | | 5,232,451 | |
Fee/expense recovery (Note 6) | | | 8,278 | | | | — | | | | — | | | | 19 | |
Less waiver and/or expense reimbursement (Note 6) | | | — | | | | (2 | ) | | | (174,569 | ) | | | — | |
| | | | | | | | | | | | | | | | |
Net expenses | | | 11,851,921 | | | | 1,853,446 | | | | 143,850 | | | | 5,232,470 | |
| | | | | | | | | | | | | | | | |
Net investment income | | | 50,461,918 | | | | 8,288,158 | | | | 136,374 | | | | 9,093,415 | |
| | | | | | | | | | | | | | | | |
NET REALIZED AND UNREALIZED GAIN (LOSS) ON INVESTMENTS, FUTURES CONTRACTS AND FOREIGN CURRENCY TRANSACTIONS | | | | | | | | | | | | | | | | |
Net realized gain (loss) on: | | | | | | | | | | | | | | | | |
Investments | | | 24,024,153 | | | | 5,506,494 | | | | (134,655 | ) | | | 685,538 | |
Futures contracts | | | — | | | | (399,513 | ) | | | 47,559 | | | | — | |
Foreign currency transactions | | | 143,640 | | | | (305,326 | ) | | | (10,289 | ) | | | — | |
Net change in unrealized appreciation (depreciation) on: | | | | | | | | | | | | | | | | |
Investments | | | 21,191,120 | | | | 185,515 | | | | 34,851 | | | | (170,093 | ) |
Futures contracts | | | — | | | | 62,266 | | | | (11,011 | ) | | | — | |
Foreign currency translations | | | (274,397 | ) | | | 371,541 | | | | (39,212 | ) | | | — | |
| | | | | | | | | | | | | | | | |
Net realized and unrealized gain (loss) on investments, futures contracts and foreign currency transactions | | | 45,084,516 | | | | 5,420,977 | | | | (112,757 | ) | | | 515,445 | |
| | | | | | | | | | | | | | | | |
NET INCREASE IN NET ASSETS RESULTING FROM OPERATIONS | | $ | 95,546,434 | | | $ | 13,709,135 | | | $ | 23,617 | | | $ | 9,608,860 | |
| | | | | | | | | | | | | | | | |
See accompanying notes to financial statements.
| 70
Statements of Changes in Net Assets
| | | | | | | | | | | | | | | | |
| | | Core Plus Bond Fund | | | High Income Fund | |
| | | Year Ended
September 30,
2014 | | | Year Ended
September 30,
2013 | | | Year Ended
September 30,
2014 | | | Year Ended
September 30,
2013 | |
FROM OPERATIONS: | | | | | | | | | | | | | | | | |
Net investment income | | $ | 50,461,918 | | | $ | 51,424,057 | | | $ | 8,288,158 | | | $ | 11,194,515 | |
Net realized gain on investments, futures contracts and foreign currency transactions | | | 24,167,793 | | | | 10,004,991 | | | | 4,801,655 | | | | 9,721,190 | |
Net change in unrealized appreciation (depreciation) on investments, futures contracts and foreign currency translations | | | 20,916,723 | | | | (79,732,461 | ) | | | 619,322 | | | | (6,196,937 | ) |
| | | | | | | | | | | | | | | | |
Net increase (decrease) in net assets resulting from operations | | | 95,546,434 | | | | (18,303,413 | ) | | | 13,709,135 | | | | 14,718,768 | |
| | | | | | | | | | | | | | | | |
FROM DISTRIBUTIONS TO SHAREHOLDERS: | | | | | | | | | | | | | | | | |
Net investment income | | | | | | | | | | | | | | | | |
Class A | | | (16,342,911 | ) | | | (22,049,388 | ) | | | (2,319,281 | ) | | | (4,012,237 | ) |
Class B | | | (25,257 | ) | | | (57,416 | ) | | | (10,542 | ) | | | (24,416 | ) |
Class C | | | (5,957,503 | ) | | | (9,800,300 | ) | | | (607,126 | ) | | | (826,420 | ) |
Class N | | | (1,590,647 | ) | | | (139,775 | ) | | | — | | | | — | |
Class Y | | | (31,114,909 | ) | | | (32,556,568 | ) | | | (5,768,684 | ) | | | (7,718,674 | ) |
Net realized capital gains | | | | | | | | | | | | | | | | |
Class A | | | (136,985 | ) | | | (7,656,569 | ) | | | (2,541,543 | ) | | | (224,929 | ) |
Class B | | | (359 | ) | | | (28,613 | ) | | | (15,464 | ) | | | (1,686 | ) |
Class C | | | (68,534 | ) | | | (4,172,024 | ) | | | (825,367 | ) | | | (52,693 | ) |
Class N | | | (6,286 | ) | | | — | | | | — | | | | — | |
Class Y | | | (216,547 | ) | | | (10,215,543 | ) | | | (5,865,247 | ) | | | (409,949 | ) |
| | | | | | | | | | | | | | | | |
Total distributions | | | (55,459,938 | ) | | | (86,676,196 | ) | | | (17,953,254 | ) | | | (13,271,004 | ) |
| | | | | | | | | | | | | | | | |
NET INCREASE (DECREASE) IN NET ASSETS FROM CAPITAL SHARE TRANSACTIONS (NOTE 11) | | | 959,743,921 | | | | 28,754,694 | | | | 17,157,058 | | | | (56,084,432 | ) |
| | | | | | | | | | | | | | | | |
Net increase (decrease) in net assets | | | 999,830,417 | | | | (76,224,915 | ) | | | 12,912,939 | | | | (54,636,668 | ) |
NET ASSETS | | | | | | | | | | | | | | | | |
Beginning of the year | | | 1,316,277,217 | | | | 1,392,502,132 | | | | 169,579,156 | | | | 224,215,824 | |
| | | | | | | | | | | | | | | | |
End of the year | | $ | 2,316,107,634 | | | $ | 1,316,277,217 | | | $ | 182,492,095 | | | $ | 169,579,156 | |
| | | | | | | | | | | | | | | | |
UNDISTRIBUTED (DISTRIBUTIONS IN EXCESS OF) NET INVESTMENT INCOME | | $ | 2,265,864 | | | $ | 2,382,095 | | | $ | (990,073 | ) | | $ | (316,940 | ) |
| | | | | | | | | | | | | | | | |
See accompanying notes to financial statements.
71 |
Statements of Changes in Net Assets (continued)
| | | | | | | | | | | | | | | | |
| | | International Bond Fund | | | Limited Term Government and
Agency Fund | |
| | | Year Ended
September 30,
2014 | | | Year Ended
September 30,
2013 | | | Year Ended
September 30,
2014 | | | Year Ended
September 30,
2013 | |
FROM OPERATIONS: | | | | | | | | | | | | | | | | |
Net investment income | | $ | 136,374 | | | $ | 229,231 | | | $ | 9,093,415 | | | $ | 7,651,464 | |
Net realized gain (loss) on investments, futures contracts and foreign currency transactions | | | (97,385 | ) | | | 284,540 | | | | 685,538 | | | | 960,423 | |
Net change in unrealized appreciation (depreciation) on investments, futures contracts and foreign currency translations | | | (15,372 | ) | | | (1,122,879 | ) | | | (170,093 | ) | | | (14,157,642 | ) |
| | | | | | | | | | | | | | | | |
Net increase (decrease) in net assets resulting from operations | | | 23,617 | | | | (609,108 | ) | | | 9,608,860 | | | | (5,545,755 | ) |
| | | | | | | | | | | | | | | | |
FROM DISTRIBUTIONS TO SHAREHOLDERS: | | | | | | | | | | | | | | | | |
Net investment income | | | | | | | | | | | | | | | | |
Class A | | | (60,780 | ) | | | (206,411 | ) | | | (7,143,858 | ) | | | (8,021,271 | ) |
Class B | | | — | | | | — | | | | (70,496 | ) | | | (103,744 | ) |
Class C | | | (20,131 | ) | | | (54,617 | ) | | | (819,006 | ) | | | (1,101,044 | ) |
Class Y | | | (19,438 | ) | | | (65,554 | ) | | | (5,695,825 | ) | | | (5,835,575 | ) |
Net realized capital gains | | | | | | | | | | | | | | | | |
Class A | | | (239,613 | ) | | | (216,225 | ) | | | — | | | | (122,270 | ) |
Class B | | | — | | | | — | | | | — | | | | (2,674 | ) |
Class C | | | (87,333 | ) | | | (81,575 | ) | | | — | | | | (26,374 | ) |
Class Y | | | (74,045 | ) | | | (62,926 | ) | | | — | | | | (83,455 | ) |
Paid-in capital | | | | | | | | | | | | | | | | |
Class A | | | — | | | | — | | | | — | | | | (57,173 | ) |
Class B | | | — | | | | — | | | | — | | | | (955 | ) |
Class C | | | — | | | | — | | | | — | | | | (11,573 | ) |
Class Y | | | — | | | | — | | | | — | | | | (40,475 | ) |
| | | | | | | | | | | | | | | | |
Total distributions | | | (501,340 | ) | | | (687,308 | ) | | | (13,729,185 | ) | | | (15,406,583 | ) |
| | | | | | | | | | | | | | | | |
NET INCREASE (DECREASE) IN NET ASSETS FROM CAPITAL SHARE TRANSACTIONS (NOTE 11) | | | (5,654,159 | ) | | | (3,307,652 | ) | | | 24,611,252 | | | | 43,978,695 | |
| | | | | | | | | | | | | | | | |
Net increase (decrease) in net assets | | | (6,131,882 | ) | | | (4,604,068 | ) | | | 20,490,927 | | | | 23,026,357 | |
NET ASSETS | | | | | | | | | | | | | | | | |
Beginning of the year | | | 14,912,569 | | | | 19,516,637 | | | | 685,231,995 | | | | 662,205,638 | |
| | | | | | | | | | | | | | | | |
End of the year | | $ | 8,780,687 | | | $ | 14,912,569 | | | $ | 705,722,922 | | | $ | 685,231,995 | |
| | | | | | | | | | | | | | | | |
DISTRIBUTIONS IN EXCESS OF NET INVESTMENT INCOME | | $ | (290,213 | ) | | $ | (67,205 | ) | | $ | (509,665 | ) | | $ | (594,519 | ) |
| | | | | | | | | | | | | | | | |
See accompanying notes to financial statements.
| 72
Financial Highlights
For a share outstanding throughout each period.
| | | | | | | | | | | | | | | | | | | | |
| | | Core Plus Bond Fund—Class A | |
| | | Year Ended
September 30,
2014 | | | Year Ended
September 30,
2013 | | | Year Ended
September 30,
2012 | | | Year Ended
September 30,
2011 | | | Year Ended
September 30,
2010 | |
Net asset value, beginning of the period | | $ | 12.71 | | | $ | 13.52 | | | $ | 12.71 | | | $ | 12.75 | | | $ | 11.91 | |
| | | | | | | | | | | | | | | | | | | | |
INCOME (LOSS) FROM INVESTMENT OPERATIONS: | | | | | | | | | | | | | | | | | | | | |
Net investment income(a) | | | 0.42 | | | | 0.44 | | | | 0.43 | | | | 0.52 | | | | 0.54 | |
Net realized and unrealized gain (loss) | | | 0.51 | | | | (0.51 | ) | | | 1.07 | | | | 0.03 | (b) | | | 0.91 | |
| | | | | | | | | | | | | | | | | | | | |
Total from Investment Operations | | | 0.93 | | | | (0.07 | ) | | | 1.50 | | | | 0.55 | | | | 1.45 | |
| | | | | | | | | | | | | | | | | | | | |
LESS DISTRIBUTIONS FROM: | | | | | | | | | | | | | | | | | | | | |
Net investment income | | | (0.46 | ) | | | (0.55 | ) | | | (0.50 | ) | | | (0.59 | ) | | | (0.61 | ) |
Net realized capital gains | | | (0.00 | )(c) | | | (0.19 | ) | | | (0.19 | ) | | | — | | | | — | |
| | | | | | | | | | | | | | | | | | | | |
Total Distributions | | | (0.46 | ) | | | (0.74 | ) | | | (0.69 | ) | | | (0.59 | ) | | | (0.61 | ) |
| | | | | | | | | | | | | | | | | | | | |
Net asset value, end of the period | | $ | 13.18 | | | $ | 12.71 | | | $ | 13.52 | | | $ | 12.71 | | | $ | 12.75 | |
| | | | | | | | | | | | | | | | | | | | |
Total return(d) | | | 7.43 | % | | | (0.61 | )% | | | 12.18 | % | | | 4.42 | % | | | 12.55 | % |
RATIOS TO AVERAGE NET ASSETS: | | | | | | | | | | | | | | | | | | | | |
Net assets, end of the period (000’s) | | $ | 642,784 | | | $ | 436,199 | | | $ | 479,823 | | | $ | 237,759 | | | $ | 214,723 | |
Net expenses | | | 0.79 | %(e) | | | 0.79 | % | | | 0.82 | % | | | 0.87 | % | | | 0.90 | % |
Gross expenses | | | 0.79 | %(e) | | | 0.79 | % | | | 0.82 | % | | | 0.87 | % | | | 0.90 | % |
Net investment income | | | 3.19 | % | | | 3.29 | % | | | 3.31 | % | | | 4.07 | % | | | 4.41 | % |
Portfolio turnover rate | | | 122 | % | | | 107 | % | | | 78 | % | | | 86 | % | | | 87 | % |
| (a) | Per share net investment income has been calculated using the average shares outstanding during the period. |
| (b) | The amount shown for a share outstanding does not correspond with the aggregate realized and unrealized gain (loss) on investments for the period due to the timing of sales and redemptions of fund shares in relation to fluctuating market values of investments of the Fund. |
| (c) | Amount rounds to less than $0.01 per share. |
| (d) | A sales charge for Class A shares is not reflected in total return calculations. |
| (e) | Includes fee/expense recovery of less than 0.01%. |
See accompanying notes to financial statements.
73 |
Financial Highlights (continued)
For a share outstanding throughout each period.
| | | | | | | | | | | | | | | | | | | | |
| | | Core Plus Bond Fund—Class B | |
| | | Year Ended
September 30,
2014 | | | Year Ended
September 30,
2013 | | | Year Ended
September 30,
2012 | | | Year Ended
September 30,
2011 | | | Year Ended
September 30,
2010 | |
Net asset value, beginning of the period | | $ | 12.77 | | | $ | 13.57 | | | $ | 12.75 | | | $ | 12.79 | | | $ | 11.95 | |
| | | | | | | | | | | | | | | | | | | | |
INCOME (LOSS) FROM INVESTMENT OPERATIONS: | | | | | | | | | | | | | | | | | | | | |
Net investment income(a) | | | 0.33 | | | | 0.33 | | | | 0.34 | | | | 0.42 | | | | 0.44 | |
Net realized and unrealized gain (loss) | | | 0.50 | | | | (0.50 | ) | | | 1.07 | | | | 0.03 | (b) | | | 0.92 | |
| | | | | | | | | | | | | | | | | | | | |
Total from Investment Operations | | | 0.83 | | | | (0.17 | ) | | | 1.41 | | | | 0.45 | | | | 1.36 | |
| | | | | | | | | | | | | | | | | | | | |
LESS DISTRIBUTIONS FROM: | | | | | | | | | | | | | | | | | | | | |
Net investment income | | | (0.36 | ) | | | (0.44 | ) | | | (0.40 | ) | | | (0.49 | ) | | | (0.52 | ) |
Net realized capital gains | | | (0.00 | )(c) | | | (0.19 | ) | | | (0.19 | ) | | | — | | | | — | |
| | | | | | | | | | | | | | | | | | | | |
Total Distributions | | | (0.36 | ) | | | (0.63 | ) | | | (0.59 | ) | | | (0.49 | ) | | | (0.52 | ) |
| | | | | | | | | | | | | | | | | | | | |
Net asset value, end of the period | | $ | 13.24 | | | $ | 12.77 | | | $ | 13.57 | | | $ | 12.75 | | | $ | 12.79 | |
| | | | | | | | | | | | | | | | | | | | |
Total return(d) | | | 6.56 | % | | | (1.32 | )% | | | 11.38 | % | | | 3.60 | % | | | 11.64 | % |
RATIOS TO AVERAGE NET ASSETS: | | | | | | | | | | | | | | | | | | | | |
Net assets, end of the period (000’s) | | $ | 678 | | | $ | 1,180 | | | $ | 2,386 | | | $ | 3,092 | | | $ | 4,490 | |
Net expenses | | | 1.55 | %(e) | | | 1.54 | % | | | 1.57 | % | | | 1.62 | % | | | 1.65 | % |
Gross expenses | | | 1.55 | %(e) | | | 1.54 | % | | | 1.57 | % | | | 1.62 | % | | | 1.65 | % |
Net investment income | | | 2.51 | % | | | 2.50 | % | | | 2.61 | % | | | 3.32 | % | | | 3.64 | % |
Portfolio turnover rate | | | 122 | % | | | 107 | % | | | 78 | % | | | 86 | % | | | 87 | % |
| (a) | Per share net investment income has been calculated using the average shares outstanding during the period. |
| (b) | The amount shown for a share outstanding does not correspond with the aggregate realized and unrealized gain (loss) on investments for the period due to the timing of sales and redemptions of fund shares in relation to fluctuating market values of investments of the Fund. |
| (c) | Amount rounds to less than $0.01 per share. |
| (d) | A contingent deferred sales charge for Class B shares is not reflected in total return calculations. |
| (e) | Includes fee/expense recovery of less than 0.01%. |
See accompanying notes to financial statements.
| 74
Financial Highlights (continued)
For a share outstanding throughout each period.
| | | | | | | | | | | | | | | | | | | | |
| | | Core Plus Bond Fund—Class C | |
| | | Year Ended
September 30,
2014 | | | Year Ended
September 30,
2013 | | | Year Ended
September 30,
2012 | | | Year Ended
September 30,
2011 | | | Year Ended
September 30,
2010 | |
Net asset value, beginning of the period | | $ | 12.72 | | | $ | 13.53 | | | $ | 12.71 | | | $ | 12.76 | | | $ | 11.92 | |
| | | | | | | | | | | | | | | | | | | | |
INCOME (LOSS) FROM INVESTMENT OPERATIONS: | | | | | | | | | | | | | | | | | | | | |
Net investment income(a) | | | 0.32 | | | | 0.34 | | | | 0.33 | | | | 0.42 | | | | 0.45 | |
Net realized and unrealized gain (loss) | | | 0.50 | | | | (0.51 | ) | | | 1.08 | | | | 0.02 | (b) | | | 0.91 | |
| | | | | | | | | | | | | | | | | | | | |
Total from Investment Operations | | | 0.82 | | | | (0.17 | ) | | | 1.41 | | | | 0.44 | | | | 1.36 | |
| | | | | | | | | | | | | | | | | | | | |
LESS DISTRIBUTIONS FROM: | | | | | | | | | | | | | | | | | | | | |
Net investment income | | | (0.36 | ) | | | (0.45 | ) | | | (0.40 | ) | | | (0.49 | ) | | | (0.52 | ) |
Net realized capital gains | | | (0.00 | )(c) | | | (0.19 | ) | | | (0.19 | ) | | | — | | | | — | |
| | | | | | | | | | | | | | | | | | | | |
Total Distributions | | | (0.36 | ) | | | (0.64 | ) | | | (0.59 | ) | | | (0.49 | ) | | | (0.52 | ) |
| | | | | | | | | | | | | | | | | | | | |
Net asset value, end of the period | | $ | 13.18 | | | $ | 12.72 | | | $ | 13.53 | | | $ | 12.71 | | | $ | 12.76 | |
| | | | | | | | | | | | | | | | | | | | |
Total return(d) | | | 6.54 | % | | | (1.36 | )% | | | 11.46 | % | | | 3.56 | % | | | 11.71 | % |
RATIOS TO AVERAGE NET ASSETS: | | | | | | | | | | | | | | | | | | | | |
Net assets, end of the period (000’s) | | $ | 256,307 | | | $ | 232,034 | | | $ | 275,346 | | | $ | 137,836 | | | $ | 123,123 | |
Net expenses | | | 1.54 | %(e) | | | 1.54 | % | | | 1.57 | % | | | 1.62 | % | | | 1.65 | % |
Gross expenses | | | 1.54 | %(e) | | | 1.54 | % | | | 1.57 | % | | | 1.62 | % | | | 1.65 | % |
Net investment income | | | 2.46 | % | | | 2.54 | % | | | 2.55 | % | | | 3.32 | % | | | 3.66 | % |
Portfolio turnover rate | | | 122 | % | | | 107 | % | | | 78 | % | | | 86 | % | | | 87 | % |
| (a) | Per share net investment income has been calculated using the average shares outstanding during the period. |
| (b) | The amount shown for a share outstanding does not correspond with the aggregate realized and unrealized gain (loss) on investments for the period due to the timing of sales and redemptions of fund shares in relation to fluctuating market values of investments of the Fund. |
| (c) | Amount rounds to less than $0.01 per share. |
| (d) | A contingent deferred sales charge for Class C shares is not reflected in total return calculations. |
| (e) | Includes fee/expense recovery of less than 0.01%. |
See accompanying notes to financial statements.
75 |
Financial Highlights (continued)
For a share outstanding throughout each period.
| | | | | | | | |
| | | Core Plus Bond Fund—Class N | |
| | | Year Ended
September 30,
2014 | | | Period Ended
September 30,
2013* | |
Net asset value, beginning of the period | | $ | 12.80 | | | $ | 13.43 | |
| | | | | | | | |
INCOME (LOSS) FROM INVESTMENT OPERATIONS: | | | | | | | | |
Net investment income(a) | | | 0.46 | | | | 0.32 | |
Net realized and unrealized gain (loss) | | | 0.52 | | | | (0.59 | ) |
| | | | | | | | |
Total from Investment Operations | | | 0.98 | | | | (0.27 | ) |
| | | | | | | | |
LESS DISTRIBUTIONS FROM: | | | | | | | | |
Net investment income | | | (0.50 | ) | | | (0.36 | ) |
Net realized capital gains | | | (0.00 | )(b) | | | — | |
| | | | | | | | |
Total Distributions | | | (0.50 | ) | | | (0.36 | ) |
| | | | | | | | |
Net asset value, end of the period | | $ | 13.28 | | | $ | 12.80 | |
| | | | | | | | |
Total return | | | 7.81 | % | | | (2.02 | )%(c) |
RATIOS TO AVERAGE NET ASSETS: | | | | | | | | |
Net assets, end of the period (000’s) | | $ | 105,514 | | | $ | 19,247 | |
Net expenses | | | 0.46 | % | | | 0.44 | %(d) |
Gross expenses | | | 0.46 | % | | | 0.44 | %(d) |
Net investment income | | | 3.42 | % | | | 3.81 | %(d) |
Portfolio turnover rate | | | 122 | % | | | 107 | % |
| * | From commencement of Class operations on February 1, 2013 through September 30, 2013. |
| (a) | Per share net investment income has been calculated using the average shares outstanding during the period. |
| (b) | Amount rounds to less than $0.01 per share. |
| (c) | Periods less than one year are not annualized. |
| (d) | Computed on an annualized basis for periods less than one year. |
See accompanying notes to financial statements.
| 76
Financial Highlights (continued)
For a share outstanding throughout each period.
| | | | | | | | | | | | | | | | | | | | |
| | | Core Plus Bond Fund—Class Y | |
| | | Year Ended
September 30,
2014 | | | Year Ended
September 30,
2013 | | | Year Ended
September 30,
2012 | | | Year Ended
September 30,
2011 | | | Year Ended
September 30,
2010 | |
Net asset value, beginning of the period | | $ | 12.80 | | | $ | 13.61 | | | $ | 12.78 | | | $ | 12.82 | | | $ | 11.97 | |
| | | | | | | | | | | | | | | | | | | | |
INCOME (LOSS) FROM INVESTMENT OPERATIONS: | | | | | | | | | | | | | | | | | | | | |
Net investment income(a) | | | 0.45 | | | | 0.47 | | | | 0.46 | | | | 0.55 | | | | 0.57 | |
Net realized and unrealized gain (loss) | | | 0.51 | | | | (0.51 | ) | | | 1.09 | | | | 0.03 | (b) | | | 0.92 | |
| | | | | | | | | | | | | | | | | | | | |
Total from Investment Operations | | | 0.96 | | | | (0.04 | ) | | | 1.55 | | | | 0.58 | | | | 1.49 | |
| | | | | | | | | | | | | | | | | | | | |
LESS DISTRIBUTIONS FROM: | | | | | | | | | | | | | | | | | | | | |
Net investment income | | | (0.49 | ) | | | (0.58 | ) | | | (0.53 | ) | | | (0.62 | ) | | | (0.64 | ) |
Net realized capital gains | | | (0.00 | )(c) | | | (0.19 | ) | | | (0.19 | ) | | | — | | | | — | |
| | | | | | | | | | | | | | | | | | | | |
Total Distributions | | | (0.49 | ) | | | (0.77 | ) | | | (0.72 | ) | | | (0.62 | ) | | | (0.64 | ) |
| | | | | | | | | | | | | | | | | | | | |
Net asset value, end of the period | | $ | 13.27 | | | $ | 12.80 | | | $ | 13.61 | | | $ | 12.78 | | | $ | 12.82 | |
| | | | | | | | | | | | | | | | | | | | |
Total return | | | 7.65 | % | | | (0.35 | )% | | | 12.54 | % | | | 4.65 | % | | | 12.85 | % |
RATIOS TO AVERAGE NET ASSETS: | | | | | | | | | | | | | | | | | | | | |
Net assets, end of the period (000’s) | | $ | 1,310,824 | | | $ | 627,617 | | | $ | 634,946 | | | $ | 143,215 | | | $ | 69,322 | |
Net expenses | | | 0.54 | %(d) | | | 0.54 | % | | | 0.58 | % | | | 0.62 | % | | | 0.65 | % |
Gross expenses | | | 0.54 | %(d) | | | 0.54 | % | | | 0.58 | % | | | 0.62 | % | | | 0.65 | % |
Net investment income | | | 3.42 | % | | | 3.54 | % | | | 3.50 | % | | | 4.31 | % | | | 4.66 | % |
Portfolio turnover rate | | | 122 | % | | | 107 | % | | | 78 | % | | | 86 | % | | | 87 | % |
| (a) | Per share net investment income has been calculated using the average shares outstanding during the period. |
| (b) | The amount shown for a share outstanding does not correspond with the aggregate realized and unrealized gain (loss) on investments for the period due to the timing of sales and redemptions of fund shares in relation to fluctuating market values of investments of the Fund. |
| (c) | Amount rounds to less than $0.01 per share. |
| (d) | Includes fee/expense recovery of less than 0.01%. |
See accompanying notes to financial statements.
77 |
Financial Highlights (continued)
For a share outstanding throughout each period.
| | | | | | | | | | | | | | | | | | | | |
| | | High Income Fund—Class A | |
| | | Year Ended
September 30,
2014 | | | Year Ended
September 30,
2013 | | | Year Ended
September 30,
2012 | | | Year Ended
September 30,
2011 | | | Year Ended
September 30,
2010 | |
Net asset value, beginning of the period | | $ | 4.59 | | | $ | 4.60 | | | $ | 4.46 | | | $ | 4.91 | | | $ | 4.49 | |
| | | | | | | | | | | | | | | | | | | | |
INCOME (LOSS) FROM INVESTMENT OPERATIONS: | | | | | | | | | | | | | | | | | | | | |
Net investment income(a) | | | 0.21 | | | | 0.24 | | | | 0.24 | | | | 0.28 | | | | 0.32 | |
Net realized and unrealized gain (loss) | | | 0.17 | | | | 0.03 | | | | 0.59 | | | | (0.42 | ) | | | 0.42 | |
| | | | | | | | | | | | | | | | | | | | |
Total from Investment Operations | | | 0.38 | | | | 0.27 | | | | 0.83 | | | | (0.14 | ) | | | 0.74 | |
| | | | | | | | | | | | | | | | | | | | |
LESS DISTRIBUTIONS FROM: | | | | | | | | | | | | | | | | | | | | |
Net investment income | | | (0.22 | ) | | | (0.27 | ) | | | (0.30 | ) | | | (0.31 | ) | | | (0.32 | ) |
Net realized capital gains | | | (0.26 | ) | | | (0.01 | ) | | | (0.39 | ) | | | — | | | | — | |
| | | | | | | | | | | | | | | | | | | | |
Total Distributions | | | (0.48 | ) | | | (0.28 | ) | | | (0.69 | ) | | | (0.31 | ) | | | (0.32 | ) |
| | | | | | | | | | | | | | | | | | | | |
Net asset value, end of the period | | $ | 4.49 | | | $ | 4.59 | | | $ | 4.60 | | | $ | 4.46 | | | $ | 4.91 | |
| | | | | | | | | | | | | | | | | | | | |
Total return(c) | | | 8.42 | % | | | 6.27 | % | | | 20.90 | %(b) | | | (3.30 | )% | | | 17.05 | %(b) |
RATIOS TO AVERAGE NET ASSETS: | | | | | | | | | | | | | | | | | | | | |
Net assets, end of the period (000’s) | | $ | 42,630 | | | $ | 45,791 | | | $ | 95,876 | | | $ | 59,907 | | | $ | 68,011 | |
Net expenses | | | 1.14 | % | | | 1.15 | %(e) | | | 1.15 | %(d) | | | 1.15 | %(f) | | | 1.15 | %(d) |
Gross expenses | | | 1.14 | % | | | 1.15 | %(e) | | | 1.19 | % | | | 1.15 | %(f) | | | 1.20 | % |
Net investment income | | | 4.57 | % | | | 5.11 | % | | | 5.50 | % | | | 5.60 | % | | | 6.72 | % |
Portfolio turnover rate | | | 59 | % | | | 47 | % | | | 34 | % | | | 67 | % | | | 56 | % |
| (a) | Per share net investment income has been calculated using the average shares outstanding during the period. |
| (b) | Had certain expenses not been waived/reimbursed during the period, total returns would have been lower. |
| (c) | A sales charge for Class A shares is not reflected in total return calculations. |
| (d) | The investment adviser agreed to waive its fees and/or reimburse a portion of the Fund’s expenses during the period. Without this waiver/reimbursement, expenses would have been higher. |
| (e) | Includes fee/expense recovery of 0.02%. |
| (f) | Includes fee/expense recovery of 0.01%. |
See accompanying notes to financial statements.
| 78
Financial Highlights (continued)
For a share outstanding throughout each period.
| | | | | | | | | | | | | | | | | | | | |
| | | High Income Fund—Class B | |
| | | Year Ended
September 30,
2014 | | | Year Ended
September 30,
2013 | | | Year Ended
September 30,
2012 | | | Year Ended
September 30,
2011 | | | Year Ended
September 30,
2010 | |
Net asset value, beginning of the period | | $ | 4.61 | | | $ | 4.61 | | | $ | 4.47 | | | $ | 4.92 | | | $ | 4.50 | |
| | | | | | | | | | | | | | | | | | | | |
INCOME (LOSS) FROM INVESTMENT OPERATIONS: | | | | | | | | | | | | | | | | | | | | |
Net investment income(a) | | | 0.18 | | | | 0.21 | | | | 0.21 | | | | 0.25 | | | | 0.28 | |
Net realized and unrealized gain (loss) | | | 0.16 | | | | 0.03 | | | | 0.58 | | | | (0.43 | ) | | | 0.42 | |
| | | | | | | | | | | | | | | | | | | | |
Total from Investment Operations | | | 0.34 | | | | 0.24 | | | | 0.79 | | | | (0.18 | ) | | | 0.70 | |
| | | | | | | | | | | | | | | | | | | | |
LESS DISTRIBUTIONS FROM: | | | | | | | | | | | | | | | | | | | | |
Net investment income | | | (0.18 | ) | | | (0.23 | ) | | | (0.26 | ) | | | (0.27 | ) | | | (0.28 | ) |
Net realized capital gains | | | (0.26 | ) | | | (0.01 | ) | | | (0.39 | ) | | | — | | | | — | |
| | | | | | | | | | | | | | | | | | | | |
Total Distributions | | | (0.44 | ) | | | (0.24 | ) | | | (0.65 | ) | | | (0.27 | ) | | | (0.28 | ) |
| | | | | | | | | | | | | | | | | | | | |
Net asset value, end of the period | | $ | 4.51 | | | $ | 4.61 | | | $ | 4.61 | | | $ | 4.47 | | | $ | 4.92 | |
| | | | | | | | | | | | | | | | | | | | |
Total return(c) | | | 7.51 | % | | | 5.66 | % | | | 19.93 | %(b) | | | (4.04 | )% | | | 16.13 | %(b) |
RATIOS TO AVERAGE NET ASSETS: | | | | | | | | | | | | | | | | | | | | |
Net assets, end of the period (000’s) | | $ | 122 | | | $ | 385 | | | $ | 560 | | | $ | 738 | | | $ | 1,209 | |
Net expenses | | | 1.90 | % | | | 1.90 | %(e) | | | 1.90 | %(d) | | | 1.90 | %(e) | | | 1.90 | %(d) |
Gross expenses | | | 1.90 | % | | | 1.90 | %(e) | | | 1.94 | % | | | 1.90 | %(e) | | | 1.94 | % |
Net investment income | | | 3.88 | % | | | 4.37 | % | | | 4.79 | % | | | 4.90 | % | | | 6.00 | % |
Portfolio turnover rate | | | 59 | % | | | 47 | % | | | 34 | % | | | 67 | % | | | 56 | % |
| (a) | Per share net investment income has been calculated using the average shares outstanding during the period. |
| (b) | Had certain expenses not been waived/reimbursed during the period, total returns would have been lower. |
| (c) | A contingent deferred sales charge for Class B shares is not reflected in total return calculations. |
| (d) | The investment adviser agreed to waive its fees and/or reimburse a portion of the Fund’s expenses during the period. Without this waiver/reimbursement, expenses would have been higher. |
| (e) | Includes fee/expense recovery of 0.01%. |
See accompanying notes to financial statements.
79 |
Financial Highlights (continued)
For a share outstanding throughout each period.
| | | | | | | | | | | | | | | | | | | | |
| | | High Income Fund—Class C | |
| | | Year Ended
September 30,
2014 | | | Year Ended
September 30,
2013 | | | Year Ended
September 30,
2012 | | | Year Ended
September 30,
2011 | | | Year Ended
September 30,
2010 | |
Net asset value, beginning of the period | | $ | 4.61 | | | $ | 4.61 | | | $ | 4.47 | | | $ | 4.92 | | | $ | 4.50 | |
| | | | | | | | | | | | | | | | | | | | |
INCOME (LOSS) FROM INVESTMENT OPERATIONS: | | | | | | | | | | | | | | | | | | | | |
Net investment income(a) | | | 0.18 | | | | 0.21 | | | | 0.21 | | | | 0.25 | | | | 0.28 | |
Net realized and unrealized gain (loss) | | | 0.16 | | | | 0.04 | | | | 0.59 | | | | (0.43 | ) | | | 0.43 | |
| | | | | | | | | | | | | | | | | | | | |
Total from Investment Operations | | | 0.34 | | | | 0.25 | | | | 0.80 | | | | (0.18 | ) | | | 0.71 | |
| | | | | | | | | | | | | | | | | | | | |
LESS DISTRIBUTIONS FROM: | | | | | | | | | | | | | | | | | | | | |
Net investment income | | | (0.19 | ) | | | (0.24 | ) | | | (0.27 | ) | | | (0.27 | ) | | | (0.29 | ) |
Net realized capital gains | | | (0.26 | ) | | | (0.01 | ) | | | (0.39 | ) | | | — | | | | — | |
| | | | | | | | | | | | | | | | | | | | |
Total Distributions | | | (0.45 | ) | | | (0.25 | ) | | | (0.66 | ) | | | (0.27 | ) | | | (0.29 | ) |
| | | | | | | | | | | | | | | | | | | | |
Net asset value, end of the period | | $ | 4.50 | | | $ | 4.61 | | | $ | 4.61 | | | $ | 4.47 | | | $ | 4.92 | |
| | | | | | | | | | | | | | | | | | | | |
Total return(c) | | | 7.60 | % | | | 5.46 | % | | | 19.96 | %(b) | | | (4.02 | )% | | | 16.15 | %(b) |
RATIOS TO AVERAGE NET ASSETS: | | | | | | | | | | | | | | | | | | | | |
Net assets, end of the period (000’s) | | $ | 14,555 | | | $ | 15,233 | | | $ | 16,863 | | | $ | 15,790 | | | $ | 19,312 | |
Net expenses | | | 1.89 | % | | | 1.90 | %(e) | | | 1.90 | %(d) | | | 1.90 | %(e) | | | 1.90 | %(d) |
Gross expenses | | | 1.89 | % | | | 1.90 | %(e) | | | 1.94 | % | | | 1.90 | %(e) | | | 1.95 | % |
Net investment income | | | 3.84 | % | | | 4.36 | % | | | 4.78 | % | | | 4.89 | % | | | 5.97 | % |
Portfolio turnover rate | | | 59 | % | | | 47 | % | | | 34 | % | | | 67 | % | | | 56 | % |
| (a) | Per share net investment income has been calculated using the average shares outstanding during the period. |
| (b) | Had certain expenses not been waived/reimbursed during the period, total returns would have been lower. |
| (c) | A contingent deferred sales charge for Class C shares is not reflected in total return calculations. |
| (d) | The investment adviser agreed to waive its fees and/or reimburse a portion of the Fund’s expenses during the period. Without this waiver/reimbursement, expenses would have been higher. |
| (e) | Includes fee/expense recovery of 0.01%. |
See accompanying notes to financial statements.
| 80
Financial Highlights (continued)
For a share outstanding throughout each period.
| | | | | | | | | | | | | | | | | | | | |
| | | High Income Fund—Class Y | |
| | | Year Ended
September 30,
2014 | | | Year Ended
September 30,
2013 | | | Year Ended
September 30,
2012 | | | Year Ended
September 30,
2011 | | | Year Ended
September 30,
2010 | |
Net asset value, beginning of the period | | $ | 4.59 | | | $ | 4.59 | | | $ | 4.46 | | | $ | 4.90 | | | $ | 4.49 | |
| | | | | | | | | | | | | | | | | | | | |
INCOME (LOSS) FROM INVESTMENT OPERATIONS: | | | | | | | | | | | | | | | | | | | | |
Net investment income(a) | | | 0.22 | | | | 0.25 | | | | 0.26 | | | | 0.29 | | | | 0.33 | |
Net realized and unrealized gain (loss) | | | 0.16 | | | | 0.04 | | | | 0.57 | | | | (0.41 | ) | | | 0.41 | |
| | | | | | | | | | | | | | | | | | | | |
Total from Investment Operations | | | 0.38 | | | | 0.29 | | | | 0.83 | | | | (0.12 | ) | | | 0.74 | |
| | | | | | | | | | | | | | | | | | | | |
LESS DISTRIBUTIONS FROM: | | | | | | | | | | | | | | | | | | | | |
Net investment income | | | (0.23 | ) | | | (0.28 | ) | | | (0.31 | ) | | | (0.32 | ) | | | (0.33 | ) |
Net realized capital gains | | | (0.26 | ) | | | (0.01 | ) | | | (0.39 | ) | | | — | | | | — | |
| | | | | | | | | | | | | | | | | | | | |
Total Distributions | | | (0.49 | ) | | | (0.29 | ) | | | (0.70 | ) | | | (0.32 | ) | | | (0.33 | ) |
| | | | | | | | | | | | | | | | | | | | |
Net asset value, end of the period | | $ | 4.48 | | | $ | 4.59 | | | $ | 4.59 | | | $ | 4.46 | | | $ | 4.90 | |
| | | | | | | | | | | | | | | | | | | | |
Total return | | | 8.72 | % | | | 6.56 | % | | | 20.93 | %(b) | | | (2.86 | )% | | | 17.11 | %(b) |
RATIOS TO AVERAGE NET ASSETS: | | | | | | | | | | | | | | | | | | | | |
Net assets, end of the period (000’s) | | $ | 125,185 | | | $ | 108,170 | | | $ | 110,917 | | | $ | 38,011 | | | $ | 69,887 | |
Net expenses | | | 0.89 | % | | | 0.90 | %(d) | | | 0.90 | %(c) | | | 0.90 | %(d) | | | 0.90 | %(c) |
Gross expenses | | | 0.89 | % | | | 0.90 | %(d) | | | 0.95 | % | | | 0.90 | %(d) | | | 0.93 | % |
Net investment income | | | 4.83 | % | | | 5.37 | % | | | 5.78 | % | | | 5.86 | % | | | 7.02 | % |
Portfolio turnover rate | | | 59 | % | | | 47 | % | | | 34 | % | | | 67 | % | | | 56 | % |
| (a) | Per share net investment income has been calculated using the average shares outstanding during the period. |
| (b) | Had certain expenses not been waived/reimbursed during the period, total returns would have been lower. |
| (c) | The investment adviser agreed to waive its fees and/or reimburse a portion of the Fund’s expenses during the period. Without this waiver/reimbursement, expenses would have been higher. |
| (d) | Includes fee/expense recovery of 0.01%. |
See accompanying notes to financial statements.
81 |
Financial Highlights (continued)
For a share outstanding throughout each period.
| | | | | | | | | | | | | | | | | | | | |
| | | International Bond Fund—Class A | |
| | | Year Ended
September 30,
2014 | | | Year Ended
September 30,
2013 | | | Year Ended
September 30,
2012 | | | Year Ended
September 30,
2011 | | | Year Ended
September 30,
2010 | |
Net asset value, beginning of the period | | $ | 9.81 | | | $ | 10.44 | | | $ | 10.94 | | | $ | 11.17 | | | $ | 10.84 | |
| | | | | | | | | | | | | | | | | | | | |
INCOME (LOSS) FROM INVESTMENT OPERATIONS: | | | | | | | | | | | | | | | | | | | | |
Net investment income(a) | | | 0.12 | | | | 0.14 | | | | 0.19 | | | | 0.25 | | | | 0.22 | |
Net realized and unrealized gain (loss) | | | (0.25 | ) | | | (0.41 | ) | | | 0.62 | | | | 0.06 | (b) | | | 0.48 | |
| | | | | | | | | | | | | | | | | | | | |
Total from Investment Operations | | | (0.13 | ) | | | (0.27 | ) | | | 0.81 | | | | 0.31 | | | | 0.70 | |
| | | | | | | | | | | | | | | | | | | | |
LESS DISTRIBUTIONS FROM: | | | | | | | | | | | | | | | | | | | | |
Net investment income | | | (0.07 | ) | | | (0.18 | ) | | | (0.94 | ) | | | (0.40 | ) | | | (0.29 | ) |
Net realized capital gains | | | (0.29 | ) | | | (0.18 | ) | | | (0.37 | ) | | | (0.14 | ) | | | (0.08 | ) |
| | | | | | | | | | | | | | | | | | | | |
Total Distributions | | | (0.36 | ) | | | (0.36 | ) | | | (1.31 | ) | | | (0.54 | ) | | | (0.37 | ) |
| | | | | | | | | | | | | | | | | | | | |
Net asset value, end of the period | | $ | 9.32 | | | $ | 9.81 | | | $ | 10.44 | | | $ | 10.94 | | | $ | 11.17 | |
| | | | | | | | | | | | | | | | | | | | |
Total return(c)(d) | | | (1.29 | )% | | | (2.62 | )% | | | 8.42 | % | | | 2.70 | % | | | 6.66 | % |
RATIOS TO AVERAGE NET ASSETS: | | | | | | | | | | | | | | | | | | | | |
Net assets, end of the period (000’s) | | $ | 3,292 | | | $ | 8,983 | | | $ | 11,898 | | | $ | 10,927 | | | $ | 18,758 | |
Net expenses(e) | | | 1.06 | %(f) | | | 1.05 | % | | | 1.09 | %(g)(h) | | | 1.10 | % | | | 1.10 | % |
Gross expenses | | | 2.46 | % | | | 1.93 | % | | | 1.85 | % | | | 1.64 | % | | | 1.49 | % |
Net investment income | | | 1.24 | % | | | 1.39 | % | | | 1.83 | % | | | 2.26 | % | | | 2.14 | % |
Portfolio turnover rate | | | 51 | %(i) | | | 107 | % | | | 169 | % | | | 136 | % | | | 128 | % |
| (a) | Per share net investment income has been calculated using the average shares outstanding during the period. |
| (b) | The amount shown for a share outstanding does not correspond with the aggregate realized and unrealized gain (loss) on investments for the period due to the timing of sales and redemptions of fund shares in relation to fluctuating market values of investments of the Fund. |
| (c) | Had certain expenses not been waived/reimbursed during the period, total returns would have been lower. |
| (d) | A sales charge for Class A shares is not reflected in total return calculations. |
| (e) | The investment adviser agreed to waive its fees and/or reimburse a portion of the Fund’s expenses during the period. Without this waiver/reimbursement, expenses would have been higher. |
| (f) | Includes interest expense from bank overdraft charges of 0.01%. Without this expense the ratio of net expenses would have been 1.05%. |
| (g) | Includes interest expense from bank overdraft charges of less than 0.01%. |
| (h) | Effective July 1, 2012, the expense limit decreased from 1.10% to 1.05%. |
| (i) | The variation in the Fund’s turnover rate from 2013 to 2014 was primarily due to a decrease in trade activity due to a reduction in the level of Fund assets. |
See accompanying notes to financial statements.
| 82
Financial Highlights (continued)
For a share outstanding throughout each period.
| | | | | | | | | | | | | | | | | | | | |
| | | International Bond Fund—Class C | |
| | | Year Ended
September 30,
2014 | | | Year Ended
September 30,
2013 | | | Year Ended
September 30,
2012 | | | Year Ended
September 30,
2011 | | | Year Ended
September 30,
2010 | |
Net asset value, beginning of the period | | $ | 9.73 | | | $ | 10.37 | | | $ | 10.87 | | | $ | 11.11 | | | $ | 10.82 | |
| | | | | | | | | | | | | | | | | | | | |
INCOME (LOSS) FROM INVESTMENT OPERATIONS: | | | | | | | | | | | | | | | | | | | | |
Net investment
income(a) | | | 0.05 | | | | 0.06 | | | | 0.12 | | | | 0.17 | | | | 0.15 | |
Net realized and unrealized gain (loss) | | | (0.25 | ) | | | (0.39 | ) | | | 0.61 | | | | 0.05 | (b) | | | 0.46 | |
| | | | | | | | | | | | | | | | | | | | |
Total from Investment Operations | | | (0.20 | ) | | | (0.33 | ) | | | 0.73 | | | | 0.22 | | | | 0.61 | |
| | | | | | | | | | | | | | | | | | | | |
LESS DISTRIBUTIONS FROM: | | | | | | | | | | | | | | | | | | | | |
Net investment income | | | (0.07 | ) | | | (0.13 | ) | | | (0.86 | ) | | | (0.32 | ) | | | (0.24 | ) |
Net realized capital gains | | | (0.29 | ) | | | (0.18 | ) | | | (0.37 | ) | | | (0.14 | ) | | | (0.08 | ) |
| | | | | | | | | | | | | | | | | | | | |
Total Distributions | | | (0.36 | ) | | | (0.31 | ) | | | (1.23 | ) | | | (0.46 | ) | | | (0.32 | ) |
| | | | | | | | | | | | | | | | | | | | |
Net asset value, end of the period | | $ | 9.17 | | | $ | 9.73 | | | $ | 10.37 | | | $ | 10.87 | | | $ | 11.11 | |
| | | | | | | | | | | | | | | | | | | | |
Total return(c)(d) | | | (2.11 | )% | | | (3.27 | )% | | | 7.64 | % | | | 1.87 | % | | | 5.86 | % |
RATIOS TO AVERAGE NET ASSETS: | | | | | | | | | | | | | | | | | | | | |
Net assets, end of the period (000’s) | | $ | 2,285 | | | $ | 3,328 | | | $ | 4,355 | | | $ | 7,503 | | | $ | 6,145 | |
Net expenses(e) | | | 1.81 | %(f) | | | 1.80 | % | | | 1.84 | %(g)(h) | | | 1.85 | % | | | 1.85 | % |
Gross expenses | | | 3.26 | % | | | 2.68 | % | | | 2.61 | % | | | 2.40 | % | | | 2.24 | % |
Net investment
income | | | 0.50 | % | | | 0.65 | % | | | 1.13 | % | | | 1.52 | % | | | 1.40 | % |
Portfolio turnover rate | | | 51 | %(i) | | | 107 | % | | | 169 | % | | | 136 | % | | | 128 | % |
| (a) | Per share net investment income has been calculated using the average shares outstanding during the period. |
| (b) | The amount shown for a share outstanding does not correspond with the aggregate realized and unrealized gain (loss) on investments for the period due to the timing of sales and redemptions of fund shares in relation to fluctuating market values of investments of the Fund. |
| (c) | Had certain expenses not been waived/reimbursed during the period, total returns would have been lower. |
| (d) | A contingent deferred sales charge for Class C shares is not reflected in total return calculations. |
| (e) | The investment adviser agreed to waive its fees and/or reimburse a portion of the Fund’s expenses during the period. Without this waiver/reimbursement, expenses would have been higher. |
| (f) | Includes interest expense from bank overdraft charges of 0.01%. Without this expense the ratio of net expenses would have been 1.80%. |
| (g) | Includes interest expense from bank overdraft charges of less than 0.01%. |
| (h) | Effective July 1, 2012, the expense limit decreased from 1.85% to 1.80%. |
| (i) | The variation in the Fund’s turnover rate from 2013 to 2014 was primarily due to a decrease in trade activity due to a reduction in the level of Fund assets. |
See accompanying notes to financial statements.
83 |
Financial Highlights (continued)
For a share outstanding throughout each period.
| | | | | | | | | | | | | | | | | | | | |
| | | International Bond Fund—Class Y | |
| | | Year Ended
September 30,
2014 | | | Year Ended
September 30,
2013 | | | Year Ended
September 30,
2012 | | | Year Ended
September 30,
2011 | | | Year Ended
September 30,
2010 | |
Net asset value, beginning of the period | | $ | 9.82 | | | $ | 10.44 | | | $ | 10.93 | | | $ | 11.16 | | | $ | 10.82 | |
| | | | | | | | | | | | | | | | | | | | |
INCOME (LOSS) FROM INVESTMENT OPERATIONS: | | | | | | | | | | | | | | | | | | | | |
Net investment
income(a) | | | 0.15 | | | | 0.16 | | | | 0.21 | | | | 0.28 | | | | 0.25 | |
Net realized and unrealized gain (loss) | | | (0.25 | ) | | | (0.40 | ) | | | 0.63 | | | | 0.06 | (b) | | | 0.47 | |
| | | | | | | | | | | | | | | | | | | | |
Total from Investment Operations | | | (0.10 | ) | | | (0.24 | ) | | | 0.84 | | | | 0.34 | | | | 0.72 | |
| | | | | | | | | | | | | | | | | | | | |
LESS DISTRIBUTIONS FROM: | | | | | | | | | | | | | | | | | | | | |
Net investment income | | | (0.08 | ) | | | (0.20 | ) | | | (0.96 | ) | | | (0.43 | ) | | | (0.30 | ) |
Net realized capital gains | | | (0.29 | ) | | | (0.18 | ) | | | (0.37 | ) | | | (0.14 | ) | | | (0.08 | ) |
| | | | | | | | | | | | | | | | | | | | |
Total Distributions | | | (0.37 | ) | | | (0.38 | ) | | | (1.33 | ) | | | (0.57 | ) | | | (0.38 | ) |
| | | | | | | | | | | | | | | | | | | | |
Net asset value, end of the period | | $ | 9.35 | | | $ | 9.82 | | | $ | 10.44 | | | $ | 10.93 | | | $ | 11.16 | |
| | | | | | | | | | | | | | | | | | | | |
Total return(c) | | | (1.05 | )% | | | (2.34 | )% | | | 8.68 | % | | | 3.06 | % | | | 6.92 | % |
RATIOS TO AVERAGE NET ASSETS: | | | | | | | | | | | | | | | | | | | | |
Net assets, end of the period (000’s) | | $ | 3,203 | | | $ | 2,601 | | | $ | 3,264 | | | $ | 5,852 | | | $ | 8,908 | |
Net expenses(d) | | | 0.81 | %(e) | | | 0.80 | % | | | 0.85 | %(f)(g) | | | 0.85 | % | | | 0.85 | % |
Gross expenses | | | 2.33 | % | | | 1.68 | % | | | 1.60 | % | | | 1.36 | % | | | 1.23 | % |
Net investment
income | | | 1.52 | % | | | 1.64 | % | | | 2.05 | % | | | 2.47 | % | | | 2.41 | % |
Portfolio turnover rate | | | 51 | %(h) | | | 107 | % | | | 169 | % | | | 136 | % | | | 128 | % |
| (a) | Per share net investment income has been calculated using the average shares outstanding during the period. |
| (b) | The amount shown for a share outstanding does not correspond with the aggregate realized and unrealized gain (loss) on investments for the period due to the timing of sales and redemptions of fund shares in relation to fluctuating market values of investments of the Fund. |
| (c) | Had certain expenses not been waived/reimbursed during the period, total returns would have been lower. |
| (d) | The investment adviser agreed to waive its fees and/or reimburse a portion of the Fund’s expenses during the period, if applicable. Without this waiver/reimbursement, expenses would have been higher. |
| (e) | Includes interest expense from bank overdraft charges of 0.01%. Without this expense the ratio of net expenses would have been 0.80%. |
| (f) | Includes interest expense from bank overdraft charges of less than 0.01%. Without this expense the ratio of net expenses would have been 0.84%. |
| (g) | Effective July 1, 2012, the expense limit decreased from 0.85% to 0.80%. |
| (h) | The variation in the Fund’s turnover rate from 2013 to 2014 was primarily due to a decrease in trade activity due to a reduction in the level of Fund assets. |
See accompanying notes to financial statements.
| 84
Financial Highlights (continued)
For a share outstanding throughout each period.
| | | | | | | | | | | | | | | | | | | | |
| | | Limited Term Government and Agency Fund—Class A | |
| | | Year Ended
September 30,
2014 | | | Year Ended
September 30,
2013 | | | Year Ended
September 30,
2012 | | | Year Ended
September 30,
2011 | | | Year Ended
September 30,
2010 | |
Net asset value, beginning of the period | | $ | 11.68 | | | $ | 12.04 | | | $ | 11.87 | | | $ | 12.02 | | | $ | 11.60 | |
| | | | | | | | | | | | | | | | | | | | |
INCOME (LOSS) FROM INVESTMENT OPERATIONS: | | | | | | | | | | | | | | | | | | | | |
Net investment income(a) | | | 0.16 | | | | 0.13 | | | | 0.18 | | | | 0.17 | | | | 0.20 | |
Net realized and unrealized gain (loss) | | | 0.01 | | | | (0.23 | ) | | | 0.28 | | | | 0.03 | | | | 0.49 | |
| | | | | | | | | | | | | | | | | | | | |
Total from Investment Operations | | | 0.17 | | | | (0.10 | ) | | | 0.46 | | | | 0.20 | | | | 0.69 | |
| | | | | | | | | | | | | | | | | | | | |
LESS DISTRIBUTIONS FROM: | | | | | | | | | | | | | | | | | | | | |
Net investment income | | | (0.24 | ) | | | (0.26 | ) | | | (0.29 | ) | | | (0.26 | ) | | | (0.27 | ) |
Net realized capital gains | | | — | | | | (0.00 | )(b) | | | (0.00 | )(b) | | | (0.09 | ) | | | — | |
Paid-in capital | | | — | | | | (0.00 | )(b) | | | — | | | | — | | | | — | |
| | | | | | | | | | | | | | | | | | | | |
Total Distributions | | | (0.24 | ) | | | (0.26 | ) | | | (0.29 | ) | | | (0.35 | ) | | | (0.27 | ) |
| | | | | | | | | | | | | | | | | | | | |
Net asset value, end of the period | | $ | 11.61 | | | $ | 11.68 | | | $ | 12.04 | | | $ | 11.87 | | | $ | 12.02 | |
| | | | | | | | | | | | | | | | | | | | |
Total return(d) | | | 1.44 | % | | | (0.81 | )% | | | 3.94 | %(c) | | | 1.71 | %(c) | | | 6.03 | %(c) |
RATIOS TO AVERAGE NET ASSETS: | | | | | | | | | | | | | | | | | | | | |
Net assets, end of the period (000’s) | | $ | 314,360 | | | $ | 355,212 | | | $ | 357,870 | | | $ | 293,675 | | | $ | 164,265 | |
Net expenses | | | 0.80 | %(f) | | | 0.87 | %(g) | | | 0.85 | %(e) | | | 0.85 | %(e) | | | 0.89 | %(e) |
Gross expenses | | | 0.80 | %(f) | | | 0.87 | %(g) | | | 0.90 | % | | | 0.92 | % | | | 0.97 | % |
Net investment income | | | 1.35 | % | | | 1.11 | % | | | 1.54 | % | | | 1.44 | % | | | 1.73 | % |
Portfolio turnover rate | | | 24 | % | | | 39 | % | | | 56 | % | | | 66 | % | | | 89 | % |
| (a) | Per share net investment income has been calculated using the average shares outstanding during the period. |
| (b) | Amount rounds to less than $0.01 per share. |
| (c) | Had certain expenses not been waived/reimbursed during the period, total returns would have been lower. |
| (d) | A sales charge for Class A shares is not reflected in total return calculations. |
| (e) | The investment adviser agreed to waive its fees and/or reimburse a portion of the Fund’s expenses during the period. Without this waiver/reimbursement, expenses would have been higher. |
| (f) | Includes fee/expense recovery of less than 0.01%. |
| (g) | Includes corporate tax expenses of 0.03%. Without this expense the ratio of net expenses would have been 0.84%. |
See accompanying notes to financial statements.
85 |
Financial Highlights (continued)
For a share outstanding throughout each period.
| | | | | | | | | | | | | | | | | | | | |
| | | Limited Term Government and Agency Fund—Class B | |
| | | Year Ended
September 30,
2014 | | | Year Ended
September 30,
2013 | | | Year Ended
September 30,
2012 | | | Year Ended
September 30,
2011 | | | Year Ended
September 30,
2010 | |
Net asset value, beginning of the period | | $ | 11.67 | | | $ | 12.03 | | | $ | 11.86 | | | $ | 12.00 | | | $ | 11.59 | |
| | | | | | | | | | | | | | | | | | | | |
INCOME (LOSS) FROM INVESTMENT OPERATIONS: | | | | | | | | | | | | | | | | | | | | |
Net investment income(a) | | | 0.07 | | | | 0.04 | | | | 0.10 | | | | 0.09 | | | | 0.12 | |
Net realized and unrealized gain (loss) | | | 0.01 | | | | (0.23 | ) | | | 0.27 | | | | 0.03 | | | | 0.47 | |
| | | | | | | | | | | | | | | | | | | | |
Total from Investment Operations | | | 0.08 | | | | (0.19 | ) | | | 0.37 | | | | 0.12 | | | | 0.59 | |
| | | | | | | | | | | | | | | | | | | | |
LESS DISTRIBUTIONS FROM: | | | | | | | | | | | | | | | | | | | | |
Net investment income | | | (0.15 | ) | | | (0.17 | ) | | | (0.20 | ) | | | (0.17 | ) | | | (0.18 | ) |
Net realized capital
gains | | | — | | | | (0.00 | )(b) | | | (0.00 | )(b) | | | (0.09 | ) | | | — | |
Paid-in capital | | | — | | | | (0.00 | )(b) | | | — | | | | — | | | | — | |
| | | | | | | | | | | | | | | | | | | | |
Total Distributions | | | (0.15 | ) | | | (0.17 | ) | | | (0.20 | ) | | | (0.26 | ) | | | (0.18 | ) |
| | | | | | | | | | | | | | | | | | | | |
Net asset value, end of the period | | $ | 11.60 | | | $ | 11.67 | | | $ | 12.03 | | | $ | 11.86 | | | $ | 12.00 | |
| | | | | | | | | | | | | | | | | | | | |
Total return(d) | | | 0.69 | % | | | (1.56 | )% | | | 3.17 | %(c) | | | 1.04 | %(c) | | | 5.16 | %(c) |
RATIOS TO AVERAGE NET ASSETS: | | | | | | | | | | | | | | | | | | | | |
Net assets, end of the period (000’s) | | $ | 4,203 | | | $ | 5,930 | | | $ | 8,370 | | | $ | 10,976 | | | $ | 4,049 | |
Net expenses | | | 1.55 | %(f) | | | 1.62 | %(g) | | | 1.60 | %(e) | | | 1.60 | %(e) | | | 1.64 | %(e) |
Gross expenses | | | 1.55 | %(f) | | | 1.62 | %(g) | | | 1.65 | % | | | 1.68 | % | | | 1.72 | % |
Net investment income | | | 0.61 | % | | | 0.34 | % | | | 0.81 | % | | | 0.72 | % | | | 1.00 | % |
Portfolio turnover rate | | | 24 | % | | | 39 | % | | | 56 | % | | | 66 | % | | | 89 | % |
| (a) | Per share net investment income has been calculated using the average shares outstanding during the period. |
| (b) | Amount rounds to less than $0.01 per share. |
| (c) | Had certain expenses not been waived/reimbursed during the period, total returns would have been lower. |
| (d) | A contingent deferred sales charge for Class B shares is not reflected in total return calculations. |
| (e) | The investment adviser agreed to waive its fees and/or reimburse a portion of the Fund’s expenses during the period. Without this waiver/reimbursement, expenses would have been higher. |
| (f) | Includes fee/expense recovery of less than 0.01%. |
| (g) | Includes corporate tax expenses of 0.03%. Without this expense the ratio of net expenses would have been 1.59%. |
See accompanying notes to financial statements.
| 86
Financial Highlights (continued)
For a share outstanding throughout each period.
| | | | | | | | | | | | | | | | | | | | |
| | | Limited Term Government and Agency Fund—Class C | |
| | | Year Ended
September 30,
2014 | | | Year Ended
September 30,
2013 | | | Year Ended
September 30,
2012 | | | Year Ended
September 30,
2011 | | | Year Ended
September 30,
2010 | |
Net asset value, beginning of the period | | $ | 11.69 | | | $ | 12.05 | | | $ | 11.88 | | | $ | 12.03 | | | $ | 11.61 | |
| | | | | | | | | | | | | | | | | | | | |
INCOME (LOSS) FROM INVESTMENT OPERATIONS: | | | | | | | | | | | | | | | | | | | | |
Net investment income(a) | | | 0.07 | | | | 0.04 | | | | 0.10 | | | | 0.08 | | | | 0.12 | |
Net realized and unrealized gain (loss) | | | 0.01 | | | | (0.23 | ) | | | 0.27 | | | | 0.03 | | | | 0.48 | |
| | | | | | | | | | | | | | | | | | | | |
Total from Investment Operations | | | 0.08 | | | | (0.19 | ) | | | 0.37 | | | | 0.11 | | | | 0.60 | |
| | | | | | | | | | | | | | | | | | | | |
LESS DISTRIBUTIONS FROM: | | | | | | | | | | | | | | | | | | | | |
Net investment income | | | (0.15 | ) | | | (0.17 | ) | | | (0.20 | ) | | | (0.17 | ) | | | (0.18 | ) |
Net realized capital gains | | | — | | | | (0.00 | )(b) | | | (0.00 | )(b) | | | (0.09 | ) | | | — | |
Paid-in capital | | | — | | | | (0.00 | )(b) | | | — | | | | — | | | | — | |
| | | | | | | | | | | | | | | | | | | | |
Total Distributions | | | (0.15 | ) | | | (0.17 | ) | | | (0.20 | ) | | | (0.26 | ) | | | (0.18 | ) |
| | | | | | | | | | | | | | | | | | | | |
Net asset value, end of the period | | $ | 11.62 | | | $ | 11.69 | | | $ | 12.05 | | | $ | 11.88 | | | $ | 12.03 | |
| | | | | | | | | | | | | | | | | | | | |
Total return(d) | | | 0.69 | % | | | (1.55 | )% | | | 3.17 | %(c) | | | 0.96 | %(c) | | | 5.24 | %(c) |
RATIOS TO AVERAGE NET ASSETS: | | | | | | | | | | | | | | | | | | | | |
Net assets, end of the period (000’s) | | $ | 56,936 | | | $ | 71,963 | | | $ | 75,522 | | | $ | 68,776 | | | $ | 75,984 | |
Net expenses | | | 1.55 | %(f) | | | 1.62 | %(g) | | | 1.60 | %(e) | | | 1.60 | %(e) | | | 1.64 | %(e) |
Gross expenses | | | 1.55 | %(f) | | | 1.62 | %(g) | | | 1.65 | % | | | 1.67 | % | | | 1.72 | % |
Net investment income | | | 0.61 | % | | | 0.36 | % | | | 0.80 | % | | | 0.68 | % | | | 0.98 | % |
Portfolio turnover rate | | | 24 | % | | | 39 | % | | | 56 | % | | | 66 | % | | | 89 | % |
| (a) | Per share net investment income has been calculated using the average shares outstanding during the period. |
| (b) | Amount rounds to less than $0.01 per share. |
| (c) | Had certain expenses not been waived/reimbursed during the period, total returns would have been lower. |
| (d) | A contingent deferred sales charge for Class C shares is not reflected in total return calculations. |
| (e) | The investment adviser agreed to waive its fees and/or reimburse a portion of the Fund’s expenses during the period. Without this waiver/reimbursement, expenses would have been higher. |
| (f) | Includes fee/expense recovery of less than 0.01%. |
| (g) | Includes corporate tax expenses of 0.03%. Without this expense the ratio of net expenses would have been 1.59%. |
See accompanying notes to financial statements.
87 |
Financial Highlights (continued)
For a share outstanding throughout each period.
| | | | | | | | | | | | | | | | | | | | |
| | | Limited Term Government and Agency Fund—Class Y | |
| | | Year Ended
September 30,
2014 | | | Year Ended
September 30,
2013 | | | Year Ended
September 30,
2012 | | | Year Ended
September 30,
2011 | | | Year Ended
September 30,
2010 | |
Net asset value, beginning of the period | | $ | 11.72 | | | $ | 12.08 | | | $ | 11.91 | | | $ | 12.05 | | | $ | 11.64 | |
| | | | | | | | | | | | | | | | | | | | |
INCOME (LOSS) FROM INVESTMENT OPERATIONS: | | | | | | | | | | | | | | | | | | | | |
Net investment income(a) | | | 0.18 | | | | 0.16 | | | | 0.21 | | | | 0.20 | | | | 0.23 | |
Net realized and unrealized gain (loss) | | | 0.02 | | | | (0.23 | ) | | | 0.28 | | | | 0.04 | | | | 0.48 | |
| | | | | | | | | | | | | | | | | | | | |
Total from Investment Operations | | | 0.20 | | | | (0.07 | ) | | | 0.49 | | | | 0.24 | | | | 0.71 | |
| | | | | | | | | | | | | | | | | | | | |
LESS DISTRIBUTIONS FROM: | | | | | | | | | | | | | | | | | | | | |
Net investment income | | | (0.27 | ) | | | (0.29 | ) | | | (0.32 | ) | | | (0.29 | ) | | | (0.30 | ) |
Net realized capital gains | | | — | | | | (0.00 | )(b) | | | (0.00 | )(b) | | | (0.09 | ) | | | — | |
Paid-in capital | | | — | | | | (0.00 | )(b) | | | — | | | | — | | | | — | |
| | | | | | | | | | | | | | | | | | | | |
Total Distributions | | | (0.27 | ) | | | (0.29 | ) | | | (0.32 | ) | | | (0.38 | ) | | | (0.30 | ) |
| | | | | | | | | | | | | | | | | | | | |
Net asset value, end of the period | | $ | 11.65 | | | $ | 11.72 | | | $ | 12.08 | | | $ | 11.91 | | | $ | 12.05 | |
| | | | | | | | | | | | | | | | | | | | |
Total return | | | 1.70 | % | | | (0.56 | )% | | | 4.19 | %(c) | | | 2.05 | %(c) | | | 6.20 | %(c) |
RATIOS TO AVERAGE NET ASSETS: | | | | | | | | | | | | | | | | | | | | |
Net assets, end of the period (000’s) | | $ | 330,224 | | | $ | 252,127 | | | $ | 220,444 | | | $ | 130,874 | | | $ | 95,847 | |
Net expenses | | | 0.55 | %(e) | | | 0.62 | %(f) | | | 0.60 | %(d) | | | 0.60 | %(d) | | | 0.63 | %(d) |
Gross expenses | | | 0.55 | %(e) | | | 0.62 | %(f) | | | 0.65 | % | | | 0.67 | % | | | 0.71 | % |
Net investment income | | | 1.58 | % | | | 1.35 | % | | | 1.77 | % | | | 1.68 | % | | | 1.94 | % |
Portfolio turnover rate | | | 24 | % | | | 39 | % | | | 56 | % | | | 66 | % | | | 89 | % |
| (a) | Per share net investment income has been calculated using the average shares outstanding during the period. |
| (b) | Amount rounds to less than $0.01 per share. |
| (c) | Had certain expenses not been waived/reimbursed during the period, total returns would have been lower. |
| (d) | The investment adviser agreed to waive its fees and/or reimburse a portion of the Fund’s expenses during the period. Without this waiver/reimbursement, expenses would have been higher. |
| (e) | Includes fee/expense recovery of less than 0.01%. |
| (f) | Includes corporate tax expenses of 0.03%. Without this expense the ratio of net expenses would have been 0.59%. |
See accompanying notes to financial statements.
| 88
Notes to Financial Statements
September 30, 2014
1. Organization. Natixis Funds Trust I and Loomis Sayles Funds II (the “Trusts” and each a “Trust”) are each organized as a Massachusetts business trust. Each Trust is registered under the Investment Company Act of 1940, as amended (the “1940 Act”), as an open-end management investment company. Each Declaration of Trust permits the Board of Trustees to authorize the issuance of an unlimited number of shares of the Trust in multiple series. The financial statements for certain funds of the Trusts are presented in separate reports. The following funds (individually, a “Fund” and collectively, the “Funds”) are included in this report:
Natixis Funds Trust I:
Loomis Sayles Core Plus Bond Fund (the “Core Plus Bond Fund”)
Loomis Sayles Funds II:
Loomis Sayles High Income Fund (the “High Income Fund”)
Loomis Sayles International Bond Fund (the “International Bond Fund”)
Loomis Sayles Limited Term Government and Agency Fund (the “Limited Term Government and Agency Fund”)
Each Fund is a diversified investment company, except for International Bond Fund, which is a non-diversified investment company.
The Funds each offer Class A, Class C and Class Y shares. In addition, Core Plus Bond Fund offers Class N shares. Effective October 12, 2007, Class B shares are no longer offered. Existing Class B shareholders may continue to reinvest dividends into Class B shares and exchange their Class B shares for Class B shares of other Natixis Funds subject to existing exchange privileges as described in the prospectus.
Class A shares of all Funds except Limited Term Government and Agency Fund are sold with a maximum front-end sales charge of 4.50%. Class A shares of Limited Term Government and Agency Fund are sold with a maximum front-end sales charge of 3.00%. Class B shares do not pay a front-end sales charge; however, they are charged higher Rule 12b-1 fees, and are subject to a contingent deferred sales charge (“CDSC”) if such shares are redeemed within six years of purchase. After eight years of ownership, Class B shares convert to Class A shares. Class C shares do not pay a front-end sales charge, do not convert to any other class of shares, pay higher Rule 12b-1 fees than Class A shares and may be subject to a CDSC of 1.00% if those shares are redeemed within one year of acquisition, except for reinvested distributions. Class N and Class Y shares do not pay a front-end sales charge, a CDSC or Rule 12b-1 fees. Class N shares are offered exclusively through intermediaries and are primarily intended for employer-sponsored retirement plans. Class Y shares are intended for institutional investors with a minimum initial investment of $100,000, though some categories of investors are exempted from the minimum investment amount as outlined in the Funds’ prospectus.
89 |
Notes to Financial Statements (continued)
September 30, 2014
Most expenses can be directly attributed to a fund. Expenses which cannot be directly attributed to a fund are generally apportioned based on the relative net assets of each of the funds in Natixis Funds Trust I, Natixis Funds Trust II, Natixis Funds Trust IV, Gateway Trust (“Natixis Funds Trusts”), Loomis Sayles Funds I, Loomis Sayles Funds II (“Loomis Sayles Funds Trusts”) and Hansberger International Series. Expenses of a Fund are borne pro rata by the holders of each class of shares, except that each class bears expenses unique to that class (including the Rule 12b-1 service and distribution fees and, for Core Plus Bond Fund, transfer agent fees). In addition, each class votes as a class only with respect to its own Rule 12b-1 Plan. Shares of each class would receive their pro rata share of the net assets of a Fund if the Fund were liquidated. The Trustees approve separate distributions from net investment income on each class of shares.
2. Significant Accounting Policies. The following is a summary of significant accounting policies consistently followed by each Fund in the preparation of its financial statements. The Funds’ financial statements follow the accounting and reporting guidelines provided for investment companies and are prepared in accordance with accounting principles generally accepted in the United States of America which require the use of management estimates that affect the reported amounts and disclosures in the financial statements. Actual results could differ from those estimates. Management has evaluated the events and transactions subsequent to year-end through the date the financial statements were issued and has determined that there were no material events that would require disclosure in the Funds’ financial statements.
a. Valuation. Fund securities and other investments are valued at market value based on market quotations obtained or determined by independent pricing services recommended by the adviser and approved by the Board of Trustees. Fund securities and other investments for which market quotations are not readily available are valued at fair value as determined in good faith by the adviser pursuant to procedures approved by the Board of Trustees, as described below. Market value is determined as follows:
Debt securities (other than short-term obligations purchased with an original or remaining maturity of sixty days or less) and unlisted equity securities are valued based on evaluated bids furnished to the Fund by an independent pricing service, using market information, transactions for comparable securities and various relationships between securities, if available, or bid prices obtained from broker-dealers. Senior loans are valued at bid prices supplied by an independent pricing service, if available. Equity securities (including closed-end investment companies and exchange-traded funds) are valued at the last sale price quoted on the exchange or market where traded most extensively or, if there is no reported sale during the day, the closing bid quotation as reported by an independent pricing service. Securities traded on the NASDAQ Global Select Market, NASDAQ Global Market and NASDAQ Capital Market are valued at the NASDAQ Official Closing Price (“NOCP”), or if lacking an NOCP, at the most recent bid quotations on the applicable NASDAQ Market. In some foreign markets, an official close price and a last sale price may be available from the foreign exchange or market.
| 90
Notes to Financial Statements (continued)
September 30, 2014
In those cases, the official close price is used. Broker-dealer bid prices may be used to value debt and equity securities and senior loans where an independent pricing service is unable to price a security or where an independent pricing service does not provide a reliable price for the security. Forward foreign currency contracts are valued utilizing interpolated rates determined based on information provided by an independent pricing service. Futures contracts are valued at the current settlement price on the exchange on which the adviser believes that, over time, they are traded most extensively. Centrally cleared credit default swap agreements are valued at settlement prices of the clearinghouse on which the contracts were traded or prices obtained from broker-dealers. Bilateral credit default swaps are valued based on mid prices (between the bid price and the ask price) supplied by an independent pricing service. Short-term obligations (purchased with an original or remaining maturity of sixty days or less) are valued at amortized cost (which approximates market value).
Fund securities and other investments for which market quotations are not readily available are valued at fair value as determined in good faith by the adviser pursuant to procedures approved by the Board of Trustees. The Fund may also value securities and other investments at fair value in other circumstances such as when extraordinary events occur after the close of a foreign market but prior to the close of the New York Stock Exchange (“NYSE”). This may include situations relating to a single issuer (such as a declaration of bankruptcy or a delisting of the issuer’s security from the primary market on which it has traded) as well as events affecting the securities markets in general (such as market disruptions or closings and significant fluctuations in U.S. and/or foreign markets). When fair valuing its securities or other investments, the Fund may, among other things, use modeling tools or other processes that may take into account factors such as securities or other market activity and/or significant events that occur after the close of the foreign market and before the time the Fund’s net asset value (“NAV”) is calculated. Fair value pricing may require subjective determinations about the value of a security, and fair values used to determine a Fund’s NAV may differ from quoted or published prices, or from prices that are used by others, for the same securities. In addition, the use of fair value pricing may not always result in adjustments to the prices of securities held by the Fund.
b. Investment Transactions and Related Investment Income. Investment transactions are accounted for on a trade date plus one day basis for daily NAV calculation. However, for financial reporting purposes, investment transactions are reported on trade date. Dividend income is recorded on ex-dividend date, or in the case of certain foreign securities, as soon as a Fund is notified, and interest income is recorded on an accrual basis. Interest income is increased by the accretion of discount and decreased by the amortization of premium. Periodic principal adjustments for inflation-protected securities are recorded to interest income. Negative principal adjustments (in the event of deflation) are recorded as reductions of interest income to the extent of interest income earned, not to exceed the amount of positive principal adjustments on a cumulative basis. In determining net gain or loss on securities sold, the cost of securities
91 |
Notes to Financial Statements (continued)
September 30, 2014
has been determined on an identified cost basis. Investment income, non-class specific expenses and realized and unrealized gains and losses are allocated on a pro rata basis to each class based on the relative net assets of each class to the total net assets of the Fund.
c. Foreign Currency Translation. The books and records of the Funds are maintained in U.S. dollars. The values of securities, currencies and other assets and liabilities denominated in currencies other than U.S. dollars are translated into U.S. dollars based upon foreign exchange rates prevailing at the end of the period. Purchases and sales of investment securities, income and expenses are translated on the respective dates of such transactions.
Since the values of investment securities are presented at the foreign exchange rates prevailing at the end of the period, it is not practical to isolate that portion of the results of operations arising from changes in exchange rates from fluctuations which arise due to changes in market prices of investment securities. Such changes are included with the net realized and unrealized gain or loss on investments.
Net realized foreign exchange gains or losses arise from sales of foreign currency, currency gains or losses realized between the trade and settlement dates on securities transactions, and the difference between the amounts of dividends, interest and foreign withholding taxes recorded on the Funds’ books and the U.S. dollar equivalent of the amounts actually received or paid. Net unrealized foreign exchange gains and losses arise from changes in the value of assets and liabilities, other than investment securities, at the end of the fiscal period, resulting from changes in exchange rates.
Each Fund may use foreign currency exchange contracts to facilitate transactions in foreign-denominated investments. Losses may arise from changes in the value of the foreign currency or if the counterparties do not perform under the contracts’ terms.
d. Forward Foreign Currency Contracts. The Funds may enter into forward foreign currency contracts, including forward foreign cross currency contracts to acquire exposure to foreign currencies or to hedge the Funds’ investments against currency fluctuation. A contract can also be used to offset a previous contract. These contracts involve market risk in excess of the unrealized gain or loss reflected in the Funds’ Statements of Assets and Liabilities. The U.S. dollar value of the currencies a Fund has committed to buy or sell represents the aggregate exposure to each currency a Fund has acquired or hedged through currency contracts outstanding at period end. Gains or losses are recorded for financial statement purposes as unrealized until settlement date. Contracts are traded over-the-counter directly with a counterparty. Risks may arise upon entering into these contracts from the potential inability of counterparties to meet the terms of their contracts and from unanticipated movements in the value of a foreign currency relative to the U.S. dollar. Certain contracts may require the movement of cash and/or securities as collateral for the Funds’ or counterparty’s net obligations under the contracts.
| 92
Notes to Financial Statements (continued)
September 30, 2014
e. Futures Contracts. The Funds may enter into futures contracts. Futures contracts are agreements between two parties to buy and sell a particular instrument or index for a specified price on a specified future date.
When a Fund enters into a futures contract, it is required to deposit with (or for the benefit of) its broker an amount of cash or short-term high-quality securities as “initial margin.” As the value of the contract changes, the value of the futures contract position increases or declines. Subsequent payments, known as “variation margin,” are made or received by a Fund, depending on the price fluctuations in the fair value of the contract and the value of cash or securities on deposit with the broker. The aggregate principal amounts of the contracts are not recorded in the financial statements. Fluctuations in the value of the contracts are recorded in the Statements of Assets and Liabilities as an asset (liability) and in the Statements of Operations as unrealized appreciation (depreciation) until the contracts are closed, when they are recorded as realized gains (losses). Realized gain or loss on a futures position is equal to the difference between the value of the contract at the time it was opened and the value at the time it was closed, minus brokerage commissions. When a Fund enters into a futures contract certain risks may arise, such as illiquidity in the futures market, which may limit a Fund’s ability to close out a futures contract prior to settlement date, and unanticipated movements in the value of securities or interest rates.
Futures contracts are exchange-traded. Exchange-traded futures contracts are standardized and are settled through a clearing house with fulfillment supported by the credit of the exchange. Therefore, counterparty credit risks to the Funds are reduced; however, in the event that a counterparty enters into bankruptcy, the Fund’s claim against initial/variation margin on deposit with the counterparty may be subject to terms of a final settlement in bankruptcy court.
f. Swap Agreements. Each Fund may enter into credit default swaps. A credit default swap is an agreement between two parties (the “protection buyer” and “protection seller”) to exchange the credit risk of an issuer (“reference obligation”) for a specified time period. The reference obligation may be one or more debt securities or an index of such securities. The Funds may be either the protection buyer or the protection seller. As a protection buyer, the Funds have the ability to hedge the downside risk of an issuer or group of issuers. As a protection seller, the Funds have the ability to gain exposure to an issuer or group of issuers whose bonds are unavailable or in short supply in the cash bond market, as well as realize additional income in the form of fees paid by the protection buyer. The protection buyer is obligated to pay the protection seller a stream of payments (“fees”) over the term of the contract, provided that no credit event, such as a default or a downgrade in credit rating, occurs on the reference obligation. The Funds may also pay or receive upfront premiums. If a credit event occurs, the protection seller must pay the protection buyer the difference between the agreed upon notional value and market value of the reference obligation. Market value in this case is determined by a facilitated auction whereby a minimum number of allowable broker
93 |
Notes to Financial Statements (continued)
September 30, 2014
bids, together with a specified valuation method, are used to calculate the value. The maximum potential amount of undiscounted future payments that a Fund as the protection seller could be required to make under a credit default swap agreement would be an amount equal to the notional amount of the agreement.
The notional amounts of swap agreements are not recorded in the financial statements. Swap agreements are valued daily, and fluctuations in the value are recorded in the Statements of Operations as change in unrealized appreciation (depreciation) on swap agreements. Fees are accrued in accordance with the terms of the agreement and are recorded in the Statement of Assets and Liabilities as fees receivable or payable. When received or paid, fees are recorded in the Statement of Operations as realized gain or loss. Upfront premiums paid or received by the Funds are recorded on the Statements of Assets and Liabilities as an asset or liability, respectively, and are amortized or accreted over the term of the agreement and recorded as realized gain or loss. Payments made or received by the Funds as a result of a credit event or termination of the agreement are recorded as realized gain or loss.
Swap agreements are privately negotiated in the over-the-counter market and may be entered into as a bilateral contract or centrally cleared (“centrally cleared swaps”). Bilateral swap agreements are traded between counterparties and, as such, are subject to the risk that a party to the agreement will not be able to meet its obligations. In a centrally cleared swap, immediately following execution of the swap agreement, the swap agreement is novated to a central counterparty (the “CCP”) and the Fund is required to deposit initial margin with the broker in the form of cash or securities in an amount that varies depending on the size and risk profile of the particular swap. Subsequent payments, known as “variation margin,” are made or received by the Fund based on the daily change in the value of the centrally cleared swap agreement. For centrally cleared swaps, the Fund’s counterparty credit risk is reduced as the CCP stands between the Fund and the counterparty. The Funds cover their net obligations under outstanding swap agreements by segregating or earmarking liquid assets or cash.
No swap agreements were held by the Funds during the year ended September 30, 2014.
g. Delayed Delivery Commitments. The Funds may purchase securities, including those designated as TBAs in the Portfolio of Investments, for which delivery or payment will occur at a later date, beyond the normal settlement period. The price of the security and the date when the security will be delivered and paid for are fixed at the time the transaction is negotiated. The security and the obligation to pay for it are recorded by the Funds at the time the commitment is entered into. The actual security that will be delivered to fulfill a TBA trade is not designated at the time of the trade. The security is “to be announced” 48 hours prior to the established trade settlement date. The value of the security may vary with market fluctuations during the time before the Funds take delivery of the security. Certain transactions require the Fund or counterparty to post cash and/or securities as collateral for the net mark-to-market exposure to the other
| 94
Notes to Financial Statements (continued)
September 30, 2014
party. The Funds cover their net obligations under outstanding delayed delivery commitments by segregating or earmarking cash or securities at the custodian. No interest accrues to each Fund until the transaction settles.
Purchases of delayed delivery securities may have a similar effect on the Funds’ net asset value as if the Funds had created a degree of leverage in the portfolio. Risks may arise upon entering into such transactions from the potential inability of counterparties to meet their obligations under the transactions. Additionally, losses may arise due to changes in the value of the underlying securities.
h. Federal and Foreign Income Taxes. Each Trust treats each Fund as a separate entity for federal income tax purposes. Each Fund intends to meet the requirements of the Internal Revenue Code of 1986, as amended, applicable to regulated investment companies, and to distribute to its shareholders substantially all of its net investment income and any net realized capital gains at least annually. Management has performed an analysis of each Fund’s tax positions for the open tax years as of September 30, 2014 and has concluded that no provisions for income tax are required. The Funds’ federal tax returns for the prior three fiscal years remain subject to examination by the Internal Revenue Service. Management is not aware of any events that are reasonably possible to occur in the next twelve months that would result in the amounts of any unrecognized tax benefits significantly increasing or decreasing for the Funds. However, management’s conclusions regarding tax positions taken may be subject to review and adjustment at a later date based on factors including, but not limited to, new tax laws and accounting regulations and interpretations thereof.
A Fund may be subject to foreign withholding taxes on investment income and taxes on capital gains on investments that are accrued and paid based upon the Fund’s understanding of the tax rules and regulations that exist in the countries in which the Fund invests. Foreign withholding taxes on dividend and interest income are reflected on the Statements of Operations as a reduction of investment income, net of amounts eligible to be reclaimed. Dividends and interest receivable on the Statements of Assets and Liabilities are net of foreign withholding taxes. Foreign withholding taxes eligible to be reclaimed are reflected on the Statements of Assets and Liabilities as tax reclaims receivable. Capital gains taxes paid are included in net realized gain (loss) on investments in the Statements of Operations. Accrued but unpaid capital gains taxes are reflected as foreign taxes payable on the Statements of Assets and Liabilities, if applicable, and reduce unrealized gains on investments. In the event that realized gains on investments are subsequently offset by realized losses, taxes paid on realized gains may be returned to a Fund. Such amounts, if applicable, are reflected as foreign tax rebates receivable on the Statements of Assets and Liabilities and are recorded as a realized gain when received.
95 |
Notes to Financial Statements (continued)
September 30, 2014
i. Dividends and Distributions to Shareholders. Dividends and distributions are recorded on ex-dividend date. The timing and characterization of certain income and capital gain distributions are determined annually in accordance with federal tax regulations, which may differ from accounting principles generally accepted in the United States of America. Permanent differences are primarily due to differing treatments for book and tax purposes of items such as foreign currency transactions, contingent payment debt instruments, preferred securities adjustments, premium amortization, defaulted bond adjustments, paydown gains and losses, return of capital and capital gain distributions received, deferred Trustees’ fees, distribution redesignations. Permanent book and tax basis differences relating to shareholder distributions will result in reclassifications to capital accounts. Temporary differences between book and tax distributable earnings are primarily due to deferred Trustees’ fees, wash sales, premium amortization, forward foreign currency and futures contracts mark to market, dividends payable, contingent payment debt instruments, return of capital distributions received and defaulted bond interest. Distributions from net investment income and short-term capital gains are considered to be distributed from ordinary income for tax purposes.
The tax characterization of distributions is determined on an annual basis. The tax character of distributions paid to shareholders during the years ended September 30, 2014 and 2013 were as follows:
| | | | | | | | | | | | |
| | | 2014 Distributions Paid From: | |
Fund | | Ordinary
Income | | | Long-Term
Capital Gains | | | Total | |
Core Plus Bond Fund | | $ | 55,031,227 | | | $ | 428,711 | | | $ | 55,459,938 | |
High Income Fund | | | 10,202,315 | | | | 7,750,939 | | | | 17,953,254 | |
International Bond Fund | | | 203,566 | | | | 297,774 | | | | 501,340 | |
Limited Term Government and Agency Fund | | | 13,729,185 | | | | — | | | | 13,729,185 | |
| | | | | | | | | | | | | | | | |
| | | 2013 Distributions Paid From: | |
Fund | | Ordinary
Income | | | Long-Term
Capital Gains | | | Return
of Capital | | | Total | |
Core Plus Bond Fund | | $ | 78,998,718 | | | $ | 7,677,478 | | | $ | — | | | $ | 86,676,196 | |
High Income Fund | | | 12,581,747 | | | | 689,257 | | | | — | | | | 13,271,004 | |
International Bond Fund | | | 523,768 | | | | 163,540 | | | | — | | | | 687,308 | |
Limited Term Government and Agency Fund | | | 15,061,634 | | | | 234,773 | | | | 110,176 | | | | 15,406,583 | |
Differences between these amounts and those reported in the Statements of Changes in Net Assets are primarily attributable to different book and tax treatment for short-term capital gains.
| 96
Notes to Financial Statements (continued)
September 30, 2014
As of September 30, 2014, the components of distributable earnings on a tax basis were as follows:
| | | | | | | | | | | | | | | | |
| | | Core Plus
Bond Fund | | | High Income
Fund | | | International
Bond Fund | | | Limited Term
Government and
Agency Fund | |
Undistributed ordinary income | | $ | 13,690,639 | | | $ | 1,542,394 | | | $ | — | | | $ | 178,752 | |
Undistributed long-term capital gains | | | 9,332,349 | | | | 3,411,381 | | | | 130,876 | | | | — | |
| | | | | | | | | | | | | | | | |
Total undistributed earnings | | | 23,022,988 | | | | 4,953,775 | | | | 130,876 | | | | 178,752 | |
| | | | | | | | | | | | | | | | |
Capital loss carryforward: | | | | | | | | | | | | | | | | |
Short-term: | | | | | | | | | | | | | | | | |
No expiration date | | | — | | | | — | | | | — | | | | (3,476,934 | ) |
Long-term: | | | | | | | | | | | | | | | | |
No expiration date | | | — | | | | — | | | | — | | | | (8,321,892 | ) |
| | | | | | | | | | | | | | | | |
Total capital loss carryforward | | | — | | | | — | | | | — | | | | (11,798,826 | ) |
| | | | | | | | | | | | | | | | |
Late-year ordinary and post-October capital loss deferrals* | | | — | | | | — | | | | (239,916 | ) | | | — | |
Unrealized appreciation (depreciation) | | | 1,513,553 | | | | 2,288,657 | | | | (855,450 | ) | | | 3,896,463 | |
| | | | | | | | | | | | | | | | |
Total accumulated earnings (losses) | | $ | 24,536,541 | | | $ | 7,242,432 | | | $ | (964,490 | ) | | $ | (7,723,611 | ) |
| | | | | | | | | | | | | | | | |
| * | Under current tax law, capital losses, foreign currency losses, and losses on passive foreign investment companies and contingent payment debt instruments after October 31 or December 31, as applicable, may be deferred and treated as occurring on the first day of the following taxable year. |
j. Repurchase Agreements. Each Fund may enter into repurchase agreements, under the terms of a Master Repurchase Agreement, under which each Fund acquires securities as collateral and agrees to resell the securities at an agreed upon time and at an agreed upon price. It is each Fund’s policy that the market value of the collateral for repurchase agreements be at least equal to 102% of the repurchase price, including interest. Certain repurchase agreements are tri-party arrangements whereby the collateral is held in a segregated account for the benefit of the Fund and on behalf of the counterparty. Repurchase agreements could involve certain risks in the event of default or insolvency of the counterparty, including possible delays or restrictions upon a Fund’s ability to dispose of the underlying securities. As of September 30, 2014, each Fund, as applicable, had investments in repurchase agreements for which the value of the related collateral exceeded the value of the repurchase agreement. The gross value of repurchase agreements is included in the Statements of Assets and Liabilities for financial reporting purposes.
97 |
Notes to Financial Statements (continued)
September 30, 2014
k. Due to Brokers. Transactions and positions in certain futures, forward foreign currency contracts, swap agreements and delayed delivery commitments are maintained and cleared by registered U.S. broker/dealers pursuant to customer agreements between the Funds and the various broker/dealers. Due to brokers’ balances in the Statement of Assets and Liabilities for Core Plus Bond Fund represent cash received as collateral for delayed delivery securities. In certain circumstances the Fund’s use of cash held at brokers is restricted by regulation or broker mandated limits.
l. Securities Lending. The Funds have entered into an agreement with State Street Bank and Trust Company (“State Street Bank”), as agent of the Funds, to lend securities to certain designated borrowers. The loans are collateralized with cash or securities in an amount equal to at least 105% or 102% of the market value (including accrued interest) of the loaned international or domestic securities, respectively, when the loan is initiated. Thereafter, the value of the collateral must remain at least 102% of the market value (including accrued interest) of loaned securities for U.S. equities and U.S. corporate debt; at least 105% of the market value (including accrued interest) of loaned securities for non-U.S. equities; and at least 100% of the market value (including accrued interest) of loaned securities for U.S. Government securities, sovereign debt issued by non-U.S. Governments and non-U.S. corporate debt. In the event that the market value of the collateral falls below the required percentages described above, the borrower will deliver additional collateral on the next business day. As with other extensions of credit, the Funds may bear the risk of loss with respect to the investment of the collateral. The Funds invest cash collateral in short-term investments, a portion of the income from which is remitted to the borrowers and the remainder allocated between the Funds and State Street Bank as lending agent.
For the year ended September 30, 2014, none of the Funds had loaned securities under this agreement.
m. Indemnifications. Under the Trusts’ organizational documents, their officers and Trustees are indemnified against certain liabilities arising out of the performance of their duties to the Funds. Additionally, in the normal course of business, the Funds enter into contracts with service providers that contain general indemnification clauses. The Funds’ maximum exposure under these arrangements is unknown as this would involve future claims that may be made against the Funds that have not yet occurred. However, based on experience, the Funds expect the risk of loss to be remote.
| 98
Notes to Financial Statements (continued)
September 30, 2014
3. Fair Value Measurements. In accordance with accounting standards related to fair value measurements and disclosures, the Funds have categorized the inputs utilized in determining the value of each Fund’s assets or liabilities. These inputs are summarized in the three broad levels listed below:
| | • | | Level 1 – quoted prices in active markets for identical assets or liabilities; |
| | • | | Level 2 – prices determined using other significant inputs that are observable either directly, or indirectly through corroboration with observable market data (which could include quoted prices for similar assets or liabilities, interest rates, credit risk, etc.); and |
| | • | | Level 3 – prices determined using significant unobservable inputs when quoted prices or observable inputs are unavailable such as when there is little or no market activity for an asset or liability (unobservable inputs reflect each Fund’s own assumptions in determining the fair value of assets or liabilities and would be based on the best information available). |
The inputs or methodology used for valuing securities are not necessarily an indication of the risk associated with investing in those securities.
The Fund’s pricing policies and procedures are recommended by the adviser and approved by the Board of Trustees. Debt securities are valued based on evaluated bids furnished to the Fund by an independent pricing service. Broker-dealer bid prices may be used if an independent pricing service either is unable to price a security or does not provide a reliable price for a security. Broker-dealer bid prices for which the Fund does not have knowledge of the inputs used by the broker-dealer are categorized in Level 3. All security prices, including those obtained from an independent pricing service and broker-dealer bid prices, are reviewed on a daily basis by the adviser, subject to oversight by Fund management and the Board of Trustees. If the adviser, in good faith, believes that the price provided by an independent pricing service is unreliable, broker-dealer bid prices may be used until the price provided by the independent pricing service is considered to be reliable. Reliability of all security prices, including those obtained from an independent pricing service and broker-dealer bid prices, is tested in a variety of ways, including comparison to recent transaction prices and daily fluctuations, amongst other validation procedures in place. Securities for which market quotations are not readily available are valued at fair value as determined in good faith by the Funds’ adviser pursuant to procedures approved by the Board of Trustees. Fair valued securities may be categorized in Level 3.
99 |
Notes to Financial Statements (continued)
September 30, 2014
The following is a summary of the inputs used to value the Funds’ investments as of September 30, 2014, at value:
Core Plus Bond Fund
Asset Valuation Inputs
| | | | | | | | | | | | | | | | |
Description | | Level 1 | | | Level 2 | | | Level 3 | | | Total | |
Bonds and Notes | | | | | | | | | | | | | | | | |
Non-Convertible Bonds | | | | | | | | | | | | | | | | |
ABS Other | | $ | — | | | $ | — | | | $ | 12,623,552 | (b) | | $ | 12,623,552 | |
Airlines | | | — | | | | — | | | | 4,362,720 | (b) | | | 4,362,720 | |
All Other Non-Convertible Bonds(a) | | | — | | | | 2,024,630,486 | | | | — | | | | 2,024,630,486 | |
| | | | | | | | | | | | | | | | |
Total Non-Convertible Bonds | | | — | | | | 2,024,630,486 | | | | 16,986,272 | | | | 2,041,616,758 | |
| | | | | | | | | | | | | | | | |
Convertible Bonds(a) | | | — | | | | — | | | | 265,482 | (c) | | | 265,482 | |
| | | | | | | | | | | | | | | | |
Total Bonds and Notes | | | — | | | | 2,024,630,486 | | | | 17,251,754 | | | | 2,041,882,240 | |
| | | | | | | | | | | | | | | | |
Senior Loans(a) | | | — | | | | 63,639,753 | | | | — | | | | 63,639,753 | |
Preferred Stocks | | | | | | | | | | | | | | | | |
Cable Satellite | | | — | | | | 9,302,800 | | | | — | | | | 9,302,800 | |
All Other Preferred Stocks(a) | | | 2,640,173 | | | | — | | | | — | | | | 2,640,173 | |
| | | | | | | | | | | | | | | | |
Total Preferred Stocks | | | 2,640,173 | | | | 9,302,800 | | | | — | | | | 11,942,973 | |
| | | | | | | | | | | | | | | | |
Short-Term Investments | | | — | | | | 251,304,785 | | | | — | | | | 251,304,785 | |
| | | | | | | | | | | | | | | | |
Total | | $ | 2,640,173 | | | $ | 2,348,877,824 | | | $ | 17,251,754 | | | $ | 2,368,769,751 | |
| | | | | | | | | | | | | | | | |
| (a) | Details of the major categories of the Fund’s investments are reflected within the Portfolio of Investments. |
| (b) | Valued using broker-dealer bid prices. |
| (c) | Fair valued by the Fund’s adviser. |
For the year ended September 30, 2014, there were no transfers among Levels 1, 2 and 3.
| 100
Notes to Financial Statements (continued)
September 30, 2014
High Income Fund
Asset Valuation Inputs
| | | | | | | | | | | | | | | | |
Description | | Level 1 | | | Level 2 | | | Level 3 | | | Total | |
Bonds and Notes | | | | | | | | | | | | | | | | |
Non-Convertible Bonds | | | | | | | | | | | | | | | | |
ABS Other | | $ | — | | | $ | 185,379 | | | $ | 447,739 | (b) | | $ | 633,118 | |
Airlines | | | — | | | | 360,253 | | | | 4,985 | (b) | | | 365,238 | |
All Other Non-Convertible Bonds(a) | | | — | | | | 142,186,588 | | | | — | | | | 142,186,588 | |
| | | | | | | | | | | | | | | | |
Total Non-Convertible Bonds | | | — | | | | 142,732,220 | | | | 452,724 | | | | 143,184,944 | |
| | | | | | | | | | | | | | | | |
Convertible Bonds | | | | | | | | | | | | | | | | |
Wirelines | | | — | | | | — | | | | 5,740 | (c) | | | 5,740 | |
All Other Convertible Bonds(a) | | | — | | | | 18,919,235 | | | | — | | | | 18,919,235 | |
| | | | | | | | | | | | | | | | |
Total Convertible Bonds | | | — | | | | 18,919,235 | | | | 5,740 | | | | 18,924,975 | |
| | | | | | | | | | | | | | | | |
Total Bonds and Notes | | | — | | | | 161,651,455 | | | | 458,464 | | | | 162,109,919 | |
| | | | | | | | | | | | | | | | |
Senior Loans(a) | | | — | | | | 2,805,473 | | | | — | | | | 2,805,473 | |
Preferred Stocks | | | | | | | | | | | | | | | | |
Convertible Preferred Stocks | | | | | | | | | | | | | | | | |
Food & Beverage | | | — | | | | 941,666 | | | | — | | | | 941,666 | |
REITs - Mortgage | | | — | | | | 477,488 | | | | — | | | | 477,488 | |
All Other Convertible Preferred Stocks(a) | | | 3,203,875 | | | | — | | | | — | | | | 3,203,875 | |
| | | | | | | | | | | | | | | | |
Total Convertible Preferred Stocks | | | 3,203,875 | | | | 1,419,154 | | | | — | | | | 4,623,029 | |
| | | | | | | | | | | | | | | | |
Non-Convertible Preferred Stocks(a) | | | 3,604,481 | | | | — | | | | — | | | | 3,604,481 | |
| | | | | | | | | | | | | | | | |
Total Preferred Stocks | | | 6,808,356 | | | | 1,419,154 | | | | — | | | | 8,227,510 | |
| | | | | | | | | | | | | | | | |
Common Stocks(a) | | | 2,488,118 | | | | — | | | | — | | | | 2,488,118 | |
Warrants(d) | | | 81,944 | | | | — | | | | — | | | | 81,944 | |
Short-Term Investments | | | — | | | | 13,823,945 | | | | — | | | | 13,823,945 | |
| | | | | | | | | | | | | | | | |
Total Investments | | | 9,378,418 | | | | 179,700,027 | | | | 458,464 | | | | 189,536,909 | |
| | | | | | | | | | | | | | | | |
Forward Foreign Currency Contracts (unrealized appreciation) | | | — | | | | 220,346 | | | | — | | | | 220,346 | |
Futures Contracts (unrealized appreciation) | | | 51,042 | | | | — | | | | — | | | | 51,042 | |
| | | | | | | | | | | | | | | | |
Total | | $ | 9,429,460 | | | $ | 179,920,373 | | | $ | 458,464 | | | $ | 189,808,297 | |
| | | | | | | | | | | | | | | | |
101 |
Notes to Financial Statements (continued)
September 30, 2014
High Income Fund (continued)
Liability Valuation Inputs
| | | | | | | | | | | | | | | | |
Description | | Level 1 | | | Level 2 | | | Level 3 | | | Total | |
Forward Foreign Currency Contracts (unrealized depreciation) | | $ | — | | | $ | (98,261 | ) | | $ | — | | | $ | (98,261 | ) |
| | | | | | | | | | | | | | | | |
| (a) | Details of the major categories of the Fund’s investments are reflected within the Portfolio of Investments. |
| (b) | Valued using broker-dealer bid prices. |
| (c) | Fair valued by the Fund’s adviser. |
| (d) | Includes a security fair valued at zero using Level 2 inputs. |
A preferred stock valued at $444,425 was transferred from Level 1 to Level 2 during the period ended September 30, 2014. At September 30, 2013, this security was valued at the last sale price in accordance with the Fund’s valuation policies. At September 30, 2014, this security was valued on the basis of evaluated bids furnished to the Fund by an independent pricing service as a market price was not available.
All transfers are recognized at the beginning of the reporting period.
International Bond Fund
Asset Valuation Inputs
| | | | | | | | | | | | | | | | |
Description | | Level 1 | | | Level 2 | | | Level 3 | | | Total | |
Bonds and Notes | | | | | | | | | | | | | | | | |
Non-Convertible Bonds | | | | | | | | | | | | | | | | |
United States | | $ | — | | | $ | 993,379 | | | $ | 45,337 | (b) | | $ | 1,038,716 | |
All Other Non-Convertible Bonds(a) | | | — | | | | 7,634,357 | | | | — | | | | 7,634,357 | |
| | | | | | | | | | | | | | | | |
Total Non-Convertible Bonds | | | — | | | | 8,627,736 | | | | 45,337 | | | | 8,673,073 | |
| | | | | | | | | | | | | | | | |
Convertible Bonds(a) | | | — | | | | 5,544 | | | | — | | | | 5,544 | |
| | | | | | | | | | | | | | | | |
Total Bonds and Notes | | | — | | | | 8,633,280 | | | | 45,337 | | | | 8,678,617 | |
| | | | | | | | | | | | | | | | |
Preferred Stocks(a) | | | 19,007 | | | | — | | | | — | | | | 19,007 | |
| | | | | | | | | | | | | | | | |
Total Investments | | | 19,007 | | | | 8,633,280 | | | | 45,337 | | | | 8,697,624 | |
| | | | | | | | | | | | | | | | |
Forward Foreign Currency Contracts (unrealized appreciation) | | | — | | | | 8,096 | | | | — | | | | 8,096 | |
Futures Contracts (unrealized appreciation) | | | 2,644 | | | | — | | | | — | | | | 2,644 | |
| | | | | | | | | | | | | | | | |
Total | | $ | 21,651 | | | $ | 8,641,376 | | | $ | 45,337 | | | $ | 8,708,364 | |
| | | | | | | | | | | | | | | | |
Liability Valuation Inputs
| | | | | | | | | | | | | | | | |
Description | | Level 1 | | | Level 2 | | | Level 3 | | | Total | |
Forward Foreign Currency Contracts (unrealized depreciation) | | $ | — | | | $ | (27,802 | ) | | $ | — | | | $ | (27,802 | ) |
| | | | | | | | | | | | | | | | |
| (a) | Details of the major categories of the Fund’s investments are reflected within the Portfolio of Investments. |
| (b) | Valued using broker-dealer bid prices. |
For the year ended September 30, 2014, there were no transfers among Levels 1, 2 and 3.
| 102
Notes to Financial Statements (continued)
September 30, 2014
Limited Term Government and Agency Fund
Asset Valuation Inputs
| | | | | | | | | | | | | | | | |
Description | | Level 1 | | | Level 2 | | | Level 3 | | | Total | |
Bonds and Notes | | | | | | | | | | | | | | | | |
ABS Car Loan | | $ | — | | | $ | 11,146,386 | | | $ | 2,694,542 | | | $ | 13,840,928 | |
ABS Home Equity | | | — | | | | 272,675 | | | | 160,459 | (b) | | | 433,134 | |
Agency Commercial Mortgage-Backed Securities | | | — | | | | 66,949,234 | | | | 14,488,062 | | | | 81,437,296 | |
Collateralized Mortgage Obligations | | | — | | | | 92,359,184 | | | | 604,116 | | | | 92,963,300 | |
All Other Bonds and Notes(a) | | | — | | | | 477,244,531 | | | | — | | | | 477,244,531 | |
| | | | | | | | | | | | | | | | |
Total Bonds and Notes | | | — | | | | 647,972,010 | | | | 17,947,179 | | | | 665,919,189 | |
| | | | | | | | | | | | | | | | |
Short-Term Investments | | | — | | | | 20,873,976 | | | | — | | | | 20,873,976 | |
| | | | | | | | | | | | | | | | |
Total | | $ | — | | | $ | 668,845,986 | | | $ | 17,947,179 | | | $ | 686,793,165 | |
| | | | | | | | | | | | | | | | |
| (a) | Details of the major categories of the Fund’s investments are reflected within the Portfolio of Investments. |
| (b) | Fair valued by the Fund’s adviser. |
The following is a reconciliation of Level 3 investments for which significant unobservable inputs were used to determine fair value as of September 30, 2013 and/or September 30, 2014:
Core Plus Fund
Asset Valuation Inputs
| | | | | | | | | | | | | | | | | | | | |
Investments in Securities | | Balance as of
September 30,
2013 | | | Accrued
Discounts
(Premiums) | | | Realized
Gain
(Loss) | | | Change in
Unrealized
Appreciation
(Depreciation) | | | Purchases | |
Bonds and Notes | | | | | | | | | | | | | | | | | | | | |
Non-Convertible Bonds | | | | | | | | | | | | | | | | | | | | |
ABS Other | | $ | 8,485,775 | | | $ | — | | | $ | — | | | $ | 336,590 | | | $ | 3,801,187 | |
Airlines | | | 4,343,325 | | | | 589 | | | | 435 | | | | 188,501 | | | | — | |
Convertible Bonds | | | | | | | | | | | | | | | | | | | | |
Wirelines | | | 1,513,625 | | | | 4,367 | | | | 577,437 | | | | (269,379 | ) | | | — | |
| | | | | | | | | | | | | | | | | | | | |
Total | | $ | 14,342,725 | | | $ | 4,956 | | | $ | 577,872 | | | $ | 255,712 | | | $ | 3,801,187 | |
| | | | | | | | | | | | | | | | | | | | |
103 |
Notes to Financial Statements (continued)
September 30, 2014
Core Plus Fund (continued)
Asset Valuation Inputs (continued)
| | | | | | | | | | | | | | | | | | | | |
Investments in Securities | | Sales | | | Transfers
into Level 3 | | | Transfers
out of
Level 3 | | | Balance as of
September 30,
2014 | | | Change in
Unrealized
Appreciation
(Depreciation)
from
Investments
Still Held at
September 30,
2014 | |
Bonds and Notes | | | | | | | | | | | | | | | | | | | | |
Non-Convertible Bonds | | | | | | | | | | | | | | | | | | | | |
ABS Other | | $ | — | | | $ | — | | | $ | — | | | $ | 12,623,552 | | | $ | 336,590 | |
Airlines | | | (170,130 | ) | | | — | | | | — | | | | 4,362,720 | | | | 190,921 | |
Convertible Bonds | | | | | | | | | | | | | | | | | | | | |
Wirelines | | | (1,560,568 | ) | | | — | | | | — | | | | 265,482 | | | | 7,426 | |
| | | | | | | | | | | | | | | | | | | | |
Total | | $ | (1,730,698 | ) | | $ | — | | | $ | — | | | $ | 17,251,754 | | | $ | 534,937 | |
| | | | | | | | | | | | | | | | | | | | |
High Income Fund
Asset Valuation Inputs
| | | | | | | | | | | | | | | | | | | | |
Investments in Securities | | Balance as of
September 30,
2013 | | | Accrued
Discounts
(Premiums) | | | Realized
Gain
(Loss) | | | Change in
Unrealized
Appreciation
(Depreciation) | | | Purchases | |
Bonds and Notes | | | | | | | | | | | | | | | | | | | | |
Non-Convertible Bonds | | | | | | | | | | | | | | | | | | | | |
ABS Other | | $ | — | | | $ | — | | | $ | — | | | $ | (2,142 | ) | | $ | 449,881 | |
Airlines | | | 740,816 | | | | 7,948 | | | | 109,503 | | | | (94,573 | ) | | | — | |
Convertible Bonds | | | | | | | | | | | | | | | | | | | | |
Wirelines | | | 43,333 | | | | — | | | | 3,789 | | | | 5,701 | | | | — | |
| | | | | | | | | | | | | | | | | | | | |
Total | | $ | 784,149 | | | $ | 7,948 | | | $ | 113,292 | | | $ | (91,014 | ) | | $ | 449,881 | |
| | | | | | | | | | | | | | | | | | | | |
| 104
Notes to Financial Statements (continued)
September 30, 2014
High Income Fund (continued)
Asset Valuation Inputs (continued)
| | | | | | | | | | | | | | | | | | | | |
Investments in Securities | | Sales | | | Transfers
into Level 3 | | | Transfers
out of
Level 3 | | | Balance as of
September 30,
2014 | | | Change in
Unrealized
Appreciation
(Depreciation)
from
Investments
Still Held at
September 30,
2014 | |
Bonds and Notes | | | | | | | | | | | | | | | | | | | | |
Non-Convertible Bonds | | | | | | | | | | | | | | | | | | | | |
ABS Other | | $ | — | | | $ | — | | | $ | — | | | $ | 447,739 | | | $ | (2,142 | ) |
Airlines | | | (758,709 | ) | | | — | | | | — | | | | 4,985 | | | | 66 | |
Convertible Bonds | | | | | | | | | | | | | | | | | | | | |
Wirelines | | | (47,083 | ) | | | — | | | | — | | | | 5,740 | | | | 160 | |
| | | | | | | | | | | | | | | | | | | | |
Total | | $ | (805,792 | ) | | $ | — | | | $ | — | | | $ | 458,464 | | | $ | (1,916 | ) |
| | | | | | | | | | | | | | | | | | | | |
International Bond Fund
Asset Valuation Inputs
| | | | | | | | | | | | | | | | | | | | |
Investments in Securities | | Balance as of
September 30,
2013 | | | Accrued
Discounts
(Premiums) | | | Realized
Gain
(Loss) | | | Change in
Unrealized
Appreciation
(Depreciation) | | | Purchases | |
Bonds and Notes | | | | | | | | | | | | | | | | | | | | |
Non-Convertible Bonds | | | | | | | | | | | | | | | | | | | | |
United States | | $ | 41,625 | | | $ | — | | | $ | — | | | $ | 3,712 | | | $ | — | |
| | | | | | | | | | | | | | | | | | | | |
| | | | | |
Investments in Securities | | Sales | | | Transfers
into Level 3 | | | Transfers
out of
Level 3 | | | Balance as of
September 30,
2014 | | | Change in
Unrealized
Appreciation
(Depreciation)
from
Investments
Still Held at
September 30,
2014 | |
Bonds and Notes | | | | | | | | | | | | | | | | | | | | |
Non-Convertible Bonds | | | | | | | | | | | | | | | | | | | | |
United States | | $ | — | | | $ | — | | | $ | — | | | $ | 45,337 | | | $ | 3,712 | |
| | | | | | | | | | | | | | | | | | | | |
105 |
Notes to Financial Statements (continued)
September 30, 2014
Limited Term Government and Agency Fund
Asset Valuation Inputs
| | | | | | | | | | | | | | | | | | | | |
Investments in Securities | | Balance as of
September 30,
2013 | | | Accrued
Discounts
(Premiums) | | | Realized
Gain
(Loss) | | | Change in
Unrealized
Appreciation
(Depreciation) | | | Purchases | |
Bonds and Notes | | | | | | | | | | | | | | | | | | | | |
ABS Car Loan | | $ | — | | | $ | — | | | $ | — | | | $ | 31 | | | $ | 2,694,511 | |
ABS Home Equity | | | — | | | | — | | | | (483 | ) | | | (5,497 | ) | | | — | |
ABS Student Loan | | | 1,336,443 | | | | — | | | | — | | | | (4,130 | ) | | | — | |
Agency Commercial Mortgage-Backed Securities | | | 15,008,145 | | | | — | | | | — | | | | (520,083 | ) | | | — | |
Collateralized Mortgage Obligations | | | 23,331,092 | | | | — | | | | — | | | | (196 | ) | | | 23,973 | |
| | | | | | | | | | | | | | | | | | | | |
Total | | $ | 39,675,680 | | | $ | — | | | $ | (483 | ) | | $ | (529,875 | ) | | $ | 2,718,484 | |
| | | | | | | | | | | | | | | | | | | | |
| | | | | |
Investments in Securities | | Sales | | | Transfers
into Level 3 | | | Transfers
out of
Level 3 | | | Balance as of
September 30,
2014 | | | Change in
Unrealized
Appreciation
(Depreciation)
from
Investments
Still Held at
September 30,
2014 | |
Bonds and Notes | | | | | | | | | | | | | | | | | | | | |
ABS Car Loan | | $ | — | | | $ | — | | | $ | — | | | $ | 2,694,542 | | | $ | 31 | |
ABS Home Equity | | | (70,264 | ) | | | 236,703 | | | | — | | | | 160,459 | | | | (5,497 | ) |
ABS Student Loan | | | (1,332,313 | ) | | | — | | | | — | | | | — | | | | — | |
Agency Commercial Mortgage-Backed Securities | | | — | | | | — | | | | — | | | | 14,488,062 | | | | (520,083 | ) |
Collateralized Mortgage Obligations | | | (201,592 | ) | | | — | | | | (22,549,161 | ) | | | 604,116 | | | | 36 | |
| | | | | | | | | | | | | | | | | | | | |
Total | | $ | (1,604,169 | ) | | $ | 236,703 | | | $ | (22,549,161 | ) | | $ | 17,947,179 | | | $ | (525,513 | ) |
| | | | | | | | | | | | | | | | | | | | |
| 106
Notes to Financial Statements (continued)
September 30, 2014
A debt security valued at $236,703 was transferred from Level 2 to Level 3 during the period ended September 30, 2014. At September 30, 2013, this security was valued on the basis of evaluated bids furnished to the Fund by an independent pricing service in accordance with the Fund’s valuation policies. At September 30, 2014, this security was valued at fair value as determined in good faith by the Fund’s adviser as an independent pricing service did not provide a reliable price for the security.
A debt security valued at $15,279,698 was transferred from Level 3 to Level 2 during the period ended September 30, 2014. At September 30, 2013, this security was valued using broker-dealer bid prices based on inputs unobservable to the Fund as an independent pricing service did not provide a reliable price for the security. At September 30, 2014, this security was valued on the basis of evaluated bids furnished to the Fund by an independent pricing service in accordance with the Fund’s valuation policies.
Debt securities valued at $7,269,463 were transferred from Level 3 to Level 2 during the period ended September 30, 2014. At September 30, 2013, these securities were valued using broker-dealer bid prices based on inputs unobservable to the Fund as an independent pricing service was unable to price the securities. At September 30, 2014, these securities were valued on the basis of evaluated bids furnished to the Fund by an independent pricing service in accordance with the Fund’s valuation policies.
All transfers are recognized as of the beginning of the reporting period.
4. Derivatives. Derivative instruments are defined as financial instruments whose value and performance are based on the value and performance of another security or financial instrument. Derivative instruments that High Income Fund and International Bond Fund used during the period include forward foreign currency contracts and futures contracts.
High Income Fund and International Bond Fund are subject to the risk that changes in foreign currency exchange rates will have an unfavorable effect on the value of Fund assets denominated in foreign currencies. The Funds may enter into forward foreign currency contracts for hedging purposes to protect the value of the Funds’ holdings of foreign securities. The Funds may also use forward foreign currency contracts to gain exposure to foreign currencies, regardless of whether securities denominated in such currencies are held in the Funds. During the year ended September 30, 2014, High Income Fund engaged in forward foreign currency transactions for hedging purposes. During the same period, International Bond Fund engaged in forward foreign currency transactions for hedging purposes and to gain exposure to foreign currencies.
High Income Fund and International Bond Fund are subject to the risk that changes in interest rates will affect the value of the Funds’ investments in fixed-income securities. A Fund will be subject to increased interest rate risk to the extent that it invests in fixed-income securities with longer maturities or durations, as compared to investing in fixed-income securities with shorter maturities or durations. The Funds may use futures contracts to hedge against changes in interest rates and to manage duration without having to buy or sell portfolio securities. During the year ended September 30, 2014, High Income Fund and International Bond Fund used futures contracts to manage duration.
107 |
Notes to Financial Statements (continued)
September 30, 2014
The following is a summary of derivative instruments for High Income Fund as of September 30, 2014, as reflected within the Statement of Assets and Liabilities:
| | | | | | | | | | | | |
Assets | | Unrealized
appreciation on
forward foreign
currency contracts | | | Unrealized
appreciation on
futures contracts1 | | | Total | |
Over-the-counter asset derivatives | | | | | | | | | | | | |
Foreign exchange contracts | | $ | 220,346 | | | $ | — | | | $ | 220,346 | |
Exchange traded/cleared asset derivatives | | | | | | | | | | | | |
Interest rate contracts | | | — | | | | 51,042 | | | | 51,042 | |
| | | | | | | | | | | | |
Total asset derivatives | | $ | 220,346 | | | $ | 51,042 | | | $ | 271,388 | |
| | | | | | | | | | | | |
| | | |
Liabilities | | Unrealized
depreciation on
forward foreign
currency contracts | | | Unrealized
depreciation on
futures contracts1 | | | Total | |
Over-the-counter liability derivatives | | | | | | | | | | | | |
Foreign exchange contracts | | $ | (98,261 | ) | | $ | — | | | $ | (98,261 | ) |
| | | | | | | | | | | | |
| 1 | Represents cumulative unrealized appreciation (depreciation) on futures contracts. Only the current day’s variation margin on futures contracts is reported within the Statement of Assets and Liabilities as receivable or payable for variation margin, as applicable. |
Transactions in derivative instruments for High Income Fund during the year ended September 30, 2014, as reflected within the Statement of Operations, were as follows:
| | | | | | | | |
Net Realized Gain (Loss) on: | | Futures contracts | | | Foreign
currency transactions2 | |
Interest rate contracts | | $ | (399,513 | ) | | $ | — | |
Foreign exchange contracts | | | — | | | | (305,345 | ) |
| | | | | | | | |
Total | | $ | (399,513 | ) | | $ | (305,345 | ) |
| | | | | | | | |
| | | | | | | | |
Net Change in Unrealized Appreciation (Depreciation) on: | | Futures contracts | | | Foreign
currency translations2 | |
Interest rate contracts | | $ | 62,266 | | | $ | — | |
Foreign exchange contracts | | | — | | | | 394,816 | |
| | | | | | | | |
Total | | $ | 62,266 | | | $ | 394,816 | |
| | | | | | | | |
| 2 | Represents realized loss and change in unrealized appreciation (depreciation), respectively, for forward foreign currency contracts during the period. Does not include other foreign currency gains or losses included in the Statement of Operations. |
| 108
Notes to Financial Statements (continued)
September 30, 2014
The following is a summary of derivative instruments for International Bond Fund as of September 30, 2014, as reflected within the Statement of Assets and Liabilities:
| | | | | | | | | | | | |
Assets | | Unrealized
appreciation on
forward foreign
currency contracts | | | Unrealized
appreciation on
futures contracts1 | | | Total | |
Over-the-counter asset derivatives | | | | | | | | | | | | |
Foreign exchange contracts | | $ | 8,096 | | | $ | — | | | $ | 8,096 | |
Exchange traded/cleared asset derivatives | | | | | | | | | | | | |
Interest rate contracts | | | — | | | | 2,644 | | | | 2,644 | |
| | | | | | | | | | | | |
Total asset derivatives | | $ | 8,096 | | | $ | 2,644 | | | $ | 10,740 | |
| | | | | | | | | | | | |
| | | |
Liabilities | | Unrealized
depreciation on
forward foreign
currency contracts | | | Unrealized
depreciation on
futures contracts1 | | | Total | |
Over-the-counter liability derivatives | | | | | | | | | | | | |
Foreign exchange contracts | | $ | (27,802 | ) | | $ | — | | | $ | (27,802 | ) |
| | | | | | | | | | | | |
| 1 | Represents cumulative unrealized appreciation (depreciation) on futures contracts. Only the current day’s variation margin on futures contracts is reported within the Statement of Assets and Liabilities as receivable or payable for variation margin, as applicable. |
Transactions in derivative instruments for International Bond Fund during the year ended September 30, 2014, as reflected within the Statement of Operations, were as follows:
| | | | | | | | |
Net Realized Gain (Loss) on: | | Futures
contracts | | | Foreign
currency
transactions2 | |
Interest rate contracts | | $ | 47,559 | | | $ | — | |
Foreign exchange contracts | | | — | | | | 5,541 | |
| | | | | | | | |
Total | | $ | 47,559 | | | $ | 5,541 | |
| | | | | | | | |
| | | | | | | | |
Net Change in Unrealized Appreciation (Depreciation) on: | | Futures
contracts | | | Foreign
currency
translations2 | |
Interest rate contracts | | $ | (11,011 | ) | | $ | — | |
Foreign exchange contracts | | | — | | | | (30,957 | ) |
| | | | | | | | |
Total | | $ | (11,011 | ) | | $ | (30,957 | ) |
| | | | | | | | |
| 2 | Represents realized gain and change in unrealized appreciation (depreciation), respectively, for forward foreign currency contracts during the period. Does not include other foreign currency gains or losses included in the Statement of Operations. |
109 |
Notes to Financial Statements (continued)
September 30, 2014
As the Funds value their derivatives at fair value and recognize changes in fair value through the Statements of Operations, they do not qualify for hedge accounting under authoritative guidance for derivative instruments. The Funds’ investments in derivatives may represent an economic hedge; however, they are considered to be non-hedge transactions for the purpose of these disclosures.
The volume of forwards foreign currency contract and futures contract activity, as a percentage of net assets, based on gross month-end notional amounts outstanding during the period, including long and short positions at absolute value, was as follows for the year ended September 30, 2014:
| | | | | | | | |
High Income Bond Fund | | Forwards | | | Futures | |
Average Notional Amount Outstanding | | | 3.60 | % | | | 2.24 | % |
Highest Notional Amount Outstanding | | | 3.81 | % | | | 3.37 | % |
Lowest Notional Amount Outstanding | | | 2.52 | % | | | 0.53 | % |
Notional Amount Outstanding as of September 30, 2014 | | | 2.52 | % | | | 3.25 | % |
| | |
International Bond Fund | | Forwards | | | Futures | |
Average Notional Amount Outstanding | | | 21.61 | % | | | 7.02 | % |
Highest Notional Amount Outstanding | | | 29.86 | % | | | 9.23 | % |
Lowest Notional Amount Outstanding | | | 8.64 | % | | | 5.87 | % |
Notional Amount Outstanding as of September 30, 2014 | | | 17.43 | % | | | 9.20 | % |
Notional amounts outstanding at the end of the prior period are included in the average notional amount outstanding.
Unrealized gain and/or loss on open forwards and futures is recorded in the Statements of Assets and Liabilities. The aggregate notional values of forwards, and futures contracts are not recorded in the Statements of Assets and Liabilities, and therefore are not included in the Funds’ net assets.
Over-the-counter derivatives, including forward foreign currency contracts, are entered into pursuant to International Swaps and Derivatives Association, Inc. (“ISDA”) agreements negotiated between the Funds and their counterparties. ISDA agreements typically contain, among other things, terms for the posting of collateral and master netting provisions in the event of a default or other termination event. Collateral is posted by a Fund or the counterparty to the extent of the net mark-to-market exposure to the other party of all open contracts under the agreements, subject to minimum transfer requirements. Master netting provisions allow the Funds and the counterparty, in the event of a default or other termination event, to offset amounts owed by each related to derivative contracts, including any posted collateral, to one net amount payable by either the Funds or the counterparty. The Funds’ ISDA agreements typically contain provisions that allow a counterparty to terminate open contracts early if the net asset value of a Fund declines beyond a certain threshold. For financial reporting purposes, the Funds do not offset derivative assets and liabilities, and any related
| 110
Notes to Financial Statements (continued)
September 30, 2014
collateral received or pledged, on the Statements of Assets and Liabilities. As of September 30, 2014, gross amounts of over-the-counter derivative assets and liabilities not offset in the Statement of Assets and Liabilities and the related net amounts after taking into account master netting arrangements for the Funds, by counterparty, are as follows:
| | | | | | | | | | | | | | | | | | | | |
Counterparty | | Gross Amounts of
Assets | | | Offset
Amount | | | Net Asset
Balance | | | Collateral
(Received)/
Pledged | | | Net
Amount | |
Barclays Bank PLC | | $ | 220,346 | | | $ | (98,261 | ) | | $ | 122,085 | | | $ | — | | | $ | 122,085 | |
| | | | | |
Counterparty | | Gross Amounts of
Liabilities | | | Offset
Amount | | | Net
Liability
Balance | | | Collateral
(Received)/
Pledged | | | Net
Amount | |
Barclays Bank PLC | | $ | (98,261 | ) | | $ | 98,261 | | | $ | — | | | $ | — | | | $ | — | |
|
International Bond Fund | |
Counterparty | | Gross Amounts of
Assets | | | Offset
Amount | | | Net Asset
Balance | | | Collateral
(Received)/
Pledged | | | Net
Amount | |
Bank of America, N.A. | | $ | 6,338 | | | $ | (5,995 | ) | | $ | 343 | | | $ | — | | | $ | 343 | |
Barclays Bank PLC | | | 1,758 | | | | (1,758 | ) | | | — | | | | — | | | | — | |
| | | | | | | | | | | | | | | | | | | | |
| | $ | 8,096 | | | $ | (7,753 | ) | | $ | 343 | | | $ | — | | | $ | 343 | |
| | | | | | | | | | | | | | | | | | | | |
| | | | | |
Counterparty | | Gross Amounts of
Liabilities | | | Offset
Amount | | | Net
Liability
Balance | | | Collateral
(Received)/
Pledged | | | Net
Amount | |
Bank of America, N.A. | | $ | (5,995 | ) | | $ | 5,995 | | | $ | — | | | $ | — | | | $ | — | |
Barclays Bank PLC | | | (11,504 | ) | | | 1,758 | | | | (9,746 | ) | | | — | | | | (9,746 | ) |
Credit Suisse International | | | (521 | ) | | | — | | | | (521 | ) | | | — | | | | (521 | ) |
UBS AG | | | (9,782 | ) | | | — | | | | (9,782 | ) | | | — | | | | (9,782 | ) |
| | | | | | | | | | | | | | | | | | | | |
| | $ | (27,802 | ) | | $ | 7,753 | | | $ | (20,049 | ) | | $ | — | | | $ | (20,049 | ) |
| | | | | | | | | | | | | | | | | | | | |
The actual collateral received or pledged, if any, may exceed the amounts shown in the table due to overcollateralization. Timing differences may exist between when contracts under the ISDA agreement are marked-to-market and when collateral moves. The ISDA agreements include tri-party control agreements under which collateral is held for the benefit of the secured party at a third party custodian, State Street Bank.
Counterparty risk is managed based on policies and procedures established by each Fund’s adviser. Such policies and procedures may include, but are not limited to, minimum counterparty credit rating requirements, monitoring of counterparty credit
111 |
Notes to Financial Statements (continued)
September 30, 2014
default swap spreads and posting of collateral. A Fund’s risk of loss from counterparty credit risk on over-the-counter derivatives is generally limited to the Fund’s aggregated unrealized gains and the amount of any collateral pledged to the counterparty, which may be offset by any collateral posted to the Fund by the counterparty. ISDA master agreements can help to manage counterparty risk by specifying collateral posting arrangements at pre-arranged exposure levels. Under these ISDA agreements, collateral is routinely transferred if the total net exposure in respect of certain transactions, net of existing collateral already in place, exceeds a specified amount (typically $250,000, depending on the counterparty). With exchange traded derivatives, there is minimal counterparty credit risk to the Fund because the exchange’s clearinghouse, as counterparty to these instruments, stands between the buyer and the seller of the contract. Credit risk still exists in exchange traded derivatives with respect to initial and variation margin that is held in a broker’s customer accounts. While brokers are required to segregate customer margin from their own assets, in the event that a broker becomes insolvent or goes into bankruptcy and at that time there is a shortfall in the aggregate amount of margin held by the broker for all its clients, U.S. bankruptcy laws will typically allocate that shortfall on a pro rata basis across all of the broker’s customers, potentially resulting in losses to the Fund. Based on balances reflected on each Fund’s Statement of Assets and Liabilities, the following table shows (i) the maximum amount of loss due to credit risk that, based on the gross fair value of the financial instrument, the applicable Fund would incur if parties to the relevant financial instruments failed completely to perform according to the terms of the contracts and the collateral or other security, if any, for the amount due proved to be of no value to the Fund, and (ii) the amount of loss that the applicable Fund would incur after taking into account master netting provisions pursuant to ISDA agreements, as of September 30, 2014:
| | | | | | | | |
Fund | | Maximum Amount
of Loss - Gross | | | Maximum Amount
of Loss - Net | |
High Income Fund | | $ | 342,807 | | | $ | 244,546 | |
International Bond Fund | | | 28,745 | | | | 20,992 | |
5. Purchases and Sales of Securities. For the year ended September 30, 2014, purchases and sales of securities (excluding short-term investments and including paydowns) were as follows:
| | | | | | | | | | | | | | | | |
| | | U.S. Government/
Agency Securities | | | Other Securities | |
Fund | | Purchases | | | Sales | | | Purchases | | | Sales | |
Core Plus Bond Fund | | $ | 1,821,292,383 | | | $ | 1,535,662,225 | | | $ | 834,773,500 | | | $ | 340,638,280 | |
High Income Fund | | | 19,828,692 | | | | 13,856,805 | | | | 88,185,335 | | | | 84,672,113 | |
International Bond Fund | | | 1,384,890 | | | | 1,580,101 | | | | 4,598,577 | | | | 10,036,347 | |
Limited Term Government and Agency Fund | | | 100,336,867 | | | | 98,043,431 | | | | 57,167,230 | | | | 66,233,842 | |
| 112
Notes to Financial Statements (continued)
September 30, 2014
6. Management Fees and Other Transactions with Affiliates.
a. Management Fees. Loomis, Sayles & Company, L.P. (“Loomis Sayles”) serves as investment adviser to each Fund. Under the terms of the management agreements, each Fund pays a management fee at the following annual rates, calculated daily and payable monthly, based on each Fund’s average daily net assets:
| | | | | | | | | | | | | | | | |
| | | Percentage of Average Daily Net Assets | |
Fund | | First $100 million | | | Next $400 million | | | Next $1.5 billion | | | Over $2 billion | |
Core Plus Bond Fund | | | 0.2000 | % | | | 0.1875 | % | | | 0.1875 | % | | | 0.1500 | % |
High Income Fund | | | 0.6000 | % | | | 0.6000 | % | | | 0.6000 | % | | | 0.6000 | % |
International Bond Fund | | | 0.6000 | % | | | 0.6000 | % | | | 0.6000 | % | | | 0.6000 | % |
Limited Term Government and Agency Fund | | | 0.3750 | % | | | 0.3750 | % | | | 0.3500 | % | | | 0.3000 | % |
NGAM Advisors, L.P. (“NGAM Advisors”) serves as the advisory administrator to Core Plus Bond Fund. Under the terms of the advisory administration agreement, the Fund pays an advisory administration fee at the following annual rates, calculated daily and payable monthly, based on its average daily net assets:
| | | | | | | | | | | | |
| | | Percentage of Average Daily Net Assets | |
Fund | | First $100 million | | | Next $1.9 billion | | | Over $2 billion | |
Core Plus Bond Fund | | | 0.2000 | % | | | 0.1875 | % | | | 0.1500 | % |
Management and advisory administration fees are presented in the Statements of Operations as management fees.
Loomis Sayles has given binding undertakings to the Funds to waive management fees and/or reimburse certain expenses to limit the Funds’ operating expenses, exclusive of acquired fund fees and expenses, brokerage expenses, interest expense, taxes and extraordinary expenses. These undertakings are in effect until January 31, 2015 and are reevaluated on an annual basis. Management fees payable, as reflected on the Statements of Assets and Liabilities, is net of waivers and/or expense reimbursements, if any, pursuant to these undertakings. Waivers/reimbursements that exceed management fees payable are reflected on the Statements of Assets and Liabilities as receivable from investment adviser.
113 |
Notes to Financial Statements (continued)
September 30, 2014
For the year ended September 30, 2014, the expense limits as a percentage of average daily net assets under the expense limitation agreements were as follows:
| | | | | | | | | | | | | | | | | | | | |
| | | Expense Limit as a Percentage of
Average Daily Net Assets | |
Fund | | Class A | | | Class B | | | Class C | | | Class N | | | Class Y | |
Core Plus Bond Fund | | | 0.80 | % | | | 1.55 | % | | | 1.55 | % | | | 0.50 | % | | | 0.55 | % |
High Income Fund | | | 1.15 | % | | | 1.90 | % | | | 1.90 | % | | | — | | | | 0.90 | % |
International Bond Fund | | | 1.05 | % | | | — | | | | 1.80 | % | | | — | | | | 0.80 | % |
Limited Term Government and Agency Fund | | | 0.80 | % | | | 1.55 | % | | | 1.55 | % | | | — | | | | 0.55 | % |
Loomis Sayles and NGAM Advisors have agreed to equally bear the waivers and/or expense reimbursements for Core Plus Bond Fund.
Loomis Sayles (and NGAM Advisors for Core Plus Bond Fund) shall be permitted to recover expenses borne under the expense limitation agreements (whether through waiver of its management fees or otherwise) on a class by class basis in later periods to the extent the annual operating expenses of a class fall below a class’ expense limits, provided, however, that a class is not obligated to pay such waived/reimbursed fees or expenses more than one year after the end of the fiscal year in which the fees or expenses were waived/reimbursed.
For the year ended September 30, 2014, the management fees and waivers of management fees for each Fund were as follows:
| | | | | | | | | | | | | | | | | | | | |
| | | Gross
Management
Fees | | | Waivers of
Management
Fees1 | | | Net
Management
Fees | | | Percentage of
Average
Daily Net Assets | |
Fund | | | | | Gross | | | Net | |
Core Plus Bond Fund | | $ | 2,946,015 | | | $ | — | | | $ | 2,946,015 | | | | 0.188 | % | | | 0.188 | % |
High Income Fund | | | 1,064,303 | | | | 2 | | | | 1,064,301 | | | | 0.600 | % | | | 0.600 | % |
International Bond Fund | | | 73,102 | | | | 73,102 | | | | — | | | | 0.600 | % | | | — | |
Limited Term Government and Agency Fund | | | 2,469,783 | | | | — | | | | 2,469,783 | | | | 0.369 | % | | | 0.369 | % |
| 1 | Management fee waivers are subject to possible recovery until September 30, 2015. |
In addition, the investment adviser reimbursed non-class-specific expenses of International Bond Fund in the amount of $101,467 for the year ended September 30, 20142.
| 114
Notes to Financial Statements (continued)
September 30, 2014
For the year ended September 30, 2014, the advisory administration fees for Core Plus Bond Fund were as follows:
| | | | |
Advisory Administration Fee | | Percentage of Average
Daily Net Assets | |
$2,946,015 | | | 0.188 | % |
| 2 | Expense reimbursements are subject to possible recovery until September 30, 2015. |
For the year ended September 30, 2014, expense reimbursements related to the prior fiscal year were recovered as follows:
| | | | | | | | | | | | | | | | | | | | |
| | | Recovered Expenses | |
Fund | | Class A | | | Class B | | | Class C | | | Class Y | | | Total | |
Core Plus Bond Fund | | $ | 2,937 | | | $ | 9 | | | $ | 1,711 | | | $ | 3,621 | | | $ | 8,278 | |
Limited Term Government and Agency Fund | | | 10 | | | | — | | | | 2 | | | | 7 | | | | 19 | |
Certain officers and employees of Loomis Sayles are also officers or Trustees of the Trust. Loomis Sayles’ general partner is indirectly owned by Natixis Global Asset Management, L.P. (“Natixis US”), which is part of Natixis Global Asset Management, an international asset management group based in Paris, France.
b. Service and Distribution Fees. NGAM Distribution, L.P. (“NGAM Distribution”), which is a wholly-owned subsidiary of Natixis US, has entered into a distribution agreement with the Trusts. Pursuant to this agreement, NGAM Distribution serves as principal underwriter of the Funds of the Trusts.
Pursuant to Rule 12b-1 under the 1940 Act, the Trusts have adopted a Service Plan relating to each Fund’s Class A shares (the “Class A Plans”), and a Distribution and Service Plan relating to each Fund’s Class B (if applicable) and Class C shares (the “Class B and Class C Plans”).
Under the Class A Plans, each Fund pays NGAM Distribution a monthly service fee at an annual rate not to exceed 0.25% of the average daily net assets attributable to the Funds’ Class A shares, as reimbursement for expenses incurred by NGAM Distribution in providing personal services to investors in Class A shares and/or the maintenance of shareholder accounts.
Under the Class B (if applicable) and Class C Plans, each Fund pays NGAM Distribution a monthly service fee at an annual rate not to exceed 0.25% of the average daily net assets attributable to the Funds’ Class B (if applicable) and Class C shares, as compensation for services provided by NGAM Distribution in providing personal services to investors in Class B (if applicable) and Class C shares and/or the maintenance of shareholder accounts.
Also under the Class B (if applicable) and Class C Plans, each Fund pays NGAM Distribution a monthly distribution fee at the annual rate of 0.75% of the average daily
115 |
Notes to Financial Statements (continued)
September 30, 2014
net assets attributable to the Funds’ Class B (if applicable) and Class C shares, as compensation for services provided by NGAM Distribution in connection with the marketing or sale of Class B (if applicable) and Class C shares.
For the year ended September 30, 2014, the service and distribution fees for each Fund were as follows:
| | | | | | | | | | | | | | | | | | | | |
| | | Service Fees | | | Distribution Fees | |
Fund | | Class A | | | Class B | | | Class C | | | Class B | | | Class C | |
Core Plus Bond Fund | | $ | 1,174,415 | | | $ | 2,311 | | | $ | 541,992 | | | $ | 6,934 | | | $ | 1,625,979 | |
High Income Fund | | | 122,056 | | | | 648 | | | | 37,048 | | | | 1,943 | | | | 111,144 | |
International Bond Fund | | | 18,831 | | | | — | | | | 6,718 | | | | — | | | | 20,155 | |
Limited Term Government and Agency Fund | | | 876,460 | | | | 13,489 | | | | 157,708 | | | | 40,465 | | | | 473,124 | |
c. Administrative Fees. NGAM Advisors provides certain administrative services for the Funds and contracts with State Street Bank to serve as sub-administrator. NGAM Advisors is a wholly-owned subsidiary of Natixis US. Pursuant to an agreement among Natixis Funds Trusts, Loomis Sayles Funds Trusts, Hansberger International Series and NGAM Advisors, each Fund pays NGAM Advisors monthly its pro rata portion of fees equal to an annual rate of 0.0575% of the first $15 billion of the average daily net assets of the Natixis Funds Trusts, Loomis Sayles Funds Trusts and Hansberger International Series, 0.0500% of the next $15 billion, 0.0400% of the next $30 billion, 0.0350% of the next $30 billion and 0.0325% of such assets in excess of $90 billion, subject to an annual aggregate minimum fee for the Natixis Funds Trusts, Loomis Sayles Funds Trusts and Hansberger International Series of $10 million, which is reevaluated on an annual basis.
For the year ended September 30, 2014, the administrative fees for each Fund were as follows:
| | | | |
Fund | | Administrative
Fees | |
Core Plus Bond Fund | | $ | 681,061 | |
High Income Fund | | | 77,171 | |
International Bond Fund | | | 5,309 | |
Limited Term Government and Agency Fund | | | 291,541 | |
Prior to July 1, 2014, each Fund paid NGAM Advisors monthly its pro rata portion of fees equal to an annual rate of 0.0575% of the first $15 billion of the average daily net assets of the Natixis Funds Trusts, Loomis Sayles Funds Trusts and Hansberger International Series, 0.0500% of the next $15 billion, 0.0400% of the next $30 billion and 0.0350% of such assets in excess of $60 billion, subject to an annual aggregate minimum fee for the Natixis Funds Trusts, Loomis Sayles Funds Trusts and Hansberger International Series of $10 million.
| 116
Notes to Financial Statements (continued)
September 30, 2014
d. Sub-Transfer Agent Fees. NGAM Distribution has entered into agreements, which include servicing agreements, with financial intermediaries that provide recordkeeping, processing, shareholder communications and other services to customers of the intermediaries that hold positions in the Funds and has agreed to compensate the intermediaries for providing those services. Intermediaries transact with the Funds primarily through the use of omnibus accounts on behalf of their customers who hold positions in the Funds. These services would have been provided by the Funds’ transfer agent and other service providers if the shareholders’ accounts were maintained directly at the Funds’ transfer agent. Accordingly, the Funds have agreed to reimburse NGAM Distribution for all or a portion of the servicing fees paid to these intermediaries. The reimbursement amounts (sub-transfer agent fees) paid to NGAM Distribution are subject to a current per-account equivalent fee limit approved by the Funds’ Board, which is based on fees for similar services paid to the Funds’ transfer agent and other service providers. Class N shares do not bear such expenses.
For the year ended September 30, 2014, the sub-transfer agent fees (which are reflected in transfer agent fees and expenses in the Statements of Operations) for each Fund were as follows:
| | | | |
Fund | | Sub-Transfer
Agent Fees | |
Core Plus Bond Fund | | $ | 1,132,176 | |
High Income Fund | | | 141,476 | |
International Bond Fund | | | 7,052 | |
Limited Term Government and Agency Fund | | | 290,576 | |
As of September 30, 2014, the Funds owe NGAM Distribution the following reimbursements for sub-transfer agent fees:
| | | | |
Fund | | Reimbursements
of Sub-Transfer
Agent Fees | |
Core Plus Bond Fund | | $ | 16,133 | |
High Income Fund | | | 1,144 | |
International Bond Fund | | | 82 | |
Limited Term Government and Agency Fund | | | 3,535 | |
Sub-transfer agent fees attributable to Class A, Class B, Class C and Class Y are allocated on a pro rata basis to each class based on the relative net assets of each class to the total net assets of those classes.
117 |
Notes to Financial Statements (continued)
September 30, 2014
e. Commissions. Commissions (including CDSCs) on Fund shares retained by NGAM Distribution during the year ended September 30, 2014 were as follows:
| | | | |
Fund | | Commissions | |
Core Plus Bond Fund | | $ | 869,199 | |
High Income Fund | | | 55,445 | |
International Bond Fund | | | 3,432 | |
Limited Term Government and Agency Fund | | | 175,604 | |
f. Trustees Fees and Expenses. The Trusts do not pay any compensation directly to their officers or Trustees who are directors, officers or employees of NGAM Advisors, NGAM Distribution, Natixis US or their affiliates. Effective January 1, 2014, the Chairperson of the Board receives a retainer fee at the annual rate of $300,000. The Chairperson does not receive any meeting attendance fees for Board of Trustees meetings or committee meetings that she attends. Each Independent Trustee (other than the Chairperson) receives, in the aggregate, a retainer fee at the annual rate of $130,000. Each Independent Trustee also receives a meeting attendance fee of $10,000 for each meeting of the Board of Trustees that he or she attends in person and $5,000 for each meeting of the Board of Trustees that he or she attends telephonically. In addition, each committee chairperson (except for the Chairperson of the Governance Committee) receives an additional retainer fee at an annual rate of $17,500. Each Contract Review Committee member is compensated $6,000 for each Committee meeting that he or she attends in person and $3,000 for each meeting that he or she attends telephonically. Each Audit Committee member is compensated $6,000 for each Committee meeting that he or she attends in person and $3,000 for each meeting that he or she attends telephonically. These fees are allocated among the funds in the Natixis Funds Trusts, Loomis Sayles Funds Trusts and Hansberger International Series based on a formula that takes into account, among other factors, the relative net assets of each Fund. Trustees are reimbursed for travel expenses in connection with attendance at meetings.
Prior to January 1, 2014, the Chairperson of the Board received a retainer fee at the annual rate of $285,000 and each Independent Trustee (other than the Chairperson) received, in the aggregate, a retainer fee at the annual rate of $115,000. All other Trustee fees remained unchanged.
A deferred compensation plan (the “Plan”) is available to the Trustees on a voluntary basis. Deferred amounts remain in the Funds until distributed in accordance with the provisions of the Plan. The value of a participating Trustee’s deferral account is based on theoretical investments of deferred amounts, on the normal payment dates, in certain funds of the Natixis Funds Trusts, Loomis Sayles Funds Trusts and Hansberger International Series as designated by the participating Trustees. Changes in the value of participants’ deferral accounts are allocated pro rata among the funds in the Natixis Funds Trusts, Loomis Sayles Funds Trusts, and Hansberger International Series, and are
| 118
Notes to Financial Statements (continued)
September 30, 2014
normally reflected as Trustees’ fees and expenses in the Statements of Operations. The portions of the accrued obligations allocated to the Funds under the Plan are reflected as Deferred Trustees’ fees in the Statements of Assets and Liabilities.
g. Payment by Affiliates. For the year ended September 30, 2014, Loomis Sayles reimbursed the Limited Term Government and Agency Fund $412 for losses incurred in connection with a trading error.
h. Affiliated Ownership. As of September 30, 2014, the Loomis Sayles Employees’ Profit Sharing Retirement Plan (“Retirement Plan”) held shares of the Funds representing the following percentage of net assets:
| | | | |
Fund | | Retirement
Plan | |
Core Plus Bond Fund | | | 0.11 | % |
International Bond Fund | | | 1.29 | % |
Limited Term Government and Agency Fund | | | 0.14 | % |
7. Class-Specific Transfer Agent Fees and Expenses. For the year ended September 30, 2014, Core Plus Bond Fund incurred the following class-specific transfer agent fees and expenses (including sub-transfer agent fees, where applicable):
| | | | | | | | | | | | | | | | | | | | |
| | | Class A | | | Class B | | | Class C | | | Class N | | | Class Y | |
Transfer Agent Fees and Expenses | | $ | 393,242 | | | $ | 796 | | | $ | 182,883 | | | $ | 161 | | | $ | 694,409 | |
Transfer agent fees and expenses attributable to Class A, Class B, Class C and Class Y are allocated on a pro rata basis to each class based on the relative net assets of each class to the total net assets of those classes. Transfer agent fees and expenses attributable to Class N are allocated to Class N.
All other Funds in this report allocate transfer agent fees and expenses on a pro rata basis based on the relative net assets of each class to the total net assets of those classes.
8. Line of Credit. Each Fund, together with certain other funds of Natixis Funds Trusts, Loomis Sayles Funds Trusts and Hansberger International Series, participates in a $200,000,000 committed unsecured line of credit provided by State Street Bank, with an individual limit of $125,000,000 for each Fund that participates in the line of credit. Interest is charged to each participating Fund based on its borrowings at a rate per annum equal to the greater of the Federal Funds rate or overnight LIBOR, plus 1.25%. In addition, a commitment fee of 0.10% per annum, payable at the end of each calendar quarter, is accrued and apportioned among the participating funds based on their average daily unused portion of the line of credit.
For the year ended September 30, 2014, none of the Funds had borrowings under this agreement.
9. Concentration of Risk. International Bond Fund is a non-diversified fund. Compared with diversified mutual funds, International Bond Fund may invest a greater percentage
119 |
Notes to Financial Statements (continued)
September 30, 2014
of its assets in a particular country. Therefore, International Bond Fund’s returns could be significantly affected by the performance of any one of the small number of countries in its portfolio.
Limited Term Government and Agency Fund’s investments in mortgage-related and asset-backed securities are subject to certain risks not associated with investments in other securities. Mortgage-related and asset-backed securities are subject to the risk that unexpected changes in interest rates will have a direct effect on expected maturity. A shortened maturity may result in the reinvestment of prepaid amounts in securities with lower yields than the original obligations. An extended maturity may result in a reduction of a security’s value.
Each Fund’s investments in foreign securities are subject to foreign currency fluctuations, higher volatility than U.S. securities, varying degrees of regulation and limited liquidity. Greater political, economic, credit and information risks are also associated with foreign securities.
10. Concentration of Ownership. From time to time, a Fund may have a concentration of one or more accounts constituting a significant percentage of shares outstanding. Investment activities by holders of such accounts could have material impacts on the Funds. As of September 30, 2014, based on management’s evaluation of the shareholder account base, the Funds had accounts representing controlling ownership of more than 5% of the Fund’s total outstanding shares. The number of such accounts, based on accounts that represent more than 5% of an individual class of shares, and the aggregate percentage of net assets represented by such holdings were as follows:
| | | | | | | | | | | | | | | | |
Fund | | Number of 5% Non-Affiliated Account Holders | | | Percentage of
Non-Affiliated Ownership | | | Percentage of
Affiliated Ownership (Note 6) | | | Total Percentage of
Ownership | |
Core Plus Bond Fund | | | — | | | | — | | | | 0.11 | % | | | 0.11 | % |
High Income Fund | | | 2 | | | | 14.48 | % | | | — | | | | 14.48 | % |
International Bond Fund | | | — | | | | — | | | | 1.29 | % | | | 1.29 | % |
Limited Term Government and Agency Fund | | | 1 | | | | 11.26 | % | | | 0.14 | % | | | 11.40 | % |
Omnibus shareholder accounts for which NGAM Advisors understands that the intermediary has discretion over the underlying shareholder accounts or investment models where a shareholder account may be invested for a non-discretionary customer are included in the table above. For other omnibus accounts, the Funds do not have information on the individual shareholder accounts underlying omnibus accounts; therefore, there could be other 5% shareholders in addition to those disclosed in the table above.
| 120
Notes to Financial Statements (continued)
September 30, 2014
11. Capital Shares. Each Fund may issue an unlimited number of shares of beneficial interest, without par value. Transactions in capital shares were as follows:
| | | | | | | | | | | | | | | | |
| |
| Year Ended
September 30, 2014 |
| |
| Year Ended
September 30, 2013* |
|
Core Plus Bond Fund | | | Shares | | | | Amount | | | | Shares | | | | Amount | |
| Class A | | | | | | | | | | | | | | | | |
Issued from the sale of shares | | | 29,795,175 | | | $ | 393,768,013 | | | | 23,400,679 | | | $ | 312,055,029 | |
Issued in connection with the reinvestment of distributions | | | 1,003,545 | | | | 13,146,005 | | | | 1,815,759 | | | | 23,994,065 | |
Redeemed | | | (16,328,796 | ) | | | (214,096,387 | ) | | | (26,393,734 | ) | | | (344,871,782 | ) |
| | | | | | | | | | | | | | | | |
Net change | | | 14,469,924 | | | $ | 192,817,631 | | | | (1,177,296 | ) | | $ | (8,822,688 | ) |
| | | | | | | | | | | | | | | | |
| Class B | | | | | | | | | | | | | | | | |
Issued from the sale of shares | | | 923 | | | $ | 12,023 | | | | 3,363 | | | $ | 45,726 | |
Issued in connection with the reinvestment of distributions | | | 1,536 | | | | 20,111 | | | | 5,269 | | | | 70,185 | |
Redeemed | | | (43,656 | ) | | | (574,001 | ) | | | (92,007 | ) | | | (1,231,008 | ) |
| | | | | | | | | | | | | | | | |
Net change | | | (41,197 | ) | | $ | (541,867 | ) | | | (83,375 | ) | | $ | (1,115,097 | ) |
| | | | | | | | | | | | | | | | |
| Class C | | | | | | | | | | | | | | | | |
Issued from the sale of shares | | | 7,230,506 | | | $ | 95,528,924 | | | | 8,354,865 | | | $ | 111,674,557 | |
Issued in connection with the reinvestment of distributions | | | 260,172 | | | | 3,405,772 | | | | 591,854 | | | | 7,828,050 | |
Redeemed | | | (6,291,404 | ) | | | (81,808,202 | ) | | | (11,061,448 | ) | | | (144,010,707 | ) |
| | | | | | | | | | | | | | | | |
Net change | | | 1,199,274 | | | $ | 17,126,494 | | | | (2,114,729 | ) | | $ | (24,508,100 | ) |
| | | | | | | | | | | | | | | | |
| Class N | | | | | | | | | | | | | | | | |
Issued from the sale of shares | | | 7,101,873 | | | $ | 95,126,708 | | | | 1,567,247 | | | $ | 19,814,495 | |
Issued in connection with the reinvestment of distributions | | | 119,610 | | | | 1,591,071 | | | | 10,969 | | | | 139,775 | |
Redeemed | | | (776,670 | ) | | | (10,310,123 | ) | | | (75,008 | ) | | | (954,522 | ) |
| | | | | | | | | | | | | | | | |
Net change | | | 6,444,813 | | | $ | 86,407,656 | | | | 1,503,208 | | | $ | 18,999,748 | |
| | | | | | | | | | | | | | | | |
| Class Y | | | | | | | | | | | | | | | | |
Issued from the sale of shares | | | 68,813,227 | | | $ | 914,578,778 | | | | 45,112,822 | | | $ | 603,948,919 | |
Issued in connection with the reinvestment of distributions | | | 1,861,139 | | | | 24,597,610 | | | | 2,320,259 | | | | 30,841,104 | |
Redeemed | | | (20,930,186 | ) | | | (275,242,381 | ) | | | (45,057,119 | ) | | | (590,589,192 | ) |
| | | | | | | | | | | | | | | | |
Net change | | | 49,744,180 | | | $ | 663,934,007 | | | | 2,375,962 | | | $ | 44,200,831 | |
| | | | | | | | | | | | | | | | |
Increase (decrease) from capital share transactions | | | 71,816,994 | | | $ | 959,743,921 | | | | 503,770 | | | $ | 28,754,694 | |
| | | | | | | | | | | | | | | | |
| * | From commencement of operations on February 1, 2013 through September 30, 2013 for Class N shares. |
121 |
Notes to Financial Statements (continued)
September 30, 2014
11. Capital Shares (continued).
| | | | | | | | | | | | | | | | |
| |
| Year Ended
September 30, 2014 |
| |
| Year Ended
September 30, 2013 |
|
High Income Fund | | | Shares | | | | Amount | | | | Shares | | | | Amount | |
| Class A | | | | | | | | | | | | | | | | |
Issued from the sale of shares | | | 5,133,818 | | | $ | 23,326,417 | | | | 4,989,606 | | | $ | 23,721,653 | |
Issued in connection with the reinvestment of distributions | | | 971,866 | | | | 4,324,321 | | | | 812,256 | | | | 3,817,055 | |
Redeemed | | | (6,566,505 | ) | | | (29,978,953 | ) | | | (16,692,970 | ) | | | (78,579,586 | ) |
| | | | | | | | | | | | | | | | |
Net change | | | (460,821 | ) | | $ | (2,328,215 | ) | | | (10,891,108 | ) | | $ | (51,040,878 | ) |
| | | | | | | | | | | | | | | | |
| Class B | | | | | | | | | | | | | | | | |
Issued from the sale of shares | | | 3,463 | | | $ | 15,765 | | | | 11,352 | | | $ | 52,895 | |
Issued in connection with the reinvestment of distributions | | | 4,994 | | | | 22,266 | | | | 4,586 | | | | 21,581 | |
Redeemed | | | (64,948 | ) | | | (299,817 | ) | | | (53,925 | ) | | | (252,094 | ) |
| | | | | | | | | | | | | | | | |
Net change | | | (56,491 | ) | | $ | (261,786 | ) | | | (37,987 | ) | | $ | (177,618 | ) |
| | | | | | | | | | | | | | | | |
| Class C | | | | | | | | | | | | | | | | |
Issued from the sale of shares | | | 504,940 | | | $ | 2,306,974 | | | | 702,239 | | | $ | 3,347,581 | |
Issued in connection with the reinvestment of distributions | | | 269,328 | | | | 1,199,074 | | | | 150,549 | | | | 707,094 | |
Redeemed | | | (844,464 | ) | | | (3,842,672 | ) | | | (1,205,196 | ) | | | (5,689,434 | ) |
| | | | | | | | | | | | | | | | |
Net change | | | (70,196 | ) | | $ | (336,624 | ) | | | (352,408 | ) | | $ | (1,634,759 | ) |
| | | | | | | | | | | | | | | | |
| Class Y | | | | | | | | | | | | | | | | |
Issued from the sale of shares | | | 12,451,931 | | | $ | 56,610,742 | | | | 17,170,028 | | | $ | 80,940,800 | |
Issued in connection with the reinvestment of distributions | | | 1,946,529 | | | | 8,656,379 | | | | 1,311,917 | | | | 6,160,472 | |
Redeemed | | | (10,009,792 | ) | | | (45,183,438 | ) | | | (19,061,214 | ) | | | (90,332,449 | ) |
| | | | | | | | | | | | | | | | |
Net change | | | 4,388,668 | | | $ | 20,083,683 | | | | (579,269 | ) | | $ | (3,231,177 | ) |
| | | | | | | | | | | | | | | | |
Increase (decrease) from capital share
transactions | | | 3,801,160 | | | $ | 17,157,058 | | | | (11,860,772 | ) | | $ | (56,084,432 | ) |
| | | | | | | | | | | | | | | | |
| 122
Notes to Financial Statements (continued)
September 30, 2014
11. Capital Shares (continued).
| | | | | | | | | | | | | | | | |
| |
| Year Ended
September 30, 2014 |
| |
| Year Ended
September 30, 2013 |
|
International Bond Fund | | | Shares | | | | Amount | | | | Shares | | | | Amount | |
| Class A | | | | | | | | | | | | | | | | |
Issued from the sale of shares | | | 251,225 | | | $ | 2,423,574 | | | | 418,554 | | | $ | 4,190,166 | |
Issued in connection with the reinvestment of distributions | | | 27,646 | | | | 261,255 | | | | 31,172 | | | | 316,920 | |
Redeemed | | | (840,947 | ) | | | (8,207,626 | ) | | | (673,797 | ) | | | (6,649,849 | ) |
| | | | | | | | | | | | | | | | |
Net change | | | (562,076 | ) | | $ | (5,522,797 | ) | | | (224,071 | ) | | $ | (2,142,763 | ) |
| | | | | | | | | | | | | | | | |
| Class C | | | | | | | | | | | | | | | | |
Issued from the sale of shares | | | 35,986 | | | $ | 344,217 | | | | 108,173 | | | $ | 1,088,309 | |
Issued in connection with the reinvestment of distributions | | | 8,952 | | | | 83,701 | | | | 9,072 | | | | 91,839 | |
Redeemed | | | (138,017 | ) | | | (1,323,477 | ) | | | (194,937 | ) | | | (1,913,707 | ) |
| | | | | | | | | | | | | | | | |
Net change | | | (93,079 | ) | | $ | (895,559 | ) | | | (77,692 | ) | | $ | (733,559 | ) |
| | | | | | | | | | | | | | | | |
| Class Y | | | | | | | | | | | | | | | | |
Issued from the sale of shares | | | 312,197 | | | $ | 3,041,181 | | | | 152,390 | | | $ | 1,539,901 | |
Issued in connection with the reinvestment of distributions | | | 4,536 | | | | 42,916 | | | | 5,073 | | | | 51,430 | |
Redeemed | | | (239,134 | ) | | | (2,319,900 | ) | | | (205,113 | ) | | | (2,022,661 | ) |
| | | | | | | | | | | | | | | | |
Net change | | | 77,599 | | | $ | 764,197 | | | | (47,650 | ) | | $ | (431,330 | ) |
| | | | | | | | | | | | | | | | |
Increase (decrease) from capital share transactions | | | (577,556 | ) | | $ | (5,654,159 | ) | | | (349,413 | ) | | $ | (3,307,652 | ) |
| | | | | | | | | | | | | | | | |
123 |
Notes to Financial Statements (continued)
September 30, 2014
11. Capital Shares (continued).
| | | | | | | | | | | | | | | | |
| |
| Year Ended
September 30, 2014 |
| |
| Year Ended
September 30, 2013 |
|
Limited Term Government and Agency Fund | | | Shares | | | | Amount | | | | Shares | | | | Amount | |
| Class A | | | | | | | | | | | | | | | | |
Issued from the sale of shares | | | 10,352,825 | | | $ | 120,783,887 | | | | 12,850,713 | | | $ | 153,126,484 | |
Issued in connection with the reinvestment of distributions | | | 509,189 | | | | 5,940,640 | | | | 561,467 | | | | 6,662,144 | |
Redeemed | | | (14,196,566 | ) | | | (165,594,450 | ) | | | (12,732,399 | ) | | | (151,248,094 | ) |
| | | | | | | | | | | | | | | | |
Net change | | | (3,334,552 | ) | | $ | (38,869,923 | ) | | | 679,781 | | | $ | 8,540,534 | |
| | | | | | | | | | | | | | | | |
| Class B | | | | | | | | | | | | | | | | |
Issued from the sale of shares | | | 109,804 | | | $ | 1,281,761 | | | | 57,224 | | | $ | 682,522 | |
Issued in connection with the reinvestment of distributions | | | 5,851 | | | | 68,193 | | | | 8,642 | | | | 102,565 | |
Redeemed | | | (261,431 | ) | | | (3,046,644 | ) | | | (253,623 | ) | | | (3,009,576 | ) |
| | | | | | | | | | | | | | | | |
Net change | | | (145,776 | ) | | $ | (1,696,690 | ) | | | (187,757 | ) | | $ | (2,224,489 | ) |
| | | | | | | | | | | | | | | | |
| Class C | | | | | | | | | | | | | | | | |
Issued from the sale of shares | | | 1,307,714 | | | $ | 15,266,049 | | | | 2,982,402 | | | $ | 35,505,345 | |
Issued in connection with the reinvestment of distributions | | | 43,490 | | | | 507,877 | | | | 58,167 | | | | 690,850 | |
Redeemed | | | (2,606,942 | ) | | | (30,440,808 | ) | | | (3,153,586 | ) | | | (37,432,038 | ) |
| | | | | | | | | | | | | | | | |
Net change | | | (1,255,738 | ) | | $ | (14,666,882 | ) | | | (113,017 | ) | | $ | (1,235,843 | ) |
| | | | | | | | | | | | | | | | |
| Class Y | | | | | | | | | | | | | | | | |
Issued from the sale of shares | | | 19,913,274 | | | $ | 232,904,721 | | | | 19,772,954 | | | $ | 235,387,316 | |
Issued in connection with the reinvestment of distributions | | | 270,399 | | | | 3,163,665 | | | | 321,692 | | | | 3,829,024 | |
Redeemed | | | (13,350,830 | ) | | | (156,223,639 | ) | | | (16,833,635 | ) | | | (200,317,847 | ) |
| | | | | | | | | | | | | | | | |
Net change | | | 6,832,843 | | | $ | 79,844,747 | | | | 3,261,011 | | | $ | 38,898,493 | |
| | | | | | | | | | | | | | | | |
Increase (decrease) from capital share transactions | | | 2,096,777 | | | $ | 24,611,252 | | | | 3,640,018 | | | $ | 43,978,695 | |
| | | | | | | | | | | | | | | | |
| 124
Report of Independent Registered Public Accounting Firm
To the Trustees of Natixis Funds Trust I and Loomis Sayles Funds II and Shareholders of Loomis Sayles Core Plus Bond Fund, Loomis Sayles High Income Fund, Loomis Sayles International Bond Fund, and Loomis Sayles Limited Term Government and Agency Fund:
In our opinion, the accompanying statements of assets and liabilities, including the portfolios of investments, and the related statements of operations and of changes in net assets and the financial highlights present fairly, in all material respects, the financial position of Loomis Sayles Core Plus Bond Fund, a series of Natixis Funds Trust I, and Loomis Sayles High Income Fund, Loomis Sayles International Bond Fund and Loomis Sayles Limited Term Government and Agency Fund, each a series of Loomis Sayles Funds II (collectively, the “Funds”), at September 30, 2014 and the results of each of their operations, the changes in each of their net assets and the financial highlights for each of the periods indicated, in conformity with accounting principles generally accepted in the United States of America. These financial statements and financial highlights (hereafter referred to as “financial statements”) are the responsibility of the Funds’ management. Our responsibility is to express an opinion on these financial statements based on our audits. We conducted our audits of these financial statements in accordance with the standards of the Public Company Accounting Oversight Board (United States). Those standards require that we plan and perform the audits to obtain reasonable assurance about whether the financial statements are free of material misstatement. An audit includes examining, on a test basis, evidence supporting the amounts and disclosures in the financial statements, assessing the accounting principles used and significant estimates made by management, and evaluating the overall financial statement presentation. We believe that our audits, which included confirmation of securities at September 30, 2014 by correspondence with the custodian and the application of alternative auditing procedures where securities purchased had not been received, provide a reasonable basis for the opinion expressed above.
PricewaterhouseCoopers LLP
Boston, Massachusetts
November 21, 2014
125 |
2014 U.S. Tax Distribution Information to Shareholders (Unaudited)
Corporate Dividends Received Deduction. For the fiscal year ended September 30, 2014, a percentage of dividends distributed by the Funds listed below qualify for the dividends received deduction for corporate shareholders. These percentages are as follows:
| | | | |
Fund | | Qualifying
Percentage | |
Core Plus Bond | | | 0.23 | % |
High Income | | | 3.76 | % |
International Bond | | | 0.64 | % |
Capital Gains Distributions. Pursuant to Internal Revenue Section 852(b), the following Funds paid distributions, which have been designated as capital gains distributions for the fiscal year ended September 30, 2014, unless subsequently determined to be different.
| | | | |
Fund | | Amount | |
Core Plus Bond | | $ | 428,711 | |
High Income | | | 7,750,939 | |
International Bond | | | 297,774 | |
Qualified Dividend Income. For the fiscal year ended September 30, 2014, the Funds below will designate up to the maximum amount allowable pursuant to the Internal Revenue Code as qualified dividend income eligible for reduced tax rates. These lower rates range from 0% to 20% depending on an individual’s tax bracket. If the Funds pay a distribution during calendar year 2014, complete information will be reported in conjunction with Form 1099-DIV.
| | |
Fund | | |
Core Plus Bond | | |
High Income | | |
International Bond | | |
| 126
Trustee and Officer Information
The tables below provide certain information regarding the trustees and officers of Natixis Funds Trust I and Loomis Sayles Funds II (the “Trusts”). Unless otherwise indicated, the address of all persons below is 399 Boylston Street, Boston, MA 02116. The Funds’ Statement of Additional Information includes additional information about the trustees of the Trusts and is available by calling Natixis Funds at 800-225-5478.
| | | | | | | | |
Name and Year of Birth | | Position(s) Held with the Trusts, Length of Time Served and Term of Office1 | | Principal Occupation(s) During Past 5 Years | | Number of Portfolios in Fund Complex Overseen2 and Other Directorships Held During Past 5 Years | | Experience, Qualifications, Attributes, Skills for Board Membership |
|
| INDEPENDENT TRUSTEES |
| | | | |
Kenneth A. Drucker (1945) | | Trustee since 2008 for Natixis Funds Trust I and Loomis Sayles Funds II Chairman of the Audit Committee and Governance Committee Member | | Retired | | 42 None | | Significant experience on the Board and on the board of other business organizations (including at investment companies); executive experience (including as treasurer of an aerospace, automotive, and metal manufacturing corporation) |
| | | | |
| Edmond J. English (1953) | | Trustee since 2013 for Natixis Funds Trust I and Loomis Sayles Funds II Contract Review Committee Member | | Chief Executive Officer of Bob’s Discount Furniture (retail) | | 42 Formerly, Director, BJ’s Wholesale Club (retail); formerly, Director, Citizens Financial Group (bank) | | Experience on the Board and significant experience on the board of other business organizations (including at a retail company and a bank); executive experience (including at a retail company) |
127 |
Trustee and Officer Information
| | | | | | | | |
Name and Year of Birth | | Position(s) Held with the Trusts, Length of Time Served and Term of Office1 | | Principal Occupation(s) During Past 5 Years | | Number of Portfolios in Fund Complex Overseen2 and Other Directorships Held During Past 5 Years | | Experience, Qualifications, Attributes, Skills for Board Membership |
|
INDEPENDENT TRUSTEES continued |
| | | | |
Wendell J. Knox (1948) | | Trustee since 2009 for Natixis Funds Trust I and Loomis Sayles Funds II Audit Committee Member and Governance Committee Member | | Director of Abt Associates Inc. (research and consulting) | | 42 Director, Eastern Bank (bank); Director, The Hanover Insurance Group (property and casualty insurance) | | Significant experience on the Board and on the board of other business organizations (including at a bank and at a property and casualty insurance firm); executive experience (including roles as president and chief executive officer of a research and consulting company) |
| | | | |
Martin T. Meehan (1956) | | Trustee since 2012 for Natixis Funds Trust I and Loomis Sayles Funds II Contract Review Committee Member | | Chancellor and faculty member, University of Massachusetts Lowell | | 42 None | | Experience on the Board and on the board of other business organizations; experience as Chancellor of the University of Massachusetts Lowell; government experience (including as a member of the U.S. House of Representatives); academic experience |
| 128
Trustee and Officer Information
| | | | | | | | |
Name and Year of Birth | | Position(s) Held with the Trusts, Length of Time Served and Term of Office1 | | Principal Occupation(s) During Past 5 Years | | Number of Portfolios in Fund Complex Overseen2 and Other Directorships Held During Past 5 Years | | Experience, Qualifications, Attributes, Skills for Board Membership |
|
INDEPENDENT TRUSTEES continued |
| | | | |
Sandra O. Moose (1942) | | Chairperson of the Board of Trustees since November 2005 Trustee since 1982 for Natixis Funds Trust I (including its predecessors) and since 2003 for Loomis Sayles Funds II Ex Officio member of the Audit Committee, the Contract Review Committee and the Governance Committee | | President, Strategic Advisory Services (management consulting) | | 42 Director, AES Corporation (international power company); formerly, Director, Rohm and Haas Company (specialty chemicals); formerly, Director, Verizon Communications (telecommunications company) | | Significant experience on the Board and on the board of other business organizations (including at a telecommunications company, an international power company and a specialty chemicals corporation); executive experience (including at a management consulting company) |
| | | | |
Erik R. Sirri (1958) | | Trustee since 2009 for Natixis Funds Trust I and Loomis Sayles Funds II Audit Committee Member | | Professor of Finance at Babson College | | 42 None | | Significant experience on the Board; experience as Director of the Division of Trading and Markets at the Securities and Exchange Commission; academic experience; training as an economist |
129 |
Trustee and Officer Information
| | | | | | | | |
Name and Year of Birth | | Position(s) Held with the Trusts, Length of Time Served and Term of Office1 | | Principal Occupation(s) During Past 5 Years | | Number of Portfolios in Fund Complex Overseen2 and Other Directorships Held During Past 5 Years | | Experience, Qualifications, Attributes, Skills for Board Membership |
|
INDEPENDENT TRUSTEES continued |
| | | | |
Peter J. Smail (1952) | | Trustee since 2009 for Natixis Funds Trust I and Loomis Sayles Funds II Chairman of the Contract Review Committee and Governance Committee Member | | Retired | | 42 None | | Significant experience on the Board; mutual fund industry and executive experience (including roles as president and chief executive officer for an investment adviser) |
| | | | |
Cynthia L. Walker (1956) | | Trustee since 2005 for Natixis Funds Trust I and Loomis Sayles Funds II Chairperson of the Governance Committee and Contract Review Committee Member | | Deputy Dean for Finance and Administration, Yale University School of Medicine | | 42 None | | Significant experience on the Board; executive experience in a variety of academic organizations (including roles as dean for finance and administration) |
|
| INTERESTED TRUSTEES |
| | | | |
Robert J. Blanding3 (1947) 555 California Street San Francisco, CA 94104 | | Trustee since 2003 for Natixis Funds Trust I and since 2002 for Loomis Sayles Funds II Chief Executive Officer of Loomis Sayles Funds II since 2002 | | Chairman, Director and Chief Executive Officer (formerly, President), Loomis, Sayles & Company, L.P. | | 42 None | | Significant experience on the Board; continuing service as Chairman and Chief Executive Officer of Loomis, Sayles & Company, L.P. |
| 130
Trustee and Officer Information
| | | | | | | | |
Name and Year of Birth | | Position(s) Held with the Trusts, Length of Time Served and Term of Office1 | | Principal Occupation(s) During Past 5 Years | | Number of Portfolios in Fund Complex Overseen2 and Other Directorships Held During Past 5 Years | | Experience, Qualifications, Attributes, Skills for Board Membership |
|
INTERESTED TRUSTEES continued |
| | | | |
David L. Giunta4 (1965) | | Trustee since 2011 for Natixis Funds Trust I and Loomis Sayles Funds II President and Chief Executive Officer of Natixis Funds Trust I and President of Loomis Sayles Funds II since 2008 | | President and Chief Executive Officer, NGAM Distribution Corporation, NGAM Advisors, L.P. and NGAM Distribution, L.P. | | 42 None | | Experience on the Board; continuing experience as President and Chief Executive Officer of NGAM Advisors, L.P. |
| | | | |
John T. Hailer5 (1960) | | Trustee since 2000 for Natixis Funds Trust I and since 2003 for Loomis Sayles Funds II | | President and Chief Executive Officer – U.S. and Asia, Natixis Global Asset Management, L.P. | | 42 None | | Significant experience on the Board; continuing experience as President and Chief Executive Officer – U.S. and Asia, Natixis Global Asset Management, L.P. |
| 1 | Each trustee serves until retirement, resignation or removal from the Board. The current retirement age is 75. The position of Chairperson of the Board is appointed for a three-year term. Ms. Moose was appointed to serve an additional three-year term as the Chairperson of the Board on December 13, 2013. |
| 2 | The trustees of the Trusts serve as trustees of a fund complex that includes all series of the Natixis Funds Trust I, Natixis Funds Trust II, Natixis Funds Trust IV and Gateway Trust (collectively, the “Natixis Funds Trusts”), Loomis Sayles Funds I and Loomis Sayles Funds II (collectively, the “Loomis Sayles Funds Trusts”). |
| 3 | Mr. Blanding is deemed an “interested person” of the Trusts because he holds the following positions with an affiliated person of the Trusts: Chairman, Director and Chief Executive Officer of Loomis, Sayles & Company, L.P. and Director of Loomis Sayles Investment Asia Pte., Ltd. |
| 4 | Mr. Giunta is deemed an “interested person” of the Trusts because he holds the following positions with an affiliated person of the Trusts: President and Chief Executive Officer of NGAM Distribution Corporation, NGAM Advisors, L.P. and NGAM Distribution, L.P. |
| 5 | Mr. Hailer is deemed an “interested person” of the Trusts because he holds the following positions with an affiliated person of the Trusts: President and Chief Executive Officer – U.S. and Asia, Natixis Global Asset Management, L.P. |
131 |
Trustee and Officer Information
| | | | | | |
Name and Year of Birth | | Position(s) Held with the Trusts | | Term of Office1 and Length of Time Served | | Principal Occupation(s) During Past 5 Years2 |
|
| OFFICERS OF THE TRUST |
| | | |
Coleen Downs Dinneen (1960) | | Secretary, Clerk and Chief Legal Officer | | Since September 2004 | | Executive Vice President, General Counsel, Secretary and Clerk, NGAM Distribution Corporation, NGAM Advisors, L.P. and NGAM Distribution, L.P. |
| | | |
Daniel J. Fuss (1933) One Financial Center Boston, MA 02111 | | Executive Vice President of Loomis Sayles Funds II | | Since June 2003 | | Vice Chairman and Director, Loomis, Sayles & Company, L.P. |
| | | |
Russell L. Kane (1969) | | Chief Compliance Officer, Assistant Secretary and Anti-Money Laundering Officer | | Chief Compliance Officer since May 2006; Assistant Secretary since June 2004; and Anti-Money Laundering Officer since April 2007 | | Chief Compliance Officer for Mutual Funds, Senior Vice President, Deputy General Counsel, Assistant Secretary and Assistant Clerk, NGAM Distribution Corporation, NGAM Advisors, L.P. and NGAM Distribution, L.P. |
| | | |
Michael C. Kardok (1959) | | Treasurer, Principal Financial and Accounting Officer | | Since October 2004 | | Senior Vice President, NGAM Advisors, L.P. and NGAM Distribution, L.P. |
| 1 | Each officer of the Trusts serves for an indefinite term in accordance with the Trusts’ current by-laws until the date his or her successor is elected and qualified, or until he or she sooner dies, retires, is removed or becomes disqualified. |
| 2 | Each person listed above, except as noted, holds the same position(s) with the Fund Complex. Mr. Fuss is not an officer of the Natixis Funds Trusts. Previous positions during the past five years with NGAM Distribution, L.P., NGAM Advisors, L.P. or Loomis, Sayles & Company, L.P. are omitted, if not materially different from a trustee’s or officer’s current position with such entity. |
| 132
ANNUAL REPORT
September 30, 2014

Loomis Sayles Investment Grade Bond Fund

TABLE OF CONTENTS
Portfolio Review page 1
Portfolio of Investments page 11
Financial Statements page 28
Notes to Financial Statements page 38
Barron’s/Lipper 2013 one-year ranking is based on 64 qualifying U.S. fund companies. Award recipient must have at least three funds in Lipper’s general U.S.-stock category (including at least one world and one mixed asset/balanced), two taxable bond and one tax-exempt bond fund. Natixis was not ranked for the 5- and 10-year periods. Past performance is no guarantee of future results.
For more details visit ngam.natixis.com/TopFundFamily
LOOMIS SAYLES INVESTMENT GRADE BOND FUND
| | | | |
| Managers | | Symbols | | |
| Matthew J. Eagan, CFA® | | Class A | | LIGRX |
| Daniel J. Fuss, CFA®, CIC | | Class B | | LGBBX |
| Brian P. Kennedy | | Class C | | LGBCX |
| Elaine M. Stokes | | Class N | | LGBNX |
| Loomis, Sayles & Company, L.P. | | Class Y | | LSIIX |
| | Admin Class | | LIGAX |
Objective
High total investment return through a combination of current income and capital appreciation.
Market Conditions
In January 2014, the U.S. Federal Reserve (the Fed) began tapering its quantitative easing (QE) program. The Fed reduced its monthly bond purchases by $10 billion per policy meeting with the goal of concluding the program in October 2014. Despite the reduced Fed bond buying, the fixed-income market remained resilient. By the third quarter of 2014, global unrest in the Middle East and Eastern Europe led to a decline in the market. Additionally, more hawkish announcements from the Fed triggered uncertainty surrounding future rate policy.
Against the backdrop of a rallying U.S. dollar, foreign currencies struggled during the first nine months of 2014. In particular, the New Zealand and Australian dollars sagged due to concerns about slower economic expansion in China and waning demand for commodities. Additionally, the Central Bank of New Zealand stated its local dollar was too strong, prompting an immediate selloff during the third quarter. In general, U.S. Treasuries benefited from market conditions in the third quarter. Yields on short maturities rose, but yields on 10- and 30-year Treasuries fell 4 and 16 basis points, respectively.
Performance Results
For the 12 months ended September 30, 2014, Class A shares of Loomis Sayles Investment Grade Bond Fund returned 6.04%. The Fund outperformed its benchmark, the Barclays U.S. Government/Credit Bond Index, which returned 4.08%.
Explanation of Fund Performance
High-yield and investment-grade credits were among the largest contributors to the Fund’s relative outperformance, primarily due to security selection. In particular, selected banking, basic industry and electric names bolstered results. In addition, out-of-benchmark positions in convertible securities boosted the Fund’s performance, as the sector posted positive results and favorable relative returns. Within the sector, one particular technology name performed exceptionally well. We also opportunistically added to the Fund’s non-benchmark, non-U.S.-dollar holdings during the period. Within this allocation, securities denominated in the euro, British pound sterling, Icelandic krona and Indonesian rupiah
1 |
were leading contributors. In addition, an out-of-benchmark common stock position buoyed performance.
Overall, allocations to non-U.S.-dollar-denominated issues weighed on relative performance. In particular, positions denominated in the Canadian dollar, New Zealand dollar, Norwegian krone, Australian dollar, Mexican peso and Brazilian real were notable detractors, as the dollar rallied versus most foreign currencies. In addition, a small position in asset-backed securities related to auto loans weighed on relative performance during the period.
Outlook
A healthier U.S. economy and accommodative monetary policies abroad should help global growth in 2015. U.S. core inflation remains well below the 2.0% target set by the Fed, giving policy makers time to evaluate potential shifts away from historically low rates. We do not believe the Fed will raise rates until the third quarter of 2015, and the pace of hikes may be slow and gradual.
We believe corporate bonds can outperform if rates rise slowly on the back of stronger U.S. economic fundamentals. Corporate credit fundamentals remain sound, profits are positive and companies issuing new debt are primarily using the proceeds to refinance. Market liquidity remains good despite recent volatility in the bond markets, and opportunities have improved with higher yields. While we do not foresee a large liquidity drain in fixed income markets, we constantly monitor for indications of future flows.
We continue to pursue a lower sensitivity to rising U.S. Treasury yields through lower nominal durations and diversification across multiple market sectors. We believe current markets will reward solid security selection, and our objective is to drive returns through capital appreciation and attractive income.
Growth of $10,000 Investment in Class A Shares4
September 30, 2004 through September 30, 2014
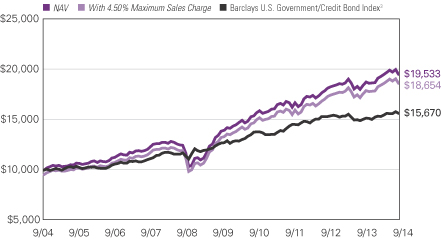
See notes to chart on page 3.
| 2
LOOMIS SAYLES INVESTMENT GRADE BOND FUND
Average Annual Total Returns — September 30, 20144
| | | | | | | | | | | | | | | | |
| | | | | |
| | | 1 Year | | | 5 Years | | | 10 Years | | | Life of Class N | |
| | | | | |
| Class A (Inception 12/31/96) | | | | | | | | | | | | | | | | |
| NAV | | | 6.04 | % | | | 7.10 | % | | | 6.93 | % | | | — | % |
| With 4.50% Maximum Sales Charge | | | 1.23 | | | | 6.11 | | | | 6.43 | | | | — | |
| | | | | |
| Class B (Inception 9/12/03) | | | | | | | | | | | | | | | | |
| NAV | | | 5.17 | | | | 6.27 | | | | 6.06 | | | | — | |
| With CDSC2 | | | 0.22 | | | | 5.95 | | | | 6.06 | | | | — | |
| | | | | |
| Class C (Inception 9/12/03) | | | | | | | | | | | | | | | | |
| NAV | | | 5.29 | | | | 6.30 | | | | 6.12 | | | | — | |
| With CDSC2 | | | 4.30 | | | | 6.30 | | | | 6.12 | | | | — | |
| | | | | |
| Class N (Inception 2/1/13) | | | | | | | | | | | | | | | | |
| NAV | | | 6.41 | | | | — | | | | — | | | | 3.22 | |
| | | | | |
| Class Y (Inception 12/31/96) | | | | | | | | | | | | | | | | |
| NAV | | | 6.30 | | | | 7.37 | | | | 7.22 | | | | — | |
| | | | | |
| Admin Class (Inception 2/1/10)1 | | | | | | | | | | | | | | | | |
| NAV | | | 5.79 | | | | 6.81 | | | | 6.52 | | | | — | |
| | | | | |
| Comparative Performance | | | | | | | | | | | | | | | | |
| Barclays U.S. Government/Credit Bond Index3 | | | 4.08 | | | | 4.27 | | | | 4.59 | | | | 1.58 | |
Past performance does not guarantee future results. The table(s) do not reflect taxes shareholders might owe on any Fund distributions or when they redeem their shares. Performance for periods less than one year is cumulative, not annualized. Returns reflect changes in share price and reinvestment of dividends and capital gains, if any. Unlike a fund, an index is not managed and does not reflect fees and expenses.
| 1 | Prior to the inception of Admin Class shares (2/1/10), performance is that of Class A shares, restated to reflect the higher net expenses of Admin Class shares. |
| 2 | Performance for Class B shares assumes a maximum 5% contingent deferred sales charge (“CDSC”) applied when you sell shares, which declines annually between years 1-6 according to the following schedule: 5, 4, 3, 3, 2, 1, 0%. Class C shares performance assumes a 1% CDSC applied when you sell shares within one year of purchase. |
| 3 | Barclays U.S. Government/Credit Bond Index is an unmanaged index that includes U.S. Treasuries, government-related issues, and investment grade U.S. corporate securities. |
| 4 | Fund performance has been increased by fee waivers and/or expense reimbursements, if any, without which performance would have been lower. |
3 |
ADDITIONAL INFORMATION
The views expressed in this report reflect those of the portfolio managers as of the dates indicated. The managers’ views are subject to change at any time without notice based on changes in market or other conditions. References to specific securities or industries should not be regarded as investment advice. Because the fund is actively managed, there is no assurance that it will continue to invest in the securities or industries mentioned.
ADDITIONAL INDEX INFORMATION
This document may contain references to third party copyrights, indexes, and trademarks, each of which is the property of its respective owner. Such owner is not affiliated with Natixis Global Asset Management or any of its related or affiliated companies (collectively “NGAM”) and does not sponsor, endorse or participate in the provision of any NGAM services, funds or other financial products.
The index information contained herein is derived from third parties and is provided on an “as is” basis. The user of this information assumes the entire risk of use of this information. Each of the third party entities involved in compiling, computing or creating index information disclaims all warranties (including, without limitation, any warranties of originality, accuracy, completeness, timeliness, non-infringement, merchantability and fitness for a particular purpose) with respect to such information.
PROXY VOTING INFORMATION
A description of the fund’s proxy voting policies and procedures is available without charge, upon request, by calling Natixis Funds at 800-225-5478; on the fund’s website at ngam.natixis.com; and on the Securities and Exchange Commission’s (“SEC’s”) website at www.sec.gov. Information regarding how the fund voted proxies relating to portfolio securities during the 12 months ended June 30, 2014 is available from the fund’s website and the SEC’s website.
QUARTERLY PORTFOLIO SCHEDULES
The fund files a complete schedule of portfolio holdings with the SEC for the first and third quarters of each fiscal year on Form N-Q. The fund’s Forms N-Q are available on the SEC’s website at www.sec.gov and may be reviewed and copied at the SEC’s Public Reference Room in Washington, DC. Information on the operation of the Public Reference Room may be obtained by calling 800-SEC-0330.
| 4
UNDERSTANDING YOUR FUND’S EXPENSES
As a mutual fund shareholder, you incur different types of costs: transaction costs, including sales charges (loads) on purchases and contingent deferred sales charges on redemptions; and ongoing costs, including management fees, distribution fees (12b-1 fees) and/or service fees, and other fund expenses. Certain exemptions may apply. These costs are described in more detail in the Fund’s prospectus. The following examples are intended to help you understand the ongoing costs of investing in the Fund and help you compare these with the ongoing costs of investing in other mutual funds.
The first line in the table for each class of Fund shares shows the actual account values and actual fund expenses you would have paid on a $1,000 investment in the Fund from April 1, 2014 through September 30, 2014. To estimate the expenses you paid over the period, simply divide your account value by $1,000 (for example $8,600 account value divided by $1,000 = 8.60) and multiply the result by the number in the Expenses Paid During Period row as shown below for your class.
The second line in the table for each class of Fund shares provides information about hypothetical account values and hypothetical expenses based on the Fund’s actual expense ratios and an assumed rate of return of 5% per year before expenses, which is not the Fund’s actual return. The hypothetical account values and expenses may not be used to estimate the actual ending account balance or expenses you paid on your investment for the period. You may use this information to compare the ongoing costs of investing in the Fund to other funds. To do so, compare this 5% hypothetical example with the 5% hypothetical examples that appear in the shareholder reports of the other funds.
Please note that the expenses shown reflect ongoing costs only, and do not include any transaction costs. Therefore, the second line in the table is useful in comparing ongoing costs only, and will not help you determine the relative costs of owning different funds. If transaction costs were included, total costs would be higher.
5 |
| | | | | | | | | | | | |
LOOMIS SAYLES INVESTMENT GRADE
BOND FUND | | BEGINNING
ACCOUNT VALUE
4/1/2014 | | | ENDING
ACCOUNT VALUE
9/30/2014 | | | EXPENSES PAID
DURING PERIOD*
4/1/2014 – 9/30/2014 | |
| Class A | | | | | | | | | | | | |
| Actual | | | $1,000.00 | | | | $1,010.60 | | | | $4.18 | |
| Hypothetical (5% return before expenses) | | | $1,000.00 | | | | $1,020.91 | | | | $4.20 | |
| Class B | | | | | | | | | | | | |
| Actual | | | $1,000.00 | | | | $1,005.90 | | | | $7.95 | |
| Hypothetical (5% return before expenses) | | | $1,000.00 | | | | $1,017.15 | | | | $7.99 | |
| Class C | | | | | | | | | | | | |
| Actual | | | $1,000.00 | | | | $1,006.90 | | | | $7.95 | |
| Hypothetical (5% return before expenses) | | | $1,000.00 | | | | $1,017.15 | | | | $7.99 | |
| Class N | | | | | | | | | | | | |
| Actual | | | $1,000.00 | | | | $1,012.50 | | | | $2.37 | |
| Hypothetical (5% return before expenses) | | | $1,000.00 | | | | $1,022.71 | | | | $2.38 | |
| Class Y | | | | | | | | | | | | |
| Actual | | | $1,000.00 | | | | $1,011.90 | | | | $2.93 | |
| Hypothetical (5% return before expenses) | | | $1,000.00 | | | | $1,022.16 | | | | $2.94 | |
| Admin Class | | | | | | | | | | | | |
| Actual | | | $1,000.00 | | | | $1,009.40 | | | | $5.44 | |
| Hypothetical (5% return before expenses) | | | $1,000.00 | | | | $1,019.65 | | | | $5.47 | |
| * | Expenses are equal to the Fund’s annualized expense ratio: 0.83%, 1.58%, 1.58%, 0.47%, 0.58% and 1.08% for Class A, B, C, N, Y and Admin Class, respectively, multiplied by the average account value over the period, multiplied by the number of days in the most recent fiscal half-year (183), divided by 365 (to reflect the half-year period). |
| 6
BOARD APPROVAL OF THE EXISTING ADVISORY AGREEMENT
The Board of Trustees of the Trust (the “Board”), including the Independent Trustees, considers matters bearing on the Fund’s advisory agreement (the “Agreement”) at most of its meetings throughout the year. Each year, usually in the spring, the Contract Review Committee of the Board meets to review the Agreement to determine whether to recommend that the full Board approve the continuation of the Agreement, typically for an additional one-year period. After the Committee has made its recommendation, the full Board, including the Independent Trustees, determines whether to approve the continuation of the Agreement.
In connection with these meetings, the Trustees receive materials that the Fund’s investment adviser (the “Adviser”) believes to be reasonably necessary for the Trustees to evaluate the Agreement. These materials generally include, among other items, (i) information on the investment performance of the Fund and the performance of a peer group and category of funds and the Fund’s performance benchmarks, (ii) information on the Fund’s advisory fee and other expenses, including information comparing the Fund’s expenses to the fees charged to institutional accounts with similar strategies managed by the Adviser, if any, and to those of a peer group of funds and information about any applicable expense caps and fee “breakpoints,” (iii) sales and redemption data in respect of the Fund, (iv) information about the profitability of the Agreement to the Adviser and (v) information obtained through the completion by the Adviser of a questionnaire distributed on behalf of the Trustees. The Board, including the Independent Trustees, also considers other matters such as (i) the Adviser’s financial results and/or financial condition, (ii) the Fund’s investment objective and strategies and the size, education and experience of the Adviser’s investment staff and its use of technology, external research and trading cost measurement tools, (iii) arrangements in respect of the distribution of the Fund’s shares and the related costs, (iv) the procedures employed to determine the value of the Fund’s assets, (v) the allocation of the Fund’s brokerage, if any, including, if applicable, allocations to brokers affiliated with the Adviser and the use of “soft” commission dollars to pay Fund expenses and to pay for research and other similar services, (vi) the resources devoted to, and the record of compliance with, the Fund’s investment policies and restrictions, policies on personal securities transactions and other compliance policies, (vii) information about amounts invested by the Fund’s portfolio managers in the Fund or in similar accounts that they manage and (viii) the general economic outlook with particular emphasis on the mutual fund industry. Throughout the process, the Trustees are afforded the opportunity to ask questions of and request additional materials from the Adviser.
In addition to the materials requested by the Trustees in connection with their annual consideration of the continuation of the Agreement, the Trustees receive materials in advance of each regular quarterly meeting of the Board that provide detailed information about the Fund’s investment performance and the fees charged to the Fund for advisory and other services. This information generally includes, among other things, an internal performance rating for the Fund based on agreed-upon criteria, graphs showing the Fund’s performance and fee differentials against the Fund’s peer group/category, performance ratings provided by a third-party, total return information for various periods, and
7 |
third-party performance rankings for various periods comparing the Fund against similarly categorized funds. The portfolio management team for the Fund or other representatives of the Adviser make periodic presentations to the Contract Review Committee and/or the full Board, and if the Fund is identified as presenting possible performance concerns it may be subject to more frequent board presentations and reviews. In addition, each quarter the Trustees are provided with detailed statistical information about the Fund’s portfolio. The Trustees also receive periodic updates between meetings.
The Board most recently approved the continuation of the Agreement at its meeting held in June 2014. The Agreement was continued for a one-year period. In considering whether to approve the continuation of the Agreement, the Board, including the Independent Trustees, did not identify any single factor as determinative. Individual Trustees may have evaluated the information presented differently from one another, giving different weights to various factors. Matters considered by the Trustees, including the Independent Trustees, in connection with their approval of the Agreement included, but were not limited to, the factors listed below.
The nature, extent and quality of the services provided to the Fund under the Agreement. The Trustees considered the nature, extent and quality of the services provided by the Adviser and its affiliates to the Fund and the resources dedicated to the Fund by the Adviser and its affiliates.
The Trustees considered not only the advisory services provided by the Adviser to the Fund, but also the administrative services provided by NGAM Advisors, L.P. (“NGAM Advisors”) and its affiliates to the Fund.
The Trustees also considered the benefits to shareholders of investing in a mutual fund that is part of a family of funds that offers shareholders the right to exchange shares of one type of fund for shares of another type of fund, and provides a variety of fund and shareholder services.
After reviewing these and related factors, the Trustees concluded, within the context of their overall conclusions regarding the Agreement, that the nature, extent and quality of services provided supported the renewal of the Agreement.
Investment performance of the Fund and the Adviser. As noted above, the Trustees received information about the performance of the Fund over various time periods, including information that compared the performance of the Fund to the performance of a peer group and category of funds and the Fund’s performance benchmark. In addition, the Trustees also reviewed data prepared by an independent third party that analyzed the performance of the Fund using a variety of performance metrics, including metrics that also measured the performance of the Fund on a risk adjusted basis. The Board concluded that the Fund’s performance or other relevant factors supported the renewal of the Fund’s Agreement.
The Trustees also considered the Adviser’s performance and reputation generally, the performance of the fund family generally, and the historical responsiveness of the Adviser to Trustee concerns about performance and the willingness of the Adviser to take steps intended to improve performance.
After reviewing these and related factors, the Trustees concluded, within the context of their overall conclusions regarding the Agreement, that the performance of the Fund and the Adviser supported the renewal of the Agreement.
| 8
The costs of the services to be provided and profits to be realized by the Adviser and its affiliates from their respective relationships with the Fund. The Trustees considered the fees charged to the Fund for advisory services as well as the total expense level of the Fund. This information included comparisons (provided both by management and also by an independent third party) of the Fund’s advisory fee and total expense level to those of its peer group and information about the advisory fees charged by the Adviser to comparable accounts (such as institutional separate accounts), as well as information about differences in such fees and the reasons for any such differences. In considering the fees charged to comparable accounts, the Trustees considered, among other things, management’s representations about the differences between managing mutual funds as compared to other types of accounts, including the additional resources required to effectively manage mutual fund assets and the greater regulatory costs associated with the management of such assets. In evaluating the Fund’s advisory fee, the Trustees also took into account the demands, complexity and quality of the investment management of the Fund, as well as the need for the Adviser to offer competitive compensation in order to attract and retain capable personnel and the need for the Adviser to expend additional resources as the Fund grows in size. The Trustees considered that over the past several years, management had made recommendations regarding reductions in advisory fee rates, implementation of advisory fee breakpoints and the institution of advisory fee waivers and expense caps for various funds in the fund family. They noted that the Fund currently has an expense cap in place, although the current expenses of the Fund are below the cap.
The Trustees also considered the compensation directly or indirectly received by the Adviser and its affiliates from their relationships with the Fund. The Trustees reviewed information provided by management as to the profitability of the Adviser’s and its affiliates’ relationships with the Fund, and information about the allocation of expenses used to calculate profitability. They also reviewed information provided by management about the effect of distribution costs and changes in asset levels on Adviser profitability, including information regarding resources spent on distribution activities. When reviewing profitability, the Trustees also considered information about court cases in which adviser compensation or profitability were issues, the performance of the Fund, the expense levels of the Fund and whether the Adviser had implemented breakpoints and/or expense caps with respect to the Fund.
After reviewing these and related factors, the Trustees concluded, within the context of their overall conclusions regarding the Agreement, that the advisory fee charged to the Fund was fair and reasonable, and that the costs of these services generally and the related profitability of the Adviser and its affiliates in respect of their relationships with the Fund supported the renewal of the Agreement.
Economies of Scale. The Trustees considered the existence of any economies of scale in the provision of services by the Adviser and whether those economies are shared with the Fund through breakpoints in its investment advisory fee or other means, such as expense waivers or caps. The Trustees also discussed with management the factors considered with respect to the implementation of breakpoints in investment advisory fees or expense waivers or caps for certain funds. Management explained that a number of factors are taken into account in considering the possible implementation of breakpoints or an expense cap for a fund, including, among other things, factors such as a fund’s assets, the projected growth of a
9 |
fund, projected profitability and a fund’s fees and performance. With respect to economies of scale, the Trustees noted that the Fund was subject to an expense cap and the Fund’s overall net expense ratio was below the median compared to a peer group of funds. The Trustees considered that current expenses are below the cap. In considering these issues, the Trustees also took note of the costs of the services provided (both on an absolute and a relative basis) and the profitability to the Adviser and its affiliates of their relationships with the Fund, as discussed above.
After reviewing these and related factors, the Trustees concluded, within the context of their overall conclusions regarding the Agreement, that the extent to which economies of scale were shared with the Fund supported the renewal of the Agreement.
The Trustees also considered other factors, which included but were not limited to the following:
| · | | The effect of recent market and economic events on the performance, asset levels and expense ratios of the Fund. |
| · | | Whether the Fund has operated in accordance with its investment objective and the Fund’s record of compliance with its investment restrictions, and the compliance programs of the Fund and the Adviser. They also considered the compliance-related resources the Adviser and its affiliates were providing to the Fund. |
| · | | The nature, quality, cost and extent of administrative and shareholder services performed by the Adviser and its affiliates, both under the Agreement and under a separate agreement covering administrative services. |
| · | | So-called “fallout benefits” to the Adviser, such as the engagement of affiliates of the Adviser to provide distribution, administrative and brokerage services to the Fund, and the benefits of research made available to the Adviser by reason of brokerage commissions (if any) generated by the Fund’s securities transactions. The Trustees also considered the benefits to the parent company of NGAM Advisors from the retention of the Adviser. The Trustees considered the possible conflicts of interest associated with these fallout and other benefits, and the reporting, disclosure and other processes in place to disclose and monitor such possible conflicts of interest. |
| · | | The Trustees’ review and discussion of the Fund’s advisory arrangements in prior years, and management’s record of responding to Trustee concerns raised during the year and in prior years. |
Based on their evaluation of all factors that they deemed to be material, including those factors described above, and assisted by the advice of independent counsel, the Trustees, including the Independent Trustees, concluded that the existing Agreement should be continued through June 30, 2015.
| 10
Portfolio of Investments – as of September 30, 2014
Loomis Sayles Investment Grade Bond Fund
| | | | | | | | |
Principal Amount (‡) | | | Description | | Value (†) | |
| | Bonds and Notes — 90.8% of Net Assets | |
| | Non-Convertible Bonds — 85.0% | |
| | | | ABS Car Loan — 0.5% | | | | |
| $ | 21,683,000 | | | Avis Budget Rental Car Funding AESOP LLC, Series 2010-3A, Class B, 6.740%, 5/20/2016, 144A | | $ | 22,187,260 | |
| | 20,999,250 | | | Avis Budget Rental Car Funding AESOP LLC, Series 2010-5A, Class B, 5.110%, 3/20/2017, 144A | | | 22,028,549 | |
| | 5,481,000 | | | Ford Auto Securitization Trust, Series 2010-R3A, Class D, 4.526%, 3/15/2017, 144A, (CAD) | | | 4,944,376 | |
| | | | | | | | |
| | | | | | | 49,160,185 | |
| | | | | | | | |
| | | | ABS Credit Card — 0.0% | | | | |
| | 2,324,000 | | | World Financial Network Credit Card Master Trust, Series 2010-A, Class B, 6.750%, 4/15/2019 | | | 2,410,360 | |
| | | | | | | | |
| | | | ABS Other — 2.0% | | | | |
| | 975,386 | | | Community Program Loan Trust, Series 1987-A, Class A5, 4.500%, 4/01/2029 | | | 983,935 | |
| | 57,694,000 | | | Crown Castle Towers LLC, 6.113%, 1/15/2040, 144A | | | 66,738,977 | |
| | 3,082,928 | | | Diamond Resorts Owner Trust, Series 2011-1, Class A,
4.000%, 3/20/2023, 144A | | | 3,144,220 | |
| | 58,168,166 | | | FAN Engine Securitization Ltd., Series 2013-1A, Class 1A, 4.625%, 10/15/2043, 144A(b)(g) | | | 57,499,232 | |
| | 7,391,490 | | | SVO VOI Mortgage Corp., Series 2009-BA, Class NT,
5.810%, 12/20/2028, 144A | | | 7,387,654 | |
| | 36,244,592 | | | Trinity Rail Leasing LP, Series 2009-1A, Class A, 6.657%, 11/16/2039, 144A | | | 41,850,471 | |
| | 14,369,725 | | | Trinity Rail Leasing LP, Series 2010-1A, Class A, 5.194%, 10/16/2040, 144A | | | 15,083,727 | |
| | 3,642,926 | | | Trinity Rail Leasing LP, Series 2012-1A, Class A1, 2.266%, 1/15/2043, 144A | | | 3,633,819 | |
| | 8,283,930 | | | Trip Rail Master Funding LLC, Series 2011-1A, Class A1A, 4.370%, 7/15/2041, 144A | | | 8,659,009 | |
| | | | | | | | |
| | | | | | | 204,981,044 | |
| | | | | | | | |
| | | | Aerospace & Defense — 1.1% | | | | |
| | 2,100,000 | | | Bombardier, Inc., 7.450%, 5/01/2034, 144A | | | 2,121,000 | |
| | 78,795,000 | | | Textron, Inc., 5.950%, 9/21/2021 | | | 90,761,990 | |
| | 11,040,000 | | | Textron, Inc., EMTN, 6.625%, 4/07/2020, (GBP) | | | 20,458,630 | |
| | | | | | | | |
| | | | | | | 113,341,620 | |
| | | | | | | | |
| | | | Airlines — 2.8% | | | | |
| | 5,014,678 | | | Air Canada Pass Through Trust, Series 2013-1, Class B, 5.375%, 11/15/2022, 144A | | | 5,140,045 | |
| | 11,384,683 | | | American Airlines Pass Through Trust, Series 2013-1, Class A, 4.000%, 1/15/2027 | | | 11,591,201 | |
| | 18,340,000 | | | Continental Airlines Pass Through Certificates, Series 2012-3, Class C, 6.125%, 4/29/2018 | | | 19,440,400 | |
| | 15,940 | | | Continental Airlines Pass Through Trust, Series 1997-1, Class A, 7.461%, 10/01/2016 | | | 16,318 | |
| | 426,953 | | | Continental Airlines Pass Through Trust, Series 1998-1, Class A, 6.648%, 3/15/2019 | | | 452,570 | |
| | 711,446 | | | Continental Airlines Pass Through Trust, Series 1999-1, Class A, 6.545%, 8/02/2020 | | | 788,852 | |
| | 7,681,981 | | | Continental Airlines Pass Through Trust, Series 2000-1, Class A-1, 8.048%, 5/01/2022 | | | 8,843,496 | |
See accompanying notes to financial statements.
11 |
Portfolio of Investments – as of September 30, 2014
Loomis Sayles Investment Grade Bond Fund – (continued)
| | | | | | | | |
Principal Amount (‡) | | | Description | | Value (†) | |
| | | | Airlines — continued | | | | |
| $ | 1,629,450 | | | Continental Airlines Pass Through Trust, Series 2000-2, Class A-1, 7.707%, 10/02/2022 | | $ | 1,835,086 | |
| | 3,068,771 | | | Continental Airlines Pass Through Trust, Series 2001-1, Class A-1, 6.703%, 12/15/2022 | | | 3,314,272 | |
| | 50,526,164 | | | Continental Airlines Pass Through Trust, Series 2007-1, Class A, 5.983%, 10/19/2023 | | | 56,084,042 | |
| | 10,908,462 | | | Continental Airlines Pass Through Trust, Series 2007-1, Class B, 6.903%, 10/19/2023 | | | 11,739,687 | |
| | 21,913,886 | | | Continental Airlines Pass Through Trust, Series 2009-1, 9.000%, 1/08/2018 | | | 24,105,274 | |
| | 17,322,099 | | | Continental Airlines Pass Through Trust, Series 2009-2, Class A, 7.250%, 5/10/2021 | | | 20,310,161 | |
| | 2,754,354 | | | Continental Airlines Pass Through Trust, Series 2012-1, Class B, 6.250%, 10/11/2021 | | | 2,933,387 | |
| | 1,586,442 | | | Delta Air Lines Pass Through Trust, Series 2007-1, Class A, 6.821%, 2/10/2024 | | | 1,848,205 | |
| | 10,644,503 | | | Delta Air Lines Pass Through Trust, Series 2007-1, Class B, 8.021%, 2/10/2024 | | | 12,427,458 | |
| | 24,925,015 | | | Delta Air Lines Pass Through Trust, Series 2009-1, Class A, 7.750%, 6/17/2021 | | | 29,162,267 | |
| | 2,236,278 | | | Delta Air Lines Pass Through Trust, Series 2009-1, Series B, 9.750%, 6/17/2018 | | | 2,515,812 | |
| | 14,922,886 | | | Delta Air Lines Pass Through Trust, Series 2010-1, Class A, 6.200%, 1/02/2020 | | | 16,542,019 | |
| | 5,101,259 | | | Northwest Airlines, Inc., Series 2007-1, Class B, 8.028%, 5/01/2019 | | | 5,687,903 | |
| | 20,266,772 | | | UAL Pass Through Trust, Series 2007-1, Class A, 6.636%, 1/02/2024 | | | 21,888,113 | |
| | 392,329 | | | UAL Pass Through Trust, Series 2009-1, 10.400%, 5/01/2018 | | | 434,505 | |
| | 14,714,233 | | | US Airways Pass Through Trust, Series 2011-1, Class A, 7.125%, 4/22/2025 | | | 17,068,511 | |
| | 9,492,177 | | | US Airways Pass Through Trust, Series 2012-2A, Class A, 4.625%, 12/03/2026 | | | 9,895,594 | |
| | 2,810,075 | | | Virgin Australia Pass Through Trust, Series 2013-1A, 5.000%, 4/23/2025, 144A | | | 2,928,519 | |
| | | | | | | | |
| | | | | | | 286,993,697 | |
| | | | | | | | |
| | | | Automotive — 1.0% | | | | |
| | 23,581,000 | | | Cummins, Inc., 5.650%, 3/01/2098 | | | 26,678,152 | |
| | 5,274,000 | | | Cummins, Inc., 6.750%, 2/15/2027 | | | 6,585,211 | |
| | 2,680,000 | | | Ford Motor Co., 6.375%, 2/01/2029 | | | 3,191,274 | |
| | 125,000 | | | Ford Motor Co., 6.500%, 8/01/2018 | | | 144,454 | |
| | 255,000 | | | Ford Motor Co., 6.625%, 2/15/2028 | | | 297,536 | |
| | 5,074,000 | | | Ford Motor Co., 6.625%, 10/01/2028 | | | 6,239,706 | |
| | 3,243,000 | | | Ford Motor Co., 7.400%, 11/01/2046 | | | 4,424,869 | |
| | 4,569,000 | | | Ford Motor Co., 7.450%, 7/16/2031 | | | 6,032,570 | |
| | 240,000 | | | Ford Motor Co., 7.500%, 8/01/2026 | | | 302,729 | |
| | 5,000,000 | | | Ford Motor Credit Co. LLC, 5.000%, 5/15/2018 | | | 5,460,730 | |
| | 40,126,000 | | | Ford Motor Credit Co. LLC, 6.625%, 8/15/2017 | | | 45,361,600 | |
| | 2,370,000 | | | Goodyear Tire & Rubber Co. (The), 7.000%, 3/15/2028 | | | 2,500,350 | |
| | | | | | | | |
| | | | | | | 107,219,181 | |
| | | | | | | | |
See accompanying notes to financial statements.
| 12
Portfolio of Investments – as of September 30, 2014
Loomis Sayles Investment Grade Bond Fund – (continued)
| | | | | | | | |
Principal Amount (‡) | | | Description | | Value (†) | |
| | | | Banking — 14.2% | | | | |
| $ | 22,547,000 | | | AgriBank FCB, 9.125%, 7/15/2019, 144A | | $ | 28,680,641 | |
| | 2,285,000 | | | Ally Financial, Inc., 8.000%, 11/01/2031 | | | 2,844,825 | |
| | 7,200,000 | | | American Express Centurion Bank, Series BKN1, 6.000%, 9/13/2017 | | | 8,108,921 | |
| | 35,878,000 | | | Associates Corp. of North America, 6.950%, 11/01/2018 | | | 42,076,965 | |
| | 11,400,000 | | | Banco Santander Brasil S.A., 8.000%, 3/18/2016, 144A, (BRL) | | | 4,447,758 | |
| | 11,641,000 | | | Bank of America Corp., 2.600%, 1/15/2019 | | | 11,618,323 | |
| | 3,590,000 | | | Bank of America Corp., 5.420%, 3/15/2017 | | | 3,888,031 | |
| | 3,132,000 | | | Bank of America Corp., EMTN, 4.625%, 9/14/2018, (EUR) | | | 4,461,348 | |
| | 16,757,000 | | | Bank of America Corp., MTN, 3.300%, 1/11/2023 | | | 16,343,454 | |
| | 100,000 | | | Bank of America Corp., MTN, 4.000%, 4/01/2024 | | | 101,042 | |
| | 11,000,000 | | | Bank of America Corp., MTN, 5.000%, 5/13/2021 | | | 12,079,738 | |
| | 2,393,000 | | | Bank of America Corp., Series L, MTN, 7.625%, 6/01/2019 | | | 2,890,880 | |
| | 17,249,000 | | | Bank of America NA, 5.300%, 3/15/2017 | | | 18,687,808 | |
| | 1,056,000 | | | Barclays Bank PLC, 6.050%, 12/04/2017, 144A | | | 1,173,812 | |
| | 7,110,000,000 | | | Barclays Bank PLC, EMTN, 3.680%, 8/20/2015, (KRW) | | | 6,829,238 | |
| | 337,230,000,000 | | | Barclays Financial LLC, EMTN, 8.250%, 10/27/2014, (IDR) | | | 27,713,996 | |
| | 2,173,000 | | | Bear Stearns Cos., Inc. (The), 4.650%, 7/02/2018 | | | 2,369,963 | |
| | 370,000 | | | BNP Paribas/Australia, 7.000%, 5/24/2016, (AUD) | | | 342,318 | |
| | 8,994,000 | | | Capital One Financial Corp., 6.150%, 9/01/2016 | | | 9,827,393 | |
| | 56,000,000 | | | Citigroup, Inc., 2.500%, 9/26/2018 | | | 56,364,224 | |
| | 17,000,000 | | | Citigroup, Inc., 3.500%, 5/15/2023 | | | 16,297,781 | |
| | 1,660,000 | | | Citigroup, Inc., 4.500%, 1/14/2022 | | | 1,779,829 | |
| | 2,700,000 | | | Citigroup, Inc., 5.365%, 3/06/2036, (CAD)(b)(g) | | | 2,526,276 | |
| | 2,740,000 | | | Citigroup, Inc., 5.875%, 2/22/2033 | | | 3,073,916 | |
| | 5,445,000 | | | Citigroup, Inc., 6.125%, 5/15/2018 | | | 6,165,085 | |
| | 8,705,000 | | | Citigroup, Inc., 6.125%, 8/25/2036 | | | 9,980,857 | |
| | 44,910,000 | | | Citigroup, Inc., 6.250%, 6/29/2017, (NZD) | | | 36,214,425 | |
| | 2,398,000 | | | Citigroup, Inc., EMTN, 1.440%, 11/30/2017, (EUR)(c) | | | 3,021,223 | |
| | 4,750,000 | | | Cooperatieve Centrale Raiffeisen-Boerenleenbank BA/Netherlands, 1.700%, 3/19/2018 | | | 4,745,554 | |
| | 21,855,000 | | | Cooperatieve Centrale Raiffeisen-Boerenleenbank BA/Netherlands, 3.875%, 2/08/2022 | | | 23,021,642 | |
| | 5,265,000 | | | Cooperatieve Centrale Raiffeisen-Boerenleenbank BA/Netherlands, 3.950%, 11/09/2022 | | | 5,287,413 | |
| | 86,800,000 | | | Goldman Sachs Group, Inc. (The), 3.375%, 2/01/2018, (CAD) | | | 79,694,483 | |
| | 1,174,000 | | | Goldman Sachs Group, Inc. (The), 6.450%, 5/01/2036 | | | 1,367,278 | |
| | 112,330,000 | | | Goldman Sachs Group, Inc. (The), 6.750%, 10/01/2037 | | | 134,098,094 | |
| | 6,645,000 | | | Goldman Sachs Group, Inc. (The), GMTN, 5.375%, 3/15/2020 | | | 7,398,337 | |
| | 4,467,000 | | | HBOS PLC, 6.000%, 11/01/2033, 144A | | | 4,958,370 | |
| | 1,000,000 | | | HBOS PLC, GMTN, 6.750%, 5/21/2018, 144A | | | 1,131,154 | |
| | 700,000 | | | ICICI Bank Ltd., (fixed rate to 4/30/2017, variable rate thereafter), 6.375%, 4/30/2022, 144A | | | 730,100 | |
| | 36,745,000 | | | JPMorgan Chase & Co., 4.250%, 11/02/2018, (NZD) | | | 28,079,067 | |
| | 2,950,000 | | | JPMorgan Chase & Co., EMTN, 1.068%, 5/30/2017, (GBP)(c) | | | 4,717,831 | |
| | 16,000,000,000 | | | JPMorgan Chase Bank NA, 7.700%, 6/01/2016, 144A, (IDR) | | | 1,283,677 | |
| | 100,000 | | | Keybank NA, 6.950%, 2/01/2028 | | | 127,868 | |
| | 9,787,000 | | | Lloyds Bank PLC, EMTN, 4.570%, 10/13/2015, (CAD) | | | 8,971,934 | |
| | 81,622,000 | | | Lloyds Bank PLC, MTN, 6.500%, 9/14/2020, 144A | | | 94,899,287 | |
| | 6,479,000 | | | Merrill Lynch & Co., Inc., 5.700%, 5/02/2017 | | | 7,103,984 | |
See accompanying notes to financial statements.
13 |
Portfolio of Investments – as of September 30, 2014
Loomis Sayles Investment Grade Bond Fund – (continued)
| | | | | | | | |
Principal Amount (‡) | | | Description | | Value (†) | |
| | | | Banking — continued | | | | |
| $ | 103,309,000 | | | Merrill Lynch & Co., Inc., 6.110%, 1/29/2037 | | $ | 118,252,027 | |
| | 40,126,000 | | | Merrill Lynch & Co., Inc., Series C, MTN, 6.050%, 6/01/2034 | | | 46,158,101 | |
| | 78,200,000 | | | Morgan Stanley, 2.125%, 4/25/2018 | | | 78,191,789 | |
| | 4,250,000 | | | Morgan Stanley, 3.450%, 11/02/2015 | | | 4,370,318 | |
| | 30,000,000 | | | Morgan Stanley, 4.750%, 11/16/2018, (AUD) | | | 26,797,351 | |
| | 3,300,000 | | | Morgan Stanley, 4.875%, 11/01/2022 | | | 3,486,391 | |
| | 56,867,000 | | | Morgan Stanley, 5.500%, 7/24/2020 | | | 63,978,161 | |
| | 5,900,000 | | | Morgan Stanley, 5.750%, 1/25/2021 | | | 6,703,568 | |
| | 151,076,000 | | | Morgan Stanley, 7.600%, 8/08/2017, (NZD) | | | 125,009,698 | |
| | 60,800,000 | | | Morgan Stanley, 8.000%, 5/09/2017, (AUD) | | | 58,746,626 | |
| | 550,000 | | | Morgan Stanley, EMTN, 5.750%, 2/14/2017, (GBP) | | | 968,506 | |
| | 24,100,000 | | | Morgan Stanley, GMTN, 7.625%, 3/03/2016, (AUD) | | | 22,269,087 | |
| | 10,695,000 | | | Morgan Stanley, MTN, 4.100%, 5/22/2023 | | | 10,665,460 | |
| | 3,800,000 | | | Morgan Stanley, MTN, 7.250%, 5/26/2015, (AUD) | | | 3,413,595 | |
| | 38,206,000 | | | Morgan Stanley, Series F, GMTN, 5.625%, 9/23/2019 | | | 43,007,539 | |
| | 5,187,000 | | | Morgan Stanley, Series F, GMTN, 6.625%, 4/01/2018 | | | 5,940,277 | |
| | 9,400,000 | | | Morgan Stanley, Series F, MTN, 0.684%, 10/18/2016(c) | | | 9,424,966 | |
| | 2,239,000 | | | Morgan Stanley, Series G & H, GMTN, 5.125%, 11/30/2015, (GBP) | | | 3,782,212 | |
| | 2,875,000 | | | National City Bank of Indiana, 4.250%, 7/01/2018 | | | 3,085,657 | |
| | 8,638,000 | | | National City Corp., 6.875%, 5/15/2019 | | | 10,235,253 | |
| | 35,900,000 | | | Royal Bank of Scotland Group PLC, 6.125%, 12/15/2022 | | | 37,997,924 | |
| | 5,250,000 | | | Royal Bank of Scotland PLC (The), EMTN, 4.350%, 1/23/2017, (EUR) | | | 6,970,854 | |
| | 6,150,000 | | | Royal Bank of Scotland PLC (The), EMTN, 6.934%, 4/09/2018, (EUR) | | | 8,913,505 | |
| | 1,650,000 | | | Royal Bank of Scotland PLC (The), EMTN, (fixed rate to 9/22/2016, variable rate thereafter), 4.625%, 9/22/2021, (EUR) | | | 2,120,504 | |
| | 700,000 | | | Santander Financial Issuances Ltd., 7.250%, 11/01/2015 | | | 745,284 | |
| | 16,175,000 | | | Santander Holdings USA, Inc., 4.625%, 4/19/2016 | | | 17,038,179 | |
| | 1,800,000 | | | Santander Issuances SAU, 5.911%, 6/20/2016, 144A | | | 1,905,955 | |
| | 5,600,000 | | | Santander U.S. Debt SAU, 3.724%, 1/20/2015, 144A | | | 5,647,874 | |
| | 3,300,000 | | | Standard Chartered Bank, 6.400%, 9/26/2017, 144A | | | 3,692,367 | |
| | | | | | | | |
| | | | | | | 1,477,045,171 | |
| | | | | | | | |
| | | | Brokerage — 1.5% | | | | |
| | 34,260,000 | | | Cantor Fitzgerald LP, 6.375%, 6/26/2015, 144A | | | 35,287,800 | |
| | 13,100,000 | | | Cantor Fitzgerald LP, 7.875%, 10/15/2019, 144A(b)(g) | | | 14,298,349 | |
| | 50,270,000 | | | Jefferies Group LLC, 5.125%, 1/20/2023 | | | 53,431,782 | |
| | 19,498,000 | | | Jefferies Group LLC, 6.250%, 1/15/2036 | | | 20,523,653 | |
| | 8,760,000 | | | Jefferies Group LLC, 6.450%, 6/08/2027 | | | 9,814,879 | |
| | 1,693,000 | | | Jefferies Group LLC, 6.875%, 4/15/2021 | | | 1,972,844 | |
| | 16,875,000 | | | Jefferies Group LLC, 8.500%, 7/15/2019 | | | 20,850,919 | |
| | | | | | | | |
| | | | | | | 156,180,226 | |
| | | | | | | | |
| | | | Building Materials — 1.2% | | | | |
| | 6,640,000 | | | Masco Corp., 4.800%, 6/15/2015 | | | 6,797,700 | |
| | 10,942,000 | | | Masco Corp., 5.850%, 3/15/2017 | | | 11,875,353 | |
| | 6,616,000 | | | Masco Corp., 6.125%, 10/03/2016 | | | 7,059,272 | |
| | 6,058,000 | | | Masco Corp., 6.500%, 8/15/2032 | | | 6,058,000 | |
| | 28,539,000 | | | Masco Corp., 7.125%, 3/15/2020 | | | 32,819,850 | |
| | 5,725,000 | | | Masco Corp., 7.750%, 8/01/2029 | | | 6,559,636 | |
See accompanying notes to financial statements.
| 14
Portfolio of Investments – as of September 30, 2014
Loomis Sayles Investment Grade Bond Fund – (continued)
| | | | | | | | |
Principal Amount (‡) | | | Description | | Value (†) | |
| | | | Building Materials — continued | | | | |
| | 9,300,000 | | | Odebrecht Finance Ltd., 8.250%, 4/25/2018, 144A, (BRL) | | $ | 3,428,965 | |
| | 4,949,000 | | | Owens Corning, Inc., 6.500%, 12/01/2016 | | | 5,452,051 | |
| | 41,379,000 | | | Owens Corning, Inc., 7.000%, 12/01/2036 | | | 50,150,438 | |
| | | | | | | | |
| | | | | | | 130,201,265 | |
| | | | | | | | |
| | | | Cable Satellite — 1.1% | | | | |
| | 17,832,000 | | | Shaw Communications, Inc., 5.650%, 10/01/2019, (CAD) | | | 17,905,720 | |
| | 13,630,000 | | | Time Warner Cable, Inc., 4.125%, 2/15/2021 | | | 14,424,874 | |
| | 4,101,000 | | | Time Warner Cable, Inc., 5.850%, 5/01/2017 | | | 4,545,548 | |
| | 64,548,000 | | | Time Warner Cable, Inc., 6.750%, 7/01/2018 | | | 75,051,444 | |
| | | | | | | | |
| | | | | | | 111,927,586 | |
| | | | | | | | |
| | | | Construction Machinery — 0.1% | | | | |
| | 6,787,000 | | | Toro Co., 6.625%, 5/01/2037(b)(g) | | | 7,866,445 | |
| | 400,000 | | | United Rentals North America, Inc., 8.375%, 9/15/2020 | | | 430,000 | |
| | | | | | | | |
| | | | | | | 8,296,445 | |
| | | | | | | | |
| | | | Consumer Products — 0.2% | | | | |
| | 7,458,000 | | | Hasbro, Inc., 6.600%, 7/15/2028 | | | 8,573,210 | |
| | 11,754,000 | | | Snap-on, Inc., 6.700%, 3/01/2019 | | | 13,549,623 | |
| | | | | | | | |
| | | | | | | 22,122,833 | |
| | | | | | | | |
| | | | Diversified Manufacturing — 0.0% | | | | |
| | 1,395,000 | | | Ingersoll-Rand Global Holding Co. Ltd., 6.875%, 8/15/2018 | | | 1,633,791 | |
| | | | | | | | |
| | | | Electric — 2.1% | | | | |
| | 31,602,793 | | | Alta Wind Holdings LLC, 7.000%, 6/30/2035, 144A | | | 36,019,220 | |
| | 9,643,063 | | | Bruce Mansfield Unit Pass Through Trust, 6.850%, 6/01/2034 | | | 10,721,447 | |
| | 9,066,000 | | | Cleveland Electric Illuminating Co. (The), 5.700%, 4/01/2017 | | | 9,813,664 | |
| | 12,285,000 | | | EDP Finance BV, 4.900%, 10/01/2019, 144A | | | 12,686,105 | |
| | 3,200,000 | | | EDP Finance BV, 6.000%, 2/02/2018, 144A | | | 3,443,104 | |
| | 4,491,000 | | | Endesa S.A., 7.875%, 2/01/2027 | | | 5,799,057 | |
| | 40,453,000 | | | Enel Finance International NV, 6.000%, 10/07/2039, 144A | | | 46,069,980 | |
| | 9,007,000 | | | Enel Finance International NV, 6.800%, 9/15/2037, 144A | | | 11,030,017 | |
| | 7,921,000 | | | Enel Finance International NV, EMTN, 5.750%, 9/14/2040, (GBP) | | | 14,612,128 | |
| | 6,085,354 | | | Mackinaw Power LLC, 6.296%, 10/31/2023, 144A(b)(g) | | | 6,398,044 | |
| | 50,026,000 | | | Southwestern Electric Power Co., 6.450%, 1/15/2019 | | | 58,360,882 | |
| | | | | | | | |
| | | | | | | 214,953,648 | |
| | | | | | | | |
| | | | Finance Companies — 5.7% | | | | |
| | 66,384,000 | | | Aviation Capital Group Corp., 6.750%, 4/06/2021, 144A | | | 75,345,840 | |
| | 3,500,000 | | | GE Capital Australia Funding Pty Ltd., 7.000%, 10/08/2015, (AUD) | | | 3,182,715 | |
| | 10,350,000 | | | GE Capital Australia Funding Pty Ltd., MTN, 6.000%, 4/15/2015, (AUD) | | | 9,205,730 | |
| | 1,874,000 | | | GE Capital Australia Funding Pty Ltd., MTN, 6.000%, 3/15/2019, (AUD) | | | 1,778,200 | |
| | 35,580,000 | | | General Electric Capital Corp., GMTN, 4.250%, 1/17/2018, (NZD) | | | 27,421,968 | |
| | 14,225,000 | | | General Electric Capital Corp., Series A, EMTN, 6.750%, 9/26/2016, (NZD) | | | 11,586,535 | |
| | 51,370,000 | | | General Electric Capital Corp., Series A, GMTN, 5.500%, 2/01/2017, (NZD) | | | 40,941,399 | |
| | 36,850,000 | | | General Electric Capital Corp., Series A, GMTN, 7.625%, 12/10/2014, (NZD) | | | 28,960,751 | |
| | 7,130,000 | | | General Electric Capital Corp., Series A, MTN, 0.534%, 5/13/2024(c) | | | 6,741,066 | |
| | 26,931,000 | | | General Electric Capital Corp., Series A, MTN, 6.500%, 9/28/2015, (NZD) | | | 21,498,502 | |
| | 210,000 | | | International Lease Finance Corp., 3.875%, 4/15/2018 | | | 208,425 | |
| | 18,830,000 | | | International Lease Finance Corp., 4.625%, 4/15/2021 | | | 18,688,775 | |
See accompanying notes to financial statements.
15 |
Portfolio of Investments – as of September 30, 2014
Loomis Sayles Investment Grade Bond Fund – (continued)
| | | | | | | | |
Principal Amount (‡) | | | Description | | Value (†) | |
| | | | Finance Companies — continued | | | | |
| $ | 27,395,000 | | | International Lease Finance Corp., 5.875%, 4/01/2019 | | $ | 29,175,675 | |
| | 3,063,000 | | | International Lease Finance Corp., 5.875%, 8/15/2022 | | | 3,200,835 | |
| | 12,465,000 | | | International Lease Finance Corp., 6.250%, 5/15/2019 | | | 13,356,247 | |
| | 60,419,000 | | | International Lease Finance Corp., 7.125%, 9/01/2018, 144A | | | 67,971,375 | |
| | 90,196,000 | | | Navient LLC, 5.500%, 1/25/2023 | | | 86,700,905 | |
| | 62,425(††) | | | Navient LLC, 6.000%, 12/15/2043 | | | 1,349,161 | |
| | 2,270,000 | | | Navient LLC, MTN, 4.625%, 9/25/2017 | | | 2,295,538 | |
| | 8,895,000 | | | Navient LLC, MTN, 7.250%, 1/25/2022 | | | 9,651,075 | |
| | 641,000 | | | Navient LLC, MTN, 8.000%, 3/25/2020 | | | 718,721 | |
| | 15,792,000 | | | Navient LLC, Series A, MTN, 5.000%, 6/15/2018 | | | 15,673,560 | |
| | 19,496,000 | | | Navient LLC, Series A, MTN, 5.625%, 8/01/2033 | | | 16,425,380 | |
| | 48,535,000 | | | Springleaf Finance Corp., 7.750%, 10/01/2021 | | | 54,359,200 | |
| | 19,414,000 | | | Springleaf Finance Corp., 8.250%, 10/01/2023 | | | 21,840,750 | |
| | 19,727,000 | | | Springleaf Finance Corp., Series J, MTN, 6.900%, 12/15/2017 | | | 20,959,937 | |
| | | | | | | | |
| | | | | | | 589,238,265 | |
| | | | | | | | |
| | | | Financial Other — 0.4% | | | | |
| | 26,914,000 | | | National Life Insurance Co., 10.500%, 9/15/2039, 144A | | | 40,896,603 | |
| | | | | | | | |
| | | | Government Guaranteed — 0.4% | | | | |
| | 12,910,000 | | | Instituto de Credito Oficial, EMTN, 4.530%, 3/17/2016, (CAD) | | | 11,867,817 | |
| | 4,000,000 | | | Japan Bank for International Cooperation (Japan), 2.300%, 3/19/2018, (CAD) | | | 3,595,089 | |
| | 31,142,000 | | | Queensland Treasury Corp., 7.125%, 9/18/2017, 144A, (NZD) | | | 26,111,665 | |
| | | | | | | | |
| | | | | | | 41,574,571 | |
| | | | | | | | |
| | | | Government Owned – No Guarantee – 1.1% | | | | |
| | 3,720,000 | | | Abu Dhabi National Energy Co., 6.500%, 10/27/2036, 144A | | | 4,504,697 | |
| | 36,975,000 | | | Abu Dhabi National Energy Co., 7.250%, 8/01/2018, 144A | | | 43,516,617 | |
| | 58,060,000 | | | DP World Ltd., 6.850%, 7/02/2037, 144A | | | 65,102,678 | |
| | 1,000,000 | | | Telekom Malaysia Berhad, 7.875%, 8/01/2025, 144A | | | 1,309,322 | |
| | | | | | | | |
| | | | | | | 114,433,314 | |
| | | | | | | | |
| | | | Health Insurance — 0.0% | | | | |
| | 1,569,000 | | | CIGNA Corp., 7.875%, 5/15/2027 | | | 2,055,221 | |
| | 1,174,000 | | | CIGNA Corp., (Step to 8.080% on 1/15/2023), 8.300%, 1/15/2033(d) | | | 1,616,093 | |
| | | | | | | | |
| | | | | | | 3,671,314 | |
| | | | | | | | |
| | | | Healthcare — 1.1% | | | | |
| | 7,692,000 | | | Boston Scientific Corp., 6.000%, 1/15/2020 | | | 8,769,811 | |
| | 7,374,000 | | | Covidien International Finance S.A., 6.000%, 10/15/2017 | | | 8,330,010 | |
| | 9,459,000 | | | Express Scripts, Inc., 7.250%, 6/15/2019 | | | 11,425,460 | |
| | 6,440,000 | | | HCA, Inc., 4.750%, 5/01/2023 | | | 6,295,100 | |
| | 802,000 | | | HCA, Inc., 5.875%, 3/15/2022 | | | 843,102 | |
| | 52,905,000 | | | HCA, Inc., 5.875%, 5/01/2023 | | | 54,095,362 | |
| | 2,936,000 | | | HCA, Inc., 7.050%, 12/01/2027 | | | 2,950,680 | |
| | 4,119,000 | | | HCA, Inc., 7.500%, 12/15/2023 | | | 4,489,710 | |
| | 1,282,000 | | | HCA, Inc., 7.500%, 11/06/2033 | | | 1,346,100 | |
| | 3,807,000 | | | HCA, Inc., 7.690%, 6/15/2025 | | | 4,187,700 | |
| | 4,164,000 | | | HCA, Inc., 8.360%, 4/15/2024 | | | 4,788,600 | |
| | 1,199,000 | | | HCA, Inc., MTN, 7.580%, 9/15/2025 | | | 1,306,910 | |
See accompanying notes to financial statements.
| 16
Portfolio of Investments – as of September 30, 2014
Loomis Sayles Investment Grade Bond Fund – (continued)
| | | | | | | | |
Principal Amount (‡) | | | Description | | Value (†) | |
| | | | Healthcare — continued | | | | |
| $ | 3,068,000 | | | HCA, Inc., MTN, 7.750%, 7/15/2036 | | $ | 3,328,780 | |
| | 2,256,000 | | | Owens & Minor, Inc., 6.350%, 4/15/2016 | | | 2,446,934 | |
| | 2,200,000 | | | Tenet Healthcare Corp., 6.875%, 11/15/2031 | | | 2,123,000 | |
| | | | | | | | |
| | | | | | | 116,727,259 | |
| | | | | | | | |
| | | | Home Construction — 0.1% | | | | |
| | 9,200,000 | | | Pulte Group, Inc., 6.000%, 2/15/2035 | | | 8,740,000 | |
| | 3,567,000 | | | Pulte Group, Inc., 6.375%, 5/15/2033 | | | 3,558,082 | |
| | | | | | | | |
| | | | | | | 12,298,082 | |
| | | | | | | | |
| | | | Independent Energy — 0.8% | | | | |
| | 9,787,000 | | | EQT Corp., 8.125%, 6/01/2019 | | | 11,987,538 | |
| | 60,038,000 | | | Equitable Resources, Inc., 6.500%, 4/01/2018 | | | 68,579,967 | |
| | 7,240,000 | | | Newfield Exploration Co., 5.625%, 7/01/2024 | | | 7,746,800 | |
| | | | | | | | |
| | | | | | | 88,314,305 | |
| | | | | | | | |
| | | | Industrial Other — 0.1% | | | | |
| | 4,893,000 | | | Worthington Industries, Inc., 6.500%, 4/15/2020 | | | 5,555,586 | |
| | | | | | | | |
| | | | Life Insurance — 0.8% | | | | |
| | 3,920,000 | | | American International Group, Inc., 4.125%, 2/15/2024 | | | 4,071,892 | |
| | 1,475,000 | | | American International Group, Inc., 4.875%, 6/01/2022 | | | 1,622,388 | |
| | 1,515,000 | | | American International Group, Inc., Series G, MTN, 5.850%, 1/16/2018 | | | 1,704,258 | |
| | 2,036,000 | | | American International Group, Inc., Series MP, MTN, 5.450%, 5/18/2017 | | | 2,243,662 | |
| | 600,000 | | | AXA S.A., EMTN, (fixed rate to 10/16/2019, variable rate thereafter), 6.772%, (GBP)(e) | | | 1,045,642 | |
| | 5,900,000 | | | AXA S.A., EMTN, (fixed rate to 4/16/2020, variable rate thereafter), 5.250%, 4/16/2040, (EUR) | | | 8,335,447 | |
| | 15,000,000 | | | Forethought Financial Group, Inc., 8.625%, 4/15/2021, 144A | | | 17,051,850 | |
| | 9,063,000 | | | Mutual of Omaha Insurance Co., 6.800%, 6/15/2036, 144A | | | 11,426,223 | |
| | 6,440,000 | | | NLV Financial Corp., 7.500%, 8/15/2033, 144A | | | 7,061,370 | |
| | 2,872,000 | | | Penn Mutual Life Insurance Co. (The), 6.650%, 6/15/2034, 144A | | | 3,584,741 | |
| | 14,489,000 | | | Penn Mutual Life Insurance Co. (The), 7.625%, 6/15/2040, 144A | | | 19,998,080 | |
| | 4,732,000 | | | Unum Group, 7.125%, 9/30/2016 | | | 5,285,365 | |
| | | | | | | | |
| | | | | | | 83,430,918 | |
| | | | | | | | |
| | | | Local Authorities — 2.2% | | | | |
| | 7,448,000 | | | Manitoba (Province of), GMTN, 6.375%, 9/01/2015, (NZD) | | | 5,920,786 | |
| | 11,311,000 | | | New South Wales Treasury Corp., 3.500%, 3/20/2019, (AUD) | | | 10,029,943 | |
| | 152,895,000 | | | New South Wales Treasury Corp., 6.000%, 2/01/2018, (AUD) | | | 146,547,818 | |
| | 17,930,000 | | | New South Wales Treasury Corp., Series 17RG, 5.500%, 3/01/2017, (AUD) | | | 16,680,893 | |
| | 8,104 | | | Province of Alberta, 5.930%, 9/16/2016, (CAD) | | | 7,637 | |
| | 489,000 | | | Province of Nova Scotia, 6.600%, 6/01/2027, (CAD) | | | 590,804 | |
| | 29,791,000 | | | Province of Quebec, Canada, Series QC, 6.750%, 11/09/2015, (NZD) | | | 23,882,820 | |
| | 26,518,000 | | | Queensland Treasury Corp., Series 14, 5.750%, 11/21/2014, (AUD) | | | 23,312,243 | |
| | | | | | | | |
| | | | | | | 226,972,944 | |
| | | | | | | | |
| | | | Lodging — 0.5% | | | | |
| | 52,516,000 | | | Choice Hotels International, Inc., 5.700%, 8/28/2020 | | | 56,914,215 | |
| | 100,000 | | | Wyndham Worldwide Corp., 6.000%, 12/01/2016 | | | 109,234 | |
| | | | | | | | |
| | | | | | | 57,023,449 | |
| | | | | | | | |
See accompanying notes to financial statements.
17 |
Portfolio of Investments – as of September 30, 2014
Loomis Sayles Investment Grade Bond Fund – (continued)
| | | | | | | | |
Principal Amount (‡) | | | Description | | Value (†) | |
| | | | Media Entertainment — 0.4% | | | | |
| $ | 4,482,000 | | | 21st Century Fox America, Inc., 8.150%, 10/17/2036 | | $ | 6,313,390 | |
| | 358,000,000 | | | Grupo Televisa SAB, EMTN, 7.250%, 5/14/2043, (MXN) | | | 22,428,465 | |
| | 5,000,000 | | | iHeartCommunications, Inc., 9.000%, 3/01/2021 | | | 4,975,000 | |
| | 1,805,000 | | | R.R. Donnelley & Sons Co., 6.500%, 11/15/2023 | | | 1,800,488 | |
| | 4,445,000 | | | R.R. Donnelley & Sons Co., 7.875%, 3/15/2021 | | | 4,878,387 | |
| | 3,616,000 | | | Viacom, Inc., 6.125%, 10/05/2017 | | | 4,083,603 | |
| | | | | | | | |
| | | | | | | 44,479,333 | |
| | | | | | | | |
| | | | Metals & Mining — 2.3% | | | | |
| | 15,000,000 | | | Alcoa, Inc., 5.400%, 4/15/2021 | | | 15,884,685 | |
| | 15,060,000 | | | Alcoa, Inc., 5.870%, 2/23/2022 | | | 16,073,116 | |
| | 45,700,000 | | | Alcoa, Inc., 5.900%, 2/01/2027 | | | 47,868,739 | |
| | 5,505,000 | | | Alcoa, Inc., 5.950%, 2/01/2037 | | | 5,494,909 | |
| | 5,804,000 | | | Alcoa, Inc., 6.750%, 1/15/2028 | | | 6,585,590 | |
| | 430,000 | | | ArcelorMittal, 6.000%, 3/01/2021 | | | 452,038 | |
| | 4,085,000 | | | ArcelorMittal, 6.750%, 2/25/2022 | | | 4,386,269 | |
| | 47,920,000 | | | ArcelorMittal, 7.250%, 3/01/2041 | | | 48,039,800 | |
| | 19,365,000 | | | ArcelorMittal, 7.500%, 10/15/2039 | | | 19,945,950 | |
| | 20,625,000 | | | Barminco Finance Pty Ltd., 9.000%, 6/01/2018, 144A | | | 17,840,625 | |
| | 2,325,000 | | | Essar Steel Algoma, Inc., 9.875%, 6/15/2015, 144A(b)(f)(g) | | | 1,720,500 | |
| | 15,701,000 | | | Plains Exploration & Production Co., 6.500%, 11/15/2020 | | | 17,194,479 | |
| | 4,612,000 | | | United States Steel Corp., 6.650%, 6/01/2037 | | | 4,369,870 | |
| | 31,210,000 | | | United States Steel Corp., 7.000%, 2/01/2018 | | | 34,018,900 | |
| | 3,655,000 | | | Vale Overseas Ltd., 6.875%, 11/21/2036 | | | 4,121,013 | |
| | | | | | | | |
| | | | | | | 243,996,483 | |
| | | | | | | | |
| | | | Midstream — 2.1% | | | | |
| | 650,000 | | | DCP Midstream LP, 6.450%, 11/03/2036, 144A | | | 750,838 | |
| | 525,000 | | | Energy Transfer Partners LP, 4.150%, 10/01/2020 | | | 545,171 | |
| | 3,328,000 | | | Florida Gas Transmission Co., 7.900%, 5/15/2019, 144A | | | 4,074,401 | |
| | 14,300,000 | | | IFM U.S. Colonial Pipeline 2 LLC, 6.450%, 5/01/2021, 144A | | | 15,339,581 | |
| | 14,660,000 | | | Kinder Morgan Energy Partners LP, 3.500%, 9/01/2023 | | | 13,921,356 | |
| | 3,105,000 | | | Kinder Morgan Energy Partners LP, 5.300%, 9/15/2020 | | | 3,416,621 | |
| | 7,461,000 | | | Kinder Morgan Energy Partners LP, 5.800%, 3/01/2021 | | | 8,366,795 | |
| | 303,000 | | | Kinder Morgan Finance Co. LLC, 5.700%, 1/05/2016 | | | 312,469 | |
| | 8,715,000 | | | NGPL PipeCo LLC, 7.119%, 12/15/2017, 144A | | | 8,715,000 | |
| | 330,000 | | | NGPL PipeCo LLC, 7.768%, 12/15/2037, 144A | | | 340,725 | |
| | 1,745,000 | | | NiSource Finance Corp., 6.125%, 3/01/2022 | | | 2,043,201 | |
| | 22,365,000 | | | NiSource Finance Corp., 6.400%, 3/15/2018 | | | 25,526,718 | |
| | 21,614,000 | | | NiSource Finance Corp., 6.800%, 1/15/2019 | | | 25,419,426 | |
| | 9,899,000 | | | Panhandle Eastern Pipeline Co., 6.200%, 11/01/2017 | | | 11,234,266 | |
| | 47,594,000 | | | Panhandle Eastern Pipeline Co., 7.000%, 6/15/2018 | | | 54,852,656 | |
| | 1,404,000 | | | Panhandle Eastern Pipeline Co., 8.125%, 6/01/2019 | | | 1,709,460 | |
| | 1,880,000 | | | Plains All American Pipeline LP, 6.125%, 1/15/2017 | | | 2,074,236 | |
| | 15,683,000 | | | Plains All American Pipeline LP/PAA Finance Corp., 6.500%, 5/01/2018 | | | 18,084,961 | |
| | 4,125,000 | | | Southern Natural Gas Co., 5.900%, 4/01/2017, 144A | | | 4,553,786 | |
| | 19,574,000 | | | Texas Eastern Transmission LP, 6.000%, 9/15/2017, 144A | | | 21,822,465 | |
| | | | | | | | |
| | | | | | | 223,104,132 | |
| | | | | | | | |
See accompanying notes to financial statements.
| 18
Portfolio of Investments – as of September 30, 2014
Loomis Sayles Investment Grade Bond Fund – (continued)
| | | | | | | | |
Principal Amount (‡) | | | Description | | Value (†) | |
| | | | Mortgage Related — 0.0% | | | | |
| $ | 35,753 | | | FHLMC, 5.000%, 12/01/2031 | | $ | 39,490 | |
| | 5,749 | | | FNMA, 6.000%, 7/01/2029 | | | 6,572 | |
| | | | | | | | |
| | | | | | | 46,062 | |
| | | | | | | | |
| | | | Non-Agency Commercial Mortgage-Backed Securities — 2.1% | | | | |
| | 49,222,104 | | | Credit Suisse Mortgage Capital Certificates, Series 2007-C3, Class A4, 5.893%, 6/15/2039(c) | | | 53,090,715 | |
| | 28,624,126 | | | Credit Suisse Mortgage Capital Certificates, Series 2007-C4, Class A4, 6.097%, 9/15/2039(c) | | | 31,119,348 | |
| | 6,711,090 | | | Credit Suisse Mortgage Capital Certificates, Series 2007-C5, Class A4, 5.695%, 9/15/2040 | | | 7,289,640 | |
| | 69,500,000 | | | Extended Stay America Trust, Series 2013, Class 7-ESH7,
3.902%, 12/05/2031, 144A | | | 70,432,898 | |
| | 10,541,178 | | | Institutional Mortgage Securities Canada, Inc., Series 2014-5A, Class A1, 2.003%, 1/12/2019, 144A, (CAD) | | | 9,411,810 | |
| | 27,000,000 | | | Institutional Mortgage Securities Canada, Inc., Series 2014-5A, Class A2, 2.616%, 1/12/2024, 144A, (CAD) | | | 24,102,192 | |
| | 9,786,870 | | | Morgan Stanley Re-REMIC Trust, Series 2009-GG10, Class A4B, 5.991%, 8/12/2045, 144A(c) | | | 10,618,901 | |
| | 6,851,000 | | | Vornado DP LLC, Series 2010-VNO, Class D, 6.356%, 9/13/2028, 144A | | | 7,866,866 | |
| | 2,125,000 | | | WFRBS Commercial Mortgage Trust, Series 2011-C3, Class D, 5.723%, 3/15/2044, 144A(c) | | | 2,265,282 | |
| | | | | | | | |
| | | | | | | 216,197,652 | |
| | | | | | | | |
| | | | Oil Field Services — 0.5% | | | | |
| | 5,000,000 | | | Nabors Industries, Inc., 5.100%, 9/15/2023 | | | 5,417,015 | |
| | 12,575,000 | | | Pertamina Persero PT, 6.450%, 5/30/2044, 144A | | | 12,700,750 | |
| | 23,338,000 | | | Rowan Cos., Inc., 7.875%, 8/01/2019 | | | 28,216,599 | |
| | 587,000 | | | Transocean Ltd., 7.375%, 4/15/2018 | | | 663,059 | |
| | | | | | | | |
| | | | | | | 46,997,423 | |
| | | | | | | | |
| | | | Paper — 1.1% | | | | |
| | 4,365,000 | | | Celulosa Arauco y Constitucion S.A., 7.250%, 7/29/2019 | | | 5,116,339 | |
| | 23,225,000 | | | Georgia-Pacific LLC, 5.400%, 11/01/2020, 144A | | | 26,243,925 | |
| | 644,000 | | | Georgia-Pacific LLC, 7.750%, 11/15/2029 | | | 885,738 | |
| | 1,031,000 | | | Georgia-Pacific LLC, 8.875%, 5/15/2031 | | | 1,543,084 | |
| | 7,049,000 | | | International Paper Co., 8.700%, 6/15/2038 | | | 10,381,866 | |
| | 5,270,000 | | | Mead Corp. (The), 7.550%, 3/01/2047(b)(g) | | | 6,444,567 | |
| | 5,068,000 | | | Westvaco Corp., 8.200%, 1/15/2030 | | | 6,647,995 | |
| | 26,007,000 | | | Weyerhaeuser Co., 6.875%, 12/15/2033 | | | 33,284,253 | |
| | 7,374,000 | | | Weyerhaeuser Co., 7.375%, 10/01/2019 | | | 8,913,404 | |
| | 13,539,000 | | | Weyerhaeuser Co., 7.375%, 3/15/2032 | | | 17,945,971 | |
| | | | | | | | |
| | | | | | | 117,407,142 | |
| | | | | | | | |
| | | | Property & Casualty Insurance — 0.3% | | | | |
| | 2,740,000 | | | Fidelity National Financial, Inc., 5.500%, 9/01/2022 | | | 2,976,054 | |
| | 9,038,000 | | | Liberty Mutual Group, Inc., 6.500%, 3/15/2035, 144A | | | 11,086,932 | |
| | 1,889,000 | | | MBIA Insurance Corp., 11.494%, 1/15/2033, 144A(c)(h) | | | 1,341,190 | |
See accompanying notes to financial statements.
19 |
Portfolio of Investments – as of September 30, 2014
Loomis Sayles Investment Grade Bond Fund – (continued)
| | | | | | | | |
Principal Amount (‡) | | | Description | | Value (†) | |
| | | | Property & Casualty Insurance — continued | | | | |
| $ | 6,555,000 | | | Old Republic International Corp., 4.875%, 10/01/2024 | | $ | 6,563,705 | |
| | 7,609,000 | | | Sirius International Group, 6.375%, 3/20/2017, 144A | | | 8,434,455 | |
| | 2,212,000 | | | XLIT Ltd., 6.250%, 5/15/2027 | | | 2,626,675 | |
| | 1,463,000 | | | XLIT Ltd., 6.375%, 11/15/2024 | | | 1,741,922 | |
| | | | | | | | |
| | | | | | | 34,770,933 | |
| | | | | | | | |
| | | | Railroads — 0.1% | | | | |
| | 9,787,000 | | | Canadian Pacific Railway Co., 7.250%, 5/15/2019 | | | 11,845,529 | |
| | 237,000 | | | Missouri Pacific Railroad Co., 4.750%, 1/01/2030(b)(g) | | | 227,968 | |
| | 1,701,000 | | | Missouri Pacific Railroad Co., 5.000%, 1/01/2045(b)(g) | | | 1,587,302 | |
| | 191,000 | | | Missouri Pacific Railroad Co., Series A, 4.750%, 1/01/2020(b)(g) | | | 189,062 | |
| | | | | | | | |
| | | | | | | 13,849,861 | |
| | | | | | | | |
| | | | Real Estate Operations/Development — 0.1% | | | | |
| | 10,276,000 | | | First Industrial LP, 5.950%, 5/15/2017 | | | 11,208,177 | |
| | | | | | | | |
| | | | Refining — 0.1% | | | | |
| | 7,700,000 | | | Reliance Holdings USA, Inc., 5.400%, 2/14/2022, 144A | | | 8,405,566 | |
| | | | | | | | |
| | | | REITs – Apartments — 0.3% | | | | |
| | 12,243,000 | | | Camden Property Trust, 5.000%, 6/15/2015 | | | 12,608,380 | |
| | 16,491,000 | | | Camden Property Trust, 5.700%, 5/15/2017 | | | 18,180,421 | |
| | | | | | | | |
| | | | | | | 30,788,801 | |
| | | | | | | | |
| | | | REITs – Diversified — 0.3% | | | | |
| | 4,140,000 | | | Duke Realty LP, 5.950%, 2/15/2017 | | | 4,543,410 | |
| | 19,574,000 | | | Duke Realty LP, 6.500%, 1/15/2018 | | | 22,206,605 | |
| | | | | | | | |
| | | | | | | 26,750,015 | |
| | | | | | | | |
| | | | REITs – Health Care — 0.1% | | | | |
| | 5,972,000 | | | Health Care REIT, Inc., 6.500%, 3/15/2041 | | | 7,447,986 | |
| | | | | | | | |
| | | | REITs – Office Property — 0.3% | | | | |
| | 20,817,000 | | | Highwoods Properties, Inc., 5.850%, 3/15/2017 | | | 22,852,923 | |
| | 11,306,000 | | | Highwoods Properties, Inc., 7.500%, 4/15/2018 | | | 13,192,768 | |
| | | | | | | | |
| | | | | | | 36,045,691 | |
| | | | | | | | |
| | | | REITs – Shopping Centers — 0.1% | | | | |
| | 4,893,000 | | | Equity One, Inc., 6.000%, 9/15/2017 | | | 5,410,694 | |
| | | | | | | | |
| | | | REITs – Single Tenant — 0.4% | | | | |
| | 8,690,000 | | | Realty Income Corp., 5.750%, 1/15/2021 | | | 9,893,026 | |
| | 22,701,000 | | | Realty Income Corp., 6.750%, 8/15/2019 | | | 26,800,869 | |
| | | | | | | | |
| | | | | | | 36,693,895 | |
| | | | | | | | |
| | | | REITs – Warehouse/Industrials — 0.2% | | | | |
| | 18,869,000 | | | ProLogis LP, 7.375%, 10/30/2019 | | | 22,926,231 | |
| | | | | | | | |
| | | | Restaurants — 0.1% | | | | |
| | 10,320,000 | | | Darden Restaurants, Inc., 6.000%, 8/15/2035 | | | 9,957,510 | |
| | | | | | | | |
| | | | Retailers — 0.4% | | | | |
| | 1,696,000 | | | J.C. Penney Corp., Inc., 5.750%, 2/15/2018 | | | 1,585,760 | |
| | 5,979,000 | | | J.C. Penney Corp., Inc., 6.375%, 10/15/2036 | | | 4,633,725 | |
See accompanying notes to financial statements.
| 20
Portfolio of Investments – as of September 30, 2014
Loomis Sayles Investment Grade Bond Fund – (continued)
| | | | | | | | |
Principal Amount (‡) | | | Description | | Value (†) | |
| | | | Retailers — continued | | | | |
| $ | 5,446,000 | | | J.C. Penney Corp., Inc., 7.625%, 3/01/2097 | | $ | 4,465,720 | |
| | 10,467,000 | | | Macy’s Retail Holdings, Inc., 6.790%, 7/15/2027 | | | 12,609,176 | |
| | 8,064,000 | | | Marks & Spencer PLC, 7.125%, 12/01/2037, 144A | | | 9,490,997 | |
| | 3,755,000 | | | Phillips-Van Heusen Corp., 7.750%, 11/15/2023 | | | 4,522,447 | |
| | | | | | | | |
| | | | | | | 37,307,825 | |
| | | | | | | | |
| | | | Sovereigns — 0.4% | | | | |
| | 33,600,000 | | | Republic of Iceland, 5.875%, 5/11/2022, 144A | | | 37,847,846 | |
| | | | | | | | |
| | | | Supermarkets — 0.3% | | | | |
| | 1,120,000 | | | Delhaize Group S.A., 5.700%, 10/01/2040 | | | 1,188,702 | |
| | 3,269,000 | | | Kroger Co. (The), 6.400%, 8/15/2017 | | | 3,695,179 | |
| | 6,595,000 | | | New Albertson’s, Inc., 7.450%, 8/01/2029 | | | 6,001,450 | |
| | 7,875,000 | | | New Albertson’s, Inc., 8.000%, 5/01/2031 | | | 7,481,250 | |
| | 979,000 | | | New Albertson’s, Inc., Series C, MTN, 6.625%, 6/01/2028 | | | 797,885 | |
| | 17,290,000 | | | SUPERVALU, Inc., 6.750%, 6/01/2021 | | | 17,030,650 | |
| | | | | | | | |
| | | | | | | 36,195,116 | |
| | | | | | | | |
| | | | Supranational — 0.4% | | | | |
| | 9,640,000 | | | European Investment Bank, MTN, 6.000%, 8/06/2020, (AUD) | | | 9,447,190 | |
| | 12,982,000 | | | Inter-American Development Bank, EMTN, 6.000%, 12/15/2017, (NZD) | | | 10,610,470 | |
| | 58,420,000 | | | International Finance Corp., GMTN, 5.000%, 12/21/2015, (BRL) | | | 22,422,874 | |
| | | | | | | | |
| | | | | | | 42,480,534 | |
| | | | | | | | |
| | | | Technology — 1.5% | | | | |
| | 4,600,000 | | | Alcatel-Lucent USA, Inc., 6.450%, 3/15/2029 | | | 4,335,500 | |
| | 1,028,000 | | | Arrow Electronics, Inc., 6.875%, 6/01/2018 | | | 1,171,362 | |
| | 1,507,000 | | | Avnet, Inc., 6.625%, 9/15/2016 | | | 1,659,849 | |
| | 7,487,000 | | | Corning, Inc., 7.250%, 8/15/2036 | | | 9,516,314 | |
| | 7,051,000 | | | Equifax, Inc., 7.000%, 7/01/2037 | | | 9,005,333 | |
| | 70,969,000 | | | Ingram Micro, Inc., 5.250%, 9/01/2017 | | | 77,286,448 | |
| | 7,795,000 | | | Intuit, Inc., 5.750%, 3/15/2017 | | | 8,600,785 | |
| | 19,078,000 | | | KLA-Tencor Corp., 6.900%, 5/01/2018 | | | 22,112,222 | |
| | 1,502,000 | | | Motorola Solutions, Inc., 6.625%, 11/15/2037 | | | 1,648,905 | |
| | 1,974,000 | | | Samsung Electronics Co. Ltd., 7.700%, 10/01/2027, 144A | | | 2,415,367 | |
| | 5,603,000 | | | Tyco Electronics Group S.A., 6.550%, 10/01/2017 | | | 6,380,074 | |
| | 561,000 | | | Xerox Corp., 6.350%, 5/15/2018 | | | 641,015 | |
| | 7,110,000 | | | Xerox Corp., 6.750%, 2/01/2017 | | | 7,957,213 | |
| | | | | | | | |
| | | | | | | 152,730,387 | |
| | | | | | | | |
| | | | Transportation Services — 0.8% | | | | |
| | 8,436,000 | | | Erac USA Finance Co., 6.375%, 10/15/2017, 144A | | | 9,596,844 | |
| | 2,824,000 | | | Erac USA Finance Co., 6.700%, 6/01/2034, 144A | | | 3,566,961 | |
| | 51,504,000 | | | Erac USA Finance Co., 7.000%, 10/15/2037, 144A | | | 68,025,453 | |
| | | | | | | | |
| | | | | | | 81,189,258 | |
| | | | | | | | |
| | | | Treasuries — 25.1% | | | | |
| | 312,405,000 | | | Canadian Government, 1.000%, 8/01/2016, (CAD) | | | 278,281,598 | |
| | 209,501,000 | | | Canadian Government, 1.250%, 9/01/2018, (CAD) | | | 185,450,334 | |
| | 61,795,000 | | | Canadian Government, 1.750%, 9/01/2019, (CAD) | | | 55,485,559 | |
See accompanying notes to financial statements.
21 |
Portfolio of Investments – as of September 30, 2014
Loomis Sayles Investment Grade Bond Fund – (continued)
| | | | | | | | |
Principal Amount (‡) | | | Description | | Value (†) | |
| | | | Treasuries — continued | | | | |
| | 372,145,000 | | | Canadian Government, 2.500%, 6/01/2015, (CAD) | | $ | 335,663,193 | |
| | 90,055,000 | | | Canadian Government, 2.750%, 9/01/2016, (CAD) | | | 82,884,050 | |
| | 156,655,000 | | | Canadian Government, 3.000%, 12/01/2015, (CAD) | | | 143,082,756 | |
| | 4,159,000 | | | Canadian Government, 4.000%, 6/01/2016, (CAD) | | | 3,890,324 | |
| | 2,755,000(†††) | | | Mexican Fixed Rate Bonds, Series M, 7.750%, 5/29/2031, (MXN) | | | 22,651,801 | |
| | 2,965,000(†††) | | | Mexican Fixed Rate Bonds, Series M-20, 7.500%, 6/03/2027, (MXN) | | | 24,139,058 | |
| | 7,555,000(†††) | | | Mexican Fixed Rate Bonds, Series M-20, 8.000%, 12/07/2023, (MXN) | | | 63,711,143 | |
| | 1,925,000(†††) | | | Mexican Fixed Rate Bonds, Series M-20, 8.500%, 5/31/2029, (MXN) | | | 16,893,561 | |
| | 9,635,000(†††) | | | Mexican Fixed Rate Bonds, Series M-20, 10.000%, 12/05/2024, (MXN) | | | 92,631,301 | |
| | 109,763,000 | | | New Zealand Government Bond, 6.000%, 12/15/2017, (NZD) | | | 91,043,590 | |
| | 974,276,000 | | | Norway Government Bond, 4.250%, 5/19/2017, (NOK) | | | 162,191,042 | |
| | 802,302,000 | | | Norway Government Bond, 5.000%, 5/15/2015, (NOK) | | | 127,686,493 | |
| | 43,590,000 | | | Republic of Brazil, 8.500%, 1/05/2024, (BRL) | | | 16,116,413 | |
| | 23,848,000 | | | Republic of Brazil, 10.250%, 1/10/2028, (BRL) | | | 9,645,397 | |
| | 1,040,764,000 | | | Republic of Iceland, 6.000%, 10/13/2016, (ISK) | | | 7,300,237 | |
| | 391,985,000 | | | Republic of Iceland, 7.250%, 10/26/2022, (ISK) | | | 2,829,642 | |
| | 1,195,394,000 | | | Republic of Iceland, 8.750%, 2/26/2019, (ISK) | | | 9,087,485 | |
| | 300,000,000 | | | U.S. Treasury Note, 0.375%, 1/31/2016 | | | 300,433,500 | |
| | 500,000,000 | | | U.S. Treasury Note, 0.375%, 3/31/2016 | | | 500,117,000 | |
| | 60,000,000 | | | U.S. Treasury Note, 0.375%, 4/30/2016 | | | 59,976,540 | |
| | 25,000,000 | | | U.S. Treasury Note, 0.500%, 6/30/2016 | | | 25,014,650 | |
| | | | | | | | |
| | | | | | | 2,616,206,667 | |
| | | | | | | | |
| | | | Wireless — 0.5% | | | | |
| | 559,910,000 | | | America Movil SAB de CV, 6.450%, 12/05/2022, (MXN) | | | 40,350,749 | |
| | 6,373,000 | | | Sprint Capital Corp., 6.875%, 11/15/2028 | | | 6,086,215 | |
| | 1,996,000 | | | Sprint Capital Corp., 6.900%, 5/01/2019 | | | 2,098,295 | |
| | 612,000 | | | Sprint Capital Corp., 8.750%, 3/15/2032 | | | 667,845 | |
| | 598,000 | | | Sprint Communications, Inc., 6.000%, 11/15/2022 | | | 580,060 | |
| | | | | | | | |
| | | | | | | 49,783,164 | |
| | | | | | | | |
| | | | Wirelines — 3.7% | | | | |
| | 406,000 | | | Bell Canada, MTN, 7.300%, 2/23/2032, (CAD) | | | 478,115 | |
| | 2,936,000 | | | BellSouth Telecommunications LLC, 5.850%, 11/15/2045 | | | 3,018,117 | |
| | 62,040,000 | | | CenturyLink, Inc., 6.450%, 6/15/2021 | | | 66,382,800 | |
| | 4,990,000 | | | CenturyLink, Inc., Series G, 6.875%, 1/15/2028 | | | 4,965,050 | |
| | 2,708,000 | | | CenturyLink, Inc., Series P, 7.600%, 9/15/2039 | | | 2,674,150 | |
| | 24,103,000 | | | Embarq Corp., 7.995%, 6/01/2036 | | | 26,052,933 | |
| | 825,000 | | | Level 3 Financing, Inc., 7.000%, 6/01/2020 | | | 869,344 | |
| | 200,000 | | | Level 3 Financing, Inc., 9.375%, 4/01/2019 | | | 213,750 | |
| | 5,200,000 | | | Oi S.A., 9.750%, 9/15/2016, 144A, (BRL) | | | 1,934,903 | |
| | 8,450,000 | | | Portugal Telecom International Finance BV, EMTN,
4.500%, 6/16/2025, (EUR) | | | 10,566,049 | |
| | 18,850,000 | | | Portugal Telecom International Finance BV, EMTN,
5.000%, 11/04/2019, (EUR) | | | 25,184,490 | |
| | 300,000 | | | Portugal Telecom International Finance BV, GMTN,
4.375%, 3/24/2017, (EUR) | | | 395,019 | |
| | 1,698,000 | | | Qwest Capital Funding, Inc., 6.500%, 11/15/2018 | | | 1,867,800 | |
| | 2,755,000 | | | Qwest Capital Funding, Inc., 6.875%, 7/15/2028 | | | 2,727,588 | |
See accompanying notes to financial statements.
| 22
Portfolio of Investments – as of September 30, 2014
Loomis Sayles Investment Grade Bond Fund – (continued)
| | | | | | | | |
Principal Amount (‡) | | | Description | | Value (†) | |
| | | | Wirelines — continued | | | | |
| $ | 4,370,000 | | | Qwest Capital Funding, Inc., 7.625%, 8/03/2021 | | $ | 4,861,625 | |
| | 3,469,000 | | | Qwest Capital Funding, Inc., 7.750%, 2/15/2031 | | | 3,547,052 | |
| | 333,000 | | | Qwest Corp., 6.500%, 6/01/2017 | | | 368,399 | |
| | 14,480,000 | | | Qwest Corp., 6.875%, 9/15/2033 | | | 14,450,142 | |
| | 4,668,000 | | | Qwest Corp., 7.200%, 11/10/2026 | | | 4,690,901 | |
| | 9,077,000 | | | Qwest Corp., 7.250%, 9/15/2025 | | | 10,586,696 | |
| | 9,474,000 | | | Qwest Corp., 7.250%, 10/15/2035 | | | 9,763,753 | |
| | 46,411,000 | | | Telecom Italia Capital S.A., 6.000%, 9/30/2034 | | | 45,424,766 | |
| | 23,660,000 | | | Telecom Italia Capital S.A., 6.375%, 11/15/2033 | | | 23,541,700 | |
| | 4,200,000 | | | Telefonica Emisiones SAU, 4.570%, 4/27/2023 | | | 4,385,174 | |
| | 525,000 | | | Telefonica Emisiones SAU, 5.134%, 4/27/2020 | | | 577,061 | |
| | 975,000 | | | Telefonica Emisiones SAU, 5.462%, 2/16/2021 | | | 1,085,815 | |
| | 14,375,000 | | | Telefonica Emisiones SAU, 7.045%, 6/20/2036 | | | 18,209,229 | |
| | 4,100,000 | | | Telefonica Emisiones SAU, EMTN, 5.289%, 12/09/2022, (GBP) | | | 7,396,478 | |
| | 9,100,000 | | | Telefonica Emisiones SAU, EMTN, 5.375%, 2/02/2026, (GBP) | | | 16,251,760 | |
| | 2,100,000 | | | Telefonica Emisiones SAU, EMTN, 5.445%, 10/08/2029, (GBP) | | | 3,767,571 | |
| | 14,137,000 | | | Telus Corp., 4.950%, 3/15/2017, (CAD) | | | 13,516,080 | |
| | 54,665,000 | | | Telus Corp., Series CG, 5.050%, 12/04/2019, (CAD) | | | 54,133,945 | |
| | 2,642,000 | | | Verizon New England, Inc., 7.875%, 11/15/2029 | | | 3,360,022 | |
| | 2,095,000 | | | Verizon Pennsylvania, Inc., 6.000%, 12/01/2028 | | | 2,277,240 | |
| | | | | | | | |
| | | | | | | 389,525,517 | |
| | | | | | | | |
| | | | Total Non-Convertible Bonds (Identified Cost $8,292,829,227) | | | 8,846,353,563 | |
| | | | | | | | |
| | | | | |
| | Convertible Bonds – 4.9% | |
| | | | Automotive — 0.6% | | | | |
| | 34,827,000 | | | Ford Motor Co., 4.250%, 11/15/2016 | | | 59,684,771 | |
| | | | | | | | |
| | | | Communications — 0.0% | | | | |
| | 2,926,000 | | | Level 3 Communications, Inc., 7.000%, 3/15/2015, 144A(b)(g) | | | 4,990,659 | |
| | | | | | | | |
| | | | Energy — 0.4% | | | | |
| | 34,700,000 | | | Chesapeake Energy Corp., 2.500%, 5/15/2037 | | | 34,981,937 | |
| | 11,225,000 | | | Chesapeake Energy Corp., 2.750%, 11/15/2035 | | | 11,365,313 | |
| | | | | | | | |
| | | | | | | 46,347,250 | |
| | | | | | | | |
| | | | Property & Casualty Insurance — 0.8% | | | | |
| | 72,915,000 | | | Old Republic International Corp., 3.750%, 3/15/2018 | | | 85,356,122 | |
| | | | | | | | |
| | | | REITs – Warehouse/Industrials — 0.3% | | | | |
| | 27,359,000 | | | ProLogis LP, 3.250%, 3/15/2015 | | | 28,761,149 | |
| | | | | | | | |
| | | | Technology — 2.8% | | | | |
| | 35,120,000 | | | Intel Corp., 2.950%, 12/15/2035 | | | 44,690,200 | |
| | 137,016,000 | | | Intel Corp., 3.250%, 8/01/2039 | | | 229,758,705 | |
| | 11,515,000 | | | Lam Research Corp., Series B, 1.250%, 5/15/2018 | | | 15,502,069 | |
| | 376,337 | | | Liberty Media LLC, 3.500%, 1/15/2031 | | | 205,574 | |
| | | | | | | | |
| | | | | | | 290,156,548 | |
| | | | | | | | |
| | | | Total Convertible Bonds (Identified Cost $361,745,831) | | | 515,296,499 | |
| | | | | | | | |
See accompanying notes to financial statements.
23 |
Portfolio of Investments – as of September 30, 2014
Loomis Sayles Investment Grade Bond Fund – (continued)
| | | | | | | | |
Principal Amount (‡) | | | Description | | Value (†) | |
| | Municipals — 0.9% | |
| | | | District of Columbia — 0.2% | | | | |
| $ | 14,680,000 | | | Metropolitan Washington Airports Authority, 7.462%, 10/01/2046 | | $ | 19,729,186 | |
| | | | | | | | |
| | | | Illinois — 0.6% | | | | |
| | 530,000 | | | Chicago O’Hare International Airport, Series A, (AGMC insured), 4.500%, 1/01/2038 | | | 539,254 | |
| | 24,640,000 | | | State of Illinois, 5.100%, 6/01/2033 | | | 23,926,672 | |
| | 33,395,000 | | | State of Illinois, Series B, 5.520%, 4/01/2038 | | | 32,898,082 | |
| | | | | | | | |
| | | | | | | 57,364,008 | |
| | | | | | | | |
| | | | Michigan — 0.0% | | | | |
| | 2,310,000 | | | Michigan Tobacco Settlement Finance Authority Taxable Turbo, Series A, 7.309%, 6/01/2034 | | | 1,982,558 | |
| | | | | | | | |
| | | | Ohio — 0.0% | �� | | | |
| | 5,075,000 | | | Buckeye Tobacco Settlement Financing Authority, Series A-2, 5.875%, 6/01/2047 | | | 3,958,804 | |
| | | | | | | | |
| | | | Virginia — 0.1% | | | | |
| | 13,845,000 | | | Virginia Tobacco Settlement Financing Corp., Series A-1, 6.706%, 6/01/2046 | | | 10,133,848 | |
| | | | | | | | |
| | | | Total Municipals (Identified Cost $88,348,042) | | | 93,168,404 | |
| | | | | | | | |
| | | | Total Bonds and Notes (Identified Cost $8,742,923,100) | | | 9,454,818,466 | |
| | | | | | | | |
| | | | | |
| | Senior Loans — 0.5% | |
| | | | Finance Companies — 0.4% | | | | |
| | 25,783,804 | | | AWAS Finance Luxembourg 2012 S.A., New Term Loan, 3.500%, 7/16/2018(c) | | | 25,601,255 | |
| | 15,234,337 | | | AWAS Finance Luxembourg S.a.r.l., Term Loan B, 3.500%, 6/10/2016(c) | | | 15,120,079 | |
| | | | | | | | |
| | | | | | | 40,721,334 | |
| | | | | | | | |
| | | | Supermarkets — 0.1% | | | | |
| | 9,084,349 | | | Supervalu, Inc., Refi Term Loan B, 4.500%, 3/21/2019(c) | | | 8,907,749 | |
| | | | | | | | |
| | | | Total Senior Loans (Identified Cost $50,092,516) | | | 49,629,083 | |
| | | | | | | | |
| | | | | |
| Shares | | | | | | |
| | Common Stocks — 3.3% | |
| | | | Electronic Equipment, Instruments & Components — 3.3% | | | | |
| | 17,550,000 | | | Corning, Inc. (Identified Cost $226,654,590) | | | 339,417,000 | |
| | | | | | | | |
| | | | | |
| | Preferred Stocks — 0.2% | |
| | | | Energy — 0.0% | | | | |
| | 43,031 | | | Chesapeake Energy Corp., 5.000% | | | 4,217,043 | |
| | | | | | | | |
See accompanying notes to financial statements.
| 24
Portfolio of Investments – as of September 30, 2014
Loomis Sayles Investment Grade Bond Fund – (continued)
| | | | | | | | |
Shares | | | Description | | Value (†) | |
| | | | Metals & Mining — 0.1% | | | | |
| | 340,285 | | | ArcelorMittal, 6.000% | | $ | 7,190,222 | |
| | | | | | | | |
| | | | REITs – Diversified — 0.1% | | | | |
| | 258,873 | | | Weyerhaeuser Co., Series A, 6.375% | | | 13,986,908 | |
| | | | | | | | |
| | | | Total Preferred Stocks (Identified Cost $25,066,558) | | | 25,394,173 | |
| | | | | | | | |
| | | | | |
Principal
Amount (‡) | | | | | | |
| | Short-Term Investments — 3.2% | |
| $ | 104,470 | | | Repurchase Agreement with State Street Bank and Trust Company, dated 9/30/2014 at 0.000%, to be repurchased at $104,470 on 10/01/2014 collateralized by $106,500 U.S. Treasury Note, 1.500% due 8/31/2018 valued at $106,582 including accrued interest (Note 2 of Notes to Financial Statements) | | | 104,470 | |
| | 332,063,122 | | | Tri-Party Repurchase Agreement with Fixed Income Clearing Corporation, dated 9/30/2014 at 0.000% to be repurchased at $332,063,122 on 10/01/2014 collateralized by $325,290,000 U.S. Treasury Bond, 2.625% due 11/15/2020 valued at $338,708,213 including accrued interest (Note 2 of Notes to Financial Statements) | | | 332,063,122 | |
| | | | | | | | |
| | | | Total Short-Term Investments (Identified Cost $332,167,592) | | | 332,167,592 | |
| | | | | | | | |
| | | | | | | | |
| | | | Total Investments — 98.0% (Identified Cost $9,376,904,356)(a) | | | 10,201,426,314 | |
| | | | Other assets less liabilities — 2.0% | | | 205,070,701 | |
| | | | | | | | |
| | | | Net Assets — 100.0% | | $ | 10,406,497,015 | |
| | | | | | | | |
| | | | | | | | |
| | (‡) | | | Principal Amount stated in U.S. dollars unless otherwise noted. | |
| | (†) | | | See Note 2 of Notes to Financial Statements. | |
| | (††) | | | Amount shown represents units. One unit represents a principal amount of 25. | |
| | (†††) | | | Amount shown represents units. One unit represents a principal amount of 100. | |
| | (a) | | | Federal Tax Information: | |
| | | | At September 30, 2014, the net unrealized appreciation on investments based on a cost of $9,468,386,778 for federal income tax purposes was as follows: | |
| | | | Aggregate gross unrealized appreciation for all investments in which there is an excess of value over tax cost | | $ | 986,772,734 | |
| | | | Aggregate gross unrealized depreciation for all investments in which there is an excess of tax cost over value | | | (253,733,198 | ) |
| | | | | | | | |
| | | | Net unrealized appreciation | | $ | 733,039,536 | |
| | | | | | | | |
| | (b) | | | Illiquid security. At September 30, 2014, the value of these securities amounted to $103,748,404 or 1.0% of net assets. | |
| | (c) | | | Variable rate security. Rate as of September 30, 2014 is disclosed. | |
| | (d) | | | Coupon rate is a fixed rate for an initial period then resets at a specified date and rate. | |
| | (e) | | | Perpetual bond with no specified maturity date. | |
See accompanying notes to financial statements.
25 |
Portfolio of Investments – as of September 30, 2014
Loomis Sayles Investment Grade Bond Fund – (continued)
| | | | | | |
| | | | | | |
| | (f) | | | The issuer is in default with respect to interest and/or principal payments. Income is not being accrued. |
| | (g) | | | Fair valued by the Fund’s adviser or deemed to be fair valued pursuant to the Fund’s pricing policies and procedures. At September 30, 2014, the value of this security amounted to $103,748,404 or 1.0% of net assets. |
| | (h) | | | Non-income producing security. |
| | | | | | |
| | 144A | | | All or a portion of these securities are exempt from registration under Rule 144A of the Securities Act of 1933. These securities may be resold in transactions exempt from registration, normally to qualified institutional buyers. At September 30, 2014, the value of Rule 144A holdings amounted to $1,370,378,216 or 13.2% of net assets. |
| | ABS | | | Asset-Backed Securities |
| | AGMC | | | Assured Guaranty Municipal Corp. | | |
| | EMTN | | | Euro Medium Term Note | | |
| | FHLMC | | | Federal Home Loan Mortgage Corp. | | |
| | FNMA | | | Federal National Mortgage Association | | |
| | GMTN | | | Global Medium Term Note | | |
| | MTN | | | Medium Term Note | | |
| | REITs | | | Real Estate Investment Trusts | | |
| | REMIC | | | Real Estate Mortgage Investment Conduit | | |
| | | | | | |
| | AUD | | | Australian Dollar | | |
| | BRL | | | Brazilian Real | | |
| | CAD | | | Canadian Dollar | | |
| | EUR | | | Euro | | |
| | GBP | | | British Pound | | |
| | IDR | | | Indonesian Rupiah | | |
| | ISK | | | Icelandic Krona | | |
| | KRW | | | South Korean Won | | |
| | MXN | | | Mexican Peso | | |
| | NOK | | | Norwegian Krone | | |
| | NZD | | | New Zealand Dollar | | |
See accompanying notes to financial statements.
| 26
Portfolio of Investments – as of September 30, 2014
Loomis Sayles Investment Grade Bond Fund – (continued)
Industry Summary at September 30, 2014
| | | | |
Treasuries | | | 25.1 | % |
Banking | | | 14.2 | |
Finance Companies | | | 6.1 | |
Technology | | | 4.3 | |
Wirelines | | | 3.7 | |
Electronic Equipment, Instruments & Components | | | 3.3 | |
Airlines | | | 2.8 | |
Metals & Mining | | | 2.4 | |
Local Authorities | | | 2.2 | |
Midstream | | | 2.1 | |
Non-Agency Commercial Mortgage-Backed Securities | | | 2.1 | |
Electric | | | 2.1 | |
ABS Other | | | 2.0 | |
Other Investments, less than 2% each | | | 22.4 | |
Short-Term Investments | | | 3.2 | |
| | | | |
Total Investments | | | 98.0 | |
Other assets less liabilities | | | 2.0 | |
| | | | |
Net Assets | | | 100.0 | % |
| | | | |
Currency Exposure Summary at September 30, 2014
| | | | |
United States Dollar | | | 69.6 | % |
Canadian Dollar | | | 12.6 | |
New Zealand Dollar | | | 4.8 | |
Australian Dollar | | | 3.2 | |
Norwegian Krone | | | 2.8 | |
Mexican Peso | | | 2.7 | |
Other, less than 2% each | | | 2.3 | |
| | | | |
Total Investments | | | 98.0 | |
Other assets less liabilities | | | 2.0 | |
| | | | |
Net Assets | | | 100.0 | % |
| | | | |
See accompanying notes to financial statements.
27 |
Statement of Assets and Liabilities
September 30, 2014
| | | | |
ASSETS | | | | |
Investments at cost | | $ | 9,376,904,356 | |
Net unrealized appreciation | | | 824,521,958 | |
| | | | |
Investments at value | | | 10,201,426,314 | |
Foreign currency at value (identified cost $1,296,578) | | | 1,503,421 | |
Receivable for Fund shares sold | | | 109,732,409 | |
Receivable for securities sold | | | 79,180 | |
Dividends and interest receivable | | | 111,296,616 | |
| | | | |
TOTAL ASSETS | | | 10,424,037,940 | |
| | | | |
LIABILITIES | | | | |
Payable for Fund shares redeemed | | | 12,488,516 | |
Management fees payable (Note 5) | | | 3,409,821 | |
Deferred Trustees’ fees (Note 5) | | | 625,742 | |
Administrative fees payable (Note 5) | | | 366,233 | |
Payable to distributor (Note 5d) | | | 139,806 | |
Other accounts payable and accrued expenses | | | 510,807 | |
| | | | |
TOTAL LIABILITIES | | | 17,540,925 | |
| | | | |
NET ASSETS | | $ | 10,406,497,015 | |
| | | | |
NET ASSETS CONSIST OF: | | | | |
Paid-in capital | | $ | 9,505,370,717 | |
Undistributed net investment income | | | 17,386,896 | |
Accumulated net realized gain on investments and foreign currency transactions | | | 60,599,514 | |
Net unrealized appreciation on investments and foreign currency translations | | | 823,139,888 | |
| | | | |
NET ASSETS | | $ | 10,406,497,015 | |
| | | | |
See accompanying notes to financial statements.
| 28
Statement of Assets and Liabilities (continued)
September 30, 2014
| | | | |
COMPUTATION OF NET ASSET VALUE AND OFFERING PRICE: | | | | |
Class A shares: | | | | |
Net assets | | $ | 1,932,847,262 | |
| | | | |
Shares of beneficial interest | | | 159,624,805 | |
| | | | |
Net asset value and redemption price per share | | $ | 12.11 | |
| | | | |
Offering price per share (100/95.50 of net asset value) (Note 1) | | $ | 12.68 | |
| | | | |
Class B shares: (redemption price per share is equal to net asset value less any applicable contingent deferred sales charge) (Note 1) | | | | |
Net assets | | $ | 5,220,108 | |
| | | | |
Shares of beneficial interest | | | 433,407 | |
| | | | |
Net asset value and offering price per share | | $ | 12.04 | |
| | | | |
Class C shares: (redemption price per share is equal to net asset value less any applicable contingent deferred sales charge) (Note 1) | | | | |
Net assets | | $ | 1,524,805,571 | |
| | | | |
Shares of beneficial interest | | | 127,083,233 | |
| | | | |
Net asset value and offering price per share | | $ | 12.00 | |
| | | | |
Class N shares: | | | | |
Net assets | | $ | 6,100,892 | |
| | | | |
Shares of beneficial interest | | | 503,757 | |
| | | | |
Net asset value, offering and redemption price per share | | $ | 12.11 | |
| | | | |
Class Y shares: | | | | |
Net assets | | $ | 6,911,938,132 | |
| | | | |
Shares of beneficial interest | | | 570,427,565 | |
| | | | |
Net asset value, offering and redemption price per share | | $ | 12.12 | |
| | | | |
Admin Class shares: | | | | |
Net assets | | $ | 25,585,050 | |
| | | | |
Shares of beneficial interest | | | 2,116,916 | |
| | | | |
Net asset value, offering and redemption price per share | | $ | 12.09 | |
| | | | |
See accompanying notes to financial statements.
29 |
Statement of Operations
For the Year Ended September 30, 2014
| | | | |
INVESTMENT INCOME | | | | |
Interest | | $ | 453,759,384 | |
Dividends | | | 8,664,404 | |
| | | | |
| | | 462,423,788 | |
| | | | |
Expenses | | | | |
Management fees (Note 5) | | | 40,377,872 | |
Service and distribution fees (Note 5) | | | 22,032,669 | |
Administrative fees (Note 5) | | | 4,392,783 | |
Trustees’ fees and expenses (Note 5) | | | 257,795 | |
Transfer agent fees and expenses (Notes 5 and 6) | | | 12,056,674 | |
Audit and tax services fees | | | 63,577 | |
Custodian fees and expenses | | | 434,467 | |
Legal fees | | | 90,033 | |
Registration fees | | | 409,943 | |
Shareholder reporting expenses | | | 735,082 | |
Miscellaneous expenses | | | 238,069 | |
| | | | |
Total expenses | | | 81,088,964 | |
Fee/expense recovery (Note 5) | | | 11 | |
Less waiver and/or expense reimbursement (Note 5) | | | (67 | ) |
| | | | |
Net expenses | | | 81,088,908 | |
| | | | |
Net investment income | | | 381,334,880 | |
| | | | |
NET REALIZED AND UNREALIZED GAIN (LOSS) ON INVESTMENTS AND FOREIGN CURRENCY TRANSACTIONS | | | | |
Net realized gain on: | | | | |
Investments | | | 164,436,601 | |
Foreign currency transactions | | | 999,119 | |
Net change in unrealized appreciation (depreciation) on: | | | | |
Investments | | | 38,862,715 | |
Foreign currency translations | | | (1,682,919 | ) |
| | | | |
Net realized and unrealized gain on investments and foreign currency transactions | | | 202,615,516 | |
| | | | |
NET INCREASE IN NET ASSETS RESULTING FROM OPERATIONS | | $ | 583,950,396 | |
| | | | |
See accompanying notes to financial statements.
| 30
Statement of Changes in Net Assets
| | | | | | | | |
| | | Year Ended
September 30,
2014 | | | Year Ended
September 30,
2013 | |
FROM OPERATIONS: | | | | | | | | |
Net investment income | | $ | 381,334,880 | | | $ | 457,104,505 | |
Net realized gain on investments and foreign currency transactions | | | 165,435,720 | | | | 279,257,933 | |
Net change in unrealized appreciation (depreciation) on investments and foreign currency translations | | | 37,179,796 | | | | (589,427,566 | ) |
| | | | | | | | |
Net increase in net assets resulting from operations | | | 583,950,396 | | | | 146,934,872 | |
| | | | | | | | |
FROM DISTRIBUTIONS TO SHAREHOLDERS: | | | | | | | | |
Net investment income | | | | | | | | |
Class A | | | (97,103,740 | ) | | | (137,547,979 | ) |
Class B | | | (240,518 | ) | | | (434,962 | ) |
Class C | | | (55,536,557 | ) | | | (86,375,065 | ) |
Class N | | | (146,112 | ) | | | (330 | ) |
Class Y | | | (267,549,875 | ) | | | (341,402,630 | ) |
Admin Class | | | (853,378 | ) | | | (914,415 | ) |
Net realized capital gains | | | | | | | | |
Class A | | | (61,443,747 | ) | | | (27,197,220 | ) |
Class B | | | (193,236 | ) | | | (106,865 | ) |
Class C | | | (42,676,071 | ) | | | (20,576,316 | ) |
Class N | | | (71,304 | ) | | | — | |
Class Y | | | (149,212,926 | ) | | | (63,063,034 | ) |
Admin Class | | | (529,493 | ) | | | (171,884 | ) |
| | | | | | | | |
Total distributions | | | (675,556,957 | ) | | | (677,790,700 | ) |
| | | | | | | | |
NET INCREASE (DECREASE) IN NET ASSETS FROM CAPITAL SHARE TRANSACTIONS (NOTE 10) | | | 159,293,101 | | | | (1,217,980,423 | ) |
| | | | | | | | |
Net increase (decrease) in net assets | | | 67,686,540 | | | | (1,748,836,251 | ) |
NET ASSETS | | | | | | | | |
Beginning of the year | | | 10,338,810,475 | | | | 12,087,646,726 | |
| | | | | | | | |
End of the year | | $ | 10,406,497,015 | | | $ | 10,338,810,475 | |
| | | | | | | | |
UNDISTRIBUTED NET INVESTMENT INCOME | | $ | 17,386,896 | | | $ | 15,275,810 | |
| | | | | | | | |
See accompanying notes to financial statements.
31 |
Financial Highlights
For a share outstanding throughout each period.
| | | | | | | | | | | | | | | | | | | | |
| | | Class A | |
| | | Year Ended
September 30,
2014 | | | Year Ended
September 30,
2013 | | | Year Ended
September 30,
2012 | | | Year Ended
September 30,
2011 | | | Year Ended
September 30,
2010 | |
Net asset value, beginning of the period | | $ | 12.22 | | | $ | 12.76 | | | $ | 12.12 | | | $ | 12.56 | | | $ | 11.64 | |
| | | | | | | | | | | | | | | | | | | | |
INCOME (LOSS) FROM INVESTMENT OPERATIONS: | | | | | | | | | | | | | | | | | | | | |
Net investment income(a) | | | 0.46 | | | | 0.48 | | | | 0.51 | | | | 0.57 | | | | 0.55 | |
Net realized and unrealized gain (loss) | | | 0.26 | | | | (0.30 | ) | | | 0.86 | | | | (0.15 | ) | | | 0.96 | |
| | | | | | | | | | | | | | | | | | | | |
Total from Investment Operations | | | 0.72 | | | | 0.18 | | | | 1.37 | | | | 0.42 | | | | 1.51 | |
| | | | | | | | | | | | | | | | | | | | |
LESS DISTRIBUTIONS FROM: | | | | | | | | | | | | | | | | | | | | |
Net investment income | | | (0.51 | ) | | | (0.60 | ) | | | (0.62 | ) | | | (0.60 | ) | | | (0.56 | ) |
Net realized capital gains | | | (0.32 | ) | | | (0.12 | ) | | | (0.11 | ) | | | (0.26 | ) | | | (0.03 | ) |
| | | | | | | | | | | | | | | | | | | | |
Total Distributions | | | (0.83 | ) | | | (0.72 | ) | | | (0.73 | ) | | | (0.86 | ) | | | (0.59 | ) |
| | | | | | | | | | | | | | | | | | | | |
Net asset value, end of the period | | $ | 12.11 | | | $ | 12.22 | | | $ | 12.76 | | | $ | 12.12 | | | $ | 12.56 | |
| | | | | | | | | | | | | | | | | | | | |
Total return(b) | | | 6.04 | % | | | 1.34 | % | | | 11.74 | % | | | 3.47 | % | | | 13.41 | % |
RATIOS TO AVERAGE NET ASSETS: | | | | | | | | | | | | | | | | | | | | |
Net assets, end of the period (000’s) | | $ | 1,932,847 | | | $ | 2,431,718 | | | $ | 2,960,119 | | | $ | 2,705,810 | | | $ | 3,092,956 | |
Net expenses | | | 0.83 | % | | | 0.83 | % | | | 0.84 | % | | | 0.81 | % | | | 0.81 | % |
Gross expenses | | | 0.83 | % | | | 0.83 | % | | | 0.84 | % | | | 0.81 | % | | | 0.81 | % |
Net investment income | | | 3.75 | % | | | 3.85 | % | | | 4.17 | % | | | 4.56 | % | | | 4.58 | % |
Portfolio turnover rate | | | 19 | % | | | 30 | % | | | 19 | % | | | 19 | % | | | 25 | % |
| (a) | Per share net investment income has been calculated using the average shares outstanding during the period. |
| (b) | A sales charge for Class A shares is not reflected in total return calculations. |
See accompanying notes to financial statements.
| 32
Financial Highlights (continued)
For a share outstanding throughout each period.
| | | | | | | | | | | | | | | | | | | | |
| | | Class B | |
| | | Year Ended
September 30,
2014 | | | Year Ended
September 30,
2013 | | | Year Ended
September 30,
2012 | | | Year Ended
September 30,
2011 | | | Year Ended
September 30,
2010 | |
Net asset value, beginning of the period | | $ | 12.16 | | | $ | 12.70 | | | $ | 12.06 | | | $ | 12.50 | | | $ | 11.59 | |
| | | | | | | | | | | | | | | | | | | | |
INCOME (LOSS) FROM INVESTMENT OPERATIONS: | | | | | | | | | | | | | | | | | | | | |
Net investment income(a) | | | 0.37 | | | | 0.39 | | | | 0.42 | | | | 0.47 | | | | 0.45 | |
Net realized and unrealized gain (loss) | | | 0.24 | | | | (0.31 | ) | | | 0.86 | | | | (0.14 | ) | | | 0.95 | |
| | | | | | | | | | | | | | | | | | | | |
Total from Investment Operations | | | 0.61 | | | | 0.08 | | | | 1.28 | | | | 0.33 | | | | 1.40 | |
| | | | | | | | | | | | | | | | | | | | |
LESS DISTRIBUTIONS FROM: | | | | | | | | | | | | | | | | | | | | |
Net investment income | | | (0.41 | ) | | | (0.50 | ) | | | (0.53 | ) | | | (0.51 | ) | | | (0.46 | ) |
Net realized capital gains | | | (0.32 | ) | | | (0.12 | ) | | | (0.11 | ) | | | (0.26 | ) | | | (0.03 | ) |
| | | | | | | | | | | | | | | | | | | | |
Total Distributions | | | (0.73 | ) | | | (0.62 | ) | | | (0.64 | ) | | | (0.77 | ) | | | (0.49 | ) |
| | | | | | | | | | | | | | | | | | | | |
Net asset value, end of the period | | $ | 12.04 | | | $ | 12.16 | | | $ | 12.70 | | | $ | 12.06 | | | $ | 12.50 | |
| | | | | | | | | | | | | | | | | | | | |
Total return(b) | | | 5.17 | % | | | 0.57 | % | | | 10.96 | % | | | 2.70 | % | | | 12.43 | % |
RATIOS TO AVERAGE NET ASSETS: | | | | | | | | | | | | | | | | | | | | |
Net assets, end of the period (000’s) | | $ | 5,220 | | | $ | 7,972 | | | $ | 12,507 | | | $ | 13,549 | | | $ | 17,113 | |
Net expenses | | | 1.58 | % | | | 1.58 | % | | | 1.59 | % | | | 1.56 | % | | | 1.65 | % |
Gross expenses | | | 1.58 | % | | | 1.58 | % | | | 1.59 | % | | | 1.56 | % | | | 1.65 | % |
Net investment income | | | 3.02 | % | | | 3.09 | % | | | 3.42 | % | | | 3.81 | % | | | 3.74 | % |
Portfolio turnover rate | | | 19 | % | | | 30 | % | | | 19 | % | | | 19 | % | | | 25 | % |
| (a) | Per share net investment income has been calculated using the average shares outstanding during the period. |
| (b) | A contingent deferred sales charge for Class B shares is not reflected in total return calculations. |
See accompanying notes to financial statements.
33 |
Financial Highlights (continued)
For a share outstanding throughout each period.
| | | | | | | | | | | | | | | | | | | | |
| | | Class C | |
| | | Year Ended
September 30,
2014 | | | Year Ended
September 30,
2013 | | | Year Ended
September 30,
2012 | | | Year Ended
September 30,
2011 | | | Year Ended
September 30,
2010 | |
Net asset value, beginning of the period | | $ | 12.11 | | | $ | 12.66 | | | $ | 12.03 | | | $ | 12.47 | | | $ | 11.56 | |
| | | | | | | | | | | | | | | | | | | | |
INCOME (LOSS) FROM INVESTMENT OPERATIONS: | | | | | | | | | | | | | | | | | | | | |
Net investment income(a) | | | 0.36 | | | | 0.39 | | | | 0.42 | | | | 0.47 | | | | 0.46 | |
Net realized and unrealized gain (loss) | | | 0.27 | | | | (0.32 | ) | | | 0.85 | | | | (0.14 | ) | | | 0.96 | |
| | | | | | | | | | | | | | | | | | | | |
Total from Investment Operations | | | 0.63 | | | | 0.07 | | | | 1.27 | | | | 0.33 | | | | 1.42 | |
| | | | | | | | | | | | | | | | | | | | |
LESS DISTRIBUTIONS FROM: | | | | | | | | | | | | | | | | | | | | |
Net investment income | | | (0.42 | ) | | | (0.50 | ) | | | (0.53 | ) | | | (0.51 | ) | | | (0.48 | ) |
Net realized capital gains | | | (0.32 | ) | | | (0.12 | ) | | | (0.11 | ) | | | (0.26 | ) | | | (0.03 | ) |
| | | | | | | | | | | | | | | | | | | | |
Total Distributions | | | (0.74 | ) | | | (0.62 | ) | | | (0.64 | ) | | | (0.77 | ) | | | (0.51 | ) |
| | | | | | | | | | | | | | | | | | | | |
Net asset value, end of the period | | $ | 12.00 | | | $ | 12.11 | | | $ | 12.66 | | | $ | 12.03 | | | $ | 12.47 | |
| | | | | | | | | | | | | | | | | | | | |
Total return(b) | | | 5.29 | % | | | 0.50 | % | | | 10.91 | % | | | 2.71 | % | | | 12.58 | % |
RATIOS TO AVERAGE NET ASSETS: | | | | | | | | | | | | | | | | | | | | |
Net assets, end of the period (000’s) | | $ | 1,524,806 | | | $ | 1,746,822 | | | $ | 2,281,142 | | | $ | 2,091,834 | | | $ | 2,593,324 | |
Net expenses | | | 1.58 | % | | | 1.58 | % | | | 1.59 | % | | | 1.56 | % | | | 1.56 | % |
Gross expenses | | | 1.58 | % | | | 1.58 | % | | | 1.59 | % | | | 1.56 | % | | | 1.56 | % |
Net investment income | | | 3.00 | % | | | 3.10 | % | | | 3.42 | % | | | 3.81 | % | | | 3.83 | % |
Portfolio turnover rate | | | 19 | % | | | 30 | % | | | 19 | % | | | 19 | % | | | 25 | % |
| (a) | Per share net investment income has been calculated using the average shares outstanding during the period. |
| (b) | A contingent deferred sales charge for Class C shares is not reflected in total return calculations. |
See accompanying notes to financial statements.
| 34
Financial Highlights (continued)
For a share outstanding throughout each period.
| | | | | | | | |
| | | Class N | |
| | | Year Ended
September 30,
2014 | | | Period Ended
September 30,
2013* | |
Net asset value, beginning of the period | | $ | 12.22 | | | $ | 12.66 | |
| | | | | | | | |
INCOME (LOSS) FROM INVESTMENT OPERATIONS: | | | | | | | | |
Net investment income(a) | | | 0.50 | | | | 0.34 | |
Net realized and unrealized gain (loss) | | | 0.26 | | | | (0.46 | ) |
| | | | | | | | |
Total from Investment Operations | | | 0.76 | | | | (0.12 | ) |
| | | | | | | | |
LESS DISTRIBUTIONS FROM: | | | | | | | | |
Net investment income | | | (0.55 | ) | | | (0.32 | ) |
Net realized capital gains | | | (0.32 | ) | | | — | |
| | | | | | | | |
Total Distributions | | | (0.87 | ) | | | (0.32 | ) |
| | | | | | | | |
Net asset value, end of the period | | $ | 12.11 | | | $ | 12.22 | |
| | | | | | | | |
Total return | | | 6.41 | % | | | (0.95 | )%(b) |
RATIOS TO AVERAGE NET ASSETS: | | | | | | | | |
Net assets, end of the period (000’s) | | $ | 6,101 | | | $ | 41 | |
Net expenses | | | 0.47 | %(e) | | | 0.65 | %(c)(d) |
Gross expenses | | | 0.47 | %(e) | | | 0.78 | %(d) |
Net investment income | | | 4.07 | % | | | 4.18 | %(d) |
Portfolio turnover rate | | | 19 | % | | | 30 | % |
| * | From commencement of Class operations on February 1, 2013 through September 30, 2013. |
| (a) | Per share net investment income has been calculated using the average shares outstanding during the period. |
| (b) | Had certain expenses not been waived/reimbursed during the period, total returns would have been lower. Periods less than one year, are not annualized. |
| (c) | The investment adviser agreed to waive its fees and/or reimburse a portion of the Fund’s expenses during the period. Without this waiver/reimbursement, expenses would have been higher. |
| (d) | Computed on an annualized basis for periods less than one year. |
| (e) | Includes fee/expense recovery of less than 0.01%. |
See accompanying notes to financial statements.
35 |
Financial Highlights (continued)
For a share outstanding throughout each period.
| | | | | | | | | | | | | | | | | | | | |
| | | Class Y | |
| | | Year Ended
September 30,
2014 | | | Year Ended
September 30,
2013 | | | Year Ended
September 30,
2012 | | | Year Ended
September 30,
2011 | | | Year Ended
September 30,
2010 | |
Net asset value, beginning of the period | | $ | 12.23 | | | $ | 12.77 | | | $ | 12.13 | | | $ | 12.56 | | | $ | 11.65 | |
| | | | | | | | | | | | | | | | | | | | |
INCOME (LOSS) FROM INVESTMENT OPERATIONS: | | | | | | | | | | | | | | | | | | | | |
Net investment income(a) | | | 0.49 | | | | 0.52 | | | | 0.54 | | | | 0.60 | | | | 0.58 | |
Net realized and unrealized gain (loss) | | | 0.26 | | | | (0.31 | ) | | | 0.86 | | | | (0.14 | ) | | | 0.95 | |
| | | | | | | | | | | | | | | | | | | | |
Total from Investment Operations | | | 0.75 | | | | 0.21 | | | | 1.40 | | | | 0.46 | | | | 1.53 | |
| | | | | | | | | | | | | | | | | | | | |
LESS DISTRIBUTIONS FROM: | | | | | | | | | | | | | | | | | | | | |
Net investment income | | | (0.54 | ) | | | (0.63 | ) | | | (0.65 | ) | | | (0.63 | ) | | | (0.59 | ) |
Net realized capital gains | | | (0.32 | ) | | | (0.12 | ) | | | (0.11 | ) | | | (0.26 | ) | | | (0.03 | ) |
| | | | | | | | | | | | | | | | | | | | |
Total Distributions | | | (0.86 | ) | | | (0.75 | ) | | | (0.76 | ) | | | (0.89 | ) | | | (0.62 | ) |
| | | | | | | | | | | | | | | | | | | | |
Net asset value, end of the period | | $ | 12.12 | | | $ | 12.23 | | | $ | 12.77 | | | $ | 12.13 | | | $ | 12.56 | |
| | | | | | | | | | | | | | | | | | | | |
Total return | | | 6.30 | % | | | 1.60 | % | | | 12.01 | % | | | 3.81 | % | | | 13.60 | % |
RATIOS TO AVERAGE NET ASSETS: | | | | | | | | | | | | | | | | | | | | |
Net assets, end of the period (000’s) | | $ | 6,911,938 | | | $ | 6,130,700 | | | $ | 6,817,911 | | | $ | 4,887,742 | | | $ | 4,473,001 | |
Net expenses | | | 0.59 | % | | | 0.58 | % | | | 0.59 | % | | | 0.56 | % | | | 0.56 | % |
Gross expenses | | | 0.59 | % | | | 0.58 | % | | | 0.59 | % | | | 0.56 | % | | | 0.56 | % |
Net investment income | | | 3.99 | % | | | 4.11 | % | | | 4.41 | % | | | 4.81 | % | | | 4.82 | % |
Portfolio turnover rate | | | 19 | % | | | 30 | % | | | 19 | % | | | 19 | % | | | 25 | % |
| (a) | Per share net investment income has been calculated using the average shares outstanding during the period. |
See accompanying notes to financial statements.
| 36
Financial Highlights (continued)
For a share outstanding throughout each period.
| | | | | | | | | | | | | | | | | | | | |
| | | Admin Class | |
| | | Year Ended
September 30,
2014 | | | Year Ended
September 30,
2013 | | | Year Ended
September 30,
2012 | | | Year Ended
September 30,
2011 | | | Period Ended
September 30,
2010* | |
Net asset value, beginning of the period | | $ | 12.20 | | | $ | 12.74 | | | $ | 12.11 | | | $ | 12.55 | | | $ | 11.80 | |
| | | | | | | | | | | | | | | | | | | | |
INCOME (LOSS) FROM INVESTMENT OPERATIONS: | | | | | | | | | | | | | | | | | | | | |
Net investment income(a) | | | 0.43 | | | | 0.45 | | | | 0.48 | | | | 0.54 | | | | 0.33 | |
Net realized and unrealized gain (loss) | | | 0.26 | | | | (0.30 | ) | | | 0.85 | | | | (0.15 | ) | | | 0.73 | |
| | | | | | | | | | | | | | | | | | | | |
Total from Investment Operations | | | 0.69 | | | | 0.15 | | | | 1.33 | | | | 0.39 | | | | 1.06 | |
| | | | | | | | | | | | | | | | | | | | |
LESS DISTRIBUTIONS FROM: | | | | | | | | | | | | | | | | | | | | |
Net investment income | | | (0.48 | ) | | | (0.57 | ) | | | (0.59 | ) | | | (0.57 | ) | | | (0.31 | ) |
Net realized capital gains | | | (0.32 | ) | | | (0.12 | ) | | | (0.11 | ) | | | (0.26 | ) | | | — | |
| | | | | | | | | | | | | | | | | | | | |
Total Distributions | | | (0.80 | ) | | | (0.69 | ) | | | (0.70 | ) | | | (0.83 | ) | | | (0.31 | ) |
| | | | | | | | | | | | | | | | | | | | |
Net asset value, end of the period | | $ | 12.09 | | | $ | 12.20 | | | $ | 12.74 | | | $ | 12.11 | | | $ | 12.55 | |
| | | | | | | | | | | | | | | | | | | | |
Total return | | | 5.79 | % | | | 1.10 | % | | | 11.41 | % | | | 3.26 | % | | | 9.13 | %(b) |
RATIOS TO AVERAGE NET ASSETS: | | | | | | | | | | | | | | | | | | | | |
Net assets, end of the period (000’s) | | $ | 25,585 | | | $ | 21,557 | | | $ | 15,968 | | | $ | 5,967 | | | $ | 879 | |
Net expenses | | | 1.09 | % | | | 1.08 | % | | | 1.09 | % | | | 1.07 | % | | | 1.08 | %(c)(d) |
Gross expenses | | | 1.09 | % | | | 1.08 | % | | | 1.09 | % | | | 1.07 | % | | | 7.68 | %(d) |
Net investment income | | | 3.49 | % | | | 3.62 | % | | | 3.89 | % | | | 4.32 | % | | | 4.06 | %(d) |
Portfolio turnover rate | | | 19 | % | | | 30 | % | | | 19 | % | | | 19 | % | | | 25 | % |
| * | From commencement of Class operations on February 1, 2010 through September 30, 2010. |
| (a) | Per share net investment income has been calculated using the average shares outstanding during the period. |
| (b) | Had certain expenses not been waived/reimbursed during the period, total returns would have been lower. Periods less than one year, are not annualized. |
| (c) | The investment adviser agreed to waive its fees and/or reimburse a portion of the Fund’s expenses during the period. Without this waiver/reimbursement, expenses would have been higher. |
| (d) | Computed on an annualized basis for periods less than one year. |
See accompanying notes to financial statements.
37 |
Notes to Financial Statements
September 30, 2014
1. Organization. Loomis Sayles Funds II (the “Trust”) is organized as a Massachusetts business trust. The Trust is registered under the Investment Company Act of 1940, as amended (the “1940 Act”), as an open-end management investment company. The Declaration of Trust permits the Board of Trustees to authorize the issuance of an unlimited number of shares of the Trust in multiple series. The financial statements for certain funds of the Trust are presented in separate reports. Information presented in these financial statements pertains to Loomis Sayles Investment Grade Bond Fund (the “Fund”).
The Fund is a diversified investment company.
The Fund offers Class A, Class C, Class N, Class Y and Admin Class shares. Effective October 12, 2007, Class B shares are no longer offered. Existing Class B shareholders may continue to reinvest dividends into Class B shares and exchange their Class B shares for Class B shares of other Natixis Funds subject to existing exchange privileges as described in the prospectus.
Class A shares are sold with a maximum front-end sales charge of 4.50%. Class B shares do not pay a front-end sales charge; however, they are charged higher Rule 12b-1 fees, and are subject to a contingent deferred sales charge (“CDSC”) if such shares are redeemed within six years of purchase. After eight years of ownership, Class B shares convert to Class A shares. Class C shares do not pay a front-end sales charge, do not convert to any other class of shares, pay higher Rule 12b-1 fees than Class A shares and may be subject to a CDSC of 1.00% if those shares are redeemed within one year of acquisition, except for reinvested distributions. Class N and Class Y shares do not pay a front-end sales charge, a CDSC or Rule 12b-1 fees. Class N shares are primarily intended for employer-sponsored retirement plans. Class Y shares are intended for institutional investors with a minimum initial investment of $100,000, though some categories of investors are exempted from the minimum investment amount as outlined in the Fund’s prospectus. Admin Class shares do not pay a front-end sales charge or a CDSC, but do pay a Rule 12b-1 fee. Class N and Admin Class shares are offered exclusively through intermediaries.
Most expenses can be directly attributed to a fund. Expenses which cannot be directly attributed to a fund are generally apportioned based on the relative net assets of each of the funds in Natixis Funds Trust I, Natixis Funds Trust II, Natixis Funds Trust IV, Gateway Trust (“Natixis Funds Trusts”), Loomis Sayles Funds I, Loomis Sayles Funds II (“Loomis Sayles Funds Trusts”) and Hansberger International Series. Expenses of the Fund are borne pro rata by the holders of each class of shares, except that each class bears expenses unique to that class (including the Rule 12b-1 service and distribution fees for Class A, Class B, Class C and Admin Class and transfer agent fees). In addition, each class votes as a class only with respect to its own Rule 12b-1 Plan. Shares of each class would receive their pro rata share of the net assets of the Fund if the Fund were liquidated. The Trustees approve separate distributions from net investment income on each class of shares.
| 38
Notes to Financial Statements (continued)
September 30, 2014
2. Significant Accounting Policies. The following is a summary of significant accounting policies consistently followed by the Fund in the preparation of its financial statements. The Fund’s financial statements follow the accounting and reporting guidelines provided for investment companies and are prepared in accordance with accounting principles generally accepted in the United States of America which require the use of management estimates that affect the reported amounts and disclosures in the financial statements. Actual results could differ from those estimates. Management has evaluated the events and transactions subsequent to year-end through the date the financial statements were issued and has determined that there were no material events that would require disclosure in the Fund’s financial statements.
a. Valuation. Fund securities and other investments are valued at market value based on market quotations obtained or determined by independent pricing services recommended by the adviser and approved by the Board of Trustees. Fund securities and other investments for which market quotations are not readily available are valued at fair value as determined in good faith by the adviser pursuant to procedures approved by the Board of Trustees, as described below. Market value is determined as follows:
Debt securities (other than short-term obligations purchased with an original or remaining maturity of sixty days or less) and unlisted equity securities are valued based on evaluated bids furnished to the Fund by an independent pricing service using market information, transactions for comparable securities and various relationships between securities, if available, or bid prices obtained from broker-dealers. Senior loans are valued at bid prices supplied by an independent pricing service, if available. Equity securities (including closed-end investment companies and exchange-traded funds) are valued at the last sale price quoted on the exchange or market where traded most extensively or, if there is no reported sale during the day, the closing bid quotation as reported by an independent pricing service. Securities traded on the NASDAQ Global Select Market, NASDAQ Global Market and NASDAQ Capital Market are valued at the NASDAQ Official Closing Price (“NOCP”), or if lacking an NOCP, at the most recent bid quotations on the applicable NASDAQ Market. In some foreign markets, an official close price and a last sale price may be available from the foreign exchange or market. In those cases, the official close price is used. Broker-dealer bid prices may be used to value debt and equity securities and senior loans where an independent pricing service is unable to price a security or where an independent pricing service does not provide a reliable price for the security. Forward foreign currency contracts are valued utilizing interpolated rates determined based on information provided by an independent pricing service. Short-term obligations (purchased with an original or remaining maturity of sixty days or less) are valued at amortized cost (which approximates market value.)
Fund securities and other investments for which market quotations are not readily available are valued at fair value as determined in good faith by the adviser pursuant to
39 |
Notes to Financial Statements (continued)
September 30, 2014
procedures approved by the Board of Trustees. The Fund may also value securities and other investments at fair value in other circumstances such as when extraordinary events occur after the close of a foreign market but prior to the close of the New York Stock Exchange (“NYSE”). This may include situations relating to a single issuer (such as a declaration of bankruptcy or a delisting of the issuer’s security from the primary market on which it has traded) as well as events affecting the securities markets in general (such as market disruptions or closings and significant fluctuations in U.S. and/or foreign markets). When fair valuing its securities or other investments, the Fund may, among other things, use modeling tools or other processes that may take into account factors such as securities or other market activity and/or significant events that occur after the close of the foreign market and before the time a Fund’s net asset value (“NAV”) is calculated. Fair value pricing may require subjective determinations about the value of a security, and fair values used to determine the Fund’s NAV may differ from quoted or published prices, or from prices that are used by others, for the same securities. In addition, the use of fair value pricing may not always result in adjustments to the prices of securities held by the Fund.
b. Investment Transactions and Related Investment Income. Investment transactions are accounted for on a trade date plus one day basis for daily NAV calculation. However, for financial reporting purposes, investment transactions are reported on trade date. Interest income is recorded on an accrual basis. Interest income is increased by the accretion of discount and decreased by the amortization of premium. In determining net gain or loss on securities sold, the cost of securities has been determined on an identified cost basis. Investment income, non-class specific expenses and realized and unrealized gains and losses are allocated on a pro rata basis to each class based on the relative net assets of each class to the total net assets of the Fund.
c. Foreign Currency Translation. The books and records of the Fund are maintained in U.S. dollars. The values of securities, currencies and other assets and liabilities denominated in currencies other than U.S. dollars are translated into U.S. dollars based upon foreign exchange rates prevailing at the end of the period. Purchases and sales of investment securities, income and expenses are translated on the respective dates of such transactions.
Since the values of investment securities are presented at the foreign exchange rates prevailing at the end of the period, it is not practical to isolate that portion of the results of operations arising from changes in exchange rates from fluctuations which arise due to changes in market prices of investment securities. Such changes are included with the net realized and unrealized gain or loss on investments.
Net realized foreign exchange gains or losses arise from sales of foreign currency, currency gains or losses realized between the trade and settlement dates on securities transactions and the difference between the amounts of interest and foreign withholding taxes recorded on the Fund’s books and the U.S. dollar equivalent of the
| 40
Notes to Financial Statements (continued)
September 30, 2014
amounts actually received or paid. Net unrealized foreign exchange gains and losses arise from changes in the value of assets and liabilities, other than investment securities, at the end of the fiscal period, resulting from changes in exchange rates.
The Fund may use foreign currency exchange contracts to facilitate transactions in foreign-denominated investments. Losses may arise from changes in the value of the foreign currency or if the counterparties do not perform under the contracts’ terms.
d. Forward Foreign Currency Contracts. The Fund may enter into forward foreign currency contracts, including forward foreign cross currency contracts, to acquire exposure to foreign currencies or to hedge the Fund’s investments against currency fluctuation. A contract can also be used to offset a previous contract. These contracts involve market risk in excess of the unrealized gain or loss reflected in the Fund’s Statement of Assets and Liabilities. The U.S. dollar value of the currencies the Fund has committed to buy or sell represents the aggregate exposure to each currency the Fund has acquired or hedged through currency contracts outstanding at period end. Gains or losses are recorded for financial statement purposes as unrealized until settlement date. Contracts are traded over-the-counter directly with a counterparty. Risks may arise upon entering into these contracts from the potential inability of counterparties to meet the terms of their contracts and from unanticipated movements in the value of a foreign currency relative to the U.S. dollar. Certain contracts may require the movement of cash and/or securities as collateral for the Fund’s or counterparty’s net obligations under the contracts.
No forward foreign currency contracts were held by the Fund during the year ended September 30, 2014.
e. Federal and Foreign Income Taxes. The Trust treats each Fund as a separate entity for federal income tax purposes. The Fund intends to meet the requirements of the Internal Revenue Code of 1986, as amended, applicable to regulated investment companies, and to distribute to its shareholders substantially all of its net investment income and any net realized capital gains at least annually. Management has performed an analysis of the Fund’s tax positions for the open tax years as of September 30, 2014 and has concluded that no provisions for income tax are required. The Fund’s federal tax returns for the prior three fiscal years remain subject to examination by the Internal Revenue Service. Management is not aware of any events that are reasonably possible to occur in the next twelve months that would result in the amounts of any unrecognized tax benefits significantly increasing or decreasing for the Fund. However, management’s conclusions regarding tax positions taken may be subject to review and adjustment at a later date based on factors including, but not limited to, new tax laws and accounting regulations and interpretations thereof.
The Fund may be subject to foreign withholding taxes on investment income and taxes on capital gains on investments that are accrued and paid based upon the Fund’s
41 |
Notes to Financial Statements (continued)
September 30, 2014
understanding of the tax rules and regulations that exist in the countries in which the Fund invests. Foreign withholding taxes on dividend and interest income are reflected on the Statement of Operations as a reduction of investment income, net of amounts eligible to be reclaimed. Dividends and interest receivable on the Statement of Assets and Liabilities are net of foreign withholding taxes. Foreign withholding taxes eligible to be reclaimed are reflected on the Statement of Assets and Liabilities as tax reclaims receivable. Capital gains taxes paid are included in net realized gain (loss) on investments in the Statement of Operations. Accrued but unpaid capital gains taxes are reflected as foreign taxes payable on the Statement of Assets and Liabilities, if applicable, and reduce unrealized gains on investments. In the event that realized gains on investments are subsequently offset by realized losses, taxes paid on realized gains may be returned to the Fund. Such amounts, if applicable, are reflected as foreign tax rebates receivable on the Statement of Assets and Liabilities and are recorded as a realized gain when received.
f. Dividends and Distributions to Shareholders. Dividends and distributions are recorded on ex-dividend date. The timing and characterization of certain income and capital gain distributions are determined annually in accordance with federal tax regulations, which may differ from accounting principles generally accepted in the United States of America. Permanent differences are primarily due to differing treatments for book and tax purposes of items such as foreign currency transactions, paydown gains and losses, capital gain distributions received, defaulted bond adjustments, distribution redesignations, deferred Trustees’ fees, and premium amortization. Permanent book and tax basis differences relating to shareholder distributions will result in reclassifications to capital accounts. Temporary differences between book and tax distributable earnings are primarily due to premium amortization, deferred Trustees’ fees, defaulted bond adjustments, contingent payment debt instruments and wash sales. Distributions from net investment income and short-term capital gains are considered to be distributed from ordinary income for tax purposes.
The tax characterization of distributions is determined on an annual basis. The tax character of distributions paid to shareholders during the years ended September 30, 2014 and 2013 was as follows:
| | | | | | | | | | | | | | | | | | | | |
| 2014 Distributions Paid From: | | | 2013 Distributions Paid From: | |
Ordinary Income | | Long-Term
Capital Gains | | | Total | | | Ordinary Income | | | Long-Term
Capital Gains | | | Total | |
| $423,122,747 | | $ | 252,434,210 | | | $ | 675,556,957 | | | $ | 575,333,718 | | | $ | 102,456,982 | | | $ | 677,790,700 | |
Differences between these amounts and those reported in the Statement of Changes in Net Assets are primarily attributable to different book and tax treatment for short-term capital gains.
| 42
Notes to Financial Statements (continued)
September 30, 2014
As of September 30, 2014, the components of distributable earnings on a tax basis were as follows:
| | | | |
Undistributed ordinary income | | $ | 68,266,782 | |
Undistributed long-term capital gain | | | 102,530,533 | |
| | | | |
Total undistributed earnings | | | 170,797,315 | |
| | | | |
Unrealized appreciation | | | 731,657,466 | |
| | | | |
Total accumulated earnings | | $ | 902,454,781 | |
| | | | |
g. Repurchase Agreements. The Fund may enter into repurchase agreements, under the terms of a Master Repurchase Agreement, under which the Fund acquires securities as collateral and agrees to resell the securities at an agreed upon time and at an agreed upon price. It is the Fund’s policy that the market value of the collateral for repurchase agreements be at least equal to 102% of the repurchase price, including interest. Certain repurchase agreements are tri-party arrangements whereby the collateral is held in a segregated account for the benefit of the Fund and on behalf of the counterparty. Repurchase agreements could involve certain risks in the event of default or insolvency of the counterparty including possible delays or restrictions upon the Fund’s ability to dispose of the underlying securities. As of September 30, 2014, the Fund had investments in repurchase agreements for which the value of the related collateral exceeded the value of the repurchase agreement. The gross value of repurchase agreements is included in the Statement of Assets and Liabilities for financial reporting purposes.
h. Securities Lending. The Fund has entered into an agreement with State Street Bank and Trust Company (“State Street Bank”), as agent of the Fund, to lend securities to certain designated borrowers. The loans are collateralized with cash or securities in an amount equal to at least 105% or 102% of the market value (including accrued interest) of the loaned international or domestic securities, respectively, when the loan is initiated. Thereafter, the value of the collateral must remain at least 102% of the market value (including accrued interest) of loaned securities for U.S. equities and U.S. corporate debt; at least 105% of the market value (including accrued interest) of loaned securities for non-U.S. equities; and at least 100% of the market value (including accrued interest) of loaned securities for U.S. Government securities, sovereign debt issued by non-U.S. Governments and non-U.S. corporate debt. In the event that the market value of the collateral falls below the required percentages described above, the borrower will deliver additional collateral on the next business day. As with other extensions of credit, the Fund may bear the risk of loss with respect to the investment of the collateral. The Fund invests cash collateral in short-term investments, a portion of the income from which is remitted to the borrowers and the remainder allocated between the Fund and State Street Bank as lending agent.
For the year ended September 30, 2014, the Fund did not loan securities under this agreement.
43 |
Notes to Financial Statements (continued)
September 30, 2014
i. Indemnifications. Under the Trust’s organizational documents, its officers and Trustees are indemnified against certain liabilities arising out of the performance of their duties to the Fund. Additionally, in the normal course of business, the Fund enters into contracts with service providers that contain general indemnification clauses. The Fund’s maximum exposure under these arrangements is unknown as this would involve future claims that may be made against the Fund that have not yet occurred. However, based on experience, the Fund expects the risk of loss to be remote.
3. Fair Value Measurements. In accordance with accounting standards related to fair value measurements and disclosures, the Fund has categorized the inputs utilized in determining the value of the Fund’s assets or liabilities. These inputs are summarized in the three broad levels listed below:
| | • | | Level 1 – quoted prices in active markets for identical assets or liabilities; |
| | • | | Level 2 – prices determined using other significant inputs that are observable either directly, or indirectly through corroboration with observable market data (which could include quoted prices for similar assets or liabilities, interest rates, credit risk, etc.); and |
| | • | | Level 3 – prices determined using significant unobservable inputs when quoted prices or observable inputs are unavailable such as when there is little or no market activity for an asset or liability (unobservable inputs reflect the Fund’s own assumptions in determining the fair value of assets or liabilities and would be based on the best information available). |
The inputs or methodology used for valuing securities are not necessarily an indication of the risk associated with investing in those securities.
The following is a summary of the inputs used to value the Fund’s investments as of September 30, 2014, at value:
Asset Valuation Inputs
| | | | | | | | | | | | | | | | |
Description | | Level 1 | | | Level 2 | | | Level 3 | | | Total | |
Bonds and Notes | | | | | | | | | | | | | | | | |
Non-Convertible Bonds | | | | | | | | | | | | | | | | |
ABS Other | | $ | — | | | $ | 83,769,575 | | | $ | 121,211,469 | (b) | | $ | 204,981,044 | |
Airlines | | | — | | | | 14,519,720 | | | | 272,473,977 | (b) | | | 286,993,697 | |
Finance Companies | | | 1,349,161 | | | | 587,889,104 | | | | — | | | | 589,238,265 | |
Metals & Mining | | | — | | | | 242,275,983 | | | | 1,720,500 | (c) | | | 243,996,483 | |
All Other Non-Convertible Bonds(a) | | | — | | | | 7,521,144,074 | | | | — | | | | 7,521,144,074 | |
| | | | | | | | | | | | | | | | |
Total Non-Convertible Bonds | | | 1,349,161 | | | | 8,449,598,456 | | | | 395,405,946 | | | | 8,846,353,563 | |
| | | | | | | | | | | | | | | | |
Convertible Bonds(a) | | | — | | | | 515,296,499 | | | | — | | | | 515,296,499 | |
Municipals(a) | | | — | | | | 93,168,404 | | | | — | | | | 93,168,404 | |
| | | | | | | | | | | | | | | | |
Total Bonds and Notes | | | 1,349,161 | | | | 9,058,063,359 | | | | 395,405,946 | | | | 9,454,818,466 | |
| | | | | | | | | | | | | | | | |
| 44
Notes to Financial Statements (continued)
September 30, 2014
Asset Valuation Inputs (continued)
| | | | | | | | | | | | | | | | |
Description | | Level 1 | | | Level 2 | | | Level 3 | | | Total | |
Senior Loans(a) | | $ | — | | | $ | 49,629,083 | | | $ | — | | | $ | 49,629,083 | |
Common Stocks(a) | | | 339,417,000 | | | | — | | | | — | | | | 339,417,000 | |
Preferred Stocks(a) | | | 25,394,173 | | | | — | | | | — | | | | 25,394,173 | |
Short-Term Investments | | | — | | | | 332,167,592 | | | | — | | | | 332,167,592 | |
| | | | | | | | | | | | | | | | |
Total | | $ | 366,160,334 | | | $ | 9,439,860,034 | | | $ | 395,405,946 | | | $ | 10,201,426,314 | |
| | | | | | | | | | | | | | | | |
| (a) | Details of the major categories of the Fund’s investments are reflected within the Portfolio of Investments. |
| (b) | Valued using broker-dealer bid prices. |
| (c) | Fair valued by the Fund’s adviser. |
The Fund’s pricing policies and procedures are recommended by the adviser and approved by the Board of Trustees. Debt securities are valued based on evaluated bids furnished to the Fund by an independent pricing service. Broker-dealer bid prices may be used if an independent pricing service either is unable to price a security or does not provide a reliable price for a security. Broker-dealer bid prices for which the Fund does not have knowledge of the inputs used by the broker-dealer are categorized in Level 3. All security prices, including those obtained from an independent pricing service and broker-dealer bid prices, are reviewed on a daily basis by the adviser, subject to oversight by Fund management and the Board of Trustees. If the adviser, in good faith, believes that the price provided by an independent pricing service is unreliable, broker-dealer bid prices may be used until the price provided by the independent pricing service is considered to be reliable. Reliability of all security prices, including those obtained from an independent pricing service and broker-dealer bid prices, is tested in a variety of ways, including comparison to recent transaction prices and daily fluctuations, amongst other validation procedures in place. Securities for which market quotations are not readily available are valued at fair value as determined in good faith by the Fund’s adviser pursuant to procedures approved by the Board of Trustees. Fair valued securities may be categorized in Level 3.
The following is a reconciliation of Level 3 investments for which significant unobservable inputs were used to determine fair value as of September 30, 2013 and/or September 30, 2014:
Asset Valuation Inputs
| | | | | | | | | | | | | | | | | | | | |
Investments in Securities | | Balance as of
September 30,
2013 | | | Accrued
Discounts
(Premiums) | | | Realized
Gain
(Loss) | | | Change in
Unrealized
Appreciation
(Depreciation) | | | Purchases | |
Bonds and Notes | | | | | | | | | | | | | | | | | | | | |
Non-Convertible Bonds | | | | | | | | | | | | | | | | | | | | |
ABS Other | | $ | 67,016,089 | | | $ | — | | | $ | 50,051 | | | $ | 1,419,937 | | | $ | 60,660,658 | |
Airlines | | | 292,528,124 | | | | 417,775 | | | | 341,778 | | | | 6,210,813 | | | | — | |
Metals & Mining | | | — | | | | 84,794 | | | | (554,945 | ) | | | 189,726 | | | | — | |
| | | | | | | | | | | | | | | | | | | | |
Total | | $ | 359,544,213 | | | $ | 502,569 | | | $ | (163,116 | ) | | $ | 7,820,476 | | | $ | 60,660,658 | |
| | | | | | | | | | | | | | | | | | | | |
45 |
Notes to Financial Statements (continued)
September 30, 2014
Asset Valuation Inputs (continued)
| | | | | | | | | | | | | | | | | | | | |
Investments in Securities | | Sales | | | Transfers
into
Level 3 | | | Transfers
out of
Level 3 | | | Balance as of
September 30,
2014 | | | Change in
Unrealized
Appreciation
(Depreciation)
from
Investments
Still Held at
September 30,
2014 | |
Bonds and Notes | | | | | | | | | | | | | | | | | | | | |
Non-Convertible Bonds | | | | | | | | | | | | | | | | | | | | |
ABS Other | | $ | (7,935,266 | ) | | $ | — | | | $ | — | | | $ | 121,211,469 | | | $ | 1,699,981 | |
Airlines | | | (30,189,126 | ) | | | 3,164,613 | | | | — | | | | 272,473,977 | | | | 8,045,871 | |
Metals & Mining | | | (1,531,575 | ) | | | 3,532,500 | | | | — | | | | 1,720,500 | | | | 189,726 | |
| | | | | | | | | | | | | | | | | | | | |
Total | | $ | (39,655,967 | ) | | $ | 6,697,113 | | | $ | — | | | $ | 395,405,946 | | | $ | 9,935,578 | |
| | | | | | | | | | | | | | | | | | | | |
A debt security valued at $3,164,613 was transferred from Level 2 to Level 3 during the period ended September 30, 2014. At September 30, 2013, this security was valued on the basis of evaluated bids furnished to the Fund by an independent pricing service in accordance with the Fund’s valuation policies. At September 30, 2014, this security was valued using broker-dealer bid prices based on inputs unobservable to the Fund as an independent pricing service was unable to price the security.
A debt security valued at $3,532,500 was transferred from Level 2 to Level 3 during the period ended September 30, 2014. At September 30, 2013, this security was valued on the basis of evaluated bids furnished to the Fund by an independent pricing service in accordance with the Fund’s valuation policies. At September 30, 2014, this security was valued at fair value as determined in good faith by the Fund’s adviser as an independent pricing service did not provide a reliable price for the security.
All transfers are recognized as of the beginning of the reporting period.
4. Purchases and Sales of Securities. For the year ended September 30, 2014, purchases and sales of securities (excluding short-term investments and U.S. Government/Agency securities and including paydowns) were $1,008,229,399 and $1,737,458,210, respectively. Purchases and sales of U.S. Government/Agency securities (excluding short-term investments and including paydowns) were $885,162,374 and $384,042,995, respectively.
5. Management Fees and Other Transactions with Affiliates.
a. Management Fees. Loomis, Sayles & Company, L.P. (“Loomis Sayles”) serves as investment adviser to the Fund. Under the terms of the management agreement, the Fund pays a management fee at the annual rate of 0.40% of the first $15 billion of the
| 46
Notes to Financial Statements (continued)
September 30, 2014
Fund’s average daily net assets and 0.38% of the Fund’s average daily net assets in excess of $15 billion, calculated daily and payable monthly.
Loomis Sayles has given a binding undertaking to the Fund to waive management fees and/or reimburse certain expenses to limit the Fund’s operating expenses, exclusive of acquired fund fees and expenses, brokerage expenses, interest expense, taxes and extraordinary expenses. This undertaking is in effect until January 31, 2015 and is reevaluated on an annual basis. Management fees payable, as reflected on the Statement of Assets and Liabilities, is net of waivers and/or expense reimbursements, if any, pursuant to these undertakings.
For the year ended September 30, 2014, the expense limits as a percentage of average daily net assets under the expense limitation agreement were as follows:
| | | | | | | | | | | | | | | | | | | | |
Expense Limit as a Percentage of Average Daily Net Assets | |
Class A | | Class B | | | Class C | | | Class N | | | Class Y | | | Admin Class | |
| 0.95% | | | 1.70 | % | | | 1.70 | % | | | 0.65 | % | | | 0.70 | % | | | 1.20 | % |
Loomis Sayles shall be permitted to recover expenses it has borne under the expense limitation agreement (whether through waiver of its management fees or otherwise) on a class by class basis in later periods to the extent the annual operating expenses of a class fall below a class’ expense limits, provided, however, that a class is not obligated to pay such waived/reimbursed fees or expenses more than one year after the end of the fiscal year in which the fees or expenses were waived/reimbursed.
For the year ended September 30, 2014, the management fees for the Fund were $40,377,872 (effective rate of 0.40% of average daily net assets). Expense reimbursements related to the prior fiscal year of $11 have been recovered for Class N.
Certain officers and employees of Loomis Sayles are also officers or Trustees of the Trust. Loomis Sayles’ general partner is indirectly owned by Natixis Global Asset Management, L.P. (“Natixis US”), which is part of Natixis Global Asset Management, an international asset management group based in Paris, France.
b. Service and Distribution Fees. NGAM Distribution, L.P. (“NGAM Distribution”), which is a wholly-owned subsidiary of Natixis US, has entered into a distribution agreement with the Trust. Pursuant to this agreement, NGAM Distribution serves as principal underwriter of the Funds of the Trust.
Pursuant to Rule 12b-1 under the 1940 Act, the Trust has adopted a Service Plan relating to the Fund’s Class A shares (the “Class A Plan”), a Distribution and Service Plan relating to the Fund’s Class B and Class C shares (the “Class B and Class C Plans”), and a Distribution Plan relating to its Admin Class shares (the “Admin Class Plan”).
Under the Class A Plan, the Fund pays NGAM Distribution a monthly service fee at an annual rate not to exceed 0.25% of the average daily net assets attributable to the
47 |
Notes to Financial Statements (continued)
September 30, 2014
Fund’s Class A shares, as reimbursement for expenses incurred by NGAM Distribution in providing personal services to investors in Class A shares and/or the maintenance of shareholder accounts.
Under the Class B and Class C Plans, the Fund pays NGAM Distribution a monthly service fee at an annual rate not to exceed 0.25% of the average daily net assets attributable to the Fund’s Class B and Class C shares, as compensation for services provided by NGAM Distribution in providing personal services to investors in Class B and Class C shares and/or the maintenance of shareholder accounts.
Also under the Class B and Class C Plans, the Fund pays NGAM Distribution a monthly distribution fee at an annual rate of 0.75% of the average daily net assets attributable to the Fund’s Class B and Class C shares, as compensation for services provided by NGAM Distribution in connection with the marketing or sale of Class B and Class C shares.
Under the Admin Class Plan, the Fund pays NGAM Distribution a monthly distribution fee at an annual rate not to exceed 0.25% of the average daily net assets attributable to the Fund’s Admin Class shares, as compensation for services provided by NGAM Distribution in connection with the marketing or sale of Admin Class shares or for payments made by NGAM Distribution to securities dealers or other financial intermediaries as commissions, asset-based sales charges or other compensation with respect to the sale of Admin Class shares, or for providing personal services to investors and/or the maintenance of shareholder accounts.
In addition, the Admin Class shares of the Fund may pay NGAM Distribution an administrative service fee, at an annual rate not to exceed 0.25% of the average daily net assets attributable to Admin Class shares. These fees are subsequently paid to securities dealers or financial intermediaries for providing personal services and/or account maintenance for their customers who hold such shares.
For the year ended September 30, 2014, the service and distribution fees for the Fund were as follows:
| | | | | | | | | | | | | | | | | | | | | | | | |
| Service Fees | | | Distribution Fees | |
Class A | | Class B | | | Class C | | | Admin Class | | | Class B | | | Class C | | | Admin Class | |
| $5,800,107 | | $ | 17,199 | | | $ | 4,013,097 | | | $ | 55,691 | | | $ | 51,595 | | | $ | 12,039,289 | | | $ | 55,691 | |
c. Administrative Fees. NGAM Advisors, L.P. (“NGAM Advisors”) provides certain administrative services for the Fund and contracts with State Street Bank to serve as sub-administrator. NGAM Advisors is a wholly-owned subsidiary of Natixis US. Pursuant to an agreement among Natixis Funds Trusts, Loomis Sayles Funds Trusts, Hansberger International Series and NGAM Advisors, the Fund pays NGAM Advisors monthly its pro rata portion of fees equal to an annual rate of 0.0575% of the first $15 billion of the average daily net assets of the Natixis Funds Trusts, Loomis Sayles Funds
| 48
Notes to Financial Statements (continued)
September 30, 2014
Trusts and Hansberger International Series, 0.0500% of the next $15 billion, 0.0400% of the next $30 billion, 0.0350% of the next $30 billion and 0.0325% of such assets in excess of $90 billion, subject to an annual aggregate minimum fee for the Natixis Funds Trusts, Loomis Sayles Funds Trusts and Hansberger International Series of $10 million, which is reevaluated on an annual basis.
For the year ended September 30, 2014, the administrative fees for the Fund were $4,392,783.
Prior to July 1, 2014, the Fund paid NGAM Advisors monthly its pro rata portion of fees equal to an annual rate of 0.0575% of the first $15 billion of the average daily net assets of the Natixis Funds Trusts, Loomis Sayles Funds Trusts and Hansberger International Series, 0.0500% of the next $15 billion, 0.0400% of the next $30 billion and 0.0350% of such assets in excess of $60 billion, subject to an annual aggregate minimum fee for the Natixis Funds Trusts, Loomis Sayles Funds Trusts and Hansberger International Series of $10 million.
d. Sub-Transfer Agent Fees. NGAM Distribution has entered into agreements, which include servicing agreements, with financial intermediaries that provide recordkeeping, processing, shareholder communications and other services to customers of the intermediaries that hold positions in the Fund and has agreed to compensate the intermediaries for providing those services. Intermediaries transact with the Fund primarily through the use of omnibus accounts on behalf of their customers who hold positions in the Fund. These services would have been provided by the Fund’s transfer agent and other service providers if the shareholders’ accounts were maintained directly at the Fund’s transfer agent. Accordingly, the Fund has agreed to reimburse NGAM Distribution for all or a portion of the servicing fees paid to these intermediaries. The reimbursement amounts (sub-transfer agent fees) paid to NGAM Distribution are subject to a current per-account equivalent fee limit approved by the Fund’s Board, which is based on fees for similar services paid to the Fund’s transfer agent and other service providers. Class N shares do not bear such expenses.
For the year ended September 30, 2014, the sub-transfer agent fees (which are reflected in transfer agent fees and expenses in the Statement of Operations) for the Fund were $11,479,493.
As of September 30, 2014, the Fund owes NGAM Distribution $139,806 in reimbursements for sub-transfer agent fees (which are reflected in the Statement of Assets and Liabilities as payable to distributor).
Sub-transfer agent fees attributable to Class A, Class B, Class C, Class Y and Admin Class are allocated on a pro rata basis to each class based on the relative net assets of each class to the total net assets of those classes.
e. Commissions. Commissions (including CDSCs) on Fund shares retained by NGAM Distribution were $1,474,369 for the year ended September 30, 2014.
49 |
Notes to Financial Statements (continued)
September 30, 2014
f. Trustees Fees and Expenses. The Trust does not pay any compensation directly to its officers or Trustees who are directors, officers or employees of NGAM Advisors, NGAM Distribution, Natixis US or their affiliates. Effective January 1, 2014, the Chairperson of the Board receives a retainer fee at the annual rate of $300,000. The Chairperson does not receive any meeting attendance fees for Board of Trustees meetings or committee meetings that she attends. Each Independent Trustee (other than the Chairperson) receives, in the aggregate, a retainer fee at the annual rate of $130,000. Each Independent Trustee also receives a meeting attendance fee of $10,000 for each meeting of the Board of Trustees that he or she attends in person and $5,000 for each meeting of the Board of Trustees that he or she attends telephonically. In addition, each committee chairperson (except for the Chairperson of the Governance Committee) receives an additional retainer fee at an annual rate of $17,500. Each Contract Review Committee member is compensated $6,000 for each Committee meeting that he or she attends in person and $3,000 for each meeting that he or she attends telephonically. Each Audit Committee member is compensated $6,000 for each Committee meeting that he or she attends in person and $3,000 for each meeting that he or she attends telephonically. These fees are allocated among the funds in the Natixis Funds Trusts, Loomis Sayles Funds Trusts and Hansberger International Series based on a formula that takes into account, among other factors, the relative net assets of each Fund. Trustees are reimbursed for travel expenses in connection with attendance at meetings.
Prior to January 1, 2014, the Chairperson of the Board received a retainer fee at the annual rate of $285,000 and each Independent Trustee (other than the Chairperson) received, in the aggregate, a retainer fee at the annual rate of $115,000. All other Trustees fees remained unchanged.
A deferred compensation plan (the “Plan”) is available to the Trustees on a voluntary basis. Deferred amounts remain in the Fund until distributed in accordance with the provisions of the Plan. The value of a participating Trustee’s deferral account is based on theoretical investments of deferred amounts, on the normal payment dates, in certain funds of the Natixis Funds Trusts, Loomis Sayles Funds Trusts and Hansberger International Series as designated by the participating Trustees. Changes in the value of participants’ deferral accounts are allocated pro rata among the funds in the Natixis Funds Trusts, Loomis Sayles Funds Trusts, and Hansberger International Series, and are normally reflected as Trustees’ fees and expenses in the Statement of Operations. The portions of the accrued obligations allocated to the Fund under the Plan are reflected as Deferred Trustees’ fees in the Statement of Assets and Liabilities.
g. Affiliated Ownership. As of September 30, 2014, Loomis Sayles Employees’ Profit Sharing Retirement Plan held shares of the Fund representing 0.07% of net assets.
Investment activities of affiliated shareholders could have material impacts on the Fund.
| 50
Notes to Financial Statements (continued)
September 30, 2014
h. Reimbursement of Transfer Agent Fees and Expenses. Effective July 1, 2014, NGAM Advisors has given a binding contractual undertaking to the Fund to reimburse any and all transfer agency expenses for the Fund’s Class N shares. This undertaking is in effect through January 31, 2016 and is not subject to recovery under the expense limitation agreement described above.
For the period July 1, 2014 to September 30, 2014, NGAM Advisors reimbursed the Fund $67 for transfer agency expenses related to Class N shares.
6. Class-Specific Transfer Agent Fees and Expenses. For the year ended September 30, 2014, the Fund incurred the following class-specific expenses (including sub-transfer agent fees, where applicable):
| | | | | | | | | | | | | | | | | | | | | | | | |
| | | Class A | | | Class B | | | Class C | | | Class N | | | Class Y | | | Admin Class | |
Transfer Agent Fees and Expenses | | $ | 2,773,912 | | | $ | 8,244 | | | $ | 1,919,916 | | | $ | 122 | | | $ | 7,327,888 | | | $ | 26,592 | |
Transfer agent fees and expenses attributable to Class A, Class B, Class C, Class Y and Admin Class are allocated on a pro rata basis to each class based on the relative net assets of each class to the total net assets of those classes. Transfer agent fees and expenses attributable to Class N are allocated to Class N.
7. Line of Credit. The Fund, together with certain other funds of Natixis Funds Trusts, Loomis Sayles Funds Trusts and Hansberger International Series, participates in a $200,000,000 committed unsecured line of credit provided by State Street Bank, with an individual limit of $125,000,000 for each Fund that participates in the line of credit. Interest is charged to each participating Fund based on its borrowings at a rate per annum equal to the greater of the Federal Funds rate or overnight LIBOR, plus 1.25%. In addition, a commitment fee of 0.10% per annum, payable at the end of each calendar quarter, is accrued and apportioned among the participating funds based on their average daily unused portion of the line of credit.
For the year ended September 30, 2014, the Fund had no borrowings under this agreement.
8. Concentration of Risk. The Fund’s investments in foreign securities are subject to foreign currency fluctuations, higher volatility than U.S. securities, varying degrees of regulation and limited liquidity. Greater political, economic, credit and information risks are also associated with foreign securities.
9. Concentration of Ownership. From time to time, the Fund may have a concentration of one or more accounts constituting a significant percentage of shares outstanding. Investment activities by holders of such accounts could have material impacts on the Fund. As of September 30, 2014, based on management’s evaluation of the shareholder account base, the Fund had accounts representing controlling ownership of more than 5% of the Fund’s total outstanding shares. The number of such accounts, based on
51 |
Notes to Financial Statements (continued)
September 30, 2014
accounts that represent more than 5% of an individual class of shares, and the aggregate percentage of net assets represented by such holdings were as follows:
| | | | | | | | | | | | |
Number of 5% Non-Affiliated Account Holders | | Percentage of Non-Affiliated Ownership | | | Percentage of Affiliated Ownership
(Note 5) | | | Total Percentage of Ownership | |
| 1 | | | 16.65 | % | | | 0.07 | % | | | 16.72 | % |
Omnibus shareholder accounts for which NGAM Advisors understands that the intermediary has discretion over the underlying shareholder accounts or investment models where a shareholder account may be invested for a non-discretionary customer are included in the table above. For other omnibus accounts, the Fund does not have information on the individual shareholder accounts underlying omnibus accounts; therefore, there could be other 5% shareholders in addition to those disclosed in the table above.
10. Capital Shares. The Fund may issue an unlimited number of shares of beneficial interest, without par value. Transactions in capital shares were as follows:
| | | | | | | | | | | | | | | | |
| | | Year Ended
September 30, 2014 | | | Year Ended
September 30, 2013* | |
| | | Shares | | | Amount | | | Shares | | | Amount | |
| Class A | | | | | | | | | | | | | | | | |
Issued from the sale of shares | | | 61,980,287 | | | $ | 757,402,370 | | | | 65,384,516 | | | $ | 824,657,215 | |
Issued in connection with the reinvestment of distributions | | | 11,402,236 | | | | 137,522,730 | | | | 11,205,711 | | | | 140,613,943 | |
Redeemed | | | (112,771,964 | ) | | | (1,382,727,194 | ) | | | (109,489,794 | ) | | | (1,363,484,888 | ) |
| | | | | | | | | | | | | | | | |
Net change | | | (39,389,441 | ) | | $ | (487,802,094 | ) | | | (32,899,567 | ) | | $ | (398,213,730 | ) |
| | | | | | | | | | | | | | | | |
| Class B | | | | | | | | | | | | | | | | |
Issued from the sale of shares | | | 12,684 | | | $ | 152,583 | | | | 19,932 | | | $ | 250,047 | |
Issued in connection with the reinvestment of distributions | | | 22,585 | | | | 270,690 | | | | 26,217 | | | | 327,849 | |
Redeemed | | | (257,679 | ) | | | (3,138,970 | ) | | | (375,212 | ) | | | (4,657,988 | ) |
| | | | | | | | | | | | | | | | |
Net change | | | (222,410 | ) | | $ | (2,715,697 | ) | | | (329,063 | ) | | $ | (4,080,092 | ) |
| | | | | | | | | | | | | | | | |
| Class C | | | | | | | | | | | | | | | | |
Issued from the sale of shares | | | 13,814,441 | | | $ | 167,086,533 | | | | 16,055,822 | | | $ | 201,222,605 | |
Issued in connection with the reinvestment of distributions | | | 5,186,123 | | | | 61,978,474 | | | | 5,110,753 | | | | 63,653,947 | |
Redeemed | | | (36,110,742 | ) | | | (436,564,015 | ) | | | (57,170,562 | ) | | | (705,694,940 | ) |
| | | | | | | | | | | | | | | | |
Net change | | | (17,110,178 | ) | | $ | (207,499,008 | ) | | | (36,003,987 | ) | | $ | (440,818,388 | ) |
| | | | | | | | | | | | | | | | |
| Class N | | | | | | | | | | | | | | | | |
Issued from the sale of shares | | | 549,445 | | | $ | 6,730,576 | | | | 3,814 | | | $ | 46,815 | |
Issued in connection with the reinvestment of distributions | | | 17,975 | | | | 217,415 | | | | 28 | | | | 330 | |
Redeemed | | | (67,008 | ) | | | (816,584 | ) | | | (497 | ) | | | (6,093 | ) |
| | | | | | | | | | | | | | | | |
Net change | | | 500,412 | | | $ | 6,131,407 | | | | 3,345 | | | $ | 41,052 | |
| | | | | | | | | | | | | | | | |
| 52
Notes to Financial Statements (continued)
September 30, 2014
10. Capital Shares (continued)
| | | | | | | | | | | | | | | | |
| | | Year Ended
September 30, 2014 | | | Year Ended
September 30, 2013* | |
| | | Shares | | | Amount | | | Shares | | | Amount | |
| Class Y | | | | | | | | | | | | | | | | |
Issued from the sale of shares | | | 207,507,155 | | | $ | 2,542,512,176 | | | | 159,420,265 | | | $ | 2,006,761,237 | |
Issued in connection with the reinvestment of distributions | | | 30,655,508 | | | | 370,436,791 | | | | 27,504,363 | | | | 345,126,073 | |
Redeemed | | | (169,118,479 | ) | | | (2,066,048,547 | ) | | | (219,327,621 | ) | | | (2,733,370,926 | ) |
| | | | | | | | | | | | | | | | |
Net change | | | 69,044,184 | | | $ | 846,900,420 | | | | (32,402,993 | ) | | $ | (381,483,616 | ) |
| | | | | | | | | | | | | | | | |
| Admin Class | | | | | | | | | | | | | | | | |
Issued from the sale of shares | | | 1,285,768 | | | $ | 15,672,285 | | | | 1,283,717 | | | $ | 16,138,159 | |
Issued in connection with the reinvestment of distributions | | | 46,748 | | | | 562,942 | | | | 39,685 | | | | 496,698 | |
Redeemed | | | (982,879 | ) | | | (11,957,154 | ) | | | (809,135 | ) | | | (10,060,506 | ) |
| | | | | | | | | | | | | | | | |
Net change | | | 349,637 | | | $ | 4,278,073 | | | | 514,267 | | | $ | 6,574,351 | |
| | | | | | | | | | | | | | | | |
Increase (decrease) from capital share transactions | | | 13,172,204 | | | $ | 159,293,101 | | | | (101,117,998 | ) | | $ | (1,217,980,423 | ) |
| | | | | | | | | | | | | | | | |
| * | From commencement of operations on February 1, 2013 through September 30, 2013 for Class N shares. |
53 |
Report of Independent Registered Public Accounting Firm
To the Trustees of Loomis Sayles Funds II and Shareholders of Loomis Sayles Investment Grade Bond Fund:
In our opinion, the accompanying statement of assets and liabilities, including the portfolio of investments, and the related statements of operations and of changes in net assets and the financial highlights present fairly, in all material respects, the financial position of the Loomis Sayles Investment Grade Bond Fund, a series of Loomis Sayles Funds II (the “Fund”), at September 30, 2014, and the results of its operations, the changes in its net assets and the financial highlights for each of the periods indicated, in conformity with accounting principles generally accepted in the United States of America. These financial statements and financial highlights (hereafter referred to as “financial statements”) are the responsibility of the Fund’s management. Our responsibility is to express an opinion on these financial statements based on our audits. We conducted our audits of these financial statements in accordance with the standards of the Public Company Accounting Oversight Board (United States). Those standards require that we plan and perform the audits to obtain reasonable assurance about whether the financial statements are free of material misstatement. An audit includes examining, on a test basis, evidence supporting the amounts and disclosures in the financial statements, assessing the accounting principles used and significant estimates made by management, and evaluating the overall financial statement presentation. We believe that our audits, which included confirmation of securities at September 30, 2014 by correspondence with the custodian and the application of alternative auditing procedures where securities purchased had not been received, provide a reasonable basis for the opinion expressed above.
PricewaterhouseCoopers LLP
Boston, Massachusetts
November 21, 2014
| 54
2014 U.S. Tax Distribution Information to Shareholders (Unaudited)
Corporate Dividends Received Deduction. For the fiscal year ended September 30, 2014, 1.62% of dividends distributed by Investment Grade Bond Fund qualify for the dividends received deduction for corporate shareholders.
Capital Gains Distributions. Pursuant to Internal Revenue Section 852(b), the Investment Grade Bond Fund designated $252,434,210 as capital gains distributions for the fiscal year ended September 30, 2014, unless subsequently determined to be different.
Qualified Dividend Income. For the fiscal year ended September 30, 2014, the Investment Grade Bond Fund will designate up to the maximum amount allowable pursuant to the Internal Revenue Code as qualified dividend income eligible for reduced tax rates. These lower rates range from 0% to 20% depending on an individual’s tax bracket. If the Fund pays a distribution during calendar year 2014 complete information will be reported in conjunction with Form 1099-DIV.
55 |
Trustee and Officer Information
The tables below provide certain information regarding the trustees and officers of Loomis Sayles Funds II (the “Trust”). Unless otherwise indicated, the address of all persons below is 399 Boylston Street, Boston, MA 02116. The Fund’s Statement of Additional Information include additional information about the trustees of the Trust and is available by calling Natixis Funds at 800-225-5478.
| | | | | | | | |
Name and Year of Birth | | Position(s) Held
with the Trust,
Length of Time
Served and Term of Office1 | | Principal
Occupation(s)
During Past 5 Years | | Number of
Portfolios in
Fund Complex
Overseen2 and Other
Directorships Held
During Past 5 Years | | Experience,
Qualifications,
Attributes, Skills
for Board Membership |
| | | |
| INDEPENDENT TRUSTEES | | | | | | |
| | | | |
Kenneth A. Drucker (1945) | | Trustee since 2008 Chairman of the Audit Committee and Governance Committee Member | | Retired | | 42 None | | Significant experience on the Board and on the board of other business organizations (including at investment companies); executive experience (including as treasurer of an aerospace, automotive, and metal manufacturing corporation) |
| | | | |
| Edmond J. English (1953) | | Trustee since 2013 Contract Review Committee Member | | Chief Executive Officer of Bob’s Discount Furniture (retail) | | 42 Formerly, Director, BJ’s Wholesale Club (retail); formerly, Director, Citizens Financial Group (bank) | | Experience on the Board and significant experience on the board of other business organizations (including at a retail company and a bank); executive experience (including at a retail company) |
| 56
Trustee and Officer Information
| | | | | | | | |
Name and Year of Birth | | Position(s) Held
with the Trust,
Length of Time
Served and Term of Office1 | | Principal
Occupation(s)
During Past 5 Years | | Number of
Portfolios in
Fund Complex
Overseen2 and Other
Directorships Held
During Past 5 Years | | Experience,
Qualifications,
Attributes, Skills
for Board Membership |
| | | |
INDEPENDENT TRUSTEES continued | | | | | | |
Wendell J. Knox (1948) | | Trustee since 2009 Audit Committee Member and Governance Committee Member | | Director of Abt Associates Inc. (research and consulting) | | 42 Director, Eastern Bank (bank); Director, The Hanover Insurance Group (property and casualty insurance) | | Significant experience on the Board and on the board of other business organizations (including at a bank and at a property and casualty insurance firm); executive experience (including roles as president and chief executive officer of a research and consulting company) |
| | | | |
| Martin T. Meehan (1956) | | Trustee since 2012 Contract Review Committee Member | | Chancellor and faculty member, University of Massachusetts Lowell | | 42 None | | Experience on the Board and on the board of other business organizations; experience as Chancellor of the University of Massachusetts Lowell; government experience (including as a member of the U.S. House of Representatives); academic experience |
57 |
Trustee and Officer Information
| | | | | | | | |
Name and Year of Birth | | Position(s) Held
with the Trust,
Length of Time
Served and Term of Office1 | | Principal
Occupation(s)
During Past 5 Years | | Number of
Portfolios in
Fund Complex
Overseen2 and Other
Directorships Held
During Past 5 Years | | Experience,
Qualifications,
Attributes, Skills
for Board Membership |
| | | |
INDEPENDENT TRUSTEES continued | | | | | | |
| | | | |
Sandra O. Moose (1942) | | Chairperson of the Board of Trustees since November 2005 Trustee since 2003 Ex Officio member of the Audit Committee, the Contract Review Committee and the Governance Committee | | President, Strategic Advisory Services (management consulting) | | 42 Director, AES Corporation (international power company); formerly, Director, Rohm and Haas Company (specialty chemicals); formerly, Director, Verizon Communications (telecommunications company) | | Significant experience on the Board and on the board of other business organizations (including at a telecommunications company, an international power company and a specialty chemicals corporation); executive experience (including at a management consulting company) |
| | | | |
Erik R. Sirri (1958) | | Trustee since 2009 Audit Committee Member | | Professor of Finance at Babson College | | 42 None | | Significant experience on the Board; experience as Director of the Division of Trading and Markets at the Securities and Exchange Commission; academic experience; training as an economist |
| 58
Trustee and Officer Information
| | | | | | | | |
Name and Year of Birth | | Position(s) Held
with the Trust,
Length of Time
Served and Term of Office1 | | Principal
Occupation(s)
During Past 5 Years | | Number of
Portfolios in
Fund Complex
Overseen2 and Other
Directorships Held
During Past 5 Years | | Experience,
Qualifications,
Attributes, Skills
for Board Membership |
| | | |
INDEPENDENT TRUSTEES continued | | | | | | |
| | | | |
Peter J. Smail (1952) | | Trustee since 2009 Chairman of the Contract Review Committee and Governance Committee Member | | Retired | | 42 None | | Significant experience on the Board; mutual fund industry and executive experience (including roles as president and chief executive officer for an investment adviser) |
| | | | |
Cynthia L. Walker (1956) | | Trustee since 2005 Chairperson of the Governance Committee and Contract Review Committee Member | | Deputy Dean for Finance and Administration, Yale University School of Medicine | | 42 None | | Significant experience on the Board; executive experience in a variety of academic organizations (including roles as dean for finance and administration) |
| | | |
| INTERESTED TRUSTEES | | | | | | |
| | | | |
Robert J. Blanding3 (1947)
555 California Street San Francisco, CA 94104 | | Trustee since 2002 Chief Executive Officer since 2002 | | Chairman, Director and Chief Executive Officer (formerly, President), Loomis, Sayles & Company, L.P. | | 42 None | | Significant experience on the Board; continuing service as Chairman, and Chief Executive Officer of Loomis, Sayles & Company, L.P. |
| | | | |
David L. Giunta4 (1965) | | Trustee since 2011 President since 2008 | | President and Chief Executive Officer, NGAM Distribution Corporation, NGAM Advisors, L.P. and NGAM Distribution, L.P. | | 42 None | | Experience on the Board; continuing experience as President and Chief Executive Officer of NGAM Advisors, L.P. |
59 |
Trustee and Officer Information
| | | | | | | | |
Name and Year of Birth | | Position(s) Held
with the Trust,
Length of Time
Served and Term of Office1 | | Principal
Occupation(s)
During Past 5 Years | | Number of
Portfolios in
Fund Complex
Overseen2 and Other
Directorships Held
During Past 5 Years | | Experience,
Qualifications,
Attributes, Skills
for Board Membership |
| | | |
INTERESTED TRUSTEES continued | | | | | | |
| | | | |
John T. Hailer5 (1960) | | Trustee since 2003 | | President and Chief Executive Officer – U.S. and Asia, Natixis Global Asset Management, L.P. | | 42 None | | Significant experience on the Board; continuing experience as President and Chief Executive Officer – U.S. and Asia, Natixis Global Asset Management, L.P. |
| 1 | Each trustee serves until retirement, resignation or removal from the Board. The current retirement age is 75. The position of Chairperson of the Board is appointed for a three-year term. Ms. Moose was appointed to serve an additional three-year term as the Chairperson of the Board on December 13, 2013. |
| 2 | The trustees of the Trust serve as trustees of a fund complex that includes all series of the Natixis Funds Trust I, Natixis Funds Trust II, Natixis Funds Trust IV and Gateway Trust (collectively, the “Natixis Funds Trusts”), Loomis Sayles Funds I and Loomis Sayles Funds II (collectively, the “Loomis Sayles Funds Trusts”). |
| 3 | Mr. Blanding is deemed an “interested person” of the Trust because he holds the following positions with an affiliated person of the Trust: Chairman, Director and Chief Executive Officer of Loomis, Sayles & Company, L.P. and Director of Loomis Sayles Investment Asia Pte., Ltd. |
| 4 | Mr. Giunta is deemed an “interested person” of the Trust because he holds the following positions with an affiliated person of the Trust: President and Chief Executive Officer of NGAM Distribution Corporation, NGAM Advisors, L.P. and NGAM Distribution, L.P. |
| 5 | Mr. Hailer is deemed an “interested person” of the Trust because he holds the following positions with an affiliated person of the Trust: President and Chief Executive Officer – U.S. and Asia, Natixis Global Asset Management, L.P. |
| 60
Trustee and Officer Information
| | | | | | |
Name and Year of Birth | | Position(s) Held
with the Trust(s) | | Term of Office1 and
Length of Time Served | | Principal Occupation(s)
During Past 5 Years2 |
|
| OFFICERS OF THE TRUST |
| | | |
Coleen Downs Dinneen (1960) | | Secretary, Clerk and Chief Legal Officer | | Since September 2004 | | Executive Vice President, General Counsel, Secretary and Clerk, NGAM Distribution Corporation, NGAM Advisors, L.P. and NGAM Distribution, L.P. |
| | | |
Daniel J. Fuss (1933) One Financial Center Boston, MA 02111 | | Executive Vice President | | Since June 2003 | | Vice Chairman and Director, Loomis, Sayles & Company, L.P. |
| | | |
Russell L. Kane (1969) | | Chief Compliance Officer, Assistant Secretary and Anti-Money Laundering Officer | | Chief Compliance Officer since May 2006; Assistant Secretary since June 2004; and Anti-Money Laundering Officer since April 2007 | | Chief Compliance Officer for Mutual Funds, Senior Vice President, Deputy General Counsel, Assistant Secretary and Assistant Clerk, NGAM Distribution Corporation, NGAM Advisors, L.P. and NGAM Distribution, L.P. |
| | | |
Michael C. Kardok (1959) | | Treasurer, Principal Financial and Accounting Officer | | Since October 2004 | | Senior Vice President, NGAM Advisors, L.P. and NGAM Distribution, L.P. |
| 1 | Each officer of the Trusts serves for an indefinite term in accordance with the Trusts’ current by-laws until the date his or her successor is elected and qualified, or until he or she sooner dies, retires, is removed or becomes disqualified. |
| 2 | Each person listed above, except as noted, holds the same position(s) with the Fund Complex. Mr. Fuss is not an officer of the Natixis Funds Trusts. Previous positions during the past five years with NGAM Distribution, L.P., NGAM Advisors, L.P. or Loomis, Sayles & Company, L.P. are omitted, if not materially different from a trustee’s or officer’s current position with such entity. |
61 |
ANNUAL REPORT
September 30, 2014

Loomis Sayles Strategic Income Fund
TABLE OF CONTENTS
Portfolio Review page 1
Portfolio of Investments page 12
Financial Statements page 35
Notes to Financial Statements page 45

Barron’s/Lipper 2013 one-year ranking is based on 64 qualifying U.S. fund companies. Award recipient must have at least three funds in Lipper’s general U.S.-stock category (including at least one world and one mixed-asset/balanced), two taxable bond and one tax-exempt bond fund. Natixis was not ranked for the 5- and 10-year periods.
Past performance is no guarantee of future results.
For more details visit ngam.natixis.com/TopFundFamily
LOOMIS SAYLES STRATEGIC INCOME FUND
| | | | |
| Managers | | Symbols | | |
| Matthew J. Eagan, CFA® | | Class A | | NEFZX |
| Daniel J. Fuss, CFA®, CIC | | Class B | | NEZBX |
| Elaine M. Stokes | | Class C | | NECZX |
| Loomis, Sayles & Company, L.P. | | Class N | | NEZNX |
| | Class Y | | NEZYX |
| | Admin Class | | NEZAX |
Objective
High current income with a secondary objective of capital growth.
Market Conditions
After a weak fourth quarter of 2013, credit rebounded and delivered robust returns through the first several months of 2014, stemming from low volatility in the U.S. Treasury and equity markets. Performance stalled in July as political unrest in Israel and the Ukraine unnerved investors. Additionally, “hawkish” announcements from the U.S. Federal Reserve (the Fed) left investors uncertain about future rate policy. Overall, bonds were up fractionally in the final months of the period.
The Fed began tapering its quantitative easing (QE) program in January, reducing its monthly bond purchases by $10 billion per policy meeting, effectively ceasing purchases by the end of October. The markets discounted the taper initiative, and long-term U.S. Treasuries rallied for three consecutive quarters in 2014, flattening the yield curve (a curve that shows the relationship among bond yields across the maturity spectrum). With yields lower, longer duration (greater price sensitivity to interest rate changes) positions posted strong performance.
Although U.S. macroeconomic indicators remained largely positive, a weak first quarter gross domestic product (GDP) report sparked debate. Ultimately, economists attributed the contraction in first quarter GDP to reduced healthcare spending and weather-related factors. GDP rebounded sharply in the second quarter, fueling a third quarter rally in the U.S. dollar.
The European economy remained a concern. Growth slowed across the euro zone, including Germany. The annual inflation rate dropped to a low of 0.3% in August, well below the European Central Bank’s (ECB’s) target of 2%. The ECB has cut the deposit rate for institutions and the refinancing rate and is also considering full-scale QE programs to trigger growth. In Asia, China’s growth outlook enticed investors as one of the few positive currency opportunities during the period. Although the Bank of Japan maintained its stimulus programs, the yen remained weak.
Performance Results
For the 12 months ended September 30, 2014, Class A shares of Loomis Sayles Strategic Income Fund returned 9.34%. The Fund outperformed its benchmark, the Barclays U.S. Aggregate Bond Index, which returned 3.96%.
1 |
Explanation of Fund Performance
Out-of-benchmark allocations to common stocks, convertible securities and high-yield bonds were top contributors to the Fund’s performance advantage relative to its benchmark. Security selection within the common stock allocation was a relative driver of Fund performance. Selections in the technology and pharmaceutical industries delivered the highest returns. The Fund’s convertible bonds mirrored swings in the equity markets and provided ample return. Selected technology and communications issues were among the top contributors for the period. In addition, high-yield corporate bonds, particularly within the industrials sector, produced strong performance. Allocations to financial and utility issues also contributed to results.
The Fund’s allocations to non-U.S.-dollar-denominated issues weighed on relative performance for the period. A volatile commodities environment hampered performance of positions denominated in the Canadian dollar, New Zealand dollar and Australian dollar. In addition, sluggish growth trends in China and a stagnant growth outlook for New Zealand further pressured holdings denominated in the New Zealand and Australian dollars. These high-yield currencies typically exhibit volatility due to choppier flows and greater vulnerability to “risk-off” market scenarios. We continued to focus on high quality, highly liquid positions with long-term yield potential. Investment grade corporate holdings also hampered relative performance. High quality financial issues were helpful, but high-grade industrials and utilities holdings detracted from performance.
Outlook
A healthier U.S. economy and accommodative monetary policies abroad should help global growth in 2015. U.S. core inflation remains well below the 2.0% target set by the Fed, giving policy makers time to evaluate potential shifts away from historically low rates. We do not believe the Fed will raise rates until the third quarter of 2015, and the pace of hikes may be slow and gradual.
We believe corporate bonds can outperform if rates rise slowly on the back of stronger U.S. economic fundamentals. Corporate credit fundamentals remain sound, profits are positive and companies issuing new debt are primarily using the proceeds to refinance. Market liquidity remains good despite recent volatility in the bond markets, and opportunities have improved with higher yields. While we do not foresee a large liquidity drain in fixed income markets, we constantly monitor for indications of future flows.
We continue to pursue a lower sensitivity to rising U.S. Treasury yields through lower nominal durations and diversification across multiple market sectors. We believe current markets will reward solid security selection, and our objective is to drive returns through capital appreciation and attractive income.
| 2
Growth of $10,000 Investment in Class A Shares5
September 30, 2004 through September 30, 2014
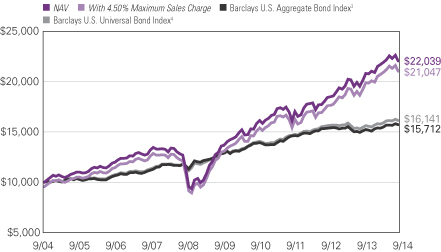
3 |
Average Annual Total Returns — September 30, 20145
| | | | | | | | | | | | | | | | |
| | | | | |
| | | 1 Year | | | 5 Years | | | 10 Years | | | Life of
Class N | |
| | | | | |
| Class A (Inception 5/1/95) | | | | | | | | | | | | | | | | |
| NAV | | | 9.34 | % | | | 10.13 | % | | | 8.23 | % | | | — | % |
| With 4.50% Maximum Sales Charge | | | 4.43 | | | | 9.12 | | | | 7.73 | | | | — | |
| | | | | |
| Class B (Inception 5/1/95) | | | | | | | | | | | | | | | | |
| NAV | | | 8.55 | | | | 9.32 | | | | 7.43 | | | | — | |
| With CDSC2 | | | 3.55 | | | | 9.04 | | | | 7.43 | | | | — | |
| | | | | |
| Class C (Inception 5/1/95) | | | | | | | | | | | | | | | | |
| NAV | | | 8.54 | | | | 9.32 | | | | 7.42 | | | | — | |
| With CDSC2 | | | 7.54 | | | | 9.32 | | | | 7.42 | | | | — | |
| | | | | |
| Class N (Inception 2/1/13) | | | | | | | | | | | | | | | | |
| NAV | | | 9.70 | | | | — | | | | — | | | | 8.27 | |
| | | | | |
| Class Y (Inception 12/1/99) | | | | | | | | | | | | | | | | |
| NAV | | | 9.63 | | | | 10.42 | | | | 8.51 | | | | — | |
| | | | | |
| Admin Class (Inception 2/1/10)1 | | | | | | | | | | | | | | | | |
| NAV | | | 9.12 | | | | 9.84 | | | | 7.92 | | | | — | |
| | | | | |
| Comparative Performance | | | | | | | | | | | | | | | | |
| Barclays U.S. Aggregate Bond Index3 | | | 3.96 | | | | 4.12 | | | | 4.62 | | | | 1.68 | |
| Barclays U.S. Universal Bond Index4 | | | 4.39 | | | | 4.65 | | | | 4.90 | | | | 2.03 | |
Past performance does not guarantee future results. The table(s) do not reflect taxes shareholders might owe on any Fund distributions or when they redeem their shares. Performance for periods less than one year is cumulative, not annualized. Returns reflect changes in share price and reinvestment of dividends and capital gains, if any. Unlike a fund, an index is not managed and does not reflect fees and expenses.
| 1 | Prior to the inception of Admin Class shares (2/1/10), performance is that of Class A shares, restated to reflect the higher net expenses of Admin Class shares. |
| 2 | Performance for Class B shares assumes a maximum 5% contingent deferred sales charge (“CDSC”) applied when you sell shares, which declines annually between years 1-6 according to the following schedule: 5, 4, 3, 3, 2, 1, 0%. Class C share performance assumes a 1% CDSC applied when you sell shares within one year of purchase. |
| 3 | Barclays U.S. Aggregate Bond Index is an unmanaged index that covers the U.S.-dollar denominated, investment-grade, fixed-rate, taxable bond market of SEC-registered securities. The index includes bonds from the Treasury, government-related, corporate, mortgage-backed securities, asset-backed securities, and collateralized mortgage-backed securities sectors. |
| 4 | Barclays U.S. Universal Bond Index is an unmanaged index that covers U.S. dollar-denominated taxable bonds, including U.S. government and investment grade debt, non-investment grade debt, asset-backed and mortgage-backed securities, Eurobonds, 144A securities and emerging market debt. |
| 5 | Fund performance has been increased by fee waivers and/or expense reimbursements, if any, without which performance would have been lower. |
| 4
ADDITIONAL INFORMATION
The views expressed in this report reflect those of the portfolio managers as of the dates indicated. The managers’ views are subject to change at any time without notice based on changes in market or other conditions. References to specific securities or industries should not be regarded as investment advice. Because the Fund is actively managed, there is no assurance that it will continue to invest in the securities or industries mentioned.
ADDITIONAL INDEX INFORMATION
This document may contain references to third party copyrights, indexes, and trademarks, each of which is the property of its respective owner. Such owner is not affiliated with Natixis Global Asset Management or any of its related or affiliated companies (collectively “NGAM”) and does not sponsor, endorse or participate in the provision of any NGAM services, funds or other financial products.
The index information contained herein is derived from third parties and is provided on an “as is” basis. The user of this information assumes the entire risk of use of this information. Each of the third party entities involved in compiling, computing or creating index information disclaims all warranties (including, without limitation, any warranties of originality, accuracy, completeness, timeliness, non-infringement, merchantability and fitness for a particular purpose) with respect to such information.
PROXY VOTING INFORMATION
A description of the Fund’s proxy voting policies and procedures is available without charge, upon request, by calling Natixis Funds at 800-225-5478; on the Fund’s website at ngam.natixis.com; and on the Securities and Exchange Commission’s (“SEC’s”) website at www.sec.gov. Information regarding how the Fund voted proxies relating to portfolio securities during the 12 months ended June 30, 2014 is available from the Fund’s website and the SEC’s website.
QUARTERLY PORTFOLIO SCHEDULES
The Fund files a complete schedule of portfolio holdings with the SEC for the first and third quarters of each fiscal year on Form N-Q. The Fund’s Forms N-Q are available on the SEC’s website at www.sec.gov and may be reviewed and copied at the SEC’s Public Reference Room in Washington, DC. Information on the operation of the Public Reference Room may be obtained by calling 800-SEC-0330.
5 |
UNDERSTANDING YOUR FUND’S EXPENSES
As a mutual fund shareholder, you incur different types of costs: transaction costs, including sales charges (loads) on purchases and contingent deferred sales charges on redemptions; and ongoing costs, including management fees, distribution fees (12b-1 fees) and/or service fees, and other fund expenses. Certain exemptions may apply. These costs are described in more detail in the Fund’s prospectus. The following examples are intended to help you understand the ongoing costs of investing in the Fund and help you compare these with the ongoing costs of investing in other mutual funds.
The first line in the table for each class of Fund shares shows the actual account values and actual Fund expenses you would have paid on a $1,000 investment in the Fund from April 1, 2014 through September 30, 2014. To estimate the expenses you paid over the period, simply divide your account value by $1,000 (for example $8,600 account value divided by $1,000 =8.60) and multiply the result by the number in Expenses Paid During Period column as shown below for your class.
The second line in the table for each class of Fund shares provides information about hypothetical account values and hypothetical expenses based on the Fund’s actual expense ratios and an assumed rate of return of 5% per year before expenses, which is not the Fund’s actual return. The hypothetical account values and expenses may not be used to estimate the actual ending account balance or expenses you paid on your investment for the period. You may use this information to compare the ongoing costs of investing in the Fund to other funds. To do so, compare this 5% hypothetical example with the 5% hypothetical examples that appear in the shareholder reports of the other funds.
Please note that the expenses shown reflect ongoing costs only, and do not include any transaction costs. Therefore, the second line in the table is useful in comparing ongoing costs only, and will not help you determine the relative costs of owning different funds. If transaction costs were included, total costs would be higher.
| 6
| | | | | | | | | | | | |
| LOOMIS SAYLES STRATEGIC INCOME FUND | | BEGINNING
ACCOUNT VALUE
4/1/2014 | | | ENDING
ACCOUNT VALUE
9/30/2014 | | | EXPENSES PAID
DURING PERIOD*
4/1/2014 – 9/30/2014 | |
| Class A | | | | | | | | | | | | |
| Actual | | | $1,000.00 | | | | $1,016.30 | | | | $4.75 | |
| Hypothetical (5% return before expenses) | | | $1,000.00 | | | | $1,020.36 | | | | $4.76 | |
| Class B | | | | | | | | | | | | |
| Actual | | | $1,000.00 | | | | $1,012.70 | | | | $8.53 | |
| Hypothetical (5% return before expenses) | | | $1,000.00 | | | | $1,016.60 | | | | $8.54 | |
| Class C | | | | | | | | | | | | |
| Actual | | | $1,000.00 | | | | $1,012.40 | | | | $8.53 | |
| Hypothetical (5% return before expenses) | | | $1,000.00 | | | | $1,016.60 | | | | $8.54 | |
| Class N | | | | | | | | | | | | |
| Actual | | | $1,000.00 | | | | $1,018.00 | | | | $3.14 | |
| Hypothetical (5% return before expenses) | | | $1,000.00 | | | | $1,021.96 | | | | $3.14 | |
| Class Y | | | | | | | | | | | | |
| Actual | | | $1,000.00 | | | | $1,017.60 | | | | $3.49 | |
| Hypothetical (5% return before expenses) | | | $1,000.00 | | | | $1,021.61 | | | | $3.50 | |
| Admin Class | | | | | | | | | | | | |
| Actual | | | $1,000.00 | | | | $1,015.70 | | | | $6.01 | |
| Hypothetical (5% return before expenses) | | | $1,000.00 | | | | $1,019.10 | | | | $6.02 | |
| * | Expenses are equal to the Fund's annualized expense ratio: 0.94%, 1.69%, 1.69%, 0.62%, 0.69% and 1.19% for Class A, B, C, N, Y and Admin Class, respectively, multiplied by the average account value over the period, multiplied by the number of days in the most recent fiscal half-year (183), divided by 365 (to reflect the half-year period). |
7 |
BOARD APPROVAL OF THE EXISTING ADVISORY AGREEMENT
The Board of Trustees of the Trust (the “Board”), including the Independent Trustees, considers matters bearing on the Fund’s advisory agreement (the “Agreement”) at most of its meetings throughout the year. Each year, usually in the spring, the Contract Review Committee of the Board meets to review the Agreement to determine whether to recommend that the full Board approve the continuation of the Agreement, typically for an additional one-year period. After the Committee has made its recommendation, the full Board, including the Independent Trustees, determines whether to approve the continuation of the Agreement.
In connection with these meetings, the Trustees receive materials that the Fund’s investment adviser (the “Adviser”) believes to be reasonably necessary for the Trustees to evaluate the Agreement. These materials generally include, among other items, (i) information on the investment performance of the Fund and the performance of a peer group of funds and the Fund’s performance benchmarks, (ii) information on the Fund’s advisory fee and other expenses, including information comparing the Fund’s expenses to the fees charged to institutional accounts with similar strategies managed by the Adviser, if any, and to those of a peer group of funds and information about any applicable expense caps and fee “breakpoints,” (iii) sales and redemption data in respect of the Fund, (iv) information about the profitability of the Agreement to the Adviser and (v) information obtained through the completion by the Adviser of a questionnaire distributed on behalf of the Trustees. The Board, including the Independent Trustees, also considers other matters such as (i) the Adviser’s financial results and financial condition, (ii) the Fund’s investment objective and strategies and the size, education and experience of the Adviser’s investment staff and its use of technology, external research and trading cost measurement tools, (iii) arrangements in respect of the distribution of the Fund’s shares and the related costs, (iv) the procedures employed to determine the value of the Fund’s assets, (v) the allocation of the Fund’s brokerage, if any, including, if applicable, allocations to brokers affiliated with the Adviser and the use of “soft” commission dollars to pay Fund expenses and to pay for research and other similar services, (vi) the resources devoted to, and the record of compliance with, the Fund’s investment policies and restrictions, policies on personal securities transactions and other compliance policies, (vii) information about amounts invested by the Fund’s portfolio managers in the Fund or in similar accounts that they manage and (viii) the general economic outlook with particular emphasis on the mutual fund industry. Throughout the process, the Trustees are afforded the opportunity to ask questions of and request additional materials from the Adviser.
In addition to the materials requested by the Trustees in connection with their annual consideration of the continuation of the Agreement, the Trustees receive materials in advance of each regular quarterly meeting of the Board that provide detailed information about the Fund’s investment performance and the fees charged to the Fund for advisory and other services. This information generally includes, among other things, an internal performance rating for the Fund based on agreed-upon criteria, graphs showing the Fund’s performance and fee differentials against the Fund’s peer group/category, performance ratings provided by a third-party, total return information for various periods, and third-party performance rankings for various periods comparing the Fund against similarly
| 8
categorized funds. The portfolio management team for the Fund or other representatives of the Adviser make periodic presentations to the Contract Review Committee and/or the full Board, and if the Fund is identified as presenting possible performance concerns it may be subject to more frequent board presentations and reviews. In addition, each quarter the Trustees are provided with detailed statistical information about the Fund’s portfolio. The Trustees also receive periodic updates between meetings.
The Board most recently approved the continuation of the Agreement at its meeting held in June 2014. The Agreement was continued for a one-year period for the Fund. In considering whether to approve the continuation of the Agreement, the Board, including the Independent Trustees, did not identify any single factor as determinative. Individual Trustees may have evaluated the information presented differently from one another, giving different weights to various factors. Matters considered by the Trustees, including the Independent Trustees, in connection with their approval of the Agreement included, but were not limited to, the factors listed below.
The nature, extent and quality of the services provided to the Fund under the Agreement. The Trustees considered the nature, extent and quality of the services provided by the Adviser and its affiliates to the Fund and the resources dedicated to the Fund by the Adviser and its affiliates.
The Trustees considered not only the advisory services provided by the Adviser to the Fund, but also the administrative services provided by NGAM Advisors, L.P. (“NGAM Advisors”) and its affiliates to the Fund.
The Trustees also considered the benefits to shareholders of investing in a mutual fund that is part of a family of funds that offers shareholders the right to exchange shares of one type of fund for shares of another type of fund, and provides a variety of fund and shareholder services.
After reviewing these and related factors, the Trustees concluded, within the context of their overall conclusions regarding the Agreement, that the nature, extent and quality of services provided supported the renewal of the Agreement.
Investment performance of the Fund and the Adviser. As noted above, the Trustees received information about the performance of the Fund over various time periods, including information that compared the performance of the Fund to the performance of a peer group and category of funds and the Fund’s performance benchmarks. In addition, the Trustees also reviewed data prepared by an independent third party that analyzed the performance of the Fund using a variety of performance metrics, including metrics that also measured the performance of the Fund on a risk adjusted basis. The Board concluded that the Fund’s performance or other relevant factors supported the renewal of the Agreement.
The Trustees also considered the Adviser’s performance and reputation generally, the performance of the fund family generally, and the historical responsiveness of the Adviser to Trustee concerns about performance and the willingness of the Adviser to take steps intended to improve performance.
After reviewing these and related factors, the Trustees concluded, within the context of their overall conclusions regarding each of the Agreement, that the performance of the Fund and the Adviser and/or other relevant factors supported the renewal of the Agreement.
9 |
The costs of the services to be provided and profits to be realized by the Adviser and its affiliates from their respective relationships with the Fund. The Trustees considered the fees charged to the Fund for advisory services as well as the total expense levels of the Fund. This information included comparisons (provided both by management and also by an independent third party) of the Fund’s advisory fee and total expense levels to those of its peer group and information about the advisory fees charged by the Adviser to comparable accounts (such as institutional separate accounts), as well as information about differences in such fees and the reasons for any such differences. In considering the fees charged to comparable accounts, the Trustees considered, among other things, management’s representations about the differences between managing mutual funds as compared to other types of accounts, including the additional resources required to effectively manage mutual fund assets and the greater regulatory costs associated with the management of such assets. In evaluating the Fund’s advisory fee, the Trustees also took into account the demands, complexity and quality of the investment management of the Fund, as well as the need for the Adviser to offer competitive compensation and to expend additional resources as the Fund grows in size. The Trustees considered that over the past several years, management had made recommendations regarding reductions in advisory fee rates, implementation of advisory fee breakpoints and the institution of advisory fee waivers and expense caps for various funds in the fund family. They noted that the Fund has an expense cap in place, and the Trustees considered that the current expenses are below the cap. The Trustees noted that the Fund had an advisory fee rate that was above the median of a peer group of funds. The Trustees considered the factors which management believed justified such relatively higher fees, including: (1) that the Fund’s advisory fee rate was not significantly above its peer group median; and (2) that management had proposed to add an additional breakpoint to the Fund’s advisory fee.
The Trustees also considered the compensation directly or indirectly received by the Adviser and its affiliates from their relationships with the Fund. The Trustees reviewed information provided by management as to the profitability of the Adviser’s and its affiliates’ relationships with the Fund, and information about the allocation of expenses used to calculate profitability. They also reviewed information provided by management about the effect of distribution costs and changes in asset levels on Adviser profitability, including information regarding resources spent on distribution activities. When reviewing profitability, the Trustees also considered information about court cases in which adviser compensation or profitability were issues, the performance of the Fund, the expense levels of the Fund, whether the Adviser had implemented breakpoints and/or expense caps with respect to the Fund and the overall profit margin of the Adviser compared to other investment managers.
After reviewing these and related factors, the Trustees concluded, within the context of their overall conclusions regarding the Agreement, that the advisory fee charged to the Fund was fair and reasonable, and that the costs of these services generally and the related profitability of the Adviser and its affiliates in respect of their relationships with the Fund supported the renewal of the Agreement.
Economies of Scale. The Trustees considered the existence of any economies of scale in the provision of services by the Adviser and whether those economies are shared with the Fund through breakpoints in its investment advisory fee or other means, such as expense waivers
| 10
or caps. The Trustees also discussed with management the factors considered with respect to the implementation of breakpoints in investment advisory fees or expense waivers or caps for certain funds. Management explained that a number of factors are taken into account in considering the possible implementation of breakpoints or an expense cap for a fund, including, among other things, factors such as a fund’s assets, the projected growth of a fund, projected profitability and a fund’s fees and performance. With respect to economies of scale, the Trustees noted the Fund is subject to breakpoints in its advisory fee, and that management had proposed to add an additional breakpoint to the Fund’s advisory fee. The Trustees further noted that the Fund was subject to an expense cap or waiver. In considering these issues, the Trustees also took note of the costs of the services provided (both on an absolute and a relative basis) and the profitability to the Adviser and its affiliates of their relationships with the Fund, as discussed above.
After reviewing these and related factors, the Trustees concluded, within the context of their overall conclusions regarding the Agreement, that the extent to which economies of scale were shared with the Fund supported the renewal of the Agreement.
The Trustees also considered other factors, which included but were not limited to the following:
| · | | The effect of recent market and economic events on the performance, asset levels and expense ratios of the Fund. |
| · | | Whether the Fund has operated in accordance with its investment objective and the Fund’s record of compliance with its investment restrictions, and the compliance programs of the Fund and the Adviser. They also considered the compliance-related resources the Adviser and its affiliates were providing to the Fund. |
| · | | The nature, quality, cost and extent of administrative and shareholder services performed by the Adviser and its affiliates, both under the Agreement and under a separate agreement covering administrative services. |
| · | | So-called “fallout benefits” to the Adviser, such as the engagement of affiliates of the Adviser to provide distribution, administrative and brokerage services to the Fund, and the benefits of research made available to the Adviser by reason of brokerage commissions (if any) generated by the Fund’s securities transactions. The Trustees also considered the benefits to the parent company of NGAM Advisors from the retention of the Adviser. The Trustees considered the possible conflicts of interest associated with these fallout and other benefits, and the reporting, disclosure and other processes in place to disclose and monitor such possible conflicts of interest. |
| · | | The Trustees’ review and discussion of the Fund’s advisory arrangements in prior years, and management’s record of responding to Trustee concerns raised during the year and in prior years. |
Based on their evaluation of all factors that they deemed to be material, including those factors described above, and assisted by the advice of independent counsel, the Trustees, including the Independent Trustees, concluded that the existing Agreement, with the addition of the breakpoint described above, should be continued through June 30, 2015.
11 |
Portfolio of Investments – as of September 30, 2014
Loomis Sayles Strategic Income Fund
| | | | | | | | |
Principal Amount (‡) | | | Description | | Value (†) | |
| | Bonds and Notes — 77.7% of Net Assets | |
| | Non-Convertible Bonds — 70.1% | |
| | | | ABS Car Loan — 0.0% | | | | |
| $ | 4,093,750 | | | Avis Budget Rental Car Funding AESOP LLC, Series 2010-5A, Class B, 5.110%, 3/20/2017, 144A | | $ | 4,294,409 | |
| | | | | | | | |
| | | | ABS Home Equity — 0.0% | | | | |
| | 3,115,229 | | | Wells Fargo Mortgage Backed Securities Trust, Series 2005-AR4, Class 2A2, 2.610%, 4/25/2035(b) | | | 3,164,920 | |
| | | | | | | | |
| | | | Aerospace & Defense — 0.5% | | | | |
| | 620,000 | | | Bombardier, Inc., 7.350%, 12/22/2026, 144A, (CAD) | | | 598,515 | |
| | 11,800,000 | | | Bombardier, Inc., 7.450%, 5/01/2034, 144A | | | 11,918,000 | |
| | 2,425,000 | | | Ducommun, Inc., 9.750%, 7/15/2018 | | | 2,622,031 | |
| | 8,236,000 | | | Meccanica Holdings USA, Inc., 6.250%, 7/15/2019, 144A | | | 8,894,880 | |
| | 11,543,000 | | | Meccanica Holdings USA, Inc., 6.250%, 1/15/2040, 144A | | | 10,908,135 | |
| | 20,755,000 | | | Meccanica Holdings USA, Inc., 7.375%, 7/15/2039, 144A | | | 21,688,975 | |
| | 5,310,000 | | | Textron Financial Corp., (fixed rate to 2/15/2017, variable rate thereafter), 6.000%, 2/15/2067, 144A | | | 4,832,100 | |
| | 24,513,000 | | | TransDigm, Inc., 6.500%, 7/15/2024, 144A | | | 24,421,076 | |
| | | | | | | | |
| | | | | | | 85,883,712 | |
| | | | | | | | |
| | | | Airlines — 2.8% | | | | |
| | 13,620,000 | | | Air Canada, 7.625%, 10/01/2019, 144A, (CAD) | | | 13,009,140 | |
| | 5,014,678 | | | Air Canada Pass Through Trust, Series 2013-1, Class B,
5.375%, 11/15/2022, 144A | | | 5,140,045 | |
| | 2,285,000 | | | Allegiant Travel Co., 5.500%, 7/15/2019 | | | 2,330,700 | |
| | 179,895,000 | | | American Airlines Group, Inc., 5.500%, 10/01/2019, 144A | | | 177,646,312 | |
| | 13,851,364 | | | American Airlines Pass Through Trust, Series 2013-1, Class A, 4.000%, 1/15/2027 | | | 14,102,628 | |
| | 5,088,172 | | | American Airlines Pass Through Trust, Series 2013-1, Class B, 5.625%, 1/15/2021, 144A | | | 5,280,301 | |
| | 10,425,000 | | | American Airlines Pass Through Trust, Series 2013-2, Class C, 6.000%, 1/15/2017, 144A | | | 10,806,868 | |
| | 3,119,612 | | | Continental Airlines Pass Through Certificates, Series 2012-2, Class B, 5.500%, 4/29/2022 | | | 3,291,191 | |
| | 21,015,000 | | | Continental Airlines Pass Through Certificates, Series 2012-3, Class C, 6.125%, 4/29/2018 | | | 22,275,900 | |
| | 176,964 | | | Continental Airlines Pass Through Trust, Series 1997-1, Class A, 7.461%, 10/01/2016 | | | 181,158 | |
| | 425,877 | | | Continental Airlines Pass Through Trust, Series 1997-4, Class B, 6.900%, 7/02/2018 | | | 446,617 | |
| | 1,605,933 | | | Continental Airlines Pass Through Trust, Series 1999-1, Class B, 6.795%, 2/02/2020 | | | 1,688,237 | |
| | 703,193 | | | Continental Airlines Pass Through Trust, Series 1999-2, Class B, 7.566%, 9/15/2021 | | | 734,837 | |
| | 1,132,578 | | | Continental Airlines Pass Through Trust, Series 2000-1, Class A-1, 8.048%, 5/01/2022 | | | 1,303,824 | |
| | 1,379,032 | | | Continental Airlines Pass Through Trust, Series 2000-2, Class A-1, 7.707%, 10/02/2022 | | | 1,553,065 | |
See accompanying notes to financial statements.
| 12
Portfolio of Investments – as of September 30, 2014
Loomis Sayles Strategic Income Fund – (continued)
| | | | | | | | |
Principal Amount (‡) | | | Description | | Value (†) | |
| | | | Airlines — continued | | | | |
| $ | 1,592,923 | | | Continental Airlines Pass Through Trust, Series 2000-2, Class B, 8.307%, 10/02/2019 | | $ | 1,756,198 | |
| | 1,828,567 | | | Continental Airlines Pass Through Trust, Series 2001-1, Class A-1, 6.703%, 12/15/2022 | | | 1,974,852 | |
| | 1,063,631 | | | Continental Airlines Pass Through Trust, Series 2001-1, Class B, 7.373%, 6/15/2017 | | | 1,120,748 | |
| | 10,041,353 | | | Continental Airlines Pass Through Trust, Series 2007-1, Class A, 5.983%, 10/19/2023 | | | 11,145,901 | |
| | 17,937,609 | | | Continental Airlines Pass Through Trust, Series 2007-1, Class B, 6.903%, 10/19/2023 | | | 19,304,455 | |
| | 14,927,207 | | | Continental Airlines Pass Through Trust, Series 2009-1, 9.000%, 1/08/2018 | | | 16,419,927 | |
| | 13,952,000 | | | Continental Airlines Pass Through Trust, Series 2009-2, Class A, 7.250%, 5/10/2021 | | | 16,358,720 | |
| | 3,576,616 | | | Continental Airlines Pass Through Trust, Series 2012-1, Class B, 6.250%, 10/11/2021 | | | 3,809,096 | |
| | 1,139,822 | | | Delta Air Lines Pass Through Trust, Series 2007-1, Class A, 6.821%, 2/10/2024 | | | 1,327,893 | |
| | 5,324,914 | | | Delta Air Lines Pass Through Trust, Series 2007-1, Class B, 8.021%, 2/10/2024 | | | 6,216,837 | |
| | 899,738 | | | Northwest Airlines, Inc., Series 2002-1, Class G2, (MBIA insured), 6.264%, 5/20/2023 | | | 972,797 | |
| | 15,288,496 | | | UAL Pass Through Trust, Series 2007-1, Class A, 6.636%, 1/02/2024 | | | 16,511,576 | |
| | 551,701 | | | UAL Pass Through Trust, Series 2009-1, 10.400%, 5/01/2018 | | | 611,009 | |
| | 9,585,000 | | | United Airlines Pass Through Trust, Series 2014-1, Class B, 4.750%, 10/11/2023 | | | 9,641,935 | |
| | 12,214,221 | | | US Airways Pass Through Trust, Series 2010-1B, Class B, 8.500%, 10/22/2018 | | | 13,496,715 | |
| | 28,940,722 | | | US Airways Pass Through Trust, Series 2010-1C, Class C, 11.000%, 10/22/2014, 144A | | | 29,157,777 | |
| | 44,303,984 | | | US Airways Pass Through Trust, Series 2011-1B, Class B, 9.750%, 4/22/2020 | | | 51,503,381 | |
| | 8,387,604 | | | US Airways Pass Through Trust, Series 2011-1C, Class C, 10.875%, 10/22/2014 | | | 8,450,511 | |
| | 13,067,459 | | | US Airways Pass Through Trust, Series 2012-1A, Class A, 5.900%, 4/01/2026 | | | 14,635,554 | |
| | 6,745,834 | | | US Airways Pass Through Trust, Series 2012-1B, Class B, 8.000%, 4/01/2021 | | | 7,555,334 | |
| | 3,965,102 | | | US Airways Pass Through Trust, Series 2012-1C, Class C, 9.125%, 10/01/2015 | | | 4,143,531 | |
| | 7,200,000 | | | US Airways Pass Through Trust, Series 2013-1, Class B, 5.375%, 5/15/2023 | | | 7,452,000 | |
| | 6,242,161 | | | Virgin Australia Pass Through Trust, Series 2013-1B, 6.000%, 4/23/2022, 144A | | | 6,410,700 | |
| | 10,332,481 | | | Virgin Australia Pass Through Trust, Series 2013-1C, 7.125%, 10/23/2018, 144A | | | 10,415,761 | |
| | | | | | | | |
| | | | | | | 520,184,031 | |
| | | | | | | | |
| | | | Automotive — 0.9% | | | | |
| | 19,011,000 | | | Ford Motor Co., 6.375%, 2/01/2029 | | | 22,637,805 | |
| | 1,220,000 | | | Ford Motor Co., 6.625%, 2/15/2028 | | | 1,423,503 | |
| | 74,829,000 | | | Ford Motor Co., 6.625%, 10/01/2028 | | | 92,020,289 | |
| | 2,365,000 | | | Ford Motor Co., 7.125%, 11/15/2025 | | | 2,913,084 | |
| | 1,345,000 | | | Ford Motor Co., 7.500%, 8/01/2026 | | | 1,696,544 | |
| | 29,265,000 | | | General Motors Financial Co., Inc., 4.375%, 9/25/2021 | | | 29,923,463 | |
| | 6,000,000 | | | Goodyear Tire & Rubber Co. (The), 7.000%, 5/15/2022 | | | 6,427,500 | |
| | 4,977,000 | | | Goodyear Tire & Rubber Co. (The), 7.000%, 3/15/2028 | | | 5,250,735 | |
| | 6,900,000 | | | Midas Intermediate Holdco II LLC/Midas Intermediate Holdco II Finance, Inc., 7.875%, 10/01/2022, 144A | | | 6,882,750 | |
| | | | | | | | |
| | | | | | | 169,175,673 | |
| | | | | | | | |
See accompanying notes to financial statements.
13 |
Portfolio of Investments – as of September 30, 2014
Loomis Sayles Strategic Income Fund – (continued)
| | | | | | | | |
Principal Amount (‡) | | | Description | | Value (†) | |
| | | | Banking — 7.9% | | | | |
| $ | 1,175,000 | | | AgriBank FCB, 9.125%, 7/15/2019, 144A | | $ | 1,494,645 | |
| | 2,000,000 | | | Ally Financial, Inc., 5.125%, 9/30/2024 | | | 1,960,000 | |
| | 28,582,000 | | | Ally Financial, Inc., 8.000%, 12/31/2018 | | | 32,440,570 | |
| | 29,332,000 | | | Ally Financial, Inc., 8.000%, 11/01/2031 | | | 36,591,670 | |
| | 20,565,000 | | | Associates Corp. of North America, 6.950%, 11/01/2018 | | | 24,118,200 | |
| | 63,900,000 | | | Banco Santander Brasil S.A., 8.000%, 3/18/2016, 144A, (BRL) | | | 24,930,855 | |
| | 900,000 | | | Bank of America Corp., 5.490%, 3/15/2019 | | | 993,562 | |
| | 3,450,000 | | | Bank of America Corp., EMTN, 4.625%, 9/14/2018, (EUR) | | | 4,914,320 | |
| | 3,135,000 | | | Bank of America Corp., MTN, 3.300%, 1/11/2023 | | | 3,057,631 | |
| | 265,000 | | | Bank of America Corp., MTN, 4.000%, 4/01/2024 | | | 267,761 | |
| | 1,500,000 | | | Bank of America Corp., Series K, (fixed rate to 1/30/2018, variable rate thereafter), 8.000%(c) | | | 1,617,195 | |
| | 10,000,000 | | | Bank of Nova Scotia, 2.462%, 3/14/2019, (CAD) | | | 8,994,598 | |
| | 39,890,000,000 | | | Barclays Bank PLC, EMTN, 3.680%, 8/20/2015, (KRW) | | | 38,314,813 | |
| | 57,792,000,000 | | | Barclays Financial LLC, EMTN, 3.500%, 11/29/2016, (KRW) | | | 56,150,658 | |
| | 1,600,000 | | | BNP Paribas S.A., (fixed rate to 4/13/2017, variable rate thereafter), 5.019%, (EUR)(c) | | | 2,135,060 | |
| | 5,331,000 | | | BNP Paribas S.A., (fixed rate to 6/29/2015, variable rate thereafter), 5.186%, 144A(c) | | | 5,384,310 | |
| | 4,000,000 | | | Citigroup, Inc., 5.365%, 3/06/2036, (CAD)(d)(f) | | | 3,742,631 | |
| | 24,610,000 | | | Citigroup, Inc., 5.875%, 2/22/2033 | | | 27,609,147 | |
| | 8,999,000 | | | Citigroup, Inc., 6.000%, 10/31/2033 | | | 10,074,029 | |
| | 6,060,000 | | | Citigroup, Inc., 6.125%, 8/25/2036 | | | 6,948,190 | |
| | 22,091,000 | | | Citigroup, Inc., 6.250%, 6/29/2017, (NZD) | | | 17,813,691 | |
| | 3,350,000 | | | Citigroup, Inc., EMTN, 1.440%, 11/30/2017, (EUR)(b) | | | 4,220,641 | |
| | 3,000,000 | | | Cooperatieve Centrale Raiffeisen-Boerenleenbank BA/Netherlands, 1.700%, 3/19/2018 | | | 2,997,192 | |
| | 14,330,000 | | | Cooperatieve Centrale Raiffeisen-Boerenleenbank BA/Netherlands, 3.875%, 2/08/2022 | | | 15,094,950 | |
| | 3,450,000 | | | Cooperatieve Centrale Raiffeisen-Boerenleenbank BA/Netherlands, 3.950%, 11/09/2022 | | | 3,464,687 | |
| | 25,000,000 | | | Goldman Sachs Group, Inc. (The), 3.550%, 2/12/2021, (CAD) | | | 22,807,491 | |
| | 400,000 | | | Goldman Sachs Group, Inc. (The), 6.450%, 5/01/2036 | | | 465,853 | |
| | 34,060,000 | | | Goldman Sachs Group, Inc. (The), 6.750%, 10/01/2037 | | | 40,660,385 | |
| | 32,705,000 | | | HBOS PLC, 6.000%, 11/01/2033, 144A | | | 36,302,550 | |
| | 50,604,000 | | | HBOS PLC, GMTN, 6.750%, 5/21/2018, 144A | | | 57,240,917 | |
| | 9,090,000 | | | ICICI Bank Ltd., (fixed rate to 4/30/2017, variable rate thereafter), 6.375%, 4/30/2022, 144A | | | 9,480,870 | |
| | 98,840,000 | | | Intesa Sanpaolo SpA, 3.875%, 1/15/2019 | | | 102,538,988 | |
| | 33,360,000 | | | Intesa Sanpaolo SpA, 5.017%, 6/26/2024, 144A | | | 32,503,849 | |
| | 45,620,000 | | | JPMorgan Chase & Co., 4.250%, 11/02/2018, (NZD) | | | 34,860,989 | |
| | 227,000,000,000 | | | JPMorgan Chase Bank NA, 7.700%, 6/01/2016, 144A, (IDR) | | | 18,212,162 | |
| | 27,555,000 | | | Lloyds Bank PLC, MTN, 6.500%, 9/14/2020, 144A | | | 32,037,317 | |
| | 18,500,000 | | | Lloyds Banking Group PLC, (fixed rate to 10/01/2015, variable rate thereafter), 5.920%, 144A(c) | | | 18,685,000 | |
| | 3,010,000 | | | Merrill Lynch & Co., Inc., 5.700%, 5/02/2017 | | | 3,300,354 | |
| | 6,700,000 | | | Merrill Lynch & Co., Inc., 6.110%, 1/29/2037 | | | 7,669,115 | |
See accompanying notes to financial statements.
| 14
Portfolio of Investments – as of September 30, 2014
Loomis Sayles Strategic Income Fund – (continued)
| | | | | | | | |
Principal Amount (‡) | | | Description | | Value (†) | |
| | | | Banking — continued | | | | |
| $ | 800,000 | | | Merrill Lynch & Co., Inc., Series C, MTN, 6.050%, 6/01/2034 | | $ | 920,263 | |
| | 16,185,000 | | | Morgan Stanley, 4.350%, 9/08/2026 | | | 15,906,893 | |
| | 35,325,000 | | | Morgan Stanley, 4.750%, 11/16/2018, (AUD) | | | 31,553,881 | |
| | 23,950,000 | | | Morgan Stanley, 4.875%, 11/01/2022 | | | 25,302,744 | |
| | 185,000,000 | | | Morgan Stanley, 5.000%, 9/30/2021, (AUD) | | | 162,624,689 | |
| | 74,310,000 | | | Morgan Stanley, 7.600%, 8/08/2017, (NZD) | | | 61,488,725 | |
| | 100,265,000 | | | Morgan Stanley, 8.000%, 5/09/2017, (AUD) | | | 96,878,791 | |
| | 950,000 | | | Morgan Stanley, EMTN, 5.750%, 2/14/2017, (GBP) | | | 1,672,873 | |
| | 79,700,000 | | | Morgan Stanley, GMTN, 7.625%, 3/03/2016, (AUD) | | | 73,645,072 | |
| | 38,835,000 | | | Morgan Stanley, MTN, 4.100%, 5/22/2023 | | | 38,727,738 | |
| | 10,000,000 | | | Morgan Stanley, MTN, 6.250%, 8/09/2026 | | | 12,024,640 | |
| | 6,600,000 | | | Morgan Stanley, Series F, 3.875%, 4/29/2024 | | | 6,593,156 | |
| | 7,900,000 | | | Morgan Stanley, Series F, GMTN, 6.625%, 4/01/2018 | | | 9,047,270 | |
| | 12,100,000 | | | Morgan Stanley, Series F, MTN, 0.684%, 10/18/2016(b) | | | 12,132,138 | |
| | 53,095,000 | | | Morgan Stanley, Series MPLE, 3.125%, 8/05/2021, (CAD) | | | 47,005,395 | |
| | 1,905,000 | | | RBS Capital Trust C, (fixed rate to 1/12/2016, variable rate thereafter), 4.243%, (EUR)(c) | | | 2,394,081 | |
| | 4,050,000 | | | RBS Capital Trust II, (fixed rate to 1/03/2034, variable rate thereafter), 6.425%(c) | | | 4,242,375 | |
| | 2,085,000 | | | RBS Capital Trust III, 2.073%(b)(c) | | | 2,043,300 | |
| | 930,000 | | | Royal Bank of Scotland Group PLC, 5.250%, (EUR)(c) | | | 1,118,842 | |
| | 15,100,000 | | | Royal Bank of Scotland Group PLC, 5.500%, (EUR)(c) | | | 18,366,396 | |
| | 24,985,000 | | | Royal Bank of Scotland Group PLC, 6.000%, 12/19/2023 | | | 26,192,750 | |
| | 17,700,000 | | | Royal Bank of Scotland Group PLC, 6.125%, 12/15/2022 | | | 18,734,353 | |
| | 9,990,000 | | | Royal Bank of Scotland Group PLC, (fixed rate to 9/30/2017, variable rate thereafter), 7.640%(c) | | | 10,564,425 | |
| | 850,000 | | | Royal Bank of Scotland PLC (The), EMTN, 4.350%, 1/23/2017, (EUR) | | | 1,128,614 | |
| | 7,750,000 | | | Royal Bank of Scotland PLC (The), EMTN, 6.934%, 4/09/2018, (EUR) | | | 11,232,466 | |
| | 2,150,000 | | | Royal Bank of Scotland PLC (The), EMTN, (fixed rate to 9/22/2016, variable rate thereafter), 4.625%, 9/22/2021, (EUR) | | | 2,763,081 | |
| | 700,000 | | | Santander Financial Issuances Ltd., 7.250%, 11/01/2015 | | | 745,284 | |
| | 1,800,000 | | | Santander Issuances SAU, 5.911%, 6/20/2016, 144A | | | 1,905,955 | |
| | 4,140,000 | | | Societe Generale S.A., (fixed rate to 1/26/2015, variable rate thereafter), 4.196%, (EUR)(c) | | | 5,236,716 | |
| | 18,054,000 | | | Societe Generale S.A., (fixed rate to 4/05/2017, variable rate thereafter), 5.922%, 144A(c) | | | 19,046,970 | |
| | | | | | | | |
| | | | | | | 1,473,336,722 | |
| | | | | | | | |
| | | | Brokerage — 0.7% | | | | |
| | 1,640,000 | | | Cantor Fitzgerald LP, 6.375%, 6/26/2015, 144A | | | 1,689,200 | |
| | 5,000,000 | | | Jefferies Finance LLC/JFIN Co-Issuer Corp., 6.875%, 4/15/2022, 144A | | | 4,925,000 | |
| | 43,025,000 | | | Jefferies Group LLC, 5.125%, 1/20/2023 | | | 45,731,101 | |
| | 20,010,000 | | | Jefferies Group LLC, 6.250%, 1/15/2036 | | | 21,062,586 | |
| | 15,215,000 | | | Jefferies Group LLC, 6.450%, 6/08/2027 | | | 17,047,190 | |
| | 39,040,000 | | | Jefferies Group LLC, 6.875%, 4/15/2021 | | | 45,493,117 | |
| | | | | | | | |
| | | | | | | 135,948,194 | |
| | | | | | | | |
See accompanying notes to financial statements.
15 |
Portfolio of Investments – as of September 30, 2014
Loomis Sayles Strategic Income Fund – (continued)
| | | | | | | | |
Principal Amount (‡) | | | Description | | Value (†) | |
| | | | Building Materials — 0.5% | | | | |
| $ | 12,005,000 | | | Atrium Windows & Doors, Inc., 7.750%, 5/01/2019, 144A | | $ | 11,644,850 | |
| | 6,995,000 | | | Masco Corp., 6.500%, 8/15/2032 | | | 6,995,000 | |
| | 5,510,000 | | | Masco Corp., 7.125%, 3/15/2020 | | | 6,336,500 | |
| | 2,630,000 | | | Masco Corp., 7.750%, 8/01/2029 | | | 3,013,422 | |
| | 32,100,000 | | | Odebrecht Finance Ltd., 8.250%, 4/25/2018, 144A, (BRL) | | | 11,835,461 | |
| | 35,980,000 | | | Owens Corning, Inc., 7.000%, 12/01/2036 | | | 43,606,969 | |
| | 14,155,000 | | | USG Corp., 9.750%, 1/15/2018 | | | 16,419,800 | |
| | | | | | | | |
| | | | | | | 99,852,002 | |
| | | | | | | | |
| | | | Cable Satellite — 1.0% | | | | |
| | 3,315,000 | | | CCO Holdings LLC/CCO Holdings Capital Corp., 5.750%, 1/15/2024 | | | 3,298,425 | |
| | 11,620,000 | | | Intelsat Jackson Holdings S.A., 5.500%, 8/01/2023 | | | 11,097,100 | |
| | 3,995,000 | | | Intelsat Luxembourg S.A., 6.750%, 6/01/2018 | | | 4,104,862 | |
| | 28,785,000 | | | Intelsat Luxembourg S.A., 7.750%, 6/01/2021 | | | 29,324,719 | |
| | 16,000,000 | | | Intelsat Luxembourg S.A., 8.125%, 6/01/2023 | | | 16,680,000 | |
| | 25,270,000 | | | Shaw Communications, Inc., 5.650%, 10/01/2019, (CAD) | | | 25,374,469 | |
| | 135,000 | | | Time Warner Cable, Inc., 5.875%, 11/15/2040 | | | 158,843 | |
| | 44,800,000 | | | UPC Holding BV, 6.375%, 9/15/2022, 144A, (EUR) | | | 60,854,540 | |
| | 11,275,000 | | | Videotron Ltd., 5.625%, 6/15/2025, 144A, (CAD) | | | 10,126,811 | |
| | 7,000,000 | | | Virgin Media Finance PLC, 6.000%, 10/15/2024, 144A | | | 7,008,750 | |
| | 20,300,000 | | | VTR Finance BV, 6.875%, 1/15/2024, 144A | | | 21,010,500 | |
| | | | | | | | |
| | | | | | | 189,039,019 | |
| | | | | | | | |
| | | | Chemicals — 0.4% | | | | |
| | 20,070,000 | | | Hercules, Inc., 6.500%, 6/30/2029 | | | 17,862,300 | |
| | 5,200,000 | | | Hexion U.S. Finance Corp./Hexion Nova Scotia Finance ULC, 8.875%, 2/01/2018 | | | 5,297,500 | |
| | 7,295,000 | | | Hexion U.S. Finance Corp./Hexion Nova Scotia Finance ULC, 9.000%, 11/15/2020 | | | 6,948,488 | |
| | 26,164,000 | | | Momentive Specialty Chemicals, Inc., 7.875%, 2/15/2023(d)(f) | | | 23,482,190 | |
| | 5,191,000 | | | Momentive Specialty Chemicals, Inc., 8.375%, 4/15/2016(d)(f) | | | 5,074,203 | |
| | 8,757,000 | | | Momentive Specialty Chemicals, Inc., 9.200%, 3/15/2021(d)(f) | | | 8,472,397 | |
| | | | | | | | |
| | | | | | | 67,137,078 | |
| | | | | | | | |
| | | | Construction Machinery — 0.1% | | | | |
| | 1,425,000 | | | Joy Global, Inc., 6.625%, 11/15/2036 | | | 1,710,217 | |
| | 5,105,000 | | | United Rentals North America, Inc., 5.750%, 11/15/2024 | | | 5,168,813 | |
| | 11,655,000 | | | United Rentals North America, Inc., 7.625%, 4/15/2022 | | | 12,674,812 | |
| | 525,000 | | | United Rentals North America, Inc., 8.375%, 9/15/2020 | | | 564,375 | |
| | | | | | | | |
| | | | | | | 20,118,217 | |
| | | | | | | | |
| | | | Consumer Cyclical Services — 0.0% | | | | |
| | 670,000 | | | ServiceMaster Co. (The), 7.100%, 3/01/2018 | | | 690,100 | |
| | 5,500,000 | | | ServiceMaster Co. (The), 7.450%, 8/15/2027 | | | 5,555,000 | |
| | | | | | | | |
| | | | | | | 6,245,100 | |
| | | | | | | | |
| | | | Consumer Products — 0.0% | | | | |
| | 1,335,000 | | | Visant Corp., 10.000%, 10/01/2017 | | | 1,191,488 | |
| | | | | | | | |
See accompanying notes to financial statements.
| 16
Portfolio of Investments – as of September 30, 2014
Loomis Sayles Strategic Income Fund – (continued)
| | | | | | | | |
Principal Amount (‡) | | | Description | | Value (†) | |
| | | | Electric — 1.5% | | | | |
| $ | 1,540,000 | | | AES Corp. (The), 4.875%, 5/15/2023 | | $ | 1,463,000 | |
| | 34,125,000 | | | AES Corp. (The), 5.500%, 3/15/2024 | | | 33,186,563 | |
| | 43,248,286 | | | Alta Wind Holdings LLC, 7.000%, 6/30/2035, 144A | | | 49,292,147 | |
| | 58,038,836 | | | Bruce Mansfield Unit Pass Through Trust, 6.850%, 6/01/2034 | | | 64,529,319 | |
| | 2,086,195 | | | CE Generation LLC, 7.416%, 12/15/2018 | | | 2,067,941 | |
| | 38,368,000 | | | DPL, Inc., 6.750%, 10/01/2019, 144A | | | 39,039,440 | |
| | 42,200,000 | | | EDP Finance BV, 4.900%, 10/01/2019, 144A | | | 43,577,830 | |
| | 14,800,000 | | | EDP Finance BV, 6.000%, 2/02/2018, 144A | | | 15,924,356 | |
| | 3,570,000 | | | Endesa S.A., 7.875%, 2/01/2027 | | | 4,609,805 | |
| | 13,642,000 | | | Enel Finance International NV, 6.000%, 10/07/2039, 144A | | | 15,536,219 | |
| | 1,435,000 | | | Enel Finance International NV, 6.800%, 9/15/2037, 144A | | | 1,757,308 | |
| | 2,732,000 | | | Enel Finance International NV, EMTN, 5.750%, 9/14/2040, (GBP) | | | 5,039,810 | |
| | 555,000 | | | Enersis S.A., 7.400%, 12/01/2016 | | | 621,592 | |
| | 655,039 | | | Red Oak Power LLC, Series A, 8.540%, 11/30/2019 | | | 707,442 | |
| | | | | | | | |
| | | | | | | 277,352,772 | |
| | | | | | | | |
| | | | Finance Companies — 5.5% | | | | |
| | 19,005,000 | | | Aviation Capital Group Corp., 6.750%, 4/06/2021, 144A | | | 21,570,675 | |
| | 57,000,000 | | | General Electric Capital Corp., GMTN, 4.250%, 1/17/2018, (NZD) | | | 43,930,640 | |
| | 79,035,000 | | | General Electric Capital Corp., Series A, EMTN, 6.750%, 9/26/2016, (NZD) | | | 64,375,521 | |
| | 25,320,000 | | | General Electric Capital Corp., Series A, GMTN, 5.500%, 2/01/2017, (NZD) | | | 20,179,798 | |
| | 58,490,000 | | | General Electric Capital Corp., Series A, GMTN, 7.625%, 12/10/2014, (NZD) | | | 45,967,824 | |
| | 10,650,000 | | | General Electric Capital Corp., Series A, MTN, 0.534%, 5/13/2024(b) | | | 10,069,053 | |
| | 215,797,000 | | | General Electric Capital Corp., Series A, MTN, 6.500%, 9/28/2015, (NZD) | | | 172,266,613 | |
| | 325,000 | | | International Lease Finance Corp., 3.875%, 4/15/2018 | | | 322,563 | |
| | 1,435,000 | | | International Lease Finance Corp., 4.625%, 4/15/2021 | | | 1,424,238 | |
| | 2,085,000 | | | International Lease Finance Corp., 5.875%, 4/01/2019 | | | 2,220,525 | |
| | 24,940,000 | | | International Lease Finance Corp., 5.875%, 8/15/2022 | | | 26,062,300 | |
| | 950,000 | | | International Lease Finance Corp., 6.250%, 5/15/2019 | | | 1,017,925 | |
| | 20,610,000 | | | International Lease Finance Corp., 7.125%, 9/01/2018, 144A | | | 23,186,250 | |
| | 10,245,000 | | | International Lease Finance Corp., 8.250%, 12/15/2020 | | | 12,101,906 | |
| | 11,995,000 | | | iStar Financial, Inc., 4.875%, 7/01/2018 | | | 11,665,138 | |
| | 14,060,000 | | | iStar Financial, Inc., 5.000%, 7/01/2019 | | | 13,532,750 | |
| | 23,175,000 | | | iStar Financial, Inc., 5.850%, 3/15/2017 | | | 24,044,062 | |
| | 19,240,000 | | | iStar Financial, Inc., 7.125%, 2/15/2018 | | | 19,913,400 | |
| | 19,915,000 | | | Ladder Capital Finance Holdings LLLP/Ladder Capital Finance Corp., 7.375%, 10/01/2017 | | | 21,060,112 | |
| | 23,020,000 | | | Navient LLC, 4.875%, 6/17/2019 | | | 23,020,000 | |
| | 22,945,000 | | | Navient LLC, 5.500%, 1/25/2023 | | | 22,055,881 | |
| | 109,950(††) | | | Navient LLC, 6.000%, 12/15/2043 | | | 2,376,295 | |
| | 7,515,000 | | | Navient LLC, MTN, 4.625%, 9/25/2017 | | | 7,599,544 | |
| | 7,780,000 | | | Navient LLC, MTN, 5.500%, 1/15/2019 | | | 7,935,600 | |
| | 18,655,000 | | | Navient LLC, MTN, 6.125%, 3/25/2024 | | | 18,188,625 | |
| | 17,600,000 | | | Navient LLC, MTN, 7.250%, 1/25/2022 | | | 19,096,000 | |
| | 2,160,000 | | | Navient LLC, MTN, 8.000%, 3/25/2020 | | | 2,421,900 | |
| | 14,465,000 | | | Navient LLC, Series A, MTN, 5.000%, 6/15/2018 | | | 14,356,512 | |
| | 50,910,000 | | | Navient LLC, Series A, MTN, 5.625%, 8/01/2033 | | | 42,891,675 | |
| | 49,850,000 | | | Navient LLC, Series A, MTN, 8.450%, 6/15/2018 | | | 56,081,250 | |
See accompanying notes to financial statements.
17 |
Portfolio of Investments – as of September 30, 2014
Loomis Sayles Strategic Income Fund – (continued)
| | | | | | | | |
Principal Amount (‡) | | | Description | | Value (†) | |
| | | | Finance Companies — continued | | | | |
| $ | 137,545,000 | | | Springleaf Finance Corp., 7.750%, 10/01/2021 | | $ | 154,050,400 | |
| | 55,015,000 | | | Springleaf Finance Corp., 8.250%, 10/01/2023 | | | 61,891,875 | |
| | 10,120,000 | | | Springleaf Finance Corp., MTN, 5.750%, 9/15/2016 | | | 10,499,500 | |
| | 800,000 | | | Springleaf Finance Corp., Series J, MTN, 6.500%, 9/15/2017 | | | 844,000 | |
| | 55,730,000 | | | Springleaf Finance Corp., Series J, MTN, 6.900%, 12/15/2017 | | | 59,213,125 | |
| | | | | | | | |
| | | | | | | 1,037,433,475 | |
| | | | | | | | |
| | | | Financial Other — 0.2% | | | | |
| | 20,000,000 | | | National Life Insurance Co., 10.500%, 9/15/2039, 144A | | | 30,390,580 | |
| | | | | | | | |
| | | | Food & Beverage — 0.2% | | | | |
| | 25,280,000 | | | Crestview DS Merger Sub II, Inc., 10.000%, 9/01/2021 | | | 27,934,400 | |
| | 4,880,000 | | | Shearer’s Foods LLC/Chip Finance Corp., 9.000%, 11/01/2019, 144A | | | 5,307,000 | |
| | | | | | | | |
| | | | | | | 33,241,400 | |
| | | | | | | | |
| | | | Government Owned – No Guarantee — 0.1% | | | | |
| | 19,500,000 | | | DP World Ltd., 6.850%, 7/02/2037, 144A | | | 21,865,350 | |
| | | | | | | | |
| | | | Government Sponsored — 0.0% | | | | |
| | 1,000,000 | | | EDP Finance BV, EMTN, 2.250%, 2/11/2021, (CHF) | | | 1,016,654 | |
| | | | | | | | |
| | | | Healthcare — 1.9% | | | | |
| | 2,160,000 | | | BioScrip, Inc., 8.875%, 2/15/2021, 144A | | | 2,211,300 | |
| | 2,795,000 | | | HCA Holdings, Inc., 6.250%, 2/15/2021 | | | 2,920,775 | |
| | 9,960,000 | | | HCA, Inc., 5.875%, 3/15/2022 | | | 10,470,450 | |
| | 108,560,000 | | | HCA, Inc., 5.875%, 5/01/2023 | | | 111,002,600 | |
| | 14,620,000 | | | HCA, Inc., 7.050%, 12/01/2027 | | | 14,693,100 | |
| | 20,447,000 | | | HCA, Inc., 7.500%, 12/15/2023 | | | 22,287,230 | |
| | 24,215,000 | | | HCA, Inc., 7.500%, 11/06/2033 | | | 25,425,750 | |
| | 46,148,000 | | | HCA, Inc., 7.690%, 6/15/2025 | | | 50,762,800 | |
| | 32,745,000 | | | HCA, Inc., 8.360%, 4/15/2024 | | | 37,656,750 | |
| | 15,815,000 | | | HCA, Inc., MTN, 7.580%, 9/15/2025 | | | 17,238,350 | |
| | 9,492,000 | | | HCA, Inc., MTN, 7.750%, 7/15/2036 | | | 10,298,820 | |
| | 19,250,000 | | | Tenet Healthcare Corp., 5.000%, 3/01/2019, 144A | | | 19,009,375 | |
| | 32,559,000 | | | Tenet Healthcare Corp., 6.875%, 11/15/2031 | | | 31,419,435 | |
| | | | | | | | |
| | | | | | | 355,396,735 | |
| | | | | | | | |
| | | | Home Construction — 0.5% | | | | |
| | 3,075,000 | | | Beazer Homes USA, Inc., 7.250%, 2/01/2023 | | | 3,059,625 | |
| | 13,360,000 | | | K. Hovnanian Enterprises, Inc., 5.000%, 11/01/2021 | | | 11,623,200 | |
| | 3,620,000 | | | KB Home, 4.750%, 5/15/2019 | | | 3,520,450 | |
| | 11,315,000 | | | KB Home, 7.250%, 6/15/2018 | | | 12,107,050 | |
| | 5,865,000 | | | Lennar Corp., 4.500%, 6/15/2019 | | | 5,813,681 | |
| | 47,260,000 | | | Pulte Group, Inc., 6.000%, 2/15/2035 | | | 44,897,000 | |
| | 13,190,000 | | | Pulte Group, Inc., 6.375%, 5/15/2033 | | | 13,157,025 | |
| | 6,565,000 | | | Weyerhaeuser Real Estate Co., 4.375%, 6/15/2019, 144A | | | 6,417,288 | |
| | | | | | | | |
| | | | | | | 100,595,319 | |
| | | | | | | | |
| | | | Independent Energy — 0.4% | | | | |
| | 2,195,000 | | | Baytex Energy Corp., 5.125%, 6/01/2021, 144A | | | 2,140,125 | |
| | 1,220,000 | | | Baytex Energy Corp., 5.625%, 6/01/2024, 144A | | | 1,171,200 | |
See accompanying notes to financial statements.
| 18
Portfolio of Investments – as of September 30, 2014
Loomis Sayles Strategic Income Fund – (continued)
| | | | | | | | |
Principal Amount (‡) | | | Description | | Value (†) | |
| | | | Independent Energy — continued | | | | |
| $ | 55,000 | | | Chesapeake Energy Corp., 6.875%, 11/15/2020 | | $ | 61,325 | |
| | 2,990,000 | | | Halcon Resources Corp., 9.250%, 2/15/2022 | | | 2,978,788 | |
| | 12,635,000 | | | QEP Resources, Inc., 6.875%, 3/01/2021 | | | 13,708,975 | |
| | 7,170,000 | | | Rex Energy Corp., 6.250%, 8/01/2022, 144A | | | 6,919,050 | |
| | 6,250,000 | | | Rice Energy, Inc., 6.250%, 5/01/2022, 144A | | | 6,093,750 | |
| | 1,975,000 | | | Rosetta Resources, Inc., 5.625%, 5/01/2021 | | | 1,925,625 | |
| | 7,360,000 | | | RSP Permian, Inc., 6.625%, 10/01/2022, 144A | | | 7,406,000 | |
| | 2,780,000 | | | SandRidge Energy, Inc., 7.500%, 2/15/2023 | | | 2,700,075 | |
| | 39,800,000 | | | Ultra Petroleum Corp., 6.125%, 10/01/2024, 144A | | | 38,009,000 | |
| | | | | | | | |
| | | | | | | 83,113,913 | |
| | | | | | | | |
| | | | Industrial Other — 0.2% | | | | |
| | 7,875,000 | | | AECOM Technology Corp., 5.750%, 10/15/2022, 144A | | | 7,904,531 | |
| | 8,215,000 | | | AECOM Technology Corp., 5.875%, 10/15/2024, 144A | | | 8,266,344 | |
| | 7,475,000 | | | Permian Holdings, Inc., 10.500%, 1/15/2018, 144A | | | 7,624,500 | |
| | 6,880,000 | | | Transfield Services Ltd., 8.375%, 5/15/2020, 144A | | | 7,155,200 | |
| | 10,000,000 | | | Worthington Industries, Inc., 6.500%, 4/15/2020 | | | 11,354,150 | |
| | | | | | | | |
| | | | | | | 42,304,725 | |
| | | | | | | | |
| | | | Integrated Energy — 0.5% | | | | |
| | 4,945,000 | | | California Resources Corp., 5.000%, 1/15/2020, 144A | | | 5,019,175 | |
| | 81,805,000 | | | California Resources Corp., 5.500%, 9/15/2021, 144A | | | 83,032,075 | |
| | 10,905,000 | | | California Resources Corp., 6.000%, 11/15/2024, 144A | | | 11,204,887 | |
| | | | | | | | |
| | | | | | | 99,256,137 | |
| | | | | | | | |
| | | | Life Insurance — 0.5% | | | | |
| | 11,135,000 | | | American International Group, Inc., 4.125%, 2/15/2024 | | | 11,566,459 | |
| | 4,190,000 | | | American International Group, Inc., 4.875%, 6/01/2022 | | | 4,608,682 | |
| | 2,416,000 | | | American International Group, Inc., 6.250%, 3/15/2087 | | | 2,705,579 | |
| | 1,933,000 | | | American International Group, Inc., (fixed rate to 5/15/2038, variable rate thereafter), 8.175%, 5/15/2068 | | | 2,604,717 | |
| | 4,300,000 | | | American International Group, Inc., Series G, MTN, 5.850%, 1/16/2018 | | | 4,837,169 | |
| | 23,200,000 | | | AXA S.A., (fixed rate to 12/14/2036, variable rate thereafter), 6.379%, 144A(c) | | | 24,940,000 | |
| | 1,000,000 | | | AXA S.A., EMTN, (fixed rate to 10/16/2019, variable rate thereafter), 6.772%, (GBP)(c) | | | 1,742,736 | |
| | 1,350,000 | | | AXA S.A., EMTN, (fixed rate to 4/16/2020, variable rate thereafter), 5.250%, 4/16/2040, (EUR) | | | 1,907,263 | |
| | 15,000,000 | | | Forethought Financial Group, Inc., 8.625%, 4/15/2021, 144A | | | 17,051,850 | |
| | 1,475,000 | | | MetLife Capital Trust X, 9.250%, 4/08/2068, 144A | | | 2,127,688 | |
| | 8,145,000 | | | MetLife, Inc., 10.750%, 8/01/2069 | | | 13,154,175 | |
| | 8,920,000 | | | NLV Financial Corp., 7.500%, 8/15/2033, 144A | | | 9,780,655 | |
| | 3,910,000 | | | Penn Mutual Life Insurance Co. (The), 6.650%, 6/15/2034, 144A | | | 4,880,341 | |
| | | | | | | | |
| | | | | | | 101,907,314 | |
| | | | | | | | |
| | | | Local Authorities — 0.9% | | | | |
| | 6,735,000 | | | City of Rome, Italy, EMTN, 5.345%, 1/27/2048, (EUR) | | | 9,190,367 | |
| | 3,905,000 | | | Manitoba (Province of), GMTN, 6.375%, 9/01/2015, (NZD) | | | 3,104,279 | |
| | 95,480,000 | | | New South Wales Treasury Corp., 4.000%, 4/08/2021, (AUD) | | | 86,047,941 | |
| | 82,840,000 | | | New South Wales Treasury Corp., 6.000%, 2/01/2018, (AUD) | | | 79,401,035 | |
| | | | | | | | |
| | | | | | | 177,743,622 | |
| | | | | | | | |
See accompanying notes to financial statements.
19 |
Portfolio of Investments – as of September 30, 2014
Loomis Sayles Strategic Income Fund – (continued)
| | | | | | | | |
Principal Amount (‡) | | | Description | | Value (†) | |
| | | | Media Entertainment — 0.9% | | | | |
| $ | 7,180,000 | | | CBS Outdoor Americas Capital LLC/CBS Outdoor Americas Capital Corp., 5.250%, 2/15/2022, 144A | | $ | 7,171,025 | |
| | 17,950,000 | | | CBS Outdoor Americas Capital LLC/CBS Outdoor Americas Capital Corp., 5.875%, 3/15/2025, 144A | | | 18,039,750 | |
| | 90,000,000 | | | Grupo Televisa SAB, EMTN, 7.250%, 5/14/2043, (MXN) | | | 5,638,441 | |
| | 64,250,000 | | | iHeartCommunications, Inc., 9.000%, 3/01/2021 | | | 63,928,750 | |
| | 33,370,000 | | | iHeartCommunications, Inc., 9.000%, 9/15/2022, 144A | | | 33,119,725 | |
| | 23,305,000 | | | R.R. Donnelley & Sons Co., 6.000%, 4/01/2024 | | | 23,013,687 | |
| | 2,410,000 | | | R.R. Donnelley & Sons Co., 6.500%, 11/15/2023 | | | 2,403,975 | |
| | 3,730,000 | | | R.R. Donnelley & Sons Co., 7.000%, 2/15/2022 | | | 3,935,150 | |
| | 5,925,000 | | | R.R. Donnelley & Sons Co., 7.875%, 3/15/2021 | | | 6,502,688 | |
| | | | | | | | |
| | | | | | | 163,753,191 | |
| | | | | | | | |
| | | | Metals & Mining — 1.0% | | | | |
| | 3,949,000 | | | Alcoa, Inc., 5.870%, 2/23/2022 | | | 4,214,657 | |
| | 5,075,000 | | | Alcoa, Inc., 5.900%, 2/01/2027 | | | 5,315,839 | |
| | 1,405,000 | | | Alcoa, Inc., 5.950%, 2/01/2037 | | | 1,402,425 | |
| | 4,330,000 | | | Alcoa, Inc., 6.750%, 1/15/2028 | | | 4,913,095 | |
| | 25,271,000 | | | ArcelorMittal, 7.250%, 3/01/2041 | | | 25,334,178 | |
| | 30,695,000 | | | Barminco Finance Pty Ltd., 9.000%, 6/01/2018, 144A | | | 26,551,175 | |
| | 8,705,000 | | | Barrick North America Finance LLC, 5.750%, 5/01/2043 | | | 8,615,173 | |
| | 8,160,000 | | | Cliffs Natural Resources, Inc., 4.800%, 10/01/2020 | | | 6,324,000 | |
| | 3,980,000 | | | Cliffs Natural Resources, Inc., 4.875%, 4/01/2021 | | | 3,034,750 | |
| | 42,279,000 | | | Cliffs Natural Resources, Inc., 6.250%, 10/01/2040 | | | 29,912,392 | |
| | 10,983,000 | | | Emeco Pty Ltd., 9.875%, 3/15/2019, 144A | | | 10,928,085 | |
| | 11,284,000 | | | Essar Steel Algoma, Inc., 9.875%, 6/15/2015, 144A(d)(e)(f) | | | 8,350,160 | |
| | 10,000,000 | | | First Quantum Minerals Ltd., 7.250%, 5/15/2022, 144A | | | 10,225,000 | |
| | 4,200,000 | | | Rain CII Carbon LLC/CII Carbon Corp., 8.250%, 1/15/2021, 144A | | | 4,368,000 | |
| | 16,135,000 | | | Russel Metals, Inc., 6.000%, 4/19/2022, 144A, (CAD) | | | 14,870,219 | |
| | 6,779,000 | | | United States Steel Corp., 6.650%, 6/01/2037 | | | 6,423,103 | |
| | 7,490,000 | | | United States Steel Corp., 6.875%, 4/01/2021 | | | 7,939,400 | |
| | 16,435,000 | | | United States Steel Corp., 7.000%, 2/01/2018 | | | 17,914,150 | |
| | | | | | | | |
| | | | | | | 196,635,801 | |
| | | | | | | | |
| | | | Midstream — 0.2% | | | | |
| | 750,000 | | | El Paso Corp., GMTN, 7.800%, 8/01/2031 | | | 907,500 | |
| | 8,935,000 | | | IFM U.S. Colonial Pipeline 2 LLC, 6.450%, 5/01/2021, 144A | | | 9,584,557 | |
| | 23,179,000 | | | NGPL PipeCo LLC, 7.119%, 12/15/2017, 144A | | | 23,179,000 | |
| | 2,005,000 | | | NGPL PipeCo LLC, 7.768%, 12/15/2037, 144A | | | 2,070,162 | |
| | 3,185,492 | | | Transportadora de Gas del Sur S.A., 9.625%, 5/14/2020, 144A | | | 3,153,637 | |
| | | | | | | | |
| | | | | | | 38,894,856 | |
| | | | | | | | |
| | | | Non-Agency Commercial Mortgage-Backed Securities — 0.7% | | | | |
| | 8,222,513 | | | Column Canada Issuer Corp., Series 2006-WEM, Class A1, 4.591%, 1/15/2022, (CAD) | | | 7,507,122 | |
| | 2,785,000 | | | Column Canada Issuer Corp., Series 2006-WEM, Class A2, 4.934%, 1/15/2022, (CAD) | | | 2,622,294 | |
| | 27,969,000 | | | Commercial Mortgage Pass Through Certificates, Series 2014-FL4, Class AR1, 1.854%, 5/13/2031, 144A(b)(d)(f) | | | 27,981,139 | |
See accompanying notes to financial statements.
| 20
Portfolio of Investments – as of September 30, 2014
Loomis Sayles Strategic Income Fund – (continued)
| | | | | | | | |
Principal Amount (‡) | | | Description | | Value (†) | |
| | | | Non-Agency Commercial Mortgage-Backed Securities — continued | | | | |
| $ | 12,902,000 | | | Commercial Mortgage Pass Through Certificates, Series 2014-FL4, Class AR2, 2.354%, 5/13/2031, 144A(b)(d)(f) | | $ | 12,907,999 | |
| | 8,622,000 | | | Commercial Mortgage Pass Through Certificates, Series 2014-FL4, Class AR3, 2.804%, 5/13/2031, 144A(b)(d)(f) | | | 8,625,958 | |
| | 16,080,000 | | | Commercial Mortgage Pass Through Certificates, Series 2014-FL4, Class AR4, 3.904%, 5/13/2031, 144A(b)(d)(f) | | | 16,087,140 | |
| | 35,060,000 | | | GS Mortgage Securities Corp. II, Series 2007-GG10, Class AM, 5.991%, 8/10/2045(b) | | | 36,350,488 | |
| | 19,346,978 | | | Institutional Mortgage Securities Canada, Inc., Series 2014-5A, Class A1, 2.003%, 1/12/2019, 144A, (CAD) | | | 17,274,168 | |
| | | | | | | | |
| | | | | | | 129,356,308 | |
| | | | | | | | |
| | | | Oil Field Services — 0.4% | | | | |
| | 4,000,000 | | | Hercules Offshore, Inc., 6.750%, 4/01/2022, 144A | | | 3,130,000 | |
| | 15,000 | | | Hercules Offshore, Inc., 7.500%, 10/01/2021, 144A | | | 12,075 | |
| | 7,170,000 | | | Pan American Energy LLC/Argentine Branch, 7.875%, 5/07/2021, 144A | | | 7,492,650 | |
| | 17,482,000 | | | Paragon Offshore Ltd., 6.750%, 7/15/2022, 144A | | | 14,772,290 | |
| | 40,403,000 | | | Paragon Offshore Ltd., 7.250%, 8/15/2024, 144A | | | 34,140,535 | |
| | 22,160,000 | | | Pertamina Persero PT, 6.450%, 5/30/2044, 144A | | | 22,381,600 | |
| | | | | | | | |
| | | | | | | 81,929,150 | |
| | | | | | | | |
| | | | Paper — 0.7% | | | | |
| | 14,715,000 | | | Georgia-Pacific LLC, 7.250%, 6/01/2028 | | | 19,203,237 | |
| | 47,875,000 | | | Georgia-Pacific LLC, 7.750%, 11/15/2029 | | | 65,845,839 | |
| | 775,000 | | | Georgia-Pacific LLC, 8.875%, 5/15/2031 | | | 1,159,932 | |
| | 4,865,000 | | | Westvaco Corp., 7.950%, 2/15/2031 | | | 6,261,075 | |
| | 23,365,000 | | | Westvaco Corp., 8.200%, 1/15/2030 | | | 30,649,249 | |
| | 2,840,000 | | | Weyerhaeuser Co., 6.950%, 10/01/2027 | | | 3,507,056 | |
| | | | | | | | |
| | | | | | | 126,626,388 | |
| | | | | | | | |
| | | | Pharmaceuticals — 0.2% | | | | |
| | 33,160,000 | | | Valeant Pharmaceuticals International, 6.375%, 10/15/2020, 144A | | | 34,071,900 | |
| | | | | | | | |
| | | | Property & Casualty Insurance — 0.4% | | | | |
| | 14,855,000 | | | Hanover Insurance Group, Inc. (The), 6.375%, 6/15/2021 | | | 17,043,216 | |
| | 12,510,000 | | | MBIA Insurance Corp., 11.494%, 1/15/2033, 144A(b)(g) | | | 8,882,100 | |
| | 6,555,000 | | | Old Republic International Corp., 4.875%, 10/01/2024 | | | 6,563,705 | |
| | 11,200,000 | | | Sirius International Group, 6.375%, 3/20/2017, 144A | | | 12,415,021 | |
| | 3,000,000 | | | Sirius International Group, (fixed rate to 6/30/2017, variable rate thereafter), 7.506%, 144A(c) | | | 3,150,000 | |
| | 17,870,000 | | | XL Group PLC, (fixed rate to 4/15/2017, variable rate thereafter), 6.500%(c) | | | 17,289,225 | |
| | 1,425,000 | | | XLIT Ltd., 6.375%, 11/15/2024 | | | 1,696,677 | |
| | | | | | | | |
| | | | | | | 67,039,944 | |
| | | | | | | | |
| | | | Railroads — 0.6% | | | | |
| | 90,000,000 | | | Hellenic Railways Organization S.A., EMTN, 0.663%, 5/24/2016, (EUR)(b)(d)(f) | | | 106,285,697 | |
| | 1,153,000 | | | Missouri Pacific Railroad Co., 5.000%, 1/01/2045(d)(f) | | | 1,075,931 | |
| | | | | | | | |
| | | | | | | 107,361,628 | |
| | | | | | | | |
See accompanying notes to financial statements.
21 |
Portfolio of Investments – as of September 30, 2014
Loomis Sayles Strategic Income Fund – (continued)
| | | | | | | | |
Principal Amount (‡) | | | Description | | Value (†) | |
| | | | Retailers — 0.6% | | | | |
| $ | 3,325,000 | | | Dillard’s, Inc., 7.000%, 12/01/2028 | | $ | 3,441,375 | |
| | 4,187,000 | | | Dillard’s, Inc., 7.130%, 8/01/2018 | | | 4,699,908 | |
| | 1,500,000 | | | Dillard’s, Inc., 7.750%, 7/15/2026 | | | 1,642,500 | |
| | 425,000 | | | Dillard’s, Inc., 7.875%, 1/01/2023 | | | 482,375 | |
| | 10,270,000 | | | Foot Locker, Inc., 8.500%, 1/15/2022(f) | | | 11,232,004 | |
| | 5,930,000 | | | GameStop Corp., 5.500%, 10/01/2019, 144A | | | 5,855,875 | |
| | 2,025,000 | | | J.C. Penney Corp., Inc., 5.750%, 2/15/2018 | | | 1,893,375 | |
| | 27,224,000 | | | J.C. Penney Corp., Inc., 6.375%, 10/15/2036 | | | 21,098,600 | |
| | 2,510,000 | | | J.C. Penney Corp., Inc., 7.625%, 3/01/2097 | | | 2,058,200 | |
| | 24,115,000 | | | J.C. Penney Corp., Inc., 8.125%, 10/01/2019 | | | 23,512,125 | |
| | 12,275,000 | | | Macy’s Retail Holdings, Inc., 6.790%, 7/15/2027 | | | 14,787,201 | |
| | 6,365,000 | | | Marks & Spencer PLC, 7.125%, 12/01/2037, 144A | | | 7,491,344 | |
| | 3,910,000 | | | Nine West Holdings, Inc., 6.125%, 11/15/2034 | | | 2,727,225 | |
| | 25,299,000 | | | Toys R Us, Inc., 7.375%, 10/15/2018 | | | 17,456,310 | |
| | | | | | | | |
| | | | | | | 118,378,417 | |
| | | | | | | | |
| | | | Sovereigns — 1.8% | | | | |
| | 317,570,000 | | | Republic of Portugal, 5.125%, 10/15/2024, 144A | | | 329,008,871 | |
| | | | | | | | |
| | | | Supermarkets — 0.9% | | | | |
| | 79,276,000 | | | New Albertson’s, Inc., 7.450%, 8/01/2029 | | | 72,141,160 | |
| | 23,830,000 | | | New Albertson’s, Inc., 7.750%, 6/15/2026 | | | 22,519,350 | |
| | 17,480,000 | | | New Albertson’s, Inc., 8.000%, 5/01/2031 | | | 16,606,000 | |
| | 5,815,000 | | | New Albertson’s, Inc., 8.700%, 5/01/2030 | | | 5,727,775 | |
| | 16,342,000 | | | New Albertson’s, Inc., Series C, MTN, 6.625%, 6/01/2028 | | | 13,318,730 | |
| | 34,580,000 | | | SUPERVALU, Inc., 6.750%, 6/01/2021 | | | 34,061,300 | |
| | | | | | | | |
| | | | | | | 164,374,315 | |
| | | | | | | | |
| | | | Supranational — 0.7% | | | | |
| | 16,375,000 | | | European Bank for Reconstruction & Development, 6.250%, 2/05/2016, (BRL) | | | 6,358,671 | |
| | 250,500,000,000 | | | European Bank for Reconstruction & Development, 7.200%, 6/08/2016, (IDR) | | | 19,931,043 | |
| | 60,665,000 | | | European Investment Bank, MTN, 6.250%, 4/15/2015, (AUD) | | | 54,098,627 | |
| | 24,450,000 | | | Inter-American Development Bank, EMTN, 6.000%, 12/15/2017, (NZD) | | | 19,983,515 | |
| | 72,900,000 | | | International Finance Corp., GMTN, 5.000%, 12/21/2015, (BRL) | | | 27,980,615 | |
| | | | | | | | |
| | | | | | | 128,352,471 | |
| | | | | | | | |
| | | | Technology — 1.3% | | | | |
| | 6,890,000 | | | Advanced Micro Devices, Inc., 7.000%, 7/01/2024 | | | 6,579,950 | |
| | 93,399,000 | | | Alcatel-Lucent USA, Inc., 6.450%, 3/15/2029 | | | 88,028,557 | |
| | 5,845,000 | | | Alcatel-Lucent USA, Inc., 6.500%, 1/15/2028 | | | 5,508,913 | |
| | 2,145,000 | | | Alcatel-Lucent USA, Inc., 6.750%, 11/15/2020, 144A | | | 2,177,175 | |
| | 25,000,000 | | | Alcatel-Lucent USA, Inc., 8.875%, 1/01/2020, 144A | | | 27,062,500 | |
| | 34,955,000 | | | Amkor Technology, Inc., 6.375%, 10/01/2022 | | | 36,178,425 | |
| | 9,100,000 | | | First Data Corp., 10.625%, 6/15/2021 | | | 10,351,250 | |
| | 5,210,000 | | | First Data Corp., 11.250%, 1/15/2021 | | | 5,932,888 | |
| | 50,531,000 | | | First Data Corp., 11.750%, 8/15/2021 | | | 58,489,632 | |
| | 2,562,000 | | | Motorola Solutions, Inc., 6.625%, 11/15/2037 | | | 2,812,579 | |
See accompanying notes to financial statements.
| 22
Portfolio of Investments – as of September 30, 2014
Loomis Sayles Strategic Income Fund – (continued)
| | | | | | | | |
Principal Amount (‡) | | | Description | | Value (†) | |
| | | | Technology — continued | | | | |
| $ | 210,000 | | | Samsung Electronics Co. Ltd., 7.700%, 10/01/2027, 144A | | $ | 256,954 | |
| | 1,400,000 | | | SunGard Data Systems, Inc., 6.625%, 11/01/2019 | | | 1,400,000 | |
| | | | | | | | |
| | | | | | | 244,778,823 | |
| | | | | | | | |
| | | | Transportation Services — 0.3% | | | | |
| | 10,503,000 | | | APL Ltd., 8.000%, 1/15/2024(d)(f) | | | 9,662,760 | |
| | 4,938,659 | | | Atlas Air Pass Through Trust, Series 1998-1, Class B, 7.680%, 1/02/2016(f) | | | 5,025,086 | |
| | 6,862,758 | | | Atlas Air Pass Through Trust, Series 1998-1, Class C, 8.010%, 7/02/2011(f)(g)(h) | | | 8,990,213 | |
| | 3,945,121 | | | Atlas Air Pass Through Trust, Series 1999-1, Class A-1, 7.200%, 7/02/2020(f) | | | 4,024,023 | |
| | 3,379,822 | | | Atlas Air Pass Through Trust, Series 1999-1, Class B, 7.630%, 7/02/2016(f) | | | 3,430,519 | |
| | 4,744,556 | | | Atlas Air Pass Through Trust, Series 1999-1, Class C, 8.770%, 7/02/2012(f)(g)(h) | | | 6,215,368 | |
| | 1,864,358 | | | Atlas Air Pass Through Trust, Series 2000-1, Class B, 9.057%, 7/02/2017(f) | | | 2,004,185 | |
| | 3,970,000 | | | Erac USA Finance Co., 7.000%, 10/15/2037, 144A | | | 5,243,497 | |
| | 4,115,000 | | | Jack Cooper Holdings Corp., 9.250%, 6/01/2020, 144A | | | 4,423,625 | |
| | | | | | | | |
| | | | | | | 49,019,276 | |
| | | | | | | | |
| | | | Treasuries — 28.2% | | | | |
| | 352,975,000 | | | Canadian Government, 1.000%, 8/01/2016, (CAD) | | | 314,420,215 | |
| | 317,256,000 | | | Canadian Government, 1.250%, 2/01/2016, (CAD) | | | 284,002,121 | |
| | 29,490,000 | | | Canadian Government, 1.250%, 9/01/2018, (CAD) | | | 26,104,555 | |
| | 80,645,000 | | | Canadian Government, 1.750%, 9/01/2019, (CAD) | | | 72,410,922 | |
| | 201,485,000 | | | Canadian Government, 2.500%, 6/01/2015, (CAD) | | | 181,733,191 | |
| | 89,045,000 | | | Canadian Government, 3.000%, 12/01/2015, (CAD) | | | 81,330,337 | |
| | 64,132,000,000 | | | Indonesia Treasury Bond, Series FR43, 10.250%, 7/15/2022, (IDR) | | | 5,757,933 | |
| | 10,000,000,000 | | | Indonesia Treasury Bond, Series FR47, 10.000%, 2/15/2028, (IDR) | | | 915,609 | |
| | 9,710,000(†††) | | | Mexican Fixed Rate Bonds, Series M, 5.000%, 6/15/2017, (MXN) | | | 73,402,771 | |
| | 9,930,439(†††) | | | Mexican Fixed Rate Bonds, Series M, 6.500%, 6/10/2021, (MXN) | | | 77,096,821 | |
| | 4,250,000(†††) | | | Mexican Fixed Rate Bonds, Series M, 7.750%, 5/29/2031, (MXN) | | | 34,943,794 | |
| | 7,740,000(†††) | | | Mexican Fixed Rate Bonds, Series M-20, 7.500%, 6/03/2027, (MXN) | | | 63,013,933 | |
| | 27,224,481(†††) | | | Mexican Fixed Rate Bonds, Series M-20, 8.000%, 12/07/2023, (MXN) | | | 229,583,427 | |
| | 3,035,000(†††) | | | Mexican Fixed Rate Bonds, Series M-20, 8.500%, 5/31/2029, (MXN) | | | 26,634,783 | |
| | 17,140,000(†††) | | | Mexican Fixed Rate Bonds, Series M-20, 10.000%, 12/05/2024, (MXN) | | | 164,784,691 | |
| | 194,210,000 | | | New Zealand Government Bond, 5.000%, 3/15/2019, (NZD) | | | 157,836,636 | |
| | 175,365,000 | | | New Zealand Government Bond, 6.000%, 5/15/2021, (NZD) | | | 151,890,438 | |
| | 836,485,000 | | | Norway Government Bond, 4.250%, 5/19/2017, (NOK) | | | 139,252,505 | |
| | 1,266,835,000 | | | Norway Government Bond, 5.000%, 5/15/2015, (NOK) | | | 201,616,995 | |
| | 162,850,000 | | | Republic of Brazil, 8.500%, 1/05/2024, (BRL) | | | 60,210,091 | |
| | 55,925,000 | | | Republic of Brazil, 10.250%, 1/10/2028, (BRL) | | | 22,619,038 | |
| | 49,120,000 | | | Republic of Brazil, 12.500%, 1/05/2016, (BRL) | | | 20,318,251 | |
| | 3,842,906,000 | | | Republic of Iceland, 6.000%, 10/13/2016, (ISK) | | | 26,955,317 | |
| | 1,605,660,000 | | | Republic of Iceland, 7.250%, 10/26/2022, (ISK) | | | 11,590,858 | |
| | 4,496,156,000 | | | Republic of Iceland, 8.750%, 2/26/2019, (ISK) | | | 34,180,153 | |
| | 126,655,000 | | | U.S. Treasury Note, 0.250%, 9/30/2015 | | | 126,803,440 | |
| | 500,000,000 | | | U.S. Treasury Note, 0.250%, 2/29/2016 | | | 499,590,000 | |
| | 700,000,000 | | | U.S. Treasury Note, 0.375%, 1/31/2016 | | | 701,011,500 | |
See accompanying notes to financial statements.
23 |
Portfolio of Investments – as of September 30, 2014
Loomis Sayles Strategic Income Fund – (continued)
| | | | | | | | |
Principal Amount (‡) | | | Description | | Value (†) | |
| | | | Treasuries — continued | | | | |
| $ | 745,560,000 | | | U.S. Treasury Note, 0.375%, 3/31/2016 | | $ | 745,734,461 | |
| | 300,000,000 | | | U.S. Treasury Note, 0.375%, 4/30/2016 | | | 299,882,700 | |
| | 300,000,000 | | | U.S. Treasury Note, 0.375%, 5/31/2016 | | | 299,695,200 | |
| | 152,075,000 | | | U.S. Treasury Note, 0.500%, 6/30/2016 | | | 152,164,116 | |
| | | | | | | | |
| | | | | | | 5,287,486,802 | |
| | | | | | | | |
| | | | Wireless — 0.6% | | | | |
| | 293,000,000 | | | America Movil SAB de CV, 6.450%, 12/05/2022, (MXN) | | | 21,115,482 | |
| | 5,275,000 | | | Consolidated Communications Finance II Co., 6.500%, 10/01/2022, 144A | | | 5,248,625 | |
| | 31,041,000 | | | Sprint Capital Corp., 6.875%, 11/15/2028 | | | 29,644,155 | |
| | 16,622,000 | | | Sprint Capital Corp., 6.900%, 5/01/2019 | | | 17,473,877 | |
| | 6,260,000 | | | Sprint Capital Corp., 8.750%, 3/15/2032 | | | 6,831,225 | |
| | 12,630,000 | | | Sprint Communications, Inc., 6.000%, 11/15/2022 | | | 12,251,100 | |
| | 23,641,000 | | | Sprint Corp., 7.250%, 9/15/2021, 144A | | | 24,616,191 | |
| | | | | | | | |
| | | | | | | 117,180,655 | |
| | | | | | | | |
| | | | Wirelines — 3.4% | | | | |
| | 4,370,000 | | | Bell Canada, MTN, 6.550%, 5/01/2029, 144A, (CAD) | | | 4,804,678 | |
| | 7,545,000 | | | Bell Canada, Series M-17, 6.100%, 3/16/2035, (CAD) | | | 8,069,940 | |
| | 72,320,000 | | | CenturyLink, Inc., 6.450%, 6/15/2021 | | | 77,382,400 | |
| | 765,000 | | | CenturyLink, Inc., 7.650%, 3/15/2042 | | | 753,525 | |
| | 7,410,000 | | | CenturyLink, Inc., Series G, 6.875%, 1/15/2028 | | | 7,372,950 | |
| | 2,965,000 | | | CenturyLink, Inc., Series P, 7.600%, 9/15/2039 | | | 2,927,938 | |
| | 350,000 | | | Cincinnati Bell Telephone Co. LLC, 6.300%, 12/01/2028 | | | 334,250 | |
| | 17,900,000 | | | Eircom Finance Ltd., 9.250%, 5/15/2020, 144A, (EUR) | | | 24,473,813 | |
| | 5,330,000 | | | Embarq Corp., 7.995%, 6/01/2036 | | | 5,761,197 | |
| | 37,225,000 | | | FairPoint Communications, Inc., 8.750%, 8/15/2019, 144A | | | 38,993,187 | |
| | 16,755,000 | | | Frontier Communications Corp., 6.250%, 9/15/2021 | | | 16,587,450 | |
| | 18,725,000 | | | Frontier Communications Corp., 6.875%, 1/15/2025 | | | 18,490,938 | |
| | 38,336,000 | | | Frontier Communications Corp., 7.875%, 1/15/2027 | | | 38,527,680 | |
| | 1,120,000 | | | Koninklijke (Royal) KPN NV, EMTN, 5.750%, 3/18/2016, (GBP) | | | 1,921,405 | |
| | 1,800,000 | | | Koninklijke (Royal) KPN NV, GMTN, 4.000%, 6/22/2015, (EUR) | | | 2,333,102 | |
| | 28,505,000 | | | Level 3 Financing, Inc., 7.000%, 6/01/2020 | | | 30,037,144 | |
| | 5,965,000 | | | Level 3 Financing, Inc., 8.625%, 7/15/2020 | | | 6,457,113 | |
| | 2,555,000 | | | Level 3 Financing, Inc., 9.375%, 4/01/2019 | | | 2,730,656 | |
| | 4,667,000 | | | Oi S.A., 5.750%, 2/10/2022, 144A | | | 4,364,112 | |
| | 500,000 | | | OTE PLC, GMTN, 4.625%, 5/20/2016, (EUR) | | | 655,182 | |
| | 16,550,000 | | | Portugal Telecom International Finance BV, EMTN, 4.500%, 6/16/2025, (EUR) | | | 20,694,450 | |
| | 29,750,000 | | | Portugal Telecom International Finance BV, EMTN, 5.000%, 11/04/2019, (EUR) | | | 39,747,404 | |
| | 800,000 | | | Portugal Telecom International Finance BV, GMTN, 4.375%, 3/24/2017, (EUR) | | | 1,053,384 | |
| | 16,145,000 | | | Qwest Capital Funding, Inc., 6.500%, 11/15/2018 | | | 17,759,500 | |
| | 42,460,000 | | | Qwest Capital Funding, Inc., 6.875%, 7/15/2028 | | | 42,037,523 | |
| | 12,463,000 | | | Qwest Capital Funding, Inc., 7.625%, 8/03/2021 | | | 13,865,088 | |
| | 32,395,000 | | | Qwest Capital Funding, Inc., 7.750%, 2/15/2031 | | | 33,123,888 | |
| | 31,060,000 | | | Qwest Corp., 6.875%, 9/15/2033 | | | 30,995,954 | |
| | 3,075,000 | | | Qwest Corp., 7.200%, 11/10/2026 | | | 3,090,086 | |
| | 3,999,000 | | | Qwest Corp., 7.250%, 9/15/2025 | | | 4,664,118 | |
See accompanying notes to financial statements.
| 24
Portfolio of Investments – as of September 30, 2014
Loomis Sayles Strategic Income Fund – (continued)
| | | | | | | | |
Principal Amount (‡) | | | Description | | Value (†) | |
| | | | Wirelines — continued | | | | |
| $ | 39,171,000 | | | Telecom Italia Capital S.A., 6.000%, 9/30/2034 | | $ | 38,338,616 | |
| | 22,645,000 | | | Telecom Italia Capital S.A., 6.375%, 11/15/2033 | | | 22,531,775 | |
| | 7,200,000 | | | Telecom Italia SpA, EMTN, 5.250%, 3/17/2055, (EUR) | | | 9,047,748 | |
| | 5,250,000 | | | Telefonica Emisiones SAU, 4.570%, 4/27/2023 | | | 5,481,467 | |
| | 4,350,000 | | | Telefonica Emisiones SAU, 7.045%, 6/20/2036 | | | 5,510,271 | |
| | 31,690,000 | | | Telus Corp., 4.950%, 3/15/2017, (CAD) | | | 30,298,124 | |
| | 18,600,000 | | | Telus Corp., Series CG, 5.050%, 12/04/2019, (CAD) | | | 18,419,306 | |
| | 3,346,000 | | | Verizon New England, Inc., 7.875%, 11/15/2029 | | | 4,255,349 | |
| | 2,080,000 | | | Verizon Pennsylvania, Inc., 6.000%, 12/01/2028 | | | 2,260,935 | |
| | | | | | | | |
| | | | | | | 636,153,646 | |
| | | | | | | | |
| | | | Total Non-Convertible Bonds (Identified Cost $12,777,120,265) | | | 13,157,591,003 | |
| | | | | | | | |
| | | | | | | | |
| | Convertible Bonds — 6.8% | |
| | | | Automotive — 1.1% | | | | |
| | 125,580,000 | | | Ford Motor Co., 4.250%, 11/15/2016 | | | 215,212,725 | |
| | | | | | | | |
| | | | Basic Industry — 0.2% | | | | |
| | 30,570,000 | | | Owens-Brockway Glass Container, Inc., 3.000%, 6/01/2015, 144A | | | 30,761,062 | |
| | | | | | | | |
| | | | Chemicals — 0.0% | | | | |
| | 4,305,000 | | | RPM International, Inc., 2.250%, 12/15/2020 | | | 4,832,363 | |
| | | | | | | | |
| | | | Communications — 0.7% | | | | |
| | 54,075,000 | | | Level 3 Communications, Inc., 7.000%, 3/15/2015, 144A(d)(f) | | | 92,231,672 | |
| | 24,135,000 | | | Level 3 Communications, Inc., Series B, 7.000%, 3/15/2015(d)(f) | | | 41,165,259 | |
| | | | | | | | |
| | | | | | | 133,396,931 | |
| | | | | | | | |
| | | | Construction Machinery — 0.2% | | | | |
| | 16,727,000 | | | Trinity Industries, Inc., 3.875%, 6/01/2036 | | | 32,471,289 | |
| | | | | | | | |
| | | | Consumer Products — 0.1% | | | | |
| | 15,648,000 | | | Jarden Corp., 1.125%, 3/15/2034, 144A | | | 15,599,100 | |
| | | | | | | | |
| | | | Energy — 0.4% | | | | |
| | 39,231,000 | | | Chesapeake Energy Corp., 2.250%, 12/15/2038 | | | 37,441,086 | |
| | 24,655,000 | | | Chesapeake Energy Corp., 2.500%, 5/15/2037 | | | 24,855,322 | |
| | 9,196,000 | | | Chesapeake Energy Corp., 2.750%, 11/15/2035 | | | 9,310,950 | |
| | | | | | | | |
| | | | | | | 71,607,358 | |
| | | | | | | | |
| | | | Finance Companies — 0.0% | | | | |
| | 5,025,000 | | | Jefferies Group LLC, 3.875%, 11/01/2029 | | | 5,313,938 | |
| | | | | | | | |
| | | | Healthcare — 0.4% | | | | |
| | 15,025,000 | | | Hologic, Inc., (accretes to principal after 3/01/2018), 2.000%, 3/01/2042(i) | | | 15,823,203 | |
| | 3,780,000 | | | Omnicare, Inc., 3.250%, 12/15/2035 | | | 3,900,487 | |
| | 20,495,000 | | | Omnicare, Inc., 3.750%, 12/15/2025 | | | 48,867,766 | |
| | | | | | | | |
| | | | | | | 68,591,456 | |
| | | | | | | | |
| | | | Home Construction — 0.6% | | | | |
| | 17,761,000 | | | KB Home, 1.375%, 2/01/2019 | | | 17,094,962 | |
| | 52,005,000 | | | Lennar Corp., 3.250%, 11/15/2021, 144A | | | 89,188,575 | |
See accompanying notes to financial statements.
25 |
Portfolio of Investments – as of September 30, 2014
Loomis Sayles Strategic Income Fund – (continued)
| | | | | | | | |
Principal Amount (‡) | | | Description | | Value (†) | |
| | | | Home Construction — continued | | | | |
| $ | 9,592,000 | | | Ryland Group, Inc. (The), 0.250%, 6/01/2019 | | $ | 8,776,680 | |
| | | | | | | | |
| | | | | | | 115,060,217 | |
| | | | | | | | |
| | | | Pharmaceuticals — 0.0% | | | | |
| | 1,195,000 | | | BioMarin Pharmaceutical, Inc., 0.750%, 10/15/2018 | | | 1,265,206 | |
| | 1,655,000 | | | BioMarin Pharmaceutical, Inc., 1.500%, 10/15/2020 | | | 1,812,225 | |
| | 1,810,000 | | | Illumina, Inc., 0.250%, 3/15/2016 | | | 3,596,244 | |
| | | | | | | | |
| | | | | | | 6,673,675 | |
| | | | | | | | |
| | | | Property & Casualty Insurance — 0.5% | | | | |
| | 72,915,000 | | | Old Republic International Corp., 3.750%, 3/15/2018 | | | 85,356,122 | |
| | | | | | | | |
| | | | REITs – Mortgage — 0.0% | | | | |
| | 1,175,000 | | | iStar Financial, Inc., 3.000%, 11/15/2016 | | | 1,481,969 | |
| | | | | | | | |
| | | | REITs – Warehouse/Industrials — 0.1% | | | | |
| | 19,445,000 | | | ProLogis LP, 3.250%, 3/15/2015 | | | 20,441,556 | |
| | | | | | | | |
| | | | Technology — 2.5% | | | | |
| | 5,275,000(††††) | | | Alcatel-Lucent, Series ALU, 0.125%, 1/30/2020, (EUR) | | | 24,248,223 | |
| | 60,500,000 | | | Ciena Corp., 0.875%, 6/15/2017 | | | 59,327,812 | |
| | 7,185,000 | | | Ciena Corp., 3.750%, 10/15/2018, 144A | | | 8,370,525 | |
| | 6,075,000 | | | Ciena Corp., 4.000%, 3/15/2015, 144A | | | 6,291,422 | |
| | 2,429,000 | | | Intel Corp., 2.950%, 12/15/2035 | | | 3,090,903 | |
| | 205,005,000 | | | Intel Corp., 3.250%, 8/01/2039 | | | 343,767,759 | |
| | 10,550,000 | | | JDS Uniphase Corp., 0.625%, 8/15/2033 | | | 10,543,406 | |
| | 1,055,000 | | | Lam Research Corp., Series B, 1.250%, 5/15/2018 | | | 1,420,294 | |
| | 5,582,928 | | | Liberty Media LLC, 3.500%, 1/15/2031 | | | 3,049,674 | |
| | 7,640,000 | | | Nuance Communications, Inc., 2.750%, 11/01/2031 | | | 7,534,950 | |
| | | | | | | | |
| | | | | | | 467,644,968 | |
| | | | | | | | |
| | | | Wirelines — 0.0% | | | | |
| | 457,900 | | | Axtel SAB de CV, (Step to 9.000% on 1/31/2015),
8.000%, 1/31/2020, 144A, (MXN)(d)(f)(i)(j) | | | 53,861 | |
| | | | | | | | |
| | | | Total Convertible Bonds (Identified Cost $879,755,431) | | | 1,274,498,590 | |
| | | | | | | | |
| | | | | | | | |
| | Municipals — 0.8% | | | | |
| | | | District of Columbia — 0.0% | | | | |
| | 3,850,000 | | | Metropolitan Washington Airports Authority, Series D, 8.000%, 10/01/2047 | | | 5,042,614 | |
| | | | | | | | |
| | | | Illinois — 0.2% | | | | |
| | 1,725,000 | | | Chicago O’Hare International Airport, Series A, (AGMC insured), 4.500%, 1/01/2038 | | | 1,755,119 | |
| | 47,285,000 | | | State of Illinois, 5.100%, 6/01/2033 | | | 45,916,099 | |
| | | | | | | | |
| | | | | | | 47,671,218 | |
| | | | | | | | |
| | | | Michigan — 0.1% | | | | |
| | 12,400,000 | | | Michigan Tobacco Settlement Finance Authority Taxable Turbo, Series A, 7.309%, 6/01/2034 | | | 10,642,300 | |
| | | | | | | | |
See accompanying notes to financial statements.
| 26
Portfolio of Investments – as of September 30, 2014
Loomis Sayles Strategic Income Fund – (continued)
| | | | | | | | |
Principal Amount (‡) | | | Description | | Value (†) | |
| | | | Virginia — 0.5% | | | | |
| $ | 125,265,000 | | | Virginia Tobacco Settlement Financing Corp., Series A-1, 6.706%, 6/01/2046 | | $ | 91,687,717 | |
| | | | | | | | |
| | | | Total Municipals (Identified Cost $179,445,914) | | | 155,043,849 | |
| | | | | | | | |
| | | | Total Bonds and Notes (Identified Cost $13,836,321,610) | | | 14,587,133,442 | |
| | | | | | | | |
| | | | | | | | |
| | Loan Participations — 0.1% | | | | |
| | | | ABS Other — 0.1% | | | | |
| | 14,891,534 | | | Rise Ltd., Series 2014-1, Class B, 6.500%, 2/15/2039(b)(d)(f)
(Identified Cost $15,003,220) | | | 15,059,064 | |
| | | | | | | | |
| | | | | | | | |
| | Senior Loans — 2.1% | | | | |
| | | | Automotive — 0.2% | | | | |
| | 22,305,340 | | | IBC Capital Ltd., 1st Lien Term Loan, 4.750%, 9/09/2021(b) | | | 22,193,813 | |
| | 5,948,124 | | | IBC Capital Ltd., 2nd Lien Term Loan, 8.000%, 9/09/2022(b) | | | 5,940,689 | |
| | | | | | | | |
| | | | | | | 28,134,502 | |
| | | | | | | | |
| | | | Chemicals — 0.3% | | | | |
| | 4,801,491 | | | Ascend Performance Materials LLC, Term Loan B, 6.750%, 4/10/2018(b) | | | 4,681,454 | |
| | 5,688,682 | | | Emerald Performance Materials LLC, New 1st Lien Term Loan, 4.500%, 8/01/2021(b) | | | 5,630,373 | |
| | 6,147,386 | | | Emerald Performance Materials LLC, New 2nd Lien Term Loan, 7.750%, 8/01/2022(b) | | | 6,098,699 | |
| | 31,355,000 | | | Houghton International, Inc., New 2nd Lien Term Loan, 9.500%, 12/20/2020(b) | | | 31,590,162 | |
| | | | | | | | |
| | | | | | | 48,000,688 | |
| | | | | | | | |
| | | | Construction Machinery — 0.4% | | | | |
| | 34,837,826 | | | Neff Rental LLC, 2nd Lien Term Loan, 7.250%, 6/09/2021(b) | | | 34,881,373 | |
| | 44,673,214 | | | Onsite U.S. Finco LLC, Term Loan, 5.500%, 7/30/2021(b) | | | 43,891,433 | |
| | | | | | | | |
| | | | | | | 78,772,806 | |
| | | | | | | | |
| | | | Consumer Products — 0.1% | | | | |
| | 14,580,644 | | | Visant Corp., New Term Loan, 7.000%, 9/23/2021(b) | | | 14,389,346 | |
| | | | | | | | |
| | | | Diversified Manufacturing — 0.0% | | | | |
| | 6,385,000 | | | Ameriforge Group, Inc., 2nd Lien Term Loan, 8.750%, 12/19/2020(b) | | | 6,448,850 | |
| | | | | | | | |
| | | | Finance Companies — 0.4% | | | | |
| | 68,315,612 | | | iStar Financial, Inc., Add on Term Loan A2, 7.000%, 3/19/2017(b) | | | 69,852,713 | |
| | | | | | | | |
| | | | Food & Beverage — 0.1% | | | | |
| | 11,385,990 | | | DS Waters of America, Inc., New Term Loan, 5.250%, 8/30/2020(b) | | | 11,499,850 | |
| | | | | | | | |
| | | | Media Entertainment — 0.0% | | | | |
| | 7,212,102 | | | SuperMedia, Inc., Exit Term Loan, 11.600%, 12/30/2016(b) | | | 5,863,439 | |
| | | | | | | | |
| | | | Metals & Mining — 0.1% | | | | |
| | 11,416,650 | | | Essar Steel Algoma, Inc., ABL Term Loan, 12.250%, 11/15/2014(b) | | | 11,409,572 | |
| | | | | | | | |
See accompanying notes to financial statements.
27 |
Portfolio of Investments – as of September 30, 2014
Loomis Sayles Strategic Income Fund – (continued)
| | | | | | | | |
Principal Amount (‡) | | | Description | | Value (†) | |
| | | | Natural Gas — 0.0% | | | | |
| $ | 7,810,425 | | | Southcross Holdings Borrower LP, Term Loan B, 6.000%, 8/04/2021(b) | | $ | 7,790,899 | |
| | | | | | | | |
| | | | Oil Field Services — 0.0% | | | | |
| | 2,618,182 | | | FTS International, Inc., New Term Loan B, 5.750%, 4/16/2021(b) | | | 2,617,711 | |
| | | | | | | | |
| | | | Other Utility — 0.0% | | | | |
| | 1,298,000 | | | PowerTeam Services LLC, 2nd Lien Term Loan, 8.250%, 11/06/2020(b) | | | 1,259,060 | |
| | | | | | | | |
| | | | Retailers — 0.1% | | | | |
| | 14,335,611 | | | J.C. Penney Corp., Inc., New Term Loan, 5.000%, 6/20/2019(b) | | | 14,201,286 | |
| | 2,977,500 | | | Toys ‘R’ Us Property Co. I LLC, New Term Loan B, 6.000%, 8/21/2019(b) | | | 2,858,400 | |
| | | | | | | | |
| | | | | | | 17,059,686 | |
| | | | | | | | |
| | | | Supermarkets — 0.3% | | | | |
| | 28,622,449 | | | Albertson’s Holdings LLC, Term Loan B4, 4.500%, 8/25/2021(b) | | | 28,467,315 | |
| | 18,130,800 | | | New Albertson’s, Inc., Term Loan, 4.750%, 6/27/2021(b) | | | 17,802,270 | |
| | 13,626,523 | | | Supervalu, Inc., Refi Term Loan B, 4.500%, 3/21/2019(b) | | | 13,361,624 | |
| | | | | | | | |
| | | | | | | 59,631,209 | |
| | | | | | | | |
| | | | Technology — 0.0% | | | | |
| | 4,070,400 | | | Aptean, Inc., 2nd Lien Term Loan, 8.500%, 2/26/2021(b) | | | 4,038,610 | |
| | | | | | | | |
| | | | Transportation Services — 0.0% | | | | |
| | 4,408,668 | | �� | OSG Bulk Ships, Inc., Exit Term Loan, 5.250%, 8/05/2019(b) | | | 4,377,454 | |
| | | | | | | | |
| | | | Wirelines — 0.1% | | | | |
| | 17,525,514 | | | Hawaiian Telcom Communications, Inc., Term Loan B, 5.000%, 6/06/2019(b) | | | 17,498,175 | |
| | 1,495,000 | | | Integra Telecom, Inc., 2nd Lien Term Loan, 9.750%, 2/22/2020(b) | | | 1,492,503 | |
| | 1,672,963 | | | LTS Buyer LLC, 2nd Lien Term Loan, 8.000%, 4/12/2021(b) | | | 1,663,343 | |
| | | | | | | | |
| | | | | | | 20,654,021 | |
| | | | | | | | |
| | | | Total Senior Loans (Identified Cost $389,834,386) | | | 391,800,416 | |
| | | | | | | | |
| | | | | | | | |
| Shares | | | | | | |
| | Common Stocks — 17.0% | | | | |
| | | | Airlines — 0.0% | | | | |
| | 38,455 | | | United Continental Holdings, Inc.(g) | | | 1,799,309 | |
| | | | | | | | |
| | | | Banks — 0.4% | | | | |
| | 3,979,932 | | | Bank of America Corp. | | | 67,857,841 | |
| | | | | | | | |
| | | | Chemicals — 2.5% | | | | |
| | 1,364,851 | | | Dow Chemical Co. (The) | | | 71,572,786 | |
| | 2,000,000 | | | PPG Industries, Inc. | | | 393,480,000 | |
| | | | | | | | |
| | | | | | | 465,052,786 | |
| | | | | | | | |
| | | | Containers & Packaging — 0.1% | | | | |
| | 460,656 | | | Owens-Illinois, Inc.(g) | | | 12,000,089 | |
| | 4,608 | | | Rock-Tenn Co., Class A | | | 219,248 | |
| | | | | | | | |
| | | | | | | 12,219,337 | |
| | | | | | | | |
See accompanying notes to financial statements.
| 28
Portfolio of Investments – as of September 30, 2014
Loomis Sayles Strategic Income Fund – (continued)
| | | | | | | | |
Shares | | | Description | | Value (†) | |
| | | | Diversified Telecommunication Services — 1.9% | | | | |
| | 283,397 | | | Hawaiian Telcom Holdco, Inc.(g) | | $ | 7,280,469 | |
| | 323,886 | | | Level 3 Communications, Inc.(g) | | | 14,811,307 | |
| | 3,346,339 | | | Telecom Italia SpA, Sponsored ADR | | | 29,414,320 | |
| | 19,550,590 | | | Telefonica S.A., Sponsored ADR | | | 300,492,568 | |
| | | | | | | | |
| | | | | | | 351,998,664 | |
| | | | | | | | |
| | | | Electric Utilities — 0.0% | | | | |
| | 94,166 | | | Duke Energy Corp. | | | 7,040,792 | |
| | | | | | | | |
| | | | Electronic Equipment, Instruments & Components — 3.3% | | | | |
| | 32,000,000 | | | Corning, Inc. | | | 618,880,000 | |
| | | | | | | | |
| | | | Food Products — 0.4% | | | | |
| | 2,309,175 | | | ConAgra Foods, Inc. | | | 76,295,142 | |
| | | | | | | | |
| | | | Household Durables — 0.2% | | | | |
| | 477,725 | | | KB Home | | | 7,137,212 | |
| | 549,450 | | | Lennar Corp., Class A | | | 21,335,143 | |
| | | | | | | | |
| | | | | | | 28,472,355 | |
| | | | | | | | |
| | | | Insurance — 0.7% | | | | |
| | 1,510,275 | | | Prudential Financial, Inc. | | | 132,813,583 | |
| | | | | | | | |
| | | | Multi-Utilities — 0.0% | | | | |
| | 73,618 | | | CMS Energy Corp. | | | 2,183,510 | |
| | | | | | | | |
| | | | Oil, Gas & Consumable Fuels — 1.7% | | | | |
| | 846,398 | | | Chesapeake Energy Corp. | | | 19,458,690 | |
| | 5,351,804 | | | Repsol YPF S.A., Sponsored ADR | | | 126,543,406 | |
| | 2,134,173 | | | Royal Dutch Shell PLC, ADR | | | 162,474,590 | |
| | 141,249 | | | Spectra Energy Corp. | | | 5,545,436 | |
| | | | | | | | |
| | | | | | | 314,022,122 | |
| | | | | | | | |
| | | | Pharmaceuticals — 2.6% | | | | |
| | 8,514,190 | | | Bristol-Myers Squibb Co. | | | 435,756,244 | |
| | 2,288 | | | Teva Pharmaceutical Industries Ltd., Sponsored ADR | | | 122,980 | |
| | 442,672 | | | Valeant Pharmaceuticals International, Inc.(g) | | | 58,078,567 | |
| | | | | | | | |
| | | | | | | 493,957,791 | |
| | | | | | | | |
| | | | REITs – Apartments — 0.3% | | | | |
| | 290,904 | | | Apartment Investment & Management Co., Class A | | | 9,256,565 | |
| | 889,730 | | | Associated Estates Realty Corp. | | | 15,579,173 | |
| | 460,000 | | | Equity Residential | | | 28,326,800 | |
| | | | | | | | |
| | | | | | | 53,162,538 | |
| | | | | | | | |
| | | | REITs – Regional Malls — 0.1% | | | | |
| | 123,159 | | | Simon Property Group, Inc. | | | 20,249,803 | |
| | | | | | | | |
| | | | REITs – Shopping Centers — 0.0% | | | | |
| | 201,557 | | | DDR Corp. | | | 3,372,048 | |
| | 61,579 | | | Washington Prime Group, Inc. | | | 1,076,401 | |
| | | | | | | | |
| | | | | | | 4,448,449 | |
| | | | | | | | |
See accompanying notes to financial statements.
29 |
Portfolio of Investments – as of September 30, 2014
Loomis Sayles Strategic Income Fund – (continued)
| | | | | | | | |
Shares | | | Description | | Value (†) | |
| | | | Semiconductors & Semiconductor Equipment — 2.7% | | | | |
| | 14,733,856 | | | Intel Corp. | | $ | 513,032,866 | |
| | | | | | | | |
| | | | Trading Companies & Distributors — 0.1% | | | | |
| | 176,859 | | | United Rentals, Inc.(g) | | | 19,649,035 | |
| | | | | | | | |
| | | | Total Common Stocks (Identified Cost $2,134,384,084) | | | 3,183,135,923 | |
| | | | | | | | |
| | | | | | | | |
| | Preferred Stocks — 1.9% | | | | |
| | Convertible Preferred Stocks — 1.4% | | | | |
| | | | Banking — 0.2% | | | | |
| | 19,062 | | | Bank of America Corp., Series L, 7.250% | | | 21,854,583 | |
| | 8,533 | | | Wells Fargo & Co., Series L, Class A, 7.500% | | | 10,261,018 | |
| | | | | | | | |
| | | | | | | 32,115,601 | |
| | | | | | | | |
| | | | Communications — 0.0% | | | | |
| | 9,749 | | | Cincinnati Bell, Inc., 6.750% | | | 466,429 | |
| | | | | | | | |
| | | | Energy — 0.4% | | | | |
| | 147,562 | | | Chesapeake Energy Corp., 4.500% | | | 13,962,316 | |
| | 69,532 | | | Chesapeake Energy Corp., 5.000% | | | 6,814,143 | |
| | 24,658 | | | Chesapeake Energy Corp., Series A, 5.750%, 144A | | | 27,354,969 | |
| | 242,297 | | | El Paso Energy Capital Trust I, 4.750% | | | 13,835,159 | |
| | 81,049 | | | SandRidge Energy, Inc., 7.000% | | | 7,274,148 | |
| | 99,800 | | | SandRidge Energy, Inc., 8.500% | | | 9,468,525 | |
| | | | | | | | |
| | | | | | | 78,709,260 | |
| | | | | | | | |
| | | | Metals & Mining — 0.5% | | | | |
| | 4,043,707 | | | ArcelorMittal, 6.000% | | | 85,443,529 | |
| | 250,639 | | | Cliffs Natural Resources, Inc., 7.000% | | | 2,807,157 | |
| | | | | | | | |
| | | | | | | 88,250,686 | |
| | | | | | | | |
| | | | Natural Gas — 0.1% | | | | |
| | 380,577 | | | AES Trust III, 6.750% | | | 19,515,989 | |
| | | | | | | | |
| | | | REITs – Diversified — 0.1% | | | | |
| | 29,153 | | | Crown Castle International Corp., Series A, 4.500% | | | 3,066,313 | |
| | 391,776 | | | Weyerhaeuser Co., Series A, 6.375% | | | 21,167,657 | |
| | | | | | | | |
| | | | | | | 24,233,970 | |
| | | | | | | | |
| | | | REITs – Health Care — 0.0% | | | | |
| | 116,700 | | | Health Care REIT, Inc., Series I, 6.500% | | | 6,672,906 | |
| | | | | | | | |
| | | | REITs – Hotels — 0.0% | | | | |
| | 164,608 | | | FelCor Lodging Trust, Inc., Series A, 1.950% | | | 4,248,532 | |
| | | | | | | | |
| | | | REITs – Mortgage — 0.1% | | | | |
| | 147,595 | | | iStar Financial, Inc., Series J, 4.500% | | | 8,781,902 | |
| | | | | | | | |
| | | | Total Convertible Preferred Stocks (Identified Cost $243,571,607) | | | 262,995,275 | |
| | | | | | | | |
See accompanying notes to financial statements.
| 30
Portfolio of Investments – as of September 30, 2014
Loomis Sayles Strategic Income Fund – (continued)
| | | | | | | | |
Shares | | | Description | | Value (†) | |
| | Non-Convertible Preferred Stocks — 0.5% | | | | |
| | | | Banking — 0.3% | | | | |
| | 45,861 | | | Ally Financial, Inc., Series G, 7.000%, 144A | | $ | 45,903,995 | |
| | 35,000 | | | Bank of America Corp., 6.375% | | | 870,100 | |
| | 389,800 | | | Countrywide Capital IV, 6.750% | | | 9,936,002 | |
| | | | | | | | |
| | | | | | | 56,710,097 | |
| | | | | | | | |
| | | | Electric — 0.0% | | | | |
| | 393 | | | Entergy New Orleans, Inc., 4.750% | | | 37,372 | |
| | | | | | | | |
| | | | Finance Companies — 0.0% | | | | |
| | 39,200 | | | iStar Financial, Inc., Series E, 7.875% | | | 968,240 | |
| | 39,300 | | | iStar Financial, Inc., Series F, 7.800% | | | 965,994 | |
| | 10,425 | | | iStar Financial, Inc., Series G, 7.650% | | | 252,076 | |
| | 101,175 | | | SLM Corp., Series A, 6.970% | | | 4,985,904 | |
| | | | | | | | |
| | | | | | | 7,172,214 | |
| | | | | | | | |
| | | | Government Sponsored — 0.2% | | | | |
| | 26,000 | | | Falcons Funding Trust I, (Step to 10.875% on 3/15/2015, variable rate after 3/15/2020), 8.875%, 144A(i) | | | 26,983,125 | |
| | | | | | | | |
| | | | Home Construction — 0.0% | | | | |
| | 208,246 | | | Hovnanian Enterprises, Inc., 7.625%(g) | | | 3,325,688 | |
| | | | | | | | |
| | | | REITs – Office Property — 0.0% | | | | |
| | 1,596 | | | Highwoods Properties, Inc., Series A, 8.625% | | | 1,903,729 | |
| | | | | | | | |
| | | | REITs – Warehouse/Industrials — 0.0% | | | | |
| | 116,192 | | | ProLogis, Inc., Series Q, 8.540% | | | 7,129,541 | |
| | | | | | | | |
| | | | Total Non-Convertible Preferred Stocks (Identified Cost $63,496,051) | | | 103,261,766 | |
| | | | | | | | |
| | | | Total Preferred Stocks (Identified Cost $307,067,658) | | | 366,257,041 | |
| | | | | | | | |
| | | | | | | | |
| | Closed-End Investment Companies — 0.0% | | | | |
| | 681,131 | | | NexPoint Credit Strategies Fund (Identified Cost $10,230,352) | | | 7,233,611 | |
| | | | | | | | |
| | | | | | | | |
Principal Amount (‡) | | | | | | |
| | Short-Term Investments — 1.2% | | | | |
| $ | 2,354,522 | | | Repurchase Agreement with State Street Bank and Trust Company, 9/30/2014 at 0.000% to be repurchased at $2,354,522 on 10/01/2014 collateralized by $2,399,800 U.S. Treasury Note, 1.500% due 8/31/2018 valued at $2,401,658 including accrued interest (Note 2 of Notes to Financial Statements) | | | 2,354,522 | |
See accompanying notes to financial statements.
31 |
Portfolio of Investments – as of September 30, 2014
Loomis Sayles Strategic Income Fund – (continued)
| | | | | | | | |
Principal Amount (‡) | | | Description | | Value (†) | |
| | Short-Term Investments — continued | | | | |
| $ | 221,672,777 | | | Tri-Party Repurchase Agreement with Fixed Income Clearing Corporation, dated 9/30/2014 at 0.000% to be repurchased at $221,672,777 on 10/01/2014 collateralized by $226,110,000 U.S. Treasury Note, 0.100% due 7/31/2016 valued at $226,110,000 including accrued interest (Note 2 of Notes to Financial Statements) | | $ | 221,672,777 | |
| | | | | | | | |
| | | | Total Short-Term Investments
(Identified Cost $224,027,299) | | | 224,027,299 | |
| | | | | | | | |
| | | | | | | | |
| | | | Total Investments — 100.0%
(Identified Cost $16,916,868,609)(a) | | | 18,774,646,796 | |
| | | | Other assets less liabilities — 0.0% | | | (863,134 | ) |
| | | | | | | | |
| | | | Net Assets — 100.0% | | $ | 18,773,783,662 | |
| | | | | | | | |
| | (‡) | | | Principal Amount stated in U.S. dollars unless otherwise noted. | |
| | (†) | | | See Note 2 of Notes to Financial Statements. | |
| | (††) | | | Amount shown represents units. One unit represents a principal amount of 25. | |
| | (†††) | | | Amount shown represents units. One unit represents a principal amount of 100. | |
| | (††††) | | | Amount shown represents units. One unit represents a principal amount of 4.02. | |
| | (a) | | | Federal Tax Information: | |
| | | | At September 30, 2014, the net unrealized appreciation on investments based on a cost of $17,026,635,125 for federal income tax purposes was as follows: | |
| | | | Aggregate gross unrealized appreciation for all investments in which there is an excess of value over tax cost | | $ | 2,338,732,723 | |
| | | | Aggregate gross unrealized depreciation for all investments in which there is an excess of tax cost over value | | | (590,721,052 | ) |
| | | | | | | | |
| | | | Net unrealized appreciation | | $ | 1,748,011,671 | |
| | | | | | | | |
| | | | | | | | |
| | (b) | | | Variable rate security. Rate as of September 30, 2014 is disclosed. | |
| | (c) | | | Perpetual bond with no specified maturity date. | |
| | (d) | | | Illiquid security. At September 30, 2014, the value of these securities amounted to $380,258,061 or 2.0% of net assets. | |
| | (e) | | | The issuer is in default with respect to interest and/or principal payments. Income is not being accrued. | |
| | (f) | | | Fair valued by the Fund’s adviser or deemed to be fair valued pursuant to the Fund’s pricing policies and procedures. At September 30, 2014, the value of these securities amounted to $421,179,459 or 2.2% of net assets. | |
| | (g) | | | Non-income producing security. | |
| | (h) | | | Maturity has been extended under the terms of a plan of reorganization. | |
| | (i) | | | Coupon rate is a fixed rate for an initial period then resets at a specified date and rate. | |
| | (j) | | | Convertible dollar-indexed note. Coupon rate is based on MXN denominated par value and is payable in USD. | |
| | | | | | | | |
| | 144A | | | All or a portion of these securities are exempt from registration under Rule 144A of the Securities Act of 1933. These securities may be resold in transactions exempt from registration, normally to qualified institutional buyers. At September 30, 2014, the value of Rule 144A holdings amounted to $2,506,131,568 or 13.3% of net assets. | |
See accompanying notes to financial statements.
| 32
Portfolio of Investments – as of September 30, 2014
Loomis Sayles Strategic Income Fund – (continued)
| | | | | | |
| | ADR | | | An American Depositary Receipt is a certificate issued by a custodian bank representing the right to receive securities of the foreign issuer described. The values of ADRs may be significantly influenced by trading on exchanges not located in the United States. |
| | ABS | | | Asset-Backed Securities |
| | AGMC | | | Assured Guaranty Municipal Corp. |
| | EMTN | | | Euro Medium Term Note |
| | GMTN | | | Global Medium Term Note |
| | MBIA | | | Municipal Bond Investors Assurance Corp. |
| | MTN | | | Medium Term Note |
| | REITs | | | Real Estate Investment Trusts |
| | | | | | |
| | AUD | | | Australian Dollar |
| | BRL | | | Brazilian Real |
| | CAD | | | Canadian Dollar |
| | CHF | | | Swiss Franc |
| | EUR | | | Euro |
| | GBP | | | British Pound |
| | IDR | | | Indonesian Rupiah |
| | ISK | | | Icelandic Krona |
| | KRW | | | South Korean Won |
| | MXN | | | Mexican Peso |
| | NOK | | | Norwegian Krone |
| | NZD | | | New Zealand Dollar |
| | USD | | | U.S. Dollar |
Industry Summary at September 30, 2014
| | | | |
Treasuries | | | 28.2 | % |
Banking | | | 8.4 | |
Finance Companies | | | 5.9 | |
Technology | | | 3.8 | |
Wirelines | | | 3.5 | |
Electronic Equipment, Instruments & Components | | | 3.3 | |
Chemicals | | | 3.2 | |
Pharmaceuticals | | | 2.8 | |
Airlines | | | 2.8 | |
Semiconductors & Semiconductor Equipment | | | 2.7 | |
Healthcare | | | 2.3 | |
Automotive | | | 2.2 | |
Other Investments, less than 2% each | | | 29.7 | |
Short-Term Investments | | | 1.2 | |
| | | | |
Total Investments | | | 100.0 | |
Other assets less liabilities | | | (0.0 | ) |
| | | | |
Net Assets | | | 100.0 | % |
| | | | |
See accompanying notes to financial statements.
33 |
Portfolio of Investments – as of September 30, 2014
Loomis Sayles Strategic Income Fund – (continued)
Currency Exposure Summary at September 30, 2014
| | | | |
United States Dollar | | | 76.8 | % |
Canadian Dollar | | | 6.5 | |
New Zealand Dollar | | | 4.2 | |
Mexican Peso | | | 3.7 | |
Australian Dollar | | | 3.2 | |
Other, less than 2% each | | | 5.6 | |
| | | | |
Total Investments | | | 100.0 | |
Other assets less liabilities | | | (0.0 | ) |
| | | | |
Net Assets | | | 100.0 | % |
| | | | |
See accompanying notes to financial statements.
| 34
Statement of Assets and Liabilities
September 30, 2014
| | | | |
ASSETS | | | | |
Investments at cost | | $ | 16,916,868,609 | |
Net unrealized appreciation | | | 1,857,778,187 | |
| | | | |
Investments at value | | | 18,774,646,796 | |
Cash | | | 576,875 | |
Foreign currency at value (identified cost $1,962,409) | | | 1,941,962 | |
Receivable for Fund shares sold | | | 56,177,013 | |
Receivable for securities sold | | | 485,670 | |
Dividends and interest receivable | | | 170,745,815 | |
Tax reclaims receivable | | | 1,174,330 | |
| | | | |
TOTAL ASSETS | | | 19,005,748,461 | |
| | | | |
LIABILITIES | | | | |
Payable for securities purchased | | | 198,524,902 | |
Payable for Fund shares redeemed | | | 21,892,710 | |
Foreign taxes payable (Note 2) | | | 70,408 | |
Management fees payable (Note 5) | | | 8,655,635 | |
Deferred Trustees’ fees (Note 5) | | | 1,183,271 | |
Administrative fees payable (Note 5) | | | 671,574 | |
Payable to distributor (Note 5d) | | | 143,520 | |
Other accounts payable and accrued expenses | | | 822,779 | |
| | | | |
TOTAL LIABILITIES | | | 231,964,799 | |
| | | | |
NET ASSETS | | $ | 18,773,783,662 | |
| | | | |
NET ASSETS CONSIST OF: | | | | |
Paid-in capital | | $ | 16,586,116,104 | |
Distributions in excess of net investment income | | | (53,367,332 | ) |
Accumulated net realized gain on investments and foreign currency transactions | | | 385,462,239 | |
Net unrealized appreciation on investments and foreign currency translations | | | 1,855,572,651 | |
| | | | |
NET ASSETS | | $ | 18,773,783,662 | |
| | | | |
See accompanying notes to financial statements.
35 |
Statement of Assets and Liabilities (continued)
September 30, 2014
| | | | |
COMPUTATION OF NET ASSET VALUE AND OFFERING PRICE: | | | | |
Class A shares: | | | | |
Net assets | | $ | 4,408,256,584 | |
| | | | |
Shares of beneficial interest | | | 263,251,060 | |
| | | | |
Net asset value and redemption price per share | | $ | 16.75 | |
| | | | |
Offering price per share (100/95.50 of net asset value) (Note 1) | | $ | 17.54 | |
| | | | |
Class B shares: (redemption price per share is equal to net asset value less any applicable contingent deferred sales charge) (Note 1) | | | | |
Net assets | | $ | 30,746,010 | |
| | | | |
Shares of beneficial interest | | | 1,821,441 | |
| | | | |
Net asset value and offering price per share | | $ | 16.88 | |
| | | | |
Class C shares: (redemption price per share is equal to net asset value less any applicable contingent deferred sales charge) (Note 1) | | | | |
Net assets | | $ | 5,390,221,573 | |
| | | | |
Shares of beneficial interest | | | 319,862,958 | |
| | | | |
Net asset value and offering price per share | | $ | 16.85 | |
| | | | |
Class N shares: | | | | |
Net assets | | $ | 57,751,964 | |
| | | | |
Shares of beneficial interest | | | 3,451,513 | |
| | | | |
Net asset value, offering and redemption price per share | | $ | 16.73 | |
| | | | |
Class Y shares: | | | | |
Net assets | | $ | 8,747,384,135 | |
| | | | |
Shares of beneficial interest | | | 522,794,905 | |
| | | | |
Net asset value, offering and redemption price per share | | $ | 16.73 | |
| | | | |
Admin Class shares: | | | | |
Net assets | | $ | 139,423,396 | |
| | | | |
Shares of beneficial interest | | | 8,349,941 | |
| | | | |
Net asset value, offering and redemption price per share | | $ | 16.70 | |
| | | | |
See accompanying notes to financial statements.
| 36
Statement of Operations
For the Year Ended September 30, 2014
| | | | |
INVESTMENT INCOME | | | | |
Interest | | $ | 636,224,836 | |
Dividends | | | 130,080,406 | |
Less net foreign taxes withheld | | | (6,743,142 | ) |
| | | | |
| | | 759,562,100 | |
| | | | |
Expenses | | | | |
Management fees (Note 5) | | | 96,609,367 | |
Service and distribution fees (Note 5) | | | 67,845,347 | |
Administrative fees (Note 5) | | | 7,571,620 | |
Trustees’ fees and expenses (Note 5) | | | 449,183 | |
Transfer agent fees and expenses (Notes 5 and 6) | | | 12,520,273 | |
Audit and tax services fees | | | 65,272 | |
Custodian fees and expenses | | | 764,650 | |
Legal fees | | | 155,552 | |
Registration fees | | | 936,222 | |
Shareholder reporting expenses | | | 772,086 | |
Miscellaneous expenses | | | 353,450 | |
| | | | |
Total expenses | | | 188,043,022 | |
| | | | |
Net investment income | | | 571,519,078 | |
| | | | |
NET REALIZED AND UNREALIZED GAIN (LOSS) ON INVESTMENTS AND FOREIGN CURRENCY TRANSACTIONS | | | | |
Net realized gain on: | | | | |
Investments | | | 451,828,442 | |
Foreign currency transactions | | | 1,613,204 | |
Net change in unrealized appreciation (depreciation) on: | | | | |
Investments | | | 417,907,043 | |
Foreign currency translations | | | (2,044,602 | ) |
| | | | |
Net realized and unrealized gain on investments and foreign currency transactions | | | 869,304,087 | |
| | | | |
NET INCREASE IN NET ASSETS RESULTING FROM OPERATIONS | | $ | 1,440,823,165 | |
| | | | |
See accompanying notes to financial statements.
37 |
Statement of Changes in Net Assets
| | | | | | | | |
| | | Year Ended
September 30,
2014 | | | Year Ended
September 30,
2013 | |
FROM OPERATIONS: | | | | | | | | |
Net investment income | | $ | 571,519,078 | | | $ | 590,817,828 | |
Net realized gain on investments and foreign currency transactions | | | 453,441,646 | | | | 337,211,720 | |
Net change in unrealized appreciation (depreciation) on investments and foreign currency translations | | | 415,862,441 | | | | 375,765,948 | |
| | | | | | | | |
Net increase in net assets resulting from operations | | | 1,440,823,165 | | | | 1,303,795,496 | |
| | | | | | | | |
FROM DISTRIBUTIONS TO SHAREHOLDERS: | | | | | | | | |
Net investment income | | | | | | | | |
Class A | | | (208,260,687 | ) | | | (257,191,132 | ) |
Class B | | | (1,352,357 | ) | | | (3,107,922 | ) |
Class C | | | (153,941,242 | ) | | | (209,818,508 | ) |
Class N | | | (1,422,761 | ) | | | (310,035 | ) |
Class Y | | | (247,038,167 | ) | | | (237,288,037 | ) |
Admin Class | | | (3,946,091 | ) | | | (3,078,138 | ) |
Net realized capital gains | | | | | | | | |
Class A | | | (14,707,851 | ) | | | — | |
Class B | | | (138,778 | ) | | | — | |
Class C | | | (13,369,858 | ) | | | — | |
Class N | | | (37,074 | ) | | | — | |
Class Y | | | (13,975,709 | ) | | | — | |
Admin Class | | | (252,447 | ) | | | — | |
| | | | | | | | |
Total distributions | | | (658,443,022 | ) | | | (710,793,772 | ) |
| | | | | | | | |
NET INCREASE (DECREASE) IN NET ASSETS FROM CAPITAL SHARE TRANSACTIONS (NOTE 9) | | | 2,898,606,286 | | | | (197,955,273 | ) |
| | | | | | | | |
Net increase in net assets | | | 3,680,986,429 | | | | 395,046,451 | |
NET ASSETS | | | | | | | | |
Beginning of the year | | | 15,092,797,233 | | | | 14,697,750,782 | |
| | | | | | | | |
End of the year | | $ | 18,773,783,662 | | | $ | 15,092,797,233 | |
| | | | | | | | |
DISTRIBUTIONS IN EXCESS OF NET INVESTMENT INCOME | | $ | (53,367,332 | ) | | $ | (30,654,351 | ) |
| | | | | | | | |
See accompanying notes to financial statements.
| 38
Financial Highlights
For a share outstanding throughout each period.
| | | | | | | | | | | | | | | | | | | | |
| | | Class A | |
| | | Year Ended
September 30,
2014 | | | Year Ended
September 30,
2013 | | | Year Ended
September 30,
2012 | | | Year Ended
September 30,
2011 | | | Year Ended
September 30,
2010 | |
Net asset value, beginning of the period | | $ | 15.93 | | | $ | 15.30 | | | $ | 14.21 | | | $ | 14.69 | | | $ | 13.39 | |
| | | | | | | | | | | | | | | | | | | | |
INCOME (LOSS) FROM INVESTMENT OPERATIONS: | | | | | | | | | | | | | | | | | | | | |
Net investment income(a) | | | 0.58 | | | | 0.65 | | | | 0.72 | | | | 0.77 | | | | 0.80 | |
Net realized and unrealized gain (loss) | | | 0.90 | | | | 0.76 | | | | 1.21 | | | | (0.42 | ) | | | 1.31 | |
| | | | | | | | | | | | | | | | | | | | |
Total from Investment Operations | | | 1.48 | | | | 1.41 | | | | 1.93 | | | | 0.35 | | | | 2.11 | |
| | | | | | | | | | | | | | | | | | | | |
LESS DISTRIBUTIONS FROM: | | | | | | | | | | | | | | | | | | | | |
Net investment income | | | (0.62 | ) | | | (0.78 | ) | | | (0.84 | ) | | | (0.83 | ) | | | (0.81 | ) |
Net realized capital gains | | | (0.04 | ) | | | — | | | | — | | | | — | | | | — | |
| | | | | | | | | | | | | | | | | | | | |
Total Distributions | | | (0.66 | ) | | | (0.78 | ) | | | (0.84 | ) | | | (0.83 | ) | | | (0.81 | ) |
| | | | | | | | | | | | | | | | | | | | |
Net asset value, end of the period | | $ | 16.75 | | | $ | 15.93 | | | $ | 15.30 | | | $ | 14.21 | | | $ | 14.69 | |
| | | | | | | | | | | | | | | | | | | | |
Total return(b) | | | 9.34 | % | | | 9.43 | % | | | 14.02 | % | | | 2.20 | % | | | 16.20 | % |
RATIOS TO AVERAGE NET ASSETS: | | | | | | | | | | | | | | | | | | | | |
Net assets, end of the period (000’s) | | $ | 4,408,257 | | | $ | 5,239,885 | | | $ | 5,155,287 | | | $ | 5,262,765 | | | $ | 5,758,070 | |
Net expenses | | | 0.94 | % | | | 0.95 | % | | | 0.96 | % | | | 0.95 | % | | | 0.96 | % |
Gross expenses | | | 0.94 | % | | | 0.95 | % | | | 0.96 | % | | | 0.95 | % | | | 0.96 | % |
Net investment income | | | 3.44 | % | | | 4.14 | % | | | 4.84 | % | | | 5.10 | % | | | 5.67 | % |
Portfolio turnover rate | | | 26 | % | | | 22 | % | | | 30 | % | | | 25 | % | | | 27 | % |
| (a) | Per share net investment income has been calculated using the average shares outstanding during the period. |
| (b) | A sales charge for Class A shares is not reflected in total return calculations. |
See accompanying notes to financial statements.
39 |
Financial Highlights (continued)
For a share outstanding throughout each period.
| | | | | | | | | | | | | | | | | | | | |
| | | Class B | |
| | | Year Ended
September 30,
2014 | | | Year Ended
September 30,
2013 | | | Year Ended
September 30,
2012 | | | Year Ended
September 30,
2011 | | | Year Ended
September 30,
2010 | |
Net asset value, beginning of the period | | $ | 16.05 | | | $ | 15.41 | | | $ | 14.30 | | | $ | 14.78 | | | $ | 13.46 | |
| | | | | | | | | | | | | | | | | | | | |
INCOME (LOSS) FROM INVESTMENT OPERATIONS: | | | | | | | | | | | | | | | | | | | | |
Net investment income(a) | | | 0.46 | | | | 0.54 | | | | 0.61 | | | | 0.66 | | | | 0.69 | |
Net realized and unrealized gain (loss) | | | 0.90 | | | | 0.76 | | | | 1.23 | | | | (0.43 | ) | | | 1.33 | |
| | | | | | | | | | | | | | | | | | | | |
Total from Investment Operations | | | 1.36 | | | | 1.30 | | | | 1.84 | | | | 0.23 | | | | 2.02 | |
| | | | | | | | | | | | | | | | | | | | |
LESS DISTRIBUTIONS FROM: | | | | | | | | | | | | | | | | | | | | |
Net investment income | | | (0.49 | ) | | | (0.66 | ) | | | (0.73 | ) | | | (0.71 | ) | | | (0.70 | ) |
Net realized capital gains | | | (0.04 | ) | | | — | | | | — | | | | — | | | | — | |
| | | | | | | | | | | | | | | | | | | | |
Total Distributions | | | (0.53 | ) | | | (0.66 | ) | | | (0.73 | ) | | | (0.71 | ) | | | (0.70 | ) |
| | | | | | | | | | | | | | | | | | | | |
Net asset value, end of the period | | $ | 16.88 | | | $ | 16.05 | | | $ | 15.41 | | | $ | 14.30 | | | $ | 14.78 | |
| | | | | | | | | | | | | | | | | | | | |
Total return(b) | | | 8.55 | % | | | 8.58 | % | | | 13.15 | % | | | 1.48 | % | | | 15.39 | % |
RATIOS TO AVERAGE NET ASSETS: | | | | | | | | | | | | | | | | | | | | |
Net assets, end of the period (000’s) | | $ | 30,746 | | | $ | 57,276 | | | $ | 89,552 | | | $ | 107,400 | | | $ | 137,268 | |
Net expenses | | | 1.69 | % | | | 1.70 | % | | | 1.70 | % | | | 1.70 | % | | | 1.71 | % |
Gross expenses | | | 1.69 | % | | | 1.70 | % | | | 1.70 | % | | | 1.70 | % | | | 1.71 | % |
Net investment income | | | 2.75 | % | | | 3.39 | % | | | 4.11 | % | | | 4.35 | % | | | 4.92 | % |
Portfolio turnover rate | | | 26 | % | | | 22 | % | | | 30 | % | | | 25 | % | | | 27 | % |
| (a) | Per share net investment income has been calculated using the average shares outstanding during the period. |
| (b) | A contingent deferred sales charge for Class B shares is not reflected in total return calculations. |
See accompanying notes to financial statements.
| 40
Financial Highlights (continued)
For a share outstanding throughout each period.
| | | | | | | | | | | | | | | | | | | | |
| | | Class C | |
| | | Year Ended
September 30,
2014 | | | Year Ended
September 30,
2013 | | | Year Ended
September 30,
2012 | | | Year Ended
September 30,
2011 | | | Year Ended
September 30,
2010 | |
Net asset value, beginning of the period | | $ | 16.03 | | | $ | 15.39 | | | $ | 14.29 | | | $ | 14.77 | | | $ | 13.45 | |
| | | | | | | | | | | | | | | | | | | | |
INCOME (LOSS) FROM INVESTMENT OPERATIONS: | | | | | | | | | | | | | | | | | | | | |
Net investment income(a) | | | 0.45 | | | | 0.54 | | | | 0.61 | | | | 0.66 | | | | 0.69 | |
Net realized and unrealized gain (loss) | | | 0.90 | | | | 0.76 | | | | 1.23 | | | | (0.43 | ) | | | 1.33 | |
| | | | | | | | | | | | | | | | | | | | |
Total from Investment Operations | | | 1.35 | | | | 1.30 | | | | 1.84 | | | | 0.23 | | | | 2.02 | |
| | | | | | | | | | | | | | | | | | | | |
LESS DISTRIBUTIONS FROM: | | | | | | | | | | | | | | | | | | | | |
Net investment income | | | (0.49 | ) | | | (0.66 | ) | | | (0.74 | ) | | | (0.71 | ) | | | (0.70 | ) |
Net realized capital gains | | | (0.04 | ) | | | — | | | | — | | | | — | | | | — | |
| | | | | | | | | | | | | | | | | | | | |
Total Distributions | | | (0.53 | ) | | | (0.66 | ) | | | (0.74 | ) | | | (0.71 | ) | | | (0.70 | ) |
| | | | | | | | | | | | | | | | | | | | |
Net asset value, end of the period | | $ | 16.85 | | | $ | 16.03 | | | $ | 15.39 | | | $ | 14.29 | | | $ | 14.77 | |
| | | | | | | | | | | | | | | | | | | | |
Total return(b) | | | 8.54 | % | | | 8.61 | % | | | 13.18 | % | | | 1.42 | % | | | 15.40 | % |
RATIOS TO AVERAGE NET ASSETS: | | | | | | | | | | | | | | | | | | | | |
Net assets, end of the period (000’s) | | $ | 5,390,222 | | | $ | 4,912,727 | | | $ | 5,064,186 | | | $ | 4,666,077 | | | $ | 5,146,164 | |
Net expenses | | | 1.69 | % | | | 1.70 | % | | | 1.71 | % | | | 1.70 | % | | | 1.71 | % |
Gross expenses | | | 1.69 | % | | | 1.70 | % | | | 1.71 | % | | | 1.70 | % | | | 1.71 | % |
Net investment income | | | 2.68 | % | | | 3.39 | % | | | 4.08 | % | | | 4.35 | % | | | 4.92 | % |
Portfolio turnover rate | | | 26 | % | | | 22 | % | | | 30 | % | | | 25 | % | | | 27 | % |
| (a) | Per share net investment income has been calculated using the average shares outstanding during the period. |
| (b) | A contingent deferred sales charge for Class C shares is not reflected in total return calculations. |
See accompanying notes to financial statements.
41 |
Financial Highlights (continued)
For a share outstanding throughout each period.
| | | | | | | | |
| | | Class N | |
| | | Year Ended
September 30,
2014 | | | Period Ended
September 30,
2013* | |
Net asset value, beginning of the period | | $ | 15.92 | | | $ | 15.78 | |
| | | | | | | | |
INCOME (LOSS) FROM INVESTMENT OPERATIONS: | | | | | | | | |
Net investment income(a) | | | 0.61 | | | | 0.46 | |
Net realized and unrealized gain (loss) | | | 0.91 | | | | 0.16 | |
| | | | | | | | |
Total from Investment Operations | | | 1.52 | | | | 0.62 | |
| | | | | | | | |
LESS DISTRIBUTIONS FROM: | | | | | | | | |
Net investment income | | | (0.67 | ) | | | (0.48 | ) |
Net realized capital gains | | | (0.04 | ) | | | — | |
| | | | | | | | |
Total Distributions | | | (0.71 | ) | | | (0.48 | ) |
| | | | | | | | |
Net asset value, end of the period | | $ | 16.73 | | | $ | 15.92 | |
| | | | | | | | |
Total return | | | 9.70 | % | | | 4.01 | % |
RATIOS TO AVERAGE NET ASSETS: | | | | | | | | |
Net assets, end of the period (000’s) | | $ | 57,752 | | | $ | 12,921 | |
Net expenses | | | 0.62 | % | | | 0.63 | %(b) |
Gross expenses | | | 0.62 | % | | | 0.63 | %(b) |
Net investment income | | | 3.62 | % | | | 4.38 | %(b) |
Portfolio turnover rate | | | 26 | % | | | 22 | % |
| * | From commencement of Class operations on February 1, 2013 through September 30, 2013. |
| (a) | Per share net investment income has been calculated using the average shares outstanding during the period. |
| (b) | Computed on an annualized basis for periods less than one year. |
See accompanying notes to financial statements.
| 42
Financial Highlights (continued)
For a share outstanding throughout each period.
| | | | | | | | | | | | | | | | | | | | |
| | | Class Y | |
| | | Year Ended
September 30,
2014 | | | Year Ended
September 30,
2013 | | | Year Ended
September 30,
2012 | | | Year Ended
September 30,
2011 | | | Year Ended
September 30,
2010 | |
Net asset value, beginning of the period | | $ | 15.92 | | | $ | 15.29 | | | $ | 14.20 | | | $ | 14.68 | | | $ | 13.38 | |
| | | | | | | | | | | | | | | | | | | | |
INCOME (LOSS) FROM INVESTMENT OPERATIONS: | | | | | | | | | | | | | | | | | | | | |
Net investment income(a) | | | 0.61 | | | | 0.69 | | | | 0.75 | | | | 0.81 | | | | 0.83 | |
Net realized and unrealized gain (loss) | | | 0.90 | | | | 0.76 | | | | 1.22 | | | | (0.43 | ) | | | 1.31 | |
| | | | | | | | | | | | | | | | | | | | |
Total from Investment Operations | | | 1.51 | | | | 1.45 | | | | 1.97 | | | | 0.38 | | | | 2.14 | |
| | | | | | | | | | | | | | | | | | | | |
LESS DISTRIBUTIONS FROM: | | | | | | | | | | | | | | | | | | | | |
Net investment income | | | (0.66 | ) | | | (0.82 | ) | | | (0.88 | ) | | | (0.86 | ) | | | (0.84 | ) |
Net realized capital gains | | | (0.04 | ) | | | — | | | | — | | | | — | | | | — | |
| | | | | | | | | | | | | | | | | | | | |
Total Distributions | | | (0.70 | ) | | | (0.82 | ) | | | (0.88 | ) | | | (0.86 | ) | | | (0.84 | ) |
| | | | | | | | | | | | | | | | | | | | |
Net asset value, end of the period | | $ | 16.73 | | | $ | 15.92 | | | $ | 15.29 | | | $ | 14.20 | | | $ | 14.68 | |
| | | | | | | | | | | | | | | | | | | | |
Total return | | | 9.63 | % | | | 9.72 | % | | | 14.31 | % | | | 2.46 | % | | | 16.50 | % |
RATIOS TO AVERAGE NET ASSETS: | | | | | | | | | | | | | | | | | | | | |
Net assets, end of the period (000’s) | | $ | 8,747,384 | | | $ | 4,789,322 | | | $ | 4,339,240 | | | $ | 2,807,777 | | | $ | 2,521,337 | |
Net expenses | | | 0.69 | % | | | 0.70 | % | | | 0.71 | % | | | 0.70 | % | | | 0.71 | % |
Gross expenses | | | 0.69 | % | | | 0.70 | % | | | 0.71 | % | | | 0.70 | % | | | 0.71 | % |
Net investment income | | | 3.65 | % | | | 4.39 | % | | | 5.05 | % | | | 5.35 | % | | | 5.92 | % |
Portfolio turnover rate | | | 26 | % | | | 22 | % | | | 30 | % | | | 25 | % | | | 27 | % |
| (a) | Per share net investment income has been calculated using the average shares outstanding during the period. |
See accompanying notes to financial statements.
43 |
Financial Highlights (continued)
For a share outstanding throughout each period.
| | | | | | | | | | | | | | | | | | | | |
| | | Admin Class | |
| | | Year Ended
September 30,
2014 | | | Year Ended
September 30,
2013 | | | Year Ended
September 30,
2012 | | | Year Ended
September 30,
2011 | | | Period Ended
September 30,
2010* | |
Net asset value, beginning of the period | | $ | 15.89 | | | $ | 15.27 | | | $ | 14.18 | | | $ | 14.66 | | | $ | 13.87 | |
| | | | | | | | | | | | | | | | | | | | |
INCOME (LOSS) FROM INVESTMENT OPERATIONS: | | | | | | | | | | | | | | | | | | | | |
Net investment income(a) | | | 0.53 | | | | 0.61 | | | | 0.67 | | | | 0.73 | | | | 0.52 | |
Net realized and unrealized gain (loss) | | | 0.90 | | | | 0.75 | | | | 1.23 | | | | (0.42 | ) | | | 0.79 | |
| | | | | | | | | | | | | | | | | | | | |
Total from Investment Operations | | | 1.43 | | | | 1.36 | | | | 1.90 | | | | 0.31 | | | | 1.31 | |
| | | | | | | | | | | | | | | | | | | | |
LESS DISTRIBUTIONS FROM: | | | | | | | | | | | | | | | | | | | | |
Net investment income | | | (0.58 | ) | | | (0.74 | ) | | | (0.81 | ) | | | (0.79 | ) | | | (0.52 | ) |
Net realized capital gains | | | (0.04 | ) | | | — | | | | — | | | | — | | | | — | |
| | | | | | | | | | | | | | | | | | | | |
Total Distributions | | | (0.62 | ) | | | (0.74 | ) | | | (0.81 | ) | | | (0.79 | ) | | | (0.52 | ) |
| | | | | | | | | | | | | | | | | | | | |
Net asset value, end of the period | | $ | 16.70 | | | $ | 15.89 | | | $ | 15.27 | | | $ | 14.18 | | | $ | 14.66 | |
| | | | | | | | | | | | | | | | | | | | |
Total return | | | 9.12 | % | | | 9.12 | % | | | 13.79 | % | | | 1.98 | % | | | 9.61 | % |
RATIOS TO AVERAGE NET ASSETS: | | | | | | | | | | | | | | | | | | | | |
Net assets, end of the period (000’s) | | $ | 139,423 | | | $ | 80,666 | | | $ | 49,486 | | | $ | 25,424 | | | $ | 4,379 | |
Net expenses | | | 1.19 | % | | | 1.20 | % | | | 1.21 | % | | | 1.21 | % | | | 1.24 | %(b) |
Gross expenses | | | 1.19 | % | | | 1.20 | % | | | 1.21 | % | | | 1.21 | % | | | 1.24 | %(b) |
Net investment income | | | 3.15 | % | | | 3.89 | % | | | 4.52 | % | | | 4.87 | % | | | 5.52 | %(b) |
Portfolio turnover rate | | | 26 | % | | | 22 | % | | | 30 | % | | | 25 | % | | | 27 | % |
| * | From commencement of Class operations on February 1, 2010 through September 30, 2010. |
| (a) | Per share net investment income has been calculated using the average shares outstanding during the period. |
| (b) | Computed on an annualized basis for periods less than one year. |
See accompanying notes to financial statements.
| 44
Notes to Financial Statements
September 30, 2014
1. Organization. Loomis Sayles Funds II (the “Trust”) is organized as a Massachusetts business trust. The Trust is registered under the Investment Company Act of 1940, as amended (the “1940 Act”), as an open-end management investment company. The Declaration of Trust permits the Board of Trustees to authorize the issuance of an unlimited number of shares of the Trust in multiple series. The financial statements for certain funds of the Trust are presented in separate reports. Information presented in these financial statements pertains to Loomis Sayles Strategic Income Fund (the “Fund”).
The Fund is a diversified investment company.
The Fund offers Class A, Class C, Class N, Class Y and Admin Class shares. Effective October 12, 2007, Class B shares are no longer offered. Existing Class B shareholders may continue to reinvest dividends into Class B shares and exchange their Class B shares for Class B shares of other Natixis Funds subject to existing exchange privileges as described in the prospectus.
Class A shares are sold with a maximum front-end sales charge of 4.50%. Class B shares do not pay a front-end sales charge; however, they are charged higher Rule 12b-1 fees, and are subject to a contingent deferred sales charge (“CDSC”) if such shares are redeemed within six years of purchase. After eight years of ownership, Class B shares convert to Class A shares. Class C shares do not pay a front-end sales charge, do not convert to any other class of shares, pay higher Rule 12b-1 fees than Class A shares and may be subject to a CDSC of 1.00% if those shares are redeemed within one year of acquisition, except for reinvested distributions. Class N and Class Y shares do not pay a front-end sales charge, a CDSC or Rule 12b-1 fees. Class N shares are primarily intended for employer-sponsored retirement plans. Class Y shares are intended for institutional investors with a minimum initial investment of $100,000, though some categories of investors are exempted from the minimum investment amount as outlined in the Fund’s prospectus. Admin Class shares do not pay a front-end sales charge or a CDSC, but do pay a Rule 12b-1 fee. Class N and Admin Class shares are offered exclusively through intermediaries.
Most expenses can be directly attributed to a fund. Expenses which cannot be directly attributed to a fund are generally apportioned based on the relative net assets of each of the funds in Natixis Funds Trust I, Natixis Funds Trust II, Natixis Funds Trust IV, Gateway Trust (“Natixis Funds Trusts”), Loomis Sayles Funds I, Loomis Sayles Funds II (“Loomis Sayles Funds Trusts”) and Hansberger International Series. Expenses of the Fund are borne pro rata by the holders of each class of shares, except that each class bears expenses unique to that class (including the Rule 12b-1 service and distribution fees for Class A, Class B, Class C and Admin Class and transfer agent fees). In addition, each class votes as a class only with respect to its own Rule 12b-1 Plan. Shares of each class would receive their pro rata share of the net assets of the Fund if the Fund were liquidated. The Trustees approve separate distributions from net investment income on each class of shares.
45 |
Notes to Financial Statements (continued)
September 30, 2014
2. Significant Accounting Policies. The following is a summary of significant accounting policies consistently followed by the Fund in the preparation of its financial statements. The Fund’s financial statements follow the accounting and reporting guidelines provided for investment companies and are prepared in accordance with accounting principles generally accepted in the United States of America which require the use of management estimates that affect the reported amounts and disclosures in the financial statements. Actual results could differ from those estimates. Management has evaluated the events and transactions subsequent to year-end through the date the financial statements were issued and has determined that there were no material events that would require disclosure in the Fund’s financial statements.
a. Valuation. Fund securities and other investments are valued at market value based on market quotations obtained or determined by independent pricing services recommended by the adviser and approved by the Board of Trustees. Fund securities and other investments for which market quotations are not readily available are valued at fair value as determined in good faith by the adviser pursuant to procedures approved by the Board of Trustees, as described below. Market value is determined as follows:
Debt securities (other than short-term obligations purchased with an original or remaining maturity of sixty days or less) and unlisted equity securities are valued based on evaluated bids furnished to the Fund by an independent pricing service using market information, transactions for comparable securities and various relationships between securities, if available, or bid prices obtained from broker-dealers. Senior loans are valued at bid prices supplied by an independent pricing service, if available. Equity securities (including closed-end investment companies and exchange-traded funds) are valued at the last sale price quoted on the exchange or market where traded most extensively or, if there is no reported sale during the day, the closing bid quotation as reported by an independent pricing service. Securities traded on the NASDAQ Global Select Market, NASDAQ Global Market and NASDAQ Capital Market are valued at the NASDAQ Official Closing Price (“NOCP”), or if lacking an NOCP, at the most recent bid quotations on the applicable NASDAQ Market. In some foreign markets, an official close price and a last sale price may be available from the foreign exchange or market. In those cases, the official close price is used. Broker-dealer bid prices may be used to value debt and equity securities and senior loans where an independent pricing service is unable to price a security or where an independent pricing service does not provide a reliable price for the security. Short-term obligations (purchased with an original or remaining maturity of sixty days or less) are valued at amortized cost (which approximates market value).
Fund securities and other investments for which market quotations are not readily available are valued at fair value as determined in good faith by the adviser pursuant to procedures approved by the Board of Trustees. The Fund may also value securities and other investments at fair value in other circumstances such as when extraordinary
| 46
Notes to Financial Statements (continued)
September 30, 2014
events occur after the close of a foreign market but prior to the close of the New York Stock Exchange (“NYSE”). This may include situations relating to a single issuer (such as a declaration of bankruptcy or a delisting of the issuer’s security from the primary market on which it has traded) as well as events affecting the securities markets in general (such as market disruptions or closings and significant fluctuations in U.S. and/or foreign markets). When fair valuing its securities or other investments, the Fund may, among other things, use modeling tools or other processes that may take into account factors such as securities or other market activity and/or significant events that occur after the close of the foreign market and before the time the Fund’s net asset value (“NAV”) is calculated. Fair value pricing may require subjective determinations about the value of a security, and fair values used to determine a Fund’s NAV may differ from quoted or published prices, or from prices that are used by others, for the same securities. In addition, the use of fair value pricing may not always result in adjustments to the prices of securities held by the Fund.
b. Investment Transactions and Related Investment Income. Investment transactions are accounted for on a trade date plus one day basis for daily NAV calculation. However, for financial reporting purposes, investment transactions are reported on trade date. Dividend income is recorded on ex-dividend date, or in the case of certain foreign securities, as soon as the Fund is notified, and interest income is recorded on an accrual basis. Interest income is increased by the accretion of discount and decreased by the amortization of premium. Distributions received from investments in securities that represent a return of capital or capital gain are recorded as a reduction of the cost of investments or as a realized gain, respectively. In determining net gain or loss on securities sold, the cost of securities has been determined on an identified cost basis. Investment income, non-class specific expenses and realized and unrealized gains and losses are allocated on a pro rata basis to each class based on the relative net assets of each class to the total net assets of the Fund.
c. Foreign Currency Translation. The books and records of the Fund are maintained in U.S. dollars. The values of securities, currencies and other assets and liabilities denominated in currencies other than U.S. dollars are translated into U.S. dollars based upon foreign exchange rates prevailing at the end of the period. Purchases and sales of investment securities, income and expenses are translated on the respective dates of such transactions.
Since the values of investment securities are presented at the foreign exchange rates prevailing at the end of the period, it is not practical to isolate that portion of the results of operations arising from changes in exchange rates from fluctuations which arise due to changes in market prices of investment securities. Such changes are included with the net realized and unrealized gain or loss on investments.
Net realized foreign exchange gains or losses arise from sales of foreign currency, currency gains or losses realized between the trade and settlement dates on securities
47 |
Notes to Financial Statements (continued)
September 30, 2014
transactions, and the difference between the amounts of dividends, interest and foreign withholding taxes recorded on the Fund’s books and the U.S. dollar equivalent of the amounts actually received or paid. Net unrealized foreign exchange gains and losses arise from changes in the value of assets and liabilities, other than investment securities, at the end of the fiscal period, resulting from changes in exchange rates.
The Fund may use foreign currency exchange contracts to facilitate transactions in foreign-denominated investments. Losses may arise from changes in the value of the foreign currency or if the counterparties do not perform under the contracts’ terms.
d. Federal and Foreign Income Taxes. The Trust treats each fund as a separate entity for federal income tax purposes. The Fund intends to meet the requirements of the Internal Revenue Code of 1986, as amended, applicable to regulated investment companies, and to distribute to its shareholders substantially all of its net investment income and any net realized capital gains at least annually. Management has performed an analysis of the Fund’s tax positions for the open tax years as of September 30, 2014 and has concluded that no provisions for income tax are required. The Fund’s federal tax returns for the prior three fiscal years remain subject to examination by the Internal Revenue Service. Management is not aware of any events that are reasonably possible to occur in the next twelve months that would result in the amounts of any unrecognized tax benefits significantly increasing or decreasing for the Fund. However, management’s conclusions regarding tax positions taken may be subject to review and adjustment at a later date based on factors including, but not limited to, new tax laws and accounting regulations and interpretations thereof.
The Fund may be subject to foreign withholding taxes on investment income and taxes on capital gains on investments that are accrued and paid based upon the Fund’s understanding of the tax rules and regulations that exist in the countries in which the Fund invests. Foreign withholding taxes on dividend and interest income are reflected on the Statement of Operations as a reduction of investment income, net of amounts eligible to be reclaimed. Dividends and interest receivable on the Statement of Assets and Liabilities are net of foreign withholding taxes. Foreign withholding taxes eligible to be reclaimed are reflected on the Statement of Assets and Liabilities as tax reclaims receivable. Capital gains taxes paid are included in net realized gain (loss) on investments in the Statement of Operations. Accrued but unpaid capital gains taxes are reflected as foreign taxes payable on the Statement of Assets and Liabilities, if applicable, and reduce unrealized gains on investments. In the event that realized gains on investments are subsequently offset by realized losses, taxes paid on realized gains may be returned to the Fund. Such amounts, if applicable, are reflected as foreign tax rebates receivable on the Statement of Assets and Liabilities and are recorded as a realized gain when received.
e. Dividends and Distributions to Shareholders. Dividends and distributions are recorded on ex-dividend date. The timing and characterization of certain income and
| 48
Notes to Financial Statements (continued)
September 30, 2014
capital gain distributions are determined annually in accordance with federal tax regulations, which may differ from accounting principles generally accepted in the United States of America. Permanent differences are primarily due to differing treatments for book and tax purposes of items such as foreign currency transactions, premium amortization, defaulted bond adjustments, paydown gains and losses, trust preferred securities adjustments, deferred Trustees’ fees, contingent payment debt instruments and return of capital and capital gain distributions received. Permanent book and tax basis differences relating to shareholder distributions will result in reclassifications to capital accounts. Temporary differences between book and tax distributable earnings are primarily due to wash sales, deferred Trustees’ fees, premium amortization, return of capital distributions received, trust preferred securities adjustments, forward foreign currency contract mark to market, reversal of bankruptcy income, contingent payment debt instruments and defaulted bond interest. Distributions from net investment income and short-term capital gains are considered to be distributed from ordinary income for tax purposes.
The tax characterization of distributions is determined on an annual basis. The tax character of distributions paid to shareholders during the years ended September 30, 2014 and 2013 were as follows:
| | | | | | | | | | | | | | | | | | | | | | |
| 2014 Distributions Paid From: | | | 2013 Distributions Paid From: | |
Ordinary Income | | | Long-Term Capital Gains | | | Total | | | Ordinary Income | | | Long-Term Capital Gains | | | Total | |
| | $617,621,510 | | | $ | 40,821,512 | | | $ | 658,443,022 | | | $ | 710,793,772 | | | $ | — | | | $ | 710,793,772 | |
Differences between these amounts and those reported in the Statement of Changes in Net Assets are primarily attributable to different book and tax treatment for short-term capital gains.
As of September 30, 2014, the components of distributable earnings on a tax basis were as follows:
| | | | |
Undistributed ordinary income | | $ | 67,294,097 | |
Undistributed long-term capital gains | | | 379,723,717 | |
| | | | |
Total undistributed earnings | | | 447,017,814 | |
| | | | |
Unrealized appreciation | | | 1,745,811,553 | |
| | | | |
Total accumulated earnings | | $ | 2,192,829,367 | |
| | | | |
f. Loan Participations. The Fund may invest in loans to corporate, governmental or other borrowers. The Fund’s investments in loans may be in the form of participations in loans or assignments of all or a portion of loans. A loan is often administered by a bank or other financial institution that acts as agent for all holders. The agent administers the terms of the loan, as specified in the loan agreement. When investing in a loan participation, (i) the Fund has the right to receive payments of principal, interest and any fees to which it is entitled only from the party from whom the Fund has purchased the participation and only upon receipt by that party of payments from the borrower and (ii) the Fund generally has no right to enforce compliance by the borrower with the
49 |
Notes to Financial Statements (continued)
September 30, 2014
terms of the loan agreement or to vote on matters arising under the loan agreement. Thus, the Fund may be subject to credit risk both of the party from whom it purchased the loan participation and the borrower and the Fund may have minimal control over the terms of any loan modification. When the Fund purchases assignments from lenders, it acquires direct rights against the borrower on the loan. Loan agreements and participations outstanding at the end of the year, if any, are listed in each applicable Fund’s Schedule of Investments.
g. Repurchase Agreements. The Fund may enter into repurchase agreements, under the terms of a Master Repurchase Agreement, under which the Fund acquires securities as collateral and agrees to resell the securities at an agreed upon time and at an agreed upon price. It is the Fund’s policy that the market value of the collateral for repurchase agreements be at least equal to 102% of the repurchase price, including interest. Certain repurchase agreements are tri-party arrangements whereby the collateral is held in a segregated account for the benefit of the Fund and on behalf of the counterparty. Repurchase agreements could involve certain risks in the event of default or insolvency of the counterparty including possible delays or restrictions upon the Fund’s ability to dispose of the underlying securities. As of September 30, 2014, the Fund had investments in repurchase agreements for which the value of the related collateral exceeded the value of the repurchase agreement. The gross value of repurchase agreements is included in the Statement of Assets and Liabilities for financial reporting purposes.
h. Securities Lending. The Fund has entered into an agreement with State Street Bank and Trust Company (“State Street Bank”), as agent of the Fund, to lend securities to certain designated borrowers. The loans are collateralized with cash or securities in an amount equal to at least 105% or 102% of the market value (including accrued interest) of the loaned international or domestic securities, respectively, when the loan is initiated. Thereafter, the value of the collateral must remain at least 102% of the market value (including accrued interest) of loaned securities for U.S. equities and U.S. corporate debt; at least 105% of the market value (including accrued interest) of loaned securities for non-U.S. equities; and at least 100% of the market value (including accrued interest) of loaned securities for U.S. Government securities, sovereign debt issued by non-U.S. Governments and non-U.S. corporate debt. In the event that the market value of the collateral falls below the required percentages described above, the borrower will deliver additional collateral on the next business day. As with other extensions of credit, the Fund may bear the risk of loss with respect to the investment of the collateral. The Fund invests cash collateral in short-term investments, a portion of the income from which is remitted to the borrowers and the remainder allocated between the Fund and State Street Bank as lending agent. Excess collateral in the amount of $2,798,698 related to terminated loans with a bankrupt borrower is held by State Street Bank on behalf of the Fund.
| 50
Notes to Financial Statements (continued)
September 30, 2014
For the year ended September 30, 2014, the Fund did not loan securities under this agreement.
i. Indemnifications. Under the Trust’s organizational documents, its officers and Trustees are indemnified against certain liabilities arising out of the performance of their duties to the Fund. Additionally, in the normal course of business, the Fund enters into contracts with service providers that contain general indemnification clauses. The Fund’s maximum exposure under these arrangements is unknown as this would involve future claims that may be made against the Fund that have not yet occurred. However, based on experience, the Fund expects the risk of loss to be remote.
3. Fair Value Measurements. In accordance with accounting standards related to fair value measurements and disclosures, the Fund has categorized the inputs utilized in determining the value of the Fund’s assets or liabilities. These inputs are summarized in the three broad levels listed below:
| | • | | Level 1 – quoted prices in active markets for identical assets or liabilities; |
| | • | | Level 2 – prices determined using other significant inputs that are observable either directly, or indirectly through corroboration with observable market data (which could include quoted prices for similar assets or liabilities, interest rates, credit risk, etc.); and |
| | • | | Level 3 – prices determined using significant unobservable inputs when quoted prices or observable inputs are unavailable such as when there is little or no market activity for an asset or liability (unobservable inputs reflect the Fund’s own assumptions in determining the fair value of assets or liabilities and would be based on the best information available). |
The inputs or methodology used for valuing securities are not necessarily an indication of the risk associated with investing in those securities.
51 |
Notes to Financial Statements (continued)
September 30, 2014
The following is a summary of the inputs used to value the Fund’s investments as of September 30, 2014, at value:
Asset Valuation Inputs
| | | | | | | | | | | | | | | | |
Description | | Level 1 | | | Level 2 | | | Level 3 | | | Total | |
Bonds and Notes | | | | | | | | | | | | | | | | |
Non-Convertible Bonds | | | | | | | | | | | | | | | | |
Airlines | | $ | — | | | $ | 249,644,345 | | | $ | 270,539,686 | (b) | | $ | 520,184,031 | |
Banking | | | — | | | | 1,310,712,033 | | | | 162,624,689 | (b) | | | 1,473,336,722 | |
Finance Companies | | | 2,376,295 | | | | 1,035,057,180 | | | | — | | | | 1,037,433,475 | |
Metals & Mining | | | — | | | | 188,285,641 | | | | 8,350,160 | (c) | | | 196,635,801 | |
Retailers | | | — | | | | 107,146,413 | | | | 11,232,004 | (c) | | | 118,378,417 | |
Transportation Services | | | — | | | | 19,329,882 | | | | 29,689,394 | (c) | | | 49,019,276 | |
All Other Non-Convertible Bonds(a) | | | — | | | | 9,762,603,281 | | | | — | | | | 9,762,603,281 | |
| | | | | | | | | | | | | | | | |
Total Non-Convertible Bonds | | | 2,376,295 | | | | 12,672,778,775 | | | | 482,435,933 | | | | 13,157,591,003 | |
| | | | | | | | | | | | | | | | |
Convertible Bonds | | | | | | | | | | | | | | | | |
Wirelines | | | — | | | | — | | | | 53,861 | (c) | | | 53,861 | |
All Other Convertible Bonds(a) | | | — | | | | 1,274,444,729 | | | | — | | | | 1,274,444,729 | |
| | | | | | | | | | | | | | | | |
Total Convertible Bonds | | | — | | | | 1,274,444,729 | | | | 53,861 | | | | 1,274,498,590 | |
| | | | | | | | | | | | | | | | |
Municipals(a) | | | — | | | | 155,043,849 | | | | — | | | | 155,043,849 | |
| | | | | | | | | | | | | | | | |
Total Bonds and Notes | | | 2,376,295 | | | | 14,102,267,353 | | | | 482,489,794 | | | | 14,587,133,442 | |
| | | | | | | | | | | | | | | | |
Loan Participations(a) | | | — | | | | — | | | | 15,059,064 | (b) | | | 15,059,064 | |
Senior Loans(a) | | | — | | | | 391,800,416 | | | | — | | | | 391,800,416 | |
Common Stocks(a) | | | 3,183,135,923 | | | | — | | | | — | | | | 3,183,135,923 | |
Preferred Stocks | | | | | | | | | | | | | | | | |
Convertible Preferred Stocks | | | | | | | | | | | | | | | | |
Communications | | | — | | | | 466,429 | | | | — | | | | 466,429 | |
Energy | | | 41,885,766 | | | | 36,823,494 | | | | — | | | | 78,709,260 | |
REITs – Mortgage | | | — | | | | 8,781,902 | | | | — | | | | 8,781,902 | |
All Other Convertible Preferred Stocks(a) | | | 175,037,684 | | | | — | | | | — | | | | 175,037,684 | |
| | | | | | | | | | | | | | | | |
Total Convertible Preferred Stocks | | | 216,923,450 | | | | 46,071,825 | | | | — | | | | 262,995,275 | |
| | | | | | | | | | | | | | | | |
| 52
Notes to Financial Statements (continued)
September 30, 2014
Asset Valuation Inputs (continued)
| | | | | | | | | | | | | | | | |
Description | | Level 1 | | | Level 2 | | | Level 3 | | | Total | |
Preferred Stocks (continued) | | | | | | | | | | | | | |
Non-Convertible Preferred Stocks | | | | | | | | | | | | | | | | |
Electric | | $ | — | | | $ | 37,372 | | | $ | — | | | $ | 37,372 | |
Government Sponsored | | | — | | | | 26,983,125 | | | | — | | | | 26,983,125 | |
REITs – Office Property | | | — | | | | 1,903,729 | | | | — | | | | 1,903,729 | |
All Other Non-Convertible Preferred Stocks(a) | | | 74,337,540 | | | | — | | | | — | | | | 74,337,540 | |
| | | | | | | | | | | | | | | | |
Total Non-Convertible Preferred Stocks | | | 74,337,540 | | | | 28,924,226 | | | | — | | | | 103,261,766 | |
| | | | | | | | | | | | | | | | |
Total Preferred Stocks | | | 291,260,990 | | | | 74,996,051 | | | | — | | | | 366,257,041 | |
| | | | | | | | | | | | | | | | |
Closed-End Investment Companies | | | 7,233,611 | | | | — | | | | — | | | | 7,233,611 | |
Short-Term Investments | | | — | | | | 224,027,299 | | | | — | | | | 224,027,299 | |
| | | | | | | | | | | | | | | | |
Total | | $ | 3,484,006,819 | | | $ | 14,793,091,119 | | | $ | 497,548,858 | | | $ | 18,774,646,796 | |
| | | | | | | | | | | | | | | | |
| (a) | Details of the major categories of the Fund’s investments are reflected within the Portfolio of Investments. |
| (b) | Valued using broker-dealer bid prices. |
| (c) | Fair valued by the Fund’s adviser. |
Preferred stocks valued at $52,175,298 were transferred from Level 1 to Level 2 during the period ended September 30, 2014. At September 30, 2013, these securities were valued at the last sale price in accordance with the Fund’s valuation policies. At September 30, 2014, these securities were valued on the basis of evaluated bids furnished to the Fund by an independent pricing service as a market price was not available.
All transfers are recognized as of the beginning of the reporting period.
The Fund’s pricing policies and procedures are recommended by the adviser and approved by the Board of Trustees. Debt securities are valued based on evaluated bids furnished to the Fund by an independent pricing service. Broker-dealer bid prices may be used if an independent pricing service either is unable to price a security or does not provide a reliable price for a security. Broker-dealer bid prices for which the Fund does not have knowledge of the inputs used by the broker-dealer are categorized in Level 3. All security prices, including those obtained from an independent pricing service and broker-dealer bid prices, are reviewed on a daily basis by the adviser, subject to oversight by Fund management and the Board of Trustees. If the adviser, in good faith,
53 |
Notes to Financial Statements (continued)
September 30, 2014
believes that the price provided by an independent pricing service is unreliable, broker-dealer bid prices may be used until the price provided by the independent pricing service is considered to be reliable. Reliability of all security prices, including those obtained from an independent pricing service and broker-dealer bid prices, is tested in a variety of ways, including comparison to recent transaction prices and daily fluctuations, amongst other validation procedures in place. Securities for which market quotations are not readily available are valued at fair value as determined in good faith by the Fund’s adviser pursuant to procedures approved by the Board of Trustees. Fair valued securities may be categorized in Level 3.
The following is a reconciliation of Level 3 investments for which significant unobservable inputs were used to determine fair value as of September 30, 2013 and/or September 30, 2014:
Asset Valuation Inputs
| | | | | | | | | | | | | | | | | | | | |
Investments in Securities | | Balance as of
September 30,
2013 | | | Accrued
Discounts
(Premiums) | | | Realized
Gain
(Loss) | | | Change in
Unrealized
Appreciation
(Depreciation) | | | Purchases | |
Bonds and Notes | | | | | | | | | | | | | | | | | | | | |
Non-Convertible Bonds | | | | | | | | | | | | | | | | | | | | |
Airlines | | $ | 324,635,747 | | | $ | 231,600 | | | $ | 523,599 | | | $ | 4,813,832 | | | $ | — | |
Banking | | | — | | | | — | | | | — | | | | (1,636,804 | ) | | | 164,261,493 | |
Metals & Mining | | | — | | | | 376,312 | | | | (2,765,510 | ) | | | 1,023,798 | | | | — | |
Retailers | | | 11,276,382 | | | | 34,190 | | | | — | | | | (78,568 | ) | | | — | |
Transportation Services | | | 33,966,589 | | | | — | | | | 651,308 | | | | (703,787 | ) | | | — | |
Convertible Bonds | | | | | | | | | | | | | | | | | | | | |
Wirelines | | | 368,219 | | | | — | | | | (36,032 | ) | | | 115,432 | | | | — | |
Loan Participations | | | — | | | | — | | | | (4,226 | ) | | | 55,843 | | | | 15,570,913 | |
| | | | | | | | | | | | | | | | | | | | |
Total | | $ | 370,246,937 | | | $ | 642,102 | | | $ | (1,630,861 | ) | | $ | 3,589,746 | | | $ | 179,832,406 | |
| | | | | | | | | | | | | | | | | | | | |
| 54
Notes to Financial Statements (continued)
September 30, 2014
Asset Valuation Inputs (continued)
| | | | | | | | | | | | | | | | | | | | |
Investments in Securities | | Sales | | | Transfers
into Level 3 | | | Transfers
out of
Level 3 | | | Balance as of
September 30,
2014 | | | Change in
Unrealized
Appreciation
(Depreciation)
from
Investments
Still Held at
September 30,
2014 | |
Bonds and Notes | | | | | | | | | | | | | | | | | | | | |
Non-Convertible Bonds | | | | | | | | | | | | | | | | | | | | |
Airlines | | $ | (67,066,742 | ) | | $ | 7,401,650 | | | $ | — | | | $ | 270,539,686 | | | $ | 6,564,513 | |
Banking | | | — | | | | — | | | | — | | | | 162,624,689 | | | | (1,636,804 | ) |
Metals & Mining | | | (7,479,865 | ) | | | 17,195,425 | | | | — | | | | 8,350,160 | | | | 1,023,798 | |
Retailers | | | — | | | | — | | | | — | | | | 11,232,004 | | | | (78,568 | ) |
Transportation Services | | | (4,224,716 | ) | | | — | | | | — | | | | 29,689,394 | | | | 37,645 | |
Convertible Bonds | | | | | | | | | | | | | | | | | | | | |
Wirelines | | | (393,758 | ) | | | — | | | | — | | | | 53,861 | | | | 1,507 | |
Loan Participations | | | (563,466 | ) | | | — | | | | — | | | | 15,059,064 | | | | 55,843 | |
| | | | | | | | | | | | | | | | | | | | |
Total | | $ | (79,728,547 | ) | | $ | 24,597,075 | | | $ | — | | | $ | 497,548,858 | | | $ | 5,967,934 | |
| | | | | | | | | | | | | | | | | | | | |
Debt securities valued at $7,401,650 were transferred from Level 2 to Level 3 during the period ended September 30, 2014. At September 30, 2013, these securities were valued on the basis of evaluated bids furnished to the Fund by an independent pricing service in accordance with the Fund’s valuation policies. At September 30, 2014, these securities were valued using broker-dealer bid prices based on inputs unobservable to the Fund as an independent pricing service was unable to price the securities.
A debt security valued at $17,195,425 was transferred from Level 2 to Level 3 during the period ended September 30, 2014. At September 30, 2013, this security was valued on the basis of evaluated bids furnished to the Fund by an independent pricing service in accordance with the Fund’s valuation policies. At September 30, 2014, this security was valued at fair value as determined in good faith by the Fund’s adviser as an independent pricing service did not provide a reliable price for the security.
All transfers are recognized as of the beginning of the reporting period.
4. Purchases and Sales of Securities. For the year ended September 30, 2014, purchases and sales of securities (excluding short-term investments and U.S. Government/Agency securities and including paydowns) were $4,618,916,750 and $3,472,512,858, respectively. Purchases and sales of U.S. Government/Agency securities (excluding short-term investments and including paydowns) were $3,420,058,140 and $897,980,739, respectively.
55 |
Notes to Financial Statements (continued)
September 30, 2014
5. Management Fees and Other Transactions with Affiliates.
a. Management Fees. Loomis, Sayles & Company, L.P. (“Loomis Sayles”) serves as investment adviser to the Fund. Under the terms of the management agreement, the Fund pays a management fee at the following annual rates, calculated daily and payable monthly, based on the Fund’s average daily net assets:
| | | | | | | | | | | | | | | | |
Percentage of Average Daily Net Assets | |
First $200 million | | Next $1.8 billion | | | Next
$13 billion | | | Next
$10 billion | | | Over
$25 billion | |
0.65% | | | 0.60% | | | | 0.55% | | | | 0.54% | | | | 0.53% | |
Prior to July 1, 2014, the Fund paid a management fee at the following annual rates, calculated daily and payable monthly, based on the Fund’s average daily net assets:
| | | | | | | | | | | | |
Percentage of Average Daily Net Assets | |
First $200 million | | Next $1.8 billion | | | Next
$13 billion | | | Over
$15 billion | |
0.65% | | | 0.60% | | | | 0.55% | | | | 0.54% | |
Loomis Sayles has given a binding undertaking to the Fund to waive management fees and/or reimburse certain expenses to limit the Fund’s operating expenses, exclusive of acquired fund fees and expenses, brokerage expenses, interest expense, taxes and extraordinary expenses. This undertaking is in effect until January 31, 2015 and is reevaluated on an annual basis. Management fees payable, as reflected on the Statement of Assets and Liabilities, is net of waivers and/or expense reimbursements, if any, pursuant to this undertaking.
For the year ended September 30, 2014, the expense limits as a percentage of average daily net assets under the expense limitation agreement were as follows:
| | | | | | | | | | | | | | | | | | | | |
Expense Limit as a Percentage of Average Daily Net Assets | |
Class A | | Class B | | | Class C | | | Class N | | | Class Y | | | Admin Class | |
1.25% | | | 2.00% | | | | 2.00% | | | | 0.95% | | | | 1.00% | | | | 1.50% | |
Loomis Sayles shall be permitted to recover expenses it has borne under the expense limitation agreement (whether through waiver of its management fees or otherwise) on a class by class basis in later periods to the extent the annual operating expenses of a class fall below a class’ expense limits, provided, however, that a class is not obligated to pay such waived/reimbursed fees or expenses more than one year after the end of the fiscal year in which the fees or expenses were waived/reimbursed.
For the year ended September 30, 2014, the management fees for the Fund were $96,609,367 (effective rate of 0.55% of average daily net assets).
No expenses were recovered during the year ended September 30, 2014 under the terms of the expense limitation agreement.
| 56
Notes to Financial Statements (continued)
September 30, 2014
Certain officers and employees of Loomis Sayles are also officers or Trustees of the Trust. Loomis Sayles’ general partner is indirectly owned by Natixis Global Asset Management, L.P. (“Natixis US”), which is part of Natixis Global Asset Management, an international asset management group based in Paris, France.
b. Service and Distribution Fees. NGAM Distribution, L.P. (“NGAM Distribution”), which is a wholly-owned subsidiary of Natixis US, has entered into a distribution agreement with the Trust. Pursuant to this agreement, NGAM Distribution serves as principal underwriter of the Funds of the Trust.
Pursuant to Rule 12b-1 under the 1940 Act, the Trust has adopted a Service Plan relating to the Fund’s Class A shares (the “Class A Plan”), a Distribution and Service Plan relating to the Fund’s Class B and Class C shares (the “Class B and Class C Plans”), and a Distribution Plan relating to its Admin Class shares (the “Admin Class Plan”).
Under the Class A Plan, the Fund pays NGAM Distribution a monthly service fee at an annual rate not to exceed 0.25% of the average daily net assets attributable to the Fund’s Class A shares, as reimbursement for expenses incurred by NGAM Distribution in providing personal services to investors in Class A shares and/or the maintenance of shareholder accounts.
Under the Class B and Class C Plans, the Fund pays NGAM Distribution a monthly service fee at an annual rate not to exceed 0.25% of the average daily net assets attributable to the Fund’s Class B and Class C shares, as compensation for services provided by NGAM Distribution in providing personal services to investors in Class B and Class C shares and/or the maintenance of shareholder accounts.
Also under the Class B and Class C Plans, the Fund pays NGAM Distribution a monthly distribution fee at an annual rate of 0.75% of the average daily net assets attributable to the Fund’s Class B and Class C shares, as compensation for services provided by NGAM Distribution in connection with the marketing or sale of Class B and Class C shares.
Under the Admin Class Plan, the Fund pays NGAM Distribution a monthly distribution fee at an annual rate not to exceed 0.25% of the average daily net assets attributable to the Fund’s Admin Class shares, as compensation for services provided by NGAM Distribution in connection with the marketing or sale of Admin Class shares or for payments made by NGAM Distribution to securities dealers or other financial intermediaries as commissions, asset-based sales charges or other compensation with respect to the sale of Admin Class shares, or for providing personal services to investors and/or the maintenance of shareholder accounts.
In addition, the Admin Class shares of the Fund may pay NGAM Distribution an administrative service fee, at an annual rate not to exceed 0.25% of the average daily net assets attributable to Admin Class shares. These fees are subsequently paid to securities dealers or financial intermediaries for providing personal services and/or account maintenance for their customers who hold such shares.
57 |
Notes to Financial Statements (continued)
September 30, 2014
For the year ended September 30, 2014, the service and distribution fees for the Fund were as follows:
| | | | | | | | | | | | | | | | | | | | | | | | |
Service Fees | | | Distribution Fees | |
Class A | | Class B | | | Class C | | | Admin Class | | | Class B | | | Class C | | | Admin Class | |
$14,152,377 | | $ | 114,870 | | | $ | 13,164,293 | | | $ | 288,159 | | | $ | 344,611 | | | $ | 39,492,878 | | | $ | 288,159 | |
c. Administrative Fees. NGAM Advisors, L.P. (“NGAM Advisors”) provides certain administrative services for the Fund and contracts with State Street Bank to serve as sub-administrator. NGAM Advisors is a wholly-owned subsidiary of Natixis US. Pursuant to an agreement among Natixis Funds Trusts, Loomis Sayles Funds Trusts, Hansberger International Series and NGAM Advisors, the Fund pays NGAM Advisors monthly its pro rata portion of fees equal to an annual rate of 0.0575% of the first $15 billion of the average daily net assets of the Natixis Funds Trusts, Loomis Sayles Funds Trusts and Hansberger International Series, 0.0500% of the next $15 billion, 0.0400% of the next $30 billion, 0.0350% of the next $30 billion and 0.0325% of such assets in excess of $90 billion, subject to an annual aggregate minimum fee for the Natixis Funds Trusts, Loomis Sayles Funds Trusts and Hansberger International Series of $10 million, which is reevaluated on an annual basis.
For the year ended September 30, 2014, the administrative fees for the Fund were $7,571,620.
Prior to July 1, 2014, each Fund paid NGAM Advisors monthly its pro rata portion of fees equal to an annual rate of 0.0575% of the first $15 billion of the average daily net assets of the Natixis Funds Trusts, Loomis Sayles Funds Trusts and Hansberger International Series, 0.0500% of the next $15 billion, 0.0400% of the next $30 billion and 0.0350% of such assets in excess of $60 billion, subject to an annual aggregate minimum fee for the Natixis Funds Trusts, Loomis Sayles Funds Trusts and Hansberger International Series of $10 million.
d. Sub-Transfer Agent Fees. NGAM Distribution has entered into agreements, which include servicing agreements, with financial intermediaries that provide recordkeeping, processing, shareholder communications and other services to customers of the intermediaries that hold positions in the Fund and has agreed to compensate the intermediaries for providing those services. Intermediaries transact with the Fund primarily through the use of omnibus accounts on behalf of their customers who hold positions in the Fund. These services would have been provided by the Fund’s transfer agent and other service providers if the shareholders’ accounts were maintained directly at the Fund’s transfer agent. Accordingly, the Fund has agreed to reimburse NGAM Distribution for all or a portion of the servicing fees paid to these intermediaries. The reimbursement amounts (sub-transfer agent fees) paid to NGAM Distribution are subject to a current per-account equivalent fee limit approved by the Fund’s Board, which is based on fees for similar services paid to the Fund’s transfer agent and other service providers. Class N shares do not bear such expenses.
| 58
Notes to Financial Statements (continued)
September 30, 2014
For the year ended September 30, 2014, the sub-transfer agent fees (which are reflected in transfer agent fees and expenses in the Statement of Operations) for the Fund were $11,458,671.
As of September 30, 2014, the Fund owes NGAM Distribution $143,520 in reimbursements for sub-transfer agent fees.
Sub-transfer agent fees attributable to Class A, Class B, Class C, Class Y and Admin Class are allocated on a pro rata basis to each class based on the relative net assets of each class to the total net assets of those classes.
e. Commissions. Commissions (including CDSCs) on Fund shares retained by NGAM Distribution during the year ended September 30, 2014 amounted to $5,164,639.
f. Trustees Fees and Expenses. The Trust does not pay any compensation directly to its officers or Trustees who are directors, officers or employees of NGAM Advisors, NGAM Distribution, Natixis US or their affiliates. Effective January 1, 2014, the Chairperson of the Board receives a retainer fee at the annual rate of $300,000. The Chairperson does not receive any meeting attendance fees for Board of Trustees meetings or committee meetings that she attends. Each Independent Trustee (other than the Chairperson) receives, in the aggregate, a retainer fee at the annual rate of $130,000. Each Independent Trustee also receives a meeting attendance fee of $10,000 for each meeting of the Board of Trustees that he or she attends in person and $5,000 for each meeting of the Board of Trustees that he or she attends telephonically. In addition, each committee chairperson (except for the Chairperson of the Governance Committee) receives an additional retainer fee at an annual rate of $17,500. Each Contract Review Committee member is compensated $6,000 for each Committee meeting that he or she attends in person and $3,000 for each meeting that he or she attends telephonically. Each Audit Committee member is compensated $6,000 for each Committee meeting that he or she attends in person and $3,000 for each meeting that he or she attends telephonically. These fees are allocated among the funds in the Natixis Funds Trusts, Loomis Sayles Funds Trusts and Hansberger International Series based on a formula that takes into account, among other factors, the relative net assets of each Fund. Trustees are reimbursed for travel expenses in connection with attendance at meetings.
Prior to January 1, 2014, the Chairperson of the Board received a retainer fee at the annual rate of $285,000 and each Independent Trustee (other than the Chairperson) received, in the aggregate, a retainer fee at the annual rate of $115,000. All other Trustee fees remained unchanged.
A deferred compensation plan (the “Plan”) is available to the Trustees on a voluntary basis. Deferred amounts remain in the Fund until distributed in accordance with the provisions of the Plan. The value of a participating Trustee’s deferral account is based on theoretical investments of deferred amounts, on the normal payment dates, in certain funds of the Natixis Funds Trusts, Loomis Sayles Funds Trusts and Hansberger
59 |
Notes to Financial Statements (continued)
September 30, 2014
International Series as designated by the participating Trustees. Changes in the value of participants’ deferral accounts are allocated pro rata among the funds in the Natixis Funds Trusts, Loomis Sayles Funds Trusts, and Hansberger International Series, and are normally reflected as Trustees’ fees and expenses in the Statement of Operations. The portions of the accrued obligations allocated to the Fund under the Plan are reflected as Deferred Trustees’ fees in the Statement of Assets and Liabilities.
6. Class-Specific Transfer Agent Fees and Expenses. For the year ended September 30, 2014, the Fund incurred the following class-specific transfer agent fees and expenses (including sub-transfer agent fees, where applicable):
| | | | | | | | | | | | | | | | | | | | | | | | |
| | | Class A | | | Class B | | | Class C | | | Class N | | | Class Y | | | Admin Class | |
Transfer Agent Fees and Expenses | | $ | 4,083,127 | | | $ | 33,244 | | | $ | 3,797,307 | | | $ | 373 | | | $ | 4,523,249 | | | $ | 82,973 | |
Transfer agent fees and expenses attributable to Class A, Class B, Class C, Class Y and Admin Class are allocated on a pro rata basis to each class based on the relative net assets of each class to the total net assets of those classes. Transfer agent fees and expenses attributable to Class N are allocated to Class N.
7. Line of Credit. The Fund, together with certain other funds of Natixis Funds Trusts, Loomis Sayles Funds Trusts and Hansberger International Series, participates in a $200,000,000 committed unsecured line of credit provided by State Street Bank, with an individual limit of $125,000,000 for each Fund that participates in the line of credit. Interest is charged to each participating Fund based on its borrowings at a rate per annum equal to the greater of the Federal Funds rate or overnight LIBOR, plus 1.25%. In addition, a commitment fee of 0.10% per annum, payable at the end of each calendar quarter, is accrued and apportioned among the participating funds based on their average daily unused portion of the line of credit.
For the year ended September 30, 2014, the Fund had no borrowings under this agreement.
8. Concentration of Risk. The Fund’s investments in foreign securities are subject to foreign currency fluctuations, higher volatility than U.S. securities, varying degrees of regulation and limited liquidity. Greater political, economic, credit and information risks are also associated with foreign securities.
| 60
Notes to Financial Statements (continued)
September 30, 2014
9. Capital Shares. The Fund may issue an unlimited number of shares of beneficial interest, without par value. Transactions in capital shares were as follows:
| | | | | | | | | | | | | | | | |
| |
| Year Ended
September 30, 2014 |
| |
| Year Ended
September 30, 2013* |
|
| | | Shares | | | | Amount | | | | Shares | | | | Amount | |
| Class A | | | | | | | | | | | | | | | | |
Issued from the sale of shares | | | 96,833,211 | | | $ | 1,613,333,700 | | | | 85,161,020 | | | $ | 1,344,652,662 | |
Issued in connection with the reinvestment of distributions | | | 10,982,373 | | | | 182,518,046 | | | | 13,495,375 | | | | 211,445,205 | |
Redeemed | | | (173,467,513 | ) | | | (2,943,275,774 | ) | | | (106,628,096 | ) | | | (1,673,657,377 | ) |
| | | | | | | | | | | | | | | | |
Net change | | | (65,651,929 | ) | | $ | (1,147,424,028 | ) | | | (7,971,701 | ) | | $ | (117,559,510 | ) |
| | | | | | | | | | | | | | | | |
| Class B | | | | | | | | | | | | | | | | |
Issued from the sale of shares | | | 36,090 | | | $ | 598,526 | | | | 84,938 | | | $ | 1,342,254 | |
Issued in connection with the reinvestment of distributions | | | 55,643 | | | | 927,891 | | | | 116,207 | | | | 1,831,113 | |
Redeemed | | | (1,838,778 | ) | | | (31,002,903 | ) | | | (2,445,061 | ) | | | (38,778,882 | ) |
| | | | | | | | | | | | | | | | |
Net change | | | (1,747,045 | ) | | $ | (29,476,486 | ) | | | (2,243,916 | ) | | $ | (35,605,515 | ) |
| | | | | | | | | | | | | | | | |
| Class C | | | | | | | | | | | | | | | | |
Issued from the sale of shares | | | 52,092,722 | | | $ | 875,512,700 | | | | 36,207,754 | | | $ | 574,188,840 | |
Issued in connection with the reinvestment of distributions | | | 5,620,301 | | | | 93,940,364 | | | | 7,359,016 | | | | 115,930,122 | |
Redeemed | | | (44,336,735 | ) | | | (744,451,969 | ) | | | (66,124,686 | ) | | | (1,046,914,424 | ) |
| | | | | | | | | | | | | | | | |
Net change | | | 13,376,288 | | | $ | 225,001,095 | | | | (22,557,916 | ) | | $ | (356,795,462 | ) |
| | | | | | | | | | | | | | | | |
| Class N | | | | | | | | | | | | | | | | |
Issued from the sale of shares | | | 2,745,644 | | | $ | 45,891,917 | | | | 795,587 | | | $ | 12,674,081 | |
Issued in connection with the reinvestment of distributions | | | 85,441 | | | | 1,433,052 | | | | 19,538 | | | | 310,035 | |
Redeemed | | | (191,196 | ) | | | (3,219,311 | ) | | | (3,501 | ) | | | (57,560 | ) |
| | | | | | | | | | | | | | | | |
Net change | | | 2,639,889 | | | $ | 44,105,658 | | | | 811,624 | | | $ | 12,926,556 | |
| | | | | | | | | | | | | | | | |
| Class Y | | | | | | | | | | | | | | | | |
Issued from the sale of shares | | | 288,746,772 | | | $ | 4,865,529,460 | | | | 114,234,013 | | | $ | 1,799,718,390 | |
Issued in connection with the reinvestment of distributions | | | 9,613,689 | | | | 160,340,745 | | | | 8,900,319 | | | | 139,377,642 | |
Redeemed | | | (76,423,525 | ) | | | (1,273,844,644 | ) | | | (106,030,487 | ) | | | (1,668,831,214 | ) |
| | | | | | | | | | | | | | | | |
Net change | | | 221,936,936 | | | $ | 3,752,025,561 | | | | 17,103,845 | | | $ | 270,264,818 | |
| | | | | | | | | | | | | | | | |
| Admin Class | | | | | | | | | | | | | | | | |
Issued from the sale of shares | | | 3,718,005 | | | $ | 61,793,225 | | | | 2,237,182 | | | $ | 35,129,300 | |
Issued in connection with the reinvestment of distributions | | | 217,039 | | | | 3,607,944 | | | | 163,798 | | | | 2,563,820 | |
Redeemed | | | (661,926 | ) | | | (11,026,683 | ) | | | (565,879 | ) | | | (8,879,280 | ) |
| | | | | | | | | | | | | | | | |
Net change | | | 3,273,118 | | | $ | 54,374,486 | | | | 1,835,101 | | | $ | 28,813,840 | |
| | | | | | | | | | | | | | | | |
Increase (decrease) from capital share transactions | | | 173,827,257 | | | $ | 2,898,606,286 | | | | (13,022,963 | ) | | $ | (197,955,273 | ) |
| | | | | | | | | | | | | | | | |
| * | From commencement of operations on February 1, 2013 through September 30, 2013 for Class N shares. |
61 |
Report of Independent Registered Public
Accounting Firm
To the Trustees of Loomis Sayles Funds II and Shareholders of
Loomis Sayles Strategic Income Fund:
In our opinion, the accompanying statement of assets and liabilities, including the portfolio of investments, and the related statements of operations and of changes in net assets and the financial highlights present fairly, in all material respects, the financial position of the Loomis Sayles Strategic Income Fund, a series of Loomis Sayles Funds II (the “Fund”), at September 30, 2014, and the results of its operations, the changes in its net assets and the financial highlights for each of the periods indicated, in conformity with accounting principles generally accepted in the United States of America. These financial statements and financial highlights (hereafter referred to as “financial statements”) are the responsibility of the Fund’s management. Our responsibility is to express an opinion on these financial statements based on our audits. We conducted our audits of these financial statements in accordance with the standards of the Public Company Accounting Oversight Board (United States). Those standards require that we plan and perform the audits to obtain reasonable assurance about whether the financial statements are free of material misstatement. An audit includes examining, on a test basis, evidence supporting the amounts and disclosures in the financial statements, assessing the accounting principles used and significant estimates made by management, and evaluating the overall financial statement presentation. We believe that our audits, which included confirmation of securities at September 30, 2014 by correspondence with the custodian and the application of alternative auditing procedures where securities purchased had not been received, provide a reasonable basis for the opinion expressed above.
PricewaterhouseCoopers LLP
Boston, Massachusetts
November 21, 2014
| 62
2014 U.S. Tax Distribution Information to
Shareholders (Unaudited)
Corporate Dividends Received Deduction. For the fiscal year ended September 30, 2014, 10.84% of dividends distributed by Strategic Income Fund qualify for the dividends received deduction for corporate shareholders.
Capital Gains Distributions. Pursuant to Internal Revenue Section 852(b), the Strategic Income Fund designated $40,821,512 as capital gains distributions for the fiscal year ended September 30, 2014, unless subsequently determined to be different.
Qualified Dividend Income. For the fiscal year ended September 30, 2014, the Strategic Income Fund will designate up to the maximum amount allowable pursuant to the Internal Revenue Code as qualified dividend income eligible for reduced tax rates. These lower rates range from 0% to 20% depending on an individual’s tax bracket. If the Fund pays a distribution during calendar year 2014, complete information will be reported in conjunction with Form 1099-DIV.
63 |
Trustee and Officer Information
The tables below provide certain information regarding the trustees and officers of Loomis Sayles Funds II (the “Trust”). Unless otherwise indicated, the address of all persons below is 399 Boylston Street, Boston, MA 02116. The Fund’s Statement of Additional Information include additional information about the trustees of the Trust and is available by calling Natixis Funds at 800-225-5478.
| | | | | | | | |
Name and Year of Birth | | Position(s) Held
with the Trust,
Length of Time
Served and Term of Office1 | | Principal
Occupation(s)
During Past 5 Years | | Number of
Portfolios in
Fund Complex
Overseen2
and Other
Directorships Held
During Past 5 Years | | Experience,
Qualifications,
Attributes, Skills
for Board Membership |
| | | |
| INDEPENDENT TRUSTEES | | | | | | |
| | | | |
Kenneth A. Drucker (1945) | | Trustee since 2008 Chairman of the Audit Committee and Governance Committee Member | | Retired | | 42 None | | Significant experience on the Board and on the board of other business organizations (including at investment companies); executive experience (including as treasurer of an aerospace, automotive, and metal manufacturing corporation) |
| | | | |
Edmond J. English (1953) | | Trustee since 2013 Contract Review Committee Member | | Chief Executive Officer of Bob’s Discount Furniture (retail) | | 42 Formerly, Director, BJ’s Wholesale Club (retail); formerly, Director, Citizens Financial Group (bank) | | Experience on the Board and significant experience on the board of other business organizations (including at a retail company and a bank); executive experience (including at a retail company) |
| 64
Trustee and Officer Information
| | | | | | | | |
Name and Year of Birth | | Position(s) Held
with the Trust,
Length of Time
Served and Term of Office1 | | Principal
Occupation(s)
During Past 5 Years | | Number of
Portfolios in
Fund Complex
Overseen2
and Other
Directorships Held
During Past 5 Years | | Experience,
Qualifications,
Attributes, Skills
for Board Membership |
| | | |
INDEPENDENT TRUSTEES continued | | | | | | |
| | | | |
Wendell J. Knox (1948) | | Trustee since 2009 Audit Committee Member and Governance Committee Member | | Director of Abt Associates Inc. (research and consulting) | | 42 Director, Eastern Bank (bank); Director, The Hanover Insurance Group (property and casualty insurance) | | Significant experience on the Board and on the board of other business organizations (including at a bank and at a property and casualty insurance firm); executive experience (including roles as president and chief executive officer of a research and consulting company) |
| | | | |
Martin T. Meehan (1956) | | Trustee since 2012 Contract Review Committee Member | | Chancellor and faculty member, University of Massachusetts Lowell | | 42 None | | Experience on the Board and on the board of other business organizations; experience as Chancellor of the University of Massachusetts Lowell; government experience (including as a member of the U.S. House of Representatives); academic experience |
65 |
Trustee and Officer Information
| | | | | | | | |
Name and Year of Birth | | Position(s) Held
with the Trust,
Length of Time
Served and Term of Office1 | | Principal
Occupation(s)
During Past 5 Years | | Number of
Portfolios in
Fund Complex
Overseen2
and Other
Directorships Held
During Past 5 Years | | Experience,
Qualifications,
Attributes, Skills
for Board Membership |
| | | |
INDEPENDENT TRUSTEES continued | | | | | | |
| | | | |
Sandra O. Moose (1942) | | Chairperson of the Board of Trustees since November 2005 Trustee since 2003 Ex Officio member of the Audit Committee, the Contract Review Committee and the Governance Committee | | President, Strategic Advisory Services (management consulting) | | 42 Director, AES Corporation (international power company); formerly, Director, Rohm and Haas Company (specialty chemicals); formerly, Director, Verizon Communications (telecommunications company) | | Significant experience on the Board and on the board of other business organizations (including at a telecommunications company, an international power company and a specialty chemicals corporation); executive experience (including at a management consulting company) |
| | | | |
Erik R. Sirri (1958) | | Trustee since 2009 Audit Committee Member | | Professor of Finance at Babson College | | 42 None | | Significant experience on the Board; experience as Director of the Division of Trading and Markets at the Securities and Exchange Commission; academic experience; training as an economist |
| 66
Trustee and Officer Information
| | | | | | | | |
Name and Year of Birth | | Position(s) Held
with the Trust,
Length of Time
Served and Term of Office1 | | Principal
Occupation(s)
During Past 5 Years | | Number of
Portfolios in
Fund Complex
Overseen2
and Other
Directorships Held
During Past 5 Years | | Experience,
Qualifications,
Attributes, Skills
for Board Membership |
| | | |
INDEPENDENT TRUSTEES continued | | | | | | |
| | | | |
Peter J. Smail (1952) | | Trustee since 2009 Chairman of the Contract Review Committee and Governance Committee Member | | Retired | | 42 None | | Significant experience on the Board; mutual fund industry and executive experience (including roles as president and chief executive officer for an investment adviser) |
| | | | |
Cynthia L. Walker (1956) | | Trustee since 2005 Chairperson of the Governance Committee and Contract Review Committee Member | | Deputy Dean for Finance and Administration, Yale University School of Medicine | | 42 None | | Significant experience on the Board; executive experience in a variety of academic organizations (including roles as dean for finance and administration) |
| | | |
| INTERESTED TRUSTEES | | | | | | |
| | | | |
Robert J. Blanding3 (1947) 555 California Street San Francisco, CA 94104 | | Trustee since 2002 Chief Executive Officer since 2002 | | Chairman, Director and Chief Executive Officer (formerly, President), Loomis, Sayles & Company, L.P. | | 42 None | | Significant experience on the Board; continuing service as Chairman and Chief Executive Officer of Loomis, Sayles & Company, L.P. |
67 |
Trustee and Officer Information
| | | | | | | | |
Name and Year of Birth | | Position(s) Held
with the Trust,
Length of Time
Served and Term of Office1 | | Principal
Occupation(s)
During Past 5 Years | | Number of
Portfolios in
Fund Complex
Overseen2
and Other
Directorships Held
During Past 5 Years | | Experience,
Qualifications,
Attributes, Skills
for Board Membership |
| | | |
INTERESTED TRUSTEES continued | | | | | | |
| | | | |
David L. Giunta4 (1965) | | Trustee since 2011 President since 2008 | | President and Chief Executive Officer, NGAM Distribution Corporation, NGAM Advisors, L.P. and NGAM Distribution, L.P. | | 42 None | | Experience on the Board; continuing experience as President and Chief Executive Officer of NGAM Advisors, L.P. |
| | | | |
John T. Hailer5 (1960) | | Trustee since 2003 | | President and Chief Executive Officer – U.S. and Asia, Natixis Global Asset Management, L.P. | | 42 None | | Significant experience on the Board; continuing experience as President and Chief Executive Officer – U.S. and Asia, Natixis Global Asset Management, L.P. |
| 1 | Each trustee serves until retirement, resignation or removal from the Board. The current retirement age is 75. The position of Chairperson of the Board is appointed for a three-year term. Ms. Moose was appointed to serve an additional three-year term as the Chairperson of the Board on December 13, 2013. |
| 2 | The trustees of the Trust serve as trustees of a fund complex that includes all series of the Natixis Funds Trust I, Natixis Funds Trust II, Natixis Funds Trust IV and Gateway Trust (collectively, the “Natixis Funds Trusts”), Loomis Sayles Funds I and Loomis Sayles Funds II (collectively, the “Loomis Sayles Funds Trusts”). |
| 3 | Mr. Blanding is deemed an “interested person” of the Trust because he holds the following positions with an affiliated person of the Trust: Chairman, Director and Chief Executive Officer of Loomis, Sayles & Company, L.P. and Director of Loomis Sayles Investment Asia Pte., Ltd. |
| 4 | Mr. Giunta is deemed an “interested person” of the Trust because he holds the following positions with an affiliated person of the Trust: President and Chief Executive Officer of NGAM Distribution Corporation, NGAM Advisors, L.P. and NGAM Distribution, L.P. |
| 5 | Mr. Hailer is deemed an “interested person” of the Trust because he holds the following positions with an affiliated person of the Trust: President and Chief Executive Officer – U.S. and Asia, Natixis Global Asset Management, L.P. |
| 68
Trustee and Officer Information
| | | | | | |
Name and Year of Birth | | Position(s) Held with the Trust | | Term of Office1 and Length of Time Served | | Principal Occupation(s) During Past 5 Years2 |
|
| OFFICERS OF THE TRUST |
| | | |
Coleen Downs Dinneen (1960) | | Secretary, Clerk and Chief Legal Officer | | Since September 2004 | | Executive Vice President, General Counsel, Secretary and Clerk, NGAM Distribution Corporation, NGAM Advisors, L.P. and NGAM Distribution, L.P. |
| | | |
Daniel J. Fuss (1933) One Financial Center Boston, MA 02111 | | Executive Vice President | | Since June 2003 | | Vice Chairman and Director, Loomis, Sayles & Company, L.P. |
| | | |
Russell L. Kane (1969) | | Chief Compliance Officer, Assistant Secretary and Anti-Money Laundering Officer | | Chief Compliance Officer since May 2006; Assistant Secretary since June 2004; and Anti-Money Laundering Officer since April 2007 | | Chief Compliance Officer for Mutual Funds, Senior Vice President, Deputy General Counsel, Assistant Secretary and Assistant Clerk, NGAM Distribution Corporation, NGAM Advisors, L.P. and NGAM Distribution, L.P. |
| | | |
Michael C. Kardok (1959) | | Treasurer, Principal Financial and Accounting Officer | | Since October 2004 | | Senior Vice President, NGAM Advisors, L.P. and NGAM Distribution, L.P. |
| 1 | Each officer of the Trust serves for an indefinite term in accordance with the Trust’s current by-laws until the date his or her successor is elected and qualified, or until he or she sooner dies, retires, is removed or becomes disqualified. |
| 2 | Each person listed above, except as noted, holds the same position(s) with the Fund Complex. Mr. Fuss is not an officer of the Natixis Funds Trusts. Previous positions during the past five years with NGAM Distribution, L.P., NGAM Advisors, L.P. or Loomis, Sayles & Company, L.P. are omitted, if not materially different from a trustee’s or officer’s current position with such entity. |
69 |
The Registrant has adopted a code of ethics that applies to the Registrant’s principal executive officer, principal financial officer and persons performing similar functions. There have been no amendments or waivers of the Registrant’s code of ethics during the period.
| Item 3. | Audit Committee Financial Expert. |
The Board of Trustees of the Registrant has established an audit committee. Mr. Kenneth A. Drucker, Mr. Wendell J. Knox and Mr. Erik R. Sirri are members of the audit committee and have been designated as “audit committee financial experts” by the Board of Trustees. Each of these individuals is also an Independent Trustee of the Registrant.
| Item 4. | Principal Accountant Fees and Services. |
Fees billed by the Principal Accountant for services rendered to the Registrant.
The table below sets forth fees billed by the principal accountant, PricewaterhouseCoopers LLP, for the past two fiscal years for professional services rendered in connection with a) the audit of the Registrant’s annual financial statements and services provided in connection with regulatory filings; b) audit-related services (including services that are reasonably related to the performance of the audit of the Registrant’s financial statements and but not reported under “Audit Fees”); c) tax compliance, tax advice and tax planning and d) all other fees billed for professional services rendered by the principal accountant to the Registrant, other than the services reported as a part of (a) through (c) of this Item.
| | | | | | | | | | | | | | | | | | | | | | | | | | | | | | | | |
| | | Audit fees | | | Audit-related fees1 | | | Tax fees2 | | | All other fees3 | |
| | | 10/1/12-
9/30/13 | | | 10/1/13-
9/30/14 | | | 10/1/12-
9/30/13 | | | 10/1/13-
9/30/14 | | | 10/1/12-
9/30/13 | | | 10/1/13-
9/30/14 | | | 10/1/12-
9/30/13 | | | 10/1/13-
9/30/14 | |
Loomis Sayles Funds II | | $ | 390,231 | | | $ | 382,158 | | | $ | 4,977 | | | $ | 4,886 | | | $ | 99,229 | | | $ | 85,916 | | | $ | — | | | $ | — | |
| 1. | Audit-related fees consist of: |
2013 & 2014 – performance of agreed-upon procedures related to the Registrant’s deferred compensation plan.
2013 & 2014 – review of Registrant’s tax returns, tax consulting services and review of liquidating fund distributions.
Aggregate fees billed to the Registrant for non-audit services during 2013 and 2014 were $104,206 and $90,802 respectively.
Fees billed by the Principal Accountant for services rendered to the Adviser and Control Affiliates.
The following table sets forth the fees billed by the Registrant’s principal accountant for non-audit services rendered to Loomis, Sayles & Company, L.P. and entities controlling, controlled by or under common control with Loomis, Sayles & Company, L.P. Registrant (“Control Affiliates”) that provide ongoing services to the Registrant, for engagements that related directly to the operations and financial reporting of the Registrant for the last two fiscal years.
| | | | | | | | | | | | | | | | | | | | | | | | |
| | | Audit-related fees | | | Tax fees | | | All other fees | |
| | | 10/1/12-
9/30/13 | | | 10/1/13-
9/30/14 | | | 10/1/12-
9/30/13 | | | 10/1/13-
9/30/14 | | | 10/1/12-
9/30/13 | | | 10/1/13-
9/30/14 | |
Control Affiliates | | $ | — | | | $ | — | | | $ | — | | | $ | — | | | $ | — | | | $ | — | |
The following table sets forth the aggregate fees billed by the Registrant’s principal accountant for non-audit services rendered to Loomis, Sayles & Company, L.P. and Control Affiliates that provide ongoing services to the Registrant, for the last two fiscal years, including the fees disclosed in the table above.
| | | | | | | | |
| | | Aggregate Non-Audit Fees | |
| | | 10/1/12-9/30/13 | | | 10/1/13-9/30/14 | |
Control Affiliates | | $ | 73,039 | | | $ | 228,621 | |
None of the services described above were approved pursuant to (c)(7)(i)(C) of Regulation S-X.
Audit Committee Pre Approval Policies.
Annually, the Registrant’s Audit Committee reviews the audit, audit-related, tax and other non-audit services together with the projected fees, for services proposed to be rendered to the Trust and/or other entities for which pre-approval is required during the upcoming year. Any subsequent revisions to already pre-approved services or fees (including fee increases) and requests for pre-approval of new services would be presented for consideration quarterly as needed.
If, in the opinion of management, a proposed engagement by the Registrant’s independent accountants needs to commence before the next regularly scheduled Audit Committee meeting, any member of the Audit Committee who is an independent Board member is authorized to pre-approve the engagement, but only for engagements to provide audit, audit related and tax services. This approval is subject to review of the full Audit Committee at its next quarterly meeting. All other engagements require the approval of all the members of the Audit Committee.
| Item 5. | Audit Committee of Listed Registrants. |
Not applicable.
| Item 6. | Schedule of Investments. |
Included as part of the Report to Shareholders filed as Item 1 herewith.
| Item 7. | Disclosure of Proxy Voting Policies and Procedures for Closed-End Management Investment Companies. |
Not applicable.
| Item 8. | Portfolio Managers of Closed-End Management Investment Companies |
Not applicable.
| Item 9. | Purchases of Equity Securities by Closed-End Management Investment Companies and Affiliated Purchasers. |
Not applicable.
| Item 10. | Submission of Matters to a Vote of Securities Holders. |
There were no material changes to the procedures by which shareholders may recommend nominees to the Registrant’s Board of Trustees.
| Item 11. | Controls and Procedures. |
The Registrant’s principal executive officer and principal financial officer have concluded that the Registrant’s disclosure controls and procedures are sufficient to ensure that information required to be disclosed by the Registrant in this Form N-CSR was recorded, processed, summarized and reported within the time periods specified in the Securities and Exchange Commission’s rules and forms, based upon such officers’ evaluation of these controls and procedures as of a date within 90 days of the filing date of the report.
There were no changes in the Registrant’s internal control over financial reporting that occurred during the Registrant’s last fiscal quarter of the period covered by the report that has materially affected, or is reasonably likely to materially affect, the Registrant’s internal control over financial reporting.
| | | | |
| (a) | | (1) | | Code of Ethics required by Item 2 hereof, filed herewith as Exhibit (a)(1). |
| (a) | | (2) | | Certifications of Principal Executive Officer and Principal Financial Officer pursuant to Rule 30a-2(a) under the Investment Company Act of 1940 (17 CFR 270.30a-2(a)), filed herewith as Exhibits (a)(2)(1) and (a)(2)(2), respectively. |
| (a) | | (3) | | Not applicable. |
| (b) | | | | Certification of Principal Executive Officer and Principal Financial Officer pursuant to Section 906 of Sarbanes-Oxley Act of 2002 are filed herewith as Exhibit (b). |
SIGNATURES
Pursuant to the requirements of the Securities Exchange Act of 1934 and the Investment Company Act of 1940, the Registrant has duly caused this report to be signed on its behalf by the undersigned, thereunto duly authorized.
| | |
| Loomis Sayles Funds II |
| |
| By: | | /s/ Robert J. Blanding |
| Name: | | Robert J. Blanding |
| Title: | | Chief Executive Officer |
| |
| Date: | | November 21, 2014 |
Pursuant to the requirements of the Securities Exchange Act of 1934 and the Investment Company Act of 1940, this report has been signed by the following persons on behalf of the Registrant and in the capacities and on the dates indicated.
| | |
| By: | | /s/ Robert J. Blanding |
| Name: | | Robert J. Blanding |
| Title: | | Chief Executive Officer |
| |
| Date: | | November 21, 2014 |
| |
| By: | | /s/ Michael C. Kardok |
| Name: | | Michael C. Kardok |
| Title: | | Treasurer |
| |
| Date: | | November 21, 2014 |