UNITED STATES
SECURITIES AND EXCHANGE COMMISSION
Washington, D.C. 20549
FORM N-CSR
CERTIFIED SHAREHOLDER REPORT OF REGISTERED
MANAGEMENT INVESTMENT COMPANIES
Investment Company Act file number 811-6318
Consulting Group Capital Markets Funds
(Exact name of registrant as specified in charter)
125 Broad Street, New York, NY 10004
(Address of principal executive offices) (Zip code)
Robert I. Frenkel, Esq.
Smith Barney Fund Management LLC
300 First Stamford Place
Stamford, CT 06902
(Name and address of agent for service)
Registrant’s telephone number, including area code: (800) 451-2010
Date of fiscal year end: August 31
Date of reporting period: August 31, 2004
ITEM 1. REPORT TO STOCKHOLDERS.
The Annual Report to Stockholders is filed herewith.

Consulting Group
Capital Markets Funds
Large Capitalization Value Equity Investments
Large Capitalization Growth Investments
Small Capitalization Value Equity Investments
Small Capitalization Growth Investments
International Equity Investments
Emerging Markets Equity Investments
Government Money Investments
Core Fixed Income Investments
High Yield Investments
Municipal Bond Investments
International Fixed Income Investments
Annual Report
August 31, 2004

NOT FDIC INSURED • NOT BANK GUARANTEED • MAY LOSE VALUE
Table of Contents
Consulting Group
Capital Markets Funds
DEAR SHAREHOLDER,
Opportunities in the global financial markets allowed each of the portfolios of the Consulting Group Capital Markets Funds (or collectively the “Funds”) to post positive returns for the fiscal year ending August 31, 2004. The fundamental environment was generally positive for investing with global economic growth, very strong corporate profit comparisons, and low interest rates. The most significant fundamental development was the beginning of a change in the Federal Reserve Board’s (the “Fed”) interest rate policy. In June 2004, the Fed reversed the falling interest rate policy and began a process of regular increases in interest rates. The returns for the asset classes benefited from the favorable environment. US equities, as represented by the Standard & Poor’s 500 Indexi, rose 11.45%, international equities increased 22.64% as measured by the MSCI EAFE Indexii , and fixed income securities rose 6.13% according to the Lehman Brothers Aggregate Bond Index.iii
While the broad equity and bond indices rose, factors within those indices, such as quality, sectors, and style greatly influenced returns. Until the Fed changed its stance on the direction of future interest rate moves, lower quality and riskier securities led the market. From March 2003 through March 2004, the advantage to these types of securities was significantly greater than higher quality and lower risk securities. As interest rates began to increase in April 2004, higher risk styles and sectors, such as information technology companies and small cap growth stocks, began to fall through most of the summer of 2004. Many market participants entered the calendar year 2004 anticipating a change in interest rate policy, but fewer investors anticipated the continued rise in energy costs during 2004. Economic growth continued into 2004, although at a slower pace, as these two factors began to affect the economy.
From the period that the market peaked in 2000, fell into a bear market, and then began recovery in 2003, smaller stocks and value oriented stocks produced returns greater than larger and growth oriented stocks. This effect was in both the United States and the international markets. Smaller and value stocks outperformed due to many factors, including the valuation anomaly between growth and value stocks, the impact of the global economic recovery on commodity and materials based companies, the sharp slowdown in technology based spending, and the benefit of low interest rates for many smaller financial institutions.
During the year ended August 31, 2004, Consulting Group recommended, and the Board of Trustees approved, the following changes to the Funds:
Large Capitalization Value Equity Investments:
| | Ÿ | The termination of The Boston Company Asset Management LLC and the hiring of Cambiar Investors LLC as an investment adviser effective July 1, 2004 with an investment advisory fee of 0.30% on the first $250 million and 0.25% thereafter. |
Large Capitalization Growth Investments:
| | Ÿ | The addition of Sands Capital Management Inc. as an investment adviser effective January 2, 2004 with an investment advisory fee of 0.35% on the first $300 million and 0.30% thereafter. |
| | Ÿ | The termination of Alliance Capital Management L.P. and the hiring of Westfield Capital Management Company, Inc. as an investment adviser effective April 1, 2004 with an investment advisory fee of 0.35% on the first $300 million and 0.30% thereafter. |
Small Capitalization Growth Investments:
| | Ÿ | The termination of Westpeak Global Advisors, L.P. effective April 16, 2004. |
1
International Equity Investments:
| | Ÿ | The termination of Oechlsle International Advisors, LLC and the hiring of William Blair & Company, LLC as an investment adviser effective April 1, 2004 with an investment advisory fee of 0.40% on the first $100 million and 0.35% thereafter. |
Emerging Markets Equity Investments:
| | Ÿ | The termination of F&C Emerging Markets Ltd. and the hiring of Newgate LLP as an investment adviser effective April 1, 2004 with an investment advisory fee of 0.50%. |
Core Fixed Income Investments (formerly known as Intermediate Fixed Income Investments):
| | Ÿ | The addition of Western Asset Management Company as an investment adviser effective June 7, 2004 with an investment advisory fee 0.20%. |
High Yield Investments:
| | Ÿ | A new investment advisory agreement with Seix Investment Advisors Inc. following its acquisition by Trusco Capital Management, Inc. effective May 28, 2004. |
Subsequent to the reporting period, the Board of Trustees terminated Julius Baer Investments Ltd., and hired Pacific Investment Management Company as an investment adviser to International Fixed Income Investments effective October 6, 2004 with an investment advisory fee of 0.25%.
A summary of the Funds’ performance for the year ended August 31, 2004 can be found on page 4.
Shareholder Notice
On March 22, 2004, the shareholders of Mortgage Backed Investments, Multi-Sector Fixed Income Investments and Long-Term Bond Investments (the “Acquired Funds”) approved a Plan of Reorganization providing for (i) the acquisition of all of the assets of each of the Acquired Funds in exchange for shares of beneficial interest of Intermediate Fixed Income Investments (the “Acquiring Fund”) and the assumption by the Acquiring Fund of all the liabilities of each of the Acquired Funds and (ii) the distribution to shareholders of each Acquired Fund of such shares of beneficial interest of the Acquiring Fund in liquidation of each Acquired Fund and the cancellation of each Acquired Fund’s outstanding shares.
On March 22, 2004, the shareholders of the Acquiring Fund also approved a change in its investment objective from “current income and reasonable stability of principal” to “maximum total return, consistent with preservation of capital and prudent investment management.” The reorganization and change in investment objective occurred on June 4, 2004 at which time the Acquiring Fund was renamed Core Fixed Income Investments.
Information About Your Funds
As previously reported to you, the mutual fund industry has come under the scrutiny of federal and state regulators. Along with others in the industry, Smith Barney Fund Management LLC (“SBFM”), the adviser to your fund, and some of its affiliates have responded to requests for information from various government regulators regarding market timing, late trading, fees and other mutual fund issues. The regulators appear to be examining, among other things, how fund managers dealt with market timing and shareholder exchange activity, including compliance with prospectus disclosure related to these subjects. We have identified market timing in your fund, including an arrangement with an investor that permitted frequent trading to occur in your fund. We do not believe that arrangement involved selective portfolio disclosure or late trading. The arrangement was terminated early in 2001. Governmental review of these matters is continuing. Any resolution of this matter is not expected to have a financial impact on the fund. We thank you for your continued support and encourage you to contact your Financial Consultant for further assistance and guidance.
In November 2003, Citigroup Asset Management (“CAM”) disclosed an investigation by the Securities and Exchange Commission (“SEC”) and the U.S. Attorney relating to Citigroup Asset Management’s entry into the transfer agency business during 1997-1999. Citigroup has disclosed that the Staff of the SEC is considering
2
recommending a civil injunctive action and/or an administrative proceeding against certain advisory and transfer agent entities affiliated with Citigroup, the former CEO of CAM, a former employee and a current employee of CAM, relating to the creation, operation and fees of its internal transfer agent unit that serves various CAM-managed funds. Citigroup is cooperating with the SEC and will seek to resolve this matter in discussion with the SEC Staff. Although there can be no assurance, Citigroup does not believe that this matter will have a material adverse effect on the fund.
The recent twelve-month period offered investors positive opportunities across all asset classes. The importance of asset allocation and diversification of assets remains at the core of our process. We thank you for your continued support and encourage you to contact your Financial Consultant for further assistance and guidance.
Sincerely,
|
 |
R. Jay Gerken, CFA Chairman, President and Chief Executive Officer |
October 10, 2004
| i | | The S&P 500 Index is a market-value weighted index comprised of 500 widely held common stocks. An investor cannot invest directly in an index. |
| ii | | The Morgan Stanley Capital International EAFE (Europe, Australasia and Far East) Index is a market capitalization-weighted index that measures the performance of the leading stocks in 21 developed countries outside of North America. (The 21 countries include Austria, Belgium, Denmark, Finland, France, Germany, Greece, Ireland, Italy, Netherlands, Norway, Portugal, Spain, Sweden, Switzerland, United Kingdom, Australia, New Zealand, Hong Kong, Japan and Singapore.) An investor cannot invest directly in an index. |
| iii | | The Lehman Brothers Aggregate Bond Index is a broad-based bond index comprised of Government, Corporate, Mortgage and Asset-backed issues, rated investment grade or higher, and having at least one year to maturity. An investor cannot invest directly in an index. |
3
Performance of the Consulting Group Capital Markets Funds for the Year Ended August 31, 2004†* (unaudited)
| | | |
Large Capitalization Value Equity Investments | | 12.89 | % |
Russell 1000 Value Index (1) | | 17.52 | |
| |
Large Capitalization Growth Investments | | 4.14 | |
Russell 1000 Growth Index (2) | | 5.36 | |
| |
Small Capitalization Value Equity Investments | | 23.24 | |
Russell 2000 Value Index (3) | | 19.49 | |
| |
Small Capitalization Growth Investments | | 1.18 | |
Russell 2000 Growth Index (4) | | 3.38 | |
| |
International Equity Investments | | 16.90 | |
Morgan Stanley Capital International EAFE-Capitalization Weighted Index (5) | | 22.64 | |
| |
Emerging Markets Equity Investments | | 17.71 | |
Morgan Stanley Capital International Emerging Markets Free Index (6) | | 20.50 | |
| |
Government Money Investments‡ | | 0.48 | |
90-day Treasury Bill Index | | 1.06 | |
| |
Core Fixed Income Investments | | 5.17 | |
Lehman Brothers Aggregate Bond Index (7) | | 6.13 | |
Lehman Brothers Intermediate Government/Credit Bond Index (8) | | 5.07 | |
| |
High Yield Investments | | 11.81 | |
Lehman Brothers High Yield Index (9) | | 13.98 | |
| |
Municipal Bond Investments | | 7.12 | |
Lehman Brothers Municipal Bond Index (10) | | 7.11 | |
| |
International Fixed Income Investments | | 14.00 | |
Citigroup Non-U.S. Government Bond Index (11) | | 13.12 | |
See pages 26 through 28 for all footnotes.
4

Large Capitalization Value Equity Investments
ABOUTTHE SUB-ADVISERS
| | Ÿ | | Cambiar Investors LLC (“CI”) | |
Cambiar applies a disciplined, relative-value approach to investing with the Large Cap Value universe. They conduct a detailed, independent analysis of a company’s future prospects, often focusing on specific products or business initiatives. The team looks to uncover catalysts than can unlock the valuation potential and focus on companies that are leaders, offering strong brands or valuable and unique intellectual property.
| | Ÿ | | Chartwell Investment Partners (“Chartwell”)
| |
Employs “top-down” and “bottom-up” management techniques in managing its portion of the Portfolio’s assets. Chartwell focuses on a combination of low price-to-sales, price-to-earnings, price-to-cash flow and price-to-book ratios, along with a preference for premium yielding issues. The sub-adviser then shifts its focus to identifying those companies with evidence of a major catalyst for change.
| | Ÿ | | Alliance Capital Management L.P., through its Bernstein Investment Research and Management unit (“Alliance”)
| |
Seeks to exploit security mispricings and the opportunities this creates. The screening process begins by searching for undervalued securities within a universe of stocks comprising the S&P 500 Index and 200 additional large/mid-cap stocks not contained in the S&P 500 Index. Quantitative ranks in quintiles are then applied based on a stock’s expected return and risk considerations. Alliance also takes into consideration earnings estimate revisions and relative price trend determinations in attempting to avoid the classic value trap of buying too early.
During the year of September 1, 2003 through August 31, 2004, there was a change in the sub-adviser line-up for the Large Capitalization Value Equity Investments (“Portfolio”). Cambiar Investors (“CI”) replaced The Boston Company Asset Management. The allocation among the sub-advisers at the end of the period was Alliance Bernstein (“Alliance”) 34%, CI 33% and Chartwell Investment Partners (“Chartwell”) 33%. The Portfolio underperformed the Russell 1000 Value Index.
The powerful rally that began in 2003 and continued into January of 2004 moderated as the year progressed. During the period of September 1, 2003 through August 31, 2004, the S&P 500 Index posted an 11.45% gain. Value stocks outperformed growth stocks for the period with the Russell 1000 Value up 17.52% while the Growth Index was up 5.36%. Against this backdrop, your Portfolio returned 12.89%, underperforming its benchmark, but outperforming both the Growth Index and the S&P 500.
In the Alliance allocation, much of the positive performance for the period resulted from good stock selection in the energy sector. Within the utilities sector, the majority of our holdings posted double digit gains. On the negative side, stock selection in the Consumer Cyclicals sector was the largest detractor to performance. The Consumer Staples sector also detracted from performance.
CI began managing their allocation in July 2004 and during this time Utilities, Energy and REITS were the strong performers within the Index; each of these sectors were underweight in the CI allocation. The CI allocation has positioned its allocation to have overweight positions in Healthcare, Consumer Cyclicals and Consumer Staples.
The Chartwell allocation was overweight in the Industrials sector, which contributed favorably to performance due to increased spending on capital goods. In addition, stock selection in the Basic Materials and Healthcare sectors benefited performance. Alternatively, the Chartwell overweight position in the Technology sector detracted from performance, as signs of improved demand in this sector are slow to develop.
The Portfolio and each of its sub-advisers remain committed to the asset class and their individual investment styles.
5
The following graph depicts the performance of the Large Capitalization Value Equity Investments vs. the Russell 1000 Value Index1 and the Lipper Large-Cap Value Funds Average.12
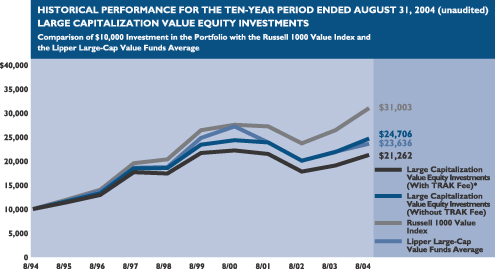
The performance shown above represents past performance. Past performance is no guarantee of future results and current performance may be higher or lower than the performance shown above. Principal value and investment returns will fluctuate and investors’ shares, when redeemed, may be worth more or less than their original cost. To obtain performance data current to the most recent month-end, please visit our website at www.smithbarney.com.
The graph above and returns shown below do not reflect the deduction of taxes that a shareholder would pay on fund distributions or the redemption of fund shares.
LARGE CAPITALIZATION VALUE EQUITY INVESTMENTS (unaudited)
Average Annual Total Returns for the Period Ended August 31, 2004
| | | | | | |
| | | Without TRAK Fee | | | With TRAK Fee* | |
Since inception (11/18/91) | | 9.03 | % | | 7.41 | % |
10 year | | 9.47 | | | 7.84 | |
5 year | | 1.08 | | | (0.43 | ) |
3 year | | 1.15 | | | (0.36 | ) |
1 year | | 12.89 | | | 11.21 | |
|
|
See pages 26 through 28 for all footnotes.
RISKS: The Portfolio may use derivatives, such as options and futures, which can be illiquid, may disproportionately increase losses and have a potentially large impact on performance. Foreign securities are subject to certain risks of overseas investing, including currency fluctuations and changes in political and economic conditions, which could result in significant market fluctuations. Investments in small and medium-capitalizations companies may involve a higher degree of risk and volatility than investments in larger, more established companies.
6
Large Capitalization
Growth Investments
ABOUTTHE SUB-ADVISERS
| | Ÿ | | Turner Investment Partners, Inc. (“Turner”) | |
Employs an active management style and seeks to invest in companies with improving earnings dynamics in each of ten broad market sectors. In order to identify potential investments, Turner utilizes (i) a proprietary computer model which ranks stocks by sector and size by examining 80 factors; (ii) fundamental analysis of stocks selected by the proprietary model, including communications with company management, industry experts and competitors; and (iii) technical analysis, including examination of money flow and relative strength. Turner will sell a stock because of a poor ranking from the model, concern about the fundamentals of a stock, a downward revision in earnings estimates from Wall Street analysts or company management, or changes in money flow for a stock.
| | Ÿ | | TCW Investment Management Co. (“TCW”) | |
Seeks to maximize total return with an emphasis on capital appreciation. Their investment philosophy stresses investment in high-quality companies with opportunities for growth that are not fully reflected in stock market valuations. TCW utilizes a “bottom-up” investment strategy that focuses primarily on assessing the operating prospects of each prospective holding. Companies targeted for investment typically are those believed to have strong and enduring business models and inherent advantages over their competitors.
| | Ÿ | | Sands Capital Management, Inc (“SCM”): | |
Sands Capital Management’s goal is to manage assets for the long-term by owning the best ideas in a focused portfolio of generally 25 to 30 companies. The Investment Team is a firm believer in the simple, yet powerful idea that over the long-term stock prices eventually follow earnings growth.
| | Ÿ | | Westfield Capital Management Co., LLC (“Westfield”) | |
Uses an active management style and favors investing in earnings stocks given its conviction that stock prices follow earnings progress and that they offer the best opportunity for superior real rates of return. The sub-adviser believes that reasonably priced stocks with high earnings potential are best identified through in-depth, fundamental research. The sub-adviser believes that the small cap portion of the market is under-researched, and therefore less efficient than the large cap sector. It generally sells a security when a stock price exceeds full value as calculated by the sub-adviser or as evidenced by declining earnings growth rates and balance sheet trends.
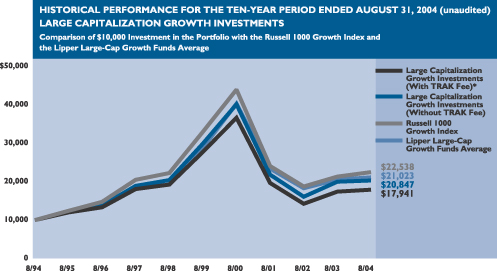
During the year of September 1, 2003 through August 31, 2004, there was a change in the sub-adviser line-up for the Large Capitalization Growth Equity Investments (“Portfolio”). Sands Capital Management (“SCM”) replaced Alliance Capital Management and Westfield Capital Management (“Westfield”) was retained as an additional sub-adviser. The allocation among the sub-advisers at the end of the period was SCM 25%, TCW Investment Management (“TCW”) 25%, Turner Investment (“Turner”) 25% and Westfield 25%. The Portfolio underperformed the Russell 1000 Growth Index.
The stock market set a torrid pace in the first half of the period, but then cooled considerably over the next six months as investors’ psychology turned pessimistic and increasingly risk averse. Among the developments putting a damper on stocks: rising oil prices, softening retail sales, the threat of renewed terrorist attacks, weak earnings reports by bellwether companies, the Iraq quagmire and the outcome of the Bush-Kerry presidential race in November. For the entire period, 9 of the 10 market sectors of the Russell 1000 Growth Index generated positive returns, the only exception being Technology.
The SCM allocation concluded the period overweight in the Healthcare sector, owning securities in the three sub-sectors of Biotechnology, Medical Devices, and Pharmaceuticals. Noticeably absent were positions in any of the large pharmaceutical companies, which no longer can fit the definition of a growth company as defined by SCM. The other major contributing sector was Consumer Discretionary, which held a significantly overweight position. The added value or outperformance of the SCM allocation came from superior stock selection. The SCM turnover is typically less than 25% per year, giving them an average holding period of approximately four to five years. This low turnover means they generally own the same businesses throughout the year and beyond, with minimal trading activity. Earnings growth was balanced across all growth sectors represented in the portfolio, including Consumer/Retail (EPS +40% year-over-year), Financial Services (+27%), Healthcare (+28%), and Technology (+30%). Results like these do not go unnoticed for long.
In the Turner Large Cap Growth allocation the underperformance was mainly due to poor results in the Healthcare, Producer Durable, Financials, and Auto and Transportation sectors, which amounted to a 40% average weighting over the year. The Consumer Discretionary sector contributed the most to performance, while Energy and Materials added modest gains for the year. In the Turner Mid Cap Growth allocation, leading the way was the underperformance in the Consumer Discretionary, Producer Durable, Financials and Healthcare sectors. Significant industry detractors included Commercial Services within the Consumer Discretionary sector and Production Technology within the Producer Durable sector.
In the Westfield allocation the Industrial sector was the largest detractor from performance. Within the Information Technology sector the underweight
7
allocation still had negative performance due to stock selection. The allocation to the Energy and Healthcare sectors added value during the year.
For the TCW allocation, for the 12 months ended August 31, 2004, holdings within the Information Technology and Consumer Discretionary sectors were the strongest positive contributors to performance. These areas were also the largest sectors within the TCW portion of the Portfolio. Financials, a sector that is overweight versus the Russell 1000 Growth, also provided a boost to performance for the period. The weakest performing sector for the period was Healthcare, where the TCW portion is underweight versus the benchmark, followed by industrials. Consumer Staples also underperformed for the period. Finally, small net underperformance can be attributed to Energy, Materials, Telecommunications and Utilities, to which the TCW portion of the Portfolio had no exposure.
The following graph depicts the performance of the Large Capitalization Growth Investments vs. the Russell 1000 Growth Index2 and the Lipper Large-Cap Growth Funds Average.13
The performance shown above represents past performance. Past performance is no guarantee of future results and current performance may be higher or lower than the performance shown above. Principal value and investment returns will fluctuate and investors’ shares, when redeemed, may be worth more or less than their original cost. To obtain performance data current to the most recent month-end, please visit our website at www.smithbarney.com.
The graph above and returns shown below do not reflect the deduction of taxes that a shareholder would pay on fund distributions or the redemption of fund shares.
LARGE CAPITALIZATION GROWTH INVESTMENTS (unaudited)
Average Annual Total Returns for the Period Ended August 31, 2004
| | | | | | |
| | | Without TRAK Fee | | | With TRAK Fee* | |
Since inception (11/18/91) | | 7.79 | % | | 6.18 | % |
10 year | | 7.62 | | | 6.02 | |
5 year | | (6.98 | ) | | (8.37 | ) |
3 year | | (1.58 | ) | | (3.05 | ) |
1 year | | 4.14 | | | 2.59 | |
|
|
See pages 26 through 28 for all footnotes.
RISKS: The Portfolio may use derivatives, such as options and futures, which can be illiquid, may disproportionately increase losses and have a potentially large impact on performance. Foreign securities are subject to certain risks of overseas investing, including currency fluctuations and changes in political and economic conditions, which could result in significant market fluctuations. Investments in small and medium-capitalizations companies may involve a higher degree of risk and volatility than investments in larger, more established companies.
8
Small Capitalization Value Equity Investments
ABOUTTHE SUB-ADVISERS
| | Ÿ | | Rutabaga Capital Management LLC (“RCM”) | |
Focuses exclusively on micro and small capitalization stocks and looks to unearth uncommon or currently unfavored stocks. The firm’s analysts employ extensive bottom-up fundamental research to identify high quality companies with catalysts to increase margins and intrinsic value but are neglected or misperceived by the market.
| | Ÿ | | ING Investment Management Co. (“ING”) | |
Selects stocks on a bottom-up basis utilizing fundamental research in order to identify stocks of companies undergoing a material change that may be purchased at a reasonable price in relation to their earnings growth rate.
| | Ÿ | | NFJ Investment Group (“NFJ”) | |
An active management style that invests in a diversified portfolio of small capitalization common stocks that it believes are undervalued in the marketplace generally and within their respective industries. The sub-adviser also considers valuation factors such as price-to-book, price-to-cash flow, dividend policy and industry outlook in selecting stocks for investment.
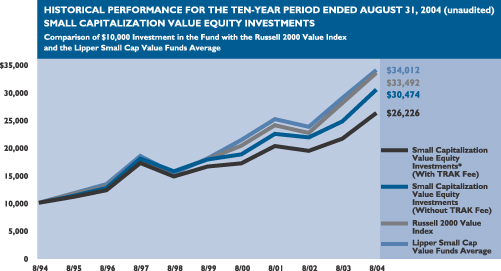
During the year of September 1, 2003 through August 31, 2004, the sub-advisers to Small Capitalization Value Equity Investments (“Portfolio”) were Rutabaga Capital Management (“RCM”) 33%, ING Investment Management, formerly known as Furman Selz Capital Management, (“ING”) 33% and NFJ Investment Group (“NFJ”) 34%. The Portfolio significantly outperformed the Russell 2000 Value Index.
Small Cap stocks generally tracked the performance of Large Cap stocks during the period under review, with the Dow, S&P and the Russell 2000 all up between ten to eleven percentage points. Within the Small Cap sector, value stocks outpaced growth stocks as the Technology sector significantly underperformed the other sectors.
The RCM allocation benefited from their sector weights, specifically, by being equal or overweight in the two best performing sectors — Energy and Materials and Processing, and by being underweight in Technology, the worst performing sector. Favorable sector weightings, coupled with solid stock selection helped the RCM outperform the Russell 2000 Value Index.
The ING allocation during the period was diversified among all sectors, with Financials, Industrials, and Consumer Discretionary the three largest allocations. The ING allocation trailed the index due to stock selection within the Consumer Discretionary and Information Technology. The underweight to Financials was also a drag on performance. Reallocation benefited from the overweight in the Healthcare and Materials sector.
The NFJ allocation maintained a portfolio of approximately 100 names that are broadly diversified by economic sector and industry. In addition, all companies at the time of purchase had a dividend policy. The allocation has consistently maintained a smaller weight to the Finance sector, which hindered performance. The overweight allocation to the Energy sector provided strong returns as strong stock selection generated significant value added. With the Technology sector posting the worst gain within the Index, the underweight helped performance.
The Portfolio and each of the sub-advisers remain committed to the asset class and their individual investment styles.
9
The following graph depicts the performance of the Small Capitalization Value Equity Investments vs. the Russell 2000 Value Index3 and the Lipper Small Cap Value Funds Average.14
The performance shown above represents past performance. Past performance is no guarantee of future results and current performance may be higher or lower than the performance shown above. Principal value and investment returns will fluctuate and investors’ shares, when redeemed, may be worth more or less than their original cost. To obtain performance data current to the most recent month-end, please visit our website at www.smithbarney.com.
The graph above and returns shown below do not reflect the deduction of taxes that a shareholder would pay on fund distributions or the redemption of fund shares.
SMALL CAPITALIZATION VALUE EQUITY INVESTMENTS (unaudited)
Average Annual Total Returns for Period Ended August 31, 2004
| | | | | | |
| | | Without TRAK Fee | | | With TRAK Fee* | |
Since inception (11/18/91) | | 10.77 | % | | 9.12 | % |
10 year | | 11.79 | | | 10.12 | |
5 year | | 11.30 | | | 9.64 | |
3 year | | 10.64 | | | 8.99 | |
1 year | | 23.24 | | | 21.41 | |
|
|
See pages 26 through 28 for all footnotes.
RISKS: The Portfolio may use derivatives, such as options and futures, which can be illiquid, may disproportionately increase losses and have a potentially large impact on performance. Foreign securities are subject to certain risks of overseas investing, including currency fluctuations and changes in political and economic conditions, which could result in significant market fluctuations. Investments in small and medium-capitalizations companies may involve a higher degree of risk and volatility than investments in larger, more established companies.
10
Small Capitalization
Growth Investments
ABOUTTHE SUB-ADVISERS
| | Ÿ | | Wall Street Associates (“WSA”) | |
Follows a bottom-up investment style. It looks for companies with superior earnings growth, strong balance sheets, attractive valuations and potentially positive earning surprises.
| | Ÿ | | Westfield Capital Management Co., LLC (“Westfield”) | |
Favors investing in earnings growth stocks given their conviction that stock prices follow earnings progress and that they offer the best opportunity for superior real rates of return. Reasonably priced stocks of companies with high foreseen earnings potential are best identified through in-depth, fundamental research. It is their belief that the small cap portion of the market is under-researched, and therefore less efficient, than the large cap sector.
During the year of September 1, 2003 through August 31, 2004 there was a change in the sub-adviser line-up for the Small Capitalization Growth Equity Investments (“Portfolio”). Westpeak Global Advisors, LP was terminated and the assets were reallocated to the remaining sub-advisers. The allocation among the sub-advisers at the end of the period was Wall Street Associates (“WSA”) 50% and Westfield Capital Management (“Westfield”) 50%. The Portfolio underperformed the Russell 2000 Growth Index.
The twelve-month period proved to be fairly volatile within the asset class. The market exhibited strength in the fourth quarter of 2003 and early 2004. However, equity prices softened during the second quarter of 2004 as investors digested the implications of record oil prices, a restrictive monetary policy and continued terrorist threats.
WSA’s technology position diminished performance, as these stocks experienced a bit of consolidation following the large gain in 2003. The WSA’s Technology and Producer Durable stocks produced double-digit declines for the year-end. By comparison, the Energy sector gained 19%, while Materials and Processing stocks rose 52%, with Healthcare stocks returning 9% for the period.
The Westfield allocation outperformance was driven primarily by the Healthcare sector. Within the Healthcare sector, the allocation was well diversified through Biotechnology, Service Equipment and Facilities industries. An overweight to Financials contributed positively to performance, while the allocation within the Industrial, and Consumer Discretionary sectors detracted from performance.
The portfolio and each of the sub-advisers remain committed to the asset class and their individual investment styles.
11
The following graph depicts the performance of the Small Capitalization Growth Investments vs. the Russell 2000 Growth Index4 and the Lipper Small Cap Growth Funds Average.15

The performance shown above represents past performance. Past performance is no guarantee of future results and current performance may be higher or lower than the performance shown above. Principal value and investment returns will fluctuate and investors’ shares, when redeemed, may be worth more or less than their original cost. To obtain performance data current to the most recent month-end, please visit our website at www.smithbarney.com.
The graph above and returns shown below do not reflect the deduction of taxes that a shareholder would pay on fund distributions or the redemption of fund shares.
SMALL CAPITALIZATION GROWTH INVESTMENTS (unaudited)
Average Annual Total Returns for Period Ended August 31, 2004
| | | | | | |
| | | Without TRAK Fee | | | With TRAK Fee* | |
Since inception (11/18/91) | | 9.71 | % | | 8.07 | % |
10 year | | 7.50 | | | 5.90 | |
5 year | | (0.67 | ) | | (2.15 | ) |
3 year | | (0.79 | ) | | (2.27 | ) |
1 year | | 1.18 | | | (0.32 | ) |
|
|
See pages 26 through 28 for all footnotes.
RISKS: The Portfolio may use derivatives, such as options and futures, which can be illiquid, may disproportionately increase losses and have a potentially large impact on performance. Foreign securities are subject to certain risks of overseas investing, including currency fluctuations and changes in political and economic conditions, which could result in significant market fluctuations. Investments in small and medium-capitalizations companies may involve a higher degree of risk and volatility than investments in larger, more established companies.
12
International Equity Investments
ABOUTTHE SUB-ADVISERS
| | Ÿ | | William Blair & Co., LLC (“WBC”) | |
William Blair & Company’s investment approach is focused on a conservative, long-term approach to growth investing. They seek companies with growth characteristics that include high benchmark revenue growth, EPS growth, DPS growth and consensus long-term growth estimates.
| | Ÿ | | Philadelphia International Advisors, LP (“PIA”) | |
PIA utilizes a bottom-up approach to international investing. It selects stocks to buy and sell by evaluating a company’s growth outlook and market valuation based on traditional value characteristics, positive company-specific catalysts and other operating and financial conditions. It selects countries primarily by evaluating a country’s valuation ratios such as price-to-earnings and dividend yield, prospective economic growth, government policies and other factors.
| | Ÿ | | Brandywine Asset Management, Inc. (“BAM”) | |
With regard to stock selection, Brandywine employs a quantitative screen which takes into account country, industry and company valuation history. Brandywine seeks stocks whose performance has deviated from their historical mean and likely will revert to this historical mean.
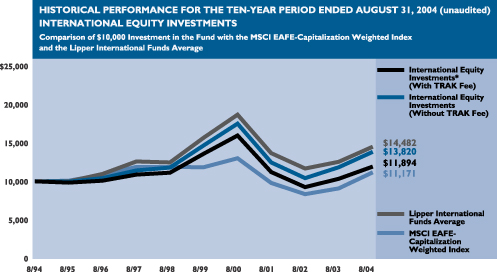
During the year of September 1, 2003 through August 31, 2004 there was a change in the sub-adviser line-up for International Equity investments (“Portfolio”). William Blair & Company (“WBC”) replaced Oechsle International Advisors. The allocation among the sub-advisers at the end of the period was Brandywine Asset Management (“BAM”) 30%, Philadelphia International Advisors (“PIA”) 40% and WBC 30%. The Portfolio underperformed its benchmark.
The market environment during the period can be divided into two distinct six-month periods. From September 2003 to February 2004, equities around the world were recovering, strongly in responses to signs of broad economic growth and a significant rebound in corporate profits. By March 2004 this “acceleration” phase was fully discounted and investors became increasingly concerned. Surging oil prices, rising interest rates, a slowdown in China and terrorism were issues that halted the once strong recovery. As a result, markets moved sideways within a five to ten percentage point trading range through August 2004.
The BAM assets were allocated to be positioned with an overweighting in the Consumer Cyclical, Technology and Basic Materials sectors. The allocation was overweight to the MSCI EAFE Index in Energy, Financials, Industrial and Telecommunications. From a country perspective, performance was dominated by Austria, Belgium, Ireland, Norway and Portugal. The allocations to Germany, Switzerland and Japan all registered sub-par results.
The PIA assets, allocated to overweight Continental Europe, generated strong returns relative to France, Germany, Netherlands, and Switzerland. These were offset somewhat, however, by stock selection in Japan. From a sector perspective, stock selection in Consumer Staples, Industrials, and Information Technology added to the performance relative to the benchmark while an underweight in Financial stocks modestly detracted from performance.
With respect to the WBC allocation, there were setbacks in individual stocks during the period, particularly in Japan and the UK. However, the overweight positions in the emerging markets had a positive influence on the Portfolio and helped performance. Stock selection in the emerging markets as well as the allocation to these regions benefited the Portfolio. Sectorally, Information Technology and Telecommunication Services helped performance, in relation to the benchmark. The selection of stocks in these sectors helped to improve performance. The largest detractors from performance were the Consumer Discretionary and Healthcare sectors. The selection of securities in these sectors hurt overall performance.
The Portfolio and each of the sub-advisers are committed to the asset class and their individual investment styles.
13
The following graph depicts the performance of the International Equity Investments vs. the MSCI EAFE-Capitalization Weighted Index5 and the Lipper International Funds Average.16
The performance shown above represents past performance. Past performance is no guarantee of future results and current performance may be higher or lower than the performance shown above. Principal value and investment returns will fluctuate and investors’ shares, when redeemed, may be worth more or less than their original cost. To obtain performance data current to the most recent month-end, please visit our website at www.smithbarney.com.
The graph above and returns shown below do not reflect the deduction of taxes that a shareholder would pay on fund distributions or the redemption of fund shares.
INTERNATIONAL EQUITY INVESTMENTS (unaudited)
Average Annual Total Returns for Period Ended August 31, 2004
| | | | | | |
| | | Without TRAK Fee | | | With TRAK Fee* | |
Since inception (11/18/91) | | 5.30 | % | | 3.74 | % |
10 year | | 3.29 | | | 1.75 | |
5 year | | (1.14 | ) | | (2.62 | ) |
3 year | | 3.56 | | | 2.02 | |
1 year | | 16.90 | | | 15.16 | |
|
|
See pages 26 through 28 for all footnotes.
RISKS: The Portfolio may use derivatives, such as options and futures, which can be illiquid, may disproportionately increase losses and have a potentially large impact on performance. Foreign securities are subject to certain risks of overseas investing, including currency fluctuations and changes in political and economic conditions, which could result in significant market fluctuations. Investments in small and medium-capitalizations companies may involve a higher degree of risk and volatility than investments in larger, more established companies.
14
Emerging Markets
Equity Investments
ABOUTTHE SUB-ADVISERS
| | Ÿ | | SSgA Funds Management, Inc. (“SSgA”) | |
Uses quantitative analysis to identify countries and stocks which are undervalued relative to their growth rates. It employs an investment process that combines top-down country selection with bottom-up stock selection to determine an optimal country and security mix.
| | Ÿ | | Newgate LLP (“Newgate”) | |
Newgate seeks long-term growth of capital by utilizing a top-down value approach in identifying undervalued economic countries, regions and sectors. Newgate incorporates both geopolitical and macroeconomic factors into its investment strategy through fundamental quantitative analysis, investment experience and professional judgment.
During the year of September 1, 2003 through August 31, 2004 there was a change in the sub-adviser line-up for Emerging Markets Equity Investments (“Portfolio”). Newgate LLP (“Newgate”) replaced F&C Emerging Markets. The allocation among the sub-advisers at the end of the period was State Street Global Advisors (“SSgA”) 50% and Newgate 50%. The Portfolio underperformed its benchmark.
In general, investors’ appetite for risk has fallen off and their focus has shifted towards quality of corporate earnings. Global economic growth has moderated from its rapid pace in late 2003 due to slowdowns in China and the US, but still remains above long-term average growth rates. The emerging markets’ strong first quarter was negated by a disappointing second quarter, but then recovered slightly through August. Some emerging countries offered an interesting mix of highlights. For example, Russia has benefited from higher oil prices, robust GDP growth and attractive stock market valuations, although these positive results have been offset primarily by the Yukos saga. The government takeover of the oil giant has shaken the confidence of many foreign investors despite the country’s recent growth and valuation levels. In addition, although China’s recent rapid growth has slowed, it still remains higher than most countries. China is running a current account surplus, and inflation remains low.
The Newgate allocation had an overweight within Latin America and specifically their overweight position in Brazil hurt performance during the second quarter as US interest rate fears pushed Brazilian shares lower by 12%. The Brazilian economy now appears healthier than ever, with a $28 billion dollar trade surplus, accelerating GDP growth and record tax collections. In July and August, Brazilian shares have rallied over 15%. Stocks, however, are still priced at just 7 times 2004 earnings, a significant discount to most of its Latin American peers. In Latin America, we remain bullish in Brazil and Argentina, with a fairly neutral position in Mexico. Trading at just 8 times earnings, Brazil currently offers a unique combination of vibrant domestic growth and global trade participation.
Newgate has been underweight Israel for the past year based on their negative outlook for technology related companies and ongoing geopolitical concerns. This underweight reduced portfolio performance in second quarter, but enhanced performance in the third. The Newgate allocation rebounded in July and August as global investors shrugged off higher oil prices and snapped up assets on the cheap. Presidential elections, re-elections and election surprises all faded into the background as emerging market growth continued to accelerate. According to the International Monetary Fund, world GDP growth is now expected to hit 5% this year, the fastest pace in nearly 3 decades. Global demand for raw materials, natural resources and cheaper labor could easily fuel emerging markets for the next five years.
In Asia, Newgate continues to favor India and Taiwan over China. There is no doubt that Chinese growth leads the world, but they prefer to access that growth via Taiwanese and Hong Kong companies trading at much lower relative multiples. In Southeast Asia, Newgate remains overweight Thailand and Indonesia while avoiding the Malaysian market entirely. And in the EMEA, they continue to underweight South Africa and Israel, while focusing the portfolio on Russia and Turkey.
For the SSgA allocation, the overweight to Thailand and Brazil were positive for performance. The underweight for India was also a positive to performance as the market remained expensive, and already jittery investors were surprised when India’s ruling BJP party unexpectedly lost power in parliamentary elections. The allocations to Taiwan, Russia and Chile were all detractors to performance.
15
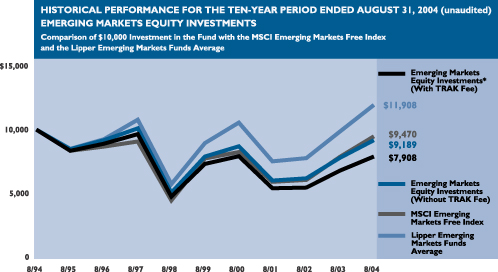
The following graph depicts the performance of the Emerging Markets Equity Investments vs. the MSCI Emerging Markets Free Index6 and the Lipper Emerging Markets Funds Average.17
The performance shown above represents past performance. Past performance is no guarantee of future results and current performance may be higher or lower than the performance shown above. Principal value and investment returns will fluctuate and investors’ shares, when redeemed, may be worth more or less than their original cost. To obtain performance data current to the most recent month-end, please visit our website at www.smithbarney.com.
The graph above and returns shown below do not reflect the deduction of taxes that a shareholder would pay on fund distributions or the redemption of fund shares.
EMERGING MARKETS EQUITY INVESTMENTS (unaudited)
Average Annual Total Returns for Period Ended August 31, 2004
| | | | | | |
| | | Without TRAK Fee | | | With TRAK Fee* | |
Since inception (4/20/94) | | 0.84 | % | | (0.67 | )% |
10 year | | (0.84 | ) | | (2.32 | ) |
5 year | | 3.00 | | | 1.47 | |
3 year | | 14.88 | | | 13.17 | |
1 year | | 17.71 | | | 15.95 | |
|
|
See pages 26 through 28 for all footnotes.
RISKS: The Portfolio may use derivatives, such as options and futures, which can be illiquid, may disproportionately increase losses and have a potentially large impact on performance. Foreign securities are subject to certain risks of overseas investing, including currency fluctuations and changes in political and economic conditions, which could result in significant market fluctuations. Investments in small and medium-capitalizations companies may involve a higher degree of risk and volatility than investments in larger, more established companies.
16
Government Money Investments
ABOUTTHE SUB-ADVISER
| | Ÿ | | Standish Mellon Financial Management LLC (“Standish”) | |
The Portfolio invests exclusively in U.S. Treasury securities and other U.S. government securities rated by a nationally recognized rating organization in the two highest short-term rating categories or, if unrated, of equivalent quality as determined by the sub-adviser. Individual securities must have remaining maturities of 397 days or less. Standish seeks to improve the Portfolio’s yield through actively managing sector allocations and the average maturity of the Portfolio. Standish monitors the spread relationships between U.S. Treasury and government agency issues, and purchases agencies when they provide a yield advantage. In addition, Standish will change the maturity structure modestly to reflect its outlook on interest rates.
During the year of September 1, 2003 through August 31, 2004, the sub-adviser to the Government Money Investments (“Portfolio”) was Standish Mellon Financial Management (“Standish”). The Portfolio underperformed its benchmark.
GOVERNMENT MONEY INVESTMENTS (unaudited)
Average Annual Total Returns for the Period Ended August 31, 2004‡
| | | | | | |
| | | Without TRAK Fee | | | With TRAK Fee* | |
Since inception (11/18/91) | | 3.67 | % | | 2.12 | % |
10 year | | 3.83 | | | 2.28 | |
5 year | | 2.70 | | | 1.17 | |
3 year | | 1.04 | | | (0.46 | ) |
1 year | | 0.48 | | | (1.02 | ) |
|
|
The returns shown do not reflect the deduction of taxes that a shareholder would pay on fund distributions or the redemption of fund shares.
See pages 26 through 28 for all footnotes.
RISKS: An investment in a money market fund is neither insured nor guaranteed by the FDIC or any other government agency. Although the Portfolio seeks to preserve the value of your investment at one dollar per share, it is possible to lose money by investing in the Portfolio.
17
Core Fixed
Income Investments
ABOUTTHE SUB-ADVISERS
| | Ÿ | | BlackRock Financial Management, Inc. (“BlackRock”) | |
Employs a relative value approach which entails portfolio duration within a narrow range and value added through sector and sub-sector rotation within the corporate and mortgage sectors. BlackRock evaluates securities within a risk management framework which consists of determining interest rate risk, yield curve risk, cash flow risk, credit risk and liquidity risk of securities.
| | Ÿ | | Pacific Investment Management Co. (“PIMCO”) | |
Employs “top-down” and “bottom-up” investment techniques. It implements the following “top-down” strategies: duration and volatility analysis, sector evaluation and yield curve shape analysis. The sub-adviser also employs the following “bottom-up” strategies: credit analysis, quantitative research, issue selection and cost-effective trading.
| | Ÿ | | Western Asset Management Co. (“Western”) | |
Emphasizes three key strategies to enhance the Portfolio’s total return: (i) adjusting the allocation of the Portfolio among the key sectors of the fixed-income market depending on its forecast of relative values; (ii) tracking the duration of the overall Portfolio so that it falls within a narrow band relative to the benchmark index, with adjustment made to reflect its long-term outlook for interest rates; and (iii) purchasing under-valued securities in each of the key sectors of the bond market while keeping overall quality high.
During the period of June 4, 2004 through August 31, 2004, the sub-advisers to the Core Fixed Income Investments (“Portfolio”) were Pacific Investment Management Co. (“PIMCO”) 30%, Western Asset Management Company (“Western”) 30% and BlackRock Financial Management (“BlackRock”) 40%. The Portfolio slightly underperformed its benchmark for the period.
The fiscal year was marked by continued volatility across all fixed income sectors. In the first half of the period there were several shifts in sentiment as the market experienced both optimism regarding strengthening economic data and pessimism regarding US dollar weakness, softness in the equity markets, and the lack of job creation. Strong employment figures in March 2004 ended a string of disappointing releases and triggered a sharp rise in 10-year Treasury yields in April and May. Weaker economic data released in July and August caused a reevaluation of the pace and magnitude of assumed future rate hikes. The Federal Reserve Board’s (the “Fed”) statement from their August meeting acknowledged recent economic softness and attributed it to the rise in energy prices. They expressed a view that price pressures were likely to be transitory and that the economy was poised to resume a stronger pace of expansion. The Fed still considers current monetary policy to be accommodative and continues to believe that this accommodation can be removed gradually.
Within the PIMCO allocation the targeted duration is below-index when rates are near the bottom of their range and move toward neutral as they rise. There was also a modest emphasis on short/intermediate maturities and while there was a under weight to mortgage and corporates. Also during the period PIMCO sought to exploit other structural strategies such as buying bonds forward and investing the cash backing these positions in short maturities.
The Western allocation exceeded that of its benchmark as most strategies produced positive results. An overweight exposure to corporate bonds added to performance as credit spreads generally tightened, and a focus on the BBB subsector was rewarded by strong performance. Moderate exposure to the high-yield and emerging market sectors benefited substantially from tighter credit spreads. A moderate position in inflation-indexed bonds benefited from declining real yields and higher-than-expected inflation. The allocation’s largely neutral duration exposure during the past year had little impact on returns, but an emphasis on the longer end of the yield curve benefited as the yield curve flattened.
The BlackRock allocation was positioned in anticipation of a flattening yield curve, whereby the difference in yields between short and long-term bonds would decrease. This bias benefited performance as yields on the 2-year Treasuries increased 42 basis points (“bps”) over the period while 10-year yields fell by 34 bps. BlackRock’s overall duration positioning was also a positive contributor to performance as they tactically traded interest rates. Believing that interest rates were too low given the economic situation, BlackRock maintained their shorter duration relative to the benchmark for the majority of the period. The BlackRock allocation maintained an underweight in the corporate sector throughout the reporting period. This hurt relative performance as corporate bonds outperformed other sectors during the fiscal year. However, the individual security selection within the sector helped mitigate the negative impact.
18
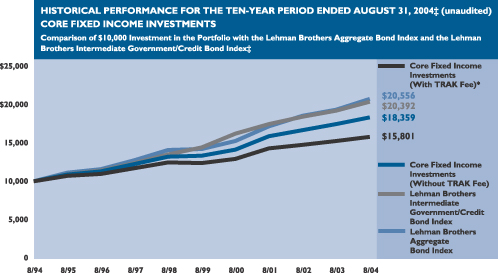
The following graph depicts the performance of the Core Fixed Income Investments vs. the Lehman Brothers Aggregate Bond Index7 and the Lehman Brothers Intermediate Government/Credit Bond Index.8
The performance shown above represents past performance. Past performance is no guarantee of future results and current performance may be higher or lower than the performance shown above. Principal value and investment returns will fluctuate and investors’ shares, when redeemed, may be worth more or less than their original cost. To obtain performance data current to the most recent month-end, please visit our website at www.smithbarney.com.
The graph above and returns shown below do not reflect the deduction of taxes that a shareholder would pay on fund distributions or the redemption of fund shares.
CORE FIXED INCOME INVESTMENTS (unaudited)
Average Annual Total Returns for the Period Ended August 31, 2004‡
| | | | | | |
| | | Without TRAK Fee | | | With TRAK Fee* | |
Since inception (11/18/91) | | 6.20 | % | | 4.62 | % |
10 year | | 6.26 | | | 4.68 | |
5 year | | 6.55 | | | 4.97 | |
3 year | | 4.89 | | | 3.33 | |
1 year | | 5.17 | | | 3.60 | |
|
|
See pages 26 through 28 for all footnotes.
RISKS: The Portfolio may use derivatives, such as options and futures, which can be illiquid, may disproportionately increase losses and have a potentially large impact on performance. Foreign securities are subject to certain risks of overseas investing, including currency fluctuations and changes in political and economic conditions, which could result in significant market fluctuations. Investments in small and medium-capitalizations companies may involve a higher degree of risk and volatility than investments in larger, more established companies. The Portfolio may invest in high yield bonds, which involve greater credit and liquidity risks than investment grade bonds.
19
High Yield Investments
ABOUTTHE SUB-ADVISERS
| | Ÿ | | Seix Investment Advisors, Inc. (“Seix”) | |
Targets the healthiest segment of the high yield market (those securities rated “BB” and strong “B”). The Seix high yield portfolio seeks multiple sources of value through in-depth company research, active industry weightings and security selection.
| | Ÿ | | Western Asset Management Co. (“Western”) | |
Combines traditional analysis with innovative technology applied to all sectors of the market. Western believes inefficiencies exist in the fixed-income market and attempts to add incremental value by exploiting these inefficiencies across all eligible market sectors. The key areas of focus are (i) sector and sub-sector allocation; (ii) issue selection; (iii) duration; and (iv) term structure.
During the year of September 1, 2003 through August 31, 2004 there were no changes in the sub-adviser line-up for High Yield Investments (“Portfolio”). The allocation of sub-advisers was Seix Investment Advisors (“Seix”) 50% and Western Asset Management Company (“Western”) 50%. The Portfolio underperformed its benchmark.
Over the past year, the US economy’s strength has generally exceeded most forecasts, with a growth rate of approximately 5%. High Yield bonds did well in this environment as easy money, stronger economic growth and corporate restructuring led to increasing profitability and reduced default risk, resulting in solid restoration of the asset class. The Seix allocation remained overweight in the Cable TV, Energy and Media sectors. With the price of oil reaching new highs, the oil related industries did quite well. Seix continued to avoid issues that they feel will not see strong improvement in the near future - Auto Supply, Airlines and Supermarkets.
The Western allocation was structured to incorporate their view that economic activity would exceed market expectations. This resulted in their allocation being overweight in the most economically sensitive industries, and maintaining a short duration position in anticipation of higher interest rates. An overweight to the Basic Industry composites, which returned 17%, aided relative performance. However, the short duration of the allocation hurt performance as the general level of interest rates declined during the period.
The portfolio and each of the sub-advisers remain committed to the asset class and their individual investment style.
20
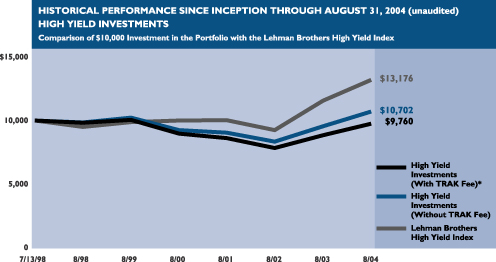
The following graph depicts the performance of the High Yield Investments vs. the Lehman Brothers High Yield Index.9
The performance shown above represents past performance. Past performance is no guarantee of future results and current performance may be higher or lower than the performance shown above. Principal value and investment returns will fluctuate and investors’ shares, when redeemed, may be worth more or less than their original cost. To obtain performance data current to the most recent month-end, please visit our website at www.smithbarney.com.
The graph above and returns shown below do not reflect the deduction of taxes that a shareholder would pay on fund distributions or the redemption of fund shares.
HIGH YIELD INVESTMENTS (unaudited)
Average Annual Total Returns for the Period Ended August 31, 2004
| | | | | | |
| | | Without TRAK Fee | | | With TRAK Fee* | |
Since inception (7/13/98) | | 1.11 | % | | (0.39 | )% |
5 year | | 0.92 | | | (0.59 | ) |
3 year | | 5.73 | | | 4.15 | |
1 year | | 11.81 | | | 10.14 | |
|
|
See pages 26 through 28 for all footnotes.
RISKS: The Portfolio may use derivatives, such as options and futures, which can be illiquid, may disproportionately increase losses and have a potentially large impact on performance. Foreign securities are subject to certain risks of overseas investing, including currency fluctuations and changes in political and economic conditions, which could result in significant market fluctuations. Investments in small and medium-capitalizations companies may involve a higher degree of risk and volatility than investments in larger, more established companies. The Portfolio may invest in high yield bonds, which involve greater credit and liquidity risks than investment grade bonds.
21
Municipal Bond Investments
ABOUTTHE SUB-ADVISER
| | Ÿ | | Smith Affiliated Capital Corp. (“Smith”) | |
Uses an active fixed-income management style that focuses first on the appropriate maturity allocation for the Portfolio within a given market environment. The maturity allocation is supplemented by a long-term market sector rotation. The sub-adviser focuses primarily on “vital service” revenue bonds and secondarily on general obligation bonds of high-quality issuers.
During the year of September 1, 2003 through August 31, 2004, the sub-adviser to the Municipal Bond Investments (“Portfolio”) was Smith Affiliated Capital (“Smith”). The Portfolio outperformed its benchmark.
During the year ended August 31, 2004 the fixed income markets witnessed a change in Federal Reserve (“Fed”) policy from one of accommodation in the face of threatening deflation, to the beginning of a steady, “measured”, series of Fed Funds increases aimed towards a loosely defined “neutral” stance. However, contrary to consensus opinion, this has not resulted in a uniform rise in rates across the curve, but in a flattening of both the taxable and tax-exempt curves about a pivot point situated between three and four years. Municipals in the intermediate maturity range have, therefore, actually had their yields decline by about 50 basis points during this time, albeit with some volatility.
The Portfolio has performed well given our policy of taking prudent call-protected maturity risk on high quality credits, while emphasizing cash flow from coupon income. While having allowed duration to decline slightly, we continue to use relative analysis to take advantage of yield enhancement opportunities when they arise, both with respect to specialty state valuations and bond structures that are attractive to different investment classes.
The Portfolio and sub-adviser remain committed to the asset class and their investment style.
22
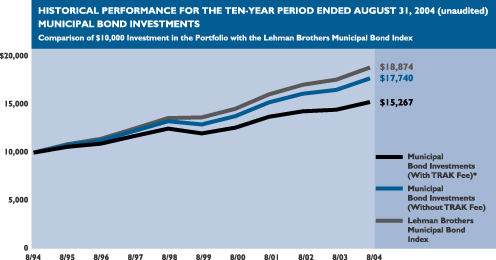
The following graph depicts the performance of the Municipal Bond Investments vs. the Lehman Brothers Municipal Bond Index.10
The performance shown above represents past performance. Past performance is no guarantee of future results and current performance may be higher or lower than the performance shown above. Principal value and investment returns will fluctuate and investors’ shares, when redeemed, may be worth more or less than their original cost. To obtain performance data current to the most recent month-end, please visit our website at www.smithbarney.com.
The graph above and returns shown below do not reflect the deduction of taxes that a shareholder would pay on fund distributions or the redemption of fund shares.
MUNICIPAL BOND INVESTMENTS (unaudited)
Average Annual Total Returns for the Period Ended August 31, 2004
| | | | | | |
| | | Without TRAK Fee | | | With TRAK Fee* | |
Since inception (11/18/91) | | 5.83 | % | | 4.25 | % |
10 year | | 5.90 | | | 4.32 | |
5 year | | 6.52 | | | 4.93 | |
3 year | | 5.16 | | | 3.59 | |
1 year | | 7.12 | | | 5.53 | |
|
|
See pages 26 through 28 for all footnotes.
RISKS: The Portfolio may use derivatives, such as options and futures, which can be illiquid, may disproportionately increase losses and have a potentially large impact on performance. Foreign securities are subject to certain risks of overseas investing, including currency fluctuations and changes in political and economic conditions, which could result in significant market fluctuations. Investments in small and medium-capitalizations companies may involve a higher degree of risk and volatility than investments in larger, more established companies. The Portfolio may invest in high yield bonds, which involve greater credit and liquidity risks than investment grade bonds.
23
International Fixed
Income Investments
ABOUTTHE SUB-ADVISER
| | Ÿ | | Julius Baer Investments Ltd. (“Julius Baer”) | |
Applies portfolio economic analysis to select a portfolio of high-quality, well-diversified foreign bonds. From a universe of 20 developed countries outside the U.S., the sub-adviser forecasts which bond markets offer the best opportunity to outperform the U.S. bond market, considering factors such as currencies, local bond market conditions, issuers and instruments. It pays particular attention to markets that offer attractive yields. The sub-adviser employs a proprietary computer model to analyze exchange rates to assist in its forecasts and to help manage the risk of the Portfolio.
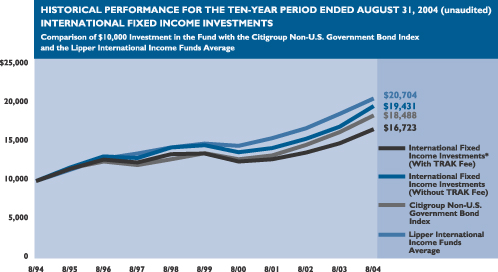
During the year of September 1, 2003 through August 31, 2004, the sub-adviser to the International Fixed Income Investments (“Portfolio”) was Julius Baer Investments Ltd. (“Julius Baer”). The Portfolio outperformed its benchmark.
The key theme in global markets over the past year has been the cyclical upturn in the global economy, driven by the U.S. and Asia (especially China) markets. As a result, global interest rates have begun to rise. In the U.S., the Federal Reserve began raising rates in June, initially in 25 basis point increments. Bond markets have been generally well behaved in spite of the increase in official rates, as the rate rises have been well telegraphed by central banks and global inflation remains generally well subdued. The other key feature of the past year has been the sharp increase in oil prices, driven primarily by strong growth in emerging economies.
2004 was a good year for bond returns, with a large portion of the gains earnings in the front half of the period under review. The biggest contributor to returns was the strength of the Euro, which toward the end of December 2003, was close to 1.301, approximately more than 15%. The growth in the budget and current account deficits took a toll on the dollar. The Portfolio was well situated to take advantage of this. Overseas purchases of U.S. treasuries have scaled back some of the Euro’s gains (which has kept the ten-year bond at a high price/low yield), but the deficits remains a threat to the level of the U.S. dollar. The other main sources of return, duration and country selection, were also positive. The Portfolio benefits from being exposed to these countries, which could benefit from growth, as well as those countries in Europe that could benefit from membership in the expanded European Union.
The Portfolio and the sub-adviser remain committed to the asset class and its investment style.
24
The following graph depicts the performance of the International Fixed Income Investments vs. the Citigroup Non-U.S. Government Bond Index11 and the Lipper International Income Funds Average.18
The performance shown above represents past performance. Past performance is no guarantee of future results and current performance may be higher or lower than the performance shown above. Principal value and investment returns will fluctuate and investors’ shares, when redeemed, may be worth more or less than their original cost. To obtain performance data current to the most recent month-end, please visit our website at www.smithbarney.com.
The graph above and returns shown below do not reflect the deduction of taxes that a shareholder would pay on fund distributions or the redemption of fund shares.
INTERNATIONAL FIXED INCOME INVESTMENTS (unaudited)
Average Annual Total Returns for Period Ended August 31, 2004
| | | | | | |
| | | Without TRAK Fee | | | With TRAK Fee* | |
Since inception (11/18/91) | | 7.19 | % | | 5.59 | % |
10 year | | 6.87 | | | 5.28 | |
5 year | | 5.83 | | | 4.26 | |
3 year | | 10.87 | | | 9.22 | |
1 year | | 14.00 | | | 12.30 | |
|
|
See pages 26 through 28 for all footnotes.
RISKS: The Portfolio may use derivatives, such as options and futures, which can be illiquid, may disproportionately increase losses and have a potentially large impact on performance. Foreign securities are subject to certain risks of overseas investing, including currency fluctuations and changes in political and economic conditions, which could result in significant market fluctuations. Investments in small and medium-capitalizations companies may involve a higher degree of risk and volatility than investments in larger, more established companies. The Portfolio may invest in high yield bonds, which involve greater credit and liquidity risks than investment grade bonds.
25
FOOTNOTES
| † | | The performance shown represents past performance. Past performance is no guarantee of future results and current performance may be higher or lower than the performance shown above. Principal value and investment returns will fluctuate so that an investor’s shares, when redeemed, may be worth more or less than their original cost. The returns shown do not reflect the deduction of taxes that a shareholder would pay on fund distributions or the redemption of fund shares. To obtain performance data current to the most recent month-end, please visit our website at www.smithbarney.com. |
| * | | The Funds are available only to investors participating in an advisory program. These programs charge an annual fee, which in the case of TRAK® may be up to 1.50%. The performance data shown does not reflect this fee, which would reduce returns. |
| ‡ | | Performance figures may reflect fee waivers and/or expense reimbursements. Past performance is no guarantee of future results. In the absence of fee waivers and/or expense reimbursements, the total return would be reduced. |
| 1 | | The Russell 1000 Value Index is a capitalization weighted total return index which is comprised of 1,000 of the largest capitalized U.S. domiciled companies with greater-than-average value orientation whose common stock is traded in the United States on the New York Stock Exchange, American Stock Exchange and NASDAQ. Because the index is not a managed portfolio, there are no advisory fees or internal management expenses reflected in the index’s performance. Please note that an investor cannot invest directly in an index. |
| 2 | | The Russell 1000 Growth Index is a capitalization weighted total return index which is comprised of 1,000 of the largest capitalized U.S. domiciled companies with greater-than-average growth orientation whose common stock is traded in the United States on the New York Stock Exchange, American Stock Exchange and NASDAQ. Because the index is not a managed portfolio, there are no advisory fees or internal management expenses reflected in the index’s performance. Please note that an investor cannot invest directly in an index. |
| 3 | | The Russell 2000 Value Index is a capitalization weighted total return index which is comprised of 2,000 of the smallest capitalized U.S. domiciled companies with less-than-average growth orientation whose common stock is traded in the United States on the New York Stock Exchange, American Stock Exchange and NASDAQ. Because the index is not a managed portfolio, there are no advisory fees or internal management expenses reflected in the index’s performance. Please note that an investor cannot invest directly in an index. |
| 4 | | The Russell 2000 Growth Index is a capitalization weighted total return index which is comprised of 2,000 of the smallest capitalized U.S. domiciled companies with greater-than-average growth orientation whose common stock is traded in the United States on the New York Stock Exchange, American Stock Exchange and NASDAQ. Because the index is not a managed portfolio, there are no advisory fees or internal management expenses reflected in the index’s performance. Please note that an investor cannot invest directly in an index. |
| 5 | | The Morgan Stanley Capital International EAFE-Capitalization Weighted Index is a composite portfolio of equity total returns for the countries of Australia, New Zealand and countries in Europe and the Far East, weighted based on each country’s market capitalization. Because |
26
| | the index is not a managed portfolio, there are no advisory fees or internal management expenses reflected in the index’s performance. Please note that an investor cannot invest directly in an index. |
| 6 | | The Morgan Stanley Capital International Emerging Markets Free Index is an index comprised of thirteen emerging markets open to direct foreign participation. Because the index is not a managed portfolio, there are no advisory fees or internal management expenses reflected in the index’s performance. Please note that an investor cannot invest directly in an index. |
| 7 | | The Lehman Brothers Aggregate Bond Index is composed of the Lehman Brothers Intermediate Government/Credit Bond Index and the Lehman Brothers Mortgage-Backed Securities Index and includes treasury issues, agency issues, corporate bond issues and mortgage-backed securities. Because the index is not a managed portfolio, there are no advisory fees or internal management expenses reflected in the index’s performance. Please note that an investor cannot invest directly in an index. |
| 8 | | The Lehman Brothers Intermediate Government/Credit Bond Index is a weighted composite of: (i) Lehman Brothers Government Bond Index, which is comprised of all publicly issued, non-convertible debt of the U.S. government or any agency thereof, quasi-federal corporations, and corporate debt guaranteed by the U.S. government with a maturity between one and ten years; and (ii) Lehman Brothers Credit Bond Index, which is comprised of all public fixed-rate, non-convertible investment-grade domestic corporate debt with a maturity of between one and ten years, excluding collateralized mortgage obligations. Because the index is not a managed portfolio, there are no advisory fees or internal management expenses reflected in the index’s performance. Please note that an investor cannot invest directly in an index. |
| 9 | | The Lehman Brothers High Yield Index is composed of fixed rate, publicly issued, non-investment grade debt registered with the SEC. All bonds must be dollar-denominated, non-convertible, and have at least one year remaining to maturity as well as an outstanding par value of $100 million. Because the index is not a managed portfolio, there are no advisory fees or internal management expenses reflected in the index’s performance. Please note that an investor cannot invest directly in an index. |
| 10 | | The Lehman Brothers Municipal Bond Index is a weighted composite which is comprised of more than 15,000 bonds issued within the last five years, having a minimum credit rating of at least Baa and maturity of at least two years, excluding all bonds subject to the Alternative Minimum Tax and bonds with floating or zero coupons. Because the index is not a managed portfolio, there are no advisory fees or internal management expenses reflected in the index’s performance. Please note that an investor cannot invest directly in an index. |
| 11 | | The Citigroup Non-U.S. Government Bond Index is an index subset of the Citigroup World Bond Index that excludes corporate bonds denominated in U.S. dollars. It contains foreign government and supranational bonds denominated in Australian, Austrian, Belgian, British, Canadian, Danish, Dutch, French, German, Italian, Japanese, Spanish and Swedish currencies. Because the index is not a managed portfolio, there are no advisory fees or internal management expenses reflected in the index’s performance. Please note that an investor cannot invest directly in an index. |
| 12 | | The Lipper Large-Cap Value Funds Average is comprised of the Fund’s peer group of mutual funds investing in value oriented funds. |
27
| 13 | | The Lipper Large-Cap Growth Funds Average is comprised of the Portfolio’s peer group of mutual funds investing in growth oriented funds. |
| 14 | | The Lipper Small Cap Value Funds Average is comprised of the Portfolio’s peer group of mutual funds which limit their investments to small cap value companies. |
| 15 | | The Lipper Small Cap Growth Funds Average is comprised of the Portfolio’s peer group of mutual funds which limit their investments to small cap growth companies. |
| 16 | | The Lipper International Funds Average is an equally weighted average of the funds that invest their assets in securities with primary trading markets outside of the United States. |
| 17 | | The Lipper Emerging Markets Funds Average is an equally weighted average of the funds that seek long-term capital appreciation by investing at least 65% of total assets in emerging market equity securities, where “emerging market” is defined by a country’s GNP per capita or other economic measures. |
| 18 | | The Lipper International Income Funds Average is an equally weighted average of the funds that invest primarily in U.S. dollar and non-U.S. dollar debt securities of issuers located in at least three countries, excluding the United States. |
28
Fund Expenses
(unaudited)
Example
As a shareholder of the Fund, you may incur two types of costs: (1) advisory program annual fees, which in the case of TRAK® may be up to 1.50%; and (2) ongoing costs, including management fees and other Fund expenses. This Example is intended to help you understand your ongoing costs (in dollars) of investing in the Fund and to compare these costs with the ongoing costs of investing in other mutual funds.
This Example is based on an investment of $1,000 invested on March 1, 2004 and held for the six months ended August 31, 2004.
Actual Expenses
The table below titled “Based on Actual Total Return” provides information about actual account values and actual expenses. You may use the information provided in this table, together with the amount you invested, to estimate the expenses that you paid over the period. To estimate the expenses you paid on your account, divide your ending account value by $1,000 (for example, an $8,600 ending account value divided by $1,000 = 8.6), then multiply the result by the number under the heading entitled “Expenses Paid During the Period”.
Based on Actual Total Return(1)
| | | | | | | | | | | | | | | |
| | | Actual
Total Return
Without
TRAK Fee(2) | | | Beginning
Account
Value | | Ending
Account
Value | | Annualized
Expense
Ratios | | | Expenses
Paid During
the Period(3) |
Large Capitalization Value Equity Investments | | (2.72 | )% | | $ | 1,000.00 | | $ | 972.80 | | 0.85 | % | | $ | 4.22 |
Large Capitalization Growth Investments | | (5.51 | ) | | | 1,000.00 | | | 944.90 | | 0.89 | | | | 4.35 |
Small Capitalization Value Equity Investments | | (0.46 | ) | | | 1,000.00 | | | 995.40 | | 1.17 | | | | 5.87 |
Small Capitalization Growth Investments | | (11.46 | ) | | | 1,000.00 | | | 885.40 | | 1.24 | | | | 5.88 |
International Equity Investments | | (4.56 | ) | | | 1,000.00 | | | 954.40 | | 1.07 | | | | 5.26 |
Emerging Markets Equity Investments | | (8.10 | ) | | | 1,000.00 | | | 919.00 | | 1.50 | | | | 7.24 |
Government Money Investments | | 0.26 | | | | 1,000.00 | | | 1,002.60 | | 0.60 | | | | 3.02 |
Core Fixed Income Investments | | 1.30 | | | | 1,000.00 | | | 1,013.00 | | 0.74 | | | | 3.74 |
High Yield Investments | | 2.84 | | | | 1,000.00 | | | 1,028.40 | | 1.02 | | | | 5.20 |
Municipal Bond Investments | | 0.63 | | | | 1,000.00 | | | 1,006.30 | | 0.90 | | | | 4.54 |
International Fixed Income Investments | | 0.89 | | | | 1,000.00 | | | 1,008.90 | | 1.03 | | | | 5.20 |
| (1) | | For the six months ended August 31, 2004. |
| (2) | | Assumes reinvestment of all dividends and capital gain distributions, if any, at net asset value and does not reflect the deduction of the advisory program annual fees. Total return is not annualized, as it may not be representative of the total return for the year. Performance figures may reflect fee waivers and/or expense reimbursements. Past performance is no guarantee of future results. In the absence of fee waivers and/or expense reimbursements, the total return would be reduced. |
| (3) | | Expenses are equal to each Fund’s respective annualized expense ratio multiplied by the average account value over the period, multiplied by the number of days in the most recent fiscal half-year, then divided by 366. |
29
Fund Expenses
(unaudited) (continued)
Hypothetical Example for Comparison Purposes
The table below titled “Based on Hypothetical Total Return” provides information about hypothetical account values and hypothetical expenses based on the actual expense ratio and an assumed rate of return of 5.00% per year before expenses, which is not the Fund’s actual return. The hypothetical account values and expenses may not be used to estimate the actual ending account balance or expenses you paid for the period. You may use the information provided in this table to compare the ongoing costs of investing in the Fund and other funds. To do so, compare the 5.00% hypothetical example relating to the Fund with the 5.00% hypothetical examples that appear in the shareholder reports of the other funds.
Please note that the expenses shown in the table below are meant to highlight your ongoing costs only and do not reflect any advisory program annual fees. Therefore, the table is useful in comparing ongoing costs only, and will not help you determine the relative total costs of owning different funds. In addition, if these advisory program annual fees were included, your costs would have been higher.
Based on Hypothetical Total Return(1)
| | | | | | | | | | | | | | | |
| | | Hypothetical
Annualized
Total Return | | | Beginning
Account
Value | | Ending
Account
Value | | Annualized
Expense
Ratios | | | Expenses
Paid During
the Period(2) |
Large Capitalization Value Equity Investments | | 5.00 | % | | $ | 1,000.00 | | $ | 1,020.86 | | 0.85 | % | | $ | 4.32 |
Large Capitalization Growth Investments | | 5.00 | | | | 1,000.00 | | | 1,020.66 | | 0.89 | | | | 4.52 |
Small Capitalization Value Equity Investments | | 5.00 | | | | 1,000.00 | | | 1,019.25 | | 1.17 | | | | 5.94 |
Small Capitalization Growth Investments | | 5.00 | | | | 1,000.00 | | | 1,018.90 | | 1.24 | | | | 6.29 |
International Equity Investments | | 5.00 | | | | 1,000.00 | | | 1,019.76 | | 1.07 | | | | 5.43 |
Emerging Markets Equity Investments | | 5.00 | | | | 1,000.00 | | | 1,017.60 | | 1.50 | | | | 7.61 |
Government Money Investments | | 5.00 | | | | 1,000.00 | | | 1,022.12 | | 0.60 | | | | 3.05 |
Core Fixed Income Investments | | 5.00 | | | | 1,000.00 | | | 1,021.42 | | 0.74 | | | | 3.76 |
High Yield Investments | | 5.00 | | | | 1,000.00 | | | 1,020.01 | | 1.02 | | | | 5.18 |
Municipal Bond Investments | | 5.00 | | | | 1,000.00 | | | 1,020.61 | | 0.90 | | | | 4.57 |
International Fixed Income Investments | | 5.00 | | | | 1,000.00 | | | 1,019.96 | | 1.03 | | | | 5.23 |
| (1) | | For the six months ended August 31, 2004. |
| (2) | | Expenses are equal to each Fund’s respective annualized expense ratio multiplied by the average account value over the period, multiplied by the number of days in the most recent fiscal half-year, then divided by 366. |
30
Schedules of Investments
August 31, 2004
| | | | | |
| Large Capitalization Value Equity Investments |
| | |
| Shares | | Security | | Value |
COMMON STOCK — 95.3% | | | |
CONSUMER DISCRETIONARY — 11.6% | | | |
| |
Auto Components — 1.3% | | | |
| 48,800 | | Borg Warner, Inc. | | $ | 2,183,312 |
| 153,630 | | Lear Corp. | | | 8,277,584 |
| 94,000 | | Magna International Inc., Class A Shares | | | 7,001,120 |
| | | | |
|
|
| | | | | | 17,462,016 |
| | | | |
|
|
| |
Automobiles — 0.6% | | | |
| 70,250 | | General Motors Corp. | | | 2,902,028 |
| 90,000 | | Harley-Davidson, Inc. | | | 5,491,800 |
| | | | |
|
|
| | | | | | 8,393,828 |
| | | | |
|
|
| |
Hotels, Restaurants & Leisure — 1.2% | | | |
| 222,000 | | Brinker International, Inc.* | | | 6,759,900 |
| 100,000 | | Carnival Corp. | | | 4,579,000 |
| 28,400 | | Harrah’s Entertainment, Inc. | | | 1,368,596 |
| 94,265 | | International Game Technology | | | 2,719,545 |
| | | | |
|
|
| | | | | | 15,427,041 |
| | | | |
|
|
| |
Leisure Equipment & Products — 0.9% | | | |
| 736,360 | | Mattel, Inc. | | | 11,848,032 |
| | | | |
|
|
| |
Media — 4.3% | | | |
| 501,000 | | Comcast Corp., Special Class A Shares* | | | 13,902,750 |
| 181,900 | | Fox Entertainment Group Inc., Class A Shares* | | | 4,936,766 |
| 423,120 | | The Interpublic Group of Cos., Inc.* | | | 4,463,916 |
| 550,400 | | Time Warner Inc.* | | | 8,999,040 |
| 518,655 | | Viacom Inc., Class B Shares | | | 17,276,398 |
| 268,000 | | The Walt Disney Co. | | | 6,016,600 |
| | | | |
|
|
| | | | | | 55,595,470 |
| | | | |
|
|
| |
Multiline Retail — 1.1% | | | |
| 70,119 | | Federated Department Stores, Inc. | | | 3,043,165 |
| 216,725 | | The May Department Stores Co. | | | 5,311,930 |
| 125,000 | | Target Corp. | | | 5,572,500 |
| | | | |
|
|
| | | | | | 13,927,595 |
| | | | |
|
|
| |
Specialty Retail — 1.5% | | | |
| 205,000 | | The Home Depot, Inc. | | | 7,494,800 |
| 415,000 | | Limited Brands | | | 8,333,200 |
| 272,200 | | Office Depot, Inc.* | | | 4,357,922 |
| | | | |
|
|
| | | | | | 20,185,922 |
| | | | |
|
|
| |
Textiles & Apparel — 0.7% | | | |
| 251,570 | | Jones Apparel Group, Inc. | | | 8,978,533 |
| | | | |
|
|
| | | TOTAL CONSUMER DISCRETIONARY | | | 151,818,437 |
| | | | |
|
|
CONSUMER STAPLES — 6.0% | | | |
| |
Beverages — 0.9% | | | |
| 80,025 | | Anheuser-Busch Co., Inc. | | | 4,225,320 |
| 140,600 | | Pepsi Co, Inc. | | | 7,030,000 |
| | | | |
|
|
| | | | | | 11,255,320 |
| | | | |
|
|
See Notes to Financial Statements.
31
Schedules of Investments
(continued)
| | | | | |
| Large Capitalization Value Equity Investments |
| | |
| Shares | | Security | | Value |
| |
Food & Drug Retailing — 1.6% | | | |
| 185,000 | | CVS Corp. | | $ | 7,400,000 |
| 409,400 | | The Kroger Co.* | | | 6,767,382 |
| 303,700 | | Safeway Inc.* | | | 6,134,740 |
| | | | |
|
|
| | | | | | 20,302,122 |
| | | | |
|
|
| |
Food Products — 0.4% | | | |
| 210,000 | | Smithfield Foods, Inc.* | | | 5,397,000 |
| | | | |
|
|
| |
Household Products — 0.9% | | | |
| 54,805 | | Colgate-Palmolive Co. | | | 2,959,470 |
| 159,370 | | The Procter & Gamble Co. | | | 8,919,939 |
| | | | |
|
|
| | | | | | 11,879,409 |
| | | | |
|
|
| |
Tobacco — 2.2% | | | |
| 596,080 | | Altria Group, Inc. | | | 29,178,116 |
| | | | |
|
|
| | | TOTAL CONSUMER STAPLES | | | 78,011,967 |
| | | | |
|
|
ENERGY — 7.5% | | | |
| |
Energy Equipment & Services — 0.9% | | | |
| 417,370 | | Halliburton Co. | | | 12,174,683 |
| | | | |
|
|
| |
Oil & Gas — 6.6% | | | |
| 282,040 | | BP PLC, Sponsored ADR | | | 15,145,548 |
| 144,300 | | ChevronTexaco Corp. | | | 14,069,250 |
| 249,000 | | Conoco Phillips | | | 18,533,070 |
| 340,390 | | Exxon Mobil Corp. | | | 15,691,979 |
| 331,600 | | Occidental Petroleum Corp. | | | 17,127,140 |
| 48,030 | | Total SA, Sponsored ADR | | | 4,706,460 |
| 4,100 | | Valero Energy Corp. | | | 270,723 |
| | | | |
|
|
| | | | | | 85,544,170 |
| | | | |
|
|
| | | TOTAL ENERGY | | | 97,718,853 |
| | | | |
|
|
FINANCIALS — 28.4% | | | |
| |
Banks — 9.1% | | | |
| 988,202 | | Bank of America Corp. | | | 44,449,326 |
| 158,835 | | The Bank of New York Co., Inc. | | | 4,733,283 |
| 255,700 | | National City Corp. | | | 9,662,903 |
| 360,600 | | SunTrust Banks, Inc. | | | 24,556,860 |
| 230,000 | | U.S. Bancorp | | | 6,785,000 |
| 406,385 | | Wachovia Corp. | | | 19,063,520 |
| 166,794 | | Wells Fargo & Co. | | | 9,799,148 |
| | | | |
|
|
| | | | | | 119,050,040 |
| | | | |
|
|
| |
Diversified Financials — 11.5% | | | |
| 400,000 | | Assured Guaranty Ltd. | | | 6,412,000 |
| 389,665 | | Fannie Mae | | | 29,010,559 |
| 258,385 | | Freddie Mac | | | 17,342,801 |
| 161,400 | | The Goldman Sachs Group, Inc. | | | 14,469,510 |
| 420,000 | | ING Groep NV, Sponsored ADR | | | 10,264,800 |
| 595,360 | | J.P. Morgan Chase & Co. | | | 23,564,349 |
| 143,550 | | Lehman Brothers Holdings Inc. | | | 10,606,910 |
| 318,595 | | MBNA Corp. | | | 7,690,883 |
See Notes to Financial Statements.
32
Schedules of Investments
(continued)
| | | | | |
| Large Capitalization Value Equity Investments |
| | |
| Shares | | Security | | Value |
| |
Diversified Financials — 11.5% (continued) | | | |
| 275,590 | | Merrill Lynch & Co., Inc. | | $ | 14,074,381 |
| 320,935 | | Morgan Stanley | | | 16,281,033 |
| | | | |
|
|
| | | | | | 149,717,226 |
| | | | |
|
|
| |
Insurance — 7.8% | | | |
| 240,000 | | ACE Ltd. | | | 9,252,000 |
| 215,000 | | Allstate Corp. | | | 10,150,150 |
| 66,600 | | American International Group, Inc. | | | 4,744,584 |
| 400,000 | | Conseco, Inc.* | | | 6,800,000 |
| 212,310 | | Genworth Financial Inc., Class A Shares* | | | 4,825,806 |
| 272,820 | | The Hartford Financial Services Group, Inc. | | | 16,685,671 |
| 5,900 | | Jefferson-Pilot Corp. | | | 282,610 |
| 136,800 | | Manulife Financial Corp. | | | 5,667,624 |
| 110,145 | | Marsh & McLennan Cos., Inc. | | | 4,922,380 |
| 203,600 | | MetLife, Inc. | | | 7,584,100 |
| 114,815 | | Prudential Financial, Inc. | | | 5,302,157 |
| 25,700 | | RenaissanceRe Holdings Ltd. | | | 1,236,684 |
| 634,530 | | Unum Provident Corp. | | | 10,266,695 |
| 196,155 | | XL Capital Ltd., Class A Shares | | | 13,770,081 |
| | | | |
|
|
| | | | | | 101,490,542 |
| | | | |
|
|
| | | TOTAL FINANCIALS | | | 370,257,808 |
| | | | |
|
|
HEALTHCARE — 9.3% | | | |
| |
Healthcare Equipment & Supplies — 0.4% | | | |
| 94,000 | | Guidant Corp. | | | 5,621,200 |
| | | | |
|
|
| |
Healthcare Providers & Services — 2.4% | | | |
| 155,000 | | AmerisourceBergen Corp. | | | 8,385,500 |
| 132,000 | | CIGNA Corp. | | | 8,785,920 |
| 230,000 | | HCA Inc. | | | 8,926,300 |
| 286,300 | | Humana, Inc.* | | | 5,439,700 |
| | | | |
|
|
| | | | | | 31,537,420 |
| | | | |
|
|
| |
Pharmaceuticals — 6.5% | | | |
| 375,090 | | Abbott Laboratories | | | 15,637,502 |
| 406,000 | | Glaxo Smith Kline PLC, Sponsored ADR | | | 16,702,840 |
| 273,900 | | Medco Health Solutions, Inc.* | | | 8,553,897 |
| 100,380 | | Merck & Co., Inc. | | | 4,514,089 |
| 499,605 | | Pfizer Inc. | | | 16,322,095 |
| 615,830 | | Wyeth | | | 22,520,903 |
| | | | |
|
|
| | | | | | 84,251,326 |
| | | | |
|
|
| | | TOTAL HEALTHCARE | | | 121,409,946 |
| | | | |
|
|
INDUSTRIALS — 11.2% | | | |
| |
Aerospace & Defense — 1.2% | | | |
| 80,100 | | The Boeing Co. | | | 4,182,822 |
| 130,275 | | Lockheed Martin Corp. | | | 7,006,190 |
| 91,130 | | Northrop Grumman Corp. | | | 4,706,864 |
| | | | |
|
|
| | | | | | 15,895,876 |
| | | | |
|
|
| |
Building Products — 0.7% | | | |
| 283,065 | | Masco Corp. | | | 9,094,878 |
| | | | |
|
|
See Notes to Financial Statements.
33
Schedules of Investments
(continued)
| | | | | |
| Large Capitalization Value Equity Investments |
| | |
| Shares | | Security | | Value |
| |
Commercial Services & Supplies — 0.9% | | | |
| 307,000 | | Allied Waste Industries, Inc.* | | $ | 3,143,680 |
| 125,000 | | Pitney Bowes, Inc. | | | 5,445,000 |
| 151,930 | | Sabre Holdings Corp., Class A Shares | | | 3,494,390 |
| | | | |
|
|
| | | | | | 12,083,070 |
| | | | |
|
|
| |
Construction & Engineering — 0.6% | | | |
| 180,000 | | Jacobs Engineering Group Inc.* | | | 7,039,800 |
| | | | |
|
|
| |
Electrical Equipment — 0.9% | | | |
| 208,150 | | Cooper Industries, Inc., Class A Shares | | | 11,494,043 |
| | | | |
|
|
| |
Industrial Conglomerates — 3.7% | | | |
| 82,955 | | 3M Co. | | | 6,832,174 |
| 800,700 | | General Electric Co. | | | 26,254,953 |
| 201,880 | | Honeywell International Inc. | | | 7,263,642 |
| 130,100 | | Textron, Inc. | | | 8,260,049 |
| | | | |
|
|
| | | | | | 48,610,818 |
| | | | |
|
|
| |
Machinery — 1.5% | | | |
| 61,200 | | Eaton Corp. | | | 3,693,420 |
| 50,000 | | Illinois Tool Works, Inc. | | | 4,564,500 |
| 44,965 | | Ingersoll-Rand Co. Ltd., Class A Shares | | | 2,923,175 |
| 337,320 | | Pall Corp. | | | 8,217,115 |
| | | | |
|
|
| | | | | | 19,398,210 |
| | | | |
|
|
| |
Road & Rail — 1.7% | | | |
| 270,400 | | Burlington Northern Santa Fe Corp. | | | 9,680,320 |
| 91,705 | | Canadian National Railway Co. | | | 4,178,997 |
| 266,700 | | CSX Corp. | | | 8,422,386 |
| | | | |
|
|
| | | | | | 22,281,703 |
| | | | |
|
|
| | | TOTAL INDUSTRIALS | | | 145,898,398 |
| | | | |
|
|
INFORMATION TECHNOLOGY — 8.7% | | | |
| |
Communications Equipment — 0.7% | | | |
| 336,900 | | Corning, Inc.* | | | 3,409,428 |
| 530,400 | | Nortel Networks Corp.* | | | 1,994,304 |
| 465,900 | | Tellabs, Inc.* | | | 4,225,713 |
| | | | |
|
|
| | | | | | 9,629,445 |
| | | | |
|
|
| |
Computers & Peripherals — 2.4% | | | |
| 1,493,800 | | Hewlett-Packard Co. | | | 26,724,082 |
| 37,420 | | International Business Machines Corp. | | | 3,169,100 |
| 287,880 | | Sun Microsystems, Inc.* | | | 1,105,459 |
| | | | |
|
|
| | | | | | 30,998,641 |
| | | | |
|
|
| |
Electronic Equipment & Instruments — 2.5% | | | |
| 150,290 | | Celestica, Inc., Subordinate Voting Shares* | | | 2,149,147 |
| 518,222 | | Flextronics International Ltd.* | | | 6,431,135 |
| 238,100 | | Ingram Micro Inc., Class A Shares* | | | 3,528,642 |
| 318,280 | | Sanmina-SCI Corp.* | | | 2,202,498 |
| 2,841,427 | | Solectron Corp.* | | | 14,661,763 |
| 98,150 | | Tech Data Corp.* | | | 3,696,329 |
| | | | |
|
|
| | | | | | 32,669,514 |
| | | | |
|
|
See Notes to Financial Statements.
34
Schedules of Investments
(continued)
| | | | | |
| Large Capitalization Value Equity Investments |
| | |
| Shares | | Security | | Value |
| |
IT Consulting & Services — 1.0% | | | |
| 498,030 | | Accenture Ltd., Class A Shares* | | $ | 12,998,583 |
| | | | |
|
|
| |
Software — 2.1% | | | |
| 600,000 | | BMC Software, Inc.* | | | 8,982,000 |
| 672,600 | | Microsoft Corp. | | | 18,361,980 |
| | | | |
|
|
| | | | | | 27,343,980 |
| | | | |
|
|
| | | TOTAL INFORMATION TECHNOLOGY | | | 113,640,163 |
| | | | |
|
|
MATERIALS — 5.9% | | | |
| |
Chemicals — 2.0% | | | |
| 284,780 | | Air Products & Chemicals, Inc. | | | 14,916,776 |
| 133,380 | | The Dow Chemical Co. | | | 5,709,998 |
| 140,640 | | Monsanto Co. | | | 5,147,424 |
| | | | |
|
|
| | | | | | 25,774,198 |
| | | | |
|
|
| |
Containers & Packaging — 0.7% | | | |
| 270,000 | | Pactiv Corp.* | | | 6,385,500 |
| 196,800 | | Smurfit-Stone Container Corp.* | | | 3,491,232 |
| | | | |
|
|
| | | | | | 9,876,732 |
| | | | |
|
|
| |
Metals & Mining — 1.5% | | | |
| 433,495 | | Alcoa Inc. | | | 14,036,568 |
| 137,995 | | Freeport-McMoRan Copper & Gold, Inc., Class B Shares | | | 5,192,752 |
| | | | |
|
|
| | | | | | 19,229,320 |
| | | | |
|
|
| |
Paper & Forest Products — 1.7% | | | |
| 226,702 | | International Paper Co. | | | 9,072,614 |
| 419,600 | | Mead Westvaco Corp. | | | 12,650,940 |
| | | | |
|
|
| | | | | | 21,723,554 |
| | | | |
|
|
| | | TOTAL MATERIALS | | | 76,603,804 |
| | | | |
|
|
TELECOMMUNICATION SERVICES — 3.2% | | | |
| |
Diversified Telecommunication Services — 3.2% | | | |
| 160,930 | | Bell South Corp. | | | 4,306,487 |
| 201,925 | | Citizens Communications Co. | | | 2,550,313 |
| 125,773 | | Qwest Communications International Inc.* | | | 363,484 |
| 361,664 | | SBC Communications Inc. | | | 9,327,315 |
| 811,500 | | Sprint Corp., Series 1 FON Shares | | | 15,970,320 |
| 236,980 | | Verizon Communications Inc. | | | 9,301,465 |
| | | | |
|
|
| | | | | | 41,819,384 |
| | | | |
|
|
| | | TOTAL TELECOMMUNICATION SERVICES | | | 41,819,384 |
| | | | |
|
|
UTILITIES — 3.5% | | | |
| |
Electric Utilities — 2.7% | | | |
| 267,263 | | American Electric Power Co., Inc. | | | 8,747,518 |
| 217,020 | | Entergy Corp. | | | 13,086,306 |
| 167,400 | | PPL Corp. | | | 8,006,742 |
| 148,000 | | Wisconsin Energy Corp. | | | 4,847,000 |
| | | | |
|
|
| | | | | | 34,687,566 |
| | | | |
|
|
See Notes to Financial Statements.
35
Schedules of Investments
(continued)
| | | | | |
| Large Capitalization Value Equity Investments |
| | |
| Shares | | Security | | Value |
| |
Gas Utilities — 0.8% | | | |
| 290,400 | | Sempra Energy | | $ | 10,497,960 |
| | | | |
|
|
| | | TOTAL UTILITIES | | | 45,185,526 |
| | | | |
|
|
| | | TOTAL COMMON STOCK
(Cost — $ 1,138,157,032) | | | 1,242,364,286 |
| | | | |
|
|
| | |
Face Amount
| | | | |
REPURCHASE AGREEMENTS — 4.1% | | | |
| $14,544,000 | | Merrill Lynch & Co. dated 8/31/04, 1.570% due 9/1/04; Proceeds at maturity — $14,544,634; (Fully collateralized by various U.S. Government Agency Obligations, 0.000% to 2.500% due 11/17/04 to 2/24/06;
Market value — $14,834,886) | | | 14,544,000 |
| 1,222,000 | | State Street Bank and Trust Co. dated 8/31/04, 1.490% due 9/1/04; Proceeds at maturity — $1,222,051; (Fully collateralized by U.S. Treasury Bonds, 6.125% due 8/15/29; Market value — $1,251,317) | | | 1,222,000 |
| 37,507,000 | | UBS Securities LLC dated 8/31/04, 1.580% due 9/1/04; Proceeds at maturity — $37,508,646; (Fully collateralized by various U.S. Government Agency Obligations, 0.000% to 9.800% due 10/22/04 to 3/1/26;
Market value — $38,257,251) | | | 37,507,000 |
| | | | |
|
|
| | | TOTAL REPURCHASE AGREEMENTS
(Cost — $53,273,000) | | | 53,273,000 |
| | | | |
|
|
| | | TOTAL INVESTMENTS — 99.4%
(Cost — $1,191,430,032**) | | | 1,295,637,286 |
| | | Other Assets in Excess of Liabilities — 0.6% | | | 8,160,665 |
| | | | |
|
|
| | | TOTAL NET ASSETS — 100.0% | | $ | 1,303,797,951 |
| | | | |
|
|
| * | | Non-income producing security. |
| ** | | Aggregate cost for Federal income tax purposes is $1,202,176,109. |
Abbreviation used in this schedule:
ADR — American Depositary Receipt
See Notes to Financial Statements.
36
Schedules of Investments
(continued)
| | | | | |
| Large Capitalization Growth Investments |
| | |
| Shares | | Security | | Value |
COMMON STOCK — 97.8% | | | |
CONSUMER DISCRETIONARY — 23.8% | | | |
| |
Auto Components — 0.0% | | | |
| 6,810 | | Autoliv, Inc. | | $ | 287,722 |
| | | | |
|
|
| |
Automobiles — 1.5% | | | |
| 299,741 | | Harley-Davidson, Inc. | | | 18,290,196 |
| | | | |
|
|
| |
Hotels, Restaurants & Leisure — 4.5% | | | |
| 13,190 | | Aztar Corp.* | | | 327,903 |
| 175,800 | | Carnival Corp. | | | 8,049,882 |
| 381,400 | | Hilton Hotels Corp. | | | 6,807,990 |
| 97,750 | | Marriott International Inc., Class A Shares | | | 4,638,238 |
| 7,090 | | PF Chang’s China Bistro Inc.* | | | 297,213 |
| 14,310 | | Ruby Tuesday, Inc. | | | 387,085 |
| 743,650 | | Starbucks Corp.* | | | 32,155,426 |
| 8,820 | | Starwood Hotels & Resorts Worldwide, Inc. | | | 389,844 |
| 13,740 | | Station Casinos, Inc. | | | 632,040 |
| 10,410 | | WMS Industries Inc.* | | | 210,386 |
| 9,420 | | Wynn Resorts, Ltd.* | | | 363,612 |
| 14,560 | | Yum! Brands, Inc. | | | 578,178 |
| | | | |
|
|
| | | | | | 54,837,797 |
| | | | |
|
|
| |
Household Durables — 0.5% | | | |
| 5,180 | | Harman International Industries, Inc. | | | 500,854 |
| 173,340 | | Sony Corp., Sponsored ADR | | | 6,009,698 |
| | | | |
|
|
| | | | | | 6,510,552 |
| | | | |
|
|
| |
Internet & Catalog Retail — 6.1% | | | |
| 456,900 | | Amazon.com, Inc.* | | | 17,426,166 |
| 648,748 | | eBay Inc.* | | | 56,142,652 |
| | | | |
|
|
| | | | | | 73,568,818 |
| | | | |
|
|
| |
Leisure Equipment & Products — 0.0% | | | |
| 7,870 | | Brunswick Corp. | | | 309,370 |
| | | | |
|
|
| |
Media — 4.8% | | | |
| 140,600 | | Clear Channel Communications, Inc. | | | 4,711,506 |
| 75,700 | | The E.W. Scripps Co., Class A Shares | | | 7,744,867 |
| 107,700 | | The News Corp. Ltd., Sponsored ADR | | | 3,365,625 |
| 134,100 | | Pixar* | | | 10,422,252 |
| 276,820 | | Time Warner Inc.* | | | 4,526,007 |
| 204,400 | | Univision Communications Inc., Class A Shares* | | | 6,745,200 |
| 240,700 | | Viacom Inc., Class B Shares | | | 8,017,717 |
| 462,105 | | XM Satellite Radio Holdings Inc., Class A Shares* | | | 12,694,024 |
| | | | |
|
|
| | | | | | 58,227,198 |
| | | | |
|
|
| |
Multiline Retail — 2.3% | | | |
| 156,400 | | Costco Wholesale Corp. | | | 6,438,988 |
| 179,700 | | Kohl’s Corp.* | | | 8,891,556 |
| 238,810 | | Wal-Mart Stores, Inc. | | | 12,578,123 |
| | | | |
|
|
| | | | | | 27,908,667 |
| | | | |
|
|
See Notes to Financial Statements.
37
Schedules of Investments
(continued)
| | | | | |
| Large Capitalization Growth Investments |
| | |
| Shares | | Security | | Value |
| |
Specialty Retail — 3.9% | | | |
| 8,630 | | Abercrombie & Fitch Co., Class A Shares | | $ | 241,640 |
| 11,970 | | American Eagle Outfitters, Inc.* | | | 398,601 |
| 240,970 | | Bed Bath and Beyond Inc.* | | | 9,017,097 |
| 179,100 | | Best Buy Co., Inc. | | | 8,331,732 |
| 12,170 | | CDW Corp. | | | 711,945 |
| 16,470 | | Chico’s FAS, Inc.* | | | 673,623 |
| 290,830 | | Lowe’s Cos., Inc. | | | 14,454,251 |
| 135,900 | | Tiffany & Co. | | | 4,206,105 |
| 13,300 | | Urban Outfitters, Inc.* | | | 403,655 |
| 241,850 | | Williams-Sonoma, Inc.* | | | 8,462,332 |
| | | | |
|
|
| | | | | | 46,900,981 |
| | | | |
|
|
| |
Textiles & Apparel — 0.2% | | | |
| 17,240 | | Coach, Inc.* | | | 726,666 |
| 28,080 | | Nike, Inc., Class B Shares | | | 2,114,705 |
| | | | |
|
|
| | | | | | 2,841,371 |
| | | | |
|
|
| | | TOTAL CONSUMER DISCRETIONARY | | | 289,682,672 |
| | | | |
|
|
CONSUMER STAPLES — 3.7% | | | |
| |
Beverages — 0.7% | | | |
| 7,650 | | Constellation Brands, Inc., Class A Shares* | | | 281,291 |
| 166,270 | | PepsiCo, Inc. | | | 8,313,500 |
| | | | |
|
|
| | | | | | 8,594,791 |
| | | | |
|
|
| |
Food & Drug Retailing — 1.6% | | | |
| 522,153 | | Walgreen Co. | | | 19,032,477 |
| 3,670 | | Whole Foods Market, Inc. | | | 285,269 |
| | | | |
|
|
| | | | | | 19,317,746 |
| | | | |
|
|
| |
Food Products — 0.4% | | | |
| 223,120 | | Archer-Daniels-Midland Co. | | | 3,563,226 |
| 13,010 | | McCormick & Co., Inc. | | | 436,486 |
| | | | |
|
|
| | | | | | 3,999,712 |
| | | | |
|
|
| |
Household Products — 0.8% | | | |
| 11,180 | | The Clorox Co. | | | 590,751 |
| 166,810 | | The Procter & Gamble Co. | | | 9,336,356 |
| | | | |
|
|
| | | | | | 9,927,107 |
| | | | |
|
|
| |
Personal Products — 0.2% | | | |
| 50,060 | | Avon Products, Inc. | | | 2,211,651 |
| 12,030 | | Nu Skin Enterprises, Inc., Class A Shares | | | 310,614 |
| | | | |
|
|
| | | | | | 2,522,265 |
| | | | |
|
|
| | | TOTAL CONSUMER STAPLES | | | 44,361,621 |
| | | | |
|
|
ENERGY — 3.0% | | | |
| |
Energy Equipment & Services — 0.1% | | | |
| 12,400 | | Baker Hughes Inc. | | | 487,692 |
| 6,680 | | Smith International, Inc.* | | | 380,626 |
| | | | |
|
|
| | | | | | 868,318 |
| | | | |
|
|
See Notes to Financial Statements.
38
Schedules of Investments
(continued)
| | | | | |
| Large Capitalization Growth Investments |
| | |
| Shares | | Security | | Value |
| |
Oil & Gas — 2.9% | | | |
| 215,700 | | Apache Corp. | | $ | 9,639,633 |
| 8,860 | | Ashland Inc. | | | 455,670 |
| 93,300 | | ChevronTexaco Corp. | | | 9,096,750 |
| 91,000 | | ConocoPhillips | | | 6,773,130 |
| 179,300 | | Exxon Mobil Corp. | | | 8,265,730 |
| 20,680 | | Range Resources Corp. | | | 310,200 |
| 7,410 | | Teekay Shipping Corp. | | | 259,720 |
| 10,180 | | Western Gas Resources, Inc. | | | 284,226 |
| 16,542 | | XTO Energy, Inc. | | | 463,838 |
| | | | |
|
|
| | | | | | 35,548,897 |
| | | | |
|
|
| | | TOTAL ENERGY | | | 36,417,215 |
| | | | |
|
|
FINANCIALS — 10.2% | | | |
| |
Banks — 0.1% | | | |
| 3,840 | | City National Corp. | | | 253,363 |
| 11,410 | | Investors Financial Services Corp. | | | 529,196 |
| 17,320 | | Sovereign Bancorp, Inc. | | | 378,615 |
| 10,430 | | UCBH Holdings, Inc. | | | 418,765 |
| | | | |
|
|
| | | | | | 1,579,939 |
| | | | |
|
|
| |
Diversified Financials — 5.3% | | | |
| 11,445 | | Affiliated Managers Group, Inc.* | | | 561,377 |
| 274,096 | | American Express Co. | | | 13,710,282 |
| 3,810 | | The Bear Stearns Cos. Inc. | | | 334,975 |
| 246,900 | | Capital One Financial Corp. | | | 16,729,944 |
| 1,065,275 | | The Charles Schwab Corp. | | | 10,066,849 |
| 2,650 | | Doral Financial Corp. | | | 107,776 |
| 31,130 | | E*TRADE Financial Corp.* | | | 366,711 |
| 54,620 | | The Goldman Sachs Group, Inc. | | | 4,896,683 |
| 165,100 | | Merrill Lynch & Co., Inc. | | | 8,431,657 |
| 123,800 | | Moody’s Corp. | | | 8,487,728 |
| 14,830 | | T. Rowe Price Group Inc. | | | 734,530 |
| | | | |
|
|
| | | | | | 64,428,512 |
| | | | |
|
|
| |
Insurance — 4.8% | | | |
| 226,500 | | AFLAC, Inc. | | | 9,082,650 |
| 336,310 | | American International Group, Inc. | | | 23,958,725 |
| 5,590 | | MGIC Investment Corp. | | | 381,629 |
| 308,930 | | The Progressive Corp. | | | 24,807,079 |
| | | | |
|
|
| | | | | | 58,230,083 |
| | | | |
|
|
| |
Real Estate — 0.0% | | | |
| 21,750 | | Host Marriott Corp.* | | | 290,362 |
| | | | |
|
|
| | | TOTAL FINANCIALS | | | 124,528,896 |
| | | | |
|
|
HEALTHCARE — 20.9% | | | |
| |
Biotechnology — 9.7% | | | |
| 621,490 | | Amgen Inc.* | | | 36,848,142 |
| 173,380 | | Biogen Idec Inc.* | | | 10,286,635 |
| 127,000 | | Celgene Corp.* | | | 7,207,250 |
| 10,730 | | Charles River Laboratories International, Inc.* | | | 467,291 |
| 16,340 | | Gen-Probe Inc.* | | | 589,874 |
See Notes to Financial Statements.
39
Schedules of Investments
(continued)
| | | | | |
| Large Capitalization Growth Investments |
| | |
| Shares | | Security | | Value |
| |
Biotechnology — 9.7% (continued) | | | |
| 848,940 | | Genentech, Inc.* | | $ | 41,411,293 |
| 184,800 | | Genzyme Corp.* | | | 9,979,200 |
| 152,650 | | Gilead Sciences, Inc.* | | | 10,552,695 |
| 8,920 | | Neurocrine Biosciences, Inc.* | | | 443,949 |
| 7,930 | | OSI Pharmaceuticals, Inc.* | | | 472,549 |
| | | | |
|
|
| | | | | | 118,258,878 |
| | | | |
|
|
| |
Healthcare Equipment & Supplies — 3.8% | | | |
| 6,690 | | Bausch & Lomb Inc. | | | 441,205 |
| 13,250 | | Biomet, Inc. | | | 604,862 |
| 93,590 | | Boston Scientific Corp.* | | | 3,343,971 |
| 17,860 | | C.R. Bard, Inc. | | | 1,001,946 |
| 14,920 | | Fisher Scientific International Inc.* | | | 849,992 |
| 13,085 | | INAMED Corp.* | | | 695,337 |
| 257,514 | | Medtronic, Inc. | | | 12,811,322 |
| 72,260 | | Patterson Cos. Inc.* | | | 5,291,600 |
| 50,520 | | St. Jude Medical, Inc.* | | | 3,397,470 |
| 191,800 | | Stryker Corp. | | | 8,688,540 |
| 130,480 | | Zimmer Holdings, Inc.* | | | 9,303,224 |
| | | | |
|
|
| | | | | | 46,429,469 |
| | | | |
|
|
| |
Healthcare Providers & Services — 2.6% | | | |
| 110,300 | | Aetna Inc. | | | 10,219,295 |
| 69,820 | | Anthem, Inc.* | | | 5,672,177 |
| 151,800 | | Caremark Rx, Inc.* | | | 4,356,660 |
| 162,200 | | HCA, Inc. | | | 6,294,982 |
| 4,290 | | Henry Schein, Inc.* | | | 267,181 |
| 11,930 | | Laboratory Corp. of America Holdings* | | | 496,169 |
| 9,300 | | Manor Care, Inc. | | | 285,231 |
| 91,140 | | McKesson Corp. | | | 2,820,783 |
| 9,510 | | PacifiCare Health Systems, Inc.* | | | 310,121 |
| | | | |
|
|
| | | | | | 30,722,599 |
| | | | |
|
|
| |
Pharmaceuticals — 4.8% | | | |
| 130,500 | | Allergan, Inc. | | | 9,741,825 |
| 20,990 | | Elan Corp. PLC, Sponsored ADR* | | | 475,004 |
| 126,480 | | Eli Lilly and Co. | | | 8,025,156 |
| 14,812 | | IVAX Corp.* | | | 286,760 |
| 108,902 | | Johnson & Johnson | | | 6,327,206 |
| 506,531 | | Pfizer Inc. | | | 16,548,368 |
| 57,220 | | Sanofi-Aventis, ADR* | | | 2,037,032 |
| 8,950 | | Sepracor Inc.* | | | 444,009 |
| 531,340 | | Teva Pharmaceutical Industries Ltd., Sponsored ADR | | | 14,479,015 |
| | | | |
|
|
| | | | | | 58,364,375 |
| | | | |
|
|
| | | TOTAL HEALTHCARE | | | 253,775,321 |
| | | | |
|
|
INDUSTRIALS — 8.9% | | | |
| |
Air Freight & Couriers — 0.0% | | | |
| 6,770 | | Expeditors International of Washington, Inc. | | | 330,240 |
| | | | |
|
|
| |
Airlines — 0.4% | | | |
| 348,190 | | Southwest Airlines Co. | | | 5,160,176 |
| | | | |
|
|
See Notes to Financial Statements.
40
Schedules of Investments
(continued)
| | | | | |
| Large Capitalization Growth Investments |
| | |
| Shares | | Security | | Value |
| |
Building Products — 0.1% | | | |
| 16,080 | | American Standard Cos. Inc.* | | $ | 604,769 |
| | | | |
|
|
| |
Commercial Services & Supplies — 5.5% | | | |
| 11,470 | | Alliance Data Systems Corp.* | | | 438,154 |
| 412,235 | | Apollo Group, Inc., Class A Shares* | | | 32,154,330 |
| 175,000 | | Career Education Corp.* | | | 5,397,000 |
| 16,420 | | CheckFree Corp.* | | | 447,445 |
| 12,890 | | ChoicePoint Inc.* | | | 544,602 |
| 97,150 | | First Data Corp. | | | 4,104,588 |
| 17,900 | | Fiserv, Inc.* | | | 622,562 |
| 11,320 | | Global Payments Inc. | | | 502,155 |
| 8,960 | | Iron Mountain Inc.* | | | 276,237 |
| 9,080 | | Manpower Inc. | | | 383,448 |
| 33,260 | | Monster Worldwide Inc.* | | | 672,850 |
| 332,070 | | Paychex, Inc. | | | 9,852,517 |
| 291,600 | | Republic Services, Inc. | | | 8,150,220 |
| 101,600 | | Weight Watchers International, Inc.* | | | 3,966,464 |
| | | | |
|
|
| | | | | | 67,512,572 |
| | | | |
|
|
| |
Electrical Equipment — 0.0% | | | |
| 10,280 | | Rockwell Automation, Inc. | | | 400,920 |
| | | | |
|
|
| |
Industrial Conglomerates — 2.5% | | | |
| 77,800 | | 3M Co. | | | 6,407,608 |
| 650,320 | | General Electric Co. | | | 21,323,993 |
| 80,030 | | Tyco International Ltd. | | | 2,506,539 |
| | | | |
|
|
| | | | | | 30,238,140 |
| | | | |
|
|
| |
Machinery — 0.4% | | | |
| 49,470 | | Caterpillar Inc. | | | 3,596,469 |
| 7,100 | | Eaton Corp. | | | 428,485 |
| 14,820 | | Pentair, Inc. | | | 492,617 |
| | | | |
|
|
| | | | | | 4,517,571 |
| | | | |
|
|
| | | TOTAL INDUSTRIALS | | | 108,764,388 |
| | | | |
|
|
INFORMATION TECHNOLOGY — 25.4% | | | |
| |
Communications Equipment — 6.1% | | | |
| 503,200 | | Alcatel S.A., Sponsored ADR* | | | 5,902,536 |
| 34,970 | | Avaya Inc.* | | | 423,836 |
| 1,632,351 | | Cisco Systems, Inc.* | | | 30,622,905 |
| 34,710 | | Comverse Technology, Inc.* | | | 607,772 |
| 17,180 | | F5 Networks, Inc.* | | | 422,113 |
| 98,930 | | JDS Uniphase Corp.* | | | 307,672 |
| 179,620 | | Juniper Networks, Inc.* | | | 4,111,502 |
| 42,490 | | Polycom, Inc.* | | | 829,830 |
| 797,400 | | QUALCOMM Inc. | | | 30,341,070 |
| 7,910 | | Research In Motion Ltd.* | | | 476,340 |
| 18,060 | | Tekelec* | | | 329,956 |
| | | | |
|
|
| | | | | | 74,375,532 |
| | | | |
|
|
See Notes to Financial Statements.
41
Schedules of Investments
(continued)
| | | | | |
| Large Capitalization Growth Investments |
| | |
| Shares | | Security | | Value |
| |
Computers & Peripherals — 5.1% | | | |
| 105,020 | | Apple Computer, Inc.* | | $ | 3,622,140 |
| 1,080,724 | | Dell Inc.* | | | 37,652,424 |
| 293,250 | | EMC Corp.* | | | 3,158,303 |
| 9,540 | | Lexmark International, Inc., Class A Shares* | | | 843,813 |
| 665,470 | | Network Appliance, Inc.* | | | 13,355,983 |
| 859,080 | | Sun Microsystems, Inc.* | | | 3,298,867 |
| | | | |
|
|
| | | | | | 61,931,530 |
| | | | |
|
|
| |
Electronic Equipment & Instruments — 1.0% | | | |
| 21,370 | | Celestica Inc., Subordinate Voting Shares* | | | 305,591 |
| 135,100 | | Diebold, Inc. | | | 6,605,039 |
| 9,600 | | Tektronix, Inc. | | | 274,272 |
| 188,100 | | Thermo Electron Corp.* | | | 4,941,387 |
| 12,050 | | Waters Corp.* | | | 521,885 |
| | | | |
|
|
| | | | | | 12,648,174 |
| | | | |
|
|
| |
Internet Software & Services — 2.3% | | | |
| 20,370 | | Akamai Technologies, Inc.* | | | 273,977 |
| 61,230 | | CNET Networks, Inc.* | | | 497,800 |
| 21,320 | | Google Inc., Class A Shares* | | | 2,184,234 |
| 8,500 | | InfoSpace, Inc.* | | | 323,000 |
| 40,370 | | VeriSign, Inc.* | | | 700,823 |
| 824,000 | | Yahoo! Inc.* | | | 23,492,240 |
| | | | |
|
|
| | | | | | 27,472,074 |
| | | | |
|
|
| |
IT Consulting & Services — 0.1% | | | |
| 17,870 | | Cognizant Technology Solutions Corp., Class A Shares* | | | 489,995 |
| 4,260 | | NAVTEQ Corp.* | | | 140,069 |
| | | | |
|
|
| | | | | | 630,064 |
| | | | |
|
|
| |
Office Electronics — 0.0% | | | |
| 10,635 | | Zebra Technologies Corp., Class A Shares* | | | 607,790 |
| | | | |
|
|
| |
Semiconductor Equipment & Products — 4.4% | | | |
| 30,450 | | Altera Corp.* | | | 576,114 |
| 212,490 | | Analog Devices, Inc. | | | 7,377,653 |
| 756,290 | | Applied Materials, Inc.* | | | 12,017,448 |
| 7,950 | | Cymer, Inc. * | | | 212,424 |
| 326,498 | | Intel Corp. | | | 6,951,142 |
| 29,350 | | Lam Research Corp.* | | | 632,493 |
| 14,120 | | Marvell Technology Group Ltd.* | | | 326,454 |
| 347,900 | | Maxim Integrated Products, Inc. | | | 15,109,297 |
| 48,240 | | PMC-Sierra, Inc.* | | | 450,562 |
| 12,090 | | Silicon Laboratories Inc.* | | | 396,431 |
| 324,400 | | Xilinx, Inc. | | | 8,898,292 |
| | | | |
|
|
| | | | | | 52,948,310 |
| | | | |
|
|
| |
Software — 6.4% | | | |
| 16,070 | | Activision, Inc.* | | | 231,247 |
| 39,080 | | Citrix Systems, Inc.* | | | 621,763 |
| 284,300 | | Computer Associates International, Inc. | | | 6,885,746 |
| 161,175 | | Electronic Arts Inc.* | | | 8,023,291 |
| 14,790 | | Mercury Interactive Corp.* | | | 510,403 |
See Notes to Financial Statements.
42
Schedules of Investments
(continued)
| | | | | |
| Large Capitalization Growth Investments |
| | |
| Shares | | Security | | Value |
| |
Software — 6.4% (continued) | | | |
| 1,130,430 | | Microsoft Corp. | | $ | 30,860,739 |
| 373,600 | | Red Hat, Inc.* | | | 4,580,336 |
| 321,850 | | SAP AG, Sponsored ADR | | | 11,734,651 |
| 157,255 | | Symantec Corp.* | | | 7,541,950 |
| 10,210 | | Take-Two Interactive Software, Inc.* | | | 334,377 |
| 33,130 | | TIBCO Software Inc.* | | | 209,382 |
| 369,300 | | VERITAS Software Corp.* | | | 6,174,696 |
| | | | |
|
|
| | | | | | 77,708,581 |
| | | | |
|
|
| | | TOTAL INFORMATION TECHNOLOGY | | | 308,322,055 |
| | | | |
|
|
MATERIALS — 1.4% | | | |
| |
Chemicals — 0.7% | | | |
| 281,220 | | Ecolab Inc. | | | 8,414,102 |
| | | | |
|
|
| |
Containers & Packaging — 0.0% | | | |
| 8,400 | | Ball Corp. | | | 313,656 |
| | | | |
|
|
| |
Metals & Mining — 0.5% | | | |
| 66,060 | | Alcoa Inc. | | | 2,139,023 |
| 15,300 | | Allegheny Technologies, Inc. | | | 287,793 |
| 99,000 | | Inco Ltd.* | | | 3,379,860 |
| 8,780 | | Peabody Energy Corp. | | | 468,150 |
| 5,280 | | Phelps Dodge Corp. | | | 430,637 |
| | | | |
|
|
| | | | | | 6,705,463 |
| | | | |
|
|
| |
Paper & Forest Products — 0.2% | | | |
| 51,600 | | International Paper Co. | | | 2,065,032 |
| | | | |
|
|
| | | TOTAL MATERIALS | | | 17,498,253 |
| | | | |
|
|
TELECOMMUNICATION SERVICES — 0.5% | | | |
| |
Diversified Telecommunication Services — 0.2% | | | |
| 78,500 | | Telefonaktiebolaget LM Ericsson, Sponsored ADR* | | | 2,122,640 |
| | | | |
|
|
| |
Wireless Telecommunication Services — 0.3% | | | |
| 87,970 | | America Movil S.A. de C.V., Series L Shares, ADR | | | 3,012,972 |
| 8,850 | | NII Holdings Inc.* | | | 324,353 |
| 19,510 | | Western Wireless Corp., Class A Shares* | | | 489,506 |
| | | | |
|
|
| | | | | | 3,826,831 |
| | | | |
|
|
| | | TOTAL TELECOMMUNICATION SERVICES | | | 5,949,471 |
| | | | |
|
|
UTILITIES — 0.0% | | | |
| |
Electric Utilities — 0.0% | | | |
| 19,170 | | Reliant Energy Inc.* | | | 190,933 |
| | | | |
|
|
| | | TOTAL UTILITIES | | | 190,933 |
| | | | |
|
|
| | | TOTAL COMMON STOCK
(Cost — $1,050,426,969) | | | 1,189,490,825 |
| | | | |
|
|
See Notes to Financial Statements.
43
Schedules of Investments
(continued)
| | | | | |
| Large Capitalization Growth Investments |
| | |
Face
Amount | | Security | | Value |
REPURCHASE AGREEMENTS — 2.2% | | | |
| $ 500,000 | | Deutsche Bank Securities Inc. dated 8/31/04, 1.570% due 9/1/04; Proceeds at maturity — $500,022; (Fully collateralized by various U.S. Government Agency Obligations, 0.000% to 6.750% due 9/9/04 to 3/15/31;
Market value — $510,000) | | $ | 500,000 |
| 19,614,000 | | Merrill Lynch & Co., Inc. dated 8/31/04, 1.570% due 9/1/04; Proceeds at maturity — $19,614,855; (Fully collateralized by various U.S. Government Agency Obligations, 0.000% to 2.500% due 11/17/04 to 2/24/06; Market value — $20,006,288) | | | 19,614,000 |
| 4,194,000 | | State Street Bank and Trust Co. dated 8/31/04, 1.490% due 9/1/04; Proceeds at maturity — $4,194,174; (Fully collateralized by U.S. Treasury Bonds, 6.125% due 8/15/29; Market value — $4,284,465) | | | 4,194,000 |
| 2,460,000 | | UBS Securities LLC dated 8/31/04, 1.580% due 9/1/04; Proceeds at maturity — $2,460,108; (Fully collateralized by various U.S. Government Agency Obligations, 0.000% to 9.800% due 10/22/04 to 3/1/26;
Market value — $2,509,207) | | | 2,460,000 |
| | | | |
|
|
| | | TOTAL REPURCHASE AGREEMENTS
(Cost — $26,768,000) | | | 26,768,000 |
| | | | |
|
|
| | | TOTAL INVESTMENTS — 100.0%
(Cost — $1,077,194,969**) | | | 1,216,258,825 |
| | | Other Assets in Excess of Liabilities — 0.0% | | | 529,194 |
| | | | |
|
|
| | | TOTAL NET ASSETS — 100.0% | | $ | 1,216,788,019 |
| | | | |
|
|
| * | | Non-income producing security. |
| ** | | Aggregate cost for Federal income tax purposes is $1,103,193,761. |
Abbreviation used in this schedule:
ADR — American Depositary Receipt
See Notes to Financial Statements.
44
Schedules of Investments
(continued)
| | | | | |
| Small Capitalization Value Equity Investments |
| | |
| Shares | | Security | | Value |
COMMON STOCK — 95.7% | | | |
CONSUMER DISCRETIONARY — 13.7% | | | |
| |
Auto Components — 1.5% | | | |
| 82,800 | | ArvinMeritor, Inc. | | $ | 1,581,480 |
| 92,700 | | Cooper Tire & Rubber Co. | | | 2,098,728 |
| 98,188 | | Modine Manufacturing Co.† | | | 2,926,002 |
| | | | |
|
|
| | | | | | 6,606,210 |
| | | | |
|
|
| |
Hotels, Restaurants & Leisure — 3.4% | | | |
| 55,300 | | Bob Evans Farms, Inc. | | | 1,384,712 |
| 61,535 | | CBRL Group, Inc. | | | 1,961,736 |
| 597,300 | | CKE Restaurants, Inc.*† | | | 7,149,681 |
| 201,100 | | The Steak n Shake Co.* | | | 3,458,920 |
| 28,100 | | Vail Resorts, Inc.* | | | 510,296 |
| | | | |
|
|
| | | | | | 14,465,345 |
| | | | |
|
|
| |
Household Durables — 2.2% | | | |
| 194,200 | | Fleetwood Enterprises, Inc.* | | | 2,479,934 |
| 38,200 | | Lancaster Colony Corp. | | | 1,576,896 |
| 54,100 | | Libbey Inc. | | | 1,022,490 |
| 16,200 | | Russ Berrie and Co., Inc.† | | | 312,660 |
| 81,100 | | Snap-on Inc. | | | 2,576,547 |
| 58,315 | | Yankee Candle Co., Inc.* | | | 1,580,920 |
| | | | |
|
|
| | | | | | 9,549,447 |
| | | | |
|
|
| |
Leisure Equipment & Products — 2.1% | | | |
| 252,598 | | Arctic Cat Inc. | | | 6,597,860 |
| 92,600 | | Callaway Golf Co. | | | 1,119,534 |
| 138,800 | | Sturm, Ruger & Co., Inc. | | | 1,250,588 |
| | | | |
|
|
| | | | | | 8,967,982 |
| | | | |
|
|
| |
Multiline Retail — 0.4% | | | |
| 81,000 | | Burlington Coat Factory Warehouse Corp. | | | 1,556,010 |
| | | | |
|
|
| |
Specialty Retail — 1.4% | | | |
| 49,280 | | American Eagle Outfitters, Inc.* | | | 1,641,024 |
| 70,600 | | The Cato Corp., Class A Shares | | | 1,493,190 |
| 142,500 | | CSK Auto Corp.* | | | 1,672,950 |
| 61,800 | | The Sports Authority, Inc.* | | | 1,312,014 |
| | | | |
|
|
| | | | | | 6,119,178 |
| | | | |
|
|
| |
Textiles & Apparel — 2.7% | | | |
| 56,900 | | Brown Shoe Co., Inc. | | | 1,508,988 |
| 23,600 | | Columbia Sportswear Co.*† | | | 1,287,144 |
| 44,500 | | Kellwood Co. | | | 1,624,250 |
| 76,400 | | Russell Corp. | | | 1,364,504 |
| 437,200 | | Skechers U.S.A., Inc., Class A Shares* | | | 5,814,760 |
| | | | |
|
|
| | | | | | 11,599,646 |
| | | | |
|
|
| | | TOTAL CONSUMER DISCRETIONARY | | | 58,863,818 |
| | | | |
|
|
CONSUMER STAPLES — 5.9% | | | |
| |
Food & Drug Retailing — 2.3% | | | |
| 97,500 | | Casey’s General Stores, Inc. | | | 1,609,725 |
| 80,900 | | Ruddick Corp. | | | 1,542,763 |
See Notes to Financial Statements.
45
Schedules of Investments
(continued)
| | | | | |
| Small Capitalization Value Equity Investments |
| | |
| Shares | | Security | | Value |
| |
Food & Drug Retailing — 2.3% (continued) | | | |
| 188,900 | | Smart & Final Inc.* | | $ | 3,080,959 |
| 49,100 | | Weis Markets, Inc. | | | 1,645,832 |
| 248,450 | | Wild Oats Markets, Inc.*† | | | 2,193,814 |
| | | | |
|
|
| | | | | | 10,073,093 |
| | | | |
|
|
| |
Food Products — 1.4% | | | |
| 36,100 | | Central Garden & Pet Co.* | | | 1,131,374 |
| 34,300 | | Corn Products International, Inc. | | | 1,582,945 |
| 61,000 | | Fresh Del Monte Produce Inc.† | | | 1,581,120 |
| 77,700 | | Sensient Technologies Corp.† | | | 1,631,700 |
| | | | |
|
|
| | | | | | 5,927,139 |
| | | | |
|
|
| |
Household Products — 0.4% | | | |
| 63,900 | | WD-40 Co. | | | 1,826,262 |
| | | | |
|
|
| |
Tobacco — 1.8% | | | |
| 197,050 | | Schweitzer-Mauduit International, Inc. | | | 5,992,290 |
| 36,000 | | Universal Corp. | | | 1,624,680 |
| | | | |
|
|
| | | | | | 7,616,970 |
| | | | |
|
|
| | | TOTAL CONSUMER STAPLES | | | 25,443,464 |
| | | | |
|
|
ENERGY — 9.7% | | | |
| |
Energy Equipment & Services — 5.6% | | | |
| 1,061,720 | | Input/Output, Inc.*† | | | 10,447,325 |
| 125,100 | | Rowan Cos., Inc.* | | | 3,042,432 |
| 2,332,800 | | Stolt Offshore S.A., ADR*† | | | 9,030,269 |
| 52,000 | | Tidewater, Inc. | | | 1,517,360 |
| | | | |
|
|
| | | | | | 24,037,386 |
| | | | |
|
|
| |
Oil & Gas — 4.1% | | | |
| 53,000 | | Berry Petroleum Co., Class A Shares | | | 1,638,760 |
| 43,500 | | Cabot Oil & Gas Corp. | | | 1,757,835 |
| 50,400 | | Frontline Ltd.† | | | 1,896,048 |
| 129,300 | | The Meridian Resource Corp.* | | | 981,387 |
| 51,200 | | Penn Virginia Corp. | | | 1,764,352 |
| 110,500 | | Range Resources Corp. | | | 1,657,500 |
| 84,300 | | Spinnaker Exploration Co.* | | | 2,878,002 |
| 49,900 | | St. Mary Land & Exploration Co.† | | | 1,741,011 |
| 51,600 | | Teekay Shipping Corp.† | | | 1,808,580 |
| 54,500 | | Western Gas Resources, Inc. | | | 1,521,640 |
| | | | |
|
|
| | | | | | 17,645,115 |
| | | | |
|
|
| | | TOTAL ENERGY | | | 41,682,501 |
| | | | |
|
|
FINANCIALS — 16.4% | | | |
| |
Banks — 6.6% | | | |
| 53,200 | | AMCORE Financial, Inc. | | | 1,495,984 |
| 54,805 | | Astoria Financial Corp. | | | 1,991,614 |
| 71,400 | | BancorpSouth, Inc.† | | | 1,599,360 |
| 144,700 | | Brookline Bancorp, Inc.† | | | 2,190,758 |
| 14,700 | | Chittenden Corp. | | | 527,730 |
| 75,500 | | The Colonial BancGroup, Inc. | | | 1,523,590 |
| 58,500 | | Commercial Federal Corp. | | | 1,595,295 |
See Notes to Financial Statements.
46
Schedules of Investments
(continued)
| | | | | |
| Small Capitalization Value Equity Investments |
| | |
| Shares | | Security | | Value |
| |
Banks — 6.6% (continued) | | | |
| 58,400 | | FirstMerit Corp. | | $ | 1,538,256 |
| 132,650 | | Fulton Financial Corp. | | | 2,802,895 |
| 41,775 | | Hudson United Bancorp | | | 1,512,673 |
| 245,925 | | Ocwen Financial Corp.*† | | | 2,228,081 |
| 63,395 | | Old National Bancorp† | | | 1,579,169 |
| 55,999 | | Pacific Capital Bancorp | | | 1,600,451 |
| 54,899 | | Provident Bankshares Corp. | | | 1,738,651 |
| 66,600 | | Susquehanna Bancshares, Inc. | | | 1,598,400 |
| 65,420 | | Washington Federal, Inc. | | | 1,685,219 |
| 25,500 | | Webster Financial Corp. | | | 1,254,600 |
| | | | |
|
|
| | | | | | 28,462,726 |
| | | | |
|
|
| |
Diversified Financials — 0.4% | | | |
| 93,000 | | Intrawest Corp. | | | 1,455,450 |
| | | | |
|
|
| |
Insurance — 5.3% | | | |
| 39,600 | | AmerUs Group Co.† | | | 1,578,456 |
| 37,650 | | Delphi Financial Group, Inc., Class A Shares | | | 1,480,398 |
| 89,245 | | HCC Insurance Holdings, Inc. | | | 2,597,029 |
| 62,500 | | Hilb, Rogal and Hobbs Co.† | | | 2,127,500 |
| 76,838 | | IPC Holdings, Ltd. | | | 2,788,451 |
| 31,900 | | LandAmerica Financial Group, Inc. | | | 1,372,976 |
| 15,500 | | Markel Corp.* | | | 4,554,675 |
| 125,100 | | Ohio Casualty Corp.* | | | 2,520,765 |
| 77,000 | | Scottish Re Group Ltd.† | | | 1,635,480 |
| 29,700 | | StanCorp Financial Group, Inc. | | | 2,153,250 |
| | | | |
|
|
| | | | | | 22,808,980 |
| | | | |
|
|
| |
Real Estate — 4.1% | | | |
| 29,400 | | CBL & Associates Properties, Inc. | | | 1,795,752 |
| 113,800 | | Crescent Real Estate Equities Co. | | | 1,817,386 |
| 95,500 | | Equity One, Inc. | | | 1,892,810 |
| 41,500 | | First Industrial Realty Trust, Inc.† | | | 1,660,000 |
| 43,900 | | Healthcare Realty Trust, Inc. | | | 1,657,225 |
| 161,700 | | HRPT Properties Trust | | | 1,743,126 |
| 272,100 | | MeriStar Hospitality Corp.* | | | 1,567,296 |
| 83,300 | | Nationwide Health Properties, Inc. | | | 1,690,990 |
| 59,000 | | New Plan Excel Realty Trust† | | | 1,517,480 |
| 21,200 | | Post Properties, Inc. | | | 644,480 |
| 44,700 | | Shurgard Storage Centers, Inc., Class A Shares | | | 1,783,530 |
| | | | |
|
|
| | | | | | 17,770,075 |
| | | | |
|
|
| | | TOTAL FINANCIALS | | | 70,497,231 |
| | | | |
|
|
HEALTHCARE — 4.1% | | | |
| |
Biotechnology — 0.5% | | | |
| 112,605 | | Serologicals Corp.*† | | | 2,357,949 |
| | | | |
|
|
| |
Healthcare Equipment & Supplies — 1.6% | | | |
| 57,900 | | Arrow International, Inc. | | | 1,635,675 |
| 39,500 | | Invacare Corp.† | | | 1,748,665 |
| 28,600 | | West Pharmaceutical Services, Inc. | | | 1,143,714 |
| 73,310 | | Zoll Medical Corp.* | | | 2,444,888 |
| | | | |
|
|
| | | | | | 6,972,942 |
| | | | |
|
|
See Notes to Financial Statements.
47
Schedules of Investments
(continued)
| | | | | |
| Small Capitalization Value Equity Investments |
| | |
| Shares | | Security | | Value |
| |
Healthcare Providers & Services — 1.3% | | | |
| 132,640 | | Cross Country Healthcare, Inc.*† | | $ | 1,967,051 |
| 65,200 | | Owens & Minor, Inc. | | | 1,597,400 |
| 58,400 | | Triad Hospitals, Inc.* | | | 1,856,536 |
| | | | |
|
|
| | | | | | 5,420,987 |
| | | | |
|
|
| |
Pharmaceuticals — 0.7% | | | |
| 71,540 | | Par Pharmaceutical Cos. Inc.* | | | 2,936,002 |
| | | | |
|
|
| | | TOTAL HEALTHCARE | | | 17,687,880 |
| | | | |
|
|
INDUSTRIALS — 21.7% | | | |
| |
Aerospace & Defense — 1.3% | | | |
| 29,800 | | Curtiss-Wright Corp. | | | 1,628,570 |
| 84,300 | | Kaman Corp., Class A Shares | | | 982,938 |
| 30,300 | | Precision Castparts Corp. | | | 1,669,227 |
| 43,500 | | World Fuel Services Corp. | | | 1,530,330 |
| | | | |
|
|
| | | | | | 5,811,065 |
| | | | |
|
|
| |
Building Products — 2.8% | | | |
| 59,900 | | Crane Co. | | | 1,617,300 |
| 441,800 | | Lennox International, Inc.† | | | 7,183,668 |
| 48,400 | | Universal Forest Products, Inc. | | | 1,446,676 |
| 48,500 | | York International Corp. | | | 1,579,160 |
| | | | |
|
|
| | | | | | 11,826,804 |
| | | | |
|
|
| |
Commercial Services & Supplies — 7.1% | | | |
| 40,800 | | Banta Corp. | | | 1,579,368 |
| 90,700 | | Ennis Inc. | | | 1,694,276 |
| 110,200 | | Headwaters, Inc.*† | | | 3,373,222 |
| 296,870 | | Herman Miller, Inc.† | | | 7,478,155 |
| 102,615 | | Ionics, Inc.*† | | | 2,689,539 |
| 36,000 | | Landauer, Inc. | | | 1,612,080 |
| 4,100 | | McGrath Rentcorp | | | 140,589 |
| 333,900 | | Schawk, Inc. | | | 4,701,312 |
| 44,700 | | United Stationers Inc.* | | | 1,840,299 |
| 89,300 | | Valassis Communications, Inc.* | | | 2,523,618 |
| 113,465 | | Watson Wyatt & Co. Holdings | | | 2,859,318 |
| | | | |
|
|
| | | | | | 30,491,776 |
| | | | |
|
|
| |
Construction & Engineering — 0.9% | | | |
| 59,600 | | Chicago Bridge & Iron Co. N.V., NY Shares | | | 1,766,544 |
| 57,837 | | Washington Group International, Inc.* | | | 2,034,706 |
| | | | |
|
|
| | | | | | 3,801,250 |
| | | | |
|
|
| |
Electrical Equipment — 3.2% | | | |
| 70,900 | | Acuity Brands, Inc. | | | 1,631,409 |
| 91,500 | | AMETEK, Inc. | | | 2,612,325 |
| 277,700 | | Belden CDT Inc.† | | | 5,562,331 |
| 101,615 | | Rayovac Corp.*† | | | 2,336,129 |
| 71,000 | | Regal-Beloit Corp.† | | | 1,566,260 |
| | | | |
|
|
| | | | | | 13,708,454 |
| | | | |
|
|
| |
Industrial Conglomerates — 0.4% | | | |
| 36,500 | | Teleflex Inc. | | | 1,596,145 |
| | | | |
|
|
See Notes to Financial Statements.
48
Schedules of Investments
(continued)
| | | | | |
| Small Capitalization Value Equity Investments |
| | |
| Shares | | Security | | Value |
| |
Machinery — 3.7% | | | |
| 49,600 | | Albany International Corp., Class A Shares | | $ | 1,445,840 |
| 63,100 | | Barnes Group Inc. | | | 1,639,338 |
| 36,000 | | Harsco Corp. | | | 1,615,680 |
| 52,500 | | Lincoln Electric Holdings, Inc. | | | 1,578,150 |
| 83,400 | | Pentair, Inc. | | | 2,772,216 |
| 282,850 | | Robbins & Myers, Inc.† | | | 5,402,435 |
| 76,300 | | Valmont Industries, Inc. | | | 1,506,162 |
| | | | |
|
|
| | | | | | 15,959,821 |
| | | | |
|
|
| |
Marine — 0.4% | | | |
| 51,600 | | Alexander & Baldwin, Inc. | | | 1,588,764 |
| | | | |
|
|
| |
Road and Rail — 0.7% | | | |
| 42,600 | | Arkansas Best Corp. | | | 1,467,570 |
| 46,800 | | USF Corp. | | | 1,603,368 |
| | | | |
|
|
| | | | | | 3,070,938 |
| | | | |
|
|
| |
Transportation Infrastructure — 1.2% | | | |
| 326,450 | | Sea Containers Ltd., Class A Shares† | | | 5,157,910 |
| | | | |
|
|
| | | TOTAL INDUSTRIALS | | | 93,012,927 |
| | | | |
|
|
INFORMATION TECHNOLOGY — 6.1% | | | |
| |
Communications Equipment — 0.7% | | | |
| 130,000 | | 3Com Corp.* | | | 586,300 |
| 377,800 | | Powerwave Technologies, Inc.*† | | | 2,285,690 |
| | | | |
|
|
| | | | 2,871,990 |
| | | | |
|
|
| |
Computers & Peripherals — 0.6% | | | |
| 78,700 | | Imation Corp. | | | 2,709,641 |
| | | | |
|
|
| |
Electronic Equipment & Instruments — 0.9% | | | |
| 116,400 | | Itron, Inc.*† | | | 2,173,188 |
| 115,400 | | Methode Electronics, Inc. | | | 1,520,972 |
| | | | |
|
|
| | | | | | 3,694,160 |
| | | | |
|
|
| |
Internet Software & Services — 0.5% | | | |
| 422,500 | | SonicWALL, Inc.*† | | | 2,281,500 |
| | | | |
|
|
| |
IT Consulting & Services — 0.6% | | | |
| 143,330 | | Forrester Research, Inc.* | | | 2,426,577 |
| | | | |
|
|
| |
Semiconductor Equipment & Products — 2.7% | | | |
| 269,600 | | Asyst Technologies, Inc.* | | | 1,229,376 |
| 270,000 | | Brooks Automation, Inc.* | | | 3,356,100 |
| 321,700 | | Cohu, Inc. | | | 5,076,426 |
| 127,700 | | Ultratech, Inc.*† | | | 2,032,984 |
| | | | |
|
|
| | | | | | 11,694,886 |
| | | | |
|
|
| |
Software — 0.1% | | | |
| 78,100 | | KFx Inc.*† | | | 531,080 |
| | | | |
|
|
| | | TOTAL INFORMATION TECHNOLOGY | | | 26,209,834 |
| | | | |
|
|
MATERIALS — 13.3% | | | |
| |
Chemicals — 4.4% | | | |
| 845,900 | | Intertape Polymer Group Inc.* | | | 6,843,331 |
| 45,400 | | The Lubrizol Corp. | | | 1,618,510 |
See Notes to Financial Statements.
49
Schedules of Investments
(continued)
| | | | | |
| Small Capitalization Value Equity Investments |
| | |
| Shares | | Security | | Value |
| |
Chemicals — 4.4% (continued) | | | |
| 358,550 | | Lyondell Chemical Co.† | | $ | 7,059,849 |
| 119,100 | | Methanex Corp. | | | 1,610,232 |
| 101,900 | | RPM International Inc. | | | 1,611,039 |
| | | | |
|
|
| | | | | | 18,742,961 |
| | | | |
|
|
| |
Construction Materials — 1.4% | | | |
| 131,600 | | Martin Marietta Materials, Inc. | | | 5,920,684 |
| | | | |
|
|
| |
Containers & Packaging — 2.7% | | | |
| 198,240 | | Caraustar Industries, Inc.*† | | | 3,146,069 |
| 181,500 | | Greif Inc., Class A Shares† | | | 7,078,500 |
| 96,500 | | Rock-Tenn Co., Class A Shares | | | 1,389,600 |
| | | | |
|
|
| | | | | | 11,614,169 |
| | | | |
|
|
| |
Metals & Mining — 4.8% | | | |
| 140,300 | | Arch Coal, Inc.† | | | 4,521,869 |
| 50,400 | | Commercial Metals Co. | | | 1,762,992 |
| 123,500 | | Goldcorp Inc. | | | 1,588,210 |
| 270,200 | | IAMGOLD Corp.* | | | 2,034,606 |
| 67,000 | | Massey Energy Co.† | | | 1,843,840 |
| 558,150 | | Ryerson Tull, Inc.† | | | 8,896,911 |
| | | | |
|
|
| | | | | | 20,648,428 |
| | | | |
|
|
| | | TOTAL MATERIALS | | | 56,926,242 |
| | | | |
|
|
TELECOMMUNICATION SERVICES — 0.3% | | | |
| |
Diversified Telecommunication Services — 0.3% | | | |
| 236,700 | | TALK America Holdings, Inc.*† | | | 1,365,759 |
| | | | |
|
|
| | | TOTAL TELECOMMUNICATION SERVICES | | | 1,365,759 |
| | | | |
|
|
UTILITIES — 4.5% | | | |
| |
Electric Utilities — 1.1% | | | |
| 184,400 | | Cleco Corp. | | | 3,239,908 |
| 75,450 | | PNM Resources Inc.† | | | 1,612,366 |
| | | | |
|
|
| | | | | | 4,852,274 |
| | | | |
|
|
| |
Gas Utilities — 3.0% | | | |
| 62,700 | | Atmos Energy Corp.† | | | 1,585,683 |
| 38,500 | | Energen Corp. | | | 1,826,440 |
| 60,100 | | National Fuel Gas Co. | | | 1,609,478 |
| 45,700 | | Nicor, Inc.† | | | 1,638,345 |
| 53,200 | | Northwest Natural Gas Co. | | | 1,640,156 |
| 37,500 | | Peoples Energy Corp.† | | | 1,558,125 |
| 46,600 | | UGI Corp. | | | 1,591,856 |
| 54,700 | | WGL Holdings Inc. | | | 1,567,155 |
| | | | |
|
|
| | | | | | 13,017,238 |
| | | | |
|
|
| |
Multi-Utilities — 0.4% | | | |
| 63,300 | | Vectren Corp. | | | 1,547,685 |
| | | | |
|
|
| | | TOTAL UTILITIES | | | 19,417,197 |
| | | | |
|
|
| | | TOTAL COMMON STOCK
(Cost — $326,763,716) | | | 411,106,853 |
| | | | |
|
|
See Notes to Financial Statements.
50
Schedules of Investments
(continued)
| | | | | | |
| Small Capitalization Value Equity Investments | |
| | |
Face
Amount | | Security | | Value | |
REPURCHASE AGREEMENTS — 4.6% | | | | |
| $ 9,967,000 | | Merrill Lynch & Co., Inc. dated 8/31/04, 1.570% due 9/1/04; Proceeds at maturity — $9,967,435; (Fully collateralized by various U.S. Government Agency Obligations, 0.000% to 2.500% due 11/17/04 to 2/24/06;
Market value — $10,166,344) | | $ | 9,967,000 | |
| 495,000 | | State Street Bank and Trust Co. dated 8/31/04, 1.490% due 9/1/04; Proceeds at maturity $495,020; (Fully collateralized by U.S. Treasury Bonds, 13.250% due 5/15/14; Market value — $507,150) | | | 495,000 | |
| 9,322,000 | | UBS Securities LLC dated 8/31/04, 1.580% due 9/1/04; Proceeds at maturity — $9,322,409; (Fully collateralized by various U.S. Government Agency Obligations, 0.000% to 9.800% due 10/22/04 to 3/1/26;
Market value — $9,508,468) | | | 9,322,000 | |
| | | | |
|
|
|
| | | TOTAL REPURCHASE AGREEMENTS
(Cost — $19,784,000) | | | 19,784,000 | |
| | | | |
|
|
|
| | | TOTAL INVESTMENTS — 100.3%
(Cost — $346,547,716**) | | | 430,890,853 | |
| | | Liabilities in Excess of Other Assets — (0.3)% | | | (1,490,523 | ) |
| | | | |
|
|
|
| | | TOTAL NET ASSETS — 100.0% | | $ | 429,400,330 | |
| | | | |
|
|
|
LOANED SECURITIES COLLATERAL | | | | |
| 83,851,265 | | State Street Navigator Securities Lending Trust Prime Portfolio
(Cost — $83,851,265) | | $ | 83,851,265 | |
| | | | |
|
|
|
| * | | Non-income producing security. |
| † | | All or a portion of this security is on loan (See Note 3). |
| ** | | Aggregate cost for Federal income tax purposes is $348,765,338. |
Abbreviation used in this schedule:
ADR — American Depositary Receipt
See Notes to Financial Statements.
51
Schedules of Investments
(continued)
| | | | | |
| Small Capitalization Growth Investments |
| | |
| Shares | | Security | | Value |
COMMON STOCK — 97.3% | | | |
CONSUMER DISCRETIONARY — 18.3% | | | |
| |
Auto Components — 0.6% | | | |
| 111,400 | | Westinghouse Air Brake Technologies Corp. | | $ | 1,906,054 |
| | | | |
|
|
| |
Hotels, Restaurants & Leisure — 2.0% | | | |
| 36,800 | | P.F. Chang’s China Bistro, Inc.*† | | | 1,542,656 |
| 99,199 | | RARE Hospitality International, Inc.*† | | | 2,682,341 |
| 102,700 | | WMS Industries Inc.*† | | | 2,075,567 |
| | | | |
|
|
| | | | | | 6,300,564 |
| | | | |
|
|
| |
Household Durables — 3.3% | | | |
| 78,700 | | Fleetwood Enterprises, Inc.*† | | | 1,004,999 |
| 58,700 | | Hovnanian Enterprises, Inc., Class A Shares*† | | | 2,020,454 |
| 64,200 | | Standard Pacific Corp.*† | | | 3,240,174 |
| 66,900 | | Tempur-Pedic International Inc.*† | | | 813,504 |
| 131,400 | | Yankee Candle Co., Inc.* | | | 3,562,254 |
| | | | |
|
|
| | | | | | 10,641,385 |
| | | | |
|
|
| |
Internet & Catalog Retail — 0.4% | | | |
| 88,600 | | Insight Enterprises, Inc.*† | | | 1,417,600 |
| | | | |
|
|
| |
Leisure Equipment & Products — 1.5% | | | |
| 134,800 | | JAKKS Pacific, Inc.*† | | | 2,639,384 |
| 187,100 | | Oakley, Inc.*† | | | 2,146,037 |
| | | | |
|
|
| | | | | | 4,785,421 |
| | | | |
|
|
| |
Media — 1.8% | | | |
| 75,400 | | Information Holdings Inc.*† | | | 2,046,356 |
| 243,500 | | Radio One, Inc., Class D Shares*† | | | 3,798,600 |
| | | | |
|
|
| | | | | | 5,844,956 |
| | | | |
|
|
| |
Multiline Retail — 0.0% | | | |
| 45,400 | | Procurenet Inc.*@ | | | 0 |
| | | | |
|
|
| |
Specialty Retail — 8.0% | | | |
| 87,949 | | Bebe Stores, Inc.† | | | 1,598,033 |
| 95,500 | | Chico’s FAS, Inc.*† | | | 3,905,950 |
| 88,400 | | Christopher & Banks Corp.† | | | 1,556,724 |
| 85,500 | | Cost Plus, Inc.*† | | | 2,929,230 |
| 36,300 | | Guitar Center, Inc.* | | | 1,486,848 |
| 170,000 | | HOT Topic, Inc.*† | | | 2,567,000 |
| 35,200 | | Hughes Supply, Inc. | | | 2,132,768 |
| 63,000 | | Linens ‘n Things, Inc.* | | | 1,580,040 |
| 139,748 | | Pacific Sunwear of California, Inc.*† | | | 2,677,572 |
| 158,100 | | Tweeter Home Entertainment Group, Inc.*† | | | 902,751 |
| 112,600 | | Williams-Sonoma, Inc.*† | | | 3,939,874 |
| | | | |
|
|
| | | | | | 25,276,790 |
| | | | |
|
|
| |
Textiles & Apparel — 0.7% | | | |
| 54,000 | | Oxford Industries, Inc.† | | | 2,184,840 |
| | | | |
|
|
| | | TOTAL CONSUMER DISCRETIONARY | | | 58,357,610 |
| | | | |
|
|
See Notes to Financial Statements.
52
Schedules of Investments
(continued)
| | | | | |
| Small Capitalization Growth Investments |
| | |
| Shares | | Security | | Value |
CONSUMER STAPLES — 1.6% | | | |
| |
Food Products — 0.9% | | | |
| 1,651 | | Aurora Foods Inc.*@ | | $ | 0 |
| 120,200 | | Delta & Pine Land Co. | | | 3,054,282 |
| | | | |
|
|
| | | | | | 3,054,282 |
| | | | |
|
|
| |
Personal Products — 0.7% | | | |
| 81,400 | | Nu Skin Enterprises, Inc., Class A Shares | | | 2,101,748 |
| | | | |
|
|
| | | TOTAL CONSUMER STAPLES | | | 5,156,030 |
| | | | |
|
|
ENERGY — 10.2% | | | |
| |
Energy Equipment & Services — 6.4% | | | |
| 250,100 | | Horizon Offshore, Inc.*† | | | 140,056 |
| 302,300 | | Key Energy Services, Inc.*† | | | 3,050,207 |
| 138,000 | | Maverick Tube Corp.*† | | | 4,087,560 |
| 164,000 | | NS Group, Inc.*† | | | 2,460,000 |
| 272,600 | | Patterson-UTI Energy, Inc.† | | | 4,721,432 |
| 87,800 | | Precision Drilling Corp.* | | | 4,337,320 |
| 145,400 | | Superior Energy Services, Inc.*† | | | 1,627,026 |
| | | | |
|
|
| | | | | | 20,423,601 |
| | | | |
|
|
| |
Oil & Gas — 3.8% | | | |
| 261,560 | | Chesapeake Energy Corp.† | | | 3,695,843 |
| 1,455 | | Cross Timbers Royalty Trust† | | | 43,359 |
| 129,000 | | Quicksilver Resources Inc.† | | | 3,633,930 |
| 170,132 | | XTO Energy, Inc.† | | | 4,770,501 |
| | | | |
|
|
| | | | | | 12,143,633 |
| | | | |
|
|
| | | TOTAL ENERGY | | | 32,567,234 |
| | | | |
|
|
FINANCIALS — 6.8% | | | |
| |
Banks — 4.8% | | | |
| 105,900 | | East-West Bancorp, Inc. | | | 3,836,757 |
| 89,800 | | Investors Financial Services Corp.† | | | 4,164,924 |
| 170,400 | | Southwest Bancorp of Texas, Inc.† | | | 3,592,032 |
| 88,700 | | UCBH Holdings, Inc.*† | | | 3,561,305 |
| | | | |
|
|
| | | | | | 15,155,018 |
| | | | |
|
|
| |
Diversified Financials — 0.6% | | | |
| 92,200 | | Psychiatric Solutions, Inc.*† | | | 2,020,102 |
| | | | |
|
|
| |
Insurance — 1.4% | | | |
| 67,400 | | Infinity Property & Casualty Corp. | | | 1,848,108 |
| 229,400 | | Universal American Financial Corp.* | | | 2,617,454 |
| | | | |
|
|
| | | | | | 4,465,562 |
| | | | |
|
|
| | | TOTAL FINANCIALS | | | 21,640,682 |
| | | | |
|
|
HEALTHCARE — 18.6% | | | |
| |
Biotechnology — 2.4% | | | |
| 74,300 | | Celgene Corp.*† | | | 4,216,525 |
| 166,000 | | Cell Therapeutics, Inc.*† | | | 941,220 |
| 33,989 | | Cephalon, Inc.*† | | | 1,597,823 |
| 95,200 | | Cubist Pharmaceuticals, Inc.*† | | | 749,224 |
| | | | |
|
|
| | | | | | 7,504,792 |
| | | | |
|
|
See Notes to Financial Statements.
53
Schedules of Investments
(continued)
| | | | | |
| Small Capitalization Growth Investments |
| | |
| Shares | | Security | | Value |
| |
Healthcare Equipment & Supplies — 7.3% | | | |
| 86,500 | | Advanced Medical Optics, Inc.* | | $ | 3,219,530 |
| 147,500 | | I-Flow Corporation*† | | | 2,239,050 |
| 83,200 | | Integra LifeSciences Holdings Corp.* | | | 2,485,184 |
| 67,400 | | Kyphon Inc.*† | | | 1,505,042 |
| 35,300 | | Orthofix International N.V.*† | | | 1,196,317 |
| 257,000 | | PolyMedica Corp.† | | | 7,815,370 |
| 46,000 | | Wilson Greatbatch Technologies, Inc.* | | | 753,480 |
| 152,400 | | Wright Medical Group, Inc.*† | | | 4,114,800 |
| | | | |
|
|
| | | | | | 23,328,773 |
| | | | |
|
|
| |
Healthcare Providers & Services — 3.4% | | | |
| 117,400 | | Accredo Health Inc.*† | | | 2,565,190 |
| 69,300 | | American Healthways, Inc.*† | | | 1,871,100 |
| 99,150 | | First Horizon Pharmaceutical Corp.*† | | | 1,669,686 |
| 154,700 | | Manor Care, Inc.† | | | 4,744,649 |
| | | | |
|
|
| | | | | | 10,850,625 |
| | | | |
|
|
| |
Pharmaceuticals — 5.5% | | | |
| 170,300 | | Bentley Pharmaceuticals, Inc.*† | | | 1,924,390 |
| 363,700 | | Elan Corp. PLC, Sponsored ADR*† | | | 8,230,531 |
| 76,300 | | Medicis Pharmaceutical Corp., Class A Shares† | | | 2,794,106 |
| 124,900 | | MGI Pharma, Inc.*† | | | 2,901,427 |
| 118,900 | | Nektar Therapeutics*† | | | 1,514,786 |
| | | | |
|
|
| | | | | | 17,365,240 |
| | | | |
|
|
| | | TOTAL HEALTHCARE | | | 59,049,430 |
| | | | |
|
|
INDUSTRIALS — 13.1% | | | |
| |
Aerospace & Defense — 0.4% | | | |
| 120,300 | | Aeroflex Inc.*† | | | 1,212,624 |
| 1,758 | | TIMCO Aviation Services, Inc.* | | | 563 |
| | | | |
|
|
| | | | | | 1,213,187 |
| | | | |
|
|
| |
Air Freight & Couriers — 0.7% | | | |
| 91,600 | | EGL, Inc.*† | | | 2,219,468 |
| | | | |
|
|
| |
Commercial Services & Supplies — 8.3% | | | |
| 79,400 | | Career Education Corp.*† | | | 2,448,696 |
| 55,800 | | CheckFree Corp.*† | | | 1,520,550 |
| 55,000 | | The Corporate Executive Board Co.† | | | 3,237,300 |
| 49,500 | | CoStar Group, Inc.* | | | 2,093,355 |
| 38,800 | | Global Payments Inc.† | | | 1,721,168 |
| 196,200 | | Labor Ready, Inc.*† | | | 2,430,918 |
| 117,600 | | Laureate Education, Inc.*† | | | 4,020,744 |
| 222,000 | | Navigant Consulting, Inc.*† | | | 4,255,740 |
| 50,300 | | Resources Connection, Inc.*† | | | 1,648,834 |
| 96,750 | | Waste Connections, Inc.*† | | | 2,839,612 |
| | | | |
|
|
| | | | | | 26,216,917 |
| | | | |
|
|
| |
Electrical Equipment — 0.5% | | | |
| 220,300 | | Power-One, Inc.*† | | | 1,654,453 |
| | | | |
|
|
See Notes to Financial Statements.
54
Schedules of Investments
(continued)
| | | | | |
| Small Capitalization Growth Investments |
| | |
| Shares | | Security | | Value |
| |
Machinery — 1.2% | | | |
| 22,600 | | Actuant Corp., Class A Shares*† | | $ | 855,184 |
| 113,200 | | Wabash National Corp.*† | | | 3,003,196 |
| | | | |
|
|
| | | | | | 3,858,380 |
| | | | |
|
|
| |
Road & Rail — 2.0% | | | |
| 119,800 | | J.B. Hunt Transport Services, Inc.† | | | 4,061,220 |
| 55,600 | | Pacer International, Inc.*† | | | 861,800 |
| 73,600 | | Sirva Inc.* | | | 1,558,848 |
| | | | |
|
|
| | | | | | 6,481,868 |
| | | | |
|
|
| | | TOTAL INDUSTRIALS | | | 41,644,273 |
| | | | |
|
|
INFORMATION TECHNOLOGY — 26.8% | | | |
| |
Communications Equipment — 1.9% | | | |
| 145,900 | | Carrier Access Corp.*† | | | 1,005,251 |
| 88,800 | | Ditech Communications Corp.*† | | | 1,910,976 |
| 161,300 | | Emulex Corp.*† | | | 1,711,393 |
| 251,200 | | Powerwave Technologies, Inc.*† | | | 1,519,760 |
| | | | |
|
|
| | | | | | 6,147,380 |
| | | | |
|
|
| |
Computers & Peripherals — 1.6% | | | |
| 207,300 | | Advanced Digital Information Corp.*† | | | 1,961,058 |
| 124,700 | | Novatel Wireless, Inc.*† | | | 2,450,355 |
| 22,300 | | PalmOne, Inc.*† | | | 728,095 |
| | | | |
|
|
| | | | | | 5,139,508 |
| | | | |
|
|
| |
Electronic Equipment & Instruments — 5.6% | | | |
| 209,000 | | Artesyn Technologies, Inc.*† | | | 1,778,590 |
| 193,600 | | Exar Corp.*† | | | 2,669,744 |
| 75,150 | | Intermagnetics General Corp.*† | | | 1,726,947 |
| 145,700 | | Multi-Fineline Electronix, Inc.* | | | 1,282,160 |
| 407,800 | | PerkinElmer, Inc.† | | | 7,128,344 |
| 78,000 | | Varian Inc.*† | | | 3,066,960 |
| | | | |
|
|
| | | | | | 17,652,745 |
| | | | |
|
|
| |
Internet Software & Services — 2.2% | | | |
| 53,800 | | Ask Jeeves, Inc.*† | | | 1,394,496 |
| 290,700 | | Autobytel Inc.*† | | | 2,046,528 |
| 30,700 | | Digital River, Inc.*† | | | 738,949 |
| 370,200 | | HomeStore, Inc.* | | | 807,036 |
| 348,400 | | iVillage Inc.*† | | | 2,024,204 |
| | | | |
|
|
| | | | | | 7,011,213 |
| | | | |
|
|
| |
IT Consulting & Services — 2.5% | | | |
| 68,100 | | Forrester Research, Inc.* | | | 1,152,933 |
| 288,400 | | Keane, Inc.*† | | | 4,066,440 |
| 345,800 | | Lionbridge Technologies, Inc.*† | | | 2,756,026 |
| | | | |
|
|
| | | | | | 7,975,399 |
| | | | |
|
|
| |
Semiconductor Equipment & Products — 9.2% | | | |
| 45,000 | | AMIS Holdings, Inc.*† | | | 541,800 |
| 49,100 | | Artisan Components, Inc.*† | | | 1,352,705 |
| 79,000 | | ASE Test Ltd.*† | | | 376,830 |
See Notes to Financial Statements.
55
Schedules of Investments
(continued)
| | | | | |
| Small Capitalization Growth Investments |
| | |
| Shares | | Security | | Value |
| |
Semiconductor Equipment & Products — 9.2% (continued) | | | |
| 206,700 | | Asyst Technologies, Inc.*† | | $ | 942,552 |
| 106,000 | | ATMI, Inc.*† | | | 1,997,040 |
| 50,100 | | Cymer, Inc.*† | | | 1,338,672 |
| 99,400 | | Integrated Circuit Systems, Inc.*† | | | 2,184,812 |
| 112,300 | | Integrated Silicon Solution, Inc.*† | | | 886,047 |
| 107,300 | | Lam Research Corp.*† | | | 2,312,315 |
| 175,500 | | LTX Corp.*† | | | 902,070 |
| 74,600 | | Marvell Technology Group Ltd.* | | | 1,724,752 |
| 142,600 | | Mattson Technology, Inc.*† | | | 1,063,796 |
| 84,600 | | Microchip Technology Inc.† | | | 2,232,594 |
| 46,800 | | MKS Instruments, Inc.* | | | 628,992 |
| 235,800 | | MPS Group, Inc.*† | | | 2,105,694 |
| 103,200 | | O2Micro International Ltd.* | | | 991,752 |
| 76,100 | | Power Integrations, Inc.*† | | | 1,528,088 |
| 120,400 | | Semtech Corp.*† | | | 2,178,036 |
| 135,200 | | Varian Semiconductor Equipment Associates, Inc.*† | | | 3,785,600 |
| | | | |
|
|
| | | | | | 29,074,147 |
| | | | |
|
|
| |
Software — 3.8% | | | |
| 247,700 | | Concur Technologies, Inc.*† | | | 2,600,850 |
| 96,900 | | Epicor Software Corp.*† | | | 959,310 |
| 35,400 | | Hyperion Solutions Corp.*† | | | 1,294,224 |
| 42,400 | | Manhattan Associates, Inc.* | | | 989,616 |
| 500,100 | | ScanSoft, Inc.*† | | | 2,135,427 |
| 547,300 | | SkillSoft PLC, Sponsored ADR*† | | | 3,398,733 |
| 118,400 | | TIBCO Software Inc.*† | | | 748,288 |
| | | | |
|
|
| | | | | | 12,126,448 |
| | | | |
|
|
| | | TOTAL INFORMATION TECHNOLOGY | | | 85,126,840 |
| | | | |
|
|
MATERIALS — 1.4% | | | |
| |
Metals & Mining — 1.4% | | | |
| 134,300 | | Arch Coal, Inc.† | | | 4,328,489 |
| | | | |
|
|
| | | TOTAL MATERIALS | | | 4,328,489 |
| | | | |
|
|
TELECOMMUNICATION SERVICES — 0.5% | | | |
| |
Diversified Telecommunication Services — 0.5% | | | |
| 194,400 | | General Communication, Class A Shares*† | | | 1,667,952 |
| | | | |
|
|
| | | TOTAL TELECOMMUNICATION SERVICES | | | 1,667,952 |
| | | | |
|
|
| | | TOTAL COMMON STOCK
(Cost — $262,843,766) | | | 309,538,540 |
| | | | |
|
|
| | |
Warrants
| | | | |
WARRANTS — 0.0% | | | |
| 5,615 | | TIMCO Aviation Services, Inc., Expires 2/28/07*
(Cost — $6 ) | | | 1 |
| | | | |
|
|
See Notes to Financial Statements.
56
Schedules of Investments
(continued)
| | | | | | | |
| Small Capitalization Growth Investments | |
| | |
Face Amount | | Security | | Value | |
| | CONVERTIBLE BONDS — 0.0% | | | | |
| $ | 6,480 | | TIMCO Aviation Services, Inc., Jr. Sub. Notes*@
(Cost — $704) | | $ | 0 | |
| | | | | |
|
|
|
| | | | SUB-TOTAL INVESTMENTS
(Cost — $262,844,476) | | | 309,538,541 | |
| | | | | |
|
|
|
| | REPURCHASE AGREEMENTS — 3.0% | | | | |
| | 5,052,000 | | Merrill Lynch & Co., Inc. dated 8/31/04, 1.570% due 9/1/04; Proceeds at maturity — $5,052,220; (Fully collateralized by various U.S. Government Agency Obligations, 0.000% to 2.500% due 11/17/04 to 2/24/06;
Market value — $5,153,042) | | | 5,052,000 | |
| | 3,087,000 | | State Street Bank and Trust Co. dated 8/31/04, 1.490% due 9/1/04; Proceeds at maturity — $3,087,128; (Fully collateralized by U.S. Treasury Bonds, 6.125% due 8/15/19; Market value — $3,154,243) | | | 3,087,000 | |
| | 1,325,000 | | UBS Securities LLC dated 8/31/04, 1.580% due 9/1/04; Proceeds at maturity — $1,325,058; (Fully collateralized by various U.S. Government Agency Obligations, 0.000% to 9.800% due 10/22/04 to 3/1/26;
Market value — $1,351,504) | | | 1,325,000 | |
| | | | | |
|
|
|
| | | | TOTAL REPURCHASE AGREEMENTS
(Cost — $9,464,000) | | | 9,464,000 | |
| | | | | |
|
|
|
| | | | TOTAL INVESTMENTS — 100.3%
(Cost — $272,308,476**) | | | 319,002,541 | |
| | | | Liabilities in Excess of Other Assets — (0.3)% | | | (1,089,723 | ) |
| | | | | |
|
|
|
| | | | TOTAL NET ASSETS — 100.0% | | $ | 317,912,818 | |
| | | | | |
|
|
|
| | LOANED SECURITIES COLLATERAL | | | | |
| | 81,889,326 | | State Street Navigator Securities Lending Trust Prime Portfolio
(Cost — $81,889,326) | | $ | 81,889,326 | |
| | | | | |
|
|
|
| * | | Non-income producing security. |
| † | | All or a portion of this security is on loan (See Note 3). |
| @ | | Security is valued in accordance with fair valuation procedures. |
| ** | | Aggregate cost for Federal income tax purposes is $274,605,169. |
Abbreviation used in this schedule:
ADR — American Depositary Receipt
See Notes to Financial Statements.
57
Schedules of Investments
(continued)
| | | | | |
| International Equity Investments |
| | |
| Shares | | Security | | Value |
COMMON STOCK — 95.6% | | | |
| |
Australia — 2.0% | | | |
| 158,700 | | Commonwealth Bank of Australia | | $ | 3,387,988 |
| 849,000 | | John Fairfax Holdings Ltd. | | | 2,292,604 |
| 1,134,000 | | Qantas Airways Ltd. | | | 2,733,540 |
| 991,000 | | WMC Resources Ltd.† | | | 3,446,647 |
| | | | |
|
|
| | | | | | 11,860,779 |
| | | | |
|
|
| |
Belgium — 0.4% | | | |
| 107,400 | | Fortis† | | | 2,391,953 |
| | | | |
|
|
| |
Bermuda — 0.3% | | | |
| 83,900 | | Axis Capital Holdings Ltd. | | | 2,002,693 |
| | | | |
|
|
| |
Brazil — 0.8% | | | |
| 21,500 | | Banco Bradesco S.A., Sponsored ADR | | | 1,048,125 |
| 37,375 | | Banco Itau Holding Financeira S.A., ADR | | | 1,883,700 |
| 103,900 | | Gerdau S.A., Sponsored ADR† | | | 1,709,155 |
| | | | |
|
|
| | | | | | 4,640,980 |
| | | | |
|
|
| |
Canada — 2.8% | | | |
| 99,900 | | Cognos, Inc.* | | | 3,158,838 |
| 107,300 | | Manulife Financial Corp. | | | 4,445,439 |
| 25,200 | | Open Text Corp.*† | | | 543,564 |
| 50,035 | | Precision Drilling Corp.* | | | 2,471,729 |
| 52,990 | | Research In Motion Ltd.* | | | 3,191,058 |
| 105,200 | | Talisman Energy Inc.† | | | 2,401,513 |
| | | | |
|
|
| | | | | | 16,212,141 |
| | | | |
|
|
| |
Chile — 0.3% | | | |
| 68,500 | | Linea Aerea Nacional Chile S.A., Sponsored ADR† | | | 1,503,575 |
| | | | |
|
|
| |
China — 0.4% | | | |
| 3,935,000 | | People’s Food Holdings Ltd. | | | 2,461,460 |
| | | | |
|
|
| |
France — 9.3% | | | |
| 46,800 | | Assurances Generales de France† | | | 2,677,032 |
| 167,000 | | Axa | | | 3,416,169 |
| 73,400 | | Club Mediterranee S.A.*† | | | 3,299,853 |
| 43,400 | | Compagnie de Saint-Gobain† | | | 2,182,738 |
| 70,300 | | Dassault Systemes S.A., ADR† | | | 3,024,939 |
| 152,000 | | France Telecom S.A. | | | 3,598,227 |
| 51,600 | | Lafarge S.A.† | | | 4,428,971 |
| 66,600 | | LVMH Moet Hennessy Louis Vuitton S.A.† | | | 4,268,076 |
| 28,025 | | Pernod-Ricard† | | | 3,469,058 |
| 39,833 | | Sanofi-Aventis† | | | 2,839,037 |
| 98,600 | | Sanofi-Aventis, ADR*† | | | 3,551,572 |
| 26,700 | | Societe BIC S.A.† | | | 1,141,476 |
| 35,200 | | Technip S.A.† | | | 5,283,547 |
| 48,835 | | Technip S.A., ADR† | | | 1,843,033 |
| 71,310 | | Thomson† | | | 1,355,337 |
| 17,613 | | Total S.A.† | | | 3,435,555 |
| 49,755 | | Total S.A., Sponsored ADR† | | | 4,875,492 |
| | | | |
|
|
| | | | | | 54,690,112 |
| | | | |
|
|
See Notes to Financial Statements.
58
Schedules of Investments
(continued)
| | | | | |
| International Equity Investments |
| | |
| Shares | | Security | | Value |
| |
Germany — 7.1% | | | |
| 70,800 | | Altana AG† | | $ | 3,843,710 |
| 50,507 | | BASF AG | | | 2,732,779 |
| 155,500 | | Bayerische Hypo- und Vereinsbank AG (HVB Group)* | | | 2,550,044 |
| 69,500 | | Bayerische Motoren Werke (BMW) AG | | | 2,869,647 |
| 65,700 | | Continental AG | | | 3,413,145 |
| 78,600 | | Deutsche Boerse AG | | | 3,798,892 |
| 46,700 | | E.ON AG | | | 3,317,662 |
| 85,300 | | Fresenius Medical Care AG† | | | 6,227,203 |
| 108,857 | | Kontron AG*† | | | 789,124 |
| 48,400 | | Metro AG† | | | 2,249,635 |
| 27,864 | | Rhoen-Klinikum AG † | | | 1,357,925 |
| 30,155 | | Rhoen-Klinikum AG, Preferred Shares† | | | 1,425,487 |
| 143,100 | | SAP AG, Sponsored ADR | | | 5,217,426 |
| 39,000 | | Schering AG | | | 2,167,665 |
| | | | |
|
|
| | | | | | 41,960,344 |
| | | | |
|
|
| |
Greece — 1.4% | | | |
| 133,300 | | Coca-Cola Hellenic Bottling Co. S.A., ADR† | | | 3,172,540 |
| 763,360 | | National Bank of Greece S.A., ADR† | | | 3,358,784 |
| 155,600 | | Piraeus Bank S.A. | | | 1,744,093 |
| | | | |
|
|
| | | | | | 8,275,417 |
| | | | |
|
|
| |
Hong Kong — 2.2% | | | |
| 1,248,000 | | Cafe De Coral Holdings Ltd. | | | 1,440,018 |
| 5,232,000 | | Glorious Sun Enterprises Ltd. | | | 1,660,175 |
| 1,500,000 | | Hang Lung Properties Ltd.† | | | 2,182,720 |
| 3,232,000 | | Hung Hing Printing Group Ltd. | | | 2,444,749 |
| 2,928,000 | | PCCW Ltd.*† | | | 1,952,025 |
| 1,048,000 | | TPV Technology Ltd. | | | 678,522 |
| 1,100,600 | | Yue Yuen Industrial Holdings Ltd.† | | | 2,652,762 |
| | | | |
|
|
| | | | | | 13,010,971 |
| | | | |
|
|
| |
India — 0.9% | | | |
| 54,300 | | HDFC Bank Ltd., ADR | | | 1,526,373 |
| 77,000 | | Infosys Technologies Ltd., Sponsored ADR† | | | 4,019,400 |
| | | | |
|
|
| | | | | | 5,545,773 |
| | | | |
|
|
| |
Indonesia — 0.2% | | | |
| 1,800,000 | | PT Telekomunikasi Indonesia | | | 1,468,800 |
| | | | |
|
|
| |
Ireland — 2.0% | | | |
| 206,500 | | Allied Irish Banks PLC | | | 3,263,114 |
| 159,700 | | CRH PLC | | | 3,654,035 |
| 102,400 | | Irish Life & Permanent PLC | | | 1,561,984 |
| 99,400 | | Ryanair Holdings PLC, Sponsored ADR*† | | | 3,086,370 |
| | | | |
|
|
| | | | | | 11,565,503 |
| | | | |
|
|
| |
Israel — 0.5% | | | |
| 102,000 | | Teva Pharmaceutical Industries Ltd.† | | | 2,779,500 |
| | | | |
|
|
| |
Italy — 1.5% | | | |
| 125,900 | | Benetton Group S.p.A.† | | | 1,375,911 |
| 147,295 | | Eni S.p.A.† | | | 3,016,671 |
See Notes to Financial Statements.
59
Schedules of Investments
(continued)
| | | | | |
| International Equity Investments |
| | |
| Shares | | Security | | Value |
| |
Italy — 1.5% (continued) | | | |
| 251,500 | | Mediaset S.p.A.† | | $ | 2,580,015 |
| 300,000 | | Telecom Italia Mobile S.p.A.† | | | 1,597,257 |
| | | | |
|
|
| | | | | | 8,569,854 |
| | | | |
|
|
| |
Japan — 21.0% | | | |
| 634,000 | | The Bank of Fukuoka, Ltd.† | | | 3,308,686 |
| 82,100 | | CANNON INC. | | | 3,930,680 |
| 92,300 | | CANNON INC., Sponsored ADR | | | 4,427,631 |
| 88,300 | | Coca-Cola West Japan Co. Ltd. | | | 2,142,103 |
| 300,000 | | Daiwa Securities Group Inc. | | | 1,953,591 |
| 63,000 | | FamilyMart Co., Ltd.† | | | 1,785,472 |
| 454,000 | | Fuji Heavy Industries Ltd.† | | | 2,306,851 |
| 69,000 | | Fuji Photo Film Co. Ltd. | | | 2,177,016 |
| 260,000 | | Fujirebio Inc.† | | | 3,460,149 |
| 155,000 | | Kao Corp. | | | 3,824,177 |
| 120,000 | | Kirin Brewery Co. Ltd. | | | 1,087,407 |
| 28,000 | | Kyocera Corp. | | | 2,059,617 |
| 63,500 | | Meitec Corp.† | | | 2,300,514 |
| 375 | | Millea Holdings, Inc. | | | 5,193,525 |
| 177,000 | | Mitsubishi Estate Co. Ltd. | | | 1,998,413 |
| 668,800 | | Mitsubishi Tokyo Financial Group, Inc., ADR† | | | 6,059,328 |
| 651,000 | | Nippon Express Co. Ltd. | | | 3,361,579 |
| 830,000 | | Nippon Shinpan Co. Ltd.* | | | 2,778,593 |
| 484,000 | | Nippon Yusen Kabushiki Kaisha | | | 2,516,995 |
| 1,016,000 | | NIPPONKOA Insurance Co. Ltd. | | | 6,066,367 |
| 134,800 | | Nomura Holdings, Inc. | | | 1,864,426 |
| 221,100 | | Nomura Holdings, Inc., ADR† | | | 3,068,868 |
| 58,600 | | Orix Corp., Sponsored ADR† | | | 3,006,180 |
| 85,500 | | Secom Co. Ltd. | | | 3,175,961 |
| 170,000 | | SEVEN-ELEVEN JAPAN CO., LTD.† | | | 5,207,741 |
| 474,000 | | Sharp Corp.† | | | 6,651,564 |
| 300,000 | | Sumitomo Chemical Co. Ltd. | | | 1,351,004 |
| 53,000 | | Taisho Pharmaceutical Co. Ltd. | | | 1,015,959 |
| 194,300 | | Takeda Pharmaceutical Co. Ltd. | | | 8,803,467 |
| 62,300 | | TDK Corp.† | | | 4,142,667 |
| 113,800 | | Toyota Motor Corp. | | | 4,508,998 |
| 76,600 | | Toyota Motor Corp., Sponsored ADR | | | 6,065,954 |
| 116,900 | | YAMADA DENKI Co. Ltd.† | | | 4,235,119 |
| 266,000 | | The Yamaguchi Bank Ltd. | | | 2,717,821 |
| 186,000 | | Yamaha Corp. | | | 2,787,526 |
| 70,900 | | Yamanouchi Pharmaceutical Co. Ltd. | | | 2,464,560 |
| | | | |
|
|
| | | | | | 123,806,509 |
| | | | |
|
|
| |
Liberia — 0.5% | | | |
| 71,200 | | Royal Caribbean Cruises Ltd.† | | | 2,917,609 |
| | | | |
|
|
| |
Mexico — 1.2% | | | |
| 95,600 | | Coca-Cola Femsa, S.A. de C.V., Sponsored ADR† | | | 1,948,328 |
| 86,900 | | Telefonos de Mexico S.A. de C.V., Series L Shares, Sponsored ADR | | | 2,814,691 |
| 79,100 | | Wal-Mart de Mexico S.A. de C.V., Series V Shares, Sponsored ADR | | | 2,514,273 |
| | | | |
|
|
| | | | | | 7,277,292 |
| | | | |
|
|
See Notes to Financial Statements.
60
Schedules of Investments
(continued)
| | | | | |
| International Equity Investments |
| | |
| Shares | | Security | | Value |
| |
The Netherlands — 6.3% | | | |
| 172,900 | | ABN AMRO Holding NV | | $ | 3,673,784 |
| 192,800 | | Akzo Nobel NV | | | 6,494,928 |
| 187,595 | | ASML Holding NV, NY Registered Shares* | | | 2,427,479 |
| 59,900 | | DSM NV† | | | 2,917,708 |
| 170,487 | | Heineken NV† | | | 5,159,588 |
| 13,375 | | Heineken Holding NV, Class A Shares | | | 358,174 |
| 101,700 | | ING Groep NV | | | 2,484,320 |
| 369,700 | | Koninklijke Ahold NV* | | | 2,279,146 |
| 248,600 | | Reed Elsevier NV† | | | 3,189,346 |
| 49,600 | | Royal Dutch Petroleum Co.† | | | 2,505,435 |
| 118,915 | | TPG NV† | | | 2,757,069 |
| 50,100 | | Unilever NV† | | | 3,004,357 |
| | | | |
|
|
| | | | | | 37,251,334 |
| | | | |
|
|
| |
Norway — 0.6% | | | |
| 51,200 | | Norsk Hydro ASA† | | | 3,199,163 |
| 51,200 | | Yara International ASA* | | | 455,695 |
| | | | |
|
|
| | | | | | 3,654,858 |
| | | | |
|
|
| |
Panama — 0.8% | | | |
| 107,400 | | Carnival Corp.† | | | 4,917,846 |
| | | | |
|
|
| |
Russia — 0.3% | | | |
| 12,675 | | Mobile Telesystems | | | 1,639,638 |
| | | | |
|
|
| |
Singapore — 0.3% | | | |
| 1,484,000 | | Singapore Telecommunications Ltd.* | | | 1,986,706 |
| | | | |
|
|
| |
South Korea — 2.0% | | | |
| 140,400 | | Kookmin Bank, Sponsored ADR*† | | | 4,485,780 |
| 263,000 | | Korea Electric Power Corp., Sponsored ADR† | | | 2,640,520 |
| 6,800 | | Samsung Electronics Co. Ltd., GDR‡ | | | 1,317,500 |
| 178,500 | | SK Telecom Co. Ltd., ADR† | | | 3,373,650 |
| | | | |
|
|
| | | | | | 11,817,450 |
| | | | |
|
|
| |
Spain — 2.2% | | | |
| 169,326 | | ACS, Actividades de Construccion y Servicios, S.A. | | | 2,888,177 |
| 240,000 | | Endesa, S.A.† | | | 4,450,390 |
| 137,900 | | Repsol YPF, S.A. | | | 2,856,179 |
| 182,200 | | Telefonica S.A. | | | 2,592,766 |
| | | | |
|
|
| | | | | | 12,787,512 |
| | | | |
|
|
| |
Sweden — 2.0% | | | |
| 506,700 | | Nordea Bank AB | | | 3,876,176 |
| 86,700 | | Sandvik AB† | | | 2,967,316 |
| 172,900 | | Telefonaktiebolaget LM Ericsson, Sponsored ADR*† | | | 4,675,216 |
| | | | |
|
|
| | | | | | 11,518,708 |
| | | | |
|
|
| |
Switzerland — 4.8% | | | |
| 29,000 | | Ciba Specialty Chemicals AG, Registered Shares | | | 1,765,915 |
| 64,200 | | Credit Suisse Group | | | 2,005,457 |
| 4,600 | | Forbo Holding AG | | | 960,380 |
| 33,500 | | Logitech International S.A., Registered Shares* | | | 1,515,382 |
See Notes to Financial Statements.
61
Schedules of Investments
(continued)
| | | | | |
| International Equity Investments |
| | |
| Shares | | Security | | Value |
| |
Switzerland — 4.8% (continued) | | | |
| 46,000 | | Lonza Group AG | | $ | 2,044,444 |
| 31,100 | | Nestle S.A., Registered Shares | | | 7,366,113 |
| 79,787 | | Novartis AG, Registered Shares | | | 3,694,368 |
| 86,500 | | UBS AG, Registered Shares | | | 5,837,885 |
| 20,600 | | Zurich Financial Services AG | | | 2,879,439 |
| | | | |
|
|
| | | | | | 28,069,383 |
| | | | |
|
|
| |
Taiwan — 1.6% | | | |
| 164,700 | | Chunghwa Telecom Co. Ltd., ADR† | | | 2,809,782 |
| 857,285 | | Compal Electronics Inc. | | | 810,659 |
| 766,156 | | Taiwan Semiconductor Manufacturing Co. Ltd., Sponsored ADR | | | 5,784,478 |
| | | | |
|
|
| | | | | | 9,404,919 |
| | | | |
|
|
| |
United Kingdom — 19.9% | | | |
| 127,000 | | Acambis PLC, Sponsored ADR*† | | | 1,445,260 |
| 1,365,100 | | Aegis Group PLC | | | 2,054,995 |
| 258,900 | | Amdocs Ltd.* | | | 5,203,890 |
| 136,900 | | AstraZeneca PLC, Sponsored ADR | | | 6,369,957 |
| 182,960 | | BG Group PLC, Sponsored ADR† | | | 5,754,092 |
| 263,500 | | BOC Group PLC | | | 4,249,333 |
| 250,000 | | Boots Group PLC | | | 3,055,832 |
| 431,700 | | BP PLC | | | 3,835,028 |
| 807,000 | | Centrica PLC | | | 3,579,056 |
| 413,178 | | Diageo PLC | | | 5,091,380 |
| 422,225 | | GlaxoSmithKline PLC | | | 8,609,271 |
| 70,800 | | HBOS PLC | | | 867,326 |
| 70,200 | | HSBC Holdings PLC, Sponsored ADR† | | | 5,467,176 |
| 1,761,937 | | International Power PLC* | | | 4,320,054 |
| 188,400 | | Johnson Matthey PLC | | | 3,082,389 |
| 662,179 | | Kingfisher PLC | | | 3,306,854 |
| 465,800 | | Lloyds TSB Group PLC | | | 3,501,833 |
| 615,600 | | Michael Page International PLC | | | 1,847,875 |
| 967,100 | | Misys PLC | | | 3,046,831 |
| 82,900 | | Next PLC | | | 2,223,910 |
| 384,500 | | Pearson PLC | | | 4,294,351 |
| 232,200 | | Reed Elsevier PLC | | | 2,059,620 |
| 502,000 | | Rexam PLC | | | 3,995,713 |
| 107,100 | | Royal Bank of Scotland Group PLC | | | 2,987,030 |
| 252,200 | | Scottish Power PLC | | | 1,828,946 |
| 533,100 | | Shire Pharmaceuticals Group PLC | | | 4,632,501 |
| 79,200 | | Smith & Nephew PLC, Sponsored ADR | | | 3,599,640 |
| 1,775,200 | | Tesco PLC | | | 8,513,120 |
| 22,471 | | TI Automotive Ltd., Class A Shares*@ | | | 5,789 |
| 1,762,800 | | Vodafone Group PLC | | | 4,012,308 |
| 452,045 | | WPP Group PLC | | | 4,042,250 |
| | | | |
|
|
| | | | | | 116,883,610 |
| | | | |
|
|
| | | TOTAL COMMON STOCK
(Cost — $499,612,341) | | | 562,873,229 |
| | | | |
|
|
See Notes to Financial Statements.
62
Schedules of Investments
(continued)
| | | | | |
| International Equity Investments |
| | |
| Rights | | Security | | Value |
| |
RIGHTS* — 0.1% | | | |
| |
Mexico — 0.0% | | | |
| 34,900 | | Coca-Cola Femsa, S.A. de C.V., Expires 9/1/04† | | $ | 0 |
| | | | |
|
|
| |
United Kingdom — 0.1% | | | |
| 581,439 | | International Power PLC, Expires 9/14/04 | | | 558,192 |
| | | | |
|
|
| | | TOTAL RIGHTS
(Cost — $0) | | | 558,192 |
| | | | |
|
|
| | | SUB-TOTAL INVESTMENTS
(Cost — $499,612,341) | | | 563,431,421 |
| | | | |
|
|
| | |
Face
Amount
| | | | |
| | | | | | |
REPURCHASE AGREEMENT — 3.9% | | | |
| $ 22,776,000 | | State Street Bank and Trust Co. dated 8/31/04, 1.490% due 9/1/04; Proceeds at maturity — $22,776,943; (Fully collateralized by U.S. Treasury Bonds, 5.250% due 2/15/29; Market value — $23,242,853)
(Cost — $22,776,000) | | | 22,776,000 |
| | | | |
|
|
| | | TOTAL INVESTMENTS — 99.6%
(Cost — $522,388,341**) | | | 586,207,421 |
| | | Other Assets in Excess of Liabilities — 0.4% | | | 2,348,797 |
| | | | |
|
|
| | | TOTAL NET ASSETS — 100.0% | | $ | 588,556,218 |
| | | | |
|
|
LOANED SECURITIES COLLATERAL | | | |
| 147,645,078 | | State Street Navigator Securities Lending Trust Prime Portfolio
(Cost — $147,645,078) | | $ | 147,645,078 |
| | | | |
|
|
| * | | Non-income producing security. |
| † | | All or a portion of this security is on loan (See Note 3). |
| @ | | Security is valued in accordance with fair valuation procedures. |
| ‡ | | Security is exempt from registration under Rule 144A of the Securities Act of 1933. This security may be resold in transactions that are exempt from registration, normally to qualified institutional buyers. These securities have been deemed liquid pursuant to guidelines approved by the Board of Trustees. |
| ** | | Aggregate cost for Federal income tax purposes is $525,314,552. |
Abbreviations used in this schedule:
ADR — American Depositary Receipt
GDR — Global Depositary Receipt
Summary of Investments by Sector†
| | | |
Financials | | 20.1 | % |
Consumer Discretionary | | 15.5 | |
Healthcare | | 11.7 | |
Consumer Staples | | 9.8 | |
Information Technology | | 9.7 | |
Materials | | 7.6 | |
Energy | | 7.2 | |
Industrials | | 5.6 | |
Telecommunication Services | | 5.5 | |
Repurchase Agreement | | 3.9 | |
Utilities | | 3.4 | |
| | |
|
|
| | | 100.0 | % |
| | |
|
|
| † | | As a percentage of total investments. Please note that fund holdings are subject to change. |
See Notes to Financial Statements.
63
Schedules of Investments
(continued)
| | | | | |
| Emerging Markets Equity Investments |
| | |
| Shares | | Security | | Value |
STOCK — 99.1% |
| |
Argentina — 1.5% | | | |
| 190,400 | | Grupo Financiero Galicia S.A., Sponsored ADR | | $ | 967,232 |
| 197,300 | | IRSA Inversiones y Representaciones S.A., Sponsored GDR* | | | 1,404,776 |
| 47,800 | | Telecom Argentina SA, Sponsored ADR* | | | 435,936 |
| | | | |
|
|
| | | | | | 2,807,944 |
| | | | |
|
|
| |
Brazil — 13.0% | | | |
| 12,000 | | All America Latina Logistica, Preferred Shares* | | | 249,319 |
| 5,883 | | Aracruz Celulose S.A., Sponsored ADR | | | 204,787 |
| 4,643 | | Banco Bradesco S.A., Preferred Shares | | | 225,666 |
| 7,904 | | Banco Bradesco S.A., Sponsored ADR | | | 385,320 |
| 20,594,059 | | Banco Itau Holding Financeira S.A., Preferred Shares | | | 2,083,255 |
| 203,009,139 | | Brasil Telecom Participacoes S.A., Preferred Shares | | | 1,311,677 |
| 1,120,000 | | Caemi Mineracao e Metalurgica S.A., Preferred Shares (a)* | | | 598,910 |
| 103,700,000 | | Companhia Brasileira de Distribuicao Grupo Pao de Acucar S.A., Preferred Shares | | | 2,150,998 |
| 11,530 | | Companhia de Bebidas das Americas, Preferred ADR | | | 250,201 |
| 8,488,475 | | Companhia de Bebidas das Americas, Preferred Shares | | | 1,844,595 |
| 20,300 | | Companhia de Concessoes Rodoviarias | | | 252,367 |
| 19,900,000 | | Companhia Energetica de Minas Gerais, Preferred Shares | | | 366,008 |
| 8,747 | | Companhia Energetica de Minas Gerais, Sponsored ADR | | | 162,169 |
| 334,894,684 | | Companhia Paranaense de Energia-Copel, Preferred Class B Shares | | | 1,140,649 |
| 18,000 | | Companhia Siderurgica Nacional S.A. | | | 278,031 |
| 24,856 | | Companhia Siderurgica Nacional S.A., Sponsored ADR | | | 384,771 |
| 2,919 | | Companhia Vale do Rio Doce, ADR | | | 168,631 |
| 7,800 | | Companhia Vale do Rio Doce, Preferred Class A Shares | | | 149,518 |
| 17,206 | | Companhia Vale do Rio Doce, Sponsored ADR | | | 837,932 |
| 66,342 | | Gerdau S.A., Preferred Shares | | | 1,094,779 |
| 337,000 | | Itausa - Investimentos Itau S.A., Preferred Shares | | | 412,067 |
| 3,200 | | Natura Cosmeticos S.A. | | | 61,689 |
| 195,739 | | Petroleo Brasileiro S.A., ADR | | | 5,582,878 |
| 14,888 | | Petroleo Brasileiro S.A., Preferred Shares | | | 415,809 |
| 93,266,608 | | Tele Celular Sul Participacoes S.A. | | | 108,006 |
| 21,670,106 | | Tele Celular Sul Participacoes S.A., Preferred Shares | | | 29,819 |
| 53,432 | | Tele Norte Leste Participacoes S.A. | | | 694,292 |
| 27,804 | | Tele Norte Leste Participacoes S.A., ADR | | | 380,915 |
| 576 | | Telefonica Data Brasil Holding, Preferred Shares* | | | 0 |
| 10,276 | | Telemar Norte Leste S.A., Preferred Class A Shares | | | 187,986 |
| 134,099,592 | | Telemig Celular Participacoes S.A., Preferred Shares | | | 199,596 |
| 576 | | Telesp - Telecomunicacoes de Sao Paulo S.A., Preferred Shares | | | 10 |
| 26,100,000 | | Telesp Celular Participacoes S.A., Preferred Shares* | | | 68,095 |
| 115,300 | | Usinas Siderurgicas de Minas Gerais S.A., Preferred Class A Shares | | | 1,818,253 |
| 8,036 | | Votorantim Celulose e Papel S.A., Sponsored ADR | | | 282,305 |
| | | | |
|
|
| | | | | | 24,381,303 |
| | | | |
|
|
| |
China — 1.4% | | | |
| 42,400 | | China International Marine Containers (Group) Co., Ltd., Class B Shares | | | 59,415 |
| 282,000 | | China Life Insurance Co., Ltd.* | | | 167,214 |
| 1,086,000 | | China Petroleum and Chemical Corp. | | | 424,659 |
| 204,000 | | China Shipping Development Co. Ltd. | | | 141,233 |
| 1,330,000 | | China Telecom Corp. Ltd. | | | 430,550 |
| 84,700 | | Datang Power Generation Co. Ltd. | | | 65,698 |
| 184,000 | | Huadian Power International Corp. Ltd. | | | 53,667 |
See Notes to Financial Statements.
64
Schedules of Investments
(continued)
| | | | | |
| Emerging Markets Equity Investments |
| | |
| Shares | | Security | | Value |
| |
China — 1.4% (continued) | | | |
| 166,000 | | Huaneng Power International, Inc. | | $ | 123,437 |
| 128,000 | | Jiangsu Expressway Co. Ltd. | | | 51,693 |
| 843,500 | | PetroChina Co. Ltd. | | | 424,459 |
| 67,500 | | Ping An Insurance (Group) Co. of China Ltd.* | | | 88,270 |
| 190,000 | | Sinopec Beijing Yanhua Petrochemical Co. Ltd. | | | 65,770 |
| 490,000 | | Sinopec Shanghai Petrochemical Co. Ltd. | | | 169,618 |
| 110,000 | | Sinopec Zhenhai Refining and Chemical Co. Ltd. | | | 105,771 |
| 198,000 | | Tencent Holdings Ltd.* | | | 93,290 |
| 74,000 | | Weichai Power Co., Ltd. | | | 134,720 |
| 50,000 | | Yanzhou Coal Mining Co. Ltd. | | | 54,167 |
| 86,100 | | Zhejiang Southeast Electric Power Co., Ltd., Class B Shares | | | 56,137 |
| | | | |
|
|
| | | | | | 2,709,768 |
| | | | |
|
|
| |
Czech Republic — 0.6% | | | |
| 22,840 | | Cesky Telecom A.S. | | | 288,331 |
| 43,286 | | CEZ A.S. | | | 338,430 |
| 2,836 | | Erste Bank der oesterreichischen Sparkassen AG | | | 109,243 |
| 1,921 | | Komercni Banka A.S. | | | 206,533 |
| 35,266 | | Unipetrol A.S.* | | | 110,976 |
| 5,917 | | Zentiva NV* | | | 134,723 |
| | | | |
|
|
| | | | | | 1,188,236 |
| | | | |
|
|
| |
Egypt — 0.6% | | | |
| 40,330 | | Commercial International Bank | | | 162,291 |
| 12,278 | | Egyptian Co. for Mobile Services | | | 187,150 |
| 2 | | Medinet NASR for Housing & Development Co. | | | 14 |
| 28,713 | | Orascom Construction Industries | | | 575,872 |
| 5,209 | | Orascom Telecommunications* | | | 119,458 |
| | | | |
|
|
| | | | | | 1,044,785 |
| | | | |
|
|
| |
Hong Kong — 3.8% | | | |
| 112,000 | | China Mengniu Dairy Co. Ltd.* | | | 70,360 |
| 1,570,000 | | China Merchants Holdings International Co. Ltd. | | | 2,375,159 |
| 654,500 | | China Mobile (Hong Kong) Ltd. | | | 1,908,983 |
| 176,000 | | CITIC International Financial Holdings Ltd. | | | 72,206 |
| 604,000 | | CNOOC Ltd. | | | 284,581 |
| 230,000 | | Denway Motors Ltd. | | | 90,674 |
| 181,000 | | Digital China Holdings Ltd.* | | | 48,151 |
| 322,000 | | GZI Transport Ltd. | | | 85,661 |
| 177,700 | | iShares MSCI Hong Kong Index Fund | | | 1,944,038 |
| 173,500 | | Lifestyle International Holdings Ltd. | | | 231,336 |
| 40,000 | | Shanghai Industrial Holdings Ltd. | | | 73,078 |
| 360,000 | | Shenzhen Investment Ltd. | | | 43,847 |
| | | | |
|
|
| | | | | | 7,228,074 |
| | | | |
|
|
| |
Hungary — 1.1% | | | |
| 2,149 | | Gedeon Richter RT. | | | 230,769 |
| 168 | | Gedeon Richter RT., Sponsored GDR | | | 17,943 |
| 50,591 | | Magyar Tavkozlesi RT. | | | 205,400 |
| 10,672 | | MOL Magyar Olaj-es Gazipari RT. | | | 465,991 |
| 47,794 | | OTP Bank RT. | | | 1,045,215 |
| | | | |
|
|
| | | | | | 1,965,318 |
| | | | |
|
|
See Notes to Financial Statements.
65
Schedules of Investments
(continued)
| | | | | |
| Emerging Markets Equity Investments |
| | |
| Shares | | Security | | Value |
| |
India — 5.3% | | | |
| 11,748 | | ICICI Bank Ltd., Sponsored ADR | | $ | 143,326 |
| 44,464 | | Infosys Technologies Ltd., Sponsored ADR | | | 2,321,021 |
| 53,138 | | Ranbaxy Laboratories Ltd., Sponsored GDR | | | 1,107,396 |
| 139,263 | | Reliance Industries Ltd., Sponsored GDR (b) | | | 2,971,872 |
| 57,559 | | Satyam Computer Services Ltd., ADR | | | 1,129,308 |
| 77,600 | | State Bank of India, GDR | | | 1,656,760 |
| 67,600 | | Tata Motors Ltd., Sponsored GDR | | | 561,080 |
| | | | |
|
|
| | | | | | 9,890,763 |
| | | | |
|
|
| |
Indonesia — 2.9% | | | |
| 894,000 | | PT Aneka Tambang Tbk. | | | 119,200 |
| 679,675 | | PT Astra International Tbk. | | | 460,367 |
| 942,500 | | PT Bank Rakyat Indonesia | | | 173,420 |
| 117,500 | | PT Gudang Garam Tbk. | | | 159,800 |
| 615,920 | | PT Hanjaya Mandala Sampoerna Tbk. | | | 348,200 |
| 471,500 | | PT Indonesian Satellite Corp. Tbk. | | | 211,232 |
| 38,300 | | PT Indonesian Satellite Corp. Tbk., ADR | | | 853,324 |
| 178,000 | | PT International Nickel Indonesia Tbk. | | | 153,792 |
| 1,363,500 | | PT Kalbe Farma Tbk. | | | 57,449 |
| 2,084,000 | | PT Tambang Batubara Bukit Asam Tbk. | | | 172,277 |
| 1,937,898 | | PT Telekomunikasi Indonesia | | | 1,581,325 |
| 75,600 | | PT Telekomunikasi Indonesia, Sponsored ADR | | | 1,229,256 |
| | | | |
|
|
| | | | | | 5,519,642 |
| | | | |
|
|
| |
Israel — 0.9% | | | |
| 62,898 | | Teva Pharmaceutical Industries Ltd., Sponsored ADR | | | 1,713,970 |
| | | | |
|
|
| |
Kazakhstan — 0.1% | | | |
| 7,385 | | PetroKazakhstan Inc., Class A Shares | | | 221,328 |
| | | | |
|
|
| |
Luxembourg — 0.2% | | | |
| 8,780 | | Tenaris S.A., ADR | | | 338,469 |
| | | | |
|
|
| |
Malaysia — 1.8% | | | |
| 214,000 | | AMMB Holdings Berhad | | | 184,716 |
| 207,000 | | Commerce Asset-Holding Berhad | | | 250,579 |
| 87,000 | | DRB-Hicom Berhad | | | 47,163 |
| 50,000 | | Genting Berhad | | | 209,211 |
| 53,000 | | Hong Leong Bank Berhad | | | 69,458 |
| 85,000 | | IOI Corp. Berhad | | | 193,487 |
| 43,000 | | Kuala Lumpur Kepong Berhad | | | 73,553 |
| 126,000 | | Malayan Banking Berhad | | | 344,842 |
| 107,000 | | Malaysia International Shipping Corp. Berhad | | | 351,974 |
| 72,000 | | Malaysian Airline System Berhad | | | 81,474 |
| 55,000 | | Maxis Communications Berhad | | | 123,750 |
| 183,000 | | PLUS (Projek Lebuhraya Utara Selatan) Expressways Berhad | | | 119,913 |
| 85,000 | | Public Bank Berhad | | | 152,105 |
| 43,000 | | Puncak Niaga Holdings Berhad* | | | 25,913 |
| 99,000 | | Resorts World Berhad | | | 230,566 |
| 89,000 | | Tanjong PLC | | | 292,763 |
| 141,000 | | Telekom Malaysia Berhad | | | 393,316 |
| 48,000 | | UMW Holdings Berhad | | | 61,895 |
| 95,000 | | YTL Corp. Berhad | | | 115,000 |
| | | | |
|
|
| | | | | | 3,321,678 |
| | | | |
|
|
See Notes to Financial Statements.
66
Schedules of Investments
(continued)
| | | | | |
| Emerging Markets Equity Investments |
| | |
| Shares | | Security | | Value |
| |
Mexico — 8.4% | | | |
| 71,000 | | Alfa, S.A., Series A Shares | | $ | 233,493 |
| 566,350 | | America Movil S.A. de C.V., Series L Shares | | | 973,589 |
| 28,738 | | America Movil S.A. de C.V., Series L Shares, ADR | | | 984,276 |
| 58,370 | | Cemex S.A. de C.V., Participation Certificate, Sponsored ADR | | | 1,651,871 |
| 84,441 | | Cemex S.A. de C.V., Series CPO | | | 479,508 |
| 12,850 | | Coca-Cola Femsa, S.A. de C.V., Sponsored ADR | | | 261,883 |
| 36,600 | | Consorcio ARA, S.A. de C.V.* | | | 98,158 |
| 137,880 | | Corporacion GEO, S.A. de C.V., Series B Shares* | | | 179,799 |
| 3,198,700 | | Empresas ICA Sociedad Controladora S.A. de C.V.* | | | 945,054 |
| 3,634 | | Fomento Economico Mexicano, S.A. de C.V., Sponsored ADR | | | 157,098 |
| 66,200 | | Grupo Aeroportuario del Sureste S.A. de C.V., ADR | | | 1,403,440 |
| 89,600 | | Grupo Aeroportuario del Sureste S.A. de C.V., Series B Shares | | | 194,682 |
| 58,000 | | Grupo Carso S.A. de C.V., Series A1 Shares | | | 265,966 |
| 282,829 | | Grupo Financiero Banorte S.A. de C.V., Series O Shares | | | 1,115,151 |
| 56,103 | | Grupo Financiero Inbursa, S.A. de C.V., Series O Shares | | | 82,878 |
| 72,000 | | Grupo Mexico S.A. de C.V., Series B Shares* | | | 257,041 |
| 73,600 | | Grupo Modelo, S.A. de C.V., Series C Shares | | | 175,708 |
| 39,590 | | Grupo Televisa S.A., Sponsored ADR | | | 1,905,467 |
| 701,045 | | Telefonos de Mexico S.A. de C.V., Series L Shares | | | 1,138,562 |
| 46,674 | | Telefonos de Mexico S.A. de C.V., Series L Shares, Sponsored ADR | | | 1,511,771 |
| 60,300 | | Urbi, Desarrollos Urbanos, S.A. de C.V.* | | | 191,677 |
| 464,525 | | Wal-Mart de Mexico S.A. de C.V., Series V Shares | | | 1,480,680 |
| 4,492 | | Wal-Mart de Mexico S.A. de C.V., Series V Shares, Sponsored ADR | | | 142,783 |
| | | | |
|
|
| | | | | | 15,830,535 |
| | | | |
|
|
| |
The Philippines — 0.1% | | | |
| 9,700 | | Philippine Long Distance Telephone Co., Sponsored ADR* | | | 219,899 |
| | | | |
|
|
| |
Poland — 1.5% | | | |
| 1,052 | | Bank Przemyslowo-Handlowy BPH | | | 114,279 |
| 3,607 | | Bank Zachodni WBK S.A. | | | 79,945 |
| 2,817 | | ComputerLand S.A.* | | | 88,643 |
| 3,842 | | Echo Investment S.A.* | | | 87,256 |
| 1,605 | | Grupa Kety S.A. | | | 61,265 |
| 11,382 | | KGHM Polska Miedz S.A.* | | | 93,433 |
| 31,333 | | Polski Koncern Naftowy Orlen S.A. | | | 276,927 |
| 52,110 | | Telekomunikacja Polska S.A. | | | 206,039 |
| 472,500 | | Telekomunikacja Polska S.A., GDR | | | 1,833,300 |
| | | | |
|
|
| | | | | | 2,841,087 |
| | | | |
|
|
| |
Russia — 6.1% | | | |
| 9,572 | | AO VimpelCom, Sponsored ADR* | | | 939,013 |
| 1,461 | | Cherepovets MK Severstal | | | 255,675 |
| 15,101 | | Gazprom, Registered Shares, Sponsored ADR | | | 498,333 |
| 28,684 | | LUKOIL, Sponsored ADR | | | 3,384,712 |
| 49,542 | | Mining and Metallurgical Co. Norilsk Nickel, ADR | | | 2,794,169 |
| 7,299 | | Mobile Telesystems, Sponsored ADR | | | 944,199 |
| 9,446 | | RAO Unified Energy System, Registered Shares, GDR | | | 252,114 |
| 689 | | Sberbank RF | | | 270,088 |
| 9,058 | | Surgutneftegaz, Preferred Shares, Sponsored ADR | | | 391,758 |
| 36,216 | | Surgutneftegaz, Sponsored ADR | | | 1,263,938 |
| 343 | | Transneft, Preferred Shares | | | 286,405 |
| 8,688 | | YUKOS, ADR | | | 145,958 |
| | | | |
|
|
| | | | | | 11,426,362 |
| | | | |
|
|
See Notes to Financial Statements.
67
Schedules of Investments
(continued)
| | | | | |
| Emerging Markets Equity Investments |
| | |
| Shares | | Security | | Value |
| |
South Africa — 8.4% | | | |
| 33,396 | | ABSA Group Ltd. | | $ | 276,918 |
| 135,403 | | African Bank Investments Ltd. | | | 241,260 |
| 108,400 | | Alexander Forbes Ltd. | | | 176,017 |
| 308,612 | | Anglo American PLC | | | 7,003,565 |
| 56,740 | | AngloGold Ashanti Ltd. | | | 2,006,606 |
| 29,600 | | Barloworld Ltd. | | | 334,086 |
| 320,300 | | FirstRand Ltd. | | | 515,276 |
| 12,300 | | Impala Platinum Holdings Ltd. | | | 1,033,792 |
| 10,200 | | Imperial Holdings Ltd. | | | 117,872 |
| 24,590 | | Ispat Iscor Ltd. | | | 173,925 |
| 34,904 | | JD Group Ltd. | | | 238,997 |
| 14,000 | | Kumba Resources Ltd. | | | 76,900 |
| 27,542 | | Liberty Group Ltd. | | | 227,966 |
| 35,091 | | Massmart Holdings Ltd. | | | 184,353 |
| 81,773 | | MTN Group Ltd. | | | 375,331 |
| 92,000 | | Old Mutual PLC | | | 176,108 |
| 10,000 | | Remgro Ltd. | | | 121,896 |
| 184,200 | | Sanlam Ltd. | | | 248,649 |
| 33,571 | | Sappi Ltd. | | | 473,328 |
| 22,849 | | Sasol Ltd. | | | 391,957 |
| 53,639 | | Standard Bank Group Ltd. | | | 358,320 |
| 273,521 | | Steinhoff International Holdings Ltd. | | | 337,116 |
| 42,515 | | Telkom South Africa Ltd. | | | 507,045 |
| 155,400 | | Truworths International Ltd. | | | 247,892 |
| | | | |
|
|
| | | | | | 15,845,175 |
| | | | |
|
|
| |
South Korea — 19.4% | | | |
| 4,580 | | CJ Corp. | | | 233,801 |
| 6,930 | | Daelim Industrial Co., Ltd. | | | 263,218 |
| 13,420 | | Daishin Securities Co., Preferred Shares | | | 94,372 |
| 10,550 | | Hanjin Shipping Co., Ltd. | | | 182,726 |
| 19,486 | | Hyosung Corp. | | | 158,175 |
| 39,484 | | Hyundai Department Store Co., Ltd. | | | 1,177,476 |
| 9,100 | | Hyundai Mobis | | | 447,159 |
| 7,700 | | Hyundai Motor Co., Ltd. | | | 183,500 |
| 51,865 | | Hyundai Motor Co., Ltd., Preferred Shares | | | 2,246,875 |
| 25,500 | | Industrial Bank of Korea | | | 166,037 |
| 116,912 | | Kookmin Bank* | | | 3,735,175 |
| 112,300 | | Korea Electric Power (KEPCO) Corp. | | | 1,974,280 |
| 10,546 | | Korean Air Lines Co., Ltd.* | | | 149,238 |
| 58,840 | | KT Corp. | | | 1,861,977 |
| 79,881 | | KT Corp., Sponsored ADR | | | 1,399,515 |
| 12,490 | | KT&G Corp. | | | 318,797 |
| 61,621 | | LG Chem Ltd. | | | 2,343,187 |
| 28,229 | | LG Electronics Inc. | | | 1,347,914 |
| 14,850 | | LG Electronics Inc., Preferred Shares | | | 391,281 |
| 9,890 | | LG Petrochemical Co., Ltd. | | | 228,822 |
| 1,960 | | NCsoft Corp.* | | | 141,574 |
| 2,240 | | ORION Corp. | | | 156,548 |
| 14,190 | | Poongsan Corp. | | | 134,280 |
| 22,990 | | POSCO | | | 3,303,247 |
| 45,150 | | Samsung Corp. | | | 544,850 |
| 22,400 | | Samsung Electronics Co., Ltd. | | | 8,770,586 |
See Notes to Financial Statements.
68
Schedules of Investments
(continued)
| | | | | |
| Emerging Markets Equity Investments |
| | |
| Shares | | Security | | Value |
| |
South Korea — 19.4% (continued) | | | |
| 5,350 | | Samsung Electronics Co., Ltd., Preferred Shares | | $ | 1,379,476 |
| 5,355 | | Samsung Fire & Marine Insurance Co., Ltd. | | | 319,389 |
| 54,810 | | Samsung Heavy Industries Co., Ltd. | | | 241,252 |
| 5,280 | | Samsung SDI Co., Ltd. | | | 540,904 |
| 36,920 | | Shinhan Financial Group Co., Ltd. | | | 625,029 |
| 12,950 | | SK Corp. | | | 491,310 |
| 6,590 | | SK Telecom Co., Ltd. | | | 992,634 |
| | | | |
|
|
| | | | | | 36,544,604 |
| | | | |
|
|
| |
Taiwan — 14.2% | | | |
| 234,261 | | Acer Inc. | | | 311,642 |
| 267,522 | | Advanced Semiconductor Engineering Inc.* | | | 194,836 |
| 183,366 | | Asustek Computer Inc. | | | 409,251 |
| 269,850 | | AU Optronics Corp. | | | 346,307 |
| 292,969 | | Benq Corp. | | | 299,404 |
| 807,691 | | Cathay Financial Holding Co., Ltd. | | | 1,411,301 |
| 65,760 | | Cheng Shin Rubber Industry Co., Ltd. | | | 84,971 |
| 567,326 | | China Development Financial Holding Corp. | | | 251,575 |
| 88,000 | | China Motor Corp. | | | 102,596 |
| 580,231 | | China Steel Corp. | | | 541,858 |
| 3,444,465 | | Chinatrust Financial Holding Co., Ltd. | | | 3,631,396 |
| 149,000 | | Chunghwa Telecom Co., Ltd. | | | 236,286 |
| 170,000 | | CMC Magnetics Corp. | | | 83,872 |
| 184,988 | | Compal Electronics Inc. | | | 174,927 |
| 205,658 | | Delta Electronics Inc. | | | 263,323 |
| 140,283 | | Evergreen Marine Corp.* | | | 127,298 |
| 381,000 | | Far Eastern Department Stores Ltd. | | | 186,852 |
| 321,988 | | Far Eastern Textile Ltd. | | | 191,007 |
| 312,000 | | First Financial Holding Co., Ltd.* | | | 217,150 |
| 307,503 | | Formosa Chemicals & Fibre Corp. | | | 492,156 |
| 282,359 | | Formosa Plastics Corp. | | | 422,892 |
| 732,598 | | Hon Hai Precision Industry Co., Ltd. | | | 2,398,822 |
| 20,194 | | Hon Hai Precision Industry Co., Ltd., Registered Shares, GDR | | | 143,377 |
| 185,300 | | iShares MSCI Taiwan Index Fund | | | 1,971,592 |
| 70,150 | | Kaulin Manufacturing Co., Ltd. | | | 85,081 |
| 199,232 | | Lite-On Technology Corp. | | | 186,056 |
| 46,412 | | MediaTek Inc. | | | 327,114 |
| 844,000 | | Mega Financial Holding Co., Ltd. | | | 510,584 |
| 420,976 | | Nan Ya Plastics Corp. | | | 581,049 |
| 104,000 | | Nien Hsing Textile Co., Ltd. | | | 89,487 |
| 691 | | Pacific Electric Wire & Cable Co., Ltd.*† | | | 0 |
| 87,000 | | Phoenixtec Power Co., Ltd. | | | 90,700 |
| 180,519 | | Polaris Securities Co., Ltd. | | | 84,820 |
| 122,000 | | Powerchip Semiconductor Corp.* | | | 85,986 |
| 61,828 | | President Chain Store Corp. | | | 91,693 |
| 623,486 | | Quanta Computer Inc. | | | 1,061,970 |
| 159,500 | | Siliconware Precision Industries Co. | | | 117,100 |
| 62,700 | | Synnex Technology International Corp. | | | 92,986 |
| 266,701 | | Taishin Financial Holdings Co., Ltd. | | | 202,853 |
| 354,600 | | Taiwan Cellular Corp. | | | 333,232 |
| 216,315 | | Taiwan Cement Corp. | | | 107,992 |
| 1,182,000 | | Taiwan Fertilizer Co., Ltd. | | | 937,214 |
| 1,177,477 | | Taiwan Semiconductor Manufacturing Co., Ltd. | | | 1,625,203 |
See Notes to Financial Statements.
69
Schedules of Investments
(continued)
| | | | | |
| Emerging Markets Equity Investments |
| | |
| Shares | | Security | | Value |
| |
Taiwan — 14.2% (continued) | | | |
| 1,689,206 | | United Microelectronics Corp.* | | $ | 1,145,914 |
| 378,701 | | United Microelectronics Corp., ADR* | | | 1,439,064 |
| 208,000 | | Walsin Lihwa Corp.* | | | 102,009 |
| 135,450 | | Wan Hai Lines Ltd. | | | 121,719 |
| 2,137,000 | | Yageo Corp.* | | | 888,011 |
| 409,700 | | Yageo Corp., Sponsored GDR* | | | 848,079 |
| 1,498,578 | | Yuanta Core Pacific Securities Co. | | | 994,592 |
| | | | |
|
|
| | | | | | 26,645,199 |
| | | | |
|
|
| |
Thailand — 4.7% | | | |
| 209,550 | | Advanced Info Service Public Co. Ltd. | | | 470,757 |
| 186,800 | | Airports of Thailand Public Co. Ltd.* | | | 228,900 |
| 860,800 | | Bangkok Bank Public Co. Ltd.* | | | 2,047,554 |
| 196,200 | | Bangkok Bank Public Co. Ltd., NVDR* | | | 438,409 |
| 536,200 | | Kasikornbank Public Co. Ltd., NVDR* | | | 602,291 |
| 147,400 | | Kiatnakin Finance Public Co. Ltd. | | | 108,018 |
| 8,955,900 | | Land and Houses Public Co. Ltd., NVDR | | | 1,958,162 |
| 67,000 | | PTT Exploration and Production Public Co. Ltd. | | | 450,745 |
| 168,700 | | PTT Public Co. Ltd. | | | 630,294 |
| 376,600 | | Shin Corp. Public Co. Ltd. | | | 321,223 |
| 59,700 | | The Siam Cement Public Co. Ltd. | | | 347,126 |
| 31,900 | | The Siam Cement Public Co. Ltd., NVDR | | | 174,753 |
| 308,400 | | Siam City Bank Public Co. Ltd. | | | 166,723 |
| 455,500 | | Sino Thai Engineering & Construction Public Co. Ltd. | | | 102,876 |
| 274,800 | | Thai Airways International Public Co. Ltd. | | | 353,239 |
| 50,000 | | Total Access Communication Public Co. Ltd.* | | | 151,000 |
| 911,700 | | True Corp. Public Co. Ltd.* | | | 114,455 |
| 205,800 | | Univanich Palm Oil Public Co. Ltd. | | | 139,689 |
| | | | |
|
|
| | | | | | 8,806,214 |
| | | | |
|
|
| |
Turkey — 3.1% | | | |
| 35,810,728 | | Akbank T.A.S. | | | 1,516,299 |
| 36,700 | | Aktas Elektrik Ticaret A.S.†* | | | 0 |
| 5,868,232 | | Anadolu Efes Biracilik ve Malt Sanayii A.S. | | | 784,243 |
| 1,151,383 | | Arcelik A.S.* | | | 59,797 |
| 46 | | Beko Elektronik A.S.* | | | 2 |
| 6,623,688 | | Dogan Sirketler Grubu Holding A.S.* | | | 112,842 |
| 2,635,490 | | Dogan Yayin Holding A.S.* | | | 94,156 |
| 5,220,600 | | Eregli Demir ve Celik Fabrikalari T.A.S. | | | 177,877 |
| 8,528,600 | | Finansbank A.S.* | | | 98,743 |
| 1,623,900 | | Ford Otomotiv Sanayi A.S. | | | 120,329 |
| 1 | | Haci Omer Sabanci Holding A.S. | | | 0 |
| 12,379,475 | | Koc Holding A.S. | | | 667,501 |
| 1,309,675 | | Tupras-Turkiye Petrol Rafinerileri A.S. | | | 100,511 |
| 3,785,415 | | Turk Sise ve Cam Fabrikalari A.S. | | | 83,272 |
| 43,496,076 | | Turkcell Iletisim Hizmetleri A.S. | | | 1,582,722 |
| 3,692,669 | | Turkiye Garanti Bankasi A.S.* | | | 120,320 |
| 7,570,848 | | Turkiye Is Bankasi, Class C Shares | | | 249,189 |
| 2,061,168 | | Vestel Elektronik Sanayi ve Ticaret A.S.* | | | 74,319 |
| | | | |
|
|
| | | | | | 5,842,122 |
| | | | |
|
|
| | | TOTAL STOCK
(Cost — $149,494,704) | | | 186,332,475 |
| | | | |
|
|
See Notes to Financial Statements.
70
Schedules of Investments
(continued)
| | | | | |
| Emerging Markets Equity Investments |
| | |
| Rights | | Security | | Value |
RIGHTS — 0.0%* | | | |
| |
Mexico — 0.0% | | | |
| 4,691 | | Coca Cola Femsa S.A. de C.V., Expire 9/1/04 (Cost — $0) | | $ | 0 |
| | | | |
|
|
| | | SUB-TOTAL INVESTMENTS
(Cost — $149,494,704) | | | 186,332,475 |
| | | | |
|
|
| | |
Face
Amount
| | | | |
REPURCHASE AGREEMENT — 0.2% | | | |
| $422,000 | | State Street Bank and Trust Co. dated 8/31/04, 1.490% due 9/1/04; Proceeds at maturity — $422,017; (Fully collaterized by U.S. Treasury Bonds, 13.250% due 5/15/14; Market value — $433,650) (Cost — $422,000) | | | 422,000 |
| | | | |
|
|
| | | TOTAL INVESTMENTS — 99.3%
(Cost — $149,916,704**) | | | 186,754,475 |
| | | Other Assets in Excess of Liabilities — 0.7% | | | 1,330,232 |
| | | | |
|
|
| | | NET ASSETS — 100.0% | | $ | 188,084,707 |
| | | | |
|
|
| (a) | | All or a portion of this security is segregated for open futures contracts commitments. |
| (b) | | Security is exempt from registration under Rule 144A of the Securities Act of 1933. This security may be resold in transactions that are exempt from registration, normally to qualified institutional buyers. These securities have been deemed liquid pursuant to guidelines approved by the Board of Trustees. |
| * | | Non-income producing security. |
| † | | Security is valued in accordance with fair valuation procedures. |
| ** | | Aggregate cost for Federal income tax purposes is $154,160,621. |
Abbreviations used in this schedule:
ADR — American Depositary Receipt
GDR — Global Depositary Receipt
NVDR — Non-Voting Depositary Receipt
Summary of Investments by Industry†
| | | |
Financials | | 17.9 | % |
Materials | | 17.5 | |
Telecommunication Services | | 14.9 | |
Information Technology | | 13.2 | |
Industrials | | 9.2 | |
Energy | | 8.4 | |
Consumer Discretionary | | 7.3 | |
Consumer Staples | | 4.0 | |
Utilities | | 2.5 | |
Exchange Traded Funds | | 2.1 | |
Other | | 3.0 | |
| | |
|
|
| | | 100.0 | % |
| | |
|
|
| † | | As a percentage of total investments. Please note that fund holdings are subject to change. |
See Notes to Financial Statements.
71
Schedules of Investments
(continued)
| | | | | | | | |
| Government Money Investments | | | | | |
| | | |
Face
Amount | | Security | | Annualized
Yield | | Value | |
U.S. GOVERNMENT AGENCY DISCOUNT NOTES — 94.3% | | | | | | |
| $ 3,500,000 | | Federal Farm Credit Bank due 9/22/04 | | 1.46% | | $ | 3,497,019 | |
| 39,829,000 | | Federal Home Loan Bank due 9/1/04 | | 2.95 | | | 39,829,000 | |
| 23,500,000 | | Freddie Mac Discount Notes due 9/1/04 to 12/6/04 | | 1.06 to 1.64 | | | 23,460,338 | |
| 18,800,000 | | Federal National Mortgage Association due 9/6/05 to 11/8/04 | | 1.07 to 1.61 | | | 18,768,984 | |
| 3,000,000 | | Tennessee Valley Authority due 9/2/04 | | 1.41 | | | 2,999,883 | |
| | | | | | |
|
|
|
| | | TOTAL U.S. GOVERNMENT AGENCY DISCOUNT NOTES
(Cost — $88,555,224) | | | | | 88,555,224 | |
| | | | | | |
|
|
|
U.S. TREASURY OBLIGATIONS — 8.0% | | | | | | |
| 5,000,000 | | U.S. Treasury Bills due 9/16/04 to 6/24/05 | | 1.29 to 1.78 | | | 4,981,445 | |
| 2,500,000 | | U.S. Treasury Note due 10/31/04 | | 2.12 | | | 2,502,583 | |
| | | | | | |
|
|
|
| | | TOTAL U.S. TREASURY OBLIGATIONS
(Cost — $7,484,028) | | | | | 7,484,028 | |
| | | | | | |
|
|
|
| | | TOTAL INVESTMENTS — 102.3%
(Cost — $96,039,252*) | | | | | 96,039,252 | |
| | | Liabilities in Excess of Other Assets — (2.3)% | | | | | (2,164,416 | ) |
| | | | | | |
|
|
|
| | | TOTAL NET ASSETS — 100.0% | | | | $ | 93,874,836 | |
| | | | | | |
|
|
|
| * | | Aggregate cost for Federal income tax purposes is substantially the same. |
See Notes to Financial Statements.
72
Schedules of Investments
(continued)
| | | | | |
| Core Fixed Income Investments | | |
| | |
Face Amount‡ | | Security | | Value |
U.S. GOVERNMENT OBLIGATIONS & AGENCIES — 28.0% | | | |
| |
U.S. Government Obligations — 21.6% | | | |
| | | U.S. Treasury Notes: | | | |
| 410,000 | | 1.625% due 2/28/06 (a) | | $ | 406,829 |
| 550,000 | | 2.750% due 6/30/06 (a) | | | 554,276 |
| 5,250,000 | | 2.750% due 7/31/06 (a)(b) | | | 5,288,556 |
| 4,665,000 | | 2.375% due 8/31/06 | | | 4,666,460 |
| 470,000 | | 2.625% due 11/15/06 | | | 471,579 |
| 160,000 | | 2.250% due 2/15/07 (a) | | | 158,888 |
| 120,000 | | 3.125% due 5/15/07 (a) | | | 121,491 |
| 50,000 | | 3.000% due 11/15/07 (a) | | | 50,314 |
| 375,000 | | 3.125% due 10/15/08 (a) | | | 375,439 |
| 150,000 | | 3.000% due 2/15/09 (a) | | | 148,816 |
| 600,000 | | 2.625% due 3/15/09 (a) | | | 585,235 |
| 11,550,000 | | 3.875% due 5/15/09 (a)(b) | | | 11,860,418 |
| 80,000 | | 4.000% due 6/15/09 (a) | | | 82,541 |
| 280,000 | | 3.625% due 7/15/09 (a) | | | 284,080 |
| 18,285,000 | | 3.500% due 8/15/09 (a)(b) | | | 18,442,141 |
| 4,250,000 | | 4.375% due 8/15/12 (a)(b) | | | 4,382,315 |
| 1,305,000 | | 4.000% due 11/15/12 (a)(b) | | | 1,311,016 |
| 1,310,000 | | 4.250% due 11/15/13 (a) | | | 1,326,632 |
| 925,000 | | 4.750% due 5/15/14 (a) | | | 971,070 |
| 40,000 | | 4.250% due 8/15/14 (a) | | | 40,413 |
| | | U.S. Treasury Bonds: | | | |
| 2,530,000 | | 10.375% due 11/15/12 (a)(b) | | | 3,105,874 |
| 1,445,000 | | 12.000% due 8/15/13 (a) | | | 1,920,496 |
| 2,565,000 | | 8.125% due 8/15/19 (a)(b) | | | 3,506,137 |
| 1,715,000 | | 8.000% due 11/15/21 (a) | | | 2,348,881 |
| 70,000 | | 7.250% due 8/15/22 (a) | | | 89,772 |
| 4,430,000 | | 6.250% due 8/15/23 (a)(b) | | | 5,147,283 |
| 1,020,000 | | 6.000% due 2/15/26 (a) | | | 1,155,908 |
| 665,000 | | 6.750% due 8/15/26 (a)(b) | | | 821,171 |
| 3,880,000 | | 6.125% due 11/15/27 (a)(b) | | | 4,475,037 |
| 100,000 | | 5.250% due 11/15/28 (a) | | | 103,285 |
| 510,000 | | 5.250% due 2/15/29 (a) | | | 527,233 |
| 12,355,000 | | 5.375% due 2/15/31 (a)(b) | | | 13,158,087 |
| | | U.S. Treasury Inflation-Indexed Notes: | | | |
| 1,761,135 | | 3.625% due 1/15/08 (a) | | | 1,936,493 |
| 901,928 | | 4.250% due 1/15/10 (a) | | | 1,048,175 |
| 3,779,902 | | 1.875% due 7/15/13 (b) | | | 3,836,305 |
| 4,711,865 | | 2.000% due 1/15/14 (a)(b) | | | 4,818,254 |
| 1,939,871 | | 2.000% due 7/15/14 | | | 1,980,413 |
| | | U.S. Treasury Inflation-Indexed Bonds: | | | |
| 1,499,357 | | 2.375% due 1/15/25 (a) | | | 1,556,462 |
| 311,531 | | 3.875% due 4/15/29 (a) | | | 411,477 |
| | | U.S. Treasury Principal Strips: | | | |
| 660,000 | | Due 11/15/21 (a) | | | 272,410 |
| 20,000 | | Due 2/15/23 | | | 7,658 |
| 230,000 | | Due 8/15/26 | | | 72,315 |
| 100,000 | | Due 11/15/26 | | | 30,963 |
| | | | |
|
|
| | | | | | 103,858,598 |
| | | | |
|
|
See Notes to Financial Statements.
73
Schedules of Investments
(continued)
| | | | | | | |
| Core Fixed Income Investments | | |
| | | |
Face Amount‡ | | Rating(c) | | Security | | Value |
| |
U.S. Government Agencies — 6.4% | | | |
| | | | | Fannie Mae: | | | |
| | | | | Notes: | | | |
| 60,000 | | AAA | | 2.375% due 2/15/07 (a) | | $ | 59,414 |
| 1,500,000 | | Aaa* | | 6.625% due 9/15/09 (a) | | | 1,697,401 |
| 2,300,000 | | Aaa* | | 7.125% due 6/15/10 (a) | | | 2,674,155 |
| 400,000 | | AAA | | 6.125% due 3/15/12 | | | 447,092 |
| 1,890,000 | | AAA | | 4.750% due 2/21/13 (a) | | | 1,884,595 |
| 130,000 | | AAA | | 3.000% due 4/26/19 | | | 130,254 |
| | | | | Bonds: | | | |
| 725,000 | | AAA | | 1.750% due 6/16/06 (a) | | | 715,497 |
| 230,000 | | AAA | | 3.125% due 3/16/09 (a) | | | 224,324 |
| | | | | Federal Home Loan Bank, Bonds: | | | |
| 60,000 | | AAA | | 2.750% due 5/15/06 | | | 60,269 |
| 120,000 | | Aaa* | | 4.875% due 11/15/06 | | | 124,445 |
| 70,000 | | AAA | | 3.500% due 11/15/07 | | | 70,762 |
| 30,000 | | AAA | | 3.625% due 11/14/08 (a) | | | 30,155 |
| 20,000 | | AAA | | 4.500% due 9/16/13 | | | 20,014 |
| | | | | Freddie Mac: | | | |
| | | | | Notes: | | | |
| 2,250,000 | | AAA | | 2.850% due 2/23/07 (b) | | | 2,249,917 |
| 685,000 | | AAA | | 3.500% due 4/1/08 (a) | | | 685,088 |
| 750,000 | | AAA | | 3.875% due 1/12/09 | | | 752,265 |
| 4,325,000 | | AAA | | 4.750% due 12/8/10 (a)(b) | | | 4,376,796 |
| 200,000 | | AAA | | 4.500% due 7/15/13 (a) | | | 200,218 |
| 400,000 | | AAA | | 6.250% due 7/15/32 (a) | | | 447,115 |
| | | | | Bonds: | | | |
| 850,000 | | AAA | | 6.750% due 3/15/31 (a)(b) | | | 1,007,423 |
| | | | | Small Business Administration, Participation Certificates: | | | |
| 2,036,123 | | NR | | 6.150% due 11/1/13 (b) | | | 2,140,822 |
| 650,111 | | NR | | 6.850% due 10/1/15 | | | 695,143 |
| 1,315,501 | | NR | | 6.650% due 11/1/15 | | | 1,402,899 |
| 1,055,504 | | NR | | 7.700% due 7/1/16 | | | 1,152,019 |
| 3,717,259 | | NR | | 7.190% due 12/1/19 (b) | | | 4,134,600 |
| 2,881,733 | | NR | | 7.590% due 1/1/20 (b) | | | 3,245,398 |
| | | | | | |
|
|
| | | | | | | | 30,628,080 |
| | | | | | |
|
|
| | | | | TOTAL U.S. GOVERNMENT OBLIGATIONS & AGENCIES
(Cost — $131,871,654) | | | 134,486,678 |
| | | | | | |
|
|
CORPORATE BONDS AND NOTES — 17.1% | | | |
| |
Advertising — 0.0% | | | |
| 10,000 | | B | | Lamar Media Corp., 7.250% due 1/1/13 | | | 10,700 |
| | | | | | |
|
|
| |
Aerospace/Defense — 0.3% | | | |
| | | | | Lockheed Martin Corp.: | | | |
| 245,000 | | BBB | | 7.650% due 5/1/16 | | | 296,290 |
| 150,000 | | BBB | | Bonds, 8.500% due 12/1/29 | | | 197,110 |
| 70,000 | | BBB | | Loral Corp., Debentures, 7.000% due 9/15/23 | | | 77,920 |
| | | | | Northrop Grumman Corp.: | | | |
| 180,000 | | BBB | | 7.125% due 2/15/11 | | | 207,220 |
| 280,000 | | BBB | | Notes, 4.079% due 11/16/06 | | | 285,409 |
See Notes to Financial Statements.
74
Schedules of Investments
(continued)
| | | | | | | |
| Core Fixed Income Investments | | |
| | | |
Face Amount‡ | | Rating(c) | | Security | | Value |
| |
Aerospace/Defense — 0.3% (continued) | | | |
| | | | | Raytheon Co., Notes: | | | |
| 20,000 | | BBB- | | 6.750% due 8/15/07 | | $ | 21,956 |
| 55,000 | | BBB- | | 6.150% due 11/1/08 | | | 60,012 |
| 115,000 | | BBB- | | 4.850% due 1/15/11 | | | 118,237 |
| | | | | | |
|
|
| | | | | | | | 1,264,154 |
| | | | | | |
|
|
| |
Agriculture — 0.1% | | | |
| | | | | Altria Group Inc.: | | | |
| 300,000 | | BBB | | Debentures, 7.750% due 1/15/27 | | | 318,080 |
| 250,000 | | BBB | | Notes, 7.000% due 11/4/13 | | | 263,973 |
| | | | | Reynolds American Inc.: | | | |
| 85,000 | | BB+ | | 7.250% due 6/1/12 | | | 84,362 |
| 10,000 | | BB+ | | Series B, 7.750% due 5/15/06 | | | 10,500 |
| | | | | | |
|
|
| | | | | | | | 676,915 |
| | | | | | |
|
|
| |
Airlines — 0.0% | | | |
| 50,000 | | AAA | | Delta Air Lines Inc., Pass-Through Certificates, Series 02-1, 6.417% due 7/2/12 (a) | | | 51,587 |
| | | | | | |
|
|
| |
Auto Manufacturers — 0.6% | | | |
| | | | | DaimlerChrysler N.A. Holding Corp.: | | | |
| 700,000 | | NR | | 6.900% due 9/1/04 | | | 700,000 |
| 150,000 | | BBB | | 4.750% due 1/15/08 | | | 154,832 |
| 1,860,000 | | BBB | | 4.050% due 6/4/08 (b) | | | 1,875,215 |
| 85,000 | | BBB | | 7.300% due 1/15/12 | | | 96,173 |
| 30,000 | | BBB | | Notes, 6.500% due 11/15/13 | | | 32,421 |
| | | | | | |
|
|
| | | | | | | | 2,858,641 |
| | | | | | |
|
|
| |
Banks — 1.9% | | | |
| 250,000 | | A+ | | American Express Centurion Bank, Notes, Series BKNT, 4.375% due 7/30/09 | | | 256,020 |
| | | | | Bank of America Corp.: | | | |
| | | | | Sr. Notes: | | | |
| 50,000 | | A+ | | 5.250% due 2/1/07 | | | 52,523 |
| 1,200,000 | | A+ | | 3.875% due 1/15/08 | | | 1,220,485 |
| | | | | Sub. Notes: | | | |
| 850,000 | | A | | 7.800% due 2/15/10 | | | 1,000,404 |
| 50,000 | | A | | 7.400% due 1/15/11 | | | 58,323 |
| | | | | Bank One Corp.: | | | |
| | | | | Notes: | | | |
| 575,000 | | A+ | | 6.500% due 2/1/06 | | | 606,256 |
| 150,000 | | A+ | | 2.625% due 6/30/08 | | | 144,777 |
| 960,000 | | A+ | | 6.000% due 8/1/08 | | | 1,042,329 |
| 80,000 | | A | | Sub. Notes, 5.900% due 11/15/11 | | | 85,837 |
| 500,000 | | AAA | | Depfa ACS Bank, Sr. Notes, Series DTC, 3.625% due 10/29/08 | | | 501,050 |
| 275,000 | | A+ | | Firstar Bank N.A., Sub. Notes, Series BKNT, 7.800% due 7/5/10 | | | 287,008 |
| 195,000 | | AA | | HBOS Treasury Services PLC, Notes, 3.600% due 8/15/07 (d) | | | 196,842 |
| 110,000 | | AAA | | KfW - Kreditanstalt fuer Wiederaufbau, 3.375% due 1/23/08 (a) | | | 110,966 |
| 10,000 | | BBB | | Sumitomo Mitsui Banking Corp./New York, Sub. Notes, 8.000% due 6/15/12 | | | 12,037 |
| | | | | SunTrust Banks Inc.: | | | |
| 265,000 | | AA- | | Deposit Notes, 4.415% due 6/15/09 | | | 271,625 |
| 385,000 | | A+ | | Sr. Notes, 3.625% due 10/15/07 | | | 388,393 |
| | | | | US BanCorp., Sr. Notes, Series MTNN: | | | |
| 160,000 | | A+ | | 3.950% due 8/23/07 | | | 163,114 |
| 100,000 | | A+ | | 3.125% due 3/15/08 | | | 98,663 |
See Notes to Financial Statements.
75
Schedules of Investments
(continued)
| | | | | | | |
| Core Fixed Income Investments | | |
| | | |
Face Amount‡ | | Rating(c) | | Security | | Value |
| |
Banks — 1.9% (continued) | | | |
| 325,000 | | A- | | Wachovia Corp., Sub. Notes, 5.250% due 8/1/14 | | $ | 333,182 |
| | | | | Wells Fargo & Co.: | | | |
| 405,000 | | AA- | | Notes, 3.500% due 4/4/08 (a) | | | 406,889 |
| | | | | Sr. Notes: | | | |
| 25,000 | | AA- | | 5.125% due 2/15/07 | | | 26,186 |
| 1,650,000 | | AA- | | 4.000% due 8/15/08 | | | 1,673,514 |
| | | | | Sub. Notes: | | | |
| 10,000 | | AA- | | 6.450% due 2/1/11 | | | 11,261 |
| 180,000 | | A+ | | 6.375% due 8/1/11 | | | 199,615 |
| | | | | | |
|
|
| | | | | | | | 9,147,299 |
| | | | | | |
|
|
| |
Beverages — 0.1% | | | |
| 500,000 | | A+ | | Anheuser-Busch Cos. Inc., Notes, 4.950% due 1/15/14 (a) | | | 511,449 |
| 34,000 | | B+ | | Constellation Brands Inc., Series B, 8.125% due 1/15/12 | | | 37,145 |
| 155,000 | | A | | Diageo Capital PLC, Notes, 3.375% due 3/20/08 (b) | | | 154,818 |
| | | | | | |
|
|
| | | | | | | | 703,412 |
| | | | | | |
|
|
| |
Chemicals — 0.0% | | | |
| 14,000 | | BB+ | | FMC Corp., Secured Notes, 10.250% due 11/1/09 | | | 16,362 |
| 23,000 | | B+ | | IMC Global Inc., Series B, 10.875% due 6/1/08 | | | 27,945 |
| | | | | | |
|
|
| | | | | | | | 44,307 |
| | | | | | |
|
|
| |
Coal — 0.0% | | | |
| 14,000 | | BB- | | Peabody Energy Corp., Series B, 6.875% due 3/15/13 | | | 14,840 |
| | | | | | |
|
|
| |
Computers — 0.0% | | | |
| 60,000 | | BBB- | | Electronic Data Systems Corp., Notes, 7.125% due 10/15/09 (a) | | | 64,039 |
| 150,000 | | A+ | | International Business Machines Corp., Notes, 4.750% due 11/29/12 | | | 151,878 |
| | | | | | |
|
|
| | | | | | | | 215,917 |
| | | | | | |
|
|
| |
Diversified Financial Services — 4.3% | | | |
| 725,000 | | AAA | | AIG SunAmerica Global Financing XII, Notes, 5.300% due 5/30/07 (d) | | | 764,366 |
| 80,000 | | A | | Boeing Capital Corp., Notes, 6.500% due 2/15/12 (a) | | | 89,285 |
| | | | | CIT Group Inc.: | | | |
| 15,000 | | A | | Notes, 6.500% due 2/7/06 | | | 15,808 |
| 70,000 | | A | | Sr. Notes, 7.750% due 4/2/12 | | | 82,721 |
| 10,000 | | BB- | | Eircom Funding, 8.250% due 8/15/13 | | | 10,850 |
| | | | | Ford Motor Credit Co.: | | | |
| 100,000 | | BBB- | | Bonds, 7.375% due 2/1/11 | | | 108,569 |
| | | | | Notes: | | | |
| 600,000 | | BBB- | | 3.535% due 10/25/04 | | | 601,237 |
| 695,000 | | BBB- | | 6.875% due 2/1/06 | | | 731,308 |
| 1,210,000 | | BBB- | | 7.375% due 10/28/09 | | | 1,325,772 |
| 30,000 | | BBB- | | 7.875% due 6/15/10 | | | 33,391 |
| 85,000 | | BBB- | | 7.250% due 10/25/11 | | | 91,715 |
| | | | | General Electric Capital Corp., Notes: | | | |
| 1,175,000 | | AAA | | 3.500% due 8/15/07 (a) | | | 1,184,825 |
| | | | | Series MTNA: | | | |
| 810,000 | | AAA | | 3.450% due 7/16/07 | | | 816,910 |
| 505,000 | | AAA | | 4.250% due 1/15/08 | | | 520,287 |
| 200,000 | | AAA | | 5.875% due 2/15/12 | | | 217,469 |
| 90,000 | | AAA | | 5.450% due 1/15/13 (a) | | | 95,426 |
See Notes to Financial Statements.
76
Schedules of Investments
(continued)
| | | | | | | |
| Core Fixed Income Investments | | |
| | | |
Face Amount‡ | | Rating(c) | | Security | | Value |
| |
Diversified Financial Services — 4.3% (continued) | | | |
| | | | | General Motors Acceptance Corp., Notes: | | | |
| 2,000,000 | | BBB | | 6.125% due 9/15/06 (b) | | $ | 2,099,994 |
| 1,925,000 | | BBB | | 5.625% due 5/15/09 (b) | | | 1,958,818 |
| 1,055,000 | | BBB | | 6.875% due 9/15/11 | | | 1,106,069 |
| 110,000 | | BBB | | 7.000% due 2/1/12 | | | 115,028 |
| 10,000 | | BBB | | Series MTN, 4.375% due 12/10/07 | | | 10,124 |
| | | | | Goldman Sachs Group Inc., Notes: | | | |
| 255,000 | | A+ | | 4.125% due 1/15/08 | | | 260,429 |
| 375,000 | | A+ | | 5.700% due 9/1/12 | | | 396,293 |
| 135,000 | | A+ | | 4.750% due 7/15/13 | | | 132,720 |
| 110,000 | | A+ | | 6.125% due 2/15/33 | | | 110,531 |
| | | | | Household Finance Corp., Notes: | | | |
| 20,000 | | A | | 7.200% due 7/15/06 | | | 21,572 |
| 585,000 | | A | | 4.625% due 1/15/08 | | | 606,654 |
| 20,000 | | A | | 8.000% due 7/15/10 | | | 23,691 |
| 1,225,000 | | A | | 6.375% due 10/15/11 | | | 1,352,150 |
| 175,000 | | A | | 6.375% due 11/27/12 | | | 194,015 |
| 80,000 | | A- | | John Deere Capital Corp., Notes, 7.000% due 3/15/12 | | | 92,467 |
| | | | | JPMorgan Chase & Co.: | | | |
| 60,000 | | A+ | | Notes, 4.500% due 11/15/10 | | | 60,905 |
| | | | | Sr. Notes: | | | |
| 500,000 | | A+ | | 5.250% due 5/30/07 (a) | | | 527,567 |
| 850,000 | | A+ | | 3.625% due 5/1/08 | | | 853,074 |
| | | | | Sub. Notes: | | | |
| 20,000 | | A | | 6.000% due 2/15/09 | | | 21,661 |
| 80,000 | | A | | 6.750% due 2/1/11 | | | 89,545 |
| 205,000 | | A | | 6.625% due 3/15/12 | | | 229,372 |
| 70,000 | | A | | 5.250% due 5/1/15 | | | 71,034 |
| | | | | Lehman Brothers Holdings Inc., Notes: | | | |
| 350,000 | | A | | 4.000% due 1/22/08 | | | 355,423 |
| 155,000 | | A | | 7.000% due 2/1/08 | | | 171,919 |
| 310,000 | | AAA | | MassMutual Global Funding II, Notes, 2.550% due 7/15/08 (d) | | | 300,099 |
| 50,000 | | A+ | | Merrill Lynch & Co. Inc., Notes, Series MTNB, 2.940% due 1/30/06 | | | 50,424 |
| | | | | Morgan Stanley: | | | |
| 125,000 | | A+ | | Bonds, 5.800% due 4/1/07 (a) | | | 133,382 |
| 390,000 | | A+ | | Notes, 3.625% due 4/1/08 | | | 390,575 |
| 45,000 | | A+ | | Unsub. Bonds, 6.100% due 4/15/06 | | | 47,441 |
| 330,000 | | AA+ | | New York Life Global Funding, Notes, 3.875% due 1/15/09 (d) | | | 332,099 |
| 1,285,000 | | AA | | Principal Life Global Funding I, Notes, 3.625% due 4/30/08 (d) | | | 1,296,224 |
| | | | | SLM Corp., Notes: | | | |
| 90,000 | | A | | Series CPI, 4.180% due 4/1/09 | | | 90,271 |
| 270,000 | | A | | Series MTN, 5.125% due 8/27/12 | | | 275,587 |
| 250,000 | | AAA | | TIAA Global Markets, 3.875% due 1/22/08 (d) | | | 254,164 |
| 110,000 | | AAA | | Toyota Motor Credit Corp., Notes, 2.875% due 8/1/08 (a) | | | 107,681 |
| | | | | | |
|
|
| | | | | | | | 20,828,941 |
| | | | | | |
|
|
| |
Electric — 1.3% | | | |
| | | | | AES Corp., Secured Sr. Notes: | | | |
| 7,689 | | BB | | 10.000% due 7/15/05 (d) | | | 7,843 |
| 85,000 | | B+ | | 8.750% due 5/15/13 (d) | | | 94,987 |
| 34,000 | | CCC+ | | Calpine Canada Energy Finance ULC, 8.500% due 5/1/08 | | | 21,845 |
See Notes to Financial Statements.
77
Schedules of Investments
(continued)
| | | | | | | |
| Core Fixed Income Investments | | |
| | | |
Face Amount‡ | | Rating(c) | | Security | | Value |
| |
Electric — 1.3% (continued) | | | |
| | | | | Calpine Corp.: | | | |
| 10,000 | | CCC+ | | Sr. Notes, 8.750% due 7/15/07 (a) | | $ | 7,350 |
| 60,000 | | B | | Sr. Secured Notes, 8.750% due 7/15/13 (a)(d) | | | 47,100 |
| 30,000 | | BB+ | | Cleveland Electric Illuminating Co., Sr. Notes, 5.650% due 12/15/13 | | | 30,691 |
| | | | | Dominion Resources Inc., Sr. Notes: | | | |
| 525,000 | | BBB+ | | 5.700% due 9/17/12 | | | 550,806 |
| 175,000 | | BBB+ | | Series D, 5.125% due 12/15/09 | | | 181,982 |
| 430,000 | | BBB | | Duke Energy Corp., Sr. Notes, 5.625% due 11/30/12 | | | 447,906 |
| | | | | FirstEnergy Corp., Notes: | | | |
| 20,000 | | BB+ | | Series A, 5.500% due 11/15/06 | | | 20,923 |
| 40,000 | | BB+ | | Series B, 6.450% due 11/15/11 | | | 43,339 |
| 485,000 | | BB+ | | Series C, 7.375% due 11/15/31 | | | 543,534 |
| | | | | Hydro Quebec: | | | |
| 120,000 | | A+ | | Series IU, 7.500% due 4/1/16 | | | 149,721 |
| 10,000 | | A+ | | Series JL, 6.300% due 5/11/11 | | | 11,230 |
| 40,000 | | BBB- | | Midamerican Energy Holdings Co., Sr. Notes, 5.875% due 10/1/12 | | | 42,027 |
| 110,000 | | A- | | Niagara Mohawk Power Corp., Sr. Notes, Series G, 7.750% due 10/1/08 | | | 125,855 |
| 130,000 | | BBB | | Oncor Electric Delivery Co., Sr. Secured Notes, 6.375% due 1/15/15 | | | 142,977 |
| 200,000 | | AA | | Ontario Electricity Financial Corp., 6.100% due 1/30/08 | | | 218,027 |
| 17,000 | | B- | | Orion Power Holdings Inc., Sr. Notes, 12.000% due 5/1/10 | | | 21,335 |
| | | | | Pacific Gas & Electric Co., 1st Mortgage: | | | |
| 800,000 | | BBB | | 2.300% due 4/3/06 | | | 800,918 |
| 120,000 | | BBB | | 6.050% due 3/1/34 | | | 120,841 |
| 80,000 | | NR | | PG&E Corp., Secured, 6.875% due 7/15/08 | | | 87,200 |
| 245,000 | | BBB | | Progress Energy Florida Inc., 1st Mortgage, 5.900% due 3/1/33 | | | 245,706 |
| 75,000 | | BBB- | | Progress Energy Inc., Sr. Notes, 7.750% due 3/1/31 | | | 88,065 |
| 800,000 | | BBB | | PSEG Power LLC, 7.750% due 4/15/11 | | | 924,968 |
| 325,000 | | AA- | | SP PowerAssets Ltd., Notes, 3.800% due 10/22/08 (d) | | | 326,634 |
| 460,000 | | BBB | | TXU Energy Co. LLC, Notes, 2.380% due 1/17/06 (d) | | | 460,976 |
| 250,000 | | BBB+ | | Virginia Electric and Power Co., Notes, Series MTNF, 5.730% due 11/25/08 | | | 266,232 |
| | | | | | |
|
|
| | | | | | | | 6,031,018 |
| | | | | | |
|
|
| |
Entertainment — 0.0% | | | |
| | | | | Mohegan Tribal Gaming Authority, Sr. Sub. Notes: | | | |
| 2,000 | | BB- | | 6.375% due 7/15/09 | | | 2,045 |
| 10,000 | | BB- | | 8.000% due 4/1/12 | | | 11,025 |
| | | | | | |
|
|
| | | | | | | | 13,070 |
| | | | | | |
|
|
| |
Environmental Control — 0.1% | | | |
| 5,000 | | BB- | | Allied Waste North America, Series B, 8.875% due 4/1/08 | | | 5,512 |
| | | | | Waste Management Inc.: | | | |
| 185,000 | | BBB | | 6.375% due 11/15/12 | | | 203,163 |
| 40,000 | | BBB | | 7.375% due 5/15/29 | | | 45,758 |
| 100,000 | | BBB | | 7.750% due 5/15/32 | �� | | 120,455 |
| | | | | | |
|
|
| | | | | | | | 374,888 |
| | | | | | |
|
|
| | |
Food — 0.4% | | | | | |
| 245,000 | | BBB | | Cadbury Schweppes US Finance LLC, Notes, 3.875% due 10/1/08 (d) | | | 245,728 |
| | | | | General Mills Inc., Notes: | | | |
| 255,000 | | BBB+ | | 5.125% due 2/15/07 | | | 267,011 |
| 85,000 | | BBB+ | | 6.000% due 2/15/12 | | | 91,574 |
| 305,000 | | BBB+ | | Kellogg Co., Notes, Series B, 6.600% due 4/1/11 | | | 343,481 |
See Notes to Financial Statements.
78
Schedules of Investments
(continued)
| | | | | | | |
| Core Fixed Income Investments | | |
| | | |
Face Amount‡ | | Rating(c) | | Security | | Value |
| |
Food — 0.4% (continued) | | | |
| 770,000 | | BBB+ | | Kraft Foods Inc., Notes, 5.625% due 11/1/11 | | $ | 816,335 |
| 70,000 | | A- | | Nabisco Inc., Debentures, 7.550% due 6/15/15 | | | 83,793 |
| | | | | Smithfield Foods Inc., Sr. Notes: | | | |
| 10,000 | | BB | | 7.000% due 8/1/11 (d) | | | 10,400 |
| 20,000 | | BB | | Series B, 8.000% due 10/15/09 | | | 21,850 |
| | | | | | |
|
|
| | | | | | | | 1,880,172 |
| | | | | | |
|
|
| |
Forest Products & Paper — 0.2% | | | |
| 38,000 | | BB | | Abitibi-Consolidated Inc., Notes, 8.550% due 8/1/10 | | | 41,040 |
| 9,000 | | BB+ | | Cascades Inc., Sr. Notes, 7.250% due 2/15/13 | | | 9,382 |
| | | | | Georgia-Pacific Corp.: | | | |
| 56,000 | | BB+ | | 8.875% due 2/1/10 | | | 65,940 |
| | | | | Debentures: | | | |
| 1,000 | | BB+ | | 9.500% due 12/1/11 (a) | | | 1,232 |
| 4,000 | | BB+ | | 7.700% due 6/15/15 | | | 4,490 |
| 1,000 | | BB+ | | Notes, 8.125% due 5/15/11 | | | 1,157 |
| 210,000 | | BBB | | International Paper Co., Notes, 5.500% due 1/15/14 | | | 214,689 |
| 130,000 | | BBB | | MeadWestvaco Corp., 6.850% due 4/1/12 | | | 144,083 |
| 585,000 | | BBB | | Weyerhaeuser Co., Notes, 6.750% due 3/15/12 | | | 655,545 |
| | | | | | |
|
|
| | | | | | | | 1,137,558 |
| | | | | | |
|
|
| |
Healthcare-Products — 0.0% | | | |
| 120,000 | | A- | | Boston Scientific Corp., Notes, 5.450% due 6/15/14 | | | 124,554 |
| | | | | | |
|
|
| |
Healthcare-Services — 0.3% | | | |
| | | | | HCA Inc.: | | | |
| 740,000 | | BBB- | | Notes, 5.750% due 3/15/14 | | | 734,896 |
| 30,000 | | BBB- | | Sr. Notes, 7.875% due 2/1/11 | | | 34,013 |
| 6,000 | | BBB | | Manor Care Inc., Sr. Notes, 7.500% due 6/15/06 | | | 6,488 |
| | | | | Tenet Healthcare Corp.: | | | |
| 121,000 | | B- | | Notes, 7.375% due 2/1/13 (a) | | | 112,530 |
| | | | | Sr. Notes: | | | |
| 10,000 | | B- | | 5.375% due 11/15/06 | | | 10,125 |
| 76,000 | | B- | | 6.375% due 12/1/11 (a) | | | 67,830 |
| 500,000 | | B- | | 9.875% due 7/1/14 (d) | | | 523,750 |
| | | | | | |
|
|
| | | | | | | | 1,489,632 |
| | | | | | |
|
|
| |
Holding Companies-Diversified — 0.0% | | | |
| 10,000 | | B+ | | Kansas City Southern Railway, 9.500% due 10/1/08 | | | 10,900 |
| | | | | | |
|
|
| |
Home Builders — 0.0% | | | |
| 10,000 | | BB | | Beazer Homes USA Inc., 8.375% due 4/15/12 | | | 10,925 |
| 8,000 | | BB- | | Schuler Homes Inc., 10.500% due 7/15/11 | | | 9,220 |
| | | | | | |
|
|
| | | | | | | | 20,145 |
| | | | | | |
|
|
| |
Household Products/Wares — 0.0% | | | |
| 150,000 | | A | | Avery Dennison Corp., Notes, 4.875% due 1/15/13 | | | 152,049 |
| | | | | | |
|
|
| | |
Insurance — 0.2% | | | | | |
| 160,000 | | A | | Loews Corp., Debentures, 8.875% due 4/15/11 | | | 190,781 |
| 100,000 | | A | | Metlife Inc., Sr. Notes, 6.125% due 12/1/11 | | | 109,313 |
| 200,000 | | AA | | Monumental Global Funding II, Notes, 4.375% due 7/30/09 (d) | | | 203,418 |
| 195,000 | | AA | | Protective Life Secured Trust, Notes, Series MTN, 3.700% due 11/24/08 | | | 195,908 |
| 230,000 | | BBB+ | | RLI Corp., Sr. Notes, 5.950% due 1/15/14 | | | 232,966 |
| | | | | | |
|
|
| | | | | | | | 932,386 |
| | | | | | |
|
|
See Notes to Financial Statements.
79
Schedules of Investments
(continued)
| | | | | | | |
| Core Fixed Income Investments | | |
| | | |
Face Amount‡ | | Rating(c) | | Security | | Value |
| |
Investment Companies — 0.1% | | | |
| 275,000 | | A+ | | Credit Suisse First Boston USA Inc., Notes, 4.625% due 1/15/08 | | $ | 284,676 |
| | | | | | |
|
|
| | |
Lodging — 0.1% | | | | | |
| 11,000 | | BB+ | | Caesars Entertainment Inc., Sr. Notes, 8.500% due 11/15/06 | | | 12,100 |
| 28,000 | | BB+ | | Harrah’s Operating Co. Inc., 7.875% due 12/15/05 | | | 29,750 |
| 10,000 | | BBB- | | Hilton Hotels Corp., Notes, 7.625% due 5/15/08 | | | 11,200 |
| | | | | Mandalay Resort Group: | | | |
| 20,000 | | BB+ | | Debentures, 7.000% due 11/15/36 (a) | | | 21,100 |
| 10,000 | | BB+ | | Sr. Notes, 9.500% due 8/1/08 | | | 11,450 |
| | | | | MGM Mirage: | | | |
| 6,000 | | BB- | | 9.750% due 6/1/07 | | | 6,675 |
| 35,000 | | BB+ | | 8.500% due 9/15/10 | | | 39,550 |
| 50,000 | | BB+ | | Sr. Notes, 6.750% due 9/1/12 (d) | | | 51,250 |
| 30,000 | | BB+ | | Starwood Hotels & Resorts Worldwide Inc., 7.375% due 5/1/07 | | | 32,250 |
| 28,000 | | BB- | | Station Casinos Inc., Sr. Notes, 6.000% due 4/1/12 | | | 28,210 |
| | | | | | |
|
|
| | | | | | | | 243,535 |
| | | | | | |
|
|
| |
Machinery-Diversified — 0.0% | | | |
| 20,000 | | BB- | | AGCO Corp., 9.500% due 5/1/08 | | | 21,800 |
| 4,000 | | BB+ | | Cummins Inc., Sr. Notes, 9.500% due 12/1/10 | | | 4,640 |
| | | | | | |
|
|
| | | | | | | | 26,440 |
| | | | | | |
|
|
| |
Media — 1.5% | | | |
| 601,000 | | BBB | | Comcast Cable Communications Holdings Inc., 8.375% due 3/15/13 | | | 727,864 |
| | | | | Comcast Corp.: | | | |
| 595,000 | | BBB | | 5.500% due 3/15/11 | | | 619,430 |
| 640,000 | | BBB | | 6.500% due 1/15/15 | | | 690,477 |
| 395,000 | | BBB | | Comcast MO of Delaware Inc., Sr. Notes, 8.300% due 5/15/06 | | | 428,867 |
| | | | | COX Communications Inc., Notes: | | | |
| 160,000 | | BBB | | 3.875% due 10/1/08 (a) | | | 154,544 |
| 650,000 | | BBB | | 7.125% due 10/1/12 | | | 699,890 |
| 65,000 | | BBB | | COX Enterprises Inc., Notes, 4.375% due 5/1/08 (d) | | | 63,622 |
| | | | | CSC Holdings Inc.: | | | |
| 4,000 | | BB- | | Debentures, 7.875% due 2/15/18 | | | 4,094 |
| 40,000 | | BB- | | Sr. Notes, Series B, 7.625% due 4/1/11 | | | 41,700 |
| 6,000 | | BB- | | Echostar DBS Corp., Sr. Notes, 4.850% due 10/1/08 | | | 6,255 |
| 12,000 | | B+ | | Entercom Radio LLC/Entercom Capital Inc., 7.625% due 3/1/14 | | | 12,840 |
| 475,000 | | BBB+ | | Historic TW Inc., Notes, 8.180% due 8/15/07 | | | 535,344 |
| 865,000 | | BBB- | | Liberty Media Corp., Sr. Notes, 3.020% due 9/17/06 | | | 875,614 |
| 315,000 | | BBB- | | News America Inc., 7.625% due 11/30/28 | | | 369,326 |
| 5,000 | | B | | Sun Media Corp., 7.625% due 2/15/13 | | | 5,350 |
| 100,000 | | BBB | | Tele-Communications-TCI Group, Sr. Notes, 7.125% due 2/15/28 | | | 107,781 |
| 125,000 | | BBB+ | | Time Warner Cos. Inc., Debentures, 7.570% due 2/1/24 | | | 141,430 |
| 50,000 | | BBB+ | | Time Warner Entertainment Co. L.P., Sr. Notes, 8.375% due 7/15/33 | | | 61,008 |
| | | | | Time Warner Inc.: | | | |
| 525,000 | | BBB+ | | 6.875% due 5/1/12 | | | 585,166 |
| 410,000 | | BBB+ | | 7.700% due 5/1/32 | | | 473,968 |
| 280,000 | | BBB+ | | Turner Broadcasting System Inc., Sr. Notes, 8.375% due 7/1/13 | | | 338,264 |
| | | | | Viacom Inc.: | | | |
| 25,000 | | A- | | 6.400% due 1/30/06 | | | 26,309 |
| 40,000 | | A- | | 5.625% due 8/15/12 (a) | | | 42,027 |
| 75,000 | | BBB+ | | Walt Disney Co., Sr. Notes, Series MTN, 6.200% due 6/20/14 | | | 81,504 |
| | | | | | |
|
|
| | | | | | | | 7,092,674 |
| | | | | | |
|
|
See Notes to Financial Statements.
80
Schedules of Investments
(continued)
| | | | | | | |
| Core Fixed Income Investments | | |
| | | |
Face Amount‡ | | Rating(c) | | Security | | Value |
| |
Miscellaneous Manufacturing — 0.2% | | | |
| 230,000 | | AAA | | General Electric Co., Notes, 5.000% due 2/1/13 | | $ | 236,998 |
| 22,000 | | BB+ | | SPX Corp., Sr. Notes, 7.500% due 1/1/13 | | | 23,100 |
| | | | | Tyco International Group S.A.: | | | |
| 220,000 | | BBB | | 6.375% due 10/15/11 | | | 241,363 |
| 26,000 | | BBB | | 7.000% due 6/15/28 | | | 28,861 |
| 429,000 | | BBB | | 6.875% due 1/15/29 (a) | | | 474,645 |
| | | | | | |
|
|
| | | | | | | | 1,004,967 |
| | | | | | |
|
|
| |
Oil & Gas — 1.2% | | | |
| 275,000 | | BBB- | | Amerada Hess Corp., Notes, 7.300% due 8/15/31 | | | 296,709 |
| | | | | Anadarko Finance Co., Series B: | | | |
| 385,000 | | BBB+ | | 6.750% due 5/1/11 | | | 435,822 |
| 370,000 | | BBB+ | | 7.500% due 5/1/31 | | | 451,593 |
| 80,000 | | A- | | Apache Corp., Notes, 6.250% due 4/15/12 (a) | | | 89,677 |
| 370,000 | | A- | | Apache Finance Canada Corp., 4.375% due 5/15/15 (a) | | | 356,188 |
| | | | | Atlantic Richfield Co.: | | | |
| 755,000 | | AA+ | | Debentures, 9.125% due 3/1/11 | | | 960,286 |
| 40,000 | | AA+ | | Notes, 5.900% due 4/15/09 | | | 43,764 |
| 20,000 | | AA+ | | BP Capital Markets PLC, 2.750% due 12/29/06 | | | 20,021 |
| 5,000 | | BB- | | Chesapeake Energy Corp., 9.000% due 8/15/12 | | | 5,725 |
| 380,000 | | AA | | ChevronTexaco Capital Co., 3.500% due 9/17/07 | | | 384,785 |
| 80,000 | | A- | | Conoco Funding Co., 7.250% due 10/15/31 | | | 96,062 |
| 770,000 | | A- | | ConocoPhillips Holding Co., Sr. Notes, 6.950% due 4/15/29 | | | 888,022 |
| 680,000 | | BBB | | Devon Energy Corp., Debentures, 7.950% due 4/15/32 | | | 833,692 |
| 40,000 | | BBB | | Devon Financing Corp. ULC, 6.875% due 9/30/11 | | | 45,197 |
| | | | | EnCana Corp., Bonds: | | | |
| 190,000 | | A- | | 6.300% due 11/1/11 | | | 207,674 |
| 75,000 | | A- | | 6.500% due 8/15/34 | | | 79,650 |
| 40,000 | | BB- | | Gaz Capital for Gazprom, Notes, 8.625% due 4/28/34 | | | 41,385 |
| 10,000 | | BB- | | Morgan Stanley Bank AG for OAO Gazprom, Notes, 9.625% due 3/1/13 | | | 10,882 |
| 125,000 | | BBB+ | | Occidental Petroleum Corp., Sr. Notes, 6.750% due 1/15/12 | | | 141,609 |
| 10,000 | | A- | | Petronas Capital Ltd., 7.875% due 5/22/22 (d) | | | 11,924 |
| 30,000 | | B+ | | Petrozuata Finance Inc., 8.220% due 4/1/17 (d) | | | 28,950 |
| 125,000 | | BBB- | | Pioneer Natural Resources Co., Sr. Notes, 5.875% due 7/15/16 | | | 129,422 |
| 100,000 | | BB- | | Pride International Inc., Sr. Notes, 7.375% due 7/15/14 (d) | | | 107,000 |
| 90,000 | | AAA | | Seariver Maritime Inc., zero coupon due 9/1/12 | | | 63,850 |
| | | | | Vintage Petroleum Inc.: | | | |
| 30,000 | | BB- | | Sr. Notes, 8.250% due 5/1/12 | | | 32,850 |
| 10,000 | | B | | Sr. Sub. Notes, 7.875% due 5/15/11 | | | 10,500 |
| 40,000 | | BB+ | | Western Oil Sands Inc., Sr. Secured Notes, 8.375% due 5/1/12 | | | 44,900 |
| 30,000 | | BBB- | | XTO Energy Inc., Sr. Notes, 6.250% due 4/15/13 | | | 32,586 |
| 11,000 | | BB- | | Grant Prideco Escrow Corp., 9.000% due 12/15/09 | | | 12,265 |
| | | | | | |
|
|
| | | | | | | | 5,862,990 |
| | | | | | |
|
|
| |
Pharmaceuticals — 0.9% | | | |
| 40,000 | | BB | | AmerisourceBergen Corp., Sr. Notes, 8.125% due 9/1/08 | | | 44,100 |
| 595,000 | | A+ | | Bristol-Myers Squibb Co., Notes, 5.750% due 10/1/11 | | | 637,188 |
| 2,825,000 | | AAA | | Merck & Co. Inc., Notes, Series MTNB, 5.760% due 5/3/37 | | | 3,148,564 |
| 49,000 | | BB+ | | Omnicare Inc., Series B, 8.125% due 3/15/11 | | | 52,920 |
| 245,000 | | A | | Wyeth, Bonds, 6.500% due 2/1/34 | | | 245,782 |
| | | | | | |
|
|
| | | | | | | | 4,128,554 |
| | | | | | |
|
|
See Notes to Financial Statements.
81
Schedules of Investments
(continued)
| | | | | | | |
| Core Fixed Income Investments | | |
| | | |
Face Amount‡ | | Rating(c) | | Security | | Value |
| |
Pipelines — 0.2% | | | |
| 110,000 | | CCC+ | | Dynegy Holdings Inc., Sr. Notes, 8.750% due 2/15/12 (a) | | $ | 110,825 |
| | | | | El Paso Corp., Sr. Notes, Series MTN: | | | |
| 170,000 | | CCC+ | | 7.800% due 8/1/31 | | | 144,500 |
| 125,000 | | CCC+ | | 7.750% due 1/15/32 (a) | | | 106,719 |
| 10,000 | | B- | | El Paso Natural Gas Co., Bonds, 8.375% due 6/15/32 | | | 10,375 |
| 20,000 | | B- | | Southern Natural Gas Co., Notes, 8.000% due 3/1/32 | | | 20,350 |
| | | | | Williams Cos. Inc.; | | | |
| 95,000 | | B+ | | Debentures, Series A, 7.500% due 1/15/31 | | | 96,425 |
| | | | | Notes: | | | |
| 30,000 | | B+ | | 7.750% due 6/15/31 | | | 30,675 |
| 385,000 | | B+ | | 8.750% due 3/15/32 | | | 434,087 |
| | | | | | |
|
|
| | | | | | | | 953,956 |
| | | | | | |
|
|
| |
Real Estate Investment Trust — 0.5% | | | |
| 325,000 | | BBB+ | | Archstone-Smith Operating Trust, Notes, 3.000% due 6/15/08 | | | 315,887 |
| 225,000 | | BBB+ | | AvalonBay Communities Inc., Notes, Series MTN, 5.000% due 8/1/07 | | | 236,158 |
| | | | | EOP Operating L.P.: | | | |
| 360,000 | | BBB+ | | 4.750% due 3/15/14 | | | 344,480 |
| 105,000 | | BBB+ | | Notes, 7.250% due 6/15/28 | | | 113,317 |
| 650,000 | | BBB+ | | ERP Operating L.P., Notes, 6.625% due 3/15/12 | | | 723,198 |
| 9,000 | | BBB- | | Health Care REIT Inc., Notes, 8.000% due 9/12/12 | | | 10,408 |
| 11,000 | | B+ | | Host Marriott Corp., Series B, 7.875% due 8/1/08 | | | 11,385 |
| | | | | Host Marriott L.P.: | | | |
| 2,000 | | B+ | | Series G, 9.250% due 10/1/07 | | | 2,245 |
| 20,000 | | B+ | | Series I, 9.500% due 1/15/07 | | | 22,400 |
| 10,000 | | BB- | | La Quinta Properties Inc., Sr. Notes, 7.000% due 8/15/12 (d) | | | 10,362 |
| 500,000 | | BBB | | Simon Property Group L.P., Notes, 3.750% due 1/30/09 (a) | | | 492,551 |
| | | | | Ventas Realty L.P.: | | | |
| 10,000 | | BB | | 8.750% due 5/1/09 | | | 10,950 |
| 30,000 | | BB | | 9.000% due 5/1/12 | | | 33,600 |
| | | | | | |
|
|
| | | | | | | | 2,326,941 |
| | | | | | |
|
|
| |
Regional Authority — 0.3% | | | |
| 170,000 | | AA | | Province of Ontario, Notes, 3.500% due 9/17/07 (a) | | | 171,803 |
| 970,000 | | A+ | | Province of Quebec, Debentures, 7.000% due 1/30/07 | | | 1,061,572 |
| | | | | | |
|
|
| | | | | | | | 1,233,375 |
| | | | | | |
|
|
| |
Retail — 0.2% | | | |
| | | | | Target Corp., Notes: | | | |
| 300,000 | | A+ | | 5.400% due 10/1/08 | | | 320,034 |
| 170,000 | | A+ | | 5.875% due 3/1/12 (a) | | | 185,016 |
| 580,000 | | AA | | Wal-Mart Stores Inc., Notes, 3.375% due 10/1/08 | | | 577,498 |
| | | | | | |
|
|
| | | | | | | | 1,082,548 |
| | | | | | |
|
|
| |
Telecommunications — 2.0% | | | |
| 225,000 | | A | | Ameritech Capital Funding, 6.250% due 5/18/09 | | | 244,836 |
| 1,500,000 | | BB+ | | AT&T Corp., Sr. Notes, 8.750% due 11/15/31 (b) | | | 1,582,500 |
| | | | | AT&T Wireless Services Inc.: | | | |
| 55,000 | | BBB | | Notes, 8.125% due 5/1/12 | | | 66,285 |
| 45,000 | | BBB | | Sr. Notes, 7.350% due 3/1/06 | | | 48,051 |
| | | | | British Telecommunications PLC: | | | |
| 85,000 | | A- | | Bonds, 8.875% due 12/15/30 | | | 110,799 |
| 295,000 | | A- | | Notes, 8.375% due 12/15/10 | | | 355,836 |
See Notes to Financial Statements.
82
Schedules of Investments
(continued)
| | | | | | | |
| Core Fixed Income Investments | | |
| | | |
Face Amount‡ | | Rating(c) | | Security | | Value |
| |
Telecommunications — 2.0% (continued) | | | |
| 125,000 | | BBB+ | | CenturyTel Inc., Sr. Notes, Series L, 7.875% due 8/15/12 (a) | | $ | 143,984 |
| 10,000 | | B- | | Cincinnati Bell Inc., 7.250% due 7/15/13 | | | 9,450 |
| | | | | Deutsche Telekom International Finance B.V.: | | | |
| 140,000 | | BBB+ | | 5.250% due 7/22/13 | | | 142,670 |
| 360,000 | | BBB+ | | 8.750% due 6/15/30 | | | 462,836 |
| | | | | MCI Inc., Sr. Notes: | | | |
| 46,000 | | NR | | 5.908% due 5/1/07 | | | 45,368 |
| 46,000 | | NR | | 6.688% due 5/1/09 (a) | | | 43,470 |
| 39,000 | | NR | | 7.735% due 5/1/14 | | | 36,124 |
| 40,000 | | BB | | Nextel Communications Inc., Sr. Notes, 7.375% due 8/1/15 | | | 42,000 |
| 4,000 | | BB+ | | PanAmSat Corp., Notes, 6.375% due 1/15/08 | | | 4,085 |
| 30,000 | | B | | Qwest Capital Funding Inc., 7.750% due 2/15/31 | | | 22,200 |
| | | | | SBC Communications Inc.: | | | |
| 50,000 | | A | | Bonds, 6.450% due 6/15/34 | | | 50,868 |
| 1,600,000 | | A | | Notes, 4.206% due 6/5/05 (d) | | | 1,623,566 |
| | | | | Sprint Capital Corp.: | | | |
| 760,000 | | BBB- | | 6.000% due 1/15/07 | | | 807,723 |
| 100,000 | | BBB- | | 6.125% due 11/15/08 | | | 108,327 |
| 30,000 | | BBB+ | | Telecom Italia Capital S.A., 5.250% due 11/15/13 (d) | | | 30,521 |
| 225,000 | | A | | Telefonica Europe B.V., 7.750% due 9/15/10 | | | 265,849 |
| | | | | Verizon Global Funding Corp., Notes: | | | |
| 55,000 | | A+ | | 6.875% due 6/15/12 | | | 62,140 |
| 445,000 | | A+ | | 7.375% due 9/1/12 (a) | | | 518,698 |
| 1,015,000 | | A+ | | Verizon New Jersey Inc., Debentures, Series A, 5.875% due 1/17/12 | | | 1,078,711 |
| 700,000 | | A3* | | Verizon Wireless Capital LLC, Notes, 1.810% due 5/23/05 (d) | | | 699,909 |
| | | | | Vodafone Group PLC: | | | |
| 390,000 | | A | | Notes, 3.950% due 1/30/08 | | | 396,939 |
| 360,000 | | A | | Sr. Notes, 7.750% due 2/15/10 | | | 423,622 |
| | | | | | |
|
|
| | | | | | | | 9,427,367 |
| | | | | | |
|
|
| |
Transportation — 0.1% | | | |
| 300,000 | | BBB+ | | Burlington Northern Santa Fe Corp., Notes, 7.875% due 4/15/07 | | | 335,130 |
| 20,000 | | BBB | | Norfolk Southern Corp., Sr. Notes, 6.750% due 2/15/11 (a) | | | 22,374 |
| 5,000 | | BB- | | Teekay Shipping Corp., Sr. Notes, 8.875% due 7/15/11 | | | 5,631 |
| 45,000 | | BBB | | Union Pacific Corp., Notes, 6.650% due 1/15/11 | | | 50,131 |
| | | | | | |
|
|
| | | | | | | | 413,266 |
| | | | | | |
|
|
| | | | | TOTAL CORPORATE BONDS & NOTES
(Cost — $80,172,383) | | | 82,064,374 |
| | | | | | |
|
|
MUNICIPAL BOND INVESTMENTS — 0.2% | | | |
| 600,000 | | AAA | | Oregon School Boards Association, zero coupon due 6/30/09 | | | 493,062 |
| 210,000 | | AA | | State of Illinois, 5.100% due 6/1/33 | | | 198,643 |
| 345,000 | | AA | | Texas State Public Finance Authority, 3.125% due 6/15/07 | | | 344,034 |
| | | | | | |
|
|
| | | | | TOTAL MUNICIPAL BOND INVESTMENTS
(Cost — $1,019,293) | | | 1,035,739 |
| | | | | | |
|
|
ASSET-BACKED SECURITIES — 3.7% | | | |
| 491,289 | | AAA | | Bayview Financial Acquisition Trust, 2.140% due 9/28/43 | | | 492,960 |
| 118,987 | | AAA | | Capital Asset Research Funding L.P., 5.905% due 12/15/05 (d) | | | 115,196 |
| | | | | Capital Auto Receivables Asset Trust: | | | |
| 32,909 | | AAA | | 1.650% due 6/15/05 | | | 32,930 |
| 1,000,000 | | AAA | | 3.580% due 10/16/06 | | | 1,012,244 |
See Notes to Financial Statements.
83
Schedules of Investments
(continued)
| | | | | | | |
| Core Fixed Income Investments | | |
| | | |
Face Amount‡ | | Rating(c) | | Security | | Value |
| | | | | Chase Funding Mortgage Loan Asset-Backed Certificates: | | | |
| 20,313 | | AAA | | 1.865% due 5/25/32 | | $ | 20,339 |
| 25,856 | | AAA | | 1.935% due 8/25/32 | | | 25,911 |
| 100,000 | | AAA | | Chase USA Master Trust, 1.770% due 4/15/09 | | | 99,981 |
| | | | | Countrywide Asset-Backed Certificates: | | | |
| 13,152 | | AAA | | 1.855% due 12/25/31 | | | 13,169 |
| 67,617 | | AAA | | 1.985% due 5/25/32 | | | 67,781 |
| 1,562,550 | | AAA | | 1.915% due 6/25/33 (b) | | | 1,565,548 |
| | | | | Countrywide Home Equity Loan Trust: | | | |
| 14,253 | | AAA | | 1.840% due 4/15/27 | | | 14,269 |
| 25,955 | | AAA | | 1.840% due 5/15/28 | | | 25,986 |
| 6,090 | | AAA | | Delta Funding Home Equity Loan Trust, 2.200% due 2/15/31 | | | 6,111 |
| | | | | EMC Mortgage Loan Trust: | | | |
| 198,793 | | AAA | | 2.165% due 8/25/40 (d) | | | 199,409 |
| 42,083 | | AAA | | 2.100% due 2/25/41 (d) | | | 42,083 |
| 1,325,000 | | AAA | | Honda Auto Receivables Owner Trust, 4.490% due 9/17/07 | | | 1,349,229 |
| 80,000 | | AAA | | M&I Auto Loan Trust, 2.310% due 2/20/08 | | | 79,922 |
| | | | | MBNA Credit Card Master Note Trust: | | | |
| 1,575,000 | | AAA | | 2.700% due 9/15/09 (a) | | | 1,563,537 |
| 1,775,000 | | AAA | | 2.650% due 11/15/10 | | | 1,726,503 |
| 825,000 | | AAA | | MBNA Master Credit Card Trust USA, 7.800% due 10/15/12 | | | 985,213 |
| 1,380,968 | | AAA | | Merrill Lynch Mortgage Investors Inc., 1.975% due 11/25/33 | | | 1,384,207 |
| | | | | Option One Mortgage Loan Trust: | | | |
| 34,625 | | AAA | | 2.015% due 11/25/32 | | | 34,782 |
| 97,301 | | AAA | | 2.035% due 2/25/33 | | | 97,687 |
| 100,000 | | AAA | | Public Service New Hampshire Funding LLC, 6.480% due 5/1/15 | | | 112,522 |
| 1,732,204 | | AAA | | Renaissance Home Equity Loan Trust, 1.815% due 3/25/34 | | | 1,733,240 |
| | | | | Residential Asset Mortgage Products Inc.: | | | |
| 1,527,598 | | AAA | | 1.945% due 6/25/30 | | | 1,530,225 |
| 128,316 | | AAA | | 1.945% due 5/25/33 | | | 128,555 |
| 1,427,760 | | AAA | | Residential Asset Securities Corp., 2.025% due 1/25/33 | | | 1,432,548 |
| 1,461,723 | | AAA | | Structured Asset Investment Loan Trust, 1.955% due 6/25/33 | | | 1,464,465 |
| | | | | Structured Asset Securities Corp.: | | | |
| 635,341 | | AAA | | 3.357% due 4/25/31 (d) | | | 595,670 |
| 45,946 | | AAA | | 2.115% due 8/25/32 | | | 46,096 |
| | | | | | |
|
|
| | | | | TOTAL ASSET-BACKED SECURITIES
(Cost — $18,042,188) | | | 17,998,318 |
| | | | | | |
|
|
MORTGAGE-BACKED SECURITIES — 26.1% | | | |
| |
Federal Home Loan Mortgage Corp. (FHLMC) — 2.1% | | | |
| | | | | FHLMC: | | | |
| 45,243 | | | | 10.000% due 4/1/09 - 10/1/09 | | | 49,426 |
| 20,721 | | | | 10.250% due 5/1/09 - 2/1/10 | | | 22,775 |
| 26,871 | | | | 9.000% due 12/1/04 - 7/1/11 | | | 28,805 |
| 34,742 | | | | 11.500% due 10/1/15 | | | 39,721 |
| 872 | | | | 7.500% due 7/1/16 | | | 940 |
| 70,062 | | | | 9.500% due 10/1/08 - 8/1/16 | | | 75,831 |
| 228,742 | | | | 8.000% due 8/1/08 - 6/1/17 | | | 248,780 |
| 509,612 | | | | 8.500% due 12/1/06 - 7/1/17 | | | 555,447 |
| 1,252,129 | | | | 4.833% due 11/1/33 (b) | | | 1,283,699 |
| | | | | FHLMC Gold: | | | |
| 8,625 | | | | 9.500% due 4/1/10 | | | 9,431 |
| 280,365 | | | | 7.000% due 5/1/12 - 8/1/12 | | | 297,526 |
See Notes to Financial Statements.
84
Schedules of Investments
(continued)
| | | | | | | |
| Core Fixed Income Investments | | |
| | | |
Face Amount‡ | | | | Security | | Value |
| |
Federal Home Loan Mortgage Corp. (FHLMC) — 2.1% (continued) | | | |
| 90,302 | | | | 8.000% due 8/1/09 - 8/1/12 | | $ | 96,624 |
| 411,522 | | | | 6.500% due 7/1/14 | | | 432,998 |
| 98,834 | | | | 8.500% due 9/1/08 - 2/1/18 | | | 107,890 |
| 2,897,346 | | | | 6.000% due 5/1/16 - 2/1/18 (b) | | | 3,046,960 |
| 3,648,730 | | | | 5.500% due 10/1/13 - 7/1/18 | | | 3,783,540 |
| 38,687 | | | | 4.500% due 8/1/18 | | | 38,780 |
| 193,758 | | | | 5.000% due 10/1/33 | | | 192,861 |
| | | | | | |
|
|
| | | | | | | | 10,312,034 |
| | | | | | |
|
|
| |
Federal National Mortgage Association (FNMA) — 10.5% | | | |
| | | | | FNMA: | | | |
| 1,641,079 | | | | 6.225% due 7/1/08 | | | 1,760,094 |
| 25,180 | | | | 10.750% due 10/1/12 | | | 27,747 |
| 2,468 | | | | 12.500% due 6/1/15 | | | 2,578 |
| 83,802 | | | | 8.500% due 6/1/06 - 6/1/17 | | | 89,047 |
| 36,353 | | | | 8.000% due 8/1/17 | | | 40,000 |
| 95,556 | | | | 9.000% due 10/1/05 - 3/1/18 | | | 101,716 |
| 1,778,631 | | | | 4.000% due 7/1/18 - 6/1/19 | | | 1,740,736 |
| 4,972,659 | | | | 4.500% due 5/1/19 - 8/1/19 | | | 4,978,459 |
| 5,252 | | | | 10.000% due 1/1/21 | | | 5,931 |
| 58,736 | | | | 9.500% due 11/1/09 - 11/1/21 | | | 64,068 |
| 82,864 | | | | 7.049% due 1/1/30 | | | 85,756 |
| 56,955 | | | | 6.565% due 3/1/30 | | | 57,470 |
| 1,685,727 | | | | 7.000% due 9/1/26 - 2/1/33 | | | 1,798,277 |
| 1,291,173 | | | | 4.024% due 4/1/34 | | | 1,274,625 |
| 9,675,565 | | | | 5.000% due 7/1/19 - 9/20/34 (f) | | | 9,679,400 |
| 18,102,286 | | | | 5.500% due 12/1/08 - 9/15/34 (f) | | | 18,551,281 |
| 1,654,291 | | | | 6.000% due 4/1/16 - 9/15/34 (f) | | | 1,741,676 |
| 7,522,747 | | | | 6.500% due 11/1/23 - 10/14/34 (f)(g) | | | 7,895,131 |
| 520,472 | | | | 6.206% due 4/1/40 | | | 524,364 |
| | | | | | |
|
|
| | | | | | | | 50,418,356 |
| | | | | | |
|
|
| |
Government National Mortgage Association (GNMA) — 5.5% | | | |
| | | | | GNMA I: | | | |
| 15,287 | | | | 11.000% due 7/15/10 - 9/15/10 | | | 17,196 |
| 35,784 | | | | 9.500% due 12/15/16 - 8/15/19 | | | 40,411 |
| 112,743 | | | | 9.000% due 10/15/16 - 9/15/30 | | | 124,478 |
| 250,684 | | | | 8.500% due 5/15/17 - 11/15/30 | | | 274,935 |
| 58,597 | | | | 4.500% due 9/15/33 | | | 56,867 |
| 7,300,000 | | | | 5.000% due 9/22/34 (f)(g) | | | 7,272,625 |
| 9,799,999 | | | | 5.500% due 12/15/32 - 9/22/34 (f)(g) | | | 9,988,762 |
| 4,959,778 | | | | 6.000% due 12/15/33 - 9/22/34 (f)(g) | | | 5,149,562 |
| 934,403 | | | | 6.500% due 6/15/08 - 9/22/34 (f)(g) | | | 989,849 |
| | | | | GNMA II: | | | |
| 153,627 | | | | 8.500% due 6/20/16 - 1/20/17 | | | 169,304 |
| 98,344 | | | | 9.000% due 4/20/17 - 11/20/21 | | | 110,248 |
| 216,966 | | | | 4.625% due 10/20/27 | | | 220,376 |
| 9,449 | | | | 8.000% due 3/20/30 | | | 10,311 |
| 742,156 | | | | 3.375% due 2/20/26 - 5/20/30 | | | 749,762 |
| 1,287,909 | | | | 3.750% due 5/20/34 | | | 1,269,480 |
| | | | | | |
|
|
| | | | | | | | 26,444,166 |
| | | | | | |
|
|
See Notes to Financial Statements.
85
Schedules of Investments
(continued)
| | | | | | | |
| Core Fixed Income Investments | | |
| | | |
Face Amount‡ | | | | Security | | Value |
| |
Collateralized Mortgage Obligations (CMOs) — 8.0% | | | |
| 594,042 | | | | Banc of America Alternative Loan Trust, 5.000% due 7/25/19 | | $ | 599,355 |
| 31,657 | | | | Banc of America Funding Corp., 6.000% due 5/20/33 | | | 32,034 |
| | | | | Bear Stearns Adjustable Rate Mortgage Trust: | | | |
| 272,876 | | | | 5.843% due 8/25/32 | | | 277,653 |
| 382,352 | | | | 6.060% due 10/25/32 | | | 395,671 |
| 229,429 | | | | 5.640% due 2/25/33 | | | 230,112 |
| 498,189 | | | | Capco America Securitization Corp., 5.860% due 10/15/30 | | | 518,330 |
| | | | | Chase Commercial Mortgage Securities Corp.: | | | |
| 2,000,000 | | | | 7.370% due 6/19/29 (b) | | | 2,189,053 |
| 900,000 | | | | 7.319% due 10/15/32 (b) | | | 1,039,930 |
| 100,000 | | | | Commercial Mortgage Acceptance Corp., 6.570% due 12/15/30 | | | 108,320 |
| 90,168 | | | | CS First Boston Mortgage Securities Corp., 6.500% due 4/25/16 | | | 90,781 |
| 198,311 | | | | Deutsche Mortgage and Asset Receiving Corp., 6.538% due 6/15/31 | | | 214,724 |
| | | | | Fannie Mae: | | | |
| 56,409 | | | | 5.500% due 10/18/27 | | | 58,263 |
| 271,182 | | | | 2.065% due 10/25/30 | | | 272,919 |
| 1,919,390 | | | | 5.500% due 10/25/30 | | | 1,998,203 |
| 1,452,833 | | | | 5.500% due 11/25/30 | | | 1,521,073 |
| 508,753 | | | | 2.000% due 5/18/32 | | | 511,371 |
| | | | | Fannie Mae Grantor Trust: | | | |
| 676,558 | | | | 4.831% due 1/25/28 | | | 698,608 |
| 318,131 | | | | 3.310% due 2/25/32 | | | 318,544 |
| 810,000 | | | | First Union-Lehman Brothers-Bank of America, 6.560% due 11/18/35 | | | 887,039 |
| | | | | Freddie Mac: | | | |
| 1,921,129 | | | | 6.500% due 8/15/17 | | | 1,941,995 |
| 60,783 | | | | 23.447% due 2/15/24 (e) | | | 15,489 |
| 197,010 | | | | 6.500% due 2/15/30 | | | 198,912 |
| | | | | GMAC Commercial Mortgage Securities Inc.: | | | |
| 200,000 | | | | 6.700% due 5/15/30 | | | 219,336 |
| 914,436 | | | | 7.179% due 8/15/36 | | | 1,015,942 |
| | | | | Government National Mortgage Association: | | | |
| 463,601 | | | | 2.150% due 12/16/25 | | | 467,740 |
| 384,006 | | | | 2.000% due 3/16/32 | | | 385,811 |
| 300,000 | | | | GS Mortgage Securities Corp. II, 6.624% due 5/3/18 (b)(d) | | | 336,555 |
| | | | | Impac CMB Trust: | | | |
| 1,579,767 | | | | 1.885% due 6/25/32 | | | 1,582,266 |
| 115,861 | | | | 2.015% due 3/25/33 | | | 116,226 |
| 1,500,000 | | | | Impac Secured Assets CMN Owner Trust, 1.800% due 12/25/34 | | | 1,500,000 |
| 635,000 | | | | JP Morgan Chase Commercial Mortgage Securities Corp., 4.985% due 1/12/37 | | | 651,865 |
| 592,801 | | | | LB Commercial Conduit Mortgage Trust, 7.105% due 10/15/32 | | | 634,277 |
| | | | | LB-UBS Commercial Mortgage Trust: | | | |
| 839,223 | | | | 6.410% due 12/15/19 | | | 901,745 |
| 1,150,000 | | | | 4.187% due 8/15/29 | | | 1,157,128 |
| 1,084,543 | | | | Merrill Lynch Mortgage Investors Inc., 6.540% due 12/10/29 | | | 1,172,178 |
| 93,290 | | | | Nationslink Funding Corp., 6.867% due 1/22/26 | | | 103,017 |
| 200,000 | | | | Nomura Asset Securities Corp., 7.120% due 4/13/39 | | | 213,014 |
| 44,141 | | | | Ocwen Residential MBS Corp., 7.000% due 10/25/40 (d) | | | 45,067 |
| 44,375 | | | | Ryland Mortgage Securities Corp., 4.541% due 10/25/31 | | | 44,672 |
| | | | | Small Business Administration: | | | |
| 2,191,239 | | | | 7.540% due 8/10/09 (b) | | | 2,428,777 |
| 2,789,227 | | | | 8.017% due 2/10/10 (b) | | | 3,136,887 |
| 2,305,423 | | | | Participation Certificates, 5.080% due 11/1/22 (b) | | | 2,367,262 |
See Notes to Financial Statements.
86
Schedules of Investments
(continued)
| | | | | | | | |
| Core Fixed Income Investments | | |
| | | |
Face Amount‡ | | | | | Security | | Value |
| |
| Collateralized Mortgage Obligations (CMOs) — 8.0% (continued) | | | |
| 2,067,554 | | | | | Structured Adjustable Rate Mortgage Loan Trust, 4.906% due 6/25/34 | | $ | 2,079,197 |
| 201,240 | | | | | Structured Asset Securities Corp., 6.150% due 7/25/32 | | | 204,587 |
| | | | | | Washington Mutual, Inc.: | | | |
| 770,000 | | | | | 3.813% due 6/25/34 | | | 757,118 |
| 600,000 | | | | | 3.963% due 7/25/34 | | | 596,520 |
| 208,178 | | | | | MSC Mortgage Pass-Through Certificates, 6.298% due 7/25/32 | | | 211,182 |
| 1,960,785 | | | | | Wells Fargo Mortgage Backed Securities Trust, 4.539% due 6/25/34 | | | 1,950,370 |
| | | | | | | |
|
|
| | | | | | | | | 38,397,118 |
| | | | | | | |
|
|
| | | | | | TOTAL MORTGAGE-BACKED SECURITIES
(Cost — $122,386,347) | | | 125,571,674 |
| | | | | | | |
|
|
| | | |
Face Amount
| | | Rating(c)
| | | | |
| SOVEREIGN BONDS & NOTES — 3.8% | | | |
| |
| Brazil — 0.6% | | | |
| | | | | | Federative Republic of Brazil: | | | |
| | | | | | Bonds: | | | |
| 510,000 | | | BB- | | 14.500% due 10/15/09 | | | 643,620 |
| 160,000 | | | BB- | | 12.750% due 1/15/20 | | | 193,600 |
| 200,000 | | | BB- | | 11.000% due 8/17/40 (a) | | | 214,100 |
| 254,118 | | | BB- | | DCB, Series L, 2.125% due 4/15/12 | | | 229,659 |
| 1,419,052 | | | BB- | | Series C, 8.000% due 4/15/14 | | | 1,389,784 |
| 30,000 | | | BB- | | Notes, 12.000% due 4/15/10 | | | 34,687 |
| | | | | | | |
|
|
| | | | | | | | | 2,705,450 |
| | | | | | | |
|
|
| |
| Bulgaria — 0.2% | | | |
| | | | | | Republic of Bulgaria, Bonds: | | | |
| 121,000 | | | BBB- | | 8.250% due 1/15/15 (d) | | | 148,301 |
| 470,000 | | | BBB- | | 8.250% due 1/15/15 | | | 576,044 |
| | | | | | | |
|
|
| | | | | | | | | 724,345 |
| | | | | | | |
|
|
| |
| Colombia — 0.1% | | | |
| | | | | | Republic of Colombia: | | | |
| 190,000 | | | BB | | Bonds, 11.750% due 2/25/20 (a) | | | 232,513 |
| 195,000 | | | BB | | Notes, 10.500% due 7/9/10 (a) | | | 224,250 |
| | | | | | | |
|
|
| | | | | | | | | 456,763 |
| | | | | | | |
|
|
| |
| France — 0.5% | | | |
| 2,000,000 | EUR | | AAA | | French Treasury Note, 3.500% due 1/12/05 (b) | | | 2,448,224 |
| | | | | | | |
|
|
| |
| Hong Kong — 0.2% | | | |
| 1,000,000 | | | A+ | | Hong Kong Special Administrative Region Government, Notes, 5.125% due 8/1/14 (d) | | | 1,028,053 |
| | | | | | | |
|
|
| |
| Italy — 0.0% | | | |
| 55,000 | | | AA- | | Republic of Italy, Notes, Series DTC, 4.375% due 10/25/06 | | | 56,824 |
| | | | | | | |
|
|
| |
| Mexico — 0.8% | | | |
| | | | | | United Mexican States: | | | |
| 1,290,000 | | | BBB- | | Bonds, 11.500% due 5/15/26 (a) | | | 1,938,225 |
See Notes to Financial Statements.
87
Schedules of Investments
(continued)
| | | | | | | | |
| Core Fixed Income Investments | | |
| | | |
Face Amount‡ | | | Rating(c) | | Security | | Value |
| |
| Mexico — 0.8% (continued) | | | |
| | | | | | Notes: | | | |
| 620,000 | | | BBB- | | 8.375% due 1/14/11 | | $ | 730,980 |
| 695,000 | | | BBB- | | 8.125% due 12/30/19 | | | 801,682 |
| 250,000 | | | BBB- | | Series MTNA, 8.000% due 9/24/22 | | | 282,625 |
| | | | | | | |
|
|
| | | | | | | | | 3,753,512 |
| | | | | | | |
|
|
| |
| Panama — 0.1% | | | |
| | | | | | Republic of Panama, Bonds: | | | |
| 190,000 | | | BB | | 9.625% due 2/8/11 | | | 217,550 |
| 10,000 | | | BB | | 9.375% due 7/23/12 (a) | | | 11,400 |
| 125,000 | | | BB | | 10.750% due 5/15/20 | | | 150,625 |
| | | | | | | |
|
|
| | | | | | | | | 379,575 |
| | | | | | | |
|
|
| |
| Peru — 0.1% | | | |
| | | | | | Republic of Peru, Bonds: | | | |
| 210,000 | | | BB | | 8.750% due 11/21/33 | | | 202,650 |
| 273,000 | | | BB | | PDI, 5.000% due 3/7/17 | | | 249,112 |
| | | | | | | |
|
|
| | | | | | | | | 451,762 |
| | | | | | | |
|
|
| |
| Russia — 0.7% | | | |
| | | | | | Russian Federation: | | | |
| 3,030,000 | | | BB+ | | Bonds, step bond to yield 3.906% due 3/31/30 | | | 2,905,012 |
| 600,000 | | | BB+ | | Notes, 8.750% due 7/24/05 | | | 630,300 |
| | | | | | | |
|
|
| | | | | | | | | 3,535,312 |
| | | | | | | |
|
|
| |
| South Africa — 0.3% | | | |
| 1,400,000 | | | BBB | | Republic of South Africa, Notes, 6.500% due 6/2/14 | | | 1,480,500 |
| | | | | | | |
|
|
| |
| South Korea — 0.0% | | | |
| 20,000 | | | A- | | Export-Import Bank of Korea, Notes, 5.250% due 2/10/14 (d) | | | 20,198 |
| | | | | | | |
|
|
| |
| United Kingdom — 0.2% | | | |
| 600,000 | GBP | | AAA | | United Kingdom Treasury Bond, 5.000% due 3/7/12 | | | 1,088,106 |
| | | | | | | |
|
|
| | | | | | TOTAL SOVEREIGN BONDS & NOTES
(Cost — $17,326,202) | | | 18,128,624 |
| | | | | | | |
|
|
| PREFERRED STOCK — 0.0% | | | |
| 200 | | | | | Fresenius Medical Care Capital Trust II, 7.875% due 2/1/08 | | | 21,400 |
| 1,000 | | | | | Home Ownership Funding CP II, 13.338% (d) | | | 44,309 |
| 35 | | | | | McLeodUSA Inc., Series A, 2.500% due 4/18/12 | | | 75 |
| | | | | | | |
|
|
| | | | | | TOTAL PREFERRED STOCK
(Cost — $89,818) | | | 65,784 |
| | | | | | | |
|
|
| WARRANTS — 0.0% | | | |
| 77 | | | | | McLeodUSA Inc., Expire 4/16/07† (Cost — $0) | | | 8 |
| | | | | | | |
|
|
| PURCHASED OPTIONS — 0.0% | | | |
| 7 | | | | | Euro Dollar, Call @ 97.00, Expire 9/13/04 | | | 19,819 |
| 3 | | | | | Euro Dollar Midcurve 1Year Future, Call @ 96.25, Expire 9/10/04 | | | 6,262 |
| | | | | | | |
|
|
| | | | | | TOTAL PURCHASED OPTIONS
(Cost — $17,688) | | | 26,081 |
| | | | | | | |
|
|
| | | | | | SUB-TOTAL INVESTMENTS
(Cost — $370,925,573) | | | 379,377,280 |
| | | | | | | |
|
|
See Notes to Financial Statements.
88
Schedules of Investments
(continued)
| | | | | |
| Core Fixed Income Investments | | |
| | |
Face Amount‡ | | Security | | Value |
SHORT TERM INVESTMENTS — 23.0% |
COMMERCIAL PAPER — 11.4% |
| 4,400,000 | | AB Spintab, 3.215% due 12/3/04 | | $ | 4,389,755 |
| 100,000 | | ABN Amor North America, 1.480% due 10/6/04 | | | 99,848 |
| 1,350,000 | | Altria Group Inc., 2.394 % due 10/29/04 | | | 1,350,000 |
| 4,000,000 | | ANZ Delware Inc., 1.635% due 11/18/04 (b) | | | 3,985,830 |
| 100,000 | | CBA Finance Discount Note, 1.650% due 11/19/04 | | | 99,638 |
| 4,400,000 | | Danske Corp., 4,765% due 11/19/04 (b) | | | 4,387,993 |
| 3,400,000 | | DnB NOR Bank ASA, 1.660% due 9/21/04 | | | 3,388,852 |
| 2,900,000 | | Federal Home Loan Bank, zero coupon due 9/1/04 | | | 2,900,000 |
| | | Federal National Mortgage Association (FNMA): | | | |
| 4,000,000 | | Zero coupon due 9/1/04 | | | 4,000,000 |
| 430,000 | | Zero coupon due 9/8/04 (h) | | | 429,895 |
| 3,800,000 | | General Electric Cap Corp., 1.590% due 11/5/04 (b) | | | 3,789,091 |
| 200,000 | | General Motors Acceptance Corp., 2.495% due 4/5/05 | | | 197,006 |
| 4,400,000 | | HBOS Treasury Service, 8.065% due 11/9/04 | | | 4,385,255 |
| 330,000 | | The Herts Corp., zero coupon due 3/24/05 | | | 330,000 |
| 1,600,000 | | ING Funding LLC, 1.590% due 11/8/04 | | | 1,595,195 |
| 1,000,000 | | National Australia Funding Inc., 1.590% due 10/19/04 | | | 997,880 |
| 4,000,000 | | Rabobank USA Financial Corp., 1.560% due 9/1/04 | | | 4,000,000 |
| 4,400,000 | | Royal Bank of Scotland, 3.200% due 11/3/04 | | | 4,387,768 |
| 150,000 | | SunTrust Banks, Inc., 1.435% due 6/2/09 | | | 153,750 |
| 300,000 | | Svenska Handelsbanken, 1.370% due 9/7/04 | | | 299,931 |
| | | UBS Finance Delaware LLC: | | | |
| 300,000 | | 1.575% due 11/9/04 | | | 299,094 |
| 4,100,000 | | 3.390% due 11/29/04 | | | 4,082,863 |
| 4,000,000 | | Uncredit Delware, 1.640% due 11/16/04 | | | 3,986,151 |
| 1,100,000 | | Westpac Capital Corp., 1.690% due 11/26/04 | | | 1,095,559 |
| 100,000 | | Westpac Trust Life New Zealand Ltd., 1.460% due 10/4/04 | | | 99,866 |
| | | | |
|
|
| | | TOTAL COMMERCIAL PAPER
(Cost — $54,728,289) | | | 54,731,220 |
| | | | |
|
|
U.S. TREASURY BILLS — 0.4% |
| | | U.S. Treasury Bills: | | | |
| 930,000 | | Due 9/2/04 (h) | | | 929,970 |
| 90,000 | | Due 9/16/04 (h) | | | 89,956 |
| 690,000 | | Due 12/2/04 | | | 687,200 |
| | | | |
|
|
| | | TOTAL U.S. TREASURY BILLS
(Cost — $1,707,179) | | | 1,707,126 |
| | | | |
|
|
See Notes to Financial Statements.
89
Schedules of Investments
(continued)
| | | | | | |
| Core Fixed Income Investments | | | |
| | |
Face Amount‡ | | Security | | Value | |
REPURCHASE AGREEMENTS — 11.2% | |
| 4,000,000 | | CS First Boston Corp. dated 8/31/04, 1.490% due 9/1/04; Proceeds at maturity — $4,000,166;
(Fully collateralized by U.S. Treasury Bills due 9/16/04; Market value — $4,098,503) | | $ | 4,000,000 | |
| 258,000 | | State Street Bank and Trust Co. dated 8/31/04, 1.490% due 9/1/04; Proceeds at maturity — $258,011;
(Fully collateralized by U.S. Treasury Bonds, 6.000% due 2/15/26; Market value — $266,725) | | | 258,000 | |
| 49,695,000 | | UBS Financial Services Inc., dated 8/31/04, 1.580% due 9/1/04; Proceeds at maturity — $49, 697,181;
(Fully collateralized by various U.S. Government Agency Obligations, 0.000% to 9.800% due 10/22/04 to 3/1/26; Market value — $50,688,900) (b) | | | 49,695,000 | |
| | | | |
|
|
|
| | | TOTAL REPURCHASE AGREEMENTS
(Cost — $53,953,000) | | | 53,953,000 | |
| | | | |
|
|
|
| | | TOTAL SHORT-TERM INVESTMENTS
(Cost — $110,388,468) | | | 110,391,346 | |
| | | | |
|
|
|
| | | TOTAL INVESTMENTS — 101.9%
(Cost — $481,314,041**) | | | 489,768,626 | |
| | | Liabilities in Excess of Other Assets — (1.9)% | | | (8,960,704 | ) |
| | | | |
|
|
|
| | | TOTAL NET ASSETS — 100.0% | | $ | 480,807,922 | |
| | | | |
|
|
|
LOANED SECURITIES COLLATERAL | |
| 113,065,099 | | State Street Navigator Securities Lending Trust Prime Portfolio (Cost — $113,065,099) | | $ | 113,065,099 | |
| | | | |
|
|
|
| ‡ | | Face amount represents U.S. dollars unless otherwise indicated. |
| (a) | | All or a portion of this security is on loan (See Note 3). |
| (b) | | All or a portion of this security is segregated for open futures contracts, open option contracts, open purchase, open forward foreign currency contracts and/ or to-be-announced securities. |
| (c) | | All ratings are by Standard & Poor’s Ratings Service, except for those which are identified by an asterisk(*), are rated by Moody’s Investors Services. |
| (d) | | Security is exempt from registration under Rule 144A of the Securities Act of 1933. This security may be resold in transactions that are exempt from registration, normally to qualified institutional buyers. These securities have been deemed liquid pursuant to guidelines approved by the Board of Trustees. |
| (e) | | Interest only security. |
| (f) | | All or a portion of this security is traded on a “to-be-announced” basis. |
| (g) | | All or a portion of this security is acquired under mortgage dollar roll agreement. (See Note 3). |
| (h) | | A portion of this security is held as collateral for open futures contracts. |
| † | | Non-income producing security. |
| ** | | Aggregate cost for Federal income tax purposes is $482,031,434. |
Abbreviations used in this schedule:
DCB — Debt Conversion Bonds
PDI — Past Due Interest
Currency abbreviations used in this schedule:
EUR — Euro
GBP — British Pound
See page 113 for definitions of ratings and certain abbreviations.
Summary of Investments by Security Type†
| | | |
Mortgaged-Backed Securities | | 25.6 | % |
Short Term Investments | | 22.5 | |
U.S. Government Obligations | | 21.2 | |
Corporate Bonds and Notes | | 16.8 | |
U.S. Government Agencies | | 6.3 | |
Asset-Backed Securities | | 3.7 | |
Sovereign Bonds and Notes | | 3.7 | |
Municipal Bond Investments | | 0.2 | |
| | |
|
|
| | | 100.0 | % |
| | |
|
|
| † | | As a percentage of total investments. Please note that fund holdings are subject to change. |
See Notes to Financial Statements.
90
Schedule of Options Written
| | | | | | | | | | | |
| Core Fixed Income Investments | | | | | | | |
| | | | |
| Contracts | | Security | | Expiration | | Strike Price | | Value | |
| 15 | | 90 Day GBP Libor Future Put | | 12/05 | | $ | 94.25 | | $ | (5,409 | ) |
| 2 | | Euro Dollar Call | | 9/04 | | | 96.75 | | | (1,925 | ) |
| 8 | | Euro Dollar Call | | 9/05 | | | 96.75 | | | (12,200 | ) |
| 3 | | Euro Dollar Midcurve 1 Year Future Call | | 9/04 | | | 96.50 | | | (4,425 | ) |
| 9 | | Euro Dollar Midcurve 1 Year Future Call | | 9/04 | | | 96.63 | | | (10,687 | ) |
| 21 | | Euro Dollar Midcurve 1 Year Future Call | | 9/04 | | | 97.00 | | | (8,400 | ) |
| 2 | | Euro Dollar Midcurve 1 Year Future Put | | 9/04 | | | 96.63 | | | (50 | ) |
| 17 | | Euro Dollar Midcurve 1 Year Future Put | | 9/04 | | | 96.75 | | | (850 | ) |
| 7 | | U.S. Treasury 5 Year Note Future Put | | 11/04 | | | 108.00 | | | (1,969 | ) |
| 72 | | U.S. Treasury 10 Year Note Future Call | | 11/04 | | | 112.00 | | | (127,125 | ) |
| 36 | | U.S. Treasury 10 Year Note Future Call | | 11/04 | | | 113.00 | | | (45,562 | ) |
| 5 | | U.S. Treasury 10 Year Note Future Call | | 11/04 | | | 114.00 | | | (4,766 | ) |
| 36 | | U.S. Treasury 10 Year Note Future Put | | 11/04 | | | 106.00 | | | (4,500 | ) |
| 16 | | U.S. Treasury 10 Year Note Future Put | | 11/04 | | | 109.00 | | | (7,250 | ) |
| 10 | | U.S. Treasury 10 Year Note Future Put | | 2/05 | | | 102.00 | | | (1,562 | ) |
| | | | | | | | | |
|
|
|
| | | TOTAL OPTIONS WRITTEN
(Premiums received — $175,573) | | | | | | | $ | (236,680 | ) |
| | | | | | | | | |
|
|
|
See Notes to Financial Statements.
91
Schedules of Investments
(continued)
| | | | | | | |
| High Yield Investments | | |
| | | |
Face
Amount | | Rating(a) | | Security | | Value |
CORPORATE BONDS & NOTES — 94.9% | | | |
| |
Advertising — 1.1% | | | |
| $ 380,000 | | B | | Lamar Media Corp., 7.250% due 1/1/13 | | $ | 406,600 |
| | | | | RH Donnelley Finance Corp.: | | | |
| 475,000 | | BB | | 8.875% due 12/15/10 | | | 537,344 |
| 420,000 | | B+ | | 10.875% due 12/15/12 | | | 498,750 |
| 210,000 | | B+ | | 10.875% due 12/15/12 (b) | | | 249,375 |
| 966,000 | | B- | | Vertis Inc., 10.875% due 6/15/09 (c) | | | 1,048,110 |
| | | | | | |
|
|
| | | | | | | | 2,740,179 |
| | | | | | |
|
|
| |
Aerospace & Defense Equipment — 1.3% | | | |
| 900,000 | | B+ | | Armor Holdings Inc., Sr. Sub. Notes, 8.250% due 8/15/13 | | | 976,500 |
| 669,000 | | B+ | | Esterline Technologies Corp., Sr. Sub. Notes, 7.750% due 6/15/13 | | | 714,157 |
| 1,345,000 | | BB- | | L-3 Communications Corp., 7.625% due 6/15/12 | | | 1,462,688 |
| | | | | | |
|
|
| | | | | | | | 3,153,345 |
| | | | | | |
|
|
| | |
Agriculture — 0.2% | | | | | |
| 215,000 | | B- | | Gold Kist Inc., 10.250% due 3/15/14 (b) | | | 237,575 |
| 200,000 | | B- | | Seminis Vegetable Seeds Inc., Sr. Sub. Notes, 10.250% due 10/1/13 | | | 223,000 |
| | | | | | |
|
|
| | | | | | | | 460,575 |
| | | | | | |
|
|
| | |
Airlines — 0.2% | | | | | |
| 589,422 | | BBB | | Continental Airlines Inc., Pass-Through Certificates, 7.373% due 12/15/15 | | | 464,001 |
| | | | | | |
|
|
| | |
Apparel — 0.8% | | | | | |
| 619,000 | | B | | Oxford Industries Inc., Sr. Notes, 8.875% due 6/1/11 (b) | | | 665,425 |
| 573,000 | | BB- | | Russell Corp., 9.250% due 5/1/10 | | | 622,421 |
| 630,000 | | B+ | | The William Carter Co., 10.875% due 8/15/11 | | | 711,900 |
| | | | | | |
|
|
| | | | | | | | 1,999,746 |
| | | | | | |
|
|
| |
Auto Manufacturers — 0.0% | | | |
| 80,000 | | BB- | | Navistar International Corp., Sr. Notes, 7.500% due 6/15/11 | | | 84,400 |
| | | | | | |
|
|
| |
Auto Parts & Equipment — 0.7% | | | |
| 790,000 | | B- | | Keystone Automotive Operations Inc., Sr. Sub. Notes, 9.750% due 11/1/13 | | | 855,175 |
| | | | | TRW Automotive Inc.: | | | |
| 309,000 | | BB- | | Sr. Notes, 9.375% due 2/15/13 | | | 357,668 |
| 437,000 | | BB- | | Sr. Sub. Notes, 11.000% due 2/15/13 | | | 530,955 |
| | | | | | |
|
|
| | | | | | | | 1,743,798 |
| | | | | | |
|
|
| | |
Beverages — 0.6% | | | | | |
| 800,000 | | BB | | Constellation Brands Inc., 8.625% due 8/1/06 | | | 871,000 |
| 540,000 | | B+ | | Cott Beverages U.S.A. Inc., 8.000% due 12/15/11 | | | 587,925 |
| | | | | | |
|
|
| | | | | | | | 1,458,925 |
| | | | | | |
|
|
| | |
Biotechnology — 0.0% | | | | | |
| 90,000 | | BB- | | Bio-Rad Laboratories Inc., Sr. Sub. Notes, 7.500% due 8/15/13 | | | 96,300 |
| | | | | | |
|
|
| |
Building Materials — 1.3% | | | |
| 455,000 | | BBB- | | American Standard Inc., 7.375% due 2/1/08 | | | 503,912 |
| 1,240,000 | | B- | | Associated Materials Inc., Sr. Disc. Notes, (zero coupon until 3/1/09, 11.250% thereafter)
due 3/1/14 (b) | | | 883,500 |
| 85,000 | | B- | | Ply Gem Industries Inc., Sr. Sub. Notes, 9.000% due 2/15/12 (b) | | | 85,850 |
See Notes to Financial Statements.
92
Schedules of Investments
(continued)
| | | | | | | |
| High Yield Investments | | |
| | | |
Face
Amount | | Rating(a) | | Security | | Value |
| |
Building Materials — 1.3% (continued) | | | |
| $1,575,000 | | B- | | THL Buildco Inc. Sr. Sub. Notes, 8.500% due 9/1/14 (b) | | $ | 1,649,813 |
| 90,000 | | B- | | U.S. Concrete Inc., Sr. Sub. Notes, 8.375% due 4/1/14 | | | 92,700 |
| | | | | | |
|
|
| | | | | | | | 3,215,775 |
| | | | | | |
|
|
| |
Casinos & Gaming — 3.9% | | | |
| 150,000 | | B | | Ameristar Casinos Inc., 10.750% due 2/15/09 | | | 169,875 |
| 1,251,000 | | B+ | | Argosy Gaming Co., Sr. Sub Notes, 9.000% due 9/1/11 | | | 1,401,120 |
| 520,000 | | B+ | | Boyd Gaming Corp., Sr. Sub. Notes, 6.750% due 4/15/14 | | | 523,900 |
| 225,000 | | BB- | | Chumash Casino & Resort Enterprise, Sr. Notes, 9.000% due 7/15/10 (b) | | | 246,937 |
| 890,000 | | B | | Inn of the Mountain Gods Resort & Casino, Sr. Notes, 12.000% due 11/15/10 | | | 1,010,150 |
| 360,000 | | B | | Isle of Capri Casinos Inc., 9.000% due 3/15/12 | | | 399,600 |
| | | | | Mandalay Resort Group: | | | |
| | | | | Sr. Notes: | | | |
| 600,000 | | BB+ | | 9.500% due 8/1/08 | | | 687,000 |
| 65,000 | | BB+ | | 6.500% due 7/31/09 | | | 67,600 |
| 540,000 | | BB- | | Sr. Sub. Notes, 10.250% due 8/1/07 | | | 608,175 |
| | | | | MGM Mirage Inc.: | | | |
| 380,000 | | BB- | | 9.750% due 6/1/07 | | | 422,750 |
| 150,000 | | BB+ | | 6.000% due 10/1/09 | | | 153,000 |
| 1,515,000 | | BB+ | | 8.500% due 9/15/10 | | | 1,711,950 |
| 48,000 | | BB+ | | Mirage Resorts Inc., Sr. Notes, 7.250% due 10/15/06 (c) | | | 51,240 |
| | | | | Penn National Gaming Inc.: | | | |
| 260,000 | | B | | 11.125% due 3/1/08 | | | 284,700 |
| 190,000 | | B | | 8.875% due 3/15/10 | | | 209,000 |
| | | | | Station Casinos Inc., Sr. Sub. Notes: | | | |
| 420,000 | | B+ | | 6.500% due 2/1/14 | | | 422,100 |
| 270,000 | | B+ | | 6.875% due 3/1/16 | | | 271,013 |
| 180,000 | | B | | Venetian Casino Resort L.L.C., 11.000% due 6/15/10 | | | 205,875 |
| 319,000 | | CCC+ | | Wynn Las Vegas L.L.C./Wynn Las Vegas Capital Corp., Second Mortgage, 12.000% due 11/1/10 | | | 393,965 |
| | | | | | |
|
|
| | | | | | | | 9,239,950 |
| | | | | | |
|
|
| | |
Chemicals — 4.8% | | | | | |
| 195,000 | | B+ | | Acetex Corp., Sr. Notes, 10.875% due 8/1/09 | | | 215,475 |
| 95,000 | | B+ | | Airgas Inc., Sr. Sub. Notes, 6.250% due 7/15/14 | | | 93,931 |
| 135,000 | | B+ | | Arco Chemical Co., Debentures, 9.800% due 2/1/20 | | | 137,025 |
| 445,000 | | B- | | BCP Caylux Holdings Luxembourg S.C.A., Sr. Sub. Notes, 9.625% due 6/15/14 (b) | | | 480,044 |
| | | | | Equistar Chemicals L.P./Equistar Funding Corp.: | | | |
| 350,000 | | B+ | | 10.125% due 9/1/08 | | | 391,125 |
| 255,000 | | B+ | | Sr. Notes, 10.625% due 5/1/11 | | | 288,150 |
| | | | | FMC Corp.: | | | |
| 685,000 | | BB+ | | Notes, 7.000% due 5/15/08 | | | 715,825 |
| 606,000 | | BB+ | | Secured Notes, 10.250% due 11/1/09 | | | 708,262 |
| 17,000 | | BBB- | | Georgia Gulf Corp., Notes, 7.625% due 11/15/05 | | | 17,850 |
| 540,000 | | BB- | | Hercules Inc., 11.125% due 11/15/07 | | | 637,200 |
| 210,000 | | B | | Huntsman Advanced Materials L.L.C., Secured Notes, 11.000% due 7/15/10 (b) | | | 240,450 |
| | | | | Huntsman International L.L.C.: | | | |
| 207,000 | | B- | | 9.875% due 3/1/09 | | | 224,595 |
| 541,000 | | CCC+ | | 10.125% due 7/1/09 (c) | | | 559,935 |
| 325,000 | | B | | 11.625% due 10/15/10 | | | 365,625 |
| 555,000 | | CCC+ | | Sr. Disc. Notes, zero coupon due 12/31/09 | | | 285,825 |
| 317,000 | | B+ | | IMC Global Inc., 10.875% due 6/1/08 | | | 385,155 |
See Notes to Financial Statements.
93
Schedules of Investments
(continued)
| | | | | | | |
| High Yield Investments | | |
| | | |
Face
Amount | | Rating(a) | | Security | | Value |
| |
Chemicals — 4.8% (continued) | | | |
| | | | | Lyondell Chemical Co., Secured Notes: | | | |
| $ 590,000 | | B+ | | 9.625% due 5/1/07 | | $ | 633,512 |
| 150,000 | | B+ | | 11.125% due 7/15/12 | | | 171,375 |
| | | | | Millennium America Inc.: | | | |
| 78,000 | | BB- | | 7.000% due 11/15/06 | | | 80,535 |
| 581,000 | | BB- | | 9.250% due 6/15/08 (c) | | | 636,195 |
| | | | | Nalco Co.: | | | |
| 670,000 | | B- | | Sr. Notes, 7.750% due 11/15/11 (b) | | | 716,900 |
| 450,000 | | B- | | Sr. Sub. Notes, 8.875% due 11/15/13 (b)(c) | | | 487,688 |
| | | | | Rhodia SA.: | | | |
| 850,000 | | CCC+ | | Sr. Notes, 10.250% due 6/1/10 (c) | | | 871,250 |
| 1,297,000 | | CCC+ | | Sr. Sub. Notes, 8.875% due 6/1/11 (c) | | | 1,102,450 |
| 840,000 | | BB- | | Westlake Chemical Corp., 8.750% due 7/15/11 | | | 938,700 |
| | | | | | |
|
|
| | | | | | | | 11,385,077 |
| | | | | | |
|
|
| | |
Coal — 0.2% | | | | | |
| 230,000 | | BB | | Massey Energy Co., Sr. Notes, 6.625% due 11/15/10 | | | 239,200 |
| 265,000 | | BB- | | Peabody Energy Corp., Sr. Notes, 5.875% due 4/15/16 | | | 254,400 |
| | | | | | |
|
|
| | | | | | | | 493,600 |
| | | | | | |
|
|
| |
Commerical Services — 2.4% | | | |
| 140,000 | | B | | Alderwoods Group Inc., Sr. Notes, 7.750% due 9/15/12 (b) | | | 146,300 |
| | | | | Corrections Corp. of America: | | | |
| 400,000 | | B | | 9.875% due 5/1/09 | | | 448,500 |
| 845,000 | | B | | Sr. Notes, 7.500% due 5/1/11 | | | 893,587 |
| 230,000 | | B | | The Geo Group Inc., Sr. Notes, 8.250% due 7/15/13 | | | 234,025 |
| 761,000 | | B- | | H&E Equipment Services L.L.C./H&E Finance Corp., 11.125% due 6/15/12 | | | 780,025 |
| 870,000 | | BB- | | NationsRent Inc., Secured Notes, 9.500% due 10/15/10 (b) | | | 935,250 |
| | | | | Service Corp. International, Notes: | | | |
| 95,000 | | BB | | 7.200% due 6/1/06 | | | 99,750 |
| 120,000 | | BB | | 6.875% due 10/1/07 | | | 124,800 |
| 380,000 | | BB | | 7.700% due 4/15/09 | | | 405,650 |
| 805,000 | | B+ | | Stewart Enterprises Inc., 10.750% due 7/1/08 | | | 893,550 |
| | | | | United Rentals North America Inc.: | | | |
| 430,000 | | BB- | | 6.500% due 2/15/12 | | | 410,650 |
| 335,000 | | B+ | | Sr. Sub. Notes, 7.750% due 11/15/13 | | | 313,225 |
| | | | | | |
|
|
| | | | | | | | 5,685,312 |
| | | | | | |
|
|
| | |
Computers — 0.8% | | | | | |
| 97,000 | | B | | DigitalNet Holdings Inc., Sr. Notes, 9.000% due 7/15/10 | | | 105,730 |
| 470,000 | | BB+ | | Seagate Technology HDD Holdings, 8.000% due 5/15/09 | | | 495,850 |
| 1,190,000 | | BB+ | | Unysis Corp., Sr. Notes, 6.875% due 3/15/10 | | | 1,234,625 |
| | | | | | |
|
|
| | | | | | | | 1,836,205 |
| | | | | | |
|
|
| |
Cosmetics/Personal Care — 0.1% | | | |
| 250,000 | | B- | | Elizabeth Arden Inc., 7.750% due 1/15/14 | | | 260,000 |
| | | | | | |
|
|
| |
Diversified Financial Services — 0.9% | | | |
| 160,000 | | B- | | Borden U.S. Finance Corp./Nova Scotia Finance ULC, Secured Notes, 9.000% due 7/15/14 (b) | | | 165,600 |
| 290,000 | | CCC+ | | Gemstone Investor Ltd., 7.710% due 10/31/04 (b) | | | 292,900 |
| 158,997 | | BB- | | Midland Funding II, Bonds, 11.750% due 7/23/05 | | | 170,497 |
See Notes to Financial Statements.
94
Schedules of Investments
(continued)
| | | | | | | |
| High Yield Investments | | |
| | | |
Face
Amount | | Rating(a) | | Security | | Value |
| |
Diversified Financial Services — 0.9% (continued) | | | |
| $ 630,000 | | B | | Refco Finance Holdings L.L.C., 9.000% due 8/1/12 (b) | | $ | 655,200 |
| 755,000 | | B- | | UGS Corp., Sr. Sub. Notes, 10.000% due 6/1/12 (b) | | | 826,725 |
| | | | | | |
|
|
| | | | | | | | 2,110,922 |
| | | | | | |
|
|
| |
Diversified Machinery — 2.1% | | | |
| 1,020,000 | | BB- | | Case New Holland Inc., Sr. Notes, 9.250% due 8/1/11 (b) | | | 1,132,200 |
| | | | | Cummins Inc.: | | | |
| 127,000 | | BB+ | | Debentures, 7.125% due 3/1/28 (c) | | | 127,953 |
| 315,000 | | BB+ | | Sr. Notes, 9.500% due 12/1/10 | | | 365,400 |
| 616,000 | | B+ | | Joy Global Inc., 8.750% due 3/15/12 | | | 697,620 |
| 841,000 | | B | | National Waterworks Inc., 10.500% due 12/1/12 | | | 954,535 |
| 844,000 | | B+ | | NMHG Holding Co., 10.000% due 5/15/09 | | | 932,620 |
| | | | | Terex Corp.: | | | |
| 428,000 | | B | | 10.375% due 4/1/11 | | | 484,710 |
| 330,000 | | B | | 9.250% due 7/15/11 | | | 371,250 |
| | | | | | |
|
|
| | | | | | | | 5,066,288 |
| | | | | | |
|
|
| |
Electric Utilities — 8.1% | | | |
| | | | | The AES Corp.: | | | |
| | | | | Secured Notes: | | | |
| 1,265,000 | | B+ | | 8.750% due 5/15/13 (b) | | | 1,413,637 |
| 1,674,000 | | B+ | | 9.000% due 5/15/15 (b) | | | 1,870,695 |
| 285,000 | | B- | | Sr. Notes, 9.375% due 9/15/10: | | | 318,487 |
| 491,000 | | B- | | Sr. Sub. Notes, 8.500% due 11/1/07 (c) | | | 504,502 |
| 100,000 | | BB+ | | AES Eastern Energy L.P., Pass-Through Certificates, 9.670% due 1/2/29 | | | 116,062 |
| 145,175 | | B+ | | AES Ironwood L.L.C., Secured Notes, 8.857% due 11/30/25 | | | 156,063 |
| 100,000 | | B+ | | AES Red Oak L.L.C., Secured Notes, 9.200% due 11/30/29 | | | 107,500 |
| 1,035,000 | | BB- | | BRL Universal Equipment Corp., Secured Notes, 8.875% due 2/15/08 | | | 1,110,037 |
| 418,000 | | CCC+ | | Calpine Canada Energy Finance ULC, 8.500% due 5/1/08 (c) | | | 268,565 |
| | | | | Calpine Corp.: | | | |
| | | | | Secured Notes.: | | | |
| 358,000 | | B | | 9.875% due 12/1/11 (b)(c) | | | 291,770 |
| 690,000 | | B | | 8.750% due 7/15/13 (b)(c) | | | 541,650 |
| | | | | Sr. Notes: | | | |
| 350,000 | | CCC+ | | 7.625% due 4/15/06 (c) | | | 322,875 |
| 430,000 | | CCC+ | | 8.625% due 8/15/10 (c) | | | 269,825 |
| 699,000 | | CCC+ | | 8.500% due 2/15/11 (c) | | | 435,127 |
| 340,000 | | CCC+ | | Calpine Generating Co. L.L.C., Secured Notes, 11.500% due 4/1/11 (b) | | | 292,400 |
| | | | | Edison Mission Energy, Sr. Notes: | | | |
| 200,000 | | B | | 7.730% due 6/15/09 | | | 210,500 |
| 750,000 | | B | | 9.875% due 4/15/11 | | | 864,375 |
| 340,000 | | BB+ | | FirstEnergy Corp., Notes, 6.450% due 11/15/11 | | | 368,382 |
| 283,800 | | BB- | | FPL Energy Wind Funding L.L.C., Notes, 6.876% due 6/27/17 (b) | | | 280,962 |
| 396,000 | | BB | | Homer City Funding L.L.C., 8.137% due 10/1/19 | | | 427,680 |
| 70,000 | | BB- | | Kansas Gas & Electric, Debentures, 8.290% due 3/29/16 | | | 72,800 |
| | | | | Midwest Generation L.L.C.: | | | |
| 400,000 | | B | | Pass-Through Certificates, 8.560% due 1/2/16 | | | 416,250 |
| 785,000 | | B- | | Secured Notes, 8.750% due 5/1/34 | | | 837,987 |
| | | | | MSW Energy Holdings L.L.C./MSW Energy Finance Co. Inc.: | | | |
| 220,000 | | BB- | | 7.375% due 9/1/10 | | | 229,900 |
| 290,000 | | BB | | Secured Notes, 8.500% due 9/1/10 | | | 317,550 |
See Notes to Financial Statements.
95
Schedules of Investments
(continued)
| | | | | | | |
| High Yield Investments | | |
| | | |
Face
Amount | | Rating(a) | | Security | | Value |
| |
Electric Utilities — 8.1% (continued) | | | |
| $ 640,000 | | BB | | Nevada Power Co., 6.500% due 4/15/12 (b) | | $ | 643,200 |
| 1,584,000 | | B+ | | NRG Energy Inc., Secured Notes, 8.000% due 12/15/13 (b) | | | 1,671,120 |
| 1,016,000 | | B- | | Orion Power Holdings Inc., Sr. Notes, 12.000% due 5/1/10 | | | 1,275,080 |
| | | | | PSEG Energy Holdings L.L.C.: | | | |
| 605,000 | | BB- | | Notes, 7.750% due 4/16/07 | | | 645,838 |
| | | | | Sr. Notes: | | | |
| 570,000 | | BB- | | 8.625% due 2/15/08 | | | 627,000 |
| 60,000 | | BB- | | 10.000% due 10/1/09 | | | 70,125 |
| 915,000 | | B | | Reliant Energy Inc., Secured Notes, 9.250% due 7/15/10 | | | 1,006,500 |
| | | | | Salton SEA Funding: | | | |
| 171,080 | | BB+ | | 7.475% due 11/30/18 | | | 180,489 |
| 91,721 | | BB+ | | Sr. Notes, 7.840% due 5/30/10 | | | 98,284 |
| 525,000 | | BBB- | | Sithe Independence Funding Corp., Notes, 9.000% due 12/30/13 | | | 595,451 |
| 420,000 | | BB | | TECO Energy Inc., Sr. Notes, 10.500% due 12/1/07 (c) | | | 487,200 |
| | | | | | |
|
|
| | | | | | | | 19,345,868 |
| | | | | | |
|
|
| |
Electrical Components & Equipment — 1.0% | | | |
| 445,000 | | B+ | | FIMEP SA, Sr. Unsub. Notes, 10.500% due 2/15/13 | | | 516,200 |
| 245,000 | | B | | General Cable Corp., Sr. Notes, 9.500% due 11/15/10 | | | 271,950 |
| 500,000 | | B- | | Rayovac Corp., Sr. Sub. Notes, 8.500% due 10/1/13 | | | 537,500 |
| 986,000 | | B | | UCAR Finance Inc., 10.250% due 2/15/12 (c) | | | 1,124,040 |
| | | | | | |
|
|
| | | | | | | | 2,449,690 |
| | | | | | |
|
|
| | |
Electronics — 0.9% | | | | | |
| 500,000 | | B+ | | Celestica Inc., Sr. Sub. Notes, 7.875% due 7/1/11 | | | 525,625 |
| 755,000 | | BB- | | Sanmina-SCI Corp., 10.375% due 1/15/10 | | | 860,700 |
| 215,000 | | B | | SCI Systems Inc., Sub. Notes, 3.000% due 3/15/07 | | | 203,175 |
| 650,000 | | CCC+ | | Viasystems Inc., Sr. Sub. Notes, 10.500% due 1/15/11 | | | 630,500 |
| | | | | | |
|
|
| | | | | | | | 2,220,000 |
| | | | | | |
|
|
| |
Engineering & Construction — 0.2% | | | |
| 540,000 | | B+ | | North American Energy Partners Inc., Sr. Notes, 8.750% due 12/1/11 (b) | | | 502,200 |
| | | | | | |
|
|
| |
Entertainment — 2.0% | | | |
| 750,000 | | B | | Alliance Atlantis Communications Inc., Sr. Sub. Notes, 13.000% due 12/15/09 | | | 821,250 |
| 320,000 | | BBB- | | Capitol Records Inc., 8.375% due 8/15/09 (b) | | | 348,358 |
| 710,000 | | B- | | Cinemark Inc., Sr. Disc. Notes, (zero coupon until 3/15/09, 9.750% thereafter) due 3/15/14 (c) | | | 492,562 |
| 650,000 | | B | | Kerzner International Ltd., 8.875% due 8/15/11 | | | 716,625 |
| 420,000 | | CCC+ | | LCE Acquisition Corp., 9.000% due 8/1/14 (b) | | | 428,400 |
| 333,000 | | CCC+ | | Pinnacle Entertainment Inc., 9.250% due 2/15/07 (c) | | | 344,239 |
| 580,000 | | B+ | | River Rock Entertainment Authority, Sr. Notes, 9.750% due 11/1/11 | | | 617,700 |
| 210,000 | | CCC+ | | Six Flags Inc., Sr. Notes, 9.750% due 4/15/13 | | | 196,350 |
| 705,000 | | B- | | Warner Music Group, Sr. Sub. Notes, 7.375% due 4/15/14 (b) | | | 705,000 |
| | | | | | |
|
|
| | | | | | | | 4,670,484 |
| | | | | | |
|
|
| |
Environmental Control — 1.6% | | | |
| | | | | Allied Waste North America: | | | |
| 55,000 | | BB- | | 7.625% due 1/1/06 | | | 57,956 |
| 597,000 | | BB- | | 8.875% due 4/1/08 (c) | | | 658,192 |
| 830,000 | | BB- | | 9.250% due 9/1/12 | | | 935,825 |
| | | | | Sr. Notes: | | | |
| 628,000 | | BB- | | 8.500% due 12/1/08 | | | 692,370 |
| 60,000 | | B+ | | 7.375% due 4/15/14 | | | 58,575 |
See Notes to Financial Statements.
96
Schedules of Investments
(continued)
| | | | | | | |
| High Yield Investments | | |
| | | |
Face
Amount | | Rating(a) | | Security | | Value |
| |
Environmental Control — 1.6% (continued) | | | |
| $ 335,000 | | B | | Casella Waste Systems Inc., Sr. Sub. Notes, 9.750% due 2/1/13 | | $ | 360,962 |
| 1,130,000 | | CCC | | Waste Services Inc., Sr. Sub. Notes, 9.500% due 4/15/14 (b) | | | 1,005,700 |
| | | | | | |
|
|
| | | | | | | | 3,769,580 |
| | | | | | |
|
|
| | |
Food — 1.2% | | | | | |
| 235,000 | | BB- | | Dean Foods Co., Sr. Notes, 8.150% due 8/1/07 | | | 257,619 |
| 310,000 | | B | | Del Monte Corp., Sr. Sub. Notes, 8.625% due 12/15/12 | | | 346,425 |
| 562,000 | | B- | | Domino’s Inc., Sr. Sub. Notes, 8.250% due 7/1/11 | | | 604,150 |
| 335,000 | | B | | Pinnacle Foods Holding Corp., Sr. Sub. Notes, 8.250% due 12/1/13 (b) | | | 320,763 |
| 325,000 | | BB | | Smithfield Foods Inc., Sr. Notes, 7.750% due 5/15/13 | | | 347,750 |
| | | | | Stater Brothers Holdings, Sr. Notes: | | | |
| 525,000 | | BB- | | 5.060% due 6/15/10 (b) | | | 538,125 |
| 110,000 | | BB- | | 8.125% due 6/15/12 (b) | | | 114,950 |
| 280,000 | | B- | | United Agri Products, Sr. Notes, 8.250% due 12/15/11 (b) | | | 303,800 |
| | | | | | |
|
|
| | | | | | | | 2,833,582 |
| | | | | | |
|
|
| |
Forest Products & Paper — 2.7% | | | |
| | | | | Abitibi-Consolidated Inc., Notes: | | | |
| 350,000 | | BB | | 8.550% due 8/1/10 | | | 378,000 |
| 250,000 | | BB | | 5.020% due 6/15/11 (b) | | | 256,250 |
| | | | | Appleton Papers Inc.: | | | |
| 95,000 | | BB- | | Sr. Notes, 8.125% due 6/15/11 (b) | | | 96,900 |
| 125,000 | | B+ | | Sr. Sub. Notes, 9.750% due 6/15/14 (b) | | | 126,875 |
| 675,000 | | BB+ | | Cascades Inc., Sr. Notes, 7.250% due 2/15/13 | | | 703,687 |
| | | | | Georgia-Pacific Corp.: | | | |
| 630,000 | | BB+ | | 8.875% due 2/1/10 | | | 741,825 |
| 527,000 | | BB+ | | 9.375% due 2/1/13 | | | 623,178 |
| | | | | Debentures: | | | |
| 516,000 | | BB+ | | 9.500% due 12/1/11 (c) | | | 635,970 |
| 55,000 | | BB+ | | 7.700% due 6/15/15 | | | 61,738 |
| | | | | Notes: | | | |
| 200,000 | | BB+ | | 8.125% due 5/15/11 | | | 231,500 |
| 38,000 | | BB+ | | 7.750% due 11/15/29 (c) | | | 39,710 |
| 850,000 | | BB+ | | 8.875% due 5/15/31 | | | 986,000 |
| 690,000 | | BB+ | | Sr. Notes, 7.375% due 7/15/08 | | | 757,275 |
| 210,000 | | B+ | | Millar Western Forest Products Ltd., Sr. Notes, 7.750% due 11/15/13 | | | 219,450 |
| 620,000 | | B- | | WII Components Inc., Sr. Notes, 10.000% due 2/15/12 (b) | | | 616,900 |
| | | | | | |
|
|
| | | | | | | | 6,475,258 |
| | | | | | |
|
|
| | |
Gas — 0.1% | | | | | |
| 300,000 | | B- | | Colorado Interstate Gas Co., Debentures, 10.000% due 6/15/05 | | | 318,000 |
| | | | | | |
|
|
| | |
Healthcare — 3.8% | | | | | |
| 459,000 | | B- | | Ameripath Inc., 10.500% due 4/1/13 (c) | | | 472,770 |
| 860,000 | | B- | | Ardent Health Services Inc., Sr. Sub. Notes, 10.000% due 8/15/13 | | | 928,800 |
| 440,000 | | BBB- | | Coventry Health Care Inc., Sr. Notes, 8.125% due 2/15/12 | | | 488,400 |
| | | | | Extendicare Health Services Inc.: | | | |
| 496,000 | | B | | 9.500% due 7/1/10 (c) | | | 556,760 |
| 60,000 | | B- | | Sr. Sub. Notes, 6.875% due 5/1/14 (c) | | | 59,700 |
See Notes to Financial Statements.
97
Schedules of Investments
(continued)
| | | | | | | |
| High Yield Investments | | |
| | | |
Face
Amount | | Rating(a) | | Security | | Value |
| |
Healthcare — 3.8% (continued) | | | |
| | | | | HCA Inc.: | | | |
| $ 145,000 | | BBB- | | Debentures, 7.500% due 11/15/95 | | $ | 140,031 |
| | | | | Notes: | | | |
| 200,000 | | BBB- | | 8.750% due 9/1/10 | | | 234,870 |
| 100,000 | | BBB- | | 6.300% due 10/1/12 | | | 103,803 |
| 100,000 | | BBB- | | 6.250% due 2/15/13 | | | 103,070 |
| 620,000 | | BBB- | | 9.000% due 12/15/14 | | | 754,428 |
| | | | | Sr. Notes: | | | |
| 310,000 | | BBB- | | 7.875% due 2/1/11 | | | 351,467 |
| 435,000 | | BBB- | | 6.950% due 5/1/12 | | | 468,849 |
| 300,000 | | B- | | IASIS Healthcare L.L.C./IASIS Capital Corp., Sr. Sub. Notes, 8.750% due 6/15/14 (b) | | | 316,500 |
| 245,000 | | B- | | Mariner Health Care Inc., Sr. Sub. Notes, 8.250% due 12/15/13 (b) | | | 260,925 |
| 533,000 | | BBB- | | Pacificare Health Systems, 10.750% due 6/1/09 | | | 620,945 |
| 60,000 | | B- | | Psychiatric Solutions Inc., Sr. Sub. Notes, 10.625% due 6/15/13 | | | 67,800 |
| 330,000 | | B | | Select Medical Corp., Sr. Sub. Notes, 9.500% due 6/15/09 | | | 360,525 |
| | | | | Tenet Healthcare Corp.: | | | |
| 659,000 | | B- | | Notes, 7.375% due 2/1/13 (c) | | | 612,870 |
| | | | | Sr. Notes: | | | |
| 274,000 | | B- | | 5.375% due 11/15/06 (c) | | | 277,425 |
| 605,000 | | B- | | 5.000% due 7/1/07 | | | 606,513 |
| 159,000 | | B- | | 6.375% due 12/1/11 (c) | | | 141,908 |
| 750,000 | | B- | | 9.875% due 7/1/14 (b) | | | 785,625 |
| | | | | Triad Hospitals Inc.: | | | |
| 400,000 | | B+ | | Sr. Notes, 7.000% due 5/15/12 | | | 419,000 |
| 20,000 | | B | | Sr. Sub. Notes, 7.000% due 11/15/13 | | | 20,225 |
| | | | | | |
|
|
| | | | | | | | 9,153,209 |
| | | | | | |
|
|
| |
Healthcare - Products — 0.7% | | | |
| 570,161 | | B+ | | Dade Behring Holdings Inc., 11.910% due 10/3/10 | | | 652,834 |
| 163,000 | | B | | Kinetic Concepts Inc., Sr. Sub. Notes, 7.375% due 5/15/13 | | | 170,335 |
| 510,000 | | BB- | | Sybron Dental Specialties Inc., 8.125% due 6/15/12 | | | 552,075 |
| 290,000 | | B- | | Universal Hospital Services Inc., Sr. Notes, 10.125% due 11/1/11 | | | 295,800 |
| | | | | | |
|
|
| | | | | | | | 1,671,044 |
| | | | | | |
|
|
| |
Holding Companies — 0.5% | | | |
| 1,017,000 | | B+ | | Kansas City Southern Railway, 9.500% due 10/1/08 | | | 1,108,530 |
| 100,000 | | B | | Leucadia National Corp., Sub. Notes, 8.650% due 1/15/27 | | | 102,500 |
| | | | | | |
|
|
| | | | | | | | 1,211,030 |
| | | | | | |
|
|
| |
Home Builders — 2.0% | | | |
| 1,135,000 | | B- | | Atrium Cos., Inc., 10.500% due 5/1/09 | | | 1,197,425 |
| 710,000 | | BB+ | | D.R. Horton Inc., 8.500% due 4/15/12 (c) | | | 809,400 |
| 250,000 | | BB | | K. Hovnanian Enterprises Inc., 8.000% due 4/1/12 | | | 276,250 |
| 165,000 | | BB+ | | KB Home, Sr. Notes, 5.750% due 2/1/14 | | | 161,288 |
| 14,000 | | BBB- | | Lennar Corp., 9.950% due 5/1/10 | | | 15,434 |
| 340,000 | | BB- | | Meritage Corp., 9.750% due 6/1/11 | | | 380,800 |
| 300,000 | | BBB- | | Ryland Group Inc., Sr. Notes, 9.750% due 9/1/10 | | | 336,000 |
| 580,000 | | BB- | | Schuler Homes Inc., 10.500% due 7/15/11 (c) | | | 668,450 |
| 520,000 | | BB | | Standard-Pacific Corp., Sr. Notes, 6.875 due 5/15/11 | | | 542,100 |
| 263,000 | | BB+ | | Toll Corp., 8.000% due 5/1/09 (c) | | | 275,493 |
| | | | | | |
|
|
| | | | | | | | 4,662,640 |
| | | | | | |
|
|
See Notes to Financial Statements.
98
Schedules of Investments
(continued)
| | | | | | | |
| High Yield Investments | | |
| | | |
Face
Amount | | Rating(a) | | Security | | Value |
| | |
Housewares — 1.2% | | | | | |
| $ 440,000 | | B- | | American Achievement Corp., Sr. Sub. Notes, 8.250% due 4/1/12 (b) | | $ | 451,000 |
| 950,000 | | CCC+ | | Ames True Temper Inc., Sr. Sub. Notes, 10.000% due 7/15/12 (b) | | | 959,500 |
| 950,000 | | B- | | Norcraft Cos. L.P./Norcraft Finance Corp., Sr. Sub. Notes, 9.000% due 11/1/11 (b) | | | 1,026,000 |
| 410,000 | | B- | | Norcraft Holdings L.P./Norcraft Capital Corp., Sr. Disc. Notes, (zero coupon until 9/1/08, 9.750% thereafter) due 9/1/12 (b) | | | 292,125 |
| 110,000 | | B+ | | The Scotts Co., Sr. Sub. Notes, 6.625% due 11/15/13 | | | 115,500 |
| | | | | | |
|
|
| | | | | | | | 2,844,125 |
| | | | | | |
|
|
| | |
Insurance — 0.6% | | | | | |
| 75,000 | | B | | AFC Capital Trust I, 8.207% due 2/3/27 | | | 73,219 |
| 240,000 | | BB | | Allmerica Financial Corp., Debentures, 7.625% due 10/15/25 | | | 234,000 |
| 130,000 | | BB | | Crum & Forster Holdings Corp., Sr. Notes, 10.375% due 6/15/13 | | | 143,000 |
| | | | | Fairfax Financial Holdings Ltd.: | | | |
| | | | | Notes: | | | |
| 230,000 | | BB | | 7.375% due 3/15/06 | | | 242,650 |
| 25,000 | | BB | | 7.750% due 4/26/12 | | | 24,437 |
| 210,000 | | BB | | 7.375% due 4/15/18 | | | 189,525 |
| 460,000 | | BB | | Sr. Notes, 7.750% due 7/15/37 | | | 397,900 |
| 175,000 | | BB | | Markel Capital Trust I, 8.710% due 1/1/46 | | | 189,687 |
| | | | | | |
|
|
| | | | | | | | 1,494,418 |
| | | | | | |
|
|
| | |
Iron/Steel — 0.4% | | | | | |
| 880,000 | | B | | Ispat Inland ULC, Secured Notes, 9.750% due 4/1/14 (b) | | | 943,800 |
| | | | | | |
|
|
| | |
Leisure — 0.3% | | | | | |
| 540,000 | | B- | | Equinox Holdings Inc., Sr. Notes, 9.000% due 12/15/09 (b)(c) | | | 556,200 |
| 150,000 | | BB | | K2 Inc., Sr. Notes, 7.375% due 7/1/14 (b) | | | 156,000 |
| | | | | | |
|
|
| | | | | | | | 712,200 |
| | | | | | |
|
|
| | |
Lodging — 0.5% | | | | | |
| 150,000 | | BB+ | | Caesars Entertainment Inc., Sr. Notes, 7.500% due 9/1/09 | | | 166,875 |
| | | | | Hilton Hotels Corp., Notes: | | | |
| 120,000 | | BBB- | | 7.625% due 5/15/08 | | | 134,400 |
| 305,000 | | BBB- | | 8.250% due 2/15/11 | | | 356,850 |
| 350,000 | | BB+ | | ITT Corp., Notes, 6.750% due 11/15/05 | | | 364,875 |
| 90,000 | | BB- | | La Quinta Inns, Sr. Notes, 7.400% due 9/15/05 (c) | | | 93,713 |
| | | | | | |
|
|
| | | | | | | | 1,116,713 |
| | | | | | |
|
|
| |
Manufacturing - Miscellaneous — 2.9% | | | |
| | | | | Hexcel Corp.: | | | |
| 545,000 | | B | | 9.875% due 10/1/08 | | | 610,400 |
| 200,000 | | CCC+ | | Sr. Sub. Notes, 9.750% due 1/15/09 (c) | | | 210,750 |
| 1,165,000 | | B | | Jacuzzi Brands Inc., Secured Notes, 9.625% due 7/1/10 | | | 1,290,238 |
| 1,090,000 | | B | | Koppers Inc., 9.875% due 10/15/13 | | | 1,204,450 |
| 670,000 | | CCC+ | | Milacron Escrow Corp., Secured Notes, 11.500% due 5/15/11 (b) | | | 716,900 |
| 820,000 | | B- | | Samsonite Corp., Sr. Sub. Notes, 8.875% due 6/1/11 (b) | | | 848,700 |
| 573,000 | | B- | | Sensus Metering Systems Inc., Sr. Sub. Notes, 8.625% due 12/15/13 (b) | | | 564,405 |
| | | | | SPX Corp., Sr. Notes: | | | |
| 70,000 | | BB+ | | 6.250% due 6/15/11 | | | 69,650 |
| 748,000 | | BB+ | | 7.500% due 1/1/13 | | | 785,400 |
| 666,000 | | B- | | TD Funding Corp., 8.375% due 7/15/11 | | | 707,625 |
| | | | | | |
|
|
| | | | | | | | 7,008,518 |
| | | | | | |
|
|
See Notes to Financial Statements.
99
Schedules of Investments
(continued)
| | | | | | | |
| High Yield Investments | | |
| | | |
Face
Amount | | Rating(a) | | Security | | Value |
| | |
Media — 8.8% | | | | | |
| | | | | Charter Communications Holdings L.L.C., Sr. Notes: | | | |
| $ 1,250,000 | | CCC- | | 9.625% due 11/15/09 | | $ | 1,015,625 |
| 901,000 | | CCC- | | 10.250% due 9/15/10 | | | 932,535 |
| | | | | Charter Communications Operating L.L.C., Sr. Notes: | | | |
| 240,000 | | B- | | 8.000% due 4/30/12 (b) | | | 239,400 |
| 330,000 | | B- | | 8.375% due 4/30/14 (b) | | | 328,350 |
| 195,000 | | B+ | | Corus Entertainment Inc., Sr. Sub. Notes, 8.750% due 3/1/12 | | | 214,012 |
| | | | | CSC Holdings Inc.: | | | |
| | | | | Debentures: | | | |
| 270,000 | | BB- | | 7.875% due 2/15/18 | | | 276,345 |
| 530,000 | | BB- | | 7.625% due 7/15/18 (c) | | | 535,300 |
| | | | | Sr. Notes: | | | |
| 285,000 | | BB- | | 7.250% due 7/15/08 | | | 297,825 |
| 400,000 | | BB- | | 8.125% due 7/15/09 | | | 431,000 |
| 640,000 | | BB- | | 7.625% due 4/1/11 | | | 667,200 |
| 145,000 | | BB- | | 6.750% due 4/15/12 (b) | | | 145,000 |
| 70,000 | | B+ | | Sr. Sub. Debentures, 10.500% due 5/15/16 | | | 79,975 |
| | | | | Dex Media East L.L.C./Dex Media East Finance Co.: | | | |
| 870,000 | | B | | 9.875% due 11/15/09 | | | 1,004,850 |
| 255,000 | | B | | 12.125% due 11/15/12 | | | 315,562 |
| 335,000 | | B | | Dex Media West L.L.C./Dex Media West Finance Co., Sr. Notes, 8.500% due 8/15/10 | | | 378,969 |
| 1,605,000 | | BB- | | DirecTV Holdings L.L.C., Sr. Notes, 8.375% due 3/15/13 | | | 1,833,712 |
| | | | | Echostar DBS Corp., Sr. Notes: | | | |
| 50,000 | | BB- | | 10.375% due 10/1/07 | | | 53,000 |
| 1,420,000 | | BB- | | 4.850% due 10/1/08 | | | 1,480,350 |
| 195,000 | | BB- | | 5.750% due 10/1/08 | | | 196,462 |
| 190,000 | | BB- | | 6.375% due 10/1/11 | | | 191,425 |
| 225,000 | | B- | | Emmis Operating Co., Sr. Sub. Notes, 6.875% due 5/15/12 | | | 226,766 |
| 85,000 | | B- | | Entravision Communications Corp., 8.125% due 3/15/09 | | | 90,100 |
| 245,000 | | B- | | Gray Television Inc., 9.250% due 12/15/11 | | | 275,931 |
| 859,381 | | B- | | Hollinger Participation Trust, Sr. Notes, 12.125% due 11/15/10 (b) | | | 973,249 |
| 1,000,000 | | B | | Kabel Deutschland GmbH, 10.625% due 7/1/14 (b) | | | 1,030,000 |
| 658,000 | | B- | | Lodgenet Entertainment Corp., Sr. Sub. Debentures, 9.500% due 6/15/13 (c) | | | 722,155 |
| 25,000 | | B | | Quebecor Media Inc., Sr. Notes, 11.125% due 7/15/11 | | | 28,906 |
| 150,000 | | B+ | | Mediacom LLC/Mediacom Capital Corp., Sr. Notes, 9.500% due 1/15/13 | | | 147,750 |
| 285,000 | | B+ | | Medianews Group Inc., Sr. Sub. Notes, 6.875% due 10/1/13 | | | 288,562 |
| 310,000 | | B+ | | Morris Publishing Group Inc., 7.000% due 8/1/13 | | | 308,450 |
| | | | | Paxson Communications Corp.: | | | |
| 276,000 | | CCC | | 10.750% due 7/15/08 | | | 278,760 |
| 198,000 | | CCC | | (zero coupon until 1/15/06, 12.250% thereafter) due 1/15/09 | | | 168,548 |
| 330,000 | | B | | Primedia Inc., Sr. Notes, 7.086% due 5/15/10 (b) | | | 331,238 |
| 335,000 | | B- | | Radio One Inc., 8.875% due 7/1/11 | | | 373,106 |
| | | | | Rainbow National Services L.L.C.: | | | |
| 260,000 | | CCC+ | | Sr. Notes, 8.750% due 9/1/12 (b) | | | 268,450 |
| 630,000 | | CCC+ | | Sr. Sub. Debentures, 10.375% due 9/1/14 (b) | | | 655,200 |
| 345,000 | | BB- | | The Reader’s Digest Association Inc., Sr. Notes, 6.500% due 3/1/11 | | | 350,175 |
| 450,000 | | BBB- | | Rogers Cable Inc., Secured Notes, 7.875% due 5/1/12 | | | 491,072 |
| | | | | Shaw Communications Inc., Sr. Notes: | | | |
| 815,000 | | BB+ | | 8.250% due 4/11/10 | | | 916,039 |
| 160,000 | | BB+ | | 7.200% due 12/15/11 | | | 171,722 |
| 1,254,000 | | B | | Sinclair Broadcast Group Inc., 8.750% due 12/15/11 | | | 1,362,158 |
| 60,000 | | B | | Sun Media Corp., 7.625% due 2/15/13 (c) | | | 64,200 |
See Notes to Financial Statements.
100
Schedules of Investments
(continued)
| | | | | | | |
| High Yield Investments | | |
| | | |
Face
Amount | | Rating(a) | | Security | | Value |
| |
Media — 8.8% (continued) | | | |
| $ 335,000 | | B | | Susquehanna Media Co., Sr. Sub. Notes, 7.375% due 4/15/13 | | $ | 346,725 |
| 170,000 | | B+ | | Videotron Ltee, 6.875% due 1/15/14 | | | 172,550 |
| 410,000 | | BB- | | Yell Finance B.V., 10.750% due 8/1/11 (c) | | | 481,750 |
| | | | | | |
|
|
| | | | | | | | 21,140,459 |
| | | | | | |
|
|
| |
Metals & Mining — 0.7% | | | |
| 745,000 | | BB- | | Century Aluminum Co., 7.500% due 8/15/14 (b) | | | 769,212 |
| 485,000 | | BB | | Luscar Coal Ltd., Sr. Notes, 9.750% due 10/15/11 | | | 549,263 |
| 260,000 | | BB- | | Peabody Energy Corp., 6.875% due 3/15/13 | | | 275,600 |
| | | | | | |
|
|
| | | | | | | | 1,594,075 |
| | | | | | |
|
|
| |
Office/Business Equipment — 1.1% | | | |
| 1,035,000 | | B- | | Interface Inc., Sr. Notes, 10.375% due 2/1/10 | | | 1,169,550 |
| 390,000 | | B- | | Xerox Capital Trust I, 8.000% due 2/1/27 | | | 375,375 |
| | | | | Xerox Corp.: | | | |
| 390,000 | | B+ | | 9.750% due 1/15/09 | | | 455,325 |
| | | | | Sr. Notes: | | | |
| 350,000 | | B+ | | 6.875% due 8/15/11 | | | 364,000 |
| 330,000 | | B+ | | 7.625% due 6/15/13 | | | 352,275 |
| | | | | | |
|
|
| | | | | | | | 2,716,525 |
| | | | | | |
|
|
| |
Oil & Gas Operations — 6.1% | | | |
| 740,000 | | B- | | Belden & Blake Corp., Secured Notes, 8.750% due 7/15/12 (b) | | | 775,150 |
| | | | | Chesapeake Energy Corp.: | | | |
| 87,000 | | BB- | | 8.375% due 11/1/08 | | | 95,265 |
| 602,000 | | BB- | | 9.000% due 8/15/12 | | | 689,290 |
| | | | | Sr. Notes: | | | |
| 115,000 | | BB- | | 7.500% due 9/15/13 | | | 124,200 |
| 800,000 | | BB- | | 7.500% due 6/15/14 | | | 858,000 |
| | | | | Citgo Petroleum Corp., Sr. Notes: | | | |
| 180,000 | | BB | | 7.875% due 5/15/06 | | | 189,900 |
| 745,000 | | BB | | 11.375% due 2/1/11 | | | 873,512 |
| 530,000 | | BB | | Compagnie Generale de Geophysique S.A., Sr. Notes, 10.625% due 11/15/07 | | | 565,775 |
| 533,000 | | CCC+ | | El Paso CGP Co., Notes, 7.750% due 6/15/10 (c) | | | 515,011 |
| 210,000 | | B- | | El Paso Production Holding Co., 7.750% due 6/1/13 | | | 207,375 |
| | | | | Encore Acquisition Co.: | | | |
| 110,000 | | B | | 8.375% due 6/15/12 | | | 121,550 |
| 90,000 | | B | | Sr. Sub. Notes, 6.250% due 4/15/14 | | | 88,650 |
| 710,000 | | BB- | | Evergreen Resources Inc., Sr. Sub. Notes, 5.875% due 3/15/12 (c) | | | 727,750 |
| 505,000 | | B | | Exco Resources Inc., 7.250% due 1/15/11 | | | 532,775 |
| | | | | Forest Oil Corp., Sr. Notes: | | | |
| 445,000 | | BB- | | 8.000% due 6/15/08 | | | 487,275 |
| 160,000 | | BB- | | 8.000% due 12/15/11 (b) | | | 176,400 |
| 486,000 | | BB- | | Grant Prideco Escrow Corp., 9.000% due 12/15/09 | | | 541,890 |
| | | | | Hanover Compressor Co.: | | | |
| 105,000 | | B | | 8.625% due 12/15/10 | | | 112,350 |
| 130,000 | | B | | Sr. Notes, 9.000% due 6/1/14 | | | 140,075 |
| | | | | Hanover Equipment Trust, Secured Notes: | | | |
| 25,000 | | B+ | | 8.500% due 9/1/08 | | | 26,813 |
| 175,000 | | B+ | | 8.750% due 9/1/11 | | | 189,875 |
| 520,000 | | B- | | KCS Energy Inc., Sr. Notes, 7.125% due 4/1/12 | | | 535,600 |
See Notes to Financial Statements.
101
Schedules of Investments
(continued)
| | | | | | | |
| High Yield Investments | | |
| | | |
Face
Amount | | Rating(a) | | Security | | Value |
| |
Oil & Gas Operations — 6.1% (continued) | | | |
| | | | | Parker Drilling Co.: | | | |
| $ 170,000 | | B- | | 10.125% due 11/15/09 (c) | | $ | 181,475 |
| 630,000 | | B- | | 6.540% due 9/1/10 (b) | | | 633,150 |
| 480,000 | | BB- | | Plains Exploration & Production Co., Sr. Notes, 7.125% due 6/15/14 (b) | | | 511,200 |
| | | | | The Premcor Refining Group Inc.: | | | |
| 175,000 | | BB- | | 6.125% due 5/1/11 | | | 178,063 |
| | | | | Sr. Notes: | | | |
| 415,000 | | BB- | | 9.250% due 2/1/10 | | | 475,175 |
| 150,000 | | BB- | | 9.500% due 2/1/13 | | | 175,875 |
| 200,000 | | B | | Sr. Sub. Notes, 7.750% due 2/1/12 | | | 214,500 |
| 725,000 | | BB- | | Pride International Inc., Sr. Notes, 7.375% due 7/15/14 (b) | | | 775,750 |
| | | | | Swift Energy Co.: | | | |
| 260,000 | | B | | Sr. Sub. Notes, 9.375% due 5/1/12 | | | 287,300 |
| 135,000 | | BB- | | Sr. Notes, 7.625% due 7/15/11 | | | 142,425 |
| 60,000 | | B+ | | Universal Compression Inc., Sr. Notes, 7.250% due 5/15/10 | | | 62,700 |
| | | | | Vintage Petroleum Inc.: | | | |
| 219,000 | | B | | Sr. Sub. Notes, 7.875% due 5/15/11 (c) | | | 229,950 |
| 10,000 | | BB- | | Sr. Notes, 8.250% due 5/1/12 | | | 10,950 |
| 1,855,000 | | BB+ | | Western Oil Sands Inc., Secured Notes, 8.375% due 5/1/12 | | | 2,082,238 |
| | | | | | |
|
|
| | | | | | | | 14,535,232 |
| | | | | | |
|
|
| |
Packaging & Containers — 3.2% | | | |
| 570,000 | | BB | | Ball Corp., 6.875% due 12/15/12 | | | 597,075 |
| 380,000 | | B- | | Berry Plastics Corp., 10.750% due 7/15/12 | | | 427,500 |
| 300,000 | | B | | Crown Cork & Seal Co. Inc., Debentures, 8.000% due 4/15/23 | | | 280,500 |
| | | | | Crown European Holdings S.A., Secured Notes: | | | |
| 430,000 | | B+ | | 9.500% due 3/1/11 | | | 479,450 |
| 25,000 | | B | | 10.875% due 3/1/13 | | | 29,187 |
| 975,000 | | B- | | Graphic Packaging International Corp., Sr. Sub. Notes, 9.500% due 8/15/13 | | | 1,096,875 |
| 200,000 | | B | | Jefferson Smurfit Corp. (U.S.), 8.250% due 10/1/12 | | | 219,000 |
| | | | | Owens-Brockway: | | | |
| 50,000 | | BB- | | 8.875% due 2/15/09 | | | 54,625 |
| 180,000 | | BB- | | 7.750% due 5/15/11 | | | 191,700 |
| 1,155,000 | | BB- | | Secured Notes, 8.750% due 11/15/12 | | | 1,287,825 |
| 260,000 | | B | | Owens-Illinois Inc., Debentures, 7.500% due 5/15/10 | | | 266,500 |
| 90,000 | | B+ | | Plastipak Holdings Inc., 10.750% due 9/1/11 | | | 97,650 |
| 360,000 | | B+ | | Silgan Holdings Inc., Sr. Sub. Notes, 6.750% due 11/15/13 | | | 360,000 |
| 1,040,000 | | B- | | Solo Cup Co., Sr. Sub. Notes, 8.500% due 2/15/14 | | | 1,014,000 |
| 220,000 | | BB- | | Smurfit Capital Funding PLC, Notes, 6.750% due 11/20/05 | | | 228,250 |
| | | | | Smurfit-Stone Container Corp., Sr. Notes: | | | |
| 700,000 | | B | | 9.250% due 2/1/08 | | | 785,750 |
| 100,000 | | B | | 9.750% due 2/1/11 | | | 112,500 |
| 100,000 | | B | | Stone Container Finance of Canada II, 7.375% due 7/15/14 (b) | | | 103,750 |
| | | | | | |
|
|
| | | | | | | | 7,632,137 |
| | | | | | |
|
|
| |
Pharmaceuticals — 0.5% | | | |
| 480,000 | | CCC+ | | Leiner Health Products Inc., Sr. Sub. Notes, 11.000% due 6/1/12 (b) | | | 504,000 |
| 140,000 | | BB+ | | Omnicare Inc., 8.125% due 3/15/11 | | | 151,200 |
| 471,000 | | B | | Vicar Operating Inc., 9.875% due 12/1/09 | | | 522,810 |
| | | | | | |
|
|
| | | | | | | | 1,178,010 |
| | | | | | |
|
|
See Notes to Financial Statements.
102
Schedules of Investments
(continued)
| | | | | | | |
| High Yield Investments | | |
| | | |
Face
Amount | | Rating(a) | | Security | | Value |
| | |
Pipelines — 4.5% | | | | | |
| | | | | ANR Pipeline Co.: | | | |
| $ 260,000 | | B- | | Debentures, 9.625% due 11/1/21 | | $ | 308,750 |
| 210,000 | | B- | | Notes, 8.875% due 3/15/10 | | | 237,300 |
| 2,005,000 | | B- | | Dynergy Holdings Inc., Secured Notes, 10.125% due 7/15/13 (b) | | | 2,265,650 |
| | | | | El Paso Corp.: | | | |
| | | | | Notes: | | | |
| 340,000 | | CCC+ | | 6.950% due 12/15/07 (c) | | | 338,300 |
| 325,000 | | CCC+ | | 7.875% due 6/15/12 | | | 314,437 |
| | | | | Sr. Notes: | | | |
| 380,000 | | CCC+ | | 7.800% due 8/1/31 | | | 323,000 |
| 395,000 | | CCC+ | | 7.750% due 1/15/32 (c) | | | 337,231 |
| 573,000 | | BB- | | El Paso Energy Partners L.P./El Paso Energy Partners Finance Corp., 8.500% due 6/1/11 | | | 650,355 |
| | | | | GulfTerra Energy Partners L.P.: | | | |
| 216,000 | | BB- | | 8.500% due 6/1/10 | | | 253,530 |
| 605,000 | | BB- | | 10.625% due 12/1/12 (c) | | | 765,325 |
| 179,000 | | B+ | | Northwest Pipeline Corp., 8.125% due 3/1/10 | | | 202,494 |
| 320,000 | | BB | | Pacific Energy Partners L.P./Pacific Energy Finance Corp., Sr. Notes, 7.125% due 6/15/14 (b) | | | 340,000 |
| 340,000 | | CCC+ | | Sonat Inc., Notes, 6.875% due 6/1/05 | | | 345,950 |
| 301,000 | | B- | | Southern Natural Gas Co., Notes, 8.875% due 3/15/10 | | | 340,130 |
| 268,000 | | B+ | | Transcontinental Gas Pipe Line Corp., Sr. Notes, 8.875% due 7/15/12 | | | 326,290 |
| 215,000 | | B | | Transmontaigne Inc., Sr. Sub. Notes, 9.125% due 6/1/10 | | | 239,725 |
| | | | | The Williams Cos. Inc.: | | | |
| 895,000 | | B+ | | Credit Linked Certificate Trust, Notes, 6.750% due 4/15/09 (b) | | | 936,394 |
| 762,000 | | B+ | | Notes, 8.750% due 3/15/32 | | | 859,155 |
| 1,250,000 | | B+ | | Sr. Notes, 8.625% due 6/1/10 (c) | | | 1,456,250 |
| | | | | | |
|
|
| | | | | | | | 10,840,266 |
| | | | | | |
|
|
| |
Real Estate Investment Trusts — 2.4% | | | |
| | | | | CB Richard Ellis Services Inc.: | | | |
| 50,000 | | B- | | 11.250% due 6/15/11 | | | 57,750 |
| 136,000 | | B+ | | Sr. Notes, 9.750% due 5/15/10 | | | 151,640 |
| 610,000 | | BB- | | Choctaw Resort Development Enterprise, Sr. Notes, 9.250% due 4/1/09 | | | 655,750 |
| 70,000 | | BB- | | Forest City Enterprises Inc., Sr. Notes, 7.625% due 6/1/15 | | | 72,100 |
| | | | | Host Marriott L.P.: | | | |
| 700,000 | | B+ | | 9.250% due 10/1/07 | | | 785,750 |
| 570,000 | | B+ | | Sr. Notes, 7.125% due 11/1/13 | | | 582,825 |
| | | | | iStar Financial Inc., Sr. Notes: | | | |
| 185,000 | | BB+ | | 7.000% due 3/15/08 | | | 199,519 |
| 292,000 | | BB+ | | 8.750% due 8/15/08 | | | 335,438 |
| 260,000 | | BB+ | | 6.000% due 12/15/10 | | | 269,689 |
| 210,000 | | BB+ | | 6.500% due 12/15/13 | | | 218,024 |
| 270,000 | | BB- | | La Quinta Properties Inc., Sr. Notes, 8.875% due 3/15/11 | | | 301,050 |
| 1,325,000 | | B+ | | LNR Property Corp., Sr. Sub. Notes, 7.250% due 10/15/13 | | | 1,391,250 |
| 115,000 | | BB- | | Omega Healthcare Investors Inc., Sr. Notes, 7.000% due 4/1/14 (b) | | | 113,275 |
| | | | | Ventas Realty L.P./Ventas Capital Corp.: | | | |
| 447,000 | | BB | | 8.750% due 5/1/09 | | | 489,465 |
| 183,000 | | BB | | 9.000% due 5/1/12 | | | 204,960 |
| | | | | | |
|
|
| | | | | | | | 5,828,485 |
| | | | | | |
|
|
| | |
Retail — 4.5% | | | | | |
| | | | | AmeriGas Partners L.P./AmeriGas Eagle Finance Corp., Sr. Notes: | | | |
| 100,000 | | BB- | | 10.000% due 4/15/06 | | | 110,000 |
| 957,000 | | BB- | | 8.875% due 5/20/11 | | | 1,047,915 |
See Notes to Financial Statements.
103
Schedules of Investments
(continued)
| | | | | | | |
| High Yield Investments | | |
| | | |
Face
Amount | | Rating(a) | | Security | | Value |
| |
Retail — 4.5% (continued) | | | |
| $1,094,000 | | B | | Asbury Automotive Group Inc., 9.000% due 6/15/12 (c) | | $ | 1,156,905 |
| 555,000 | | BBB- | | Autonation Inc., 9.000% due 8/1/08 | | | 636,862 |
| 110,000 | | B | | Couche-Tard U.S. L.P./Couche-Tard Financing Corp., Sr. Sub. Notes, 7.500% due 12/15/13 | | | 116,600 |
| 290,000 | | BB- | | Ferrellgas Escrow L.L.C./Ferrellgas Finance Escrow Corp., Sr. Notes, 6.750% due 5/1/14 | | | 290,000 |
| 980,000 | | B | | Ferrellgas Partners L.P./Ferrellgas Partners Finance Corp., Sr. Notes, 8.750% due 6/15/12 | | | 1,073,100 |
| 895,000 | | BB+ | | The Gap, Inc., Notes, 10.300% due 12/15/08 | | | 1,100,850 |
| 240,000 | | B+ | | Group 1 Automotive Inc., Sr. Sub. Notes, 8.250% due 8/15/13 | | | 254,400 |
| 291,000 | | B- | | Hollywood Entertainment Corp., 9.625% due 3/15/11 | | | 309,915 |
| | | | | Jean Coutu Group Inc.: | | | |
| 630,000 | | B | | Sr. Notes, 7.625% due 8/1/12 (b) | | | 652,050 |
| 330,000 | | B | | Sr. Sub. Notes, 8.500% due 8/1/14 (b) | | | 334,125 |
| 300,000 | | BB+ | | Office Depot Inc., Sr. Sub. Notes, 10.000% due 7/15/08 | | | 354,000 |
| 200,000 | | B- | | The Pantry Inc., Sr. Sub. Notes, 7.750% due 2/15/14 | | | 201,500 |
| 555,000 | | B+ | | PETCO Animal Supplies Inc., Sr. Sub. Notes, 10.750% due 11/1/11 | | | 629,925 |
| | | | | Rite Aid Corp.: | | | |
| 315,000 | | B+ | | 9.500% due 2/15/11 | | | 348,075 |
| 300,000 | | B+ | | Secured Notes, 8.125% due 5/1/10 | | | 316,500 |
| 240,000 | | B+ | | Sonic Automotive Inc., Sr. Sub. Notes, 8.625% due 8/15/13 | | | 253,200 |
| 630,000 | | B | | Suburban Propane Partners L.P./Suburban Energy Finance Corp., Sr. Notes, 6.875% due 12/15/13 | | | 633,150 |
| 610,000 | | BB | | Toys “R” US Inc., Notes, 7.875% due 4/15/13 (c) | | | 606,188 |
| 275,000 | | B | | United Auto Group Inc., 9.625% due 3/15/12 | | | 306,625 |
| | | | | | |
|
|
| | | | | | | | 10,731,885 |
| | | | | | |
|
|
| | |
Semiconductors — 0.4% | | | | | |
| 300,000 | | B | | Fairchild Semiconductor International Inc., 5.000% due 11/1/08 | | | 298,500 |
| | | | | Freescale Semiconductor Inc., Sr. Notes: | | | |
| 200,000 | | BB+ | | 4.380% due 7/15/09 (b) | | | 204,500 |
| 225,000 | | BB+ | | 6.875% due 7/15/11 (b) | | | 230,344 |
| 190,000 | | BB+ | | 7.125% due 7/15/14 (b) | | | 194,037 |
| | | | | | |
|
|
| | | | | | | | 927,381 |
| | | | | | |
|
|
| |
Ship Building — 0.2% | | | |
| 430,000 | | B | | Ship Finance International Ltd., Sr. Notes, 8.500% due 12/15/13 | | | 423,550 |
| | | | | | |
|
|
| |
Storage/Warehousing — 0.3% | | | |
| 715,000 | | BB- | | Mobile Mini Inc., Sr. Notes, 9.500% due 7/1/13 | | | 797,225 |
| | | | | | |
|
|
| |
Telecommunications — 8.6% | | | |
| 637,000 | | CCC | | Alamosa Delaware Inc., 11.000% due 7/31/10 | | | 700,700 |
| 213,000 | | B+ | | Avaya Inc., Secured Notes, 11.125% due 4/1/09 | | | 249,742 |
| 740,000 | | CCC | | Centennial Communications Corp., Sr. Notes, 8.125% due 2/1/14 (b)(c) | | | 690,050 |
| | | | | Cincinnati Bell Inc.: | | | |
| 340,000 | | B- | | 7.250% due 7/15/13 (c) | | | 321,300 |
| 1,320,000 | | B- | | Sr. Sub. Notes, 8.375% due 1/15/14 (c) | | | 1,174,800 |
| 140,000 | | B- | | Consolidated Communications Illinois/Texas Holdings Inc., Sr. Notes, 9.750% due 4/1/12 (b) | | | 142,100 |
| | | | | Corning Inc., Notes: | | | |
| 225,000 | | BB+ | | 5.900% due 3/15/14 | | | 220,117 |
| 305,000 | | BB+ | | 6.200% due 3/15/16 | | | 298,544 |
| | | | | Crown Castle International Corp., Sr. Notes: | | | |
| 330,000 | | CCC | | 9.375% due 8/1/11 | | | 382,800 |
| 280,000 | | CCC | | 10.750% due 8/1/11 | | | 315,700 |
See Notes to Financial Statements.
104
Schedules of Investments
(continued)
| | | | | | | |
| High Yield Investments | | |
| | | |
Face
Amount | | Rating(a) | | Security | | Value |
| |
Telecommunications — 8.6% (continued) | | | |
| $ 320,000 | | B+ | | GCI Inc., Sr. Notes, 7.250% due 2/15/14 | | $ | 315,200 |
| | | | | GTE Hawaiian Telephone Co., Debentures: | | | |
| 190,000 | | A+ | | 7.000% due 2/1/06 | | | 196,809 |
| 140,000 | | A+ | | 7.375% due 9/1/06 | | | 146,643 |
| 1,320,000 | | B | | Inmarsat Finance PLC, 7.625% due 6/30/12 (b) | | | 1,300,200 |
| 590,000 | | B+ | | Insight Midwest L.P./Insight Capital Inc., Sr. Notes, 10.500% due 11/1/10 | | | 641,625 |
| | | | | MCI Inc., Sr. Notes: | | | |
| 207,000 | | NR | | 5.908% due 5/1/07 | | | 204,154 |
| 207,000 | | NR | | 6.688% due 5/1/09 (c) | | | 195,615 |
| 178,000 | | NR | | 7.735% due 5/1/14 | | | 164,873 |
| | | | | Nextel Communications Inc., Sr. Notes: | | | |
| 735,000 | | BB | | 9.375% due 11/15/09 | | | 782,775 |
| 633,000 | | BB | | 5.250% due 1/15/10 | | | 633,791 |
| 20,000 | | BB | | 9.500% due 2/1/11 | | | 22,800 |
| 150,000 | | BB | | 6.875% due 10/31/13 | | | 152,250 |
| 1,135,000 | | BB | | 5.950% due 3/15/14 | | | 1,083,925 |
| 600,000 | | BB | | 7.375% due 8/1/15 | | | 630,000 |
| 320,000 | | B- | | Nortel Networks Ltd., Notes, 6.125% due 2/15/06 (c) | | | 326,400 |
| 170,000 | | B- | | NTL Cable PLC, Sr. Notes, 8.750% due 4/15/14 (b) | | | 177,650 |
| | | | | PanAmSat Corp.: | | | |
| 525,000 | | B+ | | 9.000% due 8/15/14 (b) | | | 549,938 |
| 279,000 | | BB+ | | Notes, 6.375% due 1/15/08 | | | 284,929 |
| 697,000 | | B | | Qwest Capital Funding Inc., 7.000% due 8/3/09 | | | 616,845 |
| 680,000 | | B | | Qwest Communications International Inc., Sr. Notes, 7.250% due 2/15/11 (b) | | | 632,400 |
| | | | | Qwest Corp.; | | | |
| 570,000 | | BB- | | Debentures, 8.875% due 6/1/31 | | | 557,175 |
| 185,000 | | BB- | | Notes, 9.125% due 3/15/12 (b) | | | 199,338 |
| 1,505,000 | | BB- | | Sr. Notes, 7.875% due 9/1/11 (b) | | | 1,531,338 |
| 1,379,000 | | B | | Qwest Services Corp., Notes, 14.000% due 12/15/10 (b) | | | 1,609,983 |
| 185,000 | | BB+ | | Rogers Cantel Inc., Debentures, 9.750% due 6/1/16 | | | 214,600 |
| | | | | Rogers Wireless Communications Inc., Secured Notes: | | | |
| 406,000 | | BB+ | | 9.625% due 5/1/11 | | | 465,885 |
| 400,000 | | BB+ | | 6.375% due 3/1/14 | | | 385,000 |
| 440,000 | | B- | | Rural Cellular Corp., Secured Notes, 8.250% due 3/15/12 (b) | | | 449,900 |
| 920,000 | | CCC- | | SBA Telecommunications Inc./SBA Communications Corp., Sr. Disc. Notes, (zero coupon until 12/15/07, 9.750% thereafter) due 12/15/11 | | | 722,200 |
| 125,000 | | BB+ | | TCI Communications Financing III, 9.650% due 3/31/27 | | | 148,070 |
| 480,000 | | CCC- | | U.S. Unwired Inc., Secured Notes, 10.000% due 6/15/12 | | | 494,400 |
| 280,000 | | CCC | | UbiquiTel Operating Co., Sr. Notes, 9.875% due 3/1/11 (c) | | | 288,400 |
| | | | | | |
|
|
| | | | | | | | 20,620,964 |
| | | | | | |
|
|
| |
Transportation — 1.3% | | | |
| 215,000 | | B | | CHC Helicopter Corp., Sr. Sub. Notes, 7.375% due 5/1/14 | | | 218,494 |
| 680,000 | | BB- | | Gulfmark Offshore Inc., Sr. Notes, 7.750% due 7/15/14 (b) | | | 678,300 |
| 480,000 | | B- | | Horizon Lines L.L.C., Notes, 9.000% due 11/1/12 (b) | | | 506,400 |
| 422,000 | | B+ | | OMI Corp., Sr. Notes, 7.625% due 12/1/13 | | | 426,220 |
| 560,000 | | BB- | | Petroleum Helicopters, Inc., 9.375% due 5/1/09 | | | 593,600 |
| 707,000 | | BB- | | Teekay Shipping Corp., Sr. Notes, 8.875% due 7/15/11 | | | 796,259 |
| | | | | | |
|
|
| | | | | | | | 3,219,273 |
| | | | | | |
|
|
See Notes to Financial Statements.
105
Schedules of Investments
(continued)
| | | | | | | |
| High Yield Investments | | |
| | | |
Face
Amount | | Rating(a) | | Security | | Value |
| |
Venture Capital — 0.2% | | | |
| $ 360,000 | | BB | | Arch Western Finance L.L.C., Sr. Notes, 7.500% due 7/1/13 (b) | | $ | 374,400 |
| | | | | | |
|
|
| | | | | TOTAL CORPORATE BONDS & NOTES
(Cost — $216,613,672) | | | 227,456,624 |
| | | | | | |
|
|
| | | |
Shares
| | | | | | |
COMMON STOCK — 0.0% | | | |
| 65,574 | | | | Frank’s Nursery & Crafts, Inc. (d) (Cost — $713,595) | | | 28,853 |
| | | | | | |
|
|
PREFERRED STOCK — 0.6% | | | |
| 4,890 | | | | Fresenius Medical Care Capital Trust II, 7.875% due 2/1/08 | | | 523,230 |
| 1,350 | | | | iStar Financial Inc., 7.500% | | | 33,277 |
| 4,900 | | | | Paxson Communications Corp., 14.250% due 11/15/06 (d) | | | 407,925 |
| 240 | | | | Rural Cellular Corp., 11.375% due 5/15/10 (c)(d) | | | 201,000 |
| 8,460 | | | | Shaw Communications Inc., 8.500% | | | 215,688 |
| | | | | | |
|
|
| | | | | TOTAL PREFERRED STOCK
(Cost — $1,204,127) | | | 1,381,120 |
| | | | | | |
|
|
| | | |
Face
Amount
| | | | | | |
SOVEREIGN BONDS — 0.3% | | | |
| $ 590,000 | | B+ | | Federative Republic of Brazil, Global Notes, 14.500% due 10/15/09 (Cost — $756,675) | | | 744,580 |
| | | | | | |
|
|
| | | | | SUB-TOTAL INVESTMENTS
(Cost — $219,288,069) | | | 229,611,177 |
| | | | | | |
|
|
REPURCHASE AGREEMENTS — 2.4% | | | |
| 4,015,000 | | | | State Street Bank & Trust Co. dated 8/31/04, 1.490% due 9/1/04; Proceeds at maturity — $4,015,166; (Fully collateralized by U.S. Treasury Bonds, 5.250% due 2/15/29; Market value — $4,099,559) | | | 4,015,000 |
| 1,692,000 | | | | UBS Securities LLC dated 8/31/04, 1.580% due 9/1/04; Proceeds at maturity — $1,692,074; (Fully collateralized by various U.S. Government Agency Obligations, 0.000% to 9.800% due 10/22/04 to 3/1/26; Market value — $1,725,845) | | | 1,692,000 |
| | | | | | |
|
|
| | | | | TOTAL REPURCHASE AGREEMENTS
(Cost — $5,707,000) | | | 5,707,000 |
| | | | | | |
|
|
| | | | | TOTAL INVESTMENTS — 98.2%
(Cost — $224,995,069**) | | | 235,318,177 |
| | | | | Other Assets in Excess of Liabilities — 1.8% | | | 4,331,879 |
| | | | | | |
|
|
| | | | | NET ASSETS — 100.0% | | $ | 239,650,056 |
| | | | | | |
|
|
LOANED SECURITIES COLLATERAL | | | |
| 22,820,074 | | | | State Street Navigator Securities Lending Trust Prime Portfolio (Cost — $22,820,074) | | $ | 22,820,074 |
| | | | | | |
|
|
| (a) | | All ratings are by Standard & Poor’s Rating Service, except those which are identified by an asterisk(*), are rated by Moody’s Investors Service. |
| (b) | | Security is exempt under Rule 144A of the Securities Act of 1933. This security may be resold in transactions that are exempt from registration, normally to qualified institutional buyers. This security has been deemed liquid pursuant to guidelines established by the Board of Trustees. |
| (c) | | All or a portion of this security is on loan (See Note 3). |
| (d) | | Non-income producing security. |
| ** | | Aggregate cost for Federal income tax purposes is $225,953,310. |
See page 113 for definitions of ratings and certain abbreviations.
See Notes to Financial Statements.
106
Summary of Investments by Industry†
| | | |
Media | | 9.0 | % |
Telecommunications | | 8.8 | |
Electric Utilities | | 8.2 | |
Oil & Gas Operations | | 6.2 | |
Chemicals | | 4.8 | |
Pipelines | | 4.6 | |
Retail | | 4.6 | |
Casinos & Gaming | | 3.9 | |
Healthcare | | 3.9 | |
Packaging & Containers | | 3.2 | |
Manufacturing - Miscellaneous | | 3.0 | |
Forest Products & Paper | | 2.8 | |
Real Estate Investment Trusts | | 2.5 | |
Repurchase Agreements | | 2.4 | |
Commercial Services | | 2.4 | |
Diversified Machinery | | 2.2 | |
Entertainment | | 2.0 | |
Home Builders | | 2.0 | |
Environmental Control | | 1.6 | |
Transportation | | 1.4 | |
Building Materials | | 1.4 | |
Aerospace & Defense Equipment | | 1.3 | |
Other | | 17.8 | |
| | |
|
|
| | | 100.0 | % |
| | |
|
|
| † | | As a percentage of total investments. Please note that fund holdings are subject to change. |
See Notes to Financial Statements.
107
Schedules of Investments
(continued)
| | | | | | | |
| Municipal Bond Investments | | |
| | | |
Face
Amount | | Rating(a) | | Security | | Value |
| | |
Arizona — 3.2% | | | | | |
| $1,000,000 | | Aaa* | | Arizona Student Loan Acquisition Authority Revenue, Series A-1, 5.650% due 5/1/14 | | $ | 1,077,400 |
| | | | | | |
|
|
| | |
California — 6.8% | | | | | |
| 1,110,000 | | AAA | | Costa Mesa, CA COP, MBIA-Insured, 5.000% due 10/1/18 | | | 1,199,033 |
| 1,000,000 | | AAA | | Los Angeles, CA Department of Water and Power Waterworks Revenue, Series C, MBIA-Insured,
5.250% due 7/1/19 | | | 1,102,410 |
| | | | | | |
|
|
| | | | | | | | 2,301,443 |
| | | | | | |
|
|
| | |
Connecticut — 3.2% | | | | | |
| 1,000,000 | | AAA | | State of Connecticut, Series B, MBIA-Insured, 5.00% due 6/01/17 | | | 1,091,800 |
| | | | | | |
|
|
| |
District of Columbia — 3.4% | | | |
| 1,075,000 | | AAA | | Metropolitan Washington D.C. Airport Authority System, Series D, FSA-Insured, 5.375% due 10/1/18 | | | 1,156,163 |
| | | | | | |
|
|
| | |
Florida — 8.1% | | | | | |
| 1,000,000 | | AAA | | Florida State Board Education Lottery Revenue, Series C, FGIC-Insured, 5.250% due 7/1/20 | | | 1,088,610 |
| 100,000 | | A-1 | | Jacksonville, FL Electric Authority Revenue, Series B, 1.350 due 10/1/30 (b)(c) | | | 100,000 |
| 200,000 | | A-1 | | Putnam County, FL Development Authority PCR, 1.330% due 9/1/24 (b)(c) | | | 200,000 |
| 1,250,000 | | AAA | | Tampa, FL Utility Tax and Special Revenue, Series A, AMBAC-Insured, 5.250% due 10/1/19 | | | 1,375,075 |
| | | | | | |
|
|
| | | | | | | | 2,763,685 |
| | | | | | |
|
|
| | |
Hawaii — 3.3% | | | | | |
| 1,000,000 | | AA- | | Maui County, HI GO, Series A, 5.500% due 3/1/15 | | | 1,117,750 |
| | | | | | |
|
|
| | |
Illinois — 7.0% | | | | | |
| 1,000,000 | | AAA | | Chicago, IL Board of Education GO, School Reform Board, Series A, FGIC-Insured,
5.250% due 12/1/20 | | | 1,123,930 |
| 100,000 | | A-1+ | | Illinois Health Facilities Authority Revenue, MBIA-Insured, 1.360% due 8/15/26 (b)(c) | | | 100,000 |
| 1,000,000 | | AAA | | University of Illinois, University Revenue, Series B, FGIC-Insured, 5.500% due 4/1/19 | | | 1,157,230 |
| | | | | | |
|
|
| | | | | | | | 2,381,160 |
| | | | | | |
|
|
| | |
Indiana — 10.4% | | | | | |
| 1,000,000 | | Aaa* | | Allen County, IN Public Library Building Corp., MBIA-Insured, 5.000% due 1/15/17 | | | 1,066,930 |
| 1,200,000 | | A | | Indiana Bond Bank Special Project-Hendricks, Series B, (Pre-Refunded — Escrowed with U.S. government securities to 2/1/07 call @ 102), 6.125% due 2/1/17 | | | 1,337,292 |
| 100,000 | | Aaa* | | Indiana Educational Facilities Authority, 1.350% due 7/1/32 (b)(c) | | | 100,000 |
| 1,000,000 | | AAA | | Indiana Health Facility Financing Authority, Hospital Revenue, Series A, (Escrowed to maturity with U.S. government securities), 5.750% due 9/1/15 | | | 1,016,470 |
| | | | | | |
|
|
| | | | | | | | 3,520,692 |
| | | | | | |
|
|
| | |
Iowa — 3.4% | | | | | |
| 1,000,000 | | AAA | | Des Moines, IA Public Parking System Revenue, Series A, FGIC-Insured, 5.750% due 6/1/13 | | | 1,140,100 |
| | | | | | |
|
|
| | |
Michigan — 3.4% | | | | | |
| 1,000,000 | | AAA | | Michigan State House of Representatives COP, AMBAC-Insured,
5.250% due 8/15/14 | | | 1,140,540 |
| | | | | | |
|
|
| | |
Minnesota — 2.4% | | | | | |
| 750,000 | | AAA | | Southern Minnesota Municipal Power Agency, Power Supply System Revenue, Series A,
(Pre-Refunded — Escrowed with U.S. government securities to sinking fund 1/13/13 @ 100),
5.750% due 1/1/18 | | | 813,712 |
| | | | | | |
|
|
| | |
Missouri — 0.3% | | | | | |
| 100,000 | | A-1+ | | Missouri State Health and Educational Facilities Authority, Educational Facilities Revenue,
1.350% due 11/1/32 (b)(c) | | | 100,000 |
| | | | | | |
|
|
| | |
Nevada — 3.9% | | | | | |
| 1,220,000 | | AAA | | University of Nevada, University Revenue, Community College System, FSA-Insured,
5.250% due 7/1/16 | | | 1,314,282 |
| | | | | | |
|
|
See Notes to Financial Statements.
108
Schedules of Investments
(continued)
| | | | | | | |
| Municipal Bond Investments | | |
| | | |
Face
Amount | | Rating(a) | | Security | | Value |
| | |
New Jersey — 3.4% | | | | | |
| $1,000,000 | | AAA | | New Jersey State Transit Corp. COP, Series A, AMBAC-Insured, 5.500% due 9/15/15 | | $ | 1,153,990 |
| | | | | | |
|
|
| | |
New York — 3.7% | | | | | |
| 1,100,000 | | AAA | | New York State Urban Development Corporate Revenue, Series A, FSA-Insured, 5.250% due 1/1/14 | | | 1,247,334 |
| | | | | | |
|
|
| |
North Carolina — 3.1% | | | |
| 1,000,000 | | AAA | | Johnston County, NC GO, FGIC-Insured, 5.000% due 6/1/21 | | | 1,066,490 |
| | | | | | |
|
|
| | |
Ohio — 3.2% | | | | | |
| 1,000,000 | | AAA | | Ohio State Building Authority Revenue, Series A, MBIA-Insured, 4.500% due 4/1/24 | | | 989,700 |
| 100,000 | | A-1+ | | Ohio State Higher Educational Facility Revenue, Series A, 1.360% due 10/1/31 (b)(c) | | | 100,000 |
| | | | | | |
|
|
| | | | | | | | 1,089,700 |
| | | | | | |
|
|
| | |
Oklahoma — 3.1% | | | | | |
| 1,000,000 | | AAA | | Oklahoma City, OK Airport Trust, Series A, FSA-Insured, 5.250% due 7/1/21 | | | 1,054,780 |
| | | | | | |
|
|
| |
Pennsylvania — 2.9% | | | |
| 1,000,000 | | Aaa* | | Pennsylvania State Higher Educational Facilities Authority Revenue, Series Z, MBIA-Insured,
4.000% due 6/15/20 | | | 973,660 |
| | | | | | |
|
|
| | |
Tennessee — 0.6% | | | | | |
| 100,000 | | Aaa* | | Blount County, TN Public Building Authority, Series A, AMBAC-Insured, 1.360% due 6/1/21 (b)(c) | | | 100,000 |
| 100,000 | | Aaa* | | Sevier County, TN Public Building Authority, FSA-Insured, 1.360% due 6/1/20 (b)(c) | | | 100,000 |
| | | | | | |
|
|
| | | | | | | | 200,000 |
| | | | | | |
|
|
| | |
Texas — 10.3% | | | | | |
| 1,000,000 | | AAA | | Grapevine, TX GO, FGIC-Insured, 5.700% due 8/15/16 | | | 1,130,980 |
| | | | | Harris County Health Facilities Development Corporate, MBIA-Insured (b)(c): | | | |
| 200,000 | | A-1+ | | Corporate Revenue, 1.350% due 9/1/31 | | | 200,000 |
| 300,000 | | A-1+ | | Special Facility Revenue, 1.350% due 2/15/22 | | | 300,000 |
| 785,000 | | AAA | | Texas State Department of Housing & Community Affairs Residential Mortgage Revenue, Series A, GNMA/FNMA-Insured, 6.200% due 7/1/19 | | | 819,556 |
| 1,000,000 | | AAA | | University of North Texas, University Revenue, FGIC-Insured, 5.000% due 4/15/18 | | | 1,060,340 |
| | | | | | |
|
|
| | | | | | | | 3,510,876 |
| | | | | | |
|
|
| |
Washington — 6.1% | | | |
| 1,000,000 | | AAA | | Seattle, WA Water System Revenue, MBIA-Insured, 4.625% due 9/1/24 | | | 992,910 |
| 1,000,000 | | AAA | | Washington State GO, MBIA-Insured, 5.000% due 1/1/17 | | | 1,067,500 |
| | | | | | |
|
|
| | | | | | | | 2,060,410 |
| | | | | | |
|
|
| | |
Wisconsin — 3.3% | | | | | |
| 1,000,000 | | Aaa* | | Sun Prairie, WI Area School District GO, FGIC-Insured, 5.625% due 4/1/16 | | | 1,122,410 |
| | | | | | |
|
|
| | | | | TOTAL INVESTMENTS — 98.5%
(Cost $31,645,735**) | | | 33,398,377 |
| | | | | Other Assets in Excess of Liabilities — 1.5% | | | 496,322 |
| | | | | | |
|
|
| | | | | TOTAL NET ASSETS — 100.0% | | $ | 33,894,699 |
| | | | | | |
|
|
| (a) | | All ratings are by Standard & Poor’s Ratings Service, except those which are identified by an asterisk (*), are rated by Moody’s Investors Service. |
| (b) | | Rate shown reflects current rate on instruments with variable or step coupon rates. |
| (c) | | Variable rate obligation payable at par on demand at any time on no more than seven days notice. |
| ** | | Aggregate cost for Federal income tax purposes is substantially the same. |
See page 113 for definitions of ratings and certain abbreviations.
See Notes to Financial Statements.
109
Summary of Investments by Industry†
| | | |
Education | | 21.0 | % |
General Obligation | | 16.4 | |
Facility | | 13.9 | |
Utility | | 7.4 | |
General | | 7.0 | |
Airport | | 6.6 | |
Medical | | 4.8 | |
Bank | | 4.0 | |
Transportation | | 3.5 | |
School | | 3.3 | |
Other | | 12.1 | |
| | |
|
|
| | | 100.0 | % |
| | |
|
|
| † | | As a percentage of total investments. Please note that fund holdings are subject to change. |
See Notes to Financial Statements.
110
Schedules of Investments
(continued)
| | | | | | |
| International Fixed Income Investments |
| | |
Face
Amount† | | | Security | | Value |
| BONDS — 95.3% |
|
| Austria — 5.0% |
| 610,000,000 | JPY | | Pfandbriefstelle der Oesterreichischen Landes-Hypothekenbanken, 1.600% due 2/15/11 | | $ | 5,781,097 |
| | | | | |
|
|
|
| Belgium — 2.5% |
| 2,200,000 | | | Kingdom of Belgium, 5.750% due 3/28/08* | | | 2,923,212 |
| | | | | |
|
|
|
| France — 3.5% |
| 320,000 | GBP | | France Telecom, 7.500% due 3/14/11 | | | 638,642 |
| | | | French Treasury Note: | | | |
| 1,750,000 | | | 5.000% due 1/12/06 | | | 2,207,671 |
| 1,000,000 | | | 3.000% due 7/12/08 | | | 1,224,884 |
| | | | | |
|
|
| | | | | | | 4,071,197 |
| | | | | |
|
|
|
| Germany — 21.5% |
| 4,600,000 | | | Bundesschatzanweisungen, 2.750% due 6/23/06 | | | 5,633,947 |
| | | | Deutsche Bundesrepublik: | | | |
| 2,740,000 | | | 6.000% due 1/5/06 | | | 3,497,983 |
| 8,910,000 | | | 4.750% due 7/4/08 | | | 11,494,890 |
| 3,400,000 | | | 4.500% due 7/4/09* | | | 4,358,210 |
| | | | | |
|
|
| | | | | | | 24,985,030 |
| | | | | |
|
|
|
| Greece — 15.1% |
| | | | Hellenic Republic Government Bond: | | | |
| 4,900,000 | | | 4.650% due 4/19/07 | | | 6,263,039 |
| 1,400,000 | | | 6.300% due 1/29/09 | | | 1,918,155 |
| 6,200,000 | | | 6.500% due 1/11/14 | | | 8,915,452 |
| 370,000 | | | Public Power Corp., 4.500% due 3/12/09 | | | 464,742 |
| | | | | |
|
|
| | | | | | | 17,561,388 |
| | | | | |
|
|
|
| Hong Kong — 0.5% |
| 500,000 | EUR | | Hutchison Whampoa Finance Ltd., 5.875% due 7/8/13 | | | 643,167 |
| | | | | |
|
|
|
| Italy — 3.8% |
| 2,740,000 | | | Buoni Poliennali Del Tesoro, 4.750% due 3/15/06 | | | 3,461,296 |
| 720,000 | | | Telecom Italia S.p.A., 6.250% due 2/1/12 | | | 974,495 |
| | | | | |
|
|
| | | | | | | 4,435,791 |
| | | | | |
|
|
|
| Japan — 19.1% |
| | | | Development Bank of Japan: | | | |
| 530,000,000 | | | 1.400% due 6/20/12 | | | 4,901,880 |
| 560,000,000 | | | 1.600% due 6/20/14 | | | 5,150,582 |
| | | | Japan Finance Corp. for Municipal Enterprises: | | | |
| 550,000,000 | | | 1.550% due 2/21/12 | | | 5,167,569 |
| 770,000,000 | | | 1.350% due 11/26/13 | | | 6,970,114 |
| | | | | |
|
|
| | | | | | | 22,190,145 |
| | | | | |
|
|
|
| Luxembourg — 0.6% |
| 500,000 | | | Hannover Finance (Luxembourg) S.A., 6.250% due 3/14/31 | | | 669,605 |
| | | | | |
|
|
|
| Mexico — 0.6% |
| 540,000 | EUR | | Pemex Project Funding Master Trust, 6.250% due 8/5/13‡ | | | 690,250 |
| | | | | |
|
|
|
| The Netherlands — 0.3% |
| 280,000 | | | TPSA Eurofinance BV, 6.625% due 3/1/06 | | | 360,395 |
| | | | | |
|
|
See Notes to Financial Statements.
111
Schedules of Investments
(continued)
| | | | | | |
| International Fixed Income Investments |
| | |
Face
Amount† | | | Security | | Value |
|
| New Zealand — 4.5% |
| | | | New Zealand Government Bond: | | | |
| 4,800,000 | | | 6.500% due 4/15/13 | | $ | 3,213,147 |
| 3,200,000 | | | 6.000% due 4/15/15 | | | 2,066,689 |
| | | | | |
|
|
| | | | | | | 5,279,836 |
| | | | | |
|
|
|
| Poland — 3.6% |
| | | | Poland Government Bond: | | | |
| 2,200,000 | | | 8.500% due 5/12/07 | | | 613,315 |
| 14,100,000 | | | Zero coupon due 8/12/05 | | | 3,605,443 |
| | | | | |
|
|
| | | | | | | 4,218,758 |
| | | | | |
|
|
|
| United Kingdom — 14.0% |
| | | | United Kingdom Gilt: | | | |
| 860,000 | | | 7.500% due 12/7/06 | | | 1,638,053 |
| 5,340,000 | | | 5.000% due 9/7/14 | | | 9,704,242 |
| 2,200,000 | | | 8.000% due 12/7/15 | | | 4,997,503 |
| | | | | |
|
|
| | | | | | | 16,339,798 |
| | | | | |
|
|
|
| United States — 0.7% |
| 670,000 | EUR | | General Motors Acceptance Corp. Swift Trust 1999-1, 5.000% due 1/18/05‡ | | | 822,376 |
| | | | | |
|
|
| | | | TOTAL BONDS
(Cost — $105,638,169) | | $ | 110,972,045 |
| | | | | |
|
|
| REPURCHASE AGREEMENT — 2.1% |
| 2,421,000 | | | State Street Bank and Trust Co. dated 8/31/04, 1.490% due 9/1/04; Proceeds at maturity — $2,421,100; (Fully collateralized by U.S. Treasury Bonds, 5.250% due 2/15/29; Market value — $2,472,096) (Cost — $2,421,000) | | | 2,421,000 |
| | | | | |
|
|
| | | | TOTAL INVESTMENTS — 97.4%
(Cost — $108,059,169**) | | | 113,393,045 |
| | | | | | | |
| | | | Other Assets in Excess of Liabilities — 2.6% | | | 3,018,773 |
| | | | | |
|
|
| | | | NET ASSETS — 100.0% | | $ | 116,411,818 |
| | | | | |
|
|
| † | | Face amount represents local currency unless otherwise indicated. |
| ‡ | | Security is exempt from registration under Rule 144A of the Securities Act of 1933. This security may be resold in transactions that are exempt from registration, normally to qualified institutional buyers. These securities have been deemed liquid pursuant to guidelines approved by the Board of Trustees. |
| * | | All or a portion of this security is segregated for open forward foreign currency contracts. |
| ** | | Aggregate cost for Federal income tax purposes is $112,132,141. |
Currency abbreviations used in this schedule:
EUR — Euro
GBP — British Pound
JPY — Japanese Yen
Summary of Investments by Industry†
| | | |
Sovereign | | 88.1 | % |
Financial | | 7.0 | |
Repurchase Agreements | | 2.1 | |
Communications | | 1.8 | |
Energy | | 0.6 | |
Utilities | | 0.4 | |
| | |
|
|
| | | 100.0 | % |
| | |
|
|
| † | | As a percentage of total investments. Please note that fund holdings are subject to change. |
See Notes to Financial Statements.
112
Ratings and Security Descriptions
(Unaudited)
| | |
|
| Bond Ratings |
| The definitions of the applicable rating symbols are set forth below: |
Standard & Poor’s Ratings Service (“Standard & Poor’s”) — Ratings from “AA” to “CCC” may be modified by the addition of a plus (+) or a minus (-) sign to
show relative standings within the major rating categories. |
| AAA | | — Bonds rated “AAA” have the highest rating assigned by Standard & Poor’s. Capacity to pay interest and repay principal is extremely strong. |
| AA | | — Bonds rated “AA” have a very strong capacity to pay interest and repay principal and differ from the highest rated issue only in a small degree. |
| A | | — Bonds rated “A” have a strong capacity to pay interest and repay principal although they are somewhat more susceptible to the adverse effects of changes in circumstances and economic conditions than bonds in higher rated categories. |
| BBB | | — Bonds rated “BBB” are regarded as having an adequate capacity to pay interest and repay principal. Whereas they normally exhibit adequate protection parameters, adverse economic conditions or changing circumstances are more likely to lead to a weakened capacity to pay interest and repay principal for debt in this category than in higher rated categories. |
BB,B,
CCC, CC
and C | | — Bonds rated “BB”, “B”, “CCC”, “CC” and “C” are regarded, on balance, as predominantly speculative with respect to the issuer’s capacity to pay interest and repay principal in accordance with the terms of the obligation. BB indicates the lowest degree of speculation and “C” the highest degree of speculation. While such bonds will likely have some quality and protective characteristics, these are outweighted by large uncertainties or major risk exposures to adverse conditions. |
| D | | — Bonds rated “D” are in default, and payment of interest and/or repayment of principal is in arrears. |
Moody’s Investors Service (“Moody’s”) — Numerical modifiers 1, 2 and 3 may be applied to each generic rating from “Aa” to “Caa,” where 1 is the highest and
3 the lowest rating within its generic category. |
| Aaa | | — Bonds rated “Aaa” are judged to be of the best quality. They carry the smallest degree of investment risk and are generally referred to as “gilt edge.” Interest payments are protected by a large or by an exceptionally stable margin and principal is secure. While the various protective elements are likely to change, such changes as can be visualized are most unlikely to impair the fundamentally strong position of such issues. |
| Aa | | — Bonds rated “Aa” are judged to be of high quality by all standards. Together with the “Aaa” group they comprise what are generally known as high grade bonds. They are rated lower than the best bonds because margins of protection may not be as large as in “Aaa” securities or fluctuation of protective elements may be of greater amplitude or there may be other elements present which make the long-term risks appear somewhat larger than in “Aaa” securities. |
| A | | — Bonds rated “A” possess many favorable investment attributes and are to be considered as upper medium grade obligations. Factors giving security to principal and interest are considered adequate but elements may be present which suggest a susceptibility to impairment some time in the future. |
| Baa | | — Bonds rated “Baa” are considered to be medium grade obligations, i.e., they are neither highly protected nor poorly secured. Interest payments and principal security appear adequate for the present but certain protective elements may be lacking or may be characteristically unreliable over any great length of time. Such bonds lack outstanding investment characteristics and in fact have speculative characteristics as well. |
| Ba | | — Bonds rated “Ba” are judged to have speculative elements; their future cannot be considered as well assured. Often the protection of interest and principal payments may be very moderate, and thereby not well safeguarded during both good and bad times over the future. Uncertainty of position characterizes bonds in this class. |
| B | | — Bonds rated “B” generally lack characteristics of desirable investments. Assurance of interest and principal payments or of maintenance of other terms of the contract over any long period of time may be small. |
Caa
and Ca | | — Bonds rated “Caa” and “Ca” are of poor standing. These issues may be in default, or present elements of danger may exist with respect to principal or interest. |
| C | | — Bonds rated “C” are the lowest rated class of bonds, and issues so rated can be regarded as having extremely poor prospects of ever attaining any real investment standing. |
| NR | | — Indicates that the bond is not rated by Standard & Poor’s or Moody’s. |
|
| Short-Term Security Ratings |
| VMIG 1 | | — Moody’s highest rating for issues having demand feature — variable-rate demand obligation (VRDO). |
| P-1 | | — Moody’s highest rating for commercial paper and for VRDO prior to the advent of the VMIG 1 rating. |
| A-1 | | — Standard & Poor’s highest commercial paper and VRDO rating indicating that the degree of safety regarding timely payment is either overwhelming or very strong; those issues determined to possess overwhelming safety characteristics are denoted with a plus (+) sign. |
| | | | | | |
| | |
Abbreviations* | | | | |
| AMBAC | | — Ambac Assurance Corporation | | GO | | — General Obligation |
| CMO | | — Collateralized Mortgage Obligations | | ISD | | — Independent School District |
| COP | | — Certificate of Participation | | MBIA | | — Municipal Bond Investors Assurance Corporation |
| FGIC | | — Financial Guaranty Insurance Company | | PCR | | — Pollution Control Revenue |
| FHLMC | | — Federal Home Loan Mortgage Corporation | | PDI | | — Past Due Interest |
| FNMA | | — Federal National Mortgage Association | | PSFG | | — Permanent School Fund Guaranty |
| FSA | | — Financial Security Assurance | | VRDN | | — Variable Rate Demand Note |
| GNMA | | — Government National Mortgage Association | | | | |
| * | | Abbreviations may or may not appear in the schedules of investments. |
113
Statements of Assets and Liabilities
August 31, 2004
| | | | | | | | | | | |
| | | Large
Capitalization
Value Equity
Investments | | | Large
Capitalization
Growth
Investments | | | Small
Capitalization
Value Equity
Investments |
| ASSETS: | | | | | | | | | | | |
Investments, at cost | | $ | 1,138,157,032 | | | $ | 1,050,426,969 | | | $ | 326,763,716 |
Short-term investments, at cost | | | 53,273,000 | | | | 26,768,000 | | | | 19,784,000 |
Loaned securities collateral, at cost (Note 3) | | | — | | | | — | | | | 83,851,265 |
Foreign currency, at cost | | | — | | | | — | | | | — |
| | |
|
|
| |
|
|
| |
|
|
Investments, at value | | $ | 1,242,364,286 | | | $ | 1,189,490,825 | | | $ | 411,106,853 |
Short-term investments, at value | | | 53,273,000 | | | | 26,768,000 | | | | 19,784,000 |
Loaned securities collateral, at value (Note 3) | | | — | | | | — | | | | 83,851,265 |
Foreign currency, at value | | | — | | | | — | | | | — |
Cash | | | 2,260 | | | | 2,384 | | | | 179,816 |
Cash collateral at broker (Note 3) | | | — | | | | — | | | | — |
Receivable for securities sold | | | 15,515,611 | | | | 6,275,768 | | | | 402,249 |
Dividends and interest receivable | | | 3,121,974 | | | | 830,981 | | | | 660,653 |
Receivable for Fund shares sold | | | 2,078,921 | | | | 2,045,038 | | | | 510,276 |
Receivable for open forward foreign currency contracts (Note 3) | | | — | | | | — | | | | — |
Receivable from broker — variation margin | | | — | | | | — | | | | — |
Receivable from Manager | | | — | | | | — | | | | — |
Receivable from broker — option margin | | | — | | | | — | | | | — |
Other receivables | | | 137,068 | | | | — | | | | — |
| | |
|
|
| |
|
|
| |
|
|
Total Assets | | | 1,316,493,120 | | | | 1,225,412,996 | | | | 516,495,112 |
| | |
|
|
| |
|
|
| |
|
|
| LIABILITIES: | | | | | | | | | | | |
Payable for securities purchased | | | 11,011,612 | | | | 7,185,299 | | | | 2,473,798 |
Payable for Fund shares reacquired | | | 440,838 | | | | 384,449 | | | | 236,450 |
Management fees payable | | | 619,443 | | | | 588,417 | | | | 268,287 |
Administration fees payable | | | 210,730 | | | | 196,570 | | | | 69,784 |
Payable for loaned securities collateral (Note 3) | | | — | | | | — | | | | 83,851,265 |
Bank overdraft | | | — | | | | — | | | | — |
Payable for open forward foreign currency contracts (Note 3) | | | — | | | | — | | | | — |
Dividends payable | | | — | | | | — | | | | — |
Written options, at value (Premiums received — $175,573) (Note 3) | | | — | | | | — | | | | — |
Deferred mortgage dollar roll income | | | — | | | | — | | | | — |
Other liabilities | | | — | | | | — | | | | — |
Accrued expenses | | | 412,546 | | | | 270,242 | | | | 195,198 |
| | |
|
|
| |
|
|
| |
|
|
Total Liabilities | | | 12,695,169 | | | | 8,624,977 | | | | 87,094,782 |
| | |
|
|
| |
|
|
| |
|
|
Total Net Assets | | $ | 1,303,797,951 | | | $ | 1,216,788,019 | | | $ | 429,400,330 |
| | |
|
|
| |
|
|
| |
|
|
| NET ASSETS: | | | | | | | | | | | |
Par value of shares of beneficial interest | | $ | 130,291 | | | $ | 112,548 | | | $ | 28,536 |
Capital paid in excess of par value | | | 1,267,272,606 | | | | 1,473,241,220 | | | | 305,592,453 |
Undistributed (overdistributed) net investment income | | | 8,054,688 | | | | — | | | | 2,713,452 |
Accumulated net realized gain (loss) from investment transactions,
futures contracts, options and swap contracts | | | (75,867,148 | ) | | | (395,629,605 | ) | | | 36,722,752 |
Net unrealized appreciation of investments, futures contracts,
options, swap contracts and foreign currencies | | | 104,207,514 | | | | 139,063,856 | | | | 84,343,137 |
| | |
|
|
| |
|
|
| |
|
|
Total Net Assets | | $ | 1,303,797,951 | | | $ | 1,216,788,019 | | | $ | 429,400,330 |
| | |
|
|
| |
|
|
| |
|
|
Shares Outstanding | | | 130,290,798 | | | | 112,548,337 | | | | 28,535,712 |
| | |
|
|
| |
|
|
| |
|
|
Net Asset Value | | | $10.01 | | | | $10.81 | | | | $15.05 |
| | |
|
|
| |
|
|
| |
|
|
See Notes to Financial Statements.
114
| | | | | | | | | | | | | | | | | | | | | | | | | | | | | | |
Small
Capitalization
Growth
Investments | | | International
Equity
Investments | | | Emerging
Markets
Equity
Investments | | | Government
Money
Investments | | | Core Fixed
Income
Investments | | | High Yield
Investments | | | Municipal
Bond
Investments | | | International
Fixed Income
Investments | |
| | | | | | | | | | | | | | | | | | | | | | | | | | | | | | | |
| $ | 262,844,476 | | | $ | 499,612,341 | | | $ | 149,494,704 | | | $ | 96,039,252 | | | $ | 370,925,573 | | | $ | 219,288,069 | | | $ | 31,645,735 | | | $ | 105,638,169 | |
| | 9,464,000 | | | | 22,776,000 | | | | 422,000 | | | | — | | | | 110,388,468 | | | | 5,707,000 | | | | — | | | | 2,421,000 | |
| | 81,889,326 | | | | 147,645,078 | | | | — | | | | — | | | | 113,065,099 | | | | 22,820,074 | | | | — | | | | — | |
| | — | | | | 1,213,596 | | | | 685,756 | | | | — | | | | 178,161 | | | | — | | | | — | | | | 706,548 | |
|
|
| |
|
|
| |
|
|
| |
|
|
| |
|
|
| |
|
|
| |
|
|
| |
|
|
|
| $ | 309,538,541 | | | $ | 563,431,421 | | | $ | 186,332,475 | | | $ | 96,039,252 | | | $ | 379,377,280 | | | $ | 229,611,177 | | | $ | 33,398,377 | | | $ | 110,972,045 | |
| | 9,464,000 | | | | 22,776,000 | | | | 422,000 | | | | — | | | | 110,391,346 | | | | 5,707,000 | | | | — | | | | 2,421,000 | |
| | 81,889,326 | | | | 147,645,078 | | | | — | | | | — | | | | 113,065,099 | | | | 22,820,074 | | | | — | | | | — | |
| | — | | | | 1,225,770 | | | | 684,000 | | | | — | | | | 177,234 | | | | — | | | | — | | | | 716,235 | |
| | 3,169 | | | | 2,563 | | | | — | | | | 972 | | | | — | | | | 3,317 | | | | — | | | | 528 | |
| | — | | | | — | | | | 117,356 | | | | — | | | | — | | | | — | | | | — | | | | — | |
| | 72,360 | | | | 1,626,914 | | | | 349,130 | | | | — | | | | 34,806,400 | | | | 2,171,755 | | | | — | | | | 3,267,210 | |
| | 29,661 | | | | 1,708,437 | | | | 731,059 | | | | 26,779 | | | | 3,173,091 | | | | 4,493,985 | | | | 431,559 | | | | 1,689,056 | |
| | 366,562 | | | | 831,207 | | | | 569,441 | | | | 107,452 | | | | 1,516,467 | | | | 677,652 | | | | 150,715 | | | | 364,471 | |
| | — | | | | 4,881 | | | | 11 | | | | — | | | | 12,994 | | | | — | | | | — | | | | 985,824 | |
| | — | | | | — | | | | 460 | | | | — | | | | 232,694 | | | | — | | | | — | | | | — | |
| | — | | | | — | | | | — | | | | 64,506 | | | | — | | | | — | | | | — | | | | — | |
| | — | | | | — | | | | — | | | | — | | | | 6,529 | | | | — | | | | — | | | | — | |
| | — | | | | — | | | | — | | | | — | | | | — | | | | — | | | | — | | | | — | |
|
|
| |
|
|
| |
|
|
| |
|
|
| |
|
|
| |
|
|
| |
|
|
| |
|
|
|
| | 401,363,619 | | | | 739,252,271 | | | | 189,205,932 | | | | 96,238,961 | | | | 642,759,134 | | | | 265,484,960 | | | | 33,980,651 | | | | 120,416,369 | |
|
|
| |
|
|
| |
|
|
| |
|
|
| |
|
|
| |
|
|
| |
|
|
| |
|
|
|
| | | | | | | | | | | | | | | | | | | | | | | | | | | | | | | |
| | 827,332 | | | | 2,107,117 | | | | 89,107 | | | | 1,983,036 | | | | 47,813,687 | | | | 2,505,597 | | | | — | | | | 3,288,796 | |
| | 271,916 | | | | 194,176 | | | | 121,835 | | | | 191,053 | | | | 365,299 | | | | 230,684 | | | | 24,923 | | | | 106,666 | |
| | 207,672 | | | | 318,529 | | | | 119,181 | | | | — | | | | 156,628 | | | | 106,624 | | | | 10,873 | | | | 47,212 | |
| | 52,025 | | | | 95,381 | | | | 29,880 | | | | — | | | | 78,413 | | | | 38,895 | | | | 5,437 | | | | 18,885 | |
| | 81,889,326 | | | | 147,645,078 | | | | — | | | | — | | | | 113,065,099 | | | | 22,820,074 | | | | — | | | | — | |
| | — | | | | — | | | | 308,323 | | | | — | | | | 1,510 | | | | — | | | | 9,370 | | | | — | |
| | — | | | | 26,214 | | | | — | | | | — | | | | 735 | | | | — | | | | — | | | | 443,441 | |
| | — | | | | — | | | | — | | | | 29,149 | | | | — | | | | — | | | | — | | | | — | |
| | — | | | | — | | | | — | | | | — | | | | 236,680 | | | | — | | | | — | | | | — | |
| | — | | | | — | | | | — | | | | — | | | | 55,068 | | | | — | | | | — | | | | — | |
| | — | | | | — | | | | 218,585 | | | | — | | | | — | | | | — | | | | — | | | | — | |
| | 202,530 | | | | 309,558 | | | | 234,314 | | | | 160,887 | | | | 178,093 | | | | 133,030 | | | | 35,349 | | | | 99,551 | |
|
|
| |
|
|
| |
|
|
| |
|
|
| |
|
|
| |
|
|
| |
|
|
| |
|
|
|
| | 83,450,801 | | | | 150,696,053 | | | | 1,121,225 | | | | 2,364,125 | | | | 161,951,212 | | | | 25,834,904 | | | | 85,952 | | | | 4,004,551 | |
|
|
| |
|
|
| |
|
|
| |
|
|
| |
|
|
| |
|
|
| |
|
|
| |
|
|
|
| $ | 317,912,818 | | | $ | 588,556,218 | | | $ | 188,084,707 | | | $ | 93,874,836 | | | $ | 480,807,922 | | | $ | 239,650,056 | | | $ | 33,894,699 | | | $ | 116,411,818 | |
|
|
| |
|
|
| |
|
|
| |
|
|
| |
|
|
| |
|
|
| |
|
|
| |
|
|
|
| | | | | | | | | | | | | | | | | | | | | | | | | | | | | | | |
| $ | 26,567 | | | $ | 65,351 | | | $ | 24,761 | | | $ | 93,902 | | | $ | 57,795 | | | $ | 49,773 | | | $ | 3,671 | | | $ | 14,275 | |
| | 652,799,690 | | | | 792,681,200 | | | | 271,687,614 | | | | 93,802,046 | | | | 484,897,265 | | | | 320,432,307 | | | | 33,857,169 | | | | 112,438,481 | |
| | — | | | | (87,915 | ) | | | 1,548,075 | | | | — | | | | 956,818 | | | | (119,460 | ) | | | 237,353 | | | | 603,274 | |
| | | | | | | | | | | | | | | | | | | | | | | | | | | | | | | |
| | (381,607,504 | ) | | | (267,962,676 | ) | | | (121,796,195 | ) | | | (21,112 | ) | | | (14,992,262 | ) | | | (91,035,672 | ) | | | (1,956,136 | ) | | | (2,524,975 | ) |
| | | | | | | | | | | | | | | | | | | | | | | | | | | | | | | |
| | 46,694,065 | | | | 63,860,258 | | | | 36,620,452 | | | | — | | | | 9,888,306 | | | | 10,323,108 | | | | 1,752,642 | | | | 5,880,763 | |
|
|
| |
|
|
| |
|
|
| |
|
|
| |
|
|
| |
|
|
| |
|
|
| |
|
|
|
| $ | 317,912,818 | | | $ | 588,556,218 | | | $ | 188,084,707 | | | $ | 93,874,836 | | | $ | 480,807,922 | | | $ | 239,650,056 | | | $ | 33,894,699 | | | $ | 116,411,818 | |
|
|
| |
|
|
| |
|
|
| |
|
|
| |
|
|
| |
|
|
| |
|
|
| |
|
|
|
| | 26,567,086 | | | | 65,350,693 | | | | 24,761,218 | | | | 93,901,735 | | | | 57,795,232 | | | | 49,773,089 | | | | 3,670,827 | | | | 14,274,756 | |
|
|
| |
|
|
| |
|
|
| |
|
|
| |
|
|
| |
|
|
| |
|
|
| |
|
|
|
| | $11.97 | | | | $9.01 | | | | $7.60 | | | | $1.00 | | | | $8.32 | | | | $4.81 | | | | $9.23 | | | | $8.16 | |
|
|
| |
|
|
| |
|
|
| |
|
|
| |
|
|
| |
|
|
| |
|
|
| |
|
|
|
See Notes to Financial Statements.
115
Statements of Operations
For the Year Ended August 31, 2004
| | | | | | | | | | | | |
| | | Large
Capitalization
Value Equity
Investments | | | Large
Capitalization
Growth
Investments | | | Small
Capitalization
Value Equity
Investments | |
| INVESTMENT INCOME: | | | | | | | | | | | | |
Dividends | | $ | 25,537,152 | | | $ | 6,682,258 | | | $ | 7,806,203 | |
Interest | | | 432,381 | | | | 286,123 | | | | 273,583 | |
Less: Foreign withholding tax | | | (219,146 | ) | | | (26,186 | ) | | | (7,214 | ) |
| | |
|
|
| |
|
|
| |
|
|
|
Total Investment Income | | | 25,750,387 | | | | 6,942,195 | | | | 8,072,572 | |
| | |
|
|
| |
|
|
| |
|
|
|
| EXPENSES: | | | | | | | | | | | | |
Management fees (Note 2) | | | 7,270,312 | | | | 7,163,802 | | | | 3,406,859 | |
Administration fees (Note 2) | | | 2,481,656 | | | | 2,459,599 | | | | 885,397 | |
Transfer agency services | | | 870,309 | | | | 922,499 | | | | 713,900 | |
Audit and legal | | | 39,182 | | | | 41,601 | | | | 38,594 | |
Trustees’ fees | | | 39,162 | | | | 37,696 | | | | 16,049 | |
Shareholder communications | | | 29,917 | | | | 34,895 | | | | 32,087 | |
Custody | | | 24,024 | | | | 101,999 | | | | 40,133 | |
Registration fees | | | 19,998 | | | | 40,000 | | | | 18,053 | |
Interest expense (Note 3) | | | — | | | | — | | | | — | |
Other | | | 10,047 | | | | 11,999 | | | | 6,128 | |
| | |
|
|
| |
|
|
| |
|
|
|
Total Expenses | | | 10,784,607 | | | | 10,814,090 | | | | 5,157,200 | |
Less: Management and administration fee waiver and expense reimbursement (Note 2) | | | — | | | | — | | | | — | |
| | |
|
|
| |
|
|
| |
|
|
|
Net Expenses | | | 10,784,607 | | | | 10,814,090 | | | | 5,157,200 | |
| | |
|
|
| |
|
|
| |
|
|
|
Net Investment Income (Loss) | | | 14,965,780 | | | | (3,871,895 | ) | | | 2,915,372 | |
| | |
|
|
| |
|
|
| |
|
|
|
REALIZED AND UNREALIZED GAIN (LOSS) ON INVESTMENTS, FUTURES CONTRACTS, OPTIONS, SWAP CONTRACTS AND FOREIGN CURRENCIES
(NOTES 1 AND 3): | | | | | | | | | | | | |
Realized Gain (Loss) From: | | | | | | | | | | | | |
Investment transactions | | | 97,398,524 | | | | 102,680,075 | | | | 54,676,867 | |
Futures contracts | | | — | | | | — | | | | — | |
Options written | | | — | | | | — | | | | — | |
Swap contracts | | | — | | | | — | | | | — | |
Foreign currency transactions | | | 120 | | | | — | | | | — | |
| | |
|
|
| |
|
|
| |
|
|
|
Net Realized Gain | | | 97,398,644 | | | | 102,680,075 | | | | 54,676,867 | |
| | |
|
|
| |
|
|
| |
|
|
|
Change in Net Unrealized Appreciation From: | | | | | | | | | | | | |
Investments | | | 28,820,479 | | | | (53,872,509 | ) | | | 34,280,803 | |
Foreign currencies | | | 260 | | | | — | | | | — | |
| | |
|
|
| |
|
|
| |
|
|
|
Increase (Decrease) in Net Unrealized Appreciation | | | 28,820,739 | | | | (53,872,509 | ) | | | 34,280,803 | |
| | |
|
|
| |
|
|
| |
|
|
|
Net Gain on Investments, Futures Contracts, Options, Swap Contracts and Foreign Currencies | | | 126,219,383 | | | | 48,807,566 | | | | 88,957,670 | |
| | |
|
|
| |
|
|
| |
|
|
|
Increase in Net Assets From Operations | | $ | 141,185,163 | | | $ | 44,935,671 | | | $ | 91,873,042 | |
| | |
|
|
| |
|
|
| |
|
|
|
See Notes to Financial Statements.
116
| | | | | | | | | | | | | | | | | | | | | | | | | | | | | |
Small
Capitalization
Growth
Investments | | | International
Equity
Investments | | | Emerging
Markets
Equity
Investments | | | Government
Money
Investments | | | Core Fixed
Income
Investments | | | High Yield
Investments | | | Municipal
Bond
Investments | | International
Fixed Income
Investments | |
| | | | | | | | | | | | | | | | | | | | | | | | | | | | | | |
| $ | 1,313,230 | | | $ | 12,711,053 | | | $ | 6,383,152 | | | $ | — | | | $ | — | | | $ | 300,021 | | | $ | — | | $ | — | |
| | 367,774 | | | | 615,575 | | | | 62,354 | | | | 1,105,871 | | | | 14,463,629 | | | | 17,803,898 | | | | 1,360,482 | | | 4,138,246 | |
| | (1,213 | ) | | | (1,481,505 | ) | | | (1,462,894 | ) | | | — | | | | — | | | | (547 | ) | | | — | | | — | |
|
|
| |
|
|
| |
|
|
| |
|
|
| |
|
|
| |
|
|
| |
|
| |
|
|
|
| | 1,679,791 | | | | 11,845,123 | | | | 4,982,612 | | | | 1,105,871 | | | | 14,463,629 | | | | 18,103,372 | | | | 1,360,482 | | | 4,138,246 | |
|
|
| |
|
|
| |
|
|
| |
|
|
| |
|
|
| |
|
|
| |
|
| |
|
|
|
| | | | | | | | | | | | | | | | | | | | | | | | | | | | | | |
| | 3,586,065 | | | | 3,965,557 | | | | 1,857,805 | | | | 154,301 | | | | 1,438,101 | | | | 1,280,911 | | | | 120,448 | | | 566,210 | |
| | 898,338 | | | | 1,195,289 | | | | 432,412 | | | | 205,734 | | | | 721,526 | | | | 467,301 | | | | 60,224 | | | 226,484 | |
| | 750,040 | | | | 839,976 | | | | 463,270 | | | | 540,979 | | | | 405,719 | | | | 364,107 | | | | 17,051 | | | 232,423 | |
| | 39,585 | | | | 37,098 | | | | 48,245 | | | | 39,590 | | | | 42,100 | | | | 37,565 | | | | 35,713 | | | 37,991 | |
| | 16,999 | | | | 18,549 | | | | 9,521 | | | | 6,518 | | | | 12,009 | | | | 11,000 | | | | 2,510 | | | 5,519 | |
| | 30,001 | | | | 30,087 | | | | 21,056 | | | | 25,082 | | | | 30,355 | | | | 26,250 | | | | 1,504 | | | 10,731 | |
| | 30,354 | | | | 330,921 | | | | 681,441 | | | | 17,456 | | | | 72,475 | | | | 98,000 | | | | 12,235 | | | 91,600 | |
| | 13,130 | | | | 21,067 | | | | 27,700 | | | | 15,567 | | | | 25,500 | | | | 25,638 | | | | 16,700 | | | 17,793 | |
| | — | | | | 3,852 | | | | — | | | | — | | | | — | | | | — | | | | — | | | 1,828 | |
| | 3,999 | | | | 7,028 | | | | 3,000 | | | | 2,016 | | | | 4,000 | | | | 3,016 | | | | 2,400 | | | 2,879 | |
|
|
| |
|
|
| |
|
|
| |
|
|
| |
|
|
| |
|
|
| |
|
| |
|
|
|
| | 5,368,511 | | | | 6,449,424 | | | | 3,544,450 | | | | 1,007,243 | | | | 2,751,785 | | | | 2,313,788 | | | | 268,785 | | | 1,193,458 | |
| | — | | | | — | | | | — | | | | (390,039 | ) | | | — | | | | — | | | | — | | | — | |
|
|
| |
|
|
| |
|
|
| |
|
|
| |
|
|
| |
|
|
| |
|
| |
|
|
|
| | 5,368,511 | | | | 6,449,424 | | | | 3,544,450 | | | | 617,204 | | | | 2,751,785 | | | | 2,313,788 | | | | 268,785 | | | 1,193,458 | |
|
|
| |
|
|
| |
|
|
| |
|
|
| |
|
|
| |
|
|
| |
|
| |
|
|
|
| | (3,688,720 | ) | | | 5,395,699 | | | | 1,438,162 | | | | 488,667 | | | | 11,711,844 | | | | 15,789,584 | | | | 1,091,697 | | | 2,944,788 | |
|
|
| |
|
|
| |
|
|
| |
|
|
| |
|
|
| |
|
|
| |
|
| |
|
|
|
| | | | | | | | | | | | | | | | | | | | | | | | | | | | | | |
| | | | | | | | | | | | | | | | | | | | | | | | | | | | | | |
| | | | | | | | | | | | | | | | | | | | | | | | | | | | | | |
| | | | | | | | | | | | | | | | | | | | | | | | | | | | | | |
| | 83,365,060 | | | | 99,789,893 | | | | 48,620,389 | | | | — | | | | (462,293 | ) | | | 7,591,698 | | | | 144,567 | | | 6,769,156 | |
| | — | | | | — | | | | 227,378 | | | | — | | | | 1,110,231 | | | | — | | | | — | | | — | |
| | — | | | | — | | | | — | | | | — | | | | 289,762 | | | | — | | | | — | | | — | |
| | — | | | | — | | | | 847,578 | | | | — | | | | — | | | | — | | | | — | | | — | |
| | — | | | | (2,408,161 | ) | | | (143,401 | ) | | | — | | | | (112,170 | ) | | | — | | | | — | | | 2,278,070 | |
|
|
| |
|
|
| |
|
|
| |
|
|
| |
|
|
| |
|
|
| |
|
| |
|
|
|
| | 83,365,060 | | | | 97,381,732 | | | | 49,551,944 | | | | — | | | | 825,530 | | | | 7,591,698 | | | | 144,567 | | | 9,047,226 | |
|
|
| |
|
|
| |
|
|
| |
|
|
| |
|
|
| |
|
|
| |
|
| |
|
|
|
| | | | | | | | | | | | | | | | | | | | | | | | | | | | | | |
| | (54,958,133 | ) | | | (13,523,761 | ) | | | (12,443,662 | ) | | | — | | | | 5,813,492 | | | | 2,519,959 | | | | 810,297 | | | 4,030,022 | |
| | — | | | | 21,846 | | | | (127,851 | ) | | | — | | | | (145,728 | ) | | | — | | | | — | | | (1,297,824 | ) |
|
|
| |
|
|
| |
|
|
| |
|
|
| |
|
|
| |
|
|
| |
|
| |
|
|
|
| | (54,958,133 | ) | | | (13,501,915 | ) | | | (12,571,513 | ) | | | — | | | | 5,667,764 | | | | 2,519,959 | | | | 810,297 | | | 2,732,198 | |
|
|
| |
|
|
| |
|
|
| |
|
|
| |
|
|
| |
|
|
| |
|
| |
|
|
|
| | 28,406,927 | | | | 83,879,817 | | | | 36,980,431 | | | | — | | | | 6,493,294 | | | | 10,111,657 | | | | 954,864 | | | 11,779,424 | |
|
|
| |
|
|
| |
|
|
| |
|
|
| |
|
|
| |
|
|
| |
|
| |
|
|
|
| $ | 24,718,207 | | | $ | 89,275,516 | | | $ | 38,418,593 | | | $ | 488,667 | | | $ | 18,205,138 | | | $ | 25,901,241 | | | $ | 2,046,561 | | $ | 14,724,212 | |
|
|
| |
|
|
| |
|
|
| |
|
|
| |
|
|
| |
|
|
| |
|
| |
|
|
|
See Notes to Financial Statements.
117
Statements of Changes in Net Assets
For the Years Ended August 31,
| | | | | | | | | | | | | | | | |
| | | Large Capitalization
Value Equity Investments
| | | Large Capitalization
Growth Investments
| |
| | | 2004 | | | 2003 | | | 2004 | | | 2003 | |
| OPERATIONS: | | | | | | | | | | | | | | | | |
Net investment income (loss) | | $ | 14,965,780 | | | $ | 16,796,633 | | | $ | (3,871,895 | ) | | $ | (3,092,689 | ) |
Net realized gain (loss) | | | 97,398,644 | | | | (85,279,960 | ) | | | 102,680,075 | | | | (122,806,019 | ) |
Increase (decrease) in net unrealized appreciation | | | 28,820,739 | | | | 164,242,522 | | | | (53,872,509 | ) | | | 354,822,413 | |
| | |
|
|
| |
|
|
| |
|
|
| |
|
|
|
Increase in Net Assets From Operations | | | 141,185,163 | | | | 95,759,195 | | | | 44,935,671 | | | | 228,923,705 | |
| | |
|
|
| |
|
|
| |
|
|
| |
|
|
|
| DISTRIBUTIONS TO SHAREHOLDERS FROM: | | | | | | | | | | | | | | | | |
Net investment income | | | (17,504,343 | ) | | | (14,867,262 | ) | | | — | | | | — | |
Net realized gains | | | — | | | | — | | | | — | | | | — | |
| | |
|
|
| |
|
|
| |
|
|
| |
|
|
|
Decrease in Net Assets From Distributions to Shareholders | | | (17,504,343 | ) | | | (14,867,262 | ) | | | — | | | | — | |
| | |
|
|
| |
|
|
| |
|
|
| |
|
|
|
| FUND SHARE TRANSACTIONS (NOTE 5): | | | | | | | | | | | | | | | | |
Net proceeds from sale of shares | | | 319,541,600 | | | | 229,595,833 | | | | 289,471,578 | | | | 181,518,438 | |
Net asset value of shares issued for reinvestment of distributions | | | 17,116,878 | | | | 14,583,574 | | | | — | | | | — | |
Cost of shares reacquired | | | (270,125,513 | ) | | | (292,704,256 | ) | | | (272,541,080 | ) | | | (281,475,014 | ) |
| | |
|
|
| |
|
|
| |
|
|
| |
|
|
|
Increase (Decrease) in Net Assets From Fund Share Transactions | | | 66,532,965 | | | | (48,524,849 | ) | | | 16,930,498 | | | | (99,956,576 | ) |
| | |
|
|
| |
|
|
| |
|
|
| |
|
|
|
Increase (Decrease) in Net Assets | | | 190,213,785 | | | | 32,367,084 | | | | 61,866,169 | | | | 128,967,129 | |
| NET ASSETS: | | | | | | | | | | | | | | | | |
Beginning of year | | | 1,113,584,166 | | | | 1,081,217,082 | | | | 1,154,921,850 | | | | 1,025,954,721 | |
| | |
|
|
| |
|
|
| |
|
|
| |
|
|
|
End of year* | | $ | 1,303,797,951 | | | $ | 1,113,584,166 | | | $ | 1,216,788,019 | | | $ | 1,154,921,850 | |
| | |
|
|
| |
|
|
| |
|
|
| |
|
|
|
* Note: | | | | | | | | | | | | | | | | |
Includes undistributed (overdistributed) net investment income of: | | | $8,054,688 | | | | $11,636,042 | | | | — | | | | — | |
| | |
|
|
| |
|
|
| |
|
|
| |
|
|
|
See Notes to Financial Statements.
118
| | | | | | | | | | | | | | | | | | | | | | | | | | | | | | |
Small Capitalization
Value Equity Investments
| | | Small Capitalization
Growth Investments
| | | International Equity Investments
| | | Emerging Markets
Equity Investments
| |
| 2004 | | | 2003 | | | 2004 | | | 2003 | | | 2004 | | | 2003 | | | 2004 | | | 2003 | |
| | | | | | | | | | | | | | | | | | | | | | | | | | | | | | | |
| $ | 2,915,372 | | | $ | 4,001,915 | | | $ | (3,688,720 | ) | | $ | (3,150,735 | ) | | $ | 5,395,699 | | | $ | 7,444,234 | | | $ | 1,438,162 | | | $ | 1,334,519 | |
| | 54,676,867 | | | | (16,338,058 | ) | | | 83,365,060 | | | | (82,008,985 | ) | | | 97,381,732 | | | | (65,759,653 | ) | | | 49,551,944 | | | | (4,117,228 | ) |
| | 34,280,803 | | | | 51,779,889 | | | | (54,958,133 | ) | | | 195,592,765 | | | | (13,501,915 | ) | | | 117,013,212 | | | | (12,571,513 | ) | | | 36,780,080 | |
|
|
| |
|
|
| |
|
|
| |
|
|
| |
|
|
| |
|
|
| |
|
|
| |
|
|
|
| | 91,873,042 | | | | 39,443,746 | | | | 24,718,207 | | | | 110,433,045 | | | | 89,275,516 | | | | 58,697,793 | | | | 38,418,593 | | | | 33,997,371 | |
|
|
| |
|
|
| |
|
|
| |
|
|
| |
|
|
| |
|
|
| |
|
|
| |
|
|
|
| | | | | | | | | | | | | | | | | | | | | | | | | | | | | | | |
| | (3,200,315 | ) | | | (1,967,532 | ) | | | — | | | | — | | | | (8,500,192 | ) | | | (1,584,789 | ) | | | (822,753 | ) | | | (1,744,393 | ) |
| | — | | | | (22,740,420 | ) | | | — | | | | — | | | | — | | | | — | | | | — | | | | — | |
|
|
| |
|
|
| |
|
|
| |
|
|
| |
|
|
| |
|
|
| |
|
|
| |
|
|
|
| | (3,200,315 | ) | | | (24,707,952 | ) | | | — | | | | — | | | | (8,500,192 | ) | | | (1,584,789 | ) | | | (822,753 | ) | | | (1,744,393 | ) |
|
|
| |
|
|
| |
|
|
| |
|
|
| |
|
|
| |
|
|
| |
|
|
| |
|
|
|
| | | | | | | | | | | | | | | | | | | | | | | | | | | | | | | |
| | 64,371,901 | | | | 38,780,587 | | | | 82,723,146 | | | | 79,014,613 | | | | 118,534,396 | | | | 81,500,116 | | | | 59,116,228 | | | | 40,256,929 | |
| | 3,136,620 | | | | 24,340,026 | | | | — | | | | — | | | | 8,352,717 | | | | 1,558,411 | | | | 813,221 | | | | 1,727,402 | |
| | (151,582,004 | ) | | | (156,247,315 | ) | | | (286,056,954 | ) | | | (166,521,061 | ) | | | (152,194,637 | ) | | | (141,711,972 | ) | | | (105,476,274 | ) | | | (61,717,701 | ) |
|
|
| |
|
|
| |
|
|
| |
|
|
| |
|
|
| |
|
|
| |
|
|
| |
|
|
|
| | (84,073,483 | ) | | | (93,126,702 | ) | | | (203,333,808 | ) | | | (87,506,448 | ) | | | (25,307,524 | ) | | | (58,653,445 | ) | | | (45,546,825 | ) | | | (19,733,370 | ) |
|
|
| |
|
|
| |
|
|
| |
|
|
| |
|
|
| |
|
|
| |
|
|
| |
|
|
|
| | 4,599,244 | | | | (78,390,908 | ) | | | (178,615,601 | ) | | | 22,926,597 | | | | 55,467,800 | | | | (1,540,441 | ) | | | (7,950,985 | ) | | | 12,519,608 | |
| | | | | | | | | | | | | | | | | | | | | | | | | | | | | | | |
| | 424,801,086 | | | | 503,191,994 | | | | 496,528,419 | | | | 473,601,822 | | | | 533,088,418 | | | | 534,628,859 | | | | 196,035,692 | | | | 183,516,084 | |
|
|
| |
|
|
| |
|
|
| |
|
|
| |
|
|
| |
|
|
| |
|
|
| |
|
|
|
| $ | 429,400,330 | | | $ | 424,801,086 | | | $ | 317,912,818 | | | $ | 496,528,419 | | | $ | 588,556,218 | | | $ | 533,088,418 | | | $ | 188,084,707 | | | $ | 196,035,692 | |
|
|
| |
|
|
| |
|
|
| |
|
|
| |
|
|
| |
|
|
| |
|
|
| |
|
|
|
| | | | | | | | | | | | | | | | | | | | | | | | | | | | | | | |
| | $2,713,452 | | | | $3,452,442 | | | | — | | | | $907 | | | | $(87,915 | ) | | | $3,012,587 | | | | $1,548,075 | | | | $466,829 | |
|
|
| |
|
|
| |
|
|
| |
|
|
| |
|
|
| |
|
|
| |
|
|
| |
|
|
|
See Notes to Financial Statements.
119
Statements of Changes in Net Assets
For the Years Ended August 31,
| | | | | | | | |
| | | Government Money
Investments
| |
| | | 2004 | | | 2003 | |
| OPERATIONS: | | | | | | | | |
Net investment income | | $ | 488,667 | | | $ | 990,340 | |
Net realized gain (loss) | | | — | | | | 9,752 | |
Increase (decrease) in net unrealized appreciation | | | — | | | | — | |
| | |
|
|
| |
|
|
|
Increase in Net Assets From Operations | | | 488,667 | | | | 1,000,092 | |
| | |
|
|
| |
|
|
|
| DISTRIBUTIONS TO SHAREHOLDERS FROM: | | | | | | | | |
Net investment income | | | (488,667 | ) | | | (1,058,373 | ) |
| | |
|
|
| |
|
|
|
Decrease in Net Assets From Distributions to Shareholders | | | (488,667 | ) | | | (1,058,373 | ) |
| | |
|
|
| |
|
|
|
| FUND SHARE TRANSACTIONS (NOTE 5): | | | | | | | | |
Net proceeds from sale of shares | | | 88,254,534 | | | | 119,236,885 | |
Net asset value of shares issued for reinvestment of distributions | | | 472,008 | | | | 1,109,055 | |
Net asset value of shares issued in connection with the transfer of net assets of (Note 4): | | | | | | | | |
Long-Term Bond Investments | | | — | | | | — | |
Mortgage Backed Investments | | | — | | | | — | |
Multi-Sector Fixed Income Investments | | | — | | | | — | |
Cost of shares reacquired | | | (105,312,733 | ) | | | (150,237,821 | ) |
| | |
|
|
| |
|
|
|
Increase (Decrease) in Net Assets From Fund Share Transactions | | | (16,586,191 | ) | | | (29,891,881 | ) |
| | |
|
|
| |
|
|
|
Increase (Decrease) in Net Assets | | | (16,586,191 | ) | | | (29,950,162 | ) |
| NET ASSETS: | | | | | | | | |
Beginning of year | | | 110,461,027 | | | | 140,411,189 | |
| | |
|
|
| |
|
|
|
End of year* | | $ | 93,874,836 | | | $ | 110,461,027 | |
| | |
|
|
| |
|
|
|
* Includes undistributed (overdistributed) net investment income of: | | | — | | | | — | |
| | |
|
|
| |
|
|
|
See Notes to Financial Statements.
120
| | | | | | | | | | | | | | | | | | | | | | | | | | | | | | |
Core Fixed Income
Investments
| | | High Yield
Investments
| | | Municipal Bond
Investments
| | | International Fixed
Income Investments
| |
| 2004 | | | 2003 | | | 2004 | | | 2003 | | | 2004 | | | 2003 | | | 2004 | | | 2003 | |
| | | | | | | | | | | | | | | | | | | | | | | | | | | | | | | |
| $ | 11,711,844 | | | $ | 13,394,756 | | | $ | 15,789,584 | | | $ | 17,590,527 | | | $ | 1,091,697 | | | $ | 1,105,587 | | | $ | 2,944,788 | | | $ | 3,792,910 | |
| | 825,530 | | | | (168,559 | ) | | | 7,591,698 | | | | (24,870,352 | ) | | | 144,567 | | | | 415,893 | | | | 9,047,226 | | | | 9,865,889 | |
| | 5,667,764 | | | | 1,101,000 | | | | 2,519,959 | | | | 37,703,076 | | | | 810,297 | | | | (865,184 | ) | | | 2,732,198 | | | | (2,079,027 | ) |
|
|
| |
|
|
| |
|
|
| |
|
|
| |
|
|
| |
|
|
| |
|
|
| |
|
|
|
| | 18,205,138 | | | | 14,327,197 | | | | 25,901,241 | | | | 30,423,251 | | | | 2,046,561 | | | | 656,296 | | | | 14,724,212 | | | | 11,579,772 | |
|
|
| |
|
|
| |
|
|
| |
|
|
| |
|
|
| |
|
|
| |
|
|
| |
|
|
|
| | | | | | | | | | | | | | | | | | | | | | | | | | | | | | | |
| | (11,889,622 | ) | | | (15,588,205 | ) | | | (16,171,887 | ) | | | (18,966,872 | ) | | | (1,152,482 | ) | | | (1,115,834 | ) | | | (11,403,364 | ) | | | (4,474,320 | ) |
|
|
| |
|
|
| |
|
|
| |
|
|
| |
|
|
| |
|
|
| |
|
|
| |
|
|
|
| | (11,889,622 | ) | | | (15,588,205 | ) | | | (16,171,887 | ) | | | (18,966,872 | ) | | | (1,152,482 | ) | | | (1,115,834 | ) | | | (11,403,364 | ) | | | (4,474,320 | ) |
|
|
| |
|
|
| |
|
|
| |
|
|
| |
|
|
| |
|
|
| |
|
|
| |
|
|
|
| | | | | | | | | | | | | | | | | | | | | | | | | | | | | | | |
| | 146,617,588 | | | | 103,849,038 | | | | 63,711,334 | | | | 58,424,053 | | | | 13,164,319 | | | | 10,746,905 | | | | 30,768,542 | | | | 23,681,301 | |
| | 11,409,013 | | | | 15,019,237 | | | | 15,618,102 | | | | 18,417,303 | | | | 1,023,857 | | | | 1,013,760 | | | | 10,891,966 | | | | 4,299,562 | |
| | | | | | | | | | | | | | | | | | | | | | | | | | | | | | | |
| | 15,333,480 | | | | — | | | | — | | | | — | | | | — | | | | — | | | | — | | | | — | |
| | 70,385,745 | | | | — | | | | — | | | | — | | | | — | | | | — | | | | — | | | | — | |
| | 27,160,561 | | | | — | | | | — | | | | — | | | | — | | | | — | | | | — | | | | — | |
| | (114,272,118 | ) | | | (131,079,827 | ) | | | (76,599,296 | ) | | | (83,480,243 | ) | | | (9,573,581 | ) | | | (13,519,066 | ) | | | (40,598,864 | ) | | | (49,133,422 | ) |
|
|
| |
|
|
| |
|
|
| |
|
|
| |
|
|
| |
|
|
| |
|
|
| |
|
|
|
| | 156,634,269 | | | | (12,211,552 | ) | | | 2,730,140 | | | | (6,638,887 | ) | | | 4,614,595 | | | | (1,758,401 | ) | | | 1,061,644 | | | | (21,152,559 | ) |
|
|
| |
|
|
| |
|
|
| |
|
|
| |
|
|
| |
|
|
| |
|
|
| |
|
|
|
| | 162,949,785 | | | | (13,472,560 | ) | | | 12,459,494 | | | | 4,817,492 | | | | 5,508,674 | | | | (2,217,939 | ) | | | 4,382,492 | | | | (14,047,107 | ) |
| | | | | | | | | | | | | | | | | | | | | | | | | | | | | | | |
| | 317,858,137 | | | | 331,330,697 | | | | 227,190,562 | | | | 222,373,070 | | | | 28,386,025 | | | | 30,603,964 | | | | 112,029,326 | | | | 126,076,433 | |
|
|
| |
|
|
| |
|
|
| |
|
|
| |
|
|
| |
|
|
| |
|
|
| |
|
|
|
| $ | 480,807,922 | | | $ | 317,858,137 | | | $ | 239,650,056 | | | $ | 227,190,562 | | | $ | 33,894,699 | | | $ | 28,386,025 | | | $ | 116,411,818 | | | $ | 112,029,326 | |
|
|
| |
|
|
| |
|
|
| |
|
|
| |
|
|
| |
|
|
| |
|
|
| |
|
|
|
| | $956,818 | | | | $(206,132) | | | | $(119,460) | | | | $(266,788) | | | | $237,353 | | | | $298,138 | | | | $603,274 | | | | $143,018 | |
|
|
| |
|
|
| |
|
|
| |
|
|
| |
|
|
| |
|
|
| |
|
|
| |
|
|
|
See Notes to Financial Statements.
121
Financial Highlights
For a share of beneficial interest outstanding throughout each year ended August 31, unless otherwise noted:
| | | | | | | | | | | | | | | |
| Large Capitalization Value Equity Investments | | | | | | | | | | | | | | | |
| | | 2004
| | | 2003
| | | 2002
| | | 2001(1)
| | | 2000
| |
Net Asset Value, Beginning of Year | | $9.00 | | | $8.39 | | | $10.07 | | | $11.93 | | | $13.53 | |
| | |
|
| |
|
| |
|
| |
|
| |
|
|
Income (Loss) From Operations: | | | | | | | | | | | | | | | |
Net investment income | | 0.12 | | | 0.13 | | | 0.12 | | | 0.12 | | | 0.17 | |
Net realized and unrealized gain (loss) | | 1.03 | | | 0.59 | | | (1.68 | ) | | (0.34 | ) | | 0.31 | |
| | |
|
| |
|
| |
|
| |
|
| |
|
|
Total Income (Loss) From Operations | | 1.15 | | | 0.72 | | | (1.56 | ) | | (0.22 | ) | | 0.48 | |
| | |
|
| |
|
| |
|
| |
|
| |
|
|
Less Distributions From: | | | | | | | | | | | | | | | |
Net investment income | | (0.14 | ) | | (0.11 | ) | | (0.12 | ) | | (0.15 | ) | | (0.17 | ) |
Net realized gains | | — | | | — | | | — | | | (1.49 | ) | | (1.91 | ) |
| | |
|
| |
|
| |
|
| |
|
| |
|
|
Total Distributions | | (0.14 | ) | | (0.11 | ) | | (0.12 | ) | | (1.64 | ) | | (2.08 | ) |
| | |
|
| |
|
| |
|
| |
|
| |
|
|
Net Asset Value, End of Year | | $10.01 | | | $9.00 | | | $8.39 | | | $10.07 | | | $11.93 | |
| | |
|
| |
|
| |
|
| |
|
| |
|
|
Total Return | | 12.89 | % | | 8.75 | % | | (15.71 | )% | | (1.96 | )% | | 4.00 | % |
Net Assets, End of Year (millions) | | $1,304 | | | $1,114 | | | $1,081 | | | $1,612 | | | $1,933 | |
Ratios to Average Net Assets: | | | | | | | | | | | | | | | |
Expenses | | 0.87 | % | | 0.93 | % | | 0.87 | % | | 0.78 | % | | 0.78 | % |
Net investment income | | 1.21 | | | 1.60 | | | 1.16 | | | 1.10 | | | 1.34 | |
Portfolio Turnover Rate | | 94 | % | | 81 | % | | 111 | % | | 79 | % | | 78 | % |
| | | | | |
| Large Capitalization Growth Investments | | | | | | | | | | | | | | | |
| | | 2004
| | | 2003
| | | 2002
| | | 2001(1)
| | | 2000
| |
Net Asset Value, Beginning of Year | | $10.38 | | | $8.36 | | | $11.34 | | | $29.33 | | | $24.35 | |
| | |
|
| |
|
| |
|
| |
|
| |
|
|
Income (Loss) From Operations: | | | | | | | | | | | | | | | |
Net investment loss | | (0.03 | ) | | (0.00 | )* | | (0.04 | ) | | (0.05 | ) | | (0.04 | ) |
Net realized and unrealized gain (loss) | | 0.46 | | | 2.02 | | | (2.94 | ) | | (11.65 | ) | | 7.87 | |
| | |
|
| |
|
| |
|
| |
|
| |
|
|
Total Income (Loss) From Operations | | 0.43 | | | 2.02 | | | (2.98 | ) | | (11.70 | ) | | 7.83 | |
| | |
|
| |
|
| |
|
| |
|
| |
|
|
Less Distributions From: | | | | | | | | | | | | | | | |
Net investment income | | — | | | — | | | — | | | — | | | — | |
Net realized gains | | — | | | — | | | — | | | (6.29 | ) | | (2.85 | ) |
| | |
|
| |
|
| |
|
| |
|
| |
|
|
Total Distributions | | — | | | — | | | — | | | (6.29 | ) | | (2.85 | ) |
| | |
|
| |
|
| |
|
| |
|
| |
|
|
Net Asset Value, End of Year | | $10.81 | | | $10.38 | | | $8.36 | | | $11.34 | | | $29.33 | |
| | |
|
| |
|
| |
|
| |
|
| |
|
|
Total Return | | 4.14 | % | | 24.16 | % | | (26.28 | )% | | (45.61 | )% | | 34.31 | % |
Net Assets, End of Year (millions) | | $1,217 | | | $1,155 | | | $1,026 | | | $1,651 | | | $2,758 | |
Ratios to Average Net Assets: | | | | | | | | | | | | | | | |
Expenses | | 0.88 | % | | 0.90 | % | | 0.86 | % | | 0.77 | % | | 0.71 | % |
Net investment loss | | (0.31 | ) | | (0.30 | ) | | (0.30 | ) | | (0.29 | ) | | (0.15 | ) |
Portfolio Turnover Rate | | 117 | % | | 79 | % | | 122 | % | | 115 | % | | 59 | % |
| (1) | | Per share amounts have been calculated using the monthly average shares method. |
| * | | Amount represents less than $0.01 per share. |
See Notes to Financial Statements.
122
Financial Highlights
(continued)
For a share of beneficial interest outstanding throughout each year ended August 31, unless otherwise noted:
| | | | | | | | | | | | | | | |
| Small Capitalization Value Equity Investments | | | | | | | | | | | | | |
| | | 2004(1)
| | | 2003
| | | 2002
| | | 2001(1)
| | | 2000
| |
Net Asset Value, Beginning of Year | | $12.30 | | | $11.56 | | | $12.54 | | | $10.72 | | | $10.56 | |
| | |
|
| |
|
| |
|
| |
|
| |
|
|
Income (Loss) From Operations: | | | | | | | | | | | | | | | |
Net investment income | | 0.09 | | | 0.13 | | | 0.15 | | | 0.19 | | | 0.20 | |
Net realized and unrealized gain (loss) | | 2.76 | | | 1.25 | | | (0.48 | ) | | 1.90 | | | 0.30 | |
| | |
|
| |
|
| |
|
| |
|
| |
|
|
Total Income (Loss) From Operations | | 2.85 | | | 1.38 | | | (0.33 | ) | | 2.09 | | | 0.50 | |
| | |
|
| |
|
| |
|
| |
|
| |
|
|
Less Distributions From: | | | | | | | | | | | | | | | |
Net investment income | | (0.10 | ) | | (0.05 | ) | | (0.19 | ) | | (0.13 | ) | | (0.16 | ) |
Net realized gains | | — | | | (0.59 | ) | | (0.46 | ) | | (0.14 | ) | | (0.18 | ) |
| | |
|
| |
|
| |
|
| |
|
| |
|
|
Total Distributions | | (0.10 | ) | | (0.64 | ) | | (0.65 | ) | | (0.27 | ) | | (0.34 | ) |
| | |
|
| |
|
| |
|
| |
|
| |
|
|
Net Asset Value, End of Year | | $15.05 | | | $12.30 | | | $11.56 | | | $12.54 | | | $10.72 | |
| | |
|
| |
|
| |
|
| |
|
| |
|
|
Total Return | | 23.24 | % | | 13.12 | % | | (2.85 | )% | | 19.98 | % | | 5.09 | % |
Net Assets, End of Year (millions) | | $429 | | | $425 | | | $503 | | | $639 | | | $852 | |
Ratios to Average Net Assets: | | | | | | | | | | | | | | | |
Expenses | | 1.16 | % | | 1.20 | % | | 1.13 | % | | 0.94 | % | | 0.91 | % |
Net investment income | | 0.66 | | | 1.00 | | | 0.94 | | | 1.70 | | | 2.12 | |
Portfolio Turnover Rate | | 33 | % | | 33 | % | | 54 | % | | 63 | % | | 72 | % |
| | | | | |
| Small Capitalization Growth Investments | | | | | | | | | | | | | | | |
| | | 2004(1)
| | | 2003(1)
| | | 2002(1)
| | | 2001(1)
| | | 2000(1)
| |
Net Asset Value, Beginning of Year | | $11.83 | | | $ 9.01 | | | $12.26 | | | $24.36 | | | $17.93 | |
| | |
|
| |
|
| |
|
| |
|
| |
|
|
Income (Loss) From Operations: | | | | | | | | | | | | | | | |
Net investment loss | | (0.11 | ) | | (0.07 | ) | | (0.09 | ) | | (0.08 | ) | | (0.11 | ) |
Net realized and unrealized gain (loss) | | 0.25 | | | 2.89 | | | (3.16 | ) | | (7.71 | ) | | 8.66 | |
| | |
|
| |
|
| |
|
| |
|
| |
|
|
Total Income (Loss) From Operations | | 0.14 | | | 2.82 | | | (3.25 | ) | | (7.79 | ) | | 8.55 | |
| | |
|
| |
|
| |
|
| |
|
| |
|
|
Less Distributions From: | | | | | | | | | | | | | | | |
Net realized gains | | — | | | — | | | — | | | (4.31 | ) | | (2.12 | ) |
| | |
|
| |
|
| |
|
| |
|
| |
|
|
Total Distributions | | — | | | — | | | — | | | (4.31 | ) | | (2.12 | ) |
| | |
|
| |
|
| |
|
| |
|
| |
|
|
Net Asset Value, End of Year | | $11.97 | | | $11.83 | | | $ 9.01 | | | $12.26 | | | $24.36 | |
| | |
|
| |
|
| |
|
| |
|
| |
|
|
Total Return | | 1.18 | % | | 31.30 | % | | (26.51 | )% | | (34.21 | )% | | 50.57 | % |
Net Assets, End of Year (millions) | | $318 | | | $497 | | | $474 | | | $752 | | | $1,572 | |
Ratios to Average Net Assets: | | | | | | | | | | | | | | | |
Expenses | | 1.19 | % | | 1.27 | % | | 1.20 | % | | 1.06 | % | | 0.98 | % |
Net investment loss | | (0.82 | ) | | (0.77 | ) | | (0.79 | ) | | (0.51 | ) | | (0.50 | ) |
Portfolio Turnover Rate | | 80 | % | | 88 | % | | 91 | % | | 80 | % | | 110 | % |
| (1) | | Per share amounts have been calculated using the monthly average shares method. |
See Notes to Financial Statements.
123
Financial Highlights
(continued)
For a share of beneficial interest outstanding throughout each year ended August 31, unless otherwise noted:
| | | | | | | | | | | | | | | |
| International Equity Investments | | | | | | | | | | | | | | | |
| | | 2004(1)
| | | 2003(1)
| | | 2002(1)
| | | 2001(1)
| | | 2000
| |
Net Asset Value, Beginning of Year | | $7.82 | | | $6.93 | | | $8.26 | | | $13.50 | | | $12.43 | |
| | |
|
| |
|
| |
|
| |
|
| |
|
|
Income (Loss) From Operations: | | | | | | | | | | | | | | | |
Net investment income | | 0.08 | | | 0.10 | | | 0.03 | | | 0.05 | | | 0.14 | |
Net realized and unrealized gain (loss) | | 1.24 | | | 0.81 | | | (1.36 | ) | | (3.59 | ) | | 2.19 | |
| | |
|
| |
|
| |
|
| |
|
| |
|
|
Total Income (Loss) From Operations | | 1.32 | | | 0.91 | | | (1.33 | ) | | (3.54 | ) | | 2.33 | |
| | |
|
| |
|
| |
|
| |
|
| |
|
|
Less Distributions From: | | | | | | | | | | | | | | | |
Net investment income | | (0.13 | ) | | (0.02 | ) | | (0.00 | )* | | (0.05 | ) | | (0.11 | ) |
Net realized gains | | — | | | — | | | — | | | (1.65 | ) | | (1.15 | ) |
| | |
|
| |
|
| |
|
| |
|
| |
|
|
Total Distributions | | (0.13 | ) | | (0.02 | ) | | (0.00 | )* | | (1.70 | ) | | (1.26 | ) |
| | |
|
| |
|
| |
|
| |
|
| |
|
|
Net Asset Value, End of Year | | $9.01 | | | $7.82 | | | $6.93 | | | $8.26 | | | $13.50 | |
| | |
|
| |
|
| |
|
| |
|
| |
|
|
Total Return | | 16.90 | % | | 13.21 | % | | (16.08 | )% | | (28.67 | )% | | 19.17 | % |
Net Assets, End of Year (millions) | | $589 | | | $533 | | | $535 | | | $749 | | | $1,569 | |
Ratios to Average Net Assets: | | | | | | | | | | | | | | | |
Expenses | | 1.08 | % | | 1.14 | % | | 1.23 | % | | 1.03 | % | | 0.94 | % |
Net investment income | | 0.90 | | | 1.55 | | | 0.39 | | | 0.49 | | | 0.54 | |
Portfolio Turnover Rate | | 84 | % | | 110 | % | | 131 | % | | 64 | % | | 75 | % |
| | | | | |
| Emerging Markets Equity Investments | | | | | | | | | | | | | | | |
| | | 2004(1)
| | | 2003(1)
| | | 2002(1)
| | | 2001(1)
| | | 2000(1)
| |
Net Asset Value, Beginning of Year | | $6.48 | | | $5.22 | | | $5.12 | | | $7.35 | | | $6.74 | |
| | |
|
| |
|
| |
|
| |
|
| |
|
|
Income (Loss) From Operations: | | | | | | | | | | | | | | | |
Net investment income (loss) | | 0.05 | | | 0.04 | | | 0.02 | | | 0.05 | | | (0.02 | ) |
Net realized and unrealized gain (loss) | | 1.10 | | | 1.28 | | | 0.11 | | | (2.28 | ) | | 0.67 | |
| | |
|
| |
|
| |
|
| |
|
| |
|
|
Total Income (Loss) From Operations | | 1.15 | | | 1.32 | | | 0.13 | | | (2.23 | ) | | 0.65 | |
| | |
|
| |
|
| |
|
| |
|
| |
|
|
Less Distributions From: | | | | | | | | | | | | | | | |
Net investment income | | (0.03 | ) | | (0.06 | ) | | (0.03 | ) | | — | | | (0.04 | ) |
| | |
|
| |
|
| |
|
| |
|
| |
|
|
Total Distributions | | (0.03 | ) | | (0.06 | ) | | (0.03 | ) | | — | | | (0.04 | ) |
| | |
|
| |
|
| |
|
| |
|
| |
|
|
Net Asset Value, End of Year | | $7.60 | | | $6.48 | | | $5.22 | | | $5.12 | | | $7.35 | |
| | |
|
| |
|
| |
|
| |
|
| |
|
|
Total Return | | 17.71 | % | | 25.51 | % | | 2.62 | % | | (30.34 | )% | | 9.62 | % |
Net Assets, End of Year (millions) | | $188 | | | $196 | | | $184 | | | $246 | | | $305 | |
Ratios to Average Net Assets: | | | | | | | | | | | | | | | |
Expenses | | 1.64 | % | | 1.79 | % | | 1.72 | % | | 1.69 | % | | 1.66 | % |
Net investment income (loss) | | 0.67 | | | 0.86 | | | 0.40 | | | 0.79 | | | (0.24 | ) |
Portfolio Turnover Rate | | 117 | % | | 88 | % | | 65 | % | | 83 | % | | 110 | % |
| (1) | | Per share amounts have been calculated using the monthly average shares method. |
| * | | Amount represents less than $0.01 per share. |
See Notes to Financial Statements.
124
Financial Highlights
(continued)
For a share of beneficial interest outstanding throughout each year ended August 31, unless otherwise noted:
| | | | | | | | | | | | | | | |
| Government Money Investments | | | | | | | | | | | | | | | |
| | | 2004
| | | 2003(1)
| | | 2002(1)
| | | 2001(1)
| | | 2000(1)
| |
Net Asset Value, Beginning of Year | | $1.00 | | | $1.00 | | | $1.00 | | | $1.00 | | | $1.00 | |
| | |
|
| |
|
| |
|
| |
|
| |
|
|
Net investment income | | 0.00 | * | | 0.01 | | | 0.02 | | | 0.05 | | | 0.05 | |
Dividends from net investment income | | (0.00 | )* | | (0.01 | ) | | (0.02 | ) | | (0.05 | ) | | (0.05 | ) |
| | |
|
| |
|
| |
|
| |
|
| |
|
|
Net Asset Value, End of Year | | $1.00 | | | $1.00 | | | $1.00 | | | $1.00 | | | $1.00 | |
| | |
|
| |
|
| |
|
| |
|
| |
|
|
Total Return(2) | | 0.48 | % | | 0.85 | % | | 1.80 | % | | 5.04 | % | | 5.44 | % |
Net Assets, End of Year (000s) | | $93,875 | | | $110,461 | | | $140,411 | | | $181,954 | | | $225,756 | |
Ratios to Average Net Assets: | | | | | | | | | | | | | | | |
Expenses(3)(4) | | 0.60 | % | | 0.60 | % | | 0.60 | % | | 0.60 | % | | 0.60 | % |
Net investment income | | 0.48 | | | 0.81 | | | 1.82 | | | 5.04 | | | 5.30 | |
| | | | |
| Core Fixed Income Investments | | | | | | | | | | | | | |
| | | 2004
| | | 2003(1)
| | | 2002(1)
| | | 2001
| | | 2000
| |
Net Asset Value, Beginning of Year | | $8.18 | | | $8.20 | | | $8.31 | | | $7.82 | | | $7.83 | |
| | |
|
| |
|
| |
|
| |
|
| |
|
|
Income (Loss) From Operations: | | | | | | | | | | | | | | | |
Net investment income(5) | | 0.27 | | | 0.35 | | | 0.44 | | | 0.50 | | | 0.48 | |
Net realized and unrealized gain (loss)(5) | | 0.15 | | | 0.04 | | | (0.06 | ) | | 0.46 | | | (0.05 | ) |
| | |
|
| |
|
| |
|
| |
|
| |
|
|
Total Income From Operations | | 0.42 | | | 0.39 | | | 0.38 | | | 0.96 | | | 0.43 | |
| | |
|
| |
|
| |
|
| |
|
| |
|
|
Less Distributions From: | | | | | | | | | | | | | | | |
Net investment income | | (0.28 | ) | | (0.41 | ) | | (0.49 | ) | | (0.47 | ) | | (0.44 | ) |
| | |
|
| |
|
| |
|
| |
|
| |
|
|
Total Distributions | | (0.28 | ) | | (0.41 | ) | | (0.49 | ) | | (0.47 | ) | | (0.44 | ) |
| | |
|
| |
|
| |
|
| |
|
| |
|
|
Net Asset Value, End of Year | | $8.32 | | | $8.18 | | | $8.20 | | | $8.31 | | | $7.82 | |
| | |
|
| |
|
| |
|
| |
|
| |
|
|
Total Return | | 5.17 | % | | 4.78 | % | | 4.73 | % | | 12.57 | % | | 5.73 | % |
Net Assets, End of Year (000s) | | $480,808 | | | $317,858 | | | $331,331 | | | $368,637 | | | $564,715 | |
Ratios to Average Net Assets: | | | | | | | | | | | | | | | |
Expenses | | 0.76 | % | | 0.77 | % | | 0.75 | % | | 0.79 | % | | 0.78 | % |
Net investment income(5) | | 3.25 | | | 4.22 | | | 5.39 | | | 6.15 | | | 6.02 | |
Portfolio Turnover Rate | | 369 | %** | | 257 | % | | 280 | % | | 325 | % | | 195 | % |
| (1) | | Per share amounts have been calculated using the monthly average shares method. |
| (2) | | Performance figures may reflect fee waivers and/or expense reimbursements. Past performance is no guarantee of future results. In the absence of fee waivers and/or expense reimbursements, the total return would be reduced. |
| (3) | | Expense ratios before fee waivers and/or expense reimbursements were as follows: |
| | | | | | | | | | | | | | | |
| | | Expense ratios without waivers
and/or reimbursements
| |
Fund
| | 2004
| | | 2003
| | | 2002
| | | 2001
| | | 2000
| |
Government Money Investments | | 0.98 | % | | 0.90 | % | | 0.91 | % | | 0.74 | % | | 0.78 | % |
| (4) | | As a result of a voluntary expense limitation, expense ratios will not exceed 0.60%. |
| (5) | | Effective September 1, 2001, the Fund adopted a change in the accounting method that requires the Fund to amortize premiums and accrete all discounts. Without the adoption of this change, for the year ended August 31, 2002, those amounts for Core Fixed Income Investments would have been $0.46 for net investment income, $0.08 for net realized and unrealized loss and 5.47% for the ratio of net investment income to average net assets. Per share information, ratios and supplemental data for the periods prior to September 1, 2001 have not been restated to reflect this change in presentation. |
| * | | Amount represents less than $0.01 per share. |
| ** | | Excluding mortgage dollar roll transactions. If mortgage dollar transactions had been included, the portfolio turnover rate would have been 392%. |
See Notes to Financial Statements.
125
Financial Highlights
(continued)
For a share of beneficial interest outstanding throughout each year ended August 31, unless otherwise noted:
| | | | | | | | | | | | | | | |
| High Yield Investments | | | | | | | | | | | | | | | |
| | | 2004
| | | 2003
| | | 2002(1)
| | | 2001(1)
| | | 2000(1)
| |
Net Asset Value, Beginning of Year | | $4.61 | | | $4.38 | | | $5.20 | | | $5.85 | | | $7.33 | |
| | |
|
| |
|
| |
|
| |
|
| |
|
|
Income (Loss) From Operations: | | | | | | | | | | | | | | | |
Net investment income(2) | | 0.32 | | | 0.36 | | | 0.44 | | | 0.51 | | | 0.69 | |
Net realized and unrealized gain (loss)(2) | | 0.21 | | | 0.25 | | | (0.82 | ) | | (0.64 | ) | | (1.37 | ) |
| | |
|
| |
|
| |
|
| |
|
| |
|
|
Total Income (Loss) From Operations | | 0.53 | | | 0.61 | | | (0.38 | ) | | (0.13 | ) | | (0.68 | ) |
| | |
|
| |
|
| |
|
| |
|
| |
|
|
Less Distributions From: | | | | | | | | | | | | | | | |
Net investment income | | (0.33 | ) | | (0.38 | ) | | (0.44 | ) | | (0.52 | ) | | (0.71 | ) |
Capital | | — | | | — | | | — | | | — | | | (0.09 | ) |
| | |
|
| |
|
| |
|
| |
|
| |
|
|
Total Distributions | | (0.33 | ) | | (0.38 | ) | | (0.44 | ) | | (0.52 | ) | | (0.80 | ) |
| | |
|
| |
|
| |
|
| |
|
| |
|
|
Net Asset Value, End of Year | | $4.81 | | | $4.61 | | | $4.38 | | | $5.20 | | | $5.85 | |
| | |
|
| |
|
| |
|
| |
|
| |
|
|
Total Return | | 11.81 | % | | 14.57 | % | | (7.75 | )% | | (2.27 | )% | | (9.37 | )% |
Net Assets, End of Year (000s) | | $239,650 | | | $227,191 | | | $222,373 | | | $263,525 | | | $164,056 | |
Ratios to Average Net Assets: | | | | | | | | | | | | | | | |
Expenses | | 0.99 | % | | 0.97 | % | | 0.97 | % | | 1.12 | % | | 1.20 | % |
Net investment income(2) | | 6.76 | | | 7.78 | | | 9.05 | | | 9.38 | | | 11.30 | |
Portfolio Turnover Rate | | 127 | % | | 158 | % | | 69 | % | | 81 | % | | 129 | % |
| | | | | |
| Municipal Bond Investments | | | | | | | | | | | | | | | |
| | | 2004(1)
| | | 2003
| | | 2002
| | | 2001(1)
| | | 2000
| |
Net Asset Value, Beginning of Year | | $8.95 | | | $9.07 | | | $8.91 | | | $8.40 | | | $8.22 | |
| | |
|
| |
|
| |
|
| |
|
| |
|
|
Income (Loss) From Operations: | | | | | | | | | | | | | | | |
Net investment income | | 0.33 | | | 0.35 | | | 0.37 | | | 0.37 | | | 0.37 | |
Net realized and unrealized gain (loss) | | 0.30 | | | (0.12 | ) | | 0.14 | | | 0.49 | | | 0.17 | |
| | |
|
| |
|
| |
|
| |
|
| |
|
|
Total Income From Operations | | 0.63 | | | 0.23 | | | 0.51 | | | 0.86 | | | 0.54 | |
| | |
|
| |
|
| |
|
| |
|
| |
|
|
Less Distributions From: | | | | | | | | | | | | | | | |
Net investment income | | (0.35 | ) | | (0.35 | ) | | (0.35 | ) | | (0.35 | ) | | (0.35 | ) |
Net realized gains | | — | | | — | | | — | | | — | | | (0.01 | ) |
| | |
|
| |
|
| |
|
| |
|
| |
|
|
Total Distributions | | (0.35 | ) | | (0.35 | ) | | (0.35 | ) | | (0.35 | ) | | (0.36 | ) |
| | |
|
| |
|
| |
|
| |
|
| |
|
|
Net Asset Value, End of Year | | $9.23 | | | $8.95 | | | $9.07 | | | $8.91 | | | $8.40 | |
| | |
|
| |
|
| |
|
| |
|
| |
|
|
Total Return | | 7.12 | % | | 2.51 | % | | 5.88 | % | | 10.44 | % | | 6.79 | % |
Net Assets, End of Year (000s) | | $33,895 | | | $28,386 | | | $30,604 | | | $31,404 | | | $48,789 | |
Ratios to Average Net Assets: | | | | | | | | | | | | | | | |
Expenses | | 0.89 | % | | 0.88 | % | | 0.91 | % | | 0.85 | % | | 0.79 | % |
Net investment income | | 3.63 | | | 3.79 | | | 4.17 | | | 4.32 | | | 4.50 | |
Portfolio Turnover Rate | | 19 | % | | 15 | % | | 21 | % | | 23 | % | | 37 | % |
| (1) | | Per share amounts have been calculated using the monthly average shares method. |
| (2) | | Effective September 1, 2001, the Fund adopted a change in the accounting method that requires the Fund to amortize premiums and accrete all discounts. Without the adoption of this change, for the year ended August 31, 2002, those amounts would have been $0.45, $0.83 and 9.22% for net investment income, net realized and unrealized loss and ratio of net investment income to average net assets, respectively. Per share information, ratios and supplemental data for the periods prior to September 1, 2001 have not been restated to reflect this change in presentation. |
See Notes to Financial Statements.
126
Financial Highlights
(continued)
For a share of beneficial interest outstanding throughout each year ended August 31, unless otherwise noted:
| | | | | | | | | | | | | | | |
| International Fixed Income Investments | | | | | | | | | | | | | | | |
| | | 2004(1)
| | | 2003(1)
| | | 2002(1)
| | | 2001(1)
| | | 2000(1)
| |
Net Asset Value, Beginning of Year | | $7.93 | | | $7.47 | | | $7.19 | | | $7.24 | | | $8.10 | |
| | |
|
| |
|
| |
|
| |
|
| |
|
|
Income (Loss) From Operations: | | | | | | | | | | | | | | | |
Net investment income(2) | | 0.21 | | | 0.25 | | | 0.29 | | | 0.31 | | | 0.36 | |
Net realized and unrealized gain (loss)(2) | | 0.88 | | | 0.51 | | | 0.29 | | | (0.05 | ) | | (0.84 | ) |
| | |
|
| |
|
| |
|
| |
|
| |
|
|
Total Income (Loss) From Operations | | 1.09 | | | 0.76 | | | 0.58 | | | 0.26 | | | (0.48 | ) |
| | |
|
| |
|
| |
|
| |
|
| |
|
|
Less Distributions From: | | | | | | | | | | | | | | | |
Net investment income | | (0.86 | ) | | (0.30 | ) | | (0.12 | ) | | (0.00 | )* | | (0.06 | ) |
Capital | | — | | | — | | | (0.18 | ) | | (0.31 | ) | | (0.32 | ) |
| | |
|
| |
|
| |
|
| |
|
| |
|
|
Total Distributions | | (0.86 | ) | | (0.30 | ) | | (0.30 | ) | | (0.31 | ) | | (0.38 | ) |
| | |
|
| |
|
| |
|
| |
|
| |
|
|
Net Asset Value, End of Year | | $8.16 | | | $7.93 | | | $7.47 | | | $7.19 | | | $7.24 | |
| | |
|
| |
|
| |
|
| |
|
| |
|
|
Total Return | | 14.00 | % | | 10.28 | % | | 8.39 | % | | 3.80 | % | | (6.13 | )% |
Net Assets, End of Year (millions) | | $116 | | | $112 | | | $126 | | | $160 | | | $236 | |
Ratios to Average Net Assets: | | | | | | | | | | | | | | | |
Expenses | | 1.05 | % | | 1.04 | % | | 1.02 | % | | 0.94 | % | | 0.98 | % |
Net investment income(2) | | 2.60 | | | 3.21 | | | 4.04 | | | 4.26 | | | 4.70 | |
Portfolio Turnover Rate | | 243 | % | | 288 | % | | 271 | % | | 293 | % | | 225 | % |
| (1) | | Per share amounts have been calculated using the monthly average shares method. |
| (2) | | Effective September 1, 2001, the Fund adopted a change in the accounting method that requires the Fund to amortize premiums and accrete all discounts. Without the adoption of this change, for the year ended August 31, 2002, net investment income, net realized and unrealized gain per share and the ratio of net investment income to average net assets would have been $0.31, $0.27 and 4.42%, respectively. Per share information, ratios and supplemental data for the periods prior to September 1, 2001 have not been restated to reflect this change in presentation. |
| * | | Amount represents less than $0.01 per share. |
See Notes to Financial Statements.
127
Notes to Financial Statements
1. Organization and Significant Accounting Policies
Large Capitalization Value Equity Investments, Large Capitalization Growth Investments, Small Capitalization Value Equity Investments, Small Capitalization Growth Investments, International Equity Investments, Emerging Markets Equity Investments, Government Money Investments, Core Fixed Income Investments (formerly known as Intermediate Fixed Income Investments), High Yield Investments, Municipal Bond Investments and International Fixed Income Investments (“Fund(s)”) are separate investment funds of the Consulting Group Capital Markets Funds (“Trust”). The Trust, a Massachusetts business trust, is registered under the Investment Company Act of 1940, as amended, as a diversified, open-end management investment company. The Trust offers one other Fund, Multi-Strategy Market Neutral Investments. The financial statements and financial highlights for this fund are presented in a separate shareholder report.
The following is a summary of the significant accounting policies consistently followed by the Funds and is in conformity with U.S. generally accepted accounting principles (“GAAP”). The preparation of financial statements in accordance with GAAP requires management to make estimates and assumptions regarding assets, liabilities and changes in net assets resulting from operations when financial statements are prepared. Changes in the economic environment, financial markets and any other parameters used in determining these estimates could cause actual results to differ.
(a) Investment Valuation. Securities traded on national securities markets and in the over-the-counter market are valued at the closing prices on such markets or, if there were no sales during the day, at the mean between the current bid and asked prices; except for Government Money Investments, which values investments using the amortized cost method. Securities primarily traded on foreign exchanges are generally valued at the preceding closing values of such securities on their respective exchanges, except that when a significant occurrence subsequent to the time a value was so established is likely to have significantly changed the value then the fair value of those securities will be determined by consideration of other factors by or under the direction of the Board of Trustees or its delegates. Fair valuing of securities may be determined with the assistance of a pricing service using calculations based on indices of domestic securities and other appropriate indicators, such as prices of relevant ADRs and futures contracts. Certain debt securities of U.S. issuers (other than U.S. government securities and short-term investments) are valued at the mean between the quoted bid and asked prices. U.S. government agencies and obligations are valued at the mean between the bid and asked prices. Securities listed on the NASDAQ National Market System for which market quotations are available are valued at the official closing price or, if there is no official closing price on that day, at the last sale price. Securities maturing within 60 days are valued at cost plus accreted discount, or minus amortized premium, which approximates value. Securities for which market quotations are not available will be valued in good faith at fair value by or under the direction of the Board of Trustees.
(b) Repurchase Agreements. When entering into repurchase agreements, it is each Fund’s policy that a custodian takes possession of the underlying collateral securities, the value of which at least equals the principal amount of the repurchase transaction, including accrued interest. To the extent that any repurchase transaction exceeds one business day, the value of the collateral is marked-to-market to ensure the adequacy of the collateral. If the seller defaults and the value of the collateral declines or if bankruptcy proceedings are commenced with respect to the seller of the security, realization of the collateral by the Fund may be delayed or limited.
(c) Futures Contracts. The Funds, except Government Money Investments, may enter into futures contracts. Securities or cash equal to the initial margin amount are either deposited with the broker or segregated by the custodian upon entering into the futures contract. Additional securities are also segregated up to the current market value of the futures contracts. During the period the futures contract is open, changes in the value of the contract are recognized as unrealized gains or losses by “marking-to-market” on a daily basis to reflect the market value of the contract at the end of each day’s trading. Variation margin payments are received or made and recognized as assets due from or liabilities due to broker, depending upon whether unrealized gains or losses are incurred. When the contract is closed, the Fund records a realized gain or loss equal to the difference between the proceeds from (or cost of) the closing transactions and the Fund’s basis in the contract. The Fund enters into such contracts typically to hedge a portion of its portfolio. The Fund bears the market risk that arises from changes in the value of the financial instruments and securities indices.
128
Notes to Financial Statements
(continued)
(d) Option Contracts. The Funds, except Government Money Investments, may enter option contracts. Premiums paid when put or call options are purchased by the Fund represent investments which are marked-to-market daily. When a purchased option expires, the Fund will realize a loss in the amount of the premium paid. When the Fund enters into a closing sales transaction, the Fund will realize a gain or loss depending on whether the proceeds from the closing sales transaction are greater or less than the premium paid for the option. When the Fund exercises a put option, it will realize a gain or loss from the sale of the underlying security and the proceeds from such sale will be decreased by the premium originally paid. When the Fund exercises a call option, the cost of the security which the Fund purchases upon exercise will be increased by the premium originally paid.
When a Fund writes a call or put option, an amount equal to the premium received by the Fund is recorded as a liability, the value of which is marked-to-market daily. When a written option expires, the Fund realizes a gain equal to the amount of the premium received. When the Fund enters into a closing purchase transaction, the Fund realizes a gain or loss depending upon whether the cost of the closing transaction is greater or less than the premium originally received, without regard to any unrealized gain or loss on the underlying security, and the liability related to such option is eliminated. When a written call option is exercised, the proceeds of the security sold will be increased by the premium originally received. When a written put option is exercised, the amount of the premium originally received will reduce the cost of the security which the Fund purchased upon exercise. When written index options are exercised, settlement is made in cash. The risk associated with purchasing options is limited to the premium originally paid. The Fund enters into options for hedging purposes. The risk in writing a covered call option is that the Fund gives up the opportunity to participate in any increase in the price of the underlying security beyond the exercise price. The risk in writing a put option is that the Fund is exposed to the risk of loss if the market price of the underlying security declines. The risk in writing a call option is that the Fund is exposed to the risk of loss if the market price of the underlying security increases.
(e) Forward Foreign Currency Contracts. A forward foreign currency contract is an agreement between two parties to buy and sell a currency at a set price on a future date. The contract is marked-to-market daily and the change in value is recorded by the Fund as an unrealized gain or loss. When a forward foreign currency contract is extinguished, through either delivery or offset by entering into another forward foreign currency contract, the Fund records a realized gain or loss equal to the difference between the value of the contract at the time it was opened and the value of the contract at the time it was extinguished or offset. The Fund bears the market risk that arises from changes in foreign currency exchange rates and the credit risk should a counterparty fail to meet the terms of such contracts.
(f) Swap Contracts. Emerging Markets Equity Investments may enter into index swaps. Index swaps involve the exchange by the Fund with another party of the respective amounts payable with respect to a notional principal amount related to one or more indices. The Fund may enter into these transactions to preserve a return or spread on a particular investment or portion of its assets, as a duration management technique or to protect against any increase in the price of securities the Fund anticipates purchasing at a later date. The Fund may also use these transactions for speculative purposes, such as to obtain the price performance of a security without actually purchasing the security in circumstances where, for example, the subject security is illiquid, is unavailable for direct investment or available only on less attractive terms. Swaps have risks associated with them, including possible default by the counterparty to the transaction, illiquidity and, where swaps are used as hedges, the risk that the use of a swap could result in losses greater than if the swap had not been employed.
(g) Lending of Portfolio Securities. The Funds, except Large Capitalization Value Equity Investments, Large Capitalization Growth Investments, Emerging Markets Equity Investments, Government Money Investments and Municipal Bond Investments, have an agreement with their custodian whereby the custodian may lend securities owned by the Funds to brokers, dealers and other financial organizations, and receives a lender’s fee. Fees earned by the Funds on securities lending are recorded in interest income. Loans of securities by the Funds are collateralized by cash, U.S. government securities or high quality money market instruments that are maintained at all times in an amount at least equal to the current market value of the loaned securities, plus a margin which may vary depending on the type of securities loaned. The Funds maintain exposure for the risk of any losses in the investment of amounts received as collateral. The Funds also maintain exposure for the risk of any loss in the investment securities loaned. The Funds have the right under the lending agreement to recover the securities from the borrower on demand.
129
Notes to Financial Statements
(continued)
(h) Securities Traded on a To-Be-Announced Basis. The Funds may trade securities on a to-be-announced (“TBA”) basis. In a TBA transaction, the Fund commits to purchasing or selling securities for which specific information is not yet known at the time of the trade, for example the face amount and maturity date in Government National Mortgage Association (“GNMA”) transactions. Securities purchased on a TBA basis are not settled until they are delivered to the Fund, normally 15 to 45 days later. Beginning on the date the Fund enters into a TBA transaction, cash, U.S. government securities or other liquid high grade debt obligations are segregated in an amount equal in value to the purchase price of the TBA security. These transactions are subject to market fluctuations and their current value is determined in the same manner as for other securities.
(i) Mortgage Dollar Roll Transactions. Core Fixed Income Investments may enter into mortgage dollar roll transactions. A mortgage dollar roll transaction involves a sale by the Fund of mortgage related securities that it holds with an agreement by the Fund to repurchase similar securities at an agreed upon price and date. The securities purchased will bear the same interest rate as those sold, but generally will be collateralized by pools of mortgages with different prepayment histories than those securities sold. Proceeds from the sale will be reinvested and the income from these investments, together with any additional income received on the sale, is included in investment income. During the period between the sale and repurchase in a mortgage dollar roll transaction, the Fund will not be entitled to receive interest and principal payments on the securities sold but will invest the proceeds of the sale in other securities which may enhance the yield and total return. In addition, the difference between the sale price and the future purchase price is recorded as an adjustment to investment income. Losses may arise due to changes in the value of the securities or if the counterparty does not perform under the terms of the agreement. If the counterparty files for bankruptcy or becomes insolvent, the Fund’s right to repurchase the securities may be limited.
(j) Investment Transactions and Investment Income. Security transactions are accounted for on trade date. Dividend income is recorded on the ex-dividend date. Foreign dividend income is recorded on the ex-dividend date or as soon as practical after the Trust determines the existence of a dividend declaration after exercising reasonable due diligence. Interest income, adjusted for amortization of premium and accretion of discount, is recorded on an accrual basis. Gains or losses on the sale of securities are calculated by using the specific identification method.
(k) Foreign Currency Translation. The accounting records of the Fund are maintained in U.S. dollars. All assets and liabilities denominated in foreign currencies are translated into U.S. dollars based on the rate of exchange of such currencies against U.S. dollars on the date of valuation. Purchases and sales of securities, and income and expenses are translated at the rate of exchange quoted on the respective date that such transactions are recorded. The Fund does not isolate that portion of the results of operations resulting from changes in foreign exchange rates on investments from the fluctuations arising from changes in market prices of securities held at the date of the financial statements. Net unrealized appreciation or depreciation on investments and foreign currency translation arise from changes in the value of assets and liabilities, including investments in securities at the date of the financial statements, resulting from changes in the exchange rates and changes in market prices of securities held. Differences between income and expense amounts recorded and collected or paid are adjusted when reported by the custodian bank. Net realized gains and losses on foreign currency transactions represent net gains and losses from sales and maturities of forward foreign currency contracts, disposition of foreign currencies, currency gains and losses realized between the trade date and settlement date on securities transactions and the difference between the amount of net investment income accrued and the U.S. dollar amount actually received.
(l) Exempt Interest, Dividends and Distributions to Shareholders. Dividends and distributions to shareholders are recorded on the ex-dividend date. Large Capitalization Value Equity Investments, Large Capitalization Growth Investments, Small Capitalization Value Equity Investments, Small Capitalization Growth Investments, International Equity Investments and Emerging Markets Equity Investments distribute dividends and capital gains, if any, at least annually. Government Money Investments declares and records a dividend of substantially all of its net investment income on each business day. Such dividends are paid or reinvested monthly on the payable date. Net realized gains, if any, are distributed at least annually. Core Fixed Income Investments, High Yield Investments, Municipal Bond Investments and International Fixed Income Investments distribute dividends monthly and capital gains, if any, at least annually.
130
Notes to Financial Statements
(continued)
Municipal Bond Investments intends to satisfy conditions that will enable interest from municipal securities, which are exempt from regular Federal income tax and from designated state income taxes, to retain such tax-exempt status when distributed to the shareholders of the Fund. Capital gain distributions, if any, are taxable to shareholders. Additional taxable distributions may be made if necessary to avoid a Federal excise tax.
The character of income and gains to be distributed is determined in accordance with income tax regulations, which may differ from GAAP. At August 31, 2004, reclassifications were made to the capital accounts of Large Capitalization Value Equity Investments, Large Capitalization Growth Investments, Small Capitalization Value Equity Investments, Small Capitalization Growth Investments, International Equity Investments, Emerging Markets Equity Investments, Government Money Investments, Core Fixed Income Investments, High Yield Investments and International Fixed Income Investments to reflect permanent book/tax differences and income and gains available for distributions under income regulations. Accordingly, Large Capitalization Value Equity Investments reclassified $1,042,911 of undistributed net investment income to paid-in-capital. Large Capitalization Growth Investments reclassified $3,871,895 of net investment loss to paid-in-capital. Small Capitalization Growth Investments reclassified $3,687,813 and $348,451 of accumulated net investment loss and accumulated net realized loss, respectively, to paid-in-capital. International Equity Investments reclassified $81,000 of net investment income to paid-in-capital. Government Money Investments reclassified $5,787 of accumulated net realized loss to paid-in-capital. Core Fixed Income Investments reclassified $1,452,898 of undistributed net investment income and $7,250,052 of net realized loss to paid-in-capital.
(m) Federal Income Taxes. Each Fund intends to comply with the applicable provisions of the Internal Revenue Code of 1986, as amended, pertaining to regulated investment companies and to make distributions of taxable income sufficient to relieve it from substantially all Federal income and excise taxes.
(n) Fund Investment Risks. International Equity Investments, Emerging Markets Equity Investments and International Fixed Income Investments invest in foreign securities which may involve risks not present in domestic investments. Since securities may be denominated in a foreign currency and may require settlement in foreign currencies and pay interest and/or a dividend in foreign currencies, changes in the relationship of these foreign currencies to the U.S. dollar can significantly affect the value of the investments and earnings of the Funds. Foreign investments may also subject the Funds to foreign government exchange restrictions, expropriation, taxation or other political, social or economic developments, all of which could affect the market and/or credit risk of the investments.
High Yield Investments and International Fixed Income Investments may invest in high yield instruments that are subject to certain credit and market risks. The yields of high yield debt obligations reflect, among other things, perceived credit risk. Investments in securities rated below investment grade typically involve risks not associated with higher rated securities including, among others, greater risk of timely and ultimate payment of interest and principal, greater market price volatility and less liquid secondary market trading.
2. Investment Advisory Agreement, Administration Agreement and Other Transactions
The Trust has entered into an investment management agreement (“Management Agreement”) with Smith Barney Fund Management LLC (“SBFM”), an indirect wholly-owned subsidiary of Citigroup Inc. (“Citigroup”). The Consulting Group (“Manager”), a division of SBFM, provides investment evaluation services with respect to the investment advisers of the Funds. SBFM has entered into an investment advisory agreement with each adviser selected for the Funds (collectively, “Sub-Advisers”).
Under the Management Agreement, each Fund pays SBFM a fee, calculated daily and paid monthly, based on the rates applied to the value of each Fund’s average daily net assets. In addition, SBFM pays each Sub-Adviser based on the rates applied to each respective Fund’s average daily net assets on a monthly basis.
131
Notes to Financial Statements
(continued)
Indicated below for each Fund is the applicable maximum allowable management fee, actual management fee incurred, sub-advisory fee and the sub-adviser. The maximum allowable management fee represents the total amount that could be charged to the Fund while the actual management fee is what the Fund incurred during the reporting period. The actual management fee could fluctuate from year to year if Sub-Advisers are added or terminated in a particular Fund.
| | | | | | | | | | | |
| Fund | | Sub-Adviser | | Sub-
Adviser
Fee | | | Actual
Management
Fee
Incurred | | | Maximum
Allowable
Annual
Management Fee | |
Large Capitalization Value Equity Investments | | | | | | | 0.59 | % | | 0.60 | % |
| | | Cambiar Investors LLC.: | | | | | | | | | |
| | | on the first $250 million | | 0.30 | % | | | | | | |
| | | on the amount over $250 million | | 0.25 | | | | | | | |
| | | Chartwell Investment Partners: | | | | | | | | | |
| | | on the first $250 million | | 0.30 | | | | | | | |
| | | on the amount over $250 million | | 0.25 | | | | | | | |
| | | Alliance Capital Management L.P.: | | | | | | | | | |
| | | on the first $200 million | | 0.35 | | | | | | | |
| | | on the amount over $200 million | | 0.30 | | | | | | | |
Large Capitalization Growth Investments | | | | | | | 0.58 | | | 0.60 | |
| | | Turner Investment Partners, Inc. – Large Cap: | | | | | | | | | |
| | | on the first $300 million | | 0.35 | | | | | | | |
| | | on the amount over $300 million | | 0.30 | | | | | | | |
| | | Turner Investment Partners, Inc. – Mid Cap | |
0.50 | | | | | | | |
| | | TCW Investment Management Co.: | | | | | | | | | |
| | | on the first $500 million | | 0.40 | | | | | | | |
| | | on the amount over $500 million | | 0.35 | | | | | | | |
| | | Westfield Capital Management Co., LLC | | | | | | | | | |
| | | on the first $300 million | | 0.35 | | | | | | | |
| | | on the amount over $300 million | | 0.30 | | | | | | | |
| | | Sands Capital Management, Inc.: | | | | | | | | | |
| | | on the first $300 million | | 0.35 | | | | | | | |
| | | on the amount over $300 million | | 0.30 | | | | | | | |
Small Capitalization Value Equity Investments | | | | | | | 0.77 | | | 0.80 | |
| | | NFJ Investment Group: | | | | | | | | | |
| | | on the first $450 million | | 0.50 | | | | | | | |
| | | on the amount over $450 million | | 0.45 | | | | | | | |
| | | Rutabaga Capital Management LLC | | 0.50 | | | | | | | |
| | | ING Investment Management Co. | | 0.40 | | | | | | | |
Small Capitalization Growth Investments | | | | | | | 0.80 | | | 0.80 | |
| | | Wall Street Associates | | 0.50 | | | | | | | |
| | | Westfield Capital Management Co., LLC | | 0.50 | | | | | | | |
132
Notes to Financial Statements
(continued)
| | | | | | | | | | | |
| Fund | | Sub-Adviser | | Sub-
Adviser
Fee | | | Actual
Management
Fee
Incurred | | | Maximum
Allowable
Annual
Management Fee | |
International Equity Investments | | | | | | | 0.66 | % | | 0.70 | % |
| | | Philadelphia International Advisors, LP: | | | | | | | | | |
| | | on the first $100 million | | 0.40 | % | | | | | | |
| | | on the next $100 million | | 0.35 | | | | | | | |
| | | on the amount over $200 million | | 0.30 | | | | | | | |
| | | Brandywine Asset Management, Inc.: | | | | | | | | | |
| | | on the first $150 million | | 0.45 | | | | | | | |
| | | on the amount over $150 million | | 0.25 | | | | | | | |
| | | William Blair & Co., LLC | | | | | | | | | |
| | | on the first $100 million | | 0.40 | | | | | | | |
| | | on the amount over $100 million | | 0.35 | | | | | | | |
Emerging Markets Equity Investments | | | | | | | 0.86 | | | 0.90 | |
| | | Newgate LLP | | 0.50 | | | | | | | |
| | | SSgA Funds Management, Inc. | | 0.50 | | | | | | | |
Government Money Investments | | | | | | | 0.15 | | | 0.15 | |
| | | Standish Mellon Asset Management LLC: | | | | | | | | | |
| | | on the first $100 million | | 0.15 | | | | | | | |
| | | on the amount over $100 million | | 0.10 | | | | | | | |
Core Fixed Income Investments | | | | | | | 0.40 | | | 0.65 | |
| | | BlackRock Financial Management, Inc.: | | | | | | | | | |
| | | on the first $500 million | | 0.20 | | | | | | | |
| | | on the amount over $500 million | | 0.15 | | | | | | | |
| | | Pacific Investment Management Co. | | 0.25 | | | | | | | |
| | | Western Asset Management Co. | | 0.20 | | | | | | | |
High Yield Investments | | | | | | | 0.55 | | | 0.70 | |
| | | Seix Investment Advisors, Inc. | | 0.30 | | | | | | | |
| | | Western Asset Management Co. | | 0.30 | | | | | | | |
Municipal Bond Investments | | | | | | | 0.40 | | | 0.40 | |
| | | Smith Affiliated Capital Corp. | | 0.20 | | | | | | | |
International Fixed Income Investments | | | | | | | 0.50 | | | 0.50 | |
| | | Julius Baer Investments Ltd. | | 0.25 | | | | | | | |
In addition, the following changes were made:
Large Capitalization Value Equity Investments:
The Boston Company Asset Management, LLC was terminated, effective June 30, 2004.
Cambiar Investors LLC was added as an additional adviser, effective July 1, 2004.
Large Capitalization Growth Investments:
Alliance Capital Management L.P. was terminated, effective March 31, 2004.
Sands Capital Management, Inc. was added as an additional adviser, effective January 2, 2004.
Westfield Capital Management Co., LLC was added as an additional adviser, effective April 1, 2004.
Small Capitalization Growth Investments:
Westpeak Global Advisors, L.P. was terminated, effective April 16, 2004.
International Equity Investments:
Oechsle International Advisors, LLC was terminated, effective March 31, 2004.
William Blair & Co., LLC was added as an additional adviser, effective April 1, 2004.
133
Notes to Financial Statements
(continued)
Emerging Markets Equity Investments:
Effective April 1, 2004, SBFM entered into a new investment advisory contract with SSgA Funds Management, Inc. that lowered the investment advisory fee to 0.50%. Prior to April 1, 2004, the advisory fee was 0.60%.
F&C Emerging Markets Ltd. was terminated, effective March 31, 2004.
Newgate LLP was added as an additional adviser, effective April 1, 2004.
Core Fixed Income Investments (formerly known as Intermediate Fixed Income Investments):
Western Asset Management Company was added as an additional adviser, effective June 7, 2004.
High Yield Investments:
Effective May 28, 2004, SBFM entered into a new investment advisory agreement with Seix Investment Advisors Inc. following its acquisition by Trusco Capital Management.
Subsequent Event:
International Fixed Income Investments:
Julius Baer Investments Ltd. was terminated, effective October 5, 2004.
Pacific Investment Management Company was added as an additional adviser, effective October 6, 2004.
SBFM also acts as the Trust’s administrator for which each Fund pays a fee calculated at an annual rate of 0.20% of the average daily net assets of each respective Fund. This fee is calculated daily and paid monthly.
During the year ended August 31, 2004, Government Money Investments had a voluntary expense limitation in place of 0.60% of the Fund’s average daily net assets resulting in waived investment advisory fees and administration fees of $154,301 and $205,734, respectively. In addition, SBFM has agreed to reimburse expenses of $30,004 for the Fund. This expense limitation can be terminated at any time by SBFM.
Citicorp Trust Bank, fsb. (“CTB”), another indirect wholly-owned subsidiary of Citigroup, acts as the Funds’ transfer agent. PFPC Inc. (“PFPC”) acts as the Funds’ sub-transfer agent. CTB receives account fees and asset-based fees that vary according to the size and type of account. PFPC is responsible for shareholder recordkeeping and financial processing for all shareholder accounts and is paid by CTB. For the year ended August 31, 2004, the Funds paid transfer agent fees totaling $4,628,614 to CTB. The totals for each Fund were as follows:
| | | |
| Fund | | Transfer Agent Fees |
Large Capitalization Value Equity Investments | | $ | 608,181 |
Large Capitalization Growth Investments | | | 609,550 |
Small Capitalization Value Equity Investments | | | 578,016 |
Small Capitalization Growth Investments | | | 580,946 |
International Equity Investments | | | 550,068 |
Emerging Markets Equity Investments | | | 370,558 |
Government Money Investments | | | 512,165 |
Core Fixed Income Investments | | | 292,974 |
High Yield Investments | | | 318,531 |
Municipal Bond Investments | | | 14,915 |
International Fixed Income Investments | | | 192,710 |
134
Notes to Financial Statements
(continued)
For the year ended August 31, 2004, Citigroup Global Markets Inc., another indirect wholly-owned subsidiary of Citigroup, and its affiliates received brokerage commissions of:
| | | |
| Fund | | Commissions |
Large Capitalization Value Equity Investments | | $ | 18,392 |
Large Capitalization Growth Investments | | | 7,336 |
Small Capitalization Value Equity Investments | | | 4,265 |
Small Capitalization Growth Investments | | | 2,676 |
International Equity Investments | | | 38,333 |
Emerging Markets Equity Investments | | | 69,871 |
All officers and one Trustee of the Trust are employees of Citigroup or its affiliates.
3. Investments
During the year ended August 31, 2004, the aggregate cost of purchases and proceeds from sales of investments (including maturities of long-term investments, but excluding short-term investments and mortgage dollar rolls) were as follows:
| | | | | | |
| Fund | | Purchases | | Sales |
Large Capitalization Value Equity Investments | | $ | 1,172,507,654 | | $ | 1,124,303,776 |
Large Capitalization Growth Investments | | | 1,409,711,247 | | | 1,398,501,084 |
Small Capitalization Value Equity Investments | | | 141,689,389 | | | 227,619,169 |
Small Capitalization Growth Investments | | | 341,726,312 | | | 534,859,626 |
International Equity Investments | | | 482,207,640 | | | 527,836,247 |
Emerging Markets Equity Investments | | | 241,118,281 | | | 272,012,185 |
| | |
Core Fixed Income Investments | | | | | | |
U.S. government securities | | $ | 814,421,882 | | $ | 826,141,838 |
Other investments | | | 215,818,105 | | | 228,466,904 |
| | |
|
| |
|
|
| | | $ | 1,030,239,987 | | $ | 1,054,608,742 |
| | |
|
| |
|
|
| | |
High Yield Investments | | $ | 285,054,174 | | $ | 288,098,232 |
Municipal Bond Investments | | | 9,985,758 | | | 5,331,200 |
International Fixed Income Investments | | | 262,558,439 | | | 267,032,106 |
At August 31, 2004, the aggregate gross unrealized appreciation and depreciation of investments for Federal income tax purposes were as follows:
| | | | | | | | | | |
| Fund | | Appreciation | | Depreciation | | | Net Unrealized
Appreciation |
Large Capitalization Value Equity Investments | | $ | 141,691,589 | | $ | (48,230,412 | ) | | $ | 93,461,177 |
Large Capitalization Growth Investments | | | 187,223,808 | | | (74,158,744 | ) | | | 113,065,064 |
Small Capitalization Value Equity Investments | | | 98,280,951 | | | (16,155,436 | ) | | | 82,125,515 |
Small Capitalization Growth Investments | | | 79,385,009 | | | (34,987,637 | ) | | | 44,397,372 |
International Equity Investments | | | 85,037,493 | | | (24,144,624 | ) | | | 60,892,869 |
Emerging Markets Equity Investments | | | 42,862,154 | | | (10,268,300 | ) | | | 32,593,854 |
Core Fixed Income Investments | | | 10,344,106 | | | (2,606,914 | ) | | | 7,737,192 |
High Yield Investments | | | 12,296,557 | | | (2,931,690 | ) | | | 9,364,867 |
Municipal Bond Investments | | | 1,820,265 | | | (67,623 | ) | | | 1,752,642 |
International Fixed Income Investments | | | 1,907,444 | | | (646,540 | ) | | | 1,260,904 |
135
Notes to Financial Statements
(continued)
At August 31, 2004, Core Fixed Income Investments and Emerging Markets Equity Investments had the following open futures contracts:
| | | | | | | | | | | | | | |
| Core Fixed Income Investments | | Number of
Contracts | | Expiration | | Basis Value | | Market Value | | Unrealized
Gain (Loss) | |
Contracts to Buy: | | | | | | | | | | | | | | |
Euro Dollar | | 2 | | 9/04 | | $ | 489,660 | | $ | 490,660 | | $ | 1,000 | |
Euro Dollar | | 20 | | 6/05 | | | 4,862,300 | | | 4,867,000 | | | 4,700 | |
Euro Dollar | | 132 | | 9/05 | | | 31,765,929 | | | 32,038,050 | | | 272,121 | |
Euro Dollar | | 125 | | 9/05 | | | 30,316,962 | | | 30,339,062 | | | 22,100 | |
Germany Federation Republic Bonds 10 Year | | 19 | | 9/04 | | | 2,636,863 | | | 2,689,410 | | | 52,547 | |
U.S. 2 Year Treasury Notes | | 3 | | 9/04 | | | 630,188 | | | 637,875 | | | 7,687 | |
U.S. 2 Year Treasury Notes | | 1 | | 12/04 | | | 211,453 | | | 211,672 | | | 219 | |
U.S. 5 Year Treasury Notes | | 190 | | 12/04 | | | 20,851,180 | | | 21,027,657 | | | 176,477 | |
U.S. 10 Year Treasury Notes | | 95 | | 9/04 | | | 10,416,641 | | | 10,779,531 | | | 362,890 | |
U.S. 10 Year Treasury Notes | | 325 | | 12/04 | | | 35,634,437 | | | 36,501,563 | | | 867,126 | |
| | | | | | | | | | | | |
|
|
|
| | | | | | | | | | | | | | 1,766,867 | |
| | | | | | | | | | | | |
|
|
|
Contracts to Sell: | | | | | | | | | | | | | | |
U.S. Treasury Bonds | | 50 | | 9/04 | | | 5,475,563 | | | 5,626,563 | | | (151,000 | ) |
U.S. Treasury Bonds | | 14 | | 9/04 | | | 1,512,438 | | | 1,575,438 | | | (63,000 | ) |
U.S. 5 Year Treasury Notes | | 14 | | 9/04 | | | 1,549,508 | | | 1,561,219 | | | (11,711 | ) |
U.S. 10 Year Treasury Notes | | 27 | | 9/04 | | | 3,033,006 | | | 3,063,656 | | | (30,650 | ) |
U.S. 10 Year Treasury Notes | | 13 | | 12/04 | | | 1,463,255 | | | 1,460,062 | | | 3,193 | |
| | | | | | | | | | | | |
|
|
|
| | | | | | | | | | | | | | (253,168 | ) |
| | | | | | | | | | | | |
|
|
|
| | | | | | | | | | | | | $ | 1,513,699 | |
| | | | | | | | | | | | |
|
|
|
| | | | | | | | | | | | | |
| Emerging Markets Equity Investments | | Number of
Contracts | | Expiration | | Basis Value | | Market Value | | Unrealized
Gain |
Contracts to Buy: | | | | | | | | | | | | | |
Taiwan MSCI | | 20 | | 9/04 | | $ | 488,340 | | $ | 488,800 | | $ | 460 |
| | | | | | | | | | | | |
|
|
At August 31, 2004, Emerging Markets Equity Investments had deposited cash of $117,356 with the broker as initial margin collateral.
At August 31, 2004, Core Fixed Income Investments held purchased call options with a total cost of $17,688.
The written call option transactions for Core Fixed Income Investments which occurred during the year ended August 31, 2004, were as follows:
| | | | | | | |
| Core Fixed Income Investments | | Number of
Contracts | | | Premiums | |
Options written, outstanding at August 31, 2003 | | 120,000 | | | $ | 154,688 | |
Options written | | (582 | ) | | | (428,535 | ) |
Options cancelled in closing purchase transactions | | (119,748 | ) | | | 57,051 | |
Options expired | | 71 | | | | 41,223 | |
| | |
|
| |
|
|
|
Options written, outstanding at August 31, 2004 | | (259 | ) | | $ | (175,573 | ) |
| | |
|
| |
|
|
|
136
Notes to Financial Statements
(continued)
At August 31, 2004, International Equity Investments, Emerging Markets Equity Investments, International Fixed Income Investments and Core Fixed Income Investments had the following open forward foreign currency contracts. The unrealized gain (loss) on the contracts reflected in the accompanying financial statements were as follows:
International Equity Investments
| | | | | | | | | | | |
Forward Foreign Currency Contracts
| | Local Currency
| | Market Value
| | Settlement Date
| | Unrealized
Gain (Loss)
| |
To Buy: | | | | | | | | | | | |
British Pound | | 26,707 | | $ | 48,149 | | 9/1/04 | | $ | 317 | |
British Pound | | 26,668 | | | 48,078 | | 9/2/04 | | | 217 | |
Euro | | 351,946 | | | 428,794 | | 9/1/04 | | | 4,347 | |
| | | | | | | | | |
|
|
|
| | | | | | | | | | | 4,881 | |
| | | | | | | | | |
|
|
|
To Sell: | | | | | | | | | | | |
British Pound | | 523,672 | | | 944,102 | | 9/1/04 | | | (7,149 | ) |
British Pound | | 299,262 | | | 539,525 | | 9/2/04 | | | (3,247 | ) |
Euro | | 117,607 | | | 143,287 | | 9/1/04 | | | (1,782 | ) |
Euro | | 921,086 | | | 1,122,206 | | 9/1/04 | | | (13,955 | ) |
Japanese Yen | | 1,908,825 | | | 17,507 | | 9/1/04 | | | (46 | ) |
Singapore Dollar | | 75,981 | | | 44,419 | | 9/1/04 | | | (35 | ) |
| | | | | | | | | |
|
|
|
| | | | | | | | | | | (26,214 | ) |
| | | | | | | | | |
|
|
|
Net Unrealized Loss on Open Forward
Foreign Currency Contracts | | | | | | | | | $ | (21,333 | ) |
| | | | | | | | | |
|
|
|
Emerging Markets Equity Investments
| | | | | | | | | | |
Forward Foreign Currency Contracts
| | Local Currency
| | Market Value
| | Settlement Date
| | Unrealized
Gain
|
To Sell: | | | | | | | | | | |
South African Rand | | 96,458 | | $ | 14,516 | | 9/1/04 | | $ | 11 |
| | | | | | | | | |
|
|
Core Fixed Income Investments
| | | | | | | | | | |
Forward Foreign Currency Contracts
| | Local Currency
| | Market Value
| | Settlement Date
| | Unrealized
Gain
| |
To Buy: | | | | | | | | | | |
Euro | | 326,000 | | 397,063 | | 9/23/04 | | $ | 1,363 | |
Japanese Yen | | 171,020,000 | | 1,570,627 | | 9/27/04 | | | 6,808 | |
| | | | | | | | |
|
|
|
| | | | | | | | | | 8,171 | |
| | | | | | | | |
|
|
|
To Sell: | | | | | | | | | | |
Euro | | 414,000 | | 504,245 | | 9/23/04 | | | 4,823 | |
Japanese Yen | | 9,900,000 | | 90,920 | | 9/27/04 | | | (735 | ) |
| | | | | | | | |
|
|
|
| | | | | | | | | | 4,088 | |
| | | | | | | | |
|
|
|
Net Unrealized Gain on Open Forward
Foreign Currency Contracts | | | | | | | | $ | 12,259 | |
| | | | | | | | |
|
|
|
International Fixed Income Investments
| | | | | | | | | | | |
Forward Foreign Currency Contracts
| | Local Currency
| | Market Value
| | Settlement Date
| | Unrealized
Gain (Loss)
| |
To Buy: | | | | | | | | | | | |
Euro | | 818,477 | | $ | 997,152 | | 9/3/04 | | $ | (12,848 | ) |
Euro | | 834,711 | | | 1,016,328 | | 10/28/04 | | | 6,328 | |
| | | | | | | | | |
|
|
|
| | | | | | | | | | | (6,520 | ) |
| | | | | | | | | |
|
|
|
To Sell: | | | | | | | | | | | |
Euro | | 834,228 | | | 1,016,342 | | 9/3/04 | | | (6,342 | ) |
| | | | | | | | | |
|
|
|
| | | | | | | | | | $ | (12,862 | ) |
| | | | | | | | | |
|
|
|
137
Notes to Financial Statements
(continued)
| | | | | | | | | | | | |
| International Fixed Income Investments (continued) | | | | | | | | | |
| | | |
Forward Foreign Cross Currency Contracts*
| | Market Value
| | Settlement Date
| | Unrealized
Gain (Loss)
| |
| | | Australian Dollar
| | Euro
| | |
To Buy: | | | | | | | | | | | | |
Australian Dollar vs. Euro | | $ | 5,605,177 | | $ | 5,603,743 | | 10/20/04 | | $ | 1,434 | |
Australian Dollar vs. Euro | | | 3,305,437 | | | 3,294,111 | | 10/20/04 | | | 11,326 | |
| | | | |
| | | British Pound
| | Canadian Dollar
| | | | | |
British Pound vs. Canadian Dollar | | $ | 6,589,045 | | $ | 6,601,877 | | 10/18/04 | | | (12,832 | ) |
| | | | |
| | | Canadian Dollar
| | British Pound
| | | | | |
Canadian Dollar vs. British Pound | | $ | 6,716,156 | | $ | 6,589,045 | | 10/18/04 | | | 127,111 | |
| | | | |
| | | Canadian Dollar
| | Euro
| | | | | |
Canadian Dollar vs. Euro | | $ | 3,721,040 | | $ | 3,778,329 | | 9/2/04 | | | (57,289 | ) |
Canadian Dollar vs. Euro | | | 6,454,865 | | | 6,223,494 | | 9/2/04 | | | 231,371 | |
Canadian Dollar vs. Euro | | | 4,708,254 | | | 4,547,880 | | 9/2/04 | | | 160,374 | |
Canadian Dollar vs. Euro | | | 6,449,544 | | | 6,565,702 | | 11/2/04 | | | (116,158 | ) |
| | | | |
| | | Euro
| | British Pound
| | | | | |
Euro vs. British Pound | | $ | 9,900,397 | | $ | 9,779,510 | | 10/25/04 | | | 120,887 | |
| | | | |
| | | Euro
| | Canadian Dollar
| | | | | |
Euro vs. Canadian Dollar | | $ | 3,589,376 | | $ | 3,721,040 | | 9/2/04 | | | (131,664 | ) |
Euro vs. Canadian Dollar | | | 4,653,909 | | | 4,708,254 | | 9/2/04 | | | (54,345 | ) |
Euro vs. Canadian Dollar | | | 6,570,880 | | | 6,454,865 | | 9/2/04 | | | 116,015 | |
Euro vs. Canadian Dollar | | | 3,774,947 | | | 3,717,972 | | 11/2/04 | | | 56,975 | |
| | | | |
| | | Euro
| | New Zealand Dollar
| | | | | |
Euro vs. New Zealand Dollar | | $ | 1,986,347 | | $ | 2,030,790 | | 9/13/04 | | | (44,443 | ) |
Euro vs. New Zealand Dollar | | | 3,275,353 | | | 3,275,468 | | 9/13/04 | | | (115 | ) |
| | | | |
| | | Euro
| | Swedish Krona
| | | | | |
Euro vs. Swedish Krona | | $ | 4,674,315 | | $ | 4,681,720 | | 9/27/04 | | | (7,405 | ) |
| | | | |
| | | Japanese Yen
| | Euro
| | | | | |
Japanese Yen vs. Euro | | $ | 11,902,307 | | $ | 11,790,021 | | 9/27/04 | | | 112,286 | |
| | | | |
| | | New Zealand Dollar
| | Euro
| | | | | |
New Zealand Dollar vs. Euro | | $ | 3,288,796 | | $ | 3,287,971 | | 9/1/04 | | | 825 | |
| | | | |
| | | Swedish Krona
| | Euro
| | | | | |
Swedish Krona vs. Euro | | $ | 10,483,851 | | $ | 10,442,959 | | 9/27/04 | | | 40,892 | |
| | | | | | | | | | |
|
|
|
| | | | | | | | | | | | 555,245 | |
| | | | | | | | | | |
|
|
|
Net Unrealized Gain on Open Forward
Foreign and Cross Currency Contracts | | | | | | | | | | $ | 542,383 | |
| | | | | | | | | | |
|
|
|
138
Notes to Financial Statements
(continued)
International Fixed Income Investments (continued)
| | | | |
*Local Currency on Forward Foreign
Cross Currency Contracts
| | Buy
| | Sell
|
| Australian Dollar vs. Euro | | 7,970,000 | | 4,602,042 |
| Australian Dollar vs. Euro | | 4,700,000 | | 2,705,270 |
| British Pound vs. Canadian Dollar | | 3,670,000 | | 8,699,001 |
| Canadian Dollar vs. British Pound | | 8,849,581 | | 3,670,000 |
| Canadian Dollar vs. Euro | | 4,900,000 | | 3,101,266 |
| Canadian Dollar vs. Euro | | 8,500,000 | | 5,108,265 |
| Canadian Dollar vs. Euro | | 6,200,000 | | 3,732,916 |
| Canadian Dollar vs. Euro | | 8,500,000 | | 5,392,614 |
| Euro vs. British Pound | | 8,130,991 | | 5,450,000 |
| Euro vs. Canadian Dollar | | 2,946,172 | | 4,900,000 |
| Euro vs. Canadian Dollar | | 3,819,945 | | 6,200,000 |
| Euro vs. Canadian Dollar | | 5,393,401 | | 8,500,000 |
| Euro vs. Canadian Dollar | | 3,100,481 | | 4,900,000 |
| Euro vs. New Zealand Dollar | | 1,630,635 | | 3,100,000 |
| Euro vs. New Zealand Dollar | | 2,688,808 | | 5,000,000 |
| Euro vs. Swedish Krona | | 3,837,949 | | 35,100,000 |
| Japanese Yen vs. Euro | | 1,296,000,000 | | 9,680,455 |
| New Zealand Dollar vs. Euro | | 5,011,500 | | 2,698,708 |
| Swedish Krona vs. Euro | | 78,600,000 | | 8,574,421 |
In addition, during the year ended August 31, 2004, International Equity Investments and International Fixed Income Investments incurred $3,852 and $1,828, respectively, of interest expense related to overdrafts in foreign currency accounts.
At August 31, 2004, the Funds listed below had securities on loan. The market value for the securities on loan was as follows:
| | | |
| Fund | | Value |
Small Capitalization Value Equity Investments | | $ | 82,350,692 |
Small Capitalization Growth Investments | | | 79,483,581 |
International Equity Investments | | | 141,862,805 |
Core Fixed Income Investments | | | 114,734,454 |
High Yield Investments | | | 22,349,545 |
At August 31, 2004, the Funds listed below received cash collateral which was invested into the State Street Navigator Securities Lending Trust Prime Portfolio. The amount of the cash collateral was as follows:
| | | |
| Fund | | Value |
Small Capitalization Value Equity Investments | | $ | 83,851,265 |
Small Capitalization Growth Investments | | | 81,889,326 |
International Equity Investments | | | 147,645,078 |
Core Fixed Income Investments | | | 113,065,099 |
High Yield Investments | | | 22,820,074 |
In addition, Core Fixed Income Investments received securities as collateral having a market value of $3,423,660, which is maintained in a segregated account by the custodian.
139
Notes to Financial Statements
(continued)
Income earned by the Funds from securities lending for the year ended August 31, 2004 was as follows:
| | | |
| Fund | | Value |
Small Capitalization Value Equity Investments | | $ | 131,907 |
Small Capitalization Growth Investments | | | 241,441 |
International Equity Investments | | | 432,573 |
Core Fixed Income Investments | | | 70,531 |
High Yield Investments | | | 42,698 |
International Fixed Income Investments | | | 701 |
During the year ended August 31, 2004, Core Fixed Income Investments entered into mortgage dollar roll transactions in the aggregate amount of $63,394,763. For the year ended August 31, 2004, Core Fixed Income Investments recorded interest income of $136,699 related to such transactions.
At August 31, 2004, Core Fixed Income Investments held securities under outstanding mortgage dollar rolls with a total cost of $24,160,844.
4. Transfer of Net Assets
On June 4, 2004, Core Fixed Income Investments acquired the assets and certain liabilities of Long-Term Bond Investments, Mortgage Backed Investments and Multi-Sector Fixed Income Investments pursuant to a plan of reorganization. The total net assets of Core Fixed Income Investments on the date of the transfer was $354,713,984. Total shares issued by Core Fixed Income Investments and the total net assets of Long-Term Bond Investments, Mortgage Backed Investments and Multi-Sector Fixed Income Investments on the date of the transfer were as follows:
| | | | | |
| Acquired Fund | | Shares Issued by
Core Fixed Income
Investments | | Total Net Assets of
the Acquired Funds |
Long-Term Bond Investments | | 1,902,502 | | $ | 15,333,480 |
Mortgage Backed Investments | | 8,738,304 | | | 70,385,745 |
Multi-Sector Fixed Income Investments | | 3,367,867 | | | 27,160,561 |
| | |
| |
|
|
Total | | 14,008,673 | | $ | 112,879,786 |
| | |
| |
|
|
The total net assets of Long-Term Bond Investments, Mortgage Backed Investments and Multi-Sector Fixed Income Investments before the acquisition included:
| | | | | | | | | | | | |
| Acquired Fund | | Undistributed
(Overdistributed)
Income | | | Accumulated Net
Realized Losses | | | Unrealized
Depreciation | |
Long-Term Bond Investments | | $ | 4,503 | | | $ | (97,636 | ) | | $ | (553,501 | ) |
Mortgage Backed Investments | | | (195,893 | ) | | | (3,563,965 | ) | | | (1,523,152 | ) |
Multi-Sector Fixed Income Investments | | | (10,534 | ) | | | (1,881,533 | ) | | | (608,392 | ) |
| | |
|
|
| |
|
|
| |
|
|
|
Total | | $ | (201,924 | ) | | $ | (5,543,134 | ) | | $ | (2,685,045 | ) |
| | |
|
|
| |
|
|
| |
|
|
|
Total net assets of Core Fixed Income Investments immediately after the transfer was $467,593,770. The transaction was structured to qualify as a tax-free reorganization under the Internal Revenue Code of 1986, as amended.
140
Notes to Financial Statements
(continued)
5. Shares of Beneficial Interest
At August 31, 2004, the Trust had an unlimited number of shares of beneficial interest authorized with a par value of $0.001 per share. Transactions in shares for each Fund were as follows:
| | | | | | |
| | | Year Ended
August 31, 2004
| | | Year Ended
August 31, 2003
| |
| Large Capitalization Value Equity Investments | | | | | | |
Shares sold | | 32,330,509 | | | 29,548,329 | |
Shares issued on reinvestment | | 1,790,468 | | | 1,816,137 | |
Shares reacquired | | (27,608,264 | ) | | (36,415,635 | ) |
| | |
|
| |
|
|
Net Increase (Decrease) | | 6,512,713 | | | (5,051,169 | ) |
| | |
|
| |
|
|
| Large Capitalization Growth Investments | | | | | | |
Shares sold | | 25,950,577 | | | 21,097,785 | |
Shares reacquired | | (24,638,754 | ) | | (32,559,041 | ) |
| | |
|
| |
|
|
Net Increase (Decrease) | | 1,311,823 | | | (11,461,256 | ) |
| | |
|
| |
|
|
| Small Capitalization Value Equity Investments | | | | | | |
Shares sold | | 4,528,362 | | | 3,615,984 | |
Shares issued on reinvestment | | 226,307 | | | 2,381,607 | |
Shares reacquired | | (10,752,205 | ) | | (14,981,108 | ) |
| | |
|
| |
|
|
Net Decrease | | (5,997,536 | ) | | (8,983,517 | ) |
| | |
|
| |
|
|
| Small Capitalization Growth Investments | | | | | | |
Shares sold | | 6,528,376 | | | 8,074,273 | |
Shares reacquired | | (21,950,636 | ) | | (18,667,992 | ) |
| | |
|
| |
|
|
Net Decrease | | (15,422,260 | ) | | (10,593,719 | ) |
| | |
|
| |
|
|
| International Equity Investments | | | | | | |
Shares sold | | 13,287,948 | | | 12,202,021 | |
Shares issued on reinvestment | | 958,980 | | | 236,123 | |
Shares reacquired | | (17,028,026 | ) | | (21,504,389 | ) |
| | |
|
| |
|
|
Net Decrease | | (2,781,098 | ) | | (9,066,245 | ) |
| | |
|
| |
|
|
| Emerging Markets Equity Investments | | | | | | |
Shares sold | | 8,074,971 | | | 6,880,913 | |
Shares issued on reinvestment | | 111,706 | | | 340,040 | |
Shares reacquired | | (13,668,849 | ) | | (12,122,150 | ) |
| | |
|
| |
|
|
Net Decrease | | (5,482,172 | ) | | (4,901,197 | ) |
| | |
|
| |
|
|
| Government Money Investments | | | | | | |
Shares sold | | 88,254,534 | | | 119,236,885 | |
Shares issued on reinvestment | | 472,008 | | | 1,109,055 | |
Shares reacquired | | (105,312,733 | ) | | (150,237,821 | ) |
| | |
|
| |
|
|
Net Decrease | | (16,586,191 | ) | | (29,891,881 | ) |
| | |
|
| |
|
|
| Core Fixed Income Investments | | | | | | |
Shares sold | | 17,383,247 | | | 12,462,259 | |
Net asset value of shares issued in connection with the transfer of the net assets of Long-Term Bond Investments, Mortgage Backed Investments and Multi-Sector Fixed Income Investments (Note 4) | | 14,008,673 | | | — | |
Shares issued on reinvestment | | 1,384,301 | | | 1,811,533 | |
Shares reacquired | | (13,858,301 | ) | | (15,782,023 | ) |
| | |
|
| |
|
|
Net Increase (Decrease) | | 18,917,920 | | | (1,508,231 | ) |
| | |
|
| |
|
|
141
Notes to Financial Statements
(continued)
| | | | | | |
| | | Year Ended
August 31, 2004
| | | Year Ended
August 31, 2003
| |
| High Yield Investments | | | | | | |
Shares sold | | 13,283,796 | | | 13,057,303 | |
Shares issued on reinvestment | | 3,262,152 | | | 4,146,205 | |
Shares reacquired | | (16,010,234 | ) | | (18,700,844 | ) |
| | |
|
| |
|
|
Net Increase (Decrease) | | 535,714 | | | (1,497,336 | ) |
| | |
|
| |
|
|
| Municipal Bond Investments | | | | | | |
Shares sold | | 1,433,520 | | | 1,168,016 | |
Shares issued on reinvestment | | 112,062 | | | 111,303 | |
Shares reacquired | | (1,047,071 | ) | | (1,480,395 | ) |
| | |
|
| |
|
|
Net Increase (Decrease) | | 498,511 | | | (201,076 | ) |
| | |
|
| |
|
|
| International Fixed Income Investments | | | | | | |
Shares sold | | 3,742,621 | | | 2,998,104 | |
Shares issued on reinvestment | | 1,323,587 | | | 548,064 | |
Shares reacquired | | (4,925,091 | ) | | (6,290,975 | ) |
| | |
|
| |
|
|
Net Increase (Decrease) | | 141,117 | | | (2,744,807 | ) |
| | |
|
| |
|
|
6. Income Tax Information and Distributions to Shareholders
The tax character of distributions paid during the fiscal year ended August 31, 2004 were as follows:
| | | | | | | | | | | | |
| | | Large
Capitalization
Value Equity
Investments
| | Large
Capitalization
Growth
Investments
| | Small
Capitalization
Value Equity
Investments
| | Small
Capitalization
Growth
Investments
|
Distributions paid from: | | | | | | | | | | | | |
Ordinary Income | | $ | 17,504,343 | | | — | | $ | 3,200,315 | | | — |
Net Long-term Capital Gains | | | — | | | — | | | — | | | — |
| | |
|
| |
|
| |
|
| |
|
|
Total Distributions Paid | | $ | 17,504,343 | | | — | | $ | 3,200,315 | | | — |
| | |
|
| |
|
| |
|
| |
|
|
| | | | |
| | | International
Equity
Investments
| | Emerging
Markets
Equity
Investments
| | Government
Money
Investments
| | Core Fixed
Income
Investments
|
Distributions paid from: | | | | | | | | | | | | |
Ordinary Income | | $ | 8,500,192 | | $ | 822,753 | | $ | 488,667 | | $ | 11,889,622 |
Net Long-term Capital Gains | | | — | | | — | | | — | | | — |
| | |
|
| |
|
| |
|
| |
|
|
Total Distributions Paid | | $ | 8,500,192 | | $ | 822,753 | | $ | 488,667 | | $ | 11,889,622 |
| | |
|
| |
|
| |
|
| |
|
|
| | | | |
| | | High Yield
Investments
| | Municipal
Bond
Investments
| | International
Fixed Income
Investments
| | |
Distributions paid from: | | | | | | | | | | | | |
Tax Exempt | | | — | | $ | 1,152,482 | | | — | | | |
Ordinary Income | | $ | 16,171,887 | | | — | | $ | 11,403,364 | | | |
Net Long-term Capital Gains | | | — | | | — | | | — | | | |
| | |
|
| |
|
| |
|
| | | |
Total Distributions Paid | | $ | 16,171,887 | | $ | 1,152,482 | | $ | 11,403,364 | | | |
| | |
|
| |
|
| |
|
| | | |
142
Notes to Financial Statements
(continued)
The tax character of distributions paid during the fiscal year ended August 31, 2003 were as follows:
| | | | | | | | | | | | |
| | | Large
Capitalization
Value Equity
Investments
| | Large
Capitalization
Growth
Investments
| | Small
Capitalization
Value Equity
Investments
| | Small
Capitalization
Growth
Investments
|
Distributions paid from: | | | | | | | | | | | | |
Ordinary Income | | $ | 14,867,262 | | | — | | $ | 12,971,233 | | | — |
Net Long-term Capital Gains | | | — | | | — | | | 11,736,719 | | | — |
| | |
|
| |
|
| |
|
| |
|
|
Total Distributions Paid | | $ | 14,867,262 | | | — | | $ | 24,707,952 | | | — |
| | |
|
| |
|
| |
|
| |
|
|
| | | | |
| | | International
Equity
Investments
| | Emerging
Markets
Equity
Investments
| | Government
Money
Investments
| | Core Fixed
Income
Investments
|
Distributions paid from: | | | | | | | | | | | | |
Ordinary Income | | $ | 1,584,789 | | $ | 1,744,393 | | $ | 1,058,373 | | $ | 15,588,205 |
Net Long-term Capital Gains | | | — | | | — | | | — | | | — |
| | |
|
| |
|
| |
|
| |
|
|
Total Distributions Paid | | $ | 1,584,789 | | $ | 1,744,393 | | $ | 1,058,373 | | $ | 15,588,205 |
| | |
|
| |
|
| |
|
| |
|
|
| | | | |
| | | High Yield
Investments
| | Municipal
Bond
Investments
| | International
Fixed Income
Investments
| | |
Distributions paid from: | | | | | | | | | | | | |
Tax Exempt | | | — | | $ | 1,115,805 | | | — | | | |
Ordinary Income | | $ | 18,966,872 | | | 29 | | $ | 4,474,320 | | | |
Net Long-term Capital Gains | | | — | | | — | | | — | | | |
| | |
|
| |
|
| |
|
| | | |
Total Distributions Paid | | $ | 18,966,872 | | $ | 1,115,834 | | $ | 4,474,320 | | | |
| | |
|
| |
|
| |
|
| | | |
As of August 31, 2004, the components of accumulated earnings on a tax basis were as follows:
| | | | | | | | | | | | | | | |
| | | Large
Capitalization
Value Equity
Investments
| | | Large
Capitalization
Growth
Investments
| | | Small
Capitalization
Value Equity
Investments
| | Small
Capitalization
Growth
Investments
| |
Undistributed ordinary income — net | | $ | 8,054,686 | | | | — | | | $ | 2,373,938 | | | — | |
Undistributed long-term capital gains — net | | | — | | | | — | | | | 39,279,888 | | | — | |
| | |
|
|
| |
|
|
| |
|
| |
|
|
|
Total undistributed earnings | | $ | 8,054,686 | | | | — | | | $ | 41,653,826 | | | — | |
Capital loss carryforward (1) | | $ | (65,121,072 | ) | | $ | (369,630,812 | ) | | | — | | $ | (379,310,811 | ) |
Unrealized appreciation/(depreciation) (2) | | | 93,461,437 | | | | 113,065,064 | | | $ | 82,125,515 | | | 44,397,372 | |
| | |
|
|
| |
|
|
| |
|
| |
|
|
|
Total accumulated earnings/(losses) — net | | $ | 36,395,051 | | | $ | (256,565,748 | ) | | $ | 123,779,341 | | $ | (334,913,439 | ) |
| | |
|
|
| |
|
|
| |
|
| |
|
|
|
| (1) | | On August 31, 2004 Large Capitalization Value Equity Investments had a net capital loss carryforward of $65,121,072, all of which expires in 2011. Large Capitalization Growth Investments had a net capital loss carryforward of $369,630,812, of which $197,213,317 expires in 2010, $159,803,398 expires in 2011 and $12,614,097 expires in 2012. Small Capitalization Growth Investments had a net capital loss carryforward of $379,310,811 of which $187,437,505 expires in 2010 and $191,873,306 expires in 2011. These amounts will be available to offset like amount of any future taxable capital gains. |
| (2) | | The difference between book-basis and tax-basis unrealized appreciation/(depreciation) is attributable primarily to the tax deferral of losses on wash sales and the difference between book and tax cost basis on real estate investment trusts. |
143
Notes to Financial Statements
(continued)
| | | | | | | | | | | | | | | | |
| | | International
Equity
Investments
| | | Emerging
Markets Equity
Investments
| | | Government
Money
Investments
| | | Core Fixed
Income
Investments
| |
Undistributed ordinary income — net | | $ | 6,461,611 | | | $ | 2,336,454 | | | $ | — | | | $ | 1,616,384 | |
Undistributed long-term capital gains — net | | | — | | | | — | | | | — | | | | — | |
| | |
|
|
| |
|
|
| |
|
|
| |
|
|
|
Total undistributed earnings | | $ | 6,461,611 | | | $ | 2,336,454 | | | $ | — | | | $ | 1,616,384 | |
Capital loss carryforward (3) | | $ | (265,589,790 | ) | | $ | (117,985,357 | ) | | $ | (21,111 | ) | | $ | (13,300,380 | ) |
Other book/tax temporary differences (4) | | | (5,996,199 | ) | | | (355,300 | ) | | | — | | | | (1,634,054 | ) |
Unrealized appreciation/(depreciation) (5) | | | 60,934,047 | | | | 32,376,535 | | | | — | | | | 9,170,913 | |
| | |
|
|
| |
|
|
| |
|
|
| |
|
|
|
Total accumulated earnings/(losses) — net | | $ | (204,190,331 | ) | | $ | (83,627,668 | ) | | $ | (21,111 | ) | | $ | (4,147,137 | ) |
| | |
|
|
| |
|
|
| |
|
|
| |
|
|
|
| (3) | | On August 31, 2004 International Equity Investments had a net capital loss carryforward of $265,589,790, of which $180,951,282 expires in 2010 and $84,638,508 expires in 2011. Emerging Markets Equity Investments had a net capital loss carryforward of $117,985,357, of which $38,390,213 expires in 2007, $2,094,241 expires in 2009, $41,587,790 expires in 2010 and $35,913,113 expires in 2011. Government Money Investments had a net capital loss carryforward of $21,111, of which $9,983 expires in 2008 and $11,128 expires in 2009. Core Fixed Income Investments had a net capital loss carryforward of $13,300,380, of which $6,358,307 expires in 2008, $4,723,104 expires in 2011 and $2,218,969 expires in 2012. This amount will be available to offset like amounts of any future taxable capital gains. |
| (4) | | Other book/tax temporary differences are attributable primarily to the deferral of post-October capital losses for tax purposes and the realization for tax purposes of unrealized gains on certain futures contracts. |
| (5) | | The difference between book-basis and tax-basis unrealized appreciation/(depreciation) is attributable primarily to the tax deferral of losses on wash sales and the difference between book and tax cost basis on real estate investment trusts. |
| | | | | | | | | | | | |
| | | High Yield
Investments
| | | Municipal
Bond
Investments
| | | International
Fixed Income
Investments
| |
Undistributed tax exempt income — net | | | — | | | $ | 237,353 | | | | — | |
Undistributed ordinary income — net | | $ | 534,106 | | | | — | | | $ | 5,070,986 | |
Undistributed long-term capital gains — net | | | — | | | | — | | | | — | |
| | |
|
|
| |
|
|
| |
|
|
|
Total undistributed earnings | | $ | 534,106 | | | $ | 237,353 | | | $ | 5,070,986 | |
Capital loss carryforward (6) | | $ | (90,730,997 | ) | | | (1,956,135 | ) | | | (2,447,878 | ) |
Unrealized appreciation/(depreciation) (7) | | | 9,364,867 | | | | 1,752,642 | | | | 1,335,953 | |
| | |
|
|
| |
|
|
| |
|
|
|
Total accumulated earnings/(losses) — net | | $ | (80,832,024 | ) | | $ | 33,860 | | | $ | 3,959,061 | |
| | |
|
|
| |
|
|
| |
|
|
|
| (6) | | On August 31, 2004, High Yield Investments had a net capital loss carryforward of $90,730,997 of which $1,840,144 expires in 2008, $5,866,773 expires in 2009, $45,159,946 expires in 2010, and $37,864,134 expires in 2011. Municipal Bond Investments had a net capital loss carryforward of $1,956,135, all of which expires in 2009. International Fixed Income Investments had a net capital loss carryforward of $2,447,878 all of which expires in 2009. These amounts will be available to offset like amounts of any future taxable capital gains. |
| (7) | | The difference between book-basis and tax-basis unrealized appreciation/(depreciation) is attributable primarily to the tax deferral of losses on wash sales and other book/tax temporary differences. |
7. Additional Information
In connection with an investigation previously disclosed by Citigroup, the Staff of the Securities and Exchange Commission (SEC) has notified Citigroup Asset Management (CAM), the Citigroup business unit that includes the funds’ investment manager and other investment advisory companies; Citicorp Trust Bank (CTB), an affiliate of CAM; Thomas W. Jones, the former CEO of CAM; and two other individuals, one of whom is an employee and the other of whom is a former employee of CAM, that the SEC Staff is considering recommending a civil injunctive action and/or an administrative proceeding against each of them relating to the creation and operation of an internal transfer agent unit to serve various CAM-managed funds.
In 1999, CTB entered the transfer agent business. CTB hired an unaffiliated subcontractor to perform some of the transfer agent services. The subcontractor, in exchange, had signed a separate agreement with CAM in 1998 that guaranteed investment
144
Notes to Financial Statements
(continued)
management revenue to CAM and investment banking revenue to a CAM affiliate. The subcontractor’s business was later taken over by PFPC Inc., and at that time the revenue guarantee was eliminated and a one-time payment was made by the subcontractor to a CAM affiliate.
CAM did not disclose the revenue guarantee when the boards of various CAM-managed funds hired CTB as transfer agent. Nor did CAM disclose to the boards of the various CAM-managed funds the one-time payment received by the CAM affiliate when it was made.
In addition, the SEC Staff has indicated that it is considering recommending action based on the adequacy of the disclosures made to the fund boards that approved the transfer agency arrangement, CAM’s initiation and operation of, and compensation for, the transfer agent business and CAM’s retention of, and agreements with, the subcontractor.
Citigroup is cooperating fully in the investigation and will seek to resolve the matter in discussions with the SEC Staff. Although there can be no assurance, Citigroup does not believe that this matter will have a material adverse effect on the funds. As previously disclosed, CAM has already agreed to pay the applicable funds, primarily through fee waivers, a total of approximately $17 million (plus interest) that is the amount of the revenue received by Citigroup relating to the revenue guarantee.
145
Report of Independent Registered Public Accounting Firm
The Shareholders and Board of Trustees of
Consulting Group Capital Markets Funds:
We have audited the accompanying statements of assets and liabilities, including the schedules of investments, of Large Capitalization Value Equity Investments, Large Capitalization Growth Investments, Small Capitalization Value Equity Investments, Small Capitalization Growth Investments, International Equity Investments, Emerging Markets Equity Investments, Government Money Investments, Core Fixed Income Investments, High Yield Investments, Municipal Bond Investments and International Fixed Income Investments (“Fund(s)”), which are separate investment funds of the Consulting Group Capital Markets Funds (“Trust”) as of August 31, 2004, and the related statements of operations for the year then ended, the statements of changes in net assets for each of the years in the two-year period then ended, and the financial highlights for each of the years in the five-year period then ended. These financial statements and financial highlights are the responsibility of the Funds’ management. Our responsibility is to express an opinion on these financial statements and financial highlights based on our audits.
We conducted our audits in accordance with the standards of the Public Company Accounting Oversight Board (United States). Those standards require that we plan and perform the audit to obtain reasonable assurance about whether the financial statements and financial highlights are free of material misstatement. An audit includes examining, on a test basis, evidence supporting the amounts and disclosures in the financial statements. Our procedures included confirmation of securities owned as of August 31, 2004, by correspondence with the custodian and brokers. As to securities purchased or sold but not yet received or delivered, we performed other appropriate auditing procedures. An audit also includes assessing the accounting principles used and significant estimates made by management, as well as evaluating the overall financial statement presentation. We believe that our audits provide a reasonable basis for our opinion.
In our opinion, the financial statements and financial highlights referred to above present fairly, in all material respects, the financial position of the Funds of the Trust as of August 31, 2004, and the results of their operations for the year then ended, the changes in their net assets for each of the years in the two-year period then ended, and the financial highlights for each of the years in the five-year period then ended, in conformity with U.S. generally accepted accounting principles.

New York, New York
October 22, 2004
146
Additional Information
(unaudited)
Information about Trustees and Officers
The business and affairs of the Consulting Group Capital Markets Funds (“Trust”) are managed under the direction of the Board of Trustees. Information pertaining to the Trustees and Officers of the Trust is set forth below. The Statement of Additional Information includes additional information about Trustees and is available, without charge, upon request by calling the Trust’s transfer agent, (Citicorp Trust Bank, fsb. at 1-800-451-2010).
| | | | | | | | | | |
Name, Address and Age
| | Position(s)
Held with
Fund
| | Term of
Office*
and
Length
of Time
Served
| | Principal Occupation(s) During Past Five Years
| | Number of
Portfolios
in Fund
Complex
Overseen
by Trustee
| | Other Board
Memberships Held by Trustee
|
| Non-Interested Trustees: | | | | | | | | |
H. John Ellis
858 East Crystal Downs Drive Frankfort, MI 49635
Age 77 | | Trustee | | Since
1999 | | Retired | | 24 | | None |
Armon E. Kamesar 7328 Country Club Drive
LaJolla, CA 92037
Age 77 | | Trustee | | Since
1994 | | Chairman, TEC International; Trustee,
U.S. Bankruptcy Court | | 24 | | Inter Ocean Systems Inc. |
Stephen E. Kaufman
Stephen E. Kaufman PC Co. 277 Park Avenue, 47th Floor New York, NY 10172 Age 72 | | Trustee | | Since
1991 | | Attorney | | 51 | | None |
John J. Murphy
123 Prospect Street
Ridgewood, NJ 07450
Age 60 | | Trustee | | Since
2002 | | President, Murphy Capital Management | | 24 | | Barclays International Funds Group Ltd. and affiliated companies |
147
Additional Information
(unaudited) (continued)
| | | | | | | | | | |
Name, Address and Age
| | Position(s)
Held with
Fund
| | Term of
Office*
and
Length
of Time
Served
| | Principal Occupation(s) During Past Five Years
| | Number of
Portfolios
in Fund
Complex
Overseen
by Trustee
| | Other Board
Memberships Held by Trustee
|
| Interested Trustee: | | | | | | | | |
R. Jay Gerken, CFA** Citigroup Asset Management (“CAM”) 399 Park Avenue, 4th Floor New York, NY 10022
Age 53 | | Chairman, President and Chief Executive Officer | | Since
2002 | | Managing Director of Citigroup Global Markets Inc. (“CGM”); Chairman, President and Chief Executive Officer of Smith Barney Fund Management LLC (“SBFM”), Travelers Investment Adviser, Inc. (“TIA”) and Citi Fund Management Inc. (“CFM”); President and Chief Executive Officer of certain mutual funds associated with Citigroup Inc. (“Citigroup”); Formerly, Portfolio Manager of Smith Barney Allocation Series Inc. (from 1996 to 2001) and Smith Barney Growth and Income Fund (from 1996 to 2000) | | 221 | | None |
| | | | | |
| Officers: | | | | | | | | | | |
Andrew B. Shoup CAM 125 Broad Street, 11th Floor New York, NY 10004 Age 47 | | Senior Vice President and Chief Administrative Officer | | Since
2003 | | Director of CAM; Senior Vice President and Chief Administrative Officer of mutual funds associated with Citigroup; Treasurer of certain mutual funds associated with Citigroup; Head of International Funds Administration of CAM (from 2001 to 2003); Director of Global Funds Administration of CAM (from 2000 to 2001); Head of U.S. Citibank Funds Administration of CAM (from 1998 to 2000) | | N/A | | N/A |
148
Additional Information
(unaudited) (continued)
| | | | | | | | | | |
Name, Address and Age
| | Position(s)
Held with
Fund
| | Term of
Office*
and
Length
of Time
Served
| | Principal Occupation(s) During Past Five Years
| | Number of
Portfolios
in Fund
Complex
Overseen
by Trustee
| | Other Board
Memberships Held by Trustee
|
Frances M. Guggino CAM 125 Broad Street, 10th Floor New York, NY 10004 Age 45 | | Chief Financial Officer and Treasurer | | Since
2004 | | Vice President of CGM; Chief Financial Officer and Treasurer of certain mutual funds associated with Citigroup; Formerly, Controller of certain mutual Funds associated with Citigroup | | N/A | | N/A |
Paul M. Hatch The Consulting Group 222 Delaware Avenue Wilmington, DE 19801 Age 48 | | Investment Officer | | Since
2001 | | Chief Operating Officer of CGM’s Consulting Group and Director of National Sales for Consulting Group. | | N/A | | N/A |
Leroy T. Pease The Consulting Group 222 Delaware Avenue Wilmington, DE 19801 Age 45 | | Investment Officer | | Since
1996 | | First Vice President of CGM | | N/A | | N/A |
Stephen M. Hagan The Consulting Group 222 Delaware Avenue Wilmington, DE 19801 Age 36 | | Investment Officer | | Since
1997 | | First Vice President of CGM | | N/A | | N/A |
149
Additional Information
(unaudited) (continued)
| | | | | | | | | | |
Name, Address and Age
| | Position(s)
Held with
Fund
| | Term of
Office*
and
Length
of Time
Served
| | Principal Occupation(s) During Past Five Years
| | Number of
Portfolios
in Fund
Complex
Overseen
by Trustee
| | Other Board
Memberships Held by Trustee
|
Andrew Beagley CAM 399 Park Avenue, 4th Floor New York, NY 10022 Age 41 | | Chief Anti-Money Laundering Compliance Officer Chief Compliance Officer | | Since
2002
Since
2004 | | Director of CGM (since 2000); Director of Compliance, North America, CAM (since 2000); Chief Anti-Money Laundering Compliance Officer, Chief Compliance Officer and Vice President of certain mutual funds associated with Citigroup; Director of Compliance, Europe, the Middle East and Africa, CAM (from 1999 to 2000); Compliance Officer, Salomon Brothers Asset Management Limited, Smith Barney Global Capital Management Inc., Salomon Brothers Asset Management Asia Pacific Limited (from 1997 to 1999) | | N/A | | N/A |
Wendy S. Setnicka CAM 125 Broad Street, 10th Floor New York, NY 10004 Age 40 | | Controller | | Since
2004 | | Vice President of CGM; Controller of certain mutual funds associated with Citigroup; Assistant Controller of CAM
(Since 2002) | | N/A | | N/A |
Robert I. Frenkel CAM 300 First Stamford Place,
4th Floor Stamford, CT 06902 Age 49 | | Secretary and Chief Legal Officer | | Since
2003 | | Managing Director and General Counsel of Global Mutual Funds for CAM and its predecessor (since 1994); Secretary of CFM (from 2001 to 2004); Secretary and Chief Legal Officer of mutual funds associated with Citigroup | | N/A | | N/A |
| * | | Each Trustee and Officer serves until his or her successor has been duly elected and qualified. |
| ** | | Mr. Gerken is an “interested person” of the Trust as defined in the Investment Company Act of 1940, as amended, because Mr. Gerken is an officer of SBFM and certain of its affiliates. |
150
Additional Shareholder Information
(unaudited)
On March 22, 2004, a Special Meeting of Shareholders of Mortgage Backed Investments, Multi-Sector Fixed Income Investments and Long-Term Bond Investments (the “Acquired Funds”) was held to approve a Plan of Reorganization providing for (i) the acquisition of all of the assets of each of the Acquired Funds in exchange for shares of beneficial interest of Intermediate Fixed Income Investments (the “Acquiring Fund”) and the assumption by the Acquiring Fund of all the liabilities of each of the Acquired Funds and (ii) the distribution to shareholders of each Acquired Fund of such shares of beneficial interest of the Acquiring Fund in liquidation of each Acquired Fund and the cancellation of each Acquired Fund’s outstanding shares.
On March 22, 2004, a Special Meeting of Shareholders of the Acquiring Fund was held to approve a change in its investment objective from current income and reasonable stability of principal to “maximum total return, consistent with preservation of capital and prudent investment of such shares of beneficial interest of the Acquiring Fund in liquidation of each Acquired Fund and the cancellation of each Acquired Fund’s management.” The reorganization and change in investment objective occurred on June 4, 2004 at which time the Acquiring Fund was renamed Core Fixed Income Investments.
The following tables provide information concerning the matters voted on at the Shareholder Meetings:
To Approve Plan of Reorganization:
| | | | | | |
| | | Votes For | | Votes Against | | Votes Withheld |
Mortgage Backed Investments | | 3,759,706.722 | | 123,140.041 | | 656,848.906 |
Multi-Sector Fixed Income Investments | | 1,991,383.928 | | 148.913 | | 32,711.769 |
Long-Term Bond Investments | | 951,565.080 | | 18,863.272 | | 212,310.182 |
To Approve Change in Investment Objective:
| | | | | | |
| | | Votes For | | Votes Against | | Votes Withheld |
Intermediate Fixed Income Investments | | 15,441,721.045 | | 558,280.838 | | 2,382,033.895 |
151
Tax Information
(unaudited)
The following information is provided with respect to the distributions paid during the taxable year ended August 31, 2004:
| | | | | | | | | | |
| | | Large
Capitalization
Value Equity
Investments | | Small
Capitalization
Value Equity
Investments | | International
Equity
Investments | | | Emerging
Markets
Equity
Investments | |
Record Date: | | 12/11/2003 | | 12/11/2003 | | 12/11/2003 | | | 12/11/2003 | |
Payable Date: | | 12/12/2003 | | 12/12/2003 | | 12/12/2003 | | | 12/12/2003 | |
Qualified Dividend Income for Individuals | | 100.00% | | 100.00% | | 97.88% | * | | 100.00% | * |
Dividends Qualifying for the Dividends Received Deduction for Corporations | | 100.00% | | 100.00% | | — | | | — | |
Interest from Federal Obligations | | — | | — | | — | | | — | |
Foreign Source Income | | — | | — | | 89.81% | * | | 100.00% | * |
Foreign Taxes Paid Per Share | | — | | — | | $0.023000 | | | $0.022740 | |
| | | | |
| | | Government
Money
Investments | | Core Fixed
Income
Investments | | High Yield
Investments | | | Municipal
Bond
Investments | |
Record Date: | | Monthly | | Monthly | | Monthly | | | Monthly | |
Payable Date: | | Monthly | | Monthly | | Monthly | | | Monthly | |
Qualified Dividend Income for Individuals | | — | | — | | 1.40% | | | — | |
Dividends Qualifying for the Dividends Received Deduction for Corporations | | — | | — | | 1.40% | | | — | |
Interest from Tax-Exempt Obligations | | — | | — | | — | | | 100.00% | |
Interest from Federal Obligations | | 54.19% | | 18.54% | | — | | | — | |
Foreign Source Income | | — | | — | | — | | | — | |
Foreign Taxes Paid Per Share | | — | | — | | — | | | — | |
| * | | Expressed as a percentage of the cash distribution grossed-up for foreign taxes. |
The above figures may differ from those cited elsewhere in this report due to differences in the calculations of income and capital gain for Securities and Exchange Commission (book) purposes and Internal Revenue Service (tax) purposes.
The law varies in each state as to whether and what percentage of dividend income attributable to Federal obligations is exempt from state income tax. We recommend that you consult with your tax adviser to determine if any portion of the dividends you received is exempt from state income taxes.
The foreign taxes paid represent taxes incurred by the Fund on income received by the Fund from foreign sources. Foreign taxes paid may be included in taxable income with an offsetting deduction from gross income or may be taken as a credit for taxes paid to foreign governments. You should consult your tax adviser regarding the appropriate treatment of foreign taxes paid.
152
WWW.SMITHBARNEY.COM

©2004 Citigroup Global Markets Inc. Member NASD, SIPC. Smith Barney and Consulting Group are divisions of Citigroup Global Markets Inc. Smith Barney is a service mark of Citigroup Global Markets Inc. and its affiliates and is used and registered throughout the world. CITIGROUP and the Umbrella Device are trademarks and service marks of Citicorp or its affiliates and are used and registered throughout the world.
This report is submitted for the general information of the shareholders of Consulting Group Capital Markets Funds. It is not authorized for distribution to prospective investors unless accompanied or preceded by a current Prospectus for the Trust which contains information concerning the Trust’s Investment policies, charges and expenses as well as other pertinent information.
The Funds file their complete schedule of portfolio holdings with Securities and Exchange Commission for the first and third quarters of each fiscal year on Form N-Q. The Funds’ Forms N-Q are available on the Commission’s website at www.sec.gov. The Funds’ Forms N-Q may be reviewed and copied at the Commission’s Public Reference Room in Washington D.C., and information on the operation of the Public Reference Room may be obtained by calling 1-800-SEC-0330. To obtain information on Form N-Q from the Funds, shareholders can call 1-800-451-2010.
Information on how the Funds voted proxies relating to portfolio securities during the 12 month period ended June 30, 2004 and a description of the policies and procedures that the Funds use to determine how to vote proxies relating to portfolio securities is available (1) without charge, upon request, by calling 1-800-451-2010, (2) on the Funds’ website at www.citigroupAM.com and (3) on the SEC’s website at www.sec.gov.
TK 2120A, 8/04 Consulting Group Capital Markets Funds Ÿ 222 Delaware Avenue Ÿ Wilmington, Delaware Ÿ 19801
ITEM 2. CODE OF ETHICS.
The registrant has adopted a code of ethics that applies to the registrant’s principal executive officer, principal financial officer, principal accounting officer or controller.
ITEM 3. AUDIT COMMITTEE FINANCIAL EXPERT.
The Board of Trustees of the registrant has determined that Armon Kamesar, the Chairman of the Board’s Audit Committee, possesses the technical attributes identified in Instruction 2(b) of Item 3 to Form N-CSR to qualify as an “audit committee financial expert,” and has designated Mr. Kamesar as the Audit Committee’s financial expert. Mr. Kamesar is an “independent” Trustee pursuant to paragraph (a)(2) of Item 3 to Form N-CSR.
Item 4. Principal Accountant Fees and Services
| | (a) | Audit Fees for the Consulting Group Capital Markets Fund were $322,000 and $322,000 for the years ended 8/31/04 and 8/31/03. |
| | (b) | Audit-Related Fees for the Consulting Group Capital Markets Fund were $11,000 and $0 for the years ended 8/31/04 and 8/31/03. |
| | (c) | Tax Fees for Consulting Group Capital Markets Fund of $35,100 and $35,100 for the years ended 8/31/04 and 8/31/03. These amounts represent aggregate fees paid for tax compliance, tax advice and tax planning services, which include (the filing and amendment of federal, state and local income tax returns, timely RIC qualification review and tax distribution and analysis planning) rendered by the Accountant to Consulting Group Capital Markets Fund. |
| | (d) | All Other Fees for Consulting Group Capital Markets Fund of $0 and $0 for the years ended 8/31/04 and 8/31/03. |
| | (e) | (1) Audit Committee’s pre-approval policies and procedures described in paragraph (c) (7) of Rule 2-01 of Regulation S-X. |
The Charter for the Audit Committee (the “Committee”) of the Board of each registered investment company (the “Fund”) advised by Smith Barney Fund Management LLC or Salomon Brothers Asset Management Inc. or one of their affiliates (each, an “Adviser”) requires that the Committee shall approve (a) all audit and permissible non-audit services to be provided to the Fund and (b) all permissible non-audit services to be provided by the Fund’s independent auditors to the Adviser and any Covered Service Providers if the engagement relates directly to the operations and financial reporting of the Fund. The Committee may implement policies and procedures by which such services are approved other than by the full Committee.
The Committee shall not approve non-audit services that the Committee believes may impair the independence of the auditors. As of the date of the approval of this Audit Committee Charter, permissible non-audit services include any professional services (including tax services), that are not prohibited services as described below, provided to the Fund by
the independent auditors, other than those provided to the Fund in connection with an audit or a review of the financial statements of the Fund. Permissible non-audit services may not include: (i) bookkeeping or other services related to the accounting records or financial statements of the Fund; (ii) financial information systems design and implementation; (iii) appraisal or valuation services, fairness opinions or contribution-in-kind reports; (iv) actuarial services; (v) internal audit outsourcing services; (vi) management functions or human resources; (vii) broker or dealer, investment adviser or investment banking services; (viii) legal services and expert services unrelated to the audit; and (ix) any other service the Public Company Accounting Oversight Board determines, by regulation, is impermissible.
Pre-approval by the Committee of any permissible non-audit services is not required so long as: (i) the aggregate amount of all such permissible non-audit services provided to the Fund, the Adviser and any service providers controlling, controlled by or under common control with the Adviser that provide ongoing services to the Fund (“Covered Service Providers”) constitutes not more than 5% of the total amount of revenues paid to the independent auditors during the fiscal year in which the permissible non-audit services are provided to (a) the Fund, (b) the Adviser and (c) any entity controlling, controlled by or under common control with the Adviser that provides ongoing services to the Fund during the fiscal year in which the services are provided that would have to be approved by the Committee; (ii) the permissible non-audit services were not recognized by the Fund at the time of the engagement to be non-audit services; and (iii) such services are promptly brought to the attention of the Committee and approved by the Committee (or its delegate(s)) prior to the completion of the audit.
(2) For the Consulting Group Capital Markets Funds, the percentage of fees that were approved by the audit committee, with respect to: Audit-Related Fees were 100% and 100% for the years ended 8/31/04 and 8/31/03; Tax Fees were 100% and 100% for the years ended 8/31/04 and 8/31/03; and Other Fees were 100% and 100% for the years ended 8/31/04 and 8/31/03.
| | (g) | Non-audit fees billed by the Accountant for services rendered to Consulting Group Capital Markets Funds and CAM and any entity controlling, controlled by, or under common control with CAM that provides ongoing services to Consulting Group Capital Markets Funds were $0 and $0 for the years ended 8/31/04 and 8/31/03. |
| | (h) | Yes. The Consulting Group Capital Markets Funds’ Audit Committee has considered whether the provision of non-audit services that were rendered to Service Affiliates which were not pre-approved (not requiring pre-approval) is compatible with maintaining the Accountant’s independence. All services provided by the Accountant to the Consulting Group Capital Markets Funds or to Service Affiliates which were required to be pre-approved were pre-approved as required. |
| ITEM | 5. AUDIT COMMITTEE OF LISTED REGISTRANTS. |
Not applicable.
ITEM 6. [RESERVED]
ITEM 7. DISCLOSURE OF PROXY VOTING POLICIES AND PROCEDURES FOR CLOSED-END MANAGEMENT INVESTMENT COMPANIES.
Not applicable.
ITEM 8. [RESERVED]
ITEM 9. SUBMISSION OF MATTERS TO A VOTE OF SECURITY HOLDERS.
Not applicable.
ITEM 10. CONTROLS AND PROCEDURES.
| | (a) | The registrant’s principal executive officer and principal financial officer have concluded that the registrant’s disclosure controls and procedures (as defined in Rule 30a-3 (c) under the Investment Company Act of 1940, as amended (the “1940 Act”)) are effective as of a date within 90 days of the filing date of this report that includes the disclosure required by this paragraph, based on their evaluation of the disclosure controls and procedures required by Rule 30a-3 (b) under the 1940 Act and 15d-15 (b) under the Securities Exchange Act of 1934. |
| | (b) | There were no changes in the registrant’s internal control over financial reporting (as defined in Rule 30a-3 (d) under the 1940 Act) that occurred during the registrant’s last fiscal half-year (the registrant’s second fiscal half-year in the case of an annual report) that have materially affected, or are likely to materially affect the registrant’s internal control over financial reporting. |
ITEM 11. EXHIBITS.
| | |
| Exhibit 99.CERT | | Certifications pursuant to section 302 of the Sarbanes-Oxley Act of 2002 |
| |
| Exhibit 99.906CERT | | Certifications pursuant to Section 906 of the Sarbanes-Oxley Act of 2002 |
SIGNATURES
Pursuant to the requirements of the Securities Exchange Act of 1934 and the Investment Company Act of 1940, the registrant has duly caused this Report to be signed on its behalf by the undersigned, there unto duly authorized.
Consulting Group Capital Markets Funds
| | |
| |
By: | | /s/ R. Jay Gerken
|
| | | (R. Jay Gerken) |
| | | Chief Executive Officer of |
| | | Consulting Group Capital Markets Funds |
| |
Date: | | November 10, 2004 |
Pursuant to the requirements of the Securities Exchange Act of 1934 and the Investment Company Act of 1940, this report has been signed below by the following persons on behalf of the registrant and in the capacities and on the dates indicated.
| | |
| |
By: | | /s/ R. Jay Gerken
|
| | | (R. Jay Gerken) |
| | | Chief Executive Officer of |
| | | Consulting Group Capital Markets Funds |
| |
| Date: | | November 10, 2004 |
| |
| By: | | /s/ Frances M. Guggino
|
| | | (Frances M. Guggino) |
| | | Chief Financial Officer of |
| | | Consulting Group Capital Markets Funds |
| |
| Date: | | November 10, 2004 |