UNITED STATES
SECURITIES AND EXCHANGE COMMISSION
Washington, D.C. 20549
FORM N-CSR
CERTIFIED SHAREHOLDER REPORT OF REGISTERED
MANAGEMENT INVESTMENT COMPANIES
Investment Company Act file number 811-6318
Consulting Group Capital Markets Funds
(Exact name of registrant as specified in charter)
| | |
125 Broad Street, New York, NY | | 10004 |
(Address of principal executive offices) | | (Zip code) |
Robert I. Frenkel, Esq.
Legg Mason & Co., LLC
300 First Stamford Place, 4th Fl.
Stamford, CT 06902
(Name and address of agent for service)
Registrant’s telephone number, including area code: (800) 451-2010
Date of fiscal year end: August 31,
Date of reporting period: August 31, 2006
ITEM 1. REPORT TO STOCKHOLDERS.
The Annual Report to Stockholders is filed herewith.

Consulting Group
Capital Markets Funds
Large Capitalization Value Equity Investments
Large Capitalization Growth Investments
Small Capitalization Value Equity Investments
Small Capitalization Growth Investments
International Equity Investments
Emerging Markets Equity Investments
Government Money Investments
Core Fixed Income Investments
High Yield Investments
Municipal Bond Investments
International Fixed Income Investments
| | |
Annual Report August 31, 2006 | |  |
NOT FDIC INSURED • NO BANK GUARANTEE • MAY LOSE VALUE
Table of Contents
Consulting Group
Capital Markets Funds
DEAR SHAREHOLDER,
The fiscal year for the Consulting Group Capital Markets Funds (“Fund”) ended August 31, 2006, with International Equity Investments and Emerging Markets Equity Investments returning the strongest performance among the Fund’s equity portfolios. U.S. equity returns favored value over growth during this period. High Yield Investments generated the highest return within the fixed income portfolios.
The fundamental economic focus over the past fiscal year was on the divergence between the Federal Reserve Board’s (“Fed”)i policy to increase interest rates in order to prevent higher inflation and the economy’s ability to continue its growth despite these increases. Unpredictable energy prices, volatility in the Middle East and the end of the real estate boom also drove market psychology. These factors were among the reasons for the market’s daily and short-term swings. However, those factors are rarely solely responsible for determining why markets make longer-term movements.
Since the end of the equity bear market, prudent investors would have ideally been fully diversified across the stock and bond markets. Opportunities in U.S. small-cap stocks and international equities helped investors to make up some large losses in these areas from earlier in this decade. This diversified approach positioned investors to control market risks and to situate them well for new opportunities.
Equities outpaced fixed income investments, as global economic growth continued to generate above-average corporate profits. The two main drivers of equity price appreciation were the rate of change of the earnings-per-share stream and valuations. Earnings of companies comprising the Standard & Poor’s (“S&P”) 500 Indexii grew at double-digit rates during the year ended August 31, 2006. However, under the negative impact of rising interest rates, the price-to-earnings ratioiii fell during this period. The S&P 500 Index produced a total return for the period of 8.87%.
The value investing style enjoyed greater success across the market during the year ended August 31, 2006. Advantages to small and mid-size companies were not as evident during the period. Value indices led the overall market, as they provided greater downside protection in the sharp downturn from mid-May to mid-July 2006. During the year ended August 31, 2006, the Russell 1000 Value Indexiv increased 13.96%, and the Russell 2000 Value Indexv rose 12.72%. The Russell 2000 Growth Indexvi increased 6.00%, and the Russell 1000 Growth Indexvii gained only 3.68%.
Investors fared better in both the developed and emerging equity markets. A combination of relatively lower valuations, economic growth patterns, the recovery of the Japanese economy and markets, and the weakening U.S. dollar drove these returns. The MSCI EAFEviii Index (net of dividends) rose 24.28% during the year ended August 31, 2006. The MSCI Emerging Markets Indexix increased 30.58% during this period.
The Fed’s raising of its targeted Federal Funds ratex resulted in an increase in both short- and long-term rates. The three-month Treasury-Bill yield rose from 3.52% to 5.05%, and the 10-year Treasury-Note yield increased from 4.02% to 4.74% during the year ended August 31, 2006. As of the date of this letter, the Fed has thus far declined to further raise rates until it has a better sense of where inflation and the rate of economic growth are headed. The rising rate environment had a negative impact upon bond market returns. The Lehman Brothers (“LB”) U.S. Aggregate Indexxi rose 1.71% for the year ended August 31, 2006. The high yield market outperformed other fixed income markets and the LB High Yield Indexxii returned 5.50%.
I
The Consulting Group Capital Markets Funds
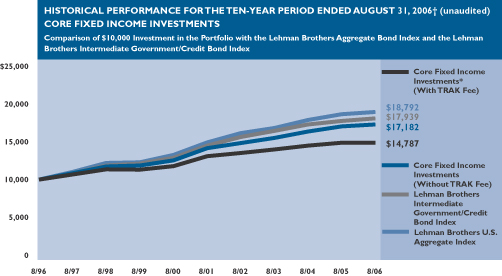
Core Fixed Income Investments returned 1.51% for the year ended August 31, 2006, as compared to the LB U.S. Aggregate Index return of 1.71% during that period. The portfolio’s subadvisers are Pacific Investment Management Company LLC (“PIMCO”), BlackRock Financial Management, Inc., and Western Asset Management Company (“WAMCO”).
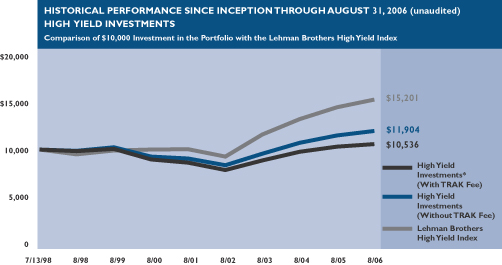
High Yield Investments returned 3.80% for the year ended August 31, 2006, trailing the LB High Yield Index return of 5.50%. The portfolio’s subadvisers are WAMCO and Seix Advisors, the fixed income division of Trusco Capital Management Inc. (“Seix”). The portfolio has struggled compared to its benchmark index over the past several years as it has maintained a higher quality exposure than the benchmark. Following the portfolio’s fiscal year end, Penn Capital Management Company, Inc., replaced Seix as a subadviser to the portfolio.
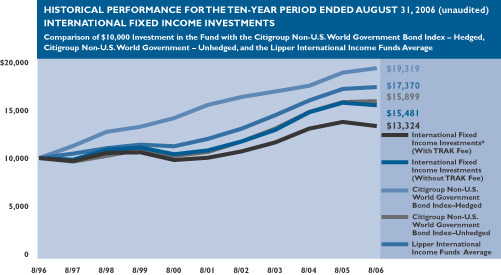
International Fixed Income Investments returned –1.70%, trailing the Citigroup Non-U.S. World Government Hedged Indexxiii return of 2.55%. PIMCO is the portfolio’s subadviser. In January 2006, the portfolio switched from an unhedged to a hedged currency exposure. The new benchmark is the Citigroup Non-U.S. World Government Hedged Index. The unhedged version of the indexxiv returned 0.51% for the year ended August 31, 2006.
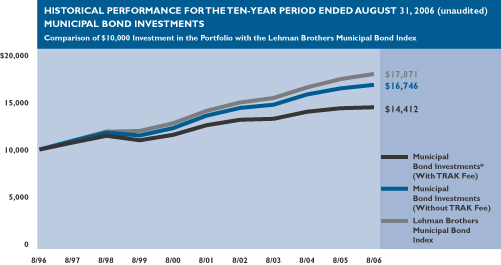
Municipal Bond Investments returned 2.26% for the year ended August 31, 2006, versus the LB Municipal Bond Indexxv return of 3.03%. McDonnell Investment Management, LLC replaced Smith Affiliated Capital Corporation as subadviser to the portfolio during October of 2005.
Large Capitalization Growth Investments returned 1.18% for the year ended August 31, 2006, versus the comparative return of 3.68% for its benchmark, the Russell 1000 Growth Index. At the onset of the fiscal year, the portfolio’s subadvisers were Westfield Capital Management Company (“Westfield”), TCW Investment Management Company (“TCW”), and Sands Capital Management, LLC (“Sands”). Delaware Management Company replaced TCW during August of 2006. Wells Capital Management replaced Sands following the portfolio’s fiscal year end. TCW was terminated following a reduction in its rating by the Consulting Group’s Research Department. Sands resigned as subadviser to the portfolio. The portfolio struggled against its benchmark due to its overweighted position in technology issues. This overweight hurt the portfolio as that sector was the overall market’s weakest sector during the year ended August 31, 2006.
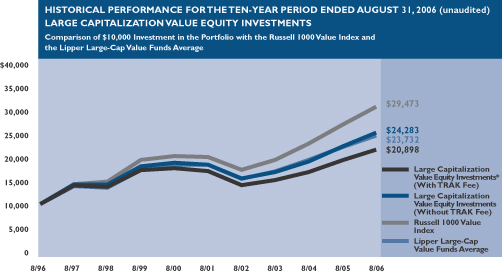
Large Capitalization Value Equity Investments rose 12.82% for the year ended August 31, 2006, as compared to the return of 13.96% of its benchmark, the Russell 1000 Value Index. The portfolio’s subadvisers are Cambiar Investors, LLC, AllianceBernstein LP and NFJ Investment Group. The portfolio’s relative underperformance against its benchmark principally resulted from the subadvisers taking positions in stocks that declined during this period, as well as in stocks that were formerly considered growth stocks. Most of the positions that lagged the market were in the Healthcare, Consumer, and Technology sectors.
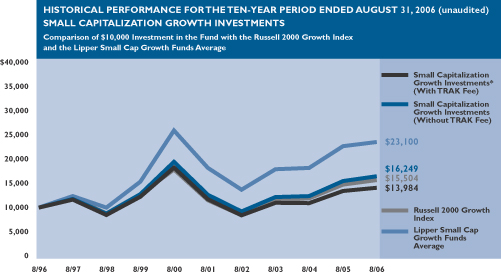
Small Capitalization Growth Investments returned 6.31% for the year ended August 31, 2006, ahead of the 6.00% return of its benchmark, the Russell 2000 Growth Index. The portfolio’s subadvisers are Wall Street Associates and Westfield. The portfolio added value during what proved to be a very volatile period for the market’s small-cap growth segment. Value added came through successful stock selections in a combination of the Energy and Health Care sectors.
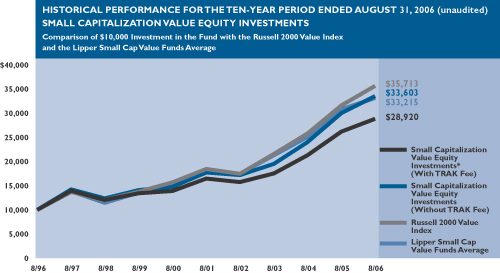
Small Capitalization Value Equity Investments gained 11.73% for the year ended August 31, 2006, trailing the 12.72% return of its benchmark, the Russell 2000 Value Index. The portfolio’s subadvisers are NFJ Investment Group, Delaware Management Company, and Rutabaga Capital Management LLC. The fund struggled against its benchmark during calendar year 2006 to date, but retains a superior three-year record against the benchmark, a period during which small-cap value investing led the U.S. market.
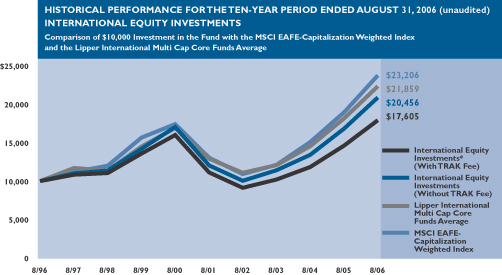
International Equity Investments returned 23.55% for the year ended August 31, 2006, less than the 24.28% return of its benchmark, the MSCI EAFE-Capitalization Weighted Index (net of dividends). The portfolio’s subadvisers are Philadelphia International Advisors LP, Brandywine Global Investment Management, LLC (“Brandywine”), and William Blair & Company, LLC (“William Blair”). The portfolio had benefited from smaller and mid-size
II
companies that are a part of the William Blair growth oriented philosophy and Brandywine’s value-oriented approach. As with the domestic equity downturn in mid-2006, international small and mid-size companies were more negatively impacted than the larger companies in the benchmark.
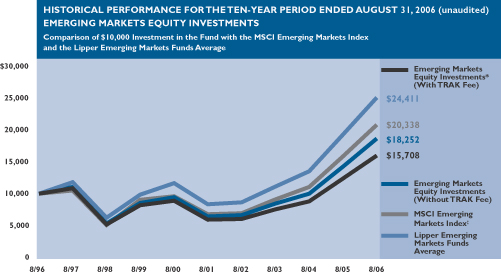
Emerging Markets Equity Investments gained 30.10% for the year ended August 31, 2006. Its benchmark, the MSCI Emerging Markets Index, rose 30.58% during this period. The portfolio’s subadvisers are Newgate Capital Management LLC and SSgA Funds Management, Inc. Emerging markets have benefited from strong economic growth and the recent global focus on commodity-oriented companies, which comprise a major portion of the emerging market benchmark.
Information About Your Fund
As you may be aware, several issues in the mutual fund industry have recently come under the scrutiny of federal and state regulators. The Fund’s former manager, Smith Barney Fund Management LLC (“SBFM”), and some of its affiliates have received requests for information from various government regulators regarding market timing, late trading, fees, and other mutual fund issues in connection with various investigations. The regulators appear to be examining, among other things, the funds’ response to market timing and shareholder exchange activity, including compliance with prospectus disclosure related to these subjects. The Fund has been informed that SBFM and its affiliates are responding to those information requests, but are not in a position to predict the outcome of these requests and investigations. Important information concerning the Fund and its former manager and affiliates with regard to recent regulatory developments is contained in the Notes to Financial Statements included in this report.
We thank you for your continued support of the Consulting Group Capital Markets Funds. For additional information regarding the portfolios and the asset allocation advice that guides portfolio construction, we urge you to discuss these issues with your Financial Advisor.
Sincerely,
|
 |
R. Jay Gerken, CFA Chairman and Chief Executive Officer |
October 10, 2006
The performance shown represents past performance. Past performance is no guarantee of future results, and current performance may be higher or lower than the performance shown above. Performance figures may reflect voluntary fee waivers and/or expense reimbursements. In the absence of voluntary fee waivers and/or expense reimbursements, the total return would have been lower. Principal value and investment returns will fluctuate so that an investor’s shares, when redeemed, may be worth more or less than their original cost. The returns shown do not reflect the deduction of taxes that a shareholder would pay on fund distributions or the redemption of fund shares. To obtain performance data current to the most recent month-end, please visit our website at www.smithbarney.com.
The portfolios are only available to investors participating in an advisory program. These programs charge an annual fee, which in the case of TRAK® may be up to 1.50%. The performance data shown does not reflect this fee, which would reduce returns.
III
All index performance reflects no deduction for fees, expenses or taxes. Please note an investor cannot invest directly in an index.
RISKS: Certain of the portfolios may invest in derivatives, such as options and futures, which can be illiquid, may disproportionately increase losses, and have a potentially large impact on fund performance. Foreign securities are subject to certain risks of overseas investing including currency fluctuations and changes in political and economic conditions, which could result in significant market fluctuations. These risks are magnified in emerging or developing markets. Investments in small or medium-capitalization companies may involve a higher degree of risk and volatility than investments in larger, more established companies. Certain of the portfolios may invest in high yield bonds, which involve greater credit and liquidity risks than investment grade bonds.
| i | The Fed is responsible for the formulation of a policy designed to promote economic growth, full employment, stable prices and a sustainable pattern of international trade and payments. |
| ii | The S&P 500® Index is a market capitalization-weighted index of 500 widely-held common stocks. Standard & Poor’s 500 and S&P 500® are registered trademarks of the McGraw-Hill Companies, Inc. |
| iii | A price to earnings ratio is used to measure how inexpensive or expensive share prices are. The price to earnings ratio is obtained by dividing the price per share by the earnings per share. |
| iv | The Russell 1000® Value Index is a capitalization weighted total return index which is comprised of 1,000 of the largest capitalized U.S.-domiciled companies with greater than average value orientation whose common stock is traded in the U.S. on the New York Stock Exchange, American Stock Exchange and NASDAQ. Russell 1000® Index is a registered trademark of the Frank Russell Company. |
| v | The Russell 2000® Value Index is a capitalization weighted total return index which is comprised of 2,000 of the smallest capitalized U.S.-domiciled companies with less-than-average growth orientation whose common stock is traded in the U.S. on the New York Stock Exchange, American Stock Exchange and NASDAQ. |
| vi | The Russell 2000® Growth Index is a capitalization weighted total return index which is comprised of 2,000 of the smallest capitalized U.S.-domiciled companies with greater-than-average growth orientation whose common stock is traded in the U.S. on the New York Stock Exchange, American Stock Exchange and NASDAQ. Russell 2000® Index is a registered trademark of the Frank Russell Company. |
| vii | The Russell 1000® Growth Index is a capitalization weighted total return index which is comprised of 1,000 of the largest capitalized U.S.-domiciled companies with greater-than-average growth orientation whose common stock is traded in the U.S. on the New York Stock Exchange, American Stock Exchange and NASDAQ. |
| viii | The MSCI EAFE® — Capitalization Weighted Index is a composite portfolio or equity total returns for the countries of Australia, New Zealand and countries in Europe and the Far East, weighted based on each country’s market capitalization. MSCI EAFE® — Capitalization Weighted Index is a registered trademark of Morgan Stanley Capital International Inc. |
| ix | The MSCI Emerging Markets Index is an index comprised of thirteen emerging markets open to direct foreign participation. |
| x | The federal funds rate is the interest rate that banks with excess reserves at a Federal Reserve district bank charge other banks that need overnight loans. |
| xi | The Lehman Brothers U.S. Aggregate Index is composed of the Lehman Brothers Intermediate Government/Credit Bond Index and the Lehman Brothers Mortgage-Backed Securities Index and includes treasury issues, agency issues, corporate bond issues and mortgage-backed securities. Lehman Brothers U.S. Aggregate Index is a trademark of Lehman Brothers Inc. |
| xii | The Lehman Brothers High Yield Index is composed of fixed rate, publicly issued, non-investment grade debt registered with the SEC. All bonds must be dollar-denominated, non-convertible and have at least one year remaining to maturity as well as an outstanding par value of $100 million. |
| xiii | The Citigroup Non-U.S. World Government Bond Index-Hedged is a market capitalization weighted index that is designed to represent the hedged performance of the government bond markets in thirteen developed countries, excluding the U.S. |
| xiv | The Citigroup Non-U.S. World Government Bond Index-Unhedged is a market capitalization weighted index that is designed to represent the unhedged performance of the government bond markets in thirteen developed countries, excluding the U.S. |
| xv | The Lehman Brothers Municipal Bond Index is a weighted composite which is comprised of more than 15,000 bonds issued within the last five years, having a minimum credit rating of at least Baa and maturity of at least two years, excluding all bonds subject to the Alternative Minimum Tax and bonds with floating or zero coupons. |
IV
Performance of the Consulting Group Capital Markets Funds For the Year Ended August 31, 2006†* (unaudited)
| | | |
Large Capitalization Value Equity Investments | | 12.82 | % |
Russell 1000® Value Index (1) | | 13.96 | |
| |
Large Capitalization Growth Investments | | 1.18 | |
Russell 1000® Growth Index (2) | | 3.68 | |
| |
Small Capitalization Value Equity Investments | | 11.73 | |
Russell 2000® Value Index (3) | | 12.72 | |
| |
Small Capitalization Growth Investments | | 6.31 | |
Russell 2000® Growth Index (4) | | 6.00 | |
| |
International Equity Investments | | 23.55 | |
MSCI EAFE® — Capitalization Weighted Index (5) | | 24.28 | |
| |
Emerging Markets Equity Investments | | 30.10 | |
MSCI Emerging Markets Index (6) | | 30.58 | |
| |
Government Money Investments | | 4.03 | |
90-day Treasury Bill | | 4.27 | |
| |
Core Fixed Income Investments | | 1.51 | |
Lehman Brothers U.S. Aggregate Index (7) | | 1.71 | |
Lehman Brothers Intermediate Government/Credit Bond Index (8) | | 1.87 | |
| |
High Yield Investments | | 3.80 | |
Lehman Brothers High Yield Index (9) | | 5.50 | |
| |
Municipal Bond Investments | | 2.26 | |
Lehman Brothers Municipal Bond Index (10) | | 3.03 | |
| |
International Fixed Income Investments | | (1.70 | ) |
Citigroup Non-U.S. World Government Bond Index — Unhedged (11) | | 0.51 | |
Citigroup Non-U.S. World Government Bond Index — Hedged (11) | | 2.55 | |
See pages 22 through 24 for all footnotes.
V
(This page intentionally left blank.)

Large Capitalization Value Equity Investments
ABOUTTHE SUBADVISERS
| | Ÿ | | Cambiar Investors LLC (“CI”) | |
CI utilizes a bottom-up process that seeks to identify companies that are attractively priced, demonstrate positive developments not yet recognized by the market and offer significant appreciation potential within a one to two-year time frame.
| | Ÿ | | NFJ Investment Group (“NFJ”) | |
The NFJ Investment process initially screens for positive fundamentals by applying a screen over a universe of approximately 800 stocks to identify companies with positive fundamental characteristics. After the screen, the next step involves conducting in-depth research and analysis by reviewing each of the remaining 150-200 possible investments for a low price-to-earnings multiple, a high dividend yield, positive prospective earnings and quality operations. As part of the portfolio construction process, industry concentration is mitigated by avoiding overexposure to any one sector by restricting the number of stocks held in a single industry. Generally the portfolio holds 40 to 50 companies. The process involves regularly monitoring the portfolio and universe for buy and sell candidates. The research process is continually repeated to identify new buy and sell candidates. The sell discipline is an important part of the process. A stock is sold when an alternative stock with equally strong fundamentals demonstrates a substantially lower price-to-earnings ratio, and/or a substantially higher dividend yield.
For the period of September 1, 2005 through August 31, 2006, the subadvisers for the portfolio were CI, NFJ, and AllianceBernstein. At a board meeting held on September 26, 2005, the Consulting Group recommended and the Board of Trustees approved, the termination of Chartwell Investment Partners (“Chartwell”) as a subadviser to the portfolio. Chartwell was terminated on September 30, 2005.
For the CI portion, the Financials sector was the key driver of performance, contributing 6.3% (the country’s largest banks and brokers, and some of the largest constituents within the index, posted solid double digit returns for the period). Energy was the second largest index driver at 1.6%, as the commodity hovered near all time highs much of the past twelve months. Consumer Staples was the next largest contributor, adding 1.3%, primarily due to one security accounting for a quarter of the performance. In all, the performance of the index was strong, but rather narrow as the top 15 names (primarily financials) contributed nearly 50% of the index’s performance. While market leadership remains unclear, a less polarized market should offer better performance as we move away from commodity driven and asset-intensive outperformance that has taken place the past three years.
For the NFJ portion, returns were positive in nine out of ten economic sectors. The bulk of the excess return was attributed to stock selection. Stock selection in the Health Care, Consumer Discretionary, Energy and Financial Services sectors was particularly strong. Stock selection was weak in the Industrial and Materials sectors.
The AllianceBernstein portion benefited from both an overweight to, and stock selection in the Consumer Growth sector, which included pharmaceutical and media stocks. Also contributing to returns were railroad holdings, helped by strong revenue improvement driven by increased cargo rates and shipments of consumer goods and commodities. Detracting from returns was an overweight to, and stock selection in the Technology sector, and stock selection in the Utilities sector.
1
| | Ÿ | | AllianceBernstein L.P. (“AllianceBernstein”)
| |
Seeks to exploit undervalued securities and the opportunities these create. The screening process begins by searching for undervalued securities within a universe of stocks comprising the S&P 500 Index and 150 additional large/mid-cap stocks not contained in the S&P 500 Index. Quantitative ranks in quintiles are then applied based on a stock’s expected return and risk considerations. AllianceBernstein also takes into consideration earnings estimate revisions and relative price trend determinations in attempting to avoid the classic value trap of buying too early.
The following graph depicts the performance of the Large Capitalization Value Equity Investments vs. the Russell 1000 Value Index1 and the Lipper Large-Cap Value Funds Average.12
The performance shown above represents past performance. Past performance is no guarantee of future results and current performance may be higher or lower than the performance shown above. Performance figures may reflect voluntary fee waivers and/or expense reimbursements. In the absence of voluntary fee waivers and/or expense reimbursements, the total return would have been lower. Principal value and investment returns will fluctuate and investors’ shares, when redeemed, may be worth more or less than their original cost. To obtain performance data current to the most recent month-end, please visit our website at www.smithbarney.com.
The graph above and returns shown below do not reflect the deduction of taxes that a shareholder would pay on fund distributions or the redemption of fund shares.
LARGE CAPITALIZATION VALUE EQUITY INVESTMENTS (unaudited)
Average Annual Total Returns for the Period Ended August 31, 2006†
| | | | | | |
| | | Without TRAK Fee | | | With TRAK Fee* | |
Since inception (11/18/91) | | 9.75 | % | | 8.11 | % |
10 year | | 9.28 | | | 7.65 | |
5 year | | 6.27 | | | 4.69 | |
3 year | | 13.93 | | | 12.23 | |
1 year | | 12.82 | | | 11.14 | |
|
|
See pages 22 through 24 for all footnotes.
RISKS: The Portfolio may use derivatives, such as options and futures, which can be illiquid, may disproportionately increase losses and have a potentially large impact on performance. Foreign securities are subject to certain risks of overseas investing, including currency fluctuations and changes in political and economic conditions, which could result in significant market fluctuations. Investments in small and medium-capitalizations companies may involve a higher degree of risk and volatility than investments in larger, more established companies.
2
Large Capitalization
Growth Investments
ABOUTTHE SUBADVISERS
| | Ÿ | | Delaware Management Company (“DMC”) | |
DMC invests primarily in common stocks of large capitalization growth-oriented companies that DMC believes have long-term capital appreciation potential and are expected to grow faster than the U.S. economy. Using a bottom up approach, DMC seeks to select securities of companies that it believes have attractive end market potential, dominant business models and strong free cash flow generation that are attractively priced compared to the intrinsic value of the securities. DMC also considers a company’s operational efficiencies, management’s plans for capital allocation and the company’s shareholder orientation. DMC currently defines large capitalization companies as those that, at the time of investment, have market capitalizations within the range of market capitalizations of companies in the Russell 1000® Growth Index. While the market capitalization of companies in the Russell 1000® Growth Index ranged from approximately $1.2 billion to $406 billion as of September 30, 2006, DMC will normally invest in common stocks of companies with market capitalizations of at least $3 billion at the time of purchase.
| | Ÿ | | Wells Capital Management Inc. (“Wells Capital”) | |
Wells Capital employs both proprietary screens and intensive grassroots research in order to identify high growth companies expected to outperform their peers. Their investment philosophy is firmly rooted in the belief that successful investing is the result of focusing on companies with favorable underlying fundamentals, strong growth potential and solid management teams. Security selection is based on fundamental research. This research process works to “surround” an investment by focusing on the company’s financials and verifying fundamentals with the management team, mid-level employees, customers, competitors, suppliers and/or distributors.
For the period of September 1, 2005 through August 31, 2006 the subadvisers for the portfolio were TCW Investment Management Company (“TCW”), Sands Capital Management, LLC (“Sands”), Westfield and, for part of August 2006, DMC. In August 2006, Consulting Group recommended and the Board of Trustees approved hiring DMC as an additional subadviser to the portfolio. It started managing a portion of the portfolio on August 21, 2006. At a board meeting on September 25, 2006, the Consulting Group recommended and the Board of Trustees approved, the hiring of Wells Capital as an additional subadviser. Wells Capital began managing a portion of the portfolio on October 12, 2006.
The Sands portion of the portfolio underperformed the Russell 1000 Growth Index during the one-year period ending August 31, 2006 primarily due to the negative effects from the portfolio’s specific security selections and style factor exposure, and to a lesser degree, the portfolio’s sector allocations. Return associated with security specific factors was the primary source of relative underperformance during the period. Overweights in some portfolio holdings in the Technology, Healthcare, Consumer Discretionary, and Financial sectors were among the most significant detractors from relative performance. With few exceptions, companies with above average growth rates and above average P/E multiples have lagged broad market indices. Style factors were also a significant detractor from relative performance, as large cap growth lagged value, international, and small cap disciplines. To a lesser extent, the portfolio’s sector allocations, namely an overweight in Consumer Discretionary and an underweight in Energy, also detracted from relative performance. On October 5, 2006, Sands resigned as a subadviser.
The Westfield portion of the portfolio outperformed the benchmark for the twelve months ended August 31, 2006. During the year, the portfolio was overweight in the Energy, Materials and Health Care sectors. Strong stock selection with Healthcare, most notably in biotechnology, contributed to relative performance. The Westfield portion benefited from an overweight to the Materials sector, the best performing sector of the portfolio on an absolute basis. While exposure to the Energy sector has been reduced, an overweight to that sector contributed to relative outperformance, particularly in coal and consumable fuel. An underweight to Consumer Staples detracted from relative performance.
TCW faced a number of headwinds including the Federal Reserve’s on-going tightening campaign. In this environment, their large cap growth portfolio underperformed the Russell 1000 Growth Index as value stocks continued their dominance over growth stocks. Stock selection for the period was weak as a result of negative sentiment around several of their larger holdings. Consumer Discretionary, Information Technology and Financials were the most significant underperformers for the period, all areas in which TCW remained overweight. Smaller weightings in Health Care, Consumer Staples, Industrials and Energy rounded out the TCW allocation and provided overall net drag to the portfolio for the period. At the August 3, 2006 Board of Trustees meeting, Consulting Group recommended and the Board approved, the termination of TCW. TCW was terminated on September 14, 2006.
3
| | Ÿ | | Westfield Capital Management Co., LLC (“Westfield”) | |
Uses an active management style and favors investing in earnings stocks given its conviction that stock prices follow earnings progress and that they offer the best opportunity for superior real rates of return. The sub-adviser believes that reasonably priced stocks with high earnings potential are best identified through in-depth, fundamental research.
The following graph depicts the performance of the Large Capitalization Growth Investments vs. the Russell 1000 Growth Index2 and the Lipper Large-Cap Growth Funds Average.13

The performance shown above represents past performance. Past performance is no guarantee of future results and current performance may be higher or lower than the performance shown above. Performance figures may reflect voluntary fee waivers and/or expense reimbursements. In the absence of voluntary fee waivers and/or expense reimbursements, the total return would have been lower. Principal value and investment returns will fluctuate and investors’ shares, when redeemed, may be worth more or less than their original cost. To obtain performance data current to the most recent month-end, please visit our website at www.smithbarney.com.
The graph above and returns shown below do not reflect the deduction of taxes that a shareholder would pay on fund distributions or the redemption of fund shares.
LARGE CAPITALIZATION GROWTH INVESTMENTS (unaudited)
Average Annual Total Returns for the Period Ended August 31, 2006†
| | | | | | |
| | | Without TRAK Fee | | | With TRAK Fee* | |
Since inception (11/18/91) | | 7.97 | % | | 6.36 | % |
10 year | | 6.05 | | | 4.47 | |
5 year | | 2.58 | | | 1.05 | |
3 year | | 7.46 | | | 5.86 | |
1 year | | 1.18 | | | (0.33 | ) |
|
|
See pages 22 through 24 for all footnotes.
RISKS: The Portfolio may use derivatives, such as options and futures, which can be illiquid, may disproportionately increase losses and have a potentially large impact on performance. Foreign securities are subject to certain risks of overseas investing, including currency fluctuations and changes in political and economic conditions, which could result in significant market fluctuations. Investments in small and medium-capitalizations companies may involve a higher degree of risk and volatility than investments in larger, more established companies.
4
Small Capitalization Value Equity Investments
ABOUTTHE SUBADVISERS
| | Ÿ | | Rutabaga Capital Management LLC (“RCM”) | |
Focuses exclusively on micro and small capitalization stocks and looks to unearth uncommon or currently unfavored stocks. The firm’s analysts employ extensive bottom-up fundamental research to identify high quality companies with catalysts to increase margins and intrinsic value but are neglected or misperceived by the market.
| | Ÿ | | NFJ Investment Group (“NFJ”) | |
An active management style that invests in a diversified portfolio of small capitalization common stocks that it believes are undervalued in the marketplace generally and within their respective industries. The subadviser also considers valuation factors such as price-to-book, price-to-cash flow, dividend policy and industry outlook in selecting stocks for investment.
| | Ÿ | | Delaware Management Company (“DMC”) | |
DMC believes that markets can misprice securities. DMC seeks to exploit this inefficiency on a consistent basis through active, research-based management. DMC identifies companies with market capitalizations typically less than $2 billion at the time of purchase whose values it believes are not currently recognized in the market. To do so, DMC considers a variety of factors, including, the financial strength of a company, its management, the prospects for its industry and any anticipated changes within the company that might suggest a more favorable outlook going forward. DMC’s focus is on value stocks whose prices are historically low on a given financial measure, such as profits, book value or cash flow.
For the period of September 1, 2005 through August 31, 2006 the subadvisers for the portfolio were NFJ, RCM and DMC.
For the NFJ portion, positive excess returns can mainly be attributed to favorable issue selection within the Materials sector where three gold mining companies performed exceptionally well as gold prices rose from $438/oz to $634/oz over the period. Other positions supporting infrastructure development also performed well within the Materials sector. Positive issue selection was significant in the Consumer Discretionary and Energy sectors as well, and to a lesser degree in the Utilities sector. Other highlights included eight holdings that received tender offers (two of which were utilities). Sector weighting strategy was also positive mainly due to an underweighting in an underperforming Consumer Discretionary sector and an overweighting in an outperforming Materials sector. Stock selection within the Financial sector was unfavorable (as one insurance position declined significantly). This sector has consistently accounted for over 30% of the benchmark weighting over the years, while the portfolio has consistently maintained sector weightings with broader diversification and less concentration. To a lesser degree, stock selection within the Industrial sector also hindered performance. Underweighting in the technology related Telecomm Services sector and the Information Technology sector were negatives.
The RCM portion of the portfolio benefited from an overweight in the Materials & Processing sector, one of the better performing sectors in the Russell 2000 Index, but RCM was also hampered by weak stock performance in the Automotive and Consumer Discretionary sectors, two of the weaker sectors in the index. As a result, RCM’s portion of the portfolio trailed the Russell 2000 Value Index for the fiscal year, while performing roughly in line with the Russell 2000 Index. As the stock market continues to sort out the potential ramifications of a deflating housing bubble and high energy prices (albeit on the decline at present), the firm remains focused on identifying superior companies that are neglected and attractively valued and that possess internal catalysts to grow their earnings faster than investors’ expectations.
The DMC portion essentially performed in-line with the Russell 2000 Value Index that had a return of 12.7%. Financial Services, Technology and Consumer Services were the major positive contributors to this performance, while Capital Spending, Utilities and Consumer Staples were the sectors that were relatively weak versus the benchmark. On an overall basis, stock selection and group weightings provided modest contributions, while cash was a very modest negative for account returns.
5
The following graph depicts the performance of the Small Capitalization Value Equity Investments vs. the Russell 2000 Value Index3 and the Lipper Small Cap Value Funds Average.14
The performance shown above represents past performance. Past performance is no guarantee of future results and current performance may be higher or lower than the performance shown above. Performance figures may reflect voluntary fee waivers and/or expense reimbursements. In the absence of voluntary fee waivers and/or expense reimbursements, the total return would have been lower. Principal value and investment returns will fluctuate and investors’ shares, when redeemed, may be worth more or less than their original cost. To obtain performance data current to the most recent month-end, please visit our website at www.smithbarney.com.
The graph above and returns shown below do not reflect the deduction of taxes that a shareholder would pay on fund distributions or the redemption of fund shares.
SMALL CAPITALIZATION VALUE EQUITY INVESTMENTS (unaudited)
Average Annual Total Returns for Period Ended August 31, 2006†
| | | | | | |
| | | Without TRAK Fee | | | With TRAK Fee* | |
Since inception (11/18/91) | | 11.74 | % | | 10.08 | % |
10 year | | 12.89 | | | 11.20 | |
5 year | | 13.58 | | | 11.88 | |
3 year | | 19.81 | | | 18.02 | |
1 year | | 11.73 | | | 10.07 | |
|
|
See pages 22 through 24 for all footnotes.
RISKS: The Portfolio may use derivatives, such as options and futures, which can be illiquid, may disproportionately increase losses and have a potentially large impact on performance. Foreign securities are subject to certain risks of overseas investing, including currency fluctuations and changes in political and economic conditions, which could result in significant market fluctuations. Investments in small and medium-capitalizations companies may involve a higher degree of risk and volatility than investments in larger, more established companies.
6
Small Capitalization
Growth Investments
ABOUTTHE SUBADVISERS
| | Ÿ | | Wall Street Associates (“WSA”) | |
Follows a bottom-up investment style. It looks for companies with superior earnings growth, strong balance sheets, attractive valuations and potentially positive earning surprises.
| | Ÿ | | Westfield Capital Management Co., LLC (“Westfield”) | |
Favors investing in earnings growth stocks given their conviction that stock prices follow earnings progress and that they offer the best opportunity for superior real rates of return. Reasonably priced stocks of companies with high foreseen earnings potential are best identified through in-depth, fundamental research. It is their belief that the small cap portion of the market is under-researched, and therefore less efficient, than the large cap sector.
For the period of September 1, 2005 through August 31, 2006 the subadvisers for the portfolio were WSA and WCM.
The WSA portion outperformed the Russell 2000 Growth Index during the period, primarily due to stock selection within the Consumer Discretionary and Producer Durables sectors during the period. Although the portfolio was slightly underweight Consumer Discretionary stocks, reflecting the difficult environment for consumers, stock selection within this sector added significantly to overall portfolio returns. An overweight position in the Energy sector also benefited the portfolio during the period, as returns for this sector were generally strong. Investments within the Health Care sector reduced returns, partially due to stock selection, a slight overweight position and a difficult politically-charged environment ahead of the mid-term elections.
The Westfield portion was overweight the Energy, Health Care and Industrial sectors, and underweight Consumer Discretionary during the year. Average weightings over the year within Information Technology, Materials, Consumer Staples and Financials were basically in line with the benchmark. The Consumer Staples sector was the best performing sector on an absolute basis. The performance benefit of an overweight position and strong stock selection in Health Care was overshadowed by disappointments within Energy, most notably coal and consumable fuel. Stock selection in Information Technology also lowered returns — specifically semiconductors and internet software and services.
7
The following graph depicts the performance of the Small Capitalization Growth Investments vs. the Russell 2000 Growth Index4 and the Lipper Small Cap Growth Funds Average.15
The performance shown above represents past performance. Past performance is no guarantee of future results and current performance may be higher or lower than the performance shown above. Performance figures may reflect voluntary fee waivers and/or expense reimbursements. In the absence of voluntary fee waivers and/or expense reimbursements, the total return would have been lower. Principal value and investment returns will fluctuate and investors’ shares, when redeemed, may be worth more or less than their original cost. To obtain performance data current to the most recent month-end, please visit our website at www.smithbarney.com.
The graph above and returns shown below do not reflect the deduction of taxes that a shareholder would pay on fund distributions or the redemption of fund shares.
SMALL CAPITALIZATION GROWTH INVESTMENTS (unaudited)
Average Annual Total Returns for Period Ended August 31, 2006†
| | | | | | |
| | | Without TRAK Fee | | | With TRAK Fee* | |
Since inception (11/18/91) | | 10.41 | % | | 8.76 | % |
10 year | | 4.97 | | | 3.41 | |
5 year | | 5.24 | | | 3.68 | |
3 year | | 10.20 | | | 8.55 | |
1 year | | 6.31 | | | 4.73 | |
|
|
See pages 22 through 24 for all footnotes.
RISKS: The Portfolio may use derivatives, such as options and futures, which can be illiquid, may disproportionately increase losses and have a potentially large impact on performance. Foreign securities are subject to certain risks of overseas investing, including currency fluctuations and changes in political and economic conditions, which could result in significant market fluctuations. Investments in small and medium-capitalizations companies may involve a higher degree of risk and volatility than investments in larger, more established companies.
8
International Equity Investments
ABOUTTHE SUBADVISERS
| | Ÿ | | William Blair & Co., LLC (“WBC”) | |
WBC’s investment approach is focused on a conservative, long-term approach to growth investing. They seek companies with growth characteristics that include high benchmark revenue growth, EPS growth, DPS growth and consensus long-term growth estimates.
| | Ÿ | | Philadelphia International Advisors, LP (“PIA”) | |
PIA utilizes a bottom-up approach to international investing. It selects stocks to buy and sell by evaluating a company’s growth outlook and market valuation based on traditional value characteristics, positive company-specific catalysts and other operating and financial conditions. It selects countries primarily by evaluating a country’s valuation ratios such as price-to-earnings and dividend yield, prospective economic growth, government policies and other factors.
| | Ÿ | | Brandywine Global Investment Management (“Brandywine”) | |
With regard to stock selection, Brandywine employs a quantitative screen which takes into account country, industry and company valuation history. Brandywine seeks stocks whose performance has deviated from their historical mean and likely will revert to this historical mean.
For the period of September 1, 2005 through August 31, 2006 the subadvisers for the portfolio were PIA, WBC and Brandywine.
The PIA allocation remained ahead of the market. Some of the value and quality criteria employed in the selection of stocks lead PIA to buy stocks that are also attractive from an M&A standpoint. In this relatively short period, several of PIA’s holdings received acquisition offers at substantial premiums to where the stocks traded before the bids. Not surprisingly, from an attribution standpoint, security selection drove PIA’s performance in the quarter in countries that experienced takeover offers, as well as within the Japanese market. The portfolio’s underweight in the U.K. also bolstered relative returns versus the Index. On a sector basis, the attractive relative gains were again driven by security selection, particularly within Health Care and Industrials, as well as a favorable overweighting in Materials stocks.
For the WBC portion, primary performance drivers during the year included stock selection in Consumer Staples, Energy, Financials, Industrials, Telecommunication Services and Utilities. From a regional perspective, stock selection in Japan and the U.K. added value, as did the portfolio’s allocation to emerging markets, particularly in Latin America. The largest dectractor from relative results was the portfolio’s pro growth positioning within regions and sectors during the second quarter of 2006 when investors became wary about the prospects for global growth amidst increased political turmoil and concerns about increasing interest rates. As of August 31, the portfolio’s emerging markets weighting approximated 24% and its weighting in Canada approximated 8.5%. As a result, it was underweight in the remaining developed regions relative to the EAFE Index. From a sector perspective, the portfolio’s largest exposure was in Financials, although below the Index weighting of nearly 30%. The largest relative weightings within the portfolio were in Energy and IT at the expense of Materials, Industrials and Telecommunication Services. These regional and sector weightings are largely the result of the team’s bottom up, fundamental process focused on finding quality growth companies.
The Brandywine portion outperformed the MSCI EAFE-Capitalization Weighted Index by approximately 150 basis points. From a stock selection perspective, on a sector basis, stock selection was most positive in Financials, Materials and Industrials stocks, offset by Healthcare, Energy and Technology stocks. On a country basis, positive selections in the U.K., Korea, Japan and Australia were partially offset by selections in Germany, Singapore and the Netherlands. The portfolio also benefited from a modest overweight in Materials, an underweight in Energy and some exposure to the emerging markets.
9
The following graph depicts the performance of the International Equity Investments vs. the MSCI EAFE-Capitalization Weighted Index5 and the Lipper International Multi Cap Core Funds Average.16
The performance shown above represents past performance. Past performance is no guarantee of future results and current performance may be higher or lower than the performance shown above. Performance figures may reflect voluntary fee waivers and/or expense reimbursements. In the absence of voluntary fee waivers and/or expense reimbursements, the total return would have been lower. Principal value and investment returns will fluctuate and investors’ shares, when redeemed, may be worth more or less than their original cost. To obtain performance data current to the most recent month-end, please visit our website at www.smithbarney.com.
The graph above and returns shown below do not reflect the deduction of taxes that a shareholder would pay on fund distributions or the redemption of fund shares.
INTERNATIONAL EQUITY INVESTMENTS (unaudited)
Average Annual Total Returns for Period Ended August 31, 2006†
| | | | | | |
| | | Without TRAK Fee | | | With TRAK Fee* | |
Since inception (11/18/91) | | 7.67 | % | | 6.07 | % |
10 year | | 7.42 | | | 5.82 | |
5 year | | 11.33 | | | 9.67 | |
3 year | | 21.65 | | | 19.84 | |
1 year | | 23.55 | | | 21.71 | |
|
|
See pages 22 through 24 for all footnotes.
RISKS: The Portfolio may use derivatives, such as options and futures, which can be illiquid, may disproportionately increase losses and have a potentially large impact on performance. Foreign securities are subject to certain risks of overseas investing, including currency fluctuations and changes in political and economic conditions, which could result in significant market fluctuations. Investments in small and medium-capitalizations companies may involve a higher degree of risk and volatility than investments in larger, more established companies.
10
Emerging Markets
Equity Investments
ABOUTTHE SUBADVISERS
| | Ÿ | | SSgA Funds Management, Inc. (“SSgA”) | |
Uses quantitative analysis to identify countries and stocks which are undervalued relative to their growth rates. It employs an investment process that combines top-down country selection with bottom-up stock selection to determine an optimal country and security mix.
| | Ÿ | | Newgate Capital Management LLC (“Newgate”) | |
Newgate seeks long-term growth of capital by utilizing a top-down value approach in identifying undervalued economic countries, regions and sectors. Newgate incorporates both geopolitical and macroeconomic factors into its investment strategy through fundamental quantitative analysis, investment experience and professional judgment.
For the period of September 1, 2005 through August 31, 2006 the subadvisers for the portfolio were SSgA and Newgate.
The SSgA portion of the portfolio benefited from numerous equity positions across the emerging regions over the twelve month period ending August 31, 2006. In 2006, emerging markets as a whole reminded investors of the volatility of the asset class and its susceptibility to changes in global risk appetite. In May, there was a sharp sell off where emerging markets were down 10 days in a row, but the markets corrected themselves and recovered some of their losses in June. Within Latin America, overweight positions in both Argentina and Brazil contributed to the portfolio’s performance. The SSgA portion also benefited from its overweight to Brazil, whose market returned 44% over the portfolio’s year. The portfolio’s Brazilian holdings returned 56%, reflecting superior stock selection, primarily in traditional large capitalization stocks. In the Europe, Middle East and Africa region, one of the big stories in 2006 has been in the Russian market, which rose 67.7%.
The Newgate portion was positioned in a barbell, over-allocated to both the Technology and Energy sectors. Such a barbell is counter-intuitive, since these sectors often move in opposite directions. However, this structure proved to be a benefit. Exposure to commodity related stocks, both Energy and Mining, provided positive contributions to performance. Technology stocks in the aggregate were neither a contributing nor a detracting factor to the portfolio relative to the Index, though they were beneficial on an absolute basis. Newgate’s allocation to Taiwan proved beneficial to the portfolio. Many of Newgate’s technology related stocks are located in Taiwan and had a positive effect on the portfolio during the year. Newgate also held positions in stocks tied to the local economy, and these also made a positive contribution to the portfolio. The Newgate allocation benefited through its avoidance of some of the more peripheral markets, many of which had strong performance in the first half of the year, only to give up this performance in the correction that began in May, 2006. These markets include the smaller ones in Eastern Europe and South America. Finally, the portfolio benefited by its exposure to Turkey, a market in which Newgate over-allocated its assets and then reduced exposure before that market saw significant losses.
11
The following graph depicts the performance of the Emerging Markets Equity Investments vs. the MSCI Emerging Markets Index6 and the Lipper Emerging Markets Funds Average.17
The performance shown above represents past performance. Past performance is no guarantee of future results and current performance may be higher or lower than the performance shown above. Performance figures may reflect voluntary fee waivers and/or expense reimbursements. In the absence of voluntary fee waivers and/or expense reimbursements, the total return would have been lower. Principal value and investment returns will fluctuate and investors’ shares, when redeemed, may be worth more or less than their original cost. To obtain performance data current to the most recent month-end, please visit our website at www.smithbarney.com.
The graph above and returns shown below do not reflect the deduction of taxes that a shareholder would pay on fund distributions or the redemption of fund shares.
| ‡ | | Gross returns used for MSCI Emerging Markets Index from 1997 to 1999. Net returns used for MSCI Emerging Markets Index from 2000 to 2006. |
EMERGING MARKETS EQUITY INVESTMENTS (unaudited)
Average Annual Total Returns for Period Ended August 31, 2006†
| | | | | | |
| | | Without TRAK Fee | | | With TRAK Fee* | |
Since inception (4/20/94) | | 5.72 | % | | 4.15 | % |
10 year | | 6.20 | | | 4.62 | |
5 year | | 22.58 | | | 20.75 | |
3 year | | 29.04 | | | 27.12 | |
1 year | | 30.10 | | | 28.16 | |
|
|
See pages 22 through 24 for all footnotes.
RISKS: The Portfolio may use derivatives, such as options and futures, which can be illiquid, may disproportionately increase losses and have a potentially large impact on performance. Foreign securities are subject to certain risks of overseas investing, including currency fluctuations and changes in political and economic conditions, which could result in significant market fluctuations. Investments in small and medium-capitalizations companies may involve a higher degree of risk and volatility than investments in larger, more established companies.
12
Government Money Investments
ABOUTTHE SUBADVISER
| | Ÿ | | Standish Mellon Asset Management LLC (“Standish”) | |
The Portfolio invests exclusively in U.S. Treasury securities and other U.S. government securities rated by a nationally recognized rating organization in the two highest short-term rating categories or, if unrated, of equivalent quality as determined by the sub-adviser. Individual securities must have remaining maturities of 397 days or less. Standish seeks to improve the Portfolio’s yield through actively managing sector allocations and the average maturity of the Portfolio. Standish monitors the spread relationships between U.S. Treasury and government agency issues, and purchases agencies when they provide a yield advantage. In addition, Standish will change the maturity structure modestly to reflect its outlook on interest rates.
For the period of September 1, 2005 through August 31, 2006 the subadviser for the portfolio was Standish.
Short-term interest rates rose steadily throughout the year ended August 31, 2006. The Federal Reserve tightened at every meeting until August 2006, raising the overnight rate 1.75% during the year, with it ultimately reaching 5.25%. Long-term interest rates also rose during the year, though to a lesser degree. The 10-year Treasury rate ended August 2006 at 4.72%, up only 71 basis points over the year.
The economy showed strong consistent growth during most of the year. Hurricane related weakness during the fall of 2005 translated later into strength as the rebuilding assisted the economy. Consumer and corporate spending, commercial building and employment also showed strength. Recent concerns over the residential housing market was the only point of economic weakness during the year. Fears of a housing recession caused an end-of-summer rally in the bond market.
Government Money Investments continues to invest in high quality short term instruments, as is mandated by its guidelines. The average maturity of the portfolio ranged between one to two months during the year. With a short average maturity, performance benefited by the increase in interest rates during the year. The portfolio returned 4.03% in the 1-year period vs. the 90-day Treasury Bill which returned 4.27%.
GOVERNMENT MONEY INVESTMENTS (unaudited)
Average Annual Total Returns for the Period Ended August 31, 2006†
| | | | | | |
| | | Without TRAK Fee | | | With TRAK Fee* | |
Since inception (11/18/91) | | 3.59 | % | | 2.05 | % |
10 year | | 3.43 | | | 1.89 | |
5 year | | 1.86 | | | 0.34 | |
3 year | | 2.22 | | | 0.69 | |
1 year | | 4.03 | | | 2.48 | |
|
|
Performance figures may reflect voluntary fee waivers and/or expense reimbursements. In the absence of voluntary fee waivers and/or expense reimbursements, the total return would have been lower.
The returns shown do not reflect the deduction of taxes that a shareholder would pay on fund distributions or the redemption of fund shares.
See pages 22 through 24 for all footnotes.
RISKS: An investment in a money market fund is neither insured nor guaranteed by the FDIC or any other government agency. Although the Portfolio seeks to preserve the value of your investment at one dollar per share, it is possible to lose money by investing in the Portfolio.
13
Core Fixed
Income Investments
ABOUTTHE SUBADVISERS
| | Ÿ | | BlackRock Financial Management, Inc. (“BFM”) | |
Employs a relative value approach which entails portfolio duration within a narrow range and value added through sector and sub-sector rotation within the corporate and mortgage sectors. BFM evaluates securities within a risk management framework which consists of determining interest rate risk, yield curve risk, cash flow risk, credit risk and liquidity risk of securities.
| | Ÿ | | Pacific Investment Management Co. (“PIMCO”) | |
Employs “top-down” and “bottom-up” investment techniques. It implements the following “top-down” strategies: duration and volatility analysis, sector evaluation and yield curve shape analysis. The subadviser also employs the following “bottom-up” strategies: credit analysis, quantitative research, issue selection and cost-effective trading.
| | Ÿ | | Western Asset Management Co. (“WAMCO”) | |
Emphasizes three key strategies to enhance the Portfolio’s total return: (i) adjusting the allocation of the Portfolio among the key sectors of the fixed-income market depending on its forecast of relative values; (ii) tracking the duration of the overall Portfolio so that it falls within a narrow band relative to the benchmark index, with adjustment made to reflect its long-term outlook for interest rates; and (iii) purchasing under-valued securities in each of the key sectors of the bond market while keeping overall quality high.
For the period of September 1, 2005 through August 31, 2006 the subadvisers for the portfolio were BFM, PIMCO and WAMCO.
Throughout the period, the BFM portion maintained its short duration position. The portfolio’s defensive posture has been advantageous in this rising rate environment. The duration underweight was a positive contributor to performance as yields trended higher over the past fiscal year. The yield on the 5-year Treasury rose 86 basis points (bps) from 3.83% to 4.69%. The BFM portion maintained an underweight in mortgages during the period, which detracted from relative performance as the sector performed well during the period. The portfolio remained defensive on 30-year mortgage pass-throughs which have greater extension risk. The mortgage allocation is concentrated in 15-year fixed rate pass-through mortgages, floating rate securities and collateralized mortgage obligations (CMOs). The BFM allocation maintained an underweight in credit, with a bias toward short maturity issues. An overweight in Asset Backed Securities (ABS) contributed to the positive performance.
The PIMCO portion underperformed its benchmark due to an overweight to mortgage backed securities and coupon selection within the sector on falling implied volatility. Exposure to emerging market bonds on credit rating upgrades and improving economic fundamentals were a positive to performance. Pay fixed swap positions in Europe and Japan, as rates rose in these regions on central bank tightening, were a strategy taken during the year. Short duration asset backed bonds, which gained amid demand for their attractive yields and strong credit quality, were positive for performance. PIMCO’s municipal bond holdings benefited the portfolio, as these lower volatility assets typically outperform taxable bonds when rates are rising.
The various strategies within the WAMCO portion of the portfolio produced mixed but generally positive results during the period. A tactically overweight duration stance detracted from performance as interest rates rose a bit more than WAMCO had expected, and a modestly bulleted yield curve exposure suffered as the curve flattened. However, overweight exposure to lower quality corporate bonds benefited from tighter spreads, and overweight exposure to the mortgage-backed sector contributed positively to performance as low-volatility conditions helped the sector to outperform. Treasury Inflation-Protected Securities (“TIPS”) exposure also contributed to performance, thanks to an outsized inflation adjustment.
14
The following graph depicts the performance of the Core Fixed Income Investments vs. the Lehman Brothers U.S. Aggregate Index7 and the Lehman Brothers Intermediate Government/Credit Bond Index.8
The performance shown above represents past performance. Past performance is no guarantee of future results and current performance may be higher or lower than the performance shown above. Performance figures may reflect voluntary fee waivers and/or expense reimbursements. In the absence of voluntary fee waivers and/or expense reimbursements, the total return would have been lower. Principal value and investment returns will fluctuate and investors’ shares, when redeemed, may be worth more or less than their original cost. To obtain performance data current to the most recent month-end, please visit our website at www.smithbarney.com.
The graph above and returns shown below do not reflect the deduction of taxes that a shareholder would pay on fund distributions or the redemption of fund shares.
CORE FIXED INCOME INVESTMENTS (unaudited)
Average Annual Total Returns for the Period Ended August 31, 2006†
| | | | | | |
| | | Without TRAK Fee | | | With TRAK Fee* | |
Since inception (11/18/91) | | 5.75 | % | | 4.17 | % |
10 year | | 5.56 | | | 3.99 | |
5 year | | 4.09 | | | 2.54 | |
3 year | | 3.65 | | | 2.10 | |
1 year | | 1.51 | | | (0.00 | ) |
|
|
See pages 22 through 24 for all footnotes.
RISKS: The Portfolio may use derivatives, such as options and futures, which can be illiquid, may disproportionately increase losses and have a potentially large impact on performance. Foreign securities are subject to certain risks of overseas investing, including currency fluctuations and changes in political and economic conditions, which could result in significant market fluctuations. The Portfolio may invest in high yield bonds, which involve greater credit and liquidity risks than investment grade bonds.
15
High Yield Investments
ABOUTTHE SUBADVISERS
| | Ÿ | | Penn Capital Management Co., Inc. (“Penn”) | |
Penn’s initial universe is well-defined and includes all domestic, corporate cash paying dollar denominated bond issues that have spread-to-treasury and yield characteristics that are consistent with or wider than the single-B credit tier. Penn’s investment team determines sectors/industries that may offer relative value based on its macro-economic outlook. The team will review and evaluate the economic cycle, business environment, industry/sector analysis and interest rates. Penn then scans this group for companies with spreads to treasury that are wider than comparable companies, industry averages and historical averages. The team analyzes the liquidity outlook of the company through qualitative research, including bank loan facility analysis, covenant review analysis and asset value analysis. After the high yield bond universe has been narrowed and potential relative value is identified, the team performs its qualitative research to confirm or justify the credit’s value. The team determines whether or not the credit is suitable for the portfolio given its impact on Penn’s current industry weightings and the diversification it brings to the basket of credits currently held within an industry.
| | Ÿ | | Western Asset Management Co. (“WAMCO”) | |
Combines traditional analysis with innovative technology applied to all sectors of the market. WAMCO believes inefficiencies exist in the fixed-income market and attempts to add incremental value by exploiting these inefficiencies across all eligible market sectors. The key areas of focus are (i) sector and sub-sector allocation; (ii) issue selection; (iii) duration; and (iv) term structure.
For the period of September 1, 2005 through August 31, 2006 the subadvisers for the portfolio were WAMCO and Seix Advisors, the fixed income division of Trusco Capital Management, Inc. (“Seix”).
The WAMCO portion outperformed the portfolio’s primary benchmark, the Lehman Brothers High Yield Index by 82 basis points (bps). For the second year in a row the portfolio was positioned to incorporate WAMCO’s view that economic activity would exceed market expectations. This resulted in the portfolio being overweight lower rated issuers, which are generally disproportionately leveraged to economic improvement. The CCC rated category significantly outperformed for the period, generating a return of 8.29%. Issue selection on balance was positive. The portfolio was overweight outperforming industries such as Transportation (which returned 11.83%) and Wireline (which returned 9.80%), as well as underweight to underperforming industries such as Consumer Non-Cyclical (which returned 2.78%) and Media Non-Cable (which returned 4.75%).
The Seix portion lagged the return of the Lehman Brothers High Yield Index. While Treasuries, the highest quality securities, were under pressure, the riskiest sectors outperformed. CCC’s and BB/B rated bonds, yielding over 8%, outperformed despite cracks in other risky asset classes, such as emerging markets and small cap equities. After a difficult late 2005, GM and Ford recovered significantly this year. During the period, interest rates continued to rise as the Federal Reserve Board maintained a tight monetary policy. Longer term rates responded and yields increased across all maturities. Although High Yield is cushioned by more generous income, rising Treasury rates have affected returns. Autos have been the most volatile industry over the past year. Seix remains underweight in the sector. However, after being void GM and Ford, Seix established a position (2.3% of net portfolio assets as of 8/31) in GMAC starting in May. With GM’s deal to sell 51% of GMAC to Cerberus Capital, Seix concluded that the finance subsidiary would not be linked with GM in the case of a default. In addition, Seix was reassured that the deal would go through when the threat of a strike at Delphi, GM’s parts supplier, subsided. Similarly, Seix purchased Ford Motor Credit bonds after signals that Ford was moving toward separating the finance unit. It continues to be void the auto manufacturing parent companies because they do not pass the firm’s credit screens for a number of reasons, including negative free cash flow, inadequate management and unremarkable product lines compared to their competitors.
At a board meeting on September 25, 2006, the Consulting Group recommended and the Board of Trustees approved, the termination of Seix and the hiring of Penn as an additional subadviser. Penn began managing a portion of the portfolio on October 4, 2006.
16
The following graph depicts the performance of the High Yield Investments vs. the Lehman Brothers High Yield Index.9
The performance shown above represents past performance. Past performance is no guarantee of future results and current performance may be higher or lower than the performance shown above. Performance figures may reflect voluntary fee waivers and/or expense reimbursements. In the absence of voluntary fee waivers and/or expense reimbursements, the total return would have been lower. Principal value and investment returns will fluctuate and investors’ shares, when redeemed, may be worth more or less than their original cost. To obtain performance data current to the most recent month-end, please visit our website at www.smithbarney.com.
The graph above and returns shown below do not reflect the deduction of taxes that a shareholder would pay on fund distributions or the redemption of fund shares.
HIGH YIELD INVESTMENTS (unaudited)
Average Annual Total Returns for the Period Ended August 31, 2006†
| | | | | | |
| | | Without TRAK Fee | | | With TRAK Fee* | |
Since inception (7/13/98) | | 2.17 | % | | 0.64 | % |
5 year | | 5.62 | | | 4.05 | |
3 year | | 7.54 | | | 5.94 | |
1 year | | 3.80 | | | 2.26 | |
|
|
See pages 22 through 24 for all footnotes.
RISKS: The Portfolio may use derivatives, such as options and futures, which can be illiquid, may disproportionately increase losses and have a potentially large impact on performance. Foreign securities are subject to certain risks of overseas investing, including currency fluctuations and changes in political and economic conditions, which could result in significant market fluctuations. The Portfolio may invest in high yield bonds, which involve greater credit and liquidity risks than investment grade bonds.
17
Municipal Bond Investments
ABOUTTHE SUBADVISER
| | Ÿ | | McDonnell Investment Management, LLC (“McDonnell”) | |
Employs a value-added approach to active municipal bond management utilizing a team oriented philosophy. This approach attempts to maximize after-tax total returns while reducing the volatility in relative rates of return. By limiting dependence on market timing and tightly controlling duration, the McDonnell reduces the portfolio’s exposure to interest rate risk relative to the benchmark. McDonnell utilizes extensive internal research to identify relative value opportunities among sectors and securities and to control credit risk. Additionally, McDonnell seeks to exploit yield curve anomalies through quantitative analysis of historical spreads and future expectations.
At a board meeting held on September 26, 2005, the Consulting Group recommended and the Board of Trustees approved, the termination of Smith Affiliated Capital Corporation and the hiring of McDonnell as the portfolio’s subadviser. McDonnell began managing the portfolio on October 17, 2005.
After assuming management of Municipal Bond Investments in October 2005, several structural and strategic opportunities were initially identified by McDonnell.
First, the portfolio maintained a curve mismatch relative to its benchmark (Lehman Brothers Broad Municipal Bond Index - “Index”), which is generally comprised of bonds ranging from one to 30 years. McDonnell believed that the mismatch was inconsistent with an appropriate strategy given the shape of the municipal yield curve. In an effort to minimize this risk and to benefit from anticipated future flattening of the yield curve, McDonnell increased exposure to both the longer and shorter ends of the maturity spectrum. As the Federal Reserve Board continued to raise rates through early 2006, this strategic move proved advantageous to the portfolio. Longer term yields declined, producing positive returns, which more than offset price declines on shorter maturity bonds.
Second, with respect to credit quality, the portfolio initially maintained underweight positions in single-A and BBB-rated bonds. Consistent with McDonnell’s credit spread outlook, an increased exposure to lower rated bonds was implemented. The portfolio currently maintains lower tier quality weightings similar to those of the Index. This quality composition has contributed positively to portfolio returns, as lower quality bonds continued to outperform the broad market over the one year period. Savvy security selection also contributed favorably to the portfolio’s performance.
18
The following graph depicts the performance of the Municipal Bond Investments vs. the Lehman Brothers Municipal Bond Index.10
The performance shown above represents past performance. Past performance is no guarantee of future results and current performance may be higher or lower than the performance shown above. Performance figures may reflect voluntary fee waivers and/or expense reimbursements. In the absence of voluntary fee waivers and/or expense reimbursements, the total return would have been lower. Principal value and investment returns will fluctuate and investors’ shares, when redeemed, may be worth more or less than their original cost. To obtain performance data current to the most recent month-end, please visit our website at www.smithbarney.com.
The graph above and returns shown below do not reflect the deduction of taxes that a shareholder would pay on fund distributions or the redemption of fund shares.
MUNICIPAL BOND INVESTMENTS (unaudited)
Average Annual Total Returns for the Period Ended August 31, 2006†
| | | | | | |
| | | Without TRAK Fee | | | With TRAK Fee* | |
Since inception (11/18/91) | | 5.47 | % | | 3.90 | % |
10 year | | 5.29 | | | 3.72 | |
5 year | | 4.37 | | | 2.82 | |
3 year | | 4.50 | | | 2.94 | |
1 year | | 2.26 | | | 0.73 | |
|
|
See pages 22 through 24 for all footnotes.
RISKS: The Portfolio may use derivatives, such as options and futures, which can be illiquid, may disproportionately increase losses and have a potentially large impact on performance.
19
International Fixed
Income Investments
ABOUTTHE SUBADVISER
| | Ÿ | | Pacific Investment Management Company (“PIMCO”) | |
PIMCO’s total return approach focuses on both capital appreciation and income while managing overall risk. PIMCO employs a core philosophy toward managing global bonds focusing on both economic and credit fundamentals as key determinants of value in fixed income markets, limiting volatility with respect to the benchmark index.
For the period of September 1, 2005 through August 31, 2006 the subadviser for the portfolio was PIMCO.
The contributors to performance included: an underweight to Euroland bonds as yields rose when the European Central Bank hiked rates to forestall inflationary pressures from rising energy prices and an underweight to Japanese duration, as strong economic growth and rising inflation led to an end of the Bank of Japan’s policy of quantitative easing. Strategies that also benefited the portfolio included an allocation to U.S. mortgages, which outperformed on falling implied volatility and an allocation to emerging market bonds, which outperformed on strong demand amid improving economic fundamentals. Factors that also benefited the portfolio were wider swap spreads in the U.S., Europe and Japan and rising rates and wider global swap rates relative to government bonds as a result of increased volatility.
20
The following graph depicts the performance of the International Fixed Income Investments vs. the Citigroup Non-U.S. World Government Bond Index - Hedged11, the Citigroup Non-U.S. World Government Bond Index - Unhedged11 and the Lipper International Income Funds Average.18
The performance shown above represents past performance. Past performance is no guarantee of future results and current performance may be higher or lower than the performance shown above. Performance figures may reflect voluntary fee waivers and/or expense reimbursements. In the absence of voluntary fee waivers and/or expense reimbursements, the total return would have been lower. Principal value and investment returns will fluctuate and investors’ shares, when redeemed, may be worth more or less than their original cost. To obtain performance data current to the most recent month-end, please visit our website at www.smithbarney.com.
The graph above and returns shown below do not reflect the deduction of taxes that a shareholder would pay on fund distributions or the redemption of fund shares.
INTERNATIONAL FIXED INCOME INVESTMENTS (unaudited)
Average Annual Total Returns for Period Ended August 31, 2006†
| | | | | | |
| | | Without TRAK Fee | | | With TRAK Fee* | |
Since inception (11/18/91) | | 6.54 | % | | 4.95 | % |
10 year | | 4.47 | | | 2.91 | |
5 year | | 7.44 | | | 5.84 | |
3 year | | 6.19 | | | 4.61 | |
1 year | | (1.70 | ) | | (3.17 | ) |
|
|
See pages 22 through 24 for all footnotes.
RISKS: The Portfolio may use derivatives, such as options and futures, which can be illiquid, may disproportionately increase losses and have a potentially large impact on performance. Foreign securities are subject to certain risks of overseas investing, including currency fluctuations and changes in political and economic conditions, which could result in significant market fluctuations. Investments in small and medium-capitalizations companies may involve a higher degree of risk and volatility than investments in larger, more established companies. The Portfolio may invest in high yield bonds, which involve greater credit and liquidity risks than investment grade bonds.
21
FOOTNOTES
| † | | All figures represent past performance and are not a guarantee of future results. Investment return and principal value of an investment will fluctuate so that an investor’s shares, where redeemed, may be worth more or less than their original cost. The returns shown do not reflect the deduction of taxes that a shareholder would pay on fund distributions or the redemptions of fund shares. Performance figures may reflect fee waivers and/or expense reimbursements. In the absence of fee waivers and/or expense reimbursements, the total return would have been lower. To obtain performance data current to the most recent month-end, please visit our website at www.smithbarney.com. |
| * | | The Funds are available only to investors participating in an advisory program. These programs charge an annual fee, which in the case of TRAK® may be up to 1.50%. The performance data shown does not reflect this fee, which would reduce returns. |
| 1 | | The Russell 1000® Value Index measures the performance of those Russell 1000 Index companies with lower price-to-book ratios and lower forecasted growth values. Because the index is not a managed portfolio, there are no advisory fees or internal management expenses reflected in the index’s performance. Please note that an investor cannot invest directly in an index. |
| 2 | | The Russell 1000® Growth Index measures the performance of those Russell 1000 companies with higher price-to-book ratios and higher forecasted growth values. Because the index is not a managed portfolio, there are no advisory fees or internal management expenses reflected in the index’s performance. Please note that an investor cannot invest directly in an index. |
| 3 | | The Russell 2000® Value Index measures the performance of those Russell 2000 Index companies with lower price-to-book ratios and lower forecasted growth values. Because the index is not a managed portfolio, there are no advisory fees or internal management expenses reflected in the index’s performance. Please note that an investor cannot invest directly in an index. |
| 4 | | The Russell 2000® Growth Index measures the performance of those Russell 2000 companies with higher price-to-book ratios and higher forecasted growth values. Because the index is not a managed portfolio, there are no advisory fees or internal management expenses reflected in the index’s performance. Please note that an investor cannot invest directly in an index. |
| 5 | | The MSCI EAFE®-Capitalization Weighted Index is a composite portfolio of equity total returns for the countries of Australia, New Zealand and countries in Europe and the Far East, weighted based on each country’s market capitalization. Because the index is not a managed portfolio, there are no advisory fees or internal management expenses reflected in the index’s performance. Please note that an investor cannot invest directly in an index. |
| 6 | | The MSCI Emerging Markets Index is an index comprised of thirteen emerging markets open to direct foreign participation. Because the index is not a managed portfolio, there are no advisory fees or internal management expenses reflected in the index’s performance. Please note that an investor cannot invest directly in an index. |
22
| 7 | | The Lehman Brothers U.S. Aggregate Index is composed of the Lehman Brothers Intermediate Government/Credit Bond Index and the Lehman Brothers Mortgage-Backed Securities Index and includes treasury issues, agency issues, corporate bond issues and mortgage-backed securities. Because the index is not a managed portfolio, there are no advisory fees or internal management expenses reflected in the index’s performance. Please note that an investor cannot invest directly in an index. |
| 8 | | The Lehman Brothers Intermediate Government/Credit Bond Index is a weighted composite of: (i) Lehman Brothers Government Bond Index, which is comprised of all publicly issued, non-convertible debt of the U.S. government or any agency thereof, quasi-federal corporations, and corporate debt guaranteed by the U.S. government with a maturity between one and ten years; and (ii) Lehman Brothers Credit Bond Index, which is comprised of all public fixed-rate, non-convertible investment-grade domestic corporate debt with a maturity of between one and ten years, excluding collateralized mortgage obligations. Because the index is not a managed portfolio, there are no advisory fees or internal management expenses reflected in the index’s performance. Please note that an investor cannot invest directly in an index. |
| 9 | | The Lehman Brothers High Yield Index is composed of fixed rate, publicly issued, non-investment grade debt registered with the SEC. All bonds must be dollar-denominated, non-convertible, and have at least one year remaining to maturity as well as an outstanding par value of $100 million. Because the index is not a managed portfolio, there are no advisory fees or internal management expenses reflected in the index’s performance. Please note that an investor cannot invest directly in an index. |
| 10 | | The Lehman Brothers Municipal Bond Index is a weighted composite which is comprised of more than 15,000 bonds issued within the last five years, having a minimum credit rating of at least Baa and maturity of at least two years, excluding all bonds subject to the Alternative Minimum Tax and bonds with floating or zero coupons. Because the index is not a managed portfolio, there are no advisory fees or internal management expenses reflected in the index’s performance. Please note that an investor cannot invest directly in an index. |
| 11 | | The Citigroup Non-U.S. World Government Bond Index is an index subset of the Citigroup World Bond Index that excludes corporate bonds denominated in U.S. dollars. It contains foreign government and supranational bonds denominated in Australian, Austrian, Belgian, British, Canadian, Danish, Dutch, French, German, Italian, Japanese, Spanish and Swedish currencies. Because the index is not a managed portfolio, there are no advisory fees or internal management expenses reflected in the index’s performance. Please note that an investor cannot invest directly in an index. |
| 12 | | The Lipper Large-Cap Value Funds Average is comprised of the Portfolio’s peer group of mutual funds investing in value oriented funds. |
| 13 | | The Lipper Large-Cap Growth Funds Average is comprised of the Portfolio’s peer group of mutual funds investing in growth oriented funds. |
| 14 | | The Lipper Small Cap Value Funds Average is comprised of the Portfolio’s peer group of mutual funds which limit their investments to small cap value companies. |
| 15 | | The Lipper Small Cap Growth Funds Average is comprised of the Portfolio’s peer group of mutual funds which limit their investments to small cap growth companies. |
23
| 16 | | The Lipper International Multi-Cap Core Funds Average is an equally weighted average of the funds that invest in a variety of market capitalization ranges without concentrating 75% of their equity assets in any one market capitalization range over an extended period of time. Multi-Cap funds typically have 25% to 75% of their assets invested in companies strictly outside of the U.S. with market capitalizations greater than the 250th largest company in the S&P/Citigroup World ex-U.S. Broad Market Index. |
| 17 | | The Lipper Emerging Markets Funds Average is an equally weighted average of the funds that seek long-term capital appreciation by investing at least 65% of total assets in emerging market equity securities, where “emerging market” is defined by a country’s GNP per capita or other economic measures. |
| 18 | | The Lipper International Income Funds Average is an equally weighted average of the funds that invest primarily in U.S. dollar and non-U.S. dollar debt securities of issuers located in at least three countries, excluding the United States. |
24
Fund Expenses
(unaudited)
Example
As a shareholder of the Fund, you may incur two types of costs: (1) advisory program annual fees, which in the case of TRAK® may be up to 1.50%; and (2) ongoing costs, including management fees and other Fund expenses. This example is intended to help you understand your ongoing costs (in dollars) of investing in the Fund and to compare these costs with the ongoing costs of investing in other mutual funds.
This example is based on an investment of $1,000 invested on March 1, 2006 and held for the six months ended August 31, 2006.
Actual Expenses
The table below titled “Based on Actual Total Return” provides information about actual account values and actual expenses. You may use the information provided in this table, together with the amount you invested, to estimate the expenses that you paid over the period. To estimate the expenses you paid on your account, divide your account value by $1,000 (for example, an $8,600 account value divided by $1,000 = 8.6), then multiply the result by the number under the heading entitled “Expenses Paid During the Period”.
Based on Actual Total Return(1)
| | | | | | | | | | | | | | | |
| | | Actual
Total Return
Without
TRAK® Fee(2) | | | Beginning
Account
Value | | Ending
Account
Value | | Annualized
Expense
Ratios | | | Expenses
Paid During
the Period(3) |
Large Capitalization Value Equity Investments | | 5.42 | % | | $ | 1,000.00 | | $ | 1,054.20 | | 0.74 | % | | $ | 3.83 |
Large Capitalization Growth Investments | | (3.81 | ) | | | 1,000.00 | | | 961.90 | | 0.75 | | | | 3.71 |
Small Capitalization Value Equity Investments | | 3.35 | | | | 1,000.00 | | | 1,033.50 | | 0.99 | | | | 5.07 |
Small Capitalization Growth Investments | | (6.66 | ) | | | 1,000.00 | | | 933.40 | | 1.00 | | | | 4.87 |
International Equity Investments | | 6.19 | | | | 1,000.00 | | | 1,061.90 | | 0.80 | | | | 4.16 |
Emerging Markets Equity Investments | | 1.32 | | | | 1,000.00 | | | 1,013.20 | | 1.24 | | | | 6.29 |
Government Money Investments | | 2.29 | | | | 1,000.00 | | | 1,022.90 | | 0.38 | | | | 1.94 |
Core Fixed Income Investments | | 1.59 | | | | 1,000.00 | | | 1,015.90 | | 0.57 | | | | 2.90 |
High Yield Investments | | 1.92 | | | | 1,000.00 | | | 1,019.20 | | 0.79 | | | | 4.02 |
Municipal Bond Investments | | 1.73 | | | | 1,000.00 | | | 1,017.30 | | 0.71 | | | | 3.61 |
International Fixed Income Investments | | 1.51 | | | | 1,000.00 | | | 1,015.10 | | 0.74 | | | | 3.76 |
| (1) | | For the six months ended August 31, 2006. |
| (2) | | Assumes reinvestment of all distributions, including returns of capital, if any, at net asset value and does not reflect the deduction of the applicable advisory program charge, which in the case of TRAK® may be up to 1.50%. Total return is not annualized as it may not be representative of the total return for the year. Performance figures may reflect fee waivers and/or expense reimbursements. Past performance is no guarantee of future results. In the absence of fee waivers and/or expense reimbursements, the total return would have been lower. |
| (3) | | Expenses (net of fee waivers and/or expense reimbursements) are equal to each Fund's respective annualized expense ratio multiplied by the average account value over the period, multiplied by the number of days in the most recent fiscal half-year, then divided by 365. |
25
Fund Expenses
(unaudited) (continued)
Hypothetical Example for Comparison Purposes
The table below titled “Based on Hypothetical Total Return” provides information about hypothetical account values and hypothetical expenses based on the actual expense ratio and an assumed rate of return of 5.00% per year before expenses, which is not the Fund’s actual return. The hypothetical account values and expenses may not be used to estimate the actual ending account balance or expenses you paid for the period. You may use the information provided in this table to compare the ongoing costs of investing in the Fund and other funds. To do so, compare the 5.00% hypothetical example relating to the Fund with the 5.00% hypothetical examples that appear in the shareholder reports of the other funds.
Please note that the expenses shown in the table below are meant to highlight your ongoing costs only and do not reflect any advisory program annual fees. Therefore, the table is useful in comparing ongoing costs only, and will not help you determine the relative total costs of owning different funds. In addition, if these advisory program annual fees were included, your costs would have been higher.
Based on Hypothetical Total Return(1)
| | | | | | | | | | | | | | | |
| | | Hypothetical
Annualized
Total Return | | | Beginning
Account
Value | | Ending
Account
Value | | Annualized
Expense
Ratios | | | Expenses
Paid During
the Period(2) |
Large Capitalization Value Equity Investments | | 5.00 | % | | $ | 1,000.00 | | $ | 1,021.48 | | 0.74 | % | | $ | 3.77 |
Large Capitalization Growth Investments | | 5.00 | | | | 1,000.00 | | | 1,021.42 | | 0.75 | | | | 3.82 |
Small Capitalization Value Equity Investments | | 5.00 | | | | 1,000.00 | | | 1,020.21 | | 0.99 | | | | 5.04 |
Small Capitalization Growth Investments | | 5.00 | | | | 1,000.00 | | | 1,020.16 | | 1.00 | | | | 5.09 |
International Equity Investments | | 5.00 | | | | 1,000.00 | | | 1,021.17 | | 0.80 | | | | 4.08 |
Emerging Markets Equity Investments | | 5.00 | | | | 1,000.00 | | | 1,018.95 | | 1.24 | | | | 6.31 |
Government Money Investments | | 5.00 | | | | 1,000.00 | | | 1,023.29 | | 0.38 | | | | 1.94 |
Core Fixed Income Investments | | 5.00 | | | | 1,000.00 | | | 1,022.33 | | 0.57 | | | | 2.91 |
High Yield Investments | | 5.00 | | | | 1,000.00 | | | 1,021.22 | | 0.79 | | | | 4.02 |
Municipal Bond Investments | | 5.00 | | | | 1,000.00 | | | 1,021.63 | | 0.71 | | | | 3.62 |
International Fixed Income Investments | | 5.00 | | | | 1,000.00 | | | 1,021.48 | | 0.74 | | | | 3.77 |
| (1) | | For the six months ended August 31, 2006. |
| (2) | | Expenses (net of fee waivers and/or expense reimbursements) are equal to each Fund's respective annualized expense ratio multiplied by the average account value over the period, multiplied by the number of days in the most recent fiscal half-year, then divided by 365. |
26
Schedules of Investments
August 31, 2006
| | | | | |
| Large Capitalization Value Equity Investments |
| | |
| Shares | | Security | | Value |
COMMON STOCKS — 97.5% |
CONSUMER DISCRETIONARY — 12.9% |
|
Auto Components — 0.2% |
| 48,800 | | BorgWarner Inc. | | $ | 2,767,448 |
| | | | |
|
|
| |
Automobiles — 0.5% | | | |
| 63,100 | | DaimlerChrysler AG | | | 3,330,418 |
| 40,200 | | Toyota Motor Corp., ADR | | | 4,355,268 |
| | | | |
|
|
| | | Total Automobiles | | | 7,685,686 |
| | | | |
|
|
| |
Hotels, Restaurants & Leisure — 0.8% | | | |
| 207,400 | | McDonald’s Corp. | | | 7,445,660 |
| 180,000 | | Wyndham Worldwide Corp.* | | | 5,266,800 |
| | | | |
|
|
| | | Total Hotels, Restaurants & Leisure | | | 12,712,460 |
| | | | |
|
|
| |
Household Durables — 1.2% | | | |
| 216,700 | | Stanley Works | | | 10,234,741 |
| 107,100 | | Whirlpool Corp. | | | 8,665,461 |
| | | | |
|
|
| | | Total Household Durables | | | 18,900,202 |
| | | | |
|
|
| |
Leisure Equipment & Products — 0.8% | | | |
| 627,800 | | Mattel Inc. | | | 11,827,752 |
| | | | |
|
|
| |
Media — 5.3% | | | |
| 786,645 | | CBS Corp., Class B Shares | | | 22,458,715 |
| 300,100 | | Comcast Corp., Special Class A Shares* | | | 10,476,491 |
| 885,000 | | DIRECTV Group Inc.* | | | 16,629,150 |
| 1,150,800 | | Interpublic Group of Cos. Inc.* | | | 10,564,344 |
| 364,500 | | Time Warner Inc. | | | 6,057,990 |
| 250,000 | | WPP Group PLC, ADR | | | 15,177,500 |
| | | | |
|
|
| | | Total Media | | | 81,364,190 |
| | | | |
|
|
| |
Multiline Retail — 1.4% | | | |
| 456,200 | | Target Corp. | | | 22,075,518 |
| | | | |
|
|
| |
Specialty Retail — 1.8% | | | |
| 475,000 | | Home Depot Inc. | | | 16,287,750 |
| 303,000 | | Limited Brands Inc. | | | 7,796,190 |
| 119,000 | | Office Depot Inc.* | | | 4,383,960 |
| | | | |
|
|
| | | Total Specialty Retail | | | 28,467,900 |
| | | | |
|
|
| |
Textiles, Apparel & Luxury Goods — 0.9% | | | |
| 64,600 | | Jones Apparel Group Inc. | | | 2,021,980 |
| 164,600 | | V.F. Corp. | | | 11,503,894 |
| | | | |
|
|
| | | Total Textiles, Apparel & Luxury Goods | | | 13,525,874 |
| | | | |
|
|
| | | TOTAL CONSUMER DISCRETIONARY | | | 199,327,030 |
| | | | |
|
|
CONSUMER STAPLES — 12.3% | | | |
| |
Beverages — 2.0% | | | |
| 242,000 | | Anheuser-Busch Cos. Inc. | | | 11,949,960 |
| 419,200 | | Coca-Cola Co. | | | 18,784,352 |
| | | | |
|
|
| | | Total Beverages | | | 30,734,312 |
| | | | |
|
|
See Notes to Financial Statements.
27
Schedules of Investments
(continued)
| | | | | |
| Large Capitalization Value Equity Investments |
| | |
| Shares | | Security | | Value |
| |
Food & Staples Retailing — 3.2% | | | |
| 289,000 | | CVS Corp. | | $ | 9,695,950 |
| 309,400 | | Kroger Co. | | | 7,366,814 |
| 220,500 | | Safeway Inc. | | | 6,820,065 |
| 397,800 | | SUPERVALU Inc. | | | 11,361,168 |
| 437,000 | | Sysco Corp. | | | 13,717,430 |
| | | | |
|
|
| | | Total Food & Staples Retailing | | | 48,961,427 |
| | | | |
|
|
| |
Food Products — 2.2% | | | |
| 968,000 | | ConAgra Foods Inc. | | | 23,038,400 |
| 72,900 | | Kellogg Co. | | | 3,696,030 |
| 546,000 | | Tyson Foods Inc., Class A Shares | | | 8,042,580 |
| | | | |
|
|
| | | Total Food Products | | | 34,777,010 |
| | | | |
|
|
| |
Household Products — 1.6% | | | |
| 104,700 | | Clorox Co. | | | 6,262,107 |
| 179,400 | | Kimberly-Clark Corp. | | | 11,391,900 |
| 105,900 | | Procter & Gamble Co. | | | 6,555,210 |
| | | | |
|
|
| | | Total Household Products | | | 24,209,217 |
| | | | |
|
|
| |
Tobacco — 3.3% | | | |
| 482,200 | | Altria Group Inc. | | | 40,278,166 |
| 172,000 | | Reynolds American Inc. | | | 11,192,040 |
| | | | |
|
|
| | | Total Tobacco | | | 51,470,206 |
| | | | |
|
|
| | | TOTAL CONSUMER STAPLES | | | 190,152,172 |
| | | | |
|
|
ENERGY — 12.1% | | | |
| |
Energy Equipment & Services — 2.4% | | | |
| 207,000 | | BJ Services Co. | | | 7,102,170 |
| 369,600 | | GlobalSantaFe Corp. | | | 18,191,712 |
| 373,000 | | Halliburton Co. | | | 12,167,260 |
| | | | |
|
|
| | | Total Energy Equipment & Services | | | 37,461,142 |
| | | | |
|
|
| |
Oil, Gas & Consumable Fuels — 9.7% | | | |
| 247,800 | | Anadarko Petroleum Corp. | | | 11,624,298 |
| 105,500 | | BP PLC, ADR | | | 7,179,275 |
| 609,900 | | Chevron Corp. | | | 39,277,560 |
| 258,300 | | ConocoPhillips | | | 16,383,969 |
| 683,000 | | El Paso Corp. | | | 9,917,160 |
| 330,300 | | Exxon Mobil Corp. | | | 22,351,401 |
| 250,100 | | Marathon Oil Corp. | | | 20,883,350 |
| 225,800 | | Occidental Petroleum Corp. | | | 11,513,542 |
| 99,700 | | PetroChina Co., Ltd., ADR | | | 11,184,346 |
| | | | |
|
|
| | | Total Oil, Gas & Consumable Fuels | | | 150,314,901 |
| | | | |
|
|
| | | TOTAL ENERGY | | | 187,776,043 |
| | | | |
|
|
FINANCIALS — 25.9% | | | |
| |
Capital Markets — 1.5% | | | |
| 8,400 | | Goldman Sachs Group Inc. | | | 1,248,660 |
| 170,400 | | Merrill Lynch & Co. Inc. | | | 12,529,512 |
| 154,400 | | Morgan Stanley | | | 10,157,976 |
| | | | |
|
|
| | | Total Capital Markets | | | 23,936,148 |
| | | | |
|
|
See Notes to Financial Statements.
28
Schedules of Investments
(continued)
| | | | | |
| Large Capitalization Value Equity Investments |
| | |
| Shares | | Security | | Value |
| |
Commercial Banks — 4.6% | | | |
| 582,100 | | KeyCorp | | $ | 21,415,459 |
| 133,000 | | National City Corp. | | | 4,599,140 |
| 554,800 | | Regions Financial Corp. | | | 19,967,252 |
| 83,400 | | SunTrust Banks Inc. | | | 6,371,760 |
| 343,000 | | U.S. Bancorp | | | 11,000,010 |
| 143,200 | | Wachovia Corp. | | | 7,823,016 |
| | | | |
|
|
| | | Total Commercial Banks | | | 71,176,637 |
| | | | |
|
|
| |
Diversified Financial Services — 5.1% | | | |
| 797,000 | | Bank of America Corp. | | | 41,021,590 |
| 295,000 | | ING Groep NV, ADR | | | 12,811,850 |
| 536,000 | | JPMorgan Chase & Co. | | | 24,473,760 |
| | | | |
|
|
| | | Total Diversified Financial Services | | | 78,307,200 |
| | | | |
|
|
| |
Insurance — 9.4% | | | |
| 266,000 | | ACE Ltd. | | | 14,326,760 |
| 470,200 | | Allstate Corp. | | | 27,243,388 |
| 230,000 | | American International Group Inc. | | | 14,678,600 |
| 383,000 | | Assured Guaranty Ltd. | | | 10,245,250 |
| 512,000 | | Conseco Inc.* | | | 10,598,400 |
| 97,500 | | Genworth Financial Inc., Class A Shares | | | 3,356,925 |
| 55,600 | | Hartford Financial Services Group Inc. | | | 4,773,816 |
| 182,900 | | Lincoln National Corp. | | | 11,102,030 |
| 235,000 | | MBIA Inc. | | | 14,483,050 |
| 143,000 | | MetLife Inc. | | | 7,869,290 |
| 43,600 | | RenaissanceRe Holdings Ltd. | | | 2,245,400 |
| 383,200 | | St. Paul Travelers Cos. Inc. | | | 16,822,480 |
| 106,100 | | XL Capital Ltd., Class A Shares | | | 6,964,404 |
| | | | |
|
|
| | | Total Insurance | | | 144,709,793 |
| | | | |
|
|
| |
Real Estate Investment Trusts (REITs) — 0.7% | | | |
| 264,700 | | Duke Realty Corp. | | | 10,053,306 |
| | | | |
|
|
| |
Real Estate Management & Development — 0.3% | | | |
| 246,000 | | Realogy Corp.* | | | 5,264,400 |
| | | | |
|
|
| |
Thrifts & Mortgage Finance — 4.3% | | | |
| 221,900 | | Fannie Mae | | | 11,683,035 |
| 328,300 | | Freddie Mac | | | 20,879,880 |
| 808,200 | | Washington Mutual Inc. | | | 33,855,498 |
| | | | |
|
|
| | | Total Thrifts & Mortgage Finance | | | 66,418,413 |
| | | | |
|
|
| | | TOTAL FINANCIALS | | | 399,865,897 |
| | | | |
|
|
HEALTH CARE — 9.4% | | | |
| |
Biotechnology — 0.9% | | | |
| 201,000 | | Amgen Inc.* | | | 13,653,930 |
| | | | |
|
|
| |
Health Care Providers & Services — 0.9% | | | |
| 101,000 | | CIGNA Corp. | | | 11,420,070 |
| 55,000 | | HCA Inc. | | | 2,712,600 |
| | | | |
|
|
| | | Total Health Care Providers & Services | | | 14,132,670 |
| | | | |
|
|
See Notes to Financial Statements.
29
Schedules of Investments
(continued)
| | | | | |
| Large Capitalization Value Equity Investments |
| | |
| Shares | | Security | | Value |
| |
Pharmaceuticals — 7.6% | | | |
| 79,700 | | Eli Lilly & Co. | | $ | 4,457,621 |
| 204,600 | | GlaxoSmithKline PLC, ADR | | | 11,617,188 |
| 497,200 | | Merck & Co. Inc. | | | 20,161,460 |
| 1,873,100 | | Pfizer Inc. | | | 51,622,636 |
| 343,000 | | Sanofi-Aventis, ADR | | | 15,417,850 |
| 278,000 | | Wyeth | | | 13,538,600 |
| | | | |
|
|
| | | Total Pharmaceuticals | | | 116,815,355 |
| | | | |
|
|
| | | TOTAL HEALTH CARE | | | 144,601,955 |
| | | | |
|
|
INDUSTRIALS — 5.8% | | | |
| |
Aerospace & Defense — 0.6% | | | |
| 81,000 | | Boeing Co. | | | 6,066,900 |
| 44,100 | | Northrop Grumman Corp. | | | 2,946,321 |
| | | | |
|
|
| | | Total Aerospace & Defense | | | 9,013,221 |
| | | | |
|
|
| |
Building Products — 0.5% | | | |
| 309,900 | | Masco Corp. | | | 8,494,359 |
| | | | |
|
|
| |
Commercial Services & Supplies — 0.8% | | | |
| 860,000 | | Cendant Corp.* | | | 1,659,800 |
| 339,800 | | R.R. Donnelley & Sons Co. | | | 11,016,316 |
| | | | |
|
|
| | | Total Commercial Services & Supplies | | | 12,676,116 |
| | | | |
|
|
| |
Industrial Conglomerates — 1.3% | | | |
| 518,600 | | General Electric Co. | | | 17,663,516 |
| 26,300 | | Textron Inc. | | | 2,205,518 |
| | | | |
|
|
| | | Total Industrial Conglomerates | | | 19,869,034 |
| | | | |
|
|
| |
Machinery — 2.2% | | | |
| 72,100 | | Deere & Co. | | | 5,631,010 |
| 226,200 | | Eaton Corp. | | | 15,042,300 |
| 247,000 | | Illinois Tool Works Inc. | | | 10,843,300 |
| 43,100 | | SPX Corp. | | | 2,275,680 |
| | | | |
|
|
| | | Total Machinery | | | 33,792,290 |
| | | | |
|
|
|
Road & Rail — 0.4% |
| 181,800 | | CSX Corp. | | | 5,493,996 |
| | | | |
|
|
| | | TOTAL INDUSTRIALS | | | 89,339,016 |
| | | | |
|
|
INFORMATION TECHNOLOGY — 9.7% |
|
Communications Equipment — 0.6% |
| 73,900 | | ADC Telecommunications Inc.* | | | 1,008,735 |
| 156,700 | | Cisco Systems Inc.* | | | 3,445,833 |
| 169,700 | | Nokia Oyj, ADR | | | 3,543,336 |
| 185,500 | | Tellabs Inc.* | | | 1,890,245 |
| | | | |
|
|
| | | Total Communications Equipment | | | 9,888,149 |
| | | | |
|
|
|
Computers & Peripherals — 2.2% |
| 201,000 | | Diebold Inc. | | | 8,423,910 |
| 200,000 | | EMC Corp.* | | | 2,330,000 |
| 134,900 | | Hewlett-Packard Co. | | | 4,931,944 |
| 88,670 | | International Business Machines Corp. | | | 7,179,610 |
| 547,500 | | Seagate Technology* | | | 12,181,875 |
| | | | |
|
|
| | | Total Computers & Peripherals | | | 35,047,339 |
| | | | |
|
|
See Notes to Financial Statements.
30
Schedules of Investments
(continued)
| | | | | |
| Large Capitalization Value Equity Investments |
| | |
| Shares | | Security | | Value |
|
Electronic Equipment & Instruments — 0.9% |
| 444,800 | | Flextronics International Ltd.* | | $ | 5,248,640 |
| 182,520 | | Sanmina-SCI Corp.* | | | 618,743 |
| 1,397,977 | | Solectron Corp.* | | | 4,389,648 |
| 98,150 | | Tech Data Corp.* | | | 3,424,453 |
| | | | |
|
|
| | | Total Electronic Equipment & Instruments | | | 13,681,484 |
| | | | |
|
|
|
IT Services — 1.6% |
| 192,500 | | Electronic Data Systems Corp. | | | 4,587,275 |
| 460,000 | | First Data Corp. | | | 19,766,200 |
| | | | |
|
|
| | | Total IT Services | | | 24,353,475 |
| | | | |
|
|
|
Semiconductors & Semiconductor Equipment — 2.3% |
| 1,500,000 | | Infineon Technologies AG, ADR* | | | 17,745,000 |
| 910,000 | | Intel Corp. | | | 17,781,400 |
| | | | |
|
|
| | | Total Semiconductors & Semiconductor Equipment | | | 35,526,400 |
| | | | |
|
|
|
Software — 2.1% |
| 517,000 | | Cadence Design Systems Inc.* | | | 8,494,310 |
| 920,300 | | Microsoft Corp. | | | 23,642,507 |
| | | | |
|
|
| | | Total Software | | | 32,136,817 |
| | | | |
|
|
| | | TOTAL INFORMATION TECHNOLOGY | | | 150,633,664 |
| | | | |
|
|
MATERIALS — 1.5% | | | |
|
Chemicals — 1.3% |
| 295,500 | | Dow Chemical Co. | | | 11,267,415 |
| 328,300 | | Lyondell Chemical Co. | | | 8,529,234 |
| | | | |
|
|
| | | Total Chemicals | | | 19,796,649 |
| | | | |
|
|
|
Containers & Packaging — 0.2% |
| 108,400 | | Owens-Illinois, Inc.* | | | 1,643,344 |
| 196,800 | | Smurfit-Stone Container Corp.* | | | 2,241,552 |
| | | | |
|
|
| | | Total Containers & Packaging | | | 3,884,896 |
| | | | |
|
|
| | | TOTAL MATERIALS | | | 23,681,545 |
| | | | |
|
|
TELECOMMUNICATION SERVICES — 4.3% | | | |
|
Diversified Telecommunication Services — 3.6% |
| 1,108,834 | | AT&T Inc. | | | 34,518,003 |
| 13,575 | | Embarq Corp. | | | 640,061 |
| 296,400 | | Verizon Communications Inc. | | | 10,427,352 |
| 819,272 | | Windstream Corp. | | | 10,814,390 |
| | | | |
|
|
| | | Total Diversified Telecommunication Services | | | 56,399,806 |
| | | | |
|
|
| |
Wireless Telecommunication Services — 0.7% | | | |
| 170,100 | | Crown Castle International Corp.* | | | 5,844,636 |
| 271,500 | | Sprint Nextel Corp. | | | 4,593,780 |
| | | | |
|
|
| | | Total Wireless Telecommunication Services | | | 10,438,416 |
| | | | |
|
|
| | | TOTAL TELECOMMUNICATION SERVICES | | | 66,838,222 |
| | | | |
|
|
UTILITIES — 3.6% | | | |
| |
Electric Utilities — 1.3% | | | |
| 65,200 | | American Electric Power Co. Inc. | | | 2,378,496 |
| 123,200 | | Entergy Corp. | | | 9,566,480 |
See Notes to Financial Statements.
31
Schedules of Investments
(continued)
| | | | | |
| Large Capitalization Value Equity Investments |
| | |
| Shares | | Security | | Value |
| |
Electric Utilities — 1.3% (continued) | | | |
| 181,600 | | Progress Energy Inc. | | $ | 8,050,328 |
| | | | |
|
|
| | | Total Electric Utilities | | | 19,995,304 |
| | | | |
|
|
| |
Multi-Utilities — 2.3% | | | |
| 224,900 | | DTE Energy Co. | | | 9,387,326 |
| 211,800 | | KeySpan Corp. | | | 8,683,800 |
| 231,500 | | Sempra Energy | | | 11,510,180 |
| 132,300 | | Wisconsin Energy Corp. | | | 5,688,900 |
| | | | |
|
|
| | | Total Multi-Utilities | | | 35,270,206 |
| | | | |
|
|
| | | TOTAL UTILITIES | | | 55,265,510 |
| | | | |
|
|
| | | TOTAL INVESTMENTS BEFORE SHORT-TERM INVESTMENT
(Cost — $1,286,604,498) | | | 1,507,481,054 |
| | | | |
|
|
| | |
Face
Amount
| | | | |
SHORT-TERM INVESTMENT — 2.2% | | | |
REPURCHASE AGREEMENT — 2.2% | | | |
| $33,986,000 | | State Street Bank & Trust Co. dated 8/31/06, 4.810% due 9/1/06; Proceeds at maturity — $33,990,541;
(Fully collateralized by U.S. Treasury Bond, 4.500% due 2/15/36; Market value — $34,672,713)
(Cost — $33,986,000) | | | 33,986,000 |
| | | | |
|
|
| | | TOTAL INVESTMENTS — 99.7%
(Cost — $1,320,590,498#) | | | 1,541,467,054 |
| | | Other Assets in Excess of Liabilities — 0.3% | | | 4,203,387 |
| | | | |
|
|
| | | TOTAL NET ASSETS — 100.0% | | $ | 1,545,670,441 |
| | | | |
|
|
| * | | Non-income producing security. |
| # | | Aggregate cost for federal income tax purposes is $1,325,934,493. |
Abbreviation used in this schedule:
| | | | |
| ADR | | — | | American Depositary Receipt |
See Notes to Financial Statements.
32
Schedules of Investments
(continued)
| | | | | |
| Large Capitalization Growth Investments |
| | |
| Shares | | Security | | Value |
COMMON STOCKS — 96.9% |
CONSUMER DISCRETIONARY — 13.8% |
|
Diversified Consumer Services — 2.0% |
| 570,400 | | Apollo Group Inc., Class A Shares* | | $ | 28,639,784 |
| 155,000 | | Weight Watchers International, Inc. | | | 6,581,300 |
| | | | |
|
|
| | | Total Diversified Consumer Services | | | 35,221,084 |
| | | | |
|
|
| |
Hotels, Restaurants & Leisure — 4.1% | | | |
| 772,750 | | Hilton Hotels Corp. | | | 19,681,942 |
| 200,000 | | International Game Technology | | | 7,736,000 |
| 190,000 | | MGM MIRAGE Inc.* | | | 6,779,200 |
| 1,304,800 | | Starbucks Corp.* | | | 40,461,848 |
| | | | |
|
|
| | | Total Hotels, Restaurants & Leisure | | | 74,658,990 |
| | | | |
|
|
| |
Household Durables — 1.1% | | | |
| 541,000 | | Newell Rubbermaid Inc. | | | 14,601,590 |
| 187,400 | | Pulte Homes Inc. | | | 5,560,158 |
| | | | |
|
|
| | | Total Household Durables | | | 20,161,748 |
| | | | |
|
|
| |
Internet & Catalog Retail — 0.8% | | | |
| 452,200 | | Amazon.com Inc.* | | | 13,941,326 |
| | | | |
|
|
| |
Media — 2.5% | | | |
| 512,200 | | Comcast Corp., Class A Shares* | | | 17,927,000 |
| 8,025 | | Getty Images Inc.* | | | 364,576 |
| 785,340 | | Walt Disney Co. | | | 23,285,331 |
| 300,000 | | XM Satellite Radio Holdings Inc., Class A Shares* | | | 3,888,000 |
| | | | |
|
|
| | | Total Media | | | 45,464,907 |
| | | | |
|
|
| |
Multiline Retail — 0.4% | | | |
| 120,250 | | Kohl’s Corp.* | | | 7,516,827 |
| | | | |
|
|
| |
Specialty Retail — 2.9% | | | |
| 272,000 | | Best Buy Co. Inc. | | | 12,784,000 |
| 790,900 | | Lowe’s Cos. Inc. | | | 21,401,754 |
| 425,000 | | Staples Inc. | | | 9,588,000 |
| 260,710 | | Williams-Sonoma Inc. | | | 7,680,517 |
| | | | |
|
|
| | | Total Specialty Retail | | | 51,454,271 |
| | | | |
|
|
| | | TOTAL CONSUMER DISCRETIONARY | | | 248,419,153 |
| | | | |
|
|
CONSUMER STAPLES — 3.4% | | | |
| |
Food & Staples Retailing — 2.9% | | | |
| 180,000 | | Wal-Mart Stores Inc. | | | 8,049,600 |
| 915,800 | | Walgreen Co. | | | 45,295,468 |
| | | | |
|
|
| | | Total Food & Staples Retailing | | | 53,345,068 |
| | | | |
|
|
| |
Household Products — 0.5% | | | |
| 140,000 | | Procter & Gamble Co. | | | 8,666,000 |
| | | | |
|
|
| | | TOTAL CONSUMER STAPLES | | | 62,011,068 |
| | | | |
|
|
ENERGY — 5.2% | | | |
| |
Energy Equipment & Services — 2.4% | | | |
| 178,700 | | National-Oilwell Varco Inc.* | | | 11,669,110 |
| 524,890 | | Schlumberger Ltd. | | | 32,175,757 |
| | | | |
|
|
| | | Total Energy Equipment & Services | | | 43,844,867 |
| | | | |
|
|
See Notes to Financial Statements.
33
Schedules of Investments
(continued)
| | | | | |
| Large Capitalization Growth Investments |
| | |
| Shares | | Security | | Value |
| |
Oil, Gas & Consumable Fuels — 2.8% | | | |
| 236,500 | | ConocoPhillips | | $ | 15,001,195 |
| 127,650 | | Marathon Oil Corp. | | | 10,658,775 |
| 204,300 | | Occidental Petroleum Corp. | | | 10,417,257 |
| 183,350 | | Suncor Energy Inc. | | | 14,224,293 |
| | | | |
|
|
| | | Total Oil, Gas & Consumable Fuels | | | 50,301,520 |
| | | | |
|
|
| | | TOTAL ENERGY | | | 94,146,387 |
| | | | |
|
|
FINANCIALS — 9.1% |
|
Capital Markets — 0.5% |
| 560,250 | | Charles Schwab Corp. | | | 9,137,677 |
| | | | |
|
|
|
Commercial Banks — 0.7% |
| 347,660 | | Commerce Bancorp Inc. | | | 11,580,555 |
| | | | |
|
|
|
Consumer Finance — 1.5% |
| 235,596 | | American Express Co. | | | 12,378,214 |
| 303,100 | | SLM Corp. | | | 14,709,443 |
| | | | |
|
|
| | | Total Consumer Finance | | | 27,087,657 |
| | | | |
|
|
|
Diversified Financial Services — 3.9% |
| 71,100 | | Chicago Mercantile Exchange | | | 31,284,000 |
| 196,500 | | IntercontinentalExchange Inc.* | | | 12,430,590 |
| 430,000 | | Moody’s Corp. | | | 26,307,400 |
| | | | |
|
|
| | | Total Diversified Financial Services | | | 70,021,990 |
| | | | |
|
|
|
Insurance — 1.7% |
| 33,540 | | AFLAC Inc. | | | 1,511,648 |
| 87,700 | | American International Group Inc. | | | 5,597,014 |
| 967,920 | | Progressive Corp. | | | 23,801,152 |
| | | | |
|
|
| | | Total Insurance | | | 30,909,814 |
| | | | |
|
|
|
Thrifts & Mortgage Finance — 0.8% |
| 444,585 | | Countrywide Financial Corp. | | | 15,026,973 |
| | | | |
|
|
| | | TOTAL FINANCIALS | | | 163,764,666 |
| | | | |
|
|
HEALTH CARE — 27.1% | | | �� |
|
Biotechnology — 10.0% |
| 108,025 | | Amgen Inc.* | | | 7,338,138 |
| 410,370 | | Biogen Idec Inc.* | | | 18,113,732 |
| 752,850 | | Celgene Corp.* | | | 30,633,467 |
| 764,940 | | Genentech Inc.* | | | 63,122,849 |
| 757,850 | | Genzyme Corp.* | | | 50,192,405 |
| 178,750 | | Gilead Sciences Inc.* | | | 11,332,750 |
| | | | |
|
|
| | | Total Biotechnology | | | 180,733,341 |
| | | | |
|
|
|
Health Care Equipment & Supplies — 5.4% |
| 309,000 | | Fisher Scientific International Inc.* | | | 24,173,070 |
| 101,400 | | Intuitive Surgical Inc.* | | | 9,572,160 |
| 206,600 | | Stryker Corp. | | | 9,922,998 |
| 520,600 | | Varian Medical Systems Inc.* | | | 27,747,980 |
| 398,600 | | Zimmer Holdings Inc.* | | | 27,104,800 |
| | | | |
|
|
| | | Total Health Care Equipment & Supplies | | | 98,521,008 |
| | | | |
|
|
See Notes to Financial Statements.
34
Schedules of Investments
(continued)
| | | | | |
| Large Capitalization Growth Investments |
| | |
| Shares | | Security | | Value |
|
Health Care Providers & Services — 3.2% |
| 54,080 | | Cerner Corp.* | | $ | 2,490,925 |
| 415,400 | | Omnicare Inc. | | | 18,821,774 |
| 193,600 | | Patterson Cos. Inc.* | | | 5,966,752 |
| 489,900 | | UnitedHealth Group Inc. | | | 25,450,305 |
| 60,895 | | WellPoint Inc.* | | | 4,713,882 |
| | | | |
|
|
| | | Total Health Care Providers & Services | | | 57,443,638 |
| | | | |
|
|
|
Pharmaceuticals — 8.5% |
| 217,300 | | Abraxis BioScience Inc.* | | | 5,406,424 |
| 307,000 | | Allergan Inc. | | | 35,169,920 |
| 1,280,050 | | Elan Corp. PLC, ADR* | | | 21,159,226 |
| 253,550 | | Novartis AG, ADR | | | 14,482,776 |
| 689,200 | | Schering-Plough Corp. | | | 14,438,740 |
| 323,600 | | Shire PLC, ADR | | | 16,584,500 |
| 660,000 | | Teva Pharmaceutical Industries Ltd., ADR | | | 22,941,600 |
| 479,300 | | Wyeth | | | 23,341,910 |
| | | | |
|
|
| | | Total Pharmaceuticals | | | 153,525,096 |
| | | | |
|
|
| | | TOTAL HEALTH CARE | | | 490,223,083 |
| | | | |
|
|
INDUSTRIALS — 5.9% | | | |
| |
Air Freight & Logistics — 2.2% | | | |
| 405,190 | | Expeditors International of Washington Inc. | | | 16,154,925 |
| 343,500 | | United Parcel Service Inc., Class B Shares | | | 24,062,175 |
| | | | |
|
|
| | | Total Air Freight & Logistics | | | 40,217,100 |
| | | | |
|
|
| |
Commercial Services & Supplies — 0.4% | | | |
| 160,300 | | Iron Mountain Inc.* | | | 6,570,697 |
| | | | |
|
|
| |
Industrial Conglomerates — 1.1% | | | |
| 613,240 | | General Electric Co. | | | 20,886,954 |
| | | | |
|
|
| |
Machinery — 0.6% | | | |
| 212,450 | | ITT Industries Inc. | | | 10,399,428 |
| | | | |
|
|
| |
Road & Rail — 1.6% | | | |
| 283,250 | | Canadian Pacific Railway Ltd. | | | 13,904,743 |
| 342,900 | | Norfolk Southern Corp. | | | 14,652,117 |
| | | | |
|
|
| | | Total Road & Rail | | | 28,556,860 |
| | | | |
|
|
| | | TOTAL INDUSTRIALS | | | 106,631,039 |
| | | | |
|
|
INFORMATION TECHNOLOGY — 27.5% | | | |
| |
Communications Equipment — 4.3% | | | |
| 182,500 | | Cisco Systems Inc.* | | | 4,013,175 |
| 1,060,650 | | Corning Inc.* | | | 23,588,856 |
| 1,352,500 | | QUALCOMM Inc. | | | 50,948,675 |
| | | | |
|
|
| | | Total Communications Equipment | | | 78,550,706 |
| | | | |
|
|
| |
Computers & Peripherals — 4.3% | | | |
| 302,200 | | Apple Computer Inc.* | | | 20,504,270 |
| 381,500 | | Dell Inc.* | | | 8,602,825 |
| 302,700 | | Hewlett-Packard Co. | | | 11,066,712 |
| 594,640 | | Network Appliance Inc.* | | | 20,360,474 |
See Notes to Financial Statements.
35
Schedules of Investments
(continued)
| | | | | |
| Large Capitalization Growth Investments |
| | |
| Shares | | Security | | Value |
| |
Computers & Peripherals — 4.3% (continued) | | | |
| 145,000 | | SanDisk Corp.* | | $ | 8,543,400 |
| 405,000 | | Seagate Technology* | | | 9,011,250 |
| | | | |
|
|
| | | Total Computers & Peripherals | | | 78,088,931 |
| | | | |
|
|
| |
Internet Software & Services — 8.7% | | | |
| 1,734,210 | | eBay Inc.* | | | 48,315,091 |
| 200,200 | | Google Inc., Class A Shares* | | | 75,781,706 |
| 1,130,250 | | Yahoo! Inc.* | | | 32,573,805 |
| | | | |
|
|
| | | Total Internet Software & Services | | | 156,670,602 |
| | | | |
|
|
| |
IT Services — 1.0% | | | |
| 225,000 | | First Data Corp. | | | 9,668,250 |
| 225,000 | | Paychex Inc. | | | 8,079,750 |
| | | | |
|
|
| | | Total IT Services | | | 17,748,000 |
| | | | |
|
|
| |
Semiconductors & Semiconductor Equipment — 3.9% | | | |
| 583,150 | | Intel Corp. | | | 11,394,751 |
| 641,220 | | Maxim Integrated Products Inc. | | | 18,659,502 |
| 470,100 | | Micron Technology Inc.* | | | 8,123,328 |
| 556,100 | | NVIDIA Corp.* | | | 16,188,071 |
| 687,200 | | Xilinx Inc. | | | 15,716,264 |
| | | | |
|
|
| | | Total Semiconductors & Semiconductor Equipment | | | 70,081,916 |
| | | | |
|
|
| |
Software — 5.3% | | | |
| 232,335 | | Adobe Systems Inc.* | | | 7,536,947 |
| 177,200 | | Autodesk Inc.* | | | 6,159,472 |
| 118,400 | | Electronic Arts Inc.* | | | 6,034,848 |
| 235,000 | | Intuit Inc.* | | | 7,101,700 |
| 724,860 | | Microsoft Corp. | | | 18,621,653 |
| 135,000 | | NAVTEQ* | | | 3,585,600 |
| 872,450 | | Oracle Corp.* | | | 13,653,843 |
| 518,500 | | Red Hat Inc.* | | | 12,049,940 |
| 267,290 | | Salesforce.com Inc.* | | | 9,216,159 |
| 663,300 | | Symantec Corp.* | | | 12,363,912 |
| | | | |
|
|
| | | Total Software | | | 96,324,074 |
| | | | |
|
|
| | | TOTAL INFORMATION TECHNOLOGY | | | 497,464,229 |
| | | | |
|
|
MATERIALS — 3.5% | | | |
| |
Chemicals — 1.8% | | | |
| 172,550 | | Ecolab Inc. | | | 7,692,279 |
| 415,500 | | Praxair Inc. | | | 23,853,855 |
| | | | |
|
|
| | | Total Chemicals | | | 31,546,134 |
| | | | |
|
|
| |
Metals & Mining — 1.7% | | | |
| 188,200 | | Phelps Dodge Corp. | | | 16,843,900 |
| 158,200 | | Southern Copper Corp. | | | 14,605,024 |
| | | | |
|
|
| | | Total Metals & Mining | | | 31,448,924 |
| | | | |
|
|
| | | TOTAL MATERIALS | | | 62,995,058 |
| | | | |
|
|
TELECOMMUNICATION SERVICES — 1.4% | | | |
| |
Diversified Telecommunication Services — 0.4% | | | |
| 212,150 | | Verizon Communications Inc. | | | 7,463,437 |
| | | | |
|
|
See Notes to Financial Statements.
36
Schedules of Investments
(continued)
| | | | | | |
| Large Capitalization Growth Investments | |
| | |
| Shares | | Security | | Value | |
| |
Wireless Telecommunication Services — 1.0% | | | | |
| 475,600 | | America Movil SA de CV, Series L Shares, ADR | | $ | 17,744,636 | |
| | | | |
|
|
|
| | | TOTAL TELECOMMUNICATION SERVICES | | | 25,208,073 | |
| | | | |
|
|
|
| | | TOTAL INVESTMENTS BEFORE SHORT-TERM INVESTMENTS
(Cost — $1,511,454,705) | | | 1,750,862,756 | |
| | | | |
|
|
|
| | |
Face
Amount
| | | | | |
SHORT-TERM INVESTMENTS — 4.5% | | | | |
U.S. GOVERNMENT AGENCY — 0.6% | | | | |
| $11,270,000 | | Federal Home Loan Bank (FHLB), Discount Notes, 4.921%- 4.980% due 9/1/06 (a)
(Cost — $11,270,000) | | | 11,270,000 | |
| | | | |
|
|
|
REPURCHASE AGREEMENT — 3.9% | | | | |
| 69,909,000 | | State Street Bank & Trust Co., dated 8/31/06, 4.810% due 9/1/06; Proceeds at maturity — $69,918,341;
(Fully collateralized by U.S. Treasury Notes, 4.500% due 2/15/36; Market value — $71,316,838)
(Cost — $69,909,000) | | | 69,909,000 | |
| | | | |
|
|
|
| | | TOTAL SHORT-TERM INVESTMENTS
(Cost — $81,179,000) | | | 81,179,000 | |
| | | | |
|
|
|
| | | TOTAL INVESTMENTS — 101.4%
(Cost — $1,592,633,705#) | | | 1,832,041,756 | |
| | | Liabilities in Excess of Other Assets — (1.4)% | | | (25,406,683 | ) |
| | | | |
|
|
|
| | | TOTAL NET ASSETS — 100.0% | | $ | 1,806,635,073 | |
| | | | |
|
|
|
| * | | Non-income producing security. |
| # | | Aggregate cost for federal income tax purposes is $1,612,195,406. |
| (a) | | Rate shown represents yield-to-maturity. |
Abbreviation used in this schedule:
|
| ADR — American Depositary Receipt |
See Notes to Financial Statements.
37
Schedules of Investments
(continued)
| | | | | |
| Small Capitalization Value Equity Investments |
| | |
| Shares | | Security | | Value |
COMMON STOCKS — 97.3% |
CONSUMER DISCRETIONARY — 11.1% |
|
Auto Components — 1.5% |
| 74,000 | | ArvinMeritor Inc. | | $ | 1,098,900 |
| 679,958 | | Hayes Lemmerz International Inc.* | | | 1,155,929 |
| 129,388 | | Modine Manufacturing Co. | | | 3,013,446 |
| | | | |
|
|
| | | Total Auto Components | | | 5,268,275 |
| | | | |
|
|
|
Automobiles — 0.9% |
| 324,800 | | Fleetwood Enterprises Inc.* | | | 2,283,344 |
| 21,900 | | Thor Industries Inc. | | | 923,742 |
| | | | |
|
|
| | | Total Automobiles | | | 3,207,086 |
| | | | |
|
|
|
Diversified Consumer Services — 0.3% |
| 115,400 | | Service Corporation International | | | 969,360 |
| | | | |
|
|
|
Hotels, Restaurants & Leisure — 0.9% |
| 45,600 | | Applebee’s International Inc. | | | 946,200 |
| 28,500 | | CEC Entertainment Inc.* | | | 908,580 |
| 82,600 | | CKE Restaurants Inc. | | | 1,282,778 |
| | | | |
|
|
| | | Total Hotels, Restaurants & Leisure | | | 3,137,558 |
| | | | |
|
|
|
Household Durables — 0.6% |
| 32,200 | | American Greetings Corp., Class A Shares | | | 789,544 |
| 23,200 | | Furniture Brands International Inc. | | | 444,280 |
| 11,200 | | KB HOME | | | 478,912 |
| 24,800 | | WCI Communities Inc.* | | | 382,912 |
| | | | |
|
|
| | | Total Household Durables | | | 2,095,648 |
| | | | |
|
|
|
Internet & Catalog Retail — 0.2% |
| 45,400 | | Insight Enterprises Inc.* | | | 817,654 |
| | | | |
|
|
|
Leisure Equipment & Products — 0.8% |
| 118,598 | | Arctic Cat Inc. | | | 1,972,285 |
| 87,200 | | Sturm Ruger & Co. Inc.* | | | 654,000 |
| | | | |
|
|
| | | Total Leisure Equipment & Products | | | 2,626,285 |
| | | | |
|
|
|
Media — 0.4% |
| 29,500 | | Belo Corp., Class A Shares | | | 480,850 |
| 17,900 | | Meredith Corp. | | | 847,386 |
| | | | |
|
|
| | | Total Media | | | 1,328,236 |
| | | | |
|
|
|
Multiline Retail — 0.4% |
| 36,900 | | Dollar Tree Stores Inc.* | | | 1,061,982 |
| 32,900 | | Tuesday Morning Corp. | | | 443,492 |
| | | | |
|
|
| | | Total Multiline Retail | | | 1,505,474 |
| | | | |
|
|
|
Specialty Retail — 3.3% |
| 46,000 | | Borders Group Inc. | | | 879,980 |
| 106,550 | | Cato Corp., Class A Shares | | | 2,475,156 |
| 109,800 | | Charlotte Russe Holding Inc.* | | | 2,931,660 |
| 135,516 | | Cost Plus, Inc.* | | | 1,379,553 |
| 14,600 | | Lenox Group Inc.* | | | 82,928 |
| 24,300 | | PETsMART Inc. | | | 609,930 |
| 33,400 | | Ross Stores Inc. | | | 817,966 |
See Notes to Financial Statements.
38
Schedules of Investments
(continued)
| | | | | |
| Small Capitalization Value Equity Investments |
| | |
| Shares | | Security | | Value |
|
Specialty Retail — 3.3% (continued) |
| 31,450 | | Stage Stores Inc. | | $ | 829,022 |
| 43,600 | | Zale Corp.* | | | 1,166,300 |
| | | | |
|
|
| | | Total Specialty Retail | | | 11,172,495 |
| | | | |
|
|
|
Textiles, Apparel & Luxury Goods — 1.8% |
| 37,150 | | Brown Shoe Co. Inc. | | | 1,186,943 |
| 25,200 | | K-Swiss Inc., Class A Shares | | | 693,252 |
| 43,400 | | Kellwood Co. | | | 1,189,594 |
| 19,500 | | Kenneth Cole Productions Inc., Class A Shares | | | 456,495 |
| 73,500 | | Skechers USA Inc., Class A Shares* | | | 1,664,040 |
| 38,800 | | Wolverine World Wide Inc. | | | 978,924 |
| | | | |
|
|
| | | Total Textiles, Apparel & Luxury Goods | | | 6,169,248 |
| | | | |
|
|
| | | TOTAL CONSUMER DISCRETIONARY | | | 38,297,319 |
| | | | |
|
|
CONSUMER STAPLES — 7.9% |
|
Beverages — 1.8% |
| 36,800 | | Constellation Brands Inc., Class A Shares* | | | 1,004,272 |
| 305,200 | | Cott Corp.* | | | 5,163,984 |
| | | | |
|
|
| | | Total Beverages | | | 6,168,256 |
| | | | |
|
|
|
Food & Staples Retailing — 1.4% |
| 60,800 | | Ruddick Corp. | | | 1,568,032 |
| 108,500 | | Smart & Final Inc.* | | | 1,797,845 |
| 37,400 | | Weis Markets Inc. | | | 1,477,674 |
| | | | |
|
|
| | | Total Food & Staples Retailing | | | 4,843,551 |
| | | | |
|
|
|
Food Products — 3.8% |
| 12,100 | | Bunge Ltd. | | | 681,714 |
| 47,800 | | Chiquita Brands International Inc. | | | 808,298 |
| 43,300 | | Corn Products International Inc. | | | 1,493,850 |
| 91,400 | | Del Monte Foods Co. | | | 1,014,540 |
| 66,900 | | Fresh Del Monte Produce Inc. | | | 1,197,510 |
| 32,600 | | J.M. Smucker Co. | | | 1,585,338 |
| 33,600 | | Lancaster Colony Corp. | | | 1,483,104 |
| 43,600 | | Pilgrim’s Pride Corp. | | | 1,062,096 |
| 126,800 | | Tootsie Roll Industries, Inc. | | | 3,678,468 |
| | | | |
|
|
| | | Total Food Products | | | 13,004,918 |
| | | | |
|
|
|
Household Products — 0.5% |
| 50,100 | | WD-40 Co. | | | 1,740,975 |
| | | | |
|
|
|
Tobacco — 0.4% |
| 39,700 | | Universal Corp. | | | 1,533,611 |
| | | | |
|
|
| | | TOTAL CONSUMER STAPLES | | | 27,291,311 |
| | | | |
|
|
ENERGY — 8.8% |
|
Energy Equipment & Services — 2.5% |
| 127,800 | | Grey Wolf Inc.* | | | 934,218 |
| 404,900 | | Input/Output Inc.* | | | 4,036,853 |
| 27,800 | | Tidewater Inc. | | | 1,323,558 |
| 17,900 | | Todco, Class A Shares* | | | 662,837 |
| 33,900 | | W-H Energy Services Inc.* | | | 1,710,933 |
| | | | |
|
|
| | | Total Energy Equipment & Services | | | 8,668,399 |
| | | | |
|
|
See Notes to Financial Statements.
39
Schedules of Investments
(continued)
| | | | | |
| Small Capitalization Value Equity Investments |
| | |
| Shares | | Security | | Value |
|
Oil, Gas & Consumable Fuels — 6.3% |
| 41,000 | | Alpha Natural Resources Inc.* | | $ | 743,330 |
| 16,400 | | Arch Coal Inc. | | | 537,100 |
| 44,100 | | Berry Petroleum Co., Class A Shares | | | 1,377,243 |
| 33,650 | | Cabot Oil & Gas Corp. | | | 1,718,169 |
| 35,500 | | Energy Partners Ltd.* | | | 885,725 |
| 32,000 | | Frontline Ltd. | | | 1,305,280 |
| 34,900 | | General Maritime Corp. | | | 1,310,844 |
| 33,100 | | Holly Corp. | | | 1,516,642 |
| 18,400 | | Massey Energy Co. | | | 464,416 |
| 17,700 | | Newfield Exploration Co.* | | | 765,348 |
| 25,700 | | Penn Virginia Corp. | | | 1,824,443 |
| 57,600 | | Range Resources Corp. | | | 1,611,648 |
| 39,700 | | St. Mary Land & Exploration Co. | | | 1,619,760 |
| 30,500 | | Teekay Shipping Corp. | | | 1,349,930 |
| 45,800 | | W&T Offshore Inc. | | | 1,469,722 |
| 53,800 | | Western Refining Inc. | | | 1,268,066 |
| 31,500 | | Whiting Petroleum Corp.* | | | 1,417,500 |
| 8,900 | | World Fuel Services Corp. | | | 320,756 |
| | | | |
|
|
| | | Total Oil, Gas & Consumable Fuels | | | 21,505,922 |
| | | | |
|
|
| | | TOTAL ENERGY | | | 30,174,321 |
| | | | |
|
|
FINANCIALS — 18.3% |
|
Commercial Banks — 6.7% |
| 44,600 | | AMCORE Financial Inc. | | | 1,340,230 |
| 51,900 | | BancorpSouth Inc. | | | 1,456,314 |
| 28,600 | | Bank of Hawaii Corp. | | | 1,396,252 |
| 40,900 | | Boston Private Financial Holdings Inc. | | | 1,020,864 |
| 80,500 | | Colonial BancGroup Inc. | | | 1,971,445 |
| 18,700 | | First Midwest Bancorp Inc. | | | 698,445 |
| 39,600 | | First Republic Bank | | | 1,687,752 |
| 14,200 | | FirstMerit Corp. | | | 326,742 |
| 42,200 | | Greater Bay Bancorp | | | 1,201,434 |
| 13,900 | | Independent Bank Corp., (Massachusetts) | | | 474,685 |
| 22,100 | | NBT Bancorp Inc. | | | 516,698 |
| 62,799 | | Old National Bancorp | | | 1,174,969 |
| 322,300 | | Oriental Financial Group Inc. | | | 3,951,398 |
| 71,999 | | Provident Bankshares Corp. | | | 2,698,523 |
| 36,900 | | Republic Bancorp Inc. | | | 477,117 |
| 33,250 | | Sterling Financial Corp. of Spokane | | | 1,099,245 |
| 57,000 | | Susquehanna Bancshares Inc. | | | 1,394,790 |
| | | | |
|
|
| | | Total Commercial Banks | | | 22,886,903 |
| | | | |
|
|
|
Consumer Finance — 0.4% |
| 93,700 | | Advance America Cash Advance Centers Inc. | | | 1,456,098 |
| | | | |
|
|
|
Insurance — 5.1% |
| 123,700 | | American Equity Investment Life Holding Co. | | | 1,431,209 |
| 35,500 | | AmerUs Group Co. | | | 2,406,900 |
| 37,650 | | Delphi Financial Group, Class A Shares | | | 1,463,832 |
| 21,700 | | Harleysville Group Inc. | | | 780,983 |
| 63,000 | | Infinity Property & Casualty Corp. | | | 2,390,850 |
| 143,300 | | IPC Holdings Ltd. | | | 4,005,235 |
| 20,600 | | LandAmerica Financial Group Inc. | | | 1,302,744 |
See Notes to Financial Statements.
40
Schedules of Investments
(continued)
| | | | | |
| Small Capitalization Value Equity Investments |
| | |
| Shares | | Security | | Value |
|
Insurance — 5.1% (continued) |
| 37,600 | | Platinum Underwriters Holdings Ltd. | | $ | 1,116,720 |
| 20,400 | | Scottish RE Group Ltd. | | | 185,232 |
| 16,700 | | StanCorp Financial Group Inc. | | | 777,719 |
| 44,100 | | W.R. Berkley Corp. | | | 1,543,500 |
| | | | |
|
|
| | | Total Insurance | | | 17,404,924 |
| | | | |
|
|
|
Real Estate Investment Trusts (REITs) — 4.8% |
| 56,000 | | Ashford Hospitality Trust Inc. | | | 670,320 |
| 44,864 | | Brandywine Realty Trust | | | 1,463,912 |
| 15,400 | | Camden Property Trust | | | 1,194,886 |
| 37,800 | | CBL & Associates Properties Inc. | | | 1,539,972 |
| 28,400 | | Education Realty Trust Inc. | | | 402,428 |
| 57,000 | | Equity One Inc. | | | 1,433,550 |
| 38,100 | | First Industrial Realty Trust Inc. | | | 1,650,492 |
| 45,900 | | Healthcare Realty Trust Inc. | | | 1,659,744 |
| 62,200 | | Highland Hospitality Corp. | | | 856,494 |
| 123,600 | | HRPT Properties Trust | | | 1,433,760 |
| 70,600 | | Nationwide Health Properties Inc. | | | 1,839,836 |
| 52,300 | | New Plan Excel Realty Trust Inc. | | | 1,442,957 |
| 24,000 | | Reckson Associates Realty Corp. | | | 1,026,960 |
| | | | |
|
|
| | | Total Real Estate Investment Trusts (REITs) | | | 16,615,311 |
| | | | |
|
|
|
Thrifts & Mortgage Finance — 1.3% |
| 41,000 | | BankUnited Financial Corp., Class A Shares | | | 1,056,570 |
| 22,600 | | MAF Bancorp Inc. | | | 932,702 |
| 24,100 | | Triad Guaranty Inc.* | | | 1,211,507 |
| 60,150 | | Washington Federal Inc. | | | 1,336,533 |
| | | | |
|
|
| | | Total Thrifts & Mortgage Finance | | | 4,537,312 |
| | | | |
|
|
| | | TOTAL FINANCIALS | | | 62,900,548 |
| | | | |
|
|
HEALTH CARE — 5.1% |
|
Health Care Equipment & Supplies — 2.9% |
| 66,000 | | Arrow International Inc. | | | 2,132,460 |
| 42,200 | | Invacare Corp. | | | 979,462 |
| 38,100 | | STERIS Corp. | | | 906,018 |
| 171,300 | | Viasys Healthcare Inc.* | | | 4,542,876 |
| 35,300 | | West Pharmaceutical Services Inc. | | | 1,408,823 |
| | | | |
|
|
| | | Total Health Care Equipment & Supplies | | | 9,969,639 |
| | | | |
|
|
|
Health Care Providers & Services — 2.2% |
| 23,400 | | Community Health Systems Inc.* | | | 906,984 |
| 30,300 | | Landauer Inc. | | | 1,451,976 |
| 78,400 | | Owens & Minor Inc. | | | 2,522,128 |
| 27,000 | | Pediatrix Medical Group Inc.* | | | 1,236,600 |
| 22,600 | | Universal Health Services Inc., Class B Shares | | | 1,279,612 |
| | | | |
|
|
| | | Total Health Care Providers & Services | | | 7,397,300 |
| | | | |
|
|
| | | TOTAL HEALTH CARE | | | 17,366,939 |
| | | | |
|
|
INDUSTRIALS — 19.5% |
|
Aerospace & Defense — 0.7% |
| 49,400 | | Curtiss-Wright Corp. | | | 1,535,846 |
| 16,700 | | DRS Technologies Inc. | | | 690,879 |
| | | | |
|
|
| | | Total Aerospace & Defense | | | 2,226,725 |
| | | | |
|
|
See Notes to Financial Statements.
41
Schedules of Investments
(continued)
| | | | | |
| Small Capitalization Value Equity Investments |
| | |
| Shares | | Security | | Value |
|
Airlines — 0.6% |
| 89,600 | | SkyWest Inc. | | $ | 2,165,632 |
| | | | |
|
|
|
Building Products — 3.3% |
| 29,100 | | Griffon Corp.* | | | 688,506 |
| 166,600 | | Lennox International Inc. | | | 3,921,764 |
| 49,200 | | Simpson Manufacturing Co. Inc. | | | 1,296,420 |
| 157,300 | | Trex Co. Inc.* | | | 4,236,089 |
| 20,400 | | Universal Forest Products Inc. | | | 994,704 |
| | | | |
|
|
| | | Total Building Products | | | 11,137,483 |
| | | | |
|
|
|
Commercial Services & Supplies — 6.0% |
| 85,300 | | ABM Industries Inc. | | | 1,534,547 |
| 30,400 | | Banta Corp. | | | 1,430,320 |
| 287,100 | | Bowne & Co. Inc. | | | 4,427,082 |
| 22,600 | | Brink’s Co. | | | 1,287,522 |
| 53,600 | | Casella Waste Systems Inc., Class A Shares* | | | 630,872 |
| 70,400 | | Ennis Inc. | | | 1,453,760 |
| 93,050 | | Herman Miller Inc. | | | 2,627,732 |
| 33,900 | | Kelly Services Inc. | | | 925,809 |
| 17,400 | | United Stationers Inc.* | | | 797,442 |
| 143,400 | | Viad Corp. | | | 5,080,662 |
| 14,700 | | YRC Worldwide Inc.* | | | 540,666 |
| | | | |
|
|
| | | Total Commercial Services & Supplies | | | 20,736,414 |
| | | | |
|
|
|
Construction & Engineering — 0.1% |
| 19,600 | | Insituform Technologies Inc., Class A Shares* | | | 449,820 |
| | | | |
|
|
|
Electrical Equipment — 2.1% |
| 32,600 | | Acuity Brands Inc. | | | 1,392,998 |
| 124,600 | | Belden CDT Inc. | | | 4,453,204 |
| 30,900 | | Regal-Beloit Corp. | | | 1,333,644 |
| | | | |
|
|
| | | Total Electrical Equipment | | | 7,179,846 |
| | | | |
|
|
|
Industrial Conglomerates — 0.4% |
| 10,900 | | Teleflex Inc. | | | 608,329 |
| 14,800 | | Walter Industries Inc. | | | 814,592 |
| | | | |
|
|
| | | Total Industrial Conglomerates | | | 1,422,921 |
| | | | |
|
|
|
Machinery — 4.8% |
| 34,900 | | Albany International Corp., Class A Shares | | | 1,218,708 |
| 66,000 | | Barnes Group Inc. | | | 1,083,720 |
| 44,300 | | Briggs & Stratton Corp. | | | 1,247,045 |
| 61,500 | | Crane Co. | | | 2,458,770 |
| 30,900 | | Harsco Corp. | | | 2,458,404 |
| 13,200 | | Kaydon Corp. | | | 503,052 |
| 27,400 | | Kennametal Inc. | | | 1,445,076 |
| 30,200 | | Lincoln Electric Holdings Inc. | | | 1,661,906 |
| 64,000 | | Mueller Industries Inc. | | | 2,452,480 |
| 30,500 | | Mueller Water Products Inc., Class A* | | | 518,500 |
| 46,000 | | Wabtec Corp. | | | 1,297,660 |
| | | | |
|
|
| | | Total Machinery | | | 16,345,321 |
| | | | |
|
|
See Notes to Financial Statements.
42
Schedules of Investments
(continued)
| | | | | |
| Small Capitalization Value Equity Investments |
| | |
| Shares | | Security | | Value |
|
Marine — 0.6% |
| 26,700 | | Alexander & Baldwin Inc. | | $ | 1,171,062 |
| 31,300 | | Kirby Corp.* | | | 918,029 |
| | | | |
|
|
| | | Total Marine | | | 2,089,091 |
| | | | |
|
|
|
Road & Rail — 0.9% |
| 31,400 | | Arkansas Best Corp. | | | 1,386,310 |
| 13,500 | | Saia Inc.* | | | 415,125 |
| 77,300 | | Werner Enterprises Inc. | | | 1,432,369 |
| | | | |
|
|
| | | Total Road & Rail | | | 3,233,804 |
| | | | |
|
|
| | | TOTAL INDUSTRIALS | | | 66,987,057 |
| | | | |
|
|
INFORMATION TECHNOLOGY — 8.7% |
|
Communications Equipment — 1.7% |
| 43,800 | | CommScope Inc.* | | | 1,279,398 |
| 345,900 | | MasTec Inc.* | | | 4,008,981 |
| 26,900 | | NETGEAR Inc.* | | | 529,123 |
| | | | |
|
|
| | | Total Communications Equipment | | | 5,817,502 |
| | | | |
|
|
|
Computers & Peripherals — 0.8% |
| 266,400 | | Brocade Communications Systems Inc.* | | | 1,651,680 |
| 61,400 | | Emulex Corp.* | | | 1,063,448 |
| | | | |
|
|
| | | Total Computers & Peripherals | | | 2,715,128 |
| | | | |
|
|
|
Electronic Equipment & Instruments — 0.9% |
| 60,500 | | Bell Microproducts Inc.* | | | 295,240 |
| 40,000 | | Checkpoint Systems Inc.* | | | 726,000 |
| 46,200 | | Symbol Technologies Inc. | | | 554,862 |
| 51,500 | | Technitrol Inc. | | | 1,457,965 |
| | | | |
|
|
| | | Total Electronic Equipment & Instruments | | | 3,034,067 |
| | | | |
|
|
|
IT Services — 1.7% |
| 52,600 | | Acxiom Corp. | | | 1,277,654 |
| 156,017 | | Forrester Research Inc.* | | | 4,605,622 |
| | | | |
|
|
| | | Total IT Services | | | 5,883,276 |
| | | | |
|
|
|
Semiconductors & Semiconductor Equipment — 2.0% |
| 155,000 | | Brooks Automation Inc.* | | | 2,154,500 |
| 242,464 | | Cohu Inc. | | | 4,066,121 |
| 65,300 | | Entegris Inc.* | | | 709,158 |
| | | | |
|
|
| | | Total Semiconductors & Semiconductor Equipment | | | 6,929,779 |
| | | | |
|
|
|
Software — 1.6% |
| 119,500 | | BEA Systems Inc.* | | | 1,640,735 |
| 157,000 | | Compuware Corp.* | | | 1,193,200 |
| 86,800 | | Parametric Technology Corp.* | | | 1,398,348 |
| 34,600 | | QAD Inc. | | | 255,694 |
| 46,700 | | Synopsys Inc.* | | | 885,432 |
| | | | |
|
|
| | | Total Software | | | 5,373,409 |
| | | | |
|
|
| | | TOTAL INFORMATION TECHNOLOGY | | | 29,753,161 |
| | | | |
|
|
See Notes to Financial Statements.
43
Schedules of Investments
(continued)
| | | | | |
| Small Capitalization Value Equity Investments |
| | |
| Shares | | Security | | Value |
MATERIALS — 12.0% |
|
Chemicals — 5.2% |
| 19,400 | | Albemarle Corp. | | $ | 1,065,060 |
| 15,800 | | FMC Corp. | | | 965,696 |
| 35,000 | | Georgia Gulf Corp. | | | 928,900 |
| 32,200 | | Lubrizol Corp. | | | 1,400,378 |
| 187,850 | | Lyondell Chemical Co. | | | 4,880,343 |
| 60,600 | | Methanex Corp. | | | 1,451,370 |
| 72,300 | | PolyOne Corp.* | | | 626,841 |
| 77,600 | | RPM International Inc. | | | 1,459,656 |
| 63,500 | | Sensient Technologies Corp. | | | 1,277,620 |
| 32,000 | | Spartech Corp. | | | 720,960 |
| 30,700 | | Valspar Corp. | | | 816,620 |
| 71,800 | | Westlake Chemical Corp. | | | 2,151,128 |
| | | | |
|
|
| | | Total Chemicals | | | 17,744,572 |
| | | | |
|
|
|
Construction Materials — 1.0% |
| 33,200 | | Martin Marietta Materials Inc. | | | 2,734,352 |
| 13,300 | | Texas Industries Inc. | | | 624,302 |
| | | | |
|
|
| | | Total Construction Materials | | | 3,358,654 |
| | | | |
|
|
|
Containers & Packaging — 1.9% |
| 58,700 | | Crown Holdings Inc.* | | | 1,079,493 |
| 524,900 | | Intertape Polymer Group Inc.* | | | 3,606,063 |
| 21,800 | | Pactiv Corp.* | | | 582,714 |
| 75,600 | | Rock-Tenn Co., Class A Shares | | | 1,460,592 |
| | | | |
|
|
| | | Total Containers & Packaging | | | 6,728,862 |
| | | | |
|
|
|
Metals & Mining — 2.7% |
| 48,100 | | Agnico-Eagle Mines Ltd. | | | 1,815,775 |
| 11,000 | | Chaparral Steel Co.* | | | 785,620 |
| 38,600 | | Cleveland-Cliffs Inc. | | | 1,407,742 |
| 67,400 | | Commercial Metals Co. | | | 1,455,166 |
| 14,000 | | Compass Minerals International Inc. | | | 374,220 |
| 31,500 | | Gibraltar Industries Inc. | | | 762,300 |
| 178,200 | | IAMGOLD Corp. | | | 1,956,636 |
| 9,500 | | IPSCO Inc. | | | 878,275 |
| | | | |
|
|
| | | Total Metals & Mining | | | 9,435,734 |
| | | | |
|
|
|
Paper & Forest Products — 1.2% |
| 36,400 | | Bowater, Inc. | | | 827,372 |
| 36,930 | | Potlatch Corp. | | | 1,414,788 |
| 94,912 | | Schweitzer-Mauduit International Inc. | | | 1,803,328 |
| | | | |
|
|
| | | Total Paper & Forest Products | | | 4,045,488 |
| | | | |
|
|
| | | TOTAL MATERIALS | | | 41,313,310 |
| | | | |
|
|
TELECOMMUNICATION SERVICES — 0.3% |
|
Diversified Telecommunication Services — 0.3% |
| 34,500 | | FairPoint Communications Inc. | | | 564,075 |
| 82,100 | | Premiere Global Services Inc.* | | | 640,380 |
| | | | |
|
|
| | | TOTAL TELECOMMUNICATION SERVICES | | | 1,204,455 |
| | | | |
|
|
See Notes to Financial Statements.
44
Schedules of Investments
(continued)
| | | | | | |
| Small Capitalization Value Equity Investments | |
| | |
| Shares | | Security | | Value | |
UTILITIES — 5.6% | |
|
Electric Utilities — 1.4% | |
| 55,500 | | Cleco Corp. | | $ | 1,385,280 | |
| 83,900 | | Duquesne Light Holdings Inc. | | | 1,651,991 | |
| 38,500 | | El Paso Electric Co.* | | | 920,535 | |
| 27,400 | | Otter Tail Corp. | | | 826,110 | |
| | | | |
|
|
|
| | | Total Electric Utilities | | | 4,783,916 | |
| | | | |
|
|
|
|
Gas Utilities — 3.3% | |
| 48,400 | | Atmos Energy Corp. | | | 1,393,920 | |
| 41,400 | | Energen Corp. | | | 1,806,696 | |
| 39,900 | | National Fuel Gas Co. | | | 1,522,983 | |
| 33,800 | | Peoples Energy Corp. | | | 1,432,444 | |
| 71,000 | | Southwest Gas Corp. | | | 2,392,700 | |
| 59,500 | | UGI Corp. | | | 1,475,600 | |
| 46,900 | | WGL Holdings Inc. | | | 1,457,183 | |
| | | | |
|
|
|
| | | Total Gas Utilities | | | 11,481,526 | |
| | | | |
|
|
|
|
Independent Power Producers & Energy Traders — 0.2% | |
| 15,500 | | Black Hills Corp. | | | 539,555 | |
| | | | |
|
|
|
|
Multi-Utilities — 0.7% | |
| 37,200 | | PNM Resources Inc. | | | 1,066,524 | |
| 49,900 | | Vectren Corp. | | | 1,375,244 | |
| | | | |
|
|
|
| | | Total Multi-Utilities | | | 2,441,768 | |
| | | | |
|
|
|
| | | TOTAL UTILITIES | | | 19,246,765 | |
| | | | |
|
|
|
| | | TOTAL INVESTMENTS BEFORE SHORT-TERM INVESTMENTS
(Cost — $262,174,666) | | | 334,535,186 | |
| | | | |
|
|
|
| | |
Face
Amount
| | | | | |
SHORT-TERM INVESTMENTS — 2.9% | |
COMMERCIAL PAPER — 0.6% | |
| $2,160,000 | | Starbird Funding Corp., 5.270% due 9/1/06 (a)
(Cost — $2,160,000) | | | 2,160,000 | |
| | | | |
|
|
|
REPURCHASE AGREEMENT — 2.3% | |
| 7,755,000 | | State Street Bank & Trust Co. dated 8/31/06, 4.810% due 9/1/06; Proceeds at maturity — $7,756,036;
(Fully collateralized by U.S. Treasury Bond, 4.500% due 2/15/36; Market value — $7,918,356)
(Cost — $7,755,000) | | | 7,755,000 | |
| | | | |
|
|
|
| | | TOTAL SHORT-TERM INVESTMENTS
(Cost — $9,915,000) | | | 9,915,000 | |
| | | | |
|
|
|
| | | TOTAL INVESTMENTS — 100.2%
(Cost — $272,089,666#) | | | 344,450,186 | |
| | | Liabilities in Excess of Other Assets — (0.2)% | | | (828,240 | ) |
| | | | |
|
|
|
| | | TOTAL NET ASSETS — 100.0% | | $ | 343,621,946 | |
| | | | |
|
|
|
| * | | Non-income producing security. |
| # | | Aggregate cost for federal income tax purposes is $273,241,465. |
| (a) | | Rate shown represents yield-to-maturity. |
See Notes to Financial Statements.
45
Schedules of Investments
(continued)
| | | | | |
| Small Capitalization Growth Investments | | |
| | |
| Shares | | Security | | Value |
COMMON STOCKS — 97.3% | | | |
CONSUMER DISCRETIONARY — 8.2% | | | |
| |
Distributors — 0.7% | | | |
| 71,100 | | MWI Veterinary Supply Inc.* | | $ | 2,467,881 |
| | | | |
|
|
| |
Diversified Consumer Services — 1.2% | | | |
| 89,400 | | Laureate Education Inc.* | | | 4,292,988 |
| | | | |
|
|
| |
Hotels, Restaurants & Leisure — 2.3% | | | |
| 67,150 | | PF Chang’s China Bistro Inc.* | | | 2,367,038 |
| 83,299 | | RARE Hospitality International Inc.* | | | 2,385,683 |
| 37,500 | | Red Robin Gourmet Burgers Inc.* | | | 1,582,875 |
| 174,041 | | Texas Roadhouse Inc., Class A Shares* | | | 2,102,415 |
| | | | |
|
|
| | | Total Hotels, Restaurants & Leisure | | | 8,438,011 |
| | | | |
|
|
| |
Household Durables — 0.5% | | | |
| 125,500 | | Tempur-Pedic International Inc.* | | | 2,014,275 |
| | | | |
|
|
| |
Internet & Catalog Retail — 1.3% | | | |
| 95,000 | | Nutri/System Inc.* | | | 4,719,600 |
| | | | |
|
|
| |
Specialty Retail — 1.7% | | | |
| 119,659 | | Bebe Stores Inc. | | | 2,666,003 |
| 52,500 | | Christopher & Banks Corp. | | | 1,278,375 |
| 15,700 | | Golf Galaxy Inc.* | | | 179,922 |
| 51,500 | | Stage Stores Inc. | | | 1,357,540 |
| 147,600 | | Tweeter Home Entertainment Group Inc.* | | | 660,510 |
| | | | |
|
|
| | | Total Specialty Retail | | | 6,142,350 |
| | | | |
|
|
| |
Textiles, Apparel & Luxury Goods — 0.5% | | | |
| 50,000 | | Oxford Industries Inc. | | | 2,054,000 |
| | | | |
|
|
| | | TOTAL CONSUMER DISCRETIONARY | | | 30,129,105 |
| | | | |
|
|
CONSUMER STAPLES — 0.9% | | | |
| |
Food & Staples Retailing — 0.4% | | | |
| 31,600 | | Andersons Inc. | | | 1,295,916 |
| | | | |
|
|
| |
Food Products — 0.0% | | | |
| 1,651 | | Aurora Foods Inc. (a)(b)* | | | 0 |
| | | | |
|
|
| |
Personal Products — 0.5% | | | |
| 54,500 | | Chattem Inc.* | | | 1,890,060 |
| | | | |
|
|
| | | TOTAL CONSUMER STAPLES | | | 3,185,976 |
| | | | |
|
|
ENERGY — 10.7% | | | |
| |
Energy Equipment & Services — 8.2% | | | |
| 223,800 | | Hanover Compressor Co.* | | | 4,211,916 |
| 207,200 | | Key Energy Services Inc.* | | | 3,108,000 |
| 95,600 | | NS Group Inc.* | | | 4,351,712 |
| 80,700 | | Oil States International Inc.* | | | 2,579,172 |
| 145,600 | | Patterson-UTI Energy Inc. | | | 3,989,440 |
| 144,800 | | Pioneer Drilling Co.* | | | 2,040,232 |
| 258,500 | | Superior Energy Services Inc.* | | | 8,253,905 |
| 44,396 | | Weatherford International Ltd.* | | | 1,909,028 |
| | | | |
|
|
| | | Total Energy Equipment & Services | | | 30,443,405 |
| | | | |
|
|
See Notes to Financial Statements.
46
Schedules of Investments
(continued)
| | | | | |
| Small Capitalization Growth Investments | | |
| | |
| Shares | | Security | | Value |
| |
Oil, Gas & Consumable Fuels — 2.5% | | | |
| 75,900 | | Foundation Coal Holdings Inc. | | $ | 2,726,328 |
| 106,300 | | Precision Drilling Trust | | | 3,896,958 |
| 69,299 | | Quicksilver Resources Inc.* | | | 2,607,028 |
| | | | |
|
|
| | | Total Oil, Gas & Consumable Fuels | | | 9,230,314 |
| | | | |
|
|
| | | TOTAL ENERGY | | | 39,673,719 |
| | | | |
|
|
FINANCIALS — 5.2% | | | |
| |
Capital Markets — 1.5% | | | |
| 88,229 | | Apollo Investment Corp. | | | 1,761,933 |
| 81,400 | | Investors Financial Services Corp. | | | 3,773,704 |
| | | | |
|
|
| | | Total Capital Markets | | | 5,535,637 |
| | | | |
|
|
| |
Commercial Banks — 2.8% | | | |
| 106,700 | | East-West Bancorp Inc. | | | 4,321,350 |
| 99,800 | | Signature Bank* | | | 3,278,430 |
| 156,300 | | UCBH Holdings Inc. | | | 2,835,282 |
| | | | |
|
|
| | | Total Commercial Banks | | | 10,435,062 |
| | | | |
|
|
| |
Diversified Financial Services — 0.5% | | | |
| 72,700 | | optionsXpress Holdings Inc. | | | 1,898,924 |
| | | | |
|
|
| |
Real Estate Investment Trusts (REITs) — 0.4% | | | |
| 77,100 | | DiamondRock Hospitality Co. | | | 1,295,280 |
| | | | |
|
|
| | | TOTAL FINANCIALS | | | 19,164,903 |
| | | | |
|
|
HEALTH CARE — 26.7% | | | |
| |
Biotechnology — 8.6% | | | |
| 133,200 | | Alexion Pharmaceuticals Inc.* | | | 5,001,660 |
| 33,889 | | Cephalon Inc.* | | | 1,932,351 |
| 84,800 | | Cubist Pharmaceuticals Inc.* | | | 1,989,408 |
| 104,100 | | CV Therapeutics Inc.* | | | 1,171,125 |
| 291,100 | | Human Genome Sciences Inc.* | | | 3,269,053 |
| 115,000 | | Illumina Inc.* | | | 3,873,200 |
| 106,800 | | InterMune Inc.* | | | 1,841,232 |
| 119,200 | | Keryx Biopharmaceuticals Inc.* | | | 1,636,616 |
| 74,000 | | Momenta Pharmaceuticals Inc.* | | | 1,174,380 |
| 220,600 | | Nektar Therapeutics* | | | 3,864,912 |
| 95,050 | | OSI Pharmaceuticals Inc.* | | | 3,542,513 |
| 70,300 | | Vertex Pharmaceuticals Inc.* | | | 2,421,835 |
| | | | |
|
|
| | | Total Biotechnology | | | 31,718,285 |
| | | | |
|
|
| |
Health Care Equipment & Supplies — 9.1% | | | |
| 176,500 | | American Medical Systems Holdings Inc.* | | | 3,099,340 |
| 89,000 | | Cutera Inc.* | | | 2,066,580 |
| 53,000 | | Dionex Corp.* | | | 2,672,260 |
| 42,800 | | Greatbatch Inc.* | | | 1,046,888 |
| 174,688 | | Immucor Inc.* | | | 3,628,270 |
| 137,300 | | IRIS International Inc.* | | | 1,346,913 |
| 77,100 | | Palomar Medical Technologies Inc.* | | | 3,060,870 |
| 162,300 | | PerkinElmer Inc. | | | 2,991,189 |
| 186,978 | | PolyMedica Corp. | | | 7,589,437 |
| 234,000 | | Spectranetics Corp.* | | | 2,550,600 |
| 77,700 | | Varian Inc.* | | | 3,627,036 |
| | | | |
|
|
| | | Total Health Care Equipment & Supplies | | | 33,679,383 |
| | | | |
|
|
See Notes to Financial Statements.
47
Schedules of Investments
(continued)
| | | | | |
| Small Capitalization Growth Investments | | |
| | |
| Shares | | Security | | Value |
| |
Health Care Providers & Services — 3.5% | | | |
| 80,400 | | Allscripts Healthcare Solutions, Inc.* | | $ | 1,636,944 |
| 109,800 | | Gentiva Health Services Inc.* | | | 1,984,086 |
| 106,800 | | HealthExtras Inc.* | | | 3,281,964 |
| 99,200 | | Manor Care Inc. | | | 5,178,240 |
| 46,200 | | Odyssey Healthcare Inc.* | | | 741,048 |
| | | | |
|
|
| | | Total Health Care Providers & Services | | | 12,822,282 |
| | | | |
|
|
| |
Life Sciences Tools & Services — 0.2% | | | |
| 13,700 | | Icon PLC Depositary Receipts* | | | 943,177 |
| | | | |
|
|
| |
Pharmaceuticals — 5.3% | | | |
| 204,900 | | Medicines Co.* | | | 4,622,544 |
| 196,900 | | Medicis Pharmaceutical Corp., Class A Shares | | | 5,767,201 |
| 295,800 | | MGI Pharma Inc.* | | | 4,475,454 |
| 135,300 | | Nastech Pharmaceutical Co. Inc.* | | | 2,053,854 |
| 121,500 | | Santarus Inc.* | | | 974,430 |
| 92,650 | | Sciele Pharma Inc.* | | | 1,621,375 |
| | | | |
|
|
| | | Total Pharmaceuticals | | | 19,514,858 |
| | | | |
|
|
| | | TOTAL HEALTH CARE | | | 98,677,985 |
| | | | |
|
|
INDUSTRIALS — 16.8% | | | |
| |
Aerospace & Defense — 1.6% | | | |
| 78,900 | | AAR Corp.* | | | 1,760,259 |
| 44,100 | | Ceradyne Inc.* | | | 1,943,487 |
| 60,000 | | Teledyne Technologies Inc.* | | | 2,300,400 |
| | | | |
|
|
| | | Total Aerospace & Defense | | | 6,004,146 |
| | | | |
|
|
| |
Air Freight & Logistics — 0.7% | | | |
| 52,700 | | EGL Inc.* | | | 1,611,039 |
| 36,300 | | Pacer International Inc. | | | 999,339 |
| | | | |
|
|
| | | Total Air Freight & Logistics | | | 2,610,378 |
| | | | |
|
|
| |
Airlines — 0.9% | | | |
| 75,300 | | US Airways Group Inc.* | | | 3,181,425 |
| | | | |
|
|
| |
Commercial Services & Supplies — 5.5% | | | |
| 36,400 | | Corporate Executive Board Co. | | | 3,190,096 |
| 41,600 | | Geo Group, Inc.* | | | 1,858,272 |
| 66,500 | | Global Cash Access Inc.* | | | 1,026,095 |
| 59,000 | | Huron Consulting Group, Inc.* | | | 2,227,840 |
| 102,900 | | Knoll Inc. | | | 1,834,707 |
| 152,200 | | Labor Ready Inc.* | | | 2,607,186 |
| 156,000 | | Navigant Consulting Inc.* | | | 3,071,640 |
| 389,200 | | Stewart Enterprises Inc., Class A Shares | | | 2,249,576 |
| 64,450 | | Waste Connections Inc.* | | | 2,369,826 |
| | | | |
|
|
| | | Total Commercial Services & Supplies | | | 20,435,238 |
| | | | |
|
|
| |
Construction & Engineering — 1.0% | | | |
| 152,300 | | Perini Corp.* | | | 3,650,631 |
| | | | |
|
|
| |
Electrical Equipment — 0.7% | | | |
| 39,600 | | Energy Conversion Devices Inc.* | | | 1,387,980 |
| 179,100 | | Power-One Inc.* | | | 1,216,089 |
| | | | |
|
|
| | | Total Electrical Equipment | | | 2,604,069 |
| | | | |
|
|
See Notes to Financial Statements.
48
Schedules of Investments
(continued)
| | | | | |
| Small Capitalization Growth Investments | | |
| | |
| Shares | | Security | | Value |
| |
Industrial Conglomerates — 1.0% | | | |
| 241,800 | | Hexcel Corp.* | | $ | 3,631,836 |
| | | | |
|
|
| |
Machinery — 3.9% | | | |
| 96,376 | | A.S.V. Inc.* | | | 1,481,299 |
| 74,147 | | Actuant Corp., Class A Shares | | | 3,344,030 |
| 75,200 | | Gehl Co.* | | | 1,962,720 |
| 54,900 | | Greenbrier Cos. Inc. | | | 1,525,122 |
| 152,725 | | RBC Bearings Inc.* | | | 3,248,461 |
| 96,600 | | Wabtec Corp. | | | 2,725,086 |
| | | | |
|
|
| | | Total Machinery | | | 14,286,718 |
| | | | |
|
|
| |
Road & Rail — 0.5% | | | |
| 84,900 | | J.B. Hunt Transport Services Inc. | | | 1,668,285 |
| | | | |
|
|
| |
Trading Companies & Distributors — 1.0% | | | |
| 151,100 | | Interline Brands Inc.* | | | 3,783,544 |
| | | | |
|
|
| |
Transportation Infrastructure — 0.0% | | | |
| 398 | | TIMCO Aviation Services Inc.* | | | 1,520 |
| | | | |
|
|
| | | TOTAL INDUSTRIALS | | | 61,857,790 |
| | | | |
|
|
INFORMATION TECHNOLOGY — 28.6% | | | |
| |
Communications Equipment — 2.2% | | | |
| 91,800 | | Dycom Industries Inc.* | | | 1,858,950 |
| 113,700 | | Foundry Networks Inc.* | | | 1,383,729 |
| 55,800 | | NICE Systems Ltd., ADR* | | | 1,392,768 |
| 119,700 | | Redback Networks Inc.* | | | 2,231,208 |
| 340,800 | | Stratex Networks Inc.* | | | 1,243,920 |
| | | | |
|
|
| | | Total Communications Equipment | | | 8,110,575 |
| | | | |
|
|
| |
Computers & Peripherals — 2.9% | | | |
| 292,500 | | Hypercom Corp.* | | | 2,731,950 |
| 76,200 | | M-Systems Flash Disk Pioneers Ltd.* | | | 3,381,756 |
| 211,400 | | Palm Inc.* | | | 3,077,984 |
| 152,600 | | Smart Modular Technologies (WWH) Inc.* | | | 1,510,740 |
| | | | |
|
|
| | | Total Computers & Peripherals | | | 10,702,430 |
| | | | |
|
|
| |
Electronic Equipment & Instruments — 1.5% | | | |
| 72,000 | | Littelfuse Inc.* | | | 2,599,920 |
| 18,700 | | NovAtel Inc.* | | | 823,922 |
| 103,300 | | Xyratex Ltd.* | | | 1,963,733 |
| | | | |
|
|
| | | Total Electronic Equipment & Instruments | | | 5,387,575 |
| | | | |
|
|
| |
Internet Software & Services — 3.0% | | | |
| 145,200 | | aQuantive Inc.* | | | 3,600,960 |
| 8,800 | | DealerTrack Holdings Inc.* | | | 191,400 |
| 84,700 | | Digitas Inc.* | | | 757,218 |
| 114,000 | | Openwave Systems Inc.* | | | 922,260 |
| 599,000 | | SkillSoft PLC, ADR* | | | 3,803,650 |
| 77,191 | | Sohu.com Inc.* | | | 1,683,536 |
| | | | |
|
|
| | | Total Internet Software & Services | | | 10,959,024 |
| | | | |
|
|
| |
IT Services — 2.3% | | | |
| 52,400 | | CheckFree Corp.* | | | 1,875,920 |
| 45,900 | | Global Payments Inc. | | | 1,746,495 |
See Notes to Financial Statements.
49
Schedules of Investments
(continued)
| | | | | |
| Small Capitalization Growth Investments | | |
| | |
| Shares | | Security | | Value |
| |
IT Services — 2.3% (continued) | | | |
| 245,600 | | MPS Group Inc.* | | $ | 3,453,136 |
| 317,100 | | Sapient Corp.* | | | 1,544,277 |
| | | | |
|
|
| | | Total IT Services | | | 8,619,828 |
| | | | |
|
|
| |
Semiconductors & Semiconductor Equipment — 12.1% | | | |
| 91,500 | | Advanced Analogic Technologies Inc.* | | | 871,080 |
| 191,100 | | Asyst Technologies Inc.* | | | 1,431,339 |
| 80,800 | | ATMI Inc.* | | | 2,332,696 |
| 68,900 | | Cymer Inc.* | | | 2,835,235 |
| 68,900 | | FormFactor Inc.* | | | 3,325,114 |
| 159,100 | | Genesis Microchip Inc.* | | | 2,055,572 |
| 104,800 | | Ikanos Communications Inc.* | | | 1,337,248 |
| 96,200 | | Marvell Technology Group Ltd.* | | | 1,684,462 |
| 33,200 | | Microchip Technology Inc. | | | 1,134,112 |
| 87,200 | | Microsemi Corp.* | | | 2,421,544 |
| 87,600 | | Netlogic Microsystems Inc.* | | | 2,585,076 |
| 463,800 | | PMC-Sierra Inc.* | | | 3,172,392 |
| 44,974 | | Power Integrations Inc.* | | | 827,521 |
| 91,000 | | Qimonda AG Depositary Receipts* | | | 1,469,650 |
| 56,600 | | Semtech Corp.* | | | 739,762 |
| 89,900 | | SiRF Technology Holdings Inc.* | | | 2,367,067 |
| 245,541 | | Spansion Inc., Class A Shares* | | | 4,220,850 |
| 196,400 | | Tessera Technologies Inc.* | | | 6,461,560 |
| 91,800 | | Varian Semiconductor Equipment Associates Inc.* | | | 3,241,458 |
| | | | |
|
|
| | | Total Semiconductors & Semiconductor Equipment | | | 44,513,738 |
| | | | |
|
|
| |
Software — 4.6% | | | |
| 241,300 | | Concur Technologies Inc.* | | | 3,361,309 |
| 91,700 | | Informatica Corp.* | | | 1,342,488 |
| 43,800 | | MICROS Systems Inc.* | | | 2,096,268 |
| 441,100 | | Nuance Communications Inc.* | | | 3,462,635 |
| 222,500 | | Quest Software Inc.* | | | 3,099,425 |
| 65,800 | | Transaction Systems Architects Inc., Class A Shares* | | | 2,182,586 |
| 25,426 | | Verint Systems Inc.* | | | 840,329 |
| 44,300 | | Witness Systems Inc.* | | | 719,875 |
| | | | |
|
|
| | | Total Software | | | 17,104,915 |
| | | | |
|
|
| | | TOTAL INFORMATION TECHNOLOGY | | | 105,398,085 |
| | | | |
|
|
MATERIALS — 0.1% | | | |
| |
Chemicals — 0.1% | | | |
| 15,400 | | Zoltek Cos., Inc.* | | | 393,547 |
| | | | |
|
|
TELECOMMUNICATION SERVICES — 0.1% | | | |
| |
Diversified Telecommunication Services — 0.1% | | | |
| 33,700 | | Vonage Holdings Corp.* | | | 286,787 |
| | | | |
|
|
| | | TOTAL COMMON STOCKS
(Cost — $279,820,210) | | | 358,767,897 |
| | | | |
|
|
| | |
Face Amount
| | | | |
CONVERTIBLE NOTE — 0.0% | | | |
| |
Transportation Infrastructure — 0.0% | | | |
| $ 422 | | TIMCO Aviation Services Inc., Jr. Subordinated Notes, 8.000% due 1/2/07 (a)(b)(c)* (Cost — $60) | | | 0 |
| | | | |
|
|
See Notes to Financial Statements.
50
Schedules of Investments
(continued)
| | | | | |
| Small Capitalization Growth Investments | | |
| | |
| Rights | | Security | | Value |
RIGHT — 0.0% | | | |
| 880 | | OSI Pharmaceuticals Inc.* (Cost — $123) | | $ | 61 |
| | | | |
|
|
| | |
Warrants
| | | | |
WARRANT — 0.0% | | | |
| 5,615 | | TIMCO Aviation Services Inc., Expires 12/31/07 (a)(b)* (Cost — $6) | | | 1 |
| | | | |
|
|
| | | TOTAL INVESTMENTS BEFORE SHORT-TERM INVESTMENT
(Cost — $279,820,399) | | | 358,767,959 |
| | | | |
|
|
| | |
Face
Amount
| | | | |
SHORT-TERM INVESTMENT — 2.5% | | | |
REPURCHASE AGREEMENT — 2.5% | | | |
| $9,062,000 | | State Street Bank & Trust Co. dated 8/31/06, 4.810% due 9/1/06; Proceeds at maturity — $9,063,211;
(Fully collateralized by U.S. Treasury Bond, 4.500% due 2/15/36; Market value — $9,246,688)
(Cost — $9,062,000) | | | 9,062,000 |
| | | | |
|
|
| | | TOTAL INVESTMENTS — 99.8%
(Cost — $288,882,399#) | | | 367,829,959 |
| | | Other Assets in Excess of Liabilities — 0.2% | | | 916,451 |
| | | | |
|
|
| | | TOTAL NET ASSETS — 100.0% | | $ | 368,746,410 |
| | | | |
|
|
| * | | Non-income producing security. |
| (a) | | Security is valued in good faith at fair value by or under the direction of the Board of Trustees (See Note 1). |
| (c) | | Payment-in-kind security for which part of the income earned may be paid as additional principal. |
| # | | Aggregate cost for federal income tax purposes is $290,204,485. |
Abbreviation used in this schedule:
|
| ADR — American Depositary Receipt |
See Notes to Financial Statements.
51
Schedules of Investments
(continued)
| | | | | |
| International Equity Investments |
| | |
| Shares | | Security | | Value |
COMMON STOCKS — 98.2% |
|
Australia — 1.9% |
| 231,870 | | BHP Billiton Ltd., ADR | | $ | 9,761,727 |
| 645,000 | | Goodman Fielder Ltd.* | | | 1,043,189 |
| 1,343,000 | | John Fairfax Holdings Ltd. | | | 4,139,281 |
| 1,946,000 | | Qantas Airways Ltd. | | | 5,107,035 |
| 78,600 | | Rio Tinto Ltd. | | | 4,374,369 |
| | | | |
|
|
| | | Total Australia | | | 24,425,601 |
| | | | |
|
|
|
Brazil — 1.5% |
| 150,255 | | Banco Itau Holding Financeira SA, ADR | | | 4,573,762 |
| 152,220 | | Gol-Linhas Aereas Inteligentes SA, ADR | | | 5,314,000 |
| 111,110 | | Petroleo Brasileiro SA, ADR | | | 9,962,123 |
| | | | |
|
|
| | | Total Brazil | | | 19,849,885 |
| | | | |
|
|
|
Canada — 4.2% |
| 181,500 | | Agrium Inc. | | | 4,207,170 |
| 40,000 | | Alcan Inc., New York Shares | | | 1,804,800 |
| 51,800 | | Alcan Inc., Toronto Shares | | | 2,326,822 |
| 94,000 | | Barrick Gold Corp. | | | 3,147,120 |
| 521,400 | | Bombardier Inc.* | | | 1,583,070 |
| 164,410 | | Canadian National Railway Co. | | | 7,030,172 |
| 121,000 | | CGI Group Inc.* | | | 765,373 |
| 170,110 | | Cognos Inc.* | | | 5,531,977 |
| 128,030 | | Gildan Activewear Inc.* | | | 6,396,379 |
| 195,900 | | Kinross Gold Corp.* | | | 2,746,518 |
| 109,340 | | Manulife Financial Corp. | | | 3,569,951 |
| 1,118,000 | | Nortel Networks Corp.* | | | 2,336,620 |
| 102,070 | | Ritchie Brothers Auctioneers Inc. | | | 4,996,327 |
| 362,700 | | Talisman Energy Inc. | | | 6,358,270 |
| 187,500 | | Yamana Gold Inc.* | | | 1,921,875 |
| | | | |
|
|
| | | Total Canada | | | 54,722,444 |
| | | | |
|
|
|
Cayman Islands — 0.6% |
| 1,772,000 | | Global Bio-chem Technology Group Co., Ltd. | | | 590,139 |
| 508,200 | | Himax Technologies Inc., ADR* | | | 3,659,040 |
| 137,778 | | Silicon Motion Technology Corp., ADR* | | | 2,039,114 |
| 106,100 | | Vimicro International Corp., ADR* | | | 1,133,148 |
| | | | |
|
|
| | | Total Cayman Islands | | | 7,421,441 |
| | | | |
|
|
|
Chile — 0.2% |
| 72,960 | | Banco Santander Chile SA, ADR | | | 3,178,138 |
| | | | |
|
|
|
China — 0.5% |
| 6,922,000 | | China Telecom Corp., Ltd. | | | 2,323,073 |
| 40,300 | | PetroChina Co., Ltd., ADR | | | 4,520,854 |
| | | | |
|
|
| | | Total China | | | 6,843,927 |
| | | | |
|
|
|
Denmark — 0.4% |
| 232,600 | | H. Lundbeck A/S | | | 5,354,898 |
| | | | |
|
|
|
Finland — 0.7% |
| 193,600 | | Nokia Oyj | | | 4,049,287 |
| 219,300 | | UPM-Kymmene Oyj | | | 5,189,981 |
| | | | |
|
|
| | | Total Finland | | | 9,239,268 |
| | | | |
|
|
See Notes to Financial Statements.
52
Schedules of Investments
(continued)
| | | | | |
| International Equity Investments |
| | |
| Shares | | Security | | Value |
|
France — 11.6% |
| 46,318 | | Air France-KLM | | $ | 1,262,074 |
| 254,800 | | Alcatel SA* | | | 3,191,079 |
| 120,000 | | Alcatel SA, ADR* | | | 1,503,600 |
| 76,600 | | Assurances Generales de France | | | 9,603,074 |
| 458,588 | | Axa | | | 17,012,813 |
| 66,280 | | BNP Paribas SA | | | 7,033,222 |
| 243,080 | | BNP Paribas SA, ADR | | | 12,980,472 |
| 65,900 | | Casino Guichard Perrachon SA | | | 5,644,058 |
| 114,900 | | Compagnie de Saint-Gobain | | | 8,517,829 |
| 115,400 | | Compagnie Generale des Etablissements Michelin, Class B Shares | | | 7,824,149 |
| 59,400 | | European Aeronautic Defence & Space Co. | | | 1,788,745 |
| 261,000 | | France Telecom SA | | | 5,532,462 |
| 98,573 | | Generale de Sante | | | 3,477,825 |
| 314,460 | | L’Oreal SA, ADR | | | 6,587,937 |
| 45,600 | | Lafarge SA | | | 5,862,547 |
| 153,400 | | Sanofi-Aventis | | | 13,746,399 |
| 35,400 | | Societe BIC SA | | | 2,198,156 |
| 51,700 | | Societe Generale | | | 8,333,291 |
| 90,800 | | Technip SA | | | 5,231,662 |
| 96,365 | | Technip SA, ADR | | | 5,567,970 |
| 247,652 | | Total SA | | | 16,695,825 |
| 88,700 | | Vivendi Universal SA | | | 3,046,655 |
| | | | |
|
|
| | | Total France | | | 152,641,844 |
| | | | |
|
|
| |
Germany — 9.0% | | | |
| 59,100 | | Allianz AG | | | 10,007,659 |
| 90,007 | | BASF AG | | | 7,407,050 |
| 293,700 | | Bayerische Motoren Werke AG | | | 15,193,944 |
| 87,300 | | Continental AG | | | 9,325,157 |
| 11,900 | | Deutsche Boerse AG | | | 1,803,478 |
| 140,400 | | Deutsche Telekom AG | | | 2,045,720 |
| 70,800 | | E.ON AG | | | 8,981,011 |
| 291,650 | | E.ON AG, ADR | | | 12,365,960 |
| 128,000 | | Hannover Rueckversicherung AG* | | | 4,936,882 |
| 52,600 | | Linde AG | | | 4,635,508 |
| 77,100 | | Metro AG | | | 4,525,153 |
| 275,200 | | MLP AG | | | 4,717,465 |
| 141,938 | | Rhoen-Klinikum AG | | | 5,794,032 |
| 183,290 | | SAP AG, ADR | | | 8,750,265 |
| 179,400 | | Siemens AG | | | 15,188,142 |
| 34,200 | | Siemens AG, ADR | | | 2,908,710 |
| | | | |
|
|
| | | Total Germany | | | 118,586,136 |
| | | | |
|
|
| |
Greece — 1.0% | | | |
| 649,970 | | National Bank of Greece SA, ADR | | | 5,407,750 |
| 315,000 | | Public Power Corp. | | | 7,519,304 |
| | | | |
|
|
| | | Total Greece | | | 12,927,054 |
| | | | |
|
|
| |
Hong Kong — 0.6% | | | |
| 538,000 | | Cheung Kong Holdings Ltd. | | | 5,945,917 |
| 1,628,000 | | Techtronic Industries Co., Ltd. | | | 2,398,997 |
| | | | |
|
|
| | | Total Hong Kong | | | 8,344,914 |
| | | | |
|
|
See Notes to Financial Statements.
53
Schedules of Investments
(continued)
| | | | | |
| International Equity Investments |
| | |
| Shares | | Security | | Value |
| |
India — 0.9% | | | |
| 91,840 | | HDFC Bank Ltd., ADR | | $ | 5,223,859 |
| 140,020 | | Infosys Technologies Ltd., ADR | | | 6,279,897 |
| | | | |
|
|
| | | Total India | | | 11,503,756 |
| | | | |
|
|
| |
Ireland — 3.8% | | | |
| 344,500 | | Allied Irish Banks PLC | | | 8,968,278 |
| 192,730 | | Allied Irish Banks PLC, ADR | | | 10,122,180 |
| 359,600 | | Bank of Ireland | | | 6,831,272 |
| 212,500 | | CRH PLC | | | 7,347,852 |
| 106,600 | | Irish Life & Permanent PLC | | | 2,740,998 |
| 245,370 | | Ryanair Holdings PLC, ADR* | | | 13,463,452 |
| | | | |
|
|
| | | Total Ireland | | | 49,474,032 |
| | | | |
|
|
|
Israel — 1.2% |
| 462,960 | | Teva Pharmaceutical Industries Ltd., ADR | | | 16,092,490 |
| | | | |
|
|
|
Italy — 2.3% |
| 205,295 | | Eni SpA | | | 6,276,705 |
| 340,820 | | Luxottica Group SpA, Depositary Receipts | | | 9,873,555 |
| 692,200 | | Mediaset SpA | | | 7,987,182 |
| 695,978 | | UniCredito Italiano SpA | | | 5,537,852 |
| | | | |
|
|
| | | Total Italy | | | 29,675,294 |
| | | | |
|
|
|
Japan — 16.5% |
| 434,000 | | Ajinomoto Co. Inc. | | | 4,707,784 |
| 109,900 | | Asatsu-DK Inc. | | | 3,549,240 |
| 137,000 | | Daito Trust Construction Co., Ltd. | | | 7,121,128 |
| 180,000 | | FamilyMart Co., Ltd. | | | 5,092,242 |
| 25,500 | | Funai Electric Co., Ltd. | | | 2,429,296 |
| 945,000 | | Hitachi Ltd. | | | 5,999,105 |
| 334,000 | | JS Group Corp. | | | 7,015,551 |
| 155,300 | | Konami Corp. | | | 3,956,772 |
| 460,000 | | Kuraray Co., Ltd. | | | 5,268,118 |
| 344,550 | | Matsushita Electric Industrial Co., Ltd., ADR | | | 7,349,252 |
| 391 | | Millea Holdings Inc. | | | 7,196,626 |
| 221,400 | | Miraca Holdings Inc. | | | 5,452,226 |
| 375 | | Mitsubishi UFJ Financial Group Inc. | | | 5,112,692 |
| 1,187,820 | | Mitsubishi UFJ Financial Group Inc., ADR | | | 16,118,717 |
| 87,800 | | Modec Inc. | | | 1,971,394 |
| 106,800 | | Nippon System Development Co., Ltd. | | | 4,086,166 |
| 978,000 | | Nipponkoa Insurance Co., Ltd. | | | 7,783,665 |
| 23,200 | | Obic Co., Ltd. | | | 4,663,525 |
| 23,000 | | Onward Kashiyama Co. Ltd. | | | 334,745 |
| 30,300 | | ORIX Corp. | | | 8,042,648 |
| 94,990 | | ORIX Corp., ADR | | | 12,619,422 |
| 483,000 | | Ricoh Co., Ltd. | | | 9,486,728 |
| 89,000 | | Secom Co., Ltd. | | | 4,421,371 |
| 256,200 | | Sega Sammy Holdings Inc. | | | 8,754,310 |
| 975,000 | | Sharp Corp. | | | 17,447,062 |
| 230,900 | | Sony Corp. | | | 9,995,075 |
| 141,000 | | Square Enix Co., Ltd. (b) | | | 3,280,048 |
| 976,000 | | Sumitomo Chemical Co., Ltd. | | | 7,684,581 |
| 122,300 | | Takeda Pharmaceutical Co., Ltd. | | | 8,097,405 |
See Notes to Financial Statements.
54
Schedules of Investments
(continued)
| | | | | |
| International Equity Investments |
| | |
| Shares | | Security | | Value |
|
Japan — 16.5% (continued) |
| 162,600 | | TIS Inc. | | $ | 3,429,211 |
| 636,000 | | Tokyu Corp. | | | 4,232,593 |
| 525,000 | | Toshiba Corp. | | | 3,739,934 |
| 169,300 | | Toyota Motor Corp. | | | 9,189,562 |
| | | | |
|
|
| | | Total Japan | | | 215,628,194 |
| | | | |
|
|
|
Mexico — 1.4% |
| 144,940 | | America Movil SA de CV, Series L Shares, ADR | | | 5,407,711 |
| 215,940 | | Desarrolladora Homex SA de CV, ADR* | | | 8,002,736 |
| 138,060 | | Wal-Mart de Mexico SA de CV, Series V Shares, ADR | | | 4,725,104 |
| | | | |
|
|
| | | Total Mexico | | | 18,135,551 |
| | | | |
|
|
|
Netherlands — 6.8% |
| 270,400 | | Akzo Nobel NV | | | 15,552,078 |
| 255,000 | | ING Groep NV, CVA | | | 11,009,546 |
| 352,300 | | Koninklijke Ahold NV* | | | 3,375,592 |
| 123,000 | | Koninklijke Ahold NV, ADR* | | | 1,178,340 |
| 401,300 | | Koninklijke Philips Electronics NV | | | 13,665,724 |
| 64,100 | | Koninklijke Philips Electronics NV, New York Registered Shares | | | 2,199,912 |
| 351,440 | | QIAGEN NV* | | | 5,081,823 |
| 562,600 | | Reed Elsevier NV | | | 9,010,720 |
| 284,812 | | Royal Dutch Shell PLC, Class A Shares | | | 9,833,692 |
| 170,915 | | TNT NV | | | 6,417,173 |
| 253,500 | | Unilever NV, CVA | | | 6,038,278 |
| 342,600 | | Vedior NV, CVA | | | 6,328,634 |
| | | | |
|
|
| | | Total Netherlands | | | 89,691,512 |
| | | | |
|
|
| |
Norway — 1.2% | | | |
| 274,000 | | Norsk Hydro ASA | | | 7,064,984 |
| 279,690 | | Statoil ASA, ADR | | | 7,560,021 |
| 46,900 | | Yara International ASA | | | 691,822 |
| | | | |
|
|
| | | Total Norway | | | 15,316,827 |
| | | | |
|
|
| |
Singapore — 0.8% | | | |
| 142,800 | | Flextronics International Ltd.* | | | 1,685,040 |
| 656,000 | | Neptune Orient Lines Ltd. | | | 804,729 |
| 4,804,150 | | Singapore Telecommunications Ltd. | | | 7,603,339 |
| | | | |
|
|
| | | Total Singapore | | | 10,093,108 |
| | | | |
|
|
| |
South Africa — 0.5% | | | |
| 178,770 | | Sasol Ltd., ADR | | | 6,256,950 |
| | | | |
|
|
| |
South Korea — 1.5% | | | |
| 36,580 | | Honam Petrochemical Corp. | | | 1,898,728 |
| 54,000 | | Kookmin Bank, ADR | | | 4,351,320 |
| 66,400 | | KT Corp., ADR | | | 1,467,440 |
| 8,000 | | Samsung Electronics Co., Ltd. | | | 5,409,060 |
| 281,700 | | SK Telecom Co., Ltd., ADR | | | 6,169,230 |
| | | | |
|
|
| | | Total South Korea | | | 19,295,778 |
| | | | |
|
|
| |
Spain — 0.7% | | | |
| 606,000 | | Banco Santander Central Hispano SA | | | 9,387,981 |
| | | | |
|
|
See Notes to Financial Statements.
55
Schedules of Investments
(continued)
| | | | | |
| International Equity Investments |
| | |
| Shares | | Security | | Value |
| |
Sweden — 2.9% | | | |
| 306,900 | | Assa Abloy AB | | $ | 5,379,826 |
| 178,600 | | ForeningsSparbanken AB | | | 5,139,905 |
| 689,400 | | Nordea Bank AB | | | 8,689,320 |
| 392,720 | | Telefonaktiebolaget LM Ericsson, ADR | | | 13,116,848 |
| 1,638,000 | | Telefonaktiebolaget LM Ericsson, Class B Shares | | | 5,448,771 |
| | | | |
|
|
| | | Total Sweden | | | 37,774,670 |
| | | | |
|
|
| |
Switzerland — 5.2% | | | |
| 102,100 | | Compagnie Financiere Richemont AG | | | 4,849,688 |
| 123,000 | | Credit Suisse Group | | | 6,844,411 |
| 69,300 | | Lonza Group AG, Registered Shares | | | 4,510,651 |
| 26,000 | | Nestle SA | | | 8,919,916 |
| 176,900 | | Novartis AG, ADR | | | 10,104,528 |
| 135,300 | | Roche Holding AG, ADR | | | 12,461,130 |
| 208,460 | | UBS AG | | | 11,834,274 |
| 36,700 | | Zurich Financial Services AG | | | 8,344,289 |
| | | | |
|
|
| | | Total Switzerland | | | 67,868,887 |
| | | | |
|
|
| |
Taiwan — 1.3% | | | |
| 377,600 | | Advanced Semiconductor Engineering Inc., ADR | | | 1,918,208 |
| 282,964 | | Siliconware Precision Industries Co., ADR | | | 1,661,001 |
| 795,834 | | Taiwan Semiconductor Manufacturing Co., Ltd., ADR | | | 7,409,215 |
| 7,862,922 | | United Microelectronics Corp. | | | 4,302,033 |
| 625,838 | | United Microelectronics Corp., ADR | | | 1,908,804 |
| | | | |
|
|
| | | Total Taiwan | | | 17,199,261 |
| | | | |
|
|
| |
Thailand — 0.4% | | | |
| 1,674,900 | | Bangkok Bank Public Co., Ltd., NVDR | | | 4,680,359 |
| | | | |
|
|
| |
United Kingdom — 18.6% | | | |
| 516,954 | | Admiral Group PLC | | | 6,657,457 |
| 226,100 | | Amdocs Ltd.* | | | 8,580,495 |
| 115,000 | | Anglo American PLC | | | 4,970,201 |
| 127,400 | | AstraZeneca PLC | | | 8,249,484 |
| 129,210 | | AstraZeneca PLC, ADR | | | 8,416,740 |
| 523,700 | | Aviva PLC | | | 7,352,021 |
| 454,000 | | Barclays PLC | | | 5,678,314 |
| 212,990 | | BG Group PLC, ADR | | | 13,923,156 |
| 937,700 | | BP PLC | | | 10,648,932 |
| 863,133 | | Brit Insurance Holdings PLC | | | 4,449,537 |
| 915,900 | | British Sky Broadcasting Group PLC | | | 9,765,433 |
| 641,000 | | Cattles PLC | | | 4,005,541 |
| 1,220,300 | | Centrica PLC | | | 6,847,885 |
| 595,650 | | Diageo PLC | | | 10,594,259 |
| 18,000 | | Diageo PLC, ADR | | | 1,287,000 |
| 792,125 | | GlaxoSmithKline PLC | | | 22,421,489 |
| 530,895 | | HSBC Holdings PLC | | | 9,639,045 |
| 1,177,628 | | International Power PLC | | | 7,112,457 |
| 535,270 | | Invensys PLC* | | | 2,066,982 |
| 1,054,928 | | Kingfisher PLC | | | 4,735,901 |
| 319,000 | | Michael Page International PLC | | | 2,095,039 |
| 232,000 | | Northern Rock PLC | | | 4,920,743 |
| 876,300 | | Prudential PLC | | | 9,826,626 |
See Notes to Financial Statements.
56
Schedules of Investments
(continued)
| | | | | |
| International Equity Investments |
| | |
| Shares | | Security | | Value |
| |
United Kingdom — 18.6% (continued) | | | |
| 753,300 | | Rexam PLC | | $ | 7,781,003 |
| 155,200 | | Rio Tinto PLC | | | 7,844,244 |
| 2,040,859 | | Royal & Sun Alliance Insurance Group PLC | | | 5,376,883 |
| 488,300 | | Royal Bank of Scotland Group PLC | | | 16,552,448 |
| 91,500 | | Royal Dutch Shell PLC, ADR, Class A Shares | | | 6,308,010 |
| 1,313,230 | | Tesco PLC | | | 9,424,056 |
| 22,471 | | TI Automotive Ltd., Class A Shares (a)* | | | 0 |
| 152,100 | | Travis Perkins PLC | | | 4,878,144 |
| 5,282,803 | | Vodafone Group PLC | | | 11,430,984 |
| | | | |
|
|
| | | Total United Kingdom | | | 243,840,509 |
| | | | |
|
|
| | | TOTAL COMMON STOCKS
(Cost — $1,009,749,718) | | | 1,285,450,709 |
| | | | |
|
|
PREFERRED STOCKS — 0.6% | | | |
| |
Germany — 0.6% | | | |
| 62,200 | | Henkel KGaA (Cost — $5,821,072) | | | 7,932,269 |
| | | | |
|
|
| | | TOTAL INVESTMENTS BEFORE SHORT-TERM INVESTMENT
(Cost — $1,015,570,790) | | | 1,293,382,978 |
| | | | |
|
|
| | |
Face
Amount
| | | | |
SHORT-TERM INVESTMENT — 0.6% | | | |
REPURCHASE AGREEMENT — 0.6% | | | |
| $8,066,000 | | State Street Bank & Trust Co. dated 8/31/06, 4.810% due 9/1/06; Proceeds at maturity — $8,067,078; (Fully collateralized by U.S. Treasury Bond, 4.500% due 2/15/36; Market value — $8,237,531)
(Cost — $8,066,000) | | | 8,066,000 |
| | | | |
|
|
| | | TOTAL INVESTMENTS — 99.4%
(Cost — $1,023,636,790#) | | | 1,301,448,978 |
| | | Other Assets in Excess of Liabilities — 0.6% | | | 7,978,681 |
| | | | |
|
|
| | | TOTAL NET ASSETS — 100.0% | | $ | 1,309,427,659 |
| | | | |
|
|
| * | | Non-income producing security. |
| (a) | | Security is valued in good faith at fair value by or under the direction of the Board of Trustees (See Note 1). |
| (b) | | All or a portion of this security is segregated for short sale. |
| # | | Aggregate cost for federal income tax purposes is $1,033,730,843. |
Abbreviations used in this schedule:
| | | | |
| ADR | | — | | American Depositary Receipt |
| CVA | | — | | Certificaaten van aandelen (Share Certificates) |
| NVDR | | — | | Non-Voting Depositary Receipt |
See Notes to Financial Statements.
57
Schedules of Investments
(continued)
International Equity Investments
| | | |
| Summary of Investments by Sector* (unaudited) | | | |
Financials | | 26.1 | % |
Consumer Discretionary | | 13.8 | |
Health Care | | 10.4 | |
Information Technology | | 9.9 | |
Energy | | 9.1 | |
Materials | | 9.0 | |
Industrials | | 8.3 | |
Consumer Staples | | 6.3 | |
Utilities | | 3.3 | |
Telecommunication Services | | 3.2 | |
Short-Term Investment | | 0.6 | |
| | |
|
|
| | | 100.0 | % |
| | |
|
|
* As a percentage of total investments. | | | |
Schedule of Security Sold Short
| | | | | |
| | | |
| Shares | | Security | | Value |
| 23,000 | | Onward Kashiyama Co. Ltd. | | $ | 337,626 |
| | | | |
|
|
| | | TOTAL OPEN SHORT SALE
(Proceeds — $342,160) | | $ | 337,626 |
| | | | |
|
|
See Notes to Financial Statements.
58
Schedules of Investments
(continued)
| | | | | |
| Emerging Markets Equity Investments |
| | |
| Shares | | Security | | Value |
COMMON STOCKS — 93.4% | | | |
| |
Argentina — 0.5% | | | |
| 18,800 | | Banco Macro Bansud SA, ADR | | $ | 384,460 |
| 79,790 | | IRSA Inversionesy Representaciones, GDR* | | | 941,522 |
| | | | |
|
|
| | | Total Argentina | | | 1,325,982 |
| | | | |
|
|
| |
Bermuda — 0.7% | | | |
| 15,968 | | Credicorp Ltd. | | | 594,010 |
| 340,000 | | Kingway Brewery Holdings Ltd. | | | 134,654 |
| 2,507,000 | | Pacific Basin Shipping Ltd. | | | 1,353,924 |
| | | | |
|
|
| | | Total Bermuda | | | 2,082,588 |
| | | | |
|
|
| |
Brazil — 10.4% | | | |
| 21,197 | | American Banknote SA | | | 165,358 |
| 6,609 | | Aracruz Celulose SA, ADR | | | 343,205 |
| 18,410 | | Banco Bradesco SA, ADR | | | 602,375 |
| 35,400 | | Banco do Brasil SA | | | 793,741 |
| 152,900 | | Companhia Vale do Rio Doce | | | 3,285,484 |
| 111,677 | | Companhia Vale do Rio Doce, ADR | | | 2,010,186 |
| 11,733 | | Cosan SA Industria e Comercio* | | | 619,329 |
| 32,400 | | CSU Cardsystem SA* | | | 164,062 |
| 90,900 | | Cyrela Brazil Realty SA | | | 1,605,054 |
| 29,227 | | Datasul SA* | | | 207,521 |
| 8,817 | | Diagnosticos da America SA* | | | 169,277 |
| 25,400 | | EDP - Energias do Brasil SA | | | 321,542 |
| 47,125 | | Equatorial Energia SA* | | | 344,508 |
| 19,500 | | Gafisa SA* | | | 255,051 |
| 33,207 | | Gerdau SA, ADR | | | 482,166 |
| 37,686 | | Localiza Rent A Car SA | | | 786,728 |
| 16,156 | | Lojas Renner SA (a) | | | 962,907 |
| 19,483 | | Lupatech SA* | | | 201,132 |
| 1,603 | | MMX Mineracao e Metalicos SA* | | | 610,267 |
| 149,632 | | Petroleo Brasileiro SA, ADR | | | 12,294,457 |
| 25,077 | | Porto Seguro SA | | | 532,992 |
| 29,555 | | Tele Norte Leste Participacoes SA (a) | | | 744,139 |
| 33,000 | | Tractebel Energia SA | | | 297,513 |
| 172,100 | | Unibanco-Uniao de Bancos Brasileiros SA | | | 1,234,827 |
| 22,700 | | Vivax SA* | | | 348,864 |
| 26,441 | | Votorantim Celulose e Papel SA, ADR | | | 426,493 |
| | | | |
|
|
| | | Total Brazil | | | 29,809,178 |
| | | | |
|
|
| |
Cayman Islands — 0.6% | | | |
| 269,000 | | China Mengniu Dairy Co., Ltd. | | | 344,510 |
| 2,504,000 | | Global Bio-chem Technology Group Co., Ltd. | | | 833,921 |
| 3,200 | | Suntech Power Holdings Co., Ltd., ADR* | | | 92,800 |
| 150,000 | | Tencent Holdings Ltd. | | | 327,892 |
| 190,000 | | Xinao Gas Holdings Ltd. | | | 180,791 |
| | | | |
|
|
| | | Total Cayman Islands | | | 1,779,914 |
| | | | |
|
|
| |
China — 5.8% | | | |
| 166,000 | | Aluminum Corporation of China Ltd. | | | 118,679 |
| 274,000 | | Angang New Steel Co., Ltd. | | | 224,782 |
| 306,000 | | Anhui Expressway Co., Ltd. | | | 202,244 |
See Notes to Financial Statements.
59
Schedules of Investments
(continued)
| | | | | |
| Emerging Markets Equity Investments |
| | |
| Shares | | Security | | Value |
| |
China — 5.8% (continued) | | | |
| 958,000 | | Bank of China Ltd.* | | $ | 416,364 |
| 1,825,000 | | China Construction Bank | | | 790,831 |
| 551,000 | | China Life Insurance Co., Ltd. | | | 977,736 |
| 1,698,000 | | China Petroleum & Chemical Corp., Class H Shares | | | 1,008,719 |
| 1,247,570 | | China Shenhua Energy Co., Ltd., Class H Shares | | | 2,207,365 |
| 2,944,200 | | China Shipping Development Co., Ltd. | | | 2,619,776 |
| 676,000 | | China Telecom Corp., Ltd. | | | 226,870 |
| 516,000 | | Dongfeng Motor Corp., Class H Shares* | | | 189,097 |
| 50,400 | | Guangzhou R&F Properties Co., Ltd. | | | 252,747 |
| 342,000 | | Harbin Power Equipment Co., Ltd. | | | 297,718 |
| 250,000 | | Jiangxi Copper Co., Ltd., Class H Shares | | | 237,240 |
| 1,204,000 | | Lianhua Supermarket Holdings Ltd., Class H Shares | | | 1,206,020 |
| 1,687,500 | | PetroChina Co., Ltd. | | | 1,902,979 |
| 3,803,000 | | PICC Property & Casualty Co., Ltd. | | | 1,300,764 |
| 262,500 | | Ping An Insurance Group Co. of China Ltd. | | | 859,029 |
| 61,821 | | Shenzhen Chiwan Wharf Holdings Ltd., Class B Shares | | | 93,642 |
| 574,000 | | Sinopec Shanghai Petrochemical Co., Ltd. | | | 270,137 |
| 899,100 | | Weiqiao Textile Co., Ltd., Class H Shares | | | 997,722 |
| 388,000 | | Zijin Mining Group Co., Ltd., Class H Shares | | | 183,599 |
| 23,200 | | ZTE Corp. | | | 79,352 |
| | | | |
|
|
| | | Total China | | | 16,663,412 |
| | | | |
|
|
| |
Colombia — 0.3% | | | |
| 26,600 | | BanColombia SA, ADR | | | 774,060 |
| | | | |
|
|
| |
Egypt — 0.7% | | | |
| 54,497 | | El Sewedy Cables Holding Co.* | | | 378,788 |
| 2 | | Medinet Nasr Housing | | | 27 |
| 21,918 | | Orascom Construction Industries | | | 909,136 |
| 13,644 | | Orascom Telecom Holding SAE | | | 741,560 |
| | | | |
|
|
| | | Total Egypt | | | 2,029,511 |
| | | | |
|
|
| |
Hong Kong — 3.2% | | | |
| 70,000 | | Beijing Enterprises Holdings Ltd. | | | 112,872 |
| 482,700 | | China Merchants Holdings International Co., Ltd. | | | 1,402,738 |
| 446,000 | | China Mobile (Hong Kong) Ltd. | | | 2,999,351 |
| 109,000 | | China Netcom Group Corp. (Hong Kong) Ltd. | | | 191,736 |
| 612,000 | | China Overseas Land & Investment Ltd. | | | 423,374 |
| 176,000 | | China Resources Power Holdings Co. | | | 155,701 |
| 35,000 | | Citic Pacific Ltd. | | | 111,837 |
| 2,629,000 | | CNOOC Ltd. | | | 2,295,361 |
| 454,000 | | Guangdong Investment Ltd. | | | 175,133 |
| 180,000 | | iShares Asia Trust - iShares FTSE/Xinhua A50 China Tracker | | | 1,388,719 |
| | | | |
|
|
| | | Total Hong Kong | | | 9,256,822 |
| | | | |
|
|
| |
India — 2.9% | | | |
| 11,748 | | ICICI Bank Ltd., ADR | | | 313,554 |
| 56,850 | | Infosys Technologies Ltd., ADR | | | 2,549,722 |
| 1,192 | | Larsen & Toubro Ltd., GDR (b) | | | 61,572 |
| 33,818 | | Ranbaxy Laboratories Ltd., GDR | | | 295,908 |
| 300 | | Reliance Industries Ltd., GDR, London Shares (b)* | | | 14,355 |
| 70,163 | | Reliance Industries Ltd., GDR, Luxembourg Shares (b) | | | 3,357,300 |
| 42,888 | | Satyam Computer Services Ltd., ADR | | | 1,637,035 |
| | | | |
|
|
| | | Total India | | | 8,229,446 |
| | | | |
|
|
See Notes to Financial Statements.
60
Schedules of Investments
(continued)
| | | | | |
| Emerging Markets Equity Investments |
| | |
| Shares | | Security | | Value |
| |
Indonesia — 1.7% | | | |
| 454,000 | | Aneka Tambang Tbk. (PT) | | $ | 268,904 |
| 593,175 | | PT Astra International Tbk. | | | 722,194 |
| 1,044,000 | | PT Bank Central Asia Tbk. | | | 521,027 |
| 1,238,000 | | PT Bank Mandiri Persero Tbk. | | | 285,159 |
| 1,313,500 | | PT Bank Rakyat Indonesia | | | 626,711 |
| 1,732,000 | | PT Berlian Laju Tanker Tbk. | | | 378,050 |
| 2,374,500 | | PT Bumi Resources Tbk. (c) | | | 195,336 |
| 474,500 | | PT Indosat Tbk. | | | 229,001 |
| 1,959,996 | | PT Telekomunikasi Indonesia Tbk. | | | 1,698,362 |
| | | | |
|
|
| | | Total Indonesia | | | 4,924,744 |
| | | | |
|
|
| |
Ireland — 0.1% | | | |
| 120,157 | | Dragon Oil PLC* | | | 391,995 |
| | | | |
|
|
| |
Israel — 1.7% | | | |
| 3,229 | | Elbit Systems Ltd. | | | 92,738 |
| 25,272 | | Israel Chemicals Ltd. | | | 120,643 |
| 670,200 | | Israel Discount Bank, Class A Shares* | | | 1,093,253 |
| 393,817 | | Makhteshim-Agan Industries Ltd. | | | 2,012,480 |
| 10,161 | | Ormat Industries Ltd. | | | 100,989 |
| 38,962 | | Teva Pharmaceutical Industries Ltd., ADR | | | 1,354,319 |
| | | | |
|
|
| | | Total Israel | | | 4,774,422 |
| | | | |
|
|
| |
Luxembourg — 1.2% | | | |
| 3,706 | | Evraz Group SA GDR | | | 79,679 |
| 73,150 | | Tenaris SA, ADR | | | 2,685,337 |
| 23,777 | | Ternium SA, ADR* | | | 599,418 |
| | | | |
|
|
| | | Total Luxembourg | | | 3,364,434 |
| | | | |
|
|
| |
Mexico — 5.1% | | | |
| 124,822 | | America Movil SA de CV, Series L Shares, ADR | | | 4,657,109 |
| 60,802 | | Cemex SA de CV, Participation Certificate, ADR* | | | 1,756,570 |
| 185,500 | | Controladora Comercial Mexicana SA de CV | | | 348,413 |
| 397,510 | | Corporacion GEO SA de CV, Series B Shares* | | | 1,602,496 |
| 331,200 | | Empresas ICA SA de CV* | | | 1,122,763 |
| 116,200 | | Grupo Aeroportuari del Sureste SAB de CV, Series B | | | 391,681 |
| 158,500 | | Grupo FAMSA SA, Series A* | | | 406,905 |
| 155,726 | | Grupo Financiero Banorte SA de CV, Series O Shares | | | 455,714 |
| 119,631 | | Grupo Mexico SA de CV, Series B Shares | | | 381,543 |
| 76,500 | | Grupo Modelo SA de CV, Series C Shares | | | 322,275 |
| 44,960 | | Grupo Televisa SA, ADR | | | 856,038 |
| 50,048 | | Telefonos de Mexico SA de CV, Series L Shares, ADR | | | 1,208,159 |
| 64,697 | | Wal-Mart de Mexico SA de CV | | | 220,507 |
| 23,668 | | Wal-Mart de Mexico SA de CV, Series V Shares, ADR | | | 810,037 |
| | | | |
|
|
| | | Total Mexico | | | 14,540,210 |
| | | | |
|
|
| |
Pakistan — 0.1% | | | |
| 48,240 | | National Bank of Pakistan | | | 179,057 |
| 24,500 | | Pakistan State Oil Co., Ltd. | | | 133,102 |
| | | | |
|
|
| | | Total Pakistan | | | 312,159 |
| | | | |
|
|
See Notes to Financial Statements.
61
Schedules of Investments
(continued)
| | | | | |
| Emerging Markets Equity Investments |
| | |
| Shares | | Security | | Value |
| |
Philippines — 0.3% | | | |
| 9,050 | | Ayala Corp. | | $ | 78,347 |
| 691,900 | | Ayala Land Inc. | | | 183,781 |
| 11,700 | | Philippine Long Distance Telephone Co., ADR | | | 438,048 |
| | | | |
|
|
| | | Total Philippines | | | 700,176 |
| | | | |
|
|
| |
Poland — 0.4% | | | |
| 482 | | Bank Przemyslowo-Handlowy BPH | | | 124,720 |
| 17,730 | | Globe Trade Centre SA* | | | 155,224 |
| 5,409 | | KGHM Polska Miedz SA | | | 187,666 |
| 14,961 | | Polski Koncern Naftowy Orlen SA | | | 249,350 |
| 28,401 | | Powszechna Kasa Oszczednosci Bank Polski SA | | | 341,659 |
| 16,650 | | Telekomunikacja Polska SA | | | 109,057 |
| | | | |
|
|
| | | Total Poland | | | 1,167,676 |
| | | | |
|
|
| |
Russia — 11.3% | | | |
| 97,170 | | AFK Sistema, Registered Shares, GDR | | | 2,526,420 |
| 11,633 | | AO VimpelCom, ADR* | | | 631,904 |
| 49,594 | | Comstar United Telesystems, GDR | | | 315,914 |
| 177,447 | | Gazprom, Registered Shares, ADR | | | 8,357,754 |
| 5,390 | | Kalina | | | 231,770 |
| 93,522 | | LUKOIL, ADR | | | 7,827,791 |
| 10,186 | | Mining and Metallurgical Co. Norilsk Nickel, ADR | | | 1,390,389 |
| 27,160 | | NovaTek OAO, GDR | | | 1,299,878 |
| 30,050 | | Novolipetsk Steel, GDR | | | 578,462 |
| 54,587 | | OAO Gazprom, ADR | | | 2,571,048 |
| 10,891 | | Polyus Gold, ADR* | | | 462,867 |
| 374 | | Priargunsky Plant* | | | 154,967 |
| 849,807 | | RAO Unified Energy System (UES) | | | 625,883 |
| 455 | | Sberbank RF | | | 987,350 |
| 48,808 | | Surgutneftegaz, ADR | | | 3,709,408 |
| 5,388 | | Surgutneftegaz, Preferred Shares, ADR | | | 525,330 |
| 304 | | Vsmpo-Avisma Corp. | | | 68,704 |
| 3,699 | | Wimm-Bill-Dann Foods OJSC, ADR | | | 171,153 |
| | | | |
|
|
| | | Total Russia | | | 32,436,992 |
| | | | |
|
|
| |
South Africa — 6.1% | | | |
| 60,074 | | African Bank Investments Ltd. | | | 212,163 |
| 5,298 | | Anglo Platinum Ltd. | | | 594,512 |
| 14,423 | | AngloGold Ashanti Ltd. | | | 654,779 |
| 97,731 | | Aveng Ltd. | | | 362,394 |
| 30,654 | | Bidvest Group Ltd. | | | 464,461 |
| 261,143 | | FirstRand Ltd. | | | 647,372 |
| 48,942 | | Gold Fields Ltd. | | | 951,584 |
| 26,047 | | Harmony Gold Mining Co., Ltd.* | | | 354,504 |
| 14,587 | | Impala Platinum Holdings Ltd. | | | 2,704,485 |
| 5,335 | | Investec Ltd. | | | 260,804 |
| 27,079 | | JD Group Ltd. | | | 250,463 |
| 21,807 | | Kumba Resources Ltd. | | | 440,562 |
| 56,125 | | Mittal Steel South Africa Ltd. | | | 594,728 |
| 64,207 | | MTN Group Ltd. | | | 510,054 |
| 31,289 | | Naspers Ltd. | | | 541,001 |
| 20,045 | | Nedbank Group Ltd. | | | 307,475 |
| 34,929 | | Reunert Ltd. | | | 350,236 |
See Notes to Financial Statements.
62
Schedules of Investments
(continued)
| | | | | |
| Emerging Markets Equity Investments |
| | |
| Shares | | Security | | Value |
| |
South Africa — 6.1% (continued) | | | |
| 24,806 | | Sappi Ltd. | | $ | 316,082 |
| 119,924 | | Sasol Ltd. | | | 4,163,739 |
| 167,895 | | Shoprite Holdings Ltd. | | | 575,933 |
| 80,604 | | Standard Bank Group Ltd. | | | 871,246 |
| 27,742 | | Telkom South Africa Ltd. | | | 523,979 |
| 21,773 | | Tiger Brands Ltd. | | | 461,132 |
| 71,539 | | Truworths International Ltd. | | | 227,717 |
| | | | |
|
|
| | | Total South Africa | | | 17,341,405 |
| | | | |
|
|
| |
South Korea — 18.4% | | | |
| 19,200 | | Daegu Bank | | | 321,548 |
| 6,450 | | Daelim Industrial Co. | | | 413,294 |
| 6,510 | | Daesang Corp.* | | | 89,725 |
| 17,570 | | Dongbu Insurance Co., Ltd. | | | 395,684 |
| 19,200 | | GS Engineering & Construction Corp. | | | 1,314,152 |
| 12,407 | | Hana Financial Group Inc. | | | 534,946 |
| 9,050 | | Hanjin Heavy Industries & Construction Co., Ltd. | | | 246,643 |
| 12,210 | | Hankook Tire Co., Ltd. | | | 162,571 |
| 8,040 | | Hanwha Corp. | | | 236,261 |
| 11,474 | | Humax Co., Ltd. | | | 301,963 |
| 10,250 | | Hynix Semiconductor Inc.* | | | 392,365 |
| 25,724 | | Hyundai Department Store Co., Ltd | | | 2,001,514 |
| 11,380 | | Hyundai Development Co. | | | 466,398 |
| 6,080 | | Hyundai Engineering & Construction Co., Ltd.* | | | 321,282 |
| 5,820 | | Hyundai Mipo Dockyard Co., Ltd. | | | 599,345 |
| 6,120 | | Hyundai Mobis | | | 560,849 |
| 37,158 | | Hyundai Motor Co. | | | 3,130,804 |
| 1,130 | | Hyundai Motor Co., GDR (b) | | | 46,906 |
| 5,070 | | Hyundai Steel Co. | | | 180,629 |
| 8,890 | | Industrial Bank of Korea | | | 159,055 |
| 83,117 | | Kookmin Bank | | | 6,726,481 |
| 4,560 | | Kookmin Bank, ADR | | | 367,445 |
| 21,080 | | Korea Electric Power Corp. | | | 806,932 |
| 44,430 | | Korea Investment Holdings Co., Ltd. | | | 1,797,812 |
| 6,500 | | Korea Kumho Petrochemical Co., Ltd. | | | 169,709 |
| 1,316 | | Korea Zinc Co., Ltd. | | | 113,619 |
| 5,310 | | Korean Air Lines Co., Ltd. | | | 167,361 |
| 40 | | KT Corp. | | | 1,745 |
| 11,605 | | KT Corp., ADR | | | 256,470 |
| 11,660 | | KT&G Corp. | | | 684,063 |
| 32,200 | | LG Electronics Inc. | | | 2,157,050 |
| 5,730 | | LG International Corp. | | | 128,446 |
| 68,500 | | LG Philips LCD Co., Ltd., ADR* | | | 1,361,095 |
| 6,680 | | LS Cable Ltd. | | | 223,744 |
| 6,600 | | NHN Corp.* | | | 623,373 |
| 7,064 | | POSCO | | | 1,774,542 |
| 19,324 | | Samsung Electronics Co., Ltd. | | | 13,065,585 |
| 30 | | Samsung Electronics Co., Ltd., GDR (b) | | | 10,200 |
| 770 | | Samsung Electronics Co., Ltd., Registered Shares, GDR (b) | | | 261,800 |
| 4,120 | | Samsung Engineering Co., Ltd. | | | 191,354 |
| 1,777 | | Samsung Fire & Marine Insurance Co., Ltd. | | | 249,540 |
| 8,230 | | Samsung Techwin Co., Ltd. | | | 288,502 |
| 87,680 | | Shinhan Financial Group Co., Ltd. | | | 3,953,740 |
See Notes to Financial Statements.
63
Schedules of Investments
(continued)
| | | | | |
| Emerging Markets Equity Investments |
| | |
| Shares | | Security | | Value |
| |
South Korea — 18.4% (continued) | | | |
| 6,937 | | Shinsegae Co., Ltd. | | $ | 3,441,982 |
| 15,160 | | SK Corp. | | | 976,131 |
| 4,740 | | SK Telecom Co., Ltd. | | | 922,016 |
| 13,330 | | Woori Finance Holdings Co., Ltd. | | | 262,066 |
| | | | |
|
|
| | | Total South Korea | | | 52,858,737 |
| | | | |
|
|
| |
Sri Lanka — 0.2% | | | |
| 3,532,800 | | Dialog Telekom Ltd. | | | 700,061 |
| | | | |
|
|
| |
Taiwan — 14.0% | | | |
| 164,342 | | Asustek Computer Inc. | | | 368,657 |
| 526,453 | | AU Optronics Corp. | | | 779,302 |
| 202,568 | | Catcher Technology Co., Ltd. | | | 1,588,575 |
| 1,170,789 | | Cathay Financial Holding Co., Ltd. | | | 2,238,446 |
| 1 | | China Development Financial Holding Corp.* | | | 0 |
| 636,671 | | China Steel Corp. | | | 516,706 |
| 1,795,413 | | Chinatrust Financial Holding Co., Ltd. | | | 1,176,058 |
| 212,160 | | Chunghwa Telecom Co., Ltd. | | | 348,237 |
| 53,900 | | Compal Communications Inc. | | | 229,369 |
| 191,135 | | Delta Electronics Inc. | | | 531,592 |
| 120,281 | | E.Sun Financial Holding Co., Ltd. | | | 71,659 |
| 2,179,960 | | Far Eastern Department Stores Co., Ltd. | | | 1,046,943 |
| 419,958 | | Far Eastern Textile Co., Ltd. | | | 294,873 |
| 147,000 | | Far EasTone Telecommunications Co., Ltd. | | | 159,069 |
| 462,685 | | First Financial Holding Co., Ltd. | | | 296,746 |
| 314,513 | | Formosa Chemicals & Fibre Corp. | | | 453,620 |
| 83,000 | | Formosa Petrochemical Corp. | | | 163,987 |
| 4,743 | | Formosa Plastics Corp. | | | 6,459 |
| 21,600 | | High Tech Computer Corp. | | | 544,941 |
| 871,996 | | Hon Hai Precision Industry Co., Ltd. | | | 4,916,723 |
| 29,748 | | Hon Hai Precision Industry Co., Ltd., Registered Shares, GDR | | | 340,615 |
| 880 | | Hon Hai Precision Industry Co., Ltd. GDR | | | 10,076 |
| 1,438,000 | | Hung Poo Real Estate Development Corp. | | | 1,420,560 |
| 273,520 | | Inventec Co., Ltd. | | | 166,279 |
| 13,650 | | Largan Precision Co., Ltd. | | | 282,966 |
| 76,676 | | Lite-On Technology Corp.* | | | 95,207 |
| 68,640 | | Media Tek Inc. | | | 625,916 |
| 804,000 | | Mega Financial Holding Co., Ltd. | | | 533,980 |
| 410,572 | | Nan Ya Plastics Corp. | | | 555,350 |
| 79,559 | | Nien Made Enterprises Co., Ltd. | | | 62,392 |
| 27,196 | | Novatek Microelectronics Corp. Ltd. | | | 133,917 |
| 691 | | Pacific Electric Wire & Cable Co., Ltd. (c)(d) | | | 0 |
| 3,210,212 | | Polaris Securities Co., Ltd.* | | | 1,366,089 |
| 3,493,969 | | Powerchip Semiconductor Corp. | | | 2,309,913 |
| 52,900 | | Powertech Technology Inc. | | | 147,931 |
| 352,667 | | Siliconware Precision Industries Co. | | | 418,068 |
| 451,553 | | Taishin Financial Holdings Co., Ltd.* | | | 215,489 |
| 392,009 | | Taiwan Cement Corp. | | | 261,546 |
| 885,000 | | Taiwan Fertilizer Co., Ltd. | | | 1,331,575 |
| 382,600 | | Taiwan Mobile Co., Ltd. | | | 355,864 |
| 1,401,237 | | Taiwan Semiconductor Manufacturing Co., Ltd. | | | 2,474,600 |
| 379,993 | | Taiwan Semiconductor Manufacturing Co., Ltd., ADR | | | 3,537,735 |
| 129,204 | | Tripod Technology Corp. | | | 396,656 |
| 703,981 | | Unimicron Technology Corp. | | | 981,110 |
See Notes to Financial Statements.
64
Schedules of Investments
(continued)
| | | | | |
| Emerging Markets Equity Investments |
| | |
| Shares | | Security | | Value |
| |
Taiwan — 14.0% (continued) | | | |
| 532,087 | | United Microelectronics Corp. | | $ | 291,120 |
| 910,828 | | United Microelectronics Corp., ADR | | | 2,778,026 |
| 174,381 | | Wistron Corp. | | | 193,733 |
| 1,379,000 | | Yageo Corp.* | | | 475,748 |
| 360,200 | | Yageo Corp., GDR* | | | 620,949 |
| 3,042,314 | | Yuanta Core Pacific Securities Co. | | | 2,089,920 |
| | | | |
|
|
| | | Total Taiwan | | | 40,205,292 |
| | | | |
|
|
| |
Thailand — 3.5% | | | |
| 143,050 | | Advanced Info Service Public Co., Ltd. | | | 344,538 |
| 875,800 | | Bangkok Bank Public Co., Ltd. (d) | | | 2,563,886 |
| 149,500 | | Bangkok Bank Public Co., Ltd., NVDR | | | 417,764 |
| 80,300 | | Banpu Public Co., Ltd. | | | 301,325 |
| 1,438,200 | | Kasikornbank Public Co., Ltd., NVDR | | | 2,392,216 |
| 1,467,100 | | Krung Thai Bank Public Co., Ltd. | | | 447,060 |
| 611,200 | | Land & Houses Public Co., Ltd., NVDR | | | 117,116 |
| 150,709 | | PTT Chemical Public Co., Ltd. | | | 310,844 |
| 199,700 | | PTT Public Co., Ltd. | | | 1,254,270 |
| 11,500 | | Siam Cement Public Co., Ltd. | | | 71,617 |
| 61,300 | | Siam Cement Public Co., Ltd., NVDR | | | 355,646 |
| 223,200 | | Thai Oil Public Co., Ltd. | | | 362,347 |
| 47,000 | | Total Access Communication Public Co., Ltd.* | | | 188,000 |
| 3,029,500 | | True Corp. Public Co., Ltd.* | | | 759,895 |
| | | | |
|
|
| | | Total Thailand | | | 9,886,524 |
| | | | |
|
|
| |
Turkey — 2.0% | | | |
| 112,977 | | Akbank TAS | | | 617,150 |
| 367 | | Aktas Electric Ticaret AS (c)(d)* | | | 0 |
| 11,037 | | Anadolu Efes Biracilik ve Malt Sanayii AS | | | 293,918 |
| 23,003 | | Arcelik AS | | | 148,432 |
| 1,749 | | BIM Birlesik Magazalar AS | | | 63,296 |
| 77,219 | | Bolu Cimento Sanayii AS | | | 150,800 |
| 24,000 | | Coca-Cola Icecek Uretim AS* | | | 113,896 |
| 29,226 | | Denizbank AS* | | | 283,379 |
| 70,055 | | Dogan Sirketler Grubu Holdings AS | | | 298,971 |
| 25,491 | | Dogus Otomotiv Servis ve Ticaret AS | | | 106,176 |
| 13,617 | | Enka Insaat ve Sanayi AS | | | 113,436 |
| 29,502 | | Eregli Demir ve Celik Fabrikalari TAS | | | 144,035 |
| 78,190 | | Haci Omer Sabanci Holding AS | | | 296,316 |
| 23,628 | | Koc Holding AS* | | | 87,929 |
| 18,742 | | Petrol Ofisi AS | | | 71,026 |
| 40,975 | | Tofas Turk Otomobil Fabrikasi AS | | | 111,915 |
| 36,335 | | Trakya Cam Sanayii AS | | | 88,822 |
| 20,322 | | Tupras-Turkiye Petrol Rafinerileri AS | | | 371,194 |
| 12,136 | | Turk Demir Dokum Fabrikalari AS | | | 101,099 |
| 8,700 | | Turk Ekonomi Bankasi AS | | | 84,951 |
| 82,064 | | Turkcell Iletisim Hizmet AS | | | 381,041 |
| 134,338 | | Turkiye Garanti Bankasi AS | | | 392,603 |
| 190,797 | | Turkiye Is Bankasi, Class C Shares | | | 1,100,877 |
| 54,698 | | Turkiye Vakiflar Bankasi T.A.O., Class D Shares | | | 252,108 |
| 128,000 | | Vestel Beyaz Esya Sanayi ve Ticaret AS* | | | 163,441 |
| | | | |
|
|
| | | Total Turkey | | | 5,836,811 |
| | | | |
|
|
See Notes to Financial Statements.
65
Schedules of Investments
(continued)
| | | | | |
| Emerging Markets Equity Investments |
| | |
| Shares | | Security | | Value |
| |
United Kingdom — 1.4% | | | |
| 31,000 | | Anglo American PLC | | $ | 1,337,859 |
| 8,423 | | Burren Energy PLC | | | 147,408 |
| 52,200 | | Peter Hambro Mining PLC* | | | 1,252,141 |
| 341,300 | | Tanjong PLC | | | 1,223,896 |
| | | | |
|
|
| | | Total United Kingdom | | | 3,961,304 |
| | | | |
|
|
| |
United States — 0.8% | | | |
| 47,600 | | BMB Munai Inc.* | | | 285,600 |
| 35,900 | | Caspian Services Inc.* | | | 188,475 |
| 77,663 | | Reliance Demerger Energy Capital (c) | | | 1,246,722 |
| 6,924 | | Southern Copper Corp. | | | 639,224 |
| | | | |
|
|
| | | Total United States | | | 2,360,021 |
| | | | |
|
|
| | | TOTAL COMMON STOCKS
(Cost — $177,557,035) | | | 267,713,876 |
| | | | |
|
|
PREFERRED STOCKS — 5.8% | | | |
| |
Brazil — 4.4% | | | |
| 5,800 | | All America Latina Logistica SA, 0.510% | | | 487,653 |
| 18,066 | | Banco Bradesco SA, 2.890% | | | 586,602 |
| 98,450 | | Banco Itau Holding Financeira SA, 2.590% (a) | | | 2,966,722 |
| 13,600 | | Bradespar SA, 3.790% | | | 481,487 |
| 71,108 | | Itausa - Investimentos Itau SA, 3.160% | | | 300,608 |
| 64,100 | | Tam SA, 0.280% | | | 1,990,895 |
| 150,000 | | Tele Norte Leste Participacoes SA, 5.430% | | | 1,947,915 |
| 576 | | Telefonica Data Brasil Holding, 0.000%* | | | 0 |
| 475,782,900 | | Tim Participacoes SA, 2.330% | | | 1,369,064 |
| 37,521 | | Universo Online SA* | | | 214,706 |
| 70,900 | | Usinas Siderurgicas de Minas Gerais SA, Class A Shares, 6.670% (a) | | | 2,226,275 |
| | | | |
|
|
| | | Total Brazil | | | 12,571,927 |
| | | | |
|
|
| |
Russia — 0.7% | | | |
| 892 | | Transneft, 0.000% (c) | | | 1,801,840 |
| | | | |
|
|
| |
South Korea — 0.7% | | | |
| 7,700 | | Hyundai Motor Co., Ltd., 0.000% | | | 385,260 |
| 5,410 | | LG Electronics Inc., 0.000% | | | 209,625 |
| 2,853 | | Samsung Electronics Co., Ltd., 0.000% | | | 1,483,851 |
| | | | |
|
|
| | | Total South Korea | | | 2,078,736 |
| | | | |
|
|
| | | TOTAL PREFERRED STOCKS
(Cost — $10,411,173) | | | 16,452,503 |
| | | | |
|
|
| | |
Face
Amount
| | | | |
CORPORATE NOTE — 0.1% | | | |
UNITED KINGDOM — 0.1% | | | |
| $13,340 | | UBS AG London, Structured Note, due 10/6/06 (Cost — $154,658) | | | 345,639 |
| | | | |
|
|
See Notes to Financial Statements.
66
Schedules of Investments
(continued)
| | | | | | |
| Emerging Markets Equity Investments | |
| | |
Warrants | | Security | | Value | |
WARRANTS — 0.0% | | | | |
| |
Hong Kong — 0.0% | | | | |
| 76,500 | | China Overseas Land & Investment Ltd., Expires 7/18/07* | | $ | 11,312 | |
| | | | |
|
|
|
| |
United Kingdom — 0.0% | | | | |
| 2,425 | | Sun TV Ltd., Expires 4/27/07(c)* | | | 62,455 | |
| | | | |
|
|
|
| | | TOTAL WARRANTS
(Cost — $48,277) | | | 73,767 | |
| | | | |
|
|
|
| | | TOTAL INVESTMENTS BEFORE SHORT-TERM INVESTMENT
(Cost — $188,171,143) | | | 284,585,785 | |
| | | | |
|
|
|
| | |
Face
Amount
| | | | | |
SHORT-TERM INVESTMENT — 0.9% | | | | |
REPURCHASE AGREEMENT — 0.9% | | | | |
| $2,640,000 | | State Street Bank & Trust Co. repurchase agreement dated 8/31/06, 4.810% due 9/1/06; Proceeds at maturity — $2,640,353;
(Fully collateralized by U.S. Treasury Bond, 4.500% due 2/15/36; Market value — $2,703,600)
(Cost — $2,640,000) | | | 2,640,000 | |
| | | | |
|
|
|
| | | TOTAL INVESTMENTS — 100.2%
(Cost — $190,811,143#) | | | 287,225,785 | |
| | | Liabilities in Excess of Other Assets — (0.2)% | | | (462,652 | ) |
| | | | |
|
|
|
| | | TOTAL NET ASSETS — 100.0% | | $ | 286,763,133 | |
| | | | |
|
|
|
| * | | Non-income producing security. |
| # | | Aggregate cost for federal income tax purposes is $194,962,725. |
| (a) | | All or a portion of this security is segregated for foreign currency contracts. |
| (b) | | Security is exempt from registration under Rule 144A of the Securities Act of 1933. This security may be resold in transactions that are exempt from registration, normally to qualified institutional buyers. This security has been deemed liquid pursuant to guidelines approved by the Board of Trustees, unless otherwise noted. |
| (c) | | Security is valued in good faith at fair value by or under the direction of the Board of Trustees (See Note 1). |
Abbreviations used in this schedule:
| | | | |
| ADR | | — | | American Depositary Receipt |
| GDR | | — | | Global Depositary Receipt |
| NVDR | | — | | Non-Voting Depositary Receipt |
| | | |
| Summary of Investments by Industry* (unaudited) | |
Energy | | 21.1 | % |
Financials | | 21.0 | |
Information Technology | | 16.4 | |
Materials | | 12.2 | |
Telecommunication Services | | 8.0 | |
Industrials | | 7.7 | |
Consumer Discretionary | | 7.6 | |
Consumer Staples | | 2.5 | |
Utilities | | 1.4 | |
Health Care | | 0.6 | |
Exchange Traded Funds | | 0.5 | |
Short-Term Investment | | 1.0 | |
| | |
|
|
| | | 100.0 | % |
| | |
|
|
| * | | As a percentage of total investments. |
See Notes to Financial Statements.
67
Schedules of Investments
(continued)
| | | | | | |
| Government Money Investments | | | |
| | |
Face
Amount | | Security | | Value | |
SHORT-TERM INVESTMENTS — 100.7% | | | | |
| |
U.S. Government Agencies — 100.7% | | | | |
| | | Federal Farm Credit Bank (FFCB), Discount Notes: | | | | |
| $ 3,500,000 | | 5.125% due 9/25/06 (a) | | $ | 3,488,100 | |
| 3,500,000 | | 5.329% due 10/16/06 (a) | | | 3,477,058 | |
| 3,500,000 | | 5.316% due 12/29/06 (a) | | | 3,439,839 | |
| | | Federal Home Loan Bank (FHLB), Discount Notes: | | | | |
| 48,431,000 | | 4.921% due 9/1/06 (a) | | | 48,431,000 | |
| 3,500,000 | | 5.145% due 9/6/06 (a) | | | 3,497,501 | |
| 3,000,000 | | 5.242% due 9/13/06 (a) | | | 2,994,797 | |
| 3,500,000 | | 5.155% due 10/30/06 (a) | | | 3,470,688 | |
| 3,500,000 | | 5.203% due 11/15/06 (a) | | | 3,462,521 | |
| 3,000,000 | | 5.210% due 11/24/06 (a) | | | 2,963,985 | |
| | | Federal Home Loan Mortgage Corp. (FHLMC), Discount Notes: | | | | |
| 2,127,000 | | 5.077% due 9/19/06 (a) | | | 2,121,704 | |
| 3,000,000 | | 5.338% due 10/3/06 (a) | | | 2,985,979 | |
| 1,000,000 | | 5.183% due 10/5/06 (a) | | | 995,136 | |
| 3,500,000 | | 5.281% due 10/6/06 (a) | | | 3,482,203 | |
| 3,000,000 | | 5.373% due 11/14/06 (a) | | | 2,967,440 | |
| | | Series RB: | | | | |
| 1,380,000 | | 5.171% due 10/10/06 (a) | | | 1,372,316 | |
| 3,000,000 | | 5.191% due 10/10/06 (a) | | | 2,983,262 | |
| 3,500,000 | | 5.351% due 10/17/06 (a) | | | 3,476,387 | |
| 3,000,000 | | 5.151% due 11/21/06 (a) | | | 2,966,115 | |
| | | Federal National Mortgage Association (FNMA): | | | | |
| 1,025,000 | | 5.000% due 1/15/07 | | | 1,023,211 | |
| | | Discount Notes: | | | | |
| 3,500,000 | | 5.204% due 9/1/06 (a) | | | 3,500,000 | |
| 3,000,000 | | 5.212% due 9/5/06 (a) | | | 2,998,273 | |
| 3,500,000 | | 5.218% due 9/8/06 (a) | | | 3,496,468 | |
| 3,000,000 | | 5.071% due 9/15/06 (a) | | | 2,994,178 | |
| 2,877,000 | | 5.294% due 9/27/06 (a) | | | 2,866,112 | |
| 3,500,000 | | 5.167% due 10/11/06 (a) | | | 3,480,050 | |
| 3,500,000 | | 5.306% due 10/25/06 (a) | | | 3,472,490 | |
| 3,000,000 | | 5.203% due 11/15/06 (a) | | | 2,967,875 | |
| 4,400,000 | | Notes, 4.810% due 9/22/06 (b) | | | 4,399,885 | |
| | | | |
|
|
|
| | | TOTAL INVESTMENTS — 100.7%
(Cost — $129,774,573#) | | | 129,774,573 | |
| | | Liabilities in Excess of Other Assets — (0.7)% | | | (838,633 | ) |
| | | | |
|
|
|
| | | TOTAL NET ASSETS — 100.0% | | $ | 128,935,940 | |
| | | | |
|
|
|
| (a) | | Rate shown represents yield-to-maturity. |
| (b) | | Variable rate security. Interest rate disclosed is that which is in effect at August 31, 2006. |
| # | | Aggregate cost for federal income tax purposes is substantially the same. |
See Notes to Financial Statements.
68
Schedules of Investments
(continued)
| | | | | | | |
| Core Fixed Income Investments | | |
| | | |
Face
Amount | | | | Security | | Value |
MORTGAGE-BACKED SECURITIES — 37.9% |
FHLMC — 2.9% |
| | | | | Federal Home Loan Mortgage Corp. (FHLMC): | | | |
| $ 265,490 | | | | 8.500% due 12/1/07-7/1/17 (a) | | $ | 281,178 |
| 21,620 | | | | 9.500% due 10/1/08-8/1/16 (a) | | | 22,644 |
| 140,478 | | | | 8.000% due 4/1/09-6/1/17 (a) | | | 146,429 |
| 17,108 | | | | 10.000% due 4/1/09-10/1/09 (a) | | | 17,805 |
| 8,589 | | | | 10.250% due 5/1/09-2/1/10 (a) | | | 9,023 |
| 10,196 | | | | 9.000% due 8/1/09-10/1/09 (a) | | | 10,455 |
| 31,339 | | | | 11.500% due 10/1/15 (a) | | | 34,628 |
| 600,000 | | | | 5.000% due 12/15/17 (a) | | | 587,625 |
| 8,053 | | | | 13.016% due 2/15/24 (a)(b)(c) | | | 2,540 |
| 219,923 | | | | 4.354% due 12/1/34 (a)(b) | | | 214,475 |
| 203,628 | | | | 4.081% due 1/1/35 (a)(b) | | | 197,582 |
| 36,276 | | | | 5.000% due 3/1/35 (a) | | | 34,811 |
| 929,893 | | | | 5.500% due 4/15/35 (a) | | | 931,189 |
| 1,472,959 | | | | 5.362% due 4/1/36 (a)(b) | | | 1,467,062 |
| | | | | Gold: | | | |
| 47,722 | | | | 8.500% due 9/1/08-2/1/18 (a) | | | 50,051 |
| 34,022 | | | | 8.000% due 8/1/09-8/1/12 (a) | | | 34,931 |
| 3,796 | | | | 9.500% due 4/1/10 (a) | | | 3,956 |
| 139,616 | | | | 7.000% due 5/1/12-8/1/12 (a) | | | 142,997 |
| 370,815 | | | | 5.500% due 10/1/13-4/1/18 (a) | | | 370,436 |
| 200,975 | | | | 6.500% due 7/1/14 (a) | | | 199,469 |
| 26,037 | | | | 6.000% due 5/1/16-2/1/32 (a) | | | 26,216 |
| 4,604,052 | | | | 6.000% due 5/1/17-1/1/36 (a) | | | 4,630,193 |
| 1,863,328 | | | | 5.500% due 8/1/17-7/1/18 (a) | | | 1,860,586 |
| 27,997 | | | | 4.500% due 8/1/18 (a) | | | 26,952 |
| 3,798,605 | | | | 5.000% due 12/1/18-1/1/36 (a) | | | 3,717,676 |
| 15,460 | | | | 5.000% due 7/1/19 (a)(b) | | | 15,159 |
| 5,301,135 | | | | 5.000% due 2/1/20-7/1/21 (a)(b) | | | 5,191,295 |
| 1,064,937 | | | | 4.500% due 7/1/20-8/1/20 (a) | | | 1,023,457 |
| 207,260 | | | | 5.000% due 7/1/20-8/1/20 (a) | | | 203,166 |
| 1,000,000 | | | | 5.000% due 9/13/36 (d) | | | 958,750 |
| | | | | | |
|
|
| | | | | TOTAL FHLMC | | | 22,412,736 |
| | | | | | |
|
|
FNMA — 33.6% |
| | | | | Federal National Mortgage Association (FNMA): | | | |
| 28,967 | | | | 9.000% due 3/1/08-4/1/09 (a) | | | 29,284 |
| 8,010,933 | | | | 5.500% due 12/1/08-7/1/33 (a) | | | 7,965,904 |
| 18,844 | | | | 8.500% due 2/1/09-6/1/17 (a) | | | 19,485 |
| 27,992 | | | | 9.500% due 11/1/09-11/1/21 (a) | | | 28,918 |
| 767,105 | | | | 5.507% due 12/1/11 (a) | | | 772,983 |
| 6,798 | | | | 10.750% due 10/1/12 (a) | | | 7,088 |
| 13,540,827 | | | | 6.000% due 4/1/16-3/1/36 (a) | | | 13,561,016 |
| 7,169,522 | | | | 6.000% due 4/1/16-7/1/36 (a) | | | 7,194,548 |
| 15,655 | | | | 8.000% due 8/1/17 (a) | | | 16,505 |
| 559,986 | | | | 5.500% due 11/1/17-10/18/27 (a) | | | 558,904 |
| 231,574 | | | | 5.500% due 11/1/17-1/1/20 (a)(b) | | | 231,220 |
| 4,249,282 | | | | 5.000% due 1/1/18-6/1/36 (a)(b) | | | 4,122,595 |
| 1,063,597 | | | | 5.000% due 5/1/18-11/1/20 (a)(b) | | | 1,042,681 |
| 7,129,567 | | | | 4.000% due 7/1/18-8/1/19 (a)(b) | | | 6,717,297 |
| 65,006 | | | | 4.000% due 7/1/18 (a)(b) | | | 61,336 |
See Notes to Financial Statements.
69
Schedules of Investments
(continued)
| | | | | | | |
| Core Fixed Income Investments | | |
| | | |
Face
Amount | | | | Security | | Value |
FNMA — 33.6% (continued) |
| $ 906,120 | | | | 5.000% due 9/1/18-9/1/35 (a) | | $ | 882,184 |
| 36,012,655 | | | | 5.500% due 11/1/18-6/1/36 (a)(b) | | | 35,527,377 |
| 2,446,280 | | | | 4.500% due 5/1/19-10/1/35 (a) | | | 2,309,288 |
| 348,578 | | | | 4.000% due 7/1/19 (a) | | | 328,368 |
| 26,443 | | | | 4.000% due 7/1/19 (a) | | | 24,910 |
| 7,514,649 | | | | 5.000% due 12/1/19-5/1/36 (a) | | | 7,271,274 |
| 162,152 | | | | 4.500% due 1/1/20-10/1/35 (a) | | | 151,096 |
| 4,905 | | | | 10.000% due 1/1/21 (a) | | | 5,400 |
| 10,000,000 | | | | 5.500% due 9/18/21 (d) | | | 9,965,620 |
| 7,442,585 | | | | 6.500% due 11/1/23-3/1/36 (a) | | | 7,569,293 |
| 404,147 | | | | 7.000% due 9/1/26-2/1/33 (a) | | | 416,039 |
| 18,184 | | | | 6.572% due 1/1/30 (a)(b) | | | 18,237 |
| 55,236 | | | | 6.565% due 3/1/30 (a)(b) | | | 54,641 |
| 118,780 | | | | 5.774% due 10/25/30 (a)(b) | | | 119,240 |
| 152,363 | | | | 6.000% due 1/1/32-5/1/35 (a)(b) | | | 152,908 |
| 257,493 | | | | 5.730% due 5/18/32 (a)(b) | | | 259,591 |
| 200,848 | | | | 7.000% due 6/1/32-12/1/32 (a) | | | 206,649 |
| 477,621 | | | | 6.500% due 8/1/32-11/1/35 (a) | | | 486,373 |
| 12,050,498 | | | | 6.000% due 2/1/33-6/1/36 (a)(b) | | | 12,125,879 |
| 801,559 | | | | 3.996% due 4/1/34 (a)(b) | | | 780,720 |
| 527,041 | | | | 4.217% due 12/1/34 (a)(b) | | | 512,571 |
| 74,375 | | | | 4.252% due 12/1/34 (a)(b) | | | 72,472 |
| 7,544,037 | | | | 4.500% due 1/1/35-11/1/35 (a)(b) | | | 7,029,667 |
| 1,274,717 | | | | 4.593% due 9/1/35 (a)(b) | | | 1,266,401 |
| 832,228 | | | | 6.283% due 10/1/35 (a)(b) | | | 859,771 |
| 1,365,733 | | | | 6.286% due 10/1/35 (a)(b) | | | 1,410,932 |
| 568,237 | | | | 6.279% due 11/1/35 (a)(b) | | | 587,029 |
| 280,386 | | | | 6.287% due 11/1/35 (a)(b) | | | 289,665 |
| 283,487 | | | | 6.288% due 11/1/35 (a)(b) | | | 292,869 |
| 275,389 | | | | 6.289% due 11/1/35 (a)(b) | | | 284,503 |
| 276,795 | | | | 6.290% due 11/1/35 (a)(b) | | | 285,962 |
| 284,372 | | | | 6.292% due 11/1/35 (a)(b) | | | 293,790 |
| 5,060,535 | | | | 5.018% due 1/1/36 (a)(b) | | | 4,972,112 |
| 500,000 | | | | 4.500% due 9/13/36 (d) | | | 465,625 |
| 3,600,000 | | | | 5.000% due 9/13/36 (d)(e) | | | 3,449,250 |
| 51,800,000 | | | | 5.500% due 9/13/36-10/12/36 (d)(e) | | | 50,833,555 |
| 7,300,000 | | | | 6.000% due 9/13/36 (d)(e) | | | 7,309,125 |
| 32,900,000 | | | | 6.500% due 9/13/36-10/12/36 (d)(e) | | | 33,384,650 |
| 16,200,000 | | | | 5.000% due 10/12/36 (d)(e) | | | 15,516,554 |
| 4,100,000 | | | | 6.000% due 10/12/36 (d)(e) | | | 4,101,279 |
| 233,674 | | | | 6.167% due 4/1/40 (a)(b) | | | 236,678 |
| 940,000 | | | | Grantor Trust, 5.763% due 12/25/11 (a) | | | 966,576 |
| | | | | | |
|
|
| | | | | TOTAL FNMA | | | 255,405,887 |
| | | | | | |
|
|
GNMA — 1.4% |
| | | | | Government National Mortgage Association (GNMA): | | | |
| 130,479 | | | | 6.500% due 6/15/08 (a) | | | 131,039 |
| 9,619 | | | | 11.000% due 7/15/10-9/15/10 (a) | | | 10,373 |
| 816,994 | | | | 6.000% due 6/20/15 (a) | | | 832,021 |
| 145,052 | | | | 8.500% due 11/20/16-8/15/30 (a) | | | 155,157 |
| 24,519 | | | | 9.500% due 12/15/16-8/15/19 (a) | | | 26,750 |
| 79,735 | | | | 9.000% due 4/20/17-9/15/30 (a) | | | 85,698 |
See Notes to Financial Statements.
70
Schedules of Investments
(continued)
| | | | | | | |
| Core Fixed Income Investments | | |
| | | |
Face
Amount | | | | Security | | Value |
GNMA — 1.4% (continued) |
| $ 229,730 | | | | 5.880% due 12/16/25 (a)(b) | | $ | 232,262 |
| 348,301 | | | | 5.375% due 2/20/26-5/20/30 (a)(b) | | | 350,144 |
| 101,862 | | | | 5.125% due 10/20/27 (a)(b) | | | 102,554 |
| 3,592 | | | | 8.000% due 3/20/30 (a) | | | 3,794 |
| 180,457 | | | | 5.730% due 3/16/32 (a)(b) | | | 181,920 |
| 155,290 | | | | 5.000% due 1/15/33 (a) | | | 150,599 |
| 26,213 | | | | 5.500% due 8/15/33 (a) | | | 26,000 |
| 41,426 | | | | 4.500% due 9/15/33 (a) | | | 39,054 |
| 6,385,617 | | | | 5.000% due 9/15/33-10/15/33 (a) | | | 6,192,696 |
| 887,956 | | | | 3.750% due 5/20/34 (a)(b) | | | 866,080 |
| 1,000,000 | | | | 6.000% due 10/19/36 (d) | | | 1,008,438 |
| | | | | | |
|
|
| | | | | TOTAL GNMA | | | 10,394,579 |
| | | | | | |
|
|
| | | | | TOTAL MORTGAGE-BACKED SECURITIES
(Cost — $290,130,653) | | | 288,213,202 |
| | | | | | |
|
|
| | | |
| | | Rating‡
| | | | |
ASSET-BACKED SECURITIES — 5.8% |
|
Airlines — 0.0% |
| 40,000 | | NR | | US Air Pass-Through Trust, 10.375% due 3/1/49 (f) | | | 0 |
| | | | | | |
|
|
|
Automobiles — 2.5% |
| 2,450,000 | | AAA | | Capital Auto Receivables Asset Trust, Series 2005-1, Class A4, 4.050% due 7/15/09 (a) | | | 2,425,376 |
| 1,825,000 | | AAA | | Chase Manhattan Auto Owner Trust, Series 2005-B, Class A3, 4.840% due 7/15/09 (a) | | | 1,818,023 |
| 2,225,000 | | AAA | | DaimlerChrysler Auto Trust, Series 2005-B, Class A3, 4.040% due 9/8/09 (a)(b) | | | 2,204,667 |
| | | | | Ford Credit Auto Owner Trust: | | | |
| 1,554,507 | | AAA | | Series 2005-A, Class A3, 3.480% due 11/15/08 (a) | | | 1,541,951 |
| 2,100,000 | | AAA | | Series 2006-A, Class A3, 5.050% due 11/15/09 (a) | | | 2,095,161 |
| 2,870,000 | | AAA | | Honda Auto Receivables Owner Trust, Series 2005-5, Class A3, 4.610% due 8/17/09 (a) | | | 2,851,024 |
| 7,836 | | AAA | | M&I Auto Loan Trust, Series 2003-1, Class A3, 2.310% due 2/20/08 (a) | | | 7,823 |
| 2,375,000 | | AAA | | Nissan Auto Receivables Owner Trust, Series 2005-B, Class A3, 3.990% due 7/15/09 (a) | | | 2,350,294 |
| 1,850,000 | | AAA | | USAA Auto Owner Trust, Series 2005-4, Class A4, 4.890% due 8/15/12 (a) | | | 1,841,643 |
| 1,525,000 | | AAA | | Wachovia Auto Owner Trust, Series 2005-B, Class A3, 4.790% due 4/20/10 (a) | | | 1,517,275 |
| 390,262 | | AAA | | WFS Financial Owner Trust, Series 2005-1, Class A3, 3.590% due 10/19/09 (a) | | | 386,419 |
| | | | | | |
|
|
| | | | | Total Automobiles | | | 19,039,656 |
| | | | | | |
|
|
|
Credit Card — 1.3% |
| 1,500,000 | | AAA | | Bank One Issuance Trust, Series 2003-A9, Class A9, 3.860% due 6/15/11 (a) | | | 1,463,714 |
| 1,875,000 | | AAA | | Discover Card Master Trust I, Series 2005-01, Class A, 5.340% due 9/16/10 (a)(b) | | | 1,876,756 |
| | | | | MBNA Credit Card Master Note Trust: | | | |
| 1,775,000 | | AAA | | Series 2003-A7, Class A7, 2.650% due 11/15/10 (a) | | | 1,701,477 |
| 1,575,000 | | AAA | | Series 2004-A4, Class A4, 2.700% due 9/15/09 (a) | | | 1,551,463 |
| 1,650,000 | | AAA | | Series 2005-A7, Class A7, 4.300% due 2/15/11 (a) | | | 1,625,876 |
| 1,900,000 | | AAA | | Series 2006-A1, Class A1, 4.900% due 7/15/11 (a) | | | 1,893,812 |
| | | | | | |
|
|
| | | | | Total Credit Card | | | 10,113,098 |
| | | | | | |
|
|
|
Home Equity — 2.0% |
| 1,151,213 | | AAA | | Accredited Mortgage Loan Trust, Series 2005-3, Class A1, 5.564% due 10/25/35 (a)(b) | | | 1,152,948 |
| 513,152 | | AAA | | ACE Securities Corp., Series 2004-SD1, Class A1, 5.814% due 11/25/33 (a)(b) | | | 515,400 |
| 692,880 | | AAA | | Bear Stearns Asset Backed Securities Inc., Series 2004-FR3, Class 1A2, 5.844% due 10/25/34 (a)(b) | | | 695,304 |
| | | | | Chase Funding Mortgage Loan Asset-Backed Certificates: | | | |
| 4,929 | | AAA | | Series 2002-2, Class 2A1, 5.574% due 5/25/32 (a)(b) | | | 4,934 |
| 5,179 | | AAA | | Series 2002-3, Class 2A1, 5.644% due 8/25/32 (a)(b) | | | 5,184 |
See Notes to Financial Statements.
71
Schedules of Investments
(continued)
| | | | | | | |
| Core Fixed Income Investments | | |
| | | |
Face
Amount | | Rating‡ | | Security | | Value |
|
Home Equity — 2.0% (continued) |
| | | | | Countrywide Asset-Backed Certificates: | | | |
| $ 4,685 | | AAA | | Series 2001-BC3, Class A, 5.804% due 12/25/31 (a)(b) | | $ | 4,689 |
| 5,025 | | AAA | | Series 2002-3, Class 1A1, 5.694% due 5/25/32 (a)(b) | | | 5,031 |
| 12,759 | | AAA | | Series 2003-BC2, Class 2A1, 5.624% due 6/25/33 (a)(b) | | | 12,771 |
| 47,886 | | AAA | | Series 2004-S1, Class A1, 5.544% due 12/25/18 (a)(b) | | | 47,917 |
| 492,066 | | AAA | | Series 2004-SD4, Class A1, 5.704% due 10/25/34 (a)(b)(g) | | | 492,894 |
| 400,000 | | AAA | | Series 2005-4, Class AF3, 4.456% due 5/25/35 (a)(b) | | | 394,916 |
| 2,100,000 | | AAA | | Series 2006-SD3, Class A1, 5.644% due 7/25/36 (a)(b)(g) | | | 2,100,000 |
| | | | | Countrywide Home Equity Loan Trust: | | | |
| 8,970 | | AAA | | Series 2002-C, Class A, 5.570% due 5/15/28 (a)(b) | | | 8,979 |
| 1,002,621 | | AAA | | Series 2005-F, Class 2A, 5.570% due 10/15/35 (a)(b) | | | 1,003,699 |
| 898,124 | | AAA | �� | Series 2005-H, Class 2A, 5.570% due 10/25/35 (a)(b) | | | 900,019 |
| 1,453 | | AAA | | Delta Funding Home Equity Loan Trust, Series 1998-4, Class A1A, 6.530% due 2/15/31 (a)(b) | | | 1,454 |
| | | | | EMC Mortgage Loan Trust: | | | |
| 14,386 | | AAA | | Series 2002-B, Class A1, 5.974% due 10/25/32 (a)(b)(g) | | | 14,386 |
| 78,406 | | AAA | | Series 2003-A, Class A1, 5.874% due 8/25/40 (a)(b)(g) | | | 79,178 |
| 1,335,230 | | AAA | | GSAMP Trust, Series 2006-S2, Class A1A, 5.394% due 4/25/36 (a)(b) | | | 1,336,056 |
| | | | | Option One Mortgage Loan Trust: | | | |
| 8,108 | | AAA | | Series 2002-6, Class A2, 5.724% due 1/25/33 (a)(b) | | | 8,124 |
| 15,786 | | AAA | | Series 2003-1, Class A2, 5.744% due 2/25/33 (a)(b) | | | 15,822 |
| 100,000 | | AAA | | Public Service New Hampshire Funding LLC, Series 2001-1, Class A3, 6.480% due 5/1/15 (a) | | | 105,636 |
| 2,865,839 | | AAA | | Residential Asset Securities Corp., Series 2006-EMX6, Class A1, 5.460% due 10/25/30 (a)(b) | | | 2,867,608 |
| 917,403 | | AAA | | Residential Funding Mortgage Securities II Inc., Series 2005-HS1, Class AI1,
5.444% due 7/25/20 (a)(b) | | | 915,669 |
| 1,877,133 | | AAA | | SACO I Trust, Series 2006-7, Class A1, 5.515% due 7/25/36 (a)(b) | | | 1,878,291 |
| | | | | Structured Asset Securities Corp.: | | | |
| 62,024 | | AAA | | Series 2002-14A, Class 2A1, 6.150% due 7/25/32 (a) | | | 63,235 |
| 436,287 | | AAA | | Series 2003-AL1, Class A, 3.357% due 4/25/31 (a)(g) | | | 393,306 |
| | | | | | |
|
|
| | | | | Total Home Equity | | | 15,023,450 |
| | | | | | |
|
|
| | | | | TOTAL ASSET-BACKED SECURITIES
(Cost — $44,335,570) | | | 44,176,204 |
| | | | | | |
|
|
COLLATERALIZED MORTGAGE OBLIGATIONS — 16.4% |
| | | | | Banc of America Commercial Mortgage Inc.: | | | |
| 968,411 | | Aaa(h) | | Series 2001-1, Class A2, 6.503% due 4/15/36 (a) | | | 1,007,159 |
| 864,562 | | AAA | | Series 2003-1, Class A1, 3.878% due 9/11/36 (a) | | | 833,277 |
| 1,060,000 | | AAA | | Series 2005-1, Class A4, 5.039% due 11/10/42 (a)(b) | | | 1,048,005 |
| 1,000,000 | | AAA | | Series 2005-3, Class A3A, 4.621% due 7/10/43 (a) | | | 965,746 |
| | | | | Banc of America Funding Corp.: | | | |
| 13,984 | | AAA | | Series 2003-1, Class A1, 6.000% due 5/20/33 (a) | | | 13,914 |
| 698,601 | | AAA | | Series 2005-B, Class 2A1, 5.111% due 4/25/35 (a)(b) | | | 692,930 |
| 428,630 | | Aaa(h) | | Bank of America Alternative Loan Trust, Series 2004-6, Class 4A1, 5.000% due 7/25/19 (a) | | | 421,510 |
| 1,200,000 | | AAA | | Bank of America-First Union NB Commercial Mortgage, Series 2001-3, Class A2,
5.464% due 4/11/37 (a) | | | 1,207,631 |
| 201,395 | | AAA | | Bayview Financial Acquisition Trust, Series 2003-F, Class A, 5.828% due 9/28/43 (a)(b) | | | 201,592 |
| 132,993 | | AAA | | Bear Stearns Adjustable Rate Mortgage Trust, Series 2002-11, Class 1A1, 5.622% due 2/25/33 (a)(b) | | | 132,518 |
| | | | | Bear Stearns Alt-A Trust: | | | |
| 917,816 | | AAA | | Series 2005-2, Class 2A4, 4.750% due 4/25/35 (a)(b) | | | 904,649 |
| 529,549 | | AAA | | Series 2005-4, Class 23A2, 5.406% due 5/25/35 (a)(b) | | | 527,719 |
| | | | | Bear Stearns Commercial Mortgage Securities Inc.: | | | |
| 1,725,000 | | Aaa(h) | | Series 2003-T12, Class A4, 4.680% due 8/13/39 (a) | | | 1,658,398 |
| 325,000 | | AAA | | Series 2004-PWR6, Class A6, 4.825% due 11/11/41 (a) | | | 311,646 |
| 1,030,000 | | Aaa(h) | | Series 2005-PWR7, Class A2, 4.945% due 2/11/41 (a) | | | 1,013,078 |
See Notes to Financial Statements.
72
Schedules of Investments
(continued)
| | | | | | | |
| Core Fixed Income Investments | | |
| | | |
Face
Amount | | Rating‡ | | Security | | Value |
COLLATERALIZED MORTGAGE OBLIGATIONS — 16.4% (continued) |
| $ 97,502 | | Aaa(h) | | Capco America Securitization Corp., Series 1998-D7, Class A1A, 5.860% due 10/15/30 (a) | | $ | 97,381 |
| | | | | Chase Commercial Mortgage Securities Corp.: | | | |
| 2,000,000 | | AAA | | Series 1997-1, Class D, 7.370% due 6/19/29 (a) | | | 2,017,080 |
| 410,000 | | AAA | | Series 2000-3, Class A2, 7.319% due 10/15/32 (a) | | | 436,699 |
| 1,625,000 | | AAA | | Chase Manhattan Bank-First Union National Bank, Series 1999-1, Class A2, 7.439% due 8/15/31 (a) | | | 1,712,755 |
| | | | | Commercial Mortgage Acceptance Corp.: | | | |
| 100,000 | | AAA | | Series 1997-ML1, Class A3, 6.570% due 12/15/30 (a) | | | 100,755 |
| 678,382 | | AAA | | Series 1998-C2, Class A2, 6.030% due 9/15/30 (a) | | | 683,217 |
| 920,000 | | AAA | | Commercial Mortgage Asset Trust, Series 1999-C2, Class A2, 7.546% due 11/17/32 (a)(b) | | | 969,017 |
| | | | | Commercial Mortgage Pass Through Certificates: | | | |
| 1,475,000 | | AAA | | Series 2004-LB2A, Class A3, 4.221% due 3/10/39 (a) | | | 1,420,647 |
| 800,000 | | AAA | | Series 2005-F10A, Class MOA1, 5.510% due 3/15/20 (a)(b)(g) | | | 800,626 |
| | | | | Countrywide Alternative Loan Trust: | | | |
| 1,946,965 | | AAA | | Series 2005-24, Class 4A1, 5.556% due 7/20/35 (a)(b) | | | 1,952,033 |
| 830,012 | | AAA | | Series 2005-27, Class 2A3, 5.992% due 8/25/35 (a)(b) | | | 835,848 |
| 1,693,624 | | AAA | | Series 2005-59, Class 1A1, 5.655% due 10/25/35 (a)(b) | | | 1,700,292 |
| | | | | Countrywide Home Loans: | | | |
| 929,424 | | AAA | | Series 2005-11, Class 3A3, 5.622% due 7/25/35 (a)(b) | | | 929,714 |
| 823,459 | | AAA | | Series 2005-11, Class 6A1, 5.624% due 3/25/35 (a)(b) | | | 825,388 |
| 1,010,922 | | AAA | | Series 2005-R1, Class 1AF1, 5.684% due 3/25/35 (a)(b)(g) | | | 1,014,584 |
| 3,087,423 | | Aaa(h) | | CS First Boston Mortgage Securities Corp., Series 1998-C2, Class A2, 6.300% due 11/11/30 (a) | | | 3,143,875 |
| 108,905 | | Aaa(h) | | Deutsche Mortgage and Asset Receiving Corp., Series 1998-C1, Class A2, 6.538% due 6/15/31 (a) | | | 110,109 |
| | | | | DLJ Commercial Mortgage Corp.: | | | |
| 1,445,000 | | Aaa(h) | | Series 1999-CG3, Class A1B, 7.340% due 10/10/32 (a) | | | 1,525,837 |
| 1,630,327 | | Aaa(h) | | Series 2000-CKP1, Class A1B, 7.180% due 11/10/33 (a) | | | 1,727,728 |
| 748,815 | | AAA | | Downey Savings & Loan Association Mortgage Loan Trust, Series 2004-AR2, Class A2B,
5.725% due 11/19/44 (a)(b) | | | 752,789 |
| | | | | Federal Home Loan Mortgage Corp. (FHLMC): | | | |
| 2,730,000 | | AAA | | PAC-1(11), Series 3078, Class PA, 5.500% due 7/15/24 (a) | | | 2,737,666 |
| 1,225,000 | | AAA | | Series 2911, Class BU, 5.000% due 9/15/23 (a) | | | 1,217,236 |
| 2,248,567 | | AAA | | Series 2966, Class NW, 5.000% due 8/15/25 (a) | | | 2,235,327 |
| 1,003,340 | | AAA | | Series 3084, Class BC, 5.500% due 12/15/24 (a) | | | 1,006,379 |
| 1,770,385 | | AAA | | Series 3110, Class HA, 5.500% due 1/15/27 (a) | | | 1,774,844 |
| 1,308,052 | | AAA | | Series 3131, Class MA, 5.500% due 11/15/27 (a) | | | 1,312,460 |
| 2,074,503 | | AAA | | STRIPS, Series 231, Class IO, 5.500% due 8/1/35 (a)(c) | | | 516,518 |
| 2,111,585 | | AAA | | STRIPS, Series 232, Class IO, 5.000% due 8/1/35 (a)(c) | | | 527,379 |
| 2,407,375 | | AAA | | Structured Pass Through Securities, Series T-61, Class 1A1, 5.682% due 7/25/44 (a)(b) | | | 2,465,887 |
| | | | | Federal National Mortgage Association (FNMA): | | | |
| | | | | Grantor Trust: | | | |
| 347,460 | | AAA | | Series 2000-T06, Class A3, 5.658% due 1/25/28 (a)(b) | | | 356,495 |
| 205,522 | | AAA | | Series 2002-T06, Class A1, 3.310% due 2/25/32 (a) | | | 188,987 |
| 1,397,110 | | AAA | | Series 2005-057, Class PA, PAC, 5.500% due 5/25/27 (a) | | | 1,399,101 |
| 740,695 | | AAA | | Series 2005-058, Class EP, PAC, 5.500% due 7/25/35 (a) | | | 740,345 |
| 1,520,000 | | AAA | | Series 2005-084, Class XM, 5.750% due 10/25/35 (a) | | | 1,531,700 |
| 971,546 | | AAA | | Series 2005-105, Class TL, PAC, 5.500% due 11/25/31 (a) | | | 973,343 |
| 2,589,023 | | AAA | | Series 367, Class 2, IO, 5.500% due 1/25/36 (a)(c) | | | 660,754 |
| | | | | First Union National Bank Commercial Mortgage: | | | |
| 1,525,000 | | AAA | | Series 1999-C4, Class A2, 7.390% due 12/15/31 (a) | | | 1,611,257 |
| 1,700,000 | | AAA | | Series 2001-C2, Class A2, 6.663% due 1/12/43 (a) | | | 1,787,537 |
| 925,000 | | AAA | �� | Series 2001-C3, Class A3, 6.423% due 8/15/33 (a) | | | 967,258 |
| 1,579,591 | | AAA | | Series 2001-C4, Class A1, 5.673% due 12/12/33 (a) | | | 1,591,048 |
See Notes to Financial Statements.
73
Schedules of Investments
(continued)
| | | | | | | |
| Core Fixed Income Investments | | |
| | | |
Face
Amount | | Rating‡ | | Security | | Value |
COLLATERALIZED MORTGAGE OBLIGATIONS — 16.4% (continued) |
| $ 672,778 | | AAA | | First Union-Lehman Brothers-Bank of America, Series 1998-C2, Class A2, 6.560% due 11/18/35 (a) | | $ | 682,462 |
| | | | | GE Capital Commercial Mortgage Corp.: | | | |
| 1,130,000 | | Aaa(h) | | Series 2002-1A, Class A3, 6.269% due 12/10/35 (a) | | | 1,179,949 |
| 1,850,000 | | AAA | | Series 2005-C4, Class A4, 5.511% due 11/10/45 (a)(b) | | | 1,841,347 |
| | | | | GMAC Commercial Mortgage Securities Inc.: | | | |
| 140,404 | | Aaa(h) | | Series 1998-C1, Class A2, 6.700% due 5/15/30 (a) | | | 142,706 |
| 722,694 | | Aaa(h) | | Series 1999-C3, Class A2, 7.179% due 8/15/36 (a) | | | 755,115 |
| 975,000 | | AA+ | | Series 2000-C2, Class B, 7.594% due 6/16/10 (a) | | | 1,050,699 |
| 1,745,000 | | AAA | | Series 2001-C1, Class A2, 6.465% due 4/15/34 (a) | | | 1,820,781 |
| | | | | GS Mortgage Securities Corp. II: | | | |
| 1,195,281 | | AAA | | Series 1998-C1, Class A3, 6.135% due 10/18/30 (a) | | | 1,209,239 |
| 300,000 | | AAA | | Series 2001-ROCK, Class A2, 6.624% due 5/3/18 (a)(g) | | | 318,145 |
| 1,225,000 | | AAA | | Series 2005-GG4, Class A4, 4.761% due 7/10/39 (a) | | | 1,168,642 |
| 690,173 | | AAA | | GSR Mortgage Loan Trust, Series 2005-AR6, Class 2A1, 4.540% due 9/25/35 (a)(b) | | | 679,515 |
| 888,874 | | AAA | | Homebanc Mortgage Trust, Series 2005-04, Class A1, 5.594% due 1/25/35 (a)(b) | | | 890,699 |
| 24,656 | | AAA | | Impac CMB Trust, Series 2003-1, Class 1A1, 6.124% due 2/25/33 (a)(b) | | | 24,683 |
| | | | | Indymac Index Mortgage Loan Trust: | | | |
| 773,675 | | AAA | | Series 2004-AR15, Class 1A1, 5.087% due 2/25/35 (a)(b) | | | 779,726 |
| 288,026 | | AAA | | Series 2005-AR15, Class A2, 5.099% due 9/25/35 (a)(b) | | | 278,577 |
| | | | | JPMorgan Chase Commercial Mortgage Securities Corp.: | | | |
| 635,000 | | AAA | | Series 2003-C1, Class A2, 4.985% due 1/12/37 (a) | | | 622,464 |
| 80,000 | | Aaa(h) | | Series 2005-CB12, Class A4, 4.895% due 9/12/37 (a) | | | 76,870 |
| 100,000 | | Aaa(h) | | Series 2005-CB13, Class A4, 5.472% due 1/12/43 (a)(b) | | | 99,181 |
| 1,200,000 | | Aaa(h) | | Series 2005-LDP4, Class A4, 4.918% due 10/15/42 (a)(b) | | | 1,153,867 |
| 2,697,105 | | AAA | | JPMorgan Mortgage Trust, Series 2006-A2, Class 5A3, 3.753% due 11/25/33 (a)(b) | | | 2,642,899 |
| | | | | LB Commercial Conduit Mortgage Trust: | | | |
| 2,042,012 | | AAA | | Series 1998-C4, Class A2, 6.300% due 10/15/35 (a) | | | 2,078,976 |
| 51,938 | | Aaa(h) | | Series 1999-C2, Class A1, 7.105% due 10/15/32 (a) | | | 52,138 |
| | | | | LB-UBS Commercial Mortgage Trust: | | | |
| 682,053 | | AAA | | Series 2000-C5, Class A1, 6.410% due 12/15/19 (a) | | | 688,123 |
| 1,150,000 | | AAA | | Series 2004-C6, Class A2, 4.187% due 8/15/29 (a) | | | 1,120,219 |
| 310,000 | | AAA | | Series 2005-C3, Class A5, 4.739% due 7/15/35 (a) | | | 295,027 |
| 400,000 | | AAA | | Series 2005-C3, Class AAB, 4.664% due 10/17/14 (a) | | | 385,972 |
| | | | | Lehman XS Trust: | | | |
| 1,125,241 | | AAA | | Series 2005-5N, Class 1A1, 5.624% due 11/25/35 (a)(b) | | | 1,129,084 |
| 727,620 | | AAA | | Series 2005-7N, Class 1A1B, 5.624% due 12/25/35 (a)(b) | | | 731,252 |
| | | | | MASTR Adjustable Rate Mortgages Trust: | | | |
| 1,600,000 | | AAA | | Series 2004-13, Class 3A7, 3.786% due 11/21/34 (a)(b) | | | 1,534,112 |
| 381,404 | | AAA | | Series 2004-4, Class 4A1, 5.175% due 5/25/34 (a)(b) | | | 379,504 |
| 446,507 | | AAA | | Merrill Lynch Mortgage Investors Inc., Series 2005-A2, Class A2, 4.490% due 2/25/35 (a)(b) | | | 437,683 |
| 670,000 | | AAA | | Merrill Lynch Mortgage Trust, Series 2006-C1, Class A4, 5.844% due 5/12/39 (a)(b) | | | 683,371 |
| | | | | MLCC Mortgage Investors Inc.: | | | |
| 257,798 | | Aaa(h) | | Series 2005-1, Class 2A1, 4.967% due 4/25/35 (a)(b) | | | 255,166 |
| 790,580 | | Aaa(h) | | Series 2005-1, Class 2A2, 4.967% due 4/25/35 (a)(b) | | | 782,510 |
| | | | | Morgan Stanley Capital I: | | | |
| 1,700,000 | | Aaa(h) | | Series 2003-IQ4, Class A2, 4.070% due 5/15/40 (a) | | | 1,580,498 |
| 480,000 | | AAA | | Series 2005-HQ6, Class A4A, 4.989% due 8/13/42 (a) | | | 464,524 |
| 1,625,000 | | AAA | | Morgan Stanley Dean Witter Capital I, Series 2001-TOP1, Class A4, 6.660% due 2/15/33 (a) | | | 1,702,469 |
| 1,697,664 | | AAA | | Mortgage Capital Funding Inc., Series 1998-MC1, Class A2, 6.663% due 3/18/30 (a) | | | 1,719,505 |
| | | | | Nationslink Funding Corp.: | | | |
| 1,329,806 | | Aaa(h) | | Series 1998-1, Class A3, 6.395% due 3/20/30 (a) | | | 1,335,815 |
| 57,853 | | AAA | | Series 1999-LTL1, Class A2, 6.867% due 1/22/26 (a) | | | 60,209 |
See Notes to Financial Statements.
74
Schedules of Investments
(continued)
| | | | | | | |
| Core Fixed Income Investments | | |
| | | |
Face
Amount | | Rating‡ | | Security | | Value |
COLLATERALIZED MORTGAGE OBLIGATIONS — 16.4% (continued) |
| | | | | Residential Asset Mortgage Products Inc.: | | | |
| $ 25,125 | | AAA | | Series 2003-RS4, Class AIIB, 5.654% due 5/25/33 (a)(b) | | $ | 25,417 |
| 333,256 | | AAA | | Series 2004-SL4, Class A5, 7.500% due 7/25/32 (a) | | | 339,817 |
| 202,893 | | AAA | | Residential Asset Securities Corp., Series 2003-KS1, Class A1, 5.734% due 1/25/33 (a)(b) | | | 203,115 |
| | | | | Small Business Administration: | | | |
| 779,321 | | NR | | Series 1999-P10B, Class 1, 7.540% due 8/10/09 (a) | | | 816,014 |
| 911,479 | | NR | | Series 2000-P10A, Class 1, 8.017% due 2/10/10 (a) | | | 963,976 |
| 1,222,412 | | NR | | Series 2005-P10A, Class 1, 4.638% due 2/10/15 (a) | | | 1,183,336 |
| | | | | Small Business Administration Participation Certificates: | | | |
| 564,151 | | NR | | 7.700% due 7/1/16 (a) | | | 590,502 |
| 1,217,797 | | NR | | Series 1993-20K, Class 1, 6.150% due 11/1/13 (a) | | | 1,239,931 |
| 373,093 | | NR | | Series 1995-20J, Class 1, 6.850% due 10/1/15 (a) | | | 384,544 |
| 812,781 | | NR | | Series 1995-20K, Class 1, 6.650% due 11/1/15 (a) | | | 835,366 |
| 2,479,014 | | NR | | Series 1999-20L, Class 1, 7.190% due 12/1/19 (a) | | | 2,606,800 |
| 1,783,528 | | NR | | Series 2000-20A, Class 1, 7.590% due 1/1/20 (a) | | | 1,893,286 |
| 2,006,081 | | NR | | Series 2002-20K, Class 1, 5.080% due 11/1/22 (a) | | | 1,989,762 |
| | | | | Structured Adjustable Rate Mortgage Loan Trust: | | | |
| 1,450,599 | | AAA | | Series 2004-06, Class 4A1, 4.843% due 6/25/34 (a)(b) | | | 1,425,128 |
| 834,255 | | AAA | | Series 2004-16, Class 1A2, 4.979% due 11/25/34 (a)(b) | | | 839,085 |
| 934,708 | | AAA | | Series 2005-19XS, Class 1A1, 5.644% due 9/25/35 (a)(b) | | | 938,860 |
| | | | | Thornburg Mortgage Securities Trust, Series 2006-3: | | | |
| 1,963,815 | | Aaa(h) | | Class A2, 5.429% due 6/25/09 (a)(b) | | | 1,961,221 |
| 1,967,888 | | Aaa(h) | | Class A3, 5.434% due 6/25/09 (a)(b) | | | 1,964,511 |
| | | | | Washington Mutual Inc.: | | | |
| 1,880,789 | | AAA | | Series 2003-R1, Class A1, 5.594% due 12/25/27 (a)(b) | | | 1,880,933 |
| 116,441 | | AAA | | Series 2004-AR11, Class A, 4.577% due 10/25/34 (a)(b) | | | 114,432 |
| 702,042 | | AAA | | Series 2004-AR12, Class A2A, 5.828% due 10/25/44 (a)(b) | | | 703,557 |
| 1,000,000 | | AAA | | Series 2005-AR04, Class A5, 4.673% due 4/25/35 (a)(b) | | | 972,070 |
| 1,826,489 | | AAA | | Series 2005-AR13, Class A1A1, 5.614% due 10/25/45 (a)(b) | | | 1,839,178 |
| 1,559,415 | | AAA | | Series 2005-AR19, Class A1A2, 5.614% due 12/26/45 (a)(b) | | | 1,565,772 |
| 1,367,527 | | AAA | | Washington Mutual Pass Through Certificates, Series 2005-AR15, Class A1A2,
5.604% due 12/25/45 (a)(b) | | | 1,373,209 |
| 1,520,128 | | AAA | | Wells Fargo Mortgage Backed Securities Trust, Series 2004-H, Class A1, 4.524% due 6/25/34 (a)(b) | | | 1,479,008 |
| | | | | | |
|
|
| | | | | TOTAL COLLATERALIZED MORTGAGE OBLIGATIONS
(Cost — $124,644,808) | | | 124,260,220 |
| | | | | | |
|
|
CORPORATE BONDS & NOTES — 13.5% |
|
Aerospace & Defense — 0.1% |
| 80,000 | | A | | Boeing Capital Corp., 6.500% due 2/15/12 (a) | | | 84,488 |
| 25,000 | | B+ | | DRS Technologies Inc., Senior Subordinated Notes, 6.625% due 2/1/16 (a) | | | 24,438 |
| 70,000 | | BBB+ | | Loral Corp., Debentures, 7.000% due 9/15/23 (a) | | | 78,320 |
| 105,000 | | BBB+ | | Northrop Grumman Corp., Debentures, 7.750% due 2/15/31 (a) | | | 129,489 |
| 33,000 | | BBB | | Raytheon Co., Notes, 6.150% due 11/1/08 (a) | | | 33,578 |
| | | | | | |
|
|
| | | | | Total Aerospace & Defense | | | 350,313 |
| | | | | | |
|
|
|
Auto Components — 0.0% |
| 50,000 | | B- | | Visteon Corp., Senior Notes, 8.250% due 8/1/10 | | | 49,250 |
| | | | | | |
|
|
|
Automobiles — 1.0% |
| | | | | DaimlerChrysler North America Holding Corp.: | | | |
| 300,000 | | BBB | | 5.875% due 3/15/11 (a) | | | 301,529 |
| 2,400,000 | | BBB | | Medium-Term Notes, Series D, 5.780% due 9/10/07 (a)(b) | | | 2,407,855 |
See Notes to Financial Statements.
75
Schedules of Investments
(continued)
| | | | | | | |
| Core Fixed Income Investments | | |
| | | |
Face
Amount | | Rating‡ | | Security | | Value |
|
Automobiles — 1.0% (continued) |
| | | | | Notes: | | | |
| $ 330,000 | | BBB | | 4.050% due 6/4/08 (a) | | $ | 321,864 |
| 2,800,000 | | BBB | | 5.740% due 3/13/09 (a)(b) | | | 2,805,244 |
| 285,000 | | BBB | | 4.875% due 6/15/10 (a) | | | 277,851 |
| 610,000 | | B+ | | Ford Motor Co., Notes, 7.450% due 7/16/31 (a) | | | 481,900 |
| | | | | General Motors Corp., Senior Debentures: | | | |
| 1,325,000 | | B- | | 8.250% due 7/15/23 (a) | | | 1,106,375 |
| 20,000 | | B- | | 8.375% due 7/15/33 (a) | | | 16,850 |
| | | | | | |
|
|
| | | | | Total Automobiles | | | 7,719,468 |
| | | | | | |
|
|
|
Beverages — 0.0% |
| 215,000 | | A+ | | Anheuser-Busch Cos. Inc., Notes, 4.950% due 1/15/14 (a) | | | 209,572 |
| | | | | | |
|
|
|
Capital Markets — 0.7% |
| 275,000 | | A+ | | Bank of New York Co. Inc., Senior Notes, 3.750% due 2/15/08 (a) | | | 269,308 |
| 20,000 | | B+ | | E*TRADE Financial Corp., Senior Notes, 7.375% due 9/15/13 (a) | | | 20,300 |
| | | | | Goldman Sachs Group Inc., Notes: | | | |
| 230,000 | | A+ | | 4.500% due 6/15/10 (a) | | | 223,692 |
| 135,000 | | A+ | | 4.750% due 7/15/13 (a) | | | 128,688 |
| 180,000 | | A- | | Lehman Brothers Holdings E-Capital Trust I, Notes, 6.173% due 8/19/65 (a)(b) | | | 181,457 |
| | | | | Lehman Brothers Holdings Inc.: | | | |
| 300,000 | | A+ | | Medium-Term Notes, Series H, 4.500% due 7/26/10 (a) | | | 291,236 |
| 350,000 | | A+ | | Notes, 4.000% due 1/22/08 (a) | | | 344,101 |
| | | | | Morgan Stanley: | | | |
| 940,000 | | A+ | | 5.050% due 1/21/11 (a) | | | 928,216 |
| 25,000 | | A+ | | 6.750% due 4/15/11 (a) | | | 26,361 |
| 2,305,000 | | A+ | | Medium-Term Notes, 5.625% due 1/9/12 (a) | | | 2,327,075 |
| | | | | Notes: | | | |
| 125,000 | | A+ | | 5.800% due 4/1/07 (a) | | | 125,212 |
| 60,000 | | A+ | | 3.625% due 4/1/08 (a) | | | 58,492 |
| | | | | | |
|
|
| | | | | Total Capital Markets | | | 4,924,138 |
| | | | | | |
|
|
|
Chemicals — 0.0% |
| 23,000 | | BB | | IMC Global Inc., Series B, 10.875% due 6/1/08 (a) | | | 24,667 |
| 9,000 | | BB | | Lyondell Chemical Co., Senior Secured Notes, Series A, 9.625% due 5/1/07 (a) | | | 9,225 |
| 29,000 | | BB+ | | Westlake Chemical Corp., Senior Notes, 6.625% due 1/15/16 (a) | | | 27,695 |
| | | | | | |
|
|
| | | | | Total Chemicals | | | 61,587 |
| | | | | | |
|
|
|
Commercial Banks — 2.6% |
| 90,000 | | A+ | | Bank One Corp., Notes, 2.625% due 6/30/08 (a) | | | 85,946 |
| 200,000 | | AA- | | Banque Paribas NY, Subordinated Notes, 6.875% due 3/1/09 (a) | | | 207,349 |
| 1,000,000 | | A3(h) | | Countrywide Bank NA, Certificate of Deposit, 5.340% due 9/15/06 (a)(b) | | | 1,000,014 |
| 500,000 | | AAA | | Depfa ACS Bank, Senior Notes, Series DTC, 3.625% due 10/29/08 (a) | | | 485,807 |
| 425,000 | | AA- | | Deutsche Bank AG NY, 3.843% due 3/15/07 (a)(b) | | | 420,219 |
| | | | | Glitnir Banki HF: | | | |
| 270,000 | | A- | | Notes, 6.330% due 7/28/11 (a)(g) | | | 273,505 |
| 460,000 | | BBB+ | | Subordinated Notes, 6.693% due 6/15/16 (a)(b)(g) | | | 468,660 |
| | | | | HBOS Treasury Services PLC, Notes: | | | |
| 195,000 | | AA | | 3.600% due 8/15/07 (a)(g) | | | 191,835 |
| 415,000 | | AA | | 3.500% due 11/30/07 (a)(g) | | | 406,378 |
| | | | | HSBC Bank USA: | | | |
| 1,575,000 | | AA | | 3.870% due 6/7/07 (a) | | | 1,557,299 |
| 600,000 | | AA | | Senior Notes, Series BKNT, 5.494% due 9/21/07 (a)(b) | | | 600,815 |
See Notes to Financial Statements.
76
Schedules of Investments
(continued)
| | | | | | | |
| Core Fixed Income Investments | | |
| | | |
Face
Amount | | Rating‡ | | Security | | Value |
|
Commercial Banks — 2.6% (continued) |
| $ 690,000 | | A2(h) | | Landsbanki Islands HF, 6.100% due 8/25/11 (a)(g) | | $ | 692,089 |
| 20,000 | | AA | | Rabobank Capital Funding II, 5.260% due 12/31/13 (a)(b)(g) | | | 19,415 |
| 40,000 | | AA | | Rabobank Capital Funding Trust III, Subordinated Notes, 5.254% due 10/21/16 (a)(b)(g) | | | 38,149 |
| 2,400,000 | | AAA | | Rabobank Nederland, Senior Notes, 5.527% due 1/15/09 (a)(b)(g) | | | 2,401,728 |
| 70,000 | | BBB- | | Resona Preferred Global Securities Cayman Ltd., Bonds, 7.191% due 7/30/15 (a)(b)(g) | | | 72,725 |
| 660,000 | | A | | Royal Bank of Scotland Group PLC, 9.118% due 3/31/10 (a) | | | 734,806 |
| 1,600,000 | | AA- | | Santander US Debt SA, Notes, 5.540% due 2/6/09 (a)(b)(g) | | | 1,602,376 |
| 400,000 | | BBB- | | Shinsei Finance Cayman Ltd., Bonds, 6.418% due 7/20/16 (a)(b)(g) | | | 395,727 |
| 10,000 | | A- | | Sumitomo Mitsui Banking Corp., New York, Subordinated Notes, 8.000% due 6/15/12 (a) | | | 11,218 |
| | | | | SunTrust Banks Inc.: | | | |
| 265,000 | | A+ | | Deposit Notes, 4.415% due 6/15/09 (a) | | | 259,572 |
| | | | | Senior Notes: | | | |
| 385,000 | | A+ | | 3.625% due 10/15/07 (a) | | | 378,006 |
| 145,000 | | A+ | | 4.000% due 10/15/08 (a) | | | 141,462 |
| | | | | U.S. Bancorp: | | | |
| 2,100,000 | | AA- | | Medium Term Notes, 5.358% due 4/28/09 (a)(b) | | | 2,101,737 |
| 160,000 | | AA- | | Senior Medium-Term Notes, Series N, 3.950% due 8/23/07 (a) | | | 157,341 |
| 550,000 | | AA | | U.S. Bank National Association, Senior Bank Notes, 4.400% due 8/15/08 (a) | | | 543,150 |
| 2,275,000 | | AA- | | Wachovia Bank NA, Senior Notes, Series DPNT, 5.489% due 3/23/09 (a)(b) | | | 2,275,917 |
| 275,000 | | AA- | | Wachovia Bank North America, Senior Bank Notes, 4.375% due 8/15/08 (a) | | | 270,753 |
| 230,000 | | A- | | Wachovia Capital Trust III, Bank Guaranteed, 5.800% due 3/15/11 (a)(b) | | | 229,201 |
| 340,000 | | A | | Wachovia Corp., Subordinated Notes, 5.250% due 8/1/14 (a) | | | 334,324 |
| | | | | Wells Fargo & Co.: | | | |
| 200,000 | | AA | | 5.300% due 8/26/11 (a) | | | 200,511 |
| | | | | Senior Notes: | | | |
| 25,000 | | AA | | 5.125% due 2/15/07 (a) | | | 24,968 |
| 420,000 | | AA | | 4.200% due 1/15/10 (a) | | | 407,282 |
| 165,000 | | AA | | 4.625% due 8/9/10 (a) | | | 161,995 |
| 510,000 | | AA | | 4.875% due 1/12/11 (a) | | | 503,365 |
| 10,000 | | AA- | | Subordinated Notes, 5.000% due 11/15/14 (a) | | | 9,714 |
| | | | | | |
|
|
| | | | | Total Commercial Banks | | | 19,665,358 |
| | | | | | |
|
|
|
Commercial Services & Supplies — 0.1% |
| 27,000 | | B | | DynCorp International LLC/DIV Capital Corporation, Senior Subordinated Notes,
9.500% due 2/15/13 (a) | | | 28,012 |
| 9,000 | | NR | | NationsRent Inc., Secured Notes, 9.500% due 10/15/10 (a) | | | 9,779 |
| 40,000 | | BB | | Service Corp. International, Senior Notes, 8.000% due 6/15/17 (a)(g) | | | 38,500 |
| | | | | Waste Management Inc.: | | | |
| 185,000 | | BBB | | 6.375% due 11/15/12 (a) | | | 192,404 |
| 40,000 | | BBB | | 7.375% due 5/15/29 (a) | | | 45,334 |
| 100,000 | | BBB | | Senior Notes, 7.750% due 5/15/32 (a) | | | 119,266 |
| 25,000 | | BB- | | Windstream Corp., Senior Notes, 8.625% due 8/1/16 (a)(g) | | | 26,563 |
| | | | | | |
|
|
| | | | | Total Commercial Services & Supplies | | | 459,858 |
| | | | | | |
|
|
|
Consumer Finance — 1.0% |
| | | | | Ford Motor Credit Co.: | | | |
| 100,000 | | B+ | | Bonds, 7.375% due 2/1/11 (a) | | | 96,281 |
| | | | | Notes: | | | |
| 300,000 | | B+ | | 7.375% due 10/28/09 (a) | | | 294,446 |
| 30,000 | | B+ | | 7.875% due 6/15/10 (a) | | | 29,508 |
| 700,000 | | B+ | | 7.000% due 10/1/13 (a) | | | 654,194 |
| | | | | Senior Notes: | | | |
| 2,600,000 | | B+ | | 5.800% due 1/12/09 (a) | | | 2,492,019 |
| 674,000 | | B+ | | 10.521% due 6/15/11 (a)(b)(g) | | | 713,556 |
| 85,000 | | B+ | | 7.250% due 10/25/11 (a) | | | 81,319 |
See Notes to Financial Statements.
77
Schedules of Investments
(continued)
| | | | | | | |
| Core Fixed Income Investments | | |
| | | |
Face
Amount | | Rating‡ | | Security | | Value |
|
Consumer Finance — 1.0% (continued) |
| | | | | General Motors Acceptance Corp.: | | | |
| $ 100,000 | | BB | | Global Notes, 5.125% due 5/9/08 (a) | | $ | 97,266 |
| 140,000 | | BB | | Medium-Term Notes, 4.375% due 12/10/07 (a) | | | 136,198 |
| | | | | Notes: | | | |
| 130,000 | | BB | | 6.125% due 8/28/07 (a) | | | 129,277 |
| 220,000 | | BB | | 7.750% due 1/19/10 (a) | | | 223,784 |
| 2,230,000 | | BB | | Senior Notes, 5.850% due 1/14/09 (a) | | | 2,165,446 |
| 360,000 | | BB | | GMAC LLC, 6.125% due 1/22/08 (a) | | | 355,838 |
| 90,000 | | A | | SLM Corp., Notes, CPI-Indexed, 5.290% due 4/1/09 (b) | | | 86,765 |
| 110,000 | | AAA | | Toyota Motor Credit Corp., Notes, 2.875% due 8/1/08 (a) | | | 105,418 |
| | | | | | |
|
|
| | | | | Total Consumer Finance | | | 7,661,315 |
| | | | | | |
|
|
|
Containers & Packaging — 0.0% |
| 10,000 | | CCC+ | | Graham Packaging Co. Inc., Senior Subordinated Notes, 9.875% due 10/15/14 (a) | | | 9,675 |
| | | | | | |
|
|
|
Diversified Consumer Services — 0.0% |
| 35,000 | | B | | Hertz Corp., Senior Notes, 8.875% due 1/1/14 (a)(g) | | | 36,487 |
| | | | | | |
|
|
|
Diversified Financial Services — 2.2% |
| 200,000 | | BBB+ | | Aiful Corp., Notes, 5.000% due 8/10/10 (a)(g) | | | 192,624 |
| 725,000 | | AA+ | | AIG SunAmerica Global Financing XII, Notes, 5.300% due 5/30/07 (a)(g) | | | 724,345 |
| 800,000 | | BBB(i) | | BAE Systems Holdings Inc., 5.805% due 8/15/08 (a)(b)(g) | | | 800,039 |
| | | | | Bank of America Corp.: | | | |
| 470,000 | | AA- | | 5.375% due 8/15/11 (a) | | | 472,440 |
| | | | | Subordinated Notes: | | | |
| 850,000 | | A+ | | 7.800% due 2/15/10 (a) | | | 916,945 |
| 50,000 | | A+ | | 7.400% due 1/15/11 (a) | | | 54,009 |
| 150,000 | | AA | | Belvoir Land LLC, Series A-1, 5.270% due 12/15/47 (a) | | | 136,965 |
| 70,000 | | A | | CIT Group Inc., Senior Notes, 7.750% due 4/2/12 (a) | | | 77,294 |
| 680,000 | | B+ | | El Paso Performance-Link, Notes, 7.750% due 7/15/11 (a)(g) | | | 696,150 |
| | | | | General Electric Capital Corp.: | | | |
| 2,430,000 | | AAA | | 5.000% due 11/15/11 (a) | | | 2,401,710 |
| | | | | Medium-Term Notes, Series A: | | | |
| 105,000 | | AAA | | 3.450% due 7/16/07 (a) | | | 103,372 |
| 145,000 | | AAA | | 4.250% due 1/15/08 (a) | | | 143,156 |
| 3,130,000 | | AAA | | 5.550% due 1/15/08 (a)(b) | | | 3,134,188 |
| 330,000 | | AAA | | 4.125% due 9/1/09 (a) | | | 320,878 |
| 1,175,000 | | AAA | | Notes, 3.500% due 8/15/07 (a) | | | 1,155,494 |
| 10,000 | | B | | Hexion U.S. Finance Corp./Hexion Nova Scotia Finance ULC, Second Priority, Senior Secured Notes, 9.000% due 7/15/14 (a) | | | 10,100 |
| | | | | HSBC Finance Corp.: | | | |
| | | | | Notes: | | | |
| 100,000 | | AA- | | 4.750% due 5/15/09 (a) | | | 98,937 |
| 585,000 | | AA- | | 4.125% due 11/16/09 (a) | | | 564,934 |
| 50,000 | | AA- | | 6.375% due 10/15/11 (a) | | | 52,084 |
| 20,000 | | AA- | | Senior Notes, 8.000% due 7/15/10 (a) | | | 21,820 |
| 220,000 | | A | | ILFC E-Capital Trust I, 5.900% due 12/21/65 (a)(b)(g) | | | 220,158 |
| 240,000 | | AA | | Irwin Land LLC, 5.300% due 12/15/35 (a) | | | 221,381 |
| | | | | JPMorgan Chase & Co.: | | | |
| 210,000 | | A | | 5.150% due 10/1/15 (a) | | | 203,402 |
| 500,000 | | A+ | | Senior Notes, 5.250% due 5/30/07 (a) | | | 499,052 |
| 545,000 | | A | | Subordinated Notes, 5.125% due 9/15/14 (a) | | | 531,701 |
See Notes to Financial Statements.
78
Schedules of Investments
(continued)
| | | | | | | |
| Core Fixed Income Investments | | |
| | | |
Face
Amount | | Rating‡ | | Security | | Value |
|
Diversified Financial Services — 2.2% (continued) |
| $ 310,000 | | A- | | JPMorgan Chase Capital XIII, Bonds, Series M, 6.449% due 9/30/34 (a)(b) | | $ | 312,050 |
| 310,000 | | AAA | | MassMutual Global Funding II, 2.550% due 7/15/08 (a)(g) | | | 295,034 |
| 190,000 | | BBB | | MUFG Capital Finance 1 Ltd., 6.346% due 7/25/16 (a)(b) | | | 190,537 |
| 425,000 | | A+ | | Nationwide Building Society, Notes, 4.250% due 2/1/10 (a)(g) | | | 411,060 |
| 330,000 | | AA+ | | New York Life Global Funding, Notes, 3.875% due 1/15/09 (a)(g) | | | 320,023 |
| 250,000 | | AA- | | Pricoa Global Funding I, Secured Notes, 4.350% due 6/15/08 (a)(g) | | | 245,549 |
| 205,000 | | AA | | Principal Life Global Funding I, Notes, 3.625% due 4/30/08 (a)(g) | | | 199,312 |
| 130,000 | | AAA | | TIAA Global Markets Inc., Senior Notes, 3.875% due 1/22/08 (a)(g) | | | 127,227 |
| 410,000 | | BB+ | | TNK-BP Finance SA, 7.500% due 7/18/16 (a)(g) | | | 426,275 |
| 225,000 | | AAA | | USAA Capital Corp., Medium-Term Notes, Series B, 4.000% due 12/10/07 (a)(g) | | | 220,766 |
| | | | | | |
|
|
| | | | | Total Diversified Financial Services | | | 16,501,011 |
| | | | | | |
|
|
|
Diversified Telecommunication Services — 0.6% |
| 70,000 | | A | | BellSouth Corp., Notes, 4.750% due 11/15/12 (a) | | | 66,398 |
| 295,000 | | BBB+ | | British Telecommunications PLC, Bonds, 8.375% due 12/15/10 (a) | | | 329,348 |
| 60,000 | | B- | | Cincinnati Bell Inc., Senior Notes, 7.000% due 2/15/15 (a) | | | 58,800 |
| 20,000 | | BB+ | | Citizens Communications Co., Notes, 9.250% due 5/15/11 (a) | | | 21,975 |
| 220,000 | | A- | | Deutsche Telekom International Finance, Senior Notes, 5.750% due 3/23/16 (a) | | | 214,388 |
| 185,000 | | A- | | Deutsche Telekom International Finance BV, Bonds, 8.250% due 6/15/30 (a) | | | 223,815 |
| 50,000 | | A | | GTE Corp., Debentures, 6.940% due 4/15/28 (a) | | | 50,765 |
| 10,000 | | B+ | | Intelsat Bermuda Ltd., Senior Notes, 9.250% due 6/15/16 (a)(g) | | | 10,450 |
| 300,000 | | BBB+ | | Koninklijke KPN NV, Senior Notes, 8.375% due 10/1/30 (a) | | | 341,783 |
| | | | | Qwest Communications International Inc.: | | | |
| 20,000 | | B | | 7.250% due 2/15/11 (a) | | | 19,925 |
| 470,000 | | B | | Senior Notes, 8.905% due 2/15/09 (a)(b) | | | 479,400 |
| | | | | SBC Communications Inc., Notes: | | | |
| 800,000 | | A2(h) | | 4.214% due 6/5/07 (a)(g) | | | 794,325 |
| 170,000 | | A | | 5.100% due 9/15/14 (a) | | | 162,384 |
| | | | | Telecom Italia Capital SA: | | | |
| 30,000 | | BBB+ | | 5.250% due 11/15/13 (a) | | | 28,621 |
| 160,000 | | BBB+ | | 4.950% due 9/30/14 (a) | | | 148,156 |
| 10,000 | | BBB+ | | Notes, 5.250% due 10/1/15 (a) | | | 9,364 |
| 70,000 | | BBB+ | | Senior Notes, 6.000% due 9/30/34 (a) | | | 63,401 |
| 160,000 | | BBB+ | | Telefonica Europe BV, 7.750% due 9/15/10 (a) | | | 172,491 |
| 700,000 | | A | | Verizon Communications Inc., Notes, 5.550% due 2/15/16 (a) | | | 683,119 |
| | | | | Verizon Global Funding Corp., Notes: | | | |
| 5,000 | | A | | 6.875% due 6/15/12 (a) | | | 5,314 |
| 165,000 | | A | | 7.375% due 9/1/12 (a) | | | 179,756 |
| 165,000 | | A | | Verizon Maryland Inc., Debentures, Series B, 5.125% due 6/15/33 (a) | | | 131,582 |
| 340,000 | | A | | Verizon New Jersey Inc., Debentures, Series A, 5.875% due 1/17/12 (a) | | | 340,854 |
| | | | | | |
|
|
| | | | | Total Diversified Telecommunication Services | | | 4,536,414 |
| | | | | | |
|
|
|
Electric Utilities — 0.6% |
| 85,000 | | BB- | | AES Corp., Secured Notes, 8.750% due 5/15/13 (a)(g) | | | 91,694 |
| 30,000 | | BBB- | | Cleveland Electric Illuminating Co., Senior Notes, 5.650% due 12/15/13 (a) | | | 29,863 |
| 900,000 | | BBB(i) | | DPL Inc., Senior Notes, 8.000% due 3/31/09 (a) | | | 950,324 |
| 230,000 | | BBB | | Exelon Corp., Bonds, 5.625% due 6/15/35 (a) | | | 211,376 |
| | | | | FirstEnergy Corp., Notes: | | | |
| 12,000 | | BBB- | | 5.500% due 11/15/06 (a) | | | 11,999 |
| 40,000 | | BBB- | | Series B, 6.450% due 11/15/11 (a) | | | 41,531 |
| 735,000 | | BBB- | | Series C, 7.375% due 11/15/31 (a) | | | 833,726 |
| 185,000 | | A | | Florida Power & Light Co., 4.950% due 6/1/35 (a) | | | 162,578 |
See Notes to Financial Statements.
79
Schedules of Investments
(continued)
| | | | | | | |
| Core Fixed Income Investments | | |
| | | |
Face
Amount | | Rating‡ | | Security | | Value |
|
Electric Utilities — 0.6% (continued) |
| $ 245,000 | | BBB | | Florida Power Corp., First Mortgage, 5.900% due 3/1/33 (a) | | $ | 240,397 |
| 5,000 | | A+ | | Hydro-Quebec, Global Debentures, Series JL, 6.300% due 5/11/11 (a) | | | 5,222 |
| 40,000 | | BBB+ | | Midamerican Energy Holdings Co., Senior Notes, 5.875% due 10/1/12 (a) | | | 40,607 |
| 110,000 | | A- | | Niagara Mohawk Power Corp., Senior Notes, Series G, 7.750% due 10/1/08 (a) | | | 114,873 |
| 300,000 | | BBB | | Pacific Gas & Electric Co., First Mortgage Bonds, 6.050% due 3/1/34 (a) | | | 297,495 |
| 800,000 | | BBB | | PSEG Power LLC, 7.750% due 4/15/11 (a) | | | 866,317 |
| 125,000 | | A- | | Public Service Electric & Gas Co., Medium-Term Notes, Series D, 5.250% due 7/1/35 (a) | | | 112,950 |
| 300,000 | | BBB+ | | Scottish Power PLC, Notes, 4.910% due 3/15/10 (a) | | | 294,224 |
| 175,000 | | AA | | SP PowerAssets Ltd., Notes, 3.800% due 10/22/08 (a)(g) | | | 169,573 |
| 250,000 | | BBB | | Virginia Electric and Power Co., Medium-Term Notes, Series F, 5.730% due 11/25/08 (a) | | | 251,193 |
| | | | | | |
|
|
| | | | | Total Electric Utilities | | | 4,725,942 |
| | | | | | |
|
|
|
Energy Equipment & Services — 0.1% |
| | | | | Halliburton Co.: | | | |
| 100,000 | | BBB+ | | Debentures, 7.600% due 8/15/96 (a) | | | 114,154 |
| 450,000 | | BBB+ | | Senior Notes, 5.500% due 10/15/10 (a) | | | 452,186 |
| 60,000 | | BB- | | Pride International Inc., Senior Notes, 7.375% due 7/15/14 (a) | | | 61,350 |
| 18,000 | | B+ | | Southern Natural Gas Co., Notes, 8.000% due 3/1/32 (a) | | | 19,586 |
| | | | | | |
|
|
| | | | | Total Energy Equipment & Services | | | 647,276 |
| | | | | | |
|
|
|
Food & Staples Retailing — 0.1% |
| 580,000 | | AA | | Wal-Mart Stores Inc., Notes, 3.375% due 10/1/08 (a) | | | 559,710 |
| | | | | | |
|
|
|
Food Products — 0.0% |
| 160,000 | | BBB+ | | Kraft Foods Inc., Senior Notes, 5.625% due 11/1/11 (a) | | | 161,195 |
| | | | | | |
|
|
|
Gas Utilities — 0.0% |
| 250,000 | | BBB | | CenterPoint Energy Resources Corp., Notes, 6.150% due 5/1/16 (a) | | | 253,498 |
| | | | | | |
|
|
|
Health Care Providers & Services — 0.2% |
| 50,000 | | BBB- | | AmerisourceBergen Corp., 5.875% due 9/15/15 (a) | | | 48,700 |
| 60,000 | | B | | DaVita Inc., Senior Subordinated Notes, 7.250% due 3/15/15 (a) | | | 59,100 |
| | | | | HCA Inc.: | | | |
| | | | | Debentures: | | | |
| 450,000 | | BB+ | | 6.250% due 2/15/13 (a) | | | 373,500 |
| 120,000 | | BB+ | | 7.190% due 11/15/15 (a) | | | 97,628 |
| | | | | Senior Notes: | | | |
| 30,000 | | BB+ | | 7.875% due 2/1/11 (a) | | | 28,725 |
| 15,000 | | BB+ | | 6.300% due 10/1/12 (a) | | | 12,600 |
| 96,000 | | BB+ | | 6.500% due 2/15/16 (a) | | | 76,080 |
| 49,000 | | BB+ | | Omnicare Inc., Senior Subordinated Notes, 6.875% due 12/15/15 (a) | | | 47,101 |
| | | | | Tenet Healthcare Corp., Senior Notes: | | | |
| 76,000 | | B | | 6.375% due 12/1/11 (a) | | | 66,880 |
| 621,000 | | B | | 9.875% due 7/1/14 (a) | | | 608,580 |
| 150,000 | | BBB+ | | WellPoint Inc., Notes, 5.950% due 12/15/34 (a) | | | 144,914 |
| | | | | | |
|
|
| | | | | Total Health Care Providers & Services | | | 1,563,808 |
| | | | | | |
|
|
|
Hotels, Restaurants & Leisure — 0.4% |
| | | | | Boyd Gaming Corp., Senior Subordinated Notes: | | | |
| 25,000 | | B+ | | 6.750% due 4/15/14 (a) | | | 23,688 |
| 80,000 | | B+ | | 7.125% due 2/1/16 (a) | | | 76,500 |
| | | | | Caesars Entertainment Inc.: | | | |
| 911,000 | | BBB- | | Senior Notes, 8.500% due 11/15/06 (a) | | | 915,480 |
| 200,000 | | BB+ | | Senior Subordinated Notes, 9.375% due 2/15/07 (a) | | | 203,000 |
See Notes to Financial Statements.
80
Schedules of Investments
(continued)
| | | | | | | |
| Core Fixed Income Investments | | |
| | | |
Face
Amount | | Rating‡ | | Security | | Value |
|
Hotels, Restaurants & Leisure — 0.4% (continued) |
| $ 10,000 | | BB | | Hilton Hotels Corp., Notes, 7.625% due 5/15/08 (a) | | $ | 10,275 |
| 30,000 | | B- | | Inn of the Mountain Gods Resort & Casino, Senior Notes, 12.000% due 11/15/10 (a) | | | 30,450 |
| | | | | Mandalay Resort Group: | | | |
| 20,000 | | BB | | Debentures, 7.000% due 11/15/36 (a) | | | 20,375 |
| | | | | Senior Notes: | | | |
| 10,000 | | BB | | 9.500% due 8/1/08 (a) | | | 10,625 |
| 35,000 | | BB | | 8.500% due 9/15/10 (a) | | | 37,012 |
| 200,000 | | B+ | | Senior Subordinated, Notes, Series B, 10.250% due 8/1/07 (a) | | | 208,000 |
| | | | | MGM MIRAGE Inc.: | | | |
| | | | | Senior Notes: | | | |
| 50,000 | | BB | | 6.750% due 9/1/12 (a) | | | 48,875 |
| 50,000 | | BB | | 6.625% due 7/15/15 (a) | | | 47,312 |
| 6,000 | | B+ | | Senior Subordinated Notes, 9.750% due 6/1/07 (a) | | | 6,180 |
| 1,000,000 | | BB | | Mirage Resorts Inc., Senior Notes, 7.250% due 10/15/06 (a) | | | 1,005,000 |
| | | | | Mohegan Tribal Gaming Authority, Senior Subordinated Notes: | | | |
| 2,000 | | B+ | | 6.375% due 7/15/09 (a) | | | 1,985 |
| 10,000 | | B+ | | 8.000% due 4/1/12 (a) | | | 10,363 |
| 20,000 | | B+ | | River Rock Entertainment Authority, Senior Notes, 9.750% due 11/1/11 (a) | | | 21,275 |
| 30,000 | | BBB- | | Starwood Hotels & Resorts Worldwide Inc., Senior Notes, 7.375% due 5/1/07 (a) | | | 30,413 |
| | | | | Station Casinos Inc.: | | | |
| | | | | Senior Notes: | | | |
| 28,000 | | BB- | | 6.000% due 4/1/12 (a) | | | 26,915 |
| 5,000 | | BB- | | 7.750% due 8/15/16 (a) | | | 5,181 |
| | | | | Senior Subordinated Notes: | | | |
| 20,000 | | B+ | | 6.875% due 3/1/16 (a) | | | 18,625 |
| 35,000 | | B+ | | 6.625% due 3/15/18 (a) | | | 31,413 |
| | | | | | |
|
|
| | | | | Total Hotels, Restaurants & Leisure | | | 2,788,942 |
| | | | | | |
|
|
|
Household Durables — 0.0% |
| 10,000 | | BB | | Beazer Homes USA Inc.,, 8.375% due 4/15/12 (a) | | | 9,950 |
| 235,000 | | BBB- | | D.R. Horton, Inc., Notes, 6.125% due 1/15/14 (a) | | | 228,302 |
| | | | | | |
|
|
| | | | | Total Household Durables | | | 238,252 |
| | | | | | |
|
|
|
Household Products — 0.1% |
| 20,000 | | CCC+ | | American Achievement Corp., Senior Subordinated Notes, 8.250% due 4/1/12 (a) | | | 19,950 |
| 500,000 | | A- | | Clorox Co., Senior Notes, 5.444% due 12/14/07 (a)(b) | | | 500,979 |
| | | | | | |
|
|
| | | | | Total Household Products | | | 520,929 |
| | | | | | |
|
|
|
Independent Power Producers & Energy Traders — 0.1% |
| 50,000 | | BBB | | Duke Energy Corp., Notes, 6.250% due 1/15/12 (a) | | | 51,838 |
| 95,000 | | B- | | Dynegy Holdings Inc., Senior Notes, 8.750% due 2/15/12 (a) | | | 97,375 |
| 80,000 | | B- | | NRG Energy Inc., Senior Notes, 7.250% due 2/1/14 (a) | | | 79,200 |
| 20,000 | | BBB- | | Oncor Electric Delivery Co., Senior Secured Notes, 6.375% due 1/15/15 (a) | | | 20,610 |
| | | | | TXU Corp., Senior Notes: | | | |
| 110,000 | | BB+ | | Series P, 5.550% due 11/15/14 (a) | | | 103,115 |
| 540,000 | | BB+ | | Series R, 6.550% due 11/15/34 (a) | | | 501,852 |
| | | | | | |
|
|
| | | | | Total Independent Power Producers & Energy Traders | | | 853,990 |
| | | | | | |
|
|
|
Industrial Conglomerates — 0.2% |
| 150,000 | | AAA | | General Electric Co., Notes, 5.000% due 2/1/13 (a) | | | 147,447 |
| | | | | Tyco International Group SA: | | | |
| 530,000 | | BBB+ | | 6.375% due 10/15/11 (a) | | | 553,365 |
| 26,000 | | BBB+ | | 7.000% due 6/15/28 (a) | | | 29,460 |
See Notes to Financial Statements.
81
Schedules of Investments
(continued)
| | | | | | | |
| Core Fixed Income Investments | | |
| | | |
Face
Amount | | Rating‡ | | Security | | Value |
|
Industrial Conglomerates — 0.2% (continued) |
| | | | | Notes: | | | |
| $ 420,000 | | BBB+ | | 6.000% due 11/15/13 (a) | | $ | 433,879 |
| 210,000 | | BBB+ | | 6.875% due 1/15/29 (a) | | | 235,084 |
| | | | | | |
|
|
| | | | | Total Industrial Conglomerates | | | 1,399,235 |
| | | | | | |
|
|
|
Insurance — 0.2% |
| 100,000 | | AA+ | | ASIF Global Financing XIX, 4.900% due 1/17/13 (a)(g) | | | 97,169 |
| | | | | Berkshire Hathaway Finance Corp.: | | | |
| 190,000 | | AAA | | 4.125% due 1/15/10 (a) | | | 183,599 |
| 245,000 | | AAA | | 4.750% due 5/15/12 (a) | | | 238,342 |
| 500,000 | | AAA | | Notes, 3.400% due 7/2/07 (a) | | | 492,448 |
| 400,000 | | AA | | Met Life Global Funding I, Notes, 3.375% due 10/5/07 (a)(g) | | | 388,455 |
| 200,000 | | AA | | Monumental Global Funding III, Secured Notes, Series A, 5.200% due 1/30/07 (a)(g) | | | 199,810 |
| | | | | | |
|
|
| | | | | Total Insurance | | | 1,599,823 |
| | | | | | |
|
|
|
IT Services — 0.0% |
| 110,000 | | BBB- | | Electronic Data Systems Corp., 7.125% due 10/15/09 (a) | | | 114,764 |
| 50,000 | | B- | | Sungard Data Systems Inc., Senior Notes, 9.125% due 8/15/13 (a) | | | 51,875 |
| | | | | | |
|
|
| | | | | Total IT Services | | | 166,639 |
| | | | | | |
|
|
|
Machinery — 0.0% |
| 45,000 | | B+ | | Terex Corp., Senior Subordinated Notes, 7.375% due 1/15/14 (a) | | | 45,225 |
| | | | | | |
|
|
|
Media — 0.8% |
| 20,000 | | CCC+ | | AMC Entertainment Inc., Senior Subordinated Notes, 11.000% due 2/1/16 (a) | | | 21,825 |
| 30,000 | | BBB | | BSKYB Finance UK PLC, 6.500% due 10/15/35 (a)(g) | | | 28,742 |
| | | | | Clear Channel Communications Inc.: | | | |
| 100,000 | | BBB- | | Bonds, 4.900% due 5/15/15 (a) | | | 87,758 |
| 310,000 | | BBB- | | Notes, 5.500% due 9/15/14 (a) | | | 287,261 |
| | | | | Senior Notes: | | | |
| 10,000 | | BBB- | | 4.625% due 1/15/08 (a) | | | 9,867 |
| 10,000 | | BBB- | | 6.250% due 3/15/11 (a) | | | 9,993 |
| 30,000 | | BBB+ | | Comcast Cable Communications Holdings Inc., Notes, 8.375% due 3/15/13 (a) | | | 34,049 |
| 210,000 | | BBB+ | | Comcast Cable Communications, Inc., Notes, 8.875% due 5/1/17 (a) | | | 252,273 |
| | | | | Comcast Corp.: | | | |
| | | | | Notes: | | | |
| 350,000 | | BBB+ | | 6.500% due 1/15/15 (a) | | | 361,895 |
| 30,000 | | BBB+ | | 6.500% due 1/15/17 (a) | | | 31,058 |
| 80,000 | | BBB+ | | 7.050% due 3/15/33 (a) | | | 84,240 |
| 350,000 | | BBB+ | | 6.450% due 3/15/37 (a) | | | 344,351 |
| 450,000 | | BBB+ | | Senior Unsecured, 6.500% due 11/15/35 (a) | | | 445,127 |
| 160,000 | | BBB- | | COX Communications Inc., Notes, 3.875% due 10/1/08 (a) | | | 154,748 |
| | | | | CSC Holdings Inc.: | | | |
| 4,000 | | B+ | | Senior Debentures, 7.875% due 2/15/18 (a) | | | 4,110 |
| 65,000 | | B+ | | Senior Notes, Series B, 7.625% due 4/1/11 (a) | | | 66,788 |
| 70,000 | | BB- | | DIRECTV Holdings LLC/DIRECTV Financing Co. Inc., Senior Notes, 6.375% due 6/15/15 (a) | | | 65,800 |
| | | | | EchoStar DBS Corp., Senior Notes: | | | |
| 50,000 | | BB- | | 6.625% due 10/1/14 (a) | | | 48,188 |
| 50,000 | | BB- | | 7.125% due 2/1/16 (a)(g) | | | 48,938 |
| 12,000 | | B+ | | Entercom Radio LLC, 7.625% due 3/1/14 (a) | | | 11,700 |
| 65,000 | | B- | | Kabel Deutschland GMBH, Senior Notes, 10.625% due 7/1/14 (a)(g) | | | 69,875 |
See Notes to Financial Statements.
82
Schedules of Investments
(continued)
| | | | | | | |
| Core Fixed Income Investments | | |
| | | |
Face
Amount | | Rating‡ | | Security | | Value |
|
Media — 0.8% (continued) |
| | | | | Lamar Media Corp., Senior Subordinated Notes: | | | |
| $ 40,000 | | B | | 7.250% due 1/1/13 (a) | | $ | 39,900 |
| 50,000 | | B | | 6.625% due 8/15/15 (a)(g) | | | 47,125 |
| | | | | Liberty Media Corp.: | | | |
| 10,000 | | BB+ | | 5.700% due 5/15/13 (a) | | | 9,444 |
| | | | | Senior Notes: | | | |
| 196,000 | | BB+ | | 6.829% due 9/17/06 (a)(b) | | | 196,312 |
| 640,000 | | BB+ | | 7.875% due 7/15/09 (a) | | | 672,172 |
| | | | | News America Holdings Inc., Senior Debentures: | | | |
| 125,000 | | BBB | | 8.500% due 2/23/25 (a) | | | 146,397 |
| 140,000 | | BBB | | 8.150% due 10/17/36 (a) | | | 161,957 |
| | | | | News America Inc.: | | | |
| 315,000 | | BBB | | 7.625% due 11/30/28 (a) | | | 344,624 |
| 195,000 | | BBB | | 6.200% due 12/15/34 (a) | | | 182,798 |
| 20,000 | | BB- | | Reader’s Digest Association Inc., Senior Notes, 6.500% due 3/1/11 (a) | | | 19,250 |
| 70,000 | | BB+ | | Rogers Cable Inc., Senior Secured Second Priority Notes, 6.750% due 3/15/15 (a) | | | 69,825 |
| 10,000 | | B | | Sinclair Broadcast Group Inc., Senior Subordinated Notes, 8.000% due 3/15/12 (a) | | | 10,175 |
| 5,000 | | B | | Sun Media Corp., 7.625% due 2/15/13 (a) | | | 5,100 |
| 125,000 | | BBB+ | | Time Warner Cos. Inc., Debentures, 7.570% due 2/1/24 (a) | | | 134,282 |
| 50,000 | | BBB+ | | Time Warner Entertainment Co., LP, Senior Notes, 8.375% due 7/15/33 (a) | | | 57,506 |
| | | | | Time Warner Inc.: | | | |
| 275,000 | | BBB+ | | 6.875% due 5/1/12 (a) | | | 288,266 |
| 385,000 | | BBB+ | | Debentures, 7.700% due 5/1/32 (a) | | | 422,097 |
| 115,000 | | BBB+ | | Senior Notes, 7.625% due 4/15/31 (a) | | | 124,895 |
| 280,000 | | BBB+ | | Turner Broadcasting System Inc., Senior Notes, 8.375% due 7/1/13 (a) | | | 312,654 |
| 80,000 | | BBB | | Viacom Inc., Senior Notes, 5.750% due 4/30/11 (a)(g) | | | 79,422 |
| | | | | | |
|
|
| | | | | Total Media | | | 5,792,787 |
| | | | | | |
|
|
|
Metals & Mining — 0.0% |
| 100,000 | | A | | Corporacion Nacional del Cobre, Senior Notes, 4.750% due 10/15/14 (a)(g) | | | 93,888 |
| 250,000 | | BBB | | Teck Cominco Ltd., 6.125% due 10/1/35 (a) | | | 236,782 |
| | | | | | |
|
|
| | | | | Total Metals & Mining | | | 330,670 |
| | | | | | |
|
|
|
Multi-Utilities — 0.1% |
| | | | | Dominion Resources Inc.: | | | |
| 80,000 | | BBB | | Notes, 4.750% due 12/15/10 (a) | | | 77,653 |
| 135,000 | | BBB | | Remarketable Notes, Series E, 7.195% due 9/15/14 (a) | | | 146,171 |
| 330,000 | | BBB | | Senior Notes, 5.700% due 9/17/12 (a) | | | 331,026 |
| 175,000 | | BBB | | Series D, 5.125% due 12/15/09 (a) | | | 173,491 |
| 225,000 | | BBB | | Energy East Corp., 6.750% due 7/15/36 (a) | | | 233,167 |
| | | | | | |
|
|
| | | | | Total Multi-Utilities | | | 961,508 |
| | | | | | |
|
|
|
Multiline Retail — 0.1% |
| 80,000 | | BBB | | Federated Department Stores Inc., Bonds, 6.790% due 7/15/27 (a) | | | 81,199 |
| 20,000 | | BBB- | | J.C. Penney Co. Inc., Debentures, 7.400% due 4/1/37 (a) | | | 21,768 |
| | | | | May Department Stores Co.: | | | |
| 110,000 | | BBB | | 7.875% due 3/1/30 (a) | | | 124,972 |
| 125,000 | | BBB | | Debenture, 8.750% due 5/15/29 (a) | | | 154,397 |
| 300,000 | | A+ | | Target Corp., Notes, 5.400% due 10/1/08 (a) | | | 301,007 |
| | | | | | |
|
|
| | | | | Total Multiline Retail | | | 683,343 |
| | | | | | |
|
|
|
Office Electronics — 0.0% |
| 40,000 | | BB+ | | Xerox Corp., Senior Notes, 6.750% due 2/1/17 (a) | | | 40,300 |
| | | | | | |
|
|
See Notes to Financial Statements.
83
Schedules of Investments
(continued)
| | | | | | | |
| Core Fixed Income Investments | | |
| | | |
Face
Amount | | Rating‡ | | Security | | Value |
|
Oil, Gas & Consumable Fuels — 1.1% |
| $ 510,000 | | BBB- | | Amerada Hess Corp., Notes, 7.300% due 8/15/31 (a) | | $ | 569,188 |
| 370,000 | | A- | | Apache Finance Canada Corp., 4.375% due 5/15/15 (a) | | | 340,916 |
| | | | | Atlantic Richfield Co.: | | | |
| 755,000 | | AA+ | | Debentures, 9.125% due 3/1/11 (a) | | | 873,030 |
| 40,000 | | AA+ | | Notes, 5.900% due 4/15/09 (a) | | | 40,765 |
| 20,000 | | AA+ | | BP Capital Markets PLC, 2.750% due 12/29/06 (a) | | | 19,837 |
| | | | | Chesapeake Energy Corp., Senior Notes: | | | |
| 40,000 | | BB | | 6.375% due 6/15/15 (a) | | | 38,200 |
| 30,000 | | BB | | 6.250% due 1/15/18 (a) | | | 27,825 |
| 380,000 | | AA | | ChevronTexaco Capital Co., Notes, 3.500% due 9/17/07 (a) | | | 373,130 |
| | | | | Conoco Funding Co.: | | | |
| 50,000 | | A- | | 5.450% due 10/15/06 (a) | | | 50,002 |
| 80,000 | | A- | | 7.250% due 10/15/31 (a) | | | 94,223 |
| 355,000 | | A- | | ConocoPhillips Holding Co., Senior Notes, 6.950% due 4/15/29 (a) | | | 404,811 |
| 480,000 | | BBB | | Devon Energy Corp., Debentures, 7.950% due 4/15/32 (a) | | | 583,157 |
| | | | | El Paso Corp., Medium-Term Notes: | | | |
| 504,000 | | B | | 7.800% due 8/1/31 (a) | | | 507,780 |
| 355,000 | | B | | 7.750% due 1/15/32 (a) | | | 358,550 |
| 9,000 | | B+ | | El Paso Natural Gas Co., Bonds, 8.375% due 6/15/32 (a) | | | 10,128 |
| 190,000 | | A- | | EnCana Corp., Bonds, 6.300% due 11/1/11 (a) | | | 196,964 |
| 965,000 | | BB+ | | Kerr-McGee Corp., Notes, 7.875% due 9/15/31 (a) | | | 1,156,088 |
| | | | | Kinder Morgan Energy Partners LP: | | | |
| 300,000 | | BBB+ | | 6.750% due 3/15/11 (a) | | | 311,858 |
| 70,000 | | BBB+ | | Senior Notes, 6.300% due 2/1/09 (a) | | | 70,951 |
| 30,000 | | B+ | | OMI Corp., Senior Notes, 7.625% due 12/1/13 (a) | | | 30,150 |
| 14,000 | | BB- | | Peabody Energy Corp., Series B, 6.875% due 3/15/13 (a) | | | 13,930 |
| 370,000 | | BBB | | Pemex Project Funding Master Trust, 7.375% due 12/15/14 (a) | | | 401,820 |
| 10,000 | | A- | | Petronas Capital Ltd., 7.875% due 5/22/22 (a)(g) | | | 11,994 |
| 30,000 | | B+ | | Petrozuata Finance Inc., 8.220% due 4/1/17 (a)(g) | | | 29,925 |
| 45,000 | | B+ | | Pogo Producing Co., Senior Subordinated Notes, 6.875% due 10/1/17 (a) | | | 43,088 |
| 90,000 | | AAA | | Seariver Maritime Financial Holdings, zero coupon bond to yield 3.906% due 9/1/12 (a) | | | 65,858 |
| 500,000 | | B | | Sonat Inc., 6.750% due 10/1/07 (a) | | | 505,000 |
| 49,000 | | BB- | | Teekay Shipping Corp., Senior Notes, 8.875% due 7/15/11 (a) | | | 51,695 |
| 30,000 | | A- | | Vintage Petroleum Inc., Senior Notes, 8.250% due 5/1/12 (a) | | | 31,710 |
| 50,000 | | BB+ | | Western Oil Sands Inc., Secured Notes, 8.375% due 5/1/12 (a) | | | 53,938 |
| | | | | Williams Cos. Inc.: | | | |
| 95,000 | | BB- | | Debentures, Series A, 7.500% due 1/15/31 (a) | | | 91,912 |
| 385,000 | | BB- | | Notes, 8.750% due 3/15/32 (a) | | | 416,762 |
| 130,000 | | BB- | | Senior Notes, 7.750% due 6/15/31 (a) | | | 127,725 |
| | | | | XTO Energy Inc., Senior Notes: | | | |
| 540,000 | | BBB | | 7.500% due 4/15/12 (a) | | | 588,079 |
| 30,000 | | BBB | | 6.250% due 4/15/13 (a) | | | 30,867 |
| | | | | | |
|
|
| | | | | Total Oil, Gas & Consumable Fuels | | | 8,521,856 |
| | | | | | |
|
|
|
Paper & Forest Products — 0.1% |
| | | | | Georgia-Pacific Corp.: | | | |
| 4,000 | | B | | Debentures, 7.700% due 6/15/15 (a) | | | 3,985 |
| 1,000 | | B | | Notes, 8.125% due 5/15/11 (a) | | | 1,028 |
| 80,000 | | BBB | | International Paper Co., Notes, 5.500% due 1/15/14 (a) | | | 78,625 |
| 715,000 | | BBB | | Weyerhaeuser Co., Notes, 6.750% due 3/15/12 (a) | | | 748,619 |
| | | | | | |
|
|
| | | | | Total Paper & Forest Products | | | 832,257 |
| | | | | | |
|
|
See Notes to Financial Statements.
84
Schedules of Investments
(continued)
| | | | | | | |
| Core Fixed Income Investments | | |
| | | |
Face
Amount | | Rating‡ | | Security | | Value |
|
Pharmaceuticals — 0.1% |
| $ 770,000 | | A | | Wyeth, Notes, 5.500% due 2/15/16 (a) | | $ | 764,105 |
| | | | | | |
|
|
|
Real Estate Investment Trusts (REITs) — 0.2% |
| 225,000 | | BBB+ | | AvalonBay Communities Inc., Medium-Term Notes, 5.000% due 8/1/07 (a) | | | 222,622 |
| 650,000 | | A- | | ERP Operating LP, Notes, 6.625% due 3/15/12 (a) | | | 685,675 |
| | | | | Forest City Enterprises Inc., Senior Notes: | | | |
| 10,000 | | BB- | | 7.625% due 6/1/15 (a) | | | 10,125 |
| 19,000 | | BB- | | 6.500% due 2/1/17 (a) | | | 17,860 |
| 9,000 | | BBB- | | Health Care REIT Inc., Notes, 8.000% due 9/12/12 (a) | | | 9,887 |
| | | | | Host Marriott LP: | | | |
| 20,000 | | BB | | Senior Notes, Series I, 9.500% due 1/15/07 (a) | | | 20,325 |
| 2,000 | | BB | | Series G, 9.250% due 10/1/07 (a) | | | 2,078 |
| 30,000 | | BB | | Series Q, 6.750% due 6/1/16 (a) | | | 29,250 |
| 280,000 | | BBB+ | | ProLogis, Notes, 5.500% due 4/1/12 (a) | | | 278,076 |
| 325,000 | | BB+ | | Rouse Co., Notes, 5.375% due 11/26/13 (a) | | | 299,095 |
| | | | | Ventas Realty LP/Ventas Capital Corp.: | | | |
| 10,000 | | BB+ | | 8.750% due 5/1/09 (a) | | | 10,738 |
| 30,000 | | BB+ | | 6.750% due 6/1/10 (a) | | | 30,712 |
| 30,000 | | BB+ | | 9.000% due 5/1/12 (a) | | | 33,562 |
| 20,000 | | BB+ | | 7.125% due 6/1/15 (a) | | | 20,575 |
| | | | | | |
|
|
| | | | | Total Real Estate Investment Trusts (REITs) | | | 1,670,580 |
| | | | | | |
|
|
|
Road & Rail — 0.1% |
| 27,000 | | CCC+ | | Horizon Lines LLC/Horizon Lines Holding Co., Senior Notes, 9.000% due 11/1/12 (a) | | | 27,844 |
| 10,000 | | B- | | Kansas City Southern Railway, 9.500% due 10/1/08 (a) | | | 10,425 |
| | | | | Norfolk Southern Corp., Senior Notes: | | | |
| 20,000 | | BBB+ | | 6.750% due 2/15/11 (a) | | | 21,082 |
| 105,000 | | BBB+ | | 7.250% due 2/15/31 (a) | | | 122,167 |
| | | | | Union Pacific Corp., Notes: | | | |
| 45,000 | | BBB | | 6.650% due 1/15/11 (a) | | | 47,219 |
| 140,000 | | BBB | | 5.375% due 5/1/14 (a) | | | 138,807 |
| | | | | | |
|
|
| | | | | Total Road & Rail | | | 367,544 |
| | | | | | |
|
|
|
Software — 0.1% |
| 900,000 | | A- | | Oracle Corp., Notes, 5.000% due 1/15/11 (a) | | | 886,980 |
| | | | | | |
|
|
|
Specialty Retail — 0.0% |
| 30,000 | | B1(h) | | Amerigas Partners LP, Senior Notes, 7.250% due 5/20/15 (a) | | | 29,625 |
| 60,000 | | B- | | Suburban Propane Partners LP/Suburban Energy Finance Corp., Senior Notes, 6.875% due 12/15/13 (a) | | | 57,750 |
| | | | | | |
|
|
| | | | | Total Specialty Retail | | | 87,375 |
| | | | | | |
|
|
|
Textiles, Apparel & Luxury Goods — 0.0% |
| 30,000 | | B | | Oxford Industries Inc., Senior Notes, 8.875% due 6/1/11 (a) | | | 30,450 |
| | | | | | |
|
|
|
Thrifts & Mortgage Finance — 0.0% |
| 320,000 | | A | | Countrywide Home Loans Inc., 5.560% due 2/27/08 (a)(b) | | | 320,362 |
| | | | | | |
|
|
|
Tobacco — 0.1% |
| | | | | Altria Group Inc.: | | | |
| 300,000 | | BBB | | Debentures, 7.750% due 1/15/27 (a) | | | 363,515 |
| 235,000 | | BBB | | Notes, 7.000% due 11/4/13 (a) | | | 256,014 |
| 85,000 | | BB | | Reynolds American Inc., Secured Notes, 7.250% due 6/1/12 (a)(g) | | | 87,767 |
| | | | | | |
|
|
| | | | | Total Tobacco | | | 707,296 |
| | | | | | |
|
|
See Notes to Financial Statements.
85
Schedules of Investments
(continued)
| | | | | | | |
| Core Fixed Income Investments | | |
| | | |
Face
Amount | | Rating‡ | | Security | | Value |
|
Wireless Telecommunication Services — 0.4% |
| $ 55,000 | | A | | New Cingular Wireless Services Inc., Notes, 8.125% due 5/1/12 (a) | | $ | 61,649 |
| | | | | Nextel Communications Inc., Senior Notes: | | | |
| 60,000 | | BBB+ | | Series D, 7.375% due 8/1/15 (a) | | | 61,799 |
| 15,000 | | BBB+ | | Series F, 5.950% due 3/15/14 (a) | | | 14,605 |
| 10,000 | | BB | | Rogers Wireless Communications Inc., Secured Notes, 6.375% due 3/1/14 (a) | | | 9,850 |
| | | | | Sprint Capital Corp.: | | | |
| 100,000 | | BBB+ | | 6.125% due 11/15/08 (a) | | | 101,380 |
| | | | | Notes: | | | |
| 760,000 | | BBB+ | | 6.000% due 1/15/07 (a) | | | 761,011 |
| 170,000 | | BBB+ | | 8.750% due 3/15/32 (a) | | | 206,725 |
| | | | | Vodafone Group PLC: | | | |
| | | | | Notes: | | | |
| 1,250,000 | | A- | | 5.560% due 6/29/07 (a)(b) | | | 1,250,195 |
| 390,000 | | A- | | 3.950% due 1/30/08 (a) | | | 382,743 |
| 160,000 | | A- | | Senior Notes, 7.750% due 2/15/10 (a) | | | 171,203 |
| | | | | | |
|
|
| | | | | Total Wireless Telecommunication Services | | | 3,021,160 |
| | | | | | |
|
|
| | | | | TOTAL CORPORATE BONDS & NOTES
(Cost — $102,550,179) | | | 102,727,483 |
| | | | | | |
|
|
MUNICIPAL BONDS — 0.6% |
|
Illinois — 0.0% |
| 170,000 | | AAA | | Chicago IL, GO, Drivers, Series 1287, FSA-Insured, 6.567%, 9/7/06 (a)(b) | | | 176,487 |
| 210,000 | | AA | | Illinois State GO, 5.100% due 6/1/33 (a) | | | 197,530 |
| | | | | | |
|
|
| | | | | Total Illinois | | | 374,017 |
| | | | | | |
|
|
|
New York — 0.0% |
| 130,000 | | AA+ | | New York City Municipal Water Finance Authority, Water & Sewer System Revenue, Drivers,
Series 1289, 6.910%, 9/7/06 (a)(b) | | | 136,071 |
| | | | | | |
|
|
|
Oregon — 0.1% |
| 600,000 | | AAA | | Oregon School Boards Association GO, Series A, FGIC-Insured, zero coupon bond to yield
4.168% due 6/30/09 (a) | | | 519,366 |
| | | | | | |
|
|
|
Texas — 0.0% |
| 345,000 | | AA | | Texas State PFA Revenue, Unemployment Compensation, Series B, 3.125% due 6/15/07 (a) | | | 339,256 |
| | | | | | |
|
|
|
Virginia — 0.5% |
| 1,300,000 | | BBB | | Tobacco Settlement Financing Corp., Asset Backed, 5.625% due 6/1/37 (a) | | | 1,354,964 |
| 2,165,294 | | AAA | | Virginia State Housing Development Authority, Series C, 6.000% due 6/25/34 (a) | | | 2,165,273 |
| | | | | | |
|
|
| | | | | Total Virginia | | | 3,520,237 |
| | | | | | |
|
|
| | | | | TOTAL MUNICIPAL BONDS
(Cost — $4,770,127) | | | 4,888,947 |
| | | | | | |
|
|
SOVEREIGN BONDS — 1.3% |
|
Brazil — 0.3% |
| | | | | Federative Republic of Brazil: | | | |
| 95,000 | | BB | | 8.875% due 4/15/24 (a) | | | 114,475 |
| 101,000 | | BB | | 10.125% due 5/15/27 (a) | | | 135,845 |
| 533,000 | | BB | | 11.000% due 8/17/40 (a) | | | 696,498 |
| | | | | Collective Action Securities: | | | |
| 25,000 | | BB | | 7.875% due 3/7/15 (a) | | | 27,513 |
| 325,000 | | BB | | 8.875% due 10/14/19 (a) | | | 385,612 |
| 350,000 | | BB | | 8.750% due 2/4/25 (a) | | | 416,675 |
| | | | | | |
|
|
| | | | | Total Brazil | | | 1,776,618 |
| | | | | | |
|
|
See Notes to Financial Statements.
86
Schedules of Investments
(continued)
| | | | | | | |
| Core Fixed Income Investments | | |
| | | |
Face
Amount | | Rating‡ | | Security | | Value |
|
Bulgaria — 0.0% |
| $ 67,000 | | BBB | | Republic of Bulgaria, 8.250% due 1/15/15 (a) | | $ | 78,390 |
| | | | | | |
|
|
|
Canada — 0.0% |
| 170,000 | | AA | | Ontario Province of Canada, 3.500% due 9/17/07 (a) | | | 167,032 |
| | | | | | |
|
|
|
China — 0.1% |
| 1,000,000 | | AA | | Hong Kong Government International Bond, 5.125% due 8/1/14 (a)(g) | | | 988,704 |
| | | | | | |
|
|
|
Colombia — 0.0% |
| 121,000 | | BB | | Republic of Colombia, 11.750% due 2/25/20 (a) | | | 170,005 |
| | | | | | |
|
|
|
Italy — 0.0% |
| 55,000 | | AA- | | Republic of Italy, Series DTC, 4.375% due 10/25/06 (a) | | | 54,920 |
| | | | | | |
|
|
|
Mexico — 0.4% |
| | | | | United Mexican States: | | | |
| 580,000 | | BBB | | 11.500% due 5/15/26 (a) | | | 922,200 |
| | | | | Medium-Term Notes: | | | |
| 160,000 | | BBB | | 5.625% due 1/15/17 (a) | | | 158,280 |
| 330,000 | | BBB | | 8.300% due 8/15/31 (a) | | | 415,800 |
| | | | | Series A: | | | |
| 275,000 | | BBB | | 6.375% due 1/16/13 (a) | | | 286,550 |
| 130,000 | | BBB | | 6.625% due 3/3/15 (a) | | | 138,190 |
| 25,000 | | BBB | | 8.000% due 9/24/22 (a) | | | 30,094 |
| 530,000 | | BBB | | 7.500% due 4/8/33 (a) | | | 615,462 |
| | | | | | |
|
|
| | | | | Total Mexico | | | 2,566,576 |
| | | | | | |
|
|
|
Panama — 0.0% |
| | | | | Republic of Panama: | | | |
| 40,000 | | BB | | 8.875% due 9/30/27 (a) | | | 48,950 |
| 5,000 | | BB | | 9.375% due 4/1/29 (a) | | | 6,375 |
| 19,000 | | BB | | 6.700% due 1/26/36 (a) | | | 18,596 |
| | | | | | |
|
|
| | | | | Total Panama | | | 73,921 |
| | | | | | |
|
|
|
Russia — 0.3% |
| 2,140,000 | | NR | | Russian Federation, 5.000% due 3/31/30 (a)(b) | | | 2,382,676 |
| | | | | | |
|
|
|
South Korea — 0.0% |
| 20,000 | | A | | Export-Import Bank of Korea, Notes, 5.250% due 2/10/14 (a)(g) | | | 19,649 |
| | | | | | |
|
|
|
United Kingdom — 0.2% |
| 900,000 | | AAA | | United Kingdom Treasury Notes, 4.250% due 3/7/11 (a) | | | 1,680,708 |
| | | | | | |
|
|
| | | | | TOTAL SOVEREIGN BONDS
(Cost — $9,284,155) | | | 9,959,199 |
| | | | | | |
|
|
U.S. GOVERNMENT & AGENCY OBLIGATIONS — 24.3% |
|
U.S. Government Agencies — 4.2% |
| 240,000 | | | | Federal Agricultural Mortgage Corp. (FAMC), 4.250% due 7/29/08 (a) | | | 236,362 |
| 400,000 | | | | Federal Farm Credit Bank (FFCB), 4.875% due 4/4/12 (a) | | | 396,824 |
| | | | | Federal Home Loan Bank (FHLB): | | | |
| 580,000 | | | | 5.125% due 6/13/08 (a) | | | 580,619 |
| 1,720,000 | | | | Global Bonds, 5.500% due 7/15/36 (a) | | | 1,783,055 |
| 770,000 | | | | Federal Home Loan Bank Global Bond, 4.800% due 2/15/07 (a) | | | 768,095 |
| | | | | Federal Home Loan Bank System (FHLB): | | | |
| 120,000 | | | | 4.875% due 11/15/06 (a) | | | 119,867 |
See Notes to Financial Statements.
87
Schedules of Investments
(continued)
| | | | | | | |
| Core Fixed Income Investments | | |
| | | |
Face
Amount | | | | Security | | Value |
|
U.S. Government Agencies — 4.2% (continued) |
| $ 70,000 | | | | 3.500% due 11/15/07 (a) | | $ | 68,643 |
| 30,000 | | | | 3.625% due 11/14/08 (a) | | | 29,134 |
| | | | | Federal Home Loan Mortgage Corp. (FHLMC): | | | |
| 2,125,000 | | | | 4.000% due 7/13/07 (a) | | | 2,102,154 |
| 1,120,000 | | | | 4.375% due 11/16/07 (a) | | | 1,109,577 |
| 1,610,000 | | | | 4.750% due 1/18/11 (a) | | | 1,593,704 |
| 850,000 | | | | 6.750% due 3/15/31 (a) | | | 1,024,791 |
| 470,000 | | | | 5.625% due 11/23/35 (a) | | | 448,739 |
| | | | | Federal National Mortgage Association (FNMA): | | | |
| 60,000 | | | | 2.710% due 1/30/07 (a) | | | 59,357 |
| 780,000 | | | | 5.550% due 7/16/07 (a) | | | 780,126 |
| 2,100,000 | | | | 4.250% due 9/15/07 (a) | | | 2,079,332 |
| 1,500,000 | | | | 3.250% due 11/15/07 (a) | | | 1,466,391 |
| 3,260,000 | | | | 4.000% due 1/26/09 (a) | | | 3,184,101 |
| 2,600,000 | | | | 3.740% due 2/24/09 (a) | | | 2,522,866 |
| 230,000 | | | | 3.125% due 3/16/09 (a) | | | 219,708 |
| 6,622,116 | | | | 5.500% due 11/1/34 (a) | | | 6,515,211 |
| 529,666 | | | | 5.500% due 2/1/35 (a) | | | 521,115 |
| 674,512 | | | | 4.500% due 3/1/35 (a) | | | 628,522 |
| 1,050,000 | | | | Notes, 4.625% due 10/15/13 (a) | | | 1,023,219 |
| | | | | Subordinated Notes: | | | |
| 670,000 | | | | 5.250% due 8/1/12 (a) | | | 670,529 |
| 2,075,000 | | | | 5.125% due 1/2/14 (a) | | | 2,057,358 |
| | | | | | |
|
|
| | | | | Total U.S. Government Agencies | | | 31,989,399 |
| | | | | | |
|
|
|
U.S. Government Obligations — 20.1% |
| | | | | U.S. Treasury Bonds: | | | |
| 1,800,000 | | | | 9.125% due 5/15/18 (a) | | | 2,482,033 |
| 150,000 | | | | 9.000% due 11/15/18 (a) | | | 206,637 |
| 1,900,000 | | | | 8.125% due 8/15/19 (a) | | | 2,484,400 |
| 2,330,000 | | | | 8.500% due 2/15/20 (a) | | | 3,147,504 |
| 7,455,000 | | | | 8.750% due 8/15/20 (a) | | | 10,311,197 |
| 1,540,000 | | | | 8.000% due 11/15/21 (a) | | | 2,039,417 |
| 70,000 | | | | 7.250% due 8/15/22 (a) | | | 87,642 |
| 11,650,000 | | | | 6.250% due 8/15/23 (a) | | | 13,362,014 |
| 665,000 | | | | 6.000% due 2/15/26 (a) | | | 751,294 |
| 1,965,000 | | | | 6.750% due 8/15/26 (a) | | | 2,409,121 |
| 500,000 | | | | 6.625% due 2/15/27 (a) | | | 607,227 |
| 2,990,000 | | | | 6.125% due 11/15/27 (a) | | | 3,452,517 |
| 1,800,000 | | | | 5.250% due 11/15/28 (a) | | | 1,876,923 |
| 5,735,000 | | | | 4.500% due 2/15/36 (a) | | | 5,399,416 |
| | | | | U.S. Treasury Notes: | | | |
| 470,000 | | | | 2.625% due 11/15/06 (a) | | | 467,724 |
| 600,000 | | | | 3.125% due 1/31/07 (a) | | | 595,360 |
| 160,000 | | | | 2.250% due 2/15/07 (a) | | | 157,994 |
| 6,010,000 | | | | 3.750% due 3/31/07 (a) | | | 5,964,456 |
| 7,400,000 | | | | 2.750% due 8/15/07 | | | 7,247,382 |
| 5,200,000 | | | | 4.375% due 12/31/07 (a) | | | 5,165,269 |
| 1,400,000 | | | | 4.625% due 3/31/08 (a) | | | 1,395,352 |
| 3,070,000 | | | | 3.750% due 5/15/08 (a) | | | 3,017,236 |
| 5,000 | | | | 5.125% due 6/30/08 (a) | | | 5,028 |
See Notes to Financial Statements.
88
Schedules of Investments
(continued)
| | | | | | | |
| Core Fixed Income Investments | | |
| | | |
Face
Amount | | | | Security | | Value |
|
U.S. Government Obligations — 20.1% (continued) |
| $ 100,000 | | | | 5.000% due 7/31/08 (a) | | $ | 100,391 |
| 700,000 | | | | 3.250% due 1/15/09 (a) | | | 677,141 |
| 210,000 | | | | 4.500% due 2/15/09 (a) | | | 208,868 |
| 40,000 | | | | 3.875% due 5/15/09 (a) | | | 39,172 |
| 40,000 | | | | 4.000% due 6/15/09 (a) | | | 39,281 |
| 100,000 | | | | 3.625% due 7/15/09 (a) | | | 97,172 |
| 3,885,000 | | | | 3.500% due 8/15/09 (a) | | | 3,758,893 |
| 1,000,000 | | | | 3.375% due 10/15/09 (a) | | | 962,032 |
| 3,400,000 | | | | 3.500% due 12/15/09 | | | 3,277,019 |
| 600,000 | | | | 3.625% due 1/15/10 (a) | | | 580,031 |
| 50,000 | | | | 4.000% due 4/15/10 (a) | | | 48,861 |
| 1,400,000 | | | | 4.125% due 8/15/10 (a) | | | 1,371,891 |
| 1,100,000 | | | | 3.875% due 9/15/10 (a) | | | 1,067,258 |
| 11,000,000 | | | | 4.250% due 10/15/10 | | | 10,821,690 |
| 1,000,000 | | | | 4.500% due 11/15/10 | | | 993,008 |
| 1,560,000 | | | | 4.250% due 1/15/11 (a) | | | 1,532,639 |
| 1,300,000 | | | | 4.750% due 3/31/11 (a) | | | 1,302,743 |
| 500,000 | | | | 4.875% due 4/30/11 (a) | | | 503,614 |
| 900,000 | | | | 4.875% due 5/31/11 (a) | | | 906,575 |
| 4,600,000 | | | | 4.875% due 7/31/11 (a) | | | 4,635,581 |
| 6,000,000 | | | | 4.250% due 11/15/13 (a) | | | 5,828,910 |
| 12,000,000 | | | | 4.000% due 2/15/14 | | | 11,453,448 |
| 3,090,000 | | | | 4.250% due 11/15/14 (a) | | | 2,989,819 |
| 3,890,000 | | | | 4.125% due 5/15/15 (a) | | | 3,722,703 |
| 5,135,000 | | | | 4.500% due 11/15/15 (a) | | | 5,043,135 |
| 12,300,000 | | | | 4.500% due 2/15/16 (a) | | | 12,074,664 |
| 1,340,000 | | | | 5.125% due 5/15/16 (a) | | | 1,378,473 |
| 2,175,000 | | | | 4.875% due 8/15/16 (a) | | | 2,200,319 |
| | | | | U.S. Treasury Strip Principal (STRIPS): | | | |
| 1,825,000 | | | | Zero coupon bond to yield 4.835% due 11/15/21 (a) | | | 858,717 |
| 2,000,000 | | | | Zero coupon bond to yield 5.396% due 11/15/24 (a) | | | 812,440 |
| 1,120,000 | | | | Zero coupon bond to yield 4.773% due 11/15/27 (a) | | | 396,280 |
| | | | | | |
|
|
| | | | | Total U.S. Government Obligations | | | 152,315,911 |
| | | | | | |
|
|
| | | | | TOTAL U.S. GOVERNMENT & AGENCY OBLIGATIONS
(Cost — $184,191,014) | | | 184,305,310 |
| | | | | | |
|
|
U.S. TREASURY INFLATION PROTECTED SECURITIES — 5.9% |
| | | | | U.S. Treasury Bonds, Inflation Indexed: | | | |
| 25,227,229 | | | | 3.375% due 1/15/07 (a) | | | 25,224,277 |
| 531,554 | | | | 2.000% due 1/15/16 (a) | | | 520,570 |
| 182,978 | | | | 2.375% due 1/15/25 (a) | | | 186,823 |
| 1,758,220 | | | | 2.000% due 1/15/26 (a) | | | 1,694,279 |
| | | | | U.S. Treasury Notes, Inflation Indexed: | | | |
| 10,172,304 | | | | 3.625% due 1/15/08 (a) | | | 10,308,603 |
| 817,736 | | | | 2.375% due 4/15/11 (a) | | | 821,314 |
| 2,646,252 | | | | 2.000% due 1/15/14 (a) | | | 2,599,427 |
| 10,763 | | | | 2.000% due 7/15/14 (a) | | | 10,567 |
| 425,016 | | | | 1.625% due 1/15/15 (a) | | | 404,878 |
| 417,228 | | | | 1.875% due 7/15/15 (a) | | | 404,809 |
| 2,883,289 | | | | 2.500% due 7/15/16 (a) | | | 2,949,403 |
| | | | | | |
|
|
| | | | | TOTAL U.S. TREASURY INFLATION PROTECTED SECURITIES
(Cost — $45,325,203) | | | 45,124,950 |
| | | | | | |
|
|
See Notes to Financial Statements.
89
Schedules of Investments
(continued)
| | | | | | | |
| Core Fixed Income Investments | | |
| | | |
| Shares | | | | Security | | Value |
COMMON STOCKS — 0.0% |
INDUSTRIALS — 0.0% |
|
Airlines — 0.0% |
| 340,218 | | | | US Airways Group, Inc., Liquidating Trust, Certificate of Beneficial Interest (f)(j)* (Cost — $0) | | $ | 0 |
| | | | | | |
|
|
| | | | | TOTAL COMMON STOCKS
(Cost — $0) | | | 0 |
| | | | | | |
|
|
CONVERTIBLE PREFERRED STOCKS — 0.1% |
CONSUMER DISCRETIONARY — 0.1% |
|
Automobiles — 0.1% |
| 21,900 | | | | General Motors Corp., Senior Debentures, Series A, 4.500% due 3/6/32 (a) | | | 536,550 |
| 4,400 | | | | General Motors Corp., Senior Debentures, Series B, 5.250% due 3/6/32 | | | 83,160 |
| | | | | | |
|
|
| | | | | TOTAL CONSUMER DISCRETIONARY | | | 619,710 |
| | | | | | |
|
|
TELECOMMUNICATION SERVICES — 0.0% |
|
Diversified Telecommunication Services — 0.0% |
| 35 | | | | McLeodUSA Inc., 2.500% due 4/18/12*(f) | | | 0 |
| | | | | | |
|
|
| | | | | TOTAL CONVERTIBLE PREFERRED STOCKS
(Cost — $597,391) | | | 619,710 |
| | | | | | |
|
|
PREFERRED STOCKS — 0.0% |
FINANCIALS — 0.0% |
|
Diversified Financial Services — 0.0% |
| 100 | | | | Home Ownership Funding II, 2.567% (a)(g) | | | 21,260 |
| | | | | | |
|
|
HEALTH CARE — 0.0% |
|
Health Care Equipment & Supplies — 0.0% |
| 41 | | | | Fresenius Medical Care Capital Trust II, 7.875% (a) | | | 41,923 |
| | | | | | |
|
|
| | | | | TOTAL PREFERRED STOCKS
(Cost — $106,495) | | | 63,183 |
| | | | | | |
|
|
| | | |
Contracts
| | | | | | |
PURCHASED OPTIONS — 0.1% |
| 140 | | | | Eurodollar Futures, Put @ $90.25, expires 9/17/07 | | | 875 |
| 181 | | | | Eurodollar Futures, Put @ $91.25, expires 6/18/07 | | | 1,131 |
| 138 | | | | Eurodollar Futures, Put @ $91.75, expires 12/19/06 | | | 863 |
| 69 | | | | Eurodollar Futures, Put @ $92.00, expires 12/18/06 | | | 431 |
| 134 | | | | Eurodollar Futures, Put @ $92.00, expires 3/19/07 (a) | | | 838 |
| 32 | | | | Eurodollar Futures, Put @ $92.50, expires 9/18/06 (a) | | | 200 |
| 356 | | | | Eurodollar Futures, Put @ $94.13, expires 12/18/06 | | | 4,450 |
| 22,000,000 | | | | Swaption, 3 Month LIBOR, 4.50% fixed rate, Call @ $4.50, expires 1/22/07 (a) | | | 4,752 |
| 10,000,000 | | | | Swaption, 3 Month LIBOR, 4.50% fixed rate, Call @ $4.50, expires 10/18/06 | | | 10 |
| 14,600,000 | | | | Swaption, 3 Month LIBOR, 5.00% fixed rate, Call @ $5.00, expires 3/8/07 (a) | | | 43,494 |
| 4,600,000 | | | | Swaption, 3 Month LIBOR, 5.08% fixed rate, Call @ $5.08, expires 4/19/07 (a) | | | 19,959 |
| 4,200,000 | | | | Swaption, 3 Month LIBOR, 5.13% fixed rate, Call @ $5.13, expires 10/25/06 (a) | | | 5,930 |
| 10,000,000 | | | | Swaption, 3 Month LIBOR, 5.25% fixed rate, Call @ $5.25, expires 6/7/07 (a) | | | 68,640 |
| 20,300,000 | | | | Swaption, 3 Month LIBOR, 5.25% fixed rate, Call @ $5.25, expires 7/2/07 (a) | | | 147,216 |
| 22,300,000 | | | | Swaption, 3 Month LIBOR, 5.37% fixed rate, Call @ $5.37, expires 7/2/07 (a) | | | 193,876 |
| 16,000,000 | | | | Swaption, 3 Month LIBOR, 5.50% fixed rate, Call @ $5.50, expires 6/30/07 (a) | | | 165,808 |
| | | | | | |
|
|
| | | | | TOTAL PURCHASED OPTIONS
(Cost — $552,406) | | | 658,473 |
| | | | | | |
|
|
See Notes to Financial Statements.
90
Schedules of Investments
(continued)
| | | | | | | | |
| Core Fixed Income Investments | | |
| | | |
| Warrants | | | | | Security | | Value |
| WARRANT — 0.0% |
| 77 | | | | | McLeodUSA Inc., Expires 4/16/07(f)* (Cost — $0) | | $ | 0 |
| | | | | | | |
|
|
| | | | | | TOTAL INVESTMENTS BEFORE SHORT-TERM INVESTMENTS
(Cost — $806,488,001) | | | 804,996,881 |
| | | | | | | |
|
|
| | | |
Face
Amount†
| | | | | | | |
| SHORT-TERM INVESTMENTS — 15.5% |
| COMMERCIAL PAPER — 0.9% |
| 5,300,000 | | | | | Ixis Com, 5.261% due 9/1/06 (a)(k) | | | 5,300,000 |
| 1,100,000 | | | | | Time Warner Inc., 5.332% due 9/18/06 (k) | | | 1,097,278 |
| | | | | | | |
|
|
| | | | | | Total Commercial Paper
(Cost — $6,397,278) | | | 6,397,278 |
| | | | | | | |
|
|
| SOVEREIGN BONDS — 7.5% |
| | | | | | Dutch Treasury Certificate: | | | |
| 3,120,000 | EUR | | | | Zero coupon bond to yield 2.949% due 9/29/06 (a) | | | 3,983,178 |
| 1,300,000 | EUR | | | | Zero coupon bond to yield 3.036% due 10/31/06 (a) | | | 1,655,117 |
| | | | | | French Treasury Bills: | | | |
| 1,200,000 | EUR | | | | Zero coupon bond to yield 2.842% due 9/7/06 (a) | | | 1,534,716 |
| 3,370,000 | EUR | | | | Zero coupon bond to yield 2.872% due 9/28/06 (a) | | | 4,301,696 |
| 9,370,000 | EUR | | | | Zero coupon bond to yield 2.862% due 10/12/06 (a) | | | 11,950,613 |
| 3,640,000 | EUR | | | | Zero coupon bond to yield 2.959% due 10/19/06 (a) | | | 4,638,124 |
| 7,000,000 | EUR | | | | Zero coupon bond to yield 3.118% due 11/16/06 (a) | | | 8,897,216 |
| 2,800,000 | EUR | | | | Zero coupon bond to yield 3.040% due 12/7/06 (a) | | | 3,552,350 |
| | | | | | German Treasury Bills: | | | |
| 2,360,000 | EUR | | | | Series 0306, zero coupon bond to yield 2.908% due 9/13/06 (a) | | | 3,016,796 |
| 9,100,000 | EUR | | | | Zero coupon bond to yield 2.866% due 10/18/06 (a) | | | 11,599,267 |
| 600,000 | EUR | | | | Zero coupon bond to yield 3.143% due 1/17/07 (a) | | | 758,520 |
| 1,300,000 | | | | | Government of Canada, 4.962% due 9/20/06 (a)(k) | | | 1,296,666 |
| | | | | | | |
|
|
| | | | | | Total Sovereign Bonds
(Cost — $56,679,380) | | | 57,184,259 |
| | | | | | | |
|
|
| U.S. GOVERNMENT AGENCY — 0.0% |
| 300,000 | | | | | Federal National Mortgage Association (FNMA), Discount Notes, 5.053% due 9/25/06 (a)(k)
(Cost — $299,008) | | | 299,008 |
| | | | | | | |
|
|
| U.S. GOVERNMENT OBLIGATIONS — 0.1% |
| | | | | | U.S. Treasury Bills: | | | |
| 510,000 | | | | | 4.864% due 9/14/06 (k)(l) | | | 509,115 |
| 200,000 | | | | | 4.776% due 9/14/06 (k)(l) | | | 199,659 |
| | | | | | | |
|
|
| | | | | | Total U.S. Government Obligations
(Cost — $708,774) | | | 708,774 |
| | | | | | | |
|
|
| REPURCHASE AGREEMENTS — 7.0% |
| 7,000,000 | | | | | Credit Suisse Securities (USA) LLC repurchase agreement dated 8/31/06, 5.150% due 9/1/06;
Proceeds at maturity — $7,001,001; (Fully collateralized by Inflation Indexed U.S. Treasury Bond,
3.875% due 4/15/29; Market value — $7,171,574) (a) | | | 7,000,000 |
| 46,297,000 | | | | | State Street Bank & Trust Co., dated 8/31/06, 4.810% due 9/1/06; Proceeds at maturity — $46,303,186; (Fully collateralized by various U.S. Treasury Bonds, 4.500% to 8.125% due 8/15/21 to 2/15/36;
Market value — $47,233,310) (a) | | | 46,297,000 |
| | | | | | | |
|
|
| | | | | | Total Repurchase Agreements
(Cost — $53,297,000) | | | 53,297,000 |
| | | | | | | |
|
|
See Notes to Financial Statements.
91
Schedules of Investments
(continued)
| | | | | | | | |
| Core Fixed Income Investments | | | |
| | | |
| | | | | Security | | Value | |
| | | | | TOTAL SHORT-TERM INVESTMENTS
(Cost — $117,381,440) | | $ | 117,886,319 | |
| | | | | | |
|
|
|
| | | | | TOTAL INVESTMENTS — 121.4%
(Cost — $923,869,441#) | | | 922,883,200 | |
| | | | | Liabilities in Excess of Other Assets — (21.4)% | | | (162,919,251 | ) |
| | | | | | |
|
|
|
| | | | | TOTAL NET ASSETS — 100.0% | | $ | 759,963,949 | |
| | | | | | |
|
|
|
| † | | Face amount denominated in U.S. dollars, unless otherwise noted. |
| ‡ | | All ratings are by Standard & Poor’s Ratings Service, unless otherwise noted. All ratings are unaudited. |
| * | | Non-income producing security. |
| (a) | | All or a portion of this security is segregated for open futures contracts, written options, swap contracts, foreign currency contracts, TBA’s, mortgage dollar rolls and short sales. |
| (b) | | Variable rate security. Interest rate disclosed is that which is in effect at August 31, 2006. |
| (c) | | Interest only security. |
| (d) | | This security is traded on a to-be-announced (“TBA”) basis (See Note 1). |
| (e) | | All or a portion of this security was acquired under a mortgage dollar roll agreement (See Notes 1 and 3). |
| (f) | | Security is valued in good faith at fair value by or under the direction of the Board of Trustees (See Note 1). |
| (g) | | Security is exempt from registration under Rule 144A of the Securities Act of 1933. This security may be resold in transactions that are exempt from registration, normally to qualified institutional buyers. This security has been deemed liquid pursuant to guidelines approved by the Board of Trustees, unless otherwise noted. |
| (h) | | Rating by Moody’s Investors Service. All ratings are unaudited. |
| (i) | | Rating by Fitch Ratings Service. All ratings are unaudited. |
| (k) | | Rate shown represents yield-to-maturity. |
| (l) | | All or a portion of this security is held at the broker as collateral for open futures contracts. |
| # | | Aggregate cost for federal income tax purposes is $925,658,863. |
See pages 119 and 120 for definitions of ratings.
| | |
Abbreviations used in this schedule:
|
| CPI | | — Consumer Price Index |
| FGIC | | — Financial Guaranty Insurance Company |
| FSA | | — Financial Security Assurance |
| GO | | — General Obligation |
| IO | | — Interest Only |
| LIBOR | | — London Interbank Offered Rate |
| MASTR | | — Mortgage Asset Securitization Transactions Inc. |
| PAC | | — Planned Amortization Class |
| PFA | | — Public Facilities Authority |
| STRIPS | | — Separate Trading of Registered Interest and Principal Securities |
See Notes to Financial Statements.
92
Schedules of Investments
(continued)
Core Fixed Income Investments
| | | |
| Summary of Investments by Security Type* | | | |
Mortgage-Backed Securities | | 31.2 | % |
U.S. Government & Agency Obligations | | 20.0 | |
Collateralized Mortgage Obligations | | 13.4 | |
Corporate Bonds & Notes | | 11.1 | |
U.S. Treasury Inflation Protected Securities | | 4.9 | |
Asset-Backed Securities | | 4.8 | |
Sovereign Bonds | | 1.1 | |
Municipal Bonds | | 0.5 | |
Purchased Options | | 0.1 | |
Convertible Preferred Stocks | | 0.1 | |
Preferred Stocks | | 0.0 | ** |
Warrant | | 0.0 | ** |
Common Stocks | | 0.0 | ** |
Short-Term Investments | | 12.8 | |
| | |
|
|
| | | 100.0 | % |
| | |
|
|
| * | | As a percentage of total investments. |
| ** | | Amount represents less than 0.1%. |
Schedule of Options Written
| | | | | | | | | | |
| | | | | |
| | | | |
| Contracts | | Security | | Expiration Date | | Strike Price | | Value |
| 1 | | Eurodollar Futures, Call | | 9/18/06 | | $ | 94.75 | | $ | 6 |
| 4,300,000 | | Swaption, 3 Month LIBOR, 4.56% fixed rate Call | | 10/18/06 | | | 4.56 | | | 30 |
| 9,500,000 | | Swaption, 3 Month LIBOR, 4.56% fixed rate Call | | 1/22/07 | | | 4.56 | | | 5,491 |
| 6,200,000 | | Swaption, 3 Month LIBOR, 5.04% fixed rate Call | | 3/8/07 | | | 5.04 | | | 39,748 |
| 1,800,000 | | Swaption, 3 Month LIBOR, 5.21% fixed rate Call | | 10/25/06 | | | 5.21 | | | 9,259 |
| 2,000,000 | | Swaption, 3 Month LIBOR, 5.22% fixed rate Call | | 4/19/07 | | | 5.22 | | | 22,530 |
| 4,000,000 | | Swaption, 3 Month LIBOR, 5.34% fixed rate Call | | 6/7/07 | | | 5.34 | | | 61,512 |
| 8,800,000 | | Swaption, 3 Month LIBOR, 5.37% fixed rate Call | | 7/2/07 | | | 5.37 | | | 147,726 |
| 7,300,000 | | Swaption, 3 Month LIBOR, 5.50% fixed rate Call | | 7/2/07 | | | 5.50 | | | 180,055 |
| 6,900,000 | | Swaption, 3 Month LIBOR, 5.60% fixed rate Call | | 6/30/07 | | | 5.60 | | | 161,715 |
| | | | | | | | | |
|
|
| | | TOTAL OPTIONS WRITTEN
(Premiums received — $534,420) | | | | | | | $ | 628,072 |
| | | | | | | | | |
|
|
Schedule of Securities Sold Short
| | | | | |
| |
| | |
Face
Amount | | Security | | Value |
| | | Federal National Mortgage Association (FNMA): | | | |
| $7,000,000 | | 5.000% due 9/13/36* | | $ | 6,706,875 |
| 4,000,000 | | 6.000% due 9/13/36* | | | 4,005,000 |
| | | Federal Home Loan Mortgage Corp. (FHLMC): | | | |
| 3,000,000 | | 5.000% due 9/18/21* | | | 2,936,250 |
| 2,600,000 | | U.S. Treasury Notes, 6.000% due 8/15/09 | | | 2,692,118 |
| | | | |
|
|
| | | TOTAL OPEN SHORT SALES
(Proceeds — $16,289,857) | | $ | 16,340,243 |
| | | | |
|
|
| * | | This security is traded on a to-be-announced (“TBA”) basis (See Note 1). |
See Notes to Financial Statements.
93
Schedules of Investments
(continued)
| | | | | | | |
| High Yield Investments | | |
| | | |
Face Amount | | Rating‡ | | Security | | Value |
CORPORATE BONDS & NOTES — 96.7% | | | |
| |
Aerospace & Defense — 1.7% | | | |
| $ 450,000 | | B+ | | Alliant Techsystems Inc., Senior Subordinated Notes, 6.750% due 4/1/16 | | $ | 438,750 |
| 360,000 | | B | | DRS Technologies Inc., Senior Subordinated Notes, 7.625% due 2/1/18 | | | 361,800 |
| | | | | L-3 Communications Corp., Senior Subordinated Notes: | | | |
| 660,000 | | BB+ | | 7.625% due 6/15/12 | | | 679,800 |
| 140,000 | | BB+ | | 6.125% due 1/15/14 | | | 135,100 |
| 205,000 | | BB+ | | 5.875% due 1/15/15 | | | 194,750 |
| 100,000 | | BB+ | | 6.375% due 10/15/15 | | | 96,750 |
| | | | | | |
|
|
| | | | | Total Aerospace & Defense | | | 1,906,950 |
| | | | | | |
|
|
| |
Airlines — 0.6% | | | |
| 180,000 | | B | | CHC Helicopter Corp., Senior Subordinated Notes, 7.375% due 5/1/14 | | | 170,100 |
| 420,756 | | BB+ | | United Airlines Inc., Pass-Through Certificates, Series 2000-2, Senior Secured Notes, 7.032% due 10/1/10 | | | 433,898 |
| | | | | | |
|
|
| | | | | Total Airlines | | | 603,998 |
| | | | | | |
|
|
| |
Auto Components — 0.9% | | | |
| | | | | Goodyear Tire & Rubber Co.: | | | |
| 305,000 | | B- | | Senior Notes, 9.000% due 7/1/15 | | | 307,287 |
| 80,000 | | B- | | Senior Secured Notes, 13.240% due 3/1/11 (a) | | | 90,400 |
| 300,000 | | B- | | Keystone Automotive Operations Inc., Senior Subordinated Notes, 9.750% due 11/1/13 | | | 286,500 |
| | | | | Visteon Corp., Senior Notes: | | | |
| 256,000 | | B- | | 8.250% due 8/1/10 | | | 252,160 |
| 90,000 | | B- | | 7.000% due 3/10/14 | | | 80,325 |
| | | | | | |
|
|
| | | | | Total Auto Components | | | 1,016,672 |
| | | | | | |
|
|
| |
Automobiles — 0.7% | | | |
| | | | | Ford Motor Co.: | | | |
| 300,000 | | B+ | | Debentures, 8.875% due 1/15/22 | | | 256,500 |
| 15,000 | | B+ | | Notes, 7.450% due 7/16/31 | | | 11,850 |
| | | | | General Motors Corp.: | | | |
| 115,000 | | B- | | Notes, 7.200% due 1/15/11 | | | 103,644 |
| 440,000 | | B- | | Senior Debentures, 8.375% due 7/15/33 | | | 370,700 |
| | | | | | |
|
|
| | | | | Total Automobiles | | | 742,694 |
| | | | | | |
|
|
| |
Building Products — 1.0% | | | |
| 885,000 | | CCC | | Associated Materials Inc., Senior Discount Notes, step bond to yield 10.559% due 3/1/14 | | | 486,750 |
| 110,000 | | B | | Jacuzzi Brands Inc., Secured Notes, 9.625% due 7/1/10 | | | 117,150 |
| 315,000 | | CCC+ | | Nortek Inc., Senior Subordinated Notes, 8.500% due 9/1/14 | | | 294,525 |
| 155,000 | | CCC+ | | NTK Holdings Inc., Senior Discount Notes, step bond to yield 11.315% due 3/1/14 | | | 104,625 |
| 50,000 | | B- | | US Concrete Inc., 8.375% due 4/1/14 (b) | | | 48,125 |
| | | | | | |
|
|
| | | | | Total Building Products | | | 1,051,175 |
| | | | | | |
|
|
| |
Capital Markets — 0.7% | | | |
| 290,000 | | B | | BCP Crystal U.S. Holdings Corp., Senior Subordinated Notes, 9.625% due 6/15/14 | | | 315,738 |
| | | | | E*TRADE Financial Corp., Senior Notes: | | | |
| 160,000 | | B+ | | 7.375% due 9/15/13 | | | 162,400 |
| 276,000 | | B+ | | 7.875% due 12/1/15 | | | 288,420 |
| | | | | | |
|
|
| | | | | Total Capital Markets | | | 766,558 |
| | | | | | |
|
|
| |
Chemicals — 3.6% | | | |
| 15,000 | | B+ | | ARCO Chemical Co., Debentures, 10.250% due 11/1/10 | | | 16,538 |
| 40,000 | | BB- | | Equistar Chemicals LP, Senior Notes, 10.625% due 5/1/11 | | | 43,200 |
See Notes to Financial Statements.
94
Schedules of Investments
(continued)
| | | | | | | |
| High Yield Investments | | |
| | | |
Face Amount | | Rating‡ | | Security | | Value |
| |
Chemicals — 3.6% (continued) | | | |
| $ 205,000 | | BB- | | Equistar Chemicals LP/Equistar Funding Corp., Senior Notes, 10.125% due 9/1/08 | | $ | 217,300 |
| 685,000 | | BBB- | | FMC Corp., Medium-Term Notes, Series A, 7.000% due 5/15/08 | | | 699,887 |
| 100,000 | | BB | | Hercules Inc., Debentures, 6.600% due 8/1/27 | | | 99,250 |
| 220,000 | | B | | Huntsman International LLC, Senior Notes, 9.875% due 3/1/09 | | | 229,900 |
| 251,000 | | BB- | | Huntsman LLC, 11.625% due 10/15/10 | | | 279,865 |
| 425,000 | | B- | | Ineos Group Holdings Plc, 8.500% due 2/15/16 (b) | | | 405,875 |
| | | | | Lyondell Chemical Co., Senior Secured Notes: | | | |
| 118,000 | | BB | | 9.500% due 12/15/08 | | | 122,130 |
| 50,000 | | BB | | 10.500% due 6/1/13 | | | 55,250 |
| 485,000 | | BB | | Series A, 9.625% due 5/1/07 | | | 497,125 |
| 480,000 | | B- | | Montell Finance Co. BV, Debentures, 8.100% due 3/15/27 (b) | | | 447,600 |
| 210,000 | | BB- | | Reichhold Industries Inc., 9.000% due 8/15/14 (b) | | | 206,850 |
| 232,000 | | B- | | Rockwood Specialties Group Inc., Senior Subordinated Notes, 10.625% due 5/15/11 | | | 249,980 |
| 397,000 | | BB+ | | Westlake Chemical Corp., Senior Notes, 6.625% due 1/15/16 | | | 379,135 |
| | | | | | |
|
|
| | | | | Total Chemicals | | | 3,949,885 |
| | | | | | |
|
|
| |
Commercial Services & Supplies — 4.2% | | | |
| 115,000 | | B+ | | Alderwoods Group Inc., 7.750% due 9/15/12 | | | 122,475 |
| | | | | Allied Waste North America Inc.: | | | |
| | | | | Senior Notes: | | | |
| 60,000 | | BB- | | 6.375% due 4/15/11 | | | 58,500 |
| | | | | Series B: | | | |
| 220,000 | | BB- | | 8.500% due 12/1/08 | | | 229,900 |
| 250,000 | | BB- | | 7.250% due 3/15/15 | | | 246,875 |
| 320,000 | | BB- | | Senior Secured Notes, 7.125% due 5/15/16 (b) | | | 312,800 |
| 95,000 | | B | | Ashtead Holdings PLC, Secured Notes, 8.625% due 8/1/15 (b) | | | 95,475 |
| 120,000 | | B | | Casella Waste Systems Inc., Senior Subordinated Notes, 9.750% due 2/1/13 | | | 126,300 |
| 545,000 | | BB- | | Corrections Corp. of America, Senior Notes, 7.500% due 5/1/11 | | | 559,306 |
| 767,000 | | B | | DynCorp International LLC/DIV Capital Corporation, Senior Subordinated Notes, 9.500% due 2/15/13 | | | 795,763 |
| | | | | NationsRent Inc.: | | | |
| 430,000 | | B2(c) | | Secured Notes, 9.500% due 10/15/10 | | | 467,204 |
| 260,000 | | Caa1(c) | | Senior Subordinated Notes, 9.500% due 5/1/15 | | | 305,427 |
| 110,000 | | BB | | Service Corp. International, Senior Notes, 8.000% due 6/15/17 (b) | | | 105,875 |
| 1,110,000 | | BB- | | Windstream Corp., Senior Notes, 8.625% due 8/1/16 (b) | | | 1,179,375 |
| | | | | | |
|
|
| | | | | Total Commercial Services & Supplies | | | 4,605,275 |
| | | | | | |
|
|
| |
Computers & Peripherals — 0.3% | | | |
| 270,000 | | BB+ | | Seagate Technology HDD Holdings, Senior Notes, 8.000% due 5/15/09 | | | 278,775 |
| | | | | | |
|
|
| |
Consumer Finance — 4.9% | | | |
| | | | | Ford Motor Credit Co.: | | | |
| 160,000 | | B+ | | 8.625% due 11/1/10 | | | 160,630 |
| 400,000 | | B+ | | Bonds, 7.375% due 2/1/11 | | | 385,123 |
| | | | | Notes: | | | |
| 135,000 | | B+ | | 6.625% due 6/16/08 | | | 132,813 |
| 350,000 | | B+ | | 5.625% due 10/1/08 | | | 337,717 |
| 225,000 | | B+ | | 9.957% due 4/15/12 (a) | | | 238,170 |
| | | | | Senior Notes: | | | |
| 775,000 | | B+ | | 5.800% due 1/12/09 | | | 742,813 |
| 295,000 | | B+ | | 9.875% due 8/10/11 | | | 308,515 |
| | | | | General Motors Acceptance Corp.: | | | |
| 1,635,000 | | BB | | Bonds, 8.000% due 11/1/31 | | | 1,656,965 |
| | | | | Notes: | | | |
| 405,000 | | BB | | 6.875% due 9/15/11 | | | 399,293 |
See Notes to Financial Statements.
95
Schedules of Investments
(continued)
| | | | | | | |
| High Yield Investments | | |
| | | |
Face
Amount | | Rating‡ | | Security | | Value |
| |
Consumer Finance — 4.9% (continued) | | | |
| $ 240,000 | | BB | | 6.875% due 8/28/12 | | $ | 234,571 |
| 850,000 | | BB | | 6.750% due 12/1/14 | | | 816,144 |
| | | | | | |
|
|
| | | | | Total Consumer Finance | | | 5,412,754 |
| | | | | | |
|
|
| |
Containers & Packaging — 2.4% | | | |
| 515,000 | | BB | | Ball Corp., 6.875% due 12/15/12 | | | 517,575 |
| 255,000 | | B | | Crown Americas LLC, Senior Notes, 7.625% due 11/15/13 | | | 257,550 |
| 45,000 | | B | | Crown Cork & Seal Co. Inc., Debentures, 8.000% due 4/15/23 | | | 42,750 |
| 223,000 | | CCC+ | | Graham Packaging Co. Inc., Senior Subordinated Notes, 9.875% due 10/15/14 | | | 215,753 |
| | | | | Graphic Packaging International Corp.: | | | |
| 40,000 | | B- | | Senior Notes, 8.500% due 8/15/11 | | | 40,800 |
| 290,000 | | B- | | Senior Subordinated Notes, 9.500% due 8/15/13 | | | 292,900 |
| | | | | Owens-Brockway Glass Container Inc., Senior Secured Notes: | | | |
| 44,000 | | BB- | | 8.875% due 2/15/09 | | | 45,430 |
| 505,000 | | BB- | | 8.750% due 11/15/12 | | | 539,087 |
| 440,000 | | B | | Plastipak Holdings Inc., Senior Notes, 8.500% due 12/15/15 (b) | | | 440,000 |
| 233,000 | | BB- | | Silgan Holdings Inc., Senior Subordinated Notes, 6.750% due 11/15/13 | | | 228,922 |
| | | | | | |
|
|
| | | | | Total Containers & Packaging | | | 2,620,767 |
| | | | | | |
|
|
| |
Diversified Consumer Services — 1.2% | | | |
| | | | | Hertz Corp.: | | | |
| 430,000 | | B | | Senior Notes, 8.875% due 1/1/14 (b) | | | 448,275 |
| 655,000 | | B | | Senior Subordinated Notes, 10.500% due 1/1/16 (b) | | | 709,037 |
| 200,000 | | BB | | Service Corp. International, 7.700% due 4/15/09 | | | 205,500 |
| | | | | | |
|
|
| | | | | Total Diversified Consumer Services | | | 1,362,812 |
| | | | | | |
|
|
| |
Diversified Financial Services — 4.4% | | | |
| 880,000 | | CCC+ | | AAC Group Holding Corp., step bond to yield 10.756% due 10/1/12 | | | 710,600 |
| 311,000 | | B+ | | American Commercial Lines/ACL Finance Corp., 9.500% due 2/15/15 | | | 340,545 |
| 630,000 | | B- | | Basell AF SCA, Senior Subordinated Notes, 8.375% due 8/15/15 (b) | | | 633,937 |
| 105,000 | | CCC+ | | CCM Merger Inc., Notes, 8.000% due 8/1/13 (b) | | | 101,063 |
| | | | | Citisteel USA Inc., Senior Secured Notes: | | | |
| 350,000 | | CCC+ | | 12.490% due 9/1/10 (a) | | | 361,375 |
| 45,000 | | NR | | 15.000% due 10/1/10 (b)(d) | | | 48,375 |
| 135,000 | | B+ | | Galaxy Entertainment Finance Co., Ltd., Senior Notes, 10.420% due 12/15/10 (a)(b) | | | 142,088 |
| 270,000 | | B | | Hexion U.S. Finance Corp./Hexion Nova Scotia Finance ULC, Second Priority, Senior Secured Notes, 9.000% due 7/15/14 | | | 272,700 |
| 110,000 | | B- | | Hughes Network Systems LLC/HNS Finance Corp., Senior Notes, 9.500% due 4/15/14 (b) | | | 112,200 |
| 340,000 | | BB | | Leucadia National Corp., Senior Notes, 7.000% due 8/15/13 | | | 336,600 |
| 485,000 | | CCC | | Milacron Escrow Corp., Senior Secured Notes, 11.500% due 5/15/11 | | | 465,600 |
| 565,000 | | B- | | Standard Aero Holdings Inc., 8.250% due 9/1/14 | | | 546,637 |
| 126,000 | | B- | | UCAR Finance Inc., Senior Notes, 10.250% due 2/15/12 | | | 132,930 |
| 480,000 | | B- | | UGS Corp., Senior Subordinated Notes, 10.000% due 6/1/12 | | | 518,400 |
| 145,000 | | CCC+ | | Vanguard Health Holdings Co. II LLC, Senior Subordinated Notes, 9.000% due 10/1/14 | | | 141,375 |
| | | | | | |
|
|
| | | | | Total Diversified Financial Services | | | 4,864,425 |
| | | | | | |
|
|
| |
Diversified Telecommunication Services — 9.6% | | | |
| 465,000 | | B- | | Cincinnati Bell Inc., Senior Notes, 7.000% due 2/15/15 | | | 455,700 |
| 35,000 | | BB- | | Cincinnati Bell Telephone Co., Senior Debentures, 6.300% due 12/1/28 | | | 30,100 |
| | | | | Citizens Communications Co.: | | | |
| 185,000 | | BB+ | | Notes, 9.250% due 5/15/11 | | | 203,269 |
| 1,280,000 | | BB+ | | Senior Notes, 9.000% due 8/15/31 | | | 1,356,800 |
| | | | | Embarq Corp., Notes: | | | |
| 170,000 | | BBB- | | 6.738% due 6/1/13 | | | 173,678 |
See Notes to Financial Statements.
96
Schedules of Investments
(continued)
| | | | | | | |
| High Yield Investments | | |
| | | |
Face Amount | | Rating‡ | | Security | | Value |
| |
Diversified Telecommunication Services — 9.6% (continued) | | | |
| $ 665,000 | | BBB- | | 7.995% due 6/1/36 | | $ | 697,056 |
| 210,000 | | B+ | | GCI Inc., Senior Notes, 7.250% due 2/15/14 | | | 202,913 |
| 850,000 | | CCC+ | | Hawaiian Telcom Communications Inc., Senior Subordinated Notes, Series B, 12.500% due 5/1/15 | | | 873,375 |
| 495,000 | | B+ | | Inmarsat Finance II PLC, step bond to yield 8.325% due 11/15/12 | | | 434,362 |
| 13,000 | | B+ | | Inmarsat Finance PLC, Senior Notes, 7.625% due 6/30/12 | | | 13,390 |
| 320,000 | | B | | Intelsat Bermuda Ltd., Senior Notes, 11.250% due 6/15/16 (b) | | | 333,200 |
| 310,000 | | B | | Intelsat Ltd., Notes, 7.625% due 4/15/12 | | | 270,475 |
| | | | | Intelsat Subsidiary Holding Co., Ltd., Senior Notes: | | | |
| 265,000 | | B+ | | 10.484% due 1/15/12 (a) | | | 270,300 |
| 195,000 | | B+ | | 8.250% due 1/15/13 | | | 195,488 |
| 215,000 | | B | | Nordic Telephone Co. Holdings, Senior Notes, 8.875% due 5/1/16 (b) | | | 224,675 |
| | | | | NTL Cable PLC, Senior Notes: | | | |
| 635,000 | | B- | | 8.750% due 4/15/14 | | | 661,987 |
| 215,000 | | B- | | 9.125% due 8/15/16 | | | 223,600 |
| | | | | PanAmSat Corp.: | | | |
| 220,000 | | B | | 9.000% due 6/15/16 (b) | | | 224,400 |
| 105,000 | | BB | | Notes, 6.375% due 1/15/08 | | | 105,000 |
| 365,000 | | B | | Senior Notes, 9.000% due 8/15/14 | | | 373,212 |
| 190,000 | | B | | Qwest Capital Funding Inc., 7.250% due 2/15/11 | | | 189,050 |
| | | | | Qwest Communications International Inc.: | | | |
| 315,000 | | B | | 7.250% due 2/15/11 | | | 313,819 |
| | | | | Senior Notes: | | | |
| 285,000 | | B | | 8.905% due 2/15/09 (a) | | | 290,700 |
| 820,000 | | B | | Series B, 7.500% due 2/15/14 | | | 816,925 |
| | | | | Qwest Corp.: | | | |
| 165,000 | | BB | | Debentures, 8.875% due 6/1/31 | | | 172,631 |
| | | | | Notes: | | | |
| 50,000 | | BB | | 8.875% due 3/15/12 | | | 54,375 |
| 245,000 | | BB | | 8.579% due 6/15/13 (a) | | | 264,906 |
| 180,000 | | BB | | 7.625% due 6/15/15 | | | 185,625 |
| 235,000 | | BB | | Senior Notes, 7.875% due 4/27/11 | | | 246,163 |
| 170,000 | | BBB- | | Valor Telecommunications Enterprises LLC/Finance Corp., 7.750% due 2/15/15 | | | 180,200 |
| 460,000 | | B- | | Wind Acquisition Finance SA, Senior Bond, 10.750% due 12/1/15 (b) | | | 501,975 |
| | | | | | |
|
|
| | | | | Total Diversified Telecommunication Services | | | 10,539,349 |
| | | | | | |
|
|
| |
Electric Utilities — 5.4% | | | |
| 398,000 | | BB- | | AES Corp., Secured Notes, 8.750% due 5/15/13 (b) | | | 429,343 |
| | | | | Allegheny Energy Supply Co. LLC: | | | |
| 55,000 | | BB- | | Notes, 7.800% due 3/15/11 | | | 58,300 |
| 305,000 | | BB- | | Senior Notes, 8.250% due 4/15/12 (b) | | | 330,925 |
| 405,000 | | B | | Aquila Inc., Senior Notes, 9.950% due 2/1/11 | | | 449,870 |
| 131,398 | | BB- | | Elwood Energy LLC, Secured Notes, 8.159% due 7/5/26 | | | 142,853 |
| 94,190 | | BB- | | FPL Energy National Wind, Secured Notes, 6.125% due 3/25/19 (b) | | | 93,192 |
| 237,600 | | BB- | | FPL Energy Wind Funding LLC, Notes, 6.876% due 6/27/17 (b) | | | 241,461 |
| | | | | Midwest Generation LLC: | | | |
| 1,239,678 | | B+ | | Pass-Through Certificates, Series B, 8.560% due 1/2/16 | | | 1,317,932 |
| 225,000 | | B | | Secured Notes, 8.750% due 5/1/34 | | | 240,750 |
| 225,000 | | B- | | Mission Energy Holding Co., Senior Secured Notes, 13.500% due 7/15/08 | | | 252,844 |
| | | | | Nevada Power Co.: | | | |
| 185,000 | | BB | | Second Mortgage, 9.000% due 8/15/13 | | | 202,589 |
| 50,000 | | BB | | Series A, 8.250% due 6/1/11 | | | 55,022 |
| 75,000 | | BB | | Series L, 5.875% due 1/15/15 | | | 74,512 |
| 60,000 | | B- | | Orion Power Holdings Inc., Senior Notes, 12.000% due 5/1/10 | | | 68,400 |
See Notes to Financial Statements.
97
Schedules of Investments
(continued)
| | | | | | | |
| High Yield Investments | | |
| | | |
Face
Amount | | Rating‡ | | Security | | Value |
| |
Electric Utilities — 5.4% (continued) | | | |
| | | | | PSEG Energy Holdings LLC, Senior Notes: | | | |
| $ 235,000 | | BB- | | 8.625% due 2/15/08 | | $ | 243,225 |
| 285,000 | | BB- | | 10.000% due 10/1/09 | | | 309,225 |
| | | | | Reliant Energy Inc., Senior Secured Notes: | | | |
| 260,000 | | B | | 9.250% due 7/15/10 | | | 271,700 |
| 480,000 | | B | | 9.500% due 7/15/13 | | | 501,600 |
| 145,000 | | B | | 6.750% due 12/15/14 | | | 137,388 |
| 156,000 | | B- | | Sierra Pacific Resources, Senior Notes, 7.803% due 6/15/12 | | | 163,402 |
| 275,000 | | B | | Sithe Independence Funding, Notes, 9.000% due 12/30/13 | | | 296,932 |
| 97,724 | | BB- | | Tenaska Alabama Partners LP, Secured Notes, 7.000% due 6/30/21 (b) | | | 94,339 |
| | | | | | |
|
|
| | | | | Total Electric Utilities | | | 5,975,804 |
| | | | | | |
|
|
| |
Electrical Equipment — 0.2% | | | |
| 245,000 | | B | | General Cable Corp., Senior Notes, 9.500% due 11/15/10 | | | 263,375 |
| | | | | | |
|
|
| |
Energy Equipment & Services — 1.1% | | | |
| 260,000 | | B+ | | ANR Pipeline Co., Debentures, 9.625% due 11/1/21 | | | 315,364 |
| 20,000 | | B+ | | GulfMark Offshore Inc., 7.750% due 7/15/14 | | | 20,000 |
| | | | | Hanover Compressor Co., Senior Notes: | | | |
| 105,000 | | B | | 8.625% due 12/15/10 | | | 109,725 |
| 65,000 | | B | | 7.500% due 4/15/13 | | | 65,162 |
| 280,000 | | BB- | | Pacific Energy Partners LP/Pacific Energy Finance Corp., Senior Notes, 7.125% due 6/15/14 | | | 284,200 |
| 25,000 | | BB- | | Pride International Inc., Senior Notes, 7.375% due 7/15/14 | | | 25,563 |
| 55,000 | | B+ | | Tennessee Gas Pipeline Co., Debentures, 7.500% due 4/1/17 | | | 57,172 |
| 268,000 | | BB- | | Transcontinental Gas Pipe Line Corp., Senior Notes, Series B, 8.875% due 7/15/12 | | | 298,485 |
| | | | | | |
|
|
| | | | | Total Energy Equipment & Services | | | 1,175,671 |
| | | | | | |
|
|
| |
Food & Staples Retailing — 1.2% | | | |
| | | | | Delhaize America Inc.: | | | |
| 335,000 | | BB+ | | 8.125% due 4/15/11 | | | 360,670 |
| 420,000 | | BB+ | | Debentures, 9.000% due 4/15/31 | | | 493,487 |
| | | | | Rite Aid Corp.: | | | |
| 125,000 | | B+ | | Senior Notes, 9.500% due 2/15/11 | | | 130,000 |
| 295,000 | | B+ | | Senior Secured Notes, 7.500% due 1/15/15 | | | 283,200 |
| 50,000 | | B+ | | Senior Secured Second Lien Notes, 8.125% due 5/1/10 | | | 50,437 |
| | | | | | |
|
|
| | | | | Total Food & Staples Retailing | | | 1,317,794 |
| | | | | | |
|
|
| |
Food Products — 1.1% | | | |
| 145,000 | | B- | | Chiquita Brands International Inc., Senior Notes, 8.875% due 12/1/15 | | | 135,938 |
| 425,000 | | B | | Del Monte Corp., Senior Subordinated Notes, 8.625% due 12/15/12 | | | 446,781 |
| 255,000 | | B- | | Pinnacle Foods Holding Corp., Senior Subordinated Notes, 8.250% due 12/1/13 | | | 251,812 |
| 225,000 | | B+ | | Stater Brothers Holdings Inc., Senior Notes, 8.125% due 6/15/12 | | | 225,563 |
| 150,000 | | B- | | Swift & Co., Senior Notes, 10.125% due 10/1/09 | | | 152,250 |
| | | | | | |
|
|
| | | | | Total Food Products | | | 1,212,344 |
| | | | | | |
|
|
| |
Health Care Equipment & Supplies — 0.5% | | | |
| 575,000 | | BB+ | | Fisher Scientific International Inc., Senior Subordinated Notes, 6.125% due 7/1/15 | | | 571,406 |
| | | | | | |
|
|
| |
Health Care Providers & Services — 3.5% | | | |
| | | | | Coventry Health Care Inc., Senior Notes: | | | |
| 140,000 | | BBB- | | 8.125% due 2/15/12 | | | 146,650 |
| 80,000 | | BBB- | | 6.125% due 1/15/15 | | | 79,437 |
| 520,000 | | B | | DaVita Inc., Senior Subordinated Notes, 7.250% due 3/15/15 | | | 512,200 |
| 60,000 | | B | | Extendicare Health Services Inc., Senior Subordinated Notes, 6.875% due 5/1/14 | | | 63,000 |
See Notes to Financial Statements.
98
Schedules of Investments
(continued)
| | | | | | | |
| High Yield Investments | | |
| | | |
Face Amount | | Rating‡ | | Security | | Value |
| |
Health Care Providers & Services — 3.5% (continued) | | | |
| | | | | HCA Inc.: | | | |
| | | | | Notes: | | | |
| $ 345,000 | | BB+ | | 5.500% due 12/1/09 | | $ | 341,119 |
| 120,000 | | BB+ | | 9.000% due 12/15/14 | | | 111,512 |
| 420,000 | | BB+ | | 7.690% due 6/15/25 | | | 326,670 |
| 340,000 | | BB+ | | Senior Notes, 7.875% due 2/1/11 | | | 325,550 |
| 1,139,000 | | B | | Tenet Healthcare Corp., Senior Notes, 9.875% due 7/1/14 | | | 1,116,220 |
| 745,000 | | BB- | | Triad Hospitals Inc., Senior Notes, 7.000% due 5/15/12 | | | 735,687 |
| 75,000 | | B- | | US Oncology Inc., Senior Notes, 9.000% due 8/15/12 | | | 78,000 |
| | | | | | |
|
|
| | | | | Total Health Care Providers & Services | | | 3,836,045 |
| | | | | | |
|
|
| |
Hotels, Restaurants & Leisure — 6.4% | | | |
| 285,000 | | BB+ | | American Real Estate Partners LP/American Real Estate Finance Corp., Senior Notes, 7.125% due 2/15/13 | | | 286,425 |
| 140,000 | | B+ | | Aztar Corp., Senior Subordinated Notes, 9.000% due 8/15/11 | | | 147,000 |
| | | | | Boyd Gaming Corp., Senior Subordinated Notes: | | | |
| 505,000 | | B+ | | 8.750% due 4/15/12 | | | 532,144 |
| 85,000 | | B+ | | 7.750% due 12/15/12 | | | 85,638 |
| 130,000 | | B+ | | 6.750% due 4/15/14 | | | 123,175 |
| 320,000 | | BB+ | | Capitol Records Inc., 8.375% due 8/15/09 (b) | | | 337,200 |
| 392,000 | | B | | Domino’s Inc., Senior Subordinated Notes, 8.250% due 7/1/11 | | | 407,680 |
| 150,000 | | B- | | Gaylord Entertainment Co., Senior Notes, 6.750% due 11/15/14 | | | 143,250 |
| 800,000 | | BBB- | | Harrah’s Operating Co., Inc., 6.500% due 6/1/16 | | | 795,082 |
| 285,000 | | BB | | Hilton Hotels Corp., 8.250% due 2/15/11 | | | 307,707 |
| 710,000 | | B- | | Inn of the Mountain Gods Resort & Casino, Senior Notes, 12.000% due 11/15/10 | | | 720,650 |
| | | | | Isle of Capri Casinos Inc., Senior Subordinated Notes: | | | |
| 130,000 | | B | | 9.000% due 3/15/12 | | | 136,662 |
| 50,000 | | B | | 7.000% due 3/1/14 | | | 47,750 |
| | | | | Mandalay Resort Group: | | | |
| | | | | Senior Notes: | | | |
| 425,000 | | BB | | 9.500% due 8/1/08 | | | 451,562 |
| 330,000 | | BB | | 8.500% due 9/15/10 | | | 348,975 |
| 370,000 | | B+ | | Senior Subordinated Notes, Series B, 10.250% due 8/1/07 | | | 384,800 |
| | | | | MGM MIRAGE Inc.: | | | |
| 125,000 | | BB | | Senior Notes, 6.875% due 4/1/16 (b) | | | 119,219 |
| | | | | Senior Subordinated Notes: | | | |
| 190,000 | | B+ | | 9.750% due 6/1/07 | | | 195,700 |
| 135,000 | | B+ | | 8.375% due 2/1/11 | | | 139,556 |
| 145,000 | | BB- | | Mohegan Tribal Gaming Authority, Senior Notes, 6.125% due 2/15/13 | | | 139,019 |
| 60,000 | | B | | Pokagon Gaming Authority, Senior Notes, 10.375% due 6/15/14 (b) | | | 63,750 |
| 490,000 | | B+ | | River Rock Entertainment Authority, Senior Notes, 9.750% due 11/1/11 | | | 521,237 |
| | | | | Royal Caribbean Cruises Ltd., Senior Notes: | | | |
| 30,000 | | BBB- | | 8.750% due 2/2/11 | | | 32,630 |
| 40,000 | | BBB- | | 6.875% due 12/1/13 | | | 40,113 |
| 95,000 | | B+ | | San Pasqual Casino, Notes, 8.000% due 9/15/13 (b) | | | 96,069 |
| 245,000 | | BB- | | Station Casinos Inc., Senior Notes, 7.750% due 8/15/16 | | | 253,881 |
| 70,000 | | B- | | TDS Investor Corp., 9.875% due 9/1/14 (b) | | | 68,775 |
| 185,000 | | BB- | | Wynn Las Vegas LLC/Wynn Las Vegas Capital Corp., 6.625% due 12/1/14 | | | 177,600 |
| | | | | | |
|
|
| | | | | Total Hotels, Restaurants & Leisure | | | 7,103,249 |
| | | | | | |
|
|
| |
Household Durables — 1.4% | | | |
| 20,000 | | BB+ | | American Greetings Corp., Senior Notes, 7.375% due 6/1/16 | | | 20,225 |
| 195,000 | | BB | | Beazer Homes USA Inc., Senior Notes, 8.625% due 5/15/11 | | | 196,706 |
See Notes to Financial Statements.
99
Schedules of Investments
(continued)
| | | | | | | |
| High Yield Investments | | |
| | | |
Face Amount | | Rating‡ | | Security | | Value |
| |
Household Durables — 1.4% (continued) | | | |
| $ 280,000 | | B- | | Interface Inc., Senior Notes, 10.375% due 2/1/10 | | $ | 306,250 |
| 500,000 | | BB | | K Hovnanian Enterprises Inc., 6.250% due 1/15/16 | | | 436,250 |
| 400,000 | | B- | | Norcraft Cos. LP/Norcraft Finance Corp., Senior Subordinated Notes, 9.000% due 11/1/11 | | | 404,000 |
| 165,000 | | B- | | Norcraft Holdings LP/Norcraft Capital Corp., Senior Discount Notes, step bond to yield 11.130% due 9/1/12 | | | 134,475 |
| | | | | | |
|
|
| | | | | Total Household Durables | | | 1,497,906 |
| | | | | | |
|
|
| |
Household Products — 0.2% | | | |
| 90,000 | | CCC | | Nutro Products Inc., Senior Subordinated Notes, 10.750% due 4/15/14 (b) | | | 95,400 |
| | | | | Spectrum Brands Inc., Senior Subordinated Notes: | | | |
| 126,000 | | CCC | | 8.500% due 10/1/13 | | | 105,368 |
| 35,000 | | CCC | | 7.375% due 2/1/15 | | | 27,300 |
| | | | | | |
|
|
| | | | | Total Household Products | | | 228,068 |
| | | | | | |
|
|
| |
Independent Power Producers & Energy Traders — 1.7% | | | |
| | | | | AES Corp.: | | | |
| 405,000 | | B | | Senior Notes, 7.750% due 3/1/14 | | | 419,175 |
| 30,000 | | BB- | | Senior Secured Notes, 9.000% due 5/15/15 (b) | | | 32,513 |
| | | | | Edison Mission Energy, Senior Notes: | | | |
| 30,000 | | B+ | | 7.500% due 6/15/13 (b) | | | 30,150 |
| 160,000 | | B1(c) | | 7.750% due 6/15/16 (b) | | | 160,800 |
| 200,000 | | B- | | Mirant North America LLC, Senior Notes, 7.375% due 12/31/13 | | | 199,000 |
| 1,015,000 | | B- | | NRG Energy Inc., Senior Notes, 7.375% due 2/1/16 | | | 1,002,312 |
| | | | | | |
|
|
| | | | | Total Independent Power Producers & Energy Traders | | | 1,843,950 |
| | | | | | |
|
|
| |
Industrial Conglomerates — 0.5% | | | |
| 346,000 | | B | | Koppers Inc., Senior Notes, 9.875% due 10/15/13 | | | 376,275 |
| 115,000 | | B | | Samsonite Corp., Senior Subordinated Notes, 8.875% due 6/1/11 | | | 118,738 |
| | | | | | |
|
|
| | | | | Total Industrial Conglomerates | | | 495,013 |
| | | | | | |
|
|
| |
Insurance — 0.9% | | | |
| 305,000 | | B+ | | AFC Capital Trust I, Series B, 8.207% due 2/3/27 | | | 318,175 |
| 285,000 | | BB | | Crum & Forster Holdings Corp., Senior Notes, 10.375% due 6/15/13 | | | 285,000 |
| | | | | Fairfax Financial Holdings Ltd.: | | | |
| 35,000 | | BB | | Notes, 7.375% due 4/15/18 | | | 28,000 |
| 55,000 | | BB | | Senior Notes, 7.750% due 4/26/12 | | | 47,025 |
| 255,000 | | BB | | Markel Capital Trust I, Capital Securities, Series B, 8.710% due 1/1/46 | | | 267,558 |
| 55,000 | | BBB- | | Markel Corp., Senior Notes, 7.350% due 8/15/34 | | | 56,164 |
| | | | | | |
|
|
| | | | | Total Insurance | | | 1,001,922 |
| | | | | | |
|
|
| |
Internet & Catalog Retail — 0.6% | | | |
| 550,000 | | B | | Brookstone Co. Inc., Senior Secured Notes, 12.000% due 10/15/12 | | | 503,250 |
| 155,000 | | B- | | FTD Inc., Senior Subordinated Notes, 7.750% due 2/15/14 | | | 151,900 |
| | | | | | |
|
|
| | | | | Total Internet & Catalog Retail | | | 655,150 |
| | | | | | |
|
|
| |
IT Services — 0.8% | | | |
| | | | | Sungard Data Systems Inc.: | | | |
| 250,000 | | B- | | 9.973% due 8/15/13 (a) | | | 262,500 |
| 145,000 | | B- | | Senior Notes, 9.125% due 8/15/13 | | | 150,437 |
| 460,000 | | B- | | Senior Subordinated Notes, 10.250% due 8/15/15 | | | 472,075 |
| | | | | | |
|
|
| | | | | Total IT Services | | | 885,012 |
| | | | | | |
|
|
| |
Leisure Equipment & Products — 0.4% | | | |
| 480,000 | | B- | | Warner Music Group, Senior Subordinated Notes, 7.375% due 4/15/14 | | | 464,400 |
| | | | | | |
|
|
See Notes to Financial Statements.
100
Schedules of Investments
(continued)
| | | | | | | |
| High Yield Investments | | |
| | | |
Face
Amount | | Rating‡ | | Security | | Value |
| |
Machinery — 1.0% | | | |
| | | | | Case New Holland Inc., Senior Notes: | | | |
| $ 305,000 | | BB | | 9.250% due 8/1/11 | | $ | 324,825 |
| 125,000 | | BB | | 7.125% due 3/1/14 | | | 124,062 |
| 245,000 | | B- | | Chart Industries Inc., Senior Subordinated Notes, 9.125% due 10/15/15 (b) | | | 256,025 |
| 220,000 | | B+ | | Commercial Vehicle Group Inc., Senior Notes, 8.000% due 7/1/13 | | | 210,650 |
| 80,000 | | B | | Mueller Group Inc., Senior Subordinated Notes, 10.000% due 5/1/12 | | | 87,600 |
| 50,000 | | B | | Mueller Holdings Inc., Discount Notes, step bond to yield 8.871% due 4/15/14 | | | 44,250 |
| | | | | | |
|
|
| | | | | Total Machinery | | | 1,047,412 |
| | | | | | |
|
|
| |
Media — 10.7% | | | |
| 440,000 | | B- | | Affinion Group Inc., Senior Notes, 10.125% due 10/15/13 (b) | | | 458,700 |
| 390,000 | | CCC+ | | AMC Entertainment Inc., Senior Subordinated Notes, 11.000% due 2/1/16 | | | 425,587 |
| 40,000 | | CCC+ | | Barrington Broadcasting Group LLC/Barrington Broadcasting Capital Corp., Senior Subordinated Notes, 10.500% due 8/15/14 (b) | | | 39,400 |
| 195,000 | | B- | | Block Communications Inc., Senior Notes, 8.250% due 12/15/15 (b) | | | 189,881 |
| 629 | | B- | | CanWest Media Inc., Senior Subordinated Notes, 8.000% due 9/15/12 | | | 612 |
| 180,000 | | CCC- | | CCH I Holdings LLC/CCH I Holding Capital Corp., Senior Notes, 11.750% due 5/15/14 | | | 123,300 |
| 260,000 | | CCC- | | CCH I LLC/CCH Capital Corp., Senior Secured Notes, 11.000% due 10/1/15 | | | 232,050 |
| 230,000 | | CCC- | | CCH II LLC/CCH II Capital Corp., Senior Notes, 10.250% due 9/15/10 | | | 234,025 |
| | | | | Charter Communications Holdings LLC/Charter Communications Holdings Capital Corp., Senior Notes: | | | |
| 70,000 | | CCC- | | 8.625% due 4/1/09 | | | 64,225 |
| 60,000 | | CCC- | | 10.750% due 10/1/09 | | | 55,200 |
| 90,000 | | CCC- | | Charter Communications Holdings LLC/Charter Communications Holdings II Capital Corp., Senior Notes, 9.625% due 11/15/09 | | | 82,350 |
| 75,000 | | BBB+ | | Comcast Cable Communications Holdings Inc., Notes, 8.375% due 3/15/13 | | | 85,122 |
| | | | | CSC Holdings Inc.: | | | |
| 65,000 | | B+ | | Debentures, Series B, 8.125% due 8/15/09 | | | 67,438 |
| 510,000 | | B+ | | Senior Notes, Series B, 7.625% due 4/1/11 | | | 524,025 |
| 180,000 | | B | | Dex Media East LLC/Dex Media East Finance Co., Senior Notes, Series B, 12.125% due 11/15/12 | | | 201,600 |
| 525,000 | | B | | Dex Media West LLC/Dex Media Finance Co., Senior Subordinated Notes, Series B, 9.875% due 8/15/13 | | | 566,344 |
| 1,620,000 | | BB- | | EchoStar DBS Corp., Senior Notes, 7.125% due 2/1/16 (b) | | | 1,585,575 |
| 295,000 | | B- | | Gray Television Inc., 9.250% due 12/15/11 | | | 308,275 |
| 130,000 | | CCC+ | | Houghton Mifflin Co., Senior Discount Notes, step bond to yield 6.766% due 10/15/13 | | | 109,525 |
| 1,050,000 | | B- | | Kabel Deutschland GMBH, Senior Notes, 10.625% due 7/1/14 (b) | | | 1,128,750 |
| | | | | Lamar Media Corp., Senior Subordinated Notes: | | | |
| 220,000 | | B | | 6.625% due 8/15/15 | | | 207,350 |
| 150,000 | | B | | 6.625% due 8/15/15 (b) | | | 141,375 |
| 195,000 | | BB+ | | Liberty Media Corp., Debentures, 8.250% due 2/1/30 | | | 194,990 |
| | | | | LIN Television Corp.: | | | |
| 110,000 | | B- | | Senior Subordinated Notes, 6.500% due 5/15/13 | | | 102,025 |
| 250,000 | | B- | | Series B, 6.500% due 5/15/13 | | | 231,875 |
| 135,000 | | B- | | LodgeNet Entertainment Corp., Senior Subordinated Notes, 9.500% due 6/15/13 | | | 145,463 |
| 245,000 | | B | | Mediacom Broadband LLC/Mediacom Broadband Corp., Senior Notes, 8.500% due 10/15/15 | | | 243,775 |
| 105,000 | | B+ | | Morris Publishing Group LLC, Senior Subordinated Notes, 7.000% due 8/1/13 | | | 100,275 |
| 150,000 | | B | | Primedia Inc., Senior Notes, 8.875% due 5/15/11 | | | 146,250 |
| 310,000 | | B | | Quebecor Media Inc., Senior Notes, 7.750% due 3/15/16 | | | 308,450 |
| 200,000 | | B | | R.H. Donnelley Finance Corp. I, Senior Subordinated Notes, 10.875% due 12/15/12 (b) | | | 220,000 |
| 450,000 | | B | | R.H. Donnelley Inc., Senior Subordinated Notes, 10.875% due 12/15/12 | | | 495,000 |
| 185,000 | | B | | Radio One Inc., Senior Subordinated Notes, Series B, 8.875% due 7/1/11 | | | 188,700 |
| | | | | Rainbow National Services LLC: | | | |
| 217,000 | | B+ | | Senior Notes, 8.750% due 9/1/12 (b) | | | 230,020 |
| 695,000 | | B+ | | Senior Subordinated Debentures, 10.375% due 9/1/14 (b) | | | 777,531 |
See Notes to Financial Statements.
101
Schedules of Investments
(continued)
| | | | | | | |
| High Yield Investments | | |
| | | |
Face Amount | | Rating‡ | | Security | | Value |
| |
Media — 10.7% (continued) | | | |
| | | | | Rogers Cable Inc.: | | | |
| $ 200,000 | | BB+ | | Secured Notes, 5.500% due 3/15/14 | | $ | 186,250 |
| 175,000 | | BB+ | | Senior Secured Notes, 7.875% due 5/1/12 | | | 185,281 |
| | | | | Sinclair Broadcast Group Inc., Senior Subordinated Notes: | | | |
| 300,000 | | B | | 8.750% due 12/15/11 | | | 314,625 |
| 335,000 | | B | | 8.000% due 3/15/12 | | | 340,862 |
| 60,000 | | B | | Sun Media Corp., 7.625% due 2/15/13 | | | 61,200 |
| 180,000 | | BBB | | Viacom Inc., Senior Debentures, 7.875% due 7/30/30 | | | 196,250 |
| 195,000 | | B- | | WMG Holdings Corp., Senior Discount Notes, step bond to yield 9.168% due 12/15/14 | | | 141,375 |
| | | | | XM Satellite Radio Inc., Senior Notes: | | | |
| 65,000 | | CCC | | 9.989% due 5/1/13 (a)(b) | | | 60,938 |
| 90,000 | | CCC | | 9.750% due 5/1/14 (b) | | | 85,050 |
| | | | | | |
|
|
| | | | | Total Media | | | 11,786,894 |
| | | | | | |
|
|
| |
Metals & Mining — 1.0% | | | |
| 300,000 | | B | | Chaparral Steel Co., Senior Notes, 10.000% due 7/15/13 | | | 333,000 |
| 105,000 | | BBB- | | International Steel Group Inc., Senior Notes, 6.500% due 4/15/14 | | | 100,275 |
| 420,000 | | B- | | Metals USA Inc., Senior Secured Notes, 11.125% due 12/1/15 (b) | | | 465,150 |
| 30,000 | | B- | | PNA Group Inc., Senior Notes, 10.750% due 9/1/16 (b) | | | 30,750 |
| 200,000 | | B- | | RathGibson Inc., Senior Notes, 11.250% due 2/15/14 (b) | | | 207,000 |
| | | | | | |
|
|
| | | | | Total Metals & Mining | | | 1,136,175 |
| | | | | | |
|
|
| |
Multi-Utilities — 0.1% | | | |
| 90,000 | | B+ | | CMS Energy Corporation, 8.900% due 7/15/08 | | | 94,500 |
| | | | | | |
|
|
| |
Multiline Retail — 0.5% | | | |
| 120,000 | | BBB- | | J.C. Penney Co. Inc., Notes, 8.000% due 3/1/10 | | | 128,986 |
| 420,000 | | B- | | Neiman Marcus Group Inc., Senior Notes, 9.000% due 10/15/15 | | | 448,350 |
| | | | | | |
|
|
| | | | | Total Multiline Retail | | | 577,336 |
| | | | | | |
|
|
| |
Office Electronics — 0.6% | | | |
| | | | | Xerox Corp., Senior Notes: | | | |
| 415,000 | | BB+ | | 9.750% due 1/15/09 | | | 450,275 |
| 220,000 | | BB+ | | 6.750% due 2/1/17 | | | 221,650 |
| | | | | | |
|
|
| | | | | Total Office Electronics | | | 671,925 |
| | | | | | |
|
|
| |
Oil, Gas & Consumable Fuels — 10.0% | | | |
| 390,000 | | B- | | Alpha Natural Resources LLC/Alpha Natural Resources Capital Corp., Senior Notes, 10.000% due 6/1/12 | | | 419,250 |
| 735,000 | | CCC+ | | Belden & Blake Corp., Secured Notes, 8.750% due 7/15/12 | | | 757,050 |
| | | | | Chesapeake Energy Corp., Senior Notes: | | | |
| 115,000 | | BB | | 7.500% due 9/15/13 | | | 116,725 |
| 200,000 | | BB | | 7.500% due 6/15/14 | | | 202,500 |
| 15,000 | | BB | | 6.625% due 1/15/16 | | | 14,475 |
| 30,000 | | BB | | 6.875% due 1/15/16 | | | 29,250 |
| 90,000 | | BB | | 6.500% due 8/15/17 | | | 83,925 |
| 400,000 | | BB | | 6.250% due 1/15/18 | | | 371,000 |
| 60,000 | | B+ | | Colorado Interstate Gas Co., Senior Notes, 6.800% due 11/15/15 | | | 59,764 |
| 720,000 | | BB- | | Compagnie Generale de Geophysique SA, Senior Notes, 7.500% due 5/15/15 | | | 720,000 |
| 140,000 | | B | | Compton Petroleum Finance Corp., Senior Notes, 7.625% due 12/1/13 | | | 137,200 |
| 75,000 | | B | | Copano Energy LLC, Senior Notes, 8.125% due 3/1/16 | | | 76,313 |
| | | | | El Paso Corp., Medium-Term Notes: | | | |
| 375,000 | | B | | 8.050% due 10/15/30 | | | 386,250 |
| 270,000 | | B | | 7.800% due 8/1/31 | | | 272,025 |
See Notes to Financial Statements.
102
Schedules of Investments
(continued)
| | | | | | | |
| High Yield Investments | | |
| | | |
Face
Amount | | Rating‡ | | Security | | Value |
| |
Oil, Gas & Consumable Fuels — 10.0% (continued) | | | |
| | | | | El Paso Natural Gas Co.: | | | |
| $ 65,000 | | B+ | | Bonds, 8.375% due 6/15/32 | | $ | 73,147 |
| 275,000 | | B+ | | Senior Notes, Series A, 7.625% due 8/1/10 | | | 283,938 |
| | | | | Encore Acquisition Co., Senior Subordinated Notes: | | | |
| 80,000 | | B | | 6.250% due 4/15/14 | | | 75,600 |
| 290,000 | | B | | 6.000% due 7/15/15 | | | 270,425 |
| 110,000 | | B+ | | Enterprise Products Operating LP, 8.375% due 8/1/66 (a) | | | 114,865 |
| | | | | Forest Oil Corp., Senior Notes: | | | |
| 185,000 | | B+ | | 8.000% due 6/15/08 | | | 191,475 |
| 150,000 | | B+ | | 8.000% due 12/15/11 | | | 155,625 |
| 105,000 | | B | | Inergy LP/Inergy Finance Corp., Senior Notes, 8.250% due 3/1/16 | | | 108,413 |
| 120,000 | | CCC+ | | International Coal Group Inc., Senior Notes, 10.250% due 7/15/14 (b) | | | 124,500 |
| 242,000 | | BB+ | | Kerr-McGee Corp., 6.950% due 7/1/24 | | | 258,059 |
| 175,000 | | BBB | | Kinder Morgan Finance Company, ULC, Notes, 6.400% due 1/5/36 | | | 153,329 |
| 90,000 | | B- | | Mariner Energy Inc., Senior Notes, 7.500% due 4/15/13 (b) | | | 87,975 |
| 252,000 | | B+ | | OMI Corp., Senior Notes, 7.625% due 12/1/13 | | | 253,260 |
| 280,000 | | BB- | | Peabody Energy Corp., Series B, 6.875% due 3/15/13 | | | 278,600 |
| 245,000 | | B- | | Petrohawk Energy Corp., Senior Notes, 9.125% due 7/15/13 (b) | | | 250,513 |
| | | | | Pioneer Natural Resources Co., Senior Notes: | | | |
| 260,000 | | BB+ | | 5.875% due 7/15/16 | | | 243,829 |
| 105,000 | | BB+ | | 6.875% due 5/1/18 | | | 104,223 |
| 480,000 | | BB- | | Plains Exploration & Production Co., Senior Notes, 7.125% due 6/15/14 | | | 494,400 |
| 355,000 | | B+ | | Pogo Producing Co., Senior Subordinated Notes, 6.875% due 10/1/17 | | | 339,912 |
| 115,000 | | B | | Quicksilver Resources Inc., Senior Subordinated Notes, 7.125% due 4/1/16 | | | 110,400 |
| 166,600 | | BB+ | | Salton SEA Funding Corp., 7.475% due 11/30/18 | | | 175,170 |
| 310,000 | | B1(c) | | SemGroup LP, Senior Notes, 8.750% due 11/15/15 (b) | | | 316,975 |
| 10,000 | | BB- | | SESI LLC, Senior Notes, 6.875% due 6/1/14 (b) | | | 9,850 |
| 207,000 | | BB- | | Teekay Shipping Corp., Senior Notes, 8.875% due 7/15/11 | | | 218,385 |
| 260,000 | | BB+ | | Tesoro Corp., 6.625% due 11/1/15 (b) | | | 252,200 |
| 370,000 | | B | | Utilicorp Canada Finance Corp., Senior Notes, 7.750% due 6/15/11 | | | 389,425 |
| 380,000 | | BB+ | | Western Oil Sands Inc., Secured Notes, 8.375% due 5/1/12 | | | 409,925 |
| 440,000 | | B | | Whiting Petroleum Corp., Senior Subordinated Notes, 7.000% due 2/1/14 | | | 435,600 |
| | | | | Williams Cos. Inc.: | | | |
| 160,000 | | BB- | | Debentures, Series A, 7.500% due 1/15/31 | | | 154,800 |
| | | | | Notes: | | | |
| 560,000 | | BB- | | 7.125% due 9/1/11 | | | 571,200 |
| 471,000 | | BB- | | 8.750% due 3/15/32 | | | 509,857 |
| | | | | | |
|
|
| | | | | Total Oil, Gas & Consumable Fuels | | | 11,061,602 |
| | | | | | |
|
|
| |
Paper & Forest Products — 1.9% | | | |
| 250,000 | | B | | Appleton Papers Inc., Senior Subordinated Notes, Series B, 9.750% due 6/15/14 | | | 248,125 |
| | | | | Boise Cascade LLC: | | | |
| 160,000 | | B+ | | 8.382% due 10/15/12 (a) | | | 161,600 |
| 25,000 | | B+ | | Senior Subordinated Notes, Series B, 7.125% due 10/15/14 | | | 23,375 |
| | | | | Domtar Inc., Notes: | | | |
| 260,000 | | B+ | | 7.875% due 10/15/11 | | | 259,350 |
| 170,000 | | B+ | | 5.375% due 12/1/13 | | | 146,200 |
| | | | | Georgia-Pacific Corp.: | | | |
| 415,000 | | B | | Debentures, 9.500% due 12/1/11 | | | 449,237 |
| 170,000 | | B | | Notes, 8.125% due 5/15/11 | | | 174,675 |
| 245,000 | | CCC+ | | NewPage Corp., Senior Subordinated Notes, 12.000% due 5/1/13 | | | 254,187 |
| | | | | Verso Paper Holdings LLC: | | | |
| 120,000 | | B+ | | Senior Secured Notes, 9.125% due 8/1/14 (b) | | | 120,000 |
| 45,000 | | B- | | Senior Subordinated Notes, 11.375% due 8/1/16 (b) | | | 44,775 |
| 245,000 | | B+ | | Verso Paper Holdings LLC/Verson Paper Inc., 9.235% due 8/1/14 (a)(b) | | | 248,063 |
| | | | | | |
|
|
| | | | | Total Paper & Forest Products | | | 2,129,587 |
| | | | | | |
|
|
See Notes to Financial Statements.
103
Schedules of Investments
(continued)
| | | | | | | |
| High Yield Investments | | |
| | | |
Face Amount | | Rating‡ | | Security | | Value |
| |
Personal Products — 0.1% | | | |
| $ 110,000 | | B+ | | Playtex Products Inc., Senior Secured Notes, 8.000% due 3/1/11 | | $ | 114,950 |
| | | | | | |
|
|
| |
Pharmaceuticals — 0.3% | | | |
| 330,000 | | CCC | | Leiner Health Products Inc., Senior Subordinated Notes, 11.000% due 6/1/12 | | | 315,150 |
| | | | | | |
|
|
| |
Real Estate Investment Trusts (REITs) — 2.0% | | | |
| 286,000 | | BB+ | | CB Richard Ellis Services Inc., Senior Notes, 9.750% due 5/15/10 | | | 306,735 |
| | | | | Forest City Enterprises Inc., Senior Notes: | | | |
| 90,000 | | BB- | | 7.625% due 6/1/15 | | | 91,125 |
| 270,000 | | BB- | | 6.500% due 2/1/17 | | | 253,800 |
| 530,000 | | BB | | Host Marriott LP, Senior Notes, Series I, 9.500% due 1/15/07 | | | 538,612 |
| 95,000 | | B | | Kimball Hill Inc., Senior Subordinated Notes, 10.500% due 12/15/12 | | | 81,938 |
| | | | | Omega Healthcare Investors Inc., Senior Notes: | | | |
| 155,000 | | BB | | 7.000% due 4/1/14 | | | 153,062 |
| 220,000 | | BB | | 7.000% due 1/15/16 | | | 215,050 |
| | | | | Rouse Co., Notes: | | | |
| 240,000 | | BB+ | | 8.000% due 4/30/09 | | | 250,642 |
| 145,000 | | BB+ | | 7.200% due 9/15/12 | | | 148,328 |
| | | | | Ventas Realty LP/Ventas Capital Corp.: | | | |
| 7,000 | | BB+ | | 8.750% due 5/1/09 | | | 7,516 |
| 183,000 | | BB+ | | 9.000% due 5/1/12 | | | 204,731 |
| | | | | | |
|
|
| | | | | Total Real Estate Investment Trusts (REITs) | | | 2,251,539 |
| | | | | | |
|
|
| |
Road & Rail — 0.7% | | | |
| | | | | Avis Budget Car Rental LLC/Avis Budget Finance Inc., Senior Notes: | | | |
| 180,000 | | BB- | | 7.625% due 5/15/14 (b) | | | 171,900 |
| 255,000 | | BB- | | 7.905% due 5/15/14 (a)(b) | | | 250,538 |
| 30,000 | | BB- | | 7.750% due 5/15/16 (b) | | | 28,443 |
| 300,000 | | B- | | Kansas City Southern Railway, 7.500% due 6/15/09 | | | 300,000 |
| | | | | | |
|
|
| | | | | Total Road & Rail | | | 750,881 |
| | | | | | |
|
|
| |
Semiconductors & Semiconductor Equipment — 0.8% | | | |
| 486,000 | | B | | Advanced Micro Devices Inc., Senior Notes, 7.750% due 11/1/12 | | | 489,038 |
| 55,000 | | B | | Avago Technologies Finance, Senior Notes, 10.731% due 6/1/13 (a)(b) | | | 57,681 |
| | | | | Freescale Semiconductor Inc., Senior Notes: | | | |
| 195,000 | | BBB- | | 6.875% due 7/15/11 | | | 199,875 |
| 35,000 | | BBB- | | 7.125% due 7/15/14 | | | 36,225 |
| 205,000 | | B- | | MagnaChip Semiconductor, Senior Subordinated Notes, 8.000% due 12/15/14 | | | 132,225 |
| | | | | | |
|
|
| | | | | Total Semiconductors & Semiconductor Equipment | | | 915,044 |
| | | | | | |
|
|
| |
Specialty Retail — 2.1% | | | |
| 489,000 | | B | | Asbury Automotive Group Inc., Senior Subordinated Notes, 9.000% due 6/15/12 | | | 497,557 |
| | | | | AutoNation Inc., Senior Notes: | | | |
| 585,000 | | BB+ | | 7.507% due 4/15/13 (a)(b) | | | 590,850 |
| 230,000 | | BB+ | | 7.000% due 4/15/14 (b) | | | 227,988 |
| 105,000 | | CCC | | Blockbuster Inc., Senior Subordinated Notes, 9.000% due 9/1/12 | | | 97,650 |
| | | | | GameStop Corp.: | | | |
| 45,000 | | B+ | | 9.383% due 10/1/11 (a) | | | 46,969 |
| 45,000 | | B+ | | 8.000% due 10/1/12 | | | 46,181 |
| 720,000 | | B- | | Suburban Propane Partners LP/Suburban Energy Finance Corp., Senior Notes, 6.875% due 12/15/13 | | | 693,000 |
| 150,000 | | B | | United Auto Group Inc., Senior Subordinated Notes, 9.625% due 3/15/12 | | | 158,625 |
| | | | | | |
|
|
| | | | | Total Specialty Retail | | | 2,358,820 |
| | | | | | |
|
|
See Notes to Financial Statements.
104
Schedules of Investments
(continued)
| | | | | | | |
| High Yield Investments | | |
| | | |
Face
Amount | | Rating‡ | | Security | | Value |
| |
Textiles, Apparel & Luxury Goods — 1.0% | | | |
| $ 585,000 | | B- | | Levi Strauss & Co., Senior Notes, 9.750% due 1/15/15 | | $ | 608,400 |
| 499,000 | | B | | Oxford Industries Inc., Senior Notes, 8.875% due 6/1/11 | | | 506,485 |
| | | | | | |
|
|
| | | | | Total Textiles, Apparel & Luxury Goods | | | 1,114,885 |
| | | | | | |
|
|
| |
Trading Companies & Distributors — 0.6% | | | |
| 300,000 | | B | | Ashtead Capital Inc., Notes, 9.000% due 8/15/16 (b) | | | 307,500 |
| 75,000 | | B+ | | H&E Equipment Services Inc., Senior Notes, 8.375% due 7/15/16 (b) | | | 76,500 |
| 195,000 | | CCC+ | | Penhall International Corp., Senior Secured Notes, 12.000% due 8/1/14 (b) | | | 199,875 |
| 130,000 | | B- | | Transdigm Inc., Senior Subordinated Notes, 7.750% due 7/15/14 (b) | | | 129,675 |
| | | | | | |
|
|
| | | | | Total Trading Companies & Distributors | | | 713,550 |
| | | | | | |
|
|
| |
Transportation Infrastructure — 0.4% | | | |
| 533,000 | | CCC+ | | H-Lines Finance Holding Corp., step bond to yield 10.995% due 4/1/13 | | | 467,708 |
| | | | | | |
|
|
| |
Wireless Telecommunication Services — 0.8% | | | |
| | | | | Rogers Wireless Communications Inc.: | | | |
| | | | | Secured Notes: | | | |
| 255,000 | | BB | | 8.454% due 12/15/10 (a) | | | 262,331 |
| 100,000 | | BB | | 7.250% due 12/15/12 | | | 103,625 |
| 115,000 | | BB | | Senior Notes, 9.625% due 5/1/11 | | | 129,088 |
| 325,000 | | CCC | | Rural Cellular Corp., Senior Notes, 9.875% due 2/1/10 | | | 337,187 |
| | | | | | |
|
|
| | | | | Total Wireless Telecommunication Services | | | 832,231 |
| | | | | | |
|
|
| | | | | TOTAL CORPORATE BONDS & NOTES
(Cost — $105,469,399) | | | 106,589,387 |
| | | | | | |
|
|
CONVERTIBLE BOND — 0.1% | | | |
| |
Semiconductors & Semiconductor Equipment — 0.1% | | | |
| 125,000 | | CC | | Amkor Technology Inc., Senior Subordinated Bond, 2.500% due 5/15/11 (Cost — $116,806) | | | 106,719 |
| | | | | | |
|
|
COLLATERALIZED MORTGAGE OBLIGATIONS — 0.2% | | | |
| 344,131 | | | | Blackrock Capital Finance LP, 9.530% due 9/25/26 (a) | | | 206,479 |
| 108,160 | | | | Ocwen Residential MBS Corp., Series 1998-R1, Class C1, 7.000% due 10/25/40 (e) | | | 10,275 |
| | | | | | |
|
|
| | | | | TOTAL COLLATERALIZED MORTGAGE OBLIGATIONS
(Cost — $261,575) | | | 216,754 |
| | | | | | |
|
|
| | | |
Shares
| | | | | | |
PREFERRED STOCKS — 0.5% | | | |
CONSUMER DISCRETIONARY — 0.4% | | | |
| | |
Media — 0.4% | | | | | |
| 62 | | | | ION Media Networks Inc., 14.250% (d) | | | 536,300 |
| | | | | | |
|
|
ENERGY — 0.1% | | | |
| |
Oil, Gas & Consumable Fuels — 0.1% | | | |
| 274 | | | | Chesapeake Energy Corp., 6.250% | | | 73,569 |
| | | | | | |
|
|
| | | | | TOTAL PREFERRED STOCKS
(Cost — $527,608) | | | 609,869 |
| | | | | | |
|
|
| | | | | TOTAL INVESTMENTS BEFORE SHORT-TERM INVESTMENT
(Cost — $106,375,388) | | | 107,522,729 |
| | | | | | |
|
|
See Notes to Financial Statements.
105
Schedules of Investments
(continued)
| | | | | | | |
| High Yield Investments | | |
| | | |
Face
Amount | | | | Security | | Value |
SHORT-TERM INVESTMENT — 0.9% |
REPURCHASE AGREEMENT — 0.9% |
| $ 945,000 | | | | State Street Bank & Trust Co. dated 8/31/06, 4.810% due 9/1/06; Proceeds due at maturity —- $945,126;
(Fully collateralized by U.S. Treasury Bond, 4.500% due 2/15/36; Market value —- $971,606)
(Cost — $945,000) | | $ | 945,000 |
| | | | | | |
|
|
| | | | | TOTAL INVESTMENTS — 98.4%
(Cost — $107,320,388#) | | | 108,467,729 |
| | | | | Other Assets in Excess of Liabilities — 1.6% | | | 1,739,374 |
| | | | | | |
|
|
| | | | | TOTAL NET ASSETS — 100.0% | | $ | 110,207,103 |
| | | | | | |
|
|
| ‡ | | All ratings are by Standard & Poor’s Ratings Service, unless otherwise noted. All ratings are unaudited. |
| (a) | | Variable rate security. Interest rate disclosed is that which is in effect at August 31, 2006. |
| (b) | | Security is exempt from registration under Rule 144A of the Securities Act of 1933. This security may be resold in transactions that are exempt from registration, normally to qualified institutional buyers. This security has been deemed liquid pursuant to guidelines approved by the Board of Trustees, unless otherwise noted. |
| (c) | | Rating by Moody’s Investors Service. All ratings are unaudited. |
| (d) | | Payment-in-kind security for which part of the income earned may be paid as additional principal. |
| (e) | | Security is valued in good faith at fair value by or under the direction of the Board of Trustees (See Note 1). |
| # | | Aggregate cost for federal income tax purposes is $107,899,048. |
See pages 119 and 120 for definitions of ratings.
See Notes to Financial Statements.
106
Schedules of Investments
(continued)
| | | | | | | |
| Municipal Bond Investments | | |
| | | |
Face
Amount | | Rating‡ | | Security | | Value |
MUNICIPAL BONDS — 96.3% | | | |
| |
Alabama — 1.6% | | | |
| $1,000,000 | | Aaa (a) | | Alabama State Board of Education, Revenue, Jefferson State Community College, AMBAC-Insured, 5.000% due 10/1/22 | | $ | 1,061,340 |
| | | | | | |
|
|
| |
Alaska — 1.6% | | | |
| 1,000,000 | | AAA | | Anchorage, AK, GO, Refunding School, FGIC-Insured, 6.000% due 10/1/09 | | | 1,069,420 |
| | | | | | |
|
|
| |
Arizona — 1.6% | | | |
| 1,000,000 | | Aaa (a) | | Arizona Student Loan Acquisition Authority Student Loan Revenue, Refunding, Senior Series A-1, 5.650% due 5/1/14 (b) | | | 1,055,620 |
| | | | | | |
|
|
| |
California — 5.0% | | | |
| 1,000,000 | | A+ | | California State, GO, Refunding, 5.000% due 2/1/33 | | | 1,030,540 |
| 1,110,000 | | AAA | | Costa Mesa, CA, COP, Refunding, Public Facilities Project, MBIA-Insured, 5.000% due 10/1/18 | | | 1,182,661 |
| 1,000,000 | | AAA | | Los Angeles, CA, Department of Water & Power Waterworks Revenue, Series C, MBIA-Insured, 5.250% due 7/1/19 | | | 1,098,660 |
| | | | | | |
|
|
| | | | | Total California | | | 3,311,861 |
| | | | | | |
|
|
| |
Colorado — 7.4% | | | |
| 1,000,000 | | AA | | Colorado Water Resources & Power Development Authority, Drinking Water Revenue, Refunding, Revolving Fund Series A, 5.500% due 9/1/22 | | | 1,161,700 |
| 1,240,000 | | AAA | | Dove Valley Metropolitan District, CO, Arapahoe County, GO, FSA-Insured, 5.000% due 11/1/25 | | | 1,311,771 |
| 2,165,000 | | AA | | Longmont, CO, Sales & Use Tax Revenue, Refunding, 5.250% due 5/15/17 | | | 2,420,427 |
| | | | | | |
|
|
| | | | | Total Colorado | | | 4,893,898 |
| | | | | | |
|
|
| |
District of Columbia — 1.7% | | | |
| 1,075,000 | | AAA | | Metropolitian Washington, D.C. Airport Authority System, Refunding, Series D, FSA-Insured, 5.375% due 10/1/18 (b) | | | 1,146,176 |
| | | | | | |
|
|
| |
Florida — 11.5% | | | |
| 1,500,000 | | AA+ | | Broward County, FL, GO, Parks & Land Preservation Project, 5.000% due 1/1/19 | | | 1,592,325 |
| 1,000,000 | | AAA | | Florida Municipal Loan Council Revenue, North Miami Beach Water Project, Series B, MBIA-Insured, 5.375% due 8/1/18 | | | 1,093,880 |
| 1,000,000 | | AAA | | Florida State Board of Education Lottery Revenue, Series C, FGIC-Insured, 5.250% due 7/1/20 | | | 1,060,800 |
| 1,315,000 | | AAA | | Miami-Dade County, FL, Transit Sales Surtax Revenue, XLCA-Insured, 5.000% due 7/1/16 | | | 1,429,760 |
| 1,075,000 | | AAA | | Port St Lucie, FL, Florida Stormwater Utility Revenue, MBIA-Insured, 5.000% due 5/1/23 | | | 1,122,214 |
| | | | | Tampa Florida Utility Tax & Special Revenue, Series A, AMBAC-Insured: | | | |
| 1,055,000 | | AAA | | 5.250% due 10/1/19 | | | 1,141,415 |
| 195,000 | | AAA | | Call 10/1/12 @ 101, 5.250% due 10/1/19 (c) | | | 213,186 |
| | | | | | |
|
|
| | | | | Total Florida | | | 7,653,580 |
| | | | | | |
|
|
| |
Hawaii — 4.0% | | | |
| 1,500,000 | | AAA | | Hawaii State, GO, Series DI, FSA-Insured, 5.000% due 3/1/10 | | | 1,567,710 |
| 1,000,000 | | AA- | | Maui County, HI, GO, Series A, Call 3/1/11 @ 100, 5.500% due 3/1/15 (c) | | | 1,067,380 |
| | | | | | |
|
|
| | | | | Total Hawaii | | | 2,635,090 |
| | | | | | |
|
|
| |
Illinois — 10.1% | | | |
| 2,000,000 | | AAA | | Chicago Transit Authority Capital Grant Receipts Revenue, Federal Transit Administration Section 5307-B, AMBAC-Insured, 5.250% due 6/1/13 | | | 2,177,000 |
| | | | | Chicago, IL: | | | |
| 1,000,000 | | AAA | | Board of Education, GO, School Reform Board, Series A, FGIC-Insured, 5.250% due 12/1/20 | | | 1,119,580 |
| 1,000,000 | | AAA | | Housing Authority Capital Program Revenue, Refunding, FSA-Insured, 5.000% due 7/1/14 | | | 1,069,300 |
See Notes to Financial Statements.
107
Schedules of Investments
(continued)
| | | | | | | |
| Municipal Bond Investments | | |
| | | |
Face
Amount | | Rating‡ | | Security | | Value |
| |
Illinois — 10.1% (continued) | | | |
| $1,095,000 | | Baa1 (a) | | Illinois Finance Authority Revenue, Refunding, DePaul University, Series A, 5.375% due 10/1/19 | | $ | 1,209,406 |
| 1,000,000 | | AAA | | University of Illinios, University Revenue, Auxiliary Facilities System, Series B, FGIC-Insured, 5.500% due 4/1/19 | | | 1,142,760 |
| | | | | | |
|
|
| | | | | Total Illinois | | | 6,718,046 |
| | | | | | |
|
|
| |
Indiana — 5.0% | | | |
| 1,000,000 | | Aaa (a) | | Allen County, IN, Public Library Building Corp., First Mortgage, MBIA-Insured, Call 1/15/11 @ 101, 5.000% due 1/15/17 (c) | | | 1,063,690 |
| 1,200,000 | | NR | | Indiana Bond Bank, Special Project Hendricks, Series B, Call 2/1/07 @ 102, 6.125% due 2/1/17 (c) | | | 1,235,436 |
| 1,000,000 | | AAA | | Indiana Health Facility Financing Authority Hospital Revenue, Refunding, Methodist Hospital Industry, Series A, 5.750% due 9/1/15 (d) | | | 1,010,740 |
| | | | | | |
|
|
| | | | | Total Indiana | | | 3,309,866 |
| | | | | | |
|
|
| |
Iowa — 1.6% | | | |
| 1,000,000 | | AAA | | Des Moines, IA, Public Package Systems Revenue, Series A, FGIC-Insured, 5.750% due 6/1/13 | | | 1,072,660 |
| | | | | | |
|
|
| |
Kansas — 1.7% | | | |
| 1,065,000 | | AA | | Kansas State Development Finance Authority Revenue, Kansas Transition Revolving Fund, 5.000% due 10/1/20 | | | 1,143,640 |
| | | | | | |
|
|
| |
Michigan — 1.7% | | | |
| 1,000,000 | | AAA | | Michigan State House of Representatives, COP, AMBAC-Insured, 5.250% due 8/15/14 | | | 1,103,620 |
| | | | | | |
|
|
| |
Minnesota — 4.4% | | | |
| 1,000,000 | | AAA | | Minneapolis & St. Paul, MN, Housing Finance Board Single Family Mortgage Revenue, Mortgage Backed Securities, Cityliving, Series A-3, GNMA & FNMA-Insured, 5.700% due 4/1/27 | | | 1,076,070 |
| 1,000,000 | | A2 (a) | | Minnesota State Higher EFA Revenue, University St. Thomas, Series Six-I, 5.000% due 4/1/23 | | | 1,056,820 |
| 750,000 | | AAA | | Southern Minnesota Municipal Power Agency, Power Supply System Revenue, Series A, 5.750% due 1/1/18 | | | 804,532 |
| | | | | | |
|
|
| | | | | Total Minnesota | | | 2,937,422 |
| | | | | | |
|
|
| |
Nevada — 5.8% | | | |
| 1,500,000 | | AAA | | Clark County, NV, GO, Refunding Food Control, FGIC-Insured, 4.750% due 11/1/24 | | | 1,555,185 |
| 1,000,000 | | AAA | | State of Nevada Highway Revenue, Motor Vehicle Fuel Tax, 5.000% due 12/1/08 | | | 1,029,980 |
| 1,220,000 | | AAA | | University of Nevada, University Revenue, Community College System, FSA-Insured, 5.250% due 7/1/16 | | | 1,281,390 |
| | | | | | |
|
|
| | | | | Total Nevada | | | 3,866,555 |
| | | | | | |
|
|
| |
New Jersey — 1.7% | | | |
| 1,000,000 | | AAA | | New Jersey State Transportation Corp., COP, Series A, AMBAC-Insured, 5.500% due 9/15/15 | | | 1,117,510 |
| | | | | | |
|
|
| |
New York — 7.2% | | | |
| 1,000,000 | | AA- | | New York, NY, Series D, 5.000% due 11/1/27 | | | 1,043,460 |
| 1,450,000 | | AA+ | | New York City, NY, Municipal Water Finance Authority, Water & Sewer Systems Revenue, Series E, 5.000% due 6/15/38 | | | 1,496,110 |
| 1,000,000 | | AA- | | New York State Dormitory Authority Revenue, Series B, 5.250% due 11/15/23 (e) | | | 1,073,000 |
| 1,100,000 | | AAA | | New York State Urban Development Corp. Revenue, Refunding, Correctional Capital Facilities, Series A, FSA-Insured, 5.250% due 1/1/14 | | | 1,183,369 |
| | | | | | |
|
|
| | | | | Total New York | | | 4,795,939 |
| | | | | | |
|
|
| |
North Carolina — 1.6% | | | |
| 1,000,000 | | AAA | | Johnston County, NC, GO, FGIC-Insured, 5.000% due 6/1/21 | | | 1,063,750 |
| | | | | | |
|
|
| |
Ohio — 1.6% | | | |
| 1,000,000 | | AAA | | Springboro Community City School District, MBIA-Insured, 5.000% due 12/1/25 | | | 1,053,660 |
| | | | | | |
|
|
See Notes to Financial Statements.
108
Schedules of Investments
(continued)
| | | | | | | |
| Municipal Bond Investments | | |
| | | |
Face
Amount | | Rating‡ | | Security | | Value |
| |
Oklahoma — 1.6% | | | |
| $1,000,000 | | AAA | | Oklahoma City, OK, Airport Trust, Series A, FSA-Insured, 5.250% due 7/1/21 | | $ | 1,047,420 |
| | | | | | |
|
|
| |
Oregon — 1.6% | | | |
| 1,000,000 | | AAA | | Oregon State Department Administrative Services, COP, Series A, FSA-Insured, 5.000% due 5/1/24 | | | 1,055,260 |
| | | | | | |
|
|
| |
Pennsylvania — 1.8% | | | |
| 1,120,000 | | AAA | | Mifflin County, PA, GO, Series A, FGIC-Insured, 5.000% due 9/1/27 | | | 1,169,392 |
| | | | | | |
|
|
| |
Tennessee — 2.5% | | | |
| 1,500,000 | | A+ | | Tennessee Energy Acquisition Corp., Series A, 5.250% due 9/1/17 | | | 1,649,940 |
| | | | | | |
|
|
| |
Texas — 4.6% | | | |
| 530,000 | | AAA | | Texas State Department of Housing & Community Affairs Residential Mortgage Revenue, Refunding, Series A, GNMA/FNMA-Insured, 6.200% due 7/1/19 (b) | | | 539,879 |
| 1,000,000 | | AAA | | University of North Texas, University Revenue, Financing System, FGIC-Insured, 5.000% due 4/15/18 | | | 1,051,810 |
| 1,390,000 | | AAA | | University of Texas, University Revenues, Financing Systems, Series D, 5.000% due 8/15/34 | | | 1,447,240 |
| | | | | | |
|
|
| | | | | Total Texas | | | 3,038,929 |
| | | | | | |
|
|
| |
Virginia — 1.8% | | | |
| 1,100,000 | | AA | | Newport News, VA, GO, Refunding Water, Series C, 5.000% due 5/1/11 | | | 1,164,900 |
| | | | | | |
|
|
| |
Wisconsin — 5.6% | | | |
| 1,200,000 | | BBB | | Franklin, WI, Solid Waste Disposal Revenue, Waste Management Wisconsin Inc. Series A, 4.950% due 11/1/16 | | | 1,233,312 |
| 1,000,000 | | Aaa (a) | | Sun Prairie, WI, Area School District, GO, FGIC-Insured, 5.625% due 4/1/16 | | | 1,063,440 |
| 1,340,000 | | BBB | | Wisconsin State HEFA Revenue, Refunding, Divine Savior Healthcare, 5.500% due 5/1/26 | | | 1,437,391 |
| | | | | | |
|
|
| | | | | Total Wisconsin | | | 3,734,143 |
| | | | | | |
|
|
| | | | | TOTAL INVESTMENTS BEFORE SHORT-TERM INVESTMENTS
(Cost — $62,303,550) | | | 63,869,637 |
| | | | | | |
|
|
SHORT-TERM INVESTMENTS (f) — 2.0% | | | |
| |
California — 1.1% | | | |
| 700,000 | | A-1+ | | California Statewide CDA Revenue, COP, John Muir, Mount Diablo Health, AMBAC-Insured, SPA-JPMorgan Chase, 3.320%, 9/1/06 | | | 700,000 |
| | | | | | |
|
|
| |
Illinois — 0.2% | | | |
| 120,000 | | A-1+ | | Joliet, IL, Regional Port District, Refunding Exxon Mobil Corp., 3.510%, 9/1/06 | | | 120,000 |
| | | | | | |
|
|
| |
New Jersey — 0.5% | | | |
| 270,000 | | A-1+ | | New Jersey, EFA Revenue, Refunding, Princeton University, Series F, 3.180%, 9/1/06 | | | 270,000 |
| 55,000 | | A-1+ | | Union County, NJ, Pollution Control Financing Authority, Refunding Exxon Mobil Corp., 3.180%, 9/1/06 | | | 55,000 |
| | | | | | |
|
|
| | | | | Total New Jersey | | | 325,000 |
| | | | | | |
|
|
| |
New York — 0.2% | | | |
| 160,000 | | A-1+ | | New York City, NY, Municipal Water Finance Authority, Water & Sewer System Revenue, Series F, Subordinated Series F-2, SPA-Bayerische Landesbank, 3.540%, 9/1/06 | | | 160,000 |
| | | | | | |
|
|
| | | | | TOTAL SHORT-TERM INVESTMENTS
(Cost — $1,305,000) | | | 1,305,000 |
| | | | | | |
|
|
| | | | | TOTAL INVESTMENTS — 98.3%
(Cost — $63,608,550#) | | | 65,174,637 |
| | | | | Other Assets in Excess of Liabilities — 1.7% | | | 1,151,306 |
| | | | | | |
|
|
| | | | | TOTAL NET ASSETS — 100.0% | | $ | 66,325,943 |
| | | | | | |
|
|
See Notes to Financial Statements.
109
Schedules of Investments
(continued)
| | | | | | |
| Municipal Bond Investments | | |
| ‡ | | All ratings are by Standard & Poor’s Ratings Service, unless otherwise noted. All ratings are unaudited. |
| (a) | | Rating by Moody’s Investors Service. All ratings are unaudited. |
| (b) | | Income from this issue is considered a preference item for purposes of calculating the alternative minimum tax (“AMT”). |
| (c) | | Pre-Refunded bonds are escrowed with government obligations and/or government agency securities and are considered by the Manager to be triple-A rated even if issuer has not applied for new ratings. |
| (d) | | Bonds are escrowed to maturity by government securities and/or U.S. government agency securities and are considered by the Manager to be triple-A rated even if issuer has not applied for new ratings. |
| (e) | | Variable rate security. Interest rate disclosed is that which is in effect at August 31, 2006. |
| (f) | | Variable rate demand obligations have a demand feature under which the Fund can tender them back to the issuer on no more than 7 days notice. Date shown is the date of the next interest rate change. |
| # | | Aggregate cost for federal income tax purposes is $63,590,650. |
| See | | pages 119 and 120 for definitions of ratings. |
|
Abbreviations used in this schedule:
|
| AMBAC — Ambac Assurance Corporation |
| CDA — Community Development Authority |
| COP — Certificate of Participation |
| EFA — Educational Facilities Authority |
| FGIC — Financial Guaranty Insurance Company |
| FNMA — Federal National Mortgage Association |
| FSA — Financial Security Assurance |
| GNMA — Government National Mortgage Association |
| GO — General Obligation |
| HEFA — Health & Educational Facilities Authority |
| MBIA — Municipal Bond Investors Assurance Corporation |
| SPA — Standby Bond Purchase Agreement |
| XLCA — XL Capital Assurance Inc. |
| | | |
| Summary of Investments by Industry* | | | |
General Obligation | | 26.1 | % |
Education | | 19.6 | |
Transportation | | 10.6 | |
Utilities | | 7.2 | |
Water and Sewer | | 6.0 | |
Tax Allocation | | 5.5 | |
Housing: Single-Family | | 5.3 | |
Pre-Refunded | | 4.1 | |
Miscellaneous | | 3.4 | |
Hospitals | | 3.3 | |
Public Facilities | | 3.3 | |
Industrial Development | | 2.0 | |
Solid Waste | | 1.9 | |
Escrowed to Maturity | | 1.6 | |
Pollution Control | | 0.1 | |
| | |
|
|
| | | 100.0 | % |
| | |
|
|
| * | | As a percentage of total investments. |
See Notes to Financial Statements.
110
Schedules of Investments
(continued)
| | | | | | |
| International Fixed Income Investments |
| | |
Face
Amount† | | | Security | | Value |
| SOVEREIGN BONDS — 44.8% | | | |
| |
| Belgium — 0.3% | | | |
| 400,000 | EUR | | Kingdom of Belgium, 5.750% due 3/28/08 (a) | | $ | 528,463 |
| | | | | |
|
|
| |
| France — 9.5% | | | |
| 1,000,000 | EUR | | French Treasury Notes, 3.000% due 7/12/08 (a) | | | 1,268,013 |
| | | | Government of France: | | | |
| 6,500,000 | EUR | | 6.500% due 4/25/11 (a) | | | 9,331,450 |
| 1,800,000 | EUR | | 4.000% due 4/25/14 (a) | | | 2,347,344 |
| 1,800,000 | EUR | | 4.000% due 10/25/14 (a) | | | 2,347,331 |
| 1,900,000 | EUR | | 5.500% due 4/25/29 (a) | | | 2,956,403 |
| 100,000 | EUR | | 4.750% due 4/25/35 (a) | | | 143,060 |
| | | | | |
|
|
| | | | Total France | | | 18,393,601 |
| | | | | |
|
|
| |
| Germany — 14.6% | | | |
| 400,000 | EUR | | Bundesobligation, 3.500% due 10/9/09 (a) | | | 510,963 |
| | | | Bundesrepublik Deutschland: | | | |
| 200,000 | EUR | | 4.500% due 7/4/09 (a) | | | 262,377 |
| 4,400,000 | EUR | | 5.000% due 7/4/12 | | | 6,020,114 |
| 1,600,000 | EUR | | 4.250% due 1/4/14 | | | 2,118,811 |
| 2,300,000 | EUR | | 4.250% due 7/4/14 | | | 3,048,471 |
| 2,800,000 | EUR | | 6.250% due 1/4/24 (a) | | | 4,603,311 |
| 3,700,000 | EUR | | 5.625% due 1/4/28 (a) | | | 5,806,252 |
| 3,100,000 | EUR | | 6.250% due 1/4/30 (a) | | | 5,279,079 |
| 600,000 | EUR | | 4.750% due 7/4/34 (a) | | | 859,456 |
| | | | | |
|
|
| | | | Total Germany | | | 28,508,834 |
| | | | | |
|
|
| |
| Greece — 2.7% | | | |
| 3,500,000 | EUR | | Hellenic Republic, 6.500% due 1/11/14 (a) | | | 5,209,784 |
| | | | | |
|
|
| |
| Italy — 0.7% | | | |
| 1,050,000 | EUR | | Buoni Poliennali Del Tesoro, 4.500% due 5/1/09 | | | 1,374,988 |
| | | | | |
|
|
| |
| Japan — 4.8% | | | |
| | | | Japan Government: | | | |
| 320,000,000 | JPY | | 1.500% due 3/20/11 | | | 2,782,564 |
| 80,000,000 | JPY | | 2.400% due 3/20/34 | | | 680,579 |
| 290,000,000 | JPY | | 2.300% due 6/20/35 | | | 2,422,137 |
| 400,000,000 | JPY | | Series 20, 2.500% due 9/20/35 | | | 3,478,608 |
| | | | | |
|
|
| | | | Total Japan | | | 9,363,888 |
| | | | | |
|
|
| |
| Netherlands — 2.8% | | | |
| | | | Netherlands Government: | | | |
| 4,000,000 | EUR | | 5.250% due 7/15/08 (a) | | | 5,274,118 |
| 200,000 | EUR | | 3.750% due 7/15/14 (a) | | | 256,518 |
| | | | | |
|
|
| | | | Total Netherlands | | | 5,530,636 |
| | | | | |
|
|
| |
| Poland — 1.1% | | | |
| 6,280,000 | PLN | | Poland Government Bond, 6.000% due 5/24/09 (a) | | | 2,081,158 |
| | | | | |
|
|
| |
| Portugal — 2.6% | | | |
| 4,000,000 | EUR | | Portugal Obrigacoes do Tesouro, 3.250% due 7/15/08 (a) | | | 5,087,199 |
| | | | | |
|
|
| |
| Spain — 3.7% | | | |
| 5,600,000 | EUR | | Spanish Government, 3.600% due 1/31/09 (a) | | | 7,172,203 |
| | | | | |
|
|
See Notes to Financial Statements.
111
Schedules of Investments
(continued)
| | | | | | |
| International Fixed Income Investments |
| | |
Face
Amount† | | | Security | | Value |
| |
| United Kingdom — 2.0% | | | |
| 860,000 | GBP | | United Kingdom Treasury, 7.500% due 12/7/06 (a) | | $ | 1,646,954 |
| 1,170,000 | GBP | | United Kingdom Treasury Gilt, 4.750% due 9/7/15 (a) | | | 2,262,414 |
| | | | | |
|
|
| | | | Total United Kingdom | | | 3,909,368 |
| | | | | |
|
|
| | | | TOTAL SOVEREIGN BONDS
(Cost — $85,670,516) | | | 87,160,122 |
| | | | | |
|
|
| ASSET-BACKED SECURITIES (b) — 4.8% | | | |
| |
| Home Equity — 4.0% | | | |
| | | | ACE Securities Corp.: | | | |
| 617,813 | | | Series 2006-HE1, Class A2A, 5.404% due 2/25/36 (a) | | | 618,349 |
| 642,783 | | | Series 2006-NC1, Class A2A, 5.394% due 12/25/35 (a) | | | 643,334 |
| 66,009 | | | Aegis Asset Backed Securities Trust, Series 2004-4, Class A2A, 5.605% due 10/25/34 (a) | | | 66,077 |
| | | | Asset Backed Funding Certificates: | | | |
| 188,789 | | | Series 2005-AQ1, Class A1A, 5.444% due 6/25/35 (a) | | | 188,910 |
| 93,635 | | | Series 2005-HE2, Class A2A, 5.434% due 6/25/35 (a) | | | 93,694 |
| 630,624 | | | Asset Backed Securities Corp. Home Equity, Series 2006-HE3, Class A3, 5.384% due 3/25/36 (a) | | | 631,099 |
| | | | Countrywide Asset-Backed Certificates: | | | |
| 203,143 | | | Series 2005-16, Class 4AV1, 5.424% due 1/25/35 (a) | | | 203,316 |
| 900,000 | | | Series 2006-15, Class A1, 5.434% due 10/25/36 | | | 900,000 |
| 241,102 | | | Federal Home Loan Mortgage Corp. (FHLMC) Structured Pass Through Securities, Series T-35, Class A, 5.604% due 9/25/31 (a) | | | 241,286 |
| 311,707 | | | First Franklin Mortgage Loan Asset Backed Certificates, Series 2006-FF1, Class 2A1, 5.414% due 1/25/36 (a) | | | 311,973 |
| 542,538 | | | Fremont Home Loan Trust, Series 2006-1, Class 2A1, 5.384% due 4/25/36 (a) | | | 542,904 |
| 600,853 | | | GSAMP Trust, Series 2006-S2, Class A1A, 5.394% due 1/25/36 (a) | | | 601,225 |
| 824,058 | | | Long Beach Mortgage Loan Trust, Series 2004-4, Class 1A1, 5.604% due 10/25/34 (a) | | | 826,315 |
| 590,532 | | | Residential Asset Mortgage Products Inc., Series 2006-RS1, Class AI1, 5.404% due 1/25/36 (a) | | | 590,958 |
| 356,409 | | | Residential Asset Securities Corp., Series 2006-EMX3, Class A1, 5.384% due 4/25/36 (a) | | | 356,681 |
| 109,940 | | | SACO I Trust, Series 2004-3A, Class A, 5.594% due 12/25/35 (a)(c) | | | 109,975 |
| 900,000 | | | Soundview Home Equity Loan Trust, Series 2006-EQ1, Class A1, 5.458% due 10/25/36 | | | 900,000 |
| | | | | |
|
|
| | | | Total Home Equity | | | 7,826,096 |
| | | | | |
|
|
| |
| Student Loan — 0.8% | | | |
| 835,522 | | | Nelnet Student Loan Trust, Series 2006-1, Class A1, 5.378% due 8/23/11 | | | 836,178 |
| | | | SLM Student Loan Trust: | | | |
| 129,138 | | | Series 2005-9, Class A1, 5.455% due 1/25/13 (a) | | | 129,103 |
| 557,499 | | | Series 2006-4, Class A1, 5.455% due 7/25/12 (a) | | | 557,836 |
| | | | | |
|
|
| | | | Total Student Loan | | | 1,523,117 |
| | | | | |
|
|
| | | | TOTAL ASSET-BACKED SECURITIES
(Cost — $9,343,481) | | | 9,349,213 |
| | | | | |
|
|
| COLLATERALIZED MORTGAGE OBLIGATIONS — 9.7% | | | |
| 395,103 | | | Banc of America Mortgage Securities, Series 2004-4, Class 1A9, 5.000% due 5/25/34 (a) | | | 388,523 |
| 605,897 | | | Basic Asset Backed Securities Trust, Series 2006-1, Class A1, 5.404% due 4/25/36 (a)(b) | | | 606,357 |
| 900,000 | | | Bear Stearns Alternative A Trust, Series 2006-6, Class 21A1, 5.840% due 10/25/36 | | | 900,703 |
| 900,000 | | | Commercial Mortgage Pass Through Certificates, Series 2006-CN2A, Class A2FL, 5.626% due 2/5/19 (a)(b)(c) | | | 902,344 |
| 834,979 | | | Countrywide Alternative Loan Trust, Series 2006-OA1, Class 2A1, 5.535% due 3/20/46 (a)(b) | | | 836,389 |
| 667,446 | | | Countrywide Home Loan Mortgage Pass-Through Trust, Series 2005-9, Class 1A3, 5.554% due 5/25/35 (a)(b) | | | 668,468 |
| | | | Countrywide Home Loans: | | | |
| 710,655 | | | Series 2005-002, Class 1A1, 5.664% due 3/25/35 (a)(b) | | | 712,829 |
| 137,863 | | | Series 2005-003, Class 2A1, 5.614% due 4/25/35 (a)(b) | | | 138,488 |
See Notes to Financial Statements.
112
Schedules of Investments
(continued)
| | | | | | |
| International Fixed Income Investments |
| | |
Face
Amount† | | | Security | | Value |
| COLLATERALIZED MORTGAGE OBLIGATIONS (a) — 9.7% (continued) | | | |
| 185,885 | | | Series 2005-011, Class 3A1, 5.622% due 4/25/35 (a)(b) | | $ | 186,843 |
| 268,841 | | | Series 2005-HYB9, Class 3A2A, 5.250% due 2/20/36 (a)(b) | | | 265,600 |
| 330,238 | | | CSAB Mortgage Backed Trust, Series 2006-1, Class A1A, 5.424% due 6/25/36 (a)(b) | | | 330,337 |
| | | | Federal Home Loan Mortgage Corp. (FHLMC): | | | |
| 657,060 | | | Series 2770, Class YW, 4.000% due 6/15/22 (a) | | | 647,772 |
| 793,395 | | | Series 3037, Class BC, 4.500% due 2/15/20 (a) | | | 768,385 |
| 755,526 | | | Series 3174, Class FM, 5.570% due 5/15/36 (a)(b) | | | 755,412 |
| | | | Federal National Mortgage Association (FNMA): | | | |
| 32,630 | | | Series 2003-34, Class A1, 6.000% due 4/25/43 (a) | | | 32,698 |
| 182,933 | | | Series 2004-W12, Class 1A1, 6.000% due 7/25/44 (a) | | | 183,803 |
| 295,580 | | | Series 2005-120, Class NF, 5.485% due 1/25/21 (a)(b) | | | 295,024 |
| 47,756 | | | Federal National Mortgage Association (FNMA) Grantor Trust, Series 2004-T3, Class 1A1, 6.000% due 2/25/44 (a) | | | 47,969 |
| 417,774 | | | FHLMC Structured Pass Through Securities, Series T-62, Class 1A1, 5.482% due 10/25/44 (a)(b) | | | 420,601 |
| 253,754 | | | GMAC Mortgage Corp. Loan Trust, Series 2004-J4, Class A1, 5.500% due 9/25/34 (a) | | | 251,484 |
| 563,580 | | | Government National Mortgage Association (GNMA), Series 2004-68, Class ZC, 6.000% due 8/20/34 (a) | | | 564,086 |
| | | | Lehman XS Trust: | | | |
| 893,420 | | | Series 2006-12N, Class A1A1, 5.404% due 8/25/46 (a)(b) | | | 893,141 |
| 744,358 | | | Series 2006-GP1, Class A1, 5.414% due 5/25/46 (a)(b) | | | 744,258 |
| 700,000 | GBP | | Permanent Financing PLC, Series 4, Class 5A2, 4.890% due 6/10/42 (a)(b) | | | 1,334,894 |
| 886,968 | | | Residential Accredit Loans Inc., Series 2006-Q03, Class A1, 5.530% due 4/25/46 (a)(b) | | | 885,205 |
| | | | Structured Asset Mortgage Investments Inc.: | | | |
| 322,916 | | | Series 2005-AR2, Class 2A1, 5.615% due 5/25/45 (a)(b) | | | 323,948 |
| 284,128 | | | Series 2005-AR8, Class A1A, 5.604% due 2/25/36 (a)(b) | | | 284,596 |
| 889,001 | | | Series 2006-AR3, Class 12-A1, 5.605% due 5/25/36 (a)(b) | | | 889,982 |
| 57,884 | | | Structured Asset Securities Corp., Series 2005-S5, Class A1, 5.424% due 8/25/35 (a)(b) | | | 57,923 |
| 900,000 | | | Thornburg Mortgage Securities Trust, Series 2006-5, Class A1, 5.450% due 8/25/36 (a)(b) | | | 900,000 |
| | | | Washington Mutual Inc.: | | | |
| 36,802 | | | Series 2001-7, Class A, 5.478% due 5/25/41 (a)(b) | | | 37,181 |
| 14,590 | | | Series 2002-AR9, Class 1A, 5.682% due 8/25/42 (a)(b) | | | 14,621 |
| 382,111 | | | Series 2005-AR13, Class A1A1, 5.614% due 10/25/45 (a)(b) | | | 384,765 |
| 830,216 | | | Series 2006-AR3, Class A1A, 5.432% due 2/25/46 (a)(b) | | | 830,086 |
| 380,516 | | | Series 2006-AR4, Class 2A1A, 5.590% due 5/25/46 (a)(b) | | | 379,624 |
| | | | Wells Fargo Mortgage Backed Securities Trust: | | | |
| 754,069 | | | Series 2006-AR2, Class 2A1, 4.950% due 3/25/36 (a) | | | 745,627 |
| 355,170 | | | Series 2006-AR8, Class 1A1, 5.240% due 4/25/36 (a)(b) | | | 353,120 |
| | | | | |
|
|
| | | | TOTAL COLLATERALIZED MORTGAGE OBLIGATIONS
(Cost — $18,952,537) | | | 18,963,086 |
| | | | | |
|
|
| CORPORATE BONDS & NOTES (a) — 8.2% | | | |
| |
| Cayman Islands — 0.8% | | | |
| 200,000 | EUR | | MUFG Capital Finance, 4.850% due 7/25/16 | | | 250,708 |
| 900,000 | | | MUFG Capital Finance 1 Ltd., 6.346% due 7/25/16 (b) | | | 902,545 |
| 400,000 | | | Resona Bank Ltd., 5.850% due 4/15/16 (b)(c) | | | 388,947 |
| 100,000 | | | Vita Capital Ltd., Series 2003-I, Notes, 6.830% due 1/1/07 (b)(c) | | | 100,359 |
| | | | | |
|
|
| | | | Total Cayman Islands | | | 1,642,559 |
| | | | | |
|
|
| |
| France — 0.2% | | | |
| 300,000 | EUR | | France Telecom SA, Senior Unsubordinated Medium-Term Note, 7.250% due 1/28/13 | | | 445,908 |
| | | | | |
|
|
| |
| Greece — 0.3% | | | |
| 370,000 | EUR | | Public Power Corp., Notes, 4.500% due 3/12/09 | | | 479,158 |
| | | | | |
|
|
See Notes to Financial Statements.
113
Schedules of Investments
(continued)
| | | | | | |
| International Fixed Income Investments |
| | |
Face
Amount† | | | Security | | Value |
| |
| Hong Kong — 0.4% | | | |
| 500,000 | EUR | | Hutchinson Whampoa Finance Ltd., 5.875% due 7/8/13 | | $ | 693,481 |
| | | | | |
|
|
| |
| Italy — 0.5% | | | |
| 720,000 | EUR | | Telecom Italia SpA, Medium-Term Note, 6.250% due 2/1/12 | | | 997,740 |
| | | | | |
|
|
| |
| Japan — 0.1% | | | |
| 200,000 | EUR | | Bank of Tokyo-Mitsubishi UFJ Ltd., 3.500% due 12/16/15 (b) | | | 249,602 |
| | | | | |
|
|
| |
| Luxembourg — 0.4% | | | |
| 567,000 | EUR | | Hannover Finance Luxembourg SA, 5.000% due 6/1/15 (b) | | | 705,669 |
| 100,000 | | | VTB Capital SA, Serior Notes, 6.174% due 9/21/07 (b)(c) | | | 100,075 |
| | | | | |
|
|
| | | | Total Luxembourg | | | 805,744 |
| | | | | |
|
|
| |
| Mexico — 0.4% | | | |
| 540,000 | EUR | | PEMEX Project Funding Master Trust, 6.250% due 8/5/13 (c) | | | 750,411 |
| | | | | |
|
|
| |
| United Kingdom — 1.1% | | | |
| 400,000 | | | HBOS PLC, Subordinated, 5.920% due 10/1/15 (b)(c) | | | 384,947 |
| 300,000 | | | Royal Bank of Scotland Group PLC, Senior Notes, 5.424% due 12/21/07 (b)(c) | | | 300,308 |
| 1,000,000 | | | Royal Bank of Scotland PLC, Notes, 5.570% due 7/21/08 (b)(c) | | | 1,001,101 |
| 400,000 | | | Vodafone Group PLC, Notes, 5.560% due 6/29/07 (b) | | | 400,063 |
| | | | | |
|
|
| | | | Total United Kingdom | | | 2,086,419 |
| | | | | |
|
|
| |
| United States — 4.0% | | | |
| 900,000 | | | CIT Group Inc., Series Medium-Term Note, Senior Notes, 5.463% due 2/21/08 (b) | | | 901,095 |
| 1,100,000 | | | Countrywide Bank NA, Certificate of Deposit, 5.340% due 9/15/06 (b) | | | 1,100,015 |
| 900,000 | | | Genworth Global Funding, Secured Notes, 5.389% due 2/10/09 (b) | | | 901,164 |
| 200,000 | | | Harrahs Operating Co. Inc., 6.099% due 2/8/08 (b)(c) | | | 200,551 |
| 300,000 | | | HSBC Finance Corp., Senior Unsecured, 5.459% due 9/15/08 (b) | | | 300,892 |
| 300,000 | | | IBJ Preferred Capital Co., 8.790% due 6/30/08 (b)(c) | | | 316,411 |
| 200,000 | | | Mizuho JGB Investment LLC, Bonds, 9.870% due 6/30/08 (b)(c) | | | 214,620 |
| 900,000 | | | Morgan Stanley, Series Notes, Series F, 5.550% due 2/9/09 (b) | | | 902,179 |
| 800,000 | | | Popular North America Inc., Medium-Term Note, Series F, 5.886% due 4/6/09 (b) | | | 802,415 |
| 700,000 | | | Rabobank Nederland, Senior Notes, 5.527% due 1/15/09 (b)(c) | | | 700,504 |
| 500,000 | | | U.S. Bancorp, Medium Term Notes, 5.358% due 4/28/09 (b) | | | 500,414 |
| 1,000,000 | | | Wachovia Bank NA, Senior Notes, Series DPNT, 5.489% due 3/23/09 (b) | | | 1,000,403 |
| | | | | |
|
|
| | | | Total United States | | | 7,840,663 |
| | | | | |
|
|
| | | | TOTAL CORPORATE BONDS & NOTES
(Cost — $15,459,747) | | | 15,991,685 |
| | | | | |
|
|
| MORTGAGE-BACKED SECURITIES — 2.1% | | | |
| |
| FNMA — 2.1% | | | |
| | | | Federal National Mortgage Association (FNMA): | | | |
| 785,369 | | | 4.192% due 11/1/34 (a)(b) | | | 775,570 |
| 2,400,000 | | | 5.500% due 9/13/36 (d) | | | 2,355,743 |
| 1,000,000 | | | 6.500% due 9/13/36 (d) | | | 1,015,312 |
| | | | | |
|
|
| | | | TOTAL MORTGAGE-BACKED SECURITIES
(Cost — $4,134,111) | | | 4,146,625 |
| | | | | |
|
|
| U.S. GOVERNMENT & AGENCY OBLIGATIONS (a) — 3.6% | | | |
| |
| U.S. Government Agencies — 2.3% | | | |
| 4,568,121 | | | Federal National Mortgage Association (FNMA), 5.500% due 5/1/34 | | | 4,498,931 |
| | | | | |
|
|
See Notes to Financial Statements.
114
Schedules of Investments
(continued)
| | | | | | |
| International Fixed Income Investments |
| | |
Face
Amount† | | | Security | | Value |
| |
| U.S. Government Obligations — 1.3% | | | |
| 2,600,000 | | | U.S. Treasury Notes, 3.500% due 2/15/10 | | $ | 2,501,385 |
| | | | | |
|
|
| | | | TOTAL U.S. GOVERNMENT & AGENCY OBLIGATIONS
(Cost — $7,086,211) | | | 7,000,316 |
| | | | | |
|
|
| U.S. TREASURY INFLATION PROTECTED SECURITIES (a) — 2.0% | | | |
| 2,176,969 | | | U.S. Treasury Bonds, Inflation Indexed, 3.375% due 1/15/07 | | | 2,176,714 |
| | | | U.S. Treasury Notes, Inflation Indexed: | | | |
| 321,498 | | | 0.875% due 4/15/10 | | | 305,530 |
| 850,032 | | | 1.625% due 1/15/15 | | | 809,756 |
| 521,535 | | | 1.875% due 7/15/15 | | | 506,011 |
| | | | | |
|
|
| | | | TOTAL U.S. TREASURY INFLATION PROTECTED SECURITIES
(Cost — $3,840,442) | | | 3,798,011 |
| | | | | |
|
|
| | |
Contracts
| | | | | |
| PURCHASED OPTIONS — 0.3% | | | |
| |
| Germany — 0.0% | | | |
| 4,000,000 | GBP | | Swaption, 6 Month LIBOR, 5.00% fixed rate, Call @ $5.00, expires 5/11/07 | | | 18,262 |
| 3,300,000 | GBP | | Swaption, 6 Month LIBOR, 5.00% fixed rate, Call @ $5.00, expires 5/17/07 | | | 15,065 |
| | | | | |
|
|
| | | | Total Germany | | | 33,327 |
| | | | | |
|
|
| |
| United States — 0.3% | | | |
| 255 | | | Eurodollar Futures, Put @ $92.00, expires 3/19/07 | | | 1,594 |
| 55 | | | Eurodollar Futures, Put @ $92.25, expires 12/18/06 | | | 344 |
| 322 | | | Eurodollar Futures, Put @ $92.50, expires 12/18/06 | | | 2,012 |
| 14,000,000 | | | Swaption, 3 Month LIBOR, 4.50% fixed rate, Call @ $4.50, expires 10/18/06 | | | 14 |
| 2,300,000 | | | Swaption, 3 Month LIBOR, 4.50% fixed rate, Call @ $4.50, expires 10/4/06 | | | 0 |
| 1,500,000 | | | Swaption, 3 Month LIBOR, 4.80% fixed rate, Call @ $4.80, expires 12/22/06 | | | 967 |
| 34,000,000 | | | Swaption, 3 Month LIBOR, 5.00% fixed rate, Call @ $5.00, expires 3/8/07 | | | 101,286 |
| 2,300,000 | | | Swaption, 3 Month LIBOR, 5.08% fixed rate, Call @ $5.08, expires 4/19/07 | | | 9,980 |
| 2,300,000 | | | Swaption, 3 Month LIBOR, 5.13% fixed rate, Call @ $5.13, expires 10/25/06 | | | 3,248 |
| 36,500,000 | | | Swaption, 3 Month LIBOR, 5.17% fixed rate, Call @ $5.17, expires 2/01/07 | | | 143,189 |
| 29,600,000 | | | Swaption, 3 Month LIBOR, 5.20% fixed rate, Call @ $5.20, expires 5/09/07 | | | 173,663 |
| 5,700,000 | GBP | | Swaption, 6 Month LIBOR, 5.00% fixed rate, Call @ $5.00, expires 6/15/07 | | | 29,276 |
| 3,500,000 | | | U.S. Dollar vs. Japanese Yen, 8.75% fixed rate, Call @ $8.75, expires 1/17/07 | | | 0 |
| 5,900,000 | | | U.S. Dollar vs. Japanese Yen, 8.80% fixed rate, Call @ $8.80, expires 2/13/07 | | | 6 |
| 331 | | | U.S. Treasury Notes 5 Year Futures, Put @ $101, expires 11/21/06 | | | 5,172 |
| | | | | |
|
|
| | | | Total United States | | | 470,751 |
| | | | | |
|
|
| | | | TOTAL PURCHASED OPTIONS
(Cost — $526,879) | | | 504,078 |
| | | | | |
|
|
| | | | TOTAL INVESTMENTS BEFORE SHORT-TERM INVESTMENTS
(Cost — $145,013,924) | | | 146,913,136 |
| | | | | |
|
|
| | |
Face
Amount
| | | | | |
| SHORT-TERM INVESTMENTS — 36.4% | | | |
| COMMERCIAL PAPER (a)(e) — 33.0% | | | |
| $5,100,000 | | | Bank of America Corp., 5.404% due 9/21/06 | | | 5,084,898 |
| 500,000 | | | Bank of Ireland, 5.429% due 11/3/06 | | | 495,350 |
| | | | Barclays Bank PLC: | | | |
| 4,100,000 | | | 5.460% due 10/26/06 | | | 4,066,269 |
See Notes to Financial Statements.
115
Schedules of Investments
(continued)
| | | | | | |
| International Fixed Income Investments | |
| | |
Face
Amount | | Security | | Value | |
| COMMERCIAL PAPER (a)(e) — 33.0% (continued) | | | | |
| $1,600,000 | | 5.373% due 11/15/06 | | $ | 1,582,352 | |
| 4,100,000 | | Danske Corp., 5.370% due 12/27/06 | | | 4,028,988 | |
| | | Dexia Delaware LLC: | | | | |
| 5,200,000 | | 5.342% due 11/10/06 | | | 5,146,492 | |
| 600,000 | | 5.337% due 11/21/06 | | | 592,842 | |
| 5,200,000 | | Dnb Nor Bank Asa, 5.349% due 11/13/06 | | | 5,143,892 | |
| 5,200,000 | | General Electric Capital Corp., 5.340% due 11/14/06 | | | 5,143,424 | |
| | | HBOS Treasury Services PLC: | | | | |
| 2,700,000 | | 5.445% due 10/25/06 | | | 2,678,252 | |
| 2,200,000 | | 5.444% due 11/1/06 | | | 2,180,310 | |
| 4,700,000 | | Ixis Commercial Paper Corp., 5.336% due 11/8/06 | | | 4,653,047 | |
| 3,300,000 | | Nordea North America Inc., 5.188% due 9/5/06 | | | 3,298,123 | |
| 4,900,000 | | Societe Generale North America, 5.445% due 10/10/06 | | | 4,871,494 | |
| 4,200,000 | | Spintab AB, 5.425% due 11/3/06 | | | 4,160,940 | |
| 4,000,000 | | Svenska Handlesbanken Inc., 5.261% due 9/11/06 | | | 3,994,233 | |
| 1,600,000 | | Swedbank, 5.347% due 11/9/06 | | | 1,583,696 | |
| 400,000 | | Time Warner Inc., 5.332% due 9/19/06 | | | 398,952 | |
| 5,200,000 | | UBS Finance Delaware LLC, 5.352% due 11/16/06 | | | 5,141,864 | |
| | | | |
|
|
|
| | | Total Commercial Paper (Cost — $64,247,053) | | | 64,245,418 | |
| | | | |
|
|
|
| U.S. GOVERNMENT AGENCY — 0.1% | | | | |
| 100,000 | | Federal National Mortgage Association (FNMA), Discount Notes, 5.233% due 11/1/06 (a)(e) (Cost — $99,124) | | | 99,124 | |
| | | | |
|
|
|
| U.S. GOVERNMENT OBLIGATIONS (a)(e) — 0.6% | | | | |
| | | U.S. Treasury Bills: | | | | |
| 40,000 | | 4.822% due 9/14/06 | | | 39,931 | |
| 1,140,000 | | 4.864% due 9/14/06 | | | 1,138,022 | |
| 60,000 | | 4.885% due 9/14/06 | | | 59,895 | |
| | | | |
|
|
|
| | | Total U.S. Government Obligations (Cost — $1,237,848) | | | 1,237,848 | |
| | | | |
|
|
|
| REPURCHASE AGREEMENT — 2.7% | | | | |
| 5,168,000 | | State Street Bank & Trust Co. dated 8/31/06, 4.810% due 9/1/06; Proceeds at maturity — $5,186,691;
(Fully collateralized by U.S. Treasury Bond, 4.500% due 2/15/36; Market value — $5,275,775)
(Cost — $5,168,000) (a) | | | 5,168,000 | |
| | | | |
|
|
|
| | | TOTAL SHORT-TERM INVESTMENTS
(Cost — $70,752,025) | | | 70,750,390 | |
| | | | |
|
|
|
| | | TOTAL INVESTMENTS — 111.9%
(Cost — $215,765,949#) | | | 217,663,526 | |
| | | Liabilities in Excess of Other Assets — (11.9)% | | | (23,162,199 | ) |
| | | | |
|
|
|
| | | TOTAL NET ASSETS — 100.0% | | $ | 194,501,327 | |
| | | | |
|
|
|
| † | | Face amount denominated in U.S. dollars, unless otherwise noted. |
| (a) | | All or a portion of this security is segregated for open futures contracts, extended settlements, written options, swap contracts, foreign currency contracts, TBA's and short sales. |
| (b) | | Variable rate security. Interest rate disclosed is that which is in effect at August 31, 2006. |
| (c) | | Security is exempt from registration under Rule 144A of the Securities Act of 1933. This security may be resold in transactions that are exempt from registration, normally to qualified institutional buyers. This security has been deemed liquid pursuant to guidelines approved by the Board of Trustees, unless otherwise noted. |
See Notes to Financial Statements.
116
Schedules of Investments
(continued)
| | | | |
| International Fixed Income Investments |
| (d) | | This security is traded on a to-be-announced ("TBA") basis (See Note 1). |
| (e) | | Rate shown represents yield-to-maturity. |
| # | | Aggregate cost for federal income tax purposes is $216,903,865. |
Abbreviations used in this schedule:
| | | | |
| EUR | | — | | Euro |
| GBP | | — | | Great British Pound |
| JPY | | — | | Japanese Yen |
| LIBOR | | — | | London Interbank Offered Rate |
| PLN | | — | | Polish Zloty |
| | | |
Summary of Investments by Security Type* (unaudited) | | | |
Sovereign Bonds | | 40.0 | % |
Collateralized Mortgage Obligations | | 8.7 | |
Corparate Bonds & Notes | | 7.4 | |
Asset-Backed Securities | | 4.3 | |
U.S. Government & Agency Obligation | | 3.2 | |
Mortgage-Backed Securities | | 1.9 | |
U.S. Treasury Inflation Protected Securities | | 1.7 | |
Purchased Options | | 0.3 | |
Short-Term Investments | | 32.5 | |
| | |
|
|
| | | 100.0 | % |
| | |
|
|
| * | | As a percentage of total investments. |
See Notes to Financial Statements.
117
Schedules of Investments
(continued)
International Fixed Income Investments
Schedule of Options Written
| | | | | | | | | | |
| | | | | |
| | | | |
| Contracts | | Security | | Expiration Date | | Strike Price | | Value |
| 400,000,000 | | Swaption, Japanese Yen Call | | 9/25/06 | | $ | 1.98 | | $ | 47,313 |
| 1,000,000 | | Swaption, 3 Month LIBOR, 4.54% fixed rate Call | | 10/4/06 | | | 4.54 | | | 0 |
| 6,000,000 | | Swaption, 3 Month LIBOR, 4.56% fixed rate Call | | 10/18/06 | | | 4.56 | | | 42 |
| 600,000 | | Swaption, 3 Month LIBOR, 4.85% fixed rate Call | | 12/22/06 | | | 4.85 | | | 1,026 |
| 4,000,000 | | Swaption, 3 Month LIBOR, 5.04% fixed rate Call | | 3/8/07 | | | 5.04 | | | 25,644 |
| 1,000,000 | | Swaption, 3 Month LIBOR, 5.04% fixed rate Call | | 3/8/07 | | | 5.04 | | | 6,411 |
| 10,000,000 | | Swaption, 3 Month LIBOR, 5.04% fixed rate Call | | 3/8/07 | | | 5.04 | | | 64,110 |
| 1,000,000 | | Swaption, 3 Month LIBOR, 5.21% fixed rate Call | | 10/25/06 | | | 5.21 | | | 5,144 |
| 1,000,000 | | Swaption, 3 Month LIBOR, 5.22% fixed rate Call | | 4/19/07 | | | 5.22 | | | 11,265 |
| 15,800,000 | | Swaption, 3 Month LIBOR, 5.24% fixed rate Call | | 2/01/07 | | | 5.24 | | | 152,830 |
| 1,900,000 | | Swaption, 3 Month LIBOR, 5.25% fixed rate Call | | 5/16/07 | | | 5.25 | | | 30,932 |
| 1,600,000 | | Swaption, 3 Month LIBOR, 5.25% fixed rate Call | | 5/16/07 | | | 5.25 | | | 26,048 |
| 12,700,000 | | Swaption, 3 Month LIBOR, 5.32% fixed rate Call | | 5/09/07 | | | 5.32 | | | 178,930 |
| 7,400,000 | | Swaption, 3 Month LIBOR, 5.90% fixed rate Put | | 1/2/07 | | | 5.90 | | | 6,490 |
| 1,700,000 | | Swaption, 6 Month LIBOR, 4.85% fixed rate Call | | 6/15/07 | | | 4.85 | | | 36,219 |
| 8,000,000 | | Swaption, U.S. Dollar vs. Japanese Yen Call | | 5/21/07 | | | 120.00 | | | 54,360 |
| 400,000,000 | | Swaption, U.S. Dollar vs. Japanese Yen Put | | 9/25/06 | | | 1.98 | | | 3,228 |
| 17 | | U.S. Treasury Notes 10-Year Futures, Call | | 11/21/06 | | | 107.00 | | | 16,203 |
| 22 | | U.S. Treasury Notes 10-Year Futures, Put | | 11/21/06 | | | 104.00 | | | 687 |
| 47 | | U.S. Treasury Notes Futures, Put | | 11/21/06 | | | 103.00 | | | 1,469 |
| | | | | | | | | |
|
|
| | | TOTAL OPTIONS WRITTEN
(Premiums received — $704,156) | | | | | | | $ | 668,351 |
| | | | | | | | | |
|
|
Schedule of Securities Sold Short
| | | | | |
| |
| | |
Face
Amount | | Security | | Value |
| $3,050,000 | | U.S. Treasury Note, 4.500% due 11/15/15 | | $ | 2,995,435 |
| 6,600,000 | | U.S. Treasury Note, 4.500% due 2/15/16 | | | 6,479,088 |
| 7,700,000 | | U.S. Treasury Note, 5.125% due 5/15/16 | | | 7,921,075 |
| | | | |
|
|
| | | TOTAL OPEN SHORT SALES
(Proceeds — $17,148,526) | | $ | 17,395,598 |
| | | | |
|
|
See Notes to Financial Statements.
118
Ratings
(unaudited)
| | |
Bond Ratings |
| The definitions of the applicable rating symbols are set forth below: |
| Standard & Poor’s Ratings Service (“Standard & Poor’s”) — Ratings from “AA” to “CCC” may be modified by the addition of a plus (+) or minus (-) sign to show relative standings within the major rating categories. |
| AAA | | — Bonds rated “AAA” have the highest rating assigned by Standard & Poor’s. Capacity to pay interest and repay principal is extremely strong. |
| AA | | — Bonds rated “AA” have a very strong capacity to pay interest and repay principal and differ from the highest rated issues only in a small degree. |
| A | | — Bonds rated “A” have a strong capacity to pay interest and repay principal although they are somewhat more susceptible to the adverse effects of changes in circumstances and economic conditions than debt in higher rated categories. |
| BBB | | — Bonds rated “BBB” are regarded as having an adequate capacity to pay interest and repay principal. Whereas they normally exhibit adequate protection parameters, adverse economic conditions or changing circumstances are more likely to lead to a weakened capacity to pay interest and repay principal for bonds in this category than in higher rated categories. |
| BB, B, CCC, CC and C | | — Bonds rated “BB”, “B”, “CCC”, “CC” and “C” are regarded, on balance, as predominantly speculative with respect to capacity to pay interest and repay principal in accordance with the terms of the obligation. “BB” represents the lowest degree of speculation and “C” the highest degree of speculation. While such bonds will likely have some quality and protective characteristics, these are outweighed by large uncertainties or major risk exposures to adverse conditions. |
| D | | — Bonds rated “D” are in default and payment of interest and/or repayment of principal is in arrears. |
| Moody’s Investors Service (“Moody’s”) — Numerical modifiers 1, 2 and 3 may be applied to each generic rating from “Aa” to “Caa” where 1 is the highest and 3 the lowest ranking within its generic category. |
| Aaa | | — Bonds rated “Aaa” are judged to be of the best quality. They carry the smallest degree of investment risk and are generally referred to as “gilt edge.” Interest payments are protected by a large or by an exceptionally stable margin and principal is secure. While the various protective elements are likely to change, such changes as can be visualized are most unlikely to impair the fundamentally strong position of such issues. |
| Aa | | — Bonds rated “Aa” are judged to be of high quality by all standards. Together with the “Aaa” group they comprise what are generally known as high grade bonds. They are rated lower than the best bonds because margins of protection may not be as large as in “Aaa” securities or fluctuation of protective elements may be of greater amplitude or there may be other elements present which make the long-term risks appear somewhat larger than in “Aaa” securities. |
| A | | — Bonds rated “A” possess many favorable investment attributes and are to be considered as upper medium grade obligations. Factors giving security to principal and interest are considered adequate but elements may be present which suggest a susceptibility to impairment some time in the future. |
| Baa | | — Bonds rated “Baa” are considered as medium grade obligations, i.e., they are neither highly protected nor poorly secured. Interest payments and principal security appear adequate for the present but certain protective elements may be lacking or may be characteristically unreliable over any great length of time. Such bonds lack outstanding investment characteristics and in fact have speculative characteristics as well. |
| Ba | | — Bonds rated “Ba” are judged to have speculative elements; their future cannot be considered as well assured. Often the protection of interest and principal payments may be very moderate and therefore not well safeguarded during both good and bad times over the future. Uncertainty of position characterizes bonds in this class. |
| B | | — Bonds rated “B” generally lack characteristics of desirable investments. Assurance of interest and principal payments or of maintenance of other terms of the contract over any long period of time may be small. |
| Caa | | — Bonds rated “Caa” are of poor standing. These may be in default, or present elements of danger may exist with respect to principal or interest. |
| Ca | | — Bonds rated “Ca” represent obligations which are speculative in a high degree. Such issues are often in default or have other marked short-comings. |
| C | | — Bonds rated “C” are the lowest class of bonds and issues so rated can be regarded as having extremely poor prospects of ever attaining any real investment standing. |
| Fitch Ratings Service (“Fitch”) — Ratings from “AA” to “CCC” may be modified by the addition of a plus (+) or minus (-) sign to show relative standings within the major rating categories. |
| AAA | | — Bonds rated “AAA” have the highest rating assigned by Fitch. Capacity to pay interest and repay principal is extremely strong. |
| AA | | — Bonds rated “AA” have a very strong capacity to pay interest and repay principal and differ from the highest rated issues only in a small degree. |
| A | | — Bonds rated “A” have a strong capacity to pay interest and repay principal although they are somewhat more susceptible to the adverse effects of changes in circumstances and economic conditions than debt in higher rated categories. |
| BBB | | — Bonds rated “BBB” are regarded as having an adequate capacity to pay interest and repay principal. Whereas they normally exhibit adequate protection parameters, adverse economic conditions or changing circumstances are more likely to lead to a weakened capacity to pay interest and repay principal for bonds in this category than in higher rated categories. |
| BB, B, CCC, CC and C | | — Bonds rated “BB”, “B”, “CCC” and “CC” are regarded, on balance, as predominantly speculative with respect to capacity to pay interest and repay principal in accordance with the terms of the obligation. “BB” represents a lower degree of speculation than “B”, and “CC” the highest degree of speculation. While such bonds will likely have some quality and protective characteristics, these are outweighed by large uncertainties or major risk exposures to adverse conditions. |
| NR | | — Indicates that the bond is not rated by Standard & Poor’s, Moody’s, or Fitch. |
119
Ratings
(unaudited) (continued)
| | |
Short-Term Security Ratings |
| SP-1 | | — Standard & Poor’s highest rating indicating very strong or strong capacity to pay principal and interest; those issues determined to possess overwhelming safety characteristics are denoted with a plus (+) sign. |
| A-1 | | — Standard & Poor’s highest commercial paper and variable-rate demand obligation (VRDO) rating indicating that the degree of safety regarding timely payment is either overwhelming or very strong; those issues determined to possess overwhelming safety characteristics are denoted with a plus (+) sign. |
| VMIG 1 | | — Moody’s highest rating for issues having a demand feature — VRDO. |
| P-1 | | — Moody’s highest rating for commercial paper and for VRDO prior to the advent of the VMIG 1 rating. |
| F-1 | | — Fitch’s highest rating indicating the strongest capacity for timely payment of financial commitments; those issues determined to possess overwhelming strong credit feature are denoted with a plus (+) sign. |
120
(This page intentionally left blank.)
121
Statements of Assets and Liabilities
August 31, 2006
| | | | | | | | | | |
| | | Large
Capitalization
Value Equity
Investments | | Large
Capitalization
Growth
Investments | | | Small
Capitalization
Value Equity
Investments |
| ASSETS: | | | | | | | | | | |
Investments, at cost | | $ | 1,320,590,498 | | $ | 1,592,633,705 | | | $ | 272,089,666 |
Foreign currency, at cost | | | — | | | — | | | | — |
| | |
|
| |
|
|
| |
|
|
Investments, at value | | $ | 1,541,467,054 | | $ | 1,832,041,756 | | | $ | 344,450,186 |
Foreign currency, at value | | | — | | | — | | | | — |
Cash | | | 2,592 | | | 12,354 | | | | 7,776 |
Receivable for securities sold | | | 4,966,746 | | | 8,851,487 | | | | 881,673 |
Dividends and interest receivable | | | 3,941,915 | | | 1,283,365 | | | | 544,994 |
Receivable for Fund shares sold | | | 3,530,084 | | | 6,685,697 | | | | 543,677 |
Receivable for open forward currency contracts (Notes 1 and 3) | | | — | | | — | | | | — |
Receivable from broker — variation margin on open futures contracts (Notes 1 and 3) | | | — | | | — | | | | — |
Unrealized appreciation on swaps (Notes 1 and 3) | | | — | | | — | | | | — |
Deposits with brokers for open futures contracts | | | — | | | — | | | | — |
Principal paydown receivable | | | — | | | — | | | | — |
Interest receivable for open swap contracts (Notes 1 and 3) | | | — | | | — | | | | — |
Prepaid expenses | | | 29,448 | | | 17,593 | | | | 27,989 |
| | |
|
| |
|
|
| |
|
|
Total Assets | | | 1,553,937,839 | | | 1,848,892,252 | | | | 346,456,295 |
| | |
|
| |
|
|
| |
|
|
| LIABILITIES: | | | | | | | | | | |
Payable for Fund shares repurchased | | | 3,793,105 | | | 3,138,874 | | | | 1,735,647 |
Payable for securities purchased | | | 3,285,963 | | | 37,908,240 | | | | 690,342 |
Investment management fee payable | | | 770,818 | | | 820,089 | | | | 230,926 |
Transfer agent fees payable | | | 168,012 | | | 143,820 | | | | 64,758 |
Administration fee payable | | | 166,363 | | | 171,556 | | | | 36,340 |
Interest payable for short sales (Note 1) | | | — | | | — | | | | — |
Premium paid for open swaps (Notes 1 and 3) | | | — | | | — | | | | — |
Investments sold short, at value (proceeds received $342,160, $16,289,857 and $17,148,526, respectively) (Note 1) | | | — | | | — | | | | — |
Options written, at value (premium received $534,420 and $704,156, respectively)
(Notes 1 and 3) | | | — | | | — | | | | — |
Unrealized depreciation on swaps (Notes 1 and 3) | | | — | | | — | | | | — |
Payable for open forward currency contracts (Notes 1 and 3) | | | — | | | — | | | | — |
Trustees’ fees payable | | | 350 | | | 727 | | | | 600 |
Distributions payable | | | — | | | — | | | | — |
Deferred dollar roll income | | | — | | | — | | | | — |
Interest payable for open swap contracts (Notes 1 and 3) | | | — | | | — | | | | — |
Accrued expenses | | | 82,787 | | | 73,873 | | | | 75,736 |
Other liabilities | | | — | | | — | | | | — |
| | |
|
| |
|
|
| |
|
|
Total Liabilities | | | 8,267,398 | | | 42,257,179 | | | | 2,834,349 |
| | |
|
| |
|
|
| |
|
|
Total Net Assets | | $ | 1,545,670,441 | | $ | 1,806,635,073 | | | $ | 343,621,946 |
| | |
|
| |
|
|
| |
|
|
| NET ASSETS: | | | | | | | | | | |
Par value (Note 4) | | $ | 126,129 | | $ | 140,287 | | | $ | 24,224 |
Paid-in capital in excess of par value | | | 1,223,221,583 | | | 1,820,401,748 | | | | 228,893,599 |
Accumulated net investment loss | | | — | | | — | | | | — |
Undistributed net investment income | | | 15,316,280 | | | — | | | | 1,146,367 |
Accumulated net realized gain (loss) on investments, futures contracts, options written,
swap contracts and foreign currency transactions | | | 86,129,893 | | | (253,315,047 | ) | | | 41,197,236 |
Net unrealized appreciation (depreciation) on investments, futures contracts, options written,
short sales, swap contracts and foreign currencies | | | 220,876,556 | | | 239,408,085 | | | | 72,360,520 |
| | |
|
| |
|
|
| |
|
|
Total Net Assets | | $ | 1,545,670,441 | | $ | 1,806,635,073 | | | $ | 343,621,946 |
| | |
|
| |
|
|
| |
|
|
Shares Outstanding | | | 126,129,166 | | | 140,287,073 | | | | 24,224,141 |
| | |
|
| |
|
|
| |
|
|
Net Asset Value | | | $12.25 | | | $12.88 | | | | $14.19 |
| | |
|
| |
|
|
| |
|
|
See Notes to Financial Statements.
122
| | | | | | | | | | | | | | | | | | | | | | | | | | | | | | |
Small
Capitalization
Growth
Investments | | | International
Equity
Investments | | | Emerging
Markets
Equity
Investments | | | Government
Money
Investments | | | Core Fixed
Income
Investments | | | High Yield
Investments | | | Municipal
Bond
Investments | | | International
Fixed Income
Investments | |
| | | | | | | | | | | | | | | | | | | | | | | | | | | | | | | |
| $ | 288,882,399 | | | $ | 1,023,636,790 | | | $ | 190,811,143 | | | $ | 129,774,573 | | | $ | 923,869,441 | | | $ | 107,320,388 | | | $ | 63,608,550 | | | $ | 215,765,949 | |
| | — | | | | 522,699 | | | | 942,173 | | | | — | | | | 810,202 | | | | — | | | | — | | | | 5,188,216 | |
|
|
| |
|
|
| |
|
|
| |
|
|
| |
|
|
| |
|
|
| |
|
|
| |
|
|
|
| $ | 367,829,959 | | | $ | 1,301,448,978 | | | $ | 287,225,785 | | | $ | 129,774,573 | | | $ | 922,883,200 | | | $ | 108,467,729 | | | $ | 65,174,637 | | | $ | 217,663,526 | |
| | — | | | | 522,994 | | | | 942,874 | | | | — | | | | 814,851 | | | | — | | | | — | | | | 5,141,311 | |
| | 1,911 | | | | 4,788 | | | | 1,570 | | | | 470 | | | | 1,999 | | | | 1,878 | | | | 1,742 | | | | 230 | |
| | 6,045,655 | | | | 10,985,902 | | | | 3,418,411 | | | | — | | | | 137,872,065 | | | | 1,412,153 | | | | — | | | | 33,242,007 | |
| | 35,325 | | | | 3,123,862 | | | | 819,969 | | | | 48,428 | | | | 4,712,183 | | | | 2,032,857 | | | | 937,188 | | | | 1,945,921 | |
| | 677,794 | | | | 3,324,495 | | | | 635,289 | | | | 252,199 | | | | 2,651,910 | | | | 160,517 | | | | 326,455 | | | | 719,652 | |
| | — | | | | — | | | | — | | | | — | | | | — | | | | — | | | | — | | | | 24,140 | |
| | — | | | | — | | | | — | | | | — | | | | 124,400 | | | | — | | | | — | | | | 291,200 | |
| | — | | | | — | | | | — | | | | — | | | | 717,995 | | | | — | | | | — | | | | 1,983,581 | |
| | — | | | | — | | | | 100 | | | | — | | | | — | | | | — | | | | — | | | | — | |
| | — | | | | — | | | | — | | | | — | | | | 24,545 | | | | — | | | | — | | | | — | |
| | — | | | | — | | | | — | | | | — | | | | 33,627 | | | | — | | | | — | | | | 197,778 | |
| | 15,832 | | | | 45,701 | | | | 18,497 | | | | 19,146 | | | | 34,241 | | | | 16,435 | | | | 14,613 | | | | 18,417 | |
|
|
| |
|
|
| |
|
|
| |
|
|
| |
|
|
| |
|
|
| |
|
|
| |
|
|
|
| | 374,606,476 | | | | 1,319,456,720 | | | | 293,062,495 | | | | 130,094,816 | | | | 1,069,871,016 | | | | 112,091,569 | | | | 66,454,635 | | | | 261,227,763 | |
|
|
| |
|
|
| |
|
|
| |
|
|
| |
|
|
| |
|
|
| |
|
|
| |
|
|
|
| | | | | | | | | | | | | | | | | | | | | | | | | | | | | | | |
| | 1,682,536 | | | | 3,005,472 | | | | 1,568,820 | | | | 1,036,827 | | | | 1,166,876 | | | | 546,575 | | | | 40,674 | | | | 285,813 | |
| | 3,707,696 | | | | 5,550,937 | | | | 3,914,922 | | | | — | | | | 289,475,643 | | | | 1,166,782 | | | | — | | | | 43,635,632 | |
| | 243,680 | | | | 748,509 | | | | 195,263 | | | | 29,614 | | | | 252,599 | | | | 51,487 | | | | 22,614 | | | | 81,662 | |
| | 123,700 | | | | 106,339 | | | | 52,904 | | | | 25,406 | | | | 72,106 | | | | 24,580 | | | | 850 | | | | 28,979 | |
| | 38,170 | | | | 149,583 | | | | 30,558 | | | | 12,613 | | | | 79,409 | | | | 11,340 | | | | 7,067 | | | | 20,415 | |
| | — | | | | — | | | | — | | | | — | | | | 59,625 | | | | — | | | | — | | | | 211,429 | |
| | — | | | | — | | | | — | | | | — | | | | 1,136,962 | | | | — | | | | — | | | | 1,792,518 | |
| | | | | | | | | | | | | | | | | | | | | | | | | | | | | | | |
| | — | | | | 337,626 | | | | — | | | | — | | | | 16,340,243 | | | | — | | | | — | | | | 17,395,598 | |
| | | | | | | | | | | | | | | | | | | | | | | | | | | | | | | |
| | — | | | | — | | | | — | | | | — | | | | 628,072 | | | | — | | | | — | | | | 668,351 | |
| | — | | | | — | | | | — | | | | — | | | | 181,166 | | | | — | | | | — | | | | 1,810,527 | |
| | — | | | | — | | | | 30,190 | | | | — | | | | 300,045 | | | | — | | | | — | | | | 413,261 | |
| | 600 | | | | 1,076 | | | | 230 | | | | 413 | | | | 350 | | | | 259 | | | | 350 | | | | 465 | |
| | — | | | | — | | | | — | | | | 1,636 | | | | 93,024 | | | | 32,932 | | | | 19,648 | | | | 20,567 | |
| | — | | | | — | | | | — | | | | — | | | | 18,140 | | | | — | | | | — | | | | — | |
| | — | | | | — | | | | — | | | | — | | | | 40,468 | | | | — | | | | — | | | | 297,413 | |
| | 63,684 | | | | 129,519 | | | | 201,463 | | | | 52,367 | | | | 62,339 | | | | 50,511 | | | | 37,489 | | | | 63,806 | |
| | — | | | | — | | | | 305,012 | | | | — | | | | — | | | | — | | | | — | | | | — | |
|
|
| |
|
|
| |
|
|
| |
|
|
| |
|
|
| |
|
|
| |
|
|
| |
|
|
|
| | 5,860,066 | | | | 10,029,061 | | | | 6,299,362 | | | | 1,158,876 | | | | 309,907,067 | | | | 1,884,466 | | | | 128,692 | | | | 66,726,436 | |
|
|
| |
|
|
| |
|
|
| |
|
|
| |
|
|
| |
|
|
| |
|
|
| |
|
|
|
| $ | 368,746,410 | | | $ | 1,309,427,659 | | | $ | 286,763,133 | | | $ | 128,935,940 | | | $ | 759,963,949 | | | $ | 110,207,103 | | | $ | 66,325,943 | | | $ | 194,501,327 | |
|
|
| |
|
|
| |
|
|
| |
|
|
| |
|
|
| |
|
|
| |
|
|
| |
|
|
|
| | | | | | | | | | | | | | | | | | | | | | | | | | | | | | | |
| $ | 23,296 | | | $ | 96,626 | | | $ | 21,095 | | | $ | 128,963 | | | $ | 93,969 | | | $ | 23,834 | | | $ | 7,263 | | | $ | 25,000 | |
| | 589,922,802 | | | | 1,138,408,269 | | | | 227,130,235 | | | | 128,828,089 | | | | 779,658,839 | | | | 196,926,810 | | | | 66,631,974 | | | | 199,008,573 | |
| | — | | | | — | | | | — | | | | — | | | | — | | | | — | | | | — | | | | (5,535,249 | ) |
| | — | | | | 15,470,701 | | | | 2,255,381 | | | | — | | | | 1,643,653 | | | | 1,297,235 | | | | 141,826 | | | | — | |
| | | | | | | | | | | | | | | | | | | | | | | | | | | | | | | |
| | (300,147,351 | ) | | | (122,414,164 | ) | | | (38,718,514 | ) | | | (21,112 | ) | | | (20,523,464 | ) | | | (89,188,117 | ) | | | (2,021,207 | ) | | | (1,510,120 | ) |
| | | | | | | | | | | | | | | | | | | | | | | | | | | | | | | |
| | 78,947,663 | | | | 277,866,227 | | | | 96,074,936 | | | | — | | | | (909,048 | ) | | | 1,147,341 | | | | 1,566,087 | | | | 2,513,123 | |
|
|
| |
|
|
| |
|
|
| |
|
|
| |
|
|
| |
|
|
| |
|
|
| |
|
|
|
| $ | 368,746,410 | | | $ | 1,309,427,659 | | | $ | 286,763,133 | | | $ | 128,935,940 | | | $ | 759,963,949 | | | $ | 110,207,103 | | | $ | 66,325,943 | | | $ | 194,501,327 | |
|
|
| |
|
|
| |
|
|
| |
|
|
| |
|
|
| |
|
|
| |
|
|
| |
|
|
|
| | 23,295,847 | | | | 96,626,406 | | | | 21,095,358 | | | | 128,962,839 | | | | 93,968,505 | | | | 23,833,817 | | | | 7,263,427 | | | | 25,000,194 | |
|
|
| |
|
|
| |
|
|
| |
|
|
| |
|
|
| |
|
|
| |
|
|
| |
|
|
|
| | $15.83 | | | | $13.55 | | | | $13.59 | | | | $1.00 | | | | $8.09 | | | | $4.62 | | | | $9.13 | | | | $7.78 | |
|
|
| |
|
|
| |
|
|
| |
|
|
| |
|
|
| |
|
|
| |
|
|
| |
|
|
|
See Notes to Financial Statements.
123
Statements of Operations
For the Year Ended August 31, 2006
| | | | | | | | | | | | |
| | | Large
Capitalization
Value Equity
Investments | | | Large
Capitalization
Growth
Investments | | | Small
Capitalization
Value Equity
Investments | |
| INVESTMENT INCOME: | | | | | | | | | | | | |
Dividends | | $ | 34,066,068 | | | $ | 9,529,982 | | | $ | 5,852,906 | |
Interest | | | 2,505,761 | | | | 1,851,736 | | | | 415,747 | |
Income from securities lending | | | — | | | | — | | | | 34,710 | |
Less: Foreign taxes withheld | | | (172,145 | ) | | | (102,172 | ) | | | (27,528 | ) |
| | |
|
|
| |
|
|
| |
|
|
|
Total Investment Income | | | 36,399,684 | | | | 11,279,546 | | | | 6,275,835 | |
| | |
|
|
| |
|
|
| |
|
|
|
| EXPENSES: | | | | | | | | | | | | |
Investment management fee (Note 2) | | | 8,499,149 | | | | 9,507,711 | | | | 2,904,294 | |
Administration fees | | | 1,828,498 | | | | 1,988,597 | | | | 454,956 | |
Transfer agent fees | | | 699,905 | | | | 638,369 | | | | 538,895 | |
Shareholder reports | | | 58,638 | | | | 37,725 | | | | 52,234 | |
Trustees’ fees | | | 54,389 | | | | 54,868 | | | | 17,357 | |
Legal fees | | | 40,920 | | | | 38,430 | | | | 39,375 | |
Custody fees | | | 35,861 | | | | 39,469 | | | | 26,125 | |
Audit and tax | | | 30,633 | | | | 30,620 | | | | 28,218 | |
Insurance | | | 27,677 | | | | 29,747 | | | | 8,311 | |
Registration fees | | | 25,252 | | | | 17,963 | | | | 15,833 | |
Miscellaneous expenses | | | 9,971 | | | | 10,054 | | | | 5,839 | |
| | |
|
|
| |
|
|
| |
|
|
|
Total Expenses | | | 11,310,893 | | | | 12,393,553 | | | | 4,091,437 | |
Less: Fee waivers and/or expense reimbursements (Notes 2 and 6) | | | (164,364 | ) | | | (169,691 | ) | | | (135,476 | ) |
| | |
|
|
| |
|
|
| |
|
|
|
Net Expenses | | | 11,146,529 | | | | 12,223,862 | | | | 3,955,961 | |
| | |
|
|
| |
|
|
| |
|
|
|
Net Investment Income (Loss) | | | 25,253,155 | | | | (944,316 | ) | | | 2,319,874 | |
| | |
|
|
| |
|
|
| |
|
|
|
| REALIZED AND UNREALIZED GAIN (LOSS) ON INVESTMENTS, FUTURES CONTRACTS, OPTIONS WRITTEN, SHORT SALES, SWAP CONTRACTS AND FOREIGN CURRENCY TRANSACTIONS (NOTES 1 AND 3): | | | | | | | | | | | | |
Net Realized Gain (Loss) From: | | | | | | | | | | | | |
Investment transactions | | | 112,829,841 | | | | 99,755,874 | | | | 52,272,081 | |
Futures contracts | | | — | | | | — | | | | — | |
Options written | | | — | | | | — | | | | — | |
Swap contracts | | | — | | | | — | | | | — | |
Foreign currency transactions | | | 39 | | | | 142 | | | | 15 | |
| | |
|
|
| |
|
|
| |
|
|
|
Net Realized Gain (Loss) | | | 112,829,880 | | | | 99,756,016 | | | | 52,272,096 | |
| | |
|
|
| |
|
|
| |
|
|
|
Change in Net Unrealized Appreciation/Depreciation From: | | | | | | | | | | | | |
Investments | | | 39,762,060 | | | | (79,573,476 | ) | | | (13,490,236 | ) |
Futures contracts | | | — | | | | — | | | | — | |
Options written | | | — | | | | — | | | | — | |
Short sales | | | — | | | | — | | | | — | |
Swap contracts | | | — | | | | — | | | | — | |
Foreign currencies | | | — | | | | 34 | | | | — | |
| | |
|
|
| |
|
|
| |
|
|
|
Change in Net Unrealized Appreciation/Depreciation | | | 39,762,060 | | | | (79,573,442 | ) | | | (13,490,236 | ) |
| | |
|
|
| |
|
|
| |
|
|
|
Net Gain (Loss) on Investments, Futures Contracts, Options Written, Short Sales, Swap Contracts and Foreign Currency Transactions | | | 152,591,940 | | | | 20,182,574 | | | | 38,781,860 | |
| | |
|
|
| |
|
|
| |
|
|
|
Increase (Decrease) in Net Assets From Operations | | $ | 177,845,095 | | | $ | 19,238,258 | | | $ | 41,101,734 | |
| | |
|
|
| |
|
|
| |
|
|
|
| (1) | | Net of foreign capital gain tax of $719. |
| (2) | | Net of capital gains taxes of $136,625. |
| (3) | | Net of deferred capital gains taxes of $305,012. |
See Notes to Financial Statements.
124
| | | | | | | | | | | | | | | | | | | | | | | | | | | | | | |
Small
Capitalization
Growth
Investments | | | International
Equity
Investments | | | Emerging
Markets
Equity
Investments | | | Government
Money
Investments | | | Core Fixed
Income
Investments | | | High Yield
Investments | | | Municipal
Bond
Investments | | | International
Fixed Income
Investments | |
| | | | | | | | | | | | | | | | | | | | | | | | | | | | | | | |
| $ | 3,707,569 | | | $ | 31,799,586 | | | $ | 7,634,900 | | | | — | | | $ | 46,970 | | | $ | 96,565 | | | | — | | | | — | |
| | 327,033 | | | | 2,229,343 | | | | 147,331 | | | $ | 4,688,759 | | | | 32,277,634 | | | | 14,242,935 | | | $ | 2,386,480 | | | $ | 6,865,389 | |
| | 57,952 | | | | 121,732 | | | | — | | | | — | | | | 34,389 | | | | 20,095 | | | | — | | | | — | |
| | (41,866 | ) | | | (2,850,233 | ) | | | (850,973 | ) | | | — | | | | — | | | | — | | | | — | | | | — | |
|
|
| |
|
|
| |
|
|
| |
|
|
| |
|
|
| |
|
|
| |
|
|
| |
|
|
|
| | 4,050,688 | | | | 31,300,428 | | | | 6,931,258 | | | | 4,688,759 | | | | 32,358,993 | | | | 14,359,595 | | | | 2,386,480 | | | | 6,865,389 | |
|
|
| |
|
|
| |
|
|
| |
|
|
| |
|
|
| |
|
|
| |
|
|
| |
|
|
|
| | | | | | | | | | | | | | | | | | | | | | | | | | | | | | | |
| | 3,229,556 | | | | 7,607,902 | | | | 2,277,383 | | | | 156,934 | | | | 2,520,721 | | | | 1,030,539 | | | | 215,946 | | | | 844,350 | |
| | 505,813 | | | | 1,511,624 | | | | 356,611 | | | | 130,778 | | | | 791,145 | | | | 234,820 | | | | 67,483 | | | | 211,088 | |
| | 605,729 | | | | 572,448 | | | | 333,991 | | | | 336,759 | | | | 408,350 | | | | 238,382 | | | | 12,913 | | | | 194,613 | |
| | 43,202 | | | | 42,737 | | | | 31,398 | | | | 29,843 | | | | 28,918 | | | | 22,782 | | | | 8,334 | | | | 18,616 | |
| | 19,388 | | | | 46,675 | | | | 13,931 | | | | 8,621 | | | | 26,014 | | | | 11,786 | | | | 5,460 | | | | 10,779 | |
| | 37,013 | | | | 36,440 | | | | 41,183 | | | | 36,426 | | | | 36,682 | | | | 36,375 | | | | 38,028 | | | | 36,292 | |
| | 25,441 | | | | 294,525 | | | | 624,184 | | | | 6,046 | | | | 76,788 | | | | 73,886 | | | | 5,226 | | | | 59,134 | |
| | 28,100 | | | | 34,000 | | | | 39,535 | | | | 26,205 | | | | 30,420 | | | | 28,118 | | | | 25,600 | | | | 30,100 | |
| | 8,500 | | | | 17,226 | | | | 5,478 | | | | 2,409 | | | | 11,010 | | | | 5,228 | | | | 988 | | | | 4,002 | |
| | 12,543 | | | | 26,727 | | | | 13,217 | | | | 13,195 | | | | 25,192 | | | | 13,411 | | | | 8,758 | | | | 12,824 | |
| | 5,647 | | | | 16,810 | | | | 15,238 | | | | 4,448 | | | | 4,961 | | | | 4,632 | | | | 4,171 | | | | 4,956 | |
|
|
| |
|
|
| |
|
|
| |
|
|
| |
|
|
| |
|
|
| |
|
|
| |
|
|
|
| | 4,520,932 | | | | 10,207,114 | | | | 3,752,149 | | | | 751,664 | | | | 3,960,201 | | | | 1,699,959 | | | | 392,907 | | | | 1,426,754 | |
| | (136,720 | ) | | | (147,202 | ) | | | (89,723 | ) | | | (254,760 | ) | | | (78,799 | ) | | | (82,670 | ) | | | (4,298 | ) | | | (48,937 | ) |
|
|
| |
|
|
| |
|
|
| |
|
|
| |
|
|
| |
|
|
| |
|
|
| |
|
|
|
| | 4,384,212 | | | | 10,059,912 | | | | 3,662,426 | | | | 496,904 | | | | 3,881,402 | | | | 1,617,289 | | | | 388,609 | | | | 1,377,817 | |
|
|
| |
|
|
| |
|
|
| |
|
|
| |
|
|
| |
|
|
| |
|
|
| |
|
|
|
| | (333,524 | ) | | | 21,240,516 | | | | 3,268,832 | | | | 4,191,855 | | | | 28,477,591 | | | | 12,742,306 | | | | 1,997,871 | | | | 5,487,572 | |
|
|
| |
|
|
| |
|
|
| |
|
|
| |
|
|
| |
|
|
| |
|
|
| |
|
|
|
| | | | | | | | | | | | | | | | | | | | | | | | | | | | | | | |
| | | | | | | | | | | | | | | | | | | | | | | | | | | | | | | |
| | | | | | | | | | | | | | | | | | | | | | | | | | | | | | | |
| | | | | | | | | | | | | | | | | | | | | | | | | | | | | | | |
| | 48,825,108 | | | | 94,157,056 | (1) | | | 47,447,506 | (2) | | | — | | | | (5,600,489 | ) | | | (1,913,829 | ) | | | (193,135 | ) | | | (901,577 | ) |
| | — | | | | — | | | | (4,075 | ) | | | — | | | | (1,078,493 | ) | | | — | | | | — | | | | (2,102,594 | ) |
| | — | | | | — | | | | — | | | | — | | | | 163,795 | | | | — | | | | — | | | | 202,432 | |
| | — | | | | — | | | | — | | | | — | | | | (664,079 | ) | | | — | | | | — | | | | 1,782,521 | |
| | 147 | | | | (482,553 | ) | | | (452,983 | ) | | | — | | | | (1,454,663 | ) | | | — | | | | — | | | | (6,215,484 | ) |
|
|
| |
|
|
| |
|
|
| |
|
|
| |
|
|
| |
|
|
| |
|
|
| |
|
|
|
| | 48,825,255 | | | | 93,674,503 | | | | 46,990,448 | | | | — | | | | (8,633,929 | ) | | | (1,913,829 | ) | | | (193,135 | ) | | | (7,234,702 | ) |
|
|
| |
|
|
| |
|
|
| |
|
|
| |
|
|
| |
|
|
| |
|
|
| |
|
|
|
| | | | | | | | | | | | | | | | | | | | | | | | | | | | | | | |
| | (18,351,727 | ) | | | 120,505,069 | | | | 23,973,688 | (3) | | | — | | | | (7,754,150 | ) | | | (4,652,873 | ) | | | (257,859 | ) | | | (834,967 | ) |
| | — | | | | — | | | | 15,057 | | | | — | | | | 265,824 | | | | — | | | | — | | | | 822,307 | |
| | — | | | | — | | | | — | | | | — | | | | (105,441 | ) | | | — | | | | — | | | | 35,805 | |
| | — | | | | 4,534 | | | | — | | | | — | | | | 81,467 | | | | — | | | | — | | | | (246,555 | ) |
| | — | | | | — | | | | — | | | | — | | | | 414,746 | | | | — | | | | — | | | | 627,790 | |
| | 103 | | | | 7,912 | | | | 347,889 | | | | — | | | | (236,878 | ) | | | — | | | | — | | | | (634,609 | ) |
|
|
| |
|
|
| |
|
|
| |
|
|
| |
|
|
| |
|
|
| |
|
|
| |
|
|
|
| | (18,351,624 | ) | | | 120,517,515 | | | | 24,336,634 | | | | — | | | | (7,334,432 | ) | | | (4,652,873 | ) | | | (257,859 | ) | | | (230,229 | ) |
|
|
| |
|
|
| |
|
|
| |
|
|
| |
|
|
| |
|
|
| |
|
|
| |
|
|
|
| | | | | | | | | | | | | | | | | | | | | | | | | | | | | | | |
| | 30,473,631 | | | | 214,192,018 | | | | 71,327,082 | | | | — | | | | (15,968,361 | ) | | | (6,566,702 | ) | | | (450,994 | ) | | | (7,464,931 | ) |
|
|
| |
|
|
| |
|
|
| |
|
|
| |
|
|
| |
|
|
| |
|
|
| |
|
|
|
| $ | 30,140,107 | | | $ | 235,432,534 | | | $ | 74,595,914 | | | $ | 4,191,855 | | | $ | 12,509,230 | | | $ | 6,175,604 | | | $ | 1,546,877 | | | $ | (1,977,359 | ) |
|
|
| |
|
|
| |
|
|
| |
|
|
| |
|
|
| |
|
|
| |
|
|
| |
|
|
|
See Notes to Financial Statements.
125
Statements of Changes in Net Assets
For the Years Ended August 31,
| | | | | | | | | | | | | | | | |
| | | Large Capitalization
Value Equity Investments
| | | Large Capitalization
Growth Investments
| |
| | | 2006 | | | 2005 | | | 2006 | | | 2005 | |
| OPERATIONS: | | | | | | | | | | | | | | | | |
Net investment income (loss) | | $ | 25,253,155 | | | $ | 19,016,583 | | | $ | (944,316 | ) | | $ | (1,582,254 | ) |
Net realized gain | | | 112,829,880 | | | | 105,489,327 | | | | 99,756,016 | | | | 42,558,683 | |
Change in net unrealized appreciation/depreciation | | | 39,762,060 | | | | 76,906,982 | | | | (79,573,442 | ) | | | 179,917,671 | |
Payment by affiliate (Note 2) | | | — | | | | 90,008 | | | | — | | | | — | |
| | |
|
|
| |
|
|
| |
|
|
| |
|
|
|
Increase in Net Assets From Operations | | | 177,845,095 | | | | 201,502,900 | | | | 19,238,258 | | | | 220,894,100 | |
| | |
|
|
| |
|
|
| |
|
|
| |
|
|
|
| DISTRIBUTIONS TO SHAREHOLDERS FROM (NOTE 1): | | | | | | | | | | | | | | | | |
Net investment income | | | (22,000,056 | ) | | | (15,008,704 | ) | | | — | | | | — | |
Net realized gains | | | (56,411,813 | ) | | | — | | | | — | | | | — | |
| | |
|
|
| |
|
|
| |
|
|
| |
|
|
|
Decrease in Net Assets From Distributions to Shareholders | | | (78,411,869 | ) | | | (15,008,704 | ) | | | — | | | | — | |
| | |
|
|
| |
|
|
| |
|
|
| |
|
|
|
| FUND SHARE TRANSACTIONS (NOTE 4): | | | | | | | | | | | | | | | | |
Net proceeds from sale of shares | | | 357,313,714 | | | | 235,376,292 | | | | 621,629,508 | | | | 321,826,453 | |
Reinvestment of distributions | | | 76,955,066 | | | | 14,701,468 | | | | — | | | | — | |
Cost of shares repurchased | | | (339,150,338 | ) | | | (389,251,134 | ) | | | (353,988,334 | ) | | | (239,752,931 | ) |
| | |
|
|
| |
|
|
| |
|
|
| |
|
|
|
Increase (Decrease) in Net Assets From Fund Share Transactions | | | 95,118,442 | | | | (139,173,374 | ) | | | 267,641,174 | | | | 82,073,522 | |
| | |
|
|
| |
|
|
| |
|
|
| |
|
|
|
Increase (Decrease) in Net Assets | | | 194,551,668 | | | | 47,320,822 | | | | 286,879,432 | | | | 302,967,622 | |
| NET ASSETS: | | | | | | | | | | | | | | | | |
Beginning of year | | | 1,351,118,773 | | | | 1,303,797,951 | | | | 1,519,755,641 | | | | 1,216,788,019 | |
| | |
|
|
| |
|
|
| |
|
|
| |
|
|
|
End of year* | | $ | 1,545,670,441 | | | $ | 1,351,118,773 | | | $ | 1,806,635,073 | | | $ | 1,519,755,641 | |
| | |
|
|
| |
|
|
| |
|
|
| |
|
|
|
* Includes undistributed net investment income of: | | | $15,316,280 | | | | $12,063,142 | | | | — | | | | — | |
| | |
|
|
| |
|
|
| |
|
|
| |
|
|
|
See Notes to Financial Statements.
126
| | | | | | | | | | | | | | | | | | | | | | | | | | | | | | |
Small Capitalization
Value Equity Investments
| | | Small Capitalization
Growth Investments
| | | International Equity
Investments
| | | Emerging Markets
Equity Investments
| |
| 2006 | | | 2005 | | | 2006 | | | 2005 | | | 2006 | | | 2005 | | | 2006 | | | 2005 | |
| | | | | | | | | | | | | | | | | | | | | | | | | | | | | | | |
| $ | 2,319,874 | | | $ | 2,670,534 | | | $ | (333,524 | ) | | $ | (3,086,909 | ) | | $ | 21,240,516 | | | $ | 11,231,812 | | | $ | 3,268,832 | | | $ | 2,844,749 | |
| | 52,272,096 | | | | 89,182,923 | | | | 48,825,255 | | | | 32,637,281 | | | | 93,674,503 | | | | 51,846,530 | | | | 46,990,448 | | | | 35,844,348 | |
| | (13,490,236 | ) | | | 1,043,501 | | | | (18,351,624 | ) | | | 50,605,222 | | | | 120,517,515 | | | | 93,488,454 | | | | 24,336,634 | | | | 35,013,149 | |
| | — | | | | — | | | | — | | | | — | | | | — | | | | — | | | | — | | | | 104,701 | |
|
|
| |
|
|
| |
|
|
| |
|
|
| |
|
|
| |
|
|
| |
|
|
| |
|
|
|
| | 41,101,734 | | | | 92,896,958 | | | | 30,140,107 | | | | 80,155,594 | | | | 235,432,534 | | | | 156,566,796 | | | | 74,595,914 | | | | 73,806,947 | |
|
|
| |
|
|
| |
|
|
| |
|
|
| |
|
|
| |
|
|
| |
|
|
| |
|
|
|
| | | | | | | | | | | | | | | | | | | | | | | | | | | | | | | |
| | (2,000,018 | ) | | | (3,502,303 | ) | | | — | | | | — | | | | (14,000,078 | ) | | | (6,542,279 | ) | | | (2,826,066 | ) | | | (2,337,325 | ) |
| | (93,785,810 | ) | | | (43,785,779 | ) | | | — | | | | — | | | | — | | | | — | | | | — | | | | — | |
|
|
| |
|
|
| |
|
|
| |
|
|
| |
|
|
| |
|
|
| |
|
|
| |
|
|
|
| | (95,785,828 | ) | | | (47,288,082 | ) | | | — | | | | — | | | | (14,000,078 | ) | | | (6,542,279 | ) | | | (2,826,066 | ) | | | (2,337,325 | ) |
|
|
| |
|
|
| |
|
|
| |
|
|
| |
|
|
| |
|
|
| |
|
|
| |
|
|
|
| | | | | | | | | | | | | | | | | | | | | | | | | | | | | | | |
| | 54,003,233 | | | | 53,855,042 | | | | 84,359,118 | | | | 124,795,334 | | | | 520,298,948 | | | | 291,007,801 | | | | 69,672,136 | | | | 56,437,957 | |
| | 94,075,210 | | | | 46,502,013 | | | | — | | | | — | | | | 13,786,888 | | | | 6,435,533 | | | | 2,789,952 | | | | 2,307,383 | |
| | (134,772,027 | ) | | | (190,366,637 | ) | | | (162,863,660 | ) | | | (105,752,901 | ) | | | (355,715,928 | ) | | | (126,398,774 | ) | | | (105,619,205 | ) | | | (70,149,267 | ) |
|
|
| |
|
|
| |
|
|
| |
|
|
| |
|
|
| |
|
|
| |
|
|
| |
|
|
|
| | 13,306,416 | | | | (90,009,582 | ) | | | (78,504,542 | ) | | | 19,042,433 | | | | 178,369,908 | | | | 171,044,560 | | | | (33,157,117 | ) | | | (11,403,927 | ) |
|
|
| |
|
|
| |
|
|
| |
|
|
| |
|
|
| |
|
|
| |
|
|
| |
|
|
|
| | (41,377,678 | ) | | | (44,400,706 | ) | | | (48,364,435 | ) | | | 99,198,027 | | | | 399,802,364 | | | | 321,069,077 | | | | 38,612,731 | | | | 60,065,695 | |
| | | | | | | | | | | | | | | | | | | | | | | | | | | | | | | |
| | 384,999,624 | | | | 429,400,330 | | | | 417,110,845 | | | | 317,912,818 | | | | 909,625,295 | | | | 588,556,218 | | | | 248,150,402 | | | | 188,084,707 | |
|
|
| |
|
|
| |
|
|
| |
|
|
| |
|
|
| |
|
|
| |
|
|
| |
|
|
|
| $ | 343,621,946 | | | $ | 384,999,624 | | | $ | 368,746,410 | | | $ | 417,110,845 | | | $ | 1,309,427,659 | | | $ | 909,625,295 | | | $ | 286,763,133 | | | $ | 248,150,402 | |
|
|
| |
|
|
| |
|
|
| |
|
|
| |
|
|
| |
|
|
| |
|
|
| |
|
|
|
| | $1,146,367 | | | | $1,071,903 | | | | — | | | | — | | | | $15,470,701 | | | | $8,210,830 | | | | $2,255,381 | | | | $1,741,313 | |
|
|
| |
|
|
| |
|
|
| |
|
|
| |
|
|
| |
|
|
| |
|
|
| |
|
|
|
See Notes to Financial Statements.
127
Statements of Changes in Net Assets
For the Years Ended August 31, (continued)
| | | | | | | | |
| | | Government Money Investments
| |
| | | 2006 | | | 2005 | |
| OPERATIONS: | | | | | | | | |
Net investment income | | $ | 4,191,855 | | | $ | 2,024,811 | |
Net realized gain (loss) | | | — | | | | — | |
Change in net unrealized appreciation/depreciation | | | — | | | | — | |
| | |
|
|
| |
|
|
|
Increase (Decrease) in Net Assets From Operations | | | 4,191,855 | | | | 2,024,811 | |
| | |
|
|
| |
|
|
|
| DISTRIBUTIONS TO SHAREHOLDERS FROM (NOTE 1): | | | | | | | | |
Net investment income | | | (4,191,855 | ) | | | (2,024,811 | ) |
Net realized gains | | | — | | | | — | |
Return of capital | | | — | | | | — | |
| | |
|
|
| |
|
|
|
Decrease in Net Assets From Distributions to Shareholders | | | (4,191,855 | ) | | | (2,024,811 | ) |
| | |
|
|
| |
|
|
|
| FUND SHARE TRANSACTIONS (NOTE 4): | | | | | | | | |
Net proceeds from sale of shares | | | 129,087,916 | | | | 81,520,530 | |
Reinvestment of distributions | | | 4,269,358 | | | | 1,899,900 | |
Cost of shares repurchased | | | (100,797,219 | ) | | | (80,919,381 | ) |
| | |
|
|
| |
|
|
|
Increase (Decrease) in Net Assets From Fund Share Transactions | | | 32,560,055 | | | | 2,501,049 | |
| | |
|
|
| |
|
|
|
Increase (Decrease) in Net Assets | | | 32,560,055 | | | | 2,501,049 | |
| NET ASSETS: | | | | | | | | |
Beginning of year | | | 96,375,885 | | | | 93,874,836 | |
| | |
|
|
| |
|
|
|
End of year*† | | $ | 128,935,940 | | | $ | 96,375,885 | |
| | |
|
|
| |
|
|
|
*Includes undistributed net investment income of: | | | — | | | | — | |
| | |
|
|
| |
|
|
|
† Includes accumulated net investment loss of: | | | — | | | | — | |
| | |
|
|
| |
|
|
|
See Notes to Financial Statements.
128
| | | | | | | | | | | | | | | | | | | | | | | | | | | | | | |
Core Fixed Income Investments
| | | High Yield Investments
| | | Municipal Bond Investments
| | | International Fixed Income Investments
| |
| 2006 | | | 2005 | | | 2006 | | | 2005 | | | 2006 | | | 2005 | | | 2006 | | | 2005 | |
| | | | | | | | | | | | | | | | | | | | | | | | | | | | | | | |
| $ | 28,477,591 | | | $ | 18,210,723 | | | $ | 12,742,306 | | | $ | 15,083,715 | | | $ | 1,997,871 | | | $ | 1,295,596 | | | $ | 5,487,572 | | | $ | 4,041,208 | |
| | (8,633,929 | ) | | | 6,237,699 | | | | (1,913,829 | ) | | | 6,324,470 | | | | (193,135 | ) | | | 110,072 | | | | (7,234,702 | ) | | | 4,884,956 | |
| | (7,334,432 | ) | | | (3,462,922 | ) | | | (4,652,873 | ) | | | (4,522,894 | ) | | | (257,859 | ) | | | 71,304 | | | | (230,229 | ) | | | (3,137,411 | ) |
|
|
| |
|
|
| |
|
|
| |
|
|
| |
|
|
| |
|
|
| |
|
|
| |
|
|
|
| | 12,509,230 | | | | 20,985,500 | | | | 6,175,604 | | | | 16,885,291 | | | | 1,546,877 | | | | 1,476,972 | | | | (1,977,359 | ) | | | 5,788,753 | |
|
|
| |
|
|
| |
|
|
| |
|
|
| |
|
|
| |
|
|
| |
|
|
| |
|
|
|
| | | | | | | | | | | | | | | | | | | | | | | | | | | | | | | |
| | (29,904,480 | ) | | | (19,231,971 | ) | | | (12,336,372 | ) | | | (17,408,214 | ) | | | (2,000,418 | ) | | | (1,370,584 | ) | | | (2,037,074 | ) | | | (9,192,761 | ) |
| | — | | | | — | | | | — | | | | — | | | | — | | | | — | | | | (1,072,866 | ) | | | — | |
| | — | | | | — | | | | — | | | | — | | | | — | | | | — | | | | (3,454,483 | ) | | | — | |
|
|
| |
|
|
| |
|
|
| |
|
|
| |
|
|
| |
|
|
| |
|
|
| |
|
|
|
| | (29,904,480 | ) | | | (19,231,971 | ) | | | (12,336,372 | ) | | | (17,408,214 | ) | | | (2,000,418 | ) | | | (1,370,584 | ) | | | (6,564,423 | ) | | | (9,192,761 | ) |
|
|
| |
|
|
| |
|
|
| |
|
|
| |
|
|
| |
|
|
| |
|
|
| |
|
|
|
| | | | | | | | | | | | | | | | | | | | | | | | | | | | | | | |
| | 351,686,345 | | | | 140,614,247 | | | | 40,887,349 | | | | 104,892,148 | | | | 35,619,471 | | | | 11,918,379 | | | | 95,344,851 | | | | 122,289,425 | |
| | 28,822,207 | | | | 18,455,662 | | | | 11,843,129 | | | | 16,805,849 | | | | 1,823,505 | | | | 1,235,647 | | | | 6,343,726 | | | | 8,604,306 | |
| | (136,994,645 | ) | | | (107,786,068 | ) | | | (198,601,839 | ) | | | (98,585,898 | ) | | | (11,086,466 | ) | | | (6,732,139 | ) | | | (52,555,048 | ) | | | (89,991,961 | ) |
|
|
| |
|
|
| |
|
|
| |
|
|
| |
|
|
| |
|
|
| |
|
|
| |
|
|
|
| | 243,513,907 | | | | 51,283,841 | | | | (145,871,361 | ) | | | 23,112,099 | | | | 26,356,510 | | | | 6,421,887 | | | | 49,133,529 | | | | 40,901,770 | |
|
|
| |
|
|
| |
|
|
| |
|
|
| |
|
|
| |
|
|
| |
|
|
| |
|
|
|
| | 226,118,657 | | | | 53,037,370 | | | | (152,032,129 | ) | | | 22,589,176 | | | | 25,902,969 | | | | 6,528,275 | | | | 40,591,747 | | | | 37,497,762 | |
| | | | | | | | | | | | | | | | | | | | | | | | | | | | | | | |
| | 533,845,292 | | | | 480,807,922 | | | | 262,239,232 | | | | 239,650,056 | | | | 40,422,974 | | | | 33,894,699 | | | | 153,909,580 | | | | 116,411,818 | |
|
|
| |
|
|
| |
|
|
| |
|
|
| |
|
|
| |
|
|
| |
|
|
| |
|
|
|
| $ | 759,963,949 | | | $ | 533,845,292 | | | $ | 110,207,103 | | | $ | 262,239,232 | | | $ | 66,325,943 | | | $ | 40,422,974 | | | $ | 194,501,327 | | | $ | 153,909,580 | |
|
|
| |
|
|
| |
|
|
| |
|
|
| |
|
|
| |
|
|
| |
|
|
| |
|
|
|
| | $1,643,653 | | | | $1,723,651 | | | | $1,297,235 | | | | — | | | | $141,826 | | | | $147,569 | | | | — | | | | — | |
|
|
| |
|
|
| |
|
|
| |
|
|
| |
|
|
| |
|
|
| |
|
|
| |
|
|
|
| | — | | | | — | | | | — | | | | — | | | | — | | | | — | | | | $(5,535,249 | ) | | | $(2,944,412 | ) |
|
|
| |
|
|
| |
|
|
| |
|
|
| |
|
|
| |
|
|
| |
|
|
| |
|
|
|
See Notes to Financial Statements.
129
Financial Highlights
For a share of beneficial interest outstanding throughout each year ended August 31:
| | | | | | | | | | | | | | | |
| Large Capitalization Value Equity Investments | | | | | | | | | | |
| | | 2006
| | | 2005
| | | 2004
| | | 2003
| | | 2002
| |
Net Asset Value, Beginning of Year | | $11.50 | | | $10.01 | | | $ 9.00 | | | $8.39 | | | $10.07 | |
| | |
|
| |
|
| |
|
| |
|
| |
|
|
Income (Loss) From Operations: | | | | | | | | | | | | | | | |
Net investment income | | 0.21 | | | 0.16 | | | 0.12 | | | 0.13 | | | 0.12 | |
Net realized and unrealized gain (loss) | | 1.21 | | | 1.45 | | | 1.03 | | | 0.59 | | | (1.68 | ) |
| | |
|
| |
|
| |
|
| |
|
| |
|
|
Total Income (Loss) From Operations | | 1.42 | | | 1.61 | | | 1.15 | | | 0.72 | | | (1.56 | ) |
| | |
|
| |
|
| |
|
| |
|
| |
|
|
Less Distributions From: | | | | | | | | | | | | | | | |
Net investment income | | (0.19 | ) | | (0.12 | ) | | (0.14 | ) | | (0.11 | ) | | (0.12 | ) |
Net realized gains | | (0.48 | ) | | — | | | — | | | — | | | — | |
| | |
|
| |
|
| |
|
| |
|
| |
|
|
Total Distributions | | (0.67 | ) | | (0.12 | ) | | (0.14 | ) | | (0.11 | ) | | (0.12 | ) |
| | |
|
| |
|
| |
|
| |
|
| |
|
|
Net Asset Value, End of Year | | $12.25 | | | $11.50 | | | $10.01 | | | $9.00 | | | $ 8.39 | |
| | |
|
| |
|
| |
|
| |
|
| |
|
|
Total Return(1) | | 12.82 | % | | 16.10 | %(2) | | 12.89 | % | | 8.75 | % | | (15.71 | )% |
Net Assets, End of Year (millions) | | $1,546 | | | $1,351 | | | $1,304 | | | $1,114 | | | $1,081 | |
Ratios to Average Net Assets: | | | | | | | | | | | | | | | |
Gross expenses | | 0.77 | % | | 0.88 | % | | 0.87 | % | | 0.93 | % | | 0.87 | % |
Net expenses | | 0.76 | (3) | | 0.86 | (3) | | 0.87 | | | 0.93 | | | 0.87 | |
Net investment income | | 1.73 | | | 1.41 | | | 1.21 | | | 1.60 | | | 1.16 | |
Portfolio Turnover Rate | | 58 | % | | 67 | % | | 94 | % | | 81 | % | | 111 | % |
| (1) | | Performance figures may reflect fee waivers and/or expense reimbursements. Past performance is no guarantee of future results. In the absence of fee waivers and/or expense reimbursements, the total return would have been lower. Applicable advisory program charges, which in the case of TRAK® may be up to 1.50%, are not reflected in the performance data and would reduce the total returns. |
| (2) | | The Subadviser fully reimbursed the Fund for losses incurred resulting from an investment restriction violation. Without this reimbursement, the total return would not have changed. |
| (3) | | Reflects fee waivers and/or expense reimbursements. |
See Notes to Financial Statements.
130
Financial Highlights
(continued)
For a share of beneficial interest outstanding throughout each year ended August 31:
| | | | | | | | | | | | | | | |
| Large Capitalization Growth Investments | | | | | | | | | | |
| | | 2006(1)
| | | 2005(1)
| | | 2004
| | | 2003
| | | 2002
| |
Net Asset Value, Beginning of Year | | $12.73 | | | $10.81 | | | $10.38 | | | $ 8.36 | | | $11.34 | |
| | |
|
| |
|
| |
|
| |
|
| |
|
|
Income (Loss) From Operations: | | | | | | | | | | | | | | | |
Net investment loss | | (0.01 | ) | | (0.01 | ) | | (0.03 | ) | | (0.00 | )(2) | | (0.04 | ) |
Net realized and unrealized gain (loss) | | 0.16 | | | 1.93 | | | 0.46 | | | 2.02 | | | (2.94 | ) |
| | |
|
| |
|
| |
|
| |
|
| |
|
|
Total Income (Loss) From Operations | | 0.15 | | | 1.92 | | | 0.43 | | | 2.02 | | | (2.98 | ) |
| | |
|
| |
|
| |
|
| |
|
| |
|
|
Net Asset Value, End of Year | | $12.88 | | | $12.73 | | | $10.81 | | | $10.38 | | | $ 8.36 | |
| | |
|
| |
|
| |
|
| |
|
| |
|
|
Total Return(3) | | 1.18 | % | | 17.76 | % | | 4.14 | % | | 24.16 | % | | (26.28 | )% |
Net Assets, End of Year (millions) | | $1,807 | | | $1,520 | | | $1,217 | | | $1,155 | | | $1,026 | |
Ratios to Average Net Assets: | | | | | | | | | | | | | | | |
Gross expenses | | 0.78 | % | | 0.90 | % | | 0.88 | % | | 0.90 | % | | 0.86 | % |
Net expenses | | 0.77 | (4) | | 0.88 | (4) | | 0.88 | | | 0.90 | | | 0.86 | |
Net investment loss | | (0.06 | ) | | (0.12 | ) | | (0.31 | ) | | (0.30 | ) | | (0.30 | ) |
Portfolio Turnover Rate | | 63 | % | | 77 | % | | 117 | % | | 79 | % | | 122 | % |
| (1) | | Per share amounts have been calculated using the average shares method. |
| (2) | | Amount represents less than $0.01 per share. |
| (3) | | Performance figures may reflect fee waivers and/or expense reimbursements. Past performance is no guarantee of future results. In the absence of fee waivers and/or expense reimbursements, the total return would have been lower. Applicable advisory program charges, which in the case of TRAK® may be up to 1.50%, are not reflected in the performance data and would reduce the total returns. |
| (4) | | Reflects fee waivers and/or expense reimbursements. |
See Notes to Financial Statements.
131
Financial Highlights
(continued)
For a share of beneficial interest outstanding throughout each year ended August 31:
| | | | | | | | | | | | | | | |
| Small Capitalization Value Equity Investments | | | | | | | | | | | | | | | |
| | | 2006
| | | 2005(1)
| | | 2004(1)
| | | 2003
| | | 2002
| |
Net Asset Value, Beginning of Year | | $16.95 | | | $15.05 | | | $12.30 | | | $11.56 | | | $12.54 | |
| | |
|
| |
|
| |
|
| |
|
| |
|
|
Income (Loss) From Operations: | | | | | | | | | | | | | | | |
Net investment income | | 0.09 | | | 0.10 | | | 0.09 | | | 0.13 | | | 0.15 | |
Net realized and unrealized gain (loss) | | 1.52 | | | 3.50 | | | 2.76 | | | 1.25 | | | (0.48 | ) |
| | |
|
| |
|
| |
|
| |
|
| |
|
|
Total Income (Loss) From Operations | | 1.61 | | | 3.60 | | | 2.85 | | | 1.38 | | | (0.33 | ) |
| | |
|
| |
|
| |
|
| |
|
| |
|
|
Less Distributions From: | | | | | | | | | | | | | | | |
Net investment income | | (0.09 | ) | | (0.13 | ) | | (0.10 | ) | | (0.05 | ) | | (0.19 | ) |
Net realized gains | | (4.28 | ) | | (1.57 | ) | | — | | | (0.59 | ) | | (0.46 | ) |
| | |
|
| |
|
| |
|
| |
|
| |
|
|
Total Distributions | | (4.37 | ) | | (1.70 | ) | | (0.10 | ) | | (0.64 | ) | | (0.65 | ) |
| | |
|
| |
|
| |
|
| |
|
| |
|
|
Net Asset Value, End of Year | | $14.19 | | | $16.95 | | | $15.05 | | | $12.30 | | | $11.56 | |
| | |
|
| |
|
| |
|
| |
|
| |
|
|
Total Return(2) | | 11.73 | % | | 24.89 | % | | 23.24 | % | | 13.12 | % | | (2.85 | )% |
Net Assets, End of Year (millions) | | $344 | | | $385 | | | $429 | | | $425 | | | $503 | |
Ratios to Average Net Assets: | | | | | | | | | | | | | | | |
Gross expenses | | 1.12 | % | | 1.24 | % | | 1.16 | % | | 1.20 | % | | 1.13 | % |
Net expenses | | 1.09 | (3) | | 1.17 | (3) | | 1.16 | | | 1.20 | | | 1.13 | |
Net investment income | | 0.64 | | | 0.64 | | | 0.66 | | | 1.00 | | | 0.94 | |
Portfolio Turnover Rate | | 31 | % | | 64 | % | | 33 | % | | 33 | % | | 54 | % |
| (1) | | Per share amounts have been calculated using the average shares method. |
| (2) | | Performance figures may reflect fee waivers and/or expense reimbursements. Past performance is no guarantee of future results. In the absence of fee waivers and/or expense reimbursements, the total return would have been lower. Applicable advisory program charges, which in the case of TRAK® may be up to 1.50%, are not reflected in the performance data and would reduce the total returns. |
| (3) | | Reflects fee waivers and/or expense reimbursements. |
See Notes to Financial Statements.
132
Financial Highlights
(continued)
For a share of beneficial interest outstanding throughout each year ended August 31:
| | | | | | | | | | | | | | | |
| Small Capitalization Growth Investments | | | | | | | | | | | | | | | |
| | | 2006(1)
| | | 2005(1)
| | | 2004(1)
| | | 2003(1)
| | | 2002(1)
| |
Net Asset Value, Beginning of Year | | $14.89 | | | $11.97 | | | $11.83 | | | $ 9.01 | | | $12.26 | |
| | |
|
| |
|
| |
|
| |
|
| |
|
|
Income (Loss) From Operations: | | | | | | | | | | | | | | | |
Net investment loss | | (0.01 | ) | | (0.11 | ) | | (0.11 | ) | | (0.07 | ) | | (0.09 | ) |
Net realized and unrealized gain (loss) | | 0.95 | | | 3.03 | | | 0.25 | | | 2.89 | | | (3.16 | ) |
| | |
|
| |
|
| |
|
| |
|
| |
|
|
Total Income (Loss) From Operations | | 0.94 | | | 2.92 | | | 0.14 | | | 2.82 | | | (3.25 | ) |
| | |
|
| |
|
| |
|
| |
|
| |
|
|
Net Asset Value, End of Year | | $15.83 | | | $14.89 | | | $11.97 | | | $11.83 | | | $ 9.01 | |
| | |
|
| |
|
| |
|
| |
|
| |
|
|
Total Return(2) | | 6.31 | % | | 24.39 | % | | 1.18 | % | | 31.30 | % | | (26.51 | )% |
Net Assets, End of Year (millions) | | $369 | | | $417 | | | $318 | | | $497 | | | $474 | |
Ratios to Average Net Assets: | | | | | | | | | | | | | | | |
Gross expenses | | 1.12 | % | | 1.32 | % | | 1.19 | % | | 1.27 | % | | 1.20 | % |
Net expenses | | 1.08 | (3) | | 1.24 | (3) | | 1.19 | | | 1.27 | | | 1.20 | |
Net investment loss | | (0.08 | ) | | (0.84 | ) | | (0.82 | ) | | (0.77 | ) | | (0.79 | ) |
Portfolio Turnover Rate | | 59 | % | | 70 | % | | 80 | % | | 88 | % | | 91 | % |
| (1) | | Per share amounts have been calculated using the average shares method. |
| (2) | | Performance figures may reflect fee waivers and/or expense reimbursements. Past performance is no guarantee of future results. In the absence of fee waivers and/or expense reimbursements, the total return would have been lower. Applicable advisory program charges, which in the case of TRAK® may be up to 1.50%, are not reflected in the performance data and would reduce the total returns. |
| (3) | | Reflects fee waivers and/or expense reimbursements. |
See Notes to Financial Statements.
133
Financial Highlights
(continued)
For a share of beneficial interest outstanding throughout each year ended August 31:
| | | | | | | | | | | | | | | |
| International Equity Investments | | | | | | | | | | | | | | | |
| | | 2006(1)
| | | 2005(1)
| | | 2004(1)
| | | 2003(1)
| | | 2002(1)
| |
Net Asset Value, Beginning of Year | | $11.12 | | | $ 9.01 | | | $7.82 | | | $6.93 | | | $8.26 | |
| | |
|
| |
|
| |
|
| |
|
| |
|
|
Income (Loss) From Operations: | | | | | | | | | | | | | | | |
Net investment income | | 0.22 | | | 0.15 | | | 0.08 | | | 0.10 | | | 0.03 | |
Net realized and unrealized gain (loss) | | 2.38 | | | 2.06 | | | 1.24 | | | 0.81 | | | (1.36 | ) |
| | |
|
| |
|
| |
|
| |
|
| |
|
|
Total Income (Loss) From Operations | | 2.60 | | | 2.21 | | | 1.32 | | | 0.91 | | | (1.33 | ) |
| | |
|
| |
|
| |
|
| |
|
| |
|
|
Less Distributions From: | | | | | | | | | | | | | | | |
Net investment income | | (0.17 | ) | | (0.10 | ) | | (0.13 | ) | | (0.02 | ) | | (0.00 | )(2) |
| | |
|
| |
|
| |
|
| |
|
| |
|
|
Total Distributions | | (0.17 | ) | | (0.10 | ) | | (0.13 | ) | | (0.02 | ) | | (0.00 | )(2) |
| | |
|
| |
|
| |
|
| |
|
| |
|
|
Net Asset Value, End of Year | | $13.55 | | | $11.12 | | | $9.01 | | | $7.82 | | | $6.93 | |
| | |
|
| |
|
| |
|
| |
|
| |
|
|
Total Return(3) | | 23.55 | % | | 24.65 | % | | 16.90 | % | | 13.21 | % | | (16.08 | )% |
Net Assets, End of Year (millions) | | $1,309 | | | $910 | | | $589 | | | $533 | | | $535 | |
Ratios to Average Net Assets: | | | | | | | | | | | | | | | |
Gross expenses | | 0.84 | % | | 1.02 | % | | 1.08 | % | | 1.14 | % | | 1.23 | % |
Net expenses | | 0.83 | (4) | | 0.99 | (4) | | 1.08 | | | 1.14 | | | 1.23 | |
Net investment income | | 1.76 | | | 1.49 | | | 0.90 | | | 1.55 | | | 0.39 | |
Portfolio Turnover Rate | | 50 | % | | 57 | % | | 84 | % | | 110 | % | | 131 | % |
| (1) | | Per share amounts have been calculated using the average shares method. |
| (2) | | Amount represents less than $0.01 per share. |
| (3) | | Performance figures may reflect fee waivers and/or expense reimbursements. Past performance is no guarantee of future results. In the absence of fee waivers and/or expense reimbursements, the total return would have been lower. Applicable advisory program charges, which in the case of TRAK® may be up to 1.50%, are not reflected in the performance data and would reduce the total returns. |
| (4) | | Reflects fee waivers and/or expense reimbursements. |
See Notes to Financial Statements.
134
Financial Highlights
(continued)
For a share of beneficial interest outstanding throughout each year ended August 31:
| | | | | | | | | | | | | | | |
| Emerging Markets Equity Investments | | | | | | | | | | | | | | | |
| | | 2006
| | | 2005(1)
| | | 2004(1)
| | | 2003(1)
| | | 2002(1)
| |
Net Asset Value, Beginning of Year | | $10.55 | | | $ 7.60 | | | $6.48 | | | $5.22 | | | $5.12 | |
| | |
|
| |
|
| |
|
| |
|
| |
|
|
Income (Loss) From Operations: | | | | | | | | | | | | | | | |
Net investment income | | 0.15 | | | 0.12 | | | 0.05 | | | 0.04 | | | 0.02 | |
Net realized and unrealized gain | | 3.01 | | | 2.93 | | | 1.10 | | | 1.28 | | | 0.11 | |
| | |
|
| |
|
| |
|
| |
|
| |
|
|
Total Income From Operations | | 3.16 | | | 3.05 | | | 1.15 | | | 1.32 | | | 0.13 | |
| | |
|
| |
|
| |
|
| |
|
| |
|
|
Less Distributions From: | | | | | | | | | | | | | | | |
Net investment income | | (0.12 | ) | | (0.10 | ) | | (0.03 | ) | | (0.06 | ) | | (0.03 | ) |
| | |
|
| |
|
| |
|
| |
|
| |
|
|
Total Distributions | | (0.12 | ) | | (0.10 | ) | | (0.03 | ) | | (0.06 | ) | | (0.03 | ) |
| | |
|
| |
|
| |
|
| |
|
| |
|
|
Net Asset Value, End of Year | | $13.59 | | | $10.55 | | | $7.60 | | | $6.48 | | | $5.22 | |
| | |
|
| |
|
| |
|
| |
|
| |
|
|
Total Return(2) | | 30.10 | % | | 40.31 | %(3) | | 17.71 | % | | 25.51 | % | | 2.62 | % |
Net Assets, End of Year (millions) | | $287 | | | $248 | | | $188 | | | $196 | | | $184 | |
Ratios to Average Net Assets: | | | | | | | | | | | | | | | |
Gross expenses | | 1.32 | % | | 1.52 | % | | 1.64 | % | | 1.79 | % | | 1.72 | % |
Net expenses | | 1.28 | (4) | | 1.44 | (4) | | 1.64 | | | 1.79 | | | 1.72 | |
Net investment income | | 1.15 | | | 1.27 | | | 0.67 | | | 0.86 | | | 0.40 | |
Portfolio Turnover Rate | | 70 | % | | 70 | % | | 117 | % | | 88 | % | | 65 | % |
| (1) | | Per share amounts have been calculated using the average shares method. |
| (2) | | Performance figures may reflect fee waivers and/or expense reimbursements. Past performance is no guarantee of future results. In the absence of fee waivers and/or expense reimbursements, the total return would have been lower. Applicable advisory program charges, which in the case of TRAK® may be up to 1.50%, are not reflected in the performance data and would reduce the total returns. |
| (3) | | The Subadviser fully reimbursed the Fund for losses incurred resulting from a trading error. Without this reimbursement, the total return would not have changed. |
| (4) | | Reflects fee waivers and/or expense reimbursements. |
See Notes to Financial Statements.
135
Financial Highlights
(continued)
For a share of beneficial interest outstanding throughout each year ended August 31:
| | | | | | | | | | | | | | | |
| Government Money Investments | | | | | | | | | | |
| | | 2006(1)
| | | 2005
| | | 2004
| | | 2003(1)
| | | 2002(1)
| |
Net Asset Value, Beginning of Year | | $1.00 | | | $1.00 | | | $1.00 | | | $1.00 | | | $1.00 | |
| | |
|
| |
|
| |
|
| |
|
| |
|
|
Income (Loss) From Operations: | | | | | | | | | | | | | | | |
Net investment income | | 0.04 | | | 0.02 | | | 0.00 | (2) | | 0.01 | | | 0.02 | |
| | |
|
| |
|
| |
|
| |
|
| |
|
|
Total Income From Operations | | 0.04 | | | 0.02 | | | 0.00 | (2) | | 0.01 | | | 0.02 | |
| | |
|
| |
|
| |
|
| |
|
| |
|
|
Less Distributions From: | | | | | | | | | | | | | | | |
Net investment income | | (0.04 | ) | | (0.02 | ) | | (0.00 | )(2) | | (0.01 | ) | | (0.02 | ) |
| | |
|
| |
|
| |
|
| |
|
| |
|
|
Total Distributions | | (0.04 | ) | | (0.02 | ) | | (0.00 | )(2) | | (0.01 | ) | | (0.02 | ) |
| | |
|
| |
|
| |
|
| |
|
| |
|
|
Net Asset Value, End of Year | | $1.00 | | | $1.00 | | | $1.00 | | | $1.00 | | | $1.00 | |
| | |
|
| |
|
| |
|
| |
|
| |
|
|
Total Return(3) | | 4.03 | % | | 2.17 | % | | 0.48 | % | | 0.85 | % | | 1.80 | % |
Net Assets, End of Year (000s) | | $128,936 | | | $96,376 | | | $93,875 | | | $110,461 | | | $140,411 | |
Ratios to Average Net Assets: | | | | | | | | | | | | | | | |
Gross expenses | | 0.72 | % | | 1.14 | % | | 0.98 | % | | 0.90 | % | | 0.91 | % |
Net expenses(4)(5) | | 0.47 | | | 0.34 | | | 0.60 | | | 0.60 | | | 0.60 | |
Net investment income | | 4.01 | | | 2.16 | | | 0.48 | | | 0.81 | | | 1.82 | |
| (1) | | Per share amounts have been calculated using the average shares method. |
| (2) | | Amount represents less than $0.01 per share. |
| (3) | | Performance figures may reflect fee waivers and/or expense reimbursements. Past performance is no guarantee of future results. In the absence of fee waivers and/or expense reimbursements, the total return would have been lower. Applicable advisory program charges, which in the case of TRAK® may be up to 1.50%, are not reflected in the performance data and would reduce the total returns. |
| (4) | | Reflects fee waivers and/or expense reimbursements. |
| (5) | | As a result of an expense limitation, the ratio of expenses to average net assets of the Fund did not exceed 0.60%. |
See Notes to Financial Statements.
136
Financial Highlights
(continued)
For a share of beneficial interest outstanding throughout each year ended August 31:
| | | | | | | | | | | | | | | |
| Core Fixed Income Investments | | | | | | | | | | |
| | | 2006
| | | 2005
| | | 2004
| | | 2003(1)
| | | 2002(1)
| |
Net Asset Value, Beginning of Year | | $8.35 | | | $8.32 | | | $8.18 | | | $8.20 | | | $8.31 | |
| | |
|
| |
|
| |
|
| |
|
| |
|
|
Income (Loss) From Operations: | | | | | | | | | | | | | | | |
Net investment income | | 0.37 | | | 0.30 | | | 0.27 | | | 0.35 | | | 0.44 | |
Net realized and unrealized gain (loss) | | (0.25 | ) | | 0.05 | | | 0.15 | | | 0.04 | | | (0.06 | ) |
| | |
|
| |
|
| |
|
| |
|
| |
|
|
Total Income From Operations | | 0.12 | | | 0.35 | | | 0.42 | | | 0.39 | | | 0.38 | |
| | |
|
| |
|
| |
|
| |
|
| |
|
|
Less Distributions From: | | | | | | | | | | | | | | | |
Net investment income | | (0.38 | ) | | (0.32 | ) | | (0.28 | ) | | (0.41 | ) | | (0.49 | ) |
| | |
|
| |
|
| |
|
| |
|
| |
|
|
Total Distributions | | (0.38 | ) | | (0.32 | ) | | (0.28 | ) | | (0.41 | ) | | (0.49 | ) |
| | |
|
| |
|
| |
|
| |
|
| |
|
|
Net Asset Value, End of Year | | $8.09 | | | $8.35 | | | $8.32 | | | $8.18 | | | $8.20 | |
| | |
|
| |
|
| |
|
| |
|
| |
|
|
Total Return(2) | | 1.51 | % | | 4.30 | % | | 5.17 | % | | 4.78 | % | | 4.73 | % |
Net Assets, End of Year (000s) | | $759,964 | | | $533,845 | | | $480,808 | | | $317,858 | | | $331,331 | |
Ratios to Average Net Assets: | | | | | | | | | | | | | | | |
Gross expenses | | 0.63 | % | | 0.75 | % | | 0.76 | % | | 0.77 | % | | 0.75 | % |
Net expenses | | 0.61 | (3) | | 0.71 | (3) | | 0.76 | | | 0.77 | | | 0.75 | |
Net investment income | | 4.50 | | | 3.65 | | | 3.25 | | | 4.22 | | | 5.39 | |
Portfolio Turnover Rate | | 376 | %(4) | | 376 | %(4) | | 369 | %(4) | | 257 | % | | 280 | % |
| (1) | | Per share amounts have been calculated using the average shares method. |
| (2) | | Performance figures may reflect fee waivers and/or expense reimbursements. Past performance is no guarantee of future results. In the absence of fee waivers and/or expense reimbursements, the total return would have been lower. Applicable advisory program charges, which in the case of TRAK® may be up to 1.50%, are not reflected in the performance data and would reduce the total returns. |
| (3) | | Reflects fee waivers and/or expense reimbursements. |
| (4) | | Excluding mortgage dollar roll transactions. If mortgage dollar roll transactions had been included the portfolio turnover rate would have been 443%, 418% and 392%, respectively. |
See Notes to Financial Statements.
137
Financial Highlights
(continued)
For a share of beneficial interest outstanding throughout each year ended August 31:
| | | | | | | | | | | | | | | |
| High Yield Investments | | | | | | | | | | | | | | | |
| | | 2006
| | | 2005(1)
| | | 2004
| | | 2003
| | | 2002(1)
| |
Net Asset Value, Beginning of Year | | $4.78 | | | $4.81 | | | $4.61 | | | $4.38 | | | $5.20 | |
| | |
|
| |
|
| |
|
| |
|
| |
|
|
Income (Loss) From Operations: | | | | | | | | | | | | | | | |
Net investment income | | 0.39 | | | 0.31 | | | 0.32 | | | 0.36 | | | 0.44 | |
Net realized and unrealized gain (loss) | | (0.22 | ) | | 0.03 | | | 0.21 | | | 0.25 | | | (0.82 | ) |
| | |
|
| |
|
| |
|
| |
|
| |
|
|
Total Income (Loss) From Operations | | 0.17 | | | 0.34 | | | 0.53 | | | 0.61 | | | (0.38 | ) |
| | |
|
| |
|
| |
|
| |
|
| |
|
|
Less Distributions From: | | | | | | | | | | | | | | | |
Net investment income | | (0.33 | ) | | (0.37 | ) | | (0.33 | ) | | (0.38 | ) | | (0.44 | ) |
| | |
|
| |
|
| |
|
| |
|
| |
|
|
Total Distributions | | (0.33 | ) | | (0.37 | ) | | (0.33 | ) | | (0.38 | ) | | (0.44 | ) |
| | |
|
| |
|
| |
|
| |
|
| |
|
|
Net Asset Value, End of Year | | $4.62 | | | $4.78 | | | $4.81 | | | $4.61 | | | $4.38 | |
| | |
|
| |
|
| |
|
| |
|
| |
|
|
Total Return(2) | | 3.80 | % | | 7.16 | % | | 11.81 | % | | 14.57 | % | | (7.75 | )% |
Net Assets, End of Year (000s) | | $110,207 | | | $262,239 | | | $239,650 | | | $227,191 | | | $222,373 | |
Ratios to Average Net Assets: | | | | | | | | | | | | | | | |
Gross expenses | | 0.90 | % | | 1.04 | % | | 0.99 | % | | 0.97 | % | | 0.97 | % |
Net expenses | | 0.86 | (3) | | 0.99 | (3) | | 0.99 | | | 0.97 | | | 0.97 | |
Net investment income | | 6.78 | | | 6.49 | | | 6.76 | | | 7.78 | | | 9.05 | |
Portfolio Turnover Rate | | 108 | % | | 106 | % | | 127 | % | | 158 | % | | 69 | % |
| (1) | | Per share amounts have been calculated using the average shares method. |
| (2) | | Performance figures may reflect fee waivers and/or expense reimbursements. Past performance is no guarantee of future results. In the absence of fee waivers and/or expense reimbursements, the total return would have been lower. Applicable advisory program charges, which in the case of TRAK® may be up to 1.50%, are not reflected in the performance data and would reduce the total returns. |
| (3) | | Reflects fee waivers and/or expense reimbursements. |
See Notes to Financial Statements.
138
Financial Highlights
(continued)
For a share of beneficial interest outstanding throughout each year ended August 31:
| | | | | | | | | | | | | | | |
| Municipal Bond Investments | | | | | | | | | | | | | | | |
| | | 2006
| | | 2005
| | | 2004(1)
| | | 2003
| | | 2002
| |
Net Asset Value, Beginning of Year | | $9.26 | | | $9.23 | | | $8.95 | | | $9.07 | | | $8.91 | |
| | |
|
| |
|
| |
|
| |
|
| |
|
|
Income (Loss) From Operations: | | | | | | | | | | | | | | | |
Net investment income | | 0.32 | | | 0.32 | | | 0.33 | | | 0.35 | | | 0.37 | |
Net realized and unrealized gain (loss) | | (0.12 | ) | | 0.06 | | | 0.30 | | | (0.12 | ) | | 0.14 | |
| | |
|
| |
|
| |
|
| |
|
| |
|
|
Total Income From Operations | | 0.20 | | | 0.38 | | | 0.63 | | | 0.23 | | | 0.51 | |
| | |
|
| |
|
| |
|
| |
|
| |
|
|
Less Distributions From: | | | | | | | | | | | | | | | |
Net investment income | | (0.33 | ) | | (0.35 | ) | | (0.35 | ) | | (0.35 | ) | | (0.35 | ) |
| | |
|
| |
|
| |
|
| |
|
| |
|
|
Total Distributions | | (0.33 | ) | | (0.35 | ) | | (0.35 | ) | | (0.35 | ) | | (0.35 | ) |
| | |
|
| |
|
| |
|
| |
|
| |
|
|
Net Asset Value, End of Year | | $9.13 | | | $9.26 | | | $9.23 | | | $8.95 | | | $9.07 | |
| | |
|
| |
|
| |
|
| |
|
| |
|
|
Total Return(2) | | 2.26 | % | | 4.17 | % | | 7.12 | % | | 2.51 | % | | 5.88 | % |
Net Assets, End of Year (000s) | | $66,326 | | | $40,423 | | | $33,895 | | | $28,386 | | | $30,604 | |
Ratios to Average Net Assets: | | | | | | | | | | | | | | | |
Gross expenses | | 0.73 | % | | 0.90 | % | | 0.89 | % | | 0.88 | % | | 0.91 | % |
Net expenses | | 0.72 | (3) | | 0.88 | (3) | | 0.89 | | | 0.88 | | | 0.91 | |
Net investment income | | 3.70 | | | 3.58 | | | 3.63 | | | 3.79 | | | 4.17 | |
Portfolio Turnover Rate | | 26 | % | | 7 | % | | 19 | % | | 15 | % | | 21 | % |
| (1) | | Per share amounts have been calculated using the average shares method. |
| (2) | | Performance figures may reflect fee waivers and/or expense reimbursements. Past performance is no guarantee of future results. In the absence of fee waivers and/or expense reimbursements, the total return would have been lower. Applicable advisory program charges, which in the case of TRAK® may be up to 1.50%, are not reflected in the performance data and would reduce the total returns. |
| (3) | | Reflects fee waivers and/or expense reimbursements. |
See Notes to Financial Statements.
139
Financial Highlights
(continued)
For a share of beneficial interest outstanding throughout each year ended August 31:
| | | | | | | | | | | | | | | |
| International Fixed Income Investments | | | | | | | | | | | | | | | |
| | | 2006(1)
| | | 2005(1)
| | | 2004(1)
| | | 2003(1)
| | | 2002(1)
| |
Net Asset Value, Beginning of Year | | $8.23 | | | $8.16 | | | $7.93 | | | $7.47 | | | $7.19 | |
| | |
|
| |
|
| |
|
| |
|
| |
|
|
Income (Loss) From Operations: | | | | | | | | | | | | | | | |
Net investment income | | 0.25 | | | 0.20 | | | 0.21 | | | 0.25 | | | 0.29 | |
Net realized and unrealized gain (loss) | | (0.39 | ) | | 0.37 | | | 0.88 | | | 0.51 | | | 0.29 | |
| | |
|
| |
|
| |
|
| |
|
| |
|
|
Total Income (Loss) From Operations | | (0.14 | ) | | 0.57 | | | 1.09 | | | 0.76 | | | 0.58 | |
| | |
|
| |
|
| |
|
| |
|
| |
|
|
Less Distributions From: | | | | | | | | | | | | | | | |
Net investment income | | (0.09 | ) | | (0.50 | ) | | (0.86 | ) | | (0.30 | ) | | (0.12 | ) |
Net realized gains | | (0.06 | ) | | — | | | — | | | — | | | (0.18 | ) |
Return of capital | | (0.16 | ) | | — | | | — | | | — | | | — | |
| | |
|
| |
|
| |
|
| |
|
| |
|
|
Total Distributions | | (0.31 | ) | | (0.50 | ) | | (0.86 | ) | | (0.30 | ) | | (0.30 | ) |
| | |
|
| |
|
| |
|
| |
|
| |
|
|
Net Asset Value, End of Year | | $7.78 | | | $8.23 | | | $8.16 | | | $7.93 | | | $7.47 | |
| | |
|
| |
|
| |
|
| |
|
| |
|
|
Total Return(2) | | (1.70 | )% | | 6.86 | % | | 14.00 | % | | 10.28 | % | | 8.39 | % |
Net Assets, End of Year (millions) | | $195 | | | $154 | | | $116 | | | $112 | | | $126 | |
Ratios to Average Net Assets: | | | | | | | | | | | | | | | |
Gross expenses | | 0.84 | % | | 1.01 | % | | 1.05 | % | | 1.04 | % | | 1.02 | % |
Net expenses | | 0.82 | (3) | | 0.95 | (3) | | 1.05 | | | 1.04 | | | 1.02 | |
Net investment income | | 3.25 | | | 2.38 | | | 2.60 | | | 3.21 | | | 4.04 | |
Portfolio Turnover Rate | | 416 | % | | 346 | % | | 243 | % | | 288 | % | | 271 | % |
| (1) | | Per share amounts have been calculated using the average shares method. |
| (2) | | Performance figures may reflect fee waivers and/or expense reimbursements. Past performance is no guarantee of future results. In the absence of fee waivers and/or expense reimbursements, the total return would have been lower. Applicable advisory program charges, which in the case of TRAK® may be up to 1.50%, are not reflected in the performance data and would reduce the total returns. |
| (3) | | Reflects fee waivers and/or expense reimbursements. |
See Notes to Financial Statements.
140
Notes to Financial Statements
1. Organization and Significant Accounting Policies
Large Capitalization Value Equity Investments, Large Capitalization Growth Investments, Small Capitalization Value Equity Investments, Small Capitalization Growth Investments, International Equity Investments, Emerging Markets Equity Investments, Government Money Investments, Core Fixed Income Investments, High Yield Investments, Municipal Bond Investments and International Fixed Income Investments (“Fund(s)”) are separate diversified investment funds of the Consulting Group Capital Markets Funds (“Trust”). The Trust, a Massachusetts business trust, is registered under the Investment Company Act of 1940, as amended (“1940 Act”), open-end management investment company. The Trust offered one other Fund, Multi-Strategy Market Neutral Investments, which was liquidated on September 9, 2005.
The following are significant accounting policies consistently followed by the Funds and are in conformity with U.S. generally accepted accounting principles (“GAAP”). Estimates and assumptions are required to be made regarding assets, liabilities and changes in net assets resulting from operations when financial statements are prepared. Changes in the economic environment, financial markets and any other parameters used in determining these estimates could cause actual results to differ.
(a) Investment Valuation. Equity securities for which market quotations are available are valued at the last sale price or official closing price on the primary market or exchange on which they trade. Debt securities are valued at the mean between the bid and asked prices provided by an independent pricing service that are based on transactions in debt obligations, quotations from bond dealers, market transactions in comparable securities and various relationships between securities.
Money market instruments within Government Money Investments are valued at amortized cost, in accordance with Rule 2a-7 under the 1940 Act, which approximates market value. This method involves valuing portfolio securities at its cost and thereafter assuming a constant amortization to maturity of any discount or premium. The Fund’s use of amortized cost is subject to their compliance with certain conditions as specified under Rule 2a-7 of the 1940 Act.
When prices are not readily available, or are determined not to reflect fair value, such as when the value of a security has been significantly affected by events after the close of the exchange or market on which the security is principally traded, but before the Funds calculate its net asset value, the Funds may value these investments at fair value as determined in accordance with the procedures approved by the Funds’ Board of Trustees. Fair valuing of securities may be determined with the assistance of a pricing service using calculations based on indices of domestic securities and other appropriate indictors, such as prices of relevant ADRs and futures contracts. Short-term obligations with maturities of 60 days or less are valued at amortized cost, which approximates market value.
(b) Repurchase Agreements. When entering into repurchase agreements, it is the Funds’ policy that their custodian or a third party custodian take possession of the underlying collateral securities, the market value of which at least equals the principal amount of the repurchase transaction, including accrued interest. To the extent that any repurchase transaction exceeds one business day, the value of the collateral is marked-to-market to ensure the adequacy of the collateral. If the seller defaults and the market value of the collateral declines or if bankruptcy proceedings are commenced with respect to the seller of the security, realization of the collateral by the Funds may be delayed or limited.
(c) Financial Futures Contracts. Certain Funds may enter into financial futures contracts to the extent permitted by their investment policies and objectives. Upon entering into a financial futures contract, the Funds are required to deposit cash or securities as initial margin. Additional securities are also segregated up to the current market value of the financial futures contracts. Subsequent payments, known as variation margin, are made or received by the Funds each day, depending on the daily fluctuation in the value of the underlying financial instruments. The Funds recognize an unrealized gain or loss equal to the daily variation margin. When the financial futures contracts are closed, a realized gain or loss is recognized equal to the difference between the proceeds from (or cost of) the closing transactions and the Funds’ basis in the contracts.
The risks associated with entering into financial futures contracts include the possibility that a change in the value of the contract may not correlate with the changes in the value of the underlying instruments. In addition, investing in financial
141
Notes to Financial Statements
(continued)
futures contracts involves the risk that the Funds could lose more than the original margin deposit and subsequent payments required for a futures transaction. Risks may also arise upon entering into these contracts from the potential inability of the counterparties to meet the terms of their contracts.
(d) Written Options. When a Fund writes an option, an amount equal to the premium received by the Funds are recorded as a liability, the value of which is marked-to-market daily to reflect the current market value of the option written. If the option expires, the Funds realize a gain from investments equal to the amount of the premium received. When a written call option is exercised, the difference between the premium and the amount for effecting a closing purchase transaction, including brokerage commission, is also treated as a realized gain or loss. When a written put option is exercised, the amount of the premium received reduces the cost of the security purchased by the Funds.
A risk in writing a covered call option is that the Funds may forego the opportunity of profit if the market price of the underlying security increases and the option is exercised. The risk in writing a put option is that the Funds may incur a loss if the market price of the underlying security decreases and the option is exercised. The risk in writing a call option is that the Funds are exposed to the risk of loss if the market price of the underlying security increases. In addition, there is the risk that the Funds may not be able to enter into a closing transaction because of an illiquid secondary market.
(e) Forward Foreign Currency Contracts. Certain Funds may enter into forward foreign currency contracts to hedge against foreign currency exchange rate risk on their non-U.S. dollar denominated securities or to facilitate settlement of foreign currency denominated portfolio transactions. A forward foreign currency contract is an agreement between two parties to buy and sell a currency at a set price on a future date. The contract is marked-to-market daily and the change in value is recorded by the Funds as an unrealized gain or loss. When a forward foreign currency contract is extinguished, through either delivery or offset by entering into another forward foreign currency contract, the Funds record a realized gain or loss equal to the difference between the value of the contract at the time it was opened and the value of the contract at the time it was extinguished.
Forward foreign currency contracts involve elements of market risk in excess of the amounts reflected in the Statements of Assets and Liabilities. The Funds bear the risk of an unfavorable change in the foreign exchange rate underlying the forward foreign currency contract. Risks may also arise upon entering into these contracts from the potential inability of the counterparties to meet the terms of their contracts.
(f) Stripped Securities. The Funds may invest in “Stripped Securities”, a term used collectively for stripped fixed income securities. Stripped securities can be principal only securities (“PO”), which are debt obligations that have been stripped of unmatured interest coupons or interest only securities (“IO”), which are unmatured interest coupons that have been stripped from debt obligations. As is the case with all securities, the market value of Stripped Securities will fluctuate in response to changes in economic conditions, interest rates and the market’s perception of the securities. However, fluctuations in response to interest rates may be greater in Stripped Securities than for debt obligations of comparable maturities that pay interest currently. The amount of fluctuation increases with a longer period of maturity.
The yield to maturity on IO’s is sensitive to the rate of principal repayments (including prepayments) on the related underlying debt obligation and principal payments may have a material effect on yield to maturity. If the underlying debt obligation experiences greater than anticipated prepayments of principal, the Fund may not fully recoup its initial investment in IO’s.
(g) Swaptions. The Funds may write swaption contracts to manage exposure to fluctuations in interest rates and to enhance portfolio yield. Swaption contracts written by a Fund represent an option that gives the purchaser the right, but not the obligation, to enter into a previously agreed upon swap contract on a future date. If a written call swaption is exercised, the writer will enter a swap and is obligated to pay the fixed rate and receive a floating rate in exchange. If a written put swaption is exercised, the writer will enter a swap and is obligated to pay the floating rate and receive a fixed rate in exchange. Swaptions are marked to market daily based upon quotations from market makers.
142
Notes to Financial Statements
(continued)
When a Fund writes a swaption, the premium received is recorded as a liability and is subsequently adjusted to the current market value of the swaption. Changes in the value of the swaption are reported as unrealized gains or losses in the Statements of Assets and Liabilities and Statements of Operations. Gain or loss is recognized when the swaption contract expires or is closed. Premiums received from writing swaptions that expire or are exercised are treated by the Funds as realized gains from investments. The difference between the premium and the amount paid on effecting a closing purchase transaction is also treated as a realized gain, or if the premium is less than the amount paid for the closing purchase, as a realized loss.
Entering into a swaption contract involves, to varying degrees, the elements of credit, market and interest rate risk, associated with both option contracts and swap contracts. To reduce credit risk from potential counterparty default, the Funds enter into swaption contracts with counterparties whose creditworthiness has been evaluated by the Investment Manager. The Funds bear the market risk arising from any change in index values or interest rates.
(h) Swap Contracts. Swaps involve the exchange by the Funds with another party of the respective amounts payable with respect to a notional principal amount related to one or more indices. Certain Funds may enter into these transactions to preserve a return or spread on a particular investment or portion of its assets, as a duration management technique or to protect against any increase in the price of securities the Funds anticipate purchasing at a later date. The Funds may also use these transactions for speculative purposes, such as to obtain the price performance of a security without actually purchasing the security in circumstances where, for example, the subject security is illiquid, is unavailable for direct investment or available only on less attractive terms.
Swaps are marked-to-market daily based upon quotations from market makers and the change, if any, is recorded as an unrealized gain or loss in the Statements of Operations. Net receipts or payments of interest are recorded as realized gains or losses, respectively.
Swaps have risks associated with them, including possible default by the counterparty to the transaction, illiquidity and, where swaps are used as hedges, the risk that the use of a swap could result in losses greater than if the swap had not been employed.
(i) Credit Default Swaps. Certain Funds enter into credit default swap contracts for investment purposes, to manage their credit risk or to add leverage. As a seller in a credit default swap contract, the Funds are required to pay the notional or other agreed-upon value to the counterparty in the event of a default by a third party, such as a U.S. or foreign corporate issuer, on the referenced debt obligation. In return, the Funds receive from the counterparty a periodic stream of payments over the term of the contract provided that no event of default has occurred. If no default occurs, the Funds keep the stream of payments and have no payment obligations. Such periodic payments are accrued daily and accounted for as realized gain.
The Funds may also purchase credit default swap contracts in order to hedge against the risk of default of debt securities held, in which case the Funds function as the counterparty referenced in the preceding paragraph. As a purchaser of a credit default swap contract, the Funds receive the notional or other agreed upon value from the counterparty in the event of a default by a third party, such as a U.S. or foreign corporate issuer on the referenced debt obligation. In return, the Funds make periodic payments to the counterparty over the term of the contract provided no event of default has occurred. Such periodic payments are accrued daily and accounted for as realized loss.
Swaps are marked-to-market daily based upon quotations from market makers and the change in value, if any, is recorded as unrealized appreciation or depreciation in the Funds’ Statements of Operations. For a credit default swap sold by the Funds, payment of the agreed upon amount made by the Funds in the event of default of the referenced debt obligation is recorded as the cost of the referenced debt obligation purchased/received. For a credit default swap purchased by the Funds, the agreed upon amount received by the Funds in the event of default of the referenced debt obligation is recorded as proceeds from sale/delivery of the referenced debt obligation and the resulting gain or loss realized on the referenced debt obligation is recorded as such by the Funds.
Entering into Credit Default Swaps involves, to varying degrees, elements of credit, market and documentation risk in excess of the related amounts recognized on the Statements of Assets and Liabilities. Such risks involve the possibility that there will be
143
Notes to Financial Statements
(continued)
no liquid market for these agreements, that the counterparty to the agreements may default on its obligation to perform or disagree as to the meaning of the contractual terms in the agreements, and that there will be unfavorable changes in net interest rates.
(j) Lending of Portfolio Securities. The Funds have an agreement with their custodian whereby the custodian may lend securities owned by the Funds to brokers, dealers and other financial organizations. In exchange for lending securities under the terms of the agreement with their custodian, the Funds receive a lender’s fee. Fees earned by the Funds on securities lending are recorded as securities lending income. Loans of securities by the Funds are collateralized by cash, U.S. government securities or high quality money market instruments that are maintained at all times in an amount at least equal to the current market value of the loaned securities, plus a margin which varies depending on the type of securities loaned. The custodian establishes and maintains the collateral in a segregated account. The Funds have the right under the lending agreement to recover the securities from the borrower on demand.
The Funds maintain the risk of any loss on the securities on loan as well as the potential loss on investments purchased with cash collateral received from securities lending.
(k) Securities Traded on a To-Be-Announced Basis. Certain Funds may trade securities on a to-be-announced (“TBA”) basis. In a TBA transaction, the Funds commit to purchasing or selling securities which have not yet been issued by the issuer and for which specific information is not known, such as the face amount and maturity date and the underlying pool of investments in U.S. government agency mortgage pass-through transactions. Securities purchased on a TBA basis are not settled until they are delivered to the Funds, normally 15 to 45 days later. Beginning on the date the Funds enter into a TBA transaction, cash, U.S. government securities or other liquid high-grade debt obligations are segregated in an amount equal in value to the purchase price of the TBA security. These transactions are subject to market fluctuations and their current value is determined in the same manner as for other securities.
(l) Short Sales of Securities. A short sale is a transaction in which the Fund sells securities it does not own (but has borrowed) in anticipation of a decline in the market price of the securities. To complete a short sale, the Fund may arrange through a broker to borrow the securities to be delivered to the buyer. The proceeds received by the Fund for the short sale are retained by the broker until the Fund replaces the borrowed securities. In borrowing the securities to be delivered to the buyer, the Fund becomes obligated to replace the securities borrowed at their market price at the time of replacement, whatever that price may be.
(m) Mortgage Dollar Rolls. Certain Funds may enter into dollar rolls in which the Funds sell mortgage-backed securities for delivery in the current month and simultaneously contracts to repurchase substantially similar (same type, coupon and maturity) securities to settle on a specified future date. During the roll period, the Funds forgo principal and interest paid on the securities. The Funds are compensated by a fee paid by the counterparty, often in the form of a drop in the repurchase price of the securities. Dollar rolls are accounted for as financing arrangements; the fee is accrued into interest income ratably over the term of the dollar roll and any gain or loss on the roll is deferred and realized upon disposition of the rolled security.
The risk of entering into a mortgage dollar roll is that the market value of the securities the Funds are obligated to repurchase under the agreement may decline below the repurchase price. In the event the buyer of securities under a mortgage dollar roll files for bankruptcy or becomes insolvent, the Funds’ use of proceeds of the dollar roll may be restricted pending a determination by the other party, or its trustee or receiver, whether to enforce the Funds’ obligation to repurchase the securities.
(n) Credit and Market Risk. Certain Funds invest in high yield instruments that are subject to certain credit and market risks. The yields of high yield obligations reflect, among other things, perceived credit and market risks. The Funds’ investment in securities rated below investment grade typically involve risks not associated with higher rated securities including, among others, greater risk related to timely and ultimate payment of interest and principal, greater market price volatility and less liquid secondary market trading.
(o) Foreign Risk. Certain Funds’ investments in foreign securities may involve risks not present in domestic investments. Since securities may be denominated in foreign currencies and may require settlement in foreign currencies and pay interest or
144
Notes to Financial Statements
(continued)
dividends in foreign currencies, changes in the relationship of these foreign currencies to the U.S. dollar can significantly affect the value of the investments and earnings of the Funds. Foreign investments may also subject the Funds to foreign government exchange restrictions, expropriation, taxation or other political, social or economic developments, all of which affect the market and/or credit risk of the investments.
(p) Security Transactions and Investment Income. Security transactions are accounted for on a trade date basis. Interest income, adjusted for amortization of premium and accretion of discount, is recorded on the accrual basis. Dividend income is recorded on the ex-dividend date. Foreign dividend income is recorded on the ex-dividend date or as soon as practical after the Funds determine the existence of a dividend declaration after exercising reasonable due diligence. The cost of investments sold is determined by use of the specific identification method. To the extent any issuer defaults on an expected interest payment, the Funds’ policy is to generally halt any additional interest income accruals and consider the realizability of interest accrued up to the date of default.
(q) Foreign Currency Translation. Investment securities and other assets and liabilities denominated in foreign currencies are translated into U.S. dollar amounts based upon prevailing exchange rates on the date of valuation. Purchases and sales of investment securities and income and expense items denominated in foreign currencies are translated into U.S. dollar amounts based upon prevailing exchange rates on the respective dates of such transactions.
The Funds do not isolate that portion of the results of operations resulting from changes in foreign exchange rates on investments from the fluctuations arising from changes in market prices of securities held. Such fluctuations are included with the net realized and unrealized gain or loss on investments.
Net realized foreign exchange gains or losses arise from sales of foreign currencies, including gains and losses on forward foreign currency contracts, currency gains or losses realized between the trade and settlement dates on securities transactions and the difference between the amounts of dividends, interest and foreign withholding taxes recorded on the Funds’ books and the U.S. dollar equivalent of the amounts actually received or paid. Net unrealized foreign exchange gains and losses arise from changes in the fair values of assets and liabilities, other than investments in securities, at the date of valuation, resulting from changes in exchange rates.
Foreign security and currency transactions may involve certain considerations and risks not typically associated with those of U.S. dollar denominated transactions as a result of, among other factors, the possibility of lower levels of governmental supervision and regulation of foreign securities markets and the possibility of political or economic instability.
(r) Distributions to Shareholders. Distributions from net investment income for Large Capitalization Value Equity Investments, Large Capitalization Growth Investments, Small Capitalization Value Equity Investments, Small Capitalization Growth Investments, International Equity Investments and Emerging Markets Equity Investments, if any, are declared and paid on an annual basis. Distributions from net investment income for Core Fixed Income Investments, High Yield Investments, Municipal Bond Investments and International Fixed Income Investments, if any, are declared and paid on a monthly basis. Distributions on the shares of Government Money Investments are declared each business day to shareholders of record that day, and are paid on the last business day of the month. The Funds intend to satisfy conditions that will enable interest from municipal securities, which are exempt from regular federal income tax and from designated state income taxes, to retain such tax-exempt status when distributed to the shareholders of the Funds. Distributions of net realized gains to shareholders of the Funds, if any, are taxable and are declared at least annually. Distributions to shareholders of the Funds are recorded on the ex-dividend date and are determined in accordance with income tax regulations, which may differ from GAAP.
(s) Federal and Other Taxes. It is the Funds’ policy to comply with the federal income and excise tax requirements of the Internal Revenue Code of 1986, as amended, applicable to regulated investment companies. Accordingly, the Funds intend to distribute substantially all of their income and net realized gains on investments, if any, to shareholders each year. Therefore, no federal income tax provision is required in the Funds’ financial statements. Under the applicable foreign tax laws, a withholding tax may be imposed on interest, dividends and capital gains at various rates.
145
Notes to Financial Statements
(continued)
(t) Reclassification. GAAP requires that certain components of net assets be adjusted to reflect permanent differences between financial and tax reporting. These reclassifications have no effect on net assets or net asset values per share. During the current year, the following reclassifications have been made:
| | | | | | | | | | | | | | |
Fund
| | | | (Over)/
Undistributed Net
Investment Income
| | | Undistributed
Realized Gains/
Accumulated Net
Realized Losses
| | | Paid-in Capital
| |
Large Capitalization Value Equity Investments | | (a) | | $ | 39 | | | $ | (39 | ) | | | — | |
Large Capitalization Growth Investments | | (a) | | | 142 | | | | (142 | ) | | | — | |
| | | (b) | | | 944,174 | | | | — | | | $ | (944,174 | ) |
Small Capitalization Value Equity Investments | | (c) | | | (245,392 | ) | | | 245,392 | | | | — | |
Small Capitalization Growth Investments | | (a) | | | 147 | | | | (147 | ) | | | — | |
| | | (b) | | | 333,377 | | | | — | | | | (333,377 | ) |
International Equity Investments | | (d) | | | 19,433 | | | | (19,433 | ) | | | — | |
Emerging Markets Equity Investments | | (d) | | | 71,302 | | | | (71,302 | ) | | | — | |
High Yield Investments | | (e) | | | 891,301 | | | | (891,301 | ) | | | — | |
Core Fixed Income Investments | | (f) | | | 1,346,891 | | | | (1,346,891 | ) | | | — | |
Municipal Bond Investments | | (g) | | | (3,196 | ) | | | 3,196 | | | | — | |
International Fixed Income Investments | | (f) | | | (6,041,335 | ) | | | 6,041,335 | | | | — | |
Additionally, there were no reclassifications during the current year for Government Money Investments.
| (a) | | Reclassifications are primarily due to foreign currency transactions treated as ordinary income for tax purposes. |
| (b) | | Reclassifications are primarily due to a tax net operating loss. |
| (c) | | Reclassifications are primarily due to foreign currency transactions treated as ordinary income for tax purposes and book/tax differences in the treatment of distributions from real estate investment trusts. Additionally, during the current period, Undistributed Realized Gains and Cost of Investments have each been reduced by $464,118 as a result of return of capital distributions paid by REITs. |
| (d) | | Reclassifications are primarily due to foreign currency transactions treated as ordinary income for tax purposes, book/tax differences in the treatment of passive foreign investment companies and book/tax differences in the treatment of various items. |
| (e) | | Reclassifications are primarily due to differences between book and tax amortization of premium on fixed income securities and income from mortgage backed securities treated as capital gains for tax purposes. |
| (f) | | Reclassifications are primarily due to foreign currency transactions treated as ordinary income for tax purposes, differences between book and tax amortization of premium on fixed income securities, income from mortgage backed securities treated as capital gains for tax purposes, and book/tax differences in the treatment of swap contracts. |
| (g) | | Reclassifications are primarily due to the differences between book and tax amortization of market discount on fixed income securities. |
2. Investment Management Agreement and Other Transactions with Affiliates
On December 1, 2005, Citigroup Inc. (“Citigroup”) completed the sale of substantially all of its asset management business, Citigroup Asset Management (“CAM”), to Legg Mason, Inc. (“Legg Mason”). As a result, the Trust’s former investment manager, Smith Barney Fund Management LLC (“SBFM”), previously an indirect wholly-owned subsidiary of Citigroup, became a wholly-owned subsidiary of Legg Mason. Although the Trust was not part of the sale to Legg Mason, completion of the sale caused the Trust’s existing investment management contract to terminate. The Board of Trustees approved a new investment management contract between the Trust and the Consulting Group (the “Manager”), a division of Citigroup Investment Advisory Services Inc., an indirect wholly-owned subsidiary of Citigroup, which became effective on December 1, 2005.
146
Notes to Financial Statements
(continued)
Indicated below for each Fund is the applicable subadviser, subadviser fee, actual investment management fee incurred and maximum allowable investment management fee. The maximum allowable investment management fee represents the total amount that could be charged to the Fund while the actual investment management fee is what the Fund incurred during the reporting period. The actual investment management fee could fluctuate from year to year if Subadvisers are added or terminated in a particular Fund. Under the new investment management agreement, the Funds will continue to pay the Manager an investment management fee calculated at an annual rate of the Funds’ average daily net assets as shown in the table below. This fee is calculated daily and paid monthly.
| | | | | | | | | | | |
| Fund | | Subadviser | | Subadviser
Fee | | | Actual
Investment
Management
Fee
Incurred | | | Maximum
Allowable
Annual
Investment
Management Fee | |
Large Capitalization Value Equity Investments | | | | | | | 0.58 | % | | 0.60 | % |
| | | Cambiar Investors LLC.: | | | | | | | | | |
| | | on the first $250 million | | 0.30 | % | | | | | | |
| | | on the amount over $250 million | | 0.25 | | | | | | | |
| | | AllianceBernstein L.P.: | | | | | | | | | |
| | | on the first $200 million | | 0.35 | | | | | | | |
| | | on the amount over $200 million | | 0.30 | | | | | | | |
| | | NFJ Investment Group: | | | | | | | | | |
| | | on the first $250 million | | 0.30 | | | | | | | |
| | | on the amount over $250 million | | 0.25 | | | | | | | |
Large Capitalization Growth Investments | | | | | | | 0.60 | | |
0.60 | |
| | | TCW Investment Management Co.: | | | | | | | | | |
| | | on the first $500 million | | 0.40 | | | | | | | |
| | | on the amount over $500 million | | 0.35 | | | | | | | |
| | | Westfield Capital Management Co., LLC: | | | | | | | | | |
| | | on the first $300 million | | 0.35 | | | | | | | |
| | | on the amount over $300 million | | 0.30 | | | | | | | |
| | | Sands Capital Management, LLC | | 0.40 | | | | | | | |
| | | Delaware Management Co. | | 0.40 | | | | | | | |
Small Capitalization Value Equity Investments | | | | | | | 0.80 | | | 0.80 | |
| | | NFJ Investment Group: | | | | | | | | | |
| | | on the first $450 million | | 0.50 | | | | | | | |
| | | on the amount over $450 million | | 0.45 | | | | | | | |
| | | Rutabaga Capital Management LLC | | 0.50 | | | | | | | |
| | | Delaware Management Co. | | 0.50 | | | | | | | |
Small Capitalization Growth Investments | | | | | | | 0.80 | | | 0.80 | |
| | | Wall Street Associates | | 0.50 | | | | | | | |
| | | Westfield Capital Management Co., LLC | | 0.50 | | | | | | | |
International Equity Investments | | | | | | | 0.63 | | | 0.70 | |
| | | Philadelphia International Advisors, LP: | | | | | | | | | |
| | | on the first $100 million | | 0.40 | | | | | | | |
| | | on the next $100 million | | 0.35 | | | | | | | |
| | | on the amount over $200 million | | 0.30 | | | | | | | |
147
Notes to Financial Statements
(continued)
| | | | | | | | | | | |
| Fund | | Subadviser | | Sub- Adviser
Fee | | | Actual
Investment
Management
Fee
Incurred | | | Maximum
Allowable
Annual
Investment
Management Fee | |
| | | Brandywine Global Investment Management: | | | | | | | | | |
| | | on the first $150 million | | 0.45 | % | | | | | | |
| | | on the amount over $150 million | | 0.25 | | | | | | | |
| | | William Blair & Co., LLC: | | | | | | | | | |
| | | on the first $100 million | | 0.40 | | | | | | | |
| | | on the amount over $100 million | | 0.35 | | | | | | | |
Emerging Markets Equity Investments | | | | | | | 0.80 | % | | 0.90 | % |
| | | Newgate Capital Management LLC | | 0.50 | | | | | | | |
| | | SSgA Funds Management, Inc. | | 0.50 | | | | | | | |
Government Money Investments | | | | | | | 0.15 | | | 0.15 | |
| | | Standish Mellon Asset Management LLC: | | | | | | | | | |
| | | on the first $100 million | | 0.15 | | | | | | | |
| | | on the amount over $100 million | | 0.10 | | | | | | | |
Core Fixed Income Investments | | | | | | | 0.40 | | | 0.40 | |
| | | BlackRock Financial Management, Inc.: | | | | | | | | | |
| | | on the first $500 million | | 0.20 | | | | | | | |
| | | on the amount over $500 million | | 0.15 | | | | | | | |
| | | Pacific Investment Management Co. | | 0.25 | | | | | | | |
| | | Western Asset Management Co. | | 0.20 | | | | | | | |
High Yield Investments | | | | | | | 0.55 | | | 0.70 | |
| | | Seix Advisors, the Fixed Income Division of Trusco Capital Management | |
0.30 | | | | | | | |
| | | Western Asset Management Co. | | 0.30 | | | | | | | |
Municipal Bond Investments | | | | | | | 0.40 | | | 0.40 | |
| | | McDonnell Investment Management, LLC | |
0.20 | | | | | | | |
International Fixed Income Investments | | | | | | | 0.50 | | | 0.50 | |
| | | Pacific Investment Management Co. | | 0.25 | | | | | | | |
In addition, the following changes were made:
Large Capitalization Value Equity Investments:
Chartwell Investments Partners was terminated, effective September 30, 2005.
Large Capitalization Growth Investments:
Delaware Management Company was added as a Subadviser, effective August 21, 2006.
Sands Capital Management LLC (“Sands”) entered into a new agreement effective May 1, 2006. Prior to this agreement, the subadvisory fee was 0.35% on the first $300 million and 0.30% on amounts over $300 million. Sands resigned on October 5, 2006.
Wells Capital Management was added as a Subadviser, effective October 12, 2006.
TCW Investment Management Company was terminated, effective September 14, 2006.
Municipal Bond Investments:
Smith Affiliated Capital Corp. was terminated, effective October 17, 2005.
McDonnell Investment Management, LLC was added as a Subadviser, effective October 17, 2005.
High Yield Investments:
Seix Advisors was terminated and Penn Capital Management Co., Inc. was added as a Subadviser, effective October 4, 2006.
148
Notes to Financial Statements
(continued)
SBFM continues to serve as administrator to the Trust pursuant to an amendment dated December 1, 2005 to the Trust’s Administration Agreement dated June 2, 1994. Each Fund pays SBFM a fee calculated at an annual rate of 0.125% of the average daily net assets of each respective Fund. This fee is calculated daily and paid monthly.
During the year ended August 31, 2006, SBFM waived a portion of its administration fee as follows:
| | | |
| Fund | | Fee
Waivers |
Large Capitalization Value Equity Investments | | $ | 164,364 |
Large Capitalization Growth Investments | | | 169,691 |
Small Capitalization Value Equity Investments | | | 135,476 |
Small Capitalization Growth Investments | | | 136,720 |
International Equity Investments | | | 147,202 |
Emerging Markets Equity Investments | | | 89,723 |
Core Fixed Income Investments | | | 78,799 |
High Yield Investments | | | 82,670 |
Municipal Bond Investments | | | 4,298 |
International Fixed Income Investments | | | 48,937 |
In addition, during the year ended August 31, 2006, Government Money Investments had a voluntary expense limitation in place of 0.60% of the Fund’s average daily net assets. This expense limitation can be terminated at any time by the Manager. During the year ended August 31, 2006 the Manager reimbursed the Fund for expenses in the amount of $206,198 and SBFM waived a portion of its administration fee in the amount of $48,562.
During the year ended August 31, 2005, Chartwell Investment Partners reimbursed Large Capitalization Value Equity Investments in the amount of $90,008 due to losses incurred resulting from an investment restriction violation.
During the year ended August 31, 2005, Newgate LLC reimbursed Emerging Markets Equity Investments in the amount of $104,701 due to losses incurred resulting from a trading error.
The Funds’ Board has approved PFPC Inc. (“PFPC”) to serve as transfer agent for the Funds, effective January 1, 2006. The principal business office of PFPC is located at 4400 Computer Drive, Westborough, MA 01581. Prior to January 1, 2006, Citicorp Trust Bank, fsb. (“CTB”), a subsidiary of Citigroup, acted as the Funds’ transfer agent and PFPC acted as the Funds’ sub-transfer agent. CTB received account fees and asset-based fees that varied according to the size and type of account. PFPC is responsible for shareholder recordkeeping and financial processing for all shareholder accounts and was paid by CTB. For the year ended August 31, 2006, the Funds paid transfer agent fees totaling $2,829,916 to CTB. The totals for each Fund were as follows:
| | | |
| Fund | | Transfer
Agent Fees |
Large Capitalization Value Equity Investments | | $ | 362,237 |
Large Capitalization Growth Investments | | | 362,500 |
Small Capitalization Value Equity Investments | | | 345,167 |
Small Capitalization Growth Investments | | | 345,293 |
International Equity Investments | | | 339,926 |
Emerging Markets Equity Investments | | | 227,971 |
Government Money Investments | | | 316,586 |
Core Fixed Income Investments | | | 183,846 |
High Yield Investments | | | 211,127 |
Municipal Bond Investments | | | 9,124 |
International Fixed Income Investments | | | 126,139 |
149
Notes to Financial Statements
(continued)
In addition, for the year ended August 31, 2006, the Funds also paid to other Citigroup affiliates shareholder recordkeeping fees as follows:
| | | |
| Fund | | |
Large Capitalization Value Equity Investments | | $ | 27,317 |
Large Capitalization Growth Investments | | | 27,100 |
Small Capitalization Value Equity Investments | | | 9,733 |
Small Capitalization Growth Investments | | | 22,690 |
International Equity Investments | | | 20,192 |
Emerging Markets Equity Investments | | | 5,222 |
Core Fixed Income Investments | | | 18,220 |
High Yield Investments | | | 2,139 |
International Fixed Income Investments | | | 2,483 |
For the year ended August 31, 2006, Citigroup Global Markets Inc. (“CGM”), another indirect wholly-owned subsidiary of Citigroup, and its affiliates received brokerage commissions of:
| | | |
| Fund | | Commissions |
Large Capitalization Value Equity Investments | | $ | 9,597 |
Large Capitalization Growth Investments | | | 37,545 |
Small Capitalization Value Equity Investments | | | 2,016 |
Small Capitalization Growth Investments | | | 24,163 |
International Equity Investments | | | 31,172 |
Emerging Markets Equity Investments | | | 786 |
All officers and two Trustees of the Trust are employees of Citigroup or Legg Mason or its affiliates and do not receive compensation from the Trust.
3. Investments
During the year ended August 31, 2006, the aggregate cost of purchases and proceeds from sales of investments (excluding short-term investments and mortgage dollar rolls) were as follows:
| | | | | | | | | | | | |
| | | Investments | | U.S. Government & Agency Obligations |
| Fund | | Purchases | | Sales | | Purchases | | Sales |
Large Capitalization Value Equity Investments | | $ | 859,918,382 | | $ | 807,298,534 | | | — | | | — |
Large Capitalization Growth Investments | | | 1,222,324,683 | | | 972,937,002 | | | — | | | — |
Small Capitalization Value Equity Investments | | | 108,390,624 | | | 189,049,891 | | | — | | | — |
Small Capitalization Growth Investments | | | 234,437,462 | | | 308,505,852 | | | — | | | — |
International Equity Investments | | | 779,683,667 | | | 577,689,615 | | | — | | | — |
Emerging Markets Equity Investments | | | 197,399,916 | | | 221,759,294 | | | — | | | — |
Core Fixed Income Investments | | | 300,103,463 | | | 212,542,848 | | $ | 2,498,427,385 | | $ | 2,303,904,017 |
High Yield Investments | | | 163,203,936 | | | 297,663,935 | | | 26,703,778 | | | 26,545,318 |
Municipal Bond Investments | | | 39,740,158 | | | 12,959,696 | | | — | | | — |
International Fixed Income Investments | | | 303,496,273 | | | 284,137,787 | | | 252,779,872 | | | 253,138,344 |
150
Notes to Financial Statements
(continued)
At August 31, 2006, the aggregate gross unrealized appreciation and depreciation of investments for federal income tax purposes were as follows:
| | | | | | | | | | | |
| Fund | | Gross
Unrealized Appreciation | | Gross
Unrealized Depreciation | | | Net Unrealized Appreciation/
Depreciation | |
Large Capitalization Value Equity Investments | | $ | 237,229,035 | | $ | (21,696,474 | ) | | $ | 215,532,561 | |
Large Capitalization Growth Investments | | | 268,364,417 | | | (48,518,067 | ) | | | 219,846,350 | |
Small Capitalization Value Equity Investments | | | 84,673,854 | | | (13,465,133 | ) | | | 71,208,721 | |
Small Capitalization Growth Investments | | | 95,338,328 | | | (17,712,854 | ) | | | 77,625,474 | |
International Equity Investments | | | 295,533,916 | | | (27,815,781 | ) | | | 267,718,135 | |
Emerging Markets Equity Investments | | | 98,304,613 | | | (6,041,553 | ) | | | 92,263,060 | |
Core Fixed Income Investments | | | 6,096,793 | | | (8,872,456 | ) | | | (2,775,663 | ) |
High Yield Investments | | | 2,568,055 | | | (1,999,374 | ) | | | 568,681 | |
Municipal Bond Investments | | | 1,605,805 | | | (21,818 | ) | | | 1,583,987 | |
International Fixed Income Investments | | | 2,615,430 | | | (1,855,769 | ) | | | 759,661 | |
At August 31, 2006, the Funds had the following open futures contracts:
| | | | | | | | | | | | | | |
| Core Fixed Income Investments | | Number of
Contracts | | Expiration
Date | | Basis Value | | Market
Value | | Unrealized
Gain (Loss) | |
Contracts to Buy: | | | | | | | | | | | | | | |
Euro | | 26 | | 9/06 | | $ | 6,144,030 | | $ | 6,149,325 | | $ | 5,295 | |
Euro | | 46 | | 3/07 | | | 10,885,725 | | | 10,900,275 | | | 14,550 | |
Euro | | 388 | | 6/07 | | | 91,877,800 | | | 92,077,250 | | | 199,450 | |
Euro | | 20 | | 6/07 | | | 4,739,600 | | | 4,746,250 | | | 6,650 | |
Euro | | 250 | | 9/07 | | | 59,352,875 | | | 59,403,125 | | | 50,250 | |
Euro | | 261 | | 12/07 | | | 61,998,637 | | | 62,059,275 | | | 60,638 | |
Euro | | 315 | | 3/08 | | | 74,709,875 | | | 74,910,938 | | | 201,063 | |
Euro | | 2 | | 12/08 | | | 473,950 | | | 475,200 | | | 1,250 | |
Euro | | 11 | | 3/09 | | | 2,606,037 | | | 2,612,637 | | | 6,600 | |
Euro | | 9 | | 6/09 | | | 2,131,312 | | | 2,136,712 | | | 5,400 | |
Federal Republic of Germany 10 Year Bonds | | 23 | | 9/06 | | | 3,407,302 | | | 3,470,554 | | | 63,252 | |
Federal Republic of Germany 10 Year Bonds | | 4 | | 12/06 | | | 601,046 | | | 601,708 | | | 662 | |
LIBOR Futures | | 37 | | 6/07 | | | 8,334,118 | | | 8,338,660 | | | 4,542 | |
LIBOR Futures | | 46 | | 9/07 | | | 10,363,606 | | | 10,370,625 | | | 7,019 | |
U.S. 2 Year Treasury Notes | | 97 | | 12/06 | | | 19,784,063 | | | 19,821,344 | | | 37,281 | |
U.S. 5 Year Treasury Notes | | 150 | | 12/06 | | | 15,733,500 | | | 15,766,406 | | | 32,906 | |
U.S. 5 Year Treasury Notes | | 257 | | 12/06 | | | 26,905,801 | | | 27,013,109 | | | 107,308 | |
U.S. 10 Year Treasury Notes | | 25 | | 12/06 | | | 2,678,516 | | | 2,684,375 | | | 5,859 | |
| | | | | | | | | | | | |
|
|
|
| | | | | | | | | | | | | | 809,975 | |
| | | | | | | | | | | | |
|
|
|
Contracts to Sell: | | | | | | | | | | | | | | |
U.S. Treasury Bonds | | 59 | | 9/06 | | | 6,305,164 | | | 6,530,563 | | | (225,399 | ) |
U.S. Treasury Bonds | | 23 | | 9/06 | | | 2,511,448 | | | 2,545,813 | | | (34,365 | ) |
U.S. 10 Year Treasury Notes | | 215 | | 9/06 | | | 22,585,391 | | | 23,095,703 | | | (510,312 | ) |
U.S. 10 Year Treasury Notes | | 149 | | 12/06 | | | 15,938,521 | | | 15,998,875 | | | (60,354 | ) |
| | | | | | | | | | | | |
|
|
|
| | | | | | | | | | | | | | (830,430 | ) |
| | | | | | | | | | | | |
|
|
|
Net Unrealized Loss on Open Futures Contracts | | | | | | | | | | | | $ | (20,455 | ) |
| | | | | | | | | | | | |
|
|
|
151
Notes to Financial Statements
(continued)
| | | | | | | | | | | | | | |
| International Fixed Income Investments | | Number of
Contracts | | Expiration
Date | | Basis Value | | Market
Value | | Unrealized
Gain (Loss) | |
Contracts to Buy: | | | | | | | | | | | | | | |
Euro | | 291 | | 9/06 | | $ | 69,123,412 | | $ | 68,825,137 | | $ | (298,275 | ) |
Euro | | 93 | | 12/06 | | | 21,987,525 | | | 22,007,287 | | | 19,762 | |
Euro | | 89 | | 6/07 | | | 21,081,875 | | | 21,120,813 | | | 38,938 | |
Euro | | 19 | | 9/07 | | | 4,498,488 | | | 4,514,638 | | | 16,150 | |
Euro | | 37 | | 9/08 | | | 8,769,000 | | | 8,794,900 | | | 25,900 | |
Euro | | 37 | | 12/08 | | | 8,765,300 | | | 8,791,200 | | | 25,900 | |
Euro | | 37 | | 3/09 | | | 8,762,525 | | | 8,787,963 | | | 25,438 | |
Euro | | 37 | | 6/09 | | | 8,758,825 | | | 8,784,263 | | | 25,438 | |
Federal Republic of Germany 5 Year Bonds | | 63 | | 9/06 | | | 8,790,194 | | | 8,974,695 | | | 184,501 | |
Federal Republic of Germany 5 Year Bonds | | 32 | | 12/06 | | | 4,496,001 | | | 4,502,551 | | | 6,550 | |
Federal Republic of Germany 10 Year Bonds | | 96 | | 9/06 | | | 14,264,312 | | | 14,524,502 | | | 260,190 | |
Federal Republic of Germany 10 Year Bonds | | 16 | | 12/06 | | | 2,403,474 | | | 2,406,832 | | | 3,358 | |
Japan Government Bonds 10 Year | | 19 | | 9/06 | | | 21,334,071 | | | 21,905,977 | | | 571,906 | |
Japan Government Bonds 10 Year | | 34 | | 12/06 | | | 38,886,370 | | | 38,993,311 | | | 106,941 | |
U.S. Treasury Bonds | | 1 | | 9/06 | | | 108,000 | | | 110,687 | | | 2,687 | |
U.S. 5 Year Treasury Notes | | 293 | | 12/06 | | | 30,728,375 | | | 30,797,046 | | | 68,671 | |
| | | | | | | | | | | | |
|
|
|
| | | | | | | | | | | | | | 1,084,055 | |
| | | | | | | | | | | | |
|
|
|
Contracts to Sell: | | | | | | | | | | | | | | |
U.S. 10 Year Treasury Notes | | 102 | | 9/06 | | | 10,756,500 | | | 10,957,031 | | | (200,531 | ) |
| | | | | | | | | | | | |
|
|
|
| | | | | | | | | | | | | | (200,531 | ) |
| | | | | | | | | | | | |
|
|
|
Net Unrealized Gain on Open Futures Contracts | | | | | | | | | | | | $ | 883,524 | |
| | | | | | | | | | | | |
|
|
|
At August 31, 2006, Emerging Markets Equity Investments had deposited $100 with the broker as initial margin collateral.
At August 31, 2006, Core Fixed Income Investments and International Fixed Income Investments held purchased options with a total cost of the following:
| | | | | | |
| | | Calls | | Puts |
Core Fixed Income Investments | | $ | 540,206 | | $ | 12,200 |
International Fixed Income Investments | | | 514,627 | | | 12,252 |
During the year ended August 31, 2006, written option transactions for Core Fixed Income Investments and International Fixed Income Investments were as follows:
| | | | | | | |
| Core Fixed Income Investments | | Number of
Contracts | | | Premiums
Received | |
Options written, outstanding at August 31, 2005 | | 56 | | | $ | 28,409 | |
Options written | | 59,401,027 | | | | 862,511 | |
Options closed | | (5,600,853 | ) | | | (287,680 | ) |
Options expired | | (3,000,229 | ) | | | (68,820 | ) |
| | |
|
| |
|
|
|
Options written, outstanding at August 31, 2006 | | 50,800,001 | | | $ | 534,420 | |
| | |
|
| |
|
|
|
| | |
| International Fixed Income Investments | | Number of
Contracts | | | Premiums
Received | |
Options written, outstanding at August 31, 2005 | | — | | | | — | |
Options written | | 891,300,477 | | | $ | 949,099 | |
Options closed | | (10,200,000 | ) | | | (74,477 | ) |
Options expired | | (7,400,391 | ) | | | (170,466 | ) |
| | |
|
| |
|
|
|
Options written, outstanding at August 31, 2006 | | 873,700,086 | | | $ | 704,156 | |
| | |
|
| |
|
|
|
152
Notes to Financial Statements
(continued)
At August 31, 2006, Emerging Markets Equity Investments, Core Fixed Income Investments and International Fixed Income Investments had open forward foreign currency contracts as described below. The unrealized gain (loss) on the open contracts reflected in the accompanying financial statements were as follows:
Emerging Markets Equity Investments
| | | | | | | | | | | |
Foreign Currency
| | Local Currency
| | Market Value
| | Settlement Date
| | Unrealized
Loss
| |
Contracts to Buy: | | | | | | | | | | | |
Malaysian Ringit | | 11,258,000 | | | $3,059,696 | | 11/21/06 | | | $(30,190 | ) |
| | | | | | | | | |
|
|
|
Net Unrealized Loss on Open Forward Foreign Currency Contracts | | | | | | | | | | $(30,190 | ) |
| | | | | | | | | |
|
|
|
| | | | |
| Core Fixed Income Investments | | | | | | | | | | | |
Foreign Currency
| | Local Currency
| | Market Value
| | Settlement Date
| | Unrealized
Loss
| |
Contracts to Buy: | | | | | | | | | | | |
Japanese Yen | | 607,250,000 | | $ | 5,188,041 | | 9/19/06 | | $ | (95,724 | ) |
Japanese Yen | | 313,560,000 | | | 2,678,900 | | 9/19/06 | | | (22,035 | ) |
Yuan Renminbi | | 3,860,000 | | | 492,757 | | 3/16/07 | | | (7,244 | ) |
Yuan Renminbi | | 21,339,000 | | | 2,735,245 | | 5/9/07 | | | (44,719 | ) |
Yuan Renminbi | | 10,298,480 | | | 1,330,064 | | 8/16/07 | | | (3,936 | ) |
| | | | | | | | | |
|
|
|
| | | | | | | | | | | (173,658 | ) |
| | | | | | | | | |
|
|
|
Contracts to Sell: | | | | | | | | | | | |
Euro | | 41,355,000 | | | 52,997,925 | | 9/29/06 | | | (113,564 | ) |
Pound Sterling | | 108,000 | | | 205,463 | | 9/7/06 | | | (4,720 | ) |
Pound Sterling | | 891,000 | | | 1,695,072 | | 9/7/06 | | | (6,278 | ) |
Pound Sterling | | 259,000 | | | 492,732 | | 9/7/06 | | | (1,825 | ) |
| | | | | | | | | |
|
|
|
| | | | | | | | | | | (126,387 | ) |
| | | | | | | | | |
|
|
|
Net Unrealized Loss on Open Forward Foreign Currency Contracts | | | | | | | | | $ | (300,045 | ) |
| | | | | | | | | |
|
|
|
International Fixed Income Investments
| | | | | | | | | | | |
Foreign Currency
| | Local Currency
| | Market
Value
| | Settlement Date
| | Unrealized
Gain (Loss)
| |
Contracts to Buy: | | | | | | | | | | | |
Australian Dollar | | 1,565,000 | | $ | 1,193,683 | | 9/11/06 | | $ | (1,586 | ) |
Australian Dollar | | 147,000 | | | 112,122 | | 9/11/06 | | | 704 | |
Australian Dollar | | 1,139,000 | | | 868,757 | | 9/11/06 | | | 5,452 | |
Australian Dollar | | 1,093,000 | | | 833,623 | | 9/14/06 | | | 5,129 | |
Australian Dollar | | 164,000 | | | 125,047 | | 9/28/06 | | | (290 | ) |
Australian Dollar | | 587,000 | | | 447,578 | | 9/28/06 | | | (244 | ) |
Brazilian Real | | 40,000 | | | 18,595 | | 9/29/06 | | | 1,472 | |
Brazilian Real | | 40,000 | | | 18,595 | | 9/29/06 | | | 1,427 | |
Brazilian Real | | 141,000 | | | 65,462 | | 10/6/06 | | | 1,513 | |
Brazilian Real | | 141,000 | | | 65,462 | | 10/6/06 | | | 1,589 | |
Canadian Dollar | | 191,000 | | | 172,629 | | 9/7/06 | | | 5,146 | |
Chilean Peso | | 29,606,181 | | | 54,846 | | 11/8/06 | | | 212 | |
Chilean Peso | | 30,393,819 | | | 56,305 | | 11/8/06 | | | 207 | |
153
Notes to Financial Statements
(continued)
| | | | | | | | | | | |
Foreign Currency
| | Local Currency
| | Market Value
| | Settlement Date
| | Unrealized
Gain (Loss)
| |
Contracts to Buy: | | | | | | | | | | | |
Danish Krone | | 369,000 | | $ | 63,304 | | 9/7/06 | | $ | (421 | ) |
Indian Rupee | | 6,506,000 | | | 139,704 | | 11/9/06 | | | (3,821 | ) |
Indian Rupee | | 509,000 | | | 10,884 | | 2/26/07 | | | 43 | |
Japanese Yen | | 735,995,000 | | | 6,287,975 | | 9/19/06 | | | (51,722 | ) |
New Taiwan Dollar | | 12,075,000 | | | 373,679 | | 2/22/07 | | | (3,782 | ) |
New Taiwan Dollar | | 402,000 | | | 12,446 | | 2/26/07 | | | (105 | ) |
Singapore Dollar | | 603,000 | | | 383,757 | | 9/26/06 | | | (491 | ) |
Singapore Dollar | | 215,000 | | | 136,965 | | 10/16/06 | | | (74 | ) |
South Korean Won | | 19,764,000 | | | 20,664 | | 2/26/07 | | | 20 | |
Swiss Franc | | 64,000 | | | 51,914 | | 9/7/06 | | | (1,057 | ) |
Yuan Renminbi | | 675,664 | | | 86,585 | | 5/9/07 | | | (1,415 | ) |
Yuan Renminbi | | 2,027,150 | | | 259,775 | | 5/9/07 | | | (4,226 | ) |
Yuan Renminbi | | 2,170,000 | | | 278,081 | | 5/9/07 | | | (4,324 | ) |
Yuan Renminbi | | 2,733,368 | | | 350,275 | | 5/9/07 | | | (5,725 | ) |
Yuan Renminbi | | 2,938,000 | | | 376,498 | | 5/9/07 | | | (6,204 | ) |
Yuan Renminbi | | 2,434,000 | | | 311,912 | | 5/9/07 | | | (5,016 | ) |
Yuan Renminbi | | 4,991,399 | | | 644,431 | | 8/15/07 | | | (2,794 | ) |
Yuan Renminbi | | 4,717,195 | | | 609,029 | | 8/15/07 | | | (2,086 | ) |
| | | | | | | | | |
|
|
|
| | | | | | | | | | | (72,469 | ) |
| | | | | | | | | |
|
|
|
Contracts to Sell: | | | | | | | | | | | |
Australian Dollar | | 1,094,200 | | | 834,651 | | 9/7/06 | | | (941 | ) |
Chilean Peso | | 29,075,000 | | | 53,869 | | 9/29/06 | | | (294 | ) |
Chilean Peso | | 29,075,000 | | | 53,869 | | 9/29/06 | | | (432 | ) |
Euro | | 51,670,000 | | | 66,216,969 | | 9/29/06 | | | (141,890 | ) |
Euro | | 590,000 | | | 756,106 | | 9/29/06 | | | 274 | |
Japanese Yen | | 106,485,000 | | | 909,755 | | 9/19/06 | | | (132 | ) |
New Zealand Dollar | | 1,862,475 | | | 1,218,127 | | 9/11/06 | | | (22,859 | ) |
New Zealand Dollar | | 174,702 | | | 114,262 | | 9/11/06 | | | (2,843 | ) |
New Zealand Dollar | | 1,353,075 | | | 884,961 | | 9/11/06 | | | (21,656 | ) |
New Zealand Dollar | | 194,381 | | | 127,008 | | 9/28/06 | | | (1,671 | ) |
New Zealand Dollar | | 683,914 | | | 446,869 | | 9/28/06 | | | 953 | |
Polish Zloty | | 6,891,000 | | | 2,237,031 | | 10/3/06 | | | (6,934 | ) |
Polish Zloty | | 170,000 | | | 55,287 | | 11/24/06 | | | (94 | ) |
Pound Sterling | | 2,692,000 | | | 5,121,364 | | 9/7/06 | | | (117,649 | ) |
Singapore Dollar | | 202,000 | | | 128,820 | | 11/6/06 | | | (484 | ) |
| | | | | | | | | |
|
|
|
| | | | | | | | | | | (316,652 | ) |
| | | | | | | | | |
|
|
|
Net Unrealized Loss on Open Forward Foreign Currency Contracts | | | | | | | | | $ | (389,121 | ) |
| | | | | | | | | |
|
|
|
At August 31, 2006, International Fixed Income Investments held the following interest rate swap contracts:
| | |
Swap Counterparty: | | Goldman Sachs Capital Markets, L.P. |
Effective Date: | | December 20, 2005 |
Notional Amount: | | 860,000,000 JPY |
Payments Made by Fund: | | Fixed Rate, 2.00% |
Payments Received by Fund: | | Floating Rate (6 month JPY LIBOR) |
Termination Date: | | December 20, 2013 |
Unrealized Depreciation | | $(35,750)
|
Swap Counterparty: | | Bank of America |
Effective Date: | | December 16, 2009 |
Notional Amount: | | $1,500,000 |
Payments Made by Fund: | | Floating Rate (3 month LIBOR) |
Payments Received by Fund: | | Fixed Rate, 5.50% |
Termination Date: | | December 16, 2014 |
Unrealized Depreciation | | $(158)
|
154
Notes to Financial Statements
(continued)
| | |
Swap Counterparty: | | Goldman Sachs Capital Markets, L.P. |
Effective Date: | | June 17, 2005 |
Notional Amount: | | 11,600,000 EUR |
Payments Made by Fund: | | Fixed Rate, 4.50% |
Payments Received by Fund: | | Floating Rate (6 month Euribor) |
Termination Date: | | June 17, 2015 |
Unrealized Appreciation | | $374,707
|
Swap Counterparty: | | Morgan Stanley Capital Services Inc. |
Effective Date: | | June 17, 2005 |
Notional Amount: | | 2,700,000 EUR |
Payments Made by Fund: | | Fixed Rate, 4.50% |
Payments Received by Fund: | | Floating Rate (6 month Euribor) |
Termination Date: | | June 17, 2015 |
Unrealized Appreciation | | $224,697
|
Swap Counterparty: | | Goldman Sachs Capital Markets, L.P. |
Effective Date: | | December 20, 2005 |
Notional Amount: | | 1,300,000,000 JPY |
Payments Made by Fund: | | Floating Rate (6 month JPY LIBOR) |
Payments Received by Fund: | | Fixed Rate, 1.50% |
Termination Date: | | December 20, 2015 |
Unrealized Depreciation | | $(430,226)
|
Swap Counterparty: | | Merrill Lynch Capital Services, Inc. |
Effective Date: | | June 18, 2014 |
Notional Amount: | | 1,100,000 EUR |
Payments Made by Fund: | | Fixed Rate, 6.00% |
Payments Received by Fund: | | Floating Rate (6 month Euribor) |
Termination Date: | | June 18, 2034 |
Unrealized Appreciation | | $51,700
|
Swap Counterparty: | | Morgan Stanley Capital Services Inc. |
Effective Date: | | June 18, 2014 |
Notional Amount: | | 4,100,000 EUR |
Payments Made by Fund: | | Floating Rate (6 month Euribor) |
Payments Received by Fund: | | Fixed Rate, 6.00% |
Termination Date: | | June 18, 2034 |
Unrealized Appreciation | | $221,547
|
Swap Counterparty: | | Barclays Bank PLC |
Effective Date: | | December 15, 2015 |
Notional Amount: | | 700,000 GBP |
Payments Made by Fund: | | Fixed Rate, 4.00% |
Payments Received by Fund: | | Floating Rate (6 month GBP LIBOR) |
Termination Date: | | December 15, 2035 |
Unrealized Depreciation | | $(9,453)
|
Swap Counterparty: | | Goldman Sachs Capital Markets, L.P. |
Effective Date: | | December 15, 2006 |
Notional Amount: | | 1,110,000,000 JPY |
Payments Made by Fund: | | Fixed Rate, 2.00% |
Payments Received by Fund: | | Floating Rate (6 month JPY LIBOR) |
Termination Date: | | December 15, 2015 |
Unrealized Depreciation | | $(252,292)
|
155
Notes to Financial Statements
(continued)
| | |
Swap Counterparty: | | Deutsche Bank |
Effective Date: | | December 15, 2006 |
Notional Amount: | | 950,000,000 JPY |
Payments Made by Fund: | | Fixed Rate, 2.00% |
Payments Received by Fund: | | Floating Rate (6 month JPY LIBOR) |
Termination Date: | | December 15, 2015 |
Unrealized Depreciation | | $(188,322)
|
Swap Counterparty: | | Morgan Stanley Capital Services Inc. |
Effective Date: | | December 15, 2006 |
Notional Amount: | | 320,000,000 JPY |
Payments Made by Fund: | | Fixed Rate, 2.00% |
Payments Received by Fund: | | Floating Rate (6 month JPY LIBOR) |
Termination Date: | | December 15, 2015 |
Unrealized Depreciation | | $(68,601)
|
Swap Counterparty: | | Merrill Lynch Capital Services, Inc. |
Effective Date: | | December 15, 2006 |
Notional Amount: | | 150,000,000 JPY |
Payments Made by Fund: | | Fixed Rate, 2.00% |
Payments Received by Fund: | | Floating Rate (6 month JPY LIBOR) |
Termination Date: | | December 15, 2015 |
Unrealized Depreciation | | $(30,669)
|
Swap Counterparty: | | Barclays Bank PLC |
Effective Date: | | December 15, 2006 |
Notional Amount: | | 660,000,000 JPY |
Payments Made by Fund: | | Fixed Rate, 2.00% |
Payments Received by Fund: | | Floating Rate (6 month JPY LIBOR) |
Termination Date: | | December 15, 2015 |
Unrealized Depreciation | | $(130,488)
|
Swap Counterparty: | | Morgan Stanley Capital Services Inc. |
Effective Date: | | September 18, 2007 |
Notional Amount: | | 900,000,000 JPY |
Payments Made by Fund: | | Floating Rate (6 month JPY LIBOR) |
Payments Received by Fund: | | Fixed Rate, 1.00% |
Termination Date: | | September 18, 2008 |
Unrealized Appreciation | | $8,456
|
Swap Counterparty: | | JPMorgan Chase Bank |
Effective Date: | | December 20, 2004 |
Notional Amount: | | 1,460,000,000 JPY |
Payments Made by Fund: | | Fixed Rate, 2.00% |
Payments Received by Fund: | | Floating Rate (6 month JPY LIBOR) |
Termination Date: | | December 20, 2013 |
Unrealized Appreciation | | $467,935
|
Swap Counterparty: | | UBS AG |
Effective Date: | | December 20, 2004 |
Notional Amount: | | 540,000,000 JPY |
Payments Made by Fund: | | Fixed Rate, 2.00% |
Payments Received by Fund: | | Floating Rate (6 month JPY LIBOR) |
Termination Date: | | December 20, 2013 |
Unrealized Depreciation | | $(41,789)
|
156
Notes to Financial Statements
(continued)
| | |
Swap Counterparty: | | Barclays Bank PLC |
Effective Date: | | September 15, 2005 |
Notional Amount: | | 500,000 GBP |
Payments Made by Fund: | | Floating Rate (6 month GBP LIBOR) |
Payments Received by Fund: | | Fixed Rate, 5.00% |
Termination Date: | | September 15, 2015 |
Unrealized Depreciation | | ($(18,106)
|
Swap Counterparty: | | Deutsche Bank |
Effective Date: | | March 20, 2007 |
Notional Amount: | | 200,000,000 JPY |
Payments Made by Fund: | | Floating Rate (6 month JPY LIBOR) |
Payments Received by Fund: | | Fixed Rate, 1.00% |
Termination Date: | | March 18, 2008 |
Unrealized Appreciation | | $4,454
|
Swap Counterparty: | | Goldman Sachs Capital Markets, L.P. |
Effective Date: | | March 20, 2007 |
Notional Amount: | | 7,200,000,000 JPY |
Payments Made by Fund: | | Floating Rate (6 month JPY LIBOR) |
Payments Received by Fund: | | Fixed Rate, 1.00% |
Termination Date: | | March 18, 2008 |
Unrealized Appreciation | | $143,938
|
Swap Counterparty: | | Barclays Bank PLC |
Effective Date: | | December 20, 2006 |
Notional Amount: | | $2,000,000 |
Payments Made by Fund: | | Floating Rate (3 month LIBOR) |
Payments Received by Fund: | | Fixed Rate, 5.00% |
Termination Date: | | December 20, 2036 |
Unrealized Appreciation | | $87,434
|
Swap Counterparty: | | JPMorgan Chase Bank |
Effective Date: | | December 20, 2006 |
Notional Amount: | | $3,300,000 |
Payments Made by Fund: | | Floating Rate (3 month LIBOR) |
Payments Received by Fund: | | Fixed Rate, 5.00% |
Termination Date: | | December 20, 2016 |
Unrealized Appreciation | | $50,568
|
Swap Counterparty: | | Barclays Bank PLC |
Effective Date: | | September 15, 2006 |
Notional Amount: | | 1,000,000 GBP |
Payments Made by Fund: | | Floating Rate (6 month GBP LIBOR) |
Payments Received by Fund: | | Fixed Rate, 5.00% |
Termination Date: | | September 15, 2010 |
Unrealized Appreciation | | $204
|
Swap Counterparty: | | HSBC Bank |
Effective Date: | | September 15, 2006 |
Notional Amount: | | 5,200,000 GBP |
Payments Made by Fund: | | Floating Rate (6 month GBP LIBOR) |
Payments Received by Fund: | | Fixed Rate, 5.00% |
Termination Date: | | September 15, 2010 |
Unrealized Depreciation | | $(64,912)
|
157
Notes to Financial Statements
(continued)
| | |
Swap Counterparty: | | Deutsche Bank |
Effective Date: | | June 12, 2006 |
Notional Amount: | | 100,000 GBP |
Payments Made by Fund: | | Fixed Rate, 4.25% |
Payments Received by Fund: | | Floating Rate (6 month GBP LIBOR) |
Termination Date: | | June 12, 2036 |
Unrealized Appreciation | | $3,993
|
Swap Counterparty: | | Barclays Bank PLC |
Effective Date: | | December 20, 2006 |
Notional Amount: | | 280,000,000 JPY |
Payments Made by Fund: | | Floating Rate (6 month JPY LIBOR) |
Payments Received by Fund: | | Fixed Rate, 2.00% |
Termination Date: | | December 20, 2025 |
Unrealized Appreciation | | $75,455
|
Swap Counterparty: | | Goldman Sachs Capital Markets, L.P. |
Effective Date: | | June 20, 2008 |
Notional Amount: | | 950,000,000 JPY |
Payments Made by Fund: | | Fixed Rate, 2.00% |
Payments Received by Fund: | | Floating Rate (6 month JPY LIBOR) |
Termination Date: | | June 20, 2010 |
Unrealized Depreciation | | $(60,409)
|
Swap Counterparty: | | Goldman Sachs Capital Markets, L.P. |
Effective Date: | | September 15, 2006 |
Notional Amount: | | 400,000 GBP |
Payments Made by Fund: | | Floating Rate (6 month GBP LIBOR) |
Payments Received by Fund: | | Fixed Rate, 5.00% |
Termination Date: | | September 15, 2010 |
Unrealized Appreciation | | $271
|
Swap Counterparty: | | Deutsche Bank |
Effective Date: | | December 20, 2006 |
Notional Amount: | | $4,300,000 |
Payments Made by Fund: | | Fixed Rate, 5.00% |
Payments Received by Fund: | | Floating Rate (3 month LIBOR) |
Termination Date: | | December 20, 2011 |
Unrealized Depreciation | | $(49,873)
|
Swap Counterparty: | | Morgan Stanley Capital Services Inc. |
Effective Date: | | December 20, 2006 |
Notional Amount: | | $20,700,000 |
Payments Made by Fund: | | Fixed Rate, 5.00% |
Payments Received by Fund: | | Floating Rate (3 month LIBOR) |
Termination Date: | | December 20, 2011 |
Unrealized Depreciation | | $(240,087)
|
Swap Counterparty: | | JPMorgan Chase Bank |
Effective Date: | | December 20, 2006 |
Notional Amount: | | $1,300,000 |
Payments Made by Fund: | | Floating Rate (3 month LIBOR) |
Payments Received by Fund: | | Fixed Rate, 5.00% |
Termination Date: | | December 20, 2011 |
Unrealized Appreciation | | $23,167
|
158
Notes to Financial Statements
(continued)
| | |
Swap Counterparty: | | Goldman Sachs Capital Markets, L.P. |
Effective Date: | | December 20, 2006 |
Notional Amount: | | $1,600,000 |
Payments Made by Fund: | | Fixed Rate, 5.00% |
Payments Received by Fund: | | Floating Rate (3 month LIBOR) |
Termination Date: | | December 20, 2011 |
Unrealized Depreciation | | $(18,813)
|
Swap Counterparty: | | Goldman Sachs Capital Markets, L.P. |
Effective Date: | | December 20, 2006 |
Notional Amount: | | $2,100,000 |
Payments Made by Fund: | | Fixed Rate, 5.00% |
Payments Received by Fund: | | Floating Rate (3 month LIBOR) |
Termination Date: | | December 20, 2036 |
Unrealized Appreciation | | $91,753
|
Swap Counterparty: | | Morgan Stanley Capital Services Inc. |
Effective Date: | | December 20, 2006 |
Notional Amount: | | $300,000 |
Payments Made by Fund: | | Floating Rate (3 month LIBOR) |
Payments Received by Fund: | | Fixed Rate, 5.00% |
Termination Date: | | December 20, 2036 |
Unrealized Appreciation | | $13,109
|
Swap Counterparty: | | Morgan Stanley Capital Services Inc. |
Effective Date: | | December 20, 2006 |
Notional Amount: | | $8,900,000 |
Payments Made by Fund: | | Fixed Rate, 5.00% |
Payments Received by Fund: | | Floating Rate (3 month LIBOR) |
Termination Date: | | December 20, 2008 |
Unrealized Depreciation | | $(70,559)
|
Swap Counterparty: | | Morgan Stanley Capital Services Inc. |
Effective Date: | | June 15, 2007 |
Notional Amount: | | 1,800,000 GBP |
Payments Made by Fund: | | Fixed Rate, 5.00% |
Payments Received by Fund: | | Floating Rate (6 month GBP LIBOR) |
Termination Date: | | June 15, 2009 |
Unrealized Appreciation | | $6,572
|
Swap Counterparty: | | Goldman Sachs Capital Markets, L.P. |
Effective Date: | | June 15, 2007 |
Notional Amount: | | 17,800,000 GBP |
Payments Made by Fund: | | Fixed Rate, 5.00% |
Payments Received by Fund: | | Floating Rate (6 month GBP LIBOR) |
Termination Date: | | June 15, 2009 |
Unrealized Appreciation | | $102,275
|
Swap Counterparty: | | HSBC Bank |
Effective Date: | | December 15, 2006 |
Notional Amount: | | 300,000 EUR |
Payments Made by Fund: | | Fixed Rate, 4.00% |
Payments Received by Fund: | | Floating Rate (6 month Euribor) |
Termination Date: | | December 15, 2014 |
Unrealized Depreciation | | $(7,830)
|
159
Notes to Financial Statements
(continued)
| | |
Swap Counterparty: | | Deutsche Bank |
Effective Date: | | December 15, 2006 |
Notional Amount: | | 2,100,000 EUR |
Payments Made by Fund: | | Fixed Rate, 4.00% |
Payments Received by Fund: | | Floating Rate (6 month Euribor) |
Termination Date: | | December 15, 2014 |
Unrealized Depreciation | | $(54,818)
|
Swap Counterparty: | | HSBC Bank |
Effective Date: | | September 15, 2006 |
Notional Amount: | | 200,000 GBP |
Payments Made by Fund: | | Floating Rate (6 month GBP LIBOR) |
Payments Received by Fund: | | Fixed Rate, 5.00% |
Termination Date: | | September 15, 2015 |
Unrealized Appreciation | | $3,071
|
Swap Counterparty: | | HSBC Bank |
Effective Date: | | December 15, 2006 |
Notional Amount: | | 7,500,000 AUD |
Payments Made by Fund: | | Fixed Rate, 6.00% |
Payments Received by Fund: | | Floating Rate (6 month BBSW) |
Termination Date: | | December 15, 2011 |
Unrealized Appreciation | | $3,199
|
Swap Counterparty: | | HSBC Bank |
Effective Date: | | December 15, 2006 |
Notional Amount: | | 4,300,000 AUD |
Payments Made by Fund: | | Fixed Rate, 6.00% |
Payments Received by Fund: | | Floating Rate (6 month BBSW) |
Termination Date: | | December 15, 2016 |
Unrealized Depreciation | | $(8,007)
|
At August 31, 2006, International Fixed Income Investments held the following credit default swap contracts:
| | |
Swap Counterparty: | | Merrill Lynch Capital Services, Inc. |
Effective Date: | | June 16, 2006 |
Referenced Entity: | | Russian Federation |
Notional Amount: | | $500,000 |
Termination Date: | | June 20, 2007 |
Unrealized Appreciation | | $525
|
Swap Counterparty: | | Morgan Stanley Capital Services Inc. |
Effective Date: | | August 2, 2006 |
Referenced Entity: | | Federative Republic of Brazil |
Notional Amount: | | $2,000,000 |
Termination Date: | | August 20, 2011 |
Unrealized Appreciation | | $11,389
|
Swap Counterparty: | | Morgan Stanley Capital Services Inc. |
Effective Date: | | August 2, 2006 |
Referenced Entity: | | Federative Republic of Brazil |
Notional Amount: | | $1,100,000 |
Termination Date: | | August 20, 2016 |
Unrealized Depreciation | | $(13,001)
|
160
Notes to Financial Statements
(continued)
| | |
Swap Counterparty: | | JPMorgan Chase Bank |
Effective Date: | | August 3, 2006 |
Referenced Entity: | | Federative Republic of Brazil |
Notional Amount: | | $1,100,000 |
Termination Date: | | August 20, 2016 |
Unrealized Depreciation | | $(9,474)
|
Swap Counterparty: | | JPMorgan Chase Bank |
Effective Date: | | August 3, 2006 |
Referenced Entity: | | Federative Republic of Brazil |
Notional Amount: | | $2,000,000 |
Termination Date: | | August 20, 2011 |
Unrealized Appreciation | | $8,386
|
Swap Counterparty: | | Lehman Brothers Special Financing Inc. |
Effective Date: | | August 9, 2006 |
Referenced Entity: | | Federative Republic of Brazil |
Notional Amount: | | $3,400,000 |
Termination Date: | | August 20, 2011 |
Unrealized Appreciation | | $4,776
|
Swap Counterparty: | | Lehman Brothers Special Financing Inc. |
Effective Date: | | August 9, 2006 |
Referenced Entity: | | Federative Republic of Brazil |
Notional Amount: | | $1,900,000 |
Termination Date: | | August 20, 2016 |
Unrealized Depreciation | | $(6,890)
|
At August 31, 2006, Core Fixed Income Investments held the following interest rate swap contracts:
| | |
Swap Counterparty: | | Bank of America |
Effective Date: | | June 15, 2005 |
Notional Amount: | | $1,500,000 |
Payments Made by Fund: | | Floating Rate (3 month LIBOR) |
Payments Received by Fund: | | Fixed Rate, 6.00% |
Termination Date: | | June 15, 2035 |
Unrealized Depreciation | | $(23,970)
|
Swap Counterparty: | | Barclays Bank PLC |
Effective Date: | | September 15, 2006 |
Notional Amount: | | 1,000,000 GBP |
Payments Made by Fund: | | Floating Rate (3 month GBP LIBOR) |
Payments Received by Fund: | | Fixed Rate, 5.00% |
Termination Date: | | September 15, 2010 |
Unrealized Depreciation | | $(20,275)
|
Swap Counterparty: | | Lehman Brothers Special Financing Inc. |
Effective Date: | | December 20, 2006 |
Notional Amount: | | $3,000,000 |
Payments Made by Fund: | | Floating Rate (3 month LIBOR) |
Payments Received by Fund: | | Fixed Rate, 5.00% |
Termination Date: | | December 20, 2016 |
Unrealized Appreciation | | $62,111
|
161
Notes to Financial Statements
(continued)
| | |
Swap Counterparty: | | Merrill Lynch International |
Effective Date: | | December 15, 2006 |
Notional Amount: | | 90,000,000 JPY |
Payments Made by Fund: | | Fixed Rate, 2.00% |
Payments Received by Fund: | | Floating Rate (6 month JPY LIBOR) |
Termination Date: | | December 15, 2015 |
Unrealized Depreciation | | $(18,401)
|
Swap Counterparty: | | Barclays Bank PLC |
Effective Date: | | December 15, 2006 |
Notional Amount: | | 40,000,000 JPY |
Payments Made by Fund: | | Fixed Rate, 2.00% |
Payments Received by Fund: | | Floating Rate (6 month JPY LIBOR) |
Termination Date: | | December 15, 2015 |
Unrealized Depreciation | | $(7,908)
|
Swap Counterparty: | | Goldman Sachs Capital Markets, L.P. |
Effective Date: | | December 20, 2006 |
Notional Amount: | | $6,600,000 |
Payments Made by Fund: | | Floating Rate (3 month LIBOR) |
Payments Received by Fund: | | Fixed Rate, 5.00% |
Termination Date: | | December 20, 2016 |
Unrealized Appreciation | | $136,644
|
Swap Counterparty: | | Goldman Sachs Capital Markets, L.P. |
Effective Date: | | December 20, 2006 |
Notional Amount: | | $2,400,000 |
Payments Made by Fund: | | Fixed Rate, 5.00% |
Payments Received by Fund: | | Floating Rate (3 month LIBOR) |
Termination Date: | | December 20, 2011 |
Unrealized Depreciation | | $(28,220)
|
Swap Counterparty: | | UBS AG |
Effective Date: | | December 20, 2006 |
Notional Amount: | | $7,000,000 |
Payments Made by Fund: | | Floating Rate (3 month LIBOR) |
Payments Received by Fund: | | Fixed Rate, 5.00% |
Termination Date: | | December 20, 2008 |
Unrealized Appreciation | | $55,531
|
Swap Counterparty: | | Royal Bank of Scotland |
Effective Date: | | December 20, 2006 |
Notional Amount: | | $500,000 |
Payments Made by Fund: | | Floating Rate (3 month LIBOR) |
Payments Received by Fund: | | Fixed Rate, 5.00% |
Termination Date: | | December 20, 2036 |
Unrealized Appreciation | | $21,858
|
Swap Counterparty: | | Morgan Stanley Capital Services Inc. |
Effective Date: | | December 20, 2006 |
Notional Amount: | | $6,200,000 |
Payments Made by Fund: | | Floating Rate (3 month LIBOR) |
Payments Received by Fund: | | Fixed Rate, 5.00% |
Termination Date: | | December 20, 2036 |
Unrealized Appreciation | | $270,922
|
162
Notes to Financial Statements
(continued)
| | |
Swap Counterparty: | | Goldman Sachs Capital Markets, L.P. |
Effective Date: | | December 20, 2006 |
Notional Amount: | | $1,300,000 |
Payments Made by Fund: | | Floating Rate (3 month LIBOR) |
Payments Received by Fund: | | Fixed Rate, 5.00% |
Termination Date: | | December 20, 2036 |
Unrealized Appreciation | | $56,800
|
Swap Counterparty: | | Barclays Bank PLC |
Effective Date: | | December 15, 2015 |
Notional Amount: | | 1,600,000 GBP |
Payments Made by Fund: | | Fixed Rate, 4.00% |
Payments Received by Fund: | | Floating Rate (6 month GBP LIBOR) |
Termination Date: | | December 15, 2035 |
Unrealized Depreciation | | $(24,337)
|
Swap Counterparty: | | UBS AG |
Effective Date: | | June 18, 2006 |
Notional Amount: | | $31,000,000 |
Payments Made by Fund: | | Floating Rate (3 month LIBOR) |
Payments Received by Fund: | | Fixed Rate, 5.00% |
Termination Date: | | June 18, 2009 |
Unrealized Appreciation | | $73,735
|
Swap Counterparty: | | Barclays Bank PLC |
Effective Date: | | December 20, 2006 |
Notional Amount: | | $700,000 |
Payments Made by Fund: | | Floating Rate (3 month LIBOR) |
Payments Received by Fund: | | Fixed Rate, 5.00% |
Termination Date: | | December 20, 2008 |
Unrealized Appreciation | | $2,932
|
Swap Counterparty: | | Barclays Bank PLC |
Effective Date: | | June 15, 2007 |
Notional Amount: | | 1,300,000 GBP |
Payments Made by Fund: | | Floating Rate (6 month GBP LIBOR) |
Payments Received by Fund: | | Fixed Rate, 5.00% |
Termination Date: | | June 15, 2009 |
Unrealized Appreciation | | $6,045
|
At August 31, 2006, Core Fixed Income Investments held the following credit default swap contracts:
| | |
Swap Counterparty: | | Merrill Lynch International |
Effective Date: | | March 12, 2005 |
Referenced Entity: | | Russian Federation |
Notional Amount: | | $600,000 |
Termination Date: | | March 20, 2007 |
Unrealized Appreciation | | $1,131
|
Swap Counterparty: | | JPMorgan Chase Bank |
Effective Date: | | May 19, 2005 |
Referenced Entity: | | Russian Federation |
Notional Amount: | | $100,000 |
Termination Date: | | May 20, 2007 |
Unrealized Appreciation | | $350
|
163
Notes to Financial Statements
(continued)
| | |
Swap Counterparty: | | Bear Stearns Bank PLC |
Effective Date: | | June 27, 2005 |
Referenced Entity: | | Trinity CDO, Ltd. |
Notional Amount: | | $2,000,000 |
Termination Date: | | March 8, 2040 |
Unrealized Depreciation | | $(27,722)
|
Swap Counterparty: | | Morgan Stanley Capital Services Inc. |
Effective Date: | | August 31, 2005 |
Referenced Entity: | | Republic of Turkey |
Notional Amount: | | $400,000 |
Termination Date: | | September 20, 2010 |
Unrealized Depreciation | | $(16,861)
|
Swap Counterparty: | | Bear Stearns Bank PLC |
Effective Date: | | January 20, 2006 |
Referenced Entity: | | Bear Stearns Fixed Rate ABS Index |
Notional Amount: | | $4,000,000 |
Termination Date: | | July 25, 2045 |
Unrealized Depreciation | | $(11,717)
|
Swap Counterparty: | | Goldman Sachs Capital Markets, L.P. |
Effective Date: | | February 1, 2006 |
Referenced Entity: | | Goldman Sachs Fixed Rate ABS Index |
Notional Amount: | | $600,000 |
Termination Date: | | July 25, 2045 |
Unrealized Depreciation | | $(1,383)
|
Swap Counterparty: | | Deutsche Bank |
Effective Date: | | May 13, 2006 |
Referenced Entity: | | Republic of Hungary |
Notional Amount: | | $800,000 |
Termination Date: | | May 20, 2016 |
Unrealized Appreciation | | $5,368
|
Swap Counterparty: | | JPMorgan Chase Bank |
Effective Date: | | May 13, 2006 |
Referenced Entity: | | Republic of Hungary |
Notional Amount: | | $800,000 |
Termination Date: | | May 20, 2016 |
Unrealized Appreciation | | $5,663
|
Swap Counterparty: | | Morgan Stanley Capital Services Inc. |
Effective Date: | | May 13, 2006 |
Referenced Entity: | | Republic of Hungary |
Notional Amount: | | $1,600,000 |
Termination Date: | | May 20, 2016 |
Unrealized Appreciation | | $11,916
|
Swap Counterparty: | | Barclays Bank PLC |
Effective Date: | | June 6, 2006 |
Referenced Entity: | | Republic of Brazil |
Notional Amount: | | $1,600,000 |
Termination Date: | | September 20, 2006 |
Unrealized Appreciation | | $65
|
Swap Counterparty: | | JPMorgan Chase Bank |
Effective Date: | | June 6, 2006 |
Referenced Entity: | | Russian Federation |
Notional Amount: | | $1,600,000 |
Termination Date: | | September 20, 2006 |
Unrealized Appreciation | | $218
|
164
Notes to Financial Statements
(continued)
| | |
Swap Counterparty: | | JPMorgan Chase Bank |
Effective Date: | | June 8, 2006 |
Referenced Entity: | | Russian Federation |
Notional Amount: | | $1,600,000 |
Termination Date: | | June 20, 2007 |
Unrealized Appreciation | | $1,806
|
Swap Counterparty: | | Barclays Bank PLC |
Effective Date: | | June 8, 2006 |
Referenced Entity: | | Republic of Brazil |
Notional Amount: | | $1,600,000 |
Termination Date: | | June 20, 2007 |
Unrealized Depreciation | | $(372)
|
Swap Counterparty: | | HSBC Bank |
Effective Date: | | June 17, 2006 |
Referenced Entity: | | Russian Federation |
Notional Amount: | | $1,400,000 |
Termination Date: | | September 20, 2006 |
Unrealized Appreciation | | $199
|
Swap Counterparty: | | UBS AG |
Effective Date: | | June 24, 2006 |
Referenced Entity: | | GMAC |
Notional Amount: | | $900,000 |
Termination Date: | | December 20, 2006 |
Unrealized Appreciation | | $3,887
|
At August 31, 2006, Core Fixed Income Investments held the following Index-linked swap contract:
| | |
Swap Counterparty: | | UBS AG |
Effective Date: | | October 15, 2005 |
Notional Amount: | | 200,000 EUR |
Payments Made by Fund: | | Floating Rate (France CPI Ex Tobacco Index) |
Payments Received by Fund: | | Fixed Rate, 2.1455% |
Termination Date: | | October 15, 2010 |
Unrealized Appreciation | | $814
|
At August 31, 2006, International Fixed Income Investments and Core Fixed Income Investments had total net unrealized appreciation of $173,054 and $536,829 respectively, from swap contracts.
During the year ended August 31, 2006, Core Fixed Income Investments entered into mortgage dollar roll transactions in the aggregate amount of $443,617,655.
At August 31, 2006, Core Fixed Income Investments had outstanding mortgage dollar rolls with a total cost of $68,933,570.
For the year ended August 31, 2006, Core Fixed Income Investments recorded interest income of $340,001 related to such mortgage rolls.
4. Shares of Beneficial Interest
At August 31, 2006, the Trust had an unlimited number of shares authorized with a par value of $0.001 per share.
165
Notes to Financial Statements
(continued)
Transactions in shares of each Fund were as follows:
| | | | | | |
| | | Year Ended
August 31, 2006
| | | Year Ended
August 31, 2005
| |
| Large Capitalization Value Equity Investments | | | | | | |
Shares sold | | 30,590,292 | | | 21,601,643 | |
Shares issued on reinvestment | | 6,840,450 | | | 1,349,997 | |
Shares repurchased | | (28,819,854 | ) | | (35,724,160 | ) |
| | |
|
| |
|
|
Net Increase (Decrease) | | 8,610,888 | | | (12,772,520 | ) |
| | |
|
| |
|
|
| Large Capitalization Growth Investments | | | | | | |
Shares sold | | 47,577,855 | | | 27,074,907 | |
Shares repurchased | | (26,677,870 | ) | | (20,236,156 | ) |
| | |
|
| |
|
|
Net Increase | | 20,899,985 | | | 6,838,751 | |
| | |
|
| |
|
|
| Small Capitalization Value Equity Investments | | | | | | |
Shares sold | | 3,722,228 | | | 3,390,940 | |
Shares issued on reinvestment | | 7,197,797 | | | 2,992,407 | |
Shares repurchased | | (9,403,887 | ) | | (12,211,056 | ) |
| | |
|
| |
|
|
Net Increase (Decrease) | | 1,516,138 | | | (5,827,709 | ) |
| | |
|
| |
|
|
| Small Capitalization Growth Investments | | | | | | |
Shares sold | | 5,288,132 | | | 9,265,757 | |
Shares repurchased | | (10,002,994 | ) | | (7,822,134 | ) |
| | |
|
| |
|
|
Net Increase (Decrease) | | (4,714,862 | ) | | 1,443,623 | |
| | |
|
| |
|
|
| International Equity Investments | | | | | | |
Shares sold | | 40,932,743 | | | 28,113,687 | |
Shares issued on reinvestment | | 1,153,715 | | | 635,294 | |
Shares repurchased | | (27,283,540 | ) | | (12,276,186 | ) |
| | |
|
| |
|
|
Net Increase | | 14,802,918 | | | 16,472,795 | |
| | |
|
| |
|
|
| Emerging Markets Equity Investments | | | | | | |
Shares sold | | 5,436,369 | | | 6,008,721 | |
Shares issued on reinvestment | | 231,945 | | | 258,966 | |
Shares repurchased | | (8,088,359 | ) | | (7,513,502 | ) |
| | |
|
| |
|
|
Net Decrease | | (2,420,045 | ) | | (1,245,815 | ) |
| | |
|
| |
|
|
| Government Money Investments | | | | | | |
Shares sold | | 129,087,916 | | | 81,520,530 | |
Shares issued on reinvestment | | 4,269,358 | | | 1,899,900 | |
Shares repurchased | | (100,797,219 | ) | | (80,919,381 | ) |
| | |
|
| |
|
|
Net Increase | | 32,560,055 | | | 2,501,049 | |
| | |
|
| |
|
|
| Core Fixed Income Investments | | | | | | |
Shares sold | | 43,344,838 | | | 16,906,649 | |
Shares issued on reinvestment | | 3,569,561 | | | 2,220,856 | |
Shares repurchased | | (16,907,140 | ) | | (12,961,491 | ) |
| | |
|
| |
|
|
Net Increase | | 30,007,259 | | | 6,166,014 | |
| | |
|
| |
|
|
| High Yield Investments | | | | | | |
Shares sold | | 8,699,001 | | | 21,816,312 | |
Shares issued on reinvestment | | 2,538,947 | | | 3,478,249 | |
Shares repurchased | | (42,246,239 | ) | | (20,225,542 | ) |
| | |
|
| |
|
|
Net Increase (Decrease) | | (31,008,291 | ) | | 5,069,019 | |
| | |
|
| |
|
|
166
Notes to Financial Statements
(continued)
| | | | | | |
| | | Year Ended
August 31, 2006
| | | Year Ended
August 31, 2005
| |
| Municipal Bond Investments | | | | | | |
Shares sold | | 3,916,281 | | | 1,290,255 | |
Shares issued on reinvestment | | 201,301 | | | 133,799 | |
Shares repurchased | | (1,220,800 | ) | | (728,236 | ) |
| | |
|
| |
|
|
Net Increase | | 2,896,782 | | | 695,818 | |
| | |
|
| |
|
|
| International Fixed Income Investments | | | | | | |
Shares sold | | 12,220,568 | | | 14,334,300 | |
Shares issued on reinvestment | | 816,554 | | | 1,007,080 | |
Shares repurchased | | (6,736,262 | ) | | (10,916,802 | ) |
| | |
|
| |
|
|
Net Increase | | 6,300,860 | | | 4,424,578 | |
| | |
|
| |
|
|
5. Income Tax Information and Distributions to Shareholders
Subsequent to the fiscal year end, the Funds made the following distributions:
| | | | | | | | | | | | |
Record Date Payable Date
| | Core Fixed Income
Investments
| | High Yield
Investments
| | Municipal Bond
Investments
| | International
Fixed Income
Investments
|
9/28/2006 | | | | | | | | | | | | |
9/29/2006 | | $ | 0.030855 | | $ | 0.027934 | | $ | 0.027169 | | $ | 0.025228 |
| | | | |
Record Date Payable Date
| | Government
Money Investments
| | | | | | |
Daily 9/29/2006 | | $ | 0.003987 | | | | | | | | | |
The tax character of distributions paid during the fiscal year ended August 31, 2006 were as follows:
| | | | | | | | | | | | |
| | | Large
Capitalization
Value Equity
Investments
| | Large
Capitalization
Growth
Investments
| | Small
Capitalization
Value Equity
Investments
| | Small
Capitalization
Growth
Investments
|
Distributions paid from: | | | | | | | | | | | | |
Ordinary Income | | $ | 22,000,056 | | | — | | $ | 15,125,076 | | | — |
Net Long-term Capital Gains | | | 56,411,813 | | | — | | | 80,660,752 | | | — |
| | |
|
| |
|
| |
|
| |
|
|
Total Distributions Paid | | $ | 78,411,869 | | | — | | $ | 95,785,828 | | | — |
| | |
|
| |
|
| |
|
| |
|
|
| | | | |
| | | International
Equity
Investments
| | Emerging Markets
Equity
Investments
| | Government
Money
Investments
| | Core Fixed
Income
Investments
|
Distributions paid from: | | | | | | | | | | | | |
Ordinary Income | | $ | 14,000,078 | | $ | 2,826,066 | | $ | 4,191,855 | | $ | 29,904,480 |
Net Long-term Capital Gains | | | — | | | — | | | — | | | — |
| | |
|
| |
|
| |
|
| |
|
|
Total Distributions Paid | | $ | 14,000,078 | | $ | 2,826,066 | | $ | 4,191,855 | | $ | 29,904,480 |
| | |
|
| |
|
| |
|
| |
|
|
167
Notes to Financial Statements
(continued)
| | | | | | | | | | | |
| | | | |
| | | High Yield
Investments
| | Municipal Bond
Investments
| | International Fixed
Income
Investments
| | |
Distributions paid from: | | | | | | | | | | | |
Tax Exempt | | | — | | $ | 2,000,418 | | | — | | |
Tax Return of Capital | | | — | | | — | | $ | 3,454,483 | | |
Ordinary Income | | $ | 12,336,372 | | | — | | | 2,037,074 | | |
Net Long-term Capital Gains | | | — | | | — | | | 1,072,866 | | |
| | |
|
| |
|
| |
|
| | |
Total Distributions Paid | | $ | 12,336,372 | | $ | 2,000,418 | | $ | 6,564,423 | | |
| | |
|
| |
|
| |
|
| | |
The tax character of distributions paid during the fiscal year ended August 31, 2005 were as follows:
| | | | | | | | | | | | |
| | | Large
Capitalization
Value Equity
Investments
| | Large
Capitalization
Growth
Investments
| | Small
Capitalization
Value Equity
Investments
| | Small
Capitalization
Growth
Investments
|
Distributions paid from: | | | | | | | | | | | | |
Ordinary Income | | $ | 15,008,704 | | | — | | $ | 3,502,303 | | | — |
Net Long-term Capital Gains | | | — | | | — | | | 43,785,779 | | | — |
| | |
|
| |
|
| |
|
| |
|
|
Total Distributions Paid | | $ | 15,008,704 | | | — | | $ | 47,288,082 | | | — |
| | |
|
| |
|
| |
|
| |
|
|
| | | | |
| | | International
Equity
Investments
| | Emerging Markets
Equity
Investments
| | Government
Money
Investments
| | Core Fixed
Income
Investments
|
Distributions paid from: | | | | | | | | | | | | |
Ordinary Income | | $ | 6,542,279 | | $ | 2,337,325 | | $ | 2,024,811 | | $ | 19,231,971 |
Net Long-term Capital Gains | | | — | | | — | | | — | | | — |
| | |
|
| |
|
| |
|
| |
|
|
Total Distributions Paid | | $ | 6,542,279 | | $ | 2,337,325 | | $ | 2,024,811 | | $ | 19,231,971 |
| | |
|
| |
|
| |
|
| |
|
|
| | | | |
| | | High Yield
Investments
| | Municipal Bond
Investments
| | International Fixed
Income
Investments
| | |
Distributions paid from: | | | | | | | | | | | | |
Tax Exempt | | | — | | $ | 1,370,584 | | | — | | | |
Ordinary Income | | $ | 17,408,214 | | | — | | $ | 9,192,761 | | | |
Net Long-term Capital Gains | | | — | | | — | | | — | | | |
| | |
|
| |
|
| |
|
| | | |
Total Distributions Paid | | $ | 17,408,214 | | $ | 1,370,584 | | $ | 9,192,761 | | | |
| | |
|
| |
|
| |
|
| | | |
As of August 31, 2006, the components of accumulated earnings on a tax basis were as follows:
| | | | | | | | | | | | | | | | |
| | | Large Capitalization Value Equity Investments
| | | Large Capitalization Growth Investments
| | | Small Capitalization Value Equity Investments
| | | Small Capitalization Growth Investments
| |
Undistributed ordinary income - net | | $ | 33,946,557 | | | | — | | | $ | 9,564,405 | | | | — | |
Undistributed long-term capital gains - net | | | 72,843,611 | | | | — | | | | 33,930,997 | | | | — | |
| | |
|
|
| |
|
|
| |
|
|
| |
|
|
|
Total undistributed earnings | | | 106,790,168 | | | | — | | | | 43,495,402 | | | | — | |
| | | | |
Capital loss carryforward * | | | — | | | $ | (233,753,346 | ) | | | — | | | $ | (298,825,265 | ) |
Unrealized appreciation/(depreciation) | | | 215,532,561 | (a) | | | 219,846,384 | (a) | | | 71,208,721 | (a) | | | 77,625,577 | (a) |
| | |
|
|
| |
|
|
| |
|
|
| |
|
|
|
Total accumulated earnings/(losses) - net | | $ | 322,322,729 | | | $ | (13,906,962 | ) | | $ | 114,704,123 | | | $ | (221,199,688 | ) |
| | |
|
|
| |
|
|
| |
|
|
| |
|
|
|
168
Notes to Financial Statements
(continued)
| | | | | | | | | | | | | | | | |
| | | | |
| | | International Equity
Investments
| | | Emerging Markets
Equity Investments
| | | Core Fixed Income
Investments
| | | High Yield
Investments
| |
Undistributed ordinary income - net | | $ | 23,453,230 | | | $ | 3,773,718 | | | $ | 1,343,608 | | | $ | 1,297,235 | |
Undistributed long-term capital gains - net | | | — | | | | — | | | | — | | | | — | |
| | |
|
|
| |
|
|
| |
|
|
| |
|
|
|
Total undistributed earnings | | | 23,453,230 | | | | 3,773,718 | | | | 1,343,608 | | | | 1,297,235 | |
| | | | |
Capital loss carryforward * | | | (120,303,617 | ) | | | (35,971,071 | ) | | | (10,391,089 | ) | | | (86,566,492 | ) |
Other book/tax temporary differences | | | 977 | (c) | | | 3,897 | (c) | | | (8,042,908 | )(e) | | | (2,042,965 | )(b) |
Unrealized appreciation/(depreciation) | | | 267,772,174 | (d) | | | 91,805,259 | (d) | | | (2,698,470 | )(f) | | | 568,681 | (f) |
| | |
|
|
| |
|
|
| |
|
|
| |
|
|
|
Total accumulated earnings/(losses) - net | | $ | 170,922,764 | | | $ | 59,611,803 | | | $ | (19,788,859 | ) | | $ | (86,743,541 | ) |
| | |
|
|
| |
|
|
| |
|
|
| |
|
|
|
| | | | |
| | | Municipal Bond Investments
| | | International Fixed Income Investments
| | | | | | | |
Undistributed tax-exempt income - net | | $ | 141,826 | | | | — | | | | | | | | | |
Undistributed ordinary income - net | | | — | | | | — | | | | | | | | | |
Undistributed long-term capital gains - net | | | — | | | | — | | | | | | | | | |
| | |
|
|
| |
|
|
| | | | | | | | |
Total undistributed earnings | | | 141,826 | | | | — | | | | | | | | | |
| | | | |
Capital loss carryforward * | | | (1,891,528 | ) | | $ | (242,180 | ) | | | | | | | | |
Other book/tax temporary differences | | | (147,579 | )(b) | | | (5,665,273 | )(h) | | | | | | | | |
Unrealized appreciation/(depreciation) | | | 1,583,987 | (g) | | | 1,375,207 | (f) | | | | | | | | |
| | |
|
|
| |
|
|
| | | | | | | | |
Total accumulated earnings/(losses) - net | | $ | (313,294 | ) | | $ | (4,532,246 | ) | | | | | | | | |
| | |
|
|
| |
|
|
| | | | | | | | |
As of August 31, 2006 there were no significant differences between the book and tax components of net assets for Government Money Investments.
| * | | During the taxable year ended August 31, 2006, Large Capitalization Growth Investments utilized $103,067,245, Small Capitalization Growth Investments utilized $49,026,683, International Equity Investments utilized $93,623,309, Emerging Markets Equity Investments utilized $46,624,580, of each of their respective capital loss carryover available from prior years. As of August 31, 2006, the Funds had the following net capital loss carryforwards remaining: |
| | | | | | | | | | | | | | | | | | | | | | | | |
Year of Expiration
| | Large
Capitalization
Value Equity
Investments
| | | Large
Capitalization
Growth
Investments
| | | Small
Capitalization
Value Equity
Investments
| | | Small
Capitalization
Growth
Investments
| | | International
Equity Investments
| | | Emerging Markets
Equity Investments
| |
8/31/2010 | | | — | | | $ | (61,335,851 | ) | | | — | | | $ | (106,951,959 | ) | | $ | (35,665,109 | ) | | $ | (57,958 | ) |
8/31/2011 | | | — | | | | (159,803,398 | ) | | | — | | | | (191,873,306 | ) | | | (84,638,508 | ) | | | (35,913,113 | ) |
8/31/2012 | | | — | | | | (12,614,097 | ) | | | — | | | | — | | | | — | | | | — | |
| | |
|
|
| |
|
|
| |
|
|
| |
|
|
| |
|
|
| |
|
|
|
| | | | — | | | $ | (233,753,346 | ) | | | — | | | $ | (298,825,265 | ) | | $ | (120,303,617 | ) | | $ | (35,971,071 | ) |
| | |
|
|
| |
|
|
| |
|
|
| |
|
|
| |
|
|
| |
|
|
|
| | | | | | |
Year of Expiration
| | Government
Money
Investments
| | | Core Fixed
Income
Investments
| | | High Yield
Investments
| | | Municipal Bond
Investments
| | | International Fixed
Income
Investments
| | | | |
8/31/2008 | | $ | (9,983 | ) | | $ | (2,292,182 | ) | | | — | | | | — | | | | — | | | | | |
8/31/2009 | | | (11,128 | ) | | | — | | | $ | (2,427,672 | ) | | $ | (1,846,063 | ) | | | — | | | | | |
8/31/2010 | | | — | | | | — | | | | (45,159,946 | ) | | | — | | | | — | | | | | |
8/31/2011 | | | — | | | | (4,723,104 | ) | | | (37,864,134 | ) | | | — | | | | — | | | | | |
8/31/2012 | | | — | | | | (2,218,969 | ) | | | — | | | | — | | | | — | | | | | |
8/31/2013 | | | — | | | | — | | | | — | | | | — | | | | — | | | | | |
8/31/2014 | | | — | | | | (1,156,834 | ) | | | (1,114,740 | ) | | | (45,465 | ) | | $ | (242,180 | ) | | | | |
| | |
|
|
| |
|
|
| |
|
|
| |
|
|
| |
|
|
| | | | |
| | | $ | (21,111 | ) | | $ | (10,391,089 | ) | | $ | (86,566,492 | ) | | $ | (1,891,528 | ) | | $ | (242,180 | ) | | | | |
| | |
|
|
| |
|
|
| |
|
|
| |
|
|
| |
|
|
| | | | |
169
Notes to Financial Statements
(continued)
These amounts will be available to offset any future taxable capital gains.
| (a) | | The difference between book-basis and tax-basis unrealized appreciation / (depreciation) is attributable primarily to the tax deferral of losses on wash sales. |
| (b) | | Other book/tax temporary differences are attributable primarily to the tax deferral of post-October capital losses for tax purposes. |
| (c) | | Other book/tax temporary differences are attributable primarily to the realization for tax purposes of unrealized losses on certain foreign currency contracts and differences in the book/tax treatment of various items. |
| (d) | | The difference between book-basis and tax-basis unrealized appreciation / (depreciation) is attributable primarily to the tax deferral of losses on wash sales, the realization for tax purposes of unrealized gains on investments in passive foreign investment companies, and other book/tax basis adjustments. |
| (e) | | Other book/tax temporary differences are attributable primarily to the tax deferral of losses on straddles, the realization for tax purposes of unrealized gains / (losses) on certain futures and foreign currency contracts, the deferral of post-October capital losses for tax purposes and differences in the book/tax treatment of various items. |
| (f) | | The difference between book-basis and tax-basis unrealized appreciation / (depreciation) is attributable primarily to the tax deferral of losses on wash sales and the difference between book and tax amortization methods for premiums on fixed income securities. |
| (g) | | The difference between book-basis and tax-basis unrealized appreciation / (depreciation) is attributable primarily to the difference between book and tax amortization methods for market discount on fixed income securities. |
| (h) | | Other book/tax temporary differences are attributable primarily to the tax deferral of losses on straddles, the realization for tax purposes of unrealized gains / (losses) on certain futures and foreign currency contracts and the deferral of post-October currency and capital losses for tax purposes. |
6. Regulatory Matters
On May 31, 2005, the U.S. Securities and Exchange Commission (“SEC”) issued an order in connection with the settlement of an administrative proceeding against SBFM and CGM relating to the appointment of an affiliated transfer agent for the Smith Barney family of mutual funds (the “Funds”).
The SEC order finds that SBFM and CGM willfully violated Section 206(1) of the Investment Advisers Act of 1940 (“Advisers Act”). Specifically, the order finds that SBFM and CGM knowingly or recklessly failed to disclose to the boards of the Funds in 1999 when proposing a new transfer agent arrangement with an affiliated transfer agent that: First Data Investors Services Group (“First Data”), the Funds’ then-existing transfer agent, had offered to continue as transfer agent and do the same work for substantially less money than before; and that Citigroup Asset Management (“CAM”), the Citigroup business unit that, at the time, included the fund’s investment manager and other investment advisory companies, had entered into a side letter with First Data under which CAM agreed to recommend the appointment of First Data as sub-transfer agent to the affiliated transfer agent in exchange for, among other things, a guarantee by First Data of specified amounts of asset management and investment banking fees to CAM and CGM. The order also finds that SBFM and CGM willfully violated Section 206(2) of the Advisers Act by virtue of the omissions discussed above and other misrepresentations and omissions in the materials provided to the Funds’ boards, including the failure to make clear that the affiliated transfer agent would earn a high profit for performing limited functions while First Data continued to perform almost all of the transfer agent functions, and the suggestion that the proposed arrangement was in the Funds’ best interests and that no viable alternatives existed. SBFM and CGM do not admit or deny any wrongdoing or liability. The settlement does not establish wrongdoing or liability for purposes of any other proceeding.
The SEC censured SBFM and CGM and ordered them to cease and desist from violations of Sections 206(1) and 206(2) of the Advisers Act. The order requires Citigroup to pay $208.1 million, including $109 million in disgorgement of profits, $19.1 million in interest, and a civil money penalty of $80 million. Approximately $24.4 million has already been paid to the Funds, primarily through fee waivers. The remaining $183.7 million, including the penalty, has been paid to the U.S. Treasury and will be distributed pursuant to a plan submitted for the approval of the SEC. At this time, there is no certainty as to how the above-described proceeds of the settlement will be distributed, to whom such distributions will be made, the methodology by which such distributions will be allocated, and when such distributions will be made. The order also required that transfer agency fees received from the Funds since December 1, 2004 less certain expenses be placed in escrow and provided that a portion of such fees might be subsequently distributed in accordance with the terms of the order. On April 3, 2006, an aggregate amount of approximately $9 million was distributed to the affected Funds.
The order required SBFM to recommend a new transfer agent contract to the Fund boards within 180 days of the entry of the order; if a Citigroup affiliate submitted a proposal to serve as transfer agent or sub-transfer agent, SBFM and CGM would have been required, at their expense, to engage an independent monitor to oversee a competitive bidding process. On November 21,
170
Notes to Financial Statements
(continued)
2005, and within the specified timeframe, the Fund’s Board selected a new transfer agent for the Fund. No Citigroup affiliate submitted a proposal to serve as transfer agent. Under the order, SBFM also must comply with an amended version of a vendor policy that Citigroup instituted in August 2004.
Although there can be no assurance, SBFM does not believe that this matter will have a material adverse effect on the Funds.
On December 1, 2005, Citigroup completed the sale of substantially all of its global asset management business, including SBFM, to Legg Mason Inc.
7. Legal Matters
Beginning in August 2005, five class action lawsuits alleging violations of federal securities laws and state law were filed against CGM and SBFM, (collectively, the “Defendants”) based on the May 31, 2005 settlement order issued against the Defendants by the SEC described in Note 6. The complaints seek injunctive relief and compensatory and punitive damages, removal of SBFM as the investment manager for the Smith Barney family of funds, rescission of the Funds’ management and other contracts with SBFM, recovery of all fees paid to SBFM pursuant to such contracts, and an award of attorneys’ fees and litigation expenses.
On October 5, 2005, a motion to consolidate the five actions and any subsequently filed, related action was filed. That motion contemplates that a consolidated amended complaint alleging substantially similar causes of action will be filed in the future.
As of the date of this report, SBFM believes that resolution of the pending lawsuit will not have a material effect on the financial position or results of operations of the Funds or the ability of the Funds’ investment manager and its affiliates to continue to render services to the Funds under their respective contracts.
* * *
Beginning in June 2004, class action lawsuits alleging violations of the federal securities laws were filed against CGM and a number of its then affiliates, including SBFM and Salomon Brothers Asset Management Inc (“SBAM”), which were then investment adviser or manager to certain of the Funds (the “Managers”), substantially all of the mutual funds then managed by the Managers (the “Defendant Funds”), and Board Members of the Defendant Funds (collectively, the “Defendants”). The complaints alleged, among other things, that CGM created various undisclosed incentives for its brokers to sell Smith Barney and Salomon Brothers funds. In addition, according to the complaints, the Managers caused the Defendant Funds to pay excessive brokerage commissions to CGM for steering clients towards proprietary funds. The complaints also alleged that the defendants breached their fiduciary duty to the Defendant Funds by improperly charging Rule 12b-1 fees and by drawing on fund assets to make undisclosed payments of soft dollars and excessive brokerage commissions. The complaints also alleged that the Defendant Funds failed to adequately disclose certain of the allegedly wrongful conduct. The complaints sought injunctive relief and compensatory and punitive damages, rescission of the Defendant Funds’ contracts with the Managers, recovery of all fees paid to the Managers pursuant to such contracts and an award of attorneys’ fees and litigation expenses.
On December 15, 2004, a consolidated amended complaint (the “Complaint”) was filed alleging substantially similar causes of action. On May 27, 2005, all of the Defendants filed motions to dismiss the Complaint. On July 26, 2006, the court issued a decision and order (1) finding that plaintiffs lacked standing to sue on behalf of the shareholders of the Funds in which none of the plaintiffs had invested and dismissing those Funds from the case (although stating that they could be brought back into the case if standing as to them could be established), and (2) other than one stayed claim, dismissing all of the causes of action against the remaining Defendants, with prejudice, except for the cause of action under Section 36(b) of the Investment Company Act, which the court granted plaintiffs leave to repeal as a derivative claim.
8. Other Matters
On September 16, 2005, the staff of the Securities and Exchange Commission (the “Commission”) informed SBFM and Salomon Brothers Asset Management Inc (“SBAM”) that the staff is considering recommending that the Commission institute administrative proceedings against SBFM and SBAM for alleged violations of Section 19(a) and 34(b) of the Investment Company Act (and related Rule 19a-1). The notification is a result of an industry wide inspection by the SEC and is based upon alleged deficiencies in disclosures regarding dividends and distributions paid to shareholders of certain funds. Section 19(a) and
171
Notes to Financial Statements
(continued)
related Rule 19a-1 of the Investment Company Act generally require funds that are making dividend and distribution payments to provide shareholders with a written statement disclosing the source of the dividends and distributions, and, in particular, the portion of the payments made from each of net investment income, undistributed net profits and/or paid-in capital. In connection with the contemplated proceedings, the staff may seek a cease and desist order and/or monetary damages from SBFM or SBAM.
Although there can be no assurance, SBFM and SBAM believe that this matter is not likely to have a material adverse effect on the Funds.
9. Recent Accounting Pronouncements
During June 2006, the Financial Accounting Standards Board (“FASB”) issued FASB Interpretation 48 (“FIN 48” or the “Interpretation”), Accounting for Uncertainty in Income Taxes - an interpretation of FASB statement 109. FIN 48 supplements FASB Statement 109, Accounting for Income Taxes, by defining the confidence level that a tax position must meet in order to be recognized in the financial statements. FIN 48 prescribes a comprehensive model for how a fund should recognize, measure, present, and disclose in its financial statements uncertain tax positions that the fund has taken or expects to take on a tax return. FIN 48 requires that the tax effects of a position be recognized only if it is “more likely than not” to be sustained based solely on its technical merits. Management must be able to conclude that the tax law, regulations, case law, and other objective information regarding the technical merits sufficiently support the position’s sustainability with a likelihood of more than 50 percent. FIN 48 is effective for fiscal periods beginning after December 15, 2006, which for the Funds will be September 1, 2007. At adoption, the financial statements must be adjusted to reflect only those tax positions that are more likely than not to be sustained as of the adoption date. Management of the Funds is currently evaluating the impact that FIN 48 will have on the financial statements.
* * *
On September 20, 2006, the FASB released Statement of Financial Accounting Standards No. 157 “Fair Value Measurements” (“FAS 157”). FAS 157 establishes an authoritative definition of fair value, sets out a framework for measuring fair value, and requires additional disclosures about fair-value measurements. The application of FAS 157 is required for fiscal years beginning after November 15, 2007 and interim periods within those fiscal years. At this time, management is evaluating the implications of FAS 157 and its impact on the financial statements has not yet been determined.
10. Subsequent Events
Effective September 14, 2006, TCW Investment Management Company was terminated as a Subadviser to Large Capitalization Growth Investments. Effective October 5, 2006, Sands Capital Management LLC resigned as a Subadviser to Large Capitalization Growth Investments. Effective October 12, 2006, Wells Capital Management Incorporated was added as a Subadviser to Large Capitalization Growth Investments.
Effective October 4, 2006, Seix Advisors, the fixed income division of Trusco Capital Management, Inc. was terminated and Penn Capital Management Co., Inc. was added as a Subadviser to High Yield Investments.
At a board meeting held on September 25, 2006, the Trustees appointed Armon E. Kamesar as Chairman of the Board of Trustees, effective November 29, 2006.
172
Report of Independent Registered Public Accounting Firm
The Board of Trustees and Shareholders
Consulting Group Capital Markets Funds:
We have audited the accompanying statements of assets and liabilities, including the schedules of investments, of Large Capitalization Value Equity Investments, Large Capitalization Growth Investments, Small Capitalization Value Equity Investments, Small Capitalization Growth Investments, International Equity Investments, Emerging Markets Equity Investments, Government Money Investments, Core Fixed Income Investments, High Yield Investments, Municipal Bond Investments and International Fixed Income Investments, each a series of the Consulting Group Capital Markets Funds, as of August 31, 2006, and the related statements of operations for the year then ended, the statements of changes in net assets for each of the years in the two-year period then ended, and the financial highlights for each of the years in the five-year period then ended. These financial statements and financial highlights are the responsibility of the Funds’ management. Our responsibility is to express an opinion on these financial statements and financial highlights based on our audits.
We conducted our audits in accordance with the standards of the Public Company Accounting Oversight Board (United States). Those standards require that we plan and perform the audit to obtain reasonable assurance about whether the financial statements and financial highlights are free of material misstatement. An audit includes examining, on a test basis, evidence supporting the amounts and disclosures in the financial statements. Our procedures included confirmation of securities owned as of August 31, 2006, by correspondence with the custodian and brokers or by other appropriate auditing procedures where replies from brokers were not received. An audit also includes assessing the accounting principles used and significant estimates made by management, as well as evaluating the overall financial statement presentation. We believe that our audits provide a reasonable basis for our opinion.
In our opinion, the financial statements and financial highlights referred to above present fairly, in all material respects, the financial position of Large Capitalization Value Equity Investments, Large Capitalization Growth Investments, Small Capitalization Value Equity Investments, Small Capitalization Growth Investments, International Equity Investments, Emerging Markets Equity Investments, Government Money Investments, Core Fixed Income Investments, High Yield Investments, Municipal Bond Investments and International Fixed Income Investments, as of August 31, 2006, and the results of their operations for the year then ended, the changes in their net assets for each of the years in the two-year period then ended, and the financial highlights for each of the years in the five-year period then ended, in conformity with U.S. generally accepted accounting principles.

New York, New York
October 26, 2006
173
Board Approval of Management Agreement and Investment Advisory Agreements
(unaudited)
Approval of Management Agreement and Subadvisory Agreements
At a meeting held in person on June 5, 2006, the Board of Trustees, including a majority of the Board Members who are not “interested persons,” as defined in the Investment Company Act of 1940, as amended (the “1940 Act”), of the Trust or the Consulting Group, a division of Citigroup Investment Advisory Services Inc. (“CIAS”), re-approved for an annual period the Trust’s management agreement (the “Management Agreement”) and subadvisory agreements (the “Subadvisory Agreements”). In their consideration of the re-approval of the Management Agreement and the Subadvisory Agreements, the Board considered the factors described below.
Nature, Extent and Quality of the Services Under the Management and Subadvisory Agreements
The Board received and considered information regarding the nature, extent and quality of services provided to the Funds by CIAS and the Subadvisers under the Management Agreement and the Subadvisory Agreements, respectively, during the past year. The Board also received a description of the administrative and other services rendered to the Trust and its shareholders. The Board noted information received at regular meetings throughout the year related to the services rendered by CIAS about the management of the Trust’s affairs and CIAS’ role in coordinating the activities of the Trust’s other service providers. The Board’s evaluation of the services provided by CIAS and the Subadvisers took into account the Board’s knowledge and familiarity gained as Board members of the Trust. The Board observed that the scope of services provided by CIAS had expanded over time as a result of the sale of Citigroup Asset Management to Legg Mason, including maintaining and monitoring its own and the Trust’s expanded compliance programs. The Board reviewed information received from CIAS regarding the implementation to date of the Trust’s compliance policies and procedures established pursuant to Rule 38a-1 under the 1940 Act.
The Board reviewed the qualifications, backgrounds and responsibilities of the Trust’s senior personnel and the portfolio management teams primarily responsible for the day-to-day portfolio management of the Funds. The Board also considered, based on its knowledge of CIAS and its affiliates, the financial resources available to its parent organization, Citigroup Inc.
The Board also considered CIAS’ brokerage policies and practices, the standards applied to the Subadvisers, policies and practices regarding soft dollars, and the existence of quality controls applicable to brokerage allocation procedures. In addition, management also reported to the Board on, among other things, its business plans and recent organizational changes.
The Board concluded that, overall, the nature, extent and quality of services provided (and expected to be provided) under the Management Agreement and the Subadvisory Agreements were acceptable.
Fund Performance
The Board received and considered performance information for the Funds as well as for a group of funds (the “Performance Universe”) selected by Lipper, Inc. (“Lipper”), an independent provider of investment company data for various periods ended March 31, 2006. The Board was provided with a description of the methodology Lipper used to determine the similarity of the Funds with the funds included in the Performance Universe. The Board also noted that it had received and discussed with management information throughout the year at periodic intervals comparing the Portfolios’ performance against their benchmarks.
Large Capitalization Value Equity Investments
The information comparing the Fund’s performance to that of its Performance Universe, consisting of all retail and institutional funds classified as “large cap value funds” by Lipper, showed that the Fund’s performance for all time periods presented was better than the median. Based on its review, which included careful consideration of all of the factors noted above, the Board was satisfied with the Fund’s performance.
174
Board Approval of Management Agreement and Investment Advisory Agreements
(unaudited) (continued)
Large Capitalization Growth Investments
The information comparing the Fund’s performance to that of its Performance Universe, consisting of all retail and institutional funds classified as “large cap growth funds” by Lipper, showed that the Fund’s performance for all periods presented was better than the median and was in the first quartile for the 1-year, 3-year and 5-year periods. Based on its review, which included careful consideration of all of the factors noted above, the Board was satisfied with the Fund’s performance.
Small Capitalization Value Equity Investments
The information comparing the Fund’s performance to that of its Performance Universe, consisting of all retail and institutional funds classified as “small cap value funds” by Lipper, showed that the Fund’s performance for the 1-year, 3-year and 5-year periods was better than the median while the performance for the 10-year period was at the median. Based on its review, which included careful consideration of all of the factors noted above, the Board was satisfied with the Fund’s investment performance.
Small Capitalization Growth Investments
The information comparing the Fund’s performance to that of its Performance Universe, consisting of all retail and institutional funds classified as “small cap growth funds” by Lipper, showed that the Fund’s performance for the 1-year and 3-year periods was better than the median, its performance for the 5-year period was slightly below the median and that the performance for the 10-year period was below the median. Based on its review, which included careful consideration of all of the factors noted above, the Board was satisfied with the Fund’s recent performance, but will continue to gauge the Fund’s performance and investment strategies.
International Equity Investments
The information comparing the Fund’s performance to that of its Performance Universe, consisting of all retail and institutional funds classified as “international multi-cap core funds” by Lipper, showed that the Fund’s performance for the 1-year and 3-year periods was better than the median and that its performance for the 5-year and 10-year periods was slightly below the median. The Board noted recent changes to the Fund’s management. Based on its review, which included careful consideration of all of the factors noted above, the Board was satisfied with management’s efforts to improve the Fund’s performance, but will continue to gauge the Fund’s performance and investment strategies.
Emerging Markets Equity Investments
The information comparing the Fund’s performance to that of its Performance Universe, consisting of all retail and institutional funds classified as “emerging market funds” by Lipper, showed that the Fund’s performance for the 1-year and 3-year periods was slightly below the median and for the 5-year and 10-year periods, was below the median. Based on its review, which included careful consideration of all of the factors noted above, the Board was satisfied with management’s efforts to improve the Fund’s performance, but will continue to gauge the Fund’s performance and investment strategies.
Government Money Investments
The information comparing the Fund’s performance to that of its Performance Universe, consisting of all retail funds classified as “U.S. government money market funds” by Lipper, showed that the Fund’s performance for all periods presented was better than the median, and was in the first quartile for the 3-year and 5-year periods. Based on its review, which included careful consideration of all of the factors noted above, the Board was satisfied with the Fund’s relative investment performance.
175
Board Approval of Management Agreement and Investment Advisory Agreements
(unaudited) (continued)
Core Fixed Income Investments
The information comparing the Fund’s performance to that of its Performance Universe, consisting of all retail and institutional funds classified as “intermediate investment grade debt funds” by Lipper, showed that the Fund’s performance for the 1-year and 3-year periods was better than the median, and slightly below the median for the 5-year and 10-year periods. The Board noted that the Fund was previously Intermediate Fixed Income Investments and that the long-term performance was less applicable. Based on its review, which included careful consideration of all of the factors noted above, the Board was satisfied with the Fund’s performance and investment strategies.
High Yield Investments
The information comparing the Fund’s performance to that of its Performance Universe, consisting of all retail and institutional funds classified as “high current yield funds” by Lipper, showed that the Fund’s performance for the 1-year, 3-year and 5-year periods was below the median. The Board noted that representatives of CIAS discussed the various options to improve the Fund’s performance. Based on its review, which included careful consideration of all of the factors noted above, the Board will continue to gauge the Fund’s performance and investment strategies.
Municipal Bond Investments
The information comparing the Fund’s performance to that of its Performance Universe, consisting of all retail and institutional funds classified as “general municipal debt funds” by Lipper, showed that the Fund’s performance for the 1-year period was below the median, its performance for the 3-year period was slightly below the median and that the performance for the 5-year and 10-year periods was better than the median. Based on its review, which included careful consideration of all of the factors noted above, the Board will continue to gauge the Fund’s performance and investment strategies.
International Fixed Income Investments
The information comparing the Fund’s performance to that of its Performance Universe, consisting of all retail and institutional funds classified as “international income funds” by Lipper, showed that the Fund’s performance for the 3-year period was better than the median, that its performance for the 1-year and 5-year periods was slightly better than the median and that the performance for the 10-year period was slightly below the median. Based on its review, which included careful consideration of all of the factors noted above, the Board was satisfied with the Fund’s relative investment performance.
Management Fees and Expense Ratios
The Board reviewed and considered the contractual management fees (the “Contractual Management Fees”) payable by the Funds to CIAS in light of the nature, extent and quality of the management and subadvisory services provided by CIAS and the Subadvisers. The Board also reviewed and considered whether fee waiver and/or expense reimbursement arrangements are currently in place for the Funds and considered the actual fee rate (after taking any waivers and reimbursements into account) (the “Actual Management Fee”) and whether any fee waivers and reimbursements could be discontinued. In addition, the Board noted that the compensation paid to the Subadvisers is paid by CIAS, not the Funds, and, accordingly, that the retention of the Subadvisers does not increase the fees or expenses otherwise incurred by a Fund’s shareholders.
The Board received and considered information comparing the Funds’ Contractual Management Fees and Actual Management Fees and the Funds’ overall expenses with those of funds in both the relevant expense group (the “Expense Group”) and a broader group of funds, (the “Expense Universe”), each selected and provided by Lipper. The Board also considered and discussed information about the Subadvisers’ fees and comparable information for other subadvised funds, as well as other accounts managed by the Subadvisers, and, in this connection, the amount of the Contractual and Actual Management Fees retained by CIAS.
176
Board Approval of Management Agreement and Investment Advisory Agreements
(unaudited) (continued)
Management also discussed the Funds’ distribution arrangements with the Boards. The Boards were provided with information concerning revenues received by and certain expenses incurred by the Funds’ affiliated distributor and how the amounts received by the distributor are paid.
Large Capitalization Value Equity Investments
The information comparing the Fund’s Contractual and Actual Management Fees and its total expense ratio to its Expense Group, consisting of 7 retail no-load funds (including the Fund) that are classified as “large cap value or large cap core funds” by Lipper, showed that the Fund’s Contractual Management Fee was at the median of management fees paid by the other funds in the Expense Group and that its Actual Management Fee was higher than the median. The Board noted that the Fund’s total expense ratio was lower than the median and concluded that the Fund’s fees and expenses were acceptable.
Large Capitalization Growth Investments
The information comparing the Fund’s Contractual and Actual Management Fees and its total expense ratio to its Expense Group, consisting of 7 retail no-load funds (including the Fund) that are classified as “large cap growth funds” by Lipper, showed that the Fund’s Contractual and Actual Management Fees were at or slightly higher than the median of management fees paid by the other funds in the Expense Group. The Board noted that the Fund’s total expense ratio was lower than the median and concluded that the Fund’s fees and expenses were acceptable.
Small Capitalization Value Equity Investments
The information comparing the Fund’s Contractual and Actual Management Fees and its total expense ratio to its Expense Group, consisting of 7 retail no-load funds (including the Fund) that are classified as “small cap value funds” by Lipper, showed that the Fund’s Contractual Management Fee was at the median of management fees paid by the other funds in the Expense Group and its Actual Management Fee was slightly higher than the median. The Board noted that the Fund’s total expense ratio was at the median and concluded that the Fund’s fees and expenses were acceptable.
Small Capitalization Growth Investments
The information comparing the Fund’s Contractual and Actual Management Fees and its total expense ratio to its Expense Group, consisting of 13 retail no-load funds (including the Fund) that are classified as “small cap growth funds” by Lipper, showed that the Fund’s Contractual and Actual Management Fees were lower than the median of management fees paid by the other funds in the Expense Group. The Board noted that the Fund’s total expense ratio also was lower than the median and concluded that the Fund’s fees and expenses were acceptable.
International Equity Investments
The information comparing the Fund’s Contractual and Actual Management Fees and its total expense ratio to its Expense Group, consisting of 10 retail no-load funds (including the Fund) that are classified as “international multi-cap core, international multi-cap value, or international large-cap core funds” by Lipper, showed that the Fund’s Contractual and Actual Management Fees were lower than the median of management fees paid by the other funds in the Expense Group. The Board noted that the Fund’s total expense ratio was also lower than the median and concluded that the Fund’s fees and expenses were acceptable.
177
Board Approval of Management Agreement and Investment Advisory Agreements
(unaudited) (continued)
Emerging Markets Equity Investments
The information comparing the Fund’s Contractual and Actual Management Fees and its total expense ratio to its Expense Group, consisting of 8 retail no-load funds (including the Fund) that are classified as “emerging market funds” by Lipper, showed that the Fund’s Contractual and Actual Management Fees were lower than the median of management fees paid by the other funds in the Expense Group. The Board noted that the Fund’s total expense ratio was also lower than the median and concluded that the Fund’s fees and expenses were acceptable.
Government Money Investments
The information comparing the Fund’s Contractual and Actual Management Fees and its total expense ratio to its Expense Group, consisting of 10 retail no-load funds (including the Fund) that are classified as “US government money market funds” by Lipper, showed that the Fund’s Contractual and Actual Management Fees were lower than the median of management fees paid by the other funds in the Expense Group. The Board noted that the Fund’s total expense ratio was also lower than the median and concluded that the Fund’s fees and expenses were acceptable.
Core Fixed Income Investments
The information comparing the Fund’s Contractual and Actual Management Fees and its total expense ratio to its Expense Group, consisting of 11 retail no-load funds (including the Fund) that are classified as “intermediate investment grade debt funds” by Lipper, showed that the Fund’s Contractual Management Fee was higher than the range of management fees paid by the other funds in the Expense Group and both the Contractual and Actual Management fees were higher than the median. The Board noted that the Fund’s total expense ratio was higher than the median of total expenses paid by the other funds in the Expense Group. The Fund’s total expense ratio, however, was lower than the Expense Universe average. The Board determined to continue to monitor the management fees and total expenses of the Fund.
High Yield Investments
The information comparing the Fund’s Contractual and Actual Management Fees and its total expense ratio to its Expense Group, consisting of 12 retail no-load funds (including the Fund) that are classified as “high current yield funds” by Lipper, showed that the Fund’s Contractual and Actual Management Fees were higher than the management fees paid by the other funds in the Expense Group. The Board noted that the Fund’s total expense ratio was also higher than the median. The Board determined to continue to monitor the management fees and total expenses of the Fund.
Municipal Bond Investments
The information comparing the Fund’s Contractual and Actual Management Fees and its total expense ratio to its Expense Group, consisting of 7 retail no-load funds (including the Fund) that are classified as “general municipal debt funds” by Lipper, showed that the Fund’s Contractual Management Fee was at the median of management fees paid by the other funds in the Expense Group and that its Actual Management Fee was higher than the median. The Board noted that the Fund’s total expense ratio was also higher than the median. The Board determined to continue to monitor the management fees and total expenses of the Fund.
International Fixed Income Investments
The information comparing the Fund’s Contractual and Actual Management Fees and its total expense ratio to its Expense Group, consisting of 9 retail no-load funds (including the Fund) that are classified as “international income funds or global income funds” by Lipper, showed that the Fund’s Contractual Management Fee was lower than the median of management fees
178
Board Approval of Management Agreement and Investment Advisory Agreements
(unaudited) (continued)
paid by the other funds in the Expense Group and that its Actual Management Fee was slightly higher than the median. The Board noted that the Fund’s total expense ratio was lower than the median. The Board concluded that the management fees and total expenses of the Fund were acceptable.
Taking all of the above into consideration, the Board determined that the management fee and the subadvisory fees were reasonable in light of the nature, extent and quality of the services provided to the Funds under the Management Agreement and the Subadvisory Agreements.
Manager Profitability
The Board received and considered a profitability analysis of CIAS and its affiliates in providing services to the Funds. In addition, the Board received information with respect to CIAS’ allocation methodologies used in preparing this profitability data. To the extent available, the Board also reviewed information provided by the Subadvisers with respect to the Subadvisers’ profitability in providing subadvisory services to the Funds. CIAS’ profitability was considered not excessive in light of the nature, extent and quality of the services provided to the Funds.
Economies of Scale
The Board received and discussed information concerning whether CIAS realizes economies of scale as the Funds’ assets grow beyond current levels. However, because of the nature of CIAS’ business, the Board could not reach definitive conclusions as to whether CIAS might realize economies of scale or how great they may be.
Other Benefits to the Manager and the Subadvisers
The Board considered other benefits received by CIAS, the Subadvisers and their affiliates as a result of their relationship with the Funds, including soft dollar arrangements, receipt of brokerage and the opportunity to offer additional products and services to Fund shareholders.
In light of the costs of providing investment management and other services to the Funds and CIAS’ ongoing commitment to the Funds, the profits and other ancillary benefits that CIAS and its affiliates received were considered reasonable.
The non-interested Board Members then met in executive session with their counsel. Following the closed session, the Board Members approved the Management Agreement and the Subadvisory Agreements to continue for another year.
No single factor reviewed by the Board was identified by the Board as the principal factor in determining whether to approve the Management Agreement and Subadvisory Agreements. The Non-interested Board Members were advised by separate independent legal counsel throughout the process. The Board discussed the proposed continuance of the Management Agreement and the Subadvisory Agreements in a private session with their independent legal counsel at which no representatives of management were present.
After further discussion and upon motion duly made, seconded and unanimously carried, the following resolutions were adopted as to each Fund (unless otherwise noted), first by the Board Members who were not “interested persons” of the Funds or any of their affiliates, voting separately and then by the Board voting as a whole.
179
Board Approval of Management Agreement and Investment Advisory Agreements
(unaudited) (continued)
Approval of a New Investment Advisory Agreement
At a special meeting held on August 3, 2006, the Trust’s Board, including a majority of the Independent Board Members, approved a new investment advisory agreement (the “New Investment Advisory Agreement”) with Delaware Management Company, a series of Delaware Management Business Trust LLC (“Delaware”) on behalf of the Trust’s Large Capitalization Growth Investments (the “Portfolio”). To assist the Board in its consideration of the New Investment Advisory Agreement, the Consulting Group provided materials and information about Delaware, including its financial condition, asset management capabilities and organization. The materials and information were provided in advance of and at the special meeting. Representatives of Delaware also made presentations to and responded to questions from the Board.
The Trust has received an exemption (the “Exemption”) from the Securities and Exchange Commission that permits the Trust’s Manager to enter into or change advisory agreements with investment advisers without formal shareholder approval. Accordingly, the new investment advisory agreement with Delaware did not require a shareholder vote. Shareholders of the Portfolio received an informational letter regarding the change in investment adviser, as required by the Exemption.
In their deliberations concerning the New Investment Advisory Agreement, among other things, the Board Members considered:
(i) that Consulting Group conducted a thorough search process in selecting Delaware, including a review of the universe of large cap growth or large/mid cap growth investment advisers with an aggressive investment substyle, including managers that had a recommended opinion from Consulting Group’s research department, eventually narrowing the search through discussions with research personnel and eliminating candidates with potential affiliation problems;
(ii) that Delaware met all qualitative and quantitative requirements and is rated four diamonds by Consulting Group’s research department;
(iii) the history, reputation, qualification and background of Delaware, as well as their personnel and financial condition;
(iv) the experience of Delaware’s key personnel in institutional investing and the quality of services that it would be expected to provide the Portfolio;
(v) Delaware’s investment performance;
(vi) that Delaware had approximately $124 billion in assets under management;
(vii) that Delaware was founded in 1929 and had fiduciary responsibility for approximately 650 institutional client relationships;
(viii) that Delaware’s Rule 38a-1 policies and procedures were found to be in compliance with the Rule;
(ix) the fee and expense ratios of comparable mutual funds;
(x) that Delaware will receive a fee of 0.40%, that is computed daily and paid monthly based on the value of the average net assets of the Portfolio allocated to Delaware; and
(xi) that the terms of the New Investment Advisory Agreement with Delaware were substantially similar in all respects to the agreements between the additional investment advisers to the Portfolio.
The Board concluded that, overall, the nature, extent and quality of services expected to be provided under the New Investment Advisory Agreement were acceptable. The New Investment Advisory Agreement with Delaware became effective on August 21, 2006.
180
Additional Information
(unaudited)
Information about Trustees and Officers
The business and affairs of the Consulting Group Capital Markets Funds (“Trust”) are managed under the direction of the Board of Trustees. Information pertaining to the Trustees and Officers of the Trust is set forth below. The Statement of Additional Information includes additional information about Trustees and is available, without charge, upon request by calling Shareholder Services at 1-800-451-2010.
| | | | | | | | | | |
Name, Address and
Birth Year
| | Position(s)
Held with
Fund
| | Term of
Office*
and
Length
of Time
Served
| | Principal Occupation(s)
During Past Five Years
| | Number of
Portfolios
in Fund
Complex
Overseen
by Trustee
| | Other Board
Memberships
Held by Trustee
|
| Non-Interested Trustees | | | | | | | | |
Walter E. Auch 6001 N. 62nd Place Paradise Valley, AZ 85253 Birth Year: 1921 | | Trustee | | 2006;
Mr. Auch
previously
served as a
Trustee of
the Trust
from 1991 to
December
2001. | | Retired | | 11 | | Director, Nicholas Applegate Funds; Director, UBS Funds; Director, US Bancorp Advisory Group; Director or Trustee of certain funds associated with Legg Mason (consisting of 12 portfolios) |
H. John Ellis 858 E. Crystal Downs Drive Frankfort, MI 49635 Birth Year: 1927 | | Trustee | | 1999 | | Retired | | 11 | | Director or Trustee of certain funds associated with Legg Mason (consisting of 12 portfolios) |
Armon E. Kamesar 7328 Country Club Dr. La Jolla, CA 92037 Birth Year: 1927 | | Trustee | | 1994 | | Chairman, TEC International (organization of chief executives) | | 11 | | Director or Trustee of certain funds associated with Legg Mason (consisting of 12 portfolios) |
Stephen E. Kaufman Stephen E. Kaufman, PC Co. 277 Park Ave., 47th Fl. New York, NY 10172 Birth Year: 1932 | | Trustee | | 1991 | | Attorney | | 11 | | Director or Trustee of certain funds associated with Legg Mason (consisting of 36 portfolios) |
John J. Murphy 123 Prospect Street Ridgewood, NJ 07450 Birth Year: 1944 | | Trustee | | 2006 | | President, Murphy Capital Management (investment management) | | 11 | | Director, Nicholas Applegate Funds; Director or Trustee of certain funds associated with Legg Mason (consisting of 12 portfolios) |
181
Additional Information
(unaudited) (continued)
| | | | | | | | | | |
Name, Address and
Birth Year
| | Position(s)
Held with
Fund
| | Term of
Office*
and
Length
of Time
Served
| | Principal Occupation(s)
During Past Five Years
| | Number of
Portfolios
in Fund
Complex
Overseen
by Trustee
| | Other Board
Memberships
Held by Trustee
|
| Interested Trustees: | | | | | | | | |
Laurie A. Hesslein 787 Seventh Avenue 15th Floor New York, NY 10019 Birth Year: 1959 | | Trustee | | 2006 | | Managing Director of Citigroup Global Markets Inc., July 2005 to Present - Chief Administrative Officer and Director of the Corporate Client Group, Smith Barney Global Private Client Group; July 2004 to July 2005 - Chief Administrative Officer, Director of Investment Products and the Corporate Client Group, Smith Barney Global Private Client Group; 2001 to July 2004 - Director of Wealth Management, Investment Products and the Corporate Client Group, Smith Barney Global Private Client Group | | 11 | | None |
R. Jay Gerken Legg Mason & Co. LLC (“Legg Mason”) 399 Park Avenue New York, NY 10022 Birth Year: 1951 | | Chairman and Chief Executive Officer | | 2006 | | Managing Director, Legg Mason, Chairman of the Board, Trustee, or Director of 167 funds associated with Legg Mason Partners Fund Administration, LLC (“LMPFA”) and its affiliates; President, LMPFA (since 2006); Chairman, President and Chief Executive Officer of certain mutual funds associated with Legg Mason or its affiliates; formerly, Chairman Smith Barney Fund Management LLC (“SBFM”) and Citi Fund Management Inc. (“CFM”) (2002 to 2005); formerly, Chairman, President and Chief Executive Officer Travelers Investment Advisers Inc. (2002 to 2005). | | 11 | | Director or Trustee of certain funds associated with Legg Mason (consisting of 167 portfolios) |
182
Additional Information
(unaudited) (continued)
| | | | | | | | | | |
Name, Address and
Birth Year
| | Position(s)
Held with
Fund
| | Term of
Office*
and
Length
of Time
Served
| | Principal Occupation(s) During Past Five Years
| | Number of
Portfolios
in Fund
Complex
Overseen
by Trustee
| | Other Board
Memberships Held by Trustee
|
| Officers: | | | | | | | | |
Robert J. Brault Legg Mason 125 Broad Street, 11th Floor New York, NY 10004 Birth Year: 1965 | | Chief Financial Officer and Treasurer | | Since
2004 | | Director of Legg Mason; Chief Financial Officer and Treasurer of certain mutual funds associated with Legg Mason; Director of Internal Control for CAM U.S. Mutual Fund Administration (from 2002 to 2004); Director of Project Management & Information Systems for CAM U.S. Mutual Fund Administration (from 2000 to 2002) | | N/A | | N/A |
Norman E. Nabhan The Consulting Group 222 Delaware Avenue Wilmington, DE 19801 Birth Year: 1948 | | President and Investment Officer | | Since
2002 | | Managing Director of CGM; Managing Director of Smith Barney | | N/A | | N/A |
James L. Tracy Citigroup Global Markets Inc., (“CGM”) 222 Delaware Avenue, 7th Floor Wilmington, DE 19801 Birth Year: 1957 | | Executive Vice President and Investment Officer | | Since
2006 | | January 2006 to present — Executive Vice President, Director, Consulting Group; previously Great Lakes Regional Director, Smith Barney Private Client Group, May 2000 to January 2006 | | N/A | | N/A |
Leroy T. Pease The Consulting Group 222 Delaware Avenue Wilmington, DE 19801 Birth Year: 1958 | | Investment Officer | | Since
1996 | | Senior Vice President of CGM | | N/A | | N/A |
Stephen M. Hagan The Consulting Group 222 Delaware Avenue Wilmington, DE 19801 Birth Year: 1968 | | Investment Officer | | Since
1997 | | First Vice President of CGM | | N/A | | N/A |
Jason B. Moore The Consulting Group 222 Delaware Avenue Wilmington, DE 19801 Birth Year: 1972 | | Investment Officer | | Since
2003 | | Vice President of CGM | | N/A | | N/A |
183
Additional Information
(unaudited) (continued)
| | | | | | | | | | |
Name, Address and
Birth Year
| | Position(s)
Held with
Fund
| | Term of
Office*
and
Length
of Time
Served
| | Principal Occupation(s) During Past Five Years
| | Number of
Portfolios
in Fund
Complex
Overseen
by Trustee
| | Other Board
Memberships Held by Trustee
|
Mark C. Kennard The Consulting Group 222 Delaware Avenue Wilmington, DE 19801 Birth Year: 1958 | | Investment Officer | | Since
2004 | | First Vice President of CGM | | N/A | | N/A |
Steven Hartstein CGM 485 Lexington Avenue, 14th Floor New York, NY 10017 Birth Year: 1963 | | Chief Compliance Officer | | Since
2006 | | Senior Vice President, CGM; previously Senior Compliance Officer, Mercer Global Investments, 2004 to 2006; Director and Senior Compliance Officer, UBS Global Asset Management, 2002 to 2004; Vice President and Senior Compliance Officer, Lazard Asset Management, 2000 to 2002 | | N/A | | N/A |
Carmen Menendez-Puerto CGM 111 Wall Street New York, NY 10005 Birth Year: 1961 | | Chief Anti-Money Laundering Officer | | Since
2006 | | Director of Smith Barney’s Anti-Money Laundering Program; previously, Department Risk Manager, Smith Barney Compliance Department | | N/A | | N/A |
Robert I. Frenkel Legg Mason 300 First Stamford Place,
4th Floor Stamford, CT 06902 Birth Year: 1954 | | Secretary and Chief Legal Officer | | Since
2003 | | Managing Director and General Counsel of Global Mutual Funds for Legg Mason and its predecessors (since 1994); Secretary and Chief Legal Officer of mutual funds associated with Citigroup | | N/A | | N/A |
| * | | Each Trustee and Officer serves until his or her successor has been duly elected and qualified. |
184
Important Tax Information
(unaudited)
The following information is provided with respect to the distributions paid during the taxable year ended August 31, 2006:
| | | | | | | | | | | | | | |
| | | Large Capitalization Value Equity
Investments
| | | Small Capitalization
Value Equity
Investments
| | | International
Equity
Investments
| | | Emerging Markets
Equity Investments
| | | |
Record Date: | | 12/15/2005 | | | 12/15/2005 | | | 12/15/2005 | | | 12/15/2005 | | | |
Payable Date: | | 12/16/2005 | | | 12/16/2005 | | | 12/16/2005 | | | 12/16/2005 | | | |
Ordinary Income: | | | | | | | | | | | | | | |
Qualified Dividend Income for Individuals | | 100.00 | % | | 24.16 | % | | 100.00 | % | | 100.00 | % | | |
Dividends Qualifying for the Dividends Received Deduction for Corporations | | 100.00 | % | | 24.45 | % | | — | | | 1.98 | % | | |
Foreign Source Income | | — | | | — | | | 95.65 | % ** | | 98.77 | %** | | |
Foreign Taxes Paid Per Share | | — | | | — | | | $0.007773 | | | $0.032833 | | | |
Long-Term Capital Gain Dividend | | $0.478812 | | | $3.683098 | * | | — | | | — | | | |
| | | | | | | | | | | | | | | | | |
| | | | |
| | | Government Money
Investments
| | | Core Fixed Income Investments
| | | Municipal Bond
Investments
| | | International Fixed
Income Investments
| |
Record Date: | | Monthly | | | Monthly | | | Monthly | | | Monthly | | | Monthly | | Monthly | |
Payable Date: | | Monthly | | | September 2005 to
December 2005 |
| | January 2006 to
August 2006 |
| | Monthly | | | September 2005 to
December 2005 | | January 2006 to
August 2006 |
|
Interest from Tax-Exempt Obligations | | — | | | — | | | — | | | 100.00 | % | | — | | — | |
Interest from Federal Obligations | | 47.29 | % | | 22.20 | % | | 16.33 | % | | — | | | — | | 7.93 | % |
Tax Return of Capital | | — | | | — | | | — | | | — | | | — | | 82.78 | % |
| * | Of this amount, 0.058% represented Unrecaptured Section 1250 gains subject to a maximum 25% rate. |
| ** | Expressed as a percentage of the cash distribution grossed-up for foreign taxes. |
The law varies in each state as to whether and what percentage of dividend income attributable to Federal obligations is exempt from state income tax. We recommend that you consult with your tax adviser to determine if any portion of the dividends you received is exempt from state income taxes.
The foreign taxes paid represent taxes incurred by the Fund on income received by the Fund from foreign sources. Foreign taxes paid may be included in taxable income with an offsetting deduction from gross income or may be taken as a credit for taxes paid to foreign governments. You should consult your tax adviser regarding the appropriate treatment of foreign taxes paid.
Please retain this information for your records.
185
WWW.SMITHBARNEY.COM

CITIGROUP GLOBAL MARKETS INC.
Distributor
CITIGROUP INVESTMENT ADVISORY SERVICES INC.
Investment Adviser
This report is submitted for the general information of the shareholders of Consulting Group Capital Markets Funds. It is not authorized for distribution to prospective investors unless accompanied or preceded by a current Prospectus for the Trust which contains information concerning the Trust’s Investment policies, charges and expenses as well as other pertinent information.
The Funds file their complete schedule of portfolio holdings with the Securities and Exchange Commission for the first and third quarters of each fiscal year on Form N-Q. The Funds’ Forms N-Q are available on the Commission’s website at www.sec.gov. The Funds’ Forms N-Q may be reviewed and copied at the Commission’s Public Reference Room in Washington D.C., and information on the operation of the Public Reference Room may be obtained by calling 1-800-SEC-0330. To obtain information on Form N-Q from the Funds, shareholders can call 1-800-451-2010.
Information on how the Funds voted proxies relating to portfolio securities during the most recent 12-month period ended June 30 and a description of the policies and procedures that the Funds use to determine how to vote proxies relating to portfolio securities is available (1) without charge, upon request, by calling 1-800-451-2010, (2) on the Funds’ website at www.smithbarney.com and (3) on the SEC’s website at www.sec.gov.
© 2006 Citigroup Global Markets Inc. Member SIPC. Smith Barney and Consulting Group are divisions of Citigroup Global Markets Inc. Smith Barney is a service mark of Citigroup Global Markets Inc. and its affiliates and is used and registered throughout the world. CITIGROUP and the Umbrella Device are trademarks and service marks of Citigroup Inc. or its affiliates and are used and registered throughout the world. Securities are offered through Citigroup Global Markets Inc. Investments are not FDIC-insured or bank-guaranteed, and investors may lose money.
TK 2120A, 8/06 Consulting Group Capital Markets Funds Ÿ 222 Delaware Avenue Ÿ Wilmington, Delaware Ÿ 19801
ITEM 2. CODE OF ETHICS.
The registrant has adopted a code of ethics that applies to the registrant’s principal executive officer, principal financial officer, principal accounting officer or controller.
ITEM 3. AUDIT COMMITTEE FINANCIAL EXPERT.
The Board of Trustees of the registrant has determined that Armon Kamesar, the Chairman of the Board’s Audit Committee, possesses the technical attributes identified in Instruction 2(b) of Item 3 to Form N-CSR to qualify as an “audit committee financial expert,” and has designated Mr. Kamesar as the Audit Committee’s financial expert. Mr. Kamesar is an “independent” Trustee pursuant to paragraph (2)(a) of Item 3 to Form N-CSR.
ITEM 4. PRINCIPAL ACCOUNTANT FEES AND SERVICES.
a) Audit Fees. The aggregate fees billed in the last two fiscal years ending August 31, 2005 and August 31, 2006 (the “Reporting Periods”) for professional services rendered by the Registrant’s principal accountant (the “Auditor”) for the audit of the Registrant’s annual financial statements, or services that are normally provided by the Auditor in connection with the statutory and regulatory filings or engagements for the Reporting Periods, were $265,000 in 2005 and $272,000 in 2006.
b) Audit-Related Fees. The aggregate fees billed in the Reporting Periods for assurance and related services by the Auditor that are reasonably related to the performance of the audit of the Registrant’s financial statements and are not reported under paragraph (a) of this Item 4 were $17,500 in 2005. These services consisted of procedures performed in connection with the review and preparation with the issuance of the 17-F2 Security Count Independent Accountants Reports of the Consulting Group Capital Markets Fund. There were no fees billed in the Reporting Periods for assurance and related services by the Auditor that are reasonably related to the performance of the audit of the Registrant’s financial statements and are not reported under paragraph (a) of this Item 4 in 2006.
In addition, there were no Audit-Related Fees billed in the Reporting Period for assurance and related services by the Auditor to the Registrant’s investment adviser (not including any sub-adviser whose role is primarily portfolio management and is subcontracted with or overseen by another investment adviser), and any entity controlling, controlled by or under common control with the investment adviser that provides ongoing services to the Consulting Group Capital Markets Fund (“service affiliates”), that were reasonably related to the performance of the annual audit of the service affiliates. Accordingly, there were no such fees that required pre-approval by the Audit Committee for the Reporting Periods (prior to May 6, 2003 services provided by the Auditor were not required to be pre-approved).
(c) Tax Fees. The aggregate fees billed in the Reporting Periods for professional services rendered by the Auditor for tax compliance, tax advice and tax planning (“Tax Services”) were $35,100 in 2005 and $0 in 2006. These services consisted of (i) review or preparation of U.S. federal, state, local and excise tax returns; (ii) U.S. federal, state and local tax planning, advice and assistance regarding statutory, regulatory or administrative developments, and (iii) tax advice regarding tax qualification matters and/or treatment of various financial instruments held or proposed to be acquired or held.
There were no fees billed for tax services by the Auditors to service affiliates during the Reporting Periods that required pre-approval by the Audit Committee.
d) All Other Fees. There were no other fees billed in the Reporting Periods for products and services provided by the Auditor, other than the services reported in paragraphs (a) through (c) of this Item 4 on behalf of the Consulting Group Capital Markets Fund.
All Other Fees. There were no other non-audit services rendered by the Auditor to Smith Barney Fund Management LLC (“SBFM”), and any entity controlling, controlled by or under common control with SBFM that provided ongoing services to Consulting Group Capital Markets Fund requiring pre-approval by the Audit Committee in the Reporting Period.
(e) Audit Committee’s pre-approval policies and procedures described in paragraph (c) (7) of Rule 2-01 of Regulation S-X.
(1) The Charter for the Audit Committee (the “Committee”) of the Board of each registered investment company (the “Fund”) advised by Smith Barney Fund Management LLC or Salomon Brothers Asset Management Inc. or one of their affiliates (each, an “Adviser”) requires that the Committee shall approve (a) all audit and permissible non-audit services to be provided to the Fund and (b) all permissible non-audit services to be provided by the Fund’s independent auditors to the Adviser and any Covered Service Providers if the engagement relates directly to the operations and financial reporting of the Fund. The Committee may implement policies and procedures by which such services are approved other than by the full Committee.
The Committee shall not approve non-audit services that the Committee believes may impair the independence of the auditors. As of the date of the approval of this Audit Committee Charter, permissible non-audit services include any professional services (including tax services), that are not prohibited services as described below, provided to the Fund by the independent auditors, other than those provided to the Fund in connection with an audit or a review of the financial statements of the Fund. Permissible non-audit services may not include: (i) bookkeeping or other services related to the accounting records or financial statements of the Fund; (ii) financial information systems design and implementation; (iii) appraisal or valuation services, fairness opinions or contribution-in-kind reports; (iv) actuarial services; (v) internal audit outsourcing services; (vi) management functions or human resources; (vii) broker or dealer, investment adviser or investment banking services; (viii) legal services and expert services unrelated to the audit; and (ix) any other service the Public Company Accounting Oversight Board determines, by regulation, is impermissible.
Pre-approval by the Committee of any permissible non-audit services is not required so long as: (i) the aggregate amount of all such permissible non-audit services provided to the Fund, the Adviser and any service providers controlling, controlled by or under common control with the Adviser that provide ongoing services to the Fund (“Covered Service Providers”) constitutes not more than 5% of the total amount of revenues paid to the independent auditors during the fiscal year in which the permissible non-audit services are provided to (a) the Fund, (b) the Adviser and (c) any entity controlling, controlled by or under common control with the Adviser that provides ongoing services to the Fund during the fiscal year in which the services are provided that would have to be approved by the Committee; (ii) the permissible non-audit services were not recognized by the Fund at the time of the engagement to be non-audit services; and (iii) such services are promptly brought to the attention of the Committee and approved by the Committee (or its delegate(s)) prior to the completion of the audit.
(2) For the Consulting Group Capital Markets Fund, the percentage of fees that were approved by the audit committee, with respect to: Audit-Related Fees were 100% and 0% for 2005 and 2006; Tax Fees were 100% and 0% for 2005 and 2006; and Other Fees were 100% and 0% for 2005 and 2006.
(f) N/A
(g) Non-audit fees billed by the Auditor for services rendered to Consulting Group Capital Markets Fund and CAM and any entity controlling, controlled by, or under common control with CAM that provides ongoing services to Consulting Group Capital Markets Fund during the reporting period were $0 in 2006 for fees related to the transfer agent matter as fully described in the notes the financial statements titled “additional information” and $75,000 for 2005.
(h) Yes. Consulting Group Capital Markets Fund’s Audit Committee has considered whether the provision of non-audit services that were rendered to Service Affiliates which were not pre-approved (not requiring pre-approval) is compatible with maintaining the Accountant’s independence. All services provided by the Auditor to the Consulting Group Capital Markets Fund or to Service Affiliates, which were required to be pre-approved, were pre-approved as required.
ITEM 5. AUDIT COMMITTEE OF LISTED REGISTRANTS.
Not applicable.
ITEM 6. SCHEDULE OF INVESTMENTS.
Included herein under Item 1.
ITEM 7. DISCLOSURE OF PROXY VOTING POLICIES AND PROCEDURES FOR CLOSED-END MANAGEMENT INVESTMENT COMPANIES.
Not applicable.
ITEM 8. PORTFOLIO MANAGERS OF CLOSED-END MANAGEMENT INVESTMENT COMPANIES.
Not applicable.
ITEM 9. PURCHASES OF EQUITY SECURITIES BY CLOSED-END MANAGEMENT INVESTMENT COMPANY AND AFFILIATED PURCHASERS.
Not applicable.
ITEM 10. SUBMISSION OF MATTERS TO A VOTE OF SECURITY HOLDERS.
Not applicable.
ITEM 11. CONTROLS AND PROCEDURES.
| | (a) | The registrant’s principal executive officer and principal financial officer have concluded that the registrant’s disclosure controls and procedures (as defined in Rule 30a- 3(c) under the Investment Company Act of 1940, as amended (the “1940 Act”)) are effective as of a date within 90 days of the filing date of this report that includes the disclosure required by this paragraph, based on their evaluation of the disclosure controls and procedures required by Rule 30a-3(b) under the 1940 Act and 15d-15(b) under the Securities Exchange Act of 1934. |
| | (b) | There were no changes in the registrant’s internal control over financial reporting (as defined in Rule 30a-3(d) under the 1940 Act) that occurred during the registrant’s last fiscal half-year (the registrant’s second fiscal half-year in the case of an annual report) that have materially affected, or are likely to materially affect the registrant’s internal control over financial reporting. |
ITEM 12. EXHIBITS.
| | (a) | Code of Ethics attached hereto. |
Exhibit 99.CODE ETH
| | |
| Exhibit 99.CERT | | Certifications pursuant to section 302 of the Sarbanes-Oxley Act of 2002 |
| |
| Exhibit 99.906CERT | | Certifications pursuant to Section 906 of the Sarbanes-Oxley Act of 2002 |
SIGNATURES
Pursuant to the requirements of the Securities Exchange Act of 1934 and the Investment Company Act of 1940, the registrant has duly caused this Report to be signed on its behalf by the undersigned, there unto duly authorized.
Consulting Group Capital Markets Funds
| | |
| By: | | /s/ R. Jay Gerken |
| | R. Jay Gerken |
| | Chief Executive Officer of |
| | Consulting Group Capital Markets Funds |
| |
| Date: | | November 9, 2006 |
Pursuant to the requirements of the Securities Exchange Act of 1934 and the Investment Company Act of 1940, this report has been signed below by the following persons on behalf of the registrant and in the capacities and on the dates indicated.
| | |
| By: | | /s/ R. Jay Gerken |
| | R. Jay Gerken |
| | Chief Executive Officer of |
| | Consulting Group Capital Markets Funds |
| |
| Date: | | November 9, 2006 |
| |
| By: | | /s/ Robert J. Brault |
| | Robert J. Brault |
| | Chief Financial Officer of |
| | Consulting Group Capital Markets Funds |
| |
| Date: | | November 9, 2006 |