UNITED STATES
SECURITIES AND EXCHANGE COMMISSION
WASHINGTON, D.C. 20549
FORM N-CSR
CERTIFIED SHAREHOLDER REPORT OF REGISTERED
MANAGEMENT INVESTMENT COMPANIES
Investment Company Act file number: 811-06318
CONSULTING GROUP CAPITAL MARKETS FUNDS
(Exact name of registrant as specified in charter)
222 Delaware Avenue
Wilmington, Delaware 19801
(Address of principal executive offices) (Zip code)
CT Corporation System
155 Federal Street
Suite 700
Boston MA, 02110
(Name and address of agent for service)
Registrant’s telephone number, including area code: (800) 444-4273
Date of fiscal year end:
8/31
Date of reporting period:
8/31/2007
Form N-CSR is to be used by management investment companies to file reports with the Commission not later than 10 days after the transmission to stockholders of any report that is required to be transmitted to stockholders under Rule 30e-1 under the Investment Company Act of 1940 (17 CFR 270.30e-1). The Commission may use the information provided on Form N-CSR in its regulatory, disclosure review, inspection, and policymaking rules.
A registrant is required to disclose the information specified by Form N-CSR, and the Commission will make this information public. A registrant is not required to respond to the collection of information contained in Form N-CSR unless the Form displays a currently valid Office of Management and Budget (“OMB”) control number. Please direct all comments concerning the accuracy of the information collection burden estimate and any suggestions for reducing the burden to Secretary, Securities and Exchange Commission, 100 F. Street, NE, Washington, DC 20549. The OMB has reviewed this collection of information under clearance requirements of 44 U.S.C. ss. 3507.
| ITEM 1. | REPORTS TO STOCKHOLDERS |

Consulting Group Capital Markets Funds
TRAK®
Annual Report
» August 31, 2007
| Ÿ | | Large Capitalization Growth Investments |
| Ÿ | | Large Capitalization Value Equity Investments |
| Ÿ | | Small Capitalization Growth Investments |
| Ÿ | | Small Capitalization Value Equity Investments |
| Ÿ | | International Equity Investments |
| Ÿ | | Emerging Markets Equity Investments |
| Ÿ | | Core Fixed Income Investments |
| Ÿ | | International Fixed Income Investments |
| Ÿ | | Municipal Bond Investments |
| Ÿ | | Money Market Investments |
INVESTMENT PRODUCTS: NOT FDIC INSURED • NO BANK GUARANTEE • MAY LOSE VALUE
Table of Contents
Consulting Group
Capital Markets Funds
DEAR SHAREHOLDER,
The fiscal year for the Consulting Group Capital Markets Funds (“Fund”) ended August 31, 2007, with all portfolios posting positive returns for the year then ended. The equity portfolios generally posted higher returns than the fixed income portfolios, as stocks continued to perform well globally. Emerging Markets Equity Investments continued to lead among the equity portfolios. Global economic strength in a period of stable interest rates benefited financial assets.
The relatively stable financial markets of the past several years had their first major and potentially serious disruption in July and August, as the slowdown in the US housing sector impacted global financial markets. Rising defaults in the sub-prime portion of the mortgage market resulted in billions of dollars of losses in portfolios of esoteric mortgage repackagings. Central banks were forced to enact emergency measures in order to calm the markets and provide liquidity to the system.
The US Federal Reserve Board cut its key-lending rate in response to the aforementioned market turmoil, and, as we write this letter following the Funds’ fiscal year end, markets are calmer, but are paying greater attention to risk management and they are unsure as to the potential fallout.
The broad economic and financial environment during the past fiscal year reflected continued economic growth, steady interest rates, continued rising energy and commodity prices, downward pressure on the US dollar, and ample liquidity to continue to drive up the prices for many of the equity strategies. Relative economic strength shifted to many overseas economies as the housing market in the US slowed sharply. The effect was that both the international developed equity markets and emerging equity markets outperformed the US market. The large cap company US market, as represented by the S&P 500® Index (S&P 500), rose 15.13%. The Morgan Stanley Capital International (“MSCI”) EAFE® Index, net of dividends, rose 18.71%. The MSCI Emerging Markets index rose 44.05%.
Within the US equity market, a shift in leadership occurred. Small cap value stocks posted the highest performance for much of the prior decade. Financial companies and real estate investment trusts (“REITs”) comprise a major component of the Russell 2000® Value Index, the relevant benchmark for the small cap value style. The recent poor returns in the financial and REIT companies led the small cap value index down and were the major reason smaller companies underperformed larger companies in this reporting period. Large cap stocks, as represented by the S&P 500, rose 15.13% over the past fiscal year, and small cap stocks as represented by the Russell 2000 (Ru2000) rose 11.37%.
Over much of the last decade value strategies also outperformed growth strategies in the US equity market. Value strategies in both the large cap and small cap investment styles particularly benefited from cyclical companies, helped by strong economic growth and high commodity prices, especially the rise in energy prices over the past several years. In contrast, over the past fiscal year, growth strategies outperformed value strategies in various company size categories. Growth indices benefited from sharp downturns in financial and real estate related companies that hurt the respective value indices. The growth indices also started to show better performance as many technology companies benefited from strong overseas profits.
Consulting Group Capital Markets Funds
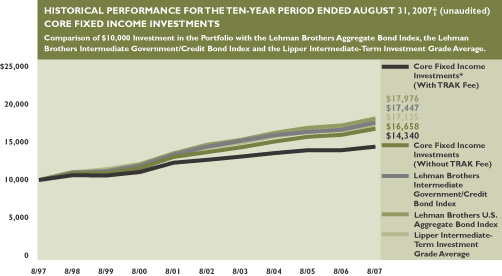
Core Fixed Income Investments returned 4.82% for the fiscal year ended August 31, 2007, as compared to its benchmark, the Lehman Bothers (“LB”) U.S. Aggregate Bond™ Index, which returned 5.25% during that period. The
I
portfolio’s subadvisers are BlackRock Financial Management, Inc., Pacific Investment Management Company LLC (“PIMCO”), Western Asset Management Company (“WAMCo”), and Metropolitan West Asset Management (“MWAM”), which became a subadviser to the portfolio in April 2007. The key factor contributing to portfolio underperformance was the subadvisers having in aggregate, an overweight position in mortgage-backed securities (“MBS”). MBS suffered during the increased market volatility that ensued during the sub-prime mortgage market crisis that occurred later in the fiscal year.
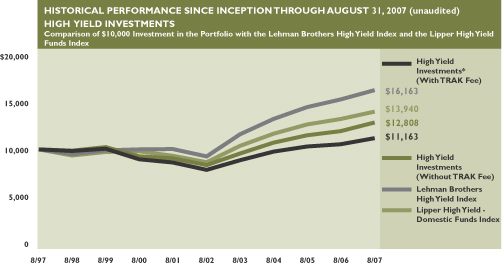
High Yield Investments returned 7.56% for the fiscal year ended August 31, 2007, beating the LB High Yield Bond Index return of 6.29%. The portfolio’s subadvisers are Penn Capital Management Co., Inc. (“Penn Capital”), and WAMCo. Both subadvisers benefited from the continued strength in the economy that generally aids the high yield market and, in particular, the higher-risk companies within that market.
International Fixed Income Investments returned 2.33%, trailing the Citigroup Non-U.S. World Government Hedged Index return of 3.98%. PIMCO is the portfolio’s sole subadviser. The portfolio’s underperformance was due to several decisions having a minimal impact individually, but in aggregate, enough to produce an underperformance. Among these decisions was a positioning in the US and UK along the yield curve as the mortgage-induced credit crisis developed. Outside of several country allocation decisions, another negative determinant was an allocation to bank notes.
Municipal Bond Investments returned 1.77% for the fiscal year ended August 31, 2007, versus the LB Municipal Bond Index return of 2.30%. McDonnell Investment Management, LLC, is the portfolio’s sole subadviser. The main reason for the portfolio’s negative relative performance versus its benchmark became a relative positive later in the fiscal year. The fund maintained a bias to higher-quality issues during the year. This decision had a negative impact earlier in the year, as the market continued to favor lower-quality issues. When the market preference shifted during the credit crisis, this position benefited the portfolio.
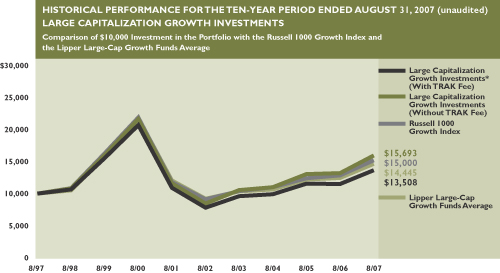
Large Capitalization Growth Investments returned 19.95% for the fiscal year ended August 31, 2007, versus the comparative return of 17.71% for its benchmark, the Russell 1000® Growth Index. The portfolio’s advisors are Wells Capital Management, Westfield Capital Management Company, LLC (“Westfield”), and Delaware Management Company (“Delaware”). The value added to the portfolio was primarily due to two factors: (1) overall, the subadvisers were overweighted to the energy sector and also picked several leading performers; and (2) within a generally difficult healthcare sector, the portfolio’s individual stock selections added value.
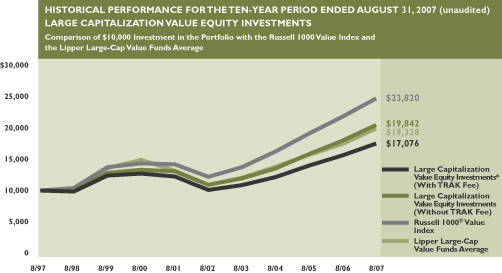
Large Capitalization Value Equity Investments rose 13.58% for the fiscal year ended August 31, 2007, as compared to the return of 12.84% of its benchmark, the Russell 1000 Value Index. The portfolio’s subadvisers are Cambiar Investors LLC, AllianceBernstein LP and NFJ Investment Group (“NFJ”). The value added of the subadvisers was from the continued emphasis on the companies that benefit from strong global growth. This overweight resulted from an underweighting of the financial sector, the sector hit hardest by the mortgage market turmoil.
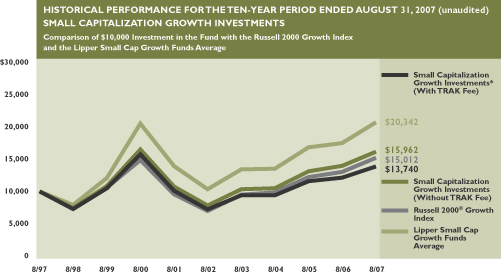
Small Capitalization Growth Investments returned 15.48% for the fiscal year ended August 31, 2007, as compared to a 16.35% return of its benchmark, the Russell 2000 Growth Index. The portfolio’s subadvisers are Wall Street Associates and Westfield. The portfolio underperformance was primarily due to stocks selected in the industrial cyclical portions of the portfolio not matching the benchmark. The decision to overweight the area was advantageous, but they did not get the full impact as some of their stocks lagged the benchmark in the sectors.
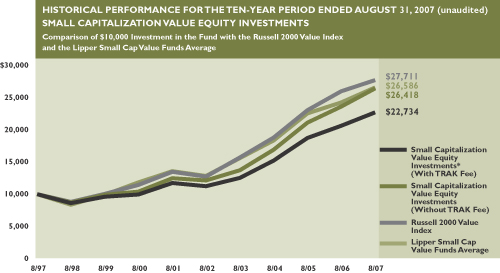
Small Capitalization Value Equity Investments gained 11.94% for the fiscal year ended August 31, 2007, as compared to the 6.65% return of its benchmark, the Russell 2000 Value Index. The portfolio’s subadvisers are NFJ, Delaware and Rutabaga Capital Management. The significant declines in financial company and REIT stocks negatively impacted the benchmark but did not hurt the portfolio to the same degree, as the subadvisers had large underweights to those areas. Small advantages in the individual stock holdings within the industrial portions of the portfolio added to the significant portfolio outperformance.
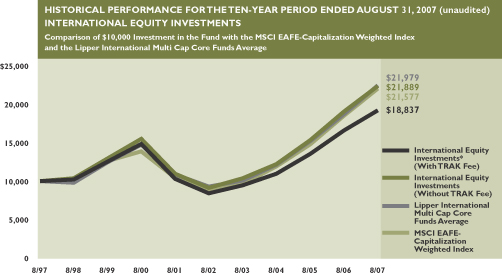
International Equity Investments returned 17.21% for the fiscal year ended August 31, 2007, trailing the 18.71% of its benchmark, the MSCI EAFE Index (net of taxes). The portfolio’s subadvisers during the past fiscal year were
II
Philadelphia International Advisors LP (“PIA”), Brandywine Global Investment Management, LLC (“Brandywine”), and William Blair & Company, LLC (“William Blair”). The relative performance of the portfolio compared to the index turned negative, as such factors as the smaller and mid-cap companies underperformed the large cap stocks. Like the US market, holdings in the financial sector hurt the portfolio return. Following the fiscal year end, Schroder Investment Management replaced William Blair as subadviser to the portfolio; PIA and Brandywine continue as subadvisers. This change in subadviser will produce a generally more diversified portfolio and substitute a Growth at a Reasonable Price investment philosophy for a more traditional Growth strategy.
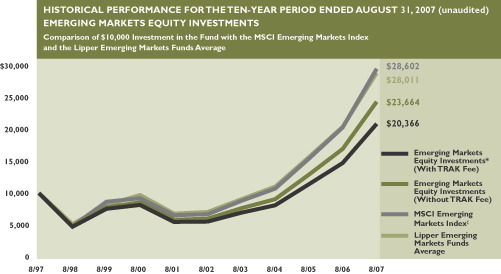
Emerging Markets Investments gained 42.41% for the fiscal year ended August 31, 2007. Its benchmark, the MSCI Emerging Markets Index, rose 44.05% during this period. The portfolio’s subadvisers are Newgate Capital Management LLC and SSgA Funds Management, Inc. The portfolio could not keep pace with the benchmark’s returns due to the market behavior in China and India. Fueling this strong rise in the emerging markets have been market returns in China and India. Both countries are slightly underweight in both subadvisers’ portfolios. The subadvisers chose to control total portfolio risk by limiting exposure to these fast-moving markets.
We thank you for continued support of the Consulting Group Capital Markets Funds. For additional information regarding the portfolios and the asset allocation advice that guides the portfolio creation, we urge you to discuss these issues with your financial adviser.
The performance shown represents past performance. Past performance is no guarantee of future results and current performance may be higher or lower than the performance shown above. Principal value and investment returns will fluctuate so that investors’ shares, when redeemed, may be worth more or less than their original cost. The returns shown do not reflect the deduction of taxes that a shareholder would pay on fund distributions or the redemption of fund shares. To obtain performance data current to the most recent month-end, please visit our website at www.smithbarney.com.
The portfolios are only available to investors participating in an advisory program. These programs charge an annual fee, which in the case of TRAK® may be up to 1.50%. The performance data shown does not reflect this fee, which would reduce returns.
All index performance reflects no deduction for fees, expenses or taxes. Please note an investor cannot invest directly in an index.
Risks
Certain of the portfolios may invest in derivatives, such as options and futures, which may be illiquid, may disproportionately increase losses, and have a potentially large impact on fund performance. Foreign securities are subject to certain risks of overseas investing including currency fluctuations and changes in political and economic conditions, which could result in significant market fluctuations. These risks are magnifies in emerging or developing markets. Investments in small or medium-capitalization companies may involve a higher degree of risk and volatility than investments in larger, more established companies. Certain of the portfolios may invest in high yield bonds, which involve greater credit and liquidity risks than investment grade bonds.
Sincerely,
| | |
| |

James J. Tracy Chief Executive Officer October 17, 2007 | | |
III
The performance shown represents past performance. Past performance is no guarantee of future results, and current performance may be higher or lower than the performance shown above. Performance figures may reflect voluntary fee waivers and/or expense reimbursements. In the absence of voluntary fee waivers and/or expense reimbursements, the total return would have been lower. Principal value and investment returns will fluctuate so that an investor’s shares, when redeemed, may be worth more or less than their original cost. The returns shown do not reflect the deduction of taxes that a shareholder would pay on fund distributions or the redemption of fund shares. To obtain performance data current to the most recent month-end, please visit our website at www.smithbarney.com.
The portfolios are only available to investors participating in an advisory program. These programs charge an annual fee, which in the case of TRAK® may be up to 1.50%. The performance data shown does not reflect this fee, which would reduce returns.
All index performance reflects no deduction for fees, expenses or taxes. Please note an investor cannot invest directly in an index.
RISKS: Certain of the portfolios may invest in derivatives, such as options and futures, which can be illiquid, may disproportionately increase losses, and have a potentially large impact on fund performance. Foreign securities are subject to certain risks of overseas investing including currency fluctuations and changes in political and economic conditions, which could result in significant market fluctuations. These risks are magnified in emerging or developing markets. Investments in small or medium-capitalization companies may involve a higher degree of risk and volatility than investments in larger, more established companies. Certain of the portfolios may invest in high yield bonds, which involve greater credit and liquidity risks than investment grade bonds.
i | The US Federal Reserve Board is responsible for the formulation of a policy designed to promote economic growth, full employment, stable prices and a sustainable pattern of international trade and payments. |
ii | The S&P 500® Index is a market capitalization-weighted index of 500 widely-held common stocks. Standard & Poor’s 500 and S&P 500® are registered trademarks of the McGraw-Hill Companies, Inc. |
iii | The Russell 1000® Value Index is a capitalization weighted total return index which is comprised of 1,000 of the largest capitalized U.S.-domiciled companies with greater than average value orientation whose common stock is traded in the U.S. on the New York Stock Exchange, American Stock Exchange and NASDAQ. Russell 1000® Index is a registered trademark of the Frank Russell Company. |
iv | The Russell 2000® Value Index is a capitalization weighted total return index which is comprised of 2,000 of the smallest capitalized U.S.-domiciled companies with less-than-average growth orientation whose common stock is traded in the U.S. on the New York Stock Exchange, American Stock Exchange and NASDAQ. |
v | The Russell 2000® Growth Index is a capitalization weighted total return index which is comprised of 2,000 of the smallest capitalized U.S.-domiciled companies with greater-than-average growth orientation whose common stock is traded in the U.S. on the New York Stock Exchange, American Stock Exchange and NASDAQ. Russell 2000® Index is a registered trademark of the Frank Russell Company. |
vi | The Russell 1000® Growth Index is a capitalization weighted total return index which is comprised of 1,000 of the largest capitalized U.S.-domiciled companies with greater-than-average growth orientation whose common stock is traded in the U.S. on the New York Stock Exchange, American Stock Exchange and NASDAQ. |
vii | The MSCI EAFE® — Capitalization Weighted Index is a composite portfolio or equity total returns for the countries of Australia, New Zealand and countries in Europe and the Far East, weighted based on each country’s market capitalization. MSCI EAFE® — Capitalization Weighted Index is a registered trademark of Morgan Stanley Capital International Inc. |
viii | The MSCI Emerging Markets Index is an index comprised of thirteen emerging markets open to direct foreign participation. |
ix | The Lehman Brothers U.S. Aggregate Index is composed of the Lehman Brothers Intermediate Government/Credit Bond Index and the Lehman Brothers Mortgage-Backed Securities Index and includes treasury issues, agency issues, corporate bond issues and mortgage-backed securities. Lehman Brothers U.S. Aggregate Index is a trademark of Lehman Brothers Inc. |
x | The Lehman Brothers High Yield Index is composed of fixed rate, publicly issued, non-investment grade debt registered with the SEC. All bonds must be dollar-denominated, non-convertible and have at least one year remaining to maturity as well as an outstanding par value of $100 million. |
xi | The Citigroup Non-U.S. World Government Bond Index-Hedged is a market capitalization weighted index that is designed to represent the hedged performance of the government bond markets in thirteen developed countries, excluding the U.S. |
xii | The Lehman Brothers Municipal Bond Index is a weighted composite which is comprised of more than 15,000 bonds issued within the last five years, having a minimum credit rating of at least Baa and maturity of at least two years, excluding all bonds subject to the Alternative Minimum Tax and bonds with floating or zero coupons. |
IV
Performance of the Consulting Group Capital Markets Funds For the Year Ended August 31, 2007†* (unaudited)
| | | |
Large Capitalization Growth Investments | | 19.95 | % |
Russell 1000® Growth Index (2) | | 17.71 | |
| |
Large Capitalization Value Equity Investments | | 13.58 | |
Russell 1000® Value Index (1) | | 12.84 | |
| |
Small Capitalization Growth Investments | | 15.48 | |
Russell 2000® Growth Index (4) | | 16.35 | |
| |
Small Capitalization Value Equity Investments | | 11.94 | |
Russell 2000® Value Index (3) | | 6.65 | |
| |
International Equity Investments | | 17.21 | |
MSCI EAFE® — Capitalization Weighted Index (5) | | 18.71 | |
| |
Emerging Markets Equity Investments | | 42.41 | |
MSCI Emerging Markets Index (6) | | 44.05 | |
| |
Core Fixed Income Investments | | 4.82 | |
Lehman Brothers U.S. Aggregate Index (7) | | 5.25 | |
Lehman Brothers Intermediate Government/Credit Bond Index (8) | | 5.44 | |
| |
High Yield Investments | | 7.56 | |
Lehman Brothers High Yield Index (9) | | 6.29 | |
| |
International Fixed Income Investments | | 2.33 | |
Citigroup Non-U.S. World Government Bond Index — Hedged (11) | | 3.98 | |
| |
Municipal Bond Investments | | 1.77 | |
Lehman Brothers Municipal Bond Index (10) | | 2.30 | |
| |
Money Market Investments | | 4.86 | |
90-day Treasury Bill | | 4.90 | |
See pages 22 through 23 for all footnotes.
V

Large Capitalization
Growth Investments
ABOUTTHE SUBADVISERS
| | Ÿ | | Delaware Management Company (“Delaware”) | |
Delaware invests primarily in common stocks of large capitalization growth-oriented companies that Delaware believes have long-term capital appreciation potential and are expected to grow faster than the US economy. Using a bottom up approach, Delaware seeks to select securities of companies that it believes have attractive end market potential, dominant business models and strong free cash flow generation that are attractively priced compared to the intrinsic value of the securities. Delaware also considers a company’s operational efficiencies, management’s plans for capital allocation and the company’s shareholder orientation. Delaware currently defines large capitalization companies as those that, at the time of investment, have market capitalizations within the range of market capitalizations of companies in the Russell 1000® Growth Index. While the market capitalization of companies in the Russell 1000 Growth Index ranged from approximately $1.2 billion to $406 billion as of September 30, 2006, Delaware will normally invest in common stocks of companies with market capitalizations of at least $3 billion at the time of purchase.
| | Ÿ | | Wells Capital Management Inc. (“Wells Capital”) | |
Wells Capital employs both proprietary screens and intensive grassroots research in order to identify high growth companies expected to outperform their peers. Their investment philosophy is firmly rooted in the belief that successful investing is the result of focusing on companies with favorable underlying fundamentals, strong growth potential and solid management teams. Security selection is based on fundamental research. This research process works to “surround” an investment by focusing on the company’s financials and verifying fundamentals with the management team, mid-level employees, customers, competitors, suppliers and/or distributors.
For the period of September 1, 2006, through August 31, 2007, except as noted below, the subadvisers for the portfolio were Wells Capital, Delaware and Westfield.
The Delaware portion of the portfolio underperformed the Russell 1000 Growth Index during the one-year period ending August 31, 2007, primarily due to sector allocations and, to a lesser extent, Delaware’s security selection. Sector allocation was a significant factor as Delaware’s portion of the portfolio was underweighted in Energy (which had the highest absolute performance of any sector), Materials, and Producer Durables. Delaware tends to avoid owning stocks in those sectors where a commodity price or the direction and magnitude of an economic cycle is the key driver of the company’s results. In contrast, they tend to own businesses that have a unique, sustainable competitive advantage that help them to manage their way through various economic cycles, and whose returns are not subject to the cyclical swings in an underlying commodity price. While facing market headwinds by not owning many of the high return sectors during the period, contribution was added in specific security selection in Consumer Discretionary and in Financial Services. In Financial Services, Delaware focused owned transaction-based business models and avoided the spread-based financial companies that were punished by the sub-prime mortgage problems in July and August 2007.
Wells Capital Management began managing a portion of the portfolio on October 12, 2006. Since that time, the strategy slightly trailed the Russell 1000 Growth Index despite solid absolute returns. Stock selection in areas of materials and financials, specifically allocations to companies within precious metals and capital markets, was the primary source of relative underperformance. In addition, holdings in the consumer discretionary sector, namely in the media and retail industries, detracted as well. Weakness experienced in certain portions of the portfolio was mitigated by decent contribution from holdings found elsewhere - especially in the telecommunications and energy sectors. In both cases, sector overweights relative to the index provided a portion of the relative gains. Finally, stock selection in the Consumer Staples sector provided an additional source of gains for the strategy.
The Westfield portion of the portfolio, stock selection in 7 of the 9 sectors in which the Portfolio was invested accounted for the vast majority of outperformance. Stock selection within Healthcare provided the most excess return for the period, as positions in Biotechnology continued to register strong returns. Energy also provided positive relative returns during the period, as positions within Oil & Gas Equipment Services continued to benefit from positive capital expenditure trends. Being underweight coupled with solid stock selection within the Consumer Staples sector was additive to relative returns. Investments in the Drugstore space were mixed, but exposure to a global Food Products company was positive for the Portfolio. The Materials sector, specifically the Metals and Mining names held in the portfolio, posted strong returns as global demand for commodities continues to grow. The Consumer Discretionary sector also contributed to relative performance. Westfield has been able to identify companies within the Hotels and Leisure industry that have continued to exhibit strong growth characteristics despite the strains on the consumer. Concerns about aggressive lending standards in sub-prime and Alt-A mortgage markets minimized Portfolio exposure to Financial Services. Strong stock selection within the Capital Markets area and a lack of exposure to Commercial Banks added to relative performance. Information Technology was the main source of weakness in the Portfolio during the period. Holdings within the Semiconductors space hurt performance and being underweight to Computer Hardware also detracted from returns.
1
| | Ÿ | | Westfield Capital Management Co., LLC (“Westfield”) | |
Uses an active management style and favors investing in earnings stocks given its conviction that stock prices follow earnings progress and that they offer the best opportunity for superior real rates of return. The sub-adviser believes that reasonably priced stocks with high earnings potential are best identified through in-depth, fundamental research.
The following graph depicts the performance of the Large Capitalization Growth Investments vs. the Russell 1000 Growth Index2 and the Lipper Large-Cap Growth Funds Average.13
The performance shown above and below represents past performance. Past performance is no guarantee of future results and current performance may be higher or lower than the performance shown above. Performance figures may reflect voluntary fee waivers and/or expense reimbursements. In the absence of voluntary fee waivers and/or expense reimbursements, the total return would have been lower. Principal value and investment returns will fluctuate and investors’ shares, when redeemed, may be worth more or less than their original cost. To obtain performance data current to the most recent month-end, please visit our website at www.smithbarney.com.
The graph above and returns shown below do not reflect the deduction of taxes that a shareholder would pay on fund distributions or the redemption of fund shares.
LARGE CAPITALIZATION GROWTH INVESTMENTS (unaudited)
Average Annual Total Returns for the Period Ended August 31, 2007†
| | | | | | |
| | | Without TRAK Fee* | | | With TRAK Fee | |
Since inception (11/18/91) | | 8.69 | % | | 7.06 | % |
10 year | | 4.61 | | | 3.05 | |
5 year | | 13.06 | | | 11.38 | |
3 year | | 12.64 | | | 10.96 | |
1 year | | 19.95 | | | 18.17 | |
|
|
See pages 22 through 23 for all footnotes.
2
Large Capitalization Value Equity Investments
ABOUTTHE SUBADVISERS
| | Ÿ | | Cambiar Investors LLC (“Cambiar”) | |
Cambiar utilizes a bottom-up process that seeks to identify companies that are attractively priced, demonstrate positive developments not yet recognized by the market and offer significant appreciation potential within a one- to two-year time frame.
| | Ÿ | | NFJ Investment Group (“NFJ”) | |
The NFJ investment process initially screens for positive fundamentals by applying a screen over a universe of approximately 800 stocks in order to identify companies with positive fundamental characteristics. After the screen has been applied, NFJ then conducts in-depth research and analysis by reviewing each of the remaining 150-200 possible investments for low price-to-earnings multiples, high dividend yields, positive prospective earnings and quality operations. As part of the portfolio construction process, industry concentration is mitigated by avoiding overexposure to any one sector by restricting the number of stocks held within a single industry. The portfolio generally holds 40 to 50 companies. NFJ’s process involves regular portfolio and universe monitoring for buy and sell candidates. NFJ continually repeats its research process in order to identify new buy and sell candidates. The sell discipline is an important part of NFJ’s process. A stock is sold when an alternative stock with equally strong fundamentals demonstrates a substantially lower price-to-earnings ratio, and/or a substantially higher dividend yield.
For the period of September 1, 2006, through August 31, 2007, the subadvisers for the portfolio were Cambiar, NFJ and AllianceBernstein.
For the Cambiar portion, an active overweight and positive stock selection within the Consumer Discretionary and Consumer Staple sectors were amongst the notable positive contributors to performance. Cambiar also benefited from an underweight allocation to Financials, and a subsequent overweight position in the Information Technology sector. Detractors for the portfolio included Cambiar’s stock selection within Healthcare, as well as an underweight allocation to Industrials and Materials. While Cambiar has maintained a market-weight in Energy the portfolio’s stock selection was a drag on performance; this was due to Cambiar’s higher exposure to oilfield services companies, vs. the larger integrated companies.
The NFJ portion of the portfolio posted an annual return that exceeded the Russell 1000® Value performance benchmark for the annual period ended August 31, 2007. All economic sectors within the large-cap value arena posted positive returns except for the Finance sector. Positive portfolio results can mainly be attributed to stock selection, which account for just over one-half of the excess returns. This was particularly true in the Consumer Staples, Information Technology, and Consumer Discretionary sectors. Financial sector stock selection had a negative impact on the portfolio. Favorable sector strategy also contributed positively as the underweighting in the Financial sector was most beneficial as was an overweighting in the Energy sector. The portfolio maintains low valuation and above average dividend yield. The economy and equity markets should continue to move forward unless there should occur adverse changes to monetary, tax, incomes and/or trade policies. Heightened geo-political tensions in the Middle East could also be disruptive to equity markets. Market valuations remain compressed in a more narrow range of earnings multiples than in times past. This presents a unique challenge for the periods to come. We are looking towards positive and sustainable free cash flow yields (after capital expenditures and dividends) and growing dividend payouts as a favorable attributes.
The AllianceBernstein portion of the portfolio outperformed its benchmark, the Russell 1000® Value Index. Much of this period’s positive portfolio performance resulted from strong stock selection in the technology and industrial resources sectors. In the technology sector, Nokia, the world’s largest maker of mobile phones, rose as new, higher-priced models continued to gain market share. Meanwhile, in the industrial resources sector, Arcelor Mittal and Owens-Illinois stood out. Steel producer Arcelor Mittal moved higher due to rising demand for raw materials and a positive outlook for an already strong steel market. Owens-Illinois posted second-quarter earnings that exceeded estimates, driven by better-than-expected price recovery, good volume growth and operating performance improvements. The company’s restructuring remains on track as the packaging products manufacturer closed on the sale of its non-core plastics division, enabling it to substantially reduce its debt burden. Relative returns were hurt by several of the portfolio’s financial holdings, including Countrywide Financial, Genworth Financial and National City Corp., amid ongoing turmoil in the global credit markets. AllianceBernstein has significantly reduced the portfolio’s position in Countrywide Financial as its research concluded that the risks associated with Countrywide’s financing needs increased, and its recent change in strategy — specifically its plans to scale back its presence in some of the more lucrative segments of the mortgage market — reduced estimates of the company’s long-term earnings power. Also detracting from returns was the portfolio’s position in Macy’s Inc. Macy’s posted disappointing April same-store-sales,
3
| | Ÿ | | AllianceBernstein L.P. (“AllianceBernstein”) | |
AllianceBernstein seeks to exploit undervalued securities and the opportunities these create. The screening process begins by searching for undervalued securities within a universe of stocks comprising the S&P 500® Index and 150 additional large/mid-cap stocks not contained in the S&P 500 Index. Quantitative ranks in quintiles are then applied based on a stock’s expected return and risk considerations. AllianceBernstein also takes into consideration earnings estimate revisions and relative price trend determinations in attempting to avoid the classic value trap of buying too early.
The following graph depicts the performance of the Large Capitalization Value Equity Investments vs. the Russell 1000® Value Index1 and the Lipper Large-Cap Value Funds Average.12
heightening concerns surrounding the slower-than-expected turnaround of recently integrated May Department Stores.
The performance shown above and below represents past performance. Past performance is no guarantee of future results and current performance may be higher or lower than the performance shown above. Performance figures may reflect voluntary fee waivers and/or expense reimbursements. In the absence of voluntary fee waivers and/or expense reimbursements, the total return would have been lower. Principal value and investment returns will fluctuate and investors’ shares, when redeemed, may be worth more or less than their original cost. To obtain performance data current to the most recent month-end, please visit our website at www.smithbarney.com.
The graph above and returns shown below do not reflect the deduction of taxes that a shareholder would pay on fund distributions or the redemption of fund shares.
LARGE CAPITALIZATION VALUE EQUITY INVESTMENTS (unaudited)
Average Annual Total Returns for the Period Ended August 31, 2007†
| | | | | | |
| | | Without TRAK Fee* | | | With TRAK Fee | |
Since inception (11/18/91) | | 9.98 | % | | 8.34 | % |
10 year | | 7.09 | | | 5.50 | |
5 year | | 12.80 | | | 11.12 | |
3 year | | 14.16 | | | 12.46 | |
1 year | | 13.58 | | | 11.89 | |
|
|
See pages 22 through 23 for all footnotes.
4
Small Capitalization
Growth Investments
ABOUTTHE SUBADVISERS
| | Ÿ | | Wall Street Associates (“WSA”) | |
WSA follows a bottom-up investment style. It looks for companies with superior earnings growth, strong balance sheets, attractive valuations and potentially positive earning surprises.
| | Ÿ | | Westfield Capital Management Co., LLC (“Westfield”) | |
Westfield favors investing in earnings growth stocks given their conviction that stock prices follow earnings progress and that they offer the best opportunity for superior real rates of return. Reasonably priced stocks of companies with high foreseen earnings potential are best identified through in-depth, fundamental research. It is their belief that the small capitalization portion of the market is under-researched, and therefore less efficient, than the large capitalization sector.
For the period of September 1, 2006, through August 31, 2007, the subadvisers for the portfolio were WSA and Westfield.
WSA’s portion of the portfolio outperformed the benchmark return of the Russell 2000® Growth Index. Investments in the Technology sector provided the largest contribution to portfolio return during the period. The Fund benefited from an over-weighted position in the sector and strong stock selection. Investments in the Health Care sector reduced returns, as this area languished and faced political headwinds. Energy stocks as a group declined during the period and negatively impacted performance. WSA’s outlook for the small-cap segment of the market remains optimistic, and there is a belief that growth stocks are currently attractive and will be increasingly favored relative to value stocks. There is anticipation that a slower growth environment should favor growth issues, as investors are willing to pay a premium for strong earnings.
Westfield’s portion underperformed the Russell 2000® Growth Index, as positive stock selection in Energy and Information Technology was outweighed by challenges in the Industrials and Consumer Discretionary sectors. Positive stock selection within the Energy Equipment and Services sectors added to positive results, and the portfolio continues to be overweight Oil, Gas & Consumable Fuels, with a focus upon coal companies. Strong stock selection in Information Technology, including Software and Communications Equipment holdings, as well as within the Capital Markets sector, added to absolute performance. Results within Healthcare were mixed over the period, with gains in Pharmaceuticals and setbacks for Biotechnology stocks. The portfolio continues to be underweight in the Financial Services and Consumer Discretionary sectors, which faced challenges during the period, with Media and Specialty Retailing weighing down performance. Additionally, disappointing results within the Industrials sector detracted from overall returns, and holdings within the Commercial Services & Supply segment accounted for the majority of Westfield’s underperformance.
5
The following graph depicts the performance of the Small Capitalization Growth Investments vs. the Russell 2000® Growth Index4 and the Lipper Small Cap Growth Funds Average.15
The performance shown above and below represents past performance. Past performance is no guarantee of future results and current performance may be higher or lower than the performance shown above. Performance figures may reflect voluntary fee waivers and/or expense reimbursements. In the absence of voluntary fee waivers and/or expense reimbursements, the total return would have been lower. Principal value and investment returns will fluctuate and investors’ shares, when redeemed, may be worth more or less than their original cost. To obtain performance data current to the most recent month-end, please visit our website at www.smithbarney.com.
The graph above and returns shown below do not reflect the deduction of taxes that a shareholder would pay on fund distributions or the redemption of fund shares.
SMALL CAPITALIZATION GROWTH INVESTMENTS (unaudited)
Average Annual Total Returns for Period Ended August 31, 2007†
| | | | | | |
| | | Without TRAK Fee* | | | With TRAK Fee | |
Since inception (11/18/91) | | 10.72 | % | | 9.06 | % |
10 year | | 4.79 | | | 3.23 | |
5 year | | 15.19 | | | 13.48 | |
3 year | | 15.16 | | | 13.44 | |
1 year | | 15.48 | | | 13.76 | |
|
|
See pages 22 through 23 for all footnotes.
6
Small Capitalization Value Equity Investments
ABOUTTHE SUBADVISERS
| | Ÿ | | Rutabaga Capital Management LLC (“Rutabaga”) | |
Focuses exclusively on micro- and small capitalization stocks and looks to unearth uncommon or currently out-of-favor stocks. The firm’s analysts employ extensive bottom-up fundamental research to identify high quality companies with catalysts to increase margins and intrinsic value but are neglected or misperceived by the market.
| | Ÿ | | NFJ Investment Group (“NFJ”) | |
An active management style that invests in a diversified portfolio of small capitalization common stocks that it believes are undervalued in the marketplace generally and within their respective industries. The subadviser also considers valuation factors such as price-to-book, price-to-cash flow, dividend policy and industry outlook in selecting stocks for investment.
| | Ÿ | | Delaware Management Company (“Delaware”) | |
Delaware believes that markets can misprice securities. Delaware seeks to exploit this inefficiency on a consistent basis through active, research-based management. Delaware identifies companies with market capitalizations typically less than $2 billion at the time of purchase whose values it believes are not currently recognized in the market. In order to do so, Delaware considers a variety of factors, including, the financial strength of a company, its management, the prospects for its industry and any anticipated changes within the company that might suggest a more favorable outlook going forward. Delaware’s focus is on value stocks whose prices are historically low on a given financial measure, such as profits, book value or cash flow.
For the period of September 1, 2006, through August 31, 2007, the subadvisers for the portfolio were NFJ, Rutabaga and Delaware.
The NFJ portion of the portfolio posted an annual return that exceeded the Russell 2000® Value performance benchmark for the annual period ending August 31, 2007. All economic sectors within the small-cap value arena posted positive returns except for the Financial Services sector. The Utilities sector was virtually unchanged. Positive portfolio results were mainly attributable to favorable sector strategy, which accounted for just over one-half of the excess return. An underweighted position in Financial Services was beneficial, as were overweightings in the Industrials and Materials sectors. Returns for the portfolio were positive in all economic sectors except Telecom services, which accounts for a very small position size within the portfolio. Favorable issue selection also contributed positively and was significant in the Financial, Energy, and Industrial sectors. Issue selection within the Materials sector was a negative due very strong performance from three positions in the benchmark portfolio that were not in the managed portfolio. The portfolio had approximately a 23% turnover in the positions for the period. The portfolio held two positions that received tender offers during the period. The portfolio is underweighted in the Finance and Technology related sectors. The portfolio maintains low valuation, with a P/E ratio of 14. The dividend yield was 2.7% as of August 31, 2007. Average market capitalization is $1.9 billion. The economy and equity markets should continue to move forward unless there should occur adverse changes to monetary, tax, incomes and/or trade policies. Heightened geo-political tensions in the Middle East could also be disruptive to equity markets. Market valuations remain compressed in a more narrow range of earnings multiples than in times past. This presents a unique challenge for the periods to come. NFJ looks towards positive and sustainable free cash flow yields (after capital expenditures and dividends) and growing dividend payouts as favorable attributes.
In Rutabaga’s portion of the portfolio, major US stock indices rose, with small cap stocks as a whole underperforming large caps. Within small cap, growth stocks outperformed value stocks by a wide margin. For the fiscal year, Rutabaga’s portfolio outperformed both the Russell 2000 and the Russell 2000 Value indices. Broadly speaking, being underweight within the poorly performing Financials and REIT sectors and overweight in the better performing Materials & Processing area helped to boost performance for the period. As the market continues to sort out the impact of the housing softness, high commodity costs, the credit crunch and the Federal Reserve’s actions, Rutabaga’s focus remains on identifying and owning attractively valued companies with strong market positions and internal catalysts to drive improved margins and earnings in the future.
For the Delaware portion, the return based upon the Russell 2000 Value Index modest. Continued global economic growth coupled with a general slowdown in US economic growth, as well as a significant decline in housing prices and sales, led to distinct sector differences in gains and losses during this period. The sectors that seemed to benefit most were those that were in economically sensitive areas that also had broad exposure to exports and also had the ability to raise prices. Conversely, those industries that generally performed poorly were more directly tied to discretionary consumer spending and those dependent on loan growth and the success of the housing markets. As a result, Basic Industries and Capital Spending sectors posted strong returns, while Financial Services and Real Estate Investment Trusts (“REITs”) were the worst performing sectors in the Russell 2000 Value Index, and were in fact the only sectors with negative total returns during this time frame. From a performance standpoint, the
7
The following graph depicts the performance of the Small Capitalization Value Equity Investments vs. the Russell 2000 Value Index3 and the Lipper Small Cap Value Funds Average.14
overweighting in Technology and Health care combined with strong stock selection had a positive impact on performance during the fiscal year. Additionally, the underweighting in Financial Services and REITs also had a positive impact on performance. Poor stock selection in several areas including Basic Industries, Consumer Cyclicals, Consumer Staples and Energy negated much of the previously mentioned positive impact. As a result, overall stock selection was a negative factor on performance while overall sector weightings were a positive contribution.
The performance shown above and below represents past performance. Past performance is no guarantee of future results and current performance may be higher or lower than the performance shown above. Performance figures may reflect voluntary fee waivers and/or expense reimbursements. In the absence of voluntary fee waivers and/or expense reimbursements, the total return would have been lower. Principal value and investment returns will fluctuate and investors’ shares, when redeemed, may be worth more or less than their original cost. To obtain performance data current to the most recent month-end, please visit our website at www.smithbarney.com.
The graph above and returns shown below do not reflect the deduction of taxes that a shareholder would pay on fund distributions or the redemption of fund shares.
SMALL CAPITALIZATION VALUE EQUITY INVESTMENTS (unaudited)
Average Annual Total Returns for Period Ended August 31, 2007†
| | | | | | |
| | | Without TRAK Fee* | | �� | With TRAK Fee | |
Since inception (11/18/91) | | 11.75 | % | | 10.08 | % |
10 year | | 10.19 | | | 8.55 | |
5 year | | 16.83 | | | 15.09 | |
3 year | | 16.03 | | | 14.30 | |
1 year | | 11.94 | | | 10.27 | |
|
|
See pages 22 through 23 for all footnotes.
8
International Equity Investments
ABOUTTHE SUBADVISERS
| | Ÿ | | William Blair & Co., LLC (“William Blair”) | |
William Blair’s investment approach is focused upon a conservative, long-term approach to growth investing. They seek companies with growth characteristics that include high benchmark revenue growth, earnings-per-share growth, dividends-per-share growth and consensus long-term growth estimates.
| | Ÿ | | Philadelphia International Advisors, LP (“PIA”) | |
PIA utilizes a bottom-up approach to international investing. It selects stocks to buy and sell by evaluating a company’s growth outlook and market valuation based on traditional value characteristics, positive company-specific catalysts and other operating and financial conditions. It selects countries primarily by evaluating a country’s valuation ratios such as price-to-earnings and dividend yield, prospective economic growth, government policies and other factors.
| | Ÿ | | Brandywine Global Investment Management, LLC (“Brandywine”) | |
With regard to stock selection, Brandywine employs a quantitative screen which takes into account country, industry and company valuation history. Brandywine seeks stocks whose performance has deviated from their historical mean and likely will revert to this historical mean.
For the period of September 1, 2006, through August 31, 2007, the subadvisers for the portfolio were PIA, William Blair and Brandywine.
PIA’s portion of the portfolio underperformed the portfolio’s benchmark index, the MSCI EAFE® Index. From a regional allocation perspective, the portfolio was well-positioned, being overweight Continental Europe and underweight Japan. However, security selection at the individual country level, particularly in Japan, Hong Kong, and the UK, more than offset these gains and the solid stock picking in Australia. Sector level security selection drove the relative return shortfall. Gains from positive stock selection in Financials and Telecommunications were eliminated by poor selection in Consumer and Materials stocks. Additionally, in early 2007, the portfolio had lighter portfolio exposure to some sectors that had been in the M&A spotlight — particularly utilities, food, and beverage/tobacco — and none of PIA’s portfolio names were highlighted in takeover stories. The M&A rally continued in the second quarter of 2007 where some of the portfolio names indeed benefited from buyout offers or speculations of takeover.
For the William Blair portion, the portfolio’s results approximated the MSCI EAFE® Index (“the benchmark”). Augmenting annual results was strong stock selection in Energy, Industrials, and Information Technology (“IT”), coupled with their overweightings relative to the benchmark, in addition to Telecommunication Services stock selection. Within Energy, the portfolio’s focus on exploration and production companies with strong production growth enhanced performance, while Industrials exposure was bolstered by companies such as ABB, which are exposed to global infrastructure spend and industrial production. IT stock selection was enhanced by performance in Japan and Canada, while Telecom Services stock selection benefited from strong cell phone demand in Latin America. Regionally, stock selection and weightings in Japan, Canada and Latin America also drove absolute and relative results. The largest detractors from the portfolio’s performance during the year was the portfolio’s underweighting in Materials, as the sector performed well, coupled with Consumer Staples stock selection. As of August 31, 2007, the portfolio maintained an 19.31% exposure to emerging markets and 16.76% exposure to Canada as compared to other developed regions. Its primary focus was in Industrials and IT stocks, which each represented approximately 17% of the portfolio, higher than the benchmark. Financials, which totaled 14.65% of the Index, was underweighted relative to the 28.02% weighting in benchmark. These regional and sector weightings are largely the result of William Blair’s bottom-up, fundamental process focused on finding quality growth companies.
Brandywine’s portion of the portfolio underperformed the MSCI EAFE index. From a stock selection perspective, on a sector basis, stock selection was most positive in Financials, Energy and Consumer Discretionary stocks, offset by Technology, Materials and Industrials stocks. On a country basis, positive selections in UK, Taiwan, Switzerland and Ireland were partially offset by selections in Germany and Japan. The portfolio also benefited from an underweight in Financials but was impacted from being underweight Utilities and Australia.
9
The following graph depicts the performance of the International Equity Investments vs. the MSCI EAFE-Capitalization Weighted Index 5 and the Lipper International Multi Cap Core Funds Average.16
The performance shown above and below represents past performance. Past performance is no guarantee of future results and current performance may be higher or lower than the performance shown above. Performance figures may reflect voluntary fee waivers and/or expense reimbursements. In the absence of voluntary fee waivers and/or expense reimbursements, the total return would have been lower. Principal value and investment returns will fluctuate and investors’ shares, when redeemed, may be worth more or less than their original cost. To obtain performance data current to the most recent month-end, please visit our website at www.smithbarney.com.
The graph above and returns shown below do not reflect the deduction of taxes that a shareholder would pay on fund distributions or the redemption of fund shares.
INTERNATIONAL EQUITY INVESTMENTS (unaudited)
Average Annual Total Returns for Period Ended August 31, 2007†
| | | | | | |
| | | Without TRAK Fee* | | | With TRAK Fee | |
Since inception (11/18/91) | | 8.25 | % | | 6.63 | % |
10 year | | 8.14 | | | 6.53 | |
5 year | | 19.01 | | | 17.24 | |
3 year | | 21.76 | | | 19.95 | |
1 year | | 17.21 | | | 15.46 | |
|
|
See pages 22 through 23 for all footnotes.
10
Emerging Markets
Equity Investments
ABOUTTHE SUBADVISERS
| | Ÿ | | SSgA Funds Management, Inc. (“SSgA”) | |
Uses quantitative analysis to identify countries and stocks which are undervalued relative to their growth rates. It employs an investment process that combines top-down country selection with bottom-up stock selection to determine an optimal country and security mix.
| | Ÿ | | Newgate Capital Management LLC (“Newgate”) | |
Newgate seeks long-term growth of capital by utilizing a top-down value approach in identifying undervalued economic countries, regions and sectors. Newgate incorporates both geopolitical and macroeconomic factors into its investment strategy through fundamental quantitative analysis, investment experience and professional judgment.
For the period of September 1, 2006, through August 31, 2007, the subadvisers for the portfolio were SSgA and Newgate.
The SSgA portion of the portfolio outperformed the benchmark, the MSCI Emerging Markets Index. The portfolio benefited from positions taken in China, Brazil, and Korea. The portfolio was modestly overweight in China over the last year, which, along with other stock selection models in Korea and Russia, added to overall outperformance. Brazil, the largest country overweight, was helpful due to its significant outperformance as the MSCI Brazil returned 61.3% over the year ended August 31, 2007, versus the benchmark’s 44.05% return. Detrimental to portfolio returns was the underweight position in India. Although, models suggested that Indian equities were expensive relative to their growth potential, the global investors remain willing to pay increasingly higher multiples for Indian stocks. The Indian market now trades at 4.4 times book value and pays a dividend yield of only 1.0%. The focus within the emerging market space is upon country allocation and stock selection.
Newgate’s portion of the portfolio over the past twelve months has been substantially invested in Asia, specifically China. Although the market has been subject to volatility, we have maintained substantial positions in Chinese companies to capture growth in the economy. Newgate has maintained allocations to the energy sector across all regions of emerging markets. Increasing energy demand, combined with supply constraints and fears of supply disruption, have led to higher energy prices and higher profits for energy companies. This strategy was executed by investing in companies from a number of countries, including Brazil, Russia, and South Africa. During the past twelve months, basic materials and energy stocks contributed positively to the fund’s performance relative to the emerging markets benchmark. Newgate’s positions in Brazil and China also contributed to performance. The technology stocks had positive returns, but detracted from the Fund’s performance relative to the Index. Most of Newgate’s holdings in this sector were in Taiwan and South Korea.
11
The following graph depicts the performance of the Emerging Markets Equity Investments vs. the MSCI Emerging Markets Index6 and the Lipper Emerging Markets Funds Average.17
The performance shown above and below represents past performance. Past performance is no guarantee of future results and current performance may be higher or lower than the performance shown above. Performance figures may reflect voluntary fee waivers and/or expense reimbursements. In the absence of voluntary fee waivers and/or expense reimbursements, the total return would have been lower. Principal value and investment returns will fluctuate and investors’ shares, when redeemed, may be worth more or less than their original cost. To obtain performance data current to the most recent month-end, please visit our website at www.smithbarney.com.
The graph above and returns shown below do not reflect the deduction of taxes that a shareholder would pay on fund distributions or the redemption of fund shares.
| ‡ | | Gross returns used for MSCI Emerging Markets Index from 1997 to 1999. Net returns used for MSCI Emerging Markets Index from 2000 to 2007. |
EMERGING MARKETS EQUITY INVESTMENTS (unaudited)
Average Annual Total Returns for Period Ended August 31, 2007†
| | | | | | |
| | | Without TRAK Fee* | | | With TRAK Fee | |
Since inception (4/20/94) | | 8.10 | % | | 6.48 | % |
10 year | | 8.99 | | | 7.36 | |
5 year | | 30.86 | | | 28.91 | |
3 year | | 37.50 | | | 35.45 | |
1 year | | 42.41 | | | 40.28 | |
|
|
See pages 22 through 23 for all footnotes.
12
Core Fixed
Income Investments
ABOUTTHE SUBADVISERS
| | Ÿ | | BlackRock Financial Management, Inc. (“BlackRock”) | |
Employs a relative value approach which entails portfolio duration within a narrow range and value added through sector and sub-sector rotation within the corporate and mortgage sectors. BlackRock evaluates securities within a risk management framework which consists of determining interest rate risk, yield curve risk, cash flow risk, credit risk and liquidity risk of securities.
| | Ÿ | | Pacific Investment Management Co. (“PIMCO”) | |
Employs “top-down” and “bottom-up” investment techniques. It implements the following “top-down” strategies: duration and volatility analysis, sector evaluation and yield curve shape analysis. The subadviser also employs the following “bottom-up” strategies: credit analysis, quantitative research, issue selection and cost-effective trading.
| | Ÿ | | Western Asset Management Co. (“WAMCo”) | |
Emphasizes three key strategies to enhance the Portfolio’s total return: (i) adjusting the allocation of the Portfolio among the key sectors of the fixed-income market depending on its forecast of relative values; (ii) tracking the duration of the overall Portfolio so that it falls within a narrow band relative to the benchmark index, with adjustment made to reflect its long-term outlook for interest rates; and (iii) purchasing under-valued securities in each of the key sectors of the bond market while keeping overall quality high.
For the period of September 1, 2006, through August 31, 2007, the subadvisers for the portfolio were BlackRock, PIMCO, WAMCo and MetWest was added as a new subadviser on April 10, 2007.
Throughout the period, BlackRock’s portion of the portfolio outperformed the benchmark, the Lehman Brothers Aggregate Bond™ Index, during the period. The re-pricing of risk and an escalation of the credit crunch led to a liquidity crisis at the end of the period with all spread sectors underperforming Treasuries. The portfolio’s sector allocations produced mixed returns. A defensive Credit posture was advantageous as Corporates underperformed during the period. Financial institutions were the worst performer in the Corporate sector, posting a negative return of 2.91% during the period. The portfolio maintained an overweight to Commercial Mortgage Backed Securities (“CMBS”) as the higher-rated classes represent attractive relative value. The overweight to CMBS detracted from performance as the sector experienced dramatic spread widening at the end of the period. The portfolio maintained an underweight to Agency securities, as the potential for increased regulatory scrutiny persists. The Agency underweight contributed to the positive performance.
The PIMCO portion outperformed the benchmark during the period. Specific strategies aiding performance included, a focus on the front end of the US yield curve, as investors raised expectations for cuts by the Federal Reserve (“Fed”) on the back of a slowing US economy led by the recession in the housing market. Additionally, an above-benchmark duration, as yields fell following the Fed’s decision to hold Fed funds at 5.25% and as investors fled to quality assets amid subprime concerns and the global credit crunch. Lastly, a below benchmark credit exposure strategy added performance as spreads widened on a flight to quality during the economic uncertainty of the months leading up to August 2007. Strategies that detracted from returns included an above-benchmark exposure to mortgage-backed securities, as volatility soared amid rising interest rates for mortgage borrowers and rising defaults among Alt-A and subprime homeowners. Also adversely affecting performance was a curve-steepening bias in the United Kingdom via Liffe futures, as investors pushed back expectations for the end of interest rate hikes by the Bank of England amid rising inflation and a strong economy.
The various strategies within WAMCo’s portion of the portfolio produced mixed but generally negative results during the period. A tactically-driven duration posture had a negligible impact on returns as rates oscillated during the period in a fairly flat trend. A curve-steepening strategy had a small positive impact upon performance as the spread between the two- and ten-year yields widened in the latter part of the period. Overweight exposure to the mortgage-backed sector detracted significantly from returns as spreads widened and volatility surged. An emphasis on lower-quality issues was a negative as spreads spiked higher toward the end of the period and erased the gains from earlier in the year. A modest exposure to dollar-denominated emerging market debt subtracted from returns as spreads widened.
MetWest’s outperformance of the funds benchmark since it began managing its portion of the portfolio on April 10, 2007, was attributable to its defensive positioning in the credit markets in expectation of both late credit-cycle spread widening and subprime market problems. Furthermore, the portfolio’s curve steepening exposure reflected MetWest’s view that there would ultimately be a flight to quality and a steeper yield curve. Given these conditions, MetWest had focused on high quality, primarily shorter duration corporate bonds with strong covenants, as
13
| | Ÿ | | Metropolitan West Asset Management (“MetWest”) | |
MetWest seeks to achieve consistent outperformance through the measured and diversified application of five fixed income management strategies, including (i) duration management, (ii) yield curve positioning, (iii) sector allocation, (iv) security selection, and (v) opportunistic execution. The philosophy is predicated on a long-term economic outlook. Portfolio risk is addressed through the limitation of duration to within one year of the benchmark. Investments are characterized by diversification amongst all US-Dollar denominated sectors of the fixed income marketplace. Finally, the philosophy recognizes the over-the-counter nature of the fixed income markets and the attendant potential for pricing inefficiencies that can be exploited to the portfolio’s advantage.
The following graph depicts the performance of the Core Fixed Income Investments vs. the Lehman Brothers U.S. Aggregate Index7, Lehman Brothers Intermediate Government/Credit Bond Index8 and the Lipper Intermediate-Term Investment Grade Average.19
well as seasoned MBS and ABS bonds with conservative underwriting, high levels of credit enhancement, and strong servicing. Although systemic widening in all of the credit markets muted performance, the fund’s conservative positioning enabled the portfolio to weather the storm and outperform the benchmark since inception. Going forward, the managers’ defensive strategy will afford the fund the ability to take advantage of wider credit market spreads if and as those conditions occur. Although the managers believe that the subprime difficulties are likely to dampen economic activity and challenge the financial markets, they will cautiously look for opportunities to take advantage of the market’s high liquidity premium by adding high quality, well-structured cash flows at much wider spreads to the Treasury market.
The performance shown above and below represents past performance. Past performance is no guarantee of future results and current performance may be higher or lower than the performance shown above. Performance figures may reflect voluntary fee waivers and/or expense reimbursements. In the absence of voluntary fee waivers and/or expense reimbursements, the total return would have been lower. Principal value and investment returns will fluctuate and investors’ shares, when redeemed, may be worth more or less than their original cost. To obtain performance data current to the most recent month-end, please visit our website at www.smithbarney.com.
The graph above and returns shown below do not reflect the deduction of taxes that a shareholder would pay on fund distributions or the redemption of fund shares.
CORE FIXED INCOME INVESTMENTS (unaudited)
Average Annual Total Returns for the Period Ended August 31, 2007†
| | | | | | |
| | | Without TRAK Fee* | | | With TRAK Fee | |
Since inception (11/18/91) | | 5.69 | % | | 4.11 | % |
10 year | | 5.22 | | | 3.66 | |
5 year | | 4.10 | | | 2.56 | |
3 year | | 3.53 | | | 1.99 | |
1 year | | 4.82 | | | 3.26 | |
|
|
See pages 22 through 23 for all footnotes.
14
High Yield Investments
ABOUTTHE SUBADVISERS
| | Ÿ | | Penn Capital Management Co., Inc. (“Penn”) | |
Penn’s initial universe is well-defined and includes all domestic, corporate cash paying dollar denominated bond issues that have spread-to-treasury and yield characteristics that are consistent with or wider than the single-B credit tier. Penn’s investment team determines sectors/industries that may offer relative value based on its macro-economic outlook. The team will review and evaluate the economic cycle, business environment, industry/sector analysis and interest rates. Penn then scans this group for companies with spreads to treasury that are wider than comparable companies, industry averages and historical averages. The team analyzes the liquidity outlook of the company through qualitative research, including bank loan facility analysis, covenant review analysis and asset value analysis. After the high yield bond universe has been narrowed and potential relative value is identified, the team performs its qualitative research to confirm or justify the credit’s value. The team determines whether or not the credit is suitable for the portfolio given its impact on Penn’s current industry weightings and the diversification it brings to the basket of credits currently held within an industry.
| | Ÿ | | Western Asset Management Co. (“WAMCo”) | |
Combines traditional analysis with innovative technology applied to all sectors of the market. WAMCo believes inefficiencies exist in the fixed-income market and attempts to add incremental value by exploiting these inefficiencies across all eligible market sectors. The key areas of focus are (i) sector and sub-sector allocation; (ii) issue selection; (iii) duration; and (iv) term structure.
For the period of September 1, 2006, through August 31, 2007, the subadvisers for the portfolio were WAMCo and Penn Capital Management, as of October 4, 2006.
WAMCo’s portion of the portfolio outperformed its primary benchmark, the Lehman Brothers High Yield Index. The portfolio was positioned to incorporate WAMCo’s view that economic activity and credit fundamentals would remain supportive of the high yield asset class. This resulted in the portfolio being overweight lower rated issues, which are disproportionately leveraged to economic activity. The primary factors contributing to the Fund’s outperformance included an overweight to CCC-rated issues which in general returned 8.71%, sub-sector allocation including overweights to Capital Goods and Wireless, which returned 7.84% and 10.78%, respectively, and a cash inflow related to the settlement of WorldCom litigation. Issue selection was neutral to performance.
Penn’s portion of the portfolio has outperformed the high yield broad market over the last 12 months thanks to strong security selection and opportunistic investments in the stressed and distressed segments of the markets. During the past 12-18 months Penn took profits primarily in the stressed segment of the market place (bonds trading below their par value, offering both income and capital appreciation potential) and gradually rotated up in credit quality in anticipation of a rise in future default rates. Despite the defensive positioning, Penn continues to find both distressed and defaulted opportunities that can contribute to short term returns, and volatility. This volatility is magnified during times of concern in the credit markets, which occurred in August 2007. This credit concern, driven largely by fears of how deeply sub-prime problems would extend, started to diminish as the quarter ended. Although the fund has no direct exposure to sub-prime mortgage credit, it did have material weakness in a credit related to the prime mortgage market. This credit was sold at a loss to minimize further weakness associated with sentiment. On the positive side, the portfolio continues to benefit from the consolidation of both the fixed and wireless segments of the telecommunications market, as four merger & acquisition transactions among Penn’s names provided positive contribution. Overall, Penn remains conservatively positioned going into the fund’s first fiscal quarter and will look to add to total return and distressed opportunities as they develop.
15
The following graph depicts the performance of the High Yield Investments vs. the Lehman Brothers High Yield Index9 and the Lipper High Yield Funds Index.20
The performance shown above and below represents past performance. Past performance is no guarantee of future results and current performance may be higher or lower than the performance shown above. Performance figures may reflect voluntary fee waivers and/or expense reimbursements. In the absence of voluntary fee waivers and/or expense reimbursements, the total return would have been lower. Principal value and investment returns will fluctuate and investors’ shares, when redeemed, may be worth more or less than their original cost. To obtain performance data current to the most recent month-end, please visit our website at www.smithbarney.com.
The graph above and returns shown below do not reflect the deduction of taxes that a shareholder would pay on fund distributions or the redemption of fund shares.
HIGH YIELD INVESTMENTS (unaudited)
Average Annual Total Returns for the Period Ended August 31, 2007†
| | | | | | |
| | | Without TRAK Fee* | | | With TRAK Fee | |
Since inception (7/13/98) | | 2.74 | % | | 1.21 | % |
5 year | | 8.91 | | | 7.29 | |
3 year | | 6.16 | | | 4.59 | |
1 year | | 7.56 | | | 5.97 | |
|
|
See pages 22 through 23 for all footnotes.
16
International Fixed
Income Investments
ABOUTTHE SUBADVISER
| | Ÿ | | Pacific Investment Management Company (“PIMCO”) | |
PIMCO’s total return approach focuses on both capital appreciation and income while managing overall risk. PIMCO employs a core philosophy toward managing global bonds focusing on both economic and credit fundamentals as key determinants of value in fixed income markets, limiting volatility with respect to the benchmark index.
For the period of September 1, 2006, through August 31, 2007, the subadviser for the portfolio was PIMCO.
The portfolio underperformed its benchmark, the Citigroup World Global Bond Index ex-US USD hedged, over the last twelve months. US yields fell sharply as subprime concerns led to a flight to quality. Euroland and UK bonds lagged Treasuries as the European Central Bank and Bank of England continued to hike while the Fed left rates unchanged at 5.25%. US Treasuries returned 6.02% over the year. Yields fell on a slowing housing market, subprime concerns and falling core inflation. The US yield curve steepened significantly over the past 12 months as investors raised expectations for cuts by the Federal Reserve. Rising spreads on mortgage-backed securities, investment-grade and high yield corporate bonds due to rising volatility, slowing growth in the US economy, and a global credit crunch, caused most other sectors to underperform Treasuries over the year ended August 31, 2007. Euroland government bonds returned 2.64% on a hedged basis, underperforming US Treasuries over the year. Yields rose across the curve while the 2-30s differential was unchanged as the ECB hiked overnight rates from 3% to 4% over the year. The ECB remains cautious of upside risks to inflation in the medium and long term but judges that risks to the outlook for growth lie on the downside due to the liquidity crisis. The market substantially reduced the probability of further rate hikes. The Euro strengthened 6.38% versus the US dollar on a narrowing interest rate differential. UK gilts underperformed US Treasuries, posting a 0.75% return on a hedged basis. Yields rose across the curve as strong credit growth and limited spare capacity kept the Bank of England (“BOE”) in tightening mode. The BOE raised rates from 4.75% to 5.75% while the Pound sterling rallied 5.91% versus the US dollar over the year. Japanese government bonds (“JGBs”) returned 6.90% during the year. The JGB curve flattened, as the Bank of Japan (“BOJ”) raised the overnight rate to 50 bps. Income growth and consumer confidence remain strong while inflation remains benign, keeping the BOJ on the sidelines and data-dependent for its next rate move. The yen rose nearly 1.4% versus the US dollar over the year on rising risk aversion and a reversal of the carry trade.
Important contributors to performance included: US duration, as US bonds outperformed the index on weak economic data and falling core inflation, a curve steepening bias in the US as short maturity yields fell more than long maturities on rising expectations of Fed easing, and an overweight to the Japanese Yen, as it strengthened on a global flight to quality. The following strategies detracted from returns: strategies that benefit when US & UK short maturity swap spreads narrow as a liquidity crunch and subprime concerns led to wider swap spreads, pay fixed swap positions on the back end of the US and UK curves as the swap curve flattened over the year, curve steepening bias in the UK as the BOE hiked rates due to limited spare capacity, tactical holdings of mortgage securities as mortgage spreads widened due to the pickup in rate volatility, and an allocation to bank capital notes as spreads widened for financial companies on rising risk aversion.
17
The following graph depicts the performance of the International Fixed Income Investments vs. the Citigroup Non-U.S. World Government Bond Index - Hedged11, the Citigroup Non-U.S. World Government Bond Index - Unhedged11 and the Lipper International Income Funds Average.18
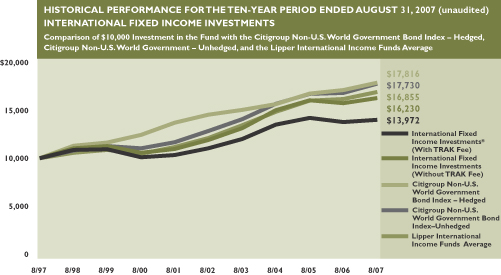
The performance shown above and below represents past performance. Past performance is no guarantee of future results and current performance may be higher or lower than the performance shown above. Performance figures may reflect voluntary fee waivers and/or expense reimbursements. In the absence of voluntary fee waivers and/or expense reimbursements, the total return would have been lower. Principal value and investment returns will fluctuate and investors’ shares, when redeemed, may be worth more or less than their original cost. To obtain performance data current to the most recent month-end, please visit our website at www.smithbarney.com.
The graph above and returns shown below do not reflect the deduction of taxes that a shareholder would pay on fund distributions or the redemption of fund shares.
INTERNATIONAL FIXED INCOME INVESTMENTS (unaudited)
Average Annual Total Returns for Period Ended August 31, 2007†
| | | | | | |
| | | Without TRAK Fee* | | | With TRAK Fee | |
Since inception (11/18/91) | | 6.27 | % | | 4.68 | % |
10 year | | 4.87 | | | 3.30 | |
5 year | | 6.20 | | | 4.62 | |
3 year | | 2.44 | | | 0.91 | |
1 year | | 2.33 | | | 0.81 | |
|
|
See pages 22 through 23 for all footnotes.
18
Municipal Bond Investments
ABOUTTHE SUBADVISER
| | Ÿ | | McDonnell Investment Management, LLC (“McDonnell”) | |
Employs a value-added approach to active municipal bond management utilizing a team oriented philosophy. This approach attempts to maximize after-tax total returns while reducing the volatility in relative rates of return. By limiting dependence on market timing and tightly controlling duration, the McDonnell reduces the portfolio’s exposure to interest rate risk relative to the benchmark. McDonnell utilizes extensive internal research to identify relative value opportunities among sectors and securities and to control credit risk. Additionally, McDonnell seeks to exploit yield curve anomalies through quantitative analysis of historical spreads and future expectations.
For the period of September 1, 2006, through August 31, 2007, the subadviser for the portfolio was McDonnell Investment Management (“McDonnell”).
While for most of the period the portfolio maintained a modestly long duration relative to its benchmark, the Lehman Brothers Broad Municipal Bond Index, several factors added to performance despite a slight increase in overall interest rate. Relative to its benchmark, the portfolio was underweight longer-maturing bonds, which were among the market’s worst performers. The portfolio was also overweight 10-15 year bonds, which added to performance due to favorable yield curve roll in this range. Moreover, with the yield curve steepening, a more bulleted position in the 10-15 year segment also helped performance.
In addition to the yield curve steepening, credit spreads also began to widen during mid-2007. McDonnell viewed this as an opportunity to increase its credit exposure. This increase was mostly achieved through the purchase of Single “A” and Triple “B” rated healthcare issues. The portfolio now has a modest overweight in the healthcare sector relative to the Index. Though spreads may widen a bit more, McDonnell believed this was a good opportunity to add to the sector. Overall, the portfolio has a higher yield than the benchmark and the credit overweight is one of the contributing factors. That said, there were times during the period where being underweight lower quality sectors may have hurt portfolio performance.
19
The following graph depicts the performance of the Municipal Bond Investments vs. the Lehman Brothers Municipal Bond Index10 and the Lipper General Municipal Debt Funds Average.21
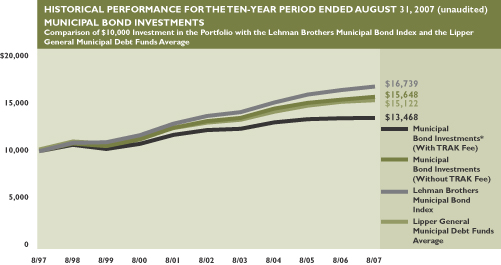
The performance shown above and below represents past performance. Past performance is no guarantee of future results and current performance may be higher or lower than the performance shown above. Performance figures may reflect voluntary fee waivers and/or expense reimbursements. In the absence of voluntary fee waivers and/or expense reimbursements, the total return would have been lower. Principal value and investment returns will fluctuate and investors’ shares, when redeemed, may be worth more or less than their original cost. To obtain performance data current to the most recent month-end, please visit our website at www.smithbarney.com.
The graph above and returns shown below do not reflect the deduction of taxes that a shareholder would pay on fund distributions or the redemption of fund shares.
MUNICIPAL BOND INVESTMENTS (unaudited)
Average Annual Total Returns for the Period Ended August 31, 2007†
| | | | | | |
| | | Without TRAK Fee* | | | With TRAK Fee | |
Since inception (11/18/91) | | 5.23 | % | | 3.66 | % |
10 year | | 4.58 | | | 3.02 | |
5 year | | 3.55 | | | 2.01 | |
3 year | | 2.73 | | | 1.20 | |
1 year | | 1.77 | | | 0.26 | |
|
|
See pages 22 through 23 for all footnotes.
20
Money Market Investments
ABOUTTHE SUBADVISER
| | Ÿ | | Standish Mellon Asset Management LLC (“Standish”) | |
The portfolio is invested mainly in Commercial paper, Certificates of Deposits, and US Treasury and other US government securities rated by a nationally recognized rating organization in the two highest short-term rating categories or, if unrated, of equivalent quality as determined by the sub-adviser. Individual securities must have remaining maturities of 397 days or less. Standish operates the portfolio in compliance with rule 2a-7 under the Investment Company Act of 1940. Standish seeks to improve the Portfolio’s yield through actively managing sector allocations and the average maturity of the Portfolio. Standish monitors the spread relationships between US Treasury and government agency issues, and purchases agencies when they provide a yield advantage. In addition, Standish will change the maturity structure modestly to reflect its outlook on interest rates.
For the period of September 1, 2006, through August 31, 2007, the subadviser for the portfolio was Standish.
While remaining relatively stable for most of the year, short-term rates have declined steadily since mid-July 2007. The Federal Reserve (“Fed”) kept its Fed Funds rate at 5.25% throughout the year ended August 31, 2007. However, in August, the Fed initiated several measures to ease the credit crisis that precipitated the sub-prime meltdown. Measures included pumping additional reserves into the system, lowering the Fed discount rate and accepting additional collateral for open market activities. While these moves eased some of the pressures, a flight to quality remained in the market, and the 2-year Treasury note ended the year at 4.14%. The 10-year treasury ended August 2007 at 4.53%, down only 23 basis points for the year.
The economy showed moderate growth throughout the year. However, weakness in the residential housing market caused considerable turmoil in the financial markets in the last quarter. The deteriorating financial market conditions may restrain future economic growth. The Federal Reserve continues to monitor the economic outlook and will take necessary action to mitigate any adverse effects of the market disruptions.
Standish continues to invest in high quality short-term instruments, as mandated by its guidelines. The average maturity of the portfolio typically ranged between one and two months during the year.
GOVERNMENT MONEY INVESTMENTS (unaudited)
Average Annual Total Returns for the Period Ended August 31, 2007†
| | | | | | |
| | | Without TRAK Fee* | | | With TRAK Fee | |
Since inception (11/18/91) | | 3.67 | % | | 2.12 | % |
10 year | | 3.41 | | | 1.87 | |
5 year | | 2.46 | | | 0.93 | |
3 year | | 3.68 | | | 2.13 | |
1 year | | 4.86 | | | 3.26 | |
|
|
Performance figures may reflect voluntary fee waivers and/or expense reimbursements. In the absence of voluntary fee waivers and/or expense reimbursements, the total return would have been lower.
The returns shown do not reflect the deduction of taxes that a shareholder would pay on fund distributions or the redemption of fund shares.
See pages 22 through 23 for all footnotes.
RISKS: An investment in a money market fund is neither insured nor guaranteed by the FDIC or any other government agency. Although the Portfolio seeks to preserve the value of your investment at one dollar per share, it is possible to lose money by investing in the Portfolio.
21
FOOTNOTES
| † | | All figures represent past performance and are not a guarantee of future results. Investment return and principal value of an investment will fluctuate so that an investor’s shares, where redeemed, may be worth more or less than their original cost. The returns shown do not reflect the deduction of taxes that a shareholder would pay on fund distributions or the redemptions of fund shares. Performance figures may reflect fee waivers and/or expense reimbursements. In the absence of fee waivers and/or expense reimbursements, the total return would have been lower. To obtain performance data current to the most recent month-end, please visit our website at www.smithbarney.com. |
* | | The Funds are available only to investors participating in an advisory program. These programs charge an annual fee, which in the case of TRAK® may be up to 1.50%. The performance data shown does not reflect this fee, which would reduce returns. |
1 | | The Russell 1000® Value Index measures the performance of those Russell 1000 Index companies with lower price-to-book ratios and lower forecasted growth values. Because the index is not a managed portfolio, there are no advisory fees or internal management expenses reflected in the index’s performance. Please note that an investor cannot invest directly in an index. |
2 | | The Russell 1000® Growth Index measures the performance of those Russell 1000 companies with higher price-to-book ratios and higher forecasted growth values. Because the index is not a managed portfolio, there are no advisory fees or internal management expenses reflected in the index’s performance. Please note that an investor cannot invest directly in an index. |
3 | | The Russell 2000® Value Index measures the performance of those Russell 2000 Index companies with lower price-to-book ratios and lower forecasted growth values. Because the index is not a managed portfolio, there are no advisory fees or internal management expenses reflected in the index’s performance. Please note that an investor cannot invest directly in an index. |
4 | | The Russell 2000® Growth Index measures the performance of those Russell 2000 companies with higher price-to-book ratios and higher forecasted growth values. Because the index is not a managed portfolio, there are no advisory fees or internal management expenses reflected in the index’s performance. Please note that an investor cannot invest directly in an index. |
5 | | The MSCI EAFE®-Capitalization Weighted Index is a composite portfolio of equity total returns for the countries of Australia, New Zealand and countries in Europe and the Far East, weighted based on each country’s market capitalization. Because the index is not a managed portfolio, there are no advisory fees or internal management expenses reflected in the index’s performance. Please note that an investor cannot invest directly in an index. |
| 6 | | The MSCI Emerging Markets Index is an index comprised of thirteen emerging markets open to direct foreign participation. Because the index is not a managed portfolio, there are no advisory fees or internal management expenses reflected in the index’s performance. Please note that an investor cannot invest directly in an index. |
7 | | The Lehman Brothers U.S. Aggregate Bond™ Index is composed of the Lehman Brothers Intermediate Government/Credit Bond Index and the Lehman Brothers Mortgage-Backed Securities Index and includes treasury issues, agency issues, corporate bond issues and mortgage-backed securities. Because the index is not a managed portfolio, there are no advisory fees or internal management expenses reflected in the index’s performance. Please note that an investor cannot invest directly in an index. |
| 8 | | The Lehman Brothers Intermediate Government/Credit Bond Index is a weighted composite of: (i) Lehman Brothers Government Bond Index, which is comprised of all publicly issued, non-convertible debt of the US government or any agency thereof, quasi-federal corporations, and corporate debt guaranteed by the US government with a maturity between one and ten years; and (ii) Lehman Brothers Credit Bond Index, which is comprised of all public fixed-rate, non-convertible investment-grade domestic corporate debt with a maturity of between one and ten years, excluding collateralized mortgage obligations. Because the index is not a managed portfolio, there are no advisory fees or internal management expenses reflected in the index’s performance. Please note that an investor cannot invest directly in an index. |
22
| 9 | | The Lehman Brothers High Yield Index is composed of fixed rate, publicly issued, non-investment grade debt registered with the SEC. All bonds must be dollar-denominated, non-convertible, and have at least one year remaining to maturity as well as an outstanding par value of $100 million. Because the index is not a managed portfolio, there are no advisory fees or internal management expenses reflected in the index’s performance. Please note that an investor cannot invest directly in an index. |
| 10 | | The Lehman Brothers Municipal Bond Index is a weighted composite which is comprised of more than 15,000 bonds issued within the last five years, having a minimum credit rating of at least Baa and maturity of at least two years, excluding all bonds subject to the Alternative Minimum Tax and bonds with floating or zero coupons. Because the index is not a managed portfolio, there are no advisory fees or internal management expenses reflected in the index’s performance. Please note that an investor cannot invest directly in an index. |
| 11 | | The Citigroup Non-U.S. World Government Bond Index is an index subset of the Citigroup World Bond Index that excludes corporate bonds denominated in US dollars. It contains foreign government and supranational bonds denominated in Australian, Austrian, Belgian, British, Canadian, Danish, Dutch, French, German, Italian, Japanese, Spanish and Swedish currencies. Because the index is not a managed portfolio, there are no advisory fees or internal management expenses reflected in the index’s performance. Please note that an investor cannot invest directly in an index. |
| 12 | | The Lipper Large-Cap Value Funds Average is comprised of the Portfolio’s peer group of mutual funds investing in value oriented funds. |
| 13 | | The Lipper Large-Cap Growth Funds Average is comprised of the Portfolio’s peer group of mutual funds investing in growth oriented funds. |
| 14 | | The Lipper Small Cap Value Funds Average is comprised of the Portfolio’s peer group of mutual funds which limit their investments to small cap value companies. |
| 15 | | The Lipper Small Cap Growth Funds Average is comprised of the Portfolio’s peer group of mutual funds which limit their investments to small cap growth companies. |
| 16 | | The Lipper International Multi-Cap Core Funds Average is an equally weighted average of the funds that invest in a variety of market capitalization ranges without concentrating 75% of their equity assets in any one market capitalization range over an extended period of time. Multi-Cap funds typically have 25% to 75% of their assets invested in companies strictly outside of the US with market capitalizations greater than the 250th largest company in the S&P/Citigroup World ex-U.S. Broad Market Index. |
| 17 | | The Lipper Emerging Markets Funds Average is an equally weighted average of the funds that seek long-term capital appreciation by investing at least 65% of total assets in emerging market equity securities, where “emerging market” is defined by a country’s GNP per capita or other economic measures. |
| 18 | | The Lipper International Income Funds Average is an equally weighted average of the funds that invest primarily in US dollar and non-US dollar debt securities of issuers located in at least three countries, excluding the United States. |
| 19 | | Lipper Intermediate-Term Investment Grade Debt Funds Average-is an average of the total returns reported by all of the mutual funds designated by Lipper Analytical Services, Inc. as falling into the category, and is not adjusted to reflect any sales charges. However, these total returns are reported net of expenses or other fees that the SEC requires to be reflected in a fund’s performance. |
| 20 | | Lipper High Yield Funds Index, an unmanaged index published by Lipper Inc., includes the 30 largest funds that are generally similar to the Fund, although some funds in the index may have somewhat different investment policies or objectives. |
| 21 | | The Lipper General Municipal Debt Funds Average is an average of funds that invest at least 65% of their assets in municipal debt issues in the top four credit ratings. The total return of the Lipper Average does not include the effect of sales charges. You cannot invest directly in a Lipper Average. |
23
Fund Expenses
(unaudited)
Example
As a shareholder of the Fund, you may incur two types of costs: (1) advisory program annual fees, which in the case of TRAK® may be up to 1.50%; and (2) ongoing costs, including management fees and other Fund expenses. This example is intended to help you understand your ongoing costs (in dollars) of investing in the Fund and to compare these costs with the ongoing costs of investing in other mutual funds.
This example is based on an investment of $1,000 invested on March 1, 2007 and held for the six months ended August 31, 2007.
Actual Expenses
The table below titled “Based on Actual Total Return” provides information about actual account values and actual expenses. You may use the information provided in this table, together with the amount you invested, to estimate the expenses that you paid over the period. To estimate the expenses you paid on your account during this period, divide your account value by $1,000 (for example, an $8,600 account value divided by $1,000 = 8.6), then multiply the result by the number under the heading entitled “Expenses Paid During the Period”.
Based on Actual Total Return(1)
| | | | | | | | | | | | | | | |
| Fund | | Total Return
Without
TRAK Fee(2) | | | Beginning
Account
Value | | Ending
Account
Value | | Annualized
Expense
Ratios(3) | | | Expense
Paid During
the Period(4) |
Large Capitalization Growth Investments | | 9.73 | % | | $ | 1,000.00 | | $ | 1,097.30 | | 0.64 | % | | $ | 3.38 |
Large Capitalization Value Equity Investments | | 3.62 | % | | | 1,000.00 | | | 1,036.20 | | 0.62 | % | | | 3.18 |
Small Capitalization Growth Investments | | 6.28 | % | | | 1,000.00 | | | 1,062.80 | | 0.89 | % | | | 4.63 |
Small Capitalization Value Equity Investments | | 2.19 | % | | | 1,000.00 | | | 1,021.90 | | 0.94 | % | | | 4.79 |
International Equity Investments | | 6.35 | % | | | 1,000.00 | | | 1,063.50 | | 0.80 | % | | | 4.16 |
Emerging Markets Equity Investments | | 22.62 | % | | | 1,000.00 | | | 1,226.20 | | 0.93 | % | | | 5.22 |
Core Fixed Income Investments | | 1.45 | % | | | 1,000.00 | | | 1,014.50 | | 0.49 | % | | | 2.49 |
High Yield Investments | | (1.68 | )% | | | 1,000.00 | | | 983.20 | | 0.78 | % | | | 3.90 |
International Fixed Income Investments | | 0.73 | % | | | 1,000.00 | | | 1,007.30 | | 0.66 | % | | | 3.34 |
Municipal Bond Investments | | (0.90 | )% | | | 1,000.00 | | | 991.00 | | 0.51 | % | | | 2.56 |
Money Market Investments | | 2.45 | % | | | 1,000.00 | | | 1,024.50 | | 0.40 | % | | | 2.04 |
| (1) | | For the six months ended August, 31 2007. |
(2) | | Assumes reinvestment of all distributions, including returns of capital, if any, at net asset value and does not reflect the deduction of the applicable advisory program charge, which in the case of TRAK® may be up to 1.50%. Total return is not annualized as it may not be representative of the total return for the year. Performance figures may reflect fee waivers and/or expense reimbursements. Past performance is no guarantee of future results. In the absence of fee waivers and/or expense reimbursements, the total return would have been lower. |
| (3) | | Annualized Expense Ratios are based on the most recent 6 month expense ratios, which may differ from expense ratios in the Financial Highlights. |
| (4) | | Expenses (net of fee waivers and/or expense reimbursements) are equal to each Portfolio’s respective annualized expense ratio multiplied by the average account value over the period, multiplied by the number of days in the most recent fiscal half-year, then divided by 365. |
24
Fund Expenses
(unaudited) (continued)
Hypothetical Example for Comparison Purposes
The table below titled “Based on Hypothetical Total Return” provides information about hypothetical account values and hypothetical expenses based on the actual expense ratio and an assumed rate of return of 5.00% per year before expenses, which is not the Fund’s actual return. The hypothetical account values and expenses may not be used to estimate the actual ending account balance or expenses you paid for the period. You may use the information provided in this table to compare the ongoing costs of investing in the Fund and other funds. To do so, compare the 5.00% hypothetical example relating to the Fund with the 5.00% hypothetical examples that appear in the shareholder reports of the other funds.
Please note that the expenses shown in the table below are meant to highlight your ongoing costs only and do not reflect any advisory program annual fees. Therefore, the table is useful in comparing ongoing costs only, and will not help you determine the relative total costs of owning different funds. In addition, if these advisory program annual fees were included, your costs would have been higher.
Based on Hypothetical Total Return(1)
| | | | | | | | | | | | | | | |
| Fund | | Hypothetical
Annualized
Total Return | | | Beginning
Account
Value | | Ending
Account
Value | | Annualized
Expense
Ratios(2) | | | Expenses
Paid During
the Period(3) |
Large Capitalization Growth Investments | | 5.00 | % | | $ | 1,000.00 | | $ | 1,021.98 | | 0.64 | % | | $ | 3.26 |
Large Capitalization Value Equity Investments | | 5.00 | % | | | 1,000.00 | | | 1,022.08 | | 0.62 | % | | | 3.16 |
Small Capitalization Growth Investments | | 5.00 | % | | | 1,000.00 | | | 1,020.72 | | 0.89 | % | | | 4.53 |
Small Capitalization Value Equity Investments | | 5.00 | % | | | 1,000.00 | | | 1,020.47 | | 0.94 | % | | | 4.79 |
International Equity Investments | | 5.00 | % | | | 1,000.00 | | | 1,021.17 | | 0.80 | % | | | 4.08 |
Emerging Markets Equity Investments | | 5.00 | % | | | 1,000.00 | | | 1,020.52 | | 0.93 | % | | | 4.74 |
Core Fixed Income Investments | | 5.00 | % | | | 1,000.00 | | | 1,000.12 | | 0.49 | % | | | 2.50 |
High Yield Investments | | 5.00 | % | | | 1,000.00 | | | 1,021.27 | | 0.78 | % | | | 3.97 |
International Fixed Income Investments | | 5.00 | % | | | 1,000.00 | | | 1,022.33 | | 0.66 | % | | | 3.36 |
Municipal Bond Investments | | 5.00 | % | | | 1,000.00 | | | 1,022.63 | | 0.51 | % | | | 2.60 |
Money Market Investments | | 5.00 | % | | | 1,000.00 | | | 1,023.19 | | 0.40 | % | | | 2.04 |
| (1) | | For the six months ended August, 31 2007. |
| (2) | | Annualized Expense Ratios are based on the most recent 6 month expense ratios, which may differ from the expense ratios in the Financial Highlights. |
| (3) | | Expenses (net of fee waivers and/or expense reimbursements) are equal to each Portfolio’s respective annualized expense ratio multiplied by the average account value over the period, multiplied by the number of days in the most recent fiscal half-year, then divided by 365. |
25
Schedules of Investments
August 31, 2007
| | | | | |
| Large Capitalization Growth Investments |
| | |
| Shares | | Security | | Value |
COMMON STOCKS — 97.5% |
CONSUMER DISCRETIONARY — 9.1% |
|
Hotels, Restaurants & Leisure — 3.6% |
| 540,000 | | International Game Technology | | $ | 20,611,800 |
| 199,500 | | Marriott International Inc., Class A Shares | | | 8,861,790 |
| 692,700 | | MGM MIRAGE Inc.* | | | 58,166,019 |
| | | | |
|
|
| | | Total Hotels, Restaurants & Leisure | | | 87,639,609 |
| | | | |
|
|
|
Media — 3.8% |
| 1,393,650 | | Comcast Corp., Class A Shares* | | | 36,360,328 |
| 466,200 | | Omnicom Group Inc. | | | 23,743,566 |
| 165,000 | | Reuters Group PLC, ADR (a) | | | 12,886,500 |
| 1,093,000 | | Time Warner Inc. | | | 20,745,140 |
| | | | |
|
|
| | | Total Media | | | 93,735,534 |
| | | | |
|
|
|
Multiline Retail — 0.8% |
| 123,000 | | JC Penney Co. Inc. | | | 8,457,480 |
| 206,400 | | Kohl’s Corp.* | | | 12,239,520 |
| | | | |
|
|
| | | Total Multiline Retail | | | 20,697,000 |
| | | | |
|
|
|
Specialty Retail — 0.9% |
| 925,000 | | Staples Inc. | | | 21,968,750 |
| | | | |
|
|
| | | TOTAL CONSUMER DISCRETIONARY | | | 224,040,893 |
| | | | |
|
|
CONSUMER STAPLES — 7.1% |
|
Beverages — 0.4% |
| 184,300 | | Coca-Cola Co. | | | 9,911,654 |
| | | | |
|
|
|
Food & Staples Retailing — 4.4% |
| 145,700 | | Costco Wholesale Corp. | | | 8,996,975 |
| 1,592,900 | | CVS/Caremark Corp. | | | 60,243,478 |
| 550,000 | | Walgreen Co. | | | 24,788,500 |
| 343,000 | | Wal-Mart Stores Inc. | | | 14,965,090 |
| | | | |
|
|
| | | Total Food & Staples Retailing | | | 108,994,043 |
| | | | |
|
|
|
Food Products — 1.3% |
| 290,400 | | Nestle SA, ADR | | | 31,574,350 |
| | | | |
|
|
|
Household Products — 1.0% |
| 385,000 | | Procter & Gamble Co. | | | 25,144,350 |
| | | | |
|
|
| | | TOTAL CONSUMER STAPLES | | | 175,624,397 |
| | | | |
|
|
ENERGY — 8.0% |
|
Energy Equipment & Services — 5.0% |
| 657,300 | | Halliburton Co. | | | 22,736,007 |
| 321,000 | | National-Oilwell Varco Inc.* | | | 41,088,000 |
| 228,100 | | Transocean Inc.* | | | 23,971,029 |
| 596,200 | | Weatherford International Ltd.* | | | 34,806,156 |
| | | | |
|
|
| | | Total Energy Equipment & Services | | | 122,601,192 |
| | | | |
|
|
|
Oil, Gas & Consumable Fuels — 3.0% |
| 380,300 | | Chesapeake Energy Corp. (a) | | | 12,268,478 |
| 412,700 | | Occidental Petroleum | | | 23,395,963 |
| 244,550 | | Suncor Energy Inc. | | | 21,860,324 |
| 515,672 | | Williams Cos. Inc. | | | 15,985,832 |
| | | | |
|
|
| | | Total Oil, Gas & Consumable Fuels | | | 73,510,597 |
| | | | |
|
|
| | | TOTAL ENERGY | | | 196,111,789 |
| | | | |
|
|
See Notes to Financial Statements.
26
Schedules of Investments
(continued)
| | | | | |
| Large Capitalization Growth Investments |
| | |
| Shares | | Security | | Value |
FINANCIALS — 5.8% |
|
Capital Markets — 0.6% |
| 742,492 | | Charles Schwab Corp. | | $ | 14,701,342 |
| | | | |
|
|
|
Consumer Finance — 1.2% |
| 516,896 | | American Express Co. | | | 30,300,444 |
| | | | |
|
|
|
Diversified Financial Services — 4.0% |
| 87,150 | | CME Group Inc. (a) | | | 48,350,820 |
| 215,000 | | IntercontinentalExchange Inc.* | | | 31,362,050 |
| 424,400 | | JPMorgan Chase & Co. (a) | | | 18,894,288 |
| | | | |
|
|
| | | Total Diversified Financial Services | | | 98,607,158 |
| | | | |
|
|
| | | TOTAL FINANCIALS | | | 143,608,944 |
| | | | |
|
|
HEALTH CARE — 21.3% |
| |
Biotechnology — 5.0% | | | |
| 550,370 | | Biogen Idec Inc.* | | | 35,124,613 |
| 412,750 | | Celgene Corp.* | | | 26,502,677 |
| 366,800 | | Genentech Inc.* | | | 27,440,308 |
| 946,200 | | Gilead Sciences Inc.* | | | 34,413,294 |
| | | | |
|
|
| | | Total Biotechnology | | | 123,480,892 |
| | | | |
|
|
| |
Health Care Equipment & Supplies — 2.1% | | | |
| 160,500 | | Alcon Inc. | | | 21,709,230 |
| 103,290 | | C.R. Bard Inc. | | | 8,613,353 |
| 280,000 | | Zimmer Holdings Inc.* | | | 21,932,400 |
| | | | |
|
|
| | | Total Health Care Equipment & Supplies | | | 52,254,983 |
| | | | |
|
|
| |
Health Care Providers & Services — 3.0% | | | |
| 1,179,100 | | UnitedHealth Group Inc. | | | 58,966,791 |
| 202,200 | | WellPoint Inc.* | | | 16,295,298 |
| | | | |
|
|
| | | Total Health Care Providers & Services | | | 75,262,089 |
| | | | |
|
|
| |
Life Sciences Tools & Services — 2.5% | | | |
| 1,115,600 | | Thermo Fisher Scientific Inc.* | | | 60,498,988 |
| | | | |
|
|
| |
Pharmaceuticals — 8.7% | | | |
| 335,700 | | Abbott Laboratories | | | 17,426,187 |
| 893,900 | | Allergan Inc. | | | 53,642,939 |
| 2,644,650 | | Elan Corp. PLC, ADR* | | | 51,253,317 |
| 326,900 | | Merck & Co. Inc. | | | 16,400,573 |
| 214,050 | | Novartis AG, ADR | | | 11,269,732 |
| 435,700 | | Shire PLC, ADR | | | 34,307,018 |
| 642,000 | | Wyeth | | | 29,724,600 |
| | | | |
|
|
| | | Total Pharmaceuticals | | | 214,024,366 |
| | | | |
|
|
| | | TOTAL HEALTH CARE | | | 525,521,318 |
| | | | |
|
|
INDUSTRIALS — 11.0% |
| |
Aerospace & Defense — 2.9% | | | |
| 190,100 | | Boeing Co. | | | 18,382,670 |
| 217,100 | | General Dynamics Corp. | | | 17,055,376 |
| 471,700 | | United Technologies Corp | | | 35,202,971 |
| | | | |
|
|
| | | Total Aerospace & Defense | | | 70,641,017 |
| | | | |
|
|
See Notes to Financial Statements.
27
Schedules of Investments
(continued)
| | | | | |
| Large Capitalization Growth Investments |
| | |
| Shares | | Security | | Value |
| |
Air Freight & Logistics — 1.7% | | | |
| 450,000 | | Expeditors International of Washington Inc. | | $ | 19,876,500 |
| 300,000 | | United Parcel Service Inc., Class B Shares | | | 22,758,000 |
| | | | |
|
|
| | | Total Air Freight & Logistics | | | 42,634,500 |
| | | | |
|
|
| |
Commercial Services & Supplies — 0.7% | | | |
| 310,000 | | Weight Watchers International Inc. (a) | | | 16,101,400 |
| | | | |
|
|
| |
Electrical Equipment — 1.4% | | | |
| 202,500 | | Cooper Industries Ltd., Class A Shares | | | 10,361,925 |
| 351,605 | | Rockwell Automation Inc. | | | 24,774,088 |
| | | | |
|
|
| | | Total Electrical Equipment | | | 35,136,013 |
| | | | |
|
|
| |
Industrial Conglomerates — 1.7% | | | |
| 733,740 | | General Electric Co. | | | 28,520,474 |
| 250,000 | | Textron Inc. | | | 14,585,000 |
| | | | |
|
|
| | | Total Industrial Conglomerates | | | 43,105,474 |
| | | | |
|
|
| |
Machinery — 2.6% | | | |
| 236,900 | | Danaher Corp. | | | 18,397,654 |
| 157,900 | | Deere & Co. | | | 21,483,874 |
| 351,550 | | ITT Industries Inc. | | | 23,901,885 |
| | | | |
|
|
| | | Total Machinery | | | 63,783,413 |
| | | | |
|
|
| | | TOTAL INDUSTRIALS | | | 271,401,817 |
| | | | |
|
|
INFORMATION TECHNOLOGY — 28.2% | | | |
| |
Communication Equipment — 5.7% | | | |
| 1,653,200 | | Cisco Systems Inc.* | | | 52,770,144 |
| 878,950 | | Corning Inc. | | | 20,541,062 |
| 1,654,600 | | QUALCOMM Inc. | | | 66,001,994 |
| | | | |
|
|
| | | Total Communication Equipment | | | 139,313,200 |
| | | | |
|
|
| |
Computers & Peripherals — 4.8% | | | |
| 143,500 | | Apple Inc.* | | | 19,871,880 |
| 371,400 | | Hewlett-Packard Corp. | | | 18,328,590 |
| 405,000 | | Research in Motion Ltd.* | | | 34,591,050 |
| 371,300 | | SanDisk Corp.* | | | 20,815,078 |
| 988,500 | | Seagate Technology | | | 25,523,070 |
| | | | |
|
|
| | | Total Computers & Peripherals | | | 119,129,668 |
| | | | |
|
|
| |
Internet Software & Services — 5.4% | | | |
| 1,237,100 | | eBay Inc.* | | | 42,185,110 |
| 93,598 | | Equinix Inc.* | | | 8,284,359 |
| 161,132 | | Google Inc., Class A Shares* | | | 83,023,263 |
| | | | |
|
|
| | | Total Internet Software & Services | | | 133,492,732 |
| | | | |
|
|
| |
IT Services — 3.5% | | | |
| 448,800 | | Cognizant Technology Solutions Corp.* | | | 32,991,288 |
| 389,800 | | Fidelity National Information Services Inc. | | | 18,476,520 |
| 543,000 | | Paychex Inc. | | | 24,125,490 |
| 600,000 | | Western Union Co. | | | 11,298,000 |
| | | | |
|
|
| | | Total IT Services | | | 86,891,298 |
| | | | |
|
|
See Notes to Financial Statements.
28
Schedules of Investments
(continued)
| | | | | |
| Large Capitalization Growth Investments |
| | |
| Shares | | Security | | Value |
| |
Semiconductors & Semiconductor Equipment — 4.4% | | | |
| 779,650 | | Intel Corp. | | $ | 20,075,988 |
| 1,644,600 | | Marvell Technology Group Ltd.* | | | 27,251,022 |
| 692,400 | | Maxim Integrated Products Inc. | | | 20,778,924 |
| 206,400 | | MEMC Electronic Materials Inc.* | | | 12,677,088 |
| 315,900 | | Nvidia Corp.* | | | 16,161,444 |
| 315,400 | | Texas Instruments Inc. | | | 10,799,296 |
| | | | |
|
|
| | | Total Semiconductors & Semiconductor Equipment | | | 107,743,762 |
| | | | |
|
|
| |
Software — 4.4% | | | |
| 601,100 | | Adobe Systems Inc.* | | | 25,697,025 |
| 481,500 | | Amdocs Ltd.* | | | 16,996,950 |
| 275,200 | | Autodesk Inc.* | | | 12,747,264 |
| 775,000 | | Intuit Inc.* | | | 21,165,250 |
| 806,360 | | Microsoft Corp. | | | 23,166,723 |
| 390,600 | | Oracle Corp.* | | | 7,921,368 |
| | | | |
|
|
| | | Total Software | | | 107,694,580 |
| | | | |
|
|
| | | TOTAL INFORMATION TECHNOLOGY | | | 694,265,240 |
| | | | |
|
|
MATERIALS — 4.0% | | | |
| |
Chemicals — 3.1% | | | |
| 70,400 | | Air Products & Chemicals Inc. | | | 6,336,704 |
| 496,850 | | Ecolab Inc. | | | 20,698,771 |
| 654,000 | | Praxair Inc. | | | 49,481,640 |
| | | | |
|
|
| | | Total Chemicals | | | 76,517,115 |
| | | | |
|
|
| |
Metals & Mining — 0.9% | | | |
| 259,900 | | Freeport-McMoRan Copper & Gold Inc. | | | 22,720,458 |
| | | | |
|
|
| | | TOTAL MATERIALS | | | 99,237,573 |
| | | | |
|
|
TELECOMMUNICATION SERVICES — 3.0% | | | |
| |
Communication Equipment — 0.3% | | | |
| 218,000 | | Juniper Networks Inc.* | | | 7,176,560 |
| | | | |
|
|
| |
Wireless Equipment — 0.7% | | | |
| 425,000 | | Crown Castle International Corp.* | | | 15,623,000 |
| | | | |
|
|
| |
Wireless Telecommuication Services — 2.0% | | | |
| 209,773 | | America Movil SAB de CV | | | 12,682,876 |
| 334,900 | | American Tower Corp., Class A Shares* | | | 13,268,738 |
| 302,633 | | NII Holdings Inc., Class B Shares* | | | 23,962,481 |
| | | | |
|
|
| | | Total Wireless Telecommuication Services | | | 49,914,095 |
| | | | |
|
|
| | | TOTAL TELECOMMUNICATION SERVICES | | | 72,713,655 |
| | | | |
|
|
| | | TOTAL COMMON STOCKS
(Cost — $2,030,623,996) | | | 2,402,525,626 |
| | | | |
|
|
| | | TOTAL INVESTMENTS BEFORE SHORT-TERM INVESTMENTS
(Cost — $2,030,623,996) | | | 2,402,525,626 |
| | | | |
|
|
See Notes to Financial Statements.
29
Schedules of Investments
(continued)
| | | | | | |
| Large Capitalization Growth Investments | |
| | |
Face Amount | | Security | | Value | |
SHORT-TERM INVESTMENTS (c) — 4.4% | |
MONEY MARKET FUND — 2.1% | |
| 51,156,602 | | BBH Securities Lending Trust (d)
(Cost — $51,156,602) | | $ | 51,156,602 | |
| | | | |
|
|
|
TIME DEPOSITS — 2.2% | |
| $31,504,014 | | BBH — Grand Cayman, 4.440% due 9/1/07 | | | 31,504,014 | |
| 23,734,968 | | Wells Fargo — Grand Cayman, 4.440% due 9/1/07 | | | 23,734,968 | |
| | | | |
|
|
|
| | | TOTAL TIME DEPOSITS
(Cost — $55,238,982) | | | 55,238,982 | |
| | | | |
|
|
|
U.S. GOVERNMENT AGENCY — 0.1% | |
| 2,260,000 | | Federal National Mortgage Association, Discount Notes, (FNMA), 4.282% due 9/4/07 (b)
(Cost — $2,258,925) | | | 2,258,925 | |
| | | | |
|
|
|
| | | TOTAL SHORT-TERM INVESTMENTS
(Cost — $108,654,509) | | | 108,654,509 | |
| | | | |
|
|
|
| | | TOTAL INVESTMENTS — 101.9%
(Cost — $2,139,278,505#) | | | 2,511,180,135 | |
| | | Liabilities in Excess of Other Assets — (1.9%) | | | (47,526,158 | ) |
| | | | |
|
|
|
| | | TOTAL NET ASSETS — 100.0% | | $ | 2,463,653,977 | |
| | | | |
|
|
|
| * | | Non-income producing securities. |
| (a) | | All or a portion of this security is on loan (See Note 1). |
| (b) | | Rate shown represents yield-to-maturity. |
| (c) | | Inclusive of all short term holdings, including collateral received from securities lending activities. Not including such collateral the percentage of portfolio holdings would be 2.3%. |
| (d) | | Represents investment of collateral received from securities lending transactions. |
| # | | Aggregate cost for federal income tax purposes is $2,152,860,681. |
Abbreviation used in this schedule:
| | | | |
| ADR | | — | | American Depositary Receipt |
See Notes to Financial Statements.
30
Schedules of Investments
(continued)
| | | | | |
| Large Capitalization Value Equity Investments |
| | |
| Shares | | Security | | Value |
COMMON STOCKS — 95.3% |
CONSUMER DISCRETIONARY — 13.4% |
|
Hotels, Restaurants & Leisure — 2.1% |
| 236,000 | | Boyd Gaming Corp. | | $ | 9,640,600 |
| 84,600 | | Las Vegas Sands Corp.* | | | 8,434,620 |
| 161,100 | | McDonald’s Corp. | | | 7,934,175 |
| 374,000 | | Wyndham Worldwide Corp. | | | 11,930,600 |
| | | | |
|
|
| | | Total Hotels, Restaurants & Leisure | | | 37,939,995 |
| | | | |
|
|
|
Household Durables — 1.7% |
| 189,500 | | Black & Decker Corp. (a) | | | 16,439,125 |
| 44,600 | | Clorox Co. | | | 2,667,080 |
| 220,700 | | Stanley Works | | | 12,522,518 |
| | | | |
|
|
| | | Total Household Durables | | | 31,628,723 |
| | | | |
|
|
|
Leisure Equipment & Products — 0.6% |
| 469,800 | | Mattel Inc. | | | 10,161,774 |
| | | | |
|
|
|
Media — 4.9% |
| 817,645 | | CBS Corp., Class B Shares | | | 25,763,994 |
| 153,800 | | Comcast Corp., Special Class A Shares* | | | 3,977,268 |
| 539,200 | | DIRECTV Group Inc.* | | | 12,579,536 |
| 227,700 | | Gannett Co. Inc. | | | 10,701,900 |
| 33 | | Gemstar-TV Guide International Inc.* | | | 201 |
| 1,090,000 | | Interpublic Group Cos. Inc. (a)* | | | 11,935,500 |
| 293,700 | | Time Warner Inc. | | | 5,574,426 |
| 261,000 | | WPP Group PLC, ADR (a) | | | 18,593,640 |
| | | | |
|
|
| | | Total Media | | | 89,126,465 |
| | | | |
|
|
|
Multiline Retail — 1.6% |
| 336,000 | | Macy’s Inc. | | | 10,657,920 |
| 277,000 | | Target Corp. | | | 18,262,610 |
| | | | |
|
|
| | | Total Multiline Retail | | | 28,920,530 |
| | | | |
|
|
|
Specialty Retail — 1.6% |
| 479,000 | | Home Depot Inc. | | | 18,350,490 |
| 450,000 | | Limited Brands Inc. | | | 10,422,000 |
| 24,790 | | Office Depot Inc.* | | | 606,116 |
| | | | |
|
|
| | | Total Specialty Retail | | | 29,378,606 |
| | | | |
|
|
|
Textiles, Apparel & Luxury Goods — 0.9% |
| 200,800 | | V. F. Corp. | | | 16,033,880 |
| | | | |
|
|
| | | TOTAL CONSUMER DISCRETIONARY | | | 243,189,973 |
| | | | |
|
|
CONSUMER STAPLES — 11.8% |
|
Beverages — 1.4% |
| 262,000 | | Anheuser-Busch Cos. Inc. | | | 12,942,800 |
| 230,500 | | Coca-Cola Co. | | | 12,396,290 |
| | | | |
|
|
| | | Total Beverages | | | 25,339,090 |
| | | | |
|
|
|
Commercial Services & Supplies — 0.7% |
| 200,000 | | Avery Dennison Corp. (a) | | | 11,958,000 |
| | | | |
|
|
See Notes to Financial Statements.
31
Schedules of Investments
(continued)
| | | | | |
| Large Capitalization Value Equity Investments |
| | |
| Shares | | Security | | Value |
|
Food & Staples Retailing — 1.7% |
| 580,000 | | CVS/Caremark Corp. | | $ | 21,935,600 |
| 144,000 | | Kroger Co. | | | 3,827,520 |
| 180,200 | | Safeway Inc. | | | 5,717,746 |
| | | | |
|
|
| | | Total Food & Staples Retailing | | | 31,480,866 |
| | | | |
|
|
|
Food Products — 3.4% |
| 760,000 | | Archer Daniels Midland | | | 25,612,000 |
| 506,000 | | ConAgra Foods Inc. | | | 13,009,260 |
| 550,057 | | Kraft Foods Inc. | | | 17,634,827 |
| 370,200 | | Sara Lee Corp. | | | 6,152,724 |
| | | | |
|
|
| | | Total Food Products | | | 62,408,811 |
| | | | |
|
|
|
Household Products — 0.7% |
| 177,400 | | Kimberly-Clark Corp. | | | 12,185,606 |
| | | | |
|
|
|
Tobacco — 3.9% |
| 837,200 | | Altria Group Inc. | | | 58,110,052 |
| 195,900 | | Reynolds American Inc. | | | 12,952,908 |
| | | | |
|
|
| | | Total Tobacco | | | 71,062,960 |
| | | | |
|
|
| | | TOTAL CONSUMER STAPLES | | | 214,435,333 |
| | | | |
|
|
ENERGY — 15.8% |
|
Energy Equipment & Services — 3.4% |
| 208,000 | | Baker Hughes Inc. | | | 17,442,880 |
| 183,400 | | GlobalSantaFe Corp. | | | 12,946,206 |
| 585,000 | | Halliburton Co. (a) | | | 20,235,150 |
| 410,000 | | Nabors Industries Ltd.* | | | 12,131,900 |
| | | | |
|
|
| | | Total Energy Equipment & Services | | | 62,756,136 |
| | | | |
|
|
|
Oil, Gas & Consumable Fuels — 12.4% |
| 359,200 | | Anadarko Petroleum Corp. | | | 17,593,616 |
| 81,400 | | BP PLC, ADR | | | 5,483,104 |
| 614,100 | | Chevron Corp. | | | 53,893,416 |
| 447,600 | | ConocoPhillips | | | 36,653,964 |
| 1,139,000 | | El Paso Corp. | | | 18,075,930 |
| 310,500 | | Exxon Mobil Corp. | | | 26,619,165 |
| 537,000 | | Marathon Oil Corp. | | | 28,938,930 |
| 246,800 | | Occidental Petroleum | | | 13,991,092 |
| 55,600 | | Petrochina Co., Ltd., ADR | | | 8,024,748 |
| 222,600 | | Petroleo Brasileiro SA | | | 13,765,584 |
| 22,200 | | Royal Dutch Shell PLC, Class A Shares, ADR | | | 1,717,170 |
| | | | |
|
|
| | | Total Oil, Gas & Consumable Fuels | | | 224,756,719 |
| | | | |
|
|
| | | TOTAL ENERGY | | | 287,512,855 |
| | | | |
|
|
FINANCIALS — 22.3% |
|
Capital Markets — 1.3% |
| 8,400 | | Goldman Sachs Group Inc. | | | 1,478,484 |
| 289,200 | | Merrill Lynch & Co. Inc. | | | 21,314,040 |
| | | | |
|
|
| | | Total Capital Markets | | | 22,792,524 |
| | | | |
|
|
|
Commercial Banks — 2.7% |
| 92,700 | | Countrywide Financial Corp. (a) | | | 1,840,095 |
| 347,000 | | Keycorp | | | 11,555,100 |
See Notes to Financial Statements.
32
Schedules of Investments
(continued)
| | | | | |
| Large Capitalization Value Equity Investments |
| | |
| Shares | | Security | | Value |
|
Commercial Banks — 2.7% (continued) |
| 754,800 | | Regions Financial Corp. | | $ | 23,625,240 |
| 249,500 | | Wachovia Corp. | | | 12,220,510 |
| | | | |
|
|
| | | Total Commercial Banks | | | 49,240,945 |
| | | | |
|
|
|
Diversified Financial Services — 5.1% |
| 1,115,200 | | Bank of America Corp. | | | 56,518,336 |
| 28,500 | | Deutsche Bank AG | | | 3,534,000 |
| 615,100 | | JPMorgan Chase & Co. (a) | | | 27,384,252 |
| 85,600 | | Morgan Stanley | | | 5,338,872 |
| | | | |
|
|
| | | Total Diversified Financial Services | | | 92,775,460 |
| | | | |
|
|
|
Insurance — 9.0% |
| 213,000 | | ACE Ltd. | | | 12,302,880 |
| 536,200 | | Allstate Corp. | | | 29,356,950 |
| 290,800 | | American International Group Inc. | | | 19,192,800 |
| 445,000 | | Assured Guaranty Ltd. | | | 11,601,150 |
| 106,800 | | Fidelity National Financial Inc. | | | 1,942,692 |
| 221,000 | | Genworth Financial Inc., Class A Shares | | | 6,404,580 |
| 55,600 | | Hartford Financial Services Group Inc. | | | 4,943,396 |
| 191,400 | | Lincoln National Corp. | | | 11,652,432 |
| 325,600 | | MBIA Inc. (a) | | | 19,536,000 |
| 206,500 | | MetLife Inc. | | | 13,226,325 |
| 43,600 | | RenaissanceRe Holdings Ltd. | | | 2,497,408 |
| 453,100 | | Travelers Cos. Inc. | | | 22,899,674 |
| 106,100 | | XL Capital Ltd., Class A Shares | | | 8,084,820 |
| | | | |
|
|
| | | Total Insurance | | | 163,641,107 |
| | | | |
|
|
|
Real Estate Investment Trusts (REITs) — 0.5% |
| 273,700 | | Duke Realty Corp. | | | 9,248,323 |
| | | | |
|
|
|
Thrifts & Mortgage Finance — 3.7% |
| 221,900 | | Fannie Mae | | | 14,558,859 |
| 410,600 | | Freddie Mac | | | 25,297,066 |
| 726,900 | | Washington Mutual Inc. | | | 26,691,768 |
| | | | |
|
|
| | | Total Thrifts & Mortgage Finance | | | 66,547,693 |
| | | | |
|
|
| | | TOTAL FINANCIALS | | | 404,246,052 |
| | | | |
|
|
HEALTH CARE — 8.2% |
|
Health Care Equipment & Supplies — 0.1% |
| 64,475 | | Covidien Ltd.* | | | 2,568,039 |
| | | | |
|
|
|
Health Care Providers & Services — 1.2% |
| 134,600 | | Amerisourcebergen Corp. Class A | | | 6,440,610 |
| 172,500 | | Cigna Corp. | | | 8,914,800 |
| 119,200 | | McKesson Corp. | | | 6,819,432 |
| | | | |
|
|
| | | Total Health Care Providers & Services | | | 22,174,842 |
| | | | |
|
|
|
Pharmaceuticals — 6.9% |
| 234,000 | | Barr Pharmaceuticals Inc.* | | | 11,905,920 |
| 491,100 | | GlaxoSmithKline PLC, ADR (a) | | | 25,645,242 |
| 365,700 | | Merck & Co. Inc. | | | 18,347,169 |
| 2,109,300 | | Pfizer Inc. | | | 52,395,012 |
| 11,222 | | PharMerica Corp.* | | | 198,966 |
See Notes to Financial Statements.
33
Schedules of Investments
(continued)
| | | | | |
| Large Capitalization Value Equity Investments |
| | |
| Shares | | Security | | Value |
|
Pharmaceuticals — 6.9% (continued) |
| 346,000 | | Wyeth | | $ | 16,019,800 |
| | | | |
|
|
| | | Total Pharmaceuticals | | | 124,512,109 |
| | | | |
|
|
| | | TOTAL HEALTH CARE | | | 149,254,990 |
| | | | |
|
|
INDUSTRIALS — 4.4% |
|
Aerospace & Defense — 0.5% |
| 110,400 | | Northrop Grumman Corp. | | | 8,703,936 |
| | | | |
|
|
|
Auto Components — 0.4% |
| 44,400 | | Autoliv Inc. | | | 2,547,228 |
| 48,800 | | BorgWarner Inc. | | | 4,123,600 |
| | | | |
|
|
| | | Total Auto Components | | | 6,670,828 |
| | | | |
|
|
|
Building Products — 0.2% |
| 113,300 | | KB Home (a) | | | 3,437,522 |
| | | | |
|
|
|
Commercial Services & Supplies — 0.6% |
| 303,800 | | R.R. Donnelley & Sons Co. | | | 10,882,116 |
| | | | |
|
|
|
Industrial Conglomerates — 1.2% |
| 383,000 | | General Electric Co. | | | 14,887,210 |
| 42,400 | | Parker Hannifin Corp. | | | 4,556,728 |
| 64,475 | | Tyco International Ltd. | | | 2,847,216 |
| | | | |
|
|
| | | Total Industrial Conglomerates | | | 22,291,154 |
| | | | |
|
|
|
Machinery — 0.8% |
| 61,200 | | Eaton Corp. | | | 5,766,264 |
| 125,600 | | Ingersoll-Rand Co., Ltd. | | | 6,522,408 |
| 64,475 | | Tyco Electronics Ltd.* | | | 2,248,243 |
| | | | |
|
|
| | | Total Machinery | | | 14,536,915 |
| | | | |
|
|
|
Road & Rail — 0.7% |
| 244,000 | | Norfolk Southern Corp. | | | 12,495,240 |
| | | | |
|
|
| | | TOTAL INDUSTRIALS | | | 79,017,711 |
| | | | |
|
|
INFORMATION TECHNOLOGY — 9.3% |
|
Computers & Peripherals — 1.7% |
| 165,370 | | International Business Machines Corp. | | | 19,297,025 |
| 465,500 | | Seagate Technology | | | 12,019,210 |
| | | | |
|
|
| | | Total Computers & Peripherals | | | 31,316,235 |
| | | | |
|
|
|
Electronic Equipment & Instruments — 1.3% |
| 1,362,000 | | Flextronics International Ltd.* | | | 15,513,180 |
| 182,520 | | Sanmina-SCI Corp.* | | | 417,971 |
| 1,397,977 | | Solectron Corp.* | | | 5,424,151 |
| 51,910 | | Tech Data Corp.* | | | 2,023,971 |
| | | | |
|
|
| | | Total Electronic Equipment & Instruments | | | 23,379,273 |
| | | | |
|
|
|
IT Services — 1.2% |
| 1,163,000 | | Western Union Co. | | | 21,899,290 |
| | | | |
|
|
|
Semiconductors & Semiconductor Equipment — 3.4% |
| 1,420,000 | | Infineon Technologies AG, ADR (a)* | | | 22,152,000 |
| 1,220,000 | | Intel Corp. | | | 31,415,000 |
See Notes to Financial Statements.
34
Schedules of Investments
(continued)
| | | | | |
| Large Capitalization Value Equity Investments |
| | |
| Shares | | Security | | Value |
|
Semiconductors & Semiconductor Equipment — 3.4% (continued) |
| 660,000 | | Qimonda AG, ADR (a)* | | $ | 8,817,600 |
| | | | |
|
|
| | | Total Semiconductors & Semiconductor Equipment | | | 62,384,600 |
| | | | |
|
|
|
Software — 1.7% |
| 406,000 | | Cadence Design Systems Inc. (a)* | | | 8,818,320 |
| 760,200 | | Microsoft Corp. | | | 21,840,546 |
| | | | |
|
|
| | | Total Software | | | 30,658,866 |
| | | | |
|
|
| | | TOTAL INFORMATION TECHNOLOGY | | | 169,638,264 |
| | | | |
|
|
MATERIALS — 2.5% |
|
Chemicals — 2.0% |
| 836,400 | | Dow Chemical Co. | | | 35,655,732 |
| | | | |
|
|
|
Metals & Mining — 0.5% |
| 143,800 | | Arcelor Mittal, Class A Shares (a) | | | 9,519,560 |
| | | | |
|
|
| | | TOTAL MATERIALS | | | 45,175,292 |
| | | | |
|
|
TELECOMMUNICATION SERVICES — 5.5% |
|
Communication Equipment — 1.0% |
| 510,000 | | Ericsson (LM) Telephone, ADR | | | 18,977,100 |
| | | | |
|
|
|
Diversified Telecommunication Services — 4.3% |
| 646,434 | | AT&T Inc. | | | 25,773,324 |
| 597,500 | | Sprint Nextel Corp. | | | 11,304,700 |
| 537,000 | | Verizon Communications | | | 22,489,560 |
| 175,000 | | Vodafone Group PLC, ADR | | | 5,670,000 |
| 897,272 | | Windstream Corp. | | | 12,813,044 |
| | | | |
|
|
| | | Total Diversified Telecommunication Services | | | 78,050,628 |
| | | | |
|
|
|
Wireless Equipment — 0.2% |
| 90,500 | | Nokia Corp., ADR | | | 2,975,640 |
| | | | |
|
|
| | | TOTAL TELECOMMUNICATION SERVICES | | | 100,003,368 |
| | | | |
|
|
UTILITIES — 2.1% |
|
Electric Utilities — 1.1% |
| 76,900 | | Ameren Corp. | | | 3,904,982 |
| 111,800 | | American Electic Power Co. Inc. | | | 4,972,864 |
| 83,200 | | Entergy Corp. | | | 8,621,184 |
| 77,900 | | Wisconsin Energy Corp. | | | 3,451,749 |
| | | | |
|
|
| | | Total Electric Utilities | | | 20,950,779 |
| | | | |
|
|
|
Independent Power Producers & Energy Traders — 0.3% |
| 70,600 | | TXU Corp. | | | 4,758,440 |
| | | | |
|
|
|
Multi-Utilities — 0.7% |
| 226,000 | | Sempra Energy | | | 12,436,780 |
| | | | |
|
|
| | | TOTAL UTILITIES | | | 38,145,999 |
| | | | |
|
|
| | | TOTAL COMMON STOCKS
(Cost — $1,464,774,760) | | | 1,730,619,837 |
| | | | |
|
|
| | | TOTAL INVESTMENTS BEFORE SHORT-TERM INVESTMENTS
(Cost — $1,464,774,760) | | | 1,730,619,837 |
| | | | |
|
|
See Notes to Financial Statements.
35
Schedules of Investments
(continued)
| | | | | | |
| Large Capitalization Value Equity Investments | |
| | |
Face
Amount | | Security | | Value | |
SHORT-TERM INVESTMENTS (b) — 12.5% | |
MONEY MARKET FUND — 8.2% | |
| 147,862,517 | | BBH Securities Lending Trust (c)
(Cost — $147,862,517) | | $ | 147,862,517 | |
| | | | |
|
|
|
TIME DEPOSITS — 4.3% | |
| $ 30,347,680 | | Bank of America — London, 4.440% due 9/1/07 | | | 30,347,680 | |
| 29,069,246 | | BBH — Grand Cayman, 4.440% due 9/1/07 | | | 29,069,246 | |
| 19,243,153 | | Wells Fargo — Grand Cayman, 4.440% due 9/1/07 | | | 19,243,153 | |
| | | | |
|
|
|
| | | TOTAL TIME DEPOSITS
(Cost — $78,660,079) | | | 78,660,079 | |
| | | | |
|
|
|
| | | TOTAL SHORT-TERM INVESTMENTS
(Cost — $226,522,596) | | | 226,522,596 | |
| | | | |
|
|
|
| | | TOTAL INVESTMENTS — 107.8%
(Cost — $1,691,297,356) | | | 1,957,142,433 | |
| | | Liabilities in Excess of Other Assets — (7.8%) | | | (141,422,288 | ) |
| | | | |
|
|
|
| | | TOTAL NET ASSETS — 100.0% | | $ | 1,815,720,145 | |
| | | | |
|
|
|
| * | | Non-income producing securities. |
| (a) | | All or a portion of this security is on loan (See Note 1). |
| (b) | | Inclusive of all short term holdings, including collateral received from securities lending activities. Not including such collateral the percentage of portfolio holdings would be 4.3%. |
| (c) | | Represents investment of collateral received from securities lending transactions. |
| # | | Aggregate cost for federal income tax purposes is $1,697,503,845. |
Abbreviation used in this schedule:
|
| ADR — American Depositary Receipt |
See Notes to Financial Statements.
36
Schedules of Investments
(continued)
| | | | | |
| Small Capitalization Growth Investments | | |
| | |
| Shares | | Security | | Value |
COMMON STOCKS — 98.5% | | | |
CONSUMER DISCRETIONARY — 6.9% | | | |
| |
Diversified Consumer Services — 1.2% | | | |
| 130,012 | | Corinthian Colleges Inc.* | | $ | 1,827,969 |
| 51,900 | | New Oriental Education & Technology Group Inc.* | | | 2,748,105 |
| | | | |
|
|
| | | Total Diversified Consumer Services | | | 4,576,074 |
| | | | |
|
|
| |
Hotels, Restaurants & Leisure — 2.2% | | | |
| 41,699 | | RARE Hospitality International Inc.* | | | 1,574,971 |
| 37,500 | | Red Robin Gourmet Burgers Inc.* | | | 1,442,625 |
| 208,058 | | Texas Roadhouse Inc., Class A Shares* | | | 2,665,223 |
| 111,150 | | WMS Industries Inc.* | | | 3,272,256 |
| | | | |
|
|
| | | Total Hotels, Restaurants & Leisure | | | 8,955,075 |
| | | | |
|
|
| |
Household Durables — 0.4% | | | |
| 54,100 | | Tempur-Pedic International Inc. (a) | | | 1,563,490 |
| | | | |
|
|
| |
Specialized Consumer Services — 0.6% | | | |
| 356,200 | | Stewart Enterprises Inc., Class A Shares | | | 2,553,954 |
| | | | |
|
|
| |
Specialty Retail — 0.4% | | | |
| 119,659 | | Bebe Stores Inc. (a) | | | 1,669,243 |
| | | | |
|
|
| |
Textiles, Apparel & Luxury Goods — 2.1% | | | |
| 71,400 | | Aeropostale Inc.* | | | 1,477,980 |
| 142,000 | | Iconix Brand Group Inc.* | | | 2,943,660 |
| 28,500 | | Lululemon Athletica Inc. (a)* | | | 970,995 |
| 42,600 | | Oxford Industries Inc. | | | 1,542,972 |
| 97,000 | | True Religion Apparel Inc. (a)* | | | 1,627,660 |
| | | | |
|
|
| | | Total Textiles, Apparel & Luxury Goods | | | 8,563,267 |
| | | | |
|
|
| | | TOTAL CONSUMER DISCRETIONARY | | | 27,881,103 |
| | | | |
|
|
CONSUMER STAPLES — 1.5% | | | |
| |
Food Products — 0.6% | | | |
| 191,500 | | SunOpta Inc.* | | | 2,483,755 |
| | | | |
|
|
| |
Personal Products — 0.9% | | | |
| 152,500 | | Bare Escentuals Inc.* | | | 3,751,500 |
| | | | |
|
|
| | | TOTAL CONSUMER STAPLES | | | 6,235,255 |
| | | | |
|
|
ENERGY — 9.7% | | | |
| |
Oil, Gas & Consumable Fuels — 9.7% | | | |
| 66,430 | | Exterran Holdings Inc. (a)* | | | 5,148,325 |
| 76,900 | | Foundation Coal Holdings Inc. | | | 2,608,448 |
| 207,200 | | Key Energy Services Inc.* | | | 3,066,560 |
| 23,000 | | NATCO Group Inc.* | | | 1,148,620 |
| 94,800 | | Oil States International Inc.* | | | 4,000,560 |
| 91,500 | | Parallel Petroleum Corp.* | | | 1,618,635 |
| 138,000 | | Patterson UTI Energy Inc. | | | 2,962,860 |
| 130,700 | | Pioneer Drilling Co.* | | | 1,589,312 |
| 98,600 | | Precision Drilling Trust (a) | | | 1,917,770 |
| 85,799 | | Quicksilver Resources Inc.* | | | 3,427,670 |
See Notes to Financial Statements.
37
Schedules of Investments
(continued)
| | | | | |
| Small Capitalization Growth Investments | | |
| | |
| Shares | | Security | | Value |
| |
Oil, Gas & Consumable Fuels — 9.7% (continued) | | | |
| 227,700 | | Superior Energy Services Inc.* | | $ | 8,839,314 |
| 81,000 | | T-3 Energy Services Inc.* | | | 2,505,330 |
| | | | |
|
|
| | | Total Oil, Gas & Consumable Fuels | | | 38,833,404 |
| | | | |
|
|
| | | TOTAL ENERGY | | | 38,833,404 |
| | | | |
|
|
FINANCIALS — 3.1% | | | |
| |
Commercial Banks — 1.9% | | | |
| 65,181 | | East-West Bancorp | | | 2,333,480 |
| 90,900 | | Signature Bank* | | | 3,141,504 |
| 143,200 | | UCBH Holdings Inc. | | | 2,379,984 |
| | | | |
|
|
| | | Total Commercial Banks | | | 7,854,968 |
| | | | |
|
|
| |
Diversified Financial Services — 0.7% | | | |
| 57,500 | | FCStone Group Inc.* | | | 2,687,550 |
| | | | |
|
|
| |
Real Estate Investment Trusts (REITs) — 0.5% | | | |
| 102,600 | | DiamondrRock Hospitality Co. | | | 1,841,670 |
| | | | |
|
|
| | | TOTAL FINANCIALS | | | 12,384,188 |
| | | | |
|
|
HEALTH CARE — 27.9% | | | |
| |
Biotechnology — 7.7% | | | |
| 122,100 | | Alexion Pharmaceuticals Inc.* | | | 7,383,387 |
| 33,889 | | Cephalon Inc.* | | | 2,543,369 |
| 84,800 | | Cubist Pharmaceuticals Inc.* | | | 1,940,224 |
| 266,100 | | Human Genome Sciences Inc. (a)* | | | 2,450,781 |
| 100,300 | | Illumina Inc. (a)* | | | 4,843,487 |
| 102,700 | | InterMune Inc. (a)* | | | 2,030,379 |
| 110,000 | | Keryx Biopharmaceuticals Inc.* | | | 1,106,600 |
| 120,400 | | Nektar Therapeutics (a)* | | | 994,504 |
| 128,700 | | TomoTherapy Inc.* | | | 3,072,069 |
| 146,700 | | Vanda Pharmaceuticals Inc. (a)* | | | 2,190,231 |
| 64,400 | | Vertex Pharmaceuticals Inc.* | | | 2,509,024 |
| | | | |
|
|
| | | Total Biotechnology | | | 31,064,055 |
| | | | |
|
|
| |
Health Care Equipment & Supplies — 10.0% | | | |
| 103,000 | | Align Technology Inc.* | | | 2,341,190 |
| 161,600 | | American Medical Systems Holdings Inc. (a)* | | | 2,973,440 |
| 101,000 | | Cutera Inc.* | | | 2,249,270 |
| 165,400 | | ev3 Inc. (a)* | | | 2,532,274 |
| 38,000 | | Greatbatch Inc.* | | | 1,140,000 |
| 104,188 | | Immucor Inc.* | | | 3,474,670 |
| 85,200 | | Masimo Corp.* | | | 1,789,200 |
| 94,800 | | Palomar Medical Technologies Inc. (a)* | | | 2,986,200 |
| 147,300 | | PerkinElmer Inc. | | | 4,037,493 |
| 156,378 | | PolyMedica Corp. (a) | | | 8,095,689 |
| 279,000 | | Spectranetics Corp. (a)* | | | 4,109,670 |
| 73,700 | | Varian Inc.* | | | 4,423,474 |
| | | | |
|
|
| | | Total Health Care Equipment & Supplies | | | 40,152,570 |
| | | | |
|
|
| |
Health Care Providers & Services — 2.1% | | | |
| 76,900 | | Gentiva Health Services Inc.* | | | 1,594,906 |
| 52,700 | | Manor Care Inc. | | | 3,367,003 |
| 236,100 | | Sun Healthcare Group Inc.* | | | 3,510,807 |
| | | | |
|
|
| | | Total Health Care Providers & Services | | | 8,472,716 |
| | | | |
|
|
See Notes to Financial Statements.
38
Schedules of Investments
(continued)
| | | | | |
| Small Capitalization Growth Investments | | |
| | |
| Shares | | Security | | Value |
| |
Life Sciences Tools & Services — 0.9% | | | |
| 48,700 | | Dionex Corp.* | | $ | 3,527,341 |
| | | | |
|
|
| |
Pharmaceuticals — 7.2% | | | |
| 230,200 | | Adolor Corp.* | | | 860,948 |
| 153,000 | | Array Biopharma Inc.* | | | 1,736,550 |
| 276,700 | | Medicines Co.* | | | 4,620,890 |
| 96,900 | | Medicis Pharmaceutical Corp., Class A Shares | | | 2,959,326 |
| 369,800 | | MGI Pharma Inc.* | | | 8,716,186 |
| 127,600 | | Nastech Pharmaceutical Co. Inc. (a)* | | | 1,765,984 |
| 145,150 | | OSI Pharmaceuticals Inc.* | | | 4,951,066 |
| 111,200 | | Santarus Inc. (a)* | | | 275,776 |
| 121,650 | | Sciele Pharma Inc. (a)* | | | 2,807,682 |
| | | | |
|
|
| | | Total Pharmaceuticals | | | 28,694,408 |
| | | | |
|
|
| | | TOTAL HEALTH CARE | | | 111,911,090 |
| | | | |
|
|
INDUSTRIALS — 14.1% | | | |
| |
Aerospace & Defense — 2.6% | | | |
| 62,300 | | EDO Corp. | | | 2,681,392 |
| 115,100 | | Hexcel Corp.* | | | 2,508,029 |
| 42,800 | | Triumph Group Inc. | | | 3,133,388 |
| 28,300 | | United Industrial Corp. | | | 1,956,379 |
| | | | |
|
|
| | | Total Aerospace & Defense | | | 10,279,188 |
| | | | |
|
|
| |
Airlines — 0.7% | | | |
| 182,800 | | Airtran Holdings Inc.* | | | 1,921,228 |
| 35,660 | | Allegiant Travel Co.* | | | 1,034,140 |
| | | | |
|
|
| | | Total Airlines | | | 2,955,368 |
| | | | |
|
|
| |
Building Products — 1.6% | | | |
| 124,100 | | Apogee Enterprises Inc. | | | 3,123,597 |
| 138,100 | | Interline Brands Inc.* | | | 3,347,544 |
| | | | |
|
|
| | | Total Building Products | | | 6,471,141 |
| | | | |
|
|
| |
Commercial Services & Supplies — 3.5% | | | |
| 113,100 | | Geo Group Inc.* | | | 3,366,987 |
| 55,900 | | Kendle International Inc.* | | | 2,189,044 |
| 190,800 | | Knoll Inc. | | | 3,627,108 |
| 142,800 | | Valueclick Inc.* | | | 2,861,712 |
| 27,700 | | VistaPrint Ltd* | | | 910,776 |
| 32,525 | | Waste Connections Inc.* | | | 989,410 |
| | | | |
|
|
| | | Total Commercial Services & Supplies | | | 13,945,037 |
| | | | |
|
|
| |
Electrical Equipment — 1.5% | | | |
| 55,000 | | Acuity Brands Inc. | | | 2,889,700 |
| 89,300 | | Energy Conversion Devices Inc. (a)* | | | 2,313,763 |
| 179,100 | | Power-One Inc. (a)* | | | 780,876 |
| | | | |
|
|
| | | Total Electrical Equipment | | | 5,984,339 |
| | | | |
|
|
| |
Machinery — 3.7% | | | |
| 67,747 | | Actuant Corp., Class A Shares | | | 4,131,890 |
| 24,800 | | Bucyrus International Inc. | | | 1,549,752 |
| 68,700 | | Gehl Co.* | | | 1,633,686 |
See Notes to Financial Statements.
39
Schedules of Investments
(continued)
| | | | | |
| Small Capitalization Growth Investments | | |
| | |
| Shares | | Security | | Value |
| |
Machinery — 3.7% (continued) | | | |
| 118,725 | | RBC Bearings Inc.* | | $ | 4,214,737 |
| 90,500 | | Wabtec Corp. | | | 3,391,035 |
| | | | |
|
|
| | | Total Machinery | | | 14,921,100 |
| | | | |
|
|
| |
Road & Rail — 0.5% | | | |
| 76,700 | | J.B. HuntTransport Services Inc. | | | 2,206,659 |
| | | | |
|
|
| | | TOTAL INDUSTRIALS | | | 56,762,832 |
| | | | |
|
|
INFORMATION TECHNOLOGY — 32.8% | | | |
| |
Communication Equipment — 2.6% | | | |
| 257,200 | | Foundry Networks Inc.* | | | 4,755,628 |
| 67,400 | | NICE Systems Ltd., ADR* | | | 2,384,612 |
| 71,600 | | Riverbed Technology Inc.* | | | 3,179,040 |
| | | | |
|
|
| | | Total Communication Equipment | | | 10,319,280 |
| | | | |
|
|
| |
Computers & Peripherals — 2.6% | | | |
| 194,900 | | Brocade Communications Systems Inc.* | | | 1,364,300 |
| 67,100 | | Magma Design Automation Inc.* | | | 921,954 |
| 40,600 | | Sigma Designs Inc. (a)* | | | 1,717,786 |
| 106,900 | | Smart Modular Technologies (WWH) Inc.* | | | 1,170,555 |
| 68,600 | | Synaptics Inc.* | | | 2,970,380 |
| 164,300 | | Virtusa Corp.* | | | 2,329,774 |
| | | | |
|
|
| | | Total Computers & Peripherals | | | 10,474,749 |
| | | | |
|
|
| |
Internet & Catalog Retail — 1.0% | | | |
| 74,500 | | Nutri/System Inc. (a)* | | | 4,040,135 |
| | | | |
|
|
| |
Internet Software & Services — 4.5% | | | |
| 221,800 | | Cybersource Corp. (a)* | | | 2,703,742 |
| 63,700 | | j2 Global Communications Inc.* | | | 2,165,800 |
| 117,400 | | Macrovision Corp* | | | 2,785,902 |
| 579,100 | | Skillsoft PLC, ADR* | | | 5,165,572 |
| 70,291 | | Sohu.com Inc. (a)* | | | 2,303,436 |
| 137,700 | | Websense Inc. (a)* | | | 2,832,489 |
| | | | |
|
|
| | | Total Internet Software & Services | | | 17,956,941 |
| | | | |
|
|
| |
IT Services — 1.4% | | | |
| 224,800 | | MPS Group Inc.* | | | 3,093,248 |
| 387,700 | | Sapient Corp.* | | | 2,496,788 |
| | | | |
|
|
| | | Total IT Services | | | 5,590,036 |
| | | | |
|
|
| |
Semiconductors & Semiconductor Equipment — 7.8% | | | |
| 245,400 | | AMIS Holdings Inc.* | | | 2,544,798 |
| 176,100 | | Asyst Technologies Inc.* | | | 1,033,707 |
| 98,300 | | ATMI Inc.* | | | 2,964,728 |
| 78,800 | | FormFactor Inc.* | | | 3,574,368 |
| 131,000 | | IXYS Corp. (a)* | | | 1,336,200 |
| 125,200 | | Marvell Technology Group Ltd.* | | | 2,074,564 |
| 94,100 | | Microsemi Corp.* | | | 2,386,376 |
| 93,500 | | Netlogic Microsystems Inc. (a)* | | | 2,742,355 |
| 423,700 | | PMC-Sierra Inc. (a)* | | | 3,254,016 |
| 72,345 | | Power Integrations Inc.* | | | 2,024,937 |
| 33,200 | | Standard Microsystems Corp.* | | | 1,194,536 |
| 55,500 | | Tessera Technologies Inc.* | | | 2,032,965 |
| 77,550 | | Varian Semiconductor Equipment Associates Inc.* | | | 4,314,107 |
| | | | |
|
|
| | | Total Semiconductors & Semiconductor Equipment | | | 31,477,657 |
| | | | |
|
|
See Notes to Financial Statements.
40
Schedules of Investments
(continued)
| | | | | |
| Small Capitalization Growth Investments | | |
| | |
| Shares | | Security | | Value |
| |
Software — 12.9% | | | |
| 50,200 | | Ansys Inc.* | | $ | 1,663,126 |
| 51,800 | | Blackboard Inc. (a)* | | | 2,163,686 |
| 220,800 | | Concur Technologies Inc.* | | | 5,913,024 |
| 73,600 | | Double-Take Software* | | | 1,271,808 |
| 175,585 | | Informatica Corp.* | | | 2,451,167 |
| 40,000 | | MICROS Systems Inc.* | | | 2,413,600 |
| 123,251 | | Net 1 UEPS Technologies Inc. (a)* | | | 3,045,532 |
| 464,100 | | Nuance Communications Inc. (a)* | | | 8,725,080 |
| 261,500 | | Phase Forward Inc.* | | | 4,665,160 |
| 202,100 | | Quest Software Inc.* | | | 2,942,576 |
| 131,800 | | Smith Micro Software Inc. (a)* | | | 2,173,382 |
| 118,200 | | Solera Holdings Inc.* | | | 2,160,696 |
| 137,000 | | Synchronoss Technolgies Inc. (a)* | | | 4,759,380 |
| 99,800 | | THQ Inc.* | | | 2,873,242 |
| 49,857 | | Verint Systems Inc.* | | | 1,228,975 |
| 164,600 | | Visual Sciences Inc.* | | | 3,033,578 |
| 6,900 | | VMware Inc. (a)* | | | 475,341 |
| | | | |
|
|
| | | Total Software | | | 51,959,353 |
| | | | |
|
|
| | | TOTAL INFORMATION TECHNOLOGY | | | 131,818,151 |
| | | | |
|
|
TELECOMMUNICATION SERVICES — 2.5% | | | |
| |
Diversified Telecommunication Services — 2.5% | | | |
| 70,500 | | Atheros Communications Inc.* | | | 2,108,655 |
| 63,000 | | Cbeyond Inc.* | | | 2,448,180 |
| 397,900 | | FiberTower Corp. (a)* | | | 1,496,104 |
| 150,400 | | MasTec Inc.* | | | 2,222,912 |
| 137,300 | | PAETEC Holding Corp.* | | | 1,637,989 |
| | | | |
|
|
| | | Total Diversified Telecommunication Services | | | 9,913,840 |
| | | | |
|
|
| | | TOTAL TELECOMMUNICATION SERVICES | | | 9,913,840 |
| | | | |
|
|
| | | TOTAL COMMON STOCKS
(Cost — $302,343,822) | | | 395,739,863 |
| | | | |
|
|
RIGHTS — 0.0% | | | |
HEALTH CARE — 0.0% | | | |
| |
Pharmaceuticals — 0.0% | | | |
| 880 | | OSI Pharmaceuticals Inc.
(Cost — $123) (b)* | | | 1 |
| | | | |
|
|
| | | TOTAL INVESTMENTS BEFORE SHORT-TERM INVESTMENTS
(Cost — $302,343,945) | | | 395,739,864 |
| | | | |
|
|
| | |
Face
Amount
| | | | |
SHORT-TERM INVESTMENTS (c) — 19.3% | | | |
MONEY MARKET FUND — 18.0% | | | |
| 72,113,980 | | BBH Securities Lending Trust (d)
(Cost — $72,113,980) | | | 72,113,980 |
| | | | |
|
|
See Notes to Financial Statements.
41
Schedules of Investments
(continued)
| | | | | | |
| Small Capitalization Growth Investments | | | |
| | |
Face
Amount | | Security | | Value | |
TIME DEPOSITS — 1.3% | | | | |
| $3,183,050 | | Bank of America — London, 4.440% due 9/1/07 | | $ | 3,183,050 | |
| 2,089,101 | | Wells Fargo — Grand Cayman, 4.440% due 9/1/07 | | | 2,089,101 | |
| | | | |
|
|
|
| | | TOTAL TIME DEPOSITS
(Cost — $5,272,151) | | | 5,272,151 | |
| | | | |
|
|
|
| | | TOTAL SHORT-TERM INVESTMENTS
(Cost — $77,386,131) | | | 77,386,131 | |
| | | | |
|
|
|
| | | TOTAL INVESTMENTS — 117.8%
(Cost — $379,730,076#) | | | 473,125,995 | |
| | | Liabilities in Excess of Other Assets — (17.8%) | | | (71,590,172 | ) |
| | | | |
|
|
|
| | | TOTAL NET ASSETS — 100.0% | | $ | 401,535,823 | |
| | | | |
|
|
|
| * | | Non-income producing securities. |
| (a) | | All or a portion of this security is on loan (See Note 1). |
| (c) | | Inclusive of all short term holdings, including collateral received from securities lending activities. Not including such collateral the percentage of portfolio holdings would be 1.3%. |
| (d) | | Represents investment of collateral received from securities lending transactions. |
| # | | Aggregate cost for federal income tax purposes is $381,291,149. |
Abbreviation used in this schedule:
| | | | |
| ADR | | — | | American Depositary Receipt |
See Notes to Financial Statements.
42
Schedules of Investments
(continued)
| | | | | |
| Small Capitalization Value Equity Investments | | |
| | |
| Shares | | Security | | Value |
COMMON STOCKS — 96.0% | | | |
CONSUMER DISCRETIONARY — 15.7% | | | |
| |
Auto Components — 3.4% | | | |
| 62,600 | | Arvinmeritor Inc. (a) | | $ | 1,092,370 |
| 991,707 | | Hayes Lemmerz Internationl Inc.* | | | 4,512,267 |
| 230,800 | | Modine Manufacturing Co. | | | 6,473,940 |
| | | | |
|
|
| | | Total Auto Components | | | 12,078,577 |
| | | | |
|
|
| |
Automobiles — 2.0% | | | |
| 528,500 | | Fleetwood Enterprises Inc. (a)* | | | 4,925,620 |
| 49,600 | | Thor Industries Inc. | | | 2,181,904 |
| | | | |
|
|
| | | Total Automobiles | | | 7,107,524 |
| | | | |
|
|
| |
Diversified Consumer Services — 0.5% | | | |
| 131,900 | | Service Corporation International | | | 1,611,818 |
| | | | |
|
|
| |
Hotels, Restaurants & Leisure — 0.9% | | | |
| 28,700 | | CEC Entertainment Inc.* | | | 881,090 |
| 62,000 | | CKE Restaurants Inc. (a) | | | 1,050,900 |
| 62,800 | | Ruby Tuesday Inc. | | | 1,391,020 |
| | | | |
|
|
| | | Total Hotels, Restaurants & Leisure | | | 3,323,010 |
| | | | |
|
|
| |
Household Durables — 1.3% | | | |
| 32,900 | | American Greetings Corp., Class A Shares | | | 813,946 |
| 37,900 | | Ethan Allen Interiors Inc. (a) | | | 1,273,440 |
| 29,300 | | Lancaster Colony Corp. | | | 1,191,631 |
| 24,800 | | MDC Holdings Inc. | | | 1,103,352 |
| | | | |
|
|
| | | Total Household Durables | | | 4,382,369 |
| | | | |
|
|
| |
Internet & Catalog Retail — 0.2% | | | |
| 36,000 | | Insight Enterprises Inc.* | | | 853,920 |
| | | | |
|
|
| |
Leisure Equipment & Products — 1.3% | | | |
| 231,977 | | Arctic Cat Inc. (a) | | | 3,922,731 |
| 29,000 | | Brunswick Corp. | | | 729,350 |
| | | | |
|
|
| | | Total Leisure Equipment & Products | | | 4,652,081 |
| | | | |
|
|
| |
Media — 0.5% | | | |
| 32,600 | | Belo Corp. | | | 562,024 |
| 20,500 | | Meredith Corp. | | | 1,145,950 |
| | | | |
|
|
| | | Total Media | | | 1,707,974 |
| | | | |
|
|
| |
Multiline Retail — 0.5% | | | |
| 29,800 | | Dollar Tree Stores Inc.* | | | 1,294,810 |
| 36,600 | | Tuesday Morning Corp. (a) | | | 386,130 |
| | | | |
|
|
| | | Total Multiline Retail | | | 1,680,940 |
| | | | |
|
|
| |
Specialty Retail — 3.8% | | | |
| 62,000 | | Asbury Automotive Group Inc. | | | 1,340,440 |
| 50,900 | | Borders Group Inc. | | | 763,500 |
| 109,950 | | Cato Corp., Class A Shares | | | 2,426,596 |
| 268,686 | | MarineMax Inc. (a)* | | | 4,927,701 |
| 26,600 | | PETsMART Inc. | | | 923,020 |
See Notes to Financial Statements.
43
Schedules of Investments
(continued)
| | | | | |
| Small Capitalization Value Equity Investments | | |
| | |
| Shares | | Security | | Value |
| |
Specialty Retail — 3.8% (continued) | | | |
| 37,200 | | Ross Stores Inc. | | $ | 1,035,276 |
| 56,475 | | Stage Stores Inc. | | | 978,712 |
| 46,600 | | Zale Corp.* | | | 1,047,102 |
| | | | |
|
|
| | | Total Specialty Retail | | | 13,442,347 |
| | | | |
|
|
| |
Textiles, Apparel & Luxury Goods — 1.3% | | | |
| 20,775 | | Brown Shoe Co. Inc. | | | 474,501 |
| 47,600 | | Kellwood Co. | | | 937,720 |
| 24,100 | | Men’s Wearhouse Inc. | | | 1,221,388 |
| 24,100 | | Warnaco Group Inc.* | | | 841,090 |
| 37,500 | | Wolverine World Wide Inc. | | | 985,875 |
| | | | |
|
|
| | | Total Textiles, Apparel & Luxury Goods | | | 4,460,574 |
| | | | |
|
|
| | | TOTAL CONSUMER DISCRETIONARY | | | 55,301,134 |
| | | | |
|
|
CONSUMER STAPLES — 6.0% | | | |
| |
Beverages — 1.6% | | | |
| 38,200 | | Constellation Brands Inc., Class A Shares* | | | 923,676 |
| 416,800 | | Cott Corp. (a)* | | | 4,705,672 |
| | | | |
|
|
| | | Total Beverages | | | 5,629,348 |
| | | | |
|
|
| |
Food & Staples Retailing — 0.7% | | | |
| 36,900 | | Ruddick Corp. | | | 1,202,202 |
| 29,300 | | Weis Markets Inc. | | | 1,259,314 |
| | | | |
|
|
| | | Total Food & Staples Retailing | | | 2,461,516 |
| | | | |
|
|
| |
Food Products — 2.9% | | | |
| 29,400 | | Corn Products International Inc. | | | 1,328,880 |
| 94,900 | | Del Monte Foods Co. | | | 1,000,246 |
| 27,700 | | J.M. Smucker Co. | | | 1,523,777 |
| 35,700 | | Pilgrim’s Pride Corp. | | | 1,449,063 |
| 177,620 | | Tootsie Roll Industries Inc. (a) | | | 4,813,502 |
| | | | |
|
|
| | | Total Food Products | | | 10,115,468 |
| | | | |
|
|
| |
Household Products — 0.4% | | | |
| 41,200 | | WD-40 Co. | | | 1,432,524 |
| | | | |
|
|
| |
Tobacco — 0.4% | | | |
| 27,300 | | Universal Corp. | | | 1,341,249 |
| | | | |
|
|
| | | TOTAL CONSUMER STAPLES | | | 20,980,105 |
| | | | |
|
|
ENERGY — 7.2% | | | |
| |
Energy Equipment & Services — 3.3% | | | |
| 104,300 | | Grey Wolf Inc.* | | | 692,552 |
| 23,100 | | Holly Corp. | | | 1,539,615 |
| 350,500 | | Input/Output Inc. (a)* | | | 4,973,595 |
| 24,500 | | Lufkin Industries Inc. | | | 1,393,315 |
| 17,800 | | Tidewater Inc. | | | 1,165,010 |
| 26,000 | | W-H Energy Services* | | | 1,652,560 |
| | | | |
|
|
| | | Total Energy Equipment & Services | | | 11,416,647 |
| | | | |
|
|
See Notes to Financial Statements.
44
Schedules of Investments
(continued)
| | | | | |
| Small Capitalization Value Equity Investments | | |
| | |
| Shares | | Security | | Value |
| |
Oil, Gas & Consumable Fuels — 3.9% | | | |
| 22,900 | | Arch Coal Inc. | | $ | 675,321 |
| 45,400 | | Berry Petroleum Co., Class A Shares | | | 1,547,232 |
| 43,900 | | Cabot Oil & Gas Corp. | | | 1,463,626 |
| 35,900 | | Cimarex Energy Co. | | | 1,285,579 |
| 29,300 | | Hercules Inc. (a)* | | | 610,026 |
| 38,124 | | Hercules Offshore Inc.* | | | 969,875 |
| 31,100 | | Newfield Exploration Co.* | | | 1,352,539 |
| 42,400 | | Penn Virginia Corp. | | | 1,692,184 |
| 40,900 | | St. Mary Land & Exploration Co. | | | 1,364,015 |
| 28,400 | | Western Refining Inc. (a) | | | 1,472,256 |
| 38,700 | | Whiting Petroleum Corp.* | | | 1,438,092 |
| | | | |
|
|
| | | Total Oil, Gas & Consumable Fuels | | | 13,870,745 |
| | | | |
|
|
| | | TOTAL ENERGY | | | 25,287,392 |
| | | | |
|
|
FINANCIALS — 15.5% | | | |
| |
Capital Markets — 0.4% | | | |
| 49,000 | | Boston Private Financial Holdings Inc. (a) | | | 1,330,350 |
| | | | |
|
|
| |
Commercial Banks — 6.2% | | | |
| 28,900 | | AMCORE Financial Inc. | | | 773,942 |
| 52,200 | | BancorpSouth Inc. | | | 1,304,478 |
| 60,200 | | Bank of Hawaii Corp. | | | 3,094,882 |
| 79,500 | | Colonial BancGroup Inc. | | | 1,686,990 |
| 25,700 | | Cullen/Frost Bankers Inc. | | | 1,325,606 |
| 25,800 | | First Midwest Bancorp Inc. | | | 884,682 |
| 14,800 | | FirstMerit Corp. | | | 285,936 |
| 85,600 | | Fulton Financial Corp. | | | 1,258,320 |
| 17,800 | | Independent Bank Corp., (Massachusetts) | | | 524,210 |
| 24,800 | | NBT Bancorp Inc. | | | 544,112 |
| 62,799 | | Old National Bancorp (a) | | | 997,248 |
| 411,000 | | Oriental Financial Group Inc. | | | 4,282,620 |
| 80,099 | | Provident Bankshares Corp. | | | 2,475,059 |
| 52,550 | | Sterling Financial Corp. of Spokane | | | 1,338,449 |
| 51,900 | | Susquehanna Bancshares Inc. (a) | | | 1,020,354 |
| | | | |
|
|
| | | Total Commercial Banks | | | 21,796,888 |
| | | | |
|
|
| |
Consumer Finance — 0.3% | | | |
| 96,800 | | Advance America Cash Advance Centers Inc. | | | 1,214,840 |
| | | | |
|
|
| |
Diversified Financial Services — 0.2% | | | |
| 30,700 | | Whitney Holding Corp. | | | 850,390 |
| | | | |
|
|
| |
Insurance — 3.9% | | | |
| 112,700 | | American Equity Investment Life Holding Co. | | | 1,150,667 |
| 33,450 | | Delphi Financial Group, Class A Shares | | | 1,348,035 |
| 27,700 | | Harleysville Group Inc. | | | 893,602 |
| 50,500 | | Infinity Property & Casualty Corp. | | | 2,093,730 |
| 41,600 | | Platinum Underwriters Holdings Ltd. | | | 1,442,688 |
| 27,400 | | Protective Life Corp. | | | 1,145,320 |
| 22,300 | | RLI Corp. | | | 1,341,345 |
| 63,300 | | Selective Insurance Group | | | 1,335,630 |
| 27,200 | | StanCorp Financial Group Inc. | | | 1,281,120 |
See Notes to Financial Statements.
45
Schedules of Investments
(continued)
| | | | | |
| Small Capitalization Value Equity Investments | | |
| | |
| Shares | | Security | | Value |
| |
Insurance — 3.9% (continued) | | | |
| 51,800 | | W.R. Berkley Corp. | | $ | 1,548,302 |
| | | | |
|
|
| | | Total Insurance | | | 13,580,439 |
| | | | |
|
|
| |
Real Estate Investment Trusts (REITs) — 3.8% | | | |
| 62,600 | | Ashford Hospitality Trust Inc. | | | 682,966 |
| 53,464 | | Brandywine Realty Trust (a) | | | 1,378,302 |
| 42,400 | | CBL & Associates Properties Inc. | | | 1,397,504 |
| 33,700 | | Education Realty Trust Inc. | | | 460,679 |
| 49,200 | | Equity One Inc. (a) | | | 1,287,072 |
| 31,100 | | First Industrial Realty Trust Inc. (a) | | | 1,268,258 |
| 40,500 | | Healthcare Realty Trust | | | 1,011,285 |
| 31,100 | | Highwoods Properties Inc. | | | 1,109,959 |
| 113,600 | | HRPT Properties Trust | | | 1,111,008 |
| 39,900 | | Nationwide Health Properties Inc. (a) | | | 1,107,225 |
| 28,130 | | Potlatch Corp. | | | 1,266,975 |
| 42,600 | | Washington Real Estate Investment Trust (a) | | | 1,395,150 |
| | | | |
|
|
| | | Total Real Estate Investment Trusts (REITs) | | | 13,476,383 |
| | | | |
|
|
| |
Thrifts & Mortgage Finance — 0.7% | | | |
| 52,200 | | BankUnited Financial Corp., Class A Shares | | | 892,620 |
| 17,900 | | Triad Guaranty Inc. (a)* | | | 299,467 |
| 50,150 | | Washington Federal Inc. | | | 1,330,981 |
| | | | |
|
|
| | | Total Thrifts & Mortgage Finance | | | 2,523,068 |
| | | | |
|
|
| | | TOTAL FINANCIALS | | | 54,772,358 |
| | | | |
|
|
HEALTH CARE — 4.6% | | | |
| |
Health Care Equipment & Supplies — 2.7% | | | |
| 42,200 | | Invacare Corp. | | | 977,774 |
| 478,795 | | Merit Medical Systems Inc.* | | | 5,870,027 |
| 44,700 | | STERIS Corp. | | | 1,254,729 |
| 31,800 | | West Pharmaceutical Services Inc. | | | 1,273,590 |
| | | | |
|
|
| | | Total Health Care Equipment & Supplies | | | 9,376,120 |
| | | | |
|
|
| |
Health Care Providers & Services — 1.9% | | | |
| 17,200 | | Amerigroup Corp.* | | | 544,724 |
| 23,400 | | Community Health Systems Inc.* | | | 812,682 |
| 69,100 | | Owens & Minor Inc. | | | 2,757,090 |
| 29,800 | | Pediatrix Medical Group Inc.* | | | 1,777,570 |
| 19,000 | | Universal Health Services Inc., Class B Shares | | | 1,003,200 |
| | | | |
|
|
| | | Total Health Care Providers & Services | | | 6,895,266 |
| | | | |
|
|
| | | TOTAL HEALTH CARE | | | 16,271,386 |
| | | | |
|
|
INDUSTRIALS — 23.5% | | | |
| |
Aerospace & Defense — 0.8% | | | |
| 24,800 | | Curtiss-Wright Corp. | | | 1,130,880 |
| 31,100 | | DRS Technologies Inc. | | | 1,632,128 |
| | | | |
|
|
| | | Total Aerospace & Defense | | | 2,763,008 |
| | | | |
|
|
| |
Airlines — 0.6% | | | |
| 84,400 | | SkyWest Inc. | | | 2,120,972 |
| | | | |
|
|
See Notes to Financial Statements.
46
Schedules of Investments
(continued)
| | | | | |
| Small Capitalization Value Equity Investments | | |
| | |
| Shares | | Security | | Value |
| |
Building Products — 2.4% | | | |
| 28,800 | | Crane Co. | | $ | 1,289,952 |
| 19,700 | | Griffon Corp.* | | | 308,502 |
| 35,100 | | Lennox International Inc. | | | 1,262,547 |
| 35,600 | | Simpson Manufacturing Co. Inc. (a) | | | 1,174,800 |
| 269,200 | | Trex Co. Inc. (a)* | | | 3,615,356 |
| 20,400 | | Universal Forest Products Inc. | | | 760,716 |
| | | | |
|
|
| | | Total Building Products | | | 8,411,873 |
| | | | |
|
|
| |
Commercial Services & Supplies — 5.1% | | | |
| 237,880 | | ACCO Brands Corp.* | | | 5,392,740 |
| 27,000 | | Brink’s Co. | | | 1,548,720 |
| 465,750 | | Calgon Carbon Corp. (a)* | | | 6,217,762 |
| 38,300 | | Casella Waste Systems Inc., Class A Shares* | | | 427,811 |
| 67,800 | | Ennis Inc. | | | 1,474,650 |
| 55,167 | | Kelly Services Inc., Class A Shares | | | 1,253,394 |
| 20,900 | | United Stationers Inc.* | | | 1,233,518 |
| 15,300 | | YRC Worldwide Inc.* | | | 471,393 |
| | | | |
|
|
| | | Total Commercial Services & Supplies | | | 18,019,988 |
| | | | |
|
|
| |
Electrical Equipment — 2.4% | | | |
| 21,300 | | Acuity Brands Inc. | | | 1,119,102 |
| 285,212 | | EnerSys* | | | 5,150,929 |
| 32,300 | | Insteel Industries Inc. | | | 610,470 |
| 29,400 | | Regal-Beloit Corp. | | | 1,484,994 |
| | | | |
|
|
| | | Total Electrical Equipment | | | 8,365,495 |
| | | | |
|
|
| |
Industrial Conglomerates — 0.7% | | | |
| 19,500 | | Teleflex Inc. | | | 1,516,515 |
| 11,900 | | TriMas Corp.* | | | 145,894 |
| 29,000 | | Walter Industries Inc. | | | 733,120 |
| | | | |
|
|
| | | Total Industrial Conglomerates | | | 2,395,529 |
| | | | |
|
|
| |
Machinery — 6.3% | | | |
| 26,900 | | Actuant Corp., Class A Shares | | | 1,640,631 |
| 31,900 | | Albany International Corp., Class A Shares | | | 1,242,186 |
| 49,000 | | Barnes Group Inc. | | | 1,541,540 |
| 198,800 | | Briggs & Stratton Corp. (a) | | | 5,802,972 |
| 29,300 | | Gardner Denver Inc* | | | 1,169,363 |
| 50,100 | | Harsco Corp. | | | 2,788,064 |
| 20,800 | | Kennametal Inc. | | | 1,677,728 |
| 20,300 | | Lincoln Electric Holdings Inc. | | | 1,460,382 |
| 60,600 | | Mueller Industries Inc. | | | 2,099,184 |
| 26,856 | | Mueller Water Products Inc., Class A Shares | | | 294,073 |
| 26,900 | | Timken Co. | | | 956,564 |
| 38,000 | | Wabtec Corp. | | | 1,423,860 |
| | | | |
|
|
| | | Total Machinery | | | 22,096,547 |
| | | | |
|
|
| |
Marine — 1.7% | | | |
| 27,700 | | Alexander & Baldwin Inc. | | | 1,437,907 |
| 30,200 | | Genco Shipping & Trading Ltd. (a) | | | 1,694,220 |
| 37,500 | | Kirby Corp.* | | | 1,435,500 |
| 800 | | Teekay Corp. | | | 46,368 |
See Notes to Financial Statements.
47
Schedules of Investments
(continued)
| | | | | |
| Small Capitalization Value Equity Investments | | |
| | |
| Shares | | Security | | Value |
| |
Marine — 1.7% (continued) | | | |
| 20,000 | | Tsakos Energy Navigation Ltd. | | $ | 1,361,400 |
| | | | |
|
|
| | | Total Marine | | | 5,975,395 |
| | | | |
|
|
| |
Road & Rail — 2.2% | | | |
| 33,800 | | Arkansas Best Corp. | | | 1,213,420 |
| 17,600 | | Saia Inc.* | | | 330,704 |
| 332,200 | | Werner Enterprises Inc. | | | 6,182,242 |
| | | | |
|
|
| | | Total Road & Rail | | | 7,726,366 |
| | | | |
|
|
| |
Trading Companies & Distributors — 0.7% | | | |
| 50,000 | | Applied Industrial Technologies Inc. | | | 1,599,000 |
| 25,500 | | World Fuel Services Corp. (a) | | | 983,025 |
| | | | |
|
|
| | | Total Trading Companies & Distributors | | | 2,582,025 |
| | | | |
|
|
| |
Transportation Infrastructure — 0.6% | | | |
| 27,400 | | Frontline Ltd. (a) | | | 1,280,128 |
| 35,600 | | General Maritime Corp. (a) | | | 920,616 |
| | | | |
|
|
| | | Total Transportation Infrastructure | | | 2,200,744 |
| | | | |
|
|
| | | TOTAL INDUSTRIALS | | | 82,657,943 |
| | | | |
|
|
INFORMATION TECHNOLOGY — 9.4% | | | |
| |
Communication Equipment — 0.3% | | | |
| 18,200 | | CommScope Inc.* | | | 1,030,120 |
| | | | |
|
|
| |
Computers & Peripherals — 0.5% | | | |
| 77,900 | | Brocade Communications Systems Inc.* | | | 545,300 |
| 63,600 | | Emulex Corp.* | | | 1,242,744 |
| | | | |
|
|
| | | Total Computers & Peripherals | | | 1,788,044 |
| | | | |
|
|
| |
Electronic Equipment & Instruments — 2.1% | | | |
| 60,500 | | Bell Microproducts Inc.* | | | 415,030 |
| 41,500 | | Checkpoint Systems Inc.* | | | 1,155,775 |
| 11,600 | | Landauer Inc. | | | 588,004 |
| 87,000 | | Technitrol Inc. | | | 2,392,500 |
| 44,900 | | Tektronix Inc. | | | 1,443,535 |
| 97,800 | | Vishay Intertechnology Inc.* | | | 1,293,894 |
| | | | |
|
|
| | | Total Electronic Equipment & Instruments | | | 7,288,738 |
| | | | |
|
|
| |
IT Services — 3.0% | | | |
| 52,600 | | Acxiom Corp. | | | 1,288,700 |
| 156,017 | | Forrester Research Inc.* | | | 3,964,392 |
| 1,038,737 | | Lionbridge Technologies* | | | 4,258,822 |
| 61,500 | | Sykes Enterprises Inc.* | | | 1,014,135 |
| | | | |
|
|
| | | Total IT Services | | | 10,526,049 |
| | | | |
|
|
| |
Semiconductors & Semiconductor Equipment — 1.8% | | | |
| 118,800 | | Cirrus Logic Inc.* | | | 809,028 |
| 252,193 | | Cohu Inc. | | | 4,990,899 |
| 71,100 | | Entegris Inc.* | | | 671,184 |
| | | | |
|
|
| | | Total Semiconductors & Semiconductor Equipment | | | 6,471,111 |
| | | | |
|
|
See Notes to Financial Statements.
48
Schedules of Investments
(continued)
| | | | | |
| Small Capitalization Value Equity Investments | | |
| | |
| Shares | | Security | | Value |
| |
Software — 1.7% | | | |
| 51,700 | | BEA Systems Inc.* | | $ | 630,740 |
| 148,400 | | Compuware Corp.* | | | 1,203,524 |
| 81,400 | | Parametric Technology Corp.* | | | 1,433,454 |
| 38,000 | | QAD Inc. | | | 309,320 |
| 50,000 | | Sybase Inc.* | | | 1,152,500 |
| 48,500 | | Synopsys Inc.* | | | 1,325,020 |
| | | | |
|
|
| | | Total Software | | | 6,054,558 |
| | | | |
|
|
| | | TOTAL INFORMATION TECHNOLOGY | | | 33,158,620 |
| | | | |
|
|
MATERIALS — 7.2% | | | |
| |
Chemicals — 3.4% | | | |
| 37,200 | | Albemarle Corp. | | | 1,505,484 |
| 19,700 | | Cytec Industries Inc. | | | 1,308,080 |
| 16,000 | | FMC Corp. | | | 1,440,000 |
| 26,700 | | Lubrizol Corp. | | | 1,697,586 |
| 55,600 | | Methanex Corp. | | | 1,253,780 |
| 64,400 | | RPM International Inc. | | | 1,458,016 |
| 46,900 | | Sensient Technologies Corp. | | | 1,270,521 |
| 33,400 | | Valspar Corp. | | | 900,798 |
| 44,000 | | Westlake Chemical Corp. (a) | | | 1,190,640 |
| | | | |
|
|
| | | Total Chemicals | | | 12,024,905 |
| | | | |
|
|
| |
Construction Materials — 0.6% | | | |
| 30,700 | | Quanex Corp. | | | 1,329,617 |
| 11,400 | | Texas Industries Inc. (a) | | | 840,408 |
| | | | |
|
|
| | | Total Construction Materials | | | 2,170,025 |
| | | | |
|
|
| |
Containers & Packaging — 0.7% | | | |
| 63,900 | | Crown Holdings Inc.* | | | 1,534,878 |
| 304,800 | | Intertape Polymer Group Inc.* | | | 932,688 |
| | | | |
|
|
| | | Total Containers & Packaging | | | 2,467,566 |
| | | | |
|
|
| |
Metals & Mining — 2.3% | | | |
| 37,600 | | Agnico-Eagle Mines Ltd. | | | 1,671,320 |
| 21,600 | | Cleveland Cliffs Inc. (a) | | | 1,647,432 |
| 51,600 | | Commercial Metals Co. | | | 1,490,724 |
| 25,331 | | Gibraltar Industries Inc. | | | 506,113 |
| 188,100 | | IAMGOLD Corp. | | | 1,243,341 |
| 53,300 | | Royal Gold Inc. (a) | | | 1,479,608 |
| | | | |
|
|
| | | Total Metals & Mining | | | 8,038,538 |
| | | | |
|
|
| |
Paper & Forest Products — 0.2% | | | |
| 49,700 | | Bowater, Inc. (a) | | | 836,948 |
| | | | |
|
|
| | | TOTAL MATERIALS | | | 25,537,982 |
| | | | |
|
|
TELECOMMUNICATION SERVICES — 2.3% | | | |
| |
Diversified Telecommunication Services — 1.9% | | | |
| 28,700 | | FairPoint Communications Inc. | | | 480,151 |
| 381,400 | | MasTec Inc.* | | | 5,637,092 |
| 52,000 | | Premiere Global Services Inc.* | | | 680,160 |
| | | | |
|
|
| | | Total Diversified Telecommunication Services | | | 6,797,403 |
| | | | |
|
|
See Notes to Financial Statements.
49
Schedules of Investments
(continued)
| | | | | |
| Small Capitalization Value Equity Investments | | |
| | |
| Shares | | Security | | Value |
| |
Wireless Telecommunication Services — 0.4% | | | |
| 76,000 | | USA Mobility Inc.* | | $ | 1,402,200 |
| | | | |
|
|
| | | TOTAL TELECOMMUNICATION SERVICES | | | 8,199,603 |
| | | | |
|
|
UTILITIES — 4.6% | | | |
| |
Electric Utilities — 1.2% | | | |
| 48,700 | | Cleco Corp. | | | 1,122,048 |
| 43,100 | | El Paso Electric Co.* | | | 961,992 |
| 21,700 | | Otter Tail Corp. (a) | | | 792,050 |
| 55,100 | | Westar Energy Inc. | | | 1,338,379 |
| | | | |
|
|
| | | Total Electric Utilities | | | 4,214,469 |
| | | | |
|
|
| |
Gas Utilities — 2.6% | | | |
| 45,900 | | Atmos Energy Corp. | | | 1,290,249 |
| 30,500 | | Energen Corp. | | | 1,637,850 |
| 34,100 | | National Fuel Gas Co. (a) | | | 1,511,994 |
| 67,300 | | Southwest Gas Corp. | | | 1,952,373 |
| 52,000 | | UGI Corp. | | | 1,328,600 |
| 39,500 | | WGL Holdings Inc. | | | 1,299,155 |
| | | | |
|
|
| | | Total Gas Utilities | | | 9,020,221 |
| | | | |
|
|
| |
Independent Power Producers & Energy Traders — 0.2% | | | |
| 17,200 | | Black Hills Corp. | | | 708,468 |
| | | | |
|
|
| |
Multi-Utilities — 0.6% | | | |
| 38,600 | | PNM Resources Inc. | | | 892,432 |
| 47,200 | | Vectren Corp. | | | 1,288,560 |
| | | | |
|
|
| | | Total Multi-Utilities | | | 2,180,992 |
| | | | |
|
|
| | | TOTAL UTILITIES | | | 16,124,150 |
| | | | |
|
|
| | | TOTAL COMMON STOCKS
(Cost — $284,074,552) | | | 338,290,673 |
| | | | |
|
|
RIGHTS — 0.0% | | | |
MATERIALS — 0.0% | | | |
| |
Containers & Packaging — 0.0% | | | |
| 304,800 | | Intertape Polymer Group Inc.
(Cost — $0)* | | | 0 |
| | | | |
|
|
| | | TOTAL INVESTMENTS BEFORE SHORT-TERM INVESTMENTS
(Cost — $284,074,552) | | | 338,290,673 |
| | | | |
|
|
| | |
Face Amount
| | | | |
SHORT-TERM INVESTMENTS (c) — 20.8% |
COMMERCIAL PAPER — 0.9% |
| $3,090,000 | | Natixis, Discount Note, 5.268% due 9/4/07
(Cost — $3,088,192) (b) | | | 3,088,192 |
| | | | |
|
|
MONEY MARKET FUND — 17.0% | | | |
| 59,936,454 | | BBH Securities Lending Trust (d)
(Cost — $59,936,454) | | | 59,936,454 |
| | | | |
|
|
See Notes to Financial Statements.
50
Schedules of Investments
(continued)
| | | | | | |
| Small Capitalization Value Equity Investments | | | |
| | |
Face Amount | | Security | | Value | |
TIME DEPOSITS — 2.9% | | | | |
| $1,259,053 | | BBH — Grand Cayman, 4.440% due 9/1/07 | | $ | 1,259,053 | |
| 9,212,967 | | Wells Fargo — Grand Cayman, 4.440% due 9/1/07 | | | 9,212,967 | |
| | | | |
|
|
|
| | | TOTAL TIME DEPOSITS
(Cost — $10,472,020) | | | 10,472,020 | |
| | | | |
|
|
|
| | | TOTAL SHORT-TERM INVESTMENTS
(Cost — $73,496,666) | | | 73,496,666 | |
| | | | |
|
|
|
| | | TOTAL INVESTMENTS — 116.8%
(Cost — $357,571,218#) | | | 411,787,339 | |
| | | Liabilities in Excess of Other Assets — (16.8%) | | | (59,345,772 | ) |
| | | | |
|
|
|
| | | TOTAL NET ASSETS — 100.0% | | $ | 352,441,567 | |
| | | | |
|
|
|
| * | | Non-income producing securities. |
| (a) | | All or a portion of this security is on loan (See Note 1). |
| (b) | | Rate shown represents yield-to-maturity. |
| (c) | | Inclusive of all short term holdings, including collateral received from securities lending activities. Not including such collateral, the percentage of portfolio holdings would be 3.8%. |
| (d) | | Represents investment of collateral received from securities lending transactions. |
| # | | Aggregate cost for federal income tax purposes is $358,099,937. |
See Notes to Financial Statements.
51
Schedules of Investments
(continued)
| | | | | |
| International Equity Investments |
| | |
| Shares | | Security | | Value |
COMMON STOCKS — 94.7% | | | |
| |
Australia — 1.6% | | | |
| 210,790 | | BHP Billiton Ltd., ADR (a) | | $ | 13,311,388 |
| 110,100 | | Macquarie Bank Ltd. (a) | | | 6,622,558 |
| 191,700 | | Woodside Petroleum Ltd. | | | 7,088,944 |
| | | | |
|
|
| | | Total Australia | | | 27,022,890 |
| | | | |
|
|
| |
Belgium — 0.3% | | | |
| 51,000 | | Mobistar SA | | | 4,150,164 |
| | | | |
|
|
| |
Brazil — 2.5% | | | |
| 168,535 | | Banco Itau Holding Financeira SA, ADR | | | 7,336,329 |
| 253,480 | | Cia Vale do Rio Doce, ADR | | | 12,504,168 |
| 339,030 | | Petroleo Brasileiro SA | | | 20,965,615 |
| | | | |
|
|
| | | Total Brazil | | | 40,806,112 |
| | | | |
|
|
| |
Canada — 6.1% | | | |
| 181,500 | | Agrium Inc. | | | 8,265,510 |
| 94,000 | | Barrick Gold Corp. | | | 3,056,880 |
| 1,210,500 | | Bombardier Inc.* | | | 7,105,756 |
| 352,420 | | Brookfield Asset Management Inc. | | | 11,936,465 |
| 213,010 | | Canadian National Railway Co. (a) | | | 11,214,977 |
| 197,890 | | Gildan Activewear Inc.* | | | 6,413,615 |
| 213,040 | | Nortel Networks Corp. (a)* | | | 3,721,809 |
| 153,420 | | Research in Motion Ltd.* | | | 13,103,602 |
| 83,380 | | Ritchie Brothers Auctioneers Inc. | | | 5,387,182 |
| 261,480 | | Roger Communications, Inc. (a) | | | 11,839,814 |
| 147,190 | | Suncor Energy Inc. | | | 13,157,314 |
| 362,700 | | Talisman Energy Inc. (a) | | | 6,222,424 |
| | | | |
|
|
| | | Total Canada | | | 101,425,348 |
| | | | |
|
|
| |
Denmark — 0.5% | | | |
| 306,600 | | H. Lundbeck A/S | | | 7,227,345 |
| | | | |
|
|
| |
Finland — 0.7% | | | |
| 193,600 | | Nokia Oyj | | | 6,384,232 |
| 219,300 | | UPM Oyj | | | 4,984,197 |
| | | | |
|
|
| | | Total Finland | | | 11,368,429 |
| | | | |
|
|
| |
France — 10.4% | | | |
| 46,318 | | Air France-KLM | | | 1,924,071 |
| 254,800 | | Alcatel SA | | | 2,802,054 |
| 120,000 | | Alcatel SA, ADR | | | 1,314,000 |
| 296,600 | | AXA | | | 11,934,256 |
| 302,170 | | AXA, ADR | | | 12,144,212 |
| 90,280 | | BNP Paribas | | | 9,563,221 |
| 65,900 | | Casino Guichard Perrachon SA | | | 6,752,079 |
| 78,000 | | Cie de Saint-Gobain | | | 8,516,440 |
| 47,400 | | Compagnie General des Etablissements Michelin, Class B Shares | | | 6,027,158 |
| 198,800 | | France Telecom SA | | | 6,025,563 |
| 457,810 | | L ‘ Oreal SA, ADR | | | 10,732,211 |
| 45,600 | | Lafarge SA | | | 7,112,748 |
| 215,700 | | Sanofi-Aventis | | | 17,678,766 |
| 48,400 | | Societe BIC SA | | | 3,679,992 |
See Notes to Financial Statements.
52
Schedules of Investments
(continued)
| | | | | |
| International Equity Investments |
| | |
| Shares | | Security | | Value |
| |
France — 10.4% (continued) | | | |
| 88,700 | | Technip SA | | $ | 7,110,528 |
| 283,152 | | Total SA | | | 21,296,545 |
| 314,500 | | Valeo | | | 15,331,917 |
| 197,220 | | Veolia Environment, ADR | | | 15,176,079 |
| 149,200 | | Vivendi Universal SA | | | 6,120,490 |
| | | | |
|
|
| | | Total France | | | 171,242,330 |
| | | | |
|
|
| |
Germany — 9.7% | | | |
| 59,100 | | Allianz AG | | | 12,692,643 |
| 79,007 | | BASF AG | | | 10,474,769 |
| 291,400 | | Bayerishe Motoren Werke AG | | | 17,817,532 |
| 76,300 | | Continental AG | | | 9,934,933 |
| 23,800 | | Deutsche Boerse AG | | | 2,632,127 |
| 140,400 | | Deutsche Telekom AG | | | 2,613,488 |
| 53,800 | | E.ON AG | | | 9,043,392 |
| 190,000 | | Hannover Rueckversicherung AG | | | 8,852,573 |
| 167,500 | | Heidelberger Druckmaschinen AG | | | 7,620,085 |
| 186,600 | | Henkel KGaA | | | 9,631,968 |
| 421,500 | | Infineon Technologies AG* | | | 6,581,636 |
| 59,800 | | Linde AG | | | 7,030,694 |
| 275,200 | | MLP AG (a) | | | 4,402,780 |
| 60,600 | | MTU Aero Engines Holding AG | | | 3,871,622 |
| 283,876 | | Rhoen-Klinikum AG | | | 8,763,405 |
| 36,200 | | RWE AG | | | 4,078,070 |
| 129,100 | | Siemens AG | | | 16,247,476 |
| 111,400 | | Siemens AG, ADR (a) | | | 13,958,420 |
| 184,600 | | Symrise AG* | | | 4,799,210 |
| | | | |
|
|
| | | Total Germany | | | 161,046,823 |
| | | | |
|
|
|
Greece — 1.1% |
| 728,410 | | National Bank of Greece SA, ADR (a) | | | 8,740,920 |
| 315,000 | | Public Power Corp. | | | 9,890,185 |
| | | | |
|
|
| | | Total Greece | | | 18,631,105 |
| | | | |
|
|
|
Hong Kong — 1.6% |
| 1,045,000 | | Cheung Kong Holdings, Ltd. | | | 15,415,981 |
| 956,000 | | Hutchison Whampoa Ltd. | | | 9,523,506 |
| 1,628,000 | | Techtronic Industries Co., Ltd. | | | 1,852,996 |
| | | | |
|
|
| | | Total Hong Kong | | | 26,792,483 |
| | | | |
|
|
|
Ireland — 3.9% |
| 389,000 | | Allied Irish Banks PLC | | | 9,960,460 |
| 224,570 | | Allied Irish Banks PLC, ADR | | | 11,536,161 |
| 16,700 | | Bank of Ireland | | | 311,026 |
| 466,900 | | Bank of Ireland (LN) | | | 8,656,453 |
| 238,100 | | CRH PLC | | | 10,258,696 |
| 106,600 | | Irish Life & Permanent PLC | | | 2,657,430 |
| 520,980 | | Ryanair Holdings PLC, ADR (a)* | | | 21,761,335 |
| | | | |
|
|
| | | Total Ireland | | | 65,141,561 |
| | | | |
|
|
|
Israel — 0.9% |
| 358,400 | | Teva Pharmaceutical Industries Ltd., ADR | | | 15,411,200 |
| | | | |
|
|
See Notes to Financial Statements.
53
Schedules of Investments
(continued)
| | | | | |
| International Equity Investments |
| | |
| Shares | | Security | | Value |
|
Italy — 1.1% |
| 205,295 | | Eni SpA | | $ | 7,090,531 |
| 899,400 | | Mediaset SpA | | | 9,561,967 |
| 666,900 | | Telecom Italia | | | 1,898,490 |
| | | | |
|
|
| | | Total Italy | | | 18,550,988 |
| | | | |
|
|
|
Japan — 15.2% |
| 109,900 | | Asatsu-DK Inc. | | | 3,681,992 |
| 80,800 | | Canon Inc. | | | 4,620,297 |
| 260,810 | | Canon Inc., ADR | | | 14,897,467 |
| 791 | | Central Japan Railway Co. | | | 8,913,762 |
| 122,000 | | Daito Trust Construction Co., Ltd. | | | 5,792,277 |
| 124,000 | | Fujitsu Ltd. | | | 848,049 |
| 52,800 | | Funai Electric Co., Ltd. | | | 2,327,798 |
| 215,000 | | Hoya Corp. | | | 7,469,538 |
| 503,000 | | Kajima Corp. (a) | | | 2,095,956 |
| 155,300 | | Konami Corp. | | | 3,915,160 |
| 460,000 | | Kuraray Co., Ltd. | | | 6,049,594 |
| 195,500 | | Millea Holdings Inc. | | | 7,561,392 |
| 309,000 | | Mitsubishi Corp. | | | 8,813,062 |
| 551,000 | | Mitsubishi Gas Chemical Co., Inc. | | | 4,653,767 |
| 375 | | Mitsubishi UFJ Financial Group Inc. | | | 3,603,968 |
| 298,900 | | Mitsubishi UFJ Financial Group Inc., ADR | | | 2,869,440 |
| 410,000 | | Mitsubishi UFJ Securities Co. | | | 3,978,783 |
| 1,140 | | Mizuho Financial Group Inc. | | | 7,172,288 |
| 2,107,000 | | Mizuho Investors Securities Co., Ltd. (a) | | | 3,802,088 |
| 40,000 | | Nintendo Co., Ltd. | | | 18,580,603 |
| 2,950 | | Nippon Telegraph & Telephone Corp. | | | 13,709,944 |
| 998,400 | | Nipponkoa Insurance Co., Ltd. | | | 9,296,794 |
| 322,200 | | Nitto Denko Corp. | | | 15,020,431 |
| 343,000 | | Onward Kashiyama Co., Ltd. | | | 4,084,396 |
| 40,700 | | ORIX Corp. | | | 8,729,279 |
| 445,000 | | Ricoh Co., Ltd. | | | 9,853,881 |
| 89,000 | | Secom Co., Ltd. | | | 4,321,116 |
| 55,000 | | SMC Corp. | | | 7,322,621 |
| 230,900 | | Sony Corp. | | | 11,051,523 |
| 1,201,000 | | Sumitomo Chemical Co., Ltd. | | | 8,979,015 |
| 122,300 | | Takeda Pharmaceutical Co., Ltd. | | | 8,418,928 |
| 833,000 | | Tokyu Corp. | | | 5,199,297 |
| 169,300 | | Toyota Motor Corp. | | | 9,816,255 |
| 124,290 | | Toyota Motor Corp., ADR | | | 14,377,867 |
| | | | |
|
|
| | | Total Japan | | | 251,828,628 |
| | | | |
|
|
| |
Mexico — 1.7% | | | |
| 162,310 | | America Movil SAB de CV | | | 9,813,263 |
| 111,030 | | Desarrolladora Homex SA de CV, ADR* | | | 6,117,753 |
| 160,090 | | Grupo Aeroportuario del Pacifico SA de CV, ADR | | | 8,079,742 |
| 649,300 | | Grupo Modelo SAB de CV | | | 3,157,270 |
| | | | |
|
|
| | | Total Mexico | | | 27,168,028 |
| | | | |
|
|
| |
Netherlands — 6.9% | | | |
| 808,160 | | Aegon NV | | | 14,797,058 |
| 205,300 | | Akzo Nobel NV | | | 16,206,533 |
| 119,600 | | European Aero Defense | | | 3,564,690 |
See Notes to Financial Statements.
54
Schedules of Investments
(continued)
| | | | | |
| International Equity Investments |
| | |
| Shares | | Security | | Value |
| |
Netherlands — 6.9% (continued) | | | |
| 249,400 | | ING Groep NV | | $ | 10,067,005 |
| 218,300 | | Koninklijke Philips Electronics NV | | | 8,635,844 |
| 64,100 | | Koninklijke Philips Electronics NV, ADR | | | 2,535,155 |
| 611,680 | | QIAGEN NV* | | | 10,410,794 |
| 435,600 | | Reed Elsevier NV | | | 7,876,749 |
| 312,200 | | Royal Dutch Shell PLC, Class A Shares | | | 12,121,436 |
| 91,500 | | Royal Dutch Shell PLC, Class A Shares, ADR | | | 7,077,525 |
| 113,300 | | Tele Atlas NV* | | | 3,154,913 |
| 170,915 | | TNT NV | | | 7,240,006 |
| 486,800 | | Vedior NV, CVA | | | 11,089,320 |
| | | | |
|
|
| | | Total Netherlands | | | 114,777,028 |
| | | | |
|
|
| |
Norway — 1.3% | | | |
| 257,000 | | Norsk Hydro ASA | | | 9,499,617 |
| 594,100 | | Telenor ASA* | | | 10,976,572 |
| 46,900 | | Yara International ASA | | | 1,249,584 |
| | | | |
|
|
| | | Total Norway | | | 21,725,773 |
| | | | |
|
|
| |
Panama — 0.3% | | | |
| 108,950 | | Copa Holdings SA | | | 5,280,807 |
| | | | |
|
|
| |
Singapore — 0.4% | | | |
| 2,962,150 | | Singapore Telecommunication Ltd. | | | 7,094,473 |
| | | | |
|
|
| |
South Africa — 0.4% | | | |
| 11,774 | | Mondi Ltd.* | | | 112,790 |
| 277,938 | | Naspers Ltd. (a) | | | 6,781,687 |
| | | | |
|
|
| | | Total South Africa | | | 6,894,477 |
| | | | |
|
|
| |
South Korea — 0.5% | | | |
| 14,000 | | Samsung Electronics Co., Ltd. | | | 8,867,391 |
| | | | |
|
|
| |
Spain — 0.7% | | | |
| 606,000 | | Banco Santander Central Hispano SA | | | 11,101,091 |
| | | | |
|
|
| |
Sweden — 2.2% | | | |
| 300,900 | | Assa Abloy AB | | | 6,244,836 |
| 342,860 | | Ericsson (LM) Telephone, ADR | | | 12,757,821 |
| 383,400 | | Nordea Bank AB | | | 5,866,479 |
| 3,104,000 | | Telefonaktiebolaget LM Ericsson, Class B Shares | | | 11,589,117 |
| | | | |
|
|
| | | Total Sweden | | | 36,458,253 |
| | | | |
|
|
| |
Switzerland — 5.3% | | | |
| 603,900 | | ABB Ltd., ADR | | | 14,892,174 |
| 408,500 | | Clariant AG* | | | 5,460,774 |
| 102,100 | | Compagnie Financiere Richemont SA | | | 6,343,534 |
| 69,300 | | Lonza Group, Registered Shares | | | 6,807,464 |
| 26,000 | | Nestle SA | | | 11,372,863 |
| 124,900 | | Novartis AG, ADR | | | 6,575,985 |
| 178,320 | | Roche Holding AG, ADR | | | 15,495,812 |
| 233,240 | | UBS AG | | | 12,184,458 |
| 30,700 | | Zurich Financial Services AG | | | 8,816,984 |
| | | | |
|
|
| | | Total Switzerland | | | 87,950,048 |
| | | | |
|
|
See Notes to Financial Statements.
55
Schedules of Investments
(continued)
| | | | | |
| International Equity Investments |
| | |
| Shares | | Security | | Value |
| |
Taiwan — 2.3% | | | |
| 434,836 | | Advanced Semiconductor Engineering Inc., ADR (a) | | $ | 2,174,180 |
| 1,616,690 | | Himax Technologies Inc., ADR* | | | 7,097,269 |
| 913,917 | | Novatek Microelectronics | | | 3,700,562 |
| 137,778 | | Silicon Motion Technology Corp., ADR (a)* | | | 2,976,005 |
| 480,052 | | Siliconware Precision Industries, ADR (a) | | | 5,179,756 |
| 1,101,070 | | Taiwan Semiconductor Manufacturing Co., Ltd., ADR | | | 10,922,614 |
| 1,514,637 | | United Microelectronics Corp., ADR (a) | | | 4,998,302 |
| | | | |
|
|
| | | Total Taiwan | | | 37,048,688 |
| | | | |
|
|
|
Thailand — 0.4% |
| 1,674,900 | | Bangkok Bank Public Co. Ltd., NVDR | | | 6,136,479 |
| | | | |
|
|
|
United Kingdom — 16.7% |
| 236,054 | | Admiral Group PLC | | | 4,027,529 |
| 170,100 | | Amdocs Ltd.* | | | 6,004,530 |
| 107,144 | | Anglo American PLC | | | 6,168,571 |
| 165,400 | | AstraZeneca PLC | | | 8,165,372 |
| 616,700 | | Aviva PLC | | | 8,828,118 |
| 611,633 | | Barclays PLC | | | 7,578,555 |
| 212,790 | | BG Group PLC, ADR (a) | | | 16,976,386 |
| 1,435,300 | | BP PLC | | | 16,105,576 |
| 863,133 | | Brit Insurance Holdings PLC | | | 6,163,002 |
| 915,900 | | British Sky Broadcasting Group PLC | | | 12,489,180 |
| 197,450 | | British Sky Broadcastng Group PLC, ADR | | | 10,834,082 |
| 641,000 | | Cattles PLC | | | 4,728,148 |
| 595,650 | | Diageo PLC | | | 12,715,164 |
| 413,000 | | Emap PLC | | | 7,557,011 |
| 788,625 | | GlaxoSmithKline PLC | | | 20,586,893 |
| 530,895 | | HSBC Holdings PLC | | | 9,562,613 |
| 993,028 | | International Power PLC | | | 8,114,885 |
| 829,100 | | Johnston Press PLC | | | 6,456,204 |
| 29,435 | | Mondi PLC* | | | 290,582 |
| 262,000 | | Northern Rock PLC | | | 3,901,621 |
| 776,300 | | Prudential PLC | | | 11,032,989 |
| 753,300 | | Rexam PLC | | | 7,950,764 |
| 152,200 | | Rio Tinto PLC | | | 10,493,303 |
| 1,529,300 | | Royal Bank of Scotland Group PLC | | | 17,758,439 |
| 2,734,481 | | Signet Group PLC | | | 5,224,136 |
| 516,000 | | Taylor Wimpey PLC | | | 3,617,336 |
| 1,583,370 | | Tesco PLC | | | 13,636,925 |
| 152,100 | | Travis Perkins PLC | | | 5,487,306 |
| 491,300 | | Trinity Mirror PLC | | | 4,661,298 |
| 5,991,931 | | Vodafone Group PLC | | | 19,386,508 |
| | | | |
|
|
| | | Total United Kingdom | | | 276,503,026 |
| | | | |
|
|
| | | TOTAL COMMON STOCKS
(Cost — $1,221,361,741) | | | 1,567,650,968 |
| | | | |
|
|
| | | TOTAL INVESTMENTS BEFORE SHORT-TERM INVESTMENTS
(Cost — $1,221,361,741) | | | 1,567,650,968 |
| | | | |
|
|
See Notes to Financial Statements.
56
Schedules of Investments
(continued)
| | | | | | | |
| International Equity Investments | |
| | |
Face Amount | | | Security | | Value | |
| SHORT-TERM INVESTMENTS (b) — 8.9% | | | | |
| MONEY MARKET FUND — 4.4% | | | | |
| 73,164,904 | | | BBH Securities Lending Trust (c)
(Cost — $73,164,904) | | $ | 73,164,904 | |
| | | | | |
|
|
|
| TIME DEPOSITS — 4.5% | | | | |
| $ 293,237 | GBP | | Bank of America — London, 4.440% due 9/1/07 | | | 591,386 | |
| | | | BBH — Grand Cayman: | | | | |
| 1,737,350 | JPY | | 0.010% due 9/1/07 | | | 14,997 | |
| 36,800 | CHF | | 1.577% due 9/1/07 | | | 30,484 | |
| 23,301 | SEK | | 2.550% due 9/1/07 | | | 3,386 | |
| 1,305 | HKD | | 3.750% due 9/1/07 | | | 167 | |
| 53,142,063 | | | 4.440% due 9/1/07 | | | 53,142,063 | |
| 36,002 | GBP | | 5.275% due 9/1/07 | | | 17,852 | |
| 176,589 | JPY | | JP Morgan Chase & Co. — London, 0.010% due 9/1/07 | | | 240,902 | |
| 19,659,932 | | | Wells Fargo — Grand Cayman, 4.440% due 9/1/07 | | | 19,659,932 | |
| | | | | |
|
|
|
| | | | TOTAL TIME DEPOSITS
(Cost — $73,701,169) | | | 73,701,169 | |
| | | | | |
|
|
|
| | | | TOTAL SHORT-TERM INVESTMENTS
(Cost — $146,866,073) | | | 146,866,073 | |
| | | | | |
|
|
|
| | | | TOTAL INVESTMENTS — 103.6%
(Cost — $1,368,227,814#) | | | 1,714,517,041 | |
| | | | Liabilities in Excess of Other Assets — (3.6%) | | | (59,813,048 | ) |
| | | | | |
|
|
|
| | | | TOTAL NET ASSETS — 100.0% | | $ | 1,654,703,993 | |
| | | | | |
|
|
|
| * | | Non-income producing securities. |
| (a) | | All or a portion of this security is on loan (See Note 1). |
| (b) | | Inclusive of all short term holdings, including collateral received from securities lending activities. Not including such collateral, the percentage of portfolio holdings would be 4.5%. |
| (c) | | Represents investment of collateral received from securities lending transactions. |
| # | | Aggregate cost for federal income tax purposes is $1,371,182,731. |
Abbreviations used in this schedule:
| | | | |
| ADR | | — | | American Depositary Receipt |
| NVDR | | — | | Non-Voting Depositary Receipt |
| | | |
| Summary of Investments by Sector* | | | |
Financials | | 21.7 | % |
Consumer Discretionary | | 13.7 | |
Industrials | | 13.4 | |
Energy | | 8.4 | |
Information Technology | | 8.4 | |
Materials | | 8.4 | |
Health Care | | 6.9 | |
Telecommunication Services | | 5.9 | |
Utilities | | 2.7 | |
Consumer Staples | | 1.9 | |
Short-Term Investments | | 8.6 | |
| | |
|
|
| | | 100.0 | % |
| | |
|
|
* As a percentage of total investments. | | | |
See Notes to Financial Statements.
57
Schedules of Investments
(continued)
| | | | | |
| Emerging Markets Equity Investments |
| | |
| Shares | | Security | | Value |
COMMON STOCKS — 92.3% |
|
Argentina — 0.5% |
| 39,693 | | Banco Macro Bansud SA, ADR | | $ | 1,083,222 |
| 26,043 | | Banco Patagonia SA* | | | 569,116 |
| 17,400 | | Empresa Distribuidora Y Comercializadora Norte, ADR* | | | 382,974 |
| 37,350 | | Pampa Holding SA, GDR (a)* | | | 760,132 |
| | | | |
|
|
| | | Total Argentina | | | 2,795,444 |
| | | | |
|
|
|
Bermuda — 0.5% |
| 26,874 | | Credicorp Ltd. | | | 1,648,720 |
| 31,877 | | Dufry South America Ltd.* | | | 837,547 |
| | | | |
|
|
| | | Total Bermuda | | | 2,486,267 |
| | | | |
|
|
|
Brazil — 11.9% |
| 61,656 | | Acucar Guarani SA* | | | 344,674 |
| 129,280 | | Agra Empreendimentos Imobiliarios SA* | | | 932,955 |
| 34,600 | | All America Latina Logistica SA | | | 399,156 |
| 21,197 | | American Banknote SA | | | 215,450 |
| 41,318 | | Anhanguera Educacional Participacoes SA* | | | 619,445 |
| 93,837 | | Banco Cruzeiro do Sul SA* | | | 626,152 |
| 63,004 | | Banco Daycoval SA* | | | 541,123 |
| 130,300 | | Banco do Brasil SA | | | 1,867,388 |
| 28,721 | | Banco do Estado do Rio Grande do Sul* | | | 480,070 |
| 97,183 | | Banco Sofisa SA* | | | 716,142 |
| 100,090 | | Cia Vale do Rio Doce | | | 4,933,033 |
| 176,870 | | Cia Vale do Rio Doce, ADR | | | 8,724,997 |
| 9,325 | | CSU Cardsystem SA* | | | 37,912 |
| 39,500 | | EDP — Energias do Brasil SA | | | 622,300 |
| 46,645 | | Equatorial Energia SA* | | | 424,563 |
| 42,000 | | Estacio Participacoes SA* | | | 482,391 |
| 109,632 | | Ez Tec Empreendimentos e Participacoes SA* | | | 567,744 |
| 54,301 | | Fertilizantes Heringer SA* | | | 659,549 |
| 116,966 | | General Shopping Brasil SA* | | | 832,202 |
| 45,946 | | Gerdau SA, ADR (b) | | | 1,104,542 |
| 29,677 | | GVT Holding SA* | | | 571,611 |
| 64,069 | | Inpar SA* | | | 599,110 |
| 53,080 | | Klabin Segall SA* | | | 499,050 |
| 6,047 | | Kroton Educacional SA* | | | 121,389 |
| 70,046 | | Log-in Logistica Intermodal SA* | | | 469,892 |
| 86,980 | | Lojas Renner SA | | | 1,495,418 |
| 37,990 | | LPS Brasil Consultoria de Imoveis SA* | | | 487,497 |
| 147,000 | | Marfrig Frigorificos e Comercio de Alimentos SA* | | | 1,494,130 |
| 43,699 | | Medial Saude SA* | | | 587,406 |
| 4,198 | | MMX Mineracao e Metalicos SA* | | | 1,132,865 |
| 20,074 | | MRV Engenharia e Participacoes SA* | | | 326,456 |
| 37,500 | | Multiplan Empreendimentos Imobiliarios SA* | | | 452,051 |
| 17,927 | | OAO TMK, GDR | | | 605,857 |
| 15,103 | | Odontoprev SA | | | 418,312 |
| 156,635 | | PDG Realty SA Empreendimentos e Participacoes* | | | 2,013,958 |
| 51,134 | | Petroleo Brasileiro SA | | | 3,162,127 |
| 272,706 | | Petroleo Brasileiro SA, Preferred Shares, ADR (b) | | | 14,516,140 |
| 62,000 | | Redecard SA* | | | 945,266 |
| 22,123 | | Rodobens Negocios Imobillarios SA* | | | 221,489 |
| 81,900 | | Rossi Residencial SA | | | 1,831,377 |
See Notes to Financial Statements.
58
Schedules of Investments
(continued)
| | | | | |
| Emerging Markets Equity Investments |
| | |
| Shares | | Security | | Value |
|
Brazil — 11.9% (continued) |
| 8,750 | | Santos-Brasil SA* | | $ | 122,287 |
| 68,715 | | Tecnisa SA* | | | 373,660 |
| 18,855 | | Tele Norte Leste Participacoes SA (c) | | | 641,915 |
| 60,700 | | Tractebel Energia SA | | | 691,000 |
| 242,630 | | Unibanco — Uniao de Bancos Brasileiros SA | | | 2,712,741 |
| 20,600 | | Usinas Siderurgicas de Minas Gerais SA (c) | | | 1,381,918 |
| | | | |
|
|
| | | Total Brazil | | | 63,006,710 |
| | | | |
|
|
|
China — 8.5% |
| 166,000 | | Aluminum Corporation of China Ltd., Class H Shares | | | 452,242 |
| 360,000 | | Angang Steel Co., Ltd. | | | 1,217,080 |
| 90,830 | | Anhui Expressway Co., Ltd. | | | 77,880 |
| 787,000 | | Bank of China Ltd.* | | | 409,090 |
| 456,000 | | China Coal Energy Co., Class H Shares* | | | 917,277 |
| 722,000 | | China Communications Construction Co., Ltd., Class H Shares* | | | 1,583,533 |
| 6,174,000 | | China Construction Bank Corp. | | | 5,187,650 |
| 1,250,000 | | China Life Insurance Co., Ltd. | | | 6,086,121 |
| 261,500 | | China Merchants Bank Co., Ltd., Class H Shares | | | 994,632 |
| 2,192,000 | | China Petroleum & Chemical Corp., Class H Shares | | | 2,413,999 |
| 934,570 | | China Shenhua Energy Co., Ltd., Class H Shares | | | 4,068,231 |
| 948,600 | | China Shipping Container Lines Co., Ltd., Class H Shares | | | 738,173 |
| 452,000 | | China Shipping Development Co., Ltd. | | | 1,395,060 |
| 658,000 | | China Telecom Corp., Ltd. | | | 381,316 |
| 356,800 | | Guangzhou R&F Properties Co., Ltd., Class H Shares | | | 1,467,964 |
| 406,000 | | Harbin Power Equipment Co., Ltd. | | | 892,711 |
| 5,807,000 | | Industrials & Commercial Bank of China* | | | 3,846,864 |
| 393,000 | | Jiangxi Copper Co., Ltd., Class H Shares | | | 918,984 |
| 12,040 | | Petrochina Co., Ltd., ADR | | | 1,737,733 |
| 3,166,500 | | PetroChina Co., Ltd., Class H shares | | | 4,574,080 |
| 223,500 | | Ping An Insurance Group Co. of China Ltd. | | | 2,339,138 |
| 93,521 | | Shenzhen Chiwan Wharf Holdings Ltd., Class B Shares | | | 241,066 |
| 760,000 | | Sinopec Shanghai Petrochemical Co., Ltd. | | | 524,308 |
| 87,000 | | Tencent Holdings Ltd. | | | 455,383 |
| 262,000 | | Xinao Gas Holdings Ltd. | | | 432,902 |
| 324,960 | | Yangzijiang Shipbuilding Holdings Ltd.* | | | 394,961 |
| 41,300 | | Yingli Green Energy Holding Co. Ltd., ADR (b)* | | | 662,865 |
| 622,500 | | Zijin Mining Group Co., Ltd., Class H Shares | | | 559,224 |
| 23,200 | | ZTE Corp. | | | 114,908 |
| | | | |
|
|
| | | Total China | | | 45,085,375 |
| | | | |
|
|
|
Colombia — 0.4% |
| 60,180 | | BanColombia SA, ADR | | | 1,972,700 |
| | | | |
|
|
|
Cyprus — 0.2% |
| 87,583 | | Mirland Development Corp., PLC* | | | 917,351 |
| | | | |
|
|
|
Egypt — 0.9% |
| 121,631 | | Egyptian Financial Group-Hermes Holding | | | 925,254 |
| 24,746 | | El Sewedy Cables Holding Co.* | | | 346,704 |
| 37,657 | | Orascom Hotels & Development* | | | 400,451 |
| 29,191 | | Orascom Telecom Holding SAE | | | 335,487 |
| 10,200 | | Orascom Telecom Holding SAE, GDR (a)(e) | | | 588,540 |
| 681,382 | | Telecom Egypt | | | 2,030,964 |
| | | | |
|
|
| | | Total Egypt | | | 4,627,400 |
| | | | |
|
|
See Notes to Financial Statements.
59
Schedules of Investments
(continued)
| | | | | |
| Emerging Markets Equity Investments |
| | |
| Shares | | Security | | Value |
|
Hong Kong — 5.5% |
| 1,267,900 | | Agile Property Holdings Ltd. | | $ | 2,303,422 |
| 96,000 | | Beijing Enterprises Holdings, Ltd. | | | 419,940 |
| 188,000 | | China Everbright Ltd.* | | | 598,292 |
| 336,000 | | China Mengniu Dairy Co., Ltd. | | | 1,278,018 |
| 807,500 | | China Mobile Ltd. | | | 10,956,133 |
| 76,819 | | China Mobile Ltd., ADR | | | 5,207,560 |
| 766,000 | | China Overseas Land & Investment Ltd. | | | 1,603,879 |
| 102,000 | | China Resources Enterprise | | | 417,779 |
| 356,000 | | China Resources Power Holdings Co. | | | 1,022,773 |
| 2,999,000 | | CNOOC Ltd. | | | 3,682,005 |
| 562,000 | | Guangdong Investment, Ltd. | | | 354,344 |
| 211,000 | | Nine Dragons Paper Holdings Ltd. | | | 641,163 |
| 66,400 | | Parkson Retail Group Ltd. | | | 532,079 |
| 488,000 | | Shenzhen Investment Ltd. | | | 407,385 |
| | | | |
|
|
| | | Total Hong Kong | | | 29,424,772 |
| | | | |
|
|
|
Hungary — 1.2% |
| 61,544 | | Magyar Telekom Telecommunications PLC | | | 309,113 |
| 15,446 | | MOL Hungarian Oil and Gas Nyrt | | | 2,216,442 |
| 69,335 | | OTP Bank Nyrt | | | 3,520,441 |
| 1,857 | | Richter Gedeon Nyrt | | | 367,966 |
| | | | |
|
|
| | | Total Hungary | | | 6,413,962 |
| | | | |
|
|
|
India — 2.5% |
| 25,756 | | ICICI Bank Ltd., ADR | | | 1,144,854 |
| 81,017 | | Infosys Technologies Ltd., ADR | | | 3,865,321 |
| 13,907 | | Larsen & Toubro Ltd., ADR (a)(e) | | | 878,753 |
| 50,107 | | Ranbaxy Laboratories Ltd., GDR (a)(e) | | | 479,494 |
| 116,755 | | Reliance Communications Ltd., GDR (a)(e)* | | | 1,553,309 |
| 850 | | Reliance Industries Ltd., GDR, London Shares (a) | | | 81,175 |
| 32,469 | | Reliance Industries Ltd., GDR, Luxemburg Shares (a)(e) | | | 3,100,789 |
| 43,518 | | Satyam Computer Services Ltd., ADR | | | 1,108,839 |
| 11,970 | | State Bank of India Ltd., GDR | | | 1,098,846 |
| | | | |
|
|
| | | Total India | | | 13,311,380 |
| | | | |
|
|
|
Indonesia — 1.5% |
| 3,802,500 | | PT Aneka Tambang Tbk | | | 912,882 |
| 792,675 | | PT Astra International Tbk | | | 1,512,122 |
| 511,500 | | PT Bank Central Asia Tbk | | | 327,247 |
| 845,000 | | PT Bank Mandiri Persero Tbk | | | 293,779 |
| 1,366,000 | | PT Bank Rakyat Indonesia | | | 910,600 |
| 2,748,500 | | PT Berlian Laju Tanker Tbk | | | 455,684 |
| 1,405,000 | | PT Berlian Laju Tanker Tbk, Singapore Shares* | | | 220,624 |
| 2,568,496 | | PT Telekomunikasi Indonesia Tbk | | | 2,976,164 |
| 537,500 | | PT United Tractors Tbk | | | 466,337 |
| | | | |
|
|
| | | Total Indonesia | | | 8,075,439 |
| | | | |
|
|
|
Ireland — 0.1% |
| 66,052 | | Dragon Oil PLC* | | | 305,608 |
| | | | |
|
|
|
Israel — 0.9% |
| 6,373 | | Elbit Systems Ltd. | | | 285,213 |
| 287,880 | | Israel Chemicals Ltd. | | | 2,260,440 |
See Notes to Financial Statements.
60
Schedules of Investments
(continued)
| | | | | |
| Emerging Markets Equity Investments |
| | |
| Shares | | Security | | Value |
|
Israel — 0.9% (continued) |
| 48,335 | | Makhteshim-Agan Industries Ltd.* | | $ | 371,381 |
| 20,736 | | Ormat Industries, Ltd. | | | 276,696 |
| 39,662 | | Teva Pharmaceutical Industries Ltd., ADR | | | 1,705,466 |
| | | | |
|
|
| | | Total Israel | | | 4,899,196 |
| | | | |
|
|
|
Kazakhstan — 0.0% |
| 9,512 | | Kazkommertsbank (a)(e)* | | | 149,814 |
| 5,088 | | Kazkommertsbank, Registered, Class S* | | | 80,345 |
| | | | |
|
|
| | | Total Kazakhstan | | | 230,159 |
| | | | |
|
|
|
Luxembourg — 0.4% |
| 47,900 | | Tenaris SA, ADR | | | 2,247,947 |
| | | | |
|
|
|
Malaysia — 1.7% |
| 1,617,500 | | AMMB Holdings Bhd* | | | 1,994,416 |
| 726,600 | | Bumiputra-Commerce Holdings Bhd | | | 2,274,306 |
| 48,900 | | Digi.Com Bhd | | | 284,865 |
| 227,100 | | Genting Bhd | | | 476,108 |
| 782,000 | | IJM Corp BHD | | | 1,634,782 |
| 337,250 | | IOI Corp Bhd (d) | | | 481,579 |
| 62,100 | | Kuala Lumpur Kepong Bhd | | | 194,877 |
| 150,600 | | Malayan Banking Bhd | | | 505,525 |
| 74,800 | | MISC Bhd | | | 193,096 |
| 326,890 | | Resorts World Bhd | | | 355,038 |
| 208,000 | | Samling Global Ltd.* | | | 73,141 |
| 114,000 | | Telekom Malaysia Bhd | | | 318,292 |
| 77,500 | | Tenaga Nasional Bhd | | | 224,001 |
| | | | |
|
|
| | | Total Malaysia | | | 9,010,026 |
| | | | |
|
|
|
Mexico — 5.5% |
| 190,646 | | America Movil SAB de CV | | | 11,526,457 |
| 75,100 | | Banco Compartamos SA de CV* | | | 389,343 |
| 119,689 | | Cemex SAB de CV, ADR (b)* | | | 3,864,758 |
| 455,300 | | Controladora Comercial Mexicana SAB de CV | | | 1,266,871 |
| 423,930 | | Corporacion GEO SA de CV* | | | 2,205,477 |
| 26,800 | | Fomento Economico Mexicano SAB de CV, ADR | | | 933,712 |
| 12,550 | | Grupo Aeroportuario del Pacifico SA de CV, ADR | | | 633,398 |
| 115,400 | | Grupo FAMSA SA, Series A* | | | 517,630 |
| 514,158 | | Grupo Financiero Banorte SA de CV, Series O Shares | | | 2,097,035 |
| 254,141 | | Grupo Mexico SAB de CV, Series B Shares | | | 1,603,173 |
| 188,100 | | Grupo Televisa SA | | | 988,470 |
| 46,716 | | Grupo Televisa SA, ADR | | | 1,217,419 |
| 32,448 | | Telefonos de Mexico SA de CV, Series L Shares, ADR | | | 1,146,712 |
| 124,897 | | Wal-Mart de Mexico SA de CV | | | 444,312 |
| 16,642 | | Wal-Mart de Mexico SA de CV, Series V Shares, ADR (b) | | | 591,676 |
| | | | |
|
|
| | | Total Mexico | | | 29,426,443 |
| | | | |
|
|
|
Netherlands — 0.1% |
| 8,500 | | X 5 Retail Group NV, GDR (a)* | | | 284,750 |
| | | | |
|
|
|
Nigeria — 0.1% |
| 44,235 | | Guaranty Trust Bank, GDR (a)* | | | 481,277 |
| | | | |
|
|
See Notes to Financial Statements.
61
Schedules of Investments
(continued)
| | | | | |
| Emerging Markets Equity Investments |
| | |
| Shares | | Security | | Value |
|
Pakistan — 0.9% |
| 123,625 | | Engro Chemical Pakistan Ltd. | | $ | 461,960 |
| 197,555 | | MCB Bank Ltd. | | | 1,013,601 |
| 203,826 | | National Bank of Pakistan | | | 771,906 |
| 249,000 | | Nishat Mills Ltd. | | | 398,613 |
| 300,300 | | Oil & Gas Development Co., Ltd. | | | 523,692 |
| 117,000 | | Pakistan State Oil Co., Ltd. | | | 634,083 |
| 960,500 | | Pakistan Telecommunication Co., Ltd. | | | 770,316 |
| | | | |
|
|
| | | Total Pakistan | | | 4,574,171 |
| | | | |
|
|
|
Peru — 0.3% |
| 34,700 | | Cia de Minas Buenaventura SA, ADR | | | 1,326,581 |
| | | | |
|
|
|
Philippines — 1.4% |
| 74,398 | | Ayala Corp. | | | 801,973 |
| 4,144,800 | | Ayala Land Inc. | | | 1,294,124 |
| 1,823,000 | | Filinvest Land Inc.* | | | 62,424 |
| 20,952,840 | | Megaworld Corp. | | | 1,584,865 |
| 36,281 | | Philippine Long Distance Telephone Co., ADR (b) | | | 2,130,783 |
| 192,169 | | SM Investments Corp. | | | 1,537,866 |
| | | | |
|
|
| | | Total Philippines | | | 7,412,035 |
| | | | |
|
|
|
Poland — 0.8% |
| 673 | | Bank BPH | | | 217,582 |
| 3,615 | | Bank Pekao SA | | | 315,448 |
| 2,163 | | Bank Zachodni WBK SA | | | 195,549 |
| 704 | | BRE Bank SA* | | | 125,631 |
| 40,822 | | Getin Holding SA* | | | 192,967 |
| 22,491 | | Globe Trade Centre SA* | | | 338,943 |
| 2,055 | | Grupa Kety SA | | | 157,667 |
| 10,549 | | KGHM Polska Miedz SA | | | 436,063 |
| 191,200 | | Polish Oil & Gas Co. | | | 356,188 |
| 28,948 | | Polski Koncern Naftowy Orlen SA* | | | 593,065 |
| 41,559 | | Powszechna Kasa Oszczednosci Bank Polski SA | | | 796,039 |
| 35,753 | | Telekomunikacja Polska SA | | | 276,866 |
| 22,949 | | TVN SA | | | 192,395 |
| | | | |
|
|
| | | Total Poland | | | 4,194,403 |
| | | | |
|
|
|
Russia — 8.4% |
| 848 | | AvtoVAZ | | | 134,832 |
| 3,413 | | Chelyabinsk Zink Plant, GDR (a)(e)* | | | 41,127 |
| 38,453 | | Comstar United Telesystems, GDR (a)(e)* | | | 422,214 |
| 5,390 | | Kalina* | | | 197,274 |
| 11,670 | | LUKOIL, ADR, | | | 864,163 |
| 84,354 | | LUKOIL, ADR, London Shares | | | 6,246,414 |
| 8,800 | | Mechel, ADR | | | 383,064 |
| 16,644 | | MMC Norilsk Nickel, ADR (b) | | | 3,706,619 |
| 56,887 | | Mobile Telesystems OJSC, ADR | | | 3,763,644 |
| 1,471 | | Novolipetsk Steel, GDR | | | 47,513 |
| 215,451 | | OAO Gazprom ADR | | | 8,932,598 |
| 223,533 | | OAO Gazprom, ADR, London Shares (a)(e) | | | 9,287,796 |
| 3,500 | | OAO TMK, GDR | | | 134,750 |
| 13,500 | | Pharmstandard* | | | 749,250 |
| 23 | | Priargunsky Plant* | | | 16,054 |
| 1,406,382 | | Sberbank RF | | | 5,386,443 |
See Notes to Financial Statements.
62
Schedules of Investments
(continued)
| | | | | |
| Emerging Markets Equity Investments |
| | |
| Shares | | Security | | Value |
|
Russia — 8.4% (continued) |
| 6,800 | | Sistema JSFC, GDR (a)(e)* | | $ | 207,327 |
| 13,157 | | Sistema-Hals, GDR (a)(e)* | | | 153,279 |
| 12,199 | | Surgutneftegaz, ADR (b) | | | 774,636 |
| 918,908 | | Unified Energy System* | | | 1,153,230 |
| 58,620 | | Vimpel-Communications, ADR | | | 1,430,328 |
| 26,400 | | VTB Bank OJSC, GDR (a)(e)* | | | 247,896 |
| 3,990 | | Wimm-Bill-Dann Foods OJSC | | | 316,806 |
| 1,465 | | Wimm-Bill-Dann Foods OJSC, ADR | | | 149,957 |
| | | | |
|
|
| | | Total Russia | | | 44,747,214 |
| | | | |
|
|
|
Singapore — 0.5% |
| 804,810 | | Cosco Corp., Singapore Ltd. | | | 2,655,533 |
| | | | |
|
|
|
South Africa — 6.3% |
| 86,132 | | African Bank Investments, Ltd. | | | 378,642 |
| 23,672 | | African Rainbow Minerals Ltd.* | | | 388,041 |
| 26,965 | | Anglo Platinum Ltd. | | | 3,592,654 |
| 107,167 | | Aveng Ltd. | | | 790,957 |
| 50,899 | | Barloworld Ltd. | | | 871,435 |
| 35,514 | | Bidvest Group Ltd.* | | | 689,636 |
| 30,862 | | Exxaro Resources Ltd. | | | 313,544 |
| 352,417 | | FirstRand Ltd. | | | 1,149,363 |
| 76,371 | | Foschini Ltd. | | | 617,818 |
| 33,587 | | Gold Fields Ltd. | | | 513,427 |
| 109,437 | | Impala Platinum Holdings Ltd. | | | 3,238,399 |
| 33,477 | | Kumba Iron Ore Ltd. | | | 969,298 |
| 40,605 | | Massmart Holdings Ltd. | | | 521,450 |
| 226,526 | | Metropolitan Holdings Ltd. | | | 467,818 |
| 64,917 | | Mittal Steel South Africa Ltd. | | | 1,119,474 |
| 280,969 | | MTN Group Ltd. | | | 4,269,405 |
| 87,098 | | Murray & Roberts Holdings Ltd. | | | 915,644 |
| 20,101 | | Naspers Ltd. | | | 502,685 |
| 76,653 | | Pretoria Portland Cement Co., Ltd. | | | 484,256 |
| 277,794 | | Sanlam Ltd. | | | 835,969 |
| 131,458 | | Sasol Ltd. | | | 5,303,973 |
| 246,459 | | Standard Bank Group Ltd. | | | 3,593,103 |
| 37,683 | | Telkom South Africa Ltd. | | | 927,318 |
| 14,091 | | Tiger Brands Ltd. | | | 369,202 |
| 145,875 | | Truworths International Ltd. | | | 667,276 |
| | | | |
|
|
| | | Total South Africa | | | 33,490,787 |
| | | | |
|
|
|
South Korea — 15.6% |
| 8,236 | | Daelim Industrials Co. | | | 1,378,484 |
| 17,430 | | Dongbu Insurance Co., Ltd. | | | 730,808 |
| 28,407 | | GS Engineering & Construction Corp. | | | 4,492,974 |
| 16,014 | | Hana Financial Group Inc. | | | 758,575 |
| 5,950 | | Hanjin Heavy Industries & Construction Co. Ltd.* | | | 510,455 |
| 2,201 | | Hanjin Heavy Industries & Construction Holdings Co., Ltd. (d) | | | 100,137 |
| 7,200 | | Hite Brewery Co., Ltd. | | | 945,073 |
| 20,677 | | Hyundai Department Store Co., Ltd. | | | 2,345,817 |
| 42,075 | | Hyundai Development Co. | | | 3,773,382 |
| 5,968 | | Hyundai Heavy Industries | | | 2,379,546 |
| 6,645 | | Hyundai Mipo Dockyard Co., Ltd. | | | 1,986,835 |
| 6,350 | | Hyundai Mobis | | | 685,509 |
See Notes to Financial Statements.
63
Schedules of Investments
(continued)
| | | | | |
| Emerging Markets Equity Investments |
| | |
| Shares | | Security | | Value |
|
South Korea — 15.6% (continued) |
| 11,640 | | Hyundai Motor Co. | | $ | 863,579 |
| 9,810 | | Hyundai Steel Co. | | | 787,970 |
| 8,890 | | Industrials Bank of Korea | | | 194,674 |
| 93,616 | | Kookmin Bank | | | 7,603,162 |
| 22,060 | | Kookmin Bank, ADR | | | 1,796,787 |
| 49,001 | | Korea Investment Holdings Co., Ltd. | | | 3,161,331 |
| 8,750 | | Korea Kumho Petrochemical, Co., Ltd. | | | 688,375 |
| 1,316 | | Korea Zinc Co., Ltd. | | | 264,843 |
| 11,767 | | Korean Air Lines Co., Ltd. | | | 799,614 |
| 50,003 | | KT&G Corp. | | | 3,805,500 |
| 10,108 | | LG Chem Ltd. | | | 1,052,716 |
| 38,093 | | LG Electronics Inc. | | | 2,928,612 |
| 7,860 | | LG Fashion Corp.* | | | 236,339 |
| 4,900 | | LG Petrochemical Co., Ltd. | | | 237,531 |
| 81,670 | | LG Philips LCD Co., Ltd. (b)* | | | 1,744,471 |
| 9,270 | | LS Cable Ltd. | | | 954,114 |
| 6,769 | | NHN Corp.* | | | 1,308,792 |
| 8,820 | | POSCO | | | 5,416,218 |
| 9,350 | | POSCO, ADR (b) | | | 1,433,449 |
| 24,490 | | Pusan Bank | | | 458,570 |
| 22,823 | | Samsung Electronics Co., Ltd. | | | 14,455,748 |
| 3,664 | | Samsung Electronics Co., Ltd., Registered Shares, GDR (a) | | | 1,163,320 |
| 5,320 | | Samsung Engineering Co., Ltd. | | | 613,516 |
| 1,953 | | Samsung Fire & Marine Insurance Co., Ltd. | | | 380,236 |
| 12,590 | | Samsung Techwin Co., Ltd. | | | 913,963 |
| 73,003 | | Shinhan Financial Group Co., Ltd. | | | 4,484,349 |
| 857 | | Shinsegae Co., Ltd. | | | 567,051 |
| 5,300 | | SK Corp. | | | 817,797 |
| 12,978 | | SK Energy Co., Ltd.* | | | 1,777,429 |
| 4,769 | | SK Telecom Co., Ltd. | | | 1,049,668 |
| 19,460 | | Woori Finance Holdings Co., Ltd. | | | 443,448 |
| | | | |
|
|
| | | Total South Korea | | | 82,490,767 |
| | | | |
|
|
|
Sri Lanka — 0.2% |
| 4,878,280 | | Dialog Telekom Ltd. | | | 971,124 |
| | | | |
|
|
|
Taiwan — 9.5% |
| 85,260 | | Acer Inc. | | | 150,334 |
| 367,200 | | Asia Cement Corp. | | | 514,627 |
| 944,394 | | Asustek Computer Inc. | | | 2,832,171 |
| 1,153,933 | | AU Optronics Corp. | | | 1,687,861 |
| 153,394 | | Au Optronics Corp. (ADR) Spons. (b) | | | 2,253,362 |
| 40,514 | | Catcher Technology Co., Ltd.* | | | 325,896 |
| 13,300 | | Cathay Financial Holding Co., Reistered Shares, GDR | | | 287,546 |
| 1,382,790 | | Cathay Financial Holding Co., Ltd. | | | 3,075,881 |
| 1 | | China Development Financial Holding Corp. (e) | | | 0 |
| 908,122 | | China Steel Corp. | | | 1,231,390 |
| 214,688 | | Chinatrust Financial Holding Co., Ltd.* | | | 161,142 |
| 341,176 | | Chunghwa Telecom Co., Ltd. | | | 605,397 |
| 706,691 | | Delta Electronics Inc. | | | 2,647,199 |
| 113,220 | | D-Link Corp. | | | 249,056 |
| 432,556 | | Far Eastern Textile Co., Ltd. | | | 511,251 |
| 471,938 | | First Financial Holding Co., Ltd. | | | 325,800 |
See Notes to Financial Statements.
64
Schedules of Investments
(continued)
| | | | | |
| Emerging Markets Equity Investments |
| | |
| Shares | | Security | | Value |
|
Taiwan — 9.5% (continued) |
| 314,513 | | Formosa Chemicals & Fibre Corp. | | $ | 768,953 |
| 146,000 | | Formosa Petrochemical Corp. | | | 406,576 |
| 286,000 | | Formosa Taffeta Co., Ltd. | | | 324,770 |
| 35,650 | | Foxconn Information Technology Co., Ltd. | | | 326,072 |
| 3,275,728 | | Fuhwa Financial Holding Co., Ltd.* | | | 1,864,103 |
| 22,880 | | High Tech Computer Corp. | | | 311,719 |
| 1,019,994 | | HON HAI Precision Industry Co., Ltd. | | | 7,620,319 |
| 75,045 | | HON HAI Precision Industry Co., Ltd., Registered Shares, GDR | | | 1,122,673 |
| 1,553,380 | | Hung Poo Real Estate Development Corp. | | | 1,645,815 |
| 169,493 | | InnoLux Display Corp. | | | 719,688 |
| 287,196 | | Inventec Co., Ltd. | | | 183,993 |
| 80,472 | | MediaTek Inc. | | | 1,374,674 |
| 410,572 | | Nan Ya Plastics Corp. | | | 997,798 |
| 691 | | Pacific Electric Wire & Cable Co., Ltd. (d)(e)* | | | 0 |
| 2,544,345 | | Polaris Securities Co., Ltd.* | | | 1,297,712 |
| 87,285 | | Powertech Technology Inc. | | | 350,066 |
| 18,400 | | Richtek Technology Corp. | | | 201,602 |
| 316,962 | | Shin Kong Financial Holding Co., Ltd. | | | 307,795 |
| 359,624 | | Siliconware Precision Industries Co. | | | 723,781 |
| 451,553 | | Taishin Financial Holdings Co., Ltd.* | | | 226,525 |
| 1,029,000 | | Taiwan Fertilizer Co., Ltd. | | | 2,138,011 |
| 1,431,857 | | Taiwan Semiconductor Manufacturing Co., Ltd. | | | 2,733,759 |
| 443,067 | | Taiwan Semiconductor Manufacturing Co., Ltd., ADR | | | 4,395,225 |
| 113,092 | | Tripod Technology Corp. | | | 468,224 |
| 260,000 | | U-Ming Marine Transport Corp.* | | | 772,633 |
| 532,089 | | United Microelectronics Corp. | | | 297,995 |
| 551,478 | | United Microelectronics Corp., ADR (b) | | | 1,819,877 |
| 184,826 | | Wistron Corp. | | | 338,264 |
| | | | |
|
|
| | | Total Taiwan | | | 50,597,535 |
| | | | |
|
|
|
Thailand — 2.1% |
| 49,450 | | Advanced Info Service Public Co. Ltd. | | | 144,353 |
| 170,900 | | Bangkok Bank Public Co. Ltd., NVDR | | | 626,141 |
| 779,700 | | Bangkok Bank Public Co., Ltd. | | | 2,849,717 |
| 96,700 | | Banpu Public Co. Ltd. | | | 894,241 |
| 950,100 | | BEC World Public Co. Ltd., NVDR | | | 677,076 |
| 232,700 | | Kasikornbank Public Co. Ltd., NVDR | | | 566,107 |
| 1,005,400 | | Krung Thai Bank Public Co. Ltd. | | | 349,932 |
| 184,009 | | PTT Chemical Public Co. Ltd. | | | 622,130 |
| 114,400 | | PTT PCL | | | 1,026,734 |
| 162,300 | | PTT Public Co. Ltd., NVDR | | | 1,533,324 |
| 11,500 | | Siam Cement Public Co. Ltd. | | | 89,828 |
| 37,600 | | Siam Cement Public Co. Ltd., NVCR | | | 290,230 |
| 124,600 | | Thai Oil Public Co., Ltd. | | | 323,612 |
| 307,000 | | Total Access Communication PCL* | | | 380,680 |
| 2,698,000 | | True Corp. Public Co. Ltd.* | | | 568,044 |
| | | | |
|
|
| | | Total Thailand | | | 10,942,149 |
| | | | |
|
|
|
Turkey — 2.8% |
| 256,680 | | Akbank TAS | | | 1,632,390 |
| 7,751 | | Akcansa Cimento AS | | | 59,315 |
| 367 | | Aktas Electric Ticaret AS (d)(e)* | | | 0 |
| 7,220 | | Anadolu Efes Biracilik Ve Malt Sanayii AS | | | 263,308 |
See Notes to Financial Statements.
65
Schedules of Investments
(continued)
| | | | | |
| Emerging Markets Equity Investments |
| | |
| Shares | | Security | | Value |
|
Turkey — 2.8% (continued) |
| 226,515 | | Asya Katilim Bankasi AS* | | $ | 1,475,972 |
| 5,315 | | BIM Birlesik Magazalar AS | | | 389,890 |
| 13,030 | | Coca-Cola Icecek AS* | | | 109,886 |
| 40,810 | | Enka Insaat ve Sanayi AS | | | 448,858 |
| 119,403 | | Eregli Demir Ve Celik Fabrikalari TAS | | | 933,146 |
| 13,834 | | Ford Otomotiv Sanayi AS | | | 132,619 |
| 93,203 | | Haci Omer Sabanci Holding AS | | | 513,980 |
| 427,059 | | KOC Holding AS | | | 1,945,158 |
| 29,850 | | Petkim Petrokimya Holding AS* | | | 225,233 |
| 69,901 | | Tofas Turk Otomobil Fabrikasi AS | | | 318,264 |
| 24,809 | | Tupras - Turkiye Petrol Rafinerileri AS | | | 565,558 |
| 66,074 | | Turk Hava Yollari* | | | 460,467 |
| 134,796 | | Turkcell Iletisim Hizmet AS | | | 976,529 |
| 305,903 | | Turkiye Garanti Bankasi AS | | | 1,950,245 |
| 177,652 | | Turkiye Halk Bankasi AS* | | | 1,191,587 |
| 178,631 | | Turkiye Is Bankasi, Class C Shares | | | 866,661 |
| 179,482 | | Yapi ve Kredi Bankasi AS | | | 513,161 |
| | | | |
|
|
| | | Total Turkey | | | 14,972,227 |
| | | | |
|
|
|
United Kingdom — 0.2% |
| 18,473 | | Anglo American PLC, ADR | | | 528,697 |
| 26,288 | | BHP Billiton PLC | | | 772,675 |
| | | | |
|
|
| | | Total United Kingdom | | | 1,301,372 |
| | | | |
|
|
| |
United States — 0.9% | | | |
| 47,600 | | BMB Munai Inc.* | | | 287,504 |
| 3,648 | | Caspian Services Inc.* | | | 10,616 |
| 42,032 | | Southern Copper Corp. (b) | | | 4,423,868 |
| | | | |
|
|
| | | Total United States | | | 4,721,988 |
| | | | |
|
|
| | | TOTAL COMMON STOCKS
(Cost — $312,643,294) | | | 489,400,092 |
| | | | |
|
|
PREFERRED STOCKS — 2.9% |
| |
Brazil — 2.5% | | | |
| 101,580 | | Banco Itau Holding Financeira SA, 2.340% (c) | | | 4,439,640 |
| 53,848 | | Banco Pine SA, 0.860%* | | | 546,772 |
| 48,900 | | Bradespar SA, 2.330% | | | 2,062,662 |
| 30,862,600 | | Eletropaulo Metropolitana de Sao Paulo SA, Class B Shares, 9.64% | | | 1,734,718 |
| 121,467 | | Itausa - Investimentos Itau SA, 3.380% | | | 728,419 |
| 126,293 | | NET Servicos de Comunicacao SA, 0.000%* | | | 1,893,400 |
| 28,230 | | Usinas Siderurgicas de Minas Gerais SA, Class A Shares, 4.280% | | | 1,676,699 |
| | | | |
|
|
| | | Total Brazil | | | 13,082,310 |
| | | | |
|
|
| |
Russia — 0.1% | | | |
| 7,088 | | Surgutneftegaz, Preferred Shares, ADR, 0.000% (b) | | | 460,720 |
| | | | |
|
|
| |
South Korea — 0.3% | | | |
| 6,570 | | Hyundai Motor Co., 3.090% | | | 261,560 |
| 1,780 | | LG Electronics Inc., 1.880% | | | 78,771 |
| 3,156 | | Samsung Electronics Co., Ltd., 1.310% | | | 1,483,508 |
| | | | |
|
|
| | | Total South Korea | | | 1,823,839 |
| | | | |
|
|
| | | TOTAL PREFERRED STOCKS
(Cost — $7,712,819) | | | 15,366,869 |
| | | | |
|
|
See Notes to Financial Statements.
66
Schedules of Investments
(continued)
| | | | | | | |
| Emerging Markets Equity Investments | |
| | |
| Shares | | | Security | | Value | |
| RIGHTS — 0.3% | | | | |
| |
| Egypt — 0.2% | | | | |
| 17,641 | | | Orascom Construction Industries* | | $ | 1,179,641 | |
| | | | | |
|
|
|
| |
| Hong Kong — 0.0% | | | | |
| 63,833 | | | China Overseas Land & Investment Ltd.* | | | 39,787 | |
| | | | | |
|
|
|
| |
| Philippines — 0.0% | | | | |
| 4,144,800 | | | Ayala Land Inc.* | | | 0 | |
| | | | | |
|
|
|
| |
| Russia — 0.1% | | | | |
| 9,956 | | | Evraz Group SA, GDR* (a)(e) | | | 502,778 | |
| | | | | |
|
|
|
| | | | TOTAL RIGHTS
(Cost — $478,280) | | | 1,722,206 | |
| | | | | |
|
|
|
| WARRANT — 0.1% | | | | |
| |
| United Kingdom — 0.1% | | | | |
| 13,340 | | | UBS AG London, expires 10/12/07
(Cost — $370,650)* | | | 415,410 | |
| | | | | |
|
|
|
| | | | TOTAL INVESTMENTS BEFORE SHORT-TERM INVESTMENTS
(Cost — $321,205,043) | | | 506,904,577 | |
| | | | | |
|
|
|
| | |
Face
Amount
| | | | | | |
| SHORT-TERM INVESTMENTS (f) — 8.8% | |
| MONEY MARKET FUND — 6.7% | |
| 35,718,804 | | | BBH Securities Lending Trust (g)
(Cost — $35,718,804) | | | 35,718,804 | |
| | | | | |
|
|
|
| TIME DEPOSITS — 2.1% | | | | |
| $ 1,192,161 | | | Bank of America — London, 4.440% due 9/1/07 | | | 1,192,161 | |
| 675,190 | ZAR | | BBH — Grand Cayman, 8.250% due 9/1/07 | | | 94,222 | |
| 12,962 | SGD | | BBH — Grand Cayman, 1.150% due 9/1/07 | | | 4,625 | |
| 1,579,530 | HKD | | JPMorgan Chase — London, 3.750% due 9/1/07 | | | 202,575 | |
| 9,576,669 | | | Wells Fargo — Grand Cayman, 4.440% due 9/1/07 | | | 9,576,669 | |
| | | | | |
|
|
|
| | | | TOTAL TIME DEPOSITS
(Cost — $11,070,252) | | | 11,070,252 | |
| | | | | |
|
|
|
| | | | TOTAL SHORT-TERM INVESTMENTS
(Cost — $46,789,056) | | | 46,789,056 | |
| | | | | |
|
|
|
| | | | TOTAL INVESTMENTS — 104.4%
(Cost — $367,994,099#) | | | 553,693,633 | |
| | | | Liabilities in Excess of Other Assets — (4.4%) | | | (23,375,884 | ) |
| | | | | |
|
|
|
| | | | TOTAL NET ASSETS — 100.0% | | $ | 530,317,749 | |
| | | | | |
|
|
|
| * | | Non-income producing securities. |
| (a) | | Security is exempt from registration under Rule 144A of the Securities Act of 1933. This security maybe resold in transactions that are exempt from registration, normally to qualified institutional buyers. This security has been deemed liquid pursuant to guidelines approved by the Board of Trustees, unless otherwise noted. |
| (b) | | All or a portion of this security is on loan (See Note 1). |
| (c) | | All or a portion of this security is segregated for foreign currency contracts. |
| (d) | | Security is valued in good faith at fair value by or under the direction of the Board of Trustees. |
| (f) | | Inclusive of all short term holdings, including collateral received from securities lending activities. Not including such collateral, the percentage of portfolio holdings would be 2.1%. |
| (g) | | Represents investment of collateral received from securities lending transactions. |
| # | | Aggregate cost for federal income tax purposes is $373,642,826. |
See Notes to Financial Statements.
67
Schedules of Investments
(continued)
Emerging Markets Equity Investments
Abbreviations used in this schedule:
| | | | |
| ADR | | — | | American Depositary Receipt |
| GDR | | — | | Global Depositary Receipt |
| NVDR | | — | | Non-Voting Depositary Receipt |
| | | |
| Summary of Investments by Sector* | | | |
Financials | | 24.4 | % |
Energy | | 15.1 | |
Materials | | 12.8 | |
Telecommunication Services | | 10.5 | |
Information Technology | | 9.8 | |
Industrials | | 8.7 | |
Consumer Discretionary | | 5.9 | |
Consumer Staples | | 2.3 | |
Utilities | | 1.2 | |
Health Care | | 0.8 | |
Consumer, Cyclical | | 0.1 | |
Short-Term Investments | | 8.4 | |
| | |
|
|
| | | 100.0 | % |
| | |
|
|
* As a percentage of total investments. | | | |
See Notes to Financial Statements.
68
Schedules of Investments
(continued)
| | | | | | | |
| Core Fixed Income Investments |
| | | |
Face Amount | | | | Security | | Value |
MORTGAGE-BACKED SECURITIES — 54.5% |
FHLMC — 6.1% |
| | | | | Federal Home Loan Mortgage Corp. (FHLMC): | | | |
| $ 5,064 | | | | 9.000% due 8/1/09-10/1/09 | | $ | 5,175 |
| 7,732 | | | | 10.000% due 4/1/09-10/1/09 | | | 8,029 |
| 3,639 | | | | 10.250% due 5/1/09-11/1/09 | | | 3,827 |
| 29,307 | | | | 11.500% due 10/1/15 | | | 32,842 |
| 13,776 | | | | 9.500% due 10/1/08-8/1/16 | | | 14,482 |
| 76,474 | | | | 8.000% due 4/1/09-6/1/17 | | | 79,854 |
| 166,042 | | | | 8.500% due 12/1/07-7/1/17 | | | 176,476 |
| 181,954 | | | | 4.359% due 12/1/34 (a) | | | 178,870 |
| 175,901 | | | | 4.087% due 1/1/35 (a) | | | 171,891 |
| 1,460,495 | | | | 5.032% due 3/1/36 (a)(b) | | | 1,457,169 |
| 1,242,062 | | | | 5.000% due 6/1/21-9/1/36 | | | 1,187,270 |
| 2,285,155 | | | | 6.002% due 10/1/36 (a) | | | 2,300,226 |
| 313,498 | | | | 5.821% due 2/1/37 | | | 313,913 |
| 888,358 | | | | 5.959% due 5/1/37 | | | 889,701 |
| 692,533 | | | | 6.039% due 5/1/37 | | | 693,838 |
| 7,178,378 | | | | 5.500% due 3/1/37-6/1/37 | | | 7,012,006 |
| 17,799,403 | | | | 6.000% due 4/1/36-9/1/37 | | | 17,794,125 |
| | | | | Gold: | | | |
| 2,662 | | | | 9.500% due 4/1/10 | | | 2,781 |
| 36,205 | | | | 7.000% due 5/1/12-8/1/12 | | | 37,374 |
| 20,024 | | | | 8.000% due 8/1/09-8/1/12 | | | 20,552 |
| 149,062 | | | | 6.500% due 7/1/14 (b) | | | 147,759 |
| 38,880 | | | | 8.500% due 8/1/09-2/1/18 | | | 40,846 |
| 947,446 | | | | 4.500% due 8/1/18-8/1/20 | | | 910,258 |
| 4,117,118 | | | | 6.000% due 5/1/16-1/1/36 | | | 4,133,612 |
| 5,203,956 | | | | 5.000% due 12/1/18-10/1/36 (b) | | | 5,054,862 |
| 6,211,556 | | | | 5.500% due 10/1/13-3/1/37 (b) | | | 6,108,766 |
| 3,787,425 | | | | 5.954% due 5/1/37 | | | 3,797,036 |
| | | | | | |
|
|
| | | | | TOTAL FHLMC | | | 52,573,540 |
| | | | | | |
|
|
FNMA — 41.5% |
| | | | | Federal National Mortgage Association (FNMA): | | | |
| 8,362 | | | | 9.000% due 12/1/08-4/1/09 | | | 8,413 |
| 2,941 | | | | 10.750% due 10/1/12 | | | 3,038 |
| 8,597 | | | | 8.500% due 1/1/10-4/1/17 | | | 9,078 |
| 14,728 | | | | 8.000% due 8/1/17 | | | 15,563 |
| 4,702 | | | | 10.000% due 1/1/21 | | | 5,259 |
| 17,316 | | | | 9.500% due 11/1/09-11/1/21 | | | 17,801 |
| 17,834 | | | | 6.572% due 1/1/30 (a)(b) | | | 18,294 |
| 54,282 | | | | 6.565% due 3/1/30 (a)(b) | | | 55,320 |
| 2,281,018 | | | | 3.963% due 3/1/34 | | | 2,240,764 |
| 7,188,373 | | | | 4.000% due 7/1/18-4/1/34 (a)(b) | | | 6,776,242 |
| 467,261 | | | | 4.205% due 12/1/34 (a) | | | 459,355 |
| 62,387 | | | | 4.246% due 12/1/34 (a) | | | 61,388 |
| 1,002,651 | | | | 4.603% due 9/1/35 (a) | | | 1,001,407 |
| 638,400 | | | | 7.007% due 10/1/35 (a) | | | 648,801 |
| 968,183 | | | | 7.027% due 10/1/35 (a) | | | 984,003 |
| 12,451,966 | | | | 4.500% due 5/1/19-11/1/35 (a)(b) | | | 11,645,814 |
| 1,276,241 | | | | 6.940% due 11/1/35 (a) | | | 1,316,502 |
| 427,746 | | | | 6.998% due 11/1/35 (a) | | | 434,704 |
See Notes to Financial Statements.
69
Schedules of Investments
(continued)
| | | | | | | |
| Core Fixed Income Investments |
| | | |
Face Amount | | | | Security | | Value |
FNMA — 41.5% (continued) |
| $ 208,737 | | | | 7.004% due 11/1/35 (a) | | $ | 212,138 |
| 211,127 | | | | 7.009% due 11/1/35 (a) | | | 214,562 |
| 211,617 | | | | 7.018% due 11/1/35 (a) | | | 215,060 |
| 204,391 | | | | 7.021% due 11/1/35 (a) | | | 207,725 |
| 204,018 | | | | 7.034% due 11/1/35 (a) | | | 207,352 |
| 4,087,299 | | | | 4.967% due 1/1/36 (a) | | | 4,075,936 |
| 1,494,085 | | | | 5.759% due 6/1/36 | | | 1,482,169 |
| 1,987,671 | | | | 5.822% due 7/1/36 | | | 1,977,820 |
| 2,385,863 | | | | 6.114% due 8/1/36 | | | 2,416,567 |
| 271,446 | | | | 5.666% due 12/1/36 | | | 273,138 |
| 2,001,581 | | | | 5.858% due 2/1/37 | | | 1,991,016 |
| 4,902,723 | | | | 6.500% due 11/1/23-2/1/37 | | | 4,994,389 |
| 2,837,686 | | | | 5.606% due 4/1/37 | | | 2,832,060 |
| 1,995,887 | | | | 5.652% due 4/1/37 | | | 1,968,758 |
| 2,666,061 | | | | 6.177% due 4/1/37 | | | 2,701,020 |
| 3,659,340 | | | | 7.000% due 9/1/26-4/1/37 (b) | | | 3,749,262 |
| 37,873,963 | | | | 5.000% due 1/1/18-5/1/37 (b) | | | 36,155,544 |
| 2,197,969 | | | | 5.638% due 5/1/37 | | | 2,192,288 |
| 86,723,934 | | | | 5.500% due 12/1/08-8/1/37 (b) | | | 85,005,725 |
| 3,200,359 | | | | 5.950% due 8/1/37 | | | 3,202,633 |
| 34,909,984 | | | | 6.000% due 5/1/12-9/1/37 (b) | | | 34,916,428 |
| 175,498 | | | | 6.188% due 4/1/40 (a) | | | 180,948 |
| | | | | TBA: | | | |
| 500,000 | | | | 4.500% due 9/1/36 (c) | | | 462,500 |
| 43,500,000 | | | | 5.500% due 9/1/21-10/1/36 (c) | | | 42,510,027 |
| 13,780,000 | | | | 6.500% due 9/1/36-10/1/36 (c) | | | 13,988,631 |
| 40,700,000 | | | | 5.000% due 9/1/37-10/1/37 (c) | | | 38,684,089 |
| 45,400,000 | | | | 6.000% due 9/1/21-10/1/37 (c) | | | 45,345,627 |
| | | | | | |
|
|
| | | | | TOTAl FNMA | | | 357,865,158 |
| | | | | | |
|
|
GNMA — 6.9% |
| | | | | Government National Mortgage Association (GNMA): | | | |
| 7,083 | | | | 11.000% due 7/15/10-9/15/10 | | | 7,699 |
| 9,609 | | | | 9.500% due 12/15/16-8/15/17 | | | 10,423 |
| 82,739 | | | | 6.125% due 10/20/27 (a)(b) | | | 83,309 |
| 2,715 | | | | 8.000% due 3/20/30 | | | 2,875 |
| 247,654 | | | | 6.375% due 2/20/26-5/20/30 (a)(b) | | | 250,094 |
| 131,439 | | | | 8.500% due 11/20/16-8/15/30 (b) | | | 140,703 |
| 56,296 | | | | 9.000% due 4/20/17-9/15/30 (b) | | | 60,358 |
| 22,917 | | | | 5.500% due 8/15/33 | | | 22,561 |
| 35,483 | | | | 4.500% due 9/15/33 (b) | | | 33,246 |
| 708,598 | | | | 4.750% due 5/20/34 (a) | | | 703,765 |
| 27,448,444 | | | | 5.000% due 11/15/32-6/15/37 (b) | | | 26,458,367 |
| 6,090,354 | | | | 6.000% due 2/20/35-9/1/37 | | | 6,110,078 |
| 1,039,096 | | | | 6.500% due 6/15/08-10/1/37 | | | 1,059,965 |
| | | | | TBA: | | | |
| 4,650,000 | | | | 6.000% due 9/1/36 (c) | | | 4,672,525 |
| 3,000,000 | | | | 5.000% due 9/1/37 (c) | | | 2,889,843 |
| 17,000,000 | | | | 5.500% due 9/1/37 (c) | | | 16,705,152 |
| | | | | | |
|
|
| | | | | TOTAl GNMA | | | 59,210,963 |
| | | | | | |
|
|
| | | | | TOTAL MORTGAGE-BACKED SECURITIES
(Cost — $470,587,999) | | | 469,649,661 |
| | | | | | |
|
|
See Notes to Financial Statements.
70
Schedules of Investments
(continued)
| | | | | | | |
| Core Fixed Income Investments |
| | | |
Face Amount | | Rating‡ | | Security | | Value |
ASSET-BACKED SECURITIES — 3.1% | | | |
Airlines — 0.1% | | | |
| $ 850,000 | | A- | | Continental Airlines Inc. Pass Thru Certificates, Series 2001-ROCK, 7.056% due 3/15/11 | | $ | 850,555 |
| | | | | | |
|
|
Automobiles — 0.5% | | | |
| 1,988,942 | | Aaa | | Chase Manhattan Auto Owner Trust, Series 2006-B, Class A2, 5.280% due 10/15/09 (b)(d) | | | 1,986,920 |
| 1,850,000 | | AAA | | USAA Auto Owner Trust, Series 2005-4, Class A4, 4.890% due 8/15/12 | | | 1,837,594 |
| 125,964 | | AAA | | WFS Financial Owner Trust, Series 2005-1, Class A3, 3.590% due 10/19/09 (b) | | | 125,213 |
| | | | | | |
|
|
| | | | | Total Automobiles | | | 3,949,727 |
| | | | | | |
|
|
Credit Card — 0.1% | | | |
| 1,200,000 | | AAA | | Bank One Issuance Trust, Series 2003-A3, Class A3, 5.721% due 12/15/10 (a)(b) | | | 1,199,843 |
| | | | | | |
|
|
Home Equity — 2.3% | | | |
| 661,278 | | AAA | | Accredited Mortgage Loan Trust, Series 2005-3, Class A1, 5.745% due 9/25/35 (a) | | | 644,550 |
| 364,319 | | AAA | | ACE Securities Corp., Series 2004-SD1, Class A1, 5.995% due 11/25/33 (a) | | | 355,833 |
| 1,024,119 | | AAA | | Asset Backed Funding Certificates, Series 2004-OPT5, Class A1, 5.855% due 6/25/34 (a)(b) | | | 996,994 |
| 110,327 | | AAA | | Asset Backed Securities Corp. Home Equity, Series 2004-HE6, Class A1, 5.780% due 9/25/34 (a)(b) | | | 107,061 |
| | | | | Chase Funding Mortgage Loan Asset-Backed Certificates: | | | |
| 2,870 | | AAA | | Series 2002-2, Class 2A1, 6.005% due 5/25/32 (a) | | | 2,779 |
| 2,831 | | AAA | | Series 2002-3, Class 2A1, 6.145% due 8/25/32 (a) | | | 2,779 |
| | | | | Countrywide Asset-Backed Certificates: | | | |
| 1,875,027 | | AAA | | Series 1998-C1, Class 3A1, 5.625% due 6/25/36 | | | 1,824,796 |
| 3,064 | | AAA | | Series 2001-BC3, Class A, 5.985% due 12/25/31 (a) | | | 3,008 |
| 5,025 | | AAA | | Series 2002-3, Class 1A1, 6.245% due 5/25/32 (a) | | | 4,813 |
| 12,759 | | AAA | | Series 2003-BC2, Class 2A1, 6.105% due 6/25/33 (a) | | | 12,040 |
| 212,726 | | AAA | | Series 2004-SD4, Class A1, 5.885% due 12/25/34 (a)(e) | | | 203,293 |
| 321,777 | | AAA | | Series 2005-4, Class AF3, 4.456% due 10/25/35 (a) | | | 315,084 |
| 478,428 | | AAA | | Series 2006-11, Class 3AV1, 5.565% due 9/25/46 (a)(b) | | | 475,868 |
| 1,376,976 | | AAA | | Series 2006-SD3, Class A1, 5.835% due 7/25/36 (a)(e) | | | 1,355,031 |
| 494,106 | | AAA | | Countrywide Home Equity Loan Trust, Series 2005-H, Class 2A, 5.851% due 12/15/35 (a) | | | 485,874 |
| | | | | EMC Mortgage Loan Trust: | | | |
| 13,462 | | AAA | | Series 2002-B, Class A1, 6.155% due 2/25/41 (a)(e) | | | 13,300 |
| 63,003 | | AAA | | Series 2003-A, Class A1, 6.055% due 8/25/40 (a)(e) | | | 61,979 |
| 1,950,000 | | AAA | | GS Mortgage Securities Corp. II, Series 2001-C2, Class A4A, 4.751% due 7/10/39 | | | 1,852,669 |
| 157,177 | | AAA | | IXIS Real Estate Capital Trust, Series 2006-HE1, Class A1, 5.595% due 3/25/36 (a) | | | 157,079 |
| 795,580 | | AAA | | JP Morgan Mortgage Acquisition Corp., Series 2006-WMC1, Class A2, 5.575% due 3/25/36 (a)(b) | | | 792,936 |
| 162,652 | | AAA | | Long Beach Mortgage Loan Trust, Series 2006-1, Class 2A1, 5.585% due 2/25/36 (a)(b) | | | 162,542 |
| | | | | Morgan Stanley ABS Capital I: | | | |
| 757,876 | | AAA | | Series 2006-HE7, Class A2A, 5.555% due 9/25/36 (a) | | | 752,816 |
| 16,094 | | AAA | | Series 2006-NC1, Class A1, 5.585% due 12/25/35 (a) | | | 16,083 |
| | | | | Option One Mortgage Loan Trust: | | | |
| 6,516 | | AAA | | Series 2002-6, Class A2, 6.305% due 11/25/32 (a) | | | 6,371 |
| 27,625 | | AAA | | Series 2003-1, Class A2, 5.925% due 2/25/33 (a) | | | 26,944 |
| 1,800,000 | | AAA | | Popular ABS Mortgaged Pass-Through Trust, Series 2003-KS1, Class AF6, 4.759% due 7/25/35 | | | 1,668,036 |
| 100,000 | | AAA | | Public Service New Hampshire Funding LLC, Series 2001-1, Class A3, 6.480% due 5/1/15 | | | 105,400 |
| | | | | Residential Asset Mortgage Products Inc.: | | | |
| 14,390 | | AAA | | Series 2003-RS4, Class AIIB, 6.165% due 5/25/33 (a) | | | 13,727 |
| 2,000,000 | | AAA | | Series 2006-NC1, Class AI6A, 6.110% due 10/25/33 | | | 1,925,271 |
| 397,462 | | AAA | | Residential Funding Mortgage Securities II Inc., Series 2005-HS1, Class AI1, 5.625% due 9/25/35 (a) | | | 394,476 |
| 1,194,510 | | AAA | | SACO I Inc., Series 2006-7, Class A1, 5.635% due 7/25/36 (a) | | | 1,042,745 |
| 435,814 | | AAA | | Soundview Home Equity Loan Trust, Series 2006-OPT3, Class 2A1, 5.565% due 6/25/36 (a) | | | 434,838 |
| 2,218,800 | | AAA | | Terwin Mortgage Trust, 4.500% due 5/25/37 (e) | | | 1,990,911 |
| 582,933 | | AAA | | UDR Inc., 5.851% due 12/15/35 (a) | | | 575,423 |
See Notes to Financial Statements.
71
Schedules of Investments
(continued)
| | | | | | | |
| Core Fixed Income Investments |
| | | |
Face Amount | | Rating‡ | | Security | | Value |
Home Equity — 2.3% (continued) | | | |
| $1,002,118 | | AAA | | Washington Mutual Inc., Series 2005-AR13, Class A1A1, 5.795% due 10/25/45 (a)(b) | | $ | 983,574 |
| | | | | | |
|
|
| | | | | Total Home Equity | | | 19,766,923 |
| | | | | | |
|
|
Student Loan — 0.1% | | | |
| 555,015 | | AAA | | SLM Corp., Series 2005-5, Class A1, 5.360% due 1/25/18 (a)(b) | | | 554,973 |
| | | | | | |
|
|
| | | | | TOTAL ASSET-BACKED SECURITIES
(Cost — $26,997,030) | | | 26,322,021 |
| | | | | | |
|
|
COLLATERALIZED MORTGAGE OBLIGATIONS — 17.3% |
| 2,107,317 | | AAA | | American Home Mortgage Investment Trust, Series 4, Class 11A1, 5.735% due 3/25/47 | | | 2,060,197 |
| 364,257 | | Aaa | | Banc of America Alternative Loan Trust, Series 2004-6, Class 4A1, 5.000% due 7/25/19 (d) | | | 356,438 |
| | | | | Banc of America Commercial Mortgage Inc.: | | | |
| 931,914 | | Aaa | | Series 2001-1, Class A2, 6.500% due 4/15/36 (d) | | | 957,449 |
| 1,060,000 | | AAA | | Series 2005-1, Class A4, 5.023% due 11/10/42 (a) | | | 1,047,178 |
| | | | | Banc of America Funding Corp.: | | | |
| 2,983,299 | | AAA | | Series 1998-D7, Class 3A1, 6.000% due 7/25/37 | | | 2,995,232 |
| 11,086 | | AAA | | Series 2003-1, Class A1, 6.000% due 5/20/33 | | | 11,005 |
| 575,010 | | AAA | | Series 2005-B, Class 2A1, 5.286% due 4/20/35 (a) | | | 570,067 |
| 939,922 | | AAA | | Banc of America Mortgage Securities Inc., Series 1865, Class 1A1, 5.668% due 7/25/34 (b) | | | 938,729 |
| | | | | Bear Stearns Adjustable Rate Mortgage Trust: | | | |
| 116,604 | | AAA | | Series 2002-11, Class 1A1, 5.626% due 2/25/33 (a)(b) | | | 116,075 |
| 2,061,713 | | AAA | | Series 2005-2, Class A2, 4.125% due 3/25/35 (b) | | | 2,002,129 |
| | | | | Bear Stearns Alt-A Trust: | | | |
| 693,660 | | AAA | | Series 2005-2, Class 2A4, 4.712% due 4/25/35 (a) | | | 684,094 |
| 413,514 | | AAA | | Series 2005-4, Class 23A2, 5.376% due 5/25/35 (a)(b)(f) | | | 409,301 |
| 591,835 | | AAA | | Series 2005-7, Class 22A1, 5.507% due 9/1/35 (b) | | | 587,485 |
| | | | | Bear Stearns Commercial Mortgage Securities: | | | |
| 400,000 | | AAA | | Series 1999-LTL1, Class AJ, 5.624% due 3/11/39 | | | 385,016 |
| 2,480,000 | | AAA | | Series 2001-T2, Class A2, 6.480% due 2/15/35 | | | 2,554,841 |
| 1,725,000 | | Aaa | | Series 2003-T12, Class A4, 4.680% due 8/13/39 (d) | | | 1,653,329 |
| 1,030,000 | | Aaa | | Series 2005-PWR7, Class A2, 4.945% due 2/11/41 (d) | | | 1,011,159 |
| 410,000 | | AAA | | Chase Commercial Mortgage Securities Corp., Series 2000-3, Class A2, 7.319% due 10/15/32 | | | 427,468 |
| 3,647,467 | | AAA | | Citigroup Mortgage Loan Trust Inc., Series 2000-34, Class A, 5.345% due 8/25/35 | | | 3,571,925 |
| 902,372 | | AAA | | Commercial Mortgage Asset Trust, Series 1999-C2, Class A2, 7.546% due 11/17/32 (a) | | | 926,878 |
| | | | | Commercial Mortgage Pass Through Certificates: | | | |
| 1,475,000 | | AAA | | Series 2004-LB2A, Class A3, 4.221% due 3/10/39 | | | 1,432,037 |
| 2,000,000 | | AAA | | Series 2004-SL4, Class AM, 5.987% due 6/10/46 (a) | | | 2,027,460 |
| | | | | Countrywide Alternative Loan Trust: | | | |
| 1,080,719 | | AAA | | Series 2005-24, Class 4A1, 5.768% due 7/20/35 (a) | | | 1,058,807 |
| 588,107 | | AAA | | Series 2005-27, Class 2A3, 6.565% due 8/25/35 (a) | | | 557,197 |
| 1,100,561 | | AAA | | Series 2005-59, Class 1A1, 5.868% due 11/20/35 (a) | | | 1,080,384 |
| 2,090,668 | | AAA | | Series 4, Class 2A1, 5.635% due 3/25/47 | | | 2,032,238 |
| | | | | Countrywide Home Loan Mortgage Pass Through Trust: | | | |
| 522,921 | | AAA | | Series 2005-11, Class 3A3, 6.068% due 4/25/35 (a) | | | 526,233 |
| 425,893 | | AAA | | Series 2005-11, Class 6A1, 5.805% due 3/25/35 (a) | | | 417,330 |
| 794,640 | | AAA | | Series 2005-R1, Class 1AF1, 5.865% due 3/25/35 (a)(e) | | | 786,469 |
| 800,000 | | AAA | | Series 2007-16, Class A1, 6.500% due 10/25/37 | | | 799,625 |
| 1,660,000 | | AAA | | Credit Suisse Mortgage Capital Certificates, Series 2005-C3, Class A3, 5.311% due 12/15/39 | | | 1,615,861 |
| | | | | CS First Boston Mortgage Securities Corp.: | | | |
| 1,807,290 | | AAA | | Series 1997-1, Class A1, 3.819% due 5/15/36 | | | 1,734,021 |
| 2,070,000 | | AAA | | Series 1998-1, Class AM, 5.100% due 8/15/38 | | | 2,001,035 |
| 1,901,273 | | AAA | | Series 2005-A2, Class 5A6, 5.500% due 11/25/35 | | | 1,893,314 |
| 32,610 | | Aaa | | Deutsche Mortgage and Asset Receiving Corp., Series 1998-C1, Class A2, 6.538% due 6/15/31 (d) | | | 32,537 |
| 2,063,070 | | Aaa | | DLJ Commercial Mortgage Corp., Series 2000-3, Class A1B, 6.460% due 3/10/32 (d) | | | 2,082,708 |
See Notes to Financial Statements.
72
Schedules of Investments
(continued)
| | | | | | | |
| Core Fixed Income Investments |
| | | |
Face Amount | | Rating‡ | | Security | | Value |
COLLATERALIZED MORTGAGE OBLIGATIONS — 17.3% (continued) |
| $ 500,271 | | AAA | | Downey Savings & Loan Association Mortgage Loan Trust, Series 2004-AR2, Class A2B, 5.938% due 11/19/44 (a) | | $ | 489,951 |
| | | | | Federal Home Loan Mortgage Corp. (FHLMC): | | | |
| 500,554 | | AAA | | Series 1565, Class G, 6.000% due 8/15/08 (b) | | | 499,563 |
| 8,053 | | AAA | | Series 1865, Class DA, 12.200% due 2/15/24 (a)(g) | | | 1,214 |
| 600,000 | | AAA | | Series 2538, Class CB, 5.000% due 12/15/17 | | | 576,766 |
| 906,993 | | AAA | | STRIPS, Series 1998-C2, Class IO, 5.500% due 8/1/35 (g) | | | 238,823 |
| 1,348,935 | | AAA | | Structured Pass Through Securities, Series T-61, Class 1A1, 6.422% due 7/25/44 (a)(b) | | | 1,343,779 |
| 11,287,141 | | AAA | | Federal Home Loan Mortgage Corp. (FHLMC), Series 3346, Class SC, 0.939% due 10/15/33 (a) | | | 722,221 |
| | | | | Federal National Mortgage Association (FNMA): | | | |
| 60,797 | | AAA | | Series 1999-18, Class A, 5.500% due 10/18/27 | | | 60,965 |
| 87,096 | | AAA | | Series 2000-34, Class F, 5.955% due 10/25/30 (a)(b) | | | 88,066 |
| 208,984 | | AAA | | Series 2002-34, Class FE, 5.938% due 5/18/32 (a)(b) | | | 209,304 |
| 940,000 | | AAA | | Series 2002-T3, Class B, 5.763% due 12/25/11 | | | 957,016 |
| 270,000 | | AAA | | Series 2003-16, Class BC, 5.000% due 3/25/18 | | | 261,390 |
| 1,189,595 | | AAA | | Series 2004-25, Class PA, 5.500% due 10/25/30 | | | 1,189,405 |
| 762,219 | | AAA | | Series 2004-36, Class BS, 5.500% due 11/25/30 | | | 764,561 |
| 358,062 | | AAA | | Series 2004-88, Class HA, 6.500% due 7/25/34 | | | 367,192 |
| 759,978 | | AAA | | Series 2005-105-1, Class TL, 5.500% due 11/25/31 | | | 762,419 |
| 1,749,789 | | AAA | | Series 2005-47, Class PA, 5.500% due 9/25/24 (a) | | | 1,753,309 |
| 1,668,157 | | AAA | | Series 2962, Class YC, 4.500% due 9/15/14 | | | 1,657,622 |
| 1,446,460 | | AAA | | Series 3110, Class HA, 5.500% due 1/15/27 | | | 1,451,860 |
| 1,646,549 | | AAA | | Series 3117, Class PN, 5.000% due 11/15/21 (b) | | | 1,644,834 |
| 1,084,780 | | AAA | | Series 3131, Class MA, 5.500% due 11/15/27 | | | 1,090,042 |
| 3,483,367 | | AAA | | STRIPS, Series 2005-105, Class 19, 5.000% due 6/1/35 | | | 927,379 |
| | | | | Federal National Mortgage Association (FNMA), Grantor Trust: | | | |
| 277,309 | | AAA | | Series 2000-T06, Class A3, 6.382% due 1/25/28 (a) | | | 284,326 |
| 169,914 | | AAA | | Series 2002-T06, Class A1, 3.310% due 2/25/32 | | | 157,914 |
| | | | | First Union National Bank Commercial Mortgage: | | | |
| 1,410,249 | | AAA | | Series 1999-C4, Class A2, 7.390% due 12/15/31 | | | 1,457,642 |
| 1,700,000 | | AAA | | Series 2001-C2, Class A2, 6.663% due 1/12/43 | | | 1,760,126 |
| | | | | GE Capital Commercial Mortgage Corp.: | | | |
| 1,925,000 | | AAA | | Series 2002-20K, Class A5, 4.772% due 6/10/48 | | | 1,835,417 |
| 1,850,000 | | AAA | | Series 2005-C4, Class A4, 5.512% due 11/10/45 (a) | | | 1,828,763 |
| 2,400,000 | | AAA | | Series 2007, Class A4, 5.540% due 12/10/49 (a) | | | 2,367,331 |
| | | | | GMAC Commercial Mortgage Securities Inc.: | | | |
| 82,388 | | Aaa | | Series 1998-C1, Class A2, 6.700% due 5/15/30 (d) | | | 82,407 |
| 1,950,000 | | AAA | | Series 1999-1, Class A4, 4.547% due 12/10/41 | | | 1,887,130 |
| 672,345 | | Aaa | | Series 1999-C3, Class A2, 7.179% due 8/15/36 (d) | | | 689,503 |
| 975,000 | | AAA | | Series 2000-C2, Class B, 7.594% due 8/16/33 | | | 1,027,846 |
| 1,745,000 | | AAA | | Series 2001-C1, Class A2, 6.465% due 4/15/34 | | | 1,795,462 |
| | | | | Government National Mortgage Association (GNMA): | | | |
| 174,442 | | AAA | | Series 2000-35, Class F, 6.139% due 12/16/25 (a)(b) | | | 175,343 |
| 146,158 | | AAA | | Series 2002-21, Class FV, 5.989% due 3/16/32 (a)(b) | | | 146,406 |
| 744,276 | | AAA | | Series 2004-65, Class VA, 6.000% due 6/20/15 | | | 758,833 |
| | | | | GS Mortgage Securities Corp. II: | | | |
| 910,000 | | Aaa | | Series 2001-C1, Class A4, 5.560% due 11/10/39 (d) | | | 903,390 |
| 300,000 | | AAA | | Series 2001-ROCK, Class A2, 6.624% due 5/3/18 (b)(e) | | | 316,531 |
| 1,225,000 | | AAA | | Series 2005-GG4, Class A4, 4.761% due 7/10/39 | | | 1,164,057 |
| | | | | GSR Mortgage Loan Trust: | | | |
| 3,774,907 | | AAA | | Series , Class 6A1, 5.250% due 7/25/35 | | | 3,626,859 |
| 601,435 | | AAA | | Series 2005-AR6, Class 2A1, 4.539% due 9/25/35 (a) | | | 593,167 |
| 57,085,541 | | AAA | | Harborview Mortgage Loan Trust, Series 2007-GG9, Class X2A, 0.612% due 10/19/35 (a) | | | 535,177 |
See Notes to Financial Statements.
73
Schedules of Investments
(continued)
| | | | | | | |
| Core Fixed Income Investments |
| | | |
Face Amount | | Rating‡ | | Security | | Value |
COLLATERALIZED MORTGAGE OBLIGATIONS — 17.3% (continued) |
| $ 12,971 | | AAA | | Impac CMB Trust, Series 2003-1, Class 1A1, 6.305% due 3/25/33 (a) | | $ | 12,821 |
| | | | | Indymac Index Mortgage Loan Trust: | | | |
| 465,172 | | AAA | | Series 2004-AR15, Class 1A1, 5.065% due 2/25/35 (a) | | | 464,659 |
| 240,843 | | AAA | | Series 2005-AR15, Class A2, 5.099% due 9/25/35 (a) | | | 235,329 |
| | | | | JP Morgan Chase Commercial Mortgage Securities Corp.: | | | |
| 635,000 | | AAA | | Series 2003-C1, Class A2, 4.985% due 1/12/37 | | | 619,916 |
| 80,000 | | Aaa | | Series 2005-CB12, Class A4, 4.895% due 9/12/37 (d) | | | 76,571 |
| 100,000 | | Aaa | | Series 2005-CB13, Class A4, 5.472% due 1/12/43 (a)(d) | | | 98,517 |
| 1,200,000 | | Aaa | | Series 2005-LDP4, Class A4, 4.918% due 10/15/42 (a)(d) | | | 1,149,719 |
| | | | | JP Morgan Mortgage Trust: | | | |
| 705,357 | | AAA | | Series 2001-A1, Class 6T1, 5.023% due 2/1/35 (b) | | | 687,075 |
| 2,340,463 | | AAA | | Series 2006-A2, Class 5A3, 3.755% due 11/25/33 (a) | | | 2,303,891 |
| | | | | LB-UBS Commercial Mortgage Trust: | | | |
| 2,895,000 | | Aaa | | Series 2001-C2, Class B, 6.799% due 9/15/34 (d) | | | 3,022,296 |
| 1,150,000 | | AAA | | Series 2004-C6, Class A2, 4.187% due 8/15/29 | | | 1,125,614 |
| 310,000 | | AAA | | Series 2005-C3, Class A5, 4.739% due 7/15/30 | | | 294,395 |
| 400,000 | | AAA | | Series 2005-C3, Class AAB, 4.664% due 7/15/30 | | | 385,080 |
| 805,000 | | AAA | | Series 2006-C6, Class A4, 5.372% due 9/15/39 | | | 789,204 |
| 500,000 | | AAA | | LB-UBS Commercial Mortgage Trust, Series 2005-F, Class AM, 5.712% due 3/15/39 | | | 494,414 |
| | | | | Lehman XS Trust: | | | |
| 619,579 | | AAA | | Series 2005-5N, Class 1A1, 5.805% due 11/25/35 (a) | | | 608,688 |
| 457,782 | | AAA | | Series 2005-7N, Class 1A1B, 5.805% due 12/25/35 (a) | | | 443,478 |
| | | | | MASTR Adjustable Rate Mortgages Trust: | | | |
| 1,900,000 | | AAA | | Series 2004-13, Class 3A7, 3.786% due 11/21/34 (a) | | | 1,865,868 |
| 236,685 | | AAA | | Series 2004-4, Class 4A1, 5.218% due 5/25/34 (a)(b) | | | 235,247 |
| | | | | Merrill Lynch Mortgage Investors Inc.: | | | |
| 1,184,567 | | AAA | | Series 2005-3, Class 4A3, 5.031% due 5/1/34 | | | 1,131,636 |
| 398,514 | | AAA | | Series 2005-A2, Class A2, 4.489% due 2/25/35 (a) | | | 391,473 |
| 670,000 | | AAA | | Merrill Lynch Mortgage Trust, Series 2006-C1, Class A4, 5.843% due 5/12/39 (a) | | | 674,670 |
| | | | | Merrill Lynch/Countrywide Commercial Mortgage Trust: | | | |
| 400,000 | | AAA | | Series 2001-C2, Class A4, 5.378% due 8/12/48 | | | 390,041 |
| 1,630,000 | | Aaa | | Series 2005-5N, Class A4, 5.485% due 3/12/51 (d) | | | 1,599,649 |
| | | | | MLCC Mortgage Investors Inc.: | | | |
| | | | | Series 2005-1, Class 2A1: | | | |
| 219,379 | | Aaa | | 4.971% due 4/25/35 (a)(d) | | | 217,177 |
| 672,761 | | Aaa | | 4.971% due 4/25/35 (a)(d) | | | 666,008 |
| | | | | Morgan Stanley Capital I: | | | |
| 1,700,000 | | Aaa | | Series 2003-IQ4, Class A2, 4.070% due 5/15/40 (d) | | | 1,585,770 |
| 410,000 | | AAA | | Series 2004-8AR, Class A4, 5.690% due 4/15/49 (a) | | | 407,725 |
| 480,000 | | AAA | | Series 2005-HQ6, Class A4A, 4.989% due 8/13/42 | | | 462,708 |
| 1,300,000 | | AAA | | Series 2006-BC3, Class A4, 5.804% due 6/11/42 | | | 1,297,868 |
| 910,638 | | AAA | | Morgan Stanley Mortgage Loan Trust, Series 2004-8AR, Class 4A2, 5.350% due 10/25/34 (a) | | | 914,325 |
| 33,422 | | AAA | | Nationslink Funding Corp., Series 1999-LTL1, Class A2, 6.867% due 1/22/26 | | | 34,145 |
| | | | | Prime Mortgage Trust: | | | |
| 1,221,700 | | AAA | | Series 2006-DR1, Class 1A1, 5.500% due 5/25/35 (e) | | | 1,204,639 |
| 580,060 | | AAA | | Series 2006-DR1, Class 1A2, 6.000% due 5/25/35 (e) | | | 581,161 |
| 2,769,402 | | AAA | | Series 2006-DR1, Class 2A1, 5.500% due 5/25/36 (e) | | | 2,732,141 |
| 3,020,976 | | AAA | | Residential Accredit Loans Inc., Series 2006-WMC1, Class A10, 6.000% due 6/25/37 | | | 3,023,808 |
| 280,568 | | AAA | | Residential Asset Mortgage Products Inc., Series 2004-SL4, Class A5, 7.500% due 7/25/32 | | | 286,618 |
| | | | | Small Business Administration: | | | |
| 475,648 | | NR | | Series 1999-P10B, Class 1, 7.540% due 8/10/09 (b) | | | 487,386 |
| 672,708 | | NR | | Series 2000-P10A, Class 1, 8.017% due 2/10/10 (b) | | | 697,169 |
| 1,032,809 | | NR | | Series 2005-P10A, Class 1, 4.638% due 2/10/10 | | | 1,005,840 |
See Notes to Financial Statements.
74
Schedules of Investments
(continued)
| | | | | | | |
| Core Fixed Income Investments |
| | | |
Face Amount | | Rating‡ | | Security | | Value |
COLLATERALIZED MORTGAGE OBLIGATIONS — 17.3% (continued) |
| | | | | Small Business Administration Participation Certificates: | | | |
| $ 951,479 | | NR | | Series 1993-20K, Class 1, 6.150% due 11/1/13 (b) | | $ | 965,490 |
| 282,227 | | NR | | Series 1995-20J, Class 1, 6.850% due 10/1/15 | | | 289,114 |
| 661,638 | | NR | | Series 1995-20K, Class 1, 6.650% due 11/1/15 (b) | | | 676,612 |
| 416,554 | | NR | | Series 1996-20G, Class 1, 7.700% due 7/1/16 (b) | | | 432,337 |
| 2,026,610 | | NR | | Series 1999-20L, Class 1, 7.190% due 12/1/19 (b) | | | 2,114,427 |
| 1,342,043 | | NR | | Series 2000-20A, Class 1, 7.590% due 1/1/20 (b) | | | 1,410,736 |
| 1,704,887 | | NR | | Series 2002-20K, Class 1, 5.080% due 11/1/22 (b) | | | 1,698,796 |
| | | | | Structured Adjustable Rate Mortgage Loan Trust: | | | |
| 556,988 | | AAA | | Series 2004-16, Class 1A2, 4.980% due 11/25/34 (a) | | | 565,834 |
| 1,276,656 | | AAA | | Series 2004-6, Class4A1, 4.844% due 6/25/34 (a) | | | 1,253,412 |
| 521,418 | | AAA | | Series 2005-19XS, Class 1A1, 5.825% due 10/25/35 (a) | | | 512,694 |
| 3,096,073 | | AAA | | Series 2005-7N, Class 4A1, 5.509% due 7/25/35 | | | 3,045,163 |
| | | | | Structured Asset Securities Corp.: | | | |
| 18,319 | | AAA | | Series 2002-14A, Class 2A1, 6.150% due 7/25/32 (a)(b) | | | 18,243 |
| 371,450 | | AAA | | Series 2003-AL1, Class A, 3.357% due 4/25/31 (e) | | | 329,737 |
| 818,455 | | AAA | | Series 2006-BC3, Class A2, 5.555% due 10/25/36 (a)(b) | | | 808,571 |
| | | | | Thornburg Mortgage Securities Trust: | | | |
| 1,695,862 | | Aaa | | Series 2006-3, Class A2, 5.610% due 6/25/36 (a)(d) | | | 1,685,097 |
| 1,729,383 | | Aaa | | Series 2006-3, Class A3, 5.615% due 6/25/36 (a)(d) | | | 1,718,062 |
| 1,970,000 | | Aaa | | Wachovia Bank Commercial Mortgage Trust, Series 2006-C25, Class AM, 5.928% due 5/15/43 (d) | | | 1,957,425 |
| 34,739,977 | | AAA | | Wamu Mortgage Pass Through Certificates, Series 2007-0A1, Class XPPP, 0.588% due 2/25/47 | | | 482,712 |
| | | | | Washington Mutual Inc.: | | | |
| 2,061,211 | | AAA | | Series 2002-3, Class 2A, 6.205% due 1/25/47 | | | 2,036,521 |
| 970,803 | | AAA | | Series 2003-A3, Class 4A1, 5.505% due 9/25/36 | | | 962,399 |
| 1,479,747 | | AAA | | Series 2003-R1, Class A1, 6.045% due 12/25/27 (a)(b) | | | 1,479,162 |
| 100,326 | | AAA | | Series 2004-AR11, Class A, 4.550% due 10/25/34 (a) | | | 98,415 |
| 343,564 | | AAA | | Series 2004-AR12, Class A2A, 5.765% due 10/25/44 (a) | | | 340,366 |
| 1,000,000 | | AAA | | Series 2005-AR 4, Class A5, 4.672% due 4/25/35 (a) | | | 972,186 |
| 770,933 | | AAA | | Series 2005-AR15, Class A1A2, 5.785% due 11/25/45 (a) | | | 752,662 |
| 771,057 | | AAA | | Series 2005-AR19, Class A1A2, 5.795% due 12/25/45 (a) | | | 753,205 |
| 2,050,761 | | AAA | | Series 2006-AR13, Class 2A, 5.793% due 10/25/46 (a)(b) | | | 2,038,221 |
| 1,368,922 | | AAA | | Wells Fargo Mortgage Backed Securities Trust, Series 2004-H, Class A1, 4.525% due 6/25/34 (a) | | | 1,328,464 |
| | | | | | |
|
|
| | | | | TOTAL COLLATERALIZED MORTGAGE OBLIGATIONS
(Cost — $150,295,804) | | | 149,225,364 |
| | | | | | |
|
|
CORPORATE BONDS & NOTES — 16.3% | | | |
| |
Aerospace & Defense — 0.0% | | | |
| 25,000 | | B+ | | DRS Technologies Inc., Company Guaranteed Notes, 6.625% due 2/1/16 | | | 24,500 |
| 300,000 | | BBB | | Goodrich (BF) Co., Notes, 6.290% due 7/1/16 (b) | | | 314,542 |
| | | | | | |
|
|
| | | | | Total Aerospace & Defense | | | 339,042 |
| | | | | | |
|
|
| |
Airlines — 0.4% | | | |
| 751,463 | | BB | | Continental Airlines Inc. Pass Thru Certificates, 7.461% due 4/1/15 | | | 737,946 |
| | | | | Delta Air Lines Inc.: | | | |
| | | | | Pass Thru Certificates: | | | |
| 352,229 | | BBB | | 7.379% due 5/18/10 | | | 352,490 |
| 866,514 | | | | 6.619% due 3/18/11 | | | 863,467 |
| | | | | Northwest Airlines Inc.: | | | |
| 1,000,468 | | BBB | | Pass Thru Certificates, 7.041% due 4/1/22 | | | 996,091 |
| 500,000 | | BBB | | Pass Thru Certificates, 6.841% due 4/1/11 | | | 496,406 |
| | | | | | |
|
|
| | | | | Total Airlines | | | 3,446,400 |
| | | | | | |
|
|
See Notes to Financial Statements.
75
Schedules of Investments
(continued)
| | | | | | | |
| Core Fixed Income Investments |
| | | |
Face Amount | | Rating‡ | | Security | | Value |
| |
Auto Components — 0.0% | | | |
| $ 50,000 | | CCC+ | | Visteon Corp., Senior Unsecured Notes, 8.250% due 8/1/10 | | $ | 43,000 |
| | | | | | |
|
|
| |
Automobiles — 0.4% | | | |
| | | | | DaimlerChrysler NA Holding Corp.: | | | |
| | | | | Company Guaranteed Notes: | | | |
| 330,000 | | BBB+ | | 4.050% due 6/4/08 | | | 325,174 |
| 300,000 | | BBB+ | | 5.875% due 3/15/11 | | | 303,075 |
| 900,000 | | BBB+ | | 5.750% due 9/8/11 (b) | | | 906,863 |
| 285,000 | | BBB+ | | Notes, 4.875% due 6/15/10 | | | 280,490 |
| 610,000 | | CCC+ | | Ford Motor Co., 7.450% due 7/16/31 (h) | | | 460,550 |
| | | | | General Motors Corp.: | | | |
| 1,325,000 | | B- | | Debentures Notes, 8.250% due 7/15/23 (h) | | | 1,063,312 |
| 20,000 | | B- | | Senior Unsubordinated Notes, 8.375% due 7/15/33 (h) | | | 16,150 |
| | | | | | |
|
|
| | | | | Total Automobiles | | | 3,355,614 |
| | | | | | |
|
|
| |
Capital Markets — 1.4% | | | |
| 377,000 | | A+ | | Credit Suisse London, Senior Unsubordinated Notes, 2.648% due 3/24/10 (i)(e) | | | 358,338 |
| 400,000 | | B+ | | CSC Holdings Inc., Senior Unsecured Notes, 7.250% due 7/15/08 (b) | | | 401,000 |
| 20,000 | | BB- | | E*Trade Financial Corp., Senior Unsecured Notes, 7.375% due 9/15/13 | | | 17,900 |
| | | | | Goldman Sachs Group Inc.: | | | |
| | | | | Notes: | | | |
| 230,000 | | AA- | | 4.500% due 6/15/10 | | | 226,161 |
| 135,000 | | AA- | | 4.750% due 7/15/13 | | | 127,853 |
| 2,000,000 | | AA- | | 5.750% due 10/1/16 (b) | | | 1,960,828 |
| 230,000 | | A- | | Lehman Brothers Holdings Capital Trust V, Notes, 5.857% due 12/31/49 | | | 211,444 |
| | | | | Lehman Brothers Holdings Inc.: | | | |
| | | | | Notes: | | | |
| 300,000 | | A+ | | 4.500% due 7/26/10 | | | 289,222 |
| 416,000 | | A+ | | 8.920% due 2/16/17 | | | 401,430 |
| | | | | Senior Notes: | | | |
| 1,550,000 | | A+ | | 6.000% due 7/19/12 | | | 1,549,774 |
| 300,000 | | A+ | | 7.205% due 9/15/22 | | | 300,753 |
| 1,050,000 | | AA- | | Merrill Lynch & Co. Inc., Senior Unsecured Notes, 8.950% due 5/18/17 | | | 1,034,250 |
| | | | | Morgan Stanley: | | | |
| | | | | Notes: | | | |
| 60,000 | | AA- | | 3.625% due 4/1/08 | | | 59,286 |
| 25,000 | | AA- | | 6.750% due 4/15/11 | | | 26,076 |
| 1,025,000 | | AA- | | 5.550% due 4/27/17 | | | 992,190 |
| 1,375,000 | | AA | | 6.250% due 8/28/17 | | | 1,391,819 |
| | | | | Senior Unsecured Notes: | | | |
| 900,000 | | AA- | | 5.625% due 1/9/12 | | | 901,852 |
| 2,000,000 | | AA- | | 5.750% due 10/18/16 (b) | | | 1,969,668 |
| | | | | | |
|
|
| | | | | Total Capital Markets | | | 12,219,844 |
| | | | | | |
|
|
| |
Chemicals — 0.0% | | | |
| 30,000 | | B- | | Georgia Gulf Corp., Company Guaranteed Notes, 9.500% due 10/15/14 (h) | | | 27,900 |
| | | | | Lyondell Chemical Co.: | | | |
| | | | | Company Guaranteed Notes: | | | |
| 30,000 | | B+ | | 8.000% due 9/15/14 | | | 32,775 |
| 15,000 | | B+ | | 8.250% due 9/15/16 | | | 16,875 |
| 29,000 | | BB+ | | Westlake Chemical Corp., Company Guaranteed Notes, 6.625% due 1/15/16 | | | 26,825 |
| | | | | | |
|
|
| | | | | Total Chemicals | | | 104,375 |
| | | | | | |
|
|
See Notes to Financial Statements.
76
Schedules of Investments
(continued)
| | | | | | | |
| Core Fixed Income Investments |
| | | |
Face Amount | | Rating‡ | | Security | | Value |
| |
Commercial Banks — 0.9% | | | |
| $ 800,000 | | BBB- | | Banponce TRust 1, Company Guaranteed Notes, 8.327% due 2/1/27 | | $ | 834,792 |
| 200,000 | | AA | | Banque Paribas, 6.875% due 3/1/09 | | | 205,764 |
| 1,048,000 | | AA | | BNP Paribas, Notes, 9.230% due 6/8/17 | | | 1,084,472 |
| | | | | Glitnir Banki HF: | | | |
| 270,000 | | A- | | Notes, 6.330% due 7/28/11 | | | 279,806 |
| 460,000 | | BBB+ | | Subordinated Notes, 6.693% due 6/15/16 (a)(e) | | | 481,551 |
| 600,000 | | AA | | HSBC Bank USA NA/New York NY, Senior Notes, 5.430% due 9/21/07 (a)(b) | | | 600,000 |
| | | | | ICICI Bank Ltd.: | | | |
| 400,000 | | BB | | 6.375% due 4/30/22 (a)(e) | | | 375,483 |
| 150,000 | | BB | | 6.375% due 4/30/22 | | | 140,514 |
| 100,000 | | Aa3 | | Kaupthing Bank Hf, Senior Notes, 5.750% due 10/4/11 (d)(e) | | | 100,846 |
| 690,000 | | Aa3 | | Landsbanki Islands HF, Notes, 6.100% due 8/25/11 (d)(e) | | | 711,901 |
| 20,000 | | AA | | Rabobank Capital Funding II, 5.260% due 12/31/49 (a)(e) | | | 19,062 |
| 40,000 | | AA | | Rabobank Capital Funding Trust, Company Guaranteed Notes, 5.254% due 12/31/49 (a)(e) | | | 37,212 |
| 660,000 | | AA3 | | Royal Bank of Scotland Group PLC, 9.118% due 12/31/49 | | | 721,610 |
| 390,000 | | AA- | | Santander Issuances S.A Unipersonal, Subordinated Notes, 5.805% due 6/20/16 (a)(e) | | | 396,859 |
| 400,000 | | BBB | | Shinsei Finance Cayman Ltd., 6.418% due 12/31/49 (a)(e) | | | 379,480 |
| 10,000 | | A | | Sumitomo Mitsui Banking Corp./New York, 8.000% due 6/15/12 (f) | | | 11,244 |
| 190,000 | | A- | | Sun Trust Capital VIII, 6.100% due 12/1/66 | | | 165,360 |
| 230,000 | | A | | Wachovia Capital Trust III, 5.800% due 3/15/42 (a) | | | 229,605 |
| 340,000 | | A+ | | Wachovia Corp., Subordinated Notes, 5.250% due 8/1/14 | | | 333,464 |
| | | | | Wells Fargo & Co.: | | | |
| | | | | Senior Unsecured Notes: | | | |
| 420,000 | | AA+ | | 4.200% due 1/15/10 | | | 410,946 |
| 200,000 | | AA+ | | 5.300% due 8/26/11 | | | 200,319 |
| 10,000 | | AA | | Subordinated Notes, 5.000% due 11/15/14 | �� | | 9,702 |
| 150,000 | | AA- | | Wells Fargo Capital X, Company Guaranteed Notes, 5.950% due 12/15/36 | | | 141,784 |
| | | | | | |
|
|
| | | | | Total Commercial Banks | | | 7,871,776 |
| | | | | | |
|
|
| |
Commercial Services & Supplies — 0.1% | | | |
| 27,000 | | B | | DI Finance/DynCorp. International, Senior Subordinated Notes, 9.500% due 2/15/13 | | | 27,540 |
| | | | | Service Corp. International, | | | |
| | | | | Senior Unsecured Notes, | | | |
| 95,000 | | BB- | | 7.500% due 4/1/27 | | | 87,875 |
| 40,000 | | BB- | | 6.750% due 4/1/16 | | | 37,900 |
| | | | | Waste Management Inc.: | | | |
| | | | | Company Guaranteed Notes: | | | |
| 185,000 | | BBB | | 6.375% due 11/15/12 | | | 193,128 |
| 40,000 | | BBB | | 7.375% due 5/15/29 | | | 42,797 |
| 100,000 | | BBB | | 7.750% due 5/15/32 | | | 111,211 |
| 105,000 | | BB- | | Windstream Corp., Company Guaranteed Notes, 8.625% due 8/1/16 | | | 110,250 |
| | | | | | |
|
|
| | | | | Total Commercial Services & Supplies | | | 610,701 |
| | | | | | |
|
|
| |
Consumer Finance — 1.2% | | | |
| | | | | Ford Motor Credit Co.: | | | |
| | | | | Notes: | | | |
| 300,000 | | B | | 7.375% due 10/28/09 | | | 284,016 |
| 30,000 | | B | | 7.875% due 6/15/10 | | | 28,181 |
| 100,000 | | B | | 7.375% due 2/1/11 | | | 92,423 |
| | | | | Senior Notes: | | | |
| 2,600,000 | | B | | 5.800% due 1/12/09 | | | 2,450,677 |
| 85,000 | | B | | 7.250% due 10/25/11 | | | 77,554 |
| 674,000 | | B | | Senior Unsecured Notes, 10.610% due 6/15/11 | | | 672,815 |
See Notes to Financial Statements.
77
Schedules of Investments
(continued)
| | | | | | | |
| Core Fixed Income Investments |
| | | |
Face Amount | | Rating‡ | | Security | | Value |
| |
Consumer Finance — 1.2% (continued) | | | |
| | | | | GMAC LLC: | | | |
| | | | | Notes: | | | |
| $ 140,000 | | BB+ | | 4.375% due 12/10/07 | | $ | 138,201 |
| 360,000 | | BB+ | | 6.125% due 1/22/08 (h) | | | 357,568 |
| 100,000 | | BB+ | | 5.125% due 5/9/08 (h) | | | 97,453 |
| 220,000 | | BB+ | | 7.750% due 1/19/10 | | | 209,507 |
| 1,210,000 | | BB+ | | 6.625% due 5/15/12 | | | 1,048,787 |
| 2,230,000 | | BB+ | | Senior Unsubordinated Notes, 5.850% due 1/14/09 | | | 2,119,053 |
| | | | | SLM Corp.: | | | |
| | | | | Notes: | | | |
| 90,000 | | BBB+ | | 3.820% due 4/1/09 (a) | | | 82,777 |
| 625,000 | | BBB+ | | 5.375% due 5/15/14 | | | 536,283 |
| 70,000 | | BBB+ | | 5.050% due 11/14/14 | | | 58,805 |
| 80,000 | | BBB+ | | 5.625% due 8/1/33 | | | 61,089 |
| 385,000 | | BBB+ | | Senior Notes, 5.660% due 1/27/14 | | | 327,193 |
| | | | | Unsecured: | | | |
| 900,000 | | BBB+ | | 5.621% due 4/14/08 (b) | | | 862,296 |
| 440,000 | | BBB+ | | 5.000% due 10/1/13 | | | 380,951 |
| 110,000 | | AAA | | Toyota Motor Credit Corp., Notes, 2.875% due 8/1/08 | | | 107,456 |
| | | | | | |
|
|
| | | | | Total Consumer Finance | | | 9,993,085 |
| | | | | | |
|
|
| |
Containers & Packaging — 0.0% | | | |
| 10,000 | | CCC+ | | Graham Packaging Co. Inc., Company Guaranteed Notes, 9.875% due 10/15/14 (h)* | | | 9,850 |
| | | | | | |
|
|
| |
Diversified Consumer Services — 0.2% | | | |
| | | | | Hertz Corp.: | | | |
| | | | | Company Guaranteed Notes: | | | |
| 35,000 | | B | | 8.875% due 1/1/14 | | | 36,400 |
| 40,000 | | B | | 10.500% due 1/1/16 | | | 43,400 |
| 1,200,000 | | BB- | | Service Corp. International/US, Senior Unsecured Notes, 6.500% due 3/15/08 (b) | | | 1,201,222 |
| | | | | | |
|
|
| | | | | Total Diversified Consumer Services | | | 1,281,022 |
| | | | | | |
|
|
| |
Diversified Financial Services — 3.9% | | | |
| 200,000 | | A- | | AGFC Capital Trust 1, Company Guaranteed Notes, 6.000% due 1/15/67 (a) | | | 191,459 |
| 200,000 | | BBB+ | | Aiful Corp., Notes, 5.000% due 8/10/10 (e) | | | 196,618 |
| 260,000 | | A- | | American Express Co., 6.800% due 9/1/66 (a) | | | 266,699 |
| 50,000 | | BBB- | | Anadarko Finance Co., Company Guaranteed Notes, 7.500% due 5/1/31 | | | 54,425 |
| 50,000 | | AA+ | | ASIF Global Financing XIX, Secured Notes, 4.900% due 1/17/13 (e) | | | 48,383 |
| | | | | Bank of America Corp.: | | | |
| | | | | Senior Notes: | | | |
| 375,000 | | AA | | 5.625% due 10/14/16 | | | 370,327 |
| 800,000 | | AA | | 6.000% due 9/1/17 | | | 809,252 |
| 470,000 | | AA | | Senior Unsecured Notes, 5.375% due 8/15/11 | | | 472,920 |
| 580,000 | | AA- | | Subordinated Notes, 7.800% due 2/15/10 | | | 617,242 |
| 450,000 | | A | | Bank of New York Mellon Corp., Senior Subordinated Notes, 6.375% due 4/1/12 | | | 471,499 |
| | | | | Bear Stearns Cos. Inc.: | | | |
| 760,000 | | A+ | | Notes, 6.950% due 8/10/12 | | | 771,673 |
| 340,000 | | A | | Subordinated Notes, 5.550% due 1/22/17 | | | 313,587 |
| 150,000 | | AA | | Belvoir Land LLC, Notes, 5.270% due 12/15/47 (e) | | | 134,422 |
| 600,000 | | BBB- | | Capital One Capital III, Company Guaranteed Notes, 7.686% due 8/15/36 | | | 557,055 |
| 1,386,789 | | BBB- | | Cedar Brakes II LLC, Secured Notes, 9.875% due 9/1/13 (e) | | | 1,521,429 |
| 680,000 | | BB | | El Paso Performance-Linked Trust, Notes, 7.750% due 7/15/11 (e) | | | 700,088 |
| 1,100,000 | | B | | Ford Motor Credit Co., Senior Unsecured Notes, 7.800% due 6/1/12 | | | 1,027,010 |
See Notes to Financial Statements.
78
Schedules of Investments
(continued)
| | | | | | | |
| Core Fixed Income Investments |
| | | |
Face Amount | | Rating‡ | | Security | | Value |
| |
Diversified Financial Services — 3.9% (continued) | | | |
| | | | | General Electric Capital Corp.: | | | |
| | | | | Notes: | | | |
| $2,080,000 | | AAA | | 5.000% due 11/15/11 | | $ | 2,073,250 |
| 145,000 | | AAA | | 5.875% due 2/15/12 | | | 148,685 |
| 55,000 | | AAA | | 5.000% due 4/10/12 | | | 54,527 |
| 710,000 | | AAA | | 6.150% due 8/7/37 | | | 728,183 |
| 40,000 | | AAA | | Senior Unsecured Notes, 4.125% due 9/1/09 | | | 39,491 |
| 1,100,000 | | | | Subordinated Notes, 0.000% due 9/15/67 (e) | | | 2,201,476 |
| | | | | General Electric Co.: | | | |
| | | | | Notes: | | | |
| 20,000 | | AAA | | 5.450% due 1/15/13 | | | 20,175 |
| 130,000 | | AAA | | 5.000% due 2/1/13 | | | 128,403 |
| 1,000,000 | | BB+ | | GMAC LLC, Bonds, 8.000% due 11/1/31 (b) | | | 900,606 |
| 1,375,000 | | AA- | | Goldman Sachs Group Inc., Notes, 5.250% due 10/15/13 | | | 1,331,080 |
| | | | | HSBC Finance Corp.: | | | |
| | | | | Notes: | | | |
| 585,000 | | AA- | | 4.125% due 11/16/09 | | | 570,885 |
| 20,000 | | AA- | | 8.000% due 7/15/10 | | | 21,423 |
| 50,000 | | AA- | | 6.375% due 10/15/11 | | | 51,383 |
| 270,000 | | A | | ILFC E-Capital Trust II, 6.250% due 12/21/65 (a)(e) | | | 262,032 |
| 240,000 | | AA | | Irwin Land LLC, 5.300% due 12/15/35 (e) | | | 224,726 |
| 310,000 | | A | | JP Morgan Chase Capital XIII, 6.310% due 9/30/34 (a) | | | 286,836 |
| | | | | JPMorgan Chase & Co.: | | | |
| | | | | Subordinated Notes: | | | |
| 355,000 | | A+ | | 5.125% due 9/15/14 | | | 345,461 |
| 400,000 | | A+ | | 5.150% due 10/1/15 | | | 382,051 |
| | | | | JPMorgan Chase Bank: | | | |
| 429,000 | | AA | | 8.750% due 11/28/21 | | | 417,846 |
| 775,000 | | AA- | | Subordinated Notes, 6.000% due 7/5/17 | | | 789,066 |
| | | | | Lehman Brothers Holdings Inc.: | �� | | |
| 640,000 | | A+ | | Notes, 11.000% due 11/7/16 | | | 637,108 |
| 120,000 | | A+ | | Senior Notes, 5.250% due 2/6/12 | | | 116,541 |
| | | | | Merrill Lynch & Co. Inc.: | | | |
| 1,000,000 | | AA- | | Notes, 8.680% due 5/2/17 | | | 989,400 |
| 1,584,000 | | AA- | | Senior Unsecured Notes, 9.570% due 6/6/17 | | | 1,590,019 |
| 190,000 | | BBB+ | | MUFG Capital Finance 1 Ltd., 6.346% due 12/31/49 (a) | | | 182,709 |
| 3,257,370 | | AAA | | Residential Asset Securitization Trust, 6.000% due 7/25/37 | | | 3,272,190 |
| | | | | Residential Capital LLC: | | | |
| | | | | Company Guaranteed Notes: | | | |
| 875,000 | | BBB- | | 5.860% due 6/9/08 | | | 744,844 |
| 40,000 | | BBB- | | 7.460% due 4/17/09 | | | 32,050 |
| 525,000 | | BB+ | | 8.690% due 4/17/09 (e)(j) | | | 315,656 |
| 110,000 | | BBB- | | 7.595% due 5/22/09 | | | 87,037 |
| 960,000 | | BBB- | | 7.000% due 2/22/11 | | | 727,716 |
| 70,000 | | BBB | | Resona Preferred Global Securities Cayman Ltd., 7.191% due 12/31/49 (a)(e) | | | 70,495 |
| | | | | SLM Corp.: | | | |
| 3,000,000 | | BBB+ | | Notes, 3.625% due 3/17/08 (b) | | | 2,955,735 |
| 1,200,000 | | BBB+ | | Senior Notes, 5.548% due 4/18/08 (b)(f) | | | 1,183,914 |
| 637,085 | | AAA | | Structured Asset Mortgage Investments Inc., Series , Class A3, 5.788% due 7/19/35 (b) | | | 618,080 |
| 410,000 | | BB+ | | TNK-BP Finance SA, Company Guaranteed Notes, 7.500% due 7/18/16 (e) | | | 405,900 |
| | | | | | |
|
|
| | | | | Total Diversified Financial Services | | | 33,431,067 |
| | | | | | |
|
|
See Notes to Financial Statements.
79
Schedules of Investments
(continued)
| | | | | | | |
| Core Fixed Income Investments |
| | | |
Face Amount | | Rating‡ | | Security | | Value |
| |
Diversified Telecommunication Services — 1.1% | | | |
| $ 170,000 | | A | | AT&T Inc., Notes, 5.100% due 9/15/14 | | $ | 163,988 |
| | | | | Bellsouth Corp.: | | | |
| 1,900,000 | | A | | Notes, 4.240% due 4/26/08 (a)(b) | | | 1,886,805 |
| 70,000 | | A | | Senior Unsecured Notes, 4.750% due 11/15/12 | | | 67,854 |
| 295,000 | | BBB+ | | British Telecommunications PLC, Senior Unsecured Notes, 8.625% due 12/15/10 | | | 323,791 |
| 60,000 | | B- | | Cincinnati Bell Telephone Co., Senior Notes, 7.000% due 2/15/15 | | | 57,900 |
| | | | | Citizens Communications Co.: | | | |
| 20,000 | | BB+ | | Notes, 9.250% due 5/15/11 | | | 21,550 |
| | | | | Senior Unsecured Notes: | | | |
| 25,000 | | BB+ | | 7.125% due 3/15/19 | | | 23,937 |
| 55,000 | | BB+ | | 7.875% due 1/15/27 | | | 51,837 |
| 220,000 | | A- | | Deutsche Telekom International Finance BV, Senior Notes, 5.750% due 3/23/16 | | | 216,817 |
| 3,000,000 | | BBB- | | Embarq Corp., Senior Unsecured Notes, 7.082% due 6/1/16 (b) | | | 3,098,841 |
| 50,000 | | A | | GTE Corp., Debentures Notes, 6.940% due 4/15/28 | | | 52,103 |
| 10,000 | | B | | Intelsat Bermuda Ltd., Company Guaranteed Notes, 9.250% due 6/15/16 | | | 10,350 |
| 65,000 | | B- | | Intelsat Corp., Company Guaranteed Notes, 9.000% due 6/15/16 | | | 66,625 |
| 95,000 | | CCC+ | | Level 3 Financing Inc., Company Guaranteed Notes, 9.250% due 11/1/14 | | | 91,912 |
| | | | | Qwest Communications International Inc.: | | | |
| | | | | Company Guaranteed Notes: | | | |
| 313,000 | | B+ | | 9.058% due 2/15/09 (a)(j) | | | 315,347 |
| 20,000 | | B+ | | 7.250% due 2/15/11 | | | 19,900 |
| 300,000 | | BBB+ | | Royal KPN NV, Senior Unsubordinated Notes, 8.375% due 10/1/30 | | | 340,687 |
| | | | | Sprint Capital Corp.: | | | |
| | | | | Company Guaranteed Notes: | | | |
| 100,000 | | BBB | | 6.125% due 11/15/08 | | | 100,534 |
| 20,000 | | BBB | | 8.750% due 3/15/32 | | | 23,150 |
| | | | | Telecom Italia Capital SA: | | | |
| | | | | Company Guaranteed Notes: | | | |
| 30,000 | | BBB+ | | 5.250% due 11/15/13 | | | 28,941 |
| 160,000 | | BBB+ | | 4.950% due 9/30/14 | | | 150,099 |
| 770,000 | | BBB+ | | 5.250% due 10/1/15 | | | 727,425 |
| 700,000 | | A | | Verizon Communications Inc., Senior Unsecured Notes, Senior Unsecured Notes,
5.550% due 2/15/16 (b) | | | 689,886 |
| | | | | Verizon Global Funding Corp.: | | | |
| 5,000 | | A | | Debenture Notes, Senior Unsecured Notes, 6.875% due 6/15/12 | | | 5,312 |
| 165,000 | | A | | Senior Unsecured Notes, 7.375% due 9/1/12 | | | 179,123 |
| 165,000 | | A | | Verizon Maryland Inc., Senior Unsecured Notes, 5.125% due 6/15/33 | | | 136,542 |
| 340,000 | | A | | Verizon New York Inc., 6.875% due 4/1/12 | | | 358,589 |
| | | | | | |
|
|
| | | | | Total Diversified Telecommunication Services | | | 9,209,845 |
| | | | | | |
|
|
| |
Electric Utilities — 0.8% | | | |
| 85,000 | | BB- | | AES Corp., Secured Notes, 8.750% due 5/15/13 (e) | | | 88,825 |
| 900,000 | | BBB+ | | DPL Inc., Senior Notes, 8.000% due 3/31/09 (b)(k) | | | 937,023 |
| 135,000 | | BBB | | Exelon Corp., Senior Unsecured Notes, 5.625% due 6/15/35 | | | 120,456 |
| | | | | FirstEnergy Corp.: | | | |
| 40,000 | | BBB- | | 6.450% due 11/15/11 | | | 41,350 |
| 640,000 | | BBB- | | 7.375% due 11/15/31 | | | 707,397 |
| 145,000 | | A | | Florida Power & Light Co., 1st Mortgage Notes, 4.950% due 6/1/35 | | | 123,430 |
| 195,000 | | A- | | Florida Power Corp., 1st Mortgage Notes, 5.900% due 3/1/33 | | | 187,939 |
| 5,000 | | A+ | | Hydro-Quebec, Global Debentures, Series JL, 6.300% due 5/11/11 | | | 5,249 |
| | | | | Midamerican Energy Holdings Co.: | | | |
| 225,000 | | BBB+ | | 6.500% due 9/15/37 | | | 227,558 |
See Notes to Financial Statements.
80
Schedules of Investments
(continued)
| | | | | | | |
| Core Fixed Income Investments |
| | | |
Face Amount | | Rating‡ | | Security | | Value |
| |
Electric Utilities — 0.8% (continued) | | | |
| | | | | Senior Unsecured Notes: | | | |
| $ 40,000 | | BBB+ | | 5.875% due 10/1/12 | | $ | 40,859 |
| 250,000 | | BBB+ | | 5.950% due 5/15/37 | | | 235,291 |
| 618,882 | | BB+ | | Midwest Generation LLC, Pass Thru Certificates, 8.300% due 7/2/09 (b) | | | 629,766 |
| 110,000 | | BBB+ | | Niagara Mohawk Power Corp., Senior Notes, 7.750% due 10/1/08 | | | 112,362 |
| 15,000 | | B | | NRG Energy Inc., Company Guaranteed Notes, 7.375% due 1/15/17 | | | 14,775 |
| 250,000 | | BBB+ | | Pacific Gas & Electric Co, 6.050% due 3/1/34 | | | 245,659 |
| 800,000 | | BBB | | PSEG Power LLC, Company Guaranteed Notes, 7.750% due 4/15/11 (b) | | | 858,552 |
| 95,000 | | A- | | Public Service Electric & Gas Co., 1St Mortgage Notes, 5.250% due 7/1/35 | | | 84,080 |
| 300,000 | | BBB+ | | Scottish Power PLC, 4.910% due 3/15/10 | | | 298,430 |
| 175,000 | | AA | | SP PowerAssets Ltd., Notes, 3.800% due 10/22/08 (e) | | | 172,106 |
| 2,000,000 | | BB+ | | SWEPCO Capital I, Company Guaranteed Notes, 5.250% due 10/1/43 | | | 1,996,510 |
| | | | | | |
|
|
| | | | | Total Electric Utilities | | | 7,127,617 |
| | | | | | |
|
|
| |
Electronic Equipment & Instruments — 0.0% | | | |
| | | | | NXP BV / NXP Funding LLC: | | | |
| 75,000 | | B | | Company Guaranteed Notes, 9.500% due 10/15/15 | | | 65,062 |
| 15,000 | | BB | | Secured Notes, 7.875% due 10/15/14 | | | 13,594 |
| | | | | | |
|
|
| | | | | Total Electronic Equipment & Instruments | | | 78,656 |
| | | | | | |
|
|
| |
Energy Equipment & Services — 0.1% | | | |
| | | | | Halliburton Co.: | | | |
| 100,000 | | A | | Debentures Notes, 7.600% due 8/15/96 (e) | | | 112,469 |
| 350,000 | | A | | Senior Unsecured Notes, 5.500% due 10/15/10 | | | 354,410 |
| 60,000 | | BB- | | Pride International Inc., Senior Unsecured Notes, 7.375% due 7/15/14 | | | 60,900 |
| 58,000 | | BB | | Southern Natural Gas Co., Notes, 8.000% due 3/1/32 | | | 65,119 |
| 110,000 | | BB | | Tennessee Gas Pipeline Co., Debentures Notes, 7.625% due 4/1/37 | | | 118,515 |
| | | | | | |
|
|
| | | | | Total Energy Equipment & Services | | | 711,413 |
| | | | | | |
|
|
| |
Food Products — 0.1% | | | |
| 600,000 | | A- | | Kraft Foods Inc., Senior Unsecured Notes, 6.500% due 8/11/17 | | | 615,181 |
| | | | | | |
|
|
| |
Gas Utilities — 0.0% | | | |
| 200,000 | | BBB | | CenterPoint Energy Resources Corp., Notes, 6.150% due 5/1/16 | | | 203,088 |
| | | | | | |
|
|
| |
Health Care Providers & Services — 0.3% | | | |
| 50,000 | | Ba1 | | AmerisourceBergen Corp., Company Guaranteed Notes, 5.875% due 9/15/15 (d) | | | 48,643 |
| 140,000 | | B | | DaVita Inc., Company Guaranteed Notes, 6.625% due 3/15/13 | | | 136,150 |
| 41,000 | | B+ | | Fresenius Medical Care Capital Trust II, Company Guaranteed Notes, 7.875% due 2/1/08 | | | 41,102 |
| | | | | HCA Inc.: | | | |
| 120,000 | | B- | | Debentures Notes, 7.190% due 11/15/15 | | | 100,587 |
| | | | | Secured Notes: | | | |
| 1,260,000 | | BB- | | 9.250% due 11/15/16 (b)(e) | | | 1,297,800 |
| 63,000 | | BB- | | 9.625% due 11/15/16 (e)(l) | | | 65,284 |
| | | | | Senior Unsecured Notes: | | | |
| 30,000 | | B- | | 7.875% due 2/1/11 | | | 29,101 |
| 410,000 | | B- | | 6.250% due 2/15/13 | | | 352,600 |
| 29,000 | | B- | | 6.500% due 2/15/16 | | | 23,780 |
| | | | | Tenet Healthcare Corp.: | | | |
| | | | | Senior Notes: | | | |
| 76,000 | | CCC+ | | 6.375% due 12/1/11 | | | 64,220 |
| 311,000 | | CCC+ | | 9.875% due 7/1/14 (h) | | | 276,790 |
| 150,000 | | BBB+ | | WellPoint Inc., 5.950% due 12/15/34 | | | 138,879 |
| | | | | | |
|
|
| | | | | Total Health Care Providers & Services | | | 2,574,936 |
| | | | | | |
|
|
See Notes to Financial Statements.
81
Schedules of Investments
(continued)
| | | | | | | |
| Core Fixed Income Investments |
| | | |
Face Amount | | Rating‡ | | Security | | Value |
| |
Hotels, Restaurants & Leisure — 0.1% | | | |
| | | | | Boyd Gaming Corp.: | | | |
| | | | | Senior Subordinated Notes: | | | |
| $ 25,000 | | B+ | | 6.750% due 4/15/14 | | $ | 23,750 |
| 80,000 | | B+ | | 7.125% due 2/1/16 | | | 75,600 |
| 10,000 | | BB+ | | Hilton Hotels Corp., Senior Unsecured Notes, 7.625% due 5/15/08 | | | 10,100 |
| 30,000 | | B | | Inn of the Mountain Gods Resort & Casino, Company Guaranteed Notes, 12.000% due 11/15/10 | | | 31,800 |
| | | | | Mandalay Resort Group: | | | |
| 20,000 | | BB | | Notes, 7.000% due 11/15/36 | | | 20,250 |
| 10,000 | | BB | | Senior Unsecured Notes, 9.500% due 8/1/08 | | | 10,275 |
| | | | | MGM Mirage: | | | |
| | | | | Company Guaranteed Notes: | | | |
| 35,000 | | BB | | 8.500% due 9/15/10 | | | 36,487 |
| 20,000 | | BB | | 6.625% due 7/15/15 | | | 18,925 |
| 130,000 | | BB | | 7.625% due 1/15/17 | | | 129,350 |
| 30,000 | | BB | | Senior Notes, 6.750% due 9/1/12 | | | 29,250 |
| | | | | Mohegan Tribal Gaming Authority: | | | |
| 2,000 | | B | | Company Guaranteed Notes, 6.375% due 7/15/09 | | | 1,975 |
| 10,000 | | B | | Senior Subordinated Notes, 8.000% due 4/1/12 | | | 10,187 |
| 20,000 | | B+ | | River Rock Entertainment Authority, Secured Notes, 9.750% due 11/1/11 | | | 20,600 |
| | | | | Station Casinos Inc.: | | | |
| 28,000 | | B+ | | Senior Notes, 6.000% due 4/1/12 | | | 26,110 |
| 5,000 | | B | | Senior Subordinated Notes, 6.875% due 3/1/16 | | | 4,212 |
| 95,000 | | B+ | | Senior Unsecured Notes, 7.750% due 8/15/16 | | | 91,438 |
| | | | | | |
|
|
| | | | | Total Hotels, Restaurants & Leisure | | | 540,309 |
| | | | | | |
|
|
| |
Household Products — 0.0% | | | |
| 20,000 | | CCC+ | | American Achievement Corp., Senior Subordinated Notes, 8.250% due 4/1/12 | | | 19,500 |
| | | | | | |
|
|
| |
Independent Power Producers & Energy Traders — 0.1% | | | |
| | | | | NRG Energy Inc.: | | | |
| | | | | Company Guaranteed Notes: | | | |
| 115,000 | | B | | 7.250% due 2/1/14 | | | 114,138 |
| 40,000 | | B | | 7.375% due 2/1/16 | | | 39,600 |
| | | | | TXU Corp.: | | | |
| 755,000 | | BB- | | Notes, 6.550% due 11/15/34 | | | 600,891 |
| | | | | Senior Unsecured Notes: | | | |
| 120,000 | | BB- | | 5.550% due 11/15/14 | | | 99,045 |
| 160,000 | | BB- | | 6.500% due 11/15/24 | | | 129,201 |
| | | | | | |
|
|
| | | | | Total Independent Power Producers & Energy Traders | | | 982,875 |
| | | | | | |
|
|
| |
Industrial Conglomerates — 0.1% | | | |
| | | | | Tyco International Group SA: | | | |
| | | | | Company Guaranteed Notes: | | | |
| 30,000 | | BBB | | 6.125% due 11/1/08 | | | 30,292 |
| 10,000 | | BBB | | 6.125% due 1/15/09 | | | 10,153 |
| 300,000 | | BBB | | 6.375% due 10/15/11 | | | 314,506 |
| 420,000 | | BBB | | 6.000% due 11/15/13 | | | 423,153 |
| 236,000 | | BBB | | 6.875% due 1/15/29 | | | 256,019 |
| | | | | | |
|
|
| | | | | Total Industrial Conglomerates | | | 1,034,123 |
| | | | | | |
|
|
| |
Insurance — 0.7% | | | |
| 245,000 | | AAA | | Berkshire Hathaway Finance Corp., Company Guaranteed Notes, 4.750% due 5/15/12 | | | 243,986 |
| 700,000 | | BBB+ | | Metlife Inc., 6.400% due 12/15/36 | | | 638,724 |
See Notes to Financial Statements.
82
Schedules of Investments
(continued)
| | | | | | | |
| Core Fixed Income Investments |
| | | |
Face Amount | | Rating‡ | | Security | | Value |
| |
Insurance — 0.7% (continued) | | | |
| $2,900,000 | | AA | | Metropolitan Life Global Funding I, Notes, 5.560% due 5/17/10 (b) | | $ | 2,875,655 |
| 720,000 | | BBB | | Travelers Cos. Inc., 6.250% due 3/15/37 | | | 679,653 |
| 1,200,000 | | BBB | | United Dominion, 4.250% due 1/15/09 | | | 1,179,073 |
| | | | | | |
|
|
| | | | | Total Insurance | | | 5,617,091 |
| | | | | | |
|
|
| |
IT Services — 0.0% | | | |
| 110,000 | | BBB- | | Electronic Data Systems Corp., 7.125% due 10/15/09 | | | 113,223 |
| 60,000 | | B- | | Sungard Data Systems Inc., Company Guaranteed Notes, 9.125% due 8/15/13 | | | 62,250 |
| | | | | | |
|
|
| | | | | Total IT Services | | | 175,473 |
| | | | | | |
|
|
| |
Media — 1.0% | | | |
| | | | | Clear Channel Communications Inc.: | | | |
| | | | | Senior Notes: | | | |
| 10,000 | | B+ | | 4.625% due 1/15/08 | | | 9,901 |
| 310,000 | | B+ | | 5.500% due 9/15/14 | | | 242,131 |
| 100,000 | | B+ | | 4.900% due 5/15/15 | | | 74,111 |
| 10,000 | | B+ | | Senior Unsecured Notes, 6.250% due 3/15/11 | | | 9,044 |
| | | | | Comcast Corp.: | | | |
| | | | | Company Guaranteed Notes: | | | |
| 30,000 | | BBB+ | | 8.375% due 3/15/13 | | | 33,595 |
| 350,000 | | BBB+ | | 6.500% due 1/15/15 | | | 361,556 |
| 210,000 | | BBB+ | | 8.875% due 5/1/17 | | | 248,336 |
| 30,000 | | BBB+ | | 5.875% due 2/15/18 | | | 29,352 |
| 80,000 | | BBB+ | | 7.050% due 3/15/33 | | | 83,259 |
| 360,000 | | BBB+ | | 6.500% due 11/15/35 | | | 351,597 |
| 250,000 | | BBB+ | | 6.450% due 3/15/37 | | | 242,185 |
| 160,000 | | BBB- | | COX Communications Inc., Notes, 3.875% due 10/1/08 | | | 157,080 |
| | | | | CSC Holdings Inc.: | | | |
| 4,000 | | B+ | | Debentures Notes, 7.875% due 2/15/18 | | | 3,770 |
| 65,000 | | B+ | | Senior Notes, 7.625% due 4/1/11 | | | 64,350 |
| 70,000 | | BB- | | DirecTV Holdings LLC/DirecTV Financing Co., Senior Notes, 8.375% due 3/15/13 | | | 72,625 |
| | | | | Echostar DBS Corp.: | | | |
| | | | | Company Guaranteed Notes: | | | |
| 50,000 | | BB- | | 6.625% due 10/1/14 | | | 48,500 |
| 50,000 | | BB- | | 7.125% due 2/1/16 | | | 49,125 |
| 20,000 | | BB- | | Echostar DBS Corp., Company Guaranteed Notes, 7.000% due 10/1/13 | | | 19,850 |
| 145,000 | | B+ | | Idearc Inc., Company Guaranteed Notes, 8.000% due 11/15/16 | | | 143,913 |
| | | | | Lamar Media Corp.: | | | |
| | | | | Company Guaranteed Notes: | | | |
| 40,000 | | B | | 7.250% due 1/1/13 | | | 40,000 |
| 50,000 | | B | | 6.625% due 8/15/15 | | | 48,000 |
| | | | | Liberty Media LLC: | | | |
| 10,000 | | BB+ | | Senior Notes, 5.700% due 5/15/13 | | | 9,295 |
| 640,000 | | BB+ | | Senior Unsecured Notes, 7.875% due 7/15/09 | | | 665,273 |
| | | | | News America Inc.: | | | |
| | | | | Company Guaranteed Notes: | | | |
| 125,000 | | BBB | | 8.500% due 2/23/25 | | | 147,367 |
| 315,000 | | BBB | | 7.625% due 11/30/28 | | | 335,632 |
| 35,000 | | BBB | | 6.200% due 12/15/34 | | | 32,602 |
| 70,000 | | BBB- | | Rogers Cable Inc., Secured Notes, 6.750% due 3/15/15 | | | 72,422 |
| 1,000 | | B | | Sinclair Broadcast Group Inc., Company Guaranteed Notes, 8.000% due 3/15/12 | | | 1,015 |
| 5,000 | | B | | Sun Media Corp., Company Guaranteed Notes, 7.625% due 2/15/13 | | | 4,913 |
See Notes to Financial Statements.
83
Schedules of Investments
(continued)
| | | | | | | |
| Core Fixed Income Investments |
| | | |
Face Amount | | Rating‡ | | Security | | Value |
| |
Media — 1.0% (continued) | | | |
| | | | | Time Warner Inc.: | | | |
| | | | | Company Guaranteed Notes: | | | |
| $ 275,000 | | BBB+ | | 6.875% due 5/1/12 | | $ | 288,542 |
| 385,000 | | BBB+ | | 7.700% due 5/1/32 | | | 422,467 |
| 125,000 | | BBB+ | | Debentures Notes, 7.570% due 2/1/24 | | | 135,270 |
| 50,000 | | BBB+ | | Senior Notes, 8.375% due 7/15/33 | | | 58,197 |
| 4,000,000 | | BBB+ | | Time Warner Inc., Company Guaranteed Notes, 5.730% due 11/13/09 (b) | | | 3,968,220 |
| 280,000 | | BBB+ | | Turner Broadcasting System Inc., Senior Notes, 8.375% due 7/1/13 | | | 314,588 |
| | | | | | |
|
|
| | | | | Total Media | | | 8,788,083 |
| | | | | | |
|
|
|
Metals & Mining — 0.1% |
| 100,000 | | A | | Corp. Nacional del Cobre de Chile - CODELCO, Senior Notes, 4.750% due 10/15/14 (e) | | | 95,021 |
| 190,000 | | BB | | Freeport-McMoRan Copper & Gold Inc., Senior Unsecured Notes, 8.375% due 4/1/17 | | | 202,825 |
| 90,000 | | BB+ | | Steel Dynamics, Senior Notes, 6.750% due 4/1/15 | | | 87,075 |
| 250,000 | | BBB | | Teck Cominco Ltd., Notes, 6.125% due 10/1/35 | | | 234,779 |
| | | | | Vale Overseas Ltd.: | | | |
| | | | | Company Guaranteed Notes: | | | |
| 40,000 | | BBB | | 8.250% due 1/17/34 | | | 47,124 |
| 550,000 | | BBB | | 6.875% due 11/21/36 | | | 559,680 |
| | | | | | |
|
|
| | | | | Total Metals & Mining | | | 1,226,504 |
| | | | | | |
|
|
|
Multiline Retail — 0.0% |
| 20,000 | | BBB- | | JC Penney Corp. Inc., Debentures Notes, 7.400% due 4/1/37 | | | 20,774 |
| 80,000 | | BBB | | Macys Retail Holdings Inc., Debentures Notes, 6.790% due 7/15/27 | | | 73,135 |
| | | | | | |
|
|
| | | | | Total Multiline Retail | | | 93,909 |
| | | | | | |
|
|
|
Multi-Utilities — 0.1% |
| | | | | Dominion Resources Inc./VA: | | | |
| | | | | Senior Notes: | | | |
| 175,000 | | BBB | | 5.125% due 12/15/09 | | | 173,983 |
| 80,000 | | BBB | | 4.750% due 12/15/10 | | | 78,374 |
| 330,000 | | BBB | | 5.700% due 9/17/12 | | | 331,651 |
| 105,000 | | BBB | | Senior Unsecured Notes, 7.195% due 9/15/14 | | | 113,867 |
| 175,000 | | BBB | | Energy East Corp., 6.750% due 7/15/36 | | | 181,489 |
| | | | | | |
|
|
| | | | | Total Multi-Utilities | | | 879,364 |
| | | | | | |
|
|
|
Office Electronics — 0.0% |
| 30,000 | | BBB- | | Xerox Corp., Senior Unsecured Notes, 6.750% due 2/1/17 | | | 30,927 |
| | | | | | |
|
|
|
Oil, Gas & Consumable Fuels — 1.4% |
| 1,305,000 | | BBB- | | Anadarko Petroleum Corp., Senior Unsecured Notes, 6.450% due 9/15/36 | | | 1,272,414 |
| | | | | Atlantic Richfield Co.: | | | |
| 755,000 | | AA+ | | Debentures Notes, 9.125% due 3/1/11 | | | 860,883 |
| 40,000 | | AA+ | | Notes, 5.900% due 4/15/09 | | | 40,759 |
| | | | | Chesapeake Energy Corp.: | | | |
| | | | | Company Guaranteed Notes: | | | |
| 40,000 | | BB | | 6.375% due 6/15/15 | | | 38,450 |
| 30,000 | | BB | | 6.250% due 1/15/18 | | | 28,238 |
| 380,000 | | NR | | ChevronTexaco Capital Co., Company Guaranteed Notes, 3.500% due 9/17/07 | | | 384,140 |
| | | | | Compagnie Generale de Geophysique-Veritas: | | | |
| | | | | Company Guaranteed Notes: | | | |
| 35,000 | | B+ | | 7.500% due 5/15/15 | | | 35,350 |
| 110,000 | | B+ | | 7.750% due 5/15/17 | | | 111,650 |
| 120,000 | | B | | Complete Production Services Inc., Company Guaranteed Notes, 8.000% due 12/15/16 | | | 116,100 |
See Notes to Financial Statements.
84
Schedules of Investments
(continued)
| | | | | | | |
| Core Fixed Income Investments |
| | | |
Face Amount | | Rating‡ | | Security | | Value |
|
Oil, Gas & Consumable Fuels — 1.4% (continued) |
| $ 80,000 | | A- | | Conoco Funding Co., Company Guaranteed Notes, 7.250% due 10/15/31 | | $ | 90,269 |
| 355,000 | | A- | | ConocoPhillips Holding Co., Senior Notes, 6.950% due 4/15/29 | | | 390,253 |
| 160,000 | | B- | | Dynegy Holdings Inc., Senior Unsecured Notes, 7.750% due 6/1/19 (e) | | | 148,800 |
| | | | | Edison Mission Energy: | | | |
| | | | | Senior Notes: | | | |
| 220,000 | | BB- | | 7.200% due 5/15/19 (e) | | | 209,000 |
| 50,000 | | BB- | | 7.625% due 5/15/27 (e) | | | 46,750 |
| | | | | El Paso Corp.: | | | |
| 700,000 | | BB- | | Notes, 6.950% due 12/15/07 (b) | | | 707,037 |
| 325,000 | | BB- | | Senior Notes, 7.750% due 1/15/32 | | | 325,202 |
| 227,000 | | BB- | | Senior Unsecured Notes, 7.800% due 8/1/31 | | | 227,159 |
| 9,000 | | BB | | El Paso Natural Gas Co., 8.375% due 6/15/32 | | | 10,503 |
| | | | | Gaz Capital for Gazprom: | | | |
| 350,000 | | BBB | | Notes, 6.212% due 11/22/16 (e) | | | 338,100 |
| 300,000 | | BBB | | Senior Unsecured Notes, 6.510% due 3/7/22 (e) | | | 290,700 |
| 510,000 | | BBB- | | Hess Corp., Notes, 7.300% due 8/15/31 | | | 556,211 |
| 875,000 | | BBB- | | Kerr-McGee Corp., Company Guaranteed Notes, 7.875% due 9/15/31 | | | 1,010,242 |
| | | | | Kinder Morgan Energy Partners LP: | | | |
| 70,000 | | BBB | | Senior Notes, 6.300% due 2/1/09 | | | 70,936 |
| 300,000 | | BBB | | Senior Unsecured Notes, 6.750% due 3/15/11 | | | 310,600 |
| 55,000 | | BB+ | | OPTI Canada Inc., Company Guaranteed Notes, 8.250% due 12/15/14 (e) | | | 55,963 |
| 39,000 | | BB | | Peabody Energy Corp., Company Guaranteed Notes, 6.875% due 3/15/13 | | | 39,098 |
| 370,000 | | BBB | | Pemex Project Funding Master Trust, Company Guaranteed Notes, 7.375% due 12/15/14 | | | 405,227 |
| | | | | Petrozuata Finance Inc., | | | |
| 283,000 | | | | 8.220% due 4/1/17 | | | 284,415 |
| 30,000 | | B | | Company Guaranteed Notes, 8.220% due 4/1/17 (e) | | | 30,150 |
| | | | | Pogo Producing Co.: | | | |
| 50,000 | | B+ | | Senior Subordinated Notes, 6.875% due 10/1/17 | | | 50,625 |
| 25,000 | | B+ | | Senior Unsecured Notes, 6.625% due 3/15/15 | | | 25,313 |
| 1,455,000 | | BB | | Sabine Pass LNG LP, Secured Notes, 7.250% due 11/30/13 | | | 1,418,625 |
| 90,000 | | AAA | | SeaRiver Maritime Inc., Company Guaranteed Notes, zero coupon bond to yield, 3.904% due 9/1/12 | | | 70,754 |
| 25,000 | | B1 | | SemGroup LP, Senior Notes, 8.750% due 11/15/15 (d)(e) | | | 24,188 |
| 500,000 | | BB- | | Sonat Inc, Notes, 6.750% due 10/1/07 | | | 503,750 |
| 40,000 | | BB | | Southern Natural Gas Co., Notes, 5.900% due 4/1/17 | | | 39,080 |
| 49,000 | | BB- | | Teekay Shipping Corp., Senior Notes, 8.875% due 7/15/11 | | | 50,715 |
| 50,000 | | BBB | | Western Oil Sands Inc., Secured Notes, 8.375% due 5/1/12 | | | 55,375 |
| | | | | Williams Cos. Inc.: | | | |
| 323,000 | | BB | | Notes, 8.750% due 3/15/32 | | | 369,028 |
| 130,000 | | BB | | Senior Unsecured Notes, 7.750% due 6/15/31 | | | 135,525 |
| | | | | XTO Energy Inc.: | | | |
| | | | | Senior Notes: | | | |
| 540,000 | | BBB | | 7.500% due 4/15/12 | | | 589,005 |
| 30,000 | | BBB | | 6.250% due 4/15/13 | | | 30,949 |
| | | | | | |
|
|
| | | | | Total Oil, Gas & Consumable Fuels | | | 11,797,531 |
| | | | | | |
|
|
|
Paper & Forest Products — 0.1% |
| 1,000 | | B | | Georgia-Pacific Corp., Notes, 8.125% due 5/15/11 | | | 1,010 |
| 475,000 | | BBB | | Weyerhaeuser Co., Notes, 6.750% due 3/15/12 | | | 490,229 |
| | | | | | |
|
|
| | | | | Total Paper & Forest Products | | | 491,239 |
| | | | | | |
|
|
|
Real Estate Investment Trusts (REITs) — 1.1% |
| 675,000 | | BBB- | | Brandywine Operating Partnership LP, Company Guaranteed Notes, 4.500% due 11/1/09 | | | 662,254 |
| 625,000 | | BBB | | BRE Properties Inc., Senior Unsecured Notes, 7.450% due 1/15/11 | | | 661,989 |
| 1,100,000 | | BBB | | Developers Diversified Realty Corp., Notes, 5.250% due 4/15/11 | | | 1,094,767 |
| 1,100,000 | | BBB- | | Equity One Inc., Company Guaranteed Notes, 3.875% due 4/15/09 | | | 1,072,341 |
See Notes to Financial Statements.
85
Schedules of Investments
(continued)
| | | | | | | |
| Core Fixed Income Investments |
| | | |
Face Amount | | Rating‡ | | Security | | Value |
|
Real Estate Investment Trusts (REITs) — 1.1% (continued) |
| | | | | Forest City Enterprises Inc.: | | | |
| $ 10,000 | | BB- | | Notes, 7.625% due 6/1/15 | | $ | 9,450 |
| 19,000 | | BB- | | Senior Notes, 6.500% due 2/1/17 | | | 17,005 |
| | | | | Health Care Property Investors Inc., Senior Notes: | | | |
| 820,000 | | BBB | | 5.950% due 9/15/11 | | | 828,829 |
| 700,000 | | BBB | | 6.450% due 6/25/12 | | | 719,711 |
| 9,000 | | BBB- | | Health Care REIT Inc., Notes, 8.000% due 9/12/12 | | | 9,889 |
| 30,000 | | BB | | Host Marriott LP, Company Guaranteed Notes, 6.750% due 6/1/16 | | | 29,325 |
| 300,000 | | BBB | | iStar Financial Inc., Senior Unsecured Notes, 5.800% due 3/15/11 (b) | | | 296,337 |
| 1,700,000 | | BBB- | | Nationwide Health Properties Inc., Notes, 7.920% due 3/18/09 | | | 1,748,651 |
| 330,000 | | B- | | Realogy Corp., Senior Subordinated Notes, Senior Subordinated Notes, 12.375% due 4/15/15 (e) | | | 243,788 |
| | | | | Rouse Co.: | | | |
| 980,000 | | BB+ | | 3.625% due 3/15/09 | | | 952,023 |
| 325,000 | | BB+ | | 5.375% due 11/26/13 | | | 299,653 |
| 800,000 | | BBB | | UDR Inc., 5.000% due 1/15/12 | | | 786,866 |
| | | | | Ventas Realty LP/Ventas Capital Corp.: | | | |
| | | | | Company Guaranteed Notes: | | | |
| 10,000 | | BB+ | | 8.750% due 5/1/09 | | | 10,425 |
| 30,000 | | BB+ | | 6.750% due 6/1/10 | | | 30,075 |
| 30,000 | | BB+ | | 9.000% due 5/1/12 | | | 32,325 |
| 20,000 | | BB+ | | 6.750% due 4/1/17 | | | 19,550 |
| | | | | | |
|
|
| | | | | Total Real Estate Investment Trusts (REITs) | | | 9,525,253 |
| | | | | | |
|
|
| |
Road & Rail — 0.0% | | | |
| 10,000 | | B- | | Kansas City Southern Railway, Company Guaranteed Notes, 9.500% due 10/1/08 | | | 10,213 |
| 20,000 | | BBB+ | | Norfolk Southern Corp., Senior Notes, 6.750% due 2/15/11 | | | 21,079 |
| | | | | Union Pacific Corp.: | | | |
| | | | | Notes: | | | |
| 45,000 | | BBB | | 6.650% due 1/15/11 | | | 46,833 |
| 140,000 | | BBB | | 5.375% due 5/1/14 | | | 137,233 |
| | | | | | |
|
|
| | | | | Total Road & Rail | | | 215,358 |
| | | | | | |
|
|
| |
Software — 0.1% | | | |
| 600,000 | | A | | Oracle Corp. and Ozark Holding Inc., 5.000% due 1/15/11 | | | 597,490 |
| | | | | | |
|
|
| |
Specialty Retail — 0.0% | | | |
| 30,000 | | B1 | | Amerigas Partners LP, Senior Unsecured Notes, 7.250% due 5/20/15 (d) | | | 29,250 |
| 60,000 | | B- | | Suburban Propane Partners LP/Suburban Energy Finance Corp., Senior Notes, 6.875% due 12/15/13 | | | 57,600 |
| | | | | | |
|
|
| | | | | Total Specialty Retail | | | 86,850 |
| | | | | | |
|
|
| |
Textiles, Apparel & Luxury Goods — 0.0% | | | |
| 30,000 | | B | | Oxford Industries Inc., Company Guaranteed Notes, 8.875% due 6/1/11 | | | 30,225 |
| | | | | | |
|
|
| |
Thrifts & Mortgage Finance — 0.3% | | | |
| 1,000,000 | | A- | | Countrywide Financial Corp., Company Guaranteed Notes, 5.580% due 3/24/09 | | | 915,853 |
| 320,000 | | A- | | Countrywide Home Loans Inc., Company Guaranteed Notes, 5.665% due 2/27/08 (a) | | | 310,047 |
| | | | | Wells Fargo Mortgage Backed Securities Trust: | | | |
| 400,000 | | AAA | | Series 7, Class 2A4, 5.775% due 4/25/36 | | | 393,035 |
| 1,190,990 | | Aaa | | Series 7, Class A96, 6.000% due 8/25/37 (d) | | | 1,186,771 |
| | | | | | |
|
|
| | | | | Total Thrifts & Mortgage Finance | | | 2,805,706 |
| | | | | | |
|
|
| |
Tobacco — 0.1% | | | |
| | | | | Altria Group Inc.: | | | |
| 300,000 | | BBB | | Debentures Notes, 7.750% due 1/15/27 | | | 366,035 |
| 145,000 | | BBB | | Senior Unsecured Notes, 7.000% due 11/4/13 | | | 157,222 |
| 85,000 | | BBB | | Reynolds American Inc., Company Guaranteed Notes, 7.250% due 6/1/12 | | | 89,528 |
| | | | | | |
|
|
| | | | | Total Tobacco | | | 612,785 |
| | | | | | |
|
|
See Notes to Financial Statements.
86
Schedules of Investments
(continued)
| | | | | | | | |
| Core Fixed Income Investments |
| | | |
Face Amount | | | Rating‡ | | Security | | Value |
| |
| Wireless Telecommunication Services — 0.1% | | | |
| $ 55,000 | | | A | | New Cingular Wireless Services Inc., Senior Unsubordinated Notes, 8.125% due 5/1/12 | | $ | 60,888 |
| | | | | | Nextel Communications Inc.: | | | |
| | | | | | Company Guaranteed Notes: | | | |
| 700,000 | | | BBB | | 6.875% due 10/31/13 | | | 700,837 |
| 15,000 | | | BBB | | 5.950% due 3/15/14 | | | 14,331 |
| 60,000 | | | BBB | | 7.375% due 8/1/15 | | | 60,451 |
| 10,000 | | | BBB- | | Rogers Wireless Inc., Secured Notes, 6.375% due 3/1/14 | | | 10,136 |
| | | | | | | |
|
|
| | | | | | Total Wireless Telecommunication Services | | | 846,643 |
| | | | | | | |
|
|
| | | | | | TOTAL CORPORATE BONDS & NOTES
(Cost — $141,477,222) | | | 139,623,750 |
| | | | | | | |
|
|
| MUNICIPAL BONDS — 0.3% | | | |
| |
| Illinois — 0.0% | | | |
| 170,000 | | | AAA | | Chicago IL, GO, Drivers, Series 1287, FSA-Insured, 5.741% due 1/1/14 (a)(b) | | | 155,276 |
| 210,000 | | | AA | | Illinois State, GO, 5.100% due 6/1/33 | | | 195,787 |
| | | | | | | |
|
|
| | | | | | Total Illinois | | | 351,063 |
| | | | | | | |
|
|
| |
| New York — 0.0% | | | |
| 130,000 | | | AA+ | | New York City Municipal Water Finance Authority, Water & Sewer System Revenue, Drivers, Series 1289, 5.781% due 12/15/13 (a)(b)(f) | | | 121,332 |
| | | | | | | |
|
|
| |
| Oregon — 0.1% | | | |
| 600,000 | | | AAA | | Oregon School Boards Association GO, Series A, FGIC-Insured, zero coupon bond to yield,
0.002% due 6/30/09 (i) | | | 547,464 |
| | | | | | | |
|
|
| |
| Virginia — 0.2% | | | |
| 1,698,241 | | | AAA | | Virginia Housing Development Authority, Series C, 6.000% due 6/25/34 | | | 1,698,190 |
| | | | | | | |
|
|
| | | | | | TOTAL MUNICIPAL BONDS
(Cost — $2,718,666) | | | 2,718,049 |
| | | | | | | |
|
|
| SENIOR LOANS — 0.1% | | | |
| 1,296,750 | | | AAA | | MGM Studios Term B1, 8.410% due 4/8/12 (Cost — $1,296,750)(d)(e)(f) | | | 1,231,912 |
| | | | | | | |
|
|
| | | | | | TOTAL SENIOR LOANS | | | 1,231,912 |
| | | | | | | |
|
|
| SOVEREIGN BONDS — 1.1% + | | | |
| |
| Brazil — 0.3% | | | |
| | | | | | Federative Republic of Brazil: | | | |
| 2,500,000 | BRL | | BB+ | | 12.500% due 1/5/22 | | | 1,518,270 |
| 70,000 | | | BB+ | | 8.875% due 4/15/24 | | | 86,800 |
| 101,000 | | | BB+ | | 10.125% due 5/15/27 | | | 141,652 |
| 193,000 | | | BB+ | | 11.000% due 8/17/40 | | | 255,677 |
| | | | | | | |
|
|
| | | | | | Total Brazil | | | 2,002,399 |
| | | | | | | |
|
|
| |
| Canada — 0.0% | | | |
| 170,000 | | | NR | | Province of Ontario Canada, 3.500% due 9/17/07 | | | 174,294 |
| | | | | | | |
|
|
| |
| Colombia — 0.0% | | | |
| 100,000 | | | BBB- | | Colombia Government International Bond, 7.375% due 9/18/37 | | | 106,300 |
| | | | | | | |
|
|
| |
| Hong Kong — 0.1% | | | |
| 1,000,000 | | | AA | | Hong Kong Government International Bond, 5.125% due 8/1/14 (b)(e) | | | 993,473 |
| | | | | | | |
|
|
| |
| Mexico — 0.2% | | | |
| | | | | | United Mexican States: | | | |
| 1,253,000 | | | BBB | | 6.750% due 9/27/34 | | | 1,363,890 |
| 160,000 | | | BBB | | Medium-Term Notes, 5.625% due 1/15/17 | | | 160,320 |
| 275,000 | | | BBB | | Series A, 6.375% due 1/16/13 | | | 286,688 |
| | | | | | | |
|
|
| | | | | | Total Mexico | | | 1,810,898 |
| | | | | | | |
|
|
See Notes to Financial Statements.
87
Schedules of Investments
(continued)
| | | | | | | |
| Core Fixed Income Investments |
| | | |
Face Amount | | Rating‡ | | Security | | Value |
| |
Panama — 0.0% | | | |
| $ 16,000 | | BB | | Republic of Panama, 6.700% due 1/26/36 | | $ | 15,920 |
| | | | | | |
|
|
| |
Russia — 0.2% | | | |
| 1,024,850 | | BAA2 | | Russian Federation, 7.500% due 3/31/30 | | | 1,141,296 |
| | | | | | |
|
|
| |
South Korea — 0.1% | | | |
| 1,050,000 | | A | | Export-Import Bank of Korea, Notes, 5.580% due 10/4/11 (a)(e) | | | 1,051,050 |
| | | | | | |
|
|
| |
United Kingdom — 0.2% | | | |
| 900,000 GBP | | AAA | | United Kingdom Treasury Notes, 4.250% due 3/7/11 | | | 1,752,860 |
| | | | | | |
|
|
| | | | | TOTAL SOVEREIGN BONDS
(Cost — $8,431,449) | | | 9,048,490 |
| | | | | | |
|
|
U.S. GOVERNMENT & AGENCY OBLIGATIONS — 17.5% |
U.S. GOVERNMENT OBLIGATIONS — 15.9% |
| | | | | U.S. Treasury Bonds: | | | |
| 60,000 | | | | 8.875% due 8/15/17 | | | 80,119 |
| 3,477,000 | | | | 8.125% due 8/15/19 | | | 4,536,129 |
| 840,000 | | | | 8.000% due 11/15/21 | | | 1,110,966 |
| 5,424,090 | | | | 2.375% due 1/15/27 | | | 5,403,327 |
| 12,140,000 | | | | 6.125% due 11/15/27 | | | 14,082,412 |
| 115,000 | | | | 4.500% due 2/15/36 | | | 109,043 |
| 860,000 | | | | 4.750% due 2/15/37 (b) | | | 848,578 |
| | | | | U.S. Treasury Notes: | | | |
| 5,200,000 | | | | 4.375% due 12/31/07 | | | 5,205,283 |
| 1,400,000 | | | | 4.625% due 3/31/08 | | | 1,402,736 |
| 3,070,000 | | | | 3.750% due 5/15/08 (b) | | | 3,055,371 |
| 80,000 | | | | 3.875% due 5/15/09 | | | 79,575 |
| 210,000 | | | | 4.625% due 7/31/09 | | | 211,788 |
| 5,226,000 | | | | 3.500% due 11/15/09 | | | 5,151,289 |
| 1,400,000 | | | | 4.125% due 8/15/10 | | | 1,398,579 |
| 50,000 | | | | 4.625% due 10/31/11 | | | 50,750 |
| 600,000 | | | | 4.750% due 1/31/12 | | | 611,906 |
| 42,745,000 | | | | 4.875% due 2/15/12 | | | 43,913,819 |
| 16,752,000 | | | | 4.500% due 3/31/12 | | | 16,919,537 |
| 400,000 | | | | 4.500% due 4/30/12 | | | 404,188 |
| 14,350,000 | | | | 4.250% due 11/15/14 (b) | | | 14,213,230 |
| 11,010,000 | | | | 5.125% due 5/15/16 | | | 11,484,817 |
| 929,844 | | | | 2.375% due 1/15/17 (b) | | | 928,973 |
| 850,000 | | | | 4.500% due 5/15/17 | | | 846,680 |
| 480,000 | | | | 4.750% due 8/15/17 (b) | | | 488,025 |
| 1,700,000 | | | | 5.000% due 5/15/37 | | | 1,745,555 |
| | | | | U.S. Treasury Strip Principal (STRIPS): | | | |
| 3,145,000 | | | | 4.860% due 8/15/19 (i) | | | 1,765,597 |
| 2,000,000 | | | | 5.425% due 11/15/24 (i) | | | 855,320 |
| | | | | | |
|
|
| | | | | TOTAL U.S. GOVERNMENT OBLIGATIONS | | | 136,903,592 |
| | | | | | |
|
|
U.S GOVERNMENT AGENCIES — 1.6% |
| 240,000 | | AAA | | Federal Agricultural Mortgage Corp.(FAMC), 4.250% due 7/29/08 | | | 238,406 |
| 400,000 | | AAA | | Federal Farm Credit Bank (FFCB), 4.875% due 4/4/12 | | | 401,782 |
| | | | | Federal Home Loan Bank (FHLB): | | | |
| 70,000 | | AAA | | 3.500% due 11/15/07 | | | 69,759 |
| 580,000 | | AAA | | 5.125% due 6/13/08 | | | 580,197 |
| 1,480,000 | | AAA | | 5.500% due 5/21/09 | | | 1,480,466 |
See Notes to Financial Statements.
88
Schedules of Investments
(continued)
| | | | | | | |
| Core Fixed Income Investments |
| | | |
Face Amount | | Rating‡ | | Security | | Value |
U.S GOVERNMENT AGENCIES — 1.6% (continued) |
| $ 1,109,000 | | AAA | | Federal Home Loan Bank (Fico) (FHLB), 5.280% due 9/26/19 | | $ | 601,445 |
| | | | | Federal Home Loan Mortgage Corp. (FHLMC): | | | |
| 1,120,000 | | AAA | | 4.375% due 11/16/07 | | | 1,117,964 |
| 307 | | AAA | | 10.250% due 2/1/10 | | | 330 |
| 380,000 | | AAA | | 4.750% due 1/18/11 | | | 380,715 |
| 850,000 | | AAA | | 6.750% due 3/15/31 | | | 1,010,112 |
| 470,000 | | AAA | | 5.625% due 11/23/35 | | | 459,251 |
| | | | | Federal National Mortgage Association (FNMA): | | | |
| 2,100,000 | | AAA | | 4.250% due 9/15/07 | | | 2,099,200 |
| 1,500,000 | | AAA | | 3.250% due 11/15/07 | | | 1,494,066 |
| 670,000 | | AA- | | 5.250% due 8/1/12 | | | 680,551 |
| 2,075,000 | | AA- | | 5.125% due 1/2/14 | | | 2,081,848 |
| 1,170,000 | | AAA | | 5.550% due 2/16/17 | | | 1,172,359 |
| | | | | | |
|
|
| | | | | TOTAL U.S GOVERNMENT AGENCIES | | | 13,868,451 |
| | | | | | |
|
|
| | | | | TOTAL U.S. GOVERNMENT & AGENCY OBLIGATIONS
(Cost — $148,916,187) | | | 150,772,043 |
| | | | | | |
|
|
U.S. TREASURY INFLATION PROTECTED SECURITIES — 0.9% | | | |
| | | | | U.S. Treasury Bonds, Inflation Indexed: | | | |
| 200,000 | | | | 4.500% due 3/31/09 | | | 200,844 |
| 1,988,834 | | | | 2.000% due 4/15/12 (b) | | | 1,958,536 |
| 187,906 | | | | 2.375% due 1/15/25 | | | 186,805 |
| 965,770 | | | | 2.000% due 1/15/26 (b) | | | 906,618 |
| | | | | U.S. Treasury Notes, Inflation Indexed: | | | |
| 406,926 | | | | 0.875% due 4/15/10 (b) | | | 389,123 |
| 1,039,203 | | | | 2.375% due 4/15/11 (b) | | | 1,037,092 |
| 11,053 | | | | 2.000% due 7/15/14 | | | 10,804 |
| 310,639 | | | | 1.875% due 7/15/15 | | | 299,573 |
| 545,870 | | | | 2.000% due 1/15/16 | | | 529,495 |
| 2,042,746 | | | | 2.500% due 7/15/16 (b) | | | 2,064,930 |
| | | | | | |
|
|
| | | | | TOTAL U.S. TREASURY INFLATION PROTECTED SECURITIES
(Cost — $7,614,331) | | | 7,583,820 |
| | | | | | |
|
|
| | | |
Shares
| | | | | | |
CONVERTIBLE PREFERRED STOCK — 0.0% | | | |
CONSUMER DISCRETIONARY — 0.0% | | | |
| |
Automobiles — 0.0% | | | |
| 3,000 | | | | General Motors Corp., 6.125% due 3/6/32 | | | 63,870 |
| | | | | | |
|
|
TELECOMMUNICATION SERVICES — 0.0% | | | |
| |
Diversified Telecommunication Services — 0.0% | | | |
| 35 | | | | McLeodUSA Inc., 2.500% due 4/18/12 (m)* | | | 0 |
| | | | | | |
|
|
| | | | | TOTAL CONVERTIBLE PREFERRED STOCK
(Cost — $74,125) | | | 63,870 |
| | | | | | |
|
|
PREFERRED STOCK — 0.0% | | | |
FINANCIALS — 0.0% | | | |
| |
Diversified Financial Services — 0.0% | | | |
| 100 | | | | Home Ownership Funding CP II, 1.000% (e)(f) | | | 15,330 |
| | | | | | |
|
|
| | | | | TOTAL PREFERRED STOCK
(Cost — $63,255) | | | 15,330 |
| | | | | | |
|
|
See Notes to Financial Statements.
89
Schedules of Investments
(continued)
| | | | | | | | |
| Core Fixed Income Investments |
| | | |
| Contracts | | | | | Security | | Value |
| PURCHASED OPTIONS — 0.3% |
|
| United States — 0.3% |
| 1,200,000 | EUR | | | | Euro vs. U.S. Dollar, Put @ $1.38, expires 5/21/10 | | $ | 60,633 |
| 1,200,000 | EUR | | | | Euro vs. U.S. Dollar, Call @ $1.38, expires 5/21/10 | | | 67,909 |
| 152 | | | | | Eurodollar Futures, Call @ $95.00, expires 9/14/07 | | | 170,050 |
| 282 | | | | | Eurodollar Futures, Call @ $95.25, expires 9/14/07 | | | 163,913 |
| 140 | | | | | Eurodollar Futures, Put @ $90.25, expires 9/17/07 | | | 875 |
| 90 | | | | | Eurodollar Futures, Put @ $91.75, expires 9/17/07 | | | 562 |
| 85 | | | | | Eurodollar Futures, Call @ $94.63, expires 9/17/07 | | | 9,562 |
| 15 | | | | | Eurodollar Futures, Call @ $95.00, expires 9/17/07 | | | 281 |
| 90 | | | | | Eurodollar Futures, Put @ $91.25, expires 12/17/07 | | | 562 |
| 73 | | | | | Eurodollar Futures, Put @ $91.75, expires 12/17/07 | | | 456 |
| 93 | | | | | Eurodollar Futures, Call @ $95.25, expires 12/17/07 | | | 36,038 |
| 44 | | | | | Eurodollar Futures, Call @ $95.25, expires 3/17/08 | | | 39,325 |
| 13,300,000 | | | | | Swaption, 3 Month LIBOR, Call @ $5.00, expires 12/20/07 | | | 99,908 |
| 23,400,000 | | | | | Swaption, 3 Month LIBOR, Call @ $5.00, expires 2/1/08 | | | 193,534 |
| 10,100,000 | | | | | Swaption, 3 Month LIBOR, Call @ $4.75, expires 3/31/08 | | | 65,012 |
| 4,600,000 | | | | | Swaption, 3 Month LIBOR, Call @ $4.75, expires 3/31/08 | | | 29,610 |
| 28,000,000 | | | | | Swaption, 3 Month LIBOR, Call @ $4.75, expires 9/26/08 | | | 212,213 |
| 13,300,000 | | | | | Swaption, 3 Month LIBOR, Call @ $4.75, expires 9/26/08 | | | 100,801 |
| 8,000,000 | | | | | Swaption, 3 Month LIBOR, Call @ $4.75, expires 9/26/08 | | | 60,632 |
| 27,000,000 | | | | | Swaption, 3 Month LIBOR, Call @ $4.75, expires 12/15/08 | | | 211,415 |
| 44,300,000 | | | | | Swaption, 3 Month LIBOR, Call @ $5.00, expires 12/15/08 | | | 449,700 |
| 5,300,000 | JPY | | | | U.S. Dollar vs. Japanese Yen, Call @ JPY104.00, expires 3/17/10 | | | 329,867 |
| 5,300,000 | JPY | | | | U.S. Dollar vs. Japanese Yen, Put @ JPY104.00, expires 3/17/10 | | | 240,106 |
| 2,000,000 | JPY | | | | U.S. Dollar vs. Japanese Yen, Put @ JPY104.65, expires 3/31/10 | | | 95,968 |
| 2,000,000 | JPY | | | | U.S. Dollar vs. Japanese Yen, Call @ JPY104.65, expires 3/31/10 | | | 116,668 |
| | | | | | | |
|
|
| | | | | | Total United States | | | 2,755,600 |
| | | | | | | |
|
|
| | | | | | TOTAL PURCHASED OPTIONS
(Cost — $1,936,422) | | | 2,755,600 |
| | | | | | | |
|
|
| | | | | | TOTAL INVESTMENTS BEFORE SHORT-TERM INVESTMENTS
(Cost — $960,409,240) | | | 959,009,910 |
| | | | | | | |
|
|
| | | |
Face
Amount
| | | | | | | |
| SHORT-TERM INVESTMENTS (o) — 10.9% |
| CERTIFICATE OF DEPOSIT — 0.7% |
| $5,800,000 | | | | | Danske Corp., 5.417% due 9/7/07 (Cost — $5,794,770) (b)(i) | | | 5,794,770 |
| | | | | | | |
|
|
| COMMERCIAL PAPER — 1.7% |
| 5,800,000 | | | | | Rabobank USA Finance Corp., 5.233% due 9/4/07 (i) | | | 5,797,472 |
| 5,800,000 | | | | | Total Fina Elf, 5.283% due 9/4/07 (b)(f)(i) | | | 5,797,448 |
| 3,000,000 | | | | | UBS Finance Delaware LLC, 5.203% due 9/4/07 (b)(i) | | | 2,998,700 |
| | | | | | | |
|
|
| | | | | | TOTAL COMMERCIAL PAPER
(Cost — $14,593,620) | | | 14,593,620 |
| | | | | | | |
|
|
| MONEY MARKET FUND — 0.2% |
| 2,319,176 | | | | | BBH Securities Lending Trust, (Cost — $2,319,176) (p) | | | 2,319,176 |
| | | | | | | |
|
|
| REPURCHASE AGREEMENTS — 0.8% |
| 1,000,000 | | | | | Credit Suisse Securities (USA) LLC repurchase agreement dated 8/31/07, 5.10% due 9/4/07, Proceeds at maturity — $1,000,567; (Fully collateralized by Inflation Indexed U.S. Treasury Notes, 1.625% due 1/15/15; Market Value — ($1,024,965) | | | 1,000,000 |
| 5,841,000 | | | | | Credit Suisse Securities (USA) LLC repurchase agreement dated 8/22/07, 5.10% due 9/24/07, Proceeds at maturity — $5,860,859; (Fully collateralized by Federal Home Loan Mortgage Corp., 5.00% due 8/1/19; Market Value — ($6,312,324) | | | 5,841,000 |
| | | | | | | |
|
|
| | | | | | TOTAL REPURCHASE AGREEMENTS
(Cost — $6,841,000) | | | 6,841,000 |
| | | | | | | |
|
|
See Notes to Financial Statements.
90
Schedules of Investments
(continued)
| | | | | | | | | |
| Core Fixed Income Investments | |
| | | |
Face
Amount† | | | | | Security | | Value | |
| TIME DEPOSITS — 7.2% | |
| | | | | | Bank of America — London: | | | | |
| $45,927,370 | | | | | 4.440% due 9/1/07 | | $ | 45,927,370 | |
| 474,504 | GBP | | | | 5.270% due 9/1/07 | | | 956,957 | |
| | | | | | BBH — Grand Cayman: | | | | |
| 15,364,866 | | | | | 4.440% due 9/1/07 | | | 15,364,866 | |
| 5,614 | AUD | | | | 5.510% due 9/1/07 | | | 4,579 | |
| | | | | | | |
|
|
|
| | | | | | TOTAL TIME DEPOSITS
(Cost — $62,253,772) | | | 62,253,772 | |
| | | | | | | |
|
|
|
| U.S. GOVERNMENT AGENCY — 0.2% | |
| 1,530,000 | | | | | Federal National Mortgage Association (FNMA), Discount Notes, 4.968% due 3/17/08
(Cost — $1,488,496) (i) | | | 1,488,496 | |
| | | | | | | |
|
|
|
| U.S. GOVERNMENT OBLIGATION — 0.1% | |
| 805,000 | | | | | U.S. Treasury Bill, 4.700% due 9/13/07
(Cost — $803,754) (i)(n) | | | 803,754 | |
| | | | | | | |
|
|
|
| | | | | | TOTAL SHORT-TERM INVESTMENTS
(Cost — $94,094,588) | | | 94,094,588 | |
| | | | | | | |
|
|
|
| | | | | | TOTAL INVESTMENTS — 122.3%
(Cost — $1,054,503,828#) | | | 1,053,104,499 | |
| | | | | | Liabilities in Excess of Other Assets — (22.3%) | | | (192,015,052 | ) |
| | | | | | | |
|
|
|
| | | | | | TOTAL NET ASSETS — 100.0% | | $ | 861,089,447 | |
| | | | | | | |
|
|
|
| † | | Face amount denominated in U.S. dollars, unless otherwise noted. |
| ‡ | | All ratings are by Standard & Poor’s Ratings Service, unless otherwise noted. |
| * | | Non-income producing securities. |
| (a) | | Variable rate security. Interest rate disclosed is that which is in effect at August 31, 2007. |
| (b) | | All or a portion of this security is segregated for open futures contracts, extended settlements, written options, swap contracts, foreign currency contracts, TBA’s and short sales. |
| (c) | | This security is traded on a to-be-announced (“TBA”) basis (See Note 1). |
| (d) | | Rating by Moody’s Investors Service. All ratings are unaudited. |
| (e) | | Security is exempt from registration under Rule 144A of the Securities Act of 1933. This security may be resold in transactions that are exempt from registration, normally to qualified institutional buyers. This security has been deemed liquid pursuant to guidelines approved by the Board of Trustees, unless otherwise noted. |
| (g) | | Interest only security. |
| (h) | | All or a portion of this security is on loan (See Note 1). |
| (i) | | Rate shown represents yield-to-maturity. |
| (j) | | Variable rate securities. Coupon rates disclosed are those which are in effect at {Report Date}. |
| (k) | | Rating by Fitch Ratings Service. All ratings are unaudited. |
| (l) | | Payment-kind security for which part of the income earned maybe paid as additional principal. |
| (m) | | Security is valued in good faith at fair value by or under the direction of the Board of Trustees. |
| (n) | | All or a portion of this security is held at the broker as collateral for open futures contracts. |
| (o) | | Inclusive of all short term holdings, including collateral received from securities lending activities. Not including such collateral, the percentage of portfolio holdings would be 10.5%. |
| (p) | | Represents investment of collateral received from securities lending transactions. |
| # | | Aggregate cost for federal income tax purposes is $1,058,102,489. |
See pages 122 and 123 for definition of ratings.
See Notes to Financial Statements.
91
Schedules of Investments
(continued)
| | | | | | |
| Core Fixed Income Investments |
Abbreviations used in this schedule:
| | | | |
| CPI | | — | | Consumer Price Index |
| FGIC | | — | | Financial Guaranty Insurance Company |
| FSA | | — | | Financial Security Assurancy |
| GO | | — | | General Obligation |
| LIBOR | | — | | London Interbank Offered Rate |
| MASTR | | — | | Mortgage Asset Securitization Transactions Inc. |
| PAC | | — | | Planned Facilities Authority |
| PFA | | — | | Public Facilities Authority |
| STRIPS | | — | | Separate Trading of Registered Interest and Principals |
| | | |
| Summary of Investments by Security Type* | | | |
Mortgage-Backed Securities | | 44.6 | % |
U.S. Government & Agency Obligations | | 14.3 | |
Collateralized Mortgage Obligations | | 14.2 | |
Corporate Bonds & Notes | | 13.3 | |
Asset-Backed Securities | | 2.5 | |
Sovereign Bonds | | 0.9 | |
U.S. Treasury Inflation Protected Securities | | 0.7 | |
Purchased Options | | 0.3 | |
Senior Loans | | 0.1 | |
Municipal Bonds | | 0.2 | |
Convertible Preferred Stock | | 0.0 | ** |
Preferred Stocks | | 0.0 | ** |
Short-Term Investments | | 8.9 | |
| | |
|
|
| | | 100.0 | % |
| | |
|
|
| * | | As a percentage of total investments. |
| ** | | Position represents less than 0.1%. |
Schedule of Written Options
| | | | | | | | | | |
| | | | | | | |
| | | | |
| Contracts | | Security Name | | Expiration Date | | Strike Price | | Value |
| | |
United States | | | | | | |
| 66 | | Eurodollar Futures, Call | | 3/17/08 | | $ | 95.50 | | $ | 40,838 |
| 5,800,000 | | Swaption, 3 Month LIBOR, Call | | 12/24/07 | | | 5.15 | | | 87,331 |
| 10,100,000 | | Swaption, 3 Month LIBOR, Call | | 2/1/08 | | | 5.10 | | | 150,423 |
| 4,000,000 | | Swaption, 3 Month LIBOR, Put | | 3/31/08 | | | 4.95 | | | 50,944 |
| 2,000,000 | | Swaption, 3 Month LIBOR, Put | | 3/31/08 | | | 4.90 | | | 23,433 |
| 12,100,000 | | Swaption, 3 Month LIBOR, Put | | 9/26/08 | | | 4.95 | | | 178,866 |
| 5,800,000 | | Swaption, 3 Month LIBOR, Call | | 9/26/08 | | | 4.95 | | | 85,737 |
| 3,500,000 | | Swaption, 3 Month LIBOR, Call | | 9/26/08 | | | 4.95 | | | 51,738 |
| 9,100,000 | | Swaption, 3 Month LIBOR, Put | | 12/15/08 | | | 5.00 | | | 162,873 |
| 14,800,000 | | Swaption, 3 Month LIBOR, Call | | 12/15/08 | | | 5.20 | | | 340,163 |
| | | | | | | | | |
|
|
| | | Total United States | | | | | | | | 1,172,346 |
| | | | | | | | | |
|
|
| | | TOTAL WRITTEN OPTIONS
(Premiums received — $773,566) | | | | | | | $ | 1,172,346 |
| | | | | | | | | |
|
|
See Notes to Financial Statements.
92
Schedules of Investments
(continued)
| | | | | | |
| Core Fixed Income Investments |
Schedule of Securities Sold Short
| | | | | |
| |
| | |
Face
Amount | | Security | | Value |
| | | Federal National Mortgage Association (FNMA) | | | |
| $40,700,000 | | 5.500% due 9/01/21-9/01/36 (a) | | $ | 39,887,213 |
| 900,000 | | 6.500% due 9/01/36 (a) | | | 913,640 |
| 21,500,000 | | 5.000% due 9/01/37 (a) | | | 20,435,084 |
| 27,400,000 | | 6.000% due 9/01/37 (a) | | | 27,370,024 |
| | | U.S. Treasury Notes | | | |
| 1,800,000 | | 6.000% due 8/15/09 | | | 1,861,033 |
| 6,800,000 | | 4.250% due 11/15/14 | | | 6,735,189 |
| 18,800,000 | | 4.625% due 2/15/17 | | | 18,913,101 |
| | | | |
|
|
| | | TOTAL OPEN SHORT SALES
(Proceeds — $115,448,667) | | $ | 116,115,284 |
| | | | |
|
|
| (a) | | This security is traded on a to-be-announced (TBA) basis (See note1). |
See Notes to Financial Statements.
93
Schedules of Investments
(continued)
| | | | | | | |
| High Yield Investments | | |
| | | |
Face
Amount | | Rating‡ | | Security | | Value |
CORPORATE BONDS & NOTES — 90.4% | | | |
| |
Aerospace & Defense — 0.12% | | | |
| $ 220,000 | | B+ | | Alliant Techsystem Inc., Senior Subordinated Notes, 6.750% due 4/1/16 | | $ | 216,150 |
| 240,000 | | BB | | Bombardier Inc., Notes, 6.300% due 5/1/14 (a) | | | 230,400 |
| 360,000 | | B | | DRS Technologies Inc., 7.625% due 2/1/18 | | | 354,600 |
| 205,000 | | BB+ | | L-3 Communications Corp., Senior Subordinated Notes, 5.875% due 1/15/15 | | | 195,262 |
| | | | | | |
|
|
| | | | | Total Aerospace & Defense | | | 996,412 |
| | | | | | |
|
|
| |
Airlines — 1.0% | | | |
| 100,000 | | CCC+ | | Continental Airlines Inc., 8.750% due 12/1/11 | | | 94,000 |
| 505,000 | | B- | | DAE Aviation Holdings Inc., Company Guaranteed Notes, 11.250% due 8/1/15 (a) | | | 505,000 |
| 271,057 | | BB+ | | United Airlines Inc., Pass-Through Certificates, Series 2000-2, Senior Secured Notes, 7.032% due 10/1/10 (b) | | | 272,329 |
| | | | | | |
|
|
| | | | | Total Airlines | | | 871,329 |
| | | | | | |
|
|
| |
Auto Components — 0.5% | | | |
| 170,000 | | CCC+ | | Keystone Automotive Operations Inc., Senior Subordinated Notes, 9.750% due 11/1/13 | | | 136,850 |
| 296,000 | | CCC+ | | Visteon Corp., Senior Unsecured Notes, 8.250% due 8/1/10 (c) | | | 254,560 |
| | | | | | |
|
|
| | | | | Total Auto Components | | | 391,410 |
| | | | | | |
|
|
| |
Automobiles — 1.3% | | | |
| 300,000 | | CCC+ | | Ford Motor Co., Debentures, 8.875% due 1/15/22 | | | 252,000 |
| | | | | General Motors Corp.: | | | |
| 515,000 | | B- | | Debentures Notes, 8.250% due 7/15/23 (c) | | | 413,287 |
| 115,000 | | B- | | Notes, 7.200% due 1/15/11 (c) | | | 102,062 |
| 480,000 | | B- | | Senior Unsubordinated Notes, 8.375% due 7/15/33 (c) | | | 387,600 |
| | | | | | |
|
|
| | | | | Total Automobiles | | | 1,154,949 |
| | | | | | |
|
|
| |
Building Products — 0.6% | | | |
| | | | | Associated Materials Inc.: | | | |
| 65,000 | | CCC | | Company Guaranteed Notes, 9.750% due 4/15/12 (c) | | | 66,300 |
| 280,000 | | CCC | | Senior Discount Notes, step bond to yield, 11.250% due 3/1/14 (c) | | | 184,100 |
| 145,000 | | CCC+ | | Nortek Inc., Senior Subordinated Notes, 8.500% due 9/1/14 | | | 126,150 |
| 270,000 | | CCC+ | | NTK Holdings Inc., Senior Discount Notes, step bond to yield, 0.000% due 3/1/14 (c) | | | 170,100 |
| | | | | | |
|
|
| | | | | Total Building Products | | | 546,650 |
| | | | | | |
|
|
| |
Capital Markets — 0.2% | | | |
| 160,000 | | BB- | | E*Trade Financial Corp., Senior Unsecured Notes, 7.375% due 9/15/13 | | | 143,200 |
| | | | | | |
|
|
| |
Chemicals — 1.0% | | | |
| 15,000 | | B+ | | Arco Chemical Co., Debentures, 10.250% due 11/1/10 (d) | | | 16,200 |
| 145,000 | | B- | | Georgia Gulf Corp., Company Guaranteed Notes, 9.500% due 10/15/14 (c) | | | 134,850 |
| 80,000 | | B | | Huntsman International LLC, Company Guaranteed Notes, 7.875% due 11/15/14 | | | 84,000 |
| | | | | Lyondell Chemical Co.: | | | |
| | | | | Company Guaranteed Notes: | | | |
| 50,000 | | B+ | | 8.000% due 9/15/14 | | | 54,625 |
| 45,000 | | B+ | | 8.250% due 9/15/16 | | | 50,625 |
| 95,000 | | BB+ | | Notes, 10.500% due 6/1/13 | | | 102,837 |
| 480,000 | | B | | Montell Finance Co. BV, Debentures, 8.100% due 3/15/27 (a) | | | 420,000 |
| 27,000 | | BB+ | | Westlake Chemical Corp., Company Guaranteed Notes, 6.625% due 1/15/16 | | | 24,975 |
| | | | | | |
|
|
| | | | | Total Chemicals | | | 888,112 |
| | | | | | |
|
|
See Notes to Financial Statements.
94
Schedules of Investments
(continued)
| | | | | | | |
| High Yield Investments | | |
| | | |
Face
Amount | | Rating‡ | | Security | | Value |
| |
Commercial Services & Supplies — 4.6% | | | |
| $ 335,000 | | B- | | ACE Cash Express Inc., Senior Notes, 10.250% due 10/1/14 (a) | | $ | 335,000 |
| 85,000 | | BB+ | | Allied Waste North America Inc., 6.875% due 6/1/17 | | | 82,875 |
| 480,000 | | B- | | Aramark Corp., Company Guaranteed Notes, 8.500% due 2/1/15 | | | 480,600 |
| 210,000 | | B- | | Cardtronics Inc., 9.250% due 8/15/13 | | | 200,550 |
| 285,000 | | B- | | Cenveo Corp., Senior Subordinated Notes, 7.875% due 12/1/13 | | | 262,200 |
| 767,000 | | B | | DI Finance/DynCorp. International, Senior Subordinated Notes, 9.500% due 2/15/13 | | | 782,340 |
| 205,000 | | NR | | Dollar Financial Corp., Senior Notes, 2.875% due 6/30/27 (a) | | | 185,002 |
| | | | | Interface Inc.: | | | |
| 240,000 | | CCC+ | | Company Guaranteed Notes, 9.500% due 2/1/14 | | | 249,600 |
| 280,000 | | B | | Senior Notes, 10.375% due 2/1/10 | | | 291,200 |
| 350,000 | | B- | | Neff Corp., Senior Notes, 10.000% due 6/1/15 (a) | | | 309,750 |
| 40,000 | | B- | | Rental Service Corp., Company Guaranteed Notes, 9.500% due 12/1/14 | | | 39,350 |
| 340,000 | | B | | RH Donnelley Corp., Senior Discount Notes, step bond to yield, 6.875% due 1/15/13 | | | 322,150 |
| 110,000 | | BB- | | Service Corp. International/US, Senior Unsecured Notes, 6.750% due 4/1/16 | | | 104,225 |
| 265,000 | | BB- | | Windstream Corp., Company Guaranteed Notes, 8.625% due 8/1/16 | | | 278,250 |
| | | | | | |
|
|
| | | | | Total Commercial Services & Supplies | | | 3,923,092 |
| | | | | | |
|
|
| |
Communication Equipment — 0.8% | | | |
| 135,000 | | NR | | Arris Group Inc., Senior Unsecured Notes, 2.000% due 11/15/26 | | | 157,623 |
| 475,000 | | B- | | Nortel Networks Ltd., 10.125% due 7/15/13 (a) | | | 488,062 |
| | | | | | |
|
|
| | | | | Total Communication Equipment | | | 645,685 |
| | | | | | |
|
|
| |
Computers & Peripherals — 0.8% | | | |
| 95,000 | | CCC+ | | Activant Solutions Inc., 9.500% due 5/1/16 | | | 84,312 |
| 165,000 | | NR | | Charys Holding Co Inc., Senior Notes, 8.750% due 2/16/12 (a) | | | 148,500 |
| 460,000 | | B- | | Sungard Data Systems Inc., 10.250% due 8/15/15 | | | 476,100 |
| | | | | | |
|
|
| | | | | Total Computers & Peripherals | | | 708,912 |
| | | | | | |
|
|
| |
Consumer Finance — 1.9% | | | |
| | | | | Ford Motor Credit Co.: | | | |
| 85,000 | | B | | Notes, 7.375% due 2/1/11 | | | 78,559 |
| | | | | Senior Notes: | | | |
| 775,000 | | B | | 5.800% due 1/12/09 | | | 730,490 |
| 295,000 | | B | | 9.875% due 8/10/11 | | | 291,449 |
| | | | | Unsecured Notes: | | | |
| 160,000 | | B | | 8.625% due 11/1/10 | | | 152,955 |
| 62,500 | | B | | 8.105% due 1/13/12 (e) | | | 57,289 |
| 125,000 | | B | | 8.000% due 12/15/16 | | | 115,535 |
| 240,000 | | BB+ | | General Motors Acceptance Corp., Notes, 6.875% due 8/28/12 | | | 212,232 |
| | | | | | |
|
|
| | | | | Total Consumer Finance | | | 1,638,509 |
| | | | | | |
|
|
| |
Containers & Packaging — 1.6% | | | |
| 223,000 | | CCC+ | | Graham Packaging Co. Inc., Company Guaranteed Notes, 9.875% due 10/15/14 (c) | | | 219,655 |
| 220,000 | | B- | | Graphic Packaging International Corp., Senior Subordinated Notes, 9.500% due 8/15/13 | | | 223,300 |
| 145,000 | | BB- | | Greif Inc., Senior Unsecured Notes, 6.750% due 2/1/17 | | | 142,100 |
| 440,000 | | B | | Plastipak Holdings Inc., Senior Notes, 8.500% due 12/15/15 (a) | | | 448,800 |
| 255,000 | | CCC | | Portola Packaging Inc., 8.250% due 2/1/12 (c) | | | 215,475 |
| 150,000 | | CCC+ | | Smurfit-Stone Container Enterprises Inc., Senior Unsecured Notes, 8.000% due 3/15/17 | | | 143,812 |
| | | | | | |
|
|
| | | | | Total Containers & Packaging | | | 1,393,142 |
| | | | | | |
|
|
See Notes to Financial Statements.
95
Schedules of Investments
(continued)
| | | | | | | |
| High Yield Investments | | |
| | | |
Face
Amount | | Rating‡ | | Security | | Value |
| |
Diversified Consumer Services — 1.9% | | | |
| $ 185,000 | | CCC+ | | Allied Security Escrow Corp., Notes, 11.375% due 7/15/11 | | $ | 185,000 |
| | | | | Education Management LLC / Education Management Corp.: | | | |
| | | | | Company Guaranteed Notes: | | | |
| 45,000 | | CCC+ | | 8.750% due 6/1/14 | | | 45,900 |
| 165,000 | | CCC+ | | 10.250% due 6/1/16 (c) | | | 171,187 |
| 390,000 | | B | | Hertz Corp., Company Guaranteed Notes, 10.500% due 1/1/16 | | | 423,150 |
| 250,000 | | CCC+ | | Pegasus Solutions Inc., Senior Notes, 10.500% due 4/15/15 (a) | | | 234,375 |
| 175,000 | | B- | | Penhall International Corp., Senior Secured Notes, 12.000% due 8/1/14 (a) | | | 182,875 |
| 260,000 | | B- | | Rental Services Corp., 9.500% due 12/1/14 (a) | | | 255,775 |
| 140,000 | | B- | | TeamHealth Inc., 11.250% due 12/1/13 | | | 149,100 |
| | | | | | |
|
|
| | | | | Total Diversified Consumer Services | | | 1,647,362 |
| | | | | | |
|
|
| |
Diversified Financial Services — 5.4% | | | |
| 880,000 | | CCC+ | | AAC Group Holding Corp., step bond to yield, 10.250% due 10/1/12 | | | 761,200 |
| 240,000 | | B- | | Algoma Acquisition Corp., Senior Unsecured Notes, 9.875% due 6/15/15 (a) | | | 225,600 |
| 350,000 | | B+ | | AmeriCredit Corp., Senior Notes, 8.500% due 7/1/15 (a) | | | 301,000 |
| 630,000 | | B | | Basell AF SCA, Senior Subordinated Notes, 8.375% due 8/15/15 (a) | | | 563,850 |
| 105,000 | | CCC+ | | CCM Merger Inc., Notes, 8.000% due 8/1/13 (a) | | | 100,800 |
| 155,000 | | B+ | | Galaxy Entertainment Finance Co., Ltd., Senior Notes, 10.409% due 12/15/10 (a)(e) | | | 157,325 |
| | | | | GMAC LLC: | | | |
| 560,000 | | BB+ | | Bonds, 8.000% due 11/1/31 | | | 504,339 |
| 1,045,000 | | BB+ | | Notes, 6.750% due 12/1/14 | | | 888,065 |
| | | | | Hawker Beechcraft Acquisition Co. LLC / Hawker Beechcraft Notes Co.: | | | |
| 105,000 | | B- | | Senior Notes, 8.875% due 4/1/15 (a)(f) | | | 102,637 |
| 130,000 | | B- | | Senior Subordinated Notes, 9.750% due 4/1/17 (a) | | | 129,025 |
| 175,000 | | CCC | | KAR Holdings Inc., Senior Notes, 8.750% due 5/1/14 (a) | | | 158,375 |
| 65,000 | | B- | | PGS Solutions Inc., 9.625% due 2/15/15 (a) | | | 60,450 |
| | | | | Residential Capital LLC: | | | |
| | | | | Company Guaranteed Notes: | | | |
| 5,000 | | BB+ | | 8.690% due 4/17/09 (a)(e) | | | 3,006 |
| 190,000 | | BBB- | | 7.500% due 6/1/12 | | | 144,533 |
| 180,000 | | B- | | Sensus Metering Systems Inc., Senior Subordinated Notes, 8.625% due 12/15/13 | | | 172,800 |
| 105,000 | | B | | Snoqualmie Entertainment Authority, 9.063% due 2/1/14 (a)(e) | | | 103,031 |
| 250,000 | | CCC+ | | Vanguard Health Holdings Co. II LLC, Senior Subordinated Notes, 9.000% due 10/1/14 | | | 235,000 |
| | | | | | |
|
|
| | | | | Total Diversified Financial Services | | | 4,611,036 |
| | | | | | |
|
|
| |
Diversified Telecommunication Services — 8.0% | | | |
| | | | | Broadview Networks Holdings Inc.: | | | |
| 90,000 | | B | | Company Guaranteed Notes, 11.375% due 9/1/12 (a) | | | 92,700 |
| 230,000 | | CCC+ | | Secured Notes, 11.375% due 9/1/12 (a) | | | 236,900 |
| | | | | Cincinnati Bell Telephone Co.: | | | |
| 460,000 | | B- | | Company Guaranteed Notes, 8.375% due 1/15/14 | | | 457,700 |
| 35,000 | | BB | | Senior Debentures, 6.300% due 12/1/28 | | | 30,625 |
| 60,000 | | B- | | Senior Notes, 7.000% due 2/15/15 | | | 57,900 |
| | | | | Citizens Communications Co.: | | | |
| 50,000 | | BB+ | | Debentures Notes, 7.050% due 10/1/46 | | | 39,750 |
| | | | | Senior Unsecured Notes: | | | |
| 235,000 | | BB+ | | 6.625% due 3/15/15 | | | 226,187 |
| 80,000 | | BB+ | | 7.875% due 1/15/27 | | | 75,400 |
| 215,000 | | NR | | Global Crossing Ltd., Senior Notes, 5.000% due 5/15/11 | | | 225,750 |
| 425,000 | | B- | | Global Crossing UK Finance PLC, 10.750% due 12/15/14 | | | 448,375 |
| 125,000 | | CCC | | Hawaiian Telcom Communications Inc., Senior Subordinated Notes, Series B, 12.500% due 5/1/15 (c) | | | 133,125 |
See Notes to Financial Statements.
96
Schedules of Investments
(continued)
| | | | | | | |
| High Yield Investments | | |
| | | |
Face
Amount | | Rating‡ | | Security | | Value |
| |
Diversified Telecommunication Services — 8.0% (continued) | | | |
| $ 320,000 | | B- | | Intelsat Bermuda Ltd, Senior Unsecured Notes, 11.250% due 6/15/16 | | $ | 336,400 |
| 210,000 | | B- | | Intelsat Corp., Company Guaranteed Notes, 9.000% due 6/15/16 | | | 215,250 |
| | | | | Level 3 Financing Inc.: | | | |
| | | | | Company Guaranteed Notes: | | | |
| 120,000 | | CCC+ | | 12.250% due 3/15/13 | | | 131,400 |
| 435,000 | | CCC+ | | 9.250% due 11/1/14 | | | 420,862 |
| 245,000 | | BB- | | Lucent Technologies Inc., Debentures Notes, 2.875% due 6/15/23 | | | 236,425 |
| 243,000 | | CCC+ | | McLeodUSA Inc., 10.500% due 10/1/11 (a) | | | 252,722 |
| 5,000 | | CCC | | MetroPCS Wireless Inc., Senior Notes, 9.250% due 11/1/14 (a) | | | 4,950 |
| 220,000 | | CCC+ | | Paetec Holding Corp., Company Guaranteed Notes, 9.500% due 7/15/15 (a) | | | 216,700 |
| | | | | Primus Telecommunications GP: | | | |
| 215,000 | | NR | | Notes, 3.750% due 9/15/10 | | | 148,887 |
| 630,000 | | Caa3 | | Senior Notes, 8.000% due 1/15/14 (c)(g) | | | 418,950 |
| | | | | Qwest Communications International Inc.: | | | |
| 17,000 | | B+ | | Company Guaranteed Notes, 9.058% due 2/15/09 (e) | | | 17,127 |
| 180,000 | | BBB- | | Senior Notes, 7.625% due 6/15/15 | | | 186,300 |
| 850,000 | | B+ | | Senior Notes, Class B, 7.500% due 2/15/14 | | | 839,375 |
| 175,000 | | NR | | SAVVIS Inc., Senior Unsecured Notes, 3.000% due 5/15/12 | | | 162,750 |
| 300,000 | | B | | Syniverse Technologies Inc., 7.750% due 8/15/13 | | | 279,000 |
| 325,000 | | CCC+ | | Time Warner Telecom Holdings Inc., Company Guaranteed Notes, 9.250% due 2/15/14 | | | 338,000 |
| 135,000 | | B- | | Virgin Media Fianance PLC, 8.750% due 4/15/14 | | | 137,362 |
| 460,000 | | B- | | Wind Acquisition Finance SA, Senior Bond, 10.750% due 12/1/15 (a) | | | 476,100 |
| | | | | | |
|
|
| | | | | Total Diversified Telecommunication Services | | | 6,842,972 |
| | | | | | |
|
|
| |
Electric Utilities — 2.3% | | | |
| | | | | AES Corp.: | | | |
| | | | | Secured Notes: | | | |
| 123,000 | | BB- | | 8.750% due 5/15/13 (a) | | | 128,535 |
| 30,000 | | BB- | | 9.000% due 5/15/15 (a) | | | 31,425 |
| 530,000 | | B+ | | Aquila Inc., 14.875% due 7/1/12 | | | 666,475 |
| 330,000 | | D | | Calpine Canada Energy Finance Ulc, Company Guaranteed Notes, 8.500% due 5/1/08 (b) | | | 355,575 |
| 180,000 | | D | | Calpine Corp., Senior Notes, 6.000% due 9/30/14 (b) | | | 165,150 |
| 123,978 | | BB- | | Elwood Energy LLC, Secured Notes, 8.159% due 7/5/26 | | | 126,770 |
| 87,614 | | BB- | | FPL Energy National Wind, Secured Notes, 6.125% due 3/25/19 (a)(d) | | | 88,073 |
| 12,520 | | BB+ | | Midwest Generation LLC, Pass-Through Certificate, Series B, 8.560% due 1/2/16 | | | 13,323 |
| 96,000 | | BB- | | PSEG Energy Holdings LLC, Senior Notes, 8.625% due 2/15/08 (d) | | | 97,327 |
| 305,000 | | B- | | Reliant Energy Inc., Senior Notes, 7.625% due 6/15/14 | | | 300,425 |
| | | | | | |
|
|
| | | | | Total Electric Utilities | | | 1,973,078 |
| | | | | | |
|
|
| |
Electrical Equipment — 0.6% | | | |
| 145,000 | | B | | Coleman Cable Inc., Company Guaranteed Notes, 9.875% due 10/1/12 | | | 140,287 |
| 340,000 | | B+ | | Superior Essex Communications LLC/Essex Group Inc., Senior Notes, 9.000% due 4/15/12 | | | 339,150 |
| | | | | | |
|
|
| | | | | Total Electrical Equipment | | | 479,437 |
| | | | | | |
|
|
| |
Electronic Equipment & Instruments — 0.5% | | | |
| 70,000 | | B | | NewPage Corp., Company Guaranteed Notes, 10.000% due 5/1/12 | | | 72,800 |
| 150,000 | | BB | | NXP BV / NXP Funding LLC, Secured Notes, 7.875% due 10/15/14 | | | 135,937 |
| 270,000 | | B+ | | Sanmina-SCI Corp., Company Guaranteed Notes, 8.110% due 6/15/14 (a)(e) | | | 255,825 |
| | | | | | |
|
|
| | | | | Total Electronic Equipment & Instruments | | | 464,562 |
| | | | | | |
|
|
See Notes to Financial Statements.
97
Schedules of Investments
(continued)
| | | | | | | |
| High Yield Investments | | |
| | | |
Face
Amount | | Rating‡ | | Security | | Value |
| |
Energy Equipment & Services — 0.8% | | | |
| $ 130,000 | | A- | | ANR Pipeline Co., Debentures, 9.625% due 11/1/21 | | $ | 174,232 |
| 65,000 | | B | | Gulfmark Offshore Inc., 7.750% due 7/15/14 | | | 64,350 |
| 45,000 | | BB- | | Pride International Inc., Senior Unsecured Notes, 7.375% due 7/15/14 | | | 45,675 |
| 20,000 | | B | | Roseton/Danskammer, Pass Thru Certificates, 7.670% due 11/8/16 | | | 19,831 |
| 20,000 | | BB | | Southern Natural Gas Co., Notes, 8.000% due 3/1/32 | | | 22,455 |
| 268,000 | | BB+ | | Transcontinental Gas Pipe Line Corp., Senior Notes, Series B, 8.875% due 7/15/12 | | | 302,170 |
| 95,000 | | B- | | VeraSun Energy Corp., Senior Notes, 9.375% due 6/1/17 (a) | | | 88,587 |
| | | | | | |
|
|
| | | | | Total Energy Equipment & Services | | | 717,300 |
| | | | | | |
|
|
| |
Food & Staples Retailing — 0.3% | | | |
| 185,000 | | BB+ | | Delhaize America Inc., Debentures, 9.000% due 4/15/31 | | | 217,375 |
| | | | | | |
|
|
| |
Food Products — 0.4% | | | |
| 165,000 | | B- | | Dole Foods Co. Inc., 7.250% due 6/15/10 | | | 153,450 |
| 300,000 | | CC | | Merisant Co., Company Guaranteed Notes, 9.500% due 7/15/13 | | | 229,500 |
| | | | | | |
|
|
| | | | | Total Food Products | | | 382,950 |
| | | | | | |
|
|
| |
Health Care Equipment & Supplies — 0.4% | | | |
| | | | | Advanced Medical Optics Inc.: | | | |
| 30,000 | | B- | | Company Guaranteed Notes, 7.500% due 5/1/17 | | | 27,525 |
| 185,000 | | B- | | Senior Subordinated Notes, 3.250% due 8/1/26 | | | 151,006 |
| 140,000 | | B- | | Invacare Corp., Company Guaranteed Notes, 9.750% due 2/15/15 | | | 135,800 |
| | | | | Universal Hospital Services Inc., Secured Notes: | | | |
| 35,000 | | B+ | | 8.500% due 6/1/15 (a)(f) | | | 33,425 |
| 30,000 | | B+ | | 8.759% due 6/1/15 (a)(e) | | | 29,100 |
| | | | | | |
|
|
| | | | | Total Health Care Equipment & Supplies | | | 376,856 |
| | | | | | |
|
|
| |
Health Care Providers & Services — 4.0% | | | |
| 410,000 | | B- | | Community Health Systems Inc., Senior Notes, 8.875% due 7/15/15 (a) | | | 411,537 |
| 220,000 | | B | | DaVita Inc., Senior Subordinated Notes, 7.250% due 3/15/15 | | | 216,700 |
| | | | | HCA Inc.: | | | |
| | | | | Notes: | | | |
| 120,000 | | B- | | 9.000% due 12/15/14 | | | 114,214 |
| 190,000 | | B- | | 7.690% due 6/15/25 | | | 154,243 |
| | | | | Secured Notes: | | | |
| 900,000 | | BB- | | 9.250% due 11/15/16 (a) | | | 927,000 |
| 160,000 | | BB- | | 9.625% due 11/15/16 (a)(f) | | | 165,800 |
| 265,000 | | CCC+ | | Healthsouth Corp., Company Guaranteed Notes, 11.409% due 6/15/14 (e) | | | 272,950 |
| 340,000 | | BB- | | Omnicare Inc., Debentures, 3.250% due 12/15/35 | | | 268,175 |
| 285,000 | | CCC+ | | Select Medical Corp., 7.625% due 2/1/15 | | | 248,662 |
| | | | | Tenet Healthcare Corp.: | | | |
| | | | | Senior Notes: | | | |
| 150,000 | | CCC+ | | 6.375% due 12/1/11 | | | 126,750 |
| 269,000 | | CCC+ | | 9.875% due 7/1/14 (c) | | | 239,410 |
| 175,000 | | CCC+ | | United Surgical Partners International Inc., Company Guaranteed Notes, 8.875% due 5/1/17 | | | 168,000 |
| 145,000 | | CCC+ | | US Oncology Holdings Inc., Senior Unsecured Notes, 9.797% due 3/15/12 (a)(f) | | | 134,850 |
| | | | | | |
|
|
| | | | | Total Health Care Providers & Services | | | 3,448,291 |
| | | | | | |
|
|
| |
Hotels, Restaurants & Leisure — 6.7% | | | |
| 130,000 | | B+ | | Boyd Gaming Corp., Senior Subordinated Notes, 6.750% due 4/15/14 | | | 123,500 |
| 150,000 | | CCC | | Buffets Inc., 12.500% due 11/1/14 (c) | | | 116,250 |
| 60,000 | | CCC+ | | El Pollo Loco, 11.750% due 11/15/13 | | | 61,500 |
See Notes to Financial Statements.
98
Schedules of Investments
(continued)
| | | | | | | |
| High Yield Investments | | |
| | | |
Face
Amount | | Rating‡ | | Security | | Value |
| |
Hotels, Restaurants & Leisure — 6.7% (continued) | | | |
| $ 65,000 | | CCC+ | | Fontainebleau Las Vegas Holdings LLC/Fontainebleau Las Vegas Capital Corp, 10.250% due 6/15/15 (a) | | $ | 56,062 |
| 355,000 | | B- | | Gaylord Entertainment Co., Senior Notes, 6.750% due 11/15/14 | | | 339,025 |
| 410,000 | | B | | Inn of the Mountain Gods Resort & Casino, Company Guaranteed Notes, 12.000% due 11/15/10 | | | 434,600 |
| 125,000 | | BBB | | International Game Technology, Senior Notes, 2.600% due 12/15/36 (a) | | | 121,012 |
| 400,000 | | B | | Isle of Capri Casino Inc., Senior Subordinated Notes, 7.000% due 3/1/14 | | | 349,000 |
| | | | | Majestic Star Casino LLC/ Majestic Star Casino Capital Corp.: | | | |
| 225,000 | | B+ | | Company Guaranteed Notes, 9.500% due 10/15/10 | | | 221,625 |
| 400,000 | | CCC+ | | Senior Unsecured Notes, 9.750% due 1/15/11 | | | 342,000 |
| | | | | MGM Mirage: | | | |
| | | | | Company Guaranteed Notes: | | | |
| 135,000 | | B+ | | 8.375% due 2/1/11 | | | 138,713 |
| 50,000 | | BB | | 7.500% due 6/1/16 | | | 49,625 |
| 530,000 | | B | | MTR Gaming Group Inc., 9.750% due 4/1/10 | | | 537,950 |
| 220,000 | | B+ | | OED Corp., 8.750% due 4/15/12 | | | 218,900 |
| 65,000 | | CCC+ | | OSI Restaurant Partners Inc., Senior Notes, 9.625% due 6/15/15 (a) | | | 56,388 |
| 725,000 | | B- | | Pinnacle Entertainment Inc., Senior Subordinated Notes, 8.250% due 3/15/12 | | | 732,250 |
| 490,000 | | B+ | | River Rock Entertainment Authority, Secured Notes, 9.750% due 11/1/11 | | | 504,700 |
| 100,000 | | CCC | | Sbarro Inc., Senior Unsecured Notes, 10.375% due 2/1/15 | | | 88,375 |
| 215,000 | | B | | Shingle Springs Tribal Gaming Authority, Senior Notes, 9.375% due 6/15/15 (a) | | | 212,850 |
| | | | | Station Casinos Inc.: | | | |
| 15,000 | | B | | Senior Subordinated Notes, 6.625% due 3/15/18 | | | 12,150 |
| 185,000 | | B+ | | Senior Unsecured Notes, 7.750% due 8/15/16 | | | 178,063 |
| 270,000 | | B | | Trump Entertainment Resorts Inc., 8.500% due 6/1/15 (c) | | | 221,400 |
| 55,000 | | B+ | | Turning Stone Resort Casino Enterprise, Senior Notes, 9.125% due 9/15/14 (a) | | | 55,825 |
| 390,000 | | B | | Virgin River Casino Corp., 9.000% due 1/15/12 | | | 388,050 |
| 185,000 | | BB+ | | Wynn Las Vegas Capital Corp., 1St Mortgage Notes, 6.625% due 12/1/14 | | | 179,913 |
| | | | | | |
|
|
| | | | | Total Hotels, Restaurants & Leisure | | | 5,739,726 |
| | | | | | |
|
|
| |
Household Durables — 1.9% | | | |
| 20,000 | | BB+ | | American Greetings Corp., Senior Notes, 7.375% due 6/1/16 | | | 19,000 |
| 230,000 | | B | | Elizabeth Arden Inc., 7.750% due 1/15/14 | | | 224,250 |
| 345,000 | | B- | | Jarden Corp., 7.500% due 5/1/17 | | | 324,300 |
| 205,000 | | BB- | | K Hovnanian Enterprises Inc., 6.250% due 1/15/16 | | | 154,775 |
| 20,000 | | BB- | | KB Home, Senior Subordinated Notes, 7.750% due 2/1/10 | | | 19,000 |
| 250,000 | | B+ | | Libbey Glass Inc., 12.385% due 6/1/11 (e) | | | 269,375 |
| 200,000 | | B- | | Norcraft Cos. LP/Norcraft Finance Corp., Senior Subordinated Notes, 9.000% due 11/1/11 | | | 201,000 |
| 415,000 | | B- | | Norcraft Holdings LP/Norcraft Capital Corp., Senior Discount Notes, step bond to yield, 9.120% due 9/1/12 | | | 369,350 |
| 50,000 | | CCC+ | | Simmons Co., Senior Discount Notes, step bond to yield, 10.000% due 12/15/14 | | | 39,125 |
| | | | | | |
|
|
| | | | | Total Household Durables | | | 1,620,175 |
| | | | | | |
|
|
| |
Household Products — 0.2% | | | |
| 160,000 | | CCC+ | | Yankee Acquisition Corp., Company Guaranteed Notes, 8.500% due 2/15/15 | | | 151,200 |
| | | | | | |
|
|
| |
Independent Power Producers & Energy Traders — 3.3% | | | |
| 1,020,000 | | D | | Calpine Corp., Senior Notes, 8.500% due 2/15/11 | | | 1,099,050 |
| | | | | Edison Mission Energy, Senior Notes: | | | |
| 30,000 | | BB- | | 7.500% due 6/15/13 | | | 30,375 |
| 160,000 | | BB- | | 7.750% due 6/15/16 | | | 162,000 |
| 355,000 | | B- | | Mirant North America LLC, Senior Notes, 7.375% due 12/31/13 | | | 355,000 |
| 545,000 | | B | | NRG Energy Inc., Company Guaranteed Notes, 7.375% due 2/1/16 | | | 539,550 |
| 590,000 | | B | | Orion Power Holdings Inc., 12.000% due 5/1/10 | | | 646,050 |
| 40,000 | | BB- | | TXU Corp., Senior Unsecured Notes, 6.500% due 11/15/24 | | | 32,300 |
| | | | | | |
|
|
| | | | | Total Independent Power Producers & Energy Traders | | | 2,864,325 |
| | | | | | |
|
|
See Notes to Financial Statements.
99
Schedules of Investments
(continued)
| | | | | | | |
| High Yield Investments | | |
| | | |
Face
Amount | | Rating‡ | | Security | | Value |
| |
Industrial Conglomerates — 0.3% | | | |
| $ 210,000 | | CCC+ | | RBS Global Inc. and Rexnord Corp., Company Guaranteed Notes, 9.500% due 8/1/14 | | $ | 213,150 |
| | | | | | |
|
|
| |
Insurance — 0.0% | | | |
| 35,000 | | BB | | Crum & Forster Holdings Corp., Senior Unsecured Notes, 7.750% due 5/1/17 | | | 33,250 |
| | | | | | |
|
|
| |
Internet Software & Services — 0.5% | | | |
| 405,000 | | NR | | Terremark Worldwide Inc., Senior Notes, 6.625% due 6/15/13 | | | 423,792 |
| | | | | | |
|
|
| |
IT Services — 0.2% | | | |
| 170,000 | | B- | | Sungard Data Systems Inc., Company Guaranteed Notes, 9.125% due 8/15/13 | | | 176,375 |
| | | | | | |
|
|
| |
Leisure Equipment & Products — 1.0% | | | |
| 215,000 | | B | | Festival Fun Parks LLC, 10.875% due 4/15/14 | | | 218,763 |
| 715,000 | | CCC | | Six Flags Inc., Senior Notes, 9.750% due 4/15/13 (c) | | | 604,175 |
| | | | | | |
|
|
| | | | | Total Leisure Equipment & Products | | | 822,938 |
| | | | | | |
|
|
| |
Machinery — 1.2% | | | |
| 270,000 | | CCC+ | | Metals USA Inc., 11.125% due 12/1/15 | | | 288,900 |
| 805,000 | | CCC- | | Thermadyne Holdings Corp., 10.500% due 2/1/14 (c) | | | 780,850 |
| | | | | | |
|
|
| | | | | Total Machinery | | | 1,069,750 |
| | | | | | |
|
|
| |
Media — 7.5% | | | |
| | | | | Affinion Gourp Inc., | | | |
| 250,000 | | B- | | Senior Notes, 10.125% due 10/15/13 | | | 251,250 |
| 20,000 | | B- | | Company Guaranteed Notes, 11.500% due 10/15/15 | | | 20,100 |
| | | | | AMC Entertainment Inc.: | | | |
| 90,000 | | CCC+ | | Company Guaranteed Notes, 11.000% due 2/1/16 | | | 94,050 |
| | | | | Senior Subordinated Notes: | | | |
| 15,000 | | CCC+ | | 8.000% due 3/1/14 | | | 13,950 |
| 260,000 | | CCC+ | | step bond to yield, 12.000% due 8/15/14 | | | 219,700 |
| 629 | | CCC+ | | CanWest Media Inc., Senior Notes, 8.000% due 9/15/12 (d) | | | 616 |
| | | | | CCH I Holdings LLC: | | | |
| 560,000 | | CCC | | 9.920% due 4/1/14 (c) | | | 473,200 |
| | | | | Company Guaranteed Notes, step bond to yield: | | | |
| 220,000 | | CCC | | 11.125% due 1/15/14 | | | 191,400 |
| 15,000 | | CCC | | 12.125% due 1/15/15 | | | 13,500 |
| 300,000 | | CCC | | Senior Discount Notes, step bond to yield, 11.750% due 5/15/14 (c) | | | 268,500 |
| 1,417,000 | | CCC | | Senior Secured Notes, 11.000% due 10/1/15 | | | 1,395,733 |
| | | | | CCH II LLC/CCH II Capital Corp.: | | | |
| 153,000 | | CCC | | Company Guaranteed Notes, 10.250% due 10/1/13 (h) | | | 155,295 |
| 10,000 | | CCC | | Senior Unsecured Notes, 10.250% due 9/15/10 (h) | | | 10,150 |
| 400,000 | | CCC | | CCO Holdings LLC/ Capital Corp., 8.750% due 11/15/13 | | | 394,000 |
| 40,000 | | CCC | | Charter Communications Holdings LLC/Charter Communications Holdings Capital Corp., Senior Discount Notes, step bond to yield, 11.750% due 5/15/11 | | | 38,800 |
| 210,000 | | CCC+ | | Cinemark Inc., Discount Notes, step bond to yield, 9.750% due 3/15/14 | | | 195,300 |
| 420,000 | | CCC | | CMP Susquehanna Corp., Company Guaranteed Notes, 9.875% due 5/15/14 | | | 390,600 |
| 510,000 | | B+ | | CSC Holdings Inc., Senior Notes, 7.625% due 4/1/11 | | | 504,900 |
| 185,000 | | BB- | | Echostar DBS Corp., Company Guaranteed Notes, 7.125% due 2/1/16 | | | 181,763 |
| 125,000 | | B+ | | Idearc Inc., Company Guaranteed Notes, 8.000% due 11/15/16 | | | 124,063 |
| 30,000 | | NR | | ION Media Networks Inc., Senior Subordinated Notes, 11.000% due 7/31/13 | | | 26,025 |
| 330,000 | | B | | Mediacom LLC/Mediacom Capital Corp., 9.500% due 1/15/13 | | | 331,650 |
| 95,000 | | B | | Quebecor Media Inc., Senior Notes, 7.750% due 3/15/16 | | | 90,844 |
| 220,000 | | CCC | | Sirius Satellite Radio Inc., 9.625% due 8/1/13 | | | 209,000 |
| 60,000 | | B | | Sun Media Corp., Company Guaranteed Notes, 7.625% due 2/15/13 | | | 58,950 |
See Notes to Financial Statements.
100
Schedules of Investments
(continued)
| | | | | | | |
| High Yield Investments | | |
| | | |
Face
Amount | | Rating‡ | | Security | | Value |
| |
Media — 7.5% (continued) | | | |
| | | | | TL Acquisitions Inc.: | | | |
| $ 150,000 | | CCC+ | | Senior Notes, 10.500% due 1/15/15 (a) | | $ | 140,625 |
| 110,000 | | CCC+ | | Senior Subordinated Notes, step bond to yield, 13.250% due 7/15/15 (a) | | | 82,225 |
| 65,000 | | CCC+ | | Univision Communications Inc., Senior Notes, 9.750% due 3/15/15 (a)(f) | | | 62,238 |
| 80,000 | | B | | WMG Acquisition Corp., Senior Subordinated Notes, 7.375% due 4/15/14 | | | 70,800 |
| | | | | XM Satellite Radio Inc.: | | | |
| 85,000 | | CCC | | Company Guaranteed Notes, 9.856% due 5/1/13 | | | 79,475 |
| 5,000 | | CCC | | Senior Notes, 9.750% due 5/1/14 (e) | | | 4,775 |
| 345,000 | | CCC- | | Young Broadcasting Inc., 10.000% due 3/1/11 | | | 312,225 |
| | | | | | |
|
|
| | | | | Total Media | | | 6,405,702 |
| | | | | | |
|
|
| |
Metals & Mining — 2.5% | | | |
| 300,000 | | B+ | | Chaparral Steel Co., Senior Notes, 10.000% due 7/15/13 | | | 342,000 |
| 120,000 | | B | | Foundation PA Coal Co., Senior Unsecured Notes, 7.250% due 8/1/14 | | | 115,500 |
| 945,000 | | BB | | Freeport-McMoRan Copper & Gold Inc., Senior Unsecured Notes, 8.375% due 4/1/17 | | | 1,008,788 |
| 90,000 | | CCC | | Metals USA Holdings Corp., Senior Notes, 11.360% due 7/1/12 (a)(f) | | | 82,811 |
| 120,000 | | CCC+ | | Noranda Aluminium Holding Corp., Senior Notes, 11.146% due 11/15/14 (a)(f) | | | 109,800 |
| 170,000 | | B | | Peabody Energy Corp, 4.750% due 12/15/41 | | | 168,300 |
| 95,000 | | B- | | Tube City IMS Corp., Company Guaranteed Notes, 9.750% due 2/1/15 | | | 93,575 |
| 235,000 | | NR | | WCI Steel Acquisition Inc., Senior Notes, 8.000% due 5/1/16 | | | 236,175 |
| | | | | | |
|
|
| | | | | Total Metals & Mining | | | 2,156,949 |
| | | | | | |
|
|
|
Multiline Retail — 1.7% |
| 475,000 | | B- | | Bon-Ton Stores Inc., 10.250% due 3/15/14 (c) | | | 434,625 |
| 360,000 | | B- | | Carrols Corp., Company Guaranteed Notes, 9.000% due 1/15/13 | | | 340,200 |
| | | | | Dollar General Corp.: | | | |
| 140,000 | | CCC+ | | Senior Notes, 10.625% due 7/15/15 (a)(f) | | | 126,700 |
| 130,000 | | CCC+ | | Senior Subordinated Notes, 11.875% due 7/15/17 (a)(f) | | | 123,825 |
| | | | | Neiman Marcus Group Inc.: | | | |
| 60,000 | | B- | | Company Guaranteed Notes, 10.375% due 10/15/15 | | | 64,800 |
| 195,000 | | B- | | Senior Notes, 9.000% due 10/15/15 (f) | | | 206,700 |
| 125,000 | | B | | Pantry Inc., Senior Subordinated Notes, 3.000% due 11/15/12 | | | 117,813 |
| | | | | | |
|
|
| | | | | Total Multiline Retail | | | 1,414,663 |
| | | | | | |
|
|
|
Oil, Gas & Consumable Fuels — 10.4% |
| | | | | Allis-Chalmers Energy Inc., Company Guaranteed Notes: | | | |
| 180,000 | | B | | 9.000% due 1/15/14 | | | 180,000 |
| 225,000 | | B | | 8.500% due 3/1/17 | | | 216,563 |
| 735,000 | | B | | Belden & Blake Corp., Secured Notes, 8.750% due 7/15/12 | | | 738,675 |
| 265,000 | | NR | | Callon Petroleum Co., Senior Notes, 9.750% due 12/8/10 | | | 253,075 |
| | | | | Chesapeake Energy Corp.: | | | |
| 245,000 | | BB | | Company Guaranteed Notes, 6.250% due 1/15/18 | | | 230,606 |
| 160,000 | | BB | | Senior Notes, 2.750% due 11/15/35 | | | 165,200 |
| 500,000 | | B+ | | Compagnie Generale de Geophysique-Veritas, Company Guaranteed Notes, 7.500% due 5/15/15 | | | 505,000 |
| 145,000 | | B | | Complete Production Services Inc., Company Guaranteed Notes, 8.000% due 12/15/16 | | | 140,288 |
| 550,000 | | B | | Comstock Resources Inc., 6.875% due 3/1/12 | | | 514,250 |
| 75,000 | | B+ | | Copano Energy LLC, Senior Notes, 8.125% due 3/1/16 (d) | | | 75,750 |
| 435,000 | | B- | | Dynegy Holdings Inc., Senior Unsecured Notes, 7.750% due 6/1/19 (a) | | | 404,550 |
| | | | | Edison Mission Energy: | | | |
| | | | | Senior Notes: | | | |
| 100,000 | | BB- | | 7.200% due 5/15/19 (a) | | | 95,000 |
| 100,000 | | BB- | | 7.625% due 5/15/27 (a) | | | 93,500 |
See Notes to Financial Statements.
101
Schedules of Investments
(continued)
| | | | | | | |
| High Yield Investments | | |
| | | |
Face
Amount | | Rating‡ | | Security | | Value |
|
Oil, Gas & Consumable Fuels — 10.4% (continued) |
| | | | | El Paso Corp.: | | | |
| $ 375,000 | | BB- | | Medium-Term Notes, 8.050% due 10/15/30 | | $ | 381,201 |
| 250,000 | | BB- | | Senior Unsecured Notes, 7.800% due 8/1/31 | | | 250,175 |
| 80,000 | | B | | Encore Acquisition Co., Senior Subordinated Notes, 6.250% due 4/15/14 | | | 73,400 |
| 360,000 | | B- | | Energy Partners Ltd., Senior Notes, 9.750% due 4/15/14 (a) | | | 336,600 |
| 190,000 | | BB | | Enterprise Products Operating LP, 8.375% due 8/1/66 (e) | | | 194,840 |
| 220,000 | | B | | EXCO Resources Inc., Senior Notes, 7.250% due 1/15/11 | | | 222,750 |
| 130,000 | | B- | | International Coal Group Inc., Senior Notes, 10.250% due 7/15/14 | | | 122,525 |
| | | | | Mariner Energy Inc., Senior Notes: | | | |
| 90,000 | | B- | | 7.500% due 4/15/13 | | | 85,950 |
| 5,000 | | B- | | 8.000% due 5/15/17 | | | 4,763 |
| 185,000 | | CCC+ | | North American Energy Partners Inc., 8.750% due 12/1/11 | | | 186,850 |
| 265,000 | | B- | | Parallel Petroleum Corp., Senior Notes, 10.250% due 8/1/14 (a) | | | 254,400 |
| 365,000 | | B- | | Petrohawk Energy Corp., Senior Notes, 9.125% due 7/15/13 | | | 382,338 |
| 535,000 | | B- | | Petroquest Energy Inc., 10.375% due 5/15/12 | | | 540,350 |
| 355,000 | | B+ | | Pogo Producing Co., Senior Subordinated Notes, 6.875% due 10/1/17 | | | 359,438 |
| 310,000 | | B1 | | SemGroup LP, Senior Notes, 8.750% due 11/15/15 (a)(g) | | | 299,925 |
| 10,000 | | BB- | | SESI LLC, Senior Notes, 6.875% due 6/1/14 | | | 9,600 |
| 550,000 | | B- | | Stone Energy Corp., Senior Subordinated Notes, 8.250% due 12/15/11 | | | 543,125 |
| 275,000 | | B | | United Refining Co., Senior Notes, 10.500% due 8/15/12 (a) | | | 279,813 |
| 80,000 | | B- | | W&T Offshore Inc., Company Guaranteed Notes, 8.250% due 6/15/14 (a) | | | 77,000 |
| 440,000 | | B | | Whiting Petroleum Corp., Senior Subordinated Notes, 7.000% due 2/1/14 | | | 416,900 |
| | | | | Williams Cos. Inc.: | | | |
| 160,000 | | BB | | Debentures, 7.500% due 1/15/31 | | | 165,200 |
| 121,000 | | BB | | Notes, 8.750% due 3/15/32 | | | 138,243 |
| | | | | | |
|
|
| | | | | Total Oil, Gas & Consumable Fuels | | | 8,937,843 |
| | | | | | |
|
|
|
Paper & Forest Products — 1.5% |
| 250,000 | | B | | Appleton Papers Inc., Senior Subordinated Notes, Series B, 9.750% due 6/15/14 | | | 252,813 |
| | | | | Domtar Inc.: | | | |
| 130,000 | | B+ | | Notes, 7.125% due 8/15/15 | | | 121,550 |
| 185,000 | | B+ | | Senior Unsecured Notes, 9.500% due 8/1/16 | | | 195,175 |
| 280,000 | | B | | Mercer International Inc., 9.250% due 2/15/13 | | | 273,000 |
| 110,000 | | B- | | NCO Group Inc., Company Guaranteed Notes, 10.428% due 11/15/13 (e) | | | 105,188 |
| | | | | Newpage Corp.: | | | |
| 85,000 | | CCC+ | | Senior Subordinated Notes, 12.000% due 5/1/13 (c) | | | 89,250 |
| 80,000 | | B | | Unsubordinated Notes, 11.606% due 5/1/12 (e) | | | 85,200 |
| 125,000 | | CCC+ | | Verso Paper Holdings LLC and Verson Paper Inc., Company Guaranteed Notes, 11.375% due 8/1/16 | | | 128,125 |
| | | | | | |
|
|
| | | | | Total Paper & Forest Products | | | 1,250,301 |
| | | | | | |
|
|
|
Pharmaceuticals — 0.8% |
| 220,000 | | B- | | Angiotech Pharmaceuticals Inc., Company Guaranteed Notes, 9.110% due 12/1/13 (a)(e) | | | 218,900 |
| 330,000 | | CCC- | | Leiner Health Products Inc., Senior Subordinated Notes, 11.000% due 6/1/12 | | | 288,750 |
| 170,000 | | B+ | | NBTY Inc., 7.125% due 10/1/15 | | | 165,750 |
| | | | | | |
|
|
| | | | | Total Pharmaceuticals | | | 673,400 |
| | | | | | |
|
|
|
Real Estate Investment Trusts (REITs) — 1.2% |
| 95,000 | | B- | | Ashton Woods USA LLC/Ashton Woods Finance Co., 9.500% due 10/1/15 | | | 76,000 |
| | | | | Forest City Enterprises Inc.: | | | |
| 90,000 | | BB- | | Notes, 7.625% due 6/1/15 | | | 85,050 |
| 270,000 | | BB- | | Senior Notes, 6.500% due 2/1/17 | | | 241,650 |
See Notes to Financial Statements.
102
Schedules of Investments
(continued)
| | | | | | | |
| High Yield Investments | | |
| | | |
Face
Amount | | Rating‡ | | Security | | Value |
|
Real Estate Investment Trusts (REITs) — 1.2% (continued) |
| $ 185,000 | | BB | | Host Hotels & Resorts Inc., Senior Notes, 2.625% due 4/15/27 (a) | | $ | 163,031 |
| 35,000 | | B- | | Kimball Hill Inc., Senior Subordinated Notes, 10.500% due 12/15/12 | | | 25,725 |
| 290,000 | | B- | | Realogy Corp., Senior Subordinated Notes, Senior Subordinated Notes, 12.375% due 4/15/15 (a) | | | 214,238 |
| | | | | Ventas Realty LP/Ventas Capital Corp.: | | | |
| | | | | Company Guaranteed Notes: | | | |
| 7,000 | | BB+ | | 8.750% due 5/1/09 | | | 7,298 |
| 183,000 | | BB+ | | 9.000% due 5/1/12 | | | 197,183 |
| | | | | | |
|
|
| | | | | Total Real Estate Investment Trusts (REITs) | | | 1,010,175 |
| | | | | | |
|
|
|
Retail-Apparel/Shoe — 0.2% |
| 180,000 | | B- | | Payless Shoesource Inc., 8.250% due 8/1/13 | | | 167,400 |
| | | | | | |
|
|
|
Road & Rail — 0.8% |
| 50,000 | | BB- | | American Railcar Industries Inc., Senior Unsecured Notes, 7.500% due 3/1/14 | | | 48,750 |
| 305,000 | | B2 | | Kansas City Southern de Mexico SA de CV, Senior Note, 9.375% due 5/1/12 (g) | | | 317,200 |
| 300,000 | | B- | | Kansas City Southern Railway, 7.500% due 6/15/09 | | | 301,500 |
| | | | | | |
|
|
| | | | | Total Road & Rail | | | 667,450 |
| | | | | | |
|
|
|
Semiconductors & Semiconductor Equipment — 0.8% |
| 210,000 | | NR | | Conexant Systems Inc., Subordinated Notes, 4.000% due 3/1/26 | | | 172,463 |
| 335,000 | | B | | Freescale Semiconductor Inc., Senior Unsecured Notes, 8.875% due 12/15/14 | | | 310,713 |
| 240,000 | | BB- | | Micron Technology Inc., Senior Unsecured Notes, 1.875% due 6/1/14 | | | 234,000 |
| | | | | | |
|
|
| | | | | Total Semiconductors & Semiconductor Equipment | | | 717,176 |
| | | | | | |
|
|
|
Specialty Retail — 1.1% |
| 115,000 | | CCC | | Blockbuster Inc., Senior Subordinated Notes, 9.000% due 9/1/12 | | | 99,475 |
| 65,000 | | CCC | | Michaels Stores Inc., Senior Notes, 10.000% due 11/1/14 (a) | | | 65,488 |
| 315,000 | | B- | | Mobile Services Group Inc., Senior Notes, 9.750% due 8/1/14 (a) | | | 318,938 |
| 180,000 | | BB- | | Rite Aid Corp., Secured Notes, 7.500% due 3/1/17 | | | 168,300 |
| 320,000 | | B- | | Suburban Propane Partners LP/Suburban Energy Finance Corp., Senior Notes, 6.875% due 12/15/13 | | | 307,200 |
| | | | | | |
|
|
| | | | | Total Specialty Retail | | | 959,401 |
| | | | | | |
|
|
|
Textiles, Apparel & Luxury Goods — 1.0% |
| | | | | Levi Strauss & Co.: | | | |
| 230,000 | | B+ | | Senior Notes, 9.750% due 1/15/15 | | | 239,200 |
| 30,000 | | B+ | | Senior Unsecured Notes, 8.875% due 4/1/16 | | | 30,300 |
| 84,000 | | B | | Oxford Industries Inc., Company Guaranteed Notes, 8.875% due 6/1/11 | | | 84,630 |
| 390,000 | | B- | | Perry Ellis International Inc., Company Guaranteed Notes, 8.875% due 9/15/13 | | | 378,300 |
| 165,000 | | CCC+ | | Rafaella Apparel Group Inc., Secured Notes, 11.250% due 6/15/11 | | | 155,925 |
| | | | | | |
|
|
| | | | | Total Textiles, Apparel & Luxury Goods | | | 888,355 |
| | | | | | |
|
|
|
Tobacco — 0.1% |
| | | | | Alliance One International Inc.: | | | |
| | | | | Company Guaranteed Notes: | | | |
| 80,000 | | B | | 8.500% due 5/15/12 (a) | | | 80,000 |
| 40,000 | | B | | 11.000% due 5/15/12 | | | 42,000 |
| | | | | | |
|
|
| | | | | Total Tobacco | | | 122,000 |
| | | | | | |
|
|
|
Trading Companies & Distributors — 0.6% |
| 175,000 | | B | | Ashtead Capital Inc., Notes, 9.000% due 8/15/16 (a) | | | 174,125 |
| 115,000 | | B+ | | H&E Equipment Services Inc., Senior Notes, 8.375% due 7/15/16 | | | 118,450 |
| 185,000 | | B | | Wesco Distribution Inc., Company Guaranteed Notes, 7.500% due 10/15/17 | | | 179,913 |
| | | | | | |
|
|
| | | | | Total Trading Companies & Distributors | | | 472,488 |
| | | | | | |
|
|
See Notes to Financial Statements.
103
Schedules of Investments
(continued)
| | | | | | | |
| High Yield Investments | | |
| | | |
Face
Amount | | Rating‡ | | Security | | Value |
|
Transportation Infrastructure — 0.3% |
| $ 45,000 | | BB+ | | Overseas Shipholding Group, 8.250% due 3/15/13 | | $ | 46,406 |
| | | | | Saint Acquisition Corp., Secured Notes: | | | |
| 30,000 | | B | | 13.308% due 5/15/15 (a)(e) | | | 20,250 |
| 235,000 | | B | | 12.500% due 5/15/17 (a) | | | 158,625 |
| | | | | | |
|
|
| | | | | Total Transportation Infrastructure | | | 225,281 |
| | | | | | |
|
|
|
Wireless Equipment — 0.2% |
| 190,000 | | NR | | Covad Communications Group Inc., Senior Notes, 3.000% due 3/15/24 | | | 168,150 |
| | | | | | |
|
|
|
Wireless Telecommuication Services — 4.3% |
| 640,000 | | CCC+ | | Centennial Communication Corp., Senior Notes, 10.000% due 1/1/13 | | | 672,000 |
| 180,000 | | CCC | | Cricket Communications Inc., Company Guaranteed Notes, 9.375% due 11/1/14 (a) | | | 177,300 |
| 435,000 | | CCC | | Dobson Communications Corp., Senior Notes, 8.875% due 10/1/13 (c) | | | 462,188 |
| 175,000 | | B | | GCI Inc., Senior Unsecured Notes, 7.250% due 2/15/14 | | | 162,750 |
| 230,000 | | CCC | | iPCS Inc., Secured Notes, 8.606% due 5/1/14 (a)(f) | | | 221,950 |
| 40,000 | | CCC | | MetroPCS Wireless Inc., Senior Notes, 9.250% due 11/1/14 (a) | | | 39,600 |
| 405,000 | | B+ | | Millicom International Cellular SA, Senior Notes, 10.000% due 12/1/13 | | | 429,300 |
| 100,000 | | BBB- | | Rogers Wireless Inc., 7.250% due 12/15/12 | | | 106,105 |
| | | | | Rural Cellular Corp.: | | | |
| 255,000 | | B+ | | Secured Notes, 8.250% due 3/15/12 | | | 266,475 |
| 70,000 | | CCC | | Senior Notes, 9.875% due 2/1/10 (e) | | | 72,800 |
| 90,000 | | CCC | | Senior Subordinated Notes, 8.360% due 6/1/13 (a) | | | 92,250 |
| 985,000 | | CCC | | Suncom Wireless Inc., 8.500% due 6/1/13 | | | 996,081 |
| | | | | | |
|
|
| | | | | Total Wireless Telecommuication Services | | | 3,698,799 |
| | | | | | |
|
|
| | | | | TOTAL CORPORATE BONDS & NOTES
(Cost — $79,234,477) | | | 77,512,835 |
| | | | | | |
|
|
COLLATERALIZED MORTGAGE OBLIGATIONS — 0.2% |
| 284,833 | | | | Blackrock Capital Finance LP, 9.554% due 9/25/26 (e) | | | 176,597 |
| 72,424 | | | | Ocwen Residential MBS Corp., Series 1998-R1, Class C1, 7.000% due 10/25/40 (i) | | | 4,345 |
| | | | | | |
|
|
| | | | | TOTAL COLLATERALIZED MORTGAGE OBLIGATIONS
(Cost — $216,264) | | | 180,942 |
| | | | | | |
|
|
| | | |
Shares
| | | | | | |
COMMON STOCK — 0.1% | | | |
FINANCIALS — 0% | | | |
| |
Diversified Financial Services — 0% | | | |
| 289 | | | | Adelphia Recovery Trust | | | 23 |
| | | | | | |
|
|
CONSUMER DISCRETIONARY — 0.1% | | | |
| |
Media — 0.1% | | | |
| 2,958 | | | | Time Warner Cable Inc. | | | 108,559 |
| | | | | | |
|
|
| | | | | TOTAL COMMON STOCKS
(Cost — $112,118) | | | 108,582 |
| | | | | | |
|
|
PREFERRED STOCKS — 1.6% | | | |
ENERGY — 0.1% | | | |
| |
Oil, Gas & Consumable Fuels — 0.1% | | | |
| 274 | | | | Chesapeake Energy Corp., 6.250% (h) | | | 72,610 |
| | | | | | |
|
|
FINANCIALS — 0.2% | | | |
| |
Real Estate Investment Trusts (REITs) — 0.2% | | | |
| 5,825 | | | | Digital Realty Trust Inc., 4.375% | | | 130,130 |
| | | | | | |
|
|
HEALTH CARE — 0.3% | | | |
| |
Pharmaceuticals — 0.3% | | | |
| 4,500 | | | | Omnicare Inc., 4.000% | | | 210,487 |
| | | | | | |
|
|
See Notes to Financial Statements.
104
Schedules of Investments
(continued)
| | | | | | | | |
| High Yield Investments | | | |
| | | |
| Shares | | Rating‡ | | Security | | Value | |
INDUSTRIALS — 0.3% | | | | |
| |
Road & Rail — 0.3% | | | | |
| 228 | | | | Kansas City Southern, 5.125% | | $ | 282,407 | |
| | | | | | |
|
|
|
INFORMATION TECHNOLOGY — 0.3% | | | | |
| |
Networking Products — 0.3% | | | | |
| 310 | | | | Lucent Technologies Capital Trust I, 7.750% | | | 296,050 | |
| | | | | | |
|
|
|
TELECOMMUNICATION SERVICES — 0.4% | | | | |
| |
Wireless Equipment — 0.4% | | | | |
| 6,400 | | | | Crown Castle International Corp., 6.250% | | | 360,000 | |
| | | | | | |
|
|
|
| | | | | TOTAL PREFERRED STOCKS
(Cost — $1,389,302) | | | 1,351,684 | |
| | | | | | |
|
|
|
| | | |
Warrants
| | | | | | | |
WARRANTS — 0.0% | | | | |
| 109,998 | | | | Charys Holding Co. Inc., expires 2/16/12 | | | 25,850 | |
| | | | | | |
|
|
|
| | | | | TOTAL INVESTMENTS BEFORE SHORT-TERM INVESTMENTS
(Cost — $80,952,161) | | | 79,179,893 | |
| | | | | | |
|
|
|
| | | |
Face
Amount
| | | | | | | |
SHORT-TERM INVESTMENTS (j) — 13.0% | | | | |
MONEY MARKET FUND — 6.5% | | | | |
| 5,589,086 | | | | BBH Securities Lending Trust (k)
(Cost — $5,589,086) | | | 5,589,086 | |
| | | | | | |
|
|
|
TIME DEPOSITS — 6.5% | | | | |
| $4,967,255 | | | | Bank of America — London, 4.440% due 9/1/07 | | | 4,967,255 | |
| 586,169 | | | | Wells Fargo — Grand Cayman, 4.440% due 9/1/07 | | | 586,169 | |
| | | | | | |
|
|
|
| | | | | TOTAL TIME DEPOSITS
(Cost — $5,553,424) | | | 5,553,424 | |
| | | | | | |
|
|
|
| | | | | TOTAL SHORT-TERM INVESTMENTS
(Cost — $11,142,510) | | | 11,142,510 | |
| | | | | | |
|
|
|
| | | | | TOTAL INVESTMENTS — 105.3%
(Cost — $92,094,671#) | | | 90,322,403 | |
| | | | | Liabilities in Excess of Other Assets — (5.3%) | | | (4,518,068 | ) |
| | | | | | |
|
|
|
| | | | | TOTAL NET ASSETS — 100.0% | | $ | 85,804,335 | |
| | | | | | |
|
|
|
| ‡ | | All ratings are by Standard & Poor’s Ratings Service, unless otherwise noted. |
| * | | Non-income producing securities. |
| (a) | | Security is exempt from registration under Rule 144A of the Securities Act of 1933. This security maybe resold in transactions that are exempt from registration, normally to qualified institutional buyers. This security has been deemed liquid pursuant to guidelines approved by the Board of Trustees, unless otherwise noted. |
| (b) | | Security is currently in default. |
| (c) | | All or a portion of this security is on loan (See Note 1). |
| (e) | | Variable rate securities. Coupon rates disclosed are those which are in effect at August 31, 2007. |
| (f) | | Payment-kind security for which part of the income earned maybe paid as additional principal. |
| (g) | | Rating by Moody’s Investors Service. All ratings are unaudited. |
| (h) | | Rating by Fitch Ratings Service. All ratings are unaudited. |
| (i) | | Security is valued in good faith at fair value by or under the direction of the Board of Trustees. |
| (j) | | Inclusive of all short term holdings, including collateral received from securities lending activities. Not including such collateral, the percentage of portfolio holdings would be 6.5%. |
| (k) | | Represents investment of collateral received from securities lending transactions. |
| # | | Aggregate cost for federal income tax purposes is $92,731,976. |
See pages 122 & 123 for definitions of ratings.
See Notes to Financial Statements.
105
Schedules of Investments
(continued)
| | | | | | |
| International Fixed Income Investments |
| | |
Face
Amount† | | | Security | | Value |
| SOVEREIGN BONDS — 47.9% | | | |
| |
| Belgium — 0.3% | | | |
| 400,000 | EUR | | Kingdom of Belgium, 5.750% due 3/28/08 (a) | | $ | 550,209 |
| | | | | |
|
|
| |
| Canada — 0.2% | | | |
| 300,000 | CAD | | Province of Ontario Canada, 6.200% due 6/2/31 (a) | | | 331,937 |
| | | | | |
|
|
| |
| France — 10.0% | | | |
| | | | Government of France: | | | |
| 1,000,000 | EUR | | 3.000% due 7/12/08 (a) | | | 1,350,737 |
| 6,500,000 | EUR | | 6.500% due 4/25/11 (a) | | | 9,552,866 |
| 1,800,000 | EUR | | 4.000% due 10/25/14 (a) | | | 2,418,849 |
| 1,900,000 | EUR | | 5.500% due 4/25/29 (a) | | | 2,917,600 |
| 100,000 | EUR | | 4.750% due 4/25/35 (a) | | | 140,321 |
| 1,800,000 | EUR | | Series A, 4.000% due 4/25/14 (a) | | | 2,423,937 |
| | | | | |
|
|
| | | | Total France | | | 18,804,310 |
| | | | | |
|
|
| |
| Germany — 15.2% | | | |
| | | | Bundesrepublik Deutschland: | | | |
| 200,000 | EUR | | 4.500% due 7/4/09 (a) | | | 274,973 |
| 400,000 | EUR | | 3.500% due 10/9/09 (a) | | | 539,900 |
| 1,700,000 | EUR | | 4.000% due 4/13/12 (a) | | | 2,307,790 |
| 4,400,000 | EUR | | 5.000% due 7/4/12 (a) | | | 6,226,132 |
| 3,900,000 | EUR | | 4.250% due 1/4/14-7/4/14 (a) | | | 5,338,397 |
| 3,700,000 | EUR | | 5.625% due 1/4/28 (a) | | | 5,754,291 |
| 4,500,000 | EUR | | 6.250% due 1/4/24-1/4/30 (a) | | | 7,452,141 |
| 600,000 | EUR | | 4.750% due 7/4/34 (a) | | | 846,723 |
| | | | | |
|
|
| | | | Total Germany | | | 28,740,347 |
| | | | | |
|
|
| |
| Greece — 2.8% | | | |
| 3,500,000 | EUR | | Hellenic Republic, 6.500% due 1/11/14 (a) | | | 5,319,861 |
| | | | | |
|
|
| |
| Italy — 0.8% | | | |
| 1,050,000 | EUR | | Buoni Poliennali Del Tesoro, 4.500% due 5/1/09 (a) | | | 1,440,403 |
| | | | | |
|
|
| |
| Japan — 7.4% | | | |
| | | | Japan Government: | | | |
| 320,000,000 | JPY | | 1.500% due 3/20/11 (a) | | | 2,807,188 |
| 80,000,000 | JPY | | 2.400% due 3/20/34 (a) | | | 703,725 |
| 470,000,000 | JPY | | 2.300% due 6/20/35 (a) | | | 4,035,545 |
| 710,000,000 | JPY | | 2.500% due 9/20/35-6/20/36 (a) | | | 6,343,352 |
| | | | | |
|
|
| | | | Total Japan | | | 13,889,810 |
| | | | | |
|
|
| |
| Netherlands — 3.1% | | | |
| | | | Netherlands Government: | | | |
| 4,000,000 | EUR | | 5.250% due 7/15/08 (a) | | | 5,504,558 |
| 200,000 | EUR | | 3.750% due 7/15/14 (a) | | | 265,162 |
| | | | | |
|
|
| | | | Total Netherlands | | | 5,769,720 |
| | | | | |
|
|
| |
| Poland — 1.2% | | | |
| 6,280,000 | PLN | | Poland Government Bond, 6.000% due 5/24/09 (a) | | | 2,266,095 |
| | | | | |
|
|
| |
| Portugal — 2.9% | | | |
| 4,000,000 | EUR | | Portugal Obrigacoes do Tesouro, 3.250% due 7/15/08 (a) | | | 5,412,878 |
| | | | | |
|
|
See Notes to Financial Statements.
106
Schedules of Investments
(continued)
| | | | | | |
| International Fixed Income Investments |
| | |
Face
Amount† | | | Security | | Value |
| |
| Spain — 4.0% | | | |
| 5,600,000 | EUR | | Spanish Government, 3.600% due 1/31/09 (a) | | $ | 7,595,264 |
| | | | | |
|
|
| |
| United Kingdom — 0.1% | | | |
| 130,000 | GBP | | United Kingdom Treasury Gilt, 4.750% due 9/7/15 (a) | | | 256,659 |
| | | | | |
|
|
| | | | TOTAL SOVEREIGN BONDS
(Cost — $88,271,868) | | | 90,377,493 |
| | | | | |
|
|
| ASSET-BACKED SECURITIES — 6.0% | | | |
| |
| Home Equity — 5.9% | | | |
| | | | ACE Securities Corp.: | | | |
| 184,980 | | | Series 2006-HE1, Class A2A, 5.585% due 2/25/36 (a)(b) | | | 184,275 |
| 218,654 | | | Series 2006-NC1, Class A2A, 5.575% due 12/25/35 (a)(b) | | | 217,914 |
| 154,427 | | | Argent Securities Inc., Series 2006-W4, Class A-2A, 5.565% due 5/25/36 (a)(b) | | | 154,176 |
| 149,383 | | | Asset Backed Securities Corp. Home Equity, Series 06-HE3, Class A3, 5.565% due 3/25/36 (a)(b) | | | 149,107 |
| 191,855 | | | Basic Asset Backed Securities Trust, Series 2006-1, Class A1, 5.585% due 4/25/36 (a)(b) | | | 191,284 |
| | | | Countrywide Asset-Backed Certificates: | | | |
| 534,453 | | | Series 2005-15, Class A, 5.615% due 10/25/46 (a)(b) | | | 531,254 |
| 38,438 | | | Series 2005-16, Class 4AV1, 5.605% due 5/25/36 (a)(b) | | | 38,324 |
| 517,052 | | | Series 2006-17, Class 2A1, 5.555% due 3/25/47 (a)(b) | | | 513,438 |
| | | | Countrywide Home Loan Mortgage Pass Through Trust: | | | |
| 104,584 | | | Series 2005-11, Class 3A1, 6.068% due 4/25/35 (a)(b) | | | 105,741 |
| 466,745 | | | Series 2005-2, Class 1A1, 5.825% due 3/25/35 (a)(b) | | | 457,703 |
| 63,989 | | | Series 2005-3, Class 2A1, 5.795% due 4/25/35 (a)(b) | | | 63,890 |
| 384,847 | | | Series 2005-9, Class 1A3, 5.735% due 5/25/35 (a)(b) | | | 374,676 |
| 227,577 | | | Series 2005-HYB9, Class 3A2A, 5.250% due 2/20/36 (a)(b) | | | 224,932 |
| 106,711 | | | CSAB Mortgage Backed Trust, 2006-1, Class A1A, 5.605% due 6/25/36 (a)(b) | | | 106,489 |
| 126,519 | | | First Franklin Mortgage Loan Asset Backed Certificates, Series 2006-FF1, Class 2A1, 5.595% due 1/25/36 (a)(b) | | | 125,865 |
| 215,290 | | | GMAC Mortgage Corp. Loan Trust, Series 2004-J4, Class A1, 5.500% due 9/25/34 | | | 213,625 |
| 129,431 | | | Harborview Mortgage Loan Trust, Series 2003-1, Class A, 4.914% due 5/19/33 | | | 129,713 |
| 474,297 | | | Indymac Residential Asset Backed Trust, Series 2006-D, Class 2A1, 5.555% due 11/25/36 (a)(b) | | | 472,263 |
| | | | Lehman XS Trust: | | | |
| 339,724 | | | Series 2006-12N, Class A1A1, 5.585% due 8/25/46 (a)(b) | | | 338,883 |
| 287,632 | | | Series 2006-GP1, Class A1, 5.595% due 5/25/46 (a)(b) | | | 286,319 |
| 84,540 | | | Long Beach Mortgage Loan Trust, Series 2004-4, Class 1A1, 5.785% due 10/25/34 (a)(b) | | | 80,008 |
| 700,000 | | | Permanent Financing PLC, 5.991% due 6/10/42 | | | 1,404,651 |
| 661,731 | | | Residential Accredit Loans Inc. Series 2006-Q03, Class A1, 5.715% due 4/25/46 (a)(b) | | | 639,669 |
| 98,211 | | | Residential Asset Mortgage Products Inc., Series 2006-RS1, Class AI1, 5.585% due 1/25/36 (a)(b) | | | 98,082 |
| 137,136 | | | Residential Asset Securities Corp. Series 2006-EM X3, Class A1, 5.565% due 4/25/36 (a)(b) | | | 136,398 |
| 457,684 | | | Soundview Home Equity Loan Trust, Series 2006-EQ1, Class A1, 5.555% due 10/25/36 (a)(b) | | | 454,205 |
| | | | Structured Asset Mortgage Investments Inc.: | | | |
| 196,234 | | | Series 2005-AR2, Class 2A1, 5.735% due 5/25/45 (a)(b) | | | 191,570 |
| 740,235 | | | Series 2006-AR3, Class 12A1, 5.725% due 5/25/36 (a)(b) | | | 723,888 |
| 724,563 | | | Thornburg Mortgage Securities Trust, Series 2006-5, Class A1, 5.625% due 8/25/36 (a)(b) | | | 713,694 |
| 655,158 | | | Wachovia Bank Commercial Mortgage Trust, Series 2006-WL7A, Class A1, 5.701% due 9/15/21 (a)(b)(c) | | | 654,605 |
| | | | Washington Mutual Inc.: | | | |
| 6,695 | | | Series 2002-AR9, Class 1A, 6.405% due 8/25/42 (a)(b) | | | 6,700 |
| 209,648 | | | Series 2005-AR13, Class A1A1, 5.795% due 10/25/45 (b) | | | 205,769 |
| 480,866 | | | Series 2006-AR3, Class A1A, 6.005% due 2/25/46 (a)(b) | | | 466,440 |
| 217,803 | | | Series 2006-AR4, Class 2A1A, 5.783% due 5/25/46 (a)(b) | | | 217,519 |
| 256,782 | | | Wells Fargo Mortgage Backed Securities Trust, Series 2006-AR8, Class 1A1, 5.258% due 4/25/36 (a)(b) | | | 254,125 |
| | | | | |
|
|
| | | | Total Home Equity | | | 11,127,194 |
| | | | | |
|
|
See Notes to Financial Statements.
107
Schedules of Investments
(continued)
| | | | | |
| International Fixed Income Investments |
| | |
Face
Amount† | | Security | | Value |
| |
Student Loan — 0.1% | | | |
| 169,035 | | SLM Student Loan Trust, Series 2006-8, Class A1, 5.340% due 4/25/12 (a)(b) | | $ | 168,930 |
| | | | |
|
|
| | | TOTAL ASSET-BACKED SECURITIES
(Cost — $11,287,240) | | | 11,296,124 |
| | | | |
|
|
COLLATERALIZED MORTGAGE OBLIGATIONS — 7.8% | | | |
| 339,898 | | Banc of America Mortgage Securities Inc., Series 2004-4, Class 1A9, 5.000% due 5/25/34 (a) | | | 331,688 |
| | | Bear Stearns Adjustable Rate Mortgage Trust: | | | |
| 41,835 | | Series 2003-7, Class 6A, 4.653% due 10/25/33 (a) | | | 40,821 |
| 147,787 | | Series 2004-2, Class 22A, 4.444% due 5/25/34 (a) | | | 144,846 |
| 57,015 | | Series 2004-2, Class 23A, 4.673% due 5/25/34 (a) | | | 55,233 |
| 709,468 | | Series 2005-2, Class A1, 4.125% due 3/25/35 (a) | | | 694,693 |
| 318,199 | | Series 2005-2, Class A2, 4.125% due 3/25/35 (a) | | | 309,003 |
| 537,212 | | Series 2005-5, Class A1, 4.550% due 8/25/35 (a) | | | 529,715 |
| 439,220 | | Series 2005-5, Class A2, 4.550% due 8/25/35 (a) | | | 429,170 |
| | | Bear Stearns Alt-A Trust: | | | |
| 59,184 | | Series 2005-7, Class 22A1, 5.507% due 9/1/35 | | | 58,749 |
| 723,472 | | Series 2006-6, Class 32A1, 5.816% due 11/25/36 (a)(b) | | | 720,172 |
| 300,000 | | Bear Stearns Structured Products Inc., Series 2007-R6, Class 1A1, 0.010% due 1/26/36 | | | 297,895 |
| 900,000 | | Commercial Mortgage Pass Through Certificates, Series 2006-CN2A, Class A2FL, 5.550% due 2/5/19 (b)(c) | | | 900,223 |
| 587,402 | | Countrywide Alternative Loan Trust, Series 2006-OA1, Class 2A1, 5.748% due 3/20/46 (a)(b) | | | 576,300 |
| 35,709 | | Countrywide Home Loan Mortgage Pass Through Trust, Series 2004-12, Class 11A1, 6.170% due 8/25/34 | | | 35,877 |
| 159,044 | | CS First Boston Mortgage Securities Corp., Series 2003-AR20, Class 2A1, 4.031% due 8/25/33 | | | 157,345 |
| 161,346 | | Federal Home Loan Mortgage Corp, (FHLMC) Structured Pass Through Securities Series T-35, Class A, 5.785% due 9/25/31 (a)(b) | | | 161,304 |
| 733,998 | | Federal Home Loan Mortgage Corp., 5.851% due 5/15/36 (a)(b) | | | 727,312 |
| 244,771 | | Federal Home Loan Mortgage Corp. (FHLMC) Structured Pass Through Securities, Series T-62, Class 1A1,
6.221% due 10/25/44 (a)(b) | | | 243,155 |
| | | First Horizon Asset Securities Inc.: | | | |
| 17,782 | | Series 2003-AR2, Class 2A1, 4.734% due 7/25/33 (a) | | | 17,799 |
| 68,587 | | Series 2003-AR4, Class 2A1, 4.412% due 12/25/33 (a) | | | 67,689 |
| 598,340 | | Government National Mortgage Association Trust, Series 2004-68, Class ZC, 6.000% due 8/20/34 (a) | | | 600,691 |
| 4,657,375 | | Government National Mortgage Association (GNMA), 5.500% due 6/20/35 (a) | | | 4,680,062 |
| 49,251 | | GSR Mortgage Loan Trust, Series 2003-1, Class A2, 4.603% due 3/25/33 (a) | | | 47,990 |
| 46,830,000 | | JLOC Ltd., Series 36A, Class A1, 1.188% due 2/16/16 (a)(c) | | | 402,476 |
| | | JP Morgan Mortgage Trust: | | | |
| 70,536 | | Series 2001-A1, Class 6T1, 5.023% due 2/1/35 (a) | | | 68,707 |
| 63,965 | | Series 2003-A2, Class 3A1, 4.390% due 11/25/33 (a) | | | 62,537 |
| 125,720 | | Merrill Lynch Mortgage Investors Inc., Series 2003-A2, Class 1A1, 4.835% due 2/25/33 (a) | | | 124,775 |
| 316,483 | | MLCC Mortgage Investors Inc., Series 2005-2, Class 1A, 4.250% due 10/25/35 (a) | | | 307,001 |
| 91,138 | | Structured Adjustable Rate Mortgage Loan Trust, Series 2004-4, Class 3A2, 4.590% due 4/25/34 (a) | | | 90,045 |
| 48,830 | | Structured Adjustable Rate Mortgage Loan Trust,, Series 2004-1, Class 4A1, 4.180% due 2/25/34 (a) | | | 48,879 |
| 216,327 | | Structured Asset Mortgage Investments Inc., Series 2005-AR8, Class A1A, 5.785% due 2/25/36 (a)(b) | | | 210,505 |
| 500,000 | | Wachovia Bank Commercial Mortgage Trust,, Series 2006-C28, Class A4, 5.572% due 10/15/48 | | | 496,584 |
| | | Washington Mutual Inc.: | | | |
| 14,656 | | Series 2001-7, Class A, 6.225% due 5/25/41 (a)(b) | | | 14,605 |
| 356,654 | | Series 2006-AR13, Class 2A, 5.793% due 10/25/46 (a)(b) | | | 354,473 |
| 665,878 | | Wells Fargo Mortgage Backed Securities Trust, Series 2006-AR2, Class 2A1, 4.950% due 3/25/36 (a)(b) | | | 653,815 |
| | | | |
|
|
| | | TOTAL COLLATERALIZED MORTGAGE OBLIGATIONS
(Cost — $14,695,603) | | | 14,662,134 |
| | | | |
|
|
See Notes to Financial Statements.
108
Schedules of Investments
(continued)
| | | | | | |
International Fixed Income Investments |
| | |
Face
Amount† | | | Security | | Value |
| CORPORATE BONDS & NOTES — 15.2% | | | |
| |
| Bermuda — 0.2% | | | |
| 400,000 | | | Intelsat Ltd., Senior Notes, 5.250% due 11/1/08 (a) | | $ | 391,000 |
| | | | | |
|
|
| |
| Canada — 0.1% | | | |
| 200,000 | CAD | | Province of Quebec Canada, 5.750% due 12/1/36 (a) | | | 209,032 |
| | | | | |
|
|
| |
| Cayman Island — 1.5% | | | |
| 500,000 | EUR | | Hutchison Whampoa Finance 03/13 Ltd., 5.875% due 7/8/13 (a) | | | 706,656 |
| 1,000,000 | | | Mizuho Finance, 8.375% due 12/31/49 (a) | | | 1,039,489 |
| 900,000 | | | MUFG Capital Finance 1 Ltd., 6.346% due 12/31/49 (a)(b) | | | 865,462 |
| 200,000 | EUR | | MUFG Capital Finance 2 Ltd., 4.850% due 12/31/49 (a)(b) | | | 245,005 |
| | | | | |
|
|
| | | | Total Cayman Island | | | 2,856,612 |
| | | | | |
|
|
| |
| Denmark — 1.1% | | | |
| 11,985,224 | DKK | | Realkredit Danmark A/S, 5.000% due 10/1/38 (a)(b) | | | 2,086,682 |
| | | | | |
|
|
| |
| France — 0.2% | | | |
| 300,000 | EUR | | France Telecom SA, Senior Unsubordinated Medium-Term Note, 7.250% due 1/28/13 (a) | | | 449,575 |
| | | | | |
|
|
| |
| Germany — 0.1% | | | |
| 100,000 | | | Deutsche Telekom International Finance BV, Company Guaranteed Notes, 8.250% due 6/15/30 (a) | | | 121,125 |
| | | | | |
|
|
| |
| Greece — 0.3% | | | |
| 370,000 | EUR | | Public Power Corp. Notes,, 4.500% due 3/12/09 (a) | | | 503,903 |
| | | | | |
|
|
| |
| Iceland — 0.1% | | | |
| 200,000 | | | Landsbanki Islands HF, 6.205% due 8/25/09 (a)(b)(c) | | | 201,172 |
| | | | | |
|
|
| |
| Italy — 0.6% | | | |
| 720,000 | EUR | | Telecom Italia SpA, Medium-Term Note, 6.250% due 2/1/12 (a) | | | 1,023,592 |
| | | | | |
|
|
| |
| Japan — 1.3% | | | |
| 200,000 | EUR | | Bank of Tokyo-Mitsubishi UFJ Ltd., 3.500% due 12/16/15 (a)(b) | | | 258,805 |
| 400,000 | | | Resona Bank Ltd., 5.850% due 12/31/49 (b)(c) | | | 380,065 |
| | | | Sumitomo Mitsui: | | | |
| 100,000,000 | JPY | | 1.545% due 12/31/49 (a)(b) | | | 867,902 |
| 100,000,000 | JPY | | 1.627% due 12/31/49 | | | 867,786 |
| | | | | |
|
|
| | | | Total Japan | | | 2,374,558 |
| | | | | |
|
|
| |
| Luxembourg — 0.4% | | | |
| 567,000 | EUR | | Hannover Finance Luxembourg SA, 5.000% due 12/31/49 (a)(b) | | | 724,202 |
| 100,000 | | | VTB Capital SA for Vneshtorgbank, Medium-Term Note, 6.110% due 9/21/07 (a)(b)(c) | | | 100,000 |
| | | | | |
|
|
| | | | Total Luxembourg | | | 824,202 |
| | | | | |
|
|
| |
| Netherlands — 0.4% | | | |
| 700,000 | | | Rabobank Nederland, Senior Notes, 5.380% due 1/15/09 (a)(b)(c)(d) | | | 700,326 |
| | | | | |
|
|
| |
| South Korea — 0.4% | | | |
| 155,000 | | | Export-Import Bank of Korea, Medium-Term Note, 4.250% due 11/27/07 | | | 154,433 |
| 561,000 | | | Korea Development Bank, 4.250% due 11/13/07 | | | 560,214 |
| | | | | |
|
|
| | | | Total South Korea | | | 714,647 |
| | | | | |
|
|
| |
| United Kingdom — 1.0% | | | |
| 200,000 | | | HBOS PLC, 5.920% due 12/31/49 (a)(b)(c) | | | 182,063 |
| 300,000 | CAD | | National Grid PLC, Medium-Term Note, 4.980% due 6/22/11 (d) | | | 283,009 |
See Notes to Financial Statements.
109
Schedules of Investments
(continued)
| | | | | | |
International Fixed Income Investments |
| | |
Face
Amount† | | | Security | | Value |
| |
| United Kingdom — 1.0% (continued) | | | |
| | | | Royal Bank of Scotland Group PLC,: | | | |
| 1,000,000 | | | Notes, 5.410% due 7/21/08 (a)(b)(c) | | $ | 1,000,582 |
| 300,000 | | | Senior Notes, 5.360% due 12/21/07 (a)(b)(c) | | | 300,095 |
| 100,000 | | | Tate & Lyle International Finance PLC, 5.000% due 11/15/14 (a)(c) | | | 94,119 |
| 100,000 | | | XL Capital Europe PLC, 6.500% due 1/15/12 | | | 104,021 |
| | | | | |
|
|
| | | | Total United Kingdom | | | 1,963,889 |
| | | | | |
|
|
| |
| United States — 7.5% | | | |
| 100,000 | | | Ace INA Holdings Inc., 5.875% due 6/15/14 | | | 100,875 |
| 500,000 | | | American Express Medium-Term Note, 5.390% due 4/6/09 (a)(b) | | | 500,245 |
| 300,000 | | | AT&T Inc., 6.500% due 9/1/37 | | | 301,419 |
| 700,000 | | | Bear Stearns Cos. Inc., Notes, 6.950% due 8/10/12 | | | 710,751 |
| 100,000 | | | Capital One Financial Corp., Medium-Term Note, 5.700% due 9/15/11 | | | 98,550 |
| 200,000 | | | Centerpoint Energy Inc., 5.875% due 6/1/08 | | | 199,452 |
| 900,000 | | | CIT Group Inc., Medium-Term Note, 5.570% due 2/21/08 (a)(b) | | | 888,133 |
| 200,000 | | | CNA Financial Corp., 6.000% due 8/15/11 | | | 201,512 |
| 100,000 | | | DaimlerChrysler NA Holding Corp., Company Guaranteed Notes, 5.750% due 9/8/11 | | | 100,763 |
| 200,000 | | | DR Horton Inc., 4.875% due 1/15/10 | | | 186,170 |
| 400,000 | | | El Paso Performance-Linked Trust, Notes, 7.750% due 7/15/11 (a)(c) | | | 411,816 |
| 200,000 | | | Fresenius Medical Care Capital Trust II, Company Guaranteed Notes, 7.875% due 2/1/08 | | | 200,500 |
| 500,000 | | | General Electric Capital Corp., Notes, 5.400% due 3/16/09 (a)(b) | | | 499,795 |
| 900,000 | | | Genworth Global Funding Trusts, 5.420% due 2/10/09 (a)(b) | | | 897,360 |
| | | | GMAC LLC: | | | |
| 400,000 | | | 6.510% due 9/23/08 | | | 383,277 |
| 200,000 | | | Bonds, 8.000% due 11/1/31 | | | 180,121 |
| 100,000 | | | GMAC LLC, Notes, 7.000% due 2/1/12 | | | 89,951 |
| 200,000 | | | Goldman Sachs Group Inc., 5.810% due 3/22/16 (a)(b) | | | 193,796 |
| 200,000 | | | Harrah’s Operating Co. Inc., 5.956% due 2/8/08 (a)(b)(c) | | | 200,215 |
| 100,000 | | | HJ Heinz Finance Co., 6.000% due 3/15/12 | | | 101,917 |
| 300,000 | | | HSBC Finance Corp., Medium-Term Note, 5.490% due 9/15/08 (a)(b) | | | 300,578 |
| 300,000 | | | IBJ Preferred Capital Co., 8.790% due 12/31/49 (a)(b)(c) | | | 308,596 |
| 300,000 | | | iStar Financial Inc., 5.150% due 3/1/12 | | | 278,505 |
| 300,000 | | | JPMorgan Chase Capital XX, 6.550% due 9/29/36 | | | 270,885 |
| 400,000 | | | Mandalay Resort Group, Senior Unsecured Notes, 6.500% due 7/31/09 | | | 399,000 |
| 100,000 | | | Mastr Adjustable Rate Mortgages Trust, Series 2004-6, Class 4A4, 4.138% due 7/25/34 | | | 98,185 |
| 200,000 | | | Mizuho JGB Investment LLC, 9.870% due 12/31/49 (a)(b)(c) | | | 207,433 |
| 900,000 | | | Morgan Stanley, 5.470% due 2/9/09 (a)(b) | | | 894,065 |
| 540,000 | EUR | | Pemex Project Funding Master Trust, 6.250% due 8/5/13 (a)(c) | | | 769,155 |
| 800,000 | | | Popular North America Inc., Medium-Term Note, Series F, 5.760% due 4/6/09 (a)(b) | | | 803,896 |
| 200,000 | | | Ryder System Inc., Medium-Term Note, 3.500% due 3/15/09 | | | 195,418 |
| 200,000 | | | Sealed Air Corp., 6.950% due 5/15/09 (a)(c) | | | 206,211 |
| 1,000,000 | | | Skandinaviska Enskilda Banken AB, 5.490% due 2/13/09 | | | 1,000,926 |
| 500,000 | | | US BanCorp., Notes, 5.535% due 4/28/09 (a)(b) | | | 498,842 |
| 1,000,000 | | | Wachovia Bank NA/Old, Senior Notes, 5.400% due 3/23/09 (a)(b) | | | 998,617 |
| 500,000 | | | Wal-Mart Stores Inc., 5.260% due 6/16/08 (a)(b) | | | 499,800 |
| 46,572 | | | WaMu Mortgage Pass Through Certificates, Series 2003-AR5, Class A7, 4.208% due 6/25/33 | | | 46,042 |
| | | | | |
|
|
| | | | Total United States | | | 14,222,772 |
| | | | | |
|
|
| | | | TOTAL CORPORATE BONDS & NOTES
(Cost — $26,902,010) | | | 28,643,087 |
| | | | | |
|
|
See Notes to Financial Statements.
110
Schedules of Investments
(continued)
| | | | | | |
International Fixed Income Investments |
| | |
Face
Amount† | | | Security | | Value |
| MORTGAGE-BACKED SECURITIES — 21.9% | �� | | |
| FHLMC — 0.5% | | | |
| | | | Federal Home Loan Mortgage Corp, (FHLMC): | | | |
| 678,003 | | | 4.500% due 2/15/20 (a) | | $ | 658,563 |
| 311,359 | | | 4.000% due 6/15/22 (a) | | | 308,908 |
| | | | | |
|
|
| | | | TOTAL FHLMC | | | 967,471 |
| | | | | |
|
|
| FNMA — 21.4% | | | |
| | | | Federal National Mortgage Association (FNMA): | | | |
| 184,820 | | | 5.605% due 1/25/21 (a)(b) | | | 184,535 |
| 617,944 | | | 4.187% due 11/1/34 (a)(b) | | | 618,290 |
| 930,863 | | | 6.500% due 7/1/36-11/1/36 (a) | | | 945,139 |
| 4,946,364 | | | 5.500% due 5/1/34-5/1/37 (a) | | | 4,842,845 |
| 12,791,549 | | | 6.000% due 4/1/36-7/25/44 (a) | | | 12,784,930 |
| 21,400,000 | | | TBA, 5.500% due 9/1/36-10/1/36 (a)(e) | | | 20,901,787 |
| | | | | |
|
|
| | | | TOTAL FNMA | | | 40,277,526 |
| | | | | |
|
|
| | | | TOTAL MORTGAGE-BACKED SECURITIES
(Cost — $41,223,252) | | | 41,244,997 |
| | | | | |
|
|
| MUNICIPAL BONDS — 0.1% | | | |
| |
| United States — 0.1% | | | |
| 200,000 | | | Dallas Area Rapid Transit, 5.00%, expires 12/1/36 (a) | | | 202,644 |
| 100,000 | | | Puerto Rico Sales Tax Financing Corp., 0.25%, expires 8/1/54 (a)(f) | | | 8,837 |
| | | | | |
|
|
| | | | Total United States | | | 211,481 |
| | | | | |
|
|
| | | | TOTAL MUNICIPAL BONDS
(Cost — $208,209) | | | 211,481 |
| | | | | |
|
|
| U.S. GOVERNMENT & AGENCY OBLIGATIONS — 1.5% | | | |
| |
| U.S. Government Agency — 0.4% | | | |
| 800,000 | | | Federal Home Loan Bank, 3.250% due 1/9/09 (a) | | | 782,992 |
| | | | | |
|
|
| U.S. GOVERNMENT OBLIGATIONS — 1.1% | | | |
| | | | U.S. Treasury Bonds: | | | |
| 1,343,108 | | | 2.375% due 1/15/27 (a) | | | 1,337,966 |
| 700,000 | | | 4.500% due 2/15/36 (a) | | | 663,743 |
| | | | | |
|
|
| | | | TOTAL U.S. GOVERNMENT OBLIGATIONS | | | 2,001,709 |
| | | | | |
|
|
| | | | TOTAL U.S. GOVERNMENT & AGENCY OBLIGATIONS
(Cost — $2,726,694) | | | 2,784,701 |
| | | | | |
|
|
| U.S. TREASURY INFLATION PROTECTED SECURITY — 0.8% | | | |
| 1,507,935 | | | U.S. Treasury Notes, 2.625% due 7/15/17 (Cost — $1,491,948) (a) | | | 1,543,631 |
| | | | | |
|
|
| | |
Contracts
| | | | | |
| PURCHASED OPTIONS — 1.7% | | | |
| |
| Germany — 0.0% | | | |
| 131 | EUR | | Eurodollar Futures, Put @ $100.90, expires 11/23/07 | | | 894 |
| 217 | EUR | | Eurodollar Futures, Call @ $101.40, expires 11/23/07 | | | 148 |
| | | | | |
|
|
| | | | Total Germany | | | 1,042 |
| | | | | |
|
|
| |
| United Kingdom — 0.0% | | | |
| 3,500,000 | GBP | | Swaption, 3 Month LIBOR, Call @ $5.15, expires 9/14/07 | | | 0 |
| 10,500,000 | GBP | | Swaption, 3 Month LIBOR, Call @ $5.19, expires 9/14/07 | | | 0 |
See Notes to Financial Statements.
111
Schedules of Investments
(continued)
| | | | | | |
| International Fixed Income Investments |
| | |
| Contracts | | | Security | | Value |
| |
| United Kingdom — 0.0% (continued) | | | |
| 8,000,000 | GBP | | Swaption, 3 Month LIBOR, Call @ $5.30, expires 3/14/08 | | $ | 28,861 |
| 7,000,000 | GBP | | Swaption, 6 Month LIBOR, Call @ $5.15, expires 9/14/07 | | | 0 |
| | | | | |
|
|
| | | | Total United Kingdom | | | 28,861 |
| | | | | |
|
|
| |
| United States — 1.7% | | | |
| 2,700,000 | EUR | | Euro vs. U.S. Dollar, Call @ $1.36, expires 5/21/08 | | | 107,557 |
| 2,700,000 | EUR | | Euro vs. U.S. Dollar, Put @ $1.36, expires 5/21/08 | | | 60,731 |
| 400,000 | EUR | | Euro vs. U.S. Dollar, Call @ $1.38, expires 6/3/10 | | | 22,767 |
| 400,000 | EUR | | Euro vs. U.S. Dollar, Put @ $1.38, expires 6/3/10 | | | 20,261 |
| 2,200,000 | EUR | | Euro vs. U.S. Dollar, Put @ $1.39, expires 7/8/10 | | | 128,765 |
| 2,200,000 | EUR | | Euro vs. U.S. Dollar, Call @ $1.39, expires 7/8/10 | | | 111,211 |
| 3,400,000 | | | Eurodollar Futures, Put @ $85.50, expires 9/6/07 | | | 0 |
| 13,000,000 | | | Eurodollar Futures, Call @ $102.08, expires 9/6/07 | | | 0 |
| 12,000,000 | | | Eurodollar Futures, Put @ $85.00, expires 10/1/07 | | | 0 |
| 6,000,000 | | | Eurodollar Futures, Put @ $86.50, expires 11/6/07 | | | 120 |
| 353 | EUR | | Eurodollar Futures, Put @ $101.00, expires 11/23/07 | | | 2,408 |
| 48 | EUR | | Eurodollar Futures, Put @ $104.50, expires 11/23/07 | | | 655 |
| 3,700,000 | | | Swaption, 3 Month LIBOR, Call @ $5.00, expires 8/28/09 | | | 38,205 |
| 8,600,000 | | | Swaption, 3 Month LIBOR, Call @ $5.00, expires 8/28/09 | | | 88,722 |
| 17,600,000 | | | Swaption, 3 Month LIBOR, Call @ $5.00, expires 8/28/09 | | | 181,730 |
| 16,800,000 | | | Swaption, 3 Month LIBOR, Call @ $5.00, expires 12/20/07 | | | 126,199 |
| 71,900,000 | | | Swaption, 3 Month LIBOR, Call @ $4.75, expires 3/31/08 | | | 462,810 |
| 23,400,000 | | | Swaption, 3 Month LIBOR, Call @ $4.75, expires 3/31/08 | | | 150,622 |
| 40,400,000 | | | Swaption, 3 Month LIBOR, Call @ $5.00, expires 2/1/08 | | | 334,136 |
| 2,300,000 | | | Swaption, 3 Month LIBOR, Call @ $5.00, expires 2/1/08 | | | 19,023 |
| 1,500,000 | | | Swaption, 3 Month LIBOR, Call @ $4.75, expires 9/26/08 | | | 11,369 |
| 5,800,000 | | | Swaption, 3 Month LIBOR, Call @ $4.75, expires 9/26/08 | | | 43,958 |
| 18,100,000 | | | Swaption, 3 Month LIBOR, Call @ $4.75, expires 9/26/08 | | | 137,180 |
| 47,800,000 | | | Swaption, 3 Month LIBOR, Call @ $5.30, expires 8/3/09 | | | 633,774 |
| 1,700,000 | | | U.S. Dollar CAP/CMS, Call @ $0.29, expires 12/7/07 | | | 44,262 |
| 11 | | | U.S. Dollar Futures, Call @ $131.00, expires 11/20/07 | | | 172 |
| 2,000,000 | | | U.S. Dollar vs. Japanese Yen, Call @ JPY116.00, expires 12/5/07 | | | 34,910 |
| 3,500,000 | | | U.S. Dollar vs. Japanese Yen, Put @ JPY114.65, expires 1/18/08 | | | 93,852 |
| 3,500,000 | | | U.S. Dollar vs. Japanese Yen, Call @ JPY114.65, expires 1/18/08 | | | 86,012 |
| 1,700,000 | | | U.S. Dollar vs. Japanese Yen, Call @ JPY120.00, expires 1/18/08 | | | 7,545 |
| 5,900,000 | | | U.S. Dollar vs. Japanese Yen, Call @ JPY115.35, expires 2/13/08 | | | 117,841 |
| 5,900,000 | | | U.S. Dollar vs. Japanese Yen, Put @ JPY115.35, expires 2/13/08 | | | 181,773 |
| 54 | | | U.S. Treasury Notes 2 Year Futures, Call @ $114.00, expires 11/20/07 | | | 844 |
| 231 | | | U.S. Treasury Notes 5 Year Futures, Call @ $123.00, expires 11/20/07 | | | 3,609 |
| | | | | |
|
|
| | | | Total United States | | | 3,253,023 |
| | | | | |
|
|
| | | | TOTAL PURCHASED OPTIONS
(Cost — $3,000,600) | | | 3,282,926 |
| | | | | |
|
|
| | | | TOTAL INVESTMENTS BEFORE SHORT-TERM INVESTMENTS
(Cost — $189,807,424) | | | 194,046,574 |
| | | | | |
|
|
| | |
Face
Amount
| | | | | |
| SHORT-TERM INVESTMENTS — 24.1% | | | |
| TIME DEPOSITS — 4.6% | | | |
| | | | Bank of America — London: | | | |
| $2,953,697 | EUR | | 3.280% due 9/1/07 | | | 4,029,433 |
| 1,799,699 | | | 4.440% due 9/1/07 | | | 1,799,699 |
| 335,569 | GBP | | 5.270% due 9/1/07 | | | 676,759 |
See Notes to Financial Statements.
112
Schedules of Investments
(continued)
| | | | | | | |
| International Fixed Income Investments | |
| | |
Face
Amount | | | Security | | Value | |
| TIME DEPOSITS — 4.6% (continued) | | | | |
| | | | BBH — Grand Cayman: | | | | |
| 160,281 | DKK | | 3.000% due 9/1/07 | | $ | 29,351 | |
| 96,261 | CAD | | 4.030% due 9/1/07 | | | 91,139 | |
| 85,324 | | | 4.440% due 9/1/07 | | | 85,324 | |
| 22,360 | AUD | | 5.510% due 9/1/07 | | | 18,239 | |
| 11,925 | NZD | | 6.750% due 9/1/07 | | | 8,370 | |
| 223,146,148 | JPY | | JP Morgan Chase & Co. — London, 0.010% due 9/1/07 | | | 1,926,248 | |
| | | | | |
|
|
|
| | | | TOTAL TIME DEPOSITS
(Cost — $8,664,562) | | | 8,664,562 | |
| | | | | |
|
|
|
| COMMERCIAL PAPER — 18.0% | | | | |
| $7,400,000 | | | Bank of America Corp., 5.327% due 10/2/07 (f) | | | 7,366,546 | |
| 1,800,000 | | | General Electric Capital Corp., 5.307% due 11/6/07 (f) | | | 1,782,939 | |
| 4,900,000 | | | Rabobank USA Finance Corp., 5.233% due 9/4/07 (f) | | | 4,897,864 | |
| 800,000 | | | Swedbank Mortgage AB, 5.317% due 9/6/07 (f) | | | 799,417 | |
| 5,100,000 | | | Total Fina Elf, 5.283% due 9/4/07 (d)(f) | | | 5,097,756 | |
| | | | UBS Finance Delaware LLC: | | | | |
| 3,900,000 | | | 5.300% due 9/4/07 (f) | | | 3,898,298 | |
| 1,800,000 | | | 5.325% due 10/15/07 (f) | | | 1,788,494 | |
| 8,400,000 | | | Westpac Banking Corp., 5.311% due 9/18/07 (d)(f) | | | 8,379,215 | |
| | | | | |
|
|
|
| | | | TOTAL COMMERCIAL PAPER
(Cost — $34,010,529) | | | 34,010,529 | |
| | | | | |
|
|
|
| REPURCHASE AGREEMENT — 0.7% | | | | |
| 1,300,000 | | | Credit Suisse Securities (USA) LLC repurchase agreement dated 8/31/07, 5.05% due 9/4/07, Proceeds at maturity — $1,300,729; (Fully collateralized by U.S. Treasury Notes,. 4.75% due 2/28/09; Market Value — ($1,330,379)
(Cost — $1,300,000) | | | 1,300,000 | |
| | | | | |
|
|
|
| U.S. GOVERNMENT OBLIGATION — 0.8% | | | | |
| 1,460,000 | | | U.S. Treasury Bill, 4.700% due 9/13/07
(Cost — $1,457,742) (f)(g) | | | 1,457,742 | |
| | | | | |
|
|
|
| | | | TOTAL SHORT-TERM INVESTMENTS
(Cost — $45,432,833) | | | 45,432,833 | |
| | | | | |
|
|
|
| | | | TOTAL INVESTMENTS — 127.0%
(Cost — $235,240,257#) | | | 239,479,407 | |
| | | | Liabilities in Excess of Other Assets — (27.0%) | | | (50,864,640 | ) |
| | | | | |
|
|
|
| | | | TOTAL NET ASSETS — 100.0% | | $ | 188,614,767 | |
| | | | | |
|
|
|
| † | | Face amount denominated in U.S. dollars, unless otherwise noted. |
| (a) | | All or a portion of this security is segregated for open futures contracts, extended settlements, written options, swap contracts, foreign currency contracts, TBA’s and short sales. |
| (b) | | Variable rate security. Interest rate disclosed is that which is in effect at August 31, 2007. |
| (c) | | Security is exempt from registration under Rule 144A of the Securities Act of 1933. This security maybe resold in transactions that are exempt from registration, normally to qualified institutional buyers. This security has been deemed liquid pursuant to guidelines approved by the Board of Trustees, unless otherwise noted. |
| (e) | | This security is traded on a to-be-announced (“TBA”) basis (See Note 1). |
| (f) | | Rate shown represents yield-to-maturity. |
| (g) | | All or a portion of this security is held at the broker as collateral for open futures contracts. |
| # | | Aggregate cost for federal income tax purposes is $237,937,467. |
See Notes to Financial Statements.
113
Schedules of Investments
(continued)
International Fixed Income Investments
Abbreviations used in this schedule:
| | | | |
| AUD | | — | | Australian Dollar |
| EUR | | — | | Euro |
| CAD | | — | | Canadian Dollar |
| DKK | | — | | Denmark Kroner |
| GBP | | — | | Great British Pound |
| JPY | | — | | Japanese Yen |
| LIBOR | | — | | London Interbank Offered Rate |
| NZD | | — | | New Zealand Dollar |
| PLN | | — | | Polish Zloty |
See pages 122 and 123 for definitions of ratings.
| | | |
| Summary of Investments by Security Type* | | | |
Sovereign Bonds | | 37.7 | % |
Mortgage-Backed Securities | | 17.2 | |
Corporate Bonds & Notes | | 12.0 | |
Collateralized Mortgage Obligations | | 6.1 | |
Asset-Backed Securities | | 4.7 | |
Purchased Options | | 1.4 | |
U.S. Government & Agency Obligations | | 1.2 | |
U.S. Treasury Inflation Protected Securities | | 0.6 | |
Municipal Bonds | | 0.1 | |
Short-Term Investments | | 19.0 | |
| | |
|
|
| | | 100.0 | % |
| | |
|
|
| * | | As a percentage of total investments. |
See Notes to Financial Statements.
114
Schedules of Investments
(continued)
International Fixed Income Investments
Schedule of Options Written
| | | | | | | | | | | |
| | | | | |
| | | | | |
| Contracts | | | Security Name | | Expiration Date | | Strike Price | | Value |
| | | |
| United Kingdom | | | | | | | | |
| 1,000,000 | GBP | | Swaption, 6 Month LIBOR, Call | | 9/14/07 | | $ | 4.85 | | $ | 0 |
| 3,000,000 | GBP | | Swaption, 6 Month LIBOR, Call | | 9/14/07 | | | 4.85 | | | 1 |
| 2,000,000 | GBP | | Swaption, 6 Month LIBOR, Call | | 9/14/07 | | | 5.15 | | | 0 |
| 2,000,000 | GBP | | Swaption, 6 Month LIBOR, Call | | 3/14/08 | | | 4.85 | | | 22,944 |
| | | | | | | | | | |
|
|
| | | | Total United Kingdom | | | | | | | | 22,945 |
| | | | | | | | | | |
|
|
| | | |
| United States | | | | | | | | |
| 7,100,000 | | | Swaption, 3 Month LIBOR, Call | | 11/19/07 | | | 5.38 | | | 105,150 |
| 4,400,000 | | | Swaption, 3 Month LIBOR, Call | | 11/21/07 | | | 5.45 | | | 84,460 |
| 2,400,000 | | | Swaption, 3 Month LIBOR, Call | | 11/22/07 | | | 5.47 | | | 49,897 |
| 18,000,000 | | | Swaption, 3 Month LIBOR, Call | | 2/1/08 | | | 5.10 | | | 268,080 |
| 1,000,000 | | | Swaption, 3 Month LIBOR, Call | | 2/1/08 | | | 5.10 | | | 14,893 |
| 29,500,000 | | | Swaption, 3 Month LIBOR, Call | | 3/31/08 | | | 4.90 | | | 345,635 |
| 10,200,000 | | | Swaption, 3 Month LIBOR, Call | | 3/31/08 | | | 4.95 | | | 129,908 |
| 600,000 | | | Swaption, 3 Month LIBOR, Call | | 9/26/08 | | | 4.95 | | | 8,869 |
| 2,500,000 | | | Swaption, 3 Month LIBOR, Call | | 9/26/08 | | | 4.95 | | | 36,956 |
| 7,600,000 | | | Swaption, 3 Month LIBOR, Call | | 9/26/08 | | | 4.95 | | | 112,346 |
| 20,800,000 | | | Swaption, 3 Month LIBOR, Call | | 8/3/09 | | | 5.50 | | | 579,569 |
| 2,900,000 | | | Swaption, 3 Month LIBOR, Call | | 8/28/09 | | | 5.32 | | | 81,360 |
| 5,900,000 | | | Swaption, 3 Month LIBOR, Call | | 8/28/09 | | | 5.32 | | | 166,114 |
| 1,200,000 | | | Swaption, 3 Month LIBOR, Call | | 8/28/09 | | | 5.32 | | | 33,786 |
| 7,300,000 | | | Swaption, 6 Month LIBOR, Call | | 12/24/07 | | | 5.15 | | | 109,917 |
| 36 | | | U.S.Treasury Notes 10 Year Futures, Call | | 11/20/07 | | | 111.00 | | | 19,687 |
| | | | | | | | | | |
|
|
| | | | Total United States | | | | | | | | 2,146,627 |
| | | | | | | | | | |
|
|
| | | | TOTAL WRITTEN OPTIONS
(Premiums received — $1,926,736) | | | | | | | $ | 2,169,572 |
| | | | | | | | | | |
|
|
Schedule of Securities Sold Short
| | | | | |
| |
| | |
Face
Amount | | Security | | Value |
| | | Federal National Mortgage Association (FNMA) | | | |
| $ 7,000,000 | | 5.500% due 9/01/36 (a) | | $ | 6,837,033 |
| 8,000,000 | | 5.000% due 9/01/37 (a) | | | 7,603,752 |
| 1,000,000 | | 6.000% due 9/01/37 (a) | | | 998,906 |
| | | U.S. Treasury Notes | | | |
| 7,700,000 | | 5.125% due 5/15/16 | | | 8,032,070 |
| 3,700,000 | | 4.625% due 11/15/16 | | | 3,724,860 |
| 29,350,000 | | 4.500% due 11/15/15-5/15/17 | | | 29,281,752 |
| | | | |
|
|
| | | TOTAL OPEN SHORT SALES
(Proceeds — $55,962,041) | | $ | 56,478,373 |
| | | | |
|
|
| (a) | | This security is traded on a to-be-announced (TBA) basis (See note 1). |
See Notes to Financial Statements.
115
Schedules of Investments
(continued)
| | | | | | | |
| Municipal Bond Investments |
| | | |
Face
Amount | | Rating‡ | | Security | | Value |
MUNICIPAL BONDS — 97.5% |
|
Alabama — 1.5% |
| $1,000,000 | | Aaa | | Alabama State Board of Education, Revenue, Jefferson State Community College, AMBAC-Insured, 5.000% due 10/1/22 (a) | | $ | 1,037,610 |
| | | | | | |
|
|
|
Alaska — 2.2% |
| 1,000,000 | | AAA | | Anchorage, AK, GO, Refunding School, FGIC-Insured, 6.000% due 10/1/09 | | | 1,045,650 |
| | | | | Valdez Alaska Marine Term Revenue: | | | |
| 310,000 | | AAA | | Exxon Pipeline Company Project, 3.880% due 10/1/25 (b) | | | 310,000 |
| 155,000 | | AAA | | Refunding, ExxonMobil PJ, 3.880% due 12/1/29 (b) | | | 155,000 |
| | | | | | |
|
|
| | | | | Total Alaska | | | 1,510,650 |
| | | | | | |
|
|
|
Arizona — 1.5% |
| 1,000,000 | | Aaa | | Arizona Student Loan Acquisition Authority Student Loan Revenue, Refunding, Senior Series A-1, GTDSTD-Insured, 5.650% due 5/1/14 (a)(c) | | | 1,042,530 |
| | | | | | |
|
|
|
California — 6.3% |
| | | | | California State, GO: | | | |
| 1,000,000 | | A+ | | Refunding, 5.000% due 2/1/33 (b) | | | 1,002,990 |
| 195,000 | | AA+ | | Daily Kindergarten University, Series A-4, 3.790% due 5/1/34 (b) | | | 195,000 |
| 1,110,000 | | AAA | | Costa Mesa, CA, COP, Refunding, Public Facilities Project, MBIA-Insured, 5.000% due 10/1/18 | | | 1,157,730 |
| 1,000,000 | | AAA | | Los Angeles, CA, Department of Water & Power Waterworks Revenue, Series C, MBIA-Insured, 5.250% due 7/1/19 | | | 1,065,940 |
| 1,000,000 | | A3 | | Rancho Mirage Joint Powers Financing Authority, Eisenhower Medical Center, Series A, 5.000% due 7/1/27 (a)(b) | | | 985,090 |
| | | | | | |
|
|
| | | | | Total California | | | 4,406,750 |
| | | | | | |
|
|
|
Colorado — 5.0% |
| 1,000,000 | | AA | | Colorado Water Resources & Power Development Authority, Drinking Water Revenue, Refunding, Revolving Fund Series A, 5.500% due 9/1/22 | | | 1,119,790 |
| 2,165,000 | | AA+ | | Longmont, CO, Sales & Use Tax Revenue, Refunding, 5.250% due 5/15/17 | | | 2,373,273 |
| | | | | | |
|
|
| | | | | Total Colorado | | | 3,493,063 |
| | | | | | |
|
|
|
District of Columbia — 1.6% |
| 1,075,000 | | AAA | | Metropolitan Washington, D.C., Airport Authority System, Refunding, Series D, FSA-Insured, 5.375% due 10/1/18 (c) | | | 1,124,138 |
| | | | | | |
|
|
|
Florida — 10.8% |
| 1,500,000 | | AA+ | | Broward County, FL, GO, Parks & Land Preservation Project, 5.000% due 1/1/19 | | | 1,558,335 |
| 1,000,000 | | AAA | | Florida Municipal Loan Council Revenue, North Miami Beach Water Project, Series B, MBIA-Insured,
5.375% due 8/1/18 (b) | | | 1,066,590 |
| 1,000,000 | | AAA | | Florida State Board of Education Lottery Revenue, Series C, FGIC-Insured, Prerefunded 7/01/10 @101,
5.250% due 7/1/20 (d) | | | 1,051,240 |
| 1,315,000 | | AAA | | Miami-Dade County, FL, Transit Sales Surtax Revenue, XLCA-Insured, 5.000% due 7/1/16 | | | 1,400,790 |
| 1,075,000 | | AAA | | Port St. Lucie, FL, Florida Stormwater Utility Revenue, MBIA-Insured, 5.000% due 5/1/23 | | | 1,096,833 |
| | | | | Tampa, Florida Utility Tax & Special Revenue: | | | |
| 195,000 | | AAA | | Series A, AMBAC-Insured - Prerefunded 10/1/12 @ 101, 5.250% due 10/1/19 (d) | | | 210,569 |
| 1,055,000 | | AAA | | Series A, AMBAC-Insured, 5.250% due 10/1/19 | | | 1,118,606 |
| | | | | | |
|
|
| | | | | Total Florida | | | 7,502,963 |
| | | | | | |
|
|
|
Hawaii — 3.7% |
| 1,500,000 | | AAA | | Hawaii State, GO, Series DI, FSA-Insured, 5.000% due 3/1/10 | | | 1,547,040 |
| | | | | Maui County, HI, GO: | | | |
| 465,000 | | AA- | | Series A, Prerefunded 3/1/11 @100, 5.500% due 3/1/15 (d) | | | 492,626 |
| 535,000 | | AA- | | Series A, 5.500% due 3/1/15 | | | 562,670 |
| | | | | | |
|
|
| | | | | Total Hawaii | | | 2,602,336 |
| | | | | | |
|
|
See Notes to Financial Statements.
116
Schedules of Investments
(continued)
| | | | | | | |
| Municipal Bond Investments |
| | | |
Face
Amount | | Rating‡ | | Security | | Value |
| |
Illinois — 13.7% | | | |
| | | | | Chicago, IL: | | | |
| $1,000,000 | | AAA | | Housing Authority Capital Program Revenue, Refunding, FSA-Insured, 5.000% due 7/1/14 | | $ | 1,048,780 |
| 1,000,000 | | AAA | | Board of Education, GO, School Reform Board, Series A, FGIC-Insured, 5.250% due 12/1/20 | | | 1,085,580 |
| | | | | Illinois Finance Authority Revenue: | | | |
| 1,095,000 | | Baa1 | | Refunding, DePaul University, Series A, 5.375% due 10/1/19 (a) | | | 1,157,284 |
| 2,000,000 | | AAA | | OBG Bradley University, XLCA, 5.000% due 8/1/34 (b) | | | 2,001,460 |
| 1,090,000 | | AAA | | Refunding, Health Services, Series B, 3.950% due 5/15/35 (b) | | | 1,090,000 |
| 345,000 | | AAA | | Joliet Regional Port District/IL, 3.880% due 10/1/24 (b) | | | 345,000 |
| 1,800,000 | | A- | | Quincy, IL, OBG Blessing Blessing Hospital, 5.000% due 11/15/29 | | | 1,732,158 |
| 1,000,000 | | AAA | | University of Illinois, University Revenue, Auxiliary Facilities System, Series B, FGIC-Insured, 5.500% due 4/1/19 | | | 1,111,360 |
| | | | | | |
|
|
| | | | | Total Illinois | | | 9,571,622 |
| | | | | | |
|
|
| |
Indiana — 3.0% | | | |
| 1,000,000 | | Aaa | | Allen County, IN, Public Library Building Corp., First Mortgage, MBIA-Insured, Prerefunded 1/15/11@ 101, 5.000% due 1/15/17 (a)(d) | | | 1,050,500 |
| 1,000,000 | | AAA | | Indiana Health Facility Financing Authority Hospital Revenue, Refunding, Methodist Hospital Industry, Series A, Escrowed to Maturity, 5.750% due 9/1/15 (e) | | | 1,010,760 |
| | | | | | |
|
|
| | | | | Total Indiana | | | 2,061,260 |
| | | | | | |
|
|
| |
Iowa — 1.5% | | | |
| 1,000,000 | | AAA | | Des Moines, IA, Public Package Systems Revenue, Series A, FGIC-Insured, 5.750% due 6/1/13 | | | 1,049,940 |
| | | | | | |
|
|
| |
Kansas — 1.6% | | | |
| 1,065,000 | | AA | | Kansas State Development Finance Authority Revenue, Kansas Transition Revolving Fund, 5.000% due 10/1/20 | | | 1,117,579 |
| | | | | | |
|
|
| |
Michigan — 1.6% | | | |
| 1,000,000 | | AAA | | Michigan State House of Representatives, COP, AMBAC-Insured, 5.250% due 8/15/14 (b) | | | 1,085,210 |
| | | | | | |
|
|
| |
Minnesota — 3.0% | | | |
| 988,385 | | AAA | | Minneapolis & St. Paul, MN, Housing Finance Board Single Family Mortgage Revenue, Mortgage Backed Securities, Cityliving, Series A-3, GNMA & FNMA-Insured, 5.700% due 4/1/27 (b) | | | 1,041,847 |
| 1,000,000 | | A2 | | Minnesota State Higher EFA Revenue, University St. Thomas, Series Six-I, 5.000% due 4/1/23 (a) | | | 1,021,640 |
| | | | | | |
|
|
| | | | | Total Minnesota | | | 2,063,487 |
| | | | | | |
|
|
| |
Nevada — 5.5% | | | |
| 1,500,000 | | AAA | | Clark County, NV, GO, Refunding Food Control, FGIC-Insured, 4.750% due 11/1/24 | | | 1,513,695 |
| 1,000,000 | | AAA | | State of Nevada Highway Revenue, Motor Vehicle Fuel Tax, 5.000% due 12/1/08 | | | 1,015,910 |
| 1,220,000 | | AAA | | University of Nevada, University Revenue, Community College System, FSA-Insured, Prerefunded 7/1/10 @100, 5.250% due 7/1/16 (d) | | | 1,271,496 |
| | | | | | |
|
|
| | | | | Total Nevada | | | 3,801,101 |
| | | | | | |
|
|
| |
New Jersey — 4.2% | | | |
| 325,000 | | AAA | | Gloucester County Pollution Control Financing Authority, 3.730% due 1/1/22 (b) | | | 325,000 |
| 1,500,000 | | A+ | | New Jersey Health Care Facilities Financing Authority, 5.000% due 7/1/27 | | | 1,499,895 |
| 1,000,000 | | AAA | | New Jersey State Transportation Corp., COP, Series A, AMBAC-Insured, 5.500% due 9/15/15 | | | 1,095,650 |
| | | | | | |
|
|
| | | | | Total New Jersey | | | 2,920,545 |
| | | | | | |
|
|
| |
New York — 8.3% | | | |
| | | | | New York City, NY: | | | |
| 250,000 | | AAA | | 3.800% due 11/1/24 (b) | | | 250,000 |
| 1,000,000 | | AA | | Series D, 5.000% due 11/1/27 | | | 1,017,990 |
| 825,000 | | AA+ | | Municipal Water Finance Authority, 3.840% due 6/15/35 (b) | | | 825,000 |
See Notes to Financial Statements.
117
Schedules of Investments
(continued)
| | | | | | | |
| Municipal Bond Investments |
| | | |
Face
Amount | | Rating‡ | | Security | | Value |
| |
New York — 8.3% (continued) | | | |
| $1,450,000 | | AA+ | | Municipal Water Finance Authority, Water & Sewer Systems Revenue, Series E, 5.000% due 6/15/38 (b) | | $ | 1,465,109 |
| | | | | New York State: | | | |
| 1,100,000 | | AAA | | Urban Development Corp. Revenue, Refunding, Correctional Capital Facilities, Series A, FSA-Insured, 5.250% due 1/1/14 | | | 1,161,248 |
| 1,000,000 | | AA- | | Dormitory Authority Revenue, Series B, 5.250% due 11/15/23 (b) | | | 1,059,100 |
| | | | | | |
|
|
| | | | | Total New York | | | 5,778,447 |
| | | | | | |
|
|
| |
North Carolina — 1.5% | | | |
| 1,000,000 | | AAA | | Johnston County, NC, GO, FGIC-Insured, 5.000% due 6/1/21 | | | 1,044,120 |
| | | | | | |
|
|
| |
Ohio — 1.5% | | | |
| 1,000,000 | | AAA | | Springboro Community City School District, MBIA-Insured, Prerefunded 6/1/14 @100, 5.000% due 12/1/25 (d) | | | 1,068,860 |
| | | | | | |
|
|
|
Oklahoma — 1.5% |
| 1,000,000 | | AAA | | Oklahoma City, OK, Airport Trust, Series A, FSA-Insured, Prerefunded 7/1/10 @100, 5.250% due 7/1/21 (d) | | | 1,042,210 |
| | | | | | |
|
|
|
Oregon — 1.5% |
| 1,000,000 | | AAA | | Oregon State Department Administrative Services, COP, Series A, FSA-Insured, 5.000% due 5/1/24 | | | 1,027,450 |
| | | | | | |
|
|
|
Pennsylvania — 1.6% |
| 1,120,000 | | AAA | | Mifflin County, PA, GO, Series A, FGIC-Insured, 5.000% due 9/1/27 | | | 1,142,758 |
| | | | | | |
|
|
|
Tennessee — 3.6% |
| 1,000,000 | | BBB+ | | Knox County, TN, Health & Housing Facilities Revenue, 5.250% due 4/1/36 | | | 968,340 |
| 1,500,000 | | AA- | | Tennessee Energy Acquisition Corp., Series A, 5.250% due 9/1/17 | | | 1,567,590 |
| | | | | | |
|
|
| | | | | Total Tennessee | | | 2,535,930 |
| | | | | | |
|
|
|
Texas — 4.2% |
| 475,000 | | AAA | | Texas State Department of Housing & Community Affairs Residential Mortgage Revenue, Refunding, Series A, GNMA/FNMA-Insured, 6.200% due 7/1/19 (c) | | | 489,687 |
| 1,000,000 | | AAA | | University of North Texas, University Revenue, Financing System, FGIC-Insured, 5.000% due 4/15/18 | | | 1,034,450 |
| 1,390,000 | | AAA | | University of Texas, University Revenues, Financing Systems, Series D, 5.000% due 8/15/34 (b) | | | 1,409,488 |
| | | | | | |
|
|
| | | | | Total Texas | | | 2,933,625 |
| | | | | | |
|
|
|
Utah — 1.9% |
| 1,200,000 | | AAA | | South Ogden City, UT, Refunding, FGIC-Insured, 5.250% due 5/1/29 | | | 1,299,216 |
| | | | | | |
|
|
|
Wisconsin — 5.0% |
| 1,200,000 | | BBB | | Franklin, WI, Solid Waste Disposal Revenue, Waste Management Wisconsin Inc., Series A, 4.950% due 11/1/16 | | | 1,178,400 |
| 1,000,000 | | Aaa | | Sun Prairie, WI, Area School District, GO, FGIC-Insured, 5.625% due 4/1/16 (a) | | | 1,041,550 |
| 1,340,000 | | BBB | | Wisconsin State HEFA Revenue, Refunding, Divine Savior Healthcare, 5.500% due 5/1/26 | | | 1,288,531 |
| | | | | | |
|
|
| | | | | Total Wisconsin | | | 3,508,481 |
| | | | | | |
|
|
|
Wyoming — 0.2% |
| 145,000 | | AAA | | Lincoln County, WY, 3.880% due 11/1/14 (b) | | | 145,000 |
| | | | | | |
|
|
| | | | | TOTAL MUNICIPAL BONDS
(Cost — $67,854,171) | | | 67,916,881 |
| | | | | | |
|
|
| | | | | TOTAL INVESTMENTS BEFORE SHORT-TERM INVESTMENT
(Cost — $67,854,171) | | | 67,916,881 |
| | | | | | |
|
|
See Notes to Financial Statements.
118
Schedules of Investments
(continued)
| | | | | | | |
Municipal Bond Investments |
| | | |
Face
Amount | | Rating‡ | | Security | | Value |
SHORT-TERM INVESTMENT — 0.0% |
TIME DEPOSITS — 0.0% |
| $ 2,157 | | | | BBH — Grand Cayman, 4.440% due 9/1/07
(Cost — $2,157) | | $ | 2,157 |
| | | | | | |
|
|
| | | | | TOTAL INVESTMENTS — 97.5%
(Cost — $67,856,328#) | | | 67,919,038 |
| | | | | Other Assets in Excess of Liabilities — 2.5% | | | 1,718,822 |
| | | | | | |
|
|
| | | | | TOTAL NET ASSETS — 100.0% | | $ | 69,637,860 |
| | | | | | |
|
|
| ‡ | | All ratings are by Standard & Poor’s Ratings Service, unless otherwise noted. |
| (a) | | Rating by Moody’s Investors Service. All ratings are unaudited. |
| (b) | | Variable rate securities. Coupon rates disclosed are those which are in effect at August 31, 2007. |
| (c) | | Income from this issue is considered a preference item for purposes of calculating the alternative minimum tax (AMT). |
| (d) | | Pre-Refunded bonds are escrowed with government obligations and/or government agency securities and are considered by the Manager to be triple-A rated even if issuer has not applied for new ratings. |
| (e) | | Bonds are escrowed to maturity by government securities and/or U.S. government agency securities and are considered by the Manager to be triple-A rated even if issuer has not applied for new ratings. |
| # | | Aggregate cost for federal income tax purposes is $67,838,428. |
See pages 122 and 123 for definition of ratings.
Abbreviations used in this schedule:
| | | | |
| AMBAC | | — | | Ambac Assurance Corporation |
| COP | | — | | Certificate of Participation |
| EFA | | — | | Educational Facilities Authority |
| FGIC | | — | | Financial Guaranty Insurance Company |
| FNMA | | — | | Federal National Mortgage Association |
| FSA | | — | | Financial Security Assurance |
| GNMA | | — | | Government National Mortgage Association |
| GO | | — | | General Obligation |
| GTDSTD | | — | | Guaranteed Student Loans |
| HEFA | | — | | Health & Educational Facilities Authority |
| MBIA | | — | | Municipal Bond Investors Assurance Corporation |
| XLCA | | — | | XL Capital Assurance Inc. |
| | | |
| Summary of Investments by Industry* | | | |
Education | | 19.4 | % |
General Obligation | | 15.7 | |
Hospitals | | 11.3 | |
Tax Allocation | | 10.6 | |
Pre-Refunded | | 9.1 | |
Water and Sewer | | 8.7 | |
Public Facilities | | 6.4 | |
Miscellaneous | | 4.8 | |
Housing: Single-Family | | 3.8 | |
Transportation | | 3.3 | |
US Municipals | | 2.6 | |
Utilities | | 2.3 | |
Escrowed to Maturity | | 1.5 | |
Pollution Control | | 0.5 | |
| | |
|
|
| | | 100.0 | % |
| | |
|
|
| * | | As a percentage of total investments. |
See Notes to Financial Statements.
119
Schedules of Investments
(continued)
| | | | | | |
| Money Market Investments | |
| | |
Face
Amount | | Security | | Value | |
SHORT-TERM INVESTMENTS — 100.1% | |
|
Certificate of Deposit — 3.8% | |
| $1,250,000 | | BNP Paribas NY Branch, 5.270% due 4/3/08 | | $ | 1,249,326 | |
| 2,000,000 | | Manufacturers & Traders Trust Co., 5.612% due 6/26/08 | | | 1,999,007 | |
| 1,250,000 | | Natixis NY Branch, 5.446% due 6/9/08 | | | 1,249,594 | |
| | | | |
|
|
|
| | | Total Certificate of Deposit | | | 4,497,927 | |
| | | | |
|
|
|
|
Commercial Paper — 44.4% | |
| 2,500,000 | | Alpine Securitization, 5.301% due 10/12/07 (a) | | | 2,485,109 | |
| 2,500,000 | | American Honda Finance, 5.268% due 9/5/07 (a) | | | 2,498,544 | |
| 2,500,000 | | Astrazeneca PLC, 5.310% due 9/6/07 (a) | | | 2,498,170 | |
| 2,500,000 | | Atlantis One Funding, 5.321% due 10/12/07 (a) | | | 2,485,052 | |
| 1,500,000 | | Barton Capital LLC, 5.372% due 9/4/07 (a) | | | 1,499,331 | |
| 1,250,000 | | BASF AG, 5.298% due 12/13/07 (a) | | | 1,231,439 | |
| 1,250,000 | | Commerzbank US Finance, 5.322% due 10/30/07 (a) | | | 1,239,286 | |
| 2,500,000 | | Cullinan Finance Corp., 5.328% due 9/4/07 (a) | | | 2,498,896 | |
| 2,500,000 | | Edison Asset Securitization LLC, 5.303% due 10/1/07 (a) | | | 2,489,083 | |
| 2,500,000 | | Eureka Asset Securitization, 5.308% due 9/4/07 (a) | | | 2,498,900 | |
| 2,500,000 | | Goldman Sachs Group Inc., 5.313% due 11/1/07 (a) | | | 2,477,845 | |
| 2,500,000 | | Irish Life & Permanent, 5.332% due 12/17/07 (a) | | | 2,461,250 | |
| 2,500,000 | | Korea Development Bank NY, 5.320% due 9/4/07 (a) | | | 2,498,896 | |
| 2,500,000 | | Mane Funding Corp., 5.307% due 9/12/07 (a) | | | 2,495,982 | |
| 2,500,000 | | Manhattan Asset Funding Co., 5.380% due 9/14/07 (a) | | | 2,495,251 | |
| 1,250,000 | | Nordea North America Inc., 5.304% due 10/2/07 (a) | | | 1,244,365 | |
| 2,500,000 | | Scaldis Capital LLC, 5.396% due 9/10/07 (a) | | | 2,496,644 | |
| 2,000,000 | | Silver Tower US Funding, 5.321% due 10/25/07 (a) | | | 1,984,250 | |
| 2,250,000 | | Societe Generale North America, 5.321% due 10/5/07 (a) | | | 2,238,844 | |
| 2,500,000 | | St. George Bank Ltd., 5.315% due 10/12/07 (a) | | | 2,485,066 | |
| 2,500,000 | | Sumitomo Corp. of America, 5.332% due 11/13/07 (a) | | | 2,473,436 | |
| 2,500,000 | | TSL (USA) Inc., 5.351% due 9/20/07 (a) | | | 2,493,007 | |
| 1,250,000 | | UBS Finance Delaware LLC, 5.316% due 11/5/07 (a) | | | 1,238,219 | |
| 2,000,000 | | Windmill Funding Corp., 5.291% due 9/10/07 (a) | | | 1,997,375 | |
| | | | |
|
|
|
| | | TOTAL COMMERCIAL PAPER | | | 52,504,240 | |
| | | | |
|
|
|
|
Corporate Note — 1.0% | |
| 1,250,000 | | Bank of America NA, 5.505% due 7/25/08 | | | 1,249,693 | |
| | | | |
|
|
|
|
Time Deposits — 0.0% | |
| 605 | | BBH — Grand Cayman, 4.440% due 9/1/07 | | | 605 | |
| | | | |
|
|
|
|
U.S. Government Agencies — 50.9% | |
| | | Federal Home Loan Mortgage Corp. (FHLMC), Discount Notes: | | | | |
| 5,000,000 | | 5.190% due 9/28/07 (a) | | | 4,980,867 | |
| 3,500,000 | | 5.201% due 10/22/07 (a) | | | 3,474,663 | |
| | | Federal National Mortgage Association (FNMA) Discount Notes: | | | | |
| 35,905,000 | | 4.282% due 9/4/07 (a) | | | 35,892,194 | |
| 3,500,000 | | 5.179% due 9/21/07 (a) | | | 3,490,122 | |
| 4,000,000 | | 5.204% due 10/5/07 (a) | | | 3,980,677 | |
| 8,500,000 | | 5.204% due 10/17/07 (a) | | | 8,444,519 | |
| | | | |
|
|
|
| | | TOTAL U.S GOVERNMENT AGENCIES | | | 60,263,042 | |
| | | | |
|
|
|
| | | TOTAL SHORT-TERM INVESTMENTS
(Cost — $118,515,507) | | | 118,515,507 | |
| | | | |
|
|
|
| | | TOTAL INVESTMENTS — 100.1%
(Cost — $118,515,507#) | | | 118,515,507 | |
| | | Liabilities in Excess of Other Assets — (0.1%) | | | (169,805 | ) |
| | | | |
|
|
|
| | | TOTAL NET ASSETS — 100.0% | | $ | 118,345,702 | |
| | | | |
|
|
|
See Notes to Financial Statements.
120
Schedules of Investments
(continued)
| (a) | | Rate shown represents yield-to-maturity. |
| # | | Aggregate cost for federal income tax purposes is $118,515,507. |
See Notes to Financial Statements.
121
Ratings
(unaudited)
| | |
Bond Ratings |
| The definitions of the applicable rating symbols are set forth below: |
| Standard & Poor’s Ratings Service (“Standard & Poor’s”) — Ratings from “AA” to “CCC” may be modified by the addition of a plus (+) or minus (-) sign to show relative standings within the major rating categories. |
| AAA | | — Bonds rated “AAA” have the highest rating assigned by Standard & Poor’s. Capacity to pay interest and repay principal is extremely strong. |
| AA | | — Bonds rated “AA” have a very strong capacity to pay interest and repay principal and differ from the highest rated issues only in a small degree. |
| A | | — Bonds rated “A” have a strong capacity to pay interest and repay principal although they are somewhat more susceptible to the adverse effects of changes in circumstances and economic conditions than debt in higher rated categories. |
| BBB | | — Bonds rated “BBB” are regarded as having an adequate capacity to pay interest and repay principal. Whereas they normally exhibit adequate protection parameters, adverse economic conditions or changing circumstances are more likely to lead to a weakened capacity to pay interest and repay principal for bonds in this category than in higher rated categories. |
| BB, B, CCC, CC and C | | — Bonds rated “BB”, “B”, “CCC”, “CC” and “C” are regarded, on balance, as predominantly speculative with respect to capacity to pay interest and repay principal in accordance with the terms of the obligation. “BB” represents the lowest degree of speculation and “C” the highest degree of speculation. While such bonds will likely have some quality and protective characteristics, these are outweighed by large uncertainties or major risk exposures to adverse conditions. |
| D | | — Bonds rated “D” are in default and payment of interest and/or repayment of principal is in arrears. |
| Moody’s Investors Service (“Moody’s”) — Numerical modifiers 1, 2 and 3 may be applied to each generic rating from “Aa” to “Caa” where 1 is the highest and 3 the lowest ranking within its generic category. |
| Aaa | | — Bonds rated “Aaa” are judged to be of the best quality. They carry the smallest degree of investment risk and are generally referred to as “gilt edge.” Interest payments are protected by a large or by an exceptionally stable margin and principal is secure. While the various protective elements are likely to change, such changes as can be visualized are most unlikely to impair the fundamentally strong position of such issues. |
| Aa | | — Bonds rated “Aa” are judged to be of high quality by all standards. Together with the “Aaa” group they comprise what are generally known as high grade bonds. They are rated lower than the best bonds because margins of protection may not be as large as in “Aaa” securities or fluctuation of protective elements may be of greater amplitude or there may be other elements present which make the long-term risks appear somewhat larger than in “Aaa” securities. |
| A | | — Bonds rated “A” possess many favorable investment attributes and are to be considered as upper medium grade obligations. Factors giving security to principal and interest are considered adequate but elements may be present which suggest a susceptibility to impairment some time in the future. |
| Baa | | — Bonds rated “Baa” are considered as medium grade obligations, i.e., they are neither highly protected nor poorly secured. Interest payments and principal security appear adequate for the present but certain protective elements may be lacking or may be characteristically unreliable over any great length of time. Such bonds lack outstanding investment characteristics and in fact have speculative characteristics as well. |
| Ba | | — Bonds rated “Ba” are judged to have speculative elements; their future cannot be considered as well assured. Often the protection of interest and principal payments may be very moderate and therefore not well safeguarded during both good and bad times over the future. Uncertainty of position characterizes bonds in this class. |
| B | | — Bonds rated “B” generally lack characteristics of desirable investments. Assurance of interest and principal payments or of maintenance of other terms of the contract over any long period of time may be small. |
| Caa | | — Bonds rated “Caa” are of poor standing. These may be in default, or present elements of danger may exist with respect to principal or interest. |
| Ca | | — Bonds rated “Ca” represent obligations which are speculative in a high degree. Such issues are often in default or have other marked short-comings. |
| C | | — Bonds rated “C” are the lowest class of bonds and issues so rated can be regarded as having extremely poor prospects of ever attaining any real investment standing. |
| Fitch Ratings Service (“Fitch”) — Ratings from “AA” to “CCC” may be modified by the addition of a plus (+) or minus (-) sign to show relative standings within the major rating categories. |
| AAA | | — Bonds rated “AAA” have the highest rating assigned by Fitch. Capacity to pay interest and repay principal is extremely strong. |
| AA | | — Bonds rated “AA” have a very strong capacity to pay interest and repay principal and differ from the highest rated issues only in a small degree. |
| A | | — Bonds rated “A” have a strong capacity to pay interest and repay principal although they are somewhat more susceptible to the adverse effects of changes in circumstances and economic conditions than debt in higher rated categories. |
| BBB | | — Bonds rated “BBB” are regarded as having an adequate capacity to pay interest and repay principal. Whereas they normally exhibit adequate protection parameters, adverse economic conditions or changing circumstances are more likely to lead to a weakened capacity to pay interest and repay principal for bonds in this category than in higher rated categories. |
| BB, B, CCC, CC and C | | — Bonds rated “BB”, “B”, “CCC” and “CC” are regarded, on balance, as predominantly speculative with respect to capacity to pay interest and repay principal in accordance with the terms of the obligation. “BB” represents a lower degree of speculation than “B”, and “CC” the highest degree of speculation. While such bonds will likely have some quality and protective characteristics, these are outweighed by large uncertainties or major risk exposures to adverse conditions. |
| NR | | — Indicates that the bond is not rated by Standard & Poor’s, Moody’s, or Fitch. |
122
Ratings
(unaudited) (continued)
| | |
Short-Term Security Ratings |
| SP-1 | | — Standard & Poor’s highest rating indicating very strong or strong capacity to pay principal and interest; those issues determined to possess overwhelming safety characteristics are denoted with a plus (+) sign. |
| A-1 | | — Standard & Poor’s highest commercial paper and variable-rate demand obligation (VRDO) rating indicating that the degree of safety regarding timely payment is either overwhelming or very strong; those issues determined to possess overwhelming safety characteristics are denoted with a plus (+) sign. |
| VMIG 1 | | — Moody’s highest rating for issues having a demand feature — VRDO. |
| P-1 | | — Moody’s highest rating for commercial paper and for VRDO prior to the advent of the VMIG 1 rating. |
| F-1 | | — Fitch’s highest rating indicating the strongest capacity for timely payment of financial commitments; those issues determined to possess overwhelming strong credit feature are denoted with a plus (+) sign. |
123
Statements of Assets and Liabilities
August 31, 2007
| | | | | | | | | | | |
| | | Large
Capitalization
Growth
Investments | | | Large
Capitalization
Value Equity
Investments | | Small
Capitalization
Growth
Investments | |
| ASSETS: | | | | | | | | | | | |
Investments, at cost | | $ | 2,139,278,505 | | | $ | 1,691,297,356 | | $ | 379,730,076 | |
Foreign currency, at cost | | | — | | | | — | | | — | |
| | |
|
|
| |
|
| |
|
|
|
Investments, at value* | | $ | 2,511,180,135 | | | $ | 1,957,142,433 | | $ | 473,125,995 | |
Foreign currency, at value | | | — | | | | — | | | — | |
Cash | | | — | | | | — | | | — | |
Receivable for securities sold | | | 2,611,628 | | | | 8,556,441 | | | 3,511,838 | |
Dividends and interest receivable | | | 1,479,515 | | | | 3,918,881 | | | 96,950 | |
Receivable for Fund shares sold | | | 6,728,437 | | | | 4,609,852 | | | 798,898 | |
Receivable for open forward currency contracts (Notes 1 and 3) | | | — | | | | — | | | — | |
Receivable from broker—variation margin on open futures contracts (Notes 1 and 3) | | | — | | | | — | | | — | |
Unrealized appreciation on swaps (Notes 1 and 3) | | | — | | | | — | | | — | |
Prepaid expenses | | | 50,750 | | | | 41,131 | | | 21,135 | |
| | |
|
|
| |
|
| |
|
|
|
Total Assets | | | 2,522,050,465 | | | | 1,974,268,738 | | | 477,554,816 | |
| | |
|
|
| |
|
| |
|
|
|
| LIABILITIES: | | | | | | | | | | | |
Payable for securities on loan | | $ | 51,156,602 | | | $ | 147,862,517 | | $ | 72,113,980 | |
Payable for Fund shares repurchased | | | 2,315,918 | | | | 1,799,151 | | | 761,285 | |
Payable for securities purchased | | | 3,340,604 | | | | 7,727,589 | | | 2,667,701 | |
Investment management fee payable | | | 1,225,503 | | | | 907,901 | | | 272,797 | |
Transfer agent fees payable | | | 102,700 | | | | 102,915 | | | 94,684 | |
Custody fee payable | | | 58,491 | | | | 50,149 | | | 9,432 | |
Trustees’ fees payable | | | 35,000 | | | | 18,060 | | | 5,046 | |
Interest payable for short sales (Note 1) | | | — | | | | — | | | — | |
Due to custodian | | | 77,047 | | | | — | | | 10,812 | |
Premium paid for open swaps (Notes 1 and 3) | | | — | | | | — | | | — | |
Investments sold short, at value (proceeds received $115,448,667 and $55,962,041, respectively) (Note 1) | | | — | | | | — | | | — | |
Options written, at value (premiums received $773,566 and $1,926,736, respectively)
(Notes 1 and 3) | | | — | | | | — | | | — | |
Unrealized depreciation on swaps (Notes 1 and 3) | | | — | | | | — | | | — | |
Payable for open forward currency contracts (Notes 1 and 3) | | | — | | | | — | | | — | |
Payable to broker—variation margin on open futures contracts (Notes 1 and 3) | | | — | | | | — | | | — | |
Distributions payable | | | — | | | | — | | | — | |
Accrued expenses | | | 84,623 | | | | 80,311 | | | 83,256 | |
Other liabilities | | | — | | | | — | | | — | |
| | |
|
|
| |
|
| |
|
|
|
Total Liabilities | | | 58,396,488 | | | | 158,548,593 | | | 76,018,993 | |
| | |
|
|
| |
|
| |
|
|
|
Total Net Assets | | $ | 2,463,653,977 | | | $ | 1,815,720,145 | | $ | 401,535,823 | |
| | |
|
|
| |
|
| |
|
|
|
| NET ASSETS: | | | | | | | | | | | |
Par value (Note 4) | | $ | 159,448 | | | $ | 141,051 | | $ | 21,969 | |
Paid-in capital in excess of par value | | | 2,091,289,154 | | | | 1,411,217,822 | | | 565,199,464 | |
Accumulated net investment loss | | | — | | | | — | | | (1,415 | ) |
Undistributed (Overdistributed) net investment income | | | 3,954,875 | | | | 20,529,144 | | | — | |
Accumulated net realized gain (loss) on investments, futures contracts, options written, swap contracts and foreign currency transactions | | | (3,651,130 | ) | | | 117,987,051 | | | (257,081,513 | ) |
Net unrealized appreciation (depreciation) on investments, futures contracts, options written, short sales, swap contracts and foreign currencies | | | 371,901,630 | | | | 265,845,077 | | | 93,397,318 | |
| | |
|
|
| |
|
| |
|
|
|
Total Net Assets | | $ | 2,463,653,977 | | | $ | 1,815,720,145 | | $ | 401,535,823 | |
| | |
|
|
| |
|
| |
|
|
|
Shares Outstanding | | | 159,447,816 | | | | 141,050,839 | | | 21,968,562 | |
| | |
|
|
| |
|
| |
|
|
|
Net Asset Value | | | $15.45 | | | | $12.87 | | | $18.28 | |
| | |
|
|
| |
|
| |
|
|
|
| * | | Includes securities on loan for the following funds: Large Capitalization Growth Investments, Large Capitalization Value Equity Investments, Small Capitalization Growth Investments, Small Capitalization Value Equity Investments, International Equity Investments, Emerging Markets Equity Investments, Core Fixed Income Investments and High Yield Investments with market value of $50,135,227, $144,202,925, $70,465,669, $58,157,473, $70,961,524, $34,974,849, $2,273,486 and $5,476,513, respectively. |
See Notes to Financial Statements.
124
| | | | | | | | | | | | | | | | | | | | | | | | | | | | |
Small
Capitalization
Value Equity
Investments | | International
Equity
Investments | | Emerging
Markets
Equity
Investments | | | Core Fixed
Income
Investments | | | High Yield
Investments | | | International
Fixed Income
Investments | | | Municipal
Bond
Investments | | | Money
Market
Investments | |
| | | | | | | | | | | | | | | | | | | | | | | | | | | | | |
| $ | 357,571,218 | | $ | 1,368,227,814 | | $ | 367,994,099 | | | $ | 1,054,503,828 | | | $ | 92,094,671 | | | $ | 235,240,257 | | | $ | 67,856,328 | | | $ | 118,515,507 | |
| | — | | | 835,526 | | | 2,024,300 | | | | 384,662 | | | | — | | | | 639,528 | | | | — | | | | — | |
|
| |
|
| |
|
|
| |
|
|
| |
|
|
| |
|
|
| |
|
|
| |
|
|
|
| $ | 411,787,339 | | $ | 1,714,517,041 | | $ | 553,693,633 | | | $ | 1,053,104,499 | | | $ | 90,322,403 | | | $ | 239,479,407 | | | $ | 67,919,038 | | | $ | 118,515,507 | |
| | — | | | 848,932 | | | 2,058,181 | | | | 392,347 | | | | — | | | | 637,853 | | | | — | | | | — | |
| | — | | | 12,052,840 | | | 7,754,300 | ** | | | — | | | | — | | | | — | | | | 942 | | | | 1,716 | |
| | 1,059,773 | | | — | | | 2,565,569 | | | | 188,682,866 | | | | 4,606 | | | | 123,296,846 | | | | — | | | | — | |
| | 598,908 | | | 2,968,453 | | | 1,263,068 | | | | 6,561,807 | | | | 1,792,032 | | | | 2,061,227 | | | | 953,626 | | | | 12,208 | |
| | 655,542 | | | 4,433,949 | | | 1,347,655 | | | | 3,316,461 | | | | 141,999 | | | | 538,658 | | | | 835,567 | | | | 440,406 | |
| | — | | | — | | | — | | | | 600,013 | | | | — | | | | 468,719 | | | | — | | | | — | |
| | — | | | — | | | 238,259 | | | | 161,184 | | | | — | | | | — | | | | — | | | | — | |
| | — | | | — | | | — | | | | 3,747,178 | | | | — | | | | 2,884,305 | | | | — | | | | — | |
| | 16,770 | | | 29,115 | | | 26,665 | | | | 18,866 | | | | 10,564 | | | | 12,809 | | | | 12,156 | | | | 15,861 | |
|
| |
|
| |
|
|
| |
|
|
| |
|
|
| |
|
|
| |
|
|
| |
|
|
|
| | 414,118,332 | | | 1,734,850,330 | | | 568,947,330 | | | | 1,256,585,221 | | | | 92,271,604 | | | | 369,379,824 | | | | 69,721,329 | | | | 118,985,698 | |
|
| |
|
| |
|
|
| |
|
|
| |
|
|
| |
|
|
| |
|
|
| |
|
|
|
| | | | | | | | | | | | | | | | | | | | | | | | | | | | | |
| $ | 59,936,454 | | $ | 73,164,904 | | $ | 35,718,804 | | | $ | 2,319,176 | | | $ | 5,589,086 | | | $ | — | | | $ | — | | | $ | — | |
| | 612,353 | | | 1,453,974 | | | 736,441 | | | | 934,193 | | | | 124,805 | | | | 177,029 | | | | 7,014 | | | | — | |
| | 687,196 | | | 4,146,762 | | | 1,003,731 | | | | 268,401,217 | | | | 238,369 | | | | 113,974,167 | | | | — | | | | — | |
| | 250,198 | | | 879,977 | | | 348,368 | | | | 268,282 | | | | 40,710 | | | | 74,699 | | | | 19,539 | | | | 16,403 | |
| | 81,033 | | | 91,343 | | | 97,360 | | | | 95,203 | | | | 34,371 | | | | 63,119 | | | | 1,506 | | | | 57,000 | |
| | 14,418 | | | 52,146 | | | 52,547 | | | | 35,226 | | | | 4,744 | | | | 6,250 | | | | 3,327 | | | | 2,693 | |
| | 1,982 | | | 11,240 | | | 5,557 | | | | 18,567 | | | | 4,552 | | | | 2,578 | | | | 3,073 | | | | 4,997 | |
| | — | | | — | | | — | | | | 443,151 | | | | — | | | | 586,388 | | | | — | | | | — | |
| | — | | | — | | | — | | | | 656,394 | | | | 344,422 | | | | 160,483 | | | | — | | | | — | |
| | — | | | — | | | — | | | | 3,260,651 | | | | — | | | | 2,165,162 | | | | — | | | | — | |
|
— | | | — | | | — | | | | 116,115,284 | | | | — | | | | 56,478,373 | | | | — | | | | — | |
|
— | | | — | | | — | | | | 1,172,346 | | | | — | | | | 2,169,572 | | | | — | | | | — | |
| | — | | | — | | | — | | | | 1,372,786 | | | | — | | | | 3,158,343 | | | | — | | | | — | |
| | — | | | — | | | — | | | | 223,404 | | | | — | | | | 1,362,207 | | | | — | | | | — | |
| | — | | | — | | | — | | | | — | | | | — | | | | 320,754 | | | | — | | | | — | |
| | — | | | — | | | — | | | | 115,300 | | | | 29,796 | | | | — | | | | 16,311 | | | | 478,874 | |
| | 93,131 | | | 88,242 | | | 75,655 | | | | 64,594 | | | | 56,414 | | | | 65,933 | | | | 32,699 | | | | 80,029 | |
| | — | | | 257,749 | | | 591,118 | | | | — | | | | — | | | | — | | | | — | | | | — | |
|
| |
|
| |
|
|
| |
|
|
| |
|
|
| |
|
|
| |
|
|
| |
|
|
|
| | 61,676,765 | | | 80,146,337 | | | 38,629,581 | | | | 395,495,774 | | | | 6,467,269 | | | | 180,765,057 | | | | 83,469 | | | | 639,996 | |
|
| |
|
| |
|
|
| |
|
|
| |
|
|
| |
|
|
| |
|
|
| |
|
|
|
| $ | 352,441,567 | | $ | 1,654,703,993 | | $ | 530,317,749 | | | $ | 861,089,447 | | | $ | 85,804,335 | | | $ | 188,614,767 | | | $ | 69,637,860 | | | $ | 118,345,702 | |
|
| |
|
| |
|
|
| |
|
|
| |
|
|
| |
|
|
| |
|
|
| |
|
|
|
| | | | | | | | | | | | | | | | | | | | | | | | | | | | | |
| $ | 26,094 | | $ | 106,307 | | $ | 27,631 | | | $ | 106,695 | | | $ | 18,723 | | | $ | 24,593 | | | $ | 7,793 | | | $ | 118,373 | |
| | 251,032,227 | | | 1,282,203,767 | | | 325,133,979 | | | | 882,830,955 | | | | 173,166,131 | | | | 201,914,221 | | | | 71,365,868 | | | | 118,248,447 | |
| | — | | | — | | | — | | | | — | | | | — | | | | — | | | | — | | | | (6 | ) |
| | 1,902,682 | | | 16,773,088 | | | 3,806,687 | | | | 1,838,566 | | | | 1,426,181 | | | | 4,083,035 | | | | 130,471 | | | | — | |
|
45,262,670 | | | 9,257,514 | | | 15,361,435 | | | | (23,882,282 | ) | | | (87,034,432 | ) | | | (20,854,256 | ) | | | (1,928,982 | ) | | | (21,112 | ) |
|
54,217,894 | | | 346,363,317 | | | 185,988,017 | | | | 195,513 | | | | (1,772,268 | ) | | | 3,447,174 | | | | 62,710 | | | | — | |
|
| |
|
| |
|
|
| |
|
|
| |
|
|
| |
|
|
| |
|
|
| |
|
|
|
| $ | 352,441,567 | | $ | 1,654,703,993 | | $ | 530,317,749 | | | $ | 861,089,447 | | | $ | 85,804,335 | | | $ | 188,614,767 | | | $ | 69,637,860 | | | $ | 118,345,702 | |
|
| |
|
| |
|
|
| |
|
|
| |
|
|
| |
|
|
| |
|
|
| |
|
|
|
| | 26,093,558 | | | 106,306,725 | | | 27,631,346 | | | | 106,694,830 | | | | 18,722,753 | | | | 24,593,298 | | | | 7,793,424 | | | | 118,372,607 | |
|
| |
|
| |
|
|
| |
|
|
| |
|
|
| |
|
|
| |
|
|
| |
|
|
|
| | $13.51 | | | $15.57 | | | $19.19 | | | | $8.07 | | | | $4.58 | | | | $7.67 | | | | $8.94 | | | | $1.00 | |
|
| |
|
| |
|
|
| |
|
|
| |
|
|
| |
|
|
| |
|
|
| |
|
|
|
| ** | | Includes $1,660,384 of restricted cash. |
See Notes to Financial Statements.
125
Statements of Operations
For the Year Ended August 31, 2007
| | | | | | | | | | | | |
| | | Large
Capitalization
Growth
Investments | | | Large
Capitalization
Value Equity
Investments | | | Small
Capitalization
Growth
Investments | |
| INVESTMENT INCOME: | | | | | | | | | | | | |
Dividends | | $ | 16,942,873 | | | $ | 38,599,909 | | | $ | 1,003,492 | |
Interest | | | 2,077,402 | | | | 2,099,552 | | | | 313,454 | |
Income from securities lending | | | 71,029 | | | | 143,424 | | | | 284,726 | |
Miscellaneous income | | | 302,134 | | | | 334,711 | | | | 47,804 | |
Less: Foreign taxes withheld | | | (278,484 | ) | | | (223,570 | ) | | | (37,412 | ) |
| | |
|
|
| |
|
|
| |
|
|
|
Total Investment Income | | | 19,114,954 | | | | 40,954,026 | | | | 1,612,064 | |
| | |
|
|
| |
|
|
| |
|
|
|
| EXPENSES: | | | | | | | | | | | | |
Investment management fee (Note 2) | | $ | 13,028,580 | | | $ | 10,447,532 | | | $ | 3,120,285 | |
Administration fees (Note 2) | | | 820,465 | | | | 680,805 | | | | 157,382 | |
Transfer agent fees (Note 2) | | | 423,774 | | | | 348,767 | | | | 334,496 | |
Custody fees | | | 466,486 | | | | 371,535 | | | | 91,100 | |
Trustees’ fees | | | 141,583 | | | | 106,577 | | | | 25,976 | |
Shareholder reports | | | 89,919 | | | | 55,493 | | | | 34,808 | |
Insurance | | | 33,077 | | | | 37,328 | | | | 6,851 | |
Audit and tax | | | 30,081 | | | | 30,067 | | | | 28,100 | |
Legal fees | | | 35,496 | | | | 28,046 | | | | 22,440 | |
Registration fees | | | 46,136 | | | | 63,431 | | | | 26,748 | |
Interest expense | | | — | | | | — | | | | — | |
Miscellaneous expenses | | | 43,812 | | | | 37,643 | | | | 13,216 | |
| | |
|
|
| |
|
|
| |
|
|
|
Total Investment Expenses | | | 15,159,409 | | | | 12,207,224 | | | | 3,861,402 | |
| | |
|
|
| |
|
|
| |
|
|
|
Less: Fee waivers and/or expense reimbursement (Note 2) | | | — | | | | (277,652 | ) | | | (6,450 | ) |
| | |
|
|
| |
|
|
| |
|
|
|
Net Investment Expenses | | | 15,159,409 | | | | 11,929,572 | | | | 3,854,952 | |
| | |
|
|
| |
|
|
| |
|
|
|
Net Investment Income (Loss) | | $ | 3,955,545 | | | $ | 29,024,454 | | | $ | (2,242,888 | ) |
| | |
|
|
| |
|
|
| |
|
|
|
| REALIZED AND UNREALIZED GAIN (LOSS) ON INVESTMENTS, FUTURES CONTRACTS, OPTIONS WRITTEN, SHORT SALES, SWAP CONTRACTS AND FOREIGN CURRENCY TRANSACTIONS (NOTES 1 AND 3): | | | | | | | | | | | | |
Net Realized Gain (Loss) From: | | | | | | | | | | | | |
Investment transactions | | $ | 249,663,247 | | | $ | 136,730,179 | | | $ | 43,063,938 | |
Futures contracts | | | — | | | | — | | | | — | |
Options written | | | — | | | | — | | | | — | |
Swap contracts | | | — | | | | — | | | | — | |
Foreign currency transactions | | | — | | | | — | | | | (306 | ) |
| | |
|
|
| |
|
|
| |
|
|
|
Net Realized Gain (Loss) | | | 249,663,247 | | | | 136,730,179 | | | | 43,063,632 | |
| | |
|
|
| |
|
|
| |
|
|
|
Change in Net Unrealized Appreciation/Depreciation From: | | | | | | | | | | | | |
Investments | | | 132,493,579 | | | | 44,968,521 | | | | 14,448,359 | |
Futures contracts | | | — | | | | — | | | | — | |
Options written | | | — | | | | — | | | | — | |
Short sales | | | — | | | | — | | | | — | |
Swap contracts | | | — | | | | — | | | | — | |
Foreign currencies | | | (34 | ) | | | — | | | | 1,296 | |
| | |
|
|
| |
|
|
| |
|
|
|
Change in Net Unrealized Appreciation/Depreciation | | | 132,493,545 | | | | 44,968,521 | | | | 14,449,655 | |
| | |
|
|
| |
|
|
| |
|
|
|
Net Gain (Loss) on Investments, Futures Contracts, Options Written, Short Sales, Swap Contracts and Foreign Currency Transactions | | | 382,156,792 | | | | 181,698,700 | | | | 57,513,287 | |
| | |
|
|
| |
|
|
| |
|
|
|
Total Net Assets Increase (Decrease) in Net Assets From Operations | | $ | 386,112,337 | | | $ | 210,723,154 | | | $ | 55,270,399 | |
| | |
|
|
| |
|
|
| |
|
|
|
See Notes to Financial Statements.
126
| | | | | | | | | | | | | | | | | | | | | | | | | | | | | | |
Small
Capitalization
Value Equity
Investments | | | International
Equity
Investments | | | Emerging
Markets
Equity
Investments | | | Core Fixed
Income
Investments | | | High Yield
Investments | | | International
Fixed Income
Investments | | | Municipal
Bond
Investments | | | Money
Market
Investments | |
| | | | | | | | | | | | | | | | | | | | | | | | | | | | | | | |
| $ | 6,518,218 | | | $ | 35,133,703 | | | $ | 8,802,792 | | | $ | 25,594 | | | $ | 61,423 | | | $ | — | | | $ | — | | | $ | — | |
| | 357,701 | | | | 1,745,035 | | | | 389,140 | | | | 42,307,853 | | | | 8,159,280 | | | | 7,280,982 | | | | 2,977,552 | | | | 6,957,282 | |
| | 309,734 | | | | 1,290,209 | | | | 69,597 | | | | 12,945 | | | | 22,629 | | | | — | | | | — | | | | — | |
| | 263,346 | | | | 295,051 | | | | 1,212,909 | | | | 60,309 | | | | 231,047 | | | | — | | | | 14,956 | | | | — | |
| | (27,971 | ) | | | (3,290,095 | ) | | | (1,101,886 | ) | | | (19 | ) | | | (2,156 | ) | | | (28,886 | ) | | | — | | | | — | |
|
|
| |
|
|
| |
|
|
| |
|
|
| |
|
|
| |
|
|
| |
|
|
| |
|
|
|
| | 7,421,028 | | | | 35,173,903 | | | | 9,372,552 | | | | 42,406,682 | | | | 8,472,223 | | | | 7,252,096 | | | | 2,992,508 | | | | 6,957,282 | |
|
|
| |
|
|
| |
|
|
| |
|
|
| |
|
|
| |
|
|
| |
|
|
| |
|
|
|
| | | | | | | | | | | | | | | | | | | | | | | | | | | | | | | |
| $ | 2,880,302 | | | $ | 10,612,763 | | | $ | 3,589.569 | | | $ | 3,249,458 | | | $ | 675,933 | | | $ | 958,463 | | | $ | 270,292 | | | $ | 199,982 | |
| | 144,964 | | | | 572,661 | | | | 125,940 | | | | 331,018 | | | | 44,080 | | | | 83,697 | | | | 28,432 | | | | 53,846 | |
| | 331,517 | | | | 337,819 | | | | 251,642 | | | | 268,298 | | | | 100,292 | | | | 174,270 | | | | 6,539 | | | | 214,135 | |
| | 98,588 | | | | 557,444 | | | | 494,285 | | | | 235,665 | | | | 38,734 | | | | 78,602 | | | | 21,119 | | | | 37,113 | |
| | 21,462 | | | | 85,873 | | | | 22,449 | | | | 61,998 | | | | 11,461 | | | | 14,109 | | | | 9,269 | | | | 13,527 | |
| | 24,654 | | | | 50,957 | | | | 12,519 | | | | 40,687 | | | | 5,967 | | | | 20,106 | | | | 1,613 | | | | 27,356 | |
| | 6,750 | | | | 26,098 | | | | 5,368 | | | | 13,263 | | | | 2,827 | | | | 4,466 | | | | 1,118 | | | | 1,991 | |
| | 24,982 | | | | 31,801 | | | | 21,165 | | | | 32,280 | | | | 27,383 | | | | 29,500 | | | | 25,600 | | | | 26,200 | |
| | 22,691 | | | | 38,373 | | | | 11,762 | | | | 21,760 | | | | 22,436 | | | | 22,525 | | | | 10,448 | | | | 22,478 | |
| | 46,003 | | | | 75,165 | | | | 20,035 | | | | 60,114 | | | | 27,435 | | | | 32,334 | | | | 23,379 | | | | 33,275 | |
| | — | | | | — | | | | — | | | | 94,604 | | | | — | | | | 78,534 | | | | — | | | | — | |
| | 24,355 | | | | 43,831 | | | | 42,811 | | | | 6,386 | | | | 8,291 | | | | 7,055 | | | | 1,426 | | | | 9,471 | |
|
|
| |
|
|
| |
|
|
| |
|
|
| |
|
|
| |
|
|
| |
|
|
| |
|
|
|
| | 3,626,268 | | | | 12,432,785 | | | | 4,597,545 | | | | 4,415,531 | | | | 964,839 | | | | 1,503,661 | | | | 399,235 | | | | 639,374 | |
|
|
| |
|
|
| |
|
|
| |
|
|
| |
|
|
| |
|
|
| |
|
|
| |
|
|
|
| | — | | | | (1,097,634 | ) | | | (443,828 | ) | | | (31,169 | ) | | | (142,745 | ) | | | (5,235 | ) | | | (3,626 | ) | | | (15,048 | ) |
|
|
| |
|
|
| |
|
|
| |
|
|
| |
|
|
| |
|
|
| |
|
|
| |
|
|
|
| | 3,626,268 | | | | 11,335,151 | | | | 4,153,717 | | | | 4,384,362 | | | | 822,094 | | | | 1,498,426 | | | | 395,609 | | | | 624,326 | |
|
|
| |
|
|
| |
|
|
| |
|
|
| |
|
|
| |
|
|
| |
|
|
| |
|
|
|
| $ | 3,794,760 | | | $ | 23,838,752 | | | $ | 5,218,835 | | | $ | 38,022,320 | | | $ | 7,650,129 | | | $ | 5,753,670 | | | $ | 2,596,899 | | | $ | 6,332,956 | |
|
|
| |
|
|
| |
|
|
| |
|
|
| |
|
|
| |
|
|
| |
|
|
| |
|
|
|
| | | | | | | | | | | | | | | | | | | | | | | | | | | | | | | |
| | | | | | | | | | | | | | | | | | | | | | | | | | | | | | | |
| $ | 53,879,903 | | | $ | 137,614,831 | | | $ | 53,570,827 | | | $ | 8,209,989 | | | $ | 2,386,209 | | | $ | (7,082,000 | ) | | $ | 92,225 | | | $ | — | |
| | — | | | | — | | | | 587,703 | | | | (8,667,683 | ) | | | — | | | | 66,242 | | | | — | | | | — | |
| | — | | | | — | | | | — | | | | 495,718 | | | | — | | | | 408,644 | | | | — | | | | — | |
| | — | | | | — | | | | — | | | | 521,001 | | | | — | | | | (730,044 | ) | | | — | | | | — | |
| | (14 | ) | | | 20,493 | | | | (1,005,650 | ) | | | (1,369,403 | ) | | | — | | | | (1,099,114 | ) | | | — | | | | — | |
|
|
| |
|
|
| |
|
|
| |
|
|
| |
|
|
| |
|
|
| |
|
|
| |
|
|
|
| | 53,879,889 | | | | 137,635,324 | | | | 53,152,880 | | | | (810,378 | ) | | | 2,386,209 | | | | (8,436,272 | ) | | | 92,225 | | | | — | |
|
|
| |
|
|
| |
|
|
| |
|
|
| |
|
|
| |
|
|
| |
|
|
| |
|
|
|
| | | | | | | | | | | | �� | | | | | | | | | | | | | | | | | | | |
| | (18,144,399 | ) | | | 68,477,039 | | | | 89,284,892 | | | | (413,088 | ) | | | (2,919,609 | ) | | | 2,341,573 | | | | (1,503,377 | ) | | | — | |
| | — | | | | — | | | | 238,259 | | | | (76,726 | ) | | | — | | | | 130,982 | | | | — | | | | — | |
| | — | | | | — | | | | — | | | | (305,128 | ) | | | — | | | | (278,641 | ) | | | — | | | | — | |
| | — | | | | (4,534 | ) | | | — | | | | (616,231 | ) | | | — | | | | (269,260 | ) | | | — | | | | — | |
| | — | | | | — | | | | — | | | | 1,837,563 | | | | — | | | | (447,092 | ) | | | — | | | | — | |
| | 1,773 | | | | 24,585 | | | | 389,930 | | | | 678,171 | | | | — | | | | (543,511 | ) | | | — | | | | — | |
|
|
| |
|
|
| |
|
|
| |
|
|
| |
|
|
| |
|
|
| |
|
|
| |
|
|
|
| | (18,142,626 | ) | | | 68,497,090 | | | | 89,913,081 | | | | 1,104,561 | | | | (2,919,609 | ) | | | 934,051 | | | | (1,503,377 | ) | | | — | |
|
|
| |
|
|
| |
|
|
| |
|
|
| |
|
|
| |
|
|
| |
|
|
| |
|
|
|
|
35,737,263 |
| | | 206,132,414 | | | | 143,065,961 | | | | 294,183 | | | | (533,400 | ) | | | (7,502,221 | ) | | | (1,411,152 | ) | | | — | |
|
|
| |
|
|
| |
|
|
| |
|
|
| |
|
|
| |
|
|
| |
|
|
| |
|
|
|
| $ | 39,532,023 | | | $ | 229,971,166 | | | $ | 148,284,796 | | | $ | 38,316,503 | | | $ | 7,116,729 | | | $ | (1,748,551 | ) | | $ | 1,185,747 | | | $ | 6,332,956 | |
|
|
| |
|
|
| |
|
|
| |
|
|
| |
|
|
| |
|
|
| |
|
|
| |
|
|
|
See Notes to Financial Statements.
127
Statements of Changes in Net Assets
For the Years Ended August 31, 2007 and 2006
| | | | | | | | | | | | | | | | |
| | | Large Capitalization
Growth Investments
| | | Large Capitalization
Value Equity Investments
| |
| | | 2007 | | | 2006 | | | 2007 | | | 2006 | |
| OPERATIONS: | | | | | | | | | | | | | | | | |
Net investment income (loss) | | $ | 3,955,545 | | | $ | (944,316 | ) | | $ | 29,024,454 | | | $ | 25,253,155 | |
Net realized gain | | | 249,663,247 | | | | 99,756,016 | | | | 136,730,179 | | | | 112,829,880 | |
Change in net unrealized appreciation/depreciation | | | 132,493,545 | | | | (79,573,442 | ) | | | 44,968,521 | | | | 39,762,060 | |
| | |
|
|
| |
|
|
| |
|
|
| |
|
|
|
Increase (Decrease) in Net Assets From Operations | | | 386,112,337 | | | | 19,238,258 | | | | 210,723,154 | | | | 177,845,095 | |
| | |
|
|
| |
|
|
| |
|
|
| |
|
|
|
| DISTRIBUTIONS TO SHAREHOLDERS FROM (NOTE 1): | | | | | | | | | | | | | | | | |
Net investment income | | | — | | | | — | | | | (23,500,020 | ) | | | (22,000,056 | ) |
Net realized gains | | | — | | | | — | | | | (105,184,591 | ) | | | (56,411,813 | ) |
Return of capital | | | — | | | | — | | | | — | | | | — | |
| | |
|
|
| |
|
|
| |
|
|
| |
|
|
|
Decrease in Net Assets From Distributions to Shareholders | | | — | | | | — | | | | (128,684,611 | ) | | | (78,411,869 | ) |
| | |
|
|
| |
|
|
| |
|
|
| |
|
|
|
| FUND SHARE TRANSACTIONS (NOTE 4): | | | | | | | | | | | | | | | | |
Net proceeds from sale of shares | | | 645,828,256 | | | | 621,629,508 | | | | 401,529,208 | | | | 357,313,714 | |
Reinvestment of distributions | | | — | | | | — | | | | 126,441,189 | | | | 76,955,066 | |
Cost of shares repurchased | | | (374,921,689 | ) | | | (353,988,334 | ) | | | (339,959,236 | ) | | | (339,150,338 | ) |
| | |
|
|
| |
|
|
| |
|
|
| |
|
|
|
Increase (Decrease) in Net Assets From Fund Share Transactions | | | 270,906,567 | | | | 267,641,174 | | | | 188,011,161 | | | | 95,118,442 | |
| | |
|
|
| |
|
|
| |
|
|
| |
|
|
|
Increase (Decrease) in Net Assets | | | 657,018,904 | | | | 286,879,432 | | | | 270,049,704 | | | | 194,551,668 | |
| NET ASSETS: | | | | | | | | | | | | | | | | |
Beginning of year | | | 1,806,635,073 | | | | 1,519,755,641 | | | | 1,545,670,441 | | | | 1,351,118,773 | |
| | |
|
|
| |
|
|
| |
|
|
| |
|
|
|
End of year*† | | $ | 2,463,653,977 | | | $ | 1,806,635,073 | | | $ | 1,815,720,145 | | | $ | 1,545,670,441 | |
| | |
|
|
| |
|
|
| |
|
|
| |
|
|
|
* Includes undistributed net investment income of: | | $ | 3,954,875 | | | | — | | | $ | 20,529,144 | | | $ | 15,316,280 | |
| | |
|
|
| |
|
|
| |
|
|
| |
|
|
|
† Includes accumulated net investment loss of: | | | — | | | | — | | | | — | | | | — | |
| | |
|
|
| |
|
|
| |
|
|
| |
|
|
|
See Notes to Financial Statements.
128
| | | | | | | | | | | | | | | | | | | | | | | | | | | | | | |
Small Capitalization
Growth Investments
| | | Small Capitalization
Value Equity Investments
| | | International Equity
Investments
| | | Emerging Markets
Equity Investments
| |
| 2007 | | | 2006 | | | 2007 | | | 2006 | | | 2007 | | | 2006 | | | 2007 | | | 2006 | |
| | | | | | | | | | | | | | | | | | | | | | | | | | | | | | | |
| $ | (2,242,888 | ) | | $ | (333,524 | ) | | $ | 3,794,760 | | | $ | 2,319,874 | | | $ | 23,838,752 | | | $ | 21,240,516 | | | $ | 5,218,835 | | | $ | 3,268,832 | |
| | 43,063,632 | | | | 48,825,255 | | | | 53,879,889 | | | | 52,272,096 | | | | 137,635,324 | | | | 93,674,503 | | | | 53,152,880 | | | | 46,990,448 | |
| | 14,449,655 | | | | (18,351,624 | ) | | | (18,142,626 | ) | | | (13,490,236 | ) | | | 68,497,090 | | | | 120,517,515 | | | | 89,913,081 | | | | 24,336,634 | |
|
|
| |
|
|
| |
|
|
| |
|
|
| |
|
|
| |
|
|
| |
|
|
| |
|
|
|
| | 55,270,399 | | | | 30,140,107 | | | | 39,532,023 | | | | 41,101,734 | | | | 229,971,166 | | | | 235,432,534 | | | | 148,284,796 | | | | 74,595,914 | |
|
|
| |
|
|
| |
|
|
| |
|
|
| |
|
|
| |
|
|
| |
|
|
| |
|
|
|
| | | | | | | | | | | | | | | | | | | | | | | | | | | | | | | |
| | — | | | | — | | | | (2,500,004 | ) | | | (2,000,018 | ) | | | (28,500,011 | ) | | | (14,000,078 | ) | | | (2,740,460 | ) | | | (2,826,066 | ) |
| | — | | | | — | | | | (50,529,436 | ) | | | (93,785,810 | ) | | | — | | | | — | | | | — | | | | — | |
| | — | | | | — | | | | — | | | | — | | | | — | | | | — | | | | — | | | | — | |
|
|
| |
|
|
| |
|
|
| |
|
|
| |
|
|
| |
|
|
| |
|
|
| |
|
|
|
| | — | | | | — | | | | (53,029,440 | ) | | | (95,785,828 | ) | | | (28,500,011 | ) | | | (14,000,078 | ) | | | (2,740,460 | ) | | | (2,826,066 | ) |
|
|
| |
|
|
| |
|
|
| |
|
|
| |
|
|
| |
|
|
| |
|
|
| |
|
|
|
| | | | | | | | | | | | | | | | | | | | | | | | | | | | | | | |
| | 83,014,757 | | | | 84,359,118 | | | | 68,386,106 | | | | 54,003,233 | | | | 415,775,725 | | | | 520,298,948 | | | | 194,316,414 | | | | 69,672,136 | |
| | — | | | | — | | | | 52,168,532 | | | | 94,075,210 | | | | 28,027,537 | | | | 13,786,888 | | | | 2,702,366 | | | | 2,789,952 | |
| | (105,495,743 | ) | | | (162,863,660 | ) | | | (98,237,600 | ) | | | (134,772,027 | ) | | | (299,998,083 | ) | | | (355,715,928 | ) | | | (99,008,500 | ) | | | (105,619,205 | ) |
|
|
| |
|
|
| |
|
|
| |
|
|
| |
|
|
| |
|
|
| |
|
|
| |
|
|
|
| | (22,480,986 | ) | | | (78,504,542 | ) | | | 22,317,038 | | | | 13,306,416 | | | | 143,805,179 | | | | 178,369,908 | | | | 98,010,280 | | | | (33,157,117 | ) |
|
|
| |
|
|
| |
|
|
| |
|
|
| |
|
|
| |
|
|
| |
|
|
| |
|
|
|
| | 32,789,413 | | | | (48,364,435 | ) | | | 8,819,621 | | | | (41,377,678 | ) | | | 345,276,334 | | | | 399,802,364 | | | | 243,554,616 | | | | 38,612,731 | |
| | | | | | | | | | | | | | | | | | | | | | | | | | | | | | | |
| | 368,746,410 | | | | 417,110,845 | | | | 343,621,946 | | | | 384,999,624 | | | | 1,309,427,659 | | | | 909,625,295 | | | | 286,763,133 | | | | 248,150,402 | |
|
|
| |
|
|
| |
|
|
| |
|
|
| |
|
|
| |
|
|
| |
|
|
| |
|
|
|
| $ | 401,535,823 | | | $ | 368,746,410 | | | $ | 352,441,567 | | | $ | 343,621,946 | | | $ | 1,654,703,993 | | | $ | 1,309,427,659 | | | $ | 530,317,749 | | | $ | 286,763,133 | |
|
|
| |
|
|
| |
|
|
| |
|
|
| |
|
|
| |
|
|
| |
|
|
| |
|
|
|
| | — | | | | — | | | $ | 1,902,682 | | | $ | 1,146,367 | | | $ | 16,773,088 | | | $ | 15,470,701 | | | $ | 3,806,687 | | | $ | 2,255,381 | |
|
|
| |
|
|
| |
|
|
| |
|
|
| |
|
|
| |
|
|
| |
|
|
| |
|
|
|
| $ | (1,415 | ) | | | — | | | | — | | | | — | | | | — | | | | — | | | | — | | | | — | |
|
|
| |
|
|
| |
|
|
| |
|
|
| |
|
|
| |
|
|
| |
|
|
| |
|
|
|
See Notes to Financial Statements.
129
Statements of Changes in Net Assets
For the Years Ended August 31, 2007 and 2006 (continued)
| | | | | | | | |
| | | Core Fixed Income
Investments
| |
| | | 2007 | | | 2006 | |
| OPERATIONS: | | | | | | | | |
Net investment income (loss) | | $ | 38,022,320 | | | $ | 28,477,591 | |
Net realized gain | | | (810,378 | ) | | | (8,633,929 | ) |
Change in net unrealized appreciation/depreciation | | | 1,104,561 | | | | (7,334,432 | ) |
| | |
|
|
| |
|
|
|
Increase (Decrease) in Net Assets From Operations | | | 38,316,503 | | | | 12,509,230 | |
| | |
|
|
| |
|
|
|
| DISTRIBUTIONS TO SHAREHOLDERS FROM (NOTE 1): | | | | | | | | |
Net investment income | | | (40,375,847 | ) | | | (29,904,480 | ) |
Net realized gains | | | — | | | | — | |
Return of capital | | | — | | | | — | |
| | |
|
|
| |
|
|
|
Decrease in Net Assets From Distributions to Shareholders | | | (40,375,847 | ) | | | (29,904,480 | ) |
| | |
|
|
| |
|
|
|
| FUND SHARE TRANSACTIONS (NOTE 4): | | | | | | | | |
Net proceeds from sale of shares | | | 298,381,907 | | | | 351,686,345 | |
Reinvestment of distributions | | | 39,137,821 | | | | 28,822,207 | |
Cost of shares repurchased | | | (234,334,886 | ) | | | (136,994,645 | ) |
| | |
|
|
| |
|
|
|
Increase (Decrease) in Net Assets From Fund Share Transactions | | | 103,184,842 | | | | 243,513,907 | |
| | |
|
|
| |
|
|
|
Increase (Decrease) in Net Assets | | | 101,125,498 | | | | 226,118,657 | |
| NET ASSETS: | | | | | | | | |
Beginning of year | | | 759,963,949 | | | | 533,845,292 | |
| | |
|
|
| |
|
|
|
End of year*† | | $ | 861,089,447 | | | $ | 759,963,949 | |
| | |
|
|
| |
|
|
|
* Includes undistributed net investment income of: | | $ | 1,838,566 | | | $ | 1,643,653 | |
| | |
|
|
| |
|
|
|
† Includes accumulated net investment loss of: | | | — | | | | — | |
| | |
|
|
| |
|
|
|
130
| | | | | | | | | | | | | | | | | | | | | | | | | | | | | | |
High Yield
Investments
| | | International Fixed
Income Investments
| | | Municipal Bond
Investments
| | | Money Market
Investments
| |
| 2007 | | | 2006 | | | 2007 | | | 2006 | | | 2007 | | | 2006 | | | 2007 | | | 2006 | |
| | | | | | | | | | | | | | | | | | | | | | | | | | | | | | | |
| $ | 7,650,129 | | | $ | 12,742,306 | | | $ | 5,753,670 | | | $ | 5,487,572 | | | $ | 2,596,899 | | | $ | 1,997,871 | | | $ | 6,332,956 | | | $ | 4,191,855 | |
| | 2,386,209 | | | | (1,913,829 | ) | | | (8,436,272 | ) | | | (7,234,702 | ) | | | 92,225 | | | | (193,135 | ) | | | — | | | | — | |
| | (2,919,609 | ) | | | (4,652,873 | ) | | | 934,051 | | | | (230,229 | ) | | | (1,503,377 | ) | | | (257,859 | ) | | | — | | | | — | |
|
|
| |
|
|
| |
|
|
| |
|
|
| |
|
|
| |
|
|
| |
|
|
| |
|
|
|
| | 7,116,729 | | | | 6,175,604 | | | | (1,748,551 | ) | | | (1,977,359 | ) | | | 1,185,747 | | | | 1,546,877 | | | | 6,332,956 | | | | 4,191,855 | |
|
|
| |
|
|
| |
|
|
| |
|
|
| |
|
|
| |
|
|
| |
|
|
| |
|
|
|
| | | | | | | | | | | | | | | | | | | | | | | | | | | | | | | |
| | (7,753,707 | ) | | | (12,336,372 | ) | | | (7,043,250 | ) | | | (2,037,074 | ) | | | (2,608,254 | ) | | | (2,000,418 | ) | | | (6,332,962 | ) | | | (4,191,855 | ) |
| | — | | | | — | | | | — | | | | (1,072,866 | ) | | | — | | | | — | | | | — | | | | — | |
| | — | | | | — | | | | — | | | | (3,454,483 | ) | | | — | | | | — | | | | — | | | | — | |
|
|
| |
|
|
| |
|
|
| |
|
|
| |
|
|
| |
|
|
| |
|
|
| |
|
|
|
| | (7,753,707 | ) | | | (12,336,372 | ) | | | (7,043,250 | ) | | | (6,564,423 | ) | | | (2,608,254 | ) | | | (2,000,418 | ) | | | (6,332,962 | ) | | | (4,191,855 | ) |
|
|
| |
|
|
| |
|
|
| |
|
|
| |
|
|
| |
|
|
| |
|
|
| |
|
|
|
| | | | | | | | | | | | | | | | | | | | | | | | | | | | | | | |
| | 19,645,227 | | | | 40,887,349 | | | | 76,932,742 | | | | 95,344,851 | | | | 23,473,795 | | | | 35,619,471 | | | | 118,948,194 | | | | 129,087,916 | |
| | 7,415,006 | | | | 11,843,129 | | | | 6,833,742 | | | | 6,343,726 | | | | 2,402,243 | | | | 1,823,505 | | | | 5,689,337 | | | | 4,269,358 | |
| | (50,826,023 | ) | | | (198,601,839 | ) | | | (80,861,243 | ) | | | (52,555,048 | ) | | | (21,141,614 | ) | | | (11,086,466 | ) | | | (135,227,763 | ) | | | (100,797,219 | ) |
|
|
| |
|
|
| |
|
|
| |
|
|
| |
|
|
| |
|
|
| |
|
|
| |
|
|
|
| | (23,765,790 | ) | | | (145,871,361 | ) | | | 2,905,241 | | | | 49,133,529 | | | | 4,734,424 | | | | 26,356,510 | | | | (10,590,232 | ) | | | 32,560,055 | |
|
|
| |
|
|
| |
|
|
| |
|
|
| |
|
|
| |
|
|
| |
|
|
| |
|
|
|
| | (24,402,768 | ) | | | (152,032,129 | ) | | | (5,886,560 | ) | | | 40,591,747 | | | | 3,311,917 | | | | 25,902,969 | | | | (10,590,238 | ) | | | 32,560,055 | |
| | | | | | | | | | | | | | | | | | | | | | | | | | | | | | | |
| | 110,207,103 | | | | 262,239,232 | | | | 194,501,327 | | | | 153,909,580 | | | | 66,325,943 | | | | 40,422,974 | | | | 128,935,940 | | | | 96,375,885 | |
|
|
| |
|
|
| |
|
|
| |
|
|
| |
|
|
| |
|
|
| |
|
|
| |
|
|
|
| $ | 85,804,335 | | | $ | 110,207,103 | | | $ | 188,614,767 | | | $ | 194,501,327 | | | $ | 69,637,860 | | | $ | 66,325,943 | | | $ | 118,345,702 | | | $ | 128,935,940 | |
|
|
| |
|
|
| |
|
|
| |
|
|
| |
|
|
| |
|
|
| |
|
|
| |
|
|
|
| $ | 1,426,181 | | | $ | 1,297,235 | | | $ | 4,083,035 | | | | — | | | $ | 130,471 | | | $ | 141,826 | | | | — | | | | — | |
|
|
| |
|
|
| |
|
|
| |
|
|
| |
|
|
| |
|
|
| |
|
|
| |
|
|
|
| | — | | | | — | | | | — | | | $ | (5,535,249 | ) | | | — | | | | — | | | $ | (6 | ) | | | — | |
|
|
| |
|
|
| |
|
|
| |
|
|
| |
|
|
| |
|
|
| |
|
|
| |
|
|
|
See Notes to Financial Statements.
131
Financial Highlights
For a share of beneficial interest outstanding throughout each year ended August 31:
| | | | | | | | | | | | | | | |
| Large Capitalization Growth Investments | | | | | | | | | | | | | | | |
| | | 2007(1)
| | | 2006(1)
| | | 2005(1)
| | | 2004
| | | 2003
| |
Net asset value, Beginning of Year | | $12.88 | | | $12.73 | | | $10.81 | | | $10.38 | | | $ 8.36 | |
| | |
|
| |
|
| |
|
| |
|
| |
|
|
Income (Loss) from Operations: | | | | | | | | | | | | | | | |
Net investment income (loss) | | 0.03 | | | (0.01 | ) | | (0.01 | ) | | (0.03 | ) | | (0.00 | )(2) |
Net realized and unrealized gain | | 2.54 | | | 0.16 | | | 1.93 | | | 0.46 | | | 2.02 | |
| | |
|
| |
|
| |
|
| |
|
| |
|
|
Total Income from Operations | | 2.57 | | | 0.15 | | | 1.92 | | | 0.43 | | | 2.02 | |
| | |
|
| |
|
| |
|
| |
|
| |
|
|
Net Asset Value, End of Year | | $15.45 | | | $12.88 | | | $12.73 | | | $10.81 | | | $10.38 | |
| | |
|
| |
|
| |
|
| |
|
| |
|
|
Total Return(3) | | 19.95 | % | | 1.18 | % | | 17.76 | % | | 4.14 | % | | 24.16 | % |
Net Assets, End of Year (millions) | | $2,464 | | | $1,807 | | | $1,520 | | | $1,217 | | | $1,155 | |
Ratios to Average Net Assets: | | | | | | | | | | | | | | | |
Gross expenses | | 0.70 | % | | 0.78 | % | | 0.90 | % | | 0.88 | % | | 0.90 | % |
Net expenses | | 0.70 | | | 0.77 | (4) | | 0.88 | (4) | | 0.88 | | | 0.90 | |
Net investment income (loss) | | 0.18 | | | (0.06 | ) | | (0.12 | ) | | (0.31 | ) | | (0.30 | ) |
Portfolio Turnover Rate | | 112 | % | | 63 | % | | 77 | % | | 117 | % | | 79 | % |
| (1) | | Per share amounts have been calculated using the average shares method. |
| (2) | | Amounts represents less than $0.01 per share. |
| (3) | | Performance figures may reflect fee waivers and/or expense reimbursements. Past performance is no guarantee of future results. In the absence of fee waivers and/or expense reimbursements, the total return would have been lower. Applicable advisory program charges, which in the case of TRAK may be up to 1.50%, are not reflected in the performance data and would reduce the total returns. |
| (4) | | Reflects fee waivers and/or expense reimbursements. |
See Notes to Financial Statements.
132
Financial Highlights
(continued)
For a share of beneficial interest outstanding throughout each year ended August 31:
| | | | | | | | | | | | | | | |
| Large Capitalization Value Equity Investments | | | | | | | | | | |
| | | 2007(1)
| | | 2006
| | | 2005
| | | 2004
| | | 2003
| |
Net Asset Value, Beginning of Year | | $12.25 | | | $11.50 | | | $10.01 | | | $ 9.00 | | | $8.39 | |
| | |
|
| |
|
| |
|
| |
|
| |
|
|
Income From Operations: | | | | | | | | | | | | | | | |
Net investment income | | 0.21 | | | 0.21 | | | 0.16 | | | 0.12 | | | 0.13 | |
Net realized and unrealized gain | | 1.43 | | | 1.21 | | | 1.45 | | | 1.03 | | | 0.59 | |
| | |
|
| |
|
| |
|
| |
|
| |
|
|
Total Income From Operations | | 1.64 | | | 1.42 | | | 1.61 | | | 1.15 | | | 0.72 | |
| | |
|
| |
|
| |
|
| |
|
| |
|
|
Less Distributions From: | | | | | | | | | | | | | | | |
From Net investment income | | (0.19 | ) | | (0.19 | ) | | (0.12 | ) | | (0.14 | ) | | (0.11 | ) |
Net realized gains | | (0.83 | ) | | (0.48 | ) | | — | | | — | | | — | |
| | |
|
| |
|
| |
|
| |
|
| |
|
|
Total Distributions | | (1.02 | ) | | (0.67 | ) | | (0.12 | ) | | (0.14 | ) | | (0.11 | ) |
| | |
|
| |
|
| |
|
| |
|
| |
|
|
Net Asset Value, End of Year | | $12.87 | | | $12.25 | | | $11.50 | | | $10.01 | | | $9.00 | |
| | |
|
| |
|
| |
|
| |
|
| |
|
|
Total Return(2) | | 13.58 | % | | 12.82 | % | | 16.10 | %(3) | | 12.89 | % | | 8.75 | % |
Net Assets, End of Year (millions) | | $1,816 | | | $1,546 | | | $1,351 | | | $1,304 | | | $1,114 | |
Ratios to Average Net Assets: | | | | | | | | | | | | | | | |
Gross expenses | | 0.70 | % | | 0.77 | % | | 0.88 | % | | 0.87 | % | | 0.93 | % |
Net expenses | | 0.69 | (4) | | 0.76 | (4) | | 0.86 | (4) | | 0.87 | | | 0.93 | |
Net investment income | | 1.67 | | | 1.73 | | | 1.41 | | | 1.21 | | | 1.60 | |
Portfolio Turnover Rate | | 46 | % | | 58 | % | | 67 | % | | 94 | % | | 81 | % |
| (1) | | Per share amounts have been calculated using the average shares method. |
| (2) | | Performance figures may reflect fee waivers and/or expense reimbursements and assumes reinvestment of dividend distributions. Past performance is no guarantee of future results. In the absence of fee waivers and/or expense reimbursements, the total return would have been lower. Applicable advisory program charges, which in the case of TRAK may be up to 1.50%, are not reflected in the performance data and would reduce the total returns. |
| (3) | | The Subadviser fully reimbursed the Fund for losses incurred resulting from an investment restriction violation. Without this reimbursement, the total return would not have changed. |
| (4) | | Reflects fee waivers and/or expense reimbursements. |
See Notes to Financial Statements.
133
Financial Highlights
(continued)
For a share of beneficial interest outstanding throughout each year ended August 31:
| | | | | | | | | | | | | | | |
| Small Capitalization Growth Investments | |
| | | 2007(1)
| | | 2006(1)
| | | 2005(1)
| | | 2004(1)
| | | 2003(1)
| |
Net asset value, Beginning of Year | | $15.83 | | | $14.89 | | | $11.97 | | | $11.83 | | | $ 9.01 | |
| | |
|
| |
|
| |
|
| |
|
| |
|
|
Income (Loss) from Operations: | | | | | | | | | | | | | | | |
Net investment loss | | (0.10 | ) | | (0.01 | ) | | (0.11 | ) | | (0.11 | ) | | (0.07 | ) |
Net realized and unrealized gain | | 2.55 | | | 0.95 | | | 3.03 | | | 0.25 | | | 2.89 | |
| | |
|
| |
|
| |
|
| |
|
| |
|
|
Total Income from Operations | | 2.45 | | | 0.94 | | | 2.92 | | | 0.14 | | | 2.82 | |
| | |
|
| |
|
| |
|
| |
|
| |
|
|
Net Asset Value, End of Year | | $18.28 | | | $15.83 | | | $14.89 | | | $11.97 | | | $11.83 | |
| | |
|
| |
|
| |
|
| |
|
| |
|
|
Total return(2) | | 15.48 | % | | 6.31 | % | | 24.39 | % | | 1.18 | % | | 31.30 | % |
Net Assets, End of Year (millions) | | $402 | | | $369 | | | $417 | | | $318 | | | $497 | |
Ratios to Average Net Assets: | | | | | | | | | | | | | | | |
Gross expenses | | 0.99 | % | | 1.12 | % | | 1.32 | % | | 1.19 | % | | 1.27 | % |
Net expenses | | 0.99 | (3) | | 1.08 | (3) | | 1.24 | (3) | | 1.19 | | | 1.27 | |
Net investment loss | | (0.58 | ) | | (0.08 | ) | | (0.84 | ) | | (0.82 | ) | | (0.77 | ) |
Portfolio Turnover Rate | | 69 | % | | 59 | % | | 70 | % | | 80 | % | | 88 | % |
| (1) | | Per share amounts have been calculated using the average shares method. |
| (2) | | Performance figures may reflect fee waivers and/or expense reimbursements. Past performance is no guarantee of future results. In the absence of fee waivers and/or expense reimbursements, the total return would have been lower. Applicable advisory program charges, which in the case of TRAK may be up to 1.50%, are not reflected in the performance data and would reduce the total returns. |
| (3) | | Reflects fee waivers and/or expense reimbursements. |
See Notes to Financial Statements.
134
Financial Highlights
(continued)
For a share of beneficial interest outstanding throughout each year ended August 31:
| | | | | | | | | | | | | | | |
| Small Capitalization Value Equity Investments | | | | | | | | | | | | | | | |
| | | 2007(1)
| | | 2006
| | | 2005(1)
| | | 2004(1)
| | | 2003
| |
Net asset value, Beginning of Year | | $14.19 | | | $16.95 | | | $15.05 | | | $12.30 | | | $11.56 | |
| | |
|
| |
|
| |
|
| |
|
| |
|
|
Income from Operations: | | | | | | | | | | | | | | | |
Net investment income | | 0.15 | | | 0.09 | | | 0.10 | | | 0.09 | | | 0.13 | |
Net realized and unrealized gain | | 1.46 | | | 1.52 | | | 3.50 | | | 2.76 | | | 1.25 | |
| | |
|
| |
|
| |
|
| |
|
| |
|
|
Total Income from Operations | | 1.61 | | | 1.61 | | | 3.60 | | | 2.85 | | | 1.38 | |
| | |
|
| |
|
| |
|
| |
|
| |
|
|
Less Distributions From: | | | | | | | | | | | | | | | |
From net investment income | | (0.11 | ) | | (0.09 | ) | | (0.13 | ) | | (0.10 | ) | | (0.05 | ) |
Net realized gains | | (2.18 | ) | | (4.28 | ) | | (1.57 | ) | | — | | | (0.59 | ) |
| | |
|
| |
|
| |
|
| |
|
| |
|
|
Total Distributions | | (2.29 | ) | | (4.37 | ) | | (1.70 | ) | | (0.10 | ) | | (0.64 | ) |
| | |
|
| |
|
| |
|
| |
|
| |
|
|
Net Asset Value, End of Year | | $13.51 | | | $14.19 | | | $16.95 | | | $15.05 | | | $12.30 | |
| | |
|
| |
|
| |
|
| |
|
| |
|
|
Total Return(2) | | 11.94 | % | | 11.73 | % | | 24.89 | % | | 23.24 | % | | 13.12 | % |
Net Assets, End of Year (millions) | | $352 | | | $344 | | | $385 | | | $429 | | | $425 | |
Ratios to Average Net Assets: | | | | | | | | | | | | | | | |
Gross expenses | | 1.01 | % | | 1.12 | % | | 1.24 | % | | 1.16 | % | | 1.20 | % |
Net expenses | | 1.01 | | | 1.09 | (3) | | 1.17 | (3) | | 1.16 | | | 1.20 | |
Net investment income | | 1.06 | | | 0.64 | | | 0.64 | | | 0.66 | | | 1.00 | |
Portfolio Turnover Rate | | 40 | % | | 31 | % | | 64 | % | | 33 | % | | 33 | % |
| (1) | | Per share amounts have been calculated using the average shares method. |
| (2) | | Performance figures may reflect fee waivers and/or expense reimbursements and assumes reinvestment of dividend distributions. Past performance is no guarantee of future results. In the absence of fee waivers and/or expense reimbursements, the total return would have been lower. Applicable advisory program charges, which in the case of TRAK may be up to 1.50%, are not reflected in the performance data and would reduce the total returns. |
| (3) | | Reflects fee waivers and/or expense reimbursements. |
See Notes to Financial Statements.
135
Financial Highlights
(continued)
For a share of beneficial interest outstanding throughout each year ended August 31:
| | | | | | | | | | | | | | | |
| International Equity Investments | | | | | | | | | | | | | | | |
| | | 2007(1)
| | | 2006(1)
| | | 2005(1)
| | | 2004(1)
| | | 2003(1)
| |
Net asset value, Beginning of Year | | $13.55 | | | $11.12 | | | $9.01 | | | $7.82 | | | $6.93 | |
| | |
|
| |
|
| |
|
| |
|
| |
|
|
Income from Operations: | | | | | | | | | | | | | | | |
Net investment income | | 0.23 | | | 0.22 | | | 0.15 | | | 0.08 | | | 0.10 | |
Net realized and unrealized gain | | 2.08 | | | 2.38 | | | 2.06 | | | 1.24 | | | 0.81 | |
| | |
|
| |
|
| |
|
| |
|
| |
|
|
Total Income from Operations | | 2.31 | | | 2.60 | | | 2.21 | | | 1.32 | | | 0.91 | |
| | |
|
| |
|
| |
|
| |
|
| |
|
|
Less Distributions From: | | | | | | | | | | | | | | | |
From net investment income | | (0.29 | ) | | (0.17 | ) | | (0.10 | ) | | (0.13 | ) | | (0.02 | ) |
| | |
|
| |
|
| |
|
| |
|
| |
|
|
Total Distributions | | (0.29 | ) | | (0.17 | ) | | (0.10 | ) | | (0.13 | ) | | (0.02 | ) |
| | |
|
| |
|
| |
|
| |
|
| |
|
|
Net Asset Value, End of Year | | $15.57 | | | $13.55 | | | $11.12 | | | $9.01 | | | $7.82 | |
| | |
|
| |
|
| |
|
| |
|
| |
|
|
Total Return(2) | | 17.21 | % | | 23.55 | % | | 24.65 | % | | 16.90 | % | | 13.21 | % |
Net Assets, End of Year (millions) | | $1,655 | | | $1,309 | | | $910 | | | $589 | | | $533 | |
Ratios to Average Net Assets: | | | | | | | | | | | | | | | |
Gross expenses | | 0.82 | % | | 0.84 | % | | 1.02 | % | | 1.08 | % | | 1.14 | % |
Net expenses | | 0.75 | (3) | | 0.83 | (3) | | 0.99 | (3) | | 1.08 | | | 1.14 | |
Net investment income | | 1.57 | | | 1.76 | | | 1.49 | | | 0.90 | | | 1.55 | |
Portfolio Turnover Rate | | 44 | % | | 50 | % | | 57 | % | | 84 | % | | 110 | % |
| (1) | | Per share amounts have been calculated using the average shares method. |
| (2) | | Performance figures may reflect fee waivers and/or expense reimbursements and assumes reinvestment of dividend distributions. Past performance is no guarantee of future results. In the absence of fee waivers and/or expense reimbursements, the total return would have been lower. Applicable advisory program charges, which in the case of TRAK may be up to 1.50%, are not reflected in the performance data and would reduce the total returns. |
| (3) | | Reflects fee waivers and/or expense reimbursements. |
See Notes to Financial Statements.
136
Financial Highlights
(continued)
For a share of beneficial interest outstanding throughout each year ended August 31:
| | | | | | | | | | | | | | | |
| Emerging Markets Equity Investments | | | | | | | | | | | | | | | |
| | | 2007(1)
| | | 2006(1)
| | | 2005(1)
| | | 2004(1)
| | | 2003(1)
| |
Net asset value, Beginning of Year | | $13.59 | | | $10.55 | | | $ 7.60 | | | $6.48 | | | $5.22 | |
| | |
|
| |
|
| |
|
| |
|
| |
|
|
Income from Operations: | | | | | | | | | | | | | | | |
Net investment income | | 0.21 | | | 0.15 | | | 0.12 | | | 0.05 | | | 0.04 | |
Net realized and unrealized gain | | 5.52 | | | 3.01 | | | 2.93 | | | 1.10 | | | 1.28 | |
| | |
|
| |
|
| |
|
| |
|
| |
|
|
Total Income from Operations | | 5.73 | | | 3.16 | | | 3.05 | | | 1.15 | | | 1.32 | |
| | |
|
| |
|
| |
|
| |
|
| |
|
|
Less Distributions From: | | | | | | | | | | | | | | | |
Net investment income | | (0.13 | ) | | (0.12 | ) | | (0.10 | ) | | (0.03 | ) | | (0.06 | ) |
| | |
|
| |
|
| |
|
| |
|
| |
|
|
Total Distributions | | (0.13 | ) | | (0.12 | ) | | (0.10 | ) | | (0.03 | ) | | (0.06 | ) |
| | |
|
| |
|
| |
|
| |
|
| |
|
|
Net Asset Value, End of Year | | $19.19 | | | $13.59 | | | $10.55 | | | $7.60 | | | $6.48 | |
| | |
|
| |
|
| |
|
| |
|
| |
|
|
Total Return(2) | | 42.41 | % | | 30.10 | % | | 40.31 | %(3) | | 17.71 | % | | 25.51 | % |
Net Assets, End of Year (millions) | | $530 | | | $287 | | | $248 | | | $188 | | | $196 | |
Ratios to Average Net Assets: | | | | | | | | | | | | | | | |
Gross expenses | | 1.15 | % | | 1.32 | % | | 1.52 | % | | 1.64 | % | | 1.79 | % |
Net expenses | | 1.04 | (4) | | 1.28 | (4) | | 1.44 | (4) | | 1.64 | | | 1.79 | |
Net investment income | | 1.31 | | | 1.15 | | | 1.27 | | | 0.67 | | | 0.86 | |
Portfolio Turnover Rate | | 66 | % | | 70 | % | | 70 | % | | 117 | % | | 88 | % |
| (1) | | Per share amounts have been calculated using the average shares method. |
| (2) | | Performance figures may reflect fee waivers and/or expense reimbursements and assumes reinvestment of dividend distributions. Past performance is no guarantee of future results. In the absence of fee waivers and/or expense reimbursements, the total return would have been lower. Applicable advisory program charges, which in the case of TRAK may be up to 1.50%, are not reflected in the performance data and would reduce the total returns. |
| (3) | | The Subadviser fully reimbursed the Fund for losses incurred resulting from a trading error. Without this reimbursement, the total return would not have changed. |
| (4) | | Reflects fee waivers and/or expense reimbursements. |
See Notes to Financial Statements.
137
Financial Highlights
(continued)
For a share of beneficial interest outstanding throughout each year ended August 31:
| | | | | | | | | | | | | | | |
| Core Fixed Income Investments | | | | | | | | | | | | | | | |
| | | 2007(1)
| | | 2006
| | | 2005
| | | 2004
| | | 2003(1)
| |
Net asset value, Beginning of Year | | $8.09 | | | $8.35 | | | $8.32 | | | $8.18 | | | $8.20 | |
| | |
|
| |
|
| |
|
| |
|
| |
|
|
Income (Loss) from Operations: | | | | | | | | | | | | | | | |
Net investment income | | 0.38 | | | 0.37 | | | 0.30 | | | 0.27 | | | 0.35 | |
Net realized and unrealized gain (loss) | | — | | | (0.25 | ) | | 0.05 | | | 0.15 | | | 0.04 | |
| | |
|
| |
|
| |
|
| |
|
| |
|
|
Total Income from Operations | | 0.38 | | | 0.12 | | | 0.35 | | | 0.42 | | | 0.39 | |
| | |
|
| |
|
| |
|
| |
|
| |
|
|
Less Distributions From: | | | | | | | | | | | | | | | |
From net investment income | | (0.40 | ) | | (0.38 | ) | | (0.32 | ) | | (0.28 | ) | | (0.41 | ) |
| | |
|
| |
|
| |
|
| |
|
| |
|
|
Total Distributions | | (0.40 | ) | | (0.38 | ) | | (0.32 | ) | | (0.28 | ) | | (0.41 | ) |
| | |
|
| |
|
| |
|
| |
|
| |
|
|
Net Asset Value, End of Year | | $8.07 | | | $8.09 | | | $8.35 | | | $8.32 | | | $8.18 | |
| | |
|
| |
|
| |
|
| |
|
| |
|
|
Total return(2) | | 4.82 | % | | 1.51 | % | | 4.30 | % | | 5.17 | % | | 4.78 | % |
Net Assets, End of Year (000s) | | $861,089 | | | $759,964 | | | $533,845 | | | $480,808 | | | $317,858 | |
Ratios to Average Net Assets: | | | | | | | | | | | | | | | |
Gross expenses | | 0.54 | %(3) | | 0.63 | % | | 0.75 | % | | 0.76 | % | | 0.77 | % |
Net expenses | | 0.54 | (3)(4) | | 0.61 | (4) | | 0.71 | (4) | | 0.76 | | | 0.77 | |
Net investment income | | 4.68 | | | 4.50 | | | 3.65 | | | 3.25 | | | 4.22 | |
Portfolio Turnover Rate | | 325 | %(5) | | 376 | %(5) | | 376 | %(5) | | 369 | %(5) | | 257 | % |
| (1) | | Per share amounts have been calculated using the average shares method. |
| (2) | | Performance figures may reflect fee waivers and/or expense reimbursements and assumes reinvestment of dividend distributions. Past performance is no guarantee of future results. In the absence of fee waivers and/or expense reimbursements, the total return would have been lower. Applicable advisory program charges, which in the case of TRAK may be up to 1.50%, are not reflected in the performance data and would reduce the total returns. |
| (3) | | Ratio includes interest expense on short sales which represent .01%. |
| (4) | | Reflects fee waivers and/or expense reimbursements. |
| (5) | | Excluding mortgage dollar roll transactions. If mortgage dollar roll transactions have been included the portfolio turnover rate would have been 400%, 443% 418% and 392%, respectively. |
See Notes to Financial Statements.
138
Financial Highlights
(continued)
For a share of beneficial interest outstanding throughout each year ended August 31:
| | | | | | | | | | | | | | | |
| High Yield Investments | | | | | | | | | | | | | | | |
| | | 2007(1)
| | | 2006
| | | 2005(1)
| | | 2004
| | | 2003
| |
Net Asset Value, Beginning of Year | | $4.62 | | | $4.78 | | | $4.81 | | | $4.61 | | | $4.38 | |
| | |
|
| |
|
| |
|
| |
|
| |
|
|
Income (Loss) From Operations: | | | | | | | | | | | | | | | |
Net investment income | | 0.38 | | | 0.39 | | | 0.31 | | | 0.32 | | | 0.36 | |
Net realized and unrealized gain (loss) | | (0.03 | ) | | (0.22 | ) | | 0.03 | | | 0.21 | | | 0.25 | |
| | |
|
| |
|
| |
|
| |
|
| |
|
|
Total Income from Operations | | 0.35 | | | 0.17 | | | 0.34 | | | 0.53 | | | 0.61 | |
| | |
|
| |
|
| |
|
| |
|
| |
|
|
Less Distributions From: | | | | | | | | | | | | | | | |
From net investment income | | (0.39 | ) | | (0.33 | ) | | (0.37 | ) | | (0.33 | ) | | (0.38 | ) |
| | |
|
| |
|
| |
|
| |
|
| |
|
|
Total Distributions | | (0.39 | ) | | (0.33 | ) | | (0.37 | ) | | (0.33 | ) | | (0.38 | ) |
| | |
|
| |
|
| |
|
| |
|
| |
|
|
Net Asset Value, End of Year | | $4.58 | | | $4.62 | | | $4.78 | | | $4.81 | | | $4.61 | |
| | |
|
| |
|
| |
|
| |
|
| |
|
|
Total Return(2) | | 7.56 | % | | 3.80 | % | | 7.16 | % | | 11.81 | % | | 14.57 | % |
Net Assets, End of Year (000s) | | $85,804 | | | $110,207 | | | $262,239 | | | $239,650 | | | $227,191 | |
Ratios to Average Net Assets: | | | | | | | | | | | | | | | |
Gross expenses | | 1.00 | % | | 0.90 | % | | 1.04 | % | | 0.99 | % | | 0.97 | % |
Net expenses | | 0.85 | (3) | | 0.86 | (3) | | 0.99 | (3) | | 0.99 | | | 0.97 | |
Net investment income | | 7.92 | | | 6.78 | | | 6.49 | | | 6.76 | | | 7.78 | |
Portfolio Turnover Rate | | 119 | % | | 108 | % | | 106 | % | | 127 | % | | 158 | % |
| (1) | | Per share amounts have been calculated using the average shares method. |
| (2) | | Performance figures may reflect fee waivers and/or expense reimbursement and assumes reinvestment of dividend distributions. Past performance is no guarantee of future results. In the absence of fee waivers and/or expense reimbursement, the total return would have been lower. Applicable advisory program charges, which in the case of TRAK may be up to 1.50%, are not reflected in the performance data and would reduce the total returns. |
| (3) | | Reflects fee waivers and/or expense reimbursements. |
See Notes to Financial Statements.
139
Financial Highlights
(continued)
For a share of beneficial interest outstanding throughout each year ended August 31:
| | | | | | | | | | | | | | | |
| International Fixed Income Investments | | | | | | | | | | |
| | | 2007(1)
| | | 2006(1)
| | | 2005(1)
| | | 2004(1)
| | | 2003(1)
| |
Net asset value, Beginning of Year | | $7.78 | | | $8.23 | | | $8.16 | | | $7.93 | | | $7.47 | |
| | |
|
| |
|
| |
|
| |
|
| |
|
|
Income (Loss) from Operations: | | | | | | | | | | | | | | | |
Net investment income | | 0.23 | | | 0.25 | | | 0.20 | | | 0.21 | | | 0.25 | |
Net realized and unrealized gain (loss) | | (0.05 | ) | | (0.39 | ) | | 0.37 | | | 0.88 | | | 0.51 | |
| | |
|
| |
|
| |
|
| |
|
| |
|
|
Total Income (Loss) from Operations | | 0.18 | | | (0.14 | ) | | 0.57 | | | 1.09 | | | 0.76 | |
| | |
|
| |
|
| |
|
| |
|
| |
|
|
Less Distributions From: | | | | | | | | | | | | | | | |
From net investment income | | (0.29 | ) | | (0.09 | ) | | (0.50 | ) | | (0.86 | ) | | (0.30 | ) |
Net realized gains | | — | | | (0.06 | ) | | — | | | — | | | — | |
Return of capital | | — | | | (0.16 | ) | | — | | | — | | | — | |
| | |
|
| |
|
| |
|
| |
|
| |
|
|
Total Distributions | | (0.29 | ) | | (0.31 | ) | | (0.50 | ) | | (0.86 | ) | | (0.30 | ) |
| | |
|
| |
|
| |
|
| |
|
| |
|
|
Net Asset Value, End of Year | | $7.67 | | | $7.78 | | | $8.23 | | | $8.16 | | | $7.93 | |
| | |
|
| |
|
| |
|
| |
|
| |
|
|
Total Return(2) | | 2.33 | % | | (1.70 | %) | | 6.86 | % | | 14.00 | % | | 10.28 | % |
Net Assets, End of Year (millions) | | $189 | | | $195 | | | $154 | | | $116 | | | $112 | |
Ratios to Average Net Assets: | | | | | | | | | | | | | | | |
Gross expenses | | 0.78 | %(3) | | 0.84 | % | | 1.01 | % | | 1.05 | % | | 1.04 | % |
Net expenses | | 0.78 | (3)(4) | | 0.82 | (4) | | 0.95 | (4) | | 1.05 | | | 1.04 | |
Net investment income | | 3.00 | | | 3.25 | | | 2.38 | | | 2.60 | | | 3.21 | |
Portfolio Turnover Rate | | 433 | % | | 416 | % | | 346 | % | | 243 | % | | 288 | % |
| (1) | | Per share amounts have been calculated using the average shares method. |
| (2) | | Performance figures may reflect fee waivers and/or expense reimbursements and assumes reinvestment of dividend distributions. Past performance is no guarantee of future results. In the absence of fee waivers and/or expense reimbursements, the total return would have been lower. Applicable advisory program charges, which in the case of TRAK may be up to 1.50%, are not reflected in the performance data and would reduce the total returns. |
| (3) | | Ratio includes interest expense on short sales which represents .04%. |
| (4) | | Reflects fee waivers and/or expense reimbursements. |
See Notes to Financial Statements.
140
Financial Highlights
(continued)
For a share of beneficial interest outstanding throughout each year ended August 31:
| | | | | | | | | | | | | | | |
| Municipal Bond Investments | | | | | | | | | | | | | | | |
| | | 2007(1)
| | | 2006
| | | 2005
| | | 2004(1)
| | | 2003
| |
Net asset value, Beginning of Year | | $9.13 | | | $9.26 | | | $9.23 | | | $8.95 | | | $9.07 | |
| | |
|
| |
|
| |
|
| |
|
| |
|
|
Income (Loss) from Operations: | | | | | | | | | | | | | | | |
Net investment income | | 0.35 | | | 0.32 | | | 0.32 | | | 0.33 | | | 0.35 | |
Net realized and unrealized gain (loss) | | (0.19 | ) | | (0.12 | ) | | 0.06 | | | 0.30 | | | (0.12 | ) |
| | |
|
| |
|
| |
|
| |
|
| |
|
|
Total Income from Operations | | 0.16 | | | 0.20 | | | 0.38 | | | 0.63 | | | 0.23 | |
| | |
|
| |
|
| |
|
| |
|
| |
|
|
Less Distributions From: | | | | | | | | | | | | | | | |
From net investment income | | (0.35 | ) | | (0.33 | ) | | (0.35 | ) | | (0.35 | ) | | (0.35 | ) |
| | |
|
| |
|
| |
|
| |
|
| |
|
|
Total Distributions | | (0.35 | ) | | (0.33 | ) | | (0.35 | ) | | (0.35 | ) | | (0.35 | ) |
| | |
|
| |
|
| |
|
| |
|
| |
|
|
Net Asset Value, End of Year | | $8.94 | | | $9.13 | | | $9.26 | | | $9.23 | | | $8.95 | |
| | |
|
| |
|
| |
|
| |
|
| |
|
|
Total return(2) | | 1.77 | % | | 2.26 | % | | 4.17 | % | | 7.12 | % | | 2.51 | % |
Net Assets, End of Year (000s) | | $69,638 | | | $66,326 | | | $40,423 | | | $33,895 | | | $28,386 | |
Ratios to Average Net Assets: | | | | | | | | | | | | | | | |
Gross expenses | | 0.59 | % | | 0.73 | % | | 0.90 | % | | 0.89 | % | | 0.88 | % |
Net expenses | | 0.59 | (3) | | 0.72 | (3) | | 0.88 | (3) | | 0.89 | | | 0.88 | |
Net investment income | | 3.84 | | | 3.70 | | | 3.58 | | | 3.63 | | | 3.79 | |
Portfolio Turnover Rate | | 14 | % | | 26 | % | | 7 | % | | 19 | % | | 15 | % |
| (1) | | Per share amounts have been calculated using the average shares method. |
| (2) | | Performance figures may reflect fee waivers and/or expense reimbursement and assumes reinvestment of dividend distributions. Past performance is no guarantee of future results. In the absence of fee waivers and/or expense reimbursement, the total return would have been lower. Applicable advisory program charges, which in the case of TRAK may be up to 1.50%, are not reflected in the performance data and would reduce the total returns. |
| (3) | | Reflects fee waivers and/or expense reimbursements. |
See Notes to Financial Statements.
141
Financial Highlights
(continued)
For a share of beneficial interest outstanding throughout each year ended August 31:
| | | | | | | | | | | | | | | |
| Money Market Investments | |
| | | 2007(1)
| | | 2006(1)
| | | 2005
| | | 2004
| | | 2003(1)
| |
Net asset value, Beginning of Year | | $1.00 | | | $1.00 | | | $1.00 | | | $1.00 | | | $1.00 | |
| | |
|
| |
|
| |
|
| |
|
| |
|
|
Income from Operations: | | | | | | | | | | | | | | | |
Net investment income | | 0.05 | | | 0.04 | | | 0.02 | | | 0.00 | (2) | | 0.01 | |
| | |
|
| |
|
| |
|
| |
|
| |
|
|
Total income from Operations | | 0.05 | | | 0.04 | | | 0.02 | | | 0.00 | (2) | | 0.01 | |
| | |
|
| |
|
| |
|
| |
|
| |
|
|
Less Distributions From: | | | | | | | | | | | | | | | |
From net investment income | | (0.05 | ) | | (0.04 | ) | | (0.02 | ) | | 0.00 | (2) | | (0.01 | ) |
| | |
|
| |
|
| |
|
| |
|
| |
|
|
Total Distributions | | (0.05 | ) | | (0.04 | ) | | (0.02 | ) | | 0.00 | (2) | | (0.01 | ) |
| | |
|
| |
|
| |
|
| |
|
| |
|
|
Net Asset Value, End of Year | | $1.00 | | | $1.00 | | | $1.00 | | | $1.00 | | | $1.00 | |
| | |
|
| |
|
| |
|
| |
|
| |
|
|
Total return(3) | | 4.86 | % | | 4.03 | % | | 2.17 | % | | 0.48 | % | | 0.85 | % |
Net Assets, End of Year (000s) | | $118,345 | | | $128,936 | | | $96,376 | | | $93,875 | | | $110,461 | |
Ratios to Average Net Assets: | | | | | | | | | | | | | | | |
Gross expenses | | 0.48 | % | | 0.72 | % | | 1.14 | % | | 0.98 | % | | 0.90 | % |
Net expenses(4)(5) | | 0.47 | | | 0.47 | | | 0.34 | | | 0.60 | | | 0.60 | |
Net investment income | | 4.75 | % | | 4.01 | % | | 2.16 | % | | 0.48 | % | | 0.81 | % |
| (1) | | Per share amounts have been calculated using the average shares method. |
| (2) | | Amounts represent less than $0.01 per share. |
| (3) | | Performance figures may reflect fee waivers and/or expense reimbursements and assumes reinvestment of dividend distributions. Past performance is no guarantee of future results. In the absence of fee waivers and/or expense reimbursements, the total return would have been lower. Applicable advisory program charges, which in the case of TRAK may be up to 1.50%, are not reflected in the performance data and would reduce the total returns. |
| (4) | | Reflects fee waivers and/or expense reimbursements. |
| (5) | | As a result of an expense limitation, the ratio of expenses to average net assets of the Fund did not exceed 0.60%. |
See Notes to Financial Statements.
142
Notes to Financial Statements
1. Organization and Significant Accounting Policies
Large Capitalization Growth Investments, Large Capitalization Value Equity Investments, Small Capitalization Growth Investments, Small Capitalization Value Equity Investments, International Equity Investments, Emerging Markets Equity Investments, Core Fixed Income Investments, High Yield Investments, International Fixed Income Investments, Municipal Bond Investments and Money Market Investments (formerly “Government Money Investments”), (“Fund(s)”) are separate diversified investment funds of the Consulting Group Capital Markets Funds (“Trust”). The Trust, a Massachusetts business trust, is registered under the Investment Company Act of 1940, as amended (“1940 Act”), as an open-end management investment company.
The following are significant accounting policies consistently followed by the Funds and are in conformity with U.S. generally accepted accounting principles (“GAAP”). Estimates and assumptions are required to be made regarding assets, liabilities and changes in net assets resulting from operations when financial statements are prepared. Changes in the economic environment, financial markets and any other parameters used in determining these estimates could cause actual results to differ.
(a) Investment Valuation. Equity securities for which market quotations are readily available are valued at the last sale price or official closing price on the primary market or exchange on which they trade. Debt securities that will mature in more than 60 days are valued using prices provided by independent pricing services, which are determined by such services’ analyses of a variety of factors, including, transactions in debt securities, quotations from bond dealers, market transactions in comparable securities and relationships between securities.
Debt securities that will mature in 60 days or less and securities held by Money Market Investments are valued at amortized cost, which approximates current market value. This method involves valuing portfolio securities at cost and thereafter assuming a constant amortization to maturity of any discount or premium. Money Market Investments’ use of amortized cost is subject to compliance with certain conditions as specified by Rule 2a-7 under the 1940 Act.
When market quotations are not readily available, or are determined to be unreliable by the Trust’s Valuation Committee pursuant to procedures approved by the Trust’s Board of Trustees, such as when the value of a security has been significantly affected by events after the close of the exchange or market on which the security is principally traded, and before the applicable Fund calculate its net asset value per share (“NAV”), the Trust may fair value these investments in accordance with the procedures approved by the Trust’s Board of Trustees. Fair valuing of foreign securities is determined with the assistance of an independent pricing service using calculations based on indices of domestic securities and other appropriate indicators, such as prices of relevant ADRs and futures contracts. Values from this pricing vendor are applied in the event that there is a movement in the U.S. market that exceeds a specific threshold that has been established by the Valuation Committee.
(b) Repurchase Agreements. When entering into repurchase agreements, it is the Funds’ policy that their custodian or a third party custodian take possession of the underlying collateral securities, the market value of which at least equals the principal amount of the repurchase transaction, including accrued interest. To the extent that any repurchase transaction exceeds one business day, the value of the collateral is marked-to-market daily to ensure the adequacy of the collateral. If the seller defaults and the market value of the collateral declines or if bankruptcy proceedings are commenced with respect to the seller of the security, realization of the collateral by the Funds may be delayed or limited.
(c) Financial Futures Contracts. Certain Funds may enter into financial futures contracts to the extent permitted by their investment policies and objectives. Upon entering into a financial futures contract, the Fund is required to deposit cash or securities as initial margin. Additional securities are also segregated up to the current market value of the financial futures contracts. Subsequent payments, known as variation margin, are made or received by the Fund each day, depending on the daily fluctuation in the value of the underlying financial instruments. The Fund recognizes an unrealized gain or loss equal to the daily variation margin. When the financial futures contracts are closed a realized gain or loss is recognized equal to the difference between the proceeds from (or cost of) the closing transactions and the Fund’s basis in the contracts.
143
Notes to Financial Statements
(continued)
The risks associated with entering into financial futures contracts include the possibility that a change in the value of the contract may not correlate with the changes in the value of the underlying instruments. In addition, investing in financial futures contracts involves the risk that the Fund could lose more than the original margin deposit and subsequent payments required for a futures transaction. Risks may also arise upon entering into these contracts from the potential inability of the counterparties to meet the terms of their contracts.
(d) Written Options. When a Fund writes an option, an amount equal to the premium received by the Fund are recorded as a liability, the value of which is marked-to-market daily to reflect the current market value of the option written. If the option expires, the Fund realizes a gain from investments equal to the amount of the premium received. When a written call option is exercised, the difference between the premium and the amount for effecting a closing purchase transaction, including brokerage commission, is also treated as a realized gain or loss. When a written put option is exercised, the amount of the premium received reduces the cost of the security purchased by the Fund.
A risk in writing a covered call option is that the Fund may forego the opportunity of profit if the market price of the underlying security increases and the option is exercised. The risk in writing a put option is that the Fund may incur a loss if the market price of the underlying security decreases and the option is exercised. In addition, there is the risk that the Fund may not be able to enter into a closing transaction because of an illiquid secondary market.
(e) Forward Foreign Currency Contracts. Certain Funds may enter into forward foreign currency contracts to hedge against foreign currency exchange rate risk on their non-U.S. dollar denominated securities or to facilitate settlement of foreign currency denominated portfolio transactions. A forward foreign currency contract is an agreement between two parties to buy and sell a currency at a set price on a future date. The contract is marked-to-market daily and the change in value is recorded by the Fund as an unrealized gain or loss. When a forward foreign currency contract is extinguished, through either delivery or offset by entering into another forward foreign currency contract, the Fund records a realized gain or loss equal to the difference between the value of the contract at the time it was opened and the value of the contract at the time it was extinguished.
Forward foreign currency contracts involve elements of market risk in excess of the amounts reflected in the Statements of Assets and Liabilities. The Fund bears the risk of an unfavorable change in the foreign exchange rate underlying the forward foreign currency contract. Risks may also arise upon entering into these contracts from the potential inability of the counterparties to meet the terms of their contracts.
(f) Stripped Securities. Certain Funds may invest in “Stripped Securities”, a term used collectively for stripped fixed income securities. Stripped securities can be principal only securities (“PO”), which are debt obligations that have been stripped of unmatured interest coupons or interest only securities (“IO”), which are unmatured interest coupons that have been stripped from debt obligations. As is the case with all securities, the market value of Stripped Securities will fluctuate in response to changes in economic conditions, interest rates and the market’s perception of the securities. However, fluctuations in response to interest rates may be greater in Stripped Securities than for debt obligations of comparable maturities that pay interest currently. The amount of fluctuation increases with a longer period of maturity.
The yield to maturity on an IO is sensitive to the rate of principal repayments (including prepayments) on the related underlying debt obligation and principal payments may have a material effect on yield to maturity. If the underlying debt obligation experiences greater than anticipated prepayments of principal, the Fund may not fully recoup its initial investment the IO.
(g) Swaptions. Certain Funds may write swaption contracts to manage exposure to fluctuations in interest rates and to enhance portfolio yield. Swaption contracts written by a Fund represent an option that gives the purchaser the right, but not the obligation, to enter into a previously agreed upon swap contract on a future date. If a written call swaption is exercised, the writer will enter a swap and is obligated to pay the fixed rate and receive a floating rate in exchange. If a written put swaption is exercised, the writer will enter a swap and is obligated to pay the floating rate and receive a fixed rate in exchange. Swaptions are marked to market daily based upon quotations from market makers.
144
Notes to Financial Statements
(continued)
When a Fund writes a swaption, the premium received is recorded as a liability and is subsequently adjusted to the current market value of the swaption. Changes in the value of the swaption are reported as unrealized gains or losses in the Statements of Assets and Liabilities and Statements of Operations. Gain or loss is recognized when the swaption contract expires or is closed. Premiums received from writing swaptions that expire or are exercised are treated by the Fund as realized gains from investments. The difference between the premium and the amount paid on effecting a closing purchase transaction is also treated as a realized gain, or if the premium is less than the amount paid for the closing purchase, as a realized loss.
Entering into a swaption contract involves, to varying degrees, the elements of credit, market and interest rate risk, associated with both option contracts and swap contracts. To reduce credit risk from potential counterparty default, the Fund enter into swaption contracts with counterparties whose creditworthiness has been evaluated by the Investment Manager. The Fund bears the market risk arising from any change in index values or interest rates.
(h) Swap Contracts. Swaps involve the exchange by a Fund with another party of the respective amounts payable with respect to a notional principal amount related to one or more indices. Certain Funds may enter into these transactions to preserve a return or spread on a particular investment or portion of its assets, as a duration management technique or to protect against any increase in the price of securities the Fund anticipates purchasing at a later date. Certain Funds may also use these transactions for speculative purposes, such as to obtain the price performance of a security without actually purchasing the security in circumstances where, for example, the subject security is illiquid, is unavailable for direct investment or available only on less attractive terms
Swaps are marked-to-market daily based upon quotations from market makers and the change, if any, is recorded as an unrealized gain or loss in the Statements of Operations. Net receipts or payments of interest are recorded as realized gains or losses, respectively.
An upfront payment received by the Fund, as the protector, is recorded as a liability on the Fund’s books. An upfront payment made by the Fund, as the protection buyer, is recorded as an asset on the Fund’s books.
Swaps have risks associated with them, including possible default by the counterparty to the transaction, illiquidity and, where swaps are used as hedges, the risk that the use of a swap could result in losses greater than if the swap had not been employed.
(i) Credit Default Swaps. Certain Funds enter into credit default swap contracts for investment purposes, to manage their credit risk or to add leverage. As a seller in a credit default swap contract, the Fund is required to pay the notional or other agreed-upon value to the counterparty in the event of a default by a third party, such as a U.S. or foreign corporate issuer, on the referenced debt obligation. In return, the Fund receives from the counterparty a periodic stream of payments over the term of the contract provided that no event of default has occurred. If no default occurs, the Fund keeps the stream of payments and have no payment obligations. Such periodic payments are accrued daily and accounted for as realized gain.
Certain Funds may also purchase credit default swap contracts in order to hedge against the risk of default by debt securities held in their portfolios. In these cases the Funds function as the counterparty referenced in the preceding paragraph. As a purchaser of a credit default swap contract, the Fund receives the notional or other agreed upon value from the counterparty in the event of a default by a third party, such as a U.S. or foreign corporate issuer on the referenced debt obligation. In return, the Fund make periodic payments to the counterparty over the term of the contract provided no event of default has occurred. Such periodic payments are accrued daily and accounted for as realized loss.
Swaps are marked-to-market daily based upon quotations from market makers and the change in value , if any, is recorded as unrealized appreciation or depreciation in the Funds’ Statements of Operations. For a credit default swap sold by the Fund, payment of the agreed upon amount made by the Funds in the event of default of the referenced debt obligation is recorded as the cost of the referenced debt obligation purchased/received. For a credit default swap purchased by a Fund, the agreed upon amount received by the Fund in the event of default of the referenced debt obligation is recorded as proceeds from sale/delivery of the referenced debt obligation and the resulting gain or loss realized on the referenced debt obligation is recorded as such by the Fund.
Entering into Credit Default Swaps involves, to varying degrees, elements of credit, market and documentation risk in excess of the related amounts recognized on the Statements of Assets and Liabilities. Such risks involve the possibility that there will be
145
Notes to Financial Statements
(continued)
no liquid market for these agreements, that the counterparty to the agreements may default on its obligation to perform or disagree as to the meaning of the contractual terms in the agreements, and that there will be unfavorable changes in net interest rates.
(j) Time Deposits. The Funds may purchase overnight time deposits issued by offshore branches of U.S. Banks that meet credit and risk standards established by the Custodian and approved by the Funds.
(k) Lending of Portfolio Securities. The Trust has an agreement with their custodian whereby the custodian may lend securities owned by the Funds to brokers, dealers and other financial organizations. In exchange for lending securities under the terms of the agreement with their custodian, the Fund receives a lender’s fee. Fees earned by a Fund on securities lending are recorded as securities lending income. Loans of securities by a Fund are collateralized by cash, U.S. government securities or high quality money market instruments that are maintained at all times in an amount at least equal to the current market value of the loaned securities, plus a margin which varies depending on the type of securities loaned. The custodian establishes and maintains the collateral in a segregated account. The Fund has the right under the lending agreement to recover any loaned securities from the borrower on demand. Each Fund maintains the risk of any market loss on its securities on loan as well as the potential loss on investments purchased with cash collateral received from its securities lending. Additionally, the Fund is exposed to risks that the borrower may not provide additional collateral when required or return the loaned securities when due. At August 31, 2007, the aggregate market value of the loaned securities and the value of the collateral each Fund received are as follows:
Loaned Securities
| | | | | | |
| Fund | | Market Value of
Securities on Loan | | Value of
Collateral Held |
Large Capitalization Growth Investments | | $ | 50,135,227 | | $ | 51,156,602 |
Large Capitalization Value Equity Investments | | | 144,202,925 | | | 147,862,517 |
Small Capitalization Growth Investments | | | 70,465,669 | | | 72,113,980 |
Small Capitalization Value Equity Investments | | | 58,157,473 | | | 59,936,454 |
International Equity Investments | | | 70,961,524 | | | 73,164,904 |
Emerging Markets Equity Investments | | | 34,974,849 | | | 35,718,804 |
Core Fixed Income Investments | | | 2,273,486 | | | 2,319,176 |
High Yield Investments | | | 5,476,513 | | | 5,589,086 |
(l) Securities Traded on a To-Be-Announced Basis. Certain Funds may trade securities on a to-be-announced (“TBA”) basis. In a TBA transaction, the Fund commits to purchasing or selling securities which have not yet been issued by the issuer and for which specific information is not known, such as the face amount and maturity date and the underlying pool of investments in U.S. government agency mortgage pass-through transactions. Securities purchased on a TBA basis are not settled until they are delivered to the Fund, normally 15 to 45 days later. Beginning on the date the Fund enters into a TBA transaction, cash, U.S. government securities or other liquid high-grade debt obligations are segregated in an amount equal in value to the purchase price of the TBA security. These transactions are subject to market fluctuations and their current value is determined in the same manner as for other securities.
(m) Short Sales of Securities. A short sale is a transaction in which the Fund sells securities it does not own (but has borrowed) in anticipation of a decline in the market price of the securities. To complete a short sale, the Fund may arrange through a broker to borrow the securities to be delivered to the buyer. The proceeds received by the Fund for the short sale are retained by the broker until the Fund replaces the borrowed securities. In borrowing the securities to be delivered to the buyer, the Fund becomes obligated to replace the securities borrowed at their market price at the time of replacement, whatever that price may be.
(n) Mortgage Dollar Rolls. Certain Funds may enter into dollar rolls in which the Funds sell mortgage-backed securities for delivery in the current month and simultaneously contracts to repurchase substantially similar (same type, coupon and maturity) securities to settle on a specified future date. During the roll period, the Fund forgoes principal and interest paid on the securities. The Fund is compensated by a fee paid by the counterparty, often in the form of a drop in the repurchase price of the securities. Dollar rolls are accounted for as financing arrangements; the fee is accrued into interest income ratably over the term of the dollar roll and any gain or loss on the roll is deferred and realized upon disposition of the rolled security.
146
Notes to Financial Statements
(continued)
The risk of entering into a mortgage dollar roll is that the market value of the securities the Fund is obligated to repurchase under the agreement may decline below the repurchase price. In the event the buyer of securities under a mortgage dollar roll files for bankruptcy or becomes insolvent, the Fund’s use of proceeds of the dollar roll may be restricted pending a determination by the other party, or its trustee or receiver, whether to enforce the Fund’s obligation to repurchase the securities.
(o) Credit and Market Risk. Certain Funds invest in high yield instruments that are subject to certain credit and market risks. The yields of high yield obligations reflect, among other things, perceived credit and market risks. Each Fund’s investment in securities rated below investment grade typically involve risks not associated with higher rated securities including, among others, greater risk related to timely and ultimate payment of interest and principal, greater market price volatility and less liquid secondary market trading.
(p) Foreign Risk. Certain Funds’ investments in foreign securities may involve risks not present in domestic investments. Because securities may be denominated in foreign currencies and may require settlement in foreign currencies and pay interest or dividends in foreign currencies, changes in the relationship of these foreign currencies to the U.S. dollar can significantly affect the value of the investments and earnings of the Fund. Foreign investments may also subject the Fund to foreign government exchange restrictions, expropriation, taxation or other political, social or economic developments, all of which affect the market and/or credit risk of the investments.
(q) Security Transactions and Investment Income. Security transactions are accounted for on a trade date basis. Interest income, adjusted for amortization of premium and accretion of discount, is recorded on the accrual basis. Dividend income is recorded on the ex-dividend date. Foreign dividend income is recorded on the ex-dividend date or as soon as practical after the Fund determines the existence of a dividend declaration after exercising reasonable due diligence. The cost of investments sold is determined by use of the specific identification method. To the extent any issuer defaults on an expected interest payment, the Trust’s policy is to generally halt any additional interest income accruals and consider the realizability of interest accrued up to the date of default.
(r) Foreign Currency Translation. Investment securities and other assets and liabilities denominated in foreign currencies are translated into U.S. dollar amounts based upon prevailing exchange rates on the date of valuation. Purchases and sales of investment securities and income and expense items denominated in foreign currencies are translated into U.S. dollar amounts based upon prevailing exchange rates on the respective dates of such transactions.
The Funds do not isolate that portion of the results of operations resulting from changes in foreign exchange rates on investments from the fluctuations arising from changes in market prices of securities held. Such fluctuations are included with the net realized and unrealized gain or loss on investments.
Net realized foreign exchange gains or losses arise from sales of foreign currencies, including gains and losses on forward foreign currency contracts, currency gains or losses realized between the trade and settlement dates on securities transactions and the difference between the amounts of dividends, interest and foreign withholding taxes recorded on the Funds’ books and the U.S. dollar equivalent of the amounts actually received or paid. Net unrealized foreign exchange gains and losses arise from changes in the fair values of assets and liabilities, other than investments in securities, at the date of valuation, resulting from changes in exchange rates.
Foreign security and currency transactions may involve certain considerations and risks not typically associated with those of U.S. dollar denominated transactions as a result of, among other factors, the possibility of lower levels of governmental supervision and regulation of foreign securities markets and the possibility of political or economic instability.
(s) Distributions to Shareholders. Distributions from net investment income for Large Capitalization Growth Investments, Large Capitalization Value Equity Investments, Small Capitalization Growth Investments, Small Capitalization Value Equity Investments, International Equity Investments, Emerging Markets Equity Investments and International Fixed Income Investments, if any, are declared and paid on an annual basis. Distributions from net investment income for Core Fixed Income Investments, High Yield Investments and Municipal Bond Investments, if any, are declared and paid on a monthly basis.
147
Notes to Financial Statements
(continued)
Distributions on the shares of Money Market Investments are declared each business day to shareholders of record that day, and are paid on the last business day of the month. The Funds intend to satisfy conditions that will enable interest from municipal securities, which are exempt from regular federal income tax and from designated state income taxes, to retain such tax-exempt status when distributed to the shareholders of the Funds. Distributions of net realized gains to shareholders of the Funds, if any, are taxable and are declared at least annually. Distributions to shareholders of the Funds are recorded on the ex-dividend date and are determined in accordance with income tax regulations, which may differ from GAAP.
(t) Federal and Other Taxes. It is the Trust’s policy to comply with the federal income and excise tax requirements of the Internal Revenue Code of 1986, as amended, applicable to regulated investment companies. Accordingly, each Fund intends to distribute substantially all of its income and net realized gains on investments, if any, to shareholders each year. Therefore, no federal income tax provision is required in the Funds’ financial statements. Under the applicable foreign tax laws, a withholding tax may be imposed on interest, dividends and capital gains at various rates.
(u) Reclassification. GAAP requires that certain components of net assets be adjusted to reflect permanent differences between financial and tax reporting. These reclassifications have no effect on net assets or net asset values per share. During the current year, the following reclassifications have been made:
| | | | | | | | | | | |
| Fund | | | | (Over)/
Undistributed Net
Investment Income | | | Undistributed
Realized Gains/
Accumulated Net
Realized Losses | | | Paid-in Capital | |
Large Capitalization Growth Investments | | (a) | | (670 | ) | | 670 | | | — | |
Large Capitalization Value Equity Investments | | (g) | | (311,570 | ) | | 311,570 | | | — | |
Small Capitalization Growth Investments | | (a) | | (2,206 | ) | | 2,206 | | | — | |
| | | (b) | | 2,243,679 | | | — | | | 2,243,679 | |
Small Capitalization Value Equity Investments | | (c) | | (538,441 | ) | | 714,981 | | | (176,540 | ) |
International Equity Investments | | (d) | | 5,963,646 | | | (5,963,646 | ) | | — | |
Emerging Markets Equity Investments | | (d) | | (927,069 | ) | | 927,069 | | | — | |
Core Fixed Income Investments | | (f) | | 2,548,440 | | | (2,548,440 | ) | | — | |
High Yield Investments | | (e) | | 232,524 | | | (232,524 | ) | | — | |
International Fixed Income Investments | | (f) | | 10,907,864 | | | (10,907,864 | ) | | — | |
Additionally, there were no reclassifications during the current year for Money Market Investments.
| (a) | | Reclassifications are primarily due to foreign currency transactions treated as ordinary income for tax purposes. |
| (b) | | Reclassifications are primarily due to a tax net operating loss. |
| (c) | | Reclassifications are primarily due to foreign currency transactions treated as ordinary income for tax purposes and book/tax differences in the treatment of distributions from real estate investment trusts. Additionally, during the current period, Undistributed Realized Gains and Cost of Investments have each been reduced by $247,260 as a result of return of capital distributions paid by REITs. |
| (d) | | Reclassifications are primarily due to foreign currency transactions treated as ordinary income for tax purposes, and book/tax differences in the treatment of passive foreign investment companies. |
| (e) | | Reclassifications are primarily due to differences between book and tax amortization of premium on fixed income securities. |
| (f) | | Reclassifications are primarily due to foreign currency transactions treated as ordinary income for tax purposes, differences between book and tax amortization of premium on fixed income securities and differences in the treatment of swap contracts. |
| (g) | | Reclassifications are primarily due to book/tax differences in the treatment of distributions from real estate investment trusts. |
(v) Restricted Securities. All Funds may invest in non-publicly traded securities, commonly called restricted securities. Restricted securities may be less liquid than publicly-traded securities. Although certain restricted securities may be resold in privately negotiated transactions the values realized from these sales could be less than originally paid by a Fund. Certain restricted securities may be deemed liquid by the Manager and/or Subadviser pursuant to procedures approved by the Board of Trustees. The value of restricted securities is determined as described in Note 1.
2. Investment Management Agreement and Other Transactions with Affiliates
The Consulting Group, a division of Citigroup Investment Advisory Services Inc. (“CIAS”), an indirect wholly-owned subsidiary of Citigroup, serves as the investment manager (the “Manager”) to the Funds. The Manager selects and oversees
148
Notes to Financial Statements
(continued)
professional money managers who are responsible for investing the assets of the Funds (each a “Subadviser,” and collectively the “Subadvisers”). Each Fund pays the Manager an investment management fee calculated daily at an annual rate based on each Fund’s average daily net assets and paid monthly. The Manager pays each Subadviser a subadviser fee from its investment management fees.
The maximum allowable investment management fee represents the total amount that could be charged to the Fund. The maximum allowable annual management fee, the aggregate advisory fee paid by CIAS to a Portfolio’s Subadvisers and the fee retained by CIAS for the year ended August 31, 2007 are indicated below:
| | | | | | | | |
| | | Subadviser
Fee | | | Citigroup Investment
Advisory Services Inc.
("CIAS") Fee retained | | | Maximum
Allowable Annual
Management Fee |
Large Capitalization Growth Investments | | 0.35 | % | | 0.25 | % | | 0.60 |
Large Capitalization Value Equity Investments | | 0.30 | % | | 0.30 | % | | 0.60 |
Small Capitalization Growth Investments | | 0.50 | % | | 0.30 | % | | 0.80 |
Small Capitalization Value Equity Investments | | 0.50 | % | | 0.30 | % | | 0.80 |
International Equity Investments | | 0.40 | % | | 0.30 | % | | 0.70 |
Emerging Markets Equity Investments | | 0.50 | % | | 0.30 | % | | 0.90 |
Core Fixed Income Investments | | 0.20 | % | | 0.20 | % | | 0.40 |
High Yield Investments | | 0.30 | % | | 0.25 | % | | 0.70 |
International Fixed Income Investments | | 0.25 | % | | 0.25 | % | | 0.50 |
Municipal Bond Investments | | 0.20 | % | | 0.20 | % | | 0.40 |
Money Market Investments | | 0.14 | % | | 0.00 | % | | 0.15 |
Prior to January 1, 2007, Smith Barney Fund Management LLC (“SBFM”) served as administrator to the Trust pursuant to an amendment dated December 1, 2005 to the Trust’s Administration Agreement dated June 2, 1994. Each Fund paid SBFM a fee calculated at an annual rate of 0.125% of the average daily net assets of each respective Fund. This fee was calculated daily and paid monthly.
The Adviser has agreed to waive a portion of its fee. For the year ended August 31, 2007 the amounts waived by the Adviser were as follows:
Management Fee Waivers
| | | |
| Fund | | |
Large Capitalization Value Equity Investments | | $ | 277,652 |
Small Capitalization Growth Investments | | | 6,450 |
International Equity Investments | | | 1,097,634 |
Emerging Markets Equity Investments | | | 443,828 |
Core Fixed Income Investments | | | 31,169 |
High Yield Investments | | | 142,745 |
International Fixed Income Investments | | | 5,235 |
Municipal Bond Investments | | | 3,626 |
Money Market Investments | | | 15,048 |
Effective January 1, 2007, Brown Brothers Harriman & Co. (“BBH”) serves as the Trust’s administrator. BBH’s principal offices are located at 40 Water Street, Boston, MA 02109. For its administrative services, BBH receives an annual asset based fee of 0.0275% of the Trust’s assets up to $5 billion and 0.02% on assets in excess of $5 billion plus out-of pocket expenses. The fee is calculated daily and paid monthly based on aggregate Trust assets.
During the year ended August 31, 2007, BBH did not waive any portion of its administration fee.
149
Notes to Financial Statements
(continued)
For the year ended August 31, 2007, the Funds paid Citigroup Institutional Trust Company, an indirect wholly-owned subsidiary of Citigroup, shareholder recordkeeping fees as follows:
Record Keeping Fees
| | | |
| Fund | | |
Large Capitalization Growth Investments | | $ | 16,521 |
Large Capitalization Value Equity Investments | | | 16,743 |
Small Capitalization Growth Investments | | | 14,312 |
Small Capitalization Value Equity Investments | | | 8,756 |
International Equity Investments | | | 13,526 |
Emerging Markets Equity Investments | | | 2,979 |
Core Fixed Income Investments | | | 5,712 |
High Yield Investments | | | 1,076 |
International Fixed Income Investments | | | 1,550 |
For the year ended August 31, 2007, Citigroup Global Markets Inc. (“CGM”), the Trust’s distributor and an indirect wholly-owned subsidiary of Citigroup, and its affiliates received brokerage commissions of:
| | | |
| Fund | | Commissions |
Large Capitalization Growth Investments | | $ | 103,845 |
Large Capitalization Value Equity Investments | | | 6,565 |
International Equity Investments | | | 22,511 |
Emerging Markets Equity Investments | | | 146 |
High Yield Investments | | | 60 |
All officers and two Trustees of the Trust are employees of Citigroup or its affiliates and do not receive compensation directly from the Trust.
3. Investments
During the year ended August 31, 2007, the aggregate cost of purchases and proceeds from sales of investments (excluding short-term investments and mortgage dollar rolls) for each Fund were as follows:
| | | | | | | | | | | | |
| | | Investments | | U.S. Government & Agency Obligations |
| Fund | | Purchases | | Sales | | Purchases | | Sales |
Large Capitalization Growth Investments | | $ | 2,629,241,899 | | $ | 2,353,627,050 | | | — | | | — |
Large Capitalization Value Equity Investments | | | 810,022,786 | | | 769,070,945 | | | — | | | — |
Small Capitalization Growth Investments | | | 263,337,116 | | | 277,810,993 | | | — | | | — |
Small Capitalization Value Equity Investments | | | 137,740,605 | | | 159,705,295 | | | — | | | — |
International Equity Investments | | | 709,277,471 | | | 642,500,124 | | | — | | | — |
Emerging Markets Equity Investments | | | 345,483,304 | | | 256,084,693 | | | — | | | — |
Core Fixed Income Investments | | | 1,544,995,462 | | | 1,525,819,005 | | $ | 1,147,332,765 | | $ | 1,101,041,515 |
High Yield Investments | | | 102,697,851 | | | 119,863,267 | | | 6,088,357 | | | 6,111,858 |
International Fixed Income Investments | | | 534,487,065 | | | 456,715,711 | | | 74,334,692 | | | 280,441,735 |
Municipal Bond Investments | | | 36,794,294 | | | 9,491,573 | | | — | | | — |
150
Notes to Financial Statements
(continued)
At August 31, 2007, the aggregate gross unrealized appreciation and depreciation of investments for federal income tax purposes were as follows:
| | | | | | | | | | | |
| Fund | | Gross
Unrealized
Appreciation | | Gross
Unrealized
Depreciation | | | Net Unrealized
Appreciation/
Depreciation | |
Large Capitalization Growth Investments | | $ | 380,624,807 | | $ | (22,305,353 | ) | | $ | 358,319,454 | |
Large Capitalization Value Equity Investments | | | 291,075,938 | | | (31,437,350 | ) | | | 259,638,588 | |
Small Capitalization Growth Investments | | | 107,954,632 | | | (16,119,786 | ) | | | 91,834,846 | |
Small Capitalization Value Equity Investments | | | 72,713,306 | | | (19,025,904 | ) | | | 53,687,402 | |
International Equity Investments | | | 376,822,096 | | | (33,487,786 | ) | | | 343,334,310 | |
Emerging Markets Equity Investments | | | 184,213,179 | | | (4,162,372 | ) | | | 180,050,807 | |
Core Fixed Income Investments | | | 7,269,456 | | | (12,267,446 | ) | | | (4,997,990 | ) |
High Yield Investments | | | 1,200,149 | | | (3,609,722 | ) | | | (2,409,573 | ) |
International Fixed Income Investments | | | 3,507,740 | | | (1,965,800 | ) | | | 1,541,940 | |
Municipal Bond Investments | | | 859,088 | | | (778,478 | ) | | | 80,610 | |
At August 31, 2007, the Funds had the following open futures contracts:
| | | | | | | | | | | | | |
| Emerging Markets Equity Investments | | Number of
Contracts | | Expiration
Date | | Basis
Value | | Market
Value | | Unrealized
Gain |
Contracts to Buy: | | | | | | | | | | | | | |
MSCI Taiwan Index | | 214 | | 9/07 | | $ | 7,198,241 | | $ | 7,436,500 | | $ | 238,259 |
| | | | | | | | | | | | |
|
|
| | | | | | | | | | | | | $ | 238,259 |
| | | | | | | | | | | | |
|
|
| | | | | | | | | | | | | | |
| Core Fixed Income Investments | | Number of
Contracts | | Expiration
Date | | Basis
Value | | Market
Value | | Unrealized
Gain (Loss) | |
Contracts to Buy: | | | | | | | | | | | | | | |
Euro-Bobl | | 16 | | 9/07 | | $ | 2,323,723 | | $ | 2,357,883 | | $ | 34,160 | |
Euro Euribor | | 24 | | 12/07 | | | 7,818,912 | | | 7,817,684 | | | (1,228 | ) |
Eurodollar | | 15 | | 9/07 | | | 3,553,007 | | | 3,543,469 | | | (9,538 | ) |
Eurodollar | | 555 | | 12/07 | | | 131,708,875 | | | 131,902,688 | | | 193,813 | |
Eurodollar | | 230 | | 6/08 | | | 54,761,325 | | | 54,880,875 | | | 119,550 | |
Eurodollar | | 111 | | 6/08 | | | 26,345,435 | | | 26,300,663 | | | (44,772 | ) |
Eurodollar | | 55 | | 12/08 | | | 13,003,537 | | | 13,117,500 | | | 113,963 | |
Eurodollar | | 81 | | 12/08 | | | 19,283,975 | | | 19,218,922 | | | (65,053 | ) |
U.S. Treasury 2-Year Notes | | 40 | | 12/07 | | | 8,236,875 | | | 8,246,250 | | | 9,375 | |
U.S. Treasury 5-Year Notes | | 145 | | 12/07 | | | 15,642,454 | | | 15,471,954 | | | (170,500 | ) |
U.S. Treasury Long Bond | | 48 | | 12/07 | | | 5,329,875 | | | 5,355,000 | | | 25,125 | |
| | | | | | | | | | | | |
|
|
|
| | | | | | | | | | | | | | 204,895 | |
| | | | | | | | | | | | |
|
|
|
Contracts to Sell: | | | | | | | | | | | | | | |
Eurodollar | | 10 | | 3/08 | | | 2,383,500 | | | 2,384,000 | | | (500 | ) |
Eurodollar | | 112 | | 9/08 | | | 26,698,000 | | | 26,723,200 | | | (25,200 | ) |
U.S. Treasury 10-Year Notes | | 22 | | 9/07 | | | 2,410,374 | | | 2,408,656 | | | 1,718 | |
U.S. Treasury 10-Year Notes | | 114 | | 12/07 | | | 12,359,874 | | | 12,431,344 | | | (71,470 | ) |
U.S. Treasury Long Bond | | 228 | | 12/07 | | | 25,229,625 | | | 25,436,250 | | | (206,625 | ) |
| | | | | | | | | | | | |
|
|
|
| | | | | | | | | | | | | | (302,076 | ) |
| | | | | | | | | | | | |
|
|
|
Net Unrealized Gain on Open Futures Contracts | | | | | | | | | | | | $ | (97,181 | ) |
| | | | | | | | | | | | |
|
|
|
151
Notes to Financial Statements
(continued)
| | | | | | | | | | | | | | |
| International Fixed Income Investments | | Number of
Contracts | | Expiration
Date | | Basis
Value | | Market
Value | | Unrealized
Gain (Loss) | |
Contracts to Buy: | | | | | | | | | | | | | | |
Euro Euribor | | 91 | | 12/07 | | $ | 29,646,708 | | $ | 29,642,053 | | $ | (4,655 | ) |
Euro Euribor | | 26 | | 9/08 | | | 8,451,062 | | | 8,489,996 | | | 38,934 | |
Euro Yen | | 28 | | 12/07 | | | 5,988,303 | | | 5,990,591 | | | 2,288 | |
Euro Yen | | 89 | | 3/08 | | | 19,005,989 | | | 19,032,878 | | | 26,889 | |
Euro-Bobl | | 353 | | 9/07 | | | 51,211,767 | | | 52,020,799 | | | 809,033 | |
Euro-Bund | | 36 | | 9/07 | | | 5,452,339 | | | 5,587,381 | | | 135,042 | |
Eurodollar | | 82 | | 9/07 | | | 19,418,626 | | | 19,370,963 | | | (47,663 | ) |
Eurodollar | | 84 | | 3/08 | | | 19,900,150 | | | 20,025,600 | | | 125,450 | |
Eurodollar | | 92 | | 6/08 | | | 21,902,900 | | | 21,952,350 | | | 49,450 | |
Eurodollar | | 47 | | 12/08 | | | 11,206,223 | | | 11,151,720 | | | (54,503 | ) |
Euro-Schatz | | 348 | | 9/07 | | | 48,979,819 | | | 49,066,917 | | | 87,098 | |
Japan Government Bonds 10 Year | | 10 | | 9/07 | | | 11,442,703 | | | 11,683,715 | | | 241,012 | |
March Futures | | 98 | | 3/08 | | | 23,346,402 | | | 23,190,759 | | | (155,643 | ) |
September Futures | | 11 | | 9/08 | | | 2,614,691 | | | 2,608,590 | | | (6,101 | ) |
U.S. Treasury 10-Year Notes | | 13 | | 12/07 | | | 15,182,614 | | | 15,143,942 | | | (38,672 | ) |
U.S. Treasury 10-Year Notes | | 134 | | 12/07 | | | 14,555,422 | | | 14,612,282 | | | 56,860 | |
| | | | | | | | | | | | |
|
|
|
| | | | | | | | | | | | | | 1,264,819 | |
| | | | | | | | | | | | |
|
|
|
| | | | | | | | | | | | | | |
| International Fixed Income Investments | | Number of
Contracts | | Expiration
Date | | Basis
Value | | Market
Value | | Unrealized
Loss | |
Contracts to Sell: | | | | | | | | | | | | | | |
U.S. Treasury 2-Year Note Futures | | 54 | | 9/07 | | $ | 11,053,125 | | $ | 11,127,375 | | $ | (74,250 | ) |
U.S. Treasury 5-Year Note Futures | | 231 | | 12/07 | | | 24,496,829 | | | 24,648,423 | | | (151,594 | ) |
U.S. Treasury Long Bond | | 27 | | 12/07 | | | 2,987,719 | | | 3,012,188 | | | (24,469 | ) |
| | | | | | | | | | | | |
|
|
|
| | | | | | | | | | | | | | (250,313 | ) |
| | | | | | | | | | | | |
|
|
|
Net Unrealized Gain on Open Futures Contracts | | | | | | | | | | | | $ | 1,014,506 | |
| | | | | | | | | | | | |
|
|
|
At August 31, 2007, Core Fixed Income Investments and International Fixed Income Investments held purchased options with a total cost of the following:
| | | | | | |
| | | Calls | | Puts |
Core Fixed Income Investments | | $ | 1,591,111 | | $ | 345,311 |
International Fixed Income Investments | | | 2,475,713 | | | 524,887 |
During the year ended August 31, 2007, written option transactions for Core Fixed Income Investments and International Fixed Income Investments were as follows:
| | | | | | | |
| Core Fixed Income Investments | | Number of
Contracts | | | Premiums
Received | |
Options written, outstanding at August 31, 2006 | | 50,800,001 | | | $ | 534,420 | |
Options written | | 85,500,643 | | | | 1,230,821 | |
Options closed | | (51,700,424 | ) | | | (765,973 | ) |
Options expired | | (17,400,048 | ) | | | (225,702 | ) |
| | |
|
| |
|
|
|
Options written, outstanding at August 31, 2007 | | 67,200,172 | | | | 773,566 | |
| | |
|
| |
|
|
|
152
Notes to Financial Statements
(continued)
| | | | | | | |
| | |
| International Fixed Income Investments | | Number of
Contracts | | | Premiums
Received | |
Options written, outstanding at August 31, 2006 | | 873,700,086 | | | $ | 704,156 | |
Options written | | 176,800,001 | | | | 2,336,303 | |
Options closed | | (89,000,000 | ) | | | (671,185 | ) |
Options expired | | (832,100,122 | ) | | | (442,538 | ) |
| | |
|
| |
|
|
|
Options written, outstanding at August 31, 2007 | | 129,399,965 | | | | 1,926,736 | |
| | |
|
| |
|
|
|
At August 31, 2007, Core Fixed Income Investments and International Fixed Income Investments had open forward foreign currency contracts as described below. The unrealized gain (loss) on the open contracts reflected in the accompanying financial statements were as follows:
Core Fixed Income Investments
| | | | | | | | | | | |
Foreign Currency
| | Local Currency
| | Market Value
| | Settlement Date
| | Unrealized
Gain (Loss)
| |
Contracts to Buy: | | | | | | | | | | | |
Brazilian Real | | 3,742,286 | | $ | 1,895,104 | | 10/2/07 | | $ | 58,177 | |
Euro | | 2,600,000 | | | 3,551,578 | | 10/4/07 | | | 15,305 | |
Indian Rupee | | 102,191,670 | | | 2,510,312 | | 10/3/07 | | | 25,623 | |
Indian Rupee | | 102,738,434 | | | 2,505,179 | | 5/12/08 | | | 61,733 | |
Japanese Yen | | 741,672,000 | | | 6,448,491 | | 10/25/07 | | | 299,303 | |
Mexican Peso | | 8,982,412 | | | 804,418 | | 3/13/08 | | | 16,418 | |
Pound Sterling | | 1,085,000 | | | 2,187,646 | | 9/20/07 | | | 14,607 | |
Russian Ruble | | 42,724,045 | | | 1,666,022 | | 9/19/07 | | | 35,022 | |
Russian Ruble | | 64,248,210 | | | 2,500,963 | | 1/11/08 | | | (4,037 | ) |
Russian Ruble | | 42,724,045 | | | 1,654,393 | | 7/10/08 | | | (32,971 | ) |
South Korean Won | | 1,666,883,700 | | | 1,779,846 | | 9/27/07 | | | (25,313 | ) |
South Korean Won | | 581,528,000 | | | 627,591 | | 8/4/08 | | | (409 | ) |
Swiss Franc | | 1,043,000 | | | 864,452 | | 9/6/07 | | | 6,016 | |
Yuan Renminbi | | 35,157,669 | | | 4,722,730 | | 1/10/08 | | | (38,889 | ) |
Yuan Renminbi | | 23,328,711 | | | 3,151,184 | | 3/5/08 | | | (25,816 | ) |
| | | | | | | | | |
|
|
|
| | | | | | | | | | | 404,769 | |
| | | | | | | | | |
|
|
|
Contracts to Sell: | | | | | | | | | | | |
Euro | | 5,196,000 | | | 7,097,692 | | 10/4/07 | | | (38,900 | ) |
Indian Rupee | | 102,191,670 | | | 2,510,312 | | 10/3/07 | | | (49,903 | ) |
Japanese Yen | | 264,464,000 | | | 2,299,391 | | 10/25/07 | | | (5,847 | ) |
Pound Sterling | | 3,141,000 | | | 6,333,083 | | 9/20/07 | | | 9,490 | |
Russian Ruble | | 42,724,045 | | | 1,666,022 | | 9/19/07 | | | 16,027 | |
Russian Ruble | | 50,920,000 | | | 1,982,141 | | 1/11/08 | | | 17,859 | |
South Korean Won | | 589,378,000 | | | 629,319 | | 9/27/07 | | | (1,319 | ) |
Yuan Renminbi | | 12,200,000 | | | 1,647,946 | | 3/5/08 | | | 24,433 | |
| | | | | | | | | |
|
|
|
| | | | | | | | | | | (28,160 | ) |
| | | | | | | | | |
|
|
|
Net Unrealized Gain on Open Forward
Foreign Currency Contracts | | | | | | | | | $ | 376,609 | |
| | | | | | | | | |
|
|
|
153
Notes to Financial Statements
(continued)
International Fixed Income Investments
| | | | | | | | | | | |
Foreign Currency
| | Local Currency
| | Market Value
| | Settlement Date
| | Unrealized
Gain (Loss)
| |
Contracts to Buy: | | | | | | | | | | | |
Australian Dollar | | 6,669,311 | | $ | 5,439,229 | | 9/13/07 | | $ | (260,150 | ) |
Brazilian Real | | 1,136,325 | | | 577,489 | | 9/5/07 | | | 13,556 | |
Brazilian Real | | 4,906,920 | | | 2,484,878 | | 10/2/07 | | | 72,878 | |
Brazilian Real | | 3,755,798 | | | 1,872,574 | | 3/4/08 | | | 6,309 | |
Chilean Peso | | 60,000,000 | | | 114,475 | | 3/13/08 | | | 623 | |
Euro | | 291,000 | | | 397,504 | | 10/4/07 | | | 2,156 | |
Indian Rupee | | 509,000 | | | 12,483 | | 11/29/07 | | | 59 | |
Indian Rupee | | 47,204,400 | | | 1,151,034 | | 5/12/08 | | | (995 | ) |
Japanese Yen | | 547,959,000 | | | 4,764,247 | | 10/25/07 | | | 211,921 | |
Malaysian Ringgits | | 1,495,564 | | | 427,300 | | 9/5/07 | | | (6,700 | ) |
Malaysian Ringgits | | 612,854 | | | 175,410 | | 10/3/07 | | | (2,590 | ) |
Malaysian Ringgits | | 9,293,163 | | | 2,685,724 | | 5/12/08 | | | (76,685 | ) |
Malaysian Ringgits | | 612,854 | | | 177,658 | | 8/4/08 | | | (2,461 | ) |
Mexican Peso | | 18,521,206 | | | 1,658,664 | | 3/13/08 | | | 14,526 | |
New Taiwan Dollar | | 19,411,494 | | | 588,489 | | 9/4/07 | | | (3,264 | ) |
New Taiwan Dollar | | 12,446,405 | | | 378,517 | | 10/4/07 | | | (357 | ) |
New Zealand Dollar | | 1,000,000 | | | 701,298 | | 9/17/07 | | | 7,998 | |
New Zealand Dollar | | 2,342,198 | | | 1,640,991 | | 9/28/07 | | | (29,511 | ) |
Norwegian Krone | | 3,452,000 | | | 593,036 | | 9/6/07 | | | 16,905 | |
Norwegian Krone | | 4,155,858 | | | 714,253 | | 9/20/07 | | | (82 | ) |
Russian Ruble | | 88,495,800 | | | 3,444,839 | | 1/11/08 | | | 52,839 | |
Russian Ruble | | 29,390,715 | | | 1,138,089 | | 7/10/08 | | | (22,911 | ) |
Singapore Dollar | | 215,000 | | | 141,608 | | 10/18/07 | | | (1,334 | ) |
Singapore Dollar | | 599,166 | | | 397,885 | | 2/20/08 | | | (4,701 | ) |
South Korean Won | | 293,003,100 | | | 312,738 | | 9/21/07 | | | (4,262 | ) |
South Korean Won | | 145,454,800 | | | 156,408 | | 1/30/08 | | | (1,592 | ) |
South Korean Won | | 1,276,285,470 | | | 1,376,661 | | 5/30/08 | | | (2,205 | ) |
Swedish Krona | | 1,140,000 | | | 165,650 | | 9/6/07 | | | (3,938 | ) |
Swedish Krona | | 1,042,108 | | | 151,546 | | 9/20/07 | | | (3,333 | ) |
Yuan Renminbi | | 8,049,110 | | | 1,067,511 | | 9/6/07 | | | 22,511 | |
Yuan Renminbi | | 8,760,700 | | | 1,171,134 | | 11/21/07 | | | (866 | ) |
Yuan Renminbi | | 8,188,756 | | | 1,095,196 | | 11/26/07 | | | 2,196 | |
Yuan Renminbi | | 30,652,908 | | | 4,117,605 | | 1/10/08 | | | (35,547 | ) |
Yuan Renminbi | | 12,590,897 | | | 1,701,163 | | 3/7/08 | | | (20,837 | ) |
Yuan Renminbi | | 9,708,595 | | | 1,329,746 | | 7/2/08 | | | (12,875 | ) |
| | | | | | | | | |
|
|
|
| | | | | | | | | | | (72,719 | ) |
| | | | | | | | | |
|
|
|
Contracts to Sell: | | | | | | | | | | | |
Australian Dollar | | 2,805,000 | | | 2,287,380 | | 9/17/07 | | | (45,624 | ) |
Australian Dollar | | 2,403,000 | | | 1,958,930 | | 9/28/07 | | | 23,172 | |
Brazilian Real | | 1,136,325 | | | 577,489 | | 9/5/07 | | | (32,489 | ) |
Brazilian Real | | 2,502,320 | | | 1,267,182 | | 10/2/07 | | | 13,272 | |
Canadian Dollar | | 1,102,000 | | | 1,043,724 | | 9/20/07 | | | 1,406 | |
Chilean Peso | | 58,150,000 | | | 110,945 | | 3/13/08 | | | (1,000 | ) |
Danish Krone | | 11,292,000 | | | 2,068,477 | | 9/6/07 | | | (17,511 | ) |
Euro | | 50,807,000 | | | 69,401,928 | | 10/4/07 | | | (550,822 | ) |
154
Notes to Financial Statements
(continued)
| | | | | | | | | | | |
Foreign Currency
| | Local Currency
| | Market Value
| | Settlement Date
| | Unrealized
Gain (Loss)
| |
Contracts to Sell (cont.): | | | | | | | | | | | |
Japanese Yen | | 136,383,875 | | $ | 1,180,967 | | 9/27/07 | | $ | 3,033 | |
Japanese Yen | | 231,276,506 | | | 2,010,841 | | 10/25/07 | | | (54,841 | ) |
Malaysian Ringgits | | 1,495,564 | | | 427,300 | | 9/5/07 | | | 626 | |
Malaysian Ringgits | | 612,854 | | | 175,410 | | 10/3/07 | | | 1,793 | |
Mexican Peso | | 5,861,806 | | | 524,953 | | 3/13/08 | | | (2,953 | ) |
New Taiwan Dollar | | 19,411,494 | | | 588,489 | | 9/4/07 | | | (64 | ) |
New Zealand Dollar | | 5,324,000 | | | 3,733,709 | | 9/17/07 | | | (42,580 | ) |
Polish Zloty | | 7,061,000 | | | 2,523,228 | | 3/13/08 | | | (77,606 | ) |
Pound Sterling | | 2,427,000 | | | 4,893,471 | | 9/20/07 | | | (34,484 | ) |
Pound Sterling | | 77,000 | | | 155,252 | | 9/20/07 | | | (373 | ) |
Pound Sterling | | 355,000 | | | 715,773 | | 9/20/07 | | | (1,438 | ) |
Singapore Dollar | | 202,000 | | | 133,046 | | 10/18/07 | | | 554 | |
South Korean Won | | 293,003,100 | | | 312,738 | | 9/21/07 | | | (2,105 | ) |
Yuan Renminbi | | 8,049,110 | | | 1,067,511 | | 9/6/07 | | | (1,121 | ) |
Yuan Renminbi | | 1,969,878 | | | 264,614 | | 1/10/08 | | | 386 | |
| | | | | | | | | |
|
|
|
| | | | | | | | | | | (820,769 | ) |
| | | | | | | | | |
|
|
|
Net Unrealized Loss on Open Forward
Foreign Currency Contracts | | | | | | | | | $ | (893,488 | ) |
| | | | | | | | | |
|
|
|
At August 31, 2007, Core Fixed Income Investments held the following interest rate swap contracts:
| | |
Interest Rate Swap Contracts | | |
Core Fixed Income Investments | | |
Swap Counterparty: | | Goldman Sachs & Co. |
Effective Date: | | May 16, 2007 |
Notional Amount: | | 8,400,000 BRL |
Payments Made by Fund: | | Floating Rate (BR-CDI-Compounded) |
Payments Received by Fund: | | Fixed Rate, 10.15% |
Termination Date: | | January 2, 2012 |
Unrealized Depreciation | | $(204,993)
|
Swap Counterparty: | | Goldman Sachs & Co. |
Effective Date: | | May 16, 2007 |
Notional Amount: | | 12,300,000 BRL |
Payments Made by Fund: | | Floating Rate (BR-CDI-Compounded) |
Payments Received by Fund: | | Fixed Rate, 10.12% |
Termination Date: | | January 2, 2012 |
Unrealized Depreciation | | $(261,172)
|
Swap Counterparty: | | UBS Securities LLC |
Effective Date: | | October 15, 2005 |
Notional Amount: | | 200,000 EUR |
Payments Made by Fund: | | Floating Rate (French CPI Ex-Tobacco Daily Reference Index) |
Payments Received by Fund: | | Fixed Rate, 2.15% |
Termination Date: | | October 15, 2010 |
Unrealized Appreciation | | $4,626
|
Swap Counterparty: | | Barclays Bank PLC |
Effective Date: | | September 15, 2006 |
Notional Amount: | | 3,300,000 GBP |
Payments Made by Fund: | | Fixed Rate, 5.00% |
Payments Received by Fund: | | Floating Rate (6-Month GBP-LIBOR) |
Termination Date: | | September 15, 2010 |
Unrealized Depreciation | | $(148,611)
|
155
Notes to Financial Statements
(continued)
| | |
Swap Counterparty: | | Barclays Bank PLC |
Effective Date: | | December 15, 2015 |
Notional Amount: | | 700,000 GBP |
Payments Made by Fund: | | Fixed Rate, 4.00% |
Payments Received by Fund: | | Floating Rate (6-Month GBP-LIBOR) |
Termination Date: | | December 15, 2035 |
Unrealized Appreciation | | $108,998
|
Swap Counterparty: | | HSBC Bank USA |
Effective Date: | | June 15, 2007 |
Notional Amount: | | 4,400,000 GBP |
Payments Made by Fund: | | Floating Rate (6-Month GBP-LIBOR) |
Payments Received by Fund: | | Fixed Rate, 5.00% |
Termination Date: | | June 15, 2009 |
Unrealized Depreciation | | $(63,706)
|
Swap Counterparty: | | HSBC Bank USA |
Effective Date: | | December 15, 2015 |
Notional Amount: | | 500,000 GBP |
Payments Made by Fund: | | Fixed Rate, 4.00% |
Payments Received by Fund: | | Floating Rate (6-Month GBP-LIBOR) |
Termination Date: | | December 15, 2035 |
Unrealized Appreciation | | $44,910
|
Swap Counterparty: | | UBS Securities LLC |
Effective Date: | | December 20, 2007 |
Notional Amount: | | 10,500,000 GBP |
Payments Made by Fund: | | Floating Rate (6-Month GBP-LIBOR) |
Payments Received by Fund: | | Fixed Rate, 5.00% |
Termination Date: | | December 20, 2008 |
Unrealized Depreciation | | $(95,962)
|
Swap Counterparty: | | Barclays Bank PLC |
Effective Date: | | December 20, 2007 |
Notional Amount: | | 40,000,000 JPY |
Payments Made by Fund: | | Fixed Rate, 2.00% |
Payments Received by Fund: | | Floating Rate (6-Month JPY-LIBOR) |
Termination Date: | | December 20, 2016 |
Unrealized Depreciation | | $(12,065)
|
Swap Counterparty: | | UBS Securities LLC |
Effective Date: | | December 20, 2007 |
Notional Amount: | | 90,000,000 JPY |
Payments Made by Fund: | | Fixed Rate, 2.00% |
Payments Received by Fund: | | Floating Rate (6-Month JPY-LIBOR) |
Termination Date: | | December 20, 2016 |
Unrealized Depreciation | | $(25,357)
|
Swap Counterparty: | | Merrill Lynch & Co., Inc. |
Effective Date: | | November 17, 2006 |
Notional Amount: | | 44,000,000 MXN |
Payments Made by Fund: | | Floating Rate (28 Day Mexico Interbank TIIE Banxico) |
Payments Received by Fund: | | Fixed Rate, 8.17% |
Termination Date: | | November 4, 2016 |
Unrealized Depreciation | | $(44,099)
|
Swap Counterparty: | | Bank of America |
Effective Date: | | December 19, 2007 |
Notional Amount: | | 8,000,000 USD |
Payments Made by Fund: | | Floating Rate (3-Month USD-LIBOR) |
Payments Received by Fund: | | Fixed Rate, 5.00% |
Termination Date: | | December 19, 2009 |
Unrealized Appreciation | | $100,017
|
156
Notes to Financial Statements
(continued)
| | |
Swap Counterparty: | | Bank of America |
Effective Date: | | June 20, 2007 |
Notional Amount: | | 100,000 USD |
Payments Made by Fund: | | Fixed Rate, 5.00% |
Payments Received by Fund: | | Floating Rate (3-Month USD-LIBOR) |
Termination Date: | | June 20, 2022 |
Unrealized Depreciation | | $(421)
|
Swap Counterparty: | | Bank of America |
Effective Date: | | June 15, 2005 |
Notional Amount: | | 1,500,000 USD |
Payments Made by Fund: | | Floating Rate (3-Month USD-LIBOR) |
Payments Received by Fund: | | Fixed Rate, 6.00% |
Termination Date: | | June 15, 2035 |
Unrealized Depreciation | | $(33,647)
|
Swap Counterparty: | | Barclays Bank PLC |
Effective Date: | | December 19, 2007 |
Notional Amount: | | 700,000 USD |
Payments Made by Fund: | | Floating Rate (3-Month USD-LIBOR) |
Payments Received by Fund: | | Fixed Rate, 5.00% |
Termination Date: | | December 19, 2009 |
Unrealized Appreciation | | $7,037
|
Swap Counterparty: | | Deutsche Bank AG |
Effective Date: | | December 19, 2007 |
Notional Amount: | | 7,000,000 USD |
Payments Made by Fund: | | Floating Rate (3-Month USD-LIBOR) |
Payments Received by Fund: | | Fixed Rate, 5.00% |
Termination Date: | | December 19, 2009 |
Unrealized Appreciation | | $92,695
|
Swap Counterparty: | | Deutsche Bank AG |
Effective Date: | | December 19, 2007 |
Notional Amount: | | 5,400,000 USD |
Payments Made by Fund: | | Floating Rate (3-Month USD-LIBOR) |
Payments Received by Fund: | | Fixed Rate, 5.00% |
Termination Date: | | December 19, 2014 |
Unrealized Appreciation | | $148,282
|
Swap Counterparty: | | Deutsche Bank AG |
Effective Date: | | December 19, 2007 |
Notional Amount: | | 5,700,000 USD |
Payments Made by Fund: | | Floating Rate (3-Month USD-LIBOR) |
Payments Received by Fund: | | Fixed Rate, 5.20% |
Termination Date: | | December 19, 2017 |
Unrealized Appreciation | | $46,234
|
Swap Counterparty: | | Deutsche Bank AG |
Effective Date: | | December 19, 2007 |
Notional Amount: | | 5,300,000 USD |
Payments Made by Fund: | | Floating Rate (3-Month USD-LIBOR) |
Payments Received by Fund: | | Fixed Rate, 5.00% |
Termination Date: | | December 19, 2037 |
Unrealized Appreciation | | $328,669
|
157
Notes to Financial Statements
(continued)
| | |
Swap Counterparty: | | Goldman Sachs & Co. |
Effective Date: | | December 19, 2007 |
Notional Amount: | | 5,800,000 USD |
Payments Made by Fund: | | Floating Rate (3-Month USD-LIBOR) |
Payments Received by Fund: | | Fixed Rate, 5.00% |
Termination Date: | | December 19, 2037 |
Unrealized Appreciation | | $421,387
|
Swap Counterparty: | | Lehman Brothers, Inc. |
Effective Date: | | December 19, 2007 |
Notional Amount: | | 2,600,000 USD |
Payments Made by Fund: | | Floating Rate (3-Month USD-LIBOR) |
Payments Received by Fund: | | Fixed Rate, 5.00% |
Termination Date: | | December 19, 2012 |
Unrealized Appreciation | | $68,102
|
Swap Counterparty: | | Lehman Brothers, Inc. |
Effective Date: | | May 18, 2007 |
Notional Amount: | | 2,100,000 USD |
Payments Made by Fund: | | Floating Rate (ATMF Straddle Premium) |
Payments Received by Fund: | | Fixed Rate, 4.65% |
Termination Date: | | May 18, 2017 |
Unrealized Depreciation | | $(27,879)
|
Swap Counterparty: | | Lehman Brothers, Inc. |
Effective Date: | | May 24, 2007 |
Notional Amount: | | 1,200,000 USD |
Payments Made by Fund: | | Floating Rate (ATMF Straddle Premium) |
Payments Received by Fund: | | Fixed Rate, 4.52% |
Termination Date: | | May 24, 2017 |
Unrealized Depreciation | | $(14,595)
|
Swap Counterparty: | | Merrill Lynch & Co., Inc. |
Effective Date: | | December 19, 2007 |
Notional Amount: | | 6,800,000 USD |
Payments Made by Fund: | | Floating Rate (3-Month USD-LIBOR) |
Payments Received by Fund: | | Fixed Rate, 5.00% |
Termination Date: | | December 19, 2017 |
Unrealized Appreciation | | $12,370
|
Swap Counterparty: | | Royal Bank of Scotland PLC |
Effective Date: | | December 19, 2007 |
Notional Amount: | | 16,100,000 USD |
Payments Made by Fund: | | Floating Rate (3-Month USD-LIBOR) |
Payments Received by Fund: | | Fixed Rate, 5.00% |
Termination Date: | | December 19, 2012 |
Unrealized Appreciation | | $317,187
|
Swap Counterparty: | | Royal Bank of Scotland PLC |
Effective Date: | | December 19, 2007 |
Notional Amount: | | 4,000,000 USD |
Payments Made by Fund: | | Fixed Rate, 5.00% |
Payments Received by Fund: | | Floating Rate (3-Month USD-LIBOR) |
Termination Date: | | December 19, 2017 |
Unrealized Appreciation | | $8,925
|
158
Notes to Financial Statements
(continued)
At August 31, 2007, Core Fixed Income Investments held the following credit default swap contracts:
| | |
Credit Default Swaps | | |
Core Fixed Income Investments | | |
Swap Counterparty: | | Bank of America |
Effective Date: | | March 28, 2007 |
Reference Entity: | | Dow Jones CDX HY |
Notional Amount: | | 2,900,000 USD |
Termination Date: | | June 20, 2012 |
Unrealized Appreciation | | $117,999
|
Swap Counterparty: | | Barclays Bank PLC |
Effective Date: | | October 19, 2006 |
Reference Entity: | | ISTAR Financial |
Notional Amount: | | 300,000 USD |
Termination Date: | | March 20, 2011 |
Unrealized Appreciation | | $11,458
|
Swap Counterparty: | | Barclays Bank PLC |
Effective Date: | | October 18, 2006 |
Reference Entity: | | Daimler Finance North America |
Notional Amount: | | 600,000 USD |
Termination Date: | | September 20, 2011 |
Unrealized Depreciation | | $(5,791)
|
Swap Counterparty: | | Barclays Bank PLC |
Effective Date: | | November 14, 2006 |
Reference Entity: | | Daimler Finance North America |
Notional Amount: | | 300,000 USD |
Termination Date: | | September 20, 2011 |
Unrealized Depreciation | | $(2,505)
|
Swap Counterparty: | | Barclays Bank PLC |
Effective Date: | | September 21, 2006 |
Reference Entity: | | Dow Jones CDX HVOL7 Index |
Notional Amount: | | 1,900,000 USD |
Termination Date: | | December 20, 2011 |
Unrealized Appreciation | | $33,041
|
Swap Counterparty: | | Barclays Bank PLC |
Effective Date: | | May 19, 2007 |
Reference Entity: | | Baxter International Inc. |
Notional Amount: | | 800,000 USD |
Termination Date: | | June 20, 2012 |
Unrealized Appreciation | | $7,124
|
Swap Counterparty: | | Barclays Bank PLC |
Effective Date: | | May 19, 2007 |
Reference Entity: | | Schlumberger Ltd. |
Notional Amount: | | 1,000,000 USD |
Termination Date: | | June 20, 2012 |
Unrealized Depreciation | | $(1,291)
|
Swap Counterparty: | | Barclays Bank PLC |
Effective Date: | | March 21, 2007 |
Reference Entity: | | Dow Jones CDX 10 YR Index |
Notional Amount: | | 4,700,000 USD |
Termination Date: | | June 20, 2017 |
Unrealized Depreciation | | $(16,990)
|
159
Notes to Financial Statements
(continued)
| | |
Swap Counterparty: | | Bear Stearns & Co., Inc. |
Effective Date: | | June 28, 2005 |
Reference Entity: | | Trinity CDO, Ltd. |
Notional Amount: | | 2,000,000 USD |
Termination Date: | | March 8, 2040 |
Unrealized Appreciation | | $928,372
|
Swap Counterparty: | | Bear Stearns & Co., Inc. |
Effective Date: | | October 17, 2006 |
Reference Entity: | | ESP Funding, Ltd. |
Notional Amount: | | 700,000 USD |
Termination Date: | | October 5, 2046 |
Unrealized Appreciation | | $348,028
|
Swap Counterparty: | | BNP Paribas Bank |
Effective Date: | | July 27, 2007 |
Reference Entity: | | Morgan Stanley |
Notional Amount: | | 2,100,000 USD |
Termination Date: | | September 20, 2012 |
Unrealized Appreciation | | $12,988
|
Swap Counterparty: | | BNP Paribas Bank |
Effective Date: | | November 16, 2006 |
Reference Entity: | | HSBC Finance Corp. |
Notional Amount: | | 300,000 USD |
Termination Date: | | December 20, 2013 |
Unrealized Appreciation | | $7,109
|
Swap Counterparty: | | Deutsche Bank AG |
Effective Date: | | May 13, 2006 |
Reference Entity: | | Republic of Hungary |
Notional Amount: | | 800,000 USD |
Termination Date: | | May 20, 2016 |
Unrealized Depreciation | | $(4,152)
|
Swap Counterparty: | | Deutsche Bank AG |
Effective Date: | | October 26, 2006 |
Reference Entity: | | Goodrich Corp. |
Notional Amount: | | 300,000 USD |
Termination Date: | | September 20, 2016 |
Unrealized Depreciation | | $(706)
|
Swap Counterparty: | | Goldman Sachs & Co. |
Effective Date: | | January 10, 2007 |
Reference Entity: | | AIG Corp. |
Notional Amount: | | 1,500,000 USD |
Termination Date: | | March 20, 2008 |
Unrealized Depreciation | | $(2,041)
|
Swap Counterparty: | | HSBC Bank USA |
Effective Date: | | February 8, 2007 |
Reference Entity: | | Russian Federation |
Notional Amount: | | 700,000 USD |
Termination Date: | | February 20, 2008 |
Unrealized Depreciation | | $(768)
|
Swap Counterparty: | | J.P. Morgan Chase & Co. |
Effective Date: | | September 21, 2006 |
Reference Entity: | | Dow Jones CDX XO7 Index |
Notional Amount: | | 2,000,000 USD |
Termination Date: | | December 20, 2011 |
Unrealized Appreciation | | $54,757
|
160
Notes to Financial Statements
(continued)
| | |
Swap Counterparty: | | J.P. Morgan Chase & Co. |
Effective Date: | | May 13, 2006 |
Reference Entity: | | Republic of Hungary |
Notional Amount: | | 800,000 USD |
Termination Date: | | May 20, 2016 |
Unrealized Depreciation | | $(3,865)
|
Swap Counterparty: | | Lehman Brothers, Inc. |
Effective Date: | | March 21, 2007 |
Reference Entity: | | Dow Jones CDX IG8 Index |
Notional Amount: | | 1,300,000 USD |
Termination Date: | | June 20, 2012 |
Unrealized Appreciation | | $4,558
|
Swap Counterparty: | | Lehman Brothers, Inc. |
Effective Date: | | March 21, 2007 |
Reference Entity: | | Dow Jones CDX IG8 Index |
Notional Amount: | | 3,800,000 USD |
Termination Date: | | June 20, 2012 |
Unrealized Appreciation | | $17,595
|
Swap Counterparty: | | Merrill Lynch & Co., Inc. |
Effective Date: | | July 24, 2007 |
Reference Entity: | | GMAC |
Notional Amount: | | 4,000,000 USD |
Termination Date: | | September 20, 2017 |
Unrealized Depreciation | | $(361,755)
|
Swap Counterparty: | | Merrill Lynch & Co., Inc. |
Effective Date: | | April 4, 2007 |
Reference Entity: | | Saratoga CLO I, Ltd. |
Notional Amount: | | 1,000,000 USD |
Termination Date: | | December 15, 2019 |
Unrealized Appreciation | | $76,069
|
Swap Counterparty: | | Merrill Lynch & Co., Inc. |
Effective Date: | | April 4, 2007 |
Reference Entity: | | Saratoga CLO I, Ltd. |
Notional Amount: | | 1,100,000 USD |
Termination Date: | | December 15, 2019 |
Unrealized Depreciation | | $(8,957)
|
Swap Counterparty: | | Merrill Lynch & Co., Inc. |
Effective Date: | | April 4, 2007 |
Reference Entity: | | Race Point CLO |
Notional Amount: | | 800,000 USD |
Termination Date: | | April 15, 2020 |
Unrealized Appreciation | | $70,363
|
Swap Counterparty: | | Merrill Lynch & Co., Inc. |
Effective Date: | | April 4, 2007 |
Reference Entity: | | Race Point CLO |
Notional Amount: | | 1,100,000 USD |
Termination Date: | | April 15, 2020 |
Unrealized Appreciation | | $160,202
|
Swap Counterparty: | | Morgan Stanley |
Effective Date: | | June 20, 2007 |
Reference Entity: | | Russian Federation |
Notional Amount: | | 200,000 USD |
Termination Date: | | June 20, 2008 |
Unrealized Depreciation | | $(382)
|
161
Notes to Financial Statements
(continued)
| | |
Swap Counterparty: | | Morgan Stanley |
Effective Date: | | August 31, 2005 |
Reference Entity: | | Republic of Turkey |
Notional Amount: | | 200,000 USD |
Termination Date: | | September 20, 2010 |
Unrealized Depreciation | | $(9,763)
|
Swap Counterparty: | | Morgan Stanley |
Effective Date: | | April 6, 2007 |
Reference Entity: | | Target Corp. |
Notional Amount: | | 1,900,000 USD |
Termination Date: | | June 20, 2012 |
Unrealized Appreciation | | $12,397
|
Swap Counterparty: | | Morgan Stanley |
Effective Date: | | October 26, 2006 |
Reference Entity: | | Sealed Air Corp. |
Notional Amount: | | 300,000 USD |
Termination Date: | | September 20, 2013 |
Unrealized Appreciation | | $5,590
|
Swap Counterparty: | | Morgan Stanley |
Effective Date: | | May 13, 2006 |
Reference Entity: | | Republic of Hungary |
Notional Amount: | | 1,600,000 USD |
Termination Date: | | May 20, 2016 |
Unrealized Depreciation | | $(7,154)
|
Swap Counterparty: | | Morgan Stanley |
Effective Date: | | September 21, 2006 |
Reference Entity: | | Dow Jones CDX IG7 10 YR Index |
Notional Amount: | | 1,100,000 USD |
Termination Date: | | December 20, 2016 |
Unrealized Appreciation | | $18,643
|
Swap Counterparty: | | Royal Bank of Scotland PLC |
Effective Date: | | April 13, 2007 |
Reference Entity: | | Autozone Inc. |
Notional Amount: | | 800,000 USD |
Termination Date: | | June 20, 2017 |
Unrealized Appreciation | | $4,516
|
Swap Counterparty: | | Royal Bank of Scotland PLC |
Effective Date: | | April 24, 2007 |
Reference Entity: | | Autozone Inc. |
Notional Amount: | | 400,000 USD |
Termination Date: | | June 20, 2017 |
Unrealized Appreciation | | $3,187
|
Swap Counterparty: | | Royal Bank of Scotland PLC |
Effective Date: | | April 28, 2007 |
Reference Entity: | | Autozone Inc. |
Notional Amount: | | 300,000 USD |
Termination Date: | | June 20, 2017 |
Unrealized Appreciation | | $2,273
|
Swap Counterparty: | | Royal Bank of Scotland PLC |
Effective Date: | | April 13, 2007 |
Reference Entity: | | Newell Rubbermaid Inc. |
Notional Amount: | | 400,000 USD |
Termination Date: | | June 20, 2017 |
Unrealized Appreciation | | $2,032
|
162
Notes to Financial Statements
(continued)
| | |
Swap Counterparty: | | UBS Securities LLC |
Effective Date: | | March 28, 2007 |
Reference Entity: | | Dow Jones CDX HY Index |
Notional Amount: | | 3,400,000 USD |
Termination Date: | | June 20, 2012 |
Unrealized Appreciation | | $138,344
|
Swap Counterparty: | | UBS Securities LLC |
Effective Date: | | March 28, 2007 |
Reference Entity: | | Dow Jones CDX HY Index |
Notional Amount: | | 1,500,000 USD |
Termination Date: | | June 20, 2012 |
Unrealized Depreciation | | $(14,159)
|
Swap Counterparty: | | UBS Securities LLC |
Effective Date: | | April 13, 2007 |
Reference Entity: | | Newell Rubbermaid Inc. |
Notional Amount: | | 200,000 USD |
Termination Date: | | June 20, 2017 |
Unrealized Appreciation | | $1,094
|
At August 31, 2007, International Fixed Income Investments held the following interest rate swap contracts:
| | |
Interest Rate Swap Contracts | | |
International Fixed Income Investments | | |
Swap Counterparty: | | Deutsche Bank AG |
Effective Date: | | January 15, 2008 |
Notional Amount: | | 8,050,000 AUD |
Payments Made by Fund: | | Floating Rate (3-Month AUD BB) |
Payments Received by Fund: | | Fixed Rate, 6.50% |
Termination Date: | | January 15, 2009 |
Unrealized Depreciation | | $(3,933)
|
Swap Counterparty: | | Deutsche Bank AG |
Effective Date: | | June 16, 2008 |
Notional Amount: | | 12,500,000 AUD |
Payments Made by Fund: | | Floating Rate (6-Month AUD BB) |
Payments Received by Fund: | | Fixed Rate, 7.00% |
Termination Date: | | June 15, 2010 |
Unrealized Appreciation | | $11,814
|
Swap Counterparty: | | HSBC Bank USA |
Effective Date: | | June 15, 2007 |
Notional Amount: | | 7,500,000 AUD |
Payments Made by Fund: | | Floating Rate (6-Month AUD BB) |
Payments Received by Fund: | | Fixed Rate, 6.00% |
Termination Date: | | June 15, 2012 |
Unrealized Depreciation | | $(145,745)
|
Swap Counterparty: | | HSBC Bank USA |
Effective Date: | | June 15, 2007 |
Notional Amount: | | 4,300,000 AUD |
Payments Made by Fund: | | Fixed Rate, 6.00% |
Payments Received by Fund: | | Floating Rate (6-Month AUD BBSW) |
Termination Date: | | June 15, 2017 |
Unrealized Appreciation | | $132,086
|
163
Notes to Financial Statements
(continued)
| | |
Swap Counterparty: | | Deutsche Bank AG |
Effective Date: | | September 20, 2007 |
Notional Amount: | | 3,000,000 CAD |
Payments Made by Fund: | | Fixed Rate, 5.00% |
Payments Received by Fund: | | Floating Rate (3-Month CAD-CBK) |
Termination Date: | | June 20, 2017 |
Unrealized Depreciation | | $(63,989)
|
Swap Counterparty: | | Merrill Lynch & Co., Inc. |
Effective Date: | | September 20, 2007 |
Notional Amount: | | 2,100,000 CAD |
Payments Made by Fund: | | Fixed Rate, 5.00% |
Payments Received by Fund: | | Floating Rate (3-Month CAD-CBK) |
Termination Date: | | June 20, 2017 |
Unrealized Depreciation | | $(59,618)
|
Swap Counterparty: | | Merrill Lynch & Co., Inc. |
Effective Date: | | June 20, 2012 |
Notional Amount: | | 2,500,000 CAD |
Payments Made by Fund: | | Fixed Rate, 5.50% |
Payments Received by Fund: | | Floating Rate (3-Month CAD-CBK) |
Termination Date: | | June 20, 2017 |
Unrealized Depreciation | | $(25,424)
|
Swap Counterparty: | | Royal Bank of Scotland PLC |
Effective Date: | | September 20, 2007 |
Notional Amount: | | 1,000,000 CAD |
Payments Made by Fund: | | Fixed Rate, 5.00% |
Payments Received by Fund: | | Floating Rate (3-Month CAD-CBK) |
Termination Date: | | June 20, 2017 |
Unrealized Depreciation | | $(18,168)
|
Swap Counterparty: | | Credit Suisse Securities (USA) LLC |
Effective Date: | | September 19, 2007 |
Notional Amount: | | 10,000,000 EUR |
Payments Made by Fund: | | Floating Rate (6-Month EUR Euribor) |
Payments Received by Fund: | | Fixed Rate, 5.00% |
Termination Date: | | September 19, 2012 |
Unrealized Appreciation | | $94,811
|
Swap Counterparty: | | Deutsche Bank AG |
Effective Date: | | December 15, 2006 |
Notional Amount: | | 10,100,000 EUR |
Payments Made by Fund: | | Fixed Rate, 4.00% |
Payments Received by Fund: | | Floating Rate (6-Month EUR Euribor) |
Termination Date: | | December 15, 2011 |
Unrealized Appreciation | | $6,400
|
Swap Counterparty: | | Deutsche Bank AG |
Effective Date: | | June 15, 2007 |
Notional Amount: | | 3,000,000 EUR |
Payments Made by Fund: | | Floating Rate (6-Month EUR-Euribor) |
Payments Received by Fund: | | Fixed Rate, 4.00% |
Termination Date: | | December 15, 2011 |
Unrealized Appreciation | | $25,420
|
Swap Counterparty: | | Deutsche Bank AG |
Effective Date: | | September 19, 2007 |
Notional Amount: | | 5,100,000 EUR |
Payments Made by Fund: | | Floating Rate (6-Month EUR Euribor) |
Payments Received by Fund: | | Fixed Rate, 4.00% |
Termination Date: | | September 19, 2012 |
Unrealized Appreciation | | $64,037
|
164
Notes to Financial Statements
(continued)
| | |
Swap Counterparty: | | Goldman Sachs & Co. |
Effective Date: | | December 19, 2007 |
Notional Amount: | | 13,000,000 EUR |
Payments Made by Fund: | | Floating Rate (6-Month EUR Euribor) |
Payments Received by Fund: | | Fixed Rate, 4.00% |
Termination Date: | | December 19, 2009 |
Unrealized Depreciation | | $(36,869)
|
Swap Counterparty: | | Goldman Sachs & Co. |
Effective Date: | | June 15, 2007 |
Notional Amount: | | 51,900,000 EUR |
Payments Made by Fund: | | Fixed Rate, 5.00% |
Payments Received by Fund: | | Floating Rate (6-Month EUR Euribor) |
Termination Date: | | December 15, 2011 |
Unrealized Appreciation | | $135,027
|
Swap Counterparty: | | Goldman Sachs & Co. |
Effective Date: | | June 15, 2007 |
Notional Amount: | | 1,300,000 EUR |
Payments Made by Fund: | | Floating Rate (French CPI Ex-Tobacco Daily Reference Index) |
Payments Received by Fund: | | Fixed Rate, 2.08% |
Termination Date: | | June 15, 2012 |
Unrealized Appreciation | | $1,061
|
Swap Counterparty: | | Goldman Sachs & Co. |
Effective Date: | | March 19, 2008 |
Notional Amount: | | 1,200,000 EUR |
Payments Made by Fund: | | Fixed Rate, 5.00% |
Payments Received by Fund: | | Floating Rate (6-Month EUR Euribor) |
Termination Date: | | March 19, 2038 |
Unrealized Depreciation | | $(74,668)
|
Swap Counterparty: | | Morgan Stanley |
Effective Date: | | January 11, 2005 |
Notional Amount: | | 3,900,000 EUR |
Payments Made by Fund: | | Fixed Rate, 6.00% |
Payments Received by Fund: | | Floating Rate (6-Month EUR Euribor) |
Termination Date: | | June 18, 2034 |
Unrealized Appreciation | | $1,357
|
Swap Counterparty: | | Barclays Bank PLC |
Effective Date: | | June 15, 2007 |
Notional Amount: | | 1,800,000 GBP |
Payments Made by Fund: | | Floating Rate (6-Month GBP-LIBOR) |
Payments Received by Fund: | | Fixed Rate, 5.00% |
Termination Date: | | June 15, 2009 |
Unrealized Depreciation | | $(47,565)
|
Swap Counterparty: | | Barclays Bank PLC |
Effective Date: | | September 15, 2006 |
Notional Amount: | | 800,000 GBP |
Payments Made by Fund: | | Fixed Rate, 5.00% |
Payments Received by Fund: | | Floating Rate (6-Month GBP-LIBOR) |
Termination Date: | | September 15, 2010 |
Unrealized Depreciation | | $(42,941)
|
165
Notes to Financial Statements
(continued)
| | |
Swap Counterparty: | | Barclays Bank PLC |
Effective Date: | | September 15, 2005 |
Notional Amount: | | 500,000 GBP |
Payments Made by Fund: | | Floating Rate (6-Month GBP-LIBOR) |
Payments Received by Fund: | | Fixed Rate, 5.00% |
Termination Date: | | September 15, 2015 |
Unrealized Depreciation | | $(70,874)
|
Swap Counterparty: | | Barclays Bank PLC |
Effective Date: | | September 15, 2015 |
Notional Amount: | | 4,100,000 GBP |
Payments Made by Fund: | | Fixed Rate, 4.50% |
Payments Received by Fund: | | Floating Rate (6-Month GBP-LIBOR) |
Termination Date: | | September 15, 2017 |
Unrealized Appreciation | | $16,413
|
Swap Counterparty: | | Barclays Bank PLC |
Effective Date: | | December 15, 2015 |
Notional Amount: | | 3,500,000 GBP |
Payments Made by Fund: | | Fixed Rate, 4.00% |
Payments Received by Fund: | | Floating Rate (6-Month GBP-LIBOR) |
Termination Date: | | December 15, 2035 |
Unrealized Appreciation | | $199,302
|
Swap Counterparty: | | Deutsche Bank AG |
Effective Date: | | September 15, 2006 |
Notional Amount: | | 900,000 GBP |
Payments Made by Fund: | | Floating Rate (6-Month GBP-LIBOR) |
Payments Received by Fund: | | Fixed Rate, 5.00% |
Termination Date: | | September 15, 2010 |
Unrealized Depreciation | | $(48,518)
|
Swap Counterparty: | | Deutsche Bank AG |
Effective Date: | | September 15, 2006 |
Notional Amount: | | 400,000 GBP |
Payments Made by Fund: | | Floating Rate (6-Month GBP-LIBOR) |
Payments Received by Fund: | | Fixed Rate, 5.00% |
Termination Date: | | September 15, 2015 |
Unrealized Depreciation | | $(36,991)
|
Swap Counterparty: | | Deutsche Bank AG |
Effective Date: | | June 12, 2006 |
Notional Amount: | | 100,000 GBP |
Payments Made by Fund: | | Fixed Rate, 4.25% |
Payments Received by Fund: | | Floating Rate (6-Month GBP-LIBOR) |
Termination Date: | | June 12, 2036 |
Unrealized Appreciation | | $20,420
|
Swap Counterparty: | | Goldman Sachs & Co. |
Effective Date: | | June 15, 2007 |
Notional Amount: | | 500,000 GBP |
Payments Made by Fund: | | Floating Rate (6-Month GBP-LIBOR) |
Payments Received by Fund: | | Fixed Rate, 5.00% |
Termination Date: | | June 15, 2009 |
Unrealized Depreciation | | $(15,024)
|
166
Notes to Financial Statements
(continued)
| | |
Swap Counterparty: | | Goldman Sachs & Co. |
Effective Date: | | September 15, 2006 |
Notional Amount: | | 1,900,000 GBP |
Payments Made by Fund: | | Floating Rate (6-Month GBP-LIBOR) |
Payments Received by Fund: | | Fixed Rate, 5.00% |
Termination Date: | | September 15, 2010 |
Unrealized Depreciation | | $(82,431)
|
Swap Counterparty: | | Goldman Sachs & Co. |
Effective Date: | | September 15, 2006 |
Notional Amount: | | 800,000 GBP |
Payments Made by Fund: | | Floating Rate (6-Month GBP-LIBOR) |
Payments Received by Fund: | | Fixed Rate, 5.00% |
Termination Date: | | September 15, 2015 |
Unrealized Depreciation | | $(34,320)
|
Swap Counterparty: | | HSBC Bank USA |
Effective Date: | | September 15, 2006 |
Notional Amount: | | 4,400,000 GBP |
Payments Made by Fund: | | Floating Rate (6-Month GBP-LIBOR) |
Payments Received by Fund: | | Fixed Rate, 5.00% |
Termination Date: | | September 15, 2010 |
Unrealized Appreciation | | $11,675
|
Swap Counterparty: | | HSBC Bank USA |
Effective Date: | | September 15, 2006 |
Notional Amount: | | 200,000 GBP |
Payments Made by Fund: | | Fixed Rate, 5.00% |
Payments Received by Fund: | | Floating Rate (6-Month GBP-LIBOR) |
Termination Date: | | September 15, 2015 |
Unrealized Depreciation | | $(8,028)
|
Swap Counterparty: | | HSBC Bank USA |
Effective Date: | | December 15, 2015 |
Notional Amount: | | 400,000 GBP |
Payments Made by Fund: | | Fixed Rate, 4.00% |
Payments Received by Fund: | | Floating Rate (6-Month GBP-LIBOR) |
Termination Date: | | December 15, 2035 |
Unrealized Appreciation | | $39,490
|
Swap Counterparty: | | HSBC Bank USA |
Effective Date: | | June 12, 2006 |
Notional Amount: | | 100,000 GBP |
Payments Made by Fund: | | Floating Rate (6-Month GBP-LIBOR) |
Payments Received by Fund: | | Fixed Rate, 4.25% |
Termination Date: | | June 12, 2036 |
Unrealized Depreciation | | $(14,088)
|
Swap Counterparty: | | J.P. Morgan Chase & Co. |
Effective Date: | | September 15, 2006 |
Notional Amount: | | 800,000 GBP |
Payments Made by Fund: | | Floating Rate (6-Month GBP-LIBOR) |
Payments Received by Fund: | | Fixed Rate, 5.00% |
Termination Date: | | September 15, 2015 |
Unrealized Depreciation | | $(76,013)
|
167
Notes to Financial Statements
(continued)
| | |
Swap Counterparty: | | Morgan Stanley |
Effective Date: | | June 15, 2007 |
Notional Amount: | | 1,800,000 GBP |
Payments Made by Fund: | | Floating Rate (6-Month GBP-LIBOR) |
Payments Received by Fund: | | Fixed Rate, 5.00% |
Termination Date: | | June 15, 2009 |
Unrealized Depreciation | | $(55,502)
|
Swap Counterparty: | | Morgan Stanley |
Effective Date: | | September 15, 2006 |
Notional Amount: | | 1,800,000 GBP |
Payments Made by Fund: | | Floating Rate (6-Month GBP-LIBOR) |
Payments Received by Fund: | | Fixed Rate, 5.00% |
Termination Date: | | September 15, 2010 |
Unrealized Depreciation | | $(122,803)
|
Swap Counterparty: | | Morgan Stanley |
Effective Date: | | December 15, 2015 |
Notional Amount: | | 200,000 GBP |
Payments Made by Fund: | | Floating Rate (6-Month GBP-LIBOR) |
Payments Received by Fund: | | Fixed Rate, 4.00% |
Termination Date: | | December 15, 2035 |
Unrealized Appreciation | | $17,266
|
Swap Counterparty: | | Royal Bank of Scotland PLC |
Effective Date: | | September 15, 2006 |
Notional Amount: | | 1,200,000 GBP |
Payments Made by Fund: | | Floating Rate (6-Month GBP-LIBOR) |
Payments Received by Fund: | | Fixed Rate, 5.00% |
Termination Date: | | September 15, 2015 |
Unrealized Depreciation | | $(115,400)
|
Swap Counterparty: | | Barclays Bank PLC |
Effective Date: | | December 20, 2007 |
Notional Amount: | | 780,000,000 JPY |
Payments Made by Fund: | | Fixed Rate, 2.00% |
Payments Received by Fund: | | Floating Rate (6-Month JPY-LIBOR) |
Termination Date: | | December 20, 2016 |
Unrealized Depreciation | | $(235,267)
|
Swap Counterparty: | | Barclays Bank PLC |
Effective Date: | | December 20, 2006 |
Notional Amount: | | 280,000,000 JPY |
Payments Made by Fund: | | Floating Rate (6-Month JPY-LIBOR) |
Payments Received by Fund: | | Fixed Rate, 2.00% |
Termination Date: | | December 20, 2025 |
Unrealized Appreciation | | $118,054
|
Swap Counterparty: | | Deutsche Bank AG |
Effective Date: | | March 19, 2008 |
Notional Amount: | | 2,800,000,000 JPY |
Payments Made by Fund: | | Floating Rate (6-Month JPY-LIBOR) |
Payments Received by Fund: | | Fixed Rate, 1.00% |
Termination Date: | | March 18, 2009 |
Unrealized Appreciation | | $3,913
|
168
Notes to Financial Statements
(continued)
| | |
Swap Counterparty: | | Deutsche Bank AG |
Effective Date: | | March 20, 2009 |
Notional Amount: | | 900,000,000 JPY |
Payments Made by Fund: | | Fixed Rate, 1.50% |
Payments Received by Fund: | | Floating Rate (6-Month JPY-LIBOR) |
Termination Date: | | March 20, 2011 |
Unrealized Depreciation | | $(27,193)
|
Swap Counterparty: | | Deutsche Bank AG |
Effective Date: | | June 20, 2007 |
Notional Amount: | | 250,000,000 JPY |
Payments Made by Fund: | | Floating Rate (6-Month JPY-LIBOR) |
Payments Received by Fund: | | Fixed Rate, 1.50% |
Termination Date: | | June 20, 2012 |
Unrealized Appreciation | | $3,090
|
Swap Counterparty: | | Deutsche Bank AG |
Effective Date: | | December 20, 2007 |
Notional Amount: | | 820,000,000 JPY |
Payments Made by Fund: | | Fixed Rate, 2.00% |
Payments Received by Fund: | | Floating Rate (6-Month JPY-LIBOR) |
Termination Date: | | December 20, 2016 |
Unrealized Depreciation | | $(246,132)
|
Swap Counterparty: | | Deutsche Bank AG |
Effective Date: | | December 20, 2007 |
Notional Amount: | | 250,000,000 JPY |
Payments Made by Fund: | | Fixed Rate, 2.50% |
Payments Received by Fund: | | Floating Rate (6-Month JPY-LIBOR) |
Termination Date: | | December 20, 2027 |
Unrealized Depreciation | | $(20,666)
|
Swap Counterparty: | | Goldman Sachs & Co. |
Effective Date: | | March 19, 2008 |
Notional Amount: | | 1,400,000,000 JPY |
Payments Made by Fund: | | Floating Rate (6-Month JPY-LIBOR) |
Payments Received by Fund: | | Fixed Rate, 1.00% |
Termination Date: | | March 18, 2009 |
Unrealized Depreciation | | $(8,545)
|
Swap Counterparty: | | Goldman Sachs & Co. |
Effective Date: | | June 20, 2008 |
Notional Amount: | | 950,000,000 JPY |
Payments Made by Fund: | | Fixed Rate, 2.00% |
Payments Received by Fund: | | Floating Rate (6-Month JPY-LIBOR) |
Termination Date: | | June 20, 2010 |
Unrealized Depreciation | | $(79,428)
|
Swap Counterparty: | | Goldman Sachs & Co. |
Effective Date: | | March 20, 2009 |
Notional Amount: | | 700,000,000 JPY |
Payments Made by Fund: | | Floating Rate (6-Month JPY-LIBOR) |
Payments Received by Fund: | | Fixed Rate, 1.50% |
Termination Date: | | March 20, 2011 |
Unrealized Depreciation | | $(12,425)
|
169
Notes to Financial Statements
(continued)
| | |
Swap Counterparty: | | Goldman Sachs & Co. |
Effective Date: | | June 20, 2007 |
Notional Amount: | | 220,000,000 JPY |
Payments Made by Fund: | | Floating Rate (6-Month JPY-LIBOR) |
Payments Received by Fund: | | Fixed Rate, 1.50% |
Termination Date: | | June 20, 2012 |
Unrealized Appreciation | | $5,732
|
Swap Counterparty: | | Goldman Sachs & Co. |
Effective Date: | | December 20, 2005 |
Notional Amount: | | 1,300,000,000 JPY |
Payments Made by Fund: | | Floating Rate (6-Month JPY-LIBOR) |
Payments Received by Fund: | | Fixed Rate, 1.50% |
Termination Date: | | December 20, 2015 |
Unrealized Depreciation | | $(324,869)
|
Swap Counterparty: | | Goldman Sachs & Co. |
Effective Date: | | December 20, 2007 |
Notional Amount: | | 850,000,000 JPY |
Payments Made by Fund: | | Fixed Rate, 2.00% |
Payments Received by Fund: | | Floating Rate (6-Month JPY-LIBOR) |
Termination Date: | | December 20, 2016 |
Unrealized Depreciation | | $(241,295)
|
Swap Counterparty: | | Goldman Sachs & Co. |
Effective Date: | | December 20, 2007 |
Notional Amount: | | 270,000,000 JPY |
Payments Made by Fund: | | Fixed Rate, 3.00% |
Payments Received by Fund: | | Floating Rate (6-Month JPY-LIBOR) |
Termination Date: | | June 20, 2036 |
Unrealized Depreciation | | $(126,435)
|
Swap Counterparty: | | J.P. Morgan Chase & Co. |
Effective Date: | | December 20, 2004 |
Notional Amount: | | 40,000,000 JPY |
Payments Made by Fund: | | Fixed Rate, 2.00% |
Payments Received by Fund: | | Floating Rate (6-Month JPY-LIBOR) |
Termination Date: | | December 20, 2013 |
Unrealized Appreciation | | $13,683
|
Swap Counterparty: | | Morgan Stanley |
Effective Date: | | March 19, 2008 |
Notional Amount: | | 2,750,000,000 JPY |
Payments Made by Fund: | | Floating Rate (6-Month JPY-LIBOR) |
Payments Received by Fund: | | Fixed Rate, 1.00% |
Termination Date: | | March 18, 2009 |
Unrealized Depreciation | | $(16,588)
|
Swap Counterparty: | | Morgan Stanley |
Effective Date: | | March 20, 2009 |
Notional Amount: | | 780,000,000 JPY |
Payments Made by Fund: | | Floating Rate (6-Month JPY-LIBOR) |
Payments Received by Fund: | | Fixed Rate, 1.50% |
Termination Date: | | March 20, 2011 |
Unrealized Depreciation | | $(11,813)
|
170
Notes to Financial Statements
(continued)
| | |
Swap Counterparty: | | Morgan Stanley |
Effective Date: | | June 20, 2007 |
Notional Amount: | | 190,000,000 JPY |
Payments Made by Fund: | | Floating Rate (6-Month JPY-LIBOR) |
Payments Received by Fund: | | Fixed Rate, 1.50% |
Termination Date: | | June 20, 2012 |
Unrealized Appreciation | | $414
|
Swap Counterparty: | | Morgan Stanley |
Effective Date: | | September 27, 2006 |
Notional Amount: | | 400,000,000 JPY |
Payments Made by Fund: | | Fixed Rate, 1.98% |
Payments Received by Fund: | | Floating Rate (6-Month JPY-LIBOR) |
Termination Date: | | September 27, 2016 |
Unrealized Depreciation | | $(71,334)
|
Swap Counterparty: | | UBS Securities LLC |
Effective Date: | | September 18, 2007 |
Notional Amount: | | 3,090,000,000 JPY |
Payments Made by Fund: | | Floating Rate (6-Month JPY-LIBOR) |
Payments Received by Fund: | | Fixed Rate, 1.00% |
Termination Date: | | September 18, 2008 |
Unrealized Depreciation | | $(18,443)
|
Swap Counterparty: | | UBS Securities LLC |
Effective Date: | | March 19, 2008 |
Notional Amount: | | 8,490,000,000 JPY |
Payments Made by Fund: | | Fixed Rate, 1.00% |
Payments Received by Fund: | | Floating Rate (6-Month JPY-LIBOR) |
Termination Date: | | March 18, 2009 |
Unrealized Depreciation | | $(43,217)
|
Swap Counterparty: | | UBS Securities LLC |
Effective Date: | | March 20, 2009 |
Notional Amount: | | 1,200,000,000 JPY |
Payments Made by Fund: | | Fixed Rate, 1.50% |
Payments Received by Fund: | | Floating Rate (6-Month JPY-LIBOR) |
Termination Date: | | March 20, 2011 |
Unrealized Depreciation | | $(15,619)
|
Swap Counterparty: | | UBS Securities LLC |
Effective Date: | | June 20, 2007 |
Notional Amount: | | 350,000,000 JPY |
Payments Made by Fund: | | Floating Rate (6-Month JPY-LIBOR) |
Payments Received by Fund: | | Fixed Rate, 1.50% |
Termination Date: | | June 20, 2012 |
Unrealized Appreciation | | $6,425
|
Swap Counterparty: | | J.P. Morgan Chase & Co. |
Effective Date: | | October 6, 2006 |
Notional Amount: | | 7,000,000 MXN |
Payments Made by Fund: | | Floating Rate (28 Day Mexico Interbank TIIE Banxico) |
Payments Received by Fund: | | Fixed Rate, 8.84% |
Termination Date: | | September 23, 2016 |
Unrealized Appreciation | | $22,264
|
171
Notes to Financial Statements
(continued)
| | |
Swap Counterparty: | | Merrill Lynch & Co., Inc. |
Effective Date: | | September 18, 2006 |
Notional Amount: | | 15,000,000 MXN |
Payments Made by Fund: | | Floating Rate (28 Day Mexico Interbank TIIE Banxico) |
Payments Received by Fund: | | Fixed Rate, 8.72% |
Termination Date: | | September 5, 2016 |
Unrealized Depreciation | | $(79)
|
Swap Counterparty: | | Merrill Lynch & Co., Inc. |
Effective Date: | | November 17, 2006 |
Notional Amount: | | 14,900,000 MXN |
Payments Made by Fund: | | Floating Rate (28 Day Mexico Interbank TIIE Banxico) |
Payments Received by Fund: | | Fixed Rate, 8.17% |
Termination Date: | | November 4, 2016 |
Unrealized Depreciation | | $(24,018)
|
Swap Counterparty: | | Bank of America |
Effective Date: | | June 18, 2008 |
Notional Amount: | | 7,700,000 USD |
Payments Made by Fund: | | Floating Rate (3-Month USD-LIBOR) |
Payments Received by Fund: | | Fixed Rate, 5.00% |
Termination Date: | | June 18, 2009 |
Unrealized Appreciation | | $7,858
|
Swap Counterparty: | | Bank of America |
Effective Date: | | December 18, 2013 |
Notional Amount: | | 32,000,000 USD |
Payments Made by Fund: | | Fixed Rate, 5.00% |
Payments Received by Fund: | | Floating Rate (3-Month USD-LIBOR) |
Termination Date: | | December 18, 2015 |
Unrealized Appreciation | | $50,237
|
Swap Counterparty: | | Bank of America |
Effective Date: | | December 19, 2007 |
Notional Amount: | | 1,800,000 USD |
Payments Made by Fund: | | Floating Rate (3-Month USD-LIBOR) |
Payments Received by Fund: | | Fixed Rate, 5.00% |
Termination Date: | | December 19, 2017 |
Unrealized Appreciation | | $44,318
|
Swap Counterparty: | | Barclays Bank PLC |
Effective Date: | | June 20, 2007 |
Notional Amount: | | 400,000 USD |
Payments Made by Fund: | | Fixed Rate, 5.00% |
Payments Received by Fund: | | Floating Rate (3-Month USD-LIBOR) |
Termination Date: | | June 20, 2017 |
Unrealized Appreciation | | $7,383
|
Swap Counterparty: | | Barclays Bank PLC |
Effective Date: | | June 20, 2007 |
Notional Amount: | | 2,000,000 USD |
Payments Made by Fund: | | Fixed Rate, 5.00% |
Payments Received by Fund: | | Floating Rate (3-Month USD-LIBOR) |
Termination Date: | | June 20, 2037 |
Unrealized Depreciation | | $(87,913)
|
172
Notes to Financial Statements
(continued)
| | |
Swap Counterparty: | | Credit Suisse Securities (USA) LLC |
Effective Date: | | June 20, 2007 |
Notional Amount: | | 2,700,000 USD |
Payments Made by Fund: | | Fixed Rate, 5.00% |
Payments Received by Fund: | | Floating Rate (3-Month USD-LIBOR) |
Termination Date: | | June 20, 2017 |
Unrealized Appreciation | | $57,045
|
Swap Counterparty: | | Deutsche Bank AG |
Effective Date: | | June 18, 2008 |
Notional Amount: | | 25,100,000 USD |
Payments Made by Fund: | | Floating Rate (3-Month USD-LIBOR) |
Payments Received by Fund: | | Fixed Rate, 5.00% |
Termination Date: | | June 18, 2009 |
Unrealized Appreciation | | $24,862
|
Swap Counterparty: | | Deutsche Bank AG |
Effective Date: | | December 19, 2007 |
Notional Amount: | | 31,100,000 USD |
Payments Made by Fund: | | Floating Rate (3-Month USD-LIBOR) |
Payments Received by Fund: | | Fixed Rate, 5.00% |
Termination Date: | | December 19, 2009 |
Unrealized Appreciation | | $148,149
|
Swap Counterparty: | | Deutsche Bank AG |
Effective Date: | | December 19, 2007 |
Notional Amount: | | 14,600,000 USD |
Payments Made by Fund: | | Floating Rate (3-Month USD-LIBOR) |
Payments Received by Fund: | | Fixed Rate, 5.00% |
Termination Date: | | December 19, 2012 |
Unrealized Appreciation | | $9,240
|
Swap Counterparty: | | Deutsche Bank AG |
Effective Date: | | December 19, 2007 |
Notional Amount: | | 5,900,000 USD |
Payments Made by Fund: | | Fixed Rate, 5.00% |
Payments Received by Fund: | | Floating Rate (3-Month USD-LIBOR) |
Termination Date: | | December 19, 2014 |
Unrealized Depreciation | | $(162,012)
|
Swap Counterparty: | | Lehman Brothers, Inc. |
Effective Date: | | June 20, 2007 |
Notional Amount: | | 1,600,000 USD |
Payments Made by Fund: | | Fixed Rate, 5.00% |
Payments Received by Fund: | | Floating Rate (3-Month USD-LIBOR) |
Termination Date: | | June 20, 2017 |
Unrealized Depreciation | | $(3,844)
|
Swap Counterparty: | | Merrill Lynch & Co., Inc. |
Effective Date: | | June 20, 2007 |
Notional Amount: | | 1,900,000 USD |
Payments Made by Fund: | | Fixed Rate, 5.00% |
Payments Received by Fund: | | Floating Rate (3-Month USD-LIBOR) |
Termination Date: | | June 20, 2017 |
Unrealized Depreciation | | $(4,108)
|
173
Notes to Financial Statements
(continued)
| | |
Swap Counterparty: | | Merrill Lynch & Co., Inc. |
Effective Date: | | December 19, 2007 |
Notional Amount: | | 1,100,000 USD |
Payments Made by Fund: | | Floating Rate (3-Month USD-LIBOR) |
Payments Received by Fund: | | Fixed Rate, 5.00% |
Termination Date: | | December 19, 2017 |
Unrealized Appreciation | | $21,374
|
Swap Counterparty: | | Morgan Stanley |
Effective Date: | | June 20, 2007 |
Notional Amount: | | 300,000 USD |
Payments Made by Fund: | | Floating Rate (3-Month USD-LIBOR) |
Payments Received by Fund: | | Fixed Rate, 5.00% |
Termination Date: | | June 20, 2037 |
Unrealized Depreciation | | $(13,181)
|
Swap Counterparty: | | Royal Bank of Scotland PLC |
Effective Date: | | December 19, 2007 |
Notional Amount: | | 4,800,000 USD |
Payments Made by Fund: | | Floating Rate (3-Month USD-LIBOR) |
Payments Received by Fund: | | Fixed Rate, 5.00% |
Termination Date: | | December 19, 2012 |
Unrealized Appreciation | | $1,118
|
Swap Counterparty: | | Royal Bank of Scotland PLC |
Effective Date: | | December 19, 2007 |
Notional Amount: | | 1,600,000 USD |
Payments Made by Fund: | | Fixed Rate, 5.00% |
Payments Received by Fund: | | Floating Rate (3-Month USD-LIBOR) |
Termination Date: | | December 19, 2014 |
Unrealized Depreciation | | $(52,486)
|
Swap Counterparty: | | Royal Bank of Scotland PLC |
Effective Date: | | June 20, 2007 |
Notional Amount: | | 7,800,000 USD |
Payments Made by Fund: | | Fixed Rate, 5.00% |
Payments Received by Fund: | | Floating Rate (3-Month USD-LIBOR) |
Termination Date: | | June 20, 2017 |
Unrealized Appreciation | | $115,651
|
Swap Counterparty: | | Royal Bank of Scotland PLC |
Effective Date: | | December 19, 2007 |
Notional Amount: | | 20,500,000 USD |
Payments Made by Fund: | | Fixed Rate, 5.00% |
Payments Received by Fund: | | Floating Rate (3-Month USD-LIBOR) |
Termination Date: | | December 19, 2017 |
Unrealized Appreciation | | $689,570
|
Swap Counterparty: | | Royal Bank of Scotland PLC |
Effective Date: | | December 19, 2007 |
Notional Amount: | | 2,100,000 USD |
Payments Made by Fund: | | Floating Rate (3-Month USD-LIBOR) |
Payments Received by Fund: | | Fixed Rate, 5.00% |
Termination Date: | | December 19, 2037 |
Unrealized Appreciation | | $138,081
|
174
Notes to Financial Statements
(continued)
| | |
Swap Counterparty: | | UBS Securities LLC |
Effective Date: | | December 19, 2007 |
Notional Amount: | | 2,600,000 USD |
Payments Made by Fund: | | Fixed Rate, 5.00% |
Payments Received by Fund: | | Floating Rate (3-Month USD-LIBOR) |
Termination Date: | | December 19, 2008 |
Unrealized Appreciation | | $4,311
|
Swap Counterparty: | | UBS Securities LLC |
Effective Date: | | December 19, 2007 |
Notional Amount: | | 200,000 USD |
Payments Made by Fund: | | Floating Rate (3-Month USD-LIBOR) |
Payments Received by Fund: | | Fixed Rate, 5.00% |
Termination Date: | | December 19, 2012 |
Unrealized Appreciation | | $1,357
|
At August 31, 2007, International Fixed Income Investments held the following credit default swap contracts:
| | |
Credit Default Swaps | | |
International Fixed Income Investments | | |
Swap Counterparty: | | Barclays Bank PLC |
Effective Date: | | September 20, 2006 |
Reference Entity: | | Dow Jones I Traxx |
Notional Amount: | | 200,000 EUR |
Termination Date: | | December 20, 2016 |
Unrealized Appreciation | | $558
|
Swap Counterparty: | | BNP Paribas Bank |
Effective Date: | | September 20, 2006 |
Reference Entity: | | Dow Jones I Traxx |
Notional Amount: | | 600,000 EUR |
Termination Date: | | December 20, 2016 |
Unrealized Appreciation | | $1,672
|
Swap Counterparty: | | Deutsche Bank AG |
Effective Date: | | September 20, 2006 |
Reference Entity: | | Dow Jones I Traxx |
Notional Amount: | | 700,000 EUR |
Termination Date: | | December 20, 2016 |
Unrealized Appreciation | | $1,953
|
Swap Counterparty: | | Goldman Sachs & Co. |
Effective Date: | | September 20, 2006 |
Reference Entity: | | Dow Jones I Traxx |
Notional Amount: | | 200,000 EUR |
Termination Date: | | December 20, 2016 |
Unrealized Appreciation | | $557
|
Swap Counterparty: | | HSBC Bank USA |
Effective Date: | | September 20, 2006 |
Reference Entity: | | Dow Jones I Traxx |
Notional Amount: | | 100,000 EUR |
Termination Date: | | December 20, 2016 |
Unrealized Appreciation | | $279
|
175
Notes to Financial Statements
(continued)
| | |
Swap Counterparty: | | J.P. Morgan Chase & Co. |
Effective Date: | | September 20, 2006 |
Reference Entity: | | Dow Jones I Traxx |
Notional Amount: | | 100,000 EUR |
Termination Date: | | December 20, 2016 |
Unrealized Appreciation | | $282
|
Swap Counterparty: | | Deutsche Bank AG |
Effective Date: | | September 16, 2006 |
Reference Entity: | | Softbank Corp. |
Notional Amount: | | 59,000,000 JPY |
Termination Date: | | September 20, 2007 |
Unrealized Appreciation | | $2,375
|
Swap Counterparty: | | Bank of America |
Effective Date: | | April 6, 2007 |
Reference Entity: | | Lehman Brothers Inc. |
Notional Amount: | | 500,000 USD |
Termination Date: | | June 20, 2008 |
Unrealized Depreciation | | $(2,876)
|
Swap Counterparty: | | Bank of America |
Effective Date: | | April 6, 2007 |
Reference Entity: | | Merrill Lynch & Co. Inc. |
Notional Amount: | | 600,000 USD |
Termination Date: | | June 20, 2008 |
Unrealized Depreciation | | $(1,580)
|
Swap Counterparty: | | Bank of America |
Effective Date: | | June 2, 2007 |
Reference Entity: | | Globalsantafe Corp. |
Notional Amount: | | 100,000 USD |
Termination Date: | | June 20, 2012 |
Unrealized Depreciation | | $(1,412)
|
Swap Counterparty: | | Bank of America |
Effective Date: | | June 2, 2007 |
Reference Entity: | | Nabors Industries Inc. |
Notional Amount: | | 100,000 USD |
Termination Date: | | June 20, 2012 |
Unrealized Depreciation | | $(625)
|
Swap Counterparty: | | Bank of America |
Effective Date: | | May 4, 2007 |
Reference Entity: | | Nabors Industries Inc. |
Notional Amount: | | 100,000 USD |
Termination Date: | | June 20, 2012 |
Unrealized Depreciation | | $(634)
|
Swap Counterparty: | | Bank of America |
Effective Date: | | June 2, 2007 |
Reference Entity: | | Noble Corp. |
Notional Amount: | | 100,000 USD |
Termination Date: | | June 20, 2012 |
Unrealized Depreciation | | $(683)
|
176
Notes to Financial Statements
(continued)
| | |
Swap Counterparty: | | Bank of America |
Effective Date: | | June 6, 2007 |
Reference Entity: | | Diamond Offshore Drilling Inc. |
Notional Amount: | | 300,000 USD |
Termination Date: | | June 20, 2017 |
Unrealized Depreciation | | $(105)
|
Swap Counterparty: | | Bank of America |
Effective Date: | | June 2, 2007 |
Reference Entity: | | Pulte Homes Inc. |
Notional Amount: | | 100,000 USD |
Termination Date: | | June 20, 2017 |
Unrealized Appreciation | | $12,602
|
Swap Counterparty: | | Bank of America |
Effective Date: | | May 4, 2007 |
Reference Entity: | | Transocean Inc. |
Notional Amount: | | 100,000 USD |
Termination Date: | | June 20, 2017 |
Unrealized Appreciation | | $740
|
Swap Counterparty: | | Barclays Bank PLC |
Effective Date: | | October 31, 2006 |
Reference Entity: | | Ryder System Inc. |
Notional Amount: | | 200,000 USD |
Termination Date: | | March 20, 2009 |
Unrealized Depreciation | | $(118)
|
Swap Counterparty: | | Barclays Bank PLC |
Effective Date: | | November 1, 2006 |
Reference Entity: | | Sealed Air Corp. |
Notional Amount: | | 200,000 USD |
Termination Date: | | June 20, 2009 |
Unrealized Appreciation | | $537
|
Swap Counterparty: | | Barclays Bank PLC |
Effective Date: | | October 18, 2006 |
Reference Entity: | | DR Horton Inc. |
Notional Amount: | | 200,000 USD |
Termination Date: | | March 20, 2010 |
Unrealized Appreciation | | $11,493
|
Swap Counterparty: | | Barclays Bank PLC |
Effective Date: | | November 4, 2006 |
Reference Entity: | | National Grid PLC |
Notional Amount: | | 300,000 USD |
Termination Date: | | June 20, 2011 |
Unrealized Appreciation | | $1,085
|
Swap Counterparty: | | Barclays Bank PLC |
Effective Date: | | September 27, 2006 |
Reference Entity: | | XL Capital Europe PLC |
Notional Amount: | | 100,000 USD |
Termination Date: | | March 20, 2012 |
Unrealized Appreciation | | $1,368
|
177
Notes to Financial Statements
(continued)
| | |
Swap Counterparty: | | Barclays Bank PLC |
Effective Date: | | March 28, 2007 |
Reference Entity: | | Dow Jones CDX HY |
Notional Amount: | | 600,000 USD |
Termination Date: | | June 20, 2012 |
Unrealized Depreciation | | $(8,951)
|
Swap Counterparty: | | Barclays Bank PLC |
Effective Date: | | March 28, 2007 |
Reference Entity: | | Dow Jones CDX HY |
Notional Amount: | | 1,000,000 USD |
Termination Date: | | June 20, 2012 |
Unrealized Appreciation | | $16,314
|
Swap Counterparty: | | Barclays Bank PLC |
Effective Date: | | June 2, 2007 |
Reference Entity: | | American Electric Power Co., Inc. |
Notional Amount: | | 100,000 USD |
Termination Date: | | June 20, 2012 |
Unrealized Appreciation | | $1,389
|
Swap Counterparty: | | Barclays Bank PLC |
Effective Date: | | June 2, 2007 |
Reference Entity: | | Capital One Bank |
Notional Amount: | | 400,000 USD |
Termination Date: | | June 20, 2012 |
Unrealized Appreciation | | $12,134
|
Swap Counterparty: | | Barclays Bank PLC |
Effective Date: | | June 2, 2007 |
Reference Entity: | | Weyerhaeuser Co. |
Notional Amount: | | 100,000 USD |
Termination Date: | | June 20, 2017 |
Unrealized Appreciation | | $1,899
|
Swap Counterparty: | | Bear Stearns & Co., Inc. |
Effective Date: | | September 22, 2006 |
Reference Entity: | | CNA Financial Corp. |
Notional Amount: | | 100,000 USD |
Termination Date: | | September 20, 2011 |
Unrealized Appreciation | | $748
|
Swap Counterparty: | | Bear Stearns & Co., Inc. |
Effective Date: | | September 27, 2006 |
Reference Entity: | | HJ Heinz Finance Co. |
Notional Amount: | | 100,000 USD |
Termination Date: | | March 20, 2012 |
Unrealized Depreciation | | $(353)
|
Swap Counterparty: | | Bear Stearns & Co., Inc. |
Effective Date: | | May 4, 2007 |
Reference Entity: | | Diamond Offshore Drilling Inc. |
Notional Amount: | | 100,000 USD |
Termination Date: | | June 20, 2012 |
Unrealized Depreciation | | $(7)
|
178
Notes to Financial Statements
(continued)
| | |
Swap Counterparty: | | Bear Stearns & Co., Inc. |
Effective Date: | | October 28, 2006 |
Reference Entity: | | Goldman Sachs Group Inc. |
Notional Amount: | | 200,000 USD |
Termination Date: | | March 20, 2016 |
Unrealized Appreciation | | $5,513
|
Swap Counterparty: | | Credit Suisse First Boston |
Effective Date: | | October 12, 2006 |
Reference Entity: | | Centerpoint Energy Inc. |
Notional Amount: | | 200,000 USD |
Termination Date: | | June 20, 2008 |
Unrealized Depreciation | | $(131)
|
Swap Counterparty: | | Credit Suisse Securities (USA) LLC |
Effective Date: | | October 18, 2006 |
Reference Entity: | | ISTAR Financial |
Notional Amount: | | 300,000 USD |
Termination Date: | | March 20, 2012 |
Unrealized Appreciation | | $14,626
|
Swap Counterparty: | | Deutsche Bank AG |
Effective Date: | | April 6, 2007 |
Reference Entity: | | Bear Stearns Cos., Inc. |
Notional Amount: | | 200,000 USD |
Termination Date: | | June 20, 2008 |
Unrealized Depreciation | | $(1,496)
|
Swap Counterparty: | | Deutsche Bank AG |
Effective Date: | | April 5, 2007 |
Reference Entity: | | Goldman Sachs Group Inc. |
Notional Amount: | | 500,000 USD |
Termination Date: | | June 20, 2008 |
Unrealized Depreciation | | $(1,008)
|
Swap Counterparty: | | Deutsche Bank AG |
Effective Date: | | April 5, 2007 |
Reference Entity: | | Lehman Brothers Inc. |
Notional Amount: | | 700,000 USD |
Termination Date: | | June 20, 2008 |
Unrealized Depreciation | | $(3,957)
|
Swap Counterparty: | | Deutsche Bank AG |
Effective Date: | | April 5, 2007 |
Reference Entity: | | Merrill Lynch & Co. Inc. |
Notional Amount: | | 900,000 USD |
Termination Date: | | June 20, 2008 |
Unrealized Depreciation | | $(2,504)
|
Swap Counterparty: | | Deutsche Bank AG |
Effective Date: | | September 19, 2006 |
Reference Entity: | | Ace Ina Holdings Inc. |
Notional Amount: | | 100,000 USD |
Termination Date: | | June 20, 2014 |
Unrealized Appreciation | | $669
|
Swap Counterparty: | | Deutsche Bank AG |
Effective Date: | | September 19, 2006 |
Reference Entity: | | Tate & Lyle International |
Notional Amount: | | 100,000 USD |
Termination Date: | | December 20, 2014 |
Unrealized Appreciation | | $2,415
|
179
Notes to Financial Statements
(continued)
| | |
Swap Counterparty: | | Deutsche Bank AG |
Effective Date: | | March 21, 2007 |
Reference Entity: | | Dow Jones CDX 10Y |
Notional Amount: | | 2,600,000 USD |
Termination Date: | | June 20, 2017 |
Unrealized Appreciation | | $37,980
|
Swap Counterparty: | | Goldman Sachs & Co. |
Effective Date: | | May 16, 2007 |
Reference Entity: | | RSHB Capital SA |
Notional Amount: | | 300,000 USD |
Termination Date: | | May 20, 2012 |
Unrealized Depreciation | | $(9,897)
|
Swap Counterparty: | | Goldman Sachs & Co. |
Effective Date: | | July 26, 2007 |
Reference Entity: | | Dow Jones CDX HY |
Notional Amount: | | 300,000 USD |
Termination Date: | | June 20, 2012 |
Unrealized Appreciation | | $10,645
|
Swap Counterparty: | | Goldman Sachs & Co. |
Effective Date: | | June 2, 2007 |
Reference Entity: | | Carnival Corp. |
Notional Amount: | | 100,000 USD |
Termination Date: | | June 20, 2012 |
Unrealized Appreciation | | $951
|
Swap Counterparty: | | Goldman Sachs & Co. |
Effective Date: | | June 7, 2007 |
Reference Entity: | | Nabors Industries Inc. |
Notional Amount: | | 200,000 USD |
Termination Date: | | June 20, 2012 |
Unrealized Depreciation | | $(857)
|
Swap Counterparty: | | Goldman Sachs & Co. |
Effective Date: | | April 14, 2007 |
Reference Entity: | | SLM Corp. |
Notional Amount: | | 100,000 USD |
Termination Date: | | June 20, 2012 |
Unrealized Depreciation | | $(7,981)
|
Swap Counterparty: | | Goldman Sachs & Co. |
Effective Date: | | March 21, 2007 |
Reference Entity: | | Dow Jones CDX 10Y |
Notional Amount: | | 22,800,000 USD |
Termination Date: | | June 20, 2017 |
Unrealized Appreciation | | $223,715
|
Swap Counterparty: | | Goldman Sachs & Co. |
Effective Date: | | June 2, 2007 |
Reference Entity: | | International Paper Co. |
Notional Amount: | | 100,000 USD |
Termination Date: | | June 20, 2017 |
Unrealized Appreciation | | $994
|
Swap Counterparty: | | Goldman Sachs & Co. |
Effective Date: | | June 2, 2007 |
Reference Entity: | | Meadwestvaco Corp. |
Notional Amount: | | 100,000 USD |
Termination Date: | | June 20, 2017 |
Unrealized Appreciation | | $882
|
180
Notes to Financial Statements
(continued)
| | |
Swap Counterparty: | | Goldman Sachs & Co. |
Effective Date: | | June 6, 2007 |
Reference Entity: | | Transocean Inc. |
Notional Amount: | | 300,000 USD |
Termination Date: | | June 20, 2017 |
Unrealized Appreciation | | $3,070
|
Swap Counterparty: | | HSBC Bank USA |
Effective Date: | | February 8, 2007 |
Reference Entity: | | Russian Federation |
Notional Amount: | | 600,000 USD |
Termination Date: | | February 20, 2008 |
Unrealized Depreciation | | $(658)
|
Swap Counterparty: | | J.P. Morgan Chase & Co. |
Effective Date: | | August 3, 2006 |
Reference Entity: | | Federative Republic of Brazil |
Notional Amount: | | 2,000,000 USD |
Termination Date: | | August 20, 2011 |
Unrealized Appreciation | | $34,034
|
Swap Counterparty: | | J.P. Morgan Chase & Co. |
Effective Date: | | September 27, 2006 |
Reference Entity: | | CNA Financial Corp. |
Notional Amount: | | 100,000 USD |
Termination Date: | | September 20, 2011 |
Unrealized Appreciation | | $748
|
Swap Counterparty: | | Lehman Brothers, Inc. |
Effective Date: | | August 9, 2006 |
Reference Entity: | | Federative Republic of Brazil |
Notional Amount: | | 3,400,000 USD |
Termination Date: | | August 20, 2011 |
Unrealized Appreciation | | $49,918
|
Swap Counterparty: | | Lehman Brothers, Inc. |
Effective Date: | | July 28, 2007 |
Reference Entity: | | Dow Jones CDX HY |
Notional Amount: | | 100,000 USD |
Termination Date: | | June 20, 2012 |
Unrealized Appreciation | | $7,213
|
Swap Counterparty: | | Lehman Brothers, Inc. |
Effective Date: | | March 21, 2007 |
Reference Entity: | | Dow Jones CDX 5YR |
Notional Amount: | | 5,700,000 USD |
Termination Date: | | June 20, 2012 |
Unrealized Depreciation | | $(2,165)
|
Swap Counterparty: | | Lehman Brothers, Inc. |
Effective Date: | | August 8, 2007 |
Reference Entity: | | GMAC |
Notional Amount: | | 400,000 USD |
Termination Date: | | September 20, 2012 |
Unrealized Depreciation | | $(15,347)
|
Swap Counterparty: | | Lehman Brothers, Inc. |
Effective Date: | | June 6, 2007 |
Reference Entity: | | Meadwestvaco Corp. |
Notional Amount: | | 300,000 USD |
Termination Date: | | June 20, 2017 |
Unrealized Appreciation | | $3,158
|
181
Notes to Financial Statements
(continued)
| | |
Swap Counterparty: | | Lehman Brothers, Inc. |
Effective Date: | | June 6, 2007 |
Reference Entity: | | Weyerhaeuser Co. |
Notional Amount: | | 100,000 USD |
Termination Date: | | June 20, 2017 |
Unrealized Appreciation | | $1,886
|
Swap Counterparty: | | Merrill Lynch & Co., Inc. |
Effective Date: | | May 15, 2007 |
Reference Entity: | | Gazprom |
Notional Amount: | | 200,000 USD |
Termination Date: | | May 20, 2012 |
Unrealized Depreciation | | $(4,044)
|
Swap Counterparty: | | Merrill Lynch & Co., Inc. |
Effective Date: | | August 10, 2007 |
Reference Entity: | | Dow Jones CDX HY |
Notional Amount: | | 2,000,000 USD |
Termination Date: | | June 20, 2012 |
Unrealized Depreciation | | $(22,968)
|
Swap Counterparty: | | Merrill Lynch & Co., Inc. |
Effective Date: | | July 31, 2007 |
Reference Entity: | | Dow Jones CDX HY |
Notional Amount: | | 300,000 USD |
Termination Date: | | June 20, 2012 |
Unrealized Appreciation | | $21,076
|
Swap Counterparty: | | Merrill Lynch & Co., Inc. |
Effective Date: | | August 8, 2007 |
Reference Entity: | | Dow Jones CDX HY |
Notional Amount: | | 1,900,000 USD |
Termination Date: | | June 20, 2012 |
Unrealized Depreciation | | $(11,938)
|
Swap Counterparty: | | Merrill Lynch & Co., Inc. |
Effective Date: | | March 28, 2007 |
Reference Entity: | | Dow Jones CDX HY |
Notional Amount: | | 1,000,000 USD |
Termination Date: | | June 20, 2012 |
Unrealized Depreciation | | $(5,074)
|
Swap Counterparty: | | Merrill Lynch & Co., Inc. |
Effective Date: | | July 25, 2007 |
Reference Entity: | | Dow Jones CDX HY |
Notional Amount: | | 300,000 USD |
Termination Date: | | June 20, 2012 |
Unrealized Appreciation | | $1,413
|
Swap Counterparty: | | Morgan Stanley |
Effective Date: | | August 2, 2006 |
Reference Entity: | | Federative Republic of Brazil |
Notional Amount: | | 2,000,000 USD |
Termination Date: | | August 20, 2011 |
Unrealized Appreciation | | $36,549
|
Swap Counterparty: | | Morgan Stanley |
Effective Date: | | June 9, 2007 |
Reference Entity: | | Weyerhaeuser Co. |
Notional Amount: | | 100,000 USD |
Termination Date: | | June 20, 2017 |
Unrealized Appreciation | | $1,197
|
182
Notes to Financial Statements
(continued)
| | |
Swap Counterparty: | | Royal Bank of Scotland PLC |
Effective Date: | | October 26, 2006 |
Reference Entity: | | Landsbanki Islands hf |
Notional Amount: | | 200,000 USD |
Termination Date: | | September 20, 2009 |
Unrealized Appreciation | | $705
|
Swap Counterparty: | | Royal Bank of Scotland PLC |
Effective Date: | | September 19, 2006 |
Reference Entity: | | Daimler Finance North America |
Notional Amount: | | 100,000 USD |
Termination Date: | | September 20, 2011 |
Unrealized Depreciation | | $(1,120)
|
Swap Counterparty: | | Royal Bank of Scotland PLC |
Effective Date: | | August 8, 2007 |
Reference Entity: | | Supervalu Inc. |
Notional Amount: | | 100,000 USD |
Termination Date: | | September 20, 2012 |
Unrealized Appreciation | | $4,924
|
Swap Counterparty: | | UBS Securities LLC |
Effective Date: | | April 5, 2007 |
Reference Entity: | | AIG, Inc. |
Notional Amount: | | 1,200,000 USD |
Termination Date: | | June 20, 2008 |
Unrealized Depreciation | | $(2,382)
|
Swap Counterparty: | | UBS Securities LLC |
Effective Date: | | September 27, 2006 |
Reference Entity: | | Capital One Financial Corp. |
Notional Amount: | | 100,000 USD |
Termination Date: | | September 20, 2011 |
Unrealized Appreciation | | $2,630
|
Swap Counterparty: | | UBS Securities LLC |
Effective Date: | | June 6, 2007 |
Reference Entity: | | DR Horton Inc. |
Notional Amount: | | 300,000 USD |
Termination Date: | | June 20, 2017 |
Unrealized Appreciation | | $39,500
|
Swap Counterparty: | | UBS Securities LLC |
Effective Date: | | June 6, 2007 |
Reference Entity: | | Pulte Homes Inc. |
Notional Amount: | | 300,000 USD |
Termination Date: | | June 20, 2017 |
Unrealized Appreciation | | $39,201
|
Swap Counterparty: | | Wachovia Bank N.A. |
Effective Date: | | May 4, 2007 |
Reference Entity: | | Globalsantafe Corp. |
Notional Amount: | | 100,000 USD |
Termination Date: | | June 20, 2012 |
Unrealized Depreciation | | $(1,650)
|
At August 31, 2007, International Fixed Income Investments and Core Fixed Income Investments had total net unrealized appreciation of $3,747,179 and $2,884,300 respectively, from swap contracts.
183
Notes to Financial Statements
(continued)
During the year ended August 31, 2007, Core Fixed Income Investments entered into mortgage dollar roll transactions in the aggregate amount of $462,844,675.
At August 31, 2007, Core Fixed Income Investments had outstanding mortgage dollar rolls with a total cost of $88,175,100.
For the year ended August 31, 2007, Core Fixed Income Investments recorded interest income of $523,146 related to such mortgage rolls.
4. Shares of Beneficial Interest
At August 31, 2007, the Trust had an unlimited number of shares authorized with a par value of $0.001 per share. At August 31, 2007, Trustees and executive officers of the Trust as a group owned of record less than 1% of the outstanding shares of the Trust.
Transactions in shares of each Fund were as follows:
| | | | | | |
| | | Year Ended
August 31, 2007
| | | Year Ended
August 31, 2006
| |
| Large Capitalization Growth Investments | | | | | | |
Shares sold | | 45,074,316 | | | 47,577,855 | |
Shares repurchased | | (25,913,573 | ) | | (26,677,870 | ) |
| | |
|
| |
|
|
Net Increase | | 19,160,743 | | | 20,899,985 | |
| | |
|
| |
|
|
| Large Capitalization Value Equity Investments | | | | | | |
Shares sold | | 31,269,276 | | | 30,590,292 | |
Shares issued on reinvestment | | 10,091,077 | | | 6,840,450 | |
Shares repurchased | | (26,438,680 | ) | | (28,819,854 | ) |
| | |
|
| |
|
|
Net Increase | | 14,921,673 | | | 8,610,888 | |
| | |
|
| |
|
|
| Small Capitalization Growth Investments | | | | | | |
Shares sold | | 4,776,289 | | | 5,288,132 | |
Shares repurchased | | (6,103,574 | ) | | (10,002,994 | ) |
| | |
|
| |
|
|
Net Decrease | | (1,327,285 | ) | | (4,714,862 | ) |
| | |
|
| |
|
|
| Small Capitalization Value Equity Investments | | | | | | |
Shares sold | | 4,945,416 | | | 3,722,228 | |
Shares issued on reinvestment | | 3,997,706 | | | 7,197,797 | |
Shares repurchased | | (7,073,705 | ) | | (9,403,887 | ) |
| | |
|
| |
|
|
Net Increase | | 1,869,417 | | | 1,516,138 | |
| | |
|
| |
|
|
| International Equity Investments | | | | | | |
Shares sold | | 27,896,868 | | | 40,932,743 | |
Shares issued on reinvestment | | 1,934,267 | | | 1,153,715 | |
Shares repurchased | | (20,150,816 | ) | | (27,283,540 | ) |
| | |
|
| |
|
|
Net Increase | | 9,680,319 | | | 14,802,918 | |
| | |
|
| |
|
|
| Emerging Markets Equity Investments | | | | | | |
Shares sold | | 11,933,875 | | | 5,436,369 | |
Shares issued on reinvestment | | 174,684 | | | 231,945 | |
Shares repurchased | | (5,572,571 | ) | | (8,088,359 | ) |
| | |
|
| |
|
|
Net Increase (Decrease) | | 6,535,988 | | | (2,420,045 | ) |
| | |
|
| |
|
|
| Core Fixed Income Investments | | | | | | |
Shares sold | | 36,757,606 | | | 43,344,838 | |
Shares issued on reinvestment | | 4,839,040 | | | 3,569,561 | |
Shares repurchased | | (28,870,321 | ) | | (16,907,140 | ) |
| | |
|
| |
|
|
Net Increase | | 12,726,325 | | | 30,007,259 | |
| | |
|
| |
|
|
184
Notes to Financial Statements
(continued)
| | | | | | |
| | | Year Ended
August 31, 2007
| | | Year Ended
August 31, 2006
| |
| High Yield Investments | | | | | | |
Shares sold | | 4,091,715 | | | 8,699,001 | |
Shares issued on reinvestment | | 1,561,954 | | | 2,538,947 | |
Shares repurchased | | (10,764,733 | ) | | (42,246,239 | ) |
| | |
|
| |
|
|
Net Decrease | | (5,111,064 | ) | | (31,008,291 | ) |
| | |
|
| |
|
|
| International Fixed Income Investments | | | | | | |
Shares sold | | 9,169,251 | | | 12,220,568 | |
Shares issued on reinvestment | | 887,334 | | | 816,554 | |
Shares repurchased | | (10,463,481 | ) | | (6,736,262 | ) |
| | |
|
| |
|
|
Net Increase (Decrease) | | (406,896 | ) | | 6,300,860 | |
| | |
|
| |
|
|
| Municipal Bond Investments | | | | | | |
Shares sold | | 2,579,007 | | | 3,916,281 | |
Shares issued on reinvestment | | 263,754 | | | 201,301 | |
Shares repurchased | | (2,312,764 | ) | | (1,220,800 | ) |
| | |
|
| |
|
|
Net Increase | | 529,997 | | | 2,896,782 | |
| | |
|
| |
|
|
| Money Market Investments | | | | | | |
Shares sold | | 118,948,194 | | | 129,087,916 | |
Shares issued on reinvestment | | 5,689,337 | | | 4,269,358 | |
Shares repurchased | | (135,227,763 | ) | | (100,797,219 | ) |
| | |
|
| |
|
|
Net Increase (Decrease) | | (10,590,232 | ) | | 32,560,055 | |
| | |
|
| |
|
|
5. Dividends Subsequent to August 31, 2007
Subsequent to the fiscal year end, the Funds made the following distributions:
| | | | | | | | | | | | |
Record Date Payable Date
| | Core Fixed Income
Investments
| | High Yield
Investments
| | Municipal Bond
Investments
| | Money Market
Investments
|
9/27/07-9/28/2007 | | $ | .032898 | | $ | .030877 | | $ | .027939 | | $ | 0.003991 |
The tax character of distributions paid during the fiscal year ended August 31, 2007 were as follows:
| | | | | | | | | | |
| | | Large
Capitalization
Growth
Investments
| | Large
Capitalization
Value Equity
Investments
| | Small
Capitalization
Growth
Investments
| | Small
Capitalization
Value Equity
Investments
|
Distributions paid from: | | | | | | | | | | |
Tax Exempt | | — | | | — | | — | | | — |
Tax Return of Capital | | — | | | — | | — | | | — |
Ordinary Income | | — | | $ | 45,066,729 | | — | | $ | 12,815,361 |
Net Long-term Capital Gains | | — | | | 83,617,882 | | — | | | 40,214,079 |
| | |
| |
|
| |
| |
|
|
Total Distributions Paid | | — | | $ | 128,684,611 | | — | | $ | 53,029,440 |
| | |
| |
|
| |
| |
|
|
185
Notes to Financial Statements
(continued)
| | | | | | | | | | | | |
| | | International
Equity
Investments
| | Emerging Markets
Equity
Investments
| | Core Fixed
Income
Investments
| | High Yield
Investments
|
Distributions paid from: | | | | | | | | | | | | |
Tax Exempt | | | — | | | — | | | — | | | — |
Tax Return of Capital | | | — | | | — | | | — | | | — |
Ordinary Income | | $ | 28,500,011 | | $ | 2,740,460 | | $ | 40,375,847 | | $ | 7,753,707 |
Net Long-term Capital Gains | | | — | | | — | | | — | | | — |
| | |
|
| |
|
| |
|
| |
|
|
Total Distributions Paid | | $ | 28,500,011 | | $ | 2,740,460 | | $ | 40,375,847 | | $ | 7,753,707 |
| | |
|
| |
|
| |
|
| |
|
|
| | | | |
| | | International Fixed
Income
Investments
| | Municipal Bond
Investments
| | Money Market Investments
| | |
Distributions paid from: | | | | | | | | | | | | |
Tax Exempt | | $ | — | | $ | 2,608,254 | | | — | | | |
Tax Return of Capital | | | — | | | — | | | — | | | |
Ordinary Income | | | 7,043,250 | | | — | | $ | 6,332,962 | | | |
Net Long-term Capital Gains | | | — | | | — | | | — | | | |
| | |
|
| |
|
| |
|
| | | |
Total Distributions Paid | | $ | 7,043,250 | | $ | 2,608,254 | | $ | 6,332,962 | | | |
| | |
|
| |
|
| |
|
| | | |
The tax character of distributions paid during the fiscal year ended August 31, 2006 were as follows:
| | | | | | | | | | | | |
| | | Large
Capitalization
Growth
Investments
| | Large
Capitalization
Value Equity
Investments
| | Small
Capitalization
Growth
Investments
| | Small
Capitalization
Value Equity
Investments
|
Distributions paid from: | | | | | | | | | | | | |
Tax Exempt | | | — | | | — | | | — | | | — |
Tax Return of Capital | | | — | | | — | | | — | | | — |
Ordinary Income | | | — | | $ | 22,000,056 | | | — | | $ | 15,125,076 |
Net Long-term Capital Gains | | | — | | | 56,411,813 | | | — | | | 80,660,752 |
| | |
|
| |
|
| |
|
| |
|
|
Total Distributions Paid | | | — | | $ | 78,411,869 | | | — | | $ | 95,785,828 |
| | |
|
| |
|
| |
|
| |
|
|
| | | | |
| | | International
Equity
Investments
| | Emerging Markets
Equity
Investments
| | Core Fixed
Income
Investments
| | High Yield
Investments
|
Distributions paid from: | | | | | | | | | | | | |
Tax Exempt | | | — | | | — | | | — | | | — |
Tax Return of Capital | | | — | | | — | | | — | | | — |
Ordinary Income | | $ | 14,000,078 | | $ | 2,826,066 | | $ | 29,904,480 | | $ | 12,336,372 |
Net Long-term Capital Gains | | | — | | | — | | | — | | | — |
| | |
|
| |
|
| |
|
| |
|
|
Total Distributions Paid | | $ | 14,000,078 | | $ | 2,826,066 | | $ | 29,904,480 | | $ | 12,336,372 |
| | |
|
| |
|
| |
|
| |
|
|
| | | | |
| | | International Fixed
Income
Investments
| | Municipal Bond
Investments
| | Money Market
Investments
| | |
Distributions paid from: | | | | | | | | | | | | |
Tax Exempt | | | — | | $ | 2,000,418 | | | — | | | |
Tax Return of Capital | | $ | 3,454,483 | | | — | | | — | | | |
Ordinary Income | | | 2,037,074 | | | — | | $ | 4,191,855 | | | |
Net Long-term Capital Gains | | | 1,072,866 | | | — | | | — | | | |
| | |
|
| |
|
| |
|
| | | |
Total Distributions Paid | | $ | 6,564,423 | | $ | 2,000,418 | | $ | 4,191,855 | | | |
| | |
|
| |
|
| |
|
| | | |
186
Notes to Financial Statements
(continued)
As of August 31, 2007, the components of accumulated earnings on a tax basis were as follows:
| | | | | | | | | | | | | | | | |
| | | Large
Capitalization
Growth
Investments
| | | Large
Capitalization
Value Equity
Investments
| | | Small
Capitalization
Growth
Investments
| | | Small
Capitalization
Value Equity
Investments
| |
Undistributed ordinary income - net | | $ | 3,954,875 | | | $ | 51,219,095 | | | $ | — | | | $ | 4,229,364 | |
Undistributed long-term capital gains - net | | $ | 9,931,043 | | | $ | 93,503,585 | | | $ | — | | | $ | 43,464,708 | |
| | |
|
|
| |
|
|
| |
|
|
| |
|
|
|
Total Undistributed earnings | | $ | 13,885,918 | | | $ | 144,722,680 | | | $ | — | | | $ | 47,694,072 | |
Capital Loss Carryforward* | | $ | — | | | $ | — | | | $ | (255,520,439 | ) | | | | |
Other book/tax temporary differences | | $ | — | | | $ | — | | | $ | (1,415 | )(b) | | | — | |
Unrealized appreciation/(depreciation) | | $ | 358,319,454 | (a) | | $ | 259,638,588 | (i) | | $ | 91,836,245 | (a) | | $ | 53,689,175 | (i) |
| | |
|
|
| |
|
|
| |
|
|
| |
|
|
|
Total accumulated earnings/(losses) - net | | $ | 372,205,372 | | | $ | 404,361,268 | | | $ | (163,685,609 | ) | | $ | 101,383,247 | |
| | |
|
|
| |
|
|
| |
|
|
| |
|
|
|
| | | | |
| | | International
Equity Investments
| | | Emerging Market
Equity
Investments
| | | Core Fixed
Income
Investments
| | | High Yield
Investments
| |
Undistributed ordinary income - net | | $ | 17,901,384 | | | $ | 6,178,376 | | | $ | 2,177,722 | | | $ | 1,426,181 | |
Undistributed long-term capital gains - net | | $ | 11,084,130 | | | $ | 18,638,474 | | | $ | — | | | $ | — | |
| | |
|
|
| |
|
|
| |
|
|
| |
|
|
|
Total Undistributed earnings | | $ | 28,985,514 | | | $ | 24,816,850 | | | $ | 2,177,722 | | | $ | 1,426,181 | |
Capital Loss Carryforward* | | $ | — | | | | — | | | $ | (16,346,058 | ) | | $ | (86,397,128 | ) |
Other book/tax temporary differences | | $ | — | (c) | | | — | (c) | | $ | (4,276,720 | )(e) | | $ | — | (b) |
Unrealized appreciation/(depreciation) | | $ | 343,408,400 | (d) | | $ | 180,339,290 | (d) | | $ | (3,403,148 | )(f) | | $ | (2,409,573 | )(f) |
| | |
|
|
| |
|
|
| |
|
|
| |
|
|
|
Total accumulated earnings/(losses) - net | | $ | 372,393,914 | | | $ | 205,156,140 | | | $ | (21,848,204 | ) | | $ | (87,380,520 | ) |
| | |
|
|
| |
|
|
| |
|
|
| |
|
|
|
| | | | |
| | | International Fixed
Income
Investments
| | | Municipal Bond
Investments
| | | | | | | |
Undistributed tax exempt income - net | | $ | — | | | $ | 102,782 | | | | | | | | | |
Undistributed ordinary income - net | | $ | 3,415,687 | | | $ | 27,689 | | | | | | | | | |
Undistributed long-term capital gains - net | | $ | — | | | $ | — | | | | | | | | | |
| | |
|
|
| |
|
|
| | | | | | | | |
Total Undistributed earnings | | $ | 3,415,687 | | | $ | 130,471 | | | | | | | | | |
Capital Loss Carryforward* | | $ | (1,117,243 | ) | | $ | (1,946,882 | ) | | | | | | | | |
Other book/tax temporary differences | | $ | (16,372,455 | )(h) | | $ | — | (b) | | | | | | | | |
Unrealized appreciation/(depreciation) | | $ | 749,964 | (f) | | $ | 80,610 | (g) | | | | | | | | |
| | |
|
|
| |
|
|
| | | | | | | | |
Total accumulated earnings/(losses) - net | | $ | (13,324,047 | ) | | $ | (1,735,801 | ) | | | | | | | | |
| | |
|
|
| |
|
|
| | | | | | | | |
As of August 31, 2007 there were no significant differences between the book and tax components of net assets for Money Market Investments.
| * | | During the taxable year ended August 31, 2007, Large Capitalization Growth Investments utilized $233,284,082, Small Capitalization Growth Investments utilized $43,304,826, International Equity Investments utilized $120,303,617, Emerging Markets Equity Investments utilized $35,784,960, High Yield Investments utilized $169,364 of each of their respective capital loss carryover available from prior years. As of August 31, 2007, the Funds had the following net capital loss carryforwards remaining: |
| | | | | | | | | | | | | | | | | |
Year of Expiration
| | Large
Capitalization
Growth
Investments
| | Large
Capitalization
Value Equity
Investments
| | Small
Capitalization
Growth
Investments
| | | Small
Capitalization
Value Equity
Investments
| | International
Equity Investments
| | Emerging Markets
Equity Investments
|
8/31/2010 | | $ | — | | — | | $ | (63,647,133 | ) | | — | | $ | — | | $ | — |
8/31/2011 | | | — | | — | | | (191,873,306 | ) | | — | | | — | | | — |
8/31/2012 | | | — | | — | | | — | | | — | | | — | | | — |
| | |
|
| |
| |
|
|
| |
| |
|
| |
|
|
| | | $ | — | | — | | $ | (255,520,439 | ) | | — | | $ | — | | $ | — |
| | |
|
| |
| |
|
|
| |
| |
|
| |
|
|
187
Notes to Financial Statements
(continued)
| | | | | | | | | | | | | | | | | | | | | | |
Year of Expiration
| | Core Fixed
Income
Investments
| | | High Yield
Investments
| | | International Fixed
Income
Investments
| | | Municipal Bond
Investments
| | | Money Market
Investments
| | | |
8/31/2008 | | $ | (2,292,182 | ) | | | — | | | | — | | | | — | | | $ | (9,983 | ) | | |
8/31/2009 | | | — | | | $ | (2,258,308 | ) | | | — | | | $ | (1,846,063 | ) | | | (11,128 | ) | | |
8/31/2010 | | | — | | | | (45,159,946 | ) | | | — | | | | — | | | | — | | | |
8/31/2011 | | | (4,723,104 | ) | | | (37,864,134 | ) | | | — | | | | — | | | | — | | | |
8/31/2012 | | | (2,218,969 | ) | | | — | | | | — | | | | — | | | | — | | | |
8/31/2013 | | | — | | | | — | | | | — | | | | — | | | | — | | | |
8/31/2014 | | | (1,156,834 | ) | | | (1,114,740 | ) | | $ | (242,180 | ) | | | (45,465 | ) | | | — | | | |
8/31/2015 | | | (5,954,469 | ) | | | — | | | | (875,063 | ) | | | (55,354 | ) | | | — | | | |
| | |
|
|
| |
|
|
| |
|
|
| |
|
|
| |
|
|
| | |
| | | $ | (16,346,058 | ) | | $ | (86,397,128 | ) | | $ | (1,117,243 | ) | | $ | (1,946,882 | ) | | $ | (21,111 | ) | | |
| | |
|
|
| |
|
|
| |
|
|
| |
|
|
| |
|
|
| | |
These amounts will be available to offset any future taxable capital gains.
| (a) | | The difference between book-basis and tax-basis unrealized appreciation / (depreciation) is attributable primarily to the tax deferral of losses on wash sales. |
| (b) | | Other book/tax temporary differences are attributable primarily to the tax deferral of post-October capital and currency losses for tax purposes. |
| (c) | | Other book/tax temporary differences are attributable primarily to the realization for tax purposes of unrealized losses on certain foreign currency contracts and differences in the book/tax treatment of various items. |
| (d) | | The difference between book-basis and tax-basis unrealized appreciation / (depreciation) is attributable primarily to the tax deferral of losses on wash sales, the realization for tax purposes of unrealized gains on investments in passive foreign investment companies, and other book/tax basis adjustments. |
| (e) | | Other book/tax temporary differences are attributable primarily to the tax deferral of losses on straddles, the realization for tax purposes of unrealized gains / (losses) on certain futures and foreign currency contracts, the deferral of post-October capital losses for tax purposes and differences in the book/tax treatment of various items. |
| (f) | | The difference between book-basis and tax-basis unrealized appreciation / (depreciation) is attributable primarily to the tax deferral of losses on wash sales and the difference between book and tax amortization methods for premiums on fixed income securities. |
| (g) | | The difference between book-basis and tax-basis unrealized appreciation / (depreciation) is attributable primarily to the difference between book and tax amortization methods for market discount on fixed income securities. |
| (h) | | Other book/tax temporary differences are attributable primarily to the realization for tax purposes of unrealized gains / (losses) on certain futures and foreign currency contracts and the deferral of post-October currency and capital losses for tax purposes. |
| (i) | | The difference between book-basis and tax-basis unrealized appreciation / (depreciation) is attributable primarily to the tax deferral of losses on wash sales and tax cost adjustments related to real estate investment trusts. |
6. Regulatory Matters
On July 13, 2007, the New York Stock Exchange, LLC (“NYSE”) issued a Hearing Board Decision in connection with the settlement of an enforcement proceeding by NYSE Regulation, Inc. (“NYSE Regulation”) and the New Jersey Bureau of Securities (“NJBS”) against Citigroup Global Markets, Inc. (“CGMI” or “the Firm”), an affiliate of Citigroup Investment Advisory Services (“CIAS”), the investment adviser to the Trust, relating to the practice of market timing in proprietary and non-proprietary mutual funds by financial advisors (“FAs”) at the Firm.
The decision concerned the Firm’s failure to supervise adequately its branch offices and certain registered representatives who engaged in deceptive mutual fund market timing on behalf of some customers during the period from January 2000 through April 2003. The decision notes that market timing occurred in the Firm’s proprietary funds, which include the Portfolios of the Trust, as well as in non-proprietary funds. Between 1998 and May 2000, the Firm made an effort to end market timing in its proprietary funds and its fee-based mutual fund trading programs, including TRAK. Market timing by CGMI FAs in proprietary funds was largely ended by late 2001 or early 2002. The decision finds that the Firm failed to supervise its FAs adequately and failed to maintain books and records of the trading in mutual fund sub-accounts. Further, the NYSE found that while the Firm had policies in place to address market timing, such policies were ineffective to stop certain FAs from market timing and were inadequately enforced. The decision cited three CGMI branches in particular for the most serious conduct, and noted that six branches accounted for over 40% of all market-timing transactions. The NYSE noted the Firm’s cooperation during the course of the investigation.
Without admitting or denying guilt, the Firm consented to a finding that it had violated NYSE Rule 342 by failing to reasonably supervise certain business activities and to establish and maintain appropriate procedures for supervision and control with respect to trading of mutual funds and mutual fund-like sub-accounts of variable annuities; violated NYSE Rules 401(a) and 476(a) by failing to prevent certain brokers from engaging in violative market timing of mutual funds, including use of deceptive practices related to market timing of mutual funds; and violated Section 17(a) of the Securities Exchange Act of 1934, Rules 17a-3 and 17a-4 thereunder, and NYSE Rule 440 by failing to make or preserve accurate books and records
188
Notes to Financial Statements
(continued)
reflecting or relating to order communication and entry time for mutual fund shares, rejection or cancellation of trades related to market timing, and orders or confirmations for transactions executed by Firm employees in variable annuity products sub-accounts held away from the Firm.
The Firm consented to the imposition of a penalty consisting of censure and a payment of $50,000,000, to be distributed as follows: (a) $35,000,000 is to be placed in a distribution fund as disgorgement; (b) a penalty of $10,000,000, of which $5,000,000 is to be paid directly to NYSE Regulation and $5,000,000 is to be placed directly in the distribution fund; and (c) a penalty of $5,000,000 which is to be paid to the State of New Jersey.
The Firm is required to retain, within 90 days as the date on which the Hearing Board Decision becomes final, an Independent Distribution Consultant not unacceptable to NYSE Regulation, who will develop a distribution plan for the distribution of the disgorgement amount and internal earnings thereon, according to a methodology developed by the Firm and not unacceptable to NYSE Regulation. To the extent feasible, this disgorgement amount shall go first to the Firm’s customers who during the period January 2000 through September 2003 invested long-term in the mutual funds that were the subject of the market timing, with any funds not distributed to be paid to NYSE Regulation. Investors who held shares in the funds during the relevant time period may be eligible to receive a portion of such distributions and will be notified of such eligibility as the distribution plan proceeds. Although there can be no assurance, the manager does not believe that this matter will have a material adverse affect on the Trust.
On May 31, 2005, the U.S. Securities and Exchange Commission (“SEC”) issued an order in connection with the settlement of an administrative proceeding against Smith Barney Fund Management, LLC (“SBFM”), a wholly-owned subsidiary of Legg Mason and the then-investment adviser or manager to the Fund, and CGM, relating to the appointment of an affiliated transfer agent for the Smith Barney family of mutual funds, including the Fund (the “Affected Funds”).
The SEC order found that SBFM and CGM willfully violated Section 206(1) of the Investment Advisers Act of 1940, as amended, and the rules promulgated thereunder (the “Advisers Act”). Specifically, the order found that SBFM and CGM knowingly or recklessly failed to disclose to the boards of the Affected Funds in 1999 when proposing a new transfer agent arrangement with an affiliated transfer agent that: First Data Investors Services Group (“First Data”), the Affected Funds’ then-existing transfer agent, had offered to continue as transfer agent and do the same work for substantially less money than before; and that Citigroup Asset Management (“CAM”), the Citigroup business unit that, at the time, included the Affected Funds’ investment manager and other investment advisory companies, had entered into a side letter with First Data under which CAM agreed to recommend the appointment of First Data as sub-transfer agent to the affiliated transfer agent in exchange, among other things, for a guarantee by First Data of specified amounts of asset management and investment banking fees to CAM and CGM. The order also found that SBFM and CGM willfully violated Section 206(2) of the Advisers Act by virtue of the omissions discussed above and other misrepresentations and omissions in the materials provided to the Affected Funds’ boards, including the failure to make clear that the affiliated transfer agent would earn a high profit for performing limited functions while First Data continued to perform almost all of the transfer agent functions, and the suggestion that the proposed arrangement was in the Affected Funds’ best interests and that no viable alternatives existed.
SBFM and CGM do not admit or deny any wrongdoing or liability. The settlement does not establish wrongdoing or liability for purposes of any other proceeding. The SEC censured SBFM and CGM and ordered them to cease and desist from violations of Sections 206(1) and 206(2) of the Advisers Act. The order required Citigroup to pay $208.1 million, including $109 million in disgorgement of profits, $19.1 million in interest, and a civil money penalty of $80 million. Approximately $24.4 million has already been paid to the Affected Funds, primarily through fee waivers. The remaining $183.7 million, including the penalty, has been paid to the U.S. Treasury and will be distributed pursuant to a plan submitted for the approval of the SEC. At this time, there is no certainty as to how the above-described proceeds of the settlement will be distributed, to whom such distributions will be made, the methodology by which such distributions will be allocated, and when such distributions will be made. The order also required that transfer agency fees received from the Affected Funds since December 1, 2004, less certain expenses, be placed in escrow and provided that a portion of such fees might be subsequently distributed in accordance with the terms of the order. On April 3, 2006, an aggregate amount of approximately $9 million held in escrow was distributed to the Affected Funds.
The order required SBFM to recommend a new transfer agent contract to the Affected Funds’ boards within 180 days of the entry of the order; if a Citigroup affiliate submitted a proposal to serve as transfer agent or sub-transfer agent, SBFM and CGM would have been required, at their expense, to engage an independent monitor to oversee a competitive bidding process. On
189
Notes to Financial Statements
(continued)
November 21, 2005, and within the specified timeframe, the Affected Funds’ Boards selected a new transfer agent for the Affected Funds. No Citigroup affiliate submitted a proposal to serve as transfer agent. Under the order, SBFM also must comply with an amended version of a vendor policy that Citigroup instituted in August 2004.
Although there can be no assurance, the manager does not believe that this matter will have a material adverse effect on the Affected Funds.
On December 1, 2005, Citigroup completed the sale of substantially all of its global asset management business, including SBFM, to Legg Mason. The Trust was not included in the sale.
7. Legal Matters
Beginning in August 2005, five putative class action lawsuits alleging violations of federal securities laws and state law were filed against CGM and SBFM, (collectively, the “Defendants”) based on the May 31, 2005 settlement order issued against the Defendants by the SEC described in Note 6. The complaints seek injunctive relief and compensatory and punitive damages, removal of SBFM as advisor to the Funds, rescission of the Funds’ management and other contracts with SBFM, recovery of all fees paid to SBFM pursuant to such contracts, and an award of attorneys’ fees and litigation expenses.
On December 28, 2005, the five actions were consolidated in Federal District Court in the Southern District of New York. On April 17, 2006, the Court appointed a lead plaintiff and lead counsel, who filed a consolidated, amended complaint on June 2, 2006. The consolidated, amended complaint alleged violations of federal securities laws and added as defendants two former SBFM executives, Thomas Jones and Lewis Daidone. On October 3, 2006, the Defendants filed a motion and supporting memorandum to dismiss all of these claims. On November 28, 2006, plaintiffs filed a memorandum in opposition to Defendants’ motion to dismiss, and Defendants filed a reply brief on December 19, 2006. Oral arguments on the motion to dismiss occurred on February 1, 2007. On September 26, 2007, the district court issued an order granting defendants’ motion to dismiss. The order gives plaintiffs through and including October 19, 2007 to replead the one claim that was dismissed without prejudice. Plaintiffs’ time to appeal is running.
CGM believes that resolution of the pending lawsuits will not have a material effect on the financial position or results of operations of the Funds or the ability of SBFM and its affiliates to continue to render services to the Funds under their respective contracts.
8. Other Matters
On September 16, 2005, the staff of the Securities and Exchange Commission (the “Commission”) informed SBFM and Salomon Brothers Asset Management Inc (“SBAM”) that the staff is considering recommending that the Commission institute administrative proceedings against SBFM and SBAM for alleged violations of Section 19(a) and 34(b) of the Investment Company Act (and related Rule 19a-1). The notification is a result of an industry wide inspection by the SEC and is based upon alleged deficiencies in disclosures regarding dividends and distributions paid to shareholders of certain funds. Section 19(a) and related Rule 19a-1 of the Investment Company Act generally require funds that are making dividend and distribution payments to provide shareholders with a written statement disclosing the source of the dividends and distributions, and, in particular, the portion of the payments made from each of net investment income, undistributed net profits and/or paid-in capital. On September 28, 2007, SBFM and SBAM entered into a settlement with the Commission without admitting or denying any wrongdoing. The settlement, which resolved the administration proceeding, required each entity to pay a civil penalty of $450,000.
Although there can be no assurance, SBFM and SBAM believe that this matter is not likely to have a material adverse effect on the Funds.
190
Notes to Financial Statements
(continued)
9. Recent Accounting Pronouncements
During June 2006, the Financial Accounting Standards Board (“FASB”) issued FASB Interpretation 48 (“FIN 48” or the “Interpretation”), Accounting for Uncertainty in Income Taxes - an interpretation of FASB statement 109. FIN 48 supplements FASB Statement 109, Accounting for Income Taxes, by defining the confidence level that a tax position must meet in order to be recognized in the financial statements. FIN 48 prescribes a comprehensive model for how a fund should recognize, measure, present, and disclose in its financial statements uncertain tax positions that the fund has taken or expects to take on a tax return. FIN 48 requires that the tax effects of a position be recognized only if it is “more likely than not” to be sustained based solely on its technical merits. Management must be able to conclude that the tax law, regulations, case law, and other objective information regarding the technical merits sufficiently support the position’s sustainability with a likelihood of more than 50 percent. FIN 48 is effective for fiscal periods beginning after December 15, 2006, which for the Funds will be September 1, 2007. At adoption, the financial statements must be adjusted to reflect only those tax positions that are more likely than not to be sustained as of the adoption date. Management of the Funds is currently evaluating the impact that FIN 48 will have on the financial statements.
* * *
On September 20, 2006, the FASB released Statement of Financial Accounting Standards No. 157 “Fair Value Measurements” (“FAS 157”). FAS 157 establishes an authoritative definition of fair value, sets out a framework for measuring fair value, and requires additional disclosures about fair-value measurements. The application of FAS 157 is required for fiscal years beginning after November 15, 2007 and interim periods within those fiscal years. At this time, management is evaluating the implications of FAS 157 and its impact on the financial statements has not yet been determined.
10. Subsequent Events
Effective September 17, 2007, the Board of Trustees approved the addition of Schroder Investment Management North America, Inc. and its affiliate, Schroder Investment Management North America Ltd, as a subadviser to International Equity Investments.
Effective September 17, 2007, the Board of Trustees approved the termination of William Blair & Co., LLC, as a subadviser to International Equity Investments.
191
Report of Independent Registered Public Accounting Firm
The Shareholders and Board of Trustees
Consulting Group Capital Markets Funds
We have audited the accompanying statements of assets and liabilities, including the schedules of investments, of Large Capitalization Growth Investments, Large Capitalization Value Equity Investments, Small Capitalization Growth Investments, Small Capitalization Value Equity Investments, International Equity Investments, Emerging Markets Equity Investments, Core Fixed Income Investments, High Yield Investments, International Fixed Income Investments, Municipal Bond Investments, and Money Market Investments (formerly “Government Money Investments”), each a series of Consulting Group Capital Markets Funds, as of August 31, 2007, and the related statements of operations for the year then ended, the statements of changes in net assets for each of the years in the two-year period then ended, and the financial highlights for each of the years in the five-year period then ended. These financial statements and financial highlights are the responsibility of management. Our responsibility is to express an opinion on these financial statements and financial highlights based on our audits.
We conducted our audits in accordance with the standards of the Public Company Accounting Oversight Board (United States). Those standards require that we plan and perform the audits to obtain reasonable assurance about whether the financial statements and financial highlights are free of material misstatement. An audit includes examining, on a test basis, evidence supporting the amounts and disclosures in the financial statements. Our procedures included confirmation of securities owned as of August 31, 2007, by correspondence with the custodian and brokers, or by other appropriate auditing procedures when replies from brokers were not received. An audit also includes assessing the accounting principles used and significant estimates made by management, as well as evaluating the overall financial statement presentation. We believe that our audits provide a reasonable basis for our opinion.
In our opinion, the financial statements and financial highlights referred to above present fairly, in all material respects, the financial position of the aforementioned funds as of August 31, 2007, the results of their operations, the changes in their net assets, and the financial highlights for the periods specified in the first paragraph above, in conformity with U.S. generally accepted accounting principles.

Boston, Massachusetts
October 30, 2007
192
Board Approval of Management Agreement and Investment Advisory Agreements
(unaudited)
Approval of Management Agreement and Subadvisory Agreements
At a meeting held in person on May 30, 2007, the Board of Trustees, including a majority of the Board Members who are not “interested persons,” as defined in the Investment Company Act of 1940, as amended (the “1940 Act”), of the Trust or the Manager, re-approved for an annual period the Trust’s management agreement (the “Management Agreement”) and certain subadvisory agreements (the “Subadvisory Agreements”). In their consideration of the re-approval of the Management Agreement and the Subadvisory Agreements, the Board considered the factors described below.
The non-interested Board Members also met in a private session with their independent legal counsel, at which no representative of management was present, and were advised by separate independent legal counsel throughout the process. Following the closed session, the Board Members approved the Management Agreement and the Subadvisory Agreements to continue for another year.
No single factor reviewed by the Board was identified by the Board as the principal factor in determining whether to approve the Management Agreement and Subadvisory Agreements.
Nature, Extent and Quality of the Services Under the Management and Subadvisory Agreements
The Board received and considered information regarding the nature, extent and quality of services provided to the Funds by the Manager and the Subadvisers under the Management Agreement and the Subadvisory Agreements, respectively, during the meeting and during past year. The Board also received a description of the administrative and other services rendered to the Trust and its shareholders. The Board noted information received at regular meetings throughout the year related to the services rendered by the Manager about the management of the Trust’s affairs and its role in coordinating the activities of the Trust’s other service providers. The Board reviewed information received from the Manager regarding the review of the Trust’s and the Sub-Advisers’ compliance policies and procedures established pursuant to Rule 38a-1 under the 1940 Act.
The Board reviewed the qualifications, backgrounds and responsibilities of the Trust’s senior personnel and the portfolio management teams primarily responsible for the day-to-day portfolio management of the Funds. The Board also considered, based on its knowledge of the Manager and its affiliates, the financial resources available to its parent organization, Citigroup Inc.
The Board also considered the Manager’s brokerage policies and practices, the standards applied to the Subadvisers, policies and practices regarding soft dollars, and the existence of quality controls applicable to brokerage allocation procedures. In addition, management also reported to the Board on, among other things, its business plans and recent organizational changes.
The Board concluded that, overall, the nature, extent and quality of services provided (and expected to be provided) under the Management Agreement and the Subadvisory Agreements were adequate and appropriate.
Fund Performance
The Board received and considered performance information for the Funds as well as for a group of funds (the “Performance Universe”) selected by Lipper, Inc. (“Lipper”), an independent provider of investment company data for various periods ended March 31, 2007. The Board was provided with a description of the methodology Lipper used to determine the similarity of the Funds with the funds included in the Performance Universe. The Board also noted that it had received and discussed with management information throughout the year at periodic intervals comparing the Portfolios’ performance against their benchmarks.
The Board was generally satisfied with the overall performance of the Portfolios and with the Adviser’s efforts to improve performance of the International Equity Investments and International Fixed Income Investments Portfolios. The Trustees determined to continue to closely gauge the performance of the International Equity and International Fixed Income Portfolios.
193
Board Approval of Management Agreement and Investment Advisory Agreements
(unaudited) (continued)
Management Fees and Expense Ratios
The Board reviewed and considered the contractual management fees (the “Contractual Management Fees”) payable by the Funds to the Manager in light of the nature, extent and quality of the management and subadvisory services provided by the Manager and the Subadvisers. The Board also reviewed and considered whether fee waiver and/or expense reimbursement arrangements are currently in place for the Funds and considered the actual fee rate (after taking any waivers and reimbursements into account) (the “Actual Management Fee”) and whether any fee waivers and reimbursements could be discontinued. In addition, the Board noted that the compensation paid to the Subadvisers is paid by the Manager, not the Funds, and, accordingly, that the retention of the Subadvisers does not increase the fees or expenses otherwise incurred by a Fund’s shareholders.
The Board received and considered information comparing the Funds’ Contractual Management Fees and Actual Management Fees and the Funds’ overall expenses with those of funds in both the relevant expense group (the “Expense Group”) and a broader group of funds, (the “Expense Universe”), each selected and provided by Lipper. The Board also considered and discussed information about the Subadvisers’ fees and comparable information for other subadvised funds, as well as other accounts managed by the Subadvisers, and, in this connection, the amount of the Contractual and Actual Management Fees retained by the Manager.
The Board concluded that the fee paid by each Portfolio to the Adviser and the fees paid by the Adviser to the Sub-Advisers were reasonable in light of comparative performance and expense and advisory fee information, costs of the services provided and profits to be realized and benefits derived or to be derived by the Adviser and Sub-advisers from the relationship with the Portfolios. The Board noted in particular the management fee reductions that took effect as of January 2007.
Manager Profitability
The Board received and considered a profitability analysis of the Manager and its affiliates in providing services to the Funds. In addition, the Board received information with respect to the Manager’s allocation methodologies used in preparing this profitability data. To the extent available, the Board also reviewed information provided by the Subadvisers with respect to the Subadvisers’ profitability in providing subadvisory services to the Funds. The Manager’s profitability was considered not excessive in light of the nature, extent and quality of the services provided to the Funds.
Economies of Scale
The Board received and discussed information concerning whether the Manager realizes economies of scale as the Funds’ assets grow beyond current levels. The Board determined that there were not at this time discernable economies of scale to be realized by the Adviser in managing the Portfolios’ assets and that, to the extent that material economies of scale had not been shared with the Trust, the Board would seek to do so.
Other Benefits to the Manager and the Subadvisers
The Board considered other benefits received by the Manager, the Subadvisers and their affiliates as a result of their relationship with the Funds, including soft dollar arrangements, receipt of brokerage and the opportunity to offer additional products and services to Fund shareholders.
In light of the costs of providing investment management and other services to the Funds and the Manager’s ongoing commitment to the Funds, the profits and other ancillary benefits that the Manager and its affiliates received were considered reasonable.
194
Board Approval of Management Agreement and Investment Advisory Agreements
(unaudited) (continued)
Board Approval of New Investment Advisory Agreements (unaudited)
At a meeting held in person on March 12, 2007, the Trust’s Board, including a majority of the Independent Board Members, approved a new investment advisory agreement (the “Investment Advisory Agreement”) with Metropolitan West Asset Management, LLC (“MWAM”) on behalf of the Trust’s Core Fixed Income Investments the (“Portfolio”). To assist the Board in its consideration of the Investment Advisory Agreement, the Manager provided materials and information about MWAM, including its financial condition, asset management capabilities and organization. The materials and information were provided in advance of and at the in person meeting. Representatives of MWAM also made a presentation to and responded to questions from the Board.
In their deliberations concerning the Investment Advisory Agreement, among other things, the Board Members considered:
(i) that the Manager conducted a thorough search process in selecting MWAM, including a review of the universe of fixed-income subadvisers, including managers that had a recommended opinion from the Manager’s research department, eventually narrowing the search through discussions with research personnel and eliminating candidates with potential affiliation problems;
(ii) MWAM met all qualitative and quantitative requirements and was “recommended” by the Manager’s research department;
(iii) the history, reputation, qualification and background of MWAM, as well as the adviser’s personnel and financial conditions;
(iv) the experience of MWAM’s key personnel in institutional investing and the quality of services that it would be expected to provide the Portfolio;
(v) MWAM’s investment performance;
(vi) that MWAM had approximately $20.7 billion in assets under management;
(vii) that MWAM’s Rule 38a-1 policies and procedures were found to be in compliance with the Rule;
(viii) the fee and expense ratios of comparable mutual funds;
(ix) that the terms of the Investment Advisory Agreement with MWAM was substantially similar in all respects to the agreements between the additional investment advisers to the Portfolio, except with respect to fees.
The Board concluded that, overall, the nature, extent and quality of services expected to be provided under the Investment Advisory Agreement was acceptable. The Investment Advisory Agreement with MWAM became effective on April 1, 2007.
At a meeting held in person on August 23, 2007, the Trust’s Board, including a majority of the Independent Board Members, approved a new investment advisory agreement with Schroder Investment Management North America, Inc. and a new investment advisory agreement with Schroder Investment Management North America Limited (together, the “Investment Advisory Agreements” and “Schroders”) on behalf of the Trust’s International Equity Investments. To assist the Board in its consideration of the Investment Advisory Agreements, the Manager provided materials and information about Schroders, including its financial condition, asset management capabilities and organization. The materials and information were provided in advance of and at the in person meeting. Representatives of Schroders also made a presentation to and responded to questions from the Board.
195
Board Approval of Management Agreement and Investment Advisory Agreements
(unaudited) (continued)
In their deliberations concerning the Investment Advisory Agreements, among other things, the Board Members considered:
(i) that the Manager conducted a thorough search process in selecting Schroders, including a review of the universe of international equity advisers, including managers that had a recommended opinion from the Manager’s research department, eventually narrowing the search through discussions with research personnel and eliminating candidates with potential affiliation problems;
(ii) that Schroders met all qualitative and quantitative requirements and was “recommended” by the Manager’s research department;
(iii) the history, reputation, qualification and background of Schroders, as well as its personnel and financial conditions;
(iv) the experience of Schroders’ key personnel in institutional investing and the quality of services that it would be expected to provide the Portfolio;
(v) Schroders’ investment performance;
(vi) that Schroder had approximately $276.2 billion in assets under management;
(vii) that Schroders’ Rule 38a-1 policies and procedures were found to be in compliance with the Rule;
(viii) the fee and expense ratios of comparable mutual funds;
(ix) that the terms of the Investment Advisory Agreements with Schroders were substantially similar in all respects to the agreements with the additional investment advisers to the Portfolios, except with respect to fees.
The Board concluded that, overall, the nature, extent and quality of services expected to be provided under the Investment Advisory Agreements, were acceptable. The Investment Advisory Agreements with Schroders became effective on September 17, 2007.
196
Additional Information
(unaudited)
Trustees and Executive Officers of the Trust
Overall responsibility for management and supervision of the Trust rests with the Board of Trustees. The Trustees approve all significant agreements between the Trust and the companies that furnish services to the Portfolios, including agreements with the Portfolio’s distributor, investment advisers, custodian and transfer agent. The day-to-day operations of the Portfolios are delegated to the Portfolios’ Manager, the Consulting Group, a division of Citigroup Investment Advisory Services Inc. (“CIAS”)
The names of the Trustees and executive officers of the Trust, together with information as to their principal business occupations, are set forth below. The executive officers of the Trust are employees of organizations that provide services to the Portfolios. Each Trustee who is an “interested person” of the Trust, as defined in the Investment Company Act of 1940, as amended (the “1940 Act”), is indicated by an asterisk.
| | | | | | | | | | |
Name, Address and
Birth Year
| | Position(s)
Held with
Fund
| | Term of
Office*
and
Length
of Time
Served
| | Principal Occupation(s)
During Past Five Years
| | Number of
Portfolios
in Fund
Complex
Overseen
by Trustee
| | Other Board
Memberships
Held by Trustee
|
| Non-Interested Trustees | | | | | | | | |
Armon E. Kamesar
7328 Country Club Drive
La Jolla, CA 92037
Birthdate: 1927 | | Chairman and Trustee | | 1994 | | Chairman, TEC International (organization of chief executives) | | 11 | | |
Walter E. Auch
6001 N. 62nd Place
Paradise Valley, AZ 85253
Birthdate: 1921 | | Trustee | | 2006;
Mr. Auch
previously
served as
a Trustee
of the
Trust
from
1991 to
December
2001. | | Retired | | 11 | | Director, UBS Funds; Director, US Bancorp Advisory Group |
H. John Ellis
858 E. Crystal Downs Drive
Frankfort, MI 49635
Birthdate: 1927 | | Trustee | | 1999 | | Retired | | 11 | | |
Stephen E. Kaufman
Stephen E. Kaufman, P.C.
277 Park Avenue, 47th Fl.
New York, NY 10172
Birthdate: 1932 | | Trustee | | 1991 | | Attorney | | 11 | | |
John J. Murphy
268 Main Street
P.O. Box 718
Gladstone, NJ 07934
Birthdate: 1944 | | Trustee | | 2006 | | President, Murphy Capital Management (investment management) | | 11 | | Director, Nicholas Applegate Funds |
197
Additional Information
(unaudited) (continued)
| | | | | | | | | | |
Name, Address and
Birth Year
| | Position(s)
Held with
Fund
| | Term of
Office*
and
Length
of Time
Served
| | Principal Occupation(s)
During Past Five Years
| | Number of
Portfolios
in Fund
Complex
Overseen
by Trustee
| | Other Board
Memberships
Held by Trustee
|
| Interested Trustees: | | | | | | | | |
Laurie A. Hesslein** Citigroup Global Markets Inc. (“CGM”) 787 Seventh Ave., 15th Floor New York, NY 10019 Birthdate: 1959 | | Trustee | | Since
2006 | | Director, CIAS (2005-present); Managing Director of CGM: Chief Administrative Officer and Director of the Corporate Client Group, Smith Barney Global Private Client Group (2005-present); Chief Administrative Officer, Director of Investment Products and the Corporate Client Group, Smith Barney Global Private Client Group (2004-2005); Director of Wealth Management, Investment Products and the Corporate Client Group, Smith Barney Global Private Client Group (2001-2004). | | 11 | | None |
W. Thomas Matthews** CGM 388 Greenwich St. New York, NY 10013 Birthdate: 1949 | | Trustee | | Since
2006 | | Advisor, Smith Barney (2005-present); previously, President and Chief Executive Officer, Smith Barney (2002-2005); Director of Sales, Smith Barney (1994-2002). | | 11 | | None |
Mark J. Reed 101 S. Hanley Rd. Suite 1260 St. Louis, MO 63105 Birthdate: 1964 | | Trustee | | Since
2007 | | Managing Director and Chief Compliance Officer Bush O’Donnell Investments Advisors, Inc., (1988-present) | | None | | None |
198
Additional Information
(unaudited) (continued)
| | | | | | | | | | |
Name, Address and
Birth Year
| | Position(s)
Held with
Fund
| | Term of
Office*
and
Length
of Time
Served
| | Principal Occupation(s) During Past Five Years
| | Number of
Portfolios
in Fund
Complex
Overseen
by Trustee
| | Other Board
Memberships Held by Trustee
|
| Officers: | | | | | | | | |
James J. Tracy CGM 787 Seventh Avenue, 15th Floor New York, NY 10019 Birthdate: 1957 | | Chief Executive Officer and President | | Since
2007 | | Executive Vice President, Director, Consulting Group (2006-present); previously, Great Lakes Regional Director, Smith Barney Private Client Group (2000-2006). Mr. Tracy previously served as EVP and Investment Officer since 2006 | | N/A | | N/A |
| | | | | | | | | N/A | | N/A |
James F. Walker CGM 787 Seventh Avenue 32nd Floor New York, NY 10019 Birthdate: 1963 | | Chief Financial Officer and Treasurer | | Since
2007 | | Managing Director, CGM: Chief Operating Officer, Investment Advisory Services, Smith Barney (2006-present); previously, Chief Administrative Officer, Merrill Lynch Global Private Client group since prior to 2002. | | N/A | | N/A |
LeRoy T. Pease III The Consulting Group 222 Delaware Avenue Wilmington, DE 19801 Birthdate: 1958 | | Investment Officer | | Since
1996 | | Senior Vice President, CGM. | | N/A | | N/A |
Stephen M. Hagan The Consulting Group 222 Delaware Avenue Wilmington, DE 19801 Birthdate: 1968 | | Investment Officer | | Since
1997 | | Senior Vice President, CGM (2006-present); previously, First Vice President, CGM (2002-2005). | | N/A | | N/A |
Mark C. Kennard The Consulting Group 222 Delaware Avenue Wilmington, DE 19801 Birthdate: 1958 | | Investment Officer | | Since
2004 | | First Vice President, CGM. | | N/A | | N/A |
Jay T. Shearon The Consulting Group 222 Delaware Avenue Wilmington, DE 19801 Birthdate: 1972 | | Investment Officer | | Since
2007 | | Vice President, CGM, (2005-present); previously, Assistant Vice President (2000-2005) | | N/A | | N/A |
199
Additional Information
(unaudited) (continued)
| | | | | | | | | | |
Name, Address and
Birth Year
| | Position(s)
Held with
Fund
| | Term of
Office*
and
Length
of Time
Served
| | Principal Occupation(s) During Past Five Years
| | Number of
Portfolios
in Fund
Complex
Overseen
by Trustee
| | Other Board
Memberships Held by Trustee
|
Steven Hartstein CGM 485 Lexington Ave. New York, NY 10017 Birthdate: 1963 | | Chief Compliance Officer | | Since
2006 | | Senior Vice President, CGM and Assistant Director, Investment Advisory Services Compliance, Smith Barney (2006-present); previously Senior Compliance Officer, Mercer Investment Consulting and Mercer Global Investments (2004-2006); Director and Senior Compliance Officer, UBS Global Asset Management (2002-2004); Vice President and Senior Compliance Officer, Lazard Asset Management (2000-2002). | | N/A | | N/A |
Carmen Z. Menendez-Puerto CGM 485 Lexington Ave. New York, NY 10017 Birthdate: 1961 | | Chief Anti-Money Laundering Officer | | Since
2006 | | Managing Director, CGM (2007-present); Director, CGM (2005-2006); Senior Vice President, CGM (2003-2004), First Vice President, Citibank Global Relationship Bank (2002-2003); Director, Smith Barney Anti-Money Laundering program (2005-present); previously, Director, Smith Barney Equity Research Compliance (2003-2005); Risk Manager-Compliance, Citigroup Global Corporate and Investment Bank (2001-2003). | | N/A | | N/A |
Paul F. Gallagher 222 Delaware Avenue 7th Floor Wilmington, DE 19801 Birthdate: 1959 | | Chief Legal Officer | | Since
2007 | | Director and Associate General Counsel, CGM (2006-present); previously, Senior Vice President and General Counsel, ICMA Retirement Corporation (2004-2006); Vice President and General Counsel, ICMA Retirement Corporation (1998-2003). | | N/A | | N/A |
200
Additional Information
(unaudited) (continued)
| | | | | | | | | | |
Name, Address and
Birth Year
| | Position(s)
Held with
Fund
| | Term of
Office*
and
Length
of Time
Served
| | Principal Occupation(s) During Past Five Years
| | Number of
Portfolios
in Fund
Complex
Overseen
by Trustee
| | Other Board
Memberships Held by Trustee
|
Israel Grafstein CGM 485 Lexington Ave. New York, NY 10017 Birthdate: 1974 | | Secretary | | Since
2006 | | First Vice President and Associate General Counsel, CGM; previously, Legal Counsel, Credit Suisse Asset Management (2005); Associate at Herrick, Feinstein LLP (2004-2005); Regulatory Attorney, State of New Jersey Attorney General’s Office (2003-2004); Alliance Capital Management (2000-2003). | | N/A | | N/A |
Dominic Maurillo CGM 787 Seventh Avenue 32nd Floor New York, NY 10019 Birthdate: 1967 | | Chief Operating Officer | | Since
2007 | | First Vice President, CGM; previously, Senior Vice President, D.F. King & Co., Inc. | | N/A | | N/A |
| * | | Each Trustee and Officer serves until his or her successor has been duly elected and qualified. |
| ** | | Ms. Hesslein and Mr. Matthews are interested persons of the Trust as defined in the 1940 Act because each is or was an officer of CGM and certain of its affiliates. |
Results of a Special Meeting of Shareholders
On August 13, 2007, a Special Meeting of Shareholders was held to elect Trustees. The following table provides the number of votes cast for or withheld, as well as the number of abstentions as to this matter.
| | | | | | | | |
Election of Trustees Nominees:
| | Votes For
| | Authority Withheld/Against
| | Abstentions
| | Broker
Non-Votes
|
Laurie A. Hesslein | | 164,775,109 | | 2,630,950 | | 0 | | 602,161,219 |
Mark J. Reed | | 164,785,947 | | 2,620,112 | | 0 | | 602,161,219 |
W. Thomas Matthews | | 164,658,310 | | 2,747,749 | | 0 | | 602,161,219 |
Messrs. Kamesar, Auch, Ellis, Kaufman, Murphy and Brody (Trustee Emeritus) continued as Trustees after the meeting.
201
Important Tax Information
(unaudited)
The following information is provided with respect to the distributions paid during the taxable year ended August 31, 2007:
| | | | | | | | | | | | | | |
| | | Large Capitalization Value Equity
Investments
| | | Small Capitalization
Value Equity
Investments
| | | International
Equity
Investments
| | | Emerging Markets
Equity Investments
| | | |
Record Date: | | 12/14/2006 | | | 12/14/2006 | | | 12/14/2006 | | | 12/14/2006 | | | |
Payable Date: | | 12/15/2006 | | | 12/15/2006 | | | 12/15/2006 | | | 12/15/2006 | | | |
Ordinary Income: | | | | | | | | | | | | | | |
Qualified Dividend Income for Individuals | | 72.70 | % | | 35.85 | % | | 93.47 | % | | 100.00 | % | | |
Dividends Qualifying for the Dividends Received Deduction for Corporations | | 68.08 | % | | 37.41 | % | | — | | | — | | | |
Foreign Source Income | | — | | | — | | | 77.30 | %** | | 100.00 | %** | | |
Foreign Taxes Paid Per Share | | — | | | — | | | $.029248 | | | $.043435 | | | |
Long-Term Capital Gain Dividend | | $.660306 | * | | $1.738724 | * | | — | | | — | | | |
| | | | | | | | | | | | | | | | | | |
| | | | |
| | | Core Fixed Income Investments
| | | International Fixed
Income Investments
| | | Municipal Bond
Investments
| | | Money Market
Investments
| |
Record Date: | | Monthly | | | Monthly | | | Monthly | | | Monthly | | | Monthly | | | Monthly | |
Payable Date: | | September 2006 to
December 2006 |
| | January 2007 to
August 2007 |
| | September 2006 to
December 2006 |
| | January 2007 to
August 2007 |
| | Monthly | | | Monthly | |
Interest from Tax-Exempt Obligations | | — | | | — | | | — | | | — | | | 98.94 | % | | — | |
Interest from Federal Obligations | | 12.20 | % | | 18.74 | % | | 11.74 | % | | 1.45 | % | | — | | | 1.34 | % |
Tax Return of Capital | | — | | | — | | | — | | | | | | — | | | — | |
| ** | Expressed as a percentage of the cash distribution grossed-up for foreign taxes. |
| * | Of this amount, 0.146% for Large Capitalization Value Equity Investments and 0.103% for Small Capitalization Value Equity Investments represented Unrecaptured Section 1250 gains subject to a maximum 25% rate. |
The law varies in each state as to whether and what percentage of dividend income attributable to Federal obligations is exempt from state income tax. We recommend that you consult with your tax adviser to determine if any portion of the dividends you received is exempt from state income taxes.
The foreign taxes paid represent taxes incurred by the Fund on income received by the Fund from foreign sources. Foreign taxes paid may be included in taxable income with an offsetting deduction from gross income or may be taken as a credit for taxes paid to foreign governments. You should consult your tax adviser regarding the appropriate treatment of foreign taxes paid.
Please retain this information for your records.
202
TK 2120A, 8/07
CITIGROUP GLOBAL MARKETS INC.
Distributor
CITIGROUP INVESTMENT ADVISORY SERVICES INC.
Investment Adviser
This report is submitted for the general information of the shareholders of Consulting Group Capital Markets Funds. It is not authorized for distribution to prospective investors unless accompanied or preceded by a current Prospectus for the Trust which contains information concerning the Trust’s Investment policies, charges and expenses as well as other pertinent information.
The Funds file their complete schedule of portfolio holdings with the Securities and Exchange Commission for the first and third quarters of each fiscal year on Form N-Q. The Funds’ Forms N-Q are available on the Commission’s website at www.sec.gov. The Funds’ Forms N-Q may be reviewed and copied at the Commission’s Public Reference Room in Washington D.C., and information on the operation of the Public Reference Room may be obtained by calling 1-800-SEC-0330. To obtain information on Form N-Q from the Funds, shareholders can call 1-800-451-2010.
Information on how the Funds voted proxies relating to portfolio securities during the most recent 12-month period ended June 30 and a description of the policies and procedures that the Funds use to determine how to vote proxies relating to portfolio securities is available (1) without charge, upon request, by calling 1-800-451-2010, (2) on the Funds’ website at www.smithbarney.com and (3) on the SEC’s website at www.sec.gov.
© 2007 Citigroup Global Markets Inc. Member SIPC. Smith Barney and Consulting Group are divisions of Citigroup Global Markets Inc. Smith Barney is a service mark of Citigroup Global Markets Inc. and its affiliates and is used and registered throughout the world. CITI, CITI and Arc Design and CITIGROUP are trademarks and service marks of Citigroup and are used and registered throughout the world. Securities are offered through Citigroup Global Markets Inc. Investments are not FDIC-insured or bank-guaranteed, and investors may lose money.
Consulting Group Capital Markets Funds
222 Delaware Avenue
Wilmington, Delaware 19801

(a) The registrant, as of the end of the period covered by this report (the “Reporting Period”), has adopted a code of ethics that applies to the registrant’s principal executive officer, principal financial officer, principal accounting officer or controller, or persons performing similar functions, regardless of whether these individuals are employed by the registrant or a third party.
(b) Not Applicable
(c) There have been no amendments, during the period covered by this report, to a provision of the code of ethics that applies to the registrant’s principal executive officer, principal financial officer, principal accounting officer or controller, or persons performing similar functions, regardless of whether these individuals are employed by the registrant or a third party, and that relates to any element of the code of ethics definition enumerated in Item 2(b) of Form N-CSR.
(d) The registrant has not granted any waiver, including any implicit waiver, from a provision of the code of ethics to the registrant’s principal executive officer, principal financial officer, principal accounting officer or controller, or persons performing similar functions, regardless of whether these individuals are employed by the registrant or a third party, that relates to one or more of the items set forth in Item 2(b) of Form N-CSR.
(e) Not Applicable
(f) The registrant has included a copy of its code of ethics as an exhibit to this report.
| ITEM 3. | AUDIT COMMITTEE FINANCIAL EXPERT. |
The Board of Trustees of the registrant has determined that Armon Kamesar possesses the attributes identified in Instruction 2(b) of Item 3 to Form N-CSR to qualify as an “audit committee financial expert,” and has designated Mr. Kamesar as the registrant’s audit committee financial expert. Mr. Kamesar is an “independent” Trustee pursuant to paragraph (2)(a) of Item 3 to Form N-CSR.
| ITEM 4. | PRINCIPAL ACCOUNTANT FEES AND SERVICES. |
AUDIT FEES
(a) Audit Fees. The aggregate fees billed for each of the last two fiscal years ending August 31, 2006 and August 31, 2007 (the “Reporting Periods”) for professional services rendered by the registrant’s principal accountant (the “Auditor”) for the audit of the Registrant’s annual financial statements, or services that are normally provided by the Auditor in connection with the statutory and regulatory filings or engagements for the Reporting Periods, were $287,500 in 2006 and $301,400 in 2007.
(b) Audit-Related Fees. The aggregate fees billed for each of the Reporting Periods for assurance and related services by the Auditor that are reasonably related to the performance of the audit of the Registrant’s financial statements and are not reported under paragraph (a) of this Item 4 were $40,000 in 2007. These services consisted of procedures performed in connection with the Registrant’s change in administrators.
There were no fees billed for each of the Reporting Periods for assurance and related services by the Auditor that were reasonably related to the performance of the audit of the Registrant’s financial statements and were not reported under paragraph (a) of this Item 4 in 2006.
(c) Tax Fees. The aggregate fees billed for each of the Reporting Periods for professional services rendered by the Auditor for tax compliance, tax advice and tax planning (“Tax Services”) were $35,500 in 2006 and $61,000 in 2007. These services consisted of (i) review or preparation of U.S. federal, state, local and excise tax returns; (ii) U.S. federal, state and local tax planning, advice and assistance regarding statutory, regulatory or administrative developments, and (iii) tax advice regarding tax qualification matters and/or treatment of various financial instruments held or proposed to be acquired or held.
(d) All Other Fees. There were no other fees billed in the Reporting Periods for products and services provided by the Auditor to the Registrant, other than the services reported in paragraphs (a) through (c) of this Item 4.
(e) Audit Committee’s pre-approval policies and procedures described in paragraph (c) (7) of Rule 2-01 of Regulation S-X.
(1) The Charter for the Audit Committee (the “Committee”) of the Consulting Group Capital Markets Funds provides that the Committee may delegate its responsibility to approve any such audit and permissible non-audit services to a sub-committee consisting of the Chairperson of the Committee (the “Chairperson”) and at least one other member of the Committee as the Chairperson, from time to time, may determine and appoint, and such sub-committee shall report to the Committee, at its next meeting after the sub-committee’s meeting, its decision(s). From year to year, and at such other times as the Committee deems appropriate, the Committee shall report to the Board whether this system of approval has been effective and efficient or whether this Charter should be amended to allow for pre-approval pursuant to such policies and procedures as the Committee shall approve, including the delegation of some or all of the Committee’s pre-approval responsibilities to other persons (other than the Adviser or the Trust’s officers).
(2) The percentage of services described in each of paragraphs (b) through (d) of this item that were approved by the audit committee pursuant to paragraph (c)(7)(i)(c) of Rule 2-01 of Regulation S-X, with respect to: Audit-Related Fees were 0% 2006 and 0% for 2007; Tax Fees were 0% for 2006 and 0% for 2007; and Other Fees were 0% for 2006 and 0% for 2007.
(f) Not Applicable
(g) Aggregate non-audit fees billed by the Auditor for services rendered to the Registrant’s investment adviser (not including any subadviser whose role is primarily portfolio management as is subcontracted with or overseen by another investment adviser), and any entity controlling, controlled by, or under common control with the advisor that provides ongoing services to the registrant for each of the last two fiscal years of the registrant (“Service Affiliates”) during the Reporting Periods were $0 in 2006 and $0 in 2007.
(h) Consulting Group Capital Markets Fund’s Audit Committee has considered whether the provision of non-audit services that were rendered to Service Affiliates that were not pre-approved is compatible with maintaining the Auditor’s independence.
| ITEM 5. | AUDIT COMMITTEE OF LISTED REGISTRANTS. |
Not Applicable
| ITEM 6. | SCHEDULE OF INVESTMENTS. |
A Schedule of Investments in securities of unaffiliated issuers as of the close of the reporting period is included as part of the report to shareholders filed under Item 1 of this Form N-CSR.
| ITEM 7. | DISCLOSURE OF PROXY VOTING POLICIES AND PROCEDURES FOR CLOSED-END MANAGEMENT INVESTMENT COMPANIES. |
Not Applicable.
| ITEM 8. | PORTFOLIO MANAGERS OF CLOSED-END MANAGEMENT INVESTMENT COMPANIES. |
Not Applicable.
| ITEM 9. | PURCHASES OF EQUITY SECURITIES BY CLOSED-END MANAGEMENT INVESTMENT COMPANIES AND AFFILIATED PURCHASERS. |
Not Applicable.
| ITEM 10. | SUBMISSION OF MATTERS TO A VOTE OF SECURITY HOLDERS. |
Not Applicable
| ITEM 11. | CONTROLS AND PROCEDURES. |
(a) The registrant’s principal executive officer and principal financial officer have concluded that the registrant’s disclosure controls and procedures (as defined in Rule 30a-3(c) under the Investment Company Act of 1940, as amended) are effective, as of a date within 90 days of the filing date of this report, based on his evaluation of these disclosure controls and procedures as required by Rule 30a-3(b) under the 1940 Act, as amended, 17 CFR 270.30a-3(b)), and Rules 13a-15(b) or 15d-15(b) under the Securities Exchange Act of 1934, as amended (17 CFR 240.13a-15(b) or 240.15d-15(b)).
(b) There were no changes in the registrant’s internal control over financial reporting (as defined in Rule 30a-3(d) under the 1940 Act, as amended (17 CFR 270.30a-3(d)), that occurred during the registrant’s second fiscal quarter of the period covered by this report that has materially affected, or is reasonably likely to materially affect, the registrant’s internal control over financial reporting.
(a)(1) Code of ethics, or any amendment thereto, that is the subject of disclosure required by Item 2 is attached hereto.
(a)(2) Certifications pursuant to Rule 30a-2(a) under the 1940 Act and Section 302 of the Sarbanes-Oxley Act of 2002 are attached hereto.
(a)(3) Not Applicable.
(b) Certifications pursuant to Rule 30a-2(b) under the 1940 Act and Section 906 of the Sarbanes-Oxley Act of 2002 are attached hereto.
SIGNATURES
Pursuant to the requirements of the Securities Exchange Act of 1934 and the Investment Company Act of 1940, the registrant has duly caused this Report to be signed on its behalf by the undersigned, thereunto duly authorized.
Consulting Group Capital Markets Funds
| | |
| By: | | /s/ James J. Tracy |
| | James J. Tracy |
| | Chief Executive Officer |
| | Consulting Group Capital Markets Funds |
Date: November , 2007
Pursuant to the requirements of the Securities Exchange Act of 1934 and the Investment Company Act of 1940, this report has been signed below by the following persons on behalf of the registrant and in the capacities and on the dates indicated.
| | |
| By: | | /s/ James J. Tracy |
| | James J. Tracy |
| | Chief Executive Officer |
| | Consulting Group Capital Markets Funds |
Date: November , 2007
| | |
| By: | | /s/ James F. Walker |
| | James F. Walker |
| | Chief Financial Officer |
| | Consulting Group Capital Markets Funds |
Date: November 7, 2007