UNITED STATES
SECURITIES AND EXCHANGE COMMISSION
Washington, D.C. 20549
FORM N-CSR
CERTIFIED SHAREHOLDER REPORT OF REGISTERED
MANAGEMENT INVESTMENT COMPANIES
Investment Company Act file number 811-6318
Consulting Group Capital Markets Funds
(Exact name of registrant as specified in charter)
| | |
| 125 Broad Street, New York, NY | | 10004 |
|
| (Address of principal executive offices) | | (Zip code) |
Robert I. Frenkel, Esq.
Smith Barney Fund Management LLC
300 First Stamford Place
Stamford, CT 06902
(Name and address of agent for service)
Registrant’s telephone number, including area code: (800) 451-2010
Date of fiscal year end: March 31
Date of reporting period: March 31, 2005
| ITEM | 1. REPORT TO STOCKHOLDERS. |
The Annual Report to Stockholders is filed herewith.

Consulting Group
Capital Markets Funds
Multi-Strategy Market Neutral Investments
| | |
Annual Report March 31, 2005 | |  |
NOT FDIC INSURED • NOT BANK GUARANTEED • MAY LOSE VALUE
Table of Contents
Consulting Group
Capital Markets Funds
DEAR SHAREHOLDER:
The fiscal year for the Consulting Group Capital Markets Funds – Multi-Strategy Market Neutral Investments (“Fund”) ended March 31, 2005 with the Fund posting a return of –1.23%. During this time period, the Three Month Treasury Bill Indexi rose 1.75%, and the S&P 500 Indexii rose 6.69%. The macro-economic environment during this period was steady economic growth and rising short-term interest rates. The Federal Reserve Boardiii implemented a rising interest rate strategy to return rates to a more normal level and fight the potential rise in inflation.
Consulting Group, in its capacity as Investment Manager of the Fund, is responsible for overseeing and implementing the strategies utilized in the Fund. At the beginning of the fiscal year, the Fund employed two strategies: convertible arbitrage and equity market neutral. Franklin Portfolio Associates LLC, Freeman Associates Investment Management LLC, and SSI Investment Management Inc. (“SSI”) sub-advise the equity market neutral strategy. Calamos Asset Management, Inc. and SSI sub-advise convertible arbitrage. Camden Asset Management L.P. was terminated during the year from the convertible arbitrage strategy.
The convertible arbitrage strategy consists of buying debt securities, preferred stocks, and other securities convertible into common stock. A hedge is constructed by selling short the common stock of the company. There were several factors that negatively impacted the convertible securities markets and the opportunities to achieve positive returns in a hedged strategy.
Issuance of convertible securities diminished during the year, redemptions increased over the previous year, and equity market volatility declined. These factors combined with the recent widening of the credit spread (the premium investors demand over a comparable Treasury security) late in the fiscal year and helped produce negative returns.
The equity market neutral strategy consists of buying stock in the companies the sub-adviser believes to be undervalued and will outperform the broad equity market return. Concurrently, short sales are initiated in the stocks that the sub-adviser believes to be overvalued and will underperform the broad equity market. This strategy produced very low positive to negative returns during this period.
There are two very important equity market factors to understand when analyzing the contribution of the equity market neutral strategy. The volatility of the market, and how differently the stocks in the market move, create opportunity for the sub-adviser. Generally, during the fiscal year, market volatility was lower than previous years. The positive returns the equity market generated during the period were primarily a function of energy and other commodity related companies. Most of the equity market struggled together during the period. Valuation sensitive models by some sub-advisers were able to create low levels of positive returns, but not enough to overcome the negative returns of other equity market neutral strategies and the convertible arbitrage strategy.
The negative return generated by the Fund is disappointing, but must be understood in context of the structure, objectives and opportunities. The Fund does not employ leverage. Very low levels of short-term interest rates have limited the short-rebate opportunity. Equity market volatility has been lower than the previous several years. The Fund is structured as a portfolio risk-reducing vehicle. Given the recent positive returns in both the fixed income and equity markets, the role and importance of market neutral investments was diminished. The long-term role of risk reduction remains in place.
1
Information About Your Fund
As you may be aware, several issues in the mutual fund industry have recently come under the scrutiny of federal and state regulators. The Fund’s Adviser and some of its affiliates have received requests for information from various government regulators regarding market timing, late trading, fees and other mutual fund issues in connection with various investigations. The regulators appear to be examining, among other things, the Fund’s response to market timing and shareholder exchange activity, including compliance with prospectus disclosure related to these subjects. The Fund has been informed that the Adviser and its affiliates are responding to those information requests, but are not in a position to predict the outcome of these requests and investigations.
Important information concerning the Fund and its Adviser with regard to recent regulatory developments is contained in the “Additional Information” note in the Notes to the Financial Statements included in this report.
We thank you for your continued support and encourage you to contact your Financial Consultant for further assistance and guidance.
Sincerely,

R. Jay Gerken, CFA
Chairman, President and Chief Executive Officer
April 29, 2005
All figures represent past performance and are not a guarantee of future results. Investment return and principal value of an investment will fluctuate so that an investor’s shares, when redeemed, may be worth more or less than their original cost. The returns shown also do not reflect the deduction of taxes that a shareholder would pay on fund distributions or the redemption of fund shares. Performance figures may reflect fee waivers and/or expense reimbursements. In the absence of fee waivers and/or expense reimbursements, the total return would have been lower. To obtain performance data current to the most recent month-end, please visit our website at www.citigroupam.com.
The Fund is only available to investors participating in an advisory program. These programs charge an annual fee, which in the case of TRAK® may be up to 1.50%. The performance data shown does not reflect this fee, which would reduce returns.
All index performance reflects no deduction for fees, expenses or taxes. Please note an investor cannot invest directly in an index.
The information provided is not intended to be a forecast of future events, a guarantee of future results or investment advice. Views expressed my differ from those of the firm as a whole.
RISKS: The Fund makes short sales of securities, which may result in losses greater than the amount invested. Although the Fund’s strategies attempt to neutralize the effect of general trends in the equity markets, an investment in the Fund is subject to the risks associated with investing in equity securities generally. Equity securities, particularly common stocks, have historically generated higher average returns than fixed income securities, but have also experienced significantly more volatility on those returns. In addition to the risks associated with equity securities, convertible arbitrage also entails risks associated with fixed income securities, such as interest rate and credit risk. The Fund may engage in active and frequent trading which would increase the investor’s tax liability and increase transaction costs, which would in turn, reduce the Fund’s performance.
| i | | The Three Month Treasury Bill Index is composed of one three-month U.S. Treasury Bill whose return is tracked until its maturity. |
| ii | | The S&P 500 Index is a market capitalization-weighted index of 500 widely held common stocks. |
| iii | | The Federal Reserve Board is responsible for the formulation of a policy designed to promote economic growth, full employment, stable prices, and a sustainable pattern of international trade and payments. |
2
The following graph depicts the performance of the Multi-Strategy Market Neutral Investments vs. the 3-Month T-Bill Index and S&P 500 Index.
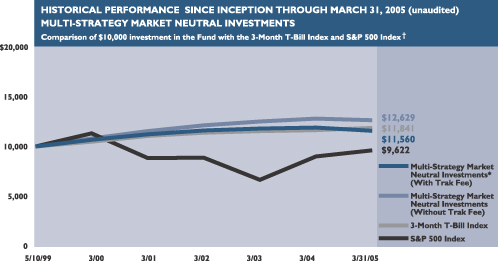
The 3-Month T-Bill Index is composed of one 3-Month U.S. T-Bill whose return is tracked until its maturity. The S&P 500 Index is an index composed of 500 widely held common stocks listed on the New York Stock Exchange, American Stock Exchange and over-the-counter market. Because the index is not a managed portfolio, there are no advisory fees or internal management expenses reflected in the index’s performance. Please note that an investor cannot invest directly in an index.
Average Annual Total Returns For the Period Ended March 31, 2005†‡ (unaudited)
| | | | | | |
Multi-Strategy Market Neutral
Investments | | Without TRAK Fee | | | With TRAK Fee* | |
Since inception (5/10/99) | | 4.04 | % | | 2.49 | % |
5 Year | | 3.18 | | | 1.64 | |
3 Year | | 1.38 | | | (0.13 | ) |
1 Year | | (1.23 | ) | | (2.70 | ) |
|
|
| † | All figures represent past performance and are not a guarantee of future results. Investment return and principal value of an investment will fluctuate so that an investor’s shares, when redeemed, may be worth more or less than their original cost. The returns shown also do not reflect the deduction of taxes that a shareholder would pay on fund distributions or the redemption of fund shares. Performance figures may reflect fee waivers and/or expense reimbursements. In the absence of fee waivers and/or expense reimbursements, the total return would have been lower. To obtain performance data current to the most recent month-end, please visit our website at www. citigroupam.com. |
| ‡ | Assumes the reinvestment of all distributions. |
| * | The Fund is available only to investors participating in an advisory program. These programs charge an annual fee, which in the case of TRAK® may be up to 1.50%. |
3
Fund at a Glance (unaudited)
4
Fund Expenses (unaudited)
Example
As a shareholder of the Fund, you may incur two types of costs: (1) advisory program annual fees, which in the case of TRAK® may be up to 1.50%; and (2) ongoing costs, including management fees and other Fund expenses. This example is intended to help you understand your ongoing costs (in dollars) of investing in the Fund and to compare these costs with the ongoing costs of investing in other mutual funds.
This example is based on an investment of $1,000 invested on October 1, 2004 and held for the six months ended March 31, 2005.
Actual Expenses
The table below titled “Based on Actual Total Return” provides information about actual account values and actual expenses. You may use the information provided in this table, together with the amount you invested, to estimate the expenses that you paid over the period. To estimate the expenses you paid on your account, divide your ending account value by $1,000 (for example, an $8,600 ending account value divided by $1,000 = 8.6), then multiply the result by the number under the heading entitled “Expenses Paid During the Period”.
Based on Actual Total Return(1)
| | | | | | | | | | | | | | | |
| | | Actual
Total
Return(2) | | | Beginning
Account
Value | | Ending
Account
Value | | Annualized
Expense
Ratio | | | Expenses
Paid During
the Period(3) |
| | | (0.77 | )% | | $ | 1,000.00 | | $ | 992.30 | | 1.77 | % | | $ | 8.79 |
|
| (1) | For the six months ended March 31, 2005. |
| (2) | Assumes reinvestment of all dividends and capital gain distributions, if any, at net asset value and does not reflect the deduction of the applicable advisory program charge, which in the case of TRAK® may be up to 1.50%. Total return is not annualized as it may not be representative of the total return for the year. Performance figures may reflect voluntary fee waivers and/or expense reimbursements. Past performance is no guarantee of future results. In the absence of voluntary fee waivers and/or expense reimbursements, the total return would have been lower. |
| (3) | Expenses (net of voluntary fee waiver) are equal to the Fund’s annualized expense ratio multiplied by the average account value over the period, multiplied by the number of days in the most recent fiscal half-year, then divided by 365. |
5
Fund Expenses (unaudited) (continued)
Hypothetical Example for Comparison Purposes
The table below titled “Based on Hypothetical Total Return” provides information about hypothetical account values and hypothetical expenses based on the actual expense ratio and an assumed rate of return of 5.00% per year before expenses, which is not the Fund’s actual return. The hypothetical account values and expenses may not be used to estimate the actual ending account balance or expenses you paid for the period. You may use the information provided in this table to compare the ongoing costs of investing in the Fund and other funds. To do so, compare the 5.00% hypothetical example relating to the Fund with the 5.00% hypothetical examples that appear in the shareholder reports of the other funds.
Please note that the expenses shown in the table below are meant to highlight your ongoing costs only and do not reflect any transactional costs such as front-end or back-end sales charges (loads). Therefore, the table is useful in comparing ongoing costs only, and will not help you determine the relative total costs of owning different funds. In addition, if these transaction costs were included, your costs would have been higher.
Based on Hypothetical Total Return(1)
| | | | | | | | | | | | | | | |
| | | Hypothetical
Annualized
Total Return | | | Beginning
Account
Value | | Ending
Account
Value | | Annualized
Expense
Ratio | | | Expenses
Paid During
the Period(2) |
| | | 5.00 | % | | $ | 1,000.00 | | $ | 1,016.11 | | 1.77 | % | | $ | 8.90 |
|
| (1) | For the six months ended March 31, 2005. |
| (2) | Expenses (net of voluntary fee waiver) are equal to the Fund’s annualized expense ratio multiplied by the average account value over the period, multiplied by the number of days in the most recent fiscal half-year, then divided by 365. |
6
Schedule of Investments
March 31, 2005
| | | | | |
| | |
| Shares | | Security | | Value |
COMMON STOCK (a) — 51.1 % | | | |
CONSUMER DISCRETIONARY — 12.1% | | | |
| |
Auto Components — 0.9% | | | |
| 2,500 | | American Axle & Manufacturing Holdings, Inc. | | $ | 61,250 |
| 12,550 | | Autoliv, Inc. | | | 598,008 |
| 3,670 | | Cooper Tire & Rubber Co. | | | 67,381 |
| 1,435 | | Dana Corp. | | | 18,354 |
| 14,800 | | The Goodyear Tire & Rubber Co. (b) | | | 197,580 |
| 1,600 | | Lear Corp. | | | 70,976 |
| 700 | | Magna International Inc., Class A Shares | | | 46,830 |
| 3,440 | | Tenneco Automotive Inc. (b) | | | 42,862 |
| 2,400 | | Wabtec Corp. | | | 49,176 |
| | | | |
|
|
| | | | | | 1,152,417 |
| | | | |
|
|
| |
Automobiles — 0.6% | | | |
| 13,400 | | Ford Motor Co. | | | 151,822 |
| 4,200 | | General Motors Corp. | | | 123,438 |
| 6,500 | | Harley-Davidson, Inc. | | | 375,440 |
| 2,100 | | Toyota Motor Corp., Sponsored ADR | | | 156,198 |
| | | | |
|
|
| | | | | | 806,898 |
| | | | |
|
|
| |
Distributors — 0.1% | | | |
| 2,050 | | WESCO International, Inc. (b) | | | 57,400 |
| | | | |
|
|
| |
Hotels, Restaurants & Leisure — 0.8% | | | |
| 1,700 | | Ameristar Casinos, Inc. | | | 92,956 |
| 1,400 | | Boyd Gaming Corp. | | | 73,010 |
| 3,380 | | CKE Restaurants, Inc. (b) | | | 53,573 |
| 8,195 | | Darden Restaurants, Inc. | | | 251,423 |
| 7,625 | | Hilton Hotels Corp. | | | 170,419 |
| 1,060 | | Jack in the Box Inc. (b) | | | 39,326 |
| 4,895 | | McDonald's Corp. | | | 152,430 |
| 8,250 | | Penn National Gaming, Inc. (b) | | | 242,385 |
| 1,300 | | Ruby Tuesday, Inc. | | | 31,577 |
| | | | |
|
|
| | | | | | 1,107,099 |
| | | | |
|
|
| |
Household Durables — 2.5% | | | |
| 17,950 | | American Greetings Corp., Class A Shares | | | 457,366 |
| 3,600 | | The Black & Decker Corp. | | | 284,364 |
| 2,333 | | D.R. Horton, Inc. | | | 68,217 |
| 6,655 | | Ethan Allen Interiors Inc. | | | 212,960 |
| 10,800 | | Furniture Brands International, Inc. | | | 235,548 |
| 900 | | Harman International Industries, Inc. | | | 79,614 |
| 1,600 | | KB HOME | | | 187,936 |
| 1,026 | | M.D.C. Holdings, Inc. | | | 71,461 |
| 10,525 | | Newell Rubbermaid Inc. | | | 230,919 |
| 100 | | NVR, Inc. (b) | | | 78,500 |
| 2,740 | | Snap-on Inc. | | | 87,105 |
| 2,600 | | Standard Pacific Corp. | | | 187,694 |
| 7,600 | | The Stanley Works | | | 344,052 |
| 1,600 | | Tempur-Pedic International Inc. (b) | | | 29,856 |
| 4,500 | | Toll Brothers, Inc. (b) | | | 354,825 |
| 1,000 | | The Toro Co. | | | 88,500 |
See Notes to Financial Statements.
7
Schedule of Investments
(continued)
| | | | | |
| | |
| Shares | | Security | | Value |
| |
Household Durables — 2.5% (continued) | | | |
| 11,500 | | Tupperware Corp. | | $ | 234,140 |
| 1,400 | | Whirlpool Corp. | | | 94,822 |
| | | | |
|
|
| | | | | | 3,327,879 |
| | | | |
|
|
| |
Leisure Equipment & Products — 0.7% | | | |
| 3,465 | | JAKKS Pacific, Inc. (b) | | | 74,394 |
| 28,945 | | Marvel Enterprises, Inc. (b) | | | 578,900 |
| 3,395 | | Polaris Industries Inc. | | | 238,431 |
| 2,400 | | SCP Pool Corp. | | | 76,464 |
| | | | |
|
|
| | | | | | 968,189 |
| | | | |
|
|
| |
Media — 1.4% | | | |
| 4,000 | | Catalina Marketing Corp. | | | 103,600 |
| 14,900 | | Citadel Broadcasting Co. (b) | | | 204,577 |
| 3,800 | | Clear Channel Communications, Inc. | | | 130,986 |
| 1,115 | | Entercom Communications Corp. (b) | | | 39,605 |
| 15,400 | | Gemstar-TV Guide International, Inc. (b) | | | 66,990 |
| 1,000 | | Grupo Televisa S.A., Sponsored ADR | | | 58,800 |
| 2,900 | | John Wiley & Sons, Inc., Class A Shares | | | 102,225 |
| 1,200 | | Lamar Advertising Co., Class A Shares (b) | | | 48,348 |
| 6,700 | | Lions Gate Entertainment Corp. (b) | | | 74,035 |
| 1,835 | | The McGraw-Hill Cos., Inc. | | | 160,104 |
| 2,100 | | Meredith Corp. | | | 98,175 |
| 1,000 | | Pixar (b) | | | 97,550 |
| 1,400 | | R.H. Donnelley Corp. (b) | | | 81,326 |
| 4,200 | | The Reader's Digest Association, Inc. | | | 72,702 |
| 7,120 | | Sinclair Broadcast Group, Inc., Class A Shares | | | 57,174 |
| 17,200 | | Sirius Satellite Radio Inc. (b) | | | 96,664 |
| 4,370 | | Time Warner Inc. (b) | | | 76,694 |
| 7,300 | | TV Azteca, S.A. de C.V., Sponsored ADR | | | 63,145 |
| 5,900 | | The Walt Disney Co. | | | 169,507 |
| 3,900 | | XM Satellite Radio Holdings Inc., Class A Shares (b) | | | 122,850 |
| | | | |
|
|
| | | | | | 1,925,057 |
| | | | |
|
|
| |
Multi-Line Retail — 1.4% | | | |
| 7,600 | | BJ's Wholesale Club, Inc. (b) | | | 236,056 |
| 7,500 | | Costco Wholesale Corp. | | | 331,350 |
| 3,100 | | Dillard's, Inc., Class A Shares | | | 83,390 |
| 5,200 | | Federated Department Stores, Inc. | | | 330,928 |
| 3,990 | | J. C. Penney Co., Inc. | | | 207,161 |
| 4,230 | | Nordstrom, Inc. | | | 234,257 |
| 3,100 | | Sears Holdings Corp. (b) | | | 412,827 |
| 1,200 | | Wal-Mart Stores, Inc. | | | 60,132 |
| | | | |
|
|
| | | | | | 1,896,101 |
| | | | |
|
|
| |
Specialty Retail — 3.3% | | | |
| 7,000 | | Abercrombie & Fitch Co., Class A Shares | | | 400,680 |
| 6,000 | | Aeropostale, Inc. (b) | | | 196,500 |
| 20,200 | | American Eagle Outfitters, Inc. | | | 596,910 |
| 23,100 | | AutoNation, Inc. (b) | | | 437,514 |
| 900 | | AutoZone, Inc. (b) | | | 77,130 |
| 11,860 | | Barnes & Noble, Inc. (b) | | | 409,051 |
| 2,100 | | Bebe Stores, Inc. | | | 71,295 |
| 4,240 | | Best Buy Co., Inc. | | | 229,002 |
See Notes to Financial Statements.
8
Schedule of Investments
(continued)
| | | | | |
| | |
| Shares | | Security | | Value |
| |
Specialty Retail — 3.3% (continued) | | | |
| 3,900 | | Borders Group, Inc. | | $ | 103,818 |
| 3,130 | | Casual Male Retail Group Inc. (b) | | | 20,314 |
| 3,545 | | Charming Shoppes, Inc. (b) | | | 28,821 |
| 11,785 | | The Gap, Inc. | | | 257,384 |
| 5,600 | | The Gymboree Corp. (b) | | | 70,224 |
| 9,100 | | Linens 'n Things, Inc. (b) | | | 225,953 |
| 9,585 | | Michaels Stores, Inc. | | | 347,936 |
| 2,400 | | Movie Gallery, Inc. | | | 68,832 |
| 6,800 | | OfficeMax Inc. | | | 227,800 |
| 2,700 | | Payless ShoeSource, Inc. (b) | | | 42,633 |
| 12,300 | | Pier 1 Imports, Inc. | | | 224,229 |
| 12,650 | | Staples, Inc. | | | 397,590 |
| | | | |
|
|
| | | | | | 4,433,616 |
| | | | |
|
|
| |
Textiles & Apparel — 0.4% | | | |
| 2,235 | | K-Swiss Inc., Class A Shares | | | 73,822 |
| 2,300 | | NIKE, Inc., Class B Shares | | | 191,613 |
| 21,340 | | Tommy Hilfiger Corp. (b) | | | 249,678 |
| 2,000 | | Wolverine World Wide, Inc. | | | 42,860 |
| | | | |
|
|
| | | | | | 557,973 |
| | | | |
|
|
| | | TOTAL CONSUMER DISCRETIONARY | | | 16,232,629 |
| | | | |
|
|
CONSUMER STAPLES — 2.6% | | | |
| |
Beverages — 0.8% | | | |
| 1,400 | | Diageo PLC, Sponsored ADR | | | 79,660 |
| 1,400 | | Fomento Economico Mexicano, S.A. de C.V., Sponsored ADR | | | 74,970 |
| 615 | | Molson Coors Brewing Co., Class B Shares | | | 47,460 |
| 14,715 | | The Pepsi Bottling Group, Inc. | | | 409,813 |
| 21,000 | | PepsiAmericas, Inc. | | | 475,860 |
| | | | |
|
|
| | | | | | 1,087,763 |
| | | | |
|
|
| |
Food & Drug Retailing — 0.5% | | | |
| 11,975 | | 7-Eleven, Inc. (b) | | | 287,640 |
| 300 | | CVS Corp. | | | 15,786 |
| 3,100 | | The Great Atlantic & Pacific Tea Co., Inc. (b) | | | 46,190 |
| 11,900 | | The Kroger Co. (b) | | | 190,757 |
| 8,100 | | Rite Aid Corp. (b) | | | 32,076 |
| 2,900 | | SUPERVALU INC. | | | 96,715 |
| | | | |
|
|
| | | | | | 669,164 |
| | | | |
|
|
| |
Food Products — 1.1% | | | |
| 7,830 | | Archer-Daniels-Midland Co. | | | 192,461 |
| 3,675 | | Cadbury Schweppes PLC, Sponsored ADR | | | 149,573 |
| 4,100 | | General Mills, Inc. | | | 201,515 |
| 6,800 | | Hormel Foods Corp. | | | 211,548 |
| 750 | | McCormick & Co., Inc., Non-voting Shares | | | 25,822 |
| 6,620 | | Pilgrim's Pride Corp. | | | 236,466 |
| 5,900 | | Sara Lee Corp. | | | 130,744 |
| 5,700 | | Sensient Technologies Corp. | | | 122,892 |
| 2,500 | | Smithfield Foods, Inc. (b) | | | 78,875 |
| 2,100 | | Tyson Foods, Inc., Class A Shares | | | 35,028 |
| | | | |
|
|
| | | | | | 1,384,924 |
| | | | |
|
|
See Notes to Financial Statements.
9
Schedule of Investments
(continued)
| | | | | |
| | |
| Shares | | Security | | Value |
| |
Personal Products — 0.2% | | | |
| 4,200 | | Avon Products, Inc. | | $ | 180,348 |
| 910 | | The Gillette Co. | | | 45,937 |
| 6,100 | | Playtex Products, Inc. (b) | | | 54,900 |
| | | | |
|
|
| | | | | | 281,185 |
| | | | |
|
|
| | | TOTAL CONSUMER STAPLES | | | 3,423,036 |
| | | | |
|
|
ENERGY — 4.2% | | | |
| |
Energy Equipment & Services — 1.4% | | | |
| 1,400 | | BJ Services Co. | | | 72,632 |
| 1,800 | | Cal Dive International, Inc. (b) | | | 81,540 |
| 1,690 | | Cooper Cameron Corp. (b) | | | 96,685 |
| 4,400 | | ENSCO International Inc. | | | 165,704 |
| 3,400 | | Grant Prideco, Inc. (b) | | | 82,144 |
| 2,850 | | Halliburton Co. | | | 123,262 |
| 1,200 | | Lone Star Technologies, Inc. (b) | | | 47,316 |
| 1,400 | | Maverick Tube Corp. (b) | | | 45,514 |
| 2,700 | | Nabors Industries, Ltd. (b) | | | 159,684 |
| 9,300 | | Patterson-UTI Energy, Inc. | | | 232,686 |
| 1,620 | | Precision Drilling Corp. (b) | | | 120,949 |
| 2,800 | | Schlumberger Ltd. | | | 197,344 |
| 4,300 | | Transocean Inc. (b) | | | 221,278 |
| 1,600 | | Unit Corp. (b) | | | 72,272 |
| 2,100 | | Universal Compression Holdings, Inc. (b) | | | 79,527 |
| 2,650 | | Weatherford International Ltd. (b) | | | 153,541 |
| | | | |
|
|
| | | | | | 1,952,078 |
| | | | |
|
|
| |
Oil & Gas — 2.8% | | | |
| 1,100 | | Amerada Hess Corp. | | | 105,831 |
| 6,400 | | Anadarko Petroleum Corp. | | | 487,040 |
| 1,500 | | Ashland Inc. | | | 101,205 |
| 2,600 | | Burlington Resources Inc. | | | 130,182 |
| 17,200 | | Chesapeake Energy Corp. | | | 377,368 |
| 2,800 | | ConocoPhillips | | | 301,952 |
| 3,600 | | Devon Energy Corp. | | | 171,900 |
| 2,400 | | Exxon Mobil Corp. | | | 143,040 |
| 1,500 | | General Maritime Corp. (b) | | | 72,660 |
| 1,510 | | The Houston Exploration Co. (b) | | | 85,994 |
| 5,500 | | Marathon Oil Corp. | | | 258,060 |
| 1,100 | | Murphy Oil Corp. | | | 108,603 |
| 1,000 | | Newfield Exploration Co. (b) | | | 74,260 |
| 1,300 | | Nordic American Tanker Shipping Ltd. | | | 61,685 |
| 1,700 | | Premcor Inc. | | | 101,456 |
| 3,400 | | Sunoco, Inc. | | | 351,968 |
| 5,695 | | Tesoro Corp. (b) | | | 210,829 |
| 2,775 | | Ultra Petroleum Corp. (b) | | | 140,970 |
| 5,650 | | Valero Energy Corp. | | | 413,975 |
| | | | |
|
|
| | | | | | 3,698,978 |
| | | | |
|
|
| | | TOTAL ENERGY | | | 5,651,056 |
| | | | |
|
|
See Notes to Financial Statements.
10
Schedule of Investments
(continued)
| | | | | |
| | |
| Shares | | Security | | Value |
FINANCIALS — 7.4% | | | |
| |
Banks — 1.8% | | | |
| 1,600 | | Associated Banc-Corp. | | $ | 49,968 |
| 3,700 | | Bank of America Corp. | | | 163,170 |
| 4,275 | | The Bank of New York Co., Inc. | | | 124,189 |
| 3,115 | | BankUnited Financial Corp., Class A Shares (b) | | | 83,669 |
| 2,300 | | City National Corp. | | | 160,586 |
| 500 | | First BanCorp. | | | 21,125 |
| 2,000 | | Golden West Financial Corp. | | | 121,000 |
| 1,000 | | M&T Bank Corp. | | | 102,060 |
| 9,060 | | National City Corp. | | | 303,510 |
| 3,570 | | Northern Trust Corp. | | | 155,081 |
| 6,292 | | SunTrust Banks, Inc. | | | 453,464 |
| 2,300 | | TD Banknorth, Inc. (b) | | | 71,852 |
| 2,400 | | UnionBanCal Corp. | | | 147,000 |
| 6,800 | | W Holding Co., Inc. | | | 68,476 |
| 3,100 | | Wachovia Corp. | | | 157,821 |
| 1,900 | | Washington Mutual, Inc. | | | 75,050 |
| 2,000 | | Westcorp | | | 84,500 |
| 1,200 | | Zions Bancorp. | | | 82,824 |
| | | | |
|
|
| | | | | | 2,425,345 |
| | | | |
|
|
| |
Diversified Financials — 2.5% | | | |
| 2,935 | | A.G. Edwards, Inc. | | | 131,488 |
| 1,400 | | Affiliated Managers Group, Inc. (b) | | | 86,842 |
| 2,700 | | American Capital Strategies, Ltd. | | | 84,807 |
| 6,715 | | AmeriCredit Corp. (b) | | | 157,400 |
| 15,600 | | Ameritrade Holding Corp. (b) | | | 159,276 |
| 1,100 | | The Bear Stearns Cos. Inc. | | | 109,890 |
| 3,000 | | Calamos Asset Management, Inc., Class A Shares (c) | | | 80,760 |
| 2,825 | | Capital One Financial Corp. | | | 211,225 |
| 200 | | The Chicago Mercantile Exchange | | | 38,806 |
| 200 | | CIT Group Inc. | | | 7,600 |
| 11,023 | | Countrywide Financial Corp. | | | 357,807 |
| 4,690 | | Doral Financial Corp. | | | 102,664 |
| 10,800 | | E*TRADE Financial Corp. (b) | | | 129,600 |
| 5,000 | | Friedman, Billings, Ramsey Group, Inc., Class A Shares | | | 79,350 |
| 2,425 | | GFI Group Inc. (b) | | | 65,063 |
| 900 | | The Goldman Sachs Group, Inc. | | | 98,991 |
| 4,000 | | JPMorgan Chase & Co. | | | 138,400 |
| 21,200 | | Knight Trading Group, Inc., Class A Shares (b) | | | 204,368 |
| 2,475 | | Legg Mason, Inc. | | | 193,396 |
| 1,795 | | Lehman Brothers Holdings Inc. | | | 169,017 |
| 6,120 | | MBNA Corp. | | | 150,246 |
| 1,100 | | Moody's Corp. | | | 88,946 |
| 5,200 | | Providian Financial Corp. (b) | | | 89,232 |
| 5,800 | | State Street Corp. | | | 253,576 |
| 2,200 | | Walter Industries, Inc. | | | 93,610 |
| 1,200 | | WFS Financial Inc. (b) | | | 51,780 |
| | | | |
|
|
| | | | | | 3,334,140 |
| | | | |
|
|
| |
Insurance — 2.1% | | | |
| 2,200 | | ACE Ltd. | | | 90,794 |
| 1,800 | | The Allstate Corp. | | | 97,308 |
| 2,300 | | American Financial Group, Inc. | | | 70,840 |
See Notes to Financial Statements.
11
Schedule of Investments
(continued)
| | | | | |
| | |
| Shares | | Security | | Value |
| |
Insurance — 2.1% (continued) | | | |
| 1,800 | | AmerUs Group Co. | | $ | 85,050 |
| 700 | | The Chubb Corp. | | | 55,489 |
| 11,180 | | Cincinnati Financial Corp. | | | 487,560 |
| 1,400 | | The Commerce Group, Inc. | | | 86,772 |
| 725 | | Everest Re Group, Ltd. | | | 61,705 |
| 10,400 | | First American Corp. | | | 342,576 |
| 3,700 | | Fremont General Corp. | | | 81,363 |
| 900 | | Infinity Property & Casualty Corp. | | | 28,134 |
| 7,305 | | Lincoln National Corp. | | | 329,748 |
| 2,380 | | MetLife, Inc. | | | 93,058 |
| 6,400 | | Nationwide Financial Services, Inc., Class A Shares | | | 229,760 |
| 2,600 | | Protective Life Corp. | | | 102,180 |
| 1,850 | | Prudential Financial, Inc. | | | 106,190 |
| 1,800 | | Reinsurance Group of America, Inc. | | | 76,644 |
| 2,490 | | SAFECO Corp. | | | 121,288 |
| 1,850 | | W. R. Berkley Corp. | | | 91,760 |
| 2,050 | | Willis Group Holdings Ltd. | | | 75,583 |
| 1,100 | | XL Capital Ltd., Class A Shares | | | 79,607 |
| | | | |
|
|
| | | | | | 2,793,409 |
| | | | |
|
|
| |
Real Estate — 1.0% | | | |
| 12,325 | | Annaly Mortgage Management Inc. | | | 231,217 |
| 4,400 | | Archstone-Smith Trust | | | 150,084 |
| 1,200 | | Avalonbay Communities, Inc. | | | 80,268 |
| 4,235 | | Bluegreen Corp. (b) | | | 54,420 |
| 1,300 | | Boston Properties, Inc. | | | 78,299 |
| 1,300 | | CBL & Associates Properties, Inc. | | | 92,963 |
| 2,000 | | Cousins Properties, Inc. | | | 51,740 |
| 1,900 | | Developers Diversified Realty Corp. | | | 75,525 |
| 3,000 | | Impac Mortgage Holdings, Inc. | | | 57,540 |
| 1,900 | | New Century Financial Corp. | | | 88,958 |
| 3,000 | | Plum Creek Timber Co., Inc. | | | 107,100 |
| 1,600 | | Regency Centers Corp. | | | 76,208 |
| 2,500 | | Saxon Capital Inc. | | | 43,000 |
| 1,500 | | SL Green Realty Corp. | | | 84,330 |
| 3,200 | | Thornburg Mortgage, Inc. | | | 89,728 |
| | | | |
|
|
| | | | | | 1,361,380 |
| | | | |
|
|
| | | TOTAL FINANCIALS | | | 9,914,274 |
| | | | |
|
|
HEALTHCARE — 5.1% | | | |
|
Biotechnology — 0.4% |
| 1,600 | | Affymetrix, Inc. (b) | | | 68,544 |
| 2,825 | | Charles River Laboratories International, Inc. (b) | | | 132,888 |
| 2,200 | | CV Therapeutics, Inc. (b) | | | 44,792 |
| 3,200 | | Gilead Sciences, Inc. (b) | | | 114,560 |
| 2,700 | | Human Genome Sciences, Inc. (b) | | | 24,894 |
| 2,750 | | Invitrogen Corp. (b) | | | 190,300 |
| 600 | | OSI Pharmaceuticals, Inc. (b) | | | 24,804 |
| | | | |
|
|
| | | | | | 600,782 |
| | | | |
|
|
|
Healthcare Equipment & Supplies — 1.3% |
| 1,370 | | Alcon, Inc. | | | 122,327 |
| 6,930 | | Applera Corp.—Applied Biosystems Group | | | 136,798 |
| 1,695 | | Bausch & Lomb Inc. | | | 124,243 |
See Notes to Financial Statements.
12
Schedule of Investments
(continued)
| | | | | |
| | |
| Shares | | Security | | Value |
|
Healthcare Equipment & Supplies — 1.3% (continued) |
| 7,000 | | Baxter International Inc. | | $ | 237,860 |
| 6,600 | | Becton, Dickinson and Co. | | | 385,572 |
| 2,050 | | Boston Scientific Corp.(b) | | | 60,044 |
| 1,100 | | C. R. Bard, Inc. | | | 74,888 |
| 1,200 | | The Cooper Cos., Inc. | | | 87,480 |
| 1,200 | | Cyberonics, Inc. (b) | | | 53,004 |
| 1,700 | | Haemonetics Corp. (b) | | | 71,672 |
| 2,000 | | Hologic, Inc. (b) | | | 63,750 |
| 1,960 | | Kyphon Inc. (b) | | | 49,333 |
| 805 | | Medtronic, Inc. | | | 41,015 |
| 5,100 | | STERIS Corp. (b) | | | 128,775 |
| 2,800 | | Wilson Greatbatch Technologies, Inc. (b) | | | 51,072 |
| | | | |
|
|
| | | | | | 1,687,833 |
| | | | |
|
|
|
Healthcare Providers & Services — 2.3% |
| 2,200 | | Aetna Inc. | | | 164,890 |
| 6,200 | | AmerisourceBergen Corp. | | | 355,198 |
| 2,400 | | Cantel Medical Corp. (b) | | | 69,504 |
| 3,000 | | Cardinal Health, Inc. | | | 167,400 |
| 2,370 | | CIGNA Corp. | | | 211,641 |
| 4,100 | | Coventry Health Care, Inc. (b) | | | 279,374 |
| 1,035 | | Express Scripts, Inc. (b) | | | 90,242 |
| 2,300 | | First Horizon Pharmaceutical Corp. (b) | | | 38,824 |
| 300 | | HCA, Inc. | | | 16,071 |
| 14,700 | | Health Management Associates, Inc., Class A Shares | | | 384,846 |
| 10,400 | | Humana Inc. (b) | | | 332,176 |
| 9,400 | | Lincare Holdings Inc. (b) | | | 415,762 |
| 3,300 | | Manor Care, Inc. | | | 119,988 |
| 7,900 | | McKesson Corp. | | | 298,225 |
| 100 | | PacifiCare Health Systems, Inc. (b) | | | 5,692 |
| 10,050 | | Service Corp. International (b) | | | 75,174 |
| 1,605 | | Sierra Health Services, Inc. (b) | | | 102,463 |
| | | | |
|
|
| | | | | | 3,127,470 |
| | | | |
|
|
|
Pharmaceuticals — 1.1% |
| 7,200 | | Forest Laboratories, Inc. (b) | | | 266,040 |
| 3,900 | | Hospira, Inc. (b) | | | 125,853 |
| 8,100 | | Johnson & Johnson | | | 543,996 |
| 3,470 | | Medicis Pharmaceutical Corp., Class A Shares | | | 104,031 |
| 1,800 | | Merck & Co. Inc. | | | 58,266 |
| 2,200 | | Sepracor Inc. (b) | | | 126,302 |
| 3,600 | | Shire Pharmaceuticals Group PLC, Sponsored ADR | | | 123,408 |
| 2,900 | | Watson Pharmaceuticals, Inc. (b) | | | 89,117 |
| | | | |
|
|
| | | | | | 1,437,013 |
| | | | |
|
|
| | | TOTAL HEALTHCARE | | | 6,853,098 |
| | | | |
|
|
INDUSTRIALS — 6.5% |
|
Aerospace & Defense — 1.1% |
| 6,075 | | BE Aerospace, Inc. (b) | | | 72,900 |
| 1,825 | | The Boeing Co. | | | 106,689 |
| 3,925 | | Engineered Support Systems, Inc. | | | 210,066 |
| 350 | | General Dynamics Corp. | | | 37,467 |
| 5,775 | | L-3 Communications Holdings, Inc. | | | 410,140 |
| 4,100 | | Lockheed Martin Corp. | | | 250,346 |
See Notes to Financial Statements.
13
Schedule of Investments
(continued)
| | | | | |
| | |
| Shares | | Security | | Value |
|
Aerospace & Defense — 1.1% (continued) |
| 6,470 | | Orbital Sciences Corp. (b) | | $ | 62,630 |
| 1,600 | | Raytheon Co. | | | 61,920 |
| 2,700 | | United Defense Industries, Inc. | | | 198,234 |
| | | | |
|
|
| | | | | | 1,410,392 |
| | | | |
|
|
| |
Air Freight & Couriers — 0.1% | | | |
| 1,275 | | EGL, Inc. (b) | | | 29,070 |
| 2,200 | | Ryder System, Inc. | | | 91,740 |
| | | | |
|
|
| | | | | | 120,810 |
| | | | |
|
|
| |
Airlines — 0.2% | | | |
| 5,310 | | Alaska Air Group, Inc. (b) | | | 156,326 |
| 6,900 | | AMR Corp. (b) | | | 73,830 |
| 5,020 | | Continental Airlines, Inc., Class B Shares (b) | | | 60,441 |
| 1,600 | | ExpressJet Holdings, Inc. (b) | | | 18,256 |
| | | | |
|
|
| | | | | | 308,853 |
| | | | |
|
|
| |
Building Products — 0.2% | | | |
| 6,300 | | Masco Corp. | | | 218,421 |
| | | | |
|
|
| |
Commercial Services & Supplies — 1.8% | | | |
| 1,900 | | Adesa, Inc. | | | 44,384 |
| 3,400 | | Alliance Data Systems Corp. (b) | | | 137,360 |
| 4,570 | | The Brink's Co. | | | 158,122 |
| 3,000 | | Career Education Corp. (b) | | | 102,780 |
| 25,000 | | Cendant Corp. | | | 513,500 |
| 2,200 | | Deluxe Corp. | | | 87,692 |
| 850 | | First Data Corp. | | | 33,413 |
| 2,375 | | Headwaters Inc. (b) | | | 77,947 |
| 1,400 | | ITT Educational Services, Inc. (b) | | | 67,900 |
| 15,600 | | Korn/Ferry International (b) | | | 296,868 |
| 1,600 | | Monster Worldwide Inc. (b) | | | 44,880 |
| 3,100 | | Robert Half International Inc. | | | 83,576 |
| 24,930 | | Sabre Holdings Corp., Class A Shares | | | 545,468 |
| 5,500 | | Waste Management, Inc. | | | 158,675 |
| 2,900 | | West Corp. (b) | | | 92,800 |
| | | | |
|
|
| | | | | | 2,445,365 |
| | | | |
|
|
| |
Electrical Equipment — 0.6% | | | |
| 2,300 | | AMETEK, Inc. | | | 92,575 |
| 2,325 | | Cooper Industries, Ltd., Class A Shares | | | 166,284 |
| 4,200 | | Energizer Holdings, Inc. (b) | | | 251,160 |
| 2,800 | | Rockwell Automation, Inc. | | | 158,592 |
| 4,000 | | Thomas & Betts Corp. (b) | | | 129,200 |
| | | | |
|
|
| | | | | | 797,811 |
| | | | |
|
|
| |
Industrial Conglomerates — 0.2% | | | |
| 1,155 | | 3M Co. | | | 98,972 |
| 2,850 | | Honeywell International Inc. | | | 106,048 |
| 3,700 | | Tyco International Ltd. | | | 125,060 |
| | | | |
|
|
| | | | | | 330,080 |
| | | | |
|
|
| |
Machinery — 0.8% | | | |
| 3,650 | | AGCO Corp. (b) | | | 66,612 |
| 1,300 | | Cummins Inc. | | | 91,455 |
See Notes to Financial Statements.
14
Schedule of Investments
(continued)
| | | | | |
| | |
| Shares | | Security | | Value |
| |
Machinery — 0.8% (continued) | | | |
| 785 | | Deere & Co. | | $ | 52,697 |
| 1,765 | | Ingersoll-Rand Co. Ltd., Class A Shares | | | 140,582 |
| 1,525 | | Joy Global Inc. | | | 53,466 |
| 1,595 | | Kennametal Inc. | | | 75,747 |
| 1,550 | | The Manitowoc Co., Inc. | | | 62,604 |
| 5,460 | | PACCAR Inc. | | | 395,249 |
| 2,015 | | Terex Corp. (b) | | | 87,249 |
| 2,700 | | Wabash National Corp. (b) | | | 65,880 |
| | | | |
|
|
| | | | | | 1,091,541 |
| | | | |
|
|
| |
Marine — 0.4% | | | |
| 5,500 | | CP Ships Ltd. | | | 77,990 |
| 6,800 | | Overseas Shipholding Group, Inc. | | | 427,788 |
| | | | |
|
|
| | | | | | 505,778 |
| | | | |
|
|
| |
Road & Rail — 0.7% | | | |
| 2,500 | | Arkansas Best Corp. | | | 94,450 |
| 1,850 | | Burlington Northern Santa Fe Corp. | | | 99,770 |
| 4,995 | | Heartland Express, Inc. | | | 95,654 |
| 3,400 | | J.B. Hunt Transport Services, Inc. | | | 148,818 |
| 3,245 | | Norfolk Southern Corp. | | | 120,227 |
| 12,300 | | Swift Transportation Co., Inc. (b) | | | 272,322 |
| 1,500 | | Yellow Roadway Corp. (b) | | | 87,810 |
| | | | |
|
|
| | | | | | 919,051 |
| | | | |
|
|
| |
Trading Companies & Distributors — 0.4% | | | |
| 1,500 | | MSC Industrial Direct Co., Inc., Class A Shares | | | 45,840 |
| 7,310 | | W.W. Grainger, Inc. | | | 455,194 |
| | | | |
|
|
| | | | | | 501,034 |
| | | | |
|
|
| | | TOTAL INDUSTRIALS | | | 8,649,136 |
| | | | |
|
|
INFORMATION TECHNOLOGY — 6.3% | | | |
| |
Communications Equipment — 1.2% | | | |
| 4,900 | | ADTRAN, Inc. | | | 86,436 |
| 4,400 | | Cisco Systems, Inc. (b) | | | 78,716 |
| 17,900 | | CommScope, Inc. (b) | | | 267,784 |
| 18,100 | | Harris Corp. | | | 590,965 |
| 16,500 | | Lucent Technologies Inc. (b) | | | 45,375 |
| 5,700 | | McDATA Corp., Class A Shares (b) | | | 21,489 |
| 23,400 | | Motorola, Inc. | | | 350,298 |
| 2,000 | | Plantronics, Inc. | | | 76,160 |
| 2,300 | | Scientific-Atlanta, Inc. | | | 64,906 |
| | | | |
|
|
| | | | | | 1,582,129 |
| | | | |
|
|
| |
Computers & Peripherals — 0.8% | | | |
| 2,000 | | Apple Computer, Inc. (b) | | | 83,340 |
| 1,300 | | Avid Technology, Inc. (b) | | | 70,356 |
| 3,600 | | Dell Inc. (b) | | | 138,312 |
| 2,350 | | Lexmark International, Inc., Class A Shares (b) | | | 187,929 |
| 9,300 | | NCR Corp. (b) | | | 313,782 |
| 1,600 | | Network Appliance, Inc. (b) | | | 44,256 |
| 8,100 | | Quantum Corp. (b) | | | 23,571 |
| 14,500 | | Western Digital Corp. (b) | | | 184,875 |
| | | | |
|
|
| | | | | | 1,046,421 |
| | | | |
|
|
See Notes to Financial Statements.
15
Schedule of Investments
(continued)
| | | | | |
| | |
| Shares | | Security | | Value |
| |
Electronic Equipment & Instruments — 1.5% | | | |
| 5,445 | | Amphenol Corp., Class A Shares | | $ | 201,683 |
| 7,200 | | Arrow Electronics, Inc. (b) | | | 182,520 |
| 6,900 | | Avnet, Inc. (b) | | | 127,098 |
| 1,100 | | FLIR Systems, Inc. (b) | | | 33,330 |
| 29,000 | | Ingram Micro Inc., Class A Shares (b) | | | 483,430 |
| 4,500 | | Jabil Circuit, Inc. (b) | | | 128,340 |
| 2,475 | | Littelfuse, Inc. (b) | | | 70,909 |
| 1,600 | | Mettler-Toledo International Inc. (b) | | | 76,000 |
| 14,100 | | PerkinElmer, Inc. | | | 290,883 |
| 2,300 | | Tech Data Corp. (b) | | | 85,238 |
| 7,100 | | Tektronix, Inc. | | | 174,163 |
| 2,295 | | Thermo Electron Corp. (b) | | | 58,041 |
| 8,230 | | Vishay Intertechnology, Inc. (b) | | | 102,299 |
| | | | |
|
|
| | | | | | 2,013,934 |
| | | | |
|
|
|
Information Technology Consulting & Services — 0.5% |
| 16,500 | | Acxiom Corp. | | | 345,345 |
| 1,700 | | Cognizant Technology Solutions Corp., Class A Shares (b) | | | 78,540 |
| 2,200 | | Computer Sciences Corp. (b) | | | 100,870 |
| 4,800 | | Perot Systems Corp., Class A Shares (b) | | | 64,512 |
| 4,200 | | The Titan Corp. (b) | | | 76,272 |
| | | | |
|
|
| | | | | | 665,539 |
| | | | |
|
|
|
Internet Software & Services — 0.2% |
| 7,200 | | EarthLink, Inc. (b) | | | 64,800 |
| 1,300 | | InterActiveCorp (b) | | | 28,951 |
| 7,600 | | McAfee Inc. (b) | | | 171,456 |
| 200 | | VeriSign, Inc. (b) | | | 5,740 |
| | | | |
|
|
| | | | | | 270,947 |
| | | | |
|
|
|
Office Electronics — 0.1% |
| 9,310 | | Xerox Corp. (b) | | | 141,046 |
| | | | |
|
|
|
Semiconductor Equipment & Products — 1.0% |
| 9,700 | | Applied Materials, Inc. (b) | | | 157,625 |
| 11,000 | | Cree, Inc. (b) | | | 239,250 |
| 6,300 | | Intel Corp. | | | 146,349 |
| 9,600 | | Kulicke and Soffa Industries, Inc. (b) | | | 60,384 |
| 2,600 | | Lam Research Corp. (b) | | | 75,036 |
| 7,100 | | MEMC Electronic Materials, Inc. (b) | | | 95,495 |
| 9,300 | | Micron Technology, Inc. (b) | | | 96,162 |
| 11,500 | | National Semiconductor Corp. | | | 237,015 |
| 18,600 | | Taiwan Semiconductor Manufacturing Co. Ltd., Sponsored ADR | | | 157,728 |
| 8,700 | | Teradyne, Inc. (b) | | | 127,020 |
| | | | |
|
|
| | | | | | 1,392,064 |
| | | | |
|
|
|
Software — 1.0% |
| 32,800 | | Activision, Inc. (b) | | | 485,440 |
| 9,200 | | Autodesk, Inc. | | | 273,792 |
| 850 | | Cerner Corp. (b) | | | 44,633 |
| 1,345 | | Hyperion Solutions Corp. (b) | | | 59,328 |
| 5,480 | | Magma Design Automation, Inc. (b) | | | 65,048 |
| 4,600 | | Quest Software, Inc. (b) | | | 63,664 |
| 5,000 | | SERENA Software, Inc. (b) | | | 118,800 |
See Notes to Financial Statements.
16
Schedule of Investments
(continued)
| | | | | |
| | |
| Shares | | Security | | Value |
|
Software — 1.0% (continued) |
| 5,200 | | Symantec Corp. (b) | | $ | 110,916 |
| 6,500 | | Wind River Systems, Inc. (b) | | | 98,020 |
| | | | |
|
|
| | | | | | 1,319,641 |
| | | | |
|
|
| | | TOTAL INFORMATION TECHNOLOGY | | | 8,431,721 |
| | | | |
|
|
MATERIALS — 3.9% |
|
Chemicals — 1.2% |
| 1,200 | | Air Products and Chemicals, Inc. | | | 75,948 |
| 1,500 | | The Dow Chemical Co. | | | 74,775 |
| 3,675 | | Eastman Chemical Co. | | | 216,825 |
| 1,700 | | FMC Corp. (b) | | | 90,865 |
| 1,000 | | International Flavors & Fragrances Inc. | | | 39,500 |
| 1,900 | | Kronos Worldwide, Inc. | | | 80,769 |
| 900 | | Monsanto Co. | | | 58,050 |
| 900 | | Potash Corp. of Saskatchewan Inc. | | | 78,759 |
| 3,300 | | PPG Industries, Inc. | | | 236,016 |
| 1,875 | | Rohm and Haas Co. | | | 90,000 |
| 7,675 | | Sigma-Aldrich Corp. | | | 470,094 |
| 3,800 | | Valhi, Inc. | | | 74,670 |
| | | | |
|
|
| | | | | | 1,586,271 |
| | | | |
|
|
|
Construction Materials — 0.2% |
| 2,100 | | Cemex S.A. de C.V., Participation Certificate, Sponsored ADR | | | 76,125 |
| 1,285 | | Martin Marietta Materials, Inc. | | | 71,857 |
| 750 | | Texas Industries, Inc. | | | 40,312 |
| 1,465 | | Vulcan Materials Co. | | | 83,256 |
| | | | |
|
|
| | | | | | 271,550 |
| | | | |
|
|
| |
Containers & Packaging — 0.3% | | | |
| 6,050 | | Ball Corp. | | | 250,954 |
| 4,100 | | Bemis Co., Inc. | | | 127,592 |
| 3,450 | | Owens-Illinois, Inc. (b) | | | 86,733 |
| | | | |
|
|
| | | | | | 465,279 |
| | | | |
|
|
| |
Metals & Mining — 1.5% | | | |
| 9,900 | | AK Steel Holding Corp. (b) | | | 109,494 |
| 1,425 | | Carpenter Technology Corp. | | | 84,659 |
| 650 | | Cleveland-Cliffs Inc. | | | 47,365 |
| 2,100 | | Commercial Metals Co. | | | 71,169 |
| 3,725 | | Newmont Mining Corp. | | | 157,381 |
| 7,000 | | Nucor Corp. | | | 402,920 |
| 2,400 | | Peabody Energy Corp. | | | 111,264 |
| 2,375 | | Phelps Dodge Corp. | | | 241,609 |
| 2,150 | | Quanex Corp. | | | 114,638 |
| 2,200 | | Steel Dynamics, Inc. | | | 75,790 |
| 6,000 | | United States Steel Corp. | | | 305,100 |
| 15,500 | | Worthington Industries, Inc. | | | 298,840 |
| | | | |
|
|
| | | | | | 2,020,229 |
| | | | |
|
|
See Notes to Financial Statements.
17
Schedule of Investments
(continued)
| | | | | |
| | |
| Shares | | Security | | Value |
| |
Paper & Forest Products — 0.7% | | | |
| 2,700 | | Georgia-Pacific Corp. | | $ | 95,823 |
| 19,300 | | Louisiana-Pacific Corp. | | | 485,202 |
| 4,350 | | MeadWestvaco Corp. | | | 138,417 |
| 2,525 | | Weyerhaeuser Co. | | | 172,962 |
| | | | |
|
|
| | | | | | 892,404 |
| | | | |
|
|
| | | TOTAL MATERIALS | | | 5,235,733 |
| | | | |
|
|
TELECOMMUNICATION SERVICES — 1.1% | | | |
| |
Diversified Telecommunication Services — 0.6% | | | |
| 6,600 | | Alaska Communications Systems Group Inc. | | | 66,330 |
| 4,860 | | ALLTEL Corp. | | | 266,571 |
| 5,450 | | CenturyTel, Inc. | | | 178,978 |
| 7,300 | | Verizon Communications Inc. | | | 259,150 |
| | | | |
|
|
| | | | | | 771,029 |
| | | | |
|
|
| |
Wireless Telecommunication Services — 0.5% | | | |
| 18,200 | | Crown Castle International Corp. (b) | | | 292,292 |
| 1,500 | | Nextel Communications, Inc., Class A Shares (b) | | | 42,630 |
| 13,100 | | Nextel Partners, Inc., Class A Shares (b) | | | 287,676 |
| | | | |
|
|
| | | | | | 622,598 |
| | | | |
|
|
| | | TOTAL TELECOMMUNICATION SERVICES | | | 1,393,627 |
| | | | |
|
|
UTILITIES — 1.9% | | | |
| |
Electric Utilities — 0.8% | | | |
| 2,740 | | American Electric Power Co., Inc. | | | 93,324 |
| 11,800 | | CMS Energy Corp. (b) | | | 153,872 |
| 13,400 | | DPL Inc. | | | 335,000 |
| 3,805 | | FirstEnergy Corp. | | | 159,620 |
| 2,800 | | FPL Group, Inc. | | | 112,420 |
| 3,200 | | PG&E Corp. | | | 109,120 |
| 1,280 | | TXU Corp. | | | 101,926 |
| 2,405 | | Wisconsin Energy Corp. | | | 85,377 |
| | | | |
|
|
| | | | | | 1,150,659 |
| | | | |
|
|
| |
Gas Utilities — 0.8% | | | |
| 11,300 | | National Fuel Gas Co. | | | 323,067 |
| 9,900 | | ONEOK, Inc. | | | 305,118 |
| 3,300 | | Sempra Energy | | | 131,472 |
| 3,175 | | Southwestern Energy Co. (b) | | | 180,213 |
| 3,400 | | WGL Holdings Inc. | | | 105,264 |
| | | | |
|
|
| | | | | | 1,045,134 |
| | | | |
|
|
| |
Multi-Utilities — 0.3% | | | |
| 3,115 | | Duke Energy Corp. | | | 87,251 |
| 10,235 | | Dynegy Inc., Class A Shares (b) | | | 40,019 |
| 2,600 | | Questar Corp. | | | 154,050 |
| 5,050 | | The Williams Cos., Inc. | | | 94,991 |
| | | | |
|
|
| | | | | | 376,311 |
| | | | |
|
|
| | | TOTAL UTILITIES | | | 2,572,104 |
| | | | |
|
|
| | | TOTAL COMMON STOCK
(Cost — $63,773,294) | | | 68,356,414 |
| | | | |
|
|
See Notes to Financial Statements.
18
Schedule of Investments
(continued)
| | | | | |
| | |
| Shares | | Security | | Value |
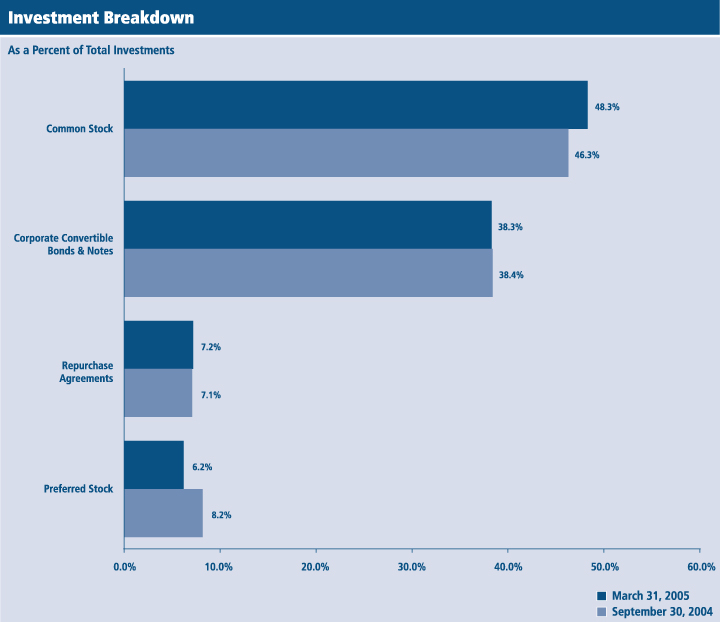
PREFERRED STOCK (a) — 6.5% | | | |
CONSUMER DISCRETIONARY — 2.0% | | | |
| |
Automobiles — 2.0% | | | |
| 48,928 | | Ford Motor Co. Capital Trust II, 6.500% | | $ | 2,218,396 |
| 26,673 | | General Motors Corp., 5.250% Sr. Series B Cumulative Trust Preferred Securities | | | 498,252 |
| | | | |
|
|
| | | | | | 2,716,648 |
| | | | |
|
|
| |
Media — 0.0% | | | |
| 132 | | Sinclair Broadcast Group Inc., 6.000% Exchangeable 12/31/49 | | | 5,527 |
| | | | |
|
|
| | | TOTAL CONSUMER DISCRETIONARY | | | 2,722,175 |
| | | | |
|
|
CONSUMER STAPLES — 0.3% | | | |
| |
Food & Drug Retailing — 0.3% | | | |
| 17,317 | | Albertson's Inc., 7.250% HITSTM | | | 391,711 |
| | | | |
|
|
FINANCIALS — 1.3% | | | |
| |
Banks — 0.6% | | | |
| 1,666 | | Boston Private Capital Trust, 4.875% Exchangeable 10/1/34 (d) | | | 81,009 |
| 12,200 | | IndyMac Capital Trust I, 6.000% WIRESSM | | | 696,620 |
| | | | |
|
|
| | | | | | 777,629 |
| | | | |
|
|
| |
Diversified Financials — 0.1% | | | |
| 4,224 | | Lehman Brothers Holdings Inc., 6.250% Exchangeable 10/15/07 | | | 111,514 |
| | | | |
|
|
| |
Insurance — 0.6% | | | |
| 31,800 | | Conseco Inc., 5.500% Mandatorily Convertible Series B | | | 842,700 |
| | | | |
|
|
| | | TOTAL FINANCIALS | | | 1,731,843 |
| | | | |
|
|
HEALTHCARE — 0.3% | | | |
| |
Pharmaceuticals — 0.3% | | | |
| 9,459 | | Schering-Plough Corp., 6.000% Mandatory Convertible | | | 475,788 |
| | | | |
|
|
INDUSTRIALS — 1.7% | | | |
| |
Aerospace/Defense — 1.2% | | | |
| 12,400 | | Northrop Grumman Corp., 7.000% Exchangeable 4/4/21 | | | 1,612,000 |
| | | | |
|
|
| |
Electrical Components & Equipment — 0.3% | | | |
| 5,339 | | General Cable Corp., 5.750% Exchangeable 11/24/13 | | | 383,073 |
| | | | |
|
|
| |
Road & Retail — 0.2% | | | |
| 358 | | Kansas City Southern, 4.250% Redeemable Cumulative Perpetual Series C | | | 251,137 |
| | | | |
|
|
| | | TOTAL INDUSTRIALS | | | 2,246,210 |
| | | | |
|
|
MATERIALS — 0.7% | | | |
| |
Chemicals — 0.4% | | | |
| 11,390 | | Celanese Corp., 4.250% Exchangeable 12/31/49 | | | 316,073 |
| 256 | | Terra Industries Inc., 4.250% Exchangeable 12/31/49 (d) | | | 245,888 |
| | | | |
|
|
| | | | | | 561,961 |
| | | | |
|
|
| |
Metals & Mining — 0.3% | | | |
| 337 | | Freeport-McMoRan Copper & Gold Inc., 5.500% Perpetual (d) | | | 334,051 |
| | | | |
|
|
| | | TOTAL MATERIALS | | | 896,012 |
| | | | |
|
|
See Notes to Financial Statements.
19
Schedule of Investments
(continued)
| | | | | |
| | |
| Shares | | Security | | Value |
TELECOMMUNICATION SERVICES — 0.2% | | | |
| |
Diversified Telecommunication Services — 0.2% | | | |
| 5,244 | | Alltel Corp., 7.750% Equity units 5/17/05 | | $ | 264,770 |
| | | | |
|
|
| | | TOTAL PREFERRED STOCK
(Cost — $8,842,767) | | | 8,728,509 |
| | | | |
|
|
| | |
Face
Amount
| | | | |
CORPORATE CONVERTIBLE BONDS & NOTES (a) — 40.5% | | | |
| |
Advertising — 1.1% | | | |
| $ 138,000 | | Getty Images Inc., Sub. Debentures, 0.500% due 6/9/23 | | | 214,935 |
| 1,200,000 | | Lamar Advertising Co., Sr. Notes, 2.875% due 12/31/10 | | | 1,222,500 |
| | | | |
|
|
| | | | | | 1,437,435 |
| | | | |
|
|
| |
Aerospace/Defense — 1.6% | | | |
| 1,600,000 | | Alliant Techsystems Inc., Sr. Sub. Notes, 2.750% due 2/15/24 | | | 1,776,000 |
| 92,000 | | Armor Holdings Inc., Sr. Sub. Notes, step bond to yield 2.459% due 11/1/24 (e) | | | 88,320 |
| 217,000 | | GenCorp Inc., Sub. Notes, 4.000% due 1/16/24 | | | 301,088 |
| | | | |
|
|
| | | | | | 2,165,408 |
| | | | |
|
|
| |
Airlines — 1.0% | | | |
| 144,000 | | Airtran Holdings Inc., Sr. Notes, 7.000% due 7/1/23 | | | 154,620 |
| 118,000 | | Alaska Air Group Inc., Sr. Notes, 5.550% due 3/21/23 (e) | | | 150,529 |
| 835,000 | | ExpressJet Holdings Inc., 4.250% due 8/1/23 | | | 770,288 |
| 212,000 | | Mesa Air Group Inc., Sr. Notes, step bond to yield 7.117% due 6/16/23 (e) | | | 81,090 |
| 129,000 | | Pinnacle Airlines Corp., Sr. Notes, 3.250% due 2/15/25 (d) | | | 127,388 |
| | | | |
|
|
| | | | | | 1,283,915 |
| | | | |
|
|
| |
Biotechnology — 2.1% | | | |
| 22,000 | | Alexion Pharmaceuticals Inc., Sr. Notes, 1.375% due 2/1/12 (d) | | | 20,432 |
| 129,000 | | Cell Genesys Inc., Sr. Notes, 3.125% due 11/1/11 (d) | | | 109,489 |
| 308,000 | | Chiron Corp., Sr. Notes, 2.750% due 6/30/34 | | | 296,065 |
| | | CuraGen Corp., Sub. Notes: | | | |
| 57,000 | | 4.000% due 2/15/11 | | | 43,391 |
| 250,000 | | 4.000% due 2/15/11 (d) | | | 190,312 |
| | | deCODE genetics Inc., Sr. Notes: | | | |
| 17,000 | | 3.500% due 4/15/11 | | | 14,174 |
| 90,000 | | 3.500% due 4/15/11 (d) | | | 75,038 |
| 134,000 | | Human Genome Sciences Inc., Sub. Notes, 2.250% due 10/15/11 (d) | | | 114,403 |
| 1,269,000 | | Invitrogen Corp., Sr. Notes, 1.500% due 2/15/24 | | | 1,142,100 |
| 794,000 | | Protein Design Labs Inc., Sub. Notes, 2.750% due 8/16/23 | | | 815,835 |
| | | | |
|
|
| | | | | | 2,821,239 |
| | | | |
|
|
| |
Building Materials — 0.1% | | | |
| 150,000 | | NCI Building Systems Inc., Sr. Sub. Notes, 2.125% due 11/15/24 (d) | | | 170,438 |
| | | | |
|
|
| |
Commercial Services — 0.8% | | | |
| 258,000 | | BearingPoint Inc., Sub. Notes, 2.750% due 12/15/24 (d) | | | 278,962 |
| 506,000 | | Quanta Services Inc., Sub. Debentures, 4.500% due 10/1/23 | | | 522,445 |
| 285,000 | | SFBC International Inc., Sr. Notes, 2.250% due 8/15/24 (d) | | | 325,969 |
| | | | |
|
|
| | | | | | 1,127,376 |
| | | | |
|
|
See Notes to Financial Statements.
20
Schedule of Investments
(continued)
| | | | | |
Face
Amount | | Security | | Value |
| |
Computers — 1.6% | | | |
| $ 322,000 | | Ciber Inc., Sr. Sub. Debentures, 2.875% due 12/15/23 | | $ | 291,007 |
| 450,000 | | Gateway Inc., Sr. Notes, 1.500% due 12/31/09 (d) | | | 363,937 |
| 210,000 | | Hutchinson Technology Inc., Sub. Notes, 2.250% due 3/15/10 | | | 270,113 |
| 315,000 | | Quantum Corp., Sub. Notes, 4.375% due 8/1/10 | | | 311,850 |
| 900,000 | | Radisys Corp., Sub. Notes, 1.375% due 11/15/23 (d) | | | 837,000 |
| | | | |
|
|
| | | | | | 2,073,907 |
| | | | |
|
|
| |
Distribution/Wholesale — 0.9% | | | |
| 1,193,000 | | Bell Microproducts Inc., Sub. Notes, 3.750% due 3/5/24 | | | 1,142,297 |
| | | | |
|
|
| |
Diversified Financials — 1.2% | | | |
| 194,000 | | AmeriCredit Corp., Bonds, 1.750% due 11/15/23 (d) | | | 265,052 |
| 389,000 | | CapitalSource Inc., Sr. Notes, 3.500% due 7/15/34 (d) | | | 384,137 |
| 810,000 | | Dress Barn, Sr. Notes, 2.500% due 12/15/24 (d) | | | 879,863 |
| 38,000 | | Providian Financial Corp., Sr. Notes, step bond to yield 1.823% due 3/15/16 (e) | | | 45,363 |
| | | | |
|
|
| | | | | | 1,574,415 |
| | | | |
|
|
| |
Electrical Components & Equipment — 0.2% | | | |
| 119,000 | | GrafTech International Ltd., Sr. Notes, 1.625% due 1/15/24 | | | 87,911 |
| 164,000 | | Wilson Greatbatch Technologies Inc., Sub. Debentures, 2.250% due 6/15/13 | | | 135,915 |
| | | | |
|
|
| | | | | | 223,826 |
| | | | |
|
|
|
Electronics — 1.1% |
| 1,150,000 | | Flextronics International Ltd., Sub. Notes, 1.000% due 8/1/10 | | | 1,151,437 |
| | | Vishay Intertechnology Inc., Sub. Notes: | | | |
| 259,000 | | 3.625% due 8/1/23 | | | 253,820 |
| 125,000 | | 3.625% due 8/1/23 (d) | | | 122,500 |
| | | | |
|
|
| | | | | | 1,527,757 |
| | | | |
|
|
|
Entertainment — 0.6% |
| 177,000 | | Six Flags Inc., Notes, 4.500% due 5/15/15 | | | 164,831 |
| 600,000 | | Sunterra Corp., Sr. Sub. Notes, 3.750% due 3/29/24 | | | 680,250 |
| | | | |
|
|
| | | | | | 845,081 |
| | | | |
|
|
|
Environmental Control — 0.3% |
| 546,000 | | Allied Waste North America, Sr. Sub. Debentures, 4.250% due 4/15/34 | | | 462,052 |
| | | | |
|
|
|
Healthcare-Products — 4.2% |
| 403,000 | | Advanced Medical Optics, Inc., 2.500% due 7/15/24 (d) | | | 401,992 |
| 215,000 | | Conmed Corp., Sr. Sub. Notes, 2.500% due 11/15/24 (d) | | | 232,200 |
| 965,000 | | Cytyc Corp., Sr. Notes, 2.250% due 3/15/24 | | | 1,021,694 |
| 650,000 | | Edwards Lifesciences Corp., Debentures, 3.875% due 5/15/33 | | | 670,313 |
| 1,650,000 | | Henry Schein Inc., Bonds, 3.000% due 8/15/34 (d) | | | 1,724,250 |
| 800,000 | | PSS World Medical Inc., Sr. Notes, 2.250% due 3/15/24 | | | 760,000 |
| 1,400,000 | | Thoratec Corp., Sr. Sub. Notes, step bond to yield 4.232% due 5/16/34 (d)(e) | | | 743,750 |
| | | | |
|
|
| | | | | | 5,554,199 |
| | | | |
|
|
|
Healthcare-Services — 1.6% |
| 276,000 | | Apria Healthcare Group Inc., Sr. Notes, 3.375% due 9/1/33 | | | 305,670 |
| 260,000 | | Beverly Enterprises Inc., Bonds, 2.750% due 11/1/33 | | | 444,925 |
| | | LabOne Inc., Sr. Notes: | | | |
| 300,000 | | 3.500% due 6/15/34 | | | 342,375 |
| 800,000 | | 3.500% due 6/15/34 (d) | | | 913,000 |
| 110,000 | | Option Care Inc., Sr. Notes, 2.250% due 11/1/24 (d) | | | 146,713 |
| | | | |
|
|
| | | | | | 2,152,683 |
| | | | |
|
|
See Notes to Financial Statements.
21
Schedule of Investments
(continued)
| | | | | |
Face
Amount | | Security | | Value |
|
Home Builders — 0.3% |
| | | WCI Communities, Inc., Sr. Sub. Notes: | | | |
| $ 150,000 | | 4.000% due 8/5/23 | | $ | 185,625 |
| 155,000 | | 4.000% due 8/5/23 (d) | | | 191,813 |
| | | | |
|
|
| | | | | | 377,438 |
| | | | |
|
|
|
Insurance — 0.7% |
| 783,000 | | American Equity Investment Life Holding Co., Sr. Notes, 5.250% due 12/6/24 (d) | | | 927,855 |
| 54 | | Fortis Insurance, 7.750% due 1/26/08 (d) | | | 57,654 |
| | | | |
|
|
| | | | | | 985,509 |
| | | | |
|
|
|
Internet — 1.4% |
| 304,000 | | CNET Networks Inc., Debentures, 0.750% due 4/15/24 | | | 283,480 |
| 750,000 | | Equinix Inc., Sub. Notes, 2.500% due 2/15/24 (d) | | | 906,563 |
| 750,000 | | Openwave Systems Inc., Sub. Notes, 2.750% due 9/9/08 | | | 744,375 |
| | | | |
|
|
| | | | | | 1,934,418 |
| | | | |
|
|
|
Leisure Time — 0.6% |
| 720,000 | | Navigant International Inc., Sub. Notes, 4.875% due 11/1/23 (d) | | | 774,900 |
| | | | |
|
|
|
Lodging — 1.0% |
| 1,190,000 | | Hilton Hotels Corp., Sr. Notes, 3.375% due 4/15/23 | | | 1,383,375 |
| | | | |
|
|
|
Machinery-Diversified — 0.6% |
| 850,000 | | AGCO Corp., Sr. Sub. Notes, 1.750% due 12/31/33 | | | 842,562 |
| | | | |
|
|
|
Media — 0.4% |
| 479,000 | | Citadel Broadcasting Corp., Sub. Notes, 1.875% due 2/15/11 | | | 404,156 |
| 117,000 | | Playboy Enterprises Inc., Sr. Sub. Notes, 3.000% due 3/15/25 (d) | | | 117,585 |
| | | | |
|
|
| | | | | | 521,741 |
| | | | |
|
|
|
Miscellaneous Manufacturers — 1.6% |
| 250,000 | | Eastman Kodak Co., Sr. Notes, 3.375% due 10/15/33 | | | 305,000 |
| 725,000 | | Griffon Corp., Sub. Notes, 4.000% due 7/18/23 | | | 860,031 |
| 2,025,000 | | Roper Industries Inc., Bonds, step bond to yield 4.842% due 1/15/34 (e) | | | 977,063 |
| | | | |
|
|
| | | | | | 2,142,094 |
| | | | |
|
|
| |
Oil & Gas — 1.6% | | | |
| 800,000 | | Grey Wolf Inc., 3.750% due 5/7/23 | | | 948,000 |
| 1,085,000 | | Hanover Compressor Co., Sr. Notes, 4.750% due 1/15/14 | | | 1,207,063 |
| | | | |
|
|
| | | | | | 2,155,063 |
| | | | |
|
|
| |
Pharmaceuticals — 3.0% | | | |
| 141,000 | | Amylin Pharmaceuticals Inc., Sr. Notes, 2.500% due 4/15/11 | | | 125,314 |
| 400,000 | | Connetics Corp., Sr. Notes, 2.000% due 3/30/15 (d) | | | 392,500 |
| 73,000 | | CV Therapeutics Inc., Sr. Sub. Notes, 2.750% due 5/16/12 | | | 99,462 |
| | | First Horizon Pharmaceutical Corp., Sr. Sub. Notes: | | | |
| 133,000 | | 1.750% due 3/8/24 | | | 129,841 |
| 140,000 | | 1.750% due 3/8/24 (d) | | | 136,675 |
| | | ImClone Systems Inc., Sr. Notes: | | | |
| 54,000 | | 1.375% due 5/15/24 | | | 46,035 |
| 330,000 | | 1.375% due 5/15/24 (d) | | | 281,325 |
| | | IVAX Corp., Sr. Notes: | | | |
| 115,000 | | 1.500% due 3/1/24 | | | 118,019 |
| 614,000 | | 1.500% due 3/1/24 (d) | | | 630,118 |
| 174,000 | | NPS Pharmaceuticals Inc., Sr. Notes, 3.000% due 6/15/08 | | | 150,510 |
See Notes to Financial Statements.
22
Schedule of Investments
(continued)
| | | | | |
Face
Amount | | Security | | Value |
| |
Pharmaceuticals — 3.0% (continued) | | | |
| $ 765,000 | | Par Pharmaceutical Cos. Inc., Sr. Sub. Notes, 2.875% due 9/30/10 | | $ | 663,638 |
| 300,000 | | QLT Inc., Notes, 3.000% due 9/15/23 | | | 303,750 |
| | | Valeant Pharmaceuticals International, Sub. Notes: | | | |
| 195,000 | | 4.000% due 11/15/13 | | | 188,419 |
| 435,000 | | 4.000% due 11/15/13 (d) | | | 420,319 |
| 277,000 | | Watson Pharmaceuticals Inc., Debentures, 1.750% due 3/15/23 | | | 264,535 |
| | | | |
|
|
| | | | | | 3,950,460 |
| | | | |
|
|
| |
Pipelines — 0.8% | | | |
| 867,000 | | Dynegy Inc., Sub. Notes, 4.750% due 8/15/23 (d) | | | 1,063,159 |
| | | | |
|
|
| |
Retail — 2.8% | | | |
| 66,000 | | Casual Male Retail Group Inc., Sr. Sub. Notes, 5.000% due 1/1/24 | | | 60,802 |
| 200,000 | | Charming Shoppes, Bonds, 4.750% due 6/1/12 | | | 211,000 |
| 28,000 | | CKE Restaurants, Inc., Sub. Notes, 4.000% due 10/1/23 (d) | | | 53,165 |
| | | Dick’s Sporting Goods Inc., Sr. Notes: | | | |
| 1,758,000 | | Step bond to yield 2.767% due 2/18/24 (d)(e) | | | 1,292,130 |
| 39,000 | | Step bond to yield 3.182% due 2/18/24 (e) | | | 28,665 |
| | | Genesco Inc., Sub. Notes: | | | |
| 149,000 | | 4.125% due 6/15/23 | | | 213,443 |
| 13,000 | | 4.125% due 6/15/23 (d) | | | 18,623 |
| | | Lithia Motors Inc., Sr. Sub. Notes: | | | |
| 350,000 | | 2.875% due 5/1/14 | | | 342,563 |
| 200,000 | | 2.875% due 5/1/14 (d) | | | 195,750 |
| 1,200,000 | | Men’s Wearhouse Inc., Sr. Notes, 3.125% due 10/15/23 | | | 1,389,000 |
| | | | |
|
|
| | | | | | 3,805,141 |
| | | | |
|
|
| |
Semiconductors — 0.6% | | | |
| 79,000 | | Advanced Micro Devices Inc., Debentures, 4.750% due 2/1/22 (e) | | | 78,506 |
| 198,000 | | Credence Systems Corp., Sub. Notes, 1.500% due 5/15/08 | | | 190,822 |
| 103,000 | | Kulicke & Soffa Industries Inc., Sub. Notes, 0.500% due 11/30/08 | | | 77,636 |
| | | ON Semiconductor Corp., Sr. Sub. Notes: | | | |
| 110,000 | | Zero coupon bond to yield 1.753% due 4/15/24 (e) | | | 82,225 |
| 110,000 | | Zero coupon bond to yield 1.965% due 4/15/24 (d)(e) | | | 82,225 |
| 238,000 | | Vitesse Semiconductor Corp., Sub. Notes, 1.500% due 10/1/24 (d) | | | 239,190 |
| | | | |
|
|
| | | | | | 750,604 |
| | | | |
|
|
| |
Software — 2.7% | | | |
| | | Allscripts Healthcare Solutions Inc., Sr. Notes: | | | |
| 650,000 | | 3.500% due 7/15/24 | | | 941,687 |
| 425,000 | | 3.500% due 7/15/24 (d) | | | 615,719 |
| 850,000 | | CSG Systems International, Notes, 2.500% due 6/15/24 (d) | | | 769,250 |
| 152,000 | | Open Solutions Inc., Sr. Sub. Notes, step bond to yield 3.326% due 2/2/35 (d)(e) | | | 78,090 |
| 600,000 | | Per-Se Technologies Inc., Notes, 3.250% due 6/30/24 (d) | | | 656,250 |
| | | Red Hat Inc., Sub. Debentures: | | | |
| 93,000 | | 0.500% due 1/15/24 | | | 76,260 |
| 173,000 | | 0.500% due 1/15/24 (d) | | | 141,860 |
| 283,000 | | Serena Software Inc., Sub. Notes, 1.500% due 12/15/23 | | | 336,416 |
| 53,000 | | Sybase Inc., Sub. Notes, 1.750% due 2/22/25 (d) | | | 51,609 |
| | | | |
|
|
| | | | | | 3,667,141 |
| | | | |
|
|
See Notes to Financial Statements.
23
Schedule of Investments
(continued)
| | | | | | |
Face
Amount | | Security | | Value | |
| |
Telecommunications — 3.3% | | | | |
| $ 186,000 | | Adaptec Inc., Sr. Sub. Notes, 0.750% due 12/22/23 | | $ | 152,287 | |
| 223,000 | | ADC Telecommunications Inc., Sub. Notes, 3.065% due 6/15/13 (e) | | | 205,439 | |
| 285,000 | | Andrew Corp., Sub. Notes, 3.250% due 8/15/13 | | | 313,500 | |
| 750,000 | | CenturyTel Inc., Debentures, 4.750% due 8/1/32 | | | 800,625 | |
| 900,000 | | Commonwealth Telephone Enterprises Inc., Bonds, 3.250% due 7/15/23 (d) | | | 906,750 | |
| | | CommScope Inc., Sr. Sub. Bonds: | | | | |
| 15,000 | | 1.000% due 3/15/24 | | | 14,006 | |
| 287,000 | | 1.000% due 3/15/24 (d) | | | 267,986 | |
| 167,000 | | Comtech Telecommunications Corp., Sr. Notes, step bond to yield 2.225% due 2/1/24 (e) | | | 211,464 | |
| 1,050,000 | | NII Holdings Inc., Sr. Notes, 2.875% due 2/1/34 | | | 1,326,938 | |
| 248,000 | | Powerwave Technologies Inc., Sub. Notes, 1.875% due 11/15/24 (d) | | | 234,670 | |
| | | | |
|
|
|
| | | | | | 4,433,665 | |
| | | | |
|
|
|
| |
Toys/Games/Hobbies — 0.3% | | | | |
| 271,000 | | Jakks Pacific Inc., Sr. Notes, 4.625% due 6/15/23 | | | 355,349 | |
| | | | |
|
|
|
| |
Transportation — 0.4% | | | | |
| | | CP Ships Ltd., Sr. Sub. Notes: | | | | |
| 68,000 | | 4.000% due 6/30/24 | | | 64,685 | |
| 239,000 | | 4.000% due 6/30/24 (d) | | | 227,349 | |
| 220,000 | | OMI Corp., Sr. Notes, 2.875% due 12/1/24 (d) | | | 210,375 | |
| | | | |
|
|
|
| | | | | | 502,409 | |
| | | | |
|
|
|
| | | TOTAL CORPORATE CONVERTIBLE BONDS & NOTES
(Cost — $54,491,077) | | | 54,207,056 | |
| | | | |
|
|
|
| | | SUB-TOTAL INVESTMENTS
(Cost — $127,107,138) | | | 131,291,979 | |
| | | | |
|
|
|
REPURCHASE AGREEMENTS — 7.6% | | | | |
| 1,377,000 | | Interest in $617,607,000 joint tri-party repurchase agreement dated 3/31/05 with Goldman, Sachs & Co.,
2.850% due 4/1/05; Proceeds at maturity — $1,377,109; (Fully collateralized by various U.S. Government Agency Obligations, 0.000% to 8.750% due 4/28/05 to 5/15/20; Market value — $1,404,540) | | | 1,377,000 | |
| 8,728,000 | | State Street Bank and Trust Co. dated 3/31/05, 2.3800% due 4/1/05; Proceeds at maturity — $8,728,577;
(Fully collateralized by U.S. Treasury Bills and Notes, 0.000% to 2.250% due 8/18/05 to 4/30/06;
Market value — $8,912,860) | | | 8,728,000 | |
| | | | |
|
|
|
| | | TOTAL REPURCHASE AGREEMENTS
(Cost — $10,105,000) | | | 10,105,000 | |
| | | | |
|
|
|
| | | TOTAL INVESTMENTS — 105.7% (Cost — $137,212,138*) | | | 141,396,979 | |
| | | Liabilities in Excess of Other Assets — (5.7)% | | | (7,568,796 | ) |
| | | | |
|
|
|
| | | TOTAL NET ASSETS — 100.0% | | $ | 133,828,183 | |
| | | | |
|
|
|
| (a) | | Securities have been segregated for short sale transactions. |
| (b) | | Non-income producing security. |
| (c) | | Security issued by Calamos Asset Management, Inc., which is an affiliate of one of the Fund’s sub-advisers. |
| (d) | | Security is exempt from registration under Rule 144A of the Securities Act of 1933. This security may be resold in transactions that are exempt from registration, normally to qualified institutional buyers. This security has been deemed liquid pursuant to guidelines approved by the Board of Trustees. |
| (e) | | Rate shown reflects rate in effect at March 31, 2005 on instrument with variable rate or step coupon rates. |
| * | | Aggregate cost for federal income tax purposes is $138,174,373. |
Abbreviations used in this schedule:
| | | | |
| ADR | | — | | American Depositary Receipt |
| HITSTM | | — | | Hybrid Income Term Security Units — Trademark of Banc of America Securities LLC |
| WIRES | | — | | Warrants and Income Redeemable Equity Securities — Servicemark of Morgan Stanley |
See Notes to Financial Statements.
24
Schedule of Securities Sold Short
March 31, 2005
| | | | | |
| | |
| Shares | | Security | | Value |
COMMON STOCK |
| 17,465 | | 99 Cents Only Stores* | | $ | 230,014 |
| 1,745 | | A.O. Smith Corp. | | | 50,378 |
| 1,500 | | Accredo Health, Inc.* | | | 66,615 |
| 5,200 | | Action Performance Cos., Inc. | | | 68,796 |
| 2,750 | | Acuity Brands, Inc. | | | 74,250 |
| 7,779 | | Adaptec, Inc.* | | | 37,261 |
| 35,774 | | ADC Telecommunications, Inc.* | | | 71,190 |
| 3,471 | | Advanced Medical Optics, Inc.* | | | 125,685 |
| 9,238 | | Advanced Micro Devices, Inc.* | | | 148,917 |
| 2,300 | | AFLAC Inc. | | | 85,698 |
| 24,700 | | AGCO Corp.* | | | 450,775 |
| 23,200 | | Agere Systems Inc., Class A Shares* | | | 33,176 |
| 2,600 | | Agilent Technologies, Inc.* | | | 57,720 |
| 3,200 | | Airgas, Inc. | | | 76,448 |
| 19,908 | | AirTran Holdings, Inc.* | | | 180,167 |
| 3,517 | | Alaska Air Group, Inc.* | | | 103,540 |
| 20,500 | | Albertson's, Inc. | | | 423,325 |
| 9,125 | | Alcoa Inc. | | | 277,309 |
| 6,350 | | Alexander & Baldwin, Inc. | | | 261,620 |
| 537 | | Alexion Pharmaceuticals, Inc.* | | | 11,634 |
| 1,400 | | Allergan, Inc. | | | 97,258 |
| 1,300 | | ALLETE, Inc. | | | 54,405 |
| 3,100 | | Alliance Gaming Corp.* | | | 29,729 |
| 10,050 | | Alliant Techsystems Inc.* | | | 718,072 |
| 12,025 | | Allied Waste Industries, Inc.* | | | 87,903 |
| 1,800 | | Allmerica Financial Corp.* | | | 64,710 |
| 67,000 | | Allscripts Healthcare Solutions, Inc.* | | | 958,100 |
| 3,105 | | ALLTEL Corp. | | | 170,309 |
| 2,000 | | Amazon.com, Inc.* | | | 68,540 |
| 6,325 | | Ameren Corp. | | | 309,988 |
| 1,200 | | America Movil S.A. de C.V., Series L Shares, ADR | | | 61,920 |
| 3,470 | | American Capital Strategies, Ltd. | | | 108,993 |
| 29,813 | | American Equity Investment Life Holding Co. | | | 381,308 |
| 2,490 | | American International Group, Inc. | | | 137,971 |
| 5,100 | | American Power Conversion Corp. | | | 133,161 |
| 410 | | AMETEK, Inc. | | | 16,503 |
| 2,525 | | AmSouth Bancorp. | | | 65,524 |
| 6,392 | | Amylin Pharmaceuticals, Inc.* | | | 111,796 |
| 2,600 | | Analog Devices, Inc. | | | 93,964 |
| 29,610 | | Andrew Corp.* | | | 346,733 |
| 7,450 | | Anheuser-Busch Cos., Inc. | | | 353,056 |
| 14,100 | | AnnTaylor Stores Corp.* | | | 360,819 |
| 1,850 | | Apache Corp. | | | 113,276 |
| 1,092 | | Apollo Group, Inc., Class A Shares* | | | 80,874 |
| 6,580 | | Applebee's International, Inc. | | | 181,345 |
| 5,537 | | Apria Healthcare Group Inc.* | | | 177,738 |
| 3,700 | | Aqua America Inc. | | | 90,132 |
| 3,830 | | Arch Coal, Inc. | | | 164,728 |
| 2,200 | | Arden Realty, Inc. | | | 74,470 |
| 1,192 | | Armor Holdings, Inc.* | | | 44,211 |
| 1,200 | | Arthur J. Gallagher & Co. | | | 34,560 |
| 4,225 | | ArvinMeritor, Inc. | | | 65,361 |
| 1,138 | | Assurant, Inc. | | | 38,351 |
| 1,300 | | Avery Dennison Corp. | | | 80,509 |
See Notes to Financial Statements.
25
Schedule of Securities Sold Short
(continued)
| | | | | |
| | |
| Shares | | Security | | Value |
| 12,200 | | Avocent Corp.* | | $ | 313,052 |
| 12,800 | | AVX Corp. | | | 156,800 |
| 2,440 | | Aztar Corp.* | | | 69,686 |
| 5,210 | | Barrick Gold Corp. | | | 124,832 |
| 9,400 | | Baxter International Inc. | | | 319,412 |
| 7,300 | | BEA Systems, Inc.* | | | 58,181 |
| 435 | | The Bear Stearns Cos. Inc. | | | 43,456 |
| 41,059 | | BearingPoint, Inc.* | | | 360,087 |
| 2,350 | | Beckman Coulter, Inc. | | | 156,158 |
| 60,397 | | Bell Microproducts Inc.* | | | 451,770 |
| 47 | | Berkshire Hathaway Inc., Class B Shares* | | | 134,232 |
| 22,677 | | Beverly Enterprises, Inc.* | | | 280,741 |
| 1,700 | | BHP Billiton Ltd., Sponsored ADR | | | 47,566 |
| 14,900 | | Big Lots, Inc.* | | | 179,098 |
| 5,400 | | The BISYS Group, Inc.* | | | 84,672 |
| 25,200 | | Blockbuster Inc., Class A Shares | | | 222,516 |
| 4,400 | | The Boeing Co. | | | 257,224 |
| 2,680 | | BorgWarner, Inc. | | | 130,462 |
| 1,666 | | Boston Private Financial Holdings, Inc. | | | 39,567 |
| 1,000 | | Boston Properties, Inc. | | | 60,230 |
| 4,000 | | Boston Scientific Corp.* | | | 117,160 |
| 8,300 | | Bowater Inc. | | | 312,661 |
| 2,165 | | Boyd Gaming Corp. | | | 112,905 |
| 2,625 | | Briggs & Stratton Corp. | | | 95,576 |
| 6,800 | | Brigham Exploration Co.* | | | 62,764 |
| 2,700 | | Brinker International, Inc.* | | | 97,794 |
| 4,360 | | Brookline Bancorp, Inc. | | | 64,964 |
| 4,400 | | Brookstone, Inc.* | | | 71,368 |
| 1,000 | | Brown & Brown, Inc. | | | 46,090 |
| 1,400 | | Business Objects S.A., Sponsored ADR* | | | 37,646 |
| 1,700 | | C.H. Robinson Worldwide, Inc. | | | 87,601 |
| 5,600 | | Cadence Design Systems, Inc.* | | | 83,720 |
| 13,270 | | Callaway Golf Co. | | | 169,856 |
| 1,600 | | Camden Property Trust | | | 75,248 |
| 1,085 | | Campbell Soup Co. | | | 31,487 |
| 10,220 | | CapitalSource Inc.* | | | 235,060 |
| 7,800 | | Capitol Federal Financial | | | 270,192 |
| 1,400 | | Caremark Rx, Inc.* | | | 55,692 |
| 1,100 | | Carlisle Cos. Inc. | | | 76,747 |
| 16,800 | | CarMax, Inc.* | | | 529,200 |
| 2,300 | | CarrAmerica Realty Corp. | | | 72,565 |
| 3,100 | | Casual Male Retail Group Inc.* | | | 20,119 |
| 3,050 | | Caterpillar Inc. | | | 278,892 |
| 1,800 | | CB Richard Ellis Group, Inc., Class A Shares* | | | 62,982 |
| 11,601 | | Celanese Corp., Series A Shares* | | | 208,702 |
| 10,663 | | Cell Genesys, Inc.* | | | 48,303 |
| 1,275 | | Centex Corp. | | | 73,019 |
| 5,600 | | CenturyTel, Inc. | | | 183,904 |
| 7,400 | | Ceridian Corp.* | | | 126,170 |
| 2,200 | | Certegy Inc. | | | 76,164 |
| 6,100 | | Champion Enterprises, Inc.* | | | 57,340 |
| 32,425 | | The Charles Schwab Corp. | | | 340,787 |
| 13,200 | | Charming Shoppes, Inc.* | | | 107,316 |
| 7,140 | | The Cheesecake Factory Inc.* | | | 253,113 |
| 700 | | Chemed Corp. | | | 53,536 |
| 1,000 | | Cheniere Energy, Inc.* | | | 64,510 |
See Notes to Financial Statements.
26
Schedule of Securities Sold Short
(continued)
| | | | | |
| | |
| Shares | | Security | | Value |
| 2,325 | | Chesapeake Energy Corp. | | $ | 51,011 |
| 3,450 | | ChevronTexaco Corp. | | | 201,169 |
| 3,000 | | Chico's FAS, Inc.* | | | 84,780 |
| 3,750 | | The Children's Place Retail Stores, Inc.* | | | 179,062 |
| 1,801 | | Chiron Corp.* | | | 63,143 |
| 1,400 | | ChoicePoint Inc.* | | | 56,154 |
| 1,800 | | Church & Dwight Co., Inc. | | | 63,846 |
| 11,864 | | CIBER, Inc.* | | | 86,251 |
| 1,670 | | Cincinnati Financial Corp. | | | 72,829 |
| 1,600 | | Cintas Corp. | | | 66,096 |
| 4,700 | | Cisco Systems, Inc.* | | | 84,083 |
| 2,100 | | CIT Group Inc. | | | 79,800 |
| 7,515 | | Citadel Broadcasting Co.* | | | 103,181 |
| 1,800 | | Clear Channel Communications, Inc. | | | 62,046 |
| 9,415 | | CMS Energy Corp.* | | | 122,772 |
| 3,000 | | CNA Financial Corp.* | | | 84,180 |
| 13,173 | | CNET Networks, Inc.* | | | 124,353 |
| 5,225 | | Colgate-Palmolive Co. | | | 272,588 |
| 2,650 | | Columbia Sportswear Co.* | | | 141,059 |
| 8,800 | | Comcast Corp., Class A Shares* | | | 297,264 |
| 6,300 | | Commonwealth Telephone Enterprises, Inc.* | | | 296,982 |
| 8,331 | | CommScope, Inc.* | | | 124,632 |
| 9,200 | | Computer Associates International, Inc. | | | 249,320 |
| 2,475 | | Comtech Telecommunications Corp.* | | | 128,947 |
| 3,940 | | CONMED Corp.* | | | 118,673 |
| 3,900 | | Connetics Corp.* | | | 98,631 |
| 26,000 | | Conseco, Inc.* | | | 530,920 |
| 8,200 | | CONSOL Energy Inc. | | | 385,564 |
| 4,075 | | Consolidated Edison, Inc. | | | 171,882 |
| 1,100 | | Constellation Brands, Inc., Class A Shares* | | | 58,157 |
| 7,405 | | Convergys Corp.* | | | 110,557 |
| 7,000 | | Cooper Tire & Rubber Co. | | | 128,520 |
| 8,900 | | Cott Corp.* | | | 215,647 |
| 5,478 | | CP Ships Ltd. | | | 77,678 |
| 11,210 | | Credence Systems Corp.* | | | 88,671 |
| 4,800 | | Crown Holdings, Inc.* | | | 74,688 |
| 17,500 | | CSG Systems International, Inc.* | | | 285,075 |
| 22,258 | | CuraGen Corp.* | | | 92,593 |
| 3,098 | | CV Therapeutics, Inc.* | | | 63,075 |
| 4,200 | | CVS Corp. | | | 221,004 |
| 1,400 | | Cymer, Inc.* | | | 37,478 |
| 20,500 | | Cypress Semiconductor Corp.* | | | 258,300 |
| 1,960 | | Cytec Industries Inc. | | | 106,330 |
| 24,226 | | Cytyc Corp.* | | | 557,440 |
| 5,070 | | DaimlerChrysler AG | | | 226,730 |
| 5,400 | | Dana Corp. | | | 69,066 |
| 2,035 | | Danaher Corp. | | | 108,689 |
| 7,600 | | DaVita, Inc.* | | | 318,060 |
| 15,905 | | Dean Foods Co.* | | | 545,541 |
| 4,966 | | deCODE genetics, Inc.* | | | 28,306 |
| 2,525 | | Developers Diversified Realty Corp. | | | 100,369 |
| 2,800 | | DeVry, Inc.* | | | 52,976 |
| 3,200 | | Dex Media, Inc. | | | 66,080 |
| 2,985 | | Diamond Offshore Drilling, Inc. | | | 148,951 |
| 22,404 | | Dick's Sporting Goods, Inc.* | | | 822,899 |
| 10,290 | | Diebold, Inc. | | | 564,407 |
See Notes to Financial Statements.
27
Schedule of Securities Sold Short
(continued)
| | | | | |
| | |
| Shares | | Security | | Value |
| 19,600 | | The DIRECTV Group, Inc.* | | $ | 282,632 |
| 9,925 | | Dollar General Corp. | | | 217,457 |
| 7,620 | | Dollar Tree Stores, Inc.* | | | 218,923 |
| 1,475 | | Dominion Resources, Inc. | | | 109,784 |
| 5,370 | | Donaldson Co., Inc. | | | 173,344 |
| 3,800 | | Dow Jones & Co., Inc. | | | 142,006 |
| 20,007 | | The Dress Barn, Inc.* | | | 364,528 |
| 2,295 | | DTE Energy Co. | | | 104,377 |
| 2,100 | | Duke Realty Corp. | | | 62,685 |
| 159,716 | | Dynegy Inc., Class A Shares* | | | 624,490 |
| 4,400 | | E*TRADE Financial Corp.* | | | 52,800 |
| 5,925 | | E. I. du Pont de Nemours and Co. | | | 303,597 |
| 3,400 | | The E.W. Scripps Co., Class A Shares | | | 165,750 |
| 15,475 | | Eastman Kodak Co. | | | 503,711 |
| 1,400 | | Eaton Vance Corp. | | | 32,816 |
| 4,345 | | EchoStar Communications Corp., Class A Shares | | | 127,091 |
| 4,370 | | Ecolab Inc. | | | 144,429 |
| 3,900 | | Edwards Lifesciences Corp.* | | | 168,558 |
| 5,700 | | El Paso Corp. | | | 60,306 |
| 8,640 | | Electronic Arts Inc.* | | | 447,379 |
| 2,195 | | Eli Lilly and Co. | | | 114,359 |
| 700 | | Enbridge Energy Partners, L.P. | | | 34,874 |
| 2,100 | | Engelhard Corp. | | | 63,063 |
| 2,800 | | ENSCO International Inc. | | | 105,448 |
| 12,400 | | Equinix, Inc.* | | | 525,016 |
| 2,700 | | Equitable Resources, Inc. | | | 155,088 |
| 7,525 | | Equity Office Properties Trust | | | 226,728 |
| 5,500 | | Equity Residential | | | 177,155 |
| 1,200 | | Erie Indemnity Co., Class A Shares | | | 62,544 |
| 1,500 | | Everest Re Group, Ltd. | | | 127,665 |
| 7,300 | | Expeditors International of Washington, Inc. | | | 390,915 |
| 21,612 | | ExpressJet Holdings, Inc.* | | | 246,593 |
| 2,800 | | Exxon Mobil Corp. | | | 166,880 |
| 3,900 | | Fairmont Hotels & Resorts Inc. | | | 129,246 |
| 9,990 | | Family Dollar Stores, Inc. | | | 303,296 |
| 1,400 | | Fastenal Co. | | | 77,434 |
| 32,770 | | Federal Signal Corp. | | | 497,121 |
| 2,300 | | Federated Investors, Inc., Class B Shares | | | 65,113 |
| 1,730 | | Fifth Third Bancorp | | | 74,355 |
| 2,405 | | First Horizon National Corp. | | | 98,100 |
| 8,627 | | First Horizon Pharmaceutical Corp.* | | | 145,624 |
| 2,825 | | First Industrial Realty Trust, Inc. | | | 106,870 |
| 6,800 | | FirstMerit Corp. | | | 181,968 |
| 4,075 | | Fisher Scientific International Inc.* | | | 231,949 |
| 6,700 | | Fleetwood Enterprises, Inc.* | | | 58,290 |
| 59,750 | | Flextronics International Ltd.* | | | 719,390 |
| 6,450 | | FLIR Systems, Inc.* | | | 195,435 |
| 1,500 | | Florida Rock Industries, Inc. | | | 88,230 |
| 12,500 | | Fluor Corp. | | | 692,875 |
| 13,980 | | Foot Locker, Inc. | | | 409,614 |
| 79,838 | | Ford Motor Co. | | | 904,565 |
| 7,100 | | Forest City Enterprises, Inc., Class A Shares | | | 452,980 |
| 1,700 | | Fossil, Inc.* | | | 44,072 |
| 6,600 | | Foundry Networks, Inc.* | | | 65,340 |
| 3,850 | | FPL Group, Inc. | | | 154,578 |
| 6,215 | | Fred's, Inc. | | | 106,712 |
See Notes to Financial Statements.
28
Schedule of Securities Sold Short
(continued)
| | | | | |
| | |
| Shares | | Security | | Value |
| 8,842 | | Freeport-McMoRan Copper & Gold, Inc., Class B Shares | | $ | 350,232 |
| 1,900 | | Frontier Airlines, Inc.* | | | 19,912 |
| 2,000 | | Gannett Co., Inc. | | | 158,160 |
| 1,700 | | Garmin Ltd. | | | 78,744 |
| 23,400 | | Gateway, Inc.* | | | 94,302 |
| 9,429 | | GenCorp Inc. | | | 188,580 |
| 22,490 | | General Cable Corp.* | | | 271,454 |
| 8,900 | | General Electric Co. | | | 320,934 |
| 1,478 | | General Mills, Inc. | | | 72,644 |
| 3,204 | | General Motors Corp. | | | 94,166 |
| 5,712 | | Genesco Inc.* | | | 162,335 |
| 2,400 | | Gen-Probe Inc.* | | | 106,944 |
| 8,355 | | Gentex Corp. | | | 266,525 |
| 1,400 | | Genuine Parts Co. | | | 60,886 |
| 3,166 | | Getty Images, Inc.* | | | 225,134 |
| 1,600 | | GlaxoSmithKline PLC, ADR | | | 73,472 |
| 2,900 | | GlobalSantaFe Corp. | | | 107,416 |
| 1,835 | | Golden West Financial Corp. | | | 111,017 |
| 3,750 | | Goodrich Corp. | | | 143,588 |
| 2,873 | | GrafTech International Ltd.* | | | 16,347 |
| 5,400 | | Great Lakes Chemical Corp. | | | 173,448 |
| 80,000 | | Grey Wolf, Inc.* | | | 526,400 |
| 17,500 | | Griffon Corp.* | | | 374,675 |
| 6,795 | | GTECH Holdings Corp. | | | 159,886 |
| 1,300 | | H&R Block, Inc. | | | 65,754 |
| 2,895 | | The Hain Celestial Group Inc.* | | | 53,963 |
| 58,330 | | Hanover Compressor Co.* | | | 704,043 |
| 1,300 | | Harley-Davidson, Inc. | | | 75,088 |
| 2,250 | | Harsco Corp. | | | 134,123 |
| 3,200 | | Hawaiian Electric Industries, Inc. | | | 81,664 |
| 3,940 | | HCA, Inc. | | | 211,066 |
| 3,475 | | Health Management Associates, Inc., Class A Shares | | | 90,976 |
| 10,100 | | Health Net Inc.* | | | 330,371 |
| 1,900 | | Healthcare Realty Trust, Inc. | | | 69,236 |
| 2,820 | | Helen of Troy Ltd.* | | | 77,212 |
| 17,250 | | Henry Schein, Inc.* | | | 618,240 |
| 1,700 | | Hershey Foods Corp. | | | 102,782 |
| 885 | | Hillenbrand Industries, Inc. | | | 49,091 |
| 30,150 | | Hilton Hotels Corp. | | | 673,853 |
| 6,600 | | HNI Corp. | | | 296,670 |
| 11,200 | | Honeywell International Inc. | | | 416,752 |
| 5,100 | | Host Marriott Corp. | | | 84,456 |
| 5,900 | | Hot Topic, Inc.* | | | 128,915 |
| 7,900 | | Hudson City Bancorp, Inc. | | | 288,745 |
| 8,564 | | Human Genome Sciences, Inc.* | | | 78,960 |
| 5,629 | | Hutchinson Technology Inc.* | | | 195,777 |
| 5,200 | | ICOS Corp.* | | | 116,792 |
| 4,165 | | IDEX Corp. | | | 168,058 |
| 8,750 | | IKON Office Solutions, Inc. | | | 86,538 |
| 2,115 | | Illinois Tool Works Inc. | | | 189,356 |
| 1,747 | | ImClone Systems Inc.* | | | 60,271 |
| 3,400 | | IMS Health Inc. | | | 82,926 |
| 3,850 | | INAMED Corp.* | | | 269,038 |
| 15,900 | | IndyMac Bancorp, Inc. | | | 540,600 |
| 11,500 | | Instinet Group Inc.* | | | 67,620 |
See Notes to Financial Statements.
29
Schedule of Securities Sold Short
(continued)
| | | | | |
| | |
| Shares | | Security | | Value |
| 3,000 | | Integrated Circuit Systems, Inc.* | | $ | 57,360 |
| 3,363 | | InterActiveCorp* | | | 74,894 |
| 2,100 | | International Game Technology | | | 55,986 |
| 9,600 | | International Paper Co. | | | 353,184 |
| 54,275 | | The Interpublic Group of Cos., Inc.* | | | 666,497 |
| 800 | | Invacare Corp. | | | 35,704 |
| 7,139 | | Invitrogen Corp.* | | | 494,019 |
| 750 | | iPayment Holdings, Inc.* | | | 31,650 |
| 25,751 | | IVAX Corp.* | | | 509,097 |
| 6,745 | | The J. M. Smucker Co. | | | 339,273 |
| 7,315 | | Jacobs Engineering Group Inc.* | | | 379,795 |
| 11,244 | | JAKKS Pacific, Inc.* | | | 241,409 |
| 10,600 | | Janus Capital Group Inc. | | | 147,870 |
| 950 | | Jarden Corp.* | | | 43,586 |
| 1,300 | | Jefferson-Pilot Corp. | | | 63,765 |
| 10,600 | | JetBlue Airways Corp.* | | | 201,824 |
| 800 | | Johnson Controls, Inc. | | | 44,608 |
| 6,600 | | Jones Apparel Group, Inc. | | | 221,034 |
| 2,400 | | Jos. A. Bank Clothiers, Inc.* | | | 70,320 |
| 4,700 | | JPMorgan Chase & Co. | | | 162,620 |
| 15,000 | | Juniper Networks, Inc.* | | | 330,900 |
| 14,985 | | Kansas City Southern* | | | 288,611 |
| 4,818 | | Kerr-McGee Corp. | | | 377,394 |
| 430 | | Kimberly-Clark Corp. | | | 28,264 |
| 1,075 | | Kimco Realty Corp. | | | 57,943 |
| 2,675 | | Kinder Morgan, Inc. | | | 202,497 |
| 1,639 | | Kinder Morgan Management, LLC* | | | 66,527 |
| 7,300 | | King Pharmaceuticals, Inc.* | | | 60,663 |
| 2,860 | | Knight Transportation, Inc. | | | 70,556 |
| 1,600 | | Kohl's Corp.* | | | 82,608 |
| 2,000 | | Kraft Foods Inc., Class A Shares | | | 66,100 |
| 20,400 | | The Kroger Co.* | | | 327,012 |
| 2,900 | | KT Corp., Sponsored ADR | | | 61,799 |
| 1,772 | | Kulicke and Soffa Industries, Inc.* | | | 11,146 |
| 15,110 | | LabOne, Inc.* | | | 520,993 |
| 17,100 | | Lamar Advertising Co., Class A Shares* | | | 688,959 |
| 1,335 | | Las Vegas Sands Corp.* | | | 60,075 |
| 5,150 | | La-Z-Boy Inc. | | | 71,740 |
| 1,600 | | Leapfrog Enterprises, Inc.* | | | 18,160 |
| 3,270 | | Lear Corp. | | | 145,057 |
| 6,500 | | Lee Enterprises, Inc. | | | 282,100 |
| 1,900 | | Leucadia National Corp. | | | 65,265 |
| 7,250 | | Lithia Motors, Inc., Class A Shares | | | 185,673 |
| 2,075 | | Lockheed Martin Corp. | | | 126,700 |
| 2,500 | | Louisiana-Pacific Corp. | | | 62,850 |
| 850 | | Lowe's Cos., Inc. | | | 48,527 |
| 2,310 | | The Lubrizol Corp. | | | 93,878 |
| 8,000 | | Lyondell Chemical Co. | | | 223,360 |
| 1,300 | | Magellan Midstream Partners, L.P. | | | 79,365 |
| 2,535 | | Manulife Financial Corp. | | | 121,477 |
| 300 | | Markel Corp.* | | | 103,563 |
| 1,200 | | Marriott International, Inc., Class A Shares | | | 80,232 |
| 2,300 | | Marsh & McLennan Cos., Inc. | | | 69,966 |
| 3,435 | | Marshall & Ilsley Corp. | | | 143,411 |
| 8,800 | | Martek Biosciences Corp.* | | | 512,072 |
See Notes to Financial Statements.
30
Schedule of Securities Sold Short
(continued)
| | | | | |
| | |
| Shares | | Security | | Value |
| 1,700 | | Masco Corp. | | $ | 58,939 |
| 17,345 | | Massey Energy Co. | | | 694,494 |
| 5,700 | | May Department Stores Co. | | | 211,014 |
| 5,400 | | Maytag Corp. | | | 75,438 |
| 5,900 | | MBNA Corp. | | | 144,845 |
| 1,000 | | The McClatchy Co., Class A Shares | | | 74,160 |
| 2,500 | | MCI Inc. | | | 62,300 |
| 2,300 | | MeadWestvaco Corp. | | | 73,186 |
| 2,500 | | MedImmune, Inc.* | | | 59,525 |
| 3,200 | | Medtronic, Inc. | | | 163,040 |
| 2,100 | | Mellon Financial Corp. | | | 59,934 |
| 12,600 | | The Men's Wearhouse, Inc.* | | | 531,846 |
| 22,200 | | Mentor Graphics Corp.* | | | 304,140 |
| 1,900 | | Merrill Lynch & Co., Inc. | | | 107,540 |
| 6,241 | | Mesa Air Group, Inc.* | | | 43,687 |
| 5,400 | | Metro-Goldwyn-Mayer Inc.* | | | 64,530 |
| 200 | | MGIC Investment Corp. | | | 12,334 |
| 2,650 | | Mine Safety Appliances Co. | | | 102,661 |
| 2,000 | | Minerals Technologies Inc. | | | 131,560 |
| 1,600 | | Modine Manufacturing Co. | | | 46,928 |
| 7,885 | | Molex Inc. | | | 207,849 |
| 3,600 | | MoneyGram International, Inc. | | | 68,004 |
| 6,900 | | Monster Worldwide Inc.* | | | 193,545 |
| 8,855 | | Mylan Laboratories Inc. | | | 156,911 |
| 3,500 | | Nalco Holding Co.* | | | 65,905 |
| 3,000 | | Nam Tai Electronics, Inc. | | | 79,800 |
| 4,585 | | National Instruments Corp. | | | 124,024 |
| 2,800 | | National-Oilwell Varco Inc.* | | | 130,760 |
| 26,000 | | Navigant International, Inc.* | | | 355,160 |
| 1,600 | | Navistar International Corp.* | | | 58,240 |
| 2,810 | | NCI Building Systems, Inc.* | | | 108,466 |
| 4,800 | | Neurocrine Biosciences, Inc.* | | | 182,688 |
| 3,050 | | New York Community Bancorp, Inc. | | | 55,388 |
| 1,900 | | The New York Times Co., Class A Shares | | | 69,502 |
| 5,400 | | NewAlliance Bancshares, Inc. | | | 75,600 |
| 2,800 | | Newell Rubbermaid Inc. | | | 61,432 |
| 1,675 | | Newfield Exploration Co.* | | | 124,385 |
| 19,300 | | News Corp., Class A Shares | | | 326,556 |
| 3,800 | | Nextel Partners, Inc., Class A Shares* | | | 83,448 |
| 21,150 | | NII Holdings Inc.* | | | 1,216,125 |
| 6,725 | | Noble Corp. | | | 378,012 |
| 3,700 | | North Fork Bancorp., Inc. | | | 102,638 |
| 1,900 | | Northeast Utilities | | | 36,613 |
| 1,600 | | Northern Trust Corp. | | | 69,504 |
| 12,800 | | Northrop Grumman Corp. | | | 690,944 |
| 4,900 | | Novellus Systems, Inc.* | | | 130,977 |
| 4,500 | | Noven Pharmaceuticals, Inc.* | | | 76,320 |
| 1,191 | | NPS Pharmaceuticals, Inc.* | | | 15,030 |
| 2,400 | | NVIDIA Corp.* | | | 57,024 |
| 2,500 | | OfficeMax Inc. | | | 83,750 |
| 1,300 | | OGE Energy Corp. | | | 35,035 |
| 3,150 | | Old National Bancorp | | | 63,945 |
| 2,600 | | Olin Corp. | | | 57,980 |
| 4,081 | | OMI Corp. | | | 78,151 |
| 15,600 | | Omnicare, Inc. | | | 553,020 |
| 13,514 | | ON Semiconductor Corp.* | | | 53,380 |
See Notes to Financial Statements.
31
Schedule of Securities Sold Short
(continued)
| | | | | |
| | |
| Shares | | Security | | Value |
| 1,841 | | Open Solutions Inc.* | | $ | 36,507 |
| 22,500 | | Openwave Systems Inc.* | | | 274,275 |
| 4,820 | | Option Care, Inc. | | | 99,244 |
| 1,200 | | Oregon Steel Mills, Inc.* | | | 27,600 |
| 1,820 | | Oshkosh Truck Corp. | | | 149,222 |
| 3,380 | | Outback Steakhouse, Inc. | | | 154,770 |
| 2,200 | | Overnite Corp. | | | 70,378 |
| 1,300 | | Overseas Shipholding Group, Inc. | | | 81,783 |
| 2,700 | | Owens & Minor, Inc. | | | 73,305 |
| 1,200 | | Pacific Sunwear of California, Inc.* | | | 33,576 |
| 7,700 | | Packaging Corp. of America | | | 187,033 |
| 3,200 | | Pall Corp. | | | 86,784 |
| 1,240 | | Panera Bread Co., Class A Shares* | | | 70,097 |
| 4,742 | | Par Pharmaceutical Cos. Inc.* | | | 158,572 |
| 900 | | Patterson Cos. Inc.* | | | 44,955 |
| 1,900 | | Paychex, Inc. | | | 62,358 |
| 3,000 | | Peabody Energy Corp. | | | 139,080 |
| 7,865 | | Pentair, Inc. | | | 306,735 |
| 11,350 | | People's Bank | | | 464,782 |
| 4,200 | | The Pep Boys — Manny, Moe & Jack | | | 73,836 |
| 3,185 | | Pepco Holdings, Inc. | | | 66,853 |
| 1,400 | | PepsiCo, Inc. | | | 74,242 |
| 4,785 | | Performance Food Group Co.* | | | 132,449 |
| 21,000 | | Per-Se Technologies, Inc.* | | | 322,350 |
| 3,500 | | PETCO Animal Supplies, Inc.* | | | 128,835 |
| 2,935 | | Petroleo Brasileiro S.A., ADR | | | 129,668 |
| 7,700 | | PETsMART, Inc. | | | 221,375 |
| 1,400 | | Phillips-Van Heusen Corp. | | | 37,296 |
| 7,084 | | Pinnacle Airlines Corp.* | | | 75,232 |
| 11,700 | | Plains Exploration & Production Co.* | | | 408,330 |
| 4,660 | | Playboy Enterprises, Inc., Class B Shares* | | | 60,114 |
| 6,700 | | PMC-Sierra, Inc.* | | | 58,960 |
| 2,400 | | PNC Financial Services Group, Inc. | | | 123,552 |
| 13,700 | | Power-One, Inc.* | | | 66,582 |
| 22,650 | | Powerwave Technologies, Inc.* | | | 175,311 |
| 2,800 | | Praxair, Inc. | | | 134,008 |
| 1,250 | | Precision Castparts Corp. | | | 96,263 |
| 2,175 | | Premcor Inc. | | | 129,804 |
| 1,400 | | Principal Financial Group, Inc. | | | 53,886 |
| 3,750 | | PrivateBancorp, Inc. | | | 117,788 |
| 2,900 | | Progress Energy, Inc. | | | 121,655 |
| 27,582 | | Protein Design Labs, Inc.* | | | 441,036 |
| 1,787 | | Providian Financial Corp.* | | | 30,665 |
| 25,000 | | PSS World Medical, Inc.* | | | 284,250 |
| 1,500 | | Public Service Enterprise Group Inc. | | | 81,585 |
| 10,962 | | QLT Inc.* | | | 140,971 |
| 29,338 | | Quanta Services, Inc.* | | | 223,849 |
| 49,520 | | Quantum Corp.* | | | 144,103 |
| 1,600 | | Quicksilver Resources Inc.* | | | 77,968 |
| 3,900 | | R. R. Donnelley & Sons Co. | | | 123,318 |
| 22,050 | | RadiSys Corp.* | | | 312,228 |
| 7,300 | | Rambus Inc.* | | | 110,011 |
| 2,700 | | Range Resources Corp. | | | 63,072 |
| 2,035 | | RARE Hospitality International, Inc.* | | | 62,841 |
| 2,000 | | Raytheon Co. | | | 77,400 |
| 2,400 | | Reckson Associates Realty Corp. | | | 73,680 |
See Notes to Financial Statements.
32
Schedule of Securities Sold Short
(continued)
| | | | | |
| | |
| Shares | | Security | | Value |
| 19,798 | | Red Hat, Inc.* | | $ | 215,996 |
| 5,100 | | Regal Entertainment Group, Class A Shares | | | 107,253 |
| 2,700 | | Regions Financial Corp. | | | 87,480 |
| 1,300 | | Regis Corp. | | | 53,209 |
| 1,200 | | Rent-A-Center, Inc.* | | | 32,772 |
| 750 | | Resources Connection, Inc.* | | | 15,697 |
| 8,800 | | Roper Industries, Inc. | | | 576,400 |
| 19,100 | | Ross Stores, Inc. | | | 556,574 |
| 2,500 | | Royal Dutch Petroleum Co., NY Registered Shares | | | 150,100 |
| 18,700 | | Safeway Inc.* | | | 346,511 |
| 14,800 | | Saks Inc. | | | 267,140 |
| 8,700 | | Sanmina-SCI Corp.* | | | 45,414 |
| 53,165 | | Schering-Plough Corp. | | | 964,945 |
| 2,300 | | Scholastic Corp.* | | | 84,847 |
| 7,085 | | Seagate Technology* | | | 138,512 |
| 1,900 | | Sealed Air Corp.* | | | 98,686 |
| 1,700 | | Sears Holdings Corp.* | | | 226,389 |
| 1,800 | | SEI Investments Co. | | | 65,088 |
| 4,900 | | Select Comfort Corp.* | | | 100,156 |
| 9,300 | | Semtech Corp.* | | | 166,191 |
| 8,926 | | SERENA Software, Inc.* | | | 212,082 |
| 2,500 | | Service Corp. International * | | | 18,700 |
| 5,201 | | SFBC International, Inc.* | | | 183,283 |
| 2,310 | | Shell Transport & Trading Co. PLC, Sponsored ADR | | | 125,572 |
| 2,800 | | The Sherwin-Williams Co. | | | 123,172 |
| 1,900 | | Shurgard Storage Centers, Inc., Class A Shares | | | 77,862 |
| 8,900 | | Siebel Systems, Inc.* | | | 81,257 |
| 2,290 | | Siemens AG, Sponsored ADR | | | 181,047 |
| 880 | | Silicon Laboratories Inc.* | | | 26,145 |
| 1,000 | | Simon Property Group, Inc. | | | 60,580 |
| 111 | | Sinclair Broadcast Group, Inc., Class A Shares | | | 891 |
| 20,789 | | Six Flags, Inc.* | | | 85,651 |
| 1,900 | | Sky Financial Group, Inc. | | | 50,958 |
| 4,500 | | SLM Corp. | | | 224,280 |
| 1,700 | | Smith International, Inc. | | | 106,641 |
| 34,125 | | Smurfit-Stone Container Corp.* | | | 527,914 |
| 2,100 | | Snap-on Inc. | | | 66,759 |
| 3,385 | | Sonic Automotive, Inc. | | | 76,873 |
| 3,050 | | The South Financial Group, Inc. | | | 93,147 |
| 4,800 | | The Southern Co. | | | 152,784 |
| 10,225 | | Southwest Airlines Co. | | | 145,604 |
| 2,900 | | Spinnaker Exploration Co.* | | | 103,037 |
| 1,800 | | SPX Corp. | | | 77,904 |
| 2,400 | | The St. Joe Co. | | | 161,520 |
| 1,300 | | Starwood Hotels & Resorts Worldwide, Inc. | | | 78,039 |
| 1,600 | | State Street Corp. | | | 69,952 |
| 7,300 | | Station Casinos, Inc. | | | 493,115 |
| 24,800 | | Steelcase Inc., Class A Shares | | | 342,240 |
| 5,500 | | Stericycle, Inc.* | | | 243,100 |
| 2,800 | | Stone Energy Corp.* | | | 135,996 |
| 700 | | Strayer Education, Inc. | | | 79,324 |
| 4,950 | | Stryker Corp. | | | 220,819 |
| 22,800 | | Sunterra Corp.* | | | 343,824 |
| 2,700 | | Swift Energy Co.* | | | 76,788 |
See Notes to Financial Statements.
33
Schedule of Securities Sold Short
(continued)
| | | | | |
| | |
| Shares | | Security | | Value |
| 1,304 | | Sybase, Inc.* | | $ | 24,072 |
| 16,845 | | Symbol Technologies, Inc. | | | 244,084 |
| 4,000 | | Synopsys, Inc.* | | | 72,400 |
| 3,570 | | Synovus Financial Corp. | | | 99,460 |
| 9,085 | | Sysco Corp. | | | 325,243 |
| 1,300 | | T. Rowe Price Group Inc. | | | 77,194 |
| 2,495 | | Taro Pharmaceutical Industries Ltd.* | | | 78,742 |
| 4,000 | | TECO Energy, Inc. | | | 62,720 |
| 900 | | Teekay Shipping Corp. | | | 40,455 |
| 3,100 | | Telecom Argentina SA, Sponsored ADR* | | | 38,006 |
| 1,160 | | Teleflex Inc. | | | 59,369 |
| 4,700 | | Telesystem International Wireless Inc.* | | | 71,675 |
| 10,300 | | Tellabs, Inc.* | | | 75,190 |
| 21,015 | | Tenet Healthcare Corp.* | | | 242,303 |
| 21,590 | | Terra Industries Inc.* | | | 167,538 |
| 26,816 | | Thoratec Corp.* | | | 327,692 |
| 3,300 | | Thornburg Mortgage, Inc. | | | 92,532 |
| 5,725 | | Tidewater Inc. | | | 222,474 |
| 15,685 | | Tiffany & Co. | | | 541,446 |
| 2,100 | | The TJX Cos., Inc. | | | 51,723 |
| 5,200 | | TLC Vision Corp.* | | | 49,244 |
| 618 | | Tootsie Roll Industries, Inc. | | | 18,540 |
| 1,300 | | Torchmark Corp. | | | 67,860 |
| 1,200 | | Total SA, Sponsored ADR | | | 140,676 |
| 2,900 | | Transatlantic Holdings, Inc. | | | 192,038 |
| 2,280 | | Triad Hospitals, Inc.* | | | 114,228 |
| 1,400 | | Tribune Co. | | | 55,818 |
| 1,800 | | Trimble Navigation Ltd.* | | | 60,858 |
| 18,715 | | Trinity Industries, Inc. | | | 527,202 |
| 1,700 | | Tuesday Morning Corp.* | | | 49,079 |
| 2,400 | | Union Pacific Corp. | | | 167,280 |
| 2,300 | | Unisys Corp.* | | | 16,238 |
| 3,100 | | United Dominion Realty Trust, Inc. | | | 64,697 |
| 4,050 | | United Natural Foods, Inc.* | | | 115,951 |
| 2,300 | | United Parcel Service, Inc., Class B Shares | | | 167,302 |
| 8,300 | | United States Cellular Corp.* | | | 378,729 |
| 40,325 | | UnumProvident Corp. | | | 686,331 |
| 21,150 | | Valeant Pharmaceuticals International | | | 476,298 |
| 1,700 | | Valley National Bancorp | | | 43,826 |
| 3,300 | | The Valspar Corp. | | | 153,582 |
| 3,200 | | VCA Antech, Inc.* | | | 64,736 |
| 4,800 | | Viacom Inc., Class B Shares | | | 167,184 |
| 15,707 | | Vishay Intertechnology, Inc.* | | | 195,238 |
| 38,396 | | Vitesse Semiconductor Corp.* | | | 102,901 |
| 1,300 | | Vornado Realty Trust | | | 90,051 |
| 1,300 | | Vulcan Materials Co. | | | 73,879 |
| 2,100 | | Walgreen Co. | | | 93,282 |
| 1,700 | | Waters Corp.* | | | 60,843 |
| 3,525 | | Watson Pharmaceuticals, Inc.* | | | 108,323 |
| 1,995 | | WCI Communities, Inc.* | | | 60,010 |
| 10,000 | | WebMD Corp.* | | | 85,000 |
| 200 | | Wesco Financial Corp. | | | 76,996 |
| 8,100 | | Western Gas Resources, Inc. | | | 279,045 |
| 1,400 | | Whole Foods Market, Inc. | | | 142,982 |
See Notes to Financial Statements.
34
Schedule of Securities Sold Short
(continued)
| | | | | |
| | |
| Shares | | Security | | Value |
| 4,300 | | The Williams Cos., Inc. | | $ | 80,883 |
| 2,036 | | Wilson Greatbatch Technologies, Inc.* | | | 37,137 |
| 4,800 | | Wm. Wrigley Jr. Co. | | | 314,736 |
| 2,210 | | WMS Industries Inc.* | | | 62,234 |
| 6,450 | | Worthington Industries, Inc. | | | 124,356 |
| 2,300 | | Wynn Resorts, Ltd.* | | | 155,802 |
| 3,300 | | Xcel Energy, Inc. | | | 56,694 |
| 6,305 | | Xilinx, Inc. | | | 184,295 |
| 2,225 | | XL Capital Ltd., Class A Shares | | | 161,023 |
| 1,833 | | XTO Energy, Inc. | | | 60,207 |
| 12,490 | | York International Corp. | | | 489,358 |
| | | | |
|
|
| | | TOTAL COMMON STOCK
(Proceeds — $92,211,566) | | | 95,650,602 |
| | | | |
|
|
| | |
Face
Amount
| | | | |
CORPORATE CONVERTIBLE BONDS & NOTES | | | |
| $136,000 | | Advanced Medical Optics, Inc., 2.500% due 7/15/24 | | | 135,660 |
| 194,000 | | AmeriCredit Corp., Bonds, 1.750% due 11/15/23 | | | 265,052 |
| 28,000 | | CKE Restaurants, Inc., Sub. Notes, 4.000% due 10/1/23 | | | 53,165 |
| 250,000 | | Eastman Kodak Co., Notes, 3.625% due 5/15/08 | | | 239,247 |
| 305,000 | | WCI Communities, Inc., Sr. Sub. Notes, 4.000% due 8/5/23 | | | 377,438 |
| | | | |
|
|
| | | TOTAL CORPORATE CONVERTIBLE BONDS & NOTES
(Proceeds — $1,097,769) | | | 1,070,562 |
| | | | |
|
|
| | | TOTAL OPEN SHORT SALES
(Proceeds — $93,309,335) | | $ | 96,721,164 |
| | | | |
|
|
| * | | Non-income producing security. |
See Notes to Financial Statements.
35
Statement of Assets and Liabilities
March 31, 2005
| | | | |
| ASSETS: | | | | |
Investments, at value (Cost — $137,212,138) | | $ | 141,396,979 | |
Deposits with brokers for short sales | | | 93,309,335 | |
Receivable for securities sold | | | 6,797,462 | |
Dividends and interest receivable | | | 488,244 | |
Receivable for Fund shares sold | | | 312,650 | |
| | |
|
|
|
Total Assets | | | 242,304,670 | |
| | |
|
|
|
| LIABILITIES: | | | | |
Short sales, at value (Proceeds — $93,309,335) | | | 96,721,164 | |
Payable for securities purchased | | | 6,674,832 | |
Securities pledged for open short sales, at market value | | | 4,539,598 | |
Management fees payable | | | 150,042 | |
Payable for Fund shares reacquired | | | 126,753 | |
Due to custodian | | | 81,168 | |
Dividends payable for short sales | | | 80,566 | |
Administration fees payable | | | 23,698 | |
Transfer agency service fees payable | | | 13,600 | |
Trustees' fees payable | | | 292 | |
Accrued expenses | | | 64,774 | |
| | |
|
|
|
Total Liabilities | | | 108,476,487 | |
| | |
|
|
|
Total Net Assets | | $ | 133,828,183 | |
| | |
|
|
|
| NET ASSETS: | | | | |
Par value of shares of beneficial interest (Note 4) | | $ | 15,919 | |
Capital paid in excess of par value | | | 133,855,764 | |
Undistributed net investment income | | | 442,960 | |
Accumulated net realized loss from investment transactions, options written, short sales and foreign currency transactions | | | (1,259,472 | ) |
Net unrealized appreciation from investments and short sales | | | 773,012 | |
| | |
|
|
|
Total Net Assets | | $ | 133,828,183 | |
| | |
|
|
|
Shares Outstanding | | | 15,918,912 | |
| | |
|
|
|
Net Asset Value | | | $8.41 | |
| | |
|
|
|
See Notes to Financial Statements.
36
Statement of Operations
For the Year Ended March 31, 2005
| | | | |
| INVESTMENT INCOME: | | | | |
Interest | | $ | 2,936,991 | |
Dividends | | | 1,942,083 | |
Less: Foreign withholding tax | | | (2,281 | ) |
| | |
|
|
|
Total Investment Income | | | 4,876,793 | |
| | |
|
|
|
| EXPENSES: | | | | |
Management fees (Note 2) | | | 2,146,265 | |
Dividends on short sales (Note 1) | | | 1,423,255 | |
Administration fees (Note 2) | | | 336,733 | |
Custody | | | 140,241 | |
Transfer agency services | | | 122,830 | |
Shareholder communications | | | 69,228 | |
Audit and legal | | | 34,027 | |
Registration fees | | | 30,000 | |
Trustees' fees | | | 12,000 | |
Other | | | 12,572 | |
| | |
|
|
|
Total Expenses | | | 4,327,151 | |
Less: Management fee waiver (Note 2) | | | (3,941 | ) |
| | |
|
|
|
Net Expenses | | | 4,323,210 | |
| | |
|
|
|
Net Investment Income | | | 553,583 | |
| | |
|
|
|
REALIZED AND UNREALIZED GAIN (LOSS) ON INVESTMENTS, OPTIONS, SHORT SALES
AND FOREIGN CURRENCIES (NOTES 1 AND 3): | | | | |
Realized Gain (Loss) From: | | | | |
Investment transactions | | | 18,571,459 | |
Options written | | | (533 | ) |
Short sales | | | (17,406,946 | ) |
Foreign currency transactions | | | 2 | |
| | |
|
|
|
Net Realized Gain | | | 1,163,982 | |
| | |
|
|
|
Net Change in Unrealized Appreciation/Depreciation on Investments and Short Sales | | | (3,799,371 | ) |
| | |
|
|
|
Net Loss on Investments, Options, Short Sales and Foreign Currencies | | | (2,635,389 | ) |
| | |
|
|
|
Decrease in Net Assets From Operations | | $ | (2,081,806 | ) |
| | |
|
|
|
See Notes to Financial Statements.
37
Statements of Changes in Net Assets
For the Years Ended March 31,
| | | | | | | | |
| | | 2005 | | | 2004 | |
| OPERATIONS: | | | | | | | | |
Net investment income (loss) | | $ | 553,583 | | | $ | (201,490 | ) |
Net realized gain | | | 1,163,982 | | | | 2,192,665 | |
Net change in unrealized appreciation/depreciation | | | (3,799,371 | ) | | | 2,815,597 | |
| | |
|
|
| |
|
|
|
Increase (Decrease) in Net Assets From Operations | | | (2,081,806 | ) | | | 4,806,772 | |
| | |
|
|
| |
|
|
|
| DISTRIBUTIONS TO SHAREHOLDERS FROM (NOTE 1): | | | | | | | | |
Net investment income | | | (251,405 | ) | | | (43,825 | ) |
Net realized gains | | | (2,442,830 | ) | | | (865,634 | ) |
| | |
|
|
| |
|
|
|
Decrease in Net Assets From Distributions to Shareholders | | | (2,694,235 | ) | | | (909,459 | ) |
| | |
|
|
| |
|
|
|
| FUND SHARE TRANSACTIONS (NOTE 4): | | | | | | | | |
Net proceeds from sale of shares | | | 48,911,318 | | | | 97,621,647 | |
Net assets value of shares issued for reinvestment of distributions | | | 2,651,335 | | | | 859,412 | |
Cost of shares reacquired | | | (103,808,649 | ) | | | (131,516,873 | ) |
| | |
|
|
| |
|
|
|
Decrease in Net Assets From Fund Share Transactions | | | (52,245,996 | ) | | | (33,035,814 | ) |
| | |
|
|
| |
|
|
|
Decrease in Net Assets | | | (57,022,037 | ) | | | (29,138,501 | ) |
| NET ASSETS: | | | | | | | | |
Beginning of year | | | 190,850,220 | | | | 219,988,721 | |
| | |
|
|
| |
|
|
|
End of year* | | $ | 133,828,183 | | | $ | 190,850,220 | |
| | |
|
|
| |
|
|
|
* Includes undistributed net investment income and net investment loss of: | | | $442,960 | | | | $(58,474 | ) |
| | |
|
|
| |
|
|
|
See Notes to Financial Statements.
38
Financial Highlights
For a share of beneficial interest outstanding throughout each year ended March 31:
| | | | | | | | | | | | | | | |
| | | 2005
| | | 2004
| | | 2003
| | | 2002
| | | 2001
| |
Net Asset Value, Beginning of Year(1) | | $8.66 | | | $8.50 | | | $8.44 | | | $8.14 | | | $8.36 | |
| | |
|
| |
|
| |
|
| |
|
| |
|
|
Income (Loss) From Operations: | | | | | | | | | | | | | | | |
Net investment income (loss) | | 0.03 | | | (0.01 | ) | | 0.03 | | | 0.10 | (2) | | 0.32 | |
Net realized and unrealized gain (loss) | | (0.14 | ) | | 0.21 | | | 0.23 | | | 0.32 | (2) | | 0.23 | |
| | |
|
| |
|
| |
|
| |
|
| |
|
|
Total Income (Loss) From Operations | | (0.11 | ) | | 0.20 | | | 0.26 | | | 0.42 | | | 0.55 | |
| | |
|
| |
|
| |
|
| |
|
| |
|
|
Less Distributions From: | | | | | | | | | | | | | | | |
Net investment income | | (0.01 | ) | | (0.00 | )* | | (0.03 | ) | | (0.12 | ) | | (0.35 | ) |
Net realized gains | | (0.13 | ) | | (0.04 | ) | | (0.17 | ) | | (0.00 | )* | | (0.42 | ) |
| | |
|
| |
|
| |
|
| |
|
| |
|
|
Total Distributions | | (0.14 | ) | | (0.04 | ) | | (0.20 | ) | | (0.12 | ) | | (0.77 | ) |
| | |
|
| |
|
| |
|
| |
|
| |
|
|
Net Asset Value, End of Year | | $8.41 | | | $8.66 | | | $8.50 | | | $8.44 | | | $8.14 | |
| | |
|
| |
|
| |
|
| |
|
| |
|
|
Total Return(3) | | (1.23 | )% | | 2.33 | % | | 3.11 | % | | 5.20 | % | | 6.68 | % |
Net Assets, End of Year (000s) | | $133,828 | | | $190,850 | | | $219,989 | | | $95,428 | | | $45,122 | |
Ratios to Average Net Assets: | | | | | | | | | | | | | | | |
Total expenses before dividend expense on short sales(4) | | 1.72 | %(5) | | 1.63 | %(5) | | 1.70 | % | | 1.88 | % | | 1.90 | %(5) |
Dividend expense from short sales | | 0.85 | | | 1.00 | | | 0.94 | | | 0.59 | | | 0.61 | |
Total expenses | | 2.57 | | | 2.63 | | | 2.64 | | | 2.47 | | | 2.51 | |
Net investment income (loss) | | 0.33 | | | (0.09 | ) | | 0.35 | | | 1.23 | (2) | | 3.71 | |
Portfolio Turnover Rate | | 180 | % | | 253 | % | | 229 | % | | 324 | % | | 317 | % |
| (1) | | Per share amounts have been calculated using the monthly average shares method. |
| (2) | | Effective April 1, 2001, the Fund adopted a change in the accounting method that requires the Fund to amortize premiums and accrete all discounts. Without the adoption of this change, for the year ended March 31, 2002, the net investment income, net realized and unrealized gain and the ratio of net investment income to average net assets would have been $0.11, $0.31 and 1.31%, respectively. Per share information, ratios and supplemental data for the periods prior to April 1, 2001 have not been restated to reflect this change in presentation. |
| (3) | | Performance figures may reflect voluntary fee waivers and/or expense reimbursements. Past performance is no guarantee of future results. In the absence of voluntary fee waivers and/or expense reimbursements, the total return would have been lower. |
| (4) | | As a result of a voluntary expense limitation, expense ratio excluding short sales dividend expense will not exceed 1.90%. |
| (5) | | The manager has agreed to voluntarily waive a portion of its management fee for the years ended March 31, 2005, 2004 and 2001. If such fees were not voluntarily waived, the expense ratios before dividend expense on short sales would have been 1.72%, 1.70% and 2.05%, respectively. |
| * | | Amount represents less than $0.01 per share. |
See Notes to Financial Statements.
39
Notes to Financial Statements
1. Organization and Significant Accounting Policies
Multi-Strategy Market Neutral Investments (“Fund”), a separate investment fund of Consulting Group Capital Markets Funds (“Trust”), a Massachusetts business trust, is registered under the Investment Company Act of 1940, as amended, as a diversified, open-end management investment company.
The following are significant accounting policies consistently followed by the Fund and is in conformity with U.S. generally accepted accounting principles (“GAAP”). Estimates and assumptions are required to be made regarding assets, liabilities and changes in net assets resulting from operations when financial statements are prepared. Changes in the economic environment, financial markets and any other parameters used in determining these estimates could cause actual results to differ.
(a) Investment Valuation. Securities traded on national securities markets are valued at the closing prices on such markets or, if there were no sales during the day, at the mean between the current bid and ask price. Securities primarily traded on foreign exchanges are generally valued at the preceding closing values of such securities on their respective exchanges, except that when a significant occurrence subsequent to the time a value was so established is likely to have significantly changed the value then the fair value of those securities will be determined by consideration of other factors by or under the direction of the Board of Trustees. Certain debt securities of U.S. issuers (other than U.S. government securities and short-term investments) are valued at the mean between the quoted bid and asked prices. U.S. government agencies and obligations are valued at the mean between the bid and asked prices. Securities listed on the NASDAQ National Market System for which market quotations are available are valued at the official closing price or, if there is no official closing price on that day, at the last sale price. When market quotations or official closing prices are not readily available, or are determined not to reflect fair value, such as when the value of a security has been significantly affected by events after the close of the exchange or market on which the security is principally traded, but before the Fund calculates its net asset value, the Fund may value these investments at fair value as determined in accordance with the procedures approved by the Fund’s Board of Trustees. Short-term obligations maturing within 60 days or less are valued at amortized cost, which approximates value.
(b) Repurchase Agreements. When entering into repurchase agreements, it is the Fund’s policy that a custodian takes possession of the underlying collateral securities, the value of which at least equals the principal amount of the repurchase transaction, including accrued interest. To the extent that any repurchase transaction exceeds one business day, the value of the collateral is marked-to-market to ensure the adequacy of the collateral. If the seller defaults and the value of the collateral declines or if bankruptcy proceedings are commenced with respect to the seller of the security, realization of the collateral by the Fund may be delayed or limited.
(c) Option Contracts. When a Fund writes or purchases a call or a put option, an amount equal to the premium received or paid by the Fund is recorded as a liability or asset, the value of which is marked-to-market daily to reflect the current market value of the option. When the option expires, the Fund realizes a gain or loss equal to the amount of the premium received or paid. When the Fund enters into a closing transaction by purchasing or selling an offsetting option, it realizes a gain or loss without regard to any unrealized gain or loss on the underlying security. When a written call option is exercised, the Fund realizes a gain or loss from the sale of the underlying security and the proceeds from such sale are increased by the premium originally received. When a written put option is exercised, the amount of the premium received reduces the cost of the security that the Fund purchased upon exercise of the option. The risk associated with purchasing options is limited to the premium originally paid. The risk in writing a covered call option is that the Fund gives up the opportunity to participate in any increase in the price of the underlying security beyond the exercise price. The risk in writing a put option is that the Fund is exposed to the risk of loss if the market price of the underlying security declines. The risk in writing a call option is that the Fund is exposed to the risk of loss if the market price of the underlying security increases.
(d) Forward Foreign Currency Contracts. A forward foreign currency contract is an agreement between two parties to buy and sell a currency at a set price on a future date. The contract is marked-to-market daily and the change in value is recorded by the Fund as an unrealized gain or loss. When a forward foreign currency contract is extinguished, through either delivery or offset by entering into another forward foreign currency contract, the Fund records a realized gain or loss equal to the difference between
40
Notes to Financial Statements
(continued)
the value of the contract at the time it was opened and the value of the contract at the time it was extinguished or offset. The Fund bears the market risk that arises from changes in foreign currency exchange rates and the credit risk should a counterparty fail to meet the terms of such contracts.
(e) Short Sales of Securities. A short sale is a transaction in which the Fund sells securities it does not own (but has borrowed) in anticipation of a decline in the market price of the securities. To complete a short sale, the Fund may arrange through a broker to borrow the securities to be delivered to the buyer. The proceeds received by the Fund for the short sale are retained by the broker until the Fund replaces the borrowed securities. In borrowing the securities to be delivered to the buyer, the Fund becomes obligated to replace the securities borrowed at their market price at the time of replacement, whatever that price may be. Dividend expenses on short sales are recorded on ex-dividend date.
(f) Fund Investment Risks. The Fund may invest in foreign securities that involve risks not present in domestic investments. Since securities may be denominated in a foreign currency and may require settlement in foreign currencies and pay interest and/or a dividend in foreign currencies, changes in the relationship of these foreign currencies to the U.S. dollar can significantly affect the value of the investments and earnings of the Fund. Foreign investments may also subject the Fund to foreign government exchange restrictions, expropriation, taxation or other political, social or economic developments, all of which could affect the market and/or credit risk of the investments.
(g) Security Transactions and Investment Income. Security transactions are accounted for on a trade date basis. Interest income, adjusted for amortization of premium and accretion of discount, is recorded on the accrual basis. Dividend income is recorded on the ex-dividend date. Foreign dividend income is recorded on the ex-dividend date or as soon as practical after the Fund determines the existence of a dividend declaration after exercising reasonable due diligence. The cost of investments sold is determined by use of the specific identification method.
(h) Foreign Currency Translation. The books and records of the Fund are maintained in U.S. dollars. Transactions denominated in foreign currencies are recorded at the current prevailing exchange rates. All assets and liabilities denominated in foreign currencies are translated into U.S. dollar amounts at the current exchange rates at the end of the period. Translation gains or losses resulting from changes in the exchange rates during the reporting period and realized gains and losses on the settlement of foreign currency transactions are reported in the statement of operations for the current period. The Fund does not isolate that portion of realized gains and losses on investments in securities, which are due to changes in the foreign exchange rates from that which is due to changes in market prices of equity securities.
(i) Distributions to Shareholders. Distributions from net investment income and distributions of net realized gains, if any, are declared at least annually. Distributions to shareholders of the Fund are recorded on the ex-dividend date and are determined in accordance with income tax regulations, which may differ from GAAP.
(j) Federal and Other Taxes. It is the Fund’s policy to comply with the federal income and excise tax requirements of the Internal Revenue Code of 1986, as amended, applicable to regulated investment companies. Accordingly, the Fund intends to distribute substantially all of its taxable income and net realized gains on investments, if any, to shareholders each year. Therefore, no federal income tax provision is required. Under the applicable foreign tax law, a withholding tax may be imposed on interest, dividends and capital gains at various rates.
(k) Reclassifications. GAAP requires that certain components of net assets be adjusted to reflect permanent differences between financial and tax reporting. These reclassifications have no effect on net assets or net asset values per share. During the current year, the following reclassifications have been made:
| | | | |
Undistributed
Net Investment
Income | | Accumulated Net
Realized Loss | |
| $199,256 | | $ | (199,256 | ) |
41
Notes to Financial Statements
(continued)
Reclassifications are primarily due to foreign currency transactions treated as ordinary income for tax purposes, differences between book and tax amortization of premium on fixed income securities, and book/tax differences in the treatment of distributions from real estate investment trusts, and book/tax differences in the treatment of various items.
2. Investment Management Agreement, Administration Agreement and Other Transactions with Affiliates
The Trust has entered into an investment management agreement (“Management Agreement”) with Smith Barney Fund Management LLC (“SBFM”), an indirect wholly-owned subsidiary of Citigroup Inc. (“Citigroup”). The Consulting Group, a division of SBFM, provides investment evaluation services with respect to the investment advisers of the Fund. SBFM has entered into an investment advisory agreement with each adviser selected for the Fund (collectively, “Advisers”).
Under the Management Agreement, the Fund pays SBFM a fee, calculated daily and paid monthly, based on the rates applied to the value of the Fund’s average daily net assets. In addition, SBFM pays each Adviser, based on the rates applied to the Fund’s average daily net assets on a monthly basis. The applicable management fee and advisory fee paid by SBFM to each Adviser are indicated below:
| | | | | | | | | |
| Advisers | | Advisory Fee | | | Actual
Management Fee
Incurred | | | Maximum
Allowable
Annual
Management Fee | |
Multi-Strategy Market Neutral Investments | | | | | 1.27 | % | | 1.80 | % |
Calamos Asset Management, Inc. | | 1.00 | % | | | | | | |
Franklin Portfolio Associates LLC | | 1.00 | | | | | | | |
Freeman Associates Investment Management, LLC | | 0.90 | | | | | | | |
SSI Investment Management Inc. | | 1.00 | | | | | | | |
Effective June 30, 2004, Camden Asset Management, L.P. was terminated as an Adviser.
During the year ended March 31, 2005, the Fund had a voluntary expense limitation in place of 1.90%. This expense limitation can be terminated at any time by SBFM. During the year ended March 31, 2005, SBFM voluntarily waived a portion of its fee amounting to $3,941.
During the fiscal year ended March 31, 2005, the Fund purchased a security in violation of the Fund’s investment restrictions. Subsequent to March 31, 2005, the position was sold resulting in a loss of $14,386. The manager has agreed to reimburse the Fund for this loss.
SBFM also acts as the Trust’s administrator for which the Fund pays a fee calculated at an annual rate of 0.20% of the average daily net assets of the Fund. This fee is calculated daily and paid monthly.
Citicorp Trust Bank, fsb. (“CTB”), another indirect wholly-owned subsidiary of Citigroup, acts as the Fund’s transfer agent. PFPC Inc. (“PFPC”) acts as the Fund’s sub-transfer agent. CTB receives account fees and asset-based fees that vary according to the size and type of account. PFPC is responsible for shareholder recordkeeping and financial processing for all shareholder accounts and is paid by CTB. For the year ended March 31, 2005, the Fund paid transfer agent fees of $72,481 to CTB.
All officers and one Trustee of the Trust are employees of Citigroup or its affiliates and do not receive compensation from the Trust.
3. Investments
During the year ended March 31, 2005, the aggregate cost of purchases and proceeds from sales of investments (excluding short-term investments) were as follows:
| | | |
Purchases | | $ | 280,385,253 |
| | |
|
|
Sales | | $ | 313,053,262 |
| | |
|
|
42
Notes to Financial Statements
(continued)
At March 31, 2005, the aggregate gross unrealized appreciation and depreciation of investments for federal income tax purposes were as follows:
| | | | |
Gross unrealized appreciation | | $ | 8,369,014 | |
Gross unrealized depreciation | | | (5,146,408 | ) |
| | |
|
|
|
Net unrealized appreciation | | $ | 3,222,606 | |
| | |
|
|
|
The following written call option transactions occurred during the year ended March 31, 2005:
| | | | | | |
| | | Number of
Contracts | | Premiums | |
Options written, outstanding at March 31, 2004 | | 41 | | $ | 19,967 | |
Options closed | | 41 | | | (19,967 | ) |
| | |
| |
|
|
|
Options written, outstanding at March 31, 2005 | | — | | | — | |
| | |
| |
|
|
|
4. Shares of Beneficial Interest
At March 31, 2005, the Trust had an unlimited number of shares of beneficial interest authorized with a par value of $0.001 per share. Transactions in shares were as follows:
| | | | | | |
| | | Year Ended
March 31, 2005
| | | Year Ended
March 31, 2004
| |
Shares sold | | 5,717,595 | | | 11,411,428 | |
Shares issued on reinvestment | | 311,989 | | | 100,048 | |
Shares reacquired | | (12,148,246 | ) | | (15,358,058 | ) |
| | |
|
| |
|
|
Net Decrease | | (6,118,662 | ) | | (3,846,582 | ) |
| | |
|
| |
|
|
5. Income Tax Information and Distributions to Shareholders
The tax character of distributions paid by the fund during the fiscal years ended March 31, were as follows:
| | | | | | |
| | | 2005 | | 2004 |
Distributions paid from: | | | | | | |
Ordinary Income | | $ | 251,405 | | $ | 772,528 |
Long-term Capital Gains | | | 2,442,830 | | | 136,931 |
| | |
|
| |
|
|
Total Distributions Paid | | $ | 2,694,235 | | $ | 909,459 |
| | |
|
| |
|
|
As of March 31, 2005, the components of accumulated earnings on a tax basis were as follows:
| | | | |
Undistributed ordinary income | | $ | 409,097 | |
| | |
|
|
|
Total undistributed earnings | | | 409,097 | |
Other book/tax temporary differences (a) | | | (263,374 | ) |
Unrealized depreciation (b) | | | (189,223 | ) |
| | |
|
|
|
Total accumulated losses | | $ | (43,500 | ) |
| | |
|
|
|
| (a) | | Other book/tax temporary differences are attributable primarily the deferral of post-October capital losses for tax purposes. |
| (b) | | The difference between book-basis and tax-basis unrealized depreciation is attributable primarily to the tax deferral of losses on wash sales, the difference between book & tax amortization methods for premiums on fixed income securities, the difference between the book and tax cost basis of investments in real estate investment trusts, recognition of gain on constructive sales of appreciated financial positions for tax purposes and other book/tax basis adjustments. |
43
Notes to Financial Statements
(continued)
6. Additional Information
Smith Barney Fund Management LLC (“SBFM”) and Citigroup Global Markets Inc. (“CGMI”) have submitted an Offer of Settlement of an administrative proceeding to the U.S. Securities and Exchange Commission (“SEC”) in connection with an investigation into the 1999 appointment of an affiliated transfer agent for the Smith Barney family of mutual funds (the “Funds”). SBFM and CGMI understand that the SEC has accepted the Offer of Settlement, but has not yet issued the administrative order.
The SEC order will find that SBFM and CGMI willfully violated Section 206(1) of the Investment Advisers Act of 1940 (“Advisers Act”). Specifically, the order will find that SBFM and CGMI knowingly or recklessly failed to disclose to the boards of the Funds in 1999 when proposing a new transfer agent arrangement with an affiliated transfer agent that: First Data Investors Services Group (“First Data”), the Funds’ then-existing transfer agent, had offered to continue as transfer agent and do the same work for substantially less money than before; and that Citigroup Asset Management (“CAM”) had entered into a side letter with First Data under which CAM agreed to recommend the appointment of First Data as sub-transfer agent to the affiliated transfer agent in exchange, among other things, for a guarantee by First Data of specified amounts of asset management and investment banking fees to CAM and CGMI. The order also will find that SBFM and CGMI willfully violated Section 206(2) of the Advisers Act by virtue of the omissions discussed above and other misrepresentations and omissions in the materials provided to the Funds’ boards, including the failure to make clear that the affiliated transfer agent would earn a high profit for performing limited functions while First Data continued to perform almost all of the transfer agent functions, and the suggestion that the proposed arrangement was in the Funds’ best interests and that no viable alternatives existed. SBFM and CGMI do not admit or deny any wrongdoing or liability. The settlement will not establish wrongdoing or liability for purposes of any other proceeding.
The SEC will censure SBFM and CGMI and order them to cease and desist from violations of Sections 206(1) and 206(2) of the Advisers Act. The order will require Citigroup to pay $208.1 million, including $109 million in disgorgement of profits, $19.1 million in interest, and a civil money penalty of $80 million. Approximately $24.4 million has already been paid to the Funds, primarily through fee waivers. The remaining $183.7 million, including the penalty, will be paid to the U.S. Treasury and then distributed pursuant to a plan to be prepared by Citigroup and submitted within 90 days of the entry of the order for approval by the SEC. The distribution plan may also include a portion of certain escrowed transfer agency fees, in accordance with the terms of the order.
The order will require SBFM to recommend a new transfer agent contract to the Fund boards within 180 days of the entry of the order; if a Citigroup affiliate submits a proposal to serve as transfer agent or sub-transfer agent, an independent monitor must be engaged at the expense of SBFM and CGMI to oversee a competitive bidding process. Under the order, Citigroup also will be required to comply with an amended version of a vendor policy that Citigroup instituted in August 2004. That policy, as amended, among other things, requires that when requested by a Fund board, CAM will retain at its own expense an independent consulting expert to advise and assist the board on the selection of certain service providers affiliated with Citigroup.
At this time, there is no certainty as to how the proceeds of the settlement will be distributed, to whom such distributions will be made, the methodology by which such distributions will be allocated, and when such distributions will be made. Although there can be no assurance, Citigroup does not believe that this matter will have a material adverse effect on the Funds.
44
Report of Independent Registered
Public Accounting Firm
The Shareholders and Board of Trustees of
Consulting Group Capital Markets Funds:
We have audited the accompanying statement of assets and liabilities, including the schedules of investments and securities sold short, of Multi-Strategy Market Neutral Investments (“Fund”) of Consulting Group Capital Markets Funds as of March 31, 2005, and the related statement of operations for the year then ended, the statements of changes in net assets for each of the years in the two-year period then ended, and the financial highlights for each of the years in the five-year period then ended. These financial statements and financial highlights are the responsibility of the Fund’s management. Our responsibility is to express an opinion on these financial statements and financial highlights based on our audits.
We conducted our audits in accordance with the standards of the Public Company Accounting Oversight Board (United States). Those standards require that we plan and perform the audit to obtain reasonable assurance about whether the financial statements and financial highlights are free of material misstatement. An audit includes examining, on a test basis, evidence supporting the amounts and disclosures in the financial statements. Our procedures included confirmation of securities owned and sold short as of March 31, 2005, by correspondence with the custodian and brokers or by other appropriate auditing procedures where replies from brokers were not received. An audit also includes assessing the accounting principles used and significant estimates made by management, as well as evaluating the overall financial statement presentation. We believe that our audits provide a reasonable basis for our opinion.
In our opinion, the financial statements and financial highlights referred to above present fairly, in all material respects, the financial position of Multi-Strategy Market Neutral Investments of Consulting Group Capital Markets Funds as of March 31, 2005, and the results of its operations for the year then ended, the changes in its net assets for each of the years in the two-year period then ended, and the financial highlights for each of the years in the five-year period then ended, in conformity with U.S. generally accepted accounting principles.

New York, New York
May 27, 2005
45
Additional Information
(unaudited)
Information about Trustees and Officers
The business and affairs of the Consulting Group Capital Markets Funds (“Trust”) are managed under the direction of the Trust’s Board of Trustees. Information pertaining to the Trustees and Officers of the Trust is set forth below. The Statement of Additional Information includes additional information about Trustees and is available without charge, upon request by calling the Trust’s transfer agent (Citicorp Trust Bank, fsb. at 1-800-451-2010).
| | | | | | | | | | |
Name, Address and Birth Year
| | Position(s) Held with
Fund
| | Term of Office*
and
Length
of Time
Served
| | Principal Occupation(s)
During Past Five Years
| | Number of Portfolios
in Fund Complex
Overseen by Trustee
| | Other Board Memberships Held by Trustee
|
| Non-Interested Trustees: | | | | | | | | | | |
H. John Ellis 858 E. Crystal Downs Drive Frankfort, MI 49635 Birth Year: 1927 | | Trustee | | Since
1999 | | Retired | | 24 | | None |
Armon E. Kamesar 7328 Country Club Drive La Jolla, CA 92037 Birth Year: 1927 | | Trustee | | Since
1994 | | Chairman, TEC International (organization of chief executives); Trustee, U.S. Bankruptcy Court | | 24 | | None |
Stephen E. Kaufman Stephen E. Kaufman, PC 277 Park Avenue, 47th Floor New York, NY 10172 Birth Year: 1932 | | Trustee | | Since
1991 | | Attorney | | 51 | | None |
John J. Murphy 123 Prospect Street Ridgewood, NJ 07450 Birth Year: 1944 | | Trustee | | Since
2002 | | President, Murphy Capital Management | | 24 | | Barclays International Funds Group Ltd. and affiliated companies |
| Interested Trustee: | | | | | | | | | | |
R. Jay Gerken, CFA** Citigroup Asset Management (“CAM”) 399 Park Avenue 4th Floor New York, NY 10022 Birth Year: 1951 | | Chairman, President and Chief Executive Officer | | Since
2002 | | Managing Director of Citigroup Global Markets Inc. (“CGM”); Chairman, President and Chief Executive Officer of Smith Barney Fund Management LLC (“SBFM”), Travelers Investment Adviser, Inc. (“TIA”) and Citi Fund Management Inc. (“CFM”); President and Chief Executive Officer of certain mutual funds associated with Citigroup Inc. (“Citigroup”); Formerly, Portfolio Manager of Smith Barney Allocation Series Inc. (from 1996 to 2001) and Smith Barney Growth and Income Fund (from 1996 to 2000) | | 219 | | None |
46
Additional Information
(unaudited) (continued)
| | | | | | | | | | |
Name, Address and Birth Year
| | Position(s) Held with
Fund
| | Term of Office*
and
Length
of Time
Served
| | Principal Occupation(s)
During Past Five Years
| | Number of Portfolios
in Fund Complex
Overseen by Trustee
| | Other Board Memberships Held by Trustee
|
| Officers: | | | | | | | | | | |
Andrew B. Shoup CAM 125 Broad Street
11th Floor New York, NY 10004 Birth Year: 1956 | | Senior Vice President and Chief Administrative Officer and Treasurer | | Since
2003 | | Director of CAM; Senior Vice President and Chief Administrative Officer of mutual funds associated with Citigroup; Treasurer of certain mutual funds associated with Citigroup; Head of International Funds Administration of CAM (from 2001 to 2003); Director of Global Funds Administration of CAM (from 2000 to 2001); Head of U.S. Citibank Funds Administration of CAM (from 1998 to 2000) | | N/A | | N/A |
Robert J. Brault CAM 125 Broad Street
11th Floor New York, NY 10004 Birth Year: 1965 | | Chief Financial Officer and Treasurer | | Since
2004 | | Director of CGM; Chief Financial Officer and Treasurer of certain mutual funds associated with Citigroup; Director of Internal Control for CAM U.S. Mutual Fund Administration (from 2002 to 2004); Director of Project Management & Information Systems for CAM U.S. Mutual Fund Administration (from 2000 to 2002); Vice President of Mutual Fund Administration at Investors Capital Services (from 1999 to 2000) | | N/A | | N/A |
Paul Hatch The Consulting Group 388 Greenwich Street New York, NY 10013 Birth Year: 1957 | | Investment Officer | | Since
2001 | | Director of Managed Accounts, Smith Barney | | N/A | | N/A |
Stephen M. Hagan The Consulting Group 222 Delaware Avenue Wilmington, DE 19801 Birth Year: 1968 | | Investment Officer | | Since
1997 | | First Vice President of The Consulting Group | | N/A | | N/A |
47
Additional Information
(unaudited) (continued)
| | | | | | | | | | |
Name, Address and Birth Year
| | Position(s) Held with
Fund
| | Term of Office*
and
Length
of Time
Served
| | Principal Occupation(s)
During Past Five Years
| | Number of Portfolios
in Fund Complex
Overseen by Trustee
| | Other Board Memberships Held by Trustee
|
LeRoy T. Pease The Consulting Group 222 Delaware Avenue Wilmington, DE 19801 Birth Year: 1958 | | Investment Officer | | Since
1996 | | First Vice President of The Consulting Group | | N/A | | N/A |
Jason B. Moore The Consulting Group 222 Delaware Avenue Wilmington, DE 19801 Birth Year: 1972 | | Investment Officer | | 2003 | | Vice President of CGM | | N/A | | N/A |
Mark C. Kennard The Consulting Group 222 Delaware Avenue Wilmington, DE 19801 Birth Year: 1958 | | Investment Officer | | 2004 | | First Vice President of CGM | | N/A | | N/A |
Andrew Beagley CAM 399 Park Avenue, 4th Floor New York, NY 10022 Birth Year: 1962 | | Chief Anti-Money Laundering Compliance Officer Chief Compliance Officer | | Since
2002 Since
2004 | | Director of CGM (since 2000); Director of Compliance, North America, CAM (since 2000); Chief Anti-Money Laundering Compliance Officer and Chief Compliance Officer of certain mutual funds associated with Citigroup, Director of Compliance, Europe, the Middle East and Africa, Citigroup Asset Management (from 1999 to 2000); Chief Compliance Officer, SBFM, CFM, TIA | | N/A | | N/A |
Robert I. Frenkel CAM 300 First Stamford Place
4th Floor Stamford, CT 06902 Birth Year: 1954 | | Secretary and Chief Legal Officer | | Since
2003 | | Managing Director and General Counsel of Global Mutual Funds for CAM and its predecessor (since 1994); Secretary and Chief Legal Officer of mutual funds associated with Citigroup | | N/A | | N/A |
| * | Each Trustee and Officer serves until his or her successors has been duly elected and qualified. |
| ** | Mr. Gerken is an “interested person” of the fund as defined in the Investment Company Act of 1940, as amended, because Mr. Gerken is an officer of SBFM and certain of its affiliates. |
48
Important Tax Information
(unaudited)
The following information is provided with respect to the distributions paid during the taxable year ended March 31, 2005:
| | | | | | | | |
Record Date: | | | 12/16/2004 | | | | 12/30/2004 | |
Payable Date: | | | 12/17/2004 | | | | 12/31/2004 | |
Qualified Dividend Income for Individuals | | | 0.00 | % | | | 42.13 | % |
Dividends Qualifying for the Dividends Received Deduction for Corporations | | | 0.00 | % | | | 42.13 | % |
Long-term capital gains paid | | $ | 0.1309 | | | $ | 0.0000 | |
Please retain this information for your records.
49
WWW.SMITHBARNEY.COM

©2005 Citigroup Global Markets Inc. Member NASD, SIPC. Smith Barney and Consulting Group are divisions of Citigroup Global Markets Inc. Smith Barney is a service mark of Citigroup Global Markets Inc. and its affiliates and is used and registered throughout the world. CITIGROUP and the Umbrella Device are trademarks and service marks of Citicorp or its affiliates and are used and registered throughout the world.
This report is submitted for the general information of the shareholders of Consulting Group Capital Markets Fund. It is not authorized for distribution to prospective Investors unless accompanied or preceded by a current Prospectus for the Trust which contains information concerning the Trust’s Investment policies, charges and expenses as well as other pertinent information.
The Fund files its complete schedule of portfolio holdings with Securities and Exchange Commission for the first and third quarters of each fiscal year on Form N-Q. The Fund’s Forms N-Q are available on the Commission’s website at www.sec.gov. The Fund’s Forms N-Q may be reviewed and copied at the Commission’s Public Reference Room in Washington, D.C., and information on the operation of the Public Reference Room may be obtained by calling 1-800-SEC-0330. To obtain information on Form N-Q from The Fund, shareholders can call 1-800-451-2010.
Information on how the Fund voted proxies relating to portfolio securities during the 12-month period ended June 30, 2004 and a description of the policies and procedures that the Fund uses to determine how to vote proxies relating to portfolio securities is available (1) without charge, upon request, by calling 1-800-451-2010, (2) on the Fund’s website at www.citigroupAM.com and (3) on the SEC’s website at www.sec.gov.
TK 2122 5/05 Consulting Group Capital Markets Funds Ÿ 222 Delaware Avenue Ÿ Wilmington, Delaware Ÿ 19801
The registrant has adopted a code of ethics that applies to the registrant’s principal executive officer, principal financial officer, principal accounting officer or controller.
| ITEM 3. | AUDIT COMMITTEE FINANCIAL EXPERT. |
The Board of Trustees of the registrant has determined that Armon E. Kamesar, the Chairman of the Board’s Audit Committee, possesses the technical attributes identified in Instruction 2(b) of Item 3 to Form N-CSR to qualify as an “audit committee financial expert,” and has designated Mr. Kamesar as the Audit Committee’s financial expert. Mr. Kamesar is an “independent” Trustee pursuant to paragraph (a)(2) of Item 3 to Form N-CSR.
| ITEM 4. | PRINCIPAL ACCOUNTANT FEES AND SERVICES. |
| | a) | Audit Fees for the Consulting Group Capital Markets Funds were $18,000 and $18,000 for the years ended 3/31/05 and 3/31/04. |
| | b) | Audit-Related Fees for the Consulting Group Capital Markets Funds were $0 and $0 for the years ended 3/31/05 and 3/31/04. |
| | c) | Tax Fees for Consulting Group Capital Markets Funds were $2,200 and $2,000 for the years ended 3/31/05 and 3/31/04. These amounts represent aggregate fees paid for tax compliance, tax advice and tax planning services, which include (the filing and amendment of federal, state and local income tax returns, timely RIC qualification review and tax distribution and analysis planning) rendered by the Accountant to Consulting Group Capital Markets Funds. |
| | d) | All Other Fees for Consulting Group Capital Markets Funds were $0 and $0 for the years ended 3/31/05 and 3/31/04. |
| | e) | (1) Audit Committee’s pre–approval policies and procedures described in paragraph (c) (7) of Rule 2-01 of Regulation S-X. |
The Charter for the Audit Committee (the “Committee”) of the Board of each registered investment company (the “Fund”) advised by Smith Barney Fund Management LLC or Salomon Brothers Asset Management Inc or one of their affiliates (each, an “Adviser”) requires that the Committee shall approve (a) all audit and permissible non-audit services to be provided to the Fund and (b) all permissible non-audit services to be provided by the Fund’s independent registered public accounting firm to the Adviser and any Covered Service Providers if the engagement relates directly to the operations and financial reporting of the Fund. The Committee may implement policies and procedures by which such services are approved other than by the full Committee.
The Committee shall not approve non-audit services that the Committee believes may impair the independence of the independent registered public accounting firm. As of the date of the approval of this Audit Committee Charter, permissible non-audit services include any professional services (including tax services), that are not prohibited services as described below, provided to the Fund by the independent registered public accounting firm, other than those
provided to the Fund in connection with an audit or a review of the financial statements of the Fund. Permissible non-audit services may not include: (i) bookkeeping or other services related to the accounting records or financial statements of the Fund; (ii) financial information systems design and implementation; (iii) appraisal or valuation services, fairness opinions or contribution-in-kind reports; (iv) actuarial services; (v) internal audit outsourcing services; (vi) management functions or human resources; (vii) broker or dealer, investment adviser or investment banking services; (viii) legal services and expert services unrelated to the audit; and (ix) any other service the Public Company Accounting Oversight Board determines, by regulation, is impermissible.
Pre-approval by the Committee of any permissible non-audit services is not required so long as: (i) the aggregate amount of all such permissible non-audit services provided to the Fund, the Adviser and any service providers controlling, controlled by or under common control with the Adviser that provide ongoing services to the Fund (“Covered Service Providers”) constitutes not more than 5% of the total amount of revenues paid to the independent registered public accounting firm during the fiscal year in which the permissible non-audit services are provided to (a) the Fund, (b) the Adviser and (c) any entity controlling, controlled by or under common control with the Adviser that provides ongoing services to the Fund during the fiscal year in which the services are provided that would have to be approved by the Committee; (ii) the permissible non-audit services were not recognized by the Fund at the time of the engagement to be non-audit services; and (iii) such services are promptly brought to the attention of the Committee and approved by the Committee (or its delegate(s)) prior to the completion of the audit.
(2) For the Consulting Group Capital Markets Funds, the percentage of fees that were approved by the audit committee, with respect to: Audit-Related Fees were 100% and 100% for the years ended 3/31/05 and 3/31/04; Tax Fees were 100% and 100% for the years ended 3/31/05 and 3/31/04; and Other Fees were 100% and 100% for the years ended 3/31/05 and 3/31/04.
| | g) | Non-audit fees billed by the Accountant for services rendered to Consulting Group Capital Markets Funds and CAM and any entity controlling, controlled by, or under common control with CAM that provides ongoing services to Consulting Group Capital Markets Funds. Fees billed to and paid by Citigroup Global Markets Inc. related to transfer agent matter as fully described in the notes to the financial statements titled “Additional Information” were $75,000 and $0 for the years ended 3/31/05 and 3/31/04. |
| | h) | Yes. The Consulting Group Capital Markets Funds’ Audit Committee has considered whether the provision of non-audit services that were rendered to Service Affiliates which were not pre-approved (not requiring pre-approval) is compatible with maintaining the Accountant’s independence. All services provided by the Accountant to the Consulting Group Capital Markets Funds or to Service Affiliates which were required to be pre-approved were pre-approved as required. |
| ITEM 5. | AUDIT COMMITTEE OF LISTED REGISTRANTS. |
Not applicable.
| ITEM 7. | DISCLOSURE OF PROXY VOTING POLICIES AND PROCEDURES FOR CLOSED-END MANAGEMENT INVESTMENT COMPANIES. |
Not applicable.
| ITEM 9. | SUBMISSION OF MATTERS TO A VOTE OF SECURITY HOLDERS. |
Not applicable.
| ITEM 10. | CONTROLS AND PROCEDURES. |
| | (a) | The registrant’s principal executive officer and principal financial officer have concluded that the registrant’s disclosure controls and procedures (as defined in Rule 30a- 3(c) under the Investment Company Act of 1940, as amended (the “1940 Act”)) are effective as of a date within 90 days of the filing date of this report that includes the disclosure required by this paragraph, based on their evaluation of the disclosure controls and procedures required by Rule 30a-3(b) under the 1940 Act and 15d-15(b) under the Securities Exchange Act of 1934. |
| | (b) | There were no changes in the registrant’s internal control over financial reporting (as defined in Rule 30a-3(d) under the 1940 Act) that occurred during the registrant’s last fiscal half-year (the registrant’s second fiscal half-year in the case of an annual report) that have materially affected, or are likely to materially affect the registrant’s internal control over financial reporting. |
| | |
| (a) Code of Ethics attached hereto. |
| |
| Exhibit 99.CODE | | ETH |
|
| (b) Attached hereto. |
| |
| Exhibit 99.CERT | | Certifications pursuant to section 302 of the Sarbanes-Oxley Act of 2002 |
| |
| Exhibit 99.906CERT | | Certifications pursuant to Section 906 of the Sarbanes-Oxley Act of 2002 |
SIGNATURES
Pursuant to the requirements of the Securities Exchange Act of 1934 and the Investment Company Act of 1940, the registrant has duly caused this Report to be signed on its behalf by the undersigned, there unto duly authorized.
Consulting Group Capital Markets Funds
| | |
| By: | | /s/ R. Jay Gerken
|
| | | R. Jay Gerken |
| | | Chief Executive Officer of |
| | | Consulting Group Capital Markets Funds |
Date: June 9, 2005
Pursuant to the requirements of the Securities Exchange Act of 1934 and the Investment Company Act of 1940, this report has been signed below by the following persons on behalf of the registrant and in the capacities and on the dates indicated.
| | |
| By: | | /s/ R. Jay Gerken
|
| | | (R. Jay Gerken) |
| | | Chief Executive Officer of |
| | | Consulting Group Capital Markets Funds |
Date: June 9, 2005
| | |
| By: | | /s/ Robert J. Brault
|
| | | (Robert J. Brault) |
| | | Chief Financial Officer of |
| | | Consulting Group Capital Markets Funds |
Date: June 9, 2005