UNITED STATES
SECURITIES AND EXCHANGE COMMISSION
Washington, D.C. 20549
FORM N-CSR
CERTIFIED SHAREHOLDER REPORT OF REGISTERED
MANAGEMENT INVESTMENT COMPANIES
Investment Company Act file number: 811-06318
CONSULTING GROUP CAPITAL MARKETS FUNDS
(Exact name of registrant as specified in charter)
2000 Westchester Avenue
Purchase, NY 10577
(Address of principal executive offices)(Zip code)
CT Corp
155 Federal Street Suite 700
Boston, MA 02110
(Name and address of agent for service)
Registrant’s telephone number, including area code: (877) 937-6739
Date of fiscal year end: 8/31
Date of reporting period: 8/31/2012
Form N-CSR is to be used by management investment companies to file reports with the Commission not later than 10 days after the transmission to stockholders of any report that is required to be transmitted to stockholders under Rule 30e-1 under the Investment Company Act of 1940 (17 CFR 270.30e-1). The Commission may use the information provided on Form N-CSR in its regulatory, disclosure review, inspection, and policymaking rules.
A registrant is required to disclose the information specified by Form N-CSR, and the Commission will make this information public. A registrant is not required to respond to the collection of information contained in Form N-CSR unless the Form displays a currently valid Office of Management and Budget (“OMB”) control number. Please direct comments concerning the accuracy of the information collection burden estimate and any suggestions for reducing the burden to Secretary, Securities and Exchange Commission, 450 Fifth Street, NW, Washington, DC 20549-0609. The OMB has reviewed this collection of information under clearance requirements of 44 U.S.C. § 3507.
ITEM 1. REPORTS TO STOCKHOLDERS

Consulting Group
Capital Markets Funds
TRAK®
Annual Report
>>August 31, 2012
| | • | | Large Capitalization Growth Investments |
| | • | | Large Capitalization Value Equity Investments |
| | • | | Small Capitalization Growth Investments |
| | • | | Small Capitalization Value Equity Investments |
| | • | | International Equity Investments |
| | • | | Emerging Markets Equity Investments |
| | • | | Core Fixed Income Investments |
| | • | | International Fixed Income Investments |
| | • | | Municipal Bond Investments |
| | • | | Money Market Investments |
INVESTMENT PRODUCTS: NOT FDIC INSURED • NO BANK GUARANTEE • MAY LOSE VALUE
Table of Contents
Consulting Group
Capital Markets Funds
DEAR SHAREHOLDER,
Political elections and global economic growth, as well as the monetary union and debt crisis in the Eurozone, were among the dominant topics that persistently confronted the financial markets during the fiscal annual reporting period ended August 31, 2012. Increased volatility in the equity and fixed income markets, encompassing ebbs and flows reflecting “risk-on” or “risk-off” investor shifts in global sentiments, defined the one-year period as investors continued to deal with uncertainties related to the global environment.
Despite a tumultuous year, domestic U.S. equities delivered strong performance results during the period. Better-than-expected economic data in the United States (“U.S.”), combined with accommodative Federal Reserve policies, created a general tone of cautious optimism throughout the year. Given that backdrop, it was not surprising to see large market capitalization stocks in the U.S. among the performance leaders from a market capitalization perspective, as investors sought and rewarded companies perceived to have greater relative stability in their earnings.
U.S. investors in overseas stocks were not as fortunate. Developed international and emerging markets equities generally ended the annual period in negative territory. Although foreign equities appeared to have been invigorated at times during the year, boosted in large part by a belief that Europe had made some progress toward containing its sovereign debt woes, a European recession and signs of a slowdown in global economic growth diminished investor enthusiasm. Notably, developed equities in the Pacific region and in Japan came under pressure, while emerging markets stocks in countries such as China and Russia typically lost value. At the same time, currency effects generally had a negative impact on performance, as the U.S. dollar strengthened relative to foreign currencies, hurting unhedged U.S.-based investors venturing into international and emerging markets.
Fueled by falling yields and rising prices, domestic taxable and tax-exempt bonds generated solid advances over the fiscal year. Investors in long-term maturing Treasury bonds were especially rewarded during the year, as negative headline news generally prompted intermittent “flight-to-safety” trades that sparked rallies in the Treasury market. Yields in other bond market segments also contracted to lower levels in the period, benefiting investments in municipal bonds, corporate issues, mortgage-backed securities, and high yield debt. Returns on money market funds continued to remain depressed, reflecting the Federal Reserve Board’s 0% to 0.25% target range for short-term interest rates.
The positive and negative confidence disposition expressed by investors, as they appeared to embrace risk or gravitate toward risk aversion over the fiscal year, draws attention to the challenges clearly faced by the Consulting Group Capital Markets (“CGCM”) Funds and active investment advisers managing portfolios through periods of uncertainty and characterized by rapidly rotating risk environments.
Consulting Group Capital Markets Funds
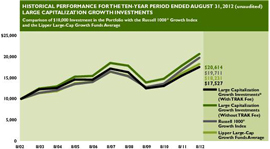
CGCM Large Capitalization Growth Investments gained +15.7% in the annual period, exceeding the average +14.1% total return of mutual funds included in the Lipper Large-Cap Growth Funds Average investment category i, but lower than the +17.4% increase in the Russell 1000® Growth Index ii. An overweight exposure to the Information Technology sector, combined with positive stock selections in the Information Technology (IT services) and Telecommunication Services (wireless) sectors, contributed to returns, while investments in the Consumer Discretionary (specialty retail, hotels restaurants & leisure) and Health Care (biotechnology) sectors unfavorably affected performance in the yearly period.
i
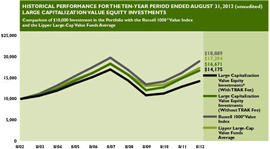
Large Capitalization Value Equity Investments registered a total return of +12.5% in the fiscal year, trailing the average +14.6% rise in the performance of mutual funds included in the Lipper Large-Cap Value Funds Average investment category iii and the +17.3% advance in the Russell 1000® Value Index iv. An overweight allocation to the Energy sector and an underweight exposure to the Consumer Discretionary sector, in addition to stock selections in the Information Technology (semiconductors & semiconductor equipment), Health Care (pharmaceuticals), Energy (equipment & services), Telecommunication Services (wireless), and Industrials (commercial services & supplies) sectors, negatively impacted relative returns in the annual fiscal period.
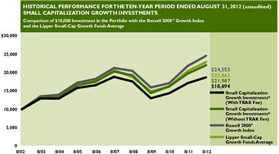
Small Capitalization Growth Investments generated an +11.5% return in the twelve-month fiscal period ending August 31, 2012, as compared to the average +11.9% increase in mutual funds included in the Lipper Small-Cap Growth Funds Average investment category v and the +12.7% gain in the Russell 2000® Growth Index vi. An underweight exposure to the Health Care sector, combined with underperforming security selections in the Health Care (biotechnology), Energy (equipment & services), and Consumer Discretionary (specialty retail) sectors, adversely affected one-year relative performance.
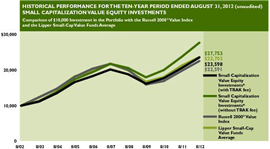
Small Capitalization Value Equity Investments experienced an increase of +16.9% in the fiscal year, exceeding the average +11.7% rise in mutual fund included in the Lipper Small-Cap Value Funds Average investment category vii and the +14.1% gain in the Russell 2000® Value Index viii. Favorable contributions from holdings in the Materials (chemicals), Information Technology (semiconductors & semiconductor equipment), Industrials (electrical equipment, marine), Energy (equipment & services), and Consumer Discretionary (leisure equipment & products) sectors helped relative performance over the period.
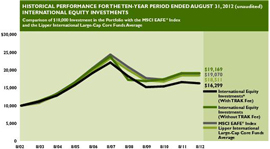
International Equity Investments fell slightly on an absolute basis, posting a decline of -0.1% in the fiscal period. Relative performance was marginally lower than the negligible -0.0% retreat in the MSCI EAFE® Index ix (Net), as well as the average +0.1% rise in mutual funds included in the Lipper International Large-Cap Core Average investment categoryx. Stock selections in the Information Technology (semiconductors & semiconductor equipment) sector, in addition to selective country exposures, contributed to one-year returns in the fiscal period. In particular, overweight allocations to China and South Korea, respectively, combined with an underweight position in Japan and Spain, added value. However, a concurrent overweight exposure to Brazil, combined with investments in Australia, China, and Hong Kong, as well as in various sectors including Energy (oil gas & consumable fuels) and Financials (commercial banks), detracted from performance during the year.
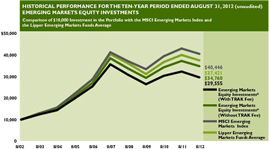
Emerging Markets Equity Investments declined -6.5% in the one-year period, marginally surpassing the average -6.8% decline in mutual funds included in the Lipper Emerging Markets Average investment category xi, but lagging the -5.8% decline in the MSCI Emerging Markets Index xii (Net). An overweight position to Turkey and an underweight exposure to India, combined with favorable stock selections in the Telecommunication Services (wireless), Information Technology (IT Services), and Industrials (construction & engineering) sectors, enhanced relative performance in period. Sector exposures, including an underweight allocation to the Materials sector, as well as selective investments in Brazil, Russia, and South Africa, also benefited relative returns. Conversely, an exposure to Argentina and an underweight allocation to Malaysia, in combination with unsuccessful stock selections in the Energy (oil gas & consumable fuels), Financials (real estate management & development, commercial banks), Materials (chemicals, metals & mining), and Consumer Discretionary (hotels restaurants & leisure) sectors, hurt relative performance over the year. Selective investments in China and Hong Kong also detracted from relative returns in the fiscal period.
Core Fixed Income Investments advanced +7.6% in the fiscal performance period, outperforming both the average +7.0% rise in mutual funds included in the Lipper Intermediate Investment Grade Debt Funds Average investment category xiii and the +5.8% increase in the Barclays Capital U.S. Aggregate BondTM Index xiv. Contributions from investment grade and high yield sector selections helped relative performance in the period, offsetting declines from interest rate management and individual bond selections.
High Yield Investments gained +11.6% in the annual fiscal reporting period, trailing the average +12.1% increase in mutual funds included in the Lipper High Current Yield Funds Average investment category xv and the +13.9% return of the Barclays Capital U.S. High Yield Index xvi. Interest rate management, sector, and individual bond selections all detracted from relative performance over the period.
ii
International Fixed Income Investments experienced a total return of +7.5% in the fiscal period, outperforming the +5.2% increase in the Citigroup Non-USD World Government Bond Index (USD) Hedged xvii and significantly above the average +0.3% rise in mutual funds included in the Lipper International Income Funds Average investment category xviii. Selective developed and emerging market country exposures, sector selections (investment grade, high yield, and mortgage-backed securities), and bond selections generally contributed to relative performance in the period. The strong performance of the U.S. dollar, as well as the fund’s mandate to hedge a majority of its foreign currency exposure, also impacted relative returns.
Municipal Bond Investments’ twelve-month performance of +7.2% lagged the +8.8% return of the Barclays Capital U.S. Municipal Bond Index xix and also underperformed the average +11.0% gain in mutual funds included in the Lipper General Municipal Debt Funds Average investment category xx. Yield curve positioning and a higher quality bias affected relative returns unfavorably over the fiscal year. Investors who sought higher yields in lower-quality municipal securities and in longer-maturing bonds benefited, as lower-quality municipal issues generally outperformed higher-quality ones and the prices of longer-term maturing debt rallied in the period.
Information regarding the sub-advisers of the CGCM Funds and commentary specific to each individual investment manager is available in the Annual Report following this Shareholder Letter.
As the fiscal reporting period came to an end, central bank intervention globally provided the ignition needed to inspire a summer rally in risk assets. Investors, at least for the moment, generally appeared to put aside unease related to the monetary union and debt crisis in the Eurozone and a deceleration in various national economies. In addition, the U.S. continued to cope with a slow economy, high unemployment, as well uncertainty surrounding approaching political elections and a potential “fiscal cliff” scheduled to take effect on January 1, 2013. Although we remain optimistic over the long-term prospects for the CGCM Funds going forward, challenges certainly remain, and diversified investors should bear in mind that market volatility may potentially provide opportunities for patient investors who maintain a long-term orientation. Investors who require individualized assistance should seek guidance from their Financial Advisor.
We thank you for your continued confidence in Morgan Stanley Wealth Management and support as shareholders of the CGCM Funds.
Sincerely,

James F. Walker
Chief Executive Officer
October 19, 2012
iii
The performance shown represents past performance. Past performance is no guarantee of future results and current performance may be higher or lower than the performance shown above. Principal value and investment returns will fluctuate so that an investor’s shares, when redeemed, may be worth more or less than their original cost. The returns shown do not reflect the deduction of taxes that a shareholder would pay on fund distributions or the redemption of fund shares. To obtain performance data current to the most recent month-end, please visit our website at https://www.smithbarney.com/products_services/managed_money/trak/trak_cgcm.html.
Shares of the Funds are available to participants in advisory programs or asset based fee programs sponsored by Morgan Stanley Smith Barney LLC (“Morgan Stanley”), including the TRAK® Personalized Investment Advisory Service (“TRAK®”), or other investment advisory programs approved by Morgan Stanley. The advisory services provide investors with asset allocation recommendations, which are implemented through the Funds. The fees and expenses of these other investment advisory programs may vary, but are generally expected to be comparable to the annual fees paid by TRAK® participants, which may be up to 2.00%. Shareholders who acquire shares of the Funds through an investment advisory program other than through TRAK® may pay higher or lower fees.
All index performance reflects no deduction for fees, expenses or taxes. Please note an investor cannot invest directly in an index.
RISKS: Certain of the Funds may invest in derivatives, such as options and futures, which can be illiquid, may disproportionately increase losses, and have a potentially large impact on Fund performance. Foreign securities are subject to certain risks of overseas investing including currency fluctuations and changes in political and economic conditions, which could result in significant market fluctuations. These risks are magnified in emerging or developing markets. Investments in small or medium-capitalization companies may involve a higher degree of risk and volatility than investments in larger, more established companies. Certain of the Funds may invest in high yield bonds, which involve greater credit and liquidity risks than investment grade bonds.
| i | The Lipper Large-Cap Growth Funds Average investment category — Funds that, by portfolio practice, invest at least 75% of their equity assets in companies with market capitalizations (on a three-year weighted basis) above Lipper’s USDE large-cap floor. Large-cap growth funds typically have an above-average price-to-earnings ratio, price-to-book ratio, and three-year sales-per-share growth value, compared to the S&P 500® Index. |
| ii | The Russell 1000® Growth Index is a capitalization weighted total return index which is comprised of 1,000 of the largest capitalized U.S.-domiciled companies with greater-than-average growth orientation whose common stock is traded in the U.S. on the New York Stock Exchange, American Stock Exchange and NASDAQ. |
| iii | The Lipper Large-Cap Value Funds Average investment category — Funds that, by portfolio practice, invest at least 75% of their equity assets in companies with market capitalizations (on a three-year weighted basis) above Lipper’s USDE large-cap floor. Large-cap value funds typically have a below average price-to-earnings ratio, price-to-book ratio, and three-year sales-per-share growth value, compared to the S&P 500® Index. |
| iv | The Russell 1000® Value Index is a capitalization weighted total return index which is comprised of 1,000 of the largest capitalized U.S.-domiciled companies with greater than average value orientation whose common stock is traded in the U.S. on the New York Stock Exchange, American Stock Exchange and NASDAQ. |
| v | The Lipper Small-Cap Growth Funds Average investment category — Funds that, by portfolio practice, invest at least 75% of their equity assets in companies with market capitalizations (on a three-year weighted basis) below Lipper’s USDE small-cap ceiling. Small-cap growth funds typically have an above-average price-to-earnings ratio, price-to-book ratio, and three year sales-per-share growth value, compared to the S&P Small-Cap 600 Index. |
| vi | The Russell 2000® Growth Index is a capitalization weighted total return index which is comprised of 2,000 of the smallest capitalized U.S.-domiciled companies with greater-than-average growth orientation whose common stock is traded in the U.S. on the New York Stock Exchange, American Stock Exchange and NASDAQ. |
| vii | The Lipper Small-Cap Value Funds Average investment category — Funds that, by portfolio practice, invest at least 75% of their equity assets in companies with market capitalizations (on a three-year weighted basis) below Lipper’s USDE small-cap ceiling. Small-cap value funds typically have a below-average price-to-earnings ratio, price-to-book ratio, and three-year sales-per-share growth value, compared to the S&P Small-Cap 600 Index. |
| viii | The Russell 2000® Value Index is a capitalization weighted total return index which is comprised of 2,000 of the smallest capitalized U.S.-domiciled companies with less-than-average growth orientation whose common stock is traded in the U.S. on the New York Stock Exchange, American Stock Exchange and NASDAQ. |
| ix | The MSCI EAFE® Index is a composite portfolio or equity total returns for the countries of Australia, New Zealand and countries in Europe and the Far East, weighted based on each country’s market capitalization. MSCI EAFE® Index is a registered trademark of MSCI Inc. |
| x | The Lipper International Large-Cap Core Average investment category — Funds that, by portfolio practice, invest at least 75% of their equity assets in companies strictly outside of the U.S. with market capitalizations (on a three-year weighted basis) above Lipper’s international large-cap floor. International large-cap core funds typically have an average price-to-cash flow ratio, price-to-book ratio, and three-year sales-per-share growth value compared to their large-cap-specific subset of the S&P/Citigroup World ex-U.S. BMI. |
| xi | The Lipper Emerging Markets Funds Average investment category — Funds that seek long-term capital appreciation by investing at least 65% of total assets in emerging market equity securities, where “emerging market” is defined by a country’s GNP per capita or other economic measures. |
| xii | The MSCI Emerging Markets Index is an index comprised of thirteen emerging markets open to direct foreign participation. |
| xiii | The Lipper Intermediate Investment Grade Debt Funds Average investment category – Funds that invest primarily in investment-grade debt issues (rated in the top four grades) with dollar-weighted average maturities of five to ten years. |
| xiv | The Barclays Capital U.S. Aggregate BondTM Index is composed of the Barclays Capital Intermediate Government/Credit Bond Index and the Barclays Capital Mortgage-Backed Securities Index and includes treasury issues, agency issues, Corporate bond issues and mortgage-backed securities. Barclays Capital U.S. Aggregate Bond Index is a trademark of Barclays Capital. |
| xv | The Lipper High Current Yield Funds Average investment category – Funds that aim to provide a high level of current yield from fixed income securities, with a substantial portion in medium- or lower-grade debt issues. The funds may invest in high-yielding government bonds (typically, of developing markets or higher-yielding OECD countries), Corporate and municipal bonds, eurobonds, convertible bonds, and preferred shares. |
| xvi | The Barclays Capital U.S. High Yield Index is composed of fixed rate, publicly issued, non-investment grade debt registered with the SEC. All bonds must be dollar-denominated, non-convertible and have at least one year remaining to maturity as well as an outstanding par value of $100 million. |
| xvii | The Citigroup Non-USD WGBI (World Government Bond Index) (USD) Hedged and Unhedged are market capitalization weighted indexes that are designed to represent the hedged performance of the government bond markets in thirteen developed countries, excluding the U.S. |
| xviii | The Lipper International Income Funds Average investment category – Funds that state in their prospectus that they invest primarily in U.S. dollar and non-U.S. dollar debt securities of issuers located in at least three countries, excluding the United States, except in periods of market weakness. |
| xix | The Barclays Capital U.S. Municipal Bond Index is a weighted composite which is comprised of more than 15,000 bonds issued within the last five years, having a minimum credit rating of at least Baa and maturity of at least two years, excluding all bonds subject to the Alternative Minimum Tax and bonds with floating or zero coupons. |
| xx | The Lipper General Municipal Debt Funds Average investment category – Funds that invest primarily in municipal debt issues in the top four credit ratings. |
iv
| | | | |
Performance of the Consulting Group Capital Markets Funds For the Year Ended August 31, 2012†* (unaudited) | | | | |
| |
Large Capitalization Growth Investments | | | 15.71 | % |
Russell 1000® Growth Index (1) | | | 17.37 | |
| |
Large Capitalization Value Equity Investments | | | 12.50 | |
Russell 1000® Value Index (2) | | | 17.30 | |
| |
Small Capitalization Growth Investments | | | 11.54 | |
Russell 2000® Growth Index (3) | | | 12.72 | |
| |
Small Capitalization Value Equity Investments | | | 16.93 | |
Russell 2000® Value Index (4) | | | 14.08 | |
| |
International Equity Investments | | | -0.06 | |
MSCI EAFE® Index (5) | | | -0.04 | |
| |
Emerging Markets Equity Investments | | | -6.52 | |
MSCI Emerging Markets Index (6) | | | -5.80 | |
| |
Core Fixed Income Investments | | | 7.58 | |
Barclays Capital U.S. Aggregate Bond™ Index (7) | | | 5.78 | |
| |
High Yield Investments | | | 11.57 | |
Barclays Capital U.S. High Yield Index (8) | | | 13.89 | |
| |
International Fixed Income Investments | | | 7.53 | |
Citigroup Non-USD WGB (USD) — Hedged (9) | | | 5.18 | |
| |
Municipal Bond Investments | | | 7.23 | |
Barclays Capital U.S. Municipal Bond Index (10) | | | 8.78 | |
| |
Money Market Investments** | | | 0.02 | |
90-day Treasury Bill Index | | | 0.06 | |
See pages 26 through 27 for all footnotes.
v

Large Capitalization Growth Investments
ABOUTTHE SUBADVISERS
| | • | | Delaware Management Company (“Delaware”) |
Delaware invests primarily in common stocks of large capitalization growth-oriented companies that Delaware believes have long-term capital appreciation potential and are expected to grow faster than the U.S. economy. Using a bottom up approach, Delaware seeks to select securities of companies that it believes have attractive end market potential, dominant business models and strong free cash flow generation that are attractively priced compared to the intrinsic value of the securities. Delaware also considers a company’s operational efficiencies, management’s plans for capital allocation and the company’s shareholder orientation. Delaware currently defines large capitalization companies as those that, at the time of investment, have market capitalizations within the range of market capitalizations of companies in the Russell 1000® Growth Index. While the market capitalization of companies in the Russell 1000® Growth Index ranged from approximately $746 million to $624 billion as of August 31, 2012, Delaware will normally invest in common stocks of companies with market capitalizations of at least $3 billion at the time of purchase.
| | • | | Wells Capital Management, Inc. (“WellsCap”) |
WellsCap employs both proprietary screens and intensive grassroots research in order to identify high-growth companies expected to outperform their peers. Their investment philosophy is firmly rooted in the belief that successful investing is the result of focusing on companies with favorable underlying fundamentals, strong growth potential and solid management teams. Security selection is based on fundamental research. This research process works to “surround” an investment by focusing on the company’s financials and verifying fundamentals with the management team, mid-level employees, customers, competitors, suppliers and/or distributors.
| | • | | Westfield Capital Management Company, L.P. (“Westfield”) |
Westfield uses an active management style and favors investing in earnings stocks given its conviction that stock prices follow earnings progress and that they offer the best opportunity for superior real rates of return. Westfield believes that reasonably priced stocks with high earnings potential are best identified through in-depth, fundamental research.
For the period of September 1, 2011, through August 31, 2012, the Sub-advisers for CGCM Large Capitalization Growth Investments (“Fund”) were Delaware Management Company (“Delaware”), Wells Capital Management, Inc. (“WellsCap”), Westfield Capital Management Company, L.P. (“Westfield”) and Frontier Capital Management Co., LLC (“Frontier”).
The portion of the Fund managed by Delaware outperformed the Fund’s benchmark, the Russell 1000® Growth Index (“benchmark”), during the year ended August 31, 2012. Typical of Delaware’s concentrated portfolio approach, stock selection was a significant factor in the Portfolio’s performance. Solid stock selection in the Technology and Energy sectors was meaningful to returns. Stock selection also helped performance in the Financial sector, and an overweight in that sector increased relative performance. Regarding the portfolio holdings in the Financial sector, it is important to note that Delaware seeks companies that are transaction-based, as opposed to “spread lending” companies, preferring business model characteristics that include high incremental margins and the ability to self-fund their businesses. In Delaware’s view, transaction-based Financials generally lack the need to access funding through the capital markets — a feature that it believes has plagued many spread lenders in the last few years.
The portion of the Fund managed by WellsCap outperformed the benchmark for the year ended August 31, 2012. Emerging from uncertainty created by debates over budget deficits and the downgrade of U.S. government debt, the economy showed continued signs of recovery and growth. Strength in corporate earnings combined with moderate, but not stellar, growth in Growth Domestic Product (“GDP”) and employment provided the backdrop for healthy returns. The return progression was not consistently positive, however, as bouts of “risk-off” mitigated clear periods of “risk-on”. Concerns over the European debt crisis, a slowdown in U.S. job growth and fears of a hard landing in China weighed on investor sentiment. By working within WellsCap’s process to manage risk and return through portfolio construction, the portfolio was tilted toward “core holdings”, domestic exposure and secular growth. This positioning stabilized returns allowing for portfolio outperformance. As can be expected from a fundamentally driven, bottom-up manager, stock selection was the primary contributor to investment returns. Portfolio holdings in the computer and peripheral and IT services industries within Information Technology were the primary drivers of sector returns. Also contributing nicely to relative returns for the year was stock selection in the Materials, Telecommunications Services and Industrials sectors. World oil prices were volatile throughout the period, with dramatic swings from quarter to quarter based on changes in attitude toward global growth or availability of supply. As a result, stock selection within the Energy sector was challenged resulting in a performance headwind.
1
• Frontier Capital Management Co., LLC (“Frontier”)
Frontier is a research-driven firm specializing in the management of growth-oriented U.S. equity portfolios. They believe that growth must be purchased at a reasonable price and that fundamental, bottom-up research is the cornerstone to adding value. The firm’s philosophy since its founding in 1980 is that stock prices ultimately follow earnings growth. Frontier believes that there are three key drivers of long-term, consistent performance and look for companies that possess 1) improving business models, 2) unrecognized earnings power and 3) attractive valuations.
The portion of the Fund managed by Westfield underperformed the Fund’s benchmark during the year ended August 31, 2012. Portfolio investments within the Industrials and Consumer Staples sectors were the most significant positive contributors to relative returns. Health Care was the largest detractor from relative results, while investments within the Energy and Financials sectors also hindered relative performance. Concerns about a double-dip recession intensified during the second half of 2011, prompting a retreat from risky assets of all types. Investors hid in slower growth names that provided stable yet predictable earnings growth at higher earnings multiples. Given Westfield’s growth-at-a-reasonable price process, many of these outperformers did not fit its investment criteria, and therefore Westfield had only limited exposure to them. Market dynamics reversed sharply as 2012 began. A strengthening domestic economy and accommodative monetary policy around the globe helped revive investor appetite for stocks. However, as the year progressed, the risk-off environment returned and “bond proxies” were again the big outperformers. The portfolio lagged its benchmark during the market selloff. During July and August, the market began to climb higher, despite wavering economic indicators. Cyclically-oriented sectors, namely Energy and Materials, experienced solid advances. The portfolio’s exposure to these sectors, combined with positive stock selection, added to relative returns during this two-month period. When searching for new investment candidates, Westfield typically focuses on firms that can deliver consistent organic revenue growth, based on the belief that solid operational performance will eventually manifest itself in above-average financial performance. Defensive stocks with little-to-no growth are very expensive and have outperformed during the last two years. Westfield continues to see far better risk/rewards in high-quality growth companies reliant on some global GDP growth.
The portion of the Fund managed by Frontier, with an emphasis on midcap growth stocks, underperformed the Fund’s large cap growth benchmark, but outperformed the Russell Midcap® Growth Index, for the year ended August 31, 2012. Healthy corporate profits and coordinated global easing by central banks helped to propel the markets forward. Frontier’s relative performance was aided by the Consumer Discretionary, Energy and Financials sectors. Consumer Discretionary stocks performed well and Energy holdings performed well due to a focus on exploration and production companies with reliable, fast growing domestic shale positions. Financials prospered by identifying the need for greater outsourcing by major financial services firms to processing companies. Looking forward, Frontier’s discipline continues to balance valuation with growth. It is likely that economic activity will remain muted given greater fiscal constraints, questionable economic conditions abroad, as well as persistent unemployment continuing domestically. As such, Frontier remains focused on companies that show sustained earnings improvement driven by favorable secular demand and innovation, market share gains in growth markets, margin expansion initiatives, and opportunities to utilize balance sheet and cash flow resources. Frontier believes such businesses will be accorded premium equity valuations in a period of low growth and expects the portfolio to benefit from this dynamic.
The performance shown above and below represents past performance. Past performance is no guarantee of future results and current performance may be higher or lower than the performance shown above and below. Performance figures may reflect voluntary fee waivers and/or expense reimbursements. In the absence of voluntary fee waivers and/or expense reimbursements, the total return would have been lower. Principal value and investment returns will fluctuate and investors’ shares, when redeemed, may be worth more or less than their original cost. To obtain performance data current to the most recent month-end, please visit our website at www.smithbarney.com.
2
The following graph depicts the performance of Large Capitalization Growth Investments vs. the Russell 1000® Growth Index1 and the Lipper Large-Cap Growth Funds Average.11
The graph above and returns shown below do not reflect the deduction of taxes that a shareholder would pay on fund distributions or the redemption of fund shares.
LARGE CAPITALIZATION GROWTH INVESTMENTS (unaudited)
Average Annual Total Returns for the Period Ended August 31, 2012†
| | | | | | | | |
| | | Without TRAK Fee | | | With TRAK Fee* | |
Since inception (11/18/1991) | | | 7.09 | % | | | 5.43 | % |
10 year | | | 7.50 | | | | 5.77 | |
5 year | | | 2.21 | | | | 0.44 | |
3 year | | | 14.13 | | | | 11.98 | |
1 year | | | 15.71 | | | | 13.42 | |
See pages 26 through 27 for all footnotes.
3
Large Capitalization Value Equity Investments
ABOUTTHE SUBADVISERS
| | • | | Cambiar Investors, LLC (“Cambiar”) |
Cambiar utilizes a bottom-up process that seeks to identify companies that are attractively priced, demonstrate positive developments not yet recognized by the market and offer significant appreciation potential within a one- to two-year time frame.
| | • | | NFJ Investment Group, LLC (“NFJ”) |
The NFJ investment process initially screens for positive fundamentals by applying a screen over a universe of approximately 800 stocks in order to identify companies with positive fundamental characteristics. After the screen has been applied, NFJ then conducts in-depth research and analysis by reviewing each of the remaining 150-200 possible investments for low price-to-earnings multiples, high dividend yields, positive prospective earnings and quality operations. As part of the portfolio construction process, industry concentration is mitigated by avoiding overexposure to any one sector by restricting the number of stocks held within a single industry. The portfolio generally holds 40 to 50 companies. NFJ’s process involves regular portfolio and universe monitoring for buy and sell candidates. NFJ continually repeats its research process in order to identify new buy and sell candidates. The sell discipline is an important part of NFJ’s process. A stock is sold when an alternative stock with equally strong fundamentals demonstrates a substantially lower price-to-earnings ratio, and/or a substantially higher dividend yield.
| | • | | Artisan Partners Limited Partnership (“Artisan”) |
The Artisan mid-cap value strategy employs a bottom-up investment process to construct a diversified portfolio of U.S. mid-cap value companies that Artisan’s mid-cap value investment team believes are undervalued, in solid financial condition and have attractive business economics. Artisan believes companies with these characteristics are less likely to experience eroding values over the long-term.
For the period from September 1, 2011, through August 31, 2012, the Sub-advisers for Large Capitalization Value Equity Investments (“Fund”) were Cambiar Investors, LLC (“Cambiar”), NFJ Investment Group, LLC (“NFJ”), Cullen Capital Management, LLC (“Cullen”), Artisan Partners Limited Partnership (“Artisan”) and HGK Asset Management, Inc. (“HGK”).
The portion of the Fund managed by Cambiar Investors LLC (“Cambiar”) underperformed the Fund’s benchmark, the Russell 1000® Value Index, for the year ended August 31, 2012. Risk aversion and a strong preference for dividend yield were dominant investment themes over the past year; Telecom, Consumer Staples and Utilities were three of the top-performing sectors in the index over this timeframe. Although Cambiar had exposure to companies in these more defensive sectors, such holdings were overshadowed by Cambiar’s higher exposure to cyclical sectors such as Energy, Materials and Technology. As part of Cambiar’s ongoing portfolio reviews, it made select changes where its original thesis was no longer intact, or if a more attractive opportunity presented itself. In other cases, Cambiar continues to stay the course with a given holding – despite underperformance in the short-term. It would be an unforced error to move into Utilities and related safe-haven stocks at this juncture, as the valuations accorded to businesses with perceived stability are very high – relative to their own history as well as to Cambiar’s other holdings. A key element to Cambiar’s investment discipline is mean reversion; at present, many such “bunker” stocks are at or near their historical peak valuations, while many of Cambiar’s positions are trading at levels last seen in the 2008-2009 timeframe. Convergence is likely at some point, with timing likely tied to the abatement in the various macro issues on which the market is currently focused.
The portion of the Fund managed by NFJ outperformed the benchmark for the year ended August 31, 2012. This reporting period was marked by volatile equity returns, as investors were whipsawed by news of U.S. fiscal policy and Europe’s seemingly intractable sovereign debt crisis. Investors kicked off 2012 in a celebratory mood, amid better-than-consensus economic reports and fresh waves of monetary easing in Europe and Asia. As the period commenced, the strategy generally protected on the downside when the market was down, and trailed when the benchmark spiked into double-digit returns. Outperformance can be attributed to strong stock selection, though negative sector weight deviations detracted somewhat from returns. Issue selection was strongest in Financials, Consumer Staples and Information Technology. Stock picks in Industrials and Health Care performed well but lagged those sectors within the benchmark. The strategy’s overweight in Energy and Materials presented a headwind as these sectors delivered the weakest returns in the benchmark due largely to macroeconomic and global growth concerns. NFJ has been overweight in these two sectors as a consequence of finding attractive valuations and sizable defensible yields among many Energy and Materials names. Conversely, NFJ’s underweight in Utilities and Financials was beneficial for the period. During the period, NFJ has found many Utilities securities to be overvalued as investors pile into the sector seeking a replacement for bond yields, while the Financials sector continues to be plagued by unappealing dividends, balance sheet concerns and regulatory uncertainty.
4
| | • | | Cullen Capital Management, LLC (“Cullen”) |
Cullen is a boutique investment adviser who has specialized in value investing since 1983. Cullen utilizes a disciplined approach in constructing investment portfolios. Individual securities are first screened for attractive price to earnings and price to book ratios as well as high absolute dividend yields. Dividend yields, payout ratios and dividend policies of screened securities are then reviewed to ensure the company can maintain and grow the dividend. Additionally, an independent assessment of the company is made through financial analysis, comparative and competitive evaluation, and management capabilities to specifically identify catalysts to encourage above average earnings and dividend growth over the anticipated three-to-five year investment horizon.
| | • | | HGK Asset Management, Inc. (“HGK”) |
HGK invests in undervalued securities through disciplined, fundamentally driven quantitative and qualitative security analysis. This analysis is coupled with a risk adverse approach to portfolio construction. HGK’s value driven domestic equity investment process has been employed in its current form since 1991. The equity team screens for disciplined companies with improving cash flows selling below their discounted present value. Rigorous qualitative fundamental analysis is applied to make the final security selection. During this analysis, the equity team focuses on undervalued companies that operate from a position of competitive advantage and whose management teams understand the principles of shareholder wealth creation.
The portion of the Fund managed by Artisan with an emphasis on midcap value stocks underperformed the Fund’s large cap value benchmark, as well as the Russell Midcap® Value Index, for the year ended August 31, 2012. U.S. mid-cap stocks turned in healthy gains despite persistent worries about Euro zone sovereign debt issues and sluggish economic growth around the world. The bulk of portfolio underperformance during the period was driven by Technology holdings. Artisan remains substantially overweight in the Technology sector due to its belief that the sector represents among the best risk/reward tradeoffs available based on a bottom-up assessment of business economics, balance sheet strength, and valuations. Accordingly, an overweight position in the sector contributed negatively to relative results, as Technology shares were up, but by less than the broader benchmark. Stock selection in the sector was also weak, driven by select holdings. The portfolio’s Energy and Consumer Staples stocks also contributed negatively to relative underperformance. Partially offsetting these weaknesses was strong stock selection in the Industrials, Utilities and Financials sectors. Artisan’s investment team is always mindful of macroeconomic risks and having appropriate economic diversification, but its process is not driven by benchmark sector weights. While this worked against relative results during the period, it is a reminder of how important it is for the team to remain committed to its process and maintain a long-term perspective.
The portion of the Fund managed by Cullen outperformed the Fund’s benchmark for the year ended August 31, 2012. Similar to the experience in 2010 and 2011, a turbulent year led into a strong first quarter of market performance, followed by a volatile and difficult second quarter. Outperformance during the period was primarily attributable to the portfolio’s defensive nature and strong stock selection. Cullen’s adherence to a fundamental, valuation-based methodology that focuses on price discipline, dividend yield and dividend growth has given a significant degree of downside protection during heightened periods of volatility. From an allocation perspective, the portfolio benefitted from its continued overweight to non-cyclical sectors, Consumer Staples and Health Care and underweight to cyclical sectors, Energy, Financials, and Materials. An underweight allocation to Information Technology and Consumer Discretionary was a small detractor as stocks in these sectors were top performers in the first quarter. Stock selection was however the core driver to outperformance, with notable strength in Consumer Staples, Industrials, and Utilities. Since inception, Cullen’s investment team has adhered to a philosophy focused on the long-term prospect of companies trading at attractive valuation levels, have leading market positions, and a strong commitment to enhancing shareholder value through responsible dividend policies.
The portion of the Fund managed by HGK performed in-line with the Fund’s benchmark for the year ended August 31, 2012. The fiscal year was marked by a number of unusual events including Standard and Poor’s credit rating downgrade of U.S. sovereign debt, concerns over global recession, and the potential breakup of Europe’s monetary union. In light of these macroeconomic conditions, the portfolio maintained a relatively defensive sector allocation for most of the year. Despite the Fund’s cautious stance towards the market, the portfolio was able to perform in line with its benchmark due to strong security selection. Security selection in most sectors was positive, though it was most significant in the Financials and Energy sectors. Conversely, on a relative basis, security selection in the Consumer Discretionary sector was the largest detractor, as HGK’s holdings provided strongly positive returns but trailed the benchmark.
HGK continues to maintain a conservatively-positioned portfolio as it finds an exceptional number of high-quality companies with strong balance sheets pricing in unusually conservative expectations. Currently, HGK favors securities in the Technology and Health Care sectors. These securities are supported by attractive valuations, adequately supported dividend yields and relatively inelastic demand for their products.
5
The following graph depicts the performance of the Large Capitalization Value Equity Investments vs. the Russell 1000® Value Index2 and the Lipper Large-Cap Value Funds Average.12
The performance shown above and below represents past performance. Past performance is no guarantee of future results and current performance may be higher or lower than the performance shown above and below. Performance figures may reflect voluntary fee waivers and/or expense reimbursements. In the absence of voluntary fee waivers and/or expense reimbursements, the total return would have been lower. Principal value and investment returns will fluctuate and investors’ shares, when redeemed, may be worth more or less than their original cost. To obtain performance data current to the most recent month-end, please visit our website at www.smithbarney.com.
The graph above and returns shown below do not reflect the deduction of taxes that a shareholder would pay on fund distributions or the redemption of fund shares.
LARGE CAPITALIZATION VALUE EQUITY INVESTMENTS (unaudited)
Average Annual Total Returns for the Period Ended August 31, 2012†
| | | | | | | | |
| | | Without TRAK Fee | | | With TRAK Fee* | |
Since inception (11/18/1991) | | | 7.02 | % | | | 5.36 | % |
10 year | | | 5.24 | | | | 3.55 | |
5 year | | | -1.81 | | | | -3.50 | |
3 year | | | 11.45 | | | | 9.34 | |
1 year | | | 12.50 | | | | 10.27 | |
See pages 26 through 27 for all footnotes.
6
Small Capitalization Growth Investments
ABOUTTHE SUBADVISERS
| | • | | Wall Street Associates (“WSA”) |
WSA follows a bottom-up investment style. It looks for companies with superior earnings growth, strong balance sheets, attractive valuations and potentially positive earning surprises.
| | • | | Westfield Capital Management Company, L.P. (“Westfield”) |
Westfield favors investing in earnings growth stocks given its conviction that stock prices follow earnings progress and that they offer the best opportunity for superior real rates of return. Reasonably priced stocks of companies with high foreseen earnings potential are best identified through in-depth, fundamental research. It is Westfield’s belief that the small capitalization portion of the market is under-researched, and therefore less efficient, than the large capitalization sector.
For the period of September 1, 2011, through August 31, 2012, the Sub-advisers for the CGCM Small Capitalization Growth Investments (“Fund”) were Wall Street Associates (“WSA”), and Westfield Capital Management Company, L.P. (“Westfield”).
The portion of the Fund managed by WSA underperformed the benchmark, the Russell 2000® Growth Index, during the period. Throughout much of the year ended August 31, 2012, equity markets gyrated as recurrent concerns over the expanding Eurozone crisis, worries about how much emerging economies might slow in the coming months, weak jobs reports and “fiscal cliff” fears caused investors’ appetite for risk to wax and wane. The Fund outperformed its benchmark for the first six months of the fiscal year, as the equity market generally moved higher. As spring approached the market swooned and was primarily moved by political and global macro-economic news flow. Investments in the Technology sector provided the greatest contribution to portfolio return, driven by strong stock selection. The portfolio benefitted from exposure to the semiconductor and software groups. Stock selection was also additive in the Consumer Discretionary sector. Specialty Retail, Education, Gaming and Entertainment added to portfolio returns. Investments in the Health Care sector produced double-digit returns and added to performance. Energy stocks declined significantly during the period amid falling commodity prices, abundant supply and curtailed global demand. This group, which had been the top performing sector in the prior fiscal year, declined significantly during the period. Although WSA decreased its exposure to the group, the stocks had a negative impact on portfolio performance.
The portion of the Fund managed by Westfield underperformed the Fund’s benchmark for the year. Portfolio investments within the Information Technology, Materials, and Financials sectors were the most significant positive contributors to relative returns. Health Care was the largest detractor from relative results, while investments within the Industrials and Consumer Discretionary sectors also hindered relative performance. Concerns over a double-dip recession intensified during the second half of 2011, prompting a retreat from all types of higher-risk assets. Investors hid in slower-growth names that provided stable yet predictable earnings growth at higher earnings multiples. Given Westfield’s growth-at-a-reasonable price process, many of these outperformers did not fit its investment criteria, and therefore it had only limited exposure to them. Market dynamics reversed sharply with the start of 2012. A strengthening domestic economy and accommodative monetary policy around the globe helped revive investor appetite for stocks. As the year progressed, the risk-off environment returned and “bond proxies” were again the big outperformers. When searching for new investment candidates, Westfield typically focuses on firms that can deliver consistent organic revenue growth, based on the belief that stellar operational performance will eventually manifest itself in above-average financial performance. Defensive stocks with little-to-no growth are very expensive and have outperformed during the last two years. Westfield continues to see far better risk/rewards in high-quality growth companies reliant on some global GDP growth.
7
The following graph depicts the performance of Small Capitalization Growth Investments vs. the Russell 2000® Growth Index3 and the Lipper Small-Cap Growth Funds Average.13
The performance shown above and below represents past performance. Past performance is no guarantee of future results and current performance may be higher or lower than the performance shown above and below. Performance figures may reflect voluntary fee waivers and/or expense reimbursements. In the absence of voluntary fee waivers and/or expense reimbursements, the total return would have been lower. Principal value and investment returns will fluctuate and investors’ shares, when redeemed, may be worth more or less than their original cost. To obtain performance data current to the most recent month-end, please visit our website at www.smithbarney.com.
The graph above and returns shown below do not reflect the deduction of taxes that a shareholder would pay on fund distributions or the redemption of fund shares.
SMALL CAPITALIZATION GROWTH INVESTMENTS (unaudited)
Average Annual Total Returns for the Period Ended August 31, 2012†
| | | | | | | | |
| | | Without TRAK Fee | | | With TRAK Fee* | |
Since inception (11/18/1991) | | | 8.45 | % | | | 6.77 | % |
10 year | | | 8.19 | | | | 6.45 | |
5 year | | | 1.62 | | | | -0.14 | |
3 year | | | 15.09 | | | | 12.92 | |
1 year | | | 11.54 | | | | 9.33 | |
See pages 26 through 27 for all footnotes.
8
Small Capitalization Value Equity Investments
ABOUTTHE SUBADVISERS
| | • | | Rutabaga Capital Management, LLC (“Rutabaga”) |
Rutabaga focuses exclusively on micro- and small capitalization stocks and looks to unearth uncommon or currently out-of-favor stocks. The firm’s analysts employ extensive bottom-up fundamental research to identify high quality companies with catalysts to increase margins and intrinsic value but are neglected or misperceived by the market.
| | • | | NFJ Investment Group, LLC (“NFJ”) |
NFJ employs an active management style that invests in a diversified portfolio of small capitalization common stocks that it believes are undervalued in the marketplace generally and within their respective industries. NFJ also considers valuation factors such as price-to-book, price-to-cash flow, dividend policy and industry outlook in selecting stocks for investment.
| | • | | Delaware Management Company (“Delaware”) |
Delaware will invest, under normal market conditions, at least 80% of its net assets, plus any borrowings for investment purposes, in the equity securities of small capitalization companies or in other investments with similar economic characteristics. Delaware will consider small capitalization companies to be companies with market capitalizations not exceeding $3 billion or the highest month-end market capitalization value of any stock in the Russell 2000® Index for the previous 12 months, whichever is greater. Securities of companies whose market capitalizations no longer meet this definition after purchase by the Fund still will be considered to be securities of small capitalization companies for purpose of the Fund’s 80% investment policy. The size of the companies in the Index change with market conditions and the composition of the Index.
For the period September 1, 2011, through August 31, 2012, the Sub-advisers for CGCM Small Capitalization Value Equity Investments (“Fund”) were Rutabaga Capital Management LLC (“Rutabaga”), NFJ Investment Group LLC (“NFJ”), and Delaware Management Company (“Delaware”).
The portion of the Fund managed by Rutabaga substantially outperformed the Fund’s benchmark, the Russell 2000® Value Index, for the year ended August 31, 2012. The portfolio had underperformed the previous fiscal year, primarily as a result of the poor performance of some of Rutabaga’s economically sensitive stocks due to investor concerns about the prospects of another global recession in late 2011 and early 2012. However, the global economy did not collapse and many of those economically sensitive stocks rebounded in late 2011 and into 2012, helping to drive the strong investment performance. Additionally, three of Rutabaga’s top nine performing stocks were acquired by strategic competitors at healthy premiums to their recent stock prices. Over the past twelve months, Rutabaga’s investment team replenished the portfolio with several new investment ideas, and the team feels comfortable with the overall risk/reward of the portfolio.
The portion of the Fund managed by NFJ underperformed the benchmark for the year ended August 31, 2012. The first half of the period presented a difficult environment, as the strategy generally lagged during months characterized by optimistic investor sentiment and strong benchmark returns. During the second half of the period, news of Europe’s seemingly intractable sovereign debt crisis and slowing growth in China drove investors into more defensive and high yielding sectors, causing valuations to jump among many REITs, limited partnerships, and issuers in the Telecommunications and Utilities sectors. Allocations to more attractively valued securities presented a headwind, as macro-economic concerns overshadowed fundamentals. Underperformance can be attributed to negative sector weight deviations and stock selection. Issue selection was strongest in Consumer Discretionary and Consumer Staples. Stock picks lagged in the Industrials and Telecommunications sectors. The strategy’s overweight in Energy and Materials, and underweight in Financials dragged on returns. NFJ has been overweight in these two sectors as a consequence of finding attractive valuations and sizable defensible yields among many Energy and Materials names. The underweight in the Financials sector resulted from the hefty benchmark weight in this sector (over 35%), combined with balance sheet concerns and low yields relative to the rest of the market. Conversely, an underweight in the Information Technology sector contributed to returns.
The portion of the Fund managed by Delaware outperformed the Fund’s benchmark for the year ended August 31, 2012. U.S. economic growth remains subpar following the recession with GDP growth, hovering in the 1.5 – 2.0% range, and unemployment remains above 8.0%. The housing market began to show signs of stability, which Delaware believes should add to GDP growth in future quarters. Corporate profitability and cash flow remain strong, but revenue growth remains subdued. Company balance sheets generally continue to be very solid, with many companies paying down debt and buying back stock and paying dividends. Delaware was again disappointed by the lack of significant merger and acquisition (“M&A”) activity in the companies reflected in its portfolio holdings. However, it still believes that M&A activity could increase as companies gain more clarity on future regulatory and tax policy. The outperformance resulted from strong stock selection in the Consumer Services, Financials, Technology and Basic Industry sectors. Detractors from performance were an underweight position and poor stock selection in REITs and poor stock selection in the Energy sector. In general, stock selection was the most significant factor in the portfolio’s outperformance.
9
The following graph depicts the performance of Small Capitalization Value Equity Investments vs. the Russell 2000® Value Index4 and the Lipper Small-Cap Value Funds Average.14
The performance shown above and below represents past performance. Past performance is no guarantee of future results and current performance may be higher or lower than the performance shown above and below. Performance figures may reflect voluntary fee waivers and/or expense reimbursements. In the absence of voluntary fee waivers and/or expense reimbursements, the total return would have been lower. Principal value and investment returns will fluctuate and investors’ shares, when redeemed, may be worth more or less than their original cost. To obtain performance data current to the most recent month-end, please visit our website at www.smithbarney.com.
The graph above and returns shown below do not reflect the deduction of taxes that a shareholder would pay on fund distributions or the redemption of fund shares.
SMALL CAPITALIZATION VALUE EQUITY INVESTMENTS (unaudited)
Average Annual Total Returns for the Period Ended August 31, 2012†
| | | | | | | | |
| | | Without TRAK Fee | | | With TRAK Fee* | |
Since inception (11/18/1991) | | | 10.08 | % | | | 8.37 | % |
10 year | | | 10.74 | | | | 8.96 | |
5 year | | | 4.96 | | | | 3.15 | |
3 year | | | 15.54 | | | | 13.36 | |
1 year | | | 16.93 | | | | 14.61 | |
See pages 26 through 27 for all footnotes.
10
International Equity Investments
ABOUTTHE SUBADVISERS
| | • | | Schroder Investment Management North America, Inc. (“Schroder”) |
Schroder uses a bottom-up growth oriented strategy for stock selection. Schroder employs a fundamental, research driven approach to identify quality growth companies with attractive medium-term growth and valuation, quality management and financial position, and a sustainable competitive advantage. Schroder’s concentrated, “best ideas” portfolio blends both core and opportunistic holdings.
| | • | | Philadelphia International Advisors LP (“PIA”) |
PIA utilizes a fundamental bottom-up process and quantitative screening in its approach to international investing. It selects stocks to buy and sell by evaluating a company’s growth outlook and market valuation based on traditional value characteristics, positive company-specific catalysts and other operating and financial conditions. It selects countries primarily by evaluating a country’s valuation ratios such as price-to-earnings and dividend yield, prospective economic growth, government policies and other factors.
| | • | | Thornburg Investment Management, Inc. (“Thornburg”) |
Thornburg employs a bottom-up investment process that seeks to acquire promising companies with sound business fundamentals at a time when their intrinsic value is not fully recognized by the marketplace. Thornburg’s idea of value centers on its assessment of the intrinsic worth of an investment, as compared to today’s price, based on intensive fundamental research.
| | • | | Marsico Capital Management, LLC (“Marsico”) |
Marsico uses an approach that combines top-down macroeconomic analysis with bottom-up stock selection. The top-down approach takes into consideration such macro-economic factors as interest rates, inflation, demographics, the regulatory environment and the global competitive landscape. In determining whether a particular company may be a suitable investment, Marsico may focus on any of a number of different attributes that may include the company’s specific market expertise or dominance; its franchise durability and pricing power; solid fundamentals; strong and ethical management; commitment to shareholder interests; and reasonable valuations in the context of projected growth rates.
For the period of September 1, 2011, through August 31, 2012, the Sub-advisers for CGCM International Equity Investments (“Fund”) were Schroder Investment Management North America Inc. (“Schroder”), Philadelphia International Advisors LP (“PIA”), Thornburg Investment Management, Inc. (“Thornburg”) and Marsico Capital Management, LLC (“Marsico”).
The portion of the Fund managed by Schroder during the year ended August 31, 2012, was in-line with the Fund’s benchmark, the MSCI EAFE® Index. Markets began the period with extreme volatility, as the Eurozone’s debt problems reached crisis point. For the remainder of the period, markets swung between optimism and disappointment regarding the region. International markets ended the period broadly flat, helped by central bank policies and a summer rally. Performance in Utilities was the largest source of added value by sector. Investors valued more stable growth opportunities given the turbulent market conditions. Exposure to Information Technology was also rewarding. Performance in Materials was the main detractor. The slowdown in global growth and in China in particular, weighed on the portfolio’s mining stocks as investors worried about the strength of demand for raw materials. Schroder has continued to pursue companies which, irrespective of the short-term market uncertainties, are benefiting from longer-term global trends. The portfolio is balanced between growth defensives and more cyclical industries, and Schroder’s trading activity has, as ever, focused on stock-specific situations where it feels there is potential for good growth, valuation upside and catalysts ahead.
The portion of the Fund managed by PIA underperformed the Fund’s benchmark during the year ended August 31, 2012. The majority of the PIA’s relative underperformance can be attributed to stock selection in the Industrials and Financials sectors. While Financials stocks overall held up reasonably well over the course of the year, results within the sector were quite mixed. Insurance companies outperformed the index; however, these positive results were overshadowed by poor performance within European bank holdings. Volatile markets driven in large part to the European sovereign debt crisis, combined with economic uncertainty, have led to a flight to safety and as such, the defensively oriented Consumer Staples and Health Care sectors significantly outperformed the overall market. The portfolio’s underweight positions within these sectors, particularly in the richly priced Consumer Staples, also had a negative impact on returns. Holdings within the UK, Canada, and Korea performed well. The portfolio’s modest exposure to emerging markets, which underperformed their develop market counterparts, weighed on returns; however, the allocation to international small cap stocks aided returns on both an absolute and relative basis.
The portion of the Fund managed by Thornburg performed in-line with the Fund’s benchmark for the year ended August 31, 2012. Concerns about the fate of the euro zone, slowing growth in China, and muted U.S. economic recovery weighed on markets during the period. This led investors to seek safety in more defensively oriented stocks. Allocation and currency effect were positive relative to the benchmark, but the impact of stock selection offset these gains. Stock selection in the Consumer Discretionary sector and an underweight allocation in the Materials sector, the worst-performing sector in the benchmark, helped the portfolio during the period. In addition, underweight positions in Japan and Spain contributed to relative performance. Stock selection in the Financials, Energy, and Information Technology sectors were the main drag on portfolio performance during the period. Three of the top five detractors came from these sectors. The European financial crisis and potential hard landing in China weighed on the Financials sector, particularly European and Chinese bank holdings. Emerging market stocks also detracted from relative performance, particularly in Russia and Taiwan. While is it not possible to know the magnitude and duration of global economic headwinds, Thornburg has constructed the portfolio to avoid some of the more likely and severe downside risks in Europe. With its bottom-up investment process, Thornburg will continue to evaluate opportunities one stock at a time, and balance the portfolio accordingly across our three baskets: basic values, consistent earners, and emerging franchises.
11
The following graph depicts the performance of International Equity Investments vs. the MSCI EAFE® Index5 and the Lipper International Large-Cap Core Funds Average.15
The portion of the Fund managed by Marsico outperformed the Fund’s benchmark for the year ended August 31, 2012. Stock selection in a number of sectors had a positive effect on performance. In particular, stock selection in the Information Technology, Consumer Staples and Industrials sectors was strong. Several of Marsico’s Information Technology holdings also posted solid gains. An underweight allocation to the weak-performing Materials sector benefited performance relative to the benchmark. The Fund also benefited from currency effect. In particular, an underweighted posture to equities denominated in the weak-performing euro added to returns. An overweight allocation to the weak-performing Information Technology sector and no exposure to Utilities, the strongest-performing sector in the benchmark, hampered performance.
The performance shown above and below represents past performance. Past performance is no guarantee of future results and current performance may be higher or lower than the performance shown above and below. Performance figures may reflect voluntary fee waivers and/or expense reimbursements. In the absence of voluntary fee waivers and/or expense reimbursements, the total return would have been lower. Principal value and investment returns will fluctuate and investors’ shares, when redeemed, may be worth more or less than their original cost. To obtain performance data current to the most recent month-end, please visit our website at www.smithbarney.com.
The graph above and returns shown below do not reflect the deduction of taxes that a shareholder would pay on fund distributions or the redemption of fund shares.
INTERNATIONAL EQUITY INVESTMENTS (unaudited)
Average Annual Total Returns for the Period Ended August 31, 2012†
| | | | | | | | |
| | | Without TRAK Fee | | | With TRAK Fee* | |
Since inception (11/18/1991) | | | 5.08 | % | | | 3.46 | % |
10 year | | | 6.72 | | | | 5 | |
5 year | | | -4.3 | | | | -5.95 | |
3 year | | | 4.25 | | | | 2.29 | |
1 year | | | -0.06 | | | | -2.04 | |
See pages 26 through 27 for all footnotes.
12
Emerging Markets Equity Investments
ABOUTTHE SUBADVISERS
| | • | | SSgA Funds Management, Inc. (“SSgA”) |
SSgA uses quantitative analysis to identify countries and stocks which are undervalued relative to their growth rates. It employs an investment process that combines top-down country selection with bottom-up stock selection to determine an optimal country and security mix.
| | • | | Newgate Capital Management, LLC (“Newgate”) |
Newgate seeks long-term growth of capital by using a top-down value approach to identify undervalued countries, regions and sectors. Newgate incorporates geopolitical and macroeconomic factors into its strategy through fundamental quantitative analysis and more than 150 years combined investment experience of its professionals.
| | • | | Lazard Asset Management, LLC (“Lazard”) |
Lazard, an indirect, wholly-owned subsidiary of Lazard Ltd., is known for its global perspective on investing and years of experience with global, regional and domestic portfolios. With more than 235 investment personnel worldwide, Lazard offers investors of all types an array of equity, fixed income, and alternative investment solutions from its network of local offices in ten different countries. Its team-based approach to portfolio management helps Lazard to deliver robust and consistent performance over time, and strong client relationships allow them to understand how to employ their capabilities to its clients’ advantage.
For the period of September 1, 2011, through August 31, 2012, the Sub-advisers for the CGCM Emerging Markets Equity Investments (“Fund”) were SSgA Funds Management, Inc. (“SSgA”), Newgate Capital Management LLC (“Newgate”), and Lazard Asset Management LLC (“Lazard”).
The portion of the Fund managed by SSgA underperformed the Fund’s benchmark, the MSCI Emerging Markets Index, for the year ended August 31, 2012. The Fund utilizes both a country selection and a stock selection model in its investment process. The underperformance of the portfolio over the year was largely a result of stock selection, while country selection was only marginally negative. The drivers of this underperformance were various positions in Taiwan, China, Poland and Brazil. Stock selection in these countries was quite weak, and the model was not able to determine in which names to invest. In some of the smaller countries, such as Poland and Malaysia, SSgA’s portfolio was hurt by both its country positioning and stock selection within those countries. SSgA’s stock selection in Korea contributed positively to overall performance, Korea has a breadth of names that can positively impact the portfolio. Additionally, the Fund benefitted from its overweight position in Thailand. The Thai market has been one of the best-performing Asian markets, as its domestic economy has been resilient in the face of the global slowdown. The year ended August 31, 2012, was difficult due to the risk-on/risk-off theme that has dominated global markets. As the year progressed, it became increasingly evident that economic activity in the United States, the Eurozone and China slowed significantly. Emerging markets investors faced and will continue to face policy-driven markets, with the risk-on/risk-off trade leading to choppy trading. The Eurozone crisis impacts emerging markets via several channels: trade, investment, commodities and finance. The Europe/Middle East/Africa region will be the most seriously affected region in emerging markets should the Eurozone recession intensify. Earnings revisions in emerging markets have been negative in recent months, but earnings were expected to grow by +12% in 2012 and +15.5% in 2013. At fiscal year-end, emerging equities traded at roughly 9.4 times next 12-month earnings. A high degree of policy uncertainty continues to characterize the global economy, and in general, a “flight to safety” to the U.S. dollar is not emerging market friendly.
The portion of the Fund managed by Newgate underperformed the Fund’s benchmark for the year ended August 31, 2012. Newgate employs a top-down, thematic approach to investing that seeks to find undervalued companies given its view on the global economy and other geopolitical considerations. At the beginning of the period, the portfolio was positioned for modest economic expansion, with a substantial weighting in materials stocks and in countries where natural resources are central to the economy and market returns, especially Brazil. Newgate’s “more optimistic than most” view proved correct for the first seven months of the year. However, as the Chinese economy slowed and economic considerations regarding Europe and the United States began to weigh heavily on investor sentiment, equity prices faltered and materials positions underperformed the markets. Newgate reduced allocations to Materials companies, resulting in less exposure to Brazil and China. The portfolio continues to hold Materials, but with greater concentration in gold stocks and less reliance on copper and coal stocks that are highly correlated with the global economy. Newgate’s allocation to Chinese companies was the largest detractor from benchmark-relative performance. Newgate believes that the market has overreacted to an economic slowdown that was thoroughly telegraphed by the government, and also believes that the government has the policy tools necessary to prevent further economic deterioration. Newgate ended the new fiscal year with an overallocation to India and Korea and a reduced, though still overweight, allocation to Chinese equities.
13
The following graph depicts the performance of Emerging Markets Equity Investments vs. the MSCI Emerging Markets Index6 and the Lipper Emerging Markets Funds Average.16
The portion of the Fund managed by Lazard outperformed the Fund’s benchmark for the year ended August 31, 2012. Equities in the developing world were buffeted by investor concerns over a European sovereign debt default. This ultimately resulted in relatively little change in the markets. The benchmark declined by approximately -5.5%, in U.S. dollar terms, with Asian stocks performing considerably better than either eastern European equities or Latin American shares. Latin American markets diverged dramatically with Brazilian shares selling off heavily due to risk aversion. Mexican and Colombian equities finished higher during the period, aided by decent earnings. The Consumer Staples, Health Care, Information Technology, and Telecom Services sectors performed relatively well. The Materials, Energy, and Industrials sectors underperformed the benchmark. Stock selection in the Telecom Services and Consumer Staples sectors, as well as in Brazil, Russia, and South Africa, benefited performance. A higher-than-benchmark exposure to Turkey also helped performance. On the other hand, exposure to Argentina (which is not a constituent country of the benchmark) hurt performance.
The performance shown above and below represents past performance. Past performance is no guarantee of future results and current performance may be higher or lower than the performance shown above and below. Performance figures may reflect voluntary fee waivers and/or expense reimbursements. In the absence of voluntary fee waivers and/or expense reimbursements, the total return would have been lower. Principal value and investment returns will fluctuate and investors’ shares, when redeemed, may be worth more or less than their original cost. To obtain performance data current to the most recent month-end, please visit our website at www.smithbarney.com.
The graph above and returns shown below do not reflect the deduction of taxes that a shareholder would pay on fund distributions or the redemption of fund shares.
EMERGING MARKETS EQUITY INVESTMENTS (unaudited)
Average Annual Total Returns for the Period Ended August 31, 2012†
| | | | | | | | |
| | | Without TRAK Fee | | | With TRAK Fee* | |
Since inception (4/20/1994) | | | 5.26 | % | | | 3.62 | % |
10 year | | | 13.26 | | | | 11.44 | |
5 year | | | -1.97 | | | | -3.66 | |
3 year | | | 5.83 | | | | 3.83 | |
1 year | | | -6.52 | | | | -8.37 | |
See pages 26 through 27 for all footnotes.
14
Core Fixed Income Investments
ABOUTTHE SUBADVISERS
| | • | | BlackRock Financial Management, Inc. (“BlackRock”) |
BlackRock employs a relative value approach which entails portfolio duration within a narrow range and value added through sector and sub-sector rotation within the corporate and mortgage sectors. BlackRock evaluates securities within a risk management framework which consists of determining interest rate risk, yield curve risk, cash flow risk, credit risk and liquidity risk of securities.
| | • | | Pacific Investment Management Company, LLC (“PIMCO”) |
PIMCO employs “top-down” and “bottom-up” investment techniques. It implements the following “top-down” strategies: duration and volatility analysis, sector evaluation and yield curve shape analysis. PIMCO also employs the following “bottom-up” strategies: credit analysis, quantitative research, issue selection and cost-effective trading.
| | • | | Western Asset Management Company (“Western Asset”) |
Western Asset emphasizes three key strategies to enhance total return: (i) adjusting the allocation among the key sectors of the fixed-income market depending on its forecast of relative values; (ii) tracking the duration of the overall portfolio so that it falls within a narrow band relative to the benchmark index, with adjustment made to reflect its long-term outlook for interest rates; and (iii) purchasing undervalued securities in each of the key sectors of the bond market while keeping overall quality high.
| | • | | Metropolitan West Asset Management, LLC (“MetWest”) |
MetWest seeks to achieve consistent outperformance through the measured and diversified application of five fixed income management strategies, including (i) duration management, (ii) yield curve positioning, (iii) sector allocation, (iv) security selection, and (v) opportunistic execution. Predicated on a long-term economic outlook, MetWest employs a value-oriented approach to managing fixed income that recognizes the periodic inefficient nature of over-the-counter markets and the mean-reverting characteristics of the investable universe.
For the period of September 1, 2011, through August 31, 2012, the Sub-advisers for CGCM Core Fixed Income Investments (“Fund”) were BlackRock Financial Management Inc. (“BlackRock”), Pacific Investment Management Company LLC (“PIMCO”), Western Asset Management Company (“Western Asset”) and Metropolitan West Asset Management LLC (“MetWest”).
The portion of the Fund managed by BlackRock outperformed the Fund’s benchmark, the Barclays Capital U.S. Aggregate BondTM Index, for the year ended August 31, 2012. The largest contributor to performance for the year was corporate security selection as BlackRock’s bias to own higher-beta credit benefited as investors continued to reach for yield. In addition, an overweight to CMBS benefitted returns as the sector experienced strong performance. Also contributing to returns during the year was the portfolio’s duration and yield curve positioning. In October, the portfolio was long duration, which contributed to performance as markets rallied following the settlement of the debt ceiling crisis. In April, however, the portfolio’s short duration position impaired performance as the Good Friday jobs report shocked to the downside and caused yields to plummet. Additionally, the portfolio benefitted from yield curve flattening positions during 2011, and successfully trading the yield curve tactically throughout the rest of the period. Partially offsetting this positive performance was the portfolio’s corporate underweight during the beginning of 2012, as the unseasonably warm weather helped to artificially boost the economy, thus benefiting the credit sector. Also detracting from performance was the portfolio’s supranational/foreign agency allocation. The portfolio has and continues to position itself well given slow growth in the U.S. and significant tail risks in Europe.
The portion of the Fund managed by PIMCO outperformed the Fund’s benchmark index for the year ended August 31, 2012. The portfolio’s underweight to U.S. duration detracted from performance, as Treasury yields fell due to uncertainty over stability of the Eurozone. This was partially mitigated by exposure to duration in Australia, as yields also fell in this market, especially in the latter half of the fiscal year. An underweight to investment grade credit detracted from returns, as the sector outperformed Treasury securities of similar duration; however, this effect was more than offset by a focus on the bonds of financial companies, which outperformed the broader investment grade corporate sector. Overall positioning of Agency mortgage-backed securities (“MBS”), especially an underweight during the second half of the year, was negative for performance as these securities outperformed like-duration Treasuries; however, within Agency MBS, active relative value positioning among Fannie Mae, Freddie Mac, and Ginnie Mae securities helped to mitigate this impact. Additionally, out-of-index allocations to select non-Agency mortgages and emerging market debt also added to returns given continued investor demand. PIMCO expects muted real global growth amid increasingly ineffective short-term solutions from policymakers as well as worsening data out of the U.S. and other developed and emerging economies. Going forward, PIMCO will continue to retain broad defensive risk positioning while focusing on yield derived from high-quality sources.
15
The portion of the Fund managed by Western Asset outperformed the Fund’s benchmark for the year ended August 31, 2012. Western Asset managed the Fund’s portfolio using its fundamental, value-oriented investment philosophy. The portfolio’s exposure to non-agency mortgage-backed securities significantly contributed to returns over the twelve months as coupon payments and principal paydowns remained steady and risk markets recovered from the lows of the fourth quarter of 2011. The high yield and investment grade credit sectors were also meaningful contributors to performance, as Western Asset added to exposure when spreads became more attractive toward the end of 2011. Western Asset’s overweight to agency mortgage-backed securities added to performance as the sector outperformed over the twelve month period. Given the outperformance of the mortgage sectors, Western Asset has moved the portfolio’s positioning back to equal-weight for agency mortgage-backed securities and cut down exposure to non-agency mortgage-backed securities. During the reporting period, Western Asset utilized U.S. Treasury futures and options as well as Eurodollar futures to manage the Fund’s duration and to maintain a particular exposure to the yield curve. Similarly the Fund employed Euro-Bobl futures to manage exposure to the German yield curve. Western Asset maintained a tactical, largely underweight duration position and employed a yield curve flattening strategy during the year. Both the tactical duration positioning and curve flattening strategy added to performance as the curve ended the period flatter.
The portion of the Fund managed by MetWest outperformed the Fund’s benchmark for the year ended August 31, 2012. Outperformance in MetWest’s portfolio most significantly resulted from its bottom-up strategies of sector allocation and security selection. The portfolio remained underweight to U.S. Treasury securities throughout the year, in favor of spread sectors within the fixed income market, which benefitted performance as all non-government sectors outperformed U.S. Treasuries on a duration-adjusted basis. Corporate security selection was additive, particularly the allocation to financials, which benefitted from solid investor sponsorship on improving fundamentals and limited new issuance. Balance sheets are generally in better condition as both banks and industrial credits have continued to reduce leverage. Among mortgages, the allocation to both Agency MBS and non-Agency MBS contributed to performance throughout the year, as both benefitted from robust investor demand and restrained new supply. Non-Agency MBS were among the best performers as these highly supportive technicals combined with improving roll rates, increased credit burnout, and a shorter foreclosure pipeline. The allocation to Agency MBS continued to emphasize specified pools with low loan balances and seasoned collateral, while non-Agency MBS focus remains on top of the capital structure, low dollar priced assets, backed by alt-a and subprime collateral. Commercial MBS holdings also contributed to returns, as the sector was a top performer in the fixed income market over the past 12 months. Duration positioning remained shorter than the benchmark, resulting in a drag on performance as rates fell across the curve.
16
The following graph depicts the performance of Core Fixed Income Investments vs. the Barclays Capital U.S. Aggregate BondTM Index7 and the Lipper Intermediate Investment Grade Debt Funds Average.17
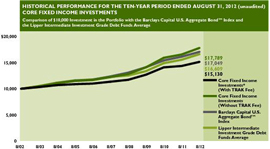
The performance shown above and below represents past performance. Past performance is no guarantee of future results and current performance may be higher or lower than the performance shown above and below. Performance figures may reflect voluntary fee waivers and/or expense reimbursements. In the absence of voluntary fee waivers and/or expense reimbursements, the total return would have been lower. Principal value and investment returns will fluctuate and investors’ shares, when redeemed, may be worth more or less than their original cost. To obtain performance data current to the most recent month-end, please visit our website at www.smithbarney.com.
The graph above and returns shown below do not reflect the deduction of taxes that a shareholder would pay on fund distributions or the redemption of fund shares.
CORE FIXED INCOME INVESTMENTS (unaudited)
Average Annual Total Returns for the Period Ended August 31, 2012†
| | | | | | | | |
| | | Without TRAK Fee | | | With TRAK Fee* | |
Since inception (11/18/1991) | | | 6.19 | % | | | 4.54 | % |
10 year | | | 5.92 | | | | 4.22 | |
5 year | | | 7.77 | | | | 5.92 | |
3 year | | | 8.07 | | | | 6.04 | |
1 year | | | 7.58 | | | | 5.45 | |
See pages 26 through 27 for all footnotes.
17
High Yield Investments
ABOUTTHE SUBADVISERS
| | • | | PENN Capital Management Co., Inc. (“PENN Capital”) |
PENN Capital’s initial universe is well-defined and includes all domestic, corporate cash paying dollar denominated bond issues that have spread-to-treasury and yield characteristics that are consistent with or wider than the single-B credit tier. PENN Capital’s investment team determines sectors/industries that may offer relative value based on its macro-economic outlook. The team will review and evaluate the economic cycle, business environment, industry/sector analysis and interest rates. PENN Capital then scans this group for companies with spreads to treasury that are wider than comparable companies, industry averages and historical averages. The team analyzes the liquidity outlook of the company through qualitative research, including bank loan facility analysis, covenant review analysis and asset value analysis. After the high yield bond universe has been narrowed and potential relative value is identified, the team performs its qualitative research to confirm or justify the credit’s value. The team determines whether or not the credit is suitable for the portfolio given its impact on PENN Capital’s current industry weightings and the diversification it brings to the basket of credits currently held within an industry.
| | • | | Western Asset Management Company (“Western Asset”) |
Western Asset combines traditional analysis with innovative technology applied to all sectors of the market. Western Asset believes inefficiencies exist in the fixed-income market and attempts to add incremental value by exploiting these inefficiencies across all eligible market sectors. The key areas of focus are (i) sector and sub-sector allocation; (ii) issue selection; (iii) duration; and (iv) term structure.
For the period of September 1, 2011, through August 31, 2012, the Sub-advisers for CGCM High Yield Investments (“Fund”) were PENN Capital Management Co., Inc. (“PENN Capital”) and Western Asset Management. Company (“Western Asset”) .
The portion of the Fund managed by PENN Capital benefited from credits impacted by positive credit technicals, M&A and special situations throughout the year. The proprietary PENN Risk Rating continued to find the most attractive relative value in B and CC rated credits with special situations; which continued as a trend over the course of the trailing 12 months. After outperforming the Fund’s benchmark, the Barclays Capital U.S. High Yield Index, through the summer of 2011 by minimizing exposure to the lowest quality bonds the strategy trailed the broader market beta rally in October of last year. Despite the underperformance, the strategy was able to take advantage of PENN Capital’s proprietary research process to find individual opportunities through the beta rally. This allowed PENN Capital to trade more on fundamentals minimizing the impact of the daily routine of “risk-on, risk-off” that pulled the market down in the second quarter of 2012. Looking ahead in the context of geopolitical uncertainty, the high yield bond market has remained an asset class whose returns best reflect actual fundamentals of U.S. based companies. PENN Capital expects this backdrop to further support this scenario for High Yield through central bank policy and an economy growing not too soft as to raise the risk of recession and not too fast to allow interest rates to rise. Finally, PENN Capital expects a relatively low default risk to the market; which will continue to create a positive setting for the market.
The portion of the Fund managed by Western Asset outperformed the Fund’s benchmark for the year ended August 31, 2012. The portfolio exhibited strong performance for the year and edged out the performance of its benchmark. Exposure to specific securities boosted relative returns. Due to solid balance sheet management and fundamental improvements, these companies benefited more than other companies during the market rally over the last year. However, not all overweights generated excess returns. Western Asset’s ratings biases also added to outperformance. The strategy maintained an overweight exposure to lower rated CCC bonds and an underweight to BB-rated bonds. Western Asset’s view that lower-rated bonds offered outsized returns given a market outlook for strong fundamentals and low default rates paid off, as lower-quality CCC issues outperformed higher-rated BB issues. Sector positioning was a net detractor. A focus on Energy and Transportation issuers was not rewarded, as these sectors lagged the performance of the overall market. Additionally, the portfolio remained underweight to the outperforming Financials and Technology sectors, which ultimately took away from relative returns.The High Yield market continued to deliver sizeable returns in a “Goldilocks”- like scenario for the asset class.
18
The following graph depicts the performance of High Yield Investments vs. the Barclays Capital U.S. High Yield Index8 and the Lipper High Current Yield Funds Average.18
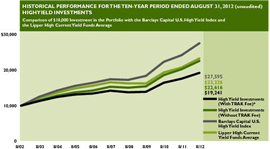
The performance shown above and below represents past performance. Past performance is no guarantee of future results and current performance may be higher or lower than the performance shown above and below. Performance figures may reflect voluntary fee waivers and/or expense reimbursements. In the absence of voluntary fee waivers and/or expense reimbursements, the total return would have been lower. Principal value and investment returns will fluctuate and investors’ shares, when redeemed, may be worth more or less than their original cost. To obtain performance data current to the most recent month-end, please visit our website at www.smithbarney.com.
The graph above and returns shown below do not reflect the deduction of taxes that a shareholder would pay on fund distributions or the redemption of fund shares.
HIGH YIELD INVESTMENTS (unaudited)
Average Annual Total Returns for the Period Ended August 31, 2010†
| | | | | | | | |
| | | Without TRAK Fee | | | With TRAK Fee* | |
Since inception (7/13/1998) | | | 4.60 | % | | | 2.96 | % |
10 year | | | 8.50 | | | | 6.76 | |
5 year | | | 8.08 | | | | 6.23 | |
3 year | | | 13.55 | | | | 11.42 | |
1 year | | | 11.57 | | | | 9.37 | |
See pages 26 through 27 for all footnotes.
19
International Fixed Income Investments
ABOUTTHE SUBADVISERS
| | • | | Pacific Investment Management Company LLC (“PIMCO”) |
PIMCO’s total return approach focuses on both capital appreciation and income while managing overall risk. PIMCO employs a core philosophy toward managing global bonds focusing on both economic and credit fundamentals as key determinants of value in fixed income markets, limiting volatility with respect to the benchmark index.
For the period of September 1, 2011, through August 31, 2012, the Sub-adviser for CGCM International Fixed Income Investments (“Fund”) was Pacific Investment Management Company LLC (“PIMCO”).
The Fund outperformed its benchmark, the Citigroup Global Markets Non-U.S. Dollar (“USD”) World Government Bond Index (“WGBI”) (USD) Hedged, for the year ended August 31, 2012. The portfolio’s overweight to duration in Australia was a positive contributor to returns as yields in this market fell amid the global slowdown. In Japan, where yields also fell, an underweight to duration negatively impacted performance. U.S. duration positioning during this period of declining rates contributed to performance, while tactical duration positioning in core Europe was in aggregate negative for returns. Off-benchmark allocations to high-quality sectors, such as Agency mortgage-backed securities (“MBS”) and investment grade credit, benefited performance as these securities outperformed government bonds. Modest allocations to non-Agency and Commercial MBS also contributed to returns as investors sought high-quality sources of income. Lastly, a decreasing out-of-index exposure to emerging market debt also contributed to performance as the returns of securities of select emerging market economies were supported by economic fundamentals which remained healthier than those of developed nations, despite increasing vulnerability to a global slowdown. PIMCO expects muted real global growth amid increasingly ineffective short-term solutions from policymakers as well as worsening data out of the U.S. and other developed and emerging economies. Going forward, PIMCO will continue to retain broad defensive risk positioning while focusing on yield derived from high-quality sources.
20
The following graph depicts the performance of International Fixed Income Investments vs. the Citigroup Global Markets Non-USD WGBI (USD)– Hedged,9 the Citigroup Global Markets Non-USD WGBI (USD)–Unhedged9 and Lipper International Income Funds Average.19
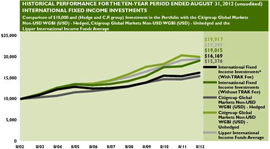
The performance shown above and below represents past performance. Past performance is no guarantee of future results and current performance may be higher or lower than the performance shown above and below. Performance figures may reflect voluntary fee waivers and/or expense reimbursements. In the absence of voluntary fee waivers and/or expense reimbursements, the total return would have been lower. Principal value and investment returns will fluctuate and investors’ shares, when redeemed, may be worth more or less than their original cost. To obtain performance data current to the most recent month-end, please visit our website at www.smithbarney.com.
The graph above and returns shown below do not reflect the deduction of taxes that a shareholder would pay on fund distributions or the redemption of fund shares.
INTERNATIONAL FIXED INCOME INVESTMENTS (unaudited)
Average Annual Total Returns for the Period Ended August 31, 2012†
| | | | | | | | |
| | | Without TRAK Fee | | | With TRAK Fee* | |
Since inception (11/18/1991) | | | 6.46 | % | | | 4.81 | % |
10 year | | | 6.63 | | | | 4.92 | |
5 year | | | 7.06 | | | | 5.21 | |
3 year | | | 7.3 | | | | 5.28 | |
1 year | | | 7.53 | | | | 5.4 | |
See pages 26 through 27 for all footnotes.
21
Municipal Bond Investments
ABOUTTHE SUBADVISERS
| | • | | McDonnell Investment Management, LLC (“McDonnell”) |
McDonnell employs a value-added approach to active municipal bond management utilizing a team oriented philosophy. This approach attempts to maximize after-tax total returns while reducing the volatility in relative rates of return. By limiting dependence on market timing and tightly controlling duration, McDonnell reduces the portfolio’s exposure to interest rate risk relative to the benchmark. McDonnell utilizes extensive internal research to identify relative value opportunities among sectors and securities and to control credit risk. Additionally, McDonnell seeks to exploit yield curve anomalies through quantitative analysis of historical spreads and future expectations.
For the period of September 1, 2011, through August 31, 2012, the Sub-adviser for CGCM Municipal Bond Investments (“Fund”) was McDonnell Investment Management, LLC (“McDonnell”).
Municipal gains were solid, as credit spreads tightened and the yield curve flattened allowing longer, lower-quality securities to post the highest returns for the year. The municipal market experienced a sharp increase in new issue supply versus last year’s paltry pace. Supply was easily absorbed as strong demand from banks and retail mutual fund investors provided ample cash available for investment. That being said, credit vigilance remains critical as fiscal challenges facing issuers continue to be formidable. Given the prolonged economic downturn, weaker municipalities will struggle as reduced revenue from taxes as well as decreased State aid put pressure on local budgets.
The Fund, managed by McDonnell, underperformed the Fund’s benchmark, the Barclays Capital U.S. Municipal Bond Index, for the year primarily due to continued spread compression and yield curve positioning while security selection and modestly long duration enhanced performance. The Fund has higher overall credit quality than the benchmark with an underweight in the A and BBB rated buckets, and is overweight in the 10-year portion of the curve, which produced appreciably lower returns than the 15-30 year range. The anticipated spread widening and higher long-term yields failed to materialize this year; nevertheless, McDonnell believes when the economy shows consistent signs of improvement this most likely will occur. To enhance yield, McDonnell continues to focus on security selection in long-dated bonds in the Higher Education, Hospital, Public Power, and Airport sectors. As a result of McDonnell’s credit concerns, it has avoided some of the larger issuers, such as Illinois and Puerto Rico, which significantly contributed to benchmark performance this year. McDonnell’s core sector holdings continue to include Local Governments, Water & Sewer, and Sales and Income Tax-backed bonds. McDonnell continues to favor a bulleted posture consistent with the respective index duration and seeks to reduce exposure to weaker credits as spread compression has eliminated a significant yield advantage.
22
The following graph depicts the performance of Municipal Bond Investments vs. the Barclays Capital U.S. Municipal Bond Index10 and the Lipper General Municipal Debt Funds Average.20

The performance shown above and below represents past performance. Past performance is no guarantee of future results and current performance may be higher or lower than the performance shown above and below. Performance figures may reflect voluntary fee waivers and/or expense reimbursements. In the absence of voluntary fee waivers and/or expense reimbursements, the total return would have been lower. Principal value and investment returns will fluctuate and investors’ shares, when redeemed, may be worth more or less than their original cost. To obtain performance data current to the most recent month-end, please visit our website at www.smithbarney.com.
The graph above and returns shown below do not reflect the deduction of taxes that a shareholder would pay on fund distributions or the redemption of fund shares.
MUNICIPAL BOND INVESTMENTS (unaudited)
Average Annual Total Returns for the Period Ended August 31, 2012†
| | | | | | | | |
| | | Without TRAK Fee | | | With TRAK Fee* | |
Since inception (11/18/1991) | | | 5.31 | % | | | 3.68 | % |
10 year | | | 4.55 | | | | 2.87 | |
5 year | | | 5.55 | | | | 3.74 | |
3 year | | | 6.12 | | | | 4.12 | |
1 year | | | 7.23 | | | | 5.11 | |
See pages 26 through 27 for all footnotes.
23
Money Market Investments
ABOUTTHE SUBADVISERS
| | • | | The Dreyfus Corporation (“Dreyfus”) |
Dreyfus seeks to improve the Fund’s yield through actively managing sector allocations and the average maturity of the Fund. Dreyfus monitors the spread relationships between U.S. Treasury and government agency issues, and purchases agencies when they provide a yield advantage. In addition, Dreyfus will change the maturity structure modestly to reflect its outlook on interest rates.
For the period of September 1, 2011, through August 31, 2012, the Sub-adviser for CGCM Money Market Investments (“Fund”) was The Dreyfus Corporation (“Dreyfus”).
The Fund, managed by Dreyfus, maintained its focus on the primary goal of providing liquidity. The Fund was affected by the same post-crisis factors as in the prior year, namely historically low rates combined with generally improving credit markets. On the monetary policy front, the past year has been marked by a continuation of post-crisis monetary easing to support a still-disappointing recovery. To that effect, the Federal Open Market Committee has committed to keeping rates low until at least 2014, and has replaced outright securities purchases with sterilized asset purchases dubbed “Operation Twist” in a bid to lower mortgage rates. This has resulted in lower rates across the curve, and contributed to keeping short-end rates range-bound. Beyond the traditional effect of monetary policy on money market rates, new drivers have appeared post-crisis. First, ongoing implementation of the Dodd-Frank Wall Street Reform and Consumer Protection Act and Basel III encourage financial institutions to reduce leverage and wholesale funding, contributing to a scarcity of available investments for money market investors. Second, the ongoing European sovereign crisis added to the challenges, which the industry and the Fund have navigated seamlessly to date. Finally, political developments will undoubtedly generate volatility in the months ahead with the approaching budget vote, presidential election and fiscal cliff.
24
MONEY MARKET INVESTMENTS (unaudited)
Average Annual Total Returns for the Period Ended August 31, 2012†
| | | | | | | | |
| | | Without TRAK Fee | | | With TRAK Fee* | |
Since inception (11/18/1991) | | | 2.99 | % | | | 1.39 | % |
10 year | | | 1.67 | | | | 0.03 | |
5 year | | | 0.89 | | | | -0.87 | |
3 year | | | 0.29 | | | | -1.6 | |
1 year | | | 0.02 | | | | -1.96 | |
Performance figures may reflect voluntary fee waivers and/or expense reimbursements. In the absence of voluntary fee waivers and/or expense reimbursements, the total return would have been lower.
The returns shown do not reflect the deduction of taxes that a shareholder would pay on fund distributions or the redemption of fund shares.
RISKS: An investment in a money market fund is neither insured nor guaranteed by the FDIC or any other government agency. Although the Fund seeks to preserve the value of your investment at one dollar per share, it is possible to lose money by investing in the Fund.
See pages 26 through 27 for all footnotes.
25
FOOTNOTES
| † | All figures represent past performance and are not a guarantee of future results. Investment return and principal value of an investment will fluctuate so that an investor’s shares, when redeemed, may be worth more or less than their original cost. The returns shown do not reflect the deduction of taxes that a shareholder would pay on fund distributions or the redemptions of fund shares. Performance figures may reflect fee waivers and/or expense reimbursements. In the absence of fee waivers and/or expense reimbursements, the total return would have been lower. To obtain performance data current to the most recent month-end, please visit our website at https://www.smithbarney.com/products- services/managed- money/trak/trak-cgcm.html. |
| * | The Funds are available only to investors participating in Morgan Stanley approved advisory programs. These programs charge an annual fee, which in the case of TRAK® may be up to 2.00%. The performance data shown does not reflect this fee, which would reduce returns. |
| ** | Consulting Group Advisory Services, LLC (“CGAS”), a business of Morgan Stanley Smith Barney Holdings LLC (‘MSSBH”), voluntarily waived and/or reimbursed certain fees or expense to maintain a positive net yield. |
| 1. | The Russell 1000® Growth Index measures the performance of those Russell 1000 companies with higher price-to-book ratios and higher forecasted growth values. Because the index is not a managed portfolio, there are no advisory fees or internal management expenses reflected in the index’s performance. Please note that an investor cannot invest directly in an index. |
| 2. | The Russell 1000® Value Index measures the performance of those Russell 1000 Index companies with lower price-to-book ratios and lower forecasted growth values. Because the index is not a managed portfolio, there are no advisory fees or internal management expenses reflected in the index’s performance. Please note that an investor cannot invest directly in an index. |
| 3. | The Russell 2000® Growth Index measures the performance of those Russell 2000 companies with higher price-to-book ratios and higher forecasted growth values. Because the index is not a managed portfolio, there are no advisory fees or internal management expenses reflected in the index’s performance. Please note that an investor cannot invest directly in an index. |
| 4. | The Russell 2000® Value Index measures the performance of those Russell 2000 Index companies with lower price-to-book ratios and lower forecasted growth values. Because the index is not a managed portfolio, there are no advisory fees or internal management expenses reflected in the index’s performance. Please note that an investor cannot invest directly in an index. |
| 5. | The MSCI EAFE® Index is a composite portfolio of equity total returns for the countries of Australia, New Zealand and countries in Europe and the Far East, weighted based on each country’s market capitalization. Because the index is not a managed portfolio, there are no advisory fees or internal management expenses reflected in the index’s performance. Please note that an investor cannot invest directly in an index. |
| 6. | The MSCI Emerging Markets Index is an index comprised of twenty-five emerging markets open to direct foreign participation. Because the index is not a managed portfolio, there are no advisory fees or internal management expenses reflected in the index’s performance. Please note that an investor cannot invest directly in an index. |
| 7. | The Barclays Capital U.S. Aggregate BondTM Index is composed of the Barclays Capital Intermediate Government/Credit Bond Index and the Barclays Capital Mortgage-Backed Securities Index and includes treasury issues, agency issues, corporate bond issues and mortgage-backed securities. Because the index is not a managed portfolio, there are no advisory fees or internal management expenses reflected in the index’s performance. Please note that an investor cannot invest directly in an index. |
26
| 8. | The Barclays Capital U.S. High Yield Index is composed of fixed rate, publicly issued, non-investment grade debt registered with the SEC. All bonds must be dollar-denominated, non-convertible, and have at least one year remaining to maturity as well as an outstanding par value of $100 million. Because the index is not a managed portfolio, there are no advisory fees or internal management expenses reflected in the index’s performance. Please note that an investor cannot invest directly in an index. |
| 9. | The Citigroup Non-USD World Government Bond Index Hedged and Unhedged are each subsets of the Citigroup World Bond Index, which excludes Corporate bonds denominated in US dollars. It contains foreign government and supranational bonds denominated in Australian, Austrian, Belgian, British, Canadian, Danish, Dutch, French, German, Italian, Japanese, Spanish and Swedish currencies. Because the index is not a managed portfolio, there are no advisory fees or internal management expenses reflected in the index’s performance. Please note that an investor cannot invest directly in an index. |
| 10. | The Barclays Capital U.S. Municipal Bond Index is a weighted composite that is comprised of more than 15,000 bonds issued within the last five years, having a minimum credit rating of at least Baa and maturity of at least two years, excluding all bonds subject to the Alternative Minimum Tax and bonds with floating or zero coupons. Because the index is not a managed portfolio, there are no advisory fees or internal management expenses reflected in the index’s performance. Please note that an investor cannot invest directly in an index. |
| 11. | The Lipper Large-Cap Growth Funds Average is comprised of the Fund’s peer group of mutual funds investing in growth oriented funds. The total return of the Lipper Average does not include the effect of sales charges. Please note that an investor cannot invest directly in an index. |
| 12. | The Lipper Large-Cap Value Funds Average is comprised of the Fund’s peer group of mutual funds investing in value oriented funds. The total return of the Lipper Average does not include the effect of sales charges. Please note that an investor cannot invest directly in an index. |
| 13. | The Lipper Small-Cap Growth Funds Average is comprised of the Fund’s peer group of mutual funds which limit their investments to small cap growth companies. The total return of the Lipper Average does not include the effect of sales charges. Please note that an investor cannot invest directly in an index. |
| 14. | The Lipper Small-Cap Value Funds Average is comprised of the Fund’s peer group of mutual funds which limit their investments to small cap value companies. The total return of the Lipper Average does not include the effect of sales charges. Please note that an investor cannot invest directly in an index. |
| 15. | The Lipper International Large-Cap Core Average includes the 30 largest large-cap core funds tracked by Lipper Inc. The total return of the Lipper Average does not include the effect of sales charges. Please note that an investor cannot invest directly in an index. |
| 16. | The Lipper Emerging Markets Funds Average is an equally weighted average of the funds that seek long-term capital appreciation by investing at least 65% of total assets in emerging market equity securities, where “emerging market” is defined by a country’s GNP per capita or other economic measures. The total return of the Lipper Average does not include the effect of sales charges. Please note that an investor cannot invest directly in an index. |
| 17. | Lipper Intermediate Investment Grade Debt Funds Average is an average of the total returns reported by all of the mutual funds designated by Lipper Analytical Services, Inc. as falling into the category, and is not adjusted to reflect any sales charges. However, these total returns are reported net of expenses or other fees that the SEC requires to be reflected in a fund’s performance. The total return of the Lipper Average does not include the effect of sales charges. Please note that an investor cannot invest directly in an index. |
| 18. | Lipper High Current Yield Bond Average, an unmanaged index published by Lipper Inc., includes the 30 largest funds that are generally similar to the Fund, although some funds in the index may have somewhat different investment policies or objectives. The total return of the Lipper Average does not include the effect of sales charges. Please note that an investor cannot invest directly in an index. |
27
| 19. | The Lipper International Income Funds Average is an equally weighted average of the funds that invest primarily in US dollar and non-US dollar debt securities of issuers located in at least three countries, excluding the United States. The total return of the Lipper Average does not include the effect of sales charges. Please note that an investor cannot invest directly in an index. |
| 20. | The Lipper General Municipal Debt Funds Average is an average of funds that invest at least 65% of their assets in municipal debt issues in the top four credit ratings. The total return of the Lipper Average does not include the effect of sales charges. Please note that an investor cannot invest directly in an index. |
28
Fund Expenses
(unaudited)
Example
As a shareholder of a Fund, you may incur two types of costs: (1) annual advisory program fees, which in the case of TRAK® may be up to 2.00%; and (2) ongoing costs, including management fees and other Fund expenses. This example is intended to help you understand your ongoing costs (in dollars) of investing in a Fund and to compare these costs with the ongoing costs of investing in other mutual funds.
This example is based on an investment of $1,000 invested on March 1, 2012, and held for the six months ended August 31, 2012.
Actual Expenses
The table below titled “Based on Actual Total Return” provides information about actual account values and actual expenses. You may use the information provided in this table, together with the amount you invested, to estimate the expenses that you paid over the period. To estimate the expenses you paid on your account during this period, divide your account value by $1,000 (for example, an $8,600 account value divided by $1,000 = 8.6), then multiply the result by the number under the heading entitled “Expenses Paid During the Period”.
Based on Actual Total Return(1)
| | | | | | | | | | | | | | | | | | | | |
Fund | | Total Return
Without
TRAK Fee(2) | | | Beginning
Account
Value | | | Ending
Account
Value | | | Annualized
Expense
Ratios(3) | | | Expense
Paid During
the Period(4) | |
Large Capitalization Growth Investments | | | 1.93 | % | | $ | 1,000.00 | | | $ | 1,019.30 | | | | 0.69 | % | | $ | 3.50 | |
Large Capitalization Value Equity Investments | | | 0.75 | % | | | 1,000.00 | | | | 1,007.50 | | | | 0.70 | % | | | 3.53 | |
Small Capitalization Growth Investments | | | -2.65 | % | | | 1,000.00 | | | | 973.50 | | | | 0.98 | % | | | 4.86 | |
Small Capitalization Value Investments | | | 0.08 | % | | | 1,000.00 | | | | 1,000.80 | | | | 1.00 | % | | | 5.03 | |
International Equity Investments | | | -4.96 | % | | | 1,000.00 | | | | 950.40 | | | | 0.88 | % | | | 4.31 | |
Emerging Markets Equity Investments | | | -9.96 | % | | | 1,000.00 | | | | 900.40 | | | | 0.94 | % | | | 4.49 | |
Core Fixed Income Investments | | | 4.40 | % | | | 1,000.00 | | | | 1,044.00 | | | | 0.53 | % | | | 2.72 | |
High Yield Investments | | | 4.37 | % | | | 1,000.00 | | | | 1,043.70 | | | | 0.79 | % | | | 4.06 | |
International Fixed Income Investments | | | 4.14 | % | | | 1,000.00 | | | | 1,041.40 | | | | 0.64 | % | | | 3.28 | |
Municipal Bond Investments | | | 2.06 | % | | | 1,000.00 | | | | 1,020.60 | | | | 0.58 | % | | | 2.95 | |
Money Market Investments | | | 0.01 | %(5) | | | 1,000.00 | | | | 1,000.10 | | | | 0.23 | % | | | 1.16 | |
| (1) | For the six months ended August 31, 2012. |
| (2) | Assumes reinvestment of all distributions, including returns of capital, if any, at net asset value and does not reflect the deduction of the applicable advisory program charge, which in the case of TRAK® may be up to 2.00%. Total return is not annualized as it may not be representative of the total return for the year. Performance figures may reflect fee waivers and/or expense reimbursements. Past performance is no guarantee of future results. In the absence of fee waivers and/or expense reimbursements, the total return would have been lower. |
| (3) | Annualized Expense Ratios are based on the most recent 6 month expense ratios, which may differ from expense ratios in the Financial Highlights. |
| (4) | Expenses (net of fee waivers and/or expense reimbursements) are equal to each Fund’s respective annualized expense ratio multiplied by the average account value over the period, multiplied by the number of days in the most recent fiscal half-year, then divided by 366. |
| (5) | CGAS, a business of MSSBH, voluntarily waived and/or reimbursed certain fees or expense to maintain a positive net yield. |
29
Fund Expenses
(unaudited) (continued)
Hypothetical Example for Comparison Purposes
The table below titled “Based on Hypothetical Total Return” provides information about hypothetical account values and hypothetical expenses based on the actual expense ratio and an assumed rate of return of 5.00% per year before expenses, which is not each Fund’s actual return. The hypothetical account values and expenses may not be used to estimate the actual ending account balance or expenses you paid for the period. You may use the information provided in this table to compare the ongoing costs of investing in each Fund and other funds. To do so, compare the 5.00% hypothetical example relating to a Fund with the 5.00% hypothetical examples that appear in the shareholder reports of the other funds.
Please note that the expenses shown in the table below are meant to highlight your ongoing costs only and do not reflect any advisory program annual fees. Therefore, the table is useful in comparing ongoing costs only, and will not help you determine the relative total costs of owning different funds. In addition, if these advisory program annual fees were included, your costs would have been higher.
Based on Hypothetical Total Return(1)
| | | | | | | | | | | | | | | | | | | | |
Fund | | Hypothetical
Annualized
Total Return | | | Beginning
Account
Value | | | Ending
Account
Value | | | Annualized
Expense
Ratios(2) | | | Expense
Paid During
the Period(3) | |
Large Capitalization Growth Investments | | | 5.00 | % | | $ | 1,000.00 | | | $ | 1,021.67 | | | | 0.69 | % | | | 3.51 | |
Large Capitalization Value Equity Investments | | | 5.00 | % | | | 1,000.00 | | | $ | 1,021.62 | | | | 0.70 | % | | | 3.56 | |
Small Capitalization Growth Investments | | | 5.00 | % | | | 1,000.00 | | | $ | 1,020.21 | | | | 0.98 | % | | | 4.98 | |
Small Capitalization Value Equity Investments | | | 5.00 | % | | | 1,000.00 | | | $ | 1,020.11 | | | | 1.00 | % | | | 5.08 | |
International Equity Investments | | | 5.00 | % | | | 1,000.00 | | | $ | 1,020.71 | | | | 0.88 | % | | | 4.47 | |
Emerging Markets Equity Investments | | | 5.00 | % | | | 1,000.00 | | | $ | 1,020.41 | | | | 0.94 | % | | | 4.77 | |
Core Fixed Income Investments | | | 5.00 | % | | | 1,000.00 | | | $ | 1,022.47 | | | | 0.53 | % | | | 2.69 | |
High Yield Investments | | | 5.00 | % | | | 1,000.00 | | | $ | 1,021.17 | | | | 0.79 | % | | | 4.01 | |
International Fixed Income Investments | | | 5.00 | % | | | 1,000.00 | | | $ | 1,021.92 | | | | 0.64 | % | | | 3.25 | |
Municipal Bond Investments | | | 5.00 | % | | | 1,000.00 | | | $ | 1,022.22 | | | | 0.58 | % | | | 2.95 | |
Money Market Investments | | | 5.00 | % | | | 1,000.00 | | | $ | 1,023.98 | | | | 0.23 | % | | | 1.17 | |
| (1) | For the six months ended August 31, 2012. |
| (2) | Annualized Expense Ratios are based on the most recent 6 month expense ratios, which may differ from the expense ratios in the Financial Highlights. |
| (3) | Expenses (net of fee waivers and/or expense reimbursements) are equal to each Fund’s respective annualized expense ratio multiplied by the average account value over the period, multiplied by the number of days in the most recent fiscal half-year, then divided by 366. |
30
Schedules of Investments
August 31, 2012
Large Capitalization Growth Investments
| | | | | | | | |
| Shares | | | Security | | Value | |
| COMMON STOCKS — 96.6% | | | | |
| CONSUMER DISCRETIONARY — 14.7% | | | | |
| Automobiles — 0.1% | | | | |
| | 41,600 | | | Harley-Davidson Inc. | | $ | 1,745,536 | |
| | | | | | | | |
| Distributors — 0.1% | | | | |
| | 39,700 | | | LKQ Corp.* | | | 1,498,278 | |
| | | | | | | | |
| Diversified Consumer Services — 0.3% | | | | |
| | 162,625 | | | Apollo Group Inc., Class A Shares* | | | 4,366,481 | |
| | | | | | | | |
| Hotels, Restaurants & Leisure — 1.6% | | | | |
| | 120,350 | | | Las Vegas Sands Corp. | | | 5,101,637 | |
| | 323,961 | | | Starbucks Corp. | | | 16,071,705 | |
| | 25,700 | | | Starwood Hotels & Resorts Worldwide Inc. | | | 1,416,841 | |
| | 38,100 | | | Wyndham Worldwide Corp. | | | 1,986,534 | |
| | 14,300 | | | Yum! Brands Inc. | | | 911,196 | |
| | | | | | | | |
| | | | Total Hotels, Restaurants & Leisure | | | 25,487,913 | |
| | | | | | | | |
| Internet & Catalog Retail — 3.5% | | | | |
| | 61,600 | | | Amazon.com Inc.* | | | 15,290,968 | |
| | 775,075 | | | Liberty Interactive Corp., Class A Shares* | | | 14,137,368 | |
| | 42,525 | | | priceline.com Inc.* | | | 25,709,339 | |
| | | | | | | | |
| | | | Total Internet & Catalog Retail | | | 55,137,675 | |
| | | | | | | | |
| Media — 2.5% | | | | |
| | 185,800 | | | CBS Corp., Class B Shares | | | 6,751,972 | |
| | 378,550 | | | Comcast Corp., Class A Shares | | | 12,692,781 | |
| | 31,900 | | | Discovery Communications Inc., Class A Shares* | | | 1,749,396 | |
| | 57,000 | | | Imax Corp.*(a) | | | 1,151,970 | |
| | 172,860 | | | Viacom Inc., Class B Shares | | | 8,644,729 | |
| | 173,290 | | | Walt Disney Co. (The) | | | 8,572,656 | |
| | | | | | | | |
| | | | Total Media | | | 39,563,504 | |
| | | | | | | | |
| Multiline Retail — 1.0% | | | | |
| | 249,000 | | | Dollar General Corp.* | | | 12,716,430 | |
| | 50,100 | | | Dollar Tree Inc.* | | | 2,413,317 | |
| | 14,400 | | | Family Dollar Stores Inc. | | | 916,416 | |
| | | | | | | | |
| | | | Total Multiline Retail | | | 16,046,163 | |
| | | | | | | | |
| Specialty Retail — 3.8% | | | | |
| | 43,000 | | | Bed Bath & Beyond Inc.* | | | 2,888,310 | |
| | 79,300 | | | Chico’s FAS Inc. | | | 1,501,942 | |
| | 29,700 | | | Dick’s Sporting Goods Inc. | | | 1,477,872 | |
| | 267,290 | | | Home Depot Inc. (The) | | | 15,168,709 | |
| | 189,000 | | | Limited Brands Inc. | | | 9,185,400 | |
| | 312,330 | | | Lowe’s Cos., Inc. | | | 8,895,158 | |
| | 20,500 | | | O’Reilly Automotive Inc.* | | | 1,741,475 | |
| | 684,900 | | | Staples Inc. | | | 7,479,108 | |
| | 187,300 | | | TJX Cos. Inc. | | | 8,576,467 | |
| | 21,800 | | | Urban Outfitters Inc.* | | | 818,372 | |
| | | | | | | | |
| | | | Total Specialty Retail | | | 57,732,813 | |
| | | | | | | | |
| Textiles, Apparel & Luxury Goods — 1.8% | | | | |
| | 93,963 | | | Lululemon Athletica Inc.*(a) | | | 6,125,448 | |
| | 194,156 | | | NIKE Inc., Class B Shares | | | 18,903,028 | |
| | 31,800 | | | Steven Madden Ltd.* | | | 1,364,856 | |
| | 11,200 | | | V.F. Corp. | | | 1,710,016 | |
| | | | | | | | |
| | | | Total Textiles, Apparel & Luxury Goods | | | 28,103,348 | |
| | | | | | | | |
| | | | TOTAL CONSUMER DISCRETIONARY | | | 229,681,711 | |
| | | | | | | | |
See Notes to Financial Statements.
31
Schedules of Investments
(continued)
Large Capitalization Growth Investments
| | | | | | | | |
| Shares | | | Security | | Value | |
| CONSUMER STAPLES — 5.0% | | | | |
| Beverages — 0.6% | | | | |
| | 20,865 | | | Brown-Forman Corp., Class B Shares | | $ | 1,337,447 | |
| | 140,400 | | | Monster Beverage Corp.* | | | 8,273,772 | |
| | | | | | | | |
| | | | Total Beverages | | | 9,611,219 | |
| | | | | | | | |
| Food & Staples Retailing — 1.9% | | | | |
| | 12,800 | | | Casey’s General Stores Inc. | | | 723,840 | |
| | 391,375 | | | Walgreen Co. | | | 13,995,570 | |
| | 147,870 | | | Whole Foods Market Inc. | | | 14,306,423 | |
| | | | | | | | |
| | | | Total Food & Staples Retailing | | | 29,025,833 | |
| | | | | | | | |
| Food Products — 2.5% | | | | |
| | 259,256 | | | Hershey Co. (The) | | | 18,619,766 | |
| | 479,195 | | | Kraft Foods Inc., Class A Shares | | | 19,900,967 | |
| | 21,900 | | | Mead Johnson Nutrition Co., Class A Shares | | | 1,605,927 | |
| | | | | | | | |
| | | | Total Food Products | | | 40,126,660 | |
| | | | | | | | |
| | | | TOTAL CONSUMER STAPLES | | | 78,763,712 | |
| | | | | | | | |
| ENERGY — 8.0% | | | | |
| Energy Equipment & Services — 1.9% | | | | |
| | 15,400 | | | Cameron International Corp.* | | | 842,534 | |
| | 74,300 | | | Ensco PLC, Class A Shares | | | 4,262,591 | |
| | 407,350 | | | Halliburton Co. | | | 13,344,786 | |
| | 83,000 | | | McDermott International Inc.* | | | 924,620 | |
| | 125,010 | | | National-Oilwell Varco Inc. | | | 9,850,788 | |
| | | | | | | | |
| | | | Total Energy Equipment & Services | | | 29,225,319 | |
| | | | | | | | |
| Oil, Gas & Consumable Fuels — 6.1% | | | | |
| | 23,200 | | | Cabot Oil & Gas Corp. | | | 960,712 | |
| | 22,600 | | | Concho Resources Inc.* | | | 2,028,124 | |
| | 26,900 | | | Continental Resources Inc.* | | | 1,992,214 | |
| | 216,400 | | | EOG Resources Inc. | | | 23,436,120 | |
| | 30,000 | | | InterOil Corp.*(a) | | | 2,386,200 | |
| | 513,478 | | | Kinder Morgan Inc. | | | 18,367,108 | |
| | 172,700 | | | Kodiak Oil & Gas Corp., Class afo aft Shares* | | | 1,543,938 | |
| | 85,460 | | | Occidental Petroleum Corp. | | | 7,264,955 | |
| | 75,800 | | | Pioneer Natural Resources Co. | | | 7,379,888 | |
| | 263,900 | | | Suncor Energy Inc. | | | 8,254,792 | |
| | 450,640 | | | Valero Energy Corp. | | | 14,087,006 | |
| | 268,600 | | | Williams Cos., Inc. (The) | | | 8,667,722 | |
| | | | | | | | |
| | | | Total Oil, Gas & Consumable Fuels | | | 96,368,779 | |
| | | | | | | | |
| | | | TOTAL ENERGY | | | 125,594,098 | |
| | | | | | | | |
| FINANCIALS — 4.7% | | | | |
| Capital Markets — 0.9% | | | | |
| | 80,900 | | | Jefferies Group Inc. | | | 1,188,421 | |
| | 81,000 | | | Raymond James Financial Inc. | | | 2,851,200 | |
| | 205,380 | | | State Street Corp. | | | 8,543,808 | |
| | 34,000 | | | T. Rowe Price Group Inc. | | | 2,088,960 | |
| | | | | | | | |
| | | | Total Capital Markets | | | 14,672,389 | |
| | | | | | | | |
| Diversified Financial Services — 2.5% | | | | |
| | 177,200 | | | CME Group Inc., Class A Shares | | | 9,728,280 | |
| | 124,450 | | | IntercontinentalExchange Inc.* | | | 17,012,315 | |
| | 303,040 | | | JPMorgan Chase & Co. | | | 11,254,906 | |
| | 34,300 | | | Moody’s Corp. | | | 1,358,280 | |
| | | | | | | | |
| | | | Total Diversified Financial Services | | | 39,353,781 | |
| | | | | | | | |
See Notes to Financial Statements.
32
Schedules of Investments
(continued)
Large Capitalization Growth Investments
| | | | | | | | |
| Shares | | | Security | | Value | |
| FINANCIALS — 4.7%—(continued) | | | | |
| Insurance — 1.3% | | | | |
| | 25,300 | | | Allied World Assurance Co. Holdings AG | | $ | 1,986,809 | |
| | 46,100 | | | Arthur J. Gallagher & Co. | | | 1,646,692 | |
| | 100,100 | | | Fidelity National Financial Inc., Class A Shares | | | 1,885,884 | |
| | 728,500 | | | Progressive Corp. (The) | | | 14,227,605 | |
| | | | | | | | |
| | | | Total Insurance | | | 19,746,990 | |
| | | | | | | | |
| | | | TOTAL FINANCIALS | | | 73,773,160 | |
| | | | | | | | |
| HEALTH CARE — 13.0% | | | | |
| Biotechnology — 3.5% | | | | |
| | 74,414 | | | Alexion Pharmaceuticals Inc.* | | | 7,977,925 | |
| | 293,957 | | | Celgene Corp.* | | | 21,176,662 | |
| | 188,600 | | | Gilead Sciences Inc.* | | | 10,880,334 | |
| | 43,300 | | | Myriad Genetics Inc.* | | | 1,082,067 | |
| | 9,800 | | | Onyx Pharmaceuticals Inc.* | | | 704,816 | |
| | 29,400 | | | Seattle Genetics Inc.*(a) | | | 780,276 | |
| | 212,912 | | | Vertex Pharmaceuticals Inc.* | | | 11,354,597 | |
| | | | | | | | |
| | | | Total Biotechnology | | | 53,956,677 | |
| | | | | | | | |
| Health Care Equipment & Supplies — 1.2% | | | | |
| | 134,730 | | | Cooper Cos., Inc. (The) | | | 11,297,111 | |
| | 11,100 | | | Edwards Lifesciences Corp.* | | | 1,133,421 | |
| | 14,200 | | | Intuitive Surgical Inc.* | | | 6,983,418 | |
| | | | | | | | |
| | | | Total Health Care Equipment & Supplies | | | 19,413,950 | |
| | | | | | | | |
| Health Care Providers & Services — 1.4% | | | | |
| | 266,849 | | | Cardinal Health Inc. | | | 10,553,878 | |
| | 20,676 | | | Catamaran Corp.* | | | 1,801,913 | |
| | 23,400 | | | Centene Corp.* | | | 950,274 | |
| | 13,300 | | | DaVita Inc.* | | | 1,293,691 | |
| | 21,700 | | | Mednax Inc.* | | | 1,503,376 | |
| | 112,600 | | | UnitedHealth Group Inc. | | | 6,114,180 | |
| | | | | | | | |
| | | | Total Health Care Providers & Services | | | 22,217,312 | |
| | | | | | | | |
| Health Care Technology — 0.0% | | | | |
| | 10,200 | | | Cerner Corp.* | | | 746,028 | |
| | | | | | | | |
| Life Sciences Tools & Services — 0.8% | | | | |
| | 218,200 | | | Thermo Fisher Scientific Inc. | | | 12,513,770 | |
| | | | | | | | |
| Pharmaceuticals — 6.1% | | | | |
| | 192,000 | | | Abbott Laboratories | | | 12,583,680 | |
| | 309,850 | | | Allergan Inc. | | | 26,687,380 | |
| | 317,860 | | | Merck & Co., Inc. | | | 13,683,873 | |
| | 108,550 | | | Novo Nordisk, ADR | | | 17,054,291 | |
| | 92,968 | | | Perrigo Co. | | | 10,223,691 | |
| | 7,300 | | | Shire PLC, ADR | | | 660,942 | |
| | 435,113 | | | Warner Chilcott PLC, Class A Shares | | | 5,926,239 | |
| | 89,670 | | | Watson Pharmaceuticals Inc.* | | | 7,294,655 | |
| | | | | | | | |
| | | | Total Pharmaceuticals | | | 94,114,751 | |
| | | | | | | | |
| | | | TOTAL HEALTH CARE | | | 202,962,488 | |
| | | | | | | | |
| INDUSTRIALS — 9.3% | | | | |
| Aerospace & Defense — 2.1% | | | | |
| | 58,900 | | | BE Aerospace Inc.* | | | 2,371,314 | |
| | 127,693 | | | Precision Castparts Corp. | | | 20,568,788 | |
| | 131,660 | | | United Technologies Corp. | | | 10,513,051 | |
| | | | | | | | |
| | | | Total Aerospace & Defense | | | 33,453,153 | |
| | | | | | | | |
See Notes to Financial Statements.
33
Schedules of Investments
(continued)
Large Capitalization Growth Investments
| | | | | | | | |
| Shares | | | Security | | Value | |
| INDUSTRIALS — 9.3%—(continued) | | | | |
| Air Freight & Logistics — 0.0% | | | | |
| | 47,800 | | | UTi Worldwide Inc. | | $ | 656,294 | |
| | | | | | | | |
| Airlines — 0.2% | | | | |
| | 25,300 | | | Alaska Air Group Inc.* | | | 848,815 | |
| | 87,400 | | | United Continental Holdings Inc.* | | | 1,612,530 | |
| | | | | | | | |
| | | | Total Airlines | | | 2,461,345 | |
| | | | | | | | |
| Commercial Services & Supplies — 0.1% | | | | |
| | 58,100 | | | Waste Connections Inc. | | | 1,681,995 | |
| | | | | | | | |
| Construction & Engineering — 0.2% | | | | |
| | 108,300 | | | Quanta Services Inc.* | | | 2,599,200 | |
| | | | | | | | |
| Electrical Equipment — 0.1% | | | | |
| | 50,675 | | | AMETEK Inc. | | | 1,738,659 | |
| | | | | | | | |
| Industrial Conglomerates — 3.0% | | | | |
| | 452,320 | | | Danaher Corp. | | | 24,230,783 | |
| | 406,510 | | | General Electric Co. | | | 8,418,822 | |
| | 266,430 | | | Tyco International Ltd. | | | 15,021,324 | |
| | | | | | | | |
| | | | Total Industrial Conglomerates | | | 47,670,929 | |
| | | | | | | | |
| Machinery — 1.8% | | | | |
| | 79,225 | | | Caterpillar Inc. | | | 6,760,269 | |
| | 57,275 | | | Cummins Inc. | | | 5,561,975 | |
| | 26,333 | | | Eaton Corp.(a) | | | 1,177,612 | |
| | 24,200 | | | Pall Corp. | | | 1,343,342 | |
| | 191,565 | | | Stanley Black & Decker Inc. | | | 12,601,146 | |
| | | | | | | | |
| | | | Total Machinery | | | 27,444,344 | |
| | | | | | | | |
| Professional Services — 0.1% | | | | |
| | 27,800 | | | Verisk Analytics Inc., Class A Shares* | | | 1,348,856 | |
| | | | | | | | |
| Road & Rail — 1.1% | | | | |
| | 499,200 | | | Hertz Global Holdings Inc.* | | | 7,078,656 | |
| | 87,097 | | | Union Pacific Corp. | | | 10,577,060 | |
| | | | | | | | |
| | | | Total Road & Rail | | | 17,655,716 | |
| | | | | | | | |
| Trading Companies & Distributors — 0.6% | | | | |
| | 55,500 | | | MRC Global Inc.* | | | 1,222,665 | |
| | 13,200 | | | MSC Industrial Direct Co., Inc., Class A Shares | | | 914,760 | |
| | 34,600 | | | WESCO International Inc.* | | | 1,999,188 | |
| | 22,315 | | | WW Grainger Inc. | | | 4,595,997 | |
| | | | | | | | |
| | | | Total Trading Companies & Distributors | | | 8,732,610 | |
| | | | | | | | |
| | | | TOTAL INDUSTRIALS | | | 145,443,101 | |
| | | | | | | | |
| INFORMATION TECHNOLOGY — 34.9% | | | | |
| Communications Equipment — 3.8% | | | | |
| | 355,990 | | | Cisco Systems Inc. | | | 6,792,289 | |
| | 45,332 | | | F5 Networks Inc.* | | | 4,419,417 | |
| | 466,081 | | | Polycom Inc.* | | | 4,856,564 | |
| | 719,325 | | | QUALCOMM Inc. | | | 44,209,714 | |
| | | | | | | | |
| | | | Total Communications Equipment | | | 60,277,984 | |
| | | | | | | | |
| Computers & Peripherals — 9.1% | | | | |
| | 200,289 | | | Apple Inc. | | | 133,240,254 | |
| | 303,040 | | | EMC Corp.* | | | 7,966,922 | |
| | 24,200 | | | NetApp Inc.* | | | 835,384 | |
| | | | | | | | |
| | | | Total Computers & Peripherals | | | 142,042,560 | |
| | | | | | | | |
| Electronic Equipment, Instruments & Components — 0.1% | | | | |
| | 66,600 | | | Jabil Circuit Inc. | | | 1,517,148 | |
| | | | | | | | |
See Notes to Financial Statements.
34
Schedules of Investments
(continued)
Large Capitalization Growth Investments
| | | | | | | | |
| Shares | | | Security | | Value | |
| INFORMATION TECHNOLOGY — 34.9%—(continued) | | | | |
| Internet Software & Services — 5.5% | | | | |
| | 31,200 | | | Akamai Technologies Inc.* | | $ | 1,170,312 | |
| | 33,660 | | | Baidu Inc., ADR* | | | 3,751,070 | |
| | 321,200 | | | eBay Inc.* | | | 15,247,364 | |
| | 76,065 | | | Google Inc., Class A Shares* | | | 52,111,371 | |
| | 299,450 | | | VeriSign Inc.* | | | 14,277,776 | |
| | | | | | | | |
| | | | Total Internet Software & Services | | | 86,557,893 | |
| | | | | | | | |
| IT Services — 8.1% | | | | |
| | 24,700 | | | Alliance Data Systems Corp.* | | | 3,399,955 | |
| | 243,325 | | | Cognizant Technology Solutions Corp., Class A Shares* | | | 15,640,931 | |
| | 42,600 | | | Gartner Inc.* | | | 2,104,014 | |
| | 40,000 | | | Jack Henry & Associates Inc. | | | 1,478,400 | |
| | 70,375 | | | MasterCard Inc., Class A Shares | | | 29,761,588 | |
| | 34,600 | | | NeuStar Inc., Class A Shares* | | | 1,299,922 | |
| | 298,875 | | | Teradata Corp.* | | | 22,828,073 | |
| | 105,000 | | | Total System Services Inc. | | | 2,433,900 | |
| | 25,000 | | | VeriFone Systems Inc.* | | | 868,500 | |
| | 352,955 | | | Visa Inc., Class A Shares | | �� | 45,266,478 | |
| | 17,500 | | | Wright Express Corp.* | | | 1,152,200 | |
| | | | | | | | |
| | | | Total IT Services | | | 126,233,961 | |
| | | | | | | | |
| Semiconductors & Semiconductor Equipment — 1.3% | | | | |
| | 31,500 | | | Altera Corp. | | | 1,175,895 | |
| | 18,600 | | | Avago Technologies Ltd. | | | 680,202 | |
| | 436,389 | | | Broadcom Corp., Class A Shares* | | | 15,504,901 | |
| | 83,800 | | | Fairchild Semiconductor International Inc., Class A Shares* | | | 1,216,776 | |
| | 30,800 | | | Maxim Integrated Products Inc. | | | 835,912 | |
| | 69,600 | | | Teradyne Inc.* | | | 1,087,152 | |
| | | | | | | | |
| | | | Total Semiconductors & Semiconductor Equipment | | | 20,500,838 | |
| | | | | | | | |
| Software — 7.0% | | | | |
| | 490,750 | | | Adobe Systems Inc.* | | | 15,345,753 | |
| | 23,600 | | | Autodesk Inc.* | | | 732,780 | |
| | 409,675 | | | BMC Software Inc.* | | | 16,960,545 | |
| | 107,300 | | | Cadence Design Systems Inc.* | | | 1,416,360 | |
| | 148,110 | | | Check Point Software Technologies Ltd.* | | | 6,826,390 | |
| | 231,770 | | | Citrix Systems Inc.* | | | 18,006,211 | |
| | 338,550 | | | Intuit Inc. | | | 19,818,717 | |
| | 21,400 | | | MICROS Systems Inc.* | | | 1,084,124 | |
| | 544,920 | | | Microsoft Corp. | | | 16,794,434 | |
| | 385,480 | | | Oracle Corp. | | | 12,200,442 | |
| | | | | | | | |
| | | | Total Software | | | 109,185,756 | |
| | | | | | | | |
| | | | TOTAL INFORMATION TECHNOLOGY | | | 546,316,140 | |
| | | | | | | | |
| MATERIALS — 4.3% | | | | |
| Chemicals — 3.4% | | | | |
| | 27,700 | | | Celanese Corp., Series A, Class A Shares | | | 1,059,802 | |
| | 9,660 | | | CF Industries Holdings Inc. | | | 1,999,717 | |
| | 26,400 | | | Cytec Industries Inc. | | | 1,807,608 | |
| | 104,640 | | | FMC Corp. | | | 5,684,045 | |
| | 220,360 | | | Monsanto Co. | | | 19,195,559 | |
| | 86,650 | | | PPG Industries Inc. | | | 9,533,233 | |
| | 12,760 | | | Sherwin-Williams Co. (The) | | | 1,825,701 | |
| | 188,100 | | | Syngenta AG, ADR | | | 12,715,560 | |
| | | | | | | | |
| | | | Total Chemicals | | | 53,821,225 | |
| | | | | | | | |
| Containers & Packaging — 0.1% | | | | |
| | 32,300 | | | Crown Holdings Inc.* | | | 1,170,875 | |
| | | | | | | | |
See Notes to Financial Statements.
35
Schedules of Investments
(continued)
Large Capitalization Growth Investments
| | | | | | | | |
| Shares | | | Security | | Value | |
| MATERIALS — 4.3%—(continued) | | | | |
| Metals & Mining — 0.1% | | | | |
| | 28,800 | | | Allegheny Technologies Inc. | | $ | 853,632 | |
| | | | | | | | |
| Paper & Forest Products — 0.7% | | | | |
| | 330,090 | | | International Paper Co. | | | 11,407,910 | |
| | | | | | | | |
| | | | TOTAL MATERIALS | | | 67,253,642 | |
| | | | | | | | |
| TELECOMMUNICATION SERVICES — 2.7% | | | | |
| Wireless Telecommunication Services — 2.7% | | | | |
| | 655,775 | | | Crown Castle International Corp.* | | | 41,615,482 | |
| | | | | | | | |
| | | | TOTAL COMMON STOCKS (Cost — $1,096,191,386) | | | 1,511,403,534 | |
| | | | | | | | |
| WARRANTS — 0.0% | | | | |
| ENERGY — 0.0% | | | | |
| Oil, Gas & Consumable Fuels — 0.0% | | | | |
| | 238,096 | | | Kinder Morgan Inc.* | | | 750,002 | |
| | | | | | | | |
| | | | TOTAL WARRANTS (Cost — $221,385) | | | 750,002 | |
| | | | | | | | |
| | | | TOTAL INVESTMENTS BEFORE SHORT-TERM INVESTMENTS (Cost — $1,096,412,771) | | | 1,512,153,536 | |
| | | | | | | | |
| | |
Face
Amount | | | | | | |
| SHORT-TERM INVESTMENTS (b) — 4.3% | | | | |
| MONEY MARKET FUND — 0.6% | | | | |
| | 9,755,298 | | | Invesco STIT — Government & Agency Portfolio(c) (Cost — $9,755,298) | | | 9,755,298 | |
| | | | | | | | |
| TIME DEPOSITS — 3.3% | | | | |
| | 37,499,597 | | | Bank of New York Mellon — Grand Cayman, 0.030% due 9/4/12 | | | 37,499,597 | |
| | 1,936 | | | BBH — Grand Cayman, 0.030% due 9/4/12 | | | 1,936 | |
| | 3,842,924 | | | HSBC Bank — Grand Cayman, 0.030% due 9/4/12 | | | 3,842,924 | |
| | 10,376,335 | | | JPMorgan Chase & Co. — London, 0.030% due 9/4/12 | | | 10,376,335 | |
| | | | | | | | |
| | | | TOTAL TIME DEPOSITS (Cost — $51,720,792) | | | 51,720,792 | |
| | | | | | | | |
| U.S. GOVERNMENT AGENCY — 0.4% | | | | |
| | 6,415,000 | | | Federal Home Loan Bank (FHLB) Discount Notes, 0.001% due 9/4/12(d) (Cost — $6,414,999) | | | 6,414,999 | |
| | | | | | | | |
| | | | TOTAL SHORT-TERM INVESTMENTS (Cost — $67,891,089) | | | 67,891,089 | |
| | | | | | | | |
| | | | TOTAL INVESTMENTS — 100.9% (Cost — $1,164,303,860#) | | | 1,580,044,625 | |
| | | | | | | | |
| | | | Liabilities in Excess of Other Assets — (0.9)% | | | (14,086,882 | ) |
| | | | | | | | |
| | | | TOTAL NET ASSETS — 100.0% | | $ | 1,565,957,743 | |
| | | | | | | | |
| * | Non-income producing security. |
| (a) | All or a portion of this security is on loan (See Note 1). |
| (b) | Inclusive of all short term holdings, including collateral received from securities lending activities. Not including such collateral, the percentage of portfolio holdings would be 3.7%. |
| (c) | Represents investment of collateral received from securities lending transactions. |
| (d) | Rate shown represents yield-to-maturity. |
See Notes to Financial Statements.
36
Schedules of Investments
(continued)
Large Capitalization Growth Investments
| # | Aggregate cost for federal income tax purposes is $1,186,938,345. |
Abbreviations used in this schedule:
ADR — American Depositary Receipts
PLC — Public Limited Company
Summary of Investments by Security Sector*
| | | | |
Information Technology | | | 34.6 | % |
Consumer Discretionary | | | 14.5 | |
Health Care | | | 12.8 | |
Industrials | | | 9.2 | |
Energy | | | 8.0 | |
Consumer Staples | | | 5.0 | |
Financials | | | 4.7 | |
Materials | | | 4.3 | |
Telecommunication Services | | | 2.6 | |
Short-Term Investments | | | 4.3 | |
| | | | |
| | | 100.0 | % |
| | | | |
| * | As a percentage of total investments. |
See Notes to Financial Statements.
37
Schedules of Investments
(continued)
Large Capitalization Value Equity Investments
| | | | | | | | |
| Shares | | | Security | | Value | |
| COMMON STOCKS — 95.2% | | | | |
| CONSUMER DISCRETIONARY — 6.0% | | | | |
| Distributors — 0.4% | | | | |
| | 66,000 | | | Genuine Parts Co. | | $ | 4,168,560 | |
| | | | | | | | |
| Diversified Consumer Services — 0.2% | | | | |
| | 118,800 | | | H&R Block Inc. | | | 1,967,328 | |
| | | | | | | | |
| Hotels, Restaurants & Leisure — 0.8% | | | | |
| | 248,000 | | | Carnival Corp. | | | 8,600,640 | |
| | | | | | | | |
| Household Durables — 0.4% | | | | |
| | 16,700 | | | Mohawk Industries Inc.* | | | 1,203,235 | |
| | 39,900 | | | Whirlpool Corp. | | | 3,010,854 | |
| | | | | | | | |
| | | | Total Household Durables | | | 4,214,089 | |
| | | | | | | | |
| Internet & Catalog Retail — 0.1% | | | | |
| | 33,200 | | | Liberty Interactive Corp., Class A Shares* | | | 605,568 | |
| | | | | | | | |
| Leisure Equipment & Products — 0.5% | | | | |
| | 164,000 | | | Mattel Inc. | | | 5,762,960 | |
| | | | | | | | |
| Media — 1.1% | | | | |
| | 172,649 | | | Comcast Corp., Class A Shares | | | 5,788,921 | |
| | 39,800 | | | Omnicom Group Inc. | | | 2,044,526 | |
| | 90,600 | | | Time Warner Inc. | | | 3,764,430 | |
| | | | | | | | |
| | | | Total Media | | | 11,597,877 | |
| | | | | | | | |
| Multiline Retail — 1.0% | | | | |
| | 66,724 | | | Kohl’s Corp. | | | 3,482,993 | |
| | 132,800 | | | Target Corp. | | | 8,511,152 | |
| | | | | | | | |
| | | | Total Multiline Retail | | | 11,994,145 | |
| | | | | | | | |
| Specialty Retail — 1.0% | | | | |
| | 169,661 | | | Best Buy Co., Inc. | | | 3,009,786 | |
| | 749,600 | | | Staples Inc. | | | 8,185,632 | |
| | | | | | | | |
| | | | Total Specialty Retail | | | 11,195,418 | |
| | | | | | | | |
| Textiles, Apparel & Luxury Goods — 0.5% | | | | |
| | 36,405 | | | V.F. Corp. | | | 5,558,315 | |
| | | | | | | | |
| | | | TOTAL CONSUMER DISCRETIONARY | | | 65,664,900 | |
| | | | | | | | |
| CONSUMER STAPLES — 9.7% | | | | |
| Beverages — 0.7% | | | | |
| | 46,500 | | | Diageo PLC, ADR | | | 5,078,730 | |
| | 25,600 | | | Molson Coors Brewing Co., Class B Shares | | | 1,140,224 | |
| | 23,300 | | | PepsiCo Inc. | | | 1,687,619 | |
| | | | | | | | |
| | | | Total Beverages | | | 7,906,573 | |
| | | | | | | | |
| Food & Staples Retailing — 2.3% | | | | |
| | 283,577 | | | CVS Caremark Corp. | | | 12,916,932 | |
| | 101,900 | | | Kroger Co. (The) | | | 2,270,332 | |
| | 199,942 | | | Sysco Corp. | | | 6,058,243 | |
| | 46,800 | | | Wal-Mart Stores Inc. | | | 3,397,680 | |
| | | | | | | | |
| | | | Total Food & Staples Retailing | | | 24,643,187 | |
| | | | | | | | |
| Food Products — 3.1% | | | | |
| | 481,949 | | | Archer-Daniels-Midland Co. | | | 12,892,136 | |
| | 90,000 | | | HJ Heinz Co. | | | 5,014,800 | |
| | 121,200 | | | Kraft Foods Inc., Class A Shares | | | 5,033,436 | |
| | 309,100 | | | Unilever NV, NY Registered Shares | | | 10,750,498 | |
| | | | | | | | |
| | | | Total Food Products | | | 33,690,870 | |
| | | | | | | | |
See Notes to Financial Statements.
38
Schedules of Investments
(continued)
Large Capitalization Value Equity Investments
| | | | | | | | |
| Shares | | | Security | | Value | |
| CONSUMER STAPLES — 9.7%—(continued) | | | | |
| Household Products — 2.3% | | | | |
| | 185,077 | | | Kimberly-Clark Corp. | | $ | 15,472,437 | |
| | 138,900 | | | Procter & Gamble Co. | | | 9,332,691 | |
| | | | | | | | |
| | | | Total Household Products | | | 24,805,128 | |
| | | | | | | | |
| Tobacco — 1.3% | | | | |
| | 162,500 | | | Altria Group Inc. | | | 5,518,500 | |
| | 57,250 | | | Philip Morris International Inc. | | | 5,112,425 | |
| | 76,000 | | | Reynolds American Inc. | | | 3,503,600 | |
| | | | | | | | |
| | | | Total Tobacco | | | 14,134,525 | |
| | | | | | | | |
| | | | TOTAL CONSUMER STAPLES | | | 105,180,283 | |
| | | | | | | | |
| ENERGY — 15.0% | | | | |
| Energy Equipment & Services — 3.1% | | | | |
| | 98,420 | | | Ensco PLC, Class A Shares | | | 5,646,355 | |
| | 329,000 | | | Halliburton Co. | | | 10,778,040 | |
| | 135,600 | | | McDermott International Inc.* | | | 1,510,584 | |
| | 108,100 | | | National-Oilwell Varco Inc. | | | 8,518,280 | |
| | 99,500 | | | Patterson-UTI Energy Inc. | | | 1,511,405 | |
| | 275,100 | | | Superior Energy Services Inc.* | | | 5,713,827 | |
| | | | | | | | |
| | | | Total Energy Equipment & Services | | | 33,678,491 | |
| | | | | | | | |
| Oil, Gas & Consumable Fuels — 11.9% | | | | |
| | 246,928 | | | Chevron Corp. | | | 27,695,445 | |
| | 39,900 | | | Cimarex Energy Co. | | | 2,282,679 | |
| | 357,251 | | | ConocoPhillips | | | 20,288,284 | |
| | 148,500 | | | Devon Energy Corp. | | | 8,587,755 | |
| | 85,708 | | | Exxon Mobil Corp. | | | 7,482,308 | |
| | 33,000 | | | Hess Corp. | | | 1,667,490 | |
| | 382,456 | | | Marathon Oil Corp. | | | 10,639,926 | |
| | 142,413 | | | Marathon Petroleum Corp. | | | 7,369,873 | |
| | 148,530 | | | Murphy Oil Corp. | | | 7,624,045 | |
| | 81,000 | | | Occidental Petroleum Corp. | | | 6,885,810 | |
| | 102,700 | | | Phillips 66 | | | 4,313,400 | |
| | 45,400 | | | Royal Dutch Shell PLC, Class A Shares, ADR | | | 3,176,638 | |
| | 186,500 | | | Royal Dutch Shell PLC, Class B Shares, ADR | | | 13,463,435 | |
| | 65,400 | | | Southwestern Energy Co.* | | | 2,035,902 | |
| | 127,100 | | | Total SA, ADR | | | 6,337,206 | |
| | | | | | | | |
| | | | Total Oil, Gas & Consumable Fuels | | | 129,850,196 | |
| | | | | | | | |
| | | | TOTAL ENERGY | | | 163,528,687 | |
| | | | | | | | |
| FINANCIALS — 16.6% | | | | |
| Capital Markets — 1.7% | | | | |
| | 61,300 | | | Ameriprise Financial Inc. | | | 3,365,983 | |
| | 60,902 | | | Goldman Sachs Group Inc. (The) | | | 6,438,559 | |
| | 25,200 | | | Northern Trust Corp. | | | 1,170,288 | |
| | 184,969 | | | State Street Corp. | | | 7,694,711 | |
| | | | | | | | |
| | | | Total Capital Markets | | | 18,669,541 | |
| | | | | | | | |
| Commercial Banks — 1.8% | | | | |
| | 632,506 | | | Fifth Third Bancorp | | | 9,576,141 | |
| | 84,300 | | | HSBC Holdings PLC, ADR | | | 3,678,009 | |
| | 53,700 | | | PNC Financial Services Group Inc. | | | 3,337,992 | |
| | 101,200 | | | Wells Fargo & Co. | | | 3,443,836 | |
| | | | | | | | |
| | | | Total Commercial Banks | | | 20,035,978 | |
| | | | | | | | |
| Consumer Finance — 0.7% | | | | |
| | 126,100 | | | Capital One Financial Corp. | | | 7,128,433 | |
| | | | | | | | |
See Notes to Financial Statements.
39
Schedules of Investments
(continued)
Large Capitalization Value Equity Investments
| | | | | | | | |
| Shares | | | Security | | Value | |
| FINANCIALS — 16.6%—(continued) | | | | |
| Diversified Financial Services — 2.7% | | | | |
| | 613,011 | | | Bank of America Corp. | | $ | 4,897,958 | |
| | 491,980 | | | JPMorgan Chase & Co. | | | 18,272,137 | |
| | 230,000 | | | NYSE Euronext | | | 5,761,500 | |
| | | | | | | | |
| | | | Total Diversified Financial Services | | | 28,931,595 | |
| | | | | | | | |
| Insurance — 8.2% | | | | |
| | 76,000 | | | ACE Ltd. | | | 5,603,480 | |
| | 7,947 | | | Alleghany Corp.* | | | 2,679,331 | |
| | 15,600 | | | Allied World Assurance Co. Holdings AG | | | 1,225,068 | |
| | 406,489 | | | Allstate Corp. (The) | | | 15,153,910 | |
| | 39,697 | | | Aon PLC | | | 2,062,656 | |
| | 48,300 | | | Arch Capital Group Ltd.* | | | 1,927,653 | |
| | 58,500 | | | Fidelity National Financial Inc., Class A Shares | | | 1,102,140 | |
| | 44,400 | | | Loews Corp. | | | 1,804,860 | |
| | 520,116 | | | MetLife Inc. | | | 17,751,559 | |
| | 79,500 | | | PartnerRe Ltd. | | | 5,835,300 | |
| | 122,100 | | | Progressive Corp. (The) | | | 2,384,613 | |
| | 162,000 | | | Prudential Financial Inc. | | | 8,830,620 | |
| | 5,800 | | | Torchmark Corp. | | | 296,844 | |
| | 260,800 | | | Travelers Cos., Inc. (The) | | | 16,884,192 | |
| | 1,300 | | | Validus Holdings Ltd. | | | 43,563 | |
| | 151,700 | | | Willis Group Holdings PLC | | | 5,661,444 | |
| | | | | | | | |
| | | | Total Insurance | | | 89,247,233 | |
| | | | | | | | |
| Real Estate Investment Trusts (REITs) — 1.5% | | | | |
| | 257,000 | | | Annaly Capital Management Inc. | | | 4,448,670 | |
| | 32,600 | | | Hatteras Financial Corp. | | | 945,074 | |
| | 122,000 | | | HCP Inc. | | | 5,594,920 | |
| | 94,000 | | | Health Care REIT Inc. | | | 5,493,360 | |
| | | | | | | | |
| | | | Total Real Estate Investment Trusts (REITs) | | | 16,482,024 | |
| | | | | | | | |
| | | | TOTAL FINANCIALS | | | 180,494,804 | |
| | | | | | | | |
| HEALTH CARE — 13.3% | | | | |
| Health Care Equipment & Supplies — 2.8% | | | | |
| | 147,000 | | | Baxter International Inc. | | | 8,625,960 | |
| | 17,500 | | | Becton Dickinson and Co. | | | 1,329,650 | |
| | 301,600 | | | Medtronic Inc. | | | 12,263,056 | |
| | 205,284 | | | St. Jude Medical Inc. | | | 7,751,524 | |
| | | | | | | | |
| | | | Total Health Care Equipment & Supplies | | | 29,970,190 | |
| | | | | | | | |
| Health Care Providers & Services — 2.2% | | | | |
| | 245,000 | | | Aetna Inc. | | | 9,410,450 | |
| | 48,590 | | | Cigna Corp. | | | 2,223,964 | |
| | 51,750 | | | McKesson Corp. | | | 4,507,943 | |
| | 136,584 | | | UnitedHealth Group Inc. | | | 7,416,511 | |
| | | | | | | | |
| | | | Total Health Care Providers & Services | | | 23,558,868 | |
| | | | | | | | |
| Life Sciences Tools & Services — 0.1% | | | | |
| | 17,400 | | | Covance Inc.* | | | 831,546 | |
| | | | | | | | |
| Pharmaceuticals — 8.2% | | | | |
| | 85,700 | | | Abbott Laboratories | | | 5,616,778 | |
| | 192,500 | | | AstraZeneca PLC, ADR(a) | | | 9,007,075 | |
| | 51,800 | | | Bristol-Myers Squibb Co. | | | 1,709,918 | |
| | 296,150 | | | Eli Lilly & Co. | | | 13,300,097 | |
| | 172,000 | | | Hospira Inc.* | | | 5,775,760 | |
| | 234,165 | | | Johnson & Johnson | | | 15,789,746 | |
| | 403,140 | | | Merck & Co., Inc. | | | 17,355,176 | |
| | 695,375 | | | Pfizer Inc. | | | 16,591,648 | |
See Notes to Financial Statements.
40
Schedules of Investments
(continued)
Large Capitalization Value Equity Investments
| | | | | | | | |
| Shares | | | Security | | Value | |
| HEALTH CARE — 13.3%—(continued) | | | | |
| Pharmaceuticals — 8.2%—(continued) | | | | |
| | 140,300 | | | Teva Pharmaceutical Industries Ltd., ADR | | $ | 5,553,074 | |
| | | | | | | | |
| | | | Total Pharmaceuticals | | | 90,699,272 | |
| | | | | | | | |
| | | | TOTAL HEALTH CARE | | | 145,059,876 | |
| | | | | | | | |
| INDUSTRIALS — 11.1% | | | | |
| Aerospace & Defense — 3.5% | | | | |
| | 60,500 | | | Boeing Co. (The) | | | 4,319,700 | |
| | 116,950 | | | General Dynamics Corp. | | | 7,661,395 | |
| | 149,800 | | | Honeywell International Inc. | | | 8,755,810 | |
| | 24,500 | | | L-3 Communications Holdings Inc. | | | 1,720,880 | |
| | 38,200 | | | Lockheed Martin Corp. | | | 3,481,548 | |
| | 53,800 | | | Northrop Grumman Corp. | | | 3,598,682 | |
| | 95,360 | | | Raytheon Co. | | | 5,389,747 | |
| | 44,800 | | | Rockwell Collins Inc. | | | 2,189,376 | |
| | 71,900 | | | Spirit Aerosystems Holdings Inc., Class A Shares* | | | 1,787,434 | |
| | | | | | | | |
| | | | Total Aerospace & Defense | | | 38,904,572 | |
| | | | | | | | |
| Commercial Services & Supplies — 0.2% | | | | |
| | 83,400 | | | R.R. Donnelley & Sons Co.(a) | | | 915,732 | |
| | 28,500 | | | Republic Services Inc., Class A Shares | | | 788,025 | |
| | | | | | | | |
| | | | Total Commercial Services & Supplies | | | 1,703,757 | |
| | | | | | | | |
| Construction & Engineering — 1.0% | | | | |
| | 55,400 | | | Jacobs Engineering Group Inc.* | | | 2,190,516 | |
| | 332,000 | | | KBR Inc. | | | 8,993,880 | |
| | | | | | | | |
| | | | Total Construction & Engineering | | | 11,184,396 | |
| | | | | | | | |
| Electrical Equipment — 0.2% | | | | |
| | 24,200 | | | Hubbell Inc., Class B Shares | | | 1,955,844 | |
| | | | | | | | |
| Industrial Conglomerates — 2.6% | | | | |
| | 54,450 | | | 3M Co. | | | 5,042,070 | |
| | 141,152 | | | Danaher Corp. | | | 7,561,513 | |
| | 762,511 | | | General Electric Co. | | | 15,791,602 | |
| | | | | | | | |
| | | | Total Industrial Conglomerates | | | 28,395,185 | |
| | | | | | | | |
| Machinery — 1.7% | | | | |
| | 137,200 | | | Dover Corp. | | | 7,931,532 | |
| | 190,000 | | | Eaton Corp.(a) | | | 8,496,800 | |
| | 13,400 | | | Flowserve Corp. | | | 1,710,644 | |
| | | | | | | | |
| | | | Total Machinery | | | 18,138,976 | |
| | | | | | | | |
| Professional Services — 0.5% | | | | |
| | 25,400 | | | Dun & Bradstreet Corp. (The) | | | 2,056,130 | |
| | 33,000 | | | Manpower Inc. | | | 1,224,630 | |
| | 31,100 | | | Towers Watson & Co., Class A Shares | | | 1,689,352 | |
| | | | | | | | |
| | | | Total Professional Services | | | 4,970,112 | |
| | | | | | | | |
| Road & Rail — 1.4% | | | | |
| | 116,600 | | | Norfolk Southern Corp. | | | 8,448,836 | |
| | 21,500 | | | Ryder System Inc. | | | 860,215 | |
| | 47,400 | | | Union Pacific Corp. | | | 5,756,256 | |
| | | | | | | | |
| | | | Total Road & Rail | | | 15,065,307 | |
| | | | | | | | |
| | | | TOTAL INDUSTRIALS | | | 120,318,149 | |
| | | | | | | | |
| INFORMATION TECHNOLOGY — 11.8% | | | | |
| Communications Equipment — 1.7% | | | | |
| | 575,881 | | | Cisco Systems Inc. | | | 10,987,810 | |
| | 77,300 | | | Harris Corp. | | | 3,635,419 | |
See Notes to Financial Statements.
41
Schedules of Investments
(continued)
Large Capitalization Value Equity Investments
| | | | | | | | |
| Shares | | | Security | | Value | |
| INFORMATION TECHNOLOGY — 11.8%—(continued) | | | | |
| Communications Equipment — 1.7%—(continued) | | | | |
| | 90,305 | | | Motorola Solutions Inc. | | $ | 4,303,936 | |
| | | | | | | | |
| | | | Total Communications Equipment | | | 18,927,165 | |
| | | | | | | | |
| Computers & Peripherals — 0.4% | | | | |
| | 177,012 | | | Hewlett-Packard Co. | | | 2,987,963 | |
| | 54,900 | | | Lexmark International Inc., Class A Shares(a) | | | 1,191,879 | |
| | | | | | | | |
| | | | Total Computers & Peripherals | | | 4,179,842 | |
| | | | | | | | |
| Electronic Equipment, Instruments & Components — 2.2% | | | | |
| | 66,300 | | | Arrow Electronics Inc.* | | | 2,403,375 | |
| | 84,300 | | | Avnet Inc.* | | | 2,715,303 | |
| | 500,000 | | | Corning Inc. | | | 5,995,000 | |
| | 1,310,000 | | | Flextronics International Ltd.* | | | 8,816,300 | |
| | 100,400 | | | FLIR Systems Inc. | | | 1,987,920 | |
| | 129,500 | | | Ingram Micro Inc., Class A Shares* | | | 1,977,465 | |
| | | | | | | | |
| | | | Total Electronic Equipment, Instruments & Components | | | 23,895,363 | |
| | | | | | | | |
| Internet Software & Services — 0.1% | | | | |
| | 26,100 | | | Open Text Corp.*(a) | | | 1,404,180 | |
| | | | | | | | |
| IT Services — 1.4% | | | | |
| | 66,800 | | | Broadridge Financial Solutions Inc. | | | 1,581,824 | |
| | 136,300 | | | SAIC Inc. | | | 1,664,223 | |
| | 7,100 | | | Total System Services Inc. | | | 164,578 | |
| | 652,900 | | | Western Union Co. (The) | | | 11,497,569 | |
| | | | | | | | |
| | | | Total IT Services | | | 14,908,194 | |
| | | | | | | | |
| Office Electronics — 0.2% | | | | |
| | 338,500 | | | Xerox Corp. | | | 2,494,745 | |
| | | | | | | | |
| Semiconductors & Semiconductor Equipment — 2.7% | | | | |
| | 64,800 | | | Analog Devices Inc. | | | 2,575,152 | |
| | 166,300 | | | Applied Materials Inc. | | | 1,944,047 | |
| | 712,800 | | | Intel Corp. | | | 17,698,824 | |
| | 56,300 | | | Lam Research Corp.* | | | 1,921,519 | |
| | 900,000 | | | ON Semiconductor Corp.* | | | 5,607,000 | |
| | | | | | | | |
| | | | Total Semiconductors & Semiconductor Equipment | | | 29,746,542 | |
| | | | | | | | |
| Software — 3.1% | | | | |
| | 32,400 | | | Autodesk Inc.* | | | 1,006,020 | |
| | 10,300 | | | BMC Software Inc.* | | | 426,420 | |
| | 124,000 | | | CA Inc. | | | 3,227,720 | |
| | 417,292 | | | Microsoft Corp. | | | 12,860,939 | |
| | 177,889 | | | Oracle Corp. | | | 5,630,187 | |
| | 490,000 | | | Symantec Corp.* | | | 8,736,700 | |
| | 39,500 | | | Synopsys Inc.* | | | 1,304,685 | |
| | | | | | | | |
| | | | Total Software | | | 33,192,671 | |
| | | | | | | | |
| | | | TOTAL INFORMATION TECHNOLOGY | | | 128,748,702 | |
| | | | | | | | |
| MATERIALS — 4.5% | | | | |
| Chemicals — 2.2% | | | | |
| | 293,000 | | | Dow Chemical Co. (The) | | | 8,587,830 | |
| | 127,900 | | | EI du Pont de Nemours & Co. | | | 6,363,025 | |
| | 144,800 | | | Mosaic Co. (The) | | | 8,385,368 | |
| | | | | | | | |
| | | | Total Chemicals | | | 23,336,223 | |
| | | | | | | | |
| Metals & Mining — 1.2% | | | | |
| | 70,400 | | | Barrick Gold Corp.(a) | | | 2,711,808 | |
| | 293,155 | | | Freeport-McMoRan Copper & Gold Inc. | | | 10,585,827 | |
| | | | | | | | |
| | | | Total Metals & Mining | | | 13,297,635 | |
| | | | | | | | |
See Notes to Financial Statements.
42
Schedules of Investments
(continued)
Large Capitalization Value Equity Investments
| | | | | | | | |
| Shares | | | Security | | Value | |
| MATERIALS — 4.5%—(continued) | | | | |
| Paper & Forest Products — 1.1% | | | | |
| | 347,421 | | | International Paper Co. | | $ | 12,006,870 | |
| | | | | | | | |
| | | | TOTAL MATERIALS | | | 48,640,728 | |
| | | | | | | | |
| TELECOMMUNICATION SERVICES — 3.5% | | | | |
| Diversified Telecommunication Services — 2.3% | | | | |
| | 246,800 | | | AT&T Inc. | | | 9,042,752 | |
| | 254,400 | | | CenturyLink Inc. | | | 10,750,944 | |
| | 119,550 | | | Verizon Communications Inc. | | | 5,133,477 | |
| | | | | | | | |
| | | | Total Diversified Telecommunication Services | | | 24,927,173 | |
| | | | | | | | |
| Wireless Telecommunication Services — 1.2% | | | | |
| | 450,000 | | | Vodafone Group PLC, ADR | | | 13,014,000 | |
| | | | | | | | |
| | | | TOTAL TELECOMMUNICATION SERVICES | | | 37,941,173 | |
| | | | | | | | |
| UTILITIES — 3.7% | | | | |
| Electric Utilities — 2.3% | | | | |
| | 277,850 | | | American Electric Power Co., Inc. | | | 11,944,771 | |
| | 112,995 | | | Entergy Corp. | | | 7,692,700 | |
| | 74,200 | | | NextEra Energy Inc. | | | 4,994,402 | |
| | 10,500 | | | OGE Energy Corp. | | | 567,525 | |
| | | | | | | | |
| | | | Total Electric Utilities | | | 25,199,398 | |
| | | | | | | | |
| Multi-Utilities — 1.3% | | | | |
| | 83,800 | | | Ameren Corp. | | | 2,741,936 | |
| | 90,450 | | | Dominion Resources Inc. | | | 4,746,816 | |
| | 185,500 | | | Public Service Enterprise Group Inc. | | | 5,872,930 | |
| | 7,400 | | | SCANA Corp. | | | 350,464 | |
| | | | | | | | |
| | | | Total Multi-Utilities | | | 13,712,146 | |
| | | | | | | | |
| Water Utilities — 0.1% | | | | |
| | 23,900 | | | American Water Works Co., Inc. | | | 881,193 | |
| | | | | | | | |
| | | | TOTAL UTILITIES | | | 39,792,737 | |
| | | | | | | | |
| | | | TOTAL COMMON STOCKS (Cost — $873,614,486) | | | 1,035,370,039 | |
| | | | | | | | |
| | | | TOTAL INVESTMENTS BEFORE SHORT-TERM INVESTMENTS (Cost — $873,614,486) | | | 1,035,370,039 | |
| | | | | | | | |
Face
Amount | | | | | | |
| SHORT-TERM INVESTMENTS (b) — 6.7% | | | | |
| MONEY MARKET FUND — 2.1% | | | | |
| | 22,847,068 | | | Invesco STIT — Government & Agency Portfolio(c) (Cost — $22,847,068) | | | 22,847,068 | |
| | | | | | | | |
| TIME DEPOSITS — 4.6% | | | | |
| | 20,107,157 | | | Bank of America — London, 0.030% due 9/4/12 | | | 20,107,157 | |
| | 20,265,015 | | | Bank of New York Mellon — Grand Cayman, 0.030% due 9/4/12 | | | 20,265,015 | |
| | 9,386,217 | | | Wells Fargo — Grand Cayman, 0.030% due 9/4/12 | | | 9,386,217 | |
| | | | | | | | |
| | | | TOTAL TIME DEPOSITS (Cost — $49,758,389) | | | 49,758,389 | |
| | | | | | | | |
| | | | TOTAL SHORT-TERM INVESTMENTS (Cost — $72,605,457) | | | 72,605,457 | |
| | | | | | | | |
| | | | TOTAL INVESTMENTS — 101.9% (Cost — $946,219,943#) | | | 1,107,975,496 | |
| | | | | | | | |
| | | | Liabilities in Excess of Other Assets — (1.9)% | | | (20,760,962 | ) |
| | | | | | | | |
| | | | TOTAL NET ASSETS — 100.0% | | $ | 1,087,214,534 | |
| | | | | | | | |
See Notes to Financial Statements.
43
Schedules of Investments
(continued)
Large Capitalization Value Equity Investments
| * | Non-income producing security. |
| (a) | All or a portion of this security is on loan (See Note 1). |
| (b) | Inclusive of all short term holdings, including collateral received from securities lending activities. Not including such collateral, the percentage of portfolio holdings would be 4.6%. |
| (c) | Represents investment of collateral received from securities lending transactions. |
| # | Aggregate cost for federal income tax purposes is $966,899,099. |
Abbreviations used in this schedule:
ADR — American Depositary Receipts
PLC — Public Limited Company
REIT — Real Estate Investment Trust
Summary of Investments by Security Sector*
| | | | |
Financials | | | 16.3 | % |
Energy | | | 14.8 | |
Health Care | | | 13.1 | |
Information Technology | | | 11.6 | |
Industrials | | | 10.9 | |
Consumer Staples | | | 9.5 | |
Consumer Discretionary | | | 5.9 | |
Materials | | | 4.4 | |
Utilities | | | 3.6 | |
Telecommunication Services | | | 3.4 | |
Short-Term Investments | | | 6.5 | |
| | | | |
| | | 100.0 | % |
| | | | |
| * | As a percentage of total investments. |
See Notes to Financial Statements.
44
Schedules of Investments
(continued)
Small Capitalization Growth Investments
| | | | | | | | |
| Shares | | | Security | | Value | |
| COMMON STOCKS — 96.3% | | | | |
| CONSUMER DISCRETIONARY — 17.1% | | | | |
| Auto Components — 0.6% | | | | |
| | 53,900 | | | Amerigon Inc.* | | $ | 639,793 | |
| | 30,840 | | | Tenneco Inc.* | | | 936,611 | |
| | | | | | | | |
| | | | Total Auto Components | | | 1,576,404 | |
| | | | | | | | |
| Diversified Consumer Services — 1.8% | | | | |
| | 23,100 | | | Coinstar Inc.(a)* | | | 1,180,872 | |
| | 436,680 | | | Stewart Enterprises Inc., Class A Shares | | | 3,213,965 | |
| | | | | | | | |
| | | | Total Diversified Consumer Services | | | 4,394,837 | |
| | | | | | | | |
| Hotels, Restaurants & Leisure — 5.2% | | | | |
| | 58,000 | | | AFC Enterprises Inc.* | | | 1,393,160 | |
| | 18,200 | | | Buffalo Wild Wings Inc.* | | | 1,397,396 | |
| | 75,700 | | | Caribou Coffee Co., Inc.* | | | 968,203 | |
| | 107,780 | | | Cheesecake Factory Inc. (The) | | | 3,579,374 | |
| | 40,740 | | | Life Time Fitness Inc.(a)* | | | 1,934,335 | |
| | 37,500 | | | Red Robin Gourmet Burgers Inc.* | | | 1,162,875 | |
| | 155,300 | | | Shuffle Master Inc.* | | | 2,355,901 | |
| | | | | | | | |
| | | | Total Hotels, Restaurants & Leisure | | | 12,791,244 | |
| | | | | | | | |
| Household Durables — 1.1% | | | | |
| | 38,400 | | | Meritage Homes Corp.* | | | 1,431,168 | |
| | 43,600 | | | Ryland Group Inc. (The)* | | | 1,168,916 | |
| | | | | | | | |
| | | | Total Household Durables | | | 2,600,084 | |
| | | | | | | | |
| Internet & Catalog Retail — 0.4% | | | | |
| | 42,360 | | | HomeAway Inc.(a)* | | | 1,002,238 | |
| | | | | | | | |
| Media — 0.6% | | | | |
| | 90,728 | | | Rentrak Corp.* | | | 1,583,204 | |
| | | | | | | | |
| Multiline Retail — 0.6% | | | | |
| | 90,700 | | | Gordmans Stores Inc.* | | | 1,594,506 | |
| | | | | | | | |
| Specialty Retail — 6.5% | | | | |
| | 93,770 | | | Aeropostale Inc.* | | | 1,306,216 | |
| | 42,900 | | | ANN Inc.* | | | 1,526,382 | |
| | 185,559 | | | bebe stores Inc. | | | 1,007,585 | |
| | 99,000 | | | Conn’s Inc.(a)* | | | 2,292,840 | |
| | 55,400 | | | Express Inc.* | | | 864,794 | |
| | 93,240 | | | Finish Line Inc. (The), Class A Shares | | | 2,140,790 | |
| | 45,100 | | | Francesca’s Holdings Corp.(a)* | | | 1,593,383 | |
| | 18,300 | | | Genesco Inc.* | | | 1,292,895 | |
| | 32,900 | | | Monro Muffler Brake Inc. | | | 1,113,665 | |
| | 55,700 | | | Rent-A-Center Inc. | | | 1,965,096 | |
| | 39,680 | | | Tilly’s Inc., Class A Shares* | | | 727,731 | |
| | | | | | | | |
| | | | Total Specialty Retail | | | 15,831,377 | |
| | | | | | | | |
| Textiles, Apparel & Luxury Goods — 0.3% | | | | |
| | 13,200 | | | Lululemon Athletica Inc.* | | | 860,508 | |
| | | | | | | | |
| | | | TOTAL CONSUMER DISCRETIONARY | | | 42,234,402 | |
| | | | | | | | |
| CONSUMER STAPLES — 3.2% | | | | |
| Food & Staples Retailing — 2.0% | | | | |
| | 24,400 | | | Casey’s General Stores Inc. | | | 1,379,820 | |
| | 91,280 | | | Natural Grocers by Vitamin Cottage Inc.* | | | 1,960,694 | |
| | 50,100 | | | Susser Holdings Corp.* | | | 1,704,402 | |
| | | | | | | | |
| | | | Total Food & Staples Retailing | | | 5,044,916 | |
| | | | | | | | |
| Food Products — 1.2% | | | | |
| | 27,100 | | | Annie’s Inc.(a)* | | | 1,126,005 | |
See Notes to Financial Statements.
45
Schedules of Investments
(continued)
Small Capitalization Growth Investments
| | | | | | | | |
| Shares | | | Security | | Value | |
| CONSUMER STAPLES — 3.2%—(continued) | | | | |
| Food Products — 1.2%—(continued) | | | | |
| | 22,450 | | | B&G Foods Inc., Class A Shares | | $ | 657,112 | |
| | 99,600 | | | Smart Balance Inc.* | | | 1,154,364 | |
| | | | | | | | |
| | | | Total Food Products | | | 2,937,481 | |
| | | | | | | | |
| | | | TOTAL CONSUMER STAPLES | | | 7,982,397 | |
| | | | | | | | |
| ENERGY — 7.2% | | | | |
| Energy Equipment & Services — 4.2% | | | | |
| | 57,900 | | | Basic Energy Services Inc.* | | | 642,690 | |
| | 60,100 | | | Helix Energy Solutions Group Inc.* | | | 1,058,962 | |
| | 27,400 | | | Hornbeck Offshore Services Inc.* | | | 1,064,216 | |
| | 35,980 | | | Oil States International Inc.* | | | 2,815,075 | |
| | 220,400 | | | Parker Drilling Co.* | | | 912,456 | |
| | 144,900 | | | Pioneer Energy Services Corp.* | | | 1,115,730 | |
| | 137,600 | | | Superior Energy Services Inc.* | | | 2,857,952 | |
| | | | | | | | |
| | | | Total Energy Equipment & Services | | | 10,467,081 | |
| | | | | | | | |
| Oil, Gas & Consumable Fuels — 3.0% | | | | |
| | 131,300 | | | Kodiak Oil & Gas Corp., Class afo aft Shares* | | | 1,173,822 | |
| | 119,080 | | | Matador Resources Co.* | | | 1,212,234 | |
| | 40,100 | | | Oasis Petroleum Inc.* | | | 1,176,133 | |
| | 97,370 | | | Tesoro Corp. | | | 3,869,484 | |
| | | | | | | | |
| | | | Total Oil, Gas & Consumable Fuels | | | 7,431,673 | |
| | | | | | | | |
| | | | TOTAL ENERGY | | | 17,898,754 | |
| | | | | | | | |
| FINANCIALS — 5.8% | | | | |
| Capital Markets — 0.3% | | | | |
| | 77,380 | | | FXCM Inc., Class A Shares | | | 677,849 | |
| | | | | | | | |
| Commercial Banks — 1.5% | | | | |
| | 113,040 | | | East West Bancorp Inc. | | | 2,480,097 | |
| | 108,420 | | | Umpqua Holdings Corp. | | | 1,370,429 | |
| | | | | | | | |
| | | | Total Commercial Banks | | | 3,850,526 | |
| | | | | | | | |
| Consumer Finance — 0.8% | | | | |
| | 106,130 | | | DFC Global Corp.* | | | 1,976,141 | |
| | | | | | | | |
| Insurance — 1.2% | | | | |
| | 88,540 | | | Validus Holdings Ltd.(a) | | | 2,966,975 | |
| | | | | | | | |
| Real Estate Investment Trusts (REITs) — 0.8% | | | | |
| | 73,460 | | | LaSalle Hotel Properties | | | 2,001,785 | |
| | | | | | | | |
| Real Estate Management & Development — 1.2% | | | | |
| | 53,950 | | | Alexander & Baldwin Inc.* | | | 1,597,999 | |
| | 30,100 | | | Zillow Inc., Class A Shares(a)* | | | 1,252,461 | |
| | | | | | | | |
| | | | Total Real Estate Management & Development | | | 2,850,460 | |
| | | | | | | | |
| | | | TOTAL FINANCIALS | | | 14,323,736 | |
| | | | | | | | |
| HEALTH CARE — 18.0% | | | | |
| Biotechnology — 3.5% | | | | |
| | 184,900 | | | Achillion Pharmaceuticals Inc.(a)* | | | 1,299,847 | |
| | 53,990 | | | Alkermes PLC* | | | 990,717 | |
| | 28,410 | | | Cubist Pharmaceuticals Inc.* | | | 1,312,542 | |
| | 149,340 | | | Idenix Pharmaceuticals Inc.* | | | 843,771 | |
| | 19,530 | | | Medivation Inc.* | | | 2,047,916 | |
| | 132,500 | | | NPS Pharmaceuticals Inc.* | | | 1,009,650 | |
| | 20,720 | | | United Therapeutics Corp.* | | | 1,121,366 | |
| | | | | | | | |
| | | | Total Biotechnology | | | 8,625,809 | |
| | | | | | | | |
See Notes to Financial Statements.
46
Schedules of Investments
(continued)
Small Capitalization Growth Investments
| | | | | | | | |
| Shares | | | Security | | Value | |
| HEALTH CARE — 18.0%—(continued) | | | | |
| Health Care Equipment & Supplies — 5.4% | | | | |
| | 122,590 | | | ArthroCare Corp.* | | $ | 3,626,212 | |
| | 107,260 | | | Masimo Corp.* | | | 2,368,301 | |
| | 45,490 | | | Orthofix International NV* | | | 1,925,137 | |
| | 103,780 | | | Quidel Corp.(a)* | | | 1,685,387 | |
| | 242,900 | | | Spectranetics Corp.* | | | 2,948,806 | |
| | 60,500 | | | Tornier NV(a)* | | | 1,084,160 | |
| | | | | | | | |
| | | | Total Health Care Equipment & Supplies | | | 13,638,003 | |
| | | | | | | | |
| Health Care Providers & Services — 3.4% | | | | |
| | 282,520 | | | Health Management Associates Inc., Class A Shares* | | | 2,164,103 | |
| | 45,300 | | | Health Net Inc.* | | | 1,053,225 | |
| | 1,250 | | | MWI Veterinary Supply Inc.* | | | 126,025 | |
| | 175,160 | | | Team Health Holdings Inc.* | | | 5,000,818 | |
| | | | | | | | |
| | | | Total Health Care Providers & Services | | | 8,344,171 | |
| | | | | | | | |
| Health Care Technology — 0.7% | | | | |
| | 63,100 | | | HealthStream Inc.* | | | 1,793,302 | |
| | | | | | | | |
| Life Sciences Tools & Services — 2.0% | | | | |
| | 59,900 | | | Fluidigm Corp.* | | | 936,836 | |
| | 120,760 | | | ICON PLC, ADR* | | | 2,767,819 | |
| | 42,600 | | | PerkinElmer Inc. | | | 1,162,980 | |
| | | | | | | | |
| | | | Total Life Sciences Tools & Services | | | 4,867,635 | |
| | | | | | | | |
| Pharmaceuticals — 3.0% | | | | |
| | 127,300 | | | Akorn Inc.* | | | 1,761,832 | |
| | 118,500 | | | Pacira Pharmaceuticals Inc.* | | | 2,151,960 | |
| | 57,100 | | | Questcor Pharmaceuticals Inc.(a)* | | | 2,480,424 | |
| | 137,300 | | | Transcept Pharmaceuticals Inc.(a)* | | | 917,164 | |
| | | | | | | | |
| | | | Total Pharmaceuticals | | | 7,311,380 | |
| | | | | | | | |
| | | | TOTAL HEALTH CARE | | | 44,580,300 | |
| | | | | | | | |
| INDUSTRIALS — 20.7% | | | | |
| Aerospace & Defense — 1.7% | | | | |
| | 84,350 | | | Hexcel Corp.* | | | 1,912,215 | |
| | 37,170 | | | Triumph Group Inc. | | | 2,209,013 | |
| | | | | | | | |
| | | | Total Aerospace & Defense | | | 4,121,228 | |
| | | | | | | | |
| Air Freight & Logistics — 0.9% | | | | |
| | 27,550 | | | HUB Group Inc., Class A Shares* | | | 829,255 | |
| | 91,500 | | | XPO Logistics Inc.(a)* | | | 1,356,945 | |
| | | | | | | | |
| | | | Total Air Freight & Logistics | | | 2,186,200 | |
| | | | | | | | |
| Commercial Services & Supplies — 2.1% | | | | |
| | 173,400 | | | InnerWorkings Inc.* | | | 2,089,470 | |
| | 51,890 | | | Progressive Waste Solutions Ltd. | | | 1,028,979 | |
| | 212,850 | | | Steelcase Inc., Class A Shares | | | 2,064,645 | |
| | | | | | | | |
| | | | Total Commercial Services & Supplies | | | 5,183,094 | |
| | | | | | | | |
| Machinery — 5.4% | | | | |
| | 32,360 | | | CLARCOR Inc. | | | 1,557,810 | |
| | 70,410 | | | Colfax Corp.* | | | 2,315,785 | |
| | 13,520 | | | Gardner Denver Inc. | | | 814,986 | |
| | 63,800 | | | Rexnord Corp.* | | | 960,190 | |
| | 37,100 | | | Sun Hydraulics Corp. | | | 858,865 | |
| | 128,920 | | | Titan International Inc.(a) | | | 2,691,849 | |
| | 162,400 | | | Wabash National Corp.* | | | 1,086,456 | |
| | 22,100 | | | Wabtec Corp. | | | 1,726,894 | |
See Notes to Financial Statements.
47
Schedules of Investments
(continued)
Small Capitalization Growth Investments
| | | | | | | | |
| Shares | | | Security | | Value | |
| INDUSTRIALS — 20.7%—(continued) | | | | |
| Machinery — 5.4%—(continued) | | | | |
| | 46,600 | | | Westport Innovations Inc.(a)* | | $ | 1,640,786 | |
| | | | | | | | |
| | | | Total Machinery | | | 13,653,621 | |
| | | | | | | | |
| Marine — 0.3% | | | | |
| | 31,740 | | | Matson Inc. | | | 720,181 | |
| | | | | | | | |
| Professional Services — 3.8% | | | | |
| | 34,100 | | | Advisory Board Co. (The)* | | | 1,511,653 | |
| | 48,400 | | | Corporate Executive Board Co. (The) | | | 2,253,504 | |
| | 120,980 | | | Huron Consulting Group Inc.* | | | 3,904,025 | |
| | 23,700 | | | Mistras Group Inc.* | | | 516,897 | |
| | 71,600 | | | On Assignment Inc.* | | | 1,182,116 | |
| | | | | | | | |
| | | | Total Professional Services | | | 9,368,195 | |
| | | | | | | | |
| Road & Rail — 4.3% | | | | |
| | 91,000 | | | Arkansas Best Corp. | | | 835,380 | |
| | 112,940 | | | Avis Budget Group Inc.* | | | 1,854,474 | |
| | 119,180 | | | Heartland Express Inc. | | | 1,551,723 | |
| | 22,600 | | | J.B. Hunt Transport Services Inc. | | | 1,185,144 | |
| | 26,450 | | | Old Dominion Freight Line Inc.* | | | 1,184,431 | |
| | 69,900 | | | Roadrunner Transportation Systems Inc.* | | | 1,221,852 | |
| | 59,900 | | | Saia Inc.* | | | 1,299,830 | |
| | 172,290 | | | Swift Transportation Co., Class A Shares* | | | 1,404,164 | |
| | | | | | | | |
| | | | Total Road & Rail | | | 10,536,998 | |
| | | | | | | | |
| Trading Companies & Distributors — 2.2% | | | | |
| | 64,330 | | | Beacon Roofing Supply Inc.* | | | 1,810,246 | |
| | 24,560 | | | Titan Machinery Inc.* | | | 566,108 | |
| | 41,720 | | | Watsco Inc. | | | 3,148,191 | |
| | | | | | | | |
| | | | Total Trading Companies & Distributors | | | 5,524,545 | |
| | | | | | | | |
| | | | TOTAL INDUSTRIALS | | | 51,294,062 | |
| | | | | | | | |
| INFORMATION TECHNOLOGY — 21.9% | | | | |
| Communications Equipment — 2.2% | | | | |
| | 103,960 | | | Aruba Networks Inc.* | | | 2,042,814 | |
| | 22,690 | | | Emulex Corp.* | | | 155,427 | |
| | 32,900 | | | NETGEAR Inc.* | | | 1,203,153 | |
| | 101,186 | | | Procera Networks Inc.* | | | 2,144,131 | |
| | | | | | | | |
| | | | Total Communications Equipment | | | 5,545,525 | |
| | | | | | | | |
| Electronic Equipment, Instruments & Components — 0.6% | | | | |
| | 46,000 | | | Fabrinet* | | | 551,080 | |
| | 24,400 | | | Universal Display Corp.(a)* | | | 985,028 | |
| | | | | | | | |
| | | | Total Electronic Equipment, Instruments & Components | | | 1,536,108 | |
| | | | | | | | |
| Internet Software & Services — 2.5% | | | | |
| | 29,710 | | | CoStar Group Inc.* | | | 2,413,938 | |
| | 75,500 | | | E2open Inc.* | | | 963,380 | |
| | 18,900 | | | Rackspace Hosting Inc.* | | | 1,133,622 | |
| | 48,100 | | | SPS Commerce Inc.* | | | 1,681,095 | |
| | | | | | | | |
| | | | Total Internet Software & Services | | | 6,192,035 | |
| | | | | | | | |
| IT Services — 1.0% | | | | |
| | 104,515 | | | MoneyGram International Inc.* | | | 1,667,015 | |
| | 88,630 | | | WNS Holdings Ltd., ADR* | | | 919,979 | |
| | | | | | | | |
| | | | Total IT Services | | | 2,586,994 | |
| | | | | | | | |
| Semiconductors & Semiconductor Equipment — 4.9% | | | | |
| | 51,210 | | | ATMI Inc.* | | | 968,381 | |
| | 42,250 | | | Cirrus Logic Inc.* | | | 1,760,558 | |
See Notes to Financial Statements.
48
Schedules of Investments
(continued)
Small Capitalization Growth Investments
| | | | | | | | |
| Shares | | | Security | | Value | |
| INFORMATION TECHNOLOGY — 21.9%—(continued) | | | | |
| Semiconductors & Semiconductor Equipment — 4.9%—(continued) | | | | |
| | 99,990 | | | Fairchild Semiconductor International Inc., Class A Shares* | | $ | 1,451,855 | |
| | 29,500 | | | Mellanox Technologies Ltd., Class d Shares* | | | 3,374,505 | |
| | 41,270 | | | Monolithic Power Systems Inc.* | | | 889,781 | |
| | 107,300 | | | Nova Measuring Instruments Ltd.* | | | 843,378 | |
| | 74,300 | | | Peregrine Semiconductor Corp.* | | | 1,181,370 | |
| | 94,500 | | | Silicon Motion Technology Corp., ADR(a)* | | | 1,449,630 | |
| | | | | | | | |
| | | | Total Semiconductors & Semiconductor Equipment | | | 11,919,458 | |
| | | | | | | | |
| Software — 10.7% | | | | |
| | 54,000 | | | Allot Communications Ltd., Class d Shares* | | | 1,426,680 | |
| | 90,800 | | | Aspen Technology Inc.* | | | 2,213,704 | |
| | 158,090 | | | Cadence Design Systems Inc.* | | | 2,086,788 | |
| | 169,200 | | | Callidus Software Inc.(a)* | | | 756,324 | |
| | 31,300 | | | CommVault Systems Inc.* | | | 1,578,146 | |
| | 20,600 | | | Concur Technologies Inc.* | | | 1,491,440 | |
| | 169,590 | | | Fortinet Inc.* | | | 4,495,830 | |
| | 37,500 | | | Guidewire Software Inc.* | | | 1,070,625 | |
| | 48,600 | | | Kenexa Corp.* | | | 2,227,824 | |
| | 78,561 | | | Net 1 UEPS Technologies Inc.* | | | 751,043 | |
| | 56,200 | | | PROS Holdings Inc.* | | | 971,136 | |
| | 131,330 | | | QLIK Technologies Inc.* | | | 2,777,630 | |
| | 31,380 | | | SolarWinds Inc.* | | | 1,722,134 | |
| | 26,400 | | | Sourcefire Inc.* | | | 1,369,896 | |
| | 12,490 | | | Ultimate Software Group Inc.* | | | 1,238,883 | |
| | | | | | | | |
| | | | Total Software | | | 26,178,083 | |
| | | | | | | | |
| | | | TOTAL INFORMATION TECHNOLOGY | | | 53,958,203 | |
| | | | | | | | |
| MATERIALS — 2.4% | | | | |
| Chemicals — 1.4% | | | | |
| | 55,140 | | | Georgia Gulf Corp. | | | 2,185,750 | |
| | 19,740 | | | Westlake Chemical Corp. | | | 1,357,717 | |
| | | | | | | | |
| | | | Total Chemicals | | | 3,543,467 | |
| | | | | | | | |
| Metals & Mining — 0.4% | | | | |
| | 19,000 | | | Haynes International Inc. | | | 926,250 | |
| | | | | | | | |
| Paper & Forest Products — 0.6% | | | | |
| | 74,190 | | | KapStone Paper and Packaging Corp.* | | | 1,486,026 | |
| | | | | | | | |
| | | | TOTAL MATERIALS | | | 5,955,743 | |
| | | | | | | | |
| | | | TOTAL COMMON STOCKS (Cost — $187,970,617) | | | 238,227,597 | |
| | | | | | | | |
| | | | TOTAL INVESTMENTS BEFORE SHORT-TERM INVESTMENTS (Cost — $187,970,617) | | | 238,227,597 | |
| | | | | | | | |
Face
Amount | | | | | | |
| SHORT-TERM INVESTMENTS (b) — 11.7% | | | | |
| MONEY MARKET FUND — 8.1% | | | | |
| $ | 19,954,594 | | | Invesco STIT — Government & Agency Portfolio(c) (Cost — $19,954,594) | | | 19,954,594 | |
| | | | | | | | |
| TIME DEPOSITS — 3.6% | | | | |
| | 4,446,352 | | | Bank of New York Mellon — Grand Cayman, 0.030% due 9/4/12 | | | 4,446,352 | |
| | 987,881 | | | HSBC Bank — Grand Cayman, 0.030% due 9/4/12 | | | 987,881 | |
See Notes to Financial Statements.
49
Schedules of Investments
(continued)
Small Capitalization Growth Investments
| | | | | | | | |
Face
Amount | | | Security | | Value | |
| TIME DEPOSITS — 3.6%—(continued) | | | | |
| $ | 3,510,714 | | | Wells Fargo — Grand Cayman, 0.030% due 9/4/12 | | $ | 3,510,714 | |
| | | | | | | | |
| | | | TOTAL TIME DEPOSITS (Cost — $8,944,947) | | | 8,944,947 | |
| | | | | | | | |
| | | | TOTAL SHORT-TERM INVESTMENTS (Cost — $28,899,541) | | | 28,899,541 | |
| | | | | | | | |
| | | | TOTAL INVESTMENTS — 108.0% (Cost — $216,870,158#) | | | 267,127,138 | |
| | | | | | | | |
| | | | Liabilities in Excess of Other Assets — (8.0)% | | | (19,712,848 | ) |
| | | | | | | | |
| | | | TOTAL NET ASSETS — 100.0% | | $ | 247,414,290 | |
| | | | | | | | |
| * | Non-income producing security. |
| (a) | All or a portion of this security is on loan (See Note 1). |
| (b) | Inclusive of all short term holdings, including collateral received from securities lending activities. Not including such collateral, the percentage of portfolio holdings would be 3.6%. |
| (c) | Represents investment of collateral received from securities lending transactions. |
| # | Aggregate cost for federal income tax purposes is $218,412,690. |
Abbreviations used in this schedule:
ADR — American Depositary Receipts
PLC — Public Limited Company
REIT — Real Estate Investment Trust
Summary of Investments by Security Sector*
| | | | |
Information Technology | | | 20.2 | % |
Industrials | | | 19.2 | |
Health Care | | | 16.7 | |
Consumer Discretionary | | | 15.8 | |
Energy | | | 6.7 | |
Financials | | | 5.4 | |
Consumer Staples | | | 3.0 | |
Materials | | | 2.2 | |
Short-Term Investments | | | 10.8 | |
| | | | |
| | | 100.0 | % |
| | | | |
| * | As a percentage of total investments. |
See Notes to Financial Statements.
50
Schedules of Investments
(continued)
Small Capitalization Value Equity Investments
| | | | | | | | |
| Shares | | | Security | | Value | |
| COMMON STOCKS — 94.7% | | | | |
| CONSUMER DISCRETIONARY — 16.5% | | | | |
| Auto Components — 1.4% | | | | |
| | 9,500 | | | Autoliv Inc. | | $ | 563,255 | |
| | 308,971 | | | Modine Manufacturing Co.* | | | 2,165,887 | |
| | | | | | | | |
| | | | Total Auto Components | | | 2,729,142 | |
| | | | | | | | |
| Automobiles — 1.2% | | | | |
| | 74,029 | | | Thor Industries Inc. | | | 2,327,472 | |
| | | | | | | | |
| Diversified Consumer Services — 1.6% | | | | |
| | 118,259 | | | Regis Corp. | | | 2,129,845 | |
| | 70,000 | | | Service Corp. International | | | 912,800 | |
| | | | | | | | |
| | | | Total Diversified Consumer Services | | | 3,042,645 | |
| | | | | | | | |
| Hotels, Restaurants & Leisure — 4.1% | | | | |
| | 21,300 | | | Brinker International Inc. | | | 733,998 | |
| | 18,900 | | | CEC Entertainment Inc. | | | 561,519 | |
| | 23,800 | | | Cheesecake Factory Inc. (The) | | | 790,398 | |
| | 44,006 | | | International Game Technology | | | 540,834 | |
| | 90,371 | | | International Speedway Corp., Class A Shares | | | 2,404,771 | |
| | 26,300 | | | Jack in the Box Inc.* | | | 686,167 | |
| | 73,519 | | | Marriott Vacations Worldwide Corp.* | | | 2,361,430 | |
| | | | | | | | |
| | | | Total Hotels, Restaurants & Leisure | | | 8,079,117 | |
| | | | | | | | |
| Household Durables — 0.6% | | | | |
| | 15,035 | | | Harman International Industries Inc. | | | 692,061 | |
| | 14,100 | | | Meritage Homes Corp.* | | | 525,507 | |
| | | | | | | | |
| | | | Total Household Durables | | | 1,217,568 | |
| | | | | | | | |
| Leisure Equipment & Products — 1.6% | | | | |
| | 99,816 | | | Brunswick Corp. | | | 2,364,641 | |
| | 15,900 | | | Sturm Ruger & Co., Inc.(a) | | | 688,470 | |
| | | | | | | | |
| | | | Total Leisure Equipment & Products | | | 3,053,111 | |
| | | | | | | | |
| Media — 1.0% | | | | |
| | 33,400 | | | Cinemark Holdings Inc. | | | 782,228 | |
| | 36,300 | | | Meredith Corp.(a) | | | 1,181,928 | |
| | | | | | | | |
| | | | Total Media | | | 1,964,156 | |
| | | | | | | | |
| Multiline Retail — 0.3% | | | | |
| | 20,200 | | | Big Lots Inc.* | | | 614,888 | |
| | | | | | | | |
| Specialty Retail — 3.6% | | | | |
| | 23,900 | | | Aaron’s Inc. | | | 713,893 | |
| | 15,500 | | | Buckle Inc. (The)(a) | | | 705,870 | |
| | 23,800 | | | Cato Corp. (The), Class A Shares | | | 699,006 | |
| | 11,600 | | | Children’s Place Retail Stores Inc. (The)* | | | 660,504 | |
| | 32,000 | | | Finish Line Inc. (The), Class A Shares | | | 734,720 | |
| | 6,500 | | | Genesco Inc.* | | | 459,225 | |
| | 12,400 | | | Group 1 Automotive Inc. | | | 682,124 | |
| | 17,600 | | | Guess? Inc. | | | 458,656 | |
| | 25,200 | | | Men’s Wearhouse Inc. (The) | | | 796,320 | |
| | 12,700 | | | Rent-A-Center Inc. | | | 448,056 | |
| | 31,200 | | | Stage Stores Inc. | | | 668,304 | |
| | | | | | | | |
| | | | Total Specialty Retail | | | 7,026,678 | |
| | | | | | | | |
| Textiles, Apparel & Luxury Goods — 1.1% | | | | |
| | 20,300 | | | True Religion Apparel Inc. | | | 470,757 | |
| | 10,400 | | | Warnaco Group Inc. (The)* | | | 534,768 | |
See Notes to Financial Statements.
51
Schedules of Investments
(continued)
Small Capitalization Value Equity Investments
| | | | | | | | |
| Shares | | | Security | | Value | |
| CONSUMER DISCRETIONARY — 16.5%—(continued) | | | | |
| Textiles, Apparel & Luxury Goods — 1.1%—(continued) | | | | |
| | 24,000 | | | Wolverine World Wide Inc. | | $ | 1,128,720 | |
| | | | | | | | |
| | | | Total Textiles, Apparel & Luxury Goods | | | 2,134,245 | |
| | | | | | | | |
| | | | TOTAL CONSUMER DISCRETIONARY | | | 32,189,022 | |
| | | | | | | | |
| CONSUMER STAPLES — 3.0% | | | | |
| Beverages — 0.3% | | | | |
| | 18,400 | | | Embotelladora Andina SA, Class B Shares, ADR | | | 605,728 | |
| | | | | | | | |
| Food & Staples Retailing — 1.7% | | | | |
| | 15,700 | | | Andersons Inc. (The) | | | 630,669 | |
| | 8,718 | | | Casey’s General Stores Inc. | | | 493,003 | |
| | 38,300 | | | Harris Teeter Supermarkets Inc. | | | 1,496,381 | |
| | 13,600 | | | Weis Markets Inc. | | | 573,240 | |
| | | | | | | | |
| | | | Total Food & Staples Retailing | | | 3,193,293 | |
| | | | | | | | |
| Food Products — 0.7% | | | | |
| | 18,200 | | | Cal-Maine Foods Inc. | | | 731,276 | |
| | 12,400 | | | Ingredion Inc. | | | 667,492 | |
| | | | | | | | |
| | | | Total Food Products | | | 1,398,768 | |
| | | | | | | | |
| Tobacco — 0.3% | | | | |
| | 13,500 | | | Universal Corp. | | | 640,305 | |
| | | | | | | | |
| | | | TOTAL CONSUMER STAPLES | | | 5,838,094 | |
| | | | | | | | |
| ENERGY — 4.5% | | | | |
| Energy Equipment & Services — 1.5% | | | | |
| | 14,700 | | | Bristow Group Inc. | | | 689,283 | |
| | 58,700 | | | Helix Energy Solutions Group Inc.* | | | 1,034,294 | |
| | 44,600 | | | Patterson-UTI Energy Inc. | | | 677,474 | |
| | 10,400 | | | Tidewater Inc. | | | 493,272 | |
| | | | | | | | |
| | | | Total Energy Equipment & Services | | | 2,894,323 | |
| | | | | | | | |
| Oil, Gas & Consumable Fuels — 3.0% | | | | |
| | 16,600 | | | Berry Petroleum Co., Class A Shares | | | 611,544 | |
| | 8,500 | | | Cimarex Energy Co. | | | 486,285 | |
| | 21,500 | | | CVR Energy Inc.* | | | 641,130 | |
| | 13,200 | | | Energen Corp. | | | 673,860 | |
| | 46,100 | | | Forest Oil Corp.* | | | 341,601 | |
| | 17,300 | | | HollyFrontier Corp. | | | 697,017 | |
| | 38,300 | | | Whiting Petroleum Corp.* | | | 1,705,116 | |
| | 20,300 | | | World Fuel Services Corp. | | | 755,363 | |
| | | | | | | | |
| | | | Total Oil, Gas & Consumable Fuels | | | 5,911,916 | |
| | | | | | | | |
| | | | TOTAL ENERGY | | | 8,806,239 | |
| | | | | | | | |
| FINANCIALS — 21.0% | | | | |
| Capital Markets — 1.7% | | | | |
| | 135,148 | | | KBW Inc. | | | 2,066,413 | |
| | 20,400 | | | Raymond James Financial Inc. | | | 718,080 | |
| | 27,800 | | | SEI Investments Co. | | | 604,650 | |
| | | | | | | | |
| | | | Total Capital Markets | | | 3,389,143 | |
| | | | | | | | |
| Commercial Banks — 8.4% | | | | |
| | 39,600 | | | Bank of Hawaii Corp. | | | 1,830,708 | |
| | 64,600 | | | Boston Private Financial Holdings Inc. | | | 613,054 | |
| | 137,988 | | | Cathay General Bancorp | | | 2,258,864 | |
| | 10,247 | | | Comerica Inc. | | | 314,685 | |
| | 39,500 | | | Community Bank System Inc. | | | 1,107,580 | |
| | 10,500 | | | Cullen/Frost Bankers Inc. | | | 583,800 | |
| | 26,300 | | | CVB Financial Corp. | | | 314,285 | |
See Notes to Financial Statements.
52
Schedules of Investments
(continued)
Small Capitalization Value Equity Investments
| | | | | | | | |
| Shares | | | Security | | Value | |
| FINANCIALS — 21.0%—(continued) | | | | |
| Commercial Banks — 8.4%—(continued) | | | | |
| | 72,085 | | | East West Bancorp Inc. | | $ | 1,581,545 | |
| | 49,800 | | | First Financial Bancorp | | | 810,744 | |
| | 41,600 | | | First Midwest Bancorp Inc. | | | 491,296 | |
| | 65,100 | | | Fulton Financial Corp. | | | 633,423 | |
| | 35,441 | | | Hancock Holding Co. | | | 1,050,471 | |
| | 34,100 | | | Independent Bank Corp.(a) | | | 994,356 | |
| | 49,000 | | | NBT Bancorp Inc. | | | 1,030,470 | |
| | 48,800 | | | Old National Bancorp | | | 644,160 | |
| | 16,400 | | | Prosperity Bancshares Inc. | | | 690,440 | |
| | 22,600 | | | S & T Bancorp Inc. | | | 392,110 | |
| | 25,200 | | | Trustmark Corp. | | | 596,988 | |
| | 23,300 | | | WesBanco Inc. | | | 473,456 | |
| | | | | | | | |
| | | | Total Commercial Banks | | | 16,412,435 | |
| | | | | | | | |
| Consumer Finance — 0.3% | | | | |
| | 14,400 | | | Cash America International Inc. | | | 559,008 | |
| | | | | | | | |
| Insurance — 5.4% | | | | |
| | 49,400 | | | American Equity Investment Life Holding Co. | | | 571,064 | |
| | 16,900 | | | American Financial Group Inc. | | | 634,764 | |
| | 78,014 | | | AMERISAFE Inc.* | | | 1,961,272 | |
| | 23,200 | | | Infinity Property & Casualty Corp. | | | 1,301,520 | |
| | 79,762 | | | National Interstate Corp. | | | 1,982,086 | |
| | 37,800 | | | Platinum Underwriters Holdings Ltd. | | | 1,502,172 | |
| | 60,900 | | | Selective Insurance Group Inc. | | | 1,091,937 | |
| | 9,900 | | | StanCorp Financial Group Inc. | | | 309,078 | |
| | 19,246 | | | Validus Holdings Ltd.(a) | | | 644,933 | |
| | 12,700 | | | W.R. Berkley Corp. | | | 474,726 | |
| | | | | | | | |
| | | | Total Insurance | | | 10,473,552 | |
| | | | | | | | |
| Real Estate Investment Trusts (REITs) — 4.4% | | | | |
| | 23,500 | | | American Realty Capital Trust Inc. | | | 277,300 | |
| | 251,473 | | | Ashford Hospitality Trust Inc. | | | 2,082,195 | |
| | 48,664 | | | Brandywine Realty Trust | | | 593,701 | |
| | 41,300 | | | Education Realty Trust Inc. | | | 477,428 | |
| | 62,300 | | | Franklin Street Properties Corp. | | | 692,776 | |
| | 16,200 | | | Government Properties Income Trust(a) | | | 365,958 | |
| | 20,600 | | | Hatteras Financial Corp. | | | 597,194 | |
| | 20,200 | | | Highwoods Properties Inc. | | | 658,722 | |
| | 26,500 | | | Omega Healthcare Investors Inc. | | | 636,530 | |
| | 10,000 | | | PS Business Parks Inc. | | | 681,700 | |
| | 23,117 | | | Retail Properties of America Inc., Class A Shares | | | 259,373 | |
| | 6,070 | | | Sovran Self Storage Inc. | | | 345,080 | |
| | 13,323 | | | Starwood Property Trust Inc. | | | 313,757 | |
| | 18,600 | | | Washington Real Estate Investment Trust | | | 499,596 | |
| | | | | | | | |
| | | | Total Real Estate Investment Trusts (REITs) | | | 8,481,310 | |
| | | | | | | | |
| Real Estate Management & Development — 0.4% | | | | |
| | 24,400 | | | Alexander & Baldwin Inc.* | | | 722,728 | |
| | | | | | | | |
| Thrifts & Mortgage Finance — 0.4% | | | | |
| | 22,655 | | | Astoria Financial Corp.(a) | | | 228,136 | |
| | 37,500 | | | Washington Federal Inc. | | | 603,750 | |
| | | | | | | | |
| | | | Total Thrifts & Mortgage Finance | | | 831,886 | |
| | | | | | | | |
| | | | TOTAL FINANCIALS | | | 40,870,062 | |
| | | | | | | | |
| HEALTH CARE — 4.7% | | | | |
| Health Care Equipment & Supplies — 3.3% | | | | |
| | 17,800 | | | Cooper Cos., Inc. (The) | | | 1,492,530 | |
See Notes to Financial Statements.
53
Schedules of Investments
(continued)
Small Capitalization Value Equity Investments
| | | | | | | | |
| Shares | | | Security | | Value | |
| HEALTH CARE — 4.7%—(continued) | | | | |
| Health Care Equipment & Supplies — 3.3%—(continued) | | | | |
| | 9,700 | | | Haemonetics Corp.* | | $ | 714,599 | |
| | 28,500 | | | Invacare Corp. | | | 391,590 | |
| | 22,300 | | | STERIS Corp. | | | 763,552 | |
| | 22,800 | | | Teleflex Inc. | | | 1,505,483 | |
| | 31,593 | | | West Pharmaceutical Services Inc. | | | 1,495,929 | |
| | | | | | | | |
| | | | Total Health Care Equipment & Supplies | | | 6,363,683 | |
| | | | | | | | |
| Health Care Providers & Services — 1.1% | | | | |
| | 47,750 | | | Owens & Minor Inc. | | | 1,336,523 | |
| | 20,500 | | | Universal Health Services Inc., Class B Shares | | | 818,975 | |
| | | | | | | | |
| | | | Total Health Care Providers & Services | | | 2,155,498 | |
| | | | | | | | |
| Life Sciences Tools & Services — 0.3% | | | | |
| | 24,200 | | | PerkinElmer Inc. | | | 660,660 | |
| | | | | | | | |
| | | | TOTAL HEALTH CARE | | | 9,179,841 | |
| | | | | | | | |
| INDUSTRIALS — 21.8% | | | | |
| Aerospace & Defense — 0.9% | | | | |
| | 13,200 | | | Alliant Techsystems Inc. | | | 646,668 | |
| | 20,100 | | | Curtiss-Wright Corp. | | | 604,206 | |
| | 14,400 | | | Elbit Systems Ltd. | | | 451,440 | |
| | | | | | | | |
| | | | Total Aerospace & Defense | | | 1,702,314 | |
| | | | | | | | |
| Commercial Services & Supplies — 4.8% | | | | |
| | 247,328 | | | ACCO Brands Corp.* | | | 1,629,892 | |
| | 42,900 | | | Brink’s Co. (The) | | | 954,954 | |
| | 42,100 | | | Ennis Inc. | | | 614,239 | |
| | 32,800 | | | Knoll Inc. | | | 476,912 | |
| | 167,843 | | | Schawk Inc., Class A Shares | | | 2,192,030 | |
| | 9,900 | | | UniFirst Corp. | | | 628,749 | |
| | 20,600 | | | United Stationers Inc. | | | 498,314 | |
| | 117,471 | | | Viad Corp. | | | 2,404,630 | |
| | | | | | | | |
| | | | Total Commercial Services & Supplies | | | 9,399,720 | |
| | | | | | | | |
| Construction & Engineering — 1.4% | | | | |
| | 28,300 | | | Chicago Bridge & Iron Co. NV, Class NY Shares | | | 1,042,006 | |
| | 149,779 | | | Great Lakes Dredge & Dock Corp. | | | 1,094,884 | |
| | 22,800 | | | KBR Inc. | | | 617,652 | |
| | | | | | | | |
| | | | Total Construction & Engineering | | | 2,754,542 | |
| | | | | | | | |
| Electrical Equipment — 2.1% | | | | |
| | 18,600 | | | Belden Inc. | | | 634,818 | |
| | 62,637 | | | EnerSys Inc.* | | | 2,333,228 | |
| | 17,900 | | | Regal-Beloit Corp. | | | 1,218,274 | |
| | | | | | | | |
| | | | Total Electrical Equipment | | | 4,186,320 | |
| | | | | | | | |
| Machinery — 9.2% | | | | |
| | 33,800 | | | Actuant Corp., Class A Shares | | | 950,456 | |
| | 32,800 | | | Altra Holdings Inc. | | | 603,848 | |
| | 25,400 | | | Barnes Group Inc. | | | 601,218 | |
| | 118,294 | | | Briggs & Stratton Corp.(a) | | | 2,048,852 | |
| | 15,500 | | | Crane Co. | | | 588,845 | |
| | 162,010 | | | Douglas Dynamics Inc. | | | 2,271,380 | |
| | 16,500 | | | Gardner Denver Inc. | | | 994,620 | |
| | 109,700 | | | Harsco Corp. | | | 2,236,783 | |
| | 32,094 | | | ITT Corp. | | | 638,671 | |
| | 150,262 | | | John Bean Technologies Corp. | | | 2,398,182 | |
| | 17,300 | | | Kennametal Inc. | | | 637,332 | |
| | 634,822 | | | Mueller Water Products Inc., Class A Shares | | | 2,431,369 | |
See Notes to Financial Statements.
54
Schedules of Investments
(continued)
Small Capitalization Value Equity Investments
| | | | | | | | |
| Shares | | | Security | | Value | |
| INDUSTRIALS — 21.8%—(continued) | | | | |
| Machinery — 9.2%—(continued) | | | | |
| | 29,200 | | | Titan International Inc.(a) | | $ | 609,696 | |
| | 9,000 | | | Twin Disc Inc. | | | 166,590 | |
| | 6,000 | | | Valmont Industries Inc. | | | 760,500 | |
| | | | | | | | |
| | | | Total Machinery | | | 17,938,342 | |
| | | | | | | | |
| Marine — 0.6% | | | | |
| | 11,000 | | | Kirby Corp.* | | | 579,150 | |
| | 24,700 | | | Matson Inc. | | | 560,443 | |
| | | | | | | | |
| | | | Total Marine | | | 1,139,593 | |
| | | | | | | | |
| Road & Rail — 1.6% | | | | |
| | 21,600 | | | Saia Inc.* | | | 468,720 | |
| | 117,374 | | | Werner Enterprises Inc. | | | 2,611,572 | |
| | | | | | | | |
| | | | Total Road & Rail | | | 3,080,292 | |
| | | | | | | | |
| Trading Companies & Distributors — 1.2% | | | | |
| | 17,600 | | | TAL International Group Inc. | | | 598,576 | |
| | 53,500 | | | United Rentals Inc.* | | | 1,728,585 | |
| | | | | | | | |
| | | | Total Trading Companies & Distributors | | | 2,327,161 | |
| | | | | | | | |
| | | | TOTAL INDUSTRIALS | | | 42,528,284 | |
| | | | | | | | |
| INFORMATION TECHNOLOGY — 8.6% | | | | |
| Communications Equipment — 0.6% | | | | |
| | 16,400 | | | Black Box Corp. | | | 426,236 | |
| | 132,200 | | | Brocade Communications Systems Inc.* | | | 766,760 | |
| | | | | | | | |
| | | | Total Communications Equipment | | | 1,192,996 | |
| | | | | | | | |
| Computers & Peripherals — 0.5% | | | | |
| | 13,081 | | | Diebold Inc. | | | 426,179 | |
| | 30,000 | | | Electronics for Imaging Inc.* | | | 463,500 | |
| | | | | | | | |
| | | | Total Computers & Peripherals | | | 889,679 | |
| | | | | | | | |
| Electronic Equipment, Instruments & Components — 1.6% | | | | |
| | 57,500 | | | AVX Corp. | | | 588,800 | |
| | 26,700 | | | Jabil Circuit Inc. | | | 608,226 | |
| | 17,000 | | | Tech Data Corp.* | | | 825,860 | |
| | 107,700 | | | Vishay Intertechnology Inc.* | | | 1,029,612 | |
| | | | | | | | |
| | | | Total Electronic Equipment, Instruments & Components | | | 3,052,498 | |
| | | | | | | | |
| Internet Software & Services — 0.3% | | | | |
| | 22,300 | | | j2 Global Inc.(a) | | | 657,181 | |
| | | | | | | | |
| IT Services — 0.7% | | | | |
| | 407,456 | | | Lionbridge Technologies Inc.* | | | 1,430,171 | |
| | | | | | | | |
| Semiconductors & Semiconductor Equipment — 2.1% | | | | |
| | 66,400 | | | Brooks Automation Inc. | | | 531,864 | |
| | 48,200 | | | Cirrus Logic Inc.* | | | 2,008,494 | |
| | 88,700 | | | ON Semiconductor Corp.* | | | 552,601 | |
| | 110,900 | | | RF Micro Devices Inc.* | | | 415,875 | |
| | 41,500 | | | Teradyne Inc.* | | | 648,230 | |
| | | | | | | | |
| | | | Total Semiconductors & Semiconductor Equipment | | | 4,157,064 | |
| | | | | | | | |
| Software — 2.8% | | | | |
| | 121,300 | | | Compuware Corp.* | | | 1,213,000 | |
| | 13,300 | | | Fair Isaac Corp. | | | 568,043 | |
| | 25,300 | | | NetScout Systems Inc.* | | | 600,875 | |
| | 51,300 | | | Parametric Technology Corp.* | | | 1,090,125 | |
| | 11,120 | | | QAD Inc., Class A Shares* | | | 136,220 | |
| | 2,780 | | | QAD Inc., Class B Shares* | | | 32,609 | |
See Notes to Financial Statements.
55
Schedules of Investments
(continued)
Small Capitalization Value Equity Investments
| | | | | | | | |
| Shares | | | Security | | Value | |
| INFORMATION TECHNOLOGY — 8.6%—(continued) | | | | |
| Software — 2.8%—(continued) | | | | |
| | 51,800 | | | Synopsys Inc.* | | $ | 1,710,954 | |
| | | | | | | | |
| | | | Total Software | | | 5,351,826 | |
| | | | | | | | |
| | | | TOTAL INFORMATION TECHNOLOGY | | | 16,731,415 | |
| | | | | | | | |
| MATERIALS — 10.9% | | | | |
| Chemicals — 7.0% | | | | |
| | 25,600 | | | Albemarle Corp. | | | 1,401,088 | |
| | 15,700 | | | Cabot Corp. | | | 546,831 | |
| | 18,500 | | | Cytec Industries Inc. | | | 1,266,695 | |
| | 6,500 | | | Ferro Corp.* | | | 21,320 | |
| | 65,538 | | | Georgia Gulf Corp. | | | 2,597,926 | |
| | 28,700 | | | HB Fuller Co. | | | 872,767 | |
| | 12,600 | | | Innophos Holdings Inc. | | | 595,854 | |
| | 7,400 | | | International Flavors & Fragrances Inc. | | | 447,848 | |
| | 101,593 | | | Kraton Performance Polymers Inc.* | | | 2,179,170 | |
| | 22,000 | | | Methanex Corp. | | | 655,820 | |
| | 3,100 | | | NewMarket Corp. | | | 762,972 | |
| | 4,500 | | | Olin Corp. | | | 96,435 | |
| | 13,700 | | | Scotts Miracle-Gro Co. (The), Class A Shares | | | 570,605 | |
| | 16,400 | | | Sensient Technologies Corp. | | | 587,940 | |
| | 19,000 | | | Valspar Corp. | | | 1,013,460 | |
| | | | | | | | |
| | | | Total Chemicals | | | 13,616,731 | |
| | | | | | | | |
| Containers & Packaging — 1.6% | | | | |
| | 88,045 | | | Myers Industries Inc. | | | 1,303,066 | |
| | 10,400 | | | Rock-Tenn Co., Class A Shares | | | 694,408 | |
| | 13,200 | | | Silgan Holdings Inc. | | | 553,476 | |
| | 19,700 | | | Sonoco Products Co. | | | 602,623 | |
| | | | | | | | |
| | | | Total Containers & Packaging | | | 3,153,573 | |
| | | | | | | | |
| Metals & Mining — 1.7% | | | | |
| | 53,400 | | | HudBay Minerals Inc. | | | 456,036 | |
| | 36,000 | | | IAMGOLD Corp. | | | 471,600 | |
| | 16,000 | | | Kaiser Aluminum Corp. | | | 893,600 | |
| | 9,200 | | | Royal Gold Inc. | | | 809,784 | |
| | 49,000 | | | Steel Dynamics Inc. | | | 598,780 | |
| | | | | | | | |
| | | | Total Metals & Mining | | | 3,229,800 | |
| | | | | | | | |
| Paper & Forest Products — 0.6% | | | | |
| | 23,200 | | | Buckeye Technologies Inc. | | | 703,424 | |
| | 33,300 | | | P.H. Glatfelter Co. | | | 559,440 | |
| | | | | | | | |
| | | | Total Paper & Forest Products | | | 1,262,864 | |
| | | | | | | | |
| | | | TOTAL MATERIALS | | | 21,262,968 | |
| | | | | | | | |
| TELECOMMUNICATION SERVICES — 0.3% | | | | |
| Diversified Telecommunication Services — 0.3% | | | | |
| | 62,800 | | | Premiere Global Services Inc.* | | | 581,528 | |
| | | | | | | | |
| UTILITIES — 3.4% | | | | |
| Electric Utilities — 1.2% | | | | |
| | 35,992 | | | El Paso Electric Co. | | | 1,190,975 | |
| | 24,500 | | | Portland General Electric Co. | | | 657,580 | |
| | 19,700 | | | Westar Energy Inc. | | | 573,664 | |
| | | | | | | | |
| | | | Total Electric Utilities | | | 2,422,219 | |
| | | | | | | | |
| Gas Utilities — 1.6% | | | | |
| | 15,100 | | | AGL Resources Inc. | | | 598,715 | |
| | 17,100 | | | Atmos Energy Corp. | | | 597,474 | |
See Notes to Financial Statements.
56
Schedules of Investments
(continued)
Small Capitalization Value Equity Investments
| | | | | | | | |
| Shares | | | Security | | Value | |
| UTILITIES — 3.4%—(continued) | | | | |
| Gas Utilities — 1.6%—(continued) | | | | |
| | 25,900 | | | Southwest Gas Corp. | | $ | 1,107,225 | |
| | 22,700 | | | UGI Corp. | | | 691,896 | |
| | | | | | | | |
| | | | Total Gas Utilities | | | 2,995,310 | |
| | | | | | | | |
| Multi-Utilities — 0.6% | | | | |
| | 13,800 | | | Black Hills Corp. | | | 471,960 | |
| | 19,000 | | | NorthWestern Corp. | | | 695,400 | |
| | | | | | | | |
| | | | Total Multi-Utilities | | | 1,167,360 | |
| | | | | | | | |
| | | | TOTAL UTILITIES | | | 6,584,889 | |
| | | | | | | | |
| | | | TOTAL COMMON STOCKS | | | | |
| | | | (Cost — $135,006,409) | | | 184,572,342 | |
| | | | | | | | |
| | | | TOTAL INVESTMENTS BEFORE SHORT-TERM INVESTMENTS | | | | |
| | | | (Cost — $135,006,409) | | | 184,572,342 | |
| | | | | | | | |
Face
Amount | | | | | | |
| SHORT-TERM INVESTMENTS (b) — 8.3% | | | | |
| COMMERCIAL PAPER — 0.8% | | | | |
| | 1,555,000 | | | Abbey National North America LLC, 0.170% due 9/4/12(c) | | | | |
| | | | (Cost — $1,554,971) | | | 1,554,971 | |
| | | | | | | | |
| MONEY MARKET FUND — 3.1% | | | | |
| | 5,954,665 | | | Invesco STIT — Government & Agency Portfolio(d) | | | | |
| | | | (Cost — $5,954,665) | | | 5,954,665 | |
| | | | | | | | |
| TIME DEPOSITS — 4.4% | | | | |
| | 4,550,193 | | | Bank of New York Mellon — Grand Cayman, 0.030% due 9/4/12 | | | 4,550,193 | |
| | 2,616 | | | BBH — Grand Cayman, 0.030% due 9/4/12 | | | 2,616 | |
| | 4,167,613 | | | Wells Fargo — Grand Cayman, 0.030% due 9/4/12 | | | 4,167,613 | |
| | | | | | | | |
| | | | TOTAL TIME DEPOSITS | | | | |
| | | | (Cost — $8,720,422) | | | 8,720,422 | |
| | | | | | | | |
| | | | TOTAL SHORT-TERM INVESTMENTS | | | | |
| | | | (Cost — $16,230,058) | | | 16,230,058 | |
| | | | | | | | |
| | | | TOTAL INVESTMENTS — 103.0% | | | | |
| | | | (Cost — $151,236,467#) | | | 200,802,400 | |
| | | | | | | | |
| | | | Liabilities in Excess of Other Assets — (3.0)% | | | (5,904,672 | ) |
| | | | | | | | |
| | | | TOTAL NET ASSETS — 100.0% | | $ | 194,897,728 | |
| | | | | | | | |
| * | Non-income producing security. |
| (a) | All or a portion of this security is on loan (See Note 1). |
| (b) | Inclusive of all short term holdings, including collateral received from securities lending activities. Not including such collateral, the percentage of portfolio holdings would be 5.2%. |
| (c) | Rate shown represents yield-to-maturity. |
| (d) | Represents investment of collateral received from securities lending transactions. |
| # | Aggregate cost for federal income tax purposes is $153,594,584. |
Abbreviations used in this schedule:
ADR — American Depositary Receipts
REIT — Real Estate Investment Trust
See Notes to Financial Statements.
57
Schedules of Investments
(continued)
Small Capitalization Value Equity Investments
Summary of Investments by Security Sector*
| | | | |
Industrials | | | 21.2 | % |
Financials | | | 20.3 | |
Consumer Discretionary | | | 16.0 | |
Materials | | | 10.6 | |
Information Technology | | | 8.3 | |
Health Care | | | 4.6 | |
Energy | | | 4.4 | |
Utilities | | | 3.3 | |
Consumer Staples | | | 2.9 | |
Telecommunication Services | | | 0.3 | |
Short-Term Investments | | | 8.1 | |
| | | | |
| | | 100.0 | % |
| | | | |
| * | As a percentage of total investments. |
See Notes to Financial Statements.
58
Schedules of Investments
(continued)
International Equity Investments
| | | | | | | | |
| Shares | | | Security | | Value | |
| COMMON STOCKS — 94.3% | | | | |
| Argentina — 0.3% | | | | |
| | 15,439 | | | MercadoLibre Inc. | | $ | 1,228,636 | |
| | | | | | | | |
| Australia — 2.3% | | | | |
| | 26,129 | | | Abacus Property Group | | | 54,541 | |
| | 2,075 | | | Adelaide Brighton Ltd. | | | 6,261 | |
| | 34,920 | | | Aditya Birla Minerals Ltd. | | | 14,795 | |
| | 110,921 | | | Amcor Ltd. | | | 863,090 | |
| | 215,715 | | | APN News & Media Ltd. | | | 63,529 | |
| | 22,744 | | | Ardent Leisure Group | | | 29,731 | |
| | 152,119 | | | Arrium Ltd. | | | 101,389 | |
| | 203,031 | | | Aspen Group | | | 58,745 | |
| | 403,785 | | | Atlas Iron Ltd. | | | 563,289 | |
| | 22,568 | | | Ausenco Ltd. | | | 69,962 | |
| | 34,244 | | | Australand Property Group | | | 102,266 | |
| | 76,850 | | | Australia & New Zealand Banking Group Ltd. | | | 1,971,028 | |
| | 5,467 | | | Australian Infrastructure Fund, Class Miscella Shares | | | 17,400 | |
| | 5,703 | | | Bank of Queensland Ltd. | | | 44,494 | |
| | 92,812 | | | Beach Energy Ltd. | | | 113,171 | |
| | 30,000 | | | BlueScope Steel Ltd.* | | | 10,385 | |
| | 86,937 | | | CSG Ltd. | | | 69,623 | |
| | 280,383 | | | Downer EDI Ltd.* | | | 1,031,451 | |
| | 111,530 | | | Emeco Holdings Ltd. | | | 89,895 | |
| | 404 | | | Flight Centre Ltd. | | | 9,978 | |
| | 875 | | | GrainCorp Ltd.(a)* | | | 8,337 | |
| | 9,621 | | | GrainCorp Ltd., Class A Shares | | | 91,664 | |
| | 289,945 | | | Grange Resources Ltd. | | | 89,884 | |
| | 25,000 | | | Hills Holdings Ltd. | | | 30,871 | |
| | 29,907 | | | Mincor Resources NL | | | 17,925 | |
| | 809,954 | | | Mount Gibson Iron Ltd. | | | 610,985 | |
| | 2,947 | | | Myer Holdings Ltd. | | | 6,060 | |
| | 51,931 | | | National Australia Bank Ltd. | | | 1,352,840 | |
| | 51,721 | | | Newcrest Mining Ltd. | | | 1,317,440 | |
| | 10,587 | | | Nufarm Ltd. | | | 63,999 | |
| | 4,753 | | | Panoramic Resources Ltd. | | | 2,628 | |
| | 16,320 | | | Primary Health Care Ltd. | | | 62,904 | |
| | 29,289 | | | Programmed Maintenance Services Ltd. | | | 68,098 | |
| | 43,506 | | | Seven West Media Ltd. | | | 65,862 | |
| | 3,388 | | | Skilled Group Ltd. | | | 9,208 | |
| | 40,492 | | | Spark Infrastructure Group(b) | | | 67,785 | |
| | 16,688 | | | STW Communications Group Ltd. | | | 17,676 | |
| | 33,681 | | | Tassal Group Ltd. | | | 43,157 | |
| | 202,112 | | | Toll Holdings Ltd. | | | 966,986 | |
| | 12,586 | | | Transfield Services Ltd. | | | 23,866 | |
| | | | | | | | |
| | | | Total Australia | | | 10,203,198 | |
| | | | | | | | |
| Austria — 0.0% | | | | |
| | 6,652 | | | Austria Technologie & Systemtechnik AG | | | 58,654 | |
| | 5,687 | | | EVN AG | | | 76,541 | |
| | 109 | | | Oesterreichische Post AG | | | 3,654 | |
| | 1,706 | | | Strabag SE | | | 38,347 | |
| | | | | | | | |
| | | | Total Austria | | | 177,196 | |
| | | | | | | | |
| Belgium — 0.9% | | | | |
| | 47,028 | | | Anheuser-Busch InBev NV | | | 3,950,315 | |
| | 2,823 | | | Arseus NV | | | 45,736 | |
| | 4,746 | | | Cie Maritime Belge SA | | | 95,516 | |
| | 370 | | | Elia System Operator SA | | | 14,458 | |
| | 1,325 | | | Exmar NV | | | 9,383 | |
See Notes to Financial Statements.
59
Schedules of Investments
(continued)
International Equity Investments
| | | | | | | | |
| Shares | | | Security | | Value | |
| Belgium — 0.9%—(continued) | | | | |
| | 1,143 | | | Gimv NV | | $ | 52,635 | |
| | 724 | | | NV Bekaert SA | | | 18,906 | |
| | 2,488 | | | Recticel SA | | | 15,679 | |
| | | | | | | | |
| | | | Total Belgium | | | 4,202,628 | |
| | | | | | | | |
| Bermuda — 0.0% | | | | |
| | 17,698 | | | Catlin Group Ltd. | | | 128,741 | |
| | | | | | | | |
| Brazil — 2.3% | | | | |
| | 77,200 | | | Banco do Brasil SA, ADR(c) | | | 910,674 | |
| | 165,900 | | | BM&FBovespa SA | | | 878,383 | |
| | 126,600 | | | BR Malls Participações SA | | | 1,577,551 | |
| | 28,190 | | | BRF — Brasil Foods SA | | | 452,767 | |
| | 17,999 | | | Cia Brasileira de Distribuição Grupo Pao de Açúcar, Class A Shares, ADR | | | 771,797 | |
| | 38,900 | | | Embraer SA, ADR | | | 1,048,355 | |
| | 75,800 | | | Itaú Unibanco Holding SA, ADR | | | 1,198,398 | |
| | 60,100 | | | Natura Cosméticos SA | | | 1,506,681 | |
| | 82,206 | | | Petróleo Brasileiro SA, ADR | | | 1,737,835 | |
| | | | | | | | |
| | | | Total Brazil | | | 10,082,441 | |
| | | | | | �� | | |
| Canada — 2.9% | | | | |
| | 46,503 | | | Canadian National Railway Co. | | | 4,254,528 | |
| | 40,439 | | | Cenovus Energy Inc. | | | 1,324,323 | |
| | 23,780 | | | First Quantum Minerals Ltd. | | | 457,855 | |
| | 25,127 | | | Imax Corp.(c)* | | | 507,817 | |
| | 19,988 | | | Potash Corp. of Saskatchewan Inc. | | | 817,921 | |
| | 41,668 | | | Potash Corp. of Saskatchewan Inc. (NYSE Shares) | | | 1,711,305 | |
| | 28,564 | | | Shoppers Drug Mart Corp. | | | 1,213,166 | |
| | 49,706 | | | Suncor Energy Inc.(c) | | | 1,552,714 | |
| | 15,185 | | | Toronto-Dominion Bank (The) | | | 1,241,527 | |
| | | | | | | | |
| | | | Total Canada | | | 13,081,156 | |
| | | | | | | | |
| China — 3.3% | | | | |
| | 2,000 | | | AAC Technologies Holdings Inc. | | | 6,820 | |
| | 35,432 | | | Baidu Inc., ADR* | | | 3,948,542 | |
| | 115,457 | | | China Life Insurance Co., Ltd., Class H Shares | | | 309,620 | |
| | 741,294 | | | China Merchants Bank Co., Ltd., Class H Shares | | | 1,278,769 | |
| | 150,000 | | | China Shenhua Energy Co., Ltd., Class H Shares | | | 546,330 | |
| | 99,000 | | | China XLX Fertiliser Ltd. | | | 24,198 | |
| | 2,268,715 | | | CNOOC Ltd. | | | 4,323,145 | |
| | 3,380,000 | | | Industrial & Commercial Bank of China, Class H Shares | | | 1,838,970 | |
| | 377,096 | | | Sinopharm Group Co., Class H Shares | | | 1,198,434 | |
| | 40,159 | | | Tencent Holdings Ltd. | | | 1,226,055 | |
| | | | | | | | |
| | | | Total China | | | 14,700,883 | |
| | | | | | | | |
| Denmark — 1.3% | | | | |
| | 1,106 | | | Dfds AS | | | 52,267 | |
| | 2,030 | | | East Asiatic Co., Ltd. | | | 41,628 | |
| | 36,107 | | | Novo Nordisk AS, Class B Shares | | | 5,685,710 | |
| | 4,294 | | | Pandora AS | | | 58,014 | |
| | 4,349 | | | Schouw & Co. | | | 97,990 | |
| | | | | | | | |
| | | | Total Denmark | | | 5,935,609 | |
| | | | | | | | |
| Finland — 0.3% | | | | |
| | 41,090 | | | Oriola-KD Oyj, Class B Shares | | | 98,202 | |
| | 9,828 | | | Outokumpu Oyj* | | | 8,789 | |
| | 17,649 | | | Technopolis Oyj | | | 75,923 | |
| | 3,430 | | | Tieto Oyj | | | 58,849 | |
| | 94,337 | | | UPM-Kymmene Oyj | | | 1,044,817 | |
| | | | | | | | |
| | | | Total Finland | | | 1,286,580 | |
| | | | | | | | |
See Notes to Financial Statements.
60
Schedules of Investments
(continued)
International Equity Investments
| | | | | | | | |
| Shares | | | Security | | Value | |
| France — 8.4% | | | | |
| | 46,479 | | | Acanthe Developpement SA(c) | | $ | 22,801 | |
| | 20,003 | | | Air Liquide SA | | | 2,353,790 | |
| | 7,906 | | | Arkema SA | | | 673,048 | |
| | 74,392 | | | BNP Paribas SA | | | 3,233,449 | |
| | 13,063 | | | Cap Gemini SA | | | 480,205 | |
| | 9,512 | | | Casino Guichard Perrachon SA | | | 844,227 | |
| | 3,246 | | | Cegid Group | | | 57,121 | |
| | 36,116 | | | Cie de Saint-Gobain | | | 1,239,063 | |
| | 2,607 | | | Cie des Alpes | | | 41,974 | |
| | 29,859 | | | Cie Générale des Établissements Michelin, Class B Shares | | | 2,142,692 | |
| | 13,287 | | | Cie Générale d’Optique Essilor International SA | | | 1,159,719 | |
| | 1,056 | | | Ciments Français SA | | | 61,101 | |
| | 2,861 | | | Crédit Agricole Nord de France | | | 43,544 | |
| | 29,555 | | | Danone SA | | | 1,842,059 | |
| | 70 | | | Derichebourg SA | | | 211 | |
| | 877 | | | Devoteam SA | | | 9,994 | |
| | 360 | | | Eiffage SA | | | 11,187 | |
| | 45 | | | Euler Hermes SA | | | 2,788 | |
| | 90,162 | | | GDF Suez | | | 2,220,006 | |
| | 8,126 | | | Jacquet Metal Service | | | 78,264 | |
| | 10,796 | | | L’Oréal SA | | | 1,327,285 | |
| | 24,575 | | | LVMH Moët Hennessy Louis Vuitton SA | | | 4,012,333 | |
| | 2,753 | | | Maisons France Confort | | | 80,685 | |
| | 2,072 | | | Nexity SA | | | 50,666 | |
| | 16,839 | | | Pernod-Ricard SA | | | 1,814,571 | |
| | 4,500 | | | Plastic Omnium SA | | | 123,565 | |
| | 40,142 | | | Publicis Groupe SA | | | 2,083,578 | |
| | 3,102 | | | Rallye SA | | | 93,254 | |
| | 30,004 | | | Safran SA | | | 1,051,262 | |
| | 39,047 | | | Sanofi | | | 3,194,948 | |
| | 30,585 | | | Schneider Electric SA | | | 1,931,646 | |
| | ]34,356 | | | Total SA | | | 1,715,839 | |
| | 5,340 | | | Unibail-Rodamco SE | | | 1,089,148 | |
| | 2,498 | | | Valeo SA | | | 118,159 | |
| | 67,325 | | | Veolia Environnement SA | | | 712,707 | |
| | 50,561 | | | Vivendi SA | | | 991,495 | |
| | | | | | | | |
| | | | Total France | | | 36,908,384 | |
| | | | | | | | |
| Germany — 9.5% | | | | |
| | 58,985 | | | Adidas AG | | | 4,615,627 | |
| | 32,326 | | | Allianz SE | | | 3,548,508 | |
| | 2,144 | | | Aurubis AG | | | 116,126 | |
| | 29,952 | | | BASF SE | | | 2,328,699 | |
| | 15,118 | | | Bayer AG | | | 1,172,728 | |
| | 34,061 | | | Bayerische Motoren Werke AG | | | 2,470,364 | |
| | 71 | | | Bilfinger Berger AG | | | 5,968 | |
| | 789 | | | Cewe Color Holding AG | | | 28,543 | |
| | 53,610 | | | Daimler AG, Registered Shares | | | 2,629,900 | |
| | 69,450 | | | Deutsche Lufthansa AG | | | 856,979 | |
| | 97,464 | | | Deutsche Telekom AG | | | 1,162,814 | |
| | 7,463 | | | Freenet AG | | | 114,432 | |
| | 35,111 | | | Fresenius Medical Care AG & Co. KGaA | | | 2,531,943 | |
| | 82,231 | | | GEA Group AG | | | 2,172,119 | |
| | 42 | | | Gerresheimer AG | | | 2,107 | |
| | 27,087 | | | Hannover Rüeckversicherung AG | | | 1,654,847 | |
| | 2,366 | | | Indus Holding AG | | | 57,513 | |
| | 211,275 | | | Infineon Technologies AG | | | 1,460,309 | |
| | 13,220 | | | Jenoptik AG | | | 98,742 | |
See Notes to Financial Statements.
61
Schedules of Investments
(continued)
International Equity Investments
| | | | | | | | |
| Shares | | | Security | | Value | |
| Germany — 9.5%—(continued) | | | | |
| | 50,735 | | | Kabel Deutschland Holding AG* | | $ | 3,363,157 | |
| | 2,003 | | | Leoni AG | | | 75,080 | |
| | 7,669 | | | Linde AG | | | 1,208,218 | |
| | 40,230 | | | Metro AG | | | 1,211,949 | |
| | 2,688 | | | MLP AG | | | 15,556 | |
| | 2,075 | | | Rheinmetall AG | | | 102,692 | |
| | 34,827 | | | SAP AG | | | 2,295,932 | |
| | 38,470 | | | Siemens AG | | | 3,649,535 | |
| | 5,988 | | | Sixt AG | | | 106,051 | |
| | 226 | | | Stada Arzneimittel AG | | | 6,356 | |
| | 29,726 | | | Symrise AG | | | 1,006,375 | |
| | 10,556 | | | Volkswagen AG | | | 1,719,483 | |
| | 4,726 | | | Wacker Neuson SE | | | 67,976 | |
| | | | | | | | |
| | | | Total Germany | | | 41,856,628 | |
| | | | | | | | |
| Greece — 0.0% | | | | |
| | 5,678 | | | Eurobank Properties Real Estate Investment Co. | | | 28,925 | |
| | 8,227 | | | Hellenic Petroleum SA | | | 58,986 | |
| | 6,005 | | | Metka SA | | | 43,659 | |
| | 5,855 | | | Motor Oil Hellas Corinth Refineries SA | | | 35,056 | |
| | | | | | | | |
| | | | Total Greece | | | 166,626 | |
| | | | | | | | |
| Hong Kong — 2.8% | | | | |
| | 628,600 | | | AIA Group Ltd. | | | 2,163,869 | |
| | 332,000 | | | Century City International Holdings Ltd.* | | | 21,830 | |
| | 23,000 | | | Champion REIT | | | 10,052 | |
| | 69,500 | | | China Mobile Ltd. | | | 741,926 | |
| | 133,200 | | | China Resources Enterprise Ltd. | | | 397,558 | |
| | 272,000 | | | China Ting Group Holdings Ltd. | | | 13,151 | |
| | 918,000 | | | China Unicom Hong Kong Ltd. | | | 1,451,037 | |
| | 264,000 | | | City Telecom HK Ltd. | | | 62,628 | |
| | 624,000 | | | COSCO Pacific Ltd. | | | 771,523 | |
| | 557,598 | | | CSI Properties Ltd. | | | 23,005 | |
| | 41,500 | | | Dickson Concepts International Ltd.* | | | 22,258 | |
| | 468,000 | | | Emperor International Holdings | | | 96,541 | |
| | 102,000 | | | Glorious Sun Enterprises Ltd. | | | 30,772 | |
| | 271,000 | | | Hang Lung Properties Ltd. | | | 922,399 | |
| | 133,400 | | | Hong Kong Exchanges & Clearing Ltd. | | | 1,774,929 | |
| | 56,610 | | | Jardine Strategic Holdings Ltd. | | | 1,881,716 | |
| | 65,100 | | | Kingboard Chemical Holdings Ltd. | | | 142,180 | |
| | 17,000 | | | Kowloon Development Co., Ltd. | | | 16,745 | |
| | 84,000 | | | Norstar Founders Group Ltd.(a)(d)* | | | 0 | |
| | 418,000 | | | Oriental Press Group | | | 43,113 | |
| | 774,000 | | | Pacific Andes International Holdings Ltd. | | | 39,417 | |
| | 74,000 | | | Regal Hotels International Holdings Ltd. | | | 30,053 | |
| | 5,000 | | | SmarTone Telecommunications Holding Ltd. | | | 10,662 | |
| | 96,000 | | | SOCAM Development Ltd. | | | 89,115 | |
| | 52,000 | | | Sun Hung Kai Properties Ltd. | | | 674,445 | |
| | 60,900 | | | Swire Pacific Ltd., Class A Shares | | | 721,570 | |
| | 178,000 | | | Truly International Holdings | | | 23,867 | |
| | 476,000 | | | Victory City International Holdings Ltd. | | | 49,096 | |
| | 36,000 | | | VST Holdings Ltd. | | | 6,869 | |
| | | | | | | | |
| | | | Total Hong Kong | | | 12,232,326 | |
| | | | | | | | |
| Ireland — 2.3% | | | | |
| | 43,053 | | | Accenture PLC, Class A Shares | | | 2,652,065 | |
| | 35,483 | | | Aer Lingus Group PLC | | | 47,623 | |
| | 12,518 | | | Beazley PLC | | | 32,901 | |
| | 4,686 | | | C&C Group PLC | | | 21,249 | |
See Notes to Financial Statements.
62
Schedules of Investments
(continued)
International Equity Investments
| | | | | | | | |
Shares | | | Security | | Value | |
| Ireland — 2.3%—(continued) | | | | |
| | 32,300 | | | Covidien PLC | | $ | 1,810,415 | |
| | 76,028 | | | Greencore Group PLC | | | 95,572 | |
| | 28,286 | | | Seagate Technology PLC | | | 905,435 | |
| | 122,279 | | | Shire PLC | | | 3,716,254 | |
| | 88,103 | | | Total Produce PLC | | | 45,436 | |
| | 18,524 | | | United Drug PLC | | | 60,581 | |
| | 70,906 | | | WPP PLC | | | 916,639 | |
| | | | | | | | |
| | | | Total Ireland | | | 10,304,170 | |
| | | | | | | | |
| Isle of Man — 0.0% | | | | |
| | 2,808 | | | Playtech Ltd. | | | 17,248 | |
| | | | | | | | |
| Israel — 2.0% | | | | |
| | 16,513 | | | Alony Hetz Properties & Investments Ltd. | | | 70,023 | |
| | 1,290 | | | Alrov Properties and Lodgings Ltd.* | | | 17,633 | |
| | 106,306 | | | Check Point Software Technologies Ltd.* | | | 4,899,644 | |
| | 15,280 | | | Clal Industries & Investments Ltd. | | | 38,114 | |
| | 1,653 | | | Gilat Satellite Networks Ltd.* | | | 5,344 | |
| | 3,404 | | | Israel Land Development Co., Ltd. (The) | | | 14,749 | |
| | 118 | | | Mellanox Technologies Ltd.* | | | 13,902 | |
| | 1,572 | | | Norstar Holdings Inc. | | | 24,703 | |
| | 53 | | | Paz Oil Co., Ltd. | | | 5,279 | |
| | 974 | | | Plasson Industries Ltd. | | | 22,655 | |
| | 96,533 | | | Teva Pharmaceutical Industries Ltd., ADR | | | 3,820,776 | |
| | | | | | | | |
| | | | Total Israel | | | 8,932,822 | |
| | | | | | | | |
| Italy — 0.5% | | | | |
| | 688 | | | Autostrada Torino-Milano SpA | | | 4,933 | |
| | 1,130 | | | Danieli & C Officine Meccaniche SpA | | | 13,929 | |
| | 7,083 | | | Hera SpA | | | 10,442 | |
| | 41,921 | | | Immobiliare Grande Distribuzione | | | 41,077 | |
| | 64,457 | | | IMMSI SpA | | | 36,485 | |
| | 3,317 | | | Indesit Co. SpA | | | 15,020 | |
| | 30,536 | | | Italcementi SpA | | | 72,978 | |
| | 4,825 | | | Lottomatica Group SpA | | | 100,505 | |
| | 95,900 | | | Prada SpA(c) | | | 738,758 | |
| | 1,282 | | | Recordati SpA | | | 9,200 | |
| | 859 | | | Società Cattolica di Assicurazioni SCRL* | | | 11,475 | |
| | 9,252 | | | Società Iniziative Autostradali e Servizi SpA | | | 66,334 | |
| | 9,304 | | | Sogefi SpA | | | 23,149 | |
| | 1,250,107 | | | Telecom Italia SpA | | | 1,163,610 | |
| | | | | | | | |
| | | | Total Italy | | | 2,307,895 | |
| | | | | | | | |
| Japan — 11.3% | | | | |
| | 5,000 | | | 77 Bank Ltd. (The) | | | 19,090 | |
| | 17,800 | | | Airport Facilities Co., Ltd. | | | 80,005 | |
| | 5,000 | | | Akita Bank Ltd. (The) | | | 14,429 | |
| | 4,000 | | | Alpha Systems Inc. | | | 53,732 | |
| | 1,700 | | | Aoyama Trading Co., Ltd. | | | 33,364 | |
| | 4,000 | | | ASKA Pharmaceutical Co., Ltd. | | | 21,554 | |
| | 29,700 | | | Astellas Pharma Inc. | | | 1,448,688 | |
| | 41,000 | | | Atsugi Co., Ltd. | | | 47,641 | |
| | 700 | | | Autobacs Seven Co., Ltd. | | | 32,982 | |
| | 23,000 | | | Bank of Nagoya Ltd. (The) | | | 78,120 | |
| | 26,000 | | | Bank of Saga Ltd. (The) | | | 60,755 | |
| | 10,350 | | | Belluna Co., Ltd. | | | 85,507 | |
| | 33,200 | | | Bridgestone Corp. | | | 769,431 | |
| | 64,200 | | | Canon Inc. | | | 2,127,295 | |
| | 600 | | | Canon Marketing Japan Inc. | | | 8,267 | |
| | 3,600 | | | Cawachi Ltd. | | | 68,952 | |
See Notes to Financial Statements.
63
Schedules of Investments
(continued)
International Equity Investments
| | | | | | | | |
| Shares | | | Security | | Value | |
| Japan — 11.3%—(continued) | | | | |
| | 55,000 | | | Chori Co., Ltd. | | $ | 66,718 | |
| | 45,000 | | | Chuetsu Pulp & Paper Co., Ltd. | | | 76,997 | |
| | 1,000 | | | Coca-Cola Central Japan Co., Ltd. | | | 12,705 | |
| | 4,200 | | | Corona Corp. | | | 55,024 | |
| | 531 | | | Dai-ichi Life Insurance Co., Ltd. (The) | | | 540,391 | |
| | 10,000 | | | Dainichiseika Color & Chemicals Manufacturing Co., Ltd. | | | 42,265 | |
| | 2,000 | | | Daishi Bank Ltd. (The) | | | 6,308 | |
| | 800 | | | DCM Holdings Co., Ltd. | | | 5,261 | |
| | 29,100 | | | Dena Co., Ltd.(c) | | | 810,036 | |
| | 11,000 | | | DIC Corp. | | | 18,119 | |
| | 4,200 | | | EDION Corp. | | | 18,449 | |
| | 27,000 | | | Eighteenth Bank Ltd. (The) | | | 68,263 | |
| | 28,020 | | | FANUC Corp. | | | 4,576,082 | |
| | 216,000 | | | Fujitsu Ltd. | | | 877,073 | |
| | 19,000 | | | Fuso Pharmaceutical Industries Ltd. | | | 59,439 | |
| | 2,700 | | | Glory Ltd. | | | 60,023 | |
| | 8,400 | | | Hakuto Co., Ltd. | | | 79,586 | |
| | 12,000 | | | Hanwa Co., Ltd. | | | 40,452 | |
| | 200 | | | Hibiya Engineering Ltd. | | | 2,352 | |
| | 35,000 | | | Higashi-Nippon Bank Ltd. (The) | | | 77,316 | |
| | 3,400 | | | Hitachi Capital Corp. | | | 59,434 | |
| | 400 | | | Hogy Medical Co., Ltd. | | | 19,817 | |
| | 107,500 | | | Honda Motor Co., Ltd. | | | 3,393,221 | |
| | 29,400 | | | Hoya Corp. | | | 662,969 | |
| | 36,600 | | | Ibiden Co., Ltd. | | | 552,400 | |
| | 13,100 | | | Inabata & Co., Ltd. | | | 85,811 | |
| | 20,000 | | | Jaccs Co., Ltd. | | | 72,017 | |
| | 2,000 | | | Japan Pulp & Paper Co., Ltd. | | | 6,589 | |
| | 15,000 | | | Japan Vilene Co., Ltd. | | | 64,355 | |
| | 15,000 | | | J-Oil Mills Inc. | | | 42,138 | |
| | 70,000 | | | JSR Corp. | | | 1,188,789 | |
| | 28,000 | | | Juroku Bank Ltd. (The)* | | | 92,958 | |
| | 8,300 | | | Kaga Electronics Co., Ltd. | | | 81,288 | |
| | 800 | | | Kato Sangyo Co., Ltd. | | | 15,016 | |
| | 256 | | | KDDI Corp. | | | 1,830,556 | |
| | 300 | | | Kissei Pharmaceutical Co., Ltd. | | | 5,221 | |
| | 12,300 | | | Kojima Co., Ltd. | | | 34,396 | |
| | 131,969 | | | Komatsu Ltd. | | | 2,595,063 | |
| | 30,000 | | | Kurabo Industries Ltd. | | | 49,416 | |
| | 62,200 | | | Kuraray Co., Ltd. | | | 717,188 | |
| | 4,000 | | | Kyodo Printing Co., Ltd. | | | 9,347 | |
| | 1,300 | | | KYORIN Holdings Inc. | | | 30,012 | |
| | 1,800 | | | Mars Engineering Corp. | | | 43,095 | |
| | 96,000 | | | Marubeni Corp. | | | 615,361 | |
| | 17,000 | | | Marudai Food Co., Ltd. | | | 61,648 | |
| | 8,000 | | | Maruzen Showa Unyu Co., Ltd. | | | 25,231 | |
| | 10,000 | | | Mie Bank Ltd. (The) | | | 22,218 | |
| | 2,600 | | | Mikuni Coca-Cola Bottling Co., Ltd. | | | 22,376 | |
| | 600 | | | Mirait Holdings Corp. | | | 4,290 | |
| | 151,400 | | | Mitsubishi Corp. | | | 2,781,902 | |
| | 13,000 | | | Mitsui Home Co., Ltd. | | | 65,237 | |
| | 33,000 | | | Miyazaki Bank Ltd. (The) | | | 82,168 | |
| | 9,500 | | | Nagase & Co., Ltd. | | | 110,630 | |
| | 3,200 | | | Namura Shipbuilding Co., Ltd. | | | 9,643 | |
| | 6,300 | | | NEC Capital Solutions Ltd. | | | 86,236 | |
| | 200 | | | NEC Mobiling Ltd. | | | 7,981 | |
| | 19,000 | | | Nice Holdings Inc. | | | 45,853 | |
| | 5,400 | | | Nichii Gakkan Co. | | | 55,369 | |
See Notes to Financial Statements.
64
Schedules of Investments
(continued)
International Equity Investments
| | | | | | | | |
| Shares | | | Security | | Value | |
| Japan — 11.3%—(continued) | | | | |
| | 23,000 | | | Nihon Yamamura Glass Co., Ltd. | | $ | 52,863 | |
| | 7,000 | | | Nippon Road Co., Ltd. (The) | | | 25,206 | |
| | 34,000 | | | Nippon Steel Trading Co., Ltd. | | | 84,658 | |
| | 32,900 | | | Nippon Telegraph & Telephone Corp. | | | 1,518,655 | |
| | 150,500 | | | Nissan Motor Co., Ltd. | | | 1,402,860 | |
| | 18,000 | | | Nisshin Oillio Group Ltd. (The) | | | 69,872 | |
| | 5,000 | | | Nissin Corp. | | | 12,769 | |
| | 39,750 | | | NKSJ Holdings Inc. | | | 714,652 | |
| | 1,000 | | | Nohmi Bosai Ltd. | | | 6,384 | |
| | 29,900 | | | Nomura Research Institute Ltd. | | | 624,229 | |
| | 26,000 | | | Oita Bank Ltd. (The)* | | | 81,670 | |
| | 9,700 | | | Onoken Co., Ltd. | | | 78,403 | |
| | 6,200 | | | Otsuka Kagu Ltd. | | | 58,267 | |
| | 4,900 | | | Paltac Corp. | | | 69,638 | |
| | 130,400 | | | Rakuten Inc. | | | 1,258,793 | |
| | 2,900 | | | Riso Kagaku Corp. | | | 49,953 | |
| | 8,300 | | | Ryoyo Electro Corp. | | | 81,288 | |
| | 7,500 | | | S Foods Inc. | | | 65,792 | |
| | 8,000 | | | Sakai Chemical Industry Co., Ltd. | | | 22,473 | |
| | 18,000 | | | Sanki Engineering Co., Ltd. | | | 89,178 | |
| | 5,800 | | | Sanshin Electronics Co., Ltd. | | | 41,325 | |
| | 22,000 | | | Sanyo Shokai Ltd. | | | 67,139 | |
| | 86,000 | | | Sekisui Chemical Co., Ltd. | | | 702,803 | |
| | 26,000 | | | Sekisui Plastics Co., Ltd. | | | 66,399 | |
| | 19,000 | | | Senko Co., Ltd. | | | 80,789 | |
| | 7,700 | | | Senshukai Co., Ltd. | | | 48,669 | |
| | 36,700 | | | Seven & I Holdings Co., Ltd. | | | 1,112,973 | |
| | 8,900 | | | Shimamura Co., Ltd. | | | 1,055,749 | |
| | 12,400 | | | Shinko Electric Industries Co., Ltd.* | | | 81,226 | |
| | 9,000 | | | Shinko Shoji Co., Ltd. | | | 81,249 | |
| | 6,000 | | | Showa Corp. | | | 51,867 | |
| | 9,000 | | | Sinanen Co., Ltd. | | | 38,269 | |
| | 77 | | | SKY Perfect JSAT Holdings Inc. | | | 34,412 | |
| | 89,100 | | | Sony Financial Holdings Inc. | | | 1,465,374 | |
| | 36,000 | | | Sumikin Bussan Corp. | | | 87,799 | |
| | 55,600 | | | Sumitomo Mitsui Financial Group Inc. | | | 1,720,927 | |
| | 361,000 | | | Sumitomo Mitsui Trust Holdings Inc. | | | 1,004,891 | |
| | 29,000 | | | Sumitomo Realty & Development Co., Ltd. | | | 706,902 | |
| | 4,300 | | | Takasago Thermal Engineering Co., Ltd. | | | 33,218 | |
| | 6,300 | | | Tenma Corp. | | | 69,182 | |
| | 27,000 | | | Toho Bank Ltd. (The) | | | 85,846 | |
| | 6,100 | | | Tohokushinsha Film Corp. | | | 47,513 | |
| | 12,000 | | | Tokyo Energy & Systems Inc. | | | 55,928 | |
| | 25,000 | | | Tokyo Tekko Co., Ltd. | | | 74,379 | |
| | 5,800 | | | Toppan Forms Co., Ltd. | | | 53,397 | |
| | 3,000 | | | Torii Pharmaceutical Co., Ltd. | | | 66,118 | |
| | 374,000 | | | Toshiba Corp. | | | 1,193,896 | |
| | 6,600 | | | Touei Housing Corp. | | | 67,251 | |
| | 23,000 | | | Toyo Kohan Co., Ltd. | | | 67,841 | |
| | 65,849 | | | Toyota Motor Corp. | | | 2,602,346 | |
| | 9,700 | | | TSI Holdings Co., Ltd. | | | 61,806 | |
| | 32,000 | | | Uchida Yoko Co., Ltd. | | | 82,947 | |
| | 19,200 | | | Unicharm Corp. | | | 1,116,721 | |
| | 14,000 | | | UNY Co., Ltd. | | | 116,019 | |
| | 6,800 | | | Vital KSK Holdings Inc. | | | 66,250 | |
| | 900 | | | Yachiyo Bank Ltd. (The) | | | 17,181 | |
| | 74,000 | | | Yaskawa Electric Corp. | | | 484,735 | |
| | 21,000 | | | Yodogawa Steel Works Ltd. | | | 72,400 | |
See Notes to Financial Statements.
65
Schedules of Investments
(continued)
International Equity Investments
| | | | | | | | |
| Shares | | | Security | | Value | |
| Japan — 11.3%—(continued) | | | | |
| | 7,200 | | | Yokohama Reito Co., Ltd. | | $ | 57,184 | |
| | 7,600 | | | Yonekyu Corp. | | | 67,543 | |
| | 2,000 | | | Yurtec Corp. | | | 6,359 | |
| | | | | | | | |
| | | | Total Japan | | | 49,472,335 | |
| | | | | | | | |
| Jersey, Channel Islands — 0.0% | | | | |
| | 11,381 | | | Phoenix Group Holdings | | | 88,457 | |
| | | | | | | | |
| Luxembourg — 0.8% | | | | |
| | 34 | | | GAGFAH SA* | | | 368 | |
| | 41,063 | | | Millicom International Cellular SA | | | 3,536,437 | |
| | 16,484 | | | Regus PLC | | | 27,219 | |
| | | | | | | | |
| | | | Total Luxembourg | | | 3,564,024 | |
| | | | | | | | |
| Mexico — 1.0% | | | | |
| | 1,280,700 | | | América Móvil SAB de CV | | | 1,634,551 | |
| | 967,900 | | | Wal-Mart de Mexico SAB de CV, Class V Shares | | | 2,580,297 | |
| | | | | | | | |
| | | | Total Mexico | | | 4,214,848 | |
| | | | | | | | |
| Netherlands — 4.2% | | | | |
| | 23,607 | | | ASML Holding NV | | | 1,337,272 | |
| | 9,380 | | | BE Semiconductor Industries NV | | | 70,556 | |
| | 1,162 | | | CSM NV | | | 19,586 | |
| | 2,022 | | | Heijmans NV | | | 17,371 | |
| | 431,507 | | | ING Groep NV* | | | 3,301,134 | |
| | 90,627 | | | Koninklijke Ahold NV | | | 1,120,573 | |
| | 101,761 | | | Koninklijke KPN NV | | | 872,960 | |
| | 47,835 | | | LyondellBasell Industries NV, Class A Shares | | | 2,336,261 | |
| | 5,825 | | | Mediq NV | | | 68,705 | |
| | 3,591 | | | Nieuwe Steen Investments NV | | | 29,916 | |
| | 25,965 | | | PostNL NV* | | | 93,049 | |
| | 193,226 | | | Reed Elsevier NV(c) | | | 2,522,852 | |
| | 82,053 | | | Royal Dutch Shell PLC, Class B Shares | | | 2,956,413 | |
| | 2,578 | | | Vastned Retail NV | | | 105,065 | |
| | 96 | | | Wereldhave NV | | | 4,930 | |
| | 105,461 | | | Yandex NV, Class A Shares(c)* | | | 2,227,336 | |
| | 46,039 | | | Ziggo NV(c)* | | | 1,438,488 | |
| | | | | | | | |
| | | | Total Netherlands | | | 18,522,467 | |
| | | | | | | | |
| New Zealand — 0.0% | | | | |
| | 8,668 | | | Infratil Ltd. | | | 14,558 | |
| | 10,100 | | | New Zealand Oil & Gas Ltd. | | | 6,818 | |
| | 22,185 | | | Nuplex Industries Ltd. | | | 52,592 | |
| | 2,455 | | | Ryman Healthcare Ltd. | | | 7,536 | |
| | 6,410 | | | Vector Ltd. | | | 13,908 | |
| | | | | | | | |
| | | | Total New Zealand | | | 95,412 | |
| | | | | | | | |
| Norway — 1.8% | | | | |
| | 6,909 | | | Atea ASA | | | 64,325 | |
| | 49,654 | | | BW Offshore Ltd. | | | 36,299 | |
| | 163,172 | | | DNB ASA | | | 1,873,665 | |
| | 2,869 | | | Fred Olsen Energy ASA | | | 121,685 | |
| | 20,940 | | | Kvaerner ASA | | | 51,447 | |
| | 5,892 | | | Petroleum Geo-Services ASA | | | 89,497 | |
| | 51,558 | | | Pronova BioPharma AS | | | 86,315 | |
| | 25,130 | | | Seadrill Ltd. | | | 1,032,496 | |
| | 16,242 | | | SpareBank 1 SMN | | | 94,932 | |
| | 95,019 | | | Statoil ASA | | | 2,437,729 | |
| | 43,800 | | | Telenor ASA | | | 799,728 | |
See Notes to Financial Statements.
66
Schedules of Investments
(continued)
International Equity Investments
| | | | | | | | |
| Shares | | | Security | | Value | |
| Norway — 1.8%—(continued) | | | | |
| | 40,089 | | | TGS Nopec Geophysical Co. ASA | | $ | 1,170,184 | |
| | | | | | | | |
| | | | Total Norway | | | 7,858,302 | |
| | | | | | | | |
| Peru — 0.0% | | | | |
| | 1,376 | | | Copeinca ASA | | | 10,249 | |
| | | | | | | | |
| Portugal — 0.0% | | | | |
| | 27,705 | | | Mota-Engil SGPS SA | | | 37,636 | |
| | 54,751 | | | Sonae | | | 34,710 | |
| | 14,249 | | | Sonaecom — SGPS SA | | | 22,243 | |
| | | | | | | | |
| | | | Total Portugal | | | 94,589 | |
| | | | | | | | |
| Singapore — 0.7% | | | | |
| | 94,600 | | | AIMS AMP Capital Industrial REIT | | | 98,933 | |
| | 54,000 | | | Cambridge Industrial Trust | | | 26,830 | |
| | 17,000 | | | CapitaRetail China Trust* | | | 20,163 | |
| | 270,000 | | | Chip Eng Seng Corp., Ltd. | | | 96,286 | |
| | 95,000 | | | Frasers Commercial Trust | | | 85,267 | |
| | 16,000 | | | Mapletree Logistics Trust | | | 14,232 | |
| | 8,444 | | | Miclyn Express Offshore Ltd. | | | 19,022 | |
| | 4,016 | | | OM Holdings Ltd.* | | | 1,452 | |
| | 355,000 | | | SembCorp. Industries Ltd. | | | 1,607,365 | |
| | 21,000 | | | Suntec Real Estate Investment Trust | | | 24,318 | |
| | 20,000 | | | Swiber Holdings Ltd.* | | | 9,456 | |
| | 21,000 | | | United Engineers Ltd. | | | 38,370 | |
| | 64,000 | | | United Overseas Bank Ltd. | | | 979,092 | |
| | 2,000 | | | Venture Corp., Ltd. | | | 12,437 | |
| | 63,000 | | | Yanlord Land Group Ltd. | | | 58,817 | |
| | | | | | | | |
| | | | Total Singapore | | | 3,092,040 | |
| | | | | | | | |
| South Africa — 0.2% | | | | |
| | 52,678 | | | MTN Group Ltd. | | | 985,897 | |
| | | | | | | | |
| South Korea — 2.4% | | | | |
| | 3,302 | | | Hyundai Mobis | | | 895,700 | |
| | 9,068 | | | Hyundai Motor Co. | | | 1,923,830 | |
| | 14,285 | | | Kia Motors Corp. | | | 933,767 | |
| | 1,249 | | | Lotte Shopping Co., Ltd. | | | 352,025 | |
| | 12,045 | | | POSCO, ADR | | | 981,668 | |
| | 5,068 | | | Samsung Electronics Co., Ltd. | | | 5,512,388 | |
| | | | | | | | |
| | | | Total South Korea | | | 10,599,378 | |
| | | | | | | | |
| Spain — 0.3% | | | | |
| | 2,594 | | | Bolsas y Mercados Españoles SA | | | 59,123 | |
| | 1,724 | | | Corp Financiera Alba | | | 55,883 | |
| | 512 | | | Ebro Foods SA | | | 8,398 | |
| | 2,876 | | | Grupo Catalana Occidente SA | | | 43,049 | |
| | 11,879 | | | Inditex SA | | | 1,321,022 | |
| | 3,552 | | | Pescanova SA | | | 61,925 | |
| | | | | | | | |
| | | | Total Spain | | | 1,549,400 | |
| | | | | | | | |
| Sweden — 1.7% | | | | |
| | 4,414 | | | Bilia AB, Class A Shares | | | 56,188 | |
| | 11,715 | | | Billerud AB | | | 96,910 | |
| | 10,555 | | | Duni AB | | | 87,314 | |
| | 18,671 | | | Elekta AB, Class B Shares(c) | | | 952,098 | |
| | 11,030 | | | Haldex AB | | | 55,329 | |
| | 60,492 | | | Hennes & Mauritz AB, Class B Shares | | | 2,189,905 | |
| | 48,838 | | | Hexagon AB, Class B Shares | | | 981,409 | |
| | 24,857 | | | Klovern AB | | | 90,136 | |
| | 2,920 | | | NCC AB, Class A Shares | | | 53,693 | |
See Notes to Financial Statements.
67
Schedules of Investments
(continued)
International Equity Investments
| | | | | | | | |
| Shares | | | Security | | Value | |
| Sweden — 1.7%—(continued) | | | | |
| | 3,560 | | | NCC AB, Class B Shares | | $ | 65,084 | |
| | 7,059 | | | Nolato AB, Class B Shares | | | 72,792 | |
| | 7,667 | | | Peab AB | | | 34,081 | |
| | 5,089 | | | Saab AB, Class B Shares | | | 90,731 | |
| | 110,156 | | | Sandvik AB | | | 1,474,627 | |
| | 40,000 | | | Svenska Handelsbanken AB, Class A Shares | | | 1,395,482 | |
| | | | | | | | |
| | | | Total Sweden | | | 7,695,779 | |
| | | | | | | | |
| Switzerland — 7.4% | | | | |
| | 600 | | | Acino Holding AG* | | | 68,817 | |
| | 3,078 | | | Ascom Holding AG* | | | 22,568 | |
| | 2,557 | | | BKW AG | | | 81,153 | |
| | 69,840 | | | Credit Suisse Group AG* | | | 1,348,957 | |
| | 312 | | | Helvetia Holding AG | | | 102,780 | |
| | 2,009 | | | Implenia AG* | | | 72,073 | |
| | 67,258 | | | Julius Baer Group Ltd.* | | | 2,209,996 | |
| | 144,887 | | | Nestlé SA | | | 9,007,064 | |
| | 84,150 | | | Novartis AG | | | 4,958,037 | |
| | 42,997 | | | Roche Holding AG | | | 7,827,463 | |
| | 2,234 | | | Schweizerische National-Versicherungs-Gesellschaft AG | | | 85,410 | |
| | 785 | | | Siegfried Holding AG* | | | 99,903 | |
| | 5,467 | | | Swatch Group AG (The) | | | 2,237,880 | |
| | 3,540 | | | Syngenta AG | | | 1,193,596 | |
| | 132 | | | Valiant Holding* | | | 10,626 | |
| | 577 | | | Valora Holding AG | | | 92,953 | |
| | 52,795 | | | Xstrata PLC | | | 797,405 | |
| | 10,007 | | | Zurich Insurance Group AG* | | | 2,405,579 | |
| | | | | | | | |
| | | | Total Switzerland | | | 32,622,260 | |
| | | | | | | | |
| Taiwan — 0.4% | | | | |
| | 122,513 | | | Taiwan Semiconductor Manufacturing Co., Ltd., ADR | | | 1,800,941 | |
| | | | | | | | |
| Thailand — 0.3% | | | | |
| | 84,300 | | | Bangkok Bank PCL, NVDR | | | 507,068 | |
| | 114,200 | | | Kasikornbank PCL, NVDR | | | 617,494 | |
| | | | | | | | |
| | | | Total Thailand | | | 1,124,562 | |
| | | | | | | | |
| United Kingdom — 21.0% | | | | |
| | 4,423 | | | Aberdeen Asset Management PLC | | | 19,553 | |
| | 13,623 | | | Aero Inventory PLC(a)(d)* | | | 0 | |
| | 101,449 | | | AMEC PLC | | | 1,784,585 | |
| | 22,477 | | | Amlin PLC | | | 137,478 | |
| | 1,396 | | | Anglo Pacific Group PLC | | | 5,176 | |
| | 277,921 | | | ARM Holdings PLC | | | 2,530,412 | |
| | 190,160 | | | Aviva PLC | | | 983,621 | |
| | 19,000 | | | Avocet Mining PLC | | | 27,365 | |
| | 223,406 | | | Barclays PLC | | | 649,377 | |
| | 1,252 | | | Bellway PLC | | | 17,258 | |
| | 234,509 | | | BG Group PLC | | | 4,791,080 | |
| | 136,753 | | | BHP Billiton PLC | | | 3,982,607 | |
| | 1,173 | | | Bodycote PLC | | | 6,479 | |
| | 363,510 | | | BP PLC | | | 2,544,822 | |
| | 60,564 | | | British American Tobacco PLC | | | 3,171,639 | |
| | 190,205 | | | British Sky Broadcasting Group PLC | | | 2,295,961 | |
| | 176,818 | | | Britvic PLC | | | 896,378 | |
| | 1,372 | | | Cairn Energy PLC* | | | 6,246 | |
| | 134,985 | | | Capita Group PLC (The) | | | 1,545,897 | |
| | 7,489 | | | Carillion PLC | | | 32,976 | |
| | 49,403 | | | Carnival PLC | | | 1,691,858 | |
| | 560,471 | | | Centrica PLC | | | 2,904,425 | |
See Notes to Financial Statements.
68
Schedules of Investments
(continued)
International Equity Investments
| | | | | | | | |
Shares | | | Security | | Value | |
| United Kingdom — 21.0%—(continued) | | | | |
| | 4,972 | | | Chesnara PLC | | $ | 14,669 | |
| | 1,527 | | | Close Brothers Group PLC | | | 18,880 | |
| | 1,302 | | | Computacenter PLC | | | 7,893 | |
| | 9,574 | | | Cookson Group PLC | | | 90,966 | |
| | 20,723 | | | CSR PLC | | | 107,027 | |
| | 1,183 | | | Dairy Crest Group PLC | | | 6,418 | |
| | 83,714 | | | Debenhams PLC | | | 128,140 | |
| | 103,027 | | | Diageo PLC | | | 2,819,020 | |
| | 10,940 | | | Drax Group PLC | | | 80,865 | |
| | 13,228 | | | DS Smith PLC | | | 33,886 | |
| | 3,295 | | | easyJet PLC | | | 27,753 | |
| | 2,618 | | | Electrocomponents PLC | | | 9,231 | |
| | 8,623 | | | EnQuest PLC* | | | 15,210 | |
| | 30,767 | | | Firstgroup PLC | | | 119,566 | |
| | 10,592 | | | Galliford Try PLC | | | 107,107 | |
| | 140,832 | | | GlaxoSmithKline PLC | | | 3,183,275 | |
| | 8,581 | | | Greene King PLC | | | 75,746 | |
| | 8,397 | | | Hargreaves Services PLC | | | 95,699 | |
| | 20,100 | | | Hays PLC | | | 21,919 | |
| | 10,863 | | | Henderson Group PLC | | | 18,282 | |
| | 13,939 | | | Hill & Smith Holdings PLC | | | 76,280 | |
| | 27,500 | | | Home Retail Group PLC | | | 40,938 | |
| | 269,938 | | | HSBC Holdings PLC | | | 2,335,242 | |
| | 413,167 | | | HSBC Holdings PLC, London Shares | | | 3,585,505 | |
| | 9,290 | | | Hunting PLC | | | 117,371 | |
| | 1,366 | | | IG Group Holdings PLC | | | 9,328 | |
| | 3,238 | | | Immunodiagnostic Systems Holdings PLC* | | | 12,840 | |
| | 22,273 | | | Inchcape PLC | | | 130,189 | |
| | 57,621 | | | Inmarsat PLC | | | 523,256 | |
| | 55,896 | | | InterContinental Hotels Group PLC | | | 1,423,029 | |
| | 25,242 | | | Intermediate Capital Group PLC | | | 112,870 | |
| | 21,765 | | | Interserve PLC | | | 123,629 | |
| | 10,591 | | | John Wood Group PLC | | | 137,839 | |
| | 12,673 | | | Keller Group PLC | | | 102,721 | |
| | 781,065 | | | Kingfisher PLC | | | 3,414,478 | |
| | 30,043 | | | Laird PLC | | | 111,606 | |
| | 84,206 | | | Lookers PLC | | | 93,831 | |
| | 5,558 | | | Mapeley Ltd.(a)(d)* | | | 0 | |
| | 46,520 | | | Marston’s PLC | | | 82,055 | |
| | 34,039 | | | McBride PLC* | | | 68,976 | |
| | 72,684 | | | Mecom Group PLC | | | 100,015 | |
| | 26,372 | | | Melrose Resources PLC | | | 53,858 | |
| | 875 | | | Millennium & Copthorne Hotels PLC | | | 6,666 | |
| | 17,997 | | | Mondi PLC | | | 158,292 | |
| | 9,927 | | | Morgan Sindall Group PLC | | | 98,650 | |
| | 14,029 | | | National Express Group PLC | | | 48,355 | |
| | 25,602 | | | Next PLC | | | 1,451,804 | |
| | 39,999 | | | Pace PLC | | | 113,569 | |
| | 72,828 | | | Pearson PLC | | | 1,380,461 | |
| | 3,370 | | | Persimmon PLC | | | 37,312 | |
| | 14,129 | | | Petropavlovsk PLC | | | 77,969 | |
| | 13,349 | | | Phoenix IT Group Ltd. | | | 44,572 | |
| | 434,342 | | | Premier Oil PLC* | | | 2,575,996 | |
| | 3,594 | | | Provident Financial PLC | | | 75,251 | |
| | 315,196 | | | Prudential PLC | | | 3,934,716 | |
| | 43,937 | | | PV Crystalox Solar PLC* | | | 5,506 | |
| | 78,690 | | | Reckitt Benckiser Group PLC | | | 4,443,525 | |
| | 68,004 | | | Rexam PLC | | | 457,144 | |
See Notes to Financial Statements.
69
Schedules of Investments
(continued)
International Equity Investments
| | | | | | | | |
| Shares | | | Security | | Value | |
| United Kingdom — 21.0%—(continued) | | | | |
| | 72,750 | | | Rio Tinto PLC | | $ | 3,156,659 | |
| | 111,728 | | | ROK PLC(a)(d)* | | | 0 | |
| | 307,110 | | | Rolls-Royce Holdings PLC* | | | 3,999,402 | |
| | 36,700 | | | SABMiller PLC | | | 1,618,045 | |
| | 104,552 | | | Smith & Nephew PLC | | | 1,106,155 | |
| | 25,319 | | | St. Ives PLC | | | 31,125 | |
| | 200,359 | | | Standard Chartered PLC | | | 4,422,318 | |
| | 2,902 | | | Synergy Health PLC | | | 40,577 | |
| | 7,838 | | | TalkTalk Telecom Group PLC | | | 24,119 | |
| | 33,118 | | | Taylor Wimpey PLC | | | 26,923 | |
| | 425,211 | | | Tesco PLC | | | 2,270,265 | |
| | 16,151 | | | Tullett Prebon PLC | | | 74,294 | |
| | 76,632 | | | Tullow Oil PLC | | | 1,656,777 | |
| | 30,980 | | | Unilever PLC | | | 1,112,540 | |
| | 135,219 | | | United Utilities Group PLC | | | 1,520,694 | |
| | 1,394,152 | | | Vodafone Group PLC | | | 4,013,698 | |
| | 2,929 | | | WH Smith PLC | | | 27,899 | |
| | 53,226 | | | Whitbread PLC | | | 1,798,297 | |
| | 29,961 | | | William Hill PLC | | | 142,715 | |
| | 272,504 | | | WM Morrison Supermarkets PLC | | | 1,210,288 | |
| | | | | | | | |
| | | | Total United Kingdom | | | 92,825,179 | |
| | | | | | | | |
| United States — 1.7% | | | | |
| | 16,833 | | | Perrigo Co. | | | 1,851,125 | |
| | 40,175 | | | Schlumberger Ltd. | | | 2,907,866 | |
| | 13,515 | | | Wynn Resorts Ltd. | | | 1,394,343 | |
| | 23,500 | | | Yum! Brands Inc. | | | 1,497,420 | |
| | | | | | | | |
| | | | Total United States | | | 7,650,754 | |
| | | | | | | | |
| | | | TOTAL COMMON STOCKS (Cost — $379,750,752) | | | 417,620,040 | |
| | | | | | | | |
| PREFERRED STOCKS — 0.5% | | | | |
| Australia — 0.0% | | | | |
| | 259 | | | Multiplex SITES Trust* | | | 20,102 | |
| | | | | | | | |
| Germany — 0.5% | | | | |
| | 63 | | | Draegerwerk AG & Co. KGaA, 0.260% | | | 5,826 | |
| | 12,700 | | | Volkswagen AG, 2.090% | | | 2,242,847 | |
| | | | | | | | |
| | | | Total Germany | | | 2,248,673 | |
| | | | | | | | |
| Italy — 0.0% | | | | |
| | 337 | | | Unipol Gruppo Finanziario SpA* | | | 479 | |
| | | | | | | | |
| | | | TOTAL PREFERRED STOCKS (Cost — $1,516,190) | | | 2,269,254 | |
| | | | | | | | |
| RIGHTS — 0.0% | | | | |
| Singapore — 0.0% | | | | |
| | 1,204 | | | OM Holdings Ltd.(a)* (Cost $0) | | | 0 | |
| | | | | | | | |
| WARRANTS — 0.1% | | | | |
| Luxembourg — 0.1% | | | | |
| | 464,723 | | | Idea Cellular Ltd., expires 3/13/17(b)* (Cost $804,482) | | | 623,565 | |
| | | | | | | | |
| | | | TOTAL INVESTMENTS BEFORE SHORT-TERM INVESTMENTS (Cost — $382,071,424) | | | 420,512,859 | |
| | | | | | | | |
See Notes to Financial Statements.
70
Schedules of Investments
(continued)
International Equity Investments
| | | | | | | | |
Face
Amount† | | | Security | | Value | |
| SHORT-TERM INVESTMENTS (e) — 32.2% | | | | |
| MONEY MARKET FUND — 1.4% | | | | |
| | 6,243,716 | | | Invesco STIT — Government & Agency Portfolio (f) (Cost — $6,243,716) | | $ | 6,243,716 | |
| | | | | | | | |
| TIME DEPOSITS — 30.8% | | | | |
| | 3,224,457 | | | Bank of America — London, 0.030% due 9/4/12 | | | 3,224,457 | |
| | 47,547,648 | | | Bank of New York Mellon — Grand Cayman, 0.030% due 9/4/12 | | | 47,547,648 | |
| | | | BBH — Grand Cayman: | | | | |
| | 7,844,846 | EUR | | -0.036% due 9/3/12 | | | 9,867,639 | |
| | 154,853 | CHF | | 0.005% due 9/3/12 | | | 162,200 | |
| | 3,045,578 | HKD | | 0.005% due 9/3/12 | | | 392,658 | |
| | 673,957 | JPY | | 0.010% due 9/3/12 | | | 8,605 | |
| | 365 | GBP | | 0.052% due 9/3/12 | | | 579 | |
| | 240 | SEK | | 0.550% due 9/3/12 | | | 36 | |
| | 1 | NZD | | 1.650% due 9/3/12 | | | 1 | |
| | 2,236 | AUD | | 2.648% due 9/3/12 | | | 2,311 | |
| | 297 | CAD | | 0.195% due 9/4/12 | | | 301 | |
| | 42,417,343 | | | HSBC Bank — Grand Cayman, 0.030% due 9/4/12 | | | 42,417,343 | |
| | 80,265 | GBP | | JPMorgan Chase & Co. — London, 0.052% due 9/3/12 | | | 127,316 | |
| | 33,043,110 | | | Wells Fargo — Grand Cayman, 0.030% due 9/4/12 | | | 33,043,110 | |
| | | | | | | | |
| | | | TOTAL TIME DEPOSITS (Cost — $136,794,204) | | | 136,794,204 | |
| | | | | | | | |
| | | | TOTAL SHORT-TERM INVESTMENTS (Cost — $143,037,920) | | | 143,037,920 | |
| | | | | | | | |
| | | | TOTAL INVESTMENTS — 127.1% (Cost — $525,109,344#) | | | 563,550,779 | |
| | | | | | | | |
| | | | Liabilities in Excess of Other Assets — (27.1)% | | | (119,987,374 | ) |
| | | | | | | | |
| | | | TOTAL NET ASSETS — 100.0% | | $ | 443,563,405 | |
| | | | | | | | |
| † | Face amount denominated in U.S. dollars, unless otherwise noted. |
| * | Non-income producing security. |
| (a) | Security is valued in good faith at fair value by or under the direction of the Board of Trustees. |
| (b) | Restricted security that may be sold to “qualified institutional buyers” pursuant to the conditions of Rule 144A under the Securities Act of 1933, as amended. This security has been deemed liquid pursuant to guidelines approved by the Board of Trustees, unless otherwise noted. |
| (c) | All or a portion of this security is on loan (See Note 1). |
| (e) | Inclusive of all short term holdings, including collateral received from securities lending activities. Not including such collateral, the percentage of portfolio holdings would be 30.8%. |
| (f) | Represents investment of collateral received from securities lending transactions. |
| # | Aggregate cost for federal income tax purposes is $536,363,748. |
Abbreviations used in this schedule:
| | | | |
| ADR | | — | | American Depositary Receipts |
| AUD | | — | | Australian Dollar |
| CAD | | — | | Canadian Dollar |
| CHF | | — | | Swiss Franc |
| EUR | | — | | Euro Dollar |
| GBP | | — | | British Pound |
| HKD | | — | | Hong Kong Dollar |
| JPY | | — | | Japanese Yen |
| NVDR | | — | | Non-Voting Depositary Receipt |
| NYSE | | — | | New York Stock Exchange |
| NZD | | — | | New Zealand Dollar |
See Notes to Financial Statements.
71
Schedules of Investments
(continued)
International Equity Investments
Abbreviations used in this schedule:
| | | | |
| PCL | | — | | Public Company Limited |
| PLC | | — | | Public Limited Company |
| REIT | | — | | Real Estate Investment Trust |
| SEK | | — | | Swedish Krona |
Summary of Investments by Security Sector*
| | | | |
Consumer Discretionary | | | 12.6 | % |
Financials | | | 12.1 | |
Consumer Staples | | | 8.7 | |
Health Care | | | 8.3 | |
Industrials | | | 7.8 | |
Information Technology | | | 7.5 | |
Energy | | | 6.4 | |
Materials | | | 5.6 | |
Telecommunication Services | | | 4.2 | |
Utilities | | | 1.4 | |
Short-Term Investments | | | 25.4 | |
| | | | |
| | | 100.0 | % |
| | | | |
| * | As a percentage of total investments. |
For details of other financial instruments held by this fund, refer to Note 3.
See Notes to Financial Statements.
72
Schedules of Investments
(continued)
Emerging Markets Equity Investments
| | | | | | | | |
Shares | | | Security | | Value | |
| COMMON STOCKS — 91.8% | | | | |
| Argentina — 0.2% | | | | |
| | 117,679 | | | YPF SA, ADR | | $ | 1,472,164 | |
| | | | | | | | |
| Brazil — 13.4% | | | | |
| | 94,377 | | | Banco Bradesco SA, ADR | | | 1,549,670 | |
| | 1,117,711 | | | Banco do Brasil SA | | | 12,760,629 | |
| | 94,300 | | | BM&FBovespa SA | | | 499,286 | |
| | 28,700 | | | BR Properties SA | | | 349,147 | |
| | 36,419 | | | BRF — Brasil Foods SA | | | 584,935 | |
| | 403,100 | | | CCR SA | | | 3,621,318 | |
| | 164,100 | | | Cia de Bebidas das Américas, ADR | | | 6,171,801 | |
| | 25,200 | | | Cia de Saneamento Basico do Estado de Sao Paulo, ADR | | | 2,144,772 | |
| | 78,925 | | | Cia Energética de Minas Gerais, ADR | | | 1,341,725 | |
| | 23,500 | | | Cia Hering | | | 513,323 | |
| | 418,500 | | | Cia Siderúrgica Nacional SA, ADR | | | 2,017,170 | |
| | 328,848 | | | Cielo SA | | | 9,719,589 | |
| | 30,300 | | | Ez Tec Empreendimentos e Participações SA | | | 365,627 | |
| | 200,900 | | | Gafisa SA, ADR(a)* | | | 825,699 | |
| | 37,500 | | | Iochpe-Maxion SA | | | 531,743 | |
| | 10,936 | | | Itaú Unibanco Holding SA, ADR | | | 172,898 | |
| | 77,576 | | | Lojas Renner SA | | | 2,556,892 | |
| | 200,100 | | | Natura Cosméticos SA | | | 5,016,421 | |
| | 78,600 | | | Obrascón Huarte Lain Brasil SA | | | 760,701 | |
| | 163,439 | | | Petróleo Brasileiro SA, ADR | | | 3,455,100 | |
| | 170,192 | | | Petróleo Brasileiro SA, Class A Shares, ADR | | | 3,502,551 | |
| | 746,100 | | | Redecard SA | | | 12,328,740 | |
| | 358,300 | | | Souza Cruz SA | | | 4,801,804 | |
| | 120,199 | | | Telefónica Brasil SA, ADR | | | 2,568,653 | |
| | 61,700 | | | Ultrapar Participações SA | | | 1,318,876 | |
| | 226,510 | | | Vale SA | | | 3,768,566 | |
| | 668,077 | | | Vale SA, Class B Shares, ADR | | | 10,936,420 | |
| | | | | | | | |
| | | | Total Brazil | | | 94,184,056 | |
| | | | | | | | |
| Canada — 0.5% | | | | |
| | 114,912 | | | First Quantum Minerals Ltd. | | | 2,212,490 | |
| | 53,879 | | | Yamana Gold Inc. | | | 922,947 | |
| | | | | | | | |
| | | | Total Canada | | | 3,135,437 | |
| | | | | | | | |
| Chile — 0.2% | | | | |
| | 799,528 | | | Empresa Nacional de Electricidad SA | | | 1,325,115 | |
| | | | | | | | |
| China — 10.1% | | | | |
| | 428,000 | | | Agile Property Holdings Ltd. | | | 491,110 | |
| | 31,159 | | | Baidu Inc., ADR* | | | 3,472,359 | |
| | 7,063,400 | | | Bank of China Ltd., Class H Shares | | | 2,568,079 | |
| | 1,312,500 | | | BBMG Corp., Class H Shares | | | 800,398 | |
| | 528,000 | | | China Communications Construction Co., Ltd., Class H Shares | | | 405,719 | |
| | 21,519,580 | | | China Construction Bank Corp., Class H Shares | | | 14,149,771 | |
| | 3,908,000 | | | China Minsheng Banking Corp., Ltd., Class H Shares(a) | | | 3,189,361 | |
| | 1,569,000 | | | China National Building Material Co., Ltd., Class H Shares(a) | | | 1,468,605 | |
| | 1,602,000 | | | China Petroleum & Chemical Corp., Class H Shares | | | 1,509,820 | |
| | 1,689,000 | | | China Railway Construction Corp., Ltd., Class H Shares | | | 1,276,065 | |
| | 63,000 | | | China Shanshui Cement Group Ltd. | | | 32,977 | |
| | 211,000 | | | China Shenhua Energy Co., Ltd., Class H Shares | | | 768,504 | |
| | 5,087,805 | | | CNOOC Ltd. | | | 9,695,056 | |
| | 254 | | | Country Garden Holdings Co., Ltd. | | | 89 | |
| | 492,000 | | | Dongfeng Motor Group Co., Ltd., Class H Shares | | | 636,860 | |
| | 287,000 | | | Dongyue Group(a) | | | 136,168 | |
| | 150,000 | | | ENN Energy Holdings Ltd. | | | 595,645 | |
| | 9,328,590 | | | Evergrande Real Estate Group Ltd.(a) | | | 3,572,053 | |
See Notes to Financial Statements.
73
Schedules of Investments
(continued)
Emerging Markets Equity Investments
| | | | | | | | |
| Shares | | | Security | | Value | |
| China — 10.1%—(continued) | | | | |
| | 156,000 | | | Great Wall Motor Co., Ltd., Class H Shares | | $ | 353,179 | |
| | 542,800 | | | Guangzhou R&F Properties Co., Ltd., Class H Shares(a) | | | 629,836 | |
| | 81,500 | | | Hengan International Group Co., Ltd. | | | 819,066 | |
| | 676,000 | | | Huaneng Power International Inc., Class H Shares | | | 465,407 | |
| | 10,764,050 | | | Industrial & Commercial Bank of China, Class H Shares | | | 5,856,438 | |
| | 50,800 | | | Inner Mongolia Yitai Coal Co., Class B Shares | | | 276,606 | |
| | 990,000 | | | Jiangxi Copper Co., Ltd., Class H Shares | | | 2,146,874 | |
| | 1,222,000 | | | Lenovo Group Ltd. | | | 994,136 | |
| | 50,100 | | | NetEase Inc., ADR(a)* | | | 2,608,707 | |
| | 859,500 | | | PetroChina Co., Ltd., Class H Shares | | | 1,038,319 | |
| | 582,000 | | | PICC Property & Casualty Co., Ltd., Class H Shares* | | | 700,084 | |
| | 139,000 | | | Ping An Insurance Group Co. of China Ltd., Class H Shares | | | 1,003,571 | |
| | 672,000 | | | Shanghai Electric Group Co., Ltd., Class H Shares | | | 270,314 | |
| | 403,000 | | | Soho China Ltd. | | | 255,632 | |
| | 132,900 | | | Tencent Holdings Ltd. | | | 4,057,440 | |
| | 604,800 | | | Weichai Power Co., Ltd., Class H Shares(a) | | | 1,598,494 | |
| | 264,000 | | | Yanzhou Coal Mining Co., Ltd., Class H Shares | | | 376,448 | |
| | 350,000 | | | Zhejiang Expressway Co., Ltd., Class H Shares | | | 230,587 | |
| | 2,414,000 | | | Zijin Mining Group Co., Ltd., Class H Shares(a) | | | 756,291 | |
| | 1,361,000 | | | Zoomlion Heavy Industry Science & Technology Co., Ltd., Class H Shares(a) | | | 1,456,403 | |
| | | | | | | | |
| | | | Total China | | | 70,662,471 | |
| | | | | | | | |
| Colombia — 0.7% | | | | |
| | 188,121 | | | Pacific Rubiales Energy Corp. | | | 4,596,691 | |
| | | | | | | | |
| Cyprus — 0.1% | | | | |
| | 45,059 | | | Globaltrans Investment PLC, GDR | | | 847,109 | |
| | | | | | | | |
| Egypt — 1.1% | | | | |
| | 480,890 | | | Commercial International Bank Egypt SAE | | | 2,371,847 | |
| | 65,764 | | | Eastern Tobacco | | | 829,762 | |
| | 91,520 | | | Orascom Construction Industries | | | 4,125,842 | |
| | | | | | | | |
| | | | Total Egypt | | | 7,327,451 | |
| | | | | | | | |
| France — 0.4% | | | | |
| | 55,421 | | | CFAO SA | | | 2,598,837 | |
| | | | | | | | |
| Hong Kong — 3.4% | | | | |
| | 444,000 | | | China Mobile Ltd. | | | 4,739,785 | |
| | 98,413 | | | China Mobile Ltd., ADR | | | 5,283,793 | |
| | 861,000 | | | China Overseas Land & Investment Ltd. | | | 1,944,835 | |
| | 768,000 | | | China Resources Land Ltd. | | | 1,483,264 | |
| | 874,000 | | | China Unicom Hong Kong Ltd. | | | 1,381,489 | |
| | 516,000 | | | COSCO Pacific Ltd. | | | 637,990 | |
| | 631,000 | | | Galaxy Entertainment Group Ltd.(a)* | | | 1,793,839 | |
| | 622,000 | | | Guangdong Investment Ltd. | | | 460,307 | |
| | 4,468,200 | | | Huabao International Holdings Ltd.(a) | | | 2,298,533 | |
| | 7,355,500 | | | REXLot Holdings Ltd.(a) | | | 531,062 | |
| | 106,000 | | | Shanghai Industrial Holdings Ltd. | | | 291,776 | |
| | 1,268,000 | | | Shimao Property Holdings Ltd.(a) | | | 1,915,986 | |
| | 1,834,000 | | | Shougang Fushan Resources Group Ltd. | | | 484,729 | |
| | 1,524,000 | | | Yuexiu Property Co., Ltd. | | | 357,604 | |
| | | | | | | | |
| | | | Total Hong Kong | | | 23,604,992 | |
| | | | | | | | |
| Hungary — 0.6% | | | | |
| | 247,216 | | | OTP Bank PLC | | | 3,916,802 | |
| | | | | | | | |
| India — 3.6% | | | | |
| | 52,834 | | | Ambuja Cements Ltd., GDR(b) | | | 176,466 | |
| | 53,929 | | | Dr. Reddy’s Laboratories Ltd., ADR | | | 1,620,027 | |
| | 7,235 | | | GAIL India Ltd., GDR(b) | | | 278,475 | |
| | 163,563 | | | HDFC Bank Ltd., ADR | | | 5,492,446 | |
See Notes to Financial Statements.
74
Schedules of Investments
(continued)
Emerging Markets Equity Investments
| | | | | | | | |
| Shares | | | Security | | Value | |
| India — 3.6%—(continued) | | | | |
| | 143,466 | | | ICICI Bank Ltd., ADR | | $ | 4,666,949 | |
| | 128,284 | | | Infosys Ltd., ADR(a) | | | 5,455,919 | |
| | 172,546 | | | ITC Ltd., GDR* | | | 831,499 | |
| | 5,540 | | | Larsen & Toubro Ltd., GDR | | | 133,846 | |
| | 62,678 | | | Mahindra & Mahindra Ltd., GDR | | | 852,421 | |
| | 49,192 | | | Reliance Industries Ltd., London Shares, GDR(c) | | | 1,345,401 | |
| | 10,054 | | | State Bank of India Ltd., London Shares, GDR | | | 698,753 | |
| | 72,318 | | | Sterlite Industries India Ltd., ADR | | | 510,565 | |
| | 123,309 | | | Tata Motors Ltd., ADR | | | 2,604,286 | |
| | 2,400 | | | Ultratech Cement Ltd., GDR | | | 73,068 | |
| | 12,309 | | | Wipro Ltd., ADR(a) | | | 95,764 | |
| | | | | | | | |
| | | | Total India | | | 24,835,885 | |
| | | | | | | | |
| Indonesia — 3.6% | | | | |
| | 12,769,619 | | | Adaro Energy Tbk PT | | | 1,834,754 | |
| | 6,598,162 | | | Bank Mandiri Persero Tbk PT | | | 5,397,553 | |
| | 843,000 | | | Bank Rakyat Indonesia Persero Tbk PT | | | 614,457 | |
| | 485,500 | | | Charoen Pokphand Indonesia Tbk PT | | | 137,478 | |
| | 177,000 | | | Indo Tambangraya Megah Tbk PT | | | 709,114 | |
| | 1,932,000 | | | Perusahaan Gas Negara PT | | | 749,701 | |
| | 1,992,500 | | | Semen Gresik Persero Tbk PT | | | 2,591,190 | |
| | 736,000 | | | Tambang Batubara Bukit Asam Tbk PT | | | 1,126,964 | |
| | 832,996 | | | Telekomunikasi Indonesia Tbk PT | | | 812,466 | |
| | 200,300 | | | Telekomunikasi Indonesia Tbk PT, ADR | | | 7,731,579 | |
| | 1,626,378 | | | United Tractors Tbk PT | | | 3,419,914 | |
| | | | | | | | |
| | | | Total Indonesia | | | 25,125,170 | |
| | | | | | | | |
| Luxembourg — 0.3% | | | | |
| | 55,674 | | | Oriflame Cosmetics SA | | | 1,943,985 | |
| | | | | | | | |
| Malaysia — 0.8% | | | | |
| | 77,600 | | | Alliance Financial Group Bhd | | | 102,573 | |
| | 141,100 | | | British American Tobacco Malaysia Bhd | | | 2,880,254 | |
| | 114,000 | | | DiGi.Com Bhd | | | 175,497 | |
| | 150,000 | | | Malayan Banking Bhd | | | 439,270 | |
| | 42,700 | | | RHB Capital Bhd | | | 99,490 | |
| | 65,300 | | | Sime Darby Bhd | | | 205,023 | |
| | 65,400 | | | Telekom Malaysia Bhd | | | 127,263 | |
| | 68,000 | | | Tenaga Nasional Bhd | | | 148,862 | |
| | 456,400 | | | UMW Holdings Bhd | | | 1,489,928 | |
| | | | | | | | |
| | | | Total Malaysia | | | 5,668,160 | |
| | | | | | | | |
| Mexico — 4.2% | | | | |
| | 31,300 | | | Alfa SAB de CV, Class A Shares | | | 500,225 | |
| | 430,216 | | | América Móvil SAB de CV, Class L Shares, ADR | | | 11,009,227 | |
| | 32,700 | | | Cemex SAB de CV, ADR* | | | 244,269 | |
| | 2,400 | | | Fomento Económico Mexicano SAB de CV, ADR | | | 202,800 | |
| | 809,241 | | | Genomma Lab Internacional SAB de CV, Class B Shares* | | | 1,628,694 | |
| | 137,100 | | | Grupo Financiero Banorte SAB de CV, Class O Shares | | | 695,986 | |
| | 2,985,527 | | | Grupo México SAB de CV, Class B Shares | | | 8,881,196 | |
| | 142,500 | | | Grupo Televisa SAB, ADR | | | 3,274,650 | |
| | 8,405 | | | Industrias Peñoles SAB de CV | | | 342,949 | |
| | 1,120,400 | | | Kimberly-Clark de México SAB de CV, Class A Shares | | | 2,283,707 | |
| | | | | | | | |
| | | | Total Mexico | | | 29,063,703 | |
| | | | | | | | |
| Netherlands — 0.2% | | | | |
| | 17,000 | | | VimpelCom Ltd., ADR | | | 180,710 | |
| | 66,208 | | | Yandex NV, Class A Shares(a)* | | | 1,398,313 | |
| | | | | | | | |
| | | | Total Netherlands | | | 1,579,023 | |
| | | | | | | | |
See Notes to Financial Statements.
75
Schedules of Investments
(continued)
Emerging Markets Equity Investments
| | | | | | | | |
| Shares | | | Security | | Value | |
| Nigeria — 0.0% | | | | |
| | 28,570 | | | Guaranty Trust Bank PLC, GDR(c) | | $ | 160,932 | |
| | | | | | | | |
| Pakistan — 0.7% | | | | |
| | 1,105,862 | | | Oil & Gas Development Co., Ltd. | | | 2,086,693 | |
| | 1,084,744 | | | Pakistan Petroleum Ltd. | | | 2,558,413 | |
| | | | | | | | |
| | | | Total Pakistan | | | 4,645,106 | |
| | | | | | | | |
| Peru — 1.0% | | | | |
| | 116,912 | | | Cia de Minas Buenaventura SA, ADR | | | 4,052,170 | |
| | 21,610 | | | Credicorp Ltd. | | | 2,604,653 | |
| | | | | | | | |
| | | | Total Peru | | | 6,656,823 | |
| | | | | | | | |
| Philippines — 1.5% | | | | |
| | 344,800 | | | Aboitiz Power Corp. | | | 278,263 | |
| | 223,034 | | | Bank of the Philippine Islands | | | 397,046 | |
| | 364,920 | | | DMCI Holdings Inc. | | | 501,516 | |
| | 99,010 | | | First Philippine Holdings Corp. | | | 178,961 | |
| | 288,426 | | | Metropolitan Bank & Trust | | | 623,337 | |
| | 113,200 | | | Philippine Long Distance Telephone Co., ADR | | | 7,278,759 | |
| | 39,570 | | | SM Investments Corp. | | | 665,918 | |
| | 756,700 | | | SM Prime Holdings Inc. | | | 251,455 | |
| | | | | | | | |
| | | | Total Philippines | | | 10,175,255 | |
| | | | | | | | |
| Russia — 8.4% | | | | |
| | 502,471 | | | Gazprom OAO, ADR | | | 4,856,382 | |
| | 658,914 | | | Gazprom OAO, London Shares, ADR | | | 6,417,163 | |
| | 32,452 | | | Lukoil OAO | | | 1,922,781 | |
| | 8,000 | | | Lukoil OAO, ADR | | | 454,560 | |
| | 115,514 | | | Lukoil OAO, London Shares, ADR | | | 6,561,195 | |
| | 79,373 | | | Magnit OJSC, GDR(c) | | | 2,531,205 | |
| | 566,153 | | | Mobile Telesystems OJSC, ADR(a) | | | 10,422,877 | |
| | 439,096 | | | Rosneft Oil Co., GDR | | | 2,595,057 | |
| | 5,916,036 | | | Sberbank of Russia | | | 17,008,604 | |
| | 27,599 | | | Severstal OAO | | | 331,188 | |
| | 25,823 | | | Tatneft, ADR | | | 985,664 | |
| | 835,783 | | | TNK-BP Holding | | | 2,223,183 | |
| | 74,038 | | | Uralkali OJSC, GDR | | | 2,862,309 | |
| | | | | | | | |
| | | | Total Russia | | | 59,172,168 | |
| | | | | | | | |
| South Africa — 9.5% | | | | |
| | 189,022 | | | African Bank Investments Ltd. | | | 732,316 | |
| | 79,204 | | | AngloGold Ashanti Ltd. | | | 2,482,127 | |
| | 7,094 | | | Assore Ltd. | | | 258,771 | |
| | 122,958 | | | AVI Ltd. | | | 850,134 | |
| | 61,188 | | | Barloworld Ltd. | | | 517,878 | |
| | 208,800 | | | Bidvest Group Ltd. | | | 5,077,657 | |
| | 19,702 | | | Exxaro Resources Ltd. | | | 351,424 | |
| | 916,738 | | | FirstRand Ltd. | | | 2,999,786 | |
| | 123,509 | | | Foschini Group Ltd. (The) | | | 1,987,628 | |
| | 42,836 | | | Gold Fields Ltd. | | | 515,896 | |
| | 294,795 | | | Growthpoint Properties Ltd. | | | 963,937 | |
| | 95,018 | | | Imperial Holdings Ltd. | | | 2,312,374 | |
| | 19,192 | | | Kumba Iron Ore Ltd. | | | 1,098,156 | |
| | 46,335 | | | Liberty Holdings Ltd. | | | 507,110 | |
| | 338,297 | | | Life Healthcare Group Holdings Ltd. | | | 1,286,446 | |
| | 25,628 | | | Massmart Holdings Ltd. | | | 519,816 | |
| | 160,133 | | | MTN Group Ltd. | | | 2,996,976 | |
| | 793,710 | | | Murray & Roberts Holdings Ltd.* | | | 2,063,575 | |
| | 45,549 | | | Naspers Ltd., Class N Shares | | | 2,655,159 | |
| | 194,892 | | | Nedbank Group Ltd. | | | 4,298,021 | |
See Notes to Financial Statements.
76
Schedules of Investments
(continued)
Emerging Markets Equity Investments
| | | | | | | | |
| Shares | | | Security | | Value | |
| South Africa — 9.5%—(continued) | | | | |
| | 733,553 | | | Pretoria Portland Cement Co., Ltd. | | $ | 2,326,033 | |
| | 947,017 | | | Sanlam Ltd. | | | 4,174,721 | |
| | 36,803 | | | Sasol Ltd. | | | 1,591,364 | |
| | 361,874 | | | Shoprite Holdings Ltd. | | | 7,289,892 | |
| | 243,226 | | | Standard Bank Group Ltd. | | | 3,218,368 | |
| | 98,513 | | | Tiger Brands Ltd. | | | 3,251,766 | |
| | 397,875 | | | Truworths International Ltd. | | | 4,517,668 | |
| | 235,708 | | | Vodacom Group Ltd. | | | 3,005,936 | |
| | 357,252 | | | Woolworths Holdings Ltd. | | | 2,555,222 | |
| | | | | | | | |
| | | | Total South Africa | | | 66,406,157 | |
| | | | | | | | |
| South Korea — 14.4% | | | | |
| | 8,655 | | | Daelim Industrials Co., Ltd. | | | 677,985 | |
| | 8,087 | | | Dongbu Insurance Co., Ltd. | | | 330,657 | |
| | 1,562 | | | Doosan Corp. | | | 186,707 | |
| | 29,884 | | | Hana Financial Group Inc. | | | 893,673 | |
| | 39,878 | | | Hite Jinro Co., Ltd. | | | 784,474 | |
| | 10,920 | | | Hotel Shilla Co., Ltd. | | | 517,294 | |
| | 32,225 | | | Hyundai Engineering & Construction Co., Ltd. | | | 1,802,280 | |
| | 2,427 | | | Hyundai Heavy Industries Co., Ltd. | | | 495,634 | |
| | 33,280 | | | Hyundai Marine & Fire Insurance Co., Ltd. | | | 960,000 | |
| | 22,422 | | | Hyundai Mobis | | | 6,082,185 | |
| | 40,064 | | | Hyundai Motor Co. | | | 8,499,817 | |
| | 84,110 | | | Industrials Bank of Korea | | | 894,077 | |
| | 266,872 | | | KB Financial Group Inc. | | | 8,651,681 | |
| | 2,260 | | | KCC Corp. | | | 564,203 | |
| | 54,824 | | | Kia Motors Corp. | | | 3,583,679 | |
| | 663,538 | | | Korea Life Insurance Co., Ltd. | | | 4,155,893 | |
| | 101,855 | | | KT&G Corp. | | | 7,718,194 | |
| | 20,840 | | | NHN Corp. | | | 4,770,625 | |
| | 13,200 | | | POSCO | | | 4,296,754 | |
| | 23,020 | | | Samsung Electronics Co., Ltd. | | | 25,038,513 | |
| | 32,140 | | | Samsung Heavy Industries Co., Ltd. | | | 1,053,282 | |
| | 338,986 | | | Shinhan Financial Group Co., Ltd. | | | 10,555,933 | |
| | 7,483 | | | SK Holdings Co., Ltd. | | | 1,102,383 | |
| | 3,621 | | | SK Innovation Co., Ltd. | | | 522,260 | |
| | 8,805 | | | SK Telecom Co., Ltd. | | | 1,130,141 | |
| | 104,040 | | | Woongjin Coway Co., Ltd. | | | 3,602,302 | |
| | 166,510 | | | Woori Finance Holdings Co., Ltd. | | | 1,586,369 | |
| | | | | | | | |
| | | | Total South Korea | | | 100,456,995 | |
| | | | | | | | |
| Taiwan — 5.8% | | | | |
| | 2,320,859 | | | Advanced Semiconductor Engineering Inc. | | | 1,739,751 | |
| | 342,523 | | | Asia Cement Corp. | | | 394,311 | |
| | 99,000 | | | Asustek Computer Inc. | | | 990,596 | |
| | 1,233,666 | | | Chinatrust Financial Holding Co., Ltd. | | | 738,994 | |
| | 335,000 | | | Chipbond Technology Corp. | | | 492,713 | |
| | 182,936 | | | Chunghwa Telecom Co., Ltd. | | | 554,036 | |
| | 494,000 | | | Compal Electronics Inc. | | | 433,957 | |
| | 422,000 | | | Coretronic Corp. | | | 390,479 | |
| | 201,062 | | | Far Eastern New Century Corp. | | | 211,949 | |
| | 87,000 | | | Farglory Land Development Co., Ltd. | | | 156,927 | |
| | 206,000 | | | Formosa Chemicals & Fibre Corp. | | | 532,889 | |
| | 76,830 | | | Formosa Plastics Corp. | | | 207,489 | |
| | 560,889 | | | Fubon Financial Holding Co., Ltd. | | | 558,411 | |
| | 113,000 | | | Highwealth Construction Corp. | | | 189,077 | |
| | 1,573,282 | | | Hon Hai Precision Industry Co., Ltd. | | | 4,464,705 | |
| | 527,475 | | | Hon Hai Precision Industry Co., Ltd., London Shares, GDR | | | 3,038,256 | |
| | 44,283 | | | HTC Corp. | | | 382,338 | |
See Notes to Financial Statements.
77
Schedules of Investments
(continued)
Emerging Markets Equity Investments
| | | | | | | | |
Shares | | | Security | | Value | |
| Taiwan — 5.8%—(continued) | | | | |
| | 67,345 | | | HTC Corp., GDR | | $ | 2,325,086 | |
| | 244,215 | | | Lite-On Technology Corp. | | | 296,258 | |
| | 519,000 | | | MediaTek Inc. | | | 5,557,861 | |
| | 566,114 | | | Mega Financial Holding Co., Ltd. | | | 427,209 | |
| | 138 | | | Pacific Electric Wire & Cable Co., Ltd.(d)* | | | 0 | |
| | 361,270 | | | Pou Chen Corp. | | | 349,398 | |
| | 140,316 | | | Silitech Technology Corp. | | | 264,366 | |
| | 124,988 | | | Taiwan Mobile Co., Ltd. | | | 464,282 | |
| | 2,224,031 | | | Taiwan Semiconductor Manufacturing Co., Ltd. | | | 6,199,779 | |
| | 537,215 | | | Taiwan Semiconductor Manufacturing Co., Ltd., ADR(a) | | | 7,897,061 | |
| | 164,381 | | | Tripod Technology Corp. | | | 363,066 | |
| | 105,000 | | | TSRC Corp. | | | 221,371 | |
| | 1,225,000 | | | United Microelectronics Corp. | | | 491,935 | |
| | | | | | | | |
| | | | Total Taiwan | | | 40,334,550 | |
| | | | | | | | |
| Thailand — 2.1% | | | | |
| | 179,050 | | | Advanced Info Service PCL | | | 1,220,210 | |
| | 153,200 | | | Advanced Info Service PCL, NVDR | | | 1,063,651 | |
| | 224,800 | | | Bangkok Bank PCL, NVDR | | | 1,352,180 | |
| | 43,850 | | | Banpu PCL | | | 631,339 | |
| | 2,007,000 | | | CP ALL PCL | | | 2,215,373 | |
| | 564,400 | | | CP ALL PCL, NVDR | | | 622,998 | |
| | 384,500 | | | PTT Exploration & Production PCL | | | 1,833,003 | |
| | 102,600 | | | PTT PCL, NVDR | | | 1,083,283 | |
| | 6,535,900 | | | Sansiri PCL, NVDR | | | 485,148 | |
| | 258,100 | | | Siam Cement PCL | | | 3,030,641 | |
| | 348,300 | | | Thai Oil PCL, NVDR | | | 729,920 | |
| | | | | | | | |
| | | | Total Thailand | | | 14,267,746 | |
| | | | | | | | |
| Turkey — 4.2% | | | | |
| | 881,027 | | | Akbank TAS | | | 3,481,439 | |
| | 367 | | | Aktaş Elektrik Ticaret A(d)* | | | 0 | |
| | 87,528 | | | Arcelik A | | | 484,607 | |
| | 5,207 | | | BIM Birlesik Magazalar A | | | 214,212 | |
| | 22,238 | | | Ford Otomotiv Sanayi A | | | 218,464 | |
| | 1,242,345 | | | Kardemir Karabük Demir Çelik Sanayi ve Ticaret A, Class D Shares | | | 793,132 | |
| | 876,058 | | | KOC Holding A | | | 3,567,875 | |
| | 22,734 | | | Koza Altin Işletmeleri A | | | 447,924 | |
| | 1,088,514 | | | Turkcell iletişim Hizmetleri A* | | | 6,469,979 | |
| | 960,340 | | | Türkiye Garanti Bankasi A | | | 4,122,538 | |
| | 172,246 | | | Türkiye Halk Bankasi A | | | 1,554,669 | |
| | 2,360,002 | | | Türkiye Iş Bankasi, Class C Shares | | | 7,195,603 | |
| | 243,983 | | | Türkiye Vakiflar Bankasi TAO, Class D Shares | | | 553,225 | |
| | | | | | | | |
| | | | Total Turkey | | | 29,103,667 | |
| | | | | | | | |
| United Kingdom — 0.1% | | | | |
| | 18,875 | | | Anglo American PLC | | | 530,446 | |
| | | | | | | | |
| United States — 0.7% | | | | |
| | 62,148 | | | Las Vegas Sands Corp. | | | 2,634,454 | |
| | 58,380 | | | Southern Copper Corp. | | | 1,899,685 | |
| | | | | | | | |
| | | | Total United States | | | 4,534,139 | |
| | | | | | | | |
| | | | TOTAL COMMON STOCKS (Cost — $538,598,554) | | | 638,331,035 | |
| | | | | | | | |
| PREFERRED STOCKS — 1.8% | | | | |
| Brazil — 1.4% | | | | |
| | 61,146 | | | Banco Bradesco SA, 0.700% | | | 993,828 | |
| | 104,055 | | | Cia Energética de Minas Gerais, 4.250% | | | 1,775,805 | |
| | 397,154 | | | Itaú Unibanco Holding SA, 0.620% | | | 6,200,794 | |
See Notes to Financial Statements.
78
Schedules of Investments
(continued)
Emerging Markets Equity Investments
| | | | | | | | |
| Shares | | | Security | | Value | |
| Brazil — 1.4%—(continued) | | | | |
| | 202,958 | | | Klabin SA, 3.160% | | $ | 909,655 | |
| | | | | | | | |
| | | | Total Brazil | | | 9,880,082 | |
| | | | | | | | |
| Russia — 0.1% | | | | |
| | 533 | | | AK Transneft OAO, 1.640% | | | 844,272 | |
| | | | | | | | |
| South Korea — 0.3% | | | | |
| | 3,027 | | | Samsung Electronics Co., Ltd., 0.680% | | | 1,946,615 | |
| | | | | | | | |
| | | | TOTAL PREFERRED STOCKS (Cost — $9,324,283) | | | 12,670,969 | |
| | | | | | | | |
| | | | TOTAL INVESTMENTS BEFORE SHORT-TERM INVESTMENTS (Cost — $547,922,837) | | | 651,002,004 | |
| | | | | | | | |
Face
Amount† | | | | | | |
| SHORT-TERM INVESTMENTS (e) — 9.9% | | | | |
| MONEY MARKET FUND — 4.2% | | | | |
| | 28,945,863 | | | Invesco STIT — Government & Agency Portfolio (f) (Cost — $28,945,863) | | | 28,945,863 | |
| | | | | | | | |
| TIME DEPOSITS — 5.7% | | | | |
| | 15,321,329 | | | Bank of New York Mellon — Grand Cayman, 0.030% due 9/4/12 | | | 15,321,329 | |
| | | | BBH — Grand Cayman: | | | | |
| | 1,685 | EUR | | -0.036% due 9/3/12 | | | 2,120 | |
| | 4,969,353 | HKD | | 0.005% due 9/3/12 | | | 640,686 | |
| | 773 | GBP | | 0.052% due 9/3/12 | | | 1,227 | |
| | 1,667,054 | ZAR | | 4.150% due 9/3/12 | | | 198,725 | |
| | 1,965,374 | | | HSBC Bank — Grand Cayman, 0.030% due 9/4/12 | | | 1,965,374 | |
| | 5,491,540 | | | JPMorgan Chase & Co. — London, 0.030% due 9/4/12 | | | 5,491,540 | |
| | 16,294,249 | | | Wells Fargo — Grand Cayman, 0.030% due 9/4/12 | | | 16,294,249 | |
| | | | | | | | |
| | | | TOTAL TIME DEPOSITS (Cost — $39,915,250) | | | 39,915,250 | |
| | | | | | | | |
| | | | TOTAL SHORT-TERM INVESTMENTS (Cost — $68,861,113) | | | 68,861,113 | |
| | | | | | | | |
| | | | TOTAL INVESTMENTS — 103.5% (Cost — $616,783,950#) | | | 719,863,117 | |
| | | | | | | | |
| | | | Liabilities in Excess of Other Assets — (3.5)% | | | (24,660,310 | ) |
| | | | | | | | |
| | | | TOTAL NET ASSETS — 100.0% | | $ | 695,202,807 | |
| | | | | | | | |
| † | Face amount denominated in U.S. dollars, unless otherwise noted. |
| * | Non-income producing security. |
| (a) | All or a portion of this security is on loan (See Note 1). |
| (c) | Restricted security that may be sold to “qualified institutional buyers” pursuant to the conditions of Rule 144A under the Securities Act of 1933, as amended. This security has been deemed liquid pursuant to guidelines approved by the Board of Trustees, unless otherwise noted. |
| (d) | Security is valued in good faith at fair value by or under the direction of the Board of Trustees. |
| (e) | Inclusive of all short term holdings, including collateral received from securities lending activities. Not including such collateral, the percentage of portfolio holdings would be 5.7%. |
| (f) | Represents investment of collateral received from securities lending transactions. |
| # | Aggregate cost for federal income tax purposes is $648,219,830. |
Abbreviations used in this schedule:
| | | | |
| ADR | | — | | American Depositary Receipts |
| EUR | | — | | Euro Dollar |
| GBP | | — | | British Pound |
See Notes to Financial Statements.
79
Schedules of Investments
(continued)
Emerging Markets Equity Investments
Abbreviations used in this schedule:
| | | | |
| GDR | | — | | Global Depositary Receipt |
| HKD | | — | | Hong Kong Dollar |
| NVDR | | — | | Non-Voting Depositary Receipt |
| PCL | | — | | Public Company Limited |
| PLC | | — | | Public Limited Company |
| ZAR | | — | | South African Rand |
Summary of Investments by Security Sector*
| | | | |
Financials | | | 23.9 | % |
Information Technology | | | 14.9 | |
Energy | | | 9.8 | |
Telecommunication Services | | | 9.5 | |
Materials | | | 9.5 | |
Consumer Discretionary | | | 8.1 | |
Consumer Staples | | | 7.8 | |
Industrials | | | 4.9 | |
Utilities | | | 1.4 | |
Health Care | | | 0.6 | |
Short-Term Investments | | | 9.6 | |
| | | | |
| | | 100.0 | % |
| | | | |
| * | As a percentage of total investments. |
For details of other financial instruments held by this fund, refer to Note 3.
See Notes to Financial Statements.
80
Schedules of Investments
(continued)
Core Fixed Income Investments
| | | | | | | | | | |
Face
Amount† | | | Rating†† | | Security | | Value | |
| MORTGAGE-BACKED SECURITIES — 27.1% | | | | |
| FHLMC — 7.4% | | | | |
| | | | | | Federal Home Loan Mortgage Corp. (FHLMC): | | | | |
| $ | 14,565 | | | | | 11.500% due 10/1/15 | | $ | 14,650 | |
| | 1,633 | | | | | 9.500% due 6/1/16 | | | 1,640 | |
| | 81,018 | | | | | 8.500% due 11/1/16 — 7/1/17 | | | 86,044 | |
| | 17,526 | | | | | 8.000% due 1/1/17 — 6/1/17 | | | 18,080 | |
| | 53,176 | | | | | 2.625% due 12/1/34(a) | | | 56,826 | |
| | 58,163 | | | | | 2.754% due 1/1/35(a) | | | 62,474 | |
| | 579,712 | | | | | 2.837% due 3/1/36(a)(b) | | | 621,834 | |
| | 49,867 | | | | | 2.320% due 2/1/37(a) | | | 52,483 | |
| | 138,999 | | | | | 2.184% due 5/1/37(a) | | | 145,933 | |
| | 124,942 | | | | | 2.870% due 5/1/37(a) | | | 133,168 | |
| | 1,112,372 | | | | | 5.923% due 5/1/37(a) | | | 1,205,202 | |
| | 140,067 | | | | | 3.130% due 3/1/41(a) | | | 147,538 | |
| | 300,000 | | | | | 2.051% due 7/1/42(a) | | | 310,808 | |
| | | | | | Gold: | | | | |
| | 10,960,729 | | | | | 5.500% due 10/1/13 — 2/1/40(b) | | | 12,115,862 | |
| | 1,546,509 | | | | | 6.500% due 7/1/14 — 9/1/39(b) | | | 1,741,597 | |
| | 2,051,724 | | | | | 6.000% due 5/1/16 — 6/1/39 | | | 2,248,844 | |
| | 8,286 | | | | | 8.500% due 2/1/18 | | | 9,172 | |
| | 3,261,958 | | | | | 5.000% due 6/1/21 — 4/1/41 | | | 3,557,261 | |
| | 24,992,654 | | | | | 4.000% due 10/1/25 — 10/1/42(c) | | | 27,011,835 | |
| | 7,334,224 | | | | | 3.500% due 12/1/25 — 6/1/42(c) | | | 7,813,025 | |
| | 3,755,000 | | | | | 2.500% due 9/15/27 — 10/15/27(c) | | | 3,890,522 | |
| | 13,352,757 | | | | | 4.500% due 4/1/29 — 6/1/42 | | | 14,724,372 | |
| | | | | | | | | | |
| | | | | | TOTAL FHLMC | | | 75,969,170 | |
| | | | | | | | | | |
| FNMA — 13.8% | | | | |
| | | | | | Federal National Mortgage Association (FNMA): | | | | |
| | 18,729,436 | | | | | 4.000% due 5/1/13 — 6/1/42 | | | 20,314,136 | |
| | 10,694,628 | | | | | 5.500% due 2/1/14 — 5/1/40 | | | 11,771,285 | |
| | 2,207 | | | | | 8.500% due 4/1/17 | | | 2,471 | |
| | 8,685 | | | | | 8.000% due 8/1/17 | | | 9,057 | |
| | 1,229,687 | | | | | 4.761% due 2/1/20 | | | 1,442,221 | |
| | 1,242,536 | | | | | 4.671% due 7/1/20 | | | 1,455,901 | |
| | 1,297,283 | | | | | 3.975% due 11/1/20 | | | 1,481,103 | |
| | 7,173,829 | | | | | 6.000% due 9/1/21 — 7/1/39 | | | 7,941,230 | |
| | 156 | | | | | 9.500% due 11/1/21 | | | 160 | |
| | 7,400,535 | | | | | 5.000% due 12/1/21 — 7/1/40 | | | 8,133,522 | |
| | 1,546,291 | | | | | 3.264% due 1/1/22 | | | 1,699,448 | |
| | 15,710,751 | | | | | 4.500% due 3/1/24 — 12/1/41 | | | 17,081,950 | |
| | 30,806,847 | | | | | 3.500% due 9/15/25 — 9/15/42(c) | | | 32,907,121 | |
| | 22,830,814 | | | | | 3.000% due 8/1/26 — 10/15/42(c) | | | 23,804,177 | |
| | 444,997 | | | | | 7.000% due 9/1/26 — 4/1/37(b) | | | 505,148 | |
| | 1,792,235 | | | | | 2.500% due 1/1/27 — 9/1/27(c) | | | 1,862,556 | |
| | 46,624 | | | | | 2.690% due 3/1/30(a)(b) | | | 47,122 | |
| | 751,332 | | | | | 2.678% due 3/1/34(a) | | | 791,434 | |
| | 15,585 | | | | | 2.488% due 12/1/34(a) | | | 16,657 | |
| | 163,569 | | | | | 2.497% due 12/1/34(a) | | | 174,863 | |
| | 242,717 | | | | | 2.607% due 9/1/35(a) | | | 259,610 | |
| | 181,746 | | | | | 2.063% due 10/1/35(a) | | | 189,625 | |
| | 245,339 | | | | | 2.145% due 10/1/35(a) | | | 257,040 | |
| | 204,387 | | | | | 2.021% due 11/1/35(a)(b) | | | 213,395 | |
| | 50,597 | | | | | 2.110% due 11/1/35 (a) | | | 53,148 | |
| | 177,824 | | | | | 2.117% due 11/1/35(a) | | | 185,974 | |
| | 45,266 | | | | | 2.118% due 11/1/35(a) | | | 47,460 | |
| | 57,765 | | | | | 2.130% due 11/1/35(a) | | | 60,688 | |
See Notes to Financial Statements.
81
Schedules of Investments
(continued)
Core Fixed Income Investments
| | | | | | | | | | |
Face
Amount† | | | Rating†† | | Security | | Value | |
| FNMA — 13.8%—(continued) | | | | |
| $ | 40,722 | | | | | 2.150% due 11/1/35(a) | | $ | 42,756 | |
| | 633,449 | | | | | 2.250% due 1/1/36(a) | | | 669,018 | |
| | 350,298 | | | | | 5.725% due 6/1/36(a) | | | 381,735 | |
| | 523,316 | | | | | 3.005% due 8/1/36(a) | | | 561,183 | |
| | 714,896 | | | | | 6.238% due 9/1/36(a) | | | 772,147 | |
| | 81,963 | | | | | 2.692% due 12/1/36(a) | | | 88,247 | |
| | 316,738 | | | | | 5.852% due 2/1/37(a) | | | 344,704 | |
| | 623,779 | | | | | 2.502% due 4/1/37(a) | | | 659,536 | |
| | 736,818 | | | | | 5.506% due 4/1/37(a) | | | 793,687 | |
| | 854,135 | | | | | 5.646% due 5/1/37(a) | | | 923,759 | |
| | 783,444 | | | | | 5.931% due 8/1/37(a) | | | 852,061 | |
| | 914,741 | | | | | 6.500% due 9/1/37 — 5/1/40 | | | 1,041,130 | |
| | 229,652 | | | | | 2.974% due 2/1/41(a) | | | 241,213 | |
| | 549,214 | | | | | 3.240% due 7/1/41(a) | | | 579,929 | |
| | 298,937 | | | | | 2.025% due 7/1/42(a) | | | 309,670 | |
| | 104,742 | | | | | 2.324% due 7/1/42(a) | | | 109,054 | |
| | | | | | | | | | |
| | | | | | TOTAL FNMA | | | 141,078,331 | |
| | | | | | | | | | |
| GNMA — 5.9% | | | | |
| | | | | | Government National Mortgage Association (GNMA): | | | | |
| | 3,069 | | | | | 9.500% due 12/15/16 — 8/15/17 | | | 3,099 | |
| | 22,574 | | | | | 8.500% due 1/20/17 — 5/15/30 | | | 25,097 | |
| | 15,631 | | | | | 9.000% due 4/20/17 — 9/15/30 | | | 17,782 | |
| | 105,060 | | | | | 1.625% due 2/20/26 — 10/20/27(a)(b) | | | 109,371 | |
| | 1,272 | | | | | 8.000% due 3/20/30(b) | | | 1,594 | |
| | 35,437 | | | | | 2.000% due 5/20/30(a)(b) | | | 37,023 | |
| | 14,388 | | | | | 4.500% due 9/15/33(b) | | | 15,890 | |
| | 1,694,976 | | | | | 6.000% due 12/15/33 — 9/1/42(c) | | | 1,913,824 | |
| | 560,477 | | | | | 6.500% due 1/15/34 — 10/15/38 | | | 640,003 | |
| | 2,650,068 | | | | | 5.000% due 10/15/34 — 9/15/40 | | | 2,947,559 | |
| | 392,962 | | | | | 5.500% due 5/15/37 — 6/15/38 | | | 439,180 | |
| | 929,138 | | | | | 4.000% due 6/15/41 — 7/15/41 | | | 1,022,102 | |
| | 5,100,000 | | | | | 3.500% due 9/15/41(c) | | | 5,514,375 | |
| | 28,000,000 | | | | | 3.000% due 10/1/42(c) | | | 29,330,000 | |
| | | | | | Government National Mortgage Association II (GNMA): | | | | |
| | 956,178 | | | | | 6.000% due 7/20/37 — 4/20/41 | | | 1,080,664 | |
| | 1,822,331 | | | | | 5.000% due 9/15/39 — 9/20/41(c) | | | 2,029,639 | |
| | 10,550,771 | | | | | 4.500% due 1/20/40 — 10/20/41 | | | 11,732,598 | |
| | 1,221,999 | | | | | 4.000% due 11/20/40 — 7/20/42 | | | 1,345,623 | |
| | 1,696,582 | | | | | 3.500% due 7/20/42 | | | 1,836,756 | |
| | | | | | | | | | |
| | | | | | TOTAL GNMA | | | 60,042,179 | |
| | | | | | | | | | |
| | | | | | TOTAL MORTGAGE-BACKED SECURITIES (Cost — $268,285,977) | | | 277,089,680 | |
| | | | | | | | | | |
| ASSET-BACKED SECURITIES — 1.5% | | | | |
| Automobiles — 0.2% | | | | |
| | 1,050,000 | | | AAA | | AmeriCredit Automobile Receivables Trust, Series 2011-2, Class A3, 1.610% due 10/8/15 | | | 1,058,148 | |
| | 960,000 | | | AAA | | Santander Drive Auto Receivables Trust, Series 2012-2, Class A3, 1.220% due 12/15/15 | | | 968,295 | |
| | | | | | | | | | |
| | | | | | Total Automobiles | | | 2,026,443 | |
| | | | | | | | | | |
| Credit Card — 0.2% | | | | |
| | 449,905 | | | Aaa(d) | | 321 Henderson Receivables I LLC, Series 2012-2A, Class A, 3.840% due 10/15/59(e) | | | 450,720 | |
| | 1,695,000 | | | AAA | | Arran Funding Ltd., Series 2012-1A, Class A1, 0.940% due 7/15/15(a)(e) | | | 1,696,170 | |
| | | | | | | | | | |
| | | | | | Total Credit Card | | | 2,146,890 | |
| | | | | | | | | | |
| Student Loan — 1.1% | | | | |
| | 840,805 | | | AA+ | | CIT Education Loan Trust, Series 2007-1, Class A, 0.558% due 3/25/42(a)(e) | | | 765,764 | |
| | 850,000 | | | AA+ | | EFS Volunteer LLC, Series 2010-1, Class A2, 1.301% due 10/25/35(a)(e) | | | 810,547 | |
See Notes to Financial Statements.
82
Schedules of Investments
(continued)
Core Fixed Income Investments
| | | | | | | | | | |
Face
Amount† | | | Rating†† | | Security | | Value | |
| Student Loan — 1.1%—(continued) | | | | |
| $ | 1,716,392 | | | AAA | | Keycorp Student Loan Trust, Series 2002-A, Class 1A2, 0.617% due 8/27/31(a) | | $ | 1,571,410 | |
| | 500,000 | | | AA+ | | Nelnet Education Loan Funding Inc., Series 2004-2A, Class A5C, 1.090% due 2/25/39(a) | | | 444,661 | |
| | | | | | SLM Student Loan Trust: | | | | |
| | 873,163 | | | AAA | | Series 2012-A, Class A1, 1.640% due 8/15/25(a)(e) | | | 879,922 | |
| | 900,000 | | | AAA | | Series 2005-4, Class A3, 0.571% due 1/25/27(a) | | | 853,438 | |
| | 935,000 | | | AAA | | Series 2011-B, Class A2, 3.740% due 2/15/29(e) | | | 999,997 | |
| | 199,553 | | | AA+ | | Series 2003-4, Class A5A, 1.218% due 3/15/33(a)(e) | | | 194,190 | |
| | 880,000 | | | AA+ | | Series 2005-5, Class A5, 1.201% due 10/25/40(a) | | | 825,000 | |
| | 1,698,907 | | | AAA | | Series 2010-A, Class 2A, 3.490% due 5/16/44(a)(b)(e) | | | 1,762,612 | |
| | 680,000 | | | AAA | | Series 2012-D, Class A2, 2.950% due 2/15/46(e) | | | 704,769 | |
| | 705,000 | | | AAA | | Series 2012-C, Class A2, 3.310% due 10/15/46(e) | | | 730,770 | |
| | | | | | | | | | |
| | | | | | Total Student Loan | | | 10,543,080 | |
| | | | | | | | | | |
| | | | | | TOTAL ASSET-BACKED SECURITIES (Cost — $14,627,287) | | | 14,716,413 | |
| | | | | | | | | | |
| COLLATERALIZED MORTGAGE OBLIGATIONS — 14.4% | | | | |
| | | | | | Accredited Mortgage Loan Trust: | | | | |
| | 126,516 | | | AAA | | Series 2005-3, Class A1, 0.480% due 9/25/35(a) | | | 120,979 | |
| | 2,800,000 | | | B- | | Series 2007-1, Class A4, 0.456% due 2/25/37(a) | | | 1,309,266 | |
| | 127,227 | | | AAA | | ACE Securities Corp., Series 2004-SD1, Class A1, 0.726% due 11/25/33(a) | | | 123,917 | |
| | | | | | Adjustable Rate Mortgage Trust: | | | | |
| | 2,517,658 | | | CCC | | Series 2005-10, Class 3A11, 5.126% due 1/25/36(a)(b) | | | 2,256,932 | |
| | 3,200,000 | | | CCC | | Series 2005-10, Class 3A31, 5.126% due 1/25/36(a)(b) | | | 2,887,909 | |
| | 158,803 | | | CC | | AFC Home Equity Loan Trust, Series 1999-2, Class 2A, 0.886% due 6/25/29(a) | | | 71,272 | |
| | 942,175 | | | CCC | | American Home Mortgage Assets, Series 2006-1, Class 2A1, 0.426% due 5/25/46(a)(b) | | | 549,880 | |
| | 880,000 | | | AAA | | Arkle Master Issuer PLC, Series 2010-2A, Class 1A1, 1.835% due 5/17/60(a)(e) | | | 888,464 | |
| | 785,895 | | | AAA | | Asset Backed Funding Certificates, Series 2004-OPT5, Class A1, 0.586% due 6/25/34(a)(b) | | | 603,395 | |
| | | | | | Asset Backed Securities Corp. Home Equity: | | | | |
| | 96,665 | | | AAA | | Series 2004-HE6, Class A1, 0.511% due 9/25/34(a)(b) | | | 85,109 | |
| | 1,956,000 | | | BBB- | | Series 2005-HE5, Class M3, 0.716% due 6/25/35(a) | | | 1,504,319 | |
| | 5,500,000 | | | A- | | Series 2006-HE3, Class A5, 0.506% due 3/25/36(a) | | | 1,844,826 | |
| | 5,474,086 | | | AA+ | | Avoca CLO I BV, Series III-X, Class A, 1.433% due 9/15/21(a) | | | 6,539,161 | |
| | | | | | Banc of America Commercial Mortgage Inc.: | | | | |
| | 1,280,000 | | | AAA | | Series 2005-2, Class A5, 4.857% due 7/10/43(a) | | | 1,403,655 | |
| | 855,000 | | | A+ | | Series 2007-2, Class A4, 5.803% due 4/10/49(a) | | | 996,825 | |
| | | | | | Banc of America Funding Corp.: | | | | |
| | 1,641 | | | AAA | | Series 2003-1, Class A1, 6.000% due 5/20/33 | | | 1,738 | |
| | 1,154,174 | | | AAA | | Series 2006-G, Class 2A3, 0.407% due 7/20/36(a) | | | 1,163,619 | |
| | | | | | Banc of America Merrill Lynch Commercial Mortgage Inc.: | | | | |
| | 57,000 | | | A | | Series 2005-3, Class AM, 4.727% due 7/10/43 | | | 60,156 | |
| | 117,000 | | | A+ | | Series 2006-1, Class AM, 5.421% due 9/10/45(a) | | | 128,502 | |
| | 925,319 | | | Aaa(d) | | Series 2007-1, Class A3, 5.449% due 1/15/49 | | | 984,482 | |
| | | | | | Banc of America Mortgage Securities Inc.: | | | | |
| | 218,564 | | | AAA | | Series 2004-F, Class 1A1, 2.998% due 7/25/34(a)(b) | | | 207,134 | |
| | 923,718 | | | CCC | | Series 2006-B, Class 4A1, 6.132% due 11/20/46(a) | | | 812,980 | |
| | 231,074 | | | AAA | | Bayview Financial Acquisition Trust, Series 2004-A, Class A, 0.911% due 2/28/44(a) | | | 225,555 | |
| | | | | | Bear Stearns Adjustable Rate Mortgage Trust: | | | | |
| | 21,855 | | | AAA | | Series 2002-11, Class 1A1, 5.657% due 2/25/33(a)(b) | | | 22,107 | |
| | 386,580 | | | AAA | | Series 2005-2, Class A2, 3.078% due 3/25/35(a)(b) | | | 389,075 | |
| | 324,896 | | | CCC | | Series 2005-4, Class 3A1, 2.981% due 8/25/35(a)(b) | | | 280,800 | |
| | 857,135 | | | D | | Series 2007-3, Class 1A1, 3.117% due 5/25/47(a)(b) | | | 616,425 | |
| | | | | | Bear Stearns ALT-A Trust: | | | | |
| | 412,650 | | | B- | | Series 2005-2, Class 2A4, 2.843% due 4/25/35(a) | | | 317,782 | |
| | 325,575 | | | AAA | | Series 2005-4, Class 23A2, 2.889% due 5/25/35(a)(b) | | | 299,998 | |
| | 455,732 | | | CCC | | Series 2005-7, Class 22A1, 3.003% due 9/25/35(a)(b) | | | 345,612 | |
| | | | | | Bear Stearns Asset Backed Securities Trust: | | | | |
| | 1,369,789 | | | AAA | | Series 2005-TC2, Class A3, 0.606% due 8/25/35(a) | | | 1,323,905 | |
See Notes to Financial Statements.
83
Schedules of Investments
(continued)
Core Fixed Income Investments
| | | | | | | | | | |
Face
Amount† | | | Rating†��� | | Security | | Value | |
| $ | 633,954 | | | CCC | | Series 2007-HE7, Class 1A1, 1.236% due 10/25/37(a)(b) | | $ | 419,355 | |
| | | | | | Bear Stearns Commercial Mortgage Securities: | | | | |
| | 210,000 | | | A- | | Series 2005-PW10, Class AM, 5.449% due 12/11/40(a) | | | 222,029 | |
| | 1,540,000 | | | Aaa(d) | | Series 2005-T20, Class A4A, 5.297% due 10/12/42(a) | | | 1,730,195 | |
| | 192,036 | | | AAA | | Series 2007-PW17, Class A3, 5.736% due 6/11/50 | | | 198,278 | |
| | 32,376 | | | B | | Bear Stearns Second Lien Trust, Series 2007-SV1A, Class A1, 0.456% due 12/25/36(a)(b)(e) | | | 32,147 | |
| | 916,585 | | | BBB | | Bear Stearns Structured Products Inc., Series 2007-EMX1, Class A1, 1.236% due 3/25/37(a)(e) | | | 824,090 | |
| | 1,700,000 | | | A+ | | Centex Home Equity, Series 2006-A, Class AV4, 0.486% due 6/25/36(a) | | | 1,296,306 | |
| | | | | | Chase Funding Mortgage Loan Asset-Backed Certificates: | | | | |
| | 779 | | | AAA | | Series 2002-2, Class 2A1, 0.736% due 5/25/32(a) | | | 712 | |
| | 1,001 | | | AAA | | Series 2002-3, Class 2A1, 0.876% due 8/25/32(a) | | | 754 | |
| | 762,980 | | | BBB | | Chase Mortgage Finance Corp., Series 2007-A1, Class 5A1, 3.015% due 2/25/37(a)(b) | | | 758,947 | |
| | 440,000 | | | Aa3(d) | | Commercial Mortgage Pass Through Certificates, Series 2006-C8, Class AM, 5.347% due 12/10/46 | | | 464,051 | |
| | | | | | Countrywide Alternative Loan Trust: | | | | |
| | 606,298 | | | BB+ | | Series 2005-24, Class 4A1, 0.467% due 7/20/35(a) | | | 414,118 | |
| | 408,553 | | | CCC | | Series 2005-27, Class 2A3, 1.708% due 8/25/35(a) | | | 275,408 | |
| | 734,834 | | | CCC | | Series 2005-59, Class 1A1, 0.567% due 11/20/35(a) | | | 457,356 | |
| | 1,080,117 | | | CCC | | Series 2006-OA17, Class 1A1A, 0.432% due 12/20/46(a)(b) | | | 619,208 | |
| | 484,893 | | | CCC | | Series 2006-OA21, Class A1, 0.427% due 3/20/47(a) | | | 267,554 | |
| | 998,151 | | | D | | Series 2006-OA9, Class 2A1A, 0.447% due 7/20/46(a)(b) | | | 447,748 | |
| | | | | | Countrywide Asset-Backed Certificates: | | | | |
| | 1,582 | | | B- | | Series 2001-BC3, Class A, 0.716% due 12/25/31(a) | | | 923 | |
| | 5,025 | | | AAA | | Series 2002-3, Class 1A1, 0.976% due 5/25/32(a) | | | 4,124 | |
| | 12,759 | | | AAA | | Series 2003-BC2, Class 2A1, 0.836% due 6/25/33(a) | | | 11,491 | |
| | 27,612 | | | AAA | | Series 2004-SD4, Class A1, 0.616% due 12/25/34(a)(e) | | | 26,569 | |
| | 41,034 | | | BBB | | Series 2005-4, Class AF3, 4.456% due 10/25/35(a) | | | 41,252 | |
| | 626,925 | | | CCC | | Series 2006-SD3, Class A1, 0.566% due 7/25/36(a)(e) | | | 343,577 | |
| | 659,404 | | | AA- | | Series 2007-13, Class 2A2, 1.036% due 10/25/47(a) | | | 481,776 | |
| | 261,781 | | | AA- | | Series 2007-8, Class 2A1, 0.296% due 11/25/37(a) | | | 258,687 | |
| | | | | | Countrywide Home Loan Mortgage Pass Through Trust: | | | | |
| | 61,309 | | | CCC | | Series 2004-R2, Class 1AF1, 0.656% due 11/25/34(a)(e) | | | 51,029 | |
| | 282,019 | | | CC | | Series 2005-11, Class 3A3, 2.893% due 4/25/35(a) | | | 148,872 | |
| | 187,474 | | | CCC | | Series 2005-11, Class 6A1, 0.536% due 3/25/35(a) | | | 126,928 | |
| | 503,780 | | | CC | | Series 2005-R1, Class 1AF1, 0.596% due 3/25/35(a)(e) | | | 414,917 | |
| | | | | | Credit Suisse First Boston Mortgage Securities Corp.: | | | | |
| | 731,094 | | | AAA | | Series 2004-AR7, Class 2A1, 3.025% due 11/25/34(a) | | | 737,800 | |
| | 523,880 | | | D | | Series 2005-10, Class 5A6, 5.500% due 11/25/35 | | | 442,757 | |
| | 972,236 | | | B+ | | Series 2005-6, Class 8A1, 4.500% due 7/25/20 | | | 1,005,494 | |
| | 2,800,000 | | | Aaa(d) | | Series 2010-UD1, Class A, 5.930% due 12/18/49(a)(b)(e) | | | 3,159,604 | |
| | | | | | Credit Suisse Mortgage Capital Certificates: | | | | |
| | 70,000 | | | AAA | | Series 2006-C1, Class A4, 5.591% due 2/15/39(a) | | | 79,609 | |
| | 975,000 | | | A+ | | Series 2006-C5, Class A3, 5.311% due 12/15/39 | | | 1,105,145 | |
| | 771,058 | | | Aaa(d) | | Series 2007-C1, Class AAB, 5.336% due 2/15/40 | | | 808,421 | |
| | 325,954 | | | AAA | | Credit-Based Asset Servicing and Securitization LLC, Series 2004-CB4, Class A5, step bond to yield, 6.280% due 5/25/35(b) | | | 289,393 | |
| | 560,000 | | | Aaa(d) | | DBRR Trust, Series 2011-LC2, Class A4A, 4.537% due 7/12/44(a)(e) | | | 651,336 | |
| | 178,276 | | | CCC | | Downey Savings & Loan Association Mortgage Loan Trust, Series 2004-AR2, Class A2B, 0.637% due 11/19/44(a) | | | 101,283 | |
| | | | | | EMC Mortgage Loan Trust: | | | | |
| | 5,781 | | | BB(f) | | Series 2002-B, Class A1, 0.886% due 2/25/41(a)(e) | | | 4,878 | |
| | 30,750 | | | BBB- | | Series 2003-A, Class A1, 0.786% due 8/25/40(a)(e) | | | 25,881 | |
| | 1,164,871 | | | A | | Equifirst Mortgage Loan Trust, Series 2003-2, Class M2, 1.936% due 9/25/33(a) | | | 1,024,365 | |
| | | | | | Extended Stay America Trust: | | | | |
| | 755,000 | | | A | | Series 2010-ESHA, Class C, 4.860% due 11/5/27(e) | | | 767,213 | |
| | 555,000 | | | BBB | | Series 2010-ESHA, Class D, 5.498% due 11/5/27(e) | | | 564,969 | |
| | 390,184 | | | AA+ | | Federal Home Loan Bank (FHLB), Series 9W-2012, Class 1, 4.770% due 9/20/12 | | | 413,108 | |
See Notes to Financial Statements.
84
Schedules of Investments
(continued)
Core Fixed Income Investments
| | | | | | | | | | |
Face
Amount† | | | Rating†† | | Security | | Value | |
| | | | | | Federal Home Loan Mortgage Corp. (FHLMC): | | | | |
| $ | 8,053 | | | NR | | Series 1865, Class DA, 26.318% due 2/15/24(a) | | $ | 12,619 | |
| | 99,718 | | | NR | | Series 4063, Class S, 5.711% due 6/15/42(a) | | | 22,571 | |
| | 782,339 | | | NR | | Series T-61, Class 1A1, 1.521% due 7/25/44(a)(b) | | | 796,752 | |
| | | | | | Federal Home Loan Mortgage Corp. (FHLMC), REMICS: | | | | |
| | 109,461 | | | AAA(f) | | Series 2808, Class FT, 0.590% due 4/15/33(a) | | | 109,600 | |
| | 164,918 | | | NR | | Series 3062, Class MC, 5.250% due 3/15/35 | | | 169,692 | |
| | 3,663,160 | | | NR | | Series 3349, Class AS, 6.261% due 7/15/37(a) | | | 629,246 | |
| | 985,674 | | | NR | | Series 3451, Class SB, 5.791% due 5/15/38(a) | | | 104,757 | |
| | 511,744 | | | NR | | Series 3621, Class SB, 5.991% due 1/15/40(a) | | | 70,288 | |
| | 7,923,964 | | | NR | | Series 3866, Class SA, 5.711% due 5/15/41(a) | | | 930,972 | |
| | 1,292,688 | | | NR | | Series 4057, Class SA, 5.811% due 4/15/39(a) | | | 297,585 | |
| | 436,090 | | | NR | | Series R007, Class ZA, 6.000% due 5/15/36 | | | 512,286 | |
| | | | | | Federal National Mortgage Association (FNMA): | | | | |
| | 37,148 | | | NR | | Series 2000-34, Class F, 0.686% due 10/25/30(a)(b) | | | 37,350 | |
| | 180,890 | | | NR | | Series 2000-T6, Class A3, 3.759% due 1/25/28(a) | | | 192,495 | |
| | 59,685 | | | NR | | Series 2002-T6, Class A1, 3.310% due 2/25/32 | | | 61,916 | |
| | 34,561 | | | NR | | Series 2004-88, Class HA, 6.500% due 7/25/34 | | | 37,017 | |
| | | | | | Federal National Mortgage Association (FNMA), Interest Strip: | | | | |
| | 571,902 | | | NR | | Series 409, Class C13, 3.500% due 11/25/41 | | | 77,414 | |
| | 1,151,880 | | | NR | | Series 409, Class C18, 4.000% due 4/25/42 | | | 167,860 | |
| | 280,468 | | | NR | | Series 409, Class C22, 4.500% due 11/25/39 | | | 38,809 | |
| | | | | | Federal National Mortgage Association (FNMA), REMICS: | | | | |
| | 93,862 | | | NR | | Series 2002-34, Class FE, 0.637% due 5/18/32(a)(b) | | | 94,410 | |
| | 185,351 | | | NR | | Series 2004-38, Class FK, 0.586% due 5/25/34(a) | | | 185,971 | |
| | 1,260,110 | | | NR | | Series 2005-117, Class LC, 5.500% due 11/25/35 | | | 1,380,837 | |
| | 495,920 | | | NR | | Series 2005-27, Class ND, 5.500% due 3/25/32 | | | 508,869 | |
| | 211,533 | | | NR | | Series 2005-64, Class EA, 5.250% due 6/25/32 | | | 218,524 | |
| | 111,994 | | | NR | | Series 2005-69, Class LE, 5.500% due 11/25/33 | | | 115,523 | |
| | 3,968,467 | | | NR | | Series 2006-27, Class SH, 6.465% due 4/25/36(a) | | | 668,627 | |
| | 3,911,144 | | | NR | | Series 2006-51, Class SP, 6.415% due 3/25/36(a) | | | 568,540 | |
| | 2,718,602 | | | NR | | Series 2007-68, Class SC, 6.465% due 7/25/37(a) | | | 403,601 | |
| | 4,679,509 | | | NR | | Series 2008-18, Class SM, 6.765% due 3/25/38(a) | | | 795,710 | |
| | 1,112,405 | | | NR | | Series 2009-101, Class NS, 5.925% due 12/25/39(a) | | | 133,928 | |
| | 425,910 | | | NR | | Series 2010-118, Class YB, 6.265% due 10/25/40(a) | | | 60,727 | |
| | 800,715 | | | NR | | Series 2010-142, Class SM, 6.295% due 12/25/40(a) | | | 117,495 | |
| | 1,802,739 | | | NR | | Series 2010-27, Class SG, 4.765% due 4/25/40(a) | | | 181,127 | |
| | 555,000 | | | NR | | Series 2011-52, Class GB, 5.000% due 6/25/41 | | | 640,743 | |
| | 1,304,807 | | | NR | | Series 2011-87, Class SJ, 5.715% due 9/25/41(a) | | | 184,079 | |
| | 1,029,057 | | | NR | | Series 2011-90, Class QI, 5.000% due 5/25/34 | | | 143,358 | |
| | 719,195 | | | NR | | Series 2011-96, Class BS, 6.195% due 5/25/41(a) | | | 147,934 | |
| | 780,000 | | | NR | | Series 2011-99, Class DB, 5.000% due 10/25/41 | | | 905,738 | |
| | 1,500,000 | | | NR | | Series 2012-25, Class B, 6.500% due 3/25/42 | | | 1,786,963 | |
| | 1,900,000 | | | NR | | Series 2012-35, Class MB, 5.500% due 4/25/42 | | | 2,163,879 | |
| | 900,000 | | | NR | | Series 2012-46, Class BA, 6.000% due 5/25/42 | | | 1,024,914 | |
| | 1,400,000 | | | NR | | Series 2012-51, Class B, 7.000% due 5/25/42 | | | 1,676,124 | |
| | 495,313 | | | NR | | Series 2012-63, Class DS, 6.315% due 3/25/39(a) | | | 98,638 | |
| | 600,000 | | | NR | | Series 2012-74, Class SA, 6.415% due 3/25/42(a) | | | 125,450 | |
| | 100,000 | | | NR | | Series 2012-75, Class AO, 0.000% due 3/25/42(g) | | | 87,279 | |
| | 600,000 | | | NR | | Series 2012-75, Class AS, 6.415% due 3/25/42(a) | | | 125,452 | |
| | 2,250,000 | | | NR | | Series 2012-76, Class AC, 6.500% due 7/25/42 | | | 2,629,653 | |
| | 5,643,538 | | | NR | | Series 2012-84, Class KS, 5.765% due 8/25/42(a) | | | 738,088 | |
| | | | | | FHLMC Multifamily Structured Pass Through Certificates: | | | | |
| | 3,016,698 | | | NR | | Series K006, Class AX1, 1.220% due 1/25/20(a) | | | 181,427 | |
| | 2,254,406 | | | NR | | Series K007, Class X1, 1.403% due 4/25/20(a) | | | 154,258 | |
| | 1,825,831 | | | NR | | Series K008, Class X1, 1.835% due 6/25/20(a) | | | 174,409 | |
| | 932,415 | | | NR | | Series K009, Class X1, 1.676% due 8/25/20(a) | | | 78,401 | |
| | 970,253 | | | NR | | Series K014, Class X1, 1.447% due 4/25/21(a) | | | 81,914 | |
See Notes to Financial Statements.
85
Schedules of Investments
(continued)
Core Fixed Income Investments
| | | | | | | | | | |
Face
Amount† | | | Rating†† | | Security | | Value | |
| $ | 1,141,192 | | | AAA(f) | | Series K016, Class X1, 1.740% due 10/25/21(a) | | $ | 124,882 | |
| | 747,374 | | | AAA(f) | | Series K017, Class X1, 1.607% due 12/25/21(a) | | | 75,226 | |
| | 4,346,501 | | | NR | | Series K702, Class X1, 1.726% due 2/25/18(a) | | | 310,623 | |
| | 4,000,000 | | | CCC | | First Franklin Mortgage Loan Asset Backed Certificates, Series 2006-FF13, Class A2D, 0.476% due 10/25/36(a) | | | 1,894,010 | |
| | 1,075,000 | | | AAA | | Ford Credit Floorplan Master Owner Trust, Series 2011-2, Class A1, 1.320% due 9/15/15 | | | 1,084,758 | |
| | 380,000 | | | BBB(f) | | FREMF Mortgage Trust, Series 2012-K709, Class C, 3.872% due 4/25/45(a)(e) | | | 344,534 | |
| | 535,000 | | | BBB+ | | GE Capital Commercial Mortgage Corp., Series 2007-C1, Class A4, 5.543% due 12/10/49 | | | 601,512 | |
| | 120,000 | | | AAA | | GMAC Commercial Mortgage Securities Inc., Series 2006-C1, Class A4, 5.238% due 11/10/45(a) | | | 133,067 | |
| | 913,139 | | | BBB+ | | GMAC Mortgage Corp. Loan Trust, Series 2004-VF1, Class A1, 0.986% due 2/25/31(a)(e) | | | 810,751 | |
| | | | | | Government National Mortgage Association (GNMA): | | | | |
| | 75,800 | | | NR | | Series 2000-35, Class F, 0.789% due 12/16/25(a)(b) | | | 76,592 | |
| | 66,623 | | | NR | | Series 2002-21, Class FV, 0.639% due 3/16/32(a)(b) | | | 67,198 | |
| | 5,090,422 | | | NR | | Series 2008-51, Class GS, 5.992% due 6/16/38(a) | | | 885,154 | |
| | 587,155 | | | NR | | Series 2009-106, Class SU, 5.963% due 5/20/37(a) | | | 91,087 | |
| | 167,867 | | | NR | | Series 2010-107, Class SG, 5.913% due 2/20/38(a) | | | 24,486 | |
| | 559,509 | | | NR | | Series 2010-113, Class BS, 5.763% due 9/20/40(a) | | | 86,933 | |
| | 488,754 | | | NR | | Series 2010-121, Class SE, 5.763% due 9/20/40(a) | | | 75,702 | |
| | 744,334 | | | NR | | Series 2010-3, Class MS, 6.313% due 11/20/38(a) | | | 110,874 | |
| | 202,375 | | | NR | | Series 2010-31, Class GS, 6.263% due 3/20/39(a) | | | 28,417 | |
| | 1,475,192 | | | NR | | Series 2010-35, Class AS, 5.513% due 3/20/40(a) | | | 224,184 | |
| | 149,964 | | | NR | | Series 2010-37, Class SG, 5.463% due 3/20/40(a) | | | 23,363 | |
| | 495,140 | | | NR | | Series 2010-85, Class HS, 6.413% due 1/20/40(a) | | | 80,515 | |
| | 462,289 | | | NR | | Series 2010-93, Class PS, 6.463% due 6/20/35(a) | | | 51,739 | |
| | 293,529 | | | NR | | Series 2011-11, Class SA, 5.763% due 1/20/41(a) | | | 43,537 | |
| | 67,961 | | | NR | | Series 2011-32, Class S, 5.762% due 3/16/41(a) | | | 8,926 | |
| | 225,846 | | | NR | | Series 2011-32, Class SD, 5.763% due 3/20/41(a) | | | 35,277 | |
| | 763,870 | | | NR | | Series 2011-40, Class SA, 5.892% due 2/16/36(a) | | | 95,102 | |
| | 314,276 | | | NR | | Series 2011-70, Class BS, 6.462% due 12/16/36(a) | | | 40,706 | |
| | 868,651 | | | A | | Granite Mortgages PLC, Series 2004-3, Class 3A2, 1.298% due 9/20/44(a) | | | 1,349,745 | |
| | | | | | Greenwich Capital Commercial Funding Corp.: | | | | |
| | 340,000 | | | A- | | Series 2006-GG7, Class A4, 6.070% due 7/10/38(a) | | | 393,858 | |
| | 90,000 | | | BB+ | | Series 2006-GG7, Class AM, 6.070% due 7/10/38(a) | | | 95,883 | |
| | | | | | GS Mortgage Securities Corp. II: | | | | |
| | 825,000 | | | AA- | | Series 2005-GG4, Class A4, 4.761% due 7/10/39 | | | 889,312 | |
| | 1,925,000 | | | Aaa(d) | | Series 2011-GC5, Class A4, 3.707% due 8/10/44 | | | 2,116,565 | |
| | 188,471 | | | CCC | | GSMPS Mortgage Loan Trust, Series 2005-RP3, Class 1AF, 0.586% due 9/25/35(a)(e) | | | 153,172 | |
| | 271,664 | | | AAA | | GSR Mortgage Loan Trust, Series 2005-AR6, Class 2A1, 2.645% due 9/25/35(a)(b) | | | 273,560 | |
| | | | | | Harborview Mortgage Loan Trust: | | | | |
| | 787,150 | | | BBB+ | | Series 2004-5, Class 2A6, 2.644% due 6/19/34(a) | | | 761,022 | |
| | 232,566 | | | D | | Series 2006-2, Class 1A, 3.010% due 2/25/36(a) | | | 142,876 | |
| | | | | | Home Equity Asset Trust: | | | | |
| | 233,848 | | | BBB+ | | Series 2007-1, Class 2A1, 0.296% due 5/25/37(a) | | | 230,740 | |
| | 44,386 | | | BBB | | Series 2007-2, Class 2A1, 0.346% due 7/25/37(a) | | | 43,727 | |
| | 234,725 | | | AAA | | HSI Asset Securitization Corp. Trust, Series 2006-OPT1, Class 2A3, 0.426% due 12/25/35(a) | | | 223,302 | |
| | 5,009 | | | AA+ | | Impac CMB Trust, Series 2003-1, Class 1A1, 1.036% due 3/25/33(a) | | | 4,444 | |
| | 224,727 | | | CCC | | Indymac INDA Mortgage Loan Trust, Series 2007-AR7, Class 1A1, 5.493% due 11/25/37(a) | | | 190,505 | |
| | | | | | Indymac Index Mortgage Loan Trust: | | | | |
| | 109,139 | | | B- | | Series 2004-AR15, Class 1A1, 2.710% due 2/25/35(a) | | | 87,946 | |
| | 143,714 | | | CCC | | Series 2005-AR15, Class A2, 4.806% due 9/25/35(a) | | | 114,871 | |
| | 1,137,203 | | | D | | Series 2007-AR5, Class 1A1, 3.145% due 5/25/37(a) | | | 554,497 | |
| | 1,421,508 | | | CCC | | IXIS Real Estate Capital Trust, Series 2006-HE2, Class A3, 0.396% due 8/25/36(a) | | | 449,846 | |
| | | | | | JP Morgan Chase Commercial Mortgage Securities Corp.: | | | | |
| | 541,625 | | | AAA | | Series 2003-C1, Class A2, 4.985% due 1/12/37 | | | 546,504 | |
| | 649,952 | | | Aaa(d) | | Series 2003-ML1A, Class A2, 4.767% due 3/12/39 | | | 655,312 | |
| | 101,000 | | | BBB+ | | Series 2006-LDP8, Class AM, 5.440% due 5/15/45 | | | 111,676 | |
| | 65,000 | | | A- | | Series 2006-LDP9, Class A3, 5.336% due 5/15/47 | | | 73,869 | |
| | 390,000 | | | BBB- | | Series 2007-CB20, Class AM, 6.088% due 2/12/51(a) | | | 426,123 | |
See Notes to Financial Statements.
86
Schedules of Investments
(continued)
Core Fixed Income Investments
| | | | | | | | | | |
Face
Amount† | | | Rating†† | | Security | | Value | |
| $ | 3,247,254 | | | Aaa(d) | | Series 2012-CBX, Class XA, 2.237% due 6/16/45(a) | | $ | 383,986 | |
| | 123,770 | | | B | | JP Morgan Mortgage Acquisition Corp., Series 2007-CH1, Class AF2, step bond to yield, 5.453% due 11/25/36 | | | 123,494 | |
| | | | | | JP Morgan Mortgage Trust: | | | | |
| | 141,207 | | | AAA | | Series 2005-A1, Class 6T1, 5.012% due 2/25/35(a)(b) | | | 144,141 | |
| | 44,368 | | | Caa1(d) | | Series 2006-S2, Class 2A2, 5.875% due 6/25/21 | | | 43,540 | |
| | | | | | LB-UBS Commercial Mortgage Trust: | | | | |
| | 40,000 | | | AAA | | Series 2006-C1, Class A4, 5.156% due 2/15/31 | | | 44,871 | |
| | 30,000 | | | AAA | | Series 2006-C6, Class A4, 5.372% due 9/15/39 | | | 34,734 | |
| | 360,000 | | | BBB+ | | Series 2006-C7, Class AM, 5.378% due 11/15/38 | | | 369,914 | |
| | | | | | Lehman XS Trust: | | | | |
| | 255,319 | | | B | | Series 2005-5N, Class 1A1, 0.536% due 11/25/35(a) | | | 184,717 | |
| | 212,785 | | | D | | Series 2005-7N, Class 1A1B, 0.536% due 12/25/35(a) | | | 66,072 | |
| | 6,811,448 | | | D | | Series 2007-12N, Class 1A3A, 0.436% due 7/25/47(a) | | | 2,123,663 | |
| | 2,530,956 | | | CCC | | Series 2007-16N, Class 2A2, 1.086% due 9/25/47(a) | | | 1,701,563 | |
| | | | | | MASTR Adjustable Rate Mortgages Trust: | | | | |
| | 1,900,000 | | | AAA | | Series 2004-13, Class 3A7, 2.623% due 11/21/34(a) | | | 1,922,098 | |
| | 122,211 | | | AAA | | Series 2004-4, Class 4A1, 2.749% due 5/25/34(a)(b) | | | 114,296 | |
| | 1,084,434 | | | AAA | | MASTR Seasoned Securities Trust, Series 2005-1, Class 4A1, 2.510% due 10/25/32(a) | | | 1,101,177 | |
| | 510,000 | | | CCC | | Merrill Lynch First Franklin Mortgage Loan Trust, Series 2007-4, Class 2A4, 0.486% due 7/25/37(a) | | | 237,543 | |
| | | | | | Merrill Lynch Mortgage Investors Inc.: | | | | |
| | 155,988 | | | AA+ | | Series 2004-A3, Class 4A3, 4.979% due 5/25/34(a) | | | 159,125 | |
| | 2,150,000 | | | AAA | | Series 2006-FF1, Class A2C, 0.436% due 8/25/36(a) | | | 1,987,482 | |
| | | | | | Merrill Lynch Mortgage Trust: | | | | |
| | 860,000 | | | Aaa(d) | | Series 2004-KEY2, Class A4, 4.864% due 8/12/39(a) | | | 929,334 | |
| | 670,000 | | | AAA | | Series 2006-C1, Class A4, 5.847% due 5/12/39(a) | | | 770,176 | |
| | 260,000 | | | Aa3(d) | | Merrill Lynch/Countrywide Commercial Mortgage Trust, Series 2007-6, Class A4, 5.485% due 3/12/51(a) | | | 290,396 | |
| | 800,872 | | | AAA | | Mid-State Trust, Series 2004-1, Class A, 6.005% due 8/15/37 | | | 852,923 | |
| | 73,027 | | | B1(d) | | MLCC Mortgage Investors Inc., Series 2005-1, Class 2A1, 2.499% due 4/25/35(a) | | | 69,882 | |
| | | | | | Morgan Stanley Capital I: | | | | |
| | 1,394,466 | | | Aaa(d) | | Series 2003-IQ4, Class A2, 4.070% due 5/15/40 | | | 1,414,554 | |
| | 337,683 | | | AAA | | Series 2004-SD3, Class A, 0.696% due 6/25/34(a)(e) | | | 302,130 | |
| | 480,000 | | | BBB | | Series 2007-HQ12, Class A5, 5.771% due 4/12/49(a) | | | 535,670 | |
| | 200,000 | | | BBB+ | | Series 2007-IQ14, Class A4, 5.692% due 4/15/49(a) | | | 226,519 | |
| | 509,037 | | | AAA | | Morgan Stanley Mortgage Loan Trust, Series 2004-8AR, Class 4A2, 2.825% due 10/25/34(a) | | | 483,507 | |
| | 2,500,000 | | | B- | | Nationstar Home Equity Loan Trust, Series 2007-A, Class AV4, 0.466% due 3/25/37(a) | | | 1,307,721 | |
| | 2,130,000 | | | AA+ | | New Century Home Equity Loan Trust, Series 2005-3, Class M1, 0.716% due 7/25/35(a) | | | 2,034,873 | |
| | | | | | Opteum Mortgage Acceptance Corp.: | | | | |
| | 2,017,687 | | | AAA | | Series 2005-3, Class APT, 0.526% due 7/25/35(a) | | | 1,837,086 | |
| | 1,079,751 | | | CCC | | Series 2006-2, Class A1C, 0.506% due 7/25/36(a) | | | 564,863 | |
| | | | | | Option One Mortgage Loan Trust: | | | | |
| | 2,662 | | | AAA | | Series 2002-6, Class A2, 1.036% due 11/25/32(a) | | | 2,250 | |
| | 14,141 | | | AAA | | Series 2003-1, Class A2, 1.076% due 2/25/33(a) | | | 11,674 | |
| | 555,487 | | | AAA | | Park Place Securities Inc., Series 2005-WHQ2, Class A2D, 0.566% due 5/25/35(a) | | | 546,522 | |
| | | | | | Permanent Master Issuer PLC: | | | | |
| | 1,000,000 | | | AAA | | Series 2011-1A, Class 1A1, 1.835% due 7/15/42(a)(b)(e) | | | 1,012,827 | |
| | 1,900,000 | | | AAA | | Series 2011-1A, Class 1A3, 1.797% due 7/15/42(a)(e) | | | 2,421,151 | |
| | 549,121 | | | AAA | | Plymouth Rock CLO Ltd., Inc., Series 2010-1A, Class A, 1.937% due 2/16/19(a)(b)(e) | | | 548,768 | |
| | | | | | Popular ABS Mortgage Pass-Through Trust: | | | | |
| | 955,806 | | | AAA | | Series 2005-3, Class AF6, step bond to yield, 4.759% due 7/25/35 | | | 968,582 | |
| | 2,787,000 | | | AA+ | | Series 2006-C, Class A4, 0.486% due 7/25/36(a) | | | 1,687,012 | |
| | | | | | Prime Mortgage Trust: | | | | |
| | 451,840 | | | CCC | | Series 2006-DR1, Class 1A1, 5.500% due 5/25/35(e) | | | 439,114 | |
| | 191,731 | | | CCC | | Series 2006-DR1, Class 1A2, 6.000% due 5/25/35(e) | | | 188,481 | |
| | 1,752,938 | | | CCC | | Series 2006-DR1, Class 2A1, 5.500% due 5/25/35(e) | | | 1,661,915 | |
| | 18,756 | | | AAA | | Public Service New Hampshire Funding LLC, Series 2001-1, Class A3, 6.480% due 5/1/15 | | | 19,131 | |
See Notes to Financial Statements.
87
Schedules of Investments
(continued)
Core Fixed Income Investments
| | | | | | | | | | |
Face
Amount† | | | Rating†† | | Security | | Value | |
| | | | | | Residential Accredit Loans Inc.: | | | | |
| $ | 139,970 | | | AAA | | Series 2005-QA1, Class A1, 0.536% due 1/25/35(a)(b) | | $ | 121,624 | |
| | 1,451,445 | | | CCC | | Series 2007-QS8, Class A10, 6.000% due 6/25/37 | | | 1,051,285 | |
| | | | | | Residential Asset Mortgage Products Inc.: | | | | |
| | 5,979 | | | B- | | Series 2003-RS4, Class AIIB, 0.896% due 5/25/33(a) | | | 4,676 | |
| | 1,247,258 | | | AAA | | Series 2003-RS9, Class AI6A, step bond to yield, 6.110% due 10/25/33 | | | 1,223,305 | |
| | 536,064 | | | AAA | | Series 2004-RZ1, Class AI7, 4.030% due 1/25/33(a) | | | 538,435 | |
| | 142,493 | | | CCC | | Series 2004-SL4, Class A5, 7.500% due 7/25/32 | | | 135,410 | |
| | 223,273 | | | D | | SACO I Inc., Series 2006-7, Class A1, 0.496% due 7/25/36(a) | | | 123,035 | |
| | | | | | Small Business Administration Participation Certificates: | | | | |
| | 102,765 | | | NR | | Series 1993-20K, Class 1, 6.150% due 11/1/13(b) | | | 105,220 | |
| | 57,158 | | | NR | | Series 1995-20J, Class 1, 6.850% due 10/1/15(b) | | | 59,924 | |
| | 108,334 | | | NR | | Series 1995-20K, Class 1, 6.650% due 11/1/15(b) | | | 113,678 | |
| | 89,586 | | | NR | | Series 1996-20G, Class 1, 7.700% due 7/1/16(b) | | | 95,954 | |
| | 458,282 | | | NR | | Series 1999-20L, Class 1, 7.190% due 12/1/19(b) | | | 512,959 | |
| | 342,009 | | | NR | | Series 2000-20A, Class 1, 7.590% due 1/1/20(b) | | | 388,130 | |
| | 765,666 | | | NR | | Series 2002-20K, Class 1, 5.080% due 11/1/22(b) | | | 849,692 | |
| | 184,761 | | | BBB+ | | Structured Adjustable Rate Mortgage Loan Trust, Series 2004-16, Class 1A2, 2.796% due 11/25/34(a) | | | 154,520 | |
| | 551,822 | | | AAA | | Structured Asset Investment Loan Trust, Series 2004-BNC1, Class A2, 1.236% due 9/25/34(a) | | | 482,199 | |
| | 390,348 | | | AAA | | Structured Asset Mortgage Investments Inc., Series 2005-AR5, Class A3, 0.487% due 7/19/35(a)(b) | | | 367,958 | |
| | | | | | Structured Asset Securities Corp.: | | | | |
| | 5,423 | | | A- | | Series 2002-14A, Class 2A1, 2.459% due 7/25/32(a)(b) | | | 5,365 | |
| | 178,075 | | | AAA | | Series 2003-AL1, Class A, 3.357% due 4/25/31(e) | | | 173,767 | |
| | 273,941 | | | CC | | Series 2005-RF3, Class 1A, 0.586% due 6/25/35(a)(e) | | | 221,303 | |
| | 910,733 | | | BB | | Series 2007-BC4, Class A3, 0.486% due 11/25/37(a) | | | 847,502 | |
| | 150,960 | | | NR | | U.S. Small Business Administration, Series 2005-P10A, Class 1, 4.638% due 2/10/15 | | | 160,152 | |
| | 827,353 | | | AAA | | Vanderbilt Mortgage Finance, Series 2001-A, Class A4, 7.235% due 6/7/28(a) | | | 858,287 | |
| | 300,000 | | | AA+ | | Venture CDO Ltd., Series 2007-8A, Class A2A, 0.673% due 7/22/21(a)(b)(e) | | | 285,019 | |
| | 30,000 | | | AA | | Wachovia Bank Commercial Mortgage Trust, Series 2006-C27, Class A3, 5.765% due 7/15/45(a) | | | 34,432 | |
| | | | | | WaMu Mortgage Pass Through Certificates: | | | | |
| | 40,884 | | | AA | | Series 2004-AR11, Class A, 2.449% due 10/25/34(a) | | | 40,846 | |
| | 159,659 | | | AAA | | Series 2004-AR12, Class A2A, 0.578% due 10/25/44(a) | | | 139,625 | |
| | 444,770 | | | AAA | | Series 2005-AR11, Class A1A, 0.556% due 8/25/45(a) | | | 399,424 | |
| | 1,144,269 | | | AAA | | Series 2005-AR13, Class A1A1, 0.526% due 10/25/45(a)(b) | | | 1,000,697 | |
| | 443,283 | | | B+ | | Series 2005-AR15, Class A1A2, 0.516% due 11/25/45(a) | | | 357,787 | |
| | 416,804 | | | AAA | | Series 2005-AR19, Class A1A2, 0.526% due 12/25/45(a) | | | 358,728 | |
| | 1,000,000 | | | B- | | Series 2005-AR4, Class A5, 2.514% due 4/25/35(a) | | | 875,941 | |
| | 2,875,935 | | | AAA | | Series 2006-AR1, Class 2A1A, 1.218% due 1/25/46(a) | | | 2,589,667 | |
| | 1,096,334 | | | B | | Series 2006-AR13, Class 2A, 2.616% due 10/25/46(a)(b) | | | 922,152 | |
| | 610,203 | | | CCC | | Series 2007-HY4, Class 4A1, 2.482% due 9/25/36(a) | | | 470,774 | |
| | 950,350 | | | CCC | | Series 2007-OA2, Class 1A, 0.848% due 3/25/47(a)(b) | | | 624,670 | |
| | 1,255,391 | | | D | | Series 2007-OA2, Class 2A, 0.847% due 1/25/47(a) | | | 582,305 | |
| | 1,191,798 | | | CCC | | Series 2007-OA5, Class 1A, 0.898% due 6/25/47(a) | | | 875,223 | |
| | 2,120,353 | | | AA | | Washington Mutual Inc., Series 2006-AR3, Class A1A, 1.148% due 2/25/46(a) | | | 1,798,411 | |
| | 2,184,000 | | | B- | | Wells Fargo Home Equity Trust, Series 2006-3, Class A3, 0.446% due 1/25/37(a) | | | 849,109 | |
| | | | | | Wells Fargo Mortgage Backed Securities Trust: | | | | |
| | 1,770,918 | | | Caa1(d) | | Series 2006-12, Class A3, 6.000% due 10/25/36(b) | | | 1,685,412 | |
| | 538,743 | | | CCC | | Series 2006-AR2, Class 2A1, 2.617% due 3/25/36(a)(b) | | | 510,146 | |
| | 133,488 | | | Caa2(d) | | Series 2006-AR7, Class 2A4, 2.623% due 5/25/36(a)(b) | | | 109,573 | |
| | | | | | WF-RBS Commercial Mortgage Trust: | | | | |
| | 795,000 | | | Aaa(d) | | Series 2011-C2, Class A2, 3.791% due 2/15/44(e) | | | 864,886 | |
| | 1,035,000 | | | Aaa(d) | | Series 2011-C5, Class A4, 3.667% due 11/15/44 | | | 1,131,247 | |
| | 2,055,305 | | | Aaa(d) | | Series 2012-C7, Class XA, 1.768% due 6/15/45(a)(e) | | | 226,897 | |
| | | | | | | | | | |
| | | | | | TOTAL COLLATERALIZED MORTGAGE OBLIGATIONS (Cost — $152,787,628) | | | 147,252,593 | |
| | | | | | | | | | |
See Notes to Financial Statements.
88
Schedules of Investments
(continued)
Core Fixed Income Investments
| | | | | | | | | | |
Face
Amount† | | | Rating†† | | Security | | Value | |
| CORPORATE BONDS & NOTES — 26.3% | | | | |
| Aerospace & Defense — 0.2% | | | | |
| $ | 300,000 | | | A | | Goodrich Corp., Senior Unsecured Notes, 6.290% due 7/1/16(b) | | $ | 353,901 | |
| | | | | | United Technologies Corp., Senior Unsecured Notes: | | | | |
| | 830,000 | | | A | | 3.100% due 6/1/22 | | | 884,843 | |
| | 445,000 | | | A | | 4.500% due 6/1/42 | | | 507,799 | |
| | | | | | | | | | |
| | | | | | Total Aerospace & Defense | | | 1,746,543 | |
| | | | | | | | | | |
| Airlines — 0.5% | | | | |
| | | | | | Continental Airlines Inc., Pass Thru Certificates: | | | | |
| | 243,917 | | | BBB+ | | 6.648% due 9/15/17 | | | 257,332 | |
| | 393,676 | | | BBB+ | | 7.256% due 3/15/20 | | | 425,170 | |
| | 1,213,865 | | | A- | | Delta Air Lines 2009-1 Class A Pass Through Trust, Pass Thru Certificates, 7.750% due 12/17/19 | | | 1,386,841 | |
| | 706,878 | | | BBB- | | JetBlue Airways 2004-2 G-1 Pass Through Trust, Pass Thru Certificates, 0.810% due 8/15/16(a) | | | 665,856 | |
| | 625,000 | | | BB+ | | JetBlue Airways 2004-2 G-2 Pass Through Trust, Pass Thru Certificates, 0.885% due 11/15/16(a) | | | 540,625 | |
| | 355,003 | | | A- | | Northwest Airlines Inc., Pass Thru Certificates, 7.041% due 4/1/22 | | | 395,608 | |
| | 87,707 | | | BBB+ | | UAL 2009-2A Pass Through Trust, Pass Thru Certificates, 9.750% due 1/15/17 | | | 100,424 | |
| | 946,456 | | | BBB+ | | United Air Lines Inc., Pass Thru Certificates, 10.400% due 11/1/16 | | | 1,090,791 | |
| | | | | | | | | | |
| | | | | | Total Airlines | | | 4,862,647 | |
| | | | | | | | | | |
| Automobiles — 0.4% | | | | |
| | | | | | Daimler Finance North America LLC, Company Guaranteed Notes: | | | | |
| | 1,030,000 | | | A- | | 1.875% due 9/15/14(e) | | | 1,044,841 | |
| | 540,000 | | | A- | | 2.625% due 9/15/16(e) | | | 562,329 | |
| | | | | | Volkswagen International Finance NV, Company Guaranteed Notes: | | | | |
| | 1,600,000 | | | A- | | 0.911% due 10/1/12(a)(b)(e) | | | 1,600,000 | |
| | 1,200,000 | | | A- | | 1.071% due 4/1/14(a)(b)(e) | | | 1,201,498 | |
| | | | | | | | | | |
| | | | | | Total Automobiles | | | 4,408,668 | |
| | | | | | | | | | |
| Beverages — 0.8% | | | | |
| | | | | | Anheuser-Busch InBev Worldwide Inc., Company Guaranteed Notes: | | | | |
| | 300,000 | | | A | | 5.375% due 1/15/20 | | | 366,953 | |
| | 620,000 | | | A | | 5.000% due 4/15/20 | | | 746,435 | |
| | 585,000 | | | A | | 2.500% due 7/15/22 | | | 595,415 | |
| | 260,000 | | | A | | 3.750% due 7/15/42 | | | 267,477 | |
| | 545,000 | | | A- | | Coca-Cola Femsa SAB de CV, Senior Unsecured Notes, 4.625% due 2/15/20 | | | 621,478 | |
| | 403,000 | | | A- | | Diageo Capital PLC, Company Guaranteed Notes, 4.828% due 7/15/20 | | | 474,043 | |
| | 200,000 | | | A- | | Diageo Investment Corp., Company Guaranteed Notes, 2.875% due 5/11/22 | | | 208,740 | |
| | 2,400,000 | | | BBB+ | | Foster’s Finance Corp., Company Guaranteed Notes, 4.875% due 10/1/14(e)(h) | | | 2,582,544 | |
| | 50,000 | | | BBB- | | Molson Coors Brewing Co., Company Guaranteed Notes, 3.500% due 5/1/22 | | | 53,085 | |
| | | | | | PepsiCo Inc., Senior Unsecured Notes: | | | | |
| | 490,000 | | | A- | | 0.700% due 8/13/15 | | | 491,595 | |
| | 310,000 | | | A- | | 7.900% due 11/1/18 | | | 420,501 | |
| | | | | | Pernod-Ricard SA, Senior Unsecured Notes: | | | | |
| | 200,000 | | | BBB- | | 2.950% due 1/15/17(e) | | | 208,648 | |
| | 390,000 | | | BBB- | | 4.450% due 1/15/22(e) | | | 421,372 | |
| | 325,000 | | | BBB+ | | SABMiller Holdings Inc., Company Guaranteed Notes, 3.750% due 1/15/22(e) | | | 353,130 | |
| | | | | | | | | | |
| | | | | | Total Beverages | | | 7,811,416 | |
| | | | | | | | | | |
| Biotechnology — 0.1% | | | | |
| | 330,000 | | | A+ | | Amgen Inc., Senior Unsecured Notes, 5.375% due 5/15/43 | | | 374,902 | |
| | 625,000 | | | BBB | | Life Technologies Corp., Senior Unsecured Notes, 4.400% due 3/1/15 | | | 664,680 | |
| | | | | | | | | | |
| | | | | | Total Biotechnology | | | 1,039,582 | |
| | | | | | | | | | |
| Building Products — 0.1% | | | | |
| | 1,400,000 | | | BB- | | PulteGroup Inc., Company Guaranteed Notes, 6.250% due 2/15/13(b) | | | 1,433,250 | |
| | | | | | | | | | |
| Capital Markets — 1.6% | | | | |
| | 450,000 | | | BB+ | | Goldman Sachs Capital II, Limited Guaranteed Notes, 4.000% due 6/1/43(a) | | | 328,775 | |
See Notes to Financial Statements.
89
Schedules of Investments
(continued)
Core Fixed Income Investments
| | | | | | | | | | |
Face
Amount† | | | Rating†† | | Security | | Value | |
| Capital Markets — 1.6%—(continued) | | | | |
| | | | | | Goldman Sachs Group Inc. (The): | | | | |
| $ | 630,000 | | | A- | | Senior Notes, 6.250% due 2/1/41 | | $ | 706,104 | |
| | | | | | Senior Unsecured Notes: | | | | |
| | 10,000 | | | A- | | 5.450% due 11/1/12 | | | 10,074 | |
| | 15,000 | | | A- | | 4.750% due 7/15/13 | | | 15,481 | |
| | 80,000 | | | A- | | 5.250% due 10/15/13 | | | 83,535 | |
| | 1,285,000 | | | A- | | 6.000% due 5/1/14 | | | 1,372,397 | |
| | 1,000,000 | | | A- | | 5.750% due 10/1/16(b) | | | 1,119,601 | |
| | 3,400,000 | | | A- | | 6.250% due 9/1/17(b) | | | 3,906,324 | |
| | 950,000 | | | A- | | 6.150% due 4/1/18 | | | 1,081,462 | |
| | 355,000 | | | A- | | 7.500% due 2/15/19 | | | 426,339 | |
| | 1,000,000 | | | A- | | 6.000% due 6/15/20 | | | 1,120,596 | |
| | 300,000 | | | A- | | 5.250% due 7/27/21 | | | 319,560 | |
| | 365,000 | | | A- | | 5.750% due 1/24/22 | | | 403,503 | |
| | 650,000 | | | NR | | Lehman Brothers Holdings Inc., , 6.750% due 12/28/17(h)(i)(j) | | | 0 | |
| | | | | | Merrill Lynch & Co., Inc., Senior Unsecured Notes: | | | | |
| | 850,000 | | | Baa2(d) | | 8.950% due 5/18/17(a) | | | 968,566 | |
| | 1,584,000 | | | Baa2(d) | | 9.570% due 6/6/17(a) | | | 1,834,486 | |
| | 2,600,000 | | | A- | | 6.875% due 4/25/18(b) | | | 3,036,345 | |
| | | | | | | | | | |
| | | | | | Total Capital Markets | | | 16,733,148 | |
| | | | | | | | | | |
| Chemicals — 0.1% | | | | |
| | 280,000 | | | BBB | | Dow Chemical Co. (The), Senior Unsecured Notes, 4.125% due 11/15/21 | | | 307,145 | |
| | 160,000 | | | BBB+ | | Ecolab Inc., Senior Unsecured Notes, 4.350% due 12/8/21 | | | 182,374 | |
| | 200,000 | | | BB+ | | LyondellBasell Industries NV, Senior Unsecured Notes, 6.000% due 11/15/21 | | | 229,000 | |
| | 60,000 | | | A- | | Potash Corp. of Saskatchewan Inc., Senior Unsecured Notes, 4.875% due 3/30/20 | | | 70,277 | |
| | 190,000 | | | BBB+ | | PPG Industries Inc., Senior Unsecured Notes, 6.650% due 3/15/18 | | | 234,193 | |
| | | | | | | | | | |
| | | | | | Total Chemicals | | | 1,022,989 | |
| | | | | | | | | | |
| Commercial Banks — 5.8% | | | | |
| | 1,400,000 | | | A | | Abbey National Treasury Services PLC, Bank Guaranteed Notes, 3.875% due 11/10/14(e) | | | 1,410,531 | |
| | 200,000 | | | B+ | | Ally Financial Inc., Company Guaranteed Notes, 8.000% due 3/15/20(b) | | | 235,000 | |
| | 200,000 | | | AA- | | ANZ National International Ltd., Bank Guaranteed Notes, 1.850% due 10/15/15(e) | | | 201,821 | |
| | | | | | Bank of America Corp., Senior Unsecured Notes: | | | | |
| | 380,000 | | | A- | | 7.375% due 5/15/14 | | | 414,840 | |
| | 1,300,000 | | | A- | | 4.500% due 4/1/15(b) | | | 1,383,747 | |
| | 810,000 | | | A- | | 6.500% due 8/1/16 | | | 924,523 | |
| | 1,500,000 | | | A- | | 5.625% due 10/14/16 | | | 1,668,702 | |
| | 290,000 | | | A- | | 3.875% due 3/22/17 | | | 305,864 | |
| | 5,340,000 | | | A- | | 5.650% due 5/1/18(b) | | | 5,973,009 | |
| | 770,000 | | | A- | | 5.000% due 5/13/21 | | | 829,093 | |
| | 300,000 | | | A- | | Bank of America NA, Subordinated Notes, 6.100% due 6/15/17 | | | 333,157 | |
| | | | | | Bank of Nova Scotia, Covered Notes: | | | | |
| | 1,000,000 | | | Aaa(d) | | 2.150% due 8/3/16(e) | | | 1,051,688 | |
| | 880,000 | | | Aaa(d) | | 1.950% due 1/30/17(e) | | | 919,811 | |
| | 985,000 | | | Aaa(d) | | 1.750% due 3/22/17(e) | | | 1,020,689 | |
| | | | | | Barclays Bank PLC: | | | | |
| | | | | | Senior Unsecured Notes: | | | | |
| | 1,200,000 | | | A+ | | 5.200% due 7/10/14 | | | 1,272,468 | |
| | 480,000 | | | A+ | | 5.125% due 1/8/20 | | | 519,193 | |
| | 3,700,000 | | | BBB+ | | Subordinated Notes, 6.050% due 12/4/17(e)(h) | | | 3,923,129 | |
| | 390,000 | | | BBB+ | | BBVA US Senior SAU, Bank Guaranteed Notes, 3.250% due 5/16/14 | | | 386,731 | |
| | | | | | Capital One Financial Corp., Senior Unsecured Notes: | | | | |
| | 700,000 | | | BBB | | 7.375% due 5/23/14 | | | 773,179 | |
| | 405,000 | | | BBB | | 2.150% due 3/23/15 | | | 415,054 | |
| | 655,000 | | | BBB | | 6.750% due 9/15/17 | | | 801,594 | |
| | 750,000 | | | BBB | | Chase Capital II, Limited Guaranteed Notes, 0.945% due 2/1/27(a) | | | 564,772 | |
| | 1,000,000 | | | BBB | | Chase Capital III, Limited Guaranteed Notes, 0.968% due 3/1/27(a) | | | 752,643 | |
See Notes to Financial Statements.
90
Schedules of Investments
(continued)
Core Fixed Income Investments
| | | | | | | | | | |
Face
Amount† | | | Rating†† | | Security | | Value | |
| Commercial Banks — 5.8%—(continued) | | | | |
| $ | 210,000 | | | AA- | | Commonwealth Bank of Australia, Senior Unsecured Notes, 5.000% due 10/15/19(e) | | $ | 238,242 | |
| | | | | | Cooperatieve Centrale Raiffeisen-Boerenleenbank BA: | | | | |
| | 40,000 | | | AA | | Bank Guaranteed Notes, 3.375% due 1/19/17 | | | 42,357 | |
| | 400,000 | | | A | | Junior Subordinated Notes, 11.000% due 12/29/49(a)(e) | | | 520,854 | |
| | 660,000 | | | BBB- | | Credit Agricole SA, Junior Subordinated Notes, 9.750% due 6/29/49 | | | 655,050 | |
| | | | | | Credit Suisse AG: | | | | |
| | | | | | Covered Notes: | | | | |
| | 910,000 | | | Aaa(d) | | 1.625% due 3/6/15(e) | | | 924,191 | |
| | 1,095,000 | | | Aaa(d) | | 2.600% due 5/27/16(e) | | | 1,153,503 | |
| | 300,000 | | | BBB+ | | Subordinated Notes, 5.400% due 1/14/20 | | | 323,407 | |
| | 1,080,000 | | | BB+ | | Eksportfinans ASA, Senior Unsecured Notes, 5.500% due 6/26/17 | | | 1,097,613 | |
| | 3,000,000 | | | NR | | Export-Import Bank of Korea, Senior Unsecured Notes, 1.401% due 7/26/13(e)(h)(i) | | | 2,999,407 | |
| | 1,300,000 | | | BB+ | | HBOS PLC, Subordinated Notes, 6.750% due 5/21/18(e) | | | 1,284,078 | |
| | | | | | HSBC Bank USA NA, Subordinated Notes: | | | | |
| | 1,600,000 | | | A | | 6.000% due 8/9/17(b) | | | 1,829,150 | |
| | 4,100,000 | | | A | | 4.875% due 8/24/20(b) | | | 4,360,748 | |
| | 250,000 | | | A+ | | HSBC Holdings PLC, Senior Unsecured Notes, 5.100% due 4/5/21 | | | 288,083 | |
| | | | | | ING Bank NV: | | | | |
| | 200,000 | | | AAA | | Government Liquid Guaranteed Notes, 3.900% due 3/19/14(b)(e) | | | 209,723 | |
| | 770,000 | | | A+ | | Unsecured Notes, 3.750% due 3/7/17(e) | | | 798,875 | |
| | 690,000 | | | NR | | Landsbanki Islands, Senior Unsecured Notes, 6.100% due 8/25/13(e)(h)(j) | | | 37,950 | |
| | | | | | Lloyds TSB Bank PLC: | | | | |
| | 400,000 | | | BBB- | | Bank Guaranteed Notes, 6.500% due 9/14/20(e) | | | 411,121 | |
| | 600,000 | | | A | | Company Guaranteed Notes, 4.200% due 3/28/17 | | | 637,033 | |
| | 2,800,000 | | | BB+ | | Junior Subordinated Notes, 12.000% due 12/29/49(a)(b)(e) | | | 3,086,124 | |
| | 1,500,000 | | | A- | | National City Bank, Subordinated Notes, 0.838% due 6/7/17(a) | | | 1,418,179 | |
| | 510,000 | | | A | | Nordea Bank AB, Subordinated Notes, 4.875% due 5/13/21(e) | | | 543,718 | |
| | 530,000 | | | AA- | | Royal Bank of Canada, Senior Unsecured Notes, 1.450% due 10/30/14 | | | 540,489 | |
| | | | | | Royal Bank of Scotland Group PLC: | | | | |
| | 1,060,000 | | | BB | | Junior Subordinated Notes, 7.648% due 8/29/49(a)(b) | | | 1,007,000 | |
| | 300,000 | | | A- | | Senior Unsecured Notes, 6.400% due 10/21/19 | | | 330,696 | |
| | 860,000 | | | A | | Royal Bank of Scotland PLC (The), Bank Guaranteed Notes, 3.950% due 9/21/15 | | | 903,313 | |
| | 200,000 | | | A- | | Santander U.S. Debt SA Unipersonal, Bank Guaranteed Notes, 3.724% due 1/20/15(e) | | | 192,850 | |
| | 740,000 | | | AAA | | Swedbank Hypotek AB, Covered Notes, 2.950% due 3/28/16(e) | | | 788,695 | |
| | | | | | UBS AG/Stamford CT: | | | | |
| | 460,000 | | | A | | Notes, 3.875% due 1/15/15 | | | 485,017 | |
| | 2,600,000 | | | A | | Senior Unsecured Notes, 5.750% due 4/25/18(b) | | | 3,010,309 | |
| | 650,000 | | | BBB+ | | Wachovia Capital Trust III, Limited Guaranteed Notes, 5.570% due 3/29/49(a) | | | 644,312 | |
| | 280,000 | | | A | | Wachovia Corp., Subordinated Notes, 5.250% due 8/1/14 | | | 301,360 | |
| | | | | | Wells Fargo & Co.: | | | | |
| | | | | | Senior Unsecured Notes: | | | | |
| | 640,000 | | | A+ | | 2.100% due 5/8/17 | | | 661,629 | |
| | 500,000 | | | A+ | | 3.500% due 3/8/22 | | | 533,900 | |
| | 10,000 | | | A | | Subordinated Notes, 5.000% due 11/15/14 | | | 10,796 | |
| | 400,000 | | | BBB+ | | Wells Fargo Capital X, Limited Guaranteed Notes, 5.950% due 12/15/36 | | | 410,000 | |
| | 480,000 | | | AA- | | Westpac Banking Corp., Senior Unsecured Notes, 4.875% due 11/19/19 | | | 542,303 | |
| | | | | | | | | | |
| | | | | | Total Commercial Banks | | | 59,303,313 | |
| | | | | | | | | | |
| Commercial Services & Supplies — 0.0% | | | | |
| | 70,000 | | | BBB | | Waste Management Inc., Company Guaranteed Notes, 7.375% due 5/15/29 | | | 94,216 | |
| | | | | | | | | | |
| Communications Equipment — 0.1% | | | | |
| | 484,000 | | | BBB | | Brocade Communications Systems Inc., Senior Secured Notes, 6.625% due 1/15/18 | | | 505,780 | |
| | | | | | | | | | |
| Consumer Finance — 0.6% | | | | |
| | | | | | Ford Motor Credit Co. LLC, Senior Unsecured Notes: | | | | |
| | 1,400,000 | | | BB+ | | 7.000% due 10/1/13(b) | | | 1,489,852 | |
| | 100,000 | | | BB+ | | 7.000% due 4/15/15 | | | 111,568 | |
| | 1,300,000 | | | BB+ | | 5.625% due 9/15/15(b) | | | 1,419,414 | |
See Notes to Financial Statements.
91
Schedules of Investments
(continued)
Core Fixed Income Investments
| | | | | | | | | | |
Face
Amount† | | | Rating†† | | Security | | Value | |
| Consumer Finance — 0.6%—(continued) | | | | |
| $ | 610,000 | | | BB+ | | 8.000% due 12/15/16 | | $ | 730,673 | |
| | 500,000 | | | BB+ | | 6.625% due 8/15/17 | | | 575,405 | |
| | 960,000 | | | BB+ | | 8.125% due 1/15/20 | | | 1,192,230 | |
| | | | | | SLM Corp., Senior Unsecured Notes: | | | | |
| | 385,000 | | | BBB- | | 0.751% due 1/27/14(a) | | | 373,381 | |
| | 70,000 | | | BBB- | | 5.050% due 11/14/14 | | | 73,251 | |
| | 440,000 | | | BBB- | | 8.000% due 3/25/20 | | | 500,500 | |
| | 80,000 | | | BBB- | | 5.625% due 8/1/33 | | | 72,400 | |
| | | | | | | | | | |
| | | | | | Total Consumer Finance | | | 6,538,674 | |
| | | | | | | | | | |
| Containers & Packaging — 0.0% | | | | |
| | 440,000 | | | BB+ | | Ball Corp., Company Guaranteed Notes, 5.750% due 5/15/21 | | | 475,750 | |
| | | | | | | | | | |
| Distributors — 0.0% | | | | |
| | 300,000 | | | BBB | | Glencore Funding LLC, Company Guaranteed Notes, 6.000% due 4/15/14(e) | | | 316,274 | |
| | | | | | | | | | |
| Diversified Financial Services — 4.2% | | | | |
| | | | | | American Express Co.: | | | | |
| | | | | | Senior Unsecured Notes: | | | | |
| | 1,200,000 | | | BBB+ | | 7.000% due 3/19/18(b) | | | 1,524,414 | |
| | 680,000 | | | BBB+ | | 8.125% due 5/20/19 | | | 922,428 | |
| | 310,000 | | | BBB- | | Subordinated Notes, 6.800% due 9/1/66(a) | | | 331,313 | |
| | 585,000 | | | A- | | American Express Credit Corp., Senior Unsecured Notes, 1.750% due 6/12/15 | | | 599,072 | |
| | 50,000 | | | A+ | | ASIF Global Financing XIX, Senior Secured Notes, 4.900% due 1/17/13(e) | | | 50,514 | |
| | 1,500,000 | | | BB(f) | | Astoria Depositor Corp., Pass Thru Certificates, 8.144% due 5/1/21(e) | | | 1,350,000 | |
| | | | | | Bear Stearns Cos. LLC (The), Senior Unsecured Notes: | | | | |
| | 20,000 | | | A | | 6.400% due 10/2/17 | | | 24,041 | |
| | 2,280,000 | | | A | | 7.250% due 2/1/18 | | | 2,847,485 | |
| | 400,000 | | | AA- | | Caisse Centrale Desjardins du Quebéc, Senior Unsecured Notes, 2.650% due 9/16/15(e) | | | 417,584 | |
| | | | | | CDP Financial Inc., Company Guaranteed Notes: | | | | |
| | 1,120,000 | | | AAA | | 3.000% due 11/25/14(e) | | | 1,176,549 | |
| | 1,400,000 | | | AAA | | 4.400% due 11/25/19(e) | | | 1,612,898 | |
| | 320,028 | | | BBB- | | Cedar Brakes II LLC, Senior Secured Notes, 9.875% due 9/1/13(e) | | | 329,389 | |
| | | | | | Credit Suisse/New York NY: | | | | |
| | 965,000 | | | A+ | | Senior Unsecured Notes, 5.000% due 5/15/13 | | | 992,852 | |
| | 1,342,000 | | | BBB+ | | Subordinated Notes, 6.000% due 2/15/18 | | | 1,492,070 | |
| | 3,000,000 | | | Aaa(d) | | DanFin Funding Ltd., Government Liquid Guaranteed Notes, 1.155% due 7/16/13(a)(b)(e) | | | 3,013,149 | |
| | | | | | Farmers Exchange Capital, Subordinated Notes: | | | | |
| | 1,300,000 | | | A- | | 7.050% due 7/15/28(e) | | | 1,571,441 | |
| | 350,000 | | | A- | | 7.200% due 7/15/48(e) | | | 414,989 | |
| | | | | | General Electric Capital Corp.: | | | | |
| | | | | | Senior Unsecured Notes: | | | | |
| | 20,000 | | | AA+ | | 5.450% due 1/15/13 | | | 20,365 | |
| | 100,000 | | | AA+ | | 0.768% due 3/20/13(a) | | | 99,464 | |
| | 770,000 | | | AA+ | | 1.875% due 9/16/13 | | | 780,999 | |
| | 700,000 | | | AA+ | | 0.564% due 3/20/14(a) | | | 688,661 | |
| | 500,000 | | | AA+ | | 0.768% due 6/20/14(a) | | | 489,902 | |
| | 750,000 | | | AA+ | | 0.638% due 5/11/16(a) | | | 729,289 | |
| | 910,000 | | | AA+ | | 5.625% due 5/1/18 | | | 1,078,990 | |
| | 1,775,000 | | | AA+ | | 0.822% due 5/5/26(a) | | | 1,462,735 | |
| | 925,000 | | | AA+ | | 6.150% due 8/7/37 | | | 1,164,071 | |
| | 170,000 | | | AA+ | | 6.875% due 1/10/39 | | | 233,174 | |
| | | | | | Subordinated Notes: | | | | |
| | 800,000 | | | AA | | 5.300% due 2/11/21 | | | 922,175 | |
| | 840,000 | | | AA- | | 6.375% due 11/15/67(a) | | | 887,250 | |
| | 935,000 | | | A- | | HSBC Finance Corp., Senior Subordinated Notes, 6.676% due 1/15/21 | | | 1,062,321 | |
| | 270,000 | | | BB | | ILFC E-Capital Trust II, Limited Guaranteed Notes, 6.250% due 12/21/65(a)(e) | | | 206,550 | |
| | | | | | International Lease Finance Corp., Senior Secured Notes: | | | | |
| | 500,000 | | | BBB- | | 6.500% due 9/1/14(e) | | | 535,000 | |
See Notes to Financial Statements.
92
Schedules of Investments
(continued)
Core Fixed Income Investments
| | | | | | | | | | |
Face
Amount† | | | Rating†† | | Security | | Value | |
| Diversified Financial Services — 4.2%—(continued) | | | | |
| $ | 880,000 | | | BBB- | | 6.750% due 9/1/16(e) | | $ | 985,600 | |
| | 590,000 | | | BBB- | | 7.125% due 9/1/18(e) | | | 681,450 | |
| | 320,000 | | | A | | John Deere Capital Corp., Unsecured Notes, 2.250% due 4/17/19 | | | 334,810 | |
| | 1,450,000 | | | BBB | | JP Morgan Chase Capital XIII, Limited Guaranteed Notes, 1.411% due 9/30/34(a) | | | 1,094,183 | |
| | 900,000 | | | BBB | | JP Morgan Chase Capital XXIII, Limited Guaranteed Notes, 1.435% due 5/15/47(a) | | | 636,311 | |
| | | | | | JPMorgan Chase & Co.: | | | | |
| | | | | | Senior Unsecured Notes: | | | | |
| | 865,000 | | | A | | 4.650% due 6/1/14 | | | 920,540 | |
| | 290,000 | | | A | | 2.000% due 8/15/17 | | | 292,579 | |
| | 90,000 | | | A | | 4.400% due 7/22/20 | | | 99,933 | |
| | 1,410,000 | | | A | | 4.250% due 10/15/20(b) | | | 1,553,373 | |
| | 150,000 | | | A | | 4.500% due 1/24/22 | | | 166,889 | |
| | | | | | Subordinated Notes: | | | | |
| | 295,000 | | | A- | | 5.125% due 9/15/14 | | | 316,109 | |
| | 330,000 | | | A- | | 5.150% due 10/1/15 | | | 361,124 | |
| | 630,000 | | | A- | | 6.125% due 6/27/17 | | | 738,728 | |
| | 990,000 | | | A | | Unsecured Notes, 1.875% due 3/20/15 | | | 1,007,707 | |
| | 100,000 | | | NR | | Kaupthing Bank, Senior Notes, 5.750% due 10/4/11(e)(h)(j) | | | 26,250 | |
| | 400,000 | | | B- | | Offshore Group Investments Ltd., Senior Secured Notes, 11.500% due 8/1/15(e) | | | 444,000 | |
| | 1,700,000 | | | BBB- | | Pipeline Funding Co. LLC, Pass Thru Certificates, 7.500% due 1/15/30(e) | | | 1,905,600 | |
| | 350,000 | | | A+ | | Prudential Holdings LLC, Senior Secured Notes, 8.695% due 12/18/23(e) | | | 433,968 | |
| | 70,000 | | | BBB | | Resona Preferred Global Securities Cayman Ltd., Junior Subordinated Notes, 7.191% due 12/29/49(a)(e) | | | 75,542 | |
| | 300,000 | | | AA- | | SSIF Nevada LP, Bank Guaranteed Notes, 1.155% due 4/14/14(a)(b)(e) | | | 301,028 | |
| | 420,000 | | | BBB+ | | State Street Corp., Junior Subordinated Debentures Notes, 4.956% due 3/15/18 | | | 461,282 | |
| | 348,484 | | | Baa2(d) | | SteelRiver Transmission Co. LLC, Senior Secured Notes, 4.710% due 6/30/17(e) | | | 360,435 | |
| | 140,000 | | | A- | | Vesey Street Investment Trust I, Company Guaranteed Notes, step bond to yield, 4.404% due 9/1/16 | | | 145,936 | |
| | | | | | | | | | |
| | | | | | Total Diversified Financial Services | | | 42,374,511 | |
| | | | | | | | | | |
| Diversified Telecommunication Services — 0.7% | | | | |
| | | | | | AT&T Inc., Senior Unsecured Notes: | | | | |
| | 170,000 | | | A- | | 5.100% due 9/15/14 | | | 185,291 | |
| | 620,000 | | | A- | | 5.500% due 2/1/18 | | | 751,784 | |
| | 30,000 | | | A- | | 5.600% due 5/15/18 | | | 36,849 | |
| | 320,000 | | | A- | | 3.875% due 8/15/21 | | | 360,604 | |
| | 10,000 | | | A- | | 6.300% due 1/15/38 | | | 13,084 | |
| | 681,000 | | | A- | | Cellco Partnership/Verizon Wireless Capital LLC, Senior Unsecured Notes, 8.500% due 11/15/18 | | | 953,933 | |
| | 260,000 | | | B+ | | Cricket Communications Inc., Senior Secured Notes, 7.750% due 5/15/16 | | | 275,600 | |
| | 220,000 | | | BBB+ | | Deutsche Telekom International Finance BV, Company Guaranteed Notes, 5.750% due 3/23/16 | | | 250,454 | |
| | 865,000 | | | B | | Intelsat Jackson Holdings SA, Company Guaranteed Notes, 8.500% due 11/1/19 | | | 957,987 | |
| | 358,000 | | | BB | | Qwest Communications International Inc., Company Guaranteed Notes, 7.125% due 4/1/18 | | | 382,075 | |
| | 90,000 | | | BBB- | | Qwest Corp., Senior Unsecured Notes, 7.500% due 10/1/14 | | | 100,798 | |
| | 10,000 | | | BBB | | Rogers Wireless Inc., Company Guaranteed Notes, 6.375% due 3/1/14 | | | 10,839 | |
| | 140,000 | | | BBB | | Royal KPN NV, Senior Unsecured Notes, 8.375% due 10/1/30 | | | 186,847 | |
| | | | | | Verizon Communications Inc., Senior Unsecured Notes: | | | | |
| | 480,000 | | | A- | | 6.100% due 4/15/18 | | | 600,356 | |
| | 50,000 | | | A- | | 8.750% due 11/1/18 | | | 70,219 | |
| | 165,000 | | | A- | | 5.125% due 6/15/33 | | | 177,605 | |
| | 280,000 | | | A- | | 6.900% due 4/15/38 | | | 398,346 | |
| | 855,000 | | | A- | | Vodafone Group PLC, Senior Unsecured Notes, 4.150% due 6/10/14 | | | 907,263 | |
| | | | | | | | | | |
| | | | | | Total Diversified Telecommunication Services | | | 6,619,934 | |
| | | | | | | | | | |
| Electric Utilities — 1.6% | | | | |
| | | | | | AES Corp. (The), Senior Unsecured Notes: | | | | |
| | 130,000 | | | BB- | | 7.750% due 10/15/15 | | | 147,550 | |
| | 10,000 | | | BB- | | 8.000% due 6/1/20 | | | 11,700 | |
| | 200,000 | | | BB- | | 7.375% due 7/1/21 | | | 230,000 | |
See Notes to Financial Statements.
93
Schedules of Investments
(continued)
Core Fixed Income Investments
| | | | | | | | | | |
Face
Amount† | | | Rating†† | | Security | | Value | |
| Electric Utilities — 1.6%—(continued) | | | | |
| $ | 1,700,000 | | | BBB | | Ameren Illinois Co., Senior Secured Notes, 6.250% due 4/1/18(b) | | $ | 2,082,891 | |
| | 570,000 | | | BB- | | Calpine Corp., Senior Secured Notes, 7.250% due 10/15/17(e) | | | 612,750 | |
| | 215,000 | | | BBB | | Cleveland Electric Illuminating Co. (The), Senior Secured Notes, 7.880% due 11/1/17 | | | 271,645 | |
| | 250,000 | | | BBB | | Columbus Southern Power Co., Senior Unsecured Notes, 6.050% due 5/1/18 | | | 302,947 | |
| | 66,000 | | | BBB- | | Constellation Energy Group Inc., Company Guaranteed Notes, 5.150% due 12/1/20 | | | 76,352 | |
| | | | | | Dominion Resources Inc., Senior Unsecured Notes: | | | | |
| | 330,000 | | | A- | | 5.700% due 9/17/12 | | | 337,129 | |
| | 105,000 | | | A- | | 7.195% due 9/15/14 | | | 118,000 | |
| | 390,000 | | | A- | | 5.200% due 8/15/19 | | | 466,125 | |
| | 200,000 | | | A- | | 5.950% due 6/15/35 | | | 258,208 | |
| | 275,000 | | | A- | | 4.900% due 8/1/41 | | | 327,127 | |
| | 98,000 | | | BB+ | | DPL Inc., Senior Unsecured Notes, 7.250% due 10/15/21(e) | | | 112,210 | |
| | | | | | Duke Energy Corp., Senior Unsecured Notes: | | | | |
| | 180,000 | | | BBB | | 5.050% due 9/15/19 | | | 210,832 | |
| | 110,000 | | | BBB | | 3.550% due 9/15/21 | | | 117,108 | |
| | 50,000 | | | B- | | Energy Future Intermediate Holding Co. LLC/EFIH Finance Inc., Senior Secured Notes, 10.000% due 12/1/20 | | | 56,375 | |
| | 920,000 | | | BBB+ | | Entergy Texas Inc., 1st Mortgage Notes, 7.125% due 2/1/19 | | | 1,131,295 | |
| | 105,000 | | | BBB- | | Exelon Corp., Senior Unsecured Notes, 5.625% due 6/15/35 | | | 121,026 | |
| | 310,000 | | | BBB | | Exelon Generation Co. LLC, Senior Unsecured Notes, 4.250% due 6/15/22(e) | | | 322,909 | |
| | 700,000 | | | BB+ | | FirstEnergy Corp., Senior Unsecured Notes, 7.375% due 11/15/31 | | | 925,186 | |
| | 55,000 | | | A | | Florida Power & Light Co., 1st Mortgage Notes, 4.950% due 6/1/35 | | | 67,020 | |
| | 195,000 | | | A | | Florida Power Corp., 1st Mortgage Notes, 5.900% due 3/1/33 | | | 248,322 | |
| | 538,264 | | | Ba1(d) | | Indiantown Cogeneration LP, 1st Mortgage Notes, 9.770% due 12/15/20 | | | 569,776 | |
| | 775,000 | | | BBB | | KCP&L Greater Missouri Operations Co., Senior Unsecured Notes, 8.270% due 11/15/21 | | | 973,748 | |
| | | | | | Midamerican Energy Holdings Co., Senior Unsecured Notes: | | | | |
| | 250,000 | | | BBB+ | | 5.950% due 5/15/37 | | | 324,525 | |
| | 225,000 | | | BBB+ | | 6.500% due 9/15/37 | | | 308,042 | |
| | 487,147 | | | B+ | | Mirant Mid Atlantic Pass Through Trust C, Pass Thru Certificates, 10.060% due 12/30/28 | | | 540,733 | |
| | 950,000 | | | BBB- | | Nisource Finance Corp., Company Guaranteed Notes, 6.125% due 3/1/22 | | | 1,150,932 | |
| | 350,000 | | | BBB | | Ohio Power Co., Senior Unsecured Notes, 6.000% due 6/1/16 | | | 408,801 | |
| | | | | | Pacific Gas & Electric Co., Senior Unsecured Notes: | | | | |
| | 350,000 | | | BBB | | 5.625% due 11/30/17 | | | 425,526 | |
| | 400,000 | | | BBB | | 6.050% due 3/1/34 | | | 530,505 | |
| | 500,000 | | | BBB | | Progress Energy Inc., Senior Unsecured Notes, 4.875% due 12/1/19 | | | 580,043 | |
| | 800,000 | | | BBB- | | Public Service Co. of New Mexico, Senior Unsecured Notes, 7.950% due 5/15/18 | | | 972,491 | |
| | 425,000 | | | A- | | Public Service Electric & Gas Co., Senior Secured Notes, 0.850% due 8/15/14 | | | 427,846 | |
| | 450,000 | | | BBB+ | | Texas-New Mexico Power Co., 1st Mortgage Notes, 9.500% due 4/1/19(e) | | | 617,171 | |
| | | | | | | | | | |
| | | | | | Total Electric Utilities | | | 16,384,846 | |
| | | | | | | | | | |
| Energy Equipment & Services — 0.1% | | | | |
| | 320,000 | | | A | | Baker Hughes Inc., Senior Unsecured Notes, 3.200% due 8/15/21 | | | 345,535 | |
| | 570,000 | | | BB- | | Chesapeake Midstream Partners LP/CHKM Finance Corp., Company Guaranteed Notes, 6.125% due 7/15/22 | | | 594,225 | |
| | | | | | | | | | |
| | | | | | Total Energy Equipment & Services | | | 939,760 | |
| | | | | | | | | | |
| Food & Staples Retailing — 0.1% | | | | |
| | 330,000 | | | BBB+ | | CVS Caremark Corp., Senior Unsecured Notes, 6.600% due 3/15/19 | | | 422,727 | |
| | 298,087 | | | BBB+ | | CVS Pass-Through Trust, Pass Thru Certificates, 6.036% due 12/10/28 | | | 341,019 | |
| | | | | | | | | | |
| | | | | | Total Food & Staples Retailing | | | 763,746 | |
| | | | | | | | | | |
| Food Products — 0.3% | | | | |
| | 370,000 | | | BBB+ | | Kellogg Co., Senior Unsecured Notes, 3.125% due 5/17/22 | | | 388,916 | |
| | 905,000 | | | BBB | | Kraft Foods Group Inc., Company Guaranteed Notes, 3.500% due 6/6/22(e) | | | 960,525 | |
| | | | | | Kraft Foods Inc., Senior Unsecured Notes: | | | | |
| | 690,000 | | | BBB- | | 6.500% due 8/11/17 | | | 849,267 | |
| | 348,000 | | | BBB- | | 5.375% due 2/10/20 | | | 418,912 | |
See Notes to Financial Statements.
94
Schedules of Investments
(continued)
Core Fixed Income Investments
| | | | | | | | | | |
Face
Amount† | | | Rating†† | | Security | | Value | |
| Food Products — 0.3%—(continued) | | | | |
| | | | | | Safeway Inc., Senior Unsecured Notes: | | | | |
| $ | 20,000 | | | BBB | | 3.950% due 8/15/20 | | $ | 18,930 | |
| | 270,000 | | | BBB | | 4.750% due 12/1/21 | | | 267,257 | |
| | | | | | | | | | |
| | | | | | Total Food Products | | | 2,903,807 | |
| | | | | | | | | | |
| Gas Utilities — 0.3% | | | | |
| | 460,000 | | | BBB- | | Energy Transfer Partners LP, Senior Unsecured Notes, 9.000% due 4/15/19 | | | 583,582 | |
| | 1,455,000 | | | BB+ | | Sabine Pass LNG LP, Senior Secured Notes, 7.250% due 11/30/13 | | | 1,520,475 | |
| | 185,000 | | | BBB+ | | Sempra Energy, Senior Unsecured Notes, 6.000% due 10/15/39 | | | 246,176 | |
| | 500,000 | | | BBB- | | Southern Union Co., Senior Unsecured Notes, 8.250% due 11/15/29 | | | 629,440 | |
| | | | | | | | | | |
| | | | | | Total Gas Utilities | | | 2,979,673 | |
| | | | | | | | | | |
| Health Care Equipment & Supplies — 0.1% | | | | |
| | | | | | Medtronic Inc., Senior Unsecured Notes: | | | | |
| | 150,000 | | | A+ | | 4.450% due 3/15/20 | | | 173,667 | |
| | 400,000 | | | A+ | | 5.550% due 3/15/40 | | | 515,435 | |
| | | | | | | | | | |
| | | | | | Total Health Care Equipment & Supplies | | | 689,102 | |
| | | | | | | | | | |
| Health Care Providers & Services — 0.4% | | | | |
| | 560,000 | | | B | | CHS/Community Health Systems Inc., Company Guaranteed Notes, 7.125% due 7/15/20 | | | 587,300 | |
| | 350,000 | | | BBB- | | Coventry Health Care Inc., Senior Unsecured Notes, 5.450% due 6/15/21 | | | 411,662 | |
| | 120,000 | | | BB+ | | Fresenius Medical Care US Finance Inc., Company Guaranteed Notes, 6.500% due 9/15/18(e) | | | 135,150 | |
| | | | | | HCA Inc.: | | | | |
| | 210,000 | | | B- | | Company Guaranteed Notes, 7.500% due 2/15/22 | | | 234,675 | |
| | | | | | Senior Unsecured Notes: | | | | |
| | 200,000 | | | B- | | 6.250% due 2/15/13 | | | 205,000 | |
| | 120,000 | | | B- | | 7.190% due 11/15/15 | | | 130,200 | |
| | 29,000 | | | B- | | 6.500% due 2/15/16 | | | 31,465 | |
| | 330,000 | | | AA | | Roche Holdings Inc., Company Guaranteed Notes, 6.000% due 3/1/19(e) | | | 417,792 | |
| | | | | | Tenet Healthcare Corp., Senior Secured Notes: | | | | |
| | 128,000 | | | BB- | | 10.000% due 5/1/18 | | | 147,840 | |
| | 278,000 | | | BB- | | 8.875% due 7/1/19 | | | 317,615 | |
| | 705,000 | | | A- | | UnitedHealth Group Inc., Senior Unsecured Notes, 3.375% due 11/15/21 | | | 754,912 | |
| | | | | | WellPoint Inc., Senior Unsecured Notes: | | | | |
| | 30,000 | | | A- | | 5.875% due 6/15/17 | | | 35,402 | |
| | 770,000 | | | A- | | 3.125% due 5/15/22 | | | 768,569 | |
| | | | | | | | | | |
| | | | | | Total Health Care Providers & Services | | | 4,177,582 | |
| | | | | | | | | | |
| Hotels, Restaurants & Leisure — 0.0% | | | | |
| | 90,000 | | | B | | Boyd Gaming Corp., Company Guaranteed Notes, 9.000% due 7/1/20(e) | | | 89,662 | |
| | 5,000 | | | NR | | Station Casinos Inc., Senior Subordinated Notes, 6.875% due 3/1/16(h)(j) | | | 0 | |
| | | | | | | | | | |
| | | | | | Total Hotels, Restaurants & Leisure | | | 89,662 | |
| | | | | | | | | | |
| Household Products — 0.1% | | | | |
| | | | | | Reynolds Group Issuer Inc./Reynolds Group Issuer LLC/Reynolds Group Issuer Lu, Senior Secured Notes: | | | | |
| | 100,000 | | | B+ | | 7.125% due 4/15/19 | | | 108,250 | |
| | 200,000 | | | B+ | | 7.875% due 8/15/19 | | | 223,500 | |
| | 270,000 | | | B+ | | 6.875% due 2/15/21 | | | 293,625 | |
| | | | | | | | | | |
| | | | | | Total Household Products | | | 625,375 | |
| | | | | | | | | | |
| Insurance — 1.3% | | | | |
| | | | | | American International Group Inc., Senior Unsecured Notes: | | | | |
| | 600,000 | | | A- | | 0.645% due 7/19/13(a) | | | 750,182 | |
| | 200,000 | | | A- | | 3.750% due 11/30/13(e) | | | 204,140 | |
| | 400,000 | | | A- | | 5.450% due 5/18/17 | | | 450,377 | |
| | 500,000 | | | A- | | 5.850% due 1/16/18(b) | | | 574,442 | |
| | 2,300,000 | | | A- | | 8.250% due 8/15/18(b) | | | 2,908,798 | |
| | 130,000 | | | A- | | 6.400% due 12/15/20 | | | 154,743 | |
See Notes to Financial Statements.
95
Schedules of Investments
(continued)
Core Fixed Income Investments
| | | | | | | | | | |
Face
Amount† | | | Rating†† | | Security | | Value | |
| Insurance — 1.3%—(continued) | | | | |
| $ | 460,000 | | | AA+ | | Berkshire Hathaway Finance Corp., Company Guaranteed Notes, 1.600% due 5/15/17 | | $ | 471,742 | |
| | 750,000 | | | AA+ | | Berkshire Hathaway Inc., Senior Unsecured Notes, 2.200% due 8/15/16 | | | 790,031 | |
| | 10,000 | | | BBB | | ING Capital Funding Trust III, Bank Guaranteed Notes, 4.061% due 12/29/49(a) | | | 8,644 | |
| | 525,000 | | | A- | | Manulife Financial Corp., Senior Unsecured Notes, 3.400% due 9/17/15 | | | 547,325 | |
| | 600,000 | | | BBB | | MetLife Capital Trust X, Junior Subordinated Notes, 9.250% due 4/8/38(e) | | | 768,000 | |
| | 1,150,000 | | | BBB | | MetLife Inc., Junior Subordinated Notes, 6.400% due 12/15/36 | | | 1,228,658 | |
| | 1,300,000 | | | AA- | | MetLife Institutional Funding II, Secured Notes, 1.625% due 4/2/15(e) | | | 1,317,988 | |
| | | | | | Metropolitan Life Global Funding I, Senior Secured Notes: | | | | |
| | 375,000 | | | AA- | | 5.125% due 6/10/14(e) | | | 403,281 | |
| | 800,000 | | | AA- | | 3.875% due 4/11/22(e) | | | 876,367 | |
| | 850,000 | | | A- | | Nationwide Mutual Insurance Co., Subordinated Notes, 5.810% due 12/15/24(a)(e) | | | 781,181 | |
| | 625,000 | | | A | | Prudential Financial Inc., Senior Unsecured Notes, 7.375% due 6/15/19 | | | 787,670 | |
| | 290,000 | | | AA- | | Teachers Insurance & Annuity Association of America, Subordinated Notes, 6.850% due 12/16/39(e) | | | 402,654 | |
| | | | | | | | | | |
| | | | | | Total Insurance | | | 13,426,223 | |
| | | | | | | | | | |
| Life Sciences Tools & Services — 0.0% | | | | |
| | 120,000 | | | A- | | Thermo Fisher Scientific Inc., Senior Unsecured Notes, 3.600% due 8/15/21 | | | 128,458 | |
| | | | | | | | | | |
| Machinery — 0.0% | | | | |
| | 405,000 | | | BBB- | | AGCO Corp., Senior Unsecured Notes, 5.875% due 12/1/21 | | | 435,738 | |
| | | | | | | | | | |
| Media — 1.0% | | | | |
| | | | | | CCO Holdings LLC/CCO Holdings Capital Corp., Company Guaranteed Notes: | | | | |
| | 130,000 | | | BB- | | 7.000% due 1/15/19 | | | 142,025 | |
| | 460,000 | | | BB- | | 6.500% due 4/30/21 | | | 495,650 | |
| | 550,000 | | | B | | Cengage Learning Acquisitions Inc., Senior Secured Notes, 11.500% due 4/15/20(e) | | | 581,625 | |
| | 200,000 | | | BBB+ | | Comcast Cable Communications Holdings Inc., Company Guaranteed Notes, 9.455% due 11/15/22 | | | 299,209 | |
| | | | | | Comcast Corp., Company Guaranteed Notes: | | | | |
| | 30,000 | | | BBB+ | | 5.875% due 2/15/18 | | | 36,395 | |
| | 840,000 | | | BBB+ | | 5.700% due 5/15/18 | | | 1,017,409 | |
| | 40,000 | | | BBB+ | | 5.650% due 6/15/35 | | | 47,387 | |
| | 250,000 | | | BBB+ | | 6.450% due 3/15/37 | | | 323,641 | |
| | 170,000 | | | BBB | | COX Communications Inc., Senior Unsecured Notes, 8.375% due 3/1/39(e) | | | 257,385 | |
| | 250,000 | | | BB+ | | CSC Holdings LLC, Senior Unsecured Notes, 6.750% due 11/15/21(e) | | | 271,250 | |
| | | | | | DIRECTV Holdings LLC/DIRECTV Financing Co., Inc., Company Guaranteed Notes: | | | | |
| | 1,000,000 | | | BBB | | 3.500% due 3/1/16 | | | 1,069,055 | |
| | 235,000 | | | BBB | | 3.800% due 3/15/22 | | | 243,231 | |
| | | | | | DISH DBS Corp., Company Guaranteed Notes: | | | | |
| | 20,000 | | | BB- | | 7.000% due 10/1/13 | | | 21,175 | |
| | 50,000 | | | BB- | | 6.625% due 10/1/14 | | | 54,188 | |
| | 25,000 | | | BB- | | 7.125% due 2/1/16 | | | 27,625 | |
| | 180,000 | | | BB- | | 6.750% due 6/1/21 | | | 192,600 | |
| | 470,000 | | | BB+ | | Interpublic Group of Cos., Inc. (The), Senior Unsecured Notes, 10.000% due 7/15/17 | | | 527,575 | |
| | 125,000 | | | BBB+ | | News America Holdings Inc., Company Guaranteed Notes, 8.500% due 2/23/25 | | | 170,033 | |
| | | | | | News America Inc., Company Guaranteed Notes: | | | | |
| | 60,000 | | | BBB+ | | 4.500% due 2/15/21 | | | 68,997 | |
| | 25,000 | | | BBB+ | | 6.200% due 12/15/34 | | | 30,212 | |
| | | | | | Omnicom Group Inc.: | | | | |
| | 89,000 | | | BBB+ | | Company Guaranteed Notes, 4.450% due 8/15/20 | | | 99,009 | |
| | 44,000 | | | BBB+ | | Senior Unsecured Notes, 5.900% due 4/15/16 | | | 51,008 | |
| | 205,000 | | | BBB+ | | Reed Elsevier Capital Inc., Company Guaranteed Notes, 8.625% due 1/15/19 | | | 263,373 | |
| | 70,000 | | | BBB | | Rogers Cable Inc., Company Guaranteed Notes, 6.750% due 3/15/15 | | | 80,109 | |
| | 598,000 | | | A- | | Scripps Networks Interactive Inc., Senior Unsecured Notes, 2.700% due 12/15/16 | | | 623,278 | |
| | 750,000 | | | BBB+ | | TCI Communications Inc., Senior Unsecured Notes, 8.750% due 8/1/15 | | | 910,617 | |
| | | | | | Time Warner Cable Inc., Company Guaranteed Notes: | | | | |
| | 560,000 | | | BBB | | 8.250% due 4/1/19 | | | 748,446 | |
| | 50,000 | | | BBB | | 4.125% due 2/15/21 | | | 55,040 | |
See Notes to Financial Statements.
96
Schedules of Investments
(continued)
Core Fixed Income Investments
| | | | | | | | | | |
Face
Amount† | | | Rating†† | | Security | | Value | |
| Media — 1.0%—(continued) | | | | |
| $ | 170,000 | | | BBB | | 5.875% due 11/15/40 | | $ | 202,455 | |
| | 40,000 | | | BBB | | 5.500% due 9/1/41 | | | 45,438 | |
| | 50,000 | | | BBB | | Time Warner Entertainment Co. LP, Company Guaranteed Notes, 8.375% due 7/15/33 | | | 72,182 | |
| | | | | | Time Warner Inc., Company Guaranteed Notes: | | | | |
| | 100,000 | | | BBB | | 4.700% due 1/15/21 | | | 114,896 | |
| | 110,000 | | | BBB | | 4.750% due 3/29/21 | | | 126,348 | |
| | 30,000 | | | BBB | | 6.250% due 3/29/41 | | | 37,367 | |
| | 280,000 | | | BBB | | Turner Broadcasting System Inc., Company Guaranteed Notes, 8.375% due 7/1/13 | | | 297,565 | |
| | 330,000 | | | B+ | | Univision Communications Inc., Senior Secured Notes, 6.750% due 9/15/22(e) | | | 332,888 | |
| | 110,000 | | | BBB | | WPP Finance UK, Company Guaranteed Notes, 8.000% due 9/15/14 | | | 123,494 | |
| | | | | | | | | | |
| | | | | | Total Media | | | 10,060,180 | |
| | | | | | | | | | |
| Metals & Mining — 0.7% | | | | |
| | 1,000,000 | | | BB- | | ALROSA Finance SA, Company Guaranteed Notes, 7.750% due 11/3/20 | | | 1,110,000 | |
| | 686,000 | | | BBB+ | | Barrick North America Finance LLC, Company Guaranteed Notes, 4.400% due 5/30/21 | | | 742,984 | |
| | | | | | BHP Billiton Finance USA Ltd., Company Guaranteed Notes: | | | | |
| | 370,000 | | | A+ | | 6.500% due 4/1/19 | | | 474,195 | |
| | 230,000 | | | A+ | | 3.250% due 11/21/21 | | | 243,774 | |
| | | | | | Corp. Nacional del Cobre de Chile, Senior Unsecured Notes: | | | | |
| | 100,000 | | | A | | 4.750% due 10/15/14(e) | | | 107,016 | |
| | 295,000 | | | A | | 3.750% due 11/4/20(e) | | | 316,520 | |
| | | | | | FMG Resources August 2006 Pty Ltd.: | | | | |
| | | | | | Company Guaranteed Notes: | | | | |
| | 250,000 | | | BB- | | 7.000% due 11/1/15(e) | | | 246,875 | |
| | 40,000 | | | BB- | | 6.375% due 2/1/16(e) | | | 38,600 | |
| | 440,000 | | | BB- | | Senior Unsecured Notes, 6.875% due 4/1/22(e) | | | 406,450 | |
| | 590,000 | | | BBB | | Freeport-McMoRan Copper & Gold Inc., Senior Unsecured Notes, 3.550% due 3/1/22 | | | 587,316 | |
| | | | | | Rio Tinto Finance USA Ltd., Company Guaranteed Notes: | | | | |
| | 500,000 | | | A- | | 9.000% due 5/1/19 | | | 686,690 | |
| | 200,000 | | | A- | | 3.500% due 11/2/20 | | | 211,682 | |
| | 90,000 | | | BB+ | | Steel Dynamics Inc., Company Guaranteed Notes, 6.750% due 4/1/15 | | | 92,250 | |
| | | | | | Vale Overseas Ltd., Company Guaranteed Notes: | | | | |
| | 1,342,000 | | | A- | | 4.375% due 1/11/22 | | | 1,382,097 | |
| | 260,000 | | | A- | | 6.875% due 11/21/36 | | | 306,964 | |
| | | | | | | | | | |
| | | | | | Total Metals & Mining | | | 6,953,413 | |
| | | | | | | | | | |
| Multiline Retail — 0.0% | | | | |
| | 87,000 | | | BBB | | Macy’s Retail Holdings Inc., Company Guaranteed Notes, 5.875% due 1/15/13 | | | 88,488 | |
| | | | | | | | | | |
| Oil, Gas & Consumable Fuels — 2.8% | | | | |
| | 2,200,000 | | | BBB | | ABN Amro Bank/Deutschland for Gazprom, Senior Unsecured Notes, 9.625% due 3/1/13 | | | 2,288,858 | |
| | 240,000 | | | BBB- | | Anadarko Finance Co., Company Guaranteed Notes, 7.500% due 5/1/31 | | | 322,413 | |
| | | | | | Anadarko Petroleum Corp., Senior Unsecured Notes: | | | | |
| | 150,000 | | | BBB- | | 7.625% due 3/15/14 | | | 164,272 | |
| | 75,000 | | | BBB- | | 5.750% due 6/15/14 | | | 80,763 | |
| | 308,000 | | | BBB- | | 5.950% due 9/15/16 | | | 356,490 | |
| | 917,000 | | | BBB- | | 6.375% due 9/15/17 | | | 1,097,649 | |
| | | | | | Apache Corp., Senior Unsecured Notes: | | | | |
| | 540,000 | | | A- | | 5.625% due 1/15/17 | | | 641,642 | |
| | 70,000 | | | A- | | 3.250% due 4/15/22 | | | 75,222 | |
| | 380,000 | | | B- | | Arch Coal Inc., Company Guaranteed Notes, 8.750% due 8/1/16(k) | | | 381,900 | |
| | | | | | BP Capital Markets PLC, Company Guaranteed Notes: | | | | |
| | 350,000 | | | A | | 5.250% due 11/7/13 | | | 369,303 | |
| | 370,000 | | | A | | 3.245% due 5/6/22 | | | 394,944 | |
| | 225,000 | | | BBB+ | | Cameron International Corp., Senior Unsecured Notes, 7.000% due 7/15/38 | | | 300,232 | |
| | | | | | Chesapeake Energy Corp., Company Guaranteed Notes: | | | | |
| | 5,000 | | | BB- | | 7.250% due 12/15/18 | | | 5,262 | |
| | 430,000 | | | BB- | | 6.875% due 11/15/20 | | | 448,275 | |
| | 130,000 | | | BB- | | Cie Générale de Géophysique — Veritas, Company Guaranteed Notes, 7.750% due 5/15/17 | | | 135,931 | |
See Notes to Financial Statements.
97
Schedules of Investments
(continued)
Core Fixed Income Investments
| | | | | | | | | | |
Face
Amount† | | | Rating†† | | Security | | Value | |
| Oil, Gas & Consumable Fuels — 2.8%—(continued) | | | | |
| | | | | | Concho Resources Inc., Company Guaranteed Notes: | | | | |
| $ | 130,000 | | | BB+ | | 6.500% due 1/15/22 | | $ | 141,050 | |
| | 110,000 | | | BB+ | | 5.500% due 10/1/22 | | | 113,713 | |
| | 410,000 | | | A | | ConocoPhillips, Company Guaranteed Notes, 6.000% due 1/15/20 | | | 522,105 | |
| | 65,000 | | | A | | ConocoPhillips Holding Co., Senior Unsecured Notes, 6.950% due 4/15/29 | | | 92,324 | |
| | 210,000 | | | BB | | Consol Energy Inc., Company Guaranteed Notes, 6.375% due 3/1/21 | | | 208,950 | |
| | 460,000 | | | BBB+ | | Devon Energy Corp., Senior Unsecured Notes, 5.600% due 7/15/41 | | | 555,536 | |
| | 325,000 | | | BB | | El Paso Corp., Senior Unsecured Notes, 7.750% due 1/15/32 | | | 384,268 | |
| | 575,000 | | | BB | | El Paso Natural Gas Co., Senior Unsecured Notes, 8.625% due 1/15/22 | | | 761,915 | |
| | | | | | El Paso Pipeline Partners Operating Co. LLC, Company Guaranteed Notes: | | | | |
| | 460,000 | | | BBB- | | 6.500% due 4/1/20 | | | 544,580 | |
| | 1,040,000 | | | BBB- | | 5.000% due 10/1/21 | | | 1,141,092 | |
| | | | | | Energy Transfer Partners LP, Senior Unsecured Notes: | | | | |
| | 50,000 | | | BBB- | | 5.200% due 2/1/22 | | | 55,138 | |
| | 333,000 | | | BBB- | | 6.500% due 2/1/42 | | | 379,210 | |
| | 220,000 | | | BBB+ | | Ensco PLC, Senior Unsecured Notes, 4.700% due 3/15/21 | | | 247,296 | |
| | | | | | Enterprise Products Operating LLC, Company Guaranteed Notes: | | | | |
| | 325,000 | | | BBB | | 5.600% due 10/15/14 | | | 356,159 | |
| | 360,000 | | | BBB | | 6.300% due 9/15/17 | | | 436,128 | |
| | 400,000 | | | BBB | | 6.500% due 1/31/19 | | | 492,292 | |
| | 130,000 | | | BBB | | 4.050% due 2/15/22 | | | 142,190 | |
| | 310,000 | | | BBB | | 5.700% due 2/15/42 | | | 358,492 | |
| | | | | | Hess Corp., Senior Unsecured Notes: | | | | |
| | 50,000 | | | BBB | | 7.875% due 10/1/29 | | | 67,054 | |
| | 310,000 | | | BBB | | 7.300% due 8/15/31 | | | 403,314 | |
| | 585,000 | | | BBB- | | Kerr-McGee Corp., Company Guaranteed Notes, 7.875% due 9/15/31 | | | 783,614 | |
| | 270,000 | | | BB- | | Key Energy Services Inc., Company Guaranteed Notes, 6.750% due 3/1/21 | | | 276,075 | |
| | | | | | Kinder Morgan Energy Partners LP, Senior Unsecured Notes: | | | | |
| | 50,000 | | | BBB | | 5.850% due 9/15/12 | | | 49,979 | |
| | 30,000 | | | BBB | | 6.000% due 2/1/17 | | | 34,948 | |
| | 220,000 | | | BBB | | 6.850% due 2/15/20 | | | 273,834 | |
| | 360,000 | | | BBB | | 3.950% due 9/1/22 | | | 382,846 | |
| | 167,000 | | | BBB | | 6.500% due 9/1/39 | | | 201,008 | |
| | 580,000 | | | BBB- | | Newfield Exploration Co., Senior Unsecured Notes, 5.625% due 7/1/24 | | | 630,025 | |
| | | | | | Nexen Inc., Senior Unsecured Notes: | | | | |
| | 250,000 | | | BBB- | | 6.200% due 7/30/19 | | | 301,126 | |
| | 52,000 | | | BBB- | | 6.400% due 5/15/37 | | | 65,055 | |
| | 100,000 | | | BBB- | | 7.500% due 7/30/39 | | | 140,501 | |
| | 280,000 | | | BBB | | Noble Energy Inc., Senior Unsecured Notes, 4.150% due 12/15/21 | | | 303,287 | |
| | | | | | Occidental Petroleum Corp., Senior Unsecured Notes: | | | | |
| | 320,000 | | | A | | 3.125% due 2/15/22 | | | 344,045 | |
| | 20,000 | | | A | | 2.700% due 2/15/23 | | | 20,617 | |
| | 1,000,000 | | | BBB- | | Panhandle Eastern Pipeline Co. LP, Senior Unsecured Notes, 8.125% due 6/1/19 | | | 1,206,144 | |
| | 190,000 | | | BB+ | | Peabody Energy Corp., Company Guaranteed Notes, 7.875% due 11/1/26 | | | 203,775 | |
| | 29,000 | | | BBB | | Pemex Project Funding Master Trust, Company Guaranteed Notes, 6.625% due 6/15/35 | | | 36,178 | |
| | 1,810,000 | | | BBB | | Petrobras International Finance Co. — Pifco, Company Guaranteed Notes, 5.375% due 1/27/21 | | | 2,023,272 | |
| | 175,000 | | | BBB+ | | Petrohawk Energy Corp., Company Guaranteed Notes, 7.250% due 8/15/18 | | | 200,009 | |
| | 460,000 | | | BB- | | Plains Exploration & Production Co., Company Guaranteed Notes, 6.125% due 6/15/19 | | | 487,600 | |
| | 60,000 | | | BB+ | | QEP Resources Inc., Senior Unsecured Notes, 6.875% due 3/1/21 | | | 68,100 | |
| | 360,000 | | | BB | | Regency Energy Partners LP/Regency Energy Finance Corp., Company Guaranteed Notes, 6.875% due 12/1/18 | | | 390,600 | |
| | 330,000 | | | A+ | | Schlumberger Investment SA, Company Guaranteed Notes, 3.300% due 9/14/21(e) | | | 356,273 | |
| | 90,000 | | | AAA | | SeaRiver Maritime Financial Holdings Inc., Company Guaranteed Notes, 0.000% due 9/1/12 | | | 90,000 | |
| | 80,000 | | | BBB- | | SESI LLC, Company Guaranteed Notes, 7.125% due 12/15/21 | | | 89,400 | |
| | 360,000 | | | AA | | Shell International Finance BV, Company Guaranteed Notes, 4.375% due 3/25/20 | | | 424,713 | |
| | | | | | Southern Natural Gas Co. LLC, Senior Unsecured Notes: | | | | |
| | 40,000 | | | BBB- | | 5.900% due 4/1/17(e) | | | 47,293 | |
See Notes to Financial Statements.
98
Schedules of Investments
(continued)
Core Fixed Income Investments
| | | | | | | | | | |
Face
Amount† | | | Rating†† | | Security | | Value | |
| Oil, Gas & Consumable Fuels — 2.8%—(continued) | | | | |
| $ | 58,000 | | | BBB- | | 8.000% due 3/1/32 | | $ | 80,998 | |
| | 1,300,000 | | | BBB+ | | Suncor Energy Inc., Senior Unsecured Notes, 6.850% due 6/1/39(b) | | | 1,781,801 | |
| | 110,000 | | | BBB | | Tennessee Gas Pipeline Co. LLC, Senior Unsecured Notes, 7.625% due 4/1/37 | | | 149,835 | |
| | 370,000 | | | BBB(f) | | TEPPCO Partners LP, Company Guaranteed Notes, 6.125% due 2/1/13 | | | 377,289 | |
| | | | | | Transocean Inc., Company Guaranteed Notes: | | | | |
| | 223,000 | | | BBB- | | 5.050% due 12/15/16 | | | 247,240 | |
| | 198,000 | | | BBB- | | 6.000% due 3/15/18 | | | 229,553 | |
| | 440,000 | | | BBB- | | 6.375% due 12/15/21 | | | 531,012 | |
| | | | | | Williams Cos., Inc., Senior Unsecured Notes: | | | | |
| | 793,000 | | | BBB- | | 7.875% due 9/1/21 | | | 1,030,926 | |
| | 264,000 | | | BBB- | | 7.500% due 1/15/31 | | | 331,901 | |
| | 166,000 | | | BBB- | | 8.750% due 3/15/32 | | | 229,038 | |
| | 20,000 | | | BB+ | | WPX Energy Inc., Senior Unsecured Notes, 6.000% due 1/15/22 | | | 21,300 | |
| | | | | | | | | | |
| | | | | | Total Oil, Gas & Consumable Fuels | | | 28,907,172 | |
| | | | | | | | | | |
| Paper & Forest Products — 0.0% | | | | |
| | 240,000 | | | BBB | | Celulosa Arauco y Constitucion SA, Senior Unsecured Notes, 4.750% due 1/11/22 | | | 253,093 | |
| | 175,000 | | | A- | | Georgia-Pacific LLC, Company Guaranteed Notes, 8.250% due 5/1/16(e) | | | 189,041 | |
| | | | | | | | | | |
| | | | | | Total Paper & Forest Products | | | 442,134 | |
| | | | | | | | | | |
| Pharmaceuticals — 0.4% | | | | |
| | 380,000 | | | AA | | Abbott Laboratories, Senior Unsecured Notes, 5.600% due 11/30/17 | | | 466,485 | |
| | 820,000 | | | BBB+ | | Express Scripts Holding Co., Company Guaranteed Notes, 3.500% due 11/15/16(e) | | | 880,801 | |
| | 830,000 | | | A+ | | GlaxoSmithKline Capital PLC, Company Guaranteed Notes, 2.850% due 5/8/22 | | | 869,591 | |
| | 240,000 | | | BBB+ | | Medco Health Solutions Inc., Senior Unsecured Notes, 4.125% due 9/15/20 | | | 261,147 | |
| | 130,000 | | | AA | | Pfizer Inc., Senior Unsecured Notes, 7.200% due 3/15/39 | | | 206,712 | |
| | 445,000 | | | BBB | | Watson Pharmaceuticals Inc., Senior Unsecured Notes, 5.000% due 8/15/14 | | | 473,781 | |
| | 350,000 | | | AA | | Wyeth LLC, Company Guaranteed Notes, 5.950% due 4/1/37 | | | 483,234 | |
| | | | | | | | | | |
| | | | | | Total Pharmaceuticals | | | 3,641,751 | |
| | | | | | | | | | |
| Real Estate Investment Trusts (REITs) — 1.0% | | | | |
| | 700,000 | | | BBB- | | Duke Realty LP, Senior Unsecured Notes, 6.500% due 1/15/18 | | | 812,473 | |
| | 2,900,000 | | | BBB | | Goodman Funding Pty Ltd., Company Guaranteed Notes, 6.375% due 11/12/20(b)(e) | | | 3,097,212 | |
| | | | | | HCP Inc., Senior Unsecured Notes: | | | | |
| | 750,000 | | | BBB | | 6.000% due 6/15/14 | | | 800,632 | |
| | 300,000 | | | BBB | | 6.700% due 1/30/18 | | | 356,411 | |
| | | | | | Health Care REIT Inc., Senior Unsecured Notes: | | | | |
| | 500,000 | | | BBB- | | 4.125% due 4/1/19 | | | 526,555 | |
| | 1,200,000 | | | BBB- | | 4.950% due 1/15/21 | | | 1,300,927 | |
| | 600,000 | | | BBB- | | 6.500% due 3/15/41 | | | 701,141 | |
| | 600,000 | | | BBB- | | Healthcare Realty Trust Inc., Senior Unsecured Notes, 6.500% due 1/17/17 | | | 674,528 | |
| | 1,300,000 | | | BBB | | Ventas Realty LP/Ventas Capital Corp., Company Guaranteed Notes, 4.000% due 4/30/19 | | | 1,383,672 | |
| | | | | | WEA Finance LLC/WT Finance Aust Pty Ltd., Company Guaranteed Notes: | | | | |
| | 465,000 | | | A- | | 7.500% due 6/2/14(e) | | | 509,709 | |
| | 250,000 | | | A- | | 6.750% due 9/2/19(e) | | | 300,210 | |
| | | | | | | | | | |
| | | | | | Total Real Estate Investment Trusts (REITs) | | | 10,463,470 | |
| | | | | | | | | | |
| Road & Rail — 0.1% | | | | |
| | 520,000 | | | BBB- | | Penske Truck Leasing Co. LP/PTL Finance Corp., Unsecured Notes, 3.125% due 5/11/15(e) | | | 528,797 | |
| | | | | | Union Pacific Corp., Senior Unsecured Notes: | | | | |
| | 43,000 | | | A- | | 5.375% due 5/1/14 | | | 46,206 | |
| | 84,000 | | | A- | | 4.163% due 7/15/22 | | | 95,582 | |
| | | | | | | | | | |
| | | | | | Total Road & Rail | | | 670,585 | |
| | | | | | | | | | |
| Specialty Retail — 0.2% | | | | |
| | | | | | QVC Inc., Senior Secured Notes: | | | | |
| | 385,000 | | | BBB- | | 7.500% due 10/1/19(e) | | | 426,791 | |
| | 554,000 | | | BBB- | | 7.375% due 10/15/20(e) | | | 617,737 | |
See Notes to Financial Statements.
99
Schedules of Investments
(continued)
Core Fixed Income Investments
| | | | | | | | | | |
Face
Amount† | | | Rating†† | | Security | | Value | |
| Specialty Retail — 0.2%—(continued) | | | | |
| $ | 700,000 | | | AA | | Wal-Mart Stores Inc., Senior Unsecured Notes, 3.250% due 10/25/20 | | $ | 773,307 | |
| | | | | | | | | | |
| | | | | | Total Specialty Retail | | | 1,817,835 | |
| | | | | | | | | | |
| Tobacco — 0.3% | | | | |
| | | | | | Altria Group Inc., Company Guaranteed Notes: | | | | |
| | 200,000 | | | BBB | | 8.500% due 11/10/13 | | | 218,155 | |
| | 400,000 | | | BBB | | 9.700% due 11/10/18(b) | | | 574,933 | |
| | 260,000 | | | BBB | | 9.250% due 8/6/19 | | | 371,093 | |
| | 230,000 | | | BBB | | 4.750% due 5/5/21 | | | 265,873 | |
| | 350,000 | | | BBB | | 2.850% due 8/9/22 | | | 349,485 | |
| | 45,000 | | | BBB | | 10.200% due 2/6/39 | | | 78,677 | |
| | 60,000 | | | BBB | | 4.250% due 8/9/42 | | | 58,783 | |
| | 358,000 | | | BBB+ | | BAT International Finance PLC, Company Guaranteed Notes, 3.250% due 6/7/22(e) | | | 367,432 | |
| | | | | | Philip Morris International Inc., Senior Unsecured Notes: | | | | |
| | 240,000 | | | A | | 2.900% due 11/15/21 | | | 251,519 | |
| | 240,000 | | | A | | 4.500% due 3/20/42 | | | 268,657 | |
| | 300,000 | | | BBB- | | Reynolds American Inc., Company Guaranteed Notes, 6.750% due 6/15/17 | | | 363,798 | |
| | | | | | | | | | |
| | | | | | Total Tobacco | | | 3,168,405 | |
| | | | | | | | | | |
| Wireless Telecommunication Services — 0.3% | | | | |
| | 230,000 | | | A- | | América Móvil SAB de CV, Company Guaranteed Notes, 5.000% due 3/30/20 | | | 268,463 | |
| | | | | | GTE Corp., Company Guaranteed Notes: | | | | |
| | 548,000 | | | A- | | 6.840% due 4/15/18 | | | 681,092 | |
| | 50,000 | | | A- | | 6.940% due 4/15/28 | | | 66,304 | |
| | | | | | Sprint Capital Corp., Company Guaranteed Notes: | | | | |
| | 50,000 | | | B+ | | 6.875% due 11/15/28 | | | 45,500 | |
| | 720,000 | | | B+ | | 8.750% due 3/15/32 | | | 730,800 | |
| | | | | | Telefónica Emisiones SAU, Company Guaranteed Notes: | | | | |
| | 70,000 | | | BBB | | 5.877% due 7/15/19 | | | 67,725 | |
| | 140,000 | | | BBB | | 5.134% due 4/27/20 | | | 128,275 | |
| | 1,370,000 | | | BBB- | | Virgin Media Secured Finance PLC, Senior Secured Notes, 6.500% due 1/15/18 | | | 1,500,150 | |
| | | | | | | | | | |
| | | | | | Total Wireless Telecommunication Services | | | 3,488,309 | |
| | | | | | | | | | |
| | | | | | TOTAL CORPORATE BONDS & NOTES | | | | |
| | | | | | (Cost — $244,587,226) | | | 268,532,409 | |
| | | | | | | | | | |
| MUNICIPAL BONDS — 1.6% | | | | |
| California — 0.3% | | | | |
| | | | | | State of California, GO: | | | | |
| | 400,000 | | | A- | | 5.000% due 6/1/37(b) | | | 429,388 | |
| | 900,000 | | | A- | | 5.000% due 11/1/37(b) | | | 971,478 | |
| | 100,000 | | | A- | | 5.000% due 12/1/37(b) | | | 108,059 | |
| | 670,000 | | | A- | | 6.200% due 10/1/19 | | | 810,392 | |
| | 815,000 | | | A- | | 7.550% due 4/1/39 | | | 1,092,018 | |
| | | | | | | | | | |
| | 268,532,409 | | | | | Total California | | | 3,411,335 | |
| | | | | | | | | | |
| Delaware — 0.0% | | | | |
| | 300,000 | | | AA+ | | Northstar Education Finance Inc., Student Loan Asset Backed Notes, GTDSTD-Insured, 1.324% due 1/29/46(a) | | | 256,039 | |
| | | | | | | | | | |
| Florida — 0.1% | | | | |
| | 550,000 | | | A | | Southwest Student Services Corp., Sub-Series B, GTDSTD-Insured, AMT, 0.525% due 12/1/36(a)(l) | | | 469,906 | |
| | | | | | | | | | |
| Illinois — 0.9% | | | | |
| | | | | | Chicago Transit Authority: | | | | |
| | 3,500,000 | | | AA | | Series A, 6.899% due 12/1/40(b) | | | 4,278,365 | |
| | 2,400,000 | | | AA | | Series B, 6.899% due 12/1/40(b) | | | 2,933,736 | |
| | 510,000 | | | AA- | | Chicago, IL, GO, Series A, FSA-Insured, 4.750% due 1/1/36(b) | | | 536,331 | |
See Notes to Financial Statements.
100
Schedules of Investments
(continued)
Core Fixed Income Investments
| | | | | | | | | | |
Face
Amount† | | | Rating†† | | Security | | Value | |
| Illinois — 0.9%—(continued) | | | | |
| | | | | | State of Illinois, GO: | | | | |
| $ | 1,140,000 | | | A | | 5.100% due 6/1/33 | | $ | 1,103,418 | |
| | 650,000 | | | A | | 5.665% due 3/1/18 | | | 727,948 | |
| | | | | | | | | | |
| | | | | | Total Illinois | | | 9,579,798 | |
| | | | | | | | | | |
| Minnesota — 0.1% | | | | |
| | | | | | Northstar Education Finance Inc.: | | | | |
| | 825,000 | | | AA+ | | 2007-1 STUDENT LN ASSET BKD NT, GTDSTD-Insured, 0.547% due 4/28/30(a) | | | 769,973 | |
| | 325,000 | | | AA+ | | Student Loan Asset Backed Notes, GTDSTD-Insured, 1.124% due 1/29/46(a) | | | 277,359 | |
| | | | | | | | | | |
| | | | | | Total Minnesota | | | 1,047,332 | |
| | | | | | | | | | |
| New York — 0.0% | | | | |
| | 190,000 | | | AAA | | New York City Municipal Water Finance Authority, Water & Sewer System Revenue, Series 1289, 7.572% due 12/15/13(a)(b)(e) | | | 225,418 | |
| | | | | | | | | | |
| Ohio — 0.1% | | | | |
| | 1,000,000 | | | B- | | Buckeye Ohio Tobacco Settlement, Series A-2, 5.750% due 6/1/34(b) | | | 804,550 | |
| | | | | | | | | | |
| Virginia — 0.1% | | | | |
| | 661,573 | | | AAA | | Virginia Housing Development Authority, Series C, 6.000% due 6/25/34 | | | 725,488 | |
| | | | | | | | | | |
| | | | | | TOTAL MUNICIPAL BONDS (Cost — $14,614,437) | | | 16,519,866 | |
| | | | | | | | | | |
| SOVEREIGN BONDS — 3.4% | | | | |
| Australia — 0.3% | | | | |
| | 3,100,000 | AUD | | Aaa(d) | | Australia Government Bond, Senior Unsecured Notes, 5.500% due 12/15/13 | | | 3,310,178 | |
| | | | | | | | | | |
| Brazil — 0.2% | | | | |
| | 2,500,000 | BRL | | BBB | | Federative Republic of Brazil, Senior Unsecured Notes, 12.500% due 1/5/22(b) | | | 1,779,250 | |
| | | | | | | | | | |
| Canada — 1.2% | | | | |
| | 8,000,000 | CAD | | AAA | | Canadian Government Bond, Bonds, 2.250% due 8/1/14(b) | | | 8,279,022 | |
| | | | | | Province of Ontario Canada: | | | | |
| | | | | | Senior Unsecured Notes: | | | | |
| | 410,000 | | | AA- | | 0.950% due 5/26/15 | | | 414,899 | |
| | 900,000 | | | AA- | | 2.300% due 5/10/16(b) | | | 950,070 | |
| | 2,900,000 | CAD | | AA- | | Unsecured Notes, 3.150% due 6/2/22 | | | 3,040,281 | |
| | | | | | | | | | |
| | | | | | Total Canada | | | 12,684,272 | |
| | | | | | | | | | |
| Germany — 0.9% | | | | |
| | 200,000 | EUR | | Aaa(d) | | Bundesobligation, Bonds, 4.000% due 10/11/13 | | | 262,729 | |
| | 7,100,000 | EUR | | Aaa(d) | | Bundesschatzanweisungen, Bonds, 0.750% due 9/13/13 | | | 8,999,510 | |
| | | | | | | | | | |
| | | | | | Total Germany | | | 9,262,239 | |
| | | | | | | | | | |
| Hong Kong — 0.1% | | | | |
| | 1,000,000 | | | AAA | | Hong Kong Government Bond, Notes, 5.125% due 8/1/14(b)(e) | | | 1,075,558 | |
| | | | | | | | | | |
| Japan — 0.1% | | | | |
| | 800,000 | | | AA- | | Japan Bank for International Cooperation, Government Guaranteed Notes, 2.875% due 2/2/15 | | | 846,303 | |
| | | | | | | | | | |
| Malaysia — 0.1% | | | | |
| | | | | | Malaysia Government Bond, Senior Unsecured Notes: | | | | |
| | 1,800,000 | MYR | | A3(d) | | 3.835% due 8/12/15 | | | 588,018 | |
| | 515,000 | MYR | | A3(d) | | 4.262% due 9/15/16 | | | 171,491 | |
| | | | | | | | | | |
| | | | | | Total Malaysia | | | 759,509 | |
| | | | | | | | | | |
| Mexico — 0.4% | | | | |
| | 34,836,000 | MXN | | A- | | Mexican Bonos, Bonds, 8.000% due 6/11/20 | | | 3,114,971 | |
| | 724,000 | | | BBB | | Mexico Government International Bond, Senior Unsecured Notes, 4.750% due 3/8/44 | | | 812,690 | |
| | 328,000 | | | BBB | | United Mexican States, Senior Unsecured Notes, 6.050% due 1/11/40 | | | 438,700 | |
| | | | | | | | | | |
| | | | | | Total Mexico | | | 4,366,361 | |
| | | | | | | | | | |
See Notes to Financial Statements.
101
Schedules of Investments
(continued)
Core Fixed Income Investments
| | | | | | | | | | |
Face
Amount† | | | Rating†† | | Security | | Value | |
| Russia — 0.1% | | | | |
| $ | 830,760 | | | BBB | | Russian Federation (Restricted), step bond to yield, Senior Unsecured Notes, 7.500% due 3/31/30 | | $ | 1,038,035 | |
| | | | | | | | | | |
| | | | | | TOTAL SOVEREIGN BONDS (Cost — $34,169,208) | | | 35,121,705 | |
| | | | | | | | | | |
| U.S. GOVERNMENT & AGENCY OBLIGATIONS — 21.4% | | | | |
| U.S. GOVERNMENT OBLIGATIONS — 20.0% | | | | |
| | | | | | U.S. Treasury Bonds: | | | | |
| | 3,600,000 | | | | | 8.125% due 5/15/21(b)(m) | | | 5,634,281 | |
| | 113,000 | | | | | 8.125% due 8/15/21(b) | | | 178,107 | |
| | 1,900,000 | | | | | 7.625% due 11/15/22(b) | | | 3,002,000 | |
| | 200,000 | | | | | 7.125% due 2/15/23(b) | | | 307,625 | |
| | 2,000,000 | | | | | 7.500% due 11/15/24(b) | | | 3,257,812 | |
| | 505,000 | | | | | 6.500% due 11/15/26 | | | 786,459 | |
| | 1,120,000 | | | | | 6.375% due 8/15/27 | | | 1,742,825 | |
| | 2,865,000 | | | | | 4.500% due 2/15/36 | | | 3,909,831 | |
| | 1,900,000 | | | | | 4.750% due 2/15/37 | | | 2,692,359 | |
| | 1,000,000 | | | | | 4.375% due 11/15/39(b) | | | 1,356,250 | |
| | 1,200,000 | | | | | 4.375% due 5/15/40(b) | | | 1,629,376 | |
| | 1,787,700 | | | | | 4.750% due 2/15/41 | | | 2,571,215 | |
| | 1,214,000 | | | | | 4.375% due 5/15/41 | | | 1,651,420 | |
| | 350,000 | | | | | 3.750% due 8/15/41 | | | 430,062 | |
| | 21,255,000 | | | | | 3.125% due 11/15/41(b) | | | 23,297,478 | |
| | 7,125,000 | | | | | 3.125% due 2/15/42 | | | 7,801,875 | |
| | 700,000 | | | | | 3.000% due 5/15/42 | | | 747,688 | |
| | 2,595,000 | | | | | 2.750% due 8/15/42 | | | 2,630,276 | |
| | | | | | U.S. Treasury Notes: | | | | |
| | 210,000 | | | | | 1.875% due 2/28/14 | | | 215,201 | |
| | 50,000 | | | | | 0.250% due 7/15/15 | | | 49,957 | |
| | 20,250,000 | | | | | 0.250% due 8/15/15 | | | 20,227,847 | |
| | 400,000 | | | | | 1.000% due 9/30/16 | | | 408,969 | |
| | 8,090,000 | | | | | 0.875% due 1/31/17 | | | 8,220,200 | |
| | 600,000 | | | | | 0.875% due 2/28/17(b) | | | 609,797 | |
| | 10,880,000 | | | | | 0.750% due 6/30/17 | | | 10,972,654 | |
| | 11,325,000 | | | | | 0.500% due 7/31/17 | | | 11,279,881 | |
| | 12,110,000 | | | | | 0.625% due 8/31/17 | | | 12,128,928 | |
| | 13,410,000 | | | | | 1.250% due 4/30/19 | | | 13,680,292 | |
| | 7,535,000 | | | | | 0.875% due 7/31/19 | | | 7,477,900 | |
| | 16,200,000 | | | | | 1.000% due 8/31/19 | | | 16,196,209 | |
| | 8,700,000 | | | | | 2.125% due 8/15/21(b)(m) | | | 9,245,794 | |
| | 500,000 | | | | | 2.000% due 2/15/22(b) | | | 523,047 | |
| | 8,360,000 | | | | | 1.750% due 5/15/22(b)(m) | | | 8,531,121 | |
| | 730,000 | | | | | 1.625% due 8/15/22 | | | 734,335 | |
| | | | | | U.S. Treasury Inflation Indexed Bonds: | | | | |
| | 121,741 | | | | | 2.375% due 1/15/25(m) | | | 163,666 | |
| | 284,799 | | | | | 1.750% due 1/15/28(m) | | | 366,100 | |
| | 125,632 | | | | | 3.875% due 4/15/29 | | | 207,646 | |
| | 3,222,262 | | | | | 2.125% due 2/15/41(b) | | | 4,765,928 | |
| | | | | | U.S. Treasury Inflation Indexed Bonds: | | | | |
| | 1,433,111 | | | | | 0.625% due 4/15/13 | | | 1,447,443 | |
| | 6,399,083 | | | | | 1.125% due 1/15/21(b)(m) | | | 7,489,429 | |
| | 5,677,784 | | | | | 0.125% due 1/15/22(b) | | | 6,142,210 | |
| | | | | | | | | | |
| | | | | | TOTAL U.S. GOVERNMENT OBLIGATIONS | | | 204,711,493 | |
| | | | | | | | | | |
| U.S. GOVERNMENT AGENCIES — 1.4% | | | | |
| | | | | | Federal Home Loan Bank (FHLB): | | | | |
| | 200,000 | | | | | 1.350% due 4/29/14 | | | 203,646 | |
See Notes to Financial Statements.
102
Schedules of Investments
(continued)
Core Fixed Income Investments
| | | | | | | | | | |
Face
Amount† | | | Rating†† | | Security | | Value | |
| U.S. GOVERNMENT AGENCIES — 1.4%—(continued) | | | | |
| $ | 290,000 | | | | | 1.375% due 5/28/14 | | $ | 296,075 | |
| | 2,880,000 | | | | | 0.450% due 9/4/14 | | | 2,880,562 | |
| | 1,000,000 | | | | | 1.250% due 8/1/19 | | | 1,003,041 | |
| | 2,800,000 | | | | | 2.375% due 1/13/22 | | | 2,948,694 | |
| | 2,000 | | | | | 5.625% due 11/23/35(m) | | | 2,304 | |
| | | | | | Federal National Mortgage Association (FNMA): | | | | |
| | 220,000 | | | | | 0.700% due 6/26/15 | | | 220,324 | |
| | 1,790,000 | | | | | 0.600% due 7/24/15 | | | 1,791,769 | |
| | 3,605,000 | | | | | 0.000% due 10/9/19 | | | 3,147,749 | |
| | 1,055,000 | | | | | 6.250% due 5/15/29 | | | 1,555,844 | |
| | | | | | | | | | |
| | | | | | TOTAL U.S. GOVERNMENT AGENCIES | | | 14,050,008 | |
| | | | | | | | | | |
| | | | | | TOTAL U.S. GOVERNMENT & AGENCY OBLIGATIONS (Cost — $208,044,026) | | | 218,761,501 | |
| | | | | | | | | | |
| Shares | | | | | | | | |
| COMMON STOCK — 0.0% | | | | |
| CONSUMER DISCRETIONARY — 0.0% | | | | |
| Automobiles — 0.0% | | | | |
| | 506 | | | | | Motors Liquidation Co. GUC Trust* (Cost - $0) (b) | | | 7,246 | |
| | | | | | | | | | |
| PREFERRED STOCK — 0.1% | | | | |
| FINANCIALS — 0.1% | | | | |
| Commercial Banks — 0.1% | | | | |
| | 26,501 | | | | | GMAC Capital Trust I, 8.125% (Cost - $657,225)(a) | | | 657,755 | |
| | | | | | | | | | |
| CONVERTIBLE PREFERRED STOCK — 0.0% | | | | |
| CONSUMER DISCRETIONARY — 0.0% | | | | |
| Automobiles — 0.0% | | | | |
| | 20,000 | | | | | General Motors Corp., 0.000% (Cost - $0)(b)(h)(i)* | | | 0 | |
| | | | | | | | | | |
| WARRANT — 0.0% | | | | |
| ENERGY — 0.0% | | | | |
| Energy Equipment & Services — 0.0% | | | | |
| | 177 | | | | | SemGroup Corp., Class A Shares, expires 11/30/14(h)* (Cost - $9,884) | | | 2,119 | |
| | | | | | | | | | |
| Contracts | | | | | | | | |
| PURCHASED OPTIONS — 0.0% | | | | |
| United States — 0.0% | | | | |
| | 24 | | | | | Eurodollar 2 Year Midcurve, Put @ $99.13, expires 12/14/12 | | | 1,800 | |
| | 90 | | | | | Eurodollar 3 Year Midcurve, Put @ $97.25, expires 12/14/12 | | | 563 | |
| | 90 | | | | | Eurodollar 3 Year Midcurve, Put @ $98.25, expires 12/14/12 | | | 3,938 | |
| | 102 | | | | | Eurodollar Futures, Put @ $98.75, expires 12/14/12 | | | 3,187 | |
| | 46 | | | | | Eurodollar Futures, Put @ $98.88, expires 12/17/12 | | | 287 | |
| | | | | | | | | | |
| | | | | | Total United States | | | 9,775 | |
| | | | | | | | | | |
| | | | | | TOTAL PURCHASED OPTIONS (Cost — $176,244) | | | 9,775 | |
| | | | | | | | | | |
| | | | | | TOTAL INVESTMENTS BEFORE SHORT-TERM INVESTMENTS (Cost — $937,959,142) | | | 978,671,062 | |
| | | | | | | | | | |
Face
Amount† | | | | | | | | |
| SHORT-TERM INVESTMENTS (n) — 12.0% | | | | |
| COMMERCIAL PAPER — 0.1% | | | | |
| | 1,375,000 | | | | | RBS Holding USA Inc., 0.370% due 9/17/12(o) (Cost — $1,374,774) | | | 1,374,774 | |
| | | | | | | | | | |
See Notes to Financial Statements.
103
Schedules of Investments
(continued)
Core Fixed Income Investments
| | | | | | | | | | |
Face
Amount† | | | Rating†† | | Security | | Value | |
| MONEY MARKET FUND - 0.0% | | | | |
| $ | 386,546 | | | | | Invesco STIT - Government & Agency Portfolio (Cost - $386,546)(p) | | $ | 386,546 | |
| | | | | | | | | | |
| REPURCHASE AGREEMENTS — 4.3% | | | | |
| | 19,200,000 | | | | | Barclays Capital Inc. repurchase agreement dated 8/31/12, 0.130% due 9/4/12, Proceeds at maturity - $19,200,277; (Fully collateralized by U.S. Treasury Notes 1.750% due 5/15/22; Market Valued - $19,642,884)(o) | | | 19,200,000 | |
| | 13,300,000 | | | | | Barclays Capital Inc. repurchase agreement dated 8/31/12, 0.230% due 11/19/12, Proceeds at maturity - $13,307,648; (Fully collateralized by FNMA Mortgage Securities 3.500% due 5/1/42; Market Valued - $13,933,689)(h)(o) | | | 13,300,000 | |
| | 11,700,000 | | | | | Deutsche Bank Securities Inc. repurchase agreement dated 8/31/12, 0.200% due 9/4/12, Proceeds at maturity - $11,700,260; (Fully collateralized by U.S. Treasury Notes 1.750% due 5/15/22; Market Valued - $12,037,299)(o) | | | 11,700,000 | |
| | | | | | | | | | |
| | | | | | TOTAL REPURCHASE AGREEMENTS (Cost — $44,200,000) | | | 44,200,000 | |
| | | | | | | | | | |
| TIME DEPOSITS — 3.3% | | | | |
| | 5,327,976 | | | | | Bank of New York Mellon — Grand Cayman, 0.030% due 9/4/12 | | | 5,327,976 | |
| | | | | | BBH — Grand Cayman: | | | | |
| | 28,670 | EUR | | | | -0.036% due 9/3/12 | | | 36,063 | |
| | 544 | JPY | | | | 0.010% due 9/3/12 | | | 7 | |
| | 172 | GBP | | | | 0.052% due 9/3/12 | | | 273 | |
| | 59 | NOK | | | | 0.500% due 9/3/12 | | | 10 | |
| | 317 | AUD | | | | 2.648% due 9/3/12 | | | 328 | |
| | 713 | CAD | | | | 0.195% due 9/4/12 | | | 723 | |
| | 28,708,294 | | | | | Wells Fargo - Grand Cayman, 0.030% due 9/4/12 | | | 28,708,294 | |
| | | | | | | | | | |
| | | | | | TOTAL TIME DEPOSITS (Cost — $34,073,674) | | | 34,073,674 | |
| | | | | | | | | | |
| U.S. GOVERNMENT AGENCIES — 3.4% | | | | |
| | | | | | Federal Home Loan Bank (FHLB), Discount Notes: | | | | |
| | 6,850,000 | | | | | 0.120% due 9/7/12(o) | | | 6,849,863 | |
| | 7,470,000 | | | | | 0.110% due 10/19/12(o) | | | 7,468,904 | |
| | 9,900,000 | | | | | 0.160% due 2/20/13(o) | | | 9,892,432 | |
| | | | | | Federal Home Loan Mortgage Corp. (FHLMC), Discount Notes: | | | | |
| | 200,000 | | | | | 0.170% due 2/11/13(o) | | | 199,846 | |
| | 800,000 | | | | | 0.150% due 2/26/13(o) | | | 799,407 | |
| | 2,790,000 | | | | | Federal National Mortgage Association (FNMA), 0.261% due 10/18/12 | | | 2,789,922 | |
| | | | | | Federal National Mortgage Association (FNMA), Discount Notes: | | | | |
| | 2,100,000 | | | | | 0.115% due 10/24/12(o) | | | 2,099,645 | |
| | 5,400,000 | | | | | 0.175% due 2/27/13(o) | | | 5,395,301 | |
| | | | | | | | | | |
| | | | | | TOTAL U.S. GOVERNMENT AGENCIES (Cost — $35,495,320) | | | 35,495,320 | |
| | | | | | | | | | |
| U.S. GOVERNMENT OBLIGATIONS — 0.9% | | | | |
| | 9,212,000 | | | | | U.S. Treasury Bills, 0.110% due 9/13/12 — 7/25/13(b)(m)(o) | | | 9,206,049 | |
| | | | | | | | | | |
| | | | | | TOTAL U.S. GOVERNMENT OBLIGATIONS (Cost — $9,206,049) | | | 9,206,049 | |
| | | | | | | | | | |
| | | | | | TOTAL SHORT-TERM INVESTMENTS (Cost — $124,736,363) | | | 124,736,363 | |
| | | | | | | | | | |
| | | | | | TOTAL INVESTMENTS — 108.0% (Cost — $1,062,695,505#) | | | 1,103,407,425 | |
| | | | | | | | | | |
| | | | | | Liabilities in Excess of Other Assets — (8.0%) | | | (81,775,802 | ) |
| | | | | | | | | | |
| | | | | | TOTAL NET ASSETS — 100.0% | | $ | 1,021,631,623 | |
| | | | | | | | | | |
| † | Face amount denominated in U.S. dollars, unless otherwise noted. |
| †† | All ratings are by Standard & Poor’s Rating Service, unless otherwise noted. All ratings are unaudited. |
See Notes to Financial Statements.
104
Schedules of Investments
(continued)
Core Fixed Income Investments
| * | Non-income producing securities. |
| (a) | Variable rate security. Interest rate disclosed is that which is in effect at August 31, 2012. |
| (b) | All or a portion of this security is segregated as collateral for open futures contracts, extended settlements, options contracts written, swap contracts, foreign currency contracts, TBA’s and repurchase agreements. |
| (c) | This security is traded on a TBA basis (see Note 1). |
| (d) | Rating by Moody’s Investors Service. All ratings are unaudited. |
| (e) | Restricted security that may be sold to “qualified institutional buyers” pursuant to the conditions of Rule 144A under the Securities Act of 1933, as amended. This security has been deemed liquid pursuant to guidelines approved by the Board of Trustees, unless otherwise noted. |
| (f) | Rating by Fitch Ratings Service. All ratings are unaudited. |
| (g) | Principal only security. |
| (i) | Security is valued in good faith at fair value by or under the direction of the Board of Trustees. |
| (j) | Security is currently in default. |
| (k) | All or a portion of this security is on loan (See Note 1). |
| (l) | Income from this issue is considered a preference item for purposes of calculating the alternative minimum tax (AMT). |
| (m) | All or a portion of this security is held at the broker as collateral for open futures contracts, repurchase agreements, or swap contracts. |
| (n) | Inclusive of all short term holdings, including collateral received from securities lending activities. Not including such collateral, the percentage of portfolio holdings would be 12.3%. |
| (o) | Rate shown represents yield-to-maturity. |
| (p) | Represents investment of collateral received from securities lending transactions. |
| # | Aggregate cost for federal income tax purposes is $1,066,183,429. |
Abbreviation used in this schedule:
| | | | |
| AUD | | — | | Australian Dollar |
| CAD | | — | | Canadian Dollar |
| EUR | | — | | Euro Dollar |
| FSA | | — | | Financial Security Assurance |
| GBP | | — | | British Pound |
| GO | | — | | General Obligation |
| GTDSTD | | — | | Guaranteed Student Loans |
| JPY | | — | | Japanese Yen |
| MASTR | | — | | Mortgage Asset Securitization Transactions Inc |
| NOK | | — | | Norwegian Krone |
| PLC | | — | | Public Limited Company |
| REIT | | — | | Real Estate Investment Trusts |
| REMICS | | — | | Real Estate Mortgage Investment Conduits |
See pages 140 and 141 for definition of ratings.
Summary of Investments by Security Type*
| | | | |
Mortgage-Backed Securities | | | 25.1 | % |
Corporate Bonds & Notes | | | 24.3 | |
U.S. Government & Agency Obligations | | | 19.7 | |
Collateralized Mortgage Obligations | | | 13.4 | |
Sovereign Bonds | | | 3.2 | |
Municipal Bonds | | | 1.5 | |
Asset-Backed Securities | | | 1.3 | |
Preferred Stock | | | 0.1 | |
Purchased Options | | | 0.0 | ** |
Common Stock | | | 0.0 | ** |
Warrant | | | 0.0 | ** |
Short-Term Investments | | | 11.4 | |
| | | | |
| | | 100.0 | % |
| | | | |
See Notes to Financial Statements.
105
Schedules of Investments
(continued)
Core Fixed Income Investments
| * | As a percentage of total investments. |
| ** | Position represents less than 0.1% |
Schedule of Options Contracts Written
| | | | | | | | | | | | | | |
| Contracts | | | Security Name | | Expiration
Date | | Strike
Price | | | Value | |
| | United States | | | | | | | | | | | | | |
| | 24 | | | Eurodollar 2 Year Midcurve, Put | | 12/14/12 | | $ | 98.63 | | | $ | 600 | |
| | 102 | | | Eurodollar 2 Year Midcurve, Put | | 12/14/12 | | | 98.25 | | | | 638 | |
| | 180 | | | Eurodollar 3 Year Midcurve, Put | | 12/14/12 | | | 97.75 | | | | 2,250 | |
| | 46 | | | Eurodollar Futures, Put | | 9/17/12 | | | 98.88 | | | | 287 | |
| | 1,200,000 | | | Swaption, 3-Month USD-LIBOR, Call | | 3/18/13 | | | 1.40 | | | | 30,131 | |
| | 1,200,000 | | | Swaption, 3-Month USD-LIBOR, Put | | 3/18/13 | | | 1.40 | | | | 3,300 | |
| | 15,200,000 | | | Swaption, 3-Month USD-LIBOR, Call | | 3/18/13 | | | 1.40 | | | | 381,657 | |
| | 15,200,000 | | | Swaption, 3-Month USD-LIBOR, Put | | 3/18/13 | | | 1.40 | | | | 41,805 | |
| | 31 | | | U.S. Treasury Bonds Futures, Call | | 9/21/12 | | | 150.00 | | | | 71,203 | |
| | | | | | | | | | | | | | |
| | | | Total United States | | | | | | | | | 531,871 | |
| | | | | | | | | | | | | | |
| | | | TOTAL OPTIONS CONTRACTS WRITTEN (Premiums received — $644,647) | | | | | | | | $ | 531,871 | |
| | | | | | | | | | | | | | |
Schedule of Forward Sale Commitments
| | | | | | | | |
Face
Amount | | | Security | | Value | |
| | | | Federal Home Loan Mortgage Corp. (FHLMC): | | | | |
| $ | 2,000,000 | | | 5.500% due 9/15/33 (a) | | | $2,185,000 | |
| | | | Gold: | | | | |
| | 1,000,000 | | | 4.500% due 9/15/34 (a) | | | 1,076,602 | |
| | | | Federal National Mortgage Association (FNMA): | | | | |
| | 6,000,000 | | | 3.500% due 9/15/25 (a) | | | 6,380,625 | |
| | 10,000,000 | | | 5.500% due 9/15/33 (a) | | | 10,971,877 | |
| | 5,000,000 | | | 6.000% due 9/15/33 (a) | | | 5,509,571 | |
| | 1,000,000 | | | 4.000% due 9/15/39 (a) | | | 1,072,344 | |
| | 1,000,000 | | | 4.500% due 9/1/42 (a) | | | 1,082,344 | |
| | | | Government National Mortgage Association (GNMA): | | | | |
| | 3,000,000 | | | 6.000% due 10/1/42(a) | | | 3,375,001 | |
| | | | | | | | |
| | | | TOTAL OPEN FORWARD SALE COMMITMENTS (Proceeds — $31,603,438) | | $ | 31,653,364 | |
| | | | | | | | |
| (a) | This security is traded on a TBA basis (see Note 1). |
For details of other financial instruments held by this fund, refer to Note 3.
See Notes to Financial Statements.
106
Schedules of Investments
(continued)
High Yield Investments
| | | | | | | | | | |
Face
Amount | | | Rating†† | | Security | | Value | |
| CORPORATE BONDS & NOTES — 79.0% | | | | |
| Aerospace & Defense — 1.1% | | | | |
| $ | 1,180,000 | | | CCC | | DAE Aviation Holdings Inc., Company Guaranteed Notes, 11.250% due 8/1/15(a) | | $ | 1,221,300 | |
| | 170,000 | | | B- | | Ducommun Inc., Company Guaranteed Notes, 9.750% due 7/15/18 | | | 178,712 | |
| | 1,005,000 | | | B | | Kratos Defense & Security Solutions Inc., Senior Secured Notes, 10.000% due 6/1/17 | | | 1,075,350 | |
| | 330,000 | | | B- | | Wyle Services Corp., Senior Subordinated Notes, 10.500% due 4/1/18(a) | | | 358,050 | |
| | | | | | | | | | |
| | | | | | Total Aerospace & Defense | | | 2,833,412 | |
| | | | | | | | | | |
| Airlines — 0.4% | | | | |
| | 370,000 | | | BBB- | | Continental Airlines 2012-1 Class B Pass Thru Trusts, Pass Thru Certificates, 6.250% due 4/11/20 | | | 377,400 | |
| | 57,756 | | | BB | | Delta Air Lines 2007-1 Class B Pass Through Trust, Pass Thru Certificates, 8.021% due 8/10/22 | | | 59,488 | |
| | 117,027 | | | B | | Delta Air Lines 2007-1 Class C Pass Through Trust, Pass Thru Certificates, 8.954% due 8/10/14 | | | 119,227 | |
| | 53,342 | | | BBB- | | Delta Air Lines 2009-1 Series B Pass Through Trust, Pass Thru Certificates, 9.750% due 12/17/16 | | | 57,610 | |
| | 30,000 | | | BB+ | | Delta Air Lines 2010-1 Class B Pass Through Trust, Pass Thru Certificates, 6.375% due 1/2/16(a) | | | 30,000 | |
| | 515,000 | | | BB- | | Delta Air Lines Inc., Senior Secured Notes, 9.500% due 9/15/14(a) | | | 543,325 | |
| | | | | | | | | | |
| | | | | | Total Airlines | | | 1,187,050 | |
| | | | | | | | | | |
| Auto Components — 1.7% | | | | |
| | | | | | Chrysler Group LLC/CG Co-Issuer Inc., Secured Notes: | | | | |
| | 1,830,000 | | | B | | 8.000% due 6/15/19 | | | 1,939,800 | |
| | 1,400,000 | | | B | | 8.250% due 6/15/21 | | | 1,484,000 | |
| | 400,000 | | | B+ | | Pittsburgh Glass Works LLC, Senior Secured Notes, 8.500% due 4/15/16(a) | | | 368,000 | |
| | 85,000 | | | BB- | | Tomkins LLC/Tomkins Inc., Secured Notes, 9.000% due 10/1/18 | | | 95,200 | |
| | 601,000 | | | B+ | | Tower Automotive Holdings USA LLC/TA Holdings Finance Inc., Senior Secured Notes, 10.625% due 9/1/17(a) | | | 644,573 | |
| | | | | | | | | | |
| | | | | | Total Auto Components | | | 4,531,573 | |
| | | | | | | | | | |
| Beverages — 0.1% | | | | |
| | 110,000 | | | BB+ | | Constellation Brands Inc., Company Guaranteed Notes, 4.625% due 3/1/23 | | | 112,475 | |
| | 50,000 | | | B- | | Innovation Ventures LLC/Innovation Ventures Finance Corp., Senior Secured Notes, 9.500% due 8/15/19(a) | | | 46,125 | |
| | | | | | | | | | |
| | | | | | Total Beverages | | | 158,600 | |
| | | | | | | | | | |
| Building Products — 0.4% | | | | |
| | | | | | Building Materials Corp. of America: | | | | |
| | | | | | Senior Notes: | | | | |
| | 180,000 | | | BB+ | | 6.875% due 8/15/18(a) | | | 193,950 | |
| | 200,000 | | | BB+ | | 6.750% due 5/1/21(a) | | | 219,000 | |
| | 140,000 | | | BB+ | | Senior Secured Notes, 7.000% due 2/15/20(a) | | | 152,250 | |
| | | | | | Nortek Inc., Company Guaranteed Notes: | | | | |
| | 285,000 | | | B | | 10.000% due 12/1/18 | | | 313,500 | |
| | 300,000 | | | B | | 8.500% due 4/15/21 | | | 320,250 | |
| | | | | | | | | | |
| | | | | | Total Building Products | | | 1,198,950 | |
| | | | | | | | | | |
| Chemicals — 1.1% | | | | |
| | 130,000 | | | B+ | | Ineos Finance PLC, Senior Secured Notes, 9.000% due 5/15/15(a) | | | 138,450 | |
| | 1,100,000 | | | BB+ | | LyondellBasell Industries NV, Senior Unsecured Notes, 6.000% due 11/15/21 | | | 1,259,500 | |
| | 1,415,000 | | | BB- | | Tronox Finance LLC, Company Guaranteed Notes, 6.375% due 8/15/20(a) | | | 1,434,456 | |
| | | | | | | | | | |
| | | | | | Total Chemicals | | | 2,832,406 | |
| | | | | | | | | | |
| Commercial Banks — 4.4% | | | | |
| | | | | | Ally Financial Inc.: | | | | |
| | | | | | Company Guaranteed Notes: | | | | |
| | 165,000 | | | B+ | | 6.750% due 12/1/14 | | | 178,612 | |
| | 80,000 | | | B+ | | 4.625% due 6/26/15 | | | 82,155 | |
| | 645,000 | | | B+ | | 5.500% due 2/15/17 | | | 671,528 | |
| | 155,000 | | | B+ | | 6.250% due 12/1/17 | | | 168,060 | |
| | 2,820,000 | | | B+ | | 8.000% due 3/15/20 | | | 3,313,500 | |
| | 60,000 | | | B+ | | Senior Unsecured Notes, 7.500% due 12/31/13 | | | 64,275 | |
See Notes to Financial Statements.
107
Schedules of Investments
(continued)
High Yield Investments
| | | | | | | | | | |
Face
Amount | | | Rating†† | | Security | | Value | |
| Commercial Banks — 4.4%—(continued) | | | | |
| $ | 415,000 | | | BBB- | | Amsouth Bank, Subordinated Notes, 4.850% due 4/1/13 | | $ | 419,150 | |
| | 120,000 | | | A- | | Bank of America Corp., Senior Unsecured Notes, 6.500% due 8/1/16 | | | 136,966 | |
| | | | | | Barclays Bank PLC, Subordinated Notes: | | | | |
| | 100,000 | | | BBB+ | | 6.050% due 12/4/17(a) | | | 106,031 | |
| | 240,000 | | | BBB+ | | 10.179% due 6/12/21(a) | | | 301,626 | |
| | 75,000 | | | A | | Cooperatieve Centrale Raiffeisen-Boerenleenbank BA, Junior Subordinated Notes, 11.000% due 12/29/49(a)(b) | | | 97,660 | |
| | 210,000 | | | BBB- | | Credit Agricole SA, Junior Subordinated Notes, 8.375% due 10/29/49(a)(b) | | | 194,513 | |
| | 390,000 | | | BBB+ | | Intesa Sanpaolo SpA, Senior Notes, 3.625% due 8/12/15(a) | | | 366,850 | |
| | 1,000,000 | | | BB+ | | NB Capital Trust II, Limited Guaranteed Notes, 7.830% due 12/15/26 | | | 1,006,250 | |
| | | | | | Royal Bank of Scotland Group PLC: | | | | |
| | 170,000 | | | BB | | Junior Subordinated Notes, 7.648% due 8/29/49(b) | | | 161,500 | |
| | 50,000 | | | BB+ | | Subordinated Notes, 5.000% due 10/1/14 | | | 50,590 | |
| | 100,000 | | | BBB+ | | Santander Issuances SAU, Bank Guaranteed Notes, 5.911% due 6/20/16(a) | | | 93,779 | |
| | 220,000 | | | BBB- | | Société Générale SA, Junior Subordinated Notes, 1.211% due 12/29/49(a)(b) | | | 121,077 | |
| | | | | | Synovus Financial Corp.: | | | | |
| | 905,000 | | | B | | Senior Unsecured Notes, 7.875% due 2/15/19 | | | 995,500 | |
| | 2,120,000 | | | B- | | Subordinated Notes, 5.125% due 6/15/17 | | | 2,056,400 | |
| | 585,000 | | | BBB+ | | Wachovia Capital Trust III, Limited Guaranteed Notes, 5.570% due 3/29/49(b) | | | 579,881 | |
| | 620,000 | | | Ba3(c) | | Western Alliance Bancorp, Senior Unsecured Notes, 10.000% due 9/1/15 | | | 675,800 | |
| | | | | | | | | | |
| | | | | | Total Commercial Banks | | | 11,841,703 | |
| | | | | | | | | | |
| Commercial Services — 2.4% | | | | |
| | 335,000 | | | B | | ACE Cash Express Inc., Senior Secured Notes, 11.000% due 2/1/19(a) | | | 312,388 | |
| | 240,000 | | | B+ | | Ashtead Capital Inc., Company Guaranteed Notes, 6.500% due 7/15/22(a) | | | 250,500 | |
| | | | | | Avis Budget Car Rental LLC/Avis Budget Finance Inc., Company Guaranteed Notes: | | | | |
| | 103,000 | | | B | | 7.750% due 5/15/16 | | | 106,220 | |
| | 380,000 | | | B | | 8.250% due 1/15/19 | | | 412,300 | |
| | 547,000 | | | BB- | | Bankrate Inc., Senior Secured Notes, 11.750% due 7/15/15 | | | 615,375 | |
| | 155,000 | | | B- | | Emergency Medical Services Corp., Company Guaranteed Notes, 8.125% due 6/1/19 | | | 166,237 | |
| | 115,000 | | | B+ | | Geo Group Inc. (The), Company Guaranteed Notes, 7.750% due 10/15/17 | | | 125,206 | |
| | 230,000 | | | B+ | | H&E Equipment Services, Inc., Company Guaranteed Notes, 7.000% due 9/1/22(a) | | | 239,200 | |
| | 250,000 | | | B2(c) | | Hertz Corp. (The), Company Guaranteed Notes, 6.750% due 4/15/19(a) | | | 263,750 | |
| | 250,000 | | | B | | Live Nation Entertainment Inc., Senior Unsecured Notes, 8.125% due 5/15/18(a) | | | 268,750 | |
| | 320,000 | | | CCC+ | | Monitronics International Inc., Company Guaranteed Notes, 9.125% due 4/1/20 | | | 328,000 | |
| | 310,000 | | | CCC+ | | NES Rentals Holdings Inc., Secured Notes, 12.250% due 4/15/15(a) | | | 306,900 | |
| | 60,000 | | | B | | Pharmaceutical Product Development Inc., Senior Unsecured Notes, 9.500% due 12/1/19(a) | | | 67,200 | |
| | | | | | ServiceMaster Co.: | | | | |
| | 180,000 | | | B- | | Company Guaranteed Notes, 8.000% due 2/15/20 | | | 192,825 | |
| | 140,000 | | | B- | | Senior Notes, 7.000% due 8/15/20(a) | | | 143,150 | |
| | 300,000 | | | BB | | Sotheby’s, Company Guaranteed Notes, 7.750% due 6/15/15 | | | 331,125 | |
| | 625,000 | | | BB- | | Stewart Enterprises Inc., Company Guaranteed Notes, 6.500% due 4/15/19 | | | 665,625 | |
| | 160,000 | | | B- | | TransUnion Holding Co., Inc., Senior Unsecured Notes, 9.625% due 6/15/18(a)(d) | | | 174,400 | |
| | 1,000,000 | | | B+ | | UR Financing Escrow Corp., Company Guaranteed Notes, 7.625% due 4/15/22(a) | | | 1,082,500 | |
| | 350,000 | | | B+ | | UR Merger Sub Corp., Company Guaranteed Notes, 7.375% due 5/15/20(a) | | | 371,875 | |
| | | | | | | | | | |
| | | | | | Total Commercial Services | | | 6,423,526 | |
| | | | | | | | | | |
| Commercial Services & Supplies — 1.6% | | | | |
| | 855,000 | | | CCC | | Altegrity Inc., Company Guaranteed Notes, 11.750% due 5/1/16(a) | | | 718,200 | |
| | 740,000 | | | B+ | | American Reprographics Co., Company Guaranteed Notes, 10.500% due 12/15/16 | | | 769,600 | |
| | | | | | Cenveo Corp.: | | | | |
| | 205,000 | | | CCC+ | | Company Guaranteed Notes, 7.875% due 12/1/13 | | | 205,000 | |
| | 1,455,000 | | | B- | | Secured Notes, 8.875% due 2/1/18 | | | 1,331,325 | |
| | 285,000 | | | B- | | FGI Operating Co. LLC/FGI Finance Inc., Senior Secured Notes, 7.875% due 5/1/20(a) | | | 301,388 | |
| | 100,000 | | | BB- | | JM Huber Corp., Senior Unsecured Notes, 9.875% due 11/1/19(a) | | | 111,250 | |
| | | | CCC+ | | Park-Ohio Industries Inc., Company Guaranteed Notes, 8.125% due 4/1/21 | | | 843,525 | |
| | 130,000 | | | B+ | | United Rentals North America Inc., Company Guaranteed Notes, 10.875% due 6/15/16 | | | 146,087 | |
| | | | | | | | | | |
| | | | | | Total Commercial Services & Supplies | | | 4,426,375 | |
| | | | | | | | | | |
See Notes to Financial Statements.
108
Schedules of Investments
(continued)
High Yield Investments
| | | | | | | | | | |
Face
Amount | | | Rating†† | | Security | | Value | |
| Containers & Packaging — 0.4% | | | | |
| $ | 400,000 | | | CCC+ | | Ardagh Packaging Finance PLC/Ardagh MP Holdings USA Inc., Company Guaranteed Notes, 9.125% due 10/15/20(a) | | $ | 419,000 | |
| | 255,000 | | | B | | Packaging Dynamics Corp., Senior Secured Notes, 8.750% due 2/1/16(a) | | | 271,894 | |
| | 660,000 | | | B- | | Pactiv Corp., Senior Unsecured Notes, 7.950% due 12/15/25(e) | | | 514,800 | |
| | | | | | | | | | |
| | | | | | Total Containers & Packaging | | | 1,205,694 | |
| | | | | | | | | | |
| Diversified Consumer Services — 0.1% | | | | |
| | 210,000 | | | B- | | Carriage Services Inc., Company Guaranteed Notes, 7.875% due 1/15/15 | | | 213,806 | |
| | 130,000 | | | BB- | | Service Corp. International, Senior Unsecured Notes, 7.500% due 4/1/27 | | | 136,988 | |
| | | | | | | | | | |
| | | | | | Total Diversified Consumer Services | | | 350,794 | |
| | | | | | | | | | |
| Diversified Financial Services — 4.5% | | | | |
| | | | | | CIT Group Inc.: | | | | |
| | 641,645 | | | BB- | | Company Guaranteed Notes, 7.000% due 5/2/16(a) | | | 644,051 | |
| | 1,000,000 | | | BB- | | Senior Unsecured Notes, 5.375% due 5/15/20 | | | 1,041,875 | |
| | 1,032,387 | | | B- | | E*Trade Financial Corp., Senior Unsecured Notes, 12.500% due 11/30/17 | | | 1,183,374 | |
| | 220,000 | | | BB- | | General Motors Financial Co., Inc., Company Guaranteed Notes, 6.750% due 6/1/18 | | | 244,216 | |
| | | | | | International Lease Finance Corp., Senior Unsecured Notes: | | | | |
| | 350,000 | | | BBB- | | 6.375% due 3/25/13 | | | 358,750 | |
| | 215,000 | | | BBB- | | 5.625% due 9/20/13 | | | 223,062 | |
| | 1,000,000 | | | BBB- | | 8.625% due 9/15/15 | | | 1,125,000 | |
| | 1,150,000 | | | BBB- | | 8.875% due 9/1/17 | | | 1,341,188 | |
| | 1,050,000 | | | BBB- | | 8.625% due 1/15/22 | | | 1,241,625 | |
| | 1,605,000 | | | BBB- | | 5.875% due 8/15/22 | | | 1,617,948 | |
| | 276,000 | | | NR | | Jack Cooper Holdings Corp., Senior Secured Notes, 13.750% due 12/15/15(a) | | | 278,760 | |
| | | | | | Nuveen Investments Inc.: | | | | |
| | 665,000 | | | CCC | | Company Guaranteed Notes, 10.500% due 11/15/15 | | | 679,962 | |
| | 450,000 | | | CCC | | Senior Unsecured Notes, 5.500% due 9/15/15 | | | 409,500 | |
| | 1,415,000 | | | B- | | Offshore Group Investments Ltd., Senior Secured Notes, 11.500% due 8/1/15 | | | 1,570,650 | |
| | 45,000 | | | B | | Rivers Pittsburgh Borrower LP/Rivers Pittsburgh Finance Corp., Senior Secured Notes, 9.500% due 6/15/19(a) | | | 47,925 | |
| | 160,000 | | | B+ | | SPL Logistics Escrow LLC/SPL Logistics Finance Corp., Senior Secured Notes, 8.875% due 8/1/20(a) | | | 165,600 | |
| | | | | | | | | | |
| | | | | | Total Diversified Financial Services | | | 12,173,486 | |
| | | | | | | | | | |
| Diversified Telecommunication Services — 4.9% | | | | |
| | | | | | Cincinnati Bell Inc., Company Guaranteed Notes: | | | | |
| | 265,000 | | | B | | 8.250% due 10/15/17 | | | 284,875 | |
| | 1,605,000 | | | CCC+ | | 8.750% due 3/15/18 | | | 1,629,075 | |
| | 35,000 | | | BB- | | Cincinnati Bell Telephone Co. LLC, Company Guaranteed Notes, 6.300% due 12/1/28 | | | 30,800 | |
| | | | | | Cricket Communications Inc.: | | | | |
| | 455,000 | | | B- | | Company Guaranteed Notes, 7.750% due 10/15/20 | | | 443,625 | |
| | 1,015,000 | | | B+ | | Senior Secured Notes, 7.750% due 5/15/16 | | | 1,075,900 | |
| | 430,000 | | | BB | | Frontier Communications Corp., Senior Unsecured Notes, 8.500% due 4/15/20 | | | 481,600 | |
| | 135,000 | | | BB+ | | Inmarsat Finance PLC, Company Guaranteed Notes, 7.375% due 12/1/17(a) | | | 147,487 | |
| | | | | | Intelsat Jackson Holdings SA, Company Guaranteed Notes: | | | | |
| | 115,000 | | | CCC+ | | 11.250% due 6/15/16 | | | 121,469 | |
| | 1,735,000 | | | B | | 7.250% due 10/15/20(a) | | | 1,878,137 | |
| | 775,000 | | | B- | | ITC Deltacom Inc., Senior Secured Notes, 10.500% due 4/1/16 | | | 838,938 | |
| | | | | | Level 3 Financing Inc., Company Guaranteed Notes: | | | | |
| | 295,000 | | | CCC | | 4.469% due 2/15/15(b) | | | 293,525 | |
| | 362,000 | | | CCC | | 10.000% due 2/1/18 | | | 399,105 | |
| | 265,000 | | | CCC | | 9.375% due 4/1/19 | | | 291,500 | |
| | 1,310,000 | | | CCC | | 7.000% due 6/1/20(a) | | | 1,308,363 | |
| | 1,170,000 | | | CCC | | 8.625% due 7/15/20 | | | 1,256,287 | |
| | 130,000 | | | B | | tw telecom holdings inc., Company Guaranteed Notes, 8.000% due 3/1/18 | | | 144,950 | |
| | 340,000 | | | BB- | | UPCB Finance V Ltd., Senior Secured Notes, 7.250% due 11/15/21(a) | | | 372,300 | |
See Notes to Financial Statements.
109
Schedules of Investments
(continued)
High Yield Investments
| | | | | | | | | | |
Face
Amount | | | Rating†† | | Security | | Value | |
| Diversified Telecommunication Services — 4.9%—(continued) | | | | |
| | | | | | West Corp., Company Guaranteed Notes: | | | | |
| $ | 320,000 | | | B | | 8.625% due 10/1/18 | | $ | 326,400 | |
| | 110,000 | | | B | | 7.875% due 1/15/19 | | | 109,450 | |
| | 260,000 | | | BB- | | Wind Acquisition Finance SA, Secured Notes, 11.750% due 7/15/17(a) | | | 239,200 | |
| | 887,337 | | | B | | Wind Acquisition Holdings Finance SA, Senior Secured Notes, 12.250% due 7/15/17(a)(d) | | | 625,573 | |
| | | | | | Windstream Corp., Company Guaranteed Notes: | | | | |
| | 310,000 | | | B | | 7.500% due 6/1/22 | | | 317,750 | |
| | 630,000 | | | B | | 7.500% due 4/1/23 | | | 642,600 | |
| | | | | | | | | | |
| | | | | | Total Diversified Telecommunication Services | | | 13,258,909 | |
| | | | | | | | | | |
| Electric Utilities — 2.4% | | | | |
| | 750,000 | | | BB- | | AES Corp. (The), Senior Unsecured Notes, 7.375% due 7/1/21 | | | 862,500 | |
| | | | | | Calpine Corp., Senior Secured Notes: | | | | |
| | 1,135,000 | | | BB- | | 7.250% due 10/15/17(a) | | | 1,220,125 | |
| | 250,000 | | | BB- | | 7.875% due 1/15/23(a) | | | 283,750 | |
| | | | | | Energy Future Intermediate Holding Co. LLC/EFIH Finance Inc.: | | | | |
| | 1,060,000 | | | CC | | Secured Notes, 11.750% due 3/1/22(a) | | | 1,134,200 | |
| | 810,000 | | | B- | | Senior Secured Notes, 10.000% due 12/1/20 | | | 913,275 | |
| | 43,922 | | | B | | FPL Energy National Wind Portfolio LLC, Senior Secured Notes, 6.125% due 3/25/19(a)(f) | | | 34,380 | |
| | 960,000 | | | B+ | | GenOn REMA LLC, Pass Thru Certificates, 9.681% due 7/2/26 | | | 1,032,000 | |
| | 246,095 | | | B- | | Midwest Generation LLC, Pass Thru Certificates, 8.560% due 1/2/16 | | | 216,564 | |
| | 420,279 | | | B+ | | Mirant Mid Atlantic Pass Through Trust B, Pass Thru Certificates, 9.125% due 6/30/17 | | | 451,800 | |
| | 311,774 | | | B+ | | Mirant Mid Atlantic Pass Through Trust C, Pass Thru Certificates, 10.060% due 12/30/28 | | | 346,069 | |
| | 50,000 | | | CCC | | Texas Competitive Electric Holdings Co. LLC/TCEH Finance Inc., Senior Secured Notes, 11.500% due 10/1/20(a) | | | 40,500 | |
| | | | | | | | | | |
| | | | | | Total Electric Utilities | | | 6,535,163 | |
| | | | | | | | | | |
| Electronic Equipment & Instruments — 1.2% | | | | |
| | 190,000 | | | B+ | | Belden Inc., Company Guaranteed Notes, 5.500% due 9/1/22(a) | | | 191,425 | |
| | 300,000 | | | B | | Coleman Cable Inc., Company Guaranteed Notes, 9.000% due 2/15/18 | | | 319,500 | |
| | 680,000 | | | B+ | | NXP BV/NXP Funding LLC, Senior Secured Notes, 9.750% due 8/1/18(a) | | | 780,300 | |
| | 1,875,000 | | | B | | Sanmina-SCI Corp., Company Guaranteed Notes, 7.000% due 5/15/19(a) | | | 1,893,750 | |
| | | | | | | | | | |
| | | | | | Total Electronic Equipment & Instruments | | | 3,184,975 | |
| | | | | | | | | | |
| Energy Equipment & Services — 1.2% | | | | |
| | | | | | Chesapeake Midstream Partners LP/CHKM Finance Corp., Company Guaranteed Notes: | | | | |
| | 1,060,000 | | | BB- | | 5.875% due 4/15/21 | | | 1,089,150 | |
| | 270,000 | | | BB- | | 6.125% due 7/15/22 | | | 281,475 | |
| | 130,000 | | | NR | | Dynegy Roseton LLC/Dynegy Danskammer LLC Pass Through Trust, Series B, Pass Thru Certificates, 7.670% due 11/8/16(g) | | | 83,200 | |
| | 225,000 | | | B+ | | First Wind Capital LLC, Senior Secured Notes, 10.250% due 6/1/18(a) | | | 226,125 | |
| | 355,000 | | | B | | Forbes Energy Services Ltd., Company Guaranteed Notes, 9.000% due 6/15/19 | | | 346,125 | |
| | 500,000 | | | BB- | | Hornbeck Offshore Services Inc., Company Guaranteed Notes, 5.875% due 4/1/20 | | | 512,500 | |
| | 200,000 | | | BB | | Petroleum Geo-Services ASA, Company Guaranteed Notes, 7.375% due 12/15/18(a) | | | 214,500 | |
| | 140,000 | | | BB | | Targa Resources Partners LP/Targa Resources Partners Finance Corp., Company Guaranteed Notes, 6.375% due 8/1/22(a) | | | 147,000 | |
| | 390,000 | | | CCC | | Xinergy Corp., Senior Secured Notes, 9.250% due 5/15/19(a) | | | 262,275 | |
| | | | | | | | | | |
| | | | | | Total Energy Equipment & Services | | | 3,162,350 | |
| | | | | | | | | | |
| Food Products — 0.6% | | | | |
| | 110,000 | | | B- | | Harmony Foods Corp., Senior Secured Notes, 10.000% due 5/1/16(a) | | | 114,400 | |
| | 200,000 | | | B+ | | Post Holdings Inc., Company Guaranteed Notes, 7.375% due 2/15/22(a) | | | 211,750 | |
| | 800,000 | | | CCC- | | Simmons Foods Inc., Secured Notes, 10.500% due 11/1/17(a) | | | 696,000 | |
| | | | B | | Viskase Cos., Inc., Secured Notes, 9.875% due 1/15/18(a) | | | 661,500 | |
| | | | | | | | | | |
| | | | | | Total Food Products | | | 1,683,650 | |
| | | | | | | | | | |
| Gas Utilities — 0.9% | | | | |
| | | | | | Sabine Pass LNG LP, Senior Secured Notes: | | | | |
| | 345,000 | | | BB+ | | 7.250% due 11/30/13 | | | 360,525 | |
See Notes to Financial Statements.
110
Schedules of Investments
(continued)
High Yield Investments
| | | | | | | | | | |
Face
Amount | | | Rating†† | | Security | | Value | |
| Gas Utilities — 0.9%—(continued) | | | | |
| $ | 1,845,000 | | | BB+ | | 7.500% due 11/30/16 | | $ | 1,983,375 | |
| | | | | | | | | | |
| | | | | | Total Gas Utilities | | | 2,343,900 | |
| | | | | | | | | | |
| Health Care Equipment & Supplies — 0.8% | | | | |
| | 205,000 | | | B- | | Alere Inc., Company Guaranteed Notes, 8.625% due 10/1/18 | | | 212,688 | |
| | | | | | Biomet Inc., Company Guaranteed Notes: | | | | |
| | 555,000 | | | B- | | 11.625% due 10/15/17 | | | 595,931 | |
| | 225,000 | | | B- | | 6.500% due 8/1/20(a) | | | 234,000 | |
| | | | | | DJO Finance LLC/DJO Finance Corp., Company Guaranteed Notes: | | | | |
| | 720,000 | | | B- | | 10.875% due 11/15/14 | | | 755,100 | |
| | 210,000 | | | B- | | 7.750% due 4/15/18 | | | 193,200 | |
| | 110,000 | | | BB | | Hologic Inc., Company Guaranteed Notes, 6.250% due 8/1/20(a) | | | 117,012 | |
| | | | | | | | | | |
| | | | | | Total Health Care Equipment & Supplies | | | 2,107,931 | |
| | | | | | | | | | |
| Health Care Providers & Services — 4.0% | | | | |
| | 450,000 | | | B- | | Acadia Healthcare Co., Inc., Company Guaranteed Notes, 12.875% due 11/1/18 | | | 524,250 | |
| | 130,000 | | | BB+ | | AMERIGROUP Corp., Senior Unsecured Notes, 7.500% due 11/15/19 | | | 152,100 | |
| | | | | | CHS/Community Health Systems Inc.: | | | | |
| | | | | | Company Guaranteed Notes: | | | | |
| | 620,000 | | | B | | 8.000% due 11/15/19 | | | 672,700 | |
| | 130,000 | | | B | | 7.125% due 7/15/20 | | | 136,338 | |
| | 180,000 | | | BB | | Senior Secured Notes, 5.125% due 8/15/18 | | | 186,075 | |
| | 465,000 | | | CCC+ | | CRC Health Corp., Company Guaranteed Notes, 10.750% due 2/1/16 | | | 417,337 | |
| | 225,000 | | | B | | DaVita Inc., Company Guaranteed Notes, 5.750% due 8/15/22 | | | 235,125 | |
| | 60,000 | | | BB+ | | Fresenius Medical Care US Finance II Inc., Company Guaranteed Notes, 5.875% due 1/31/22(a) | | | 63,900 | |
| | 500,000 | | | BB+ | | Fresenius Medical Care US Finance Inc., Company Guaranteed Notes, 6.875% due 7/15/17 | | | 572,500 | |
| | 205,000 | | | B | | Hanger Orthopedic Group Inc., Company Guaranteed Notes, 7.125% due 11/15/18 | | | 214,737 | |
| | | | | | HCA Inc.: | | | | |
| | 39,000 | | | BB | | Secured Notes, 9.875% due 2/15/17 | | | 42,315 | |
| | | | | | Senior Secured Notes: | | | | |
| | 210,000 | | | BB | | 8.500% due 4/15/19 | | | 237,825 | |
| | 60,000 | | | BB | | 7.250% due 9/15/20 | | | 66,788 | |
| | 620,000 | | | BB | | 5.875% due 3/15/22 | | | 662,625 | |
| | | | | | Senior Unsecured Notes: | | | | |
| | 960,000 | | | B- | | 6.250% due 2/15/13 | | | 984,000 | |
| | 60,000 | | | B- | | 7.690% due 6/15/25 | | | 58,800 | |
| | 615,000 | | | B- | | OnCure Holdings Inc., Secured Notes, 11.750% due 5/15/17 | | | 375,150 | |
| | 50,000 | | | B | | Physiotherapy Associates Holdings Inc., Senior Unsecured Notes, 11.875% due 5/1/19(a) | | | 52,500 | |
| | 500,000 | | | CCC+ | | Radnet Management Inc., Company Guaranteed Notes, 10.375% due 4/1/18 | | | 506,250 | |
| | 134,000 | | | B- | | Select Medical Corp., Company Guaranteed Notes, 7.625% due 2/1/15 | | | 135,926 | |
| | 610,000 | | | B- | | Select Medical Holdings Corp., Senior Unsecured Notes, 6.494% due 9/15/15(b) | | | 610,000 | |
| | | | | | Tenet Healthcare Corp.: | | | | |
| | | | | | Senior Secured Notes: | | | | |
| | 100,000 | | | BB- | | 10.000% due 5/1/18 | | | 115,500 | |
| | 60,000 | | | BB- | | 6.250% due 11/1/18 | | | 65,438 | |
| | 1,722,000 | | | BB- | | 8.875% due 7/1/19 | | | 1,967,385 | |
| | 380,000 | | | CCC+ | | Senior Unsecured Notes, 6.875% due 11/15/31 | | | 333,450 | |
| | 1,220,000 | | | B- | | Vanguard Health Holding Co. II LLC/Vanguard Holding Co. II Inc., Company Guaranteed Notes, 8.000% due 2/1/18(a) | | | 1,287,100 | |
| | | | | | | | | | |
| | | | | | Total Health Care Providers & Services | | | 10,676,114 | |
| | | | | | | | | | |
| Hotels, Restaurants & Leisure — 7.3% | | | | |
| | 140,000 | | | B | | Affinity Gaming LLC/Affinity Gaming Finance Corp., Company Guaranteed Notes, 9.000% due 5/15/18(a) | | | 143,150 | |
| | | | | | AMC Entertainment Inc., Company Guaranteed Notes: | | | | |
| | 1,425,000 | | | B- | | 8.750% due 6/1/19 | | | 1,567,500 | |
| | 320,000 | | | CCC+ | | 9.750% due 12/1/20 | | | 355,200 | |
See Notes to Financial Statements.
111
Schedules of Investments
(continued)
High Yield Investments
| | | | | | | | | | |
Face
Amount | | | Rating†† | | Security | | Value | |
| Hotels, Restaurants & Leisure — 7.3%—(continued) | | | | |
| | | | | | Ameristar Casinos Inc., Company Guaranteed Notes: | | | | |
| $ | 1,360,000 | | | B+ | | 7.500% due 4/15/21 | | $ | 1,465,400 | |
| | 310,000 | | | B+ | | 7.500% due 4/15/21(a) | | | 334,025 | |
| | 145,175 | | | NR | | Bossier Casino Venture Holdco Inc., Senior Secured Notes, 14.000% due 2/9/18(a)(d)(f)(h) | | | 124,662 | |
| | | | | | Boyd Gaming Corp., Company Guaranteed Notes: | | | | |
| | 460,000 | | | B | | 9.125% due 12/1/18 | | | 478,975 | |
| | 394,000 | | | B | | 9.000% due 7/1/20(a) | | | 392,522 | |
| | | | | | Caesars Entertainment Operating Co., Inc.: | | | | |
| | 500,000 | | | CCC | | Company Guaranteed Notes, 10.750% due 2/1/16 | | | 380,000 | |
| | 100,000 | | | CCC | | Secured Notes, 10.000% due 12/15/15 | | | 86,250 | |
| | 305,000 | | | B | | Senior Secured Notes, 11.250% due 6/1/17 | | | 330,163 | |
| | 1,675,000 | | | B | | Caesars Operating Escrow LLC/Caesars Escrow Corp., Senior Secured Notes, 9.000% due 2/15/20(a) | | | 1,676,047 | |
| | 230,000 | | | B- | | Carrols Restaurant Group Inc., Secured Notes, 11.250% due 5/15/18(a) | | | 247,825 | |
| | 170,000 | | | CCC+ | | CCM Merger Inc., Company Guaranteed Notes, 9.125% due 5/1/19(a) | | | 171,700 | |
| | 200,000 | | | BB | | Choice Hotels International Inc., Company Guaranteed Notes, 5.750% due 7/1/22 | | | 215,500 | |
| | 65,000 | | | NR | | Fontainebleau Las Vegas Holdings LLC, 2nd Mortgage Notes, 10.250% due 6/15/15(a)(g) | | | 122 | |
| | 515,000 | | | B | | Gaylord Entertainment Co., Company Guaranteed Notes, 6.750% due 11/15/14 | | | 517,575 | |
| | 475,000 | | | BB- | | GWR Operating Partnership LLP, 1st Mortgage Notes, 10.875% due 4/1/17 | | | 537,937 | |
| | 450,000 | | | B | | HOA Restaurant Group LLC/HOA Finance Corp., Secured Notes, 11.250% due 4/1/17(a) | | | 416,812 | |
| | | | | | Isle of Capri Casinos Inc., Company Guaranteed Notes: | | | | |
| | 320,000 | | | B- | | 7.750% due 3/15/19 | | | 341,600 | |
| | 455,000 | | | CCC+ | | 8.875% due 6/15/20(a) | | | 468,650 | |
| | 730,000 | | | CCC+ | | Landry’s Inc., Senior Notes, 9.375% due 5/1/20(a) | | | 775,625 | |
| | | | | | Lions Gate Entertainment Inc., Secured Notes: | | | | |
| | 225,000 | | | B | | 10.250% due 11/1/16 | | | 252,000 | |
| | 1,100,000 | | | B | | 10.250% due 11/1/16(a) | | | 1,232,000 | |
| | | | | | Marina District Finance Co., Inc., Senior Secured Notes: | | | | |
| | 135,000 | | | B+ | | 9.500% due 10/15/15(e) | | | 134,325 | |
| | 95,000 | | | B+ | | 9.875% due 8/15/18 | | | 92,031 | |
| | 140,000 | | | B- | | Mastro’s Restaurants LLC/RRG Finance Corp., Senior Secured Notes, 12.000% due 6/1/17(a) | | | 146,300 | |
| | | | | | MGM Resorts International: | | | | |
| | 195,000 | | | B- | | Company Guaranteed Notes, 8.625% due 2/1/19(a) | | | 208,650 | |
| | | | | | Senior Secured Notes: | | | | |
| | 870,000 | | | B+ | | 13.000% due 11/15/13 | | | 987,450 | |
| | 25,000 | | | B+ | | 10.375% due 5/15/14 | | | 28,500 | |
| | 55,000 | | | B+ | | 11.125% due 11/15/17 | | | 61,462 | |
| | 750,000 | | | B+ | | 9.000% due 3/15/20(a) | | | 840,938 | |
| | | | | | Mohegan Tribal Gaming Authority, Secured Notes: | | | | |
| | 610,000 | | | CCC | | 10.500% due 12/15/16(a) | | | 545,950 | |
| | 130,000 | | | CCC | | 11.500% due 11/1/17(a) | | | 136,500 | |
| | | | | | NCL Corp., Ltd.: | | | | |
| | 550,000 | | | BB | | Senior Secured Notes, 11.750% due 11/15/16 | | | 636,625 | |
| | 450,000 | | | B+ | | Senior Unsecured Notes, 9.500% due 11/15/18 | | | 497,250 | |
| | 1,240,000 | | | B- | | Palace Entertainment Holdings LLC/Palace Entertainment Holdings Corp., Senior Secured Notes, 8.875% due 4/15/17(a) | | | 1,305,100 | |
| | | | | | Pinnacle Entertainment Inc., Company Guaranteed Notes: | | | | |
| | 50,000 | | | B | | 8.750% due 5/15/20 | | | 55,125 | |
| | 100,000 | | | B | | 7.750% due 4/1/22 | | | 108,000 | |
| | | | | | Royal Caribbean Cruises Ltd., Senior Unsecured Notes: | | | | |
| | 200,000 | | | BB | | 6.875% due 12/1/13 | | | 211,500 | |
| | 165,000 | | | BB | | 11.875% due 7/15/15 | | | 202,125 | |
| | 300,000 | | | CCC+ | | Seven Seas Cruises S de RL LLC, Secured Notes, 9.125% due 5/15/19 | | | 313,500 | |
| | 120,000 | | | B | | Snoqualmie Entertainment Authority, Senior Secured Notes, 4.476% due 2/1/14(a)(b) | | | 118,200 | |
| | 15,000 | | | NR | | Station Casinos Inc., Senior Subordinated Notes, 6.625% due 3/15/18(f)(g) | | | 0 | |
| | 345,000 | | | CCC+ | | Wok Acquisition Corp., Company Guaranteed Notes, 10.250% due 6/30/20(a) | | | 363,113 | |
| | | | | | | | | | |
| | | | | | Total Hotels, Restaurants & Leisure | | | 19,503,884 | |
| | | | | | | | | | |
See Notes to Financial Statements.
112
Schedules of Investments
(continued)
High Yield Investments
| | | | | | | | | | |
Face
Amount | | | Rating†† | | Security | | Value | |
| Household Durables — 0.2% | | | | |
| $ | 460,000 | | | BB- | | Taylor Morrison Communities Inc./Monarch Communities Inc., Company Guaranteed Notes, 7.750% due 4/15/20(a) | | $ | 488,750 | |
| | | | | | | | | | |
| Household Products — 1.7% | | | | |
| | | | | | Reynolds Group Issuer Inc./Reynolds Group Issuer LLC/Reynolds Group Issuer Lu: | | | | |
| | | | | | Company Guaranteed Notes: | | | | |
| | 1,890,000 | | | B- | | 9.000% due 4/15/19 | | | 1,930,163 | |
| | 1,030,000 | | | B- | | 9.875% due 8/15/19 | | | 1,094,375 | |
| | 100,000 | | | BB- | | Senior Secured Notes, 7.875% due 8/15/19 | | | 111,750 | |
| | 1,250,000 | | | B- | | Spectrum Brands Inc., Company Guaranteed Notes, 6.750% due 3/15/20(a) | | | 1,317,187 | |
| | | | | | | | | | |
| | | | | | Total Household Products | | | 4,453,475 | |
| | | | | | | | | | |
| Independent Power Producers & Energy Traders — 0.7% | | | | |
| | 394,568 | | | B | | AES Ironwood LLC, Senior Secured Notes, 8.857% due 11/30/25 | | | 456,713 | |
| | | | | | NRG Energy Inc., Company Guaranteed Notes: | | | | |
| | 130,000 | | | BB- | | 7.375% due 1/15/17 | | | 135,362 | |
| | 175,000 | | | BB- | | 7.625% due 1/15/18 | | | 188,125 | |
| | 500,000 | | | BB- | | 7.625% due 5/15/19 | | | 525,000 | |
| | 110,000 | | | BB- | | 8.250% due 9/1/20 | | | 119,075 | |
| | 155,000 | | | BB- | | 7.875% due 5/15/21 | | | 166,625 | |
| | 370,000 | | | BB- | | Red Oak Power LLC, Senior Secured Notes, 9.200% due 11/30/29 | | | 402,375 | |
| | | | | | | | | | |
| | | | | | Total Independent Power Producers & Energy Traders | | | 1,993,275 | |
| | | | | | | | | | |
| Industrial — 0.5% | | | | |
| | 1,330,000 | | | B | | SunGard Data Systems Inc., Company Guaranteed Notes, 7.625% due 11/15/20 | | | 1,433,075 | |
| | | | | | | | | | |
| Insurance — 0.7% | | | | |
| | | | | | HUB International Holdings Inc.: | | | | |
| | 945,000 | | | CCC+ | | Senior Subordinated Notes, 10.250% due 6/15/15(a) | | | 975,713 | |
| | 805,000 | | | CCC+ | | Senior Unsecured Notes, 9.000% due 12/15/14(a) | | | 826,131 | |
| | 80,000 | | | BBB | | ING Capital Funding Trust III, Company Guaranteed Notes, 4.061% due 12/29/49(b) | | | 69,150 | |
| | 100,000 | | | BB | | Liberty Mutual Group Inc., Company Guaranteed Notes, 7.800% due 3/15/37(a) | | | 106,375 | |
| | | | | | | | | | |
| | | | | | Total Insurance | | | 1,977,369 | |
| | | | | | | | | | |
| Internet & Catalog Retail — 0.2% | | | | |
| | 475,000 | | | BB- | | NetFlix Inc., Company Guaranteed Notes, 8.500% due 11/15/17 | | | 510,625 | |
| | | | | | | | | | |
| Internet Software & Services — 0.5% | | | | |
| | 400,000 | | | B- | | Cogent Communications Group Inc., Senior Secured Notes, 8.375% due 2/15/18(a) | | | 437,000 | |
| | 785,000 | | | B- | | EarthLink Inc., Company Guaranteed Notes, 8.875% due 5/15/19 | | | 794,812 | |
| | 150,000 | | | B | | Zayo Escrow Corp./Zayo Capital Inc., Senior Secured Notes, 8.125% due 1/1/20(a) | | | 160,125 | |
| | | | | | | | | | |
| | | | | | Total Internet Software & Services | | | 1,391,937 | |
| | | | | | | | | | |
| Leisure Equipment & Products — 0.1% | | | | |
| | 240,000 | | | B | | Downstream Development Authority of the Quapaw Tribe of Oklahoma, Senior Secured Notes, 10.500% due 7/1/19(a) | | | 253,200 | |
| | | | | | | | | | |
| Machinery — 0.5% | | | | |
| | 800,000 | | | B | | Dematic SA, Senior Secured Notes, 8.750% due 5/1/16(a) | | | 856,000 | |
| | 295,000 | | | B+ | | Manitowoc Co., Inc. (The), Company Guaranteed Notes, 8.500% due 11/1/20 | | | 328,188 | |
| | 175,000 | | | B+ | | Mcron Finance Sub LLC Finance Corp., Senior Secured Notes, 8.375% due 5/15/19(a) | | | 180,687 | |
| | | | | | | | | | |
| | | | | | Total Machinery | | | 1,364,875 | |
| | | | | | | | | | |
| Media — 6.1% | | | | |
| | 300,000 | | | B | | Carmike Cinemas Inc., Secured Notes, 7.375% due 5/15/19 | | | 322,125 | |
| | | | | | CCO Holdings LLC/CCO Holdings Capital Corp., Company Guaranteed Notes: | | | | |
| | 180,000 | | | BB- | | 8.125% due 4/30/20 | | | 203,400 | |
| | 460,000 | | | BB- | | 7.375% due 6/1/20 | | | 512,900 | |
| | 1,310,000 | | | BB- | | 6.625% due 1/31/22 | | | 1,424,625 | |
| | 230,000 | | | BB- | | 5.250% due 9/30/22 | | | 228,850 | |
| | 630,000 | | | B | | Cengage Learning Acquisitions Inc., Senior Secured Notes, 11.500% due 4/15/20(a) | | | 666,225 | |
See Notes to Financial Statements.
113
Schedules of Investments
(continued)
High Yield Investments
| | | | | | | | | | |
Face
Amount | | | Rating†† | | Security | | Value | |
| Media — 6.1%—(continued) | | | | |
| $ | 515,000 | | | CCC+ | | Clear Channel Communications Inc., Senior Secured Notes, 9.000% due 3/1/21 | | $ | 444,188 | |
| | | | | | Clear Channel Worldwide Holdings Inc., Company Guaranteed Notes: | | | | |
| | 200,000 | | | B | | 9.250% due 12/15/17 | | | 218,250 | |
| | 370,000 | | | B | | 7.625% due 3/15/20 | | | 360,450 | |
| | 515,000 | | | B | | Crown Media Holdings Inc., Company Guaranteed Notes, 10.500% due 7/15/19 | | | 570,362 | |
| | | | | | CSC Holdings LLC, Senior Unsecured Notes: | | | | |
| | 450,000 | | | BB | | 7.625% due 7/15/18 | | | 514,125 | |
| | 860,000 | | | BB | | 6.750% due 11/15/21(a) | | | 933,100 | |
| | 820,000 | | | CCC+ | | Cumulus Media Holdings Inc., Company Guaranteed Notes, 7.750% due 5/1/19(e) | | | 779,000 | |
| | | | | | DISH DBS Corp., Company Guaranteed Notes: | | | | |
| | 375,000 | | | BB- | | 7.125% due 2/1/16 | | | 414,375 | |
| | 1,450,000 | | | BB- | | 7.875% due 9/1/19 | | | 1,672,938 | |
| | 870,000 | | | BB- | | 5.875% due 7/15/22(a) | | | 880,875 | |
| | 345,000 | | | B- | | Entercom Radio LLC, Company Guaranteed Notes, 10.500% due 12/1/19 | | | 379,500 | |
| | 266,000 | | | B | | Entravision Communications Corp., Senior Secured Notes, 8.750% due 8/1/17 | | | 286,615 | |
| | 580,000 | | | CCC+ | | Gray Television Inc., Secured Notes, 10.500% due 6/29/15 | | | 629,300 | |
| | 230,000 | | | CCC | | LBI Media Inc., Senior Secured Notes, 9.250% due 4/15/19(a) | | | 210,450 | |
| | 450,000 | | | CCC+ | | LIN Television Corp., Company Guaranteed Notes, 8.375% due 4/15/18 | | | 472,500 | |
| | 330,000 | | | B+ | | Nara Cable Funding Ltd., Senior Secured Notes, 8.875% due 12/1/18(a) | | | 301,125 | |
| | 650,000 | | | B | | Nexstar Broadcasting Inc./Mission Broadcasting Inc., Secured Notes, 8.875% due 4/15/17 | | | 702,000 | |
| | 130,000 | | | BB- | | Nielsen Finance LLC/Nielsen Finance Co., Company Guaranteed Notes, 11.500% due 5/1/16 | | | 146,250 | |
| | 150,000 | | | B- | | Ono Finance II PLC, Company Guaranteed Notes, 10.875% due 7/15/19(a) | | | 120,750 | |
| | | | | | Sirius XM Radio Inc.: | | | | |
| | 290,000 | | | BB | | Company Guaranteed Notes, 8.750% due 4/1/15(a) | | | 332,050 | |
| | 1,550,000 | | | BB | | Senior Unsecured Notes, 5.250% due 8/15/22(a) | | | 1,557,750 | |
| | | | | | Univision Communications Inc., Senior Secured Notes: | | | | |
| | 310,000 | | | B+ | | 6.875% due 5/15/19(a) | | | 321,625 | |
| | 690,000 | | | B+ | | 7.875% due 11/1/20(a) | | | 743,475 | |
| | 135,000 | | | BB | | XM Satellite Radio Inc., Company Guaranteed Notes, 13.000% due 8/1/13(a) | | | 150,356 | |
| | | | | | | | | | |
| | | | | | Total Media | | | 16,499,534 | |
| | | | | | | | | | |
| Metals & Mining — 2.0% | | | | |
| | | | | | FMG Resources August 2006 Pty Ltd.: | | | | |
| | | | | | Company Guaranteed Notes: | | | | |
| | 540,000 | | | BB- | | 7.000% due 11/1/15(a) | | | 533,250 | |
| | 290,000 | | | BB- | | 6.375% due 2/1/16(a) | | | 279,850 | |
| | 60,000 | | | BB- | | 8.250% due 11/1/19(a) | | | 60,000 | |
| | | | | | Senior Unsecured Notes: | | | | |
| | 310,000 | | | BB- | | 6.000% due 4/1/17(a) | | | 293,725 | |
| | 500,000 | | | BB- | | 6.875% due 4/1/22(a) | | | 461,875 | |
| | 130,000 | | | B | | Global Brass & Copper Inc., Senior Secured Notes, 9.500% due 6/1/19(a) | | | 137,475 | |
| | 545,000 | | | B- | | Horsehead Holding Corp., Senior Secured Notes, 10.500% due 6/1/17(a) | | | 546,363 | |
| | 790,000 | | | CCC+ | | Midwest Vanadium Pty Ltd., Senior Secured Notes, 11.500% due 2/15/18(a) | | | 541,150 | |
| | 110,000 | | | CCC+ | | Mirabela Nickel Ltd., Senior Unsecured Notes, 8.750% due 4/15/18(a) | | | 81,675 | |
| | 220,000 | | | CCC | | Ryerson Holding Corp., Senior Secured Notes, 0.0% due 2/1/15 | | | 112,200 | |
| | 210,000 | | | CCC+ | | Ryerson Inc., Senior Secured Notes, 12.000% due 11/1/15 | | | 214,725 | |
| | 650,000 | | | BB+ | | Steel Dynamics Inc., Company Guaranteed Notes, 7.625% due 3/15/20 | | | 710,125 | |
| | 1,390,000 | | | CCC | | Thompson Creek Metals Co., Inc., Company Guaranteed Notes, 12.500% due 5/1/19 | | | 1,264,900 | |
| | | | | | | | | | |
| | | | | | Total Metals & Mining | | | 5,237,313 | |
| | | | | | | | | | |
| Multiline Retail — 0.1% | | | | |
| | 150,000 | | | BB- | | Neiman Marcus Group Inc., Senior Secured Notes, 7.125% due 6/1/28 | | | 144,750 | |
| | 40,000 | | | B- | | New Albertsons Inc., Unsecured Notes, 7.250% due 5/1/13 | | | 40,000 | |
| | | | | | | | | | |
| | | | | | Total Multiline Retail | | | 184,750 | |
| | | | | | | | | | |
| Office Electronics — 0.2% | | | | |
| | 410,000 | | | B | | CDW LLC/CDW Finance Corp., Senior Secured Notes, 8.000% due 12/15/18 | | | 457,150 | |
| | | | | | | | | | |
See Notes to Financial Statements.
114
Schedules of Investments
(continued)
High Yield Investments
| | | | | | | | | | |
Face
Amount | | | Rating†† | | Security | | Value | |
| Oil, Gas & Consumable Fuels — 12.9% | | | | |
| $ | 1,900,000 | | | BB- | | Alpha Appalachia Holdings Inc., Company Guaranteed Notes, 3.250% due 8/1/15(e) | | $ | 1,714,750 | |
| | | | | | Arch Coal Inc., Company Guaranteed Notes: | | | | |
| | 940,000 | | | B- | | 8.750% due 8/1/16(e) | | | 944,700 | |
| | 480,000 | | | B- | | 7.000% due 6/15/19(e) | | | 436,800 | |
| | 100,000 | | | BB | | Atwood Oceanics Inc., Senior Unsecured Notes, 6.500% due 2/1/20 | | | 107,250 | |
| | | | | | Basic Energy Services Inc., Company Guaranteed Notes: | | | | |
| | 270,000 | | | B+ | | 7.125% due 4/15/16 | | | 271,350 | |
| | 360,000 | | | B+ | | 7.750% due 2/15/19 | | | 358,200 | |
| | | | | | Berry Petroleum Co., Senior Unsecured Notes: | | | | |
| | 350,000 | | | B+ | | 6.750% due 11/1/20 | | | 376,250 | |
| | 90,000 | | | B+ | | 6.375% due 9/15/22 | | | 96,075 | |
| | 250,000 | | | BB- | | Bill Barrett Corp., Company Guaranteed Notes, 9.875% due 7/15/16 | | | 276,875 | |
| | 400,000 | | | NR | | Callon Petroleum Co., Secured Notes, 13.000% due 9/15/16 | | | 414,000 | |
| | | | | | Calumet Specialty Products Partners LP/Calumet Finance Corp., Company Guaranteed Notes: | | | | |
| | 190,000 | | | B | | 9.375% due 5/1/19 | | | 200,450 | |
| | 170,000 | | | B | | 9.625% due 8/1/20(a) | | | 181,475 | |
| | | | | | Chaparral Energy Inc., Company Guaranteed Notes: | | | | |
| | 160,000 | | | B- | | 9.875% due 10/1/20 | | | 182,400 | |
| | 1,220,000 | | | B- | | 7.625% due 11/15/22(a) | | | 1,296,250 | |
| | | | | | Chesapeake Energy Corp., Company Guaranteed Notes: | | | | |
| | 280,000 | | | BB- | | 9.500% due 2/15/15 | | | 308,700 | |
| | 150,000 | | | BB- | | 6.875% due 8/15/18 | | | 155,250 | |
| | 500,000 | | | BB- | | 6.775% due 3/15/19 | | | 504,375 | |
| | 595,000 | | | BB- | | 6.625% due 8/15/20(e) | | | 614,337 | |
| | | | | | Cie Générale de Géophysique — Veritas, Company Guaranteed Notes: | | | | |
| | 250,000 | | | BB- | | 9.500% due 5/15/16 | | | 273,750 | |
| | 400,000 | | | BB- | | 6.500% due 6/1/21 | | | 418,500 | |
| | 280,000 | | | BB | | Coffeyville Resources LLC/Coffeyville Finance Inc., Senior Secured Notes, 9.000% due 4/1/15(a) | | | 299,600 | |
| | | | | | Comstock Resources Inc., Company Guaranteed Notes: | | | | |
| | 415,000 | | | B- | | 7.750% due 4/1/19 | | | 410,850 | |
| | 140,000 | | | B- | | 9.500% due 6/15/20 | | | 148,050 | |
| | | | | | Concho Resources Inc., Company Guaranteed Notes: | | | | |
| | 625,000 | | | BB+ | | 7.000% due 1/15/21 | | | 700,000 | |
| | 40,000 | | | BB+ | | 5.500% due 10/1/22 | | | 41,350 | |
| | | | | | CONSOL Energy Inc., Company Guaranteed Notes: | | | | |
| | 640,000 | | | BB | | 8.250% due 4/1/20 | | | 692,800 | |
| | 200,000 | | | BB | | 6.375% due 3/1/21 | | | 199,000 | |
| | 550,000 | | | BB+ | | Continental Resources Inc., Company Guaranteed Notes, 5.000% due 9/15/22 | | | 577,500 | |
| | | | | | Crosstex Energy LP/Crosstex Energy Finance Corp., Company Guaranteed Notes: | | | | |
| | 190,000 | | | B+ | | 8.875% due 2/15/18 | | | 203,181 | |
| | 70,000 | | | B+ | | 7.125% due 6/1/22(a) | | | 69,825 | |
| | 730,000 | | | BB | | Denbury Resources Inc., Company Guaranteed Notes, 8.250% due 2/15/20 | | | 832,200 | |
| | | | | | El Paso Corp., Senior Unsecured Notes: | | | | |
| | 200,000 | | | BB | | 8.050% due 10/15/30 | | | 236,852 | |
| | 10,000 | | | BB | | 7.800% due 8/1/31 | | | 11,795 | |
| | 570,000 | | | B- | | Energy Partners Ltd., Company Guaranteed Notes, 8.250% due 2/15/18 | | | 580,688 | |
| | 250,000 | | | B | | Energy XXI Gulf Coast Inc., Company Guaranteed Notes, 9.250% due 12/15/17 | | | 280,000 | |
| | 220,000 | | | BB+ | | Enterprise Products Operating LLC, Company Guaranteed Notes, 8.375% due 8/1/66(b) | | | 246,607 | |
| | 380,000 | | | B- | | EV Energy Partners LP/EV Energy Finance Corp., Company Guaranteed Notes, 8.000% due 4/15/19 | | | 394,250 | |
| | 740,000 | | | CCC+ | | EXCO Resources Inc., Company Guaranteed Notes, 7.500% due 9/15/18 | | | 677,100 | |
| | 305,000 | | | CCC+ | | Goodrich Petroleum Corp., Company Guaranteed Notes, 8.875% due 3/15/19 | | | 297,375 | |
| | 280,000 | | | CCC+ | | Halcon Resources Corp., Company Guaranteed Notes, 9.750% due 7/15/20(a) | | | 286,300 | |
| | 93,000 | | | B | | Helix Energy Solutions Group Inc., Company Guaranteed Notes, 9.500% due 1/15/16(a) | | | 97,301 | |
| | | | | | Hercules Offshore Inc.: | | | | |
| | | | | | Company Guaranteed Notes: | | | | |
| | 1,050,000 | | | B- | | 10.500% due 10/15/17(a) | | | 1,092,000 | |
See Notes to Financial Statements.
115
Schedules of Investments
(continued)
High Yield Investments
| | | | | | | | | | |
Face
Amount | | | Rating†† | | Security | | Value | |
| Oil, Gas & Consumable Fuels — 12.9%—(continued) | | | | |
| $ | 1,095,000 | | | B- | | 10.250% due 4/1/19(a) | | $ | 1,125,113 | |
| | 330,000 | | | B+ | | Senior Secured Notes, 7.125% due 4/1/17(a) | | | 340,312 | |
| | | | | | Key Energy Services Inc., Company Guaranteed Notes: | | | | |
| | 150,000 | | | BB- | | 6.750% due 3/1/21 | | | 153,375 | |
| | 230,000 | | | BB- | | 6.750% due 3/1/21(a) | | | 234,025 | |
| | 690,000 | | | CCC+ | | Kodiak Oil & Gas Corp., Company Guaranteed Notes, 8.125% due 12/1/19(a) | | | 733,988 | |
| | | | | | Linn Energy LLC/Linn Energy Finance Corp., Company Guaranteed Notes: | | | | |
| | 424,000 | | | B | | 6.250% due 11/1/19(a) | | | 419,230 | |
| | 140,000 | | | B | | 8.625% due 4/15/20 | | | 151,900 | |
| | 145,000 | | | B | | 7.750% due 2/1/21 | | | 151,888 | |
| | 470,000 | | | CCC+ | | Magnum Hunter Resources Corp., Company Guaranteed Notes, 9.750% due 5/15/20(a) | | | 466,475 | |
| | | | | | MarkWest Energy Partners LP/MarkWest Energy Finance Corp., Company Guaranteed Notes: | | | | |
| | 500,000 | | | BB | | 6.500% due 8/15/21 | | | 538,750 | |
| | 300,000 | | | BB | | 6.250% due 6/15/22 | | | 320,250 | |
| | 520,000 | | | BB | | MEG Energy Corp., Company Guaranteed Notes, 6.375% due 1/30/23(a) | | | 542,750 | |
| | 210,000 | | | CCC+ | | Milagro Oil & Gas Inc., Secured Notes, 10.500% due 5/15/16 | | | 148,050 | |
| | 220,000 | | | BBB- | | Newfield Exploration Co., Senior Unsecured Notes, 5.625% due 7/1/24 | | | 238,975 | |
| | 145,000 | | | B | | Oasis Petroleum Inc., Company Guaranteed Notes, 7.250% due 2/1/19 | | | 153,700 | |
| | 100,000 | | | BB | | Oil States International Inc., Company Guaranteed Notes, 6.500% due 6/1/19 | | | 106,750 | |
| | | | | | Parker Drilling Co., Company Guaranteed Notes: | | | | |
| | 360,000 | | | B+ | | 9.125% due 4/1/18 | | | 387,900 | |
| | 60,000 | | | B+ | | 9.125% due 4/1/18(a) | | | 64,650 | |
| | | | | | Peabody Energy Corp., Company Guaranteed Notes: | | | | |
| | 400,000 | | | BB+ | | 6.500% due 9/15/20 | | | 416,000 | |
| | 100,000 | | | BB+ | | 7.875% due 11/1/26 | | | 107,250 | |
| | 230,000 | | | B | | Petroquest Energy Inc., Company Guaranteed Notes, 10.000% due 9/1/17 | | | 236,900 | |
| | 765,000 | | | B+ | | Pioneer Drilling Co., Company Guaranteed Notes, 9.875% due 3/15/18 | | | 831,937 | |
| | | | | | Plains Exploration & Production Co., Company Guaranteed Notes: | | | | |
| | 1,290,000 | | | BB- | | 6.125% due 6/15/19 | | | 1,367,400 | |
| | 680,000 | | | BB- | | 8.625% due 10/15/19 | | | 773,500 | |
| | 40,000 | | | BB- | | 6.750% due 2/1/22 | | | 43,400 | |
| | 90,000 | | | BB+ | | QEP Resources Inc., Senior Unsecured Notes, 5.375% due 10/1/22 | | | 92,475 | |
| | 840,000 | | | CCC+ | | Quicksilver Resources Inc., Company Guaranteed Notes, 11.750% due 1/1/16 | | | 827,400 | |
| | 130,000 | | | BB | | Range Resources Corp., Company Guaranteed Notes, 8.000% due 5/15/19 | | | 144,300 | |
| | 250,000 | | | BB | | Regency Energy Partners LP/Regency Energy Finance Corp., Company Guaranteed Notes, 6.875% due 12/1/18 | | | 271,250 | |
| | 275,000 | | | B- | | Resolute Energy Corp., Company Guaranteed Notes, 8.500% due 5/1/20(a) | | | 283,594 | |
| | | | | | Rockies Express Pipeline LLC, Senior Unsecured Notes: | | | | |
| | 1,160,000 | | | BB | | 6.850% due 7/15/18(a) | | | 1,194,800 | |
| | 440,000 | | | BB | | 5.625% due 4/15/20(a) | | | 422,400 | |
| | 250,000 | | | BB- | | Rosetta Resources Inc., Company Guaranteed Notes, 9.500% due 4/15/18 | | | 276,875 | |
| | 490,000 | | | B | | Samson Investment Co., Senior Unsecured Notes, 9.750% due 2/15/20(a) | | | 505,312 | |
| | | | | | SandRidge Energy Inc., Company Guaranteed Notes: | | | | |
| | 250,000 | | | B | | 9.875% due 5/15/16 | | | 275,625 | |
| | 180,000 | | | B | | 7.500% due 3/15/21 | | | 183,150 | |
| | 250,000 | | | BBB- | | SESI LLC, Company Guaranteed Notes, 7.125% due 12/15/21 | | | 279,375 | |
| | 430,000 | | | BB | | SM Energy Co., Senior Unsecured Notes, 6.500% due 1/1/23(a) | | | 448,812 | |
| | 230,000 | | | BB- | | Suburban Propane Partners LP/Suburban Energy Finance Corp., Senior Unsecured Notes, 7.375% due 3/15/20 | | | 244,950 | |
| | 250,000 | | | B+ | | Swift Energy Co., Company Guaranteed Notes, 7.875% due 3/1/22 | | | 261,250 | |
| | 365,000 | | | B | | W&T Offshore Inc., Company Guaranteed Notes, 8.500% due 6/15/19 | | | 395,113 | |
| | 475,000 | | | BB | | Western Refining Inc., Senior Secured Notes, 11.250% due 6/15/17(a) | | | 532,000 | |
| | 470,000 | | | CCC+ | | Westmoreland Coal Co./Westmoreland Partners, Senior Secured Notes, 10.750% due 2/1/18 | | | 438,275 | |
| | | | | | | | | | |
| | | | | | Total Oil, Gas & Consumable Fuels | | | 34,637,785 | |
| | | | | | | | | | |
| Paper & Forest Products — 1.4% | | | | |
| | | | | | Appleton Papers Inc.: | | | | |
| | 310,000 | | | CCC+ | | Secured Notes, 11.250% due 12/15/15 | | | 311,550 | |
See Notes to Financial Statements.
116
Schedules of Investments
(continued)
High Yield Investments
| | | | | | | | | | |
Face
Amount | | | Rating†† | | Security | | Value | |
| Paper & Forest Products — 1.4%—(continued) | | | | |
| $ | 800,000 | | | B+ | | Senior Secured Notes, 10.500% due 6/15/15(a) | | $ | 860,000 | |
| | 1,185,000 | | | BB | | Boise Paper Holdings LLC/Boise Co-Issuer Co., Company Guaranteed Notes, 8.000% due 4/1/20 | | | 1,315,350 | |
| | 160,000 | | | BB | | Boise Paper Holdings LLC/Boise Finance Co., Company Guaranteed Notes, 9.000% due 11/1/17 | | | 178,000 | |
| | 430,000 | | | CCC+ | | Exopack Holding Corp., Company Guaranteed Notes, 10.000% due 6/1/18 | | | 423,550 | |
| | | | | | Verso Paper Holdings LLC/Verso Paper Inc.: | | | | |
| | 36,000 | | | CCC+ | | Company Guaranteed Notes, 11.375% due 8/1/16 | | | 22,140 | |
| | 199,000 | | | BB- | | Senior Secured Notes, 11.750% due 1/15/19(a) | | | 191,805 | |
| | 410,000 | | | B | | Xerium Technologies Inc., Company Guaranteed Notes, 8.875% due 6/15/18 | | | 357,725 | |
| | | | | | | | | | |
| | | | | | Total Paper & Forest Products | | | 3,660,120 | |
| | | | | | | | | | |
| Personal Products — 0.2% | | | | |
| | 425,000 | | | B | | Revlon Consumer Products Corp., Secured Notes, 9.750% due 11/15/15 | | | 452,625 | |
| | | | | | | | | | |
| Pharmaceuticals — 1.4% | | | | |
| | 1,865,000 | | | BB- | | Valeant Pharmaceuticals International, Company Guaranteed Notes, 6.750% due 8/15/21(a) | | | 1,902,300 | |
| | 1,780,000 | | | BB- | | Warner Chilcott Co. LLC/Warner Chilcott Finance LLC, Company Guaranteed Notes, 7.750% due 9/15/18 | | | 1,926,850 | |
| | | | | | | | | | |
| | | | | | Total Pharmaceuticals | | | 3,829,150 | |
| | | | | | | | | | |
| Professional Services — 0.1% | | | | |
| | 270,000 | | | B3(c) | | Good Sam Enterprises LLC, Senior Secured Notes, 11.500% due 12/1/16 | | | 281,813 | |
| | 100,000 | | | CCC | | inVentiv Health Inc., Senior Notes, 10.000% due 8/15/18(a) | | | 84,750 | |
| | | | | | | | | | |
| | | | | | Total Professional Services | | | 366,563 | |
| | | | | | | | | | |
| Real Estate Investment Trusts (REITs) — 0.9% | | | | |
| | 310,200 | | | NR | | Ashton Woods USA LLC/Ashton Woods Finance Co., Company Guaranteed Notes, step bond to yield, 11.000% due 6/30/15(a)(f) | | | 292,364 | |
| | 945,000 | | | B+ | | CNL Lifestyle Properties Inc., Company Guaranteed Notes, 7.250% due 4/15/19 | | | 884,756 | |
| | 103,000 | | | B- | | Felcor Lodging LP, Senior Secured Notes, 10.000% due 10/1/14 | | | 118,707 | |
| | 315,000 | | | B+ | | iStar Financial Inc., Senior Unsecured Notes, 9.000% due 6/1/17 | | | 326,419 | |
| | 90,000 | | | BBB- | | Omega Healthcare Investors Inc., Company Guaranteed Notes, 5.875% due 3/15/24(a) | | | 96,300 | |
| | 680,000 | | | CC | | Realogy Corp., Company Guaranteed Notes, 11.000% due 4/15/18(a) | | | 659,600 | |
| | | | | | | | | | |
| | | | | | Total Real Estate Investment Trusts (REITs) | | | 2,378,146 | |
| | | | | | | | | | |
| Semiconductors & Semiconductor Equipment — 0.0% | | | | |
| | | | | | Advanced Micro Devices Inc., Senior Unsecured Notes: | | | | |
| | 65,000 | | | BB- | | 8.125% due 12/15/17 | | | 68,575 | |
| | 60,000 | | | BB- | | 7.500% due 8/15/22(a) | | | 59,400 | |
| | | | | | | | | | |
| | | | | | Total Semiconductors & Semiconductor Equipment | | | 127,975 | |
| | | | | | | | | | |
| Software — 0.5% | | | | |
| | | | | | First Data Corp.: | | | | |
| | | | | | Company Guaranteed Notes: | | | | |
| | 4,667 | | | B- | | 10.550% due 9/24/15 | | | 4,807 | |
| | 110,000 | | | CCC+ | | 11.250% due 3/31/16 | | | 106,150 | |
| | 330,000 | | | B- | | 12.625% due 1/15/21 | | | 335,775 | |
| | 940,000 | | | B- | | Secured Notes, 8.250% due 1/15/21(a) | | | 936,475 | |
| | 90,000 | | | Caa1(c) | | Legend Acquisition Sub Inc., Senior Notes, 10.750% due 8/15/20(a) | | | 89,325 | |
| | | | | | | | | | |
| | | | | | Total Software | | | 1,472,532 | |
| | | | | | | | | | |
| Speciality Retail — 0.3% | | | | |
| | 100,000 | | | B- | | Bon-Ton Department Stores Inc. (The), Company Guaranteed Notes, 10.625% due 7/15/17(a) | | | 81,500 | |
| | 380,000 | | | B | | Edcon Proprietary Ltd., Senior Secured Notes, 9.500% due 3/1/18(a) | | | 353,400 | |
| | 250,000 | | | CCC+ | | Party City Holdings Inc., Senior Notes, 8.875% due 8/1/20(a) | | | 265,625 | |
| | | | | | | | | | |
| | | | | | Total Speciality Retail | | | 700,525 | |
| | | | | | | | | | |
| Textiles, Apparel & Luxury Goods — 0.6% | | | | |
| | 485,000 | | | Caa1(c) | | Burlington Coat Factory Warehouse Corp., Company Guaranteed Notes, 10.000% due 2/15/19 | | | 525,013 | |
| | 130,000 | | | B- | | Empire Today LLC, Senior Secured Notes, 11.375% due 2/1/17(a) | | | 136,825 | |
| | 760,000 | | | CCC+ | | Gymboree Corp., Company Guaranteed Notes, 9.125% due 12/1/18 | | | 725,800 | |
See Notes to Financial Statements.
117
Schedules of Investments
(continued)
High Yield Investments
| | | | | | | | | | |
Face
Amount | | | Rating†† | | Security | | Value | |
| Textiles, Apparel & Luxury Goods — 0.6%—(continued) | | | | |
| $ | 160,000 | | | CCC+ | | Quiksilver Inc., Company Guaranteed Notes, 6.875% due 4/15/15(e) | | $ | 153,600 | |
| | | | | | | | | | |
| | | | | | Total Textiles, Apparel & Luxury Goods | | | 1,541,238 | |
| | | | | | | | | | |
| Tobacco — 0.3% | | | | |
| | 850,000 | | | B- | | Alliance One International Inc., Senior Unsecured Notes, 10.000% due 7/15/16 | | | 868,063 | |
| | | | | | | | | | |
| Transportation Infrastructure — 2.7% | | | | |
| | 860,000 | | | BB+ | | Aircastle Ltd., Senior Unsecured Notes, 9.750% due 8/1/18 | | | 991,150 | |
| | 360,000 | | | CCC- | | CMA CGM SA, Senior Unsecured Notes, 8.500% due 4/15/17(a) | | | 234,000 | |
| | 700,000 | | | BB- | | Commercial Barge Line Co., Secured Notes, 12.500% due 7/15/17 | | | 787,500 | |
| | 464,150 | | | CCC | | Florida East Coast Holdings Corp., Senior Unsecured Notes, 10.500% due 8/1/17(d) | | | 417,735 | |
| | 570,000 | | | B- | | Florida East Coast Railway Corp., Senior Secured Notes, 8.125% due 2/1/17 | | | 601,350 | |
| | 80,000 | | | BB- | | Gulfmark Offshore Inc., Senior Unsecured Notes, 6.375% due 3/15/22(a) | | | 81,800 | |
| | 280,000 | | | B | | Hapag-Lloyd AG, Company Guaranteed Notes, 9.750% due 10/15/17(a) | | | 274,400 | |
| | 840,000 | | | B3(c) | | Horizon Lines LLC, Senior Secured Notes, 11.000% due 10/15/16(a) | | | 835,800 | |
| | | | | | Kansas City Southern de Mexico SA de CV, Senior Unsecured Notes: | | | | |
| | 180,000 | | | BB+ | | 12.500% due 4/1/16 | | | 203,850 | |
| | 310,000 | | | BB+ | | 8.000% due 2/1/18 | | | 348,750 | |
| | 280,000 | | | B | | Navios Maritime Acquisition Corp./Navios Acquisition Finance US Inc., Senior Secured Notes, 8.625% due 11/1/17 | | | 263,900 | |
| | 385,000 | | | CCC+ | | Overseas Shipholding Group Inc., Senior Unsecured Notes, 8.125% due 3/30/18(e) | | | 240,625 | |
| | 415,000 | | | B- | | Quality Distribution LLC/QD Capital Corp., Secured Notes, 9.875% due 11/1/18 | | | 450,275 | |
| | 85,000 | | | B+ | | Swift Services Holdings Inc., Secured Notes, 10.000% due 11/15/18 | | | 93,713 | |
| | 630,000 | | | B | | syncreon Global Ireland Ltd./syncreon Global Finance US Inc., Company Guaranteed Notes, 9.500% due 5/1/18(a) | | | 648,900 | |
| | 370,000 | | | BB- | | Teekay Corp., Senior Unsecured Notes, 8.500% due 1/15/20 | | | 387,112 | |
| | 265,000 | | | B- | | WaveDivision Escrow LLC/WaveDivision Escrow Corp., Senior Unsecured Notes, 8.125% due 9/1/20(a) | | | 274,275 | |
| | | | | | | | | | |
| | | | | | Total Transportation Infrastructure | | | 7,135,135 | |
| | | | | | | | | | |
| Wireless Telecommunication Services — 2.7% | | | | |
| | 275,000 | | | B- | | Crown Castle International Corp., Senior Unsecured Notes, 7.125% due 11/1/19 | | | 300,438 | |
| | 495,000 | | | B- | | Integra Telecom Holdings Inc., Senior Secured Notes, 10.750% due 4/15/16(a) | | | 508,612 | |
| | 300,000 | | | B | | MetroPCS Wireless Inc., Company Guaranteed Notes, 7.875% due 9/1/18 | | | 324,000 | |
| | 770,000 | | | B+ | | Nextel Communications Inc., Company Guaranteed Notes, 5.950% due 3/15/14 | | | 775,775 | |
| | 270,000 | | | BB- | | PAETEC Holding Corp., Senior Secured Notes, 8.875% due 6/30/17 | | | 293,625 | |
| | 100,000 | | | B+ | | SBA Telecommunications Inc., Company Guaranteed Notes, 5.750% due 7/15/20(a) | | | 104,875 | |
| | | | | | Sprint Capital Corp., Company Guaranteed Notes: | | | | |
| | 1,290,000 | | | B+ | | 6.875% due 11/15/28 | | | 1,173,900 | |
| | 665,000 | | | B+ | | 8.750% due 3/15/32 | | | 674,975 | |
| | | | | | Sprint Nextel Corp.: | | | | |
| | 860,000 | | | BB- | | Company Guaranteed Notes, 9.000% due 11/15/18(a) | | | 1,016,950 | |
| | | | | | Senior Unsecured Notes: | | | | |
| | 620,000 | | | B+ | | 6.000% due 12/1/16 | | | 635,500 | |
| | 275,000 | | | B+ | | 9.125% due 3/1/17 | | | 309,375 | |
| | 275,000 | | | B+ | | 11.500% due 11/15/21 | | | 344,781 | |
| | 200,000 | | | B- | | Syniverse Holdings Inc., Company Guaranteed Notes, 9.125% due 1/15/19 | | | 217,000 | |
| | 542,000 | | | BB- | | Virgin Media Finance PLC, Company Guaranteed Notes, 9.500% due 8/15/16(a) | | | 608,395 | |
| | | | | | | | | | |
| | | | | | Total Wireless Telecommunication Services | | | 7,288,201 | |
| | | | | | | | | | |
| | | | | | TOTAL CORPORATE BONDS & NOTES (Cost — $206,295,821) | | | 212,323,831 | |
| | | | | | | | | | |
| COLLATERALIZED MORTGAGE OBLIGATIONS — 0.0% | | | | |
| | 3,392 | | | NR | | Blackrock Capital Finance LP, Series 1996-R1, Class B3, 9.643% due 9/25/26(h) | | | 187 | |
| | | | | | | | | | |
| | | | | | TOTAL COLLATERALIZED MORTGAGE OBLIGATIONS (Cost — $2,634) | | | 187 | |
| | | | | | | | | | |
| SENIOR LOANS — 0.6% | | | | |
| | 1,470,000 | | | NR | | Chesapeake Energy Corp. (Restricted), 8.500% due 12/1/17 | | | 1,476,357 | |
See Notes to Financial Statements.
118
Schedules of Investments
(continued)
High Yield Investments
| | | | | | | | | | |
Face
Amount | | | Rating†† | | Security | | Value | |
| SENIOR LOANS — 0.6%—(continued) | | | | |
| | | | | | Trico Marine Services Inc. (Restricted): | | | | |
| $ | 67,808 | | | NR | | 1.000% due 5/13/14(f) | | $ | 67,808 | |
| | 38,513 | | | NR | | 10.000% due 5/13/14(f) | | | 38,513 | |
| | | | | | | | | | |
| | | | | | TOTAL SENIOR LOANS (Cost — $1,567,920) | | | 1,582,678 | |
| | | | | | | | | | |
| Shares | | | | | | | | |
| COMMON STOCKS — 0.4% | | | | |
| COMMUNICATIONS — 0.0% | | | | |
| Media — 0.0% | | | | |
| | 9,157 | | | | | Cumulus Media Inc., Class A Shares* | | | 25,365 | |
| | | | | | | | | | |
| CONSUMER DISCRETIONARY — 0.2% | | | | |
| Hotels, Restaurants & Leisure — 0.0% | | | | |
| | 9,953 | | | | | Bossier Casino Venture Holdco Inc. (Restricted)(a)(f)(h)* | | | 19,906 | |
| | | | | | | | | | |
| Media — 0.2% | | | | |
| | 6,359 | | | | | Charter Communications Inc., Class A Shares* | | | 494,730 | |
| | | | | | | | | | |
| | | | | | TOTAL CONSUMER DISCRETIONARY | | | 514,636 | |
| | | | | | | | | | |
| ENERGY — 0.1% | | | | |
| Energy Equipment & Services — 0.1% | | | | |
| | 18,163 | | | | | DeepOcean Group Holdings AS (Restricted)(f)(h)* | | | 321,939 | |
| | | | | | | | | | |
| INDUSTRIALS — 0.1% | | | | |
| Transportation Infrastructure — 0.1% | | | | |
| | 135,004 | | | | | Horizon Lines Inc. (Restricted), Class A Shares* | | | 243,007 | |
| | | | | | | | | | |
| | | | | | TOTAL COMMON STOCKS (Cost — $960,837) | | | 1,104,947 | |
| | | | | | | | | | |
| PREFERRED STOCKS — 1.0% | | | | |
| FINANCIALS — 1.0% | | | | |
| Commercial Banks — 1.0% | | | | |
| | 35,700 | | | | | GMAC Capital Trust I, 8.125%(b) | | | 886,074 | |
| | 62,000 | | | | | Zions Bancorporation, Series C, 9.500% | | | 1,632,460 | |
| | 7,585 | | | | | Zions Capital Trust B, 8.000% | | | 198,272 | |
| | | | | | | | | | |
| | | | | | Total Commercial Banks | | | 2,716,806 | |
| | | | | | | | | | |
| Diversified Financial Services — 0.0% | | | | |
| | 4,700 | | | | | Federal National Mortgage Association (FNMA), Series S, 8.250%(b) | | | 4,519 | |
| | 814 | | | | | Jack Cooper Holdings Corp.(a)(b) | | | 80,586 | |
| | | | | | | | | | |
| | | | | | Total Diversified Financial Services | | | 85,105 | |
| | | | | | | | | | |
| | | | | | TOTAL FINANCIALS | | | 2,801,911 | |
| | | | | | | | | | |
| | | | | | TOTAL PREFERRED STOCKS (Cost — $2,798,515) | | | 2,801,911 | |
| | | | | | | | | | |
| CONVERTIBLE PREFERRED STOCKS — 0.8% | | | | |
| CONSUMER DISCRETIONARY — 0.0% | | | | |
| Media — 0.0% | | | | |
| | 220 | | | | | LodgeNet Interactive Corp., 10.000% (a)(f) | | | 43,450 | |
| | | | | | | | | | |
| FINANCIALS — 0.8% | | | | |
| Commercial Banks — 0.8% | | | | |
| | 650 | | | | | Bank of America Corp., Series L, 7.250% | | | 687,050 | |
| | 1,165 | | | | | Wells Fargo & Co., Series L, 7.500% | | | 1,393,340 | |
| | | | | | | | | | |
See Notes to Financial Statements.
119
Schedules of Investments
(continued)
High Yield Investments
| | | | | | | | | | |
| Shares | | | Rating†† | | Security | | Value | |
| Commercial Banks — 0.8%—(continued) | | | | |
| | | | | | Total Commercial Banks | | $ | 2,080,390 | |
| | | | | | | | | | |
| | | | | | TOTAL FINANCIALS | | | 2,080,390 | |
| | | | | | | | | | |
| | | | | | TOTAL CONVERTIBLE PREFERRED STOCKS | | | | |
| | | | | | (Cost — $2,088,276) | | | 2,123,840 | |
| | | | | | | | | | |
| WARRANTS — 0.0% | | | | |
| CONSUMER DISCRETIONARY — 0.0% | | | | |
| Media — 0.0% | | | | |
| | 554 | | | | | Charter Communications Inc., expires 11/30/14* | | | 15,803 | |
| | | | | | | | | | |
| ENERGY — 0.0% | | | | |
| Energy Equipment & Services — 0.0% | | | | |
| | 1,280 | | | | | SemGroup Corp., Class A Shares, expires 11/30/14(f)* | | | 15,322 | |
| | | | | | | | | | |
| FINANCIALS — 0.0% | | | | |
| Diversified Financial Services — 0.0% | | | | |
| | | | | | Jack Cooper Holdings Corp.: | | | | |
| | 376 | | | | | expires 12/15/17 (a)* | | | 28,200 | |
| | 183 | | | | | expires 5/6/18 (a)* | | | 13,725 | |
| | | | | | | | | | |
| | | | | | Total Diversified Financial Services | | | 41,925 | |
| | | | | | | | | | |
| | | | | | TOTAL FINANCIALS | | | 41,925 | |
| | | | | | | | | | |
| INDUSTRIALS — 0.0% | | | | |
| Building Products — 0.0% | | | | |
| | 875 | | | | | Nortek Inc., expires 12/7/14(f)* | | | 7,984 | |
| | | | | | | | | | |
| | | | | | TOTAL WARRANTS (Cost — $613,569) | | | 81,034 | |
| | | | | | | | | | |
| EXCHANGE TRADED SECURITIES — 3.6% | | | | |
| | 50,000 | | | | | iShares iBoxx $ High Yield Corporate Bond Fund | | | 4,616,500 | |
| | 125,000 | | | | | SPDR Barclays Capital High Yield Bond ETF | | | 5,017,500 | |
| | | | | | | | | | |
| | | | | | TOTAL EXCHANGE TRADED SECURITIES (Cost — $9,602,955) | | | 9,634,000 | |
| | | | | | | | | | |
| | | | | | TOTAL INVESTMENTS BEFORE SHORT-TERM INVESTMENTS (Cost — $223,930,527) | | | 229,652,428 | |
| | | | | | | | | | |
Face
Amount† | | | | | | | | |
| SHORT-TERM INVESTMENTS (i) — 41.3% | | | | |
| MONEY MARKET FUND- 1.0% | | | | |
| | 2,539,760 | | | | | Invesco STIT — Government & Agency Portfolio(j) (Cost — $2,539,760) | | | 2,539,760 | |
| | | | | | | | | | |
| TIME DEPOSITS — 40.3% | | | | |
| | 108,324,528 | | | | | Wells Fargo — Grand Cayman, 0.030% due 9//4/12 (Cost — $108,324,528) | | | 108,324,528 | |
| | | | | | | | | | |
| | | | | | TOTAL SHORT-TERM INVESTMENTS (Cost — $110,864,288) | | | 110,864,288 | |
| | | | | | | | | | |
| | | | | | TOTAL INVESTMENTS — 126.7% (Cost — $334,794,815 #) | | | 340,516,716 | |
| | | | | | | | | | |
| | | | | | Liabilities in Excess of Other Assets — (26.7%) | | | (71,773,204 | ) |
| | | | | | | | | | |
| | | | | | TOTAL NET ASSETS — 100.0% | | $ | 268,743,512 | |
| | | | | | | | | | |
| †† | All ratings are by Standard & Poor’s Rating Service, unless otherwise noted. All ratings are unaudited. |
| * | Non-income producing securities |
| (a) | Restricted security that may be sold to “qualified institutional buyers” pursuant to the conditions of Rule 144A under the Securities Act of 1933, as amended. This security has been deemed liquid pursuant to guidelines approved by the Board of Trustees, unless otherwise noted. |
See Notes to Financial Statements.
120
Schedules of Investments
(continued)
High Yield Investments
| (b) | Variable rate security. Interest rate disclosed is that which is in effect at August 31, 2012. |
| (c) | Rating by Moody’s Investors Service. All ratings are unaudited. |
| (d) | Payment in-kind security for which part of the income earned maybe paid as additional principal. |
| (e) | All or a portion of this security is on loan (See Note 1). |
| (g) | Security is currently in default. |
| (h) | Security is valued in good faith at fair value by or under the direction of the Board of Trustees. |
| (i) | Inclusive of all short term holdings, including collateral received from securities lending activities. Not including such collateral, the percentage of portfolio holdings would be 40.3%. |
| (j) | Represents investment of collateral received from securities lending transactions. |
| # | Aggregate cost for federal income tax purposes is $335,601,256. |
Abbreviations used in this schedule:
PLC — Public Limited Company
See pages 140 and 141 for definition of ratings.
Summary of Investments by Security Type*
| | | | |
Corporate Bonds & Notes | | | 62.4 | % |
Exchange Traded Securities | | | 2.8 | |
Preferred Stock | | | 0.8 | |
Convertible Preferred Stock | | | 0.6 | |
Senior Loans | | | 0.5 | |
Common Stock | | | 0.3 | |
Warrant | | | 0.0 | ** |
Collateralized Mortgage Obligations | | | 0.0 | ** |
Short-Term Investments | | | 32.6 | |
| | | | |
| | | 100.0 | % |
| | | | |
| * | As a percentage of total investments. |
| ** | Position represents less than 0.1% |
See Notes to Financial Statements.
121
Schedules of Investments
(continued)
International Fixed Income Investments
| | | | | | | | |
Face
Amount† | | | Security | | Value | |
| SOVEREIGN BONDS — 48.8% | | | | |
| Australia — 1.8% | | | | |
| | | | Australia Government Bond: | | | | |
| $ | 2,700,000 | AUD | | 5.500% due 12/15/13 | | $ | 2,883,059 | |
| | 4,300,000 | AUD | | 4.750% due 6/15/16 | | | 4,806,767 | |
| | | | | | | | |
| | | | Total Australia | | | 7,689,826 | |
| | | | | | | | |
| Belgium — 2.4% | | | | |
| | | | Belgium Government Bond: | | | | |
| | 4,500,000 | EUR | | 3.500% due 3/28/15 | | | 6,084,266 | |
| | 3,000,000 | EUR | | 3.250% due 9/28/16 | | | 4,110,196 | |
| | | | | | | | |
| | | | Total Belgium | | | 10,194,462 | |
| | | | | | | | |
| Brazil — 1.4% | | | | |
| | | | Brazil Notas do Tesouro Nacional Serie F: | | | | |
| | 12,036,000 | BRL | | 10.000% due 1/1/15 — 1/1/21 | | | 6,236,414 | |
| | | | | | | | |
| | | | Total Brazil | | | 6,236,414 | |
| | | | | | | | |
| Canada — 3.2% | | | | |
| | 2,800,000 | CAD | | Canada Housing Trust No 1, 2.400% due 12/15/22(a)(b) | | | 2,855,216 | |
| | 5,000,000 | CAD | | Canadian Government Bond, 1.500% due 8/1/15(a) | | | 5,110,058 | |
| | | | Province of Ontario Canada: | | | | |
| | 2,200,000 | CAD | | 3.150% due 6/2/22 | | | 2,306,420 | |
| | 1,500,000 | CAD | | 4.600% due 6/2/39 (a) | | | 1,835,694 | |
| | 1,500,000 | CAD | | Province of Quebec Canada, 5.000% due 12/1/38(a) | | | 1,879,388 | |
| | | | | | | | |
| | | | Total Canada | | | 13,986,776 | |
| | | | | | | | |
| Colombia — 0.1% | | | | |
| | 454,000,000 | COP | | Colombia Government International Bond, 9.850% due 6/28/27 | | | 378,556 | |
| | | | | | | | |
| Germany — 4.1% | | | | |
| | 5,300,000 | EUR | | Bundesobligation, 2.250% due 4/10/15 | | | 7,060,934 | |
| | | | Bundesrepublik Deutschland: | | | | |
| | 700,000 | EUR | | 3.750% due 1/4/15 | | | 958,629 | |
| | 2,300,000 | EUR | | 3.250% due 7/4/15 | | | 3,159,190 | |
| | 1,300,000 | EUR | | 4.000% due 7/4/16 | | | 1,874,727 | |
| | 1,000,000 | EUR | | 6.250% due 1/4/30 | | | 2,050,308 | |
| | 1,300,000 | EUR | | 4.750% due 7/4/34 | | | 2,410,390 | |
| | | | | | | | |
| | | | Total Germany | | | 17,514,178 | |
| | | | | | | | |
| Indonesia — 0.8% | | | | |
| | | | Indonesia Treasury Bond: | | | | |
| | 16,450,000,000 | IDR | | 7.000% due 5/15/22 — 5/15/27 | | | 1,805,025 | |
| | 2,500,000,000 | IDR | | 8.375% due 9/15/26 | | | 305,304 | |
| | 4,700,000,000 | IDR | | 9.500% due 7/15/31 | | | 625,899 | |
| | 4,330,000,000 | IDR | | 8.250% due 6/15/32 | | | 515,793 | |
| | 672,000,000 | IDR | | 6.375% due 4/15/42 | | | 65,896 | |
| | | | | | | | |
| | | | Total Indonesia | | | 3,317,917 | |
| | | | | | | | |
| | Italy — 5.7% | | | | | | | |
| | | | Italy Buoni Poliennali Del Tesoro: | | | | |
| | 2,500,000 | EUR | | 4.250% due 7/1/14 | | | 3,226,841 | |
| | 12,600,000 | EUR | | 3.000% due 4/15/15 | | | 15,711,785 | |
| | 4,500,000 | EUR | | Italy Certificati di Credito del Tesoro, 0.000% due 1/31/14 | | | 5,470,115 | |
| | | | | | | | |
| | | | Total Italy | | | 24,408,741 | |
| | | | | | | | |
| | Japan — 8.8% | | | | | | | |
| | | | Japan Government Ten Year Bond: | | | | |
| | 520,000,000 | JPY | | 1.500% due 12/20/17 | | | 7,073,859 | |
| | 1,470,000,000 | JPY | | 1.200% due 6/20/21 | | | 19,615,279 | |
See Notes to Financial Statements.
122
Schedules of Investments
(continued)
International Fixed Income Investments
| | | | | | | | |
Face
Amount† | | | Security | | Value | |
| Japan — 8.8%—(continued) | | | | |
| | | | Japan Government Thirty Year Bond: | | | | |
| $ | 767,000,000 | JPY | | 2.500% due 9/20/35 — 6/20/36 | | $ | 11,148,483 | |
| | | | | | | | |
| | | | Total Japan | | | 37,837,621 | |
| | | | | | | | |
| Malaysia —0.7% | | | | |
| | | | Malaysia Government Bond: | | | | |
| | 2,200,000 | MYR | | 4.012% due 9/15/17 | | | 728,236 | |
| | 1,300,000 | MYR | | 5.734% due 7/30/19 | | | 475,038 | |
| | 1,100,000 | MYR | | 4.378% due 11/29/19 | | | 373,386 | |
| | 2,590,000 | MYR | | 4.160% due 7/15/21 | | | 866,821 | |
| | 1,500,000 | MYR | | 3.418% due 8/15/22 | | | 477,627 | |
| | | | | | | | |
| | | | Total Malaysia | | | 2,921,108 | |
| | | | | | | | |
| Mexico — 1.3% | | | | |
| | | | Mexican Bonos: | | | | |
| | 9,900,000 | MXN | | 6.000% due 6/18/15 | | | 772,006 | |
| | 14,300,000 | MXN | | 5.000% due 6/15/17 | | | 1,079,860 | |
| | 18,900,000 | MXN | | 7.750% due 12/14/17 | | | 1,610,774 | |
| | 10,000,000 | MXN | | 6.500% due 6/10/21 | | | 820,129 | |
| | 11,600,000 | MXN | | 10.000% due 12/5/24 — 11/20/36 | | | 1,233,926 | |
| | | | | | | | |
| | | | Total Mexico | | | 5,516,695 | |
| | | | | | | | |
| Netherlands — 4.2% | | | | |
| | | | Netherlands Government Bond: | | | | |
| | 4,600,000 | EUR | | 0.750% due 4/15/15 (b) | | | 5,881,285 | |
| | 200,000 | EUR | | 3.250% due 7/15/15 (b) | | | 273,583 | |
| | 7,000,000 | EUR | | 4.000% due 7/15/19 (b) | | | 10,444,634 | |
| | 900,000 | EUR | | 3.500% due 7/15/20 (b) | | | 1,311,376 | |
| | | | | | | | |
| | | | Total Netherlands | | | 17,910,878 | |
| | | | | | | | |
| Nigeria — 0.0% | | | | |
| | | | Nigeria Government Bond: | | | | |
| | 13,600,000 | NGN | | 16.000% due 6/29/19 | | | 91,419 | |
| | 16,500,000 | NGN | | 16.390% due 1/27/22 | | | 111,410 | |
| | | | | | | | |
| | | | Total Nigeria | | | 202,829 | |
| | | | | | | | |
| Norway — 0.5% | | | | |
| | 12,300,000 | NOK | | Norway Government Bond, 5.000% due 5/15/15 | | | 2,324,522 | |
| | | | | | | | |
| Peru — 0.2% | | | | |
| | | | Peruvian Government International Bond: | | | | |
| | 1,190,000 | PEN | | 7.840% due 8/12/20 (b)(c) | | | 558,067 | |
| | 20,000 | PEN | | 5.200% due 9/12/23 (b)(c)(d) | | | 8,040 | |
| | 150,000 | PEN | | 8.200% due 8/12/26 (b)(c) | | | 76,838 | |
| | 710,000 | PEN | | 6.950% due 8/12/31 (b)(c) | | | 327,908 | |
| | | | | | | | |
| | | | Total Peru | | | 970,853 | |
| | | | | | | | |
| Poland — 0.9% | | | | |
| | | | Poland Government Bond: | | | | |
| | 7,600,000 | PLN | | 5.500% due 4/25/15 — 10/25/19 | | | 2,390,711 | |
| | 2,610,000 | PLN | | 5.250% due 10/25/17 | | | 818,630 | |
| | 1,900,000 | PLN | | 5.750% due 9/23/22 | | | 610,320 | |
| | | | | | | | |
| | | | Total Poland | | | 3,819,661 | |
| | | | | | | | |
| Qatar — 1.3% | | | | |
| | | | Qatar Government International Bond: | | | | |
| | 3,575,000 | | | 5.250% due 1/20/20 (a)(b) | | | 4,213,137 | |
| | 1,150,000 | | | 6.400% due 1/20/40 (a)(b) | | | 1,539,275 | |
| | | | | | | | |
| | | | Total Qatar | | | 5,752,412 | |
| | | | | | | | |
See Notes to Financial Statements.
123
Schedules of Investments
(continued)
International Fixed Income Investments
| | | | | | | | |
Face
Amount† | | | Security | | Value | |
| Russia — 0.1% | | | | |
| $ | 10,000,000 | RUB | | Russian Foreign Bond — Eurobond, 7.850% due 3/10/18 | | $ | 332,442 | |
| | | | | | | | |
| South Africa — 2.1% | | | | |
| | | | South Africa Government Bond: | | | | |
| | 10,000,000 | ZAR | | 13.500% due 9/15/15 | | | 1,456,691 | |
| | 32,700,000 | ZAR | | 8.250% due 9/15/17 | | | 4,283,348 | |
| | 27,900,000 | ZAR | | 7.250% due 1/15/20 | | | 3,459,504 | |
| | | | | | | | |
| | | | Total South Africa | | | 9,199,543 | |
| | | | | | | | |
| Spain — 1.1% | | | | |
| | 3,800,000 | EUR | | Spain Government Bond, 2.500% due 10/31/13 | | | 4,734,020 | |
| | | | | | | | |
| Thailand — 0.5% | | | | |
| | | | Thailand Government Bond: | | | | |
| | 40,600,000 | THB | | 3.250% due 6/16/17 | | | 1,297,784 | |
| | 15,000,000 | THB | | 3.650% due 12/17/21 | | | 489,850 | |
| | 11,000,000 | THB | | 3.580% due 12/17/27 | | | 351,527 | |
| | | | | | | | |
| | | | Total Thailand | | | 2,139,161 | |
| | | | | | | | |
| Turkey — 0.2% | | | | |
| | | | Turkey Government Bond: | | | | |
| | 1,755,689 | TRY | | 3.000% due 1/6/21 — 2/23/22 | | | 995,202 | |
| | | | | | | | |
| | | | Total Turkey | | | 995,202 | |
| | | | | | | | |
| United Kingdom — 7.4% | | | | |
| | | | United Kingdom Treasury GH: | | | | |
| | 5,200,000 | GBP | | 2.000% due 1/22/16 | | | 8,725,170 | |
| | 6,550,000 | GBP | | 3.750% due 9/7/19 — 9/7/21 | | | 12,399,739 | |
| | 100,000 | GBP | | 4.750% due 3/7/20 | | | 200,455 | |
| | 100,000 | GBP | | 8.000% due 6/7/21 | | | 246,851 | |
| | 1,400,000 | GBP | | 4.000% due 3/7/22 | | | 2,719,493 | |
| | 3,900,000 | GBP | | 4.250% due 6/7/32 — 12/7/40 | | | 7,800,167 | |
| | | | | | | | |
| | | | Total United Kingdom | | | 32,091,875 | |
| | | | | | | | |
| | | | TOTAL SOVEREIGN BONDS (Cost — $201,692,320) | | | 210,475,692 | |
| | | | | | | | |
| ASSET-BACKED SECURITIES — 0.2% | | | | |
| Student Loan — 0.2% | | | | |
| | 399,578 | | | Massachusetts Educational Financing Authority, Series 2008-1, Class A1, 1.401% due 4/25/38(a)(e) | | | 399,649 | |
| | 293,227 | | | South Carolina Student Loan Corp., Series 2008-1, Class A2, 0.968% due 3/1/18(a)(e) | | | 293,280 | |
| | | | | | | | |
| | | | Total Student Loan | | | 692,929 | |
| | | | | | | | |
| | | | TOTAL ASSET-BACKED SECURITIES (Cost — $692,805) | | | 692,929 | |
| | | | | | | | |
| COLLATERALIZED MORTGAGE OBLIGATIONS — 3.4% | | | | |
| | | | Banc of America Large Loan Inc.: | | | | |
| | 464,513 | | | Series 2010-HLTN, Class HLTN, 1.990% due 11/15/15(a)(b)(e) | | | 455,345 | |
| | 300,000 | | | Series 2010-UB5, Class A4A, 5.665% due 2/17/51(a)(b)(d)(e) | | | 337,967 | |
| | | | Bear Stearns Adjustable Rate Mortgage Trust: | | | | |
| | 20,463 | | | Series 2003-5, Class 1A2, 2.732% due 8/25/33(a)(e) | | | 20,624 | |
| | 26,324 | | | Series 2003-7, Class 6A, 2.723% due 10/25/33(a)(e) | | | 26,617 | |
| | 88,492 | | | Series 2004-2, Class 22A, 3.229% due 5/25/34(a)(e) | | | 87,511 | |
| | 20,757 | | | Series 2004-2, Class 23A, 3.189% due 5/25/34(a)(e) | | | 19,367 | |
| | 60,403 | | | Series 2005-2, Class A2, 3.078% due 3/25/35(a)(e) | | | 60,793 | |
| | 228,673 | | | Bear Stearns Structured Products Inc., Series 2007-R6, Class 1A1, 2.829% due 1/26/36(a)(e) | | | 128,489 | |
| | 674,464 | | | Commercial Mortgage Pass Through Certificates, Series 2006-CN2A, Class A2FL, 0.464% due 2/5/19(a)(b)(e) | | | 660,063 | |
| | | | Countrywide Alternative Loan Trust: | | | | |
| | 23,951 | | | Series 2005-21CB, Class A3, 5.250% due 6/25/35(a) | | | 20,348 | |
| | 141,445 | | | Series 2007-11T1, Class A12, 0.586% due 5/25/37(a)(e) | | | 74,378 | |
See Notes to Financial Statements.
124
Schedules of Investments
(continued)
International Fixed Income Investments
| | | | | | | | |
Face
Amount† | | | Security | | Value | |
| COLLATERALIZED MORTGAGE OBLIGATIONS — 3.4%—(continued) | | | | |
| $ | 62,643 | | | Series 2007-16CB, Class 5A1, 6.250% due 8/25/37(a) | | $ | 44,504 | |
| | 78,197 | | | Series 2007-7T2, Class A9, 6.000% due 4/25/37(a) | | | 51,711 | |
| | | | Countrywide Home Loan Mortgage Pass Through Trust: | | | | |
| | 11,515 | | | Series 2004-12, Class 11A1, 3.012% due 8/25/34(a)(e) | | | 9,076 | |
| | 56,404 | | | Series 2005-11, Class 3A1, 2.893% due 4/25/35(a)(e) | | | 39,278 | |
| | 257,253 | | | Series 2005-2, Class 1A1, 0.556% due 3/25/35(a)(e) | | | 151,536 | |
| | 30,690 | | | Series 2005-3, Class 2A1, 0.526% due 4/25/35(a)(e) | | | 21,344 | |
| | 205,530 | | | Series 2005-9, Class 1A3, 0.466% due 5/25/35(a)(e) | | | 149,564 | |
| | 119,106 | | | Series 2005-HYB9, Class 3A2A, 2.595% due 2/20/36(a)(e) | | | 94,976 | |
| | 43,578 | | | Credit Suisse First Boston Mortgage Securities Corp., Series 2003-AR20, Class 2A1, 2.702% due 8/25/33(a)(e) | | | 44,092 | |
| | 68,685 | | | Credit Suisse Mortgage Capital Certificates, Series 2007-5R, Class A5, 6.500% due 7/26/36(a) | | | 35,219 | |
| | 110,377 | | | Crusade Global Trust, Series 2004-2, Class A2, 0.479% due 11/19/37(e) | | | 137,867 | |
| | 290,232 | | | CSAB Mortgage Backed Trust, Series 2006-4, Class A6A, step bond to yield, 5.684% due 12/25/36(a) | | | 195,970 | |
| | | | Federal Home Loan Mortgage Corp. (FHLMC): | | | | |
| | 77,317 | | | Structured Pass Through Securities, Series T-35, Class A, 0.516% due 9/25/31(a)(e) | | | 71,392 | |
| | 111,039 | | | Structured Pass Through Securities, Series T-62, Class 1A1, 1.308% due 10/25/44(a)(e) | | | 111,779 | |
| | | | Federal Home Loan Mortgage Corp. (FHLMC), REMICS: | | | | |
| | 144,017 | | | Series 2391, Class FJ, 0.740% due 4/15/28(a)(e) | | | 145,362 | |
| | 367,628 | | | Series 2614, Class SJ, 19.004% due 5/15/33(a)(c)(e) | | | 512,377 | |
| | 104,659 | | | Series 3037, Class BC, 4.500% due 2/15/20(a) | | | 107,758 | |
| | 248,084 | | | Series 3174, Class FM, 0.480% due 5/15/36(a)(e) | | | 248,379 | |
| | 21,489 | | | Federal National Mortgage Association (FNMA), Grantor Trust, Series 2004-T3, Class 1A1, 6.000% due 2/25/44(a) | | | 24,267 | |
| | | | Federal National Mortgage Association (FNMA), REMICS: | | | | |
| | 14,808 | | | Series 2003-34, Class A1, 6.000% due 4/25/43(a) | | | 16,670 | |
| | 20,665 | | | Series 2005-120, Class NF, 0.336% due 1/25/21(a)(e) | | | 20,657 | |
| | 143,842 | | | Federal National Mortgage Association (FNMA), Whole Loan, Series 2004-W12, Class 1A1, 6.000% due 7/25/44(a) | | | 161,016 | |
| | 18,788 | | | First Horizon Asset Securities Inc., Series 2003-AR4, Class 2A1, 2.544% due 12/25/33(a)(e) | | | 18,309 | |
| | | | Government National Mortgage Association (GNMA): | | | | |
| | 807,071 | | | Series 2004-68, Class ZC, 6.000% due 8/20/34(a) | | | 983,327 | |
| | 189,036 | | | Series 2007-2, Class PA, 5.500% due 6/20/35(a) | | | 189,402 | |
| | 17,676 | | | GSR Mortgage Loan Trust, Series 2003-1, Class A2, 1.920% due 3/25/33(a)(e) | | | 17,842 | |
| | | | Harborview Mortgage Loan Trust: | | | | |
| | 42,967 | | | Series 2003-1, Class A, 2.956% due 5/19/33(a)(e) | | | 43,246 | |
| | 54,716 | | | Series 2005-2, Class 2A1A, 0.457% due 5/19/35(a)(e) | | | 37,763 | |
| | 182,082 | | | Series 2006-SB1, Class A1A, 0.998% due 12/19/36(a)(e) | | | 113,056 | |
| | 28,070 | | | JP Morgan Alternative Loan Trust, Series 2006-A5, Class 2A1, 5.550% due 10/25/36(a)(e) | | | 27,815 | |
| | 1,000,000 | | | JP Morgan Chase Commercial Mortgage Securities Corp., Series 2008-C2, Class A3, 6.288% due 2/12/51(a) | | | 1,046,555 | |
| | | | JP Morgan Mortgage Trust: | | | | |
| | 22,877 | | | Series 2003-A2, Class 3A1, 2.365% due 11/25/33(a)(e) | | | 23,026 | |
| | 14,121 | | | Series 2005-A1, Class 6T1, 5.012% due 2/25/35(a)(e) | | | 14,414 | |
| | 571,726 | | | Merrill Lynch Floating Trust, Series 2008-LAQA, Class A1, 0.779% due 7/9/21(a)(b)(e) | | | 561,926 | |
| | 19,924 | | | Merrill Lynch Mortgage Investors Inc., Series 2003-A2, Class 1A1, 2.539% due 2/25/33(a)(e) | | | 20,052 | |
| | 493,090 | | | Merrill Lynch Mortgage Trust, Series 2007-C1, Class ASB, 6.042% due 6/12/50(a)(e) | | | 536,637 | |
| | 121,359 | | | MLCC Mortgage Investors Inc., Series 2005-2, Class 1A, 1.986% due 10/25/35(a)(e) | | | 119,059 | |
| | 126,309 | | | Opteum Mortgage Acceptance Corp., Series 2005-3, Class A1B, 0.496% due 7/25/35(a)(e) | | | 124,511 | |
| | | | Puma Finance Ltd.: | | | | |
| | 183,132 | | | Series G5, Class A1, 0.505% due 2/21/38(a)(b)(e) | | | 176,309 | |
| | 65,064 | | | Series P10, Class BA, 4.140% due 7/12/36(c)(e) | | | 66,315 | |
| | 238,938 | | | Series P11, Class BA, 4.030% due 8/22/37(e) | | | 239,387 | |
| | 113,872 | | | RALI Trust, Series 2007-QO2, Class A1, 0.386% due 2/25/47(a)(e) | | | 56,520 | |
| | | | Residential Asset Securitization Trust: | | | | |
| | 45,618 | | | Series 2005-A15, Class 5A1, 5.750% due 2/25/36(a) | | | 35,294 | |
| | 94,472 | | | Series 2006-R1, Class A2, 0.636% due 1/25/46(a)(e) | | | 38,791 | |
| | | | Structured Adjustable Rate Mortgage Loan Trust: | | | | |
| | 26,710 | | | Series 2004-1, Class 4A1, 2.778% due 2/25/34(a)(e) | | | 27,107 | |
See Notes to Financial Statements.
125
Schedules of Investments
(continued)
International Fixed Income Investments
| | | | | | | | |
Face
Amount† | | | Security | | Value | |
| COLLATERALIZED MORTGAGE OBLIGATIONS — 3.4%—(continued) | | | | |
| $ | 92,762 | | | Series 2004-19, Class 2A1, 1.636% due 1/25/35(a)(e) | | $ | 61,209 | |
| | 126,771 | | | Series 2004-4, Class 3A2, 2.828% due 4/25/34(a)(e) | | | 120,615 | |
| | | | Structured Asset Mortgage Investments Inc.: | | | | |
| | 130,971 | | | Series 2005-AR2, Class 2A1, 0.466% due 5/25/45(a)(e) | | | 87,960 | |
| | 136,858 | | | Series 2005-AR8, Class A1A, 0.516% due 2/25/36(a)(e) | | | 84,196 | |
| | 90,760 | | | Series 2006-AR5, Class 1A1, 0.446% due 5/25/46(a)(e) | | | 46,367 | |
| | 200,000 | | | Series 2007-AR4, Class A3, 0.456% due 9/25/47(a)(e) | | | 92,294 | |
| | 221,247 | | | Series 2007-AR6, Class A1, 1.648% due 8/25/47(a)(e) | | | 140,982 | |
| | | | Swan Trust: | | | | |
| | 219,482 | | | Series 2006-1E, Class A1, 0.518% due 5/12/37(e) | | | 215,059 | |
| | 282,191 | | | Series 2006-1E, Class A2, 3.788% due 5/12/37(e) | | | 285,550 | |
| | 296,736 | | | Torrens Trust, Series 2007-1, Class A, 4.022% due 10/19/38(e) | | | 302,890 | |
| | | | Wachovia Bank Commercial Mortgage Trust: | | | | |
| | 900,000 | | | Series 2003-C9, Class A4, 5.012% due 12/15/35(a)(e) | | | 937,107 | |
| | 900,000 | | | Series 2006-C23, Class A5, 5.416% due 1/15/45(a)(e) | | | 1,018,331 | |
| | 500,000 | | | Series 2006-C28, Class A4, 5.572% due 10/15/48(a) | | | 571,414 | |
| | 299,373 | | | Series 2006-WL7A, Class A1, 0.330% due 9/15/21(a)(b)(e) | | | 296,540 | |
| | | | WaMu Mortgage Pass Through Certificates: | | | | |
| | 3,673 | | | Series 2001-7, Class A, 1.343% due 5/25/41(a)(e) | | | 3,657 | |
| | 33,581 | | | Series 2002-AR9, Class 1A, 1.548% due 8/25/42(a)(e) | | | 29,668 | |
| | 14,724 | | | Series 2003-AR5, Class A7, 2.453% due 6/25/33(a)(e) | | | 15,161 | |
| | 1,205,963 | | | Series 2003-AR9, Class 1A6, 2.449% due 9/25/33(a)(e) | | | 1,238,962 | |
| | 116,762 | | | Series 2005-AR13, Class A1A1, 0.526% due 10/25/45(a)(e) | | | 102,112 | |
| | 190,667 | | | Series 2006-AR13, Class 2A, 2.616% due 10/25/46(a)(e) | | | 160,374 | |
| | 121,984 | | | Series 2006-AR4, Class 2A1A, 2.616% due 5/25/46(a)(e) | | | 90,369 | |
| | 53,158 | | | Washington Mutual Alternative Mortgage Pass-Through Certificates, Series 2006-AR5, Class 3A, 1.088% due 7/25/46(a)(e) | | | 23,451 | |
| | | | | | | | |
| | | | TOTAL COLLATERALIZED MORTGAGE OBLIGATIONS (Cost — $14,522,539) | | | 14,727,227 | |
| | | | | | | | |
| CORPORATE BONDS & NOTES — 11.8% | | | | |
| Australia — 1.1% | | | | |
| | 2,100,000 | AUD | | Investec Bank Australia Ltd., Government Liquid Guaranteed Notes, 5.000% due 2/27/14 | | | 2,218,417 | |
| | 1,400,000 | GBP | | Suncorp-Metway Ltd., Government Liquid Guaranteed Notes, 4.000% due 1/16/14 | | | 2,323,942 | |
| | | | | | | | |
| | | | Total Australia | | | 4,542,359 | |
| | | | | | | | |
| Bermuda — 0.2% | | | | |
| | 900,000 | | | Qtel International Finance Ltd., Company Guaranteed Notes, 4.750% due 2/16/21 | | | 992,250 | |
| | | | | | | | |
| Cayman Islands — 0.5% | | | | |
| | 900,000 | | | IPIC GMTN Ltd., Company Guaranteed Notes, 5.500% due 3/1/22(b)(c) | | | 1,012,500 | |
| | 1,000,000 | | | QNB FINANCE Ltd., Bank Guaranteed Notes, 3.375% due 2/22/17 | | | 1,040,000 | |
| | | | | | | | |
| | | | Total Cayman Islands | | | 2,052,500 | |
| | | | | | | | |
| Columbia — 0.1% | | | | |
| | 648,000,000 | COP | | Empresas Publicas de Medellin ESP, Senior Unsecured Notes, 8.375% due 2/1/21 | | | 398,813 | |
| | | | | | | | |
| France — 0.6% | | | | |
| | | | BPCE SA: | | | | |
| | 300,000 | EUR | | Junior Subordinated Notes, 6.117% due 10/29/49(e) | | | 271,129 | |
| | 1,000,000 | | | Senior Unsecured Notes, 2.189% due 2/7/14(a)(b)(e) | | | 1,004,362 | |
| | 209,000 | EUR | | France Telecom SA, Senior Unsecured Notes, 7.250% due 1/28/13 | | | 270,140 | |
| | 900,000 | EUR | | Société Générale SA, Junior Subordinated Notes, 7.756% due 5/29/49(e) | | | 971,040 | |
| | | | | | | | |
| | | | Total France | | | 2,516,671 | |
| | | | | | | | |
| Japan — 0.0% | | | | |
| | 100,000 | EUR | | Tokyo Electric Power Co., Inc. (The), Senior Secured Notes, 4.500% due 3/24/14 | | | 125,666 | |
| | | | | | | | |
| Jersey Channel Islands — 0.1% | | | | |
| | 200,000 | GBP | | HBOS Capital Funding LP, Bank Guaranteed Notes, 9.540% due 3/29/49(e) | | | 270,257 | |
| | | | | | | | |
See Notes to Financial Statements.
126
Schedules of Investments
(continued)
International Fixed Income Investments
| | | | | | | | |
Face
Amount† | | | Security | | Value | |
| CORPORATE BONDS & NOTES — 11.8%—(continued) | | | | |
| Luxembourg — 0.1% | | | | |
| $ | 13,000,000 | RUB | | Russian Agricultural Bank OJSC Via RSHB Capital SA, Senior Unsecured Notes, 8.700% due 3/17/16 | | $ | 416,467 | |
| | | | | | | | |
| Netherlands — 0.5% | | | | |
| | 1,000,000 | | | Deutsche Telekom International Finance BV, Company Guaranteed Notes, 6.750% due 8/20/18(a) | | | 1,239,361 | |
| | 100,000 | EUR | | NIBC Bank NV, Government Liquid Guaranteed Notes, 3.500% due 4/7/14 | | | 132,212 | |
| | 335,742 | EUR | | NXP BV/NXP Funding LLC, Senior Secured Notes, 3.247% due 10/15/13(a)(e) | | | 421,257 | |
| | 500,000 | | | SABIC Capital I BV, Company Guaranteed Notes, 3.000% due 11/2/15 | | | 515,314 | |
| | | | | | | | |
| | | | Total Netherlands | | | 2,308,144 | |
| | | | | | | | |
| New Zealand — 0.0% | | | | |
| | 200,000 | | | ANZ National International Ltd., Bank Guaranteed Notes, 6.200% due 7/19/13(a)(b) | | | 208,580 | |
| | | | | | | | |
| Norway — 0.9% | | | | |
| | 1,200,000 | EUR | | DNB Boligkreditt AS, Covered Notes, 4.125% due 2/1/13 | | | 1,533,649 | |
| | | | Eksportfinans ASA, Senior Unsecured Notes: | | | | |
| | 300,000 | | | 1.875% due 4/2/13(a) | | | 297,042 | |
| | 900,000 | | | 2.375% due 5/25/16(a) | | | 824,219 | |
| | 100,000 | CHF | | 2.875% due 11/16/16 | | | 102,478 | |
| | 500,000 | | | 5.500% due 6/26/17(a) | | | 508,154 | |
| | | | Statoil ASA, Company Guaranteed Notes: | | | | |
| | 300,000 | | | 3.125% due 8/17/17(a) | | | 329,461 | |
| | 300,000 | | | 5.100% due 8/17/40(a) | | | 380,614 | |
| | | | | | | | |
| | | | Total Norway | | | 3,975,617 | |
| | | | | | | | |
| Qatar — 0.3% | | | | |
| | 100,000 | | | Qatari Diar Finance QSC, Government Guaranteed Notes, 5.000% due 7/21/20 | | | 114,750 | |
| | 850,000 | | | Ras Laffan Liquefied Natural Gas Co., Ltd. III, Senior Secured Notes, 6.750% due 9/30/19 | | | 1,058,250 | |
| | | | | | | | |
| | | | Total Qatar | | | 1,173,000 | |
| | | | | | | | |
| South Korea — 2.0% | | | | |
| | | | Export-Import Bank of Korea, Senior Unsecured Notes: | | | | |
| | 575,000 | EUR | | 5.750% due 5/22/13 | | | 745,974 | |
| | 1,900,000 | | | 1.401% due 7/26/13(b)(c)(d) | | | 1,899,625 | |
| | 2,200,000 | | | 5.000% due 4/11/22(a) | | | 2,549,316 | |
| | | | Korea Development Bank (The), Senior Unsecured Notes: | | | | |
| | 600,000 | | | 4.000% due 9/9/16(a) | | | 647,492 | |
| | 250,000 | | | 4.000% due 9/9/16 | | | 269,788 | |
| | 2,300,000 | | | 3.875% due 5/4/17(a) | | | 2,476,960 | |
| | | | | | | | |
| | | | Total South Korea | | | 8,589,155 | |
| | | | | | | | |
| Sweden �� 0.2% | | | | |
| | 800,000 | EUR | | Stadshypotek AB, Covered Notes, 3.750% due 12/12/13 | | | 1,050,678 | |
| | | | | | | | |
| United Kingdom — 0.9% | | | | |
| | 600,000 | | | HBOS PLC, Subordinated Notes, 6.750% due 5/21/18(a)(b) | | | 592,651 | |
| | 200,000 | | | LBG Capital No.1 PLC, Bank Guaranteed Notes, 8.500% due 12/29/49(b)(c)(e) | | | 180,500 | |
| | 1,000,000 | | | Pearson Dollar Finance PLC, Company Guaranteed Notes, 5.700% due 6/1/14(a)(b) | | | 1,071,630 | |
| | 500,000 | EUR | | Royal Bank of Scotland PLC (The), Subordinated Notes, 4.625% due 9/22/21(e) | | | 519,728 | |
| | | | Standard Chartered PLC, Senior Unsecured Notes: | | | | |
| | 600,000 | | | 5.500% due 11/18/14(a)(b) | | | 649,740 | |
| | 600,000 | | | 3.850% due 4/27/15(a)(b) | | | 627,694 | |
| | 100,000 | | | Tate & Lyle International Finance PLC, Company Guaranteed Notes, 5.000% due 11/15/14(b)(c) | | | 105,772 | |
| | | | | | | | |
| | | | Total United Kingdom | | | 3,747,715 | |
| | | | | | | | |
| United States — 4.3% | | | | |
| | 200,000 | | | Advanced Micro Devices Inc., Senior Unsecured Notes, 7.500% due 8/15/22(b)(c) | | | 198,000 | |
| | | | Ally Financial Inc.: | | | | |
| | 200,000 | | | Company Guaranteed Notes, 6.750% due 12/1/14(a) | | | 216,500 | |
| | 500,000 | | | Senior Unsecured Notes, 0.000% due 6/15/15(a) | | | 438,750 | |
See Notes to Financial Statements.
127
Schedules of Investments
(continued)
International Fixed Income Investments
| | | | | | | | |
Face
Amount† | | | Security | | Value | |
| CORPORATE BONDS & NOTES — 11.8%—(continued) | | | | |
| United States — 4.3%—(continued) | | | | |
| | | | American International Group Inc.: | | | | |
| $ | 800,000 | EUR | | Junior Subordinated Notes, 8.000% due 5/22/38(e) | | $ | 1,105,597 | |
| | | | Senior Unsecured Notes: | | | | |
| | 441,000 | GBP | | 6.765% due 11/15/17(b) | | | 794,893 | |
| | 712,000 | EUR | | 6.797% due 11/15/17(b)(c) | | | 1,043,504 | |
| | 800,000 | EUR | | BA Covered Bond Issuer, Covered Notes, 4.250% due 4/5/17 | | | 1,092,619 | |
| | 900,000 | EUR | | Bank of America Corp., Subordinated Notes, 0.898% due 5/23/17(e) | | | 968,199 | |
| | 1,000,000 | | | Boston Scientific Corp., Senior Unsecured Notes, 4.500% due 1/15/15(a) | | | 1,068,327 | |
| | 300,000 | | | CenterPoint Energy Resources Corp., Senior Unsecured Notes, 4.500% due 1/15/21(a) | | | 339,267 | |
| | 300,000 | | | CMS Energy Corp., Senior Unsecured Notes, 5.050% due 2/15/18(a) | | | 336,372 | |
| | | | Ford Motor Credit Co. LLC, Senior Unsecured Notes: | | | | |
| | 600,000 | | | 8.000% due 6/1/14(a) | | | 665,151 | |
| | 400,000 | | | 8.700% due 10/1/14(a) | | | 453,508 | |
| | | | Goldman Sachs Group Inc. (The), Senior Unsecured Notes: | | | | |
| | 900,000 | EUR | | 5.375% due 2/15/13 | | | 1,153,194 | |
| | 200,000 | | | 0.918% due 3/22/16(a)(e) | | | 188,349 | |
| | 500,000 | AUD | | 4.097% due 4/12/16(e) | | | 475,959 | |
| | 1,300,000 | | | HSBC Finance Corp., Senior Subordinated Notes, 6.676% due 1/15/21(a) | | | 1,477,024 | |
| | 300,000 | | | Lazard Group LLC, Senior Unsecured Notes, 7.125% due 5/15/15(a) | | | 329,401 | |
| | | | Lehman Brothers Holdings Inc., : | | | | |
| | 1,300,000 | | | 0.000% due 12/30/16(i) | | | 323,375 | |
| | 600,000 | | | 6.875% due 5/2/18(i) | | | 155,250 | |
| | 500,000 | | | Limited Brands Inc., Senior Unsecured Notes, 6.900% due 7/15/17(a) | | | 571,250 | |
| | 650,000 | | | Macy’s Retail Holdings Inc., Company Guaranteed Notes, 5.750% due 7/15/14(a) | | | 707,290 | |
| | 1,100,000 | | | NBCUniversal Media LLC, Senior Unsecured Notes, 5.150% due 4/30/20(a) | | | 1,300,363 | |
| | 1,100,000 | | | Reynolds American Inc., Company Guaranteed Notes, 6.750% due 6/15/17(a) | | | 1,333,927 | |
| | 100,000 | | | SLM Corp., Senior Unsecured Notes, 5.000% due 10/1/13(a) | | | 103,500 | |
| | 1,000,000 | | | Starwood Hotels & Resorts Worldwide Inc., Senior Unsecured Notes, 6.750% due 5/15/18(a) | | | 1,182,696 | |
| | 500,000 | | | UST LLC, Senior Unsecured Notes, 5.750% due 3/1/18(a) | | | 596,647 | |
| | | | | | | | |
| | | | Total United States | | | 18,618,912 | |
| | | | | | | | |
| | | | TOTAL CORPORATE BONDS & NOTES (Cost — $47,304,077) | | | 50,986,784 | |
| | | | | | | | |
| MORTGAGE-BACKED SECURITIES — 7.8% | | | | |
| FNMA — 7.7% | | | | |
| | | | Federal National Mortgage Association (FNMA): | | | | |
| | 700,000 | | | 5.480% due 7/1/18 (a)(e) | | | 758,126 | |
| | 977,863 | | | 5.700% due 8/1/18 (a)(e) | | | 1,056,231 | |
| | 5,099,018 | | | 3.000% due 1/1/22 — 10/15/42(a)(f) | | | 5,282,313 | |
| | 3,000,000 | | | 2.500% due 9/1/27 — 10/1/27(a)(f) | | | 3,115,313 | |
| | 193,187 | | | 2.485% due 11/1/34 (a)(e) | | | 207,113 | |
| | 348,498 | | | 6.500% due 8/1/37 (a) | | | 394,701 | |
| | 15,000,000 | | | 4.000% due 10/15/39 (a)(f) | | | 16,066,406 | |
| | 6,000,000 | | | 3.500% due 9/15/42 (a)(f) | | | 6,362,812 | |
| | 14,171 | | | 7.000% due 10/1/48 (a) | | | 15,983 | |
| | | | | | | | |
| | | | TOTAL FNMA | | | 33,258,998 | |
| | | | | | | | |
| GNMA — 0.1% | | | | |
| | 91,371 | | | Government National Mortgage Association II (GNMA), 6.000% due 9/20/38 (a) | | | 99,299 | |
| | | | | | | | |
| | | | TOTAL GNMA | | | 99,299 | |
| | | | | | | | |
| | | | TOTAL MORTGAGE-BACKED SECURITIES (Cost — $32,983,090) | | | 33,358,297 | |
| | | | | | | | |
| MUNICIPAL BONDS — 1.2% | | | | |
| United States — 1.2% | | | | |
| | 200,000 | | | Buckeye Tobacco Settlement Financing Authority, Tobacco Settlement Revenue Bonds, Series A-2, 5.875% due 6/1/47(a) | | | 162,060 | |
See Notes to Financial Statements.
128
Schedules of Investments
(continued)
International Fixed Income Investments
| | | | | | | | |
Face
Amount† | | | Security | | Value | |
| MUNICIPAL BONDS — 1.2%—(continued) | | | | |
| United States — 1.2%—(continued) | | | | |
| | | | Central Puget Sound Regional Transit Authority, Sales Tax and Motor Vehicle Excise Tax Refunding Bonds, Series P-1: | | | | |
| $ | 300,000 | | | 5.000%, due 2/1/27(a) | | $ | 364,737 | |
| | 100,000 | | | 5.000%, due 2/1/28(a) | | | 121,017 | |
| | 1,500,000 | | | Missouri Joint Municipal Electric Utility Commission, Power Project Revenue Bonds, 6.890% due 1/1/42(a) | | | 1,940,535 | |
| | 200,000 | | | New York City Transitional Finance Authority, Future Tax Secured Revenue, Build America Bonds, 5.508% due 8/1/37(a) | | | 254,588 | |
| | 300,000 | | | Philadelphia School District, Build America General Obligation Bonds, 6.765% due 6/1/40(a) | | | 376,248 | |
| | 750,000 | | | Port Authority of New York & New Jersey, Consolidated Bonds, One hundred Sixth-Eight Series, 4.926% due 10/1/51(a) | | | 878,730 | |
| | 100,000 | | | Puerto Rico Sales Tax Financing Corp., Revenue Bonds, Series A, AMBAC-Insured, 0.000% due 8/1/54(a) | | | 8,782 | |
| | 600,000 | | | State of Washington, GO, Motor Vehicle Fuel Tax, General Obligation Bond, Series B, 5.000% due 7/1/25(a) | | | 742,242 | |
| | 100,000 | | | Tobacco Settlement Financing Corp., New Jersey, Tobacco Settlement Revenue Bonds, Series 1A, 5.000% due 6/1/41(a) | | | 82,827 | |
| | | | | | | | |
| | | | Total United States | | | 4,931,766 | |
| | | | | | | | |
| | | | TOTAL MUNICIPAL BONDS (Cost — $4,253,965) | | | 4,931,766 | |
| | | | | | | | |
| U.S. GOVERNMENT & AGENCY OBLIGATIONS — 8.5% | | | | |
| | | | U.S. Treasury Bonds: | | | | |
| | 700,000 | | | 5.500% due 8/15/28(a) | | | 1,018,172 | |
| | 2,000,000 | | | 4.375% due 5/15/41(a) | | | 2,720,626 | |
| | 2,400,000 | | | 3.750% due 8/15/41(a) | | | 2,949,000 | |
| | 1,650,000 | | | 3.000% due 5/15/42(a) | | | 1,762,406 | |
| | | | U.S. Treasury Notes: | | | | |
| | 1,100,000 | | | 0.625% due 8/31/17(a) | | | 1,101,719 | |
| | | | U.S. Treasury Inflation Indexed Bonds: | | | | |
| | 3,461,778 | | | 0.625% due 7/15/21(a) | | | 3,921,004 | |
| | 15,208,350 | | | 0.125% due 1/15/22(a)(g) | | | 16,451,848 | |
| | 6,264,046 | | | U.S. Treasury Notes, Inflation Indexed, 0.125% due 4/15/17(a) | | | 6,723,082 | |
| | | | | | | | |
| | | | TOTAL U.S. GOVERNMENT & AGENCY OBLIGATIONS (Cost — $34,759,641) | | | 36,647,857 | |
| | | | | | | | |
| PURCHASED OPTIONS — 0.0% | | | | |
| United States — 0.0% | | | | |
| | 3,600,000 | | | Swaption, 3-Month USD-LIBOR, Put @ $3.88, expires 4/14/14 | | | 79,653 | |
| | | | | | | | |
| | | | TOTAL PURCHASED OPTIONS (Cost — $181,440) | | | 79,653 | |
| | | | | | | | |
| | | | TOTAL INVESTMENTS BEFORE SHORT-TERM INVESTMENTS (Cost — $336,389,877) | | | 351,900,205 | |
| | | | | | | | |
| SHORT-TERM INVESTMENTS — 30.9% | | | | |
| REPURCHASE AGREEMENTS — 6.6% | | | | |
| | 7,400,000 | | | Barclays Capital Inc. repurchase agreement dated 8/31/12, 0.220% due 9/4/12, Proceeds at maturity — $7,400,226; (Fully collateralized by GNMA Mortgage Securities 4.500% due 3/20/41 Market Valued — $7,626,180)(h) | | | 7,400,000 | |
| | 6,600,000 | | | Deutsche Bank Securities Inc. repurchase agreement dated 8/31/12, 0.200% due 9/4/12, Proceeds at maturity — $6,600,183; (Fully collateralized by U.S. Treasury Notes 1.750% due 5/15/22; Market Valued — $6,776,949)(h) | | | 6,600,000 | |
| | 5,800,000 | | | Goldman Sachs & Co. repurchase agreement dated 8/31/12, 0.200% due 9/4/12, Proceeds at maturity — $5,800,161; (Fully collateralized by FNMA Mortgage Securities 5.000% due 4/1/38 Market Valued — $5,992,365)(h) | | | 5,800,000 | |
| | 100,000 | | | Merrill Lynch & Co., Inc. repurchase agreement dated 8/31/12, 0.200% due 9/4/12, Proceeds at maturity — $100,003; (Fully collateralized by U.S. Treasury Notes 0.6250% due 8/31/17; Market Valued — $103,180)(h) | | | 100,000 | |
See Notes to Financial Statements.
129
Schedules of Investments
(continued)
International Fixed Income Investments
| | | | | | | | |
Face
Amount† | | | Security | | Value | |
| REPURCHASE AGREEMENTS — 6.6%—(continued) | | | | |
| $ | 8,600,000 | | | Merrill Lynch & Co., Inc. repurchase agreement dated 8/29/12, 0.160% due 9/5/12, Proceeds at maturity — $8,600,191; (Fully collateralized by U.S. Treasury Notes 0.250% due 7/15/15; Market Valued — $8,793,144)(h) | | $ | 8,600,000 | |
| | | | | | | | |
| | | | TOTAL REPURCHASE AGREEMENTS (Cost — $28,500,000) | | | 28,500,000 | |
| | | | | | | | |
| SOVEREIGN BOND — 11.6% | | | | |
| | 2,500,000 | | | Australia Government Bond, 4.750% due 11/15/12 (Cost — $2,558,557) | | | 2,590,220 | |
| | 7,400,000 | | | Canadian Government Bond, 1.500% due 12/1/12 (Cost — $7,099,073)(a) | | | 7,510,666 | |
| | 7,500,000 | | | Netherlands Government Bond, 4.250% due 7/15/13 (Cost — $9,764,225)(b) | | | 9,778,013 | |
| | 1,180,000,000 | JPY | | Japan Treasury Discount Bill, 0.099% due 9/18/12 (Cost — $14,881,402) | | | 15,066,661 | |
| | 1,190,000,000 | JPY | | Japan Treasury Discount Bill, 0.098% due 10/9/12 (Cost — $15,099,989) | | | 15,193,499 | |
| | | | | | | | |
| | | | TOTAL SOVEREIGN BOND (Cost — $49,403,246) | | | 50,139,059 | |
| | | | | | | | |
| TIME DEPOSITS — 2.5% | | | | |
| | | | BBH — Grand Cayman: | | | | |
| | 63 | DKK | | -0.490% due 9/3/12 | | | 11 | |
| | 158,479 | EUR | | -0.036% due 9/3/12 | | | 199,342 | |
| | 18 | CHF | | 0.005% due 9/3/12 | | | 19 | |
| | 16,453,605 | JPY | | 0.010% due 9/3/12 | | | 210,095 | |
| | 617 | NOK | | 0.500% due 9/3/12 | | | 106 | |
| | 123 | NZD | | 1.650% due 9/3/12 | | | 99 | |
| | 744 | AUD | | 2.648% due 9/3/12 | | | 769 | |
| | 522 | ZAR | | 4.150% due 9/3/12 | | | 62 | |
| | 818 | CAD | | 0.195% due 9/4/12 | | | 829 | |
| | | | JPMorgan Chase & Co. — London: | | | | |
| | 50,049 | GBP | | 0.052% due 9/3/12 | | | 79,388 | |
| | 107,513 | AUD | | 2.648% due 9/3/12 | | | 111,099 | |
| | 10,101,018 | | | Wells Fargo — Grand Cayman, 0.030% due 9/4/12 | | | 10,101,018 | |
| | | | | | | | |
| | | | TOTAL TIME DEPOSITS (Cost — $10,702,837) | | | 10,702,837 | |
| | | | | | | | |
| U.S. GOVERNMENT AGENCIES — 6.7% | | | | |
| | | | Federal Home Loan Bank (FHLB), Discount Notes: | | | | |
| | 8,600,000 | | | 0.160% due 2/20/13(h) | | | 8,593,426 | |
| | | | Federal Home Loan Mortgage Corp. (FHLMC), Discount Notes: | | | | |
| | 800,000 | | | 0.170% due 2/11/13(a)(h) | | | 799,384 | |
| | 1,300,000 | | | 0.175% due 2/19/13(a)(h) | | | 1,298,919 | |
| | 800,000 | | | 0.175% due 2/25/13(a)(h) | | | 799,312 | |
| | 800,000 | | | 0.150% due 2/26/13(a)(h) | | | 799,407 | |
| | 800,000 | | | 0.140% due 3/5/13(a)(h) | | | 799,424 | |
| | | | Federal National Mortgage Association (FNMA), Discount Notes: | | | | |
| | 2,300,000 | | | 0.175% due 2/20/13(h) | | | 2,298,077 | |
| | 8,400,000 | | | 0.175% due 2/27/13(a)(h) | | | 8,392,691 | |
| | 5,300,000 | | | 0.180% due 8/1/13(a)(h) | | | 5,291,149 | |
| | | | | | | | |
| | | | TOTAL U.S. GOVERNMENT AGENCIES (Cost — $29,071,789) | | | 29,071,789 | |
| | | | | | | | |
| U.S. GOVERNMENT OBLIGATIONS — 3.5% | | | | |
| | | | U.S. Treasury Bills: | | | | |
| | 857,000 | | | 0.130% due 2/7/13 (g)(h) | | | 856,508 | |
| | 2,601,000 | | | 0.137% due 2/14/13 (g)(h) | | | 2,599,359 | |
| | 705,000 | | | 0.164% due 4/4/13 (g)(h) | | | 704,311 | |
| | 50,000 | | | 0.153% due 5/2/13 (g)(h) | | | 49,948 | |
| | 690,000 | | | 0.169% due 5/30/13 (g)(h) | | | 689,122 | |
| | 80,000 | | | 0.171% due 7/25/13 (g)(h) | | | 79,876 | |
See Notes to Financial Statements.
130
Schedules of Investments
(continued)
International Fixed Income Investments
| | | | | | | | |
Face
Amount† | | | Security | | Value | |
| U.S. GOVERNMENT OBLIGATIONS — 3.5%—(continued) | | | | |
| $ | 9,990,000 | | | 0.173% due 8/22/13 (g)(h) | | $ | 9,972,992 | |
| | | | | | | | |
| | | | TOTAL U.S. GOVERNMENT OBLIGATIONS (Cost — $14,952,116) | | | 14,952,116 | |
| | | | | | | | |
| | | | TOTAL SHORT-TERM INVESTMENTS (Cost — $132,629,988) | | | 133,365,801 | |
| | | | | | | | |
| | | | TOTAL INVESTMENTS — 112.6% (Cost — $469,019,865 #) | | | 485,266,006 | |
| | | | | | | | |
| | | | Liabilities in Excess of Other Assets — (12.6%) | | | (54,116,248 | ) |
| | | | | | | | |
| | | | TOTAL NET ASSETS — 100.0% | | $ | 431,149,758 | |
| | | | | | | | |
| † | Face amount denominated in U.S. dollars, unless otherwise noted. |
| (a) | All or a portion of this security is segregated as collateral for open futures contracts, options contracts written, swap contracts, foreign currency contracts, TBA’s and repurchase agreements. |
| (b) | Restricted security that may be sold to “qualified institutional buyers” pursuant to the conditions of Rule 144A under the Securities Act of 1933, as amended. This security has been deemed liquid pursuant to guidelines approved by the Board of Trustees, unless otherwise noted. |
| (d) | Security is valued in good faith at fair value by or under the direction of the Board of Trustees. |
| (e) | Variable rate security. Interest rate disclosed is that which is in effect at August 31, 2012. |
| (f) | This security is traded on a TBA basis (see Note 1). |
| (g) | All or a portion of this security is held at the broker as collateral for open futures contracts or swaps contracts. |
| (h) | Rate shown represents yield-to-maturity. |
| (i) | Security is currently in default. |
| # | Aggregate cost for federal income tax purposes is $472,588,553. |
Abbreviations used in this schedule:
| | | | | | |
AMBAC | | | — | | | American Bond Assurance Corporation |
AUD | | | — | | | Australian Dollar |
BRL | | | — | | | Brazilian Real |
CAD | | | — | | | Canadian Dollar |
CHF | | | — | | | Swiss Franc |
COP | | | — | | | Columbia Peso |
DKK | | | — | | | Danish Krone |
EUR | | | — | | | Euro Dollar |
GBP | | | — | | | British Pound |
GMTN | | | — | | | Global Medium Term Note |
IDR | | | — | | | Indonesia Rupiah |
JPY | | | — | | | Japanese Yen |
MXN | | | — | | | Mexico Peso |
MYR | | | — | | | Malaysian Ringgitt |
NGN | | | — | | | Nigerian Naira |
NOK | | | — | | | Norwegian Krone |
NZD | | | — | | | New Zealand Dollar |
PEN | | | — | | | Peru Nuevo |
PLC | | | — | | | Public Limited Company |
PLN | | | — | | | Poland Zloty |
RUB | | | — | | | Russia Ruble |
THB | | | — | | | Thailand Baht |
TRY | | | — | | | Turkey Lira |
ZAR | | | — | | | South African Rand |
See Notes to Financial Statements.
131
Schedules of Investments
(continued)
International Fixed Income Investments
Summary of Investments by Security Type*
| | | | |
Sovereign Bonds | | | 49.6 | % |
Corporate Bonds & Notes | | | 10.5 | |
U.S. Government & Agency Obligations | | | 7.6 | |
Mortgage-Backed Securities | | | 6.9 | |
Collateralized Mortgage Obligations | | | 3.0 | |
Municipal Bonds | | | 1.0 | |
Asset-Backed Securities | | | 0.2 | |
Purchased Options | | | 0.0 | ** |
Short-Term Investments | | | 21.2 | |
| | | | |
| | | 100.0 | % |
| | | | |
| * | As a percentage of total investments. |
| ** | Position represents less than 0.1% |
Schedule of Options Contracts Written
| | | | | | | | | | | | | | | | |
| Contracts | | | Security Name | | Expiration
Date | | | Strike
Price | | | Value | |
| | United States | | | | | | | | | | | | | | | |
| | 1,400,000 | | | Swaption, 3-Month USD-LIBOR, Call | | | 10/11/12 | | | $ | 0.85 | | | $ | 6,774 | |
| | 1,500,000 | | | Swaption, 3-Month USD-LIBOR, Call | | | 10/11/12 | | | | 0.85 | | | | 7,258 | |
| | 9,600,000 | | | Swaption, 3-Month USD-LIBOR, Call | | | 10/11/12 | | | | 0.85 | | | | 46,452 | |
| | 1,400,000 | | | Swaption, 3-Month USD-LIBOR, Put | | | 10/11/12 | | | | 1.20 | | | | 336 | |
| | 1,500,000 | | | Swaption, 3-Month USD-LIBOR, Put | | | 10/11/12 | | | | 1.20 | | | | 360 | |
| | 4,800,000 | | | Swaption, 3-Month USD-LIBOR, Call | | | 10/11/12 | | | | 1.20 | | | | 25,148 | |
| | 9,600,000 | | | Swaption, 3-Month USD-LIBOR, Put | | | 10/11/12 | | | | 1.20 | | | | 2,307 | |
| | 4,800,000 | | | Swaption, 3-Month USD-LIBOR, Put | | | 10/11/12 | | | | 1.60 | | | | 3,216 | |
| | 1,600,000 | | | Swaption, 3-Month USD-LIBOR, Put | | | 3/18/13 | | | | 1.40 | | | | 4,400 | |
| | 1,600,000 | | | Swaption, 3-Month USD-LIBOR, Call | | | 3/18/13 | | | | 1.40 | | | | 40,174 | |
| | 5,600,000 | | | Swaption, 3-Month USD-LIBOR, Call | | | 3/18/13 | | | | 1.40 | | | | 140,610 | |
| | 5,600,000 | | | Swaption, 3-Month USD-LIBOR, Put | | | 3/18/13 | | | | 1.40 | | | | 15,402 | |
| | 6,300,000 | | | Swaption, 3-Month USD-LIBOR, Call | | | 3/18/13 | | | | 1.40 | | | | 158,187 | |
| | 6,300,000 | | | Swaption, 3-Month USD-LIBOR, Put | | | 3/18/13 | | | | 1.40 | | | | 17,327 | |
| | 1,100,000 | | | Swaption, 3-Month USD-LIBOR, Call | | | 7/11/13 | | | | 1.20 | | | | 16,479 | |
| | 1,100,000 | | | Swaption, 3-Month USD-LIBOR, Put | | | 7/11/13 | | | | 1.20 | | | | 686 | |
| | 15,100,000 | | | Swaption, 3-Month USD-LIBOR, Put | | | 4/14/14 | | | | 2.85 | | | | 54,747 | |
| | 3,000,000 | EUR | | Swaption, 6-Month EUR-LIBOR, Put | | | 7/1/14 | | | | 10.00 | | | | 34 | |
| | | | | | | | | | | | | | | | |
| | | | Total United States | | | | | | | | | | | 539,897 | |
| | | | | | | | | | | | | | | | |
| | | | TOTAL OPTIONS CONTRACTS WRITTEN (Premiums received — $653,469) | | | | | | | | | | $ | 539,897 | |
| | | | | | | | | | | | | | | | |
See Notes to Financial Statements.
132
Schedules of Investments
(continued)
International Fixed Income Investments
Schedule of Forward Sale Commitments
| | | | | | | | |
Face
Amount | | | Security | | Value | |
| | | | Federal National Mortgage Association (FNMA): | | | | |
| $ | 1,000,000 | | | 6.000% due 9/15/33 (a) | | $ | 1,101,914 | |
| | 3,000,000 | | | 4.500% due 9/1/42 (a) | | | 3,247,031 | |
| | | | | | | | |
| | | | TOTAL FORWARD SALE COMMITMENTS (Proceeds — $4,342,031) | | $ | 4,348,945 | |
| | | | | | | | |
| (a) | This security is traded on a TBA basis (see Note 1). |
| | For details of other financial instruments held by this fund, refer to Note 3. |
See Notes to Financial Statements.
133
Schedules of Investments
(continued)
Municipal Bond Investments
| | | | | | | | | | |
Face
Amount | | | Rating†† | | Security | | Value | |
| MUNICIPAL BONDS — 94.5% | | | | |
| Alaska — 2.3% | | | | |
| $ | 1,750,000 | | | AA- | | North Slope Boro Alaska, GO, Series A, NPFG-Insured, 5.000% due 6/30/16 | | $ | 2,025,012 | |
| | | | | | | | | | |
| California — 9.1% | | | | |
| | 1,000,000 | | | AA+ | | California Infrastructure & Economic Development Bank Revenue, Series A, Prerefunded 1/1/28 @ 100, AMBAC-Insured, 5.000% due 7/1/36(a) | | | 1,373,430 | |
| | 1,050,000 | | | AA- | | California Statewide Communities Development Authority, Sutter Health Project, Series A, 5.500% due 8/15/26 | | | 1,234,254 | |
| | 1,000,000 | | | AA | | Los Angeles, CA, Department of Water & Power Waterworks Revenue, Series C, Prerefunded 7/1/14 @ 100, NPFG-Insured, 5.250% due 7/1/19(a) | | | 1,089,750 | |
| | 1,500,000 | | | A+ | | San Francisco, CA, City & County Airports Commission, Series C-2, 5.000% due 5/1/21 | | | 1,758,570 | |
| | 1,000,000 | | | AA- | | San Francisco, CA, Public Utilities Commission Water Revenue, Sub-Series D, 5.000% due 11/1/19 | | | 1,244,970 | |
| | 1,230,000 | | | Aa1(b) | | Santa Monica-Malibu, California, Unified School District, Election of 2006 Project, Series A, FGIC & NPFG-Insured, 5.000% due 8/1/26 | | | 1,407,674 | |
| | | | | | | | | | |
| | | | | | Total California | | | 8,108,648 | |
| | | | | | | | | | |
| Colorado — 6.5% | | | | |
| | 1,000,000 | | | AAA | | Colorado Water Resources & Power Development Authority, Drinking Water Revenue, Revolving Fund, Series A, 5.500% due 9/1/22 | | | 1,316,460 | |
| | 1,500,000 | | | AA- | | Jefferson County School District R-1, GO, Broomfield Counties, Colorado, Refunding Bonds, Series 2012, 5.000% due 12/15/26 | | | 1,875,990 | |
| | 2,165,000 | | | AA+ | | Longmont, CO, Sales & Use Tax Revenue, Refunding, 5.250% due 5/15/17 | | | 2,559,463 | |
| | | | | | | | | | |
| | | | | | Total Colorado | | | 5,751,913 | |
| | | | | | | | | | |
| Connecticut — 1.4% | | | | |
| | 1,000,000 | | | AA | | State of Connecticut, GO, Series C, 5.000% due 6/1/17 | | | 1,194,800 | |
| | | | | | | | | | |
| District of Colombia — 4.6% | | | | |
| | 2,500,000 | | | AAA | | District of Columbia, Income Tax Revenue Bonds, Series A, 5.000% due 12/1/28 | | | 3,023,975 | |
| | 1,075,000 | | | AA- | | Metropolitan Washington D.C., Airports Authority System, Refunding, Series D, Prerefunded 10/1/12 @ 100, AGM-Insured, AMT, 5.375% due 10/1/18(a)(c) | | | 1,078,580 | |
| | | | | | | | | | |
| | | | | | Total District of Colombia | | | 4,102,555 | |
| | | | | | | | | | |
| Florida — 3.9% | | | | |
| | 1,000,000 | | | A | | Florida Municipal Loan Council Revenue, North Miami Beach Water Project, Series B, NPFG-Insured, 5.375% due 8/1/18 | | | 1,012,400 | |
| | 1,000,000 | | | A | | Jacksonville, FL, Sales Tax Revenue, Better Jacksonville Projects, 5.000% due 10/1/21 | | | 1,140,560 | |
| | 1,000,000 | | | A+ | | Miami-Dade County, FL, Water & Sewer Revenue, XLCA-Insured, 5.000% due 10/1/21 | | | 1,145,490 | |
| | 195,000 | | | AA- | | Tampa, Florida, Utility Tax & Special Revenue, Series A, Prerefunded 10/1/12 @ 101, AMBAC-Insured, 5.250% due 10/1/19(a) | | | 197,636 | |
| | | | | | | | | | |
| | | | | | Total Florida | | | 3,496,086 | |
| | | | | | | | | | |
| Georgia — 5.1% | | | | |
| | 2,000,000 | | | AA- | | Augusta, GA, Water and Sewer Revenue, AGM-Insured, 5.000% due 10/1/21 | | | 2,322,760 | |
| | 1,800,000 | | | A | | Municipal Electric Authority of Georgia, Series B, 5.000% due 1/1/20 | | | 2,155,104 | |
| | | | | | | | | | |
| | | | | | Total Georgia | | | 4,477,864 | |
| | | | | | | | | | |
| Illinois — 4.0% | | | | |
| | | | | | Illinois Finance Authority Revenue : | | | | |
| | 1,095,000 | | | A3(b) | | DePaul University, Series A, 5.375%, due 10/1/19 | | | 1,323,844 | |
| | 1,000,000 | | | A | | OBG Bradley University, XLCA-Insured, 5.000% due 8/1/34 | | | 1,058,230 | |
| | 1,025,000 | | | AA- | | Illinois State Toll Highway Authority, Series A-1, Prerefunded 7/1/16 @ 100, FSA-Insured, 5.000% due 1/1/25(a) | | | 1,200,982 | |
| | | | | | | | | | |
| | | | | | Total Illinois | | | 3,583,056 | |
| | | | | | | | | | |
| Indiana — 1.1% | | | | |
| | 1,000,000 | | | AA+ | | Indiana Health Facility Financing Authority Hospital Revenue, Refunding, Methodist Hospital Industry, Series A, Escrowed To Maturity, 5.750% due 9/1/15(d) | | | 1,003,430 | |
| | | | | | | | | | |
See Notes to Financial Statements.
134
Schedules of Investments
(continued)
Municipal Bond Investments
| | | | | | | | | | |
Face
Amount | | | Rating†† | | Security | | Value | |
| Kansas — 1.3% | | | | |
| $ | 1,065,000 | | | AA+ | | Kansas State Development Finance Authority Revenue, Kansas Tansition Revolving Fund, 5.000% due 10/1/20 | | $ | 1,185,228 | |
| | | | | | | | | | |
| Massachusetts — 4.6% | | | | |
| | 1,400,000 | | | AA+ | | Commonwealth of Massachusetts, GO, Series A, NPFG-Insured, 5.250% due 8/1/16 | | | 1,649,550 | |
| | 1,000,000 | | | AAA | | Massachusetts Bay Transportation Authority Revenue, Series A, 5.250% due 7/1/34 | | | 1,323,880 | |
| | 1,000,000 | | | A2(b) | | Massachusetts HEFA Revenue, Northeastern University, Series R, 5.000% due 10/1/28 | | | 1,112,550 | |
| | | | | | | | | | |
| | | | | | Total Massachusetts | | | 4,085,980 | |
| | | | | | | | | | |
| Michigan — 2.1% | | | | |
| | 1,750,000 | | | AA- | | Kalamazoo, Michigan, Hospital Finance Authority, Hospital Facilities Revenue, Bronson Hospital A RMK 4/30/08, AGM-Insured, 5.000% due 5/15/26 | | | 1,902,198 | |
| | | | | | | | | | |
| Minnesota — 0.4% | | | | |
| | 327,664 | | | AA+ | | Minneapolis & St. Paul, MN, Housing Finance Board Single Family Mortgage Revenue, Mortgage Backed Securities, Cityliving, Series A-3, GNMA & FNMA-Insured, 5.700% due 4/1/27 | | | 345,872 | |
| | | | | | | | | | |
| New Jersey — 3.9% | | | | |
| | 1,340,000 | | | Aa3(b) | | Manalapan-Englishtown Regional Board of Education, GO, FGIC & NPFG-Insured, 5.750% due 12/1/22 | | | 1,802,997 | |
| | 1,500,000 | | | A+ | | New Jersey Health Care Facilities Financing Authority, Atlanticare Regional Medical Center, 5.000% due 7/1/27 | | | 1,621,035 | |
| | | | | | | | | | |
| | | | | | Total New Jersey | | | 3,424,032 | |
| | | | | | | | | | |
| New York — 3.8% | | | | |
| | | | | | New York City, NY: | | | | |
| | 1,450,000 | | | AAA | | Municipal Water Finance Authority, Water and Sewer Systems Revenue, Series E, 5.000% due 6/15/38 | | | 1,494,878 | |
| | 1,000,000 | | | AA | | Series D, 5.000% due 11/1/27 | | | 1,076,730 | |
| | 750,000 | | | AA- | | New York State, Urban Development Corp., Refunding, Correctional Capital Facilities, Series A, AGM-Insured, 5.250% due 1/1/14 | | | 776,002 | |
| | | | | | | | | | |
| | | | | | Total New York | | | 3,347,610 | |
| | | | | | | | | | |
| North Carolina — 2.6% | | | | |
| | 2,000,000 | | | A— | | North Carolina Eastern Municipal Power Agency, Series B, 5.000% due 1/1/26 | | | 2,266,780 | |
| | | | | | | | | | |
| Oregon — 4.4% | | | | |
| | 1,000,000 | | | AA | | Oregon State Department of Administrative Services, COP, Series A, AGM-Insured, 5.000% due 5/1/24 | | | 1,073,080 | |
| | 1,000,000 | | | AA- | | Port of Portland Airport Revenue, Portland International Project, Sub-series Twenty C, AMT, 5.000% due 7/1/16(c) | | | 1,130,230 | |
| | 1,330,000 | | | Aa2(b) | | Washington & Clackamas Counties School District No. 23, GO, NPFG-Insured, 5.000% due 6/15/22 | | | 1,657,220 | |
| | | | | | | | | | |
| | | | | | Total Oregon | | | 3,860,530 | |
| | | | | | | | | | |
| Pennsylvania — 2.7% | | | | |
| | 2,000,000 | | | AA | | Commonwealth of Pennsylvania, GO, 5.000% due 7/1/17 | | | 2,392,140 | |
| | | | | | | | | | |
| Tennessee — 1.2% | | | | |
| | 1,000,000 | | | BBB+ | | Knox County, TN, Health & Housing Facilities Revenue, University Health System, 5.250% due 4/1/36 | | | 1,055,120 | |
| | | | | | | | | | |
| Texas — 15.3% | | | | |
| | 2,000,000 | | | AAA | | Keller, Texas, Independent School District, PSF-GTD-Insured, 4.750% due 8/15/32 | | | 2,173,020 | |
| | 2,500,000 | | | AAA | | North East, Texas, Independent School District, Refunding, PSF-GTD-Insured, 5.250% due 2/1/30 | | | 3,355,600 | |
| | 2,000,000 | | | AA | | RoundRock, Texas, Independent School District, GO, 5.000% due 8/1/33 | | | 2,308,360 | |
| | | | | | Texas State, Transportation Commission: | | | | |
| | 1,000,000 | | | AAA | | 5.000%, due 4/1/27 | | | 1,151,610 | |
| | 2,575,000 | | | AAA | | 5.250%, due 4/1/26 | | | 3,456,062 | |
See Notes to Financial Statements.
135
Schedules of Investments
(continued)
Municipal Bond Investments
| | | | | | | | | | |
Face
Amount | | | Rating†† | | Security | | Value | |
| Texas — 15.3%—(continued) | | | | |
| $ | 1,000,000 | | | AA- | | Waxahachie, Texas, GO, Series A, AGM-Insured, 5.000% due 8/1/25 | | $ | 1,108,810 | |
| | | | | | | | | | |
| | | | | | Total Texas | | | 13,553,462 | |
| | | | | | | | | | |
| Washington — 9.1% | | | | |
| | 1,500,000 | | | AAA | | Central Puget Sound Regional Transportation Authority, Sales & Use Tax Revenue, Series A, Prerefunded 5/01/15 @ 100, AMBAC-Insured, 5.000% due 11/1/24(a) | | | 1,684,440 | |
| | 2,000,000 | | | AA+ | | King County, Washington School District No. 210 Federal Way, FGIC & NPFG-Insured, 5.000% due 12/1/23 | | | 2,289,320 | |
| | 2,000,000 | | | AA+ | | State of Washington, GO, Series A, 5.000% due 7/1/22 | | | 2,384,960 | |
| | 1,500,000 | | | A+ | | Washington Health Care Facilities Authority, Revenue Bonds, Series A, 5.000% due 11/1/18 | | | 1,751,700 | |
| | | | | | | | | | |
| | | | | | Total Washington | | | 8,110,420 | |
| | | | | | | | | | |
| Wisconsin — 5.1% | | | | |
| | 2,500,000 | | | AA+ | | State of Wisconsin, Series I, FGIC & NPFG-Insured, 5.000% due 7/1/20 | | | 3,111,975 | |
| | 1,340,000 | | | BBB | | Wisconsin State, HEFA Revenue, Refunding, Divine Savior Healthcare, 5.500% due 5/1/26 | | | 1,413,191 | |
| | | | | | | | | | |
| | | | | | Total Wisconsin | | | 4,525,166 | |
| | | | | | | | | | |
| | | | | | TOTAL MUNICIPAL BONDS (Cost — $75,972,044) | | | 83,797,902 | |
| | | | | | | | | | |
| | | | | | TOTAL INVESTMENTS BEFORE SHORT-TERM INVESTMENTS (Cost — $75,972,044) | | | 83,797,902 | |
| | | | | | | | | | |
| SHORT-TERM INVESTMENTS — 6.7% | | | | |
| TIME DEPOSITS- 6.7% | | | | |
| | | | | | Bank of New York Mellon — Grand Cayman: | | | | |
| | 5,184,767 | | | | | 0.030% due 9/4/12 | | | 5,184,767 | |
| | | | | | HSBC Bank — Grand Cayman: | | | | |
| | 786,479 | | | | | 0.030% due 9/4/12 | | | 786,479 | |
| | | | | | | | | | |
| | | | | | TOTAL TIME DEPOSITS (Cost — $5,971,246) | | | 5,971,246 | |
| | | | | | | | | | |
| | | | | | TOTAL SHORT-TERM INVESTMENTS (Cost — $5,971,246) | | | 5,971,246 | |
| | | | | | | | | | |
| | | | | | TOTAL INVESTMENTS — 101.2% (Cost — $81,943,290 #) | | | 89,769,148 | |
| | | | | | | | | | |
| | | | | | Liabilities in Excess of Other Assets — (1.2%) | | | (1,048,455 | ) |
| | | | | | | | | | |
| | | | | | TOTAL NET ASSETS — 100.0% | | $ | 88,720,693 | |
| | | | | | | | | | |
| †† | All ratings are by Standard & Poor’s Rating Service, unless otherwise noted. All ratings are unaudited. |
| (a) | Pre-refunded bonds are escrowed with government obligations and/or government agency securities and are considered by the Manager to be triple-A rated even if the issuer has not applied for new ratings. |
| (b) | Rating by Moody’s Investors Service. All ratings are unaudited. |
| (c) | Income from this issue is considered a preference item for purposes of calculating the alternative minimum tax (AMT). |
| (d) | Bonds are escrowed to maturity by government securities and/or U.S. government agency securities and are considered by the Manager to be triple-A rated even if the issuer has not applied for new ratings. |
| # | Aggregate cost for federal income tax purposes is $81,943,290. |
Abbreviations used in this schedule:
| | | | |
| AGM | | — | | Assured Guaranty Municipal Corp. |
| AMBAC | | — | | Ambac Assurance Corporation |
| AMT | | — | | Alternative Minimum Tax |
| COP | | — | | Certificate of Participation |
| FGIC | | — | | Financial Guarantee Insurance Company |
| FSA | | — | | Financial Security Assurance |
| GO | | — | | General Obligation |
See Notes to Financial Statements.
136
Schedules of Investments
(continued)
Municipal Bond Investments
Abbreviations used in this schedule:
| | | | |
| HEFA | | — | | Health & Education Facility Authority |
| NPFG | | — | | National Public Finance Guarantee Corp. |
| PSF | | — | | Permanent School Fund |
| XLCA | | — | | XL Capital Assurance Inc. |
See pages 140 and 141 for definition of ratings.
Summary of Investments by Industry*
| | | | |
General Obligation | | | 21.8 | % |
Education | | | 21.5 | |
Transportation | | | 13.2 | |
Health Care Providers & Services | | | 11.0 | |
Utilities | | | 7.0 | |
Power | | | 4.9 | |
Airport | | | 4.4 | |
Development | | | 4.2 | |
Water and Sewer | | | 2.9 | |
Public Facilities | | | 2.0 | |
Housing | | | 0.4 | |
Short-Term Investments | | | 6.7 | |
| | | | |
| | | 100.0 | % |
| | | | |
| * | As a percentage of total investments. |
See Notes to Financial Statements.
137
Schedules of Investments
(continued)
Money Market Investments
| | | | | | | | |
Face
Amount | | | Security | | Value | |
| SHORT-TERM INVESTMENTS — 99.5% | | | | |
| CERTIFICATES OF DEPOSIT — 2.9% | | | | |
| $ | 2,900,000 | | | National Bank of Canada, 0.550% due 7/11/13 | | $ | 2,900,000 | |
| | 4,000,000 | | | Svenska Handelsbanken, 0.295% due 10/24/12 | | | 4,000,000 | |
| | | | | | | | |
| | | | TOTAL CERTIFICATES OF DEPOSIT (Cost — $6,900,000) | | | 6,900,000 | |
| | | | | | | | |
| COMMERCIAL PAPER — 71.7% | | | | |
| | 4,000,000 | | | ABN AMRO Funding USA LLC, 0.501% due 9/5/12(a)(b) | | | 3,999,778 | |
| | 8,760,000 | | | Antalis U.S. Funding Corp., 0.230% due 9/4/12(a)(b) | | | 8,759,832 | |
| | 4,000,000 | | | Bank of Nova Scotia, 0.305% due 10/22/12(a) | | | 3,998,272 | |
| | 3,100,000 | | | Barton Capital LLC, 0.400% due 9/11/12(a)(b) | | | 3,099,656 | |
| | | | Bryant Park Funding LLC: | | | | |
| | 2,917,000 | | | 0.180% due 9/12/12(a)(b) | | | 2,916,840 | |
| | 4,400,000 | | | 0.180% due 9/17/12(a)(b) | | | 4,399,648 | |
| | 2,000,000 | | | Canadian Imperial Bank of Commerce, 0.401% due 4/17/13(a) | | | 1,994,933 | |
| | 5,000,000 | | | Chariot Funding LLC, 0.170% due 9/12/12(a)(b) | | | 4,999,740 | |
| | 5,500,000 | | | Coca-Cola Co., 0.260% due 1/7/13(a)(b) | | | 5,494,916 | |
| | 2,000,000 | | | Collateralized Commercial Paper Program Co. LLC, 0.451% due 2/1/13(a) | | | 1,996,175 | |
| | 2,500,000 | | | Concord Minuteman Capital Co. LLC, 0.270% due 10/2/12(a)(b) | | | 2,499,419 | |
| | | | Crown Point Capital Co. LLC: | | | | |
| | 3,000,000 | | | 0.410% due 10/2/12(a)(b) | | | 2,998,941 | |
| | 5,000,000 | | | 0.430% due 11/19/12(a)(b) | | | 4,995,282 | |
| | 4,500,000 | | | DnB Bank ASA, 0.496% due 10/24/12(a)(b) | | | 4,496,721 | |
| | 3,600,000 | | | Fairway Financial Corp. LLC, 0.280% due 12/17/12(a)(b) | | | 3,600,000 | |
| | 10,000,000 | | | Gemini Security Corp. LLC, 0.150% due 9/4/12(a)(b) | | | 9,999,875 | |
| | 5,000,000 | | | General Electric Capital Corp., 0.240% due 1/28/13(a) | | | 4,995,033 | |
| | | | Hannover Funding Co. LLC: | | | | |
| | 5,000,000 | | | 0.350% due 9/18/12(a)(b) | | | 4,999,173 | |
| | 4,000,000 | | | 0.350% due 9/25/12(a)(b) | | | 3,999,067 | |
| | 1,000,000 | | | ING (US) Funding LLC, 0.200% due 9/12/12(a) | | | 999,939 | |
| | | | LMA Americas LLC: | | | | |
| | 5,000,000 | | | 0.380% due 9/4/12(a)(b) | | | 4,999,842 | |
| | 5,200,000 | | | 0.450% due 9/12/12(a)(b) | | | 5,199,284 | |
| | 4,500,000 | | | MetLife Short Term Funding LLC, 0.341% due 11/14/12(a)(b) | | | 4,496,855 | |
| | 3,200,000 | | | Nordea North America Inc., 0.572% due 9/7/12(a) | | | 3,199,696 | |
| | | | NRW.BANK: | | | | |
| | 5,000,000 | | | 0.260% due 10/17/12(a)(b) | | | 4,998,339 | |
| | 2,700,000 | | | 0.320% due 11/26/12(a)(b) | | | 2,697,936 | |
| | 4,500,000 | | | Oversea-Chinese Bank Corp., Ltd., 0.421% due 10/12/12(a) | | | 4,497,848 | |
| | 6,000,000 | | | PACCAR Financial Corp., 0.180% due 10/5/12(a) | | | 5,998,980 | |
| | 4,500,000 | | | PNC Bank NA, 0.331% due 10/24/12(a) | | | 4,497,814 | |
| | 5,000,000 | | | Rabobank USA Financial Corp., 0.300% due 12/3/12(a) | | | 4,996,125 | |
| | 5,000,000 | | | Regency Markets No. 1 LLC, 0.220% due 9/17/12(a)(b) | | | 4,999,511 | |
| | 10,000,000 | | | Salisbury Receivables Co. LLC, 0.150% due 9/4/12(a)(b) | | | 9,999,875 | |
| | 10,000,000 | | | Societe Generale North America Inc., 0.160% due 9/4/12(a) | | | 9,999,867 | |
| | 4,000,000 | | | Sumitomo Mitsui Banking Corp., 0.250% due 10/17/12(a)(b) | | | 3,998,722 | |
| | | | Versailles Commercial Paper LLC: | | | | |
| | 3,000,000 | | | 0.460% due 9/6/12(a)(b) | | | 2,999,808 | |
| | 5,000,000 | | | 0.440% due 9/14/12(a)(b) | | | 4,999,205 | |
| | 2,800,000 | | | 0.370% due 9/19/12(a)(b) | | | 2,799,482 | |
| | | | | | | | |
| | | | TOTAL COMMERCIAL PAPER (Cost — $170,622,429) | | | 170,622,429 | |
| | | | | | | | |
| TIME DEPOSITS — 1.4% | | | | |
| | 497,162 | | | JPMorgan Chase & Co. — London, 0.030% due 9/4/12 | | | 497,162 | |
See Notes to Financial Statements.
138
Schedules of Investments
(continued)
Money Market Investments
| | | | | | | | |
Face
Amount | | | Security | | Value | |
| TIME DEPOSITS — 1.4%—(continued) | | | | |
| $ | 2,763,371 | | | Wells Fargo — Grand Cayman, 0.030% due 9/4/12 | | $ | 2,763,371 | |
| | | | | | | | |
| | | | TOTAL TIME DEPOSITS (Cost — $3,260,533) | | | 3,260,533 | |
| | | | | | | | |
| U.S. GOVERNMENT AGENCIES — 14.7% | | | | |
| | | | Federal Home Loan Bank (FHLB), Discount Notes: | | | | |
| | 14,216,000 | | | 0.100% due 9/21/12(a) | | | 14,215,209 | |
| | 5,810,000 | | | 0.115% due 9/28/12(a) | | | 5,809,499 | |
| | 5,800,000 | | | 0.100% due 10/9/12(a) | | | 5,799,388 | |
| | 5,000,000 | | | 0.100% due 10/17/12(a) | | | 4,999,361 | |
| | 2,250,000 | | | Federal Home Loan Mortgage Corp. (FHLMC), Discount Notes, 0.120% due 9/12/12(a) | | | 2,249,918 | |
| | 2,000,000 | | | Federal National Mortgage Association (FNMA), Discount Notes, 0.100% due 10/15/12(a) | | | 1,999,756 | |
| | | | | | | | |
| | | | TOTAL U.S. GOVERNMENT AGENCIES (Cost — $35,073,131) | | | 35,073,131 | |
| | | | | | | | |
| U.S. GOVERNMENT OBLIGATIONS — 8.8% | | | | |
| | | | U.S. Treasury Bills: | | | | |
| | 12,000,000 | | | 0.093% due 9/6/12(a) | | | 11,999,845 | |
| | 4,000,000 | | | 0.149% due 9/13/12(a) | | | 3,999,802 | |
| | 5,000,000 | | | 0.136% due 1/10/13(a) | | | 4,997,526 | |
| | | | | | | | |
| | | | TOTAL U.S. GOVERNMENT OBLIGATIONS (Cost — $20,997,173) | | | 20,997,173 | |
| | | | | | | | |
| | | | TOTAL SHORT-TERM INVESTMENTS (Cost — $236,853,266) | | | 236,853,266 | |
| | | | | | | | |
| | | | TOTAL INVESTMENTS — 99.5% (Cost — $236,853,266 #) | | | 236,853,266 | |
| | | | | | | | |
| | | | Cash and Other Assets in Excess of Liabilities — 0.5% | | | 1,200,057 | |
| | | | | | | | |
| | | | TOTAL NET ASSETS — 100.0% | | $ | 238,053,323 | |
| | | | | | | | |
| (a) | Rate shown represents yield-to-maturity. |
| (b) | Restricted security that may be sold to “qualified institutional buyers” pursuant to the conditions of Rule 144A under the Securities Act of 1933, as amended. This security has been deemed liquid pursuant to guidelines approved by the Board of Trustees, unless otherwise noted. |
| # | Aggregate cost for federal income tax purposes is $238,853,266. |
See Notes to Financial Statements.
139
Ratings
(unaudited)
Bond Ratings
The definitions of the applicable rating symbols are set forth below:
Standard & Poor’s Ratings Service (“Standard & Poor’s”) —Ratings from “AA” to “CCC” may be modified by the addition of a plus (+) or minus (-) sign to show relative standings within the major rating categories.
| | |
| AAA | | — Bonds rated “AAA” have the highest rating assigned by Standard & Poor’s. Capacity to pay interest and repay principal is extremely strong. |
| AA | | — Bonds rated “AA” have a very strong capacity to pay interest and repay principal and differ from the highest rated issues only in a small degree. |
| A | | — Bonds rated “A” have a strong capacity to pay interest and repay principal although they are somewhat more susceptible to the adverse effects of changes in circumstances and economic conditions than debt in higher rated categories. |
| BBB | | — Bonds rated “BBB” are regarded as having an adequate capacity to pay interest and repay principal. Whereas they normally exhibit adequate protection parameters, adverse economic conditions or changing circumstances are more likely to lead to a weakened capacity to pay interest and repay principal for bonds in this category than in higher rated categories. |
BB, B, CCC, CC and C | | — Bonds rated “BB”, “B”, “CCC”, “CC” and “C” are regarded, on balance, as predominantly speculative with respect to capacity to pay interest and repay principal in accordance with the terms of the obligation. “BB” represents the lowest degree of speculation and “C” the highest degree of speculation. While such bonds will likely have some quality and protective characteristics, these are outweighed by large uncertainties or major risk exposures to adverse conditions. |
| D | | — Bonds rated “D” are in default and payment of interest and/or repayment of principal is in arrears. |
Moody’s Investors Service (“Moody’s”)— Numerical modifiers 1, 2 and 3 may be applied to each generic rating from “Aa” to “Caa” where 1 is the highest and 3 the lowest ranking within its generic category. |
| Aaa | | — Bonds rated “Aaa” are judged to be of the best quality. They carry the smallest degree of investment risk and are generally referred to as “gilt edge.” Interest payments are protected by a large or by an exceptionally stable margin and principal is secure. While the various protective elements are likely to change, such changes as can be visualized are most unlikely to impair the fundamentally strong position of such issues. |
| Aa | | — Bonds rated “Aa” are judged to be of high quality by all standards. Together with the “Aaa” group they comprise what are generally known as high grade bonds. They are rated lower than the best bonds because margins of protection may not be as large as in “Aaa” securities or fluctuation of protective elements may be of greater amplitude or there may be other elements present which make the long-term risks appear somewhat larger than in “Aaa” securities. |
| A | | — Bonds rated “A” possess many favorable investment attributes and are to be considered as upper medium grade obligations. Factors giving security to principal and interest are considered adequate but elements may be present which suggest a susceptibility to impairment some time in the future. |
| Baa | | — Bonds rated “Baa” are considered as medium grade obligations, i.e., they are neither highly protected nor poorly secured. Interest payments and principal security appear adequate for the present but certain protective elements may be lacking or may be characteristically unreliable over any great length of time. Such bonds lack outstanding investment characteristics and in fact have speculative characteristics as well. |
| Ba | | — Bonds rated “Ba” are judged to have speculative elements; their future cannot be considered as well assured. Often the protection of interest and principal payments may be very moderate and therefore not well safeguarded during both good and bad times over the future. Uncertainty of position characterizes bonds in this class. |
| B | | — Bonds rated “B” generally lack characteristics of desirable investments. Assurance of interest and principal payments or of maintenance of other terms of the contract over any long period of time may be small. |
| Caa | | — Bonds rated “Caa” are of poor standing. These may be in default, or present elements of danger may exist with respect to principal or interest. |
| Ca | | — Bonds rated “Ca” represent obligations which are speculative in a high degree. Such issues are often in default or have other marked shortcomings. |
| C | | — Bonds rated “C” are the lowest class of bonds and issues so rated can be regarded as having extremely poor prospects of ever attaining any real investment standing. |
Fitch Ratings Service (“Fitch”)— Ratings from “AA” to “CCC” may be modified by the addition of a plus (+) or minus (-) sign to show relative standings within the major rating categories. |
AAA | | — Bonds rated “AAA” have the highest rating assigned by Fitch. Capacity to pay interest and repay principal is extremely strong. |
AA | | — Bonds rated “AA” have a very strong capacity to pay interest and repay principal and differ from the highest rated issues only in a small degree. |
A | | — Bonds rated “A” have a strong capacity to pay interest and repay principal although they are somewhat more susceptible to the adverse effects of changes in circumstances and economic conditions than debt in higher rated categories. |
BBB | | — Bonds rated “BBB” are regarded as having an adequate capacity to pay interest and repay principal. Whereas they normally exhibit adequate protection parameters, adverse economic conditions or changing circumstances are more likely to lead to a weakened capacity to pay interest and repay principal for bonds in this category than in higher rated categories. |
BB,B, CCC, CC and C | | — Bonds rated “BB”, “B”, “CCC” and “CC” are regarded, on balance, as predominantly speculative with respect to capacity to pay interest and repay principal in accordance with the terms of the obligation. “BB” represents a lower degree of speculation than “B”, and “CC” the highest degree of speculation. While such bonds will likely have some quality and protective characteristics, these are outweighed by large uncertainties or major risk exposures to adverse conditions. |
NR | | — Indicates that the bond is not rated by Standard & Poor’s, Moody’s, or Fitch. |
Short-Term SecurityRatings |
SP-1 | | — Standard & Poor’s highest rating indicating very strong or strong capacity to pay principal and interest; those issues determined to possess overwhelming safety characteristics are denoted with a plus (+) sign. |
140
Ratings
(unaudited) (continued)
| | |
A-1 | | — Standard & Poor’s highest commercial paper and variable-rate demand obligation (VRDO) rating indicating that the degree of safety regarding timely payment is either overwhelming or very strong; those issues determined to possess overwhelming safety characteristics are denoted with a plus (+) sign. |
VMIG1 | | — Moody’s highest rating for issues having a demand feature —VRDO. |
P-1 | | — Moody’s highest rating for commercial paper and for VRDO prior to the advent of the VMIG 1 rating. |
F-1 | | — Fitch’s highest rating indicating the strongest capacity for timely payment of financial commitments; those issues determined to possess overwhelming strong credit feature are denoted with a plus (+) sign. |
141
Statements of Assets and Liabilities
August 31, 2012
| | | | | | | | | | | | | | | | | | | | | | | | | | | | | | | | | | | | | | | | | | | | |
| | | Large
Capitalization
Growth
Investments | | | Large
Capitalization
Value Equity
Investments | | | Small
Capitalization
Growth
Investments | | | Small
Capitalization
Value Equity
Investments | | | International
Equity
Investments | | | Emerging
Markets
Equity
Investments | | | Core Fixed
Income
Investments | | | High
Yield
Investments | | | International
Fixed
Income
Investments | | | Municipal
Bond
Investments | | | Money
Market
Investments | |
ASSETS: | | | | | | | | | | | | | | | | | | | | | | | | | | | | | | | | | | | | | | | | | | | | |
Investments, at cost | | $ | 1,164,303,860 | | | $ | 946,219,943 | | | $ | 216,870,158 | | | $ | 151,236,467 | | | $ | 525,109,344 | | | $ | 616,783,950 | | | $ | 1,062,695,505 | | | $ | 334,794,815 | | | $ | 469,019,865 | | | $ | 81,943,290 | | | $ | 236,853,266 | |
Foreign currency, at cost | | | — | | | | — | | | | — | | | | — | | | | 591,389 | | | | 4,781,694 | | | | 153,811 | | | | — | | | | 83,042 | | | | — | | | | — | |
Investments, at value* | | $ | 1,580,044,625 | | | $ | 1,107,975,496 | | | $ | 267,127,138 | | | $ | 200,802,400 | | | $ | 563,550,779 | | | $ | 719,863,117 | | | $ | 1,103,407,425 | | | $ | 340,516,716 | | | $ | 485,266,006 | | | $ | 89,769,148 | | | $ | 236,853,266 | ** |
Foreign currency, at value | | | — | | | | — | | | | — | | | | — | | | | 604,552 | | | | 4,786,107 | | | | 157,962 | | | | — | | | | 81,109 | | | | — | | | | — | |
Cash | | | 1,290 | | | | 1,629 | | | | 206 | | | | 173 | | | | 584 | | | | 866 | | | | 597 | | | | 622 | | | | 241 | | | | 102 | | | | 13 | |
Receivable for manager waiver | | | — | | | | — | | | | — | | | | — | | | | — | | | | — | | | | — | | | | — | | | | — | | | | — | | | | 25 | |
Receivable for securities sold | | | 18,830,750 | | | | 1,379,589 | | | | 3,802,223 | | | | 508,397 | | | | 458,290 | | | | 5,428,531 | | | | 130,837,084 | | | | 105,498 | | | | 17,977,807 | | | | — | | | | — | |
Dividends and interest receivable | | | 3,322,961 | | | | 3,552,321 | | | | 63,652 | | | | 318,912 | | | | 927,503 | | | | 1,753,293 | | | | 6,048,791 | | | | 4,631,648 | | | | 3,037,100 | | | | 879,778 | | | | 3,979 | |
Receivable for Fund shares sold | | | 91,272 | | | | 41,169 | | | | 38,570 | | | | 37,587 | | | | 272,844 | | | | 382,825 | | | | 161,308 | | | | 521,071 | | | | 374,523 | | | | 155,646 | | | | 1,487,385 | |
Unrealized appreciation on open forward foreign currency contracts (Notes 1 and 3) | | | — | | | | — | | | | — | | | | — | | | | 195,849 | | | | 164,053 | | | | 337,304 | | | | — | | | | 1,535,250 | | | | — | | | | — | |
Variation margin on open future contacts (Notes 1 and 3) | | | — | | | | — | | | | — | | | | — | | | | — | | | | 1,723,264 | | | | 348,682 | | | | — | | | | 51,050 | | | | — | | | | — | |
Swap contracts at value (Notes 1 and 3) | | | — | | | | — | | | | — | | | | — | | | | — | | | | — | | | | 3,093,633 | | | | — | | | | 1,942,597 | | | | — | | | | — | |
Deposits with counterparty | | | — | | | | — | | | | — | | | | — | | | | — | | | | — | | | | 14,000 | | | | — | | | | 6,000 | | | | — | | | | — | |
Prepaid expenses | | | 34,132 | | | | 26,241 | | | | 14,034 | | | | 12,087 | | | | 13,839 | | | | 17,937 | | | | 27,235 | | | | 9,980 | | | | 14,965 | | | | 10,938 | | | | 12,217 | |
Other assets | | | — | | | | — | | | | — | | | | — | | | | 85 | | | | — | | | | — | | | | — | | | | — | | | | — | | | | — | |
| | | | | | | | | | | | | | | | | | | | | | | | | | | | | | | | | | | | | | | | | | | | |
Total Assets | | | 1,602,325,030 | | | | 1,112,976,445 | | | | 271,045,823 | | | | 201,679,556 | | | | 566,024,325 | | | | 734,119,993 | | | | 1,244,434,021 | | | | 345,785,535 | | | | 510,286,648 | | | | 90,815,612 | | | | 238,356,885 | |
| | | | | | | | | | | | | | | | | | | | | | | | | | | | | | | | | | | | | | | | | | | | |
LIABILITIES: | | | | | | | | | | | | | | | | | | | | | | | | | | | | | | | | | | | | | | | | | | | | |
Payable for securities on loan | | | 9,755,298 | | | | 22,847,068 | | | | 19,954,594 | | | | 5,954,665 | | | | 6,243,716 | | | | 28,945,863 | | | | 386,546 | | | | 2,539,760 | | | | — | | | | — | | | | — | |
Payable for Fund shares repurchased | | | 2,407,678 | | | | 1,334,512 | | | | 463,555 | | | | 230,479 | | | | 602,011 | | | | 824,248 | | | | 2,062,695 | | | | 401,662 | | | | 519,869 | | | | 124,017 | | | | 225,532 | |
Payable for securities purchased | | | 23,238,777 | | | | 872,557 | | | | 2,924,590 | | | | 350,470 | | | | 115,262,165 | | | | 8,217,579 | | | | 183,202,075 | | | | 73,919,248 | | | | 66,387,826 | | | | 1,881,660 | | | | – | |
Investment management fee payable | | | 802,072 | | | | 561,855 | | | | 167,257 | | | | 130,091 | | | | 197,335 | | | | 477,014 | | | | 384,375 | | | | 83,282 | | | | 172,967 | | | | 32,705 | | | | 18,947 | |
Transfer agent fees payable | | | 39,806 | | | | 33,864 | | | | 23,051 | | | | 15,024 | | | | 22,401 | | | | 17,076 | | | | 27,198 | | | | 4,292 | | | | 8,109 | | | | 1,074 | | | | 391 | |
Custody fee payable | | | 83,238 | | | | 55,376 | | | | 16,963 | | | | 13,184 | | | | 39,560 | | | | 119,842 | | | | 123,459 | | | | 21,807 | | | | 12,882 | | | | 8,406 | | | | 13,044 | |
Trustees’ fees payable | | | 6,198 | | | | 5,042 | | | | 1,544 | | | | 1,166 | | | | 4,056 | | | | 3,327 | | | | 4,474 | | | | 769 | | | | 1,404 | | | | 822 | | | | 562 | |
Forward sale commitments, at value (proceeds received $31,603,438 and $4,342,031, respectively) (Note 1) | | | — | | | | — | | | | — | | | | — | | | | — | | | | — | | | | 31,653,364 | | | | — | | | | 4,348,945 | | | | — | | | | — | |
Options Contracts written, at value (premiums received $644,647 and $653,469, respectively) (Notes 1 and 3) | | | — | | | | — | | | | — | | | | — | | | | — | | | | — | | | | 531,871 | | | | — | | | | 539,897 | | | | — | | | | — | |
Swap contracts at value (Notes 1 and 3) | | | — | | | | — | | | | — | | | | — | | | | — | | | | — | | | | 247,115 | | | | — | | | | 148,480 | | | | — | | | | — | |
Unrealized depreciation on open forward foreign currency contracts (Notes 1 and 3) | | | — | | | | — | | | | — | | | | — | | | | — | | | | 243,965 | | | | 1,103,684 | | | | — | | | | 5,880,376 | | | | — | | | | — | |
Variation margin on open swap contracts (Notes 1 and 3) | | | — | | | | — | | | | — | | | | — | | | | — | | | | — | | | | 23,942 | | | | — | | | | 1,012 | | | | — | | | | — | |
Deposits from counterparty | | | — | | | | — | | | | — | | | | — | | | | — | | | | — | | | | 2,975,000 | | | | — | | | | 1,030,000 | | | | — | | | | — | |
Distributions payable | | | — | | | | — | | | | — | | | | — | | | | — | | | | — | | | | 20 | | | | 1,438 | | | | — | | | | 195 | | | | 8 | |
Accrued expenses | | | 34,220 | | | | 51,637 | | | | 79,979 | | | | 86,749 | | | | 89,676 | | | | 68,272 | | | | 76,580 | | | | 69,765 | | | | 85,123 | | | | 46,040 | | | | 45,078 | |
| | | | | | | | | | | | | | | | | | | | | | | | | | | | | | | | | | | | | | | | | | | | |
Total Liabilities | | | 36,367,287 | | | | 25,761,911 | | | | 23,631,533 | | | | 6,781,828 | | | | 122,460,920 | | | | 38,917,186 | | | | 222,802,398 | | | | 77,042,023 | | | | 79,136,890 | | | | 2,094,919 | | | | 303,562 | |
| | | | | | | | | | | | | | | | | | | | | | | | | | | | | | | | | | | | | | | | | | | | |
Total Net Assets | | $ | 1,565,957,743 | | | $ | 1,087,214,534 | | | $ | 247,414,290 | | | $ | 194,897,728 | | | $ | 443,563,405 | | | $ | 695,202,807 | | | $ | 1,021,631,623 | | | $ | 268,743,512 | | | $ | 431,149,758 | | | $ | 88,720,693 | | | $ | 238,053,323 | |
| | | | | | | | | | | | | | | | | | | | | | | | | | | | | | | | | | | | | | | | | | | | |
NET ASSETS: | | | | | | | | | | | | | | | | | | | | | | | | | | | | | | | | | | | | | | | | | | | | |
Par value (Note 4) | | $ | 95,524 | | | $ | 115,201 | | | $ | 12,488 | | | $ | 15,028 | | | $ | 46,320 | | | $ | 48,070 | | | $ | 115,128 | | | $ | 63,434 | | | $ | 50,375 | | | $ | 8,984 | | | $ | 238,053 | |
Paid-in capital in excess of par value | | | 1,304,191,789 | | | | 1,411,090,409 | | | | 224,092,874 | | | | 135,028,123 | | | | 746,951,665 | | | | 664,158,154 | | | | 946,950,749 | | | | 285,873,413 | | | | 403,838,063 | | | | 80,844,710 | | | | 237,809,364 | |
Accumulated net investment loss | | | — | | | | — | | | | (736,931 | ) | | | — | | | | — | | | | — | | | | — | | | | — | | | | — | | | | — | | | | — | |
Undistributed (Overdistributed) net investment income | | | 6,647,674 | | | | 15,567,504 | | | | — | | | | 1,858,564 | | | | 6,839,235 | | | | 12,060,825 | | | | 9,443,322 | | | | 809,714 | | | | 28,944,093 | | | | 144,126 | | | | 35 | |
Accumulated net realized gain (loss) on investments, futures contracts, options contracts written, forward sale commitments, swap contracts and foreign currency transactions | | | (160,718,009 | ) | | | (501,314,133 | ) | | | (26,211,121 | ) | | | 8,430,080 | | | | (348,834,560 | ) | | | (83,818,264 | ) | | | 24,313,885 | | | | (23,724,950 | ) | | | (15,238,693 | ) | | | (102,985 | ) | | | 5,871 | |
Net unrealized appreciation on investments, futures contracts, options contracts written, forward sale commitments, swap contracts and foreign currency transactions | | | 415,740,765 | | | | 161,755,553 | | | | 50,256,980 | | | | 49,565,933 | | | | 38,560,745 | | | | 102,754,022 | | | | 40,808,539 | | | | 5,721,901 | | | | 13,555,920 | | | | 7,825,858 | | | | — | |
| | | | | | | | | | | | | | | | | | | | | | | | | | | | | | | | | | | | | | | | | | | | |
Total Net Assets | | $ | 1,565,957,743 | | | $ | 1,087,214,534 | | | $ | 247,414,290 | | | $ | 194,897,728 | | | $ | 443,563,405 | | | $ | 695,202,807 | | | $ | 1,021,631,623 | | | $ | 268,743,512 | | | $ | 431,149,758 | | | $ | 88,720,693 | | | $ | 238,053,323 | |
| | | | | | | | | | | | | | | | | | | | | | | | | | | | | | | | | | | | | | | | | | | | |
Shares Outstanding | | | 95,523,227 | | | | 115,201,720 | | | | 12,488,055 | | | | 15,028,472 | | | | 46,320,286 | | | | 48,070,048 | | | | 115,128,090 | | | | 63,434,059 | | | | 50,375,098 | | | | 8,983,547 | | | | 238,053,252 | |
| | | | | | | | | | | | | | | | | | | | | | | | | | | | | | | | | | | | | | | | | | | | |
Net Asset Value | | $ | 16.39 | | | $ | 9.44 | | | $ | 19.81 | | | $ | 12.97 | | | $ | 9.58 | | | $ | 14.46 | | | $ | 8.87 | | | $ | 4.24 | | | $ | 8.56 | | | $ | 9.88 | | | $ | 1.00 | |
| | | | | | | | | | | | | | | | | | | | | | | | | | | | | | | | | | | | | | | | | | | | |
| * | Includes securities on loan for the following funds: Large Capitalization Growth Investments, Large Capitalization Value Equity Investments, Small Capitalization Growth Investments, Small Capitalization Value Equity Investments, International Equity Investments, Emerging Markets Equity Investments, Core Fixed Income Investments, and High Yield Investments with a market value of $9,569,391, $22,465,976, $19,763,710, $5,834,748, $6,089,464, $27,685,842, $378,081 and $2,464,362, respectively. |
| ** | Value represents amortized cost. |
See Notes to Financial Statements.
142
Statements of Operations
For the Year Ended August 31, 2012
| | | | | | | | | | | | | | | | | | | | | | | | | | | | | | | | | | | | | | | | | | | | |
| | | Large
Capitalization
Growth
Investments | | | Large
Capitalization
Value Equity
Investments | | | Small
Capitalization
Growth
Investments | | | Small
Capitalization
Value Equity
Investments | | | International
Equity
Investments | | | Emerging
Markets
Equity
Investments | | | Core Fixed
Income
Investments | | | High Yield
Investments | | | International
Fixed
Income
Investments | | | Municipal
Bond
Investments | | | Money
Market
Investments | |
INVESTMENT INCOME: | | | | | | | | | | | | | | | | | | | | | | | | | | | | | | | | | | | | | | | | | | | | |
Dividends | | $ | 16,884,939 | | | $ | 31,916,054 | | | $ | 893,846 | | | $ | 3,582,351 | | | $ | 10,133,072 | | | $ | 23,422,962 | | | $ | — | | | $ | 248,813 | | | $ | — | | | $ | — | | | $ | — | |
Interest | | | 14,708 | | | | 9,880 | | | | 3,150 | | | | 1,399 | | | | 5,411 | | | | 43,350 | | | | 40,922,489 | | | | 11,527,546 | | | | 10,243,734 | | | | 3,472,048 | | | | 559,102 | |
Income from securities lending | | | 729,649 | | | | 243,836 | | | | 589,924 | | | | 181,182 | | | | 286,942 | | | | 581,258 | | | | 932 | | | | 30,142 | | | | 581 | | | | — | | | | — | |
Miscellaneous income | | | — | | | | — | | | | — | | | | — | | | | — | | | | — | | | | 11,928 | | | | — | | | | — | | | | — | | | | — | |
Less: Foreign taxes withheld | | | (131,294 | ) | | | (210,763 | ) | | | (5,961 | ) | | | (24,513 | ) | | | (825,183 | ) | | | (2,260,899 | ) | | | — | | | | — | | | | (7,881 | ) | | | — | | | | — | |
| | | | | | | | | | | | | | | | | | | | | | | | | | | | | | | | | | | | | | | | | | | | |
Total Investment Income | | | 17,498,002 | | | | 31,959,007 | | | | 1,480,959 | | | | 3,740,419 | | | | 9,600,242 | | | | 21,786,671 | | | | 40,935,349 | | | | 11,806,501 | | | | 10,236,434 | | | | 3,472,048 | | | | 559,102 | |
| | | | | | | | | | | | | | | | | | | | | | | | | | | | | | | | | | | | | | | | | | | | |
EXPENSES: | | | | | | | | | | | | | | | | | | | | | | | | | | | | | | | | | | | | | | | | | | | | |
Investment management fee (Note 2) | | | 9,643,737 | | | | 6,738,611 | | | | 2,079,680 | | | | 1,580,612 | | | | 2,486,510 | | | | 6,740,094 | | | | 4,857,459 | | | | 985,612 | | | | 1,776,667 | | | | 408,135 | | | | 182,939 | |
Transfer agent fees | | | 235,597 | | | | 177,612 | | | | 79,032 | | | | 44,969 | | | | 82,362 | | | | 103,188 | | | | 170,793 | | | | 17,976 | | | | 48,504 | | | | 9,661 | | | | 22,584 | |
Custody fees | | | 464,917 | | | | 333,372 | | | | 91,678 | | | | 73,226 | | | | 271,698 | | | | 649,179 | | | | 738,836 | | | | 145,262 | | | | 155,656 | | | | 49,271 | | | | 72,738 | |
Trustees’ fees | | | 210,386 | | | | 147,528 | | | | 25,969 | | | | 14,318 | | | | 56,145 | | | | 98,624 | | | | 141,644 | | | | 18,177 | | | | 35,281 | | | | 10,575 | | | | 20,838 | |
Shareholder reports | | | 129,452 | | | | 142,469 | | | | 129,881 | | | | 123,738 | | | | 133,013 | | | | 118,895 | | | | 104,327 | | | | 59,238 | | | | 89,598 | | | | 7,218 | | | | 119,389 | |
Insurance | | | 90,782 | | | | 61,848 | | | | 15,000 | | | | 11,555 | | | | 34,267 | | | | 44,766 | | | | 57,653 | | | | 10,469 | | | | 12,651 | | | | 4,927 | | | | 6,927 | |
Audit and tax | | | 61,854 | | | | 56,497 | | | | 47,307 | | | | 45,417 | | | | 54,571 | | | | 61,740 | | | | 89,555 | | | | 62,906 | | | | 71,824 | | | | 37,220 | | | | 36,852 | |
Legal fees | | | 32,172 | | | | 32,171 | | | | 34,385 | | | | 34,385 | | | | 32,154 | | | | 32,172 | | | | 32,771 | | | | 32,171 | | | | 32,172 | | | | 32,172 | | | | 29,793 | |
Registration fees | | | 20,949 | | | | 20,893 | | | | 20,428 | | | | 20,441 | | | | 18,146 | | | | 19,913 | | | | 20,473 | | | | 18,623 | | | | 19,606 | | | | 17,659 | | | | 22,872 | |
Miscellaneous expenses | | | 125,936 | | | | 79,481 | | | | 15,597 | | | | 13,077 | | | | 49,152 | | | | 72,798 | | | | 113,483 | | | | 11,676 | | | | 30,294 | | | | 6,393 | | | | 14,319 | |
| | | | | | | | | | | | | | | | | | | | | | | | | | | | | | | | | | | | | | | | | | | | |
Total Investment Expenses | | | 11,015,782 | | | | 7,790,482 | | | | 2,538,957 | | | | 1,961,738 | | | | 3,218,018 | | | | 7,941,369 | | | | 6,326,994 | | | | 1,362,110 | | | | 2,272,253 | | | | 583,231 | | | | 529,251 | |
Less: Fee waivers and/or expense reimbursement (Note 2) | | | — | | | | — | | | | (23,397 | ) | | | (20,926 | ) | | | (23,977 | ) | | | (945,932 | ) | | | (52,640 | ) | | | (226,582 | ) | | | (35,061 | ) | | | — | | | | (29,185 | ) |
| | | | | | | | | | | | | | | | | | | | | | | | | | | | | | | | | | | | | | | | | | | | |
Net Expenses | | | 11,015,782 | | | | 7,790,482 | | | | 2,515,560 | | | | 1,940,812 | | | | 3,194,041 | | | | 6,995,437 | | | | 6,274,354 | | | | 1,135,528 | | | | 2,237,192 | | | | 583,231 | | | | 500,066 | |
| | | | | | | | | | | | | | | | | | | | | | | | | | | | | | | | | | | | | | | | | | | | |
Net Investment Income (Loss) | | $ | 6,482,220 | | | | $24,168,525 | | | ($ | 1,034,601 | ) | | $ | 1,799,607 | | | $ | 6,406,201 | | | $ | 14,791,234 | | | $ | 34,660,995 | | | $ | 10,670,973 | | | $ | 7,999,242 | | | $ | 2,888,817 | | | $ | 59,036 | |
| | | | | | | | | | | | | | | | | | | | | | | | | | | | | | | | | | | | | | | | | | | | |
REALIZED AND UNREALIZED GAIN (LOSS) ON INVESTMENTS, FUTURES CONTRACTS, OPTIONS CONTRACTS WRITTEN, FORWARD SALE COMMITMENT, SWAP CONTRACTS AND FOREIGN CURRENCY TRANSACTIONS (NOTES 1 AND 3): | | | | | | | | | | | | | | | | | | | | | | | | | | | | | | | | | | | | | | | | | | | | |
Net Realized Gain (Loss) From: | | | | | | | | | | | | | | | | | | | | | | | | | | | | | | | | | | | | | | | | | | | | |
Investment transactions | | $ | 87,906,066 | | | $ | 38,734,227 | | | $ | 11,601,336 | | | $ | 21,056,940 | | | ($ | 7,468,239 | ) | | ($ | 23,317,709 | ) | | $ | 42,044,476 | | | ($ | 4,673,833 | ) | | $ | 1,305,979 | | | $ | 1,247,270 | | | $ | 5,871 | |
Futures contracts | | | — | | | | — | | | | — | | | | — | | | | — | | | | (20,793 | ) | | | 2,713,496 | | | | — | | | | 4,795,591 | | | | — | | | | — | |
Options contracts written | | | — | | | | — | | | | — | | | | — | | | | — | | | | — | | | | 855,477 | | | | — | | | | 267,162 | | | | — | | | | — | |
Forward sale commitments | | | — | | | | — | | | | — | | | | — | | | | — | | | | — | | | | (1,680,835 | ) | | | — | | | | (625,547 | ) | | | — | | | | — | |
Swap contracts | | | — | | | | — | | | | — | | | | — | | | | — | | | | — | | | | (599,799 | ) | | | — | | | | (1,074,295 | ) | | | — | | | | — | |
Foreign currency transactions | | | — | | | | — | | | | — | | | | — | | | | (192,695 | ) | | | (1,558,705 | ) | | | 2,465,000 | | | | — | | | | 20,031,728 | | | | — | | | | — | |
| | | | | | | | | | | | | | | | | | | | | | | | | | | | | | | | | | | | | | | | | | | | |
Net Realized Gain (Loss) | | | 87,906,066 | | | | 38,734,227 | | | | 11,601,336 | | | | 21,056,940 | | | | (7,660,934 | ) | | | (24,897,207 | ) | | | 45,797,815 | | | | (4,673,833 | ) | | | 24,700,618 | | | | 1,247,270 | | | | 5,871 | |
| | | | | | | | | | | | | | | | | | | | | | | | | | | | | | | | | | | | | | | | | | | | |
Change in Net Unrealized Appreciation/Depreciation From: | | | | | | | | | | | | | | | | | | | | | | | | | | | | | | | | | | | | | | | | | | | | |
Investments | | | 129,328,340 | | | | 61,932,505 | | | | 16,669,721 | | | | 5,818,527 | | | | (14,753,412 | ) | | | (44,425,625 | ) | | | 10,670,665 | | | | 6,130,587 | | | | (2,193,316 | ) | | | 3,054,364 | | | | — | |
Futures contracts | | | — | | | | — | | | | — | | | | — | | | | — | | | | (507,434 | ) | | | (2,557,767 | ) | | | — | | | | (1,379,096 | ) | | | — | | | | — | |
Options contracts written | | | — | | | | — | | | | — | | | | — | | | | — | | | | — | | | | (127,965 | ) | | | — | | | | (7,030 | ) | | | — | | | | — | |
Forward sale commitments | | | — | | | | — | | | | — | | | | — | | | | — | | | | — | | | | 47,125 | | | | — | | | | (64,609 | ) | | | — | | | | — | |
Swap contracts | | | — | | | | — | | | | — | | | | — | | | | — | | | | — | | | | 900,866 | | | | — | | | | 1,810,494 | | | | — | | | | — | |
Foreign currency transactions | | | — | | | | — | | | | — | | | | — | | | | 234,863 | | | | (235,118 | ) | | | 332,509 | | | | — | | | | (3,560,923 | ) | | | — | | | | — | |
| | | | | | | | | | | | | | | | | | | | | | | | | | | | | | | | | | | | | | | | | | | | |
Change in Net Unrealized Appreciation (Depreciation) | | | 129,328,340 | | | | 61,932,505 | | | | 16,669,721 | | | | 5,818,527 | | | | (14,518,549 | ) | | | (45,168,177 | ) | | | 9,265,433 | | | | 6,130,587 | | | | (5,394,480 | ) | | | 3,054,364 | | | | — | |
| | | | | | | | | | | | | | | | | | | | | | | | | | | | | | | | | | | | | | | | | | | | |
Net Gain (Loss) on Investments, Futures Contracts, Options Written, Forward Sale Commitment, Swap Contracts and Foreign Currency Transactions | | | 217,234,406 | | | | 100,666,732 | | | | 28,271,057 | | | | 26,875,467 | | | | (22,179,483 | ) | | | (70,065,384 | ) | | | 55,063,248 | | | | 1,456,754 | | | | 19,306,138 | | | | 4,301,634 | | | | 5,871 | |
| | | | | | | | | | | | | | | | | | | | | | | | | | | | | | | | | | | | | | | | | | | | |
Total Net Assets Increase (Decrease) in Net Assets From Operations | | $ | 223,716,626 | | | $ | 124,835,257 | | | $ | 27,236,456 | | | $ | 28,675,074 | | | ($ | 15,773,282 | ) | | ($ | 55,274,150 | ) | | $ | 89,724,243 | | | $ | 12,127,727 | | | $ | 27,305,380 | | | $ | 7,190,451 | | | $ | 64,907 | |
| | | | | | | | | | | | | | | | | | | | | | | | | | | | | | | | | | | | | | | | | | | | |
See Notes to Financial Statements.
143
Statements of Changes in Net Assets
For the Year Ended August 31, 2012 and August 31, 2011
| | | | | | | | | | | | | | | | | | | | | | | | | | | | | | | | | | | | | | | | | | | | | | | | |
| | | Large Capitalization
Growth Investments | | | Large Capitalization
Value Equity Investments | | | Small Capitalization
Growth Investments | | | Small Capitalization
Value Equity Investments | | | International Equity
Investments | | | Emerging Markets
Equity Investments | |
| | | 2012 | | | 2011 | | | 2012 | | | 2011 | | | 2012 | | | 2011 | | | 2012 | | | 2011 | | | 2012 | | | 2011 | | | 2012 | | | 2011 | |
OPERATIONS: | | | | | | | | | | | | | | | | | | | | | | | | | | | | | | | | | | | | | | | | | | | | | | | | |
Net investment income (loss) | | $ | 6,482,220 | | | $ | 8,644,503 | | | $ | 24,168,525 | | | $ | 25,138,927 | | | $ | (1,034,601 | ) | | $ | (1,201,218 | ) | | $ | 1,799,607 | | | $ | 2,101,769 | | | $ | 6,406,201 | | | $ | 10,391,296 | | | $ | 14,791,234 | | | $ | 17,031,458 | |
Net realized gain | | | 87,906,066 | | | | 132,590,173 | | | | 38,734,227 | | | | 82,134,498 | | | | 11,601,336 | | | | 58,769,480 | | | | 21,056,940 | | | | 31,578,837 | | | | (7,660,934 | ) | | | 107,736,713 | | | | (24,897,207 | ) | | | 85,337,819 | |
Change in net unrealized appreciation/
depreciation | | | 129,328,340 | | | | 167,645,620 | | | | 61,932,505 | | | | 72,181,730 | | | | 16,669,721 | | | | 1,296,368 | | | | 5,818,527 | | | | 3,194,328 | | | | (14,518,549 | ) | | | (7,239,958 | ) | | | (45,168,177 | ) | | | (31,984,324 | ) |
| | | | | | | | | | | | | | | | | | | | | | | | | | | | | | | | | | | | | | | | | | | | | | | | |
Increase (Decrease) in Net Assets From Operations | | | 223,716,626 | | | | 308,880,296 | | | | 124,835,257 | | | | 179,455,155 | | | | 27,236,456 | | | | 58,864,630 | | | | 28,675,074 | | | | 36,874,934 | | | | (15,773,282 | ) | | | 110,888,051 | | | | (55,274,150 | ) | | | 70,384,953 | |
| | | | | | | | | | | | | | | | | | | | | | | | | | | | | | | | | | | | | | | | | | | | | | | | |
DISTRIBUTIONS TO SHAREHOLDERS FROM (NOTE 1): | | | | | | | | | | | | | | | | | | | | | | | | | | | | | | | | | | | | | | | | | | | | | | | | |
Net investment income | | | (8,294,405 | ) | | | (3,133,697 | ) | | | (24,720,654 | ) | | | (20,058,283 | ) | | | — | | | | — | | | | (1,889,698 | ) | | | (2,997,673 | ) | | | (6,661,132 | ) | | | (13,556,896 | ) | | | (18,066,459 | ) | | | (12,702,280 | ) |
Net realized gains | | | — | | | | — | | | | — | | | | — | | | | — | | | | — | | | | — | | | | — | | | | — | | | | — | | | | — | | | | — | |
| | | | | | | | | | | | | | | | | | | | | | | | | | | | | | | | | | | | | | | | | | | | | | | | |
Decrease in Net Assets From Distributions to Shareholders | | | (8,294,405 | ) | | | (3,133,697 | ) | | | (24,720,654 | ) | | | (28,058,283 | ) | | | — | | | | — | | | | (1,889,698 | ) | | | (2,997,673 | ) | | | (6,661,132 | ) | | | (13,556,896 | ) | | | (18,066,459 | ) | | | (12,702,280 | ) |
| | | | | | | | | | | | | | | | | | | | | | | | | | | | | | | | | | | | | | | | | | | | | | | | |
FUND SHARE TRANSACTIONS (NOTE 4): | | | | | | | | | | | | | | | | | | | | | | | | | | | | | | | | | | | | | | | | | | | | | | | | |
Net proceeds from sale of shares | | | 78,804,323 | | | | 270,250,580 | | | | 50,974,293 | | | | 199,832,147 | | | | 22,648,577 | | | | 51,632,925 | | | | 16,051,002 | | | | 51,786,373 | | | | 150,284,899 | | | | 67,559,954 | | | | 75,670,441 | | | | 147,739,601 | |
Reinvestment of distributions | | | 8,294,405 | | | | 3,133,697 | | | | 24,720,654 | | | | 28,058,283 | | | | — | | | | — | | | | 1,889,286 | | | | 2,997,673 | | | | 6,661,132 | | | | 13,556,896 | | | | 18,066,459 | | | | 12,702,280 | |
Cost of shares repurchased | | | (474,585,749 | ) | | | (336,526,822 | ) | | | (309,029,807 | ) | | | (261,174,590 | ) | | | (80,861,429 | ) | | | (94,209,909 | ) | | | (72,335,177 | ) | | | (69,289,295 | ) | | | (227,066,046 | ) | | | (437,420,269 | ) | | | (166,210,600 | ) | | | (185,941,119 | ) |
| | | | | | | | | | | | | | | | | | | | | | | | | | | | | | | | | | | | | | | | | | | | | | | | |
Increase (Decrease) in Net Assets From Fund Share Transactions | | | (387,487,021 | ) | | | (63,142,545 | ) | | | (233,334,860 | ) | | | (33,284,160 | ) | | | (58,212,852 | ) | | | (42,576,984 | ) | | | (54,394,889 | ) | | | (14,505,249 | ) | | | (70,120,015 | ) | | | (356,303,419 | ) | | | (72,473,700 | ) | | | (25,499,238 | ) |
| | | | | | | | | | | | | | | | | | | | | | | | | | | | | | | | | | | | | | | | | | | | | | | | |
Increase (Decrease) in Net Assets | | | (172,064,800 | ) | | | 242,604,054 | | | | (133,220,257 | ) | | | 118,112,712 | | | | (30,976,396 | ) | | | 16,287,646 | | | | (27,609,513 | ) | | | 19,372,012 | | | | (92,554,429 | ) | | | (258,972,264 | ) | | | (145,814,309 | ) | | | 32,183,435 | |
NET ASSETS: | | | | | | | | | | | | | | | | | | | | | | | | | | | | | | | | | | | | | | | | | | | | | | | | |
Beginning of year | | | 1,738,022,543 | | | | 1,495,418,489 | | | | 1,220,434,791 | | | | 1,102,322,079 | | | | 278,390,686 | | | | 262,103,040 | | | | 222,507,241 | | | | 203,135,229 | | | | 536,117,834 | | | | 795,090,098 | | | | 841,017,116 | | | | 808,833,681 | |
| | | | | | | | | | | | | | | | | | | | | | | | | | | | | | | | | | | | | | | | | | | | | | | | |
End of year*† | | $ | 1,565,957,743 | | | $ | 1,738,022,543 | | | $ | 1,087,214,534 | | | $ | 1,220,434,791 | | | $ | 247,414,290 | | | $ | 278,390,686 | | | $ | 194,897,728 | | | $ | 222,507,241 | | | $ | 443,563,405 | | | $ | 536,117,834 | | | $ | 695,202,807 | | | $ | 841,017,116 | |
| | | | | | | | | | | | | | | | | | | | | | | | | | | | | | | | | | | | | | | | | | | | | | | | |
* Includes undistributed net investment income of: | | $ | 6,647,674 | | | $ | 8,513,117 | | | $ | 15,567,504 | | | $ | 16,453,946 | | | | — | | | | — | | | $ | 1,858,564 | | | $ | 1,889,651 | | | $ | 6,839,235 | | | $ | 6,711,709 | | | $ | 12,060,825 | | | $ | 16,554,021 | |
| | | | | | | | | | | | | | | | | | | | | | | | | | | | | | | | | | | | | | | | | | | | | | | | |
† Includes accumulated net investment loss of: | | | — | | | | — | | | | — | | | | — | | | $ | (736,931 | ) | | | — | | | | — | | | | — | | | | — | | | | — | | | | — | | | | — | |
| | | | | | | | | | | | | | | | | | | | | | | | | | | | | | | | | | | | | | | | | | | | | | | | |
See Notes to Financial Statements.
144
Statements of Changes in Net Assets
For the Year Ended August 31, 2012 August 31, 2011
| | | | | | | | | | | | | | | | | | | | | | | | | | | | | | | | | | | | | | | | |
| | | Core
Fixed Income
Investments | | | High Yield
Investments | | | International
Fixed Income
Investments | | | Municipal Bond
Investments | | | Money Market
Investments | |
| | | 2012 | | | 2011 | | | 2012 | | | 2011 | | | 2012 | | | 2011 | | | 2012 | | | 2011 | | | 2012 | | | 2011 | |
OPERATIONS: | | | | | | | | | | | | | | | | | | | | | | | | | | | | | | | | | | | | | | | | |
Net investment income (loss) | | $ | 34,660,995 | | | $ | 32,869,408 | | | $ | 10,670,973 | | | $ | 16,871,483 | | | $ | 7,999,242 | | | $ | 6,241,666 | | | $ | 2,888,817 | | | $ | 2,942,778 | | | $ | 59,036 | | | $ | 3,151 | |
Net realized gain (loss) | | | 45,797,815 | | | | 8,302,500 | | | | (4,673,833 | ) | | | 6,625,511 | | | | 24,700,618 | | | | (11,806,799 | ) | | | 1,247,270 | | | | (15,290 | ) | | | 5,871 | | | | 986 | |
Change in net unrealized appreciation (depreciation) | | | 9,265,433 | | | | (24,738 | ) | | | 6,130,587 | | | | (6,383,907 | ) | | | (5,394,480 | ) | | | 8,375,508 | | | | 3,054,364 | | | | (1,080,197 | ) | | | — | | | | — | |
| | | | | | | | | | | | | | | | | | | | | | | | | | | | | | | | | | | | | | | | |
Increase (Decrease) in Net Assets From Operations | | | 89,724,243 | | | | 41,147,170 | | | | 12,127,727 | | | | 17,113,087 | | | | 27,305,380 | | | | 2,810,375 | | | | 7,190,451 | | | | 1,847,291 | | | | 64,907 | | | | 4,137 | |
| | | | | | | | | | | | | | | | | | | | | | | | | | | | | | | | | | | | | | | | |
DISTRIBUTIONS TO SHAREHOLDERS FROM (NOTE 1): | | | | | | | | | | | | | | | | | | | | | | | | | | | | | | | | | | | | | | | | |
Net investment income | | | (38,112,222 | ) | | | (34,164,850 | ) | | | (12,483,168 | ) | | | (17,008,732 | ) | | | (1,284,299 | ) | | | (12,802,845 | ) | | | (2,888,713 | ) | | | (2,942,635 | ) | | | (59,001 | ) | | | (3,155 | ) |
Net realized gains | | | (10,147,005 | ) | | | (30,133,209 | ) | | | — | | | | — | | | | — | | | | — | | | | — | | | | — | | | | — | | | | (13,621 | ) |
| | | | | | | | | | | | | | | | | | | | | | | | | | | | | | | | | | | | | | | | |
Decrease in Net Assets From Distributions to Shareholders | | | (48,259,227 | ) | | | (64,298,059 | ) | | | (12,483,168 | ) | | | (17,008,732 | ) | | | (1,284,299 | ) | | | (12,802,845 | ) | | | (2,888,713 | ) | | | (2,942,635 | ) | | | (59,001 | ) | | | (16,776 | ) |
| | | | | | | | | | | | | | | | | | | | | | | | | | | | | | | | | | | | | | | | |
FUND SHARE TRANSACTIONS (NOTE 4): | | | | | | | | | | | | | | | | | | | | | | | | | | | | | | | | | | | | | | | | |
Net proceeds from sale of shares | | | 320,711,752 | | | | 227,961,080 | | | | 163,104,819 | | | | 39,620,418 | | | | 227,373,965 | | | | 52,103,680 | | | | 32,848,538 | | | | 26,043,070 | | | | 293,627,375 | | | | 114,041,013 | |
Reinvestment of distributions | | | 48,259,553 | | | | 64,293,061 | | | | 12,483,271 | | | | 17,006,873 | | | | 1,284,299 | | | | 12,802,844 | | | | 2,888,768 | | | | 2,942,386 | | | | 58,949 | | | | 16,775 | |
Cost of shares repurchased | | | (456,181,435 | ) | | | (202,478,811 | ) | | | (104,844,963 | ) | | | (48,232,524 | ) | | | (50,955,234 | ) | | | (47,746,313 | ) | | | (38,831,946 | ) | | | (32,010,951 | ) | | | (174,430,607 | ) | | | (120,488,142 | ) |
| | | | | | | | | | | | | | | | | | | | | | | | | | | | | | | | | | | | | | | | |
Increase (Decrease) in Net Assets From Fund Share Transactions | | | (87,210,130 | ) | | | 89,775,330 | | | | 70,743,127 | | | | 8,394,767 | | | | 177,703,030 | | | | 17,160,211 | | | | (3,094,640 | ) | | | (3,025,495 | ) | | | 119,255,717 | | | | (6,430,354 | ) |
| | | | | | | | | | | | | | | | | | | | | | | | | | | | | | | | | | | | | | | | |
Increase (Decrease) in Net Assets | | | (45,745,114 | ) | | | 66,624,441 | | | | 70,387,686 | | | | 8,499,122 | | | | 203,724,111 | | | | 7,167,741 | | | | 1,207,098 | | | | (4,120,839 | ) | | | 119,261,623 | | | | (6,442,993 | ) |
NET ASSETS: | | | | | | | | | | | | | | | | | | | | | | | | | | | | | | | | | | | | | | | | |
Beginning of year | | | 1,067,376,737 | | | | 1,000,752,296 | | | | 198,355,826 | | | | 189,856,704 | | | | 227,425,647 | | | | 220,257,906 | | | | 87,513,595 | | | | 91,634,434 | | | | 118,791,700 | | | | 125,234,693 | |
| | | | | | | | | | | | | | | | | | | | | | | | | | | | | | | | | | | | | | | | |
End of year*† | | $ | 1,021,631,623 | | | $ | 1,067,376,737 | | | $ | 268,743,512 | | | $ | 198,355,826 | | | $ | 431,149,758 | | | $ | 227,425,647 | | | $ | 88,720,693 | | | $ | 87,513,595 | | | $ | 238,053,323 | | | $ | 118,791,700 | |
| | | | | | | | | | | | | | | | | | | | | | | | | | | | | | | | | | | | | | | | |
* Includes undistributed net investment income of: | | $ | 9,443,322 | | | $ | 4,578,943 | | | $ | 809,714 | | | $ | 1,962,680 | | | $ | 28,944,093 | | | | — | | | $ | 144,126 | | | $ | 144,022 | | | $ | 35 | | | | — | |
| | | | | | | | | | | | | | | | | | | | | | | | | | | | | | | | | | | | | | | | |
† Includes accumulated net investment loss of: | | $ | — | | | $ | — | | | $ | — | | | $ | — | | | $ | — | | | $ | (1,055,003 | ) | | $ | — | | | $ | — | | | $ | — | | | $ | — | |
| | | | | | | | | | | | | | | | | | | | | | | | | | | | | | | | | | | | | | | | |
See Notes to Financial Statements.
145
Financial Highlights
For a share of beneficial interest outstanding throughout each year ended August 31, unless otherwise noted:
Large Capitalization Growth Investments
| | | | | | | | | | | | | | | | | | | | |
| | | 2012 | | | 2011 | | | 2010 | | | 2009 | | | 2008 | |
Net asset value, Beginning of Year | | $ | 14.24 | | | $ | 11.80 | | | $ | 11.15 | | | $ | 14.66 | | | $ | 15.45 | |
| | | | | | | | | | | | | | | | | | | | |
Income (Loss) from Operations: | | | | | | | | | | | | | | | | | | | | |
Net investment income(1) | | | 0.06 | | | | 0.07 | | | | 0.03 | | | | 0.04 | | | | 0.03 | |
Net realized and unrealized gain (loss) | | | 2.17 | | | | 2.40 | | | | 0.68 | | | | (3.35 | ) | | | (0.55 | ) |
| | | | | | | | | | | | | | | | | | | | |
Total Income (Loss) from Operations | | | 2.23 | | | | 2.47 | | | | 0.71 | | | | (3.31 | ) | | | (0.52 | ) |
| | | | | | | | | | | | | | | | | | | | |
Less Distributions From: | | | | | | | | | | | | | | | | | | | | |
Net investment income | | | (0.08 | ) | | | (0.03 | ) | | | (0.06 | ) | | | (0.03 | ) | | | (0.03 | ) |
Net realized gain | | | — | | | | — | | | | — | | | | (0.17 | ) | | | (0.24 | ) |
| | | | | | | | | | | | | | | | | | | | |
Total Distributions | | | (0.08 | ) | | | (0.03 | ) | | | (0.06 | ) | | | (0.20 | ) | | | (0.27 | ) |
| | | | | | | | | | | | | | | | | | | | |
Net Asset Value, End of Year | | $ | 16.39 | | | $ | 14.24 | | | $ | 11.80 | | | $ | 11.15 | | | $ | 14.66 | |
| | | | | | | | | | | | | | | | | | | | |
Total Return(2) | | | 15.71 | % | | | 20.89 | % | | | 6.30 | % | | | (22.25 | )% | | | (3.52 | )% |
Net Assets, End of Year (millions) | | $ | 1,566 | | | $ | 1,738 | | | $ | 1,495 | | | $ | 1,310 | | | $ | 2,214 | |
Ratios of Average Net Assets: | | | | | | | | | | | | | | | | | | | | |
Gross expenses | | | 0.69 | % | | | 0.68 | % | | | 0.70 | % | | | 0.71 | % | | | 0.69 | % |
Net expenses | | | 0.69 | | | | 0.68 | | | | 0.70 | (3) | | | 0.71 | (3) | | | 0.69 | (3) |
Net investment income (loss) | | | 0.40 | | | | 0.47 | | | | 0.22 | | | | 0.44 | | | | 0.18 | |
Portfolio Turnover Rate | | | 66 | % | | | 76 | % | | | 92 | % | | | 113 | % | | | 79 | % |
| (1) | Per share amounts have been calculated using the average shares method. |
| (2) | Performance figures may reflect fee waivers and/or expense reimbursements and assume reinvestment of dividend distribution. In the absence of fee waivers and/or expense reimbursements, the total return would have been lower. Applicable advisory program charges, which in the case of TRAK® may be up to 2.00%, are not reflected in the performance data and would reduce the total returns. Past performance is no guarantee of future results. |
| (3) | Reflects fee waivers and/or expense reimbursements. |
Large Capitalization Value Equity Investments
| | | | | | | | | | | | | | | | | | | | |
| | | 2012 | | | 2011 | | | 2010 | | | 2009 | | | 2008 | |
Net asset value, Beginning of Year | | $ | 8.58 | | | $ | 7.54 | | | $ | 7.34 | | | $ | 9.88 | | | $ | 12.87 | |
| | | | | | | | | | | | | | | | | | | | |
Income (Loss) from Operations: | | | | | | | | | | | | | | | | | | | | |
Net investment income(1) | | | 0.19 | | | | 0.17 | | | | 0.19 | | | | 0.22 | | | | 0.23 | |
Net realized and unrealized gain (loss) | | | 0.87 | | | | 1.07 | | | | 0.23 | | | | (2.55 | ) | | | (1.92 | ) |
| | | | | | | | | | | | | | | | | | | | |
Total Income (Loss) from Operations | | | 1.06 | | | | 1.24 | | | | 0.42 | | | | (2.33 | ) | | | (1.69 | ) |
| | | | | | | | | | | | | | | | | | | | |
Less Distributions From: | | | | | | | | | | | | | | | | | | | | |
Net investment income | | | (0.20 | ) | | | (0.20 | ) | | | (0.22 | ) | | | (0.21 | ) | | | (0.23 | ) |
Net realized gain | | | — | | | | — | | | | — | | | | — | | | | (1.07 | ) |
| | | | | | | | | | | | | | | | | | | | |
Total Distributions | | | (0.20 | ) | | | (0.20 | ) | | | (0.22 | ) | | | (0.21 | ) | | | (1.30 | ) |
| | | | | | | | | | | | | | | | | | | | |
Net Asset Value, End of Year | | $ | 9.44 | | | $ | 8.58 | | | $ | 7.54 | | | $ | 7.34 | | | $ | 9.88 | |
| | | | | | | | | | | | | | | | | | | | |
Total Return(2) | | | 12.50 | % | | | 16.46 | % | | | 5.67 | % | | | (23.14 | )% | | | (14.23 | )% |
Net Assets, End of Year (millions) | | $ | 1,087 | | | $ | 1,220 | | | $ | 1,102 | | | $ | 1,273 | | | $ | 1,972 | |
Ratios of Average Net Assets: | | | | | | | | | | | | | | | | | | | | |
Gross expenses | | | 0.69 | % | | | 0.68 | % | | | 0.69 | % | | | 0.72 | % | | | 0.69 | % |
Net expenses | | | 0.69 | | | | 0.68 | | | | 0.69 | (3) | | | 0.71 | (3) | | | 0.67 | (3) |
Net investment income | | | 2.15 | | | | 1.95 | | | | 2.43 | | | | 3.30 | | | | 2.12 | |
Portfolio Turnover Rate | | | 32 | % | | | 38 | % | | | 104 | % | | | 97 | % | | | 55 | % |
| (1) | Per share amounts have been calculated using the average shares method. |
| (2) | Performance figures may reflect fee waivers and/or expense reimbursements and assume reinvestment of dividend distribution. In the absence of fee waivers and/or expense reimbursements, the total return would have been lower. Applicable advisory program charges, which in the case of TRAK® may be up to 2.00%, are not reflected in the performance data and would reduce the total returns. Past performance is no guarantee of future results. |
| (3) | Reflects fee waivers and/or expense reimbursements. |
See Notes to Financial Statements.
146
Financial Highlights
(continued)
For a share of beneficial interest outstanding throughout each year ended August 31, unless otherwise noted:
Small Capitalization Growth Investments
| | | | | | | | | | | | | | | | | | | | |
| | | 2012 | | | 2011 | | | 2010 | | | 2009 | | | 2008 | |
Net asset value, Beginning of Year | | $ | 17.76 | | | $ | 14.62 | | | $ | 12.99 | | | $ | 17.32 | | | $ | 18.28 | |
| | | | | | | | | | | | | | | | | | | | |
Income (Loss) from Operations: | | | | | | | | | | | | | | | | | | | | |
Net investment income(1) | | | (0.07 | ) | | | (0.07 | ) | | | (0.09 | ) | | | (0.07 | ) | | | (0.09 | ) |
Net realized and unrealized gain (loss) | | | 2.12 | | | | 3.21 | | | | 1.72 | | | | (4.26 | ) | | | (0.87 | ) |
| | | | | | | | | | | | | | | | | | | | |
Total Income (Loss) from Operations | | | 2.05 | | | | 3.14 | | | | 1.63 | | | | (4.33 | ) | | | (0.96 | ) |
| | | | | | | | | | | | | | | | | | | | |
Net Asset Value, End of Year | | $ | 19.81 | | | $ | 17.76 | | | $ | 14.62 | | | $ | 12.99 | | | $ | 17.32 | |
| | | | | | | | | | | | | | | | | | | | |
Total Return(2) | | | 11.54 | % | | | 21.48 | % | | | 12.55 | % | | | (25.00 | )% | | | (5.25 | )% |
Net Assets, End of Year (millions) | | $ | 247 | | | $ | 278 | | | $ | 262 | | | $ | 371 | | | $ | 458 | |
Ratios of Average Net Assets: | | | | | | | | | | | | | | | | | | | | |
Gross expenses | | | 0.98 | % | | | 0.95 | % | | | 0.99 | % | | | 1.08 | % | | | 1.00 | % |
Net expenses | | | 0.97 | (3) | | | 0.93 | (3) | | | 0.98 | (3) | | | 1.07 | (3) | | | 0.99 | (3) |
Net investment income (loss) | | | (0.40 | ) | | | (0.37 | ) | | | (0.56 | ) | | | (0.59 | ) | | | (0.51 | ) |
Portfolio Turnover Rate | | | 68 | % | | | 73 | % | | | 84 | % | | | 73 | % | | | 66 | % |
| (1) | Per share amounts have been calculated using the average shares method. |
| (2) | Performance figures may reflect fee waivers and/or expense reimbursements and assume reinvestment of dividend distribution. In the absence of fee waivers and/or expense reimbursements, the total return would have been lower. Applicable advisory program charges, which in the case of TRAK® may be up to 2.00%, are not reflected in the performance data and would reduce the total returns. Past performance is no guarantee of future results. |
| (3) | Reflects fee waivers and/or expense reimbursements. |
Small Capitalization Value Equity Investments
| | | | | | | | | | | | | | | | | | | | |
| | | 2012 | | | 2011 | | | 2010 | | | 2009 | | | 2008 | |
Net asset value, Beginning of Year | | $ | 11.20 | | | $ | 9.57 | | | $ | 8.67 | | | $ | 10.65 | | | $ | 13.51 | |
| | | | | | | | | | | | | | | | | | | | |
Income (Loss) from Operations: | | | | | | | | | | | | | | | | | | | | |
Net investment income(1) | | | 0.11 | | | | 0.10 | | | | 0.08 | | | | 0.11 | | | | 0.12 | |
Net realized and unrealized gain (loss) | | | 1.77 | | | | 1.68 | | | | 0.90 | | | | (1.63 | ) | | | (0.89 | ) |
| | | | | | | | | | | | | | | | | | | | |
Total Income (Loss) from Operations | | | 1.88 | | | | 1.78 | | | | 0.98 | | | | (1.52 | ) | | | (0.77 | ) |
| | | | | | | | | | | | | | | | | | | | |
Less Distributions From: | | | | | | | | | | | | | | | | | | | | |
Net investment income | | | (0.11 | ) | | | (0.15 | ) | | | (0.08 | ) | | | (0.07 | ) | | | (0.10 | ) |
Net realized gain | | | — | | | | — | | | | — | | | | (0.39 | ) | | | (1.99 | ) |
| | | | | | | | | | | | | | | | | | | | |
Total Distributions | | | (0.11 | ) | | | (0.15 | ) | | | (0.08 | ) | | | (0.46 | ) | | | (2.09 | ) |
| | | | | | | | | | | | | | | | | | | | |
Net Asset Value, End of Year | | $ | 12.97 | | | $ | 11.20 | | | $ | 9.57 | | | $ | 8.67 | | | $ | 10.65 | |
| | | | | | | | | | | | | | | | | | | | |
Total Return(2) | | | 16.93 | % | | | 18.52 | % | | | 11.35 | % | | | (12.73 | )% | | | (5.36 | )% |
Net Assets, End of Year (millions) | | $ | 195 | | | $ | 223 | | | $ | 203 | | | $ | 374 | | | $ | 379 | |
Ratios of Average Net Assets: | | | | | | | | | | | | | | | | | | | | |
Gross expenses | | | 0.99 | % | | | 0.98 | % | | | 0.98 | % | | | 1.09 | % | | | 1.01 | % |
Net expenses | | | 0.98 | (3) | | | 0.95 | (3) | | | 0.97 | (3) | | | 1.08 | (3) | | | 0.99 | (3) |
Net investment income | | | 0.91 | | | | 0.85 | | | | 0.86 | | | | 1.54 | | | | 1.07 | |
Portfolio Turnover Rate | | | 24 | % | | | 36 | % | | | 25 | % | | | 53 | % | | | 39 | % |
| (1) | Per share amounts have been calculated using the average shares method. |
| (2) | Performance figures may reflect fee waivers and/or expense reimbursements and assume reinvestment of dividend distribution. In the absence of fee waivers and/or expense reimbursements, the total return would have been lower. Applicable advisory program charges, which in the case of TRAK® may be up to 2.00%, are not reflected in the performance data and would reduce the total returns. Past performance is no guarantee of future results. |
| (3) | Reflects fee waivers and/or expense reimbursements. |
See Notes to Financial Statements.
147
Financial Highlights
(continued)
For a share of beneficial interest outstanding throughout each year ended August 31, unless otherwise noted:
International Equity Investments
| | | | | | | | | | | | | | | | | | | | |
| | | 2012 | | | 2011 | | | 2010 | | | 2009 | | | 2008 | |
Net asset value, Beginning of Year | | $ | 9.77 | | | $ | 9.02 | | | $ | 8.97 | | | $ | 11.90 | | | $ | 15.57 | |
| | | | | | | | | | | | | | | | | | | | |
Income (Loss) from Operations: | | | | | | | | | | | | | | | | | | | | |
Net investment income(1) | | | 0.17 | | | | 0.15 | | | | 0.14 | | | | 0.15 | | | | 0.30 | |
Net realized and unrealized gain (loss) | | | (0.18 | ) | | | 0.76 | | | | 0.15 | | | | (2.32 | ) | | | (2.61 | ) |
| | | | | | | | | | | | | | | | | | | | |
Total Income (Loss) from Operations | | | (0.01 | ) | | | 0.91 | | | | 0.29 | | | | (2.17 | ) | | | (2.31 | ) |
| | | | | | | | | | | | | | | | | | | | |
Less Distributions From: | | | | | | | | | | | | | | | | | | | | |
Net investment income | | | (0.18 | ) | | | (0.16 | ) | | | (0.24 | ) | | | (0.30 | ) | | | (0.21 | ) |
Net realized gain | | | — | | | | — | | | | — | | | | (0.46 | ) | | | (1.15 | ) |
| | | | | | | | | | | | | | | | | | | | |
Total Distributions | | | (0.18 | ) | | | (0.16 | ) | | | (0.24 | ) | | | (0.76 | ) | | | (1.36 | ) |
| | | | | | | | | | | | | | | | | | | | |
Net Asset Value, End of Year | | $ | 9.58 | | | $ | 9.77 | | | $ | 9.02 | | | $ | 8.97 | | | $ | 11.90 | |
| | | | | | | | | | | | | | | | | | | | |
Total Return(2) | | | (0.06 | )% | | | 9.97 | % | | | 3.12 | % | | | (15.48 | )% | | | (16.23 | )% |
Net Assets, End of Year (millions) | | $ | 444 | | | $ | 536 | | | $ | 795 | | | $ | 725 | | | $ | 1,407 | |
Ratios of Average Net Assets: | | | | | | | | | | | | | | | | | | | | |
Gross expenses | | | 0.91 | % | | | 0.84 | % | | | 0.85 | % | | | 0.91 | % | | | 0.83 | % |
Net expenses | | | 0.90 | (3) | | | 0.82 | (3) | | | 0.84 | (3) | | | 0.90 | (3) | | | 0.77 | (3) |
Net investment income | | | 1.80 | | | | 1.41 | | | | 1.52 | | | | 1.98 | | | | 2.16 | |
Portfolio Turnover Rate | | | 75 | % | | | 70 | % | | | 73 | % | | | 72 | % | | | 124 | % |
| (1) | Per share amounts have been calculated using the average shares method. |
| (2) | Performance figures may reflect fee waivers and/or expense reimbursements and assume reinvestment of dividend distribution. In the absence of fee waivers and/or expense reimbursements, the total return would have been lower. Applicable advisory program charges, which in the case of TRAK® may be up to 2.00%, are not reflected in the performance data and would reduce the total returns. Past performance is no guarantee of future results. |
| (3) | Reflects fee waivers and/or expense reimbursements. |
Emerging Markets Equity Investments
| | | | | | | | | | | | | | | | | | | | |
| | | 2012 | | | 2011 | | | 2010 | | | 2009 | | | 2008 | |
Net asset value, Beginning of Year | | $ | 15.85 | | | $ | 14.79 | | | $ | 12.80 | | | $ | 15.36 | | | $ | 19.19 | |
| | | | | | | | | | | | | | | | | | | | |
Income (Loss) from Operations: | | | | | | | | | | | | | | | | | | | | |
Net investment income(1) | | | 0.29 | | | | 0.31 | | | | 0.23 | | | | 0.19 | | | | 0.23 | |
Net realized and unrealized gain (loss) | | | (1.33 | ) | | | 0.99 | | | | 1.90 | | | | (2.39 | ) | | | (2.24 | ) |
| | | | | | | | | | | | | | | | | | | | |
Total Income (Loss) from Operations | | | (1.04 | ) | | | 1.30 | | | | 2.13 | | | | (2.20 | ) | | | (2.01 | ) |
| | | | | | | | | | | | | | | | | | | | |
Less Distributions From: | | | | | | | | | | | | | | | | | | | | |
Net investment income | | | (0.35 | ) | | | (0.24 | ) | | | (0.14 | ) | | | (0.08 | ) | | | (0.35 | ) |
Net realized gain | | | — | | | | — | | | | — | | | | (0.28 | ) | | | (1.47 | ) |
| | | | | | | | | | | | | | | | | | | | |
Total Distributions | | | (0.35 | ) | | | (0.24 | ) | | | (0.14 | ) | | | (0.36 | ) | | | (1.82 | ) |
| | | | | | | | | | | | | | | | | | | | |
Net Asset Value, End of Year | | $ | 14.46 | | | $ | 15.85 | | | $ | 14.79 | | | $ | 12.80 | | | $ | 15.36 | |
| | | | | | | | | | | | | | | | | | | | |
Total Return(2) | | | (6.52 | )% | | | 8.67 | % | | | 16.69 | % | | | (12.86 | )% | | | (12.37 | )% |
Net Assets, End of Year (millions) | | $ | 695 | | | $ | 841 | | | $ | 809 | | | $ | 671 | | | $ | 634 | |
Ratio of Average Net Assets: | | | | | | | | | | | | | | | | | | | | |
Gross expenses | | | 1.06 | % | | | 1.05 | % | | | 1.08 | % | | | 1.12 | % | | | 1.08 | % |
Net expenses | | | 0.93 | (3) | | | 0.91 | (3) | | | 0.94 | (3) | | | 0.98 | (3) | | | 0.93 | (3) |
Net investment income | | | 1.98 | | | | 1.87 | | | | 1.57 | | | | 1.87 | | | | 1.24 | |
Portfolio Turnover Rate | | | 40 | % | | | 42 | % | | | 53 | % | | | 133 | % | | | 74 | % |
| (1) | Per share amounts have been calculated using the average shares method. |
| (2) | Performance figures may reflect fee waivers and/or expense reimbursements and assume reinvestment of dividend distribution. In the absence of fee waivers and/or expense reimbursements, the total return would have been lower. Applicable advisory program charges, which in the case of TRAK® may be up to 2.00%, are not reflected in the performance data and would reduce the total returns. Past performance is no guarantee of future results. |
| (3) | Reflects fee waivers and/or expense reimbursements. |
See Notes to Financial Statements.
148
Financial Highlights
(continued)
For a share of beneficial interest outstanding throughout each year ended August 31, unless otherwise noted:
Core Fixed Income Investments
| | | | | | | | | | | | | | | | | | | | |
| | | 2012 | | | 2011 | | | 2010 | | | 2009 | | | 2008 | |
Net asset value, Beginning of Year | | $ | 8.58 | | | $ | 8.81 | | | $ | 8.25 | | | $ | 8.05 | | | $ | 8.07 | |
| | | | | | | | | | | | | | | | | | | | |
Income (Loss) from Operations: | |
Net investment income(1) | | | 0.25 | | | | 0.28 | | | | 0.32 | | | | 0.39 | | | | 0.38 | |
Net realized and unrealized gain (loss) | | | 0.38 | | | | 0.05 | | | | 0.71 | | | | 0.36 | | | | 0.01 | |
| | | | | | | | | | | | | | | | | | | | |
Total Income from Operations | | | 0.63 | | | | 0.33 | | | | 1.03 | | | | 0.75 | | | | 0.39 | |
| | | | | | | | | | | | | | | | | | | | |
Less Distributions From: | |
Net investment income | | | (0.27 | ) | | | (0.29 | ) | | | (0.33 | ) | | | (0.40 | ) | | | (0.41 | ) |
Net realized gain | | | (0.07 | ) | | | (0.27 | ) | | | (0.14 | ) | | | (0.15 | ) | | | — | |
| | | | | | | | | | | | | | | | | | | | |
Total Distributions | | | (0.34 | ) | | | (0.56 | ) | | | (0.47 | ) | | | (0.55 | ) | | | (0.41 | ) |
| | | | | | | | | | | | | | | | | | | | |
Net Asset Value, End of Year | | $ | 8.87 | | | $ | 8.58 | | | $ | 8.81 | | | $ | 8.25 | | | $ | 8.05 | |
| | | | | | | | | | | | | | | | | | | | |
Total Return(2) | | | 7.58 | % | | | 3.93 | % | | | 12.93 | % | | | 9.96 | % | | | 4.78 | % |
Net Assets, End of Year (millions) | | $ | 1,022 | | | $ | 1,067 | | | $ | 1,001 | | | $ | 872 | | | $ | 953 | |
Ratios of Average Net Assets: | |
Gross expenses | | | 0.52 | % | | | 0.52 | % | | | 0.53 | %(3) | | | 0.54 | %(3) | | | 0.52 | %(3) |
Net expenses | | | 0.52 | (4) | | | 0.52 | (4) | | | 0.53 | (3)(4) | | | 0.53 | (3)(4) | | | 0.52 | (3)(4) |
Net investment income | | | 2.85 | | | | 3.23 | | | | 3.79 | | | | 4.98 | | | | 4.56 | |
Portfolio Turnover Rate | | | 429 | % | | | 390 | % | | | 257 | % | | | 374 | % | | | 346 | % |
| (1) | Per share amounts have been calculated using the average shares method. |
| (2) | Performance figures may reflect fee waivers and/or expense reimbursements and assume reinvestment of dividend distribution. In the absence of fee waivers and/or expense reimbursements, the total return would have been lower. Applicable advisory program charges, which in the case of TRAK® may be up to 2.00%, are not reflected in the performance data and would reduce the total returns. Past performance is no guarantee of future results. |
| (3) | Ratio includes interest expense on forward sale commitments which represents less than 0.01%, 0. 01% and 0.01%, respectively. |
| (4) | Reflects fee waivers and/or expense reimbursements. |
High Yield Investments
| | | | | | | | | | | | | | | | | | | | |
| | | 2012 | | | 2011 | | | 2010 | | | 2009 | | | 2008 | |
Net asset value, Beginning of Year | | $ | 4.15 | | | $ | 4.14 | | | $ | 3.77 | | | $ | 4.13 | | | $ | 4.58 | |
| | | | | | | | | | | | | | | | | | | | |
Income (Loss) from Operations: | | | | | | | | | | | | | | | | | | | | |
Net investment income(1) | | | 0.29 | | | | 0.36 | | | | 0.37 | | | | 0.37 | | | | 0.39 | |
Net realized and unrealized gain (loss) | | | 0.16 | | | | 0.02 | | | | 0.38 | | | | (0.35 | ) | | | (0.46 | ) |
| | | | | | | | | | | | | | | | | | | | |
Total Income (Loss) from Operations | | | 0.45 | | | | 0.38 | | | | 0.75 | | | | 0.02 | | | | (0.07 | ) |
| | | | | | | | | | | | | | | | | | | | |
Less Distributions From: | | | | | | | | | | | | | | | | | | | | |
Net investment income | | | (0.36 | ) | | | (0.37 | ) | | | (0.38 | ) | | | (0.38 | ) | | | (0.38 | ) |
| | | | | | | | | | | | | | | | | | | | |
Total Distributions | | | (0.36 | ) | | | (0.37 | ) | | | (0.38 | ) | | | (0.38 | ) | | | (0.38 | ) |
| | | | | | | | | | | | | | | | | | | | |
Net Asset Value, End of Year | | $ | 4.24 | | | $ | 4.15 | | | $ | 4.14 | | | $ | 3.77 | | | $ | 4.13 | |
| | | | | | | | | | | | | | | | | | | | |
Total Return(2) | | | 11.57 | % | | | 9.01 | % | | | 20.41 | % | | | 2.48 | % | | | (1.69 | )% |
Net Assets, End of Year (millions) | | $ | 269 | | | $ | 198 | | | $ | 190 | | | $ | 153 | | | $ | 130 | |
Ratios of Average Net Assets: | | | | | | | | | | | | | | | | | | | | |
Gross expenses | | | 0.97 | % | | | 0.88 | % | | | 0.95 | % | | | 0.97 | % | | | 0.90 | % |
Net expenses(3) | | | 0.81 | | | | 0.72 | | | | 0.79 | | | | 0.81 | | | | 0.74 | |
Net investment income (loss) | | | 7.58 | | | | 8.26 | | | | 9.06 | | | | 11.24 | | | | 8.78 | |
Portfolio Turnover Rate | | | 101 | % | | | 62 | % | | | 74 | % | | | 68 | % | | | 73 | % |
| (1) | Per share amounts have been calculated using the average shares method. |
| (2) | Performance figures may reflect fee waivers and/or expense reimbursements and assume reinvestment of dividend distribution. In the absence of fee waivers and/or expense reimbursements, the total return would have been lower. Applicable advisory program charges, which in the case of TRAK® may be up to 2.00%, are not reflected in the performance data and would reduce the total returns. Past performance is no guarantee of future results. |
| (3) | Reflects fee waivers and/or expense reimbursements. |
See Notes to Financial Statements.
149
Financial Highlights
(continued)
For a share of beneficial interest outstanding throughout each year ended August 31, unless otherwise noted:
International Fixed Income Investments
| | | | | | | | | | | | | | | | | | | | |
| | | 2012 | | | 2011 | | | 2010 | | | 2009 | | | 2008 | |
Net asset value, Beginning of Year | | $ | 7.99 | | | $ | 8.41 | | | $ | 7.77 | | | $ | 7.86 | | | $ | 7.67 | |
| | | | | | | | | | | | | | | | | | | | |
Income (Loss) from Operations: | | | | | | | | | | | | | | | | | | | | |
Net investment income(1) | | | 0.19 | | | | 0.23 | | | | 0.19 | | | | 0.30 | | | | 0.32 | |
Net realized and unrealized gain (loss) | | | 0.41 | | | | (0.15 | ) | | | 0.83 | | | | 0.31 | | | | 0.05 | |
| | | | | | | | | | | | | | | | | | | | |
Total Income from Operations | | | 0.60 | | | | 0.08 | | | | 1.02 | | | | 0.61 | | | | 0.37 | |
| | | | | | | | | | | | | | | | | | | | |
Less Distributions From: | | | | | | | | | | | | | | | | | | | | |
Net investment income | | | (0.03 | ) | | | (0.50 | ) | | | (0.38 | ) | | | (0.70 | ) | | | (0.18 | ) |
| | | | | | | | | | | | | | | | | | | | |
Total Distributions | | | (0.03 | ) | | | (0.50 | ) | | | (0.38 | ) | | | (0.70 | ) | | | (0.18 | ) |
| | | | | | | | | | | | | | | | | | | | |
Net Asset Value, End of Year | | $ | 8.56 | | | $ | 7.99 | | | $ | 8.41 | | | $ | 7.77 | | | $ | 7.86 | |
| | | | | | | | | | | | | | | | | | | | |
Total Return(2) | | | 7.53 | % | | | 1.21 | % | | | 13.55 | % | | | 8.54 | % | | | 4.90 | % |
Net Assets, End of Year (millions) | | $ | 431 | | | $ | 227 | | | $ | 220 | | | $ | 197 | | | $ | 286 | |
Ratios of Average Net Assets: | | | | | | | | | | | | | | | | | | | | |
Gross expenses | | | 0.64 | % | | | 0.72 | % | | | 0.79 | % | | | 0.79 | %(3) | | | 0.70 | %(3) |
Net expenses | | | 0.63 | (4) | | | 0.72 | (4) | | | 0.79 | | | | 0.79 | (3) | | | 0.70 | (3) |
Net investment income (loss) | | | 2.25 | | | | 2.86 | | | | 2.44 | | | | 4.00 | | | | 4.12 | |
Portfolio Turnover Rate | | | 223 | % | | | 150 | % | | | 93 | % | | | 263 | % | | | 263 | % |
| (1) | Per share amounts have been calculated using the average shares method. |
| (2) | Performance figures may reflect fee waivers and/or expense reimbursements and assume reinvestment of dividend distribution. In the absence of fee waivers and/or expense reimbursements, the total return would have been lower. Applicable advisory program charges, which in the case of TRAK® may be up to 2.00%, are not reflected in the performance data and would reduce the total returns. Past performance is no guarantee of future results. |
| (3) | Ratio includes interest expense on forward sale commitments which represents less than 0.01% and 0.01%, respectively. |
| (4) | Reflects fee waivers and/or expense reimbursements. |
Municipal Bond Investments
| | | | | | | | | | | | | | | | | | | | |
| | | 2012 | | | 2011 | | | 2010 | | | 2009 | | | 2008 | |
Net asset value, Beginning of Year | | $ | 9.48 | | | $ | 9.63 | | | $ | 9.09 | | | $ | 8.92 | | | $ | 8.94 | |
| | | | | | | | | | | | | | | | | | | | |
Income (Loss) from Operations: | | | | | | | | | | | | | | | | | | | | |
Net investment income(1) | | | 0.28 | | | | 0.30 | | | | 0.31 | | | | 0.34 | | | | 0.33 | |
Net realized and unrealized gain (loss) | | | 0.40 | | | | (0.15 | ) | | | 0.54 | | | | 0.17 | | | | (0.02 | ) |
| | | | | | | | | | | | | | | | | | | | |
Total Income (Loss) from Operations | | | 0.68 | | | | 0.15 | | | | 0.85 | | | | 0.51 | | | | 0.31 | |
| | | | | | | | | | | | | | | | | | | | |
Less Distributions From: | | | | | | | | | | | | | | | | | | | | |
Net investment income | | | (0.28 | ) | | | (0.30 | ) | | | (0.31 | ) | | | (0.34 | ) | | | (0.33 | ) |
| | | | | | | | | | | | | | | | | | | | |
Total Distributions | | | (0.28 | ) | | | (0.30 | ) | | | (0.31 | ) | | | (0.34 | ) | | | (0.33 | ) |
| | | | | | | | | | | | | | | | | | | | |
Net Asset Value, End of Year | | $ | 9.88 | | | $ | 9.48 | | | $ | 9.63 | | | $ | 9.09 | | | $ | 8.92 | |
| | | | | | | | | | | | | | | | | | | | |
Total Return(2) | | | 7.23 | % | | | 1.71 | % | | | 9.59 | % | | | 5.98 | % | | | 3.48 | % |
Net Assets, End of Year (millions) | | $ | 89 | | | $ | 88 | | | $ | 92 | | | $ | 84 | | | $ | 101 | |
Ratios of Average Net Assets: | | | | | | | | | | | | | | | | | | | | |
Gross expenses | | | 0.57 | % | | | 0.58 | % | | | 0.62 | % | | | 0.56 | % | | | 0.56 | % |
Net expenses | | | 0.57 | | | | 0.58 | | | | 0.62 | | | | 0.56 | | | | 0.56 | |
Net investment income (loss) | | | 2.83 | | | | 3.27 | | | | 3.39 | | | | 3.86 | | | | 3.66 | |
Portfolio Turnover Rate | | | 26 | % | | | 20 | % | | | 2 | % | | | 25 | % | | | 26 | % |
| (1) | Per share amounts have been calculated using the average shares method. |
| (2) | Performance figures may reflect fee waivers and/or expense reimbursements and assume reinvestment of dividend distribution. In the absence of fee waivers and/or expense reimbursements, the total return would have been lower. Applicable advisory program charges, which in the case of TRAK® may be up to 2.00%, are not reflected in the performance data and would reduce the total returns. Past performance is no guarantee of future results. |
See Notes to Financial Statements.
150
Financial Highlights
(continued)
For a share of beneficial interest outstanding throughout each year ended August 31, unless otherwise noted:
Money Market Investments
| | | | | | | | | | | | | | | | | | | | |
| | | 2012 | | | 2011 | | | 2010 | | | 2009 | | | 2008 | |
Net asset value, Beginning of Year | | $ | 1.00 | | | $ | 1.00 | | | $ | 1.00 | | | $ | 1.00 | | | $ | 1.00 | |
| | | | | | | | | | | | | | | | | | | | |
Income (Loss) from Operations: | | | | | | | | | | | | | | | | | | | | |
Net investment income(1) | | | 0.00 | (2) | | | 0.00 | (2) | | | 0.00 | (2) | | | 0.00 | (2) | | | 0.03 | |
Net realized and unrealized gain (loss) | | | 0.00 | (2) | | | 0.00 | (2) | | | 0.01 | | | | — | | | | — | |
| | | | | | | | | | | | | | | | | | | | |
Total Income from Operations | | | 0.00 | | | | 0.00 | | | | 0.01 | | | | 0.00 | | | | 0.03 | |
| | | | | | | | | | | | | | | | | | | | |
Less Distributions From: | | | | | | | | | | | | | | | | | | | | |
Net investment income | | | 0.00 | (2) | | | 0.00 | (2) | | | 0.00 | (2) | | | 0.00 | (2) | | | (0.03 | ) |
Net realized gains | | | — | | | | 0.00 | (2) | | | (0.01 | ) | | | — | | | | — | |
| | | | | | | | | | | | | | | | | | | | |
Total Distributions | | | 0.00 | | | | 0.00 | | | | (0.01 | ) | | | 0.00 | | | | (0.03 | ) |
| | | | | | | | | | | | | | | | | | | | |
Net Asset Value, End of Year | | $ | 1.00 | | | $ | 1.00 | | | $ | 1.00 | | | $ | 1.00 | | | $ | 1.00 | |
| | | | | | | | | | | | | | | | | | | | |
Total Return(3) | | | 0.02 | % | | | 0.01 | % | | | 0.85 | % | | | 0.49 | % | | | 3.10 | % |
Net Assets, End of Year (millions) | | $ | 238 | | | $ | 119 | | | $ | 125 | | | $ | 292 | | | $ | 144 | |
Ratios of Average Net Assets: | | | | | | | | | | | | | | | | | | | | |
Gross expenses | | | 0.23 | % | | | 0.29 | % | | | 0.34 | % | | | 0.51 | % | | | 0.44 | % |
Net expenses(4) | | | 0.22 | | | | 0.21 | | | | 0.27 | | | | 0.47 | | | | 0.42 | |
Net investment income | | | 0.03 | | | | 0.00 | | | | 0.01 | | | | 0.46 | | | | 3.11 | |
| (1) | Per share amounts have been calculated using the average shares method. |
| (2) | Amounts represent less than $0.01 per share. |
| (3) | Performance figures may reflect fee waivers and/or expense reimbursements and assume reinvestment of dividend distribution. In the absence of fee waivers and/or expense reimbursements, the total return would have been lower. Applicable advisory program charges, which in the case of TRAK® may be up to 2.00%, are not reflected in the performance data and would reduce the total returns. Past performance is no guarantee of future results. |
| (4) | Reflects fee waivers and/or expense reimbursements. |
See Notes to Financial Statements.
151
Notes to Financial Statements
1. Organization and Significant Accounting Policies
Large Capitalization Growth Investments, Large Capitalization Value Equity Investments, Small Capitalization Growth Investments, Small Capitalization Value Equity Investments, International Equity Investments, Emerging Markets Equity Investments, Core Fixed Income Investments, High Yield Investments, International Fixed Income Investments, Municipal Bond Investments and Money Market Investments (individually, a “Fund” and collectively, the “Funds”), are each a diversified series of the Consulting Group Capital Markets Funds (the “Trust”) except for International Fixed Income Investments, which is non-diversified. The Trust, a Massachusetts business trust, is registered under the Investment Company Act of 1940, as amended (“1940 Act”), as an open-end management investment company.
The following are significant accounting policies consistently followed by the Funds and are in conformity with accounting principles generally accepted in the United States (“GAAP”). Estimates and assumptions are required to be made regarding assets, liabilities and changes in net assets resulting from operations when financial statements are prepared. Changes in the economic environment, financial markets and any other parameters used in determining these estimates could cause actual results to differ.
(a) Investment Valuation. Each Fund calculates its net asset value (“NAV”) once daily as of the close of regular trading on the New York Stock Exchange (“NYSE”) (generally at 4:00 p.m. Eastern time) on each day the NYSE is open. If the NYSE closes early, the Funds may accelerate calculation of NAV. Portfolio securities of Money Market Investments are valued at amortized cost. Portfolio securities for each Fund (other than Money Market Investments) for which market quotations are readily available and are traded on an exchange are valued at the closing sale price or official closing price on the exchange on which such security is principally traded. In the event there are no sales that day, such securities are valued at the mean between the bid and ask prices. For securities that are primarily traded on foreign exchanges, these values are converted to U.S. dollars using the current exchange rates as of the close of the London Stock Exchange.
Exchange-traded options and futures contracts are valued at the last sale price (closing price) in the market where such contracts are principally traded or, if no sales are reported, the bid price. Swaps for which quotations are available on an automated basis from approved broker-dealers are valued using those automated broker-dealer quotations. Swaps are marked-to-market daily based upon quotations from market makers and the change, if any, is recorded as unrealized appreciation or depreciation in the Statements of Operations. Net receipts or payments of interest are recorded as realized gains or losses, respectively. Gains and losses are realized upon termination of a swap agreement. Foreign currency contracts are valued using the official closing price for such contracts on the London Stock Exchange.
Portfolio securities traded in the over-the-counter market for which market quotations are readily available are valued at the last sales price that day. In the event there are no sales that day, such securities are valued at the mean between the bid and ask prices. Investments in registered open-end management investment companies are valued at reported net asset value per share.
Debt obligations that will mature in 60 days or less are valued at amortized cost, which approximates market value. Debt obligations that will mature in more than 60 days are valued using valuations furnished by an approved pricing service; such valuations are determined by the pricing service based upon its analysis of a variety of factors, including transactions in debt obligations, quotations from bond dealers, market transactions in comparable securities and its analysis of various relationships between securities.
Overnight repurchase agreements and repurchase agreements maturing in seven days or less are valued at cost. Term repurchase agreements maturing in more than seven days are valued at the average of the bid quotations obtained daily from at least two recognized purchasers of such term repurchase agreements selected by CGAS (the “Manager”).
The Board of Trustees (the “Board”) has delegated primary responsibility for determining or causing to be determined the value of the Funds’ investments (including any fair valuation) to the Manager pursuant to valuation policies and procedures approved by the Board. When market quotations are not readily available or are determined to be unreliable, investments are valued at fair value as determined in good faith by the valuation committee established by the Manager (the “Valuation Committee”) in accordance with such procedures under the oversight of the Board. Circumstances that may indicate that market quotations are not readily available or are unreliable include, but are not limited to, such instances when the value of a security has been significantly affected by events after the close of the exchange or market on which the security is principally traded, and before the applicable Fund calculates its NAV.
152
Notes to Financial Statements
(continued)
In accordance with the authoritative guidance on fair value measurements and disclosures under GAAP, the Funds disclose the fair value of their investments in a hierarchy that prioritizes the inputs to valuation techniques used to measure the fair value. The hierarchy prioritizes inputs to valuation methods and requires disclosure of the fair value hierarchy, separately for each major category of assets and liabilities, that segregates fair value measurements into levels (Level 1, 2, and 3). The three levels of the fair value hierarchy are as follows:
Level 1– unadjusted quoted prices in active markets for identical securities.
Level 2 – significant observable inputs (including quoted prices for similar securities, interest rates, prepayment speeds, credit risk, etc.)
Level 3 – significant unobservable inputs (including assumptions made by the Board or persons acting at their direction that are used in determining the fair value of investments.)
The inputs or methodology used for valuing securities are not necessarily an indication of the risk associated with investing in those securities. The following are certain inputs and techniques that the Funds generally use to evaluate how to classify each major category of assets and liabilities in accordance with GAAP.
Fixed income securities including corporate, convertible and municipal bonds and notes, U.S. government agencies, U.S. treasury obligations, sovereign issues, bank loans, convertible preferred securities and non-U.S. bonds are normally valued by pricing service providers that use broker-dealer quotations, reported trades or valuation estimates from their internal pricing models. The service providers’ internal models use inputs that are observable such as issuer details, interest rates, yield curves, prepayment speeds, credit risks/spreads, default rates and quoted prices for similar assets. Securities that use similar valuation techniques and inputs as described above are categorized as Level 2 of the fair value hierarchy. To the extent that these inputs are unobservable, the values are categorized as Level 3 of the fair value hierarchy.
Mortgage-related and asset-backed securities are usually issued as separate tranches, or classes, of securities within each deal. These securities are also normally valued by pricing service providers that use broker-dealer quotations or valuation estimates from their internal pricing models. The pricing models for these securities usually consider tranche-level attributes, current market data, estimated cash flows and market-based yield spreads for each tranche, and incorporate deal collateral performance, as available. Mortgage-related and asset-backed securities that use similar valuation techniques and inputs as described above are categorized as Level 2 of the fair value hierarchy. To the extent that these inputs are unobservable, the values are categorized as Level 3 of the fair value hierarchy.
To the extent these securities are actively traded and valuation adjustments are not applied, common stocks, exchange-traded funds and financial derivative instruments, such as futures contracts or options contracts that are traded on a national securities exchange, are categorized as Level 1 of the fair value hierarchy.
Valuation adjustments may be applied to certain securities that are solely traded on a foreign exchange to account for the market movement between the close of the foreign market and the NYSE Close. Securities using these valuation adjustments are categorized as Level 2 of the fair value hierarchy. Preferred securities and other equities traded on inactive markets or valued by reference to similar instruments are also categorized as Level 2 of the fair value hierarchy.
Investments in registered open-end investment management companies are valued based upon the NAVs of such investments and are categorized as Level 1 of the fair value hierarchy.
Short-term investments having a maturity of 60 days or less are generally valued at amortized cost which approximates fair market value. These investments are categorized as Level 2 of the fair value hierarchy.
Over-the-counter financial derivative instruments, such as foreign currency contracts, forward currency contracts, options contracts, or swap agreements, derive their value from underlying asset prices, indices, reference rates, and other inputs or a combination of these factors. These contracts are normally valued on the basis of broker dealer quotations or by pricing service providers. Depending on the product and the terms of the transaction, the value of financial derivatives can be estimated by a pricing service provider using a series of techniques, including simulation pricing models. The pricing models use inputs that are observed from actively quoted
153
Notes to Financial Statements
(continued)
markets such as issuer details, indices, spreads, interest rates, yield curves, dividends and exchange rates. Financial derivatives that use similar valuation techniques and inputs as described above are categorized as Level 2 of the fair value hierarchy. To the extent that these inputs are unobservable, the values are categorized as Level 3 of the fair value hierarchy.
Centrally cleared swaps listed or traded on a multilateral or trade facility platform, such as a registered exchange, are valued at the daily settlement price determined by the respective exchange. For centrally cleared credit default swaps the clearing facility requires its members to provide actionable levels across complete term structures. These levels along with external third party prices are used to produce daily settlement prices. These securities are categorized as Level 2 of the fair value hierarchy. Centrally cleared interest rate swaps are valued using a pricing model that references the underlying rates including the overnight index swap rate and London Interbank Offered Rate (“LIBOR”) forward rate to produce the daily settlement price. These securities are categorized as Level 2 of the fair value hierarchy.
Securities and other assets for which market quotes are not readily available are valued at fair market value as determined in good faith by the Board or persons acting at their direction and are categorized as Level 3 of the fair value hierarchy.
The valuation techniques used by the Funds to measure fair value during the year ended August 31, 2012, maximized the use of observable inputs and minimized the use of unobservable inputs.
The Funds’ policy is to recognize transfers between levels at the end of the reporting period. In some instances, the inputs used to measure fair value might fall in different levels of the fair value hierarchy. The level in the fair value hierarchy within which the fair value measurement in its entirety falls is determined based on the lowest level input that is significant to the fair value measurement in its entirety. Because of the inherent uncertainties of valuation, the values reflected in the financial statements may materially differ from the value received upon actual sale of those investments.
The following table summarizes the valuation of each Fund’s securities using the fair value hierarchy:
| | | | | | | | | | | | | | | | |
| | | Total Fair Value at
August 31, 2012 | | | Unadjusted Quoted Prices
in Active Markets
for Identical Investments
(Level 1) | | | Significant Observable
Inputs (Level 2) | | | Significant
Unobservable
Inputs (Level 3) | |
Large Capitalization Growth Investments | | | | | | | | | | | | | | | | |
Investments, at value | | | | | | | | | | | | | | | | |
Common Stock: | | | | | | | | | | | | | | | | |
Consumer Discretionary | | $ | 229,681,711 | | | $ | 229,681,711 | | | $ | — | | | $ | — | |
Consumer Staples | | | 78,763,712 | | | | 78,763,712 | | | | — | | | | — | |
Energy | | | 125,594,098 | | | | 125,594,098 | | | | — | | | | — | |
Financials | | | 73,773,160 | | | | 73,773,160 | | | | — | | | | — | |
Health Care | | | 202,962,488 | | | | 202,962,488 | | | | — | | | | — | |
Industrials | | | 145,443,101 | | | | 145,443,101 | | | | — | | | | — | |
Information Technology | | | 546,316,140 | | | | 546,316,140 | | | | — | | | | — | |
Materials | | | 67,253,642 | | | | 67,253,642 | | | | — | | | | — | |
Telecommunication Services | | | 41,615,482 | | | | 41,615,482 | | | | — | | | | — | |
Warrants: | | | | | | | | | | | | | | | | |
Energy | | | 750,002 | | | | 750,002 | | | | — | | | | — | |
Short-term: | | | | | | | | | | | | | | | | |
Money Market Fund | | | 9,755,298 | | | | 9,755,298 | | | | — | | | | — | |
Time Deposits | | | 51,720,792 | | | | — | | | | 51,720,792 | | | | — | |
U.S. Government Agencies | | | 6,414,999 | | | | — | | | | 6,414,999 | | | | — | |
| | | | | | | | | | | | | | | | |
Total Investments, at value | | $ | 1,580,044,625 | | | $ | 1,521,908,834 | | | $ | 58,135,791 | | | $ | — | |
| | | | | | | | | | | | | | | | |
Large Capitalization Value Equity Investments | | | | | | | | | | | | | | | | |
Investments, at value | | | | | | | | | | | | | | | | |
154
Notes to Financial Statements
(continued)
| | | | | | | | | | | | | | | | |
| | | Total Fair Value at
August 31, 2012 | | | Unadjusted Quoted Prices
in Active Markets
for Identical Investments
(Level 1) | | | Significant Observable
Inputs (Level 2) | | | Significant
Unobservable
Inputs (Level 3) | |
Common Stock: | | | | | | | | | | | | | | | | |
Consumer Discretionary | | $ | 65,664,900 | | | $ | 65,664,900 | | | $ | — | | | $ | — | |
Consumer Staples | | | 105,180,283 | | | | 105,180,283 | | | | — | | | | — | |
Energy | | | 163,528,687 | | | | 163,528,687 | | | | — | | | | — | |
Financials | | | 180,494,804 | | | | 180,494,804 | | | | — | | | | — | |
Health Care | | | 145,059,876 | | | | 145,059,876 | | | | — | | | | — | |
Industrials | | | 120,318,149 | | | | 120,318,149 | | | | — | | | | — | |
Information Technology | | | 128,748,702 | | | | 128,748,702 | | | | — | | | | — | |
Materials | | | 48,640,728 | | | | 48,640,728 | | | | — | | | | — | |
Telecommunication Services | | | 37,941,173 | | | | 37,941,173 | | | | — | | | | — | |
Utilities | | | 39,792,737 | | | | 39,792,737 | | | | — | | | | — | |
Short-term: | | | | | | | | | | | | | | | | |
Money Market Fund | | | 22,847,068 | | | | 22,847,068 | | | | — | | | | — | |
Time Deposits | | | 49,758,389 | | | | — | | | | 49,758,389 | | | | — | |
| | | | | | | | | | | | | | | | |
Total - Investments, at value | | $ | 1,107,975,496 | | | $ | 1,058,217,107 | | | $ | 49,758,389 | | | $ | — | |
| | | | | | | | | | | | | | | | |
Small Capitalization Growth Investments | | | | | | | | | | | | | | | | |
Investments, at value | | | | | | | | | | | | | | | | |
Common Stock: | | | | | | | | | | | | | | | | |
Consumer Discretionary | | $ | 42,234,402 | | | $ | 42,234,402 | | | $ | — | | | $ | — | |
Consumer Staples | | | 7,982,397 | | | | 7,982,397 | | | | — | | | | — | |
Energy | | | 17,898,754 | | | | 17,898,754 | | | | — | | | | — | |
Financials | | | 14,323,736 | | | | 14,323,736 | | | | — | | | | — | |
Health Care | | | 44,580,300 | | | | 44,580,300 | | | | — | | | | — | |
Industrials | | | 51,294,062 | | | | 51,294,062 | | | | — | | | | — | |
Information Technology | | | 53,958,203 | | | | 53,958,203 | | | | — | | | | — | |
Materials | | | 5,955,743 | | | | 5,955,743 | | | | — | | | | — | |
Short-term: | | | | | | | | | | | | | | | | |
Money Market Fund | | | 19,954,594 | | | | 19,954,594 | | | | | | | | — | |
Time Deposits | | | 8,944,947 | | | | — | | | | 8,944,947 | | | | — | |
| | | | | | | | | | | | | | | | |
Total - Investments, at value | | $ | 267,127,138 | | | $ | 258,182,191 | | | $ | 8,944,947 | | | $ | — | |
| | | | | | | | | | | | | | | | |
Small Capitalization Value Equity Investments | | | | | | | | | | | | | | | | |
Investments, at value | | | | | | | | | | | | | | | | |
Common Stock: | | | | | | | | | | | | | | | | |
Consumer Discretionary | | $ | 32,189,022 | | | $ | 32,189,022 | | | $ | — | | | $ | — | |
Consumer Staples | | | 5,838,094 | | | | 5,838,094 | | | | — | | | | — | |
Energy | | | 8,806,239 | | | | 8,806,239 | | | | — | | | | — | |
Financials | | | 40,870,062 | | | | 40,870,062 | | | | — | | | | — | |
Health Care | | | 9,179,841 | | | | 9,179,841 | | | | — | | | | — | |
Industrials | | | 42,528,284 | | | | 42,528,284 | | | | — | | | | — | |
Information Technology | | | 16,731,415 | | | | 16,731,415 | | | | — | | | | — | |
Materials | | | 21,262,968 | | | | 21,262,968 | | | | — | | | | — | |
Telecommunication Services | | | 581,528 | | | | 581,528 | | | | — | | | | — | |
Utilities | | | 6,584,889 | | | | 6,584,889 | | | | — | | | | — | |
Short-term: | | | | | | | | | | | | | | | | |
155
Notes to Financial Statements
(continued)
| | | | | | | | | | | | | | | | |
| | | Total Fair Value at
August 31, 2012 | | | Unadjusted Quoted Prices
in Active Markets
for Identical Investments
(Level 1) | | | Significant Observable
Inputs (Level 2) | | | Significant
Unobservable
Inputs (Level 3) | |
Commercial Paper | | $ | 1,554,971 | | | $ | — | | | $ | 1,554,971 | | | $ | — | |
Money Market Fund | | | 5,954,665 | | | | 5,954,665 | | | | — | | | | — | |
Time Deposits | | | 8,720,422 | | | | — | | | | 8,720,422 | | | | — | |
| | | | | | | | | | | | | | | | |
Total - Investments, at value | | $ | 200,802,400 | | | $ | 190,527,007 | | | $ | 10,275,393 | | | $ | — | |
| | | | | | | | | | | | | | | | |
International Equity Investments | | | | | | | | | | | | | | | | |
Investments, at value | | | | | | | | | | | | | | | | |
Common Stocks: | | | | | | | | | | | | | | | | |
United Kingdom | | $ | 92,825,179 | | | $ | 92,825,179 | | | $ | — | | | $ | — | |
Japan | | | 49,472,335 | | | | 49,472,335 | | | | — | | | | — | |
Germany | | | 41,856,628 | | | | 41,856,628 | | | | — | | | | — | |
France | | | 36,908,384 | | | | 36,908,384 | | | | — | | | | — | |
Switzerland | | | 32,622,260 | | | | 32,622,260 | | | | — | | | | — | |
Netherlands | | | 18,522,467 | | | | 18,522,467 | | | | — | | | | — | |
China | | | 14,700,883 | | | | 14,700,883 | | | | — | | | | — | |
Canada | | | 13,081,156 | | | | 13,081,156 | | | | — | | | | — | |
Hong Kong | | | 12,232,326 | | | | 12,232,326 | | | | — | | | | — | |
Other Countries | | | 105,398,422 | | | | 105,390,085 | | | | — | | | | 8,337 | |
Preferred Stocks: | | | | | | | | | | | | | | | | |
Germany | | | 2,248,673 | | | | 2,248,673 | | | | — | | | | — | |
Australia | | | 20,102 | | | | 20,102 | | | | — | | | | — | |
Italy | | | 479 | | | | 479 | | | | — | | | | — | |
Rights: | | | | | | | | | | | | | | | | |
Singapore | | | — | | | | — | | | | — | | | | — | |
Warrants: | | | | | | | | | | | | | | | | |
Luxembourg | | | 623,565 | | | | 623,565 | | | | — | | | | — | |
Short-term: | | | | | | | | | | | | | | | | |
Money Market Fund | | | 6,243,716 | | | | 6,243,716 | | | | — | | | | — | |
Time Deposits | | | 136,794,204 | | | | — | | | | 136,794,204 | | | | — | |
| | | | | | | | | | | | | | | | |
Total - Investments, at value | | $ | 563,550,779 | | | $ | 426,748,238 | | | $ | 136,794,204 | | | $ | 8,337 | |
| | | | | | | | | | | | | | | | |
Other Financial Instruments | | | | | | | | | | | | | | | | |
Forward Foreign Currency Contracts | | $ | 195,849 | | | $ | — | | | $ | 195,849 | | | $ | — | |
| | | | | | | | | | | | | | | | |
Total - Other Financial Instruments | | $ | 195,849 | | | $ | — | | | $ | 195,849 | | | $ | — | |
| | | | | | | | | | | | | | | | |
Emerging Markets Equity Investments | | | | | | | | | | | | | | | | |
Investments, at value | | | | | | | | | | | | | | | | |
Common Stocks: | | | | | | | | | | | | | | | | |
South Korea | | $ | 100,456,995 | | | $ | 100,456,995 | | | $ | — | | | $ | — | |
Brazil | | | 94,184,056 | | | | 94,184,056 | | | | — | | | | — | |
China | | | 70,662,471 | | | | 70,662,471 | | | | — | | | | — | |
South Africa | | | 66,406,157 | | | | 66,406,157 | | | | — | | | | — | |
Russia | | | 59,172,168 | | | | 59,172,168 | | | | — | | | | — | |
Taiwan | | | 40,334,550 | | | | 40,334,550 | | | | — | | | | — | |
Turkey | | | 29,103,667 | | | | 29,103,667 | | | | — | | | | — | |
Mexico | | | 29,063,703 | | | | 29,063,703 | | | | — | | | | — | |
Indonesia | | | 25,125,170 | | | | 25,125,170 | | | | — | | | | — | |
156
Notes to Financial Statements
(continued)
| | | | | | | | | | | | | | | | |
| | | Total Fair Value at
August 31, 2012 | | | Unadjusted Quoted Prices
in Active Markets
for Identical Investments
(Level 1) | | | Significant Observable
Inputs (Level 2) | | | Significant
Unobservable
Inputs (Level 3) | |
Other Countries | | $ | 123,822,098 | | | $ | 123,822,098 | | | $ | — | | | $ | — | |
Preferred Stocks: | | | | | | | | | | | | | | | | |
Brazil | | | 9,880,082 | | | | 9,880,082 | | | | — | | | | — | |
South Korea | | | 1,946,615 | | | | 1,946,615 | | | | — | | | | — | |
Russia | | | 844,272 | | | | 844,272 | | | | — | | | | — | |
Short-term: | | | | | | | | | | | | | | | | |
Money Market Fund | | | 28,945,863 | | | | 28,945,863 | | | | — | | | | — | |
Time Deposits | | | 39,915,250 | | | | — | | | | 39,915,250 | | | | — | |
| | | | | | | | | | | | | | | | |
Total - Investments, at value | | $ | 719,863,117 | | | $ | 679,947,867 | | | $ | 39,915,250 | | | $ | — | |
| | | | | | | | | | | | | | | | |
Other Financial Instruments | | | | | | | | | | | | | | | | |
Forward Foreign Currency Contracts | | $ | (79,912 | ) | | $ | — | | | $ | (79,912 | ) | | $ | — | |
Futures Contracts | | | (236,950 | ) | | | (236,950 | ) | | | — | | | | — | |
| | | | | | | | | | | | | | | | |
Total - Other Financial Instruments | | $ | (316,862 | ) | | $ | (236,950 | ) | | $ | (79,912 | ) | | $ | — | |
| | | | | | | | | | | | | | | | |
Core Fixed Income Investments | | | | | | | | | | | | | | | | |
Investments, at value | | | | | | | | | | | | | | | | |
Mortgage-Backed Securities | | $ | 277,089,680 | | | $ | — | | | $ | 277,089,680 | | | $ | — | |
Asset-Backed Securities | | | 14,716,413 | | | | — | | | | 14,716,413 | | | | — | |
Collateralized Mortgage Obligations | | | 147,252,593 | | | | — | | | | 147,252,593 | | | | — | |
Corporate Bonds & Notes | | | 268,532,409 | | | | — | | | | 268,532,409 | | | | — | |
Municipal Bonds | | | 16,519,866 | | | | — | | | | 16,519,866 | | | | — | |
Sovereign Bonds | | | 35,121,705 | | | | — | | | | 35,121,705 | | | | — | |
U.S. Government & Agency Obligations | | | 218,761,501 | | | | — | | | | 218,761,501 | | | | — | |
Common Stocks: | | | | | | | | | | | | | | | | |
Consumer Discretionary | | | 7,246 | | | | 7,246 | | | | — | | | | — | |
Preferred Stocks: | | | | | | | | | | | | | | | | |
Financials | | | 657,755 | | | | 657,755 | | | | — | | | | — | |
Warrants: | | | | | | | | | | | | | | | | |
Energy | | | 2,119 | | | | 2,119 | | | | — | | | | — | |
Purchased Options | | | 9,775 | | | | 9,775 | | | | — | | | | — | |
Short-term: | | | | | | | | | | | | | | | | |
Commercial Paper | | | 1,374,774 | | | | — | | | | 1,374,774 | | | | — | |
Money Market Fund | | | 386,546 | | | | 386,546 | | | | — | | | | — | |
Repurchase Agreements | | | 44,200,000 | | | | — | | | | 44,200,000 | | | | — | |
Time Deposits | | | 34,073,674 | | | | — | | | | 34,073,674 | | | | — | |
U.S. Government Agencies | | | 35,495,320 | | | | — | | | | 35,495,320 | | | | — | |
U.S. Government Obligations | | | 9,206,049 | | | | — | | | | 9,206,049 | | | | — | |
| | | | | | | | | | | | | | | | |
Total - Investments, at value | | $ | 1,103,407,425 | | | $ | 1,063,441 | | | $ | 1,102,343,984 | | | $ | — | |
| | | | | | | | | | | | | | | | |
Other Financial Instruments | | | | | | | | | | | | | | | | |
Options Written | | $ | (531,871 | ) | | $ | (74,978 | ) | | $ | (456,893 | ) | | $ | — | |
Forward Sale Commitments | | | (31,653,364 | ) | | | — | | | | (31,653,364 | ) | | | — | |
Futures Contracts | | | (468,820 | ) | | | (468,820 | ) | | | — | | | | — | |
Forward Currency Contracts | | | (766,380 | ) | | | — | | | | (766,380 | ) | | | — | |
Centrally Cleared Swaps | | | (637,139 | ) | | | — | | | | (637,139 | ) | | | — | |
OTC Credit Default Swaps | | | 629,825 | | | | — | | | | 629,825 | | | | — | |
157
Notes to Financial Statements
(continued)
| | | | | | | | | | | | | | | | |
| | | Total Fair Value at
August 31, 2012 | | | Unadjusted Quoted Prices
in Active Markets
for Identical Investments
(Level 1) | | | Significant Observable
Inputs (Level 2) | | | Significant
Unobservable
Inputs (Level 3) | |
OTC Interest Rate Swaps | | $ | 2,216,693 | | | $ | — | | | $ | 2,216,693 | | | $ | — | |
| | | | | | | | | | | | | | | | |
Total - Other Financial Instruments | | $ | (31,211,056 | ) | | $ | (543,798 | ) | | $ | (30,667,258 | ) | | $ | — | |
| | | | | | | | | | | | | | | | |
High Yield Investments | | | | | | | | | | | | | | | | |
Investments, at value | | | | | | | | | | | | | | | | |
Corporate Bonds & Notes | | $ | 212,323,831 | | | $ | — | | | $ | 212,199,169 | | | $ | 124,662 | |
Collateralized Mortgage Obligations | | | 187 | | | | — | | | | 187 | | | | — | |
Senior Loans | | | 1,582,678 | | | | — | | | | 1,582,678 | | | | — | |
Common Stocks: | | | | | | | | | | | | | | | | |
Consumer Discretionary | | | 514,636 | | | | 494,730 | | | | — | | | | 19,906 | |
Energy | | | 321,939 | | | | — | | | | — | | | | 321,939 | |
Industrials | | | 243,007 | | | | 243,007 | | | | — | | | | — | |
Media | | | 25,365 | | | | 25,365 | | | | — | | | | — | |
Preferred Stocks: | | | | | | | | | | | | | | | | |
Financials | | | 2,801,911 | | | | 2,721,325 | | | | 80,586 | | | | — | |
Convertible Preferred Stock: | | | | | | | | | | | | | | | | |
Consumer Discretionary | | | 43,450 | | | | 43,450 | | | | — | | | | — | |
Financials | | | 2,080,390 | | | | 2,080,390 | | | | — | | | | — | |
Warrants: | | | | | | | | | | | | | | | | |
Consumer Discretionary | | | 15,803 | | | | — | | | | 15,803 | | | | — | |
Energy | | | 15,322 | | | | 15,322 | | | | — | | | | — | |
Financials | | | 41,925 | | | | 41,925 | | | | — | | | | — | |
Industrials | | | 7,984 | | | | — | | | | 7,984 | | | | — | |
Exchange Traded Securities | | | 9,634,000 | | | | 9,634,000 | | | | — | | | | — | |
Short-terms: | | | | | | | | | | | | | | | | |
Money Market Fund | | | 2,539,760 | | | | 2,539,760 | | | | — | | | | — | |
Time Deposits | | | 108,324,528 | | | | — | | | | 108,324,528 | | | | — | |
| | | | | | | | | | | | | | | | |
Total - Investments, at value | | $ | 340,516,716 | | | $ | 17,839,274 | | | $ | 322,210,935 | | | $ | 466,507 | |
| | | | | | | | | | | | | | | | |
International Fixed Income Investments | | | | | | | | | | | | | | | | |
Investments, at value | | | | | | | | | | | | | | | | |
Sovereign Bonds: | | | | | | | | | | | | | | | | |
Japan | | $ | 37,837,621 | | | $ | — | | | $ | 37,837,621 | | | $ | — | |
United Kingdom | | | 32,091,875 | | | | — | | | | 32,091,875 | | | | — | |
Italy | | | 24,408,741 | | | | — | | | | 24,408,741 | | | | — | |
Netherlands | | | 17,910,878 | | | | — | | | | 17,910,878 | | | | — | |
Germany | | | 17,514,178 | | | | — | | | | 17,514,178 | | | | — | |
Canada | | | 13,986,776 | | | | — | | | | 13,986,776 | | | | — | |
Belgium | | | 10,194,462 | | | | — | | | | 10,194,462 | | | | — | |
South Africa | | | 9,199,543 | | | | — | | | | 9,199,543 | | | | — | |
Australia | | | 7,689,826 | | | | — | | | | 7,689,826 | | | | — | |
Other Countries | | | 39,641,792 | | | | — | | | | 39,641,792 | | | | — | |
Asset-Backed Securities | | | 692,929 | | | | — | | | | 692,929 | | | | — | |
Collateralized Mortgage Obligations | | | 14,727,227 | | | | — | | | | 14,727,227 | | | | — | |
Corporate Bonds & Notes: | | | | | | | | | | | | | | | | |
United States | | | 18,618,912 | | | | — | | | | 18,618,912 | | | | — | |
South Korea | | | 8,589,155 | | | | — | | | | 8,589,155 | | | | — | |
158
Notes to Financial Statements
(continued)
| | | | | | | | | | | | | | | | |
| | | Total Fair Value at
August 31, 2012 | | | Unadjusted Quoted Prices
in Active Markets
for Identical Investments
(Level 1) | | | Significant Observable
Inputs (Level 2) | | | Significant
Unobservable
Inputs (Level 3) | |
Australia | | $ | 4,542,359 | | | $ | — | | | $ | 4,542,359 | | | $ | — | |
Norway | | | 3,975,617 | | | | — | | | | 3,975,617 | | | | — | |
United Kingdom | | | 3,747,715 | | | | — | | | | 3,747,715 | | | | — | |
France | | | 2,516,671 | | | | — | | | | 2,516,671 | | | | — | |
Netherlands | | | 2,308,144 | | | | — | | | | 2,308,144 | | | | — | |
Cayman Islands | | | 2,052,500 | | | | — | | | | 2,052,500 | | | | — | |
Qatar | | | 1,173,000 | | | | — | | | | 1,173,000 | | | | — | |
Other Countries | | | 3,462,711 | | | | — | | | | 3,462,711 | | | | — | |
Mortgage-Backed Securities | | | 33,358,297 | | | | — | | | | 33,358,297 | | | | — | |
Municipal Bonds | | | 4,931,766 | | | | — | | | | 4,931,766 | | | | — | |
U.S. Government & Agency Obligations | | | 36,647,857 | | | | — | | | | 36,647,857 | | | | — | |
Purchased Options | | | 79,653 | | | | — | | | | 79,653 | | | | — | |
Short-Term: | | | | | | | | | | | | | | | | |
Repurchase Agreements | | | 28,500,000 | | | | — | | | | 28,500,000 | | | | — | |
Time Deposits | | | 10,702,837 | | | | — | | | | 10,702,837 | | | | — | |
Sovereign Bond | | | 50,139,059 | | | | — | | | | 50,139,059 | | | | — | |
U.S. Government Agencies | | | 29,071,789 | | | | — | | | | 29,071,789 | | | | — | |
U.S. Government Obligations | | | 14,952,116 | | | | — | | | | 14,952,116 | | | | — | |
| | | | | | | | | | | | | | | | |
Total Investments, at value | | $ | 485,266,006 | | | $ | — | | | $ | 485,266,006 | | | $ | — | |
| | | | | | | | | | | | | | | | |
Other Financial Instruments | | | | | | | | | | | | | | | | |
Options Written | | $ | (539,897 | ) | | $ | — | | | $ | (539,897 | ) | | $ | — | |
Forward Sale Commitments | | | (4,348,945 | ) | | | — | | | | (4,348,945 | ) | | | — | |
Futures Contracts | | | 82,287 | | | | 82,287 | | | | — | | | | — | |
Forward Currency Contracts | | | (4,345,126 | ) | | | — | | | | (4,345,126 | ) | | | — | |
Centrally Cleared Swaps | | | (60,638 | ) | | | — | | | | (60,638 | ) | | | — | |
OTC Credit Default Swaps | | | 375,883 | | | | — | | | | 375,883 | | | | — | |
OTC Interest Rate Swaps | | | 1,418,234 | | | | — | | | | 1,418,234 | | | | — | |
| | | | | | | | | | | | | | | | |
Total - Other Financial Instruments | | $ | (7,418,202 | ) | | $ | 82,287 | | | $ | (7,500,489 | ) | | $ | — | |
| | | | | | | | | | | | | | | | |
Municipal Bond Investments | | | | | | | | | | | | | | | | |
Investments, at value | | | | | | | | | | | | | | | | |
Municipal Bonds | | $ | 83,797,902 | | | $ | — | | | $ | 83,797,902 | | | $ | — | |
Short-Term: | | | | | | | | | | | | | | | | |
Time Deposits | | | 5,971,246 | | | | — | | | | 5,971,246 | | | | — | |
| | | | | | | | | | | | | | | | |
Total - Investments, at value | | $ | 89,769,148 | | | $ | — | | | $ | 89,769,148 | | | $ | — | |
| | | | | | | | | | | | | | | | |
Money Market Investments | | | | | | | | | | | | | | | | |
Investments, at value | | | | | | | | | | | | | | | | |
Short-term: | | | | | | | | | | | | | | | | |
Certificates of Deposit | | $ | 6,900,000 | | | $ | — | | | $ | 6,900,000 | | | $ | — | |
Commercial Paper | | | 170,622,429 | | | | — | | | | 170,622,429 | | | | — | |
Time Deposits | | | 3,260,533 | | | | — | | | | 3,260,533 | | | | — | |
U.S. Government Agencies | | | 35,073,131 | | | | — | | | | 35,073,131 | | | | — | |
U.S. Government Obligations | | $ | 20,997,173 | | | $ | — | | | $ | 20,997,173 | | | $ | — | |
| | | | | | | | | | | | | | | | |
Total - Investments, at value | | $ | 236,853,266 | | | $ | — | | | $ | 236,853,266 | | | $ | — | |
| | | | | | | | | | | | | | | | |
For further information regarding security characteristics, see the Schedules of Investments.
159
Notes to Financial Statements
(continued)
During the period, Emerging Markets Equity Investments had transfers from Level 2 to Level 1 of $20,341,761. These transfers were primarily due to these securities not being actively traded in prior period.
The Funds’ policy is to recognize transfers in and out as of the end of the reporting period. No other Funds had transfers during the period
The following is a reconciliation of assets for which significant unobservable inputs (Level 3) were used in determining fair value for the year ended August 31, 2012:
| | | | | | | | | | | | | | | | | | | | | | | | | | | | |
| | | Total | | | Collateralized
Mortgage
Obligations | | | Common
Stocks | | | Corporate
Bonds &
Notes | | | Warrants | | | Convertible
Preferred
Stocks | | | Preferred
Stocks | |
International Equity Investments | | | | | | | | | | | | | | | | | | | | | | | | | | | | |
Balance as of August 31, 2011 | | $ | 6,836 | | | $ | — | | | $ | 6,836 | | | $ | — | | | $ | — | | | $ | — | | | $ | — | |
Total realized gain (loss) | | | (74,608 | ) | | | — | | | | (74,608 | ) | | | — | | | | — | | | | — | | | | — | |
Change in unrealized appreciation (depreciation) | | | 67,929 | | | | — | | | | 67,929 | | | | — | | | | — | | | | — | | | | — | |
Purchases | | | 10,530 | | | | — | | | | 10,530 | | | | — | | | | — | | | | — | | | | — | |
(Sales) | | | (2,350 | ) | | | — | | | | (2,350 | ) | | | — | | | | — | | | | | | | | | |
| | | | | | | | | | | | | | | | | | | | | | | | | | | | |
Balance as of August 31, 2012 | | $ | 8,337 | | | $ | — | | | $ | 8,337 | | | $ | — | | | $ | — | | | $ | — | | | $ | — | |
| | | | | | | | | | | | | | | | | | | | | | | | | | | | |
Change in unrealized appreciation (depreciation) from Investments held as of August 31, 2012 | | $ | 291 | | | $ | — | | | $ | 291 | | | $ | — | | | $ | — | | | $ | — | | | $ | — | |
| | | | | | | | | | | | | | | | | | | | | | | | | | | | |
Core Fixed Income Investments | | | | | | | | | | | | | | | | | | | | | | | | | | | | |
Balance as of August 31, 2011 | | $ | — | | | $ | — | | | $ | — | | | $ | — | | | $ | — | | | $ | — | | | $ | — | |
Total realized gain (loss) | | | (5,984 | ) | | | — | | | | — | | | | — | | | | — | | | | (5,984 | ) | | | — | |
Change in unrealized appreciation (depreciation) | | | 5,985 | | | | — | | | | — | | | | — | | | | — | | | | 5,985 | | | | — | |
Purchases | | | — | | | | — | | | | — | | | | — | | | | — | | | | — | | | | — | |
(Sales) | | | (1 | ) | | | — | | | | — | | | | — | | | | — | | | | (1 | ) | | | — | |
| | | | | | | | | | | | | | | | | | | | | | | | | | | | |
Balance as of August 31, 2012 | | $ | — | | | $ | — | | | $ | — | | | $ | — | | | $ | — | | | $ | — | | | $ | — | |
| | | | | | | | | | | | | | | | | | | | | | | | | | | | |
Change in unrealized appreciation (depreciation) from Investments held as of August 31, 2012 | | $ | — | | | $ | — | | | $ | — | | | $ | — | | | $ | — | | | $ | — | | | $ | — | |
| | | | | | | | | | | | | | | | | | | | | | | | | | | | |
High Yield Investments | | | | | | | | | | | | | | | | | | | | | | | | | | | | |
Balance as of August 31, 2011 | | $ | 312,869 | | | $ | 4,584 | | | $ | 277,453 | | | $ | 14 | | | $ | 30,746 | | | $ | — | | | $ | 72 | |
Total realized gain (loss) | | | 41,792 | | | | 12,002 | | | | 18,144 | | | | — | | | | — | | | | — | | | | 11,646 | |
Accrued discounts/premiums | | | 1,531 | | | | 438 | | | | — | | | | 1,093 | | | | — | | | | — | | | | — | |
Paydown | | | (51,667 | ) | | | (51,667 | ) | | | — | | | | — | | | | — | | | | — | | | | — | |
160
Notes to Financial Statements
(continued)
| | | | | | | | | | | | | | | | | | | | | | | | | | | | |
| | | Total | | | Collateralized
Mortgage
Obligations | | | Common
Stocks | | | Corporate
Bonds &
Notes | | | Warrants | | | Convertible
Preferred
Stocks | | | Preferred
Stocks | |
Change in unrealized appreciation (depreciation) | | $ | 115,736 | | | $ | 34,830 | | | $ | 44,486 | | | $ | (1,715 | ) | | $ | 13,473 | | | $ | — | | | $ | 24,662 | |
Purchases | | | 145,176 | | | | — | | | | 19,906 | | | | 125,270 | | | | — | | | | — | | | | — | |
(Sales) | | | (56,820 | ) | | | — | | | | (18,144 | ) | | | — | | | | (2,296 | ) | | | — | | | | (36,380 | ) |
Transfers in | | | — | | | | — | | | | — | | | | — | | | | — | | | | — | | | | — | |
Transfers Out | | | (42,110 | ) | | | (187 | ) | | | — | | | | — | | | | (41,923 | ) | | | — | | | | — | |
| | | | | | | | | | | | | | | | | | | | | | | | | | | | |
Balance as of August 31, 2012 | | $ | 466,507 | | | $ | — | | | $ | 341,845 | | | $ | 124,662 | | | $ | — | | | $ | — | | | $ | — | |
| | | | | | | | | | | | | | | | | | | | | | | | | | | | |
Change in unrealized appreciation (depreciation) from Investments held as of August 31, 2012 | | $ | 56,875 | | | $ | — | | | $ | 58,576 | | | $ | (1,701 | ) | | $ | — | | | $ | — | | | $ | — | |
| | | | | | | | | | | | | | | | | | | | | | | | | | | | |
The following table presents additional information about valuation techniques and inputs used for investments that are measured at fair value and categorized within Level 3 at August 31, 2012:
| | | | | | | | | | |
| | | Fair Value at
August 31, 2012 | | | Valuation
Technique(s) | | Unobservable
Input(s) | | Range
(Weighted Average) |
International Equity Investments | | | | | | | | | | |
Common Stocks | | $ | 8,337 | | | Market Comparable | | Affiliated series | | N/A |
Emerging Markets Equity Investments | | | | | | | | | | |
Common Stocks | | | — | | | Market Comparable | | Affiliated series | | N/A |
Core Fixed Income Investments | | | | | | | | | | |
Convertible Preferred Stocks | | | — | | | Market Comparable | | Affiliated series | | N/A |
High Yield Investments | | | | | | | | | | |
Common Stocks | | | 321,939 | | | Market Comparable | | TEV/EBITDA multiple | | 3.3X-8.3X (6.0X) |
| | | 19,906 | | | Cost | | N/A | | N/A |
Corporate Bonds and Notes | | | 124,662 | | | Yield Analysis | | Spread over yield | | 7.56% |
A significant increase (decrease) in the TEV/EBITDA multiple or the spread over yield would result in a significantly higher (lower) fair value measurement.
(b) Accounting for Derivative Instruments. Relevant authoritative accounting guidance establishes disclosure requirements for derivative instruments and hedging activities. It requires qualitative disclosures about objectives and strategies for using derivatives, quantitative disclosures about fair value amounts and gains and losses on derivative instruments, and disclosures about credit-risk-related contingent features in derivative agreements.
It also requires enhanced disclosures regarding a Fund’s credit derivatives holdings, including credit default swaps, credit spread options, and hybrid financial instruments containing embedded credit derivatives.
All open derivative positions at year-end for each Fund are disclosed in Note 3.
Following is a description of the derivative instruments utilized by the Funds during the reporting period, including the primary underlying risk exposures related to each instrument type:
(i) Futures Contracts. Certain Funds may enter into financial futures contracts, to the extent permitted by their investment policies and objectives, for bonafide hedging and other permissible risk management purposes including protecting against anticipated changes in the value of securities a Fund intends to purchase. Upon entering into a financial futures contract, a Fund is required to deposit cash or securities as initial margin. Additional securities are also segregated as collateral up to the current market
161
Notes to Financial Statements
(continued)
value of the financial futures contracts. Subsequent payments, known as variation margin, are made or received by the Fund, depending on the fluctuation in the value of the underlying financial instruments. The Fund recognizes an unrealized gain or loss equal to the variation margin. When the financial futures contracts are closed, a realized gain or loss is recognized equal to the difference between the proceeds from (or cost of) the closing transactions and the Fund’s basis in the contracts.
The risks associated with entering into financial futures contracts include the possibility that a change in the value of the contract may not correlate with the changes in the value of the underlying instruments. In addition, investing in financial futures contracts involves the risk that the Fund could lose more than the original margin deposit and subsequent payments required for a futures transaction.
(ii) Options Written. Certain Funds may write options to manage exposure to certain changes in the market. When a Fund writes an option, an amount equal to the premium received by the Fund is recorded as a liability, the value of which is marked-to-market daily to reflect the current market value of the option written. If the option expires, the Fund realizes a gain from investments equal to the amount of the premium received. When a written call option is exercised, the premium received is added to the proceeds from the sale of the underlying security in determining whether the Fund has a realized gain or loss. When a written put option is exercised, the amount of the premium received reduces the cost of the security purchased by the Fund.
A risk in writing a covered call option is that the Fund may forego the opportunity of profit if the market price of the underlying security increases and the option is exercised. The risk in writing a put option is that the Fund may incur a loss if the market price of the underlying security decreases and the option is exercised. In addition, there is the risk that the Fund may not be able to enter into a closing transaction because of an illiquid secondary market.
(iii) Purchased Options. A Fund will normally purchase call options in anticipation of an increase in the market value of securities of the type in which they may invest. The purchase of a call option will entitle a Fund, in return for the premium paid, to purchase specified securities at a specified price during the option period. A Fund will ordinarily realize a gain if, during the option period, the value of such securities exceeded the sum of the exercise price, the premium paid and transaction costs; otherwise, the Fund will realize a loss equal to the amount of the premium paid on the purchase of the call option.
A Fund will normally purchase put options in anticipation of a decline in the market value of securities in its portfolio (“protective puts”) or in securities in which it may invest. The purchase of a put option will entitle the Fund, in exchange for the premium paid, to sell specified securities at a specified price during the option period. The purchase of protective puts is designed to offset or hedge against a decline in the market value of the Fund’s securities. Put options may also be purchased by a Fund for the purpose of affirmatively benefiting from a decline in the price of securities which it does not own. The Fund will ordinarily realize a gain if, during the option period, the value of the underlying securities decreased below the exercise price sufficiently to more than cover the premium and transaction costs; otherwise the Fund will realize a loss equal to the amount of the premium paid on the purchase of the put option. Gains and losses on the purchase of protective put options would tend to be offset by countervailing changes in the value of the underlying portfolio securities.
(iv) Forward Foreign Currency Contracts. Certain Funds may enter into forward foreign currency contracts to hedge against foreign currency exchange rate risk on their non-U.S. dollar denominated securities or to facilitate settlement of foreign currency denominated portfolio transactions. A forward foreign currency contract is an agreement between two parties to buy and sell a currency at a set price on a future date. The contract is marked-to-market daily and the change in value is recorded by a Fund as an unrealized gain or loss. When a forward foreign currency contract is extinguished, through either delivery or offset by entering into another forward foreign currency contract, the Fund records a realized gain or loss equal to the difference between the value of the contract at the time it was opened and the value of the contract at the time it was extinguished.
Forward foreign currency contracts involve elements of market risk in excess of the amounts reflected in the Statements of Assets and Liabilities. The Fund bears the risk of an unfavorable change in the foreign exchange rate underlying the forward foreign currency contract. Risks may also arise upon entering into these contracts from the potential inability of the counterparties to meet the terms of their contracts.
162
Notes to Financial Statements
(continued)
(v) Swaptions. Certain Funds may write swaption contracts to manage exposure to fluctuations in interest rates and to enhance portfolio yield. Swaption contracts written by a Fund represent an option that obligates the writer upon exercise by the purchaser, to enter into a previously agreed upon swap contract on a future date. If a written call swaption is exercised, the writer will enter into a swap and is obligated to pay the fixed rate and receive a floating rate in exchange. If a written put swaption is exercised, the writer will enter a swap and is obligated to pay the floating rate and receive a fixed rate in exchange.
When a Fund writes a swaption, the premium received is recorded as a liability and is subsequently adjusted to the current market value of the swaption. Changes in the value of the swaption are reported as unrealized gains or losses in the Statements of Assets and Liabilities and Statements of Operations. Gain or loss is recognized when the swaption contract expires or is closed. Premiums received from writing swaptions that expire or are exercised are treated by the Fund as realized gains from investments. The difference between the premium and the amount paid on effecting a closing purchase transaction is also treated as a realized gain or, if the premium received is less than the amount paid for the closing purchase, as a realized loss.
Entering into a swaption contract involves, to varying degrees, the elements of credit, market and interest rate risk, associated with both option contracts and swap contracts. To reduce credit risk from potential counterparty default, a Fund only enters into swaption contracts with counterparties that meet certain standards of creditworthiness. A Fund bears the market risk arising from any change in index values or interest rates.
(vi) Swap Contracts. Swaps involve the exchange by a Fund with another party of the respective amounts payable with respect to a notional principal amount related to one or more indices. Certain Funds may enter into these transactions to preserve a return or spread on a particular investment or portion of its assets, as a duration management technique or to protect against any increase in the price of securities the Fund anticipates purchasing at a later date. Certain Funds may also use these transactions for speculative purposes, such as to obtain the price performance of a security without actually purchasing the security in circumstances where, for example, the subject security is illiquid, is unavailable for direct investment or available only on less attractive terms.
An upfront payment received by the Fund, is recorded as a liability on the Fund’s books. An upfront payment made by the Fund, is recorded as an asset on the Fund’s books. Any upfront payments paid or received upon entering a swap contract to compensate for differences between stated terms of the agreement and prevailing market conditions (e.g. credit spreads, interest rates or other factors) are recorded as realized gain or loss at the termination of the swap.
Swaps have risks associated with them, including possible default by the counterparty to the transaction, illiquidity and, where swaps are used as hedges, the risk that the use of a swap could result in losses greater than if the swap had not been employed. This risk is mitigated by the posting of collateral by the counterparty to the Fund to cover the Fund’s exposure to the counterparty.
(vii) Credit Default Swaps. Certain Funds enter into credit default swap contracts for investment purposes, to manage their credit risk or to add leverage. As a seller in a credit default swap contract, a Fund is required to pay the notional or other agreed-upon value to the counterparty in the event of a default by a third party, such as a U.S. or foreign corporate issuer, on the referenced debt obligation. In return, the Fund receives from the counterparty a periodic stream of payments over the term of the contract provided that no event of default has occurred. If no default occurs, the Fund keeps the stream of payments and has no payment obligations. Such periodic payments are accrued daily and accounted for as realized gains.
Certain Funds may also purchase credit default swap contracts in order to hedge against the risk of default by debt securities held in their portfolios. In these cases a Fund functions as the counterparty referenced in the preceding paragraph. As a purchaser of a credit default swap contract, the Fund receives the notional or other agreed upon value from the counterparty in the event of a default by a third party, such as a U.S. or foreign corporate issuer, on the referenced debt obligation. In return, the Fund makes periodic payments to the counterparty over the term of the contract provided no event of default has occurred. Such periodic payments are accrued daily and accounted for as realized losses.
For a credit default swap sold by a Fund, payment of the agreed upon amount made by the Fund in the event of default of the referenced debt obligation is recorded as the cost of the referenced debt obligation received. For a credit default swap purchased by a Fund, the agreed upon amount received by the Fund in the event of default of the referenced debt obligation is recorded as proceeds from sale/delivery of the referenced debt obligation and the resulting gain or loss realized on the referenced debt obligation is recorded as such by the Fund.
163
Notes to Financial Statements
(continued)
Entering into credit default swaps involves, to varying degrees, elements of credit, market and documentation risk in excess of the related amounts recognized on the Statements of Assets and Liabilities. Such risks involve the possibility that there will be no liquid market for these agreements, that the counterparty to the agreements may default on its obligation to perform or disagree as to the meaning of the contractual terms in the agreements, and that there will be unfavorable changes in net interest rates. As privately negotiated transactions, swaps may involve documentation risk, which is the risk that the swap agreements fail to contemplate a particular outcome or that the parties disagree about the proper interpretation of a transaction term.
(viii) Interest Rate Swaps. Certain Funds may enter into interest rate swaps for investment purposes to manage exposure to fluctuations in interest rates or to add leverage.
Interest rate swaps represent an agreement between two counterparties to exchange cash flows based on the difference in two interest rates, applied to the notional principal amount for a specified period. The payment flows are usually netted against each other, with the difference being paid by one party to the other. Once the payments are settled in cash, the net amount is recorded as realized gain / (loss) from swap contracts on the Statement of Operations. The Funds settle accrued net receivable or payable under the swap contracts on a periodic basis.
The primary risk associated with interest rate swaps is that unfavorable changes in interest rates could adversely impact the Fund.
(ix) Centrally Cleared Swaps. Certain clearinghouses currently offer clearing for limited types of derivatives transactions, principally credit derivatives. In a cleared derivative transaction, a Fund typically enters into the transaction with a financial institution counterparty, and performance of the transaction is effectively guaranteed by a central clearinghouse, thereby reducing or eliminating the Fund’s exposure to a the credit risk of the original counterparty. The Fund typically will be required to post specified levels of margin with the clearinghouse or at the instruction of the clearinghouse; the margin required by a clearinghouse may be greater than the margin the Fund would be required to post in an uncleared derivative transaction. Daily changes in valuation of centrally cleared swaps, if any, are recorded as variation margin receivable or payable for the change in value as appropriate on the Statements of Assets and Liabilities. Only a limited number of derivative transactions are currently eligible for clearing by clearinghouses.
The following is a summary of the fair valuations of the Funds’ derivative instruments categorized by risk exposure:
International Equity Investments
Fair Values of Derivative Instruments on the Statement of Assets and Liabilities as of August 31, 2012:
| | | | | | | | | | | | | | | | | | | | |
| Location | | Interest rate
risk | | | Foreign
exchange
risk | | | Credit
risk | | | Equity
risk | | | Total | |
Asset derivatives | | | | | | | | | | | | | | | |
Unrealized appreciation on forward foreign currency contracts (c) | | $ | — | | | $ | 195,849 | | | $ | — | | | $ | — | | | $ | 195,849 | |
| | | | | | | | | | | | | | | | | | | | |
| | $ | — | | | $ | 195,849 | | | $ | — | | | $ | — | | | $ | 195,849 | |
| | | | | | | | | | | | | | | | | | | | |
Effect of Derivative Instruments on the Statement of Operations for the Year Ended August 31, 2012:
| | | | | | | | | | | | | | | | | | | | |
| Location | | Interest rate
risk | | | Foreign
exchange
risk | | | Credit
risk | | | Equity
risk | | | Total | |
Realized gain/(loss) on derivatives recognized in income (d) | | | | | | | | | | | | | | | | | | | | |
Net realized gain (loss) on forward foreign currency contracts | | $ | — | | | $ | 389,198 | | | $ | — | | | $ | — | | | $ | 389,198 | |
| | | | | | | | | | | | | | | | | | | | |
| | $ | — | | | $ | 389,198 | | | $ | — | | | $ | — | | | $ | 389,198 | |
| | | | | | | | | | | | | | | | | | | | |
Change in unrealized appreciation (depreciation) on derivatives recognized in income (e) | | | | | | | | | | | | | | | | | | | | |
164
Notes to Financial Statements
(continued)
Effect of Derivative Instruments on the Statement of Operations for the Year Ended August 31, 2012:
| | | | | | | | | | | | | | | | | | | | |
| Location | | Interest rate
risk | | | Foreign
exchange
risk | | | Credit
risk | | | Equity
risk | | | Total | |
Net change in unrealized appreciation (depreciation) on forward foreign currency contracts | | $ | — | | | $ | 532,079 | | | $ | — | | | $ | — | | | $ | 532,079 | |
| | | | | | | | | | | | | | | | | | | | |
| | $ | — | | | | $532,079 | | | $ | — | | | $ | — | | | $ | 532,079 | |
| | | | | | | | | | | | | | | | | | | | |
Emerging Markets Equity Investments
Fair Values of Derivative Instruments on the Statement of Assets and Liabilities as of August 31, 2012:
| | | | | | | | | | | | | | | | | | | | |
| Location | | Interest rate
risk | | | Foreign
exchange
risk | | | Credit
risk | | | Equity
risk | | | Total | |
Asset derivatives | | | | | | | | | | | | | | | | | | | | |
Variation margin on open futures contracts (b) | | $ | — | | | $ | — | | | $ | — | | | $ | 1,723,264 | | | $ | 1,723,264 | |
Unrealized appreciation on forward foreign currency contracts (c) | | | — | | | | 164,053 | | | | — | | | | — | | | | 164,053 | |
| | | | | | | | | | | | | | | | | | | | |
| | $ | — | | | $ | 164,053 | | | $ | — | | | $ | 1,723,264 | | | $ | 1,887,317 | |
| | | | | | | | | | | | | | | | | | | | |
Liability derivatives | | | | | | | | | | | | | | | | | | | | |
Unrealized depreciation on forward foreign currency contracts (a) | | $ | — | | | | 243,965 | | | $ | — | | | $ | — | | | $ | 243,965 | |
| | | | | | | | | | | | | | | | | | | | |
| | $ | — | | | $ | 243,965 | | | $ | — | | | $ | — | | �� | $ | 243,965 | |
| | | | | | | | | | | | | | | | | | | | |
Effect of Derivative Instruments on the Statement of Operations for the Year Ended August 31, 2012:
| | | | | | | | | | | | | | | | | | | | |
| Location | | Interest rate
risk | | | Foreign
exchange
risk | | | Credit
risk | | | Equity
risk | | | Total | |
Realized gain/(loss) on derivatives recognized in income (d) | | | | | | | | | | | | | | | | | | | | |
Net realized gain (loss) on futures contracts | | $ | — | | | $ | — | | | $ | — | | | $ | (20,793 | ) | | $ | (20,793 | ) |
Net realized gain (loss) on forward foreign currency contracts | | | — | | | | (385,774 | ) | | | — | | | | — | | | | (385,774 | ) |
| | | | | | | | | | | | | | | | | | | | |
| | $ | — | | | | (385,774 | ) | | $ | — | | | $ | (20,793 | ) | | $ | (406,567 | ) |
| | | | | | | | | | | | | | | | | | | | |
Change in unrealized appreciation (depreciation) on derivatives recognized in income (e) | | | | | | | | | | | | | | | | | | | | |
Net change in unrealized appreciation (depreciation) on futures contracts | | $ | — | | | $ | — | | | $ | — | | | $ | (507,434 | ) | | $ | (507,434 | ) |
Net change in unrealized appreciation (depreciation) on forward foreign currency contracts | | | — | | | | (154,503 | ) | | | — | | | | — | | | | (154,503 | ) |
| | | | | | | | | | | | | | | | | | | | |
| | $ | — | | | | (154,503 | ) | | $ | — | | | $ | (507,434 | ) | | $ | (661,937 | ) |
| | | | | | | | | | | | | | | | | | | | |
165
Notes to Financial Statements
(continued)
Core Fixed Income Investments
Fair Values of Derivative Instruments on the Statement of Assets and Liabilities as of August 31, 2012:
| | | | | | | | | | | | | | | | | | | | |
| Location | | Interest rate
risk | | | Foreign
exchange
risk | | | Credit
risk | | | Equity
risk | | | Total | |
Asset derivatives | | | | | | | | | | | | | | | | | | | | |
Purchased Options (c) | | $ | 9,775 | | | $ | — | | | $ | — | | | $ | — | | | $ | 9,775 | |
Variation margin on open futures contracts (b) | | | 348,682 | | | | — | | | | — | | | | — | | | | 348,682 | |
Unrealized appreciation on forward foreign currency contracts (c) | | | — | | | | 337,304 | | | | — | | | | — | | | | 337,304 | |
Unrealized appreciation on centrally cleared swaps (f) | | | 160,267 | | | | — | | | | — | | | | — | | | | 160,267 | |
Swap contracts, at value (c) | | | 2,313,737 | | | | — | | | | 779,896 | | | | — | | | | 3,093,633 | |
| | | | | | | | | | | | | | | | | | | | |
| | $ | 2,832,461 | | | $ | 337,304 | | | $ | 779,896 | | | $ | — | | | $ | 3,949,661 | |
| | | | | | �� | | | | | | | | | | | | | | |
Liability derivatives | | | | | | | | | | | | | | | | | | | | |
Options contracts written outstanding (a) | | $ | 531,871 | | | $ | — | | | $ | — | | | $ | — | | | $ | 531,871 | |
Unrealized depreciation on forward foreign currency contracts (a) | | | — | | | | 1,103,684 | | | | — | | | | — | | | | 1,103,684 | |
Unrealized depreciation on centrally cleared swaps (f) | | | — | | | | — | | | | 797,406 | | | | — | | | | 797,406 | |
Swap contracts, at value (a) | | | 97,044 | | | | — | | | | 150,071 | | | | — | | | | 247,115 | |
| | | | | | | | | | | | | | | | | | | | |
| | $ | 628,915 | | | $ | 1,103,684 | | | $ | 947,477 | | | $ | — | | | $ | 2,680,076 | |
| | | | | | | | | | | | | | | | | | | | |
Effect of Derivative Instruments on the Statement of Operations for the Year Ended August 31, 2012:
| | | | | | | | | | | | | | | | | | | | |
| Location | | Interest rate
risk | | | Foreign
exchange
risk | | | Credit
risk | | | Equity
risk | | | Total | |
Realized gain/(loss) on derivatives recognized in income (d) | | | | | | | | | | | | | | | | | | | | |
Net realized gain (loss) on purchased options | | $ | (24,824 | ) | | $ | — | | | $ | — | | | $ | — | | | $ | (24,824 | ) |
Net realized gain (loss) on futures contracts | | | 2,713,496 | | | | — | | | | — | | | | — | | | | 2,713,496 | |
Net realized gain (loss) on options written | | | 747,667 | | | | — | | | | 107,810 | | | | — | | | | 855,477 | |
Net realized gain (loss) on swaps contracts | | | (636,648 | ) | | | — | | | | 36,849 | | | | — | | | | (599,799 | ) |
Net realized gain (loss) on forward foreign currency contracts | | | — | | | | 1,360,739 | | | | — | | | | — | | | | 1,360,739 | |
| | | | | | | | | | | | | | | | | | | | |
| | $ | 2,799,691 | | | $ | 1,360,739 | | | $ | 144,659 | | | $ | — | | | $ | 4,305,089 | |
| | | | | | | | | | | | | | | | | | | | |
Change in unrealized appreciation (depreciation) on derivatives recognized in income (e) | | | | | | | | | | | | | | | | | | | | |
Net change in unrealized appreciation (depreciation) on purchased options | | $ | (156,307 | ) | | $ | — | | | $ | — | | | $ | — | | | $ | (156,307 | ) |
Net change in unrealized appreciation (depreciation) on futures contracts | | | (2,557,767 | ) | | | — | | | | — | | | | — | | | | (2,557,767 | ) |
Net change in unrealized appreciation (depreciation) on options written | | | (112,353 | ) | | | — | | | | (15,612 | ) | | | — | | | | (127,965 | ) |
Net change in unrealized appreciation (depreciation) on swaps contracts | | | 1,424,836 | | | | — | | | | (523,970 | ) | | | — | | | | 900,866 | |
Net change in unrealized appreciation (depreciation) on forward foreign currency contracts | | | — | | | | 311,475 | | | | — | | | | — | | | | 311,475 | |
| | | | | | | | | | | | | | | | | | | | |
| | $ | (1,401,591 | ) | | $ | 311,475 | | | $ | (539,582 | ) | | $ | — | | | $ | (1,629,698 | ) |
| | | | | | | | | | | | | | | | | | | | |
166
Notes to Financial Statements
(continued)
International Fixed Income Investments
Fair Values of Derivative Instruments on the Statement of Assets and Liabilities as of August 31, 2012:
| | | | | | | | | | | | | | | | | | | | |
| | | Interest rate
risk | | | Foreign
exchange
risk | | | Credit
risk | | | Equity
risk | | | Total | |
Asset derivatives | | | | | | | | | | | | | | | | | | | | |
Purchased Options (c) | | $ | 79,653 | | | $ | — | | | $ | — | | | $ | — | | | $ | 79,653 | |
Variation margin on open futures contracts (b) | | | 51,050 | | | | — | | | | — | | | | — | | | | 51,050 | |
Unrealized appreciation on forward foreign currency contracts (c) | | | — | | | | 1,535,250 | | | | — | | | | — | | | | 1,535,250 | |
Unrealized appreciation on centrally cleared swaps (f) | | | 315,577 | | | | — | | | | — | | | | — | | | | 315,577 | |
Swap contracts, at value (c) | | | 1,418,234 | | | | — | | | | 524,363 | | | | — | | | | 1,942,597 | |
| | | | | | | | | | | | | | | | | | | | |
| | $ | 1,864,514 | | | $ | 1,535,250 | | | $ | 524,363 | | | $ | — | | | $ | 3,924,127 | |
| | | | | | | | | | | | | | | | | | | | |
Liability derivatives | | | | | | | | | | | | | | | | | | | | |
Options contracts written outstanding (a) | | $ | 539,897 | | | $ | — | | | $ | — | | | $ | — | | | $ | 539,897 | |
Unrealized depreciation on forward foreign currency contracts (a) | | | — | | | | 5,880,376 | | | | — | | | | — | | | | 5,880,376 | |
Unrealized depreciation on centrally cleared swaps (f) | | | 376,215 | | | | — | | | | — | | | | — | | | | 376,215 | |
Swap contracts, at value (a) | | | — | | | | — | | | | 148,480 | | | | — | | | | 148,480 | |
| | | | | | | | | | | | | | | | | | | | |
| | $ | 916,112 | | | $ | 5,880,376 | | | $ | 148,480 | | | $ | — | | | $ | 6,944,968 | |
| | | | | | | | | | | | | | | | | | | | |
Effect of Derivative Instruments on the Statement of Operations for the Year Ended August 31, 2012:
| | | | | | | | | | | | | | | | | | | | |
| Location | | Interest rate
risk | | | Foreign
exchange
risk | | | Credit
risk | | | Equity
risk | | | Total | |
Realized gain/(loss) on derivatives recognized in income (d) | | | | | | | | | | | | | | | | | | | | |
Net realized gain (loss) on purchased options | | $ | (25,407 | ) | | $ | — | | | $ | — | | | $ | — | | | $ | (25,407 | ) |
Net realized gain (loss) on futures contracts | | | 4,795,591 | | | | — | | | | — | | | | — | | | | 4,795,591 | |
Net realized gain (loss) on options contracts written | | | 267,162 | | | | — | | | | — | | | | — | | | | 267,162 | |
Net realized gain (loss) on swaps contracts | | | (524,827 | ) | | | — | | | | (549,468 | ) | | | — | | | | (1,074,295 | ) |
Net realized gain (loss) on forward foreign currency contracts | | | — | | | | 18,161,028 | | | | — | | | | — | | | | 18,161,028 | |
| | | | | | | | | | | | | | | | | | | | |
| | $ | 4,512,519 | | | $ | 18,161,028 | | | $ | (549,468 | ) | | $ | — | | | $ | 22,124,079 | |
| | | | | | | | | | | | | | | | | | | | |
Change in unrealized appreciation (depreciation) on derivatives recognized in income (e) | | | | | | | | | | | | | | | | | | | | |
Net change in unrealized appreciation (depreciation) on purchased options | | $ | (101,787 | ) | | $ | — | | | $ | — | | | $ | — | | | $ | (101,787 | ) |
Net change in unrealized appreciation (depreciation) on futures contracts | | | (1,379,096 | ) | | | — | | | | — | | | | — | | | | (1,379,096 | ) |
Net change in unrealized appreciation (depreciation) on options contracts written | | | (7,030 | ) | | | — | | | | — | | | | — | | | | (7,030 | ) |
Net change in unrealized appreciation (depreciation) on swaps contracts | | | 1,235,728 | | | | — | | | | 574,766 | | | | — | | | | 1,810,494 | |
Net change in unrealized appreciation (depreciation) on forward foreign currency contracts | | | — | | | | (3,554,107 | ) | | | — | | | | — | | | | (3,554,107 | ) |
| | | | | | | | | | | | | | | | | | | | |
| | $ | (252,185 | ) | | $ | (3,554,107 | ) | | $ | 574,766 | | | $ | — | | | $ | (3,231,526 | ) |
| | | | | | | | | | | | | | | | | | | | |
| (a) | Statements of Assets and Liabilities location: Payable for open forward foreign currency contracts, swap contracts, at value, or options contracts written. |
| (b) | Only variation margin, if any, reported within the Statements of Assets and Liabilities. Cumulative appreciation (depreciation) on futures contracts is reported in “Open Future Contracts” table (see Note 3). |
| (c) | Statements of Assets and Liabilities location: Investments, at value, receivable for open forward foreign currency contracts or unrealized appreciation on swap contracts, at value. |
167
Notes to Financial Statements
(continued)
| (d) | Statements of Operations location: Net realized gain (loss) from investment transactions, foreign currency transactions, futures contracts, options contracts written or swap contracts. |
| (e) | Statements of Operations location: Change in net unrealized appreciation (depreciation) from investment transactions, foreign currency transactions, futures contracts, options contracts written or swap contracts. |
| (f) | Only variation margin, if any, reported within the Statements of Assets and Liabilities. Cumulative appreciation (depreciation) on centrally cleared swaps is reported in “Open Swap Contracts” table (see Note 3). |
The average notional amounts of futures contracts, swaps contracts and forward foreign currency contracts, and the average market value of options contracts written and purchased options outstanding during the year ended August 31, 2012, were approximately as follows:
International Equity Investments
| | | | | | | | | | | | | | | | | | | | |
| | | Interest rate
risk | | | Foreign
exchange
risk | | | Credit
risk | | | Equity
risk | | | Total | |
Forward foreign currency contracts | | $ | — | | | $ | 10,052,901 | | | $ | — | | | $ | — | | | $ | 10,052,901 | |
Emerging Markets Equity Investments
| | | | | | | | | | | | | | | | | | | | |
| | | Interest rate
risk | | | Foreign
exchange
risk | | | Credit
risk | | | Equity
risk | | | Total | |
Futures contracts | | $ | — | | | $ | — | | | $ | — | | | $ | 11,646,856 | | | $ | 11,646,856 | |
Forward foreign currency contracts | | | — | | | | 7,815,055 | | | | — | | | | — | | | | 7,815,055 | |
Core Fixed Income Investments
| | | | | | | | | | | | | | | | | | | | |
| | | Interest rate
risk | | | Foreign
exchange
risk | | | Credit
risk | | | Equity
risk | | | Total | |
Purchased Options | | $ | 37,462 | | | $ | — | | | $ | — | | | $ | — | | | $ | 37,462 | |
Futures contracts | | | 135,647,589 | | | | — | | | | — | | | | — | | | | 135,647,589 | |
Option contracts written | | | 323,827 | | | | — | | | | 14,403 | | | | — | | | | 338,230 | |
Swaps contracts | | | 110,859,231 | | | | — | | | | 36,229,994 | | | | — | | | | 147,089,225 | |
Forward foreign currency contracts | | | — | | | | 115,923,272 | | | | — | | | | — | | | | 115,923,272 | |
International Fixed Income Investments
| | | | | | | | | | | | | | | | | | | | |
| | | Interest rate
risk | | | Foreign
exchange
risk | | | Credit
risk | | | Equity
risk | | | Total | |
Purchased Options | | $ | 54,749 | | | $ | — | | | $ | — | | | $ | — | | | $ | 54,749 | |
Futures contracts | | | 65,144,459 | | | | — | | | | — | | | | — | | | | 65,144,459 | |
Option contracts written | | | 271,731 | | | | — | | | | — | | | | — | | | | 271,731 | |
Swaps contracts | | | 1,346,746,154 | | | | — | | | | 43,157,692 | | | | — | | | | 1,389,903,846 | |
Forward foreign currency contracts | | | — | | | | 333,858,539 | | | | — | | | | — | | | | 333,858,539 | |
(c) Repurchase Agreements. When entering into repurchase agreements, it is the Funds’ policy that their custodian or a third party custodian takes possession of the underlying collateral securities, the market value of which at least equals the principal amount of the repurchase transaction, including accrued interest. To the extent that any repurchase transaction exceeds one business day, the value of the collateral is marked-to-market daily to ensure the adequacy of the collateral. If the seller defaults and the market value of the collateral declines or if bankruptcy proceedings are commenced with respect to the seller of the security, realization of the collateral by the Funds may be delayed or limited.
168
Notes to Financial Statements
(continued)
(d) Stripped Securities. Certain Funds may invest in “Stripped Securities”, a term used collectively for stripped fixed income securities. Stripped securities can be principal-only securities, which are debt obligations that have been stripped of interest coupons, or interest-only securities (“IO”), which are interest coupons that have been stripped from debt obligations. As is the case with all securities, the market value of Stripped Securities will fluctuate in response to changes in economic conditions, interest rates and the market’s perception of the securities. However, fluctuations in response to interest rates may be greater in Stripped Securities than for debt obligations of comparable maturities that pay interest currently. The amount of fluctuation increases with a longer period of maturity.
The yield-to-maturity on an IO is sensitive to the rate of principal repayments (including prepayments) on the related underlying debt obligation and principal payments may have a material effect on yield to maturity. If the underlying debt obligation experiences greater than anticipated prepayments of principal, the Fund may not fully recoup its initial investment in the IO.
(e) Time Deposits. Certain Funds may purchase overnight time deposits issued by offshore branches of U.S. banks that meet credit and risk standards established by the custodian and approved by the Funds.
(f) Lending of Portfolio Securities. The Trust has an agreement with its custodian whereby the custodian may lend securities owned by the Funds to brokers, dealers and other financial organizations that have been approved as borrowers by the Funds. Loans of securities by a Fund are collateralized by cash, U.S. government securities or irrevocable performance letters of credit issued by banks approved by the Funds. Such collateral is maintained at all times in an amount at least equal to the current market value of the loaned securities, plus a margin which varies depending on the type of securities loaned. All collateral is received, held and administered by the custodian in an applicable custody account or other account established for the purpose of holding collateral for each Fund. Cash collateral received by the Funds as a result of securities lending activities is invested in an unaffiliated registered money market fund, and is recorded as Payable for securities on loan on the Funds’ Statement of Assets and Liabilities. Securities lending income represents the income earned on investing cash collateral plus any premium payments that may be received on the loan of certain types of securities, less fees and expenses associated with the loan. The Funds have the right under the securities lending agreement to recover any loaned securities from the borrower on demand. Each Fund maintains the risk of any market loss on its securities on loan as well as the potential loss on investments purchased with cash collateral received from its securities lending. Additionally, the Funds are exposed to risks that a borrower may not provide additional collateral when required or return loaned securities when due.
At August 31, 2012, the aggregate market value of the loaned securities and the value of the collateral each Fund received were as follows:
Loaned Securities
| | | | | | | | |
Fund | | Market Value of
Securities on Loan | | | Value of
Collateral Held | |
Large Capitalization Growth Investments | | $ | 9,569,391 | | | $ | 9,755,298 | |
Large Capitalization Value Equity Investments | | | 22,465,976 | | | | 22,847,068 | |
Small Capitalization Growth Investments | | | 19,763,710 | | | | 19,954,594 | |
Small Capitalization Value Equity Investments | | | 5,834,748 | | | | 5,954,665 | |
International Equity Investments | | | 6,089,464 | | | | 6,243,716 | |
Emerging Markets Equity Investments | | | 27,685,842 | | | | 28,945,863 | |
Core Fixed Income Investments | | | 378,081 | | | | 386,546 | |
High Yield Investments | | | 2,464,362 | | | | 2,539,760 | |
(g) To-Be-Announced Purchase and Sale Commitments. Certain Funds may trade securities on a to-be-announced (“TBA”) basis. In a TBA transaction, a Fund commits to purchasing or selling securities which have not yet been issued by the issuer and for which specific information is not known, such as the face amount and maturity date and the underlying pool of investments in U.S. government agency mortgage pass-through transactions. Securities purchased on a TBA basis are not settled until they are delivered to the Fund, normally 15 to 45 days later. Beginning on the date the Fund enters into a TBA transaction, cash, U.S. government securities or other liquid high-grade debt obligations are segregated in an amount equal in value to the purchase price of the TBA security. These transactions are marked to market on a daily basis and are subject to market fluctuations.
169
Notes to Financial Statements
(continued)
Additionally, when a Fund sells TBA securities without already owning or having the right to obtain the deliverable securities (an uncovered forward commitment to sell), it incurs a risk of loss because it could have to purchase the securities at a price that is higher than the price at which it sold them. A Fund may be unable to purchase the deliverable securities if the corresponding market is illiquid.
TBA securities subject to a forward commitment to sell at period end are included at the end of the Schedule of Investments under the caption “Schedule of Forward Sale Commitments”. The proceeds and value of these commitments are reflected in the Statement of Assets and Liabilities.
(h) Short Sales of Securities. A short sale is a transaction in which a Fund sells securities it does not own in anticipation of a decline in the market price of the securities. To complete a short sale, the Fund may arrange through a broker to borrow the securities to be delivered to the buyer. The proceeds received by the Fund for the short sale are retained by the broker until the Fund replaces the borrowed securities. In borrowing the securities to be delivered to the buyer, the Fund becomes obligated to replace the securities borrowed at their market price at the time of replacement, whatever that price may be.
The risk of engaging in short sale transactions is that selling short magnifies the potential for loss to a Fund. The larger the Fund’s short position, the greater the potential loss. If a security sold short increases in price, the Fund may have to cover its short position at a higher price than the short sale price, resulting in a loss. To borrow the security, the Fund also may be required to pay a premium, which could decrease the proceeds of the security sold short. The amount of any gain will be decreased, and the amount of any loss increased, by the amount of the premium, dividends, interest or expenses the Fund may be required to pay in connection with the short sale. In addition, because the Fund’s loss on a short sale arises from increases in the value of the security sold short, such loss is unlimited.
(i) Mortgage Dollar Rolls. Certain Funds may sell mortgage-backed securities for delivery in the current month and simultaneously contract to repurchase substantially similar (same type, coupon and maturity) securities to settle on a specific future date at an agreed upon price. Pools of mortgage securities are used to collateralize mortgage dollar roll transactions and may have different prepayment histories than those sold. During the period between the sale and the repurchase, a Fund forgoes principal and interest paid on the securities sold. Proceeds of the sale will be invested in short-term instruments and the income from these investments, together with any additional fee income received on a sale, is intended to generate income for a Fund. A Fund accounts for dollar roll transactions as purchases and sales and realizes the gain or loss at the time the transaction is entered into on these transactions.
Mortgage dollar roll transactions involve the risk that the market value of the securities a Fund is obligated to repurchase under the agreement may decline below the repurchase price of those securities. If investment performance of securities purchased with proceeds from these transactions does not exceed the income, capital appreciation and gain or loss that would have been realized on the securities sold as part of the dollar roll, the use of this technique will adversely impact the investment performance of a Fund. In the event the buyer of securities under a mortgage dollar roll files for bankruptcy or becomes insolvent, the Fund’s use of proceeds of the dollar roll may be restricted pending a determination by the other party, or its trustee or receiver, whether to enforce the Fund’s obligation to repurchase the securities.
(j) Credit and Market Risk. Certain Funds invest in high yield instruments that are subject to certain credit and market risks. The yields of high yield obligations reflect, among other things, perceived credit and market risks. Each Fund’s investment in securities rated below investment grade typically involve risks not associated with higher rated securities, including, among others, greater risk related to timely and ultimate payment of interest and principal, greater market price volatility and less liquid secondary market trading.
(k) Foreign Risk. Certain Funds’ investments in foreign securities may involve risks not present in domestic investments. Because securities may be denominated in foreign currencies and may require settlement in foreign currencies and pay interest or dividends in foreign currencies, changes in the relationship of these foreign currencies to the U.S. dollar can significantly affect the value of the investments and earnings of a Fund. Foreign investments may also subject the Fund to foreign government exchange restrictions, expropriation, taxation or other political, social or economic developments, all of which affect the market and/or credit risk of the investments.
170
Notes to Financial Statements
(continued)
(l) Security Transactions and Investment Income. Security transactions are accounted for on a trade date basis. Interest income, adjusted for amortization of premium and accretion of discount, is recorded on an accrual basis. Dividend income is recorded on the ex-dividend date. Foreign dividend income is recorded on the ex-dividend date or as soon as practical after a Fund determines the existence of a dividend declaration after exercising reasonable due diligence. The cost of investments sold is determined by use of the specific identification method. To the extent any issuer defaults on an expected interest payment, the Trust’s policy is to generally halt any additional interest income accruals and consider the Fund’s ability to realize interest accrued up to the date of default.
(m) Foreign Currency Translation. Investment securities and other assets and liabilities denominated in foreign currencies are translated into U.S. dollar amounts based upon prevailing exchange rates on the date of valuation. Purchases and sales of investment securities and income and expense items denominated in foreign currencies are translated into U.S. dollar amounts based upon prevailing exchange rates on the respective dates of such transactions.
The Funds do not isolate that portion of the results of operations resulting from changes in foreign exchange rates on investments from the fluctuations arising from changes in market prices of securities held. Such fluctuations are included with the net realized and unrealized gain or loss on investments in the Statements of Operations.
Net realized foreign exchange gains or losses arise from sales of foreign currencies, including gains and losses on forward foreign currency contracts, currency gains or losses realized between the trade and settlement dates on securities transactions and the difference between the amounts of dividends, interest and foreign withholding taxes recorded on the Funds’ books and the U.S. dollar equivalent of the amounts actually received or paid. Net unrealized foreign exchange gains and losses arise from changes in the fair values of assets and liabilities, other than investments in securities, at the date of valuation, resulting from changes in exchange rates.
Foreign security and currency transactions may involve certain considerations and risks not typically associated with those of U.S. dollar denominated transactions as a result of, among other factors, the possibility of lower levels of governmental supervision and regulation of foreign securities markets and the possibility of political or economic instability.
(n) Distributions to Shareholders. Distributions from net investment income for Large Capitalization Growth Investments, Large Capitalization Value Equity Investments, Small Capitalization Growth Investments, Small Capitalization Value Equity Investments, International Equity Investments, Emerging Markets Equity Investments and International Fixed Income Investments, if any, are declared and paid on an annual basis. Distributions from net investment income for Core Fixed Income Investments, High Yield Investments and Municipal Bond Investments, if any, are declared and paid on a monthly basis. Distributions on the shares of Money Market Investments are declared each business day to shareholders of record that day, and are paid on the last business day of the month.
The Funds intend to satisfy conditions that will enable interest from municipal securities, which are exempt from regular federal income tax and from designated state income taxes, to retain such tax-exempt status when distributed to the shareholders of the Funds. Distributions of net realized gains to shareholders of the Funds, if any, are taxable and are declared at least annually. Distributions to shareholders of the Funds are recorded on the ex-dividend date and are determined in accordance with income tax regulations, which may differ from GAAP.
(o) Federal and Other Taxes. It is the Trust’s policy to comply with the federal income and excise tax requirements of the Internal Revenue Code of 1986, as amended, applicable to regulated investment companies. Accordingly, each Fund intends to distribute substantially all of its income and net realized gains on investments, if any, to shareholders each year. Therefore, no federal income tax provision is required in the Funds’ financial statements. Under the applicable foreign tax laws, a withholding tax may be imposed on interest, dividends and capital gains at various rates.
Management has reviewed the tax positions and has concluded that no liability for unrecognized tax benefits should be recorded related to uncertain tax positions taken on returns filed for open tax years or expected to be taken in 2012 tax returns. Each Fund’s federal tax returns for the prior three fiscal years remain subject to examination by the Internal Revenue Service.
(p) Reclassification. GAAP requires that certain components of net assets be adjusted to reflect permanent differences between financial and tax reporting. These reclassifications have no effect on net assets or net asset values per share.
171
Notes to Financial Statements
(continued)
| | | | | | | | | | | | | | |
Fund | | | | Undistributed
(Dividend in
excess of) Net
Investment Income | | | Undistributed
Realized Gains/
(Accumulated Net
Realized Losses) | | | Paid-in Capital | |
Large Capitalization Growth Investments | | (a) | | $ | (53,258 | ) | | $ | 53,257 | | | $ | 1 | |
Large Capitalization Value Equity Investments | | (a) | | | (334,313 | ) | | | 334,311 | | | | 2 | |
Small Capitalization Growth Investments | | (a),(b) | | | 297,670 | | | | 2,098 | | | | (299,768 | ) |
Small Capitalization Value Equity Investments | | (a) | | | 59,004 | | | | (59,004 | ) | | | — | |
International Equity Investments | | (c),(e) | | | 382,457 | | | | (382,457 | ) | | | — | |
Emerging Markets Equity Investments | | (c),(e) | | | (1,217,971 | ) | | | 1,217,755 | | | | 216 | |
Core Fixed Income Investments | | (d),(f),(g) | | | 8,315,606 | | | | (8,253,631 | ) | | | (61,975 | ) |
High Yield Investments | | (f) | | | 659,229 | | | | (659,229 | ) | | | — | |
International Fixed Income Investments | | (d),(e),(g) | | | 23,284,153 | | | | (23,362,124 | ) | | | 77,971 | |
Municipal Bond Investments | | (d) | | | 1 | | | | — | | | | (1 | ) |
Money Market Investments | | | | | — | | | | — | | | | — | |
| (a) | Reclassifications are primarily due to book/tax differences in the treatment of distributions from real estate investment trusts. |
| (b) | Reclassifications are primarily due to a tax net operating loss. |
| (c) | Reclassifications are primarily due to foreign currency transactions treated as ordinary income for tax purposes, and book/tax differences in the treatment of passive foreign investment companies. |
| (d) | Reclassifications are primarily due to differences between book and tax amortization of premium on fixed income securities. |
| (e) | Reclassifications are primarily due to Brazilian IOF Tax reclass. |
| (f) | Reclassifications are primarily due to defaulted bond interest reclass. |
| (g) | Reclassifications are primarily due to foreign currency transactions treated as ordinary income for tax purposes. |
(q) Restricted Securities. All Funds may invest in non-publicly traded securities, commonly called restricted securities. Restricted securities may be less liquid than publicly-traded securities. Although certain restricted securities may be resold in privately negotiated transactions, the values realized from these sales could be less than originally paid by a Fund. Certain restricted securities may be deemed liquid by Manager and/or Sub-adviser pursuant to procedures approved by the Board of Trustees. The value of restricted securities is determined as described in Note 1(a).
(r) Indemnification. In the normal course of business, the Trust may enter into contracts that provide certain indemnifications. The Funds’ maximum exposure under these arrangements is dependent on future claims that may be made against the Funds and, therefore, cannot be estimated; however, based on experience, risk of loss from such claims is considered remote.
2. Investment Management Agreement and Other Transactions with Affiliates
CGAS, a business of MSSBH, serves as the investment manager (“Manager”) to the Funds. The Manager selects and oversees professional money managers who are responsible for investing the assets of the Funds (each a “Sub-adviser,” and collectively the “Sub-advisers”). Each Fund pays the Manager an investment management fee calculated daily at an annual rate based on each Fund’s average daily net assets and paid monthly in arrears. The Manager pays each Sub-adviser a subadvisory fee from its investment management fees.
The maximum allowable investment management fee represents the total amount that could be charged to each Fund. The aggregate fees paid by CGAS to each Fund’s Sub-advisers and the fees retained by CGAS for the year ended August 31, 2012, are indicated below:
| | | | | | | | | | | | |
| | | Subadvisory
Fee | | | Consulting Group
Advisory Services LLC
Fee | | | Maximum
Allowable Annual
Management Fee | |
Large Capitalization Growth Investments | | | 0.37 | % | | | 0.23 | % | | | 0.60 | % |
Large Capitalization Value Equity Investments | | | 0.32 | % | | | 0.28 | % | | | 0.60 | % |
Small Capitalization Growth Investments | | | 0.49 | % | | | 0.30 | % | | | 0.80 | % |
Small Capitalization Value Equity Investments | | | 0.49 | % | | | 0.30 | % | | | 0.80 | % |
International Equity Investments | | | 0.40 | % | | | 0.30 | % | | | 0.70 | % |
172
Notes to Financial Statements
(continued)
| | | | | | | | | | | | |
| | | Subadvisory
Fee | | | Consulting Group
Advisory Services LLC
Fee | | | Maximum
Allowable Annual
Management Fee | |
Emerging Markets Equity Investments | | | 0.47 | % | | | 0.30 | % | | | 0.90 | % |
Core Fixed Income Investments | | | 0.20 | % | | | 0.20 | % | | | 0.40 | % |
High Yield Investments | | | 0.29 | % | | | 0.25 | % | | | 0.70 | % |
International Fixed Income Investments | | | 0.24 | % | | | 0.25 | % | | | 0.50 | % |
Municipal Bond Investments | | | 0.20 | % | | | 0.20 | % | | | 0.40 | % |
Money Market Investments * | | | 0.08 | % | | | 0.00 | % | | | 0.08 | % |
| * | The Manager voluntarily waived and/or reimbursed certain fees or expense to maintain a positive net yield. For the year ended August 31, 2012, the Manager reimbursed the Fund $24,909. |
The Manager has agreed to waive and/or reimburse a portion of its fee. For the year ended August 31, 2012, the amounts waived and/or reimbursed by the Manager were as follows:
| | | | |
Fund | | | |
Small Capitalization Growth Investments | | $ | 23,397 | |
Small Capitalization Value Equity Investments | | | 20,926 | |
International Equity Investments | | | 23,977 | |
Emerging Markets Equity Investments | | | 945,932 | |
Core Fixed Income Investments | | | 52,640 | |
High Yield Investments | | | 226,582 | |
International Fixed Income Investments | | | 35,061 | |
Money Market Investments | | | 24,909 | |
Brown Brothers Harriman & Co. (“BBH”) serves as the Trust’s administrator. For its administrative services, BBH receives an annual asset based fee of 0.0250% of the Trust’s assets up to $5 billion, 0.02% on assets between $5 billion and $8 billion and 0.0175% on assets in excess of $8 billion plus out-of-pocket expenses. The fee is calculated and allocated daily based on the relative assets of each Fund. BBH voluntarily agreed to waive a portion of its fee for Money Market Investments. As of the period ended August 31, 2012, BBH waived $4,276.
For the year ended August 31, 2012, Citigroup Global Markets Inc. (“CGMI”), the Trust’s distributor until May 31, 2012, and an indirect, wholly-owned subsidiary of Citigroup Inc., and its affiliates, and Morgan Stanley & Co. Incorporated (“MS&Co.”), and its affiliates, including Morgan Stanley Smith Barney LLC, the Trust’s distributor since May 31, 2012, received brokerage commissions of:
| | | | | | | | | | | | |
Fund | | Commission
Dollars to CGMI | | | Commission
Dollars to MS&Co. | | | Commission
Aggregate | |
Large Capitalization Growth Investments | | $ | 32,921 | | | $ | 37,279 | | | $ | 70,200 | |
Large Capitalization Value Equity Investments | | | 3,787 | | | | 10,018 | | | | 13,805 | |
Small Capitalization Growth Investments | | | 1,845 | | | | 3,718 | | | | 5,563 | |
Small Capitalization Value Investments | | | — | | | | 375 | | | | 375 | |
International Equity Investments | | | 1,179 | | | | 4,541 | | | | 5,720 | |
Emerging Markets Equity Investments | | | 24,412 | | | | 33,059 | | | | 57,471 | |
All officers, with the exception of the Funds’ Chief Compliance Officer (“CCO”), do not receive compensation directly from the Trust. The Funds bear a portion of the CCO’s annual compensation.
173
Notes to Financial Statements
(continued)
During the year ended August 31, 2012, the aggregate cost of purchases and proceeds from sales of investments (excluding short-term investments) for each Fund were as follows:
| | | | | | | | | | | | | | | | |
| | | Investments | | | U.S. Government & Agency Obligations | |
| Fund | | Purchases | | | Sales | | | Purchases | | | Sales | |
Large Capitalization Growth Investments | | $ | 1,027,304,277 | | | $ | 1,411,869,634 | | | $ | — | | | $ | — | |
Large Capitalization Value Equity Investments | | | 352,091,198 | | | | 606,935,741 | | | | — | | | | — | |
Small Capitalization Growth Investments | | | 169,640,045 | | | | 220,147,487 | | | | — | | | | — | |
Small Capitalization Value Equity Investments | | | 46,367,964 | | | | 100,759,932 | | | | — | | | | — | |
International Equity Investments | | | 270,099,997 | | | | 340,552,688 | | | | — | | | | — | |
Emerging Markets Equity Investments | | | 284,303,893 | | | | 377,031,489 | | | | — | | | | — | |
Core Fixed Income Investments | | | 1,103,331,665 | | | | 1,091,838,824 | | | | 3,763,851,042 | | | | 3,793,048,231 | |
High Yield Investments | | | 199,444,059 | | | | 137,952,473 | | | | — | | | | — | |
International Fixed Income Investments | | | 265,081,878 | | | | 169,472,745 | | | | 587,901,055 | | | | 528,307,816 | |
Municipal Bond Investments | | | 24,438,696 | | | | 25,257,808 | | | | — | | | | — | |
At August 31, 2012, the aggregate gross unrealized appreciation and depreciation of investments for federal income tax purposes were as follows:
Unrealized Appreciation (Depreciation)
| | | | | | | | | | | | |
Fund | | Gross
Unrealized
Appreciation | | | Gross
Unrealized
(Depreciation) | | | Net Unrealized
Appreciation
(Depreciation) | |
Large Capitalization Growth Investments | | $ | 440,985,098 | | | $ | (47,878,818 | ) | | $ | 393,106,280 | |
Large Capitalization Value Equity Investments | | | 199,408,148 | | | | (58,331,751 | ) | | | 141,076,397 | |
Small Capitalization Growth Investments | | | 59,993,123 | | | | (11,278,675 | ) | | | 48,714,448 | |
Small Capitalization Value Equity Investments | | | 54,512,954 | | | | (7,305,138 | ) | | | 47,207,816 | |
International Equity Investments | | | 58,699,900 | | | | (31,512,869 | ) | | | 27,187,031 | |
Emerging Markets Equity Investments | | | 158,597,011 | | | | (82,167,617 | ) | | | 76,429,394 | |
Core Fixed Income Investments | | | 56,645,592 | | | | (19,421,596 | ) | | | 37,223,996 | |
High Yield Investments | | | 8,491,922 | | | | (3,576,462 | ) | | | 4,915,460 | |
International Fixed Income Investments | | | 18,832,237 | | | | (6,154,784 | ) | | | 12,677,453 | |
Municipal Bond Investments | | | 7,831,528 | | | | (5,670 | ) | | | 7,825,858 | |
At August 31, 2012, Emerging Markets Equity Investments, Core Fixed Income Investments and International Fixed Income Investments had open exchange traded futures contracts as described below. The unrealized gain (loss) on the open contracts reflected in the accompanying financial statements were as follows:
| | | | | | | | | | | | | | | | |
Emerging Markets Equity Investments | | Number of
Contracts | | | Expiration
Date | | | Market
Value | | | Unrealized
Gain (Loss) | |
Contracts to Buy: | | | | | | | | | | | | | | | | |
FTSE® Bursa Malaysia KLCI Index | | | 91 | | | | 9/12 | | | $ | 2,395,503 | | | $ | (6,519 | ) |
FTSE®/JSE Top 40 Index | | | 54 | | | | 9/12 | | | | 2,001,452 | | | | 76,934 | |
Hang Seng China Enterprises Index | | | 90 | | | | 9/12 | | | | 5,352,101 | | | | (181,589 | ) |
Mini MSCI Emerging Markets Index | | | 129 | | | | 9/12 | | | | 6,110,085 | | | | (17,415 | ) |
TurkDEX-ISE 30 Index | | | 772 | | | | 10/12 | | | | 3,506,291 | | | | 34,988 | |
| | | | | | | | | | | | | | | | |
| | | | | | | | | | | | | | | (93,601 | ) |
| | | | | | | | | | | | | | | | |
Contracts to Sell: | | | | | | | | | | | | | | | | |
KOSPI 200® Index | | | 20 | | | | 9/12 | | | | 2,206,246 | | | | (143,349 | ) |
| | | | | | | | | | | | | | | | |
174
Notes to Financial Statements
(continued)
| | | | | | | | | | |
Emerging Markets Equity Investments | | Number of
Contracts | | Expiration
Date | | Market
Value | | Unrealized
Gain (Loss) | |
Net Unrealized (Loss) on Open Futures Contracts | | | | | | | | $ | (236,950 | ) |
| | | | | | | | | | |
| | | | | | | | | | | | | | | | |
Core Fixed Income Investments | | Number of
Contracts | | | Expiration
Date | | | Market
Value | | | Unrealized
Gain (Loss) | |
Contracts to Buy: | | | | | | | | | | | | | | | | |
90-Day Eurodollar March Futures | | | 45 | | | | 3/13 | | | $ | 11,210,063 | | | $ | 29,666 | |
U.S. Treasury Long Bond | | | 1 | | | | 12/12 | | | | 151,406 | | | | 1,375 | |
U.S. Treasury Ultra Bond | | | 12 | | | | 12/12 | | | | 2,028,000 | | | | 25,742 | |
| | | | | | | | | | | | | | | | |
| | | | | | | | | | | | | | | 56,783 | |
| | | | | | | | | | | | | | | | |
Contracts to Sell: | | | | | | | | | | | | | | | | |
90-Day Eurodollar March Futures | | | 45 | | | | 3/14 | | | | 11,201,625 | | | | (29,912 | ) |
U.S. Treasury 10-Year Note | | | 304 | | | | 12/12 | | | | 40,650,500 | | | | (316,919 | ) |
U.S. Treasury 2-Year Note | | | 161 | | | | 12/12 | | | | 35,513,077 | | | | (22,640 | ) |
U.S. Treasury 5-Year Note | | | 173 | | | | 12/12 | | | | 21,566,883 | | | | (156,132 | ) |
| | | | | | | | | | | | | | | | |
| | | | | | | | | | | | | | | (525,603 | ) |
| | | | | | | | | | | | | �� | | | |
Net Unrealized (Loss) on Open Futures Contracts | | | | | | | | | | | | | | $ | (468,820 | ) |
| | | | | | | | | | | | | | | | |
At August 31, 2012, Core Fixed Income Investments had deposited $14,000 with a broker or brokers as margin collateral.
| | | | | | | | | | | | | | | | |
International Fixed Income Investments | | Number of
Contracts | | | Expiration
Date | | | Market
Value | | | Unrealized
Gain (Loss) | |
Contracts to Buy: | | | | | | | | | | | | | | | | |
Euro-Bund | | | 55 | | | | 12-Sep | | | $ | 9,963,555 | | | $ | (101,697 | ) |
Japan Government 10-Year Bond | | | 21 | | | | 12-Sep | | | | 38,613,292 | | | | 181,319 | |
United Kingdom Long Gilt | | | 4 | | | | 12-Dec | | | | 767,404 | | | | 2,665 | |
| | | | | | | | | | | | | | | | |
Net Unrealized Gain on Open Futures Contracts | | | | | | | | | | | | | | $ | 82,287 | |
| | | | | | | | | | | | | | | | |
At August 31, 2012, International Fixed Income Investments had deposited $6,000 with a broker or brokers as margin collateral.
During the year ended August 31, 2012, options contracts written transactions for Core Fixed Income Investments and International Fixed Income Investments were as follows:
| | | | | | | | |
Core Fixed Income Investments | | Number of
Contracts | | | Premiums
Received | |
Options contracts written, outstanding at August 31, 2011 | | | 86,200,146 | | | $ | 742,479 | |
Options written | | | 32,800,791 | | | | 855,246 | |
Options closed | | | (31,500,482 | ) | | | (568,267 | ) |
Options expired | | | (54,700,072 | ) | | | (384,811 | ) |
| | | | | | | | |
Options contracts written, outstanding at August 31, 2012 | | | 32,800,383 | | | $ | 644,647 | |
| | | | | | | | |
| | | | | | | | |
International Fixed Income Investments | | Number of
Contracts | | | Premiums
Received | |
Options contracts written, outstanding at August 31, 2011 | | | 55,800,004 | | | $ | 249,865 | |
Options written | | | 93,700,000 | | | | 771,395 | |
Options closed | | | (34,600,004 | ) | | | (311,176 | ) |
Options expired | | | (33,000,000 | ) | | | (56,615 | ) |
| | | | | | | | |
Options contracts written, outstanding at August 31, 2012 | | | 81,900,000 | | | $ | 653,469 | |
| | | | | | | | |
175
Notes to Financial Statements
(continued)
At August 31, 2012, International Equity Investments, Emerging Markets Equity Investments, Core Fixed Income Investments and International Fixed Income Investments had open forward foreign currency contracts as described below. The unrealized gain (loss) on the open contracts reflected in the accompanying financial statements were as follows:
International Equity Investments
| | | | | | | | | | | | | | | | | | | | |
Foreign Currency | | Local Currency | | | Counterparty | | | Market Value | | | Settlement Date | | | Unrealized
Gain (Loss) | |
Contracts to Buy: | | | | | | | | | | | | | | | | | | | | |
Brazilian Real | | | 1,856,678 | | | | BBH | | | $ | 914,462 | | | | 9/4/12 | | | $ | 6,729 | |
South African Rand | | | 1,768,990 | | | | BBH | | | | 210,848 | | | | 9/6/12 | | | | 2,142 | |
| | | | | | | | | | | | | | | | | | | | |
| | | | | | | | | | | | | | | | | | | 8,871 | |
| | | | | | | | | | | | | | | | | | | | |
Contracts to Sell: | | | | | | | | | | | | | | | | | | | | |
Euro | | | 6,054,600 | | | | SSB | | | | 7,621,477 | | | | 11/8/12 | | | | 186,978 | |
| | | | | | | | | | | | | | | | | | | | |
Net Unrealized Gain on Open Forward Foreign Currency Contracts | | | | | | | | | | | | | | | | | | $ | 195,849 | |
| | | | | | | | | | | | | | | | | | | | |
Emerging Markets Equity Investments
| | | | | | | | | | | | | | | | | | | | |
Foreign Currency | | Local Currency | | | Counterparty | | | Market Value | | | Settlement Date | | | Unrealized
Gain (Loss) | |
Contracts to Buy: | | | | | | | | | | | | | | | | | | | | |
Malaysian Ringgit | | | 6,252,000 | | | | DUB | | | $ | 1,998,616 | | | | 9/21/2012 | | | $ | (1,384 | ) |
Mexican Peso | | | 54,130,000 | | | | RBS | | | | 4,081,520 | | | | 9/21/2012 | | | | 164,023 | |
South African Rand | | | 45,142 | | | | BBH | | | | 5,381 | | | | 9/4/2012 | | | | 30 | |
South African Rand | | | 13,099,040 | | | | CSFB | | | | 1,558,087 | | | | 9/21/2012 | | | | (41,913 | ) |
Turkish Lira | | | 5,040,560 | | | | GSC | | | | 2,767,970 | | | | 9/21/2012 | | | | (32,030 | ) |
| | | | | | | | | | | | | | | | | | | | |
| | | | | | | | | | | | | | | | | | | 88,726 | |
| | | | | | | | | | | | | | | | | | | | |
Contracts to Sell: | | | | | | | | | | | | | | | | | | | | |
Korean Won | | | 3,065,985,000 | | | | UBS | | | | 2,701,975 | | | | 9/21/2012 | | | | (1,975 | ) |
Mexican Peso | | | 54,130,000 | | | | RBC | | | | 4,081,519 | | | | 9/21/2012 | | | | (165,105 | ) |
South African Rand | | | 4,570,881 | | | | BBH | | | | 544,882 | | | | 9/4/2012 | | | | (1,558 | ) |
| | | | | | | | | | | | | | | | | | | | |
| | | | | | | | | | | | | | | | | | | (168,638 | ) |
| | | | | | | | | | | | | | | | | | | | |
Net Unrealized (Loss) on Open Forward Foreign Currency Contracts | | | | | | | | | | | | | | | | | | $ | (79,912 | ) |
| | | | | | | | | | | | | | | | | | | | |
Core Fixed Income Investments
| | | | | | | | | | | | | | | | | | | | |
Foreign Currency | | Local Currency | | | Counterparty | | | Market Value | | | Settlement Date | | | Unrealized
Gain (Loss) | |
Contracts to Buy: | | | | | | | | | | | | | | | | | | | | |
Brazilian Real | | | 2,984,000 | | | | JPM | | | $ | 1,454,283.00 | | | | 11/16/2012 | | | $ | 1,932 | |
Euro | | | 2,276,000 | | | | HSBC | | | | 2,863,073 | | | | 9/14/2012 | | | | 59,895 | |
Euro | | | 90,000 | | | | UBS | | | | 113,215 | | | | 9/14/2012 | | | | 2,464 | |
Japanese Yen | | | 12,836,000 | | | | JPM | | | | 163,907 | | | | 9/10/2012 | | | | 1,710 | |
Japanese Yen | | | 39,087,000 | | | | UBS | | | | 499,114 | | | | 9/10/2012 | | | | 2,791 | |
Malaysian Ringgit | | | 37,770 | | | | HSBC | | | | 12,052 | | | | 10/16/2012 | | | | 176 | |
Mexican Peso | | | 237,214 | | | | DUB | | | | 17,764 | | | | 12/3/2012 | | | | (77 | ) |
Mexican Peso | | | 34,026,180 | | | | HSBC | | | | 2,548,102 | | | | 12/3/2012 | | | | 35,275 | |
176
Notes to Financial Statements
(continued)
| | | | | | | | | | | | | | | | | | | | |
Foreign Currency | | Local Currency | | | Counterparty | | | Market Value | | | Settlement Date | | | Unrealized
Gain (Loss) | |
New Taiwan Dollar | | | 64,005,160 | | | | BCLY | | | $ | 2,142,671 | | | | 11/30/2012 | | | $ | (29,204 | ) |
Norwegian Krone | | | 7,469,000 | | | | DUB | | | | 1,283,969 | | | | 11/21/2012 | | | | 12,065 | |
Pound Sterling | | | 67,000 | | | | JPM | | | | 106,271 | | | | 9/12/2012 | | | | 2,071 | |
Yuan Renminbi | | | 7,449,727 | | | | DUB | | | | 1,161,727 | | | | 2/1/2013 | | | | (15,858 | ) |
Yuan Renminbi | | | 3,117,681 | | | | GSC | | | | 486,178 | | | | 2/1/2013 | | | | (10,822 | ) |
Yuan Renminbi | | | 9,881,487 | | | | JPM | | | | 1,540,941 | | | | 2/1/2013 | | | | (21,208 | ) |
Yuan Renminbi | | | 45,026,021 | | | | UBS | | | | 7,021,456 | | | | 2/1/2013 | | | | (121,563 | ) |
Yuan Renminbi | | | 1,000,000 | | | | DUB | | | | 154,623 | | | | 8/5/2013 | | | | (5,020 | ) |
Yuan Renminbi | | | 1,161,380 | | | | UBS | | | | 179,576 | | | | 8/5/2013 | | | | (4,333 | ) |
| | | | | | | | | | | | | | | | | | | | |
| | | | | | | | | | | | | | | | | | | (89,706 | ) |
| | | | | | | | | | | | | | | | | | | | |
Contracts to Sell: | | | | | | | | | | | | | | | | | | | | |
Australian Dollar | | | 7,494,000 | | | | BOA | | | | 7,733,132 | | | | 9/20/2012 | | | | 165,544 | |
Brazilian Real | | | 4,568,591 | | | | UBS | | | | 2,240,091 | | | | 10/2/2012 | | | | 11,445 | |
Canadian Dollar | | | 150,000 | | | | BCLY | | | | 152,037 | | | | 9/20/2012 | | | | (5,943 | ) |
Canadian Dollar | | | 8,144,000 | | | | UBS | | | | 8,254,595 | | | | 9/20/2012 | | | | (331,722 | ) |
Canadian Dollar | | | 2,888,000 | | | | WBK | | | | 2,927,219 | | | | 9/20/2012 | | | | (22,210 | ) |
Euro | | | 9,000 | | | | BNP | | | | 11,321 | | | | 9/14/2012 | | | | (343 | ) |
Euro | | | 12,506,000 | | | | DUB | | | | 15,731,807 | | | | 9/14/2012 | | | | (92,116 | ) |
Euro | | | 94,000 | | | | RBC | | | | 118,246 | | | | 9/14/2012 | | | | (2,525 | ) |
Euro | | | 2,050,000 | | | | JPM | | | | 2,580,044 | | | | 10/25/2012 | | | | (48,499 | ) |
Euro | | | 5,149,729 | | | | CSFB | | | | 6,481,234 | | | | 10/25/2012 | | | | (121,627 | ) |
Euro | | | 7,100,000 | | | | JPM | | | | 8,976,683 | | | | 9/13/2013 | | | | (172,543 | ) |
Euro | | | 216,000 | | | | JPM | | | | 273,220 | | | | 10/11/2013 | | | | (11,228 | ) |
Indian Rupee | | | 1,213,607 | | | | HSBC | | | | 21,730 | | | | 10/3/2012 | | | | (834 | ) |
Japanese Yen | | | 84,039,000 | | | | DUB | | | | 1,073,121 | | | | 9/10/2012 | | | | 1,066 | |
Korean Won | | | 32,762,100 | | | | BCLY | | | | 28,860 | | | | 9/28/2012 | | | | (645 | ) |
New Taiwan Dollar | | | 63,645,600 | | | | UBS | | | | 2,130,635 | | | | 11/30/2012 | | | | 5,365 | |
Pound Sterling | | | 1,756,000 | | | | BNP | | | | 2,785,259 | | | | 9/12/2012 | | | | (70,130 | ) |
Pound Sterling | | | 931,000 | | | | CSFB | | | | 1,476,634 | | | | 9/25/2012 | | | | (15,215 | ) |
Pound Sterling | | | 924,000 | | | | CSFB | | | | 1,465,399 | | | | 10/25/2012 | | | | 259 | |
Singapore Dollar | | | 2,785 | | | | RBS | | | | 2,232 | | | | 10/22/2012 | | | | (19 | ) |
Yuan Renminbi | | | 48,053,377 | | | | BNP | | | | 7,544,688 | | | | 10/15/2012 | | | | 24,442 | |
Yuan Renminbi | | | 370,968 | | | | HSBC | | | | 57,850 | | | | 2/1/2013 | | | | 150 | |
Yuan Renminbi | | | 13,105,890 | | | | RBS | | | | 2,043,761 | | | | 2/1/2013 | | | | 7,239 | |
Yuan Renminbi | | | 5,678,932 | | | | UBS | | | | 885,585 | | | | 2/1/2013 | | | | 3,415 | |
| | | | | | | | | | | | | | | | | | | | |
| | | | | | | | | | | | | | | | | | | (676,674 | ) |
| | | | | | | | | | | | | | | | | | | | |
Net Unrealized (Loss) on Open Forward Foreign Currency Contracts | | | | | | | | | | | | | | | | | | $ | (766,380 | ) |
| | | | | | | | | | | | | | | | | | | | |
International Fixed Income Investments
| | | | | | | | | | | | | | | | | | | | |
Foreign Currency | | Local Currency | | | Counterparty | | | Market Value | | | Settlement Date | | | Unrealized
Gain (Loss) | |
Contracts to Buy: | | | | | | | | | | | | | | | | | | | | |
Brazilian Real | | | 169,838 | | | | HSBC | | | $ | 83,276.00 | | | | 10/2/2012 | | | $ | 1,276 | |
Brazilian Real | | | 1,259,188 | | | | UBS | | | | 617,411 | | | | 10/2/2012 | | | | 6,411 | |
Canadian Dollar | | | 2,798,000 | | | | RBS | | | | 2,835,997 | | | | 9/20/2012 | | | | 1,144 | |
177
Notes to Financial Statements
(continued)
| | | | | | | | | | | | | | | | | | | | |
Foreign Currency | | Local Currency | | | Counterparty | | | Market Value | | | Settlement Date | | | Unrealized
Gain (Loss) | |
Chilean Peso | | | 40,660,000 | | | | HSBC | | | $ | 85,344 | | | | 1/9/2013 | | | $ | 5,115 | |
Colombian Peso | | | 1,430,520,000 | | | | JPM | | | | 772,817 | | | | 12/12/2012 | | | | (7,183 | ) |
Colombian Peso | | | 334,800,000 | | | | UBS | | | | 180,871 | | | | 12/12/2012 | | | | 871 | |
Euro | | | 11,402,000 | | | | BCLY | | | | 14,342,012 | | | | 9/4/2012 | | | | 63,287 | |
Euro | | | 355,000 | | | | BNP | | | | 446,537 | | | | 9/4/2012 | | | | 3,765 | |
Euro | | | 25,075,000 | | | | JPM | | | | 31,540,603 | | | | 9/4/2012 | | | | 36,373 | |
Euro | | | 36,477,000 | | | | GSC | | | | 45,882,615 | | | | 9/4/2012 | | | | 264,479 | |
Euro | | | 86,000 | | | | BCLY | | | | 108,204 | | | | 10/2/2012 | | | | 671 | |
Hungarian Forint | | | 18,313,392 | | | | BCLY | | | | 80,232 | | | | 11/14/2012 | | | | 232 | |
Hungarian Forint | | | 27,670,800 | | | | DUB | | | | 121,228 | | | | 11/14/2012 | | | | 1,228 | |
Hungarian Forint | | | 183,128,477 | | | | JPM | | | | 802,298 | | | | 11/14/2012 | | | | (5,396 | ) |
Indian Rupee | | | 12,359,000 | | | | BCLY | | | | 221,291 | | | | 10/3/2012 | | | | 1,291 | |
Indonesian Rupiah | | | 3,735,400,000 | | | | BCLY | | | | 383,098 | | | | 1/30/2013 | | | | 3,098 | |
Indonesian Rupiah | | | 1,459,915,000 | | | | DUB | | | | 149,727 | | | | 1/30/2013 | | | | (1,273 | ) |
Indonesian Rupiah | | | 7,125,000,000 | | | | JPM | | | | 730,732 | | | | 1/30/2013 | | | | 7,381 | |
Japanese Yen | | | 237,444,000 | | | | BNP | | | | 3,031,998 | | | | 9/10/2012 | | | | 39,978 | |
Japanese Yen | | | 560,427,000 | | | | JPM | | | | 7,156,271 | | | | 9/10/2012 | | | | 128,092 | |
Japanese Yen | | | 1,189,991,000 | | | | UBS | | | | 15,195,374 | | | | 9/10/2012 | | | | 87,403 | |
Korean Won | | | 231,550,000 | | | | BCLY | | | | 203,971 | | | | 9/28/2012 | | | | 4,557 | |
Malaysian Ringgit | | | 1,377,772 | | | | BCLY | | | | 439,647 | | | | 10/16/2012 | | | | (353 | ) |
Malaysian Ringgit | | | 234,041 | | | | DUB | | | | 74,683 | | | | 10/16/2012 | | | | 683 | |
Malaysian Ringgit | | | 8,521,305 | | | | HSBC | | | | 2,719,150 | | | | 10/16/2012 | | | | 39,747 | |
Malaysian Ringgit | | | 295,368 | | | | JPM | | | | 94,252 | | | | 10/16/2012 | | | | 1,252 | |
Mexican Peso | | | 6,195,919 | | | | DUB | | | | 463,991 | | | | 12/3/2012 | | | | 3,991 | |
Mexican Peso | | | 5,306,115 | | | | HSBC | | | | 397,356 | | | | 12/3/2012 | | | | 5,501 | |
New Taiwan Dollar | | | 50,320,000 | | | | BCLY | | | | 1,684,539 | | | | 11/30/2012 | | | | (22,960 | ) |
Peruvian Sol | | | 560,735 | | | | UBS | | | | 213,461 | | | | 12/12/2012 | | | | 3,461 | |
Philippine Peso | | | 1,691,200 | | | | BCLY | | | | 40,070 | | | | 10/31/2012 | | | | 70 | |
Philippine Peso | | | 25,998,200 | | | | JPM | | | | 615,983 | | | | 10/31/2012 | | | | 5,983 | |
Polish Zloty | | | 1,447,738 | | | | DUB | | | | 432,700 | | | | 11/14/2012 | | | | 2,700 | |
Polish Zloty | | | 3,017,409 | | | | UBS | | | | 901,843 | | | | 11/14/2012 | | | | 26,216 | |
Pound Sterling | | | 202,000 | | | | JPM | | | | 320,400 | | | | 9/12/2012 | | | | 4,860 | |
Pound Sterling | | | 7,066,000 | | | | RBC | | | | 11,207,654 | | | | 9/12/2012 | | | | 144,842 | |
Russian Ruble | | | 10,066,230 | | | | BOA | | | | 310,827 | | | | 9/27/2012 | | | | 827 | |
Russian Ruble | | | 1,348,310 | | | | DUB | | | | 41,633 | | | | 9/27/2012 | | | | 633 | |
Russian Ruble | | | 623,800 | | | | HSBC | | | | 19,262 | | | | 9/27/2012 | | | | 262 | |
Russian Ruble | | | 90,826,095 | | | | JPM | | | | 2,804,541 | | | | 9/27/2012 | | | | 87,542 | |
Singapore Dollar | | | 510,804 | | | | JPM | | | | 409,339 | | | | 10/22/2012 | | | | 2,699 | |
Singapore Dollar | | | 29,557 | | | | RBS | | | | 23,686 | | | | 10/22/2012 | | | | 199 | |
South African Rand | | | 815,000 | | | | BCLY | | | | 96,470 | | | | 10/26/2012 | | | | (897 | ) |
South African Rand | | | 332,692 | | | | JPM | | | | 39,380 | | | | 10/26/2012 | | | | (316 | ) |
South African Rand | | | 3,354,869 | | | | DUB | | | | 397,108 | | | | 10/26/2012 | | | | 804 | |
Thai Baht | | | 8,491,500 | | | | BCLY | | | | 270,914 | | | | 10/30/2012 | | | | 914 | |
Thai Baht | | | 1,899,900 | | | | HSBC | | | | 60,615 | | | | 10/30/2012 | | | | 615 | |
Thai Baht | | | 16,183,525 | | | | UBS | | | | 516,321 | | | | 10/30/2012 | | | | 7,805 | |
Turkish Lira | | | 286,966 | | | | BCLY | | | | 157,934 | | | | 9/4/2012 | | | | 666 | |
Turkish Lira | | | 92,175 | | | | DUB | | | | 50,365 | | | | 10/24/2012 | | | | 365 | |
178
Notes to Financial Statements
(continued)
| | | | | | | | | | | | | | | | | | | | |
Foreign Currency | | Local Currency | | | Counterparty | | | Market Value | | | Settlement Date | | | Unrealized
Gain (Loss) | |
Turkish Lira | | | 6,374,739 | | | | HSBC | | | $ | 3,483,215 | | | | 10/24/2012 | | | $ | 33,058 | |
Turkish Lira | | | 771,859 | | | | JPM | | | | 421,751 | | | | 10/24/2012 | | | | 1,751 | |
Yuan Renminbi | | | 63,560 | | | | DUB | | | | 9,979 | | | | 10/15/2012 | | | | (21 | ) |
Yuan Renminbi | | | 383,418 | | | | BCLY | | | | 59,791 | | | | 2/1/2013 | | | | (209 | ) |
Yuan Renminbi | | | 3,832,200 | | | | HSBC | | | | 597,602 | | | | 2/1/2013 | | | | (2,398 | ) |
Yuan Renminbi | | | 46,411,603 | | | | JPM | | | | 7,237,527 | | | | 2/1/2013 | | | | (24,527 | ) |
Yuan Renminbi | | | 11,502,158 | | | | UBS | | | | 1,793,672 | | | | 2/1/2013 | | | | (6,776 | ) |
Yuan Renminbi | | | 3,000,000 | | | | DUB | | | | 463,868 | | | | 8/5/2013 | | | | (15,059 | ) |
Yuan Renminbi | | | 10,260,000 | | | | UBS | | | | 1,586,429 | | | | 8/5/2013 | | | | (38,274 | ) |
Yuan Renminbi | | | 14,100,000 | | | | JPM | | | | 2,119,962 | | | | 9/8/2015 | | | | (176,455 | ) |
| | | | | | | | | | | | | | | | | | | | |
| | | | | | | | | | | | | | | | | | | 732,001 | |
| | | | | | | | | | | | | | | | | | | | |
Contracts to Sell: | | | | | | | | | | | | | | | | | | | | |
Australian Dollar | | | 13,931,000 | | | | BOA | | | | 14,375,535 | | | | 9/20/2012 | | | | 307,739 | |
Australian Dollar | | | 100,000 | | | | BOA | | | | 102,987 | | | | 10/11/2012 | | | | 163 | |
Brazilian Real | | | 2,059,391 | | | | UBS | | | | 1,009,769 | | | | 10/2/2012 | | | | 5,159 | |
Canadian Dollar | | | 2,789,000 | | | | JPM | | | | 2,826,874 | | | | 9/20/2012 | | | | (8,621 | ) |
Canadian Dollar | | | 16,145,000 | | | | UBS | | | | 16,364,248 | | | | 9/20/2012 | | | | (621,732 | ) |
Colombian Peso | | | 56,606,000 | | | | UBS | | | | 30,581 | | | | 12/12/2012 | | | | 419 | |
Euro | | | 36,561,000 | | | | BNP | | | | 45,988,274 | | | | 9/4/2012 | | | | (1,175,932 | ) |
Euro | | | 98,000 | | | | JPM | | | | 123,269 | | | | 9/4/2012 | | | | (2,165 | ) |
Euro | | | 88,000 | | | | HSBC | | | | 110,691 | | | | 9/4/2012 | | | | (2,768 | ) |
Euro | | | 36,562,000 | | | | RBS | | | | 45,989,532 | | | | 9/4/2012 | | | | (1,129,896 | ) |
Euro | | | 11,402,000 | | | | BCLY | | | | 14,345,838 | | | | 10/2/2012 | | | | (62,609 | ) |
Euro | | | 25,075,000 | | | | JPM | | | | 31,549,016 | | | | 10/2/2012 | | | | (34,931 | ) |
Euro | | | 36,477,000 | | | | GSC | | | | 45,894,853 | | | | 10/2/2012 | | | | (262,309 | ) |
Indonesian Rupiah | | | 3,002,180,000 | | | | DUB | | | | 307,900 | | | | 1/30/2013 | | | | (2,955 | ) |
Indonesian Rupiah | | | 868,803,700 | | | | JPM | | | | 89,104 | | | | 1/30/2013 | | | | 482 | |
Indonesian Rupiah | | | 948,260,656 | | | | UBS | | | | 97,253 | | | | 1/30/2013 | | | | 406 | |
Japanese Yen | | | 1,186,929,000 | | | | BCLY | | | | 15,156,275 | | | | 9/10/2012 | | | | (49,727 | ) |
Japanese Yen | | | 3,250,428,000 | | | | BNP | | | | 41,505,751 | | | | 9/10/2012 | | | | (954,457 | ) |
Japanese Yen | | | 240,000,000 | | | | DUB | | | | 3,064,637 | | | | 9/10/2012 | | | | (48,443 | ) |
Japanese Yen | | | 206,423,000 | | | | UBS | | | | 2,635,881 | | | | 9/10/2012 | | | | (47,378 | ) |
Japanese Yen | | | 1,180,000,000 | | | | BCLY | | | | 15,068,700 | | | | 9/18/2012 | | | | (164,441 | ) |
Japanese Yen | | | 1,190,000,000 | | | | JPM | | | | 15,199,072 | | | | 10/9/2012 | | | | (140,927 | ) |
Malaysian Ringgit | | | 1,175,656 | | | | DUB | | | | 375,152 | | | | 10/16/2012 | | | | 85 | |
Malaysian Ringgit | | | 335,000 | | | | HSBC | | | | 106,899 | | | | 10/16/2012 | | | | (2,325 | ) |
Malaysian Ringgit | | | 1,971,600 | | | | JPM | | | | 629,138 | | | | 10/16/2012 | | | | (12,966 | ) |
Malaysian Ringgit | | | 1,134,334 | | | | UBS | | | | 361,966 | | | | 10/16/2012 | | | | (7,328 | ) |
Mexican Peso | | | 14,472,250 | | | | HSBC | | | | 1,083,776 | | | | 12/3/2012 | | | | (10,232 | ) |
Mexican Peso | | | 1,567,795 | | | | UBS | | | | 117,407 | | | | 12/3/2012 | | | | (2,407 | ) |
New Taiwan Dollar | | | 50,320,000 | | | | HSBC | | | | 1,684,539 | | | | 11/30/2012 | | | | 4,051 | |
Norwegian Krone | | | 13,568,000 | | | | DUB | | | | 2,332,426 | | | | 11/21/2012 | | | | (21,917 | ) |
Peruvian Sol | | | 224,834 | | | | UBS | | | | 85,590 | | | | 12/12/2012 | | | | (590 | ) |
Philippine Peso | | | 3,782,700 | | | | DUB | | | | 89,625 | | | | 10/31/2012 | | | | 375 | |
Polish Zloty | | | 779,114 | | | | BCLY | | | | 232,862 | | | | 11/14/2012 | | | | (1,450 | ) |
Pound Sterling | | | 17,777,000 | | | | BCLY | | | | 28,196,783 | | | | 9/12/2012 | | | | (383,955 | ) |
Pound Sterling | | | 6,306,000 | | | | BNP | | | | 10,002,189 | | | | 9/12/2012 | | | | (251,738 | ) |
179
Notes to Financial Statements
(continued)
| | | | | | | | | | | | | | | | | | | | |
Foreign Currency | | Local Currency | | | Counterparty | | | Market Value | | | Settlement Date | | | Unrealized
Gain (Loss) | |
Pound Sterling | | | 95,000 | | | | JPM | | | $ | 150,683 | | | | 9/12/2012 | | | $ | (1,930 | ) |
Pound Sterling | | | 165,000 | | | | DUB | | | | 261,713 | | | | 9/12/2012 | | | | (2,705 | ) |
Pound Sterling | | | 3,488,000 | | | | RBS | | | | 5,532,451 | | | | 9/12/2012 | | | | (135,992 | ) |
Pound Sterling | | | 1,737,000 | | | | UBS | | | | 2,755,122 | | | | 9/12/2012 | | | | (31,440 | ) |
Singapore Dollar | | | 28,675 | | | | HSBC | | | | 22,979 | | | | 10/22/2012 | | | | 21 | |
Singapore Dollar | | | 84,763 | | | | UBS | | | | 67,926 | | | | 10/22/2012 | | | | 74 | |
South African Rand | | | 7,455,482 | | | | BCLY | | | | 882,489 | | | | 10/26/2012 | | | | 16,000 | |
South African Rand | | | 440,271 | | | | JPM | | | | 52,114 | | | | 10/26/2012 | | | | 886 | |
South African Rand | | | 8,850,046 | | | | DUB | | | | 1,047,560 | | | | 10/26/2012 | | | | (796 | ) |
South African Rand | | | 29,821,929 | | | | HSBC | | | | 3,529,954 | | | | 10/26/2012 | | | | 66,039 | |
Turkish Lira | | | 286,966 | | | | BCLY | | | | 156,801 | | | | 10/24/2012 | | | | (721 | ) |
Turkish Lira | | | 415,657 | | | | DUB | | | | 227,119 | | | | 10/24/2012 | | | | (498 | ) |
Yuan Renminbi | | | 46,411,603 | | | | JPM | | | | 7,237,527 | | | | 2/1/2013 | | | | 46,724 | |
Yuan Renminbi | | | 11,502,158 | | | | UBS | | | | 1,793,672 | | | | 2/1/2013 | | | | 27,010 | |
Yuan Renminbi | | | 3,000,000 | | | | DUB | | | | 463,868 | | | | 8/5/2013 | | | | 3,022 | |
Yuan Renminbi | | | 10,260,000 | | | | UBS | | | | 1,586,429 | | | | 8/5/2013 | | | | 10,458 | |
Yuan Renminbi | | | 14,100,000 | | | | JPM | | | | 2,119,962 | | | | 9/8/2015 | | | | 12,041 | |
| | | | | | | | | | | | | | | | | | | | |
| | | | | | | | | | | | | | | | | | | (5,077,127 | ) |
| | | | | | | | | | | | | | | | | | | | |
Net Unrealized (Loss) on Open Forward Foreign Currency Contracts | | | | | | | | | | | | | | | | | | $ | (4,345,126 | ) |
| | | | | | | | | | | | | | | | | | | | |
At August 31, 2012, Core Fixed Income Investments held the following OTC interest rate swap contracts:
| | | | | | | | | | | | | | | | | | | | | | | | | | |
Pay/Receive
Floating Rate | | Floating
Rate Index | | Fixed
Rate | | | Maturity
Date | | | Counterparty | | Notional
Amount | | Market
Value | | | Upfront
Market
Paid
(Received) | | | Unrealized
Appreciation
(Depreciation) | |
Pay | | 6-Month Australian Bank Bill, AAA | | | 3.750 | % | | | 03/15/2018 | | | DUB | | AUD 4,700,000 | | $ | 61,860 | | | $ | 6,898 | | | $ | 54,962 | |
Pay | | 6-Month Australian Bank Bill, AAA | | | 3.750 | % | | | 03/15/2018 | | | GSC | | AUD 2,500,000 | | | 32,905 | | | | 5,419 | | | | 27,486 | |
Pay | | 6-Month Australian Bank Bill, AAA | | | 4.000 | % | | | 03/15/2023 | | | GSC | | AUD 2,500,000 | | | 28,363 | | | | (4,313 | ) | | | 32,676 | |
Pay | | 6-Month Australian Bank Bill, AAA | | | 5.500 | % | | | 12/15/2017 | | | BCLY | | AUD 1,500,000 | | | 158,654 | | | | (7,490 | ) | | | 166,144 | |
Pay | | 6-Month Australian Bank Bill, AAA | | | 5.500 | % | | | 12/15/2017 | | | DUB | | AUD 1,000,000 | | | 105,770 | | | | (4,460 | ) | | | 110,230 | |
Pay | | BRL-CDI-Compounded | | | 9.940 | % | | | 01/02/2015 | | | GSC | | BRL 6,200,000 | | | 99,467 | | | | — | | | | 99,467 | |
Pay | | BRL-CDI-Compounded | | | 10.135 | % | | | 01/02/2015 | | | HSBC | | BRL 3,500,000 | | | 63,209 | | | | 11,465 | | | | 51,744 | |
Pay | | BRL-CDI-Compounded | | | 9.930 | % | | | 01/02/2015 | | | UBS | | BRL 9,200,000 | | | 146,630 | | | | 7,136 | | | | 139,494 | |
Pay | | BRL-CDI-Compounded | | | 10.530 | % | | | 01/02/2014 | | | HSBC | | BRL 4,500,000 | | | 78,214 | | | | 1,915 | | | | 76,299 | |
Pay | | BRL-CDI-Compounded | | | 11.935 | % | | | 01/02/2014 | | | HSBC | | BRL 2,100,000 | | | 68,487 | | | | 6,189 | | | | 62,298 | |
Pay | | BRL-CDI-Compounded | | | 11.960 | % | | | 01/02/2014 | | | GSC | | BRL 12,600,000 | | | 458,447 | | | | (32,965 | ) | | | 491,412 | |
Pay | | BRL-CDI-Compounded | | | 11.990 | % | | | 01/02/2014 | | | BCLY | | BRL 1,100,000 | | | 40,429 | | | | 358 | | | | 40,071 | |
Pay | | BRL-CDI-Compounded | | | 12.120 | % | | | 01/02/2014 | | | HSBC | | BRL 8,300,000 | | | 324,297 | | | | 19,221 | | | | 305,076 | |
Pay | | BRL-CDI-Compounded | | | 12.510 | % | | | 01/02/2014 | | | BCLY | | BRL 3,200,000 | | | 112,518 | | | | 3,263 | | | | 109,255 | |
Pay | | BRL-CDI-Compounded | | | 12.555 | % | | | 01/02/2014 | | | HSBC | | BRL 3,000,000 | | | 106,799 | | | | 4,785 | | | | 102,014 | |
Pay | | Mexico Interbank, TIIE, A- | | | 7.500 | % | | | 06/02/2021 | | | UBS | | MXN 43,300,000 | | | 427,688 | | | | 135,498 | | | | 292,190 | |
Receive | | 3-Month USD-LIBOR, AA+ | | | 2.750 | % | | | 02/17/2042 | | | BCLY | | USD 1,545,000 | | | (97,044 | ) | | | — | | | | (97,044 | ) |
| | | | | | | | | | | | | | | | | | | | | | | | | | |
| | | | | | | | | | | | | | | | $ | 2,216,693 | | | $ | 152,919 | | | $ | 2,063,774 | |
| | | | | | | | | | | | | | | | | | | | | | | | | | |
180
Notes to Financial Statements
(continued)
At August 31, 2012, Core Fixed Income Investments had the following centrally cleared interest rate swap contracts:
| | | | | | | | | | | | | | |
Pay/Receive Floating Rate | | Floating
Rate Index | | Fixed
Rate | | Maturity
Date | | Counterparty | | Notional
Amount | | Unrealized
Appreciation
(Depreciation) | |
Pay | | 6-Month EURIBOR, AA- | | 2.00% | | 3/21/2017 | | BCLY | | EUR 2,200,000 | | $ | 160,267 | |
| | | | | | | | | | | | | | |
| | | | | | | | | | | | $ | 160,267 | |
| | | | | | | | | | | | | | |
At August 31, 2012, Core Fixed Income Investments held the following OTC credit default swap contracts:
OTC Credit Default Swaps on Corporate and Sovereign Issues - Buy Protection (1)
| | | | | | | | | | | | | | | | | | | | | | | | | | | | | | | | |
Reference Obligation | | Fixed Deal
(Pay) Rate | | | Maturity
Date | | | Counterparty | | | Implied Credit
Spread at
August 31, 2012 (3) | | | Notional
Amount (4) | | | Market
Value | | | Upfront
Premiums
Paid
(Received) | | | Unrealized
Appreciation
(Depreciation) | |
Embarq Corp., BB, | | | (1.425%) | | | | 03/20/2014 | | | | DUB | | | | 0.008% | | | | USD 600,000 | | | $ | (7,919 | ) | | $ | — | | | $ | (7,919 | ) |
Embarq Corp., BB, | | | (1.300%) | | | | 03/20/2014 | | | | DUB | | | | 0.008% | | | | USD 200,000 | | | | (2,201 | ) | | | 1,445 | | | | (3,646 | ) |
Embarq Corp., BB, | | | (1.270%) | | | | 03/20/2014 | | | | DUB | | | | 0.008% | | | | USD 600,000 | | | | (6,286 | ) | | | — | | | | (6,286 | ) |
Embarq Corp., BB, | | | (1.250%) | | | | 03/20/2014 | | | | DUB | | | | 0.008% | | | | USD 1,200,000 | | | | (12,151 | ) | | | — | | | | (12,151 | ) |
Foster’s Finance Corp., BBB+, | | | (2.140%) | | | | 12/20/2014 | | | | BCLY | | | | 0.002% | | | | USD 2,400,000 | | | | (116,243 | ) | | | — | | | | (116,243 | ) |
Goodrich Corp., BBB+, | | | (0.510%) | | | | 09/20/2016 | | | | DUB | | | | 0.001% | | | | USD 300,000 | | | | (5,271 | ) | | | — | | | | (5,271 | ) |
HSBC Finance Corp., A, | | | (0.165%) | | | | 12/20/2013 | | | | BNP | | | | 0.008% | | | | USD 300,000 | | | | 2,427 | | | | — | | | | 2,427 | |
Race Point CLO, B+, | | | (4.030%) | | | | 04/15/2020 | | | | BOA | | | | 0.001% | | | | USD 1,100,000 | | | | 297,828 | | | | 8,250 | | | | 289,578 | |
Race Point CLO, BB+, | | | (1.950%) | | | | 04/15/2020 | | | | BOA | | | | 0.001% | | | | USD 800,000 | | | | 187,354 | | | | 2,800 | | | | 184,554 | |
Saratoga CLO I Ltd., BB+, | | | (1.880%) | | | | 12/15/2019 | | | | BOA | | | | 0.000% | | | | USD 1,000,000 | | | | 263,489 | | | | 7,500 | | | | 255,989 | |
| | | | | | | | | | | | | | | | | | | | | | | | | | | | | | | | |
| | | | | | | | | | | | | | | | | | | | | | $ | 601,027 | | | $ | 19,995 | | | $ | 581,032 | |
| | | | | | | | | | | | | | | | | | | | | | | | | | | | | | | | |
|
| OTC Credit Default Swaps on Corporate and Sovereign Issues - Sell Protection (2) | |
| | | | | | | | |
Reference Obligation | | Fixed Deal
Receive Rate | | | Maturity
Date | | | Counterparty | | | Implied Credit
Spread at
August 31,
2012 (3) | | | Notional
Amount (4) | | | Market
Value | | | Upfront
Premiums
Paid
(Received) | | | Unrealized
Appreciation
(Depreciation) | |
Ally Financial Inc., B+, | | | 3.570 | % | | | 09/20/2017 | | | | BOA | | | | 0.035 | % | | | USD 2,800,000 | | | $ | 28,798 | | | $ | — | | | $ | 28,798 | |
| | | | | | | | | | | | | | | | | | | | | | | | | | | | | | | | |
| | | | | | | | | | | | | | | | | | | | | | $ | 28,798 | | | $ | — | | | $ | 28,798 | |
| | | | | | | | | | | | | | | | | | | | | | | | | | | | | | | | |
At August 31, 2012, Core Fixed Income Investments held the following centrally cleared credit default swap contracts:
Centrally Cleared - Credit Default Swaps on Credit Indices - Buy Protection (1)
| | | | | | | | | | | | | | | | | | | | |
Reference Obligation | | Fixed Deal
(Pay) Rate | | | Maturity
Date | | | Counterparty | | | Notional
Amount (4) | | | Unrealized
Appreciation
(Depreciation) | |
Dow Jones CDX HY14 5 Year Index, B-, | | | (5.000 | %) | | | 06/20/2015 | | | | BCLY | | | | USD 4,992,000 | | | $ | (318,166 | ) |
Dow Jones CDX HY15 5 Year Index, B-, | | | (5.000 | %) | | | 12/20/2015 | | | | BCLY | | | | USD 3,840,000 | | | | (334,565 | ) |
Dow Jones CDX IG10 10 Year Index, BAA+, | | | (1.500 | %) | | | 06/20/2018 | | | | CSFB | | | | USD 1,161,600 | | | | (24,908 | ) |
Dow Jones CDX IG12 5 Year Index, BAA+, | | | (1.000 | %) | | | 06/20/2014 | | | | BCLY | | | | USD 3,600,960 | | | | (38,401 | ) |
Dow Jones CDX IG9 10 Year Index, BAA+, | | | (0.800 | %) | | | 12/20/2017 | | | | BCLY | | | | USD 4,743,200 | | | | (81,366 | ) |
| | | | | | | | | | | | | | | | | | | | |
| | | | | | | | | | | | | | | | | | $ | (797,406 | ) |
| | | | | | | | | | | | | | | | | | | | |
181
Notes to Financial Statements
(continued)
At August 31, 2012, International Fixed Income Investments held the following OTC interest rate swap contracts:
| | | | | | | | | | | | | | | | | | | | | | | | | | | | | | |
Pay/Receive
Floating Rate | | Floating
Rate Index | | Fixed
Rate | | | Maturity
Date | | | Counterparty | | | Notional Amount | | | Market
Value | | | Upfront
Market
Paid
(Received) | | | Unrealized
Appreciation
(Depreciation) | |
Pay | | 6-Month Australian Bank Bill, AAA | | | 3.500 | % | | | 03/15/2018 | | | | BOA | | | | AUD 10,700,000 | | | $ | 16,660 | | | $ | (42,646 | ) | | $ | 59,306 | |
Pay | | 6-Month Australian Bank Bill, AAA | | | 3.750 | % | | | 03/15/2018 | | | | DUB | | | | AUD 6,100,000 | | | | 80,286 | | | | (2,667 | ) | | | 82,953 | |
Pay | | 6-Month Australian Bank Bill, AAA | | | 4.000 | % | | | 03/15/2023 | | | | GSC | | | | AUD 2,700,000 | | | | 30,631 | | | | (18,066 | ) | | | 48,697 | |
Pay | | 6-Month Australian Bank Bill, AAA | | | 4.000 | % | | | 03/15/2023 | | | | JPM | | | | AUD 5,600,000 | | | | 63,532 | | | | 9,075 | | | | 54,457 | |
Pay | | 6-Month Australian Bank Bill, AAA | | | 4.250 | % | | | 03/15/2023 | | | | BCLY | | | | AUD 700,000 | | | | 22,724 | | | | 2,342 | | | | 20,382 | |
Pay | | 6-Month Australian Bank Bill, AAA | | | 4.250 | % | | | 03/15/2023 | | | | BOA | | | | AUD 3,100,000 | | | | 100,632 | | | | 11,847 | | | | 88,785 | |
Pay | | 6-Month Australian Bank Bill, AAA | | | 4.250 | % | | | 03/15/2023 | | | | DUB | | | | AUD 6,200,000 | | | | 201,262 | | | | 64,795 | | | | 136,467 | |
Pay | | BRL-CDI-Compounded | | | 8.825 | % | | | 01/02/2015 | | | | HSBC | | | | BRL 8,000,000 | | | | 39,606 | | | | 30,881 | | | | 8,725 | |
Pay | | 6-Month JPY-LIBOR, AA- | | | 1.500 | % | | | 12/20/2015 | | | | GSC | | | | JPY 870,000,000 | | | | 460,198 | | | | 126,714 | | | | 333,484 | |
Pay | | 6-Month JPY-LIBOR, AA- | | | 1.500 | % | | | 12/21/2021 | | | | RBS | | | | JPY 410,000,000 | | | | 372,565 | | | | 110,980 | | | | 261,585 | |
Pay | | Mexico InterBank, TIIE, A- | | | 6.000 | % | | | 09/02/2022 | | | | HSBC | | | | MXN 21,800,000 | | | | 22,179 | | | | (1,012 | ) | | | 23,191 | |
Pay | | 3-Month SEK-STIBOR-SIDE, AAA | | | 4.500 | % | | | 03/18/2014 | | | | GSC | | | | SEK 1,000,000 | | | | 7,959 | | | | (1,040 | ) | | | 8,999 | |
| | | | | | | | | | | | | | | | | | | | | | | | | | | | | | |
| | | | | | | | | | | | | | | | | | | | $ | 1,418,234 | | | $ | 291,203 | | | $ | 1,127,031 | |
| | | | | | | | | | | | | | | | | | | | | | | | | | | | | | |
At August 31, 2012, International Fixed Income Investments held the following credit default swap contracts:
Credit Default Swaps on Corporate and Sovereign Issues - Buy Protection (1)
| | | | | | | | | | | | | | | | | | | | | | | | | | | | | | | | |
Reference Obligation | | Fixed Deal
(Pay) Rate | | | Maturity
Date | | | Counterparty | | | Implied Credit
Spread at
August 31,
2012 (3) | | | Notional
Amount (4) | | | Market
Value | | | Upfront
Premiums
Paid
(Received) | | | Unrealized
Appreciation
(Depreciation) | |
American General Finance Corp., CCC, | | | (1.820 | %) | | | 12/20/2017 | | | | RBS | | | | 0.097 | % | | | USD 1,000,000 | | | $ | 263,359 | | | $ | — | | | $ | 263,359 | |
First Energy, BBB-, | | | (0.940 | %) | | | 06/20/2017 | | | | RBS | | | | 0.012 | % | | | USD 1,000,000 | | | | 11,948 | | | | — | | | | 11,948 | |
Limited Brands Inc., BB-, | | | (3.550 | %) | | | 09/20/2017 | | | | GSC | | | | 0.022 | % | | | USD 500,000 | | | | (35,478 | ) | | | — | | | | (35,478 | ) |
Macy’s Retail Holdings Inc., BBB, | | | (5.000 | %) | | | 09/20/2014 | | | | BNP | | | | 0.006 | % | | | USD 650,000 | | | | (65,789 | ) | | | (67,377 | ) | | | 1,588 | |
Marsh & McLennan Cos., Inc., BBB-, | | | (0.670 | %) | | | 09/20/2014 | | | | DUB | | | | 0.003 | % | | | USD 1,000,000 | | | | (8,904 | ) | | | — | | | | (8,904 | ) |
Pearson Dollar Finance PLC, BBB+, | | | (1.000 | %) | | | 06/20/2014 | | | | BNP | | | | 0.003 | % | | | USD 1,000,000 | | | | (14,648 | ) | | | (13,718 | ) | | | (930 | ) |
Starwood Hotels & Resorts World, BBB-, | | | (1.490 | %) | | | 06/20/2018 | | | | BOA | | | | 0.014 | % | | | USD 1,000,000 | | | | (8,421 | ) | | | — | | | | (8,421 | ) |
Tate & Lyle International Finance PLC, BBB, | | | (0.510 | %) | | | 12/20/2014 | | | | DUB | | | | 0.004 | % | | | USD 100,000 | | | | (426 | ) | | | — | | | | (426 | ) |
UST Inc., BBB, | | | (0.720 | %) | | | 03/20/2018 | | | | GSC | | | | 0.004 | % | | | USD 500,000 | | | | (10,154 | ) | | | — | | | | (10,154 | ) |
| | | | | | | | | | | | | | | | | | | | | | | | | | | | | | | | |
| | | | | | | | | | | | | | | | | | | | | | $ | 131,487 | | | $ | (81,095 | ) | | $ | 212,582 | |
| | | | | | | | | | | | | | | | | | | | | | | | | | | | | | | | |
At August 31, 2012, International Fixed Income Investments held the following centrally cleared interest rate swap contracts:
| | | | | | | | | | | | | | | | | | | | | | |
Pay/Receive Floating Rate | | Floating
Rate Index | | Fixed
Rate | | | Maturity
Date | | | Counterparty | | | Notional
Amount | | | Unrealized
Appreciation
(Depreciation) | |
Pay | | 6-Month GBP-LIBOR | | | 2.50 | % | | | 09/19/2022 | | | | BCLY | | | | GBP 3,500,000 | | | $ | 315,577 | |
Pay | | 6-Month GBP-LIBOR | | | 3.50 | % | | | 09/19/2042 | | | | BCLY | | | | GBP 1,700,000 | | | | (358,357 | ) |
Pay | | 3-Month USD-LIBOR | | | 1.50 | % | | | 06/20/2017 | | | | BCLY | | | | USD 1,600,000 | | | | (8,278 | ) |
Pay | | 3-Month USD-LIBOR | | | 2.00 | % | | | 06/20/2019 | | | | BCLY | | | | USD 1,600,000 | | | | (9,580 | ) |
| | | | | | | | | | | | | | | | | | | | | | |
| | | | | | | | | | | | | | | | | | | | $ | (60,638 | ) |
| | | | | | | | | | | | | | | | | | | | | | |
182
Notes to Financial Statements
(continued)
OTC Credit Default Swaps on Corporate and Sovereign Issues - Sell Protection (2)
| | | | | | | | | | | | | | | | | | | | | | | | | | | | | | |
Reference Obligation | | Fixed
Deal
(Pay)
Rate | | | Maturity
Date | | | Counterparty | | | Implied
Credit
Spread at
August 31,
2012(3) | | | Notional
Amount (4) | | Market
Value | | | Upfront
Premiums
Paid
(Received) | | | Unrealized
Appreciation
(Depreciation) | |
Australia Government Bond, AAA, | | | 1.000 | % | | | 03/20/2015 | | | | DUB | | | | 0.003 | % | | USD 300,000 | | $ | 6,105 | | | $ | 4,304 | | | $ | 1,801 | |
Australia Government Bond, AAA, | | | 1.000 | % | | | 09/20/2015 | | | | UBS | | | | 0.003 | % | | USD 400,000 | | | 9,144 | | | | 9,263 | | | | (119 | ) |
Australia Government Bond, AAA, | | | 1.000 | % | | | 03/20/2016 | | | | DUB | | | | 0.004 | % | | USD 300,000 | | | 6,878 | | | | 6,749 | | | | 129 | |
Bundesrepublik Deutschland, AAA, | | | 0.250 | % | | | 06/20/2016 | | | | HSBC | | | | 0.004 | % | | USD 300,000 | | | (1,297 | ) | | | (4,964 | ) | | | 3,667 | |
Emirate of Abu Dhabi, AA, | | | 1.000 | % | | | 12/20/2014 | | | | BCLY | | | | 0.006 | % | | USD 800,000 | | | 9,577 | | | | (20,483 | ) | | | 30,060 | |
Japan Government 20 Year Bond, AA-, | | | 1.000 | % | | | 03/20/2015 | | | | DUB | | | | 0.004 | % | | USD 1,500,000 | | | 25,514 | | | | 11,496 | | | | 14,018 | |
Japan Government 20 Year Bond, AA-, | | | 1.000 | % | | | 03/20/2016 | | | | RBS | | | | 0.006 | % | | USD 6,600,000 | | | 113,383 | | | | 15,542 | | | | 97,841 | |
Japan Government 20 Year Bond, AA-, | | | 1.000 | % | | | 03/20/2016 | | | | BCLY | | | | 0.006 | % | | USD 200,000 | | | 3,436 | | | | 2,676 | | | | 760 | |
Japan Government 20 Year Bond, AA-, | | | 1.000 | % | | | 03/20/2016 | | | | GSC | | | | 0.006 | % | | USD 4,300,000 | | | 73,870 | | | | (46,371 | ) | | | 120,241 | |
Lloyds TSB Bank PLC, A, | | | 1.000 | % | | | 06/20/2013 | | | | DUB | | | | 0.012 | % | | EUR 600,000 | | | 565 | | | | (9,100 | ) | | | 9,665 | |
Republic of Korea, A, | | | 1.000 | % | | | 09/20/2017 | | | | UBS | | | | 0.010 | % | | USD 2,000,000 | | | (69 | ) | | | (4,822 | ) | | | 4,753 | |
U.S. Treasury Notes, AA+, | | | 0.250 | % | | | 09/20/2012 | | | | SOG | | | | 0.001 | % | | EUR 200,000 | | | 146 | | | | (1,639 | ) | | | 1,785 | |
U.S. Treasury Notes, AA+, | | | 0.250 | % | | | 09/20/2012 | | | | UBS | | | | 0.001 | % | | EUR 600,000 | | | 438 | | | | (5,777 | ) | | | 6,215 | |
U.S. Treasury Notes, AA+, | | | 0.250 | % | | | 06/20/2016 | | | | BNP | | | | 0.004 | % | | EUR 700,000 | | | (3,294 | ) | | | (7,057 | ) | | | 3,763 | |
| | | | | | | | | | | | | | | | | | | | | | | | | | | | | | |
| | | | | | | | | | | | | | | | | | | | $ | 244,396 | | | $ | (50,183 | ) | | $ | 294,579 | |
| | | | | | | | | | | | | | | | | | | | | | | | | | | | | | |
| (1) | If the Fund is a buyer of protection and a credit event occurs, as defined under the terms of that particular swap agreement, the Fund will either (i) receive from the seller of protection an amount equal to the notional amount of the swap and deliver the reference obligation or underlying securities comprising the referenced index or (ii) receive a net settlement amount in the form of cash or securities equal to the notional amount of the swap less the recovery value of the reference obligation or underlying securities comprising the referenced index. |
| (2) | If the Fund is a seller of protection and a credit event occurs, as defined under the terms of that particular swap agreement, the Fund will either (i) pay to the buyer of protection an amount equal to the notional amount of the swap and take delivery of the referenced obligation or underlying securities comprising the referenced index or (ii) pay a net settlement amount in the form of cash or securities equal to the notional amount of the swap less the recovery value of the referenced obligation or underlying securities comprising the referenced index. |
| (3) | Implied credit spreads, represented in absolute terms, utilized in determining the market value of credit default swap agreements on corporate issues or sovereign issues of an emerging country as of period end serve as an indicator of the current status of the payment/performance risk and represent the likelihood or risk of default for the credit derivative. The implied credit spread of a particular referenced entity reflects the cost of buying/selling protection and may include upfront payments required to be made to enter into the agreement. Wider credit spreads represent a deterioration of the referenced entity’s credit soundness and a greater likelihood or risk of default or other credit event occurring as defined under the terms of the agreement. A credit spread identified as “Defaulted” indicates a credit event has occurred for the referenced entity or obligation. |
| (4) | The maximum potential amount the Fund could be required to make as a seller of credit protection or receive as a buyer of credit protection if a credit event occurs as defined under the terms of that particular swap agreement. |
| | | | | | |
Counterparty Abbreviations: | | Counterparty Abbreviations: |
| BBH | | Brown Brothers Harriman & Co. | | BOA | | Bank of America |
| BCLY | | Barclays Bank PLC | | CSFB | | Credit Suisse Securities (USA) LLC |
| BNP | | BNP Paribas Bank | | DUB | | Deutsche Bank AG |
183
Notes to Financial Statements
(continued)
| | | | | | |
Counterparty Abbreviations: | | Currency Abbreviations: |
| GSC | | Goldman Sachs & Co. | | AUD | | Australian Dollar |
| HSBC | | HSBC Bank USA | | BRL | | Brazilian Real |
| JPM | | J.P. Morgan Chase & Co. | | EUR | | Euro Dollar |
| RBC | | Royal Bank of Canada | | GBP | | British Pound |
| RBS | | Royal Bank of Scotland PLC | | JPY | | Japanese Yen |
| SOG | | Société Générale | | MXN | | Mexican Peso |
| SSB | | State Street Corp. | | SEK | | Swedish Krona |
| UBS | | UBS Securities LLC | | | | |
| WBK | | Westpac Banking Corp. | | | | |
At August 31, 2012, Core Fixed Income Investments and International Fixed Income Investments had total unrealized appreciation of $2,036,465 and $1,573,554, respectively, from swap contracts.
At August 31, 2012, Core Fixed Income Investments and International Fixed Income Investments had collateral held from brokers in the net amount of $2,725,000 and $1,030,000, respectively, for the open swaps contracts. Core Fixed Income Investments also had collateral held from brokers in the net amount of $250,000 for open repurchase agreements. These amounts are disclosed within “Deposits from counterparty” within the Statement of Assets and Liabilities for the respective Funds.
| 4. | Shares of Beneficial Interest |
At August 31, 2012, the Trust had an unlimited number of units of beneficial interest (shares) authorized with a par value of $0.001 per share. At August 31, 2012, Trustees and executive officers of the Trust as a group owned of record less than 1% of the outstanding shares of the Trust.
Transactions in shares of each Fund were as follows:
| | | | | | | | |
| | | Year Ended
August 31,
2012 | | | Year Ended
August 31,
2011 | |
Large Capitalization Growth Investments | | | | | | | | |
Shares sold | | | 5,180,984 | | | | 18,051,112 | |
Shares issued on reinvestment | | | 574,007 | | | | 215,671 | |
Shares repurchased | | | (32,258,133 | ) | | | (23,021,253 | ) |
| | | | | | | | |
Net (Decrease) | | | (26,503,142 | ) | | | (4,754,470 | ) |
| | | | | | | | |
Large Capitalization Value Equity Investments | | | | | | | | |
Shares sold | | | 5,705,534 | | | | 22,239,556 | |
Shares issued on reinvestment | | | 2,851,287 | | | | 3,300,974 | |
Shares repurchased | | | (35,541,226 | ) | | | (29,605,751 | ) |
| | | | | | | | |
Net (Decrease) | | | (26,984,405 | ) | | | (4,065,221 | ) |
| | | | | | | | |
Small Capitalization Growth Investments | | | | | | | | |
Shares sold | | | 1,257,944 | | | | 2,625,466 | |
Shares repurchased | | | (4,443,637 | ) | | | (4,878,566 | ) |
| | | | | | | | |
Net (Decrease) | | | (3,185,693 | ) | | | (2,253,100 | ) |
| | | | | | | | |
Small Capitalization Value Equity Investments | | | | | | | | |
Shares sold | | | 1,295,454 | | | | 4,208,742 | |
Shares issued on reinvestment | | | 160,653 | | | | 252,755 | |
Shares repurchased | | | (6,302,842 | ) | | | (5,821,618 | ) |
| | | | | | | | |
Net (Decrease) | | | (4,846,735 | ) | | | (1,360,121 | ) |
| | | | | | | | |
184
Notes to Financial Statements
(continued)
| | | | | | | | |
| | | Year Ended
August 31,
2012 | | | Year Ended
August 31,
2011 | |
International Equity Investments | | | | | | | | |
Shares sold | | | 15,658,185 | | | | 6,413,849 | |
Shares issued on reinvestment | | | 722,465 | | | | 1,302,296 | |
Shares repurchased | | | (24,944,029 | ) | | | (40,954,399 | ) |
| | | | | | | | |
Net (Decrease) | | | (8,563,379 | ) | | | (33,238,254 | ) |
| | | | | | | | |
Emerging Markets Equity Investments | | | | | | | | |
Shares sold | | | 5,237,523 | | | | 8,719,348 | |
Shares issued on reinvestment | | | 1,274,080 | | | | 748,073 | |
Shares repurchased | | | (11,510,055 | ) | | | (11,076,096 | ) |
| | | | | | | | |
Net (Decrease) | | | (4,998,452 | ) | | | (1,608,675 | ) |
| | | | | | | | |
Core Fixed Income Investments | | | | | | | | |
Shares sold | | | 37,472,242 | | | | 26,842,963 | |
Shares issued on reinvestment | | | 5,596,967 | | | | 7,603,431 | |
Shares repurchased | | | (52,327,337 | ) | | | (23,699,040 | ) |
| | | | | | | | |
Net Increase (Decrease) | | | (9,258,128 | ) | | | 10,747,354 | |
| | | | | | | | |
High Yield Investments | | | | | | | | |
Shares sold | | | 38,796,919 | | | | 9,055,394 | |
Shares issued on reinvestment | | | 3,025,307 | | | | 3,919,509 | |
Shares repurchased | | | (26,136,959 | ) | | | (11,060,798 | ) |
| | | | | | | | |
Net Increase | | | 15,685,267 | | | | 1,914,105 | |
| | | | | | | | |
International Fixed Income Investments | | | | | | | | |
Shares sold | | | 27,945,492 | | | | 6,666,778 | |
Shares issued on reinvestment | | | 160,537 | | | | 1,673,575 | |
Shares repurchased | | | (6,208,191 | ) | | | (6,043,643 | ) |
| | | | | | | | |
Net Increase | | | 21,897,838 | | | | 2,296,710 | |
| | | | | | | | |
Municipal Bond Investments | | | | | | | | |
Shares sold | | | 3,437,485 | | | | 2,850,377 | |
Shares issued on reinvestment | | | 297,345 | | | | 318,500 | |
Shares repurchased | | | (3,981,895 | ) | | | (3,452,468 | ) |
| | | | | | | | |
Net (Decrease) | | | (247,065 | ) | | | (283,591 | ) |
| | | | | | | | |
Money Market Investments | | | | | | | | |
Shares sold | | | 293,627,375 | | | | 114,041,013 | |
Shares issued on reinvestment | | | 58,949 | | | | 16,775 | |
Shares repurchased | | | (174,430,607 | ) | | | (120,488,142 | ) |
| | | | | | | | |
Net Increase (Decrease) | | | 119,255,717 | | | | (6,430,354 | ) |
| | | | | | | | |
185
Notes to Financial Statements
(continued)
| 5. | Dividends and Tax Components of Capital |
The tax character of distributions paid during the fiscal year ended August 31, 2012, were as follows:
| | | | | | | | | | | | | | | | |
| | | Large
Capitalization
Growth
Investments | | | Large
Capitalization
Value
Equity
Investments | | | Small
Capitalization
Growth
Investments | | | Small
Capitalization
Value
Equity
Investments | |
Distributions paid from: | | | | | | | | | | | | | | | | |
Tax Exempt | | $ | — | | | $ | — | | | $ | — | | | $ | — | |
Tax Return of Capital | | | — | | | | — | | | | — | | | | — | |
Ordinary Income | | | 8,294,405 | | | | 24,720,654 | | | | — | | | | 1,889,698 | |
Net Long-term Capital Gains | | | — | | | | — | | | | — | | | | — | |
| | | | | | | | | | | | | | | | |
Total Distributions Paid | | $ | 8,294,405 | | | $ | 24,720,654 | | | $ | — | | | $ | 1,889,698 | |
| | | | | | | | | | | | | | | | |
| | | | | | | | | | | | | | | | |
| | | International
Equity
Investments | | | Emerging
Markets
Equity
Investments | | | Core
Fixed
Income
Investments | | | High
Yield
Investments | |
Distributions paid from: | | | | | | | | | | | | | | | | |
Tax Exempt | | $ | — | | | $ | — | | | $ | — | | | $ | — | |
Tax Return of Capital | | | — | | | | — | | | | — | | | | — | |
Ordinary Income | | | 6,661,132 | | | | 18,066,459 | | | | 44,956,878 | | | | 12,483,168 | |
Net Long-term Capital Gains | | | — | | | | — | | | | 3,302,349 | | | | — | |
| | | | | | | | | | | | | | | | |
Total Distributions Paid | | $ | 6,661,132 | | | $ | 18,066,459 | | | $ | 48,259,227 | | | $ | 12,483,168 | |
| | | | | | | | | | | | | | | | |
| | | | | | | | | | | | |
| | | International
Fixed
Income
Investments | | | Municipal
Investments
Bond | | | Money
Market
Investments | |
Distributions paid from: | | | | | | | | | | | | |
Tax Exempt | | $ | — | | | $ | 2,884,427 | | | $ | — | |
Tax Return of Capital | | | — | | | | — | | | | — | |
Ordinary Income | | | 1,284,299 | | | | 4,286 | | | | 59,001 | |
Net Long-term Capital Gains | | | | | | | — | | | | — | |
| | | | | | | | | | | | |
Total Distributions Paid | | $ | 1,284,299 | | | $ | 2,888,713 | | | $ | 59,001 | |
| | | | | | | | | | | | |
The tax character of distributions paid during the fiscal year ended August 31, 2011, were as follows:
| | | | | | | | | | | | | | | | |
| | | Large
Capitalization
Growth
Investments | | | Large
Capitalization
Value
Equity
Investments | | | Small
Capitalization
Growth
Investments | | | Small
Capitalization
Value
Equity
Investments | |
Distributions paid from: | | | | | | | | | | | | | | | | |
Tax Exempt | | $ | — | | | $ | — | | | $ | — | | | $ | — | |
Tax Return of Capital | | | — | | | | — | | | | — | | | | — | |
Ordinary Income | | | 3,133,697 | | | | 28,058,283 | | | | — | | | | 2,997,673 | |
Net Long-term Capital Gains | | | — | | | | — | | | | — | | | | — | |
| | | | | | | | | | | | | | | | |
Total Distributions Paid | | $ | 3,133,697 | | | $ | 28,058,283 | | | $ | — | | | $ | 2,997,673 | |
| | | | | | | | | | | | | | | | |
186
Notes to Financial Statements
(continued)
| | | | | | | | | | | | | | | | |
| | | International
Equity
Investments | | | Emerging
Markets
Equity
Investments | | | Core
Fixed
Income
Investments | | | High
Yield
Investments | |
Distributions paid from: | | | | | | | | | | | | | | | | |
Tax Exempt | | $ | — | | | $ | — | | | $ | — | | | $ | — | |
Tax Return of Capital | | | — | | | | — | | | | — | | | | — | |
Ordinary Income | | | 13,556,896 | | | | 12,702,280 | | | | 61,357,104 | | | | 17,008,732 | |
Net Long-term Capital Gains | | | — | | | | — | | | | 2,940,955 | | | | — | |
| | | | | | | | | | | | | | | | |
Total Distributions Paid | | $ | 13,556,896 | | | $ | 12,702,280 | | | $ | 64,298,059 | | | | 17,008,732 | |
| | | | | | | | | | | | | | | | |
| | | | | | | | | | | | |
| | | International
Fixed
Income
Investments | | | Municipal
Bond
Investments | | | Money
Market
Investments | |
Distributions paid from: | | | | | | | | | | | | |
Tax Exempt | | $ | — | | | $ | 2,938,052 | | | $ | — | |
Tax Return of Capital | | | — | | | | — | | | | — | |
Ordinary Income | | | 12,802,845 | | | | 4,583 | | | | 16,776 | |
Net Long-term Capital Gains | | | — | | | | — | | | | — | |
| | | | | | | | | | | | |
Total Distributions Paid | | $ | 12,802,845 | | | | 2,942,635 | | | $ | 16,776 | |
| | | | | | | | | | | | |
As of August 31, 2012, the components of accumulated earnings on a tax basis were as follows:
| | | | | | | | | | | | | | | | |
| | | Large
Capitalization
Growth
Investments | | | Large
Capitalization
Value
Equity
Investments | | | Small
Capitalization
Growth
Investments | | | Small
Capitalization
Value
Equity
Investments | |
Undistributed ordinary income - net | | $ | 5,600,995 | | | $ | 14,877,631 | | | $ | — | | | $ | 1,676,707 | |
Undistibuted long-term capital gains - net | | | — | | | | — | | | | — | | | | 11,058,111 | |
Total Undistributed earnings | | | 5,600,995 | | | | 14,877,631 | | | | — | | | | 12,734,818 | |
Capital Loss Carryforward | | | (137,036,845 | ) | | | (479,945,104 | ) | | | (16,893,807 | ) | | | — | |
Current Year Late Year Loss Deferral | | | — | | | | — | | | | (8,511,713 | ) | | | (88,057 | ) |
Other book/tax temporary differences | | | (22,634,485 | )(a) | | | (20,679,156 | )(a) | | | (1,542,532 | )(a) | | | (2,358,117 | )(a) |
Unrealized appreciation (depreciation) | | | 415,740,765 | | | | 161,755,553 | | | | 50,256,980 | | | | 49,565,933 | |
| | | | | | | | | | | | | | | | |
Total accumulated earnings/(losses) - net | | $ | 261,670,430 | | | $ | (323,991,076 | ) | | $ | 23,308,928 | | | $ | 59,854,577 | |
| | | | | | | | | | | | | | | | |
| | | | | | | | | | | | | | | | |
| | | International
Equity
Investments | | | Emerging
Market
Equity
Investments | | | Core
Fixed
Income
Investments | | | High
Yield
Investments | |
Undistributed ordinary income - net | | $ | 7,125,766 | | | $ | 12,983,371 | | | $ | 26,654,911 | | | $ | 831,432 | |
Undistibuted long-term capital gains - net | | | — | | | | — | | | | 9,608,403 | | | | — | |
Total Undistributed earnings | | | 7,125,766 | | | | 12,983,371 | | | | 36,263,314 | | | | 831,432 | |
Capital Loss Carryforward | | | (331,585,759 | ) | | | (45,400,705 | ) | | | — | | | | (21,083,770 | ) |
Current Year Late Year Loss Deferral | | | (6,076,398 | ) | | | (12,785,158 | ) | | | — | | | | (1,855,023 | ) |
Other book/tax temporary differences | | | (11,458,934 | )(b) | | | (26,554,947 | )(b) | | | (2,506,107 | )(c)(d) | | | (807,875 | )(d) |
Unrealized appreciation (depreciation) | | | 38,560,745 | | | | 102,754,022 | | | | 40,808,539 | | | | 5,721,901 | |
| | | | | | | | | | | | | | | | |
Total accumulated earnings/(losses) - net | | $ | (303,434,580 | ) | | $ | 30,996,583 | | | | 74,565,746 | | | $ | (17,193,335 | ) |
| | | | | | | | | | | | | | | | |
187
Notes to Financial Statements
(continued)
| | | | | | | | | | | | |
| | | International
Fixed
Income
Investments | | | Municipal
Bond
Investments | | | Money
Market
Investments | |
Undistributed tax exempt income - net | | $ | — | | | $ | 144,126 | | | $ | — | |
Undistributed ordinary income - net | | | 24,541,420 | | | | — | | | | 5,906 | |
Undistributed long-term capital gains - net | | | — | | | | — | | | | — | |
| | | | | | | | | | | | |
Total Undistributed earnings | | | 24,541,420 | | | | 144,126 | | | | 5,906 | |
Capital Loss Carryforward | | | (11,600,849 | ) | | | (102,985 | ) | | | — | |
Current Year Late Year Loss Deferral | | | — | | | | — | | | | — | |
Other book/tax temporary differences | | | 764,829 | (c) | | | — | | | | — | |
Unrealized appreciation (depreciation) | | | 13,555,920 | | | | 7,825,858 | | | | — | |
| | | | | | | | | | | | |
Total accumulated earnings/(losses) - net | | $ | 27,261,320 | | | $ | 7,866,999 | | | $ | 5,906 | |
| | | | | | | | | | | | |
As of August 31, 2012, there were no significant differences between the book and tax components of net assets for Money Market Investments
| (a) | The difference between book-basis and tax-basis unrealized appreciation (depreciation) is attributable primarily to the tax deferral of losses on wash sales and tax cost adjustments related to real estate investments. |
| (b) | The difference between book-basis and tax-basis unrealized appreciation (depreciation) is attributable primarily to the tax deferral of losses on wash sales, the realization for tax purposes of unrealized gains on investments in passive foreign investment companies, and other book/tax basis adjustments. |
| (c) | The difference between book-basis and tax-basis unrealized appreciation (depreciation) is attributable primarily to the tax deferral of losses on wash sales and the difference between book and tax amortization methods for premiums on fixed income securities. |
| (d) | The difference between book-basis and tax-basis unrealized appreciation (depreciation) is attributable primarily to the tax deferral of losses on wash sales, the tax accrual of defaulted bond interest and the difference between book and tax amortization methods for premiums on fixed income securities. |
| 6. | Capital Loss Carry Forward |
Under the Regulated Investment Company Modernization Act of 2010 (the “Act”), the Funds are permitted to carry forward capital losses incurred in taxable years beginning after December 22, 2010, for an unlimited period. However, any losses incurred during those future taxable years will be required to be utilized prior to the losses incurred in pre-enactment taxable years. As a result of this, pre-enactment capital loss carryforwards may be more likely to expire unused.
As of August 31, 2012, the Funds had the following net capital loss carryforwards remaining:
| | | | | | | | | | | | | | | | | | | | | | | | |
Year of Expiration | | Large
Capitalization
Growth
Investments | | | Large
Capitalization
Value Equity
Investments | | | Small
Capitalization
Growth
Investments | | | Small
Capitalization
Value Equity
Investments | | | International
Equity
Investments | | | Emerging
Markets
Equity
Investments | |
8/31/2012 | | $ | — | | | $ | — | | | $ | — | | | $ | — | | | $ | — | | | $ | — | |
8/31/2013 | | | — | | | | — | | | | — | | | | — | | | | — | | | | — | |
8/31/2014 | | | — | | | | — | | | | — | | | | — | | | | — | | | | — | |
8/31/2015 | | | — | | | | — | | | | — | | | | — | | | | — | | | | — | |
8/31/2016 | | | — | | | | — | | | | — | | | | — | | | | — | | | | — | |
8/31/2017 | | | — | | | | 29,079,706 | | | | 1,565,236 | | | | — | | | | 4,446,685 | | | | — | |
8/31/2018 | | | 137,036,845 | | | | 450,865,398 | | | | 15,328,571 | | | | — | | | | 317,009,031 | | | | 35,702,208 | |
8/31/2019 | | | — | | | | — | | | | — | | | | — | | | | — | | | | — | |
Non-expiring: | | | | | | | | | | | | | | | | | | | | | | | | |
Short Term | | | — | | | | — | | | | — | | | | — | | | | 10,130,043 | | | | 9,698,497 | |
Long Term | | | — | | | | — | | | | — | | | | — | | | | — | | | | — | |
| | | | | | | | | | | | | | | | | | | | | | | | |
| | $ | 137,036,845 | | | $ | 479,945,104 | | | $ | 16,893,807 | | | $ | — | | | $ | 331,585,759 | | | $ | 45,400,705 | |
| | | | | | | | | | | | | | | | | | | | | | | | |
188
Notes to Financial Statements
(continued)
| | | | | | | | | | | | | | | | | | | | |
Year of Expiration | | Core Fixed
Income
Investments | | | High Yield
Investments | | | International
Fixed
Income
Investments | | | Municipal
Bond
Investments | | | Money
Market
Investments | |
8/31/2012 | | $ | — | | | $ | — | | | $ | — | | | $ | — | | | $ | — | |
8/31/2013 | | | — | | | | — | | | | — | | | | — | | | | — | |
8/31/2014 | | | — | | | | 1,114,740 | | | | — | | | | — | | | | — | |
8/31/2015 | | | — | | | | — | | | | — | | | | — | | | | — | |
8/31/2016 | | | — | | | | — | | | | — | | | | — | | | | — | |
8/31/2017 | | | — | | | | 10,731,217 | | | | 6,343,658 | | | | — | | | | — | |
8/31/2018 | | | — | | | | 5,672,191 | | | | 5,257,191 | | | | 101,811 | | | | — | |
8/31/2019 | | | — | | | | — | | | | — | | | | 1,174 | | | | — | |
Non-expiring: | | | | | | | | | | | | | | | | | | | | |
Short Term | | | — | | | | 3,565,622 | | | | — | | | | — | | | | — | |
Long Term | | | — | | | | — | | | | — | | | | — | | | | — | |
| | | | | | | | | | | | | | | | | | | | |
| | $ | — | | | $ | 21,083,770 | | | $ | 11,600,849 | | | $ | 102,985 | | | $ | — | |
| | | | | | | | | | | | | | | | | | | | |
These amounts will be available to offset any future taxable capital gains.
| 7. | Recent Accounting Pronouncements |
In December 2011, Financial Accounting Standards Board (“FASB”) issued an Accounting Standards Codification (“ASU”) No. 2011-11 related to disclosures about offsetting assets and liabilities in financial statements. The amendments in this update require an entity to disclose both gross and net information for derivatives and other financial instruments that are either offset in the statement of assets and liabilities or subject to an enforceable master netting arrangement or similar agreement. The ASU is effective during interim or annual reporting periods beginning on or after January 1, 2013. At this time, management is evaluating the implication of this ASU and its impact on the financial statements has not been determined.
Management has evaluated subsequent events after the balance sheet date through the date that the financial statements were issued and has not identified any additional events or transactions that would require recognition or disclosure in the financial statements.
Subsequent to August 31, 2012, the Funds made the following distributions:
| | | | | | | | | | | | | | | | |
Record Date Payable Date | | Core Fixed
Income
Investments | | | High Yield
Investments | | | Municipal
Bond
Investments | | | Money
Market
Investments | |
9/27/12-9/28/12 | | $ | 0.021550 | | | $ | 0.022731 | | | $ | 0.022835 | | | $ | 0.000012 | |
189
Report of Independent Registered Public Accounting Firm
To the Board of Trustees of
Consulting Group Capital Markets Funds
We have audited the accompanying statements of assets and liabilities, including the schedules of investments, of Consulting Group Capital Markets Funds, comprised of Large Capitalization Growth Investments, Large Capitalization Value Equity Investments, Small Capitalization Growth Investments, Small Capitalization Value Equity Investments, International Equity Investments, Emerging Markets Equity Investments, Core Fixed Income Investments, High Yield Investments, International Fixed Income Investments, Municipal Bond Investments and Money Market Investments (“the Funds”) as of August 31, 2012, and the related statements of operations for the year then ended, the statements of changes in net assets for each of the two years in the period then ended, and the financial highlights for each of the four years in the period then ended. These financial statements and financial highlights are the responsibility of the Funds’ management. Our responsibility is to express an opinion on these financial statements and financial highlights based on our audits. The financial highlights for the year ended August 31, 2008 were audited by other auditors whose report, dated October 29, 2008, expressed an unqualified opinion on those financial highlights.
We conducted our audits in accordance with the standards of the Public Company Accounting Oversight Board (United States). Those standards require that we plan and perform the audit to obtain reasonable assurance about whether the financial statements and financial highlights are free of material misstatement. The Funds are not required to have, nor were we engaged to perform, an audit of their internal control over financial reporting. Our audits included consideration of internal control over financial reporting as a basis for designing audit procedures that are appropriate in the circumstances, but not for the purpose of expressing an opinion on the effectiveness of the Funds’ internal control over financial reporting. Accordingly, we express no such opinion. An audit also includes examining, on a test basis, evidence supporting the amounts and disclosures in the financial statements, assessing the accounting principles used and significant estimates made by management, as well as evaluating the overall financial statement presentation. Our procedures included confirmation of securities owned as of August 31, 2012, by correspondence with the custodian and brokers; where replies were not received from brokers, we performed other auditing procedures.
We believe that our audits provide a reasonable basis for our opinion. In our opinion, the financial statements and financial highlights referred to above present fairly, in all material respects, the financial position of each of the Funds constituting Consulting Group Capital Markets Funds as of August 31, 2012, the results of their operations for the year then ended, the changes in their net assets for each of the two years in the period then ended, and the financial highlights for each of the four years in the period then ended, in conformity with accounting principles generally accepted in the United States of America.
DELOITTE & TOUCHE LLP
October 30, 2012
190
Board Approval of Management Agreement and Investment Advisory Agreements
(unaudited)
Approval of Management Agreement and Subadvisory Agreements
At a meeting held in person on May 24, 2012, the Board of Trustees (“Board”), including a majority of the Board who are not “interested persons,” (“Independent Trustees”), as defined in the Investment Company Act of 1940, as amended (“1940 Act”), of the Trust, re-approved for an annual period the Trust’s management agreement (“Management Agreement”) and certain subadvisory agreements (“Subadvisory Agreements”).
In their consideration of the re-approval of the Management Agreement and the Subadvisory Agreements, the Board considered the factors described below.
The Independent Trustees requested and received information from the Manager and the Sub-advisers that they deemed reasonably necessary for their review of the Management Agreement and the Subadvisory Agreements and the performance of the Manager and Sub-advisers. The Independent Trustees met in a private session with their independent legal counsel, at which meeting no representative of management was present, and were advised by separate independent legal counsel throughout the process. Following the closed session, the Board Members approved the Management Agreement and the Subadvisory Agreements to continue for another year.
No single factor reviewed by the Board was identified by the Board as the principal factor in determining whether to approve the Management Agreement and Subadvisory Agreements.
Nature, Extent and Quality of the Services Under the Management and Subadvisory Agreements
The Board received and considered information regarding the nature, extent and quality of services provided to the Funds by the Manager and the Sub-advisers under the Management Agreement and the Subadvisory Agreements, respectively, during the meeting and during the past year. The Board also received a description of the administrative and other services rendered to the Trust and its shareholders. The Board noted information received at regular meetings throughout the year related to the services rendered by the Manager about the management of the Trust’s affairs and its role in coordinating the activities of the Trust’s other service providers. The Board reviewed information received from the Manager and the Trust’s Chief Compliance Officer regarding the review of the Trust’s and the Sub-Advisers’ compliance policies and procedures established pursuant to Rule 38a-1 under the 1940 Act.
The Board reviewed the qualifications, backgrounds and responsibilities of the Trust’s senior personnel and the portfolio management teams primarily responsible for the day-to-day portfolio management of the Funds.
The Board also considered the Manager’s brokerage policies and practices, the standards applied to the Sub-advisers, policies and practices regarding soft dollars, and the existence of quality controls applicable to brokerage allocation procedures.
The Board concluded that, overall, the nature, extent and quality of services provided (and expected to be provided) under the Management Agreement and the Subadvisory Agreements were adequate and appropriate.
Fund Performance
The Board received and considered performance information for the Funds as well as for a group of funds (“Performance Universe”) selected by Lipper, Inc. (“Lipper”), an independent provider of investment company data for various periods. The Board was provided with a description of the methodology Lipper used to determine the similarity of the Funds with the funds included in the Performance Universe. The Board also noted that it had received and discussed with management information throughout the year at periodic intervals comparing each Fund’s performance against its benchmarks.
The Board was generally satisfied with the overall performance of the Funds and with the efforts of the Manager and respective Sub-advisers to continue to improve performance. The Trustees determined to continue to evaluate the Funds’ performance and directed the Trust’s Investment Committee to continue to periodically review Fund performance with the Manager and report to the full Board.
191
Board Approval of Management Agreement and Investment Advisory Agreements
(unaudited) (continued)
Management Fees and Expense Ratios
The Board reviewed and considered the contractual management fees (“Contractual Management Fees”) payable by the Funds to the Manager in light of the nature, extent and quality of the management and subadvisory services provided by the Manager and the Sub-advisers. The Board also reviewed and considered whether fee waiver and/or expense reimbursement arrangements are currently in place for the Funds and considered the actual fee rate (after taking any waivers and reimbursements into account) (“Actual Management Fee”) and whether any fee waivers and reimbursements could be discontinued. In addition, the Board noted that the compensation paid to the Sub-advisers is paid by the Manager, not the Funds, and, accordingly, that the retention of the Sub-advisers does not increase the fees or expenses otherwise incurred by a Fund’s shareholders.
The Board received and considered information comparing the Funds’ Contractual Management Fees and Actual Management Fees and the Funds’ actual total expenses with those of a group of comparable funds and a broader group of funds, each selected and provided by Lipper. The Board also considered and discussed information about the Sub-advisers’ fees and comparable information for other subadvised funds and accounts managed by the Sub-advisers, and, in this regard, the amount of the Contractual and Actual Management Fees retained by the Manager.
The Board concluded that the fee paid by each Fund to the Manager and the fees paid by the Manager to the Sub-advisers were reasonable in light of comparative performance and expense and advisory fee information, and (as discussed below) costs of the services provided and profits to be realized and benefits derived or to be derived by the Manager and Sub-advisers from the relationship with the Funds.
Manager Profitability
The Board received and considered a profitability analysis of the Manager and its affiliates in providing services to the Funds. In addition, the Board received information with respect to the Manager’s allocation methodologies used in preparing this profitability data. To the extent available, the Board also reviewed information provided by the Sub-advisers with respect to the relevant Sub-advisers’ profitability in providing subadvisory services to the Funds. The Board also noted the profitability percentage ranges determined by appropriate court cases to be reasonable given the services rendered to investment companies. The Board determined that the Manager’s profitability was not excessive in light of the nature, extent and quality of the services provided to the Funds.
Other Benefits to the Manager and the Sub-advisers
The Board considered other benefits received by the Manager, the Sub-advisers and their affiliates as a result of their relationship with the Funds, including soft dollar arrangements, receipt of brokerage and the opportunity to offer additional products and services to Fund shareholders.
In light of the costs of providing investment management and other services to the Funds and the Manager’s ongoing commitment to the Funds, the profits and other ancillary benefits that the Manager and its affiliates received were considered reasonable.
192
Additional Information
(unaudited)
Trustees and Officers of the Trust
Overall responsibility for management and supervision of the Trust rests with the Board of Trustees. The Trustees approve all significant agreements between the Trust and the companies that furnish services to the Funds, including agreements with the Funds’ distributor, investment advisers, custodian, transfer agent and administrator. The day-to-day operations of the Funds are delegated to the Funds’ Manager, The Consulting Group, a division of Consulting Group Advisory Services LLC (“CGAS”).
The names of the Trustees and officers of the Trust, together with information as to their principal business occupations, are set forth below. The officers of the Trust are employees of organizations that provide services to the Funds. Each Trustee who is an “interested person” of the Trust, as defined in the Investment Company Act of 1940, as amended (“1940 Act”), is indicated by a double asterisk.
| | | | | | | | | | |
Name, Address and Birth Year | | Position(s)
Held with
Trust | | Term of
Office*
and
Length
of Time
Served | | Principal Occupation(s)
During Past Five Years | | Number of
Portfolios
in Fund
Complex
Overseen
by Trustee | | Other Board
Memberships
Held During Past
Five Years by
Trustee |
INDEPENDENT TRUSTEES | | | | | | | | |
| | | | | |
John J. Murphy 268 Main Street Gladstone, NJ 07934 Birth Year: 1944 | | Chairman and Trustee | | Since 2002 (Chairman since 2010) | | Founder and Senior Principal, Murphy Capital Management (investment management) (1983-present) | | 11 | | Trustee, Legg Mason Partners Equity Trust (54 funds, 2007-present); Trustee, UBS Funds (52 funds, 2009-present); and Nicholas Applegate Funds (12 portfolios) (2005-2010) |
| | | | | |
Adela Cepeda c/o Morgan Stanley Wealth Management (“MSWM”) 2000 Westchester Avenue Purchase, NY 10577 Birth Year: 1958 | | Trustee | | Since 2008 | | President, A.C. Advisory, Inc. (1995-present) | | 11 | | Director, Amalgamated Bank of Chicago (2003-present); Trustee, MGI Funds (7 funds, 2005-present); Trustee, UBS Funds (53 funds, 2004-present); Director, Fort Dearborn Income Securities (2000-present); Director, Municipal Securities Rulemaking Board (2001-present); and formerly, Chairperson, Alta Capital Group (2005-2007) |
| | | | | |
Stephen E. Kaufman 277 Park Avenue, 47th Fl. New York, NY 10172 Birth Year: 1932 | | Trustee | | Since 1991 | | Attorney, Stephen E. Kaufman, P.C. (1957-present) | | 11 | | None |
| | | | | |
W. Thomas Matthews 453 Banks Mill Road Aiken, SC 29801 Birth Year: 1949 | | Trustee | | Since 2009 (Interested Trustee from 2006-2009) | | Retired; and Advisor, Smith Barney (2005-2007) | | 11 | | None |
| | | | | |
Mark J. Reed 101 S. Hanley Road., Suite 1260 St. Louis, MO 63105 Birth Year: 1964 | | Trustee | | Since 2007 | | Managing Director and Chief Compliance Officer, Bush O’Donnell Investment Advisors, Inc., (1988-present) | | 11 | | None |
193
Additional Information
(unaudited) (continued)
| | | | | | | | | | |
Name, Address and Birth Year | | Position(s)
Held with
Trust | | Term of
Office*
and
Length
of Time
Served | | Principal Occupation(s)
During Past Five Years | | Number of
Portfolios
in Fund
Complex
Overseen
by Trustee | | Other Board
Memberships
Held During Past
Five Years by
Trustee |
INTERESTED TRUSTEE** | | | | | | | | |
| | | | | |
James F. Walker MSWM 2000 Westchester Ave Purchase, NY 10577 Birth Year: 1963 | | Trustee, Chief Executive Officer and President | | Since 2010 | | Managing Director, Director of Product Strategy – Investment Products and Services, MSWM and Morgan Stanley Private Bank (2012-Present); Managing Director, Head of Consulting Group, MSWM (2010-2012); Managing Director and Chief Operating Officer (“COO”), Investment Products and Markets, MSWM (2009-2010); and Managing Director, Citigroup Global Markets Inc. (“CGM”) and Chief Operating Officer, Investment Advisory Services (“IAS”), Smith Barney (2006-2009) | | 11 | | None |
194
Additional Information
(unaudited) (continued)
| | | | | | |
Name, Address and Date of Birth | | Position(s)
Held with
Trust | | Term of
Office*
and
Length
of Time
Served | | Principal Occupation(s)
During Past Five Years |
OFFICERS | | | | |
| | | |
Marc Gordon MSWM 2000 Westchester Ave. Purchase, NY 10577 Birth Year: 1968 | | Chief Financial Officer and Treasurer | | Since 2010 | | Managing Director and Chief Financial Officer, Investment Strategy and Client Solutions and Capital Markets Groups, MSWM (2012-present), Executive Director and Chief Financial Officer, Investment Strategy and Client Solutions and Capital Markets Groups, MSWM (2009-2012) and Morgan Stanley & Co. (2006-2009) |
| | | |
Paul F. Gallagher MSWM Delaware Corporate Center II 2 Righter Parkway, 3rd Floor Wilmington, DE 19803 Birth Year: 1959 | | Chief Legal Officer and Secretary | | Since 2007 | | Executive Director, Counsel, MSWM (2011-present); Executive Director and Associate General Counsel, MSWM (2009-2011); and Director and Associate General Counsel, CGM (2006-2009) |
| | | |
Steven Hartstein MSWM 300 Plaza Two, 3rd Floor Jersey City, NJ 07311 Birth Year: 1963 | | Chief Compliance Officer | | Since 2006 | | Executive Director, MSWM (2009-present); Director, CGM and Assistant Director, IAS Compliance, Smith Barney (2008-2009); and Senior Vice President, CGM and Assistant Director, IAS Compliance, Smith Barney (2006-2007) |
| | | |
Donna Marley MSWM Delaware Corporate Center II 2 Righter Parkway, 3rd Floor Wilmington, DE 19803 Birth Year: 1955 | | Chief Operating Officer | | Since 2011 | | Executive Director, MSWM (2009-present); Director of Consulting Group Product Governance, MSWM (2011-present); and Director, Consulting Group Risk Management, MSWM (2009-2011); Vice President, Consulting Group Risk Management, CGM (2005-2009) |
| | | |
Charles P. Graves, III MSWM 2000 Westchester Ave. Purchase, NY 10577 Birth Year: 1962 | | Chief Administrative Officer | | Since 2011 | | Executive Director, Director of Third Party Programs, Consulting Group, MSWM (2011-present); and Director, Senior Portfolio Manager, Private Portfolio Group, MSWM (2009 - 2011) and CGM (2005-2009) |
| | | |
Vincenzo Alomia MSWM 2000 Westchester Ave. Purchase, NY 10577 Birth Year: 1967 | | Investment Officer | | Since 2009 | | Vice President, Senior Portfolio Manager, PAS, MSWM (2009-present); and Vice President and Senior Research Analyst, Morgan Stanley & Co. (2006-2009) |
| | | |
Jason B. Moore MSWM Delaware Corporate Center II 2 Righter Parkway, 3rd Floor Wilmington, DE 19803 Birth Year: 1972 | | Investment Officer | | Since 2011 | | Managing Director, MSWM (2012-present); Executive Director, MSWM (2011-2012); Managing Director, Bank of America Merrill Lynch (2010-2011); Executive Director, MSWM (2009-2010); and Director, CGM (1995- 2009) |
| | | |
Franco Piarulli MSWM 2000 Westchester Ave. Purchase, NY 10577 Birth Year: 1970 | | Investment Officer | | Since 2011 | | Executive Director, Senior Portfolio Manager & Director of Portfolio Construction, PAS, MSWM (2009-present); and Vice President, Senior Analyst, Morgan Stanley & Co. (2003- 2009) |
| | | |
Jay T. Shearon MSWM Delaware Corporate Center II 2 Righter Parkway, 3rd Floor Wilmington, DE 19803 Birth Year: 1972 | | Investment Officer | | Since 2007 | | Executive Director, MSWM (2012-Present); Vice President, MSWM (2009-2012); and Vice President, CGM (2005-2009) |
195
Additional Information
(unaudited) (continued)
| | | | | | |
Name, Address and Date of Birth | | Position(s)
Held with
Trust | | Term of
Office*
and
Length
of Time
Served | | Principal Occupation(s)
During Past Five Years |
| | | |
Jeanine Larrea MSWM 485 Lexington Avenue, 11th Floor New York, NY 10017 Birth Year: 1966 | | Anti-Money Laundering Compliance Officer | | Since 2009 | | Executive Director and Deputy AML Compliance Officer, MSSB (2010-present); Vice President and Deputy AML Compliance Officer, MSWM (2009-2010); and Vice President, Morgan Stanley & Co. (2004-2009) |
| | | |
Sean Lutz MSWM Delaware Corporate Center II 2 Righter Parkway, 3rd Floor Wilmington, DE 19803 Birth Year: 1971 | | Assistant Treasurer | | Since 2010 | | Vice President, MSWM (2009-present); and Vice President, CGM (2006-2009) |
| | | |
Suzan M. Barron BBH 50 Milk Street Boston, MA 02109 Birth Year: 1964 | | Assistant Secretary | | Since 2011 | | Senior Vice President and Senior Investor Services Counsel, Corporate Secretary and Regulatory Support Practice of Fund Administration, BBH&Co. (2005-present) |
| | | |
Alexander Tikonoff BBH 50 Milk Street Boston, MA 02109 Birth Year: 1974 | | Assistant Secretary | | Since 2011 | | Assistant Vice President and Investor Services Counsel, BBH&Co. (2006-present) |
| * | Each Trustee and Officer serves until his or her successor has been duly elected and qualified. |
| ** | Mr. Walker is an “interested person” of the Trust as defined in the 1940 Act because of his position with MSSB. |
196
Important Tax Information
(unaudited)
The following information is provided with respect to the distributions paid during the taxable year ended August 31, 2011:
| | | | | | | | | | | | | | | | | | | | |
| | | Large
Capitalization
Growth
Investments | | | Large
Capitalization
Value Equity
Investments | | | Small
Capitalization
Value Equity
Investments | | | International
Equity
Investments | | | Emerging
Markets
Equity
Investments | |
Record Date: | | | 12/6/2011 | | | | 12/6/2011 | | | | 12/6/2011 | | | | 12/6/2011 | | | | 12/6/2011 | |
Payable Date: | | | 12/7/2011 | | | | 12/7/2011 | | | | 12/7/2011 | | | | 12/7/2011 | | | | 12/7/2011 | |
Ordinary Income: | | | | | | | | | | | | | | | | | | | | |
Qualified Dividend Income for Individuals | | | 100.00 | % | | | 100.00 | % | | | 100.00 | % | | | 100.00 | % | | | 66.46 | % |
Dividends Qualifying for the Dividends Received Deduction for Corporations | | | 100.00 | % | | | 97.65 | % | | | 100.00 | % | | | 0.00 | % | | | — | |
Foreign Source Income | | | — | | | | — | | | | — | | | | 98.99 | %* | | | 99.37 | %* |
Foreign Tax Paid Per Share | | | — | | | | — | | | | — | | | $ | 0.01757 | | | $ | 0.04693 | |
| | | | | |
| | | Core Fixed
Income
Investments | | | High Yield
Investments | | | International
Fixed Income
Investments | | | Municipal
Bond
Investments | | | Money
Market
Investments | |
Record Date: | | | 12/6/2011 | | | | 12/6/2011 | | | | Monthly | | | | Monthly | | | | Monthly | |
Payable Date: | | | 12/7/2011 | | | | 12/7/2011 | | | | Monthly | | | | Monthly | | | | Monthly | |
Ordinary Income: | | | | | | | | | | | | | | | | | | | | |
Qualified Dividend Income for Individuals | | | — | | | | 0.00 | % | | | — | | | | — | | | | — | |
Dividends Qualifying for the Dividends Received Deduction for Corporations | | | — | | | | 0.00 | % | | | — | | | | — | | | | — | |
Interest from Tax-Exempt Obligations | | | — | | | | — | | | | — | | | | 100.00 | % | | | — | |
Interest from Federal Obligations | | | 31.85 | % | | | 0.00 | % | | | 1.99 | % | | | — | | | | 14.09 | % |
Long-Term Capital Gain Dividend | | $ | 0.0226 | | | | — | | | | — | | | | — | | | | — | |
| * | Expressed as a percentage of the cash distribution grossed-up for foreign taxes. |
The law varies in each state as to whether and what percentage of dividend income attributable to Federal obligations is exempt from state income tax. We recommend that you consult with your tax adviser to determine if any portion of the dividends you received is exempt from state income taxes.
The foreign taxes paid represent taxes incurred by the Fund on income received by the Fund from foreign sources. Foreign taxes paid may be included in taxable income with an offsetting deduction from gross income or may be taken as a credit for taxes paid to foreign governments. You should consult your tax adviser regarding the appropriate treatment of foreign taxes paid.
Please retain this information for your records.
197
MORGAN STANLEY SMITH BARNEY, LLC
Distributor
CONSULTING GROUP ADVISORY SERVICES LLC
Investment Adviser
This report is submitted for the general information of the shareholders of Consulting Group Capital Markets Funds. It is not authorized for distribution to prospective investors unless accompanied or preceded by a current Prospectus for the Trust which contains information concerning the Trust’s Investment policies, charges and expenses as well as other pertinent information.
The Funds file their complete schedule of portfolio holdings with the Securities and Exchange Commission (“SEC”) for the first and third quarters of each fiscal year on Form N-Q. The Funds’ Forms N-Q are available on the SEC’s website at www.sec.gov. The Funds’ Forms N-Q may be reviewed and copied at the SEC’s Public Reference Room in Washington D.C., and information on the operation of the Public Reference Room may be obtained by calling 1-800-SEC-0330. To obtain information on Form N-Q from the Funds, shareholders can call 1-877-937-6739 (“ask for Consulting Group”).
Information on how the Funds voted proxies relating to portfolio securities during the most recent 12-month period ended June 30 and a description of the policies and procedures that the Funds use to determine how to vote proxies relating to portfolio securities is available (1) without charge, upon request, by calling 1-877-937-6739 (ask for “Consulting Group”), (2) on the Funds’ website at https://www.smithbarney.com/products_services/managed_money/trak/trak_cgcm.html and (3) on the SEC’s website at www.sec.gov.
© 2012 Morgan Stanley Smith Barney LLC (“Morgan Stanley”). Consulting Group Advisory Services LLC (“CGAS”) is a business of Morgan Stanley. Securities are offered through Morgan Stanley. Investments are not FDIC-insured or bank-guaranteed, and investors may lose money.
Consulting Group Capital Markets Funds
2000 Westchester Avenue
Purchase, NY 10577
198
ITEM 2. CODE OF ETHICS.
As of the period ended August 31, 2012 (“Reporting Period”), the Registrant has adopted a code of ethics (“Code”) that applies to the Registrant’s principal executive officer, principal financial officer, principal accounting officer or controller, or persons performing similar functions, regardless of whether these individuals are employed by the Registrant or a third party. The Registrant has not amended any provision in its Code that relates to an element of the Code’s definitions enumerated in paragraph (b) of Item 2 of this Form N-CSR. A copy of this Code is filed as an Exhibit to this Form N-CSR pursuant to Item 12(a)(1).
The Registrant has not granted any waiver, including any implicit waiver, from a provision of its Code to the Registrant’s principal executive officer, principal financial officer, principal accounting officer or controller, or persons performing similar functions, regardless of whether these individuals are employed by the Registrant or a third party.
ITEM 3. AUDIT COMMITTEE FINANCIAL EXPERT.
The Board of Trustees of the Registrant has determined that Mark J. Reed possesses the attributes identified in Instruction (b) of Item 3 to Form N-CSR to qualify as an “audit committee financial expert,” and has designated Mr. Reed as the Registrant’s audit committee financial expert. Mr. Reed is an “independent” Trustee pursuant to paragraph (a)(2) of Item 3 to Form N-CSR.
ITEM 4. PRINCIPAL ACCOUNTANT FEES AND SERVICES.
AUDIT FEES –
(a) Audit Fees. The aggregate fees billed for each of the last two fiscal years ended August 31, 2012 and August 31, 2011 for professional services rendered by the Registrant’s principal accountant (“Auditor”) for the audit of the Registrant’s annual financial statements, or services that are normally provided by the Auditor in connection with the statutory and regulatory filings or engagements for each of the last two fiscal years, were $455,075 in 2012 and $417,500 in 2011.
(b) Audit-Related Fees. The aggregate fees billed for each of the last two fiscal years ended August 31, 2012, and August 31, 2011, for assurance and related services by the Auditor that were reasonably related to the performance of the audit of the Registrant’s financial statements and were not reported under paragraph (a) of this Item 4, were $0 in 2012 and $0 for 2011.
(c) Tax Fees. The aggregate fees billed for each of the last two fiscal years ended August 31, 2012 and August 31, 2011 for professional services rendered by the Auditor for tax compliance, tax advice and tax planning (“Tax Services”) were $86,925 in 2012 and $84,250 in 2011. These services consisted of (i) review or preparation of U.S. federal, state, local and excise tax returns; (ii) U.S. federal, state and local tax planning, advice and assistance regarding statutory, regulatory or administrative developments, and (iii) tax advice regarding tax qualification matters and/or treatment of various financial instruments held or proposed to be acquired or held.
(d) All Other Fees. The aggregate fees billed for each of the last two fiscal years ended August 31, 2012, and August 31, 2011, for products and services provided by the Auditor to the Registrant, other than the services reported in paragraphs (a) through (c) of this Item 4, were $0 in 2012 and $0 for 2011.
(e)(1) The Charter for the Audit Committee (“Committee”) of the Consulting Group Capital Markets Funds provides that the Committee may delegate its responsibility to approve any such audit and permissible non-audit services to a sub-committee consisting of the Chairperson of the Committee (“Chairperson”) and at least one other member of the Committee as the Chairperson, from time to time, may determine and appoint, and such sub-committee shall report to the Committee, at its next meeting after the sub-committee’s meeting, its decision(s). From year to year, and at such other times as the Committee deems
appropriate, the Committee shall report to the Board whether this system of approval has been effective and efficient or whether this Charter should be amended to allow for pre-approval pursuant to such policies and procedures as the Committee shall approve, including the delegation of some or all of the Committee’s pre-approval responsibilities to other persons (other than the Adviser or the Trust’s officers).
(e)(2) The percentage of services described in each of paragraphs (b) through (d) of this Item that were approved by the audit committee pursuant to paragraph (c)(7)(i)(c) of Rule 2-01 of Regulation S-X, with respect to: Audit-Related Fees were 0% for 2012 and 0% for 2011; Tax Fees were 0% for 2012 and 0% for 2011; and Other Fees were 0% for 2012 and 0% for 2011.
(f) Not Applicable.
(g) Aggregate non-audit fees billed by the Auditor for services rendered to the Registrant and the Registrant’s investment adviser (not including any sub-adviser whose role is primarily portfolio management as is subcontracted with or overseen by another investment adviser), and any entity controlling, controlled by, or under common control with the adviser that provides ongoing services to the Registrant of each of the last two fiscal years of the Registrant (“Service Affiliates”) were $0 in 2012 and $0 in 2011.
(h) The Registrant’s Audit Committee has considered whether the provision of non-audit services that were rendered to Service Affiliates that were not pre-approved pursuant to paragraph (c)(7)ii of Rule 2-01 of Regulation S-X is compatible with maintaining the Auditor’s independence.
ITEM 5. AUDIT COMMITTEE OF LISTED REGISTRANTS.
Not Applicable.
ITEM 6. INVESTMENTS.
A Schedule of Investments in securities of unaffiliated issuers as of the close of the Reporting Period is included as part of the report to shareholders filed under Item 1 of this Form N-CSR.
ITEM 7. DISCLOSURE OF PROXY VOTING POLICIES AND PROCEDURES FOR CLOSED-END MANAGEMENT INVESTMENT COMPANIES.
Not Applicable.
ITEM 8. PORTFOLIO MANAGERS OF CLOSED-END MANAGEMENT INVESTMENT COMPANIES.
Not Applicable.
ITEM 9. PURCHASES OF EQUITY SECURITIES BY CLOSED-END MANAGEMENT INVESTMENT COMPANIES AND AFFILIATED PURCHASERS.
Not Applicable.
ITEM 10. SUBMISSION OF MATTERS TO A VOTE OF SECURITY HOLDERS.
There have been no material changes to the procedures by which the shareholders may recommend nominees to the Registrant’s board of directors, where those changes were implemented after the Registrant last provided disclosure in response to the requirements of Item 407(c)(2)(iv) of Regulation S-K (as required by Item 22(b)(15) Schedule 14A (17 CFR 240.14a-101)), or this Item.
ITEM 11. CONTROLS AND PROCEDURES.
(a) The Registrant’s principal executive officer and principal financial officer, or persons performing similar functions, have concluded that the Registrant’s disclosure controls and procedures (as defined in
Rule 30a-3(c) under the Investment Company Act of 1940, as amended (17 CFR 270.30a-3(c)) were effective, as of a date within 90 days of the filing date of this report, based on his evaluation of these disclosure controls and procedures as required by
Rule 30a-3(b) under the Investment Company Act of 1940, as amended (17 CFR 270.30a-3(b)), and Rules 13a-15(b) or 15d-15(b) under the Securities Exchange Act of 1934, as amended (17 CFR 240.13a-15(b) or 240.15d-15(b)).
(b) There were no changes in the Registrant’s internal control over financial reporting (as defined in Rule 30a-3(d) under the Investment Company Act of 1940, as amended (17 CFR 270.30a-3(d)), that occurred during the Registrant’s second fiscal quarter of the period covered by this report that has materially affected, or is reasonably likely to materially affect, the Registrant’s internal control over financial reporting.
ITEM 12. EXHIBITS.
(a)(1) Code of ethics, or any amendment thereto, that is the subject of disclosure required by Item 2 is attached hereto.
(a)(2) Certifications pursuant to Rule 30a-2(a) under the Investment Company Act of 1940, as amended (17 CFR 270.30a-2(a)) are attached hereto.
(a)(3) Not Applicable.
(b) Certifications pursuant to 18 U.S.C. Section 1350 as adopted pursuant to Section 906 of the Sarbanes-Oxley Act of 2002 are attached hereto.
SIGNATURES
Pursuant to the requirements of the Securities Exchange Act of 1934 and the Investment Company Act of 1940, the Registrant has duly caused this Report to be signed on its behalf by the undersigned, thereunto duly authorized.
| | |
| Consulting Group Capital Markets Funds |
| |
| By: | | /s/ James F. Walker |
| James F. Walker |
| Chief Executive Officer |
| Consulting Group Capital Markets Funds |
|
| Date: November 7, 2012 |
Pursuant to the requirements of the Securities Exchange Act of 1934 and the Investment Company Act of 1940, this report has been signed below by the following persons on behalf of the Registrant and in the capacities and on the dates indicated.
| | |
| By: | | /s/ James F. Walker |
| James F. Walker |
| Chief Executive Officer |
| Consulting Group Capital Markets Funds |
|
| Date: November 7, 2012 |
| |
| By: | | /s/ Marc Gordon |
| Marc Gordon |
| Chief Financial Officer |
| Consulting Group Capital Markets Funds |
|
| Date: November 7, 2012 |