UNITED STATES
SECURITIES AND EXCHANGE COMMISSION
Washington, D.C. 20549
FORM N-CSR
CERTIFIED SHAREHOLDER REPORT OF REGISTERED
MANAGEMENT INVESTMENT COMPANIES
Investment Company Act file number: 811-06318
CONSULTING GROUP CAPITAL MARKETS FUNDS
(Exact name of registrant as specified in charter)
2000 Westchester Avenue
Purchase, NY 10577
(Address of principal executive offices)(Zip code)
CT Corp
155 Federal Street Suite 700
Boston, MA 02110
(Name and address of agent for service)
Registrant’s telephone number, including area code: (888) 454-3965
Date of fiscal year end: August 31
Date of reporting period: August 31, 2015
Form N-CSR is to be used by management investment companies to file reports with the Commission not later than 10 days after the transmission to stockholders of any report that is required to be transmitted to stockholders under Rule 30e-1 under the Investment Company Act of 1940 (17 CFR 270.30e-1). The Commission may use the information provided on Form N-CSR in its regulatory, disclosure review, inspection, and policymaking rules.
A registrant is required to disclose the information specified by Form N-CSR, and the Commission will make this information public. A registrant is not required to respond to the collection of information contained in Form N-CSR unless the Form displays a currently valid Office of Management and Budget (“OMB”) control number. Please direct comments concerning the accuracy of the information collection burden estimate and any suggestions for reducing the burden to Secretary, Securities and Exchange Commission, 450 Fifth Street, NW, Washington, DC 20549-0609. The OMB has reviewed this collection of information under clearance requirements of 44 U.S.C. § 3507.
| ITEM 1. | REPORTS TO STOCKHOLDERS |

Consulting Group
Capital Markets Funds
Annual Report
| • | | Large Capitalization Growth Investments |
| • | | Large Capitalization Value Equity Investments |
| • | | Small Capitalization Growth Investments |
| • | | Small Capitalization Value Equity Investments |
| • | | International Equity Investments |
| • | | Emerging Markets Equity Investments |
| • | | Core Fixed Income Investments |
| • | | International Fixed Income Investments |
| • | | Municipal Bond Investments |
| • | | Money Market Investments |
INVESTMENT PRODUCTS: NOT FDIC INSURED • NO BANK GUARANTEE • MAY LOSE VALUE
Table of Contents
Consulting Group
Capital Markets Funds
DEAR SHAREHOLDER,
Global risk markets were volatile over the twelve months ending August 31, 2015. Over the period, the S&P 500® Index i rose a modest 0.5%. Investor uncertainty centered around a much anticipated rate hike, global growth concerns, and volatility in emerging market currencies as well as commodities. For the twelve months, the Health Care and Consumer Discretionary sectors posted the strongest returns, while Commodities-related equities registered the weakest performance amongst the major S&P 500 sectors. During the period, European and Japanese equities were the top-performing global equity markets.
The sectors in the S&P 500® Index which generated a positive return over the twelve month period included Health Care (+12.0%), Consumer Discretionary (+10.7%), Consumer Staples (+7.2%), Utilities (+1.6%), Information Technology (+2.4%), and Financials (+2.3%). Industrials (-2.9%) and Telecommunications (-4.1%) fell modestly.
Morgan Stanley & Co. economists expect U.S. real GDP growth will be approximately 2.5% in 2015 and 2.7% in 2016. They forecast global GDP growth to be close to 3.4% in 2015 and 3.9% in 2016.
Growth-style stocks of large-cap companies rose during the period. The large-cap Russell 1000® Growth Index ii rose 4.3%. The Russell 1000® Index iii, a large-cap index, declined 0.4% for the period. The Russell 1000® Value Index iv, also a large-cap index, decreased 3.5% for the period. The Russell 2000® Growth Index v, a small-cap index, rose 5.1% for the period. The small-cap Russell 2000® Index vi was flat over the period. The Russell 2000® Value Index vii, also a small-cap index, declined 5.0% for the period.
Over the twelve-month period, the MSCI All Country World Index viii decreased 8.1% in U.S. dollar terms, the MSCI Emerging Markets Index ix fell 22.9% in U.S. dollar terms, and the MSCI EAFE Index x (a benchmark for developed markets) declined 7.1% in U.S. dollar terms.
Over the twelve-month period, bond market returns were mixed. The Barclays US Aggregate Bond Index xi, a general measure of the bond market, rose 1.6% for the period. Interest rates decreased during the period, as the yield on the 10-Year U.S. Treasury note moved down slightly from 2.42% to 2.41%. Riskier parts of the bond market such as U.S. High Yield debt declined in the period. The Barclays US Corporate High Yield Bond Index xii, a measure of lower-rated corporate bonds, fell 2.9%.
Consulting Group Capital Markets (CGCM) Funds
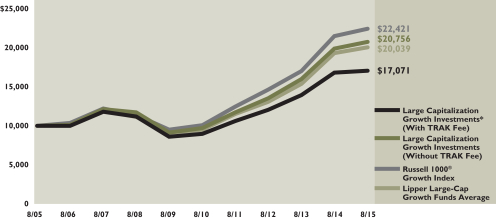
Large Capitalization Growth Investments increased 4.4% over the fiscal year, outperforming both the Russell 1000® Growth Index ii, which rose 4.3% in the period, and the average performance of mutual funds included in the Lipper Large-Cap Growth investment category xiii, which rose 3.6%. Favorable stock selection in the Consumer Staples (beverages), Health Care (pharmaceuticals, biotechnology), and Financials (real estate investment trusts) sectors enhanced returns, while poor stock selection in the Consumer Discretionary (internet and catalog retail) and Industrials (aerospace and defense) sectors detracted value relative to the index. The fund’s overweight exposure to the Energy sector also detracted.
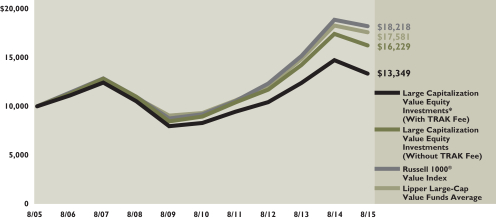
Large Capitalization Value Equity Investments registered a loss of 6.8% in the fiscal year, trailing both the Russell 1000® Value Index iv, which declined 3.5%, and the average performance of mutual funds included in the Lipper Large-Cap Value investment category xiv, which fell 3.8%. An overweight allocation to the Consumer Discretionary (consumer durables & apparel) sector, combined with favorable stock selection within the Consumer Staples sector (food & staples retailing), benefitted relative performance; however, these positive attributes were more than offset by negative contributions from stock picks within the Energy (oil gas & consumable fuels) and Consumer Discretionary (media, hotels restaurants & leisure) sectors, which subtracted from returns in the annual period.
I
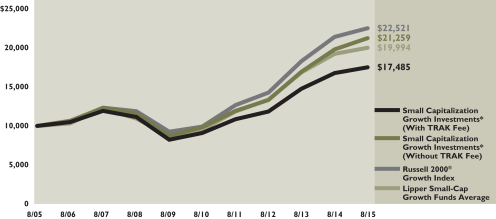
Small Capitalization Growth Investments increased 7.4% over the yearly performance period, as compared to the 5.1% increase of the Russell 2000® Growth Index v and the 4.1% return of the average mutual fund included in the Lipper Small-Cap Growth investment category xv. Positive stock selection in the Energy (oil gas & consumable fuels) and Consumer Staples (food and staples retailing) sectors enhanced returns in the one-year period, while underperformance in Financials (real estate investment trusts) detracted value. Overall, sector positioning detracted value, as an overweight to the struggling Energy and Industrials sectors hurt relative performance.
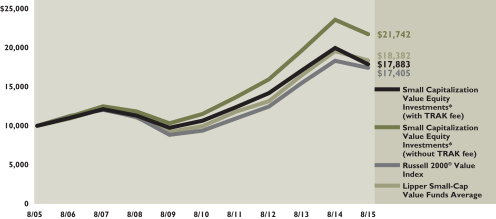
Small Capitalization Value Equity Investments declined 7.9% in the annual reporting period that ended on August 31, 2015. Performance over this period fared worse in comparison to the Russell 2000® Value Index vii, which declined 5.0%, and the average mutual fund included in the Lipper Small-Cap Value investment category xvi, which fell 6.0% in the most recent fiscal year. Negative relative results were predominantly attributed to an overweight allocation to Materials (metals & mining) and an underweight allocation to Financials (banks). Overall, stock selection positively affected relative performance given positive contributions from the Financials (insurance) and Information Technology (semiconductors & semiconductor equipment) sectors.
International Equity Investments fell 7.7% in the annual reporting period that ended on August 31, 2015, as compared to the 7.5% decline of the MSCI EAFE Index (Net) x and the 9.1% decline in the performance of the average mutual fund included in the Lipper International Large-Cap Core investment category xvii. Favorable stock selection in the United Kingdom and Spain aided returns over the fiscal annual period while the fund’s underweight exposure to Japan and unfavorable stock selection in the country detracted value. From a sector perspective, favorable stock selection in the Financials and Materials sectors aided returns, while underperformance in the Industrials and Information Technology sectors detracted from relative performance results. Overall, sector positioning was positive with the most benefit coming from the fund’s overweight exposure to the Telecommunication Services and Consumer Discretionary sectors.
Emerging Markets Equity Investments registered a twelve-month loss of 24.1% and underperformed both the 23.0% decline of the MSCI Emerging Markets Index (Net) ix and the 22.5% decrease of the average mutual fund included in the Lipper Emerging Markets investment category xviii. Relative to the index, the fund’s overweight exposure to Brazil and Canada detracted value. At the same time, positive stock selection in South Korea and India benefited performance in the twelve months ended August 31, 2015. Unfavorable stock selection in the Consumer Staples and Financials sectors detracted value, while the fund’s overweight exposure to the Consumer Discretionary sector added value relative to the index.
Core Fixed Income Investments rose 1.4% in the fiscal year, trailing the 1.6% gain of its market benchmark, the Barclays US Aggregate Bond Index xi, and exceeding the 0.8% rise for the average mutual fund included in the Lipper Core Bond investment category xix. Detractors included an underweight to the Treasury and agency sectors and the overweight to the corporate and high-yield sectors. Favorable contributions from asset-backed and residential mortgage-backed sector selections benefited relative performance.
High Yield Investments experienced a decline of 6.1% in the annual fiscal reporting period, below the 2.9% decrease of the Barclays US Corporate High Yield Bond Index xii, and behind the 3.5% average loss of mutual funds included in the Lipper High Yield investment category xx. The portfolio was negatively impacted by its overweight to B and CCC credit as BB-rated paper outperformed by a significant margin. Bond selections in energy also detracted from excess returns in the fiscal year. At the same time, however, the underweight to metals and mining contributed positively to returns.
International Fixed Income Investments’ fiscal year return gained 0.3%, as compared to the 3.2% rise of the Citigroup Non-USD World Government Bond Index (USD) Hedged xxi and the 8.0% loss for the average mutual fund included in the Lipper International Income investment category xxii. Contributions from developed market currency allocation were more than offset by off-benchmark sector exposures to investment grade and high yield credit. The fund’s EMD sub-account, which invests in local currency emerging market debt, lost 22.1% in the yearly period. Among the detractors were currency exposures to Brazil, Colombia, Russia, and Turkey, each of which depreciated significantly versus the U.S. dollar over the one-year trailing period as of August 31, 2015.
II
Municipal Bond Investments’ twelve-month gain of 2.3% in the fiscal period ended August 31, 2015 fell slightly short of the 2.5% return of the Barclays US Municipal Bond Index xxiii, as well as the 2.5% increase in the average mutual fund included in the Lipper General & Insured Municipal Debt investment category xxiv. Increasing the fund’s exposure on the longer end of the yield curve and an overweight to the 10-year portion of the curve played constructive roles in performance as the yield curve flattened. Additionally, security selection, particularly within the lower credit quality categories contributed positively to performance. Spread sectors such as hospitals, higher education, and special tax enhanced performance while higher credit quality sectors such as local general obligation and water and sewer revenue were a modest drag.
Additional information regarding the investment managers of the CGCM Funds and commentary specific to each individual sub-adviser is available in the Annual Report following this Shareholder Letter.
We thank you for your continued confidence in Morgan Stanley Wealth Management and support as shareholders of the CGCM Funds.
Sincerely,

David Berdon
Chief Executive Officer
October 29, 2015
III
The performance shown represents past performance. Past performance is no guarantee of future results and current performance may be higher or lower than the performance shown above. Principal value and investment returns will fluctuate so that an investor’s shares, when redeemed, may be worth more or less than their original cost. The returns shown do not reflect the deduction of taxes that a shareholder would pay on fund distributions or the redemption of fund shares. To obtain performance data current to the most recent month-end, please visit our website at https://morganstanley.com/cgcm.
Shares of the Funds are available to participants in certain investment advisory programs sponsored by Morgan Stanley, including TRAK® CGCM, Select UMA, Consulting Group Advisor and Portfolio Management. The services offered through these programs may provide investors with asset allocation recommendations, which are implemented through the Funds. Under an investment advisory program, an investor typically pays an advisory fee that may vary based on a number of factors. The maximum shareholder fee (in addition to annual fund operating expenses) for assets invested in the Consulting Group Capital Markets Funds (“Trust”) through the TRAK® CGCM, Consulting Group Advisor, Select UMA or the Portfolio Management investment advisory programs is 2.50% of average quarter-end net assets. Investors existing prior to April 1, 2010, will be assessed a maximum shareholder fee (in addition to annual fund operating expenses) for all assets invested in the Trust under TRAK® CGCM of 1.50% of average quarter-end net assets. These fees may be reduced in certain circumstances. These fees may be paid either by redemption of shares of the Funds or by separate payment.
Although the statements of fact and data contained herein have been obtained from, and are based upon, sources the firm believes reliable, we do not guarantee their accuracy, and any such information may be incomplete or condensed. All opinions included in this report constitute the firm’s judgment as of the date herein, and are subject to change without notice. This material is for informational purposes only, and is not intended as an offer or solicitation with respect to the purchase or sale of any security. This report may contain forward-looking statements, and there can be no guarantee that they will come to pass. The index returns shown are preliminary and subject to change. Past performance is not a guarantee of future results.
Index Definitions
| i. | The S&P 500® Index tracks the performance of 500 widely held, large-capitalization U.S. stocks. Please note that an investor cannot invest directly in an index. |
| ii. | The Russell 1000® Growth Index measures the performance of those Russell 1000® Index companies with higher price-to-book ratios and higher forecasted growth values. Because the index is not a managed portfolio, there are no advisory fees or internal management expenses reflected in the index’s performance. Please note that an investor cannot invest directly in an index. |
| iii. | The Russell 1000® Index measures the performance of the 1,000 largest U.S. companies based on the market capitalization. Please note that an investor cannot invest directly in an index. |
| iv. | The Russell 1000® Value Index measures the performance of those Russell 1000® Index companies with lower price-to-book ratios and lower forecasted growth values. Because the index is not a managed portfolio, there are no advisory fees or internal management expenses reflected in the index’s performance. Please note that an investor cannot invest directly in an index. |
| v. | The Russell 2000® Growth Index measures the performance of those Russell 2000® Index companies with higher price-to-book ratios and higher forecasted growth values. Because the index is not a managed portfolio, there are no advisory fees or internal management expenses reflected in the index’s performance. Please note that an investor cannot invest directly in an index. |
| vi. | The Russell 2000® Index measures the performance of the 2,000 smallest companies in the Russell 3000® Index. Please note that an investor cannot invest directly in an index. |
| vii. | The Russell 2000® Value Index measures the performance of those Russell 2000® Index companies with lower price-to-book ratios and lower forecasted growth values. Because the index is not a managed portfolio, there are no advisory fees or internal management expenses reflected in the index’s performance. Please note that an investor cannot invest directly in an index. |
| viii. | The MSCI All Country World Index is a free float-adjusted market capitalization index that is designated to measure equity market performance in the global developed emerging markets. Please note that an investor cannot invest directly in an index. |
| ix. | The MSCI Emerging Markets Index is a free float-adjusted market capitalization index that is designed to measure equity market performance of emerging markets. The MSCI Emerging Markets Index (Net) consists of the following 21 emerging market country indexes: Brazil, Chile, China, Colombia, Czech Republic, Egypt, Greece, Hungary, India, Indonesia, South Korea, Malaysia, Mexico, Peru, Philippines, Poland, Russia, South Africa, Taiwan, Thailand, and Turkey. Net total return indexes reinvest dividends after the deduction of withholding taxes, using (for international indexes) a tax rate applicable to non-resident institutional investors who do not benefit from double taxation treaties. Because the index is not a managed portfolio, there are no advisory fees or internal management expenses reflected in the index’s performance. Please note that an investor cannot invest directly in an index. |
| x. | The Morgan Stanley Capital International Europe, Australasia, Far East (MSCI EAFE) Index (Net) is a free float-adjusted market capitalization index that is designed to measure the equity market performance of developed markets, excluding the U.S. & Canada. The MSCI EAFE Index consists of the following 21 developed market country indexes: Australia, Austria, Belgium, Denmark, Finland, France, Germany, Hong Kong, Ireland, Israel, Italy, Japan, the Netherlands, New Zealand, Norway, Portugal, Singapore, Spain, Sweden, Switzerland, and the United Kingdom. Net total return indexes reinvest dividends after the deduction of withholding taxes, using (for international indexes) a tax rate applicable to non-resident institutional investors who do not benefit from double taxation treaties. Because the index is not a managed portfolio, there are no advisory fees or internal management expenses reflected in the index’s performance. Please note that an investor cannot invest directly in an index. |
| xi. | The Barclays US Aggregate Bond Index is a broad-based index that measures the investment grade, U.S. dollar-denominated, fixed-rate taxable bond market, including Treasuries, government-related, and corporate securities, MBS (agency fixed-rate and hybrid ARM passthroughs), ABS, and CMBS. Because the index is not a managed portfolio, there are no advisory fees or internal management expenses reflected in the index’s performance. Please note that an investor cannot invest directly in an index |
| xii | The Barclays US Corporate High Yield Bond Index measures the market of U.S. dollar-denominated, non-investment grade, fixed rate, taxable corporate bonds. Because the index is not a managed portfolio, there are no advisory fees or internal management expenses reflected in the index’s performance. Please note that an investor cannot invest directly in an index. |
| xiii. | The Lipper Large-Cap Growth Funds Average is an equally weighted average of all active funds available within the investment category. The classification includes funds that, by portfolio practice, invest at least 75% of their equity assets in companies with market capitalizations (on a three-year weighted basis) above Lipper’s USDE large-cap floor. Large-cap growth funds typically have above-average characteristics compared to the S&P 500® Index. The total return of the Lipper Funds Average does not include the effect of sales charges. Please note that an investor cannot invest directly in a mutual funds classification average or an index. |
| xiv. | The Lipper Large-Cap Value Funds Average is an equally weighted average of all active funds available within the investment category. The classification includes funds that, by portfolio practice, invest at least 75% of their equity assets in companies with market capitalizations (on a three-year weighted basis) above Lipper’s USDE large-cap floor. Large-cap value funds typically have below-average characteristics compared to the S&P 500® Index. The total return of the Lipper Funds Average does not include the effect of sales charges. Please note that an investor cannot invest directly in a mutual funds classification average or an index. |
| xv. | The Lipper Small-Cap Growth Funds Average is an equally weighted average of all active funds available within the investment category. The classification includes funds that, by portfolio practice, invest at least 75% of their equity assets in companies with market capitalizations (on a three-year weighted basis) below Lipper’s USDE small-cap ceiling. Small-cap growth funds typically have above-average characteristics compared to the S&P SmallCap 600® Index. The total return of the Lipper Funds Average does not include the effect of sales charges. Please note that an investor cannot invest directly in a mutual funds classification average or an index. |
IV
| xvi. | The Lipper Small-Cap Value Funds Average is an equally weighted average of all active funds available within the investment category. The classification includes funds that, by portfolio practice, invest at least 75% of their equity assets in companies with market capitalizations (on a three-year weighted basis) below Lipper’s USDE small-cap ceiling. Small-cap growth funds typically have below-average characteristics compared to the S&P SmallCap 600® Index. The total return of the Lipper Funds Average does not include the effect of sales charges. Please note that an investor cannot invest directly in a mutual funds classification average or an index. |
| xvii. | The Lipper International Large-Cap Core Funds Average is an equally weighted average of all active funds available within the investment category. The classification includes funds that, by portfolio practice, invest at least 75% of their equity assets in companies outside of the U.S. with market capitalizations (on a three-year weighted basis) above Lipper’s international large-cap floor. International large-cap core funds typically have average characteristics compared to their large-cap-specific subset of the MSCI EAFE Index. The total return of the Lipper Funds Average does not include the effect of sales charges. Please note that an investor cannot invest directly in a mutual funds classification average or an index. |
| xviii. | The Lipper Emerging Markets Funds Average is an equally weighted average of all active funds available within the investment category. The classification includes funds that seek long-term capital appreciation by investing at least 65% of total assets in emerging market equity securities, where “emerging market” is defined by a country’s GNP per capita or other economic measures. The total return of the Lipper Funds Average does not include the effect of sales charges. Please note that an investor cannot invest directly in a mutual funds classification average or an index |
| xix. | The Lipper Core Bond Funds Average is an equally weighted average of all active funds available within the investment category. The classification includes funds that invest at least 85% of their assets in domestic investment-grade debt issues (rated in top four grades) with any remaining in investment in nonbenchmark sectors such as high-yield, global, and emerging market debt. These funds maintain dollar-weighted average maturities of five to ten years. The total return of the Lipper Funds Average does not include the effect of sales charges. Please note that an investor cannot invest directly in a mutual funds classification average or an index. |
| xx. | The Lipper High Yield Funds Average is an equally weighted average of all active funds available within the investment category. The classification includes funds that aim at high (relative) current yield from fixed income securities, have no quality or maturity restrictions, and tend to invest in lower grade debt issues. The total return of the Lipper Funds Average does not include the effect of sales charges. Please note that an investor cannot invest directly in a mutual funds classification average or an index. |
| xxi. | The Citigroup Non-USD World Government Bond Index (USD) Hedged and Unhedged are each sub-indices of the Citigroup World Government Bond Index (WGBI), which is comprised of the global sovereign debt of over 20 countries representative in the Americas, EMEA, EMU, Asia Pacific, and Japan regions. The Non-U.S. Dollar WGBI includes all WGBI markets except the United States and is stated in U.S. dollar hedged or unhedged base currency terms. Because the index is not a managed portfolio, there are no advisory fees or internal management expenses reflected in the index’s performance. Please note that an investor cannot invest directly in an index. |
| xxii. | The Lipper International Income Funds Average is an equally weighted average of all active funds available within the investment category. The classification includes funds that state in their prospectus that they invest primarily in U.S. dollar and non-U.S. dollar debt securities of issuers located in at least three countries, excluding the United States, except in periods of market weakness. The total return of the Lipper Funds Average does not include the effect of sales charges. Please note that an investor cannot invest directly in a mutual funds classification average or an index. |
| xxiii. | The Barclays US Municipal Bond Index covers the U.S. dollar-denominated long-term tax exempt bond market. The index has four main sectors: state and local general obligation bonds, revenue bonds, insured bonds, and prerefunded bonds. Because the index is not a managed portfolio, there are no advisory fees or internal management expenses reflected in the index’s performance. Please note that an investor cannot invest directly in an index. |
| xxiv. | The Lipper General & Insured Municipal Debt Funds Average is an equally weighted average of all active funds available within the investment category. The classification includes funds that either invest primarily in municipal debt issues rated in the top four credit ratings or invest primarily in municipal debt issues insured as to timely payment. The total return of the Lipper Funds Average does not include the effect of sales charges. Please note that an investor cannot invest directly in a mutual funds classification average or an index |
Risk Considerations
Equity securities may fluctuate in response to news on companies, industries, market conditions, and general economic environment.
Investing in foreign markets entails risks not typically associated with domestic markets, such as currency fluctuations and controls, restrictions on foreign investments, less governmental supervision and regulation, and the potential for political instability. These risks may be magnified in countries with emerging markets and frontier markets, since these countries may have relatively unstable governments and less established markets and economies.
Investing in small- to medium-sized companies entails special risks, such as limited product lines, markets, and financial resources, and greater volatility than securities of larger, more established companies.
The value of fixed income securities will fluctuate and, upon a sale, may be worth more or less than their original cost or maturity value. Bonds are subject to interest rate risk, call risk, reinvestment risk, liquidity risk, and credit risk of the issuer.
High yield bonds (bonds rated below investment grade) may have speculative characteristics and present significant risks beyond those of other securities, including greater credit risk, price volatility, and limited liquidity in the secondary market. High yield bonds should comprise only a limited portion of a balanced portfolio.
Yields are subject to change with economic conditions. Yield is only one factor that should be considered when making an investment decision.
Asset allocation and diversification do not assure a profit or protect against loss in declining financial markets.
The indices are unmanaged. An investor cannot invest directly in an index. They are shown for illustrative purposes only and do not represent the performance of any specific investment.
Because of their narrow focus, sector investments tend to be more volatile than investments that diversify across many sectors and companies.
Growth investing does not guarantee a profit or eliminate risk. The stocks of these companies can have relatively high valuations. Because of these high valuations, an investment in a growth stock can be more risky than an investment in a company with more modest growth expectations.
Value investing does not guarantee a profit or eliminate risk. Not all companies whose stocks are considered to be value stocks are able to turn their business around or successfully employ corrective strategies which would result in stock prices that do not rise as initially expected.
V
| | | | |
Performance of the Consulting Group Capital Markets Funds For the Year Ended August 31, 2015†* | | | |
| |
| Large Capitalization Growth Investments | | | 4.39 | % |
Russell 1000® Growth Index (1) | | | 4.26 | |
| |
| Large Capitalization Value Equity Investments | | | -6.83 | |
Russell 1000® Value Index (2) | | | -3.48 | |
| |
| Small Capitalization Growth Investments | | | 7.36 | |
Russell 2000® Growth Index (3) | | | 5.11 | |
| |
| Small Capitalization Value Equity Investments | | | -7.85 | |
Russell 2000® Value Index (4) | | | -4.95 | |
| |
| International Equity Investments | | | -7.68 | |
The Morgan Stanley Capital International Europe Australasia, Far East (MSCI EAFE®) Index (Net) (5) | | | -7.47 | |
| |
| Emerging Markets Equity Investments | | | -24.08 | |
MSCI Emerging Markets Index (Net) (6) | | | -22.95 | |
| |
| Core Fixed Income Investments | | | 1.35 | |
Barclays Capital U.S. Aggregate BondTM Index (7) | | | 1.56 | |
| |
| High Yield Investments | | | -6.14 | |
Barclays Capital U.S. Corporate High-Yield Index (8) | | | -2.93 | |
| |
| International Fixed Income Investments | | | 0.31 | |
Citigroup Non-USD World Government Bond Index (USD) Hedged (9) | | | 3.15 | |
| |
| Municipal Bond Investments | | | 2.32 | |
Barclays Capital U.S. Municipal Bond Index (10) | | | 2.52 | |
| |
| Money Market Investments** | | | 0.00 | |
90-day Treasury Bill Index | | | 0.02 | |
See pages 27 through 29 for all footnotes.
VI

Large Capitalization Growth Investments
|
| ABOUTTHE SUBADVISERS |
•Jackson Square Partners, LLC (“JSP”) |
| JSP invests primarily in common stocks of large capitalization growth-oriented companies that JSP believes have long-term capital appreciation potential and are expected to grow faster than the U.S. economy. Using a bottom up approach, JSP seeks to select securities of companies that it believes have attractive end market potential, dominant business models and strong free cash flow generation that are attractively priced compared to the intrinsic value of the securities. JSP also considers a company’s operational efficiencies, management’s plans for capital allocation and the company’s shareholder orientation. |
|
•Wells Capital Management, Inc. (“Wells”) |
| Wells employs both proprietary screens and intensive grassroots research in order to identify high-growth companies expected to outperform their peers. Wells’ philosophy is firmly rooted in the belief that successful investing is the result of focusing on companies with favorable underlying fundamentals, strong growth potential and solid management teams. Security selection is based on fundamental research. This research process works to “surround” an investment by focusing on the company’s financials and verifying fundamentals with the management team, mid-level employees, customers, competitors, suppliers and/or distributors. |
|
•Westfield Capital Management Company, L.P. (“Westfield”) |
| Westfield uses an active management style and favors investing in earnings growth stocks given a conviction that stock prices follow earnings progress and that they offer the best opportunity for superior real rates of return. Westfield believes that reasonably priced stocks with high earnings potential are best identified through in-depth, fundamental research. |
For the period of September 1, 2014, through August 31, 2015, the Sub-advisers for CGCM Large Capitalization Growth Investments (“Fund”) were Jackson Square Partners, LLC (“JSP”), Wells Capital Management, Inc. (“Wells”), Westfield Capital Management Company, L.P. (“Westfield”) and Frontier Capital Management Co., LLC (“Frontier”).
The portion of the Fund managed by JSP outperformed the Fund’s market index benchmark, the Russell 1000® Growth Index, for the year ended August 31, 2015. Strong stock selection in the Financial Services and Healthcare sectors was partially offset by weak relative performance in Consumer Discretionary and Technology sectors, as well as by our relative overweight to the Energy sector. It is important to note that sector allocation decisions are made on a fundamental, company-specific basis and are typically not made as an investment opinion or tactical portfolio positioning move, per se, on any particular sector. JSP believes the ever-changing market sentiment demonstrates that there are more than just fundamental factors affecting stock prices. A lack of confidence in the basic market outlook suggests to JSP that many investors appear to be struggling with accurately predicting the pace of the global economic recovery and are assessing external factors that threaten economic fundamentals (for example, central bank actions and fiscal policy debates across the globe). In such a tenuous environment, JSP believes the quality of a company’s business model, competitive position, and management may prove to be of utmost importance. Regardless of the economic outcome, JSP remains consistent in our long-term investment philosophy: JSP wants to own what JSP views as strong secular-growth companies with solid business models and competitive positions that JSP believes can grow market share and have the potential to deliver shareholder value in a variety of market environments.
The portion of the Fund managed by Wells modestly unperformed the Fund’s market index benchmark, the Russell 1000® Growth Index, for the year ended August 31, 2015. Over the last 12 months, the U.S. equity market was ripe with volatility and displayed a clear lack of conviction. This market activity resulted, at times, in a disconnection between underlying company specific fundamentals and stock prices movements. Wells opportunistically used the market volatility to initiate and build positions in companies that displayed a high degree of earnings visibility and “can make their own luck” in an environment of global economic uncertainty. The information technology sector proved to be fertile ground for these types of firms. As a result, holdings in the sector contributed to returns over the last 12 months. Specific strength was visible in network security and cloud based software related holdings. Further contributing to performance was positioning within the financial sector. While strength was not widespread, merger synergies helped select diversified financial services firms post strong relative returns. As was the case last year, the small absolute weight in consumer staples holdings proved additive to returns as strength was again apparent within the beverage industry. Positioning with the energy sector proved to be the largest performance detractor over the last 12 months. Consistent with past periods, our fundamentally based investment process is challenged when stock prices are driven by macroeconomic factors rather than underlying fundamentals. Within the energy sector, this dynamic was frequently apparent during the last year as crude oil prices fell precipitously, leading to a dramatic selloff in energy stocks that began in the second half of 2014. The
1
|
•Frontier Capital Management Co., LLC (“Frontier”) |
| Frontier is a research-driven firm specializing in the management of growth-oriented U.S. equity portfolios. Frontier believes that growth must be purchased at a reasonable price and that fundamental, bottom-up research is the cornerstone to adding value. The firm’s philosophy since its founding in 1980 is that stock prices ultimately follow earnings growth. Frontier believes that there are three key drivers of long-term, consistent performance and look for companies that possess, improving business models; unrecognized earnings power; and attractive valuations. |
impact of sharply lower oil prices was felt by select industrial holdings as well. Weakness was apparent in the road and rail industry as these positions further weighed on returns. Despite the geopolitical and macroeconomic challenges that were apparent over the last year, Wells remains confident that the superior growth profile and strong underlying fundamentals of the portfolio will be increasingly recognized and rewarded going forward.
The portion of the Fund managed by Westfield slightly underperformed the Fund’s market index benchmark, the Russell 1000® Growth Index, for the year ended August 31, 2015. Weakness in Industrials, Consumer Discretionary, and Energy offset strength in Health Care, Information Technology, and Consumer Staples. The Health Care sector was the portfolio’s top contributor to absolute and relative performance results. The portfolio maintains an overweight position in the pharmaceuticals sub-industry, where M&A has been generating much of the dialogue. Most transactions to this point have been highly accretive, with commercial scale and cost synergies representing the primary drivers of the success. The Information Technology sector contributed positively to relative results, outperforming across multiple sub-industries. Stock selection within application software and semiconductor equipment was particularly notable. Within the sector, Westfield continues to favor the Internet niche, particularly those companies that have the ability to monetize mobile traffic on a consistent basis, as well as areas ranking as the highest priority budget items for corporations, such as security, cloud, and mobility. The portfolio’s Industrials holdings underperformed. A maker of components for aerospace and industrial gas turbine applications struggled to meet consensus expectations for earnings against the backdrop of weak aftermarket demand in the defense business segment; the stock was sold. A global manufacturer of heavy industrial equipment also underperformed, hurt by a slowdown in its energy-related business. Despite gains across multiple sub-industries, the portfolio’s Consumer Discretionary sector detracted from relative returns. Some of the relative performance shortfall stemmed from our lack of exposure to the Internet retail sub-industry, which delivered robust gains during the period. Westfield had resisted building a position in on-line retail giant Amazon due to concerns over the company’s lofty valuation; however, Westfield purchased the shares in July, after the company demonstrated accelerating revenue growth and operating margin improvements across all of its segments. Westfield believes that if Amazon experiences further improvement in margins, the stock could realize significant upside. In addition, Westfield thinks Wall Street is moving to a sum-of-the-parts valuation model for the stock, which utilizes enterprise-value-to-sales multiples for the company’s core business, as well as its Web Services segment.
The portion of the Fund managed by Frontier outperformed the Fund’s market index benchmark, Russell Mid Cap Growth Index, for the year ended August 31, 2015. Frontier’s relative performance was driven by strength in technology, health care and financial services. The best performing stock in technology was Electronic Arts which benefitted from strong demand associated with the rollout of new video gaming consoles and games. Within health care, Centene continued to profit as more individuals became insured under the Affordable Care Act. In financial services, Global Payments recurring revenue and strong free cash flow business model continued to lead to positive surprises in earnings. Offsetting these areas was the producer durables sector, where our investments in energy-related derivative plays (Kirby, MasTec, and IHS) underperformed as oil prices declined over 50 percent during this 12 month period. After solid gains over the past several years, Frontier is not surprised to see the market consolidate and experience volatility given concerns around international growth (China and Brazil) as well as a pending inflection in Federal Reserve policy. Taking a longer term perspective, Frontier sees ample reasons to be positive about the domestic economy. The markets recent instability has us opportunistically positioned to add to companies that Frontier believes have strong secular appeal and enduring demand characteristics. This has led to the portfolio being overweight technology, health care and financial services. Frontier continues to be watchful of international developments and will make adjustments accordingly.
2
The following graph depicts the performance of Large Capitalization Growth Investments vs. the Russell 1000® Growth Index1 and the Lipper Large-Cap Growth Funds Average.11
|
HISTORICAL PERFORMANCE FOR THE TEN-YEAR PERIOD ENDED AUGUST 31, 2015 LARGE CAPITALIZATION GROWTH INVESTMENTS Comparison of $10,000 Investment in the Portfolio with the Russell 1000® Growth Index and the Lipper Large-Cap Growth investment category |
The performance shown above and below represents past performance. Past performance is no guarantee of future results and current performance may be higher or lower than the performance shown above and below. Performance figures may reflect voluntary fee waivers and/or expense reimbursements. In the absence of voluntary fee waivers and/or expense reimbursements, the total return would have been lower. Principal value and investment returns will fluctuate and investors’ shares, when redeemed, may be worth more or less than their original cost. To obtain performance data current to the most recent month-end, please visit our website at www.morganstanley.com/cgcm.
The graph above and returns shown below do not reflect the deduction of taxes that a shareholder would pay on fund distributions or the redemption of fund shares.
| | | | | | | | | | | | | | | | | | | | | | |
| | | LARGE CAPITALIZATION GROWTH INVESTMENTS Average Annual Total Returns for the Period Ended August 31, 2015† |
| | | | | Without
Annual
Advisory
Program
Fee | | With
Annual
Advisory
Program
Fee* | | Russell
1000®
Growth
Index*** | | Lipper
Large-Cap
Growth
Funds
Average*** |
| | Since inception (11/18/1991) | | | | 8.10 | % | | | | 6.29 | % | | | | 8.53 | % | | | | 8.63 | % |
| | 10 year | | | | 7.58 | | | | | 5.49 | | | | | 8.41 | | | | | 7.81 | |
| | 5 year | | | | 16.49 | | | | | 13.75 | | | | | 17.40 | | | | | 16.51 | |
| | 3 year | | | | 15.31 | | | | | 12.33 | | | | | 15.30 | | | | | 15.29 | |
| | | 1 year | | | | 4.39 | | | | | 1.49 | | | | | 4.26 | | | | | 3.55 | |
See pages 27 through 29 for all footnotes.
3
Large Capitalization Value Equity Investments
|
| ABOUTTHE SUBADVISERS |
•Cambiar Investors, LLC (“Cambiar”) |
| Cambiar utilizes a bottom-up process that seeks to identify companies that are attractively priced, demonstrate positive developments not yet recognized by the market and offer significant appreciation potential within a one- to two-year time frame. |
|
•NFJ Investment Group, LLC (“NFJ”) |
| The NFJ investment process initially screens for positive fundamentals by applying a screen over a universe of approximately 800 stocks in order to identify companies with positive fundamental characteristics. After the screen has been applied, NFJ then conducts in-depth research and analysis by reviewing each of the remaining 150-200 possible investments for low price-to-earnings multiples, high dividend yields, positive prospective earnings and quality operations. As part of the portfolio construction process, industry concentration is mitigated by avoiding overexposure to any one sector by restricting the number of stocks held within a single industry. The portfolio generally holds 40 to 50 companies. NFJ’s process involves regular portfolio and universe monitoring for buy and sell candidates. NFJ continually repeats its research process in order to identify new buy and sell candidates. The sell discipline is an important part of NFJ’s process. A stock is sold when an alternative stock with equally strong fundamentals demonstrates a substantially lower price-to-earnings ratio, and/or a substantially higher dividend yield. |
|
•HGK Asset Management, Inc. (“HGK”) |
| HGK invests in undervalued securities through disciplined, fundamentally driven quantitative and qualitative security analysis. This analysis is coupled with a risk adverse approach to portfolio construction. HGK’s value driven domestic equity investment process has been employed in its current form since 1991. The equity team screens for disciplined companies with improving cash flows selling below their discounted present value. Rigorous qualitative fundamental analysis is applied to make the final security selection. During this analysis, the equity team focuses on undervalued companies that operate from a position of competitive advantage and whose management teams understand the principles of shareholder wealth creation. |
For the period from September 1, 2014, through August 31, 2015, the Sub-advisers for Large Capitalization Value Equity Investments (“Fund”) were Cambiar Investors, LLC (“Cambiar”), NFJ Investment Group, LLC (“NFJ”), HGK Asset Management, Inc. (“HGK”) and Artisan Partners Limited Partnership (“Artisan”).
The portion of the Fund managed by Cambiar outperformed the Fund’s market index benchmark, the Russell 1000® Value Index for the year ended August 31, 2015. After a challenging stretch in recent years, active managers such as Cambiar have been able to generate solid return thus far in 2015. Stock performance has been more closely correlated to corporate fundamentals, a tailwind for active management. Within the Cambiar portfolio, outperformance for the year was primarily a function of strong stock selection across most sectors of the portfolio. Information Technology and Industrials were two notable bright spots in the portfolio, as Cambiar’s aggregate holdings in these two sectors were able to outpace the index. An overweight allocation and positive stock selection within Consumer Discretionary was another area of excess return. While many consumer discretionary companies have been bid up in recent quarters on an anticipated spending impact from lower energy prices and a stronger job market, security selection remains paramount — as not all companies will benefit to the same extent. Healthcare stocks comprised the top-performing sector of the market over the trailing year; Cambiar’s overweight allocation to the sector was subsequently a positive contribution to performance. Like many managers, Cambiar did not anticipate the sharp drop in commodity prices that took place in the 4th quarter of 2014. While unable to escape the downdraft in the sector, Cambiar’s Energy holdings declined less than the benchmark. Cambiar believes that the decline in the North American rig count should help in stabilizing oil prices in the second half of 2015. That said, the portfolio remains underweight in the sector, based on lack of visibility and higher conviction investment opportunities in other areas of the market. Cambiar’s underweight allocation to Financials was a detractor in the year, as this sector has held up reasonably well in the current market environment.
The portion of the Fund managed by NFJ underperformed the Fund’s benchmark for the year ended August 31, 2015. The reporting period was positive for equity markets as the backdrop of record cash flows, positive earnings, and low interest rates continued to support stocks. Over the trailing 12-months, growth as measured by the Russell 1000® Value Index notably outperformed the Russell 1000® Value Index by over 700 basis points creating structural headwinds for a deep value approach. During the latter half of 2014, the stock market rebounded sharply in October after falling over 7% during a stretch of apprehensiveness which included an Ebola outbreak. During the period the sustained accommodative environment resulted in more shareholder friendly activities by S&P 500 companies which paid an all-time high of $350.4 billion in dividends over the past calendar year according to S&P Dow Jones Indices. In its attempt to maximize employment and stabilize prices, the U.S. Federal Reserve (the “Fed”) officials offered conflicting views on whether they might lift rates at the September 2015 FOMC meeting, and futures prices put only 28% odds on a move. The Fed’s decision likely rests upon the trajectory of the U.S. economy, leaving the timing of the Fed’s first rate hike uncertain. Relative returns were due to negative stock selection and to a lesser extent negative sector allocation. Issue selection was strongest in the Utilities and Energy sectors, while the
4
|
•Artisan Partners Limited Partnership (“Artisan”) |
| The Artisan mid-cap value strategy employs a bottom-up investment process to construct a diversified portfolio of U.S. mid-cap value companies that Artisan’s mid-cap value investment team believes are undervalued, in solid financial condition and have attractive business economics. Artisan believes companies with these characteristics are less likely to experience eroding values over the long-term. |
strategy’s Consumer Discretionary and Health Care holdings lagged those sectors within the benchmark. The strategy’s overweight in Health Care and underweight in Industrials boosted performance. The Fund’s overweight positions in Energy and Materials were headwinds. Energy names depreciated more than 31% while Materials stocks lost 18% — both sectors failed to keep pace with the benchmark’s total return during the reporting period. Political issues (such as the relieving of Iranian sanctions and Saudi Arabia’s attempt to maintain its market share in world oil markets) are putting undeniable pressures on oil prices and have adversely affected names within the energy sector.
The portion of the Fund managed by HGK underperformed the Fund’s market index benchmark for the fiscal year ended August 31, 2015. The fiscal year saw negative returns as global markets reacted to three unusually deep shocks: Saudi Arabia decided to stop supporting the price of oil, Europe was pushed to the brink as fears of a Greek default lead markets to question the stability of the European Monetary Union and the subsequent strength of the Dollar led the Chinese and other emerging countries to devalue their currencies. These three unexpected changes to the global economy negatively impacted our strategy and led to negative sector allocation and security selection in the Energy and Materials Sector which drove the majority of the portfolio’s negative returns. For the period, the strongest stock picking was in the consumer staples sector. As HGK looks forward, HGK sees a market ripe for bottom up fundamental investing. Intra-sector correlations and stock price momentum factor returns have increased to unsustainably high levels as macroeconomic policy has played a historic role in market price changes. This has led to a dramatic valuation disconnect between domestically and internationally exposed companies. The market has also stopped differentiating among the quality of companies tied to the commodity complex which provides the portfolio with tremendous opportunity. HGK continues to maintain a well-diversified portfolio and utilize its rigorous quantitative and qualitative analysis to find value in all economic sectors.
The portion of the Fund managed by Artisan Partners underperformed the Fund’s benchmark, the Russell Midcap® Value Index, for the year ended August 31, 2015. The Russell Midcap® Value Index rallied in late 2014 before putting in a record high in the first half of 2015. Stock price momentum stalled in mid 2015 as earnings growth slowed on continued strength in the U.S. dollar. Then in August, markets globally sold off sharply owing to concerns of economic slowdown in China. The majority of our underperformance during the period was concentrated in the energy and industrials sectors. In the energy sector, key detractors included oil and natural gas company Denbury Resources, and global offshore driller Ensco. Returns in the industrials sector were held back by mining equipment manufacturer Joy Global and global metal cutting tools supplier Kennametal. Despite strong performance from managed care company Cigna, our overall exposure to the health care sector was a source of relative weakness due to our underweight positioning. On the positive side, our consumer staples and financials holdings were sources of strength. In the consumer staples sector, food retailer Kroger aided results. Financials sector insurance companies Arch Capital Group and Progressive buoyed results. After an extended period of strong gains without any major pullbacks, investors were reminded in August that markets don’t always move in one direction. HGK welcomes volatility in the market. Managing risk is at the core of our process, and we tend to come up with more investment opportunities that fit well with our approach during market dislocations and periods of volatility.
5
The following graph depicts the performance of the Large Capitalization Value Equity Investments vs. the Russell 1000® Value Index2 and the Lipper Large-Cap Value Funds Average.12
|
HISTORICAL PERFORMANCE FOR THE TEN-YEAR PERIOD ENDED AUGUST 31, 2015 LARGE CAPITALIZATION VALUE EQUITY INVESTMENTS Comparison of $10,000 Investment in the Portfolio with the Russell 1000® Value Index and the Lipper Large-Cap Value investment category |
The performance shown above and below represents past performance. Past performance is no guarantee of future results and current performance may be higher or lower than the performance shown above and below. Performance figures may reflect voluntary fee waivers and/or expense reimbursements. In the absence of voluntary fee waivers and/or expense reimbursements, the total return would have been lower. Principal value and investment returns will fluctuate and investors’ shares, when redeemed, may be worth more or less than their original cost. To obtain performance data current to the most recent month-end, please visit our website at www.morganstanley.com/cgcm.
The graph above and returns shown below do not reflect the deduction of taxes that a shareholder would pay on fund distributions or the redemption of fund shares.
| | | | | | | | | | | | | | | | | | | | | | |
| | | LARGE CAPITALIZATION VALUE EQUITY INVESTMENTS Average Annual Total Returns for the Period Ended August 31, 2015† |
| | | | | Without
Annual
Advisory
Program
Fee | | With
Annual
Advisory
Program
Fee* | | Russell
1000®
Value
Index*** | | Lipper
Large-Cap
Value
Funds
Average*** |
| | Since inception (11/18/1991) | | | | 7.59 | % | | | | 5.78 | % | | | | 9.84 | % | | | | 9.15 | % |
| | 10 year | | | | 4.96 | | | | | 2.93 | | | | | 6.18 | | | | | 5.80 | |
| | 5 year | | | | 12.70 | | | | | 10.06 | | | | | 14.68 | | | | | 13.59 | |
| | 3 year | | | | 11.54 | | | | | 8.65 | | | | | 13.92 | | | | | 13.02 | |
| | | 1 year | | | | (6.83 | ) | | | | (9.42 | ) | | | | (3.48 | ) | | | | (3.83 | ) |
See pages 27 through 29 for all footnotes.
6
Small Capitalization Growth Investments
|
| ABOUTTHE SUBADVISERS |
•Wall Street Associates (“Wall Street”) |
| Wall Street follows a bottom-up investment style. It looks for companies with superior earnings growth, strong balance sheets, attractive valuations and potentially positive earnings surprises. |
|
•Westfield Capital Management Company, L.P. (“Westfield”) |
| Westfield favors investing in earnings growth stocks given a conviction that stock prices follow earnings progress and that they offer the best opportunity for superior real rates of return. Reasonably priced stocks of companies with high foreseen earnings potential are best identified through in-depth, fundamental research. It is Westfield’s belief that the small capitalization portion of the market is under-researched, and therefore less efficient, than the large capitalization sector. |
For the period of September 1, 2014, through August 31, 2015, the Sub-advisers for the CGCM Small Capitalization Growth Investments (“Fund”) were Wall Street Associates (“Wall Street”), and Westfield Capital Management Company, L.P. (“Westfield”).
The portion of the Fund managed by Wall Street outperformed the Fund’s market index benchmark, Russell 2000® Growth Index, for the year ended August 31, 2015. The strong performance was broad based and sourced from multiple sectors. Investments in the consumer staples (drug store, grocery and food) and health care (biotech, facilities, services and medical equipment) provided the greatest contributions to portfolio return for the period. Investments in the technology sector added to portfolio returns, particularly software and communications stocks. As the fiscal year began, U.S. equity markets were volatile amid declining oil prices and OPEC’s decision to not cut oil production. U.S. equities rallied into year-end, however the market’s action continued to be turbulent as Wall Street entered 2015. Capital spending, home-building, vehicle sales and government spending levels all slowed, contributing to lackluster GDP growth in Q1. Mid-year brought negative news from abroad as Europe struggled with the Greek debt crisis and Asia dealt with the fallout of speculative excess in China’s equity market. All the while, investors continued to fret over the timing and magnitude of the first rate hike by the Federal Reserve. The energy group benefitted from an under-weighted position and strong stock selection. Producer durables (aerospace) and utilities (telecomm) also added to portfolio returns. Investments in the consumer discretionary (specialty retail, entertainment and leisure) sector were the greatest detractor from performance. Financial services and materials stocks detracted slightly from performance, although the Fund benefitted from an under-weighted exposure to the materials group. Wall Street anticipates market levels will be higher over the next twelve months, driven by earnings growth and continued improvement in the U.S. economy. This should benefit domestically-oriented small capitalization stocks. Risk control and stock selection are critically important and Wall Street continues to actively manage our exposures (on a factor/sector/industry basis, as well as at the security level) and construct portfolios with companies experiencing sustainable long-term earnings growth rates.
The portion of the Fund managed by Westfield outperformed the Fund’s market index benchmark, the Russell 2000® Growth Index, for the year ended August 31, 2015. The Health Care sector was the decisive driver of incremental gains; investments in Energy, Industrials, and Materials also contributed materially to excess returns. The Financials and Consumer Discretionary sectors underperformed. Domestic equities continued their upward pace in 2015, but the slow and methodical advance came to an abrupt halt at the end of June, when Greece effectively defaulted on its scheduled $1.7 billion debt payment to the IMF. Volatility subsided by mid-July, following news that the crisis in Greece had been averted. However, the selloff started afresh in August, triggered by concerns about the growth downshift in China and its impact on the global economy. Stock selection in biotechnology had a powerful impact on performance results, accounting for the majority of outperformance in the sector. The biotechnology segment continued to exhibit signs of a secular bull market, powered by a robust M&A environment and a healthy stream of new product cycles. The portfolio’s investments in Energy augmented relative results. Energy companies were
7
The following graph depicts the performance of Small Capitalization Growth Investments vs. the Russell 2000® Growth Index3 and the Lipper Small-Cap Growth Funds Average.13
undoubtedly the broad market’s worst performers during the period, as the economic slowdown in Europe and Asia, as well as the U.S. shale oil glut, impacted the industry’s supply and demand dynamics and put pressure on oil prices. However, our largest exposure to Energy is through oil & gas refining companies, and they surprised to the upside, benefiting from falling crude oil prices. The Financials sector was the biggest detractor from relative results. The sector, heavily influenced by global interest rates trends, delivered uneven performance during the period. U.S. rates moved higher in the spring of 2015, putting pressure on stocks that are typically viewed by investors as bond proxies, such as REITs. Although the portfolio has very limited exposure to the REITs segment, we do own shares of a Hawaii-based real estate management company, which, while not a REIT per se, declined along with the real estate peer universe.
|
HISTORICAL PERFORMANCE FOR THE TEN-YEAR PERIOD ENDED AUGUST 31, 2015 SMALL CAPITALIZATION GROWTH INVESTMENTS Comparison of $10,000 Investment in the Portfolio with the Russell 2000® Growth Index and the Lipper Small-Cap Growth investment category |
The performance shown above and below represents past performance. Past performance is no guarantee of future results and current performance may be higher or lower than the performance shown above and below. Performance figures may reflect voluntary fee waivers and/or expense reimbursements. In the absence of voluntary fee waivers and/or expense reimbursements, the total return would have been lower. Principal value and investment returns will fluctuate and investors’ shares, when redeemed, may be worth more or less than their original cost. To obtain performance data current to the most recent month-end, please visit our website at www.morganstanley.com/cgcm.
The graph above and returns shown below do not reflect the deduction of taxes that a shareholder would pay on fund distributions or the redemption of fund shares.
| | | | | | | | | | | | | | | | | | | | | | |
| | | SMALL CAPITALIZATION GROWTH INVESTMENTS Average Annual Total Returns for the Period Ended August 31, 2015† |
| | | | | Without
Annual
Advisory
Program
Fee | | With
Annual
Advisory
Program
Fee* | | Russell
2000®
Growth
Index*** | | Lipper
Small-Cap
Growth
Funds
Average*** |
| | Since inception (11/18/1991) | | | | 9.49 | % | | | | 7.66 | % | | | | 7.53 | % | | | | 9.89 | % |
| | 10 year | | | | 7.83 | | | | | 5.75 | | | | | 8.46 | | | | | 7.60 | |
| | 5 year | | | | 16.71 | | | | | 13.97 | | | | | 17.83 | | | | | 16.42 | |
| | 3 year | | | | 16.91 | | | | | 13.89 | | | | | 16.47 | | | | | 14.47 | |
| | | 1 year | | | | 7.36 | | | | | 4.38 | | | | | 5.11 | | | | | 4.11 | |
| | |
| REIT | | — Real Estate Investment Trust |
See pages 27 through 29 for all footnotes.
8
Small Capitalization Value Equity Investments
|
| ABOUTTHE SUBADVISERS |
•Rutabaga Capital Management LLC (“Rutabaga”) |
| Rutabaga focuses exclusively on micro- and small capitalization stocks and looks to unearth uncommon or currently out-of-favor stocks. The firm’s analysts employ extensive bottom-up fundamental research to identify high quality companies with catalysts to increase margins and intrinsic value but are neglected or misperceived by the market. |
|
•NFJ Investment Group LLC (“NFJ”) |
| NFJ employs an active management style that invests in a diversified portfolio of small capitalization common stocks that it believes are undervalued in the marketplace generally and within their respective industries. NFJ also considers valuation factors such as price-to-book, price-to-cash flow, dividend policy and industry outlook in selecting stocks for investment. |
|
•Delaware Investments Fund Advisers (“Delaware”) |
| Delaware will invest, under normal market conditions, at least 80% of its net assets, plus any borrowings for investment purposes, in the equity securities of small capitalization companies or in other investments with similar economic characteristics. Delaware will consider small capitalization companies to be companies with market capitalizations not exceeding $3 billion or the highest month-end market capitalization value of any stock in the Russell 2000® Index for the previous twelve months, whichever is greater. Securities of companies whose market capitalizations no longer meet this definition after purchase still will be considered to be securities of small capitalization companies for purpose of the investment policy. The size of the companies in the Index change with market conditions and the composition of the Index. |
For the period September 1, 2014, through August 31, 2015, the Sub-advisers for CGCM Small Capitalization Value Equity Investments (“Fund”) were Rutabaga Capital Management LLC (“Rutabaga”), NFJ Investment Group LLC (“NFJ”), and Delaware Investments Fund Advisers (“Delaware”).
The portion of the Fund managed by Rutabaga underperformed the Fund’s market index benchmark, the Russell 2000® Value Index, for the year ended August 31, 2015. Sector allocation was a significant headwind. Rutabaga had very little exposure to the top three performing sectors (Health Care, Consumer Staples, and Technology), and while Rutabaga had no direct exposure to the Energy sector (the worst performing sector), we do have some exposure to other commodities and companies that service the global steel industry, which underperformed during the year. We have reduced that exposure somewhat and believe the portfolio is well positioned to weather the uncertainty in the markets. Rutabaga remains committed to finding companies that are neglected and attractively valued and that possess internal catalysts to grow their earnings faster than other investors are expecting.
The portion of the Fund managed by NFJ underperformed the Fund’s market index benchmark, Russell 2000® Value Index, for the year ended August 31, 2015. The reporting period was positive for equity markets as the backdrop of record cash flows, positive earnings, and low interest rates continued to support stocks. Over the trailing 12-months, growth as measured by the notably outperformed the Russell 2000® Value Index by over 900 basis points creating structural headwinds for a deep value approach. During the latter half of 2014, the stock market rebounded sharply in October after falling over 7% during a stretch of apprehensiveness which included an Ebola outbreak. During the period the sustained accommodative environment resulted in more shareholder friendly activities by S&P 500 companies which paid an all-time high of $350.4 billion in dividends over the past calendar year according to S&P Dow Jones Indices. In its attempt to maximize employment and stabilize prices, the U.S. Federal Reserve (the “Fed”) officials offered conflicting views on whether they might lift rates at the September 2015 Federal Open Market Committee meeting, and futures prices put only 28% odds on a move. The Fed’s decision likely rests upon the trajectory of the U.S. economy, leaving the timing of the Fed’s first rate hike uncertain. The portfolio’s relative performance was due to negative sector allocation while positive stock selection offset some of the allocation effect. Issue selection was strongest in Energy and Information Technology, while stock picks lagged in the Industrials and Consumer Staples sectors. The fund’s overweight positions in Energy and Materials were headwinds. Energy names depreciated more than 50% while Materials stocks lost 24% — both sectors failed to keep pace with the benchmark’s total return during the reporting period. Political issues (such as the relieving of Iranian sanctions and Saudi Arabia’s attempt to maintain its market share in world oil markets) are putting undeniable pressures on oil prices and have adversely affected names within the energy sector. Conversely, an overweight in Consumer Staples and underweight in Telecom aided relative performance.
The portion of the Fund managed by Delaware underperformed the Fund’s market index benchmark, the Russell 2000® Value Index, for the year ended August 31, 2015. From a performance standpoint, stock selection and overweight allocations to the Capital Spending and Energy sectors were the two largest detractors from performance on a relative basis. Strong stock selection in the Basic Industry,
9
The following graph depicts the performance of Small Capitalization Value Equity Investments vs. the Russell 2000® Value Index4 and the Lipper Small-Cap Value Funds Average.14
Technology, and Financial Services led to outperformance in these sectors. As we have begun to see during the review period, higher-quality companies have outperformed. We expect this trend to continue which should be positive for our portfolio of higher-quality equities. Additionally, we have been pleased to see a pickup in the merger and acquisition (M&A) environment, which we have expected for a number of years. This pickup has been favorable for equities and we have had a number of our holdings acquired during the review period. Many of the U.S. economic indicators that we follow have been improving. Unemployment has been on a downward trend and lower energy prices have the potential to provide a tailwind to consumer spending. The U.S. continues to look like the most stable economy and, in our view, will likely outperform global economies. This should be a positive for small-caps as they derive more of their revenues from domestic sales than do large-caps and mid-caps. The bulk of the review period’s negative returns came during the month of August when worries about China and a global growth slowdown unraveled markets. We believe the market volatility will continue (both up and down) until global financial markets become more stable.
|
HISTORICAL PERFORMANCE FOR THE TEN-YEAR PERIOD ENDED AUGUST 31, 2015 SMALL CAPITALIZATION VALUE EQUITY INVESTMENTS Comparison of $10,000 Investment in the Portfolio with the Russell 2000® Value Index and the Lipper Small-Cap Value investment category |
The performance shown above and below represents past performance. Past performance is no guarantee of future results and current performance may be higher or lower than the performance shown above and below. Performance figures may reflect voluntary fee waivers and/or expense reimbursements. In the absence of voluntary fee waivers and/or expense reimbursements, the total return would have been lower. Principal value and investment returns will fluctuate and investors’ shares, when redeemed, may be worth more or less than their original cost. To obtain performance data current to the most recent month-end, please visit our website at www.morganstanley.com/cgcm.
The graph above and returns shown below do not reflect the deduction of taxes that a shareholder would pay on fund distributions or the redemption of fund shares.
| | | | | | | | | | | | | | | | | | | | | | |
| | | SMALL CAPITALIZATION VALUE EQUITY INVESTMENTS Average Annual Total Returns for the Period Ended August 31, 2015† |
| | | | | Without
Annual
Advisory
Program
Fee | | With
Annual
Advisory
Program
Fee* | | Russell
2000®
Value
Index*** | | Lipper
Small-Cap
Value
Funds
Average*** |
| | Since inception (11/18/1991) | | | | 10.19 | % | | | | 8.34 | % | | | | 10.98 | % | | | | 10.50 | % |
| | 10 year | | | | 8.08 | | | | | 5.98 | | | | | 5.70 | | | | | 6.33 | |
| | 5 year | | | | 13.58 | | | | | 10.92 | | | | | 13.23 | | | | | 13.54 | |
| | 3 year | | | | 10.90 | | | | | 8.03 | | | | | 11.77 | | | | | 12.37 | |
| | | 1 year | | | | (7.85 | ) | | | | (10.41 | ) | | | | (4.95 | ) | | | | (6.04 | ) |
See pages 27 through 29 for all footnotes.
10
International Equity Investments
|
| ABOUTTHE SUBADVISERS |
•Schroder Investment Management North America, Inc. (“Schroders”) |
| Schroders uses a bottom-up growth oriented approach towards stock selection and employs a fundamental, research driven process to identify quality growth companies with attractive medium-term growth and valuation, quality management and financial position, and a sustainable competitive advantage. Schroders’ “best ideas” portfolio blends both core and opportunistic holdings. |
|
•OppenheimerFunds, Inc. (“OFI”) |
| OFI’s Global Equity team seeks to generate alpha through high conviction decisions driven by fundamental bottom-up analysis. Several secular growth themes are used as a way to focus attention on segments of the global marketplace that may grow faster than world GDP. The team’s investment process is driven by a number of very powerful, long-term economic, demographic and technological forces summarized as MANTRA® — Mass Affluence, New Technologies, Restructuring and Aging. The portfolio managers utilize a bottom-up, fundamental investment approach, and seek to invest initially in high-quality companies that are temporarily out of favor; trading at attractive valuations; and which demonstrate sustainable, above-average growth potential over a three- to five-year time horizon. The process is index agnostic, searching for companies with high growth rates and high quality balance sheets with minimal focus with respect to region or country, sector or security. |
|
•Causeway Capital Management LLC (“Causeway”) |
| Causeway’s international developed market investment philosophy is based on a long-term value strategy and the investment team applies an active, bottom-up, research-intensive approach towards stock selection. |
| Causeway’s investment approach seeks to identify under-priced stocks of high quality companies believed to be exhibiting superior financial strength as compared to peers. In addition to fundamental analysis, quantitative research is considered an integral part of the process and is used for screenings of investment candidates as well as risk management. Portfolio managers work as a team to make investment decisions and are supported by the firm’s dedicated fundamental and quantitative research analysts. Analysts and portfolio managers are assigned global industry-specific research responsibilities. |
For the period September 1, 2014, through August 31, 2015, the Sub-advisers for CGCM International Equity Investments (“Fund”) were Schroder Investment Management North America, Inc. (“Schroder”), OppenheimerFunds, Inc. (“OFI”), and Causeway Capital Management LLC (“Causeway”).
The portion of the Fund managed by Schroders outperformed the Fund’s market index benchmark, MSCI EAFE® Index (Net) for the year ended August 31, 2015. Stock selection in Europe, our financial holdings in particular, contributed to positive relative performance. The Fund also benefitted from strong stock selection in the consumer staples sector. Performance was also helped by our underweight exposures to underperforming sectors such as energy and materials. Detracting from performance was our selection in industrials. International equity markets ended the 12-month period in negative territory amid increased volatility and poor performance from commodity cyclical stocks. Excess supply in oil markets and slowing growth in emerging markets, most notably China, weighed on these sectors. The best performing sector was healthcare amidst a prolonged period of innovation and acceleration in M&A activity. The outlook for equity markets remains finely balanced. We remain encouraged by the growth momentum in Europe, earnings momentum in Japan and consumer confidence in the U.S. The weaker Chinese macro momentum has weighed heavily on sentiment but we are not seeing evidence of significant financial system stress and believe that the Chinese government has the policy flexibility and significant reserves to cope with its current conditions. We see the recent market action as a re-pricing of the risks around Chinese and global growth, rather than an indicator of a significant negative inflection point for global growth. While there are a number of factors that provide cause for concern, company fundamentals generally remain robust and recent volatility provides attractive entry points for companies with solid fundamentals that have been unduly sold off.
The portion of the Fund managed by OFI outperformed the Fund’s market index benchmark, the MSCI EAFE® Index (Net), for the year ended August 31, 2015. Numerous concerns resulted in market volatility during the reporting period, including growth in China, Greece’s debt situation, and the timing of when the U.S. Federal Reserve would move to raise interest rates. The portfolio outperformed primarily in Materials due to stock selection and an underweight position, Energy as a result of an underweight position, and Consumer Discretionary due to an overweight position and stock selection. The portfolio underperformed the benchmark primarily in the Industrials and Consumer Staples sectors, which was attributable to stock selection. The portfolio’s country and regional allocations are a rolled up reflection of the portfolio’s individual stock selections. That being said, the portfolio’s investments in the United Kingdom outperformed due to stock selection. Australia was also a top performer, as a result of stock selection and a relative underweight position. The portfolio’s stock selection in Switzerland and underweight position in Japan were top detractors from performance.
The portion of the Fund managed by Causeway outperformed the Fund’s market index benchmark, the MSCI EAFE® Index (Net), for the year ended August 31, 2015. International equity markets delivered negative performance for the year, with nearly all of the negative performance produced in the final week of the year. Every developed market but six posted negative returns in the period. The top performing
11
|
| Fundamental research is further organized into six research clusters: financials/materials, consumer, industrial/manufacturing, energy, technology and health care. Causeway’s unconstrained, international established market value equity approach invests in a variety of market capitalization ranges, but primarily in large- and mid-capitalization non-U.S. developed market companies. Causeway can also invest in small-cap issues and less developed emerging markets. Value-driven security characteristics may include low price/earnings ratio, low price/book ratio, low price/cash flow ratio and high dividend yield, but may also include out-of-favor companies that may have high rates of growth of earnings. Sector and regional weights are byproducts of the investment process. |
markets were Israel, Ireland, Denmark, and Japan, and the Netherlands. The biggest laggards in our investable universe were Norway, Portugal, Australia, South Korea, and Canada. The portfolio outperformed primarily due to favorable currency exposure which is a by-product of our bottom up portfolio construction process. Holdings in the banks, materials, transportation and consumer services industry groups, along with an overweight to the telecommunication services industry group contributed favorably to the portfolio’s relative outperformance. Meanwhile, holdings in the automobiles & components, capital goods, technology hardware & equipment, and consumer durables & apparel industry groups, along with an overweight to the energy industry group detracted from relative performance. The single largest contributor to absolute performance was telecommunication services provider KDDI Corp. (Japan). Additional top contributors included International Consolidated Airlines Group SA (United Kingdom), Carnival PLC (United Kingdom), UBS Group AG (Switzerland), and Novartis AG (Switzerland). Two of the single largest detractors from performance were automobile manufacturers, Hyundai Motor Co. (South Korea) and Volkswagen AG (Germany). Additional notable detractors included Technip SA (France), Baytex Energy Corp. (Canada), and SK Telecom Co., Ltd. (South Korea).
12
The following graph depicts the performance of International Equity Investments vs. the Morgan Stanley Capital International Europe, Australasia, Far East (MSCI EAFE®) Index (Net)5 and the Lipper International Large-Cap Core Funds Average.15
|
HISTORICAL PERFORMANCE FOR THE TEN-YEAR PERIOD ENDED AUGUST 31, 2015 INTERNATIONAL EQUITY INVESTMENTS Comparison of $10,000 Investment in the Portfolio with the Morgan Stanley Capital International Europe, Australasia,
Far East (MSCI EAFE®) Index (Net) and the Lipper International Large-Cap Core investment category |
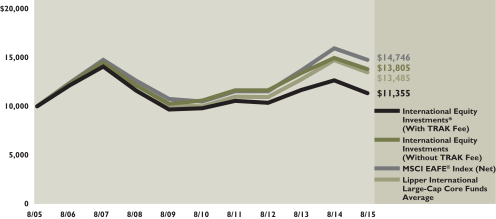
The performance shown above and below represents past performance. Past performance is no guarantee of future results and current performance may be higher or lower than the performance shown above and below. Performance figures may reflect voluntary fee waivers and/or expense reimbursements. In the absence of voluntary fee waivers and/or expense reimbursements, the total return would have been lower. Principal value and investment returns will fluctuate and investors’ shares, when redeemed, may be worth more or less than their original cost. To obtain performance data current to the most recent month-end, please visit our website at www.morganstanley.com/cgcm.
The graph above and returns shown below do not reflect the deduction of taxes that a shareholder would pay on fund distributions or the redemption of fund shares.
| | | | | | | | | | | | | | | | | | | | | | |
| | | INTERNATIONAL EQUITY INVESTMENTS Average Annual Total Returns for the Period Ended August 31, 2015† | | |
| | | | | Without
Annual
Advisory
Program
Fee | | With
Annual
Advisory
Program
Fee* | | MSCI
EAFE®
Index
(Net)*** | | Lipper
International
Large-Cap
Core Funds
Average*** |
| | Since inception (11/18/1991) | | | | 5.19 | % | | | | 3.43 | % | | | | 5.20 | % | | | | 6.47 | % |
| | 10 year | | | | 3.28 | | | | | 1.28 | | | | | 3.96 | | | | | 3.61 | |
| | 5 year | | | | 5.48 | | | | | 3.01 | | | | | 7.05 | | | | | 5.82 | |
| | 3 year | | | | 5.91 | | | | | 3.17 | | | | | 8.53 | | | | | 6.96 | |
| | | 1 year | | | | (7.68 | ) | | | | (10.25 | ) | | | | (7.47 | ) | | | | (9.05 | ) |
See pages 27 through 29 for all footnotes.
13
Emerging Markets Equity Investments
|
| ABOUTTHE SUB ADVISERS |
•Vontobel Asset Management, Inc. (“Vontobel”) |
| Vontobel, is a global investment management firm dedicated exclusively to managing long-only global equity portfolios. Vontobel’s investment philosophy is based on a conviction that long-term, stable and superior earnings growth drives long-term investment returns and risk-adjusted outperformance. Vontobel practices a fundamental bottom-up approach that integrates elements of growth investing (growth and stability of earnings) with a strict valuation discipline in a longer term context. |
|
•Lazard Asset Management, LLC (“Lazard”) |
| Lazard, an indirect, wholly-owned subsidiary of Lazard Ltd., is known for its global perspective on investing and years of experience with global, regional and domestic portfolios. With more than 300 investment personnel worldwide, Lazard offers investors of all types an array of equity, fixed income, and alternative investment solutions from its network of local offices in ten different countries. Its team-based approach to portfolio management helps Lazard to deliver robust and consistent performance over time, and strong client relationships allow them to understand how to employ their capabilities to its clients’ advantage. |
| Lazard manages a relative value strategy (“Value Strategy”) and a relative growth strategy (“Growth Strategy”) and invests primarily in equity securities, principally common stocks, of non-U.S. companies whose principal activities are located in emerging or developing market countries. In the Value Strategy, assets are invested in companies that are believed to be undervalued based on their earnings, cash flow or asset values. In the Growth Strategy, Lazard employs a relative growth investment philosophy that is based on value creation through a process of bottom-up stock selection. Lazard’s approach consists of an analytical framework, accounting validation, fundamental analysis and portfolio construction parameters and its selection process focuses on growth and considers the sustainability of growth and the trade off between valuation and growth. The percentage of the Fund’s assets allocated to Lazard is 33% to the Value Strategy and 33% to the Growth Strategy. |
For the period September 1, 2014, through August 31, 2015, the Sub-advisers for the CGCM Emerging Markets Equity Investments (“Fund”) were Vontobel Asset Management, Inc. (“Vontobel”) and Lazard Asset Management LLC (“Lazard”). Lazard manages two strategies for the Fund, an emerging markets equity value strategy (Lazard Value Strategy”) and a developing markets equity strategy (“Lazard Growth Strategy”).
The portion of the Fund managed by Vontobel outperformed the Fund’s market index benchmark, the MSCI Emerging Markets Index (Net), for the year ended August 31, 2015. The portfolio’s overweight to Consumer Staples, combined with stock selection in the sector, contributed positively to relative performance. The portfolio’s underweight to the Energy sector also added to relative returns. Stock selection in the Information Technology and Consumer Discretionary Sectors were the leading detractors from performance for the period. The portfolio’s overweight to India, combined with stock selection in the country, added to relative performance, as did stock selection in Brazil. An underweight to China, combined with stock selection in the country, detracted from relative returns, as did an underweight to Taiwan. Emerging markets ended the year in negative territory. The global stock market sell-off in August resulted in the steepest decline in years for many major markets, as fears that China’s economy is dramatically slowing sparked significant volatility. The deepening economic crisis in Brazil and uncertainty regarding a potential U.S. Federal Reserve (Fed) rate hike also contributed to volatility. Our continued focus on bottom-up, fundamental research to identify high quality companies that can generate sustainable earnings growth over the long term has enabled our strategies to withstand challenging macroeconomic environments. Central to our philosophy is the belief that compounding wealth requires preserving capital in down markets. As such, we have designed our strategies to generally hold up better than the market in a down cycle, but may underperform when the markets are excited.
The Lazard Value Strategy underperformed the Fund’s market index benchmark, the MSCI Emerging Markets Index (Net), for the year ended August 31, 2015. Over the 12-month period ended August 31, 2015 the MSCI Emerging Markets Index decreased by nearly 23% in U.S. dollar terms. Due to the geopolitical issues in the Ukraine, Greece, and Brazil, as well as general commodity price weakness, returns in Latin America and eastern Europe were significantly lower, down more than 42% and almost 30%, respectively, than for Asia. The Fund underperformed the financials and industrials sectors due to stock selection but benefited from stock selection in the information technology sector. From a regional perspective, the Fund benefited from stock selection in Taiwan and South Korea, but was hurt by stock selection in Russia and a higher-than-index exposure to Brazil.
The Lazard Growth Strategy underperformed the Fund’s market index benchmark, the MSCI Emerging Markets Index (Net), for the year ended August 31, 2015. The Fund benefited from stock selection in the consumer staples and industrials sectors, as well as in India, South Korea, China, and Turkey while stock selection in the energy, materials, information technology, and consumer discretionary sectors, as well as in Brazil, Mexico, Russia, and South Africa detracted value. A higher-than-index exposure to the health care and industrials sectors, as well as to India and China also added value, while a lower-than-index exposure to the consumer staples
14
The following graph depicts the performance of Emerging Markets Equity Investments vs. the MSCI Emerging Markets Index (Net)6 and the Lipper Emerging Markets Funds Average.16
sector and to South Africa, as well as a higher-than-index exposure to Colombia, Turkey, and Brazil hurt performance.
|
HISTORICAL PERFORMANCE FOR THE TEN-YEAR PERIOD ENDED AUGUST 31, 2015 EMERGING MARKETS EQUITY INVESTMENTS Comparison of $10,000 Investment in the Portfolio with the MSCI Emerging Markets Index (Net)
and the Lipper Emerging Markets investment category |
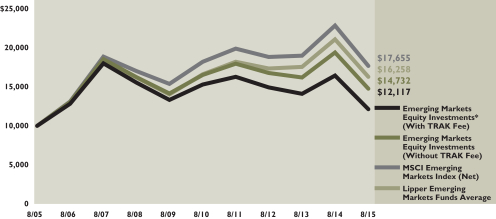
The performance shown above and below represents past performance. Past performance is no guarantee of future results and current performance may be higher or lower than the performance shown above and below. Performance figures may reflect voluntary fee waivers and/or expense reimbursements. In the absence of voluntary fee waivers and/or expense reimbursements, the total return would have been lower. Principal value and investment returns will fluctuate and investors’ shares, when redeemed, may be worth more or less than their original cost. To obtain performance data current to the most recent month-end, please visit our website at www.morganstanley.com/cgcm.
The graph above and returns shown below do not reflect the deduction of taxes that a shareholder would pay on fund distributions or the redemption of fund shares.
| | | | | | | | | | | | | | | | | | | | | | |
| | | EMERGING MARKETS EQUITY INVESTMENTS Average Annual Total Returns for the Period Ended August 31, 2015† | | |
| | | | | Without
Annual
Advisory
Program
Fee | | With
Annual
Advisory
Program
Fee* | | MSCI
Emerging
Markets
Index
(Net)*** | | Lipper
Emerging
Markets
Funds
Average*** |
| | Since inception (4/21/1994) | | | | 3.88 | % | | | | 2.11 | % | | | | N/A | | | | | 4.89 | % |
| | 10 year | | | | 3.95 | | | | | 1.94 | | | | | 5.52 | | | | | 4.77 | |
| | 5 year | | | | (2.25 | ) | | | | (4.54 | ) | | | | (0.92 | ) | | | | (0.99 | ) |
| | 3 year | | | | (4.23 | ) | | | | (6.70 | ) | | | | (2.41 | ) | | | | (2.06 | ) |
| | | 1 year | | | | (24.08 | ) | | | | (26.19 | ) | | | | (22.95 | ) | | | | (22.54 | ) |
See pages 27 through 29 for all footnotes.
15
Core Fixed Income Investments
|
| ABOUTTHE SUBADVISERS |
•BlackRock Financial Management, Inc. (“BlackRock”) |
| BlackRock employs a relative value approach which entails portfolio duration within a narrow range and value added through sector and sub-sector rotation within Investment grade fixed income sectors. BlackRock evaluates securities within a risk management framework which consists of determining interest rate risk, yield curve risk, cash flow risk, credit risk and liquidity risk of securities. |
|
•Pacific Investment Management Company LLC (“PIMCO”) |
| PIMCO employs “top-down” and “bottom-up” investment techniques. It implements the following “top-down” strategies: duration and volatility analysis, sector evaluation and yield curve shape analysis. PIMCO also employs the following “bottom-up” strategies: credit analysis, quantitative research, issue selection and cost-effective trading. |
|
•Western Asset Management Company (“Western”) |
| Western emphasizes three key strategies to enhance total return: (i) adjusting the allocation among the key sectors of the fixed-income market depending on its forecast of relative values; (ii) tracking the duration of the overall portfolio so that it falls within a narrow band relative to the benchmark index, with adjustment made to reflect its long-term outlook for interest rates; and (iii) purchasing undervalued securities in each of the key sectors of the bond market while keeping overall quality high. |
|
•Metropolitan West Asset Management LLC (“MetWest”) |
| MetWest seeks to achieve consistent outperformance through the measured and diversified application of five fixed income management strategies, including: (i) duration management; (ii) yield curve positioning; (iii) sector allocation; (iv) security selection; and (v) opportunistic execution. Predicated on a long-term economic outlook, MetWest employs a value-oriented approach to managing fixed income that recognizes the periodic inefficient nature of over-the-counter markets and the mean-reverting characteristics of the investable universe. |
For the period September 1, 2014, through August 31, 2015, the Sub-advisers for CGCM Core Fixed Income Investments (“Fund”) were BlackRock Financial Management Inc. (“BlackRock”), Pacific Investment Management Company LLC (“PIMCO”), Western Asset Management Company (“Western”) and Metropolitan West Asset Management LLC (“MetWest”).
The portion of the Fund managed by BlackRock outperformed the Fund’s market index benchmark, the Barclays Capital U.S. Aggregate BondTM Index, for the year ended August 31, 2015. During the period, high volatility and wider spread levels in the fixed income markets led BlackRock to utilize sector rotation and individual security selection within spread sectors as the primary drivers of alpha generation (excess returns versus the benchmark). Positioning within the agency mortgage sector was particularly impactful as the sector widened in the latter part of 2014 and early 2015 lagging other spread sectors that had an earlier correction. Also aiding performance was positioning and security selection within credit sectors. The overweight in the banking sub-sector against multinational industrial names proved beneficial to the portfolio’s relative performance. Additionally, selection within the commercial mortgage backed securities (“CMBS”) sector augmented returns. Detracting from relative performance was the portfolio’s duration positioning, as well as allocation to Treasury Inflation-Protected Securities (“TIPS”). The portfolio’s underweight duration positioning for most of the year was negative for results, particularly in the fourth quarter of 2014 as rates rallied alongside the sharp decline in oil prices. TIPS were also negatively impacted by the same dramatic drop in energy prices.
The portion of the Fund managed by PIMCO outperformed the Fund’s market index benchmark, the Barclays Capital U.S. Aggregate BondTM Index, for the period of September 1, 2014 through the termination date of PIMCO as a Sub-adviser of the Fund, March 27, 2015 (before fees). An underweight to U.S. duration detracted from performance as rates generally fell across the curve. Additionally, an underweight to the long-end of the curve was negative for performance as long-end rates outperformed short and intermediate rates. Exposure to European peripheral duration, namely Spanish and Italian rates, was positive for performance as yields fell in these countries. However, short exposure to U.K. interest rates detracted from returns as yields declined. Overall spread strategies were negative for performance. Security and sector selection within investment grade credit contributed to returns as financial names generally outperformed the broader credit market. An overall underweight to Agency mortgage-backed securities (“MBS”) detracted for performance as the sector outperformed like-duration Treasuries during the period; however, this was partially offset by a focus on FNMA mortgages which outperformed GNMA and FHLMC agency mortgages. Holdings of U.S. (TIPS) were negative for performance as breakeven inflation levels declined during the period. Additionally, modest exposure to Russian external debt detracted from returns as the central bank dramatically hiked rates to counter market volatility and stabilize the ruble. Lastly, a long-dollar bias versus the euro and the yen contributed to performance as these currencies depreciated relative to the dollar.
The portion of the Fund managed by Western underperformed the Fund’s market index benchmark, the Barclays Capital U.S. Aggregate BondTM Index, for the year ending August 31, 2015. The economic environment in the U.S. over the period
16
can be characterized as one of sluggish but continued growth given the tepid economic recovery. Unemployment fell to a level the Fed considers to be full employment, although questions regarding the quality of jobs people gained remain. Most measures of inflation remained quite low, especially Core Personal Consumption Expenditures which is a key measure considered by the Fed in policy considerations. Still, the slow growth environment is one typically supportive of spread product. The Fund’s holdings of emerging market bonds was a significant detractor as the sector suffered from a plunge in commodity prices, led by oil, as well as from overall concerns of slowing global growth and currencies that were generally losing value versus the U.S. dollar. High yield bonds also detracted as the energy sector was negatively impacted by the decline in crude oil prices. Our position in agency mortgages, which was generally flat to underweight over the most recent six months, contributed to returns as the sector underperformed U.S. Treasuries. Non-agency mortgage backed securities added to performance due to the combination of price improvements, continued coupon payments and principal repayments as investors continued to seek this higher yielding, low duration sector. Holdings of investment-grade credit modestly added to performance on issue and sector selection. Tactical duration positioning, which was generally overweight, moderately benefited the Fund as intermediate to long yields fell over the period. An emphasis on longer-dated yields generated positive results as the yield curve slightly flattened. Non-US developed market exposure contributed to the portfolio, benefiting from short exposures to the Japanese yen and to the Euro.
The portion of the Fund managed by MetWest outperformed the Fund’s market index benchmark, the Barclays Capital U.S. Aggregate BondTM Index, for the year ended August 31, 2015. Outperformance was driven by sector allocation and security selection via extensive bottom-up analysis. The underweight to investment grade corporates benefited returns as spreads widened, particularly among commodity-related sectors such as basic industry and energy which remain an underweight in the portfolio. An emphasis within financials on banking credits and finance companies also contributed as both sectors outpaced the Aggregate Index. Non-corporate credits such as sovereigns and foreign agencies weighed on Index returns as global volatility drove spreads wider, while the portfolio benefitted from a relative underweight to these sectors. Further contributions came from issue selection among agency and non-agency MBS, while government guaranteed student loans ABS holdings resulted in a drag as spreads widened on concerns about rating downgrades due to the potential for these bonds to extend beyond their stated maturity dates. Meanwhile, the defensive duration positioning was reduced from approximately 1-year short the Index to 0.7-year short but modestly detracted as intermediate to long rates fell.
17
The following graph depicts the performance of Core Fixed Income Investments vs. the Barclays Capital U.S. Aggregate BondTM Index7 and the Lipper Core Bond Funds Average.17
|
HISTORICAL PERFORMANCE FOR THE TEN-YEAR PERIOD ENDED AUGUST 31, 2015 CORE FIXED INCOME INVESTMENTS Comparison of $10,000 Investment in the Portfolio with the Barclays Capital U.S. Aggregate BondTM Index and the Lipper Core Bond Funds Average |
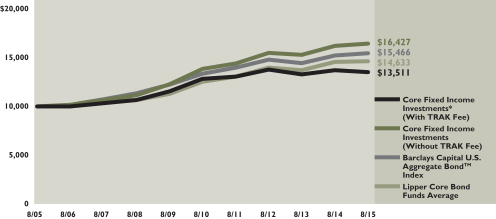
The performance shown above and below represents past performance. Past performance is no guarantee of future results and current performance may be higher or lower than the performance shown above and below. Performance figures may reflect voluntary fee waivers and/or expense reimbursements. In the absence of voluntary fee waivers and/or expense reimbursements, the total return would have been lower. Principal value and investment returns will fluctuate and investors’ shares, when redeemed, may be worth more or less than their original cost. To obtain performance data current to the most recent month-end, please visit our website at www.morganstanley.com/cgcm.
The graph above and returns shown below do not reflect the deduction of taxes that a shareholder would pay on fund distributions or the redemption of fund shares.
| | | | | | | | | | | | | | | | | | | | | | |
| | | CORE FIXED INCOME INVESTMENTS Average Annual Total Returns for the Period Ended August 31, 2015† | | |
| | | | | Without
Annual
Advisory
Program
Fee | | With
Annual
Advisory
Program
Fee* | | Barclays
Capital
U.S.
Aggregate
BondTM
Index*** | | Lipper
Core Bond
Funds
Average*** |
| | Since inception (11/18/1991) | | | | 5.65 | % | | | | 3.88 | % | | | | 5.97 | % | | | | 5.89 | % |
| | 10 year | | | | 5.09 | | | | | 3.06 | | | | | 4.46 | | | | | 4.39 | |
| | 5 year | | | | 3.48 | | | | | 1.05 | | | | | 2.98 | | | | | 3.19 | |
| | 3 year | | | | 2.00 | | | | | (0.64 | ) | | | | 1.53 | | | | | 1.69 | |
| | | 1 year | | | | 1.35 | | | | | (1.47 | ) | | | | 1.56 | | | | | 0.77 | |
See pages 27 through 29 for all footnotes.
18
High Yield Investments
|
| ABOUTTHE SUBADVISERS |
•PENN Capital Management Co., Inc. (“PENN Capital”) |
| PENN Capital’s initial universe is well-defined and includes all domestic, corporate cash paying dollar denominated bond issues that have spread-to-treasury and yield characteristics that are consistent with or wider than the single-B credit tier. PENN Capital’s investment team determines sectors/industries that may offer relative value based on its macro-economic outlook. The team will review and evaluate the economic cycle, business environment, industry/sectors and interest rates. PENN Capital then scans this group for companies with spreads to treasury that are wider than comparable companies, industry averages and historical averages. The team analyzes the liquidity outlook of the company through qualitative research, including bank loan facility analysis, covenant review analysis and asset value analysis. After the high yield bond universe has been narrowed and potential relative value is identified, the team performs its qualitative research to confirm or justify the credit’s value. The team determines whether or not the credit is suitable for the portfolio given its impact on PENN Capital’s current industry weightings and the diversification it brings to the basket of credits currently held within an industry. |
|
•Western Asset Management Company (“Western”) |
| Western combines traditional analysis with innovative technology applied to all sectors of the market. Western believes inefficiencies exist in the fixed-income market and attempts to add incremental value by exploiting these inefficiencies across all eligible market sectors. The key areas of focus are: (i) sector and sub-sector allocation; (ii) issue selection; (iii) duration; and (iv) term structure. |
For the period September 1, 2014, through August 31, 2015, the Sub-advisers for CGCM High Yield Investments (“Fund”) were PENN Capital Management Co., Inc. (“PENN Capital”) and Western Asset Management Company (“Western”).
The portion of the Fund managed by PENN Capital underperformed the Fund’s market index benchmark, the Barclays Capital U.S. High Yield Index, for the year ended August 31, 2015. The largest driver to this underperformance was an over weighted position in the energy sector going into a period of steep decline in the price of oil. Several factors contributed to the oil bear market, including supply/demand, concerns on global growth, and the position of OPEC on production. These headwinds caused a significant dislocation between underlying asset value on energy credit, and clearing pricing on bonds in the market. PENN’s overweight in CCC segment of the market also had a negative impact on the portfolio, as there was a re-pricing of risk during the year, which was also largely driven by the challenges in the Energy sector (representing roughly 15% of the market). In addition to the energy overweight, a delayed merger, and integration issues on a credit in the paper and sector materially detracted from performance. Positive drivers on the year included an underweight to Metals and Mining, credit selection in the Gaming sector, and continued credit improvement in smaller market deals, which PENN identified and evaluated though its internal research process.
The portion of the Fund managed by Western underperformed the Fund’s market index benchmark, the Barclays Capital U.S. High Yield Index, for the year ending August, 31, 2015. The Fund’s overweight to lower rated bonds detracted from performance as CCC’s underperformed BBs. The strategy to maintain an overweight to CCCs was primarily a function of the high-yield team’s view that default rates would remain at historically low levels. While the default rate did in fact remain well below historical averages, the market took on a risk-off mentality over fears of a global recession triggered by increased concern that China’s economy may experience a hard landing. Lower rated issuance provided incremental income versus higher rated issuance but the risk-off environment resulted in larger price declines for lower rated issuance which overwhelmed the income advantage. From a sector allocation standpoint, relative returns were negatively impacted. The strategy of overweight to the Energy industry proved to be a significant detractor. As oil prices declined approximately 50% during the annual period, the price of bonds issued by energy companies declined sharply. The Fund has a bias towards industries that are asset rich, whose value is quantifiable and readily saleable. This style has resulted in a lower than market default rate for the Fund and in the event a default occurs, higher recoveries. However, defaults within the Energy industry moved well above the market default rate and many of those that did not default traded down to distressed levels. Overweights to the top performing sectors including Consumer Cyclical and Consumer Non-Cyclical helped to somewhat offset the large negative impact of the Energy overweight. Issue selection also detracted from performance, particularly within the Energy industry as the Fund’s top underperformers were all energy related, four of which defaulted during the period.
19
The following graph depicts the performance of High Yield Investments vs. the Barclays Capital U.S. Corporate High-Yield Index8 and the Lipper High Yield Funds Average.18
|
HISTORICAL PERFORMANCE FOR THE TEN-YEAR PERIOD ENDED AUGUST 31, 2015 HIGH YIELD INVESTMENTS Comparison of $10,000 Investment in the Portfolio with the Barclays Capital U.S. Corporate High-Yield Index and the Lipper High Yield Funds Average |
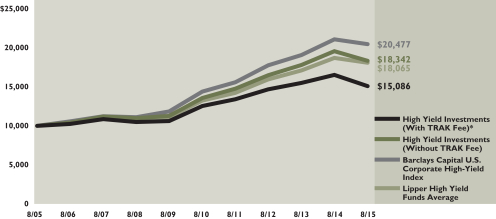
The performance shown above and below represents past performance. Past performance is no guarantee of future results and current performance may be higher or lower than the performance shown above and below. Performance figures may reflect voluntary fee waivers and/or expense reimbursements. In the absence of voluntary fee waivers and/or expense reimbursements, the total return would have been lower. Principal value and investment returns will fluctuate and investors’ shares, when redeemed, may be worth more or less than their original cost. To obtain performance data current to the most recent month-end, please visit our website at www.morganstanley.com/cgcm.
The graph above and returns shown below do not reflect the deduction of taxes that a shareholder would pay on fund distributions or the redemption of fund shares.
| | | | | | | | | | | | | | | | | | | | | | |
| | | HIGH YIELD INVESTMENTS Average Annual Total Returns for the Period Ended August 31, 2015† | | |
| | | | | Without
Annual
Advisory
Program
Fee | | With
Annual
Advisory
Program
Fee* | | Barclays
Capital
U.S.
Corporate
High Yield
Index*** | | Lipper
High Yield
Funds
Average*** |
| | Since inception (7/13/1998) | | | | 4.44 | % | | | | 2.61 | % | | | | 6.50 | % | | | | 5.60 | % |
| | 10 year | | | | 6.25 | | | | | 4.20 | | | | | 7.43 | | | | | 6.39 | |
| | 5 year | | | | 6.25 | | | | | 3.76 | | | | | 7.34 | | | | | 6.51 | |
| | 3 year | | | | 3.64 | | | | | 0.96 | | | | | 4.91 | | | | | 4.22 | |
| | | 1 year | | | | (6.14 | ) | | | | (8.75 | ) | | | | (2.93 | ) | | | | (3.48 | ) |
See pages 27 through 29 for all footnotes.
20
International Fixed Income Investments
|
| ABOUTTHE SUBADVISER |
•Pacific Investment Management Company LLC (“PIMCO”) |
| PIMCO’s total return approach focuses on both capital appreciation and income while managing overall risk. PIMCO employs a core philosophy toward managing global bonds focusing on both economic and credit fundamentals as key determinants of value in fixed income markets, limiting volatility with respect to the benchmark market index. |
For the period September 1, 2014, through August 31, 2015, the Sub-adviser for CGCM International Fixed Income Investments (“Fund”) was Pacific Investment Management Company LLC (“PIMCO”). PIMCO manages a developed market debt strategy (“PIMCO DM Strategy”) and an emerging market debt strategy (“PIMCO EMD Strategy”) for the Fund.
The PIMCO DM Strategy outperformed its benchmark, the Citigroup Non-USD World Government Bond Index — (USD) Hedged, for the year ended August 31, 2015. Short exposure to U.S. duration during the period detracted from performance as U.S. rates generally fell across the curve. This was partially offset by an allocation to long-rates as the yield curve flattened. Non-U.S. duration positioning was negative for performance. Core European interest rate positioning detracted from performance as the Fund was underweight during the first half of the period as rates fell and overweight during the second half of the period as rates rose. Additionally, an underweight to U.K. duration detracted from returns as rates fell in this region as well. An overweight to European peripherals, especially Spain and Italy, contributed to returns as spreads tightened during the period. Spread strategies were overall negative for performance driven by short exposure to Agency mortgage-backed securities (MBS) which outperformed like-duration Treasuries over the period. Additionally, an allocation to U.S. Treasury Inflation Protected Securities (TIPS) detracted from performance as inflation breakeven levels declined over the period due to falling energy costs. Positive security and sector selection within non-U.S. high yield credit contributed to performance as financial names generally outperformed the broader credit market. Lastly, a long-dollar bias relative to the euro, yen and Australian dollar was positive for performance as these currencies depreciated versus the U.S. dollar.
The PIMCO Strategy EMD underperformed its benchmark, the JP Morgan Government Bond Index — Emerging Markets Global Diversified Index, for the year ended August 31, 2015. The portfolio’s overweight to Latin American duration, especially Brazil, detracted from performance as the central bank hiked rates multiple times in order to combat persistently high inflation. An underweight to Turkish rates was also negative for performance as the central bank cut rates amid sluggish growth and the central bank’s preference for a weaker baht. An underweight to Russian rates contributed to performance as the central bank dramatically hiked rates towards the end of 2014 to counter market volatility and stabilize the ruble. Lastly, currency strategies were positive for returns, primarily short exposure to the euro and yen and an underweight to the real as these currencies depreciated.
21
The following graph depicts the performance of International Fixed Income Investments vs. the Citigroup Non-USD World Government Bond Index (USD) — Hedged,9 and Lipper International Income Funds Average.19
|
HISTORICAL PERFORMANCE FOR THE TEN-YEAR PERIOD ENDED AUGUST 31, 2015
INTERNATIONAL FIXED INCOME INVESTMENTS Comparison of $10,000 and (Hedge and C.P. group) Investment in the Portfolio with the Citigroup Non-USD World Government Bond Index (USD) Hedged, and the Lipper International Income investment category |
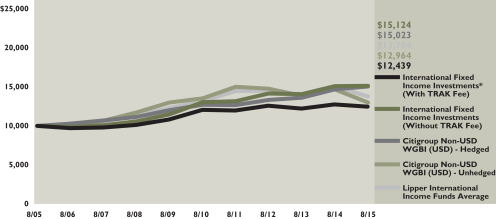
The performance shown above and below represents past performance. Past performance is no guarantee of future results and current performance may be higher or lower than the performance shown above and below. Performance figures may reflect voluntary fee waivers and/or expense reimbursements. In the absence of voluntary fee waivers and/or expense reimbursements, the total return would have been lower. Principal value and investment returns will fluctuate and investors’ shares, when redeemed, may be worth more or less than their original cost. To obtain performance data current to the most recent month-end, please visit our website at www.morganstanley.com/cgcm.
The graph above and returns shown below do not reflect the deduction of taxes that a shareholder would pay on fund distributions or the redemption of fund shares.
| | | | | | | | | | | | | | | | | | | | | | |
| | | INTERNATIONAL FIXED INCOME INVESTMENTS Average Annual Total Returns for the Period Ended August 31, 2015† | | |
| | | | | Without
Annual
Advisory
Program
Fee | | With
Annual
Advisory
Program
Fee* | | Citigroup
Non-USD
WGBI
(USD)
Hedged*** | | Lipper
International
Income
Funds
Average*** |
| | Since inception (11/18/1991) | | | | 5.92 | % | | | | 4.14 | % | | | | 6.27 | % | | | | 4.64 | % |
| | 10 year | | | | 4.22 | | | | | 2.21 | | | | | 4.22 | | | | | 3.58 | |
| | 5 year | | | | 3.06 | | | | | 0.65 | | | | | 3.58 | | | | | 0.88 | |
| | 3 year | | | | 2.24 | | | | | (0.41 | ) | | | | 4.31 | | | | | (1.40 | ) |
| | | 1 year | | | | 0.31 | | | | | (2.48 | ) | | | | 3.15 | | | | | (7.98 | ) |
See pages 27 through 29 for all footnotes.
22
Municipal Bond Investments
|
| ABOUTTHE SUBADVISER |
•McDonnell Investment Management, LLC (“McDonnell”) |
| McDonnell employs a value-added approach to active municipal bond management utilizing a team oriented philosophy. This approach attempts to maximize after-tax total returns while reducing the volatility in relative rates of return. By limiting dependence on market timing and tightly controlling duration, McDonnell reduces the portfolio’s exposure to interest rate relative risk. McDonnell utilizes extensive internal research to identify relative value opportunities among sectors and securities and to control credit risk. Additionally, McDonnell seeks to exploit yield curve anomalies through quantitative analysis of historical spreads and future expectations. |
For the period September 1, 2014, through August 31, 2015, the Sub-adviser for CGCM Municipal Bond Investments (“Fund”) was McDonnell Investment Management, LLC (“McDonnell”).
The Fund managed by McDonnell performed in-line with the Fund’s market index benchmark, the Barclays Capital U.S. Municipal Bond Index, for the year ended August 31, 2015. Increasing the Fund’s exposure on the longer-end of the yield curve, and an overweight to the 10-year portion of the curve played constructive roles in performance as the yield curve flattened. Additionally, security selection, particularly within the lower credit quality categories contributed positively to performance. Spread sectors such as Hospitals, Higher Education and Special Tax enhanced performance while higher credit quality sectors such as Local General Obligation and Water and Sewer Revenue were a modest drag.
Market development during the past year has been dominated by several core interrelated factors. U.S. economic growth has been steady, expected to register in the mid 2% area for 2015, and prospects going forward continue to look promising. Global growth, however, has been broadly decelerating and this imbalance has contributed to a significant strengthening of the dollar versus nearly all Developed Market (DM) and especially Emerging Market (EM) currencies. Concurrently, China, the world’s second largest economy, has been experiencing an economic slowdown as it attempts to manage a transition from double-digit growth led by a credit-fueled investment boom to a more sustainable, if slower rate of growth emphasizing greater domestic consumption. The transition away from investment has resulted in broad-based weakness across most commodity markets and the strengthening dollar has only added to downward pressure on commodity prices. The resultant collapse in energy prices has ratcheted headline inflation rates toward zero across much of the world’s major economic landscape, and in turn has pressured investor inflation expectations lower.
Against this unusual backdrop of near zero inflation and decelerating global growth, the U.S. Federal Reserve (“Fed”) appears ready to embark on a policy pivot away from its zero-lower bound interest rate policy which has been in place since December of 2008. The Fed has indicated that it intends to move gradually and that the ultimate level of rate increase is expected to be lower than recent historical policy shifts. We believe that any moves toward policy ‘normalization’ will be aimed at gradually reducing the pace of monetary accommodation as distinct from a move toward aggressively tightening monetary conditions. The Fed will likely be keen to provide enough room for the recovery to continue moving forward as the healing process from the Recession is far from complete.
Faced with an environment of declining inflation and an expected shift in U.S. monetary policy, yield curves flattened. Treasury yields declined modestly across much of the curve while municipal yields moved somewhat higher. Significantly higher new issue supply brought about by a surge in Refunding Issuance was an important factor as municipal prices edged lower while investors digested the largest new issue calendar since 2010. Demand remained relatively strong however, as industry wide mutual fund flows were positive and commercial banks continued to expand their portfolio allocations to municipals.
23
The following graph depicts the performance of Municipal Bond Investments vs. the Barclays Capital U.S. Municipal Bond Index10 and the Lipper General & Insured Municipal Debt Funds Average.20
Looking ahead, conditions seem to favor a relatively range-bound U.S. rate market amid steady domestic growth, little if any inflation, and expectations of a gradualist monetary policy. The dominant source of potential market volatility appears to revolve around the divergence of global growth prospects and the weakness of both EM and DM currencies versus the dollar. The environment of sub-par growth and deflationary tendencies abroad should augur for relatively benign conditions in U.S. fixed-income markets over the medium term horizon.
|
HISTORICAL PERFORMANCE FOR THE TEN-YEAR PERIOD ENDED AUGUST 31, 2015 MUNICIPAL BOND INVESTMENTS Comparison of $10,000 Investment in the Portfolio with the Barclays Capital U.S. Municipal Bond Index and the Lipper General & Insured Municipal Debt investment category |
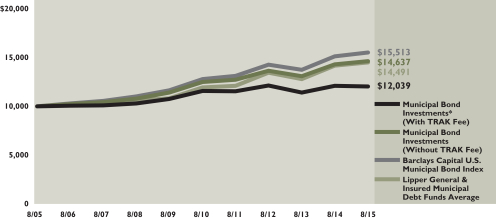
The performance shown above and below represents past performance. Past performance is no guarantee of future results and current performance may be higher or lower than the performance shown above and below. Performance figures may reflect voluntary fee waivers and/or expense reimbursements. In the absence of voluntary fee waivers and/or expense reimbursements, the total return would have been lower. Principal value and investment returns will fluctuate and investors’ shares, when redeemed, may be worth more or less than their original cost. To obtain performance data current to the most recent month-end, please visit our website at www.morganstanley.com/cgcm.
The graph above and returns shown below do not reflect the deduction of taxes that a shareholder would pay on fund distributions or the redemption of fund shares.
| | | | | | | | | | | | | | | | | | | | | | |
| | | MUNICIPAL BOND INVESTMENTS Average Annual Total Returns for the Period Ended August 31, 2015† |
| | | | | Without
Annual
Advisory
Program
Fee | | With
Annual
Advisory
Program
Fee* | | Barclay's
Capital
U.S.
Municipal
Bond
Index*** | | Lipper
General &
Insured
Municipal
Debt
Funds
Average*** |
| | Since inception (11/18/1991) | | | | 4.94 | % | | | | 3.18 | % | | | | 5.72 | % | | | | 5.21 | % |
| | 10 year | | | | 3.88 | | | | | 1.87 | | | | | 4.49 | | | | | 4.06 | |
| | 5 year | | | | 3.20 | | | | | 0.77 | | | | | 3.96 | | | | | 4.17 | |
| | 3 year | | | | 2.38 | | | | | (0.27 | ) | | | | 2.83 | | | | | 2.78 | |
| | | 1 year | | | | 2.32 | | | | | (0.52 | ) | | | | 2.52 | | | | | 2.48 | |
See pages 27 through 29 for all footnotes.
24
Money Market Investments
|
| ABOUTTHE SUBADVISER |
•The Dreyfus Corporation (“Dreyfus”) |
| Dreyfus’ approach to managing money market funds is to seek current yields consistent with the preservation of principal and the maintenance of liquidity. Dreyfus invests in a diversified portfolio of high quality, short-term debt securities with maturities of 397 days or less. The Fund is positioned based on Dreyfus’ view of the economy, yield curve analysis, anticipated changes in monetary policy, and the future path of interest rates. |
For the period September 1, 2014, through August 31, 2015, the Sub-adviser for CGCM Money Market Investments (“Fund”) was Dreyfus Corporation (“Dreyfus”).
The Fund managed by Dreyfus maintained a goal of maximum current income consistent with the maintenance of liquidity and preservation of capital. Dreyfus follows a conservative credit philosophy in managing the Fund and, as such, the Fund is structured with a diversified mix of short-term fixed income instruments issued by high quality borrowers.
July’s nonfarm payroll report showed employers adding 215,000 jobs. This was a bit short of the consensus of 225,000 but was still indicative of an economy in a modest expansion. The unemployment rate remained unchanged at 5.3%. Many other indicators of consumer sentiment, including home and auto sales, continued to point to the moderate growth pattern continuing for the 3rd quarter.
Following its meeting on July 29, the U.S. Federal Reserve’s Open Market Committee voted unanimously to maintain the current near-zero interest rate policy. However, individual members of the Committee have indicated that an interest rate increase would be appropriate during the remaining part of 2015 if the employment situation improves further and the Committee is reasonably confident that inflation will move back above 2% over the medium term.
25
| | | | | | | | | | | | | | | | | | | | | | |
| | | MONEY MARKET INVESTMENTS Average Annual Total Returns for the Period Ended August 31, 2015† | | |
| | | | | Without
Annual
Advisory
Program
Fee | | With
Annual
Advisory
Program
Fee* | | 90-day
Treasury
Bill
Index*** | | Lipper
Money
Market
Funds
Average*** |
| | Since inception (11/18/1991) | | | | 2.61 | % | | | | 0.89 | % | | | | 2.78 | % | | | | 2.61 | % |
| | 10 year | | | | 1.32 | | | | | (0.63 | ) | | | | 1.29 | | | | | 1.30 | |
| | 5 year | | | | 0.01 | | | | | (2.34 | ) | | | | 0.06 | | | | | 0.02 | |
| | 3 year | | | | 0.00 | | | | | (2.58 | ) | | | | 0.04 | | | | | 0.01 | |
| | | 1 year | | | | 0.00 | | | | | (2.78 | ) | | | | 0.02 | | | | | 0.01 | |
Performance figures may reflect voluntary fee waivers and/or expense reimbursements. In the absence of voluntary fee waivers and/or expense reimbursements, the total return would have been lower.
The returns shown do not reflect the deduction of taxes that a shareholder would pay on fund distributions or the redemption of fund shares.
RISKS: An investment in a money market fund is neither insured nor guaranteed by the FDIC or any other government agency. Although the Fund seeks to preserve the value of your investment at one dollar per share, it is possible to lose money by investing in the Fund.
See pages 27 through 29 for all footnotes.
26
FOOTNOTES
| † | | All figures represent past performance and are not a guarantee of future results. Investment return and principal value of an investment will fluctuate so that an investor’s shares, when redeemed, may be worth more or less than their original cost. The returns shown do not reflect the deduction of taxes that a shareholder would pay on fund distributions or the redemptions of fund shares. Performance figures may reflect fee waivers and/or expense reimbursements. In the absence of fee waivers and/or expense reimbursements, the total return would have been lower. To obtain performance data current to the most recent month-end, please visit our website at https://www.morganstanley.com/cgcm. |
| * | | The Funds are available only to investors participating in Morgan Stanley approved advisory programs. These programs charge an annual fee, which may be up to 2.50%. |
| ** | | Consulting Group Advisory Services, LLC (“CGAS”), a business of Morgan Stanley Smith Barney Holdings LLC (“MSSBH”), voluntarily waived and/or reimbursed certain fees or expense to maintain a positive net yield. |
| *** | | Inception returns of the market indices and Lipper investment category averages are calculated from the end of the inception month. |
| 1. | | The Russell 1000® Growth Index measures the performance of those Russell 1000 companies with higher price-to-book ratios and higher forecasted growth values. Because the index is not a managed portfolio, there are no advisory fees or internal management expenses reflected in the index’s performance. Please note that an investor cannot invest directly in an index. |
| 2. | | The Russell 1000® Value Index measures the performance of those Russell 1000 Index companies with lower price-to-book ratios and lower forecasted growth values. Because the index is not a managed portfolio, there are no advisory fees or internal management expenses reflected in the index’s performance. Please note that an investor cannot invest directly in an index. |
| 3. | | The Russell 2000® Growth Index measures the performance of those Russell 2000 companies with higher price-to-book ratios and higher forecasted growth values. Because the index is not a managed portfolio, there are no advisory fees or internal management expenses reflected in the index’s performance. Please note that an investor cannot invest directly in an index. |
| 4. | | The Russell 2000® Value Index measures the performance of those Russell 2000 Index companies with lower price-to-book ratios and lower forecasted growth values. Because the index is not a managed portfolio, there are no advisory fees or internal management expenses reflected in the index’s performance. Please note that an investor cannot invest directly in an index. |
| 5. | | The Morgan Stanley Capital International Europe, Australasia, Far East (MSCI EAFE®) Index (Net) is a free float-adjusted market capitalization index that is designed to measure the equity market performance of developed markets, excluding the U.S. & Canada. The MSCI EAFE Index consists of the following 21 developed market country indexes: Australia, Austria, Belgium, Denmark, Finland, France, Germany, Hong Kong, Ireland, Israel, Italy, Japan, the Netherlands, New Zealand, Norway, Portugal, Singapore, Spain, Sweden, Switzerland, and the United Kingdom. Net total return indexes reinvest dividends after the deduction of withholding taxes, using (for international indexes) a tax rate applicable to non-resident institutional investors who do not benefit from double taxation treaties. Because the index is not a managed portfolio, there are no advisory fees or internal management expenses reflected in the index’s performance. Please note that an investor cannot invest directly in an index. |
| 6. | | The MSCI Emerging Markets Index (Net) is a free float-adjusted market capitalization index that is designed to measure equity market performance of emerging markets. The MSCI Emerging Markets Index (Net) consists of the following 21 emerging market country indexes: Brazil, Chile, China, Colombia, Czech Republic, Egypt, Greece, Hungary, India, Indonesia, Korea, Malaysia, Mexico, Peru, Philippines, Poland, Russia, South Africa, Taiwan, Thailand, and Turkey. Net total return indexes reinvest dividends after the deduction of withholding taxes, using (for international indexes) a tax rate applicable to non-resident institutional investors who do not benefit from double taxation treaties. Because the index is not a managed portfolio, there are no advisory fees or internal management expenses reflected in the index’s performance. Please note that an investor cannot invest directly in an index. |
27
| 7. | | The Barclays Capital U.S. Aggregate BondTM Index is a broad-based index that measures the investment grade, U.S. dollar-denominated, fixed-rate taxable bond market, including Treasuries, government-related and corporate securities, MBS (agency fixed-rate and hybrid ARM passthroughs), ABS, and CMBS. Because the index is not a managed portfolio, there are no advisory fees or internal management expenses reflected in the index’s performance. Please note that an investor cannot invest directly in an index. |
| 8. | | The Barclays Capital U.S. Corporate High-Yield Index measures the market of U.S. dollar-denominated, non-investment grade, fixed rate, taxable corporate bonds. Because the index is not a managed portfolio, there are no advisory fees or internal management expenses reflected in the index’s performance. Please note that an investor cannot invest directly in an index. |
| 9. | | The Citigroup Non-USD World Government Bond Index (USD) Hedged and Unhedged are each sub-indices of the Citigroup World Government Bond Index (WGBI), which is comprised of the global sovereign debt of over 20 countries representative in the Americas, EMEA, EMU, Asia Pacific, and Japan regions. The Non-U.S. Dollar WGBI includes all WGBI markets except the United States and is stated in U.S. dollar hedged or unhedged base currency terms. Because the index is not a managed portfolio, there are no advisory fees or internal management expenses reflected in the index’s performance. Please note that an investor cannot invest directly in an index. |
| 10. | | The Barclays Capital U.S. Municipal Index covers the U.S. dollar-denominated long-term tax exempt bond market. The index has four main sectors: state and local general obligation bonds, revenue bonds, insured bonds, and prerefunded bonds. Because the index is not a managed portfolio, there are no advisory fees or internal management expenses reflected in the index’s performance. Please note that an investor cannot invest directly in an index. |
| 11. | | The Lipper Large-Cap Growth Funds Average is an equally weighted average of all active funds available within the investment category. The classification includes funds that, by portfolio practice, invest at least 75% of their equity assets in companies with market capitalizations (on a three-year weighted basis) above Lipper’s USDE large-cap floor. Large-cap growth funds typically have above-average characteristics compared to the S&P 500 Index. The total return of the Lipper Funds Average does not include the effect of sales charges. Please note that an investor cannot invest directly in a mutual funds classification average or an index. |
| 12. | | The Lipper Large-Cap Value Funds Average is an equally weighted average of all active funds available within the investment category. The classification includes funds that, by portfolio practice, invest at least 75% of their equity assets in companies with market capitalizations (on a three-year weighted basis) above Lipper’s USDE large-cap floor. Large-cap value funds typically have below-average characteristics compared to the S&P 500 Index. The total return of the Lipper Funds Average does not include the effect of sales charges. Please note that an investor cannot invest directly in a mutual funds classification average or an index. |
| 13. | | The Lipper Small-Cap Growth Funds Average is an equally weighted average of all active funds available within the investment category. The classification includes funds that, by portfolio practice, invest at least 75% of their equity assets in companies with market capitalizations (on a three-year weighted basis) below Lipper’s USDE small-cap ceiling. Small-cap growth funds typically have above-average characteristics compared to the S&P SmallCap 600 Index. The total return of the Lipper Funds Average does not include the effect of sales charges. Please note that an investor cannot invest directly in a mutual funds classification average or an index. |
| 14. | | The Lipper Small-Cap Value Funds Average is an equally weighted average of all active funds available within the investment category. The classification includes funds that, by portfolio practice, invest at least 75% of their equity assets in companies with market capitalizations (on a three-year weighted basis) below Lipper’s USDE small-cap ceiling. Small-cap growth funds typically have below-average characteristics compared to the S&P SmallCap 600 Index. The total return of the Lipper Funds Average does not include the effect of sales charges. Please note that an investor cannot invest directly in a mutual funds classification average or an index. |
28
| 15. | | The Lipper International Large-Cap Core Funds Average is an equally weighted average of all active funds available within the investment category. The classification includes funds that, by portfolio practice, invest at least 75% of their equity assets in companies outside of the U.S. with market capitalizations (on a three-year weighted basis) above Lipper’s international large-cap floor. International large-cap core funds typically have average characteristics compared to their large-cap-specific subset of the MSCI EAFE® Index. The total return of the Lipper Funds Average does not include the effect of sales charges. Please note that an investor cannot invest directly in a mutual funds classification average or an index. |
| 16. | | The Lipper Emerging Markets Funds Average is an equally weighted average of all active funds available within the investment category. The classification includes funds that seek long-term capital appreciation by investing at least 65% of total assets in emerging market equity securities, where “emerging market” is defined by a country’s GNP per capita or other economic measures. The total return of the Lipper Funds Average does not include the effect of sales charges. Please note that an investor cannot invest directly in a mutual funds classification average or an index. |
| 17. | | The Lipper Core Bond Funds Average is an equally weighted average of all active funds available within the investment category. The classification includes funds that invest at least 85% of their assets in domestic investment-grade debt issues (rated in top four grades) with any remaining in investment in non-benchmark sectors such as high-yield, global and emerging market debt. These funds maintain dollar-weighted average maturities of five to ten years. The total return of the Lipper Funds Average does not include the effect of sales charges. Please note that an investor cannot invest directly in a mutual funds classification average or an index. |
| 18. | | The Lipper High Yield Funds Average is an equally weighted average of all active funds available within the investment category. The classification includes funds that aim at high (relative) current yield from fixed income securities, have no quality or maturity restrictions, and tend to invest in lower grade debt issues. The total return of the Lipper Funds Average does not include the effect of sales charges. Please note that an investor cannot invest directly in a mutual funds classification average or an index. |
| 19. | | The Lipper International Income Funds Average is an equally weighted average of all active funds available within the investment category. The classification includes funds that state in their prospectus that they invest primarily in U.S. dollar and non-U.S. dollar debt securities of issuers located in at least three countries, excluding the United States, except in periods of market weakness. The total return of the Lipper Funds Average does not include the effect of sales charges. Please note that an investor cannot invest directly in a mutual funds classification average or an index. |
| 20. | | The Lipper General & Insured Municipal Debt Funds Average is an equally weighted average of all active funds available within the investment category. The classification includes funds that either invest primarily in municipal debt issues rated in the top four credit ratings or invest primarily in municipal debt issues insured as to timely payment. The total return of the Lipper Funds Average does not include the effect of sales charges. Please note that an investor cannot invest directly in a mutual funds classification average or an index. |
29
Example
As a shareholder of a Fund, you may incur two types of costs: (1) annual advisory program fees. Which may be up to 2.50%; and (2) ongoing costs, including management fees and other Fund expenses. This example is intended to help you understand your ongoing costs (in dollars) of investing in a Fund and to compare these costs with the ongoing costs of investing in other mutual funds. This example is based on an investment of $1,000 invested on March 1, 2015 and held for the six months ended August 31, 2015.
Actual Expenses
The table below titled “Based on Actual Total Return” provides information about actual account values and actual expenses. You may use the information provided in this table, together with the amount you invested, to estimate the expenses that you paid over the period. To estimate the expenses you paid on your account during this period, divide your account value by $1,000 (for example, an $8,600 account value divided by $1,000 = 8.6), then multiply the result by the number under the heading entitled “Expenses Paid During the Period”.
| | | | | | | | | | | | | | | | | | | | | | | | | |
| Based on Actual Total Return(1) |
| | | | | |
| Fund | | Total Return
Without
Annual Advisory
Program Fees(2) | | Beginning
Account
Value | | Ending
Account
Value | | Annualized
Expense
Ratios(3) | | Expense
Paid During
the Period(4) |
Large Capitalization Growth Investments | | | | -3.51 | % | | | $ | 1,000.00 | | | | $ | 964.90 | | | | | 0.69 | % | | | $ | 3.41 | |
Large Capitalization Value Equity Investments | | | | -7.46 | % | | | | 1,000.00 | | | | | 925.40 | | | | | 0.68 | % | | | | 3.31 | |
Small Capitalization Growth Investments | | | | -3.63 | % | | | | 1,000.00 | | | | | 963.70 | | | | | 0.94 | % | | | | 4.64 | |
Small Capitalization Value Equity Investments | | | | -6.07 | % | | | | 1,000.00 | | | | | 939.30 | | | | | 0.98 | % | | | | 4.80 | |
International Equity Investments | | | | -5.87 | % | | | | 1,000.00 | | | | | 941.30 | | | | | 0.80 | % | | | | 3.89 | |
Emerging Markets Equity Investments | | | | -14.75 | % | | | | 1,000.00 | | | | | 852.50 | | | | | 0.93 | % | | | | 4.35 | |
Core Fixed Income Investments | | | | -0.79 | % | | | | 1,000.00 | | | | | 992.10 | | | | | 0.54 | % | | | | 2.70 | |
High Yield Investments | | | | -3.67 | % | | | | 1,000.00 | | | | | 963.30 | | | | | 0.79 | % | | | | 3.89 | |
International Fixed Income Investments | | | | -3.80 | % | | | | 1,000.00 | | | | | 962.00 | | | | | 1.04 | % | | | | 5.14 | |
Municipal Bond Investments | | | | 0.33 | % | | | | 1,000.00 | | | | | 1,003.30 | | | | | 0.71 | % | | | | 3.60 | |
Money Market Investments | | | | 0.00 | %(5) | | | | 1,000.00 | | | | | 1,000.00 | | | | | 0.18 | % | | | | 0.89 | |
| (1) | For the six months ended August 31, 2015. |
| (2) | Assumes reinvestment of all distributions, including returns of capital, if any, at net asset value and does not reflect the deduction of the applicable advisory program charge, which may be up to 2.50%. Total return is not annualized as it may not be representative of the total return for the year. Performance figure may reflect fee waivers and/or expense reimbursements. Past performance is no guarantee of future results. In the absence of fee waivers and/or expenses reimbursements, the total return would have been lower. |
| (3) | Annualized Expense Ratios are based on the most recent 6 month expense ratios, which may differ from net expense ratios in the Financial Highlights. |
| (4) | Expenses (net of fee waivers and/or expense reimbursements) are equal to each Fund’s respective annualized expense ratio multiplied by the average account value over the period, multiplied by the number of days (184 days) in the most recent fiscal half-year, then divided by 365 (to reflect the one-half year period). |
| (5) | CGAS, a business of MSSBH, voluntarily waived and/or reimbursed certain fees or expenses to maintain a positive net yield. |
30
Hypothetical Example for Comparison Purposes
The table below titled “Based on Hypothetical Total Return” provides information about hypothetical account values and hypothetical expenses based on each Fund’s actual expense ratio and an assumed rate of return of 5.00% per year before expenses, which is not each Fund’s actual return. The hypothetical account values and expenses may not be used to estimate the actual ending account balances or expenses you paid for the period. You may use the information provided in this table to compare the ongoing costs of investing in each Fund and other funds. To do so, compare the 5.00% hypothetical example relating to a Fund with the 5.00% hypothetical examples that appear in the shareholder reports of the other funds.
Please note that the expenses shown in the table below are meant to highlight your ongoing costs only and do not reflect any advisory program annual fees. Therefore, the table is useful in comparing ongoing costs only, and will not help you determine the relative total costs of owning different funds. In addition, if these advisory program annual fees were included, your costs would have been higher.
| | | | | | | | | | | | | | | | | | | | | | | | | |
| Based on Hypothetical Total Return(1) |
| | | | | |
| Fund | | Hypothetical
Annualized
Total Return | | Beginning
Account
Value | | Ending
Account
Value | | Annualized
Expense
Ratios(2) | | Expense
Paid During
the Period(3) |
Large Capitalization Growth Investments | | | | 5.00 | % | | | $ | 1,000.00 | | | | $ | 1,021.73 | | | | | 0.69 | % | | | $ | 3.52 | |
Large Capitalization Value Equity Investments | | | | 5.00 | % | | | | 1,000.00 | | | | | 1,021.78 | | | | | 0.68 | % | | | | 3.47 | |
Small Capitalization Growth Investments | | | | 5.00 | % | | | | 1,000.00 | | | | | 1,020.47 | | | | | 0.94 | % | | | | 4.79 | |
Small Capitalization Value Equity Investments | | | | 5.00 | % | | | | 1,000.00 | | | | | 1,020.27 | | | | | 0.98 | % | | | | 4.99 | |
International Equity Investments | | | | 5.00 | % | | | | 1,000.00 | | | | | 1,021.17 | | | | | 0.80 | % | | | | 4.08 | |
Emerging Markets Equity Investments | | | | 5.00 | % | | | | 1,000.00 | | | | | 1,020.52 | | | | | 0.93 | % | | | | 4.74 | |
Core Fixed Income Investments | | | | 5.00 | % | | | | 1,000.00 | | | | | 1,022.48 | | | | | 0.54 | % | | | | 2.75 | |
High Yield Investments | | | | 5.00 | % | | | | 1,000.00 | | | | | 1,021.22 | | | | | 0.79 | % | | | | 4.02 | |
International Fixed Income Investments | | | | 5.00 | % | | | | 1,000.00 | | | | | 1,019.96 | | | | | 1.04 | % | | | | 5.30 | |
Municipal Bond Investments | | | | 5.00 | % | | | | 1,000.00 | | | | | 1,021.63 | | | | | 0.71 | % | | | | 3.62 | |
Money Market Investments | | | | 5.00 | % | | | | 1,000.00 | | | | | 1,024.30 | | | | | 0.18 | % | | | | 0.92 | |
| (1) | For the six months ended August 31, 2015. |
| (2) | Annualized Expense Ratios are based on the most recent 6 month expense ratios, which may differ from expense ratios in the Financial Highlights. |
| (3) | Expenses (net of fee waivers and/or expense reimbursements) are equal to each Fund’s respective annualized expense ratio multiplied by the average account value over the period, multiplied by the number of days (184 days) in the most recent fiscal half-year, then divided by 365 (to reflect the one-half year period). |
31
| | | | | | | | |
| Large Capitalization Growth Investments | |
| | |
| Shares/Units | | | Security | | Value | |
| COMMON STOCKS — 97.4% | |
| CONSUMER DISCRETIONARY — 21.4% | |
| Auto Components — 1.5% | |
| | 258,430 | | | Delphi Automotive PLC | | $ | 19,516,634 | |
| | | | | | | | |
| Distributors — 0.2% | |
| | 77,087 | | | LKQ Corp.* | | | 2,311,839 | |
| | | | | | | | |
| Diversified Consumer Services — 0.1% | |
| | 29,915 | | | Bright Horizons Family Solutions Inc.* | | | 1,828,405 | |
| | | | | | | | |
| Hotels, Restaurants & Leisure — 2.1% | |
| | 1,726 | | | Chipotle Mexican Grill Inc., Class A Shares* | | | 1,225,477 | |
| | 19,749 | | | Dunkin’ Brands Group Inc. | | | 990,610 | |
| | 341,172 | | | Hilton Worldwide Holdings Inc. | | | 8,471,301 | |
| | 36,648 | | | MGM Resorts International* | | | 748,719 | |
| | 109,770 | | | Starbucks Corp. | | | 6,005,517 | |
| | 35,682 | | | Wynn Resorts Ltd. | | | 2,677,934 | |
| | 107,090 | | | Yum! Brands Inc. | | | 8,542,569 | |
| | | | | | | | |
| | | | Total Hotels, Restaurants & Leisure | | | 28,662,127 | |
| | | | | | | | |
| Household Durables — 0.8% | |
| | 20,496 | | | Harman International Industries Inc. | | | 2,003,279 | |
| | 173,600 | | | Jarden Corp.* | | | 8,912,624 | |
| | | | | | | | |
| | | | Total Household Durables | | | 10,915,903 | |
| | | | | | | | |
| Internet & Catalog Retail — 4.7% | |
| | 50,529 | | | Amazon.com Inc.* | | | 25,915,819 | |
| | 17,248 | | | Expedia Inc. | | | 1,983,348 | |
| | 405,225 | | | Liberty Interactive Corp., Class A Shares* | | | 10,957,284 | |
| | 48,212 | | | NetFlix Inc.* | | | 5,545,826 | |
| | 10,385 | | | Priceline Group Inc. (The)* | | | 12,967,126 | |
| | 87,767 | | | TripAdvisor Inc.* | | | 6,134,913 | |
| | | | | | | | |
| | | | Total Internet & Catalog Retail | | | 63,504,316 | |
| | | | | | | | |
| Leisure Products — 0.2% | |
| | 42,672 | | | Brunswick Corp. | | | 2,121,225 | |
| | | | | | | | |
| Media — 3.9% | |
| | 211,870 | | | Comcast Corp., Class A Shares | | | 11,934,637 | |
| | 68,579 | | | Discovery Communications Inc., Class A Shares* | | | 1,824,201 | |
| | 122,956 | | | Discovery Communications Inc., Class C Shares* | | | 3,118,164 | |
| | 30,552 | | | Imax Corp.* | | | 957,805 | |
| | 147,400 | | | Liberty Global PLC, Series C* | | | 6,613,838 | |
| | 116,400 | | | Time Warner Inc. | | | 8,276,040 | |
| | 321,010 | | | Twenty-First Century Fox Inc., Class A Shares | | | 8,792,464 | |
| | 112,710 | | | Walt Disney Co. (The) | | | 11,482,895 | |
| | | | | | | | |
| | | | Total Media | | | 53,000,044 | |
| | | | | | | | |
| Multiline Retail — 1.2% | |
| | 46,352 | | | Dollar General Corp. | | | 3,452,761 | |
| | 173,974 | | | Dollar Tree Inc.* | | | 13,267,257 | |
| | | | | | | | |
| | | | Total Multiline Retail | | | 16,720,018 | |
| | | | | | | | |
| Specialty Retail — 4.1% | |
| | 7,783 | | | Advance Auto Parts Inc. | | | 1,363,971 | |
| | 61,134 | | | DSW Inc., Class A Shares | | | 1,815,068 | |
| | 40,396 | | | GNC Holdings Inc., Class A Shares | | | 1,890,533 | |
| | 213,060 | | | Home Depot Inc. (The) | | | 24,812,968 | |
| | 103,998 | | | L Brands Inc. | | | 8,725,432 | |
See Notes to Financial Statements.
32
| | | | | | | | |
| Large Capitalization Growth Investments | |
| | |
| Shares/Units | | | Security | | Value | |
| CONSUMER DISCRETIONARY — 21.4% — (continued) | |
| Specialty Retail — 4.1% — (continued) | |
| | 50,330 | | | Lowe’s Cos., Inc. | | $ | 3,481,326 | |
| | 8,830 | | | O’Reilly Automotive Inc.* | | | 2,119,818 | |
| | 58,614 | | | Ross Stores Inc. | | | 2,849,813 | |
| | 57,847 | | | Sally Beauty Holdings Inc.* | | | 1,512,120 | |
| | 105,235 | | | TJX Cos., Inc. (The) | | | 7,400,125 | |
| | | | | | | | |
| | | | Total Specialty Retail | | | 55,971,174 | |
| | | | | | | | |
| Textiles, Apparel & Luxury Goods — 2.6% | |
| | 12,748 | | | Carter’s Inc. | | | 1,253,256 | |
| | 19,116 | | | Lululemon Athletica Inc.* | | | 1,223,615 | |
| | 159,200 | | | NIKE Inc., Class B Shares | | | 17,790,600 | |
| | 64,200 | | | Under Armour Inc., Class A Shares* | | | 6,133,026 | |
| | 121,020 | | | V.F. Corp. | | | 8,765,479 | |
| | | | | | | | |
| | | | Total Textiles, Apparel & Luxury Goods | | | 35,165,976 | |
| | | | | | | | |
| | | | TOTAL CONSUMER DISCRETIONARY | | | 289,717,661 | |
| | | | | | | | |
| CONSUMER STAPLES — 5.0% | |
| Beverages — 2.8% | |
| | 18,370 | | | Brown-Forman Corp., Class B Shares | | | 1,802,097 | |
| | 203,180 | | | Coca-Cola Enterprises Inc. | | | 10,461,738 | |
| | 187,635 | | | Constellation Brands Inc., Class A Shares | | | 24,017,280 | |
| | 8,989 | | | Monster Beverage Corp.* | | | 1,244,617 | |
| | | | | | | | |
| | | | Total Beverages | | | 37,525,732 | |
| | | | | | | | |
| Food & Staples Retailing — 2.1% | |
| | 59,590 | | | Costco Wholesale Corp. | | | 8,345,580 | |
| | 32,162 | | | United Natural Foods Inc.* | | | 1,548,600 | |
| | 211,765 | | | Walgreens Boots Alliance Inc. | | | 18,328,261 | |
| | | | | | | | |
| | | | Total Food & Staples Retailing | | | 28,222,441 | |
| | | | | | | | |
| Food Products — 0.1% | |
| | 23,427 | | | Hain Celestial Group Inc. (The)* | | | 1,425,767 | |
| | 9,709 | | | Mead Johnson Nutrition Co., Class A Shares | | | 760,603 | |
| | | | | | | | |
| | | | Total Food Products | | | 2,186,370 | |
| | | | | | | | |
| | | | TOTAL CONSUMER STAPLES | | | 67,934,543 | |
| | | | | | | | |
| ENERGY — 1.3% | |
| Oil, Gas & Consumable Fuels — 1.3% | |
| | 39,582 | | | Carrizo Oil & Gas Inc.* | | | 1,441,972 | |
| | 407,600 | | | Consol Energy Inc.(a) | | | 6,207,748 | |
| | 23,696 | | | Continental Resources Inc.* | | | 760,642 | |
| | 10,949 | | | InterOil Corp.* | | | 392,631 | |
| | 141,910 | | | Valero Energy Corp. | | | 8,420,939 | |
| | 3,838 | | | Williams Cos., Inc. (The) | | | 184,992 | |
| | | | | | | | |
| | | | Total Oil, Gas & Consumable Fuels | | | 17,408,924 | |
| | | | | | | | |
| FINANCIALS — 7.0% | |
| Banks — 1.4% | |
| | 323,590 | | | Citigroup Inc. | | | 17,305,593 | |
| | 17,136 | | | Signature Bank* | | | 2,287,485 | |
| | | | | | | | |
| | | | Total Banks | | | 19,593,078 | |
| | | | | | | | |
| Capital Markets — 1.7% | |
| | 185,000 | | | Charles Schwab Corp. (The) | | | 5,620,300 | |
| | 75,547 | | | E*Trade Financial Corp.* | | | 1,986,131 | |
| | 53,896 | | | Raymond James Financial Inc. | | | 2,855,949 | |
See Notes to Financial Statements.
33
| | | | | | | | |
| Large Capitalization Growth Investments | |
| | |
| Shares/Units | | | Security | | Value | |
| FINANCIALS — 7.0% — (continued) | |
| Capital Markets — 1.7% — (continued) | |
| | 169,010 | | | State Street Corp. | | $ | 12,155,199 | |
| | 46,387 | | | WisdomTree Investments Inc. | | | 869,756 | |
| | | | | | | | |
| | | | Total Capital Markets | | | 23,487,335 | |
| | | | | | | | |
| Diversified Financial Services — 1.9% | |
| | 65,833 | | | Intercontinental Exchange Inc. | | | 15,036,916 | |
| | 104,100 | | | McGraw Hill Financial Inc. | | | 10,096,659 | |
| | | | | | | | |
| | | | Total Diversified Financial Services | | | 25,133,575 | |
| | | | | | | | |
| Insurance — 0.3% | |
| | 33,951 | | | Allied World Assurance Co. Holdings AG | | | 1,356,003 | |
| | 28,289 | | | Aon PLC | | | 2,643,324 | |
| | | | | | | | |
| | | | Total Insurance | | | 3,999,327 | |
| | | | | | | | |
| Real Estate Investment Trusts (REITs) — 1.7% | |
| | 131,800 | | | Crown Castle International Corp. | | | 10,990,802 | |
| | 45,414 | | | Equinix Inc. | | | 12,251,335 | |
| | | | | | | | |
| | | | Total Real Estate Investment Trusts (REITs) | | | 23,242,137 | |
| | | | | | | | |
| | | | TOTAL FINANCIALS | | | 95,455,452 | |
| | | | | | | | |
| HEALTH CARE — 21.5% | |
| Biotechnology — 8.3% | |
| | 326,560 | | | AbbVie Inc. | | | 20,380,609 | |
| | 43,900 | | | Alexion Pharmaceuticals Inc.* | | | 7,559,141 | |
| | 18,853 | | | Alkermes PLC* | | | 1,122,885 | |
| | 5,851 | | | Alnylam Pharmaceuticals Inc.* | | | 602,126 | |
| | 25,712 | | | Biogen Inc.* | | | 7,644,177 | |
| | 8,362 | | | BioMarin Pharmaceutical Inc.* | | | 1,080,705 | |
| | 373,174 | | | Celgene Corp.* | | | 44,064,386 | |
| | 35,998 | | | Gilead Sciences Inc. | | | 3,782,310 | |
| | 22,437 | | | Incyte Corp.* | | | 2,606,955 | |
| | 5,049 | | | Medivation Inc.* | | | 444,615 | |
| | 13,100 | | | Regeneron Pharmaceuticals Inc.* | | | 6,726,850 | |
| | 125,150 | | | Vertex Pharmaceuticals Inc.* | | | 15,959,128 | |
| | | | | | | | |
| | | | Total Biotechnology | | | 111,973,887 | |
| | | | | | | | |
| Health Care Equipment & Supplies — 1.6% | |
| | 76,512 | | | Cooper Cos., Inc. (The) | | | 12,427,079 | |
| | 17,709 | | | DexCom Inc.* | | | 1,667,125 | |
| | 113,730 | | | STERIS Corp. | | | 7,284,407 | |
| | | | | | | | |
| | | | Total Health Care Equipment & Supplies | | | 21,378,611 | |
| | | | | | | | |
| Health Care Providers & Services — 1.3% | |
| | 98,079 | | | Cardinal Health Inc. | | | 8,068,959 | |
| | 11,065 | | | Centene Corp.* | | | 682,932 | |
| | 39,574 | | | HealthSouth Corp. | | | 1,689,810 | |
| | 7,844 | | | Humana Inc. | | | 1,433,805 | |
| | 29,082 | | | MEDNAX Inc.* | | | 2,342,555 | |
| | 16,741 | | | Molina Healthcare Inc.* | | | 1,248,711 | |
| | 17,086 | | | Universal Health Services Inc., Class B Shares | | | 2,343,174 | |
| | | | | | | | |
| | | | Total Health Care Providers & Services | | | 17,809,946 | |
| | | | | | | | |
| Health Care Technology — 0.1% | |
| | 15,937 | | | Cerner Corp.* | | | 984,269 | |
| | | | | | | | |
See Notes to Financial Statements.
34
| | | | | | | | |
| Large Capitalization Growth Investments | |
| | |
| Shares/Units | | | Security | | Value | |
| HEALTH CARE — 21.5% — (continued) | |
| Life Sciences Tools & Services — 0.8% | |
| | 9,558 | | | Illumina Inc.* | | $ | 1,888,756 | |
| | 32,270 | | | PAREXEL International Corp.* | | | 2,120,785 | |
| | 60,240 | | | Thermo Fisher Scientific Inc. | | | 7,552,289 | |
| | | | | | | | |
| | | | Total Life Sciences Tools & Services | | | 11,561,830 | |
| | | | | | | | |
| Pharmaceuticals — 9.4% | |
| | 112,550 | | | Allergan PLC* | | | 34,185,937 | |
| | 108,700 | | | Endo International PLC* | | | 8,369,900 | |
| | 122,391 | | | Jazz Pharmaceuticals PLC* | | | 20,662,049 | |
| | 157,425 | | | Novo Nordisk AS, ADR | | | 8,700,880 | |
| | 9,899 | | | Perrigo Co. PLC | | | 1,811,220 | |
| | 35,900 | | | Shire PLC, ADR | | | 8,328,800 | |
| | 375,390 | | | Teva Pharmaceutical Industries Ltd., ADR | | | 24,178,870 | |
| | 48,132 | | | Valeant Pharmaceuticals International Inc.* | | | 11,099,239 | |
| | 205,100 | | | Zoetis Inc., Class A Shares | | | 9,202,837 | |
| | | | | | | | |
| | | | Total Pharmaceuticals | | | 126,539,732 | |
| | | | | | | | |
| | | | TOTAL HEALTH CARE | | | 290,248,275 | |
| | | | | | | | |
| INDUSTRIALS — 6.1% | |
| Aerospace & Defense — 0.6% | |
| | 203,660 | | | Textron Inc. | | | 7,902,008 | |
| | | | | | | | |
| Airlines — 1.6% | |
| | 62,479 | | | American Airlines Group Inc. | | | 2,435,431 | |
| | 151,100 | | | Delta Air Lines Inc. | | | 6,615,158 | |
| | 31,051 | | | Spirit Airlines Inc.* | | | 1,591,364 | |
| | 183,800 | | | United Continental Holdings Inc.* | | | 10,471,086 | |
| | | | | | | | |
| | | | Total Airlines | | | 21,113,039 | |
| | | | | | | | |
| Commercial Services & Supplies — 0.3% | |
| | 19,035 | | | Cintas Corp. | | | 1,617,785 | |
| | 46,408 | | | Copart Inc.* | | | 1,625,208 | |
| | 34,341 | | | KAR Auction Services Inc. | | | 1,271,991 | |
| | | | | | | | |
| | | | Total Commercial Services & Supplies | | | 4,514,984 | |
| | | | | | | | |
| Electrical Equipment — 0.3% | |
| | 87,250 | | | AMETEK Inc. | | | 4,695,795 | |
| | | | | | | | |
| Industrial Conglomerates — 0.8% | |
| | 85,900 | | | Carlisle Cos., Inc. | | | 8,650,130 | |
| | 10,537 | | | Roper Technologies Inc. | | | 1,707,942 | |
| | | | | | | | |
| | | | Total Industrial Conglomerates | | | 10,358,072 | |
| | | | | | | | |
| Machinery — 1.0% | |
| | 143,597 | | | Caterpillar Inc. | | | 10,976,555 | |
| | 32,820 | | | Wabtec Corp. | | | 3,142,843 | |
| | | | | | | | |
| | | | Total Machinery | | | 14,119,398 | |
| | | | | | | | |
| Marine — 0.0% | |
| | 10,101 | | | Kirby Corp.* | | | 712,424 | |
| | | | | | | | |
| Professional Services — 0.9% | |
| | 18,212 | | | CEB Inc. | | | 1,304,343 | |
| | 18,312 | | | Equifax Inc. | | | 1,792,745 | |
| | 198,430 | | | Nielsen Holdings PLC | | | 8,974,989 | |
| | | | | | | | |
| | | | Total Professional Services | | | 12,072,077 | |
| | | | | | | | |
See Notes to Financial Statements.
35
| | | | | | | | |
| Large Capitalization Growth Investments | |
| | |
| Shares/Units | | | Security | | Value | |
| INDUSTRIALS — 6.1% — (continued) | |
| Road & Rail — 0.5% | |
| | 26,288 | | | J.B. Hunt Transport Services Inc. | | $ | 1,913,241 | |
| | 50,760 | | | Union Pacific Corp. | | | 4,352,162 | |
| | | | | | | | |
| | | | Total Road & Rail | | | 6,265,403 | |
| | | | | | | | |
| Trading Companies & Distributors — 0.1% | |
| | 41,156 | | | HD Supply Holdings Inc.* | | | 1,358,148 | |
| | | | | | | | |
| | | | TOTAL INDUSTRIALS | | | 83,111,348 | |
| | | | | | | | |
| INFORMATION TECHNOLOGY — 31.1% | |
| Communications Equipment — 1.6% | |
| | 46,321 | | | Palo Alto Networks Inc.* | | | 7,606,835 | |
| | 258,378 | | | QUALCOMM Inc. | | | 14,619,027 | |
| | | | | | | | |
| | | | Total Communications Equipment | | | 22,225,862 | |
| | | | | | | | |
| Electronic Equipment, Instruments & Components — 0.2% | |
| | 39,563 | | | Amphenol Corp., Class A Shares | | | 2,071,518 | |
| | | | | | | | |
| Internet Software & Services — 9.1% | |
| | 162,129 | | | Akamai Technologies Inc.* | | | 11,561,419 | |
| | 42,118 | | | Baidu Inc., ADR* | | | 6,201,876 | |
| | 324,749 | | | eBay Inc.* | | | 8,803,945 | |
| | 415,431 | | | Facebook Inc., Class A Shares* | | | 37,151,994 | |
| | 48,242 | | | Google Inc., Class A Shares* | | | 31,252,132 | |
| | 42,322 | | | Google Inc., Class C Shares* | | | 26,165,577 | |
| | 50,050 | | | Yelp Inc., Class A Shares*(a) | | | 1,215,214 | |
| | | | | | | | |
| | | | Total Internet Software & Services | | | 122,352,157 | |
| | | | | | | | |
| IT Services — 7.2% | |
| | 11,429 | | | Alliance Data Systems Corp.* | | | 2,939,425 | |
| | 144,280 | | | Cognizant Technology Solutions Corp., Class A Shares* | | | 9,080,983 | |
| | 32,300 | | | Euronet Worldwide Inc.* | | | 2,082,381 | |
| | 9,325 | | | Gartner Inc.* | | | 797,381 | |
| | 29,172 | | | Global Payments Inc. | | | 3,249,469 | |
| | 22,959 | | | Jack Henry & Associates Inc. | | | 1,560,294 | |
| | 230,120 | | | MasterCard Inc., Class A Shares | | | 21,256,184 | |
| | 266,099 | | | PayPal Holdings Inc.* | | | 9,313,465 | |
| | 49,218 | | | Vantiv Inc., Class A Shares* | | | 2,167,561 | |
| | 633,785 | | | Visa Inc., Class A Shares | | | 45,188,870 | |
| | | | | | | | |
| | | | Total IT Services | | | 97,636,013 | |
| | | | | | | | |
| Semiconductors & Semiconductor Equipment — 1.7% | |
| | 186,310 | | | Analog Devices Inc. | | | 10,407,276 | |
| | 148,910 | | | Lam Research Corp. | | | 10,836,181 | |
| | 15,054 | | | NXP Semiconductor NV* | | | 1,274,321 | |
| | 18,684 | | | Qorvo Inc.* | | | 1,037,149 | |
| | | | | | | | |
| | | | Total Semiconductors & Semiconductor Equipment | | | 23,554,927 | |
| | | | | | | | |
| Software — 6.6% | |
| | 90,794 | | | Activision Blizzard Inc. | | | 2,599,432 | |
| | 262,640 | | | Adobe Systems Inc.* | | | 20,635,625 | |
| | 52,851 | | | Cadence Design Systems Inc.* | | | 1,058,077 | |
| | 26,303 | | | CDK Global Inc. | | | 1,303,051 | |
| | 201,577 | | | Electronic Arts Inc.* | | | 13,334,319 | |
| | 15,815 | | | Fair Isaac Corp. | | | 1,353,290 | |
| | 54,342 | | | Fortinet Inc.* | | | 2,289,972 | |
| | 52,682 | | | Intuit Inc. | | | 4,517,481 | |
| | 208,498 | | | Microsoft Corp. | | | 9,073,833 | |
| | 24,121 | | | Red Hat Inc.* | | | 1,741,777 | |
| | 277,830 | | | Salesforce.com Inc.* | | | 19,270,289 | |
See Notes to Financial Statements.
36
| | | | | | | | |
| Large Capitalization Growth Investments | |
| | |
| Shares/Units | | | Security | | Value | |
| INFORMATION TECHNOLOGY — 31.1% — (continued) | |
| Software — 6.6% — (continued) | |
| | 173,640 | | | ServiceNow Inc.* | | $ | 12,321,494 | |
| | | | | | | | |
| | | | Total Software | | | 89,498,640 | |
| | | | | | | | |
| Technology Hardware, Storage & Peripherals — 4.7% | |
| | 494,977 | | | Apple Inc. | | | 55,813,607 | |
| | 287,060 | | | EMC Corp. | | | 7,139,182 | |
| | | | | | | | |
| | | | Total Technology Hardware, Storage & Peripherals | | | 62,952,789 | |
| | | | | | | | |
| | | | TOTAL INFORMATION TECHNOLOGY | | | 420,291,906 | |
| | | | | | | | |
| MATERIALS — 2.5% | |
| Chemicals — 2.5% | |
| | 298,500 | | | Axalta Coating Systems Ltd.* | | | 8,713,215 | |
| | 129,660 | | | Celanese Corp., Class A Shares | | | 7,862,582 | |
| | 18,565 | | | CF Industries Holdings Inc. | | | 1,065,260 | |
| | 29,629 | | | Cytec Industries Inc. | | | 2,198,472 | |
| | 239,290 | | | Dow Chemical Co. (The) | | | 10,471,330 | |
| | 11,559 | | | Sherwin-Williams Co. (The) | | | 2,956,908 | |
| | | | | | | | |
| | | | Total Chemicals | | | 33,267,767 | |
| | | | | | | | |
| TELECOMMUNICATION SERVICES — 1.5% | |
| Diversified Telecommunication Services — 0.7% | |
| | 37,514 | | | Cogent Communications Holdings Inc. | | | 1,041,764 | |
| | 174,500 | | | Level 3 Communications Inc.* | | | 7,805,385 | |
| | | | | | | | |
| | | | Total Diversified Telecommunication Services | | | 8,847,149 | |
| | | | | | | | |
| Wireless Telecommunication Services — 0.8% | |
| | 96,102 | | | SBA Communications Corp., Class A Shares* | | | 11,359,255 | |
| | | | | | | | |
| | | | TOTAL TELECOMMUNICATION SERVICES | | | 20,206,404 | |
| | | | | | | | |
| | | | TOTAL COMMON STOCKS
(Cost — $961,553,629) | | | 1,317,642,280 | |
| | | | | | | | |
| | |
Face
Amount | | | | | | |
| SHORT-TERM INVESTMENTS (b) — 3.4% | | | | |
| MONEY MARKET FUND — 0.5% | |
| $ | 6,735,317 | | | Invesco STIT — Government & Agency Portfolio(c)
(Cost — $6,735,317) | | | 6,735,317 | |
| | | | | | | | |
| TIME DEPOSITS — 2.9% | |
| | 6,270,412 | | | ANZ National Bank — London, 0.030% due 9/1/15 | | | 6,270,412 | |
| | 3,410,950 | | | Banco Santander SA — Frankfurt, 0.030% due 9/1/15 | | | 3,410,950 | |
| | 13,037,899 | | | DNB — Oslo, 0.030% due 9/1/15 | | | 13,037,899 | |
| | 10,817,485 | | | National Australia Bank Ltd. — Grand Cayman, 0.030% due 9/1/15 | | | 10,817,485 | |
| | 5,575,893 | | | Skandinaviska Enskilda Banken AB — Stockholm, 0.030% due 9/1/15 | | | 5,575,893 | |
| | | | | | | | |
| | | | TOTAL TIME DEPOSITS
(Cost — $39,112,639) | | | 39,112,639 | |
| | | | | | | | |
| | | | TOTAL SHORT-TERM INVESTMENTS
(Cost — $45,847,956) | | | 45,847,956 | |
| | | | | | | | |
| | | | TOTAL INVESTMENTS — 100.8%
(Cost — $1,007,401,585#) | | | 1,363,490,236 | |
| | | | | | | | |
| | | | Liabilities in Excess of Other Assets — (0.8)% | | | (10,855,311 | ) |
| | | | | | | | |
| | | | TOTAL NET ASSETS — 100.0% | | $ | 1,352,634,925 | |
| | | | | | | | |
See Notes to Financial Statements.
37
| | | | |
| Large Capitalization Growth Investments |
| * | Non-income producing security. |
| (a) | All or a portion of this security is on loan (See Note 1). |
| (b) | Inclusive of all short term holdings, including collateral received from securities lending activities. Excluding such collateral, the percentage of portfolio holdings would be 2.9%. |
| (c) | Represents investment of collateral received from securities lending transactions. |
| # | Aggregate cost for federal income tax purposes is $1,019,863,858. |
| | |
Abbreviations used in this schedule: |
| ADR | | — American Depositary Receipts |
| PLC | | — Public Limited Company |
| | | | |
| Summary of Investments by Security Sector^ | | | |
Information Technology | | | 30.8 | % |
Health Care | | | 21.3 | |
Consumer Discretionary | | | 21.2 | |
Financials | | | 7.0 | |
Industrials | | | 6.1 | |
Consumer Staples | | | 5.0 | |
Materials | | | 2.4 | |
Telecommunication Services | | | 1.5 | |
Energy | | | 1.2 | |
Short-Term Investments | | | 3.5 | |
| | | | |
| | | 100.0 | % |
| | | | |
| ^ | As a percentage of total investments. |
See Notes to Financial Statements.
38
| | | | | | | | |
| Large Capitalization Value Equity Investments | |
| | |
| Shares/Units | | | Security | | Value | |
| COMMON STOCKS — 96.0% | |
| CONSUMER DISCRETIONARY — 8.8% | |
| Automobiles — 2.0% | |
| | 1,604,100 | | | Ford Motor Co. | | $ | 22,248,867 | |
| | 36,669 | | | Harley-Davidson Inc. | | | 2,055,297 | |
| | | | | | | | |
| | | | Total Automobiles | | | 24,304,164 | |
| | | | | | | | |
| Diversified Consumer Services — 0.2% | |
| | 60,874 | | | H&R Block Inc. | | | 2,070,934 | |
| | | | | | | | |
| Hotels, Restaurants & Leisure — 1.9% | |
| | 125,000 | | | McDonald’s Corp. | | | 11,877,500 | |
| | 570,000 | | | MGM Resorts International* | | | 11,645,100 | |
| | | | | | | | |
| | | | Total Hotels, Restaurants & Leisure | | | 23,522,600 | |
| | | | | | | | |
| Household Durables — 0.7% | |
| | 51,760 | | | Whirlpool Corp. | | | 8,700,856 | |
| | | | | | | | |
| Internet & Catalog Retail — 0.3% | |
| | 71,578 | | | Liberty Interactive Corp., Class A Shares* | | | 1,935,469 | |
| | 44,368 | | | Liberty Ventures, Series A* | | | 1,762,741 | |
| | | | | | | | |
| | | | Total Internet & Catalog Retail | | | 3,698,210 | |
| | | | | | | | |
| Leisure Products — 0.9% | |
| | 477,097 | | | Mattel Inc. | | | 11,178,383 | |
| | | | | | | | |
| Media — 0.9% | |
| | 28,756 | | | Gannett Co., Inc.* | | | 376,991 | |
| | 29,213 | | | Omnicom Group Inc. | | | 1,956,687 | |
| | 57,513 | | | TEGNA Inc. | | | 1,368,234 | |
| | 294,980 | | | Twenty-First Century Fox Inc., Class A Shares | | | 8,079,502 | |
| | | | | | | | |
| | | | Total Media | | | 11,781,414 | |
| | | | | | | | |
| Multiline Retail — 1.0% | |
| | 105,544 | | | Kohl’s Corp. | | | 5,385,910 | |
| | 102,300 | | | Macy’s Inc. | | | 5,995,803 | |
| | 13,716 | | | Nordstrom Inc. | | | 999,622 | |
| | | | | | | | |
| | | | Total Multiline Retail | | | 12,381,335 | |
| | | | | | | | |
| Specialty Retail — 0.1% | |
| | 31,048 | | | Bed Bath & Beyond Inc.* | | | 1,928,391 | |
| | | | | | | | |
| Textiles, Apparel & Luxury Goods — 0.8% | |
| | 40,606 | | | Coach Inc. | | | 1,228,332 | |
| | 114,110 | | | V.F. Corp. | | | 8,264,987 | |
| | | | | | | | |
| | | | Total Textiles, Apparel & Luxury Goods | | | 9,493,319 | |
| | | | | | | | |
| | | | TOTAL CONSUMER DISCRETIONARY | | | 109,059,606 | |
| | | | | | | | |
| CONSUMER STAPLES — 5.1% | |
| Beverages — 1.0% | |
| | 300,000 | | | Coca-Cola Co. (The) | | | 11,796,000 | |
| | | | | | | | |
| Food & Staples Retailing — 2.1% | |
| | 166,317 | | | CVS Caremark Corp. | | | 17,030,861 | |
| | 55,097 | | | Kroger Co. (The) | | | 1,900,846 | |
| | 105,300 | | | Wal-Mart Stores Inc. | | | 6,816,069 | |
| | | | | | | | |
| | | | Total Food & Staples Retailing | | | 25,747,776 | |
| | | | | | | | |
See Notes to Financial Statements.
39
| | | | | | | | |
| Large Capitalization Value Equity Investments | |
| | |
| Shares/Units | | | Security | | Value | |
| CONSUMER STAPLES — 5.1% — (continued) | |
| Food Products — 1.4% | |
| | 192,759 | | | Archer-Daniels-Midland Co. | | $ | 8,672,228 | |
| | 205,000 | | | Tyson Foods Inc., Class A Shares | | | 8,667,400 | |
| | | | | | | | |
| | | | Total Food Products | | | 17,339,628 | |
| | | | | | | | |
| Household Products — 0.6% | |
| | 71,157 | | | Kimberly-Clark Corp. | | | 7,580,355 | |
| | | | | | | | |
| | | | TOTAL CONSUMER STAPLES | | | 62,463,759 | |
| | | | | | | | |
| ENERGY — 10.6% | |
| Energy Equipment & Services — 1.9% | |
| | 130,000 | | | Baker Hughes Inc. | | | 7,280,000 | |
| | 362,250 | | | Ensco PLC, Class A Shares | | | 6,560,348 | |
| | 11,616 | | | Helmerich & Payne Inc. | | | 685,460 | |
| | 126,800 | | | McDermott International Inc.* | | | 644,144 | |
| | 197,740 | | | National Oilwell Varco Inc. | | | 8,370,334 | |
| | | | | | | | |
| | | | Total Energy Equipment & Services | | | 23,540,286 | |
| | | | | | | | |
| Oil, Gas & Consumable Fuels — 8.7% | |
| | 105,000 | | | Anadarko Petroleum Corp. | | | 7,515,900 | |
| | 35,197 | | | Apache Corp. | | | 1,592,312 | |
| | 197,708 | | | Chevron Corp. | | | 16,012,371 | |
| | 193,361 | | | ConocoPhillips | | | 9,503,693 | |
| | 184,805 | | | Denbury Resources Inc.(a) | | | 802,054 | |
| | 162,900 | | | Devon Energy Corp. | | | 6,949,314 | |
| | 100,000 | | | EOG Resources Inc. | | | 7,831,000 | |
| | 24,129 | | | Hess Corp. | | | 1,434,469 | |
| | 441,926 | | | Marathon Oil Corp. | | | 7,640,900 | |
| | 253,920 | | | Murphy Oil Corp. | | | 7,871,520 | |
| | 246,000 | | | Royal Dutch Shell PLC, Class A Shares, ADR | | | 13,018,320 | |
| | 193,400 | | | Sasol Ltd., ADR | | | 6,335,784 | |
| | 33,901 | | | SM Energy Co. | | | 1,244,167 | |
| | 67,286 | | | Southwestern Energy Co.* | | | 1,092,725 | |
| | 236,500 | | | Total SA, ADR(a) | | | 10,973,600 | |
| | 121,600 | | | Valero Energy Corp. | | | 7,215,744 | |
| | | | | | | | |
| | | | Total Oil, Gas & Consumable Fuels | | | 107,033,873 | |
| | | | | | | | |
| | | | TOTAL ENERGY | | | 130,574,159 | |
| | | | | | | | |
| FINANCIALS — 25.2% | |
| Banks — 8.8% | |
| | 327,500 | | | BB&T Corp. | | | 12,091,300 | |
| | 541,990 | | | Citigroup Inc. | | | 28,985,625 | |
| | 335,000 | | | Citizens Financial Group Inc. | | | 8,314,700 | |
| | 399,384 | | | Fifth Third Bancorp | | | 7,955,730 | |
| | 348,620 | | | JPMorgan Chase & Co. | | | 22,346,542 | |
| | 12,046 | | | M&T Bank Corp. | | | 1,424,319 | |
| | 72,600 | | | PNC Financial Services Group Inc.(The) | | | 6,615,312 | |
| | 775,000 | | | Regions Financial Corp. | | | 7,432,250 | |
| | 256,300 | | | Wells Fargo & Co. | | | 13,668,479 | |
| | | | | | | | |
| | | | Total Banks | | | 108,834,257 | |
| | | | | | | | |
| Capital Markets — 2.6% | |
| | 58,800 | | | Ameriprise Financial Inc. | | | 6,624,996 | |
| | 199,190 | | | Franklin Resources Inc. | | | 8,083,130 | |
| | 43,432 | | | Goldman Sachs Group Inc. (The) | | | 8,191,275 | |
| | 125,059 | | | State Street Corp. | | | 8,994,244 | |
| | | | | | | | |
| | | | Total Capital Markets | | | 31,893,645 | |
| | | | | | | | |
See Notes to Financial Statements.
40
| | | | | | | | |
| Large Capitalization Value Equity Investments | |
| | |
| Shares/Units | | | Security | | Value | |
| FINANCIALS — 25.2% — (continued) | |
| Consumer Finance — 4.2% | |
| | 155,000 | | | American Express Co. | | $ | 11,891,600 | |
| | 344,440 | | | Capital One Financial Corp. | | | 26,780,210 | |
| | 368,518 | | | Navient Corp. | | | 4,713,345 | |
| | 235,000 | | | Synchrony Financial*(a) | | | 7,743,250 | |
| | | | | | | | |
| | | | Total Consumer Finance | | | 51,128,405 | |
| | | | | | | | |
| Diversified Financial Services — 0.1% | |
| | 7,068 | | | Intercontinental Exchange Inc. | | | 1,614,402 | |
| | | | | | | | |
| Insurance — 8.7% | |
| | 6,360 | | | Alleghany Corp.* | | | 2,987,864 | |
| | 41,528 | | | Allied World Assurance Co. Holdings AG | | | 1,658,628 | |
| | 172,560 | | | Allstate Corp. (The) | | | 10,056,797 | |
| | 177,530 | | | American International Group Inc. | | | 10,712,160 | |
| | 23,344 | | | Aon PLC | | | 2,181,263 | |
| | 36,338 | | | Arch Capital Group Ltd.* | | | 2,481,159 | |
| | 366,590 | | | Hartford Financial Services Group Inc. (The) | | | 16,844,811 | |
| | 37,458 | | | Loews Corp. | | | 1,365,344 | |
| | 699,206 | | | MetLife Inc. | | | 35,030,221 | |
| | 63,348 | | | Progressive Corp. (The) | | | 1,897,906 | |
| | 38,355 | | | Torchmark Corp. | | | 2,242,233 | |
| | 127,900 | | | Travelers Cos., Inc. (The) | | | 12,732,445 | |
| | 163,000 | | | Willis Group Holdings PLC | | | 7,023,670 | |
| | | | | | | | |
| | | | Total Insurance | | | 107,214,501 | |
| | | | | | | | |
| Real Estate Investment Trusts (REITs) — 0.8% | |
| | 58,631 | | | American Capital Agency Corp. | | | 1,121,611 | |
| | 65,078 | | | Hatteras Financial Corp. | | | 1,056,216 | |
| | 430,000 | | | Host Hotels & Resorts Inc. | | | 7,623,900 | |
| | | | | | | | |
| | | | Total Real Estate Investment Trusts (REITs) | | | 9,801,727 | |
| | | | | | | | |
| | | | TOTAL FINANCIALS | | | 310,486,937 | |
| | | | | | | | |
| HEALTH CARE — 11.9% | |
| Biotechnology — 2.4% | |
| | 446,700 | | | Baxalta Inc.* | | | 15,701,505 | |
| | 26,500 | | | Biogen Inc.* | | | 7,878,450 | |
| | 62,101 | | | Gilead Sciences Inc. | | | 6,524,952 | |
| | | | | | | | |
| | | | Total Biotechnology | | | 30,104,907 | |
| | | | | | | | |
| Health Care Equipment & Supplies — 1.3% | |
| | 173,300 | | | Abbott Laboratories | | | 7,848,757 | |
| | 114,234 | | | St. Jude Medical Inc. | | | 8,088,909 | |
| | | | | | | | |
| | | | Total Health Care Equipment & Supplies | | | 15,937,666 | |
| | | | | | | | |
| Health Care Providers & Services — 1.7% | |
| | 66,100 | | | Aetna Inc. | | | 7,569,772 | |
| | 50,214 | | | UnitedHealth Group Inc. | | | 5,809,760 | |
| | 58,500 | | | Universal Health Services Inc., Class B Shares | | | 8,022,690 | |
| | | | | | | | |
| | | | Total Health Care Providers & Services | | | 21,402,222 | |
| | | | | | | | |
| Life Sciences Tools & Services — 0.6% | |
| | 208,000 | | | Agilent Technologies Inc. | | | 7,552,480 | |
| | | | | | | | |
| Pharmaceuticals — 5.9% | |
| | 289,800 | | | AbbVie Inc. | | | 18,086,418 | |
| | 270,000 | | | AstraZeneca PLC, ADR | | | 8,445,600 | |
| | 68,010 | | | Eli Lilly & Co. | | | 5,600,624 | |
See Notes to Financial Statements.
41
| | | | | | | | |
| Large Capitalization Value Equity Investments | |
| | |
| Shares/Units | | | Security | | Value | |
| HEALTH CARE — 11.9% — (continued) | |
| Pharmaceuticals — 5.9% — (continued) | |
| | 180,295 | | | Johnson & Johnson | | $ | 16,944,124 | |
| | 91,600 | | | Mallinckrodt PLC* | | | 7,899,584 | |
| | 218,600 | | | Pfizer Inc. | | | 7,043,292 | |
| | 127,000 | | | Teva Pharmaceutical Industries Ltd., ADR | | | 8,180,070 | |
| | | | | | | | |
| | | | Total Pharmaceuticals | | | 72,199,712 | |
| | | | | | | | |
| | | | TOTAL HEALTH CARE | | | 147,196,987 | |
| | | | | | | | |
| INDUSTRIALS — 10.0% | |
| Aerospace & Defense — 2.1% | |
| | 67,470 | | | General Dynamics Corp. | | | 9,582,764 | |
| | 77,400 | | | Honeywell International Inc. | | | 7,683,498 | |
| | 6,576 | | | L-3 Communications Holdings Inc. | | | 693,571 | |
| | 21,641 | | | Rockwell Collins Inc. | | | 1,771,316 | |
| | 73,700 | | | United Technologies Corp. | | | 6,751,657 | |
| | | | | | | | |
| | | | Total Aerospace & Defense | | | 26,482,806 | |
| | | | | | | | |
| Air Freight & Logistics — 1.0% | |
| | 124,000 | | | United Parcel Service Inc., Class B Shares | | | 12,108,600 | |
| | | | | | | | |
| Commercial Services & Supplies — 0.1% | |
| | 37,771 | | | Republic Services Inc., Class A Shares | | | 1,547,855 | |
| | | | | | | | |
| Construction & Engineering — 1.2% | |
| | 228,027 | | | Fluor Corp. | | | 10,402,592 | |
| | 51,034 | | | Jacobs Engineering Group Inc.* | | | 2,062,284 | |
| | 82,553 | | | Quanta Services Inc.* | | | 2,001,084 | |
| | | | | | | | |
| | | | Total Construction & Engineering | | | 14,465,960 | |
| | | | | | | | |
| Electrical Equipment — 0.6% | |
| | 103,600 | | | Eaton Corp. PLC | | | 5,911,416 | |
| | 11,589 | | | Hubbell Inc., Class B Shares | | | 1,143,487 | |
| | | | | | | | |
| | | | Total Electrical Equipment | | | 7,054,903 | |
| | | | | | | | |
| Industrial Conglomerates — 1.5% | |
| | 102,332 | | | Danaher Corp. | | | 8,904,931 | |
| | 389,330 | | | General Electric Co. | | | 9,663,170 | |
| | | | | | | | |
| | | | Total Industrial Conglomerates | | | 18,568,101 | |
| | | | | | | | |
| Machinery — 1.5% | |
| | 90,810 | | | Cummins Inc. | | | 11,056,118 | |
| | 62,097 | | | Joy Global Inc. | | | 1,503,989 | |
| | 53,428 | | | Kennametal Inc. | | | 1,629,554 | |
| | 45,450 | | | Parker-Hannifin Corp. | | | 4,893,147 | |
| | | | | | | | |
| | | | Total Machinery | | | 19,082,808 | |
| | | | | | | | |
| Professional Services — 1.4% | |
| | 99,709 | | | Manpowergroup Inc. | | | 8,664,712 | |
| | 180,000 | | | Nielsen Holdings PLC | | | 8,141,400 | |
| | | | | | | | |
| | | | Total Professional Services | | | 16,806,112 | |
| | | | | | | | |
| Road & Rail — 0.6% | |
| | 87,873 | | | Ryder System Inc. | | | 7,202,950 | |
| | | | | | | | |
| | | | TOTAL INDUSTRIALS | | | 123,320,095 | |
| | | | | | | | |
See Notes to Financial Statements.
42
| | | | | | | | |
| Large Capitalization Value Equity Investments | |
| | |
| Shares/Units | | | Security | | Value | |
| INFORMATION TECHNOLOGY — 13.5% | |
| Communications Equipment — 2.1% | |
| | 621,871 | | | Cisco Systems Inc. | | $ | 16,094,021 | |
| | 180,000 | | | QUALCOMM Inc. | | | 10,184,400 | |
| | | | | | | | |
| | | | Total Communications Equipment | | | 26,278,421 | |
| | | | | | | | |
| Electronic Equipment, Instruments & Components — 0.8% | |
| | 50,269 | | | Arrow Electronics Inc.* | | | 2,811,042 | |
| | 72,865 | | | Avnet Inc. | | | 3,089,476 | |
| | 75,404 | | | FLIR Systems Inc. | | | 2,158,817 | |
| | 50,128 | | | Keysight Technologies Inc.* | | | 1,606,101 | |
| | | | | | | | |
| | | | Total Electronic Equipment, Instruments & Components | | | 9,665,436 | |
| | | | | | | | |
| Internet Software & Services — 1.1% | |
| | 18,000 | | | Google Inc., Class A Shares* | | | 11,660,760 | |
| | 24,910 | | | IAC/InterActiveCorp | | | 1,738,718 | |
| | | | | | | | |
| | | | Total Internet Software & Services | | | 13,399,478 | |
| | | | | | | | |
| IT Services — 1.8% | |
| | 140,000 | | | Amdocs Ltd. | | | 8,009,400 | |
| | 88,000 | | | International Business Machines Corp. | | | 13,014,320 | |
| | 53,016 | | | Teradata Corp.* | | | 1,549,658 | |
| | | | | | | | |
| | | | Total IT Services | | | 22,573,378 | |
| | | | | | | | |
| Semiconductors & Semiconductor Equipment — 2.4% | |
| | 32,605 | | | Analog Devices Inc. | | | 1,821,315 | |
| | 97,950 | | | Broadcom Corp., Class A Shares | | | 5,061,076 | |
| | 534,640 | | | Intel Corp. | | | 15,258,626 | |
| | 9,333 | | | KLA-Tencor Corp. | | | 467,677 | |
| | 412,360 | | | Micron Technology Inc.* | | | 6,766,828 | |
| | | | | | | | |
| | | | Total Semiconductors & Semiconductor Equipment | | | 29,375,522 | |
| | | | | | | | |
| Software — 3.5% | |
| | 270,000 | | | Activision Blizzard Inc. | | | 7,730,100 | |
| | 252,100 | | | CA Inc. | | | 6,879,809 | |
| | 196,926 | | | Microsoft Corp. | | | 8,570,220 | |
| | 315,000 | | | Oracle Corp. | | | 11,683,350 | |
| | 299,800 | | | Symantec Corp. | | | 6,142,902 | |
| | 30,694 | | | Synopsys Inc.* | | | 1,440,469 | |
| | | | | | | | |
| | | | Total Software | | | 42,446,850 | |
| | | | | | | | |
| Technology Hardware, Storage & Peripherals — 1.8% | |
| | 1,500 | | | Apple Inc. | | | 169,140 | |
| | 877,860 | | | EMC Corp. | | | 21,832,378 | |
| | | | | | | | |
| | | | Total Technology Hardware, Storage & Peripherals | | | 22,001,518 | |
| | | | | | | | |
| | | | TOTAL INFORMATION TECHNOLOGY | | | 165,740,603 | |
| | | | | | | | |
| MATERIALS — 4.1% | |
| Chemicals — 2.0% | |
| | 144,201 | | | Celanese Corp., Class A Shares | | | 8,744,349 | |
| | 157,000 | | | Dow Chemical Co. (The) | | | 6,870,320 | |
| | 77,700 | | | Monsanto Co. | | | 7,587,405 | |
| | 46,694 | | | Mosaic Co. (The) | | | 1,906,516 | |
| | | | | | | | |
| | | | Total Chemicals | | | 25,108,590 | |
| | | | | | | | |
| Metals & Mining — 1.0% | |
| | 133,524 | | | Goldcorp Inc. | | | 1,850,643 | |
| | 320,742 | | | Kinross Gold Corp.* | | | 574,128 | |
| | 218,633 | | | Nucor Corp. | | | 9,464,622 | |
| | | | | | | | |
| | | | Total Metals & Mining | | | 11,889,393 | |
| | | | | | | | |
See Notes to Financial Statements.
43
| | | | | | | | |
| Large Capitalization Value Equity Investments | |
| | |
| Shares/Units | | | Security | | Value | |
| MATERIALS — 4.1% — (continued) | |
| Paper & Forest Products — 1.1% | |
| | 304,860 | | | International Paper Co. | | $ | 13,151,660 | |
| | | | | | | | |
| | | | TOTAL MATERIALS | | | 50,149,643 | |
| | | | | | | | |
| TELECOMMUNICATION SERVICES — 3.4% | |
| Diversified Telecommunication Services — 3.4% | |
| | 407,300 | | | AT&T Inc. | | | 13,522,360 | |
| | 338,880 | | | CenturyLink Inc. | | | 9,163,315 | |
| | 414,900 | | | Verizon Communications Inc. | | | 19,089,549 | |
| | | | | | | | |
| | | | TOTAL TELECOMMUNICATION SERVICES | | | 41,775,224 | |
| | | | | | | | |
| UTILITIES — 3.4% | |
| Electric Utilities — 2.0% | |
| | 268,850 | | | American Electric Power Co., Inc. | | | 14,595,866 | |
| | 26,295 | | | Edison International | | | 1,537,732 | |
| | 94,835 | | | Entergy Corp. | | | 6,195,571 | |
| | 51,427 | | | OGE Energy Corp. | | | 1,442,013 | |
| | | | | | | | |
| | | | Total Electric Utilities | | | 23,771,182 | |
| | | | | | | | |
| Multi-Utilities — 1.4% | |
| | 387,400 | | | Public Service Enterprise Group Inc. | | | 15,592,850 | |
| | 38,010 | | | SCANA Corp. | | | 2,010,349 | |
| | | | | | | | |
| | | | Total Multi-Utilities | | | 17,603,199 | |
| | | | | | | | |
| | | | TOTAL UTILITIES | | | 41,374,381 | |
| | | | | | | | |
| | | | TOTAL COMMON STOCKS
(Cost — $1,053,746,262) | | | 1,182,141,394 | |
| | | | | | | | |
| | |
Face
Amount | | | | | | |
| SHORT-TERM INVESTMENTS (b) — 5.1% | | | | |
| MONEY MARKET FUND — 1.3% | |
| $ | 16,427,951 | | | Invesco STIT — Government & Agency Portfolio(c)
(Cost — $16,427,951) | | | 16,427,951 | |
| | | | | | | | |
| TIME DEPOSITS — 3.8% | |
| | 19,238,522 | | | ANZ National Bank — London, 0.030% due 9/1/15 | | | 19,238,522 | |
| | 10,011,299 | | | DNB — Oslo, 0.030% due 9/1/15 | | | 10,011,299 | |
| | 10,393,967 | | | National Australia Bank Ltd. — Grand Cayman, 0.030% due 9/1/15 | | | 10,393,967 | |
| | 6,799,824 | | | Royal Bank of Canada — Toronto, 0.030% due 9/1/15 | | | 6,799,824 | |
| | | | | | | | |
| | | | TOTAL TIME DEPOSITS
(Cost — $46,443,612) | | | 46,443,612 | |
| | | | | | | | |
| | | | TOTAL SHORT-TERM INVESTMENTS
(Cost — $62,871,563) | | | 62,871,563 | |
| | | | | | | | |
| | | | TOTAL INVESTMENTS — 101.1%
(Cost — $1,116,617,825#) | | | 1,245,012,957 | |
| | | | | | | | |
| | | | Liabilities in Excess of Other Assets — (1.1)% | | | (13,679,291 | ) |
| | | | | | | | |
| | | | TOTAL NET ASSETS — 100.0% | | $ | 1,231,333,666 | |
| | | | | | | | |
| * | Non-income producing security. |
| (a) | All or a portion of this security is on loan (See Note 1). |
| (b) | Inclusive of all short term holdings, including collateral received from securities lending activities. Excluding such collateral, the percentage of portfolio holdings would be 3.8%. |
| (c) | Represents investment of collateral received from securities lending transactions. |
| # | Aggregate cost for federal income tax purposes is $1,128,071,914. |
See Notes to Financial Statements.
44
| | | | |
| Large Capitalization Value Equity Investments |
| | |
Abbreviations used in this schedule: |
| ADR | | — American Depositary Receipts |
| PLC | | — Public Limited Company |
| | | | |
| Summary of Investments by Security Sector^ | |
Financials | | | 24.9 | % |
Information Technology | | | 13.3 | |
Health Care | | | 11.8 | |
Energy | | | 10.5 | |
Industrials | | | 9.9 | |
Consumer Discretionary | | | 8.8 | |
Consumer Staples | | | 5.0 | |
Materials | | | 4.0 | |
Telecommunication Services | | | 3.4 | |
Utilities | | | 3.3 | |
Short-Term Investments | | | 5.1 | |
| | | | |
| | | 100.0 | % |
| | | | |
| ^ | As a percentage of total investments. |
See Notes to Financial Statements.
45
| | | | | | | | |
| Small Capitalization Growth Investments | |
| | |
| Shares/Units | | | Security | | Value | |
| COMMON STOCKS — 95.2% | |
| CONSUMER DISCRETIONARY — 17.9% | |
| Auto Components — 0.5% | |
| | 24,900 | | | Gentherm Inc.* | | $ | 1,135,191 | |
| | | | | | | | |
| Diversified Consumer Services — 1.7% | |
| | 43,700 | | | 2U Inc.* | | | 1,528,189 | |
| | 38,977 | | | Bright Horizons Family Solutions Inc.* | | | 2,382,274 | |
| | | | | | | | |
| | | | Total Diversified Consumer Services | | | 3,910,463 | |
| | | | | | | | |
| Hotels, Restaurants & Leisure — 6.5% | |
| | 98,020 | | | Bloomin’ Brands Inc. | | | 2,029,014 | |
| | 5,100 | | | Buffalo Wild Wings Inc.* | | | 967,368 | |
| | 8,100 | | | Churchill Downs Inc. | | | 1,076,247 | |
| | 43,845 | | | Dave & Buster’s Entertainment Inc.* | | | 1,510,022 | |
| | 25,300 | | | Diamond Resorts International Inc.* | | | 642,367 | |
| | 14,500 | | | Jack in the Box Inc. | | | 1,133,610 | |
| | 21,300 | | | Papa John’s International Inc. | | | 1,432,425 | |
| | 45,570 | | | Planet Fitness Inc., Class A Shares* | | | 811,602 | |
| | 19,400 | | | Popeyes Louisiana Kitchen Inc.* | | | 1,079,028 | |
| | 12,900 | | | Red Robin Gourmet Burgers Inc.* | | | 1,016,391 | |
| | 28,276 | | | Vail Resorts Inc. | | | 3,051,263 | |
| | | | | | | | |
| | | | Total Hotels, Restaurants & Leisure | | | 14,749,337 | |
| | | | | | | | |
| Household Durables — 1.7% | |
| | 13,200 | | | Helen of Troy Ltd.* | | | 1,123,848 | |
| | 65,010 | | | Installed Building Products Inc.* | | | 1,737,067 | |
| | 28,600 | | | Libbey Inc. | | | 1,007,864 | |
| | | | | | | | |
| | | | Total Household Durables | | | 3,868,779 | |
| | | | | | | | |
| Leisure Products — 1.0% | |
| | 47,715 | | | Brunswick Corp. | | | 2,371,913 | |
| | | | | | | | |
| Media — 1.2% | |
| | 24,100 | | | Imax Corp.* | | | 755,535 | |
| | 54,830 | | | Starz, Class A Shares* | | | 2,062,156 | |
| | | | | | | | |
| | | | Total Media | | | 2,817,691 | |
| | | | | | | | |
| Specialty Retail — 4.1% | |
| | 13,870 | | | Asbury Automotive Group Inc.* | | | 1,117,506 | |
| | 33,100 | | | Caleres Inc. | | | 1,102,230 | |
| | 26,040 | | | Five Below Inc.*(a) | | | 1,006,967 | |
| | 18,860 | | | Lithia Motors Inc., Class A Shares | | | 2,010,476 | |
| | 53,790 | | | Rent-A-Center Inc. | | | 1,446,413 | |
| | 29,530 | | | Restoration Hardware Holdings Inc.* | | | 2,730,934 | |
| | | | | | | | |
| | | | Total Specialty Retail | | | 9,414,526 | |
| | | | | | | | |
| Textiles, Apparel & Luxury Goods — 1.2% | |
| | 22,600 | | | G-III Apparel Group Ltd.* | | | 1,566,858 | |
| | 26,100 | | | Steven Madden Ltd.* | | | 1,066,446 | |
| | | | | | | | |
| | | | Total Textiles, Apparel & Luxury Goods | | | 2,633,304 | |
| | | | | | | | |
| | | | TOTAL CONSUMER DISCRETIONARY | | | 40,901,204 | |
| | | | | | | | |
| CONSUMER STAPLES — 1.5% | |
| Food & Staples Retailing — 0.6% | |
| | 12,600 | | | Casey’s General Stores Inc. | | | 1,333,836 | |
| | | | | | | | |
See Notes to Financial Statements.
46
| | | | | | | | |
| Small Capitalization Growth Investments | |
| | |
| Shares/Units | | | Security | | Value | |
| CONSUMER STAPLES — 1.5% — (continued) | |
| Food Products — 0.9% | |
| | 20,200 | | | Calavo Growers Inc. | | $ | 1,176,650 | |
| | 7,400 | | | J&J Snack Foods Corp. | | | 843,304 | |
| | | | | | | | |
| | | | Total Food Products | | | 2,019,954 | |
| | | | | | | | |
| | | | TOTAL CONSUMER STAPLES | | | 3,353,790 | |
| | | | | | | | |
| ENERGY — 1.3% | |
| Energy Equipment & Services — 0.1% | |
| | 43,000 | | | Basic Energy Services Inc.* | | | 224,030 | |
| | | | | | | | |
| Oil, Gas & Consumable Fuels — 1.2% | |
| | 11,300 | | | Carrizo Oil & Gas Inc.* | | | 411,659 | |
| | 96,310 | | | Navigator Holdings Ltd.*(a) | | | 1,569,853 | |
| | 70,480 | | | Synergy Resources Corp.* | | | 756,955 | |
| | | | | | | | |
| | | | Total Oil, Gas & Consumable Fuels | | | 2,738,467 | |
| | | | | | | | |
| | | | TOTAL ENERGY | | | 2,962,497 | |
| | | | | | | | |
| FINANCIALS — 6.4% | |
| Banks — 1.6% | |
| | 16,600 | | | Bank of the Ozarks Inc. | | | 693,880 | |
| | 47,370 | | | East West Bancorp Inc. | | | 1,914,222 | |
| | 27,700 | | | Webster Financial Corp. | | | 980,026 | |
| | | | | | | | |
| | | | Total Banks | | | 3,588,128 | |
| | | | | | | | |
| Capital Markets — 2.4% | |
| | 222,230 | | | BGC Partners Inc., Class A Shares | | | 1,948,957 | |
| | 24,700 | | | Financial Engines Inc.(a) | | | 801,762 | |
| | 61,500 | | | OM Asset Management PLC | | | 1,015,980 | |
| | 36,605 | | | Stifel Financial Corp.* | | | 1,705,793 | |
| | | | | | | | |
| | | | Total Capital Markets | | | 5,472,492 | |
| | | | | | | | |
| Consumer Finance — 0.3% | |
| | 13,500 | | | PRA Group Inc.* | | | 719,415 | |
| | | | | | | | |
| Insurance — 0.8% | |
| | 106,830 | | | CNO Financial Group Inc. | | | 1,911,189 | |
| | | | | | | | |
| Real Estate Investment Trusts (REITs) — 0.4% | |
| | 16,370 | | | National Health Investors Inc. | | | 901,987 | |
| | | | | | | | |
| Real Estate Management & Development — 0.9% | |
| | 64,050 | | | Alexander & Baldwin Inc. | | | 2,166,811 | |
| | | | | | | | |
| | | | TOTAL FINANCIALS | | | 14,760,022 | |
| | | | | | | | |
| HEALTH CARE — 30.8% | |
| Biotechnology — 13.9% | |
| | 73,510 | | | AMAG Pharmaceuticals Inc.*(a) | | | 4,597,315 | |
| | 11,500 | | | Anacor Pharmaceuticals Inc.* | | | 1,499,715 | |
| | 208,240 | | | ARIAD Pharmaceuticals Inc.*(a) | | | 1,965,786 | |
| | 54,100 | | | BioCryst Pharmaceuticals Inc.* | | | 629,724 | |
| | 25,900 | | | Cepheid* | | | 1,262,366 | |
| | 78,720 | | | ChemoCentryx Inc.*(a) | | | 517,978 | |
| | 18,700 | | | Chimerix Inc.* | | | 915,178 | |
| | 17,100 | | | Clovis Oncology Inc.* | | | 1,331,406 | |
| | 153,520 | | | Dyax Corp.* | | | 3,534,030 | |
| | 112,965 | | | Dynavax Technologies Corp.* | | | 3,203,687 | |
| | 28,200 | | | MacroGenics Inc.* | | | 743,070 | |
| | 161,880 | | | Merrimack Pharmaceuticals Inc.*(a) | | | 1,633,369 | |
See Notes to Financial Statements.
47
| | | | | | | | |
| Small Capitalization Growth Investments | |
| | |
| Shares/Units | | | Security | | Value | |
| HEALTH CARE — 30.8% — (continued) | |
| Biotechnology — 13.9% — (continued) | |
| | 53,360 | | | Neurocrine Biosciences Inc.* | | $ | 2,474,837 | |
| | 23,600 | | | Portola Pharmaceuticals Inc., Class A Shares* | | | 1,112,976 | |
| | 50,800 | | | Prothena Corp. PLC*(a) | | | 2,922,524 | |
| | 51,910 | | | PTC Therapeutics Inc.* | | | 1,982,443 | |
| | 8,210 | | | Puma Biotechnology Inc.*(a) | | | 754,663 | |
| | 6,400 | | | Ultragenyx Pharmaceutical Inc.* | | | 714,368 | |
| | | | | | | | |
| | | | Total Biotechnology | | | 31,795,435 | |
| | | | | | | | |
| Health Care Equipment & Supplies — 5.3% | |
| | 52,400 | | | AtriCure Inc.* | | | 1,281,704 | |
| | 16,300 | | | DexCom Inc.* | | | 1,534,482 | |
| | 22,230 | | | Integra LifeSciences Holdings Corp.* | | | 1,333,355 | |
| | 29,672 | | | LDR Holding Corp.* | | | 1,107,359 | |
| | 49,860 | | | Masimo Corp.* | | | 2,025,812 | |
| | 40,515 | | | STERIS Corp. | | | 2,594,986 | |
| | 78,780 | | | Tandem Diabetes Care Inc.* | | | 904,394 | |
| | 61,160 | | | Wright Medical Group Inc.* | | | 1,410,961 | |
| | | | | | | | |
| | | | Total Health Care Equipment & Supplies | | | 12,193,053 | |
| | | | | | | | |
| Health Care Providers & Services — 3.5% | |
| | 8,879 | | | Adeptus Health Inc., Class A Shares*(a) | | | 884,704 | |
| | 47,700 | | | AMN Healthcare Services Inc.* | | | 1,602,720 | |
| | 36,400 | | | ExamWorks Group Inc.* | | | 1,303,848 | |
| | 32,032 | | | HealthEquity Inc.* | | | 939,178 | |
| | 53,480 | | | Team Health Holdings Inc.* | | | 3,141,415 | |
| | | | | | | | |
| | | | Total Health Care Providers & Services | | | 7,871,865 | |
| | | | | | | | |
| Health Care Technology — 0.4% | |
| | 19,700 | | | Medidata Solutions Inc.* | | | 945,994 | |
| | | | | | | | |
| Life Sciences Tools & Services — 3.5% | |
| | 10,200 | | | Bio-Techne Corp. | | | 963,696 | |
| | 80,170 | | | Bruker Corp.* | | | 1,473,525 | |
| | 54,045 | | | ICON PLC* | | | 4,161,465 | |
| | 21,300 | | | PAREXEL International Corp.* | | | 1,399,836 | |
| | | | | | | | |
| | | | Total Life Sciences Tools & Services | | | 7,998,522 | |
| | | | | | | | |
| Pharmaceuticals — 4.2% | |
| | 24,800 | | | Akorn Inc.*(a) | | | 986,792 | |
| | 197,170 | | | Cardiome Pharma Corp.*(a) | | | 1,754,813 | |
| | 47,960 | | | Flamel Technologies SA, ADR* | | | 1,062,314 | |
| | 26,500 | | | Medicines Co. (The)* | | | 1,086,500 | |
| | 57,460 | | | Pacira Pharmaceuticals Inc.* | | | 3,306,823 | |
| | 22,600 | | | Relypsa Inc.* | | | 518,896 | |
| | 48,062 | | | Zogenix Inc.* | | | 923,752 | |
| | | | | | | | |
| | | | Total Pharmaceuticals | | | 9,639,890 | |
| | | | | | | | |
| | | | TOTAL HEALTH CARE | | | 70,444,759 | |
| | | | | | | | |
| INDUSTRIALS — 13.0% | |
| Aerospace & Defense — 1.8% | |
| | 40,160 | | | Hexcel Corp. | | | 1,938,122 | |
| | 94,490 | | | TASER International Inc.*(a) | | | 2,211,066 | |
| | | | | | | | |
| | | | Total Aerospace & Defense | | | 4,149,188 | |
| | | | | | | | |
| Air Freight & Logistics — 1.6% | |
| | 23,700 | | | Forward Air Corp. | | | 1,066,974 | |
| | 26,800 | | | HUB Group Inc., Class A Shares* | | | 1,010,092 | |
See Notes to Financial Statements.
48
| | | | | | | | |
| Small Capitalization Growth Investments | |
| | |
| Shares/Units | | | Security | | Value | |
| INDUSTRIALS — 13.0% — (continued) | |
| Air Freight & Logistics — 1.6% — (continued) | |
| | 41,270 | | | XPO Logistics Inc.*(a) | | $ | 1,448,577 | |
| | | | | | | | |
| | | | Total Air Freight & Logistics | | | 3,525,643 | |
| | | | | | | | |
| Building Products — 0.2% | |
| | 52,988 | | | NCI Building Systems Inc.* | | | 552,665 | |
| | | | | | | | |
| Commercial Services & Supplies — 2.0% | |
| | 59,400 | | | Interface Inc., Class A Shares | | | 1,439,856 | |
| | 30,100 | | | Mobile Mini Inc. | | | 1,023,701 | |
| | 122,460 | | | Steelcase Inc., Class A Shares | | | 2,158,970 | |
| | | | | | | | |
| | | | Total Commercial Services & Supplies | | | 4,622,527 | |
| | | | | | | | |
| Electrical Equipment — 0.5% | |
| | 37,260 | | | Power Solutions International Inc.*(a) | | | 1,171,454 | |
| | | | | | | | |
| Machinery — 0.7% | |
| | 27,300 | | | Albany International Corp., Class A Shares | | | 870,870 | |
| | 52,200 | | | Wabash National Corp.* | | | 638,406 | |
| | | | | | | | |
| | | | Total Machinery | | | 1,509,276 | |
| | | | | | | | |
| Marine — 0.6% | |
| | 38,280 | | | Matson Inc. | | | 1,442,390 | |
| | | | | | | | |
| Professional Services — 2.6% | |
| | 42,000 | | | CEB Inc. | | | 3,008,040 | |
| | 32,890 | | | Huron Consulting Group Inc.* | | | 2,380,907 | |
| | 24,112 | | | TransUnion* | | | 623,536 | |
| | | | | | | | |
| | | | Total Professional Services | | | 6,012,483 | |
| | | | | | | | |
| Road & Rail — 1.1% | |
| | 26,065 | | | Genesee & Wyoming Inc., Class A Shares* | | | 1,782,325 | |
| | 9,975 | | | Old Dominion Freight Line Inc.* | | | 663,238 | |
| | | | | | | | |
| | | | Total Road & Rail | | | 2,445,563 | |
| | | | | | | | |
| Trading Companies & Distributors — 1.9% | |
| | 58,340 | | | Rush Enterprises Inc., Class A Shares* | | | 1,488,837 | |
| | 23,260 | | | Watsco Inc. | | | 2,848,419 | |
| | | | | | | | |
| | | | Total Trading Companies & Distributors | | | 4,337,256 | |
| | | | | | | | |
| | | | TOTAL INDUSTRIALS | | | 29,768,445 | |
| | | | | | | | |
| INFORMATION TECHNOLOGY — 21.9% | |
| Communications Equipment — 1.5% | |
| | 47,800 | | | Ciena Corp.* | | | 1,068,808 | |
| | 51,670 | | | Finisar Corp.* | | | 797,268 | |
| | 36,500 | | | Infinera Corp.* | | | 796,430 | |
| | 37,406 | | | Radware Ltd.* | | | 696,126 | |
| | | | | | | | |
| | | | Total Communications Equipment | | | 3,358,632 | |
| | | | | | | | |
| Electronic Equipment, Instruments & Components — 0.7% | |
| | 14,800 | | | Belden Inc. | | | 745,772 | |
| | 10,200 | | | Littelfuse Inc. | | | 915,450 | |
| | | | | | | | |
| | | | Total Electronic Equipment, Instruments & Components | | | 1,661,222 | |
| | | | | | | | |
| Internet Software & Services — 3.8% | |
| | 16,400 | | | comScore Inc.* | | | 856,244 | |
| | 12,005 | | | CoStar Group Inc.* | | | 2,125,365 | |
| | 23,392 | | | Envestnet Inc.* | | | 730,532 | |
| | 69,703 | | | GTT Communications Inc.* | | | 1,532,769 | |
See Notes to Financial Statements.
49
| | | | | | | | |
| Small Capitalization Growth Investments | |
| | |
| Shares/Units | | | Security | | Value | |
| INFORMATION TECHNOLOGY — 21.9% — (continued) | |
| Internet Software & Services — 3.8% — (continued) | |
| | 51,520 | | | HomeAway Inc.* | | $ | 1,478,109 | |
| | 40,900 | | | Q2 Holdings Inc.* | | | 1,069,944 | |
| | 13,532 | | | SPS Commerce Inc.* | | | 920,447 | |
| | | | | | | | |
| | | | Total Internet Software & Services | | | 8,713,410 | |
| | | | | | | | |
| IT Services — 1.2% | |
| | 12,500 | | | EPAM Systems Inc.* | | | 882,625 | |
| | 20,400 | | | Euronet Worldwide Inc.* | | | 1,315,188 | |
| | 8,000 | | | MAXIMUS Inc. | | | 484,400 | |
| | | | | | | | |
| | | | Total IT Services | | | 2,682,213 | |
| | | | | | | | |
| Semiconductors & Semiconductor Equipment — 3.4% | |
| | 86,120 | | | Advanced Energy Industries Inc.* | | | 2,090,132 | |
| | 8,400 | | | Ambarella Inc.*(a) | | | 803,292 | |
| | 8,100 | | | Cavium Inc.* | | | 550,962 | |
| | 36,230 | | | Cirrus Logic Inc.* | | | 1,092,697 | |
| | 19,600 | | | M/A-COM Technology Solutions Holdings Inc.*(a) | | | 578,396 | |
| | 56,000 | | | Monolithic Power Systems Inc. | | | 2,693,040 | |
| | | | | | | | |
| | | | Total Semiconductors & Semiconductor Equipment | | | 7,808,519 | |
| | | | | | | | |
| Software — 9.5% | |
| | 11,770 | | | Aspen Technology Inc.* | | | 445,730 | |
| | 22,700 | | | Barracuda Networks Inc.* | | | 596,783 | |
| | 20,300 | | | Blackbaud Inc. | | | 1,159,942 | |
| | 55,340 | | | BroadSoft Inc.* | | | 1,746,531 | |
| | 67,780 | | | Callidus Software Inc.* | | | 1,068,891 | |
| | 37,320 | | | CommVault Systems Inc.* | | | 1,337,549 | |
| | 90,465 | | | Fortinet Inc.* | | | 3,812,195 | |
| | 17,300 | | | Guidewire Software Inc.* | | | 967,243 | |
| | 23,000 | | | Manhattan Associates Inc.* | | | 1,345,040 | |
| | 37,449 | | | Paylocity Holding Corp.* | | | 1,236,566 | |
| | 21,142 | | | Proofpoint Inc.* | | | 1,191,140 | |
| | 45,540 | | | QLIK Technologies Inc.* | | | 1,724,144 | |
| | 8,170 | | | Rapid7 Inc.* | | | 172,305 | |
| | 36,600 | | | RingCentral Inc., Class A Shares* | | | 629,886 | |
| | 7,200 | | | Tyler Technologies Inc.* | | | 993,888 | |
| | 11,830 | | | Ultimate Software Group Inc. (The)* | | | 2,084,328 | |
| | 54,890 | | | Zendesk Inc.* | | | 1,135,125 | |
| | | | | | | | |
| | | | Total Software | | | 21,647,286 | |
| | | | | | | | |
| Technology Hardware, Storage & Peripherals — 1.8% | |
| | 50,130 | | | Electronics for Imaging Inc.* | | | 2,194,190 | |
| | 36,600 | | | Nimble Storage Inc.*(a) | | | 975,756 | |
| | 35,550 | | | Super Micro Computer Inc.* | | | 972,292 | |
| | | | | | | | |
| | | | Total Technology Hardware, Storage & Peripherals | | | 4,142,238 | |
| | | | | | | | |
| | | | TOTAL INFORMATION TECHNOLOGY | | | 50,013,520 | |
| | | | | | | | |
| MATERIALS — 2.4% | |
| Chemicals — 1.5% | |
| | 74,400 | | | Chemtura Corp.* | | | 2,023,680 | |
| | 43,550 | | | PolyOne Corp. | | | 1,414,069 | |
| | | | | | | | |
| | | | Total Chemicals | | | 3,437,749 | |
| | | | | | | | |
See Notes to Financial Statements.
50
| | | | | | | | |
| Small Capitalization Growth Investments | |
| | |
| Shares/Units | | | Security | | Value | |
| MATERIALS — 2.4% — (continued) | |
| Construction Materials — 0.9% | |
| | 48,100 | | | Headwaters Inc.* | | $ | 970,658 | |
| | 42,900 | | | Summit Materials Inc., Class A Shares* | | | 1,006,434 | |
| | | | | | | | |
| | | | Total Construction Materials | | | 1,977,092 | |
| | | | | | | | |
| | | | TOTAL MATERIALS | | | 5,414,841 | |
| | | | | | | | |
| | | | TOTAL COMMON STOCKS
(Cost — $179,548,312) | | | 217,619,078 | |
| | | | | | | | |
| | |
Face
Amount | | | | | | |
| SHORT-TERM INVESTMENTS (b) — 12.9% | | | | |
| MONEY MARKET FUND — 8.0% | |
| $ | 18,339,079 | | | Invesco STIT — Government & Agency Portfolio(c)
(Cost — $18,339,079) | | | 18,339,079 | |
| | | | | | | | |
| TIME DEPOSITS — 4.9% | |
| | 5,957,373 | | | ANZ National Bank — London, 0.030% due 9/1/15 | | | 5,957,373 | |
| | 5,272,091 | | | DNB — Oslo, 0.030% due 9/1/15 | | | 5,272,091 | |
| | | | | | | | |
| | | | TOTAL TIME DEPOSITS
(Cost — $11,229,464) | | | 11,229,464 | |
| | | | | | | | |
| | | | TOTAL SHORT-TERM INVESTMENTS
(Cost — $29,568,543) | | | 29,568,543 | |
| | | | | | | | |
| | | | TOTAL INVESTMENTS — 108.1%
(Cost — $209,116,855#) | | | 247,187,621 | |
| | | | | | | | |
| | | | Liabilities in Excess of Other Assets — (8.1)% | | | (18,601,886 | ) |
| | | | | | | | |
| | | | TOTAL NET ASSETS — 100.0% | | $ | 228,585,735 | |
| | | | | | | | |
| * | Non-income producing security. |
| (a) | All or a portion of this security is on loan (See Note 1). |
| (b) | Inclusive of all short term holdings, including collateral received from securities lending activities. Excluding such collateral, the percentage of portfolio holdings would be 4.9%. |
| (c) | Represents investment of collateral received from securities lending transactions. |
| # | Aggregate cost for federal income tax purposes is $209,864,417. |
| | |
Abbreviations used in this schedule: |
| ADR | | — American Depositary Receipts |
| PLC | | — Public Limited Company |
| | | | |
| Summary of Investments by Security Sector^ | | | |
Health Care | | | 28.5 | % |
Information Technology | | | 20.2 | |
Consumer Discretionary | | | 16.5 | |
Industrials | | | 12.0 | |
Financials | | | 6.0 | |
Materials | | | 2.2 | |
Consumer Staples | | | 1.4 | |
Energy | | | 1.2 | |
Short-Term Investments | | | 12.0 | |
| | | | |
| | | 100.0 | % |
| | | | |
| ^ | As a percentage of total investments. |
See Notes to Financial Statements.
51
| | | | | | | | |
| Small Capitalization Value Equity Investments | |
| | |
| Shares/Units | | | Security | | Value | |
| COMMON STOCKS — 97% | |
| CONSUMER DISCRETIONARY — 11.4% | |
| Auto Components — 1.6% | |
| | 34,700 | | | Dana Holding Corp. | | $ | 608,638 | |
| | 172,967 | | | Modine Manufacturing Co.* | | | 1,535,947 | |
| | 15,050 | | | Standard Motor Products Inc. | | | 532,770 | |
| | 13,600 | | | Tenneco Inc.* | | | 639,880 | |
| | | | | | | | |
| | | | Total Auto Components | | | 3,317,235 | |
| | | | | | | | |
| Automobiles — 0.3% | |
| | 12,000 | | | Thor Industries Inc. | | | 654,960 | |
| | | | | | | | |
| Distributors — 0.3% | |
| | 9,340 | | | Core-Mark Holding Co., Inc. | | | 561,427 | |
| | | | | | | | |
| Diversified Consumer Services — 1.8% | |
| | 235,189 | | | Regis Corp.* | | | 2,549,449 | |
| | 47,000 | | | Service Corp. International | | | 1,393,550 | |
| | | | | | | | |
| | | | Total Diversified Consumer Services | | | 3,942,999 | |
| | | | | �� | | | |
| Hotels, Restaurants & Leisure — 1.6% | |
| | 15,600 | | | Bloomin’ Brands Inc. | | | 322,920 | |
| | 10,200 | | | Brinker International Inc | | | 541,926 | |
| | 18,100 | | | Cheesecake Factory Inc. (The) | | | 982,287 | |
| | 3,600 | | | DineEquity Inc. | | | 343,800 | |
| | 15,400 | | | International Speedway Corp., Class A Shares | | | 494,186 | |
| | 20,500 | | | Texas Roadhouse Inc. | | | 737,795 | |
| | | | | | | | |
| | | | Total Hotels, Restaurants & Leisure | | | 3,422,914 | |
| | | | | | | | |
| Household Durables — 0.8% | |
| | 25,700 | | | Meritage Homes Corp.* | | | 1,082,998 | |
| | 14,131 | | | Ryland Group Inc. (The) | | | 611,025 | |
| | | | | | | | |
| | | | Total Household Durables | | | 1,694,023 | |
| | | | | | | | |
| Internet & Catalog Retail — 1.5% | |
| | 94,450 | | | Blue Nile Inc.* | | | 3,216,967 | |
| | | | | | | | |
| Media — 1.0% | |
| | 16,497 | | | Cinemark Holdings Inc. | | | 586,468 | |
| | 25,698 | | | Meredith Corp. | | | 1,213,460 | |
| | 17,364 | | | Time Inc. | | | 360,650 | |
| | | | | | | | |
| | | | Total Media | | | 2,160,578 | |
| | | | | | | | |
| Specialty Retail — 1.9% | |
| | 6,000 | | | Asbury Automotive Group Inc.* | | | 483,420 | |
| | 14,400 | | | Buckle Inc. (The) | | | 607,680 | |
| | 11,557 | | | Cato Corp. (The), Class A Shares | | | 405,997 | |
| | 19,300 | | | Finish Line Inc. (The), Class A Shares | | | 508,941 | |
| | 6,920 | | | Genesco Inc.* | | | 414,439 | |
| | 14,509 | | | GNC Holdings Inc., Class A Shares | | | 679,021 | |
| | 7,000 | | | Group 1 Automotive Inc. | | | 611,800 | |
| | 40,500 | | | Stage Stores Inc. | | | 434,970 | |
| | | | | | | | |
| | | | Total Specialty Retail | | | 4,146,268 | |
| | | | | | | | |
| Textiles, Apparel & Luxury Goods — 0.6% | |
| | 17,100 | | | Steven Madden Ltd.* | | | 698,706 | |
| | 23,300 | | | Wolverine World Wide Inc. | | | 627,935 | |
| | | | | | | | |
| | | | Total Textiles, Apparel & Luxury Goods | | | 1,326,641 | |
| | | | | | | | |
| | | | TOTAL CONSUMER DISCRETIONARY | | | 24,444,012 | |
| | | | | | | | |
See Notes to Financial Statements.
52
| | | | | | | | |
| Small Capitalization Value Equity Investments | |
| | |
| Shares/Units | | | Security | | Value | |
| CONSUMER STAPLES — 4.0% | |
| Food & Staples Retailing — 0.6% | |
| | 17,550 | | | Andersons Inc. (The) | | $ | 620,919 | |
| | 12,001 | | | Ingles Markets Inc., Class A Shares | | | 596,450 | |
| | 3,453 | | | Weis Markets Inc. | | | 140,364 | |
| | | | | | | | |
| | | | Total Food & Staples Retailing | | | 1,357,733 | |
| | | | | | | | |
| Food Products — 1.3% | |
| | 6,600 | | | Cal-Maine Foods Inc.(a) | | | 350,592 | |
| | 8,500 | | | Ingredion Inc. | | | 733,890 | |
| | 5,300 | | | J&J Snack Foods Corp. | | | 603,988 | |
| | 16,100 | | | Pinnacle Foods Inc. | | | 721,924 | |
| | 5,881 | | | Sanderson Farms Inc.(a) | | | 406,024 | |
| | | | | | | | |
| | | | Total Food Products | | | 2,816,418 | |
| | | | | | | | |
| Household Products — 1.7% | |
| | 134,512 | | | Central Garden & Pet Co.* | | | 1,649,117 | |
| | 103,393 | | | Central Garden & Pet Co., Class A Shares* | | | 1,307,922 | |
| | 16,000 | | | Energizer Holdings Inc. | | | 668,160 | |
| | | | | | | | |
| | | | Total Household Products | | | 3,625,199 | |
| | | | | | | | |
| Tobacco — 0.4% | |
| | 15,400 | | | Universal Corp.(a) | | | 757,834 | |
| | | | | | | | |
| | | | TOTAL CONSUMER STAPLES | | | 8,557,184 | |
| | | | | | | | |
| ENERGY — 5.9% | |
| Energy Equipment & Services — 2.2% | |
| | 7,700 | | | Dril-Quip Inc.* | | | 530,838 | |
| | 60,700 | | | Helix Energy Solutions Group Inc.* | | | 421,865 | |
| | 43,100 | | | Patterson-UTI Energy Inc. | | | 701,668 | |
| | 106,600 | | | RigNet Inc.*(a) | | | 3,073,278 | |
| | | | | | | | |
| | | | Total Energy Equipment & Services | | | 4,727,649 | |
| | | | | | | | |
| Oil, Gas & Consumable Fuels — 3.7% | |
| | 23,832 | | | Alliance Resource Partners LP(a) | | | 609,622 | |
| | 20,400 | | | Alon USA Partners LP(a) | | | 530,400 | |
| | 49,010 | | | Boardwalk Pipeline Partners LP | | | 669,477 | |
| | 29,100 | | | Bonanza Creek Energy Inc.* | | | 222,615 | |
| | 18,300 | | | Delek Logistics Partners LP(a) | | | 728,706 | |
| | 16,700 | | | Jones Energy Inc., Class A Shares* | | | 99,031 | |
| | 26,000 | | | Northern Tier Energy LP | | | 670,800 | |
| | 42,700 | | | Oasis Petroleum Inc.*(a) | | | 476,532 | |
| | 39,176 | | | Ship Finance International Ltd.(a) | | | 658,157 | |
| | 15,800 | | | SM Energy Co | | | 579,860 | |
| | 40,200 | | | Stone Energy Corp.* | | | 227,934 | |
| | 17,635 | | | Sunoco LP | | | 694,466 | |
| | 15,898 | | | Western Refining Inc | | | 683,932 | |
| | 22,000 | | | Whiting Petroleum Corp.* | | | 425,260 | |
| | 17,100 | | | World Fuel Services Corp | | | 660,915 | |
| | | | | | | | |
| | | | Total Oil, Gas & Consumable Fuels | | | 7,937,707 | |
| | | | | | | | |
| | | | TOTAL ENERGY | | | 12,665,356 | |
| | | | | | | | |
| FINANCIALS — 24.9% | |
| Banks — 10.5% | |
| | 21,300 | | | Bank of Hawaii Corp. | | | 1,321,878 | |
| | 10,100 | | | BOK Financial Corp. | | | 639,128 | |
| | 55,800 | | | Boston Private Financial Holdings Inc. | | | 664,020 | |
| | 30,700 | | | Community Bank System Inc. | | | 1,094,762 | |
See Notes to Financial Statements.
53
| | | | | | | | |
| Small Capitalization Value Equity Investments | |
| | |
| Shares/Units | | | Security | | Value | |
| FINANCIALS — 24.9% — (continued) | |
| Banks — 10.5% — (continued) | |
| | 10,900 | | | Cullen/Frost Bankers Inc. | | $ | 704,794 | |
| | 200 | | | CVB Financial Corp. | | | 3,250 | |
| | 59,985 | | | East West Bancorp Inc. | | | 2,423,994 | |
| | 44,800 | | | First Financial Bancorp | | | 826,112 | |
| | 45,300 | | | First Interstate Bancsystem Inc., Class A Shares | | | 1,208,604 | |
| | 41,000 | | | First Midwest Bancorp Inc. | | | 723,240 | |
| | 34,178 | | | FirstMerit Corp. | | | 613,837 | |
| | 60,600 | | | Great Western Bancorp Inc. | | | 1,525,302 | |
| | 39,641 | | | Hancock Holding Co. | | | 1,113,119 | |
| | 25,100 | | | Independent Bank Corp. | | | 1,136,779 | |
| | 11,541 | | | National Penn Bancshares Inc. | | | 138,665 | |
| | 37,200 | | | NBT Bancorp Inc. | | | 963,480 | |
| | 51,900 | | | Old National Bancorp | | | 716,220 | |
| | 14,200 | | | Prosperity Bancshares Inc. | | | 733,714 | |
| | 21,005 | | | S&T Bancorp Inc. | | | 628,470 | |
| | 46,500 | | | TCF Financial Corp. | | | 721,680 | |
| | 28,406 | | | Trustmark Corp. | | | 654,190 | |
| | 44,254 | | | Umpqua Holdings Corp. | | | 739,484 | |
| | 94,600 | | | Valley National Bancorp | | | 894,916 | |
| | 39,800 | | | Webster Financial Corp. | | | 1,408,124 | |
| | 25,700 | | | WesBanco Inc. | | | 791,303 | |
| | | | | | | | |
| | | | Total Banks | | | 22,389,065 | |
| | | | | | | | |
| Capital Markets — 1.5% | |
| | 11,106 | | | AllianceBernstein Holding LP(a) | | | 303,638 | |
| | 8,200 | | | Artisan Partners Asset Management Inc., Class A Shares | | | 335,134 | |
| | 100,800 | | | Fortress Investment Group LLC, Class A Shares | | | 584,640 | |
| | 14,088 | | | Investment Technology Group Inc | | | 231,325 | |
| | 19,700 | | | Main Street Capital Corp.(a) | | | 553,373 | |
| | 19,847 | | | OM Asset Management PLC | | | 327,873 | |
| | 19,100 | | | Stifel Financial Corp.* | | | 890,060 | |
| | | | | | | | |
| | | | Total Capital Markets | | | 3,226,043 | |
| | | | | | | | |
| Insurance — 6.0% | |
| | 16,963 | | | Allied World Assurance Co. Holdings AG | | | 677,502 | |
| | 35,700 | | | American Equity Investment Life Holding Co. | | | 866,082 | |
| | 10,500 | | | American Financial Group Inc. | | | 725,130 | |
| | 8,300 | | | First American Financial Corp. | | | 322,538 | |
| | 5,300 | | | Hanover Insurance Group Inc. (The) | | | 418,170 | |
| | 17,472 | | | HCI Group Inc. | | | 694,512 | |
| | 9,300 | | | Infinity Property & Casualty Corp. | | | 718,704 | |
| | 175,414 | | | Maiden Holdings Ltd. | | | 2,513,683 | |
| | 105,178 | | | National Interstate Corp.(b) | | | 2,913,430 | |
| | 19,500 | | | ProAssurance Corp. | | | 940,485 | |
| | 43,500 | | | Selective Insurance Group Inc. | | | 1,318,920 | |
| | 18,646 | | | Validus Holdings Ltd. | | | 825,645 | |
| | | | | | | | |
| | | | Total Insurance | | | 12,934,801 | |
| | | | | | | | |
| Real Estate Investment Trusts (REITs) — 6.3% | |
| | 67,132 | | | Ashford Hospitality Prime Inc. | | | 928,436 | |
| | 267,433 | | | Ashford Hospitality Trust Inc. | | | 2,069,931 | |
| | 25,900 | | | Blackstone Mortgage Trust Inc., Class A Shares | | | 717,171 | |
| | 68,364 | | | Brandywine Realty Trust | | | 828,572 | |
| | 9,800 | | | Care Capital Properties Inc.* | | | 311,542 | |
| | 21,400 | | | Corrections Corp. of America | | | 628,732 | |
| | 21,600 | | | CyrusOne Inc. | | | 683,856 | |
See Notes to Financial Statements.
54
| | | | | | | | |
| Small Capitalization Value Equity Investments | |
| | |
| Shares/Units | | | Security | | Value | |
| FINANCIALS — 24.9% — (continued) | |
| Real Estate Investment Trusts (REITs) — 6.3% — (continued) | |
| | 16,466 | | | Education Realty Trust Inc. | | $ | 481,631 | |
| | 58,300 | | | Franklin Street Properties Corp. | | | 606,903 | |
| | 25,800 | | | Healthcare Realty Trust Inc. | | | 590,820 | |
| | 23,000 | | | Highwoods Properties Inc. | | | 872,620 | |
| | 78,000 | | | Lexington Realty Trust | | | 629,460 | |
| | 48,300 | | | Medical Properties Trust Inc. | | | 563,661 | |
| | 69,000 | | | Monmouth Real Estate Investment Corp.(a) | | | 656,880 | |
| | 32,000 | | | Ramco-Gershenson Properties Trust | | | 496,000 | |
| | 44,317 | | | Retail Properties of America Inc., Class A Shares | | | 604,927 | |
| | 32,423 | | | Starwood Property Trust Inc. | | | 689,961 | |
| | 44,900 | | | Summit Hotel Properties Inc. | | | 544,637 | |
| | 26,500 | | | Washington Real Estate Investment Trust | | | 651,900 | |
| | | | | | | | |
| | | | Total Real Estate Investment Trusts (REITs) | | | 13,557,640 | |
| | | | | | | | |
| Real Estate Management & Development — 0.3% | |
| | 18,600 | | | Alexander & Baldwin Inc. | | | 629,238 | |
| | | | | | | | |
| Thrifts & Mortgage Finance — 0.3% | |
| | 27,200 | | | Washington Federal Inc. | | | 617,168 | |
| | | | | | | | |
| | | | TOTAL FINANCIALS | | | 53,353,955 | |
| | | | | | | | |
| HEALTH CARE — 3.9% | |
| Health Care Equipment & Supplies — 2.4% | |
| | 16,000 | | | Haemonetics Corp.* | | | 577,760 | |
| | 154,740 | | | Invacare Corp. | | | 2,721,877 | |
| | 17,363 | | | STERIS Corp. | | | 1,112,100 | |
| | 6,100 | | | Teleflex Inc. | | | 797,880 | |
| | | | | | | | |
| | | | Total Health Care Equipment & Supplies | | | 5,209,617 | |
| | | | | | | | |
| Health Care Providers & Services — 1.2% | |
| | 41,950 | | | Owens & Minor Inc. | | | 1,425,880 | |
| | 19,400 | | | VCA Inc.* | | | 1,074,372 | |
| | | | | | | | |
| | | | Total Health Care Providers & Services | | | 2,500,252 | |
| | | | | | | | |
| Life Sciences Tools & Services — 0.3% | |
| | 23,890 | | | VWR Corp.* | | | 627,113 | |
| | | | | | | | |
| | | | TOTAL HEALTH CARE | | | 8,336,982 | |
| | | | | | | | |
| INDUSTRIALS — 23.8% | |
| Aerospace & Defense — 1.0% | |
| | 9,400 | | | Elbit Systems Ltd. | | | 721,074 | |
| | 9,600 | | | Orbital ATK Inc. | | | 726,816 | |
| | 12,900 | | | Triumph Group Inc. | | | 637,131 | |
| | | | | | | | |
| | | | Total Aerospace & Defense | | | 2,085,021 | |
| | | | | | | | |
| Airlines — 0.3% | |
| | 34,900 | | | WestJet Airlines Ltd.(c) | | | 636,643 | |
| | | | | | | | |
| Building Products — 2.1% | |
| | 215,657 | | | NCI Building Systems Inc.* | | | 2,249,303 | |
| | 172,400 | | | Ply Gem Holdings Inc.* | | | 2,344,640 | |
| | | | | | | | |
| | | | Total Building Products | | | 4,593,943 | |
| | | | | | | | |
| Commercial Services & Supplies — 3.0% | |
| | 9,200 | | | Deluxe Corp. | | | 533,692 | |
| | 42,800 | | | Ennis Inc. | | | 698,924 | |
| | 12,800 | | | Essendant Inc. | | | 441,600 | |
| | 401,596 | | | InnerWorkings Inc.* | | | 2,915,587 | |
See Notes to Financial Statements.
55
| | | | | | | | |
| Small Capitalization Value Equity Investments | |
| | |
| Shares/Units | | | Security | | Value | |
| INDUSTRIALS — 23.8% — (continued) | |
| Commercial Services & Supplies — 3.0% — (continued) | |
| | 24,935 | | | Knoll Inc. | | $ | 596,445 | |
| | 5,300 | | | UniFirst Corp. | | | 574,573 | |
| | 25,896 | | | West Corp. | | | 630,309 | |
| | | | | | | | |
| | | | Total Commercial Services & Supplies | | | 6,391,130 | |
| | | | | | | | |
| Construction & Engineering — 4.0% | |
| | 86,050 | | | Granite Construction Inc. | | | 2,968,725 | |
| | 350,116 | | | Great Lakes Dredge & Dock Corp.* | | | 1,943,144 | |
| | 257,051 | | | Layne Christensen Co.* | | | 1,917,600 | |
| | 63,700 | | | MasTec Inc.* | | | 1,054,872 | |
| | 35,000 | | | Primoris Services Corp. | | | 642,950 | |
| | | | | | | | |
| | | | Total Construction & Engineering | | | 8,527,291 | |
| | | | | | | | |
| Electrical Equipment — 2.6% | |
| | 10,700 | | | Babcock & Wilcox Enterprises Inc.* | | | 197,415 | |
| | 10,100 | | | EnerSys | | | 540,047 | |
| | 96,150 | | | Powell Industries Inc. | | | 2,822,964 | |
| | 20,561 | | | Regal Beloit Corp. | | | 1,370,802 | |
| | 26,600 | | | Thermon Group Holdings Inc.* | | | 608,608 | |
| | | | | | | | |
| | | | Total Electrical Equipment | | | 5,539,836 | |
| | | | | | | | |
| Machinery — 7.8% | |
| | 25,919 | | | Altra Industrial Motion Corp. | | | 648,234 | |
| | 37,962 | | | Barnes Group Inc. | | | 1,466,472 | |
| | 144,326 | | | Briggs & Stratton Corp. | | | 2,883,634 | |
| | 6,700 | | | CIRCOR International Inc. | | | 303,108 | |
| | 13,100 | | | Crane Co. | | | 688,274 | |
| | 57,224 | | | Douglas Dynamics Inc. | | | 1,271,517 | |
| | 9,100 | | | EnPro Industries Inc. | | | 431,704 | |
| | 241,745 | | | Harsco Corp. | | | 2,794,572 | |
| | 53,600 | | | ITT Corp. | | | 2,005,176 | |
| | 42,305 | | | John Bean Technologies Corp. | | | 1,401,142 | |
| | 319,992 | | | Mueller Water Products Inc., Class A Shares | | | 2,863,928 | |
| | | | | | | | |
| | | | Total Machinery | | | 16,757,761 | |
| | | | | | | | |
| Marine — 0.5% | |
| | 6,900 | | | Kirby Corp.* | | | 486,657 | |
| | 17,000 | | | Matson Inc. | | | 640,560 | |
| | | | | | | | |
| | | | Total Marine | | | 1,127,217 | |
| | | | | | | | |
| Professional Services — 1.1% | |
| | 157,400 | | | Mistras Group Inc.* | | | 2,304,336 | |
| | | | | | | | |
| Road & Rail — 0.6% | |
| | 11,250 | | | Saia Inc.* | | | 422,437 | |
| | 31,300 | | | Werner Enterprises Inc. | | | 829,137 | |
| | | | | | | | |
| | | | Total Road & Rail | | | 1,251,574 | |
| | | | | | | | |
| Trading Companies & Distributors — 0.8% | |
| | 15,900 | | | Applied Industrial Technologies Inc. | | | 673,206 | |
| | 38,700 | | | H&E Equipment Services Inc. | | | 801,477 | |
| | 6,000 | | | WESCO International Inc.* | | | 335,820 | |
| | | | | | | | |
| | | | Total Trading Companies & Distributors | | | 1,810,503 | |
| | | | | | | | |
| | | | TOTAL INDUSTRIALS | | | 51,025,255 | |
| | | | | | | | |
See Notes to Financial Statements.
56
| | | | | | | | |
| Small Capitalization Value Equity Investments | |
| | |
| Shares/Units | | | Security | | Value | |
| INFORMATION TECHNOLOGY — 7.4% | |
| Communications Equipment — 1.4% | |
| | 8,635 | | | Black Box Corp. | | $ | 132,979 | |
| | 74,700 | | | Brocade Communications Systems Inc. | | | 795,555 | |
| | 38,860 | | | CommScope Holding Co., Inc.* | | | 1,257,121 | |
| | 21,100 | | | NetScout Systems Inc.* | | | 771,205 | |
| | | | | | | | |
| | | | Total Communications Equipment | | | 2,956,860 | |
| | | | | | | | |
| Electronic Equipment, Instruments & Components — 1.8% | |
| | 47,300 | | | AVX Corp. | | | 617,738 | |
| | 22,731 | | | Methode Electronics Inc. | | | 603,963 | |
| | 7,813 | | | SYNNEX Corp. | | | 618,711 | |
| | 14,400 | | | Tech Data Corp.* | | | 939,456 | |
| | 114,000 | | | Vishay Intertechnology Inc. | | | 1,126,320 | |
| | | | | | | | |
| | | | Total Electronic Equipment, Instruments & Components | | | 3,906,188 | |
| | | | | | | | |
| Internet Software & Services — 0.2% | |
| | 5,642 | | | j2 Global Inc. | | | 392,571 | |
| | | | | | | | |
| IT Services — 0.8% | |
| | 25,300 | | | Booz Allen Hamilton Holding Corp., Class A Shares | | | 675,510 | |
| | 20,600 | | | Convergys Corp. | | | 465,560 | |
| | 21,900 | | | CSG Systems International Inc. | | | 676,929 | |
| | | | | | | | |
| | | | Total IT Services | | | 1,817,999 | |
| | | | | | | | |
| Semiconductors & Semiconductor Equipment — 1.1% | |
| | 19,400 | | | Cirrus Logic Inc.* | | | 585,104 | |
| | 2,200 | | | MKS Instruments Inc. | | | 74,140 | |
| | 94,000 | | | ON Semiconductor Corp.* | | | 898,170 | |
| | 40,800 | | | Teradyne Inc. | | | 736,032 | |
| | | | | | | | |
| | | | Total Semiconductors & Semiconductor Equipment | | | 2,293,446 | |
| | | | | | | | |
| Software — 1.4% | |
| | 26,649 | | | Mentor Graphics Corp. | | | 688,610 | |
| | 24,800 | | | PTC Inc.* | | | 821,376 | |
| | 31,100 | | | Synopsys Inc.* | | | 1,459,523 | |
| | | | | | | | |
| | | | Total Software | | | 2,969,509 | |
| | | | | | | | |
| Technology Hardware, Storage & Peripherals — 0.7% | |
| | 23,400 | | | Electronics for Imaging Inc.* | | | 1,024,218 | |
| | 21,200 | | | Super Micro Computer Inc.* | | | 579,820 | |
| | | | | | | | |
| | | | Total Technology Hardware, Storage & Peripherals | | | 1,604,038 | |
| | | | | | | | |
| | | | TOTAL INFORMATION TECHNOLOGY | | | 15,940,611 | |
| | | | | | | | |
| MATERIALS — 12.3% | |
| Chemicals — 3.9% | |
| | 14,900 | | | Albemarle Corp. | | | 673,629 | |
| | 18,700 | | | Cabot Corp. | | | 633,369 | |
| | 36,600 | | | Chemtura Corp.* | | | 995,520 | |
| | 1,200 | | | Cytec Industries Inc. | | | 89,040 | |
| | 30,400 | | | HB Fuller Co. | | | 1,101,696 | |
| | 6,800 | | | Innophos Holdings Inc. | | | 326,876 | |
| | 327,850 | | | Intrepid Potash Inc.* | | | 2,593,293 | |
| | 10,300 | | | Methanex Corp. | | | 419,828 | |
| | 18,000 | | | Olin Corp.(a) | | | 359,280 | |
| | 11,600 | | | Scotts Miracle-Gro Co. (The), Class A Shares | | | 721,404 | |
| | 3,215 | | | Terra Nitrogen Co. LP | | | 364,742 | |
| | | | | | | | |
| | | | Total Chemicals | | | 8,278,677 | |
| | | | | | | | |
See Notes to Financial Statements.
57
| | | | | | | | |
| Small Capitalization Value Equity Investments | |
| | |
| Shares/Units | | | Security | | Value | |
| MATERIALS — 12.3% — (continued) | |
| Construction Materials — 1.4% | |
| | 147,838 | | | Headwaters Inc.* | | $ | 2,983,371 | |
| | | | | | | | |
| Containers & Packaging — 1.2% | |
| | 45,499 | | | Berry Plastics Group Inc.* | | | 1,346,770 | |
| | 13,830 | | | Silgan Holdings Inc. | | | 724,139 | |
| | 16,400 | | | Sonoco Products Co. | | | 644,848 | |
| | | | | | | | |
| | | | Total Containers & Packaging | | | 2,715,757 | |
| | | | | | | | |
| Metals & Mining — 4.7% | |
| | 48,400 | | | Commercial Metals Co. | | | 759,880 | |
| | 8,600 | | | Compass Minerals International Inc. | | | 696,600 | |
| | 20,137 | | | Dominion Diamond Corp. | | | 238,422 | |
| | 153,754 | | | Globe Specialty Metals Inc. | | | 2,112,580 | |
| | 37,900 | | | HudBay Minerals Inc. | | | 189,500 | |
| | 16,700 | | | Kaiser Aluminum Corp. | | | 1,395,786 | |
| | 12,100 | | | Royal Gold Inc. | | | 582,252 | |
| | 29,000 | | | Ryerson Holding Corp.*(a) | | | 220,980 | |
| | 183,700 | | | Schnitzer Steel Industries Inc., Class A Shares(a) | | | 3,179,847 | |
| | 33,800 | | | Steel Dynamics Inc. | | | 658,424 | |
| | | | | | | | |
| | | | Total Metals & Mining | | | 10,034,271 | |
| | | | | | | | |
| Paper & Forest Products — 1.1% | |
| | 12,500 | | | Clearwater Paper Corp.* | | | 700,750 | |
| | 26,417 | | | KapStone Paper and Packaging Corp. | | | 575,627 | |
| | 28,100 | | | P.H. Glatfelter Co. | | | 507,486 | |
| | 17,652 | | | Schweitzer-Mauduit International Inc. | | | 623,645 | |
| | | | | | | | |
| | | | Total Paper & Forest Products | | | 2,407,508 | |
| | | | | | | | |
| | | | TOTAL MATERIALS | | | 26,419,584 | |
| | | | | | | | |
| TELECOMMUNICATION SERVICES — 0.2% | |
| Diversified Telecommunication Services — 0.2% | |
| | 35,000 | | | Premiere Global Services Inc.* | | | 377,300 | |
| | | | | | | | |
| UTILITIES — 3.2% | |
| Electric Utilities — 1.3% | |
| | 14,900 | | | ALLETE Inc. | | | 711,922 | |
| | 17,800 | | | El Paso Electric Co. | | | 630,120 | |
| | 27,700 | | | Great Plains Energy Inc. | | | 690,284 | |
| | 20,500 | | | Portland General Electric Co. | | | 708,070 | |
| | | | | | | | |
| | | | Total Electric Utilities | | | 2,740,396 | |
| | | | | | | | |
| Gas Utilities — 1.0% | |
| | 13,200 | | | Laclede Group Inc. (The) | | | 698,808 | |
| | 19,500 | | | Questar Corp. | | | 376,545 | |
| | 18,700 | | | Southwest Gas Corp. | | | 1,030,183 | |
| | | | | | | | |
| | | | Total Gas Utilities | | | 2,105,536 | |
| | | | | | | | |
| Multi-Utilities — 0.9% | |
| | 29,500 | | | Black Hills Corp. | | | 1,173,510 | |
| | 16,000 | | | NorthWestern Corp. | | | 826,240 | |
| | | | | | | | |
| | | | Total Multi-Utilities | | | 1,999,750 | |
| | | | | | | | |
| | | | TOTAL UTILITIES | | | 6,845,682 | |
| | | | | | | | |
| | | | TOTAL COMMON STOCKS
(Cost — $183,415,163) | | | 207,965,921 | |
| | | | | | | | |
See Notes to Financial Statements.
58
| | | | | | | | |
| Small Capitalization Value Equity Investments | |
| | |
| Shares/Units | | | Security | | Value | |
| CLOSED END MUTUAL FUND SECURITIES — 0.2% | |
| FINANCIALS — 0.2% | |
| Capital Markets — 0.2% | |
| | 43,100 | | | Central Fund of Canada Ltd., Class A Shares | | $ | 469,359 | |
| | | | | | | | |
| | | | Total Capital Markets | | | 469,359 | |
| | | | | | | | |
| | | | TOTAL CLOSED END MUTUAL FUND SECURITIES
(Cost — $580,877) | | | 469,359 | |
| | | | | | | | |
| | | | TOTAL INVESTMENTS BEFORE SHORT-TERM INVESTMENTS
(Cost — $183,996,040) | | | 208,435,280 | |
| | | | | | | | |
| | |
Face
Amount | | | | | | |
| SHORT-TERM INVESTMENTS (d) — 5.7% | | | | |
| MONEY MARKET FUND — 3.3% | |
| $ | 6,979,519 | | | Invesco STIT — Government & Agency Portfolio(e)
(Cost — $6,979,519) | | | 6,979,519 | |
| | | | | | | | |
| TIME DEPOSITS — 2.4% | |
| | 1,236,957 | | | DNB — Oslo, 0.030% due 9/1/15 | | | 1,236,957 | |
| | 2,362,109 | | | JPMorgan Chase & Co. — New York, 0.030% due 9/1/15 | | | 2,362,109 | |
| | 1,532,824 | | | Nordea Bank AB — Oslo, 0.030% due 9/1/15 | | | 1,532,824 | |
| | | | | | | | |
| | | | TOTAL TIME DEPOSITS
(Cost — $5,131,890) | | | 5,131,890 | |
| | | | | | | | |
| | | | TOTAL SHORT-TERM INVESTMENTS
(Cost — $12,111,409) | | | 12,111,409 | |
| | | | | | | | |
| | | | TOTAL INVESTMENTS — 102.9%
(Cost — $196,107,449#) | | | 220,546,689 | |
| | | | | | | | |
| | | | Liabilities in Excess of Other Assets — (2.9)% | | | (6,201,766 | ) |
| | | | | | | | |
| | | | TOTAL NET ASSETS — 100.0% | | $ | 214,344,923 | |
| | | | | | | | |
| * | Non-income producing security. |
| (a) | All or a portion of this security is on loan (See Note 1). |
| (c) | Security is valued in good faith at fair value by or under the direction of the Board of Trustees. |
| (d) | Inclusive of all short term holdings, including collateral received from securities lending activities. Excluding such collateral, the percentage of portfolio holdings would be 2.4%. |
| (e) | Represents investment of collateral received from securities lending transactions. |
| # | Aggregate cost for federal income tax purposes is $197,632,794. |
| | |
Abbreviations used in this schedule: |
| PLC | | — Public Limited Company |
See Notes to Financial Statements.
59
| | | | |
| Small Capitalization Value Equity Investments |
| | | | |
| Summary of Investments by Security Sector^ | |
Financials | | | 24.4 | % |
Industrials | | | 23.1 | |
Materials | | | 12.0 | |
Consumer Discretionary | | | 11.1 | |
Information Technology | | | 7.2 | |
Energy | | | 5.7 | |
Consumer Staples | | | 3.9 | |
Health Care | | | 3.8 | |
Utilities | | | 3.1 | |
Telecommunication Services | | | 0.2 | |
Short-Term Investments | | | 5.5 | |
| | | | |
| | | 100.0 | % |
| | | | |
| ^ | As a percentage of total investments. |
See Notes to Financial Statements.
60
| | | | | | | | |
| International Equity Investments | |
| | |
| Shares/Units | | | Security | | Value | |
| COMMON STOCKS — 95.8% | |
| Australia — 2.0% | |
| | 380,594 | | | Amcor Ltd. | | $ | 3,714,488 | |
| | 195,143 | | | BHP Billiton PLC | | | 3,350,481 | |
| | 386,487 | | | Brambles Ltd. | | | 2,695,231 | |
| | 124,767 | | | CIMIC Group Ltd. | | | 2,076,843 | |
| | 99,468 | | | CSL Ltd. | | | 6,476,841 | |
| | 114,136 | | | Sonic Healthcare Ltd. | | | 1,677,278 | |
| | 45,832 | | | Westfield Corp. | | | 317,714 | |
| | 168,409 | | | Westpac Banking Corp. | | | 3,723,988 | |
| | | | | | | | |
| | | | Total Australia | | | 24,032,864 | |
| | | | | | | | |
| Belgium — 0.8% | |
| | 8,821 | | | Anheuser-Busch InBev NV | | | 961,955 | |
| | 88,144 | | | KBC Groep NV | | | 5,818,895 | |
| | 38,771 | | | UCB SA | | | 2,923,481 | |
| | | | | | | | |
| | | | Total Belgium | | | 9,704,331 | |
| | | | | | | | |
| Brazil — 0.2% | |
| | 354,900 | | | BM&FBovespa SA — Bolsa de Valores Mercadorias e Futuros | | | 1,054,788 | |
| | 292,100 | | | Embraer SA | | | 1,850,641 | |
| | | | | | | | |
| | | | Total Brazil | | | 2,905,429 | |
| | | | | | | | |
| Canada — 2.4% | |
| | 389,978 | | | Baytex Energy Corp.(a) | | | 2,255,716 | |
| | 100,379 | | | Cenovus Energy Inc. | | | 1,454,967 | |
| | 118,557 | | | Dollarama Inc. | | | 6,769,279 | |
| | 230,735 | | | Hudson’s Bay Co. | | | 4,002,107 | |
| | 173,660 | | | Imperial Oil Ltd.(a) | | | 6,131,195 | |
| | 172,001 | | | Saputo Inc. | | | 3,961,259 | |
| | 98,253 | | | Toronto-Dominion Bank (The) | | | 3,919,217 | |
| | | | | | | | |
| | | | Total Canada | | | 28,493,740 | |
| | | | | | | | |
| China — 1.3% | |
| | 36,265 | | | Alibaba Group Holding Ltd., ADR* | | | 2,397,842 | |
| | 6,718,500 | | | CNOOC Ltd. | | | 8,433,394 | |
| | 3,636,000 | | | Lenovo Group Ltd. | | | 2,986,920 | |
| | 98,800 | | | Tencent Holdings Ltd. | | | 1,679,360 | |
| | | | | | | | |
| | | | Total China | | | 15,497,516 | |
| | | | | | | | |
| Denmark — 1.2% | |
| | 35,765 | | | Coloplast AS, Class B Shares | | | 2,429,833 | |
| | 154,349 | | | Novo Nordisk AS, Class B Shares | | | 8,532,316 | |
| | 9,101 | | | Novozymes AS, Class B Shares | | | 395,689 | |
| | 32,450 | | | William Demant Holding AS* | | | 2,631,285 | |
| | | | | | | | |
| | | | Total Denmark | | | 13,989,123 | |
| | | | | | | | |
| Finland — 0.5% | |
| | 946,764 | | | Nokia OYJ | | | 5,886,795 | |
| | | | | | | | |
| France — 12.3% | |
| | 57,603 | | | Accor SA | | | 2,719,976 | |
| | 88,033 | | | Airbus Group NV | | | 5,696,426 | |
| | 100,792 | | | AXA SA | | | 2,538,720 | |
| | 186,378 | | | BNP Paribas SA | | | 11,682,585 | |
| | 25,896 | | | Cie Générale des Établissements Michelin | | | 2,501,001 | |
| | 44,697 | | | Danone SA | | | 2,765,658 | |
| | 59,805 | | | Dassault Systemes | | | 4,145,009 | |
| | 134,694 | | | Edenred | | | 2,850,448 | |
See Notes to Financial Statements.
61
| | | | | | | | |
| International Equity Investments | |
| | |
| Shares/Units | | | Security | | Value | |
| France — 12.3% — (continued) | |
| | 549,038 | | | Engie | | $ | 9,824,889 | |
| | 57,272 | | | Essilor International SA | | | 6,798,494 | |
| | 9,873 | | | Hermes International | | | 3,494,954 | |
| | 16,406 | | | Iliad SA | | | 3,681,381 | |
| | 246,064 | | | Legrand SA | | | 14,132,302 | |
| | 14,277 | | | L’Oréal SA | | | 2,433,138 | |
| | 21,097 | | | LVMH Moët Hennessy Louis Vuitton SA | | | 3,508,411 | |
| | 26,364 | | | Pernod Ricard SA | | | 2,762,059 | |
| | 60,951 | | | Safran SA | | | 4,736,681 | |
| | 184,234 | | | Sanofi | | | 18,115,080 | |
| | 230,395 | | | Schneider Electric SE | | | 14,483,235 | |
| | 45,755 | | | SEB SA | | | 4,253,536 | |
| | 167,136 | | | Technip SA | | | 9,093,729 | |
| | 237,807 | | | Total SA | | | 10,818,118 | |
| | 41,368 | | | Valeo SA | | | 5,183,811 | |
| | | | | | | | |
| | | | Total France | | | 148,219,641 | |
| | | | | | | | |
| Germany — 6.9% | |
| | 62,634 | | | Bayer AG, Class Registered Shares | | | 8,500,420 | |
| | 67,967 | | | Bayerische Motoren Werke AG | | | 6,276,111 | |
| | 68,890 | | | Brenntag AG | | | 3,832,478 | |
| | 39,386 | | | Continental AG | | | 8,374,610 | |
| | 109,202 | | | Deutsche Bank AG, Class Registered Shares | | | 3,221,062 | |
| | 48,355 | | | Fresenius Medical Care AG & Co. KGaA | | | 3,704,422 | |
| | 96,238 | | | GEA Group AG | | | 3,760,863 | |
| | 31,623 | | | HeidelbergCement AG | | | 2,390,081 | |
| | 508,615 | | | Infineon Technologies AG | | | 5,566,179 | |
| | 71,525 | | | Linde AG | | | 12,431,466 | |
| | 96,350 | | | ProSiebenSat.1 Media AG | | | 4,693,338 | |
| | 223,516 | | | SAP SE | | | 15,044,311 | |
| | 30,990 | | | Symrise AG | | | 1,870,460 | |
| | 72,021 | | | United Internet AG, Class Registered Shares | | | 3,501,887 | |
| | | | | | | | |
| | | | Total Germany | | | 83,167,688 | |
| | | | | | | | |
| Hong Kong — 2.6% | |
| | 1,009,000 | | | AIA Group Ltd. | | | 5,551,817 | |
| | 1,544,000 | | | Brilliance China Automotive Holdings Ltd. | | | 1,857,478 | |
| | 1,330,313 | | | China Merchants Holdings International Co., Ltd. | | | 4,422,760 | |
| | 1,178,000 | | | China Mobile Ltd. | | | 14,370,056 | |
| | 333,400 | | | Hongkong Land Holdings Ltd. | | | 2,309,107 | |
| | 104,240 | | | Jardine Strategic Holdings Ltd. | | | 2,970,491 | |
| | | | | | | | |
| | | | Total Hong Kong | | | 31,481,709 | |
| | | | | | | | |
| India — 1.0% | |
| | 103,737 | | | HDFC Bank Ltd. | | | 1,599,712 | |
| | 97,818 | | | Hero MotoCorp Ltd. | | | 3,552,047 | |
| | 315,510 | | | ICICI Bank Ltd., ADR | | | 2,751,247 | |
| | 1,117,956 | | | Idea Cellular Ltd. | | | 2,633,653 | |
| | 41,072 | | �� | Larsen & Toubro Ltd.* | | | 990,730 | |
| | | | | | | | |
| | | | Total India | | | 11,527,389 | |
| | | | | | | | |
| Ireland — 1.2% | |
| | 235,665 | | | Experian PLC | | | 3,975,218 | |
| | 289,208 | | | James Hardie Industries PLC | | | 3,594,863 | |
| | 47,451 | | | Kerry Group PLC, Class A Shares | | | 3,519,840 | |
| | 39,800 | | | Ryanair Holdings PLC, ADR | | | 2,903,410 | |
| | | | | | | | |
| | | | Total Ireland | | | 13,993,331 | |
| | | | | | | | |
See Notes to Financial Statements.
62
| | | | | | | | |
| International Equity Investments | |
| | |
| Shares/Units | | | Security | | Value | |
| Israel — 0.3% | |
| | 39,434 | | | Check Point Software Technologies Ltd.* | | $ | 3,076,246 | |
| | | | | | | | |
| Italy — 0.5% | |
| | 8,970 | | | DiaSorin SpA | | | 412,526 | |
| | 1,064,140 | | | Intesa Sanpaolo SpA | | | 3,880,614 | |
| | 278,000 | | | Prada SpA(a) | | | 1,125,028 | |
| | 42,159 | | | Trevi Finanziaria Industriale SpA(a) | | | 59,976 | |
| | 25,126 | | | Yoox SpA* | | | 788,987 | |
| | | | | | | | |
| | | | Total Italy | | | 6,267,131 | |
| | | | | | | | |
| Japan — 11.9% | |
| | 46,700 | | | ABC-Mart Inc. | | | 2,828,534 | |
| | 172,400 | | | Astellas Pharma Inc. | | | 2,551,176 | |
| | 77,400 | | | Bridgestone Corp. | | | 2,588,242 | |
| | 47,500 | | | Daikin Industries Ltd. | | | 2,823,798 | |
| | 25,600 | | | Disco Corp.(a) | | | 1,931,718 | |
| | 135,100 | | | East Japan Railway Co. | | | 12,445,212 | |
| | 11,600 | | | FANUC Corp. | | | 1,878,620 | |
| | 1,959,000 | | | Hitachi Ltd. | | | 10,966,929 | |
| | 118,200 | | | Hoya Corp. | | | 4,610,430 | |
| | 90,000 | | | JGC Corp. | | | 1,312,982 | |
| | 803,400 | | | KDDI Corp. | | | 19,936,239 | |
| | 8,200 | | | Keyence Corp. | | | 3,795,664 | |
| | 237,000 | | | Kubota Corp. | | | 3,698,515 | |
| | 75,000 | | | Nabtesco Corp. | | | 1,492,070 | |
| | 74,000 | | | Nidec Corp. | | | 5,807,869 | |
| | 295,400 | | | Nikon Corp.(a) | | | 3,779,845 | |
| | 171,800 | | | Nippon Telegraph & Telephone Corp. | | | 6,561,530 | |
| | 241,400 | | | ORIX Corp. | | | 3,263,986 | |
| | 277,000 | | | Sekisui Chemical Co., Ltd. | | | 3,046,994 | |
| | 270,300 | | | Sekisui House Ltd. | | | 4,027,541 | |
| | 73,000 | | | Seven & i Holdings Co., Ltd. | | | 3,171,719 | |
| | 49,700 | | | Shin-Etsu Chemical Co., Ltd. | | | 2,725,169 | |
| | 14,000 | | | SMC Corp. | | | 3,391,517 | |
| | 360,200 | | | Sumitomo Mitsui Financial Group Inc. | | | 14,689,123 | |
| | 76,300 | | | Suntory Beverage & Food Ltd. | | | 3,215,066 | |
| | 66,200 | | | Suzuki Motor Corp. | | | 2,246,745 | |
| | 161,200 | | | Toyota Motor Corp. | | | 9,530,675 | |
| | 68,400 | | | Unicharm Corp. | | | 1,380,043 | |
| | 920,400 | | | Yahoo Japan Corp. | | | 3,710,310 | |
| | | | | | | | |
| | | | Total Japan | | | 143,408,261 | |
| | | | | | | | |
| Luxembourg — 0.3% | |
| | 113,239 | | | SES SA, ADR | | | 3,349,474 | |
| | | | | | | | |
| Macau — 0.1% | |
| | 367,600 | | | Sands China Ltd. | | | 1,266,994 | |
| | | | | | | | |
| Mexico — 0.3% | |
| | 112,949 | | | Grupo Financiero Banorte SAB de CV, Class O Shares | | | 540,811 | |
| | 116,380 | | | Grupo Televisa SAB, ADR | | | 3,556,573 | |
| | | | | | | | |
| | | | Total Mexico | | | 4,097,384 | |
| | | | | | | | |
| Netherlands — 4.6% | |
| | 174,114 | | | Aalberts Industries NV | | | 5,400,875 | |
| | 288,485 | | | Akzo Nobel NV | | | 19,479,307 | |
| | 26,002 | | | ASML Holding NV | | | 2,375,859 | |
| | 67,924 | | | Boskalis Westminster NV | | | 3,531,555 | |
| | 48,495 | | | Gemalto NV(a) | | | 3,489,423 | |
See Notes to Financial Statements.
63
| | | | | | | | |
| International Equity Investments | |
| | |
| Shares/Units | | | Security | | Value | |
| Netherlands — 4.6% — (continued) | |
| | 68,242 | | | Heineken NV | | $ | 5,387,098 | |
| | 218,886 | | | ING Groep NV, ADR | | | 3,329,892 | |
| | 83,860 | | | Koninklijke Vopak NV | | | 3,439,393 | |
| | 850,535 | | | PostNL NV* | | | 3,205,968 | |
| | 212,750 | | | Royal Dutch Shell PLC, Class A Shares | | | 5,528,902 | |
| | | | | | | | |
| | | | Total Netherlands | | | 55,168,272 | |
| | | | | | | | |
| Norway — 0.6% | |
| | 243,822 | | | DNB ASA | | | 3,480,174 | |
| | 203,159 | | | Statoil ASA | | | 3,084,189 | |
| | | | | | | | |
| | | | Total Norway | | | 6,564,363 | |
| | | | | | | | |
| Singapore — 0.2% | |
| | 158,332 | | | DBS Group Holdings Ltd. | | | 1,977,159 | |
| | | | | | | | |
| South Africa — 0.3% | |
| | 225,357 | | | Spar Group Ltd. (The) | | | 3,225,124 | |
| | | | | | | | |
| South Korea — 2.3% | |
| | 43,463 | | | Hyundai Motor Co. | | | 5,441,552 | |
| | 96,366 | | | KT&G Corp. | | | 9,002,004 | |
| | 63,046 | | | SK Telecom Co., Ltd. | | | 12,980,108 | |
| | | | | | | | |
| | | | Total South Korea | | | 27,423,664 | |
| | | | | | | | |
| Spain — 2.9% | |
| | 127,849 | | | Amadeus IT Holding SA, Class A Shares | | | 5,327,802 | |
| | 315,996 | | | Banco Bilbao Vizcaya Argentaria SA | | | 2,926,053 | |
| | 1,504,166 | | | CaixaBank SA | | | 6,508,075 | |
| | 98,358 | | | Grifols SA | | | 4,029,306 | |
| | 205,376 | | | Inditex SA | | | 6,840,938 | |
| | 703,423 | | | Prosegur Cia de Seguridad SA | | | 3,428,403 | |
| | 44,858 | | | Red Electrica Corp SA | | | 3,581,425 | |
| | 56,517 | | | Técnicas Reunidas SA | | | 2,717,738 | |
| | | | | | | | |
| | | | Total Spain | | | 35,359,740 | |
| | | | | | | | |
| Sweden — 1.3% | |
| | 188,126 | | | Assa Abloy AB, Class B Shares | | | 3,587,565 | |
| | 169,356 | | | Atlas Copco AB, Class A Shares | | | 4,250,145 | |
| | 67,218 | | | Hexagon AB, Class B Shares | | | 2,155,305 | |
| | 74,212 | | | Swedish Match AB | | | 2,189,256 | |
| | 388,339 | | | Telefonaktiebolaget LM Ericsson, Class B Shares | | | 3,783,918 | |
| | | | | | | | |
| | | | Total Sweden | | | 15,966,189 | |
| | | | | | | | |
| Switzerland — 12.2% | |
| | 92,073 | | | ABB Ltd., Class Registered Shares* | | | 1,774,768 | |
| | 210,621 | | | Aryzta AG* | | | 10,785,048 | |
| | 3,001 | | | Barry Callebaut AG, Class Registered Shares* | | | 3,286,471 | |
| | 127,650 | | | Cie Financiere Richemont SA, Class Registered Shares | | | 9,502,076 | |
| | 264,662 | | | Clariant AG, Class Registered Shares* | | | 4,766,397 | |
| | 106,291 | | | Credit Suisse Group AG, Class Registered Shares* | | | 2,854,712 | |
| | 3,301 | | | Galenica AG, Class Registered Shares(a) | | | 4,240,960 | |
| | 638 | | | Givaudan SA, Class Registered Shares* | | | 1,097,112 | |
| | 22,122 | | | Lonza Group AG, Class Registered Shares* | | | 3,020,130 | |
| | 110,318 | | | Nestlé SA, Class Registered Shares | | | 8,104,333 | |
| | 198,549 | | | Novartis AG, Class Registered Shares | | | 19,404,993 | |
| | 81,109 | | | Roche Holding AG | | | 22,000,772 | |
| | 1,431 | | | SGS SA, Class Registered Shares | | | 2,516,458 | |
| | 1,038 | | | Sika AG | | | 3,425,745 | |
| | 29,265 | | | Sonova Holding AG, Class Registered Shares | | | 3,806,010 | |
See Notes to Financial Statements.
64
| | | | | | | | |
| International Equity Investments | |
| | |
| Shares/Units | | | Security | | Value | |
| Switzerland — 12.2% — (continued) | |
| | 7,890 | | | Swatch Group AG (The) | | $ | 3,016,094 | |
| | 5,899 | | | Swisscom AG | | | 3,182,730 | |
| | 14,362 | | | Syngenta AG, Class Registered Shares | | | 4,969,137 | |
| | 97,713 | | | Temenos Group AG, Class Registered Shares* | | | 3,455,346 | |
| | 752,092 | | | UBS Group AG* | | | 15,548,708 | |
| | 79,330 | | | Wolseley PLC | | | 5,076,106 | |
| | 40,530 | | | Zurich Insurance Group AG* | | | 11,119,082 | |
| | | | | | | | |
| | | | Total Switzerland | | | 146,953,188 | |
| | | | | | | | |
| Taiwan — 0.4% | |
| | 1,110,000 | | | Taiwan Semiconductor Manufacturing Co., Ltd. | | | 4,362,410 | |
| | | | | | | | |
| Thailand — 0.5% | |
| | 3,452,900 | | | CP ALL PCL | | | 4,912,075 | |
| | 321,500 | | | Kasikornbank PCL, NVDR | | | 1,614,200 | |
| | | | | | | | |
| | | | Total Thailand | | | 6,526,275 | |
| | | | | | | | |
| United Kingdom — 23.2% | |
| | 150,385 | | | Aggreko PLC | | | 2,436,924 | |
| | 180,012 | | | ARM Holdings PLC | | | 2,536,242 | |
| | 31,612 | | | Associated British Foods PLC | | | 1,549,074 | |
| | 60,425 | | | Aveva Group PLC | | | 2,002,825 | |
| | 1,565,688 | | | Aviva PLC | | | 11,511,486 | |
| | 1,158,390 | | | Balfour Beatty PLC | | | 4,831,284 | |
| | 3,543,537 | | | Barclays PLC | | | 14,161,877 | |
| | 144,067 | | | BG Group PLC | | | 2,179,845 | |
| | 277,850 | | | British American Tobacco PLC | | | 14,793,525 | |
| | 1,328,228 | | | BT Group PLC, Class A Shares | | | 8,849,596 | |
| | 202,768 | | | Bunzl PLC | | | 5,367,492 | |
| | 364,791 | | | Burberry Group PLC | | | 7,850,011 | |
| | 178,970 | | | Capita PLC | | | 3,367,682 | |
| | 475,144 | | | Diageo PLC | | | 12,624,094 | |
| | 95,272 | | | Dignity PLC | | | 3,532,762 | |
| | 329,182 | | | Domino’s Pizza Group PLC | | | 4,338,112 | |
| | 387,489 | | | Essentra PLC | | | 5,028,388 | |
| | 611,863 | | | GlaxoSmithKline PLC | | | 12,535,880 | |
| | 2,382,298 | | | HSBC Holdings PLC | | | 18,769,501 | |
| | 735,107 | | | ICAP PLC | | | 5,080,358 | |
| | 77,175 | | | Imperial Tobacco Group PLC | | | 3,707,994 | |
| | 218,510 | | | Inmarsat PLC | | | 3,266,165 | |
| | 758,138 | | | International Consolidated Airlines Group SA* | | | 6,203,384 | |
| | 113,845 | | | Intertek Group PLC | | | 4,420,197 | |
| | 12,351,775 | | | Lloyds Banking Group PLC | | | 14,522,398 | |
| | 304,772 | | | Prudential PLC | | | 6,567,310 | |
| | 106,173 | | | Reckitt Benckiser Group PLC | | | 9,313,678 | |
| | 819,670 | | | Reed Elsevier NV | | | 12,602,692 | |
| | 67,474 | | | Rio Tinto PLC | | | 2,443,539 | |
| | 381,539 | | | Rolls-Royce Holdings PLC* | | | 4,338,387 | |
| | 624,527 | | | Royal Mail PLC | | | 4,420,216 | |
| | 271,967 | | | Sky PLC | | | 4,342,260 | |
| | 86,643 | | | Spectris PLC | | | 2,406,150 | |
| | 541,178 | | | SSE PLC | | | 12,117,925 | |
| | 45,275 | | | Telecity Group PLC | | | 750,893 | |
| | 73,580 | | | Travis Perkins PLC | | | 2,294,381 | |
| | 243,497 | | | Tullett Prebon PLC | | | 1,398,711 | |
| | 35,099 | | | Unilever NV | | | 1,403,439 | |
| | 143,642 | | | Unilever PLC | | | 5,748,338 | |
| | 5,824,122 | | | Vodafone Group PLC | | | 20,099,454 | |
See Notes to Financial Statements.
65
| | | | | | | | |
| International Equity Investments | |
| | |
| Shares/Units | | | Security | | Value | |
| United Kingdom — 23.2% — (continued) | |
| | 144,608 | | | Weir Group PLC (The) | | $ | 3,105,727 | |
| | 27,738 | | | Whitbread PLC | | | 2,024,295 | |
| | 887,291 | | | William Hill PLC | | | 4,869,963 | |
| | 140,201 | | | WPP PLC | | | 2,897,750 | |
| | | | | | | | |
| | | | Total United Kingdom | | | 278,612,204 | |
| | | | | | | | |
| United States — 1.5% | |
| | 119,320 | | | Carnival Corp. | | | 5,874,124 | |
| | 251,319 | | | Carnival PLC | | | 12,694,267 | |
| | | | | | | | |
| | | | Total United States | | | 18,568,391 | |
| | | | | | | | |
| | | | TOTAL COMMON STOCKS
(Cost — $1,186,223,645) | | | 1,151,072,025 | |
| | | | | | | | |
| PREFERRED STOCK — 1.1% | |
| Germany — 1.1% | |
| | 70,066 | | | Volkswagen AG, Class Preferred Shares, 1.800%
(Cost — $17,045,935) | | | 13,325,662 | |
| | | | | | | | |
| | | | TOTAL INVESTMENTS BEFORE SHORT-TERM INVESTMENTS
(Cost — $1,203,269,580) | | | 1,164,397,687 | |
| | | | | | | | |
| | |
Face
Amount† | | | | | | |
| SHORT-TERM INVESTMENTS (c) — 4.4% | | | | |
| MONEY MARKET FUND — 1.4% | |
| $ | 16,683,267 | | | Invesco STIT — Government & Agency Portfolio(d)
(Cost — $16,683,267) | | | 16,683,267 | |
| | | | | | | | |
| TIME DEPOSITS — 3.0% | |
| | 13,725,699 | | | ANZ National Bank — London, 0.030% due 9/1/15 | | | 13,725,699 | |
| | | | BBH — Grand Cayman: | | | | |
| | 34,854 | CHF | | (1.000)% due 9/1/15 | | | 36,053 | |
| | 95 | JPY | | 0.005% due 9/1/15 | | | 1 | |
| | 1,621 | | | 0.030% due 9/1/15 | | | 1,621 | |
| | 1 | CAD | | 0.100% due 9/1/15 | | | 1 | |
| | 3 | SGD | | 0.100% due 9/1/15 | | | 2 | |
| | 1 | AUD | | 1.051% due 9/1/15 | | | 1 | |
| | 1 | NZD | | 2.050% due 9/1/15 | | | 1 | |
| | | | DNB — Oslo: | | | | |
| | 212,750 | EUR | | (0.219)% due 9/1/15 | | | 238,716 | |
| | 7,994,165 | | | 0.030% due 9/1/15 | | | 7,994,165 | |
| | 178,252 | HKD | | HSBC Bank PLC — London, 0.005% due 9/1/15 | | | 23,000 | |
| | 10,730,627 | | | Royal Bank of Canada — Toronto, 0.030% due 9/1/15 | | | 10,730,627 | |
| | 3,329,099 | | | Skandinaviska Enskilda Banken AB — Stockholm, 0.030% due 9/1/15 | | | 3,329,099 | |
| | | | | | | | |
| | | | TOTAL TIME DEPOSITS
(Cost — $36,078,986) | | | 36,078,986 | |
| | | | | | | | |
| | | | TOTAL SHORT-TERM INVESTMENTS
(Cost — $52,762,253) | | | 52,762,253 | |
| | | | | | | | |
| | | | TOTAL INVESTMENTS — 101.3%
(Cost — $1,256,031,833) | | | 1,217,159,940 | |
| | | | | | | | |
| | | | Liabilities in Excess of Other Assets — (1.3)% | | | (15,316,801 | ) |
| | | | | | | | |
| | | | TOTAL NET ASSETS — 100.0% | | $ | 1,201,843,139 | |
| | | | | | | | |
See Notes to Financial Statements.
66
| | | | |
| International Equity Investments |
| † | Face amount denominated in U.S. dollars, unless otherwise noted. |
| * | Non-income producing security. |
| (a) | All or a portion of this security is on loan (See Note 1). |
| (b) | Security is valued in good faith at fair value by or under the direction of the Board of Trustees. |
| (c) | Inclusive of all short term holdings, including collateral received from securities lending activities. Excluding such collateral, the percentage of portfolio holdings would be 3.0%. |
| (d) | Represents investment of collateral received from securities lending transactions. |
| # | Aggregate cost for federal income tax purposes is $1,263,775,049. |
| | |
Abbreviations used in this schedule: |
| ADR | | — American Depositary Receipts |
| NVDR | | — Non Voting Depository Receipt |
| PCL | | — Public Company Limited |
| PLC | | — Public Limited Company |
| | |
Currency Abbreviations used in this schedule: |
| AUD | | — Australian Dollar |
| CAD | | — Canadian Dollar |
| CHF | | — Swiss Franc |
| EUR | | — Euro |
| HKD | | — Hong Kong Dollar |
| JPY | | — Japanese Yen |
| NZD | | — New Zealand Dollar |
| SGD | | — Singapore Dollar |
| | | | |
| Summary of Investments by Security Sector^ | |
Consumer Discretionary | | | 16.0 | % |
Financials | | | 15.5 | |
Industrials | | | 14.6 | |
Health Care | | | 11.4 | |
Consumer Staples | | | 9.9 | |
Information Technology | | | 8.0 | |
Telecommunication Services | | | 7.8 | |
Materials | | | 5.9 | |
Energy | | | 4.5 | |
Utilities | | | 2.1 | |
Short-Term Investments | | | 4.3 | |
| | | | |
| | | 100.0 | % |
| | | | |
| ^ | As a percentage of total investments. |
See Notes to Financial Statements.
67
| | | | | | | | |
| Emerging Markets Equity Investments | |
| | |
| Shares/Units | | | Security | | Value | |
| COMMON STOCKS — 94.0% | |
| Argentina — 0.8% | |
| | 166,979 | | | YPF SA, ADR | | $ | 3,596,728 | |
| | | | | | | | |
| Brazil — 8.7% | |
| | 1,517,503 | | | AMBEV SA, ADR | | | 7,997,241 | |
| | 198,843 | | | Banco Bradesco SA, ADR | | | 1,266,630 | |
| | 685,985 | | | Banco do Brasil SA | | | 3,372,147 | |
| | 484,896 | | | BB Seguridade Participações SA | | | 3,836,816 | |
| | 329,538 | | | BM&FBovespa SA — Bolsa de Valores Mercadorias e Futuros | | | 979,410 | |
| | 273,600 | | | CCR SA | | | 1,122,431 | |
| | 60,204 | | | CETIP SA — Mercados Organizados | | | 543,099 | |
| | 357,700 | | | Cia Energética de Minas Gerais, ADR(a) | | | 751,170 | |
| | 676,332 | | | Cielo SA | | | 7,150,984 | |
| | 147,200 | | | Cosan SA Indústria e Comércio | | | 736,588 | |
| | 248,300 | | | Estacio Participações SA | | | 853,657 | |
| | 516,750 | | | Gerdau SA, ADR | | | 764,790 | |
| | 144,673 | | | Localiza Rent a Car SA | | | 893,861 | |
| | 19,300 | | | Lojas Renner SA | | | 524,230 | |
| | 119,000 | | | Natura Cosméticos SA | | | 777,235 | |
| | 271,400 | | | Petróleo Brasileiro SA, ADR* | | | 1,367,856 | |
| | 567,155 | | | Souza Cruz SA | | | 4,149,953 | |
| | 45,989 | | | Ultrapar Participações SA | | | 804,754 | |
| | 475,975 | | | Vale SA, Class B Shares, ADR(a) | | | 2,356,076 | |
| | 228,600 | | | Via Varejo SA | | | 429,204 | |
| | | | | | | | |
| | | | Total Brazil | | | 40,678,132 | |
| | | | | | | | |
| Canada — 0.1% | |
| | 107,390 | | | First Quantum Minerals Ltd.(a) | | | 559,948 | |
| | | | | | | | |
| China — 12.5% | |
| | 276,500 | | | AAC Technologies Holdings Inc. | | | 1,551,670 | |
| | 8,550,000 | | | Agricultural Bank of China Ltd., Class H Shares(b) | | | 3,443,625 | |
| | 23,691 | | | Alibaba Group Holding Ltd., ADR* | | | 1,566,449 | |
| | 1,351,500 | | | Anhui Conch Cement Co., Ltd., Class H Shares(b) | | | 4,087,108 | |
| | 11,045 | | | Autohome Inc., ADR* | | | 343,720 | |
| | 59,385 | | | Baidu Inc., ADR* | | | 8,744,441 | |
| | 10,916 | | | Bitauto Holdings Ltd., ADR* | | | 293,095 | |
| | 10,292,380 | | | China Construction Bank Corp., Class H Shares(b) | | | 7,218,887 | |
| | 1,218,000 | | | China Medical System Holdings Ltd. | | | 1,310,551 | |
| | 1,081,500 | | | China Merchants Bank Co., Ltd., Class H Shares(b) | | | 2,553,380 | |
| | 705,500 | | | China Shenhua Energy Co., Ltd., Class H Shares(b) | | | 1,234,614 | |
| | 1,734,000 | | | CNOOC Ltd. | | | 2,176,603 | |
| | 42,852 | | | NetEase Inc., ADR | | | 4,764,285 | |
| | 165,600 | | | New Oriental Education & Technology Group Inc., ADR* | | | 3,393,144 | |
| | 740,000 | | | Ping An Insurance Group Co. of China Ltd., Class H Shares(b) | | | 3,588,855 | |
| | 307,060 | | | Tencent Holdings Ltd. | | | 5,219,275 | |
| | 138,841 | | | Tsingtao Brewery Co., Ltd., Class H Shares(b) | | | 680,499 | |
| | 152,110 | | | Vipshop Holdings Ltd., ADR*(a) | | | 2,736,459 | |
| | 929,600 | | | Weichai Power Co., Ltd., Class H Shares(b) | | | 987,751 | |
| | 354,000 | | | Zhuzhou CSR Times Electric Co., Ltd., Class H Shares(b) | | | 2,326,490 | |
| | | | | | | | |
| | | | Total China | | | 58,220,901 | |
| | | | | | | | |
| Colombia — 0.7% | |
| | 91,300 | | | Bancolombia SA, ADR | | | 3,149,850 | |
| | | | | | | | |
| Cyprus — 0.0% | |
| | 1,858 | | | Eurasia Drilling Co., Ltd., Class Registered Shares, GDR | | | 23,149 | |
| | | | | | | | |
See Notes to Financial Statements.
68
| | | | | | | | |
| Emerging Markets Equity Investments | |
| | |
| Shares/Units | | | Security | | Value | |
| Egypt — 0.4% | |
| | 323,316 | | | Commercial International Bank Egypt SAE, Class Registered Shares, GDR | | $ | 1,793,892 | |
| | | | | | | | |
| Hong Kong — 5.1% | |
| | 80,413 | | | China Mobile Ltd., ADR | | | 4,810,306 | |
| | 189,576 | | | China Resources Enterprise Ltd. | | | 596,720 | |
| | 3,321,000 | | | China State Construction International Holdings Ltd. | | | 4,425,767 | |
| | 241,964 | | | Galaxy Entertainment Group Ltd. | | | 772,602 | |
| | 2,625,200 | | | Huabao International Holdings Ltd. | | | 878,150 | |
| | 382,617 | | | Link REIT | | | 2,030,961 | |
| | 61,200 | | | Melco Crown Entertainment Ltd., ADR(a) | | | 1,078,344 | |
| | 531,651 | | | Power Assets Holdings Ltd. | | | 4,558,279 | |
| | 1,187,000 | | | Techtronic Industries Co., Ltd. | | | 4,306,432 | |
| | | | | | | | |
| | | | Total Hong Kong | | | 23,457,561 | |
| | | | | | | | |
| Hungary — 0.5% | |
| | 124,735 | | | OTP Bank PLC | | | 2,398,408 | |
| | | | | | | | |
| India — 15.1% | |
| | 720,117 | | | Adani Ports & Special Economic Zone Ltd. | | | 3,769,549 | |
| | 452,170 | | | Aurobindo Pharma Ltd. | | | 5,108,179 | |
| | 89,889 | | | Axis Bank Ltd., Class Registered Shares, GDR | | | 3,415,751 | |
| | 217,756 | | | Bharti Airtel Ltd. | | | 1,158,410 | |
| | 230,754 | | | Cipla Ltd. | | | 2,371,900 | |
| | 27,386 | | | Colgate-Palmolive India Ltd. | | | 807,098 | |
| | 36,703 | | | Dr Reddy’s Laboratories Ltd. | | | 2,384,097 | |
| | 2,271 | | | Dr Reddy’s Laboratories Ltd., ADR | | | 147,774 | |
| | 96,986 | | | Glenmark Pharmaceuticals Ltd. | | | 1,655,145 | |
| | 182,924 | | | HCL Technologies Ltd. | | | 2,676,353 | |
| | 394,806 | | | HDFC Bank Ltd. | | | 6,088,242 | |
| | 81,140 | | | HDFC Bank Ltd., ADR | | | 4,624,169 | |
| | 226,417 | | | Hindustan Unilever Ltd. | | | 2,938,792 | |
| | 457,168 | | | Housing Development Finance Corp., Ltd. | | | 8,145,968 | |
| | 236,200 | | | ICICI Bank Ltd., ADR | | | 2,059,664 | |
| | 26,074 | | | Infosys Ltd. | | | 435,225 | |
| | 88,152 | | | Infosys Ltd., ADR | | | 1,511,807 | |
| | 1,375,998 | | | ITC Ltd. | | | 6,744,846 | |
| | 173,792 | | | Kotak Mahindra Bank Ltd. | | | 1,700,232 | |
| | 6,017 | | | Nestle India Ltd. | | | 540,605 | |
| | 289,970 | | | Reliance Industries Ltd. | | | 3,739,765 | |
| | 89,104 | | | Shriram Transport Finance Co., Ltd. | | | 1,088,892 | |
| | 345,357 | | | Sun Pharmaceutical Industries Ltd. | | | 4,600,355 | |
| | 60,232 | | | Tata Consultancy Services Ltd. | | | 2,334,689 | |
| | 42,520 | | | Westlife Development Ltd.*(c) | | | 180,377 | |
| | | | | | | | |
| | | | Total India | | | 70,227,884 | |
| | | | | | | | |
| Indonesia — 4.7% | |
| | 3,967,200 | | | Astra International Tbk PT | | | 1,669,820 | |
| | 2,977,627 | | | Bank Central Asia Tbk PT | | | 2,729,059 | |
| | 4,347,162 | | | Bank Mandiri Persero Tbk PT | | | 2,809,450 | |
| | 3,665,000 | | | Bank Rakyat Indonesia Persero Tbk PT | | | 2,761,242 | |
| | 617,326 | | | Matahari Department Store Tbk PT | | | 769,573 | |
| | 1,602,200 | | | Semen Indonesia Persero Tbk PT | | | 1,055,176 | |
| | 14,849,576 | | | Telekomunikasi Indonesia Persero Tbk PT | | | 3,018,036 | |
| | 101,200 | | | Telekomunikasi Indonesia Persero Tbk PT, ADR | | | 4,069,252 | |
| | 570,908 | | | Unilever Indonesia Tbk PT | | | 1,612,369 | |
| | 1,021,478 | | | United Tractors Tbk PT | | | 1,390,872 | |
| | | | | | | | |
| | | | Total Indonesia | | | 21,884,849 | |
| | | | | | | | |
See Notes to Financial Statements.
69
| | | | | | | | |
| Emerging Markets Equity Investments | |
| | |
| Shares/Units | | | Security | | Value | |
| Jersey, Channel Islands — 0.5% | |
| | 17,674 | | | Randgold Resources Ltd. | | $ | 1,068,554 | |
| | 19,884 | | | Randgold Resources Ltd., ADR | | | 1,198,806 | |
| | | | | | | | |
| | | | Total Jersey, Channel Islands | | | 2,267,360 | |
| | | | | | | | |
| Macau — 0.8% | |
| | 761,714 | | | Sands China Ltd. | | | 2,625,372 | |
| | 765,800 | | | Wynn Macau Ltd.(a) | | | 1,181,124 | |
| | | | | | | | |
| | | | Total Macau | | | 3,806,496 | |
| | | | | | | | |
| Malaysia — 1.0% | |
| | 130,426 | | | British American Tobacco Malaysia Bhd | | | 1,932,458 | |
| | 626,655 | | | Malayan Banking Bhd | | | 1,307,857 | |
| | 302,400 | | | Public Bank Bhd | | | 1,295,308 | |
| | | | | | | | |
| | | | Total Malaysia | | | 4,535,623 | |
| | | | | | | | |
| Mexico — 4.2% | |
| | 37,700 | | | América Móvil SAB de CV, Class L Shares, ADR | | | 689,910 | |
| | 61,638 | | | Fomento Económico Mexicano SAB de CV, ADR | | | 5,487,631 | |
| | 806,000 | | | Grupo Financiero Banorte SAB de CV, Class O Shares | | | 3,859,211 | |
| | 666,571 | | | Grupo México SAB de CV, Class B Shares | | | 1,691,179 | |
| | 59,189 | | | Grupo Televisa SAB, ADR | | | 1,808,816 | |
| | 81,896 | | | Industrias Peñoles SAB de CV | | | 1,168,094 | |
| | 624,200 | | | Kimberly-Clark de México SAB de CV, Class A Shares | | | 1,400,572 | |
| | 1,369,653 | | | Wal-Mart de Mexico SAB de CV, Class V Shares | | | 3,304,439 | |
| | | | | | | | |
| | | | Total Mexico | | | 19,409,852 | |
| | | | | | | | |
| Pakistan — 1.0% | |
| | 1,197,455 | | | Habib Bank Ltd. | | | 2,515,520 | |
| | 700,362 | | | Oil & Gas Development Co., Ltd. | | | 956,659 | |
| | 884,316 | | | Pakistan Petroleum Ltd. | | | 1,181,594 | |
| | | | | | | | |
| | | | Total Pakistan | | | 4,653,773 | |
| | | | | | | | |
| Peru — 1.0% | |
| | 40,630 | | | Credicorp Ltd. | | | 4,468,487 | |
| | | | | | | | |
| Philippines — 0.6% | |
| | 50,600 | | | Philippine Long Distance Telephone Co., ADR(a) | | | 2,666,114 | |
| | | | | | | | |
| Poland — 0.5% | |
| | 211,298 | | | Eurocash SA | | | 2,327,465 | |
| | | | | | | | |
| Russia — 5.6% | |
| | 1,106,434 | | | Alrosa AO* | | | 1,104,119 | |
| | 553,011 | | | Gazprom OAO, ADR | | | 2,452,167 | |
| | 38,864 | | | Lukoil OAO, ADR | | | 1,452,931 | |
| | 19,496 | | | Magnit PJSC, Class Registered Shares, GDR | | | 965,488 | |
| | 7,973 | | | Magnit PJSC, GDR(d) | | | 398,610 | |
| | 89,013 | | | MegaFon PJSC, GDR(d) | | | 1,141,418 | |
| | 213,300 | | | Mobile Telesystems OJSC, ADR | | | 1,627,479 | |
| | 24,362 | | | NovaTek OAO, Class Registered Shares, GDR | | | 2,314,777 | |
| | 6,128,857 | | | Sberbank of Russia* | | | 7,009,917 | |
| | 273,753 | | | TMK OAO, Class Registered Shares, GDR | | | 952,003 | |
| | 274,800 | | | X5 Retail Group NV, Class Registered Shares, GDR* | | | 4,482,348 | |
| | 167,600 | | | Yandex NV, Class A Shares* | | | 2,044,720 | |
| | | | | | | | |
| | | | Total Russia | | | 25,945,977 | |
| | | | | | | | |
| Singapore — 0.3% | |
| | 107,989 | | | DBS Group Holdings Ltd. | | | 1,348,504 | |
| | | | | | | | |
See Notes to Financial Statements.
70
| | | | | | | | |
| Emerging Markets Equity Investments | |
| | |
| Shares/Units | | | Security | | Value | |
| South Africa — 5.3% | |
| | 64,715 | | | Bidvest Group Ltd. (The) | | $ | 1,552,620 | |
| | 101,923 | | | Imperial Holdings Ltd. | | | 1,419,590 | |
| | 114,162 | | | MTN Group Ltd. | | | 1,525,322 | |
| | 30,926 | | | Naspers Ltd., Class N Shares | | | 4,015,717 | |
| | 48,546 | | | Nedbank Group Ltd. | | | 862,981 | |
| | 483,815 | | | Petra Diamonds Ltd.* | | | 924,946 | |
| | 713,095 | | | PPC Ltd. | | | 1,167,595 | |
| | 141,063 | | | Remgro Ltd. | | | 2,688,700 | |
| | 296,300 | | | Sanlam Ltd. | | | 1,420,961 | |
| | 198,979 | | | Shoprite Holdings Ltd. | | | 2,438,380 | |
| | 278,254 | | | Standard Bank Group Ltd. | | | 3,059,150 | |
| | 23,969 | | | Tiger Brands Ltd. | | | 540,883 | |
| | 131,721 | | | Vodacom Group Ltd. | | | 1,402,865 | |
| | 243,363 | | | Woolworths Holdings Ltd. | | | 1,821,917 | |
| | | | | | | | |
| | | | Total South Africa | | | 24,841,627 | |
| | | | | | | | |
| South Korea — 8.3% | |
| | 5,401 | | | Amorepacific Corp. | | | 1,724,678 | |
| | 25,920 | | | CJ CGV Co., Ltd.(a) | | | 2,500,299 | |
| | 29,042 | | | Coway Co., Ltd. | | | 2,071,866 | |
| | 354,743 | | | Hanwha Life Insurance Co., Ltd. | | | 2,385,049 | |
| | 18,970 | | | Hotel Shilla Co., Ltd.(a) | | | 1,926,190 | |
| | 12,528 | | | Hyundai Mobis Co., Ltd. | | | 2,180,184 | |
| | 1,318 | | | Kangwon Land Inc. | | | 47,239 | |
| | 84,138 | | | KB Financial Group Inc. | | | 2,538,138 | |
| | 18,223 | | | Korea Aerospace Industries Ltd. | | | 1,421,097 | |
| | 27,970 | | | KT&G Corp. | | | 2,612,810 | |
| | 2,422 | | | LG Household & Health Care Ltd. | | | 1,641,216 | |
| | 792 | | | Orion Corp. | | | 622,953 | |
| | 9,150 | | | Samsung Electronics Co., Ltd. | | | 8,419,160 | |
| | 7,133 | | | Samsung Fire & Marine Insurance Co., Ltd. | | | 1,616,927 | |
| | 106,731 | | | Shinhan Financial Group Co., Ltd. | | | 3,567,498 | |
| | 106,805 | | | SK Hynix Inc. | | | 3,229,487 | |
| | | | | | | | |
| | | | Total South Korea | | | 38,504,791 | |
| | | | | | | | |
| Spain — 0.3% | |
| | 407,777 | | | Cemex Latam Holdings SA* | | | 1,561,904 | |
| | | | | | | | |
| Taiwan — 6.3% | |
| | 3,034,000 | | | Advanced Semiconductor Engineering Inc. | | | 3,087,059 | |
| | 268,100 | | | Catcher Technology Co., Ltd. | | | 2,729,551 | |
| | 163,000 | | | Eclat Textile Co., Ltd. | | | 2,452,305 | |
| | 204,473 | | | Hiwin Technologies Corp. | | | 1,052,790 | |
| | 635,000 | | | Hon Hai Precision Industry Co., Ltd.* | | | 1,776,269 | |
| | 716,000 | | | Hota Industrial Manufacturing Co., Ltd. | | | 2,147,519 | |
| | 16,000 | | | Largan Precision Co., Ltd. | | | 1,487,108 | |
| | 222,801 | | | President Chain Store Corp. | | | 1,491,446 | |
| | 2,879,737 | | | Taiwan Semiconductor Manufacturing Co., Ltd. | | | 11,317,651 | |
| | 83,342 | | | Taiwan Semiconductor Manufacturing Co., Ltd., ADR | | | 1,656,839 | |
| | | | | | | | |
| | | | Total Taiwan | | | 29,198,537 | |
| | | | | | | | |
| Thailand — 3.3% | |
| | 285,200 | | | Advanced Info Service PCL | | | 1,893,378 | |
| | 23,178 | | | Airports of Thailand PCL | | | 178,441 | |
| | 276,828 | | | Bangkok Bank PCL, Class Registered Shares | | | 1,267,000 | |
| | 1,067,200 | | | Bangkok Dusit Medical Services PCL, Class F Shares | | | 580,485 | |
| | 3,065,700 | | | CP ALL PCL | | | 4,361,247 | |
See Notes to Financial Statements.
71
| | | | | | | | |
| Emerging Markets Equity Investments | |
| | |
| Shares/Units | | | Security | | Value | |
| Thailand — 3.3% — (continued) | |
| | 520,600 | | | Kasikornbank PCL | | $ | 2,620,585 | |
| | 532,864 | | | PTT Exploration & Production PCL | | | 1,181,665 | |
| | 112,800 | | | Siam Cement PCL (The), Class Registered Shares | | | 1,494,011 | |
| | 3,104,900 | | | Thai Beverage PCL | | | 1,562,536 | |
| | | | | | | | |
| | | | Total Thailand | | | 15,139,348 | |
| | | | | | | | |
| Turkey — 3.0% | |
| | 779,867 | | | Akbank TAS | | | 1,824,300 | |
| | 609,659 | | | Aselsan Elektronik Sanayi Ve Ticaret AS | | | 2,981,761 | |
| | 2,348,087 | | | Emlak Konut Gayrimenkul Yatirim Ortakligi AS, REIT | | | 2,006,190 | |
| | 98,468 | | | Ford Otomotiv Sanayi AS | | | 996,969 | |
| | 351,643 | | | KOC Holding AS | | | 1,369,357 | |
| | 156,882 | | | TAV Havalimanlari Holding AS | | | 1,265,473 | |
| | 462,465 | | | Turkcell Iletisim Hizmetleri AS | | | 1,809,074 | |
| | 883,361 | | | Türkiye Is Bankasi, Class C Shares | | | 1,476,875 | |
| | | | | | | | |
| | | | Total Turkey | | | 13,729,999 | |
| | | | | | | | |
| United Kingdom — 3.2% | |
| | 180,677 | | | British American Tobacco PLC | | | 9,538,295 | |
| | 109,761 | | | SABMiller PLC | | | 5,084,310 | |
| | 3,800 | | | Unilever NV | | | 151,944 | |
| | | | | | | | |
| | | | Total United Kingdom | | | 14,774,549 | |
| | | | | | | | |
| United States — 0.2% | |
| | 102,740 | | | Freeport-McMoRan Inc. | | | 1,093,154 | |
| | | | | | | | |
| | | | TOTAL COMMON STOCKS
(Cost — $ 477,756,898) | | | 436,264,862 | |
| | | | | | | | |
| | | | TOTAL INVESTMENTS BEFORE SHORT-TERM INVESTMENTS
(Cost — $ 477,756,898) | | | 436,264,862 | |
| | | | | | | | |
| | |
Face
Amount† | | | | | | |
| SHORT-TERM INVESTMENTS (e) — 8.0% | |
| MONEY MARKET FUND — 2.1% | |
| $ | 9,633,182 | | | Invesco STIT — Government & Agency Portfolio(f)
(Cost — $9,633,182) | | | 9,633,182 | |
| | | | | | | | |
| TIME DEPOSITS — 5.9% | |
| | 3,317,552 | | | ANZ National Bank — London, 0.030% due 9/1/15 | | | 3,317,552 | |
| | 192 | SGD | | BBH — Grand Cayman, 0.100% due 9/1/15 | | | 136 | |
| | 8,028,186 | | | JPMorgan Chase & Co. — New York, 0.030% due 9/1/15 | | | 8,028,186 | |
| | 6,416,666 | | | National Australia Bank Ltd. — Grand Cayman, 0.030% due 9/1/15 | | | 6,416,666 | |
| | 9,646,730 | | | Skandinaviska Enskilda Banken AB — Stockholm, 0.030% due 9/1/15 | | | 9,646,730 | |
| | 1,163,675 | ZAR | | Wells Fargo — San Francisco, 5.050% due 9/1/15 | | | 87,753 | |
| | | | | | | | |
| | | | TOTAL TIME DEPOSITS
(Cost — $27,497,023) | | | 27,497,023 | |
| | | | | | | | |
| | | | TOTAL SHORT-TERM INVESTMENTS
(Cost — $37,130,205) | | | 37,130,205 | |
| | | | | | | | |
| | | | TOTAL INVESTMENTS — 102.0%
(Cost — $514,887,103#) | | | 473,395,067 | |
| | | | | | | | |
| | | | Liabilities in Excess of Other Assets — (2.0)% | | | (9,574,889 | ) |
| | | | | | | | |
| | | | TOTAL NET ASSETS — 100.0% | | $ | 463,820,178 | |
| | | | | | | | |
See Notes to Financial Statements.
72
| | | | | | |
| Emerging Markets Equity Investments |
| † | Face amount denominated in U.S. dollars, unless otherwise noted. |
| * | Non-income producing security. |
| (a) | All or a portion of this security is on loan (See Note 1). |
| (b) | Security trades on the Hong Kong exchange. |
| (d) | Restricted security that may be sold to ‘‘qualified institutional buyers’’ pursuant to the conditions of Rule 144A under the Securities Act of 1933, as amended. This security has been deemed liquid pursuant to guidelines approved by the Board of Trustees, unless otherwise noted. |
| (e) | Inclusive of all short term holdings, including collateral received from securities lending activities. Excluding such collateral, the percentage of portfolio holdings would be 5.9%. |
| (f) | Represents investment of collateral received from securities lending transactions. |
| # | Aggregate cost for federal income tax purposes is $528,794,351. |
| | |
Abbreviations used in this schedule: |
| ADR | | — American Depositary Receipts |
| GDR | | — Global Depositary Receipt |
| PCL | | — Public Company Limited |
| PLC | | — Public Limited Company |
| REIT | | — Real Estate Investment Trust |
| | |
Currency Abbreviations used in this schedule: |
| SGD | | — Singapore Dollar |
| ZAR | | — South African Rand |
| | | | |
| Summary of Investments by Security Sector^ | |
Financials | | | 25.5 | % |
Consumer Staples | | | 16.7 | |
Information Technology | | | 15.3 | |
Consumer Discretionary | | | 9.3 | |
Telecommunication Services | | | 5.5 | |
Industrials | | | 5.2 | |
Energy | | | 5.1 | |
Materials | | | 4.7 | |
Health Care | | | 3.8 | |
Utilities | | | 1.1 | |
Short-Term Investments | | | 7.8 | |
| | | | |
| | | 100.0 | % |
| | | | |
| ^ | As a percentage of total investments. |
See Notes to Financial Statements.
73
| | | | | | | | | | |
| Core Fixed Income Investments | |
| | | |
Face
Amount/Units† | | | Rating†† | | Security | | Value | |
| CORPORATE BONDS & NOTES — 27.3% | |
| Aerospace & Defense — 0.2% | |
| | | | | | Lockheed Martin Corp., Senior Unsecured Notes: | | | | |
| $ | 100,000 | | | A- | | 2.900% due 3/1/25 | | $ | 94,704 | |
| | 115,000 | | | A- | | 3.800% due 3/1/45 | | | 101,655 | |
| | 130,000 | | | BBB | | Northrop Grumman Corp., Senior Unsecured Notes, 3.850% due 4/15/45 | | | 114,803 | |
| | | | | | United Technologies Corp.: | | | | |
| | 910,000 | | | A- | | Junior Subordinated Notes, step bond to yield, 1.778% due 5/4/18 | | | 906,253 | |
| | 110,000 | | | A | | Senior Unsecured Notes, 4.500% due 6/1/42 | | | 111,810 | |
| | | | | | | | | | |
| | | | | | Total Aerospace & Defense | | | 1,329,225 | |
| | | | | | | | | | |
| Airlines — 0.5% | |
| | 650,872 | | | A | | American Airlines Class A Pass Through Trust, Series 2013-2, Pass Thru Certificates, 4.950% due 1/15/23 | | | 693,992 | |
| | 345,113 | | | BBB- | | American Airlines Class B Pass Through Trust, Series 2013-1, Pass Thru Certificates, 5.625% due 1/15/21(a) | | | 355,898 | |
| | 323,089 | | | BBB- | | American Airlines Class B Pass Through Trust, Series 2013-2, Pass Thru Certificates, 5.600% due 7/15/20(a) | | | 332,378 | |
| | 82,485 | | | A+ | | Continental Airlines Inc. Class A Pass Through Trust, Series 1998-1, Pass Thru Certificates, 6.648% due 9/15/17 | | | 84,857 | |
| | 271,437 | | | A | | Continental Airlines Inc. Class A-1 Pass Through Trust, Series 1999-2, Pass Thru Certificates, 7.256% due 3/15/20 | | | 297,224 | |
| | 765,029 | | | A | | Delta Air Lines Class A Pass Through Trust, Series 2009-1, Pass Thru Certificates, 7.750% due 12/17/19 | | | 873,090 | |
| | 238,372 | | | BBB+ | | JetBlue Airways G-1 Pass Through Trust, Series 2004-2, Pass Thru Certificates, 0.696% due 8/15/16(b) | | | 237,478 | |
| | 625,000 | | | BBB | | JetBlue Airways G-2 Pass Through Trust, Series 2004-2, Pass Thru Certificates, 0.771% due 11/15/16(b) | | | 614,844 | |
| | 291,970 | | | BBB | | Northwest Airlines Inc. Class A-1 Pass Through Trust, Pass Thru Certificates, 7.041% due 4/1/22 | | | 338,685 | |
| | 325,871 | | | A+ | | UAL Pass Through Trust, Series 2009-1, Pass Thru Certificates, 10.400% due 11/1/16 | | | 349,415 | |
| | 43,381 | | | A | | UAL Pass Through Trust, Series 2009-2A, Pass Thru Certificates, 9.750% due 1/15/17 | | | 46,688 | |
| | | | | | | | | | |
| | | | | | Total Airlines | | | 4,224,549 | |
| | | | | | | | | | |
| Automobiles — 0.3% | |
| | | | | | Daimler Finance North America LLC, Company Guaranteed Notes: | | | | |
| | 330,000 | | | A- | | 2.625% due 9/15/16(a) | | | 334,774 | |
| | 600,000 | | | A- | | 2.950% due 1/11/17(a) | | | 612,035 | |
| | 240,000 | | | A- | | 2.250% due 3/2/20(a) | | | 234,397 | |
| | 250,000 | | | A- | | 2.450% due 5/18/20(a) | | | 248,421 | |
| | 740,000 | | | BBB- | | Ford Motor Co., Senior Unsecured Notes, 4.750% due 1/15/43 | | | 706,243 | |
| | | | | | General Motors Co., Senior Unsecured Notes: | | | | |
| | 330,000 | | | BBB- | | 6.250% due 10/2/43 | | | 354,639 | |
| | 455,000 | | | BBB- | | 5.200% due 4/1/45 | | | 430,171 | |
| | | | | | | | | | |
| | | | | | Total Automobiles | | | 2,920,680 | |
| | | | | | | | | | |
| Banks — 5.2% | |
| | 200,000 | | | AA- | | ANZ New Zealand International Ltd., Company Guaranteed Notes, 1.850% due 10/15/15(a) | | | 199,994 | |
| | | | | | Bank of America Corp.: | | | | |
| | | | | | Senior Unsecured Notes: | | | | |
| | 620,000 | | | A- | | 1.500% due 10/9/15 | | | 622,833 | |
| | 495,000 | | | A- | | 3.750% due 7/12/16 | | | 505,747 | |
| | 230,000 | | | A- | | 6.500% due 8/1/16 | | | 240,865 | |
| | 600,000 | | | A- | | 5.625% due 10/14/16 | | | 627,194 | |
| | 850,000 | | | Baa1(c) | | 8.950% due 5/18/17(b) | | | 894,017 | |
| | 1,584,000 | | | Baa1(c) | | 9.570% due 6/6/17(b) | | | 1,700,131 | |
See Notes to Financial Statements.
74
| | | | | | | | | | |
| Core Fixed Income Investments | |
| | | |
Face
Amount/Units† | | | Rating†† | | Security | | Value | |
| Banks — 5.2% — (continued) | |
| $ | 80,000 | | | A- | | 5.750% due 12/1/17 | | $ | 86,588 | |
| | 350,000 | | | A- | | 5.650% due 5/1/18 | | | 381,163 | |
| | 453,000 | | | A- | | 2.600% due 1/15/19 | | | 456,426 | |
| | 375,000 | | | A- | | 2.250% due 4/21/20 | | | 368,649 | |
| | 500,000 | | | A- | | 5.000% due 5/13/21 | | | 547,969 | |
| | 830,000 | | | A- | | 3.300% due 1/11/23 | | | 819,315 | |
| | 490,000 | | | A- | | 4.125% due 1/22/24 | | | 506,599 | |
| | 280,000 | | | A- | | 4.000% due 4/1/24 | | | 286,592 | |
| | 145,000 | | | A- | | 3.875% due 8/1/25 | | | 146,753 | |
| | 570,000 | | | A- | | 5.000% due 1/21/44 | | | 604,576 | |
| | 270,000 | | | A- | | 4.875% due 4/1/44 | | | 282,202 | |
| | | | | | Subordinated Notes: | | | | |
| | 600,000 | | | BBB+ | | 5.420% due 3/15/17 | | | 631,431 | |
| | 990,000 | | | BBB+ | | 4.200% due 8/26/24 | | | 983,801 | |
| | 610,000 | | | BBB+ | | 4.000% due 1/22/25 | | | 598,068 | |
| | 400,000 | | | BBB+ | | 3.950% due 4/21/25 | | | 387,980 | |
| | 300,000 | | | A- | | Bank of America NA, Subordinated Notes, 6.100% due 6/15/17 | | | 322,418 | |
| | | | | | Bank of Nova Scotia (The), Covered Notes: | | | | |
| | 780,000 | | | Aaa(c) | | 1.650% due 10/29/15(a) | | | 796,957 | |
| | 1,500,000 | | | Aaa(c) | | 1.950% due 1/30/17(a) | | | 1,519,623 | |
| | 435,000 | | | Aaa(c) | | 1.750% due 3/22/17(a) | | | 439,730 | |
| | | | | | Barclays Bank PLC: | | | | |
| | 770,000 | | | A- | | Senior Unsecured Notes, 3.750% due 5/15/24 | | | 774,189 | |
| | 100,000 | | | BBB- | | Subordinated Notes, 5.140% due 10/14/20 | | | 108,969 | |
| | | | | | Barclays PLC: | | | | |
| | 230,000 | | | BBB | | Senior Unsecured Notes, 3.650% due 3/16/25 | | | 218,971 | |
| | 200,000 | | | BB+ | | Subordinated Notes, 4.375% due 9/11/24 | | | 193,062 | |
| | 320,000 | | | A+ | | BNP Paribas SA, Senior Unsecured Notes, 2.375% due 9/14/17 | | | 323,983 | |
| | 800,000 | | | A | | BPCE SA, Company Guaranteed Notes, 0.894% due 11/18/16(b) | | | 800,825 | |
| | 315,000 | | | Baa3(c) | | Caixa Economica Federal, Senior Unsecured Notes, 2.375% due 11/6/17(a) | | | 302,400 | |
| | | | | | Capital One Financial Corp., Senior Unsecured Notes: | | | | |
| | 644,000 | | | BBB | | 3.500% due 6/15/23 | | | 632,480 | |
| | 160,000 | | | BBB | | 3.200% due 2/5/25 | | | 149,140 | |
| | 800,000 | | | BBB- | | Chase Capital III, Limited Guaranteed Notes, 0.874% due 3/1/27(b) | | | 697,000 | |
| | 290,000 | | | BB- | | CIT Group Inc., Senior Unsecured Notes, 6.625% due 4/1/18(a) | | | 311,025 | |
| | 530,000 | | | BB+ | | Citigroup Inc., Junior Subordinated Notes, 5.950%(b)(d) | | | 507,475 | |
| | 27,000 | | | AA- | | Commonwealth Bank of Australia, Senior Unsecured Notes, 2.300% due 3/12/20 | | | 26,945 | |
| | | | | | Cooperatieve Centrale Raiffeisen-Boerenleenbank BA: | | | | |
| | 340,000 | | | BBB+ | | Bank Guaranteed Notes, 4.375% due 8/4/25 | | | 340,094 | |
| | | | | | Company Guaranteed Notes: | | | | |
| | 200,000 | | | A+ | | 3.375% due 1/19/17 | | | 205,636 | |
| | 310,000 | | | BBB+ | | 4.625% due 12/1/23 | | | 319,617 | |
| | 400,000 | | | BBB- | | Junior Subordinated Notes, 11.000%(a)(b)(d) | | | 499,340 | |
| | | | | | Credit Agricole SA: | | | | |
| | 250,000 | | | A | | Senior Unsecured Notes, 2.750% due 6/10/20(a) | | | 252,757 | |
| | 450,000 | | | BBB | | Subordinated Notes, 4.375% due 3/17/25(a) | | | 437,830 | |
| | | | | | Credit Suisse: | | | | |
| | 750,000 | | | A | | Senior Unsecured Notes, 1.700% due 4/27/18 | | | 745,271 | |
| | 471,000 | | | BBB | | Subordinated Notes, 6.000% due 2/15/18 | | | 512,890 | |
| | 770,000 | | | Aaa(c) | | Credit Suisse AG, Covered Notes, 2.600% due 5/27/16(a) | | | 779,888 | |
| | | | | | Credit Suisse Group Funding Guernsey Ltd., Company Guaranteed Notes: | | | | |
| | 505,000 | | | BBB+ | | 2.750% due 3/26/20(a) | | | 502,751 | |
| | 300,000 | | | BBB+ | | 3.750% due 3/26/25(a) | | | 291,145 | |
| | 120,000 | | | BBB+ | | Deutsche Bank AG, Senior Unsecured Notes, 3.700% due 5/30/24 | | | 119,408 | |
See Notes to Financial Statements.
75
| | | | | | | | | | |
| Core Fixed Income Investments | |
| | | |
Face
Amount/Units† | | | Rating†† | | Security | | Value | |
| Banks — 5.2% — (continued) | |
| | | | | | Discover Bank/Greenwood DE, Senior Unsecured Notes: | | | | |
| $ | 900,000 | | | BBB | | 2.600% due 11/13/18 | | $ | 901,939 | |
| | 250,000 | | | BBB | | 3.100% due 6/4/20 | | | 249,869 | |
| | 1,510,000 | | | BBB- | | HBOS PLC, Subordinated Notes, 6.750% due 5/21/18(a) | | | 1,670,004 | |
| | | | | | HSBC Holdings PLC: | | | | |
| | 210,000 | | | Baa3(c) | | Junior Subordinated Notes, 6.375%(b)(d) | | | 207,900 | |
| | | | | | Subordinated Notes: | | | | |
| | 390,000 | | | BBB+ | | 4.250% due 8/18/25 | | | 387,169 | |
| | 500,000 | | | BBB+ | | 6.500% due 9/15/37 | | | 592,725 | |
| | 650,000 | | | BBB+ | | 5.250% due 3/14/44 | | | 665,697 | |
| | 385,000 | | | A | | HSBC USA Inc., Senior Unsecured Notes, 2.350% due 3/5/20 | | | 379,567 | |
| | | | | | ING Bank NV, Senior Unsecured Notes: | | | | |
| | 770,000 | | | A | | 3.750% due 3/7/17(a) | | | 795,970 | |
| | 335,000 | | | A | | 1.800% due 3/16/18(a) | | | 334,265 | |
| | 810,000 | | | BB | | Intesa Sanpaolo SpA, Subordinated Notes, 5.017% due 6/26/24(a) | | | 793,121 | |
| | | | | | Lloyds Bank PLC, Company Guaranteed Notes: | | | | |
| | 525,000 | | | A | | 1.750% due 5/14/18 | | | 521,805 | |
| | 210,000 | | | BBB | | 6.500% due 9/14/20(a) | | | 243,069 | |
| | 600,000 | | | BBB- | | M&T Bank Corp., Junior Subordinated Notes, 6.875%(d) | | | 607,500 | |
| | 530,000 | | | A | | Macquarie Bank Ltd., Senior Unsecured Notes, 0.925% due 10/27/17(a)(b) | | | 529,527 | |
| | 300,000 | | | A- | | Nordea Bank AB, Subordinated Notes, 4.875% due 5/13/21(a) | | | 321,297 | |
| | 470,000 | | | Aaa(c) | | Royal Bank of Canada, Covered Notes, 2.200% due 9/23/19 | | | 475,710 | |
| | | | | | Royal Bank of Scotland Group PLC: | | | | |
| | 40,000 | | | B+ | | Junior Subordinated Notes, 7.648%(b)(d) | | | 50,200 | |
| | | | | | Senior Unsecured Notes: | | | | |
| | 570,000 | | | BBB- | | 2.550% due 9/18/15 | | | 572,519 | |
| | 500,000 | | | BBB- | | 1.875% due 3/31/17 | | | 497,383 | |
| | 550,000 | | | BBB- | | 6.400% due 10/21/19 | | | 616,183 | |
| | | | | | Subordinated Notes: | | | | |
| | 130,000 | | | BB | | 6.125% due 12/15/22 | | | 140,364 | |
| | 320,000 | | | BB | | 6.100% due 6/10/23 | | | 344,112 | |
| | 220,000 | | | BB | | 6.000% due 12/19/23 | | | 235,301 | |
| | 365,000 | | | BB | | 5.125% due 5/28/24 | | | 369,058 | |
| | 90,000 | | | BB+ | | Royal Bank of Scotland NV, Company Guaranteed Notes, 4.650% due 6/4/18 | | | 93,624 | |
| | | | | | Santander Holdings USA Inc., Senior Unsecured Notes: | | | | |
| | 219,000 | | | BBB | | 3.450% due 8/27/18 | | | 225,526 | |
| | 55,000 | | | BBB | | 2.650% due 4/17/20 | | | 54,275 | |
| | 120,000 | | | BBB | | 4.500% due 7/17/25 | | | 120,555 | |
| | 880,000 | | | BBB | | Standard Chartered PLC, Subordinated Notes, 5.700% due 3/26/44(a) | | | 908,171 | |
| | 1,000,000 | | | A | | UBS AG, Senior Unsecured Notes, 1.375% due 6/1/17 | | | 995,518 | |
| | 630,000 | | | BBB | | Wachovia Capital Trust III, Limited Guaranteed Notes, 5.570%(b)(d) | | | 621,968 | |
| | | | | | Wells Fargo & Co.: | | | | |
| | | | | | Senior Unsecured Notes: | | | | |
| | 345,000 | | | A+ | | 2.600% due 7/22/20 | | | 345,776 | |
| | 260,000 | | | A+ | | 3.000% due 2/19/25 | | | 250,664 | |
| | 180,000 | | | A+ | | 3.900% due 5/1/45 | | | 165,205 | |
| | | | | | Subordinated Notes: | | | | |
| | 330,000 | | | A | | 3.450% due 2/13/23 | | | 329,061 | |
| | 299,000 | | | A | | 4.480% due 1/16/24 | | | 312,434 | |
| | 730,000 | | | A | | 4.300% due 7/22/27 | | | 743,174 | |
| | 230,000 | | | A | | 5.375% due 11/2/43 | | | 248,055 | |
| | 170,000 | | | A | | 5.606% due 1/15/44 | | | 190,065 | |
| | 310,000 | | | A | | 4.650% due 11/4/44 | | | 304,518 | |
| | 250,000 | | | A+ | | Wells Fargo Bank NA, Subordinated Notes, 6.000% due 11/15/17 | | | 273,210 | |
| | 100,000 | | | BBB | | Wells Fargo Capital X, Limited Guaranteed Notes, 5.950% due 12/15/36 | | | 101,000 | |
See Notes to Financial Statements.
76
| | | | | | | | | | |
| Core Fixed Income Investments | |
| | | |
Face
Amount/Units† | | | Rating†† | | Security | | Value | |
| Banks — 5.2% — (continued) | |
| $ | 480,000 | | | AA- | | Westpac Banking Corp., Senior Unsecured Notes, 4.875% due 11/19/19 | | $ | 527,021 | |
| | | | | | | | | | |
| | | | | | Total Banks | | | 44,322,786 | |
| | | | | | | | | | |
| Beverages — 0.3% | |
| | | | | | Anheuser-Busch InBev Worldwide Inc., Company Guaranteed Notes: | | | | |
| | 440,000 | | | A | | 5.000% due 4/15/20 | | | 490,808 | |
| | 200,000 | | | A | | 2.500% due 7/15/22 | | | 192,705 | |
| | 60,000 | | | A | | 3.750% due 7/15/42 | | | 53,051 | |
| | 545,000 | | | A- | | Coca-Cola Femsa SAB de CV, Company Guaranteed Notes, 4.625% due 2/15/20 | | | 591,734 | |
| | 213,000 | | | A- | | Diageo Capital PLC, Company Guaranteed Notes, 4.828% due 7/15/20 | | | 235,884 | |
| | 200,000 | | | A- | | Diageo Investment Corp., Company Guaranteed Notes, 2.875% due 5/11/22 | | | 195,759 | |
| | 120,000 | | | BBB+ | | Heineken NV, Senior Unsecured Notes, 1.400% due 10/1/17(a) | | | 119,644 | |
| | 50,000 | | | BBB+ | | Molson Coors Brewing Co., Company Guaranteed Notes, 3.500% due 5/1/22(e) | | | 50,670 | |
| | 310,000 | | | A | | PepsiCo Inc., Senior Unsecured Notes, 7.900% due 11/1/18 | | | 366,871 | |
| | | | | | Pernod-Ricard SA, Senior Unsecured Notes: | | | | |
| | 200,000 | | | BBB- | | 2.950% due 1/15/17(a) | | | 204,221 | |
| | 390,000 | | | BBB- | | 4.450% due 1/15/22(a) | | | 407,689 | |
| | | | | | | | | | |
| | | | | | Total Beverages | | | 2,909,036 | |
| | | | | | | | | | |
| Biotechnology — 0.4% | |
| | | | | | Amgen Inc., Senior Unsecured Notes: | | | | |
| | 189,000 | | | A- | | 2.125% due 5/1/20 | | | 184,559 | |
| | 70,000 | | | A | | 3.625% due 5/22/24 | | | 69,212 | |
| | 120,000 | | | A | | 5.150% due 11/15/41 | | | 123,448 | |
| | 590,000 | | | A | | 5.375% due 5/15/43 | | | 618,743 | |
| | 125,000 | | | A | | 4.400% due 5/1/45 | | | 117,010 | |
| | | | | | Celgene Corp., Senior Unsecured Notes: | | | | |
| | 80,000 | | | BBB+ | | 3.250% due 8/15/22 | | | 77,802 | |
| | 260,000 | | | BBB+ | | 3.550% due 8/15/22 | | | 260,665 | |
| | 540,000 | | | BBB+ | | 3.875% due 8/15/25 | | | 537,766 | |
| | 90,000 | | | BBB+ | | 5.250% due 8/15/43 | | | 92,456 | |
| | 480,000 | | | BBB+ | | 5.000% due 8/15/45 | | | 486,235 | |
| | | | | | Gilead Sciences Inc., Senior Unsecured Notes: | | | | |
| | 450,000 | | | A- | | 3.700% due 4/1/24 | | | 456,279 | |
| | 85,000 | | | A- | | 4.800% due 4/1/44 | | | 87,713 | |
| | | | | | | | | | |
| | | | | | Total Biotechnology | | | 3,111,888 | |
| | | | | | | | | | |
| Capital Markets — 1.1% | |
| | | | | | Bank of New York Mellon Corp. (The), Senior Unsecured Notes: | | | | |
| | 220,000 | | | A+ | | 2.150% due 2/24/20 | | | 217,321 | |
| | 345,000 | | | A+ | | 3.400% due 5/15/24 | | | 347,185 | |
| | 35,000 | | | A+ | | 3.000% due 2/24/25 | | | 34,022 | |
| | 450,000 | | | BB | | Goldman Sachs Capital II, Limited Guaranteed Notes, 4.000%(b)(d) | | | 331,695 | |
| | | | | | Goldman Sachs Group Inc. (The): | | | | |
| | | | | | Senior Unsecured Notes: | | | | |
| | 300,000 | | | A- | | 5.350% due 1/15/16 | | | 304,802 | |
| | 500,000 | | | A- | | 0.731% due 3/22/16(b) | | | 499,946 | |
| | 800,000 | | | A- | | 6.250% due 9/1/17 | | | 869,668 | |
| | 225,000 | | | A- | | 2.375% due 1/22/18 | | | 227,234 | |
| | 950,000 | | | A- | | 6.150% due 4/1/18 | | | 1,047,384 | |
| | 799,000 | | | A- | | 2.900% due 7/19/18 | | | 816,928 | |
| | 34,000 | | | A- | | 2.625% due 1/31/19 | | | 34,365 | |
| | 150,000 | | | A- | | 7.500% due 2/15/19 | | | 175,261 | |
| | 387,000 | | | A- | | 2.550% due 10/23/19 | | | 388,120 | |
| | 256,000 | | | A- | | 2.600% due 4/23/20 | | | 255,466 | |
| | 1,060,000 | | | A- | | 6.000% due 6/15/20 | | | 1,208,978 | |
See Notes to Financial Statements.
77
| | | | | | | | | | |
| Core Fixed Income Investments | |
| | | |
Face
Amount/Units† | | | Rating†† | | Security | | Value | |
| Capital Markets — 1.1% — (continued) | |
| $ | 40,000 | | | A- | | 5.250% due 7/27/21 | | $ | 44,527 | |
| | 50,000 | | | A- | | 3.500% due 1/23/25 | | | 48,921 | |
| | 935,000 | | | A- | | 3.750% due 5/22/25 | | | 932,469 | |
| | 630,000 | | | A- | | 6.250% due 2/1/41 | | | 754,645 | |
| | 75,000 | | | A- | | 4.800% due 7/8/44 | | | 76,182 | |
| | | | | | Subordinated Notes: | | | | |
| | 700,000 | | | BBB+ | | 6.750% due 10/1/37 | | | 837,707 | |
| | 340,000 | | | BBB+ | | 5.150% due 5/22/45 | | | 337,380 | |
| | 650,000 | | | NR | | Lehman Brothers Holdings Inc., Subordinated Notes, 6.750% due 12/28/17(f)(g) | | | — | |
| | | | | | | | | | |
| | | | | | Total Capital Markets | | | 9,790,206 | |
| | | | | | | | | | |
| Chemicals — 0.2% | |
| | | | | | Dow Chemical Co. (The), Senior Unsecured Notes: | | | | |
| | 70,000 | | | BBB | | 3.500% due 10/1/24 | | | 67,555 | |
| | 40,000 | | | BBB | | 4.250% due 10/1/34 | | | 37,025 | |
| | 45,000 | | | BBB | | 4.375% due 11/15/42 | | | 40,616 | |
| | 240,000 | | | BB | | Eagle Spinco Inc., Company Guaranteed Notes, 4.625% due 2/15/21 | | | 234,900 | |
| | 355,000 | | | BBB | | Eastman Chemical Co., Senior Unsecured Notes, 3.800% due 3/15/25 | | | 348,780 | |
| | 140,000 | | | BBB+ | | Ecolab Inc., Senior Unsecured Notes, 4.350% due 12/8/21 | | | 150,699 | |
| | 200,000 | | | BBB | | LyondellBasell Industries NV, Senior Unsecured Notes, 6.000% due 11/15/21 | | | 226,861 | |
| | 410,000 | | | BBB- | | OCP SA, Senior Unsecured Notes, 4.500% due 10/22/25(a) | | | 388,065 | |
| | 60,000 | | | A- | | Potash Corp. of Saskatchewan Inc., Senior Unsecured Notes, 4.875% due 3/30/20 | | | 65,523 | |
| | 33,000 | | | A- | | PPG Industries Inc., Senior Unsecured Notes, 6.650% due 3/15/18 | | | 36,846 | |
| | | | | | | | | | |
| | | | | | Total Chemicals | | | 1,596,870 | |
| | | | | | | | | | |
| Commercial Services & Supplies — 0.2% | |
| | 460,000 | | | AAA | | Northwestern University, Unsecured Notes, 3.688% due 12/1/38 | | | 446,041 | |
| | 150,000 | | | BBB+ | | Republic Services Inc., Senior Unsecured Notes, 3.200% due 3/15/25 | | | 144,308 | |
| | 660,000 | | | BB- | | United Rentals North America Inc., Company Guaranteed Notes, 5.750% due 11/15/24 | | | 653,400 | |
| | | | | | Waste Management Inc., Company Guaranteed Notes: | | | | |
| | 40,000 | | | A- | | 4.600% due 3/1/21 | | | 43,497 | |
| | 110,000 | | | A- | | 3.500% due 5/15/24 | | | 110,978 | |
| | 70,000 | | | A- | | 7.375% due 5/15/29 | | | 95,827 | |
| | 110,000 | | | A- | | 4.100% due 3/1/45 | | | 101,687 | |
| | 150,000 | | | B+ | | West Corp., Company Guaranteed Notes, 5.375% due 7/15/22(a) | | | 141,563 | |
| | | | | | | | | | |
| | | | | | Total Commercial Services & Supplies | | | 1,737,301 | |
| | | | | | | | | | |
| Consumer Finance — 0.7% | |
| | | | | | Ford Motor Credit Co. LLC, Senior Unsecured Notes: | | | | |
| | 1,300,000 | | | BBB- | | 5.625% due 9/15/15 | | | 1,382,875 | |
| | 1,425,000 | | | BBB- | | 1.700% due 5/9/16 | | | 1,429,241 | |
| | 700,000 | | | BBB- | | 0.761% due 11/8/16(b) | | | 699,168 | |
| | 500,000 | | | BBB- | | 6.625% due 8/15/17 | | | 540,955 | |
| | 225,000 | | | BBB- | | 1.724% due 12/6/17 | | | 223,068 | |
| | 320,000 | | | BBB- | | 8.125% due 1/15/20 | | | 382,936 | |
| | | | | | General Motors Financial Co., Inc., Company Guaranteed Notes: | | | | |
| | 175,000 | | | BBB- | | 3.250% due 5/15/18 | | | 176,112 | |
| | 300,000 | | | BBB- | | 3.150% due 1/15/20 | | | 295,117 | |
| | 170,000 | | | BBB- | | 3.450% due 4/10/22 | | | 161,903 | |
| | 100,000 | | | A- | | Hyundai Capital America, Senior Unsecured Notes, 2.125% due 10/2/17(a) | | | 100,317 | |
| | 360,000 | | | BB | | Navient Corp., Senior Unsecured Notes, 8.000% due 3/25/20 | | | 365,400 | |
| | 410,000 | | | AA- | | Toyota Motor Credit Corp., Senior Unsecured Notes, 1.250% due 10/5/17 | | | 409,304 | |
| | | | | | | | | | |
| | | | | | Total Consumer Finance | | | 6,166,396 | |
| | | | | | | | | | |
See Notes to Financial Statements.
78
| | | | | | | | | | |
| Core Fixed Income Investments | |
| | | |
Face
Amount/Units† | | | Rating†† | | Security | | Value | |
| Containers & Packaging — 0.0% | |
| $ | 200,000 | | | B+ | | Ardagh Packaging Finance PLC/Ardagh Holdings USA Inc., Senior Secured Notes, 3.286% due 12/15/19(a)(b) | | $ | 196,500 | |
| | | | | | Rock-Tenn Co., Company Guaranteed Notes: | | | | |
| | 120,000 | | | BBB | | 3.500% due 3/1/20 | | | 123,461 | |
| | 20,000 | | | BBB | | 4.000% due 3/1/23 | | | 20,444 | |
| | | | | | | | | | |
| | | | | | Total Containers & Packaging | | | 340,405 | |
| | | | | | | | | | |
| Diversified Financial Services — 3.8% | |
| | | | | | American Express Co.: | | | | |
| | 72,000 | | | BBB+ | | Senior Unsecured Notes, 2.650% due 12/2/22 | | | 69,130 | |
| | 310,000 | | | BB+ | | Subordinated Notes, 6.800% due 9/1/66(b) | | | 314,650 | |
| | 415,000 | | | AAA | | Asian Development Bank, Senior Unsecured Notes, 0.750% due 1/11/17 | | | 415,325 | |
| | | | | | Bear Stearns Cos. LLC (The), Senior Unsecured Notes: | | | | |
| | 20,000 | | | A | | 6.400% due 10/2/17 | | | 21,832 | |
| | 2,280,000 | | | A | | 7.250% due 2/1/18 | | | 2,553,222 | |
| | 600,000 | | | BBB+ | | Capital One Bank USA NA, Senior Unsecured Notes, 1.200% due 2/13/17 | | | 595,518 | |
| | 1,400,000 | | | AAA | | CDP Financial Inc., Company Guaranteed Notes, 4.400% due 11/25/19(a) | | | 1,529,546 | |
| | | | | | Citigroup Inc.: | | | | |
| | | | | | Senior Unsecured Notes: | | | | |
| | 650,000 | | | A- | | 1.250% due 1/15/16 | | | 650,811 | |
| | 1,200,000 | | | A- | | 1.255% due 7/25/16(b) | | | 1,203,134 | |
| | 500,000 | | | A- | | 2.500% due 9/26/18 | | | 504,851 | |
| | 710,000 | | | A- | | 4.650% due 7/30/45 | | | 711,559 | |
| | | | | | Subordinated Notes: | | | | |
| | 410,000 | | | BBB+ | | 4.400% due 6/10/25 | | | 413,137 | |
| | 250,000 | | | BBB+ | | 5.500% due 9/13/25 | | | 272,238 | |
| | 1,190,000 | | | BBB+ | | 4.300% due 11/20/26 | | | 1,183,324 | |
| | 30,000 | | | BBB+ | | 6.625% due 6/15/32 | | | 36,079 | |
| | 280,000 | | | BBB+ | | 6.675% due 9/13/43 | | | 348,296 | |
| | 500,000 | | | BBB+ | | 5.300% due 5/6/44 | | | 528,923 | |
| | 100,000 | | | A- | | Farmers Exchange Capital, Subordinated Notes, 7.200% due 7/15/48(a) | | | 127,291 | |
| | 1,200,000 | | | A- | | Farmers Exchange Capital II, Subordinated Notes, 6.151% due 11/1/53(a)(b) | | | 1,284,913 | |
| | 240,000 | | | AAA | | FMS Wertmanagement AoeR, Government Guaranteed Notes, 1.125% due 9/5/17 | | | 240,914 | |
| | | | | | General Electric Capital Corp., Company Guaranteed Notes: | | | | |
| | 820,000 | | | AA+ | | 5.625% due 5/1/18 | | | 901,039 | |
| | 90,000 | | | AA+ | | 5.550% due 5/4/20 | | | 102,247 | |
| | 490,000 | | | AA | | 5.300% due 2/11/21 | | | 552,751 | |
| | 250,000 | | | AA+ | | 4.650% due 10/17/21 | | | 275,160 | |
| | 1,025,000 | | | AA+ | | 0.801% due 8/15/36(b) | | | 935,614 | |
| | 425,000 | | | AA+ | | 6.150% due 8/7/37 | | | 526,270 | |
| | 1,040,000 | | | AA+ | | 6.875% due 1/10/39 | | | 1,400,455 | |
| | 650,000 | | | A+ | | 6.375% due 11/15/67(b) | | | 695,500 | |
| | 430,000 | | | A- | | HSBC Finance Corp., Subordinated Notes, 6.676% due 1/15/21 | | | 500,890 | |
| | 270,000 | | | B+ | | ILFC E-Capital Trust II, Limited Guaranteed Notes, 6.250% due 12/21/65(a)(b) | | | 256,162 | |
| | | | | | International Lease Finance Corp., Senior Secured Notes: | | | | |
| | 880,000 | | | BBB- | | 6.750% due 9/1/16(a) | | | 916,476 | |
| | 1,230,000 | | | BBB- | | 7.125% due 9/1/18(a) | | | 1,362,434 | |
| | | | | | John Deere Capital Corp., Senior Unsecured Notes: | | | | |
| | 130,000 | | | A | | 2.250% due 4/17/19 | | | 131,140 | |
| | 70,000 | | | A | | 1.700% due 1/15/20 | | | 68,429 | |
| | | | | | JPMorgan Chase & Co.: | | | | |
| | | | | | Senior Unsecured Notes: | | | | |
| | 1,800,000 | | | A | | 1.100% due 10/15/15 | | | 1,806,678 | |
| | 480,000 | | | A | | 3.450% due 3/1/16 | | | 486,112 | |
| | 940,000 | | | A | | 2.000% due 8/15/17 | | | 946,479 | |
See Notes to Financial Statements.
79
| | | | | | | | | | |
| Core Fixed Income Investments | |
| | | |
Face
Amount/Units† | | | Rating†† | | Security | | Value | |
| Diversified Financial Services — 3.8% — (continued) | |
| $ | 295,000 | | | A | | 6.000% due 1/15/18 | | $ | 322,563 | |
| | 69,000 | | | A | | 1.800% due 1/25/18 | | | 68,835 | |
| | 230,000 | | | A | | 1.700% due 3/1/18 | | | 228,955 | |
| | 195,000 | | | A | | 2.200% due 10/22/19 | | | 193,536 | |
| | 200,000 | | | A | | 2.250% due 1/23/20 | | | 197,760 | |
| | 555,000 | | | A | | 2.750% due 6/23/20 | | | 557,294 | |
| | 90,000 | | | A | | 4.400% due 7/22/20 | | | 96,319 | |
| | 380,000 | | | A | | 3.900% due 7/15/25 | | | 386,330 | |
| | | | | | Subordinated Notes: | | | | |
| | 170,000 | | | A- | | 5.150% due 10/1/15 | | | 169,944 | |
| | 630,000 | | | A- | | 6.125% due 6/27/17 | | | 676,485 | |
| | 190,000 | | | A- | | 3.375% due 5/1/23 | | | 182,815 | |
| | 430,000 | | | A- | | 3.875% due 9/10/24 | | | 424,365 | |
| | 360,000 | | | A- | | 4.950% due 6/1/45 | | | 361,870 | |
| | 900,000 | | | BBB- | | JPMorgan Chase Capital XXIII, Limited Guaranteed Notes, 1.321% due 5/15/47(b) | | | 695,250 | |
| | 30,000 | | | A | | KKR Group Finance Co. II LLC, Company Guaranteed Notes, 5.500% due 2/1/43(a) | | | 30,818 | |
| | 370,000 | | | A | | Nationwide Building Society, Senior Unsecured Notes, 3.900% due 7/21/25(a) | | | 375,226 | |
| | 496,850 | | | BBB- | | Pipeline Funding Co. LLC, Senior Secured Notes, 7.500% due 1/15/30(a) | | | 612,678 | |
| | | | | | State Street Corp.: | | | | |
| | 430,000 | | | BBB | | Junior Subordinated Notes, 4.956% due 3/15/18 | | | 457,966 | |
| | 250,000 | | | A+ | | Senior Unsecured Notes, 3.300% due 12/16/24 | | | 249,674 | |
| | 286,484 | | | Baa2(c) | | SteelRiver Transmission Co. LLC, Senior Secured Notes, 4.710% due 6/30/17(a) | | | 297,085 | |
| | 25,000 | | | BBB- | | Synchrony Financial, Senior Unsecured Notes, 2.700% due 2/3/20 | | | 24,579 | |
| | 750,000 | | | A | | ZFS Finance USA Trust II, Junior Subordinated Notes, 6.450% due 12/15/65(a)(b) | | | 765,000 | |
| | | | | | | | | | |
| | | | | | Total Diversified Financial Services | | | 32,243,876 | |
| | | | | | | | | | |
| Diversified Telecommunication Services — 1.4% | |
| | | | | | AT&T Inc., Senior Unsecured Notes: | | | | |
| | 500,000 | | | BBB+ | | 0.699% due 2/12/16(b) | | | 499,681 | |
| | 330,000 | | | BBB+ | | 5.500% due 2/1/18 | | | 356,316 | |
| | 54,000 | | | BBB+ | | 2.375% due 11/27/18 | | | 54,349 | |
| | 10,000 | | | BBB+ | | 5.800% due 2/15/19 | | | 11,075 | |
| | 53,000 | | | BBB+ | | 2.300% due 3/11/19 | | | 52,819 | |
| | 265,000 | | | BBB+ | | 2.450% due 6/30/20 | | | 262,926 | |
| | 365,000 | | | BBB+ | | 3.000% due 6/30/22 | | | 351,035 | |
| | 1,370,000 | | | BBB+ | | 3.400% due 5/15/25 | | | 1,308,253 | |
| | 245,000 | | | BBB+ | | 4.500% due 5/15/35 | | | 225,808 | |
| | 5,000 | | | BBB+ | | 5.350% due 9/1/40 | | | 4,929 | |
| | 150,000 | | | BBB+ | | 5.550% due 8/15/41 | | | 151,280 | |
| | 70,000 | | | BBB+ | | 4.300% due 12/15/42 | | | 59,861 | |
| | 110,000 | | | BBB+ | | 4.800% due 6/15/44 | | | 101,486 | |
| | 195,000 | | | BBB+ | | 4.350% due 6/15/45 | | | 167,415 | |
| | 650,000 | | | BBB+ | | 4.750% due 5/15/46 | | | 594,769 | |
| | 220,000 | | | BBB+ | | Deutsche Telekom International Finance BV, Company Guaranteed Notes, 5.750% due 3/23/16 | | | 225,787 | |
| | | | | | Intelsat Jackson Holdings SA, Company Guaranteed Notes: | | | | |
| | 80,000 | | | B+ | | 7.500% due 4/1/21 | | | 77,800 | |
| | 370,000 | | | B+ | | 5.500% due 8/1/23 | | | 327,450 | |
| | | | | | Verizon Communications Inc., Senior Unsecured Notes: | | | | |
| | 754,000 | | | BBB+ | | 2.500% due 9/15/16 | | | 764,959 | |
| | 100,000 | | | BBB+ | | 3.450% due 3/15/21 | | | 102,326 | |
| | 900,000 | | | BBB+ | | 3.000% due 11/1/21 | | | 888,339 | |
| | 1,032,000 | | | BBB+ | | 5.150% due 9/15/23 | | | 1,133,267 | |
| | 284,000 | | | BBB+ | | 6.400% due 9/15/33 | | | 326,569 | |
| | 470,000 | | | BBB+ | | 4.400% due 11/1/34 | | | 434,770 | |
See Notes to Financial Statements.
80
| | | | | | | | | | |
| Core Fixed Income Investments | |
| | | |
Face
Amount/Units† | | | Rating†† | | Security | | Value | |
| Diversified Telecommunication Services — 1.4% — (continued) | |
| $ | 2,538,000 | | | BBB+ | | 6.550% due 9/15/43 | | $ | 3,016,743 | |
| | 65,000 | | | BBB+ | | 4.862% due 8/21/46 | | | 61,493 | |
| | 75,000 | | | BBB+ | | 5.012% due 8/21/54 | | | 68,943 | |
| | 520,000 | | | B | | Virgin Media Finance PLC, Company Guaranteed Notes, 6.000% due 10/15/24(a) | | | 535,600 | |
| | | | | | | | | | |
| | | | | | Total Diversified Telecommunication Services | | | 12,166,048 | |
| | | | | | | | | | |
| Electric Utilities — 1.5% | |
| | | | | | Berkshire Hathaway Energy Co., Senior Unsecured Notes: | | | | |
| | 250,000 | | | BBB+ | | 5.950% due 5/15/37 | | | 289,729 | |
| | 275,000 | | | BBB+ | | 6.500% due 9/15/37 | | | 340,232 | |
| | 31,000 | | | BB | | Calpine Corp., Senior Secured Notes, 7.875% due 1/15/23(a) | | | 33,325 | |
| | 215,000 | | | BBB+ | | Cleveland Electric Illuminating Co. (The), Senior Secured Notes, 7.880% due 11/1/17 | | | 241,988 | |
| | 500,000 | | | A | | Duke Energy Carolinas LLC, 1st Mortgage Notes, 4.250% due 12/15/41 | | | 501,822 | |
| | 310,000 | | | BBB+ | | Duke Energy Corp., Senior Unsecured Notes, 3.550% due 9/15/21 | | | 319,243 | |
| | 195,000 | | | A | | Duke Energy Florida Inc., 1st Mortgage Notes, 5.900% due 3/1/33 | | | 230,486 | |
| | 750,000 | | | BBB- | | Duquesne Light Holdings Inc., Senior Unsecured Notes, 6.400% due 9/15/20(a) | | | 860,075 | |
| | 920,000 | | | A- | | Entergy Texas Inc., 1st Mortgage Notes, 7.125% due 2/1/19 | | | 1,063,029 | |
| | | | | | Exelon Corp., Senior Unsecured Notes: | | | | |
| | 755,000 | | | BBB- | | 1.550% due 6/9/17 | | | 753,470 | |
| | 105,000 | | | BBB- | | 5.625% due 6/15/35 | | | 114,338 | |
| | | | | | FirstEnergy Corp., Senior Unsecured Notes: | | | | |
| | 100,000 | | | BB+ | | 2.750% due 3/15/18 | | | 100,390 | |
| | 1,130,000 | | | BB+ | | 7.375% due 11/15/31 | | | 1,355,926 | |
| | | | | | Florida Power & Light Co., 1st Mortgage Notes: | | | | |
| | 55,000 | | | A | | 4.950% due 6/1/35 | | | 60,529 | |
| | 275,000 | | | A | | 5.950% due 2/1/38 | | | 346,662 | |
| | 264,601 | | | BBB- | | Indiantown Cogeneration LP, 1st Mortgage Notes, 9.770% due 12/15/20 | | | 298,999 | |
| | 350,000 | | | BB+ | | IPALCO Enterprises Inc., Senior Secured Notes, 5.000% due 5/1/18 | | | 372,750 | |
| | 700,000 | | | BBB- | | Jersey Central Power & Light Co., Senior Unsecured Notes, 4.700% due 4/1/24(a) | | | 733,048 | |
| | 775,000 | | | BBB+ | | KCP&L Greater Missouri Operations Co., Senior Unsecured Notes, 8.270% due 11/15/21 | | | 979,584 | |
| | 487,147 | | | B | | Mirant Mid Atlantic Series C Pass Through Trust, Pass Thru Certificates, 10.060% due 12/30/28 | | | 505,415 | |
| | 870,000 | | | BBB | | Pacific Gas & Electric Co., Senior Unsecured Notes, 6.050% due 3/1/34 | | | 1,046,071 | |
| | 235,000 | | | A | | PacifiCorp, 1st Mortgage Notes, 4.100% due 2/1/42 | | | 228,977 | |
| | 500,000 | | | BBB | | Public Service Co. of New Mexico, Senior Unsecured Notes, 7.950% due 5/15/18 | | | 568,235 | |
| | 500,000 | | | A | | Public Service Electric & Gas Co., 1st Mortgage Notes, 4.000% due 6/1/44 | | | 483,508 | |
| | 200,000 | | | A- | | Texas-New Mexico Power Co., 1st Mortgage Notes, 6.950% due 4/1/43(a) | | | 286,008 | |
| | | | | | Virginia Electric & Power Co., Senior Unsecured Notes: | | | | |
| | 125,000 | | | A- | | 6.000% due 5/15/37 | | | 153,212 | |
| | 25,000 | | | A- | | 6.350% due 11/30/37 | | | 31,941 | |
| | 250,000 | | | A- | | 4.000% due 1/15/43 | | | 239,543 | |
| | | | | | | | | | |
| | | | | | Total Electric Utilities | | | 12,538,535 | |
| | | | | | | | | | |
| Electrical Equipment — 0.0% | |
| | 30,000 | | | A | | ABB Finance USA Inc., Company Guaranteed Notes, 4.375% due 5/8/42 | | | 29,491 | |
| | | | | | | | | | |
| Electronic Equipment, Instruments & Components — 0.0% | |
| | 303,000 | | | BBB- | | Jabil Circuit Inc., Senior Unsecured Notes, 8.250% due 3/15/18 | | | 341,678 | |
| | | | | | | | | | |
| Energy Equipment & Services — 0.2% | |
| | 600,000 | | | BB+ | | Boardwalk Pipelines LP, Company Guaranteed Notes, 4.950% due 12/15/24 | | | 563,086 | |
| | 400,000 | | | AA- | | Sinopec Group Overseas Development 2014 Ltd., Company Guaranteed Notes, 4.375% due 4/10/24(a) | | | 418,215 | |
| | | | | | Williams Partners LP, Senior Unsecured Notes: | | | | |
| | 540,000 | | | BBB | | 3.600% due 3/15/22 | | | 511,964 | |
| | 60,000 | | | BBB | | 4.500% due 11/15/23 | | | 58,319 | |
| | 40,000 | | | BBB | | 4.300% due 3/4/24 | | | 37,060 | |
See Notes to Financial Statements.
81
| | | | | | | | | | |
| Core Fixed Income Investments | |
| | | |
Face
Amount/Units† | | | Rating†† | | Security | | Value | |
| Energy Equipment & Services — 0.2% — (continued) | |
| | | | | | Williams Partners LP/ACMP Finance Corp., Senior Unsecured Notes: | | | | |
| $ | 180,000 | | | BBB | | 6.125% due 7/15/22 | | $ | 183,660 | |
| | 30,000 | | | BBB | | 4.875% due 3/15/24 | | | 28,021 | |
| | | | | | | | | | |
| | | | | | Total Energy Equipment & Services | | | 1,800,325 | |
| | | | | | | | | | |
| Food & Staples Retailing — 0.3% | |
| | | | | | CVS Health Corp., Senior Unsecured Notes: | | | | |
| | 550,000 | | | BBB+ | | 1.900% due 7/20/18 | | | 552,053 | |
| | 269,000 | | | BBB+ | | 2.800% due 7/20/20 | | | 272,084 | |
| | 420,000 | | | BBB+ | | 2.750% due 12/1/22 | | | 409,505 | |
| | 305,000 | | | BBB+ | | 3.875% due 7/20/25 | | | 312,848 | |
| | 320,000 | | | BBB+ | | 4.875% due 7/20/35 | | | 331,191 | |
| | 50,000 | | | BBB+ | | 5.300% due 12/5/43 | | | 54,081 | |
| | 560,000 | | | BBB+ | | 5.125% due 7/20/45 | | | 600,830 | |
| | 262,402 | | | BBB+ | | CVS Pass-Through Trust, Pass Thru Certificates, 6.036% due 12/10/28 | | | 298,136 | |
| | 90,000 | | | BBB | | Kroger Co. (The), Company Guaranteed Notes, 6.900% due 4/15/38 | | | 113,539 | |
| | | | | | | | | | |
| | | | | | Total Food & Staples Retailing | | | 2,944,267 | |
| | | | | | | | | | |
| Food Products — 0.3% | |
| | | | | | Kraft Heinz Foods Co.: | | | | |
| | | | | | Company Guaranteed Notes: | | | | |
| | 900,000 | | | BBB- | | 1.600% due 6/30/17(a) | | | 899,614 | |
| | 150,000 | | | BBB- | | 3.950% due 7/15/25(a) | | | 152,660 | |
| | 140,000 | | | BBB- | | 5.000% due 7/15/35(a) | | | 145,173 | |
| | 120,000 | | | BBB- | | 5.200% due 7/15/45(a) | | | 126,609 | |
| | 156,000 | | | BBB- | | Secured Notes, 4.875% due 2/15/25(a) | | | 168,555 | |
| | 270,000 | | | BBB | | Mondelez International Inc., Senior Unsecured Notes, 4.000% due 2/1/24 | | | 277,146 | |
| | 40,000 | | | BBB | | Tyson Foods Inc., Company Guaranteed Notes, 5.150% due 8/15/44 | | | 41,174 | |
| | | | | | WM Wrigley Jr Co., Senior Unsecured Notes: | | | | |
| | 50,000 | | | A- | | 2.400% due 10/21/18(a) | | | 50,548 | |
| | 180,000 | | | A- | | 2.900% due 10/21/19(a) | | | 183,244 | |
| | 60,000 | | | A- | | 3.375% due 10/21/20(a) | | | 61,621 | |
| | | | | | | | | | |
| | | | | | Total Food Products | | | 2,106,344 | |
| | | | | | | | | | |
| Health Care Equipment & Supplies — 0.3% | |
| | 400,000 | | | AA- | | Baylor Scott & White Holdings, Unsecured Notes, 4.185% due 11/15/45 | | | 372,845 | |
| | | | | | Becton Dickinson & Co., Senior Unsecured Notes: | | | | |
| | 180,000 | | | BBB+ | | 3.734% due 12/15/24 | | | 179,830 | |
| | 60,000 | | | BBB+ | | 4.685% due 12/15/44 | | | 59,315 | |
| | | | | | Boston Scientific Corp., Senior Unsecured Notes: | | | | |
| | 65,000 | | | BBB- | | 2.850% due 5/15/20 | | | 64,648 | |
| | 195,000 | | | BBB- | | 3.850% due 5/15/25 | | | 188,074 | |
| | | | | | Medtronic Inc., Company Guaranteed Notes: | | | | |
| | 100,000 | | | A | | 4.450% due 3/15/20 | | | 108,809 | |
| | 165,000 | | | A | | 3.625% due 3/15/24 | | | 167,692 | |
| | 1,115,000 | | | A | | 3.500% due 3/15/25(a) | | | 1,111,811 | |
| | 100,000 | | | A | | 5.550% due 3/15/40 | | | 115,533 | |
| | 250,000 | | | A | | 4.625% due 3/15/45(a) | | | 256,254 | |
| | 330,000 | | | BBB | | Zimmer Biomet Holdings Inc., Senior Unsecured Notes, 4.450% due 8/15/45 | | | 299,803 | |
| | | | | | | | | | |
| | | | | | Total Health Care Equipment & Supplies | | | 2,924,614 | |
| | | | | | | | | | |
| Health Care Providers & Services — 0.8% | | | | |
| | 165,000 | | | A | | Aetna Inc., Senior Unsecured Notes, 4.125% due 11/15/42 | | | 150,532 | |
| | | | | | Anthem Inc., Senior Unsecured Notes: | | | | |
| | 80,000 | | | A | | 1.250% due 9/10/15 | | | 80,000 | |
| | 30,000 | | | A | | 5.875% due 6/15/17 | | | 32,167 | |
See Notes to Financial Statements.
82
| | | | | | | | | | |
| Core Fixed Income Investments | |
| | | |
Face
Amount/Units† | | | Rating†† | | Security | | Value | |
| Health Care Providers & Services — 0.8% — (continued) | | | | |
| $ | 510,000 | | | A | | 3.125% due 5/15/22 | | $ | 493,433 | |
| | 530,000 | | | A | | 3.300% due 1/15/23 | | | 514,625 | |
| | 60,000 | | | A | | 4.650% due 8/15/44 | | | 56,746 | |
| | 30,000 | | | A | | Catholic Health Initiatives, Secured Notes, 4.350% due 11/1/42 | | | 27,699 | |
| | 560,000 | | | B- | | CHS/Community Health Systems Inc., Company Guaranteed Notes, 8.000% due 11/15/19 | | | 586,600 | |
| | | | | | DaVita HealthCare Partners Inc., Company Guaranteed Notes: | | | | |
| | 20,000 | | | B+ | | 5.125% due 7/15/24 | | | 19,950 | |
| | 60,000 | | | B+ | | 5.000% due 5/1/25 | | | 58,950 | |
| | 610,000 | | | BBB+ | | Express Scripts Holding Co., Company Guaranteed Notes, 1.250% due 6/2/17 | | | 607,141 | |
| | 20,000 | | | BB+ | | Fresenius Medical Care US Finance Inc., Company Guaranteed Notes, 5.750% due 2/15/21(a) | | | 21,750 | |
| | | | | | HCA Inc.: | | | | |
| | | | | | Company Guaranteed Notes: | | | | |
| | 120,000 | | | B+ | | 7.190% due 11/15/15 | | | 121,319 | |
| | 29,000 | | | B+ | | 6.500% due 2/15/16 | | | 29,580 | |
| | 210,000 | | | B+ | | 7.500% due 2/15/22 | | | 241,435 | |
| | 240,000 | | | B+ | | 5.375% due 2/1/25 | | | 244,200 | |
| | 10,000 | | | BBB- | | Senior Secured Notes, 4.250% due 10/15/19 | | | 10,212 | |
| | | | | | Humana Inc., Senior Unsecured Notes: | | | | |
| | 60,000 | | | BBB+ | | 3.150% due 12/1/22 | | | 58,562 | |
| | 70,000 | | | BBB+ | | 4.625% due 12/1/42 | | | 67,540 | |
| | 60,000 | | | BBB- | | Omnicare Inc., Company Guaranteed Notes, 4.750% due 12/1/22 | | | 64,050 | |
| | 1,000,000 | | | AA- | | Providence Health & Services Obligated Group, Unsecured Notes, 1.234% due 10/1/17(b) | | | 1,004,543 | |
| | 58,000 | | | AA | | Roche Holdings Inc., Company Guaranteed Notes, 6.000% due 3/1/19(a) | | | 65,590 | |
| | 600,000 | | | BB- | | Tenet Healthcare Corp., Senior Secured Notes, 3.786% due 6/15/20(a)(b) | | | 604,050 | |
| | | | | | UnitedHealth Group Inc., Senior Unsecured Notes: | | | | |
| | 570,000 | | | A+ | | 3.375% due 11/15/21 | | | 586,866 | |
| | 160,000 | | | A+ | | 3.350% due 7/15/22 | | | 163,910 | |
| | 455,000 | | | A+ | | 3.750% due 7/15/25 | | | 466,881 | |
| | 95,000 | | | A+ | | 4.625% due 7/15/35 | | | 99,578 | |
| | 205,000 | | | A+ | | 4.250% due 3/15/43 | | | 199,721 | |
| | 140,000 | | | A+ | | 4.750% due 7/15/45 | | | 147,413 | |
| | | | | | | | | | |
| | | | | | Total Health Care Providers & Services | | | 6,825,043 | |
| | | | | | | | | | |
| Hotels, Restaurants & Leisure — 0.1% | | | | |
| | 130,000 | | | B- | | 1011778 BC ULC/New Red Finance Inc., Secured Notes, 6.000% due 4/1/22(a) | | | 134,225 | |
| | 130,000 | | | A- | | McDonald’s Corp., Senior Unsecured Notes, 4.600% due 5/26/45 | | | 129,209 | |
| | 390,000 | | | BB | | Hilton Worldwide Finance LLC/Hilton Worldwide Finance Corp., Company Guaranteed Notes, 5.625% due 10/15/21 | | | 408,525 | |
| | | | | | | | | | |
| | | | | | Total Hotels, Restaurants & Leisure | | | 671,959 | |
| | | | | | | | | | |
| Household Durables — 0.0% | | | | |
| | 150,000 | | | BB- | | Taylor Morrison Communities Inc./Monarch Communities Inc., Company Guaranteed Notes, 5.250% due 4/15/21(a) | | | 151,500 | |
| Household Products — 0.1% | | | | |
| | 245,000 | | | A | | Kimberly-Clark Corp., Senior Unsecured Notes, 2.650% due 3/1/25 | | | 235,983 | |
| | 200,000 | | | B+ | | Reynolds Group Issuer Inc./Reynolds Group Issuer LLC/Reynolds Group Issuer Lu, Senior Secured Notes, 7.875% due 8/15/19 | | | 208,500 | |
| | | | | | | | | | |
| | | | | | Total Household Products | | | 444,483 | |
| | | | | | | | | | |
| Independent Power and Renewable Electricity Producers — 0.0% | | | | |
| | | | | | AES Corp., Senior Unsecured Notes: | | | | |
| | 60,000 | | | BB- | | 7.375% due 7/1/21 | | | 64,950 | |
| | 90,000 | | | BB- | | 4.875% due 5/15/23 | | | 84,150 | |
| | | | | | | | | | |
| | | | | | Total Independent Power and Renewable Electricity Producers | | | 149,100 | |
| | | | | | | | | | |
See Notes to Financial Statements.
83
| | | | | | | | | | |
| Core Fixed Income Investments | |
| | | |
Face
Amount/Units† | | | Rating†† | | Security | | Value | |
| Industrial Conglomerates — 0.2% | | | | |
| | | | | | Eaton Corp., Company Guaranteed Notes: | | | | |
| $ | 80,000 | | | A- | | 1.500% due 11/2/17 | | $ | 79,521 | |
| | 449,000 | | | A- | | 2.750% due 11/2/22 | | | 430,632 | |
| | 160,000 | | | A- | | 4.150% due 11/2/42 | | | 147,399 | |
| | | | | | General Electric Co., Senior Unsecured Notes: | | | | |
| | 530,000 | | | AA+ | | 2.700% due 10/9/22 | | | 518,686 | |
| | 220,000 | | | AA+ | | 4.500% due 3/11/44 | | | 223,689 | |
| | | | | | | | | | |
| | | | | | Total Industrial Conglomerates | | | 1,399,927 | |
| | | | | | | | | | |
| Insurance — 0.6% | | | | |
| | | | | | American International Group Inc., Senior Unsecured Notes: | | | | |
| | 330,000 | | | A- | | 4.875% due 6/1/22 | | | 360,551 | |
| | 195,000 | | | A- | | 4.375% due 1/15/55 | | | 176,718 | |
| | | | | | Berkshire Hathaway Finance Corp., Company Guaranteed Notes: | | | | |
| | 400,000 | | | AA | | 4.400% due 5/15/42 | | | 388,430 | |
| | 275,000 | | | AA | | 4.300% due 5/15/43 | | | 261,722 | |
| | 90,000 | | | BBB+ | | Hartford Financial Services Group Inc. (The), Senior Unsecured Notes, 4.300% due 4/15/43 | | | 85,784 | |
| | 250,000 | | | A+ | | Loews Corp., Senior Unsecured Notes, 4.125% due 5/15/43 | | | 226,468 | |
| | | | | | MetLife Inc.: | | | | |
| | 870,000 | | | BBB | | Junior Subordinated Notes, 6.400% due 12/15/36 | | | 958,087 | |
| | 320,000 | | | A- | | Senior Unsecured Notes, 4.050% due 3/1/45 | | | 296,798 | |
| | 850,000 | | | A- | | Nationwide Mutual Insurance Co., Subordinated Notes, 2.576% due 12/15/24(a)(b) | | | 851,702 | |
| | 390,000 | | | A | | Prudential Financial Inc., Senior Unsecured Notes, 7.375% due 6/15/19 | | | 458,209 | |
| | 230,000 | | | AA- | | Swiss Re Treasury US Corp., Company Guaranteed Notes, 2.875% due 12/6/22(a) | | | 222,926 | |
| | | | | | Teachers Insurance & Annuity Association of America, Subordinated Notes: | | | | |
| | 290,000 | | | AA- | | 6.850% due 12/16/39(a) | | | 363,100 | |
| | 300,000 | | | AA- | | 4.900% due 9/15/44(a) | | | 306,686 | |
| | 50,000 | | | BBB | | Voya Financial Inc., Company Guaranteed Notes, 2.900% due 2/15/18 | | | 50,976 | |
| | | | | | | | | | |
| | | | | | Total Insurance | | | 5,008,157 | |
| | | | | | | | | | |
| Internet & Catalog Retail — 0.1% | | | | |
| | 250,000 | | | AA- | | Amazon.com Inc., Senior Unsecured Notes, 4.950% due 12/5/44 | | | 251,246 | |
| | 590,000 | | | B+ | | Netflix Inc., Senior Unsecured Notes, 5.500% due 2/15/22(a) | | | 607,700 | |
| | | | | | | | | | |
| | | | | | Total Internet & Catalog Retail | | | 858,946 | |
| | | | | | | | | | |
| Life Sciences Tools & Services — 0.0% | | | | |
| | | | | | Thermo Fisher Scientific Inc., Senior Unsecured Notes: | | | | |
| | 235,000 | | | BBB | | 3.600% due 8/15/21 | | | 238,898 | |
| | 20,000 | | | BBB | | 5.300% due 2/1/44 | | | 20,940 | |
| | | | | | | | | | |
| | | | | | Total Life Sciences Tools & Services | | | 259,838 | |
| | | | | | | | | | |
| Machinery — 0.0% | | | | |
| | 280,000 | | | BBB- | | AGCO Corp., Senior Unsecured Notes, 5.875% due 12/1/21 | | | 311,408 | |
| | | | | | | | | | |
| Media — 1.3% | | | | |
| | | | | | 21st Century Fox America Inc., Company Guaranteed Notes: | | | | |
| | 30,000 | | | BBB+ | | 4.500% due 2/15/21 | | | 32,032 | |
| | 125,000 | | | BBB+ | | 8.500% due 2/23/25 | | | 163,124 | |
| | 25,000 | | | BBB+ | | 6.200% due 12/15/34 | | | 28,220 | |
| | 10,000 | | | BBB+ | | 6.900% due 8/15/39 | | | 12,047 | |
| | 200,000 | | | BB- | | Altice Financing SA, Senior Secured Notes, 6.625% due 2/15/23(a) | | | 199,500 | |
| | | | | | CCO Holdings LLC/CCO Holdings Capital Corp., Company Guaranteed Notes: | | | | |
| | 54,000 | | | BB- | | 7.000% due 1/15/19 | | | 55,822 | |
| | 555,000 | | | BB- | | 5.125% due 5/1/23(a) | | | 556,388 | |
| | | | | | CCO Safari II LLC, Senior Secured Notes: | | | | |
| | 705,000 | | | BBB- | | 3.579% due 7/23/20(a) | | | 704,819 | |
See Notes to Financial Statements.
84
| | | | | | | | | | |
| Core Fixed Income Investments | |
| | | |
Face
Amount/Units† | | | Rating†† | | Security | | Value | |
| Media — 1.3% — (continued) | | | | |
| $ | 125,000 | | | BBB- | | 4.464% due 7/23/22(a) | | $ | 124,556 | |
| | 410,000 | | | BBB- | | 4.908% due 7/23/25(a) | | | 406,732 | |
| | 240,000 | | | BBB- | | 6.384% due 10/23/35(a) | | | 245,033 | |
| | 435,000 | | | BBB- | | 6.484% due 10/23/45(a) | | | 443,675 | |
| | 200,000 | | | A- | | Comcast Cable Communications Holdings Inc., Company Guaranteed Notes, 9.455% due 11/15/22 | | | 275,436 | |
| | | | | | Comcast Corp., Company Guaranteed Notes: | | | | |
| | 30,000 | | | A- | | 5.875% due 2/15/18 | | | 33,043 | |
| | 540,000 | | | A- | | 5.700% due 5/15/18 | | | 597,028 | |
| | 156,000 | | | A- | | 3.375% due 8/15/25 | | | 155,707 | |
| | 170,000 | | | A- | | 4.200% due 8/15/34 | | | 166,502 | |
| | 80,000 | | | A- | | 6.500% due 11/15/35 | | | 99,704 | |
| | 40,000 | | | A- | | 6.450% due 3/15/37 | | | 49,945 | |
| | 50,000 | | | A- | | 6.950% due 8/15/37 | | | 65,414 | |
| | 90,000 | | | A- | | 6.550% due 7/1/39 | | | 115,240 | |
| | 185,000 | | | A- | | 4.650% due 7/15/42 | | | 189,867 | |
| | 108,000 | | | A- | | 4.600% due 8/15/45 | | | 110,423 | |
| | | | | | Cox Communications Inc., Senior Unsecured Notes: | | | | |
| | 72,000 | | | BBB | | 8.375% due 3/1/39(a) | | | 89,507 | |
| | 10,000 | | | BBB | | 4.700% due 12/15/42(a) | | | 8,776 | |
| | | | | | DIRECTV Holdings LLC/DIRECTV Financing Co., Inc., Company Guaranteed Notes: | | | | |
| | 620,000 | | | BBB | | 3.500% due 3/1/16 | | | 627,384 | |
| | 98,000 | | | BBB | | 4.600% due 2/15/21 | | | 103,172 | |
| | 24,000 | | | BBB | | Discovery Communications LLC, Company Guaranteed Notes, 4.875% due 4/1/43 | | | 20,758 | |
| | | | | | DISH DBS Corp., Company Guaranteed Notes: | | | | |
| | 20,000 | | | BB- | | 5.125% due 5/1/20 | | | 19,650 | |
| | 80,000 | | | BB- | | 6.750% due 6/1/21 | | | 80,512 | |
| | 60,000 | | | BB- | | 5.875% due 7/15/22 | | | 56,888 | |
| | 150,000 | | | BB- | | 5.875% due 11/15/24 | | | 137,062 | |
| | 900,000 | | | A- | | NBCUniversal Enterprise Inc., Company Guaranteed Notes, 0.826% due 4/15/16(a)(b) | | | 901,590 | |
| | 375,000 | | | A- | | NBCUniversal Media LLC, Company Guaranteed Notes, 4.450% due 1/15/43 | | | 371,599 | |
| | | | | | Numericable-SFR, Senior Secured Notes: | | | | |
| | 200,000 | | | B+ | | 6.000% due 5/15/22(a) | | | 200,500 | |
| | 380,000 | | | B+ | | 6.250% due 5/15/24(a) | | | 380,832 | |
| | 44,000 | | | BBB+ | | Omnicom Group Inc., Company Guaranteed Notes, 5.900% due 4/15/16 | | | 45,206 | |
| | 593,000 | | | BBB | | Scripps Networks Interactive Inc., Senior Unsecured Notes, 2.700% due 12/15/16 | | | 601,696 | |
| | 200,000 | | | BBB | | Sky PLC, Company Guaranteed Notes, 3.750% due 9/16/24(a) | | | 192,770 | |
| | | | | | Time Warner Cable Inc., Company Guaranteed Notes: | | | | |
| | 510,000 | | | BBB | | 8.250% due 4/1/19 | | | 596,933 | |
| | 200,000 | | | BBB | | 5.000% due 2/1/20 | | | 215,017 | |
| | 140,000 | | | BBB | | 4.125% due 2/15/21 | | | 142,898 | |
| | 90,000 | | | BBB | | 7.300% due 7/1/38 | | | 95,795 | |
| | 60,000 | | | BBB | | 5.875% due 11/15/40 | | | 56,830 | |
| | 240,000 | | | BBB | | 5.500% due 9/1/41 | | | 217,535 | |
| | 80,000 | | | BBB | | Time Warner Entertainment Co. LP, Company Guaranteed Notes, 8.375% due 7/15/33 | | | 95,468 | |
| | | | | | Time Warner Inc., Company Guaranteed Notes: | | | | |
| | 100,000 | | | BBB | | 4.700% due 1/15/21 | | | 108,292 | |
| | 110,000 | | | BBB | | 4.750% due 3/29/21 | | | 118,635 | |
| | 370,000 | | | BBB | | 7.700% due 5/1/32 | | | 481,009 | |
| | 30,000 | | | BBB | | 6.250% due 3/29/41 | | | 34,003 | |
| | 100,000 | | | B+ | | Univision Communications Inc., Senior Secured Notes, 6.750% due 9/15/22(a) | | | 106,125 | |
| | 60,000 | | | BBB | | Viacom Inc., Senior Unsecured Notes, 4.250% due 9/1/23 | | | 57,188 | |
| | | | | | | | | | |
| | | | | | Total Media | | | 10,993,887 | |
| | | | | | | | | | |
See Notes to Financial Statements.
85
| | | | | | | | | | |
| Core Fixed Income Investments | |
| | | |
Face
Amount/Units† | | | Rating†† | | Security | | Value | |
| Metals & Mining — 0.5% | | | | |
| $ | 130,000 | | | BB | | ArcelorMittal, Senior Unsecured Notes, 6.125% due 6/1/25 | | $ | 120,250 | |
| | 740,000 | | | BBB- | | Barrick Gold Corp., Senior Unsecured Notes, 4.100% due 5/1/23 | | | 655,409 | |
| | 200,000 | | | BBB- | | Barrick North America Finance LLC, Company Guaranteed Notes, 4.400% due 5/30/21 | | | 188,934 | |
| | | | | | BHP Billiton Finance USA Ltd., Company Guaranteed Notes: | | | | |
| | 370,000 | | | A+ | | 6.500% due 4/1/19 | | | 422,248 | |
| | 190,000 | | | A+ | | 5.000% due 9/30/43 | | | 195,943 | |
| | 120,000 | | | BB+ | | FMG Resources August 2006 Pty Ltd., Senior Secured Notes, 9.750% due 3/1/22(a) | | | 109,950 | |
| | | | | | Freeport-McMoRan Inc., Company Guaranteed Notes: | | | | |
| | 200,000 | | | BBB- | | 4.000% due 11/14/21 | | | 163,000 | |
| | 205,000 | | | BBB- | | 3.875% due 3/15/23 | | | 157,850 | |
| | | | | | Glencore Finance Canada Ltd., Company Guaranteed Notes: | | | | |
| | 320,000 | | | BBB | | 2.050% due 10/23/15(a) | | | 318,554 | |
| | 280,000 | | | BBB | | 2.700% due 10/25/17(a) | | | 273,527 | |
| | 390,000 | | | A- | | Rio Tinto Finance USA Ltd., Company Guaranteed Notes, 9.000% due 5/1/19 | | | 478,697 | |
| | 660,000 | | | BBB | | Southern Copper Corp., Senior Unsecured Notes, 5.250% due 11/8/42 | | | 539,946 | |
| | | | | | Vale Overseas Ltd., Company Guaranteed Notes: | | | | |
| | 382,000 | | | BBB | | 4.375% due 1/11/22(e) | | | 355,184 | |
| | 260,000 | | | BBB | | 6.875% due 11/21/36 | | | 222,560 | |
| | | | | | | | | | |
| | | | | | Total Metals & Mining | | | 4,202,052 | |
| | | | | | | | | | |
| Oil, Gas & Consumable Fuels — 2.7% | | | | |
| | 140,000 | | | BBB | | Anadarko Finance Co., Company Guaranteed Notes, 7.500% due 5/1/31 | | | 172,083 | |
| | | | | | Anadarko Petroleum Corp., Senior Unsecured Notes: | | | | |
| | 308,000 | | | BBB | | 5.950% due 9/15/16 | | | 321,467 | |
| | 827,000 | | | BBB | | 6.375% due 9/15/17 | | | 895,199 | |
| | 200,000 | | | BBB | | 3.450% due 7/15/24(e) | | | 192,446 | |
| | 170,000 | | | BBB | | 6.450% due 9/15/36 | | | 191,927 | |
| | 150,000 | | | BBB | | 4.500% due 7/15/44 | | | 136,837 | |
| | 540,000 | | | BBB+ | | Apache Corp., Senior Unsecured Notes, 5.625% due 1/15/17 | | | 575,953 | |
| | 90,000 | | | BB | | Atwood Oceanics Inc., Senior Unsecured Notes, 6.500% due 2/1/20 | | | 77,400 | |
| | | | | | BP Capital Markets PLC, Company Guaranteed Notes: | | | | |
| | 390,000 | | | A | | 4.742% due 3/11/21 | | | 427,373 | |
| | 160,000 | | | A | | 3.245% due 5/6/22 | | | 158,925 | |
| | 630,000 | | | A | | 3.506% due 3/17/25 | | | 620,744 | |
| | 160,000 | | | BB | | California Resources Corp., Company Guaranteed Notes, 5.500% due 9/15/21 | | | 124,861 | |
| | 300,000 | | | BB+ | | Chesapeake Energy Corp., Company Guaranteed Notes, 6.875% due 11/15/20 | | | 242,250 | |
| | | | | | Concho Resources Inc., Company Guaranteed Notes: | | | | |
| | 90,000 | | | BB+ | | 6.500% due 1/15/22 | | | 92,269 | |
| | 50,000 | | | BB+ | | 5.500% due 10/1/22 | | | 49,375 | |
| | 230,000 | | | A | | ConocoPhillips, Company Guaranteed Notes, 6.000% due 1/15/20 | | | 263,887 | |
| | | | | | Continental Resources Inc., Company Guaranteed Notes: | | | | |
| | 60,000 | | | BBB- | | 4.500% due 4/15/23 | | | 54,141 | |
| | 295,000 | | | BBB- | | 4.900% due 6/1/44 | | | 220,782 | |
| | 240,000 | | | BBB+ | | Devon Energy Corp., Senior Unsecured Notes, 5.600% due 7/15/41 | | | 244,692 | |
| | | | | | Ecopetrol SA, Senior Unsecured Notes: | | | | |
| | 95,000 | | | BBB | | 4.125% due 1/16/25 | | | 83,952 | |
| | 380,000 | | | BBB | | 5.375% due 6/26/26 | | | 355,205 | |
| | 220,000 | | | BBB | | 5.875% due 5/28/45 | | | 178,200 | |
| | 430,000 | | | BBB- | | El Paso Natural Gas Co. LLC, Company Guaranteed Notes, 8.625% due 1/15/22 | | | 519,062 | |
| | | | | | El Paso Pipeline Partners Operating Co. LLC, Company Guaranteed Notes: | | | | |
| | 460,000 | | | BBB- | | 6.500% due 4/1/20 | | | 511,343 | |
| | 110,000 | | | BBB- | | 4.300% due 5/1/24 | | | 100,107 | |
| | | | | | Energy Transfer Partners LP, Senior Unsecured Notes: | | | | |
| | 10,000 | | | BBB- | | 4.900% due 2/1/24 | | | 9,792 | |
| | 435,000 | | | BBB- | | 4.050% due 3/15/25 | | | 395,831 | |
See Notes to Financial Statements.
86
| | | | | | | | | | |
| Core Fixed Income Investments | |
| | | |
Face
Amount/Units† | | | Rating†† | | Security | | Value | |
| Oil, Gas & Consumable Fuels — 2.7% — (continued) | | | | |
| $ | 40,000 | | | BBB- | | 4.750% due 1/15/26 | | $ | 38,024 | |
| | 500,000 | | | BBB- | | 8.250% due 11/15/29 | | | 598,635 | |
| | 200,000 | | | BBB- | | 4.900% due 3/15/35 | | | 170,386 | |
| | 293,000 | | | BBB- | | 6.500% due 2/1/42 | | | 290,559 | |
| | 50,000 | | | BBB- | | 5.150% due 3/15/45 | | | 42,283 | |
| | 10,000 | | | BBB+ | | Ensco PLC, Senior Unsecured Notes, 4.700% due 3/15/21 | | | 9,172 | |
| | | | | | Enterprise Products Operating LLC, Company Guaranteed Notes: | | | | |
| | 160,000 | | | BBB+ | | 6.300% due 9/15/17 | | | 174,179 | |
| | 295,000 | | | BBB+ | | 3.900% due 2/15/24 | | | 288,377 | |
| | 155,000 | | | BBB+ | | 3.750% due 2/15/25 | | | 148,521 | |
| | 150,000 | | | BBB+ | | 3.700% due 2/15/26 | | | 141,821 | |
| | 290,000 | | | BBB+ | | 5.100% due 2/15/45 | | | 269,337 | |
| | 365,000 | | | A- | | EOG Resources Inc., Senior Unsecured Notes, 2.450% due 4/1/20 | | | 365,297 | |
| | 225,000 | | | AAA | | Exxon Mobil Corp., Senior Unsecured Notes, 3.567% due 3/6/45 | | | 207,316 | |
| | | | | | Freeport-McMoran Oil & Gas LLC/FCX Oil & Gas Inc., Company Guaranteed Notes: | | | | |
| | 298,000 | | | BBB- | | 6.125% due 6/15/19 | | | 280,120 | |
| | 63,000 | | | BBB- | | 6.875% due 2/15/23 | | | 56,700 | |
| | 10,000 | | | BBB | | Hess Corp., Senior Unsecured Notes, 7.300% due 8/15/31 | | | 11,249 | |
| | | | | | Kerr-McGee Corp., Company Guaranteed Notes: | | | | |
| | 200,000 | | | BBB | | 6.950% due 7/1/24 | | | 236,389 | |
| | 75,000 | | | BBB | | 7.875% due 9/15/31 | | | 93,658 | |
| | 290,000 | | | B | | Key Energy Services Inc., Company Guaranteed Notes, 6.750% due 3/1/21 | | | 123,250 | |
| | | | | | Kinder Morgan Energy Partners LP, Company Guaranteed Notes: | | | | |
| | 170,000 | | | BBB- | | 6.850% due 2/15/20 | | | 190,532 | |
| | 200,000 | | | BBB- | | 3.500% due 3/1/21 | | | 190,925 | |
| | 165,000 | | | BBB- | | 5.400% due 9/1/44 | | | 138,122 | |
| | 80,000 | | | BBB | | Marathon Petroleum Corp., Senior Unsecured Notes, 4.750% due 9/15/44 | | | 70,808 | |
| | | | | | MarkWest Energy Partners LP/MarkWest Energy Finance Corp., Company Guaranteed Notes: | | | | |
| | 140,000 | | | BB | | 5.500% due 2/15/23 | | | 137,900 | |
| | 160,000 | | | BB | | 4.875% due 12/1/24 | | | 149,200 | |
| | 210,000 | | | BB | | 4.875% due 6/1/25 | | | 194,775 | |
| | 300,000 | | | BBB- | | Newfield Exploration Co., Senior Unsecured Notes, 5.625% due 7/1/24 | | | 293,400 | |
| | | | | | Noble Energy Inc., Senior Unsecured Notes: | | | | |
| | 70,000 | | | BBB | | 4.150% due 12/15/21 | | | 69,725 | |
| | 160,000 | | | BBB | | 3.900% due 11/15/24 | | | 151,442 | |
| | 265,000 | | | BBB | | 5.250% due 11/15/43 | | | 237,532 | |
| | | | | | Occidental Petroleum Corp., Senior Unsecured Notes: | | | | |
| | 120,000 | | | A | | 3.125% due 2/15/22 | | | 119,163 | |
| | 110,000 | | | A | | 4.625% due 6/15/45 | | | 109,620 | |
| | 1,000,000 | | | BBB- | | Panhandle Eastern Pipeline Co. LP, Senior Unsecured Notes, 8.125% due 6/1/19 | | | 1,167,918 | |
| | 141,000 | | | BBB- | | Petrobras Global Finance BV, Company Guaranteed Notes, 6.250% due 3/17/24(e) | | | 123,840 | |
| | 1,800,000 | | | BBB- | | Petrobras International Finance Co. SA, Company Guaranteed Notes, 5.375% due 1/27/21 | | | 1,591,200 | |
| | | | | | Petroleos Mexicanos, Company Guaranteed Notes: | | | | |
| | 400,000 | | | BBB+ | | 6.000% due 3/5/20 | | | 436,800 | |
| | 920,000 | | | BBB+ | | 3.500% due 1/30/23 | | | 858,130 | |
| | 29,000 | | | BBB+ | | 6.625% due 6/15/35 | | | 29,710 | |
| | 220,000 | | | BBB+ | | 6.500% due 6/2/41 | | | 221,100 | |
| | 280,000 | | | BBB+ | | 6.375% due 1/23/45 | | | 274,344 | |
| | 285,000 | | | BBB+ | | Phillips 66, Company Guaranteed Notes, 4.875% due 11/15/44 | | | 273,422 | |
| | | | | | Plains All American Pipeline LP/PAA Finance Corp., Senior Unsecured Notes: | | | | |
| | 90,000 | | | BBB+ | | 3.650% due 6/1/22 | | | 87,363 | |
| | 165,000 | | | BBB+ | | 4.650% due 10/15/25 | | | 166,376 | |
| | | | | | QEP Resources Inc., Senior Unsecured Notes: | | | | |
| | 140,000 | | | BB+ | | 6.875% due 3/1/21 | | | 133,700 | |
| | 50,000 | | | BB+ | | 5.250% due 5/1/23 | | | 43,510 | |
See Notes to Financial Statements.
87
| | | | | | | | | | |
| Core Fixed Income Investments | |
| | | |
Face
Amount/Units† | | | Rating†† | | Security | | Value | |
| Oil, Gas & Consumable Fuels — 2.7% — (continued) | | | | |
| | | | | | Range Resources Corp., Company Guaranteed Notes: | | | | |
| $ | 30,000 | | | BB+ | | 5.000% due 8/15/22 | | $ | 27,825 | |
| | 260,000 | | | BB+ | | 5.000% due 3/15/23 | | | 239,200 | |
| | 110,000 | | | BB+ | | 4.875% due 5/15/25(a) | | | 99,412 | |
| | 300,000 | | | BB+ | | Sabine Pass Liquefaction LLC, Senior Secured Notes, 5.750% due 5/15/24 | | | 294,750 | |
| | 140,000 | | | D | | Samson Investment Co., Company Guaranteed Notes, 9.750% due 2/15/20 | | | 525 | |
| | 330,000 | | | AA- | | Schlumberger Investment SA, Company Guaranteed Notes, 3.300% due 9/14/21(a) | | | 335,772 | |
| | 20,000 | | | AA- | | Schlumberger Norge AS, Company Guaranteed Notes, 4.200% due 1/15/21(a) | | | 21,306 | |
| | 80,000 | | | BBB- | | SESI LLC, Company Guaranteed Notes, 7.125% due 12/15/21 | | | 80,213 | |
| | | | | | Shell International Finance BV, Company Guaranteed Notes: | | | | |
| | 230,000 | | | AA- | | 4.375% due 3/25/20 | | | 251,682 | |
| | 130,000 | | | AA- | | 4.125% due 5/11/35 | | | 126,718 | |
| | 165,000 | | | AA- | | 4.550% due 8/12/43 | | | 167,400 | |
| | 780,000 | | | AA- | | 4.375% due 5/11/45 | | | 774,588 | |
| | | | | | Southern Natural Gas Co. LLC, Company Guaranteed Notes: | | | | |
| | 40,000 | | | BBB- | | 5.900% due 4/1/17(a) | | | 42,225 | |
| | 58,000 | | | BBB- | | 8.000% due 3/1/32 | | | 68,388 | |
| | 575,000 | | | AA- | | Statoil ASA, Company Guaranteed Notes, 1.200% due 1/17/18 | | | 570,620 | |
| | | | | | Sunoco Logistics Partners Operations LP, Company Guaranteed Notes: | | | | |
| | 80,000 | | | BBB | | 3.450% due 1/15/23 | | | 72,316 | |
| | 55,000 | | | BBB | | 5.350% due 5/15/45 | | | 47,127 | |
| | 800,000 | | | BBB | | Texas Eastern Transmission LP, Senior Unsecured Notes, 2.800% due 10/15/22(a) | | | 737,492 | |
| | 3,000 | | | BB+ | | Transocean Inc., Company Guaranteed Notes, 5.550% due 12/15/16 | | | 3,019 | |
| | | | | | Williams Cos., Inc. (The), Senior Unsecured Notes: | | | | |
| | 343,000 | | | BB+ | | 7.875% due 9/1/21 | | | 378,225 | |
| | 166,000 | | | BB+ | | 8.750% due 3/15/32 | | | 191,724 | |
| | | | | | | | | | |
| | | | | | Total Oil, Gas & Consumable Fuels | | | 22,752,460 | |
| | | | | | | | | | |
| Paper & Forest Products — 0.1% | |
| | 340,000 | | | BBB- | | Celulosa Arauco y Constitucion SA, Senior Unsecured Notes, 4.750% due 1/11/22 | | | 348,426 | |
| | | | | | International Paper Co., Senior Unsecured Notes: | | | | |
| | 249,000 | | | BBB | | 3.650% due 6/15/24 | | | 243,999 | |
| | 33,000 | | | BBB | | 4.800% due 6/15/44 | | | 30,165 | |
| | | | | | | | | | |
| | | | | | Total Paper & Forest Products | | | 622,590 | |
| | | | | | | | | | |
| Pharmaceuticals — 1.1% | |
| | | | | | AbbVie Inc., Senior Unsecured Notes: | | | | |
| | 250,000 | | | A | | 1.750% due 11/6/17 | | | 249,921 | |
| | 1,000,000 | | | A | | 1.800% due 5/14/18 | | | 993,841 | |
| | 460,000 | | | A | | 2.900% due 11/6/22 | | | 444,850 | |
| | 330,000 | | | A | | 3.600% due 5/14/25 | | | 325,535 | |
| | 205,000 | | | A | | 4.500% due 5/14/35 | | | 197,014 | |
| | 130,000 | | | A | | 4.400% due 11/6/42 | | | 120,495 | |
| | | | | | Actavis Funding SCS, Company Guaranteed Notes: | | | | |
| | 255,000 | | | BBB- | | 1.850% due 3/1/17 | | | 255,337 | |
| | 200,000 | | | BBB- | | 2.350% due 3/12/18 | | | 199,970 | |
| | 695,000 | | | BBB- | | 3.000% due 3/12/20 | | | 693,830 | |
| | 440,000 | | | BBB- | | 3.450% due 3/15/22 | | | 430,526 | |
| | 480,000 | | | BBB- | | 3.850% due 6/15/24 | | | 468,739 | |
| | 620,000 | | | BBB- | | 3.800% due 3/15/25 | | | 601,209 | |
| | 70,000 | | | BBB- | | 4.550% due 3/15/35 | | | 64,555 | |
| | 90,000 | | | BBB- | | 4.850% due 6/15/44 | | | 82,627 | |
| | 700,000 | | | BBB- | | 4.750% due 3/15/45 | | | 640,835 | |
| | 140,000 | | | BBB- | | Actavis Inc., Company Guaranteed Notes, 4.625% due 10/1/42 | | | 127,594 | |
| | 130,000 | | | BBB | | Baxalta Inc., Senior Unsecured Notes, 5.250% due 6/23/45(a) | | | 131,039 | |
See Notes to Financial Statements.
88
| | | | | | | | | | |
| Core Fixed Income Investments | |
| | | |
Face
Amount/Units† | | | Rating†† | | Security | | Value | |
| Pharmaceuticals — 1.1% — (continued) | |
| $ | 160,000 | | | A+ | | Bristol-Myers Squibb Co., Senior Unsecured Notes, 4.500% due 3/1/44 | | $ | 169,179 | |
| | 780,000 | | | A+ | | GlaxoSmithKline Capital PLC, Company Guaranteed Notes, 2.850% due 5/8/22 | | | 770,195 | |
| | | | | | Merck & Co., Inc., Senior Unsecured Notes: | | | | |
| | 180,000 | | | AA | | 2.750% due 2/10/25 | | | 173,042 | |
| | 650,000 | | | AA | | 3.700% due 2/10/45 | | | 592,803 | |
| | 45,000 | | | BBB- | | Mylan Inc., Company Guaranteed Notes, 5.400% due 11/29/43 | | | 44,549 | |
| | | | | | Pfizer Inc., Senior Unsecured Notes: | | | | |
| | 70,000 | | | AA | | 3.400% due 5/15/24 | | | 70,196 | |
| | 130,000 | | | AA | | 7.200% due 3/15/39 | | | 178,335 | |
| | 40,000 | | | AA | | 4.300% due 6/15/43 | | | 39,180 | |
| | 30,000 | | | AA | | 4.400% due 5/15/44 | | | 29,880 | |
| | 125,000 | | | BBB+ | | Teva Pharmaceutical Finance Co. BV, Company Guaranteed Notes, 2.950% due 12/18/22 | | | 118,472 | |
| | | | | | Valeant Pharmaceuticals International Inc., Company Guaranteed Notes: | | | | |
| | 600,000 | | | B | | 5.500% due 3/1/23(a) | | | 609,750 | |
| | 450,000 | | | B | | 6.125% due 4/15/25(a) | | | 464,625 | |
| | 240,000 | | | AA | | Wyeth LLC, Company Guaranteed Notes, 5.950% due 4/1/37 | | | 284,962 | |
| | 60,000 | | | BBB- | | Zoetis Inc., Senior Unsecured Notes, 3.250% due 2/1/23 | | | 56,856 | |
| | | | | | | | | | |
| | | | | | Total Pharmaceuticals | | | 9,629,941 | |
| | | | | | | | | | |
| Real Estate Investment Trusts (REITs) — 1.0% | |
| | 128,000 | | | BBB- | | American Tower Corp., Senior Unsecured Notes, 4.000% due 6/1/25 | | | 124,544 | |
| | 1,000,000 | | | BB+ | | ARC Properties Operating Partnership LP, Company Guaranteed Notes, 2.000% due 2/6/17 | | | 978,750 | |
| | 140,000 | | | A- | | AvalonBay Communities Inc., Senior Unsecured Notes, 3.450% due 6/1/25 | | | 137,236 | |
| | 653,000 | | | BBB | | Duke Realty LP, Company Guaranteed Notes, 6.500% due 1/15/18 | | | 718,938 | |
| | | | | | ERP Operating LP, Senior Unsecured Notes: | | | | |
| | 750,000 | | | A- | | 5.375% due 8/1/16 | | | 778,651 | |
| | 80,000 | | | A- | | 4.500% due 7/1/44 | | | 79,753 | |
| | | | | | HCP Inc., Senior Unsecured Notes: | | | | |
| | 400,000 | | | BBB+ | | 3.750% due 2/1/16 | | | 404,471 | |
| | 500,000 | | | BBB+ | | 6.000% due 1/30/17 | | | 529,051 | |
| | 555,000 | | | BBB+ | | 4.250% due 11/15/23 | | | 555,103 | |
| | 375,000 | | | BBB+ | | 3.875% due 8/15/24 | | | 362,455 | |
| | 1,395,000 | | | BBB | | Health Care REIT Inc., Senior Unsecured Notes, 4.950% due 1/15/21 | | | 1,515,250 | |
| | 120,000 | | | BBB | | Host Hotels & Resorts LP, Senior Unsecured Notes, 4.750% due 3/1/23 | | | 125,158 | |
| | | | | | Simon Property Group LP, Senior Unsecured Notes: | | | | |
| | 80,000 | | | A | | 3.375% due 3/15/22 | | | 81,415 | |
| | 55,000 | | | A | | 3.375% due 10/1/24 | | | 54,252 | |
| | 400,000 | | | BBB- | | SL Green Realty Corp., Company Guaranteed Notes, 7.750% due 3/15/20 | | | 472,544 | |
| | 125,000 | | | BBB+ | | Ventas Realty LP, Company Guaranteed Notes, 3.750% due 5/1/24 | | | 122,724 | |
| | 1,240,000 | | | BBB+ | | Ventas Realty LP/Ventas Capital Corp., Company Guaranteed Notes, 2.700% due 4/1/20 | | | 1,229,283 | |
| | 654,000 | | | BBB+ | | WEA Finance LLC/Westfield UK & Europe Finance PLC, Company Guaranteed Notes, 2.700% due 9/17/19(a) | | | 652,913 | |
| | | | | | | | | | |
| | | | | | Total Real Estate Investment Trusts (REITs) | | | 8,922,491 | |
| | | | | | | | | | |
| Road & Rail — 0.2% | |
| | | | | | Burlington Northern Santa Fe LLC, Senior Unsecured Notes: | | | | |
| | 150,000 | | | BBB+ | | 4.375% due 9/1/42 | | | 140,977 | |
| | 385,000 | | | BBB+ | | 4.550% due 9/1/44 | | | 373,262 | |
| | 350,000 | | | BBB+ | | 4.150% due 4/1/45 | | | 319,191 | |
| | | | | | Union Pacific Corp., Senior Unsecured Notes: | | | | |
| | 84,000 | | | A | | 4.163% due 7/15/22 | | | 89,428 | |
| | 310,000 | | | A | | 2.750% due 4/15/23 | | | 302,536 | |
| | 64,000 | | | A | | 3.875% due 2/1/55 | | | 55,807 | |
| | | | | | | | | | |
| | | | | | Total Road & Rail | | | 1,281,201 | |
| | | | | | | | | | |
See Notes to Financial Statements.
89
| | | | | | | | | | |
| Core Fixed Income Investments | |
| | | |
Face
Amount/Units† | | | Rating†† | | Security | | Value | |
| Semiconductors & Semiconductor Equipment — 0.1% | |
| | | | | | Intel Corp., Senior Unsecured Notes: | | | | |
| $ | 70,000 | | | A+ | | 3.700% due 7/29/25 | | $ | 70,884 | |
| | 100,000 | | | A+ | | 4.900% due 7/29/45 | | | 103,194 | |
| | 275,000 | | | A+ | | QUALCOMM Inc., Senior Unsecured Notes, 3.450% due 5/20/25 | | | 258,236 | |
| | | | | | | | | | |
| | | | | | Total Semiconductors & Semiconductor Equipment | | | 432,314 | |
| | | | | | | | | | |
| Software — 0.3% | |
| | | | | | Activision Blizzard Inc., Company Guaranteed Notes: | | | | |
| | 120,000 | | | BB+ | | 5.625% due 9/15/21(a) | | | 126,450 | |
| | 630,000 | | | BB+ | | 6.125% due 9/15/23(a) | | | 678,825 | |
| | | | | | First Data Corp.: | | | | |
| | | | | | Company Guaranteed Notes: | | | | |
| | 30,000 | | | B- | | 12.625% due 1/15/21 | | | 34,538 | |
| | 52,000 | | | CCC+ | | 11.750% due 8/15/21 | | | 58,708 | |
| | 136,000 | | | BB- | | Senior Secured Notes, 6.750% due 11/1/20(a) | | | 143,480 | |
| | | | | | Microsoft Corp., Senior Unsecured Notes: | | | | |
| | 45,000 | | | AAA | | 3.500% due 2/12/35 | | | 41,691 | |
| | 350,000 | | | AAA | | 3.750% due 2/12/45 | | | 320,470 | |
| | | | | | Oracle Corp., Senior Unsecured Notes: | | | | |
| | 280,000 | | | AA- | | 1.200% due 10/15/17 | | | 279,035 | |
| | 375,000 | | | AA- | | 2.800% due 7/8/21 | | | 376,560 | |
| | 393,000 | | | AA- | | 3.400% due 7/8/24 | | | 393,293 | |
| | 155,000 | | | AA- | | 2.950% due 5/15/25 | | | 149,328 | |
| | 170,000 | | | AA- | | 4.500% due 7/8/44 | | | 171,055 | |
| | | | | | | | | | |
| | | | | | Total Software | | | 2,773,433 | |
| | | | | | | | | | |
| Specialty Retail — 0.3% | |
| | 120,000 | | | B- | | Argos Merger Sub Inc., Senior Unsecured Notes, 7.125% due 3/15/23(a) | | | 126,000 | |
| | 160,000 | | | B+ | | Dollar Tree Inc., Senior Secured Notes, 5.750% due 3/1/23(a) | | | 168,400 | |
| | 120,000 | | | A | | Home Depot Inc. (The), Senior Unsecured Notes, 4.400% due 3/15/45 | | | 122,014 | |
| | | | | | Lowe’s Cos Inc., Senior Unsecured Notes: | | | | |
| | 100,000 | | | A- | | 4.650% due 4/15/42 | | | 104,292 | |
| | 50,000 | | | A- | | 4.250% due 9/15/44 | | | 49,325 | |
| | 900,000 | | | BBB | | Walgreens Boots Alliance Inc., Company Guaranteed Notes, 0.774% due 5/18/16(b) | | | 899,719 | |
| | | | | | Wal-Mart Stores Inc., Senior Unsecured Notes: | | | | |
| | 700,000 | | | AA | | 3.250% due 10/25/20 | | | 734,332 | |
| | 50,000 | | | AA | | 4.000% due 4/11/43 | | | 47,785 | |
| | 475,000 | | | AA | | 4.750% due 10/2/43 | | | 507,490 | |
| | | | | | | | | | |
| | | | | | Total Specialty Retail | | | 2,759,357 | |
| | | | | | | | | | |
| Technology Hardware, Storage & Peripherals — 0.1% | |
| | | | | | Apple Inc., Senior Unsecured Notes: | | | | |
| | 200,000 | | | AA+ | | 2.000% due 5/6/20 | | | 199,544 | |
| | 525,000 | | | AA+ | | 2.850% due 5/6/21 | | | 534,761 | |
| | 75,000 | | | AA+ | | 3.450% due 2/9/45 | | | 63,645 | |
| | 305,000 | | | AA+ | | 4.375% due 5/13/45 | | | 303,130 | |
| | | | | | | | | | |
| | | | | | Total Technology Hardware, Storage & Peripherals | | | 1,101,080 | |
| | | | | | | | | | |
| Tobacco — 0.5% | |
| | | | | | Altria Group Inc., Company Guaranteed Notes: | | | | |
| | 260,000 | | | BBB+ | | 9.250% due 8/6/19 | | | 322,374 | |
| | 230,000 | | | BBB+ | | 4.750% due 5/5/21 | | | 248,343 | |
| | 150,000 | | | BBB+ | | 9.950% due 11/10/38 | | | 240,291 | |
| | 290,000 | | | BBB+ | | 10.200% due 2/6/39 | | | 466,848 | |
| | 280,000 | | | BBB+ | | 5.375% due 1/31/44 | | | 294,673 | |
See Notes to Financial Statements.
90
| | | | | | | | | | |
| Core Fixed Income Investments | |
| | | |
Face
Amount/Units† | | | Rating†† | | Security | | Value | |
| Tobacco — 0.5% — (continued) | |
| | | | | | Philip Morris International Inc., Senior Unsecured Notes: | | | | |
| $ | 240,000 | | | A | | 2.900% due 11/15/21 | | $ | 238,829 | |
| | 315,000 | | | A | | 4.500% due 3/20/42 | | | 314,030 | |
| | 215,000 | | | A | | 4.125% due 3/4/43 | | | 202,950 | |
| | | | | | Reynolds American Inc., Company Guaranteed Notes: | | | | |
| | 200,000 | | | BBB- | | 1.050% due 10/30/15 | | | 200,940 | |
| | 300,000 | | | BBB- | | 6.750% due 6/15/17 | | | 324,702 | |
| | 10,000 | | | BBB- | | 8.125% due 6/23/19(a) | | | 11,803 | |
| | 150,000 | | | BBB- | | 3.250% due 6/12/20 | | | 152,127 | |
| | 120,000 | | | BBB- | | 3.250% due 11/1/22 | | | 116,980 | |
| | 280,000 | | | BBB- | | 3.750% due 5/20/23(a) | | | 272,395 | |
| | 150,000 | | | BBB- | | 4.450% due 6/12/25 | | | 154,438 | |
| | 485,000 | | | BBB- | | 5.850% due 8/15/45 | | | 524,154 | |
| | | | | | | | | | |
| | | | | | Total Tobacco | | | 4,085,877 | |
| | | | | | | | | | |
| Transportation — 0.0% | |
| | | | | | FedEx Corp., Company Guaranteed Notes: | | | | |
| | 135,000 | | | BBB | | 3.875% due 8/1/42 | | | 117,043 | |
| | 49,000 | | | BBB | | 4.100% due 2/1/45 | | | 43,863 | |
| | | | | | | | | | |
| | | | | | Total Transportation | | | 160,906 | |
| | | | | | | | | | |
| Wireless Telecommunication Services — 0.3% | |
| | 300,000 | | | P BB- | | Altice US Finance I Corp., Senior Secured Notes, 5.375% due 7/15/23(a) | | | 297,750 | |
| | 330,000 | | | A- | | América Móvil SAB de CV, Company Guaranteed Notes, 5.000% due 3/30/20 | | | 363,446 | |
| | 300,000 | | | BBB- | | Bharti Airtel Ltd., Senior Unsecured Notes, 4.375% due 6/10/25(a) | | | 299,347 | |
| | 50,000 | | | BBB+ | | GTE Corp., Company Guaranteed Notes, 6.940% due 4/15/28 | | | 59,256 | |
| | 470,000 | | | B+ | | Sprint Capital Corp., Company Guaranteed Notes, 8.750% due 3/15/32 | | | 445,912 | |
| | 400,000 | | | BB | | Sprint Communications Inc., Company Guaranteed Notes, 9.000% due 11/15/18(a) | | | 446,500 | |
| | | | | | Sprint Corp., Company Guaranteed Notes: | | | | |
| | 40,000 | | | B+ | | 7.875% due 9/15/23 | | | 38,550 | |
| | 390,000 | | | B+ | | 7.625% due 2/15/25 | | | 364,894 | |
| | | | | | Telefónica Emisiones SAU, Company Guaranteed Notes: | | | | |
| | 70,000 | | | BBB | | 5.877% due 7/15/19 | | | 78,190 | |
| | 110,000 | | | BBB | | 5.134% due 4/27/20 | | | 121,355 | |
| | 275,000 | | | BB | | T-Mobile USA Inc., Company Guaranteed Notes, 6.250% due 4/1/21 | | | 284,708 | |
| | | | | | | | | | |
| | | | | | Total Wireless Telecommunication Services | | | 2,799,908 | |
| | | | | | | | | | |
| | | | | | TOTAL CORPORATE BONDS & NOTES
(Cost — $231,791,121) | | | 234,142,378 | |
| | | | | | | | | | |
| U.S. GOVERNMENT & AGENCY OBLIGATIONS — 24.5% | |
| U.S. GOVERNMENT OBLIGATIONS — 23.1% | |
| | | | | | U.S. Treasury Bonds: | | | | |
| | 190,000 | | | | | 0.625% due 11/30/17 | | | 188,962 | |
| | 650,000 | | | | | 4.500% due 2/15/36 | | | 839,842 | |
| | 1,665,000 | | | | | 3.125% due 2/15/42 | | | 1,731,329 | |
| | 100,000 | | | | | 3.125% due 2/15/43 | | | 103,458 | |
| | 990,000 | | | | | 3.750% due 11/15/43 | | | 1,151,042 | |
| | 105,000 | | | | | 3.375% due 5/15/44 | | | 113,902 | |
| | 1,520,000 | | | | | 3.000% due 11/15/44 | | | 1,534,825 | |
| | 2,410,000 | | | | | 2.500% due 2/15/45 | | | 2,193,163 | |
| | 29,845,000 | | | | | 3.000% due 5/15/45 | | | 30,200,573 | |
| | 15,185,000 | | | | | 2.875% due 8/15/45 | | | 15,014,366 | |
| | | | | | U.S. Treasury Inflation Indexed Bonds: | | | | |
| | 2,164,212 | | | | | 2.000% due 1/15/16 | | | 2,162,000 | |
| | 480,693 | | | | | 0.625% due 1/15/24 | | | 482,166 | |
See Notes to Financial Statements.
91
| | | | | | | | | | |
| Core Fixed Income Investments | |
| | | |
Face
Amount/Units† | | | | | Security | | Value | |
| U.S. GOVERNMENT OBLIGATIONS — 23.1% — (continued) | |
| $ | 2,497,475 | | | | | 0.125% due 7/15/24 | | $ | 2,401,999 | |
| | 6,831,053 | | | | | 0.250% due 1/15/25 | | | 6,595,437 | |
| | 3,380,247 | | | | | 2.375% due 1/15/25 | | | 3,923,770 | |
| | 289,272 | | | | | 2.125% due 2/15/40 | | | 351,608 | |
| | 654,782 | | | | | 0.750% due 2/15/42 | | | 595,336 | |
| | 669,484 | | | | | 0.625% due 2/15/43 | | | 586,688 | |
| | 3,901,211 | | | | | 1.375% due 2/15/44 | | | 4,112,602 | |
| | 2,690,577 | | | | | 0.750% due 2/15/45 | | | 2,429,123 | |
| | | | | | U.S. Treasury Inflation Indexed Notes: | | | | |
| | 3,589,352 | | | | | 0.125% due 4/15/16 | | | 3,556,100 | |
| | 1,208,259 | | | | | 0.125% due 4/15/17 | | | 1,204,326 | |
| | 1,299,263 | | | | | 0.125% due 4/15/20 | | | 1,295,102 | |
| | 4,552,954 | | | | | 0.375% due 7/15/23 | | | 4,500,845 | |
| | 1,393,726 | | | | | 0.375% due 7/15/25 | | | 1,368,283 | |
| | | | | | U.S. Treasury Notes: | | | | |
| | 110,000 | | | | | 0.250% due 10/31/15 | | | 110,042 | |
| | 6,710,000 | | | | | 0.625% due 5/31/17 | | | 6,703,357 | |
| | 70,000 | | | | | 0.750% due 6/30/17 | | | 70,059 | |
| | 2,670,000 | | | | | 0.625% due 8/31/17 | | | 2,664,089 | |
| | 675,000 | | | | | 1.000% due 5/15/18 | | | 674,969 | |
| | 1,285,000 | | | | | 1.000% due 8/15/18 | | | 1,283,143 | |
| | 655,000 | | | | | 1.250% due 11/30/18 | | | 656,612 | |
| | 2,815,000 | | | | | 1.500% due 12/31/18 | | | 2,842,142 | |
| | 1,265,000 | | | | | 1.375% due 2/28/19 | | | 1,270,526 | |
| | 1,060,000 | | | | | 3.125% due 5/15/19 | | | 1,129,645 | |
| | 20,000 | | | | | 1.625% due 7/31/19 | | | 20,203 | |
| | 250,000 | | | | | 1.750% due 9/30/19 | | | 253,457 | |
| | 200,000 | | | | | 1.500% due 10/31/19 | | | 200,630 | |
| | 6,660,000 | | | | | 1.625% due 12/31/19 | | | 6,709,084 | |
| | 310,000 | | | | | 1.375% due 4/30/20 | | | 308,275 | |
| | 2,490,000 | | | | | 1.625% due 6/30/20 | | | 2,501,056 | |
| | 14,150,000 | | | | | 1.625% due 7/31/20 | | | 14,205,822 | |
| | 20,915,000 | | | | | 1.375% due 8/31/20 | | | 20,752,428 | |
| | 10,960,000 | | | | | 2.250% due 7/31/21 | | | 11,241,562 | |
| | 400,000 | | | | | 2.125% due 9/30/21 | | | 406,789 | |
| | 2,840,000 | | | | | 1.875% due 11/30/21 | | | 2,844,030 | |
| | 1,610,000 | | | | | 1.500% due 1/31/22 | | | 1,573,461 | |
| | 6,610,000 | | | | | 2.125% due 6/30/22 | | | 6,700,630 | |
| | 3,325,000 | | | | | 1.875% due 8/31/22 | | | 3,312,963 | |
| | 3,870,000 | | | | | 2.375% due 8/15/24 | | | 3,935,987 | |
| | 6,610,000 | | | | | 2.250% due 11/15/24 | | | 6,644,769 | |
| | 8,230,000 | | | | | 2.125% due 5/15/25 | | | 8,167,040 | |
| | 2,550,000 | | | | | 2.000% due 8/15/25 | | | 2,504,977 | |
| | 945,000 | | | | | U.S. Treasury STRIPS, Principal Strip, due 11/15/27(h) | | | 692,952 | |
| | | | | | | | | | |
| | | | | | TOTAL U.S. GOVERNMENT OBLIGATIONS | | | 199,017,546 | |
| | | | | | | | | | |
| U.S. GOVERNMENT AGENCIES — 1.4% | |
| | | | | | Federal Farm Credit Banks: | | | | |
| | 1,260,000 | | | | | 0.214% due 9/14/16(b) | | | 1,261,337 | |
| | 1,250,000 | | | | | 0.253% due 2/27/17(b) | | | 1,252,374 | |
| | 1,130,000 | | | | | 0.229% due 4/26/17(b) | | | 1,131,316 | |
| | | | | | Federal Home Loan Bank (FHLB): | | | | |
| | 1,280,000 | | | | | 0.220% due 10/7/15(b) | | | 1,280,000 | |
| | 345,000 | | | | | 4.000% due 9/1/28 | | | 383,030 | |
| | 1,520,000 | | | | | 1.250% due 6/28/30 | | | 1,515,084 | |
See Notes to Financial Statements.
92
| | | | | | | | | | |
| Core Fixed Income Investments | |
| | | |
Face
Amount/Units† | | | | | Security | | Value | |
| U.S. GOVERNMENT AGENCIES — 1.4% — (continued) | |
| | | | | | Federal Home Loan Mortgage Corp. (FHLMC): | | | | |
| $ | 1,345,000 | | | | | 1.250% due 1/30/18 | | $ | 1,345,386 | |
| | 810,000 | | | | | 1.250% due 10/2/19 | | | 802,647 | |
| | 130,000 | | | | | 1.620% due 11/21/19 | | | 129,686 | |
| | 2,000 | | | | | 5.625% due 11/23/35 | | | 2,023 | |
| | | | | | Federal National Mortgage Association (FNMA): | | | | |
| | 650,000 | | | | | zero coupon bond to yield, 21.000% due 10/9/19(i) | | | 598,723 | |
| | 405,000 | | | | | 7.125% due 1/15/30 | | | 603,468 | |
| | 575,000 | | | | | Federal National Mortgage Association (FNMA), Principal Strip, due 1/15/30(h) | | | 353,143 | |
| | 595,000 | | | | | Federal National Mortgage Association (FNMA), Principal Strip, due 5/15/30(h) | | | 361,135 | |
| | 1,325,000 | | | | | Residual Funding Corp., Principal Strip, due 10/15/19(h) | | | 1,237,052 | |
| | | | | | | | | | |
| | | | | | TOTAL U.S. GOVERNMENT AGENCIES | | | 12,256,404 | |
| | | | | | | | | | |
| | | | | | TOTAL U.S. GOVERNMENT & AGENCY OBLIGATIONS
(Cost — $211,182,699) | | | 211,273,950 | |
| | | | | | | | | | |
| MORTGAGE-BACKED SECURITIES — 23.3% | |
| FHLMC — 3.3% | |
| | | | | | Federal Home Loan Mortgage Corp. (FHLMC): | | | | |
| | 20,004 | | | | | 8.500% due 11/1/16 — 7/1/17 | | | 20,079 | |
| | 3,502 | | | | | 8.000% due 1/1/17 — 6/1/17 | | | 3,520 | |
| | 37,261 | | | | | 2.258% due 12/1/34(b) | | | 39,891 | |
| | 28,613 | | | | | 2.436% due 1/1/35(b) | | | 30,629 | |
| | 41,031 | | | | | 1.945% due 2/1/37(b) | | | 43,222 | |
| | 90,389 | | | | | 1.838% due 5/1/37(b) | | | 94,806 | |
| | 100,836 | | | | | 2.495% due 5/1/37(b) | | | 108,047 | |
| | 56,634 | | | | | 3.095% due 3/1/41(b) | | | 59,896 | |
| | 150,723 | | | | | 2.032% due 7/1/42(b) | | | 154,668 | |
| | | | | | Gold: | | | | |
| | 748,545 | | | | | 6.000% due 5/1/17 — 6/1/39 | | | 832,390 | |
| | 2,022 | | | | | 8.500% due 2/1/18 | | | 2,044 | |
| | 896,209 | | | | | 5.000% due 6/1/21 — 4/1/41 | | | 988,545 | |
| | 8,796,117 | | | | | 4.000% due 10/1/25 — 7/1/44 | | | 9,446,623 | |
| | 1,017,822 | | | | | 4.500% due 4/1/29 — 7/1/41 | | | 1,113,712 | |
| | 1,595,208 | | | | | 5.500% due 1/1/30 — 2/1/40 | | | 1,769,799 | |
| | 465,730 | | | | | 6.500% due 8/1/37 — 9/1/39 | | | 526,723 | |
| | 39,340 | | | | | 7.000% due 3/1/39 | | | 44,102 | |
| | 9,221,935 | | | | | 3.500% due 12/1/42 — 8/1/45 | | | 9,585,657 | |
| | 2,886,534 | | | | | 3.000% due 2/1/43 — 4/1/45 | | | 2,902,717 | |
| | | | | | | | | | |
| | | | | | TOTAL FHLMC | | | 27,767,070 | |
| | | | | | | | | | |
| FNMA — 16.5% | |
| | | | | | Federal National Mortgage Association (FNMA): | | | | |
| | 2,381,014 | | | | | 5.500% due 11/1/16 — 5/1/40 | | | 2,674,357 | |
| | 466 | | | | | 8.500% due 4/1/17 | | | 484 | |
| | 2,189 | | | | | 8.000% due 8/1/17 | | | 2,218 | |
| | 1,060,630 | | | | | 5.181% due 5/1/19 | | | 1,179,883 | |
| | 19,955,851 | | | | | 4.000% due 10/1/19 — 7/1/45 | | | 21,405,109 | |
| | 1,035,000 | | | | | 4.400% due 2/1/20 | | | 1,144,195 | |
| | 1,145,000 | | | | | 3.459% due 11/1/20 | | | 1,226,429 | |
| | 373,676 | | | | | 6.000% due 9/1/21 — 10/1/35 | | | 422,026 | |
| | 26,625,752 | | | | | 3.500% due 11/1/21 — 6/1/45 | | | 27,848,177 | |
| | 1,175,193 | | | | | 3.650% due 11/1/21 | | | 1,260,348 | |
| | 23 | | | | | 9.500% due 11/1/21 | | | 23 | |
| | 3,083,815 | | | | | 5.000% due 12/1/21 — 5/1/42 | | | 3,382,954 | |
| | 464,854 | | | | | 2.830% due 6/1/22 | | | 480,384 | |
See Notes to Financial Statements.
93
| | | | | | | | | | |
| Core Fixed Income Investments | |
| | | |
Face
Amount/Units† | | | | | Security | | Value | |
| FNMA — 16.5% — (continued) | |
| $ | 1,085,151 | | | | | 2.647% due 10/1/22 | | $ | 1,112,691 | |
| | 8,489,884 | | | | | 4.500% due 3/1/24 — 10/1/44 | | | 9,246,340 | |
| | 760,000 | | | | | 2.800% due 6/1/25 | | | 759,855 | |
| | 1,491,923 | | | | | 2.966% due 5/1/27 | | | 1,492,645 | |
| | 4,019,641 | | | | | 2.500% due 11/1/27 — 10/1/42 | | | 4,052,207 | |
| | 12,899,092 | | | | | 3.000% due 12/1/27 — 5/1/45 | | | 13,151,600 | |
| | 21,655,000 | | | | | 3.500% due 9/1/30 — 9/1/45(j) | | | 22,485,059 | |
| | 3,285,000 | | | | | 2.500% due 9/1/30(j) | | | 3,336,030 | |
| | 11,360,000 | | | | | 3.000% due 9/1/30 — 9/1/45(j) | | | 11,637,228 | |
| | 337,330 | | | | | 2.180% due 3/1/34(b) | | | 361,362 | |
| | 91,991 | | | | | 2.161% due 12/1/34(b) | | | 98,560 | |
| | 8,670 | | | | | 2.203% due 12/1/34(b) | | | 9,284 | |
| | 90,651 | | | | | 2.341% due 9/1/35(b) | | | 96,365 | |
| | 98,755 | | | | | 2.086% due 10/1/35(b) | | | 103,769 | |
| | 145,543 | | | | | 2.156% due 10/1/35(b) | | | 153,124 | |
| | 24,982 | | | | | 2.110% due 11/1/35(b) | | | 26,422 | |
| | 26,408 | | | | | 2.114% due 11/1/35(b) | | | 27,763 | |
| | 76,699 | | | | | 2.124% due 11/1/35(b) | | | 80,684 | |
| | 31,476 | | | | | 2.133% due 11/1/35(b) | | | 33,068 | |
| | 27,458 | | | | | 2.151% due 11/1/35(b) | | | 28,900 | |
| | 31,746 | | | | | 2.153% due 11/1/35(b) | | | 33,318 | |
| | 365,507 | | | | | 2.250% due 1/1/36(b) | | | 390,400 | |
| | 182,285 | | | | | 2.293% due 9/1/36(b) | | | 193,994 | |
| | 33,816 | | | | | 2.362% due 12/1/36(b) | | | 36,242 | |
| | 135,704 | | | | | 7.000% due 4/1/37 | | | 153,241 | |
| | 197,789 | | | | | 1.869% due 5/1/37(b) | | | 210,120 | |
| | 774,028 | | | | | 6.500% due 9/1/37 — 5/1/40 | | | 889,223 | |
| | 85,592 | | | | | 2.882% due 2/1/41(b) | | | 89,827 | |
| | 204,673 | | | | | 3.269% due 7/1/41(b) | | | 218,702 | |
| | 191,067 | | | | | 2.008% due 7/1/42(b) | | | 197,167 | |
| | 38,864 | | | | | 2.264% due 7/1/42(b) | | | 40,149 | |
| | 8,585,000 | | | | | 4.000% due 9/1/45 — 10/1/45(j) | | | 9,113,028 | |
| | 600,000 | | | | | 5.000% due 09/1/45(j) | | | 661,160 | |
| | 245,000 | | | | | 4.500% due 10/1/45(j) | | | 265,174 | |
| | | | | | | | | | |
| | | | | | TOTAL FNMA | | | 141,811,288 | |
| | | | | | | | | | |
| GNMA — 3.5% | |
| | | | | | Government National Mortgage Association (GNMA): | | | | |
| | 409 | | | | | 9.500% due 12/15/16 — 8/15/17 | | | 411 | |
| | 1,714 | | | | | 8.500% due 5/15/17 | | | 1,734 | |
| | 110,890 | | | | | 6.000% due 12/15/33 — 5/15/38 | | | 126,340 | |
| | 148,195 | | | | | 6.500% due 1/15/34 — 10/15/38 | | | 169,488 | |
| | 1,034,864 | | | | | 5.000% due 10/15/34 — 9/15/40 | | | 1,151,006 | |
| | 105,538 | | | | | 5.500% due 5/15/37 — 6/15/38 | | | 118,647 | |
| | 277,662 | | | | | 4.500% due 3/15/41 | | | 301,769 | |
| | 701,610 | | | | | 4.000% due 6/15/41 — 7/15/41 | | | 756,550 | |
| | | | | | Government National Mortgage Association II (GNMA): | | | | |
| | 1,839 | | | | | 8.500% due 1/20/17 | | | 1,860 | |
| | 2,959 | | | | | 9.000% due 4/20/17 — 11/20/21 | | | 3,192 | |
| | 238,419 | | | | | 6.000% due 7/20/37 — 11/20/40 | | | 268,869 | |
| | 3,452,632 | | | | | 4.500% due 1/20/40 — 10/20/41 | | | 3,753,669 | |
| | 477,362 | | | | | 5.000% due 7/20/40 — 9/20/41 | | | 530,729 | |
| | 587,959 | | | | | 4.000% due 11/20/40 — 7/20/42 | | | 627,849 | |
| | 3,577,750 | | | | | 3.000% due 1/20/43 — 8/20/45 | | | 3,638,243 | |
| | 4,868,641 | | | | | 3.500% due 6/20/43 — 7/20/45 | | | 5,090,671 | |
See Notes to Financial Statements.
94
| | | | | | | | | | |
| Core Fixed Income Investments | |
| | | |
Face
Amount/Units† | | | Rating†† | | Security | | Value | |
| GNMA — 3.5% — (continued) | |
| $ | 2,000,000 | | | | | 3.000% due 9/1/45(j) | | $ | 2,029,570 | |
| | 2,160,000 | | | | | 4.000% due 9/1/45(j) | | | 2,291,709 | |
| | 8,950,000 | | | | | 3.500% due 9/1/45(j) | | | 9,331,424 | |
| | | | | | | | | | |
| | | | | | TOTAL GNMA | | | 30,193,730 | |
| | | | | | | | | | |
| | | | | | TOTAL MORTGAGE-BACKED SECURITIES
(Cost — $198,370,936) | | | 199,772,088 | |
| | | | | | | | | | |
| COLLATERALIZED MORTGAGE OBLIGATIONS — 16.1% | |
| | 2,800,000 | | | CCC | | Accredited Mortgage Loan Trust, Series 2007-1, Class A4, 0.419% due 2/25/37(b) | | | 2,252,751 | |
| | 45,045 | | | AAA | | ACE Securities Corp. Home Equity Loan Trust, Series 2004-SD1, Class A1, 0.689% due 11/25/33(b) | | | 44,770 | |
| | 114,607 | | | CC | | AFC Home Equity Loan Trust, Series 1999-2, Class 2A, 0.849% due 6/25/29(b) | | | 96,631 | |
| | 933,196 | | | D | | Alternative Loan Trust Resecuritization, Series 2008-2R, Class 3A1, 6.000% due 8/25/37 | | | 772,236 | |
| | 425,297 | | | A+ | | Ameriquest Mortgage Securities Trust, Series 2006-R2, Class A2B, 0.379% due 4/25/36(b) | | | 424,880 | |
| | 805,000 | | | AAA | | AMMC CLO XIII Ltd., Series 2013-13A, Class A1L, 1.743% due 1/26/26(a)(b) | | | 802,019 | |
| | | | | | Asset Backed Securities Corp. Home Equity Loan Trust: | | | | |
| | 1,956,000 | | | B- | | Series 2005-HE5, Class M3, 0.919% due 6/25/35(b) | | | 1,851,563 | |
| | 2,000,000 | | | B+ | | Series 2006-HE3, Class A5, 0.461% due 3/25/36(b) | | | 1,531,908 | |
| | 1,699,035 | | | CCC | | Series 2007-HE1, Class A1B, 0.341% due 12/25/36(b) | | | 1,460,721 | |
| | 480,000 | | | AA- | | BAMLL Commercial Mortgage Securities Trust, Series 2015-200P, Class B, 3.490% due 4/14/33(a) | | | 476,621 | |
| | | | | | Banc of America Commercial Mortgage Trust: | | | | |
| | 781,643 | | | AA | | Series 2008-1, Class A1A, 6.380% due 2/10/51(b) | | | 834,328 | |
| | 240,000 | | | B+ | | Series 2008-1, Class AJ, 6.467% due 2/10/51(b) | | | 252,207 | |
| | 749 | | | AA+ | | Banc of America Funding Trust, Series 2003-1, Class A1, 6.000% due 5/20/33 | | | 790 | |
| | 124,138 | | | AA+ | | Banc of America Mortgage Trust, Series 2004-F, Class 1A1, 2.676% due 7/25/34(b) | | | 126,022 | |
| | 482,790 | | | A+ | | Bayview Commercial Asset Trust, Series 2007-3, Class A1, 0.439% due 7/25/37(a)(b) | | | 421,955 | |
| | 46,126 | | | AAA | | Bayview Financial Mortgage Pass-Through Trust, Series 2004-A, Class A, 0.873% due 2/28/44(b) | | | 46,065 | |
| | 836,602 | | | NR | | BCAP LLC, Series 2013-RR1, Class 6A1, 2.836% due 5/26/36(a)(b) | | | 840,995 | |
| | | | | | Bear Stearns Adjustable Rate Mortgage Trust: | | | | |
| | 167,371 | | | A+ | | Series 2005-2, Class A2, 2.515% due 3/25/35(b) | | | 169,706 | |
| | 552,171 | | | D(k) | | Series 2007-3, Class 1A1, 2.781% due 5/25/47(b) | | | 495,400 | |
| | | | | | Bear Stearns ALT-A Trust: | | | | |
| | 369,665 | | | A+ | | Series 2004-7, Class 2A1, 2.604% due 8/25/34(b) | | | 374,799 | |
| | 277,784 | | | CCC | | Series 2005-2, Class 2A4, 2.501% due 4/25/35(b) | | | 266,376 | |
| | 234,700 | | | B | | Series 2005-4, Class 23A2, 2.534% due 5/25/35(b) | | | 232,675 | |
| | | | | | Bear Stearns Asset Backed Securities Trust: | | | | |
| | 890,032 | | | CCC | | Series 2005-AC6, Class 1A3, 5.500% due 9/25/35(b) | | | 913,564 | |
| | 92,494 | | | AAA | | Series 2005-TC2, Class A3, 0.569% due 8/25/35(b) | | | 92,514 | |
| | | | | | Bear Stearns Commercial Mortgage Securities Trust: | | | | |
| | 2,954,200 | | | Aaa(c) | | Series 2004-PWR5, Class F, 5.483% due 7/11/42(a)(b) | | | 3,165,130 | |
| | 210,000 | | | A- | | Series 2005-PW10, Class AM, 5.449% due 12/11/40(b) | | | 210,933 | |
| | 556,711 | | | A | | Series 2007-PW15, Class A4, 5.331% due 2/11/44 | | | 582,350 | |
| | 565,000 | | | BBB | | Series 2007-PW18, Class AM, 6.084% due 6/11/50(b) | | | 610,084 | |
| | 472,842 | | | BBB | | Bear Stearns Structured Products Trust, Series 2007-EMX1, Class A1, 1.199% due 3/25/37(a)(b) | | | 464,790 | |
| | 725,000 | | | AAA | | BlueMountain CLO Ltd., Series 2013-4A, Class A, 1.789% due 4/15/25(a)(b) | | | 723,380 | |
| | 1,700,000 | | | BB+ | | Centex Home Equity Loan Trust, Series 2006-A, Class AV4, 0.449% due 6/25/36(b) | | | 1,574,356 | |
| | 750 | | | AAA | | Chase Funding Trust, Series 2002-2, Class 2A1, 0.699% due 5/25/32(b) | | | 712 | |
| | 311,036 | | | BB | | Chase Mortgage Finance Trust, Series 2007-A1, Class 5A1, 2.645% due 2/25/37(b) | | | 309,372 | |
| | | | | | Chevy Chase Funding LLC Mortgage-Backed Certificates: | | | | |
| | 1,039,782 | | | A+ | | Series 2004-2A, Class A1, 0.469% due 5/25/35(a)(b) | | | 947,085 | |
| | 2,757,938 | | | CCC | | Series 2004-2A, Class B1, 0.668% due 5/25/35(a)(b) | | | 2,152,099 | |
See Notes to Financial Statements.
95
| | | | | | | | | | |
| Core Fixed Income Investments | |
| | | |
Face
Amount/Units† | | | Rating†† | | Security | | Value | |
| | | | | | Citigroup Commercial Mortgage Trust: | | | | |
| $ | 300,000 | | | BB(k) | | Series 2014-GC19, Class E, 4.563% due 3/10/47(a)(b) | | $ | 237,115 | |
| | 140,000 | | | Aa1(c) | | Series 2014-GC25, Class AS, 4.017% due 10/10/47 | | | 144,671 | |
| | 770,000 | | | CCC | | Citigroup Mortgage Loan Trust Inc., Series 2006-WFH2, Class M1, 0.469% due 8/25/36(b) | | | 630,367 | |
| | | | | | Citigroup/Deutsche Bank Commercial Mortgage Trust: | | | | |
| | 210,000 | | | B- | | Series 2006-CD2, Class AJ, 5.571% due 1/15/46(b) | | | 202,777 | |
| | 60,000 | | | B- | | Series 2006-CD3, Class AJ, 5.688% due 10/15/48 | | | 57,243 | |
| | 10,000 | | | CCC+ | | Series 2007-CD4, Class AJ, 5.398% due 12/11/49(b) | | | 8,895 | |
| | 50,000 | | | Aa2(c) | | COBALT CMBS Commercial Mortgage Trust, Series 2007-C2, Class AMFX, 5.526% due 4/15/47(b) | | | 52,812 | |
| | 400,000 | | | Aa2(c) | | Colony Mortgage Capital Ltd., Series 2014-FL2, Class B, 2.642% due 11/10/31(a)(b)(f) | | | 398,508 | |
| | 599,164 | | | AA+ | | Commercial Mortgage Loan Trust, Series 2008-LS1, Class A1A, 6.238% due 12/10/49(b) | | | 646,228 | |
| | | | | | Commercial Mortgage Trust: | | | | |
| | 1,600,000 | | | B- | | Series 2001-J2A, Class G, 7.380% due 7/16/34(a)(b) | | | 1,676,004 | |
| | 496,000 | | | BBB- | | Series 2006-C7, Class AM, 5.951% due 6/10/46(b) | | | 507,738 | |
| | 196,000 | | | B3(c) | | Series 2006-C8, Class AJ, 5.377% due 12/10/46 | | | 196,403 | |
| | 440,000 | | | Aa3(c) | | Series 2006-C8, Class AM, 5.347% due 12/10/46 | | | 459,076 | |
| | 575,000 | | | AA | | Series 2007-C9, Class A4, 5.989% due 12/10/49(b) | | | 611,944 | |
| | 1,333,623 | | | Aaa(c) | | Series 2012-LC4, Class A2, 2.256% due 12/10/44 | | | 1,347,724 | |
| | 665,000 | | | Aaa(c) | | Series 2012-LC4, Class A4, 3.288% due 12/10/44 | | | 688,397 | |
| | 190,000 | | | AA-(k) | | Series 2013-300P, Class B, 4.540% due 8/10/30(a)(b) | | | 203,811 | |
| | 40,000 | | | Aa3(c) | | Series 2013-CR12, Class B, 4.762% due 10/10/46(b) | | | 43,041 | |
| | 20,000 | | | A3(c) | | Series 2013-CR12, Class C, 5.254% due 10/10/46(b) | | | 21,153 | |
| | 1,272,116 | | | Aaa(c) | | Series 2013-CR6, Class A1, 0.719% due 3/10/46 | | | 1,262,965 | |
| | 260,000 | | | BB | | Series 2013-CR9, Class E, 4.400% due 7/10/45(a)(b) | | | 219,890 | |
| | 210,000 | | | A-(k) | | Series 2014-CR21, Class C, 4.566% due 12/10/47(b) | | | 206,516 | |
| | 345,000 | | | Aaa(c) | | Series 2014-LC17, Class A5, 3.917% due 10/10/47 | | | 363,339 | |
| | 535,000 | | | Aaa(c) | | Series 2015-CR25, Class A4, 3.759% due 8/10/48 | | | 552,931 | |
| | 5,400,000 | | | Aa1(c) | | Series 2015-CR25, Class XA, 1.131% due 8/10/48(b)(l) | | | 380,306 | |
| | | | | | Core Industrial Trust: | | | | |
| | 699,000 | | | AAA | | Series 2015-TEXW, Class A, 3.077% due 2/10/34(a) | | | 702,720 | |
| | 1,600,000 | | | BB- | | Series 2015-TEXW, Class E, 3.977% due 2/10/34(a)(b) | | | 1,503,911 | |
| | 535,000 | | | AAA | | Series 2015-WEST, Class A, 3.292% due 2/10/37(a) | | | 533,562 | |
| | | | | | Countrywide Alternative Loan Trust: | | | | |
| | 634,162 | | | CCC | | Series 2005-24, Class 4A1, 0.433% due 7/20/35(b) | | | 546,005 | |
| | 872,866 | | | CCC | | Series 2006-OA17, Class 1A1A, 0.398% due 12/20/46(b) | | | 670,282 | |
| | | | | | Countrywide Asset-Backed Certificates: | | | | |
| | 5,001 | | | AAA | | Series 2002-3, Class 1A1, 0.939% due 5/25/32(b) | | | 4,767 | |
| | 12,759 | | | AA+ | | Series 2003-BC2, Class 2A1, 0.799% due 6/25/33(b) | | | 10,984 | |
| | 443,711 | | | CCC | | Series 2006-SD3, Class A1, 0.529% due 7/25/36(a)(b) | | | 368,877 | |
| | 538,115 | | | AA | | Series 2007-13, Class 2A2, 0.999% due 10/25/47(b) | | | 488,697 | |
| | 1,026,654 | | | AA | | Series 2007-4, Class A4W, 5.423% due 4/25/47(b) | | | 1,012,294 | |
| | | | | | Countrywide Home Loan Mortgage Pass Through Trust: | | | | |
| | 194,131 | | | D | | Series 2005-11, Class 3A3, 2.427% due 4/25/35(b) | | | 145,396 | |
| | 82,659 | | | NR | | Series 2005-11, Class 6A1, 0.799% due 3/25/35(b) | | | 74,812 | |
| | | | | | Credit Suisse Commercial Mortgage Capital Trust: | | | | |
| | 7,079,873 | | | Caa3(c) | | Series 2006-7, Class 3A2, 7.001% due 8/25/36(b)(l) | | | 1,558,556 | |
| | 290,000 | | | B- | | Series 2014-USA, Class F, 4.373% due 9/15/37(a) | | | 249,125 | |
| | 1,431,583 | | | NR | | Series 2015-5R, Class 1A1, 1.066% due 9/27/46(a) | | | 1,393,017 | |
| | | | | | Credit Suisse Commercial Mortgage Trust: | | | | |
| | 290,000 | | | B+ | | Series 2006-C3, Class AJ, 6.008% due 6/15/38(b) | | | 283,858 | |
| | 800,000 | | | BBB- | | Series 2006-C4, Class AM, 5.509% due 9/15/39 | | | 828,446 | |
| | 40,000 | | | B- | | Series 2006-C5, Class AJ, 5.373% due 12/15/39 | | | 38,724 | |
| | 385,000 | | | BBB | | Series 2006-C5, Class AM, 5.343% due 12/15/39 | | | 400,964 | |
| | 90,648 | | | Aaa(c) | | Series 2007-C1, Class AAB, 5.336% due 2/15/40 | | | 91,755 | |
| | 310,000 | | | BBB- | | Series 2007-C2, Class AM, 5.615% due 1/15/49(b) | | | 327,186 | |
See Notes to Financial Statements.
96
| | | | | | | | | | |
| Core Fixed Income Investments | |
| | | |
Face
Amount/Units† | | | Rating†† | | Security | | Value | |
| | | | | | Credit Suisse First Boston Mortgage Securities Corp.: | | | | |
| $ | 449,941 | | | AA+ | | Series 2004-AR7, Class 2A1, 2.751% due 11/25/34(b) | | $ | 452,493 | |
| | 326,814 | | | D | | Series 2005-10, Class 5A6, 5.500% due 11/25/35 | | | 302,965 | |
| | 408,635 | | | BBB | | Series 2005-6, Class 8A1, 4.500% due 7/25/20 | | | 415,028 | |
| | 5,703 | | | NR | | DBRR Trust, Series 2013-EZ2, Class A, 0.853% due 2/25/45(a)(b) | | | 5,703 | |
| | 810,000 | | | BBB+ | | Deutsche Mortgage Securities Inc. Re-REMIC Trust Certificates, Series 2005-WF1, Class 1A4, 2.740% due 6/26/35(a)(b) | | | 802,505 | |
| | 126,058 | | | CCC | | Downey Savings & Loan Association Mortgage Loan Trust, Series 2004-AR2, Class A2B, 1.005% due 11/19/44(b) | | | 110,532 | |
| | 650,000 | | | AAA | | Dryden XXV Senior Loan Fund, Series 2012-25A, Class A, 1.669% due 1/15/25(a)(b) | | | 648,106 | |
| | | | | | EMC Mortgage Loan Trust: | | | | |
| | 3,296 | | | BB(k) | | Series 2002-B, Class A1, 1.499% due 2/25/41(a)(b) | | | 3,218 | |
| | 18,460 | | | BBB- | | Series 2003-A, Class A1, 0.749% due 8/25/40(a)(b) | | | 16,940 | |
| | 771,585 | | | B- | | Equifirst Mortgage Loan Trust, Series 2003-2, Class M2, 2.749% due 9/25/33(b) | | | 736,382 | |
| | | | | | Federal Home Loan Mortgage Corp. (FHLMC), REMICS: | | | | |
| | 8,053 | | | NR | | Series 1865, Class DA, 28.362% due 2/15/24(b)(l) | | | 8,416 | |
| | 1,514,413 | | | NR | | Series 3349, Class AS, 6.302% due 7/15/37(b)(l) | | | 271,094 | |
| | 167,732 | | | NR | | Series 3451, Class SB, 5.832% due 5/15/38(b)(l) | | | 19,811 | |
| | 197,894 | | | NR | | Series 3621, Class SB, 6.032% due 1/15/40(b)(l) | | | 33,365 | |
| | 555,000 | | | NR | | Series 3743, Class PB, 4.500% due 10/15/40 | | | 633,473 | |
| | 2,649,080 | | | NR | | Series 3866, Class SA, 5.752% due 5/15/41(b)(l) | | | 453,092 | |
| | 976,205 | | | NR | | Series 3947, Class SG, 5.752% due 10/15/41(b)(l) | | | 174,472 | |
| | 258,537 | | | NR | | Series 3997, Class SK, 6.402% due 11/15/41(b)(l) | | | 50,114 | |
| | 76,347 | | | NR | | Series 4076, Class SW, 5.852% due 7/15/42(b)(l) | | | 15,987 | |
| | 73,048 | | | NR | | Series 4097, Class ST, 5.852% due 8/15/42(b)(l) | | | 15,178 | |
| | 75,545 | | | NR | | Series 4136, Class SE, 5.952% due 11/15/42(b)(l) | | | 16,982 | |
| | 79,949 | | | NR | | Series 4136, Class SJ, 5.952% due 11/15/42(b)(l) | | | 21,461 | |
| | 77,405 | | | NR | | Series 4136, Class SQ, 5.952% due 11/15/42(b)(l) | | | 17,536 | |
| | 541,335 | | | NR | | Series 4150, Class BU, 4.000% due 2/15/42 | | | 583,143 | |
| | 686,415 | | | NR | | Series 4203, Class PS, 6.052% due 9/15/42(b)(l) | | | 133,430 | |
| | 106,974 | | | NR | | Series 4206, Class CZ, 3.000% due 5/15/43 | | | 96,131 | |
| | 314,268 | | | NR | | Series 4210, Class Z, 3.000% due 5/15/43 | | | 284,723 | |
| | 212,882 | | | NR | | Series 4226, Class GZ, 3.000% due 7/15/43 | | | 195,020 | |
| | 410,792 | | | NR | | Series 4239, Class IO, 3.500% due 6/15/27(l) | | | 47,783 | |
| | 184,228 | | | NR | | Series 4335, Class SW, 5.802% due 5/15/44(b)(l) | | | 39,742 | |
| | 223,788 | | | NR | | Series R007, Class ZA, 6.000% due 5/15/36 | | | 253,119 | |
| | | | | | Federal National Mortgage Association (FNMA), ACES: | | | | |
| | 584,509 | | | NR | | Series 2006-M2, Class A2A, 5.271% due 10/25/32(b) | | | 676,632 | |
| | 21,779,984 | | | NR | | Series 2013-M7, Class X2, 0.318% due 12/27/22(b)(l) | | | 294,237 | |
| | 758,554 | | | NR | | Series 2014-M12, Class FA, 0.501% due 10/25/21(b) | | | 759,502 | |
| | 948,622 | | | NR | | Series 2014-M8, Class FA, 0.450% due 5/25/18(b) | | | 949,704 | |
| | 100,000 | | | NR | | Series 2015-M7, Class AB2, 2.502% due 12/25/24 | | | 97,355 | |
| | 6,608,834 | | | NR | | Series 2015-M7, Class X2, 0.631% due 12/25/24(b)(l) | | | 269,343 | |
| | 21,680,690 | | | NR | | Series 2015-M8, Class X2, 0.284% due 1/25/25(b)(l) | | | 312,744 | |
| | | | | | Federal National Mortgage Association (FNMA), Grantor Trust: | | | | |
| | 121,648 | | | NR | | Series 2000-T6, Class A3, 3.960% due 1/25/28(b) | | | 127,162 | |
| | 17,304 | | | NR | | Series 2002-T6, Class A1, 3.310% due 2/25/32 | | | 17,617 | |
| | | | | | Federal National Mortgage Association (FNMA), Interest Strip: | | | | |
| | 305,187 | | | NR | | Series 409, Class C13, 3.500% due 11/25/41(l) | | | 63,121 | |
| | 601,317 | | | NR | | Series 409, Class C18, 4.000% due 4/25/42(l) | | | 131,383 | |
| | 102,191 | | | NR | | Series 409, Class C22, 4.500% due 11/25/39(l) | | | 19,680 | |
| | | | | | Federal National Mortgage Association (FNMA), REMICS: | | | | |
| | 65,762 | | | NR | | Series 2004-38, Class FK, 0.549% due 5/25/34(b) | | | 66,000 | |
| | 1,429 | | | NR | | Series 2004-88, Class HA, 6.500% due 7/25/34 | | | 1,436 | |
| | 411,736 | | | NR | | Series 2005-117, Class LC, 5.500% due 11/25/35 | | | 449,631 | |
| | 1,547,773 | | | NR | | Series 2006-51, Class SP, 6.451% due 3/25/36(b)(l) | | | 200,738 | |
See Notes to Financial Statements.
97
| | | | | | | | | | |
| Core Fixed Income Investments | |
| | | |
Face
Amount/Units† | | | Rating†† | | Security | | Value | |
| $ | 818,954 | | | NR | | Series 2007-68, Class SC, 6.501% due 7/25/37(b)(l) | | $ | 161,877 | |
| | 1,493,694 | | | NR | | Series 2008-18, Class SM, 6.801% due 3/25/38(b)(l) | | | 250,005 | |
| | 213,227 | | | NR | | Series 2010-142, Class SM, 6.331% due 12/25/40(b)(l) | | | 35,048 | |
| | 770,000 | | | NR | | Series 2011-131, Class PB, 4.500% due 12/25/41 | | | 886,999 | |
| | 802,197 | | | NR | | Series 2011-87, Class SG, 6.351% due 4/25/40(b)(l) | | | 144,885 | |
| | 305,778 | | | NR | | Series 2011-90, Class AS, 6.201% due 9/25/41(b)(l) | | | 56,661 | |
| | 520,060 | | | NR | | Series 2011-90, Class QI, 5.000% due 5/25/34(l) | | | 58,907 | |
| | 528,447 | | | NR | | Series 2012-118, Class CI, 3.500% due 12/25/39(l) | | | 75,720 | |
| | 81,920 | | | NR | | Series 2012-128, Class SL, 5.951% due 11/25/42(b)(l) | | | 20,285 | |
| | 162,150 | | | NR | | Series 2012-128, Class SQ, 5.951% due 11/25/42(b)(l) | | | 40,035 | |
| | 227,777 | | | NR | | Series 2012-133, Class CS, 5.951% due 12/25/42(b)(l) | | | 46,661 | |
| | 79,992 | | | NR | | Series 2012-133, Class SA, 5.951% due 12/25/42(b)(l) | | | 20,984 | |
| | 319,270 | | | NR | | Series 2012-46, Class BA, 6.000% due 5/25/42 | | | 361,578 | |
| | 493,509 | | | NR | | Series 2012-51, Class B, 7.000% due 5/25/42 | | | 571,367 | |
| | 67,014 | | | NR | | Series 2012-70, Class YS, 6.451% due 2/25/41(b)(l) | | | 11,465 | |
| | 331,518 | | | NR | | Series 2012-74, Class SA, 6.451% due 3/25/42(b)(l) | | | 60,247 | |
| | 55,253 | | | NR | | Series 2012-75, Class AO, due 3/25/42(h) | | | 49,572 | |
| | 218,022 | | | NR | | Series 2012-93, Class SG, 5.901% due 9/25/42(b)(l) | | | 44,457 | |
| | 475,569 | | | NR | | Series 2013-10, Class JS, 5.951% due 2/25/43(b)(l) | | | 103,103 | |
| | 474,581 | | | NR | | Series 2013-10, Class SJ, 5.951% due 2/25/43(b)(l) | | | 103,022 | |
| | 83,836 | | | NR | | Series 2013-67, Class KS, 5.901% due 7/25/43(b)(l) | | | 20,588 | |
| | 1,083,306 | | | NR | | Series 2013-9, Class BC, 6.500% due 7/25/42 | | | 1,244,700 | |
| | 828,027 | | | NR | | Series 2013-9, Class CB, 5.500% due 4/25/42 | | | 931,128 | |
| | | | | | FHLMC Multifamily Structured Pass Through Certificates: | | | | |
| | 1,580,853 | | | NR | | Series K007, Class X1, 1.341% due 4/25/20(b)(l) | | | 63,145 | |
| | 265,346 | | | AAA(k) | | Series K016, Class X1, 1.713% due 10/25/21(b)(l) | | | 20,733 | |
| | 900,000 | | | AAA(k) | | Series K045, Class A2, 3.023% due 1/25/25 | | | 914,109 | |
| | 315,000 | | | AAA(k) | | Series K047, Class A2, 3.329% due 5/25/25 | | | 327,598 | |
| | 655,000 | | | NR | | Series K151, Class A3, 3.511% due 4/25/30 | | | 674,547 | |
| | 180,000 | | | AAA(k) | | Series K717, Class A2, 2.991% due 9/25/21 | | | 187,337 | |
| | 500,000 | | | Aaa(c) | | Series K718, Class A2, 2.791% due 1/25/22 | | | 514,410 | |
| | 1,719,450 | | | Aa2(c) | | Series KF02, Class A2, 0.737% due 7/25/20(b) | | | 1,728,588 | |
| | 1,392,227 | | | NR | | Series KF05, Class A, 0.537% due 9/25/21(b) | | | 1,391,680 | |
| | 315,000 | | | NR | | Series KSCT, Class A2, 4.285% due 1/25/20 | | | 347,181 | |
| | 620,000 | | | Aaa(c) | | Flatiron CLO Ltd., Series 2013-1A, Class A1, 1.689% due 1/17/26(a)(b) | | | 617,728 | |
| | 805,000 | | | AAA | | Ford Credit Floorplan Master Owner Trust, Series 2012-5, Class A, 1.490% due 9/15/19 | | | 805,836 | |
| | 350,000 | | | BBB+(k) | | FREMF Mortgage Trust, Series 2015-K47, Class B, 3.723% due 6/25/48(a)(b) | | | 324,125 | |
| | 505,000 | | | BBB- | | GAHR Commercial Mortgage Trust, Series 2015-NRF, Class DFX, 3.495% due 12/15/19(a)(b) | | | 493,396 | |
| | 317,908 | | | BB+ | | GE Business Loan Trust, Series 2006-1A, Class C, 0.618% due 5/15/34(a)(b) | | | 288,225 | |
| | 1,318,478 | | | AAA | | GMAC Commercial Mortgage Securities Inc. Trust, Series 2006-C1, Class A1A, 5.233% due 11/10/45(b) | | | 1,319,827 | |
| | 231,334 | | | A+ | | GMAC Home Equity Notes Loan Trust, Series 2004-VF1, Class A1, 0.949% due 2/25/31(a)(b) | | | 227,997 | |
| | | | | | Government National Mortgage Association (GNMA): | | | | |
| | 2,869,753 | | | NR | | Series 2008-51, Class GS, 6.032% due 6/16/38(b)(l) | | | 602,090 | |
| | 59,540 | | | NR | | Series 2010-107, Class SG, 5.947% due 2/20/38(b)(l) | | | 4,088 | |
| | 73,772 | | | NR | | Series 2010-31, Class GS, 6.297% due 3/20/39(b)(l) | | | 9,754 | |
| | 203,413 | | | NR | | Series 2010-85, Class HS, 6.447% due 1/20/40(b)(l) | | | 35,925 | |
| | 3,690,708 | | | NR | | Series 2013-85, Class IA, 0.755% due 3/16/47(b)(l) | | | 198,191 | |
| | 2,581,432 | | | NR | | Series 2014-105, Class IO, 1.100% due 6/16/54(b)(l) | | | 197,635 | |
| | | | | | GS Mortgage Securities Corp. II: | | | | |
| | 705,000 | | | Aaa(c) | | Series 2012-GCJ9, Class A3, 2.773% due 11/10/45 | | | 699,168 | |
| | 350,000 | | | Aa2(c) | | Series 2015-GC30, Class AS, 3.777% due 5/10/50 | | | 351,320 | |
| | | | | | GS Mortgage Securities Trust: | | | | |
| | 636,230 | | | BBB- | | Series 2007-GG10, Class A1A, 5.988% due 8/10/45(b) | | | 679,049 | |
| | 705,000 | | | Aaa(c) | | Series 2011-GC5, Class A4, 3.707% due 8/10/44 | | | 742,082 | |
See Notes to Financial Statements.
98
| | | | | | | | | | |
| Core Fixed Income Investments | |
| | | |
Face
Amount/Units† | | | Rating†† | | Security | | Value | |
| $ | 135,646 | | | CCC | | GSMPS Mortgage Loan Trust, Series 2005-RP3, Class 1AF, 0.549% due 9/25/35(a)(b) | | $ | 116,479 | |
| | 143,220 | | | A+ | | GSR Mortgage Loan Trust, Series 2005-AR6, Class 2A1, 2.698% due 9/25/35(b) | | | 144,006 | |
| | | | | | Harborview Mortgage Loan Trust: | | | | |
| | 479,557 | | | BBB+ | | Series 2004-5, Class 2A6, 2.339% due 6/19/34(b) | | | 480,749 | |
| | 161,079 | | | NR | | Series 2006-2, Class 1A, 2.689% due 2/25/36(b) | | | 135,088 | |
| | 935,000 | | | AAA | | Hilton USA Trust, Series 2013-HLT, Class AFX, 2.662% due 11/5/30(a) | | | 934,934 | |
| | 588,682 | | | A+ | | HSBC Home Equity Loan Trust, Series 2007-3, Class APT, 1.403% due 11/20/36(b) | | | 588,572 | |
| | 578,061 | | | BBB+ | | HSI Asset Securitization Corp. Trust, Series 2006-OPT1, Class 2A3, 0.389% due 12/25/35(b) | | | 569,882 | |
| | 3,106 | | | AA+ | | Impac CMB Trust, Series 2003-1, Class 1A1, 0.999% due 3/25/33(b) | | | 3,043 | |
| | | | | | Indymac Index Mortgage Loan Trust: | | | | |
| | 84,010 | | | CCC | | Series 2004-AR15, Class 1A1, 2.999% due 2/25/35(b) | | | 74,457 | |
| | 93,016 | | | D | | Series 2005-AR15, Class A2, 2.802% due 9/25/35(b) | | | 79,867 | |
| | 650,000 | | | AAA | | ING Investment Management CLO Ltd., Series 2012-4A, Class A1, 1.679% due 10/15/23(a)(b) | | | 647,911 | |
| | 1,234,920 | | | CCC | | IXIS Real Estate Capital Trust, Series 2006-HE2, Class A3, 0.359% due 8/25/36(b) | | | 525,584 | |
| | | | | | JPMBB Commercial Mortgage Securities Trust: | | | | |
| | 80,000 | | | A3(c) | | Series 2013-C15, Class C, 5.251% due 11/15/45(b) | | | 84,168 | |
| | 40,000 | | | Aa3(c) | | Series 2013-C17, Class B, 5.050% due 1/15/47(b) | | | 42,933 | |
| | 350,000 | | | BB(k) | | Series 2014-C23, Class E, 3.364% due 9/15/47(a)(b) | | | 249,881 | |
| | 210,000 | | | A3(c) | | Series 2014-C24, Class C, 4.575% due 11/15/47(b) | | | 207,501 | |
| | 770,000 | | | Aaa(c) | | Series 2015-C31, Class A3, 3.801% due 8/15/48 | | | 792,750 | |
| | | | | | JPMorgan Chase Commercial Mortgage Securities Trust: | | | | |
| | 3,006,857 | | | AAA | | Series 2006-CB16, Class A4, 5.552% due 5/12/45 | | | 3,059,928 | |
| | 33,479 | | | AA | | Series 2006-LDP9, Class A3, 5.336% due 5/15/47 | | | 34,696 | |
| | 729,196 | | | AA | | Series 2007-CB18, Class A1A, 5.431% due 6/12/47(b) | | | 760,412 | |
| | 1,050,000 | | | B- | | Series 2007-CB18, Class AJ, 5.502% due 6/12/47(b) | | | 1,038,941 | |
| | 390,000 | | | BBB- | | Series 2007-CB20, Class AM, 6.082% due 2/12/51(b) | | | 419,641 | |
| | 164,969 | | | AAA | | Series 2011-C3, Class A2, 3.673% due 2/15/46(a) | | | 167,590 | |
| | 825,000 | | | AAA | | Series 2011-C4, Class A3, 4.106% due 7/15/46(a) | | | 868,937 | |
| | 140,000 | | | Aaa(c) | | Series 2011-C5, Class A3, 4.171% due 8/15/46 | | | 150,877 | |
| | 175,000 | | | Aaa(c) | | Series 2011-C5, Class AS, 5.500% due 8/15/46(a)(b) | | | 197,650 | |
| | 370,000 | | | Aa2(c) | | Series 2011-C5, Class B, 5.500% due 8/15/46(a)(b) | | | 410,563 | |
| | 1,357,124 | | | Aaa(c) | | Series 2012-CBX, Class A3, 3.139% due 6/15/45 | | | 1,387,769 | |
| | 2,580,388 | | | Aaa(c) | | Series 2012-CBX, Class XA, 1.924% due 6/15/45(b)(l) | | | 179,001 | |
| | 460,000 | | | AA | | Series 2012-HSBC, Class C, 4.021% due 7/5/32(a) | | | 472,910 | |
| | 650,000 | | | AA- | | Series 2014-FL6, Class B, 2.478% due 11/15/31(a)(b) | | | 650,721 | |
| | 150,000 | | | A- | | Series 2014-PHH, Class C, 2.288% due 8/15/27(a)(b) | | | 151,597 | |
| | 790,341 | | | Aa1(c) | | JPMorgan Trust, Series 2015-5, Class A9, 2.914% due 5/25/45(a)(b) | | | 791,140 | |
| | | | | | LB-UBS Commercial Mortgage Trust: | | | | |
| | 190,000 | | | AA- | | Series 2006-C1, Class AM, 5.217% due 2/15/31(b) | | | 191,658 | |
| | 710,000 | | | AA- | | Series 2006-C7, Class AM, 5.378% due 11/15/38 | | | 734,895 | |
| | 500,000 | | | BB | | Series 2007-C6, Class AM, 6.114% due 7/15/40(b) | | | 531,280 | |
| | 160,000 | | | A- | | Series 2007-C7, Class AM, 6.369% due 9/15/45(b) | | | 174,351 | |
| | | | | | Lehman XS Trust: | | | | |
| | 182,727 | | | CCC | | Series 2005-5N, Class 1A1, 0.499% due 11/25/35(b) | | | 165,020 | |
| | 119,336 | | | D | | Series 2005-7N, Class 1A1B, 0.499% due 12/25/35(b) | | | 72,207 | |
| | 630,000 | | | AAA | | Limerock CLO II Ltd., Series 2014-2A, Class A, 1.787% due 4/18/26(a)(b) | | | 628,566 | |
| | 760,000 | | | Aaa(c) | | Magnetite IX Ltd., Series 2014-9A, Class A1, 1.715% due 7/25/26(a)(b) | | | 756,895 | |
| | 993,070 | | | A+ | | MASTR Adjustable Rate Mortgages Trust, Series 2004-13, Class 3A7, 2.757% due 11/21/34(b) | | | 1,021,836 | |
| | 659,541 | | | AA+ | | MASTR Seasoned Securitization Trust, Series 2005-1, Class 4A1, 2.514% due 10/25/32(b) | | | 665,471 | |
| | 407,620 | | | CCC | | Merrill Lynch First Franklin Mortgage Loan Trust, Series 2007-4, Class 2A4, 0.449% due 7/25/37(b) | | | 269,638 | |
| | | | | | Merrill Lynch Mortgage Investors Trust: | | | | |
| | 67,139 | | | A+ | | Series 2004-A3, Class 4A3, 2.726% due 5/25/34(b) | | | 67,078 | |
| | 969,799 | | | BBB | | Series 2005-2, Class 2A, 2.520% due 10/25/35(b) | | | 979,573 | |
| | 328,669 | | | AAA | | Series 2006-FF1, Class A2C, 0.399% due 8/25/36(b) | | | 327,804 | |
See Notes to Financial Statements.
99
| | | | | | | | | | |
| Core Fixed Income Investments | |
| | | |
Face
Amount/Units† | | | Rating†† | | Security | | Value | |
| $ | 909,751 | | | AAA | | Mid-State Capital Corp. Trust, Series 2004-1, Class A, 6.005% due 8/15/37 | | $ | 957,091 | |
| | | | | | ML-CFC Commercial Mortgage Trust: | | | | |
| | 210,695 | | | AAA | | Series 2006-4, Class A1A, 5.166% due 12/12/49 | | | 218,495 | |
| | 291,000 | | | Caa1(c) | | Series 2007-5, Class AJ, 5.450% due 8/12/48(b) | | | 285,649 | |
| | 260,000 | | | B- | | Series 2007-9, Class AJ, 6.193% due 9/12/49(b) | | | 253,819 | |
| | 82,241 | | | AAA | | Morgan Stanley ABS Capital I Inc. Trust, Series 2004-SD3, Class A, 0.659% due 6/25/34(a)(b) | | | 82,577 | |
| | | | | | Morgan Stanley Bank of America Merrill Lynch Trust: | | | | |
| | 30,000 | | | Aaa(c) | | Series 2013-C10, Class A4, 4.218% due 7/15/46(b) | | | 32,211 | |
| | 500,000 | | | Aaa(c) | | Series 2013-C13, Class A4, 4.039% due 11/15/46 | | | 530,916 | |
| | | | | | Morgan Stanley Capital I Trust: | | | | |
| | 880,000 | | | AAA | | Series 2007-HQ11, Class A4FL, 0.329% due 2/12/44(b) | | | 872,865 | |
| | 73,572 | | | BBB | | Series 2007-HQ12, Class A5, 5.861% due 4/12/49(b) | | | 73,445 | |
| | 650,000 | | | BBB- | | Series 2007-HQ13, Class A3, 5.569% due 12/15/44 | | | 687,489 | |
| | 379,657 | | | AAA | | Series 2007-IQ13, Class A1A, 5.312% due 3/15/44 | | | 395,914 | |
| | 304,479 | | | A | | Series 2007-IQ14, Class A1A, 5.665% due 4/15/49(b) | | | 321,950 | |
| | 200,000 | | | A | | Series 2007-IQ14, Class A4, 5.692% due 4/15/49(b) | | | 209,860 | |
| | 516,359 | | | Aaa(c) | | Series 2007-T25, Class A3, 5.514% due 11/12/49(b) | | | 537,179 | |
| | 955,215 | | | AA+ | | New Century Home Equity Loan Trust, Series 2005-3, Class M1, 0.679% due 7/25/35(b) | | | 954,225 | |
| | | | | | Park Place Securities Inc. Asset-Backed Pass-Through Certificates: | | | | |
| | 1,205,000 | | | BBB | | Series 2005-WCW2, Class M1, 0.699% due 7/25/35(b) | | | 1,192,889 | |
| | 1,940,000 | | | CCC | | Series 2005-WHQ4, Class M2, 0.689% due 9/25/35(b) | | | 1,578,312 | |
| | | | | | PFS Financing Corp.: | | | | |
| | 540,000 | | | AAA | | Series 2014-BA, Class A, 0.798% due 10/15/19(a)(b) | | | 537,663 | |
| | 635,000 | | | AAA | | Series 2015-AA, Class A, 0.818% due 4/15/20(a)(b) | | | 630,466 | |
| | 1,787,000 | | | BBB+ | | Popular ABS Mortgage Pass-Through Trust, Series 2006-C, Class A4, 0.449% due 7/25/36(b) | | | 1,700,155 | |
| | | | | | Prime Mortgage Trust: | | | | |
| | 204,672 | | | CCC | | Series 2006-DR1, Class 1A1, 5.500% due 5/25/35(a) | | | 206,909 | |
| | 78,626 | | | CCC | | Series 2006-DR1, Class 1A2, 6.000% due 5/25/35(a) | | | 80,100 | |
| | 1,310,689 | | | CCC | | Series 2006-DR1, Class 2A1, 5.500% due 5/25/35(a) | | | 1,257,688 | |
| | | | | | RAMP Trust: | | | | |
| | 4,572 | | | CCC | | Series 2003-RS4, Class AIIB, 0.859% due 5/25/33(b) | | | 4,085 | |
| | 851,013 | | | AA | | Series 2003-RS9, Class AI6A, 5.939% due 10/25/33 | | | 902,355 | |
| | 587,934 | | | B+ | | Series 2006-NC1, Class A2, 0.389% due 1/25/36(b) | | | 587,088 | |
| | 640,000 | | | AAA | | RBS Commercial Funding Inc. Trust, Series 2013-GSP, Class A, 3.961% due 1/13/32(a)(b) | | | 669,016 | |
| | 30,729 | | | CCC | | Reperforming Loan REMIC Trust, Series 2004-R2, Class 1AF1, 0.619% due 11/25/34(a)(b) | | | 27,719 | |
| | 434,245 | | | Caa2(c) | | Residential Asset Securitization Trust, Series 2005-A15, Class 1A4, 5.750% due 2/25/36 | | | 413,086 | |
| | 640,000 | | | AAA | | SCG Trust, Series 2013-SRP1, Class A, 1.587% due 11/15/26(a)(b) | | | 637,084 | |
| | 201,568 | | | NR | | Small Business Administration Participation Certificates, Series 2013-20J, Class 1, 3.370% due 10/1/33 | | | 209,491 | |
| | 397,813 | | | BBB+ | | Structured Adjustable Rate Mortgage Loan Trust, Series 2004-16, Class 1A2, 2.463% due 11/25/34(b) | | | 399,851 | |
| | 241,061 | | | AA+ | | Structured Asset Mortgage Investments II Trust, Series 2005-AR5, Class A3, 0.455% due 7/19/35(b) | | | 231,717 | |
| | | | | | Structured Asset Securities Corp.: | | | | |
| | 191,437 | | | CC | | Series 2005-RF3, Class 1A, 0.549% due 6/25/35(a)(b) | | | 156,361 | |
| | 309,039 | | | BB | | Series 2007-BC4, Class A3, 0.449% due 11/25/37(b) | | | 307,920 | |
| | 100,000 | | | AAA | | VNDO Mortgage Trust, Series 2012-6AVE, Class A, 2.996% due 11/15/30(a) | | | 100,473 | |
| | 485,000 | | | B | | Wachovia Bank Commercial Mortgage Trust, Series 2007-C32, Class AMFX, 5.703% due 6/15/49(a) | | | 511,159 | |
| | | | | | WaMu Mortgage Pass Through Certificates Trust: | | | | |
| | 26,005 | | | BBB+ | | Series 2004-AR11, Class A, 2.506% due 10/25/34(b) | | | 26,319 | |
| | 100,343 | | | BBB+ | | Series 2004-AR12, Class A2A, 0.589% due 10/25/44(b) | | | 97,623 | |
| | 306,133 | | | AA+ | | Series 2005-AR11, Class A1A, 0.519% due 8/25/45(b) | | | 289,757 | |
| | 537,158 | | | AA+ | | Series 2005-AR13, Class A1A1, 0.489% due 10/25/45(b) | | | 500,665 | |
| | 296,857 | | | BBB- | | Series 2005-AR19, Class A1A2, 0.489% due 12/25/45(b) | | | 274,838 | |
| | 895,617 | | | B- | | Series 2005-AR4, Class A5, 2.454% due 4/25/35(b) | | | 883,376 | |
See Notes to Financial Statements.
100
| | | | | | | | | | |
| Core Fixed Income Investments | |
| | | |
Face
Amount/Units† | | | Rating†† | | Security | | Value | |
| $ | 2,036,925 | | | A+ | | Series 2006-AR1, Class 2A1A, 1.254% due 1/25/46(b) | | $ | 1,976,546 | |
| | 1,640,770 | | | CCC | | Series 2006-AR11, Class 1A, 1.144% due 9/25/46(b) | | | 1,387,575 | |
| | 757,356 | | | CCC | | Series 2006-AR13, Class 2A, 2.187% due 10/25/46(b) | | | 702,260 | |
| | 1,507,401 | | | B+ | | Series 2006-AR3, Class A1A, 1.184% due 2/25/46(b) | | | 1,393,252 | |
| | 406,098 | | | CCC | | Series 2007-HY4, Class 4A1, 2.126% due 9/25/36(b) | | | 364,299 | |
| | 837,343 | | | Ca(c) | | Series 2007-OA2, Class 2A, 0.884% due 1/25/47(b) | | | 614,623 | |
| | | | | | Wells Fargo Commercial Mortgage Trust: | | | | |
| | 120,000 | | | Aa3(c) | | Series 2013-LC12, Class B, 4.435% due 7/15/46(b) | | | 124,865 | |
| | 1,000,000 | | | Aa2(c) | | Series 2015-C28, Class AS, 3.872% due 5/15/48 | | | 1,011,296 | |
| | 150,000 | | | Aaa(c) | | Series 2015-LC20, Class A5, 3.184% due 4/15/50 | | | 148,018 | |
| | 1,370,000 | | | Aaa(c) | | Series 2015-NXS1, Class A5, 3.148% due 5/15/48 | | | 1,353,985 | |
| | 310,000 | | | A-(k) | | Series 2015-NXS1, Class C, 3.848% due 5/15/48(b) | | | 288,995 | |
| | 330,000 | | | BBB-(k) | | Series 2015-NXS1, Class D, 4.242% due 5/15/48(b) | | | 283,925 | |
| | | | | | Wells Fargo Mortgage Backed Securities Trust: | | | | |
| | 706,314 | | | Caa1(c) | | Series 2006-12, Class A3, 6.000% due 10/25/36 | | | 690,684 | |
| | 318,708 | | | CCC | | Series 2006-AR2, Class 2A1, 2.631% due 3/25/36(b) | | | 317,872 | |
| | 85,435 | | | Caa2(c) | | Series 2006-AR7, Class 2A4, 2.732% due 5/25/36(b) | | | 81,645 | |
| | | | | | WF-RBS Commercial Mortgage Trust: | | | | |
| | 738,913 | | | Aaa(c) | | Series 2011-C2, Class A2, 3.791% due 2/15/44(a) | | | 741,009 | |
| | 750,000 | | | Aaa(c) | | Series 2011-C2, Class A4, 4.869% due 2/15/44(a)(b) | | | 832,142 | |
| | 784,331 | | | Aaa(c) | | Series 2011-C4, Class A2, 3.454% due 6/15/44(a) | | | 794,247 | |
| | 1,050,000 | | | Aaa(c) | | Series 2011-C4, Class A3, 4.394% due 6/15/44(a) | | | 1,121,714 | |
| | 1,035,000 | | | Aaa(c) | | Series 2011-C5, Class A4, 3.667% due 11/15/44 | | | 1,089,684 | |
| | 1,914,122 | | | Aaa(c) | | Series 2012-C7, Class XA, 1.687% due 6/15/45(a)(b)(l) | | | 148,854 | |
| | 145,000 | | | Aaa(c) | | Series 2013-C14, Class A4, 3.073% due 6/15/46 | | | 145,540 | |
| | 2,607,708 | | | Aaa(c) | | Series 2014-C20, Class XA, 1.382% due 5/15/47(b)(l) | | | 178,698 | |
| | 240,000 | | | BBB-(k) | | Series 2014-C22, Class D, 4.057% due 9/15/57(a)(b) | | | 205,326 | |
| | | | | | | | | | |
| | | | | | TOTAL COLLATERALIZED MORTGAGE OBLIGATIONS
(Cost — $139,088,748) | | | 138,066,220 | |
| | | | | | | | | | |
| SOVEREIGN BONDS — 3.1% | |
| Brazil — 0.3% | |
| | 656,000 | BRL | | BBB+ | | Brazil Notas do Tesouro Nacional Serie B , 6.000% due 8/15/50 | | | 424,458 | |
| | 4,266,000 | BRL | | BBB+ | | Brazil Notas do Tesouro Nacional Serie F , 10.000% due 1/1/17 | | | 1,143,005 | |
| | | | | | Federative Republic of Brazil: | | | | |
| | 452,000 | | | BBB- | | 4.875% due 1/22/21 | | | 461,040 | |
| | 200,000 | | | BBB- | | 4.250% due 1/7/25 | | | 185,750 | |
| | 490,000 | | | BBB- | | 5.625% due 1/7/41 | | | 438,550 | |
| | 400,000 | | | BBB- | | 5.000% due 1/27/45 | | | 324,000 | |
| | | | | | | | | | |
| | | | | | Total Brazil | | | 2,976,803 | |
| | | | | | | | | | |
| Canada — 0.0% | |
| | 152,000 | | | AA | | Province of Manitoba Canada, 3.050% due 5/14/24 | | | 157,108 | |
| | | | | | | | | | |
| China — 0.0% | |
| | | | | | China Government Bond: | | | | |
| | 1,000,000 | CNH | | Aa3(c) | | 3.380% due 11/21/24 | | | 153,446 | |
| | 1,000,000 | CNY | | Aa3(c) | | 3.390% due 5/21/25 | | | 155,199 | |
| | | | | | | | | | |
| | | | | | Total China | | | 308,645 | |
| | | | | | | | | | |
| Colombia — 0.1% | |
| | | | | | Colombia Government International Bond: | | | | |
| | 615,000 | | | BBB | | 4.000% due 2/26/24 | | | 598,087 | |
| | 370,000 | | | BBB | | 5.625% due 2/26/44 | | | 361,213 | |
| | | | | | | | | | |
| | | | | | Total Colombia | | | 959,300 | |
| | | | | | | | | | |
See Notes to Financial Statements.
101
| | | | | | | | | | |
| Core Fixed Income Investments | |
| | | |
Face
Amount/Units† | | | Rating†† | | Security | | Value | |
| Indonesia — 0.1% | |
| $ | 500,000 | | | BB+ | | Indonesia Government International Bond , 3.750% due 4/25/22 | | $ | 480,650 | |
| | | | | | | | | | |
| Italy — 0.6% | |
| | 3,860,000 | EUR | | Baa2u(c) | | Italy Buoni Poliennali Del Tesoro , 3.750% due 9/1/24 | | | 4,989,074 | |
| | | | | | | | | | |
| Mexico — 0.9% | |
| | | | | | Mexican Bonos: | | | | |
| | 2,118,000 | MXN | | A | | 8.000% due 6/11/20 | | | 141,585 | |
| | 30,492,700 | MXN | | A | | 6.500% due 6/9/22 | | | 1,900,473 | |
| | 15,120,000 | MXN | | A | | 10.000% due 12/5/24 | | | 1,158,484 | |
| | 46,325,700 | MXN | | A | | 7.750% due 11/13/42 | | | 3,144,608 | |
| | | | | | Mexico Government International Bond: | | | | |
| | 61,000 | | | BBB+ | | 3.500% due 1/21/21 | | | 61,991 | |
| | 174,000 | | | BBB+ | | 3.625% due 3/15/22 | | | 174,870 | |
| | 400,000 | | | BBB+ | | 3.600% due 1/30/25 | | | 393,000 | |
| | 78,000 | | | BBB+ | | 6.050% due 1/11/40 | | | 87,750 | |
| | 828,000 | | | BBB+ | | 4.750% due 3/8/44 | | | 776,250 | |
| | 300,000 | | | BBB+ | | 5.550% due 1/21/45 | | | 314,625 | |
| | | | | | | | | | |
| | | | | | Total Mexico | | | 8,153,636 | |
| | | | | | | | | | |
| Panama — 0.0% | |
| | 200,000 | | | BBB | | Panama Government International Bond , 4.000% due 9/22/24 | | | 200,000 | |
| | | | | | | | | | |
| Peru — 0.1% | |
| | | | | | Peruvian Government International Bond: | | | | |
| | 218,000 | | | A3e(c) | | 4.125% due 8/25/27 | | | 217,455 | |
| | 60,000 | | | BBB+ | | 6.550% due 3/14/37 | | | 71,700 | |
| | 290,000 | | | BBB+ | | 5.625% due 11/18/50 | | | 313,200 | |
| | | | | | | | | | |
| | | | | | Total Peru | | | 602,355 | |
| | | | | | | | | | |
| Poland — 0.6% | |
| | 17,430,000 | PLN | | A | | Poland Government Bond , 3.250% due 7/25/25 | | | 4,727,539 | |
| | 610,000 | | | A- | | Poland Government International Bond , 4.000% due 1/22/24 | | | 642,797 | |
| | | | | | | | | | |
| | | | | | Total Poland | | | 5,370,336 | |
| | | | | | | | | | |
| Russia — 0.1% | |
| | | | | | Russian Foreign Bond — Eurobond: | | | | |
| | 375,625 | | | BB+ | | step bond to yield, 7.500% due 3/31/30 | | | 440,447 | |
| | 43,750 | | | BB+ | | step bond to yield, 7.500% due 3/31/30 | | | 51,300 | |
| | | | | | | | | | |
| | | | | | Total Russia | | | 491,747 | |
| | | | | | | | | | |
| South Africa — 0.1% | |
| | 520,000 | | | BBB- | | South Africa Government International Bond , 5.875% due 9/16/25 | | | 563,043 | |
| | | | | | | | | | |
| Turkey — 0.2% | | | | |
| | | | | | Turkey Government International Bond: | | | | |
| | 600,000 | | | Baa3(c) | | 5.750% due 3/22/24 | | | 637,962 | |
| | 580,000 | | | Baa3(c) | | 7.375% due 2/5/25 | | | 682,080 | |
| | | | | | | | | | |
| | | | | | Total Turkey | | | 1,320,042 | |
| | | | | | | | | | |
| | Uruguay — 0.0% | | | | | | | | | |
| | 150,000 | | | BBB | | Uruguay Government International Bond , 4.500% due 8/14/24 | | | 155,062 | |
| | | | | | | | | | |
| | | | | | TOTAL SOVEREIGN BONDS
(Cost — $28,943,326) | | | 26,727,801 | |
| | | | | | | | | | |
| ASSET-BACKED SECURITIES — 2.0% | | | | |
| Automobiles — 0.3% | | | | |
| | 562,071 | | | AAA | | Chrysler Capital Auto Receivables Trust, Series 2013-BA, Class A3, 0.850% due 5/15/18(a) | | | 562,412 | |
See Notes to Financial Statements.
102
| | | | | | | | | | |
| Core Fixed Income Investments | |
| | | |
Face
Amount/Units† | | | Rating†† | | Security | | Value | |
| Automobiles — 0.3% — (continued) | | | | |
| | | | | | Drive Auto Receivables Trust: | | | | |
| $ | 880,000 | | | AAA | | Series 2015-BA, Class A3, 1.300% due 6/15/18(a) | | $ | 879,973 | |
| | 965,000 | | | AAA | | Series 2015-CA, Class A3, 1.380% due 10/15/18(a) | | | 965,144 | |
| | | | | | | | | | |
| | | | | | Total Automobiles | | | 2,407,529 | |
| | | | | | | | | | |
| Credit Cards — 0.1% | | | | |
| | 600,000 | | | AAA | | Chase Issuance Trust, Series 2015-A2, Class A2, 1.590% due 2/18/20 | | | 602,910 | |
| | 750,000 | | | AAA | | Citibank Credit Card Issuance Trust, Series 2014-A3, Class A3, 0.392% due 5/9/18(b) | | | 749,887 | |
| | | | | | | | | | |
| | | | | | Total Credit Cards | | | 1,352,797 | |
| | | | | | | | | | |
| Student Loans — 1.6% | | | | |
| | 593,265 | | | AA+ | | CIT Education Loan Trust, Series 2007-1, Class A, 0.371% due 3/25/42(a)(b) | | | 551,605 | |
| | 850,000 | | | AA+ | | EFS Volunteer LLC, Series 2010-1, Class A2, 1.145% due 10/25/35(a)(b) | | | 839,430 | |
| | | | | | Navient Private Education Loan Trust: | | | | |
| | 630,000 | | | AAA | | Series 2014-AA, Class A2B, 1.448% due 2/15/29(a)(b) | | | 632,455 | |
| | 394,436 | | | AAA | | Series 2014-CTA, Class A, 0.898% due 9/16/24(a)(b) | | | 391,700 | |
| | | | | | SLM Private Education Loan Trust: | | | | |
| | 303,908 | | | AAA | | Series 2012-A, Class A1, 1.598% due 8/15/25(a)(b) | | | 305,111 | |
| | 705,000 | | | AAA | | Series 2012-C, Class A2, 3.310% due 10/15/46(a) | | | 722,418 | |
| | 680,000 | | | AAA | | Series 2012-D, Class A2, 2.950% due 2/15/46(a) | | | 694,482 | |
| | 274,107 | | | AAA | | Series 2012-E, Class A1, 0.948% due 10/16/23(a)(b) | | | 274,001 | |
| | | | | | SLM Student Loan Trust: | | | | |
| | 1,220,000 | | | AAA | | Series 2003-11, Class A6, 1.036% due 12/15/25(a)(b) | | | 1,183,165 | |
| | 1,400,000 | | | AAA | | Series 2004-1, Class A4, 0.555% due 10/27/25(b) | | | 1,334,444 | |
| | 558,121 | | | AAA | | Series 2004-8A, Class A5, 0.795% due 4/25/24(a)(b) | | | 553,454 | |
| | 880,000 | | | AA+ | | Series 2005-5, Class A5, 1.045% due 10/25/40(b) | | | 808,730 | |
| | 1,371,274 | | | AAA | | Series 2005-6, Class A5B, 1.495% due 7/27/26(b) | | | 1,375,212 | |
| | 1,070,000 | | | AAA | | Series 2005-6, Class A6, 0.435% due 10/27/31(b) | | | 1,013,861 | |
| | 1,436,078 | | | AAA | | Series 2011-2, Class A1, 0.799% due 11/25/27(b) | | | 1,427,508 | |
| | | | | | SMB Private Education Loan Trust: | | | | |
| | 895,000 | | | AAA | | Series 2015-B, Class A1, 0.891% due 2/15/23(a)(b) | | | 894,959 | |
| | 680,000 | | | AAA | | Series 2015-B, Class A2A, 2.980% due 7/15/27(a) | | | 683,391 | |
| | | | | | | | | | |
| | | | | | Total Student Loans | | | 13,685,926 | |
| | | | | | | | | | |
| | | | | | TOTAL ASSET-BACKED SECURITIES
(Cost — $17,520,526) | | | 17,446,252 | |
| | | | | | | | | | |
| MUNICIPAL BONDS — 0.5% | | | | |
| California — 0.1% | | | | |
| | 80,000 | | | AA- | | California Health Facilities Financing Authority, Revenue Bonds, Sutter Health Project, Series A, 5.000% due 8/15/52 | | | 86,590 | |
| | | | | | State of California, GO: | | | | |
| | 100,000 | | | AA- | | 5.000% due 12/1/37 | | | 108,156 | |
| | 150,000 | | | AA- | | 5.000% due 9/1/42 | | | 167,697 | |
| | | | | | University of California, Revenue Bonds: | | | | |
| | 25,000 | | | AA | | Series AD, 4.858% due 5/15/12 | | | 23,627 | |
| | 400,000 | | | AA | | Series AJ, 4.601% due 5/15/31 | | | 429,416 | |
| | 266,000 | | | AA | | Series AQ, 4.767% due 5/15/2115 | | | 246,465 | |
| | 90,000 | | | AA- | | Series G, 5.000% due 5/15/37 | | | 101,547 | |
| | | | | | | | | | |
| | | | | | Total California | | | 1,163,498 | |
| | | | | | | | | | |
| Delaware — 0.0% | | | | |
| | 300,000 | | | AA+ | | Northstar Education Finance Inc., Revenue Bonds, Student Loan Asset Backed Notes, Series 2007-1, GTDSTD-Insured, 1.325% due 1/29/46(b) | | | 276,011 | |
| | | | | | | | | | |
| Illinois — 0.0% | | | | |
| | 280,000 | | | A- | | State of Illinois, GO, 5.500% due 7/1/24 | | | 305,418 | |
| | | | | | | | | | |
See Notes to Financial Statements.
103
| | | | | | | | | | |
| Core Fixed Income Investments | |
| | | |
Face
Amount/Units† | | | Rating†† | | Security | | Value | |
| Massachusetts — 0.1% | | | | |
| $ | 185,000 | | | AA | | Massachusetts Development Finance Agency, Revenue Bonds, Series M-4, 5.000% due 7/1/44 | | $ | 201,994 | |
| | 100,000 | | | AA+ | | Massachusetts School Building Authority, Revenue Bonds, Series B, 5.000% due 10/15/41 | | | 112,645 | |
| | | | | | | | | | |
| | | | | | Total Massachusetts | | | 314,639 | |
| | | | | | | | | | |
| Minnesota — 0.0% | | | | |
| | 325,000 | | | AA+ | | Northstar Education Finance Inc., Revenue Bonds, Student Loan Asset Backed Notes, Series 2007-1, GTDSTD-Insured, 1.125% due 1/29/46(b) | | | 299,009 | |
| | | | | | | | | | |
| Missouri — 0.0% | | | | |
| | 100,000 | | | AAA | | Metropolitan St Louis Sewer District, Revenue Bonds, Series A, 5.000% due 5/1/42 | | | 111,670 | |
| | | | | | | | | | |
| Nevada — 0.1% | | | | |
| | 435,000 | | | AA+ | | Las Vegas Valley Water District, GO, Series B, 5.000% due 6/1/37 | | | 487,183 | |
| | | | | | | | | | |
| New Jersey — 0.0% | | | | |
| | 165,000 | | | A- | | New Jersey Transportation Trust Fund Authority, Revenue Bonds, Series AA, 5.000% due 6/15/36 | | | 165,304 | |
| | | | | | | | | | |
| New York — 0.1% | | | | |
| | 80,000 | | | AAA | | New York City Transitional Finance Authority, Future Tax Secured Revenue, Series A, 5.000% due 11/1/42 | | | 89,233 | |
| | | | | | New York City Water & Sewer System, Revenue Bonds: | | | | |
| | 300,000 | | | AA+ | | Series CC, 5.882% due 6/15/44 | | | 384,552 | |
| | 120,000 | | | AA+ | | Series BB, 5.000% due 6/15/47 | | | 132,534 | |
| | 270,000 | | | AAA | | New York State Urban Development Corp., Revenue Bonds, Series E, 5.000% due 3/15/24 | | | 323,252 | |
| | | | | | | | | | |
| | | | | | Total New York | | | 929,571 | |
| | | | | | | | | | |
| Texas — 0.0% | | | | |
| | 235,000 | | | A+ | | Dallas/Fort Worth International Airport, Revenue Bonds, Series A, 5.000% due 11/1/45(m) | | | 246,294 | |
| | | | | | | | | | |
| Virginia — 0.1% | | | | |
| | 377,670 | | | AAA | | Virginia Housing Development Authority, Revenue Bonds, Series C, 6.000% due 6/25/34 | | | 402,732 | |
| | | | | | | | | | |
| | | | | | TOTAL MUNICIPAL BONDS
(Cost — $4,634,284) | | | 4,701,329 | |
| | | | | | | | | | |
| SENIOR LOANS — 0.1% | | | | |
| | 49,747 | | | NR | | FMG Resources August 2006 Pty Ltd. (Restricted), 3.750% due 6/30/19 | | | 40,378 | |
| | 206,325 | | | NR | | Gardner Denver Inc. (Restricted), 4.250% due 7/30/20 | | | 197,373 | |
| | 73,980 | | | NR | | Hilton Worldwide Finance LLC (Restricted), 3.500% due 10/26/20 | | | 73,984 | |
| | 205,275 | | | NR | | Michaels Stores Inc. (Restricted), 3.750% due 1/28/20 | | | 205,019 | |
| | 160,000 | | | NR | | Staples Inc. (Restricted), due 4/23/21(n) | | | 159,560 | |
| | 113,604 | | | NR | | Sungard Data Systems Inc. (Restricted), 4.000% due 3/8/20 | | | 113,621 | |
| | | | | | | | | | |
| | | | | | TOTAL SENIOR LOANS
(Cost — $808,087) | | | 789,935 | |
| | | | | | | | | | |
| | | |
| Shares/Units | | | | | | | | |
| PREFERRED STOCK — 0.1% | | | | |
| FINANCIALS — 0.1% | | | | |
| Banks — 0.1% | | | | |
| | 30,275 | | | | | GMAC Capital Trust I, 8.125%(b)
(Cost — $751,009) | | | 772,921 | |
| | | | | | | | | | |
See Notes to Financial Statements.
104
| | | | | | | | | | |
| Core Fixed Income Investments | |
| | | |
Notional
Amount/
Number of
Contracts | | | | | Security | | Value | |
| PURCHASED OPTIONS — 0.0% | |
| United States — 0.0% | |
| | 26 | | | | | Option on 3-Month Eurodollar December Futures, Put @ 98.88, expires 12/14/2015, GSC | | $ | 162 | |
| | 26 | | | | | Option on 3-Month Eurodollar December Futures, Call @ 99.63, expires 12/14/2015, GSC | | | 1,462 | |
| | 1,450,000 | | | | | Swaption, 3-Month USD-LIBOR, Put @ 5.00%, expires 01/14/2019, BCLY | | | 19,381 | |
| | 41 | | | | | U.S. Treasury 10-Year Note November Futures, Put @ $126.00, expires 10/23/2015, GSC | | | 25,625 | |
| | 19 | | | | | U.S. Treasury 10-Year Note October Futures, Put @ $124.50, expires 09/25/2015, GSC | | | 2,078 | |
| | 12 | | | | | U.S. Treasury 10-Year Note October Futures, Put @ $126.50, expires 09/25/2015, GSC | | | 6,375 | |
| | 4 | | | | | U.S. Treasury 10-Year Note October Futures, Call @ $129.50, expires 09/25/2015, GSC | | | 375 | |
| | | | | | | | | | |
| | | | | | Total United States | | | 55,458 | |
| | | | | | | | | | |
| | | | | | TOTAL PURCHASED OPTIONS
(Cost — $140,419) | | | 55,458 | |
| | | | | | | | | | |
| | | | | | TOTAL INVESTMENTS BEFORE SHORT-TERM INVESTMENTS
(Cost — $833,231,155) | | | 833,748,332 | |
| | | | | | | | | | |
| | | |
Face
Amount† | | | | | | | | |
| SHORT-TERM INVESTMENTS(o) — 10.8% | |
| MONEY MARKET FUND — 0.1% | |
| $ | 733,911 | | | | | Invesco STIT — Government & Agency Portfolio##
(Cost — $733,911) | | | 733,911 | |
| | | | | | | | | | |
| REPURCHASE AGREEMENTS — 3.0% | |
| | 9,700,000 | | | | | Barclays Capital Inc. repurchase agreement dated 08/31/15, 0.100% due 9/1/15, Proceeds at maturity — $9,700,027; (Fully collateralized by U.S. Treasury Note, 1.625% due 7/31/19; Market Valued — $9,893,805)(i) | | | 9,700,000 | |
| | 16,000,000 | | | | | Merrill Lynch repurchase agreement dated 08/31/15, 0.110% due 9/1/15, Proceeds at maturity — $16,000,049; (Fully collateralized by U.S. Treasury Bond, 4.625% due 2/15/40; Market Valued — $16,320,000)(i) | | | 16,000,000 | |
| | | | | | | | | | |
| | | | | | TOTAL REPURCHASE AGREEMENTS
(Cost — $25,700,000) | | | 25,700,000 | |
| | | | | | | | | | |
| TIME DEPOSITS — 3.6% | | | | |
| | 4,142,441 | | | | | ANZ National Bank — London, 0.030% due 9/1/15 | | | 4,142,441 | |
| | 9,641,500 | | | | | Barclays Bank — New York, 0.030% due 9/1/15 | | | 9,641,500 | |
| | | | | | DNB — Oslo: | | | | |
| | 20,191 | EUR | | | | (0.219)% due 9/1/15 | | | 22,655 | |
| | 10,625,190 | | | | | 0.030% due 9/1/15 | | | 10,625,190 | |
| | 6,178,720 | | | | | Nordea Bank AB — Oslo, 0.030% due 9/1/15 | | | 6,178,720 | |
| | | | | | | | | | |
| | | | | | TOTAL TIME DEPOSITS
(Cost — $30,610,506) | | | 30,610,506 | |
| | | | | | | | | | |
| U.S. GOVERNMENT AGENCIES — 4.1% | | | | |
| | | | | | Federal Home Loan Bank (FHLB), Discount Notes: | | | | |
| | 3,005,000 | | | | | 0.070% due 9/9/15(i) | | | 3,004,953 | |
| | 13,300,000 | | | | | 0.071% due 10/2/15(i) | | | 13,299,190 | |
| | 1,505,000 | | | | | 0.170% due 11/9/15(i) | | | 1,504,510 | |
| | 2,775,000 | | | | | Federal Home Loan Mortgage Corp. (FHLMC), Discount Notes, 0.215% due 1/5/16(i) | | | 2,772,912 | |
| | | | | | Federal National Mortgage Association (FNMA), Discount Notes: | | | | |
| | 7,360,000 | | | | | 0.150% due 11/4/15(i) | | | 7,358,038 | |
| | 7,345,000 | | | | | 0.150% due 11/24/15(i) | | | 7,342,429 | |
| | | | | | | | | | |
| | | | | | TOTAL U.S. GOVERNMENT AGENCIES
(Cost — $35,282,032) | | | 35,282,032 | |
| | | | | | | | | | |
See Notes to Financial Statements.
105
| | | | | | | | | | |
| Core Fixed Income Investments | |
| | | |
Face
Amount† | | | | | Security | | Value | |
| U.S. GOVERNMENT OBLIGATIONS — 0.0% | |
| | | | | | U.S. Treasury Bills: | | | | |
| $ | 118,000 | | | | | 0.000% due 9/3/15(i)(p) | | $ | 118,000 | |
| | 35,000 | | | | | 0.018% due 10/15/15(i)(p) | | | 34,999 | |
| | | | | | | | | | |
| | | | | | TOTAL U.S. GOVERNMENT OBLIGATIONS
(Cost — $ 152,999) | | | 152,999 | |
| | | | | | | | | | |
| | | | | | TOTAL SHORT-TERM INVESTMENTS
(Cost — $ 92,479,448) | | | 92,479,448 | |
| | | | | | | | | | |
| | | | | | TOTAL INVESTMENTS — 107.8%
(Cost — $ 925,710,603#) | | | 926,227,780 | |
| | | | | | | | | | |
| | | | | | Liabilities in Excess of Other Assets — (7.8)% | | | (66,898,494 | ) |
| | | | | | | | | | |
| | | | | | TOTAL NET ASSETS — 100.0% | | $ | 859,329,286 | |
| | | | | | | | | | |
| † | Face amount denominated in U.S. dollars, unless otherwise noted. |
| †† | All ratings are by Standard & Poor’s Rating Service, unless otherwise noted. All ratings are unaudited. |
| (a) | Restricted security that may be sold to ‘‘qualified institutional buyers’’ pursuant to the conditions of Rule 144A under the Securities Act of 1933, as amended. This security has been deemed liquid pursuant to guidelines approved by the Board of Trustees, unless otherwise noted. |
| (b) | Variable rate security. Interest rate disclosed is that which was in effect at August 31, 2015. |
| (c) | Rating by Moody’s Investors Service. All ratings are unaudited. |
| (d) | Security is perpetual in nature and has no stated maturity date. |
| (e) | All or a portion of this security is on loan (See Note 1). |
| (f) | Security is valued in good faith at fair value by or under the direction of the Board of Trustees. |
| (h) | Principal only security. |
| (i) | Rate shown represents yield-to-maturity. |
| (j) | This security is traded on a TBA basis (see Note 1). |
| (k) | Rating by Fitch Ratings Service. All ratings are unaudited. |
| (l) | Interest only security. |
| (m) | Income from this issue is considered a preference item for purposes of calculating the alternative minimum tax (AMT). |
| (n) | This position represents an unsettled loan commitment at period end. Certain details associated with this purchase are not known prior to the settlement date, including coupon rate. |
| (o) | Inclusive of all short term holdings, including collateral received from securities lending activities. Excluding such collateral, the percentage of portfolio holdings would be 10.7%. |
| (p) | All or a portion of this security is held at the broker as collateral for open futures contracts. |
| ## | Represents investment of collateral received from securities lending transactions. |
| # | Aggregate cost for federal income tax purposes is $929,665,309. |
| | |
Abbreviations used in this schedule: |
| ABS | | — Asset-Based Security |
| CLO | | — Collateralized Loan Obligation |
| GO | | — General Obligation |
| GTDSTD | | — Guaranteed Student Loans |
| MASTR | | — Mortgage Asset Securitization Transactions Inc. |
| PLC | | — Public Limited Company |
| REMICS | | — Real Estate Mortgage Investment Conduit |
| STRIPS | | — Separate Trading of Registered Interest and Principals |
See Notes to Financial Statements.
106
| | | | | | |
| Core Fixed Income Investments |
| | | | |
| Summary of Investments by Security Type^ | | | |
Corporate Bonds & Notes | | | 25.3 | % |
U.S. Government & Agency Obligations | | | 22.8 | |
Mortgage-Backed Securities | | | 21.6 | |
Collateralized Mortgage Obligations | | | 14.9 | |
Sovereign Bonds | | | 2.9 | |
Asset-Backed Securities | | | 1.9 | |
Municipal Bonds | | | 0.5 | |
Senior Loans | | | 0.1 | |
Preferred Stock | | | 0.1 | |
Purchased Options | | | 0.0 | ** |
Short-Term Investments | | | 9.9 | |
| | | | |
| | | 100.0 | % |
| | | | |
| ^ | As a percentage of total investments. |
| ** | Position represents less than 0.1%. |
Schedule of Options Contracts Written
| | | | | | | | | | | | | | | | | | | | |
| | | | | |
Notional
Amount/ Number of
Contracts | | | Security Name | | Counterparty | | | Expiration
Date | | | Strike
Price | | | Value | |
| United States | | | | | | | | | | | | | | | | |
| | 26 | | | 3-Month Eurodollar December Futures, Call | | | GSC | | | | 12/14/15 | | | $ | 99.25 | | | $ | 17,875 | |
| | 26 | | | 3-Month Eurodollar December Futures, Put | | | GSC | | | | 12/14/15 | | | | 99.25 | | | | 325 | |
| | 28 | | | 3-Month Eurodollar March Futures, Call | | | GSC | | | | 3/14/16 | | | | 99.25 | | | | 14,000 | |
| | 5,470,000 | | | Swaption, 3-Month USD-LIBOR, Put | | | BCLY | | | | 1/14/19 | | | | 5.00 | | | | 23,598 | |
| | 13 | | | U.S. Treasury 5-Year Note October Futures, Call | | | GSC | | | | 9/25/15 | | | | 120.00 | | | | 3,047 | |
| | 36 | | | U.S. Treasury 5-Year Note October Futures, Call | | | GSC | | | | 9/25/15 | | | | 120.00 | | | | 8,437 | |
| | 81 | | | U.S. Treasury 10-Year Note November Futures, Put | | | GSC | | | | 10/23/15 | | | | 124.00 | | | | 16,453 | |
| | 41 | | | U.S. Treasury 10-Year Note November Futures, Call | | | GSC | | | | 10/23/15 | | | | 129.00 | | | | 16,016 | |
| | 35 | | | U.S. Treasury 10-Year Note November Futures, Call | | | GSC | | | | 10/23/15 | | | | 129.50 | | | | 10,391 | |
| | 36 | | | U.S. Treasury 10-Year Note October Futures, Put | | | GSC | | | | 9/25/15 | | | | 123.50 | | | | 1,687 | |
| | 24 | | | U.S. Treasury 10-Year Note October Futures, Put | | | GSC | | | | 9/25/15 | | | | 125.00 | | | | 4,125 | |
| | 25 | | | U.S. Treasury 10-Year Note October Futures, Put | | | GSC | | | | 9/25/15 | | | | 125.00 | | | | 4,296 | |
| | 9 | | | U.S. Treasury 10-Year Note October Futures, Put | | | GSC | | | | 9/25/15 | | | | 125.50 | | | | 2,250 | |
| | 11 | | | U.S. Treasury 10-Year Note October Futures, Call | | | GSC | | | | 9/25/15 | | | | 128.50 | | | | 2,578 | |
| | 19 | | | U.S. Treasury 10-Year Note October Futures, Call | | | GSC | | | | 9/25/15 | | | | 129.00 | | | | 2,672 | |
| | 10 | | | U.S. Treasury 10-Year Note October Futures, Call | | | GSC | | | | 9/25/15 | | | | 130.50 | | | | 469 | |
| | 12 | | | U.S. Treasury Long Bond November Futures, Call | | | GSC | | | | 10/23/15 | | | | 163.00 | | | | 7,125 | |
| | 19 | | | U.S. Treasury Long Bond October Futures, Put | | | GSC | | | | 9/25/15 | | | | 148.00 | | | | 6,234 | |
| | 48 | | | U.S. Treasury Long Bond October Futures, Call | | | GSC | | | | 9/25/15 | | | | 160.00 | | | | 22,500 | |
| | 8 | | | U.S. Treasury Long Bond October Futures, Call | | | GSC | | | | 9/25/15 | | | | 161.00 | | | | 2,750 | |
| | 17 | | | U.S. Treasury Long Bond October Futures, Call | | | GSC | | | | 9/25/15 | | | | 161.00 | | | | 5,844 | |
| | 31 | | | U.S. Treasury Long Bond October Futures, Call | | | GSC | | | | 9/25/15 | | | | 162.00 | | | | 7,750 | |
| | 12 | | | U.S. Treasury Long Bond October Futures, Call | | | GSC | | | | 9/25/15 | | | | 163.00 | | | | 2,063 | |
| | 12 | | | U.S. Treasury Long Bond October Futures, Call | | | GSC | | | | 9/25/15 | | | | 165.00 | | | | 1,125 | |
| | 51 | | | U.S. Treasury Long Bond October Futures, Call | | | GSC | | | | 9/25/15 | | | | 166.00 | | | | 3,188 | |
| | | | | | | | | | | | | | | | | | | | |
| | | | TOTAL OPTIONS CONRACTS WRITTEN
(Premiums received — $420,248) | | | | | | | | | | | | | | $ | 186,798 | |
| | | | | | | | | | | | | | | | | | | | |
See Notes to Financial Statements.
107
| | | | | | |
| Core Fixed Income Investments |
During the year ended August 31, 2015, options contracts written transactions for Core Fixed Income Investments was as follows:
| | | | | | | | |
| | | Number of
Contracts | | | Premiums
Received | |
Options contracts written, outstanding at August 31, 2014 | | | 44,570,078 | | | $ | 500,810 | |
Options written | | | 65,904,747 | | | | 1,884,038 | |
Options closed | | | (28,402,560 | ) | | | (1,084,794 | ) |
Options expired | | | (76,601,635 | ) | | | (879,806 | ) |
| | | | | | | | |
Options contracts written, outstanding at August 31, 2015 | | | 5,470,630 | | | $ | 420,248 | |
| | | | | | | | |
At August 31, 2015, Core Fixed Income Investments had open exchange traded futures contracts as described below. The unrealized appreciation (depreciation) on the open contracts reflected in the accompanying financial statements were as follows:
| | | | | | | | | | | | | | | | |
| Open Futures Contracts | | Number of
Contracts | | | Expiration
Date (Month/Year) | | | Market Value | | | Unrealized
Appreciation (Depreciation) | |
Contracts to Buy: | | | | | | | | | | | | | | | | |
Euro-Bobl September Futures | | | 48 | | | | 9/15 | | | $ | 7,003,207 | | | $ | 29,353 | |
Euro-BTP September Futures | | | 1 | | | | 9/15 | | | | 151,668 | | | | 4,230 | |
U.S. Treasury 2-Year Note December Futures | | | 135 | | | | 12/15 | | | | 29,493,281 | | | | (54,297 | ) |
U.S. Treasury 5-Year Note December Futures | | | 10 | | | | 12/15 | | | | 1,194,375 | | | | (6,562 | ) |
U.S. Treasury 10-Year Note December Futures | | | 101 | | | | 12/15 | | | | 12,833,313 | | | | (121,844 | ) |
U.S. Treasury Ultra Long Bond December Futures | | | 83 | | | | 12/15 | | | | 13,147,719 | | | | (312,875 | ) |
| | | | | | | | | | | | | | | | |
| | | | | | | | | | | | | | $ | (461,995 | ) |
| | | | | | | | | | | | | | | | |
Contracts to Sell: | | | | | | | | | | | | | | | | |
90-Day Eurodollar December Futures | | | 96 | | | | 12/15 | | | | 23,884,800 | | | | (33,300 | ) |
90-Day Eurodollar December Futures | | | 101 | | | | 12/16 | | | | 24,949,525 | | | | (62,650 | ) |
90-Day Eurodollar March Futures | | | 313 | | | | 3/16 | | | | 77,764,850 | | | | (122,213 | ) |
90-Day Eurodollar September Futures | | | 502 | | | | 9/15 | | | | 125,035,650 | | | | (27,163 | ) |
Euro FX Currency September Futures | | | 6 | | | | 9/15 | | | | 842,925 | | | | (7,950 | ) |
Euro-Bund September Futures | | | 66 | | | | 9/15 | | | | 11,337,125 | | | | (169,620 | ) |
U.S. Treasury 5-Year Note September Futures | | | 31 | | | | 9/15 | | | | 3,714,188 | | | | 8,507 | |
U.S. Treasury Long Bond December Futures | | | 132 | | | | 12/15 | | | | 20,410,500 | | | | 470,844 | |
| | | | | | | | | | | | | | | | |
| | | | | | | | | | | | | | | 56,455 | |
| | | | | | | | | | | | | | | | |
Net Unrealized Depreciation on Open Exchange Traded Futures Contracts | | | | | | | | | | | | | | $ | (405,540 | ) |
| | | | | | | | | | | | | | | | |
At August 31, 2015, Core Fixed Income Investments had deposited cash of $1,084,741 with a broker or brokers as margin collateral on open exchange traded futures contracts.
See Notes to Financial Statements.
108
| | | | | | |
| Core Fixed Income Investments |
At August 31, 2015, Core Fixed Income Investments had open forward foreign currency contracts as described below. The unrealized appreciation (depreciation) on the open contracts reflected in the accompanying financial statements were as follows:
| | | | | | | | | | | | | | | | | | | | |
| Foreign Currency | | Local Currency | | | Counterparty | | | Market Value | | | Settlement Date | | | Unrealized
Appreciation/
(Depreciation) | |
Contracts to Buy: | | | | | | | | | | | | | | | | | | | | |
Euro | | | 2,393,578 | | | | BCLY | | | $ | 2,687,520 | | | | 10/16/15 | | | $ | 43,727 | |
Indian Rupee | | | 8,380,000 | | | | CITI | | | | 126,023 | | | | 9/14/15 | | | | (831 | ) |
Indian Rupee | | | 14,100,000 | | | | BCLY | | | | 210,757 | | | | 10/16/15 | | | | (8,732 | ) |
Indian Rupee | | | 116,000,000 | | | | CITI | | | | 1,733,887 | | | | 10/16/15 | | | | (71,560 | ) |
| | | | | | | | | | | | | | | | | | | | |
| | | | | | | | | | | | | | | | | | | (37,396 | ) |
| | | | | | | | | | | | | | | | | | | | |
Contracts to Sell: | | | | | | | | | | | | | | | | | | | | |
British Pound | | | 1,020,000 | | | | CITI | | | | 1,564,967 | | | | 10/16/15 | | | | 17,828 | |
Euro | | | 8,746,483 | | | | BCLY | | | | 9,820,590 | | | | 10/16/15 | | | | (183,059 | ) |
Euro | | | 1,045,683 | | | | BOA | | | | 1,174,098 | | | | 10/16/15 | | | | (19,481 | ) |
Euro | | | 8,660,000 | | | | CITI | | | | 9,723,487 | | | | 10/16/15 | | | | (170,035 | ) |
Indian Rupee | | | 8,380,000 | | | | CITI | | | | 126,023 | | | | 9/14/15 | | | | 2,217 | |
Indian Rupee | | | 14,100,000 | | | | BCLY | | | | 210,757 | | | | 10/16/15 | | | | 3,724 | |
Indian Rupee | | | 107,620,000 | | | | CITI | | | | 1,608,628 | | | | 10/16/15 | | | | 20,837 | |
Indian Rupee | | | 8,380,000 | | | | CITI | | | | 125,258 | | | | 10/16/15 | | | | 795 | |
| | | | | | | | | | | | | | | | | | | | |
| | | | | | | | | | | | | | | | | | | (327,174 | ) |
| | | | | | | | | | | | | | | | | | | | |
Net Unrealized Depreciation on Open Forward Foreign Currency Contracts | | | | | | | | | | | | | | | | | | $ | (364,570 | ) |
| | | | | | | | | | | | | | | | | | | | |
At August 31, 2015, Core Fixed Income Investments held the following Over The Counter (OTC) interest rate swap contracts:
| | | | | | | | | | | | | | | | | | | | | | | | | | | | | | |
Pay/Receive
Floating Rate | | Floating Rate Index | | Fixed
Rate | | | Maturity
Date | | | Counterparty | | | Notional
Amount | | | Market
Value | | | Upfront
Premiums
Paid/
(Received) | | | Unrealized
Depreciation | |
| Receive | | 3-Month USD-LIBOR | | | 2.147% | | | | 11/15/2027 | | | | BCLY | | | USD | 595,000 | | | $ | (34,677 | ) | | | $— | | | $ | (34,677 | ) |
| Receive | | 3-Month USD-LIBOR | | | 2.750% | | | | 02/17/2042 | | | | BCLY | | | USD | 1,545,000 | | | | (15,339 | ) | | | — | | | | (15,339 | ) |
| | | | | | | | | | | | | | | | | | | | | | | | | | | | | | |
| | | | | | | | | | | | | | | | | | | | $ | (50,016 | ) | | $ | — | | | $ | (50,016 | ) |
| | | | | | | | | | | | | | | | | | | | | | | | | | | | | | |
At August 31, 2015, Core Fixed Income Investments deposited cash collateral with brokers in the amount of $50,000 for open OTC interest rate swap contracts.
At August 31, 2015, Core Fixed Income Investments held the following centrally cleared interest rate swap contracts:
| | | | | | | | | | | | | | | | | | | | | | |
Pay/Receive
Floating Rate | | Floating Rate Index | | Fixed
Rate | | | Maturity
Date | | | Counterparty | | | Notional
Amount | | | Unrealized
Depreciation | |
| Receive | | 3-Month USD-LIBOR | | | 3.676% | | | | 11/15/2043 | | | | CITI | | | | USD 910,000 | | | $ | (185,089 | ) |
| | | | | | | | | | | | | | | | | | | | | | |
At August 31, 2015, Core Fixed Income Investments deposited cash collateral with brokers in the amount of $77,241 for open centrally cleared interest rate swap contracts.
| | | | | | |
Currency Abbreviations used in this schedule: | | Counterparty Abbreviations used in this schedule: |
| BRL | | — Brazilian Real | | BCLY | | — Barclays Bank PLC |
| CNH | | — Chinese Offshore Renminbi | | BOA | | — Bank of America |
| CNY | | — Chinese Onshore Renminbi | | CITI | | — Citigroup Global Markets Inc. |
| EUR | | — Euro | | GSC | | — Goldman Sachs & Co. |
| MXN | | — Mexican Peso | | | | |
| PLN | | — Polish Zloty | | | | |
| | | | | | |
See pages 158 and 159 for definition of ratings.
See Notes to Financial Statements.
109
| | | | | | | | | | |
| High Yield Investments | |
| | | |
Face
Amount/Units† | | | Rating†† | | Security | | Value | |
| CORPORATE BONDS & NOTES — 93.1% | |
| Aerospace & Defense — 0.7% | |
| $ | 610,000 | | | BB- | | CBC Ammo LLC/CBC FinCo Inc., Senior Unsecured Notes, 7.250% due 11/15/21(a) | | $ | 574,925 | |
| | 200,000 | | | B | | GenCorp Inc., Secured Notes, 7.125% due 3/15/21 | | | 211,500 | |
| | 180,000 | | | B | | LMI Aerospace Inc., Secured Notes, 7.375% due 7/15/19 | | | 174,600 | |
| | 130,000 | | | BB- | | Orbital ATK Inc., Company Guaranteed Notes, 5.250% due 10/1/21 | | | 133,250 | |
| | 710,000 | | | CCC+ | | TransDigm Inc., Company Guaranteed Notes, 7.500% due 7/15/21 | | | 759,700 | |
| | | | | | | | | | |
| | | | | | Total Aerospace & Defense | | | 1,853,975 | |
| | | | | | | | | | |
| Airlines — 1.7% | |
| | 875,000 | | | B | | Air Canada, Company Guaranteed Notes, 7.750% due 4/15/21(a) | | | 938,980 | |
| | 283,170 | | | BBB- | | American Airlines Class B Pass Through Trust, Series 2013-1, Pass Thru Certificates, 5.625% due 1/15/21(a) | | | 292,019 | |
| | 436,607 | | | BBB- | | American Airlines Class B Pass Through Trust, Series 2013-2, Pass Thru Certificates, 5.600% due 7/15/20(a) | | | 449,159 | |
| | 40,000 | | | BB | | American Airlines Class C Pass Through Trust, Series 2013-1, Pass Thru Certificates, 6.125% due 7/15/18(a) | | | 41,400 | |
| | 430,000 | | | B+ | | American Airlines Group Inc., Company Guaranteed Notes, 5.500% due 10/1/19(a) | | | 441,288 | |
| | 124,770 | | | BB+ | | Continental Airlines Class B Pass Through Trust, Series 2007-1, Pass Thru Certificates, 6.903% due 4/19/22 | | | 133,684 | |
| | 25,826 | | | BBB | | Continental Airlines Class B Pass Through Trust, Series 2012-2, Pass Thru Certificates, 5.500% due 10/29/20 | | | 26,762 | |
| | 50,103 | | | BBB | | Delta Air Lines Class B Pass Through Trust, Series 2007-1, Pass Thru Certificates, 8.021% due 8/10/22 | | | 57,117 | |
| | 41,538 | | | A- | | Delta Air Lines Class B Pass Through Trust, Series 2009-1, Pass Thru Certificates, 9.750% due 12/17/16 | | | 44,602 | |
| | 30,000 | | | A- | | Delta Air Lines Class B Pass Through Trust, Series 2010-1, Pass Thru Certificates, 6.375% due 1/2/16(a) | | | 30,412 | |
| | 172,831 | | | BBB | | United Airlines Class B Pass Through Trust, Series 2013-1, Pass Thru Certificates, 5.375% due 8/15/21 | | | 177,368 | |
| | 420,000 | | | BBB | | United Airlines Class B Pass Through Trust, 2014-1 Series, Pass Thru Certificates, 4.750% due 4/11/22 | | | 421,575 | |
| | 270,000 | | | BBB | | United Airlines Class B Pass Through Trust, Series 2014-2, Pass Thru Certificates, 4.625% due 9/3/22 | | | 270,337 | |
| | 206,466 | | | BBB- | | US Airways Class B Pass Through Trust, Series 2012-2, Pass Thru Certificates, 6.750% due 6/3/21 | | | 218,080 | |
| | 183,712 | | | BBB- | | US Airways Class B Pass Through Trust, Series 2013-1 Pass Thru Certificates, 5.375% due 11/15/21 | | | 190,372 | |
| | 575,000 | | | (P)B- | | VistaJet Malta Finance PLC/VistaJet Co. Finance LLC, Company Guaranteed Notes, 7.750% due 6/1/20(a) | | | 520,375 | |
| | | | | | | | | | |
| | | | | | Total Airlines | | | 4,253,530 | |
| | | | | | | | | | |
| Auto Components — 0.9% | |
| | 200,000 | | | BB- | | FCA US LLC/CG Co.-Issuer Inc., Secured Notes, 8.250% due 6/15/21 | | | 215,040 | |
| | 560,000 | | | BBB- | | General Motors Co., Senior Unsecured Notes, 5.200% due 4/1/45 | | | 529,441 | |
| | 1,480,000 | | | B | | Schaeffler Holding Finance BV, Senior Secured Notes, 6.875% (6.875% cash or 7.625% PIK) due 8/15/18(a)(b) | | | 1,531,060 | |
| | | | | | | | | | |
| | | | | | Total Auto Components | | | 2,275,541 | |
| | | | | | | | | | |
| Banks — 2.5% | |
| | 440,000 | | | BB+ | | Bank of America Corp., Junior Subordinated Notes, 5.200%(c)(d) | | | 416,020 | |
| | 200,000 | | | BB+ | | Barclays Bank PLC, Subordinated Notes, 7.625% due 11/21/22 | | | 228,375 | |
| | 200,000 | | | B+ | | Barclays PLC, Junior Subordinated Notes, 8.250%(c)(d) | | | 212,549 | |
| | | | | | CIT Group Inc., Senior Unsecured Notes: | | | | |
| | 730,000 | | | BB- | | 5.375% due 5/15/20 | | | 764,675 | |
| | 30,000 | | | BB- | | 5.000% due 8/15/22 | | | 30,563 | |
| | 1,250,000 | | | BB- | | 5.000% due 8/1/23 | | | 1,268,750 | |
See Notes to Financial Statements.
110
| | | | | | | | | | |
| High Yield Investments | |
| | | |
Face
Amount/Units† | | | Rating†† | | Security | | Value | |
| Banks — 2.5% — (continued) | |
| $ | 810,000 | | | BB+ | | Citigroup Inc., Junior Subordinated Notes, 5.950%(c)(d) | | $ | 775,575 | |
| | 210,000 | | | BB+ | | Credit Agricole SA, Junior Subordinated Notes, 8.375%(a)(c)(d) | | | 241,237 | |
| | 310,000 | | | Baa3(e) | | HSBC Holdings PLC, Junior Subordinated Notes, 6.375%(c)(d) | | | 306,900 | |
| | 170,000 | | | BBB- | | M&T Bank Corp., Junior Subordinated Notes, 6.875%(d) | | | 172,125 | |
| | 785,000 | | | B | | Provident Funding Associates LP/PFG Finance Corp., Company Guaranteed Notes, 6.750% due 6/15/21(a) | | | 749,675 | |
| | 620,000 | | | BB | | Royal Bank of Scotland Group PLC, Subordinated Notes, 6.000% due 12/19/23 | | | 663,120 | |
| | 460,000 | | | BB+ | | Synovus Financial Corp., Senior Unsecured Notes, 7.875% due 2/15/19 | | | 520,375 | |
| | | | | | | | | | |
| | | | | | Total Banks | | | 6,349,939 | |
| | | | | | | | | | |
| Beverages — 1.1% | |
| | 570,000 | | | CCC+ | | Beverages & More Inc., Senior Secured Notes, 10.000% due 11/15/18(a) | | | 560,737 | |
| | 370,000 | | | B- | | Carolina Beverage Group LLC/Carolina Beverage Group Finance Inc., Senior Secured Notes, 10.625% due 8/1/18(a) | | | 366,300 | |
| | | | | | Constellation Brands Inc., Company Guaranteed Notes: | | | | |
| | 190,000 | | | BB+ | | 6.000% due 5/1/22 | | | 209,950 | |
| | 270,000 | | | BB+ | | 4.250% due 5/1/23 | | | 272,295 | |
| | | | | | Cott Beverages Inc., Company Guaranteed Notes: | | | | |
| | 260,000 | | | B- | | 6.750% due 1/1/20 | | | 270,400 | |
| | 730,000 | | | B- | | 5.375% due 7/1/22 | | | 719,050 | |
| | 370,000 | | | BB- | | DS Services of America Inc., Secured Notes, 10.000% due 9/1/21(a) | | | 431,513 | |
| | | | | | | | | | |
| | | | | | Total Beverages | | | 2,830,245 | |
| | | | | | | | | | |
| Biotechnology — 0.3% | |
| | 220,000 | | | B+ | | AMAG Pharmaceuticals Inc., Company Guaranteed Notes, 7.875% due 9/1/23(a) | | | 226,325 | |
| | 480,000 | | | CCC+ | | Concordia Healthcare Corp., Company Guaranteed Notes, 7.000% due 4/15/23(a) | | | 496,848 | |
| | | | | | | | | | |
| | | | | | Total Biotechnology | | | 723,173 | |
| | | | | | | | | | |
| Building Products — 0.4% | |
| | 415,000 | | | BB- | | Griffon Corp., Company Guaranteed Notes, 5.250% due 3/1/22 | | | 398,919 | |
| | 240,000 | | | B | | Hardwoods Acquisition Inc., Secured Notes, 7.500% due 8/1/21(a) | | | 229,200 | |
| | 450,000 | | | B | | Woodside Homes Co. LLC/Woodside Homes Finance Inc., Company Guaranteed Notes, 6.750% due 12/15/21(a) | | | 418,500 | |
| | | | | | | | | | |
| | | | | | Total Building Products | | | 1,046,619 | |
| | | | | | | | | | |
| Capital Markets — 0.3% | |
| | 810,000 | | | BBB- | | E*TRADE Financial Corp., Senior Unsecured Notes, 5.375% due 11/15/22 | | | 848,475 | |
| | | | | | | | | | |
| Chemicals — 1.1% | |
| | 500,000 | | | BB | | Axiall Corp., Company Guaranteed Notes, 4.875% due 5/15/23 | | | 486,875 | |
| | 230,000 | | | BB+ | | Celanese US Holdings LLC, Company Guaranteed Notes, 4.625% due 11/15/22 | | | 225,112 | |
| | 220,000 | | | CCC+ | | Eco Services Operations LLC/Eco Finance Corp., Senior Unsecured Notes, 8.500% due 11/1/22(a) | | | 211,200 | |
| | 90,000 | | | B+ | | Hercules Inc., Junior Subordinated Notes, 6.500% due 6/30/29 | | | 79,931 | |
| | 460,000 | | | CCC | | Hexion US Finance Corp./Hexion Nova Scotia Finance ULC, Senior Secured Notes, 8.875% due 2/1/18 | | | 402,500 | |
| | 355,000 | | | B- | | Rentech Nitrogen Partners LP/Rentech Nitrogen Finance Corp., Secured Notes, 6.500% due 4/15/21(a) | | | 360,865 | |
| | 1,095,000 | | | B | | TPC Group Inc., Senior Secured Notes, 8.750% due 12/15/20(a) | | | 985,500 | |
| | | | | | | | | | |
| | | | | | Total Chemicals | | | 2,751,983 | |
| | | | | | | | | | |
| Commercial Services & Supplies — 4.0% | |
| | 500,000 | | | BB- | | ADT Corp. (The), Senior Unsecured Notes, 4.875% due 7/15/42 | | | 392,500 | |
| | 600,000 | | | B | | Ahern Rentals Inc., Secured Notes, 7.375% due 5/15/23(a) | | | 528,000 | |
| | | | | | Ashtead Capital Inc., Secured Notes: | | | | |
| | 460,000 | | | BB | | 6.500% due 7/15/22(a) | | | 480,700 | |
| | 380,000 | | | BB | | 5.625% due 10/1/24(a) | | | 379,289 | |
See Notes to Financial Statements.
111
| | | | | | | | | | |
| High Yield Investments | |
| | | |
Face
Amount/Units† | | | Rating†† | | Security | | Value | |
| Commercial Services & Supplies — 4.0% — (continued) | |
| | | | | | Cenveo Corp.: | | | | |
| $ | 1,600,000 | | | CCC | | Company Guaranteed Notes, 11.500% due 5/15/17 | | $ | 1,510,000 | |
| | 470,000 | | | B | | Senior Secured Notes, 6.000% due 8/1/19(a) | | | 398,325 | |
| | 210,000 | | | CCC+ | | Garda World Security Corp., Company Guaranteed Notes, 7.250% due 11/15/21(a) | | | 197,400 | |
| | 744,000 | | | BB- | | H&E Equipment Services Inc., Company Guaranteed Notes, 7.000% due 9/1/22 | | | 744,000 | |
| | 565,000 | | | B- | | Jaguar Holding Co. II/Pharmaceutical Product Development LLC, Company Guaranteed Notes, 6.375% due 8/1/23(a) | | | 561,327 | |
| | 100,000 | | | BB+ | | JM Huber Corp., Senior Unsecured Notes, 9.875% due 11/1/19(a) | | | 106,250 | |
| | 400,000 | | | BB- | | Mobile Mini Inc., Company Guaranteed Notes, 7.875% due 12/1/20 | | | 419,000 | |
| | 470,000 | | | B- | | Modular Space Corp., Secured Notes, 10.250% due 1/31/19(a) | | | 345,450 | |
| | 470,000 | | | CCC+ | | Monitronics International Inc., Company Guaranteed Notes, 9.125% due 4/1/20 | | | 441,800 | |
| | 110,000 | | | B- | | NES Rentals Holdings Inc., Secured Notes, 7.875% due 5/1/18(a) | | | 109,725 | |
| | 315,000 | | | B- | | Park-Ohio Industries Inc., Company Guaranteed Notes, 8.125% due 4/1/21 | | | 329,962 | |
| | 110,000 | | | B- | | StoneMor Partners LP/Cornerstone Family Services of WV, Company Guaranteed Notes, 7.875% due 6/1/21 | | | 113,850 | |
| | | | | | United Rentals North America Inc., Company Guaranteed Notes: | | | | |
| | 200,000 | | | BB- | | 7.375% due 5/15/20 | | | 213,250 | |
| | 1,345,000 | | | BB- | | 7.625% due 4/15/22 | | | 1,455,963 | |
| | 820,000 | | | BB- | | 5.750% due 11/15/24 | | | 811,800 | |
| | 850,000 | | | B+ | | West Corp., Company Guaranteed Notes, 5.375% due 7/15/22(a) | | | 802,188 | |
| | | | | | | | | | |
| | | | | | Total Commercial Services & Supplies | | | 10,340,779 | |
| | | | | | | | | | |
| Communications Equipment — 0.3% | |
| | | | | | CommScope Inc.: | | | | |
| | | | | | Company Guaranteed Notes: | | | | |
| | 235,000 | | | B | | 5.000% due 6/15/21(a) | | | 232,991 | |
| | 235,000 | | | B | | 5.500% due 6/15/24(a) | | | 229,125 | |
| | 60,000 | | | BB | | Senior Secured Notes, 4.375% due 6/15/20(a) | | | 60,675 | |
| | 350,000 | | | B | | CommScope Technologies Finance LLC, Senior Secured Notes, 6.000% due 6/15/25(a) | | | 341,250 | |
| | | | | | | | | | |
| | | | | | Total Communications Equipment | | | 864,041 | |
| | | | | | | | | | |
| Construction Materials — 0.6% | |
| | 700,000 | | | B- | | Michael Baker Holdings LLC/Michael Baker Finance Corp., Senior Unsecured Notes, 8.875% (8.875% cash or 9.625% PIK) due 4/15/19(a)(b) | | | 609,000 | |
| | 400,000 | | | B+ | | Michael Baker International LLC/CDL Acquisition Co., Inc., Senior Secured Notes, 8.250% due 10/15/18(a) | | | 392,000 | |
| | 430,000 | | | B+ | | US Concrete Inc., Senior Secured Notes, 8.500% due 12/1/18 | | | 451,500 | |
| | | | | | | | | | |
| | | | | | Total Construction Materials | | | 1,452,500 | |
| | | | | | | | | | |
| Consumer Finance — 1.0% | |
| | | | | | Ally Financial Inc., Company Guaranteed Notes: | | | | |
| | 294,000 | | | BB+ | | 8.000% due 3/15/20 | | | 344,715 | |
| | 224,000 | | | BB+ | | 7.500% due 9/15/20 | | | 260,400 | |
| | 335,000 | | | BB+ | | 8.000% due 11/1/31 | | | 397,886 | |
| | 240,000 | | | BB | | Dufry Finance SCA, Company Guaranteed Notes, 5.500% due 10/15/20(a) | | | 250,387 | |
| | 170,000 | | | BB | | First Cash Financial Services Inc., Company Guaranteed Notes, 6.750% due 4/1/21 | | | 175,950 | |
| | | | | | Navient Corp., Senior Unsecured Notes: | | | | |
| | 120,000 | | | BB | | 8.450% due 6/15/18 | | | 127,500 | |
| | 140,000 | | | BB | | 5.875% due 3/25/21 | | | 126,000 | |
| | 860,000 | | | BB | | 5.875% due 10/25/24 | | | 728,850 | |
| | | | | | | | | | |
| | | | | | Total Consumer Finance | | | 2,411,688 | |
| | | | | | | | | | |
| Containers & Packaging — 1.8% | |
| | 200,000 | | | CCC+ | | Ardagh Finance Holdings SA, Senior Unsecured Notes, 8.625% (0.000% cash or 8.625% PIK) due 6/15/19(a)(b) | | | 212,000 | |
See Notes to Financial Statements.
112
| | | | | | | | | | |
| High Yield Investments | |
| | | |
Face
Amount/Units† | | | Rating†† | | Security | | Value | |
| Containers & Packaging — 1.8% — (continued) | |
| | | | | | Ardagh Packaging Finance PLC/Ardagh Holdings USA Inc.: | | | | |
| $ | 350,000 | | | B+ | | Senior Secured Notes, 3.286% due 12/15/19(a)(c) | | $ | 343,875 | |
| | 215,294 | | | Caa1(e) | | Senior Unsecured Notes, 7.000% due 11/15/20(a) | | | 218,524 | |
| | 440,000 | | | BB+ | | Ball Corp., Company Guaranteed Notes, 5.250% due 7/1/25 | | | 439,450 | |
| | 200,000 | | | B- | | Berry Plastics Corp., Secured Notes, 5.125% due 7/15/23 | | | 187,500 | |
| | 730,000 | | | CCC+ | | Beverage Packaging Holdings Luxembourg II SA/Beverage Packaging Holdings II Is, Company Guaranteed Notes, 6.000% due 6/15/17(a) | | | 729,087 | |
| | 290,000 | | | CCC | | BWAY Holding Co., Senior Unsecured Notes, 9.125% due 8/15/21(a) | | | 295,800 | |
| | 430,000 | | | B- | | Coveris Holdings SA, Company Guaranteed Notes, 7.875% due 11/1/19(a) | | | 419,250 | |
| | 110,000 | | | BB+ | | Graphic Packaging International Inc., Company Guaranteed Notes, 4.750% due 4/15/21 | | | 111,925 | |
| | | | | | Pactiv LLC, Senior Unsecured Notes: | | | | |
| | 310,000 | | | CCC+ | | 7.950% due 12/15/25 | | | 300,700 | |
| | 680,000 | | | CCC+ | | 8.375% due 4/15/27 | | | 666,400 | |
| | 585,000 | | | B+ | | Plastipak Holdings Inc., Senior Unsecured Notes, 6.500% due 10/1/21(a) | | | 576,225 | |
| | | | | | | | | | |
| | | | | | Total Containers & Packaging | | | 4,500,736 | |
| | | | | | | | | | |
| Diversified Consumer Services — 0.3% | |
| | | | | | Service Corp. International, Senior Unsecured Notes: | | | | |
| | 500,000 | | | BB | | 5.375% due 5/15/24 | | | 522,500 | |
| | 130,000 | | | BB | | 7.500% due 4/1/27 | | | 150,738 | |
| | | | | | | | | | |
| | | | | | Total Diversified Consumer Services | | | 673,238 | |
| | | | | | | | | | |
| Diversified Financial Services — 3.1% | |
| | | | | | AerCap Ireland Capital Ltd./AerCap Global Aviation Trust, Company Guaranteed Notes: | | | | |
| | 280,000 | | | BB+ | | 4.500% due 5/15/21 | | | 285,250 | |
| | 410,000 | | | BB+ | | 4.625% due 7/1/22 | | | 414,100 | |
| | 420,000 | | | B+ | | Ausdrill Finance Pty Ltd., Company Guaranteed Notes, 6.875% due 11/1/19(a) | | | 313,950 | |
| | 575,000 | | | B+ | | CDW LLC/CDW Finance Corp., Company Guaranteed Notes, 5.000% due 9/1/23 | | | 569,250 | |
| | 710,000 | | | Caa1(e) | | Compiler Finance Sub Inc., Senior Unsecured Notes, 7.000% due 5/1/21(a) | | | 486,350 | |
| | 610,000 | | | BBB | | Denali Borrower LLC/Denali Finance Corp., Senior Secured Notes, 5.625% due 10/15/20(a) | | | 626,775 | |
| | 410,000 | | | B | | Globe Luxembourg SCA, Senior Secured Notes, 9.625% due 5/1/18(a) | | | 340,300 | |
| | 500,000 | | | B+ | | ILFC E-Capital Trust I, Limited Guaranteed Notes, 4.690% due 12/21/65(a)(c) | | | 471,250 | |
| | | | | | International Lease Finance Corp., Senior Unsecured Notes: | | | | |
| | 520,000 | | | BB+ | | 8.250% due 12/15/20 | | | 617,500 | |
| | 755,000 | | | BB+ | | 8.625% due 1/15/22 | | | 925,819 | |
| | 570,000 | | | CCC+ | | Jack Cooper Holdings Corp., Senior Secured Notes, 10.250% due 6/1/20(a) | | | 521,550 | |
| | 740,000 | | | B | | KCA Deutag UK Finance PLC, Senior Secured Notes, 7.250% due 5/15/21(a) | | | 532,800 | |
| | 530,000 | | | B3(e) | | OPE KAG Finance Sub Inc., Senior Unsecured Notes, 7.875% due 7/31/23(a) | | | 541,925 | |
| | 740,000 | | | BB | | Quicken Loans Inc., Company Guaranteed Notes, 5.750% due 5/1/25(a) | | | 724,275 | |
| | 160,000 | | | B | | SPL Logistics Escrow LLC/SPL Logistics Finance Corp., Senior Secured Notes, 8.875% due 8/1/20(a) | | | 171,200 | |
| | 320,000 | | | B | | TMX Finance LLC/TitleMax Finance Corp., Senior Secured Notes, 8.500% due 9/15/18(a) | | | 261,200 | |
| | | | | | | | | | |
| | | | | | Total Diversified Financial Services | | | 7,803,494 | |
| | | | | | | | | | |
| Diversified Telecommunication Services — 4.4% | |
| | | | | | CenturyLink Inc., Senior Unsecured Notes: | | | | |
| | 120,000 | | | BB | | 6.450% due 6/15/21 | | | 120,432 | |
| | 430,000 | | | BB | | 5.800% due 3/15/22 | | | 409,575 | |
| | 150,000 | | | BB | | 6.750% due 12/1/23 | | | 146,437 | |
| | 35,000 | | | BB- | | Cincinnati Bell Telephone Co. LLC, Company Guaranteed Notes, 6.300% due 12/1/28 | | | 32,725 | |
| | 550,000 | | | B- | | Cogent Communications Finance Inc., Company Guaranteed Notes, 5.625% due 4/15/21(a) | | | 517,000 | |
| | 635,000 | | | B | | Gates Global LLC/Gates Global Co., Company Guaranteed Notes, 6.000% due 7/15/22(a) | | | 520,764 | |
| | 420,000 | | | BB+ | | Inmarsat Finance PLC, Company Guaranteed Notes, 4.875% due 5/15/22(a) | | | 409,248 | |
| | | | | | Intelsat Jackson Holdings SA, Company Guaranteed Notes: | | | | |
| | 190,000 | | | B+ | | 7.250% due 10/15/20 | | | 183,350 | |
| | 350,000 | | | B+ | | 7.500% due 4/1/21 | | | 340,375 | |
See Notes to Financial Statements.
113
| | | | | | | | | | |
| High Yield Investments | |
| | | |
Face
Amount/Units† | | | Rating†† | | Security | | Value | |
| Diversified Telecommunication Services — 4.4% — (continued) | |
| $ | 755,000 | | | CCC+ | | 6.625% due 12/15/22 | | $ | 664,400 | |
| | 970,000 | | | B+ | | 5.500% due 8/1/23 | | | 858,450 | |
| | 595,000 | | | CCC+ | | Intelsat Luxembourg SA, Company Guaranteed Notes, 7.750% due 6/1/21 | | | 448,035 | |
| | | | | | Level 3 Financing Inc., Company Guaranteed Notes: | | | | |
| | 210,000 | | | B | | 7.000% due 6/1/20 | | | 221,550 | |
| | 700,000 | | | B | | 8.625% due 7/15/20 | | | 743,400 | |
| | 130,000 | | | B | | 6.125% due 1/15/21 | | | 136,500 | |
| | 725,000 | | | B | | 5.375% due 8/15/22 | | | 730,285 | |
| | 30,000 | | | B | | 5.625% due 2/1/23 | | | 30,375 | |
| | 770,000 | | | B | | 5.125% due 5/1/23(a) | | | 751,713 | |
| | 130,000 | | | B | | Techniplas LLC, Senior Secured Notes, 10.000% due 5/1/20(a) | | | 123,500 | |
| | 306,000 | | | BB | | UPCB Finance V Ltd., Senior Secured Notes, 7.250% due 11/15/21(a) | | | 329,715 | |
| | 430,000 | | | BB | | VimpelCom Holdings BV, Company Guaranteed Notes, 5.950% due 2/13/23(a) | | | 379,260 | |
| | | | | | Virgin Media Finance PLC, Company Guaranteed Notes: | | | | |
| | 885,000 | | | B | | 6.375% due 4/15/23(a) | | | 923,161 | |
| | 470,000 | | | B | | 6.000% due 10/15/24(a) | | | 484,100 | |
| | 260,000 | | | BB- | | Virgin Media Secured Finance PLC, Senior Secured Notes, 5.500% due 1/15/25(a) | | | 263,900 | |
| | | | | | Windstream Corp., Company Guaranteed Notes: | | | | |
| | 210,000 | | | BB- | | 7.750% due 10/15/20 | | | 187,687 | |
| | 970,000 | | | BB- | | 7.750% due 10/1/21 | | | 795,410 | |
| | 650,000 | | | BB- | | 7.500% due 6/1/22(f) | | | 515,944 | |
| | 50,000 | | | BB- | | 7.500% due 4/1/23 | | | 39,376 | |
| | | | | | | | | | |
| | | | | | Total Diversified Telecommunication Services | | | 11,306,667 | |
| | | | | | | | | | |
| Electric Utilities — 1.3% | |
| | | | | | Calpine Corp.: | | | | |
| | 380,000 | | | BB | | Senior Secured Notes, 5.875% due 1/15/24(a) | | | 400,900 | |
| | | | | | Senior Unsecured Notes: | | | | |
| | 590,000 | | | B | | 5.375% due 1/15/23 | | | 572,123 | |
| | 240,000 | | | B | | 5.750% due 1/15/25 | | | 233,400 | |
| | 3,833 | | | B- | | FPL Energy National Wind Portfolio LLC, Senior Secured Notes, 6.125% due 3/25/19(a) | | | 3,861 | |
| | 430,000 | | | CCC+ | | Illinois Power Generating Co., Senior Unsecured Notes, 7.000% due 4/15/18(f) | | | 391,300 | |
| | 17,539 | | | NR | | Midwest Generation LLC, Pass Thru Certificates, 8.560% due 1/2/16 | | | 17,539 | |
| | 477,404 | | | B | | Mirant Mid Atlantic Series C Pass Through Trust, Pass Thru Certificates, 10.060% due 12/30/28 | | | 495,307 | |
| | | | | | NRG REMA LLC, Pass Thru Certificates: | | | | |
| | 49,562 | | | B+ | | 9.237% due 7/2/17 | | | 51,793 | |
| | 1,210,000 | | | B+ | | 9.681% due 7/2/26 | | | 1,234,200 | |
| | | | | | | | | | |
| | | | | | Total Electric Utilities | | | 3,400,423 | |
| | | | | | | | | | |
| Electronic Equipment, Instruments & Components — 0.5% | |
| | 95,000 | | | B+ | | International Wire Group Holdings Inc., Secured Notes, 8.500% due 10/15/17(a) | | | 98,088 | |
| | 250,000 | | | B | | Radio Systems Corp., Secured Notes, 8.375% due 11/1/19(a) | | | 265,000 | |
| | 1,050,000 | | | BB- | | WESCO Distribution Inc., Company Guaranteed Notes, 5.375% due 12/15/21 | | | 1,026,375 | |
| | | | | | | | | | |
| | | | | | Total Electronic Equipment, Instruments & Components | | | 1,389,463 | |
| | | | | | | | | | |
| Energy Equipment & Services — 0.8% | |
| | | | | | CGG SA, Company Guaranteed Notes: | | | | |
| | 520,000 | | | B- | | 6.500% due 6/1/21 | | | 295,100 | |
| | 200,000 | | | B- | | 6.875% due 1/15/22 | | | 116,000 | |
| | 500,000 | | | B+ | | Foresight Energy LLC/Foresight Energy Finance Corp., Company Guaranteed Notes, 7.875% due 8/15/21(a) | | | 390,000 | |
| | 410,000 | | | B | | GenOn Energy Inc., Senior Unsecured Notes, 9.500% due 10/15/18 | | | 396,162 | |
See Notes to Financial Statements.
114
| | | | | | | | | | |
| High Yield Investments | |
| | | |
Face
Amount/Units† | | | Rating†† | | Security | | Value | |
| Energy Equipment & Services — 0.8% — (continued) | |
| | | | | | Targa Resources Partners LP/Targa Resources Partners Finance Corp., Company Guaranteed Notes: | | | | |
| $ | 130,000 | | | BB+ | | 6.625% due 10/1/20(a) | | $ | 129,350 | |
| | 326,000 | | | BB+ | | 6.375% due 8/1/22 | | | 326,000 | |
| | 140,000 | | | BB+ | | 5.250% due 5/1/23 | | | 132,300 | |
| | 260,000 | | | BB- | | TerraForm Power Operating LLC, Company Guaranteed Notes, 5.875% due 2/1/23(a) | | | 248,300 | |
| | | | | | | | | | |
| | | | | | Total Energy Equipment & Services | | | 2,033,212 | |
| | | | | | | | | | |
| Food Products — 1.3% | |
| | 585,000 | | | CCC+ | | Diamond Foods Inc., Company Guaranteed Notes, 7.000% due 3/15/19(a) | | | 604,013 | |
| | 350,000 | | | CCC+ | | Dole Food Co., Inc., Senior Secured Notes, 7.250% due 5/1/19(a) | | | 354,375 | |
| | 280,000 | | | BB+ | | ESAL GmbH, Company Guaranteed Notes, 6.250% due 2/5/23(a) | | | 273,000 | |
| | 80,000 | | | CCC+ | | Hearthside Group Holdings LLC/Hearthside Finance Co., Company Guaranteed Notes, 6.500% due 5/1/22(a) | | | 75,600 | |
| | 170,000 | | | BBB- | | Kraft Heinz Foods Co., Company Guaranteed Notes, 7.125% due 8/1/39(a) | | | 209,516 | |
| | 400,000 | | | BB+ | | JBS USA LLC/JBS USA Finance Inc., Senior Unsecured Notes, 5.875% due 7/15/24(a) | | | 399,500 | |
| | 132,000 | | | BBB- | | Kraft Heinz Foods Co., Secured Notes, 4.875% due 2/15/25(a) | | | 142,623 | |
| | 430,000 | | | BB+ | | Pilgrim’s Pride Corp., Company Guaranteed Notes, 5.750% due 3/15/25(a) | | | 440,750 | |
| | 720,000 | | | CCC+ | | Simmons Foods Inc., Secured Notes, 7.875% due 10/1/21(a) | | | 673,200 | |
| | | | | | | | | | |
| | | | | | Total Food Products | | | 3,172,577 | |
| | | | | | | | | | |
| Gas Utilities — 0.0% | |
| | 80,000 | | | NR | | New Gulf Resources LLC/NGR Finance Corp., Senior Secured Notes, 12.250% due 5/15/19 | | | 24,400 | |
| | | | | | | | | | |
| Health Care Equipment & Supplies — 1.8% | |
| | | | | | Alere Inc., Company Guaranteed Notes: | | | | |
| | 430,000 | | | CCC+ | | 6.500% due 6/15/20 | | | 448,099 | |
| | 290,000 | | | CCC+ | | 6.375% due 7/1/23(a) | | | 297,975 | |
| | 200,000 | | | B- | | ConvaTec Finance International SA, Senior Unsecured Notes, 8.250% (8.250% cash or 9.000% PIK) due 1/15/19(a)(b) | | | 197,750 | |
| | | | | | DJO Finance LLC/DJO Finance Corp., Secured Notes: | | | | |
| | 80,000 | | | CCC | | 10.750% due 4/15/20(a) | | | 81,600 | |
| | 1,150,000 | | | CCC+ | | 8.125% due 6/15/21(a) | | | 1,192,550 | |
| | 620,000 | | | BB- | | Hill-Rom Holdings Inc., Senior Unsecured Notes, 5.750% due 9/1/23(a) | | | 633,950 | |
| | 1,075,000 | | | CCC+ | | Kinetic Concepts Inc./KCI USA Inc., Company Guaranteed Notes, 12.500% due 11/1/19(f) | | | 1,158,313 | |
| | 660,000 | | | B- | | Universal Hospital Services Inc., Secured Notes, 7.625% due 8/15/20 | | | 639,787 | |
| | | | | | | | | | |
| | | | | | Total Health Care Equipment & Supplies | | | 4,650,024 | |
| | | | | | | | | | |
| Health Care Providers & Services — 5.0% | |
| | | | | | Acadia Healthcare Co., Inc., Company Guaranteed Notes: | | | | |
| | 390,000 | | | B- | | 6.125% due 3/15/21 | | | 404,625 | |
| | 695,000 | | | B- | | 5.125% due 7/1/22 | | | 700,212 | |
| | 885,000 | | | B- | | Amsurg Corp., Company Guaranteed Notes, 5.625% due 7/15/22 | | | 906,576 | |
| | 1,315,000 | | | B- | | CHS/Community Health Systems Inc., Company Guaranteed Notes, 6.875% due 2/1/22 | | | 1,400,883 | |
| | 500,000 | | | B+ | | DaVita HealthCare Partners Inc., Company Guaranteed Notes, 5.125% due 7/15/24 | | | 498,750 | |
| | | | | | Fresenius Medical Care US Finance II Inc., Company Guaranteed Notes: | | | | |
| | 480,000 | | | BB+ | | 5.875% due 1/31/22(a) | | | 520,800 | |
| | 300,000 | | | BB+ | | 4.750% due 10/15/24(a) | | | 301,860 | |
| | | | | | HCA Inc.: | | | | |
| | | | | | Company Guaranteed Notes: | | | | |
| | 1,235,000 | | | B+ | | 7.500% due 2/15/22 | | | 1,419,867 | |
| | 240,000 | | | B+ | | 5.375% due 2/1/25 | | | 244,200 | |
| | 60,000 | | | B+ | | 7.690% due 6/15/25 | | | 68,400 | |
| | | | | | Senior Secured Notes: | | | | |
| | 580,000 | | | BBB- | | 4.750% due 5/1/23 | | | 589,419 | |
| | 450,000 | | | BBB- | | 5.000% due 3/15/24 | | | 461,813 | |
See Notes to Financial Statements.
115
| | | | | | | | | | |
| High Yield Investments | |
| | | |
Face
Amount/Units† | | | Rating†† | | Security | | Value | |
| Health Care Providers & Services — 5.0% — (continued) | |
| $ | 290,000 | | | B+ | | HealthSouth Corp., Company Guaranteed Notes, 5.125% due 3/15/23 | | $ | 288,188 | |
| | 620,000 | | | CCC+ | | IASIS Healthcare LLC/IASIS Capital Corp., Company Guaranteed Notes, 8.375% due 5/15/19 | | | 644,112 | |
| | 250,000 | | | B- | | Kindred Healthcare Inc., Company Guaranteed Notes, 8.750% due 1/15/23(a) | | | 280,937 | |
| | 220,000 | | | B | | MedImpact Holdings Inc., Senior Secured Notes, 10.500% due 2/1/18(a) | | | 231,550 | |
| | 870,000 | | | B- | | Select Medical Corp., Company Guaranteed Notes, 6.375% due 6/1/21 | | | 887,400 | |
| | | | | | Tenet Healthcare Corp., Senior Unsecured Notes: | | | | |
| | 460,000 | | | CCC+ | | 8.000% due 8/1/20 | | | 481,275 | |
| | 1,780,000 | | | CCC+ | | 8.125% due 4/1/22 | | | 1,975,800 | |
| | 295,000 | | | CCC+ | | 6.875% due 11/15/31 | | | 274,350 | |
| | | | | | | | | | |
| | | | | | Total Health Care Providers & Services | | | 12,581,017 | |
| | | | | | | | | | |
| Hotels, Restaurants & Leisure — 6.5% | |
| | 740,000 | | | B | | AMC Entertainment Inc., Company Guaranteed Notes, 5.750% due 6/15/25 | | | 738,150 | |
| | 139,000 | | | NR | | Bossier Casino Venture Holdco Inc., Senior Secured Notes, 14.000% (0.000% cash or 14.000% PIK) due 2/9/18(a)(b)(g)(h) | | | 130,868 | |
| | | | | | Boyd Gaming Corp., Company Guaranteed Notes: | | | | |
| | 620,000 | | | CCC+ | | 9.000% due 7/1/20 | | | 668,050 | |
| | 570,000 | | | CCC+ | | 6.875% due 5/15/23 | | | 588,525 | |
| | | | | | Caesars Entertainment Resort Properties LLC/Caesars Entertainment Resort Properties Finance Inc.: | | | | |
| | 110,000 | | | CCC- | | Secured Notes, 11.000% due 10/1/21(f) | | | 102,713 | |
| | 800,000 | | | CCC+ | | Senior Secured Notes, 8.000% due 10/1/20 | | | 794,000 | |
| | 700,000 | | | B- | | Carrols Restaurant Group Inc., Secured Notes, 8.000% due 5/1/22 | | | 740,250 | |
| | 220,000 | | | CCC+ | | CEC Entertainment Inc., Company Guaranteed Notes, 8.000% due 2/15/22 | | | 221,100 | |
| | 490,000 | | | B- | | Eldorado Resorts Inc., Senior Unsecured Notes, 7.000% due 8/1/23(a) | | | 488,775 | |
| | 545,000 | | | CCC+ | | Golden Nugget Escrow Inc., Senior Unsecured Notes, 8.500% due 12/1/21(a) | | | 562,712 | |
| | 260,000 | | | B- | | Greektown Holdings LLC/Greektown Mothership Corp., Senior Secured Notes, 8.875% due 3/15/19(a) | | | 273,000 | |
| | 1,310,000 | | | BB | | Hilton Worldwide Finance LLC/Hilton Worldwide Finance Corp., Company Guaranteed Notes, 5.625% due 10/15/21 | | | 1,372,225 | |
| | 600,000 | | | B- | | Isle of Capri Casinos Inc., Company Guaranteed Notes, 8.875% due 6/15/20 | | | 646,500 | |
| | 160,000 | | | CCC+ | | Landry’s Holdings II Inc., Senior Unsecured Notes, 10.250% due 1/1/18(a) | | | 166,000 | |
| | 565,000 | | | B- | | Landry’s Inc., Company Guaranteed Notes, 9.375% due 5/1/20(a) | | | 606,669 | |
| | 830,000 | | | BB- | | MCE Finance Ltd., Company Guaranteed Notes, 5.000% due 2/15/21(a) | | | 763,600 | |
| | | | | | MGM Resorts International, Company Guaranteed Notes: | | | | |
| | 1,125,000 | | | B+ | | 6.625% due 12/15/21 | | | 1,200,937 | |
| | 700,000 | | | B+ | | 7.750% due 3/15/22 | | | 777,875 | |
| | | | | | NCL Corp., Ltd.: | | | | |
| | 388,000 | | | BB- | | Company Guaranteed Notes, 5.000% due 2/15/18 | | | 394,790 | |
| | 750,000 | | | BB- | | Senior Unsecured Notes, 5.250% due 11/15/19(a) | | | 779,768 | |
| | 737,187 | | | NR | | New Cotai LLC/New Cotai Capital Corp., Senior Secured Notes, 10.625% (0.000% cash or 10.625% PIK) due 5/1/19(a)(b) | | | 633,981 | |
| | | | | | 1011778 BC ULC / New Red Finance Inc.: | | | | |
| | 410,000 | | | B- | | Secured Notes, 6.000% due 4/1/22(a) | | | 423,325 | |
| | 446,000 | | | B+ | | Senior Secured Notes, 4.625% due 1/15/22(a) | | | 449,345 | |
| | 835,000 | | | CCC | | PF Chang’s China Bistro Inc., Company Guaranteed Notes, 10.250% due 6/30/20(a) | | | 839,175 | |
| | | | | | Scientific Games International Inc.: | | | | |
| | 690,000 | | | B | | Company Guaranteed Notes, 10.000% due 12/1/22 | | | 636,525 | |
| | 710,000 | | | BB- | | Senior Secured Notes, 7.000% due 1/1/22(a) | | | 729,525 | |
| | 280,000 | | | BB+ | | Speedway Motorsports Inc., Senior Unsecured Notes, 5.125% due 2/1/23 | | | 278,600 | |
| | 430,000 | | | B+ | | Viking Cruises Ltd., Senior Unsecured Notes, 6.250% due 5/15/25(a) | | | 425,700 | |
| | | | | | | | | | |
| | | | | | Total Hotels, Restaurants & Leisure | | | 16,432,683 | |
| | | | | | | | | | |
See Notes to Financial Statements.
116
| | | | | | | | | | |
| High Yield Investments | |
| | | |
Face
Amount/Units† | | | Rating†† | | Security | | Value | |
| Household Durables — 2.0% | |
| | | | | | K Hovnanian Enterprises Inc.: | | | | |
| $ | 290,000 | | | CCC | | Company Guaranteed Notes, 8.000% due 11/1/19(a) | | $ | 224,750 | |
| | 545,000 | | | B- | | Senior Secured Notes, 7.250% due 10/15/20(a) | | | 531,206 | |
| | 610,000 | | | CCC+ | | Serta Simmons Holdings LLC, Senior Unsecured Notes, 8.125% due 10/1/20(a) | | | 648,888 | |
| | | | | | Shea Homes LP/Shea Homes Funding Corp., Company Guaranteed Notes: | | | | |
| | 470,000 | | | B+ | | 5.875% due 4/1/23(a) | | | 482,925 | |
| | 430,000 | | | B+ | | 6.125% due 4/1/25(a) | | | 441,825 | |
| | | | | | Standard Pacific Corp., Company Guaranteed Notes: | | | | |
| | 350,000 | | | BB- | | 6.250% due 12/15/21 | | | 373,625 | |
| | 50,000 | | | BB- | | 5.875% due 11/15/24 | | | 51,500 | |
| | 1,145,000 | | | BB- | | Taylor Morrison Communities Inc./Monarch Communities Inc., Company Guaranteed Notes, 5.250% due 4/15/21(a) | | | 1,156,450 | |
| | | | | | Toll Brothers Finance Corp., Company Guaranteed Notes: | | | | |
| | 60,000 | | | BB+ | | 4.000% due 12/31/18 | | | 61,350 | |
| | 60,000 | | | BB+ | | 6.750% due 11/1/19 | | | 66,900 | |
| | | | | | William Lyon Homes Inc., Company Guaranteed Notes: | | | | |
| | 725,000 | | | B- | | 8.500% due 11/15/20 | | | 786,625 | |
| | 250,000 | | | B- | | 7.000% due 8/15/22 | | | 259,375 | |
| | | | | | | | | | |
| | | | | | Total Household Durables | | | 5,085,419 | |
| | | | | | | | | | |
| Household Products — 1.9% | |
| | 580,000 | | | CCC+ | | American Achievement Corp., Secured Notes, 10.875% due 4/15/16(a) | | | 577,100 | |
| | 420,000 | | | BB- | | Brookfield Residential Properties Inc., Senior Unsecured Notes, 6.375% due 5/15/25(a) | | | 408,450 | |
| | 400,000 | | | B- | | Century Intermediate Holding Co. 2, Senior Unsecured Notes, 9.750% (0.000% cash or 9.750% PIK) due 2/15/19(a)(b) | | | 416,500 | |
| | 100,000 | | | CCC | | Kronos Acquisition Holdings Inc., Senior Unsecured Notes, 9.000% due 8/15/23(a) | | | 91,000 | |
| | | | | | Reynolds Group Issuer Inc./Reynolds Group Issuer LLC/Reynolds Group Issuer Lu: | | | | |
| | 112,000 | | | CCC+ | | Company Guaranteed Notes, 9.875% due 8/15/19 | | | 117,950 | |
| | 1,600,000 | | | B+ | | Senior Secured Notes, 5.750% due 10/15/20 | | | 1,654,000 | |
| | | | | | Spectrum Brands Inc., Company Guaranteed Notes: | | | | |
| | 780,000 | | | B | | 6.625% due 11/15/22 | | | 841,409 | |
| | 220,000 | | | B | | 6.125% due 12/15/24(a) | | | 229,900 | |
| | 480,000 | | | B | | 5.750% due 7/15/25(a) | | | 496,800 | |
| | | | | | | | | | |
| | | | | | Total Household Products | | | 4,833,109 | |
| | | | | | | | | | |
| Independent Power and Renewable Electricity Producers — 1.2% | |
| | | | | | AES Corp., Senior Unsecured Notes: | | | | |
| | 400,000 | | | BB- | | 4.875% due 5/15/23 | | | 374,000 | |
| | 150,000 | | | BB- | | 5.500% due 3/15/24 | | | 144,000 | |
| | | | | | NRG Energy Inc., Company Guaranteed Notes: | | | | |
| | 155,000 | | | BB- | | 7.875% due 5/15/21 | | | 160,812 | |
| | 1,460,000 | | | BB- | | 6.250% due 7/15/22 | | | 1,430,800 | |
| | 450,000 | | | BB- | | 6.250% due 5/1/24 | | | 429,750 | |
| | 470,000 | | | B+ | | Red Oak Power LLC, Senior Secured Notes, 9.200% due 11/30/29 | | | 528,750 | |
| | | | | | | | | | |
| | | | | | Total Independent Power and Renewable Electricity Producers | | | 3,068,112 | |
| | | | | | | | | | |
| Industrial Conglomerates — 1.2% | |
| | 370,000 | | | B+ | | American Builders & Contractors Supply Co., Inc., Senior Unsecured Notes, 5.625% due 4/15/21(a) | | | 370,925 | |
| | | | | | HD Supply Inc.: | | | | |
| | 1,285,000 | | | B- | | Company Guaranteed Notes, 7.500% due 7/15/20 | | | 1,378,162 | |
| | 550,000 | | | BB- | | Senior Secured Notes, 5.250% due 12/15/21(a) | | | 567,188 | |
| | 605,000 | | | B- | | SunGard Data Systems Inc., Company Guaranteed Notes, 6.625% due 11/1/19 | | | 629,956 | |
| | | | | | | | | | |
| | | | | | Total Industrial Conglomerates | | | 2,946,231 | |
| | | | | | | | | | |
See Notes to Financial Statements.
117
| | | | | | | | | | |
| High Yield Investments | |
| | | |
Face
Amount/Units† | | | Rating†† | | Security | | Value | |
| Insurance — 1.0% | |
| | | | | | CNO Financial Group Inc., Senior Unsecured Notes: | | | | |
| $ | 90,000 | | | BB+ | | 4.500% due 5/30/20 | | $ | 92,925 | |
| | 470,000 | | | BB+ | | 5.250% due 5/30/25 | | | 486,450 | |
| | 500,000 | | | BB- | | Fidelity & Guaranty Life Holdings Inc., Senior Unsecured Notes, 6.375% due 4/1/21(a) | | | 522,500 | |
| | | | | | Genworth Holdings Inc., Company Guaranteed Notes: | | | | |
| | 250,000 | | | BB- | | 7.700% due 6/15/20 | | | 261,250 | |
| | 500,000 | | | BB- | | 4.900% due 8/15/23 | | | 411,250 | |
| | 775,000 | | | CCC+ | | HUB International Ltd., Senior Unsecured Notes, 7.875% due 10/1/21(a) | | | 775,000 | |
| | | | | | | | | | |
| | | | | | Total Insurance | | | 2,549,375 | |
| | | | | | | | | | |
| Internet Software & Services — 2.1% | |
| | 490,000 | | | CCC+ | | Ancestry.com Holdings LLC, Senior Unsecured Notes, 9.625% (9.625% cash or 10.375% PIK) due 10/15/18(a)(b) | | | 496,738 | |
| | 70,000 | | | CCC+ | | Ancestry.com Inc., Company Guaranteed Notes, 11.000% due 12/15/20 | | | 78,138 | |
| | 267,000 | | | B+ | | Bankrate Inc., Company Guaranteed Notes, 6.125% due 8/15/18(a) | | | 262,995 | |
| | 700,000 | | | B+ | | Cogent Communications Group Inc., Senior Secured Notes, 5.375% due 3/1/22(a) | | | 680,750 | |
| | 600,000 | | | B+ | | CyrusOne LP/CyrusOne Finance Corp., Company Guaranteed Notes, 6.375% due 11/15/22 | | | 615,000 | |
| | | | | | EarthLink Holdings Corp.: | | | | |
| | 653,000 | | | CCC+ | | Company Guaranteed Notes, 8.875% due 5/15/19(f) | | | 675,855 | |
| | 555,000 | | | B+ | | Senior Secured Notes, 7.375% due 6/1/20 | | | 581,362 | |
| | | | | | Equinix Inc., Senior Unsecured Notes: | | | | |
| | 680,000 | | | BB | | 5.375% due 1/1/22 | | | 690,200 | |
| | 495,000 | | | BB | | 5.375% due 4/1/23 | | | 498,712 | |
| | 250,000 | | | BB | | 5.750% due 1/1/25 | | | 251,250 | |
| | 500,000 | | | B+ | | Netflix Inc., Senior Unsecured Notes, 5.750% due 3/1/24 | | | 524,375 | |
| | | | | | | | | | |
| | | | | | Total Internet Software & Services | | | 5,355,375 | |
| | | | | | | | | | |
| Leisure Products — 0.1% | |
| | 240,000 | | | B | | Downstream Development Authority of the Quapaw Tribe of Oklahoma, Senior Secured Notes, 10.500% due 7/1/19(a) | | | 247,800 | |
| | | | | | | | | | |
| Machinery — 1.1% | |
| | 930,000 | | | CCC+ | | DH Services Luxembourg Sarl, Company Guaranteed Notes, 7.750% due 12/15/20(a) | | | 953,250 | |
| | 425,000 | | | CCC+ | | Milacron LLC/Mcron Finance Corp., Company Guaranteed Notes, 7.750% due 2/15/21(a) | | | 437,750 | |
| | 650,000 | | | CCC- | | Navistar International Corp., Company Guaranteed Notes, 8.250% due 11/1/21(f) | | | 565,500 | |
| | 325,000 | | | BB | | Terex Corp., Company Guaranteed Notes, 6.000% due 5/15/21 | | | 329,875 | |
| | 520,000 | | | B | | Xerium Technologies Inc., Company Guaranteed Notes, 8.875% due 6/15/18 | | | 531,375 | |
| | | | | | | | | | |
| | | | | | Total Machinery | | | 2,817,750 | |
| | | | | | | | | | |
| Media — 8.4% | |
| | 540,000 | | | BB- | | Altice Financing SA, Senior Secured Notes, 6.625% due 2/15/23(a) | | | 538,650 | |
| | 705,000 | | | B | | Altice SA, Company Guaranteed Notes, 7.625% due 2/15/25(a) | | | 671,513 | |
| | 160,000 | | | BB | | Carmike Cinemas Inc., Secured Notes, 6.000% due 6/15/23(a) | | | 164,000 | |
| | 140,000 | | | BB- | | CCO Holdings LLC/CCO Holdings Capital Corp., Company Guaranteed Notes, 6.625% due 1/31/22 | | | 147,700 | |
| | | | | | CCO Safari II LLC, Senior Secured Notes: | | | | |
| | 720,000 | | | BBB- | | 4.908% due 7/23/25(a) | | | 714,262 | |
| | 220,000 | | | BBB- | | 6.484% due 10/23/45(a) | | | 224,387 | |
| | 275,000 | | | B- | | Cequel Communications Holdings I LLC/Cequel Capital Corp., Senior Unsecured Notes, 6.375% due 9/15/20(a) | | | 271,012 | |
| | 865,000 | | | B | | Clear Channel Worldwide Holdings Inc., Company Guaranteed Notes, 7.625% due 3/15/20 | | | 897,719 | |
| | | | | | CSC Holdings LLC, Senior Unsecured Notes: | | | | |
| | 500,000 | | | BB | | 8.625% due 2/15/19 | | | 563,750 | |
| | 200,000 | | | BB | | 6.750% due 11/15/21 | | | 210,250 | |
| | 1,645,000 | | | CCC+ | | Cumulus Media Holdings Inc., Company Guaranteed Notes, 7.750% due 5/1/19(f) | | | 1,371,519 | |
See Notes to Financial Statements.
118
| | | | | | | | | | |
| High Yield Investments | |
| | | |
Face
Amount/Units† | | | Rating†† | | Security | | Value | |
| Media — 8.4% — (continued) | |
| | | | | | DISH DBS Corp., Company Guaranteed Notes: | | | | |
| $ | 900,000 | | | BB- | | 7.875% due 9/1/19 | | $ | 977,760 | |
| | 100,000 | | | BB- | | 6.750% due 6/1/21 | | | 100,640 | |
| | 1,000,000 | | | BB- | | 5.875% due 7/15/22 | | | 948,130 | |
| | 50,000 | | | BB- | | 5.875% due 11/15/24 | | | 45,687 | |
| | 745,000 | | | B- | | Entercom Radio LLC, Company Guaranteed Notes, 10.500% due 12/1/19 | | | 792,494 | |
| | 440,000 | | | B- | | Gibson Brands Inc., Senior Secured Notes, 8.875% due 8/1/18(a) | | | 420,200 | |
| | 1,355,000 | | | B | | Gray Television Inc., Company Guaranteed Notes, 7.500% due 10/1/20 | | | 1,406,219 | |
| | 160,000 | | | BB- | | Harron Communications LP/Harron Finance Corp., Senior Unsecured Notes, 9.125% due 4/1/20(a) | | | 172,600 | |
| | | | | | iHeartCommunications Inc.: | | | | |
| | 1,680,000 | | | CCC+ | | Senior Secured Notes, 9.000% due 3/1/21 | | | 1,495,200 | |
| | 910,000 | | | CCC- | | Senior Unsecured Notes, 10.000% due 1/15/18(f) | | | 664,300 | |
| | | | | | LBI Media Inc.: | | | | |
| | 438,433 | | | CC | | Company Guaranteed Notes, 13.500% (4.250% cash or 9.250% PIK) due 4/15/20(a)(b) | | | 453,778 | |
| | 1,006 | | | CC | | Secured Notes, 13.500% ((4.250% cash or 9.250% PIK) due 4/15/20(a)(b) | | | 1,041 | |
| | 355,000 | | | CCC | | Senior Secured Notes, 10.000% due 4/15/19(a) | | | 365,428 | |
| | 1,000,000 | | | B- | | Lee Enterprises Inc., Senior Secured Notes, 9.500% due 3/15/22(a) | | | 966,250 | |
| | 570,000 | | | B+ | | LIN Television Corp., Senior Unsecured Notes, 5.875% due 11/15/22(a) | | | 568,575 | |
| | 30,000 | | | B- | | MHGE Parent LLC/MHGE Parent Finance Inc., Senior Unsecured Notes, 8.500% due 8/1/19(a) | | | 30,413 | |
| | 660,000 | | | B | | Midcontinent Communications & Midcontinent Finance Corp., Company Guaranteed Notes, 6.250% due 8/1/21(a) | | | 668,250 | |
| | 935,000 | | | B+ | | Nexstar Broadcasting Inc., Company Guaranteed Notes, 6.875% due 11/15/20 | | | 985,256 | |
| | | | | | Numericable-SFR, Senior Secured Notes: | | | | |
| | 630,000 | | | B+ | | 6.000% due 5/15/22(a) | | | 631,575 | |
| | 910,000 | | | B+ | | 6.250% due 5/15/24(a) | | | 911,993 | |
| | 130,000 | | | BB- | | Outfront Media Capital LLC/Outfront Media Capital Corp., Company Guaranteed Notes, 5.250% due 2/15/22 | | | 131,382 | |
| | 1,480,000 | | | CCC | | Radio One Inc., Company Guaranteed Notes, 9.250% due 2/15/20(a) | | | 1,324,600 | |
| | 290,000 | | | B+ | | Sinclair Television Group Inc., Company Guaranteed Notes, 5.625% due 8/1/24(a) | | | 276,950 | |
| | 650,000 | | | B- | | SiTV LLC/SiTV Finance Inc., Senior Secured Notes, 10.375% due 7/1/19(a) | | | 510,250 | |
| | 600,000 | | | B+ | | Univision Communications Inc., Senior Secured Notes, 5.125% due 2/15/25(a) | | | 583,500 | |
| | 200,000 | | | B | | Ziggo Bond Finance BV, Senior Unsecured Notes, 5.875% due 1/15/25(a) | | | 193,750 | |
| | | | | | | | | | |
| | | | | | Total Media | | | 21,400,983 | |
| | | | | | | | | | |
| Metals & Mining — 1.3% | |
| | 760,000 | | | BBB- | | Alcoa Inc., Senior Unsecured Notes, 5.125% due 10/1/24 | | | 748,600 | |
| | 500,000 | | | BB | | ArcelorMittal, Senior Unsecured Notes, 7.000% due 2/25/22 | | | 501,250 | |
| | 270,000 | | | B- | | Barminco Finance Pty Ltd., Company Guaranteed Notes, 9.000% due 6/1/18(a) | | | 211,950 | |
| | 365,000 | | | B | | Coeur Mining Inc., Company Guaranteed Notes, 7.875% due 2/1/21 | | | 234,512 | |
| | 370,000 | | | BB+ | | FMG Resources August 2006 Pty Ltd., Senior Secured Notes, 9.750% due 3/1/22(a) | | | 339,013 | |
| | 200,000 | | | B+ | | Global Brass & Copper Inc., Senior Secured Notes, 9.500% due 6/1/19 | | | 215,750 | |
| | 320,000 | | | B- | | Horsehead Holding Corp., Senior Secured Notes, 10.500% due 6/1/17(a) | | | 329,600 | |
| | 190,000 | | | NR | | Midwest Vanadium Pty Ltd., Senior Secured Notes, 11.500% due 2/15/18(a)(h)(i) | | | 9,500 | |
| | | | | | Mirabela Nickel Ltd.: | | | | |
| | 274,314 | | | NR | | Senior Secured Notes, 9.500% due 6/24/19(g)(h) | | | 192,020 | |
| | 1,139 | | | NR | | Subordinated Notes, 1.000% due 9/10/44(g)(h) | | | — | |
| | 50,000 | | | B- | | Prince Mineral Holding Corp., Senior Secured Notes, 11.500% due 12/15/19(a) | | | 43,500 | |
| | 300,000 | | | B- | | Ryerson Inc./Joseph T Ryerson & Son Inc., Senior Secured Notes, 9.000% due 10/15/17 | | | 274,500 | |
| | 270,000 | | | CCC | | Thompson Creek Metals Co., Inc., Company Guaranteed Notes, 12.500% due 5/1/19 | | | 165,631 | |
| | | | | | | | | | |
| | | | | | Total Metals & Mining | | | 3,265,826 | |
| | | | | | | | | | |
| Multiline Retail — 1.2% | |
| | 1,570,000 | | | B+ | | Dollar Tree Inc., Company Guaranteed Notes, 5.750% due 3/1/23(a) | | | 1,652,425 | |
See Notes to Financial Statements.
119
| | | | | | | | | | |
| High Yield Investments | |
| | | |
Face
Amount/Units† | | | Rating†† | | Security | | Value | |
| Multiline Retail — 1.2% — (continued) | |
| | | | | | JC Penney Corp., Inc., Company Guaranteed Notes: | | | | |
| $ | 565,000 | | | CCC- | | 7.950% due 4/1/17 | | $ | 589,012 | |
| | 760,000 | | | CCC- | | 8.125% due 10/1/19 | | | 775,200 | |
| | | | | | | | | | |
| | | | | | Total Multiline Retail | | | 3,016,637 | |
| | | | | | | | | | |
| Oil, Gas & Consumable Fuels — 14.1% | |
| | 300,000 | | | CCC+ | | American Energy-Permian Basin LLC/AEPB Finance Corp., Secured Notes, 8.000% due 6/15/20(a) | | | 273,000 | |
| | 795,000 | | | BB | | Antero Resources Corp., Company Guaranteed Notes, 5.125% due 12/1/22 | | | 723,617 | |
| | 410,000 | | | BB | | Antero Resources Finance Corp., Company Guaranteed Notes, 5.375% due 11/1/21 | | | 379,250 | |
| | 220,000 | | | B- | | Approach Resources Inc., Company Guaranteed Notes, 7.000% due 6/15/21 | | | 148,500 | |
| | | | | | Arch Coal Inc., Company Guaranteed Notes: | | | | |
| | 170,000 | | | CC | | 7.000% due 6/15/19 | | | 22,950 | |
| | 60,000 | | | CC | | 9.875% due 6/15/19 | | | 8,400 | |
| | 210,000 | | | BB | | Atwood Oceanics Inc., Senior Unsecured Notes, 6.500% due 2/1/20 | | | 180,600 | |
| | | | | | Berry Petroleum Co. LLC, Senior Unsecured Notes: | | | | |
| | 30,000 | | | B+ | | 6.750% due 11/1/20 | | | 16,050 | |
| | 280,000 | | | B+ | | 6.375% due 9/15/22 | | | 144,200 | |
| | 850,000 | | | B | | Blue Racer Midstream LLC/Blue Racer Finance Corp., Company Guaranteed Notes, 6.125% due 11/15/22(a) | | | 837,250 | |
| | 240,000 | | | CCC+ | | Bonanza Creek Energy Inc., Company Guaranteed Notes, 6.750% due 4/15/21 | | | 178,800 | |
| | | | | | BreitBurn Energy Partners LP/BreitBurn Finance Corp., Company Guaranteed Notes: | | | | |
| | 210,000 | | | B- | | 8.625% due 10/15/20 | | | 113,679 | |
| | 80,000 | | | B- | | 7.875% due 4/15/22 | | | 34,400 | |
| | 720,000 | | | BB | | California Resources Corp., Company Guaranteed Notes, 6.000% due 11/15/24 | | | 535,680 | |
| | 280,000 | | | B+ | | Calumet Specialty Products Partners LP/Calumet Finance Corp., Company Guaranteed Notes, 7.625% due 1/15/22 | | | 274,400 | |
| | | | | | Carrizo Oil & Gas Inc., Company Guaranteed Notes: | | | | |
| | 920,000 | | | B | | 7.500% due 9/15/20 | | | 874,000 | |
| | 130,000 | | | B | | 6.250% due 4/15/23 | | | 117,650 | |
| | | | | | Chesapeake Energy Corp., Company Guaranteed Notes: | | | | |
| | 150,000 | | | BB+ | | 6.875% due 11/15/20 | | | 121,125 | |
| | 550,000 | | | BB+ | | 6.125% due 2/15/21 | | | 428,659 | |
| | 120,000 | | | BB+ | | 4.875% due 4/15/22 | | | 87,600 | |
| | 690,000 | | | BB- | | Cloud Peak Energy Resources LLC/Cloud Peak Energy Finance Corp., Company Guaranteed Notes, 6.375% due 3/15/24 | | | 400,200 | |
| | 430,000 | | | CCC | | Comstock Resources Inc., Company Guaranteed Notes, 9.500% due 6/15/20 | | | 142,179 | |
| | 430,000 | | | BB+ | | Concho Resources Inc., Company Guaranteed Notes, 5.500% due 4/1/23 | | | 426,951 | |
| | | | | | Crestwood Midstream Partners LP/Crestwood Midstream Finance Corp., Company Guaranteed Notes: | | | | |
| | 380,000 | | | BB | | 6.000% due 12/15/20 | | | 361,000 | |
| | 250,000 | | | BB | | 6.125% due 3/1/22 | | | 228,750 | |
| | 270,000 | | | B+ | | CVR Refining LLC/Coffeyville Finance Inc., Company Guaranteed Notes, 6.500% due 11/1/22 | | | 265,896 | |
| | | | | | DCP Midstream LLC: | | | | |
| | 345,000 | | | B+ | | Junior Subordinated Notes, 5.850% due 5/21/43(a)(c) | | | 265,650 | |
| | | | | | Senior Unsecured Notes: | | | | |
| | 115,000 | | | BB | | 5.350% due 3/15/20(a) | | | 112,131 | |
| | 200,000 | | | BB | | 4.750% due 9/30/21(a) | | | 182,460 | |
| | 175,000 | | | BB | | 6.750% due 9/15/37(a) | | | 154,461 | |
| | 600,000 | | | CCC+ | | Eclipse Resources Corp., Company Guaranteed Notes, 8.875% due 7/15/23(a) | | | 553,500 | |
| | 64,000 | | | BBB | | Ecopetrol SA, Senior Unsecured Notes, 5.875% due 9/18/23 | | | 64,720 | |
| | | | | | EP Energy LLC/Everest Acquisition Finance Inc., Company Guaranteed Notes: | | | | |
| | 130,000 | | | B | | 9.375% due 5/1/20 | | | 126,555 | |
| | 625,000 | | | B | | 6.375% due 6/15/23 | | | 534,375 | |
| | 460,000 | | | B- | | EV Energy Partners LP/EV Energy Finance Corp., Company Guaranteed Notes, 8.000% due 4/15/19 | | | 333,500 | |
See Notes to Financial Statements.
120
| | | | | | | | | | |
| High Yield Investments | |
| | | |
Face
Amount/Units† | | | Rating†† | | Security | | Value | |
| Oil, Gas & Consumable Fuels — 14.1% — (continued) | |
| $ | 380,000 | | | CCC+ | | FTS International Inc., Senior Secured Notes, 6.250% due 5/1/22 | | $ | 144,400 | |
| | 880,000 | | | CCC+ | | Gastar Exploration Inc., Secured Notes, 8.625% due 5/15/18 | | | 726,000 | |
| | 240,000 | | | B+ | | Genesis Energy LP/Genesis Energy Finance Corp., Company Guaranteed Notes, 6.000% due 5/15/23 | | | 220,800 | |
| | 485,000 | | | NR | | Goodrich Petroleum Corp., Company Guaranteed Notes, 5.000% due 10/1/32 | | | 94,575 | |
| | 90,000 | | | B+ | | Gulfport Energy Corp., Company Guaranteed Notes, 7.750% due 11/1/20 | | | 87,975 | |
| | | | | | Halcon Resources Corp.: | | | | |
| | | | | | Company Guaranteed Notes: | | | | |
| | 160,000 | | | D | | 9.750% due 7/15/20 | | | 59,200 | |
| | 690,000 | | | D | | 8.875% due 5/15/21 | | | 231,150 | |
| | 320,000 | | | CCC+ | | Secured Notes, 8.625% due 2/1/20(a) | | | 282,000 | |
| | | | | | Hercules Offshore Inc., Company Guaranteed Notes: | | | | |
| | 30,000 | | | D | | 10.250% due 4/1/19(a)(i) | | | 7,050 | |
| | 10,000 | | | D | | 8.750% due 7/15/21(a)(i) | | | 2,350 | |
| | 770,000 | | | D | | 7.500% due 10/1/21(a)(i) | | | 177,100 | |
| | 290,000 | | | D | | 6.750% due 4/1/22(a)(i) | | | 66,700 | |
| | 660,000 | | | B | | Key Energy Services Inc., Company Guaranteed Notes, 6.750% due 3/1/21 | | | 280,500 | |
| | 10,000 | | | BBB- | | Kinder Morgan Inc., Company Guaranteed Notes, 7.800% due 8/1/31 | | | 10,896 | |
| | 360,000 | | | BB | | Kodiak Oil & Gas Corp., Company Guaranteed Notes, 8.125% due 12/1/19 | | | 347,400 | |
| | 400,000 | | | B | | Linn Energy LLC/Linn Energy Finance Corp., Company Guaranteed Notes, 6.500% due 9/15/21 | | | 155,000 | |
| | 2,140,000 | | | C | | Magnum Hunter Resources Corp., Company Guaranteed Notes, 9.750% due 5/15/20 | | | 1,481,950 | |
| | | | | | MarkWest Energy Partners LP/MarkWest Energy Finance Corp., Company Guaranteed Notes: | | | | |
| | 280,000 | | | BB | | 5.500% due 2/15/23 | | | 275,800 | |
| | 190,000 | | | BB | | 4.875% due 12/1/24 | | | 177,175 | |
| | 500,000 | | | BB | | 4.875% due 6/1/25 | | | 463,750 | |
| | | | | | MEG Energy Corp., Company Guaranteed Notes: | | | | |
| | 360,000 | | | BB- | | 6.375% due 1/30/23(a) | | | 291,600 | |
| | 320,000 | | | BB- | | 7.000% due 3/31/24(a) | | | 263,200 | |
| | | | | | Memorial Production Partners LP/Memorial Production Finance Corp., Company Guaranteed Notes: | | | | |
| | 510,000 | | | B- | | 7.625% due 5/1/21 | | | 344,250 | |
| | 435,000 | | | B- | | 6.875% due 8/1/22 | | | 275,138 | |
| | 210,000 | | | NR | | Milagro Oil & Gas Inc., Secured Notes, 10.500% due 5/15/16(h)(i) | | | 66,150 | |
| | 240,000 | | | BB+ | | Murphy Oil USA Inc., Company Guaranteed Notes, 6.000% due 8/15/23 | | | 248,400 | |
| | 830,000 | | | B- | | Murray Energy Corp., Secured Notes, 11.250% due 4/15/21(a) | | | 388,025 | |
| | 130,000 | | | B+ | | Natural Resource Partners LP/NRP Finance Corp., Senior Unsecured Notes, 9.125% due 10/1/18 | | | 96,525 | |
| | 230,000 | | | BBB- | | Newfield Exploration Co., Senior Unsecured Notes, 5.375% due 1/1/26 | | | 215,050 | |
| | | | | | NGL Energy Partners LP/NGL Energy Finance Corp., Company Guaranteed Notes: | | | | |
| | 230,000 | | | BB- | | 5.125% due 7/15/19 | | | 213,900 | |
| | 270,000 | | | BB- | | 6.875% due 10/15/21 | | | 265,950 | |
| | | | | | NGPL PipeCo LLC, Senior Secured Notes: | | | | |
| | 795,000 | | | CCC | | 9.625% due 6/1/19(a) | | | 743,325 | |
| | 205,000 | | | CCC | | 7.768% due 12/15/37(a) | | | 177,325 | |
| | | | | | Oasis Petroleum Inc., Company Guaranteed Notes: | | | | |
| | 110,000 | | | B+ | | 6.500% due 11/1/21 | | | 89,100 | |
| | 210,000 | | | B+ | | 6.875% due 3/15/22(f) | | | 175,350 | |
| | 150,000 | | | B+ | | 6.875% due 1/15/23 | | | 119,250 | |
| | 260,000 | | | B+ | | Pacific Drilling SA, Senior Secured Notes, 5.375% due 6/1/20(a) | | | 188,500 | |
| | 250,000 | | | B+ | | Parker Drilling Co., Company Guaranteed Notes, 6.750% due 7/15/22 | | | 196,250 | |
| | 320,000 | | | B- | | Parsley Energy LLC/Parsley Finance Corp., Senior Unsecured Notes, 7.500% due 2/15/22(a) | | | 315,200 | |
| | 850,000 | | | CCC | | Penn Virginia Corp., Company Guaranteed Notes, 8.500% due 5/1/20 | | | 225,250 | |
| | 200,000 | | | BBB- | | Petrobras Global Finance BV, Company Guaranteed Notes, 4.375% due 5/20/23 | | | 157,640 | |
| | 620,000 | | | B- | | PetroQuest Energy Inc., Company Guaranteed Notes, 10.000% due 9/1/17 | | | 532,425 | |
See Notes to Financial Statements.
121
| | | | | | | | | | |
| High Yield Investments | |
| | | |
Face
Amount/Units† | | | Rating†† | | Security | | Value | |
| Oil, Gas & Consumable Fuels — 14.1% — (continued) | |
| | | | | | QEP Resources Inc., Senior Unsecured Notes: | | | | |
| $ | 250,000 | | | BB+ | | 6.875% due 3/1/21 | | $ | 238,750 | |
| | 400,000 | | | BB+ | | 5.375% due 10/1/22 | | | 347,000 | |
| | 560,000 | | | BB+ | | 5.250% due 5/1/23 | | | 487,312 | |
| | 60,000 | | | NR | | Quicksilver Resources Inc., Company Guaranteed Notes, 11.000% due 7/1/21(i) | | | 4,050 | |
| | | | | | Range Resources Corp., Company Guaranteed Notes: | | | | |
| | 280,000 | | | BB+ | | 5.750% due 6/1/21 | | | 270,200 | |
| | 50,000 | | | BB+ | | 4.875% due 5/15/25(a) | | | 45,187 | |
| | | | | | Regency Energy Partners LP/Regency Energy Finance Corp., Company Guaranteed Notes: | | | | |
| | 70,000 | | | BBB- | | 6.500% due 7/15/21 | | | 72,625 | |
| | 230,000 | | | BBB- | | 5.000% due 10/1/22 | | | 225,643 | |
| | 265,000 | | | CCC+ | | Rex Energy Corp., Company Guaranteed Notes, 8.875% due 12/1/20 | | | 160,325 | |
| | | | | | Rice Energy Inc., Company Guaranteed Notes: | | | | |
| | 1,350,000 | | | B- | | 6.250% due 5/1/22 | | | 1,208,250 | |
| | 215,000 | | | B- | | 7.250% due 5/1/23(a) | | | 201,025 | |
| | | | | | Rockies Express Pipeline LLC, Senior Unsecured Notes: | | | | |
| | 370,000 | | | BB+ | | 6.850% due 7/15/18(a) | | | 379,250 | |
| | 665,000 | | | BB+ | | 5.625% due 4/15/20(a) | | | 645,050 | |
| | 250,000 | | | BB+ | | 7.500% due 7/15/38(a) | | | 258,125 | |
| | 1,735,000 | | | BB+ | | 6.875% due 4/15/40(a) | | | 1,661,262 | |
| | 270,000 | | | B | | Rose Rock Midstream LP/Rose Rock Finance Corp., Company Guaranteed Notes, 5.625% due
11/15/23(a) | | | 243,000 | |
| | 330,000 | | | B- | | RSP Permian Inc., Company Guaranteed Notes, 6.625% due 10/1/22(a) | | | 325,050 | |
| | | | | | Sabine Pass Liquefaction LLC, Senior Secured Notes: | | | | |
| | 890,000 | | | BB+ | | 5.625% due 2/1/21 | | | 881,100 | |
| | 725,000 | | | BB+ | | 6.250% due 3/15/22 | | | 732,250 | |
| | 370,000 | | | BB+ | | 5.625% due 4/15/23 | | | 361,213 | |
| | 510,000 | | | BB+ | | 5.750% due 5/15/24 | | | 501,075 | |
| | 810,000 | | | D | | Samson Investment Co., Company Guaranteed Notes, 9.750% due 2/15/20 | | | 3,038 | |
| | | | | | Sanchez Energy Corp., Company Guaranteed Notes: | | | | |
| | 590,000 | | | B- | | 7.750% due 6/15/21(f) | | | 501,500 | |
| | 1,270,000 | | | B- | | 6.125% due 1/15/23(f) | | | 958,850 | |
| | 240,000 | | | B+ | | Shelf Drilling Holdings Ltd., Secured Notes, 8.625% due 11/1/18(a) | | | 186,000 | |
| | 480,000 | | | BB | | SM Energy Co., Senior Unsecured Notes, 5.625% due 6/1/25 | | | 427,200 | |
| | 280,000 | | | BB- | | Suburban Propane Partners LP/Suburban Energy Finance Corp., Senior Unsecured Notes, 5.500% due 6/1/24 | | | 266,700 | |
| | | | | | Summit Midstream Holdings LLC/Summit Midstream Finance Corp., Company Guaranteed Notes: | | | | |
| | 80,000 | | | B | | 7.500% due 7/1/21 | | | 80,400 | |
| | 370,000 | | | B | | 5.500% due 8/15/22 | | | 329,300 | |
| | 555,000 | | | B- | | Talos Production LLC/Talos Production Finance Inc., Company Guaranteed Notes, 9.750% due
2/15/18(a) | | | 407,925 | |
| | 160,000 | | | B- | | Teine Energy Ltd., Senior Unsecured Notes, 6.875% due 9/30/22(a) | | | 139,200 | |
| | 910,000 | | | CCC+ | | Triangle USA Petroleum Corp., Senior Unsecured Notes, 6.750% due 7/15/22(a) | | | 550,550 | |
| | 340,000 | | | BB | | Ultra Petroleum Corp., Senior Unsecured Notes, 5.750% due 12/15/18(a) | | | 275,400 | |
| | 240,000 | | | B | | Vanguard Natural Resources LLC/VNR Finance Corp., Company Guaranteed Notes, 7.875% due 4/1/20 | | | 169,200 | |
| | 575,000 | | | B+ | | Western Refining Inc., Company Guaranteed Notes, 6.250% due 4/1/21 | | | 572,125 | |
| | 580,000 | | | B | | Western Refining Logistics LP/WNRL Finance Corp., Company Guaranteed Notes, 7.500% due 2/15/23 | | | 588,700 | |
| | 400,000 | | | BB | | Whiting Petroleum Corp., Company Guaranteed Notes, 5.000% due 3/15/19 | | | 360,000 | |
| | | | | | WPX Energy Inc., Senior Unsecured Notes: | | | | |
| | 170,000 | | | BB | | 7.500% due 8/1/20 | | | 164,115 | |
| | 150,000 | | | BB | | 8.250% due 8/1/23(f) | | | 144,750 | |
| | | | | | | | | | |
| | | | | | Total Oil, Gas & Consumable Fuels | | | 35,904,407 | |
| | | | | | | | | | |
See Notes to Financial Statements.
122
| | | | | | | | | | |
| High Yield Investments | |
| | | |
Face
Amount/Units† | | | Rating†† | | Security | | Value | |
| Paper & Forest Products — 0.4% | |
| $ | 580,000 | | | CCC+ | | Appvion Inc., Secured Notes, 9.000% due 6/1/20(a) | | $ | 330,600 | |
| | 160,000 | | | BB | | Clearwater Paper Corp., Company Guaranteed Notes, 4.500% due 2/1/23 | | | 152,800 | |
| | 220,000 | | | BB- | | Resolute Forest Products Inc., Company Guaranteed Notes, 5.875% due 5/15/23 | | | 181,500 | |
| | | | | | Verso Paper Holdings LLC/Verso Paper Inc., Senior Secured Notes: | | | | |
| | 1,825,000 | | | CCC | | 11.750% due 1/15/19(f) | | | 367,175 | |
| | 130,000 | | | B3(e) | | 11.750% due 1/15/19 | | | 30,875 | |
| | | | | | | | | | |
| | | | | | Total Paper & Forest Products | | | 1,062,950 | |
| | | | | | | | | | |
| Personal Products — 0.3% | |
| | 835,000 | | | B | | Revlon Consumer Products Corp., Company Guaranteed Notes, 5.750% due 2/15/21 | | | 830,825 | |
| | | | | | | | | | |
| Pharmaceuticals — 2.7% | |
| | 280,000 | | | CCC- | | BioScrip Inc., Company Guaranteed Notes, 8.875% due 2/15/21 | | | 210,700 | |
| | | | | | Endo Finance LLC/Endo Ltd./Endo Finco Inc., Company Guaranteed Notes: | | | | |
| | 550,000 | | | B | | 6.000% due 7/15/23(a) | | | 573,375 | |
| | 700,000 | | | B | | 6.000% due 2/1/25(a) | | | 722,750 | |
| | | | | | Grifols Worldwide Operations Ltd., Company Guaranteed Notes: | | | | |
| | 320,000 | | | B+ | | 5.250% due 4/1/22(a) | | | 326,000 | |
| | 200,000 | | | B+ | | 5.250% due 4/1/22 | | | 203,750 | |
| | 1,000,000 | | | B- | | Horizon Pharma Financing Inc., Senior Unsecured Notes, 6.625% due 5/1/23(a) | | | 1,036,250 | |
| | 420,000 | | | CCC+ | | JLL/Delta Dutch Newco BV, Senior Unsecured Notes, 7.500% due 2/1/22(a) | | | 439,425 | |
| | | | | | Valeant Pharmaceuticals International Inc., Company Guaranteed Notes: | | | | |
| | 1,420,000 | | | B | | 5.375% due 3/15/20(a) | | | 1,448,400 | |
| | 760,000 | | | B | | 6.375% due 10/15/20(a) | | | 794,200 | |
| | 510,000 | | | B | | 5.625% due 12/1/21(a) | | | 520,200 | |
| | 585,000 | | | B | | 5.875% due 5/15/23(a) | | | 598,163 | |
| | | | | | | | | | |
| | | | | | Total Pharmaceuticals | | | 6,873,213 | |
| | | | | | | | | | |
| Real Estate Investment Trusts (REITs) — 1.3% | |
| | 330,000 | | | B- | | Ashton Woods USA LLC/Ashton Woods Finance Co., Senior Unsecured Notes, 6.875% due 2/15/21(a) | | | 310,200 | |
| | 610,000 | | | B+ | | CTR Partnership LP/CareTrust Capital Corp., Company Guaranteed Notes, 5.875% due 6/1/21 | | | 620,675 | |
| | 360,000 | | | BB- | | ESH Hospitality Inc., Company Guaranteed Notes, 5.250% due 5/1/25(a) | | | 351,000 | |
| | 975,000 | | | B+ | | Felcor Lodging LP, Senior Secured Notes, 5.625% due 3/1/23 | | | 1,009,125 | |
| | | | | | iStar Inc., Senior Unsecured Notes: | | | | |
| | 410,000 | | | B+ | | 9.000% due 6/1/17 | | | 443,825 | |
| | 695,000 | | | B+ | | 5.000% due 7/1/19 | | | 676,756 | |
| | | | | | | | | | |
| | | | | | Total Real Estate Investment Trusts (REITs) | | | 3,411,581 | |
| | | | | | | | | | |
| Real Estate Management & Development — 1.0% | |
| | 670,000 | | | BBB | | CBRE Services Inc., Company Guaranteed Notes, 5.250% due 3/15/25 | | | 688,554 | |
| | 200,000 | | | B+ | | Greystar Real Estate Partners LLC, Senior Secured Notes, 8.250% due 12/1/22(a) | | | 209,500 | |
| | 730,000 | | | B | | Howard Hughes Corp. (The), Senior Unsecured Notes, 6.875% due 10/1/21(a) | | | 764,675 | |
| | 885,000 | | | B | | Realogy Group LLC/Realogy Co.-Issuer Corp., Company Guaranteed Notes, 5.250% due 12/1/21(a) | | | 904,912 | |
| | | | | | | | | | |
| | | | | | Total Real Estate Management & Development | | | 2,567,641 | |
| | | | | | | | | | |
| Semiconductors & Semiconductor Equipment — 0.2% | |
| | | | | | Micron Technology Inc., Senior Unsecured Notes: | | | | |
| | 230,000 | | | BB | | 5.250% due 8/1/23(a) | | | 215,050 | |
| | 230,000 | | | BB | | 5.500% due 2/1/25 | | | 214,475 | |
| | | | | | | | | | |
| | | | | | Total Semiconductors & Semiconductor Equipment | | | 429,525 | |
| | | | | | | | | | |
| Software — 1.6% | |
| | 370,000 | | | BB+ | | Activision Blizzard Inc., Company Guaranteed Notes, 6.125% due 9/15/23(a) | | | 398,675 | |
| | 120,000 | | | BB- | | Audatex North America Inc., Company Guaranteed Notes, 6.000% due 6/15/21(a) | | | 117,625 | |
See Notes to Financial Statements.
123
| | | | | | | | | | |
| High Yield Investments | |
| | | |
Face
Amount/Units† | | | Rating†† | | Security | | Value | |
| Software — 1.6% — (continued) | |
| | | | | | First Data Corp.: | | | | |
| | | | | | Company Guaranteed Notes: | | | | |
| $ | 690,000 | | | B- | | 12.625% due 1/15/21 | | $ | 794,363 | |
| | 795,000 | | | CCC+ | | 11.750% due 8/15/21 | | | 897,555 | |
| | 240,000 | | | B- | | Secured Notes, 8.750% (8.875% cash or 9.625 PIK%) due 1/15/22(a) | | | 253,200 | |
| | | | | | Senior Secured Notes: | | | | |
| | 155,000 | | | BB- | | 6.750% due 11/1/20(a) | | | 163,525 | |
| | 310,000 | | | BB- | | 5.375% due 8/15/23(a) | | | 314,650 | |
| | 440,000 | | | B- | | Interface Security Systems Holdings Inc./Interface Security Systems LLC, Secured Notes, 9.250% due 1/15/18 | | | 448,800 | |
| | 690,000 | | | BB- | | Nuance Communications Inc., Company Guaranteed Notes, 5.375% due 8/15/20(a) | | | 694,747 | |
| | | | | | | | | | |
| | | | | | Total Software | | | 4,083,140 | |
| | | | | | | | | | |
| Specialty Retail — 1.5% | |
| | 685,000 | | | B- | | Argos Merger Sub Inc., Senior Unsecured Notes, 7.125% due 3/15/23(a) | | | 719,250 | |
| | 490,000 | | | B- | | Bon-Ton Department Stores Inc. (The), Secured Notes, 8.000% due 6/15/21 | | | 322,175 | |
| | 360,000 | | | BB | | CST Brands Inc., Company Guaranteed Notes, 5.000% due 5/1/23 | | | 358,650 | |
| | 270,000 | | | BB+ | | GameStop Corp., Company Guaranteed Notes, 5.500% due 10/1/19(a) | | | 279,788 | |
| | 860,000 | | | CCC | | Guitar Center Inc., Company Guaranteed Notes, 9.625% due 4/15/20(a) | | | 756,800 | |
| | 725,000 | | | B- | | Men’s Wearhouse Inc. (The), Company Guaranteed Notes, 7.000% due 7/1/22(f) | | | 768,500 | |
| | 770,000 | | | CCC+ | | Neiman Marcus Group Ltd Inc., Company Guaranteed Notes, 8.750% (8.750% cash or 9.500% PIK) due 10/15/21(a)(b) | | | 827,750 | |
| | | | | | | | | | |
| | | | | | Total Specialty Retail | | | 4,032,913 | |
| | | | | | | | | | |
| Technology Hardware, Storage & Peripherals — 0.2% | |
| | | | | | Dell Inc., Senior Unsecured Notes: | | | | |
| | 205,000 | | | BB+ | | 6.500% due 4/15/38 | | | 182,450 | |
| | 475,000 | | | BB+ | | 5.400% due 9/10/40 | | | 380,000 | |
| | | | | | | | | | |
| | | | | | Total Technology Hardware, Storage & Peripherals | | | 562,450 | |
| | | | | | | | | | |
| Textiles, Apparel & Luxury Goods — 0.4% | |
| | 210,000 | | | B- | | Empire Today LLC/Empire Today Finance Corp., Senior Secured Notes, 11.375% due 2/1/17(a) | | | 186,900 | |
| | 270,000 | | | BB | | Hanesbrands Inc., Company Guaranteed Notes, 6.375% due 12/15/20 | | | 282,150 | |
| | 180,000 | | | BBu | | Levi Strauss & Co., Senior Unsecured Notes, 5.000% due 5/1/25 | | | 177,075 | |
| | 310,000 | | | BB+ | | William Carter Co. (The), Company Guaranteed Notes, 5.250% due 8/15/21 | | | 321,625 | |
| | | | | | | | | | |
| | | | | | Total Textiles, Apparel & Luxury Goods | | | 967,750 | |
| | | | | | | | | | |
| Tobacco — 0.2% | |
| | 480,000 | | | CCC | | Alliance One International Inc., Secured Notes, 9.875% due 7/15/21(f) | | | 406,800 | |
| | | | | | | | | | |
| Transportation Infrastructure — 3.0% | |
| | 380,000 | | | CCC+ | | Air Medical Merger Sub Corp., Senior Unsecured Notes, 6.375% due 5/15/23(a) | | | 355,300 | |
| | | | | | Aircastle Ltd., Senior Unsecured Notes: | | | | |
| | 270,000 | | | BB+ | | 6.250% due 12/1/19 | | | 293,625 | |
| | 505,000 | | | BB+ | | 7.625% due 4/15/20 | | | 575,069 | |
| | 260,000 | | | B+ | | CTP Transportation Products LLC/CTP Finance Inc., Senior Secured Notes, 8.250% due 12/15/19(a) | | | 277,550 | |
| | 325,000 | | | B | | Eletson Holdings, Senior Secured Notes, 9.625% due 1/15/22(a) | | | 297,375 | |
| | 470,000 | | | B+ | | Flexi-Van Leasing Inc., Company Guaranteed Notes, 7.875% due 8/15/18(a) | | | 478,225 | |
| | 500,000 | | | B | | Florida East Coast Holdings Corp., Senior Secured Notes, 6.750% due 5/1/19(a) | | | 505,000 | |
| | | | | | Fly Leasing Ltd., Senior Unsecured Notes: | | | | |
| | 335,000 | | | BB | | 6.750% due 12/15/20 | | | 345,887 | |
| | 315,000 | | | BB | | 6.375% due 10/15/21 | | | 322,875 | |
| | 1,280,000 | | | B- | | Gardner Denver Inc., Senior Unsecured Notes, 6.875% due 8/15/21(a) | | | 1,145,600 | |
| | 205,000 | | | B | | Gulfmark Offshore Inc., Senior Unsecured Notes, 6.375% due 3/15/22(f) | | | 132,225 | |
See Notes to Financial Statements.
124
| | | | | | | | | | |
| High Yield Investments | |
| | | |
Face
Amount/Units† | | | Rating†† | | Security | | Value | |
| Transportation Infrastructure — 3.0% — (continued) | |
| $ | 370,000 | | | CCC+ | | Neovia Logistics Intermediate Holdings LLC/Logistics Intermediate Finance Corp., Senior Unsecured Notes, 10.000% (10.000% cash or 10.750% PIK) due 2/15/18(a)(b) | | $ | 371,850 | |
| | 330,000 | | | B | | Ultrapetrol Bahamas Ltd., Senior Secured Notes, 8.875% due 6/15/21 | | | 259,050 | |
| | 710,000 | | | B | | Watco Cos LLC/Watco Finance Corp., Company Guaranteed Notes, 6.375% due 4/1/23(a) | | | 726,259 | |
| | 405,000 | | | CCC+ | | WaveDivision Escrow LLC/WaveDivision Escrow Corp., Senior Unsecured Notes, 8.125% due 9/1/20(a) | | | 402,975 | |
| | | | | | XPO Logistics Inc.: | | | | |
| | 860,000 | | | B | | Company Guaranteed Notes, 6.500% due 6/15/22(a) | | | 849,250 | |
| | 170,000 | | | B | | Senior Unsecured Notes, 7.875% due 9/1/19(a) | | | 180,838 | |
| | | | | | | | | | |
| | | | | | Total Transportation Infrastructure | | | 7,518,953 | |
| | | | | | | | | | |
| Wireless Telecommunication Services — 3.0% | |
| | 480,000 | | | B | | Communications Sales & Leasing Inc., Company Guaranteed Notes, 8.250% due 10/15/23(a) | | | 438,000 | |
| | 400,000 | | | BB+ | | Crown Castle International Corp., Senior Unsecured Notes, 5.250% due 1/15/23 | | | 420,000 | |
| | 525,000 | | | BB- | | Frontier Communications Corp., Senior Unsecured Notes, 6.875% due 1/15/25 | | | 446,250 | |
| | 360,000 | | | BB- | | GEO Group Inc. (The), Company Guaranteed Notes, 5.125% due 4/1/23 | | | 360,000 | |
| | 560,000 | | | BB+ | | Oi SA, Senior Unsecured Notes, 5.750% due 2/10/22(a) | | | 406,000 | |
| | 430,000 | | | BB+ | | Softbank Corp., Company Guaranteed Notes, 4.500% due 4/15/20(a) | | | 431,247 | |
| | | | | | Sprint Capital Corp., Company Guaranteed Notes: | | | | |
| | 50,000 | | | B+ | | 6.875% due 11/15/28 | | | 43,125 | |
| | 1,925,000 | | | B+ | | 8.750% due 3/15/32 | | | 1,826,344 | |
| | | | | | Sprint Communications Inc.: | | | | |
| | 420,000 | | | BB | | Company Guaranteed Notes, 9.000% due 11/15/18(a) | | | 468,825 | |
| | | | | | Senior Unsecured Notes: | | | | |
| | 705,000 | | | B+ | | 7.000% due 8/15/20 | | | 697,950 | |
| | 475,000 | | | B+ | | 11.500% due 11/15/21 | | | 543,875 | |
| | | | | | Sprint Corp., Company Guaranteed Notes: | | | | |
| | 1,040,000 | | | B+ | | 7.250% due 9/15/21 | | | 1,014,000 | |
| | 145,000 | | | B+ | | 7.875% due 9/15/23 | | | 139,744 | |
| | 230,000 | | | B+ | | 7.625% due 2/15/25 | | | 215,194 | |
| | 215,000 | | | CCC+ | | Syniverse Holdings Inc., Company Guaranteed Notes, 9.125% due 1/15/19 | | | 187,587 | |
| | | | | | | | | | |
| | | | | | Total Wireless Telecommunication Services | | | 7,638,141 | |
| | | | | | | | | | |
| | | | | | TOTAL CORPORATE BONDS & NOTES
(Cost — $253,450,385) | | | 236,847,328 | |
| | | | | | | | | | |
| SENIOR LOANS — 0.6% | |
| | 340,000 | | | NR | | AP NMT Acquisition BV, (Restricted) 10.000% due 8/13/22 | | | 322,150 | |
| | 134,316 | | | NR | | FMG Resources August 2006 Pty Ltd., (Restricted) 3.750% due 6/30/19 | | | 109,020 | |
| | 150,000 | | | NR | | Gymboree Corp., (Restricted) 5.000% due 2/23/18 | | | 98,140 | |
| | 280,000 | | | NR | | Lantheus Medical Imaging, (Restricted) 7.000% due 6/30/22 | | | 276,150 | |
| | 170,000 | | | NR | | Murray Energy Corp., (Restricted) 7.500% due 4/16/20 | | | 128,138 | |
| | 319,200 | | | NR | | Panda Temple Power LLC, (Restricted) 7.250% due 3/6/22 | | | 303,240 | |
| | 370,000 | | | NR | | Radnet Inc., (Restricted) 8.000% due 3/25/21 | | | 365,606 | |
| | | | | | | | | | |
| | | | | | TOTAL SENIOR LOANS
(Cost — $1,713,359) | | | 1,602,444 | |
| | | | | | | | | | |
| | | |
| Shares/Units | | | | | | | | |
| PREFERRED STOCKS — 0.5% | |
| FINANCIALS — 0.5% | |
| Banks — 0.4% | |
| | 39,709 | | | | | GMAC Capital Trust I, 8.125%(c) | | | 1,013,771 | |
| | | | | | | | | | |
See Notes to Financial Statements.
125
| | | | | | | | | | |
| High Yield Investments | |
| | | |
| Shares/Units | | | | | Security | | Value | |
| Consumer Finance — 0.1% | |
| | 211 | | | | | Ally Financial Inc., 7.000%(a)(d) | | $ | 214,409 | |
| | | | | | | | | | |
| | | | | | TOTAL FINANCIALS | | | 1,228,180 | |
| | | | | | | | | | |
| | | | | | TOTAL PREFERRED STOCKS
(Cost — $1,148,947) | | | 1,228,180 | |
| | | | | | | | | | |
| COMMON STOCKS — 0.1% | |
| CONSUMER DISCRETIONARY — 0.0% | |
| Hotels, Restaurants & Leisure — 0.0% | |
| | 9,953 | | | | | Bossier Casino Venture Holdco Inc. (Restricted)*(a)(g)(h) | | | — | |
| | | | | | | | | | |
| ENERGY — 0.1% | |
| Energy Equipment & Services — 0.1% | |
| | 18,163 | | | | | DeepOcean Group Holdings AS (Restricted)*(a)(g)(h) | | | 117,079 | |
| | | | | | | | | | |
| HEALTH CARE — 0.0% | |
| Health Care Providers & Services — 0.0% | |
| | 1,400 | | | | | Physiotherapy Associates Holdings Inc. (Restricted)*(g)(h) | | | 116,200 | |
| | | | | | | | | | |
| MATERIALS — 0.0% | |
| Metals & Mining — 0.0% | |
| | 353,070 | AUD | | | | Mirabela Nickel Ltd.*(g)(h) | | | 20,857 | |
| | | | | | | | | | |
| | | | | | TOTAL COMMON STOCKS
(Cost — $459,823) | | | 254,136 | |
| | | | | | | | | | |
| WARRANTS — 0.0% | |
| FINANCIALS — 0.0% | |
| Diversified Financial Services — 0.0% | |
| | | | | | Jack Cooper Holdings Corp., expires: | | | | |
| | 376 | | | | | 12/15/17*(a) | | | 52,640 | |
| | 183 | | | | | 5/6/18*(a) | | | 25,620 | |
| | | | | | | | | | |
| | | | | | Total Diversified Financial Services | | | 78,260 | |
| | | | | | | | | | |
| | | | | | TOTAL FINANCIALS | | | 78,260 | |
| | | | | | | | | | |
| | | | | | TOTAL WARRANTS
(Cost — $19,405) | | | 78,260 | |
| | | | | | | | | | |
| | | | | | TOTAL INVESTMENTS BEFORE SHORT-TERM INVESTMENTS
(Cost — $256,791,919) | | | 240,010,348 | |
| | | | | | | | | | |
| | | |
Face
Amount | | | | | | | | |
| SHORT-TERM INVESTMENTS (j) — 8.6% | |
| MONEY MARKET FUND — 3.5% | |
| $ | 8,761,690 | | | | | Invesco STIT — Government & Agency Portfolio(k)
(Cost — $8,761,690) | | | 8,761,690 | |
| | | | | | | | | | |
| TIME DEPOSITS — 5.1% | |
| | 11,518,022 | | | | | ANZ National Bank — London, 0.030% due 9/1/15 | | | 11,518,022 | |
| | 722,801 | | | | | DNB — Oslo, 0.030% due 9/1/15 | | | 722,801 | |
| | 775,339 | | | | | JPMorgan Chase & Co. — New York, 0.030% due 9/1/15 | | | 775,339 | |
| | | | | | | | | | |
| | | | | | TOTAL TIME DEPOSITS
(Cost — $13,016,162) | | | 13,016,162 | |
| | | | | | | | | | |
| | | | | | TOTAL SHORT-TERM INVESTMENTS
(Cost — $21,777,852) | | | 21,777,852 | |
| | | | | | | | | | |
| | | | | | TOTAL INVESTMENTS — 102.9%
(Cost — $278,569,771#) | | | 261,788,200 | |
| | | | | | | | | | |
| | | | | | Liabilities in Excess of Other Assets — (2.9)% | | | (7,450,562 | ) |
| | | | | | | | | | |
| | | | | | TOTAL NET ASSETS — 100.0% | | $ | 254,337,638 | |
| | | | | | | | | | |
See Notes to Financial Statements.
126
| † | Face amount denominated in U.S. dollars, unless otherwise noted. |
| †† | All ratings are by Standard & Poor’s Rating Service, unless otherwise noted. All ratings are unaudited. |
| * | Non-income producing security. |
| (a) | Restricted security that may be sold to ‘‘qualified institutional buyers’’ pursuant to the conditions of Rule 144A under the Securities Act of 1933, as amended. This security has been deemed liquid pursuant to guidelines approved by the Board of Trustees, unless otherwise noted. |
| (b) | Payment in-kind security for which part of the income earned may be paid as additional principal. At the option of the issuer. |
| (c) | Variable rate security. Interest rate disclosed is that which was in effect at August 31, 2015. |
| (d) | Security is perpetual in nature and has no stated maturity date. |
| (e) | Rating by Moody’s Investors Service. All ratings are unaudited. |
| (f) | All or a portion of this security is on loan (See Note 1). |
| (g) | Security is valued in good faith at fair value by or under the direction of the Board of Trustees. |
| (i) | Security is currently in default. |
| (j) | Inclusive of all short term holdings, including collateral received from securities lending activities. Excluding such collateral, the percentage of portfolio holdings would be 5.1%. |
| (k) | Represents investment of collateral received from securities lending transactions. |
| # | Aggregate cost for federal income tax purposes is $280,659,072. |
| | |
Abbreviations used in this schedule: |
| PLC | | — Public Limited Company |
See pages 158 and 159 for definitions of ratings.
| | | | |
| Summary of Investments by Security Type^ | | | |
Corporate Bonds & Notes | | | 90.5 | % |
Senior Loans | | | 0.6 | |
Preferred Stocks | | | 0.5 | |
Common Stocks | | | 0.1 | |
Warrants | | | 0.0 | ** |
Short-Term Investments | | | 8.3 | |
| | | | |
| | | 100.0 | % |
| | | | |
| ^ | As a percentage of total investments. |
| ** | Position represents less than 0.1%. |
See Notes to Financial Statements.
127
| | | | | | | | |
| International Fixed Income Investments | |
| | |
Face Amount/
Units† | | | Security | | Value | |
| SOVEREIGN BONDS — 40.0% | |
| Australia — 0.3% | |
| | 900,000 | AUD | | Queensland Treasury Corp., 4.250% due 7/21/23(a) | | $ | 697,673 | |
| | | | | | | | |
| | Brazil — 0.5% | | | | | | | |
| | | | Brazil Letras do Tesouro Nacional: | | | | |
| | 2,200,000 | BRL | | 0.000% due 7/1/17 — 7/1/18 | | | 438,986 | |
| | | | Brazil Notas do Tesouro Nacional Serie F: | | | | |
| | 2,654,000 | BRL | | 10.000% due 1/1/21 — 1/1/25 | | | 614,209 | |
| | | | | | | | |
| | | | Total Brazil | | | 1,053,195 | |
| | | | | | | | |
| | Canada — 3.2% | | | | | | | |
| | | | Province of Ontario Canada: | | | | |
| $ | 1,000,000 | | | 1.000% due 7/22/16 | | | 1,003,481 | |
| | 1,500,000 | CAD | | 4.200% due 6/2/20 | | | 1,289,876 | |
| | 3,100,000 | CAD | | 3.150% due 6/2/22 | | | 2,555,235 | |
| | 700,000 | CAD | | 3.450% due 6/2/45 | | | 557,818 | |
| | | | Province of Quebec Canada: | | | | |
| | 1,100,000 | CAD | | 3.750% due 9/1/24 | | | 938,343 | |
| | 900,000 | CAD | | 5.000% due 12/1/38 | | | 879,163 | |
| | | | | | | | |
| | | | Total Canada | | | 7,223,916 | |
| | | | | | | | |
| Colombia — 0.2% | | | | |
| | 100,000 | | | Colombia Government International Bond, 2.121% due 11/16/15(b) | | | 100,250 | |
| | | | Colombian TES: | | | | |
| | 447,000,000 | COP | | 5.000% due 11/21/18 | | | 142,529 | |
| | 258,900,000 | COP | | 7.000% due 5/4/22 | | | 84,045 | |
| | 235,200,000 | COP | | 10.000% due 7/24/24 | | | 88,644 | |
| | 146,200,000 | COP | | 7.500% due 8/26/26 | | | 45,930 | |
| | 109,000,000 | COP | | 6.000% due 4/28/28 | | | 29,560 | |
| | | | | | | | |
| | | | Total Colombia | | | 490,958 | |
| | | | | | | | |
| | France — 4.6% | | | | | | | |
| | 1,200,000 | | | Caisse d’Amortissement de la Dette Sociale, 3.375% due 3/20/24(a) | | | 1,284,803 | |
| | | | France Government Bond OAT: | | | | |
| | 1,530,135 | EUR | | 0.250% due 7/25/24 | | | 1,775,451 | |
| | 5,100,000 | EUR | | 3.250% due 5/25/45 | | | 7,213,154 | |
| | | | | | | | |
| | | | Total France | | | 10,273,408 | |
| | | | | | | | |
| Germany — 2.1% | | | | |
| | 2,600,000 | EUR | | Bundesrepublik Deutschland, 4.250% due 7/4/39 | | | 4,591,367 | |
| | | | | | | | |
| | Greece — 0.3% | | | | | | | |
| | 300,000 | EUR | | Athens Urban Transportation Organisation, 4.851% due 9/19/16(c) | | | 282,757 | |
| | 47,000,000 | JPY | | Hellenic Republic Government International Bond, 3.800% due 8/8/17 | | | 328,519 | |
| | | | | | | | |
| | | | Total Greece | | | 611,276 | |
| | | | | | | | |
| Indonesia — 0.2% | | | | |
| | | | Indonesia Treasury Bond: | | | | |
| | 1,862,000,000 | IDR | | 8.250% due 7/15/21 — 6/15/32 | | | 123,643 | |
| | 87,000,000 | IDR | | 7.000% due 5/15/22 | | | 5,649 | |
| | 1,621,000,000 | IDR | | 12.900% due 6/15/22 | | | 139,136 | |
| | 100,000,000 | IDR | | 10.250% due 7/15/22 | | | 7,648 | |
| | 300,000,000 | IDR | | 5.625% due 5/15/23 | | | 17,626 | |
| | 196,000,000 | IDR | | 8.375% due 3/15/24 | | | 13,679 | |
| | 1,231,000,000 | IDR | | 9.000% due 3/15/29 | | | 87,369 | |
| | 181,000,000 | IDR | | 10.500% due 8/15/30 | | | 14,296 | |
See Notes to Financial Statements.
128
| | | | | | | | |
| International Fixed Income Investments | |
| | |
Face Amount/
Units† | | | Security | | Value | |
| Indonesia — 0.2% — (continued) | | | | |
| | 1,902,000,000 | IDR | | 9.500% due 7/15/31 | | $ | 137,614 | |
| | 117,000,000 | IDR | | 6.625% due 5/15/33 | | | 6,455 | |
| | 107,000,000 | IDR | | 8.750% due 2/15/44 | | | 7,074 | |
| | | | | | | | |
| | | | Total Indonesia | | | 560,189 | |
| | | | | | | | |
| Italy — 10.6% | | | | |
| | | | Italy Buoni Poliennali Del Tesoro: | | | | |
| | 6,700,000 | EUR | | 4.500% due 3/1/24 | | | 9,089,392 | |
| | 4,400,000 | EUR | | 3.750% due 9/1/24 | | | 5,687,027 | |
| | 1,600,000 | EUR | | 5.000% due 3/1/25(a) | | | 2,270,168 | |
| | 3,600,000 | EUR | | 4.750% due 9/1/44(a) | | | 5,440,499 | |
| | 600,000 | GBP | | Italy Government International Bond, 6.000% due 8/4/28 | | | 1,121,913 | |
| | | | | | | | |
| | | | Total Italy | | | 23,608,999 | |
| | | | | | | | |
| Japan — 1.9% | | | | |
| | | | Japan Government Thirty Year Bond: | | | | |
| | 20,000,000 | JPY | | 2.500% due 9/20/35 | | | 203,968 | |
| | 220,000,000 | JPY | | 1.700% due 9/20/44 | | | 1,941,651 | |
| | 190,000,000 | JPY | | 1.500% due 12/20/44 | | | 1,599,940 | |
| | 50,000,000 | JPY | | Japan Government Twenty Year Bond, 1.400% due 9/20/34 | | | 433,822 | |
| | | | | | | | |
| | | | Total Japan | | | 4,179,381 | |
| | | | | | | | |
| Malaysia — 0.3% | | | | |
| | | | Malaysia Government Bond: | | | | |
| | 400,000 | MYR | | 4.012% due 9/15/17 | | | 96,543 | |
| | 680,000 | MYR | | 3.260% due 3/1/18 | | | 159,269 | |
| | 900,000 | MYR | | 5.734% due 7/30/19 | | | 226,496 | |
| | 220,000 | MYR | | 4.378% due 11/29/19 | | | 52,784 | |
| | 35,000 | MYR | | 4.160% due 7/15/21 | | | 8,343 | |
| | 300,000 | MYR | | 4.181% due 7/15/24 | | | 69,890 | |
| | 220,000 | MYR | | 4.498% due 4/15/30 | | | 51,656 | |
| | 100,000 | MYR | | 4.935% due 9/30/43 | | | 23,711 | |
| | | | | | | | |
| | | | Total Malaysia | | | 688,692 | |
| | | | | | | | |
| Mexico — 0.2% | | | | |
| | | | Mexican Bonos: | | | | |
| | 3,970,000 | MXN | | 4.750% due 6/14/18 | | | 237,950 | |
| | 1,020,000 | MXN | | 8.000% due 6/11/20 | | | 68,185 | |
| | 590,000 | MXN | | 7.750% due 11/23/34 | | | 39,916 | |
| | | | | | | | |
| | | | Total Mexico | | | 346,051 | |
| | | | | | | | |
| New Zealand — 0.1% | | | | |
| | 300,000 | NZD | | New Zealand Government Bond, 5.500% due 4/15/23 | | | 223,304 | |
| | | | | | | | |
| Peru — 0.0% | | | | |
| | | | Peruvian Government International Bond: | | | | |
| | 100,000 | PEN | | 8.200% due 8/12/26(c) | | | 32,912 | |
| | 260,000 | PEN | | 6.950% due 8/12/31 | | | 75,045 | |
| | 40,000 | PEN | | 6.950% due 8/12/31(a) | | | 11,545 | |
| | | | | | | | |
| | | | Total Peru | | | 119,502 | |
| | | | | | | | |
| Poland — 0.6% | | | | |
| | | | Poland Government Bond: | | | | |
| | 610,000 | PLN | | 5.250% due 10/25/17 — 10/25/20 | | | 174,640 | |
| | 400,000 | PLN | | 2.500% due 7/25/18 | | | 107,263 | |
| | 2,850,000 | PLN | | 3.250% due 7/25/19 — 7/25/25 | | | 773,458 | |
| | 300,000 | PLN | | 1.500% due 4/25/20 | | | 76,154 | |
See Notes to Financial Statements.
129
| | | | | | | | |
| International Fixed Income Investments | |
| | |
Face Amount/
Units† | | | Security | | Value | |
| Poland — 0.6% — (continued) | | | | |
| | 500,000 | PLN | | 5.750% due 10/25/21 — 9/23/22 | | $ | 157,075 | |
| | 500,000 | PLN | | 4.000% due 10/25/23 | | | 143,394 | |
| | | | | | | | |
| | | | Total Poland | | | 1,431,984 | |
| | | | | | | | |
| Romania — 0.1% | | | | |
| | | | Romania Government Bond: | | | | |
| | 100,000 | RON | | 5.800% due 10/26/15 | | | 25,493 | |
| | 300,000 | RON | | 5.750% due 1/27/16 — 4/29/20 | | | 80,422 | |
| | 100,000 | RON | | 5.900% due 7/26/17 | | | 27,390 | |
| | 200,000 | RON | | 4.750% due 2/24/25 | | | 54,950 | |
| | | | | | | | |
| | | | Total Romania | | | 188,255 | |
| | | | | | | | |
| Russia — 0.1% | |
| | | | Russian Federal Bond — OFZ: | | | | |
| | 3,500,000 | RUB | | 7.500% due 3/15/18 — 2/27/19 | | | 49,564 | |
| | 1,800,000 | RUB | | 7.600% due 7/20/22 | | | 23,044 | |
| | 1,500,000 | RUB | | 7.050% due 1/19/28 | | | 16,934 | |
| | 5,000,000 | RUB | | Russian Foreign Bond — Eurobond, 7.850% due 3/10/18 | | | 71,209 | |
| | | | | | | | |
| | | | Total Russia | | | 160,751 | |
| | | | | | | | |
| Slovenia — 2.6% | |
| | 1,400,000 | EUR | | Slovenia Government Bond, 4.625% due 9/9/24 | | | 1,925,101 | |
| | | | Slovenia Government International Bond: | | | | |
| $ | 1,800,000 | | | 4.750% due 5/10/18 | | | 1,916,910 | |
| | 800,000 | | | 4.125% due 2/18/19 | | | 842,344 | |
| | 400,000 | | | 5.500% due 10/26/22 | | | 450,458 | |
| | 700,000 | | | 5.250% due 2/18/24 | | | 773,675 | |
| | | | | | | | |
| | | | Total Slovenia | | | 5,908,488 | |
| | | | | | | | |
| South Africa — 0.3% | |
| | | | Eskom Holdings SOC Ltd.: | | | | |
| | 1,500,000 | ZAR | | 0.000% due 8/18/27 — 12/31/32 | | | 18,571 | |
| | | | South Africa Government Bond: | | | | |
| | 3,300,000 | ZAR | | 8.250% due 9/15/17 — 3/31/32 | | | 242,003 | |
| | 1,740,000 | ZAR | | 7.250% due 1/15/20 | | | 128,334 | |
| | 100,000 | ZAR | | 7.750% due 2/28/23 | | | 7,364 | |
| | 1,400,000 | ZAR | | 8.000% due 1/31/30 | | | 99,409 | |
| | 3,300,000 | ZAR | | 7.000% due 2/28/31 | | | 212,385 | |
| | 100,000 | ZAR | | 8.875% due 2/28/35 | | | 7,509 | |
| | 400,000 | ZAR | | 6.250% due 3/31/36 | | | 22,826 | |
| | 300,000 | ZAR | | 8.500% due 1/31/37 | | | 21,740 | |
| | | | | | | | |
| | | | Total South Africa | | | 760,141 | |
| | | | | | | | |
| South Korea — 1.1% | |
| | 2,200,000 | | | Export-Import Bank of Korea, 5.000% due 4/11/22 | | | 2,461,736 | |
| | | | | | | | |
| Spain — 4.9% | |
| | 400,000 | EUR | | Autonomous Community of Catalonia, 4.300% due 11/15/16 | | | 460,521 | |
| | 500,000 | EUR | | Autonomous Community of Madrid Spain, 4.125% due 5/21/24 | | | 635,474 | |
| | | | Spain Government Bond: | | | | |
| | 2,100,000 | EUR | | 4.800% due 1/31/24(a) | | | 2,888,948 | |
| | 4,100,000 | EUR | | 3.800% due 4/30/24(a) | | | 5,276,434 | |
| | 1,250,000 | EUR | | Xunta de Galicia, 6.964% due 12/28/17 | | | 1,618,407 | |
| | | | | | | | |
| | | | Total Spain | | | 10,879,784 | |
| | | | | | | | |
See Notes to Financial Statements.
130
| | | | | | | | |
| International Fixed Income Investments | |
| | |
Face Amount/
Units† | | | Security | | Value | |
| Sweden — 0.7% | |
| | | | Sweden Government Bond: | | | | |
| | 7,500,000 | SEK | | 4.250% due 3/12/19 | | $ | 1,028,450 | |
| | 3,500,000 | SEK | | 2.500% due 5/12/25 | | | 483,905 | |
| | | | | | | | |
| | | | Total Sweden | | | 1,512,355 | |
| | | | | | | | |
| Thailand — 0.1% | |
| | | | Thailand Government Bond: | | | | |
| | 900,000 | THB | | 3.650% due 12/17/21 | | | 26,720 | |
| | 8,279,334 | THB | | 1.250% due 3/12/28 | | | 200,679 | |
| | | | | | | | |
| | | | Total Thailand | | | 227,399 | |
| | | | | | | | |
| Turkey — 0.2% | |
| | | | Turkey Government Bond: | | | | |
| | 100,000 | TRY | | 6.300% due 2/14/18 | | | 31,346 | |
| | 380,000 | TRY | | 8.800% due 11/14/18 — 9/27/23 | | | 122,864 | |
| | 200,000 | TRY | | 10.400% due 3/27/19 — 3/20/24 | | | 69,604 | |
| | 200,000 | TRY | | 7.400% due 2/5/20 | | | 62,073 | |
| | 68,065 | TRY | | 3.000% due 7/21/21 | | | 23,264 | |
| | 300,000 | TRY | | 7.100% due 3/8/23 | | | 87,390 | |
| | 100,000 | TRY | | 9.000% due 7/24/24 | | | 32,307 | |
| | 44,000 | TRY | | 8.000% due 3/12/25 | | | 13,339 | |
| | | | | | | | |
| | | | Total Turkey | | | 442,187 | |
| | | | | | | | |
| United Kingdom — 4.8% | |
| | | | United Kingdom Gilt: | | | | |
| | 3,900,000 | GBP | | 3.250% due 1/22/44 | | | 6,802,704 | |
| | 2,100,000 | GBP | | 3.500% due 1/22/45 | | | 3,841,507 | |
| | | | | | | | |
| | | | Total United Kingdom | | | 10,644,211 | |
| | | | | | | | |
| | | | TOTAL SOVEREIGN BONDS
(Cost — $94,124,645) | | | 89,285,202 | |
| | | | | | | | |
| CORPORATE BONDS & NOTES — 38.1% | |
| Austria — 0.1% | |
| | 200,000 | EUR | | Heta Asset Resolution AG, Senior Unsecured Notes, 0.056% due 5/31/16 | | | 145,867 | |
| | | | | | | | |
| Cayman Islands — 0.6% | |
| $ | 900,000 | | | IPIC GMTN Ltd., Company Guaranteed Notes, 5.500% due 3/1/22(a) | | | 1,027,125 | |
| | 300,000 | | | NB Finance Ltd., Company Guaranteed Notes, 3.500% due 12/6/15 | | | 298,875 | |
| | | | | | | | |
| | | | Total Cayman Islands | | | 1,326,000 | |
| | | | | | | | |
| Colombia — 0.1% | |
| | 324,000,000 | COP | | Empresas Publicas de Medellin ESP, Senior Unsecured Notes, 8.375% due 2/1/21 | | | 111,108 | |
| | 95,000,000 | COP | | Financiera de Desarrollo Territorial SA Findeter, Senior Unsecured Notes, 7.875% due 8/12/24(a) | | | 29,608 | |
| | | | | | | | |
| | | | Total Colombia | | | 140,716 | |
| | | | | | | | |
| Denmark — 11.6% | |
| | | | Nykredit Realkredit AS, Covered Notes: | | | | |
| | 46,000,000 | DKK | | 1.000% due 10/1/16 | | | 6,985,374 | |
| | 47,100,000 | DKK | | 2.000% due 10/1/15 | | | 7,191,999 | |
| | 6,300,000 | DKK | | 2.000% due 1/1/16 | | | 954,841 | |
| | 71,200,000 | DKK | | Realkredit Danmark AS, Covered Notes, 2.000% due 1/1/16 | | | 10,782,162 | |
| | | | | | | | |
| | | | Total Denmark | | | 25,914,376 | |
| | | | | | | | |
| France — 0.8% | �� |
| | | | Credit Agricole SA: | | | | |
| | 600,000 | | | Junior Subordinated Notes, 7.875%(b)(d) | | | 613,613 | |
| | 1,200,000 | | | Senior Unsecured Notes, 0.833% due 6/12/17(a)(b) | | | 1,199,760 | |
| | | | | | | | |
| | | | Total France | | | 1,813,373 | |
| | | | | | | | |
See Notes to Financial Statements.
131
| | | | | | | | |
| International Fixed Income Investments | |
| | |
Face Amount/
Units† | | | Security | | Value | |
| Germany — 5.8% | |
| | 400,000 | GBP | | FMS Wertmanagement AoeR, Government Guaranteed Notes, 0.750% due 12/15/17 | | $ | 608,611 | |
| | 6,400,000 | EUR | | KFW, Government Guaranteed Notes, 3.625% due 1/20/20 | | | 8,291,479 | |
| | | | Landwirtschaftliche Rentenbank, Government Guaranteed Notes: | | | | |
| | 4,300,000 | NZD | | 4.750% due 3/12/19 | | | 2,870,777 | |
| | 1,200,000 | AUD | | 5.500% due 3/29/22 | | | 986,712 | |
| | 100,000 | AUD | | 4.250% due 1/24/23 | | | 76,693 | |
| | | | | | | | |
| | | | Total Germany | | | 12,834,272 | |
| | | | | | | | |
| Greece — 0.5% | |
| | 1,100,000 | EUR | | National Bank of Greece SA, Covered Notes, 3.875% due 10/7/16(c) | | | 1,122,025 | |
| | | | | | | | |
| Ireland — 2.2% | |
| | | | Depfa ACS Bank, Covered Notes: | | | | |
| | 2,400,000 | EUR | | 3.875% due 11/14/16 | | | 2,813,159 | |
| | 900,000 | EUR | | 4.875% due 5/21/19 | | | 1,179,014 | |
| | 500,000 | EUR | | German Postal Pensions Securitisation 2 PLC, Government Guaranteed Notes, 4.250% due 1/18/17 | | | 593,581 | |
| | 11,200,000 | RUB | | Novatek OAO via Novatek Finance Ltd., Senior Unsecured Notes, 7.750% due 2/21/17(a) | | | 166,121 | |
| | 9,500,000 | RUB | | Russian Railways via RZD Capital PLC, Senior Unsecured Notes, 8.300% due 4/2/19 | | | 131,074 | |
| | | | | | | | |
| | | | Total Ireland | | | 4,882,949 | |
| | | | | | | | |
| Italy — 2.8% | |
| | | | Banca Carige SpA, Covered Notes: | | | | |
| | 900,000 | EUR | | 3.750% due 11/25/16 | | | 1,050,929 | |
| | 400,000 | EUR | | 3.875% due 10/24/18 | | | 492,902 | |
| | | | Banca Monte dei Paschi di Siena SpA, Covered Notes: | | | | |
| | 800,000 | EUR | | 4.875% due 9/15/16 | | | 939,018 | |
| | 500,000 | EUR | | 5.000% due 2/9/18 | | | 623,882 | |
| | 900,000 | EUR | | Banco Popolare SC, Senior Unsecured Notes, 3.500% due 3/14/19 | | | 1,038,318 | |
| | 1,700,000 | EUR | | UniCredit SpA, Subordinated Notes, 5.750% due 10/28/25(b) | | | 2,074,911 | |
| | | | | | | | |
| | | | Total Italy | | | 6,219,960 | |
| | | | | | | | |
| Jersey Channel Islands — 0.1% | |
| | 200,000 | GBP | | HBOS Capital Funding LP, Company Guaranteed Notes, 9.540%(b)(d) | | | 324,701 | |
| | | | | | | | |
| Luxembourg — 0.4% | |
| | 600,000 | EUR | | Erste Europaische Pfandbrief und Kommunalkreditbank AG in Luxemburg SA, Covered Notes, 4.250% due 6/4/18 | | | 738,343 | |
| | 5,000,000 | RUB | | Sberbank of Russia Via SB Capital SA, Senior Unsecured Notes, 7.000% due 1/31/16 | | | 76,532 | |
| | | | | | | | |
| | | | Total Luxembourg | | | 814,875 | |
| | | | | | | | |
| Mexico — 0.0% | |
| | 100,000 | MXN | | Petroleos Mexicanos, Company Guaranteed Notes, 9.150% due 3/28/16 | | | 6,392 | |
| | | | | | | | |
| Netherlands — 0.7% | |
| | 700,000 | CAD | | Bank Nederlandse Gemeenten NV, Senior Unsecured Notes, 2.125% due 10/1/19(a) | | | 548,917 | |
| | | | Cooperatieve Centrale Raiffeisen-Boerenleenbank BA: | | | | |
| $ | 100,000 | | | Junior Subordinated Notes, 8.375%(b)(d) | | | 104,155 | |
| | 550,000 | EUR | | Senior Unsecured Notes, 6.875% due 3/19/20 | | | 740,499 | |
| | 200,000 | | | Petrobras Global Finance BV, Company Guaranteed Notes, 3.875% due 1/27/16 | | | 200,144 | |
| | | | | | | | |
| | | | Total Netherlands | | | 1,593,715 | |
| | | | | | | | |
| Norway — 0.7% | |
| | | | Eksportfinans ASA, Senior Unsecured Notes: | | | | |
| | 900,000 | | | 2.375% due 5/25/16 | | | 901,125 | |
| | 100,000 | CHF | | 2.875% due 11/16/16 | | | 105,301 | |
| | 500,000 | | | 5.500% due 6/26/17 | | | 527,540 | |
| | | | | | | | |
| | | | Total Norway | | | 1,533,966 | |
| | | | | | | | |
See Notes to Financial Statements.
132
| | | | | | | | |
| International Fixed Income Investments | |
| | |
Face Amount/
Units† | | | Security | | Value | |
| Portugal — 0.4% | |
| | | | Novo Banco SA: | | | | |
| | | | Senior Unsecured Notes: | | | | |
| | 200,000 | EUR | | 4.750% due 1/15/18 | | $ | 227,920 | |
| | 200,000 | EUR | | 4.000% due 1/21/19 | | | 221,250 | |
| | 300,000 | EUR | | Unsecured Notes, 5.000% due 4/4/19 | | | 344,053 | |
| | | | | | | | |
| | | | Total Portugal | | | 793,223 | |
| | | | | | | | |
| South Korea — 0.4% | |
| $ | 850,000 | | | Korea Development Bank (The), Senior Unsecured Notes, 4.000% due 9/9/16 | | | 873,811 | |
| | | | | | | | |
| Spain — 0.9% | |
| | 1,000,000 | EUR | | Banco Popular Espanol SA, Junior Subordinated Notes, 8.250%(b)(d) | | | 1,116,588 | |
| | 900,000 | EUR | | Banco Santander SA, Junior Subordinated Notes, 6.250%(b)(d) | | | 987,200 | |
| | | | | | | | |
| | | | Total Spain | | | 2,103,788 | |
| | | | | | | | |
| Supranational — 0.7% | |
| | 1,400,000 | NZD | | Asian Development Bank, Senior Unsecured Notes, 4.625% due 3/6/19 | | | 932,977 | |
| | | | European Investment Bank, Senior Unsecured Notes: | | | | |
| | 500,000 | AUD | | 0.500% due 6/21/23 | | | 279,408 | |
| | 800,000 | AUD | | 0.500% due 8/10/23 | | | 440,698 | |
| | | | | | | | |
| | | | Total Supranational | | | 1,653,083 | |
| | | | | | | | |
| Switzerland — 0.9% | |
| | | | UBS AG, Subordinated Notes: | | | | |
| $ | 600,000 | | | 7.250% due 2/22/22(b) | | | 631,657 | |
| | 250,000 | | | 7.625% due 8/17/22 | | | 291,300 | |
| | 700,000 | | | 4.750% due 5/22/23(b) | | | 714,526 | |
| | 400,000 | | | 5.125% due 5/15/24 | | | 400,901 | |
| | | | | | | | |
| | | | Total Switzerland | | | 2,038,384 | |
| | | | | | | | |
| United Kingdom — 2.4% | |
| | | | Barclays Bank PLC: | | | | |
| | 400,000 | | | Junior Subordinated Notes, 8.250%(b)(d) | | | 425,098 | |
| | | | Subordinated Notes: | | | | |
| | 400,000 | | | 7.625% due 11/21/22 | | | 456,750 | |
| | 1,600,000 | | | 7.750% due 4/10/23(b) | | | 1,730,000 | |
| | 500,000 | | | HBOS PLC, Subordinated Notes, 6.750% due 5/21/18(a) | | | 552,981 | |
| | 200,000 | GBP | | LBG Capital No.2 PLC, Company Guaranteed Notes, 15.000% due 12/21/19 | | | 432,504 | |
| | 600,000 | GBP | | Lloyds Banking Group PLC, Junior Subordinated Notes, 7.625%(b)(d) | | | 951,452 | |
| | 767,000 | | | Royal Bank of Scotland PLC (The), Subordinated Notes, 9.500% due 3/16/22(b) | | | 841,796 | |
| | | | | | | | |
| | | | Total United Kingdom | | | 5,390,581 | |
| | | | | | | | |
| United States — 6.0% | |
| | | | Ally Financial Inc.: | | | | |
| | 200,000 | | | Company Guaranteed Notes, 3.500% due 7/18/16 | | | 202,500 | |
| | 300,000 | | | Senior Unsecured Notes, 3.250% due 9/29/17 | | | 300,750 | |
| | 800,000 | EUR | | BA Covered Bond Issuer, Covered Notes, 4.250% due 4/5/17 | | | 955,816 | |
| | 900,000 | EUR | | Bank of America Corp., Subordinated Notes, 0.679% due 5/23/17(b) | | | 1,004,471 | |
| | 700,000 | | | CCO Safari II LLC, Senior Secured Notes, 4.464% due 7/23/22(a) | | | 697,514 | |
| | 600,000 | | | Citigroup Inc., Junior Subordinated Notes, 5.950%(b)(d) | | | 574,500 | |
| | 200,000 | | | DISH DBS Corp., Company Guaranteed Notes, 7.125% due 2/1/16 | | | 203,250 | |
| | 3,600,000 | | | General Motors Financial Co., Inc., Company Guaranteed Notes, 4.000% due 1/15/25 | | | 3,421,044 | |
| | 500,000 | AUD | | Goldman Sachs Group Inc. (The), Senior Unsecured Notes, 2.660% due 4/12/16(b) | | | 355,419 | |
| | 100,000 | | | HCA Inc., Company Guaranteed Notes, 6.500% due 2/15/16 | | | 102,000 | |
See Notes to Financial Statements.
133
| | | | | | | | |
| International Fixed Income Investments | |
| | |
Face Amount/
Units† | | | Security | | Value | |
| United States — 6.0% — (continued) | |
| | | | International Lease Finance Corp.: | | | | |
| $ | 200,000 | | | Senior Secured Notes, 6.750% due 9/1/16(a) | | $ | 208,290 | |
| | | | Senior Unsecured Notes: | | | | |
| | 200,000 | | | 8.625% due 9/15/15 | | | 221,500 | |
| | 100,000 | | | 5.750% due 5/15/16 | | | 102,000 | |
| | 1,200,000 | | | JPMorgan Chase & Co., Unsecured Notes, 0.845% due 4/25/18(b) | | | 1,195,919 | |
| | 1,300,000 | | | Lehman Brothers Holdings Inc., Senior Unsecured Notes, 0.000% due 12/30/16(c) | | | 136,435 | |
| | 200,000 | | | MGM Resorts International, Company Guaranteed Notes, 7.500% due 6/1/16 | | | 207,500 | |
| | 600,000 | | | Springleaf Finance Corp., Company Guaranteed Notes, 5.400% due 12/1/15 | | | 602,250 | |
| | 1,000,000 | | | Starwood Hotels & Resorts Worldwide Inc., Senior Unsecured Notes, 6.750% due 5/15/18 | | | 1,108,174 | |
| | 100,000 | | | Time Warner Cable Inc., Company Guaranteed Notes, 5.850% due 5/1/17 | | | 106,124 | |
| | 400,000 | | | T-Mobile USA Inc., Company Guaranteed Notes, 6.375% due 3/1/25 | | | 409,800 | |
| | 1,300,000 | | | Verizon Communications Inc., Senior Unsecured Notes, 1.816% due 9/15/16(b) | | | 1,314,317 | |
| | | | | | | | |
| | | | Total United States | | | 13,429,573 | |
| | | | | | | | |
| | | | TOTAL CORPORATE BONDS & NOTES
(Cost — $89,727,112) | | | 84,955,630 | |
| | | | | | | | |
| COLLATERALIZED MORTGAGE OBLIGATIONS—12.1% | |
| | | | ALBA PLC: | | | | |
| | 600,000 | GBP | | Series 2007-1, Class A3, 0.743% due 3/17/39(b) | | | 831,750 | |
| | 659,054 | GBP | | Series 2015-1, Class A, 1.759% due 4/24/49(b) | | | 1,001,719 | |
| | 525,712 | | | Atrium CDO Corp., Series 7AR, Class AR, 1.421% due 11/16/22(a)(b) | | | 525,659 | |
| | 1,572,635 | | | Banc of America Alternative Loan Trust, Series 2006-3, Class 5CB1, 6.500% due 4/25/36 | | | 1,349,970 | |
| | 68,147 | | | Banc of America Funding Trust, Series 2006-A, Class 1A1, step bond to yield, 2.675% due 2/20/36(b) | | | 67,796 | |
| | 264,975 | | | Banc of America Large Loan Inc., Series 2010-UB5, Class A4A, 5.675% due 2/17/51(a)(b) | | | 274,009 | |
| | 67,488 | | | Banc of America Mortgage Trust, Series 2003-F, Class 3A1, 2.748% due 7/25/33(b) | | | 67,875 | |
| | | | Bear Stearns Adjustable Rate Mortgage Trust: | | | | |
| | 12,392 | | | Series 2003-5, Class 1A2, 2.564% due 8/25/33(b) | | | 12,414 | |
| | 21,974 | | | Series 2003-7, Class 6A, 2.471% due 10/25/33(b) | | | 22,210 | |
| | 62,076 | | | Series 2004-2, Class 22A, 2.649% due 5/25/34(b) | | | 60,113 | |
| | 12,511 | | | Series 2004-2, Class 23A, 2.459% due 5/25/34(b) | | | 11,640 | |
| | 26,152 | | | Series 2005-2, Class A2, 2.515% due 3/25/35(b) | | | 26,517 | |
| | 176,771 | | | Bear Stearns Structured Products Trust, Series 2007-R6, Class 1A1, 2.502% due 1/26/36(b) | | | 143,923 | |
| | 275,960 | EUR | | Casa d’este Finance, Series 1, Class A2, 0.336% due 9/15/40(b) | | | 304,019 | |
| | 716,547 | EUR | | Claris ABS, Series 2011-1, Class A, 0.412% due 10/31/60(b) | | | 784,369 | |
| | 1,200,000 | | | Commercial Mortgage Trust, Series 2014-KYO, Class A, 1.092% due 6/11/27(a)(b) | | | 1,197,279 | |
| | | | Countrywide Alternative Loan Trust: | | | | |
| | 15,067 | | | Series 2005-21CB, Class A3, 5.250% due 6/25/35 | | | 13,962 | |
| | 90,616 | | | Series 2007-11T1, Class A12, 0.549% due 5/25/37(b) | | | 54,104 | |
| | 40,638 | | | Series 2007-16CB, Class 5A1, 6.250% due 8/25/37 | | | 34,940 | |
| | 49,975 | | | Series 2007-7T2, Class A9, 6.000% due 4/25/37 | | | 37,012 | |
| | | | Countrywide Home Loan Mortgage Pass Through Trust: | | | | |
| | 10,031 | | | Series 2004-12, Class 11A1, 2.766% due 8/25/34(b) | | | 8,947 | |
| | 45,081 | | | Series 2005-11, Class 3A1, 2.427% due 4/25/35(b) | | | 37,744 | |
| | 181,163 | | | Series 2005-2, Class 1A1, 0.519% due 3/25/35(b) | | | 139,173 | |
| | 21,011 | | | Series 2005-3, Class 2A1, 0.489% due 4/25/35(b) | | | 17,579 | |
| | 153,194 | | | Series 2005-9, Class 1A3, 0.429% due 5/25/35(b) | | | 130,348 | |
| | 70,174 | | | Series 2005-HYB9, Class 3A2A, 2.313% due 2/20/36(b) | | | 65,334 | |
| | 21,150 | | | Credit Suisse First Boston Mortgage Securities Corp., Series 2003-AR20, Class 2A1, 2.579% due 8/25/33(b) | | | 21,338 | |
| | 220,692 | | | CSAB Mortgage Backed Trust, Series 2006-4, Class A6A, step bond to yield, 5.684% due 12/25/36 | | | 138,203 | |
| | 48,236 | | | Credit Suisse Mortgage Capital Trust, Series 2007-5R, Class A5, 6.500% due 7/26/36 | | | 28,956 | |
| | 659,490 | GBP | | DECO 12-UK 4 PLC, Series 2007-C4X, Class A1, 0.741% due 1/27/20(b) | | | 981,723 | |
| | 345,816 | GBP | | Eurohome UK Mortgages PLC, Series 2007-1, Class A, 0.721% due 6/15/44(b) | | | 493,478 | |
| | | | Eurosail-UK PLC: | | | | |
| | 293,689 | GBP | | Series 2007-4X, Class A2A, 0.871% due 6/13/45(b) | | | 447,905 | |
| | 500,000 | GBP | | Series 2007-4X, Class A3, 1.521% due 6/13/45(b)(c) | | | 736,906 | |
| | 638,667 | GBP | | Series 2007-6NCX, Class A2A, 1.271% due 9/13/45(b) | | | 967,840 | |
See Notes to Financial Statements.
134
| | | | | | | | |
| International Fixed Income Investments | |
| | |
Face Amount/
Units† | | | Security | | Value | |
| | | | Federal Home Loan Mortgage Corp. (FHLMC): | | | | |
| $ | 51,347 | | | Series T-35, Class A, 0.479% due 9/25/31(b) | | $ | 50,751 | |
| | 75,622 | | | Series T-62, Class 1A1, 1.368% due 10/25/44(b) | | | 77,417 | |
| | | | Federal Home Loan Mortgage Corp. (FHLMC), REMICS: | | | | |
| | 77,700 | | | Series 2391, Class FJ, 0.698% due 4/15/28(b) | | | 78,766 | |
| | 121,346 | | | Series 2614, Class SJ, 19.119% due 5/15/33(b) | | | 173,564 | |
| | 27,696 | | | Series 3174, Class FM, 0.438% due 5/15/36(b) | | | 27,700 | |
| | 12,687 | | | Federal National Mortgage Association (FNMA), Grantor Trust, Series 2004-T3, Class 1A1, 6.000% due 2/25/44 | | | 14,526 | |
| | | | Federal National Mortgage Association (FNMA), REMICS: | | | | |
| | 10,213 | | | Series 2003-34, Class A1, 6.000% due 4/25/43 | | | 11,256 | |
| | 1,895 | | | Series 2005-120, Class NF, 0.299% due 1/25/21(b) | | | 1,895 | |
| | 89,639 | | | Federal National Mortgage Association (FNMA), Whole Loan, Series 2004-W12, Class 1A1, 6.000% due 7/25/44 | | | 102,633 | |
| | 487,096 | EUR | | German Residential Funding Ltd., Series 2013-2, Class A, 0.967% due 11/27/24(b) | | | 549,689 | |
| | 466,657 | EUR | | German Residential Funding PLC, Series 2013-1, Class A, 1.117% due 8/27/24(b) | | | 527,801 | |
| | 262,731 | EUR | | Giovecca Mortgages SRL, Series 2011-1, Class A, 0.581% due 4/23/48(b) | | | 293,050 | |
| | 111,637 | | | GMACM Mortgage Loan Trust , Series 2005-AR6, Class 3A1, 2.848% due 11/19/35(b) | | | 104,672 | |
| | 25,730 | | | GSR Mortgage Loan Trust, Series 2003-1, Class A2, 1.860% due 3/25/33(b) | | | 25,381 | |
| | | | Harborview Mortgage Loan Trust: | | | | |
| | 22,285 | | | Series 2003-1, Class A, 2.526% due 5/19/33(b) | | | 22,183 | |
| | 41,482 | | | Series 2005-2, Class 2A1A, 0.425% due 5/19/35(b) | | | 34,610 | |
| | 106,139 | | | Series 2005-3, Class 2A1A, 0.445% due 6/19/35(b) | | | 92,347 | |
| | 144,645 | | | Series 2006-SB1, Class A1A, 1.034% due 12/19/36(b) | | | 121,434 | |
| | 193,400 | | | Series 2007-1, Class 2A1A, 0.335% due 3/19/37(b) | | | 165,788 | |
| | | | JPMorgan Mortgage Trust: | | | | |
| | 12,275 | | | Series 2003-A2, Class 3A1, 1.990% due 11/25/33(b) | | | 12,278 | |
| | 5,636 | | | Series 2005-A1, Class 6T1, 2.648% due 2/25/35(b) | | | 5,637 | |
| | 181,641 | | | JPMorgan Resecuritization Trust, Series 2009-7, Class 17A1, 5.533% due 7/27/37(a)(b) | | | 177,866 | |
| | 659,077 | EUR | | Leo-Mesdag BV, Series 2006-1, Class A, 0.347% due 8/29/19(b) | | | 725,652 | |
| | | | Ludgate Funding PLC: | | | | |
| | 821,991 | GBP | | Series 2006-1X, Class A2A, 0.757% due 12/1/60(b) | | | 1,134,584 | |
| | 791,183 | GBP | | Series 2007-1, Class A2A, 0.737% due 1/1/61(b) | | | 1,093,149 | |
| | 156,155 | EUR | | Lunet RMBS BV, Series 2013-1, Class A1, 0.486% due 12/26/45(b) | | | 175,574 | |
| | | | Merrill Lynch Mortgage Investors Trust: | | | | |
| | 14,562 | | | Series 2003-A2, Class 1A1, 2.182% due 2/25/33(b) | | | 14,010 | |
| | 60,446 | | | Series 2005-2, Class 1A, 1.673% due 10/25/35(b) | | | 58,923 | |
| | 193,310 | | | Merrill Lynch Mortgage Trust, Series 2007-C1, Class ASB, 6.032% due 6/12/50(b) | | | 193,813 | |
| | 44,127 | GBP | | Money Partners Securities 4 PLC, Series 4X, Class A1A, 0.951% due 3/15/40(b) | | | 63,765 | |
| | 1,200,000 | | | Neuberger Berman CLO XII Ltd., Series 2012-12AR, Class A2R, 1.445% due 7/25/23(a)(b) | | | 1,201,461 | |
| | 700,000 | GBP | | Newgate Funding, Series 2007-1X, Class A3, 0.728% due 12/1/50(b) | | | 922,652 | |
| | 569,706 | | | Octagon Investment Partners XII Ltd., Series 2012-1AR, Class AR, 1.574% due 5/5/23(a)(b) | | | 567,855 | |
| | | | Puma Finance Pty Ltd.: | | | | |
| | 443,520 | AUD | | Series 2014-1, Class A, 2.955% due 5/13/45 | | | 315,684 | |
| | 430,740 | AUD | | Series 2014-2, Class A, 2.830% due 10/18/45(b) | | | 305,926 | |
| | 71,208 | | | Series G5, Class A1, 0.473% due 2/21/38(a)(b) | | | 71,073 | |
| | | | RALI Trust: | | | | |
| | 88,426 | | | Series 2007-QO2, Class A1, 0.349% due 2/25/47(b) | | | 50,708 | |
| | 651,599 | | | Series 2007-QS1, Class 1A1, 6.000% due 1/25/37 | | | 549,652 | |
| | | | Residential Asset Securitization Trust: | | | | |
| | 31,928 | | | Series 2005-A15, Class 5A1, 5.750% due 2/25/36 | | | 26,349 | |
| | 68,387 | | | Series 2006-R1, Class A2, 0.599% due 1/25/46(b) | | | 35,354 | |
| | 671,199 | GBP | | Residential Mortgage Securities 28 PLC, Series 28, Class A, 1.721% due 6/15/46 | | | 1,017,555 | |
| | 383,465 | GBP | | ResLoC UK PLC, Series 2007-1X, Class A3B, 0.731% due 12/15/43(b) | | | 528,464 | |
| | | | RMAC Securities No 1 PLC: | | | | |
| | 360,718 | GBP | | Series 2006-NS1X, Class A2A, 0.721% due 6/12/44(b) | | | 506,332 | |
| | 678,251 | GBP | | Series 2006-NS3X, Class A2A, 0.721% due 6/12/44(b) | | | 937,664 | |
See Notes to Financial Statements.
135
| | | | | | | | |
| International Fixed Income Investments | |
| | |
Face Amount/
Units† | | | Security | | Value | |
| | | | Structured Adjustable Rate Mortgage Loan Trust: | | | | |
| $ | 16,461 | | | Series 2004-1, Class 4A1, 2.563% due 2/25/34(b) | | $ | 16,508 | |
| | 74,620 | | | Series 2004-19, Class 2A1, 1.598% due 1/25/35(b) | | | 60,371 | |
| | 68,282 | | | Series 2004-4, Class 3A2, 2.487% due 4/25/34(b) | | | 68,471 | |
| | | | Structured Asset Mortgage Investments II Trust: | | | | |
| | 91,832 | | | Series 2005-AR2, Class 2A1, 0.429% due 5/25/45(b) | | | 81,256 | |
| | 107,708 | | | Series 2005-AR8, Class A1A, 0.479% due 2/25/36(b) | | | 87,895 | |
| | 68,369 | | | Series 2006-AR5, Class 1A1, 0.409% due 5/25/46(b) | | | 54,134 | |
| | 370,707 | | | Series 2007-AR4, Class A3, 0.419% due 9/25/47(b) | | | 298,324 | |
| | 161,292 | | | Series 2007-AR6, Class A1, 1.684% due 8/25/47(b) | | | 135,372 | |
| | 153,255 | | | Structured Asset Securities Corp. Trust, Series 2005-10, Class 4A1, 5.500% due 12/25/34 | | | 153,708 | |
| | 96,631 | AUD | | Torrens Trust, Series 2007-1, Class A, 2.465% due 10/19/38(b) | | | 68,777 | |
| | | | Wachovia Bank Commercial Mortgage Trust: | | | | |
| | 900,000 | | | Series 2006-C23, Class A5, 5.416% due 1/15/45(b) | | | 906,407 | |
| | 433,319 | | | Series 2006-C28, Class A4, 5.572% due 10/15/48 | | | 447,527 | |
| | | | WaMu Mortgage Pass Through Certificates Trust: | | | | |
| | 21,219 | | | Series 2002-AR9, Class 1A, 1.568% due 8/25/42(b) | | | 20,256 | |
| | 8,291 | | | Series 2003-AR5, Class A7, 2.560% due 6/25/33(b) | | | 8,435 | |
| | 81,388 | | | Series 2005-AR13, Class A1A1, 0.489% due 10/25/45(b) | | | 75,858 | |
| | 131,714 | | | Series 2006-AR13, Class 2A, 2.187% due 10/25/46(b) | | | 122,132 | |
| | 892 | | | Washington Mutual Mortgage Loan Trust, Series 2001-7, Class A, 1.061% due 5/25/41(b) | | | 872 | |
| | 34,547 | | | Washington Mutual Mortgage Pass-Through Certificates WMALT, Series 2006-AR5, Class 3A, 1.124% due 7/25/46(b) | | | 22,187 | |
| | 203,296 | | | Washington Mutual MSC Mortgage Pass-Through Certificates Trust, Series 2002-AR3, Class 1A7, 2.202% due 12/25/32(b) | | | 203,317 | |
| | | | | | | | |
| | | | TOTAL COLLATERALIZED MORTGAGE OBLIGATIONS
(Cost — $28,244,504) | | | 27,036,004 | |
| | | | | | | | |
| U.S. GOVERNMENT & AGENCY OBLIGATIONS — 9.6% | |
| U.S. GOVERNMENT OBLIGATIONS — 9.6% | |
| | 6,300,000 | | | U.S. Treasury Bonds, 2.500% due 2/15/45(e) | | | 5,733,164 | |
| | | | U.S. Treasury Inflation Indexed Bonds: | | | | |
| | 603,012 | | | 0.125% due 7/15/24(e) | | | 579,959 | |
| | 8,765,511 | | | 0.250% due 1/15/25(e) | | | 8,463,171 | |
| | 5,697,045 | | | 2.375% due 1/15/25 | | | 6,613,096 | |
| | | | | | | | |
| | | | TOTAL U.S. GOVERNMENT & AGENCY OBLIGATIONS
(Cost — $22,130,227) | | | 21,389,390 | |
| | | | | | | | |
| MORTGAGE-BACKED SECURITIES — 0.9% | |
| FNMA — 0.9% | |
| | | | Federal National Mortgage Association (FNMA): | | | | |
| | 571,073 | | | 5.700% due 8/1/18(b) | | | 589,443 | |
| | 93,581 | | | 3.000% due 1/1/22 | | | 97,662 | |
| | 885,502 | | | 2.500% due 8/1/28 | | | 907,685 | |
| | 107,091 | | | 2.523% due 11/1/34(b) | | | 114,692 | |
| | 145,442 | | | 6.500% due 8/1/37 | | | 161,663 | |
| | | | | | | | |
| | | | TOTAL FNMA | | | 1,871,145 | |
| | | | | | | | |
| GNMA — 0.0% | |
| | | | Government National Mortgage Association II (GNMA): | | | | |
| | 15,555 | | | 6.000% due 9/20/38 | | | 16,608 | |
| | | | | | | | |
| | | | TOTAL MORTGAGE-BACKED SECURITIES
(Cost — $1,829,530) | | | 1,887,753 | |
| | | | | | | | |
| ASSET-BACKED SECURITIES — 0.4% | |
| Automobiles — 0.3% | |
| | 559,147 | | | Motor PLC, Series 2014-1A, Class A1, 0.679% due 8/25/21(a)(b) | | | 560,181 | |
See Notes to Financial Statements.
136
| | | | | | | | |
| International Fixed Income Investments | |
| | |
Face Amount/
Units† | | | Security | | Value | |
| Student Loans — 0.1% | |
| $ | 212,835 | | | Massachusetts Educational Financing Authority, Series 2008-1, Class A1, 1.245% due 4/25/38(b) | | $ | 213,554 | |
| | | | | | | | |
| | | | TOTAL ASSET-BACKED SECURITIES
(Cost — $771,981) | | | 773,735 | |
| | | | | | | | |
| MUNICIPAL BOND — 0.1% | |
| United States — 0.1% | |
| | 295,000 | | | School District of Philadelphia (The), Build America General Obligation Bonds, 6.765% due 6/1/40 (Cost — $295,000) | | | 322,824 | |
| | | | | | | | |
| | |
Notional
Amount† | | | | | | |
| PURCHASED OPTIONS — 0.0% | |
| United States — 0.0% | |
| | 100,000 | | | OTC Eurodollar versus U.S. Dollar, Put @ $1.09, expires 10/23/2015, HSBC | | | 875 | |
| | 160,000 | | | OTC U.S. Dollar versus Korean Won, Call @ $1,160.00, expires 10/02/2015, HSBC | | | 4,231 | |
| | 160,000 | | | OTC U.S. Dollar versus Korean Won, Put @ $1,100.00, expires 10/02/2015, HSBC | | | 30 | |
| | | | | | | | |
| | | | TOTAL PURCHASED OPTIONS
(Cost — $5,552) | | | 5,136 | |
| | | | | | | | |
| | | | TOTAL INVESTMENTS BEFORE SHORT-TERM INVESTMENTS
(Cost — $237,128,551) | | | 225,655,674 | |
| | | | | | | | |
| | |
| Face Amount† | | | | | | |
| SHORT-TERM INVESTMENTS — 5.4% | |
| SOVEREIGN BOND — 2.4% | |
| | 670,000,000 | JPY | | Japan Treasury Discount Bill, 0.005% due 11/9/15(f)
(Cost — $5,376,629) | | | 5,526,300 | |
| | | | | | | | |
| TIME DEPOSITS — 1.0% | |
| | | | ANZ National Bank — London: | | | | |
| $ | 456,249 | | | 0.030% due 9/1/15 | | | 456,249 | |
| | 82,656 | AUD | | 1.051% due 9/1/15 | | | 58,831 | |
| | | | BBH — Grand Cayman: | | | | |
| | 526 | CHF | | (1.000)% due 9/1/15 | | | 544 | |
| | 142,582 | SEK | | (0.500)% due 9/1/15 | | | 16,847 | |
| | 3,673 | DKK | | (0.350)% due 9/1/15 | | | 552 | |
| | 969 | EUR | | (0.219)% due 9/1/15 | | | 1,088 | |
| | 45,246,561 | JPY | | 0.005% due 9/1/15 | | | 373,198 | |
| | 1,393 | SGD | | 0.100% due 9/1/15 | | | 987 | |
| | 57,009 | CAD | | 0.100% due 9/1/15 | | | 43,332 | |
| | 136,000 | NOK | | 0.134% due 9/1/15 | | | 16,443 | |
| | 127 | AUD | | 1.051% due 9/1/15 | | | 91 | |
| | 59 | NZD | | 2.050% due 9/1/15 | | | 37 | |
| | 298,182 | EUR | | DNB — Oslo, (0.219)% due 9/1/15 | | | 334,575 | |
| | 862,959 | | | National Australia Bank Ltd. — Grand Cayman, 0.030% due 9/1/15 | | | 862,959 | |
| | | | | | | | |
| | | | TOTAL TIME DEPOSITS
(Cost — $2,165,733) | | | 2,165,733 | |
| | | | | | | | |
| U.S. GOVERNMENT AGENCIES — 1.1% | |
| | | | Federal Home Loan Bank Discount Notes: | | | | |
| | 200,000 | | | 0.093% due 10/9/15(f) | | | 199,980 | |
| | 100,000 | | | 0.140% due 10/21/15(f) | | | 99,981 | |
| | 100,000 | | | 0.155% due 11/3/15(f) | | | 99,973 | |
| | 200,000 | | | 0.160% due 11/9/15(f) | | | 199,939 | |
See Notes to Financial Statements.
137
| | | | | | | | |
| International Fixed Income Investments | |
| | |
| Face Amount† | | | Security | | Value | |
| U.S. GOVERNMENT AGENCIES — 1.1% — (continued) | |
| $ | 100,000 | | | 0.180% due 11/18/15(f) | | $ | 99,961 | |
| | | | Federal National Mortgage Association (FNMA), Discount notes: | | | | |
| | 500,000 | | | 0.225% due 1/14/16(f) | | | 499,578 | |
| | 800,000 | | | 0.260% due 2/8/16(f) | | | 799,076 | |
| | 400,000 | | | Freddie Mac Discount Notes, 0.280% due 2/22/16(f) | | | 399,458 | |
| | | | | | | | |
| | | | TOTAL U.S. GOVERNMENT AGENCIES
(Cost — $2,397,946) | | | 2,397,946 | |
| | | | | | | | |
| U.S. GOVERNMENT OBLIGATIONS — 0.9% | |
| | | | United States Treasury Bill: | | | | |
| | 363,000 | | | 0.091% due 1/7/16(e)(f) | | | 362,883 | |
| | 621,000 | | | 0.130% due 2/4/16(e)(f) | | | 620,650 | |
| | 772,000 | | | 0.165% due 2/11/16(e)(f) | | | 771,423 | |
| | 151,000 | | | 0.180% due 2/18/16(e)(f) | | | 150,872 | |
| | | | | | | | |
| | | | TOTAL U.S. GOVERNMENT OBLIGATIONS
(Cost — $1,905,828) | | | 1,905,828 | |
| | | | | | | | |
| | | | TOTAL SHORT-TERM INVESTMENTS
(Cost — $11,846,136) | | | 11,995,807 | |
| | | | | | | | |
| | | | TOTAL INVESTMENTS — 106.6%
(Cost — $248,974,687#) | | | 237,651,481 | |
| | | | | | | | |
| | | | Liabilities in Excess of Other Assets — (6.6)% | | | (14,616,648 | ) |
| | | | | | | | |
| | | | TOTAL NET ASSETS — 100.0% | | $ | 223,034,833 | |
| | | | | | | | |
| † | Face amount denominated in U.S. dollars, unless otherwise noted. |
| (a) | Restricted security that may be sold to ‘‘qualified institutional buyers’’ pursuant to the conditions of Rule 144A under the Securities Act of 1933, as amended. This security has been deemed liquid pursuant to guidelines approved by the Board of Trustees, unless otherwise noted. |
| (b) | Variable rate security. Interest rate disclosed is that which was in effect at August 31, 2015. |
| (d) | Security is perpetual in nature and has no stated maturity date. |
| (e) | All or a portion of this security is held at the broker as collateral for open futures contracts. |
| (f) | Rate shown represents yield-to-maturity. |
| # | Aggregate cost for federal income tax purposes is $253,393,261. |
| | |
Abbreviations used in this schedule: |
| CDO | | — Collateralized Debt Obligation |
| CLO | | — Collateralized Loan Obligation |
| GMTN | | — Global Medium Term Note |
| PLC | | — Public Limited Company |
| OTC | | — Other the Counter |
| REMICS | | — Real Estate Mortgage Investment Conduits |
| | | | |
| Summary of Investments by Security Type^ | | | |
Sovereign Bonds | | | 37.6 | % |
Corporate Bond & Notes | | | 35.8 | |
Collateralized Mortgage Obligations | | | 11.4 | |
U.S. Government & Agency Obligations | | | 9.0 | |
Mortgage-Backed Securities | | | 0.8 | |
Asset-Backed Securities | | | 0.3 | |
Municipal Bonds | | | 0.1 | |
Purchased Options | | | 0.0 | ** |
Short-Term Investments | | | 5.0 | |
| | | | |
| | | 100.0% | |
| | | | |
| ^ | As a percentage of total investments. |
| ** | Position represents less than 0.1% |
See Notes to Financial Statements.
138
| | | | |
| International Fixed Income Investments |
Schedule of Options Contracts Written
| | | | | | | | | | | | | | | | | | | | |
Notional
Amount | | | Security Name | | Counterparty | | | Expiration
Date | | | Strike
Price | | | Value | |
| United States | | | | | | | | | | | | | | | | |
| | 7,100,000 | EUR | | iTraxx Europe Series 23 Index, Put | | | BCLY | | | | 9/16/15 | | | $ | 0.90 | | | $ | 1,671 | |
| | 100,000 | EUR | | OTC Euro versus U.S. Dollar, Put | | | HSBC | | | | 10/23/15 | | | | 1.06 | | | | 346 | |
| | 100,000 | EUR | | OTC Euro versus U.S. Dollar, Call | | | HSBC | | | | 10/23/15 | | | | 1.14 | | | | 1,452 | |
| | 130,000 | | | OTC U.S. Dollar versus Indian Rupee, Put | | | UBS | | | | 10/28/15 | | | | 63.20 | | | | 35 | |
| | 130,000 | | | OTC U.S. Dollar versus Indian Rupee, Call | | | UBS | | | | 10/28/15 | | | | 66.50 | | | | 2,305 | |
| | 60,000 | | | OTC U.S. Dollar versus Korean Won, Put | | | DUB | | | | 10/2/15 | | | | 1,100.00 | | | | 11 | |
| | 100,000 | | | OTC U.S. Dollar versus Korean Won, Put | | | UBS | | | | 10/2/15 | | | | 1,100.00 | | | | 19 | |
| | 60,000 | | | OTC U.S. Dollar versus Korean Won, Call | | | DUB | | | | 10/2/15 | | | | 1,160.00 | | | | 1,587 | |
| | 100,000 | | | OTC U.S. Dollar versus Korean Won, Call | | | UBS | | | | 10/2/15 | | | | 1,160.00 | | | | 2,644 | |
| | 100,000 | | | OTC U.S. Dollar versus Peruvian Sol, Call | | | DUB | | | | 9/22/15 | | | | 3.25 | | | | 1,160 | |
| | 75,600 | | | OTC U.S. Dollar versus South African Rand, Put | | | BOA | | | | 9/25/15 | | | | 11.78 | | | | 2 | |
| | 100,000 | | | OTC U.S. Dollar versus South African Rand, Call | | | JPM | | | | 10/28/15 | | | | 13.50 | | | | 2,498 | |
| | 100,000 | | | OTC U.S. Dollar versus South African Rand, Call | | | HSBC | | | | 10/28/15 | | | | 13.50 | | | | 2,498 | |
| | 100,000 | | | OTC U.S. Dollar versus Turkish Lira, Call | | | HSBC | | | | 11/6/15 | | | | 3.00 | | | | 2,249 | |
| | 3,000,000 | EUR | | Swaption, 6-Month EURIBOR, EUR, Call | | | BCLY | | | | 4/29/16 | | | | 0.40 | | | | 1,709 | |
| | 3,000,000 | EUR | | Swaption, 6-Month EURIBOR, EUR, Put | | | BCLY | | | | 4/29/16 | | | | 1.40 | | | | 96,540 | |
| | | | | | | | | | | | | | | | | | | | |
| | | | TOTAL OPTIONS CONRACTS WRITTEN
(Premiums received — $63,177) | | | | | | | | | | | | | | $ | 116,726 | |
| | | | | | | | | | | | | | | | | | | | |
During the year ended August 31, 2015, options contracts written transactions for International Fixed Income Investments was as follows:
| | | | | | | | |
| | | Number of
Contracts | | | Premiums
Received | |
Options contracts written, outstanding at August 31, 2014 | | | 4,128,105 | | | $ | 109,364 | |
Options written | | | 77,864,276 | | | | 596,996 | |
Options closed | | | (25,725,712 | ) | | | (389,600 | ) |
Options expired | | | (41,911,069 | ) | | | (253,583 | ) |
| | | | | | | | |
Options contracts written, outstanding at August 31, 2015 | | | 14,355,600 | | | $ | 63,177 | |
| | | | | | | | |
Schedule of Reverse Repurchase Agreements
| | | | | | | | |
| | |
Face
Amount | | | Security | | Value | |
| $ | 5,633,250 | | | SG Americas Securities
0.270% due 9/02/15 | | $ | 5,633,250 | |
| | 3,670,875 | | | JPMorgan Securities
0.220% due 9/04/15 | | | 3,670,875 | |
| | | | | | | | |
| | | | TOTAL REVERSE REPURCHASE AGREEMENTS
(Proceeds — $9,304,125) | | $ | 9,304,125 | |
| | | | | | | | |
For the year ended August 31, 2015, the average borrowing and interest rate under the reverse repurchase agreements were $1,856,235 and 0.16%, respectively.
See Notes to Financial Statements.
139
| | | | |
| International Fixed Income Investments |
Schedule of Forward Sale Commitments
| | | | | | | | |
| | |
Face
Amount | | | Security | | Value | |
| | | | Federal National Mortgage Association (FNMA) | | | | |
| $ | 9,000,000 | | | 4.500% due 9/1/45(a) | | $ | 9,755,156 | |
| | 3,000,000 | | | 3.500% due 9/14/45(a) | | | 3,112,055 | |
| | 5,000,000 | | | 4.000% due 10/1/45(a) | | | 5,303,905 | |
| | 5,000,000 | | | 4.500% due 10/1/45(a) | | | 5,411,719 | |
| | | | | | | | |
| | | | TOTAL OPEN FORWARD SALE COMMITMENTS
(Proceeds — $23,541,562) | | $ | 23,582,835 | |
| | | | | | | | |
| (a) | This security is traded on a TBA basis (see Note 1). |
At August 31, 2015, International Fixed Income Investments had open exchange traded futures contracts as described below. The unrealized appreciation (depreciation) on the open contracts reflected in the accompanying financial statements were as follows:
| | | | | | | | | | | | | | | | |
| Open Futures Contracts | | Number of
Contracts | | | Expiration
Date (Month / Year) | | | Market Value | | | Unrealized
Appreciation/ (Depreciation) | |
Contracts to Buy: | | | | | | | | | | | | | | | | |
Australia Government 10-Year Bond September Futures | | | 10 | | | | 9/15 | | | $ | 916,750 | | | $ | 30,938 | |
Euro-BOBL December Futures | | | 18 | | | | 12/15 | | | | 2,589,242 | | | | (3,231 | ) |
Euro-BTP December Futures | | | 49 | | | | 12/15 | | | | 7,340,440 | | | | (15,944 | ) |
Euro-OAT September Futures | | | 130 | | | | 9/15 | | | | 21,545,940 | | | | (63,665 | ) |
Japan Government 10-Year Bond September Futures | | | 3 | | | | 9/15 | | | | 3,661,168 | | | | 24,992 | |
U.S. Treasury 5-Year Note December Futures | | | 48 | | | | 12/15 | | | | 5,733,000 | | | | (21,000 | ) |
U.S. Treasury 10-Year Note December Futures | | | 395 | | | | 12/15 | | | | 50,189,688 | | | | (131,499 | ) |
United Kingdom Long GILT December Futures | | | 23 | | | | 12/15 | | | | 4,136,449 | | | | (29,481 | ) |
| | | | | | | | | | | | | | | | |
| | | | | | | | | | | | | | $ | (208,890 | ) |
| | | | | | | | | | | | | | | | |
Contracts to Sell: | | | | | | | | | | | | | | | | |
90-Day Eurodollar December Futures | | | 28 | | | | 12/16 | | | | 6,916,700 | | | | (22,418 | ) |
90-Day Eurodollar June Futures | | | 2 | | | | 6/16 | | | | 496,025 | | | | (1,397 | ) |
90-Day Eurodollar March Futures | | | 16 | | | | 3/17 | | | | 3,945,600 | | | | (13,343 | ) |
90-Day Eurodollar September Futures | | | 21 | | | | 9/16 | | | | 5,198,025 | | | | (16,384 | ) |
Canada Government 10-Year Bond December Futures | | | 21 | | | | 12/15 | | | | 2,257,302 | | | | 30,608 | |
Euro-Bund September Futures | | | 3 | | | | 9/15 | | | | 515,324 | | | | 8,112 | |
U.S. Treasury Long Bond December Futures | | | 37 | | | | 12/15 | | | | 5,721,125 | | | | 27,461 | |
U.S. Treasury Ultra Long Bond December Futures | | | 27 | | | | 12/15 | | | | 4,276,969 | | | | 154,828 | |
| | | | | | | | | | | | | | | | |
| | | | | | | | | | | | | | | 167,467 | |
| | | | | | | | | | | | | | | | |
Net Unrealized Depreciation on Open Futures Contracts | | | | | | | | | | | | | | $ | (41,423 | ) |
| | | | | | | | | | | | | | | | |
At August 31, 2015, International Fixed Income Investments deposited cash collateral with brokers in the amount of $1,087,334 for open exchange traded futures contracts.
See Notes to Financial Statements.
140
| | | | |
| International Fixed Income Investments |
At August 31, 2015, International Fixed Income Investments had open forward foreign currency contracts as described below. The unrealized appreciation (depreciation) on the open contracts reflected in the accompanying financial statements were as follows:
| | | | | | | | | | | | | | | | | | | | |
| Foreign Currency | | Local Currency | | | Counterparty | | | Market Value | | | Settlement Date | | | Unrealized
Appreciation/ (Depreciation) | |
Contracts to Buy: | | | | | | | | | | | | | | | | | | | | |
Australian Dollar | | | 6,553,150 | | | | DUB | | | $ | 4,664,203 | | | | 9/2/15 | | | $ | (12,367 | ) |
Australian Dollar | | | 1,747,000 | | | | GSC | | | | 1,243,427 | | | | 9/2/15 | | | | (28,279 | ) |
Australian Dollar | | | 819,000 | | | | GSC | | | | 582,924 | | | | 9/2/15 | | | | (20,770 | ) |
Brazilian Real | | | 56,952 | | | | DUB | | | | 15,702 | | | | 9/2/15 | | | | (298 | ) |
Brazilian Real | | | 342,997 | �� | | | HSBC | | | | 94,565 | | | | 9/2/15 | | | | (1,432 | ) |
Brazilian Real | | | 511,323 | | | | HSBC | | | | 140,973 | | | | 9/2/15 | | | | (9,145 | ) |
Brazilian Real | | | 118,932 | | | | JPM | | | | 32,790 | | | | 9/2/15 | | | | (1,210 | ) |
Brazilian Real | | | 1,752,255 | | | | JPM | | | | 483,101 | | | | 9/2/15 | | | | (18,827 | ) |
Brazilian Real | | | 1,835,702 | | | | JPM | | | | 506,107 | | | | 9/2/15 | | | | 2,720 | |
Brazilian Real | | | 205,088 | | | | JPM | | | | 56,543 | | | | 9/2/15 | | | | (1,457 | ) |
Brazilian Real | | | 208,380 | | | | SCB | | | | 57,451 | | | | 9/2/15 | | | | (2,549 | ) |
Brazilian Real | | | 716,051 | | | | UBS | | | | 197,417 | | | | 9/2/15 | | | | (14,080 | ) |
Brazilian Real | | | 1,100,000 | | | | DUB | | | | 300,058 | | | | 10/2/15 | | | | (22,951 | ) |
Brazilian Real | | | 2,002,868 | | | | JPM | | | | 546,344 | | | | 10/2/15 | | | | (9,985 | ) |
British Pound | | | 142,000 | | | | CITI | | | | 217,920 | | | | 9/2/15 | | | | (4,588 | ) |
British Pound | | | 642,000 | | | | GSC | | | | 985,246 | | | | 9/2/15 | | | | (10,729 | ) |
British Pound | | | 17,062,547 | | | | SCB | | | | 26,185,052 | | | | 9/2/15 | | | | (313,479 | ) |
Canadian Dollar | | | 10,570,448 | | | | SCB | | | | 8,034,392 | | | | 9/2/15 | | | | 48,251 | |
Chilean Peso | | | 15,031,250 | | | | BCLY | | | | 21,655 | | | | 9/25/15 | | | | (1,883 | ) |
Chinese Onshore Renminbi | | | 14,100,000 | | | | JPM | | | | 2,209,723 | | | | 9/8/15 | | | | (86,694 | ) |
Colombian Peso | | | 15,525,000 | | | | BNP | | | | 5,083 | | | | 9/1/15 | | | | 83 | |
Colombian Peso | | | 452,225,272 | | | | BNP | | | | 147,978 | | | | 9/22/15 | | | | (1,501 | ) |
Colombian Peso | | | 123,810,423 | | | | BNP | | | | 40,514 | | | | 9/22/15 | | | | (3,966 | ) |
Colombian Peso | | | 217,434,386 | | | | HSBC | | | | 71,150 | | | | 9/22/15 | | | | (1,196 | ) |
Danish Krone | | | 1,015,000 | | | | JPM | | | | 152,583 | | | | 9/2/15 | | | | 2,372 | |
Danish Krone | | | 24,827,000 | | | | JPM | | | | 3,734,589 | | | | 10/1/15 | | | | 3,450 | |
Danish Krone | | | 11,606,360 | | | | JPM | | | | 1,745,881 | | | | 10/1/15 | | | | 27,693 | |
Euro | | | 469,000 | | | | CITI | | | | 526,241 | | | | 9/2/15 | | | | 3,504 | |
Euro | | | 286,000 | | | | CITI | | | | 320,907 | | | | 9/2/15 | | | | 6,817 | |
Euro | | | 3,353,000 | | | | CITI | | | | 3,762,233 | | | | 9/2/15 | | | | 20,391 | |
Euro | | | 26,286,746 | | | | DUB | | | | 29,495,040 | | | | 9/2/15 | | | | (148,261 | ) |
Euro | | | 1,455,000 | | | | GSC | | | | 1,632,583 | | | | 9/2/15 | | | | 21,000 | |
Euro | | | 48,841,816 | | | | GSC | | | | 54,802,953 | | | | 9/2/15 | | | | (289,595 | ) |
Euro | | | 137,000 | | | | HSBC | | | | 153,721 | | | | 9/2/15 | | | | (2,334 | ) |
Euro | | | 819,000 | | | | JPM | | | | 918,958 | | | | 9/2/15 | | | | 26,593 | |
Euro | | | 896,000 | | | | JPM | | | | 1,005,357 | | | | 9/2/15 | | | | (21,928 | ) |
Euro | | | 1,222,000 | | | | UBS | | | | 1,371,145 | | | | 9/2/15 | | | | 21,963 | |
Euro | | | 713,000 | | | | GSC | | | | 800,370 | | | | 10/2/15 | | | | (5,825 | ) |
Euro | | | 432,000 | | | | JPM | | | | 484,937 | | | | 10/2/15 | | | | 744 | |
Euro | | | 9,000 | | | | BOA | | | | 10,110 | | | | 11/12/15 | | | | (55 | ) |
Euro | | | 84,000 | | | | BOA | | | | 94,360 | | | | 11/12/15 | | | | 972 | |
Euro | | | 32,000 | | | | BOA | | | | 35,947 | | | | 11/12/15 | | | | 579 | |
See Notes to Financial Statements.
141
| | | | |
| International Fixed Income Investments |
| | | | | | | | | | | | | | | | | | | | |
| Foreign Currency | | Local Currency | | | Counterparty | | | Market Value | | | Settlement Date | | | Unrealized
Appreciation/ (Depreciation) | |
Hungarian Forint | | | 6,953,375 | | | | BOA | | | $ | 24,884 | | | | 10/21/15 | | | $ | (116 | ) |
Hungarian Forint | | | 1,677,794 | | | | DUB | | | | 6,004 | | | | 10/21/15 | | | | 4 | |
Hungarian Forint | | | 1,955,330 | | | | DUB | | | | 6,997 | | | | 10/21/15 | | | | (3 | ) |
Hungarian Forint | | | 279,858 | | | | DUB | | | | 1,002 | | | | 10/21/15 | | | | 2 | |
Hungarian Forint | | | 31,232,953 | | | | DUB | | | | 111,772 | | | | 10/21/15 | | | | 1,995 | |
Hungarian Forint | | | 10,234,000 | | | | JPM | | | | 36,624 | | | | 10/21/15 | | | | (709 | ) |
Indian Rupee | | | 2,072,640 | | | | BNP | | | | 30,960 | | | | 10/20/15 | | | | (1,040 | ) |
Indian Rupee | | | 646,800 | | | | DUB | | | | 9,661 | | | | 10/20/15 | | | | (339 | ) |
Indian Rupee | | | 1,811,600 | | | | UBS | | | | 27,060 | | | | 10/20/15 | | | | (940 | ) |
Indian Rupee | | | 6,598,064 | | | | SCB | | | | 98,060 | | | | 11/18/15 | | | | (3,176 | ) |
Indonesian Rupiah | | | 5,035,207,890 | | | | SCB | | | | 354,280 | | | | 10/20/15 | | | | (312 | ) |
Indonesian Rupiah | | | 768,977,219 | | | | SCB | | | | 54,106 | | | | 10/20/15 | | | | 926 | |
Indonesian Rupiah | | | 1,866,739,947 | | | | SCB | | | | 131,345 | | | | 10/20/15 | | | | (673 | ) |
Indonesian Rupiah | | | 318,254,583 | | | | JPM | | | | 21,717 | | | | 2/26/16 | | | | 759 | |
Indonesian Rupiah | | | 318,254,582 | | | | BOA | | | | 20,812 | | | | 8/18/16 | | | | 796 | |
Indonesian Rupiah | | | 326,843,867 | | | | JPM | | | | 21,374 | | | | 8/18/16 | | | | 622 | |
Indonesian Rupiah | | | 188,715,617 | | | | UBS | | | | 12,341 | | | | 8/18/16 | | | | 181 | |
Indonesian Rupiah | | | 573,278,614 | | | | UBS | | | | 37,489 | | | | 8/18/16 | | | | 1,251 | |
Israeli New Shekel | | | 274,031 | | | | BCLY | | | | 69,836 | | | | 9/9/15 | | | | (2,164 | ) |
Israeli New Shekel | | | 123,218 | | | | BOA | | | | 31,402 | | | | 9/9/15 | | | | (598 | ) |
Israeli New Shekel | | | 274,031 | | | | DUB | | | | 69,946 | | | | 11/30/15 | | | | (2,340 | ) |
Israeli New Shekel | | | 123,218 | | | | JPM | | | | 31,452 | | | | 11/30/15 | | | | (856 | ) |
Japanese Yen | | | 38,500,000 | | | | GSC | | | | 317,552 | | | | 9/2/15 | | | | 8,230 | |
Japanese Yen | | | 921,359,000 | | | | HSBC | | | | 7,599,464 | | | | 9/2/15 | | | | (108,552 | ) |
Japanese Yen | | | 206,500,000 | | | | JPM | | | | 1,703,234 | | | | 9/2/15 | | | | 37,253 | |
Japanese Yen | | | 121,900,000 | | | | JPM | | | | 1,005,444 | | | | 9/2/15 | | | | 13,354 | |
Korean Won | | | 109,251,750 | | | | HSBC | | | | 92,371 | | | | 9/3/15 | | | | (629 | ) |
Korean Won | | | 63,413,000 | | | | BOA | | | | 53,595 | | | | 9/14/15 | | | | 127 | |
Korean Won | | | 940,696,000 | | | | BOA | | | | 794,651 | | | | 9/30/15 | | | | 1,905 | |
Korean Won | | | 14,257,200 | | | | BCLY | | | | 12,037 | | | | 10/20/15 | | | | 37 | |
Korean Won | | | 71,864,100 | | | | DUB | | | | 60,672 | | | | 10/20/15 | | | | (2,328 | ) |
Korean Won | | | 109,251,750 | | | | HSBC | | | | 92,237 | | | | 10/20/15 | | | | 344 | |
Korean Won | | | 3,564,000 | | | | HSBC | | | | 3,009 | | | | 10/20/15 | | | | 9 | |
Malaysian Ringgit | | | 106,294 | | | | SCB | | | | 25,326 | | | | 9/8/15 | | | | (663 | ) |
Malaysian Ringgit | | | 94,000 | | | | BCLY | | | | 22,327 | | | | 10/20/15 | | | | (27 | ) |
Malaysian Ringgit | | | 330,013 | | | | BCLY | | | | 78,385 | | | | 10/20/15 | | | | (3,484 | ) |
Malaysian Ringgit | | | 106,294 | | | | HSBC | | | | 25,246 | | | | 10/20/15 | | | | (416 | ) |
Malaysian Ringgit | | | 350,794 | | | | JPM | | | | 83,320 | | | | 10/20/15 | | | | (2,680 | ) |
Malaysian Ringgit | | | 154,755 | | | | SCB | | | | 36,757 | | | | 10/20/15 | | | | (1,243 | ) |
Malaysian Ringgit | | | 749,157 | | | | UBS | | | | 177,939 | | | | 10/20/15 | | | | (3,323 | ) |
Malaysian Ringgit | | | 163,527 | | | | UBS | | | | 38,840 | | | | 10/20/15 | | | | (947 | ) |
Malaysian Ringgit | | | 179,569 | | | | UBS | | | | 42,651 | | | | 10/20/15 | | | | (1,058 | ) |
Malaysian Ringgit | | | 423,807 | | | | UBS | | | | 100,663 | | | | 10/20/15 | | | | 920 | |
Malaysian Ringgit | | | 330,013 | | | | BCLY | | | | 77,806 | | | | 2/16/16 | | | | (3,139 | ) |
Mexican Peso | | | 305,000 | | | | BCLY | | | | 18,222 | | | | 9/30/15 | | | | (984 | ) |
Mexican Peso | | | 1,057,651 | | | | SCB | | | | 63,187 | | | | 9/30/15 | | | | (4,263 | ) |
See Notes to Financial Statements.
142
| | | | | | | | | | |
| International Fixed Income Investments |
| | | | | | | | | | | | | | | | | | | | |
| Foreign Currency | | Local Currency | | | Counterparty | | | Market Value | | | Settlement Date | | | Unrealized
Appreciation/ (Depreciation) | |
Mexican Peso | | | 125,552 | | | | UBS | | | $ | 7,500 | | | | 9/30/15 | | | $ | (406 | ) |
Mexican Peso | | | 481,000 | | | | UBS | | | | 28,736 | | | | 9/30/15 | | | | 77 | |
Mexican Peso | | | 17,774,605 | | | | UBS | | | | 1,061,905 | | | | 9/30/15 | | | | (82,533 | ) |
Mexican Peso | | | 4,589,263 | | | | UBS | | | | 274,176 | | | | 9/30/15 | | | | (16,157 | ) |
New Taiwan Dollar | | | 582,948 | | | | HSBC | | | | 17,950 | | | | 10/20/15 | | | | (50 | ) |
New Taiwan Dollar | | | 1,434,444 | | | | JPM | | | | 44,170 | | | | 10/20/15 | | | | 170 | |
New Zealand Dollar | | | 9,970,135 | | | | HSBC | | | | 6,320,068 | | | | 9/2/15 | | | | (114,039 | ) |
New Zealand Dollar | | | 437,000 | | | | JPM | | | | 277,014 | | | | 9/2/15 | | | | (9,458 | ) |
New Zealand Dollar | | | 1,007,000 | | | | JPM | | | | 638,337 | | | | 9/2/15 | | | | (26,685 | ) |
New Zealand Dollar | | | 591,000 | | | | UBS | | | | 373,735 | | | | 10/2/15 | | | | (9,576 | ) |
Nigerian Naira | | | 263,000 | | | | HSBC | | | | 1,233 | | | | 2/10/16 | | | | 233 | |
Nigerian Naira | | | 1,542,000 | | | | HSBC | | | | 7,231 | | | | 2/10/16 | | | | 1,231 | |
Nigerian Naira | | | 1,566,000 | | | | HSBC | | | | 7,344 | | | | 2/10/16 | | | | 1,344 | |
Nigerian Naira | | | 3,445,000 | | | | HSBC | | | | 16,155 | | | | 2/10/16 | | | | 3,155 | |
Nigerian Naira | | | 3,212,000 | | | | JPM | | | | 15,062 | | | | 2/10/16 | | | | 2,564 | |
Peruvian Sol | | | 192,848 | | | | BOA | | | | 59,264 | | | | 9/15/15 | | | | 347 | |
Peruvian Sol | | | 63,600 | | | | DUB | | | | 19,545 | | | | 9/15/15 | | | | (455 | ) |
Peruvian Sol | | | 132,978 | | | | UBS | | | | 40,866 | | | | 9/15/15 | | | | (573 | ) |
Peruvian Sol | | | 83,772 | | | | DUB | | | | 25,639 | | | | 9/25/15 | | | | (361 | ) |
Philippine Peso | | | 3,722,701 | | | | HSBC | | | | 79,409 | | | | 10/20/15 | | | | (2,229 | ) |
Polish Zloty | | | 621,000 | | | | BCLY | | | | 164,193 | | | | 10/21/15 | | | | (1,050 | ) |
Polish Zloty | | | 105,000 | | | | BCLY | | | | 27,762 | | | | 10/21/15 | | | | (90 | ) |
Polish Zloty | | | 295,000 | | | | BCLY | | | | 77,998 | | | | 10/21/15 | | | | (20 | ) |
Polish Zloty | | | 215,000 | | | | HSBC | | | | 56,847 | | | | 10/21/15 | | | | 248 | |
Polish Zloty | | | 234,000 | | | | JPM | | | | 61,870 | | | | 10/21/15 | | | | 3 | |
Polish Zloty | | | 617,000 | | | | JPM | | | | 163,135 | | | | 10/21/15 | | | | 187 | |
Polish Zloty | | | 104,000 | | | | JPM | | | | 27,498 | | | | 10/21/15 | | | | (94 | ) |
Polish Zloty | | | 1,852,669 | | | | UBS | | | | 489,847 | | | | 10/21/15 | | | | 6,595 | |
Romanian New Leu | | | 310,973 | | | | BOA | | | | 78,719 | | | | 10/21/15 | | | | 2,138 | |
Romanian New Leu | | | 230,000 | | | | HSBC | | | | 58,222 | | | | 10/21/15 | | | | 945 | |
Russian Ruble | | | 4,666,250 | | | | BOA | | | | 71,864 | | | | 10/7/15 | | | | 1,787 | |
Russian Ruble | | | 4,665,000 | | | | DUB | | | | 71,845 | | | | 10/7/15 | | | | 1,946 | |
Russian Ruble | | | 434,000 | | | | HSBC | | | | 6,684 | | | | 10/7/15 | | | | 350 | |
Russian Ruble | | | 7,340,000 | | | | HSBC | | | | 113,043 | | | | 10/7/15 | | | | 397 | |
Singapore Dollar | | | 16,000 | | | | BCLY | | | | 11,318 | | | | 10/9/15 | | | | (97 | ) |
Singapore Dollar | | | 29,000 | | | | UBS | | | | 20,513 | | | | 10/9/15 | | | | (151 | ) |
South African Rand | | | 233,130 | | | | BOA | | | | 17,498 | | | | 9/29/15 | | | | (1,502 | ) |
South African Rand | | | 304,000 | | | | BCLY | | | | 22,726 | | | | 10/21/15 | | | | (1,013 | ) |
South African Rand | | | 199,000 | | | | BNP | | | | 14,876 | | | | 10/21/15 | | | | (203 | ) |
South African Rand | | | 7,014,085 | | | | DUB | | | | 524,355 | | | | 10/21/15 | | | | (33,022 | ) |
South African Rand | | | 291,000 | | | | DUB | | | | 21,755 | | | | 10/21/15 | | | | (506 | ) |
South African Rand | | | 242,519 | | | | HSBC | | | | 18,100 | | | | 10/30/15 | | | | (900 | ) |
South African Rand | | | 229,810 | | | | JPM | | | | 17,152 | | | | 10/30/15 | | | | (848 | ) |
Swedish Krona | | | 1,010,000 | | | | SCB | | | | 119,418 | | | | 10/2/15 | | | | (2,185 | ) |
Thai Baht | | | 974,622 | | | | JPM | | | | 26,971 | | | | 10/20/15 | | | | (102 | ) |
Thai Baht | | | 19,316,223 | | | | UBS | | | | 534,542 | | | | 10/20/15 | | | | (5,772 | ) |
See Notes to Financial Statements.
143
| | | | | | | | | | |
| International Fixed Income Investments |
| | | | | | | | | | | | | | | | | | | | |
| Foreign Currency | | Local Currency | | | Counterparty | | | Market Value | | | Settlement Date | | | Unrealized
Appreciation/ (Depreciation) | |
Turkish Lira | | | 24,000 | | | | DUB | | | $ | 8,204 | | | | 9/18/15 | | | $ | (325 | ) |
Turkish Lira | | | 1,654,383 | | | | HSBC | | | | 565,564 | | | | 9/18/15 | | | | (39,800 | ) |
Turkish Lira | | | 651,000 | | | | JPM | | | | 222,549 | | | | 9/18/15 | | | | (57 | ) |
Turkish Lira | | | 26,867 | | | | BCLY | | | | 8,999 | | | | 11/24/15 | | | | (1 | ) |
Turkish Lira | | | 92,000 | | | | BCLY | | | | 30,813 | | | | 11/24/15 | | | | 117 | |
Turkish Lira | | | 830,378 | | | | SCB | | | | 278,114 | | | | 11/24/15 | | | | 2,310 | |
| | | | | | | | | | | | | | | | | | | | |
| | | | | | | | | | | | | | | | | | | (1,250,655 | ) |
| | | | | | | | | | | | | | | | | | | | |
Contracts to Sell: | | | | | | | | | | | | | | | | | | | | |
Australian Dollar | | | 8,212,150 | | | | DUB | | | | 5,844,997 | | | | 9/2/15 | | | | 130,221 | |
Australian Dollar | | | 754,000 | | | | HSBC | | | | 536,659 | | | | 9/2/15 | | | | 19,197 | |
Australian Dollar | | | 153,000 | | | | JPM | | | | 108,897 | | | | 9/2/15 | | | | 3,620 | |
Australian Dollar | | | 6,553,150 | | | | DUB | | | | 4,657,011 | | | | 10/2/15 | | | | 12,325 | |
Brazilian Real | | | 56,952 | | | | DUB | | | | 15,701 | | | | 9/2/15 | | | | (84 | ) |
Brazilian Real | | | 854,319 | | | | HSBC | | | | 235,538 | | | | 9/2/15 | | | | (1,266 | ) |
Brazilian Real | | | 2,002,868 | | | | JPM | | | | 552,196 | | | | 9/2/15 | | | | 9,855 | |
Brazilian Real | | | 1,566,112 | | | | JPM | | | | 431,781 | | | | 9/2/15 | | | | 17,219 | |
Brazilian Real | | | 342,997 | | | | JPM | | | | 94,565 | | | | 9/2/15 | | | | (565 | ) |
Brazilian Real | | | 208,380 | | | | SCB | | | | 57,451 | | | | 9/2/15 | | | | (309 | ) |
Brazilian Real | | | 716,051 | | | | UBS | | | | 197,417 | | | | 9/2/15 | | | | (1,061 | ) |
Brazilian Real | | | 1,100,000 | | | | BNP | | | | 300,058 | | | | 10/2/15 | | | | 106,533 | |
Brazilian Real | | | 110,040 | | | | BNP | | | | 30,017 | | | | 10/2/15 | | | | (17 | ) |
Brazilian Real | | | 342,997 | | | | HSBC | | | | 93,563 | | | | 10/2/15 | | | | 1,437 | |
Brazilian Real | | | 1,757,032 | | | | UBS | | | | 479,284 | | | | 10/2/15 | | | | 139,716 | |
Brazilian Real | | | 346,164 | | | | BCLY | | | | 90,703 | | | | 2/2/16 | | | | 3,402 | |
Brazilian Real | | | 315,000 | | | | DUB | | | | 76,739 | | | | 10/4/16 | | | | 9,911 | |
Brazilian Real | | | 400,000 | | | | BNP | | | | 91,379 | | | | 7/5/17 | | | | 49,600 | |
British Pound | | | 15,805,547 | | | | HSBC | | | | 24,255,997 | | | | 9/2/15 | | | | 391,173 | |
British Pound | | | 745,000 | | | | JPM | | | | 1,143,315 | | | | 9/2/15 | | | | 19,664 | |
British Pound | | | 1,296,000 | | | | JPM | | | | 1,988,907 | | | | 9/2/15 | | | | 30,860 | |
British Pound | | | 17,062,547 | | | | SCB | | | | 26,180,754 | | | | 10/2/15 | | | | 313,130 | |
Canadian Dollar | | | 10,361,448 | | | | GSC | | | | 7,875,535 | | | | 9/2/15 | | | | 93,277 | |
Canadian Dollar | | | 209,000 | | | | JPM | | | | 158,857 | | | | 9/2/15 | | | | 73 | |
Canadian Dollar | | | 10,570,448 | | | | SCB | | | | 8,033,763 | | | | 10/2/15 | | | | (48,335 | ) |
Chilean Peso | | | 4,896,150 | | | | JPM | | | | 7,054 | | | | 9/25/15 | | | | (54 | ) |
Chinese Onshore Renminbi | | | 14,100,000 | | | | JPM | | | | 2,209,723 | | | | 9/8/15 | | | | (77,720 | ) |
Colombian Peso | | | 15,525,000 | | | | BNP | | | | 5,082 | | | | 9/1/15 | | | | (76 | ) |
Colombian Peso | | | 864,058,694 | | | | BNP | | | | 282,740 | | | | 9/22/15 | | | | 5,260 | |
Colombian Peso | | | 15,535,000 | | | | BNP | | | | 5,083 | | | | 9/22/15 | | | | (83 | ) |
Colombian Peso | | | 190,007,730 | | | | JPM | | | | 62,175 | | | | 9/22/15 | | | | (3,175 | ) |
Danish Krone | | | 12,781,000 | | | | HSBC | | | | 1,922,575 | | | | 10/1/15 | | | | 59,373 | |
Danish Krone | | | 7,978,000 | | | | HSBC | | | | 1,200,087 | | | | 10/1/15 | | | | 26,092 | |
Danish Krone | | | 20,659,000 | | | | HSBC | | | | 3,107,620 | | | | 10/1/15 | | | | 86,212 | |
Danish Krone | | | 6,760,000 | | | | JPM | | | | 1,016,870 | | | | 10/1/15 | | | | 20,455 | |
Danish Krone | | | 13,304,000 | | | | HSBC | | | | 2,006,036 | | | | 1/4/16 | | | | 59,470 | |
Danish Krone | | | 31,228,000 | | | | HSBC | | | | 4,708,695 | | | | 1/4/16 | | | | 112,157 | |
See Notes to Financial Statements.
144
| | | | | | | | | | |
| International Fixed Income Investments |
| | | | | | | | | | | | | | | | | | | | |
| Foreign Currency | | Local Currency | | | Counterparty | | | Market Value | | | Settlement Date | | | Unrealized
Appreciation/ (Depreciation) | |
Danish Krone | | | 34,885,000 | | | | JPM | | | $ | 5,260,113 | | | | 1/4/16 | | | $ | 154,283 | |
Danish Krone | | | 11,606,360 | | | | JPM | | | | 1,765,253 | | | | 10/3/16 | | | | (28,294 | ) |
Danish Krone | | | 24,827,000 | | | | JPM | | | | 3,776,029 | | | | 10/3/16 | | | | (6,366 | ) |
Euro | | | 7,808,000 | | | | CITI | | | | 8,760,965 | | | | 9/2/15 | | | | (281,728 | ) |
Euro | | | 1,296,000 | | | | CITI | | | | 1,454,176 | | | | 9/2/15 | | | | (32,647 | ) |
Euro | | | 550,000 | | | | GSC | | | | 617,128 | | | | 9/2/15 | | | | (13,720 | ) |
Euro | | | 137,000 | | | | HSBC | | | | 153,721 | | | | 9/2/15 | | | | (2,234 | ) |
Euro | | | 1,462,000 | | | | JPM | | | | 1,640,437 | | | | 9/2/15 | | | | (38,997 | ) |
Euro | | | 17,349,198 | | | | JPM | | | | 19,466,664 | | | | 9/2/15 | | | | (485,022 | ) |
Euro | | | 2,215,000 | | | | JPM | | | | 2,485,340 | | | | 9/2/15 | | | | (64,580 | ) |
Euro | | | 52,089,365 | | | | SCB | | | | 58,446,864 | | | | 9/2/15 | | | | (894,596 | ) |
Euro | | | 859,000 | | | | UBS | | | | 963,841 | | | | 9/2/15 | | | | (23,095 | ) |
Euro | | | 26,286,746 | | | | DUB | | | | 29,507,886 | | | | 10/2/15 | | | | 148,374 | |
Euro | | | 360,000 | | | | GSC | | | | 404,114 | | | | 10/2/15 | | | | 7,227 | |
Euro | | | 48,841,816 | | | | GSC | | | | 54,826,821 | | | | 10/2/15 | | | | 289,527 | |
Euro | | | 137,000 | | | | HSBC | | | | 153,788 | | | | 10/2/15 | | | | 2,336 | |
Hungarian Forint | | | 3,881,000 | | | | HSBC | | | | 13,888 | | | | 10/21/15 | | | | 74 | |
Hungarian Forint | | | 12,039,000 | | | | UBS | | | | 43,084 | | | | 10/21/15 | | | | (46 | ) |
Indian Rupee | | | 67,460 | | | | BCLY | | | | 1,008 | | | | 10/20/15 | | | | (8 | ) |
Indian Rupee | | | 1,618,560 | | | | BOA | | | | 24,177 | | | | 10/20/15 | | | | (177 | ) |
Indian Rupee | | | 1,518,744 | | | | BOA | | | | 22,686 | | | | 10/20/15 | | | | 893 | |
Indian Rupee | | | 4,305,470 | | | | HSBC | | | | 64,312 | | | | 10/20/15 | | | | 688 | |
Indian Rupee | | | 1,618,320 | | | | JPM | | | | 24,173 | | | | 10/20/15 | | | | (173 | ) |
Indian Rupee | | | 668,885 | | | | UBS | | | | 9,991 | | | | 10/20/15 | | | | 9 | |
Indonesian Rupiah | | | 1,223,405,000 | | | | JPM | | | | 86,079 | | | | 10/20/15 | | | | (1,079 | ) |
Indonesian Rupiah | | | 5,790,266,900 | | | | SCB | | | | 407,407 | | | | 10/20/15 | | | | (407 | ) |
Israeli New Shekel | | | 274,031 | | | | DUB | | | | 69,836 | | | | 9/9/15 | | | | 2,382 | |
Israeli New Shekel | | | 123,218 | | | | JPM | | | | 31,402 | | | | 9/9/15 | | | | 877 | |
Israeli New Shekel | | | 395,735 | | | | DUB | | | | 100,930 | | | | 10/15/15 | | | | 4,312 | |
Japanese Yen | | | 94,000,000 | | | | CITI | | | | 775,322 | | | | 9/2/15 | | | | (18,443 | ) |
Japanese Yen | | | 113,600,000 | | | | GSC | | | | 936,985 | | | | 9/2/15 | | | | (25,809 | ) |
Japanese Yen | | | 1,080,659,000 | | | | JPM | | | | 8,913,387 | | | | 9/2/15 | | | | (169,052 | ) |
Japanese Yen | | | 921,359,000 | | | | HSBC | | | | 7,603,412 | | | | 10/2/15 | | | | 109,148 | |
Japanese Yen | | | 670,000,000 | | | | CITI | | | | 5,531,989 | | | | 11/9/15 | | | | (154,782 | ) |
Korean Won | | | 109,251,750 | | | | HSBC | | | | 92,371 | | | | 9/3/15 | | | | (315 | ) |
Korean Won | | | 58,625,000 | | | | BOA | | | | 49,548 | | | | 9/14/15 | | | | 452 | |
Korean Won | | | 4,788,000 | | | | SCB | | | | 4,047 | | | | 9/14/15 | | | | (47 | ) |
Korean Won | | | 635,869,000 | | | | BCLY | | | | 537,149 | | | | 9/30/15 | | | | (4,149 | ) |
Korean Won | | | 304,827,000 | | | | JPM | | | | 257,502 | | | | 9/30/15 | | | | (2,502 | ) |
Korean Won | | | 63,413,000 | | | | BOA | | | | 53,537 | | | | 10/20/15 | | | | (129 | ) |
Korean Won | | | 940,696,000 | | | | BOA | | | | 794,198 | | | | 10/20/15 | | | | (1,920 | ) |
Korean Won | | | 121,788,000 | | | | HSBC | | | | 102,822 | | | | 10/20/15 | | | | (822 | ) |
Korean Won | | | 166,893,040 | | | | HSBC | | | | 140,902 | | | | 10/20/15 | | | | 5,888 | |
Korean Won | | | 660,089,869 | | | | JPM | | | | 557,292 | | | | 10/20/15 | | | | (19 | ) |
Korean Won | | | 1,279,999,006 | | | | JPM | | | | 1,080,660 | | | | 10/20/15 | | | | 22,312 | |
Malaysian Ringgit | | | 106,294 | | | | HSBC | | | | 25,326 | | | | 9/8/15 | | | | 436 | |
See Notes to Financial Statements.
145
| | | | | | | | | | |
| International Fixed Income Investments |
| | | | | | | | | | | | | | | | | | | | |
| Foreign Currency | | Local Currency | | | Counterparty | | | Market Value | | | Settlement Date | | | Unrealized
Appreciation/ (Depreciation) | |
Malaysian Ringgit | | | 201,852 | | | | BCLY | | | $ | 47,944 | | | | 10/20/15 | | | $ | 4,322 | |
Malaysian Ringgit | | | 74,826 | | | | DUB | | | | 17,773 | | | | 10/20/15 | | | | 227 | |
Malaysian Ringgit | | | 274,862 | | | | JPM | | | | 65,285 | | | | 10/20/15 | | | | 3,715 | |
Malaysian Ringgit | | | 1,698,766 | | | | JPM | | | | 403,490 | | | | 10/20/15 | | | | 10,510 | |
Malaysian Ringgit | | | 348,213 | | | | JPM | | | | 82,707 | | | | 10/20/15 | | | | (707 | ) |
Malaysian Ringgit | | | 182,292 | | | | JPM | | | | 43,298 | | | | 10/20/15 | | | | 702 | |
Mexican Peso | | | 9,386,000 | | | | BCLY | | | | 560,746 | | | | 9/30/15 | | | | 3,310 | |
Mexican Peso | | | 2,099,000 | | | | BCLY | | | | 125,401 | | | | 9/30/15 | | | | (819 | ) |
Mexican Peso | | | 151,505 | | | | DUB | | | | 9,051 | | | | 9/30/15 | | | | (51 | ) |
Mexican Peso | | | 286,983 | | | | JPM | | | | 17,145 | | | | 9/30/15 | | | | 855 | |
Mexican Peso | | | 748,574 | | | | UBS | | | | 44,722 | | | | 9/30/15 | | | | 2,278 | |
New Taiwan Dollar | | | 1,427,400 | | | | BCLY | | | | 43,953 | | | | 10/20/15 | | | | 1,047 | |
New Taiwan Dollar | | | 1,458,160 | | | | BCLY | | | | 44,900 | | | | 10/20/15 | | | | (900 | ) |
New Taiwan Dollar | | | 2,441,285 | | | | DUB | | | | 75,172 | | | | 10/20/15 | | | | 1,828 | |
New Taiwan Dollar | | | 588,780 | | | | DUB | | | | 18,130 | | | | 10/20/15 | | | | (130 | ) |
New Taiwan Dollar | | | 53,883,600 | | | | HSBC | | | | 1,659,192 | | | | 10/20/15 | | | | 808 | |
New Taiwan Dollar | | | 529,920 | | | | JPM | | | | 16,317 | | | | 10/20/15 | | | | (317 | ) |
New Taiwan Dollar | | | 11,939,150 | | | | JPM | | | | 367,632 | | | | 10/20/15 | | | | (2,632 | ) |
New Taiwan Dollar | | | 639,700 | | | | DUB | | | | 19,705 | | | | 11/13/15 | | | | 295 | |
New Zealand Dollar | | | 11,414,135 | | | | JPM | | | | 7,235,419 | | | | 9/2/15 | | | | 306,361 | |
New Zealand Dollar | | | 9,970,135 | | | | HSBC | | | | 6,304,889 | | | | 10/2/15 | | | | 114,421 | |
Nigerian Naira | | | 181,000 | | | | BCLY | | | | 849 | | | | 2/10/16 | | | | (142 | ) |
Nigerian Naira | | | 9,847,000 | | | | SCB | | | | 46,176 | | | | 2/10/16 | | | | (2,740 | ) |
Peruvian Sol | | | 57,618 | | | | BNP | | | | 17,707 | | | | 9/15/15 | | | | 293 | |
Peruvian Sol | | | 130,781 | | | | BNP | | | | 40,190 | | | | 9/15/15 | | | | 1,533 | |
Peruvian Sol | | | 236,052 | | | | BNP | | | | 72,541 | | | | 9/15/15 | | | | (541 | ) |
Peruvian Sol | | | 56,449 | | | | DUB | | | | 17,347 | | | | 9/15/15 | | | | (347 | ) |
Peruvian Sol | | | 98,580 | | | | UBS | | | | 30,295 | | | | 9/15/15 | | | | 406 | |
Peruvian Sol | | | 22,484 | | | | DUB | | | | 6,884 | | | | 9/24/15 | | | | 116 | |
Peruvian Sol | | | 164,399 | | | | DUB | | | | 50,336 | | | | 9/24/15 | | | | 664 | |
Peruvian Sol | | | 64,000 | | | | BCLY | | | | 19,556 | | | | 9/29/15 | | | | 185 | |
Peruvian Sol | | | 60,800 | | | | BCLY | | | | 18,134 | | | | 12/28/15 | | | | (191 | ) |
Peruvian Sol | | | 94,740 | | | | BOA | | | | 28,207 | | | | 1/6/16 | | | | 667 | |
Philippine Peso | | | 281,580 | | | | DUB | | | | 6,006 | | | | 10/20/15 | | | | (6 | ) |
Philippine Peso | | | 1,168,295 | | | | UBS | | | | 24,921 | | | | 10/20/15 | | | | 79 | |
Polish Zloty | | | 52,705 | | | | BCLY | | | | 13,935 | | | | 10/21/15 | | | | 65 | |
Polish Zloty | | | 93,858 | | | | BOA | | | | 24,816 | | | | 10/21/15 | | | | 184 | |
Polish Zloty | | | 2,206,000 | | | | JPM | | | | 583,268 | | | | 10/21/15 | | | | 944 | |
Polish Zloty | | | 242,000 | | | | JPM | | | | 63,985 | | | | 10/21/15 | | | | 690 | |
Polish Zloty | | | 4,343,133 | | | | UBS | | | | 1,148,328 | | | | 10/21/15 | | | | (15,460 | ) |
Romanian New Leu | | | 51,000 | | | | BNP | | | | 12,909 | | | | 10/21/15 | | | | 66 | |
Romanian New Leu | | | 145,000 | | | | BOA | | | | 36,705 | | | | 10/21/15 | | | | 814 | |
Romanian New Leu | | | 301,000 | | | | DUB | | | | 76,194 | | | | 10/21/15 | | | | (1,145 | ) |
Romanian New Leu | | | 366,000 | | | | DUB | | | | 92,648 | | | | 10/21/15 | | | | (1,114 | ) |
Russian Ruble | | | 13,265,624 | | | | BCLY | | | | 204,302 | | | | 10/7/15 | | | | (6,302 | ) |
Russian Ruble | | | 11,477,099 | | | | BCLY | | | | 176,758 | | | | 10/7/15 | | | | (695 | ) |
See Notes to Financial Statements.
146
| | | | | | | | | | |
| International Fixed Income Investments |
| | | | | | | | | | | | | | | | | | | | |
| Foreign Currency | | Local Currency | | | Counterparty | | | Market Value | | | Settlement Date | | | Unrealized
Appreciation/ (Depreciation) | |
Russian Ruble | | | 2,882,300 | | | | DUB | | | $ | 44,390 | | | | 10/7/15 | | | $ | (3,390 | ) |
Russian Ruble | | | 140,940 | | | | JPM | | | | 2,171 | | | | 10/7/15 | | | | (171 | ) |
Singapore Dollar | | | 76,091 | | | | BCLY | | | | 53,822 | | | | 10/9/15 | | | | 178 | |
Singapore Dollar | | | 96,000 | | | | BCLY | | | | 67,904 | | | | 10/9/15 | | | | 399 | |
Singapore Dollar | | | 1,581,000 | | | | BCLY | | | | 1,118,303 | | | | 10/9/15 | | | | 6,564 | |
Singapore Dollar | | | 770,935 | | | | HSBC | | | | 545,312 | | | | 10/9/15 | | | | 4,688 | |
South African Rand | | | 233,296 | | | | JPM | | | | 17,510 | | | | 9/29/15 | | | | 1,490 | |
South African Rand | | | 5,975,000 | | | | BCLY | | | | 446,675 | | | | 10/21/15 | | | | 12,549 | |
South African Rand | | | 77,000 | | | | BCLY | | | | 5,757 | | | | 10/21/15 | | | | 29 | |
South African Rand | | | 289,000 | | | | BNP | | | | 21,605 | | | | 10/21/15 | | | | 124 | |
South African Rand | | | 488,000 | | | | BNP | | | | 36,482 | | | | 10/21/15 | | | | 1,402 | |
South African Rand | | | 42,000 | | | | BOA | | | | 3,140 | | | | 10/21/15 | | | | 141 | |
South African Rand | | | 483,861 | | | | DUB | | | | 36,172 | | | | 10/21/15 | | | | 828 | |
South African Rand | | | 448,000 | | | | JPM | | | | 33,491 | | | | 10/21/15 | | | | 262 | |
South African Rand | | | 210,000 | | | | JPM | | | | 15,699 | | | | 10/21/15 | | | | 999 | |
South African Rand | | | 301,000 | | | | SCB | | | | 22,502 | | | | 10/21/15 | | | | 323 | |
South African Rand | | | 39,000 | | | | UBS | | | | 2,915 | | | | 10/21/15 | | | | (11 | ) |
South African Rand | | | 242,577 | | | | HSBC | | | | 18,105 | | | | 10/30/15 | | | | 895 | |
South African Rand | | | 229,755 | | | | JPM | | | | 17,148 | | | | 10/30/15 | | | | 852 | |
Swedish Krona | | | 14,810,000 | | | | GSC | | | | 1,752,999 | | | | 11/12/15 | | | | (56,574 | ) |
Swiss Franc | | | 108,000 | | | | JPM | | | | 111,714 | | | | 9/2/15 | | | | (1,969 | ) |
Thai Baht | | | 430,929 | | | | BCLY | | | | 11,926 | | | | 10/20/15 | | | | 169 | |
Thai Baht | | | 2,016,095 | | | | HSBC | | | | 55,792 | | | | 10/20/15 | | | | 208 | |
Thai Baht | | | 9,149,842 | | | | HSBC | | | | 253,206 | | | | 10/20/15 | | | | 794 | |
Turkish Lira | | | 47,161 | | | | DUB | | | | 16,122 | | | | 9/18/15 | | | | (122 | ) |
Turkish Lira | | | 52,968 | | | | HSBC | | | | 18,108 | | | | 9/18/15 | | | | 892 | |
Turkish Lira | | | 212,877 | | | | JPM | | | | 72,774 | | | | 9/18/15 | | | | 5,767 | |
Turkish Lira | | | 1,177,000 | | | | JPM | | | | 402,367 | | | | 9/18/15 | | | | 1,249 | |
Turkish Lira | | | 830,378 | | | | SCB | | | | 283,871 | | | | 9/18/15 | | | | (2,339 | ) |
Turkish Lira | | | 9,000 | | | | SCB | | | | 3,077 | | | | 9/18/15 | | | | (46 | ) |
Turkish Lira | | | 156,000 | | | | BCLY | | | | 52,249 | | | | 11/24/15 | | | | 57 | |
Turkish Lira | | | 42,063 | | | | DUB | | | | 14,088 | | | | 11/24/15 | | | | (88 | ) |
| | | | | | | | | | | | | | | | | | | | |
| | | | | | | | | | | | | | | | | | | 484,842 | |
| | | | | | | | | | | | | | | | | | | | |
Net Unrealized Depreciation on Open Forward Foreign Currency Contracts | | | | | | | | | | | | | | | | | | $ | (765,813 | ) |
| | | | | | | | | | | | | | | | | | | | |
At August 31, 2015, International Fixed Income Investments held the following OTC interest rate swap contracts:
| | | | | | | | | | | | | | | | | | | | | | | | | | | | | | | | | | |
Pay/Receive
Floating Rate | | Floating Rate Index | | Fixed
Rate | | | Maturity
Date | | | Counterparty | | | Notional
Amount | | | Market
Value | | | Upfront
Premiums
Paid/
(Received) | | | Unrealized
Appreciation/
(Depreciation) | |
| Receive | | BRL-CDI-Compounded | | | 10.910% | | | | 01/02/2017 | | | | BOA | | | | BRL | | | | 1,200,000 | | | $ | 11,189 | | | $ | 4,280 | | | $ | 6,909 | |
| Receive | | BRL-CDI-Compounded | | | 11.320% | | | | 01/04/2016 | | | | BOA | | | | BRL | | | | 1,200,000 | | | | 2,355 | | | | 1,245 | | | | 1,110 | |
| Receive | | BRL-CDI-Compounded | | | 11.510% | | | | 01/04/2021 | | | | BNP | | | | BRL | | | | 200,000 | | | | 3,858 | | | | — | | | | 3,858 | |
| Pay | | BRL-CDI-Compounded | | | 11.610% | | | | 01/02/2018 | | | | BNP | | | | BRL | | | | 300,000 | | | | (3,753 | ) | | | (775 | ) | | | (2,978 | ) |
| Pay | | BRL-CDI-Compounded | | | 11.610% | | | | 01/02/2018 | | | | BOA | | | | BRL | | | | 1,000,000 | | | | (12,511 | ) | | | (3,994 | ) | | | (8,517 | ) |
See Notes to Financial Statements.
147
| | | | | | | | | | |
| International Fixed Income Investments |
| | | | | | | | | | | | | | | | | | | | | | | | | | | | | | | | | | |
Pay/Receive
Floating Rate | | Floating Rate Index | | Fixed
Rate | | | Maturity
Date | | | Counterparty | | | Notional Amount | | | Market
Value | | | Upfront
Premiums
Paid/
(Received) | | | Unrealized
Appreciation/
(Depreciation) | |
| Pay | | BRL-CDI-Compounded | | | 11.610% | | | | 01/02/2018 | | | | JPM | | | | BRL | | | | 1,300,000 | | | $ | (16,265 | ) | | $ | (1,894 | ) | | $ | (14,371 | ) |
| Pay | | BRL-CDI-Compounded | | | 11.610% | | | | 01/02/2018 | | | | UBS | | | | BRL | | | | 1,000,000 | | | | (12,511 | ) | | | (1,326 | ) | | | (11,185 | ) |
| Receive | | BRL-CDI-Compounded | | | 12.055% | | | | 01/04/2021 | | | | BNP | | | | BRL | | | | 100,000 | | | | 1,356 | | | | (887 | ) | | | 2,243 | |
| Receive | | BRL-CDI-Compounded | | | 12.230% | | | | 01/04/2021 | | | | BNP | | | | BRL | | | | 100,000 | | | | 1,174 | | | | (33 | ) | | | 1,207 | |
| Receive | | BRL-CDI-Compounded | | | 12.230% | | | | 01/04/2021 | | | | DUB | | | | BRL | | | | 100,000 | | | | 1,174 | | | | (68 | ) | | | 1,242 | |
| Receive | | BRL-CDI-Compounded | | | 12.255% | | | | 01/02/2017 | | | | BNP | | | | BRL | | | | 1,000,000 | | | | 2,705 | | | | (30,245 | ) | | | 32,950 | |
| Receive | | BRL-CDI-Compounded | | | 12.255% | | | | 01/02/2017 | | | | DUB | | | | BRL | | | | 600,000 | | | | 1,623 | | | | (766 | ) | | | 2,389 | |
| Receive | | BRL-CDI-Compounded | | | 12.255% | | | | 01/02/2017 | | | | HSBC | | | | BRL | | | | 500,000 | | | | 1,352 | | | | 375 | | | | 977 | |
| Pay | | BRL-CDI-Compounded | | | 12.360% | | | | 01/02/2018 | | | | BNP | | | | BRL | | | | 500,000 | | | | (3,954 | ) | | | (1,748 | ) | | | (2,206 | ) |
| Pay | | BRL-CDI-Compounded | | | 12.360% | | | | 01/02/2018 | | | | UBS | | | | BRL | | | | 1,210,000 | | | | (9,568 | ) | | | (33,409 | ) | | | 23,841 | |
| Pay | | BRL-CDI-Compounded | | | 12.800% | | | | 01/04/2021 | | | | HSBC | | | | BRL | | | | 300,000 | | | | (2,484 | ) | | | (673 | ) | | | (1,811 | ) |
| Pay | | BRL-CDI-Compounded | | | 12.810% | | | | 01/04/2021 | | | | DUB | | | | BRL | | | | 400,000 | | | | (3,281 | ) | | | 1,002 | | | | (4,283 | ) |
| Pay | | BRL-CDI-Compounded | | | 12.850% | | | | 01/04/2021 | | | | BNP | | | | BRL | | | | 100,000 | | | | (477 | ) | | | 167 | | | | (644 | ) |
| Pay | | BRL-CDI-Compounded | | | 12.850% | | | | 01/04/2021 | | | | DUB | | | | BRL | | | | 170,000 | | | | (810 | ) | | | 341 | | | | (1,151 | ) |
| Receive | | BRL-CDI-Compounded | | | 12.860% | | | | 01/02/2018 | | | | JPM | | | | BRL | | | | 700,000 | | | | 3,828 | | | | — | | | | 3,828 | |
| Pay | | BRL-CDI-Compounded | | | 12.985% | | | | 01/02/2018 | | | | BNP | | | | BRL | | | | 100,000 | | | | (450 | ) | | | — | | | | (450 | ) |
| Receive | | BRL-CDI-Compounded | | | 13.345% | | | | 01/04/2021 | | | | BCLY | | | | BRL | | | | 300,000 | | | | 1,159 | | | | — | | | | 1,159 | |
| Pay | | BRL-CDI-Compounded | | | 13.680% | | | | 04/01/2016 | | | | BNP | | | | BRL | | | | 1,100,000 | | | | (983 | ) | | | (187 | ) | | | (796 | ) |
| Pay | | BRL-CDI-Compounded | | | 13.770% | | | | 04/01/2016 | | | | HSBC | | | | BRL | | | | 1,200,000 | | | | (892 | ) | | | — | | | | (892 | ) |
| Receive | | BRL-CDI-Compounded | | | 13.820% | | | | 01/02/2017 | | | | HSBC | | | | BRL | | | | 1,300,000 | | | | 1,270 | | | | (48 | ) | | | 1,318 | |
| Pay | | Colombia IBR Overnight Interbank | | | 5.310% | | | | 08/29/2019 | | | | BOA | | | | COP | | | | 200,000,000 | | | | (1,151 | ) | | | — | | | | (1,151 | ) |
| Pay | | Colombia IBR Overnight Interbank | | | 5.320% | | | | 03/17/2020 | | | | DUB | | | | COP | | | | 120,000,000 | | | | (929 | ) | | | — | | | | (929 | ) |
| Pay | | Colombia IBR Overnight Interbank | | | 6.120% | | | | 10/16/2024 | | | | DUB | | | | COP | | | | 66,000,000 | | | | (1,090 | ) | | | — | | | | (1,090 | ) |
| Pay | | Colombia IBR Overnight Interbank | | | 6.220% | | | | 05/28/2025 | | | | BOA | | | | COP | | | | 60,000,000 | | | | (1,079 | ) | | | — | | | | (1,079 | ) |
| Receive | | Colombia IBR Overnight Interbank | | | 6.420% | | | | 07/02/2025 | | | | JPM | | | | COP | | | | 100,000,000 | | | | 1,296 | | | | — | | | | 1,296 | |
| Receive | | Colombia IBR Overnight Interbank | | | 6.440% | | | | 07/01/2025 | | | | HSBC | | | | COP | | | | 80,000,000 | | | | 966 | | | | — | | | | 966 | |
| Pay | | 6-Month Thailand Fixing Rate | | | 2.015% | | | | 08/17/2020 | | | | DUB | | | | THB | | | | 1,000,000 | | | | (242 | ) | | | — | | | | (242 | ) |
| Pay | | 6-Month Thailand Fixing Rate | | | 3.410% | | | | 01/15/2021 | | | | DUB | | | | THB | | | | 200,000 | | | | 337 | | | | — | | | | 337 | |
| Pay | | 6-Month Thailand Fixing Rate | | | 3.410% | | | | 01/21/2021 | | | | DUB | | | | THB | | | | 750,000 | | | | 1,270 | | | | — | | | | 1,270 | |
| | | | | | | | | | | | | | | | | | | | | | | | | | | | | | | | | | |
| | | | | | | | | | | | | | | | | | | | | | | | $ | (35,518) | | | $ | (68,643 | ) | | $ | 33,125 | |
| | | | | | | | | | | | | | | | | | | | | | | | | | | | | | | | | | |
At August 31, 2015, International Fixed Income Investments held the following centrally cleared interest rate swap contracts:
| | | | | | | | | | | | | | | | | | | | | | | | | | |
Pay/Receive
Floating Rate | | Floating Rate Index | | Fixed
Rate | | | Maturity
Date | | | Counterparty | | | Notional
Amount | | | Unrealized
Appreciation/
(Depreciation) | |
| Pay | | 6-Month EURIBOR | | | 0.150% | | | | 09/16/2017 | | | | CITI | | | | EUR | | | | 14,800,000 | | | $ | (49 | ) |
| Receive | | 6-Month EURIBOR | | | 0.750% | | | | 09/16/2025 | | | | CITI | | | | EUR | | | | 1,600,000 | | | | 19,725 | |
| Receive | | 6-Month EURIBOR | | | 1.500% | | | | 03/16/2046 | | | | CITI | | | | EUR | | | | 1,000,000 | | | | 31,813 | |
| Receive | | 6-Month EURIBOR | | | 1.500% | | | | 03/16/2046 | | | | UBS | | | | EUR | | | | 4,900,000 | | | | 732,360 | |
| Pay | | 6-Month GBP-LIBOR | | | 1.500% | | | | 03/16/2018 | | | | UBS | | | | GBP | | | | 1,700,000 | | | | 4,929 | |
| Receive | | 6-Month GBP-LIBOR | | | 1.750% | | | | 09/16/2018 | | | | CITI | | | | GBP | | | | 2,900,000 | | | | (26,346 | ) |
| Receive | | 6-Month GBP-LIBOR | | | 1.750% | | | | 09/16/2018 | | | | UBS | | | | GBP | | | | 3,200,000 | | | | (29,072 | ) |
| Receive | | 6-Month GBP-LIBOR | | | 2.000% | | | | 09/16/2025 | | | | UBS | | | | GBP | | | | 1,200,000 | | | | 61,036 | |
| Receive | | 6-Month GBP-LIBOR | | | 2.000% | | | | 09/16/2045 | | | | UBS | | | | GBP | | | | 1,950,000 | | | | (90,728 | ) |
| Receive | | 6-Month GBP-LIBOR | | | 2.250% | | | | 03/16/2046 | | | | UBS | | | | GBP | | | | 550,000 | | | | (997 | ) |
| Receive | | 6-Month JPY-LIBOR | | | 0.500% | | | | 09/18/2022 | | | | UBS | | | | JPY | | | | 1,000,000,000 | | | | (52,171 | ) |
| Pay | | 6-Month JPY-LIBOR | | | 0.750% | | | | 12/20/2024 | | | | CITI | | | | JPY | | | | 1,100,000,000 | | | | 29,083 | |
See Notes to Financial Statements.
148
| | | | | | | | | | |
| International Fixed Income Investments |
| | | | | | | | | | | | | | | | | | | | | | | | | | |
Pay/Receive
Floating Rate | | Floating Rate Index | | Fixed
Rate | | | Maturity
Date | | | Counterparty | | | Notional
Amount | | | Unrealized
Appreciation/
(Depreciation) | |
| Pay | | 6-Month JPY-LIBOR | | | 1.250% | | | | 06/17/2035 | | | | CITI | | | | JPY | | | | 140,000,000 | | | $ | (5,343 | ) |
| Pay | | 6-Month JPY-LIBOR | | | 1.500% | | | | 06/19/2033 | | | | CITI | | | | JPY | | | | 3,280,000,000 | | | | (319,921 | ) |
| Receive | | 6-Month JPY-LIBOR | | | 1.500% | | | | 12/20/2044 | | | | CITI | | | | JPY | | | | 150,000,000 | | | | 34,017 | |
| Pay | | 28-Day MXN TIIE Banxico | | | 5.430% | | | | 11/17/2021 | | | | CSFB | | | | MXN | | | | 6,200,000 | | | | 2,018 | |
| Pay | | 28-Day MXN TIIE Banxico | | | 5.630% | | | | 10/11/2021 | | | | CSFB | | | | MXN | | | | 3,100,000 | | | | (5,979 | ) |
| Receive | | 28-Day MXN TIIE Banxico | | | 5.665% | | | | 01/23/2025 | | | | CSFB | | | | MXN | | | | 1,100,000 | | | | 3,162 | |
| Pay | | 28-Day MXN TIIE Banxico | | | 5.840% | | | | 09/14/2021 | | | | CSFB | | | | MXN | | | | 2,500,000 | | | | 1,924 | |
| Pay | | 28-Day MXN TIIE Banxico | | | 7.380% | | | | 02/09/2029 | | | | CSFB | | | | MXN | | | | 500,000 | | | | (525 | ) |
| Pay | | 3-Month SEK-STIBOR | | | 1.000% | | | | 03/18/2025 | | | | CITI | | | | SEK | | | | 22,700,000 | | | | (46,798 | ) |
| Receive | | 3-Month USD-LIBOR | | | 1.300% | | | | 05/06/2017 | | | | CITI | | | | USD | | | | 2,700,000 | | | | (8,021 | ) |
| Receive | | 3-Month USD-LIBOR | | | 1.300% | | | | 05/06/2017 | | | | UBS | | | | USD | | | | 72,800,000 | | | | (144,520 | ) |
| Receive | | 3-Month USD-LIBOR | | | 1.500% | | | | 12/16/2017 | | | | CITI | | | | USD | | | | 46,300,000 | | | | (168,578 | ) |
| Receive | | 3-Month USD-LIBOR | | | 2.000% | | | | 12/16/2020 | | | | CITI | | | | USD | | | | 10,300,000 | | | | (153,188 | ) |
| Receive | | 3-Month USD-LIBOR | | | 2.250% | | | | 12/16/2022 | | | | CITI | | | | USD | | | | 33,100,000 | | | | (537,245 | ) |
| Receive | | 3-Month USD-LIBOR | | | 2.500% | �� | | | 12/16/2025 | | | | CITI | | | | USD | | | | 6,400,000 | | | | (184,101 | ) |
| Receive | | 3-Month USD-LIBOR | | | 2.500% | | | | 12/16/2025 | | | | UBS | | | | USD | | | | 12,400,000 | | | | (261,592 | ) |
| Pay | | 3-Month USD-LIBOR | | | 2.750% | | | | 12/16/2045 | | | | CSFB | | | | USD | | | | 1,000,000 | | | | (15,097 | ) |
| Receive | | 3-Month USD-LIBOR | | | 2.750% | | | | 12/16/2045 | | | | CSFB | | | | USD | | | | 100,000 | | | | (6,328 | ) |
| | | | | | | | | | | | | | | | | | | | | | | | | | |
| | | | | | | | | | | | | | | | | | | | | | | | $ | (1,136,532 | ) |
| | | | | | | | | | | | | | | | | | | | | | | | | | |
At August 31, 2015, International Fixed Income Investments held the following OTC Inflation Rate Swap Contracts:
| | | | | | | | | | | | | | | | | | | | | | | | | | | | | | |
Pay/Receive
Floating Rate | | Floating Rate Index | | Fixed
Rate | | | Maturity
Date | | | Counterparty | | | Notional
Amount | | | Market
Value | | | Upfront
Premiums
Paid | | | Unrealized
Appreciation | |
| Pay | | 15-Year GBP Inflation Linked | | | 3.310% | | | | 05/15/2030 | | | | GSC | | | | GBP 300,000 | | | $ | 7,134 | | | $ | — | | | $ | 7,134 | |
| Pay | | 15-Year GBP Inflation Linked | | | 3.311% | | | | 05/15/2030 | | | | GSC | | | | GBP 200,000 | | | | 4,811 | | | | — | | | | 4,811 | |
| Pay | | 15-Year GBP Inflation Linked | | | 3.313% | | | | 05/15/2030 | | | | GSC | | | | GBP 100,000 | | | | 2,446 | | | | — | | | | 2,446 | |
| Pay | | 30-Year GBP Inflation Linked | | | 3.495% | | | | 05/15/2045 | | | | CITI | | | | GBP 100,000 | | | | 361 | | | | — | | | | 361 | |
| Pay | | 30-Year GBP Inflation Linked | | | 3.503% | | | | 05/15/2045 | | | | DUB | | | | GBP 50,000 | | | | 436 | | | | — | | | | 436 | |
| Pay | | 30-Year GBP Inflation Linked | | | 3.537% | | | | 05/15/2045 | | | | BOA | | | | GBP 250,000 | | | | 8,106 | | | | 1,825 | | | | 6,281 | |
| Pay | | 30-Year GBP Inflation Linked | | | 3.543% | | | | 05/15/2045 | | | | GSC | | | | GBP 250,000 | | | | 9,142 | | | | 464 | | | | 8,678 | |
| | | | | | | | | | | | | | | | | | | | | | | | | | | | | | |
| | | | | | | | | | | | | | | | | | | | $ | 32,436 | | | $ | 2,289 | | | $ | 30,147 | |
| | | | | | | | | | | | | | | | | | | | | | | | | | | | | | |
At August 31, 2015, International Fixed Income Investments held the following OTC Volatility Swap Contracts:
| | | | | | | | | | | | | | | | | | | | | | | | | | |
Pay/Receive
Volatility * | | Reference Obligation | | Maturity
Date | | | Counterparty | | | Strike
Price | | | Notional
Amount | | | Value | |
| Receive | | EUR vs. CHF spot exchange rate | | | 08/16/2016 | | | | DUB | | | $ | 8.35 | | |
| CHF
|
| | | (500,000 | ) | | $ | (342 | ) |
| Receive | | EUR vs. CHF spot exchange rate | | | 08/16/2016 | | | | DUB | | | | 8.45 | | | | CHF | | | | (300,000 | ) | | | (8,393 | ) |
| Receive | | EUR vs. CHF spot exchange rate | | | 08/16/2016 | | | | DUB | | | | 8.65 | | | | CHF | | | | (300,000 | ) | | | 736 | |
| Receive | | EUR vs. CHF spot exchange rate | | | 08/16/2016 | | | | DUB | | | | 8.70 | | | | CHF | | | | (200,000 | ) | | | 471 | |
| Pay | | EUR vs. CHF spot exchange rate | | | 08/16/2016 | | | | DUB | | | | 10.25 | | | | CHF | | | | 300,000 | | | | 2,595 | |
| Pay | | EUR vs. CHF spot exchange rate | | | 08/16/2016 | | | | DUB | | | | 10.55 | | | | CHF | | | | 500,000 | | | | 2,755 | |
| Pay | | USD vs. CHF spot exchange rate | | | 08/16/2016 | | | | DUB | | | | 10.45 | | | | CHF | | | | 300,000 | | | | 2,113 | |
| Pay | | USD vs. CHF spot exchange rate | | | 08/16/2016 | | | | DUB | | | | 10.90 | | | | CHF | | | | 200,000 | | | | — | |
| | | | | | | | | | | | | | | | | | | | | | | | | | |
| | | | | | | | | | | | | | | | | | | | | | | | $ | (65 | ) |
| | | | | | | | | | | | | | | | | | | | | | | | | | |
| * | Fund will pay or receive the volatility of the reference asset depending on whether the realized volatility of the reference asset exceeds or is less than the strike price. For contracts where the Fund has elected to receive the volatility of the reference asset, it will receive a net payment of the difference between the realized volatility and the strike price multiplied by the notional amount if the realized volatility exceeds the strike price; the Fund will make a net payment of the absolute value of the difference of the realized volatility and the strike price multiplied by the notional amount if the realized volatility is less than the strike price. For contracts where the Fund has elected to pay the volatility of the reference asset, it will make a net payment of the difference between the realized volatility and the strike price multiplied by the notional amount if the realized volatility exceeds the strike price; the Fund will receive a net payment of the absolute value of the difference of the realized and the strike price multiplied by the notional amount if the realized volatility is less than the strike price. |
See Notes to Financial Statements.
149
| | | | | | | | | | |
| International Fixed Income Investments |
At August 31, 2015, International Fixed Income Investments held the following OTC and Centrally Cleared credit default swap contracts:
OTC Credit Default Swaps on Corporate and Sovereign Issues and Indexes — Buy Protection (1)
| | | | | | | | | | | | | | | | | | | | | | | | | | | | | | | | |
| Reference Obligation | | Fixed Deal
(Pay) Rate | | | Maturity
Date | | | Counterparty | | | Implied
Credit
Spread at
8/31/15 (2) | | | Notional
Amount (3) | | | Market
Value | | | Upfront
Premiums
Paid/
(Received) | | | Unrealized
(Depreciation) | |
American General Finance Corp., B | | | (1.820 | %) | | | 12/20/2017 | | | | RBS | | | | 1.741 | % | | | USD 1,000,000 | | | $ | (5,371 | ) | | $ | — | | | $ | (5,371 | ) |
First Energy, BBB- | | | (0.940 | %) | | | 06/20/2017 | | | | RBS | | | | 0.304 | % | | | USD 1,000,000 | | | | (13,387 | ) | | | — | | | | (13,387 | ) |
iTraxx Europe Sub Financials Series 23 | | | | | | | | | | | | | | | | | | | | | | | | | | | | | | | | |
Index | | | (1.000 | %) | | | 06/20/2020 | | | | BNP | | | | 1.627 | % | | | EUR 200,000 | �� | | | 6,043 | | | | 6,477 | | | | (434 | ) |
iTraxx Europe Sub Financials Series 23 | | | | | | | | | | | | | | | | | | | | | | | | | | | | | | | | |
Index | | | (1.000 | %) | | | 06/20/2020 | | | | GSC | | | | 1.627 | % | | | EUR 800,000 | | | | 24,172 | | | | 27,077 | | | | (2,905 | ) |
Starwood Hotels & Resorts World, BBB | | | (1.490 | %) | | | 06/20/2018 | | | | BOA | | | | 0.363 | % | | | USD 1,000,000 | | | | (34,385 | ) | | | — | | | | (34,385 | ) |
UBS AG/Stamford CT, BBB | | | (1.000 | %) | | | 03/20/2017 | | | | CITI | | | | 0.978 | % | | | USD 600,000 | | | | (1,391 | ) | | | 806 | | | | (2,197 | ) |
UBS AG/Stamford CT, BBB | | | (1.000 | %) | | | 06/20/2018 | | | | GSC | | | | 1.150 | % | | | USD 700,000 | | | | 1,491 | | | | 3,328 | | | | (1,837 | ) |
UST Inc., Baa1 | | | (0.720 | %) | | | 03/20/2018 | | | | GSC | | | | 0.090 | % | | | USD 500,000 | | | | (8,736 | ) | | | — | | | | (8,736 | ) |
| | | | | | | | | | | | | | | | | | | | | | | | | | | | | | | | |
| | | | | | | | | | | | | | | | | | | | | | $ | (31,564 | ) | | $ | 37,688 | | | $ | (69,252 | ) |
| | | | | | | | | | | | | | | | | | | | | | | | | | | | | | | | |
OTC Credit Default Swaps on Corporate and Sovereign Issues — Sell Protection (4)
| | | | | | | | | | | | | | | | | | | | | | | | | | | | | | | | |
| Reference Obligation | | Fixed Deal
Received Rate | | | Maturity
Date | | | Counterparty | | | Implied
Credit
Spread at
8/31/15 (2) | | | Notional
Amount (3) | | | Market
Value | | | Upfront
Premiums
Paid/
(Received) | | | Unrealized
Appreciation/
(Depreciation) | |
Colombia Government International Bond, BBB | | | 1.000% | | | | 03/20/2016 | | | | DUB | | | | 0.797% | | | | USD 100,000 | | | $ | 316 | | | $ | 601 | | | $ | (285 | ) |
Colombia Government International Bond, BBB | | | 1.000% | | | | 06/20/2019 | | | | BCLY | | | | 1.901% | | | | USD 100,000 | | | | (3,067 | ) | | | 439 | | | | (3,506 | ) |
France Government 20-Year Bond, AA | | | 0.250% | | | | 03/20/2020 | | | | CITI | | | | 0.270% | | | | USD 4,000,000 | | | | (1,548 | ) | | | (37,704 | ) | | | 36,156 | |
France Government 20-Year Bond, AA | | | 0.250% | | | | 03/20/2020 | | | | JPM | | | | 0.270% | | | | USD 600,000 | | | | (232 | ) | | | (6,106 | ) | | | 5,874 | |
France Government 20-Year Bond, AA | | | 0.250% | | | | 03/20/2020 | | | | GSC | | | | 0.270% | | | | USD 6,500,000 | | | | (2,515 | ) | | | (66,124 | ) | | | 63,609 | |
Japan Government 20-Year Bond, AA- | | | 1.000% | | | | 03/20/2016 | | | | RBS | | | | 0.071% | | | | USD 5,000,000 | | | | 36,164 | | | | 10,601 | | | | 25,563 | |
Japan Government 20-Year Bond, AA- | | | 1.000% | | | | 03/20/2016 | | | | GSC | | | | 0.071% | | | | USD 3,100,000 | | | | 22,421 | | | | (31,831 | ) | | | 54,252 | |
South Africa Government International Bond, BBB- | | | 1.000% | | | | 09/20/2015 | | | | BOA | | | | 0.683% | | | | USD 100,000 | | | | 220 | | | | 590 | | | | (370 | ) |
U.S. Treasury Notes, AA+ | | | 0.250% | | | | 06/20/2016 | | | | BNP | | | | 0.089% | | | | EUR 700,000 | | | | 1,432 | | | | (7,057 | ) | | | 8,489 | |
| | | | | | | | | | | | | | | | | | | | | | | | | | | | | | | | |
| | | | | | | | | | | | | | | | | | | | | | $ | 53,191 | | | $ | (136,591 | ) | | $ | 189,782 | |
| | | | | | | | | | | | | | | | | | | | | | | | | | | | | | | | |
See Notes to Financial Statements.
150
| | | | | | | | | | |
| International Fixed Income Investments |
Centrally Cleared — Credit Default Swaps on Corporate and Sovereign Issues — Buy Protection (1)
| | | | | | | | | | | | | | | | | | | | | | | | |
| Reference Obligation | | Fixed Deal
(Pay) Rate | | | Maturity
Date | | | Counterparty | | | Implied Credit
Spread at
8/31/15 (2) | | | Notional
Amount (3) | | | Unrealized
Appreciation/
(Depreciation) | |
CDX.IG-24 5-Year Index | | | (1.000% | ) | | | 06/20/2020 | | | | CITI | | | | 0.818% | | | | USD 4,500,000 | | | $ | 20,756 | |
iTraxx Europe Senior Financials Series 23 Index | | | (1.000% | ) | | | 06/20/2020 | | | | UBS | | | | 0.712% | | | | EUR 4,000,000 | | | | (7,893 | ) |
| | | | | | | | | | | | | | | | | | | | | | | | |
| | | | | | | | | | | | | | | | | | | | | | $ | 12,863 | |
| | | | | | | | | | | | | | | | | | | | | | | | |
Centrally Cleared — Credit Default Swaps on Corporate and Sovereign Issues — Sell Protection (4)
| | | | | | | | | | | | | | | | | | | | | | | | |
| Reference Obligation | | Fixed Deal
Received Rate | | | Maturity
Date | | | Counterparty | | | Implied Credit
Spread at
8/31/15 (2) | | | Notional
Amount (3) | | | Unrealized
Appreciation/
(Depreciation) | |
CDX.HY-24 5-Year Index | | | 5.000% | | | | 06/20/2020 | | | | CITI | | | | 3.919% | | | | USD 2,178,000 | | | $ | (34,866 | ) |
iTraxx Europe Senior Financials Series 23 Index | | | 1.000% | | | | 06/20/2020 | | | | CITI | | | | 0.805% | | | | EUR 2,900,000 | | | | 4,656 | |
| | | | | | | | | | | | | | | | | | | | | | | | |
| | | | | | | | | | | | | | | | | | | | | | $ | (30,210 | ) |
| | | | | | | | | | | | | | | | | | | | | | | | |
At August 31, 2015, International Fixed Income Investments held the following OTC cross currency swap contracts:
| | | | | | | | | | | | | | | | | | | | | | | | | | | | | | |
| Counterparty Pay | | Counterparty Receive | | Maturity
Date (5) | | | Counterparty | | | Notional
Amount of
Currency
Received (6)
(amounts
below are in
000’s) | | | Notional
Amount of
Currency
Delivered (6)
(amounts
below are in
000’s) | | | Market
Value | | | Upfront
Premiums
Paid/
(Received) | | | Unrealized
Appreciation/
(Depreciation) | |
Floating rate equal to 3-Month USD-LIBOR based on the notional amount of currency received | | Floating rate equal to 3-Month EURIBOR less 0.100% based on the notional amount of currency delivered | | | 12/16/2020 | | | | BNP | | | | USD 7,207 | | | | EUR 6,600 | | | $ | 279,172 | | | $ | 76,300 | | | $ | 202,872 | |
Floating rate equal to 3-Month USD-LIBOR based on the notional amount of currency received | | Floating rate equal to 3-Month EURIBOR less 0.200% based on the notional amount of currency delivered | | | 12/16/2025 | | | | BNP | | | | USD 3,723 | | | | EUR 3,400 | | | | 135,269 | | | | 13,430 | | | | 121,839 | |
Floating rate equal to 3-Month USD-LIBOR based on the notional amount of currency received | | Floating rate equal to 3-Month EURIBOR less 0.100% based on the notional amount of currency delivered | | | 12/16/2020 | | | | BOA | | | | USD 7,204 | | | | EUR 6,500 | | | | 168,942 | | | | 20,390 | | | | 148,552 | |
Floating rate equal to 3-Month USD-LIBOR based on the notional amount of currency received | | Floating rate equal to 3-Month EURIBOR less 0.200% based on the notional amount of currency delivered | | | 12/16/2025 | | | | BOA | | | | USD 829 | | | | EUR 760 | | | | 33,277 | | | | (532 | ) | | | 33,809 | |
Floating rate equal to 3-Month USD-LIBOR based on the notional amount of currency received | | Floating rate equal to 3-Month EURIBOR less 0.100% based on the notional amount of currency delivered | | | 12/16/2020 | | | | CITI | | | | USD 5,936 | | | | EUR 5,300 | | | | 75,784 | | | | 23,790 | | | | 51,994 | |
See Notes to Financial Statements.
151
| | | | | | | | | | |
| International Fixed Income Investments |
| | | | | | | | | | | | | | | | | | | | | | | | | | | | | | |
| Counterparty Pay | | Counterparty Receive | | Maturity
Date (5) | | | Counterparty | | | Notional
Amount of
Currency
Received (6)
(amounts
below are in
000’s) | | | Notional
Amount of
Currency
Delivered (6)
(amounts
below are in
000’s) | | | Market
Value | | | Upfront
Premiums
Paid/
(Received) | | | Unrealized
Appreciation/
(Depreciation) | |
Floating rate equal to 3-Month USD-LIBOR based on the notional amount of currency received | | Floating rate equal to 3-Month EURIBOR less 0.200% based on the notional amount of currency delivered | | | 12/16/2025 | | | | CITI | | | | USD 1,537 | | | | EUR 1,410 | | | $ | 63,147 | | | $ | (3,666 | ) | | $ | 66,813 | |
Floating rate equal to 3-Month USD-LIBOR based on the notional amount of currency received | | Floating rate equal to 3-Month EURIBOR less 0.100% based on the notional amount of currency delivered | | | 12/16/2020 | | | | DUB | | | | USD 4,007 | | | | EUR 3,600 | | | | 76,316 | | | | 48,820 | | | | 27,496 | |
Floating rate equal to 3-Month USD-LIBOR based on the notional amount of currency received | | Floating rate equal to 3 Month CHF — LIBOR less 0.230% based on the notional amount of currency delivered | | | 12/16/2017 | | | | GSC | | | | USD 1,053 | | | | CHF 1,000 | | | | (15,987 | ) | | | (1,107 | ) | | | (14,880 | ) |
Floating rate equal to 3-Month USD-LIBOR based on the notional amount of currency received | | Floating rate equal to 3 Month CHF — LIBOR less 0.230% based on the notional amount of currency delivered | | | 12/16/2017 | | | | UBS | | | | USD 1,387 | | | | CHF 1,300 | | | | (39,029 | ) | | | (5,452 | ) | | | (33,577 | ) |
| | | | | | | | | | | | | | | | | | | | | | | | | | | | | | |
| | | | | | | | | | | | | | | | | | | | $ | 776,891 | | | $ | 171,973 | | | $ | 604,918 | |
| | | | | | | | | | | | | | | | | | | | | | | | | | | | | | |
| (1) | If the Fund is a buyer of protection and a credit event occurs, as defined under the terms of that particular swap agreement, the Fund will either (i) receive from the seller of protection an amount equal to the notional amount of the swap and deliver the reference obligation or underlying securities comprising the referenced index or (ii) receive a net settlement amount in the form of cash or securities equal to the notional amount of the swap less the recovery value of the reference obligation or underlying securities comprising the referenced index. |
| (2) | Implied credit spreads, represented in absolute terms, utilized in determining the market value of credit default swap agreements on corporate issues or sovereign issues of an emerging country as of period end serve as an indicator of the current status of the payment/performance risk and represent the likelihood or risk of default for the credit derivative. The implied credit spread of a particular referenced entity reflects the cost of buying/selling protection and may include upfront payments required to be made to enter into the agreement. Wider credit spreads represent a deterioration of the referenced entity’s credit soundness and a greater likelihood or risk of default or other credit event occurring as defined under the terms of the agreement. A credit spread identified as ‘‘Defaulted’’ indicates a credit event has occurred for the referenced entity or obligation. |
| (3) | The maximum potential amount the Fund could be required to make as a seller of credit protection or receive as a buyer of credit protection if a credit event occurs as defined under the terms of that particular swap agreement. |
| (4) | If the Fund is a seller of protection and a credit event occurs, as defined under the terms of that particular swap agreement, the Fund will either (i) pay to the buyer of protection an amount equal to the notional amount of the swap and take delivery of the referenced obligation or underlying securities comprising the referenced index or (ii) pay a net settlement amount in the form of cash or securities equal to the notional amount of the swap less the recovery value of the referenced obligation or underlying securities comprising the referenced index. |
| (5) | At the maturity date, the notional amount of the currency received will be exchanged back for the notional amount of the currency delivered. |
| (6) | The notional amounts to be received or delivered may be determined and exchanged at a future date, based on the effective date of the cross-currency swap. |
See Notes to Financial Statements.
152
| | | | | | |
| International Fixed Income Investments |
At August 31, 2015, International Fixed Income Investments deposited cash collateral with brokers in the amount of $2,387,174 for open centrally cleared swap contracts.
At August 31, 2015, International Fixed Income Investments deposited cash collateral with brokers in the amount of $960,000 for open OTC swap contracts.
At August 31, 2015, International Fixed Income Investments had cash collateral from brokers in the amount of $1,210,317 for open centrally cleared swap contracts.
At August 31, 2015, International Fixed Income Investments had cash collateral from brokers in the amount of $200,000 for open OTC swap contracts.
| | | | | | |
Currency Abbreviations used in this schedule: | | Counterparty Abbreviations used in this schedule: |
| AUD | | — Australian Dollar | | BCLY | | — Barclays Bank PLC |
| BRL | | — Brazilian Real | | BNP | | — BNP Paribas SA |
| CAD | | — Canadian Dollar | | BOA | | — Bank of America |
| CHF | | — Swiss Franc | | CITI | | — Citigroup Global Markets Inc. |
| COP | | — Colombian Peso | | CSFB | | — Credit Suisse Securities (USA) LLC |
| DKK | | — Danish Krone | | DUB | | — Deutsche Bank AG |
| EUR | | — Euro | | GSC | | — Goldman Sachs & Co. |
| GBP | | — British Pound | | HSBC | | — HSBC Bank USA |
| IDR | | — Indonesian Rupiah | | JPM | | — JPMorgan Chase & Co. |
| JPY | | — Japanese Yen | | RBS | | — Royal Bank of Scotland PLC |
| MXN | | — Mexican Peso | | SCB | | — Standard Chartered Bank |
| MYR | | — Malaysian Ringgit | | UBS | | — UBS Securities LLC |
| NOK | | — Norwegian Krone | | | | |
| NZD | | — New Zealand Dollar | | | | |
| PEN | | — Peruvian Sol | | | | |
| PLN | | — Polish Zloty | | | | |
| RON | | — Romanian New Leu | | | | |
| RUB | | — Russian Ruble | | | | |
| SEK | | — Swedish Krona | | | | |
| SGD | | — Singapore Dollar | | | | |
| THB | | — Thai Baht | | | | |
| TRY | | — Turkish Lira | | | | |
| ZAR | | — South African Rand | | | | |
See Notes to Financial Statements.
153
| | | | | | | | | | |
| Municipal Bond Investments | |
| | | |
Face
Amount | | | Rating†† | | Security | | Value | |
| MUNICIPAL BONDS — 95.6% | |
| California — 10.8% | |
| $ | 1,000,000 | | | AA+ | | California Infrastructure & Economic Development Bank, Revenue Bonds, Bay Area Toll Bridges, Series A, Prerefunded 1/1/28 @ 100, AMBAC-Insured, 5.000% due 7/1/36(a) | | $ | 1,271,100 | |
| | 1,050,000 | | | AA- | | California Statewide Communities Development Authority, Revenue Bonds, Sutter Health Project, Series A, 5.500% due 8/15/26 | | | 1,222,368 | |
| | 2,000,000 | | | AA- | | Garden Grove Unified School District, GO, 2010 Election, Series C, 5.000% due 8/1/35 | | | 2,245,340 | |
| | 1,500,000 | | | A+ | | San Diego County, CA, Regional Airport Authority, Revenue Bonds, Series A, 5.000% due 7/1/43 | | | 1,642,080 | |
| | 1,500,000 | | | A+ | | San Francisco, CA, City & County Airports Commission, Revenue Bonds, Series C-2, 5.000% due 5/1/21 | | | 1,704,120 | |
| | 1,000,000 | | | Aa1(b) | | Santa Monica-Malibu, CA, Unified School District, GO, Election of 2006, Series A, Prerefunded 8/1/17 @ 100, FGIC & NPFG-Insured, 5.000% due 8/1/26(a) | | | 1,083,480 | |
| | | | | | | | | | |
| | | | | | Total California | | | 9,168,488 | |
| | | | | | | | | | |
| Colorado — 9.0% | |
| | 1,435,000 | | | AA | | City of Colorado Springs CO Utilities System Revenue, Revenue Bonds, System Improvement, Series B-2, 5.000% due 11/15/38 | | | 1,621,048 | |
| | | | | | Colorado Health Facilities Authority, Revenue Bonds: | | | | |
| | 1,000,000 | | | A | | Catholic Health Initiatives, Series A, 5.250% due 2/1/31 | | | 1,104,220 | |
| | 1,500,000 | | | AA- | | Sisters of Charity of Leavenworth Inc., Series A, 5.000% due 1/1/44 | | | 1,649,880 | |
| | 1,000,000 | | | AAA | | Colorado Water Resources & Power Development Authority, Revenue Bonds, Revolving Fund, Series A, 5.500% due 9/1/22 | | | 1,231,060 | |
| | 2,000,000 | | | AA- | | University of Colorado Hospital Authority, Revenue Bonds, Series A, 4.000% due 11/15/36 | | | 2,021,120 | |
| | | | | | | | | | |
| | | | | | Total Colorado | | | 7,627,328 | |
| | | | | | | | | | |
| District of Colombia — 3.4% | |
| | 2,500,000 | | | AAA | | District of Columbia, Revenue Bonds, Income Tax Revenue, Series A, 5.000% due 12/1/28 | | | 2,882,600 | |
| | | | | | | | | | |
| Florida — 2.6% | |
| | 1,000,000 | | | A | | City of Jacksonville FL, Revenue Bonds, Better Jacksonville, 5.000% due 10/1/21 | | | 1,113,830 | |
| | 1,000,000 | | | A+ | | County of Miami-Dade, FL — Water & Sewer System Revenue, Revenue Bonds, Prerefunded 10/1/17 @ 100, XLCA-Insured, 5.000% due 10/1/21(a) | | | 1,089,840 | |
| | | | | | | | | | |
| | | | | | Total Florida | | | 2,203,670 | |
| | | | | | | | | | |
| Georgia — 5.0% | |
| | 2,000,000 | | | AA | | Augusta GA Water & Sewerage Revenue, Revenue Bonds, AGM-Insured, 5.000% due 10/1/21 | | | 2,192,400 | |
| | 1,800,000 | | | A | | Municipal Electric Authority of Georgia, Revenue Bonds, Series B, 5.000% due 1/1/20 | | | 2,063,808 | |
| | | | | | | | | | |
| | | | | | Total Georgia | | | 4,256,208 | |
| | | | | | | | | | |
| Hawaii — 2.1% | |
| | 1,455,000 | | | Aa1(b) | | City & County of Honolulu HI, GO, Series A, 5.000% due 10/1/26 | | | 1,771,463 | |
| | | | | | | | | | |
| Illinois — 5.6% | |
| | | | | | Illinois Finance Authority, Revenue Bonds: | | | | |
| | 1,235,000 | | | AA | | Advocate Health Care, 4.000% due 6/1/47 | | | 1,226,145 | |
| | 1,000,000 | | | AAA | | Northwestern University, 5.000% due 12/1/28 | | | 1,238,260 | |
| | 1,000,000 | | | A | | Bradley University Projects, Series A, XLCA-Insured, 5.000% due 8/1/34 | | | 1,058,860 | |
| | 1,095,000 | | | A2(b) | | DePaul University, Series A, 5.375% due 10/1/19 | | | 1,253,337 | |
| | | | | | | | | | |
| | | | | | Total Illinois | | | 4,776,602 | |
| | | | | | | | | | |
| Kentucky — 1.4% | |
| | 1,000,000 | | | A+ | | Kentucky State Property & Building Commission, Revenue Bonds, Project #108, Series A, 5.000% due 8/1/22 | | | 1,171,600 | |
| | | | | | | | | | |
| Massachusetts — 2.8% | |
| | 1,000,000 | | | AAA | | Massachusetts Bay Transportation Authority, Revenue Bonds, Series A, 5.250% due 7/1/34 | | | 1,276,680 | |
| | 1,000,000 | | | A2(b) | | Massachusetts Health & Educational Facilities Authority, Revenue Bonds, Northeastern University, Series R, 5.000% due 10/1/28 | | | 1,104,560 | |
| | | | | | | | | | |
| | | | | | Total Massachusetts | | | 2,381,240 | |
| | | | | | | | | | |
See Notes to Financial Statements.
154
| | | | | | | | | | |
| Municipal Bond Investments | |
| | | |
Face
Amount | | | Rating†† | | Security | | Value | |
| Michigan — 2.2% | |
| $ | 1,750,000 | | | AA | | Kalamazoo Hospital Finance Authority, Revenue Bonds, Bronson Hospital, Series A, AGM-Insured, 5.000% due 5/15/26 | | $ | 1,902,215 | |
| | | | | | | | | | |
| New Jersey — 3.8% | |
| | 1,340,000 | | | A2(b) | | Manalapan-Englishtown Regional Board of Education, GO, FGIC & NPFG-Insured, 5.750% due 12/1/22 | | | 1,653,868 | |
| | 1,500,000 | | | A+ | | New Jersey Health Care Facilities Financing Authority, Revenue Bonds, AtlantiCare Regional Medical Centre, 5.000% due 7/1/27 | | | 1,599,060 | |
| | | | | | | | | | |
| | | | | | Total New Jersey | | | 3,252,928 | |
| | | | | | | | | | |
| North Carolina — 2.6% | |
| | 2,000,000 | | | A- | | North Carolina Eastern Municipal Power Agency, Revenue Bonds, Series B, Prerefunded 1/1/19 @ 100, 5.000% due 1/1/26(a) | | | 2,258,360 | |
| | | | | | | | | | |
| Oregon — 1.8% | |
| | 1,330,000 | | | Aa2(b) | | Washington & Clackamas Counties School District No. 23J Tigard-Tualatin, GO , NPFG-Insured, 5.000% due 6/15/22 | | | 1,582,806 | |
| | | | | | | | | | |
| Pennsylvania — 2.6% | |
| | 2,000,000 | | | A+ | | Monroeville Finance Authority, Revenue Bonds, Series B, 5.000% due 7/1/39 | | | 2,213,860 | |
| | | | | | | | | | |
| South Carolina — 4.6% | |
| | 1,535,000 | | | Aa3(b) | | Clemson University, Revenue Bonds, 5.000% due 5/1/29 | | | 1,793,571 | |
| | 2,000,000 | | | AA | | SCAGO Educational Facilities Corp. for Pickens School District, Revenue Bonds, Pickens County Project, Prerefunded 12/1/16 @ 100, AGM-Insured, 5.000% due 12/1/21(a) | | | 2,111,760 | |
| | | | | | | | | | |
| | | | | | Total South Carolina | | | 3,905,331 | |
| | | | | | | | | | |
| South Dakota — 1.9% | |
| | 1,500,000 | | | Aa2(b) | | City of Sioux Falls, SD, Sales Tax, Revenue Bonds, Series A-1, NPFG-Insured, 4.750% due 11/15/36 | | | 1,602,375 | |
| | | | | | | | | | |
| Tennessee — 3.6% | |
| | 1,000,000 | | | BBB+ | | Knox County Health Educational & Housing Facility Board, Revenue Bonds, University Health System, 5.250% due 4/1/36 | | | 1,034,870 | |
| | 2,000,000 | | | Aa2(b) | | Tennessee Housing Development Agency, Series A, 3.850% due 1/1/35 | | | 1,999,920 | |
| | | | | | | | | | |
| | | | | | Total Tennessee | | | 3,034,790 | |
| | | | | | | | | | |
| Texas — 15.2% | |
| | 1,000,000 | | | AA | | City of Waxahachie, TX, GO, Series A, AGM-Insured, 5.000% due 8/1/25 | | | 1,077,700 | |
| | 2,000,000 | | | AAA | | Keller, TX, Independent School District, GO, Prerefunded 8/15/17 @ 100, PSF-GTD-Insured, 4.750% due 8/15/32(a) | | | 2,161,060 | |
| | 2,500,000 | | | AAA | | North East, TX, Independent School District, GO, PSF-GTD-Insured, 5.250% due 2/1/30 | | | 3,177,750 | |
| | 2,000,000 | | | AA | | Round Rock, TX, Independent School District, GO, 5.000% due 8/1/33 | | | 2,210,100 | |
| | | | | | Texas Transportation Commission State Highway Fund, Revenue Bonds: | | | | |
| | 1,000,000 | | | AAA | | Prerefunded 4/1/17 @ 100, 5.000%, due 4/1/27(a) | | | 1,069,480 | |
| | 2,575,000 | | | AAA | | 5.250%, due 4/1/26 | | | 3,243,213 | |
| | | | | | | | | | |
| | | | | | Total Texas | | | 12,939,303 | |
| | | | | | | | | | |
| Utah — 2.6% | |
| | 2,000,000 | | | AA | | Utah State University of Agriculture & Applied Science, Revenue Bonds, Student Building Fee, Series B, 5.000% due 12/1/44 | | | 2,211,860 | |
| | | | | | | | | | |
| Washington — 7.1% | |
| | 2,000,000 | | | AA+ | | King County, School District No. 210 Federal Way, GO, Prerefunded 12/1/17 @ 100, FGIC & NPFG-Insured, 5.000% due 12/1/23(a) | | | 2,188,340 | |
| | 2,000,000 | | | AA+ | | State of Washington, GO, Series A, Prerefunded 7/1/18 @ 100, 5.000% due 7/1/22(a) | | | 2,226,640 | |
| | 1,500,000 | | | A | | Washington Health Care Facilities Authority, Revenue Bonds, Series A, 5.000% due 11/1/18 | | | 1,677,750 | |
| | | | | | | | | | |
| | | | | | Total Washington | | | 6,092,730 | |
| | | | | | | | | | |
See Notes to Financial Statements.
155
| | | | | | | | | | |
| Municipal Bond Investments | |
| | | |
Face
Amount | | | Rating†† | | Security | | Value | |
| Wisconsin — 4.9% | |
| $ | 2,500,000 | | | AA+ | | Wisconsin Department of Transportation, Revenue Bonds, Series I, FGIC & NPFG-Insured, 5.000% due 7/1/20 | | $ | 2,917,400 | |
| | 1,300,000 | | | A+ | | Wisconsin Health & Educational Facilities Authority, Revenue Bonds, Aspirus Inc., Obligation Group, 4.000% due 8/15/40 | | | 1,244,490 | |
| | | | | | | | | | |
| | | | | | Total Wisconsin | | | 4,161,890 | |
| | | | | | | | | | |
| | | | | | TOTAL MUNICIPAL BONDS
(Cost — $76,038,361) | | | 81,397,647 | |
| | | | | | | | | | |
| SHORT-TERM INVESTMENTS — 3.7% | |
| TIME DEPOSITS— 3.7% | |
| | 1,744,728 | | | | | DNB — Oslo, 0.030% due 9/1/15 | | | 1,744,728 | |
| | 1,385,948 | | | | | Skandinaviska Enskilda Banken AB — Stockholm, 0.030% due 9/1/15 | | | 1,385,948 | |
| | | | | | | | | | |
| | | | | | TOTAL SHORT-TERM INVESTMENTS
(Cost — $ 3,130,676) | | | 3,130,676 | |
| | | | | | | | | | |
| | | | | | TOTAL INVESTMENTS — 99.3%
(Cost — $ 79,169,037#) | | | 84,528,323 | |
| | | | | | | | | | |
| | | | | | Other Assets in Excess of Liabilities — 0.7% | | | 568,409 | |
| | | | | | | | | | |
| | | | | | TOTAL NET ASSETS — 100.0% | | $ | 85,096,732 | |
| | | | | | | | | | |
| †† | All ratings are by Standard & Poor’s Rating Service, unless otherwise noted. All ratings are unaudited. |
| (a) | Pre-refunded bonds are escrowed with government obligations and/or government agency securities and are considered by the Manager to be triple-A rated even if the issuer has not applied for new ratings. |
| (b) | Rating by Moody’s Investors Service. All ratings are unaudited. |
| # | Aggregate cost for federal income tax purposes is $79,169,037. |
| | |
Abbreviations used in this schedule: |
| AGM | | — Assured Guaranty Municipal Corp. |
| AMBAC | | — American Bond Assurance Corporation |
| FGIC | | — Financial Guarantee Insurance Company |
| GO | | — General Obligation |
| NPFG | | — National Public Finance Guarantee Corp. |
| PSF-GTD | | — Permanent School Fund Guaranteed |
| XLCA | | — XL Capital Assurance Inc. |
See pages 158 and 159 for definitions of ratings.
| | | | |
| Summary of Investments by Industry^ | |
Education | | | 32.0 | % |
Health Care Providers & Services | | | 18.5 | |
General Obligation | | | 15.5 | |
Transportation | | | 10.1 | |
Water and Sewer | | | 5.3 | |
Power | | | 5.1 | |
Airport | | | 4.0 | |
Single Family Housing | | | 2.4 | |
Utilities | | | 1.9 | |
Development | | | 1.5 | |
Short-Term Investments | | | 3.7 | |
| | | | |
| | | 100.0 | % |
| | | | |
| ^ | As a percentage of total investments. |
See Notes to Financial Statements.
156
| | | | | | | | |
| Money Market Investments | |
| | |
Face
Amount | | | Security | | Amortized Cost | |
| SHORT-TERM INVESTMENTS — 98.6% | |
| CERTIFICATES OF DEPOSIT — 31.1% | |
| $ | 13,000,000 | | | Bank of Nova Scotia, 0.300% due 11/9/15 | | $ | 13,000,000 | |
| | 10,000,000 | | | Credit Agricole North America Inc., 0.180% due 9/10/15(a) | | | 9,999,550 | |
| | 10,000,000 | | | Credit Suisse AG, 0.280% due 10/2/15 | | | 10,000,000 | |
| | 10,000,000 | | | Norinchukin Bank, 0.260% due 9/14/15 | | | 10,000,000 | |
| | 10,000,000 | | | Skandin Ens Banken, 0.210% due 9/22/15 | | | 10,000,000 | |
| | 10,000,000 | | | Wells Fargo Bank N.A., 0.313% due 10/9/15(c) | | | 10,000,000 | |
| | | | | | | | |
| | | | TOTAL CERTIFICATES OF DEPOSIT
(Cost — $62,999,550) | | | 62,999,550 | |
| | | | | | | | |
| COMMERCIAL PAPER — 45.3% | |
| | 9,000,000 | | | Autobahn Funding Co. LLC, 0.120% due 9/1/15(a)(b) | | | 9,000,000 | |
| | 10,000,000 | | | BNP Paribas Finance Inc., 0.250% due 9/3/15(a) | | | 9,999,861 | |
| | 5,000,000 | | | Collateralized Commercial Paper Co. LLC, 0.421% due 12/14/15(a) | | | 4,993,934 | |
| | 15,000,000 | | | General Electric Capital Corp., 0.301% due 10/22/15(a) | | | 14,993,625 | |
| | 6,000,000 | | | JPMorgan Securities LLC, 0.401% due 11/10/15(a) | | | 5,995,333 | |
| | 9,000,000 | | | Natixis New York Branch, 0.070% due 9/1/15(a) | | | 9,000,000 | |
| | 9,000,000 | | | Societe Generale, 0.050% due 9/1/15(a)(b) | | | 9,000,000 | |
| | 10,000,000 | | | Swedbank AB, 0.270% due 11/12/15(a) | | | 9,994,600 | |
| | 10,000,000 | | | Toyota Motor Credit Corp., 0.200% due 10/19/15(a) | | | 9,997,333 | |
| | 9,000,000 | | | United Parcel Service Inc., 0.010% due 9/1/15(a)(b) | | | 9,000,000 | |
| | | | | | | | |
| | | | TOTAL COMMERCIAL PAPER
(Cost — $91,974,686) | | | 91,974,686 | |
| | | | | | | | |
| TIME DEPOSITS — 0.4% | |
| | 500,032 | | | National Australia Bank Ltd. — Grand Cayman, 0.030% due 9/1/15 | | | 500,032 | |
| | 362,518 | | | Skandinaviska Enskilda Banken AB — Stockholm, 0.030% due 9/1/15 | | | 362,518 | |
| | | | | | | | |
| | | | TOTAL TIME DEPOSITS
(Cost — $862,550) | | | 862,550 | |
| | | | | | | | |
| U.S. GOVERNMENT AGENCIES — 21.8% | |
| | 25,000,000 | | | Federal Home Loan Bank (FHLB), Discount Notes, 0.140% due 10/30/15(a) | | | 24,994,264 | |
| | 19,114,000 | | | Tennessee Valley Authority, 0.020% due 9/1/15(a) | | | 19,114,000 | |
| | | | | | | | |
| | | | TOTAL U.S. GOVERNMENT AGENCIES
(Cost — $44,108,264) | | | 44,108,264 | |
| | | | | | | | |
| | | | TOTAL INVESTMENTS — 98.6%
(Cost — $199,945,050#) | | | 199,945,050 | |
| | | | | | | | |
| | | | Cash and Other Assets in Excess of Liabilities — 1.4% | | | 2,818,294 | |
| | | | | | | | |
| | | | TOTAL NET ASSETS — 100.0% | | $ | 202,763,344 | |
| | | | | | | | |
| (a) | Rate shown represents yield-to-maturity. |
| (b) | Restricted security that may be sold to ‘‘qualified institutional buyers’’ pursuant to the conditions of Rule 144A under the Securities Act of 1933, as amended. This security has been deemed liquid pursuant to guidelines approved by the Board of Trustees, unless otherwise noted. |
| (c) | Variable rate security. Interest rate disclosed is that which was in effect at August 31, 2015. |
| # | Aggregate cost for federal income tax purposes is $199,945,050. |
See Notes to Financial Statements.
157
The definitions of the applicable rating symbols are set forth below:
Standard & Poor’s Ratings Service (“Standard & Poor’s”) — Ratings from “AA” to “CCC” may be modified by the addition of a plus (+) or minus (-) sign to show relative standings within the major rating categories.
| | |
| AAA | | — Bonds rated “AAA” have the highest rating assigned by Standard & Poor’s. Capacity to pay interest and repay principal is extremely strong. |
| AA | | — Bonds rated “AA” have a very strong capacity to pay interest and repay principal and differ from the highest rated issues only in a small degree. |
| A | | — Bonds rated “A” have a strong capacity to pay interest and repay principal although they are somewhat more susceptible to the adverse effects of changes in circumstances and economic conditions than debt in higher rated categories. |
| BBB | | — Bonds rated “BBB” are regarded as having an adequate capacity to pay interest and repay principal. Whereas they normally exhibit adequate protection parameters, adverse economic conditions or changing circumstances are more likely to lead to a weakened capacity to pay interest and repay principal for bonds in this category than in higher rated categories. |
| BB, B, CCC, CC and C | | — Bonds rated “BB”, “B”, “CCC”, “CC” and “C” are regarded, on balance, as predominantly speculative with respect to capacity to pay interest and repay principal in accordance with the terms of the obligation. “BB” represents the lowest degree of speculation and “C” the highest degree of speculation. While such bonds will likely have some quality and protective characteristics, these are outweighed by large uncertainties or major risk exposures to adverse conditions. |
| D | | — Bonds rated “D” are in default and payment of interest and/or repayment of principal is in arrears. |
| P | | — Preliminary rating. |
Moody’s Investors Service (“Moody’s”) — Numerical modifiers 1, 2 and 3 may be applied to each generic rating from “Aa” to “Caa,” where 1 is the highest and 3 the lowest ranking within its generic category.
| | |
| Aaa | | — Bonds rated “Aaa” are judged to be of the best quality. They carry the smallest degree of investment risk and are generally referred to as “gilt edge.” Interest payments are protected by a large or by an exceptionally stable margin and principal is secure. While the various protective elements are likely to change, such changes as can be visualized are most unlikely to impair the fundamentally strong position of such issues. |
| Aa | | — Bonds rated “Aa” are judged to be of high quality by all standards. Together with the “Aaa” group they comprise what are generally known as high grade bonds. They are rated lower than the best bonds because margins of protection may not be as large as in “Aaa” securities or fluctuation of protective elements may be of greater amplitude or there may be other elements present which make the long-term risks appear somewhat larger than in “Aaa” securities. |
| A | | — Bonds rated “A” possess many favorable investment attributes and are to be considered as upper medium grade obligations. Factors giving security to principal and interest are considered adequate but elements may be present which suggest a susceptibility to impairment some time in the future. |
| Baa | | — Bonds rated “Baa” are considered as medium grade obligations, i.e., they are neither highly protected nor poorly secured. Interest payments and principal security appear adequate for the present but certain protective elements may be lacking or may be characteristically unreliable over any great length of time. Such bonds lack outstanding investment characteristics and in fact have speculative characteristics as well. |
| Ba | | — Bonds rated “Ba” are judged to have speculative elements; their future cannot be considered as well assured. Often the protection of interest and principal payments may be very moderate and therefore not well safeguarded during both good and bad times over the future. Uncertainty of position characterizes bonds in this class. |
| B | | — Bonds rated “B” generally lack characteristics of desirable investments. Assurance of interest and principal payments or of maintenance of other terms of the contract over any long period of time may be small. |
| Caa | | — Bonds rated “Caa” are of poor standing. These may be in default, or present elements of danger may exist with respect to principal or interest. |
| Ca | | — Bonds rated “Ca” represent obligations which are speculative in a high degree. Such issues are often in default or have other marked short-comings. |
| C | | — Bonds rated “C” are the lowest class of bonds and issues so rated can be regarded as having extremely poor prospects of ever attaining any real investment standing. |
Fitch Ratings Service (“Fitch”) — Ratings from “AA” to “CCC” may be modified by the addition of a plus (+) or minus (-) sign to show relative standings within the major rating categories.
| | |
| AAA | | — Bonds rated “AAA” have the highest rating assigned by Fitch. Capacity to pay interest and repay principal is extremely strong. |
| AA | | — Bonds rated “AA” have a very strong capacity to pay interest and repay principal and differ from the highest rated issues only in a small degree. |
| A | | — Bonds rated “A” have a strong capacity to pay interest and repay principal although they are somewhat more susceptible to the adverse effects of changes in circumstances and economic conditions than debt in higher rated categories. |
| BBB | | — Bonds rated “BBB” are regarded as having an adequate capacity to pay interest and repay principal. Whereas they normally exhibit adequate protection parameters, adverse economic conditions or changing circumstances are more likely to lead to a weakened capacity to pay interest and repay principal for bonds in this category than in higher rated categories. |
| BB, B, CCC, CC and C | | — Bonds rated “BB”, “B”, “CCC”, “CC” and “C” are regarded, on balance, as predominantly speculative with respect to capacity to pay interest and repay principal in accordance with the terms of the obligation. “BB” represents a lower degree of speculation than “B”, and “CC” the highest degree of speculation. While such bonds will likely have some quality and protective characteristics, these are outweighed by large uncertainties or major risk exposures to adverse conditions. |
| D | | — Bonds rated “D” are in default and payment of interest and/or repayment of principal is in arrears. |
| NR | | — Indicates that the bond is not rated by Standard & Poor’s, Moody’s, or Fitch. |
| WD | | — Indicates that the bonds rating has been withdrawn and the issuer is no longer rated by Standard & Poor’s, Moody’s or Fitch. |
158
Short-Term Security Ratings
| | |
| SP-1 | | — Standard & Poor’s highest rating indicating very strong or strong capacity to pay principal and interest; those issues determined to possess overwhelming safety characteristics are denoted with a plus (+) sign. |
| A-1 | | — Standard & Poor’s highest commercial paper and variable-rate demand obligation (VRDO) rating indicating that the degree of safety regarding timely payment is either overwhelming or very strong; those issues determined to possess overwhelming safety characteristics are denoted with a plus (+) sign. |
| VMIG 1 | | — Moody’s highest rating for issues having a demand feature — VRDO. |
| MIG1 | | — Moody’s highest rating for short-term municipal obligations. |
| P-1 | | — Moody’s highest rating for commercial paper and for VRDO prior to the advent of the VMIG 1 rating. |
| F-1 | | — Fitch’s highest rating indicating the strongest capacity for timely payment of financial commitments; those issues determined to possess overwhelming strong credit feature are denoted with a plus (+) sign. |
159
| | |
| | | |
| Statements of Assets and Liabilities | | |
| | | | | | | | | | | | | | |
| | | Large
Capitalization
Growth
Investments | | | Large
Capitalization
Value Equity
Investments | | | Small
Capitalization
Growth
Investments | | | |
| ASSETS: | | | | | | | | | | | | | | |
Investments, at value1,2 | | $ | 1,363,490,236 | | | $ | 1,245,012,957 | | | $ | 247,187,621 | | | |
Repurchase Agreements1 | | | — | | | | — | | | | — | | | |
Foreign currency, at value3 | | | — | | | | — | | | | — | | | |
Cash | | | 1,235 | | | | 1,334 | | | | 205 | | | |
Receivable for securities sold | | | 4,303,622 | | | | 1,295,771 | | | | 713,347 | | | |
Dividends and interest receivable | | | 1,042,165 | | | | 4,163,928 | | | | 91,571 | | | |
Receivable for manager waiver | | | – | | | | – | | | | – | | | |
Receivable for Fund shares sold | | | 176,247 | | | | 939,932 | | | | 16,640 | | | |
Unrealized appreciation on open forward foreign currency contracts (Note 1) | | | — | | | | — | | | | — | | | |
Variation margin on open future contracts (Note 1) | | | — | | | | — | | | | — | | | |
Variation margin on open swap contracts (Note 1) | | | — | | | | — | | | | — | | | |
Unrealized appreciation on open swap contracts (Note 1) | | | — | | | | — | | | | — | | | |
Deposits with counterparty | | | — | | | | — | | | | — | | | |
Prepaid expenses | | | 22,853 | | | | 20,775 | | | | 13,016 | | | |
| | | | | | | | | | | | | | |
Total Assets | | | 1,369,036,358 | | | | 1,251,434,697 | | | | 248,022,400 | | | |
| | | | | | | | | | | | | | |
| LIABILITIES: | | | | | | | | | | | | | | |
Payable for reverse repurchase agreements | | | — | | | | — | | | | — | | | |
Payable for collateral received from securities on loan | | | 6,735,317 | | | | 16,427,951 | | | | 18,339,079 | | | |
Payable for Fund shares repurchased | | | 1,752,690 | | | | 1,559,534 | | | | 325,650 | | | |
Payable for securities purchased | | | 6,891,474 | | | | 1,211,067 | | | | 502,002 | | | |
Investment management fee payable | | | 683,568 | | | | 612,403 | | | | 154,569 | | | |
Transfer agent fees payable | | | 18,483 | | | | 12,889 | | | | 3,133 | | | |
Interest expense payable | | | — | | | | — | | | | — | | | |
Custody fee payable | | | 166,337 | | | | 128,690 | | | | 30,296 | | | |
Trustees' fees payable | | | 66,410 | | | | 52,535 | | | | 10,697 | | | |
Variation margin on open swap contracts (Note 1) | | | — | | | | — | | | | — | | | |
Variation margin on open future contracts (Note 1) | | | — | | | | — | | | | — | | | |
Due to custodian | | | — | | | | — | | | | — | | | |
Forward sale commitments, at value (proceeds received)4 (Note 1) | | | — | | | | — | | | | — | | | |
Options contracts written, at value (premiums received)5 (Note 1) | | | — | | | | — | | | | — | | | |
Unrealized depreciation on open swap contracts (Note 1) | | | — | | | | — | | | | — | | | |
Unrealized depreciation on open forward foreign currency contracts (Note 1) | | | — | | | | — | | | | — | | | |
Deposits from counterparty | | | — | | | | — | | | | — | | | |
Foreign capital gains tax payable | | | — | | | | — | | | | — | | | |
Distributions payable | | | — | | | | — | | | | — | | | |
Accrued expenses | | | 87,154 | | | | 95,962 | | | | 71,239 | | | |
| | | | | | | | | | | | | | |
Total Liabilities | | | 16,401,433 | | | | 20,101,031 | | | | 19,436,665 | | | |
| | | | | | | | | | | | | | |
| Total Net Assets | | $ | 1,352,634,925 | | | $ | 1,231,333,666 | | | $ | 228,585,735 | | | |
| | | | | | | | | | | | | | |
| NET ASSETS: | | | | | | | | | | | | | | |
Par value (Note 4) | | $ | 65,562 | | | $ | 99,190 | | | $ | 9,373 | | | |
Paid-in capital in excess of par value | | | 713,083,955 | | | | 1,227,293,253 | | | | 138,635,670 | | | |
Undistributed net investment income | | | 5,820,229 | | | | 15,847,870 | | | | 7,013 | | | |
Accumulated net realized gain (loss) on investments, futures contracts, options contracts written, forward sale commitments, swap contracts and foreign currency transactions | | | 277,576,528 | | | | (140,301,779 | ) | | | 51,862,913 | | | |
Net unrealized appreciation (depreciation) on investments, futures contracts, options contracts written, forward sale commitments, swap contracts and foreign currency transactions | | | 356,088,651 | | | | 128,395,132 | | | | 38,070,766 | | | |
| | | | | | | | | | | | | | |
| Total Net Assets | | $ | 1,352,634,925 | | | $ | 1,231,333,666 | | | $ | 228,585,735 | | | |
| | | | | | | | | | | | | | |
| Shares Outstanding | | | 65,561,563 | | | | 99,190,017 | | | | 9,372,680 | | | |
| | | | | | | | | | | | | | |
| Net Asset Value | | $ | 20.63 | | | $ | 12.41 | | | $ | 24.39 | | | |
| | | | | | | | | | | | | | |
| 1 Investments, at cost | | $ | 1,007,401,585 | | | $ | 1,116,617,825 | | | $ | 209,116,855 | | | |
| | | | | | | | | | | | | | |
| 2 Includes securities on loan | | $ | 6,943,583 | | | $ | 16,198,670 | | | $ | 17,473,280 | | | |
| | | | | | | | | | | | | | |
| 3 Foreign currency, at cost | | $ | — | | | $ | — | | | $ | — | | | |
| | | | | | | | | | | | | | |
| 4 Proceeds received | | $ | — | | | $ | — | | | $ | — | | | |
| | | | | | | | | | | | | | |
| 5 Premiums received | | $ | — | | | $ | — | | | $ | — | | | |
| | | | | | | | | | | | | | |
| * | Investments at value represents amortized cost. |
See Notes to Financial Statements.
160
| | | | | | | | | | | | | | | | | | | | | | | | | | | | | | | | |
| | | Small
Capitalization
Value Equity
Investments | | | International
Equity
Investments | | | Emerging
Markets
Equity
Investments | | | Core Fixed
Income
Investments | | | High Yield
Investments | | | International
Fixed
Income
Investments | | | Municipal
Bond
Investments | | | Money
Market
Investments | |
| | | | | | | | | | | | | | | | | | | | | | | | | | | | | | | | |
| | $ | 220,546,689 | | | $ | 1,217,159,940 | | | $ | 473,395,067 | | | $ | 900,527,780 | | | $ | 261,788,200 | | | $ | 237,651,481 | | | $ | 84,528,323 | | | $ | 199,945,050 | * |
| | | — | | | | — | | | | — | | | | 25,700,000 | | | | — | | | | — | | | | — | | | | — | |
| | | 5,882 | | | | 113,670 | | | | 453,795 | | | | 51,307 | | | | — | | | | 158,673 | | | | — | | | | — | |
| | | 160 | | | | 932 | | | | 804 | | | | 936 | | | | 258 | | | | 50 | | | | 122 | | | | 10 | |
| | | 2,305,653 | | | | 1,619,456 | | | | 1,345,644 | | | | 39,977,535 | | | | 1,235,575 | | | | 47,424,215 | | | | — | | | | — | |
| | | 312,874 | | | | 4,055,957 | | | | 747,302 | | | | 4,692,629 | | | | 4,861,929 | | | | 2,758,712 | | | | 839,619 | | | | 34,862 | |
| | | — | | | | — | | | | — | | | | — | | | | — | | | | — | | | | — | | | | 29,875 | |
| | | 63,448 | | | | 957,605 | | | | 329,078 | | | | 144,443 | | | | 120,556 | | | | 67,305 | | | | 15,714 | | | | 3,735,177 | |
| | | — | | | | — | | | | — | | | | 89,128 | | | | — | | | | 3,249,685 | | | | — | | | | — | |
| | | — | | | | — | | | | — | | | | 860,697 | | | | — | | | | 264,541 | | | | — | | | | — | |
| | | — | | | | — | | | | — | | | | 11,073 | | | | — | | | | 439,469 | | | | — | | | | — | |
| | | — | | | | — | | | | — | | | | — | | | | — | | | | 1,002,184 | | | | — | | | | — | |
| | | — | | | | — | | | | — | | | | 1,211,982 | | | | — | | | | 4,434,508 | | | | — | | | | — | |
| | | 12,108 | | | | 19,011 | | | | 11,426 | | | | 14,627 | | | | 10,314 | | | | 12,861 | | | | 10,480 | | | | 14,180 | |
| | | | | | | | | | | | | | | | | | | | | | | | | | | | | | | | |
| | | 223,246,814 | | | | 1,223,926,571 | | | | 476,283,116 | | | | 973,282,137 | | | | 268,016,832 | | | | 297,463,684 | | | | 85,394,258 | | | | 203,759,154 | |
| | | | | | | | | | | | | | | | | | | | | | | | | | | | | | | | |
| | | | | | | | | | | | | | | | | | | | | | | | | | | | | | | | |
| | | — | | | | — | | | | — | | | | — | | | | — | | | | 9,304,125 | | | | — | | | | — | |
| | | 6,979,519 | | | | 16,683,267 | | | | 9,633,182 | | | | 733,911 | | | | 8,761,690 | | | | — | | | | — | | | | — | |
| | | 287,424 | | | | 2,134,164 | | | | 694,619 | | | | 1,150,590 | | | | 393,373 | | | | 338,776 | | | | 205,458 | | | | 856,291 | |
| | | 1,365,761 | | | | 2,326,949 | | | | 1,461,684 | | | | 110,761,141 | | | | 4,266,238 | | | | 35,138,219 | | | | — | | | | — | |
| | | 141,002 | | | | 661,619 | | | | 300,790 | | | | 262,434 | | | | 109,778 | | | | 91,894 | | | | 27,556 | | | | 13,724 | |
| | | 5,272 | | | | 7,905 | | | | 6,369 | | | | 7,871 | | | | 2,632 | | | | 3,582 | | | | 515 | | | | 4,340 | |
| | | — | | | | — | | | | — | | | | — | | | | — | | | | — | | | | — | | | | — | |
| | | 29,769 | | | | 160,524 | | | | 99,812 | | | | 236,421 | | | | 64,232 | | | | 143,380 | | | | 29,106 | | | | 40,119 | |
| | | 10,176 | | | | 39,699 | | | | 13,016 | | | | 29,069 | | | | 9,136 | | | | 9,700 | | | | 2,884 | | | | 12,450 | |
| | | — | | | | — | | | | — | | | | — | | | | — | | | | — | | | | — | | | | — | |
| | | — | | | | — | | | | — | | | | — | | | | — | | | | — | | | | — | | | | — | |
| | | — | | | | — | | | | — | | | | — | | | | — | | | | — | | | | — | | | | — | |
| | | — | | | | — | | | | — | | | | — | | | | — | | | | 23,582,835 | | | | — | | | | — | |
| | | — | | | | — | | | | — | | | | 186,798 | | | | — | | | | 116,726 | | | | — | | | | — | |
| | | — | | | | — | | | | — | | | | 50,016 | | | | — | | | | 206,813 | | | | — | | | | — | |
| | | — | | | | — | | | | — | | | | 453,698 | | | | — | | | | 4,015,498 | | | | — | | | | — | |
| | | — | | | | — | | | | — | | | | — | | | | — | | | | 1,410,317 | | | | — | | | | — | |
| | | — | | | | — | | | | 71,587 | | | | — | | | | — | | | | — | | | | — | | | | — | |
| | | — | | | | — | | | | — | | | | 324 | | | | 623 | | | | — | | | | 30 | | | | 39 | |
| | | 82,968 | | | | 69,305 | | | | 181,879 | | | | 80,578 | | | | 71,492 | | | | 66,986 | | | | 31,977 | | | | 68,847 | |
| | | | | | | | | | | | | | | | | | | | | | | | | | | | | | | | |
| | | 8,901,891 | | | | 22,083,432 | | | | 12,462,938 | | | | 113,952,851 | | | | 13,679,194 | | | | 74,428,851 | | | | 297,526 | | | | 995,810 | |
| | | | | | | | | | | | | | | | | | | | | | | | | | | | | | | | |
| | $ | 214,344,923 | | | $ | 1,201,843,139 | | | $ | 463,820,178 | | | $ | 859,329,286 | | | $ | 254,337,638 | | | $ | 223,034,833 | | | $ | 85,096,732 | | | $ | 202,763,344 | |
| | | | | | | | | | | | | | | | | | | | | | | | | | | | | | | | |
| | | | | | | | | | | | | | | | | | | | | | | | | | | | | | | | |
| | $ | 16,894 | | | $ | 110,201 | | | $ | 42,688 | | | $ | 104,450 | | | $ | 65,492 | | | $ | 29,293 | | | $ | 8,814 | | | $ | 202,763 | |
| | | 164,120,095 | | | | 1,463,224,749 | | | | 537,678,198 | | | | 855,177,841 | | | | 293,243,174 | | | | 230,666,764 | | | | 79,116,890 | | | | 202,559,815 | |
| | | 2,238,639 | | | | 20,123,723 | | | | 5,001,354 | | | | 1,719,200 | | | | 996,361 | | | | 15,513,237 | | | | 430,967 | | | | 218 | |
| | | | | | | | |
| | | 23,530,366 | | | | (242,626,671 | ) | | | (37,296,710 | ) | | | 2,587,734 | | | | (23,185,818 | ) | | | (10,416,209 | ) | | | 180,775 | | | | 548 | |
| | | | | | | | |
| | | 24,438,929 | | | | (38,988,863 | ) | | | (41,605,352 | ) | | | (259,939 | ) | | | (16,781,571 | ) | | | (12,758,252 | ) | | | 5,359,286 | | | | — | |
| | | | | | | | | | | | | | | | | | | | | | | | | | | | | | | | |
| | $ | 214,344,923 | | | $ | 1,201,843,139 | | | $ | 463,820,178 | | | $ | 859,329,286 | | | $ | 254,337,638 | | | $ | 223,034,833 | | | $ | 85,096,732 | | | $ | 202,763,344 | |
| | | | | | | | | | | | | | | | | | | | | | | | | | | | | | | | |
| | | 16,894,387 | | | | 110,201,444 | | | | 42,687,921 | | | | 104,449,877 | | | | 65,492,126 | | | | 29,292,760 | | | | 8,814,261 | | | | 202,763,115 | |
| | | | | | | | | | | | | | | | | | | | | | | | | | | | | | | | |
| | $ | 12.69 | | | $ | 10.91 | | | $ | 10.87 | | | $ | 8.23 | | | $ | 3.88 | | | $ | 7.61 | | | $ | 9.65 | | | $ | 1.00 | |
| | | | | | | | | | | | | | | | | | | | | | | | | | | | | | | | |
| | $ | 196,107,449 | | | $ | 1,256,031,833 | | | $ | 514,887,103 | | | $ | 925,710,603 | | | $ | 278,569,771 | | | $ | 248,974,687 | | | $ | 79,169,037 | | | $ | 199,945,050 | |
| | | | | | | | | | | | | | | | | | | | | | | | | | | | | | | | |
| | $ | 6,955,212 | | | $ | 16,266,678 | | | $ | 9,169,300 | | | $ | 713,893 | | | $ | 8,447,443 | | | $ | — | | | $ | — | | | $ | — | |
| | | | | | | | | | | | | | | | | | | | | | | | | | | | | | | | |
| | $ | 6,157 | | | $ | 215,647 | | | $ | 453,925 | | | $ | 788,842 | | | $ | — | | | $ | 153,920 | | | $ | — | | | $ | — | |
| | | | | | | | | | | | | | | | | | | | | | | | | | | | | | | | |
| | $ | — | | | $ | — | | | $ | — | | | $ | — | | | $ | — | | | $ | 23,541,562 | | | $ | — | | | $ | — | |
| | | | | | | | | | | | | | | | | | | | | | | | | | | | | | | | |
| | $ | — | | | $ | — | | | $ | — | | | $ | 420,248 | | | $ | — | | | $ | 63,177 | | | $ | — | | | $ | — | |
| | | | | | | | | | | | | | | | | | | | | | | | | | | | | | | | |
See Notes to Financial Statements.
161
| | |
| For the Year Ended August 31, 2015 | | |
| | | | | | | | | | | | | | |
| | | Large
Capitalization
Growth
Investments | | | Large
Capitalization
Value Equity
Investments | | | Small
Capitalization
Growth
Investments | | | |
| INVESTMENT INCOME: | | | | | | | | | | | | | | |
| | | | |
Dividends | | $ | 17,464,397 | | | $ | 33,288,332 | | | $ | 1,234,029 | | | |
Interest | | | 14,007 | | | | 17,776 | | | | 3,007 | | | |
Income from securities lending | | | 35,904 | | | | 123,552 | | | | 138,735 | | | |
Less: Foreign taxes withheld (See Note 1q) | | | (175,668 | ) | | | (371,130 | ) | | | (2,991 | ) | | |
| | | | | | | | | | | | | | |
Total Investment Income | | | 17,338,640 | | | | 33,058,530 | | | | 1,372,780 | | | |
| | | | | | | | | | | | | | |
| | | | |
| EXPENSES: | | | | | | | | | | | | | | |
| | | | |
Investment management fee (Note 2) | | | 10,036,865 | | | | 8,358,279 | | | | 2,274,466 | | | |
Transfer agent fees | | | 176,400 | | | | 147,409 | | | | 30,502 | | | |
Custody fees | | | 479,295 | | | | 391,725 | | | | 94,492 | | | |
Trustees’ fees | | | 266,259 | | | | 221,447 | | | | 44,434 | | | |
Shareholder reports | | | 157,521 | | | | 166,660 | | | | 97,792 | | | |
Insurance | | | 59,724 | | | | 52,390 | | | | 10,947 | | | |
Audit and tax | | | 63,642 | | | | 58,083 | | | | 48,240 | | | |
Legal fees | | | 44,717 | | | | 39,079 | | | | 29,931 | | | |
Registration fees | | | 19,343 | | | | 19,479 | | | | 19,437 | | | |
Miscellaneous expenses | | | 4,605 | | | | — | | | | — | | | |
Interest expense | | | — | | | | — | | | | — | | | |
| | | | | | | | | | | | | | |
Total Expenses | | | 11,308,371 | | | | 9,454,551 | | | | 2,650,241 | | | |
Less: Fee waivers and/or expense reimbursement (Note 2) | | | — | | | | (59,767 | ) | | | (8,401 | ) | | |
| | | | | | | | | | | | | | |
Net Expenses | | | 11,308,371 | | | | 9,394,784 | | | | 2,641,840 | | | |
| | | | | | | | | | | | | | |
Net Investment Income (Loss) | | $ | 6,030,269 | | | $ | 23,663,746 | | | $ | (1,269,060 | ) | | |
| | | | | | | | | | | | | | |
| | | | |
| REALIZED AND UNREALIZED GAIN (LOSS) ON INVESTMENTS, FUTURES CONTRACTS, OPTIONS CONTRACTS WRITTEN, FORWARD SALE COMMITMENTS, SWAP CONTRACTS AND FOREIGN CURRENCY TRANSACTIONS (NOTES 1 AND 3): | | | | | | | | | | | | | | |
| | | | |
Net Realized Gain (Loss) From: | | | | | | | | | | | | | | |
| | | | |
Investments | | $ | 316,791,624 | | | $ | 145,424,218 | | | $ | 53,507,287 | | | |
Futures contracts | | | — | | | | — | | | | — | | | |
Options contracts written | | | — | | | | — | | | | — | | | |
Forward sale commitments | | | — | | | | — | | | | — | | | |
Swap contracts | | | — | | | | — | | | | — | | | |
Foreign currency transactions | | | — | | | | — | | | | — | | | |
| | | | | | | | | | | | | | |
Net Realized Gain (Loss) | | | 316,791,624 | | | | 145,424,218 | | | | 53,507,287 | | | |
| | | | | | | | | | | | | | |
Change in Net Unrealized Appreciation (Depreciation): | | | | | | | | | | | | | | |
| | | | |
Investments | | | (232,169,926 | ) | | | (259,826,049 | ) | | | (27,186,435 | ) | | |
Futures contracts | | | — | | | | — | | | | — | | | |
Options contracts written | | | — | | | | — | | | | — | | | |
Forward sale commitments | | | — | | | | — | | | | — | | | |
Swap contracts | | | — | | | | — | | | | — | | | |
Foreign currency transactions | | | — | | | | — | | | | — | | | |
| | | | | | | | | | | | | | |
Change in Net Unrealized Appreciation (Depreciation): | | | (232,169,926 | ) | | | (259,826,049 | ) | | | (27,186,435 | ) | | |
| | | | | | | | | | | | | | |
Net Gain (Loss) on Investments, Futures Contracts, Options Contracts Written, Forward Sale Commitments, Swap Contracts and Foreign Currency Transactions | | | 84,621,698 | | | | (114,401,831 | ) | | | 26,320,852 | | | |
Voluntary Reimbursement from the Manager for Investment Transaction Losses (Note 2) | | | 28,721 | | | | 108,271 | | | | 161,664 | | | |
| | | | | | | | | | | | | | |
Total Increase (Decrease) in Net Assets from Operations | | $ | 90,680,688 | | | $ | (90,629,814 | ) | | $ | 25,213,456 | | | |
| | | | | | | | | | | | | | |
| (a) | Includes foreign capital gains tax of $17,303 and $210,970 for International Equity Investments and Emerging Markets Equity Investments, respectively. |
| (b) | Net increase (decrease) in accrued foreign capital gains taxes of $71,587 for Emerging Markets Equity Investments. |
See Notes to Financial Statements.
162
| | | | | | | | | | | | | | | | | | | | | | | | | | | | | | | | |
| | | Small
Capitalization
Value Equity
Investments | | | International
Equity
Investments | | | Emerging
Markets
Equity
Investments | | | Core Fixed
Income
Investments | | | High Yield
Investments | | | International
Fixed Income
Investments | | | Municipal
Bond
Investments | | | Money
Market
Investments | |
| | | | | | | | | | | | | | | | | | | | | | | | | | | | | | | | |
| | | | | | | | |
| | $ | 5,590,398 | | | $ | 31,302,576 | | | $ | 10,250,038 | | | $ | 61,680 | | | $ | 111,112 | | | $ | — | | | $ | — | | | $ | — | |
| | | 3,461 | | | | 11,683 | | | | 3,121 | | | | 21,109,594 | | | | 16,092,512 | | | | 6,339,964 | | | | 2,908,468 | | | | 478,749 | |
| | | 207,857 | | | | 551,433 | | | | 98,957 | | | | 5,673 | | | | 89,711 | | | | — | | | | — | | | | — | |
| | | (7,364 | ) | | | (2,525,083 | ) | | | (943,158 | ) | | | — | | | | — | | | | — | | | | — | | | | — | |
| | | | | | | | | | | | | | | | | | | | | | | | | | | | | | | | |
| | | 5,794,352 | | | | 29,340,609 | | | | 9,408,958 | | | | 21,176,947 | | | | 16,293,335 | | | | 6,339,964 | | | | 2,908,468 | | | | 478,749 | |
| | | | | | | | | | | | | | | | | | | | | | | | | | | | | | | | |
| | | | | | | | |
| | | | | | | | | | | | | | | | | | | | | | | | | | | | | | | | |
| | | | | | | | |
| | | 2,089,073 | | | | 7,918,320 | | | | 3,676,157 | | | | 3,262,095 | | | | 1,758,031 | | | | 1,280,303 | | | | 325,847 | | | | 235,829 | |
| | | 27,974 | | | | 112,142 | | | | 44,244 | | | | 83,552 | | | | 26,506 | | | | 27,794 | | | | 8,295 | | | | 32,725 | |
| | | 96,847 | | | | 618,768 | | | | 356,629 | | | | 731,100 | | | | 202,908 | | | | 383,274 | | | | 72,361 | | | | 120,982 | |
| | | 43,462 | | | | 190,197 | | | | 32,386 | | | | 107,052 | | | | 36,229 | | | | 32,487 | | | | 10,432 | | | | 47,587 | |
| | | 116,348 | | | | 160,615 | | | | 111,255 | | | | 100,100 | | | | 81,070 | | | | 77,243 | | | | 6,072 | | | | 88,461 | |
| | | 9,442 | | | | 40,441 | | | | 12,574 | | | | 30,479 | | | | 8,957 | | | | 9,090 | | | | 2,964 | | | | 12,872 | |
| | | 48,593 | | | | 71,117 | | | | 106,476 | | | | 104,519 | | | | 66,431 | | | | 99,587 | | | | 53,311 | | | | 36,730 | |
| | | 38,867 | | | | 42,397 | | | | 44,448 | | | | 39,315 | | | | 48,084 | | | | 39,577 | | | | 42,518 | | | | 37,379 | |
| | | 19,267 | | | | 19,547 | | | | 19,275 | | | | 21,788 | | | | 18,574 | | | | 19,273 | | | | 18,050 | | | | 19,415 | |
| | | 7,207 | | | | 33,644 | | | | — | | | | 591 | | | | 8,932 | | | | 3,291 | | | | 587 | | | | 981 | |
| | | — | | | | — | | | | — | | | | 30,630 | | | | — | | | | 254,318 | | | | — | | | | — | |
| | | | | | | | | | | | | | | | | | | | | | | | | | | | | | | | |
| | | 2,497,080 | | | | 9,207,188 | | | | 4,403,444 | | | | 4,511,221 | | | | 2,255,722 | | | | 2,226,237 | | | | 540,437 | | | | 632,961 | |
| | | (11,890 | ) | | | (260,662 | ) | | | (483,721 | ) | | | (113,756 | ) | | | (389,631 | ) | | | — | | | | — | | | | (157,250 | ) |
| | | | | | | | | | | | | | | | | | | | | | | | | | | | | | | | |
| | | 2,485,190 | | | | 8,946,526 | | | | 3,919,723 | | | | 4,397,465 | | | | 1,866,091 | | | | 2,226,237 | | | | 540,437 | | | | 475,711 | |
| | | | | | | | | | | | | | | | | | | | | | | | | | | | | | | | |
| | $ | 3,309,162 | | | $ | 20,394,083 | | | $ | 5,489,235 | | | $ | 16,779,482 | | | $ | 14,427,244 | | | $ | 4,113,727 | | | $ | 2,368,031 | | | $ | 3,038 | |
| | | | | | | | | | | | | | | | | | | | | | | | | | | | | | | | |
| | | | | | | | |
| | | | | | | | | | | | | | | | | | | | | | | | | | | | | | | | |
| | | | | | | | |
| | | | | | | | | | | | | | | | | | | | | | | | | | | | | | | | |
| | | | | | | | |
| | $ | 31,349,348 | | | $ | 1,846,393 | (a) | | $ | (23,943,981 | )(a) | | $ | 4,037,924 | | | $ | (7,826,144 | ) | | $ | (8,971,568 | ) | | $ | 270,815 | | | $ | 4,196 | |
| | | — | | | | — | | | | — | | | | 3,953,313 | | | | — | | | | 1,102,227 | | | | — | | | | — | |
| | | — | | | | — | | | | — | | | | 1,289,581 | | | | — | | | | 584,475 | | | | — | | | | — | |
| | | — | | | | — | | | | — | | | | 29,076 | | | | — | | | | (593,574 | ) | | | — | | | | — | |
| | | — | | | | — | | | | — | | | | (2,688,629 | ) | | | — | | | | (4,178,020 | ) | | | — | | | | — | |
| | | (14 | ) | | | (864,800 | ) | | | (288,304 | ) | | | 7,850,601 | | | | — | | | | 34,887,849 | | | | — | | | | — | |
| | | | | | | | | | | | | | | | | | | | | | | | | | | | | | | | |
| | | 31,349,334 | | | | 981,593 | | | | (24,232,285 | ) | | | 14,471,866 | | | | (7,826,144 | ) | | | 22,831,389 | | | | 270,815 | | | | 4,196 | |
| | | | | | | | | | | | | | | | | | | | | | | | | | | | | | | | |
| | | | | | | | | | | | | | | | | | | | | | | | | | | | | | | | |
| | | | | | | | |
| | | (54,241,490 | ) | | | (122,624,482 | ) | | | (109,447,087 | )(b) | | | (20,845,226 | ) | | | (22,807,926 | ) | | | (18,389,625 | ) | | | (863,716 | ) | | | — | |
| | | — | | | | — | | | | — | | | | (552,199 | ) | | | — | | | | (410,883 | ) | | | — | | | | — | |
| | | — | | | | — | | | | — | | | | (4,107 | ) | | | — | | | | (79,718 | ) | | | — | | | | — | |
| | | — | | | | — | | | | — | | | | — | | | | — | | | | (21,859 | ) | | | — | | | | — | |
| | | — | | | | — | | | | — | | | | (150,422 | ) | | | — | | | | (1,594,943 | ) | | | — | | | | — | |
| | | (311 | ) | | | (78,618 | ) | | | (21,334 | ) | | | (1,780,291 | ) | | | — | | | | (3,975,279 | ) | | | — | | | | — | |
| | | | | | | | | | | | | | | | | | | | | | | | | | | | | | | | |
| | | (54,241,801 | ) | | | (122,703,100 | ) | | | (109,468,421 | ) | | | (23,332,245 | ) | | | (22,807,926 | ) | | | (24,472,307 | ) | | | (863,716 | ) | | | — | |
| | | | | | | | | | | | | | | | | | | | | | | | | | | | | | | | |
| | | (22,892,467 | ) | | | (121,721,507 | ) | | | (133,700,706 | ) | | | (8,860,379 | ) | | | (30,634,070 | ) | | | (1,640,918 | ) | | | (592,901 | ) | | | 4,196 | |
| | | | | | | | |
| | | 99,697 | | | | 2,972,363 | | | | — | | | | — | | | | — | | | | — | | | | — | | | | — | |
| | | | | | | | | | | | | | | | | | | | | | | | | | | | | | | | |
| | $ | (19,483,608 | ) | | $ | (98,355,061 | ) | | $ | (128,211,471 | ) | | $ | 7,919,103 | | | $ | (16,206,826 | ) | | $ | 2,472,809 | | | $ | 1,775,130 | | | $ | 7,234 | |
| | | | | | | | | | | | | | | | | | | | | | | | | | | | | | | | |
See Notes to Financial Statements.
163
| | |
| | | |
| Statements of Changes in Net Assets | | |
| | |
| For the Year Ended August 31, 2015 and August 31, 2014 | | |
| | | | | | | | | | | | | | | | | | |
| | | Large Capitalization Growth Investments | | | Large Capitalization Value Equity Investments | | | |
| | | 2015 | | | 2014 | | | 2015 | | | 2014 | | | |
| OPERATIONS: | | | | | | | | | | | | | | | | | | |
| | | | | |
Net investment income (loss) | | $ | 6,030,269 | | | $ | 5,351,099 | | | $ | 23,663,746 | | | $ | 22,311,769 | | | |
Net realized gain (loss) | | | 316,791,624 | | | | 243,561,466 | | | | 145,424,218 | | | | 84,435,975 | | | |
Change in unrealized appreciation (depreciation) | | | (232,169,926 | ) | | | 99,840,581 | | | | (259,826,049 | ) | | | 161,259,541 | | | |
Net Increase from Payments by Affiliates | | | 28,721 | | | | — | | | | 108,271 | | | | — | | | |
| | | | | | | | | | | | | | | | | | |
Increase (Decrease) in Net Assets From Operations | | | 90,680,688 | | | | 348,753,146 | | | | (90,629,814 | ) | | | 268,007,285 | | | |
| | | | | | | | | | | | | | | | | | |
| DISTRIBUTIONS TO SHAREHOLDERS FROM (NOTE 1): | | | | | | | | | | | | | | | | | | |
| | | | | |
Net investment income | | | (5,468,121 | ) | | | (8,223,919 | ) | | | (23,380,743 | ) | | | (20,452,719 | ) | | |
Net realized gains | | | (191,632,667 | ) | | | (116,252,191 | ) | | | — | | | | — | | | |
| | | | | | | | | | | | | | | | | | |
Decrease in Net Assets From Distributions to Shareholders | | | (197,100,788 | ) | | | (124,476,110 | ) | | | (23,380,743 | ) | | | (20,452,719 | ) | | |
| | | | | | | | | | | | | | | | | | |
| FUND SHARE TRANSACTIONS (NOTE 4): | | | | | | | | | | | | | | | | | | |
| | | | | |
Net proceeds from sale of shares | | | 56,762,414 | | | | 264,426,959 | | | | 79,070,838 | | | | 292,776,028 | | | |
Reinvestment of distributions | | | 197,093,781 | | | | 124,471,782 | | | | 23,379,895 | | | | 20,452,110 | | | |
Cost of shares repurchased | | | (574,838,838 | ) | | | (403,721,008 | ) | | | (224,694,595 | ) | | | (197,456,038 | ) | | |
| | | | | | | | | | | | | | | | | | |
Increase (Decrease) in Net Assets From Fund Share Transactions | | | (320,982,643 | ) | | | (14,822,267 | ) | | | (122,243,862 | ) | | | 115,772,100 | | | |
| | | | | | | | | | | | | | | | | | |
Increase (Decrease) in Net Assets | | | (427,402,743 | ) | | | 209,454,769 | | | | (236,254,419 | ) | | | 363,326,666 | | | |
| NET ASSETS: | | | | | | | | | | | | | | | | | | |
| | | | | |
Beginning of year | | | 1,780,037,668 | | | | 1,570,582,899 | | | | 1,467,588,085 | | | | 1,104,261,419 | | | |
| | | | | | | | | | | | | | | | | | |
End of year | | $ | 1,352,634,925 | | | $ | 1,780,037,668 | | | $ | 1,231,333,666 | | | $ | 1,467,588,085 | | | |
| | | | | | | | | | | | | | | | | | |
* Includes undistributed net investment income of: | | $ | 5,820,229 | | | $ | 5,267,734 | | | $ | 15,847,870 | | | $ | 15,727,510 | | | |
| | | | | | | | | | | | | | | | | | |
† Includes accumulated net investment loss of: | | $ | — | | | $ | — | | | $ | — | | | $ | — | | | |
| | | | | | | | | | | | | | | | | | |
See Notes to Financial Statements.
164
| | | | | | | | | | | | | | | | | | | | | | | | | | | | | | | | |
| | | Small Capitalization Growth Investments | | | Small Capitalization Value Equity Investments | | | International Equity Investments | | | Emerging Markets Equity Investments | |
| | | 2015 | | | 2014 | | | 2015 | | | 2014 | | | 2015 | | | 2014 | | | 2015 | | | 2014 | |
| | | | | | | | | | | | | | | | | | | | | | | | | | | | | | | | |
| | | | | | | | |
| | $ | (1,269,060 | ) | | $ | (1,266,163 | ) | | $ | 3,309,162 | | | $ | 3,955,396 | | | $ | 20,394,083 | | | $ | 19,455,098 | | | $ | 5,489,235 | | | $ | 5,877,283 | |
| | | 53,507,287 | | | | 63,068,296 | | | | 31,349,334 | | | | 27,330,782 | | | | 981,593 | | | | 77,405,957 | | | | (24,232,285 | ) | | | (4,055,784 | ) |
| | | (27,186,435 | ) | | | (13,698,980 | ) | | | (54,241,801 | ) | | | 15,264,896 | | | | (122,703,100 | ) | | | 504,558 | | | | (109,468,421 | ) | | | 72,652,810 | |
| | | 161,664 | | | | — | | | | 99,697 | | | | — | | | | 2,972,363 | | | | — | | | | — | | | | — | |
| | | | | | | | | | | | | | | | | | | | | | | | | | | | | | | | |
| | | | | | | | |
| | | 25,213,456 | | | | 48,103,153 | | | | (19,483,608 | ) | | | 46,551,074 | | | | (98,355,061 | ) | | | 97,365,613 | | | | (128,211,471 | ) | | | 74,474,309 | |
| | | | | | | | | | | | | | | | | | | | | | | | | | | | | | | | |
| | | | | | | | |
| | | | | | | | | | | | | | | | | | | | | | | | | | | | | | | | |
| | | | | | | | |
| | | — | | | | — | | | | (3,010,671 | ) | | | (2,812,824 | ) | | | (19,199,386 | ) | | | (12,213,953 | ) | | | (5,156,168 | ) | | | (7,358,901 | ) |
| | | (60,598,970 | ) | | | (9,799,673 | ) | | | (28,744,708 | ) | | | (25,261,304 | ) | | | — | | | | — | | | | — | | | | (35,690,720 | ) |
| | | | | | | | | | | | | | | | | | | | | | | | | | | | | | | | |
| | | | | | | | | | | | | | | | | | | | | | | | | | | | | | | | |
| | | (60,598,970 | ) | | | (9,799,673 | ) | | | (31,755,379 | ) | | | (28,074,128 | ) | | | (19,199,386 | ) | | | (12,213,953 | ) | | | (5,156,168 | ) | | | (43,049,621 | ) |
| | | | | | | | | | | | | | | | | | | | | | | | | | | | | | | | |
| | | | | | | | | | | | | | | | | | | | | | | | | | | | | | | | |
| | | | | | | | |
| | | 12,063,989 | | | | 21,521,048 | | | | 17,376,774 | | | | 55,462,187 | | | | 301,685,675 | | | | 378,960,260 | | | | 265,692,576 | | | | 58,269,385 | |
| | | 60,596,534 | | | | 9,799,293 | | | | 31,719,271 | | | | 28,051,943 | | | | 19,199,115 | | | | 12,213,598 | | | | 5,156,168 | | | | 43,048,055 | |
| | | (105,041,718 | ) | | | (84,369,249 | ) | | | (72,886,492 | ) | | | (31,495,843 | ) | | | (150,715,859 | ) | | | (99,745,558 | ) | | | (59,051,423 | ) | | | (161,548,624 | ) |
| | | | | | | | | | | | | | | | | | | | | | | | | | | | | | | | |
| | | | | | | | |
| | | (32,381,195 | ) | | | (53,048,908 | ) | | | (23,790,447 | ) | | | 52,018,287 | | | | 170,168,931 | | | | 291,428,300 | | | | 211,797,321 | | | | (60,231,184 | ) |
| | | | | | | | | | | | | | | | | | | | | | | | | | | | | | | | |
| | | (67,766,709 | ) | | | (14,745,428 | ) | | | (75,029,434 | ) | | | 70,495,233 | | | | 52,614,484 | | | | 376,579,960 | | | | 78,429,682 | | | | (28,806,496 | ) |
| | | | | | | | | | | | | | | | | | | | | | | | | | | | | | | | |
| | | | | | | | |
| | | 296,352,444 | | | | 311,097,872 | | | | 289,374,357 | | | | 218,879,124 | | | | 1,149,228,655 | | | | 772,648,695 | | | | 385,390,496 | | | | 414,196,992 | |
| | | | | | | | | | | | | | | | | | | | | | | | | | | | | | | | |
| | $ | 228,585,735 | | | $ | 296,352,444 | | | $ | 214,344,923 | | | $ | 289,374,357 | | | $ | 1,201,843,139 | | | $ | 1,149,228,655 | | | $ | 463,820,178 | | | $ | 385,390,496 | |
| | | | | | | | | | | | | | | | | | | | | | | | | | | | | | | | |
| | $ | 7,013 | | | $ | 68,774 | | | $ | 2,238,639 | | | $ | 2,256,118 | | | $ | 20,123,723 | | | $ | 18,978,024 | | | $ | 5,001,354 | | | $ | 4,504,889 | |
| | | | | | | | | | | | | | | | | | | | | | | | | | | | | | | | |
| | $ | — | | | $ | — | | | $ | — | | | $ | — | | | $ | — | | | $ | — | | | $ | — | | | $ | — | |
| | | | | | | | | | | | | | | | | | | | | | | | | | | | | | | | |
See Notes to Financial Statements.
165
| | |
| | | |
| Statements of Changes in Net Assets | | |
| | |
| For the Year Ended August 31, 2015 and August 31, 2014 | | |
| | | | | | | | | | |
| | | Core Fixed Income Investments | | | |
| | | 2015 | | | 2014 | | | |
| OPERATIONS: | | | | | | | | | | |
| | | |
Net investment income | | $ | 16,779,482 | | | $ | 19,685,097 | | | |
Net realized gain (loss) | | | 14,471,866 | | | | 13,212,807 | | | |
Change in unrealized appreciation (depreciation) | | | (23,332,245 | ) | | | 21,261,384 | | | |
| | | | | | | | | | |
Increase (Decrease) in Net Assets From Operations | | | 7,919,103 | | | | 54,159,288 | | | |
| | | | | | | | | | |
| DISTRIBUTIONS TO SHAREHOLDERS FROM (NOTE 1): | | | | | | | | | | |
| | | |
Net investment income | | | (20,111,155 | ) | | | (23,795,682 | ) | | |
Net realized gains | | | (10,910,011 | ) | | | — | | | |
| | | | | | | | | | |
Decrease in Net Assets From Distributions to Shareholders | | | (31,021,166 | ) | | | (23,795,682 | ) | | |
| | | | | | | | | | |
| FUND SHARE TRANSACTIONS (NOTE 4): | | | | | | | | | | |
| | | |
Net proceeds from sale of shares | | | 171,980,043 | | | | 101,726,242 | | | |
Reinvestment of distributions | | | 31,021,046 | | | | 23,795,267 | | | |
Cost of shares repurchased | | | (119,670,967 | ) | | | (293,591,431 | ) | | |
| | | | | | | | | | |
Increase (Decrease) in Net Assets From Fund Share Transactions | | | 83,330,122 | | | | (168,069,922 | ) | | |
| | | | | | | | | | |
Increase (Decrease) in Net Assets | | | 60,228,059 | | | | (137,706,316 | ) | | |
| NET ASSETS: | | | | | | | | | | |
| | | |
Beginning of year | | | 799,101,227 | | | | 936,807,543 | | | |
| | | | | | | | | | |
End of year | | $ | 859,329,286 | | | $ | 799,101,227 | | | |
| | | | | | | | | | |
* Includes undistributed net investment income of: | | $ | 1,719,200 | | | $ | — | | | |
| | | | | | | | | | |
† Includes accumulated net investment loss of: | | $ | — | | | $ | (610,826 | ) | | |
| | | | | | | | | | |
See Notes to Financial Statements.
166
| | | | | | | | | | | | | | | | | | | | | | | | | | | | | | | | |
| | | High Yield Investments | | | International Fixed Income Investments | | | Municipal Bond Investments | | | Money Market Investments | |
| | | 2015 | | | 2014 | | | 2015 | | | 2014 | | | 2015 | | | 2014 | | | 2015 | | | 2014 | |
| | | | | | | | | | | | | | | | | | | | | | | | | | | | | | | | |
| | | | | | | | |
| | $ | 14,427,244 | | | $ | 10,594,030 | | | $ | 4,113,727 | | | $ | 5,501,170 | | | $ | 2,368,031 | | | $ | 2,530,593 | | | $ | 3,038 | | | $ | 2,856 | |
| | | (7,826,144 | ) | | | 2,500,347 | | | | 22,831,389 | | | | (2,939,708 | ) | | | 270,815 | | | | 513,812 | | | | 4,196 | | | | 362 | |
| | | (22,807,926 | ) | | | 3,431,312 | | | | (24,472,307 | ) | | | 16,760,564 | | | | (863,716 | ) | | | 4,358,889 | | | | — | | | | — | |
| | | | | | | | | | | | | | | | | | | | | | | | | | | | | | | | |
| | | (16,206,826 | ) | | | 16,525,689 | | | | 2,472,809 | | | | 19,322,026 | | | | 1,775,130 | | | | 7,403,294 | | | | 7,234 | | | | 3,218 | |
| | | | | | | | | | | | | | | | | | | | | | | | | | | | | | | | |
| | | | | | | | | | | | | | | | | | | | | | | | | | | | | | | | |
| | | | | | | | |
| | | (16,219,271 | ) | | | (11,814,472 | ) | | | (15,363,960 | ) | | | (17,201,477 | ) | | | (2,367,911 | ) | | | (2,531,172 | ) | | | (3,048 | ) | | | (2,854 | ) |
| | | — | | | | — | | | | — | | | | — | | | | (413,482 | ) | | | — | | | | (4,010 | ) | | | — | |
| | | | | | | | | | | | | | | | | | | | | | | | | | | | | | | | |
| | | (16,219,271 | ) | | | (11,814,472 | ) | | | (15,363,960 | ) | | | (17,201,477 | ) | | | (2,781,393 | ) | | | (2,531,172 | ) | | | (7,058 | ) | | | (2,854 | ) |
| | | | | | | | | | | | | | | | | | | | | | | | | | | | | | | | |
| | | | | | | | | | | | | | | | | | | | | | | | | | | | | | | | |
| | | | | | | | |
| | | 50,918,165 | | | | 155,615,893 | | | | 17,549,096 | | | | 41,475,314 | | | | 18,847,119 | | | | 18,631,793 | | | | 162,653,966 | | | | 178,917,685 | |
| | | 16,219,472 | | | | 11,813,241 | | | | 15,363,812 | | | | 17,200,635 | | | | 2,781,435 | | | | 2,530,949 | | | | 7,046 | | | | 2,840 | |
| | | (37,897,221 | ) | | | (25,374,912 | ) | | | (64,240,826 | ) | | | (111,017,975 | ) | | | (13,088,377 | ) | | | (28,873,453 | ) | | | (294,837,293 | ) | | | (310,888,302 | ) |
| | | | | | | | | | | | | | | | | | | | | | | | | | | | | | | | |
| | | 29,240,416 | | | | 142,054,222 | | | | (31,327,918 | ) | | | (52,342,026 | ) | | | 8,540,177 | | | | (7,710,711 | ) | | | (132,176,281 | ) | | | (131,967,777 | ) |
| | | | | | | | | | | | | | | | | | | | | | | | | | | | | | | | |
| | | (3,185,681 | ) | | | 146,765,439 | | | | (44,219,069 | ) | | | (50,221,477 | ) | | | 7,533,914 | | | | (2,838,589 | ) | | | (132,176,105 | ) | | | (131,967,413 | ) |
| | | | | | | | | | | | | | | | | | | | | | | | | | | | | | | | |
| | | | | | | | |
| | | 257,523,319 | | | | 110,757,880 | | | | 267,253,902 | | | | 317,475,379 | | | | 77,562,818 | | | | 80,401,407 | | | | 334,939,449 | | | | 466,906,862 | |
| | | | | | | | | | | | | | | | | | | | | | | | | | | | | | | | |
| | $ | 254,337,638 | | | $ | 257,523,319 | | | $ | 223,034,833 | | | $ | 267,253,902 | | | $ | 85,096,732 | | | $ | 77,562,818 | | | $ | 202,763,344 | | | $ | 334,939,449 | |
| | | | | | | | | | | | | | | | | | | | | | | | | | | | | | | | |
| | $ | 996,361 | | | $ | 1,103,560 | | | $ | 15,513,237 | | | $ | 4,713,483 | | | $ | 430,967 | | | $ | 340,817 | | | $ | 218 | | | $ | 228 | |
| | | | | | | | | | | | | | | | | | | | | | | | | | | | | | | | |
| | $ | — | | | $ | — | | | $ | — | | | $ | — | | | $ | — | | | $ | — | | | $ | — | | | $ | — | |
| | | | | | | | | | | | | | | | | | | | | | | | | | | | | | | | |
See Notes to Financial Statements.
167
For a share of beneficial interest outstanding throughout each year ended August 31, unless otherwise noted:
| | | | | | | | | | | | | | | | | | | | |
| Large Capitalization Growth Investments | |
| | | 2015 | | | 2014 | | | 2013 | | | 2012 | | | 2011 | |
Net asset value, Beginning of Year | | $ | 22.19 | | | $ | 19.29 | | | $ | 16.39 | | | $ | 14.24 | | | $ | 11.80 | |
| | | | | | | | | | | | | | | | | | | | |
| Income from Operations: | | | | | | | | | | | | | | | | | | | | |
Net investment income(1) | | | 0.08 | | | | 0.07 | | | | 0.11 | | | | 0.06 | | | | 0.07 | |
Net realized and unrealized gain | | | 0.87 | | | | 4.47 | | | | 2.85 | | | | 2.17 | | | | 2.40 | |
| | | | | | | | | | | | | | | | | | | | |
Total Income from Operations | | | 0.95 | | | | 4.54 | | | | 2.96 | | | | 2.23 | | | | 2.47 | |
| | | | | | | | | | | | | | | | | | | | |
| Less Distributions From: | | | | | | | | | | | | | | | | | | | | |
Net investment income . | | | (0.07 | ) | | | (0.11 | ) | | | (0.06 | ) | | | (0.08 | ) | | | (0.03 | ) |
Net realized gain | | | (2.44 | ) | | | (1.53 | ) | | | — | | | | — | | | | — | |
| | | | | | | | | | | | | | | | | | | | |
Total Distributions | | | (2.51 | ) | | | (1.64 | ) | | | (0.06 | ) | | | (0.08 | ) | | | (0.03 | ) |
| | | | | | | | | | | | | | | | | | | | |
Net Asset Value, End of Year . | | $ | 20.63 | | | $ | 22.19 | | | $ | 19.29 | | | $ | 16.39 | | | $ | 14.24 | |
| | | | | | | | | | | | | | | | | | | | |
Total Return(2) | | | 4.39 | %(3) | | | 24.35 | % | | | 18.11 | % | | | 15.71 | % | | | 20.89 | % |
Net Assets, End of Year (millions) | | $ | 1,353 | | | $ | 1,780 | | | $ | 1,571 | | | $ | 1,566 | | | $ | 1,738 | |
| Ratios to Average Net Assets: | | | | | | | | | | | | | | | | | | | | |
Gross expenses | | | 0.68 | % | | | 0.67 | % | | | 0.69 | % | | | 0.69 | % | | | 0.68 | % |
Net expenses | | | 0.68 | | | | 0.67 | | | | 0.69 | | | | 0.69 | | | | 0.68 | |
Net investment income | | | 0.36 | | | | 0.33 | | | | 0.60 | | | | 0.40 | | | | 0.47 | |
Portfolio Turnover Rate | | | 66 | % | | | 56 | % | | | 57 | % | | | 66 | % | | | 76 | % |
| (1) | Per share amounts have been calculated using the average shares method. |
| (2) | Performance figures may reflect fee waivers and/or expense reimbursements and assume reinvestment of dividend distribution. In the absence of fee waivers and/or expense reimbursements, the total return would have been lower. Applicable advisory program charges, which may be up to 2.50%, are not reflected in the performance data and would reduce the total returns. Past performance is no guarantee of future results. |
| (3) | The Manager contributed a non-recourse voluntary reimbursement to Large Capitalization Growth Investments. The effect of the reimbursement is reflected in the Fund’s total return above. Without this reimbursement, the impact was less than 0.00% to the total return for Large Capitalization Growth Investments. (See Note 2 within the Notes to Financial Statements). |
| | | | | | | | | | | | | | | | | | | | |
| Large Capitalization Value Equity Investments | |
| | | 2015 | | | 2014 | | | 2013 | | | 2012 | | | 2011 | |
Net asset value, Beginning of Year | | $ | 13.54 | | | $ | 11.24 | | | $ | 9.44 | | | $ | 8.58 | | | $ | 7.54 | |
| | | | | | | | | | | | | | | | | | | | |
| Income (Loss) from Operations: | | | | | | | | | | | | | | | | | | | | |
Net investment income(1) | | | 0.22 | | | | 0.20 | | | | 0.21 | | | | 0.19 | | | | 0.17 | |
Net realized and unrealized gain (loss) . | | | (1.13 | ) | | | 2.29 | | | | 1.80 | | | | 0.87 | | | | 1.07 | |
| | | | | | | | | | | | | | | | | | | | |
Total Income (Loss) from Operations | | | (0.91 | ) | | | 2.49 | | | | 2.01 | | | | 1.06 | | | | 1.24 | |
| | | | | | | | | | | | | | | | | | | | |
| Less Distributions From: | | | | | | | | | | | | | | | | | | | | |
Net investment income | | | (0.22 | ) | | | (0.19 | ) | | | (0.21 | ) | | | (0.20 | ) | | | (0.20 | ) |
| | | | | | | | | | | | | | | | | | | | |
Total Distributions | | | (0.22 | ) | | | (0.19 | ) | | | (0.21 | ) | | | (0.20 | ) | | | (0.20 | ) |
| | | | | | | | | | | | | | | | | | | | |
Net Asset Value, End of Year | | $ | 12.41 | | | $ | 13.54 | | | $ | 11.24 | | | $ | 9.44 | | | $ | 8.58 | |
| | | | | | | | | | | | | | | | | | | | |
Total Return(2) | | | (6.83 | )%(4) | | | 22.37 | % | | | 21.71 | % | | | 12.50 | % | | | 16.46 | % |
Net Assets, End of Year (millions) | | $ | 1,231 | | | $ | 1,468 | | | $ | 1,104 | | | $ | 1,087 | | | $ | 1,220 | |
| Ratios to Average Net Assets: | | | | | | | | | | | | | | | | | | | | |
Gross expenses | | | 0.68 | % | | | 0.67 | % | | | 0.70 | % | | | 0.69 | % | | | 0.68 | % |
Net expenses | | | 0.67 | (3) | | | 0.67 | (3) | | | 0.70 | | | | 0.69 | | | | 0.68 | |
Net investment income | | | 1.70 | | | | 1.64 | | | | 2.07 | | | | 2.15 | | | | 1.95 | |
Portfolio Turnover Rate | | | 48 | % | | | 24 | % | | | 48 | % | | | 32 | % | | | 38 | % |
| (1) | Per share amounts have been calculated using the average shares method. |
| (2) | Performance figures may reflect fee waivers and/or expense reimbursements and assume reinvestment of dividend distribution. In the absence of fee waivers and/or expense reimbursements, the total return would have been lower. Applicable advisory program charges, which may be up to 2.50%, are not reflected in the performance data and would reduce the total returns. Past performance is no guarantee of future results. |
| (3) | Reflects fee waivers and/or expense reimbursements. |
| (4) | The Manager contributed a non-recourse voluntary reimbursement to Large Capitalization Value Equity Investments. The effect of the reimbursement is reflected in the Fund’s total return above. Without this reimbursement, the impact was less than 0.00% to the total return for Large Capitalization Value Equity Investments. (See Note 2 within the Notes to Financial Statements). |
See Notes to Financial Statements.
168
For a share of beneficial interest outstanding throughout each year ended August 31, unless otherwise noted:
| | | | | | | | | | | | | | | | | | | | |
| Small Capitalization Growth Investments | |
| | | 2015 | | | 2014 | | | 2013 | | | 2012 | | | 2011 | |
Net asset value, Beginning of Year | | $ | 28.53 | | | $ | 25.22 | | | $ | 19.81 | | | $ | 17.76 | | | $ | 14.62 | |
| | | | | | | | | | | | | | | | | | | | |
| Income (Loss) from Operations: | | | | | | | | | | | | | | | | | | | | |
Net investment loss(1) | | | (0.12 | ) | | | (0.12 | ) | | | (0.00 | )(2) | | | (0.07 | ) | | | (0.07 | ) |
Net realized and unrealized gain | | | 1.93 | | | | 4.36 | | | | 5.41 | | | | 2.12 | | | | 3.21 | |
| | | | | | | | | | | | | | | | | | | | |
Total Income from Operations | | | 1.81 | | | | 4.24 | | | | 5.41 | | | | 2.05 | | | | 3.14 | |
| | | | | | | | | | | | | | | | | | | | |
| Less Distributions From: | | | | | | | | | | | | | | | | | | | | |
Net realized gain | | | (5.95 | ) | | | (0.93 | ) | | | — | | | | — | | | | — | |
| | | | | | | | | | | | | | | | | | | | |
Total Distributions | | | (5.95 | ) | | | (0.93 | ) | | | — | | | | — | | | | — | |
| | | | | | | | | | | | | | | | | | | | |
Net Asset Value, End of Year . | | $ | 24.39 | | | $ | 28.53 | | | $ | 25.22 | | | $ | 19.81 | | | $ | 17.76 | |
| | | | | | | | | | | | | | | | | | | | |
Total Return(3) | | | 7.36 | %(5) | | | 16.91 | % | | | 27.31 | % | | | 11.54 | % | | | 21.48 | % |
Net Assets, End of Year (millions) | | $ | 229 | | | $ | 296 | | | $ | 311 | | | $ | 247 | | | $ | 278 | |
| Ratios to Average Net Assets: | | | | | | | | | | | | | | | | | | | | |
Gross expenses | | | 0.93 | % | | | 0.92 | % | | | 0.97 | % | | | 0.98 | % | | | 0.95 | % |
Net expenses(4) | | | 0.93 | | | | 0.92 | | | | 0.97 | | | | 0.97 | | | | 0.93 | |
Net investment loss | | | (0.45 | ) | | | (0.42 | ) | | | (0.02 | ) | | | (0.40 | ) | | | (0.37 | ) |
Portfolio Turnover Rate | | | 89 | % | | | 80 | % | | | 90 | % | | | 68 | % | | | 73 | % |
| (1) | Per share amounts have been calculated using the average shares method. |
| (2) | Amounts represent less than $(0.01) per share. |
| (3) | Performance figures may reflect fee waivers and/or expense reimbursements and assume reinvestment of dividend distribution. In the absence of fee waivers and/or expense reimbursements, the total return would have been lower. Applicable advisory program charges, which may be up to 2.50%, are not reflected in the performance data and would reduce the total returns. Past performance is no guarantee of future results. |
| (4) | Reflects fee waivers and/or expense reimbursements. |
| (5) | The Manager contributed a non-recourse voluntary reimbursement to Small Capitalization Growth Investments. The effect of the reimbursement is reflected in the Fund’s total return above. Without this reimbursement, the total return for Small Capitalization Growth Investments was 7.27%. (See Note 2 within the Notes to Financial Statements). |
| | | | | | | | | | | | | | | | | | | | |
| Small Capitalization Value Equity Investments | |
| | | 2015 | | | 2014 | | | 2013 | | | 2012 | | | 2011 | |
Net asset value, Beginning of Year | | $ | 15.56 | | | $ | 14.45 | | | $ | 12.97 | | | $ | 11.20 | | | $ | 9.57 | |
| | | | | | | | | | | | | | | | | | | | |
| Income (Loss) from Operations: | | | | | | | | | | | | | | | | | | | | |
Net investment income(1) | | | 0.18 | | | | 0.22 | | | | 0.18 | | | | 0.11 | | | | 0.10 | |
Net realized and unrealized gain (loss) | | | (1.32 | ) | | | 2.58 | | | | 2.59 | | | | 1.77 | | | | 1.68 | |
| | | | | | | | | | | | | | | | | | | | |
Total Income (Loss) from Operations | | | (1.14 | ) | | | 2.80 | | | | 2.77 | | | | 1.88 | | | | 1.78 | |
| | | | | | | | | | | | | | | | | | | | |
| Less Distributions From: | | | | | | | | | | | | | | | | | | | | |
Net investment income | | | (0.16 | ) | | | (0.17 | ) | | | (0.22 | ) | | | (0.11 | ) | | | (0.15 | ) |
Net realized gain | | | (1.57 | ) | | | (1.52 | ) | | | (1.07 | ) | | | — | | | | — | |
| | | | | | | | | | | | | | | | | | | | |
Total Distributions | | | (1.73 | ) | | | (1.69 | ) | | | (1.29 | ) | | | (0.11 | ) | | | (0.15 | ) |
| | | | | | | | | | | | | | | | | | | | |
Net Asset Value, End of Year | | $ | 12.69 | | | $ | 15.56 | | | $ | 14.45 | | | $ | 12.97 | | | $ | 11.20 | |
| | | | | | | | | | | | | | | | | | | | |
Total Return(2) | | | (7.85 | )%(4) | | | 20.17 | % | | | 23.18 | % | | | 16.93 | % | | | 18.52 | % |
Net Assets, End of Year (millions) | | $ | 214 | | | $ | 289 | | | $ | 219 | | | $ | 195 | | | $ | 223 | |
| Ratios to Average Net Assets: | | | | | | | | | | | | | | | | | | | | |
Gross expenses | | | 0.96 | % | | | 0.92 | % | | | 1.00 | % | | | 0.99 | % | | | 0.98 | % |
Net expenses(3) | | | 0.95 | | | | 0.91 | | | | 0.99 | | | | 0.98 | | | | 0.95 | |
Net investment income | | | 1.27 | | | | 1.47 | | | | 1.29 | | | | 0.91 | | | | 0.85 | |
Portfolio Turnover Rate | | | 39 | % | | | 31 | % | | | 32 | % | | | 24 | % | | | 36 | % |
| (1) | Per share amounts have been calculated using the average shares method. |
| (2) | Performance figures may reflect fee waivers and/or expense reimbursements and assume reinvestment of dividend distribution. In the absence of fee waivers and/or expense reimbursements, the total return would have been lower. Applicable advisory program charges, which may be up to 2.50%, are not reflected in the performance data and would reduce the total returns. Past performance is no guarantee of future results. |
| (3) | Reflects fee waivers and/or expense reimbursements. |
| (4) | The Manager contributed a non-recourse voluntary reimbursement to Small Capitalization Value Equity Investments. The effect of the reimbursement is reflected in the Fund’s total return above. Without this reimbursement, the total return for Small Capitalization Value Equity Investments was (7.92)%. (See Note 2 within the Notes to Financial Statements). |
See Notes to Financial Statements.
169
For a share of beneficial interest outstanding throughout each year ended August 31, unless otherwise noted:
| | | | | | | | | | | | | | | | | | | | |
| International Equity Investments | | | | | | | | | | | | | | | |
| | | 2015 | | | 2014 | | | 2013 | | | 2012 | | | 2011 | |
Net asset value, Beginning of Year | | $ | 12.03 | | | $ | 10.92 | | | $ | 9.58 | | | $ | 9.77 | | | $ | 9.02 | |
| | | | | | | | | | | | | | | | | | | | |
| Income (Loss) from Operations: | | | | | | | | | | | | | | | | | | | | |
Net investment income(1) | | | 0.21 | | | | 0.22 | | | | 0.20 | | | | 0.17 | | | | 0.15 | |
Net realized and unrealized gain (loss) | | | (1.13 | ) | | | 1.03 | | | | 1.27 | | | | (0.18 | ) | | | 0.76 | |
| | | | | | | | | | | | | | | | | | | | |
Total Income (Loss) from Operations | | | (0.92 | ) | | | 1.25 | | | | 1.47 | | | | (0.01 | ) | | | 0.91 | |
| | | | | | | | | | | | | | | | | | | | |
| Less Distributions From: | | | | | | | | | | | | | | | | | | | | |
Net investment income | | | (0.20 | ) | | | (0.14 | ) | | | (0.13 | ) | | | (0.18 | ) | | | (0.16 | ) |
| | | | | | | | | | | | | | | | | | | | |
Total Distributions | | | (0.20 | ) | | | (0.14 | ) | | | (0.13 | ) | | | (0.18 | ) | | | (0.16 | ) |
| | | | | | | | | | | | | | | | | | | | |
Net Asset Value, End of Year | | $ | 10.91 | | | $ | 12.03 | | | $ | 10.92 | | | $ | 9.58 | | | $ | 9.77 | |
| | | | | | | | | | | | | | | | | | | | |
Total Return(2) | | | (7.68 | )%(4) | | | 11.45 | % | | | 15.47 | % | | | (0.06 | )% | | | 9.97 | % |
Net Assets, End of Year (millions) | | $ | 1,202 | | | $ | 1,149 | | | $ | 773 | | | $ | 444 | | | $ | 536 | |
| Ratios to Average Net Assets: | | | | | | | | | | | | | | | | | | | | |
Gross expenses | | | 0.81 | % | | | 0.81 | % | | | 0.84 | % | | | 0.91 | % | | | 0.84 | % |
Net expenses(3) | | | 0.79 | | | | 0.77 | | | | 0.83 | | | | 0.90 | | | | 0.82 | |
Net investment income | | | 1.80 | | | | 1.83 | | | | 1.88 | | | | 1.80 | | | | 1.41 | |
Portfolio Turnover Rate | | | 80 | % | | | 95 | % | | | 63 | % | | | 75 | % | | | 70 | % |
| (1) | Per share amounts have been calculated using the average shares method. |
| (2) | Performance figures may reflect fee waivers and/or expense reimbursements and assume reinvestment of dividend distribution. In the absence of fee waivers and/or expense reimbursements, the total return would have been lower. Applicable advisory program charges, which may be up to 2.50%, are not reflected in the performance data and would reduce the total returns. Past performance is no guarantee of future results. |
| (3) | Reflects fee waivers and/or expense reimbursements. |
| (4) | The Manager contributed a non-recourse voluntary reimbursement to International Equity Investments. The effect of the reimbursement is reflected in the Fund’s total return above. Without this reimbursement, the total return for International Equity Investments was (7.94)%. (See Note 2 within the Notes to Financial Statements). |
| | | | | | | | | | | | | | | | | | | | |
| Emerging Markets Equity Investments | | | | | | | | | | | | |
| | | 2015 | | | 2014 | | | 2013 | | | 2012 | | | 2011 | |
Net asset value, Beginning of Year | | $ | 14.54 | | | $ | 13.67 | | | $ | 14.46 | | | $ | 15.85 | | | $ | 14.79 | |
| | | | | | | | | | | | | | | | | | | | |
| Income (Loss) from Operations: | | | | | | | | | | | | | | | | | | | | |
Net investment income(1) | | | 0.17 | | | | 0.20 | | | | 0.21 | | | | 0.29 | | | | 0.31 | |
Net realized and unrealized gain (loss) | | | (3.64 | ) | | | 2.36 | | | | (0.69 | ) | | | (1.33 | ) | | | 0.99 | |
| | | | | | | | | | | | | | | | | | | | |
Total Income (Loss) from Operations | | | (3.47 | ) | | | 2.56 | | | | (0.48 | ) | | | (1.04 | ) | | | 1.30 | |
| | | | | | | | | | | | | | | | | | | | |
| Less Distributions From: | | | | | | | | | | | | | | | | | | | | |
Net investment income | | | (0.20 | ) | | | (0.29 | ) | | | (0.31 | ) | | | (0.35 | ) | | | (0.24 | ) |
Net realized gain | | | — | | | | (1.40 | ) | | | — | | | | — | | | | — | |
| | | | | | | | | | | | | | | | | | | | |
Total Distributions | | | (0.20 | ) | | | (1.69 | ) | | | (0.31 | ) | | | (0.35 | ) | | | (0.24 | ) |
| | | | | | | | | | | | | | | | | | | | |
Net Asset Value, End of Year | | $ | 10.87 | | | $ | 14.54 | | | $ | 13.67 | | | $ | 14.46 | | | $ | 15.85 | |
| | | | | | | | | | | | | | | | | | | | |
Total Return(2) | | | (24.08 | )% | | | 19.97 | % | | | (3.54 | )% | | | (6.52 | )% | | | 8.67 | % |
Net Assets, End of Year (millions) | | $ | 464 | | | $ | 385 | | | $ | 414 | | | $ | 695 | | | $ | 841 | |
| Ratios to Average Net Assets: | | | | | | | | | | | | | | | | | | | | |
Gross expenses | | | 1.08 | % | | | 1.09 | % | | | 1.10 | % | | | 1.06 | % | | | 1.05 | % |
Net expenses(3) | | | 0.96 | | | | 0.99 | | | | 0.99 | | | | 0.93 | | | | 0.91 | |
Net investment income | | | 1.34 | | | | 1.49 | | | | 1.39 | | | | 1.98 | | | | 1.87 | |
Portfolio Turnover Rate | | | 41 | % | | | 29 | % | | | 89 | % | | | 40 | % | | | 42 | % |
| (1) | Per share amounts have been calculated using the average shares method. |
| (2) | Performance figures may reflect fee waivers and/or expense reimbursements and assume reinvestment of dividend distribution. In the absence of fee waivers and/or expense reimbursements, the total return would have been lower. Applicable advisory program charges, which may be up to 2.50%, are not reflected in the performance data and would reduce the total returns. Past performance is no guarantee of future results. |
| (3) | Reflects fee waivers and/or expense reimbursements. |
See Notes to Financial Statements.
170
For a share of beneficial interest outstanding throughout each year ended August 31, unless otherwise noted:
| | | | | | | | | | | | | | | | | | | | |
| Core Fixed Income Investments | | | | | | | | | | | | | | | |
| | | 2015 | | | 2014 | | | 2013 | | | 2012 | | | 2011 | |
Net asset value, Beginning of Year | | $ | 8.44 | | | $ | 8.17 | | | $ | 8.87 | | | $ | 8.58 | | | $ | 8.81 | |
| | | | | | | | | | | | | | | | | | | | |
| Income (Loss) from Operations: | | | | | | | | | | | | | | | | | | | | |
Net investment income(1) | | | 0.17 | | | | 0.18 | | | | 0.20 | | | | 0.25 | | | | 0.28 | |
Net realized and unrealized gain (loss) | | | (0.06 | ) | | | 0.31 | | | | (0.30 | ) | | | 0.38 | | | | 0.05 | |
| | | | | | | | | | | | | | | | | | | | |
Total Income (Loss) from Operations | | | 0.11 | | | | 0.49 | | | | (0.10 | ) | | | 0.63 | | | | 0.33 | |
| | | | | | | | | | | | | | | | | | | | |
| Less Distributions From: | | | | | | | | | | | | | | | | | | | | |
Net investment income | | | (0.20 | ) | | | (0.22 | ) | | | (0.24 | ) | | | (0.27 | ) | | | (0.29 | ) |
Net realized gain | | | (0.12 | ) | | | — | | | | (0.36 | ) | | | (0.07 | ) | | | (0.27 | ) |
| | | | | | | | | | | | | | | | | | | | |
Total Distributions | | | (0.32 | ) | | | (0.22 | ) | | | (0.60 | ) | | | (0.34 | ) | | | (0.56 | ) |
| | | | | | | | | | | | | | | | | | | | |
Net Asset Value, End of Year | | $ | 8.23 | | | $ | 8.44 | | | $ | 8.17 | | | $ | 8.87 | | | $ | 8.58 | |
| | | | | | | | | | | | | | | | | | | | |
Total Return(2) | | | 1.35 | % | | | 6.10 | % | | | (1.31 | )% | | | 7.58 | % | | | 3.93 | % |
Net Assets, End of Year (millions) | | $ | 859 | | | $ | 799 | | | $ | 937 | | | $ | 1,022 | | | $ | 1,067 | |
| Ratios to Average Net Assets: | | | | | | | | | | | | | | | | | | | | |
Gross expenses | | | 0.54 | %(3) | | | 0.53 | %(3) | | | 0.54 | %(3) | | | 0.52 | % | | | 0.52 | % |
Net expenses(4) | | | 0.55 | (3) | | | 0.53 | (3) | | | 0.54 | (3) | | | 0.52 | | | | 0.52 | |
Net investment income | | | 2.06 | | | | 2.19 | | | | 2.30 | | | | 2.85 | | | | 3.23 | |
Portfolio Turnover Rate | | | 326 | % | | | 446 | % | | | 421 | % | | | 429 | % | | | 390 | % |
| (1) | Per share amounts have been calculated using the average shares method. |
| (2) | Performance figures may reflect fee waivers and/or expense reimbursements and assume reinvestment of dividend distribution. In the absence of fee waivers and/or expense reimbursements, the total return would have been lower. Applicable advisory program charges, which may be up to 2.50%, are not reflected in the performance data and would reduce the total returns. Past performance is no guarantee of future results. |
| (3) | Ratio includes interest expense on forward sale commitments and reverse repurchase agreements which represents less than 0.01%. |
| (4) | Reflects fee waivers and/or expense reimbursements. |
| | | | | | | | | | | | | | | | | | | | |
| High Yield Investments | | | | | | | | | | | | | | | |
| | | 2015 | | | 2014 | | | 2013 | | | 2012 | | | 2011 | |
Net asset value, Beginning of Year | | $ | 4.41 | | | $ | 4.27 | | | $ | 4.24 | | | $ | 4.15 | | | $ | 4.14 | |
| | | | | | | | | | | | | | | | | | | | |
| Income (Loss) from Operations: | | | | | | | | | | | | | | | | | | | | |
Net investment income(1) | | | 0.24 | | | | 0.24 | | | | 0.27 | | | | 0.29 | | | | 0.36 | |
Net realized and unrealized gain (loss) | | | (0.50 | ) | | | 0.17 | | | | 0.07 | | | | 0.16 | | | | 0.02 | |
| | | | | | | | | | | | | | | | | | | | |
Total Income (Loss) from Operations | | | (0.26 | ) | | | 0.41 | | | | 0.34 | | | | 0.45 | | | | 0.38 | |
| | | | | | | | | | | | | | | | | | | | |
| Less Distributions From: | | | | | | | | | | | | | | | | | | | | |
Net investment income | | | (0.27 | ) | | | (0.27 | ) | | | (0.31 | ) | | | (0.36 | ) | | | (0.37 | ) |
| | | | | | | | | | | | | | | | | | | | |
Total Distributions | | | (0.27 | ) | | | (0.27 | ) | | | (0.31 | ) | | | (0.36 | ) | | | (0.37 | ) |
| | | | | | | | | | | | | | | | | | | | |
Net Asset Value, End of Year | | $ | 3.88 | | | $ | 4.41 | | | $ | 4.27 | | | $ | 4.24 | | | $ | 4.15 | |
| | | | | | | | | | | | | | | | | | | | |
Total Return(2) | | | (6.14 | )% | | | 9.75 | % | | | 8.07 | % | | | 11.57 | % | | | 9.01 | % |
Net Assets, End of Year (millions) | | $ | 254 | | | $ | 258 | | | $ | 111 | | | $ | 269 | | | $ | 198 | |
| Ratios to Average Net Assets: | | | | | | | | | | | | | | | | | | | | |
Gross expenses | | | 0.90 | % | | | 0.92 | % | | | 0.93 | % | | | 0.97 | % | | | 0.88 | % |
Net expenses(3) | | | 0.74 | | | | 0.76 | | | | 0.78 | | | | 0.81 | | | | 0.72 | |
Net investment income | | | 5.74 | | | | 5.53 | | | | 6.25 | | | | 7.58 | | | | 8.26 | |
Portfolio Turnover Rate | | | 42 | % | | | 57 | % | | | 86 | % | | | 101 | % | | | 62 | % |
| (1) | Per share amounts have been calculated using the average shares method. |
| (2) | Performance figures may reflect fee waivers and/or expense reimbursements and assume reinvestment of dividend distribution. In the absence of fee waivers and/or expense reimbursements, the total return would have been lower. Applicable advisory program charges, which may be up to 2.50%, are not reflected in the performance data and would reduce the total returns. Past performance is no guarantee of future results. |
| (3) | Reflects fee waivers and/or expense reimbursements. |
See Notes to Financial Statements.
171
For a share of beneficial interest outstanding throughout each year ended August 31, unless otherwise noted:
| | | | | | | | | | | | | | | | | | | | |
| International Fixed Income Investments | | | | | | | | | | | | | | | |
| | | 2015 | | | 2014 | | | 2013 | | | 2012 | | | 2011 | |
Net asset value, Beginning of Year | | $ | 8.04 | | | $ | 8.02 | | | $ | 8.56 | | | $ | 7.99 | | | $ | 8.41 | |
| | | | | | | | | | | | | | | | | | | | |
| Income (Loss) from Operations: | | | | | | | | | | | | | | | | | | | | |
Net investment income(1) | | | 0.13 | | | | 0.16 | | | | 0.18 | | | | 0.19 | | | | 0.23 | |
Net realized and unrealized gain (loss) | | | (0.09 | ) | | | 0.40 | | | | (0.23 | ) | | | 0.41 | | | | (0.15 | ) |
| | | | | | | | | | | | | | | | | | | | |
Total Income (Loss) from Operations | | | 0.04 | | | | 0.56 | | | | (0.05 | ) | | | 0.60 | | | | 0.08 | |
| | | | | | | | | | | | | | | | | | | | |
| Less Distributions From: | | | | | | | | | | | | | | | | | | | | |
Net investment income | | | (0.47 | ) | | | (0.54 | ) | | | (0.49 | ) | | | (0.03 | ) | | | (0.50 | ) |
| | | | | | | | | | | | | | | | | | | | |
Total Distributions | | | (0.47 | ) | | | (0.54 | ) | | | (0.49 | ) | | | (0.03 | ) | | | (0.50 | ) |
| | | | | | | | | | | | | | | | | | | | |
Net Asset Value, End of Year | | $ | 7.61 | | | $ | 8.04 | | | $ | 8.02 | | | $ | 8.56 | | | $ | 7.99 | |
| | | | | | | | | | | | | | | | | | | | |
Total Return(2) | | | 0.44 | % | | | 7.36 | % | | | (0.77 | )% | | | 7.53 | % | | | 1.21 | % |
Net Assets, End of Year (millions) | | $ | 223 | | | $ | 267 | | | $ | 317 | | | $ | 431 | | | $ | 227 | |
| Ratios to Average Net Assets: | | | | | | | | | | | | | | | | | | | | |
Gross expenses | | | 0.87 | %(3) | | | 0.76 | %(3) | | | 0.69 | %(3) | | | 0.64 | % | | | 0.72 | % |
Net expenses | | | 0.87 | (3) | | | 0.76 | (3) | | | 0.69 | (3) | | | 0.63 | (4) | | | 0.72 | (4) |
Net investment income | | | 1.61 | | | | 2.00 | | | | 2.12 | | | | 2.25 | | | | 2.86 | |
Portfolio Turnover Rate | | | 416 | % | | | 397 | % | | | 198 | % | | | 223 | % | | | 150 | % |
| (1) | Per share amounts have been calculated using the average shares method. |
| (2) | Performance figures may reflect fee waivers and/or expense reimbursements and assume reinvestment of dividend distribution. In the absence of fee waivers and/or expense reimbursements, the total return would have been lower. Applicable advisory program charges, which may be up to 2.50%, are not reflected in the performance data and would reduce the total returns. Past performance is no guarantee of future results. |
| (3) | Ratio includes interest expense on forward sale commitments and reverse repurchase agreements which represents 0.10%, 0.04%, and less than 0.01%, respectively. |
| (4) | Reflects fee waivers and/or expense reimbursements. |
| | | | | | | | | | | | | | | | | | | | |
| Municipal Bond Investments | | | | | | | | | | | | |
| | | 2015 | | | 2014 | | | 2013 | | | 2012 | | | 2011 | |
Net asset value, Beginning of Year | | $ | 9.76 | | | $ | 9.21 | | | $ | 9.88 | | | $ | 9.48 | | | $ | 9.63 | |
| | | | | | | | | | | | | | | | | | | | |
| Income (Loss) from Operations: | | | | | | | | | | | | | | | | | | | | |
Net investment income(1) | | | 0.28 | | | | 0.29 | | | | 0.29 | | | | 0.28 | | | | 0.30 | |
Net realized and unrealized gain (loss) | | | (0.06 | ) | | | 0.55 | | | | (0.67 | ) | | | 0.40 | | | | (0.15 | ) |
| | | | | | | | | | | | | | | | | | | | |
Total Income (Loss) from Operations | | | 0.22 | | | | 0.84 | | | | (0.38 | ) | | | 0.68 | | | | 0.15 | |
| | | | | | | | | | | | | | | | | | | | |
| Less Distributions From: | | | | | | | | | | | | | | | | | | | | |
Net investment income | | | (0.28 | ) | | | (0.29 | ) | | | (0.29 | ) | | | (0.28 | ) | | | (0.30 | ) |
Net realized gain | | | (0.05 | ) | | | — | | | | — | | | | — | | | | — | |
| | | | | | | | | | | | | | | | | | | | |
Total Distributions | | | (0.33 | ) | | | (0.29 | ) | | | (0.29 | ) | | | (0.28 | ) | | | (0.30 | ) |
| | | | | | | | | | | | | | | | | | | | |
Net Asset Value, End of Year | | $ | 9.65 | | | $ | 9.76 | | | $ | 9.21 | | | $ | 9.88 | | | $ | 9.48 | |
| | | | | | | | | | | | | | | | | | | | |
Total Return(2) | | | 2.32 | % | | | 9.24 | % | | | (4.01 | )% | | | 7.23 | % | | | 1.71 | % |
Net Assets, End of Year (millions) | | $ | 85 | | | $ | 78 | | | $ | 80 | | | $ | 89 | | | $ | 88 | |
| Ratios to Average Net Assets: | | | | | | | | | | | | | | | | | | | | |
Gross expenses | | | 0.66 | % | | | 0.59 | % | | | 0.61 | % | | | 0.57 | % | | | 0.58 | % |
Net expenses | | | 0.66 | | | | 0.59 | | | | 0.61 | | | | 0.57 | | | | 0.58 | |
Net investment income | | | 2.91 | | | | 3.03 | | | | 2.92 | | | | 2.83 | | | | 3.27 | |
Portfolio Turnover Rate | | | 8 | % | | | 19 | % | | | 9 | % | | | 26 | % | | | 20 | % |
| (1) | Per share amounts have been calculated using the average shares method. |
| (2) | Performance figures may reflect fee waivers and/or expense reimbursements and assume reinvestment of dividend distribution. In the absence of fee waivers and/or expense reimbursements, the total return would have been lower. Applicable advisory program charges, which may be up to 2.50%, are not reflected in the performance data and would reduce the total returns. Past performance is no guarantee of future results. |
See Notes to Financial Statements.
172
For a share of beneficial interest outstanding throughout each year ended August 31, unless otherwise noted:
| | | | | | | | | | | | | | | | | | | | |
| Money Market Investments | | | | | | | | | | | | | | | |
| | | 2015 | | | 2014 | | | 2013 | | | 2012 | | | 2011 | |
Net asset value, Beginning of Year | | $ | 1.00 | | | $ | 1.00 | | | $ | 1.00 | | | $ | 1.00 | | | $ | 1.00 | |
| | | | | | | | | | | | | | | | | | | | |
| Income (Loss) from Operations: | | | | | | | | | | | | | | | | | | | | |
Net investment income(1) | | | 0.00 | (2) | | | 0.00 | (2) | | | 0.00 | (2) | | | 0.00 | (2) | | | 0.00 | (2) |
Net realized and unrealized gain | | | 0.00 | (3) | | | 0.00 | (2) | | | 0.00 | (2) | | | 0.00 | (2) | | | 0.00 | (2) |
| | | | | | | | | | | | | | | | | | | | |
Total Income from Operations | | | 0.00 | (3) | | | 0.00 | (2) | | | 0.00 | (2) | | | 0.00 | (2) | | | 0.00 | (2) |
| | | | | | | | | | | | | | | | | | | | |
| Less Distributions From: | | | | | | | | | | | | | | | | | | | | |
Net investment income | | | (0.00 | )(3) | | | (0.00 | )(3) | | | (0.00 | )(3) | | | (0.00 | )(3) | | | (0.00 | )(3) |
Net realized gain | | | (0.00 | )(3) | | | — | | | | — | | | | — | | | | (0.00 | )(3) |
| | | | | | | | | | | | | | | | | | | | |
Total Distributions | | | (0.00 | )(3) | | | (0.00 | )(3) | | | (0.00 | )(3) | | | (0.00 | )(3) | | | (0.00 | )(3) |
| | | | | | | | | | | | | | | | | | | | |
Net Asset Value, End of Year | | $ | 1.00 | | | $ | 1.00 | | | $ | 1.00 | | | $ | 1.00 | | | $ | 1.00 | |
| | | | | | | | | | | | | | | | | | | | |
Total Return(5) | | | 0.00 | %(4) | | | 0.00 | % | | | 0.00 | % | | | 0.02 | % | | | 0.01 | % |
Net Assets, End of Year (millions) | | $ | 203 | | | $ | 335 | | | $ | 467 | | | $ | 238 | | | $ | 119 | |
| Ratios to Average Net Assets: | | | | | | | | | | | | | | | | | | | | |
Gross expenses | | | 0.21 | % | | | 0.23 | % | | | 0.21 | % | | | 0.23 | % | | | 0.29 | % |
Net expenses(6) | | | 0.16 | | | | 0.13 | | | | 0.16 | | | | 0.22 | | | | 0.21 | |
Net investment income | | | 0.00 | (4) | | | 0.00 | (4) | | | 0.00 | (4) | | | 0.03 | | | | 0.00 | (4) |
| (1) | Per share amounts have been calculated using the average shares method. |
| (2) | Amounts represent less than $0.01 per share. |
| (3) | Amounts represent less than $(0.01) per share. |
| (4) | Amounts represent less than 0.01% per share. |
| (5) | Performance figures may reflect fee waivers and/or expense reimbursements and assume reinvestment of dividend distribution. In the absence of fee waivers and/or expense reimbursements, the total return would have been lower. Applicable advisory program charges, which may be up to 2.50%, are not reflected in the performance data and would reduce the total returns. Past performance is no guarantee of future results. |
| (6) | Reflects fee waivers and/or expense reimbursements. |
See Notes to Financial Statements.
173
| | |
| | | |
| Notes to Financial Statements | | |
1. Organization and Significant Accounting Policies
The Consulting Group Capital Markets Funds (“Trust”) is organized as a Massachusetts business trust and registered under the Investment Company Act of 1940, as amended (“1940 Act”), as an open-end management investment company. The Trust currently consists of Large Capitalization Growth Investments, Large Capitalization Value Equity Investments, Small Capitalization Growth Investments, Small Capitalization Value Equity Investments, International Equity Investments, Emerging Markets Equity Investments, Core Fixed Income Investments, High Yield Investments, International Fixed Income Investments, Municipal Bond Investments and Money Market Investments (individually, a “Fund” and collectively, the “Funds”). Each Fund is a diversified series of the Trust, except for International Fixed Income Investments, which is non-diversified.
The following is a summary of significant accounting policies consistently followed by the Funds which are in conformity with accounting principles generally accepted in the United States of America (“GAAP”). Estimates and assumptions are required to be made by management regarding assets, liabilities and changes in net assets resulting from operations when financial statements are prepared. Changes in the economic environment, financial markets and any other parameters used in determining these estimates could cause actual results to differ. The Funds are investment companies and follow the accounting and reporting guidance of the Financial Accounting Standards Board (“FASB”) Accounting Standards Codification Topic 946 – Investment Companies.
(a) Investment Valuation. Portfolio securities of Money Market Investments are valued at amortized cost, which approximates market value. Equity securities for each Fund (other than Money Market Investments) for which market quotations are readily available and are traded on an exchange are valued at the closing sale price or official closing price on the exchange on which such security is principally traded. In the event there are no sales that day, such securities are valued at the mean between the bid and ask prices. For securities that are primarily traded on foreign exchanges, these values are converted to U.S. dollars using the current exchange rates as of the close of the New York Stock Exchange (“NYSE”).
Exchange-traded purchased and written options and futures contracts are valued at the last sale price (closing price) in the market where such contracts are principally traded or, if no sales are reported, the bid price. Swaps for which quotations are available on an automated basis from approved third-party pricing services are valued using those automated third-party pricing service quotations. Foreign currency contracts are valued using the official closing price for such contracts on the NYSE.
Portfolio securities traded in the over-the-counter market for which market quotations are readily available are valued at the last sales price that day. In the event there are no sales that day, such securities are valued at the mean between the bid and ask prices. Investments in registered open-end management investment companies are valued at reported net asset value per share.
Debt obligations that will mature in 60 days or less are valued at amortized cost, which approximates market value. Debt obligations that will mature in more than 60 days are valued using valuations furnished by an approved third-party pricing service; such valuations are determined by the third-party pricing service based upon its analysis of a variety of factors, including transactions in debt obligations, quotations from bond dealers, market transactions in comparable securities and its analysis of various relationships between securities, prices or yields of securities with similar characteristics, benchmark curves or information pertaining to the issuer, and as well as industry and economic events.
Overnight repurchase agreements and repurchase agreements maturing in seven days or less are valued at cost. Term repurchase agreements maturing in more than seven days are valued at the average of the bid quotations obtained daily from at least two recognized purchasers of such term repurchase agreements selected by Consulting Group Advisory Services, LLC (“CGAS”) (the “Manager”).
The Board of Trustees (the “Board”) has ultimate responsibility for ensuring the Funds’ investments are valued appropriately. The Board has delegated primary responsibility for determining or causing to be determined the value of the Funds’ investments (including any fair valuation) to the Manager pursuant to valuation policies and procedures approved by the Board. When market quotations are not readily available or are determined to be unreliable, investments are valued at fair value as determined in good faith by the valuation committee established by the Manager in accordance with such procedures under the oversight of the Board. Circumstances that may indicate that market quotations are not readily available or are unreliable include, but are not limited to, such instances when the value of a security has been significantly affected by events after the close of the exchange or market on which the security is principally traded, and before the applicable Fund calculates its NAV.
174
| | |
| | | |
| Notes to Financial Statements | | |
Each business day, Emerging Markets Equity Investments and International Equity Investments use a Board-approved third-party pricing service to assist with the valuation of foreign equity securities. Events occurring after the close of trading on foreign exchanges may result in adjustments to the valuation of foreign securities to reflect market trading that occurs after the close of the applicable foreign markets of comparable securities or other instruments that have a strong correlation to the fair-valued securities to more accurately reflect their fair value as of the close of regular trading on the NYSE.
The Funds disclose the fair value of their investments in a hierarchy that prioritizes the inputs to valuation techniques used to measure the fair value. The hierarchy prioritizes inputs to valuation methods and requires disclosure of the fair value hierarchy, separately for each major category of assets and liabilities, that segregates fair value measurements into levels (Level 1, 2, and 3). The three levels of the fair value hierarchy are as follows:
Level 1 – unadjusted quoted prices in active markets for identical securities.
Level 2 – significant observable inputs (including quoted prices for similar securities, interest rates, prepayment speeds, credit risk, etc.)
Level 3 – significant unobservable inputs (including assumptions made by the Board or persons acting at their direction that are used in determining the fair value of investments.)
The inputs or methodology used for valuing securities are not necessarily an indication of the risk associated with investing in those securities. The following are certain inputs and techniques that the Funds generally use to evaluate how to classify each major category of assets and liabilities in accordance with GAAP.
Fixed income securities including corporate, convertible and municipal bonds and notes, U.S. government agencies, U.S. treasury obligations, sovereign bonds, bank loans, convertible preferred securities and non-U.S. bonds are normally valued by third-party pricing service providers that use broker-dealer quotations, reported trades or valuation estimates from their internal pricing models. The service providers’ internal models use inputs that are observable such as issuer details, interest rates, yield curves, prepayment speeds, credit risks/spreads, default rates and quoted prices for similar assets. Securities that use similar valuation techniques and inputs as described above are categorized as Level 2 of the fair value hierarchy. To the extent that these inputs are significant and unobservable, the values are categorized as Level 3 of the fair value hierarchy.
Mortgage-related and asset-backed securities are usually issued as separate tranches, or classes, of securities within each deal. These securities are also normally valued by third-party pricing service providers that use broker-dealer quotations or valuation estimates from their internal pricing models. The pricing models for these securities usually consider tranche-level attributes, current market data, estimated cash flows and market-based yield spreads for each tranche, and incorporate deal collateral performance, as available. Mortgage-related and asset-backed securities and the related forward sales commitments that use similar valuation techniques and inputs as described above are categorized as Level 2 of the fair value hierarchy. To the extent that these inputs are significant and unobservable, the values are categorized as Level 3 of the fair value hierarchy.
Common stocks, preferred stocks, rights, warrants, exchange-traded funds and financial derivative instruments, such as futures contracts or options contracts that are traded on a national securities exchange, are categorized as Level 1 of the fair value hierarchy, to the extent these securities are actively traded and valuation adjustments are not applied.
Valuation adjustments may be applied to certain securities that are solely traded on a foreign exchange to account for the market movement between the close of the foreign market and the NYSE close. Securities using these valuation adjustments are categorized as Level 2 of the fair value hierarchy. Preferred securities and other equities traded on inactive markets or valued by reference to similar instruments are also categorized as Level 2 of the fair value hierarchy.
Investments in registered open-end investment management companies are valued based upon the NAVs of such investments and are categorized as Level 1 of the fair value hierarchy.
Short-term investments having a maturity of 60 days or less are generally valued at amortized cost which approximates fair market value. These investments are categorized as Level 2 of the fair value hierarchy.
Over-the-counter financial derivative instruments, such as foreign currency contracts, forward foreign currency contracts, options contracts, or swap contracts, derive their value from underlying asset prices, indices, reference rates, and other inputs or a combination of these factors. These contracts are normally valued on the basis of broker dealer quotations or by third-party pricing
175
| | |
| | | |
| Notes to Financial Statements | | |
service providers. Depending on the product and the terms of the transaction, the value of financial derivatives can be estimated by a third-party pricing service provider using a series of techniques, including simulation pricing models. The pricing models use inputs that are observed from actively quoted markets such as issuer details, indices, spreads, interest rates, yield curves, dividends and exchange rates. Financial derivatives that use similar valuation techniques and inputs as described above are categorized as Level 2 of the fair value hierarchy. To the extent that these inputs are significant and unobservable, the values are categorized as Level 3 of the fair value hierarchy.
Centrally cleared swaps listed or traded on a multilateral or trade facility platform, such as a registered exchange, are valued at the daily settlement price determined by the respective exchange. For centrally cleared credit default swaps the clearing facility requires its members to provide actionable levels across complete term structures. These levels along with external third party prices are used to produce daily settlement prices. Centrally cleared interest rate swaps are valued using a pricing model that references the underlying rates including the overnight index swap rate and London Interbank Offered Rate (“LIBOR”) forward rate to produce the daily settlement price. These securities are categorized as Level 2 of the fair value hierarchy.
The Funds’ policy is to recognize transfers between levels at the end of the reporting period. In some instances, the inputs used to measure fair value might fall in different levels of the fair value hierarchy. The level in the fair value hierarchy within which the fair value measurement in its entirety falls is determined based on the lowest level input that is significant to the fair value measurement in its entirety. Because of the inherent uncertainties of valuation, the values reflected in the financial statements may materially differ from the value received upon actual sale of those investments.
The following table summarizes the valuation of each Fund’s assets and liabilities using the fair value hierarchy:
| | | | | | | | | | | | | | | | |
| | | Total Fair Value at
August 31, 2015 | | | Unadjusted Quoted Prices
in Active Markets
for Identical Investments
(Level 1) | | | Significant Observable
Inputs (Level 2) | | | Significant
Unobservable
Inputs (Level 3) | |
| | | | | | | | | | | | | | | | |
| Large Capitalization Growth Investments | | | | | | | | | | | | | | | | |
Investments, at value | | | | | | | | | | | | | | | | |
Common Stocks: | | | | | | | | | | | | | | | | |
Consumer Discretionary | | $ | 289,717,661 | | | $ | 289,717,661 | | | $ | — | | | $ | — | |
Consumer Staples | | | 67,934,543 | | | | 67,934,543 | | | | — | | | | — | |
Energy | | | 17,408,924 | | | | 17,408,924 | | | | — | | | | — | |
Financials | | | 95,455,452 | | | | 95,455,452 | | | | — | | | | — | |
Health Care | | | 290,248,275 | | | | 290,248,275 | | | | — | | | | — | |
Industrials | | | 83,111,348 | | | | 83,111,348 | | | | — | | | | — | |
Information Technology | | | 420,291,906 | | | | 420,291,906 | | | | — | | | | — | |
Materials | | | 33,267,767 | | | | 33,267,767 | | | | — | | | | — | |
Telecommunication Services | | | 20,206,404 | | | | 20,206,404 | | | | — | | | | — | |
Short-Term Investments: | | | | | | | | | | | | | | | | |
Money Market Fund | | | 6,735,317 | | | | 6,735,317 | | | | — | | | | — | |
Time Deposits | | | 39,112,639 | | | | — | | | | 39,112,639 | | | | — | |
| | | | | | | | | | | | | | | | |
| Total Investments, at value | | $ | 1,363,490,236 | | | $ | 1,324,377,597 | | | $ | 39,112,639 | | | $ | — | |
| | | | | | | | | | | | | | | | |
| Large Capitalization Value Equity Investments | | | | | | | | | | | | | | | | |
Investments, at value | | | | | | | | | | | | | | | | |
Common Stocks: | | | | | | | | | | | | | | | | |
Consumer Discretionary | | $ | 109,059,606 | | | $ | 109,059,606 | | | $ | — | | | $ | — | |
Consumer Staples | | | 62,463,759 | | | | 62,463,759 | | | | — | | | | — | |
Energy | | | 130,574,159 | | | | 130,574,159 | | | | — | | | | — | |
Financials | | | 310,486,937 | | | | 310,486,937 | | | | — | | | | — | |
Health Care | | | 147,196,987 | | | | 147,196,987 | | | | — | | | | — | |
Industrials | | | 123,320,095 | | | | 123,320,095 | | | | — | | | | — | |
Information Technology | | | 165,740,603 | | | | 165,740,603 | | | | — | | | | — | |
176
| | |
| | | |
| Notes to Financial Statements | | |
| | | | | | | | | | | | | | | | |
| | | Total Fair Value at
August 31, 2015 | | | Unadjusted Quoted Prices
in Active Markets
for Identical Investments
(Level 1) | | | Significant Observable
Inputs (Level 2) | | | Significant
Unobservable
Inputs (Level 3) | |
| | | | | | | | | | | | | | | | |
| | | | | | | | | | | | | | | | |
Materials | | $ | 50,149,643 | | | $ | 50,149,643 | | | $ | — | | | $ | — | |
Telecommunication Services | | | 41,775,224 | | | | 41,775,224 | | | | — | | | | — | |
Utilities | | | 41,374,381 | | | | 41,374,381 | | | | — | | | | — | |
Short-Term Investments: | | | | | | | | | | | | | | | | |
Money Market Fund | | | 16,427,951 | | | | 16,427,951 | | | | — | | | | — | |
Time Deposits | | | 46,443,612 | | | | — | | | | 46,443,612 | | | | — | |
| | | | | | | | | | | | | | | | |
| Total Investments, at value | | $ | 1,245,012,957 | | | $ | 1,198,569,345 | | | $ | 46,443,612 | | | $ | — | |
| | | | | | | | | | | | | | | | |
| Small Capitalization Growth Investments | | | | | | | | | | | | | | | | |
Investments, at value | | | | | | | | | | | | | | | | |
Common Stocks: | | | | | | | | | | | | | | | | |
Consumer Discretionary | | $ | 40,901,204 | | | $ | 40,901,204 | | | $ | — | | | $ | — | |
Consumer Staples | | | 3,353,790 | | | | 3,353,790 | | | | — | | | | — | |
Energy | | | 2,962,497 | | | | 2,962,497 | | | | — | | | | — | |
Financials | | | 14,760,022 | | | | 14,760,022 | | | | — | | | | — | |
Health Care | | | 70,444,759 | | | | 70,444,759 | | | | — | | | | — | |
Industrials | | | 29,768,445 | | | | 29,768,445 | | | | — | | | | — | |
Information Technology | | | 50,013,520 | | | | 50,013,520 | | | | — | | | | — | |
Materials | | | 5,414,841 | | | | 5,414,841 | | | | — | | | | — | |
Short-Term Investments: | | | | | | | | | | | | | | | | |
Money Market Fund | | | 18,339,079 | | | | 18,339,079 | | | | — | | | | — | |
Time Deposits | | | 11,229,464 | | | | — | | | | 11,229,464 | | | | — | |
| | | | | | | | | | | | | | | | |
| Total Investments, at value | | $ | 247,187,621 | | | $ | 235,958,157 | | | $ | 11,229,464 | | | $ | — | |
| | | | | | | | | | | | | | | | |
| Small Capitalization Value Equity Investments | | | | | | | | | | | | | | | | |
Investments, at value | | | | | | | | | | | | | | | | |
Common Stocks: | | | | | | | | | | | | | | | | |
Consumer Discretionary | | $ | 24,444,012 | | | $ | 24,444,012 | | | $ | — | | | $ | — | |
Consumer Staples | | | 8,557,184 | | | | 8,557,184 | | | | — | | | | — | |
Energy | | | 12,665,356 | | | | 12,665,356 | | | | — | | | | — | |
Financials | | | 53,353,955 | | | | 53,353,955 | | | | — | | | | — | |
Health Care | | | 8,336,982 | | | | 8,336,982 | | | | — | | | | — | |
Industrials | | | 51,025,255 | | | | 50,388,612 | | | | 636,643 | | | | — | |
Information Technology | | | 15,940,611 | | | | 15,940,611 | | | | — | | | | — | |
Materials | | | 26,419,584 | | | | 26,419,584 | | | | — | | | | — | |
Telecommunication Services | | | 377,300 | | | | 377,300 | | | | — | | | | — | |
Utilities | | | 6,845,682 | | | | 6,845,682 | | | | — | | | | — | |
Closed End Mututal Fund Securities: | | | | | | | | | | | | | | | | |
Financials | | | 469,359 | | | | 469,359 | | | | — | | | | — | |
Short-Term Investments: | | | | | | | | | | | | | | | | |
Money Market Fund | | | 6,979,519 | | | | 6,979,519 | | | | — | | | | — | |
Time Deposits | | | 5,131,890 | | | | — | | | | 5,131,890 | | | | — | |
| | | | | | | | | | | | | | | | |
| Total Investments, at value | | $ | 220,546,689 | | | $ | 214,778,156 | | | $ | 5,768,533 | | | $ | — | |
| | | | | | | | | | | | | | | | |
177
| | |
| | | |
| Notes to Financial Statements | | |
| | | | | | | | | | | | | | | | |
| | | Total Fair Value at
August 31, 2015 | | | Unadjusted Quoted Prices
in Active Markets
for Identical Investments
(Level 1) | | | Significant Observable
Inputs (Level 2) | | | Significant
Unobservable
Inputs (Level 3) | |
| | | | | | | | | | | | | | | | |
| International Equity Investments | | | | | | | | | | | | | | | | |
Investments, at value | | | | | | | | | | | | | | | | |
Common Stocks: | | | | | | | | | | | | | | | | |
France | | $ | 148,219,641 | | | $ | — | | | $ | 148,219,641 | | | $ | — | |
Germany | | | 83,167,688 | | | | — | | | | 83,167,688 | | | | — | |
Japan | | | 143,408,261 | | | | — | | | | 143,408,261 | | | | — | |
Switzerland | | | 146,953,188 | | | | — | | | | 146,953,188 | | | | — | |
United Kingdom | | | 278,612,204 | | | | — | | | | 278,612,204 | | | | — | |
Other Countries** | | | 350,711,043 | | | | 52,499,422 | | | | 298,211,621 | | | | — | |
Preferred Stock: | | | | | | | | | | | | | | | | |
Germany | | | 13,325,662 | | | | — | | | | 13,325,662 | | | | — | |
Short-Term Investments: | | | | | | | | | | | | | | | | |
Money Market Fund | | | 16,683,267 | | | | 16,683,267 | | | | — | | | | — | |
Time Deposits | | | 36,078,986 | | | | — | | | | 36,078,986 | | | | — | |
| | | | | | | | | | | | | | | | |
| Total — Investments, at value | | $ | 1,217,159,940 | | | $ | 69,182,689 | | | $ | 1,147,977,251 | | | $ | — | |
| | | | | | | | | | | | | | | | |
| Emerging Markets Equity Investments | | | | | | | | | | | | | | | | |
Investments, at value | | | | | | | | | | | | | | | | |
Common Stocks: | | | | | | | | | | | | | | | | |
Brazil | | $ | 40,678,132 | | | $ | 40,678,132 | | | $ | — | | | $ | — | |
China | | | 58,220,901 | | | | 21,841,593 | | | | 36,379,308 | | | | — | |
Hong Kong | | | 23,457,561 | | | | 5,888,650 | | | | 17,568,911 | | | | — | |
India | | | 70,227,884 | | | | 8,343,414 | | | | 61,884,470 | | | | — | |
Russia | | | 25,945,977 | | | | 4,070,809 | | | | 21,875,168 | | | | — | |
South Africa | | | 24,841,627 | | | | — | | | | 24,841,627 | | | | — | |
South Korea | | | 38,504,791 | | | | — | | | | 38,504,791 | | | | — | |
Taiwan | | | 29,198,537 | | | | 1,656,839 | | | | 27,541,698 | | | | — | |
Other Countries** | | | 125,189,452 | | | | 41,774,095 | | | | 83,415,357 | | | | — | |
Short-Term Investments: | | | | | | | | | | | | | | | | |
Money Market Fund | | | 9,633,182 | | | | 9,633,182 | | | | — | | | | — | |
Time Deposits | | | 27,497,023 | | | | — | | | | 27,497,023 | | | | — | |
| | | | | | | | | | | | | | | | |
| Total — Investments, at value | | $ | 473,395,067 | | | $ | 133,886,714 | | | $ | 339,508,353 | | | $ | — | |
| | | | | | | | | | | | | | | | |
| Core Fixed Income Investments | | | | | | | | | | | | | | | | |
Investments, at value | | | | | | | | | | | | | | | | |
Corporate Bonds & Notes | | $ | 234,142,378 | * | | $ | — | | | $ | 234,142,378 | | | $ | — | * |
U.S. Government & Agency Obligations | | | 211,273,950 | | | | — | | | | 211,273,950 | | | | — | |
Mortgage-Backed Securities | | | 199,772,088 | | | | — | | | | 199,772,088 | | | | — | |
Collateralized Mortgage Obligations | | | 138,066,220 | | | | — | | | | 137,667,712 | | | | 398,508 | |
Sovereign Bonds | | | 26,727,801 | | | | — | | | | 26,727,801 | | | | — | |
Asset-Backed Securities | | | 17,446,252 | | | | — | | | | 17,446,252 | | | | — | |
Municipal Bonds | | | 4,701,329 | | | | — | | | | 4,701,329 | | | | — | |
Senior Loans | | | 789,935 | | | | — | | | | 789,935 | | | | — | |
Preferred Stock: | | | | | | | | | | | | | | | | |
Financials | | | 772,921 | | | | 772,921 | | | | — | | | | — | |
Purchased Options | | | 55,458 | | | | 36,077 | | | | 19,381 | | | | — | |
178
| | |
| | | |
| Notes to Financial Statements | | |
| | | | | | | | | | | | | | | | |
| | | Total Fair Value at
August 31, 2015 | | | Unadjusted Quoted Prices
in Active Markets
for Identical Investments
(Level 1) | | | Significant Observable
Inputs (Level 2) | | | Significant
Unobservable
Inputs (Level 3) | |
| | | | | | | | | | | | | | | | |
Short-Term Investments: | | | | | | | | | | | | | | | | |
Money Market Fund | | $ | 733,911 | | | $ | 733,911 | | | $ | — | | | $ | — | |
Repurchase Agreements | | | 25,700,000 | | | | — | | | | 25,700,000 | | | | — | |
Time Deposits | | | 30,610,506 | | | | — | | | | 30,610,506 | | | | — | |
U.S. Government Agencies | | | 35,282,032 | | | | — | | | | 35,282,032 | | | | — | |
U.S. Government Obligations | | | 152,999 | | | | — | | | | 152,999 | | | | — | |
| | | | | | | | | | | | | | | | |
| Total Investments, at value | | $ | 926,227,780 | * | | $ | 1,542,909 | | | $ | 924,286,363 | | | $ | 398,508 | * |
| | | | | | | | | | | | | | | | |
| Other Financial Instruments | | | | | | | | | | | | | | | | |
Futures Contracts | | $ | (405,540 | ) | | $ | (405,540 | ) | | $ | — | | | $ | — | |
Forward Foreign Currency Contracts | | | (364,570 | ) | | | — | | | | (364,570 | ) | | | — | |
OTC Interest Rate Swaps | | | (50,016 | ) | | | — | | | | (50,016 | ) | | | — | |
Centrally Cleared Interest Rate Swap | | | (185,089 | ) | | | — | | | | (185,089 | ) | | | — | |
Options Contracts Written | | | (186,798 | ) | | | (163,200 | ) | | | (23,598 | ) | | | — | |
| | | | | | | | | | | | | | | | |
| Total Other Financial Instruments | | $ | (1,192,013 | ) | | $ | (568,740 | ) | | $ | (623,273 | ) | | $ | — | |
| | | | | | | | | | | | | | | | |
| High Yield Investments | | | | | | | | | | | | | | | | |
Investments, at value | | | | | | | | | | | | | | | | |
Corporate Bonds & Notes | | $ | 236,847,328 | * | | $ | — | | | $ | 236,716,460 | | | $ | 130,868 | * |
Senior Loans | | | 1,602,444 | | | | — | | | | 1,602,444 | | | | — | |
Preferred Stocks: | | | | | | | | | | | | | | | | |
Financials | | | 1,228,180 | | | | 1,228,180 | | | | — | | | | — | |
Common Stocks: | | | | | | | | | | | | | | | | |
Consumer Discretionary | | | — | * | | | — | | | | — | | | | — | * |
Energy | | | 117,079 | | | | — | | | | — | | | | 117,079 | |
Health Care | | | 116,200 | | | | — | | | | — | | | | 116,200 | |
Materials | | | 20,857 | | | | — | | | | — | | | | 20,857 | |
Warrants: | | | | | | | | | | | | | | | | |
Financials | | | 78,260 | | | | 78,260 | | | | — | | | | — | |
Short-Term Investments: | | | | | | | | | | | | | | | | |
Money Market Fund | | | 8,761,690 | | | | 8,761,690 | | | | — | | | | — | |
Time Deposits | | | 13,016,162 | | | | — | | | | 13,016,162 | | | | — | |
| | | | | | | | | | | | | | | | |
| Total Investments, at value | | $ | 261,788,200 | * | | $ | 10,068,130 | | | $ | 251,335,066 | | | $ | 385,004 | * |
| | | | | | | | | | | | | | | | |
| International Fixed Income Investments | | | | | | | | | | | | | | | | |
Investments, at value | | | | | | | | | | | | | | | | |
Sovereign Bonds | | | | | | | | | | | | | | | | |
Italy | | $ | 23,608,999 | | | $ | — | | | $ | 23,608,999 | | | $ | — | |
Other Countries** | | | 65,676,203 | | | | — | | | | 65,676,203 | | | | — | |
Corporate Bonds & Notes | | | | | | | | | | | | | | | | |
Denmark | | | 25,914,376 | | | | — | | | | 25,914,376 | | | | — | |
Germany | | | 12,834,272 | | | | — | | | | 12,834,272 | | | | — | |
United States | | | 13,429,573 | | | | — | | | | 13,429,573 | | | | — | |
Other Countries** | | | 32,777,409 | | | | — | | | | 32,777,409 | | | | — | |
Collateralized Mortgage Obligations | | | 27,036,004 | | | | — | | | | 27,036,004 | | | | — | |
U.S. Government & Agency Obligations | | | 21,389,390 | | | | — | | | | 21,389,390 | | | | — | |
Mortgage-Backed Securities | | | 1,887,753 | | | | — | | | | 1,887,753 | | | | — | |
Asset-Backed Securities | | | 773,735 | | | | — | | | | 773,735 | | | | — | |
Municipal Bond | | | 322,824 | | | | — | | | | 322,824 | | | | — | |
Purchased Options | | | 5,136 | | | | — | | | | 5,136 | | | | — | |
Short-Term Investments: | | | | | | | | | | | | | | | | |
Sovereign Bond | | | 5,526,300 | | | | — | | | | 5,526,300 | | | | — | |
Time Deposits | | | 2,165,733 | | | | — | | | | 2,165,733 | | | | — | |
U.S. Government Agencies | | | 2,397,946 | | | | — | | | | 2,397,946 | | | | — | |
U.S. Government Obligations | | | 1,905,828 | | | | — | | | | 1,905,828 | | | | — | |
| | | | | | | | | | | | | | | | |
| Total — Investments, at value | | $ | 237,651,481 | | | $ | — | | | $ | 237,651,481 | | | $ | — | |
| | | | | | | | | | | | | | | | |
179
| | |
| | | |
| Notes to Financial Statements | | |
| | | | | | | | | | | | | | | | |
| | | Total Fair Value at
August 31, 2015 | | | Unadjusted Quoted Prices
in Active Markets
for Identical Investments
(Level 1) | | | Significant Observable
Inputs (Level 2) | | | Significant
Unobservable
Inputs (Level 3) | |
| | | | | | | | | | | | | | | | |
| Other Financial Instruments | | | | | | | | | | | | | | | | |
OTC Credit Default Swaps | | $ | 120,530 | | | $ | — | | | $ | 120,530 | | | $ | — | |
Futures Contracts | | | (41,423 | ) | | | (41,423 | ) | | | — | | | | — | |
OTC Interest Rate Swaps | | | 63,272 | | | | — | | | | 63,272 | | | | — | |
Centrally Cleared Interest Rate Swaps | | | (1,136,532 | ) | | | — | | | | (1,136,532 | ) | | | — | |
Centrally Cleared Credit Default Swaps | | | (17,347 | ) | | | — | | | | (17,347 | ) | | | — | |
OTC Cross Currency Swaps | | | 604,918 | | | | — | | | | 604,918 | | | | — | |
OTC Volatility Swaps | | | (65 | ) | | | — | | | | (65 | ) | | | — | |
Forward Foreign Currency Contracts | | | (765,813 | ) | | | — | | | | (765,813 | ) | | | — | |
Options Contracts Written | | | (116,726 | ) | | | — | | | | (116,726 | ) | | | — | |
Forward Sale Commitments | | | (23,582,835 | ) | | | — | | | | (23,582,835 | ) | | | — | |
Reverse Repurchase Agreements | | | (9,304,125 | ) | | | — | | | | (9,304,125 | ) | | | — | |
| | | | | | | | | | | | | | | | |
| Total Other Financial Instruments | | $ | (34,176,146 | ) | | $ | (41,423 | ) | | $ | (34,134,723 | ) | | $ | — | |
| | | | | | | | | | | | | | | | |
| Municipal Bond Investments | | | | | | | | | | | | | | | | |
Investments, at value | | | | | | | | | | | | | | | | |
Municipal Bonds | | $ | 81,397,647 | | | $ | — | | | $ | 81,397,647 | | | $ | — | |
Short-Term Investments: | | | | | | | | | | | | | | | | |
Time Deposits | | | 3,130,676 | | | | — | | | | 3,130,676 | | | | — | |
| | | | | | | | | | | | | | | | |
| Total Investments, at value | | $ | 84,528,323 | | | $ | — | | | $ | 84,528,323 | | | $ | — | |
| | | | | | | | | | | | | | | | |
| Money Market Investments | | | | | | | | | | | | | | | | |
Investments, at value | | | | | | | | | | | | | | | | |
Short-Term Investments: | | | | | | | | | | | | | | | | |
Certificates of Deposit | | $ | 62,999,550 | | | $ | — | | | $ | 62,999,550 | | | $ | — | |
Commercial Paper | | | 91,974,686 | | | | — | | | | 91,974,686 | | | | — | |
Time Deposits | | | 862,550 | | | | — | | | | 862,550 | | | | — | |
U.S. Government Agency | | | 44,108,264 | | | | — | | | | 44,108,264 | | | | — | |
| | | | | | | | | | | | | | | | |
| Total Investments, at value | | $ | 199,945,050 | | | $ | — | | | $ | 199,945,050 | | | $ | — | |
| | | | | | | | | | | | | | | | |
| * | Includes securities that are fair valued at $0. |
| ** | Other Countries represents Countries that are individually less than 5% of Total Net Assets. |
The level classification by major category of investments is the same as the category presentation in the Schedules of Investments.
During the year ended August 31, 2015, there were no transfers from Level 2 to Level 3. High Yield Investments had a transfer from Level 1 to Level 3 of $20,858 and a transfer from Level 3 to Level 2 of $192,020.
The following is a reconciliation of assets for which significant unobservable inputs (Level 3) were used in determining fair value during the year September 1, 2014, through August 31, 2015:
| | | | | | | | | | | | | | | | | | | | | | | | | | | | |
| | | Total | | | Collateralized
Mortgage
Obligations | | | Common
Stocks | | | Corporate
Bonds &
Notes | | | Convertible
Preferred
Stocks | | | Rights | | | Credit
Default
Swaps | |
| International Equity Investments | | | | | | | | | | | | | | | | | | | | | | | | | | | | |
Balance as of August 31, 2014 | | $ | 10,505 | * | | $ | — | | | $ | — | * | | $ | — | | | $ | — | | | $ | 10,505 | | | $ | — | |
Total realized gain (loss) | | | (9,101 | ) | | | — | | | | (9,101 | ) | | | — | | | | — | | | | — | | | | — | |
Change in unrealized appreciation (depreciation) | | | (1,404 | ) | | | — | | | | 9,101 | | | | — | | | | — | | | | (10,505 | ) | | | — | |
180
| | |
| | | |
| Notes to Financial Statements | | |
| | | | | | | | | | | | | | | | | | | | | | | | | | | | |
| | | Total | | | Collateralized
Mortgage
Obligations | | | Common
Stocks | | | Corporate
Bonds &
Notes | | | Convertible
Preferred
Stocks | | | Rights | | | Credit
Default
Swaps | |
Purchases | | $ | — | | | $ | — | | | $ | — | | | $ | — | | | $ | — | | | $ | — | | | $ | — | |
(Sales) | | | — | | | | — | | | | — | | | | — | | | | — | | | | — | | | | — | |
Transfers In | | | — | | | | — | | | | — | | | | — | | | | — | | | | — | | | | — | |
Transfers Out | | | — | | | | — | | | | — | | | | — | | | | — | | | | — | | | | — | |
| | | | | | | | | | | | | | | | | | | | | | | | | | | | |
Balance as of August 31, 2015 | | $ | — | | | $ | — | | | $ | — | | | $ | — | | | $ | — | | | $ | — | | | $ | — | |
| | | | | | | | | | | | | | | | | | | | | | | | | | | | |
| Change in unrealized appreciation (depreciation) from Investments held as of August 31, 2015 | | $ | — | | | $ | — | | | $ | — | | | $ | — | | | $ | — | | | $ | — | | | $ | — | |
| | | | | | | | | | | | | | | | | | | | | | | | | | | | |
| | | | | | | |
| Core Fixed Income Investments | | | | | | | | | | | | | | | | | | | | | | | | | | | | |
Balance as of August 31, 2014 | | $ | — | * | | $ | — | | | $ | — | | | $ | — | * | | $ | — | * | | $ | — | | | $ | — | |
Total realized gain (loss) | | | — | | | | — | | | | — | | | | — | | | | — | | | | — | | | | — | |
Change in unrealized appreciation (depreciation) | | | (1,492 | ) | | | (1,492 | ) | | | — | | | | — | | | | — | | | | — | | | | — | |
Purchases | | | 400,000 | | | | 400,000 | | | | — | | | | — | | | | — | | | | — | | | | — | |
(Sales) | | | — | | | | — | | | | — | | | | — | | | | — | | | | — | | | | — | |
Transfers In | | | — | | | | — | | | | — | | | | — | | | | — | | | | — | | | | — | |
Transfers Out | | | — | | | | — | | | | — | | | | — | | | | — | | | | — | | | | — | |
| | | | | | | | | | | | | | | | | | | | | | | | | | | | |
Balance as of August 31, 2015 | | $ | 398,508 | * | | $ | 398,508 | | | $ | — | | | $ | — | * | | $ | — | | | $ | — | | | $ | — | |
| | | | | | | | | | | | | | | | | | | | | | | | | | | | |
| Change in unrealized appreciation (depreciation) from Investments held as of August 31, 2015 | | $ | (1,492 | ) | | $ | (1,492 | ) | | $ | — | | | $ | — | | | $ | — | | | $ | — | | | $ | — | |
| | | | | | | | | | | | | | | | | | | | | | | | | | | | |
| | | | | | | |
| High Yield Investments | | | | | | | | | | | | | | | | | | | | | | | | | | | | |
Balance as of August 31, 2014 | | $ | 1,081,709 | * | | $ | — | | | $ | 601,991 | | | $ | 479,718 | * | | $ | — | | | $ | — | | | $ | — | |
Total realized gain (loss) | | | 3,580 | | | | — | | | | — | | | | 3,580 | | | | — | | | | — | | | | — | |
Accrued discounts (premiums) | | | 3,217 | | | | — | | | | — | | | | 3,217 | | | | — | | | | — | | | | — | |
Change in unrealized appreciation (depreciation) | | | (455,122 | ) | | | — | | | | (368,713 | ) | | | (86,409 | ) | | | — | | | | — | | | | — | |
Purchases | | | 53,620 | | | | — | | | | — | | | | 53,620 | | | | — | | | | — | | | | — | |
(Sales) | | | (130,838 | ) | | | — | | | | — | | | | (130,838 | ) | | | — | | | | — | | | | — | |
Transfers In | | | 20,858 | | | | — | | | | 20,858 | | | | | | | | — | | | | — | | | | — | |
Transfers Out | | | (192,020 | ) | | | — | | | | — | | | | (192,020 | ) | | | — | | | | — | | | | — | |
| | | | | | | | | | | | | | | | | | | | | | | | | | | | |
Balance as of August 31, 2015 | | $ | 385,004 | * | | $ | — | | | $ | 254,136 | * | | $ | 130,868 | * | | $ | — | | | $ | — | | | $ | — | |
| | | | | | | | | | | | | | | | | | | | | | | | | | | | |
| Change in unrealized appreciation (depreciation) from Investments held as of August 31, 2015 | | $ | (374,017 | ) | | $ | — | | | $ | (368,713 | ) | | $ | (5,304 | ) | | $ | — | | | $ | — | | | $ | — | |
| | | | | | | | | | | | | | | | | | | | | | | | | | | | |
| * | Includes securities that are fair valued at $0. |
(b) Accounting for Derivative Instruments. Derivative instruments require enhanced disclosures regarding a Fund’s credit derivatives holdings, including credit default swaps, credit spread options, and hybrid financial instruments containing embedded credit derivatives.
181
| | |
| | | |
| Notes to Financial Statements | | |
All open derivative positions at year end for each Fund are disclosed in the Fund’s Schedule of Investments.
Certain Funds may use derivative instruments including futures, options, forward foreign currency contracts, swaptions and swap contracts as part of their investment strategies. Following is a description of these derivative instruments, including the primary underlying risk exposures related to each instrument type:
(i) Futures Contracts. Certain Funds may enter into futures contracts, to the extent permitted by their investment policies and objectives, for bonafide hedging and other permissible risk management purposes including protecting against anticipated changes in the value of securities a Fund intends to purchase. Upon entering into a futures contract, a Fund is required to deposit cash or securities as initial margin. Additional securities are also segregated as collateral up to the current market value of the futures contracts. Subsequent payments, known as variation margin, are made or received by the Fund, depending on the fluctuation in the value of the underlying financial instruments. The Fund recognizes an unrealized gain or loss equal to the variation margin. When futures contracts are closed, a realized gain or loss is recognized which is equal to the difference between the proceeds from (or cost of) the closing transactions and the Fund’s basis in the contracts.
The risks associated with entering into futures contracts include the possibility that a change in the value of the contract may not correlate with the changes in the value of the underlying instruments. In addition, investing in futures contracts involves the risk that the Fund could lose more than the original margin deposit due to subsequent payments that may be required for a futures transaction.
(ii) Options Written. Certain Funds may write options to manage exposure to certain changes in the market. When a Fund writes an option, an amount equal to the premium received by the Fund is recorded as a liability, the value of which is marked-to-market daily to reflect the current market value of the option written. If the option expires, the Fund realizes a gain from investments equal to the amount of the premium received. When a written call option is exercised, the premium received is added to the proceeds from the sale of the underlying security in determining whether the Fund has a realized gain or loss. When a written put option is exercised, the amount of the premium received reduces the cost of the security purchased by the Fund.
When writing a covered call option, a Fund may forego the opportunity of profit if the market price of the underlying security increases more than the premium received and the option is exercised. When writing a put option, a Fund may incur a loss if the market price of the underlying security decreases more than the premium received and the option is exercised. In addition, there is the risk that the Fund may not be able to enter into a closing transaction because of an illiquid secondary market.
(iii) Purchased Options. Certain Funds may purchase options to manage exposure to certain changes in the market. A Fund will normally purchase call options in anticipation of an increase in the market value of securities of the type in which they may invest, an amount equal to the value is recorded as an asset. The purchase of a call option will entitle a Fund, in return for the premium paid, to purchase specified securities at a specified price during the option period. A Fund will ordinarily realize a gain if, during the option period, the value of such securities exceeded the sum of the exercise price, the premium paid and transaction costs; otherwise, the Fund will realize a loss equal to the amount of the premium paid on the purchase of the call option.
A Fund will normally purchase put options in anticipation of a decline in the market value of securities in its portfolio
(“protective puts”) or in securities in which it may invest. The purchase of a put option will entitle the Fund, in exchange for the premium paid, to sell specified securities at a specified price during the option period. The purchase of protective puts is designed to offset or hedge against a decline in the market value of the Fund’s securities. Put options may also be purchased by a Fund for the purpose of affirmatively benefiting from a decline in the price of securities which it does not own. The Fund will ordinarily realize a gain if, during the option period, the value of the underlying securities decreased below the exercise price sufficiently to more than cover the premium and transaction costs; otherwise the Fund will realize a loss equal to the amount of the premium paid on the purchase of the put option. Gains and losses on the purchase of protective put options would tend to be offset by countervailing changes in the value of the underlying portfolio securities.
(iv) Forward Foreign Currency Contracts. Certain Funds may enter into forward foreign currency contracts to hedge against foreign currency exchange rate risk on their non-U.S. dollar denominated securities or to facilitate settlement of foreign currency denominated portfolio transactions. A forward foreign currency contract is an agreement between two parties to buy and sell a currency at a set price on a future date. The contract is marked-to-market daily and the change in value is recorded
182
| | |
| | | |
| Notes to Financial Statements | | |
by a Fund as an unrealized gain or loss. When a forward foreign currency contract is extinguished, through either delivery or offset by entering into another forward foreign currency contract, the Fund records a realized gain or loss equal to the difference between the value of the contract at the time it was opened and the value of the contract at the time it was extinguished.
Forward foreign currency contracts involve elements of market risk in excess of the amounts reflected in the Statements of Assets and Liabilities. The Fund bears the risk of an unfavorable change in the foreign exchange rate underlying the forward foreign currency contract. Risks may also arise upon entering into these contracts from the potential inability of the counterparties to meet the terms of their contracts.
(v) Swaptions. Swaptions contracts entered into by the Funds typically represent an option that gives the purchaser the right, but not the obligation, to enter into a swap contract on a future date. Certain Funds may purchase swaptions to manage exposure to fluctuations in interest rates and to enhance portfolio yield. Changes in the value of purchased swaptions are reported as net change in unrealized appreciation or depreciation on the Statements of Operations and Changes in Net Assets Gain or loss is recognized when the swaptions contract expires or is closed as net realized gain or loss on the Statements of Operations and changes in Net Assets. Details of purchased swaptions contracts held at year end are included on the Fund’s Schedule of Investments under the caption “Purchased Options”.
Certain Funds may write swaption contracts to manage exposure to fluctuations in interest rates and to enhance portfolio yield. Swaption contracts written by a Fund represent an option that obligates the writer upon exercise by the purchaser, to enter into a previously agreed upon swap contract on a future date. If a written call swaption is exercised, the writer will enter into a swap and is obligated to pay the fixed rate and receive a floating rate in exchange. If a written put swaption is exercised, the writer will enter a swap and is obligated to pay the floating rate and receive a fixed rate in exchange.
When a Fund writes a swaption, the premium received is recorded as a liability in the Statements of Assets and Liabilities and is subsequently adjusted to the current market value of the swaption. Changes in the value of the swaption are reported as unrealized gains or losses in the Statements of Operations. A gain or loss is recognized when the swaption contract expires or is closed. Premiums received from writing swaptions that expire or are exercised are treated by the Fund as realized gains from investments. The difference between the premium and the amount paid on effecting a closing purchase transaction is also treated as a realized gain or, if the premium received is less than the amount paid for the closing purchase, as a realized loss.
Entering into a swaption contract involves, to varying degrees, the elements of credit, market and interest rate risk, associated with both option contracts and swap contracts. To reduce credit risk from potential counterparty default, a Fund only enters into swaption contracts with counterparties that meet certain standards of creditworthiness. A Fund bears the market risk arising from any change in index values or interest rates.
(vi) Swap Contracts. Swaps involve the exchange by a Fund with another party of the respective amounts payable with respect to a notional principal amount related to one or more indices. Certain Funds may enter into these transactions to preserve a return or spread on a particular investment or portion of its assets, as a duration management technique or to protect against any increase in the price of securities the Fund anticipates purchasing at a later date. Certain Funds may also use these transactions for speculative purposes, such as to obtain the price performance of a security without actually purchasing the security in circumstances where, for example, the subject security is illiquid, is unavailable for direct investment or available only on less attractive terms.
Swaps are marked-to-market daily based upon quotations from market makers and the change, if any, is recorded as change in unrealized appreciation or depreciation in the Statements of Operations. Net receipts or payments of interest are recorded as realized gains or losses, respectively. Gains and losses are realized upon termination of a swap contract. An upfront payment received by the Fund, is recorded as a liability on the Fund’s books. An upfront payment made by the Fund is recorded as an asset on the Fund’s books. Any upfront payments paid or received upon entering a swap contract to compensate for differences between stated terms of the agreement and prevailing market conditions (e.g. credit spreads, interest rates or other factors) are recorded as a realized gain or loss at the termination of the swap.
Swaps have risks associated with them, including possible default by the counterparty to the transaction, illiquidity and, where swaps are used as hedges, the risk that the use of a swap could result in losses greater than if the swap had not been employed. This risk is mitigated by the posting of collateral by the counterparty to the Fund to cover the Fund’s exposure to the counterparty.
183
| | |
| | | |
| Notes to Financial Statements | | |
(vii) Credit Default Swaps. Certain Funds may enter into credit default swap contracts for investment purposes, to manage their credit risk or to add leverage. As a seller in a credit default swap contract, a Fund is required to pay the notional or other agreed-upon value to the counterparty in the event of a default by a third party, such as a U.S. or foreign corporate issuer, on the referenced debt obligation. In return, the Fund receives from the counterparty a periodic stream of payments over the term of the contract provided that no event of default has occurred. If no default occurs, the Fund keeps the stream of payments and has no payment obligations. Such periodic payments are accrued daily and accounted for as realized gains.
Certain Funds may also purchase credit default swap contracts in order to hedge against the risk of default by debt securities held in their portfolios. In these cases a Fund functions as the counterparty referenced in the preceding paragraph. As a purchaser of a credit default swap contract, the Fund receives the notional or other agreed upon value from the counterparty in the event of a default by a third party, such as a U.S. or foreign corporate issuer, on the referenced debt obligation. In return, the Fund makes periodic payments to the counterparty over the term of the contract provided no event of default has occurred. Such periodic payments are accrued daily and accounted for as realized losses.
For a credit default swap sold by a Fund, payment of the agreed upon amount made by the Fund in the event of default of the referenced debt obligation is recorded as the cost of the referenced debt obligation received. For a credit default swap purchased by a Fund, the agreed upon amount received by the Fund in the event of default of the referenced debt obligation is recorded as proceeds from sale/delivery of the referenced debt obligation and the resulting gain or loss realized on the referenced debt obligation is recorded as such by the Fund.
Entering into credit default swaps involves, to varying degrees, elements of credit and market risk in excess of the related amounts recognized on the Statements of Assets and Liabilities. Such risks involve the possibility that there will be no liquid market for these agreements, that the counterparty to the agreements may default on its obligation to perform or disagree as to the meaning of the contractual terms in the agreements, and that there will be unfavorable changes in net interest rates. As privately negotiated transactions, swaps may involve risk, which is the risk that the swap contracts fail to contemplate a particular outcome or that the parties disagree about the proper interpretation of a transaction term.
(viii) Interest Rate Swaps. Certain Funds may enter into interest rate swaps for investment purposes to manage exposure to fluctuations in interest rates or to add leverage. Interest rate swaps represent an agreement between two counterparties to exchange cash flows based on the difference in the fixed interest rate and the floating interest rate, applied to the notional principal amount for a specified period. The payment flows are usually netted against each other, with the difference being paid by one party to the other. Once the payments are settled in cash, the net amount is recorded as realized gain or loss from swap contracts on the Statements of Operations. The Funds settle accrued net receivable or payable under the swap contracts on a periodic basis.
The primary risk associated with interest rate swaps is that unfavorable changes in interest rates could adversely impact a Fund.
(ix) Centrally Cleared Swaps. Certain clearinghouses currently offer clearing for limited types of derivatives transactions, principally credit and interest derivatives. In a centrally cleared derivative transaction, a Fund typically enters into the transaction with a financial institution counterparty, and performance of the transaction is effectively guaranteed by a central clearinghouse, thereby reducing or eliminating the Fund’s exposure to the credit risk of the original counterparty. The Fund typically will be required to post specified levels of margin with the clearinghouse or at the instruction of the clearinghouse. The margin required by a clearinghouse may be greater than the margin the Fund would be required to post in an uncleared derivative transaction. Daily changes in valuation of centrally cleared swaps, if any, are recorded as variation margin receivable or payable on swap contracts for the change in value as appropriate on the Statements of Assets and Liabilities. Only a limited number of derivative transactions are currently eligible for clearing by clearinghouses.
(x) Cross-Currency Swaps. Certain Funds may enter into cross-currency swaps to gain or mitigate exposure to currency risk. Cross-currency swaps involve two parties exchanging two different currencies with an agreement to reverse the exchange at a later date at specific exchange rates. The exchange of currencies at the inception date of the contract takes place at the current spot rate. The re-exchange at maturity may take place at the same exchange rate, a specified rate, or the then current spot rate. Interest payments, if applicable, are made between the parties based on interest rates available in the two currencies at the inception of the contract. The terms of cross-currency swap contracts may extend for many years. Cross-currency swaps
184
| | |
| | | |
| Notes to Financial Statements | | |
are usually negotiated with commercial and investment banks. Some cross-currency swaps may not provide for exchanging principal cash flows, but only for exchanging interest cash flows.
(xi) Volatility Swap Contracts. A volatility swap is an agreement between counterparties to exchange periodic payments based on the measured volatility of a reference security, index, currency or other reference investment over a specified time frame. One cash flow is typically based on the realized volatility of the reference investment as measured by changes in its price or level over the specified time period while the other cash flow is based on a specified rate representing expected volatility for the reference investment at the time the swap is executed, or the measured volatility of a different reference investment over the specified time period. The appreciation or depreciation on a volatility swap will typically depend on the magnitude of the reference investment’s volatility, or size of the movements in its price, over the specified time period, rather than general directional increases or decreases in its price.
Volatility swaps are less standard in structure than other types of swaps and provide pure, or isolated, exposure to volatility risk of the specific underlying reference investment. Volatility swaps are typically used to speculate on future volatility levels, to trade the spread between realized and expected volatility, or to decrease the volatility exposure of investments held by the Fund.
Variance swaps are a type of volatility swap where counterparties agree to exchange periodic payments based on the measured variance (or the volatility squared) of a reference security, index, or other reference investment over a specified time period. At payment date, a net cash flow will be exchanged based on the difference between the realized variance of the reference investment over the specified time period and the specified rate representing expected variance for the reference investment at the time the swap is executed multiplied by the notional amount of the contract.
(xii) Inflation Rate Swap Contracts. The Fund may enter into inflation rate swap contracts to attempt to hedge against inflation. Pursuant to the inflation rate swap agreement, the Fund negotiates with a counterparty to exchange a periodic stream of payments, based on a benchmark inflation index. One cash flow stream will typically be a floating rate payment linked to the specified inflation index while the other is typically a fixed interest rate.
Inflation rate swaps are normally issued on a zero coupon basis where all payments compound during the life of the contract and are netted upon the termination or maturity of the contract. Final payments received or paid by the Fund are recorded as realized gains or losses in the Statement of Operations. Inflation rate swap contracts are subject to movements in interest rates.
The following is a summary of the fair valuations of the Funds’ derivative instruments categorized by risk exposure at August 31, 2015:
International Equity Investments
| | | | | | | | | | | | | | | | |
Effect of Derivative Instruments on the Statements of Operations as of August 31, 2015: | |
| | | | |
| Location | | Interest rate
risk | | | Foreign
exchange
risk | | | Credit risk | | | Total | |
| Realized gain/(loss) on derivatives recognized in income (d) | | | | | | | | | | | | | | | | |
Net realized gain (loss) on forward foreign currency contracts | | $ | — | | | $ | 23,974 | | | $ | — | | | $ | 23,974 | |
| | | | | | | | | | | | | | | | |
| | $ | — | | | $ | 23,974 | | | $ | — | | | $ | 23,974 | |
| | | | | | | | | | | | | | | | |
Emerging Markets Equity Investments
| | | | | | | | | | | | | | | | |
Effect of Derivative Instruments on the Statements of Operations as of August 31, 2015: | |
| | | | |
| Location | | Interest rate
risk | | | Foreign
exchange
risk | | | Credit
risk | | | Total | |
| Realized gain/(loss) on derivatives recognized in income (d) | | | | | | | | | | | | | | | | |
Net realized gain (loss) on forward foreign currency contracts | | $ | — | | | $ | 28,361 | | | $ | — | | | $ | 28,361 | |
| | | | | | | | | | | | | | | | |
| | $ | — | | | $ | 28,361 | | | $ | — | | | $ | 28,361 | |
| | | | | | | | | | | | | | | | |
185
| | |
| | | |
| Notes to Financial Statements | | |
Core Fixed Income Investments
| | | | | | | | | | | | | | | | |
Fair Values of Derivative Instruments on the Statements of Assets and Liabilities as of August 31, 2015 | |
| | | | |
| Location | | Interest rate
risk | | | Foreign
exchange
risk | | | Credit risk | | | Total | |
| Asset derivatives | | | | | | | | | | | | | | | | |
Purchased Options (c) | | $ | 55,458 | | | $ | — | | | $ | — | | | $ | 55,458 | |
Unrealized appreciation on open futures contracts (b) | | | 512,934 | | | | — | | | | — | | | | 512,934 | |
Unrealized appreciation on forward foreign currency contracts (c) | | | — | | | | 89,128 | | | | — | | | | 89,128 | |
| | | | | | | | | | | | | | | | |
| | $ | 568,392 | | | $ | 89,128 | | | $ | — | | | $ | 657,520 | |
| | | | | | | | | | | | | | | | |
| Liability derivatives | | | | | | | | | | | | | | | | |
Options contracts written outstanding (a) | | $ | 186,798 | | | $ | — | | | $ | — | | | $ | 186,798 | |
Unrealized depreciation on open futures contracts (b) | | | 910,524 | | | | 7,950 | | | | — | | | | 918,474 | |
Unrealized depreciation on forward foreign currency contracts (a) | | | — | | | | 453,698 | | | | — | | | | 453,698 | |
Unrealized depreciation on centrally cleared swaps (f) | | | 185,089 | | | | — | | | | — | | | | 185,089 | |
Unrealized depreciation on open swap contracts (a) | | | 50,016 | | | | — | | | | — | | | | 50,016 | |
| | | | | | | | | | | | | | | | |
| | $ | 1,332,427 | | | $ | 461,648 | | | $ | — | | | $ | 1,794,075 | |
| | | | | | | | | | | | | | | | |
|
Effect of Derivative Instruments on the Statements of Operations as of August 31, 2015: | |
| | | | |
Location | | Interest rate
risk | | | Foreign
exchange
risk | | | Credit
risk | | | Total | |
Realized gain/(loss) on derivatives recognized in income (d) | | | | | | | | | | | | | | | | |
Net realized gain (loss) on purchased options | | $ | (464,661 | ) | | $ | — | | | $ | — | | | $ | (464,661 | ) |
Net realized gain (loss) on futures contracts | | | 3,953,313 | | | | — | | | | — | | | | 3,953,313 | |
Net realized gain (loss) on options written | | | 1,110,737 | | | | 169,615 | | | | 9,229 | | | | 1,289,581 | |
Net realized gain (loss) on swaps contracts | | | (2,392,426 | ) | | | — | | | | (296,203 | ) | | | (2,688,629 | ) |
Net realized gain (loss) on forward foreign currency contracts | | | — | | | | 7,943,474 | | | | — | | | | 7,943,474 | |
| | | | | | | | | | | | | | | | |
| | $ | 2,206,963 | | | $ | 8,113,089 | | | $ | (286,974 | ) | | $ | 10,033,078 | |
| | | | | | | | | | | | | | | | |
Change in unrealized appreciation (depreciation) on derivatives recognized in income (e) | | | | | | | | | | | | | | | | |
Net change in unrealized appreciation (depreciation) on purchased options | | $ | 155,257 | | | $ | — | | | $ | — | | | $ | 155,257 | |
Net change in unrealized appreciation (depreciation) on futures contracts | | | (505,768 | ) | | | (46,431 | ) | | | — | | | | (552,199 | ) |
Net change in unrealized appreciation (depreciation) on options contracts written | | | (1,306 | ) | | | (2,801 | ) | | | — | | | | (4,107 | ) |
Net change in unrealized appreciation (depreciation) on swaps contracts | | | 69,055 | | | | — | | | | (219,477 | ) | | | (150,422 | ) |
Net change in unrealized appreciation (depreciation) on forward foreign currency contracts | | | — | | | | (1,819,947 | ) | | | — | | | | (1,819,947 | ) |
| | | | | | | | | | | | | | | | |
| | $ | (282,762 | ) | | $ | (1,869,179 | ) | | $ | (219,477 | ) | | $ | (2,371,418 | ) |
| | | | | | | | | | | | | | | | |
186
| | |
| | | |
| Notes to Financial Statements | | |
International Fixed Income Investments
| | | | | | | | | | | | | | | | |
Fair Values of Derivative Instruments on the Statements of Assets and Liabilities as of August 31, 2015 | |
| | | | |
| Location | | Interest rate
risk | | | Foreign
exchange
risk | | | Credit risk | | | Total | |
| Asset derivatives | | | | | | | | | | | | | | | | |
Purchased Options (c) | | $ | — | | | $ | 5,136 | | | $ | — | | | $ | 5,136 | |
Unrealized appreciation on open futures contracts (b) | | | 276,939 | | | | — | | | | — | | | | 276,939 | |
Unrealized appreciation on forward foreign currency contracts (c) | | | — | | | | 3,249,685 | | | | — | | | | 3,249,685 | |
Unrealized appreciation on centrally cleared swaps (f) | | | 920,067 | | | | — | | | | 25,412 | | | | 945,479 | |
Unrealized appreciation on open swap contracts (a) | | | 69,348 | | | | 840,577 | | | | 92,259 | | | | 1,002,184 | |
| | | | | | | | | | | | | | | | |
| | $ | 1,266,354 | | | $ | 4,095,398 | | | $ | 117,671 | | | $ | 5,479,423 | |
| | | | | | | | | | | | | | | | |
| Liability derivatives | | | | | | | | | | | | | | | | |
Options contracts written outstanding (a) | | $ | 98,249 | | | $ | 16,806 | | | $ | 1,671 | | | $ | 116,726 | |
Unrealized depreciation on open futures contracts (b) | | | 318,362 | | | | — | | | | — | | | | 318,362 | |
Unrealized depreciation on forward foreign currency contracts (a) | | | — | | | | 4,015,498 | | | | — | | | | 4,015,498 | |
Unrealized depreciation on centrally cleared swaps (f) | | | 2,056,599 | | | | — | | | | 42,759 | | | | 2,099,358 | |
Unrealized depreciation on open swap contracts (a) | | | 72,430 | | | | 63,751 | | | | 70,632 | | | | 206,813 | |
| | | | | | | | | | | | | | | | |
| | $ | 2,545,640 | | | $ | 4,096,055 | | | $ | 115,062 | | | $ | 6,756,757 | |
| | | | | | | | | | | | | | | | |
|
Effect of Derivative Instruments on the Statements of Operations as of August 31, 2015: | |
| | | | |
| Location | | Interest rate
risk | | | Foreign
exchange
risk | | | Credit risk | | | Total | |
| Realized gain/(loss) on derivatives recognized in income (d) | | | | | | | | | | | | | | | | |
Net realized gain (loss) on purchased options | | $ | (7,343 | ) | | $ | (9,922 | ) | | $ | (17,743 | ) | | $ | (35,008 | ) |
Net realized gain (loss) on futures contracts | | | 1,102,227 | | | | — | | | | — | | | | 1,102,227 | |
Net realized gain (loss) on options written | | | 291,061 | | | | 283,504 | | | | 9,910 | | | | 584,475 | |
Net realized gain (loss) on swaps contracts | | | (486,636 | ) | | | (4,179,358 | ) | | | 487,974 | | | | (4,178,020 | ) |
Net realized gain (loss) on forward foreign currency contracts | | | — | | | | 29,805,536 | | | | — | | | | 29,805,536 | |
| | | | | | | | | | | | | | | | |
| | $ | 899,309 | | | $ | 25,899,760 | | | $ | 480,141 | | | $ | 27,279,210 | |
| | | | | | | | | | | | | | | | |
| Change in unrealized appreciation (depreciation) on derivatives recognized in income (e) | | | | | | | | | | | | | | | | |
Net change in unrealized appreciation (depreciation) on purchased options | | $ | — | | | $ | 3,451 | | | $ | — | | | $ | 3,451 | |
Net change in unrealized appreciation (depreciation) on futures contracts | | | (410,883 | ) | | | — | | | | — | | | | (410,883 | ) |
Net change in unrealized appreciation (depreciation) on options contracts written | | | (71,362 | ) | | | (21,549 | ) | | | 13,193 | | | | (79,718 | ) |
Net change in unrealized appreciation (depreciation) on swaps contracts | | | (1,754,971 | ) | | | 620,972 | | | | (460,944 | ) | | | (1,594,943 | ) |
Net change in unrealized appreciation (depreciation) on forward foreign currency contracts | | | — | | | | (3,828,692 | ) | | | — | | | | (3,828,692 | ) |
| | | | | | | | | | | | | | | | |
| | $ | (2,237,216 | ) | | $ | (3,225,753 | ) | | $ | (447,751 | ) | | $ | (5,910,785 | ) |
| | | | | | | | | | | | | | | | |
| (a) | Statements of Assets and Liabilities location: Unrealized depreciation on open forward foreign currency contracts, unrealized depreciation on open swap contracts or options contracts written, at value. |
| (b) | Only variation margin, if any, is reported within the Statements of Assets and Liabilities. Cumulative appreciation (depreciation) on futures contracts is reported in the “Open Futures Contracts” table in the Fund’s Schedule of Investments. |
| (c) | Statements of Assets and Liabilities location: Investments, at value or unrealized appreciation on open forward foreign currency contracts or unrealized appreciation on open swap contracts. |
| (d) | Statements of Operations location: Net realized gain (loss) from investments, foreign currency transactions, futures contracts, options contracts written or swap contracts. |
| (e) | Statements of Operations location: Change in net unrealized appreciation (depreciation) from investments, foreign currency transactions, futures contracts, options contracts written or swap contracts. |
| (f) | Only variation margin, if any, is reported within the Statements of Assets and Liabilities. Cumulative appreciation (depreciation) on centrally cleared swaps is reported in the “Open Swap Contracts” table in the Fund’s Schedule of Investments. |
187
| | |
| | | |
| Notes to Financial Statements | | |
The average notional amounts of futures contracts, swaps contracts and forward foreign currency contracts, and the average market value of options contracts written and purchased options outstanding during the year ended August 31, 2015, were as follows:
International Equity Investments
| | | | | | | | | | | | | | | | | | | | |
| | | Interest rate
risk | | | Foreign
exchange
risk | | | Credit
risk | | | Equity
risk | | | Total | |
Forward foreign currency contracts | | $ | — | | | $ | 794,522 | | | $ | — | | | $ | — | | | $ | 794,522 | |
Emerging Markets Equity Investments
| | | | | | | | | | | | | | | | | | | | |
| | | Interest rate
risk | | | Foreign
exchange risk | | | Credit
risk | | | Equity
risk | | | Total | |
Forward foreign currency contracts | | $ | — | | | $ | 1,131,305 | | | $ | — | | | $ | — | | | $ | 1,131,305 | |
|
Core Fixed Income Investments |
| | | | | | | | | | | | | | | | | | | | |
| | | Interest rate
risk | | | Foreign
exchange risk | | | Credit
risk | | | Equity
risk | | | Total | |
Purchased options | | $ | 123,421 | | | $ | — | | | $ | — | | | $ | — | | | $ | 123,421 | |
Futures contracts | | | 228,147,869 | | | | 899,548 | | | | — | | | | — | | | | 229,047,417 | |
Option contracts written | | | 194,425 | | | | 41,057 | | | | 3,887 | | | | — | | | | 239,369 | |
Swap contracts | | | 56,621,331 | | | | — | | | | 11,101,150 | | | | — | | | | 67,722,481 | |
Forward foreign currency contracts | | | — | | | | 99,584,212 | | | | — | | | | — | | | | 99,584,212 | |
International Fixed Income Investments
| | | | | | | | | | | | | | | | | | | | |
| | | Interest rate
risk | | | Foreign
exchange risk | | | Credit
risk | | | Equity
risk | | | Total | |
Purchased options | | $ | 1,492 | | | $ | 23,939 | | | $ | — | | | $ | — | | | $ | 25,431 | |
Futures contracts | | | 114,891,889 | | | | — | | | | — | | | | — | | | | 114,891,889 | |
Option contracts written | | | 60,749 | | | | 52,322 | | | | 38,809 | | | | — | | | | 151,880 | |
Swap contracts | | | 208,542,871 | | | | 48,121,355 | | | | 26,637,056 | | | | — | | | | 283,301,282 | |
Forward foreign currency contracts | | | — | | | | 561,345,375 | | | | — | | | | — | | | | 561,345,375 | |
(c) Repurchase Agreements. When entering into repurchase agreements, it is the Funds’ policy that their custodian or a third party custodian takes possession of the underlying collateral securities, the market value of which at least equals the principal amount of the repurchase transaction, including accrued interest. To the extent that any repurchase transaction exceeds one business day, the value of the collateral is marked-to-market daily to ensure the adequacy of the collateral. If the seller defaults and the market value of the collateral declines or if bankruptcy proceedings are commenced with respect to the seller of the security, realization of the collateral by the Funds may be delayed or limited.
(d) Stripped Securities. Certain Funds may invest in “Stripped Securities”, a term used collectively for stripped fixed income securities. Stripped Securities can be principal-only securities (“PO”), which are debt obligations that have been stripped of interest coupons, or interest-only securities (“IO”), which are interest coupons that have been stripped from debt obligations. As is the case with all securities, the market value of Stripped Securities will fluctuate in response to changes in economic conditions, interest rates and the market’s perception of the securities. However, fluctuations in response to interest rates may be greater in Stripped Securities than for debt obligations of comparable maturities that pay interest currently. The amount of fluctuation increases with a longer period of maturity. The yield-to-maturity on an IO is sensitive to the rate of principal repayments (including prepayments) on the related underlying debt obligation and principal payments may have a material effect on yield to maturity. If the underlying debt obligation experiences greater than anticipated prepayments of principal, the Fund may not fully recoup its initial investment in the IO.
188
| | |
| | | |
| Notes to Financial Statements | | |
(e) Time Deposits. Certain Funds may purchase overnight time deposits issued by offshore branches of U.S. banks that meet credit and risk standards established by the custodian and approved by the Board.
(f) Lending of Portfolio Securities. The Trust has an agreement with its custodian, whereby the custodian, as agent, may lend securities owned by the Funds to brokers, dealers and other financial organizations that have been approved as borrowers by the Funds. The custodian enters into agreements with the borrowers. Loans of securities by a Fund are collateralized by cash, U.S. government securities or irrevocable performance letters of credit issued by banks approved by the Funds. All non-cash collateral is received, held and administered by the custodian in an applicable custody account or other account established for the purpose of holding collateral for each Fund. Cash collateral received by the Funds as a result of securities lending activities is invested in an unaffiliated registered money market fund, and is recorded as Payable for collateral received from securities on loan within the Statements of Assets and Liabilities. Securities lending income represents the income earned on investing cash collateral plus any premium payments that may be received on the loan of certain types of securities, less fees and expenses associated with the loan. Each Fund maintains the risk of any market loss on its securities on loan as well as the potential loss on investments purchased with cash collateral received from its securities lending. The custodian has the right under its agreement with the borrowers to recover any loaned securities from the borrower on demand. Additionally, the Funds are exposed to risks that a borrower may not provide additional collateral when required or return loaned securities when due. If the borrower fails to return the securities, the custodian will use the collateral to purchase replacement securities. The custodian is responsible for any shortfall in collateral value under certain circumstances. See Note 1 (v).
The following table presents securities on loan that are subject to enforceable netting arrangements as of August 31, 2015.
Gross Amounts Not Offset in the Statements of Assets and Liabilities
| | | | | | | | | | | | | | | | |
| Fund | | Gross Asset Amount
Presented in Statements
of Assets and Liabilities (a) | | | Financial
Instrument | | | Collateral
Received (b)(c) | | | Net Amount
(Not Less than $0) | |
Large Capitalization Growth Investments | | $ | 6,943,583 | | | | — | | | $ | (6,735,317 | ) | | $ | 208,266 | |
Large Capitalization Value Equity Investments | | | 16,198,670 | | | | — | | | | (16,198,670 | ) | | | — | |
Small Capitalization Growth Investments | | | 17,473,280 | | | | — | | | | (17,473,280 | ) | | | — | |
Small Capitalization Value Equity Investments | | | 6,955,212 | | | | — | | | | (6,955,212 | ) | | | — | |
International Equity Investments | | | 16,266,678 | | | | — | | | | (16,266,678 | ) | | | — | |
Emerging Markets Equity Investments | | | 9,169,300 | | | | — | | | | (9,169,300 | ) | | | — | |
Core Fixed Income Investments | | | 713,893 | | | | — | | | | (713,893 | ) | | | — | |
High Yield Investments | | | 8,447,443 | | | | — | | | | (8,447,443 | ) | | | — | |
| (a) | Represents market value of securities on loan at period end. |
| (b) | The Funds received cash collateral of $6,735,317, $16,427,951, $18,339,079, $6,979,519, $16,683,267, $9,633,182, $733,911 and $8,761,690, respectively, which was subsequently invested in Invesco STIT — Government & Agency Portfolio as reported in the Schedules of Investments. |
| (c) | The actual collateral received could be greater than the amount shown here due to overcollateralization. |
(g) To-Be-Announced Purchase and Sale Commitments. Certain Funds may trade securities on a to-be-announced (“TBA”) basis. In a TBA transaction, a Fund commits to purchasing or selling securities which have not yet been issued by the issuer and for which specific information is not known, such as the face amount and maturity date and the underlying pool of investments in U.S. government agency mortgage pass-through transactions. Securities purchased on a TBA basis are not settled until they are delivered to the Fund, normally 15 to 45 days later. Beginning on the date the Fund enters into a TBA transaction, cash, U.S. government securities or other liquid high-grade debt obligations are segregated in an amount equal in value to the purchase price of the TBA security. These transactions are marked-to-market on a daily basis and are subject to market fluctuations. Realized gains or losses on TBA purchase commitments are included in “Net realized gain (loss) on investments” on the Statements of Operations. Any fluctuation in the value of the purchased TBA commitments is included in “Net change in unrealized appreciation (depreciation) on investments” on the Statements of Operations.
Additionally, when a Fund sells TBA securities without already owning or having the right to obtain the deliverable securities (an uncovered forward commitment to sell), it incurs a risk of loss because it could have to purchase the securities at a price that is higher than the price at which it sold them. A Fund may be unable to purchase the deliverable securities if the corresponding market is illiquid.
189
| | |
| | | |
| Notes to Financial Statements | | |
TBA securities subject to a forward commitment to sell at period end are included at the end of the Fund’s Schedule of Investments under the caption “Schedule of Forward Sale Commitments”. The proceeds and value of these commitments are recorded as Forward Sale Commitments at value in the Statements of Assets and Liabilities.
(h) Short Sales of Securities. A short sale is a transaction in which a Fund sells securities it does not own in anticipation of a decline in the market price of the securities. To complete a short sale, the Fund may arrange through a broker to borrow the securities to be delivered to the buyer. The proceeds received by the Fund for the short sale are retained by the broker until the Fund replaces the borrowed securities. In borrowing the securities to be delivered to the buyer, the Fund becomes obligated to replace the securities borrowed at their market price at the time of replacement, whatever that price may be.
The risk of engaging in short sale transactions is that selling short magnifies the potential for loss to a Fund. The larger the Fund’s short position, the greater the potential loss. If a security sold short increases in price, the Fund may have to cover its short position at a higher price than the short sale price, resulting in a loss. To borrow the security, the Fund also may be required to pay a premium, which could decrease the proceeds of the security sold short. The amount of any gain will be decreased, and the amount of any loss increased, by the amount of the premium, dividends, interest or expenses the Fund may be required to pay in connection with the short sale. In addition, because the Fund’s loss on a short sale arises from increases in the value of the security sold short, such loss is unlimited.
(i) Mortgage Dollar Rolls. Certain Funds may sell mortgage-backed securities for delivery in the current month and simultaneously contract to repurchase substantially similar (same type, coupon and maturity) securities to settle on a specific future date at an agreed upon price. Pools of mortgage securities are used to collateralize mortgage dollar roll transactions and may have different prepayment histories than those sold. During the period between the sale and the repurchase, a Fund forgoes principal and interest paid on the securities sold. Proceeds of the sale will be invested in short-term instruments and the income from these investments, together with any additional fee income received on a sale, is intended to generate income for a Fund. A Fund accounts for mortgage dollar roll transactions as purchases and sales and realizes the gain or loss at the time the transaction is entered into on these transactions. If certain criteria are met, these dollar roll transactions may be considered financing transactions, whereby the difference in the sale price and the future purchase price is recorded as an adjustment to interest income.
Mortgage dollar roll transactions involve the risk that the market value of the securities a Fund is obligated to repurchase under the agreement may decline below the repurchase price of those securities. If investment performance of securities purchased with proceeds from these transactions does not exceed the income, capital appreciation and gain or loss that would have been realized on the securities sold as part of the dollar roll, the use of this technique will adversely impact the investment performance of a Fund. In the event the buyer of securities under a mortgage dollar roll files for bankruptcy or becomes insolvent, the Fund’s use of proceeds of the dollar roll may be restricted pending a determination by the other party, or its trustee or receiver, whether to enforce the Fund’s obligation to repurchase the securities.
(j) Credit and Market Risk. Certain Funds invest in high yield instruments that are subject to certain credit and market risks. The yields of high yield obligations reflect, among other things, perceived credit and market risks. Each Fund’s investment in securities rated below investment grade typically involve risks not associated with higher rated securities, including, among others, greater risk related to timely and ultimate payment of interest and principal, greater market price volatility and less liquid secondary market trading.
(k) Foreign Investment and Currency Risks. Certain Funds’ investments in foreign securities may involve risks not present in domestic investments. Because securities may be denominated in foreign currencies and may require settlement in foreign currencies and pay interest or dividends in foreign currencies, changes in the relationship of these foreign currencies to the U.S. dollar can significantly affect the value of the investments and earnings of a Fund. Foreign investments may also subject the Fund to foreign government exchange restrictions, expropriation, taxation or other political, social or economic developments, all of which affect the market and/or credit risk of the investments.
(l) Emerging Markets Risk. In addition to foreign investment and currency risks, which tend to be amplified in emerging markets, emerging markets may experience rising interest rates, or, more significantly, rapid inflation or hyperinflation. The economies of emerging market countries may grow at slower rates than expected or suffer a downturn or recession. Emerging market securities may present market, credit, liquidity, legal, political and other risks different from, or greater than, the risks of investing in developed foreign countries.
190
| | |
| | | |
| Notes to Financial Statements | | |
(m) Volatility Risk. Volatility risk refers to the magnitude of the movement, but not the direction of the movement, in a financial instrument’s price over a defined time period. Large increases or decreases in a financial instrument’s price over a relative time period typically indicate greater volatility risk, while small increases or decreases in its price typically indicate lower volatility risk.
(n) Security Transactions and Investment Income. Security transactions are accounted for on a trade date basis. Interest income, adjusted for amortization of premium and accretion of discount, is recorded on an accrual basis. Dividend income is recorded on the ex-dividend date. Foreign dividend income is recorded on the ex-dividend date or as soon as practical after a Fund determines the existence of a dividend declaration after exercising reasonable due diligence. The cost of investments sold is determined by use of the specific identification method. To the extent any issuer defaults on an expected interest payment, the Trust’s policy is to generally halt any additional “interest income accruals and accretion” and consider the Fund’s ability to realize interest accrued up to the date of default.
(o) Foreign Currency Translation. Investment securities and other assets and liabilities denominated in foreign currencies are translated into U.S. dollar amounts based upon prevailing exchange rates on the date of valuation. Purchases and sales of investment securities and income and expense items denominated in foreign currencies are translated into U.S. dollar amounts based upon prevailing exchange rates on the respective dates of such transactions.
The Funds do not isolate that portion of the results of operations resulting from changes in foreign exchange rates on investments from the fluctuations arising from changes in market prices of securities held. Such fluctuations are included with the net realized and unrealized gain or loss on investments in the Statements of Operations.
Net realized foreign exchange gains or losses arise from sales of foreign currencies, including gains and losses on forward foreign currency contracts, currency gains or losses realized between the trade and settlement dates on securities transactions and the difference between the amounts of dividends, interest and foreign withholding taxes recorded on the Funds’ books and the U.S. dollar equivalent of the amounts actually received or paid. Net unrealized foreign exchange gains and losses arise from changes in the fair values of assets and liabilities, other than investments in securities, at the date of valuation, resulting from changes in exchange rates.
Foreign security and currency transactions may involve certain considerations and risks not typically associated with those of U.S. dollar denominated transactions as a result of, among other factors, the possibility of lower levels of governmental supervision and regulation of foreign securities markets and the possibility of political or economic instability.
(p) Distributions to Shareholders. Distributions from net investment income for Large Capitalization Growth Investments, Large Capitalization Value Equity Investments, Small Capitalization Growth Investments, Small Capitalization Value Equity Investments, International Equity Investments, Emerging Markets Equity Investments and International Fixed Income Investments, if any, are declared and paid on an annual basis. Distributions from net investment income for Core Fixed Income Investments, High Yield Investments and Municipal Bond Investments, if any, are declared and paid on a monthly basis. Distributions on the shares of Money Market Investments are declared each business day to shareholders of record that day, and are paid on the last business day of the month.
The Funds intend to satisfy conditions that will enable interest from municipal securities, which are exempt from regular federal income tax and from designated state income taxes, to retain such tax-exempt status when distributed to the shareholders of the Funds. Distributions of net realized gains to shareholders of the Funds, if any, are taxable and are declared at least annually. Distributions to shareholders of the Funds are recorded on the ex-dividend date and are determined in accordance with income tax regulations, which may differ from GAAP.
(q) Federal and Other Taxes. It is the Trust’s policy to comply with the federal income and excise tax requirements of the Internal Revenue Code of 1986, as amended, applicable to regulated investment companies. Accordingly, each Fund intends to distribute substantially all of its income and net realized gains on investments, if any, to shareholders each year. Therefore, no federal income tax provision is required in the Funds’ financial statements. Under the applicable foreign tax laws, a withholding tax may be imposed on interest, dividends and capital gains at various rates.
Management has reviewed the tax positions and has concluded that no liability for unrecognized tax benefits should be recorded related to uncertain tax positions taken on returns filed for open tax years or expected to be taken in 2015 tax returns. Each Fund’s federal tax returns for the prior three fiscal years remain subject to examination by the Internal Revenue Service.
191
| | |
| | | |
| Notes to Financial Statements | | |
(r) Reclassification. GAAP requires that certain components of net assets be adjusted to reflect permanent differences between financial and tax reporting. These reclassifications have no effect on net assets or net asset values per share.
| | | | | | | | | | | | | | |
| Fund | | | | Undistributed
(Dividend in
excess of) Net
Investment Income | | | Undistributed
Realized Gains/
(Accumulated Net
Realized Losses) | | | Paid-in Capital | |
Large Capitalization Growth Investments | | (a),(e) | | $ | (9,653 | ) | | $ | 9,653 | | | $ | — | |
Large Capitalization Value Equity Investments | | (a) | | | (162,643 | ) | | | 162,643 | | | | — | |
Small Capitalization Growth Investments | | (a),(b) | | | 1,207,299 | | | | (1,207,299 | ) | | | — | |
Small Capitalization Value Equity Investments | | (a),(c),(g) | | | (315,970 | ) | | | 315,970 | | | | — | |
International Equity Investments | | (c),(g) | | | (48,998 | ) | | | 48,998 | | | | — | |
Emerging Markets Equity Investments | | (c),(g) | | | 163,398 | | | | (163,398 | ) | | | — | |
Core Fixed Income Investments | | (d),(g) | | | 5,661,699 | | | | (5,672,157 | ) | | | 10,458 | |
High Yield Investments | | (d),(f) | | | 1,684,828 | | | | (1,684,828 | ) | | | — | |
International Fixed Income Investments | | (d),(g) | | | 22,049,987 | | | | (22,049,987 | ) | | | — | |
Municipal Bond Investments | | (e) | | | 90,030 | | | | (90,030 | ) | | | — | |
Money Market Investments | | | | | — | | | | — | | | | — | |
| (a) | Reclassifications are primarily due to book/tax differences in the treatment of distributions from real estate investment trusts. |
| (b) | Reclassifications are primarily due to a tax net operating loss. |
| (c) | Reclassifications are primarily due to foreign currency transactions treated as ordinary income for tax purposes, and book/tax differences in the treatment of passive foreign investment companies. |
| (d) | Reclassifications are primarily due to differences between book and tax amortization of premium on fixed income securities. |
| (e) | Reclassifications are primarily due to distribution reclass. |
| (f) | Reclassifications are primarily due to defaulted bond interest reclass. |
| (g) | Reclassifications are primarily due to foreign currency transactions treated as ordinary income for tax purposes. |
(s) Restricted Securities. All Funds may invest in non-publicly traded securities, commonly called restricted securities. Restricted securities may be less liquid than publicly-traded securities. Although certain restricted securities may be resold in privately negotiated transactions, the values realized from these sales could be less than originally paid by a Fund. Certain restricted securities may be deemed liquid by the Manager and/or Sub-adviser pursuant to the procedures approved by the Board. The value of restricted securities is determined as described in Note 1(a).
(t) Reverse Repurchase Agreements. Certain Funds may each enter into reverse repurchase agreements with the financial institutions with which it may enter into repurchase agreements. Under a reverse repurchase agreement, a Fund sells securities to a financial institution and agrees to repurchase them at a mutually agreed upon date, price and rate of interest. During the period between the sale and repurchase, the Fund would not be entitled to principal and interest paid on the securities sold by the Fund. The Fund, however, would seek to achieve gains derived from the difference between the current sale price and the forward price for the future purchase as well as the interest earned on the proceeds on the initial sale. Reverse repurchase agreements will be viewed as borrowings by a Fund for the purpose of calculating the Fund’s indebtedness and will have the effect of leveraging the Fund’s assets.
(u) Indemnification. In the normal course of business, the Funds may enter into contracts that provide certain indemnifications. The Funds’ maximum exposure under these arrangements is dependent on future claims that may be made against the Funds and, therefore, cannot be estimated; however, based on experience, risk of loss from such claims is considered remote.
(v) Disclosure about Offsetting Assets and Liabilities. In order to better define contractual rights under derivative contracts and to secure rights that will help the Funds mitigate their counterparty risk, a sub-adviser may, on behalf of the Funds, enter into an International Swaps and Derivatives Association, Inc. Master Agreement (“ISDA Master Agreement”) or similar agreement with its derivative contract counterparties. An ISDA Master Agreement is a bilateral agreement between the Funds and a counterparty that governs OTC derivatives and foreign exchange contracts and typically contains, among other things, collateral posting terms and netting provisions in the event of a default and/or termination event. The ISDA Master Agreement gives a Fund the right, upon an event of default by the applicable counterparty or a termination of the agreement, to close out all transactions traded under such agreement and to net amounts owed under each transaction to one net amount payable by one party to the other. Absent an event of default by the counterparty or a termination of the agreement, the ISDA Master Agreement does not result in an offset of reported amounts of assets and liabilities in the Statements of Assets and Liabilities across the transactions between the
192
| | |
| | | |
| Notes to Financial Statements | | |
Funds and the applicable counterparty. The right to offset and net payments across all transactions traded under the ISDA Master Agreement could result in a reduction of the Funds’ credit risk to such counterparty equal to any amounts payable by the Funds under the applicable transactions, if any. The enforceability of the right to offset may vary by jurisdiction.
Cash collateral that has been received or pledged to cover obligations under derivative contracts, if any, will be reported separately in the Statements of Assets and Liabilities. Generally the amount of collateral due from or to a counterparty is subject to a minimum transfer threshold amount before a transfer is required, which may vary by counterparty. Collateral pledged for the benefit of the Fund and/or counterparty is held in segregated accounts by the Fund’s custodian and cannot be sold, re-pledged, assigned or otherwise used while pledged. The portion of such collateral representing cash, if any, is reflected as deposits with counterparties and, in the case of cash pledged by a counterparty for the benefit of the Fund, a corresponding liability in the Statements of Assets and Liabilities. Securities pledged by the Fund as collateral, if any, are identified as such in the Schedule of Investments. The carrying amount of such deposits due to brokers at August 31, 2015 approximated their fair value. If measured at fair value, such deposits would have been considered as Level 2 in the fair value hierarchy (see Note 1(a)).
Repurchase agreements and reverse repurchase agreements may be entered into by the Funds under Master Repurchase Agreements (“MRA”) which permit a Fund, under certain circumstances including an event of default (such as bankruptcy or insolvency), to offset payables and/or receivables under the MRA with collateral held and/or posted to the counterparty and create one single net payment due to or from a Fund. However, bankruptcy or insolvency laws of a particular jurisdiction may impose restrictions on or prohibitions against such a right of offset in the event of the MRA counterparty’s bankruptcy or insolvency. The Fund’s repurchase agreements as of August 31, 2015 are shown on a gross basis and the required offsetting disclosures are shown in the Schedules of Investments. The value of the related collateral exceeded the value of the repurchase agreements as of August 31, 2015.
For financial reporting purposes, the Funds do not offset financial assets and financial liabilities that are subject to master netting arrangements or similar agreements on the Statements of Assets and Liabilities.
The following table presents the Funds’ gross and net amounts of assets and liabilities, by derivative type, available for offset under a master netting agreement, or similar agreement as of August 31, 2015.
| | | | | | | | |
| | | Assets | | | Liabilities | |
| Derivatives Instruments (a) | | Gross Amounts of
Recognized Assets
Presented in the
Statements of
Assets and Liabilities | | | Gross Amounts of
Recognized Liabilities
Presented in the
Statements of
Assets and Liabilities | |
| Core Fixed Investments: | | | | | | | | |
Forward foreign currency contracts | | $ | 89,128 | | | $ | 453,698 | |
Options contracts | | | 19,381 | | | | 23,598 | |
Swap contracts (b) | | | — | | | | 50,016 | |
| | | | | | | | |
Total Derivative Instruments, subject to master netting arrangement or similar arrangement | | $ | 108,509 | | | $ | 527,312 | |
| | | | | | | | |
| International Fixed Income Investments: | | | | | | | | |
Forward foreign currency contracts | | $ | 3,249,685 | | | $ | 4,015,498 | |
Options contracts | | | 5,136 | | | | 115,055 | |
Swap contracts (b) | | | 973,035 | | | | 184,380 | |
| | | | | | | | |
Total Derivative Instruments, subject to master netting arrangement or similar arrangement | | $ | 4,227,856 | | | $ | 4,314,933 | |
| | | | | | | | |
| (a) | Excludes exchange-traded derivatives. |
| (b) | The total value of the net amounts of assets and liabilities is comprised of Swap contracts, at value on the Statements of Assets and Liabilities less the net value of the Upfront premiums paid (received) disclosed in the Fund’s Schedule of Investments. |
193
| | |
| | | |
| Notes to Financial Statements | | |
The following table presents the Funds’ derivative assets and liabilities by counterparty net of amounts available for offset under master netting or similar agreements, and net of related collateral received or pledged as of August 31, 2015.
| | | | | | | | | | | | | | | | |
| Counterparty | | Gross amounts
of Recognized
Assets
presented in the
Statements of
Assets and
Liabilities | | | Financial
Instruments
Available for
Offset (a) | | | Collateral
Received (e) | | | Net Amount (b) | |
| Core Fixed Income Investments | | | | | | | | | | | | | | | | |
| Over-the-counter | | | | | | | | | | | | | | | | |
Barclays Bank PLC | | $ | 66,832 | | | $ | (66,832 | ) | | $ | — | | | $ | — | |
Bank of America | | | — | | | | — | | | | — | | | | — | |
Citigroup Global Markets Inc. | | | 41,677 | | | | (41,677 | ) | | | — | | | | — | |
| | | | | | | | | | | | | | | | |
Total Over-the-counter derivative instruments | | $ | 108,509 | | | $ | (108,509 | ) | | $ | — | | | $ | — | |
| | | | | | | | | | | | | | | | |
| | | | |
| Counterparty | | Gross amounts
of Recognized
Liabilities
presented in the
Statements of
Assets and
Liabilities | | | Financial
Instruments
Available for
Offset (c) | | | Collateral
Pledged (e) | | | Net Amount (d) | |
| Core Fixed Income Investments | | | | | | | | | | | | | | | | |
| Over-the-counter | | | | | | | | | | | | | | | | |
Barclays Bank PLC | | $ | 265,405 | | | $ | (66,832 | ) | | $ | (50,000 | ) | | $ | 148,573 | |
Bank of America | | | 19,481 | | | | — | | | | — | | | | 19,481 | |
Citigroup Global Markets Inc. | | | 242,426 | | | | (41,677 | ) | | | — | | | | 200,749 | |
| | | | | | | | | | | | | | | | |
Total Over-the-counter derivative instruments | | $ | 527,312 | | | $ | (108,509 | ) | | $ | (50,000 | ) | | $ | 368,803 | |
| | | | | | | | | | | | | | | | |
| | | | |
| Counterparty | | Gross amounts
of Recognized
Assets
presented in the
Statements of
Assets and
Liabilities | | | Financial
Instruments
Available for
Offset (a) | | | Collateral
Received (e) | | | Net Amount (b) | |
| International Fixed Income Investments | | | | | | | | | | | | | | | | |
| Over-the-counter | | | | | | | | | | | | | | | | |
Bank of America | | $ | 208,463 | | | $ | (50,001 | ) | | $ | — | | | $ | 158,462 | |
Barclays Bank PLC | | | 33,589 | | | | (33,589 | ) | | | — | | | | — | |
BNP Paribas SA | | | 538,352 | | | | (14,935 | ) | | | — | | | | 523,417 | |
Citigroup Global Markets Inc. | | | 186,036 | | | | (186,036 | ) | | | — | | | | — | |
Deutsche Bank AG | | | 357,270 | | | | (249,506 | ) | | | (107,764 | ) | | | — | |
Goldman Sachs & Co. | | | 560,191 | | | | (479,659 | ) | | | — | | | | 80,532 | |
HSBC Bank USA | | | 1,013,040 | | | | (294,607 | ) | | | (560,000 | ) | | | 158,433 | |
JPMorgan Chase & Co. | | | 743,096 | | | | (743,096 | ) | | | — | | | | — | |
Royal Bank of Scotland PLC | | | 25,563 | | | | (18,758 | ) | | | — | | | | 6,805 | |
Standard Chartered Bank | | | 364,940 | | | | (364,940 | ) | | | — | | | | — | |
UBS Securities LLC | | | 197,316 | | | | (197,316 | ) | | | — | | | | — | |
| | | | | | | | | | | | | | | | |
Total Over-the-counter derivative instruments | | $ | 4,227,856 | | | $ | (2,632,443 | ) | | $ | (667,764 | ) | | $ | 927,649 | |
| | | | | | | | | | | | | | | | |
194
| | |
| | | |
| Notes to Financial Statements | | |
| | | | | | | | | | | | | | | | |
| Counterparty | | Gross amounts
of Recognized
Liabilities
presented in the
Statements of
Assets and
Liabilities | | | Financial
Instruments
Available for
Offset (c) | | | Collateral
Pledged (e) | | | Net Amount (d) | |
| International Fixed Income Investments | | | | | | | | | | | | | | | | |
| Over-the-counter | | | | | | | | | | | | | | | | |
Bank of America | | $ | 50,001 | | | $ | (50,001 | ) | | $ | — | | | $ | — | |
Barclays Bank PLC | | | 128,913 | | | | (33,589 | ) | | | — | | | | 95,324 | |
BNP Paribas SA | | | 14,935 | | | | (14,935 | ) | | | — | | | | — | |
Citigroup Global Markets Inc. | | | 494,385 | | | | (186,036 | ) | | | (298,000 | ) | | | 10,349 | |
Deutsche Bank AG | | | 249,506 | | | | (249,506 | ) | | | — | | | | — | |
Goldman Sachs & Co. | | | 479,659 | | | | (479,659 | ) | | | — | | | | — | |
HSBC Bank USA | | | 294,607 | | | | (294,607 | ) | | | — | | | | — | |
JPMorgan Chase & Co. | | | 1,081,853 | | | | (743,096 | ) | | | — | | | | 338,757 | |
Royal Bank of Scotland PLC | | | 18,758 | | | | (18,758 | ) | | | — | | | | — | |
Standard Chartered Bank | | | 1,277,362 | | | | (364,940 | ) | | | — | | | | 912,422 | |
UBS Securities LLC | | | 224,954 | | | | (197,316 | ) | | | (27,638 | ) | | | — | |
| | | | | | | | | | | | | | | | |
Total Over-the-counter derivative instruments | | $ | 4,314,933 | | | $ | (2,632,443 | ) | | $ | (325,638 | ) | | $ | 1,356,852 | |
| | | | | | | | | | | | | | | | |
| (a) | Represents the amount of assets that could be offset by liabilities with the same counterparty under master netting or similar agreements that are not offset on the Statements of Assets and Liabilities. |
| (b) | Net amount represents the net amount receivable from the counterparty in the event of default. |
| (c) | Represents the amount of liabilities that could be offset by assets with the same counterparty under master netting or similar agreements that are not offset on the Statements of Assets and Liabilities. |
| (d) | Net amount represents the net amount payable to the counterparty in the event of default. |
| (e) | In some instances, the actual collateral received and/or pledged may be more than the amount shown here due to over collateralization. |
2. Investment Management Agreement and Other Transactions with Affiliates
CGAS, a business of Morgan Stanley Smith Barney Holdings LLC (“MSSBH”), serves as the investment manager to the Funds. The Manager selects and oversees professional money managers who are responsible for investing the assets of the Funds (each a “Sub-adviser,” and collectively the “Sub-advisers”). Each Fund pays the Manager an investment management fee calculated daily at an annual rate based on each Fund’s average daily net assets and paid monthly in arrears. The Manager pays each Sub-adviser a sub-advisory fee from its investment management fees.
The maximum allowable investment management fee represents the total amount that could be charged to each Fund. The aggregate fees paid by the Manager to each Fund’s Sub-advisers and the fees retained by the Manager for the year ended August 31, 2015, are indicated below:
| | | | | | | | | | | | |
| Fund | | Subadvisory
Fee | | | Consulting Group
Advisory Services LLC
Fee | | | Maximum
Allowable Annual
Management Fee | |
Large Capitalization Growth Investments | | | 0.37 | % | | | 0.23 | % | | | 0.60 | % |
Large Capitalization Value Equity Investments | | | 0.30 | % | | | 0.30 | % | | | 0.60 | % |
Small Capitalization Growth Investments | | | 0.50 | % | | | 0.30 | % | | | 0.80 | % |
Small Capitalization Value Equity Investments | | | 0.49 | % | | | 0.30 | % | | | 0.80 | % |
International Equity Investments | | | 0.37 | % | | | 0.30 | % | | | 0.70 | % |
Emerging Markets Equity Investments | | | 0.49 | % | | | 0.30 | % | | | 0.90 | % |
Core Fixed Income Investments | | | 0.19 | % | | | 0.20 | % | | | 0.40 | % |
High Yield Investments | | | 0.29 | % | | | 0.25 | % | | | 0.70 | % |
International Fixed Income Investments | | | 0.26 | % | | | 0.24 | % | | | 0.50 | % |
195
| | |
| | | |
| Notes to Financial Statements | | |
| | | | | | | | | | | | |
| Fund | | Subadvisory
Fee | | | Consulting Group
Advisory Services LLC
Fee | | | Maximum
Allowable Annual
Management Fee | |
Municipal Bond Investments | | | 0.20 | % | | | 0.20 | % | | | 0.40 | % |
Money Market Investments * | | | 0.08 | % | | | 0.00 | % | | | 0.08 | % |
| * | The Manager voluntarily waived and/or reimbursed certain fees or expense to maintain a positive yield. For the year ended August 31, 2015, the Manager reimbursed the Fund $157,250. |
The Manager has agreed to waive and/or reimburse a portion of its fee. For the year ended August 31, 2015, the amounts waived and/or reimbursed by the Manager were as follows:
| | | | |
| Fund | | | |
Large Capitalization Value Equity Investments | | $ | 59,767 | |
Small Capitalization Growth Investments | | | 8,401 | |
Small Capitalization Value Equity Investments | | | 11,890 | |
International Equity Investments | | | 260,662 | |
Emerging Markets Equity Investments | | | 483,721 | |
Core Fixed Income Investments | | | 113,756 | |
High Yield Investments | | | 389,631 | |
Brown Brothers Harriman & Co. (“BBH”) serves as the Trust’s administrator. For its administrative services, BBH receives an annual asset based fee of 0.0250% of the Trust’s assets up to $5 billion, 0.02% on assets between $5 billion and $8 billion and 0.0175% on assets in excess of $8 billion, plus out-of-pocket expenses. The fee is calculated and allocated daily based on the relative assets of each Fund.
For the year ended August 31, 2015, Morgan Stanley & Co. Incorporated (“MS&Co.”), and its affiliates, including MSSBH, Morgan Stanley Smith Barney LLC, the Trust’s distributor, and Citigroup Global Markets Inc. (“CGMI”), received brokerage commissions of:
| | | | | | | | | | | | |
| Fund | | Commission
Dollars to CGMI | | | Commission
Dollars to MS&Co. | | | Commission
Aggregate | |
Large Capitalization Growth Investments | | $ | 30,061 | | | $ | 3,004 | | | $ | 33,065 | |
Large Capitalization Value Equity Investments | | | 20,066 | | | | 10,547 | | | | 30,613 | |
Small Capitalization Growth Investments | | | 3,267 | | | | 4,628 | | | | 7,895 | |
Small Capitalization Value Investments | | | 1,010 | | | | 114 | | | | 1,124 | |
International Equity Investments | | | 74,429 | | | | 4,885 | | | | 79,314 | |
Emerging Markets Equity Investments | | | 39,344 | | | | 59 | | | | 39,402 | |
Core Fixed Income Investments | | | 4,762 | | | | — | | | | 4,762 | |
International Fixed Income Investments | | | 272 | | | | — | | | | 272 | |
All officers, with the exception of the Funds’ Chief Compliance Officer (“CCO”), do not receive compensation directly from the Trust. The Funds bear a portion of the CCO’s annual compensation.
On May 6, 2015, Large Capitalization Growth Investments, Large Capitalization Value Equity Investments, Small Capitalization Growth Investments, Small Capitalization Value Equity Investments and International Equity Investments received $28,721, $108,271, $161,664, $99,697 and $2,972,363, respectively, as non-recourse voluntary reimbursements from the Manager. These voluntary reimbursements were intended to correct an asset allocation change error that occurred in the above Funds. The Manager did not receive any consideration in return for these capital contributions and no repayment or future consideration is expected.
196
| | |
| | | |
| Notes to Financial Statements | | |
3. Investments
During the year ended August 31, 2015, the aggregate cost of purchases and proceeds from sales of investments (excluding short-term investments) for each Fund were as follows:
| | | | | | | | | | | | | | | | |
| Fund | | Investments | | | U.S. Government & Agency Obligations | |
| | | Purchases | | | Sales | | | Purchases | | | Sales | |
Large Capitalization Growth Investments | | $ | 1,068,613,937 | | | $ | 1,551,208,693 | | | $ | — | | | $ | — | |
Large Capitalization Value Equity Investments | | | 636,917,143 | | | | 754,067,537 | | | | — | | | | — | |
Small Capitalization Growth Investments | | | 241,726,176 | | | | 336,365,382 | | | | — | | | | — | |
Small Capitalization Value Equity Investments | | | 96,784,541 | | | | 140,173,220 | | | | — | | | | — | |
International Equity Investments | | | 1,060,028,310 | | | | 871,129,554 | | | | — | | | | — | |
Emerging Markets Equity Investments | | | 353,179,888 | | | | 159,757,995 | | | | — | | | | — | |
Core Fixed Income Investments | | | 261,211,262 | | | | 217,917,589 | | | | 2,486,656,823 | | | | 2,410,183,478 | |
High Yield Investments | | | 135,227,782 | | | | 99,597,328 | | | | — | | | | — | |
International Fixed Income Investments | | | 218,329,943 | | | | 219,805,057 | | | | 775,145,922 | | | | 785,645,568 | |
Municipal Bond Investments | | | 12,607,133 | | | | 6,244,331 | | | | — | | | | — | |
At August 31, 2015, the aggregate gross unrealized appreciation and depreciation of investments for federal income tax purposes
were as follows:
| | | | | | | | | | | | |
| Fund | | Gross
Unrealized
Appreciation | | | Gross
Unrealized
(Depreciation) | | | Net Unrealized
Appreciation
(Depreciation) | |
Large Capitalization Growth Investments | | $ | 390,885,195 | | | $ | (47,258,817 | ) | | $ | 343,626,378 | |
Large Capitalization Value Equity Investments | | | 209,074,888 | | | | (92,133,845 | ) | | | 116,941,043 | |
Small Capitalization Growth Investments | | | 51,320,093 | | | | (13,996,889 | ) | | | 37,323,204 | |
Small Capitalization Value Equity Investments | | | 45,399,997 | | | | (22,486,102 | ) | | | 22,913,895 | |
International Equity Investments | | | 99,155,958 | | | | (145,771,067 | ) | | | (46,615,109 | ) |
Emerging Markets Equity Investments | | | 48,189,378 | | | | (103,588,662 | ) | | | (55,399,284 | ) |
Core Fixed Income Investments | | | 18,284,134 | | | | (21,721,663 | ) | | | (3,437,529 | ) |
High Yield Investments | | | 3,899,964 | | | | (22,770,836 | ) | | | (18,870,872 | ) |
International Fixed Income Investments | | | 8,196,447 | | | | (23,938,227 | ) | | | (15,741,780 | ) |
Municipal Bond Investments | | | 5,418,734 | | | | (59,448 | ) | | | 5,359,286 | |
4. Shares of Beneficial Interest
At August 31, 2015, the Trust had an unlimited number of units of beneficial interest (shares) authorized with a par value of $0.001 per share. At August 31, 2015, Trustees and executive officers of the Trust as a group owned of record less than 1% of the outstanding shares of the Trust.
Transactions in shares of each Fund were as follows:
| | | | | | | | |
| | | Year Ended
August 31,
2015 | | | Year Ended
August 31,
2014 | |
| Large Capitalization Growth Investments | | | | | | | | |
Shares sold | | | 2,671,031 | | | | 12,366,557 | |
Shares issued on reinvestment | | | 9,623,720 | | | | 6,165,022 | |
Shares repurchased | | | (26,936,640 | ) | | | (19,735,817 | ) |
| | | | | | | | |
Net Decrease | | | (14,641,889 | ) | | | (1,204,238 | ) |
| | | | | | | | |
197
| | |
| | | |
| Notes to Financial Statements | | |
| | | | | | | | |
| | | Year Ended
August 31,
2015 | | | Year Ended
August 31,
2014 | |
| Large Capitalization Value Equity Investments | | | | | | | | |
Shares sold | | | 6,008,983 | | | | 24,022,081 | |
Shares issued on reinvestment | | | 1,761,861 | | | | 1,691,655 | |
Shares repurchased | | | (17,008,498 | ) | | | (15,551,093 | ) |
| | | | | | | | |
Net Increase (Decrease) | | | (9,237,654 | ) | | | 10,162,643 | |
| | | | | | | | |
| | |
| Small Capitalization Growth Investments | | | | | | | | |
Shares sold | | | 470,258 | | | | 771,083 | |
Shares issued on reinvestment | | | 2,605,182 | | | | 353,254 | |
Shares repurchased | | | (4,089,603 | ) | | | (3,073,273 | ) |
| | | | | | | | |
Net Decrease | | | (1,014,163 | ) | | | (1,948,936 | ) |
| | | | | | | | |
| | |
| Small Capitalization Value Equity Investments | | | | | | | | |
Shares sold | | | 1,260,894 | | | | 3,589,353 | |
Shares issued on reinvestment | | | 2,379,540 | | | | 1,929,295 | |
Shares repurchased | | | (5,337,871 | ) | | | (2,077,176 | ) |
| | | | | | | | |
Net Increase (Decrease) | | | (1,697,437 | ) | | | 3,441,472 | |
| | | | | | | | |
| | |
| International Equity Investments | | | | | | | | |
Shares sold | | | 26,104,331 | | | | 32,103,189 | |
Shares issued on reinvestment | | | 1,708,106 | | | | 1,034,174 | |
Shares repurchased | | | (13,141,629 | ) | | | (8,350,211 | ) |
| | | | | | | | |
Net Increase | | | 14,670,808 | | | | 24,787,152 | |
| | | | | | | | |
| | |
| Emerging Markets Equity Investments | | | | | | | | |
Shares sold | | | 20,448,565 | | | | 4,170,124 | |
Shares issued on reinvestment | | | 404,405 | | | | 3,256,283 | |
Shares repurchased | | | (4,665,904 | ) | | | (11,227,992 | ) |
| | | | | | | | |
Net Increase (Decrease) | | | 16,187,066 | | | | (3,801,585 | ) |
| | | | | | | | |
| | |
| Core Fixed Income Investments | | | | | | | | |
Shares sold | | | 20,409,102 | | | | 12,310,395 | |
Shares issued on reinvestment | | | 3,721,496 | | | | 2,856,005 | |
Shares repurchased | | | (14,329,013 | ) | | | (35,172,048 | ) |
| | | | | | | | |
Net Increase (Decrease) | | | 9,801,585 | | | | (20,005,648 | ) |
| | | | | | | | |
| | |
| High Yield Investments | | | | | | | | |
Shares sold | | | 12,354,121 | | | | 35,494,848 | |
Shares issued on reinvestment | | | 3,939,050 | | | | 2,684,815 | |
Shares repurchased | | | (9,157,485 | ) | | | (5,764,894 | ) |
| | | | | | | | |
Net Increase | | | 7,135,686 | | | | 32,414,769 | |
| | | | | | | | |
| | |
| International Fixed Income Investments | | | | | | | | |
Shares sold | | | 2,234,773 | | | | 5,244,975 | |
Shares issued on reinvestment | | | 1,997,895 | | | | 2,272,211 | |
Shares repurchased | | | (8,199,895 | ) | | | (13,828,448 | ) |
| | | | | | | | |
Net Decrease | | | (3,967,227 | ) | | | (6,311,262 | ) |
| | | | | | | | |
198
| | |
| | | |
| Notes to Financial Statements | | |
| | | | | | | | |
| | | Year Ended
August 31,
2015 | | | Year Ended
August 31,
2014 | |
| Municipal Bond Investments | | | | | | | | |
Shares sold | | | 1,931,227 | | | | 1,965,811 | |
Shares issued on reinvestment | | | 285,810 | | | | 264,973 | |
Shares repurchased | | | (1,345,964 | ) | | | (3,019,390 | ) |
| | | | | | | | |
Net Increase (Decrease) | | | 871,073 | | | | (788,606 | ) |
| | | | | | | | |
| | |
| Money Market Investments | | | | | | | | |
Shares sold | | | 162,653,966 | | | | 178,917,685 | |
Shares issued on reinvestment | | | 7,046 | | | | 2,839 | |
Shares repurchased | | | (294,837,293 | ) | | | (310,888,303 | ) |
| | | | | | | | |
Net Decrease | | | (132,176,281 | ) | | | (131,967,779 | ) |
| | | | | | | | |
5. Dividend and Tax Components of Capital
The tax character of distributions paid during the fiscal year ended August 31, 2015, were as follows:
| | | | | | | | | | | | | | | | |
| | | Large
Capitalization
Growth
Investments | | | Large
Capitalization
Value Equity
Investments | | | Small
Capitalization
Growth
Investments | | | Small
Capitalization
Value Equity
Investments | |
Distributions paid from: | | | | | | | | | | | | | | | | |
Tax Exempt | | $ | — | | | $ | — | | | $ | — | | | $ | — | |
Tax Return of Capital | | | — | | | | — | | | | — | | | | — | |
Ordinary Income | | | 34,653,637 | | | | 23,380,743 | | | | 15,724,850 | | | | 5,019,007 | |
Net Long-term Capital Gains | | | 162,447,151 | | | | — | | | | 44,874,120 | | | | 26,736,372 | |
| | | | | | | | | | | | | | | | |
Total Distributions Paid | | $ | 197,100,788 | | | $ | 23,380,743 | | | $ | 60,598,970 | | | $ | 31,755,379 | |
| | | | | | | | | | | | | | | | |
| | | | |
| | | International
Equity
Investments | | | Emerging
Markets
Equity
Investments | | | Core Fixed
Income
Investments | | | High Yield
Investments | |
Distributions paid from: | | | | | | | | | | | | | | | | |
Ordinary Income | | $ | 19,199,386 | | | $ | 5,156,168 | | | $ | 24,983,497 | | | $ | 16,219,271 | |
Net Long-term Capital Gains | | | — | | | | — | | | | 6,037,669 | | | | — | |
| | | | | | | | | | | | | | | | |
Total Distributions Paid | | $ | 19,199,386 | | | $ | 5,156,168 | | | $ | 31,021,166 | | | $ | 16,219,271 | |
| | | | | | | | | | | | | | | | |
| | | | |
| | | | | | International
Fixed Income
Investments | | | Municipal
Bond
Investments | | | Money
Market
Investments | |
Distributions paid from: | | | | | | | | | | | | | |
Tax Exempt | | | $ | — | | | $ | 2,273,508 | | | $ | — | |
Ordinary Income | | | | 15,363,960 | | | | 4,373 | | | | 7,058 | |
Net Long-term Capital Gains | | | | — | | | | 503,512 | | | | — | |
| | | | | | | | | | | | | |
Total Distributions Paid | | | $ | 15,363,960 | | | $ | 2,781,393 | | | $ | 7,058 | |
| | | | | | | | | | | | | |
199
| | |
| | | |
| Notes to Financial Statements | | |
As of August 31, 2015, the components of accumulated earnings on a tax basis were as follows:
| | | | | | | | | | | | | | | | |
| | | Large
Capitalization
Growth
Investments | | | Large
Capitalization
Value Equity
Investments | | | Small
Capitalization
Growth
Investments | | | Small
Capitalization
Value Equity
Investments | |
Undistributed ordinary income - net | | $ | 5,788,208 | | | $ | 15,598,883 | | | $ | 6,608,449 | | | $ | 1,427,310 | |
Undistributed long-term capital gains - net | | | 290,070,821 | | | | — | | | | 46,009,039 | | | | 25,867,041 | |
| | | | | | | | | | | | | | | | |
Total Undistributed earnings | | | 295,859,029 | | | | 15,598,883 | | | | 52,617,488 | | | | 27,294,351 | |
Capital Loss Carryforward | | | — | | | | (128,598,703 | ) | | | — | | | | — | |
Other book/tax temporary differences | | | (12,462,272 | )(c) | | | (11,454,089 | )(c) | | | (747,562 | )(c) | | | (1,525,346 | )(i) |
Unrealized appreciation (depreciation) | | | 356,088,651 | | | | 128,395,132 | | | | 38,070,766 | | | | 24,438,929 | |
| | | | | | | | | | | | | | | | |
Total accumulated earnings/(losses) - net | | $ | 639,485,408 | | | $ | 3,941,223 | | | $ | 89,940,692 | | | $ | 50,207,934 | |
| | | | | | | | | | | | | | | | |
| | | | |
| | | International
Equity
Investments | | | Emerging
Markets Equity
Investments | | | Core Fixed
Income
Investments | | | High Yield
Investments | |
Undistributed ordinary income - net | | $ | 20,123,724 | | | $ | 4,995,215 | | | $ | 3,399,701 | | | $ | 996,361 | |
Undistributed long-term capital gains - net | | | — | | | | — | | | | 4,307,436 | | | | — | |
| | | | | | | | | | | | | | | | |
Total Undistributed earnings | | | 20,123,724 | | | | 4,995,215 | | | | 7,707,137 | | | | 996,361 | |
Capital Loss Carryforward | | | (234,883,455 | ) | | | (23,383,323 | ) | | | — | | | | (13,199,853 | ) |
Current Year Late Year Loss Deferral | | | — | | | | — | | | | — | | | | (7,896,665 | ) |
Other book/tax temporary differences | | | (7,743,217 | )(b) | | | (13,907,248 | )(b) | | | (3,400,203 | )(f) | | | (2,089,300 | )(h) |
Unrealized appreciation (depreciation) | | | (38,988,863 | ) | | | (41,605,352 | ) | | | (259,939 | ) | | | (16,781,571 | ) |
| | | | | | | | | | | | | | | | |
Total accumulated earnings/(losses) - net | | $ | (261,491,811 | ) | | $ | (73,900,708 | ) | | $ | 4,046,995 | | | $ | (38,971,028 | ) |
| | | | | | | | | | | | | | | | |
| | | | | | | | | | | | |
| | | International
Fixed Income
Investments | | | Municipal
Bond
Investments | | | Money
Market
Investments | |
Undistributed ordinary income - net | | $ | 14,332,652 | | | $ | — | | | $ | 805 | |
Undistributed long-term capital gains - net | | | — | | | | 180,775 | | | | — | |
Undistributed Tax Exempt Income - net | | | — | | | | 430,997 | | | | — | |
| | | | | | | | | | | | |
Total Undistributed earnings | | | 14,332,652 | | | | 611,772 | | | | 805 | |
Capital Loss Carryforward | | | (6,050,907 | ) | | | — | | | | — | |
Other book/tax temporary differences | | | (3,184,717 | )(f) | | | (30 | )(g) | | | (39 | )(g) |
Unrealized appreciation (depreciation) | | | (12,758,252 | ) | | | 5,359,286 | | | | — | |
| | | | | | | | | | | | |
Total accumulated earnings/(losses) - net | | $ | (7,661,224 | ) | | $ | 5,971,028 | | | $ | 766 | |
| | | | | | | | | | | | |
As of August 31, 2015, there were no significant differences between the book and tax components of net assets for Money Market Investments.
| (a) | The difference between book-basis and tax-basis unrealized appreciation (depreciation) is attributable primarily to the tax deferral of losses on wash sales. |
| (b) | The difference between book-basis and tax-basis unrealized appreciation (depreciation) is attributable primarily to the tax deferral of losses on wash sales, the realization for tax purposes of unrealized gains on investments in passive foreign investment companies. |
| (c) | The difference between book-basis and tax-basis unrealized appreciation (depreciation) is attributable primarily to the tax deferral of losses on wash sales and tax cost adjustments related to ROC dividends received. |
| (d) | The difference between book-basis and tax-basis unrealized appreciation (depreciation) is attributable primarily to the tax deferral of losses on wash sales and tax cost adjustments related to ROC dividends received and real estate investments. |
| (e) | The difference between book-basis and tax-basis unrealized appreciation (depreciation) is attributable primarily to the tax deferral of losses on wash sales, tax cost adjustments related to ROC dividends received and real estate investments, and the realization for tax purposes of unrealized gains on investments in passive foreign investment companies. |
| (f) | The difference between book-basis and tax-basis unrealized appreciation (depreciation) is attributable primarily to the tax deferral of losses on wash sales and the difference between book and tax amortization methods for premiums on fixed income securities. |
200
| | |
| | | |
| Notes to Financial Statements | | |
| (g) | The difference between book-basis and tax-basis unrealized appreciation (depreciation) is attributable primarily to distribution payables. |
| (h) | The difference between book-basis and tax-basis unrealized appreciation (depreciation) is attributable primarily to the tax deferral of losses on wash sales and interest accrual on defaulted bonds. |
| (i) | The difference between book-basis and tax-basis unrealized appreciation (depreciation) is attributable primarily to the tax deferral of losses on wash sales, tax cost adjustments related to ROC dividends received and real estate investments, and partnerships. |
6. Capital Loss Carry Forward
Under the Regulated Investment Company Modernization Act of 2010 (the “Act”), the Funds are permitted to carry forward capital losses incurred in taxable years beginning after December 22, 2010, for an unlimited period. However, any losses incurred during those future taxable years will be required to be utilized prior to the losses incurred in pre-enactment taxable years. As a result of this, pre-enactment capital loss carryforwards may be more likely to expire unused.
As of August 31, 2015, the Funds had the following net capital loss carryforwards remaining:
| | | | | | | | | | | | | | | | | | | | | | | | |
| Year of Expiration | | Large
Capitalization
Growth
Investments | | | Large
Capitalization
Value Equity
Investments | | | Small
Capitalization
Growth
Investments | | | Small
Capitalization
Value Equity
Investments | | | International
Equity Investments | | | Emerging Markets
Equity Investments | |
8/31/2015 | | $ | — | | | $ | — | | | $ | — | | | $ | — | | | $ | — | | | $ | — | |
8/31/2016 | | | — | | | | — | | | | — | | | | — | | | | — | | | | — | |
8/31/2017 | | | — | | �� | | — | | | | — | | | | — | | | | — | | | | — | |
8/31/2018 | | | — | | | | 128,598,703 | | | | — | | | | — | | | | 234,883,455 | | | | — | |
Non-expiring: | | | | | | | | | | | | | | | | | | | | | | | | |
Short-Term | | | — | | | | — | | | | — | | | | — | | | | — | | | | 13,418,679 | |
Long-Term | | | — | | | | — | | | | — | | | | — | | | | — | | | | 9,964,644 | |
| | | | | | | | | | | | | | | | | | | | | | | | |
| | $ | — | | | $ | 128,598,703 | | | $ | — | | | $ | — | | | $ | 234,883,455 | | | $ | 23,383,323 | |
| | | | | | | | | | | | | | | | | | | | | | | | |
| | | | | | | | | | | | | | | | | | | | |
| Year of Expiration | | Core Fixed
Income
Investments | | | High Yield
Investments | | | International
Fixed Income
Investments | | | Municipal
Bond
Investments | | | Money
Market
Investments | |
8/31/2015 | | $ | — | | | $ | — | | | $ | — | | | $ | — | | | $ | — | |
8/31/2016 | | | — | | | | — | | | | — | | | | — | | | | — | |
8/31/2017 | | | — | | | | 6,697,249 | | | | — | | | | — | | | | — | |
8/31/2018 | | | — | | | | 5,672,191 | | | | 4,975,707 | | | | — | | | | — | |
Non-expiring: | | | | | | | | | | | | | | | | | | | | |
Short-Term | | | — | | | | 737,023 | | | | 901,344 | | | | — | | | | — | |
Long-Term | | | — | | | | 93,390 | | | | 173,856 | | | | — | | | | — | |
| | | | | | | | | | | | | | | | | | | | |
| | $ | — | | | $ | 13,199,853 | | | $ | 6,050,907 | | | $ | — | | | $ | — | |
| | | | | | | | | | | | | | | | | | | | |
These amounts will be available to offset any future taxable capital gains.
During the year ended August 31, 2015 the Large Capitalization Value Equity Investments, International Equity Investments and International Fixed Income Investments utilized $148,139,783, $5,575,922 and $8,650 capital loss carryforwards, respectively.
7. Subsequent Events
Management has evaluated subsequent events after the balance sheet date through the date that the financial statements were issued and has not identified any additional events or transactions that would require recognition or disclosure in the financial statements other than the distribution information below.
Subsequent to August 31, 2015, the Funds made the following distributions:
| | | | | | | | | | | | | | | | |
| Record Date Payable Date | | Core Fixed Income
Investments | | | High Yield
Investments | | | Municipal Bond
Investments | | | Money Market
Investments | |
9/29/15-9/30/15 | | $ | 0.017912 | | | $ | 0.021089 | | | $ | 0.023256 | | | $ | 0.0000012 | |
201
| | |
| | | |
| Notes to Financial Statements | | |
8. Recent Accounting Pronouncements
In June 2014, FASB issued ASU 2014-11 Transfers & Servicing (Topic 860): Repurchase-to-Maturity Transactions, Repurchase Financings, and Disclosures to improve the financial reporting of repurchase agreements and other similar transactions. The guidance includes expanded disclosure requirements for entities that enter into repurchase agreements or securities lending transactions. The guidance became effective prospectively for annual periods beginning after December 15, 2014, and interim periods beginning after March 15, 2015. Management is evaluating the impact, if any, of this guidance on the Funds’ financial statement disclosures.
202
| | |
| | | |
Report of Independent Registered Public
Accounting Firm | | |
To the Board of Trustees and Shareholders of
Consulting Group Capital Markets Funds:
We have audited the accompanying statements of assets and liabilities, including the schedules of investments, of Consulting Group Capital Markets Funds, comprised of Large Capitalization Growth Investments, Large Capitalization Value Equity Investments, Small Capitalization Growth Investments, Small Capitalization Value Equity Investments, International Equity Investments, Emerging Markets Equity Investments, Core Fixed Income Investments, High Yield Investments, International Fixed Income Investments, Municipal Bond Investments and Money Market Investments (the “Funds”), as of August 31, 2015, and the related statements of operations for the year then ended, the statements of changes in net assets for each of the two years in the period then ended, and the financial highlights for each of the five years in the period then ended. These financial statements and financial highlights are the responsibility of the Funds’ management. Our responsibility is to express an opinion on these financial statements and financial highlights based on our audits.
We conducted our audits in accordance with the standards of the Public Company Accounting Oversight Board (United States). Those standards require that we plan and perform the audit to obtain reasonable assurance about whether the financial statements and financial highlights are free of material misstatement. The Funds are not required to have, nor were we engaged to perform, an audit of their internal control over financial reporting. Our audits included consideration of internal control over financial reporting as a basis for designing audit procedures that are appropriate in the circumstances, but not for the purpose of expressing an opinion on the effectiveness of the Funds’ internal control over financial reporting. Accordingly, we express no such opinion. An audit also includes examining, on a test basis, evidence supporting the amounts and disclosures in the financial statements, assessing the accounting principles used and significant estimates made by management, as well as evaluating the overall financial statement presentation. Our procedures included confirmation of securities owned as of August 31, 2015, by correspondence with the custodian and brokers; where replies were not received from brokers, we performed other auditing procedures. We believe that our audits provide a reasonable basis for our opinion.
In our opinion, the financial statements and financial highlights referred to above present fairly, in all material respects, the financial position of each of the Funds constituting the Consulting Group Capital Markets Funds as of August 31, 2015, the results of their operations for the year then ended, the changes in their net assets for each of the two years in the period then ended, and the financial highlights for each of the five years in the period then ended, in conformity with accounting principles generally accepted in the United States of America.
DELOITTE & TOUCHE LLP
Boston, Massachusetts
October 29, 2015
203
| | |
| | | |
Board Approval of Management Agreement and Investment
Advisory Agreements | | |
Approval of Management Agreement and Subadvisory Agreements
The Consulting Group Capital Markets Funds (“Trust” and, each series thereof a “Fund”) and Consulting Group Advisory Services LLC (“Manager”), a business of Morgan Stanley Smith Barney Holdings LLC, have entered into an investment management agreement (“Management Agreement”). Pursuant to the Management Agreement, the Manager serves as “manager of managers” for the Trust and selects and oversees professional money managers (each, a “Sub-adviser” and collectively, the “Sub-advisers”) who are responsible for investing the portion of assets of the Funds allocated to them pursuant to investment advisory agreements (the “Subadvisory Agreements” and, together with the Management Agreement, the “Agreements”) between the Manager and each of the Sub-advisers.
The Investment Company Act of 1940, as amended (the “1940 Act”), requires that the Agreements be approved initially, as well as annually thereafter, by the Trust’s Board of Trustees (“Board”) and by a majority of the Trustees who are not “interested persons” (as defined in the 1940 Act) of any party to the Agreements (“Independent Trustees”), by vote cast in person at a meeting called for the purpose of voting on such approval. In connection with their consideration of the approval of the Agreements, the Independent Trustees must request and evaluate such information as may reasonably be necessary to make a reasonable business judgment with respect to the approval of the Agreements, and the Manager and Sub-advisers are required to provide such information.
At an in-person meeting held on May 27-28, 2015, the Board, including a majority of the Independent Trustees, approved the continuance of the Agreements for an annual period. Both in connection with the meeting specifically held to address the continuance of the Agreements and at other meetings during the course of the year, the Independent Trustees requested and received information from the Manager and the Sub-advisers that they deemed reasonably necessary for their review of the Agreements and the performance of the Manager and Sub-advisers under the Agreements. The Independent Trustees were assisted in their review by Fund counsel and independent legal counsel (“Independent Counsel”) and met with Independent Counsel in executive sessions separate from representatives of the Manager and the Sub-advisers. In addition to the Management Agreement, the Board approved the Subadvisory Agreements with the following Sub-advisers on behalf of the indicated Fund:
| | |
Sub-adviser Name | | Fund(s) |
| |
| Artisan Partners Limited Partnership | | ¨ Large Cap Value Equity Investments |
| |
| BlackRock Financial Management, Inc. | | ¨ Core Fixed Income Investments |
| |
| Cambiar Investors, LLC | | ¨ Large Cap Value Equity Investments |
| |
| Causeway Capital Management LLC1 | | ¨ Large Cap Value Equity Investments |
| |
| Delaware Management Company | | ¨ Small Cap Value Equity Investments |
| |
| The Dreyfus Corporation | | ¨ Money Market Investments |
| |
| Frontier Capital Management Co., LLC | | ¨ Large Cap Growth Investments |
| |
| HGK Asset Management Inc. | | ¨ Large Cap Value Equity Investments |
| |
| Jackson Square Partners | | ¨ Large Cap Growth Investments |
| |
| Lazard Asset Management LLC | | ¨ Emerging Markets Equity Investments |
| |
| McDonnell Investment Management, LLC | | ¨ Municipal Bond Investments |
| |
| Metropolitan West Asset Management LLC | | ¨ Core Fixed Income Investments |
| |
| NFJ Investment Group LLC | | ¨ Large Cap Value Equity Investments ¨ Small Cap Value Equity Investments |
| |
| OppeheimerFunds Inc.2 | | ¨ International Equity Investments |
| |
| Pacific Investment Management Company LLC | | ¨ International Fixed Income Investments |
| |
| PENN Capital Management Co., Inc. | | ¨ High Yield Investments |
| |
| Rutabaga Capital Management LLC | | ¨ Small Cap Value Equity Investments |
204
| | |
| | | |
| Board Approval of Management Agreement and Investment Advisory Agreements | | |
| | |
Sub-adviser Name | | Fund(s) |
| |
| Schroder Investment Management North America Inc. | | ¨ International Equity Investments |
| |
| Schroder Investment Management North America Ltd. | | ¨ International Equity Investments |
| |
| Vontobel Asset Management, Inc. | | ¨ Emerging Markets Equity Investments |
| |
| Wall Street Associates LLC | | ¨ Small Cap Growth Investments |
| |
| Wells Capital Management Inc. | | ¨ Large Cap Growth Investments |
| |
| Western Asset Management Company | | ¨ Core Fixed Income Investments ¨ High Yield Investments |
| |
| Westfield Capital Management Company, LLC | | ¨ Large Cap Growth Investments ¨ Small Cap Growth Investments |
| 1 | Approval of Subadvisory Agreement for initial two-year period occurred on March 20, 2014. Subadvisory Agreement is dated May 22, 2014. |
| 2 | Approval of Subadvisory Agreement for initial two-year period occurred on December 19, 2013. Subadvisory Agreement is dated March 24, 2014. |
Nature, Extent and Quality of the Services Provided Under the Agreements
The Board received and considered information regarding the nature, extent and quality of services provided to the Funds by the Manager and the Sub-advisers under the Management Agreement and the Subadvisory Agreements, respectively, during the meeting and during the past year. The Independent Trustees considered information regarding the process by which the Manager selected and recommended the Sub-advisers for Board approval and the Manager’s supervisory activities over the Sub-advisers. The Independent Trustees noted that the Manager monitors and evaluates the performance of each Fund’s Sub-advisers, including the Sub-advisers’ compliance with the investment objective, policies, and restrictions of the relevant Fund. The Board also received a description of the administrative and other services rendered to the Trust and its shareholders during the past year. The Board noted information received at regular meetings throughout the year related to the services rendered by the Manager about the management of the Trust’s affairs and its role in coordinating the activities of the Sub-advisers and the Trust’s other service providers. The Board considered each Sub-adviser’s specific responsibilities in all aspects of day-to-day management of the portion of the respective Fund’s assets allocated to it, as well as the qualifications, experience and responsibilities of the persons serving as the portfolio managers for the segment of the Fund’s assets managed by the respective Sub-adviser, and other key personnel at the Sub-adviser. The Board specifically took into account each Sub-adviser’s investment process and capabilities, evaluating, if applicable, how the Sub-adviser complemented each of the other Sub-advisers to the respective Fund.
The Independent Trustees also discussed the acceptability of the terms of the Sub-advisory Agreements. The Independent Trustees also considered the Manager’s favorable assessment of the nature and quality of the sub-advisory services provided to the Funds by the Sub-advisers. The Board also reviewed information received from the Manager and the Trust’s Chief Compliance Officer regarding the Trust’s compliance policies and procedures established pursuant to Rule 38a-1 under the 1940 Act and those of each Sub-adviser.
During the course of the year and at the meeting, the Board reviewed the qualifications, backgrounds and responsibilities of the Trust’s senior personnel and the portfolio management team primarily responsible for the management of the Funds. The Board also considered the Manager’s and the Sub-advisers’ brokerage policies and practices, transaction execution standards, policies and practices regarding soft dollars, and quality controls applicable to brokerage allocation procedures.
The Board concluded that, overall, the nature, extent and quality of services provided (and expected to be provided) under the Management Agreement and the Subadvisory Agreements were adequate and appropriate.
Fund Performance
As to each Fund, the Board received and considered performance information provided by Lipper, Inc. (“Lipper”), an independent provider of investment company data, for the Fund and for all retail and institutional funds, regardless of asset size or primary channel of distribution, in the Fund’s Lipper category (the “Performance Universe”). As to each Fund, the Board was provided with a description of the methodology Lipper used to determine the similarity of the Funds with the funds included in the
205
| | |
| | | |
| Board Approval of Management Agreement and Investment Advisory Agreements | | |
Performance Universe. The Board also noted that it had received and discussed with advisory personnel of the Trust at periodic intervals throughout the year information on the investment performance of each Fund in comparison to similar mutual funds and benchmark performance indices. In addition, as to each Sub-adviser, the Board received and considered performance information provided by the Manager for the Sub-adviser managing the portion of the respective Fund’s assets allocated to it. The information comparing each Fund’s performance to that of its Performance Universe was for the one-, three-, five- and ten-year periods ended March 31, 2015. The Board noted that each of Core Fixed Income Investments and International Fixed Income Investments performed better than the median performance of the funds in their respective Performance Universe for each period, but that each of Large Cap Value Equity Investments, International Equity Investments, Emerging Markets Equity Investments and Municipal Bond Investments performed below the median performance of the funds in their respective Performance Universe for each period, High Yield Investments performed below the median performance of the funds in its Performance Universe for each period, except the ten-year period, Large Cap Growth Investments performed better than the median performance of the funds in its Performance Universe for each period other than the one-year period, and that Small Cap Growth Investments performed better than the median performance of the funds in its Performance Universe for each period other than slight underperformance for the five-year period. The Board also noted that each of Small Cap Value Equity Investments and Money Market Investments performed better than the median performance of the funds in their respective Performance Universe for the five- and ten-year periods, but performed below the median performance of the funds in their Performance Universe for the three- and one-year periods. The Independent Trustees and representatives of the Manager then discussed the reasons for certain Fund’s underperformance versus the relevant Performance Universe during certain periods under review and actions taken or proposed, as applicable, to improve performance going forward. During the discussion, the Trustees and representatives of the Manager considered the Funds’ performance in light of overall financial market conditions and the nature of the investment objectives and strategies of certain Funds, prospectus disclosure regarding the risks involved with such strategies and investor expectations.
Based on its review, as to each Fund, the Board was generally satisfied with the overall performance of the Fund and with the efforts of the Manager and respective Sub-advisers to continue to improve performance. The Trustees determined to continue to evaluate the Funds’ performance and directed the Independent Trustees’ Performance Committee to continue to periodically review Fund performance with the Manager and report to the full Board.
Management Fees and Expense Ratios
As to each Fund, the Board reviewed and considered the contractual management fees (“Contractual Management Fees”) payable by the Fund to the Manager in light of the nature, extent and quality of the management and subadvisory services provided by the Manager and the Sub-advisers, respectively. The Board also reviewed and considered whether fee waiver and/or expense reimbursement arrangements are currently in place for a Fund and considered the actual fee rate (after taking any such waivers and reimbursements into account) (“Actual Management Fee”) and whether any fee waivers and expense reimbursements could be discontinued. The Board noted that the compensation paid to the Sub-advisers is paid by the Manager, not the Funds, and, accordingly, that the retention of the Sub-advisers does not increase the fees or expenses otherwise incurred by the Fund and its shareholders. The Board also reviewed with management the scope of services provided to the Fund by the Manager, noting that the Funds are provided with regulatory compliance services, office facilities and Trust officers (including the Trust’s chief financial, chief legal and chief compliance officers), and that the Manager coordinates and oversees the provision of services to each Fund by other fund service providers, including the Sub-Advisers. The Board also considered and discussed information about the Sub-advisers’ fees and comparable information for other subadvised funds and accounts managed by the Sub-advisers.
Additionally, the Board received and considered information comparing each Funds’ Contractual Management Fees and Actual Management Fees and the Fund’s actual total expenses with those of a group of funds selected by Lipper as comparable to the particular Fund (the “Expense Group”) and a broader group of retail no-load funds selected by Lipper (the “Expense Universe”). This information showed that each Fund’s Contractual Management Fee, except for that of High Yield Investments which was slightly higher than the median, was lower than the median Contractual Management Fee for the funds in the applicable Expense Group, and that each Fund’s Actual Management Fee, except for that of Core Fixed Income Investments which was slightly higher than the average, was lower than the average Actual Management Fee for the funds in the applicable Expense Universe. The Independent Trustees also noted that the Lipper expense information showed that each Fund’s actual total expense ratio, except for Municipal Bond Investments which was slightly higher than the median, was lower than the median of the total expense ratios
206
| | |
| | | |
| Board Approval of Management Agreement and Investment Advisory Agreements | | |
of the funds in the applicable Expense Group. The Lipper expense information also showed that each Fund’s actual total expense ratio was lower than the average total expense ratios of the funds in the applicable Expense Universe.
The Board determined that, as to each Fund, the management fee paid by the Fund to the Manager and the sub-advisory fees paid by the Manager to the Sub-advisers were reasonable in light of comparative performance and expense information and the nature, extent and quality of the services provided to the Fund under the Agreements.
Manager Profitability
The Board received and considered a profitability analysis of the Manager and its affiliates in providing services to the Funds. In addition, the Board received information with respect to the Manager’s allocation methodologies used in preparing this profitability data. To the extent available, the Board also reviewed information provided by the Sub-advisers with respect to the relevant Sub-adviser’s profitability in providing subadvisory services to the Funds. The Board also noted the profitability percentage ranges determined by appropriate court cases to be reasonable given the services rendered to investment companies. As to each Fund, the Board determined that the Manager’s profitability was not excessive in light of the nature, extent and quality of the services provided to the Fund.
Economies of Scale
As to each Fund, the Board considered information regarding whether there have been economies of scale with respect to the management of the Fund, whether the Fund has appropriately benefited from any economies of scale and whether there is potential for realization of any further economies of scale. The Board considered the various ways economies of scale could be realized and shared with Fund investors, and whether economies of scale in the provision of services to the Fund were being passed along to the shareholders. As to each Fund, the Board also noted that to the extent the Fund’s assets increase over time, the Fund and its shareholders should realize economics of scale as certain expenses, such as fixed fund fees, become a smaller percentage of overall assets. The Board noted that it appeared that the benefits of any economies of scale also would be appropriately shared with shareholders through increased investment in fund management resources.
Other Benefits to the Manager and the Sub-advisers
As to each Fund, the Board considered other benefits received by the Manager, the Sub-advisers and their affiliates as a result of their relationship with the Funds, including soft dollar arrangements, receipt of brokerage and the opportunity to offer additional products and services to Fund shareholders.
In light of the Manager’s costs of providing investment management and other services to the Funds and the Manager’s ongoing commitment to the Funds and each Sub-adviser’s day-to-day management of the portion of the respective Fund’s assets allocated to it, the profits and ancillary benefits that the Manager, the Sub-advisers and their affiliates received were considered reasonable.
Based on their discussions and considerations, including those described above, the Board approved the Management Agreement and the Subadvisory Agreements to continue for another year. No single factor reviewed by the Board was identified by the Board as the principal factor in determining whether to approve the Management Agreement and the Subadvisory Agreements.
207
Trustees and Officers of the Trust
Overall responsibility for management and supervision of the Trust rests with the Board of Trustees. The Trustees approve all significant agreements between the Trust and the companies that furnish services to the Funds, including agreements with the Funds’ distributor, investment advisers, custodian, transfer agent and administrator. The day-to-day operations of the Funds are delegated to the Funds’ Manager, Consulting Group Advisory Services LLC (“CGAS”), a business of Morgan Smith Barney Holdings LLC.
The names of the Trustees and officers of the Trust, together with information as to their principal business occupations, are set forth below. The officers of the Trust are employees of organizations that provide services to the Funds. Each Trustee who is an “interested person” of the Trust, as defined in the Investment Company Act of 1940, as amended (“1940 Act”), is indicated by a double asterisk.
The Trust’s Board of Trustees (“Board” or “Trustees”) is responsible for overseeing the Trust’s management and operations. The Board approves all significant agreements between the Trust and the companies that furnish services to the Funds, including agreements with the Trust’s distributor, Sub-advisers, custodian, transfer agent and administrator. The Board elects officers who are responsible for the day-to-day operations of the Trust and the Funds and who execute policies authorized by the Board.
Consulting Group Advisory Services LLC (“CGAS” or “Manager”), a business of Morgan Stanley Smith Barney Holdings LLC (“MSSB Holdings”), serves as the investment adviser for each Fund. The Funds employ a “multi-manager” strategy. The Manager selects and oversees professional money managers (each a “Sub-adviser”) who are responsible for investing the assets of the Funds allocated to them. In addition to investment management services, the Manager monitors and supervises the services provided to the Trust by its administrator. The Manager also is responsible for conducting all operations of the Trust, except those operations contracted to the Sub-advisers, the custodian, the transfer agent and the administrator.
The names of the Trustees and officers of the Trust, their addresses and years of birth, together with information as to their principal business occupations and, for the Trustees, other board memberships they have held during the past five years, are set forth below. The executive officers of the Trust are employees of organizations that provide services to the Funds.
| | | | | | | | | | |
Name, Address and
Date of Birth | | Position(s)
Held with
Trust | | Term of Office
and
Length
of Time
Served* | | Principal Occupation(s)
During Past Five Years | | Number of
Funds
in Fund
Complex
Overseen by
Trustee | | Other Board
Memberships
Held During Past
Five Years by
Trustee |
| | | |
INDEPENDENT TRUSTEES | | | | | | |
| | | | | |
John J. Murphy Murphy Capital Management, Inc. 268 Main Street Gladstone, NJ 07934 Birth Year: 1944 | | Chairman and Trustee | | Since 2002 (Chairman since 2010) | | Founder and Senior Principal, Murphy Capital Management (investment management) (1983-present) | | 11 | | Trustee, Legg Mason Partners Equity Trust (2007-present); Trustee, UBS Funds (2009-present); Director, Fort Dearborn Income Securities (2013-present); and formerly, Trustee, Nicholas Applegate Funds (2005-2010) |
| | | | | |
Adela Cepeda A.C. Advisory, Inc. 150 North Wacker Drive, Suite 2160 Chicago, IL 60606 Birth Year: 1958 | | Trustee | | Since 2008 | | President, A.C. Advisory, Inc. (1995-present) | | 11 | | Director, BMO Financial Corp. (2012-present); Trustee, Mercer Funds (2005-present); Trustee, UBS Funds (2004-present); Director, Fort Dearborn Income Securities (2000-present); formerly, Director, Amalgamated Bank of Chicago (2003-2012); and formerly, Director, Municipal Securities Rulemaking Board (2010-2012) |
208
| | | | | | | | | | |
Name, Address and
Date of Birth | | Position(s)
Held with
Trust | | Term of Office
and
Length
of Time
Served* | | Principal Occupation(s)
During Past Five Years | | Number of
Funds
in Fund
Complex
Overseen by
Trustee | | Other Board
Memberships
Held During Past
Five Years by
Trustee |
| | | | | |
W. Thomas Matthews 453 Banks Mill Road Aiken, SC 29801 Birth Year: 1949 | | Trustee | | Since 2009 (Interested Trustee from 2006-2009) | | Retired; Advisor, Smith Barney (2005-2007) | | 11 | | Treasurer, Congressional Medal of Honor Foundation (2009-present); Co-Chairman, Congressional Medal of Honor Foundation (2005-2009); and Chairman, America’s Warrior Partnership (2013-present) |
| | | | | |
Mark J. Reed North American Management 1 North Brentwood Blvd., Suite 1510 St. Louis, MO 63105 Birth Year: 1964 | | Trustee | | Since 2007 | | Principal & Portfolio Manager, North American Management Corp. (2013-present); and Managing Director and Chief Compliance Officer, Bush O’Donnell Investment Advisors, Inc., (1988-2013) | | 11 | | None |
| | | | | |
Eric T. McKissack, CFA® Channing Capital Management, LLC 10 S. LaSalle Street, Suite 2401 Chicago, IL 60603 Birth Year: 1953 | | Trustee | | Since 2013 | | Founder and Chief Executive Officer, Channing Capital Management, LLC (investment management) (2004-present) | | 11 | | Trustee and Chairman, FlexShares Funds (2011-present); Trustee, The Art Institute of Chicago (2001-present); Director, Rehabilitation Institute of Chicago (2000-present); and Director, Urban Gateways (1995-present); and formerly, Director, ICMA Retirement Corp. (2005-2012) |
| | | |
INTERESTED TRUSTEE | | | | | | |
| | | | | |
David Berdon** Morgan Stanley 522 Fifth Avenue, 12th Floor, New York, NY 10036 Birth Year: 1970 | | Trustee and Chief Executive Officer and President | | Since September 2015 | | Managing Director, Morgan Stanley (2013-present); Managing Director, Goldman Sachs (2001-2013) | | 11 | | None |
209
| | | | | | |
Name, Address and
Date of Birth | | Position(s)
Held with
Trust | | Term of Office***
and Length of
Time Served | | Principal Occupation(s) During Past Five Years |
| | | |
OFFICERS | | | | | | |
| | | |
Francis Smith Morgan Stanley 522 Fifth Avenue, 4th Floor New York, NY 10036 Birth Year: 1965 | | Chief Financial Officer (“CFO”) and Treasurer | | Since 2014 | | Executive Director, Morgan Stanley (2001-present); Treasurer and Principal Financial Officer of various Morgan Stanley Funds (2003-present) |
| | | |
Eric Metallo Morgan Stanley 485 Lexington Ave, 11th Floor, New York, NY 10017 Birth Year: 1976 | | Chief Legal Officer and Secretary | | Since August 2015 | | Executive Director, Morgan Stanley Wealth Management (2014-present); Senior Vice President and Associate General Counsel, Pine Bridge Investments (2011-2014); Corporate Counsel, Franklin Templeton Investments (2006-2011) |
| | | |
Philip Stack Morgan Stanley 2000 Westchester Avenue, 3rd Floor Purchase, NY 10577 Birth Year: 1964 | | Chief Compliance Officer | | Since 2013 | | Executive Director, Morgan Stanley (2015-present); Vice President, Morgan Stanley (2013-2015); Vice President Corporate Audit Group – Compliance, Morgan Stanley (2012-2013); Vice President, Director of Investment Compliance and Risk Management, Gannett Welsh & Kotler (2008-2012) |
| | | |
Donna Marley Morgan Stanley Delaware Corporate Center II 2 Righter Parkway, 3rd Fl. Wilmington, DE 19803 Birth Year: 1955 | | Chief Administrative Officer Chief Operating Officer | | Since August 2015 2011-2015 | | Executive Director, Morgan Stanley (2009-present); Director, Consulting Group Product and Programs, Morgan Stanley (2011-present); Director, Consulting Group Risk Management, Morgan Stanley (2009-2011) |
| | | |
Charles P. Graves, III Morgan Stanley 2000 Westchester Avenue Purchase, NY 10577 Birth Year: 1962 | | Co-Chief Operating Officer Investment Officer Chief Administrative Officer | | Since August 2015 Since 2011 2011-2015 | | Managing Director, Head of Third Party Products and Platforms, Morgan Stanley (2015-present); Executive Director, Head of Global Investment Solutions, Morgan Stanley (2013-2015); Director of Third Party Programs, Consulting Group and Morgan Stanley (2011-2013); and Director, Senior Portfolio Manager, Private Portfolio Group, Morgan Stanley (2008-2011) |
| | | |
Robert Garcia Morgan Stanley 522 Fifth Avenue, 12th Floor New York, NY 10036 Birth Year: 1983 | | Co-Chief Operating Officer Investment Officer | | Since August 2015 Since July 2015 | | Head of Packaged Digital Solutions, Morgan Stanley (2015-present); Head of Strategy and Development – Global Investment Solutions, Morgan Stanley (2013-2015); Overlay Portfolio Manager, Morgan Stanley (2009-2013) |
| | | |
Franceen Jansen Morgan Stanley 522 Fifth Avenue, 12th Floor New York, NY 10036 Birth Year: 1959 | | Investment Officer | | Since August 2015 | | Executive Director, Morgan Stanley (2010-2015) |
210
| | | | | | |
Name, Address and
Date of Birth | | Position(s)
Held with
Trust | | Term of Office***
and Length of
Time Served | | Principal Occupation(s) During Past Five Years |
| | | |
Jason B. Moore Morgan Stanley Delaware Corporate Center II 2 Righter Parkway, 3rd Fl Wilmington, DE 19803 Birth Year: 1972 | | Investment Officer | | Since 2011 | | Managing Director, Morgan Stanley (2012-present); Executive Director, Morgan Stanley (2011-2012); Managing Director, Bank of America Merrill Lynch (2010-2011); Executive Director, Morgan Stanley (2009-2010) |
| | | |
Brian Mulley Morgan Stanley 522 Fifth Avenue, 11th Floor New York, NY 10036 Birth Year: 1977 | | Investment Officer | | Since August 2015 | | Investment Analyst, Executive Director, Morgan Stanley (2005-present) |
| | | |
Paul Ricciardelli Morgan Stanley 522 5th Ave, 14th Floor New York, NY 10036 Birth Year: 1969 | | Investment Officer | | Since August 2015 | | Head of Manager Solutions, Morgan Stanley (2015-present); Head of IAR/GIMA, Morgan Stanley (2011-present); Director, Investment Management & Guidance, Merrill Lynch (1999-2011) |
| | | |
Matthew Rizzo Morgan Stanley Delaware Corporate Center II 2 Righter Parkway, 3rd Fl Wilmington, DE 19803 Birth Year: 1970 | | Investment Officer | | Since August 2015 | | Executive Director, Manager Solutions, Morgan Stanley (2015-present); Head of Investment Strategy and Content, Morgan Stanley (2012-2015); Senior Analyst, Morgan Stanley Smith Barney (2006-2012) |
| | | |
Sukuru Saman Morgan Stanley 2000 Westchester Avenue Purchase, NY 10577 Birth Year: 1972 | | Investment Officer | | Since August 2015 | | Investment Officer, Morgan Stanley Wealth Management (2013-present); Due Diligence Analyst, Morgan Stanley Wealth Management (2009-2013) |
| | | |
Lisa Shalett Morgan Stanley 522 Fifth Avenue, 12th Floor New York, NY 10036 Birth Year: 1963 | | Investment Officer | | Since August 2015 | | Head of Investment and Portfolio Strategies, Morgan Stanley (2013-present); Chief Investment Officer, Bank of America/Merrill Lynch (2011-2013); Head of Alliance Growth Equities, Alliance Bernstein (1995-2010) |
| | | |
Drew Soffer Morgan Stanley Delaware Corporate Center II 2 Righter Parkway, 3rd Fl Wilmington, DE 19803 Birth Year: 1967 | | Investment Officer | | Since August 2015 | | Executive Director, Morgan Stanley (2010-2015) |
| | | |
Michael Wilson Morgan Stanley 522 Fifth Avenue, 12th Floor New York, NY 10036 Birth Year: 1967 | | Investment Officer | | Since August 2015 | | Managing Director, Chief Investment Officer, Morgan Stanley Wealth Management (2012-present); Managing Director, Head of Content Distribution Institutional Equities Division, Morgan Stanley (2009-2012) |
211
| | | | | | |
Name, Address and
Date of Birth | | Position(s)
Held with
Trust | | Term of Office***
and Length of
Time Served | | Principal Occupation(s) During Past Five Years |
| | | |
Anthony Scaturro Morgan Stanley 485 Lexington Avenue, 11th floor New York, NY 10172 Birth Year: 1974 | | Anti-Money Laundering (“AML”) Compliance Officer | | Since August 2015 | | AML Compliance Officer, Morgan Stanley (2014-present); Field Compliance Officer, Morgan Stanley (2009-2014) |
| | | |
Steven Ross Morgan Stanley 522 Fifth Avenue, 4th Floor New York, NY 10036 Birth Year: 1971 | | Assistant Treasurer | | Since 2014 | | Executive Director, Morgan Stanley (2013-present); Vice President, Morgan Stanley (2005-2013) |
| | | |
Robert Creaney Morgan Stanley One Financial Place 440 South LaSalle Street 39th Floor Chicago, IL 60605 Birth Year: 1974 | | Assistant Treasurer | | Since 2014 | | Executive Director, Morgan Stanley (1997-present) |
| | | |
Michael Conklin Morgan Stanley One Financial Place 440 South LaSalle Street 39th Floor Chicago, IL 60605 Birth Year: 1977 | | Assistant Treasurer | | Since 2014 | | Vice President, Morgan Stanley (2013-present); Vice President, First Trust Portfolios (2009-2013) |
| | | |
Suzan M. Barron Brown Brothers Harriman & Co. (“BBH&Co.”) 50 Post Office Square Boston, MA 02110 Birth Year: 1964 | | Assistant Secretary | | Since 2011 | | Practice Lead for Portfolio Compliance, Fund Administration, BBH&Co. (2015-present); Senior Vice President and Senior Investor Services Counsel, Corporate Secretary and Regulatory Support Practice of Fund Administration, BBH&Co. (2005-present) |
| * | Each Trustee remains in office until they resign, retire or are removed. |
| ** | Mr. Berdon is an “interested person” of the Trust as defined in the 1940 Act because of his position with Morgan Stanley. |
| *** | The President, Treasurer and Secretary hold office until their respective successors are chosen and qualified or until he or she sooner dies, resigns, is removed or becomes disqualified. Each of the other officers serves at the pleasure of the Board. |
Board Composition and Leadership Structure
Currently, five of the six Trustees on the Board (83%) are not “interested persons” (as defined in the 1940 Act) of the Trust and as such are not affiliated with the Manager or any Sub-adviser (“Independent Trustees”). The Board has appointed Mr. Murphy, an Independent Trustee, to serve as Chairman of the Board. There are three primary committees of the Board: the Audit Committee, the Corporate Governance and Nominating Committee, and the Investment Committee. Each of the Committees is chaired by an Independent Trustee and comprised solely of Independent Trustees. The Board has determined that this leadership structure is appropriate given the specific characteristics and circumstances of the Trust and in light of the services that the Manager and its affiliates and the Sub-advisers provide to the Trust and potential conflicts of interest that could arise from these relationships. The Board believes that the existing Board structure is appropriate because, among other things, it allows the Independent Trustees to exercise independent business judgment in evaluating the Trust’s management and service providers.
212
Board Oversight of Risk Management
The Board considers risk management issues as part of its general oversight responsibilities. As is the case with virtually all investment companies (as distinguished from operating companies), service providers to the Trust, primarily the Manager and its affiliates and the Sub-advisers, have responsibility for the day-to-day management of the Funds, which includes responsibility for risk management (including management of investment performance and investment risk, valuation risk, issuer and counterparty credit risk, compliance risk and operational risk). As part of its oversight, the Board, acting at its scheduled meetings, or the Chairman of the Board or the appropriate Committee, acting between Board meetings, regularly interacts with and receives reports from senior personnel of service providers, including the Manager’s investment officers, the Trust’s and the Manager’s Chief Compliance Officer (“CCO”) and the Sub-advisers’ portfolio management personnel. The Board’s Audit Committee meets during its scheduled meetings, and between meetings the Audit Committee chair maintains contact, with the Trust’s independent registered public accounting firm and the Trust’s Chief Financial Officer. The Board’s Investment Committee receives periodic presentations from senior personnel of the Manager or its affiliates regarding investment performance of the Funds and the applicable investment risk management process. The Board also receives periodic presentations from senior personnel of the Manager or its affiliates and the Sub-advisers regarding risk management generally, as well as periodic presentations regarding specific operational, compliance or investment areas, such as business continuity, anti-money laundering, personal trading, valuation, credit, investment research, portfolio trading and transactions, and securities lending. The Board has adopted policies and procedures designed to address certain risks to the Funds. In addition, the Manager and other service providers to the Trust have adopted a variety of policies, procedures and controls designed to address particular risks to the Funds. Different processes, procedures and controls are employed with respect to different types of risks. However, it is not possible to eliminate all of the risks applicable to the Funds. The Board also receives reports from counsel to the Trust or counsel to the Manager and the Independent Trustees’ own independent legal counsel regarding regulatory compliance and governance matters. The Board’s oversight role does not make the Board a guarantor of the Funds’ investments or activities.
Individual Trustee Qualifications
The Board believes that each Trustee’s experience, qualifications, attributes or skills on an individual basis and in combination with those of the other Trustees lead to the conclusion that the Board possesses the requisite attributes and skills to effectively oversee the management of the Trust and the interests of Fund shareholders. The Board believes that the significance of each Trustee’s experience, qualifications, attributes or skills is an individual matter (meaning that experience that is important for one Trustee may not have the same value for another) and that these factors are best evaluated at the Board level, with no single Trustee, or particular factor, being indicative of Board effectiveness. However, the Board believes that Trustees must have the ability to critically review, evaluate, question and discuss information provided to them, and to interact effectively with Trust management, service providers and counsel, in order to exercise effective business judgment in the performance of their duties. The Board believes that the Trustees satisfy this standard. Experience relevant to having this ability may be achieved through a Trustee’s educational background; business, professional training or practice (e.g., accounting or law), public service or academic positions; experience from service as a board member (including the Board of the Trust) or as an executive of investment funds, public companies or significant private or not-for-profit entities or other organizations; and/or other life experiences. The charter for the Board’s Corporate Governance and Nominating Committee contains certain other factors considered by the Committee in identifying and evaluating potential nominees to the Board. The Board noted that most of the Trustees had experience serving as directors on the boards of operating companies and/or other investment companies. The Board considered that Ms. Cepeda and Messrs. Matthews, Murphy, McKissack and Reed have or had careers in the financial services or investment management industries, including holding executive positions in companies engaged in these industries, which allows these Trustees to bring valuable, relevant experience as members of the Board. Mr. Berdon has substantial experience as an executive and financial officer in leadership roles with Morgan Stanley and affiliated entities.
Board Committees
The Trust has an Audit Committee, a Corporate Governance and Nominating Committee, and an Investment Committee. The members of the Audit Committee and the Corporate Governance and Nominating Committee consist of all the Independent Trustees of the Trust, namely Ms. Cepeda and Messrs. Matthews, Murphy, McKissack and Reed. The Investment Committee consists of Messrs. Matthews and Reed. The Board also at times may constitute other committees of the Board to assist in the evaluation of specific matters.
213
The Audit Committee oversees each Fund’s audit, accounting and financial reporting policies and practices and its internal controls. The Audit Committee approves, and recommends to the Board for its ratification, the selection, appointment, retention or termination of the Trust’s independent registered public accounting firm and approves the compensation of the independent registered public accounting firm. The Audit Committee also approves all audit and permissible non-audit services provided to each Fund by the independent registered public accounting firm and all permissible non-audit services provided by the Trust’s independent registered public accounting firm to the Manager and any affiliated service providers if the engagement relates directly to Fund operations and financial reporting. The Audit Committee met two times during the Trust’s most recent fiscal year.
The Corporate Governance and Nominating Committee is charged with overseeing the Board governance matters and related Trustee practices, including selecting and nominating persons for election or appointment by the Board as Independent Trustees of the Trust. The Corporate Governance and Nominating Committee will consider nominees recommended by the Funds’ shareholders if a vacancy occurs. Shareholders who wish to recommend a nominee should send nominations to the Trust’s Secretary. The Corporate Governance and Nominating Committee also considers and recommends to the Board the appropriate compensation for serving as a Trustee on the Board. The Corporate Governance and Nominating Committee met three times during the Trust’s most recent fiscal year.
The Investment Committee is charged with assisting the Board in carrying out its oversight responsibilities over the Trust and the Funds with respect to investment management, objectives, strategies, policies and procedures, performance and performance benchmarks, and the applicable risk management process. The Investment Committee met four times during the Trust’s most recent fiscal year.
214
| | |
| | | |
| Important Tax Information | | |
The following information is provided with respect to the distributions paid during the taxable year ended August 31, 2015:
| | | | | | | | | | | | | | | | | | | | | | | | |
| | | Large
Capitalization
Growth
Investments | | | Large
Capitalization
Value Equity
Investments | | | Small
Capitalization
Value Equity
Investments | | | International
Equity
Investments | | | Emerging
Markets
Equity
Investments | | | Small
Capitalization
Growth
Investments | |
Record Date: | | | 12/5/2014 | | | | 12/5/2014 | | | | 12/5/2014 | | | | 12/5/2014 | | | | 12/5/2014 | | | | 12/5/2014 | |
Payable Date: | | | 12/8/2014 | | | | 12/8/2014 | | | | 12/8/2014 | | | | 12/8/2014 | | | | 12/8/2014 | | | | 12/8/2014 | |
Ordinary Income: | | | | | | | | | | | | | | | | | | | | | | | | |
Qualified Dividend Income for Individuals | | | 47.26 | % | | | 100 | % | | | 72.92 | % | | | 92.60 | % | | | 91.50 | % | | | 6.12 | % |
Dividends Qualifying for the Dividends Received | | | | | | | | | | | | | | | | | | | | | | | | |
Deduction for Corporations | | | 43.46 | % | | | 100 | % | | | 73.40 | % | | | 12.89 | % | | | — | | | | 7.57 | % |
Foreign Source Income | | | — | | | | — | | | | — | | | | 99.64 | % | | | 87.58 | % | | | | |
Foreign Tax Paid Per Share | | | — | | | | — | | | | — | | | | 0.02180 | | | | 0.0445 | | | | | |
Long-Term Capital Gain Dividend | | | 2.07273 | | | | — | | | | 1.45774 | | | | — | | | | — | | | | 4.40601 | |
| | | | | | | | | | | | | | | | | | | | |
| | | | | |
| | | Core Fixed
Income
Investments | | | High Yield
Investments | | | International
Fixed
Income
Investments | | | Municipal
Bond
Investments | | | Money
Market
Investments | |
Record Date: | | | Monthly | | | | Monthly | | | | 12/5/2014 | | | | Monthly | | | | 12/5/2014 | |
Payable Date: | | | Monthly | | | | Monthly | | | | 12/8/2014 | | | | Monthly | | | | 12/8/2014 | |
Ordinary Income: | | | | | | | | | | | | | | | | | | | | |
Qualified Dividend Income for Individuals | | | — | | | | — | | | | — | | | | — | | | | — | |
Dividends Qualifying for the Dividends Received | | | | | | | | | | | | | | | | | | | | |
Deduction for Corporations | | | — | | | | — | | | | — | | | | — | | | | — | |
Interest from Tax-Exempt Obligations | | | — | | | | — | | | | — | | | | 100 | % | | | — | |
Interest from Federal Obligations | | | 32.88 | % | | | | | | | 4.23 | % | | | | | | | 4.91 | % |
Long-Term Capital Gain Dividend | | | .06523 | | | | — | | | | — | | | | .05140 | | | | — | |
| * | Expressed as a percentage of the cash distribution grossed-up for foreign taxes. |
The law varies in each state as to whether and what percentage of dividend income attributable to Federal obligations is exempt from state income tax. We recommend that you consult with your tax adviser to determine if any portion of the dividends you received is exempt from state income taxes.
The foreign taxes paid represent taxes incurred by the Fund on income received by the Fund from foreign sources. Foreign taxes paid may be included in taxable income with an offsetting deduction from gross income or may be taken as a credit for taxes paid to foreign governments. You should consult your tax adviser regarding the appropriate treatment of foreign taxes paid.
Please retain this information for your records.
215
MORGAN STANLEY SMITH BARNEY LLC
Distributor
CONSULTING GROUP ADVISORY SERVICES LLC
Investment Adviser
This report is submitted for the general information of the shareholders of Consulting Group Capital Markets Funds. It is not authorized for distribution to prospective investors unless accompanied or preceded by a current Prospectus for the Trust which contains information concerning the Trust’s Investment policies, charges and expenses as well as other pertinent information.
The Funds file their complete schedule of portfolio holdings with the Securities and Exchange Commission (“SEC”) for the first and third quarters of each fiscal year on Form N-Q. The Funds’ Forms N-Q are available on the SEC’s website at www.sec.gov. The Funds’ Forms N-Q may be reviewed and copied at the SEC’s Public Reference Room in Washington D.C., and information on the operation of the Public Reference Room may be obtained by calling 1-800-SEC-0330. To obtain information on Form N-Q from the Funds, shareholders can call 1-888-454-3965 (“ask for Consulting Group”).
Information on how the Funds voted proxies relating to portfolio securities during the most recent 12-month period ended June 30 and a description of the policies and procedures that the Funds use to determine how to vote proxies relating to portfolio securities is available (1) without charge, upon request, by calling 1-888-454-3965 (ask for “Consulting Group”), (2) on the Funds’ website at www.morganstanley.com/cgcm and (3) on the SEC’s website at www.sec.gov.
© 2015 Morgan Stanley Smith Barney LLC (“Morgan Stanley”). Consulting Group Advisory Services LLC (“CGAS”) is a business of Morgan Stanley. Securities are offered through Morgan Stanley.
Consulting Group Capital Markets Funds
2000 Westchester Avenue
Purchase, NY 10577
As of the period ended August 31, 2015 (“Reporting Period”), the Registrant has adopted a code of ethics (“Code”) that applies to the Registrant’s principal executive officer, principal financial officer, principal accounting officer or controller, or persons performing similar functions, regardless of whether these individuals are employed by the Registrant or a third party. The Registrant has not amended any provision in its Code that relates to an element of the Code’s definitions enumerated in paragraph (b) of Item 2 of this Form N-CSR. A copy of this Code is filed as an Exhibit to this Form N-CSR pursuant to Item 12(a)(1).
The Registrant has not granted any waiver, including any implicit waiver, from a provision of its Code to the Registrant’s principal executive officer, principal financial officer, principal accounting officer or controller, or persons performing similar functions, regardless of whether these individuals are employed by the Registrant or a third party.
| ITEM 3. | AUDIT COMMITTEE FINANCIAL EXPERT. |
The Board of Trustees of the Registrant has determined that Mark J. Reed possesses the attributes identified in Instruction (b) of Item 3 to Form N-CSR to qualify as an “audit committee financial expert,” and has designated Mr. Reed as the Registrant’s audit committee financial expert. Mr. Reed is an “independent” Trustee pursuant to paragraph (a)(2) of Item 3 to Form N-CSR.
| ITEM 4. | PRINCIPAL ACCOUNTANT FEES AND SERVICES. |
AUDIT FEES –
(a) Audit Fees. The aggregate fees billed for each of the last two fiscal years ended August 31, 2015 and August 31, 2014 for professional services rendered by the Registrant’s principal accountant (“Auditor”) for the audit of the Registrant’s annual financial statements, or services that are normally provided by the Auditor in connection with the statutory and regulatory filings or engagements for each of the last two fiscal years, were $531,100 in 2015 and $523,600 in 2014.
(b) Audit-Related Fees. The aggregate fees billed for each of the last two fiscal years ended August 31, 2015, and August 31, 2014, for assurance and related services by the Auditor that were reasonably related to the performance of the audit of the Registrant’s financial statements and were not reported under paragraph (a) of this Item 4, were $0 in 2015 and $0 in 2014.
(c) Tax Fees. The aggregate fees billed for each of the last two fiscal years ended August 31, 2015 and August 31, 2014 for professional services rendered by the Auditor for tax compliance, tax advice and tax planning (“Tax Services”) were $90,880 in 2015 and $90,880 in 2014. These services consisted of (i) review or preparation of U.S. federal, state, local and excise tax returns; (ii) U.S. federal, state and local tax planning, advice and assistance regarding statutory, regulatory or administrative developments, and (iii) tax advice regarding tax qualification matters and/or treatment of various financial instruments held or proposed to be acquired or held.
(d) All Other Fees. The aggregate fees billed for each of the last two fiscal years ended August 31, 2015, and August 31, 2014, for products and services provided by the Auditor to the Registrant, other than the services reported in paragraphs (a) through (c) of this Item 4, were $0 for 2015 and $0 for 2014.
(e)(1) The Charter for the Audit Committee (“Committee”) of the Consulting Group Capital Markets Funds provides that the Committee may delegate its responsibility to approve any such audit and permissible non-audit services to a sub-committee consisting of the Chairperson of the Committee (“Chairperson”) and at least one other member of the Committee as the Chairperson, from time to time, may determine and appoint, and such sub-committee shall report to the Committee, at its next meeting after the sub-committee’s meeting, its decision(s). From year to year, and at such other times as the Committee deems appropriate, the Committee shall report to the Board whether this system of approval has been effective and
efficient or whether this Charter should be amended to allow for pre-approval pursuant to such policies and procedures as the Committee shall approve, including the delegation of some or all of the Committee’s pre-approval responsibilities to other persons (other than the Adviser or the Trust’s officers).
(e)(2) The percentage of services described in each of paragraphs (b) through (d) of this Item that were approved by the audit committee pursuant to paragraph (c)(7)(i)(c) of Rule 2-01 of Regulation S-X, with respect to: Audit-Related Fees were 0% for 2015 and 0% for 2014; Tax Fees were 0% for 2015 and 0% for 2014; and Other Fees were 0% for 2015 and 0% for 2014.
(g) Aggregate non-audit fees billed by the Auditor for services rendered to the Registrant and the Registrant’s investment adviser (not including any sub-adviser whose role is primarily portfolio management as is subcontracted with or overseen by another investment adviser), and any entity controlling, controlled by, or under common control with the adviser that provides ongoing services to the Registrant of each of the last two fiscal years of the Registrant (“Service Affiliates”) were $0 for 2015 and $0 in 2014.
(h) The Registrant’s Audit Committee has considered whether the provision of non-audit services that were rendered to Service Affiliates that were not pre-approved pursuant to paragraph (c)(7)ii of Rule 2-01 of Regulation S-X is compatible with maintaining the Auditor’s independence.
| ITEM 5. | AUDIT COMMITTEE OF LISTED REGISTRANTS. |
Not Applicable.
A Schedule of Investments in securities of unaffiliated issuers as of the close of the Reporting Period is included as part of the report to shareholders filed under Item 1 of this Form N-CSR.
| ITEM 7. | DISCLOSURE OF PROXY VOTING POLICIES AND PROCEDURES FOR CLOSED-END MANAGEMENT INVESTMENT COMPANIES. |
Not Applicable.
| ITEM 8. | PORTFOLIO MANAGERS OF CLOSED-END MANAGEMENT INVESTMENT COMPANIES. |
Not Applicable.
| ITEM 9. | PURCHASES OF EQUITY SECURITIES BY CLOSED-END MANAGEMENT INVESTMENT COMPANIES AND AFFILIATED PURCHASERS. |
Not Applicable.
| ITEM 10. | SUBMISSION OF MATTERS TO A VOTE OF SECURITY HOLDERS. |
There have been no material changes to the procedures by which the shareholders may recommend nominees to the Registrant’s board of directors, where those changes were implemented after the Registrant last provided disclosure in response to the requirements of Item 407(c)(2)(iv) of Regulation S-K (as required by Item 22(b)(15) of Schedule 14A (17 CFR 240.14a-101)), or this Item.
| ITEM 11. | CONTROLS AND PROCEDURES. |
(a) The Registrant’s principal executive officer and principal financial officer, or persons performing similar functions, have concluded that the Registrant’s disclosure controls and procedures (as defined in Rule 30a-3(c) under the Investment Company Act of 1940, as amended (17 CFR 270.30a-3(c)) were
effective, as of a date within 90 days of the filing date of this report, based on his evaluation of these disclosure controls and procedures as required by Rule 30a-3(b) under the Investment Company Act of 1940, as amended (17 CFR 270.30a-3(b)), and Rules 13a-15(b) or 15d-15(b) under the Securities Exchange Act of 1934, as amended (17 CFR 240.13a-15(b) or 240.15d-15(b)).
(b) There were no changes in the Registrant’s internal control over financial reporting (as defined in Rule 30a-3(d) under the Investment Company Act of 1940, as amended (17 CFR 270.30a-3(d)), that occurred during the Registrant’s second fiscal quarter of the period covered by this report that has materially affected, or is reasonably likely to materially affect, the Registrant’s internal control over financial reporting.
(a)(1) Code of ethics, or any amendment thereto, that is the subject of disclosure required by Item 2 is attached hereto.
(a)(2) Certifications pursuant to Rule 30a-2(a) under the Investment Company Act of 1940, as amended (17 CFR 270.30a-2(a)) are attached hereto.
(a)(3) Not Applicable.
(b) Certifications pursuant to 18 U.S.C. Section 1350 as adopted pursuant to Section 906 of the Sarbanes-Oxley Act of 2002 are attached hereto.
SIGNATURES
Pursuant to the requirements of the Securities Exchange Act of 1934 and the Investment Company Act of 1940, the Registrant has duly caused this Report to be signed on its behalf by the undersigned, thereunto duly authorized.
| | |
| Consulting Group Capital Markets Funds |
| |
| By: | | /s/ David Berdon |
| | David Berdon |
| | Chief Executive Officer |
| | Consulting Group Capital Markets Funds |
| |
Date: | | November 6, 2015 |
Pursuant to the requirements of the Securities Exchange Act of 1934 and the Investment Company Act of 1940, this report has been signed below by the following persons on behalf of the Registrant and in the capacities and on the dates indicated.
| | |
| By: | | /s/ David Berdon |
| | David Berdon |
| | Chief Executive Officer |
| | Consulting Group Capital Markets Funds |
| |
Date: | | November 6, 2015 |
| | |
| Consulting Group Capital Markets Funds |
| |
| By: | | /s/ Francis Smith |
| | Francis Smith |
| | Chief Financial Officer |
| | Consulting Group Capital Markets Funds |
| |
Date: | | November 6, 2015 |