UNITED STATES
SECURITIES AND EXCHANGE COMMISSION
Washington, D.C. 20549
FORM N-CSR
CERTIFIED SHAREHOLDER REPORT OF REGISTERED
MANAGEMENT INVESTMENT COMPANIES
Investment Company Act file number: 811-06318
CONSULTING GROUP CAPITAL MARKETS FUNDS
(Exact name of registrant as specified in charter)
2000 Westchester Avenue
Purchase, NY 10577
(Address of principal executive offices)(Zip code)
CT Corp
155 Federal Street Suite 700
Boston, MA 02110
(Name and address of agent for service)
Registrant’s telephone number, including area code: (888) 454-3965
Date of fiscal year end: August 31
Date of reporting period: August 31, 2016
Form N-CSR is to be used by management investment companies to file reports with the Commission not later than 10 days after the transmission to stockholders of any report that is required to be transmitted to stockholders under Rule 30e-1 under the Investment Company Act of 1940 (17 CFR 270.30e-1). The Commission may use the information provided on Form N-CSR in its regulatory, disclosure review, inspection, and policymaking rules.
A registrant is required to disclose the information specified by Form N-CSR, and the Commission will make this information public. A registrant is not required to respond to the collection of information contained in Form N-CSR unless the Form displays a currently valid Office of Management and Budget (“OMB”) control number. Please direct comments concerning the accuracy of the information collection burden estimate and any suggestions for reducing the burden to Secretary, Securities and Exchange Commission, 450 Fifth Street, NW, Washington, DC 20549-0609. The OMB has reviewed this collection of information under clearance requirements of 44 U.S.C. § 3507.
ITEM 1. REPORTS TO STOCKHOLDERS

Consulting Group
Capital Markets Funds
Annual Report
| • | | Small-Mid Cap Equity Fund |
| • | | International Equity Fund |
| • | | Emerging Markets Equity Fund |
| • | | International Fixed Income Fund |
| • | | Inflation-Linked Fixed Income Fund |
| • | | Ultra-Short Term Fixed Income Fund |
INVESTMENT PRODUCTS: NOT FDIC INSURED • NO BANK GUARANTEE • MAY LOSE VALUE
Table of Contents
Consulting Group
Capital Markets Funds
DEAR SHAREHOLDER,
Global risk markets were volatile over the twelve months ending August 31, 2016. Over the period, the S&P 500® Index i gained 12.54%. Despite positive returns, a number of events contributed to increased volatility and investor uncertainty. These included questions over a precipitous decline in oil prices, global central bank policy, Brexit, and the US presidential election, among others. Additionally, markets saw a transition towards “bond proxy” yield producing securities, as global interest rates remained at historic lows. For the twelve months, the Telecommunication Services and Utilities sectors posted the strongest returns, while the Energy, Financials, and Health Care sectors registered the weakest performance amongst the major S&P 500® Index i sectors. During the period, U.S. equities were the top-performing global equity market.
All sectors in the S&P 500® Index i generated a positive total return over the twelve month period. Telecommunication Services (+23.4%), Utilities (+20.3%), Consumer Staples (+18.1%), Information Technology (+18.7%), Industrials (+17.6%), Materials (+14.7%), and Consumer Discretionary (+9.3%), Energy (+7.7%), Financials (+7.1%), and Health Care (+5.0%).
Morgan Stanley & Co. economists expect U.S. real GDP growth will be approximately 1.7% in 2016 and 1.5% in 2017. They forecast global GDP growth to be close to 1.4% in 2016 and 1.2% in 2017.
Equity markets saw a style rotation over the period, with value outperforming growth, reversing trends in recent years. The large-cap Russell 1000® Growth Index ii increased 10.5%. The Russell 1000® Index iv, a large-cap index, gained 11.7% for the period. The Russell 1000® Value Index iii, also a large-cap index, rose 12.9% for the period. The Russell 2000® Growth Index v, a small-cap index, rose by 3.54% for the period. The small-cap Russell 2000® Index vii also gained over the period, as it increased by 8.6%. The Russell 2000® Value Index vi, also a small-cap index, increased 13.8% for the period.
Over the twelve-month period, the MSCI All Country World Index ix increased 7.9% in U.S. dollar terms, the MSCI Emerging Markets Index (Net) x gained 11.8% in U.S. dollar terms, and the MSCI EAFE® Index (Net) xi (a benchmark for developed markets) fell 0.1% in U.S. dollar terms.
Over the twelve-month period, bond market returns were mixed. The Barclays Capital U.S. Aggregate Bond Index xii, a general measure of the bond market, rose 6.0% for the period. Interest rates decreased during the period, as the yield on the 10-Year U.S. Treasury note moved down significantly from 2.2% to 1.6%. Riskier parts of the bond market such as U.S. High Yield debt increased during the period. The Barclays Capital U.S. Corporate High-Yield Bond Index xiii, a measure of lower-rated corporate bonds, gained 9.1%.
Consulting Group Capital Markets (CGCM) Funds
Large Capitalization Equity Fund returned +7.1% in the fiscal year, underperforming both the Russell 1000® Index iv, which returned +11.7% in the period, and the average performance of mutual funds included in the Lipper Large-Cap Core xiv investment category, which returned +9.3%. The fund’s results incorporate the returns of the CGCM Large Capitalization Growth Investments Fund prior to the merger with the CGCM Large Capitalization Value Investments Fund in February and the returns of the merged fund thereafter. Prior to the merger, the fund’s growth emphasis relative to the core benchmark negatively impacted returns. Subsequent to the merger, favorable stock selection in the Information Technology, Consumer Staples, and Consumer Discretionary sectors enhanced returns, while poor stock selection in the Health Care sector detracted value relative to the index.
I
Small-Mid Capitalization Equity Fund returned -5.5% over the yearly performance period, as compared to the +8.8% increase of the Russell 2500® Index viii and the +7.7% return of the average mutual fund included in the Lipper Small-Cap Core xv investment category. The fund’s results incorporate the returns of the CGCM Small Capitalization Growth Investments Fund prior to the merger with the CGCM Small Capitalization Value Investments Fund in February and the returns of the merged fund thereafter. Prior to the merger, the fund’s growth emphasis relative to the core benchmark was a large drag on returns. Subsequent to the merger, the fund’s underweighting in the Utilities and Financials sectors, which were two of the index’s worst performing sectors, added value. The fund’s overweighting in two of the market’s top performing sectors — Information Technology and Health Care — aided returns. However, the fund underperformed the market in the Health Care, Financials, and Information Technology sectors due to stock selection, partially offsetting the positive sector allocations.
International Equity Fund returned +1.0% in the annual reporting period that ended on August 31, 2016, as compared to the -0.1% return of the MSCI EAFE® Index (Net) xi and the -0.2% return for the average mutual fund included in Lipper’s International Large-Cap Core xvi investment category. Favorable stock selection in France and Japan and exposure to Korea aided returns over the fiscal annual period, while unfavorable stock selection in the United Kingdom and the fund’s underweight to the Australian market detracted value. From a sector perspective, the fund’s overweight in the Information Technology sector and underweight in Financials added value, as did outperformance in the Information Technology, Health Care, and Consumer Discretionary sectors. Underperformance in the Financials and Industrials sectors detracted value, as did the fund’s underweighting in REITs.
Emerging Markets Equity Fund registered twelve-month performance of +15.3% and outperformed both the +11.8% return of the MSCI Emerging Markets Index (Net) x and the +10.1% return of the average mutual fund included in Lipper’s Emerging Markets xvii investment category. Positive stock selection in China and Taiwan added value, as did the fund’s overweight in Indonesia and Brazil. The fund’s underweight to Korea and overweight to India detracted value. Favorable stock selection in the Financials, Consumer Staples, and Information Technology sectors added value, while underperformance in Health Care and Materials detracted value.
Core Fixed Income Fund returned +5.8% in the fiscal year, slightly trailing the +6.0% return of its market benchmark, the Barclays Capital U.S. Aggregate BondTM Index xii, but exceeding the +5.6% increase for the average mutual fund included in Lipper’s Core Bond xviii investment category. While the fund’s overweight in the investment grade credit and high yield sectors added value relative to the index, unfavorable security selection detracted value.
High Yield Fund returned +4.0% in the annual fiscal reporting period, below the +9.1% return of the Barclays Capital U.S. Corporate High-Yield Index xiii and the +6.1% average return of mutual funds included in Lipper’s High Yield xix investment category. The fund was negatively impacted by both poor sector selection and poor security selection and did not participate fully in the recovery in the high yield market in the second half of the fiscal year after reducing its exposure to CCC credits.
International Fixed Income Fund returned +9.7%, as compared to the +9.0% return of the Citigroup Non-USD World Government Bond Index (USD) Hedged xx and the +7.7% return for the average mutual fund included in Lipper’s International Income xxi investment category. Local market sector allocations added value, while country allocations negatively impacted performance.
Municipal Bond Fund’s twelve-month performance of +6.1% in the fiscal period ended August 31, 2016 fell short of the +6.9% return of the Barclays Capital U.S. Municipal Bond Index xxii, as well as the +7.0% increase in the average mutual fund included in Lipper’s General & Insured Municipal Debt xxiii investment category. An overweight to shorter duration securities and an underweight to lower-quality, long dated, zero coupon securities detracted from performance. The fund’s increased exposure to the longer end of the maturity curve and an overweight to spread sectors such as hospitals and higher education added value relative to the index.
Inflation-Linked Fixed Income Fund and Ultra-Short Fixed Income Fund were incepted on March 15, 2016. Since inception through August 31, 2016, the Inflation-Linked Fixed Income Fund returned +4.6%, which matched the return of the Barclays Capital U.S. Treasury Inflation Protected Securities (TIPS) Index xxiv. Duration positioning
II
detracted slightly from returns, while yield curve positioning was additive. The fund’s spread sector positioning focused primarily on high-quality sources of yield such as corporate issues concentrated within financials.
Ultra-Short Fixed Income Fund returned +0.9% and outperformed the Citigroup 3-Month U.S. Treasury Bill Index xxv, which returned +0.1%. Relative to the index, the fund benefitted from holdings in investment grade credit and select holdings of high yield and securitized credit.
Additional information regarding the investment managers of the CGCM Funds and commentary specific to each individual sub-adviser is available in the Annual Report following this Shareholder Letter.
We thank you for your continued confidence in Morgan Stanley Wealth Management and support as shareholders of the CGCM Funds.
Sincerely,
David Berdon
Chief Executive Officer
III
Although the statements of fact and data contained herein have been obtained from, and are based upon, sources the firm believes reliable, we do not guarantee their accuracy, and any such information may be incomplete or condensed. All opinions included in this report constitute the firm’s judgment as of the date herein, and are subject to change without notice. This material is for informational purposes only, and is not intended as an offer or solicitation with respect to the purchase or sale of any security. This report may contain forward-looking statements, and there can be no guarantee that they will come to pass. The index returns shown are preliminary and subject to change. Past performance is not a guarantee of future results.
Index Definitions
| i. | The S&P 500® Index tracks the performance of 500 widely held, large-capitalization U.S. stocks. Please note that an investor cannot invest directly in an index. |
| ii. | The Russell 1000® Growth Index measures the performance of those Russell 1000® Index companies with higher price-to-book ratios and higher forecasted growth values. Because the index is not a managed portfolio, there are no advisory fees or internal management expenses reflected in the index’s performance. Please note that an investor cannot invest directly in an index. |
| iii. | The Russell 1000® Value Index measures the performance of those Russell 1000® Index companies with lower price-to-book ratios and lower forecasted growth values. Because the index is not a managed portfolio, there are no advisory fees or internal management expenses reflected in the index’s performance. Please note that an investor cannot invest directly in an index. |
| iv. | The Russell 1000® Index measures the performance of the 1,000 largest U.S. companies based on the market capitalization. Please note that an investor cannot invest directly in an index. |
| v. | The Russell 2000® Growth Index measures the performance of those Russell 2000® Index companies with higher price-to-book ratios and higher forecasted growth values. Because the index is not a managed portfolio, there are no advisory fees or internal management expenses reflected in the index’s performance. Please note that an investor cannot invest directly in an index. |
| vi. | The Russell 2000® Value Index measures the performance of those Russell 2000® Index companies with lower price-to-book ratios and lower forecasted growth values. Because the index is not a managed portfolio, there are no advisory fees or internal management expenses reflected in the index’s performance. Please note that an investor cannot invest directly in an index. |
| vii. | The Russell 2000® Index measures the performance of the 2,000 smallest companies in the Russell 3000® Index. Please note that an investor cannot invest directly in an index. |
| viii. | The Russell 2500® Index includes the smallest 2,500 U.S. companies out of the Russell 3000® Index universe. Because the index is not a managed portfolio, there are no advisory fees or internal management expenses reflected in the index’s performance. Please note that an investor cannot invest directly in an index. |
| ix. | The MSCI All Country World Index is a free float-adjusted market capitalization index that is designated to measure equity market performance in the global developed emerging markets. Please note that an investor cannot invest directly in an index. |
| x. | The MSCI Emerging Markets Index is a free float-adjusted market capitalization index that is designed to measure equity market performance of emerging markets. The MSCI Emerging Markets Index (Net) consists of the following 21 emerging market country indexes: Brazil, Chile, China, Colombia, Czech Republic, Egypt, Greece, Hungary, India, Indonesia, South Korea, Malaysia, Mexico, Peru, Philippines, Poland, Russia, South Africa, Taiwan, Thailand, and Turkey. Net total return indexes reinvest dividends after the deduction of withholding taxes, using (for international indexes) a tax rate applicable to nonresident institutional investors who do not benefit from double taxation treaties. Because the index is not a managed portfolio, there are no advisory fees or internal management expenses reflected in the index’s performance. Please note that an investor cannot invest directly in an index. |
| xi. | The Morgan Stanley Capital International Europe, Australasia, Far East (MSCI EAFE®) Index (Net) is a free float-adjusted market capitalization index that is designed to measure the equity market performance of developed markets, excluding the U.S. & Canada. The MSCI EAFE® Index consists of the following 21 developed market country indexes: Australia, Austria, Belgium, Denmark, Finland, France, Germany, Hong Kong, Ireland, Israel, Italy, Japan, the Netherlands, New Zealand, Norway, Portugal, Singapore, Spain, Sweden, Switzerland, and the United Kingdom. Net total return indexes reinvest dividends after the deduction of withholding taxes, using (for international indexes) a tax rate applicable to non-resident institutional investors who do not benefit from double taxation treaties. Because the index is not a managed portfolio, there are no advisory fees or internal management expenses reflected in the index’s performance. Please note that an investor cannot invest directly in an index. |
| xii. | The Barclays Capital U.S. Aggregate Bond Index is a broad-based index that measures the investment grade, U.S. dollar-denominated, fixed-rate taxable bond market, including Treasuries, government-related, and corporate securities, MBS (agency fixed-rate and hybrid ARM pass-throughs), ABS, and CMBS. Because the index is not a managed portfolio, there are no advisory fees or internal management expenses reflected in the index’s performance. Please note that an investor cannot invest directly in an index. |
| xiii. | The Barclays Capital U.S. Corporate High Yield Bond Index measures the market of U.S. dollar-denominated, non-investment grade, fixed rate, taxable corporate bonds. Because the index is not a managed portfolio, there are no advisory fees or internal management expenses reflected in the index’s performance. Please note that an investor cannot invest directly in an index. |
| xiv. | The Lipper Large-Cap Core Funds Average are equally weighted total returns using all the active funds available within the category of funds that, by portfolio practice, invest at least 75% of their equity assets in companies with market capitalizations (on a three-year weighted basis) greater than 300% of the dollar weighted median market capitalization of the middle 1,000 securities of the S&P SuperComposite 1500® Index. Large-cap core funds have more latitude in the companies in which they invest. These funds typically have an average price-to-earnings ratio, price-to-book ratio, and three-year sales-per-share growth value, compared to the S&P 500® Index. The total return of the Lipper Funds Average does not include the effect of sales charges. Please note that an investor cannot invest directly in a mutual funds classification average or an index. |
| xv. | The Lipper Small-Cap Core Funds Average are equally weighted total returns using all the active funds available within the category of funds that, by portfolio practice, invest at least 75% of their equity assets in companies with market capitalizations (on a three-year weighted basis) less than 250% of the dollar weighted median of the smallest 500 of the middle 1,000 securities of the S&P SuperComposite 1500® Index. Small-cap core funds have more latitude in the companies in which they invest. These funds typically have an average price-to-earnings ratio, price-to-book ratio, and three-year sales-per-share growth value, compared to the S&P SmallCap 600® Index. The total return of the Lipper Funds Average does not include the effect of sales charges. Please note that an investor cannot invest directly in a mutual funds classification average or an index. |
| xvi. | The Lipper International Large-Cap Core Funds Average is an equally weighted average of all active funds available within the investment category. The classification includes funds that, by portfolio practice, invest at least 75% of their equity assets in companies outside of the U.S. with market capitalizations (on a three-year weighted basis) above Lipper’s international large-cap floor. International large-cap core funds typically have average characteristics compared to their large-cap-specific subset of the MSCI EAFE® Index. The total return of the Lipper Funds Average does not include the effect of sales charges. Please note that an investor cannot invest directly in a mutual funds classification average or an index. |
| xvii. | The Lipper Emerging Markets Funds Average is an equally weighted average of all active funds available within the investment category. The classification includes funds that seek long-term capital appreciation by investing at least 65% of total assets in emerging market equity securities, where “emerging market” is defined by a country’s GNP per capita or other economic measures. The total return of the Lipper Funds Average does not include the effect of sales charges. Please note that an investor cannot invest directly in a mutual funds classification average or an index. |
| xviii. | The Lipper Core Bond Funds Average is an equally weighted average of all active funds available within the investment category. The classification includes funds that invest at least 85% of their assets in domestic investment-grade debt issues (rated in top four grades) with any remaining in investment in nonbenchmark sectors such as high-yield, global, and emerging market debt. These funds maintain dollar-weighted average maturities of five to ten years. The total return of the Lipper Funds Average does not include the effect of sales charges. Please note that an investor cannot invest directly in a mutual funds classification average or an index. |
| xix. | The Lipper High Yield Funds Average is an equally weighted average of all active funds available within the investment category. The classification includes funds that aim at high (relative) current yield from fixed income securities, have no quality or maturity restrictions, and tend to invest in lower grade debt issues. The total return of the Lipper Funds Average does not include the effect of sales charges. Please note that an investor cannot invest directly in a mutual funds classification average or an index. |
| xx. | The Citigroup Non-USD World Government Bond Index (USD) Hedged and Unhedged are each sub-indices of the Citigroup World Government Bond Index (WGBI), which is comprised of the global sovereign debt of over 20 countries representative in the Americas, EMEA, EMU, Asia Pacific, and Japan |
IV
| | regions. The Non-U.S. Dollar WGBI includes all WGBI markets except the United States and is stated in U.S. dollar hedged or unhedged base currency terms. Because the index is not a managed portfolio, there are no advisory fees or internal management expenses reflected in the index’s performance. Please note that an investor cannot invest directly in an index. |
| xxi. | The Lipper International Income Funds Average is an equally weighted average of all active funds available within the investment category. The classification includes funds that state in their prospectus that they invest primarily in U.S. dollar and non-U.S. dollar debt securities of issuers located in at least three countries, excluding the United States, except in periods of market weakness. The total return of the Lipper Funds Average does not include the effect of sales charges. Please note that an investor cannot invest directly in a mutual funds classification average or an index. |
| xxii. | The Barclays Capital U.S. Municipal Bond Index covers the U.S. dollar-denominated long-term tax exempt bond market. The index has four main sectors: state and local general obligation bonds, revenue bonds, insured bonds, and prerefunded bonds. Because the index is not a managed portfolio, there are no advisory fees or internal management expenses reflected in the index’s performance. Please note that an investor cannot invest directly in an index. |
| xxiii. | The Lipper General & Insured Municipal Debt Funds Average is an equally weighted average of all active funds available within the investment category. The classification includes funds that either invest primarily in municipal debt issues rated in the top four credit ratings or invest primarily in municipal debt issues insured as to timely payment. The total return of the Lipper Funds Average does not include the effect of sales charges. Please note that an investor cannot invest directly in a mutual funds classification average or an index. |
| xxiv. | Barclays Capital U.S. Treasury Inflation Protected Securities (TIPS) Index — The Barclays US TIPS Index is an unmanaged market index comprised of all US Treasury Inflation Protected Securities rated investment grade (Baa3/BBB- or better), have at lease one year to final maturity, and at least $250 million par amount outstanding. |
| xxv. | Citigroup 3-Month U.S. Treasury Bill Index — Equal dollar amounts of three-month Treasury bills are purchased at the beginning of each of three consecutive months. As each bill matures, all proceeds are rolled over or reinvested in a new three-month bill. The income used to calculate the monthly return is derived by subtracting the original amount invested from the maturity value. The yield curve average is the basis for calculating the return on the index. The index is rebalanced monthly by market capitalization. |
Risk Considerations
Equity securities may fluctuate in response to news on companies, industries, market conditions, and general economic environment.
Investing in foreign markets entails risks not typically associated with domestic markets, such as currency fluctuations and controls, restrictions on foreign investments, less governmental supervision and regulation, and the potential for political instability. These risks may be magnified in countries with emerging markets and frontier markets, since these countries may have relatively unstable governments and less established markets and economies.
Investing in small- to medium-sized companies entails special risks, such as limited product lines, markets, and financial resources, and greater volatility than securities of larger, more established companies.
The value of fixed income securities will fluctuate and, upon a sale, may be worth more or less than their original cost or maturity value. Bonds are subject to interest rate risk, call risk, reinvestment risk, liquidity risk, and credit risk of the issuer.
High yield bonds (bonds rated below investment grade) may have speculative characteristics and present significant risks beyond those of other securities, including greater credit risk, price volatility, and limited liquidity in the secondary market. High yield bonds should comprise only a limited portion of a balanced portfolio.
Yields are subject to change with economic conditions. Yield is only one factor that should be considered when making an investment decision.
Asset allocation and diversification do not assure a profit or protect against loss in declining financial markets.
The indices are unmanaged. An investor cannot invest directly in an index. They are shown for illustrative purposes only and do not represent the performance of any specific investment.
Because of their narrow focus, sector investments tend to be more volatile than investments that diversify across many sectors and companies.
Growth investing does not guarantee a profit or eliminate risk. The stocks of these companies can have relatively high valuations. Because of these high valuations, an investment in a growth stock can be more risky than an investment in a company with more modest growth expectations.
Value investing does not guarantee a profit or eliminate risk. Not all companies whose stocks are considered to be value stocks are able to turn their business around or successfully employ corrective strategies which would result in stock prices that do not rise as initially expected.
V
| | | | |
Performance of the Consulting Group Capital Markets Funds For the Year/Period Ended August 31, 2016†* | | | |
| |
| Large Cap Equity Fund | | | 7.08 | % |
Russell 1000® Index (1) | | | 11.69 | % |
| |
| Small-Mid Cap Equity Fund | | | -5.51 | % |
Russell 2500® Index (2) | | | 8.79 | % |
| |
| International Equity Fund | | | 0.96 | % |
The Morgan Stanley Capital International Europe, Australasia, Far East (MSCI EAFE®) Index (Net) (3) | | | -0.12 | % |
| |
| Emerging Markets Equity Fund | | | 15.31 | % |
MSCI Emerging Markets Index (Net) (4) | | | 11.83 | % |
| |
| Core Fixed Income Fund | | | 5.84 | % |
Barclays Capital U.S. Aggregate BondTM Index (5) | | | 5.97 | % |
| |
| High Yield Fund | | | 4.02 | % |
Barclays Capital U.S. Corporate High-Yield Index (6) | | | 9.07 | % |
| |
| International Fixed Income Fund | | | 9.56 | % |
Citigroup Non-USD World Government Bond Index (USD) Hedged (7) | | | 9.00 | % |
| |
| Municipal Bond Fund | | | 6.14 | % |
Barclays Capital U.S. Municipal Bond Index (8) | | | 6.88 | % |
| |
| Inflation-Linked Fixed Income Fund*** | | | 4.59 | % |
Barclays Capital U.S. Treasury Inflation Protected Securities (TIPS) Index (9) | | | 5.37 | % |
| |
| Ultra-Short Term Fixed Income Fund*** | | | 0.89 | % |
Citigroup 3-Month U.S. Treasury Bill Index (10) | | | 0.18 | % |
| |
Entities previous to reorganization on February 5, 2016. (See Note 8) | | | | |
| |
| Large Capitalization Growth Investments | | | | |
Russell 1000® Growth Index (11) | | | 10.54 | % |
| |
| Large Capitalization Value Equity Investments | | | | |
Russell 1000® Value Index (12) | | | 12.92 | % |
| |
| Small Capitalization Growth Investments | | | | |
Russell 2000® Growth Index (13) | | | 3.55 | % |
| |
| Small Capitalization Value Equity Investments | | | | |
Russell 2000® Value Index (14) | | | 13.80 | % |
See pages 26 through 29 for all footnotes.
VI

Large Cap Equity Fund
|
| ABOUTTHE SUBADVISERS |
•Columbia Management Investment Advisers, LLC (“CMIA”) |
CMIA uses a combination of fundamental and quantitative analysis with risk management, including cross-correlation analysis, in identifying investment opportunities and constructing it’s portion of the Fund’s portfolio. In selecting investments, CMIA considers, among other factors: |
|
| · overall economic and market conditions; and |
| · the financial condition and management of a company, including its competitive position, the quality of its balance sheet and earnings, its future prospects, and the potential for growth and stock price appreciation. |
|
| CMIA may sell a security when the security’s price reaches a target set by CMIA; if CMIA believes that there is deterioration in the issuer’s financial circumstances or fundamental prospects; if other investments are more attractive; or for other reasons. |
|
•BlackRock Financial Management, Inc. (“BlackRock”) |
| BlackRock Financial Management, Inc. employs a “passive” management approach, attempting to invest in a portfolio of assets whose performance is expected to match approximately the performance of the Russell 1000® Index. The Fund will be substantially invested in securities in the Russell 1000® Index, and will invest, under normal circumstances, at least 80% of its assets in securities or other financial instruments that are components of or have economic characteristics similar to the securities included in the Russell 1000® Index. |
|
•Lazard Asset Management, LLC (“Lazard”) |
| Lazard, an indirect, wholly-owned subsidiary of Lazard Ltd., is known for its global perspective on investing and years of experience with global, regional and domestic portfolios. With more than 300 investment personnel worldwide, Lazard offers investors of all types an array of equity, fixed income, and alternative investment solutions from its network of local offices in ten different countries. Its team-based approach to portfolio management helps Lazard to deliver robust and consistent performance over time, and strong client relationships allow them to understand how to employ their capabilities to its clients’ advantage. |
| Lazard manages an all cap, concentrated strategy designed to leverage the best collection of ideas from the US Equity team. It is benchmark-agnostic, seeking to outperform any broad-based market index (i.e., S&P 500® Index, Russell 1000® Index, Russell 3000® Index) by investing in companies that compound earnings and capital and by taking advantage of valuation anomalies. |
For the period of September 1, 2015, through August 31, 2016, the Sub-advisers for CGCM Large Cap Equity Fund (“Fund”) were Columbia Management Investment Advisers, LLC (“CMIA”), BlackRock Financial Management, Inc. (“BlackRock”), Lazard Asset Management, LLC (“Lazard”), Delaware Investments Fund Advisers (“Delaware”), Wedgewood Partners, Inc. (“Wedgewood”), and Lyrical Asset Management, LP (“Lyrical”).
The portion of the Fund managed by Columbia Threadneedle outperformed the Fund’s market index benchmark, the Russell 1000® Growth Index, for the period of March 4, 2016 — August 31, 2015. Overall our high-quality, high-growth companies fared well, with many companies exceeding revenue and earnings expectations. These strong underlying fundamentals were in stark contrast to the broader market, which in this modest- to low-growth trajectory economy, has struggled to generate positive earnings growth. Toward the end of the period, volatility increased, as the much-anticipated BREXIT referendum caught the market off guard. The sell-off proved to be short-lived, as U.S. equities rallied strongly to close out the period. The bulk of the outperformance occurred in the information technology sector. The portfolio also outperformed on a relative basis in the consumer discretionary and consumer staples sectors. These positives outweighed lesser results in the health care and materials sectors, which detracted. In the information technology sector, holdings in ecommerce leaders Alibaba and MercadoLibre were notable contributors. In June, our position in professional social networking firm LinkedIn rallied significantly as the company agreed to be acquired by Microsoft. The strategy’s holdings in the software industry also performed well. Ecommerce leader Amazon.com and electric vehicle manufacturer Tesla drove relative outperformance in the consumer discretionary sector. In consumer staples, energy drink manufacturer Monster Beverage performed well. In terms of detractors, political rhetoric in the highly polarized Presidential race has cast an overhang on the portfolio’s biotech and pharmaceuticals holdings, as drug pricing has been a political hot point. While political rhetoric can lead to indiscriminate selling pressure, we continue to believe that our companies benefit from innovation and favorable demographics — remaining extremely attractive for long term investors. In materials, a position paint manufacturer Sherwin Williams did not keep pace in the materials sector.
The portion of the Fund managed by BlackRock outperformed the Fund’s market index benchmark, the Russell 1000® Index, for the year ended August 31, 2016. During the period, U.S. equities capitalized on the upward momentum from the beginning of the year, which continued through the latter half of 2016 largely driven by healthy macro-economic data and positive earnings surprises. Domestic equity markets posted gains despite increased volatility in June from the “Brexit”, i.e., the United Kingdom’s vote to leave the European Union. Following the vote, equity markets declined worldwide and investors rushed to high quality assets, driving U.S. Treasury yields further down. The outperformance of the Fund compared to its benchmark was primarily driven by security sampling.
1
|
|
•Delaware Investments Fund Advisers (“Delaware”) |
| Delaware will invest under normal circumstances, at least 80% of its net assets, plus the amount of any borrowings for investment purposes, in securities of large-capitalization companies. Delaware invests primarily in securities of large-capitalization companies that the Manager believes have long-term capital appreciation potential. Delaware currently defines large-capitalization stocks as those with market capitalizations of $5 billion or greater at the time of purchase. Typically, the Manager seeks to select securities that it believes are undervalued in relation to their intrinsic value, as indicated by multiple factors, including the earnings and cash flow potential or the asset value of the respective issuers. The Manager also considers a company’s plans for future operations on a selective basis. The Manager may sell a security if it no longer believes the security will contribute to meeting the investment objective of the Fund. |
| Wedgewood Partners, Inc. (“Wedgewood”) seeks long-term capital appreciation by investing in equity securities of large capitalization companies that Wedgewood believes have above-average growth prospects. The Fund invests primarily in common stocks. The Fund considers companies with market capitalizations in excess of $5 billion to be large capitalization companies. The Fund is non-diversified and invests in a limited number of companies, generally holding securities of approximately 20 companies. The Fund invests primarily in the securities of U.S. companies, but it may also invest outside of the U.S. Wedgewood seeks investments in market leaders with dominant products or services that are irreplaceable or lack substitutes in today’s economy. Wedgewood invests for the long-term, and expects to hold securities, in many cases, for more than 5 years. |
Market Overview
Markets rose during the March through August period and economic data were mixed, as payroll growth generally exceeded expectations, but annualized GDP growth largely disappointed. Although US markets fell sharply in late-June due to the uncertainty caused by the United Kingdom’s vote to leave the European Union, they rebounded into the third quarter, as investors gained more confidence in the US economy’s ability to withstand global geopolitical risks. In light of an improving economic picture toward the end of the period, hawkish comments by Federal Open Market Committee officials raised expectations for a 2016 rate hike.
Portfolio Review
Stock selection in the information technology sector contributed to performance. Shares of online marketplace eBay rose after the company reported strong quarterly results and management raised guidance for the year, driven by strong gross merchandise volume growth. Stock selection in the health care sector also helped returns. Shares of animal health company Zoetis rose after the company reported strong quarterly results and management raised guidance for the year, citing solid operational performance.
In contrast, stock selection in the consumer discretionary sector hurt returns. Shares of Norwegian Cruise Line fell after management reduced its guidance for the year, citing slower demand trends in Europe. A lack of exposure to financials also hurt returns, as the sector was among the best performers in the S&P 500 benchmark during the period.
Delaware Investments began managing the large cap value portfolio in January 2016. From inception through the end of August 2016, the portfolio had a gross total return of 16.9% compared to 16.2% for the Russell 1000® Value Index. At the portfolio level, relative outperformance versus the benchmark came from stock selection. The portfolio’s investments in the financial sector made the largest contribution to relative returns. As a group, the portfolio’s four financial stocks rose 20.6% versus 13.8% for those in the benchmark. Investments in the energy sector also made a notable contribution. The portfolio’s five energy stocks returned 23.1%, on average, compared to 18.7% for the sector in the benchmark. The largest drags on relative returns came from investments in the industrial and information technology sectors. In industrials, the portfolio’s three holdings trailed those in the broader sector, 16.4% versus 20.6%. Similarly, in the technology sector, stock selection resulted in a performance shortfall. The portfolio’s four technology holdings gained 19.8% compared to 24.4% for the sector in the benchmark. The investment team believes the U.S. stock market is fully valued and expects to see ongoing softness in corporate revenue and earnings growth. Against this backdrop, the team is emphasizing quality, defensiveness and attractive relative value. It’s focused on companies with good balance sheet strength and stable demand profiles for their products and services. The portfolio remains overweight in consumer staples, healthcare and telecommunication services and underweight in most of the more-cyclical areas of the market.
Please note these are partial year returns, as the Wedgewood and Consulting Group Capital Markets (CGCM) relationship was incepted on March 1, 2016. Performance for the Wedgewood Partners’ Large Cap Focused Growth Consulting Group Capital Markets Fund from inception of March 1, 2016 to the period ended August 31, 2016 (net-of-fees) was +6.16% compared with the Russell 1000® Growth Index at 9.6% for the same time period. Positive selection in Consumer Discretionary (Ross Stares and LKQ), Consumer Staples (Kraft Heinz) and Financials (Charles Schwab) helped relative performance. However, these were more than offset by a negative selection in Producer Durables (Stericycle), Technology (Cognizant Technology Solutions), and Healthcare (Perrigo). Further, the allocation to a higher position in cash detracted from results during this time period.
The portion of the Fund managed by Lyrical outperformed the Fund’s market index benchmark, the Russell 1000® Value Index for the period from March 2, 2016, through August 31, 2016. The reporting period was positive for equity markets as stocks bounced back after a sharp selloff in the first six weeks of 2016. Lyrical invests purely on a bottom up basis, and performance is
2
|
| Lyrical Asset Management LP (“Lyrical”) employs a deep value style with a high quality focus. Lyrical employs a value investing philosophy and believes that a portfolio of companies with low valuations relative to their long-term normalized earnings power will outperform the overall market over time and unlike some traditional value investors who are willing to own any business at the right price, Lyrical’s philosophy is to invest only in businesses that it believes are of good quality. Lyrical invests only in the common stock of companies within its investable universe, which is the top 1,000 U.S. listed stocks by market capitalization. |
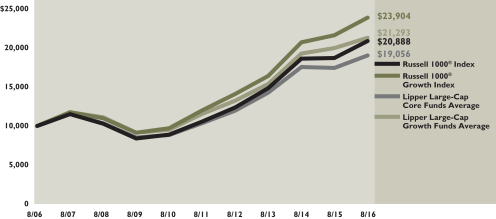
The following graph depicts the performance of Russell 1000® Index1 vs. the Russell 1000® Growth Index11 vs. the Lipper Large-Cap Core Funds Average23 and the Lipper Large-Cap Growth Funds Average15
always a function of stock selection. Lyrical stocks are typically unique businesses, that are not representative of the sectors they are assigned to. As such, the relative performance of sectors and whether Lyrical is under or over weights, has little value in analyzing return attribution. Rather, in analyzing our portfolio’s performance attribution, we find it helpful to examine both the investment success rate and any skew in the distribution of returns. For the period, 83% of the stocks in the portfolio were positive, and 53% outperformed the Russell 1000® Value Index. Skew was also a positive factor. The outperformers in the portfolio outperformed by an average margin of 11%, which was greater than the 9% average margin of underperformance for the underperformers.
|
HISTORICAL PERFORMANCE FOR THE TEN-YEAR PERIOD ENDED AUGUST 31, 2016 LARGE CAP EQUITY FUND Comparison of $10,000 Investment in the Portfolio with the Russell 1000® Index, the Russell 1000® Growth Index, the
Lipper Large-Cap Core Funds Average and the Lipper Large-Cap Growth Funds Average |
The performance shown above and below represents past performance. Past performance is no guarantee of future results and current performance may be higher or lower than the performance shown above and below. Performance figures may reflect voluntary fee waivers and/or expense reimbursements. In the absence of voluntary fee waivers and/or expense reimbursements, the total return would have been lower. Principal value and investment returns will fluctuate and investors’ shares, when redeemed, may be worth more or less than their original cost. To obtain performance data current to the most recent month-end, please visit our website at www.morganstanley.com/cgcm.
The graph above and returns shown below do not reflect the deduction of taxes that a shareholder would pay on fund distributions or the redemption of fund shares.
| | | | | | | | | | | | | | | | | | | | | | | | | | | | | | | | |
| | | LARGE CAP EQUITY FUND Average Annual Total Returns for the Period Ended August 31, 2016† |
| | | | | Without
Annual
Advisory
Program
Fee | | With
Annual
Advisory
Program
Fee* | | Russell 1000®
Index*** | | Russell 1000®
Growth
Index*** | | Lipper
Large-Cap
Core
Funds
Average*** | | Lipper
Large-Cap
Growth
Funds
Average*** |
| | Since inception 11/18/1991 | | | | 8.06 | % | | | | 6.21 | % | | | | 9.71 | % | | | | 8.75 | % | | | | 8.91 | % | | | | 8.81 | % |
| | 10 year | | | | 8.19 | | | | | 5.99 | | | | | 7.64 | | | | | 9.11 | | | | | 6.62 | | | | | 7.92 | |
| | 5 year | | | | 13.69 | | | | | 10.91 | | | | | 14.60 | | | | | 14.74 | | | | | 12.97 | | | | | 13.14 | |
| | 3 year | | | | 11.60 | | | | | 8.61 | | | | | 12.02 | | | | | 13.33 | | | | | 10.13 | | | | | 11.55 | |
| | | 1 year | | | | 7.08 | | | | | 4.43 | | | | | 11.69 | | | | | 10.54 | | | | | 9.34 | | | | | 6.63 | |
See pages 26 through 29 for all footnotes.
3
Small-Mid Cap Equity Fund
|
| ABOUTTHE SUBADVISER |
•Neuberger Berman Investment Advisers LLC (“Neuberger Berman”) |
| Neuberger Berman employs in-depth research to identify out-of-favor small cap companies selling at a significant discount to intrinsic value, where there is a dynamic plan or event that is expected to both enhance value and narrow the price/value gap. Neuberger Berman’s analysts seek to invest when there is a true disconnect between reality and market perception – something that occurs regularly in particular types of companies. For example, we believe the market tends to demonstrate inefficiency in pricing companies with complex corporate structures since many investors will not take the time to understand them. Neuberger Berman’s valuation approach resembles the due diligence effort that a private equity firm might employ to evaluate the purchase of an entire company. Neuberger Berman’s analysts also focus on investing in businesses where management has a significant ownership stake as, in our view, such companies tend to be more aligned with shareholders’ interests. |
|
•Frontier Capital Management Co., LLC (“Frontier”) |
| Frontier is a research-driven firm specializing in the management of growth-oriented U.S. equity portfolios. Frontier believes that growth must be purchased at a reasonable price and that fundamental, bottom-up research is the cornerstone to adding value. The firm’s philosophy since its founding in 1980 is that stock prices ultimately follow earnings growth. Frontier believes that there are three key drivers of long-term, consistent performance and look for companies that possess, improving business models; unrecognized earnings power; and attractive valuations. |
|
•Hahn Capital Management LLC |
| The Hahn Capital Management mid-cap value strategy employs a bottom-up investment process to construct a portfolio of U.S. mid-cap companies that Hahn’s mid-cap value investment team believes possess a combination of high quality balance sheets, sustainable & durable business models, superior management and an attractive valuation relative to Hahn’s estimate of underlying intrinsic value. Protection of capital is the strategy’s primary goal with the ability to compound earnings an important secondary goal. |
For the period of September 1, 2015, through August 31, 2016, the Sub-advisers for CGCM Small-Mid Cap Equity Fund (“Fund”) were Neuberger Berman Investment Advisers, LLC (“Neuberger Berman”), Frontier Capital Management Co., LLC (“Frontier”), Hahn Capital Management, LLC, Rutabaga Capital Management, LLC (“Rutabaga”), Westfield Capital Management Company, L.P. (“Westfield”), and BlackRock Financial Management, Inc. (“BlackRock”).
The Neuberger Berman sleeve of the Fund underperformed the Fund’s benchmark, the Russell 2000® Value Index, since inception (3/1/2016) through August 31, 2016. Given a backdrop of subdued economic growth, the overarching theme to the investment landscape of 2016 has been the search for income. With bond yields near historic lows, many investors have turned their attention to dividend paying companies. Real Estate Investment Trusts, Utilities and Consumer Staples have seen significant appreciation from investors hungry for income. Even many non-cyclical companies that don’t pay dividends but that generate high levels of discretionary cash flow are now viewed as fixed income surrogates. The apparent preference for dividends and free cash flow, coupled with doubts about the vibrancy of the global economy, presents a challenge to our investing style.
At the core of our strategy is an expectation of a return to growth or cyclical recovery. It is the prospect of a material improvement in a company’s cash flow, and financial strength beyond what investors currently expect which intrigues us. In 2015, when sentiment was that the Federal Reserve would hike interest rates several times in 2016, we outperformed the Fund’s benchmark. This year the prevailing “slower economy and lower for longer” interest rate mindset has caused our stocks to lag the market rally.
All eyes remain fixed on the Presidential election and the Federal Reserve. While we cannot predict the outcome or the market’s reaction, we firmly believe that the portfolio is attractively valued.
The portion of the fund managed by Frontier trailed the benchmark for the one year period ended August 31, 2016 with a gain of 3.5% versus the 7.0% advance of the Russell Midcap® Growth Index. The majority of underperformance was the result of negative stock selection. Specifically within health care, we incurred stock specific setbacks in the biotech and specialty pharmaceutical space in terms of new product development. Within consumer staples, increased competitive pressures in the health & nutritional industry adversely impacted our investments. Examining sector allocation, we were hindered by our positioning in these same sectors. We remain overweight health care given its attractive innovation and secular growth characteristics. We continue to be underweight consumer staples as we view valuations as extended and growth muted.
Attribution was strongest in technology and consumer discretionary. Specifically in technology, investments in video gaming firms (Activision and Electronic Arts) as well as financial data processing companies (Global Payments and Vantiv) performed well. In consumer discretionary our focus on improved fundamentals for lower income consumers led to solid gains.
4
|
•Rutabaga Capital Management LLC (“Rutabaga”) |
| Rutabaga focuses exclusively on micro- and small capitalization stocks and looks to unearth uncommon or currently out-of-favor stocks. The firm’s analysts employ extensive bottom-up fundamental research to identify high quality companies with catalysts to increase margins and intrinsic value but are neglected or misperceived by the market. |
|
•Westfield Capital Management Company, L.P. (“Westfield”) |
| Westfield favors investing in earnings growth stocks given a conviction that stock prices follow earnings progress and that they offer the best opportunity for superior real rates of return. Reasonably priced stocks of companies with high foreseen earnings potential are best identified through in-depth, fundamental research. It is Westfield’s belief that the small capitalization portion of the market is under-researched, and therefore less efficient, than the large capitalization sector. |
|
•BlackRock Financial Management, Inc. (“BlackRock”) |
| BlackRock Financial Management, Inc. employs a “passive” management approach, attempting to invest in a portfolio of assets whose performance is expected to match approximately the performance of the Russell 2500® Index. The Fund will be substantially invested in securities in the Russell 2500® Index, and will invest, under normal circumstances, at least 80% of its assets in securities or other financial instruments that are components of or have economic characteristics similar to the securities included in the Russell 2500® Index. |
After three consecutive years of flat S&P 500 operating earnings, Wall Street is forecasting 14% earnings growth in 2017. Expectations for a sharp acceleration seem overly optimistic, as such, selectivity will be vital.
We continue to find attractive investments in gaming software, transaction processing, information services, health care, infrastructure materials and wireless communications. Conversely, we have become more concerned about consumer fundamentals and valuations in safe haven sectors such as REITs, utilities and staples and have positioned the portfolio accordingly.
The portion of the Fund managed by Hahn Capital Management underperformed the Fund’s benchmark, the Russell Midcap® Value Index, for the year ended August 31, 2015. The Russell Midcap® Value Index was little changed in the fourth quarter before declining precipitously during the first six weeks of 2016. U.S. markets then started a rally that was unabated save for a brief, sharp sell-off at the end of June related to the surprise decision by U.K. voters to exit the European Union. The majority of our underperformance during the period was concentrated in economically sensitive stocks, particularly our holdings in Industrials, Consumer Discretionary and Financials. In industrials, the key detractors have been Wabtec, Snap-On and Covanta as the stronger dollar and the generally weakening growth outlook for global manufacturing caused shares to underperform the benchmark. In the Consumer Discretionary sector, key detractors included retailer Nordstrom and branded clothing companies Carters and Hanesbrands. Our consumer discretionary companies have experienced a slow-down in growth due to a cautious consumer spending environment. Returns in the financials sector were held back by real estate services company CBRE Group and our exposure to banks with CIT Group and BankUnited being the primary detractors. As U.S. interest rates have continued to decline during 2016, the banking industry stocks have come under considerable pressure due to concerns about future bank profitability and growth prospects. On the positive side, our materials sector exposure was a significant positive contributor, including portfolio companies Reliance Steel and Albemarle. Reliance Steel saw meaningful margin expansion due to lower steel input prices and Albemarle is experiencing a global boom in demand for Lithium, one of its key products, due to rising demand for batteries in the electric car industry. It is not unusual for our strategy to underperform during the late stages of a bull market. With valuations at very rich levels and economic growth slowing perceptibly, risk is rising in U.S markets. Managing risk is at the core of our philosophy and process, and our strategy tends to outperform substantially during market dislocations and periods of greater volatility.
The portion of the Fund managed by Rutabaga slightly outperformed the benchmark, the Russell 2500® Index, for the one-year period ended August 31, 2016. Sector allocation was a headwind. Rutabaga has no exposure to Utilities, which was the strongest performer during the time period, and we did have some exposure to the energy sector, which was the worst performing sector for the fiscal year. The U.S. equity markets have been reasonably robust during this time period in the face of continued global economic sluggishness and slowing earnings growth for domestic companies. Nevertheless, the investment team’s pipeline of new ideas remains healthy. Rutabaga remains committed to finding companies that are neglected and attractively valued and that possess internal catalysts to grow their earnings faster than other investors are expecting.
The CGCM Small-Mid Cap Growth Fund (“the portfolio”) returned -1.58% (gross) during the fiscal year ended August 31, 2016, underperforming the Russell 2000® Growth Index (the “index”), which gained 3.55%. The Industrials and Health Care sectors accounted for the majority of the relative performance shortfall. The portfolio’s lack of exposure to Consumer Staples and Telecommunication Services, which were the index’s best performing sectors during the period, also held back relative results. Investments in Information Technology and Financials were the most significant sources of relative gains.
The Industrials sector was the portfolio’s worst relative performer. While our investments in industrial machinery and trading companies & distributors posted double-digit gains, their
5
The following graph depicts the performance of Russell 2500® Index2 vs. the Russell 2000® Growth Index13 vs. the Lipper Small-Cap Core Funds Average24 and the Lipper Small-Cap Growth Funds Average16
positive impact was offset by stock-specific weakness within airlines and heavy electrical equipment. Most of the underperformance in the Health Care sector stemmed from our biotechnology, health care services, and pharmaceutical stocks. The biopharmaceuticals group was marked by significant volatility during the period — the Nasdaq Biotech Index was down 17.58%, a challenging environment for investing.
The Information Technology sector contributed positively to excess returns, aided by successful stock picking across multiple sub-industries. Most of the relative gains came from the portfolio’s holdings in semiconductors, IT consulting and services, and data processing. Additionally, our investments in Financials outperformed broadly during the period. As price action within the sector tends to be closely correlated with macro-economic news and the direction of interest rates, we continue to focus on idiosyncratic ideas that can outperform regardless of the rate environment.
The portion of the Fund managed by BlackRock underperformed the Fund’s market index benchmark, the Russell 2500® Index, for the year ended August 31, 2016. During the period, U.S. equities capitalized on the upward momentum from the beginning of the year, which continued through the latter half of 2016 largely driven by healthy macro-economic data and positive earnings surprises. Domestic equity markets posted gains despite increased volatility in June from the “Brexit”, i.e., the United Kingdom’s vote to leave the European Union. Following the vote, equity markets declined worldwide and investors rushed to high quality assets, driving U.S. Treasury yields further down. The underperformance of the Fund compared to its benchmark was primarily driven by security sampling and transaction costs.
|
HISTORICAL PERFORMANCE FOR THE TEN-YEAR PERIOD ENDED AUGUST 31, 2016 SMALL-MID CAP EQUITY FUND Comparison of $10,000 Investment in the Portfolio with the Russell 2500® Index, the Russell 2000® Growth Index,
the Lipper Small-Cap Core Funds Average and the Lipper Small-Cap Growth Funds Average |

The performance shown above and below represents past performance. Past performance is no guarantee of future results and current performance may be higher or lower than the performance shown above and below. Performance figures may reflect voluntary fee waivers and/or expense reimbursements. In the absence of voluntary fee waivers and/or expense reimbursements, the total return would have been lower. Principal value and investment returns will fluctuate and investors’ shares, when redeemed, may be worth more or less than their original cost. To obtain performance data current to the most recent month-end, please visit our website at www.morganstanley.com/cgcm.
The graph above and returns shown below do not reflect the deduction of taxes that a shareholder would pay on fund distributions or the redemption of fund shares.
6
| | | | | | | | | | | | | | | | | | | | | | | | | | | | | | | | |
| | | SMALL-MID CAP EQUITY FUND Average Annual Total Returns for the Period Ended August 31, 2016† |
| | | | | Without
Annual
Advisory
Program
Fee | | With
Annual
Advisory
Program
Fee* | | Russell 2500®
Index*** | | Russell 2000®
Growth
Index*** | | Lipper
Small-Cap
Core
Funds
Average*** | | Lipper
Small-Cap
Growth
Funds
Average*** |
| | Since inception 11/18/1991 | | | | 8.84 | % | | | | 6.98 | % | | | | 10.98 | % | | | | 7.62 | % | | | | 10.55 | % | | | | 10.17 | % |
| | 10 year | | | | 6.57 | | | | | 4.40 | | | | | 8.02 | | | | | 8.20 | | | | | 6.87 | | | | | 7.53 | |
| | 5 year | | | | 10.99 | | | | | 8.28 | | | | | 13.56 | | | | | 13.02 | | | | | 11.90 | | | | | 11.51 | |
| | 3 year | | | | 5.85 | | | | | 3.01 | | | | | 9.62 | | | | | 8.48 | | | | | 7.75 | | | | | 6.65 | |
| | | 1 year | | | | (5.51 | ) | | | | (7.85 | ) | | | | 8.79 | | | | | 3.55 | | | | | 7.73 | | | | | 2.50 | |
See pages 26 through 29 for all footnotes.
7
International Equity Fund
|
| ABOUTTHE SUBADVISERS |
•Causeway Capital Management LLC (“Causeway”) |
Causeway’s international developed market investment philosophy is based on a long-term value strategy and the investment team applies an active, bottom-up, research-intensive approach towards stock selection. Causeway’s investment approach seeks to identify under-priced stocks of high quality companies believed to be exhibiting superior financial strength as compared to peers. In addition to fundamental analysis, quantitative research is considered an integral part of the process and is used for screenings of investment candidates as well as risk management. Portfolio managers work as a team to make investment decisions and are supported by the firm’s dedicated fundamental and quantitative research analysts. Analysts and portfolio managers are assigned global industry-specific research responsibilities. Fundamental research is further organized into six research clusters: financials/materials, consumer, industrial/ manufacturing, energy, technology and health care. Causeway’s unconstrained, international established market value equity approach invests in a variety of market capitalization ranges, but primarily in large- and midcapitalization non-U.S. developed market companies. Causeway can also invest in small-cap issues and less developed emerging markets. Value-driven security characteristics may include low price/earnings ratio, low price/ book ratio, low price/cash flow ratio and high dividend yield, but may also include out-of-favor companies that may have high rates of growth of earnings. Sector and regional weights are byproducts of the investment process. •BlackRock Financial Management, Inc. (“BlackRock”) BlackRock Financial Management, Inc. employs a “passive” management approach, attempting to invest in a portfolio of assets whose performance is expected to match approximately the performance of the MSCI EAFE® Index (Net). The Fund will be substantially invested in securities in the MSCI EAFE® Index (Net), and will invest, under normal circumstances, at least 80% of its assets in securities or other financial instruments that are components of or have economic characteristics similar to the securities included in the MSCI EAFE® Index (Net). |
|
•OppenheimerFunds, Inc. (“OFI”) |
| OFI’s Global Equity team seeks to generate alpha through high conviction decisions driven by fundamental bottom-up analysis. Several secular growth themes are used as a way to focus attention on segments of the global marketplace that may grow faster than world |
For the period of September 1, 2015, through August 31, 2016, the Sub-advisers for CGCM International Equity Fund (“Fund”) were Causeway Capital Management, LLC (“Causeway”), BlackRock Financial Management, Inc. (“BlackRock”), OppenheimerFunds, Inc. (“OFI”), and Schroder Investment Management North America, Inc. (“Schroders”).
The portion of the Fund managed by Causeway underperformed the Fund’s market index benchmark, the MSCI EAFE® Index (Net), for the year ended August 31, 2016. International equity markets delivered slightly negative performance for the year, with mixed performance coming from the various constituent markets which comprise the investible universe. The top performing markets were New Zealand, South Korea, Australia, Hong Kong, and Belgium. The biggest laggards included Italy, Spain, Israel, Ireland, and the United Kingdom. The portfolio underperformed primarily due to weak stock selection. However, it is worth noting that the strategy faced a headwind, as ‘value’ as a style underperformed ‘growth’ by over one hundred basis points during the year. Holdings in the banks, automobiles & components, transportation, and energy industry groups, along with an underweight position in the household & personal products industry group, detracted from the portfolio’s relative performance. Meanwhile, holdings in the media, telecommunication services, technology hardware & equipment, and software & services industry groups, as well as an underweight position in the retailing industry group, offset some of that relative underperformance. Banking and financial services companies — namely Barclays Plc (United Kingdom), Lloyds Banking Group Plc (United Kingdom), and UBS Group AG (Switzerland) — were amongst the largest detractors from absolute performance. Additional notable detractors included automobile manufacturer, Volkswagen AG (Germany) and insurance company, Aviva Plc (United Kingdom). The single largest contributor to absolute performance was electronic equipment manufacturer, Samsung Electronics Co., Ltd. (South Korea). Additional top contributors included telecommunication services provider, KDDI Corp. (Japan), British American Tobacco Plc (United Kingdom), print & publishing company, RELX NV (Netherlands), and business software & services provider, SAP SE (Germany).
The portion of the Fund managed by BlackRock underperformed the Fund’s market index benchmark, the MSCI EAFE® Index (Net), for the month ended August 31, 2016. Global equity markets broadly rallied during the month as Japan announced additional fiscal and monetary stimulus and the Bank of England cut rates. Leading into August, markets had a strong start to the quarter as expectations of a near-term Fed rate hike diminished, Japan announced another round of fiscal stimulus, and the earnings season had a strong start. Despite multiple terrorist attacks in France and Germany and a failed coup in Turkey, the markets continued to rally into the latter half of 2016 on the back of a strong earnings season and monetary stimulus from the Bank of England.
The portion of the Fund managed by OFI outperformed the Fund’s market index benchmark, the MSCI EAFE® Index (Net), for the one-year period ended August 31, 2016. The portfolio’s outperformance was largely the result of an underweight position in the Financials sector, and stock selection in the Information Technology and Health Care sectors. The portfolio underperformed the benchmark in the Real Estate sector, where lack of exposure detracted from performance. The portfolio also underperformed in the Telecommunication Services sector, as a result of stock
8
|
| GDP. The team’s investment process is driven by a number of very powerful, long-term economic, demographic and technological forces summarized as MANTRA®—Mass Affluence, New Technologies, Restructuring and Aging. The portfolio managers utilize a bottom-up, fundamental investment approach, and seek to invest initially in high-quality companies that are temporarily out of favor; trading at attractive valuations; and which demonstrate sustainable, above-average growth potential over a three- to five-year time horizon. The process is index agnostic, searching for companies with high growth rates and high quality balance sheets with minimal focus with respect to region or country, sector or security. |
|
•Schroder Investment Management North America, Inc. (“Schroders”) |
| Schroders uses a bottom-up growth oriented approach towards stock selection and employs a fundamental, research driven process to identify quality growth companies with attractive medium-term growth and valuation, quality management and financial position, and a sustainable competitive advantage. Schroders’ “best ideas” portfolio blends both core and opportunistic holdings. |
selection. The portfolio’s country and regional allocations are a rolled up reflection of the portfolio’s individual stock selections. That being said, the portfolio outperformed the benchmark in France, Switzerland and Spain, due to stock selection. Top detractors on a country basis included stock selection and an overweight position in the United Kingdom, and underweight positions in Hong Kong and Belgium.
International equity markets ended the 12-month period broadly flat in dollar terms, navigating scares around China’s economic growth and Britain’s decision to exit the European Union. This dynamic presented us with some excellent buying opportunities.
The fund outperformed the benchmark over the period, driven by stock selection. Some of the top contributors have been our technology holdings. Chip manufacturer TSMC was the standout performer as their scale and lead in manufacturing delivered market share gains despite a period of de-stocking and weakness in smartphone sales around the world. Chinese e-commerce giant Alibaba was another key performer. Our conviction here strengthened, and we do not believe that the market is adequately recognising the growth potential of their cloud computing and payments businesses. The sector as a whole is home to many exceptionally strong and disruptive companies at present, and we increased our exposure through new holdings in Keyence and Naver. Japanese company Keyence is rapidly growing by offering manufacturing businesses customized automation solutions that use sensors and monitoring equipment to improve productivity. Naver are dominant in online search and ecommerce within their home country Korea, and have more recently developed a powerful messaging platform called Line which has become the main consumer messaging platform in Japan and Taiwan.
Our focus in innovation in the healthcare sector was also beneficial. Life sciences firm Lonza was a standout performer, where the company’s pipeline of contracts to supply many of the new drugs that are coming to market helped drive returns. The dual pressure from demographic trends (such as ageing populations and increasing life expectancy) and limited government budgets, necessitates ongoing innovation in the sector. New purchases Shire, Roche and Otsuka, are examples of companies we feel are ahead of the curve in this area.
A number of our bank holdings suffered, buffeted by concerns about rising credit provisions for commodity sector loans and negative interest rates in the EU and Japan. We have consolidated exposure to the sector somewhat and focused on holding only banks where we feel the capital generation and capital position is strong. Deutsche Bank and HSBC both left the portfolio in the period as a result.
A large detractor was Indian telecoms provider Idea Cellular, where a disruptive new entrant has created a phase of increased pressure on telecom industry profitability and we have sold the position. We do however remain positive on India, which is one of the most vibrant growth economies in the world today, and retain exposure through a holding in HDFC Bank.
One thing that concerns us is the extent of recent investor preference for ‘low volatility’ stocks as the era of very low interest rates forces investors to look for alternatives to bond like income streams. This group of defensive businesses are now valued at a premium to more economically sensitive industries that is hard to justify by fundamentals, and will be vulnerable to any increase in global interest rates. We have low exposure to utility and real estate stocks on this basis.
There are of course considerable political and economic uncertainties, but this is always the case. In the long run we could not be more confident that well governed companies that invest to drive growth and maintain a sustainable competitive advantage will outperform, and we remain intensely focused on seeking out these companies.
9
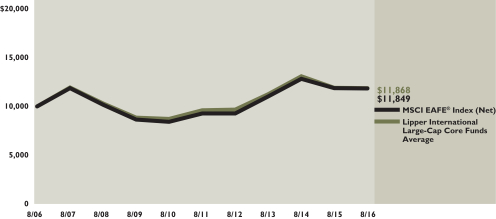
The following graph depicts the performance of Morgan Stanley Capital International Europe, Australasia, Far East (MSCI EAFE®) Index (Net)3 vs. the Lipper International Large-Cap Core Funds Average17
|
HISTORICAL PERFORMANCE FOR THE TEN-YEAR PERIOD ENDED AUGUST 31, 2016 INTERNATIONAL EQUITY FUND Comparison of $10,000 Investment in the Portfolio with the Morgan Stanley Capital International Europe, Australasia, Far East (MSCI EAFE®) Index (Net) and the Lipper International Large-Cap Core Funds Average |
The performance shown above and below represents past performance. Past performance is no guarantee of future results and current performance may be higher or lower than the performance shown above and below. Performance figures may reflect voluntary fee waivers and/or expense reimbursements. In the absence of voluntary fee waivers and/or expense reimbursements, the total return would have been lower. Principal value and investment returns will fluctuate and investors’ shares, when redeemed, may be worth more or less than their original cost. To obtain performance data current to the most recent month-end, please visit our website at www.morganstanley.com/cgcm.
The graph above and returns shown below do not reflect the deduction of taxes that a shareholder would pay on fund distributions or the redemption of fund shares.
| | | | | | | | | | | | | | | | | | | | | | |
| | | INTERNATIONAL EQUITY FUND Average Annual Total Returns for the Period Ended August 31, 2016† |
| | | | | Without
Annual
Advisory
Program
Fee | | With
Annual
Advisory
Program
Fee* | | MSCI
EAFE®
Index
(Net)*** | | Lipper
International
Large-Cap
Core Funds
Average*** |
| | Since inception 11/18/1991 | | | | 5.02 | % | | | | 3.22 | % | | | | 5.20 | % | | | | 6.28 | % |
| | 10 year | | | | 1.21 | | | | | (0.85 | ) | | | | 1.71 | | | | | 1.34 | |
| | 5 year | | | | 3.69 | | | | | 1.16 | | | | | 5.00 | | | | | 3.84 | |
| | 3 year | | | | 1.28 | | | | | (1.44 | ) | | | | 2.47 | | | | | 1.46 | |
| | | 1 year | | | | 0.96 | | | | | (1.54 | ) | | | | (0.12 | ) | | | | (0.24 | ) |
See pages 26 through 29 for all footnotes.
10
Emerging Markets Equity Fund
|
| ABOUTTHE SUBADVISER |
•Van Eck Associates Corporation (“VanEck”) |
| VanEck is privately held global asset management firm founded in 1955. VanEck’s mission is to develop and offer investors forward-looking, intelligently designed investment strategies that strengthen a long-term portfolio. VanEck’s Emerging Markets Equity Strategy (“Strategy”) seeks long-term competitive risk-adjusted returns through investments that demonstrate structural growth at a reasonable price. The Strategy seeks to uncover structural growth opportunities wherever they exist within emerging markets, and employs a fundamentally driven stock selection and research process with the flexibility to invest across the market capitalization spectrum. |
•BlackRock Financial Management, Inc. (“BlackRock”) |
| BlackRock Financial Management, Inc. employs a “passive” management approach, attempting to invest in a portfolio of assets whose performance is expected to match approximately the performance of the MSCI Emerging Market Index (Net). The Fund will be substantially invested in securities in the MSCI Emerging Market Index (Net), and will invest, under normal circumstances, at least 80% of its assets in securities or other financial instruments that are components of or have economic characteristics similar to the securities included in the MSCI Emerging Market Index (Net). |
•Lazard Asset Management, LLC (“Lazard”) |
Lazard, an indirect, wholly-owned subsidiary of Lazard Ltd., is known for its global perspective on investing and years of experience with global, regional and domestic portfolios. With more than 300 investment personnel worldwide, Lazard offers investors of all types an array of equity, fixed income, and alternative investment solutions from its network of local offices in ten different countries. Its team-based approach to portfolio management helps Lazard to deliver robust and consistent performance over time, and strong client relationships allow them to understand how to employ their capabilities to its clients’ advantage. Lazard manages a relative value strategy (“Value Strategy”) and invests primarily in equity securities, principally common stocks, |
For the period of September 1, 2015, through August 31, 2016, the Sub-advisers for CGCM Emerging Markets Equity Fund (“Fund”) were Van Eck Associates Corporation (“VanEck”), BlackRock Financial Management, Inc. (“BlackRock”), and Lazard Asset Management, LLC (“Lazard”).
For the period since its launch on July 20, 2016, until the financial year ended August 31, 2016, the VanEck Emerging Markets Equity strategy underperformed the Fund’s market index benchmark, the MSCI Emerging Markets Index (Net). Over this period the MSCI Emerging Markets Index (Net) increased by 2.52% in U.S. dollar terms.
Emerging markets equities continued to perform well during the period, outperforming most major global indices, including the S&P 500®. The asset class continued to gather momentum following the Brexit vote as investors’ expectations seemed to be settling for lower rates for longer and continued quantitative easing. Those expectations were reinforced by not-so-great macro data from the U.S.
On a strategy level, growth exposure aided relative performance, while size continued to detract, as small caps underperformed large caps. On a country level, the strategy benefited from its exposure to China, Taiwan, and Thailand. Its exposures to Russia, Jordan, South Korea, and Brazil detracted from performance. On a sector level, selection in consumer discretionary and utilities sectors aided while exposures in information technology and healthcare sectors detracted on the basis of both allocation and stock selection.
The portion of the Fund managed by BlackRock outperformed the Fund’s market index benchmark, the MSCI Emerging Markets Index (Net), for the month ended August 31, 2016. There was large dispersion among the performance of the individual countries, with EM economies at different phases of recovery and stability, both political and economic. Egypt announced it was seeking a loan package with the International Monetary Fund to improve liquidity and boost confidence in the economy. China implemented significant fiscal and monetary stimulus policies in the face of economic slowdown. Markets reacted positively to the stimulus and Moody’s upgraded its economic forecast on the back of the news. Outside the stimulus, the economic slowdown continued to be a drag on demand for raw materials, which contributed to underperformance and volatility in commodity-exporting countries such as Chile, Mexico, South Africa, and Peru. Brazilian equities, however, were resilient amid this pressure as well as political reshuffling and mixed news around the Olympic Games the country hosted during the summer.
In the twelve month period ended 31 August 2016, equities in emerging markets improved and performed reasonably well. The apparent stabilization in some commodity prices as well as a dramatic change in the Brazilian political landscape followed a period of severe commodity price weakness and political turmoil in Brazil in the last four months of 2015. The MSCI Emerging Markets Index (Net) rose by almost 12%, as measured in US dollar terms, with Latin American markets performing very strongly. Shares in eastern Europe also increased, while Asian markets, which were adversely affected by the risk of renminbi currency devaluation, performed the least well.
11
|
| of non-U.S. companies whose principal activities are located in emerging or developing market countries. In the Value Strategy, assets are invested in companies that are believed to be undervalued based on their earnings, cash flow or asset values. Lazard’s approach consists of an analytical framework, accounting validation, fundamental analysis and portfolio construction parameters and its selection process focuses on growth and considers the sustainability of growth and the tradeoff between valuation and growth. |
The period included the aftermath of the People’s Bank of China’s August 2015 attempt to devalue the renminbi due to concerns about the competitiveness of Chinese industry. The capital markets’ reaction to this, both in 2015 and when it was attempted again in January 2016, was very negative and pressured Chinese share prices.
Eastern European markets were adversely affected by the Brexit vote, in which the United Kingdom voted to leave the European Union. This negatively pressured EU member country markets such as Greece and Poland as well as shares of companies in Turkey and South Africa, which have significant trade relationships with the United Kingdom. The Turkish market was also depressed by an unsuccessful coup against the government of President Erdogan. Following this event, a crackdown occurred on individuals affiliated with the Gulen movement, the group Erdogan blamed for the coup. South African shares were also negatively affected by President Zuma’s decision to replace the Finance Minister by a relatively unknown politician. This was ultimately reconsidered and a former Finance Minister, Pravin Gordhan, was installed. In August 2016, the market and the rand were again hit, this time from an apparent dispute between Zuma and Gordhan over a tax investigation.
Latin American markets rebounded strongly over the twelve months, helped by the apparent stability in commodity prices as well as the dramatic change in Brazilian political circumstances. Towards the end of 2015, the Petrobras fraud scandal, known as Operation Car Wash, had paralyzed the Congress and caused the end of Finance Minister Joaquim Levy’s period in office. With the economy deep in recession, many Brazilian companies cut costs aggressively and feared for more economic hardship. In March 2016, a phone conversation between President Dilma Rousseff and former President Luiz Inacio Lula da Silva, apparently explaining that she would put him in her cabinet to protect him from a corruption investigation, was leaked. This set in motion two impeachment votes which ultimately removed Rousseff from office. The market as well as the real rallied very strongly in anticipation of efforts to reduce the budget deficit and help stabilize the economy.
From a sector perspective, the information technology and materials sectors outperformed the index while the telecom services and industrials sectors underperformed during the period.
Portfolio Review
During the period, Sberbank, a Russian bank, announced strong earnings and upgraded its guidance for return on equity. Taiwan Semiconductor Manufacturing (TSMC), a Taiwanese manufacturer of semiconductors, performed well on expectations of a strong third quarter ramp up from sales of Apple’s new iPhone 7. NetEase, a Chinese publisher of online games and web portal, reported solid first quarter results and gave an upbeat assessment of its game pipeline. Telekomunikasi Indonesia, an Indonesian telecom services company, experienced strong growth in data usage leading to improving average revenue per user (APRUs). Stock selection in the financials, information technology, and industrials sectors, and in China and Taiwan helped performance. A higher-than-index exposure to Brazil added value.
In contrast, shares of Pretoria Portland Cement (PPC), a South African cement company, declined after the company announced a major capital raise in order to shore up the stressed balance sheet. Shares of Hanwha Life Insurance, a Korean insurance company, fell on expectations for a continued environment of low interest rates in Korea. PLDT, a Philippine telecom services company, announced disappointing results coupled with weak guidance as the company conducts its turnaround strategy. Shares of YPF, an Argentine energy company, declined on concerns that the country’s oil producer subsidy scheme could be adjusted after the presidential elections. Stock selection in the materials and energy sectors hurt performance.
Outlook
We emphasize that during times of higher market volatility, while often trying for individual investors, can be opportunities for skilled active management. Our fundamental approach and portfolio construction processes are consistent across all market environments. We continue to
12
The following graph depicts the performance of MSCI Emerging Markets Index (Net)4 vs. the Lipper Emerging Markets Funds Average18
seek out companies with strong cash flows that can withstand lower economic growth. Emerging markets relative valuations have not changed significantly due to the Brexit vote, and emerging markets equities are still inexpensive compared to other global equities. In addition, emerging markets still have strong profitability levels, which have proved to be resilient. Unless the world has a significant recession, in our view, emerging markets are attractively priced.
We also acknowledge that the uncertainty in the markets is palpable. We believe that many of the drivers of that uncertainty are not as dire as the markets seem to believe, but we doubt that this uncertainty will dissipate over the next few months. For now, the risk tail is wagging the fundamental dog, but we believe investors should prepare for when fundamentals drive markets again. If global growth accelerates and commodities prices stabilize, we believe the ensuing confidence to investors could lead to significant support for emerging markets assets.
|
HISTORICAL PERFORMANCE FOR THE TEN-YEAR PERIOD ENDED AUGUST 31, 2016 EMERGING MARKETS EQUITY FUND Comparison of $10,000 Investment in the Portfolio with the MSCI Emerging Markets (Net)
and the Lipper Emerging Markets Funds Average |
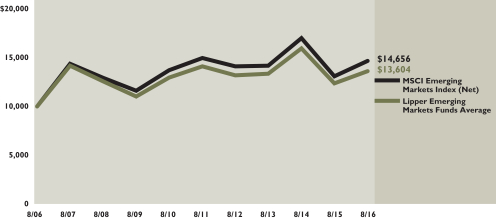
The performance shown above and below represents past performance. Past performance is no guarantee of future results and current performance may be higher or lower than the performance shown above and below. Performance figures may reflect voluntary fee waivers and/or expense reimbursements. In the absence of voluntary fee waivers and/or expense reimbursements, the total return would have been lower. Principal value and investment returns will fluctuate and investors’ shares, when redeemed, may be worth more or less than their original cost. To obtain performance data current to the most recent month-end, please visit our website at www.morganstanley.com/cgcm.
The graph above and returns shown below do not reflect the deduction of taxes that a shareholder would pay on fund distributions or the redemption of fund shares.
| | | | | | | | | | | | | | | | | | | | | | |
| | | EMERGING MARKETS EQUITY FUND Average Annual Total Returns for the Period Ended August 31, 2016† |
| | | | | Without
Annual
Advisory
Program
Fee | | With
Annual
Advisory
Program
Fee* | | MSCI
Emerging
Markets
Index
(Net)*** | | Lipper
Emerging
Markets
Funds
Average*** |
| | Since inception 4/20/1994 | | | | 4.36 | % | | | | 2.55 | % | | | | N/A | | | | | 5.41 | % |
| | 10 year | | | | 2.70 | | | | | 0.61 | | | | | 3.90 | % | | | | 3.43 | |
| | 5 year | | | | (1.08 | ) | | | | (3.50 | ) | | | | (0.42 | ) | | | | (0.42 | ) |
| | 3 year | | | | 1.65 | | | | | (1.08 | ) | | | | 1.12 | | | | | 0.86 | |
| | | 1 year | | | | 15.31 | | | | | 12.46 | | | | | 11.83 | | | | | 10.08 | |
See pages 26 through 29 for all footnotes.
13
Core Fixed Income Fund
|
| ABOUTTHE SUB-ADVISER |
•Metropolitan West Asset Management LLC (“MetWest”) |
| MetWest seeks to achieve consistent outperformance through the measured and diversified application of five fixed income management strategies, including: (i) duration management; (ii) yield curve positioning; (iii) sector allocation; (iv) security selection; and (v) opportunistic execution. Predicated on a long-term economic outlook, MetWest employs a value-oriented approach to managing fixed income that recognizes the periodic inefficient nature of over-the-counter markets and the mean-reverting characteristics of the investable universe. |
|
•Western Asset Management Company (“Western”) |
| Western combines traditional analysis with innovative technology applied to all sectors of the market. Western believes inefficiencies exist in the fixed-income market and attempts to add incremental value by exploiting these inefficiencies across all eligible market sectors. The key areas of focus are: (i) sector and sub-sector allocation; (ii) issue selection; (iii) duration; and (iv) term structure. |
|
•BlackRock Financial Management, Inc. (“BlackRock”) |
BlackRock’s Customized Core strategy employs a fundamental, diversified, relative-value approach that seeks alpha by strategically allocating among three alpha sources - macro strategies, sector allocation and security selection - based on best and highest information ratio ideas, and aims to provide superior long-term performance relative to the benchmark index by creating a diversified portfolio of investment grade securities. A disciplined and risk-budgeted risk management framework which consists of determining interest rate risk, yield curve risk, cash flow risk, credit risk and liquidity risk of all securities. |
For the period of September 1, 2015, through August 31, 2016, the Sub-advisers for CGCM Core Fixed Income Fund (“Fund”) were Metropolitan West Asset Management, LLC (“MetWest”), Western Asset Management Company (“Western”), and BlackRock Financial Management, Inc. (“BlackRock”).
The portion of the Consulting Group Capital Markets Core Fixed Income Fund (CGCM) managed by Metropolitan West Asset Management lagged the Barclays Capital U.S. Aggregate BondTM Index (“Index”) during the twelve month period ending 8/31/2016, returning 5.3% versus an Index return of 6.0%. Underperformance was due in part to the defensive duration profile as Treasury rates beyond the 2-Year fell over the period. Additionally, the relative underweight to outperforming non-U.S. sovereign credit and better performing industrial sectors such as basic industry and communications weighed on relative returns. Meanwhile, issue selections in investment grade corporate in electric, banking, insurance, midstream, airlines, and healthcare contributed, but the less-than-Index allocations to technology, consumer non-cyclicals such as food and beverage, metals and mining, as well as wirelines and media entertainment weighted on returns. In securitized products, the overweight to commercial mortgage-backed securities (CMBS) was additive, though the emphasis on agency-backed issues detracted as the sector was weighed down by abundant issuance. Finally, favorable issue selection among non-agency mortgage-backed securities (MBS) boosted returns, particularly those backed by alt-a and subprime collateral given ongoing improvements in the underlying borrower profiles.
The portion of the Fund managed by Western Asset Management outperformed its benchmark, the Barclays Capital U.S. Aggregate BondTM Index, by 180 basis points for the trailing 12-month period ending August 31, 2016. The US saw continued mild yet positive economic growth as the economy continued to recover from the financial crisis of 2008. Unemployment hovered around 5% over the period but questions remained regarding the quality of new jobs. Wage gains remained tepid and most measures of inflation failed to show much growth. Nonetheless, the Fed deemed economic improvement to be robust enough to announce in December 2015 its first rate hike since before the crisis. While the Fed indicated that markets should expect further hikes, it remained on hold for the rest of the period as neither subsequent data nor market conditions fully cooperated with the Fed’s expectations. The Fund’s interest rate positioning was a key source of returns over the period. With an emphasis on longer-dated yields, yield curve positioning was the largest contributor over the 1-year period as the curve significantly flattened.
An overweight to duration also contributed as intermediate to long rates fell. Overweights to IG Credit and to HY were also important contributors as these sectors benefited from spread tightening of 27 and 28 bps, respectively. Emerging market positions, which detracted in much of 2015, began to recover in 2016 as oil and commodity prices stabilized and ended the 12-month period as modest contributors. Non-agency MBS also contributed, largely due to coupon payments and principal paydowns. Non-US developed market exposure detracted as a short position to the Japanese yen lost value as the currency rose vs the USD. An underweight to Agency MBS was also a mild detractor as the sector generated positive excess returns vs UST over the year.
14
The following graph depicts the performance of Barclays Capital U.S. Aggregate BondTM Index5 vs. the Lipper Core Bond Funds Average19
The portion of the Fund managed by BlackRock outperformed the Fund’s market index benchmark, the Barclays Capital U.S. Aggregate BondTM Index, for the year ended August 31, 2016. During the period, high volatility and wider spread levels early in the fiscal year were followed by improved risk sentiment and a generally strong fixed income market. BlackRock managed the volatility and to capitalized on its deep expertise across sectors to add returns both via sector rotation and individual security selection within spread sectors as the primary drivers of alpha generation (excess returns versus the benchmark). Positioning within securitized products (ABS and CMBS) was particularly impactful as both sectors exhibited strong performance over the period. Further adding to performance was the portfolio’s preference for single-asset/single-borrower deals within CMBS, which performed better than the more generic conduit deals in the benchmark. Also aiding performance was security selection within credit sectors. The overweight in the midstream energy sub-sector proved particularly beneficial in the latter half of the period. Another sub-sector that augmented performance was the portfolio’s preference for US Banks versus European banks within financials. Detracting from relative performance was the portfolio’s duration positioning. The portfolio’s underweight duration positioning for most of the year was negative for results, particularly in the first quarter of 2016 as rates rallied alongside the sharp decline in oil prices and fears of a global growth slowdown.
|
HISTORICAL PERFORMANCE FOR THE TEN-YEAR PERIOD ENDED AUGUST 31, 2016 CORE FIXED INCOME FUND Comparison of $10,000 Investment in the Portfolio with the Barclays Capital U.S. Aggregate BondTM Index
and the Lipper Core Bond Funds Average |
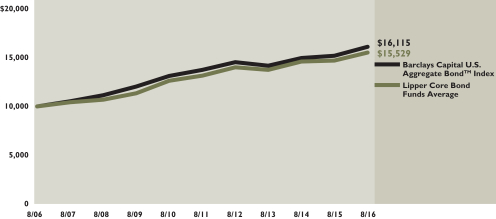
The performance shown above and below represents past performance. Past performance is no guarantee of future results and current performance may be higher or lower than the performance shown above and below. Performance figures may reflect voluntary fee waivers and/or expense reimbursements. In the absence of voluntary fee waivers and/or expense reimbursements, the total return would have been lower. Principal value and investment returns will fluctuate and investors’ shares, when redeemed, may be worth more or less than their original cost. To obtain performance data current to the most recent month-end, please visit our website at www.morganstanley.com/cgcm.
The graph above and returns shown below do not reflect the deduction of taxes that a shareholder would pay on fund distributions or the redemption of fund shares.
| | | | | | | | | | | | | | | | | | | | | | |
| | | CORE FIXED INCOME FUND Average Annual Total Returns for the Period Ended August 31, 2016† |
| | | | | Without
Annual
Advisory
Program
Fee | | With
Annual
Advisory
Program
Fee* | | Barclays
Capital U.S.
Aggregate
BondTM
Index*** | | Lipper
Core Bond
Funds
Average*** |
| | Since inception 11/18/1991 | | | | 5.66 | % | | | | 3.85 | % | | | | 5.95 | % | | | | 5.76 | % |
| | 10 year | | | | 5.53 | | | | | 3.38 | | | | | 4.89 | | | | | 4.44 | |
| | 5 year | | | | 3.86 | | | | | 1.32 | | | | | 3.24 | | | | | 3.27 | |
| | 3 year | | | | 4.41 | | | | | 1.61 | | | | | 4.37 | | | | | 4.02 | |
| | | 1 year | | | | 5.84 | | | | | 3.22 | | | | | 5.97 | | | | | 5.59 | |
See pages 26 through 29 for all footnotes.
15
High Yield Fund
|
| ABOUTTHE SUBADVISERS |
•PENN Capital Management Co., Inc. (“PENN Capital”) |
| PENN Capital’s initial universe is well-defined and includes all domestic, corporate cash paying dollar denominated bond issues that have spread-to-treasury and yield characteristics that are consistent with or wider than the single-B credit tier. PENN Capital’s investment team determines sectors/ industries that may offer relative value based on its macro-economic outlook. The team will review and evaluate the economic cycle, business environment, industry/sectors and interest rates. PENN Capital then scans this group for companies with spreads to treasury that are wider than comparable companies, industry averages and historical averages. The team analyzes the liquidity outlook of the company through qualitative research, including bank loan facility analysis, covenant review analysis and asset value analysis. After the high yield bond universe has been narrowed and potential relative value is identified, the team performs its qualitative research to confirm or justify the credit’s value. The team determines whether or not the credit is suitable for the portfolio given its impact on PENN Capital’s current industry weightings and the diversification it brings to the basket of credits currently held within an industry. |
|
•Western Asset Management Company (“Western”) |
| Western combines traditional analysis with innovative technology applied to all sectors of the market. Western believes inefficiencies exist in the fixed-income market and attempts to add incremental value by exploiting these inefficiencies across all eligible market sectors. The key areas of focus are: (i) sector and sub-sector allocation; (ii) issue selection; (iii) duration; and (iv) term structure. |
For the period of September 1, 2015, through August 31, 2016, the Sub-advisers for CGCM High Yield Fund (“Fund”) were PENN Capital Management Co., Inc. (“PENN Capital”) and Western Asset Management Company (“Western”).
The portion of the Fund managed by PENN Capital underperformed its benchmark by -569 bps using the Opportunistic High Yield strategy for the twelve-month period ending August 31, 2016, generating a 3.56% return compared with a 9.25% return for the BAML US High Yield Constrained Index. Positively, strong security selection in leisure, food & beverage, and gaming contributed favorably to performance. Despite maintaining an in line position to energy production companies over the time period, the strategy’s exposure to energy issuers of mid-tier quality early in the period caused our companies to lag higher quality peers due to falling oil prices. A sizeable underweight to metals and mining also detracted from performance as recovering base metal prices caused the industry to outperform all other areas of the high yield market. The portfolio maintains a positive bias towards single B credit quality bonds, which tend to underperform higher quality double B bonds during periods when treasuries rally. While our double B bonds outperformed those in the index, our single B allocation did not keep up with the strong returns seen in that higher quality segment. The investment that made the largest positive contribution to performance was a position in the unsecured bonds of a US telecommunication company that successfully raised new term loan capital and refinanced their short dated bonds. An investment in the unsecured bonds of an energy production company detracted most greatly from performance. The bonds represented a small position in the fund and were sold in the fourth quarter as we found better value further up the quality spectrum.
The portion of the Fund managed by Western Asset Management underperformed its benchmark, the Barclays Capital U.S. Corporate High-Yield Index, for the trailing 12-month period ending August, 31st, 2016. Energy significantly underperformed from August 2015 — February 2016 and outperformed from March 2016 — August 2016. It was the Fund’s overweight position to Energy during the first six months of the fiscal year and its underweight position in the final six months that was the primary reason for the underperformance. Additionally, issue selection within the energy sub-sector was challenged. Of the six defaults in the Fund, five were energy-related companies. Collectively, the energy defaulted companies contributed -0.81% to performance for the period. The strategy to overweight transportation and consumer cyclical companies also detracted from performance as both sub-sectors underperformed for the period. The Fund’s performance was boosted by a long duration position which was rewarded as the general level of interest rates declined. Also aiding performance was an overweight to the CCC rating category which was the top performing category.
16
The following graph depicts the performance of Barclays Capital U.S. Corporate High-Yield Index6 vs. the Lipper High-Yield Funds Average20
|
HISTORICAL PERFORMANCE FOR THE TEN-YEAR PERIOD ENDED AUGUST 31, 2016 HIGH YIELD FUND Comparison of $10,000 Investment in the Portfolio with the Barclays Capital U.S. Corporate High-Yield Index
and the Lipper High Yield Funds Average |
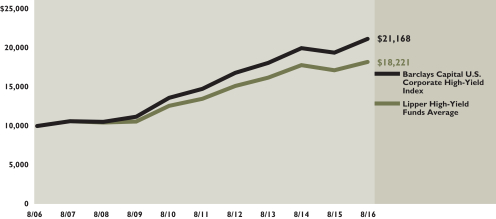
The performance shown above and below represents past performance. Past performance is no guarantee of future results and current performance may be higher or lower than the performance shown above and below. Performance figures may reflect voluntary fee waivers and/or expense reimbursements. In the absence of voluntary fee waivers and/or expense reimbursements, the total return would have been lower. Principal value and investment returns will fluctuate and investors’ shares, when redeemed, may be worth more or less than their original cost. To obtain performance data current to the most recent month-end, please visit our website at www.morganstanley.com/cgcm.
The graph above and returns shown below do not reflect the deduction of taxes that a shareholder would pay on fund distributions or the redemption of fund shares.
| | | | | | | | | | | | | | | | | | | | | | |
| | | HIGH YIELD FUND Average Annual Total Returns for the Period Ended August 31, 2016† |
| | | | | Without
Annual
Advisory
Program
Fee | | With
Annual
Advisory
Program
Fee* | | Barclays
Capital U.S.
Corporate
High-Yield
Index*** | | Lipper
High
Yield Funds
Average*** |
| | Since inception 7/13/1998 | | | | 4.41 | % | | | | 2.54 | % | | | | 6.66 | % | | | | 5.69 | % |
| | 10 year | | | | 6.28 | | | | | 4.11 | | | | | 7.79 | | | | | 6.24 | |
| | 5 year | | | | 5.26 | | | | | 2.68 | | | | | 7.48 | | | | | 6.22 | |
| | 3 year | | | | 2.33 | | | | | (0.42 | ) | | | | 5.40 | | | | | 3.93 | |
| | | 1 year | | | | 4.02 | | | | | 1.44 | | | | | 9.07 | | | | | 6.13 | |
See pages 26 through 29 for all footnotes.
17
International Fixed Income Fund
|
| ABOUTTHE SUBADVISERS |
•Pacific Investment Management Company LLC (“PIMCO”) |
| PIMCO is a leading global investment management firm, with offices in 12 countries throughout North America, Europe and Asia. Founded in 1971, PIMCO offers a wide range of innovative solutions to help millions of investors worldwide meet their needs. Our goal is to provide attractive returns while maintaining a strong culture of risk management and long-term discipline. PIMCO’s investment philosophy revolves around the principle of diversification. PIMCO believes that no single risk should dominate returns. PIMCO seeks to add value through the use of “top-down” strategies such as our exposure to interest rates, or duration, changing volatility, yield curve positioning and sector rotation. PIMCO also employs “bottom-up” strategies involving analysis and selection of specific securities. |
For the period of September 1, 2015, through August 31, 2016, the Sub-adviser for CGCM International Fixed Income Fund (“Fund”) was Pacific Investment Management Company LLC (“PIMCO”).
The Fund outperformed its benchmark, the Citigroup Non-U.S. Dollar World Government Bond Index — Hedged, for the one-year period ended August 31, 2016 (before fees). Short exposure to U.S. duration during the period detracted from performance as U.S. rates generally fell across the curve. Additionally, yield curve with a focus on shorter rates was negative for performance as intermediate and long rates fell more than short rates. Overall non-U.S. interest rate positioning was positive for performance. An overweight to long-end Japanese rates contributed to returns as long rates fell sharply amid increased central bank accommodation. An overweight to European peripherals, particularly Italy, was positive for performance as yields declined in this region. Additionally, positioning within the U.K. and Denmark added to performance. Spread strategies were positive for performance during the period. Exposure to non-Agency mortgages and European residential mortgage-backed securities added to returns as spreads generally tightened amid positive technicals and strong fundamentals. An allocation to Brazilian emerging market external debt added to performance as these securities were supported by the stabilization in commodity prices. Lastly, currency positioning was positive performance. A long-dollar bias relative to the euro contributed to returns as the U.S. dollar appreciated versus the euro. Additionally, long exposure to the Brazilian real and Russian ruble added to returns as these currencies appreciated during the period.
18
The following graph depicts the performance of Citigroup Non-USD World Government Bond Index (USD) - Hedged7 vs. the Citigroup Non-USD World Government Bond Index (USD) - Unhedged25 and the Lipper International Income Funds Average21
|
HISTORICAL PERFORMANCE FOR THE TEN-YEAR PERIOD ENDED AUGUST 31, 2016 INTERNATIONAL FIXED INCOME FUND Comparison of $10,000 Investment in the Portfolio with the Citigroup Non-USD World Government
Bond Index (USD) Hedged, Citigroup Non-USD World Government Bond Index (USD) Unhedged
and the Lipper International Income Funds Average |
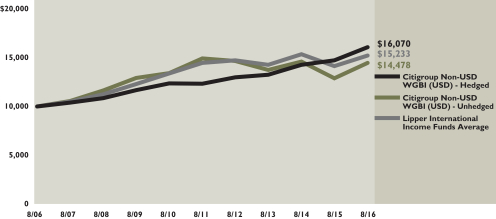
The performance shown above and below represents past performance. Past performance is no guarantee of future results and current performance may be higher or lower than the performance shown above and below. Performance figures may reflect voluntary fee waivers and/or expense reimbursements. In the absence of voluntary fee waivers and/or expense reimbursements, the total return would have been lower. Principal value and investment returns will fluctuate and investors’ shares, when redeemed, may be worth more or less than their original cost. To obtain performance data current to the most recent month-end, please visit our website at www.morganstanley.com/cgcm.
The graph above and returns shown below do not reflect the deduction of taxes that a shareholder would pay on fund distributions or the redemption of fund shares.
| | | | | | | | | | | | | | | | | | | | | | | | | | | |
| | | INTERNATIONAL FIXED INCOME FUND Average Annual Total Returns for the Period Ended August 31, 2016† |
| | | | | Without
Annual
Advisory
Program
Fee | | With
Annual
Advisory
Program
Fee* | | Citigroup
Non-USD
WGBI
(USD)
Hedged*** | | Citigroup
Non-USD
WGBI
(USD)
Unhedged*** | | Lipper
International
Income
Funds
Average*** |
| | Since inception 11/18/1991 | | | | 6.07 | % | | | | 4.26 | % | | | | 6.39 | % | | | | 5.58 | % | | | | 5.30 | % |
| | 10 year | | | | 5.37 | | | | | 3.23 | | | | | 4.86 | | | | | 3.77 | | | | | 4.40 | |
| | 5 year | | | | 4.74 | | | | | 2.18 | | | | | 5.41 | | | | | (0.63 | ) | | | | 0.67 | |
| | 3 year | | | | 5.71 | | | | | 2.88 | | | | | 6.64 | | | | | 1.70 | | | | | 2.02 | |
| | | 1 year | | | | 9.70 | | | | | 6.98 | | | | | 9.00 | | | | | 12.24 | | | | | 7.70 | |
See pages 26 through 29 for all footnotes.
19
Municipal Bond Fund
|
| ABOUTTHE SUBADVISER |
•McDonnell Investment Management, LLC (“McDonnell”) |
| McDonnell employs a value-added approach to active municipal bond management utilizing a team oriented philosophy. This approach attempts to maximize after-tax total returns while reducing the volatility in relative rates of return. By limiting dependence on market timing and tightly controlling duration, McDonnell reduces the portfolio’s exposure to interest rate relative risk. McDonnell utilizes extensive internal research to identify relative value opportunities among sectors and securities and to control credit risk. Additionally, McDonnell seeks to exploit yield curve anomalies through quantitative analysis of historical spreads and future expectations. |
For the period September 1, 2015, through August 31, 2016, the Sub-adviser for CGCM Municipal Bond Fund (“Fund”) was McDonnell Investment Management, LLC (“McDonnell”).
U.S. rate markets rallied sharply and yield curves flattened despite the first Federal Reserve interest rate increase in 7 full years. Economic growth decelerated slightly but remained positive as strong gains in employment buoyed Consumption and helped offset the drag of weak Investment and persistent inventory drawdowns. Despite Fed guidance that it expected to engineer a series of rate hikes, market participants proved prescient as skeptical investors continued to push rates lower amid declining inflation expectations and ultra-low and even negative rates across most major Developed Market sovereign yield curves. With the exception of 2 episodes, market volatility was generally muted. At the beginning of the year, plunging equity markets in China and cratering prices in crude oil, set the stage for a volatile January and February. But a double-bottom in crude oil provided the foothold that helped risk markets broadly recover for most of the remainder of the period. A second market disruption occurred in the wake of the surprising result of the Brexit Referendum in the UK in late June. The victory of the ‘Leave’ camp shocked market participants and resulted in a swift ‘flight-to-quality’ rally in safe assets generally. But as the long-winding process of Brexit became clearer, and the near-term UK economic impact appeared benign, most rate markets, with the exception of UK yields, returned to earlier levels.
The municipal market experienced strong and consistent demand in the form of mutual fund inflows, bank portfolio purchases and expanding insurance company municipal allocations as investors across the spectrum faced the dilemma of attempting to maintain portfolio yield in a persistently low yield environment. The ‘reach for yield’ helped flatten the yield curve and tightened credit spreads as incremental yield became an increasingly scarce commodity with high-grade municipal yields plummeting near 60-year lows. Against the backdrop of robust demand, New Issue Supply was moderate, and failed to accelerate meaningfully as many issuers were reluctant to add debt while facing pension gaps and Other Post-Employment Benefit (OPEB) funding shortfalls. The pace of Refunding Issuance also failed to accelerate despite declining yields as the low level of short-term Treasury yields resulted in negative arbitrage for advance refunding many outstanding issues with call features beyond 2 or 3 years.
Given this environment, the Fund registered twelve-month performance of 6.92% in fiscal period ended August 31, 2016 and performed in line with the Barclays Capital U.S. Municipal Bond Index return of 6.88%. Increasing the Fund’s exposure on the longer-end of the yield curve was additive to performance amongst yield curve flattening. Security selection, particularly within the Local General Obligation and Transportation categories contributed positively to performance. Overweight to spread sectors such as Hospital and Higher Education enhanced performance while and underweight to lower quality sectors such IDR/PCR, Lease and Special Tax hindered performance. Additionally, an overweight to shorter duration securities was a drag on performance.
We expect the Federal Reserve will attempt to engineer a modest rise in short-term interest rates over the period ahead if the domestic economy continues to generate
20
The following graph depicts the performance of Barclays Capital U.S. Municipal Bond Index8 vs. the Lipper General & Insured Municipal Debt Funds Average22
moderate growth in output and employment. The pace of any rate increases however, is expected to prove quite gradual as inflation remains below the Fed’s 2% target and global economic conditions remain beset by weak aggregate demand. Against this backdrop, we think the most likely path for fixed income markets will be a tendency to trade within the ranges that have been established over the past several quarters and for the yield curve to exhibit a tendency toward flattening. The fundamentals of moderate growth, low inflation and well-crafted monetary policy all favor a relatively range-bound interest rate environment over the near-term horizon.
The commentary or observations set forth are neither investment advice nor legal advice. It is presented only to provide information on investment strategies and our view on market opportunities. The views expressed by McDonnell Investment Management (“McDonnell”) are as of the date of compilation of this information and are subject to change without notice. They are based on data sources that may include, but are not limited to, some or all of the following: internally derived databases and information, third party research, issuer-derived documents and news media reports. McDonnell believes the data to be reliable but does not make any representations as to its accuracy or completeness. McDonnell cannot assure that the type of investments discussed herein will outperform any other investment strategy in the future, nor can it guarantee that such investments will present the best or an attractive risk-adjusted investment in the future. Past performance is no guarantee of future results. Source: Barclays, Bond Buyer, SIFMA, ICI
|
HISTORICAL PERFORMANCE FOR THE TEN-YEAR PERIOD ENDED AUGUST 31, 2016 MUNICIPAL BOND FUND Comparison of $10,000 Investment in the Portfolio with the Barclays Capital U.S. Municipal Bond Index
and the Lipper General & Insured Municipal Debt Funds Average |
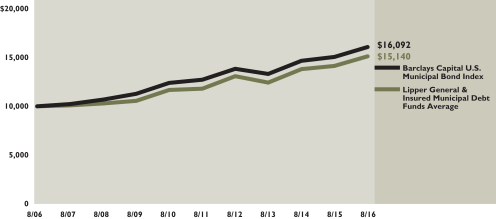
The performance shown above and below represents past performance. Past performance is no guarantee of future results and current performance may be higher or lower than the performance shown above and below. Performance figures may reflect voluntary fee waivers and/or expense reimbursements. In the absence of voluntary fee waivers and/or expense reimbursements, the total return would have been lower. Principal value and investment returns will fluctuate and investors’ shares, when redeemed, may be worth more or less than their original cost. To obtain performance data current to the most recent month-end, please visit our website at www.morganstanley.com/cgcm.
The graph above and returns shown below do not reflect the deduction of taxes that a shareholder would pay on fund distributions or the redemption of fund shares.
| | | | | | | | | | | | | | | | | | | | | | |
| | | MUNICIPAL BOND FUND Average Annual Total Returns for the Period Ended August 31, 2016† |
| | | | | Without
Annual
Advisory
Program
Fee | | With
Annual
Advisory
Program
Fee* | | Barclays
Capital U.S.
Municipal Bond
Index*** | | Lipper
General &
Insured
Municipal
Debt Funds
Average*** |
| | Since inception 11/18/1991 | | | | 4.99 | % | | | | 3.19 | % | | | | 5.78 | % | | | | 5.29 | % |
| | 10 year | | | | 4.27 | | | | | 2.15 | | | | | 4.87 | | | | | 4.22 | |
| | 5 year | | | | 4.08 | | | | | 1.53 | | | | | 4.80 | | | | | 5.12 | |
| | 3 year | | | | 5.86 | | | | | 3.02 | | | | | 6.47 | | | | | 6.75 | |
| | | 1 year | | | | 6.14 | | | | | 3.51 | | | | | 6.88 | | | | | 6.96 | |
See pages 26 through 29 for all footnotes.
21
Inflation-Linked Fixed Income Fund
|
| ABOUTTHE SUBADVISERS |
•Pacific Investment Management Company LLC (“PIMCO”) |
| PIMCO is a leading global investment management firm, with offices in 12 countries throughout North America, Europe and Asia. Founded in 1971, PIMCO offers a wide range of innovative solutions to help millions of investors worldwide meet their needs. Our goal is to provide attractive returns while maintaining a strong culture of risk management and long-term discipline. PIMCO’s investment philosophy revolves around the principle of diversification. PIMCO believes that no single risk should dominate returns. PIMCO seeks to add value through the use of “top-down” strategies such as our exposure to interest rates, or duration, changing volatility, yield curve positioning and sector rotation. PIMCO also employs “bottom-up” strategies involving analysis and selection of specific securities. |
For the period from inception (March 8, 2016) through August 31, 2016, the Sub-adviser for CGCM Inflation-Linked Fixed Income Fund (“Fund”) was Pacific Investment Management Company LLC (“PIMCO”).
The Fund outperformed its benchmark, the Barclays U.S. Treasury Inflation Protected Securities (TIPS) Index, since inception of the Fund through the period ended August 31, 2016. Short exposure to nominal U.S. duration detracted from performance as U.S. interest rates generally declined during the period. An overweight to real U.S. duration was positive for performance as real rates also fell during the period; this was partially offset by an overweight to breakeven inflation as breakeven levels declined during the period. European inflation linked bond exposure was neutral for performance. An allocation to French and Italian inflation liked-bonds added to returns as intermediate real yields fell; however, this was offset by short exposure to U.K. breakeven levels as U.K. breakeven levels increased during the period. Holdings of Agency mortgages and collateralized mortgage obligations added to performance as these securities benefitted from strong demand and improving fundamentals. Exposure to investment grade and high yield credit, especially within financials, contributed to performance as these sectors outperformed like-duration Treasuries during the period. Currency exposure was neutral to modestly positive for performance as long exposure to the Brazilian real proved beneficial as the real appreciated relative to the U.S. dollar.
22
The following graph depicts the performance of Barclays Capital U.S. Treasury Inflation Protected Securities (TIPS) Index9 vs. the Lipper Inflation Protected Bond Funds Average26
|
HISTORICAL PERFORMANCE FOR THE TEN-YEAR PERIOD ENDED AUGUST 31, 2016 INFLATION-LINKED FIXED INCOME FUND Comparison of $10,000 Investment in the Portfolio with the Barclays Capital U.S. Treasury Inflation Protected Securities
(TIPS) Index vs. the Lipper Inflation Protected Bond Funds Average |
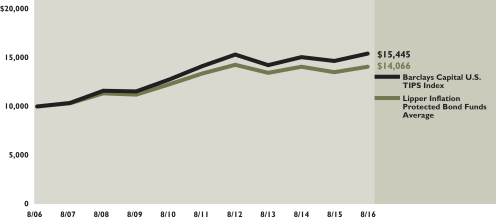
The performance shown above and below represents past performance. Past performance is no guarantee of future results and current performance may be higher or lower than the performance shown above and below. Performance figures may reflect voluntary fee waivers and/or expense reimbursements. In the absence of voluntary fee waivers and/or expense reimbursements, the total return would have been lower. Principal value and investment returns will fluctuate and investors’ shares, when redeemed, may be worth more or less than their original cost. To obtain performance data current to the most recent month-end, please visit our website at www.morganstanley.com/cgcm.
The graph above and returns shown below do not reflect the deduction of taxes that a shareholder would pay on fund distributions or the redemption of fund shares.
| | | | | | | | | | | | | | | | | | | | | | |
| | | INFLATION-LINKED FIXED INCOME FUND Average Annual Total Returns for the Period Ended August 31, 2016† |
| | | | | Without
Annual
Advisory
Program
Fee | | With
Annual
Advisory
Program
Fee* | | Barclays
Capital U.S.
TIPS
Index*** | | Lipper
Inflation
Protected Bond
Funds
Average*** |
| | Since inception 3/11/2016 | | | | 4.59 | % | | | | 3.35 | % | | | | 2.13 | % | | | | 2.15 | % |
| | 10 year | | | | N/A | | | | | N/A | | | | | 4.44 | | | | | 3.47 | |
| | 5 year | | | | N/A | | | | | N/A | | | | | 1.77 | | | | | 1.00 | |
| | 3 year | | | | N/A | | | | | N/A | | | | | 2.71 | | | | | 1.51 | |
| | | 1 year | | | | N/A | | | | | N/A | | | | | 5.37 | | | | | 4.14 | |
See pages 26 through 29 for all footnotes.
23
Ultra-Short Term Fixed Income Fund
|
| ABOUTTHE SUBADVISERS |
•Pacific Investment Management Company LLC (“PIMCO”) |
| PIMCO is a leading global investment management firm, with offices in 12 countries throughout North America, Europe and Asia. Founded in 1971, PIMCO offers a wide range of innovative solutions to help millions of investors worldwide meet their needs. Our goal is to provide attractive returns while maintaining a strong culture of risk management and long-term discipline. PIMCO’s investment philosophy revolves around the principle of diversification. PIMCO believes that no single risk should dominate returns. PIMCO seeks to add value through the use of “top-down” strategies such as our exposure to interest rates, or duration, changing volatility, yield curve positioning and sector rotation. PIMCO also employs “bottom-up” strategies involving analysis and selection of specific securities. |
For the period from inception (March 8, 2016) through August 31, 2016, the Sub-adviser for CGCM Ultra-Short Term Fixed Income Fund (“Fund”) was Pacific Investment Management Company LLC (“PIMCO”).
The Fund outperformed its benchmark, the Citigroup 3-Month U.S. Treasury Bill Index, since inception of the Fund through the period ended August 31, 2016. Overall interest rate strategies were positive for performance. Exposures to non-U.S. duration, including Australian and core European duration, added to returns as yields declined in these regions amid increase central bank accommodation. Spread sector strategies were also beneficial for performance. An allocation to investment grade and high yield credit, especially within financials and industrials, contributed to performance as these sectors outperformed like-duration Treasuries during the period. Holdings of non-Agency mortgages and commercial mortgage-backed securities were positive for performance as these securities benefitted from strong demand and improving fundamentals. Currency strategies detracted from performance as a long-dollar bias versus the Japanese yen hurt performance as the yen appreciated relative to the U.S. dollar.
24
The following graph depicts the performance of Citigroup 3-Month U.S. Treasury Bill Index10 vs. the Lipper Ultra-Short Obligations Funds Average27
|
HISTORICAL PERFORMANCE FOR THE TEN-YEAR PERIOD ENDED AUGUST 31, 2016 ULTRA-SHORT TERM FIXED INCOME FUND Comparison of $10,000 Investment in the Portfolio with the Citigroup 3-Month U.S. Treasury Bill Index vs. the Lipper
Ultra-Short Obligations Funds Average |
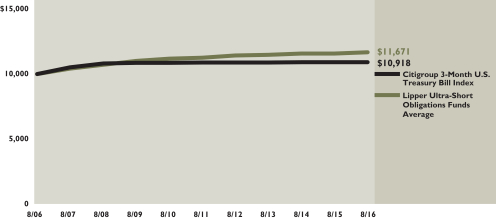
The performance shown above and below represents past performance. Past performance is no guarantee of future results and current performance may be higher or lower than the performance shown above and below. Performance figures may reflect voluntary fee waivers and/or expense reimbursements. In the absence of voluntary fee waivers and/or expense reimbursements, the total return would have been lower. Principal value and investment returns will fluctuate and investors’ shares, when redeemed, may be worth more or less than their original cost. To obtain performance data current to the most recent month-end, please visit our website at www.morganstanley.com/cgcm.
The graph above and returns shown below do not reflect the deduction of taxes that a shareholder would pay on fund distributions or the redemption of fund shares.
| | | | | | | | | | | | | | | | | | | | | | |
| | | ULTRA-SHORT TERM FIXED INCOME FUND Average Annual Total Returns for the Period Ended August 31, 2016† |
| | | | | Without
Annual
Advisory
Program
Fee | | With
Annual
Advisory
Program
Fee* | | Citigroup
3-Month
U.S. Treasury
Bill Index*** | | Lipper
Ultra-Short
Obligations
Funds
Average*** |
| | Since inception 3/11/2016 | | | | 0.89 | % | | | | (0.32 | %) | | | | 0.11 | % | | | | 0.79 | % |
| | 10 year | | | | N/A | | | | | N/A | | | | | 0.88 | | | | | 1.56 | |
| | 5 year | | | | N/A | | | | | N/A | | | | | 0.07 | | | | | 0.74 | |
| | 3 year | | | | N/A | | | | | N/A | | | | | 0.08 | | | | | 0.60 | |
| | | 1 year | | | | N/A | | | | | N/A | | | | | 0.18 | | | | | 0.81 | |
See pages 26 through 29 for all footnotes.
25
FOOTNOTES
| † | | All figures represent past performance and are not a guarantee of future results. Investment return and principal value of an investment will fluctuate so that an investor’s shares, when redeemed, may be worth more or less than their original cost. The returns shown do not reflect the deduction of taxes that a shareholder would pay on fund distributions or the redemptions of fund shares. Performance figures may reflect fee waivers and/or expense reimbursements. In the absence of fee waivers and/or expense reimbursements, the total return would have been lower. To obtain performance data current to the most recent month-end, please visit our website at https://www.morganstanley.com/cgcm. |
| * | | The Funds are available only to investors participating in Morgan Stanley approved advisory programs. These programs charge an annual fee, which may be up to 2.50%. |
| ** | | Consulting Group Advisory Services, LLC (“CGAS”), a business of Morgan Stanley Smith Barney Holdings LLC (“MSSBH”), voluntarily waived and/or reimbursed certain fees or expense to maintain a positive net yield. |
| *** | | The values shown represent the period from Fund inception (March 8, 2016) through the period end August 31, 2016. |
| 1. | | The Russell 1000® Index is composed of the 1,000 largest U.S. companies by market capitalization. Because the index is not a managed portfolio, there are no advisory fees or internal management expenses reflected in the index’s performance. Please note that an investor cannot invest directly in an index. |
| 2. | | The Russell 2500® Index includes the smallest 2,500 U.S. companies out of the Russell 3000® Index universe. Because the index is not a managed portfolio, there are no advisory fees or internal management expenses reflected in the index’s performance. Please note that an investor cannot invest directly in an index. |
| 3. | | The Morgan Stanley Capital International Europe, Australasia, Far East (MSCI EAFE®) Index (Net) is a free float-adjusted market capitalization index that is designed to measure the equity market performance of developed markets, excluding the U.S. & Canada. The MSCI EAFE® Index consists of the following 21 developed market country indexes: Australia, Austria, Belgium, Denmark, Finland, France, Germany, Hong Kong, Ireland, Israel, Italy, Japan, the Netherlands, New Zealand, Norway, Portugal, Singapore, Spain, Sweden, Switzerland, and the United Kingdom. Net total return indexes reinvest dividends after the deduction of withholding taxes, using (for international indexes) a tax rate applicable to non-resident institutional investors who do not benefit from double taxation treaties. Because the index is not a managed portfolio, there are no advisory fees or internal management expenses reflected in the index’s performance. Please note that an investor cannot invest directly in an index. |
| 4. | | The MSCI Emerging Markets Index is a free float-adjusted market capitalization index that is designed to measure equity market performance of emerging markets. The MSCI Emerging Markets Index (Net) consists of the following 21 emerging market country indexes: Brazil, Chile, China, Colombia, Czech Republic, Egypt, Greece, Hungary, India, Indonesia, Korea, Malaysia, Mexico, Peru, Philippines, Poland, Russia, South Africa, Taiwan, Thailand, and Turkey. Net total return indexes reinvest dividends after the deduction of withholding taxes, using (for international indexes) a tax rate applicable to non-resident institutional investors who do not benefit from double taxation treaties. Because the index is not a managed portfolio, there are no advisory fees or internal management expenses reflected in the index’s performance. Please note that an investor cannot invest directly in an index. |
| 5. | | The Barclays Capital U.S. Aggregate BondTM Index is a broad-based index that measures the investment grade, U.S. dollar-denominated, fixed-rate taxable bond market, including Treasuries, government-related and corporate securities, MBS (agency fixed-rate and hybrid ARM passthroughs), ABS, and CMBS. Because the index is not a managed portfolio, there are no advisory fees or internal management expenses reflected in the index’s performance. Please note that an investor cannot invest directly in an index. |
| 6. | | The Barclays Capital U.S. Corporate High-Yield Index measures the market of U.S. dollar-denominated, non-investment grade, fixed rate, taxable corporate bonds. Because the index is not a managed portfolio, there are no advisory fees or internal management expenses reflected in the index’s performance. Please note that an investor cannot invest directly in an index. |
26
| 7. | | The Citigroup Non-USD World Government Bond Index (USD) Hedged and Unhedged are each sub-indices of the Citigroup World Government Bond Index (WGBI), which is comprised of the global sovereign debt of over 20 countries representative in the Americas, EMEA, EMU, Asia Pacific, and Japan regions. The Non-U.S. Dollar WGBI includes all WGBI markets except the United States and is stated in U.S. dollar hedged or unhedged base currency terms. Because the index is not a managed portfolio, there are no advisory fees or internal management expenses reflected in the index’s performance. Please note that an investor cannot invest directly in an index. |
| 8. | | The Barclays Capital U.S. Municipal Bond Index covers the U.S. dollar-denominated long-term tax exempt bond market. The index has four main sectors: state and local general obligation bonds, revenue bonds, insured bonds, and prerefunded bonds. Because the index is not a managed portfolio, there are no advisory fees or internal management expenses reflected in the index’s performance. Please note that an investor cannot invest directly in an index. |
| 9. | | Barclays Capital U.S. Treasury Inflation Protected Securities (TIPS) Index. |
| 10. | | Citigroup 3-Month U.S. Treasury Bill Index. |
| 11. | | The Russell 1000® Growth Index measures the performance of those Russell 1000 companies with higher price-to-book ratios and higher forecasted growth values. Because the index is not a managed portfolio, there are no advisory fees or internal management expenses reflected in the index’s performance. Please note that an investor cannot invest directly in an index. |
| 12. | | The Russell 1000® Value Index measures the performance of those Russell 1000 Index companies with lower price-to-book ratios and lower forecasted growth values. Because the index is not a managed portfolio, there are no advisory fees or internal management expenses reflected in the index’s performance. Please note that an investor cannot invest directly in an index. |
| 13. | | The Russell 2000® Growth Index measures the performance of those Russell 2000 companies with higher price-to-book ratios and higher forecasted growth values. Because the index is not a managed portfolio, there are no advisory fees or internal management expenses reflected in the index’s performance. Please note that an investor cannot invest directly in an index. |
| 14. | | The Russell 2000® Value Index measures the performance of those Russell 2000 Index companies with lower price-to-book ratios and lower forecasted growth values. Because the index is not a managed portfolio, there are no advisory fees or internal management expenses reflected in the index’s performance. Please note that an investor cannot invest directly in an index. |
| 15. | | The Lipper Large-Cap Growth Funds Average is an equally weighted average of all active funds available within the investment category. The classification includes funds that, by portfolio practice, invest at least 75% of their equity assets in companies with market capitalizations (on a three-year weighted basis) above Lipper’s USDE large-cap floor. Large-cap growth funds typically have aboveaverage characteristics compared to the S&P 500® Index. The total return of the Lipper Funds Average does not include the effect of sales charges. Please note that an investor cannot invest directly in a mutual funds classification average or an index. |
| 16. | | The Lipper Small-Cap Growth Funds Average is an equally weighted average of all active funds available within the investment category. The classification includes funds that, by portfolio practice, invest at least 75% of their equity assets in companies with market capitalizations (on a three-year weighted basis) below Lipper’s USDE small-cap ceiling. Small-cap growth funds typically have aboveaverage characteristics compared to the S&P SmallCap 600® Index. The total return of the Lipper Funds Average does not include the effect of sales charges. Please note that an investor cannot invest directly in a mutual funds classification average or an index. |
| 17. | | The Lipper International Large-Cap Core Funds Average is an equally weighted average of all active funds available within the investment category. The classification includes funds that, by portfolio practice, invest at least 75% of their equity assets in companies outside of the U.S. with market capitalizations (on a three-year weighted basis) above Lipper’s international large-cap floor. International large-cap core funds typically have average characteristics compared to their large-cap-specific subset of the MSCI EAFE® Index. The total return of the Lipper Funds Average does not include the effect of sales charges. Please note that an investor cannot invest directly in a mutual funds classification average or an index. |
27
| 18. | | The Lipper Emerging Markets Funds Average is an equally weighted average of all active funds available within the investment category. The classification includes funds that seek long-term capital appreciation by investing at least 65% of total assets in emerging market equity securities, where “emerging market” is defined by a country’s GNP per capita or other economic measures. The total return of the Lipper Funds Average does not include the effect of sales charges. Please note that an investor cannot invest directly in a mutual funds classification average or an index. |
| 19. | | The Lipper Core Bond Funds Average is an equally weighted average of all active funds available within the investment category. The classification includes funds that invest at least 85% of their assets in domestic investment-grade debt issues (rated in top four grades) with any remaining in investment in non-benchmark sectors such as high-yield, global and emerging market debt. These funds maintain dollar-weighted average maturities of five to ten years. The total return of the Lipper Funds Average does not include the effect of sales charges. Please note that an investor cannot invest directly in a mutual funds classification average or an index. |
| 20. | | The Lipper High Yield Funds Average is an equally weighted average of all active funds available within the investment category. The classification includes funds that aim at high (relative) current yield from fixed income securities, have no quality or maturity restrictions, and tend to invest in lower grade debt issues. The total return of the Lipper Funds Average does not include the effect of sales charges. Please note that an investor cannot invest directly in a mutual funds classification average or an index. |
| 21. | | The Lipper International Income Funds Average is an equally weighted average of all active funds available within the investment category. The classification includes funds that state in their prospectus that they invest primarily in U.S. dollar and non-U.S. dollar debt securities of issuers located in at least three countries, excluding the United States, except in periods of market weakness. The total return of the Lipper Funds Average does not include the effect of sales charges. Please note that an investor cannot invest directly in a mutual funds classification average or an index. |
| 22. | | The Lipper General & Insured Municipal Debt Funds Average is an equally weighted average of all active funds available within the investment category. The classification includes funds that either invest primarily in municipal debt issues rated in the top four credit ratings or invest primarily in municipal debt issues insured as to timely payment. The total return of the Lipper Funds Average does not include the effect of sales charges. Please note that an investor cannot invest directly in a mutual funds classification average or an index. |
| 23. | | The Lipper Large-Cap Core Funds Average are equally weighted total returns using all the active funds available within the category. Funds that, by portfolio practice, invest at least 75% of their equity assets in companies with market capitalizations (on a three-year weighted basis) greater than 300% of the dollar-weighted median market capitalization of the middle 1,000 securities of the S&P SuperComposite 1500® Index. Large-cap core funds have more latitude in the companies in which they invest. These funds typically have an average price-to-earnings ratio, price-to-book ratio, and three-year sales-per-share growth value, compared to the S&P 500® Index. |
| 24. | | The Lipper Small-Cap Core Funds Average are equally weighted total returns using all the active funds available within the category. Funds that, by portfolio practice, invest at least 75% of their equity assets in companies with market capitalizations (on a three-year weighted basis) less than 250% of the dollar-weighted median of the smallest 500 of the middle 1,000 securities of the S&P SuperComposite 1500® Index. Small-cap core funds have more latitude in the companies in which they invest. These funds typically have an average price-to-earnings ratio, price-to-book ratio, and three-year sales-per-share growth value, compared to the S&P SmallCap 600® Index. |
| 25. | | The Citigroup Non-US World Government Bond Index (USD) — Unhedged — This index includes all the components of the World Government Bond Index except the United States. The index includes all fixed-rate bonds with a remaining maturity of one year or longer and with amounts outstanding of at least the equivalent of $25 million US dollars. Those government securities that are excluded from the indices typically fall into three categories: floating- or variable-rate bonds (including index-linked bonds); securities aimed principally at |
28
| | non-institutional investors such as savings bonds in the United States and Canada; and private placement-type securities, where liquidity may be poor and where accurate information on outstandings, market coupon, and maturity structure may be difficult or impossible to obtain. This index is designed to directly address the growing interest in and implementation of currency-hedged bond investments by global investors as a means of achieving low-risk interest rate diversification in their portfolios. |
| 26. | | The Lipper Inflation Protected Bond Funds Average — These are equally weighted total returns using all the active funds available within the category. Lipper analytical averages are an average of all funds in the specified investment objective’s universe. Averages include all funds in the group in existence for the period. The number of component funds always changes. Inflation protected bond funds invest primarily in inflation-indexed fixed income securities issued in the United States. Inflation-indexed bonds are fixed income securities that are structured to provide protection against inflation. |
| 27. | | The Lipper Ultra-Short Obligations Funds Average — These are equally weighted total returns using all the active funds available within the category. Lipper analytical averages are an average of all funds in the specified investment objective’s universe. Averages include all funds in the group in existence for the period. The number of component funds always changes. Ultra short obligations funds invest primarily in investment-grade debt issues or better and maintain a portfolio dollar-weighted average maturity between 91 days and 365 days. |
29
Example
As a shareholder of a Fund, you may incur two types of costs: (1) annual advisory program fees, which may be up to 2.50%; and (2) ongoing costs, including management fees and other Fund expenses. This example is intended to help you understand your ongoing costs (in dollars) of investing in a Fund and to compare these costs with the ongoing costs of investing in other mutual funds. This example is based on an investment of $1,000 invested on March 1, 2016 and held for the six months ended August 31, 2016.
Actual Expenses
The table below titled “Based on Actual Total Return” provides information about actual account values and actual expenses. You may use the information provided in this table, together with the amount you invested, to estimate the expenses that you paid over the period. To estimate the expenses you paid on your account during this period, divide your account value by $1,000 (for example, an $8,600 account value divided by $1,000 = 8.6), then multiply the result by the number under the heading entitled “Expenses Paid During the Period”.
| | | | | | | | | | | | | | | | | | | | | | | | | |
| Based on Actual Total Return(1) |
| | | | | |
| Fund | | Total Return
Without Annual
Advisory
Program Fees(2) | | Beginning
Account
Value | | Ending
Account
Value | | Annualized
Expense
Ratios(3) | | Expense
Paid During
the Period(4) |
Large Cap Equity Fund | | | | 14.11 | % | | | $ | 1,000.00 | | | | $ | 1,141.10 | | | | | 0.49 | % | | | $ | 2.64 | |
Small-Mid Cap Equity Fund | | | | 17.01 | % | | | | 1,000.00 | | | | | 1,170.10 | | | | | 0.72 | % | | | | 3.93 | |
International Equity Fund | | | | 9.50 | % | | | | 1,000.00 | | | | | 1,095.00 | | | | | 0.73 | % | | | | 3.84 | |
Emerging Markets Equity Fund | | | | 23.48 | % | | | | 1,000.00 | | | | | 1,234.80 | | | | | 0.95 | % | | | | 5.34 | |
Core Fixed Income Fund | | | | 4.38 | % | | | | 1,000.00 | | | | | 1,043.80 | | | | | 0.55 | % | | | | 2.83 | |
High Yield Fund | | | | 13.40 | % | | | | 1,000.00 | | | | | 1,134.00 | | | | | 0.66 | % | | | | 3.54 | |
International Fixed Income Fund | | | | 6.57 | % | | | | 1,000.00 | | | | | 1,065.70 | | | | | 0.76 | % | | | | 3.95 | |
Municipal Bond Fund | | | | 3.27 | % | | | | 1,000.00 | | | | | 1,032.70 | | | | | 0.70 | % | | | | 3.58 | |
Inflation-Linked Fixed Income Fund(5) | | | | 4.59 | % | | | | 1,000.00 | | | | | 1,045.90 | | | | | 1.01 | % | | | | 5.19 | |
Ultra-Short Term Fixed Income Fund(5) | | | | 0.89 | % | | | | 1,000.00 | | | | | 1,008.90 | | | | | 0.79 | % | | | | 3.99 | |
| (1) | For the six months ended August 31, 2016. |
| (2) | Assumes reinvestment of all distributions, including returns of capital, if any, at net asset value and does not reflect the deduction of the applicable advisory program charge, which may be up to 2.50% depending on the particular program through which you invest. Total return is not annualized as it may not be representative of the total return for the year/period. Performance figure may reflect fee waivers and/or expense reimbursements. Past performance is no guarantee of future results. In the absence of fee waivers and/or expenses reimbursements, the total return would have been lower. |
| (3) | Annualized Expense Ratios are based on the most recent 6 month expense ratios, which may differ from net expense ratios in the Financial Highlights, except for Inflation-Linked Fixed Income Fund and Ultra-Short Term Fixed Income Fund, which are based on the period from Fund inception (March 8, 2016) through the period end August 31, 2016. |
| (4) | Expenses (net of fee waivers and/or expense reimbursements) are equal to each Fund’s respective annualized expense ratio multiplied by the average account value over the period, multiplied by the number of days (184 days) in the most recent fiscal half-year, then divided 366 (to reflect the one-half year period). |
| (5) | The period from Fund inception (March 8, 2016) through the period end August 31, 2016. |
30
| | |
| |
| Fund Expenses | | |
| (continued) | | |
Hypothetical Example for Comparison Purposes
The table below titled “Based on Hypothetical Total Return” provides information about hypothetical account values and hypothetical expenses based on each Fund’s actual expense ratio and an assumed rate of return of 5.00% per year/period before expenses, which is not each Fund’s actual return. The hypothetical account values and expenses may not be used to estimate the actual ending account balances or expenses you paid for the period. You may use the information provided in this table to compare the ongoing costs of investing in each Fund and other funds. To do so, compare the 5.00% hypothetical example relating to a Fund with the 5.00% hypothetical examples that appear in the shareholder reports of the other funds.
Please note that the expenses shown in the table below are meant to highlight your ongoing costs only and do not reflect any advisory program annual fees. Therefore, the table is useful in comparing ongoing costs only, and will not help you determine the relative total costs of owning different funds. In addition, if these advisory program annual fees were included, your costs would have been higher.
| | | | | | | | | | | | | | | | | | | | | | | | | |
| Based on Hypothetical Total Return(1) |
| | | | | |
| Fund | | Hypothethical
Annualized
Total Return | | Beginning
Account
Value | | Ending
Account
Value | | Annualized
Expense
Ratios(2) | | Expense
Paid During
the Period(3) |
Large Cap Equity Fund | | | | 5.00 | % | | | $ | 1,000.00 | | | | $ | 1,022.67 | | | | | 0.49 | % | | | $ | 2.49 | |
Small-Mid Cap Equity Fund | | | | 5.00 | % | | | | 1,000.00 | | | | | 1,021.52 | | | | | 0.72 | % | | | | 3.66 | |
International Equity Fund | | | | 5.00 | % | | | | 1,000.00 | | | | | 1,021.47 | | | | | 0.73 | % | | | | 3.71 | |
Emerging Markets Equity Fund | | | | 5.00 | % | | | | 1,000.00 | | | | | 1,020.36 | | | | | 0.95 | % | | | | 4.82 | |
Core Fixed Income Fund | | | | 5.00 | % | | | | 1,000.00 | | | | | 1,022.37 | | | | | 0.55 | % | | | | 2.80 | |
High Yield Fund | | | | 5.00 | % | | | | 1,000.00 | | | | | 1,021.82 | | | | | 0.66 | % | | | | 3.35 | |
International Fixed Income Fund | | | | 5.00 | % | | | | 1,000.00 | | | | | 1,021.32 | | | | | 0.76 | % | | | | 3.86 | |
Municipal Bond Fund | | | | 5.00 | % | | | | 1,000.00 | | | | | 1,021.62 | | | | | 0.70 | % | | | | 3.56 | |
Inflation-Linked Fixed Income Fund(4) | | | | 5.00 | % | | | | 1,000.00 | | | | | 1,019.30 | | | | | 1.01 | % | | | | 5.13 | |
Ultra-Short Term Fixed Income Fund(4) | | | | 5.00 | % | | | | 1,000.00 | | | | | 1,020.36 | | | | | 0.79 | % | | | | 4.01 | |
| (1) | For the six months ended August 31, 2016. |
| (2) | Annualized Expense Ratios are based on the most recent 6 month expense ratios, which may differ from net expense ratios in the Financial Highlights, except for Inflation-Linked Fixed Income Fund and Ultra-Short Term Fixed Income Fund, which are based on the period from Fund inception (March 8, 2016) through the period end August 31, 2016. |
| (3) | Expenses (net of fee waivers and/or expense reimbursements) are equal to each Fund’s respective annualized expense ratio multiplied by the average account value over the period, multiplied by the number of days (184 days) in the most recent fiscal half-year, then divided 366 (to reflect the one-half year period). |
| (4) | The period from Fund inception (March 8, 2016) through the period end August 31, 2016. |
31
| | | | | | | | |
| Large Cap Equity Fund | |
| | |
| Shares/Units | | | Security | | Value | |
| COMMON STOCKS — 93.6% | |
| CONSUMER DISCRETIONARY — 11.8% | |
| Auto Components — 0.9% | |
| | 7,780 | | | BorgWarner Inc. | | $ | 267,554 | |
| | 69,400 | | | Delphi Automotive PLC | | | 4,903,804 | |
| | 11,380 | | | Gentex Corp. | | | 202,450 | |
| | 91,967 | | | Goodyear Tire & Rubber Co. (The) | | | 2,699,232 | |
| | 127,919 | | | Johnson Controls Inc. | | | 5,613,086 | |
| | 2,924 | | | Lear Corp. | | | 340,032 | |
| | 17,582 | | | Tenneco Inc.* | | | 981,603 | |
| | 1,459 | | | Visteon Corp. | | | 103,151 | |
| | | | | | | | |
| | | | Total Auto Components | | | 15,110,912 | |
| | | | | | | | |
| Automobiles — 0.3% | |
| | 156,429 | | | Ford Motor Co. | | | 1,971,005 | |
| | 56,468 | | | General Motors Co. | | | 1,802,459 | |
| | 7,175 | | | Harley-Davidson Inc. | | | 378,122 | |
| | 4,693 | | | Tesla Motors Inc.*(a) | | | 994,963 | |
| | 2,010 | | | Thor Industries Inc. | | | 163,112 | |
| | | | | | | | |
| | | | Total Automobiles | | | 5,309,661 | |
| | | | | | | | |
| Distributors — 0.4% | |
| | 5,928 | | | Genuine Parts Co. | | | 609,517 | |
| | 165,526 | | | LKQ Corp.* | | | 5,973,833 | |
| | 1,698 | | | Pool Corp. | | | 171,277 | |
| | | | | | | | |
| | | | Total Distributors | | | 6,754,627 | |
| | | | | | | | |
| Diversified Consumer Services — 0.0% | |
| | 177 | | | Graham Holdings Co., Class B Shares | | | 86,792 | |
| | 8,723 | | | H&R Block Inc. | | | 188,940 | |
| | 7,538 | | | Service Corp. International | | | 199,305 | |
| | 5,765 | | | ServiceMaster Global Holdings Inc.* | | | 215,092 | |
| | | | | | | | |
| | | | Total Diversified Consumer Services | | | 690,129 | |
| | | | | | | | |
| Hotels, Restaurants & Leisure — 1.3% | |
| | 9,735 | | | Aramark | | | 369,249 | |
| | 2,378 | | | Brinker International Inc. | | | 127,722 | |
| | 16,410 | | | Carnival Corp. | | | 784,398 | |
| | 1,141 | | | Chipotle Mexican Grill Inc., Class A Shares* | | | 472,066 | |
| | 1,302 | | | Choice Hotels International Inc. | | | 63,134 | |
| | 4,595 | | | Darden Restaurants Inc. | | | 283,236 | |
| | 1,958 | | | Domino’s Pizza Inc. | | | 292,858 | |
| | 3,684 | | | Dunkin’ Brands Group Inc. | | | 180,332 | |
| | 3,156 | | | Extended Stay America Inc. | | | 44,657 | |
| | 21,183 | | | Hilton Worldwide Holdings Inc. | | | 505,638 | |
| | 1,040 | | | Hyatt Hotels Corp., Class A Shares* | | | 55,619 | |
| | 3,963 | | | International Game Technology PLC | | | 90,475 | |
| | 14,773 | | | Las Vegas Sands Corp. | | | 741,752 | |
| | 7,655 | | | Marriott International Inc., Class A Shares(a) | | | 546,031 | |
| | 35,420 | | | McDonald’s Corp. | | | 4,096,677 | |
| | 19,174 | | | MGM Resorts International* | | | 458,067 | |
| | 52,618 | | | Norwegian Cruise Line Holdings Ltd.* | | | 1,888,460 | |
| | 898 | | | Panera Bread Co., Class A Shares* | | | 195,001 | |
| | 6,829 | | | Royal Caribbean Cruises Ltd. | | | 485,610 | |
| | 3,058 | | | Six Flags Entertainment Corp. | | | 149,139 | |
| | 129,817 | | | Starbucks Corp. | | | 7,299,610 | |
| | 6,901 | | | Starwood Hotels & Resorts Worldwide Inc. | | | 534,552 | |
| | 1,515 | | | Vail Resorts Inc. | | | 240,021 | |
See Notes to Financial Statements.
32
| | | | | | | | |
| Large Cap Equity Fund | |
| | |
| Shares/Units | | | Security | | Value | |
| CONSUMER DISCRETIONARY — 11.8% — (continued) | |
| Hotels, Restaurants & Leisure — 1.3% — (continued) | |
| | 8,762 | | | Wendy’s Co. (The) | | $ | 89,285 | |
| | 4,399 | | | Wyndham Worldwide Corp. | | | 311,405 | |
| | 3,074 | | | Wynn Resorts Ltd.(a) | | | 274,570 | |
| | 15,546 | | | Yum! Brands Inc. | | | 1,410,178 | |
| | | | | | | | |
| | | | Total Hotels, Restaurants & Leisure | | | 21,989,742 | |
| | | | | | | | |
| Household Durables — 0.5% | |
| | 3,131 | | | CalAtlantic Group Inc. | | | 114,250 | |
| | 13,490 | | | DR Horton Inc. | | | 432,489 | |
| | 4,478 | | | Garmin Ltd. | | | 219,780 | |
| | 2,726 | | | Harman International Industries Inc. | | | 230,865 | |
| | 5,063 | | | Leggett & Platt Inc. | | | 265,706 | |
| | 7,267 | | | Lennar Corp., Class A Shares | | | 343,729 | |
| | 513 | | | Lennar Corp., Class B Shares | | | 19,489 | |
| | 2,477 | | | Mohawk Industries Inc.* | | | 527,056 | |
| | 18,923 | | | Newell Brands Inc. | | | 1,004,433 | |
| | 131 | | | NVR Inc.* | | | 220,971 | |
| | 13,266 | | | PulteGroup Inc. | | | 283,495 | |
| | 2,289 | | | Tempur Sealy International Inc.*(a) | | | 179,503 | |
| | 6,212 | | | Toll Brothers Inc.* | | | 193,131 | |
| | 2,156 | | | Tupperware Brands Corp. | | | 141,283 | |
| | 24,138 | | | Whirlpool Corp. | | | 4,312,012 | |
| | | | | | | | |
| | | | Total Household Durables | | | 8,488,192 | |
| | | | | | | | |
| Internet & Catalog Retail — 2.5% | |
| | 23,758 | | | Amazon.com Inc.* | | | 18,273,703 | |
| | 4,852 | | | Expedia Inc. | | | 529,450 | |
| | 15,000 | | | Groupon Inc., Class A Shares*(a) | | | 79,950 | |
| | 164,005 | | | Liberty Interactive Corp. QVC Group, Class A Shares* | | | 3,465,426 | |
| | 5,348 | | | Liberty Ventures, Series A* | | | 206,112 | |
| | 16,514 | | | Netflix Inc.* | | | 1,609,289 | |
| | 13,232 | | | Priceline Group Inc. (The)* | | | 18,746,172 | |
| | 4,518 | | | TripAdvisor Inc.* | | | 275,598 | |
| | | | | | | | |
| | | | Total Internet & Catalog Retail | | | 43,185,700 | |
| | | | | | | | |
| Leisure Products — 0.1% | |
| | 3,635 | | | Brunswick Corp. | | | 167,174 | |
| | 4,511 | | | Hasbro Inc. | | | 368,729 | |
| | 13,598 | | | Mattel Inc. | | | 450,502 | |
| | 2,419 | | | Polaris Industries Inc.(a) | | | 209,582 | |
| | 2,526 | | | Vista Outdoor Inc.* | | | 100,585 | |
| | | | | | | | |
| | | | Total Leisure Products | | | 1,296,572 | |
| | | | | | | | |
| Media — 2.2% | |
| | 2,557 | | | AMC Networks Inc., Class A Shares* | | | 138,947 | |
| | 197 | | | Cable One Inc. | | | 106,601 | |
| | 16,251 | | | CBS Corp., Class B Shares | | | 829,288 | |
| | 8,071 | | | Charter Communications Inc., Class A Shares* | | | 2,075,942 | |
| | 4,544 | | | Cinemark Holdings Inc. | | | 175,626 | |
| | 1,908 | | | Clear Channel Outdoor Holdings Inc., Class A Shares | | | 12,879 | |
| | 159,911 | | | Comcast Corp., Class A Shares | | | 10,435,792 | |
| | 6,136 | | | Discovery Communications Inc., Class A Shares* | | | 156,529 | |
| | 9,100 | | | Discovery Communications Inc., Class C Shares* | | | 225,862 | |
| | 8,764 | | | DISH Network Corp., Class A Shares* | | | 440,216 | |
| | 16,080 | | | Interpublic Group of Cos., Inc. (The) | | | 372,091 | |
| | 1,809 | | | John Wiley & Sons Inc., Class A Shares | | | 105,157 | |
See Notes to Financial Statements.
33
| | | | | | | | |
| Large Cap Equity Fund | |
| | |
| Shares/Units | | | Security | | Value | |
| CONSUMER DISCRETIONARY — 11.8% — (continued) | |
| Media — 2.2% — (continued) | |
| | 565 | | | Liberty Broadband Corp., Class A Shares* | | $ | 38,109 | |
| | 4,278 | | | Liberty Broadband Corp., Class C Shares* | | | 293,171 | |
| | 3,979 | | | Liberty SiriusXM Group, Class A Shares* | | | 133,336 | |
| | 6,355 | | | Liberty SiriusXM Group, Class C Shares* | | | 211,177 | |
| | 3,959 | | | Lions Gate Entertainment Corp.(a) | | | 82,981 | |
| | 5,269 | | | Live Nation Entertainment Inc.* | | | 140,788 | |
| | 40,816 | | | Madison Square Garden Co. (The), Class A Shares* | | | 7,373,410 | |
| | 14,535 | | | News Corp., Class A Shares | | | 204,362 | |
| | 4,110 | | | News Corp., Class B Shares | | | 59,307 | |
| | 9,505 | | | Omnicom Group Inc. | | | 818,666 | |
| | 3,274 | | | Regal Entertainment Group, Class A Shares(a) | | | 69,998 | |
| | 3,311 | | | Scripps Networks Interactive Inc., Class A Shares | | | 209,818 | |
| | 67,901 | | | Sirius XM Holdings Inc.*(a) | | | 281,110 | |
| | 3,410 | | | Starz, Class A Shares* | | | 106,358 | |
| | 8,372 | | | TEGNA Inc. | | | 169,617 | |
| | 11,944 | | | Thomson Reuters Corp. | | | 495,557 | |
| | 31,690 | | | Time Warner Inc. | | | 2,484,813 | |
| | 3,332 | | | Tribune Media Co., Class A Shares | | | 126,883 | |
| | 43,771 | | | Twenty-First Century Fox Inc., Class A Shares | | | 1,074,140 | |
| | 19,683 | | | Twenty-First Century Fox Inc., Class B Shares | | | 489,122 | |
| | 546 | | | Viacom Inc., Class A Shares | | | 24,674 | |
| | 13,873 | | | Viacom Inc., Class B Shares | | | 559,637 | |
| | 65,404 | | | Walt Disney Co. (The) | | | 6,178,062 | |
| | | | | | | | |
| | | | Total Media | | | 36,700,026 | |
| | | | | | | | |
| Multiline Retail — 0.3% | |
| | 774 | | | Dillard’s Inc., Class A Shares | | | 46,626 | |
| | 11,448 | | | Dollar General Corp. | | | 840,398 | |
| | 9,092 | | | Dollar Tree Inc.* | | | 751,908 | |
| | 102,725 | | | JC Penney Co., Inc.*(a) | | | 968,697 | |
| | 7,086 | | | Kohl’s Corp. | | | 314,477 | |
| | 12,313 | | | Macy’s Inc. | | | 445,484 | |
| | 4,953 | | | Nordstrom Inc.(a) | | | 249,928 | |
| | 23,889 | | | Target Corp. | | | 1,676,769 | |
| | | | | | | | |
| | | | Total Multiline Retail | | | 5,294,287 | |
| | | | | | | | |
| Specialty Retail — 2.4% | |
| | 43,977 | | | Advance Auto Parts Inc. | | | 6,921,100 | |
| | 2,821 | | | AutoNation Inc.* | | | 133,574 | |
| | 1,179 | | | AutoZone Inc.* | | | 874,582 | |
| | 5,559 | | | Bed Bath & Beyond Inc. | | | 257,771 | |
| | 11,077 | | | Best Buy Co., Inc. | | | 426,243 | |
| | 2,823 | | | Burlington Stores Inc.* | | | 229,284 | |
| | 2,128 | | | Cabela’s Inc.* | | | 104,251 | |
| | 7,754 | | | CarMax Inc.* | | | 457,098 | |
| | 3,170 | | | CST Brands Inc. | | | 151,558 | |
| | 3,510 | | | Dick’s Sporting Goods Inc. | | | 205,686 | |
| | 5,338 | | | Foot Locker Inc. | | | 350,386 | |
| | 4,341 | | | GameStop Corp., Class A Shares | | | 123,241 | |
| | 8,450 | | | Gap Inc. (The) | | | 210,151 | |
| | 50,158 | | | Home Depot Inc. (The) | | | 6,727,191 | |
| | 9,813 | | | L Brands Inc. | | | 747,849 | |
| | 121,335 | | | Lowe’s Cos., Inc. | | | 9,289,408 | |
| | 3,917 | | | Michaels Cos., Inc. (The)* | | | 93,851 | |
| | 1,545 | | | Murphy USA Inc.* | | | 112,970 | |
See Notes to Financial Statements.
34
| | | | | | | | |
| Large Cap Equity Fund | |
| | |
| Shares/Units | | | Security | | Value | |
| CONSUMER DISCRETIONARY — 11.8% — (continued) | |
| Specialty Retail — 2.4% — (continued) | |
| | 3,845 | | | O’Reilly Automotive Inc.* | | $ | 1,076,408 | |
| | 1,602 | | | Penske Automotive Group Inc. | | | 72,571 | |
| | 81,698 | | | Ross Stores Inc. | | | 5,084,884 | |
| | 6,099 | | | Sally Beauty Holdings Inc.* | | | 166,015 | |
| | 3,081 | | | Signet Jewelers Ltd. | | | 252,580 | |
| | 24,406 | | | Staples Inc. | | | 208,915 | |
| | 4,101 | | | Tiffany & Co. | | | 292,688 | |
| | 66,879 | | | TJX Cos., Inc. (The) | | | 5,179,110 | |
| | 5,397 | | | Tractor Supply Co. | | | 453,078 | |
| | 2,399 | | | Ulta Salon Cosmetics & Fragrance Inc.* | | | 593,057 | |
| | 3,854 | | | Urban Outfitters Inc.* | | | 138,166 | |
| | 3,551 | | | Williams-Sonoma Inc. | | | 186,925 | |
| | | | | | | | |
| | | | Total Specialty Retail | | | 41,120,591 | |
| | | | | | | | |
| Textiles, Apparel & Luxury Goods — 0.9% | |
| | 2,012 | | | Carter’s Inc. | | | 191,723 | |
| | 11,155 | | | Coach Inc. | | | 425,898 | |
| | 49,500 | | | Deckers Outdoor Corp.* | | | 3,234,825 | |
| | 15,176 | | | Hanesbrands Inc. | | | 402,771 | |
| | 5,448 | | | Kate Spade & Co.* | | | 101,660 | |
| | 3,835 | | | lululemon athletica Inc.* | | | 293,416 | |
| | 6,501 | | | Michael Kors Holdings Ltd.* | | | 318,224 | |
| | 149,881 | | | NIKE Inc., Class B Shares | | | 8,639,141 | |
| | 3,199 | | | PVH Corp. | | | 344,724 | |
| | 2,294 | | | Ralph Lauren Corp., Class A Shares | | | 237,704 | |
| | 5,528 | | | Skechers U.S.A. Inc., Class A Shares* | | | 134,386 | |
| | 7,165 | | | Under Armour Inc., Class A Shares*(a) | | | 283,949 | |
| | 7,443 | | | Under Armour Inc., Class C Shares* | | | 265,343 | |
| | 13,697 | | | V.F. Corp. | | | 849,899 | |
| | | | | | | | |
| | | | Total Textiles, Apparel & Luxury Goods | | | 15,723,663 | |
| | | | | | | | |
| | | | TOTAL CONSUMER DISCRETIONARY | | | 201,664,102 | |
| | | | | | | | |
| CONSUMER STAPLES — 9.3% | |
| Beverages — 1.7% | |
| | 2,183 | | | Brown-Forman Corp., Class A Shares | | | 112,948 | |
| | 7,860 | | | Brown-Forman Corp., Class B Shares | | | 381,603 | |
| | 157,031 | | | Coca-Cola Co. (The) | | | 6,819,856 | |
| | 6,688 | | | Constellation Brands Inc., Class A Shares | | | 1,097,166 | |
| | 7,454 | | | Dr Pepper Snapple Group Inc. | | | 698,440 | |
| | 83,714 | | | Molson Coors Brewing Co., Class B Shares | | | 8,565,617 | |
| | 36,748 | | | Monster Beverage Corp.* | | | 5,655,150 | |
| | 58,216 | | | PepsiCo Inc. | | | 6,214,558 | |
| | | | | | | | |
| | | | Total Beverages | | | 29,545,338 | |
| | | | | | | | |
| Food & Staples Retailing — 2.1% | |
| | 1,643 | | | Casey’s General Stores Inc. | | | 215,742 | |
| | 17,554 | | | Costco Wholesale Corp. | | | 2,845,328 | |
| | 145,101 | | | CVS Health Corp. | | | 13,552,433 | |
| | 38,341 | | | Kroger Co. (The) | | | 1,226,529 | |
| | 41,341 | | | Rite Aid Corp.* | | | 311,298 | |
| | 6,001 | | | Sprouts Farmers Market Inc.* | | | 135,203 | |
| | 21,327 | | | Sysco Corp. | | | 1,106,018 | |
| | 1,800 | | | US Foods Holding Corp.* | | | 43,650 | |
| | 142,405 | | | Walgreens Boots Alliance Inc. | | | 11,493,508 | |
| | 60,976 | | | Wal-Mart Stores Inc. | | | 4,356,125 | |
See Notes to Financial Statements.
35
| | | | | | | | |
| Large Cap Equity Fund | |
| | |
| Shares/Units | | | Security | | Value | |
| CONSUMER STAPLES — 9.3% — (continued) | |
| Food & Staples Retailing — 2.1% — (continued) | |
| | 12,722 | | | Whole Foods Market Inc. | | $ | 386,494 | |
| | | | | | | | |
| | | | Total Food & Staples Retailing | | | 35,672,328 | |
| | | | | | | | |
| Food Products — 3.2% | |
| | 181,780 | | | Archer-Daniels-Midland Co. | | | 7,954,693 | |
| | 2,520 | | | Blue Buffalo Pet Products Inc.* | | | 64,966 | |
| | 5,523 | | | Bunge Ltd. | | | 352,920 | |
| | 7,567 | | | Campbell Soup Co. | | | 459,468 | |
| | 17,782 | | | ConAgra Foods Inc. | | | 828,819 | |
| | 7,398 | | | Flowers Foods Inc. | | | 110,304 | |
| | 24,017 | | | General Mills Inc. | | | 1,700,884 | |
| | 3,677 | | | Hain Celestial Group Inc. (The)* | | | 135,130 | |
| | 5,690 | | | Hershey Co. (The) | | | 568,374 | |
| | 10,923 | | | Hormel Foods Corp. | | | 417,914 | |
| | 2,862 | | | Ingredion Inc. | | | 391,980 | |
| | 4,714 | | | J.M. Smucker Co. (The) | | | 668,398 | |
| | 10,117 | | | Kellogg Co. | | | 831,719 | |
| | 223,819 | | | Kraft Heinz Co. (The) | | | 20,029,562 | |
| | 4,674 | | | McCormick & Co., Inc. | | | 476,561 | |
| | 59,748 | | | Mead Johnson Nutrition Co., Class A Shares | | | 5,082,762 | |
| | 212,502 | | | Mondelez International Inc., Class A Shares | | | 9,566,840 | |
| | 2,467 | | | Pilgrim’s Pride Corp. | | | 56,938 | |
| | 4,642 | | | Pinnacle Foods Inc. | | | 235,117 | |
| | 2,577 | | | Post Holdings Inc.* | | | 218,478 | |
| | 43,594 | | | TreeHouse Foods Inc.* | | | 4,129,660 | |
| | 11,688 | | | Tyson Foods Inc., Class A Shares | | | 883,262 | |
| | 6,902 | | | WhiteWave Foods Co. (The), Class A Shares* | | | 382,578 | |
| | | | | | | | |
| | | | Total Food Products | | | 55,547,327 | |
| | | | | | | | |
| Household Products — 1.4% | |
| | 5,253 | | | Church & Dwight Co., Inc. | | | 522,253 | |
| | 5,210 | | | Clorox Co. (The) | | | 682,718 | |
| | 34,970 | | | Colgate-Palmolive Co. | | | 2,599,670 | |
| | 2,656 | | | Energizer Holdings Inc. | | | 131,260 | |
| | 14,471 | | | Kimberly-Clark Corp. | | | 1,853,156 | |
| | 201,108 | | | Procter & Gamble Co. (The) | | | 17,558,739 | |
| | 1,064 | | | Spectrum Brands Holdings Inc.(a) | | | 142,789 | |
| | | | | | | | |
| | | | Total Household Products | | | 23,490,585 | |
| | | | | | | | |
| Personal Products — 0.1% | |
| | 1,979 | | | Coty Inc., Class A Shares(a) | | | 53,334 | |
| | 2,469 | | | Edgewell Personal Care Co.* | | | 197,545 | |
| | 8,831 | | | Estee Lauder Cos., Inc. (The), Class A Shares | | | 787,990 | |
| | 2,964 | | | Herbalife Ltd.*(a) | | | 180,063 | |
| | 2,318 | | | Nu Skin Enterprises Inc., Class A Shares(a) | | | 134,166 | |
| | | | | | | | |
| | | | Total Personal Products | | | 1,353,098 | |
| | | | | | | | |
| Tobacco — 0.8% | |
| | 78,850 | | | Altria Group Inc. | | | 5,211,196 | |
| | 62,459 | | | Philip Morris International Inc. | | | 6,241,528 | |
| | 33,442 | | | Reynolds American Inc. | | | 1,657,720 | |
| | | | | | | | |
| | | | Total Tobacco | | | 13,110,444 | |
| | | | | | | | |
| | | | TOTAL CONSUMER STAPLES | | | 158,719,120 | |
| | | | | | | | |
See Notes to Financial Statements.
36
| | | | | | | | |
| Large Cap Equity Fund | |
| | |
| Shares/Units | | | Security | | Value | |
| ENERGY — 6.7% | |
| Energy Equipment & Services — 2.1% | |
| | 17,613 | | | Baker Hughes Inc. | | $ | 865,327 | |
| | 58,600 | | | Core Laboratories NV | | | 6,550,308 | |
| | 2,846 | | | Diamond Offshore Drilling Inc.(a) | | | 52,566 | |
| | 1,564 | | | Dril-Quip Inc.* | | | 86,911 | |
| | 12,672 | | | Ensco PLC, Class A Shares | | | 96,180 | |
| | 9,065 | | | FMC Technologies Inc.* | | | 255,633 | |
| | 1,827 | | | Frank’s International NV(a) | | | 20,992 | |
| | 186,824 | | | Halliburton Co. | | | 8,035,300 | |
| | 4,092 | | | Helmerich & Payne Inc.(a) | | | 247,402 | |
| | 11,605 | | | Nabors Industries Ltd. | | | 115,354 | |
| | 131,379 | | | National Oilwell Varco Inc. | | | 4,406,452 | |
| | 10,511 | | | Noble Corp. PLC | | | 60,543 | |
| | 4,152 | | | Oceaneering International Inc. | | | 110,111 | |
| | 6,285 | | | Patterson-UTI Energy Inc. | | | 122,495 | |
| | 5,366 | | | Rowan Cos. PLC, Class A Shares | | | 66,860 | |
| | 2,584 | | | RPC Inc.*(a) | | | 39,613 | |
| | 168,398 | | | Schlumberger Ltd. | | | 13,303,442 | |
| | 6,392 | | | Superior Energy Services Inc. | | | 107,577 | |
| | 14,571 | | | Transocean Ltd.*(a) | | | 141,339 | |
| | 31,733 | | | Weatherford International PLC* | | | 173,580 | |
| | | | | | | | |
| | | | Total Energy Equipment & Services | | | 34,857,985 | |
| | | | | | | | |
| Oil, Gas & Consumable Fuels — 4.6% | |
| | 20,558 | | | Anadarko Petroleum Corp. | | | 1,099,236 | |
| | 7,043 | | | Antero Resources Corp.* | | | 180,019 | |
| | 15,259 | | | Apache Corp. | | | 758,372 | |
| | 18,716 | | | Cabot Oil & Gas Corp. | | | 460,975 | |
| | 7,934 | | | Cheniere Energy Inc.* | | | 340,369 | |
| | 26,081 | | | Chesapeake Energy Corp.* | | | 165,614 | |
| | 140,981 | | | Chevron Corp. | | | 14,179,869 | |
| | 3,792 | | | Cimarex Energy Co. | | | 501,227 | |
| | 5,667 | | | Concho Resources Inc.* | | | 732,176 | |
| | 202,651 | | | ConocoPhillips | | | 8,318,824 | |
| | 9,119 | | | CONSOL Energy Inc. | | | 166,331 | |
| | 3,482 | | | Continental Resources Inc.* | | | 166,997 | |
| | 21,208 | | | Devon Energy Corp. | | | 918,943 | |
| | 3,114 | | | Diamondback Energy Inc.* | | | 296,608 | |
| | 3,897 | | | Energen Corp. | | | 224,077 | |
| | 72,854 | | | EOG Resources Inc. | | | 6,446,850 | |
| | 7,043 | | | EQT Corp. | | | 503,574 | |
| | 167,128 | | | Exxon Mobil Corp. | | | 14,563,534 | |
| | 5,446 | | | Gulfport Energy Corp.* | | | 155,756 | |
| | 11,481 | | | Hess Corp. | | | 623,418 | |
| | 6,947 | | | HollyFrontier Corp. | | | 179,788 | |
| | 77,753 | | | Kinder Morgan Inc. | | | 1,698,903 | |
| | 7,086 | | | Kosmos Energy Ltd.* | | | 44,004 | |
| | 5,890 | | | Laredo Petroleum Inc.*(a) | | | 72,329 | |
| | 273,857 | | | Marathon Oil Corp. | | | 4,113,332 | |
| | 21,165 | | | Marathon Petroleum Corp. | | | 899,724 | |
| | 4,279 | | | Memorial Resource Development Corp.* | | | 61,618 | |
| | 6,558 | | | Murphy Oil Corp. | | | 175,230 | |
| | 7,977 | | | Newfield Exploration Co.* | | | 345,883 | |
| | 17,176 | | | Noble Energy Inc. | | | 592,228 | |
| | 117,960 | | | Occidental Petroleum Corp. | | | 9,065,226 | |
| | 8,444 | | | ONEOK Inc. | | | 395,939 | |
See Notes to Financial Statements.
37
| | | | | | | | |
| Large Cap Equity Fund | |
| | |
| Shares/Units | | | Security | | Value | |
| ENERGY — 6.7% — (continued) | |
| Oil, Gas & Consumable Fuels — 4.6% — (continued) | |
| | 6,547 | | | Parsley Energy Inc., Class A Shares* | | $ | 221,616 | |
| | 4,143 | | | PBF Energy Inc., Class A Shares | | | 90,732 | |
| | 18,219 | | | Phillips 66 | | | 1,429,281 | |
| | 6,502 | | | Pioneer Natural Resources Co. | | | 1,164,183 | |
| | 9,337 | | | QEP Resources Inc. | | | 178,337 | |
| | 6,621 | | | Range Resources Corp. | | | 255,372 | |
| | 2,907 | | | SM Energy Co. | | | 110,117 | |
| | 20,092 | | | Southwestern Energy Co.* | | | 279,480 | |
| | 28,160 | | | Spectra Energy Corp. | | | 1,003,059 | |
| | 109,116 | | | Suncor Energy Inc. | | | 2,958,135 | |
| | 6,127 | | | Targa Resources Corp. | | | 267,015 | |
| | 4,777 | | | Tesoro Corp. | | | 360,281 | |
| | 19,041 | | | Valero Energy Corp. | | | 1,053,919 | |
| | 8,651 | | | Whiting Petroleum Corp.*(a) | | | 63,066 | |
| | 27,871 | | | Williams Cos., Inc. (The) | | | 778,716 | |
| | 2,958 | | | World Fuel Services Corp. | | | 131,868 | |
| | 11,872 | | | WPX Energy Inc.* | | | 142,464 | |
| | | | | | | | |
| | | | Total Oil, Gas & Consumable Fuels | | | 78,934,614 | |
| | | | | | | | |
| | | | TOTAL ENERGY | | | 113,792,599 | |
| | | | | | | | |
| FINANCIALS — 12.9% | |
| Banks — 3.1% | |
| | 6,559 | | | Associated Banc-Corp. | | | 130,131 | |
| | 414,310 | | | Bank of America Corp. | | | 6,686,963 | |
| | 1,869 | | | Bank of Hawaii Corp. | | | 134,643 | |
| | 4,303 | | | BankUnited Inc. | | | 138,341 | |
| | 212,448 | | | BB&T Corp. | | | 8,179,248 | |
| | 986 | | | BOK Financial Corp.(a) | | | 68,103 | |
| | 8,002 | | | CIT Group Inc. | | | 295,114 | |
| | 118,362 | | | Citigroup Inc. | | | 5,650,602 | |
| | 20,597 | | | Citizens Financial Group Inc. | | | 510,188 | |
| | 7,017 | | | Comerica Inc. | | | 331,834 | |
| | 3,552 | | | Commerce Bancshares Inc. | | | 180,015 | |
| | 2,210 | | | Cullen/Frost Bankers Inc.(a) | | | 161,109 | |
| | 6,071 | | | East West Bancorp Inc. | | | 225,477 | |
| | 29,838 | | | Fifth Third Bancorp | | | 601,534 | |
| | 9,257 | | | First Horizon National Corp. | | | 142,373 | |
| | 5,759 | | | First Republic Bank | | | 443,213 | |
| | 43,636 | | | Huntington Bancshares Inc. | | | 436,796 | |
| | 146,745 | | | JPMorgan Chase & Co. | | | 9,905,287 | |
| | 43,547 | | | KeyCorp | | | 546,950 | |
| | 6,051 | | | M&T Bank Corp. | | | 716,015 | |
| | 4,767 | | | PacWest Bancorp | | | 206,459 | |
| | 12,423 | | | People’s United Financial Inc. | | | 201,874 | |
| | 20,055 | | | PNC Financial Services Group Inc. (The) | | | 1,806,955 | |
| | 4,114 | | | Popular Inc. | | | 161,721 | |
| | 50,090 | | | Regions Financial Corp. | | | 499,397 | |
| | 2,123 | | | Signature Bank* | | | 259,027 | |
| | 20,185 | | | SunTrust Banks Inc. | | | 889,553 | |
| | 2,150 | | | SVB Financial Group* | | | 238,779 | |
| | 5,191 | | | Synovus Financial Corp. | | | 171,718 | |
| | 6,307 | | | TCF Financial Corp. | | | 92,398 | |
| | 65,431 | | | US Bancorp | | | 2,888,779 | |
| | 184,200 | | | Wells Fargo & Co. | | | 9,357,360 | |
| | 3,841 | | | Western Alliance Bancorp* | | | 146,803 | |
See Notes to Financial Statements.
38
| | | | | | | | |
| Large Cap Equity Fund | |
| | |
| Shares/Units | | | Security | | Value | |
| FINANCIALS — 12.9% — (continued) | |
| Banks — 3.1% — (continued) | |
| | 8,089 | | | Zions Bancorporation | | $ | 247,443 | |
| | | | | | | | |
| | | | Total Banks | | | 52,652,202 | |
| | | | | | | | |
| Capital Markets — 2.2% | |
| | 2,130 | | | Affiliated Managers Group Inc.* | | | 302,566 | |
| | 49,487 | | | Ameriprise Financial Inc. | | | 5,002,146 | |
| | 1,645 | | | Artisan Partners Asset Management Inc., Class A Shares | | | 43,017 | |
| | 215,674 | | | Bank of New York Mellon Corp. (The) | | | 8,987,136 | |
| | 5,034 | | | BlackRock Inc., Class A Shares | | | 1,876,725 | |
| | 349,534 | | | Charles Schwab Corp. (The) | | | 10,996,340 | |
| | 10,959 | | | E*Trade Financial Corp.* | | | 289,098 | |
| | 4,408 | | | Eaton Vance Corp. | | | 176,452 | |
| | 4,062 | | | Federated Investors Inc., Class B Shares | | | 131,203 | |
| | 14,536 | | | Franklin Resources Inc. | | | 530,564 | |
| | 15,607 | | | Goldman Sachs Group Inc. (The) | | | 2,644,762 | |
| | 2,672 | | | Interactive Brokers Group Inc., Class A Shares | | | 95,871 | |
| | 16,469 | | | Invesco Ltd. | | | 513,668 | |
| | 5,119 | | | Lazard Ltd., Class A Shares | | | 189,557 | |
| | 4,440 | | | Legg Mason Inc. | | | 153,580 | |
| | 3,608 | | | LPL Financial Holdings Inc.(a) | | | 107,266 | |
| | 57,495 | | | Morgan Stanley(d) | | | 1,843,290 | |
| | 8,254 | | | Northern Trust Corp. | | | 582,650 | |
| | 7,892 | | | NorthStar Asset Management Group Inc. | | | 98,098 | |
| | 4,624 | | | Raymond James Financial Inc. | | | 268,978 | |
| | 4,705 | | | SEI Investments Co. | | | 216,900 | |
| | 16,047 | | | State Street Corp. | | | 1,127,141 | |
| | 9,914 | | | T. Rowe Price Group Inc. | | | 689,419 | |
| | 9,819 | | | TD Ameritrade Holding Corp. | | | 322,701 | |
| | | | | | | | |
| | | | Total Capital Markets | | | 37,189,128 | |
| | | | | | | | |
| Consumer Finance — 0.4% | |
| | 17,357 | | | Ally Financial Inc. | | | 347,834 | |
| | 32,405 | | | American Express Co. | | | 2,125,120 | |
| | 20,557 | | | Capital One Financial Corp. | | | 1,471,881 | |
| | 359 | | | Credit Acceptance Corp.*(a) | | | 71,675 | |
| | 16,495 | | | Discover Financial Services | | | 989,700 | |
| | 13,219 | | | Navient Corp. | | | 190,089 | |
| | 2,267 | | | OneMain Holdings Inc., Class A Shares* | | | 70,300 | |
| | 4,696 | | | Santander Consumer USA Holdings Inc.* | | | 59,076 | |
| | 12,967 | | | SLM Corp.* | | | 96,150 | |
| | 33,588 | | | Synchrony Financial | | | 934,754 | |
| | | | | | | | |
| | | | Total Consumer Finance | | | 6,356,579 | |
| | | | | | | | |
| Diversified Financial Services — 2.1% | |
| | 171,931 | | | Berkshire Hathaway Inc., Class B Shares* | | | 25,873,896 | |
| | 3,254 | | | CBOE Holdings Inc. | | | 223,517 | |
| | 13,694 | | | CME Group Inc., Class A Shares | | | 1,483,745 | |
| | 1,468 | | | FactSet Research Systems Inc. | | | 261,348 | |
| | 17,550 | | | Intercontinental Exchange Inc. | | | 4,949,451 | |
| | 13,213 | | | Leucadia National Corp. | | | 253,029 | |
| | 1,473 | | | MarketAxess Holdings Inc. | | | 248,259 | |
| | 6,852 | | | Moody’s Corp. | | | 744,744 | |
| | 709 | | | Morningstar Inc. | | | 58,897 | |
| | 3,605 | | | MSCI Inc., Class A Shares | | | 324,883 | |
| | 4,432 | | | Nasdaq Inc. | | | 315,603 | |
| | 10,614 | | | S&P Global Inc. | | | 1,311,254 | |
See Notes to Financial Statements.
39
| | | | | | | | |
| Large Cap Equity Fund | |
| | |
| Shares/Units | | | Security | | Value | |
| FINANCIALS — 12.9% — (continued) | |
| Diversified Financial Services — 2.1% — (continued) | |
| | 8,219 | | | Voya Financial Inc. | | $ | 240,324 | |
| | | | | | | | |
| | | | Total Diversified Financial Services | | | 36,288,950 | |
| | | | | | | | |
| Insurance — 3.0% | |
| | 77,306 | | | Aflac Inc. | | | 5,734,559 | |
| | 590 | | | Alleghany Corp.* | | | 316,358 | |
| | 3,514 | | | Allied World Assurance Co. Holdings AG | | | 142,528 | |
| | 116,963 | | | Allstate Corp. (The) | | | 8,065,769 | |
| | 2,865 | | | American Financial Group Inc. | | | 215,305 | |
| | 44,692 | | | American International Group Inc. | | | 2,673,922 | |
| | 321 | | | American National Insurance Co. | | | 37,499 | |
| | 3,682 | | | AmTrust Financial Services Inc. | | | 97,536 | |
| | 10,587 | | | Aon PLC | | | 1,178,863 | |
| | 4,351 | | | Arch Capital Group Ltd.* | | | 352,170 | |
| | 6,862 | | | Arthur J. Gallagher & Co. | | | 339,051 | |
| | 2,415 | | | Aspen Insurance Holdings Ltd. | | | 110,993 | |
| | 22,251 | | | Assurant Inc. | | | 1,992,577 | |
| | 5,594 | | | Assured Guaranty Ltd. | | | 155,345 | |
| | 3,800 | | | Axis Capital Holdings Ltd. | | | 216,106 | |
| | 4,677 | | | Brown & Brown Inc. | | | 175,247 | |
| | 18,623 | | | Chubb Ltd. | | | 2,363,817 | |
| | 6,121 | | | Cincinnati Financial Corp. | | | 471,990 | |
| | 1,198 | | | CNA Financial Corp. | | | 39,905 | |
| | 2,568 | | | Endurance Specialty Holdings Ltd. | | | 169,103 | |
| | 1,025 | | | Erie Indemnity Co., Class A Shares | | | 104,581 | |
| | 1,628 | | | Everest Re Group Ltd. | | | 314,823 | |
| | 4,438 | | | First American Financial Corp. | | | 191,233 | |
| | 10,458 | | | FNF Group | | | 394,162 | |
| | 1,840 | | | Hanover Insurance Group Inc. (The) | | | 143,888 | |
| | 15,850 | | | Hartford Financial Services Group Inc. (The) | | | 650,960 | |
| | 78,267 | | | Lincoln National Corp. | | | 3,759,164 | |
| | 11,067 | | | Loews Corp. | | | 463,265 | |
| | 556 | | | Markel Corp.* | | | 517,697 | |
| | 124,528 | | | Marsh & McLennan Cos., Inc. | | | 8,421,829 | |
| | 37,468 | | | MetLife Inc. | | | 1,626,111 | |
| | 9,712 | | | Old Republic International Corp. | | | 186,762 | |
| | 10,674 | | | Principal Financial Group Inc. | | | 523,773 | |
| | 2,314 | | | ProAssurance Corp. | | | 127,316 | |
| | 23,401 | | | Progressive Corp. (The) | | | 761,937 | |
| | 17,801 | | | Prudential Financial Inc. | | | 1,413,043 | |
| | 2,567 | | | Reinsurance Group of America Inc., Class A Shares | | | 275,491 | |
| | 1,714 | | | RenaissanceRe Holdings Ltd. | | | 205,166 | |
| | 4,719 | | | Torchmark Corp. | | | 305,225 | |
| | 11,810 | | | Travelers Cos., Inc. (The) | | | 1,401,965 | |
| | 9,119 | | | Unum Group | | | 324,728 | |
| | 3,019 | | | Validus Holdings Ltd. | | | 153,335 | |
| | 205 | | | White Mountains Insurance Group Ltd. | | | 168,924 | |
| | 32,342 | | | Willis Towers Watson PLC | | | 4,010,731 | |
| | 3,850 | | | WR Berkley Corp. | | | 228,575 | |
| | 10,884 | | | XL Group Ltd. | | | 372,559 | |
| | | | | | | | |
| | | | Total Insurance | | | 51,895,886 | |
| | | | | | | | |
| Real Estate Investment Trusts (REITs) — 2.0% | |
| | 3,070 | | | Alexandria Real Estate Equities Inc. | | | 337,976 | |
| | 5,463 | | | American Campus Communities Inc. | | | 273,751 | |
See Notes to Financial Statements.
40
| | | | | | | | |
| Large Cap Equity Fund | |
| | |
| Shares/Units | | | Security | | Value | |
| FINANCIALS — 12.9% — (continued) | |
| Real Estate Investment Trusts (REITs) — 2.0% — (continued) | |
| | 13,332 | | | American Capital Agency Corp. | | $ | 257,441 | |
| | 6,687 | | | American Homes 4 Rent, Class A Shares | | | 146,245 | |
| | 16,976 | | | American Tower Corp. | | | 1,924,739 | |
| | 40,638 | | | Annaly Capital Management Inc. | | | 435,233 | |
| | 5,820 | | | Apartment Investment & Management Co., Class A Shares | | | 262,948 | |
| | 6,602 | | | Apple Hospitality REIT Inc.(a) | | | 129,531 | |
| | 5,574 | | | AvalonBay Communities Inc. | | | 975,506 | |
| | 6,205 | | | Boston Properties Inc. | | | 869,507 | |
| | 6,910 | | | Brandywine Realty Trust | | | 111,458 | |
| | 7,968 | | | Brixmor Property Group Inc. | | | 227,566 | |
| | 3,139 | | | Camden Property Trust | | | 275,510 | |
| | 3,708 | | | Care Capital Properties Inc. | | | 111,203 | |
| | 7,531 | | | Chimera Investment Corp. | | | 124,186 | |
| | 5,397 | | | Columbia Property Trust Inc. | | | 127,261 | |
| | 4,712 | | | Communications Sales & Leasing Inc. | | | 147,014 | |
| | 4,161 | | | Corporate Office Properties Trust | | | 118,672 | |
| | 5,045 | | | Corrections Corp. of America(a) | | | 80,367 | |
| | 13,526 | | | Crown Castle International Corp. | | | 1,281,859 | |
| | 7,493 | | | CubeSmart | | | 206,282 | |
| | 2,981 | | | CyrusOne Inc. | | | 151,554 | |
| | 3,731 | | | DCT Industrial Trust Inc. | | | 181,737 | |
| | 12,684 | | | DDR Corp. | | | 239,854 | |
| | 5,947 | | | Digital Realty Trust Inc. | | | 589,288 | |
| | 4,827 | | | Douglas Emmett Inc. | | | 181,302 | |
| | 13,911 | | | Duke Realty Corp. | | | 391,177 | |
| | 4,957 | | | Empire State Realty Trust Inc., Class A Shares | | | 106,427 | |
| | 2,584 | | | EPR Properties | | | 202,379 | |
| | 2,768 | | | Equinix Inc. | | | 1,020,423 | |
| | 4,904 | | | Equity Commonwealth* | | | 153,446 | |
| | 2,790 | | | Equity LifeStyle Properties Inc. | | | 216,309 | |
| | 3,608 | | | Equity One Inc. | | | 111,992 | |
| | 14,340 | | | Equity Residential | | | 930,236 | |
| | 2,575 | | | Essex Property Trust Inc. | | | 584,783 | |
| | 4,844 | | | Extra Space Storage Inc. | | | 390,184 | |
| | 2,838 | | | Federal Realty Investment Trust | | | 451,242 | |
| | 9,179 | | | Forest City Realty Trust Inc., Class A Shares | | | 217,175 | |
| | 7,522 | | | Gaming & Leisure Properties Inc. | | | 257,328 | |
| | 23,230 | | | General Growth Properties Inc. | | | 676,922 | |
| | 18,519 | | | HCP Inc. | | | 728,352 | |
| | 5,580 | | | Healthcare Trust of America Inc., Class A Shares | | | 188,269 | |
| | 3,892 | | | Highwoods Properties Inc. | | | 206,432 | |
| | 6,499 | | | Hospitality Properties Trust | | | 198,155 | |
| | 28,661 | | | Host Hotels & Resorts Inc. | | | 510,739 | |
| | 10,055 | | | Iron Mountain Inc. | | | 386,213 | |
| | 3,637 | | | Kilroy Realty Corp. | | | 264,155 | |
| | 15,777 | | | Kimco Realty Corp. | | | 474,099 | |
| | 3,430 | | | Lamar Advertising Co., Class A Shares | | | 213,792 | |
| | 5,872 | | | Liberty Property Trust | | | 242,103 | |
| | 1,917 | | | Life Storage Inc. | | | 172,530 | |
| | 5,654 | | | Macerich Co. (The) | | | 463,006 | |
| | 14,863 | | | MFA Financial Inc. | | | 114,742 | |
| | 2,875 | | | Mid-America Apartment Communities Inc. | | | 270,221 | |
| | 5,741 | | | National Retail Properties Inc. | | | 287,624 | |
| | 7,800 | | | NorthStar Realty Finance Corp. | | | 104,052 | |
| | 7,398 | | | Omega Healthcare Investors Inc.(a) | | | 267,808 | |
See Notes to Financial Statements.
41
| | | | | | | | |
| Large Cap Equity Fund | |
| | |
| Shares/Units | | | Security | | Value | |
| FINANCIALS — 12.9% — (continued) | |
| Real Estate Investment Trusts (REITs) — 2.0% — (continued) | |
| | 5,979 | | | Outfront Media Inc. | | $ | 133,451 | |
| | 7,238 | | | Paramount Group Inc. | | | 130,284 | |
| | 5,817 | | | Piedmont Office Realty Trust Inc., Class A Shares | | | 125,705 | |
| | 2,262 | | | Post Properties Inc. | | | 149,925 | |
| | 21,008 | | | Prologis Inc. | | | 1,115,735 | |
| | 5,967 | | | Public Storage | | | 1,336,250 | |
| | 4,929 | | | Rayonier Inc. | | | 135,695 | |
| | 10,424 | | | Realty Income Corp. | | | 685,170 | |
| | 4,065 | | | Regency Centers Corp. | | | 327,395 | |
| | 9,541 | | | Retail Properties of America Inc., Class A Shares | | | 162,197 | |
| | 9,459 | | | Senior Housing Properties Trust | | | 211,314 | |
| | 12,400 | | | Simon Property Group Inc. | | | 2,671,828 | |
| | 3,778 | | | SL Green Realty Corp. | | | 444,746 | |
| | 19,268 | | | Spirit Realty Capital Inc. | | | 255,301 | |
| | 8,033 | | | Starwood Property Trust Inc. | | | 183,956 | |
| | 6,293 | | | STORE Capital Corp. | | | 186,462 | |
| | 2,564 | | | Sun Communities Inc. | | | 196,197 | |
| | 3,746 | | | Tanger Factory Outlet Centers Inc. | | | 152,237 | |
| | 2,351 | | | Taubman Centers Inc. | | | 182,602 | |
| | 9,540 | | | Two Harbors Investment Corp. | | | 84,906 | |
| | 10,193 | | | UDR Inc. | | | 368,783 | |
| | 13,656 | | | Ventas Inc. | | | 992,382 | |
| | 34,512 | | | VEREIT Inc. | | | 360,650 | |
| | 6,811 | | | Vornado Realty Trust | | | 703,644 | |
| | 4,939 | | | Weingarten Realty Investors | | | 203,734 | |
| | 14,373 | | | Welltower Inc. | | | 1,103,128 | |
| | 29,837 | | | Weyerhaeuser Co. | | | 950,309 | |
| | 4,325 | | | WP Carey Inc. | | | 288,261 | |
| | | | | | | | |
| | | | Total Real Estate Investment Trusts (REITs) | | | 34,412,552 | |
| | | | | | | | |
| Real Estate Management & Development — 0.1% | |
| | 11,065 | | | CBRE Group Inc., Class A Shares* | | | 330,733 | |
| | 1,453 | | | Howard Hughes Corp. (The)* | | | 171,774 | |
| | 1,809 | | | Jones Lang LaSalle Inc. | | | 211,201 | |
| | 6,110 | | | Realogy Holdings Corp. | | | 163,992 | |
| | | | | | | | |
| | | | Total Real Estate Management & Development | | | 877,700 | |
| | | | | | | | |
| Thrifts & Mortgage Finance — 0.0% | |
| | 16,828 | | | New York Community Bancorp Inc. | | | 254,271 | |
| | 2,294 | | | TFS Financial Corp. | | | 41,613 | |
| | | | | | | | |
| | | | Total Thrifts & Mortgage Finance | | | 295,884 | |
| | | | | | | | |
| | | | TOTAL FINANCIALS | | | 219,968,881 | |
| | | | | | | | |
| HEALTH CARE — 14.9% | |
| Biotechnology — 2.9% | |
| | 65,216 | | | AbbVie Inc. | | | 4,180,345 | |
| | 3,868 | | | ACADIA Pharmaceuticals Inc.*(a) | | | 124,279 | |
| | 1,216 | | | Agios Pharmaceuticals Inc.*(a) | | | 44,797 | |
| | 41,186 | | | Alexion Pharmaceuticals Inc.* | | | 5,183,670 | |
| | 5,752 | | | Alkermes PLC* | | | 251,765 | |
| | 2,833 | | | Alnylam Pharmaceuticals Inc.* | | | 197,885 | |
| | 30,279 | | | Amgen Inc. | | | 5,149,247 | |
| | 21,679 | | | Biogen Inc.* | | | 6,625,753 | |
| | 6,531 | | | BioMarin Pharmaceutical Inc.* | | | 613,195 | |
| | 73,889 | | | Celgene Corp.* | | | 7,886,912 | |
See Notes to Financial Statements.
42
| | | | | | | | |
| Large Cap Equity Fund | |
| | |
| Shares/Units | | | Security | | Value | |
| HEALTH CARE — 14.9% — (continued) | |
| Biotechnology — 2.9% — (continued) | |
| | 53,398 | | | Gilead Sciences Inc. | | $ | 4,185,335 | |
| | 6,557 | | | Incyte Corp.* | | | 531,773 | |
| | 33,682 | | | Intercept Pharmaceuticals Inc.*(a) | | | 4,995,377 | |
| | 2,353 | | | Intrexon Corp.* | | | 59,390 | |
| | 4,581 | | | Ionis Pharmaceuticals Inc.*(a) | | | 135,827 | |
| | 2,676 | | | Juno Therapeutics Inc.*(a) | | | 79,156 | |
| | 6,448 | | | Medivation Inc.* | | | 519,451 | |
| | 3,645 | | | Neurocrine Biosciences Inc.* | | | 176,637 | |
| | 13,694 | | | OPKO Health Inc.*(a) | | | 124,615 | |
| | 3,125 | | | Regeneron Pharmaceuticals Inc.* | | | 1,226,719 | |
| | 3,567 | | | Seattle Genetics Inc.* | | | 158,910 | |
| | 1,771 | | | United Therapeutics Corp.* | | | 216,558 | |
| | 65,682 | | | Vertex Pharmaceuticals Inc.* | | | 6,207,606 | |
| | | | | | | | |
| | | | Total Biotechnology | | | 48,875,202 | |
| | | | | | | | |
| Health Care Equipment & Supplies — 2.1% | |
| | 215,754 | | | Abbott Laboratories | | | 9,065,983 | |
| | 1,686 | | | ABIOMED Inc.* | | | 198,847 | |
| | 3,699 | | | Alere Inc.* | | | 144,742 | |
| | 2,662 | | | Align Technology Inc.* | | | 247,300 | |
| | 19,984 | | | Baxter International Inc. | | | 933,852 | |
| | 8,448 | | | Becton Dickinson and Co. | | | 1,497,070 | |
| | 54,262 | | | Boston Scientific Corp.* | | | 1,292,521 | |
| | 1,897 | | | Cooper Cos., Inc. (The) | | | 352,690 | |
| | 2,955 | | | CR Bard Inc. | | | 652,582 | |
| | 24,425 | | | Danaher Corp. | | | 1,988,439 | |
| | 9,259 | | | DENTSPLY SIRONA Inc. | | | 569,058 | |
| | 37,897 | | | DexCom Inc.* | | | 3,452,038 | |
| | 36,913 | | | Edwards Lifesciences Corp.* | | | 4,250,901 | |
| | 2,704 | | | Hill-Rom Holdings Inc. | | | 160,374 | |
| | 11,091 | | | Hologic Inc.* | | | 426,116 | |
| | 3,478 | | | IDEXX Laboratories Inc.* | | | 391,901 | |
| | 1,533 | | | Intuitive Surgical Inc.* | | | 1,052,282 | |
| | 56,526 | | | Medtronic PLC | | | 4,919,458 | |
| | 5,546 | | | ResMed Inc. | | | 369,863 | |
| | 11,267 | | | St. Jude Medical Inc. | | | 877,925 | |
| | 13,610 | | | Stryker Corp. | | | 1,574,133 | |
| | 1,755 | | | Teleflex Inc. | | | 321,323 | |
| | 3,763 | | | Varian Medical Systems Inc.* | | | 361,737 | |
| | 3,028 | | | West Pharmaceutical Services Inc. | | | 247,781 | |
| | 7,425 | | | Zimmer Biomet Holdings Inc. | | | 962,354 | |
| | | | | | | | |
| | | | Total Health Care Equipment & Supplies | | | 36,311,270 | |
| | | | | | | | |
| Health Care Providers & Services — 3.2% | |
| | 3,103 | | | Acadia Healthcare Co., Inc.* | | | 158,843 | |
| | 47,965 | | | Aetna Inc. | | | 5,617,661 | |
| | 7,247 | | | AmerisourceBergen Corp., Class A Shares | | | 630,272 | |
| | 2,282 | | | Amsurg Corp.* | | | 148,147 | |
| | 38,155 | | | Anthem Inc. | | | 4,772,427 | |
| | 7,799 | | | Brookdale Senior Living Inc.* | | | 134,221 | |
| | 94,344 | | | Cardinal Health Inc. | | | 7,516,386 | |
| | 6,754 | | | Centene Corp.* | | | 461,231 | |
| | 10,231 | | | Cigna Corp. | | | 1,312,228 | |
| | 6,698 | | | DaVita HealthCare Partners Inc.* | | | 432,892 | |
| | 7,982 | | | Envision Healthcare Holdings Inc.* | | | 171,294 | |
See Notes to Financial Statements.
43
| | | | | | | | |
| Large Cap Equity Fund | |
| | |
| Shares/Units | | | Security | | Value | |
| HEALTH CARE — 14.9% — (continued) | |
| Health Care Providers & Services — 3.2% — (continued) | |
| | 211,947 | | | Express Scripts Holding Co.* | | $ | 15,408,547 | |
| | 12,511 | | | HCA Holdings Inc.* | | | 945,206 | |
| | 3,292 | | | Henry Schein Inc.* | | | 539,197 | |
| | 5,961 | | | Humana Inc. | | | 1,065,290 | |
| | 4,140 | | | Laboratory Corp. of America Holdings* | | | 566,890 | |
| | 1,736 | | | LifePoint Health Inc.* | | | 98,258 | |
| | 9,095 | | | McKesson Corp. | | | 1,679,119 | |
| | 3,381 | | | MEDNAX Inc.* | | | 222,368 | |
| | 3,609 | | | Patterson Cos., Inc. | | | 166,014 | |
| | 1,988 | | | Premier Inc., Class A Shares* | | | 62,920 | |
| | 84,333 | | | Quest Diagnostics Inc. | | | 6,984,459 | |
| | 3,469 | | | Tenet Healthcare Corp.* | | | 82,909 | |
| | 37,786 | | | UnitedHealth Group Inc. | | | 5,140,785 | |
| | 3,398 | | | Universal Health Services Inc., Class B Shares | | | 409,561 | |
| | 3,123 | | | VCA Inc.* | | | 221,140 | |
| | 1,779 | | | WellCare Health Plans Inc.* | | | 200,493 | |
| | | | | | | | |
| | | | Total Health Care Providers & Services | | | 55,148,758 | |
| | | | | | | | |
| Health Care Technology — 0.1% | |
| | 8,070 | | | Allscripts Healthcare Solutions Inc.* | | | 104,184 | |
| | 1,659 | | | athenahealth Inc.* | | | 203,112 | |
| | 11,969 | | | Cerner Corp.* | | | 772,479 | |
| | 6,376 | | | IMS Health Holdings Inc.* | | | 190,132 | |
| | 2,440 | | | Inovalon Holdings Inc., Class A Shares*(a) | | | 38,308 | |
| | 4,088 | | | Veeva Systems Inc., Class A Shares* | | | 167,281 | |
| | | | | | | | |
| | | | Total Health Care Technology | | | 1,475,496 | |
| | | | | | | | |
| Life Sciences Tools & Services — 0.7% | |
| | 13,128 | | | Agilent Technologies Inc. | | | 616,753 | |
| | 857 | | | Bio-Rad Laboratories Inc., Class A Shares* | | | 127,530 | |
| | 1,580 | | | Bio-Techne Corp. | | | 166,453 | |
| | 4,429 | | | Bruker Corp. | | | 99,032 | |
| | 1,945 | | | Charles River Laboratories International Inc.* | | | 161,844 | |
| | 35,735 | | | Illumina Inc.* | | | 6,015,630 | |
| | 1,053 | | | Mettler-Toledo International Inc.* | | | 424,433 | |
| | 3,949 | | | PerkinElmer Inc. | | | 210,284 | |
| | 9,169 | | | QIAGEN NV* | | | 243,070 | |
| | 3,316 | | | Quintiles Transnational Holdings Inc.* | | | 256,327 | |
| | 15,806 | | | Thermo Fisher Scientific Inc. | | | 2,405,515 | |
| | 3,249 | | | VWR Corp.* | | | 90,680 | |
| | 3,097 | | | Waters Corp.* | | | 487,189 | |
| | | | | | | | |
| | | | Total Life Sciences Tools & Services | | | 11,304,740 | |
| | | | | | | | |
| Pharmaceuticals — 5.9% | |
| | 3,582 | | | Akorn Inc.* | | | 96,428 | |
| | 61,274 | | | Allergan PLC* | | | 14,371,204 | |
| | 158,152 | | | Bristol-Myers Squibb Co. | | | 9,076,343 | |
| | 39,300 | | | Eli Lilly & Co. | | | 3,055,575 | |
| | 8,762 | | | Endo International PLC* | | | 181,373 | |
| | 168,966 | | | Johnson & Johnson | | | 20,164,402 | |
| | 16,806 | | | Mallinckrodt PLC* | | | 1,252,719 | |
| | 218,174 | | | Merck & Co., Inc. | | | 13,699,146 | |
| | 17,744 | | | Mylan NV* | | | 751,636 | |
| | 55,943 | | | Novo Nordisk AS, ADR | | | 2,613,657 | |
| | 5,553 | | | Perrigo Co. PLC | | | 505,268 | |
| | 687,023 | | | Pfizer Inc. | | | 23,908,400 | |
See Notes to Financial Statements.
44
| | | | | | | | |
| Large Cap Equity Fund | |
| | |
| Shares/Units | | | Security | | Value | |
| HEALTH CARE — 14.9% — (continued) | |
| Pharmaceuticals — 5.9% — (continued) | |
| | 232,053 | | | Zoetis Inc., Class A Shares | | $ | 11,857,908 | |
| | | | | | | | |
| | | | Total Pharmaceuticals | | | 101,534,059 | |
| | | | | | | | |
| | | | TOTAL HEALTH CARE | | | 254,649,525 | |
| | | | | | | | |
| INDUSTRIALS — 8.3% | |
| Aerospace & Defense — 2.0 | |
| | 4,273 | | | B/E Aerospace Inc. | | | 216,000 | |
| | 24,040 | | | Boeing Co. (The) | | | 3,111,978 | |
| | 3,747 | | | BWX Technologies Inc. | | | 145,421 | |
| | 9,877 | | | General Dynamics Corp. | | | 1,503,477 | |
| | 812 | | | HEICO Corp. | | | 55,184 | |
| | 1,604 | | | HEICO Corp., Class A Shares | | | 91,236 | |
| | 3,724 | | | Hexcel Corp. | | | 167,021 | |
| | 30,668 | | | Honeywell International Inc. | | | 3,579,263 | |
| | 1,850 | | | Huntington Ingalls Industries Inc. | | | 305,564 | |
| | 3,085 | | | L-3 Communications Holdings Inc. | | | 459,110 | |
| | 10,245 | | | Lockheed Martin Corp. | | | 2,489,228 | |
| | 37,603 | | | Northrop Grumman Corp. | | | 7,974,468 | |
| | 2,119 | | | Orbital ATK Inc. | | | 159,836 | |
| | 59,262 | | | Raytheon Co. | | | 8,304,384 | |
| | 5,219 | | | Rockwell Collins Inc. | | | 436,778 | |
| | 4,905 | | | Spirit AeroSystems Holdings Inc., Class A Shares* | | | 224,747 | |
| | 10,665 | | | Textron Inc. | | | 435,665 | |
| | 2,035 | | | TransDigm Group Inc.* | | | 580,362 | |
| | 31,283 | | | United Technologies Corp. | | | 3,329,450 | |
| | | | | | | | |
| | | | Total Aerospace & Defense | | | 33,569,172 | |
| | | | | | | | |
| Air Freight & Logistics — 0.3% | |
| | 5,729 | | | CH Robinson Worldwide Inc. | | | 397,707 | |
| | 7,220 | | | Expeditors International of Washington Inc. | | | 365,693 | |
| | 10,056 | | | FedEx Corp. | | | 1,658,536 | |
| | 27,867 | | | United Parcel Service Inc., Class B Shares | | | 3,043,634 | |
| | | | | | | | |
| | | | Total Air Freight & Logistics | | | 5,465,570 | |
| | | | | | | | |
| Airlines — 0.2% | |
| | 4,732 | | | Alaska Air Group Inc. | | | 319,552 | |
| | 21,273 | | | American Airlines Group Inc. | | | 772,210 | |
| | 1,286 | | | Copa Holdings SA, Class A Shares | | | 98,289 | |
| | 31,051 | | | Delta Air Lines Inc. | | | 1,141,124 | |
| | 13,686 | | | JetBlue Airways Corp.* | | | 218,292 | |
| | 25,733 | | | Southwest Airlines Co. | | | 949,033 | |
| | 3,057 | | | Spirit Airlines Inc.* | | | 122,250 | |
| | 13,679 | | | United Continental Holdings Inc.* | | | 689,558 | |
| | | | | | | | |
| | | | Total Airlines | | | 4,310,308 | |
| | | | | | | | |
| Building Products — 0.1% | |
| | 3,746 | | | Allegion PLC | | | 266,790 | |
| | 2,865 | | | AO Smith Corp. | | | 276,415 | |
| | 2,069 | | | Armstrong World Industries Inc.* | | | 89,939 | |
| | 6,048 | | | Fortune Brands Home & Security Inc. | | | 384,411 | |
| | 1,595 | | | Lennox International Inc. | | | 256,907 | |
| | 13,369 | | | Masco Corp. | | | 474,332 | |
| | 4,608 | | | Owens Corning | | | 253,071 | |
| | 3,797 | | | USG Corp.* | | | 104,152 | |
| | | | | | | | |
| | | | Total Building Products | | | 2,106,017 | |
| | | | | | | | |
See Notes to Financial Statements.
45
| | | | | | | | |
| Large Cap Equity Fund | |
| | |
| Shares/Units | | | Security | | Value | |
| INDUSTRIALS — 8.3% — (continued) | |
| Commercial Services & Supplies — 1.6% | |
| | 3,443 | | | Cintas Corp. | | $ | 404,587 | |
| | 2,263 | | | Clean Harbors Inc.* | | | 108,171 | |
| | 184,064 | | | Copart Inc.* | | | 9,390,945 | |
| | 4,707 | | | Covanta Holding Corp. | | | 70,087 | |
| | 5,018 | | | KAR Auction Services Inc. | | | 212,161 | |
| | 7,837 | | | Pitney Bowes Inc. | | | 147,022 | |
| | 9,603 | | | Republic Services Inc., Class A Shares | | | 485,144 | |
| | 4,191 | | | Rollins Inc. | | | 119,443 | |
| | 8,926 | | | RR Donnelley & Sons Co. | | | 152,635 | |
| | 86,781 | | | Stericycle Inc.* | | | 7,461,430 | |
| | 16,179 | | | Tyco International PLC | | | 706,699 | |
| | 121,040 | | | Waste Management Inc. | | | 7,739,298 | |
| | | | | | | | |
| | | | Total Commercial Services & Supplies | | | 26,997,622 | |
| | | | | | | | |
| Construction & Engineering — 0.2% | |
| | 52,536 | | | AECOM* | | | 1,619,685 | |
| | 4,372 | | | Chicago Bridge & Iron Co. NV | | | 130,198 | |
| | 5,602 | | | Fluor Corp. | | | 290,744 | |
| | 4,813 | | | Jacobs Engineering Group Inc.* | | | 253,597 | |
| | 5,620 | | | KBR Inc. | | | 82,501 | |
| | 5,790 | | | Quanta Services Inc.* | | | 148,977 | |
| | 934 | | | Valmont Industries Inc. | | | 121,859 | |
| | | | | | | | |
| | | | Total Construction & Engineering | | | 2,647,561 | |
| | | | | | | | |
| Electrical Equipment — 0.7% | |
| | 15,588 | | | Acuity Brands Inc. | | | 4,288,571 | |
| | 9,156 | | | AMETEK Inc. | | | 446,355 | |
| | 81,705 | | | Eaton Corp. PLC | | | 5,436,651 | |
| | 25,605 | | | Emerson Electric Co. | | | 1,348,871 | |
| | 2,206 | | | Hubbell Inc., Class B Shares | | | 238,932 | |
| | 1,904 | | | Regal Beloit Corp. | | | 116,772 | |
| | 5,203 | | | Rockwell Automation Inc. | | | 603,184 | |
| | 2,791 | | | SolarCity Corp.* | | | 57,662 | |
| | | | | | | | |
| | | | Total Electrical Equipment | | | 12,536,998 | |
| | | | | | | | |
| Industrial Conglomerates — 1.0% | |
| | 23,712 | | | 3M Co. | | | 4,250,139 | |
| | 2,434 | | | Carlisle Cos., Inc. | | | 255,229 | |
| | 370,976 | | | General Electric Co. | | | 11,589,290 | |
| | 4,055 | | | Roper Technologies Inc. | | | 719,965 | |
| | | | | | | | |
| | | | Total Industrial Conglomerates | | | 16,814,623 | |
| | | | | | | | |
| Machinery — 0.8% | |
| | 2,919 | | | AGCO Corp. | | | 141,688 | |
| | 5,685 | | | Allison Transmission Holdings Inc. | | | 157,702 | |
| | 22,467 | | | Caterpillar Inc. | | | 1,841,171 | |
| | 4,234 | | | Colfax Corp.* | | | 125,665 | |
| | 2,109 | | | Crane Co. | | | 135,651 | |
| | 6,377 | | | Cummins Inc. | | | 801,015 | |
| | 12,672 | | | Deere & Co. | | | 1,071,418 | |
| | 5,099 | | | Donaldson Co., Inc. | | | 191,467 | |
| | 6,028 | | | Dover Corp. | | | 437,030 | |
| | 5,222 | | | Flowserve Corp. | | | 252,588 | |
| | 11,372 | | | Fortive Corp. | | | 598,963 | |
| | 2,358 | | | Graco Inc. | | | 173,714 | |
| | 3,054 | | | IDEX Corp. | | | 285,366 | |
See Notes to Financial Statements.
46
| | | | | | | | |
| Large Cap Equity Fund | |
| | |
| Shares/Units | | | Security | | Value | |
| INDUSTRIALS — 8.3% — (continued) | |
| Machinery — 0.8% — (continued) | |
| | 11,860 | | | Illinois Tool Works Inc. | | $ | 1,409,561 | |
| | 10,016 | | | Ingersoll-Rand PLC | | | 680,988 | |
| | 3,813 | | | ITT Inc. | | | 137,954 | |
| | 2,625 | | | Lincoln Electric Holdings Inc. | | | 166,845 | |
| | 5,224 | | | Manitowoc Foodservice Inc.* | | | 84,263 | |
| | 2,276 | | | Middleby Corp. (The)* | | | 291,669 | |
| | 2,292 | | | Nordson Corp. | | | 226,289 | |
| | 3,010 | | | Oshkosh Corp. | | | 162,329 | |
| | 13,845 | | | PACCAR Inc. | | | 828,485 | |
| | 5,369 | | | Parker-Hannifin Corp. | | | 657,864 | |
| | 6,530 | | | Pentair PLC | | | 418,246 | |
| | 2,319 | | | Snap-on Inc. | | | 355,480 | |
| | 6,072 | | | Stanley Black & Decker Inc. | | | 751,410 | |
| | 4,579 | | | Terex Corp. | | | 111,178 | |
| | 2,991 | | | Timken Co. (The) | | | 101,305 | |
| | 2,249 | | | Toro Co. (The) | | | 218,490 | |
| | 6,435 | | | Trinity Industries Inc. | | | 157,143 | |
| | 2,123 | | | WABCO Holdings Inc.* | | | 226,651 | |
| | 3,203 | | | Wabtec Corp. | | | 245,382 | |
| | 6,982 | | | Xylem Inc. | | | 355,105 | |
| | | | | | | | |
| | | | Total Machinery | | | 13,800,075 | |
| | | | | | | | |
| Marine — 0.0% | |
| | 2,188 | | | Kirby Corp.* | | | 113,995 | |
| | | | | | | | |
| Professional Services — 0.5% | |
| | 1,462 | | | Dun & Bradstreet Corp. (The) | | | 201,244 | |
| | 4,765 | | | Equifax Inc. | | | 628,503 | |
| | 2,866 | | | ManpowerGroup Inc. | | | 204,804 | |
| | 14,671 | | | Nielsen Holdings PLC | | | 781,671 | |
| | 5,121 | | | Robert Half International Inc. | | | 196,288 | |
| | 2,237 | | | TransUnion* | | | 73,799 | |
| | 82,398 | | | Verisk Analytics Inc., Class A Shares* | | | 6,843,154 | |
| | | | | | | | |
| | | | Total Professional Services | | | 8,929,463 | |
| | | | | | | | |
| Road & Rail — 0.6% | |
| | 269 | | | AMERCO | | | 92,458 | |
| | 34,188 | | | Avis Budget Group Inc.* | | | 1,235,213 | |
| | 38,264 | | | CSX Corp. | | | 1,082,106 | |
| | 2,412 | | | Genesee & Wyoming Inc., Class A Shares* | | | 163,992 | |
| | 36,096 | | | Hertz Global Holdings Inc.* | | | 1,778,089 | |
| | 3,469 | | | JB Hunt Transport Services Inc. | | | 275,404 | |
| | 4,320 | | | Kansas City Southern | | | 417,830 | |
| | 1,833 | | | Landstar System Inc. | | | 126,899 | |
| | 11,891 | | | Norfolk Southern Corp. | | | 1,116,565 | |
| | 2,846 | | | Old Dominion Freight Line Inc.* | | | 202,436 | |
| | 2,245 | | | Ryder System Inc. | | | 147,092 | |
| | 33,991 | | | Union Pacific Corp. | | | 3,247,160 | |
| | | | | | | | |
| | | | Total Road & Rail | | | 9,885,244 | |
| | | | | | | | |
| Trading Companies & Distributors — 0.3% | |
| | 59,894 | | | AerCap Holdings NV* | | | 2,393,963 | |
| | 4,063 | | | Air Lease Corp., Class A Shares | | | 119,371 | |
| | 11,552 | | | Fastenal Co. | | | 498,007 | |
| | 8,082 | | | HD Supply Holdings Inc.* | | | 291,841 | |
| | 1,033 | | | Herc Holdings Inc.* | | | 34,926 | |
See Notes to Financial Statements.
47
| | | | | | | | |
| Large Cap Equity Fund | |
| | |
| Shares/Units | | | Security | | Value | |
| INDUSTRIALS — 8.3% — (continued) | |
| Trading Companies & Distributors — 0.3% — (continued) | |
| | 31,033 | | | MRC Global Inc.* | | $ | 455,254 | |
| | 2,025 | | | MSC Industrial Direct Co., Inc., Class A Shares | | | 147,906 | |
| | 3,307 | | | United Rentals Inc.* | | | 272,199 | |
| | 1,099 | | | Watsco Inc. | | | 162,498 | |
| | 1,813 | | | WESCO International Inc.* | | | 112,696 | |
| | 2,255 | | | WW Grainger Inc. | | | 520,138 | |
| | | | | | | | |
| | | | Total Trading Companies & Distributors | | | 5,008,799 | |
| | | | | | | | |
| Transportation Infrastructure — 0.0% | |
| | 3,000 | | | Macquarie Infrastructure Corp. | | | 239,820 | |
| | | | | | | | |
| | | | TOTAL INDUSTRIALS | | | 142,425,267 | |
| | | | | | | | |
| INFORMATION TECHNOLOGY — 22.7% | |
| Communications Equipment — 2.3% | |
| | 1,666 | | | Arista Networks Inc.* | | | 132,747 | |
| | 52,807 | | | ARRIS International PLC* | | | 1,482,293 | |
| | 20,001 | | | Brocade Communications Systems Inc. | | | 179,609 | |
| | 789,794 | | | Cisco Systems Inc. | | | 24,831,123 | |
| | 5,430 | | | CommScope Holding Co., Inc.* | | | 160,565 | |
| | 1,880 | | | EchoStar Corp., Class A Shares* | | | 72,869 | |
| | 2,638 | | | F5 Networks Inc.* | | | 323,762 | |
| | 5,027 | | | Harris Corp. | | | 467,410 | |
| | 14,669 | | | Juniper Networks Inc. | | | 338,561 | |
| | 87,469 | | | Motorola Solutions Inc. | | | 6,734,238 | |
| | 32,673 | | | Palo Alto Networks Inc.* | | | 4,351,063 | |
| | | | | | | | |
| | | | Total Communications Equipment | | | 39,074,240 | |
| | | | | | | | |
| Electronic Equipment, Instruments & Components — 0.7% | |
| | 12,118 | | | Amphenol Corp., Class A Shares | | | 755,073 | |
| | 3,220 | | | Arrow Electronics Inc.* | | | 211,973 | |
| | 5,363 | | | Avnet Inc. | | | 223,530 | |
| | 6,537 | | | CDW Corp. | | | 291,877 | |
| | 3,263 | | | Cognex Corp. | | | 162,367 | |
| | 238,389 | | | Corning Inc. | | | 5,409,047 | |
| | 2,138 | | | Dolby Laboratories Inc., Class A Shares | | | 104,634 | |
| | 1,739 | | | FEI Co. | | | 185,151 | |
| | 5,313 | | | Fitbit Inc., Class A Shares* | | | 82,245 | |
| | 5,694 | | | FLIR Systems Inc. | | | 175,546 | |
| | 5,829 | | | Ingram Micro Inc., Class A Shares | | | 203,782 | |
| | 1,515 | | | IPG Photonics Corp.* | | | 131,775 | |
| | 8,033 | | | Jabil Circuit Inc. | | | 170,219 | |
| | 7,282 | | | Keysight Technologies Inc.* | | | 221,591 | |
| | 4,431 | | | National Instruments Corp. | | | 123,802 | |
| | 62,792 | | | TE Connectivity Ltd. | | | 3,991,688 | |
| | 9,386 | | | Trimble Navigation Ltd.* | | | 257,176 | |
| | 4,740 | | | VeriFone Systems Inc.* | | | 94,136 | |
| | 2,169 | | | Zebra Technologies Corp., Class A Shares* | | | 151,743 | |
| | | | | | | | |
| | | | Total Electronic Equipment, Instruments & Components | | | 12,947,355 | |
| | | | | | | | |
| Internet Software & Services — 5.1% | |
| | 6,925 | | | Akamai Technologies Inc.* | | | 380,182 | |
| | 66,610 | | | Alibaba Group Holding Ltd., ADR* | | | 6,473,826 | |
| | 45,235 | | | Alphabet Inc., Class A Shares* | | | 35,728,865 | |
| | 11,962 | | | Alphabet Inc., Class C Shares* | | | 9,175,452 | |
| | 571 | | | CommerceHub Inc., Series A* | | | 8,445 | |
| | 1,142 | | | CommerceHub Inc., Series C* | | | 16,822 | |
See Notes to Financial Statements.
48
| | | | | | | | |
| Large Cap Equity Fund | |
| | |
| Shares/Units | | | Security | | Value | |
| INFORMATION TECHNOLOGY — 22.7% — (continued) | |
| Internet Software & Services — 5.1% — (continued) | |
| | 1,284 | | | CoStar Group Inc.* | | $ | 266,109 | |
| | 352,970 | | | eBay Inc.* | | | 11,351,515 | |
| | 130,808 | | | Facebook Inc., Class A Shares* | | | 16,497,505 | |
| | 1,948 | | | GoDaddy Inc., Class A Shares* | | | 63,076 | |
| | 3,012 | | | IAC/InterActiveCorp. | | | 176,835 | |
| | 4,727 | | | LinkedIn Corp., Class A Shares* | | | 911,129 | |
| | 1,388 | | | Match Group Inc.* | | | 22,472 | |
| | 19,823 | | | MercadoLibre Inc. | | | 3,409,556 | |
| | 9,330 | | | Pandora Media Inc.*(a) | | | 130,620 | |
| | 4,631 | | | Rackspace Hosting Inc.* | | | 145,645 | |
| | 25,596 | | | Twitter Inc.* | | | 491,699 | |
| | 3,766 | | | VeriSign Inc.* | | | 280,379 | |
| | 34,914 | | | Yahoo! Inc.* | | | 1,492,573 | |
| | 2,900 | | | Yelp Inc., Class A Shares* | | | 111,592 | |
| | 1,706 | | | Zillow Group Inc., Class A Shares*(a) | | | 57,714 | |
| | 4,239 | | | Zillow Group Inc., Class C Shares*(a) | | | 143,490 | |
| | | | | | | | |
| | | | Total Internet Software & Services | | | 87,335,501 | |
| | | | | | | | |
| IT Services — 4.2% | |
| | 25,132 | | | Accenture PLC, Class A Shares | | | 2,890,180 | |
| | 2,342 | | | Alliance Data Systems Corp.* | | | 479,126 | |
| | 5,756 | | | Amdocs Ltd. | | | 346,051 | |
| | 18,465 | | | Automatic Data Processing Inc. | | | 1,658,342 | |
| | 1,094 | | | Black Knight Financial Services Inc., Class A Shares* | | | 42,688 | |
| | 4,854 | | | Booz Allen Hamilton Holding Corp., Class A Shares | | | 147,367 | |
| | 4,681 | | | Broadridge Financial Solutions Inc. | | | 324,393 | |
| | 204,547 | | | Cognizant Technology Solutions Corp., Class A Shares* | | | 11,749,180 | |
| | 5,386 | | | Computer Sciences Corp. | | | 253,357 | |
| | 3,794 | | | CoreLogic Inc.* | | | 155,630 | |
| | 6,893 | | | CSRA Inc. | | | 175,013 | |
| | 1,411 | | | DST Systems Inc. | | | 171,451 | |
| | 2,112 | | | Euronet Worldwide Inc.* | | | 163,912 | |
| | 13,023 | | | Fidelity National Information Services Inc. | | | 1,033,115 | |
| | 13,171 | | | First Data Corp., Class A Shares* | | | 183,340 | |
| | 8,995 | | | Fiserv Inc.* | | | 926,935 | |
| | 3,709 | | | FleetCor Technologies Inc.* | | | 609,018 | |
| | 3,176 | | | Gartner Inc.* | | | 289,016 | |
| | 6,043 | | | Genpact Ltd.* | | | 142,977 | |
| | 6,221 | | | Global Payments Inc. | | | 472,485 | |
| | 35,439 | | | International Business Machines Corp. | | | 5,630,548 | |
| | 3,099 | | | Jack Henry & Associates Inc. | | | 270,450 | |
| | 4,831 | | | Leidos Holdings Inc. | | | 195,704 | |
| | 38,841 | | | MasterCard Inc., Class A Shares | | | 3,753,206 | |
| | 12,950 | | | Paychex Inc. | | | 785,677 | |
| | 195,925 | | | PayPal Holdings Inc.* | | | 7,278,614 | |
| | 8,324 | | | Sabre Corp. | | | 234,321 | |
| | 2,438 | | | Square Inc., Class A Shares* | | | 29,719 | |
| | 5,551 | | | Teradata Corp.* | | | 176,133 | |
| | 6,666 | | | Total System Services Inc. | | | 328,301 | |
| | 6,179 | | | Vantiv Inc., Class A Shares* | | | 332,059 | |
| | 240,246 | | | Visa Inc., Class A Shares | | | 19,435,901 | |
| | 172,561 | | | Western Union Co. (The) | | | 3,713,513 | |
| | 1,653 | | | WEX Inc.* | | | 164,159 | |
| | 672,671 | | | Xerox Corp. | | | 6,625,809 | |
| | | | | | | | |
| | | | Total IT Services | | | 71,167,690 | |
| | | | | | | | |
See Notes to Financial Statements.
49
| | | | | | | | |
| Large Cap Equity Fund | |
| | |
| Shares/Units | | | Security | | Value | |
| INFORMATION TECHNOLOGY — 22.7% — (continued) | |
| Semiconductors & Semiconductor Equipment — 3.2% | |
| | 12,452 | | | Analog Devices Inc. | | $ | 778,997 | |
| | 43,725 | | | Applied Materials Inc. | | | 1,304,754 | |
| | 43,043 | | | Broadcom Ltd. | | | 7,593,646 | |
| | 4,261 | | | Cree Inc.* | | | 102,307 | |
| | 13,405 | | | Cypress Semiconductor Corp. | | | 159,922 | |
| | 3,246 | | | First Solar Inc.* | | | 122,764 | |
| | 389,507 | | | Intel Corp. | | | 13,979,406 | |
| | 6,286 | | | KLA-Tencor Corp. | | | 435,368 | |
| | 6,468 | | | Lam Research Corp. | | | 603,594 | |
| | 9,585 | | | Linear Technology Corp. | | | 558,231 | |
| | 16,176 | | | Marvell Technology Group Ltd. | | | 200,582 | |
| | 11,281 | | | Maxim Integrated Products Inc. | | | 459,362 | |
| | 8,385 | | | Microchip Technology Inc. | | | 519,115 | |
| | 42,080 | | | Micron Technology Inc.* | | | 693,899 | |
| | 31,006 | | | Microsemi Corp.* | | | 1,239,000 | |
| | 20,485 | | | NVIDIA Corp. | | | 1,256,550 | |
| | 16,564 | | | ON Semiconductor Corp.* | | | 178,891 | |
| | 4,945 | | | Qorvo Inc.* | | | 283,991 | |
| | 165,601 | | | QUALCOMM Inc. | | | 10,444,455 | |
| | 128,308 | | | Skyworks Solutions Inc. | | | 9,605,137 | |
| | 2,424 | | | SunPower Corp., Class A Shares* | | | 24,143 | |
| | 8,406 | | | Teradyne Inc. | | | 177,030 | |
| | 40,492 | | | Texas Instruments Inc. | | | 2,815,814 | |
| | 10,274 | | | Xilinx Inc. | | | 556,954 | |
| | | | | | | | |
| | | | Total Semiconductors & Semiconductor Equipment | | | 54,093,912 | |
| | | | | | | | |
| Software — 4.4% | |
| | 125,535 | | | Activision Blizzard Inc. | | | 5,193,383 | |
| | 62,498 | | | Adobe Systems Inc.* | | | 6,394,170 | |
| | 3,474 | | | ANSYS Inc.* | | | 330,343 | |
| | 1,264 | | | Atlassian Corp. PLC, Class A Shares* | | | 37,263 | |
| | 8,541 | | | Autodesk Inc.* | | | 575,663 | |
| | 216,970 | | | CA Inc. | | | 7,357,453 | |
| | 11,882 | | | Cadence Design Systems Inc.* | | | 302,278 | |
| | 6,210 | | | CDK Global Inc. | | | 360,056 | |
| | 6,232 | | | Citrix Systems Inc.* | | | 543,430 | |
| | 11,647 | | | Electronic Arts Inc.* | | | 946,086 | |
| | 6,583 | | | FireEye Inc.* | | | 94,532 | |
| | 5,820 | | | Fortinet Inc.* | | | 210,335 | |
| | 3,054 | | | Guidewire Software Inc.* | | | 187,913 | |
| | 9,701 | | | Intuit Inc. | | | 1,081,176 | |
| | 3,033 | | | Manhattan Associates Inc.* | | | 183,557 | |
| | 305,325 | | | Microsoft Corp. | | | 17,543,974 | |
| | 114,885 | | | Mobileye NV* | | | 5,616,728 | |
| | 1,690 | | | NetSuite Inc.* | | | 184,041 | |
| | 9,612 | | | Nuance Communications Inc.* | | | 140,143 | |
| | 119,209 | | | Oracle Corp. | | | 4,913,795 | |
| | 4,580 | | | PTC Inc.* | | | 195,429 | |
| | 7,333 | | | Red Hat Inc.* | | | 535,162 | |
| | 66,063 | | | Salesforce.com Inc.* | | | 5,246,723 | |
| | 73,185 | | | ServiceNow Inc.* | | | 5,318,354 | |
| | 86,005 | | | Splunk Inc.* | | | 5,008,931 | |
| | 7,116 | | | SS&C Technologies Holdings Inc. | | | 234,472 | |
| | 206,852 | | | Symantec Corp. | | | 4,991,339 | |
| | 5,990 | | | Synopsys Inc.* | | | 355,147 | |
See Notes to Financial Statements.
50
| | | | | | | | |
| Large Cap Equity Fund | |
| | |
| Shares/Units | | | Security | | Value | |
| INFORMATION TECHNOLOGY — 22.7% — (continued) | |
| Software — 4.4% — (continued) | |
| | 2,336 | | | Tableau Software Inc., Class A Shares* | | $ | 135,558 | |
| | 1,328 | | | Tyler Technologies Inc.* | | | 217,726 | |
| | 1,104 | | | Ultimate Software Group Inc. (The)* | | | 230,670 | |
| | 3,265 | | | VMware Inc., Class A Shares*(a) | | | 239,422 | |
| | 4,659 | | | Workday Inc., Class A Shares* | | | 395,037 | |
| | 31,558 | | | Zynga Inc., Class A Shares* | | | 86,153 | |
| | | | | | | | |
| | | | Total Software | | | 75,386,442 | |
| | | | | | | | |
| Technology Hardware, Storage & Peripherals — 2.8% | |
| | 357,322 | | | Apple Inc. | | | 37,911,864 | |
| | 78,781 | | | EMC Corp. | | | 2,283,861 | |
| | 69,539 | | | Hewlett Packard Enterprise Co. | | | 1,493,698 | |
| | 70,234 | | | HP Inc. | | | 1,009,263 | |
| | 2,631 | | | Lexmark International Inc., Class A Shares | | | 94,216 | |
| | 45,721 | | | NCR Corp.* | | | 1,547,656 | |
| | 11,181 | | | NetApp Inc. | | | 386,751 | |
| | 82,079 | | | Western Digital Corp. | | | 3,830,627 | |
| | | | | | | | |
| | | | Total Technology Hardware, Storage & Peripherals | | | 48,557,936 | |
| | | | | | | | |
| | | | TOTAL INFORMATION TECHNOLOGY | | | 388,563,076 | |
| | | | | | | | |
| MATERIALS — 2.9% | |
| Chemicals — 1.9% | |
| | 7,879 | | | Air Products & Chemicals Inc. | | | 1,226,130 | |
| | 4,504 | | | Albemarle Corp. | | | 360,185 | |
| | 2,448 | | | Ashland Inc. | | | 286,612 | |
| | 6,992 | | | Axalta Coating Systems Ltd.* | | | 200,111 | |
| | 2,643 | | | Cabot Corp. | | | 131,780 | |
| | 50,293 | | | Celanese Corp., Class A Shares | | | 3,240,378 | |
| | 9,190 | | | CF Industries Holdings Inc. | | | 238,940 | |
| | 45,431 | | | Dow Chemical Co. (The) | | | 2,436,919 | |
| | 5,905 | | | Eastman Chemical Co. | | | 400,890 | |
| | 10,492 | | | Ecolab Inc. | | | 1,291,041 | |
| | 135,187 | | | EI du Pont de Nemours & Co. | | | 9,409,015 | |
| | 5,370 | | | FMC Corp. | | | 252,068 | |
| | 8,560 | | | Huntsman Corp. | | | 148,002 | |
| | 3,222 | | | International Flavors & Fragrances Inc. | | | 446,505 | |
| | 13,969 | | | LyondellBasell Industries NV, Class A Shares | | | 1,102,014 | |
| | 17,646 | | | Monsanto Co. | | | 1,879,299 | |
| | 13,948 | | | Mosaic Co. (The) | | | 419,416 | |
| | 318 | | | NewMarket Corp. | | | 137,996 | |
| | 6,980 | | | Platform Specialty Products Corp.*(a) | | | 63,169 | |
| | 10,678 | | | PPG Industries Inc. | | | 1,130,587 | |
| | 11,448 | | | Praxair Inc. | | | 1,397,114 | |
| | 4,715 | | | RPM International Inc. | | | 257,109 | |
| | 1,814 | | | Scotts Miracle-Gro Co. (The), Class A Shares | | | 150,199 | |
| | 17,723 | | | Sherwin-Williams Co. (The) | | | 5,028,192 | |
| | 3,133 | | | Valspar Corp. (The) | | | 330,250 | |
| | 1,544 | | | Westlake Chemical Corp. | | | 80,010 | |
| | 2,831 | | | WR Grace & Co. | | | 221,186 | |
| | | | | | | | |
| | | | Total Chemicals | | | 32,265,117 | |
| | | | | | | | |
| Construction Materials — 0.1% | |
| | 1,928 | | | Eagle Materials Inc. | | | 154,953 | |
| | 2,541 | | | Martin Marietta Materials Inc. | | | 465,079 | |
| | 5,316 | | | Vulcan Materials Co. | | | 605,333 | |
| | | | | | | | |
| | | | Total Construction Materials | | | 1,225,365 | |
| | | | | | | | |
See Notes to Financial Statements.
51
| | | | | | | | |
| Large Cap Equity Fund | |
| | |
| Shares/Units | | | Security | | Value | |
| MATERIALS — 2.9% — (continued) | |
| Containers & Packaging — 0.7% | |
| | 2,578 | | | AptarGroup Inc. | | $ | 201,032 | |
| | 3,465 | | | Avery Dennison Corp. | | | 268,330 | |
| | 6,922 | | | Ball Corp. | | | 548,153 | |
| | 4,010 | | | Bemis Co., Inc. | | | 210,926 | |
| | 5,102 | | | Berry Plastics Group Inc.* | | | 231,580 | |
| | 150,831 | | | Crown Holdings Inc.* | | | 8,179,565 | |
| | 12,813 | | | Graphic Packaging Holding Co. | | | 183,738 | |
| | 16,524 | | | International Paper Co. | | | 801,249 | |
| | 55,243 | | | Owens-Illinois Inc.* | | | 990,507 | |
| | 3,488 | | | Packaging Corp. of America | | | 274,261 | |
| | 7,893 | | | Sealed Air Corp. | | | 371,997 | |
| | 1,713 | | | Silgan Holdings Inc. | | | 82,430 | |
| | 4,142 | | | Sonoco Products Co. | | | 213,479 | |
| | 9,750 | | | WestRock Co. | | | 467,025 | |
| | | | | | | | |
| | | | Total Containers & Packaging | | | 13,024,272 | |
| | | | | | | | |
| Metals & Mining — 0.2% | |
| | 53,403 | | | Alcoa Inc. | | | 538,302 | |
| | 1,452 | | | Compass Minerals International Inc. | | | 108,218 | |
| | 50,814 | | | Freeport-McMoRan Inc. | | | 522,876 | |
| | 21,570 | | | Newmont Mining Corp. | | | 824,837 | |
| | 12,778 | | | Nucor Corp. | | | 619,861 | |
| | 2,793 | | | Reliance Steel & Aluminum Co. | | | 201,319 | |
| | 2,743 | | | Royal Gold Inc. | | | 201,117 | |
| | 3,651 | | | Southern Copper Corp. | | | 94,269 | |
| | 9,430 | | | Steel Dynamics Inc. | | | 232,167 | |
| | 12,813 | | | Tahoe Resources Inc. | | | 167,081 | |
| | 5,850 | | | United States Steel Corp. | | | 113,724 | |
| | | | | | | | |
| | | | Total Metals & Mining | | | 3,623,771 | |
| | | | | | | | |
| Paper & Forest Products — 0.0% | |
| | 2,687 | | | Domtar Corp. | | | 100,279 | |
| | | | | | | | |
| | | | TOTAL MATERIALS | | | 50,238,804 | |
| | | | | | | | |
| TELECOMMUNICATION SERVICES — 2.1% | |
| Diversified Telecommunication Services — 2.0% | |
| | 405,155 | | | AT&T Inc. | | | 16,562,737 | |
| | 21,849 | | | CenturyLink Inc. | | | 607,402 | |
| | 45,607 | | | Frontier Communications Corp.(a) | | | 209,792 | |
| | 11,902 | | | Level 3 Communications Inc.* | | | 590,696 | |
| | 5,001 | | | SBA Communications Corp., Class A Shares* | | | 570,864 | |
| | 296,195 | | | Verizon Communications Inc. | | | 15,499,884 | |
| | 6,940 | | | Zayo Group Holdings Inc.* | | | 201,330 | |
| | | | | | | | |
| | | | Total Diversified Telecommunication Services | | | 34,242,705 | |
| | | | | | | | |
| Wireless Telecommunication Services — 0.1% | |
| | 29,337 | | | Sprint Corp.* | | | 181,303 | |
| | 4,115 | | | Telephone & Data Systems Inc. | | | 114,685 | |
| | 11,484 | | | T-Mobile US Inc.* | | | 532,169 | |
| | 511 | | | United States Cellular Corp.* | | | 19,019 | |
| | | | | | | | |
| | | | Total Wireless Telecommunication Services | | | 847,176 | |
| | | | | | | | |
| | | | TOTAL TELECOMMUNICATION SERVICES | | | 35,089,881 | |
| | | | | | | | |
See Notes to Financial Statements.
52
| | | | | | | | |
| Large Cap Equity Fund | |
| | |
| Shares/Units | | | Security | | Value | |
| UTILITIES — 2.0% | |
| Electric Utilities — 1.4% | |
| | 9,088 | | | Alliant Energy Corp. | | $ | 344,890 | |
| | 19,997 | | | American Electric Power Co., Inc. | | | 1,291,206 | |
| | 2,229 | | | Avangrid Inc. | | | 92,726 | |
| | 27,785 | | | Duke Energy Corp. | | | 2,213,353 | |
| | 106,652 | | | Edison International | | | 7,755,734 | |
| | 7,317 | | | Entergy Corp. | | | 572,190 | |
| | 12,772 | | | Eversource Energy | | | 689,305 | |
| | 35,727 | | | Exelon Corp. | | | 1,214,718 | |
| | 17,069 | | | FirstEnergy Corp. | | | 558,668 | |
| | 6,436 | | | Great Plains Energy Inc. | | | 174,802 | |
| | 4,424 | | | Hawaiian Electric Industries Inc. | | | 132,764 | |
| | 6,005 | | | ITC Holdings Corp. | | | 271,546 | |
| | 18,560 | | | NextEra Energy Inc. | | | 2,244,647 | |
| | 8,001 | | | OGE Energy Corp. | | | 249,071 | |
| | 20,095 | | | PG&E Corp. | | | 1,244,684 | |
| | 4,431 | | | Pinnacle West Capital Corp. | | | 332,502 | |
| | 27,304 | | | PPL Corp. | | | 949,633 | |
| | 37,861 | | | Southern Co. (The) | | | 1,943,405 | |
| | 5,682 | | | Westar Energy Inc., Class A Shares | | | 312,169 | |
| | 20,400 | | | Xcel Energy Inc. | | | 843,744 | |
| | | | | | | | |
| | | | Total Electric Utilities | | | 23,431,757 | |
| | | | | | | | |
| Gas Utilities — 0.1% | |
| | 4,033 | | | Atmos Energy Corp. | | | 297,232 | |
| | 2,961 | | | National Fuel Gas Co. | | | 168,955 | |
| | 3,351 | | | Piedmont Natural Gas Co., Inc. | | | 201,395 | |
| | 7,046 | | | Questar Corp. | | | 176,220 | |
| | 6,720 | | | UGI Corp. | | | 305,626 | |
| | | | | | | | |
| | | | Total Gas Utilities | | | 1,149,428 | |
| | | | | | | | |
| Independent Power and Renewable Electricity Producers — 0.0% | |
| | 25,580 | | | AES Corp. | | | 308,750 | |
| | 13,718 | | | Calpine Corp.* | | | 171,201 | |
| | 12,653 | | | NRG Energy Inc. | | | 153,228 | |
| | | | | | | | |
| | | | Total Independent Power and Renewable Electricity Producers | | | 633,179 | |
| | | | | | | | |
| Multi-Utilities — 0.5% | |
| | 9,902 | | | Ameren Corp. | | | 489,357 | |
| | 17,132 | | | CenterPoint Energy Inc. | | | 384,956 | |
| | 11,294 | | | CMS Energy Corp. | | | 474,009 | |
| | 12,275 | | | Consolidated Edison Inc. | | | 923,694 | |
| | 24,784 | | | Dominion Resources Inc. | | | 1,837,981 | |
| | 7,207 | | | DTE Energy Co. | | | 669,530 | |
| | 7,795 | | | MDU Resources Group Inc. | | | 183,728 | |
| | 12,937 | | | NiSource Inc. | | | 309,712 | |
| | 20,290 | | | Public Service Enterprise Group Inc. | | | 867,600 | |
| | 5,272 | | | SCANA Corp. | | | 372,467 | |
| | 10,136 | | | Sempra Energy | | | 1,060,530 | |
| | 2,485 | | | Vectren Corp. | | | 121,541 | |
| | 12,679 | | | WEC Energy Group Inc. | | | 759,219 | |
| | | | | | | | |
| | | | Total Multi-Utilities | | | 8,454,324 | |
| | | | | | | | |
| Water Utilities — 0.0% | |
| | 7,301 | | | American Water Works Co., Inc. | | | 540,201 | |
See Notes to Financial Statements.
53
| | | | | | | | |
| Large Cap Equity Fund | |
| | |
| Shares/Units | | | Security | | Value | |
| UTILITIES — 2.0% — (continued) | |
| Water Utilities — 0.0% — (continued) | |
| | 7,434 | | | Aqua America Inc. | | $ | 226,068 | |
| | | | | | | | |
| | | | Total Water Utilities | | | 766,269 | |
| | | | | | | | |
| | | | TOTAL UTILITIES | | | 34,434,957 | |
| | | | | | | | |
| | | | TOTAL COMMON STOCKS
(Cost — $1,239,432,980) | | | 1,599,546,212 | |
| | | | | | | | |
| CLOSED END MUTUAL FUND SECURITY — 3.8% | |
| FINANCIALS — 3.8% | |
| Capital Markets — 3.8% | |
| | 618,499 | | | iShares Russell 1000 Value(a)
(Cost — $61,063,057) | | | 65,802,109 | |
| | | | | | | | |
| | | | TOTAL INVESTMENTS BEFORE SHORT-TERM INVESTMENTS
(Cost — $1,300,496,037) | | | 1,665,348,321 | |
| | | | | | | | |
| | |
Face
Amount | | | | | | |
| SHORT-TERM INVESTMENTS (b) — 2.8% | |
| MONEY MARKET FUND — 1.1% | |
| $ | 17,790,848 | | | Invesco STIT — Government & Agency Portfolio(c)
(Cost — $17,790,848) | | | 17,790,848 | |
| | | | | | | | |
| TIME DEPOSITS — 1.7% | |
| | 5,221,377 | | | ANZ National Bank — London, 0.150% due 9/1/16 | | | 5,221,377 | |
| | 8,099,866 | | | BBH — Grand Cayman, 0.150% due 9/1/16 | | | 8,099,866 | |
| | 12,123,895 | | | BNP Paribas — Paris, 0.150% due 9/1/16 | | | 12,123,895 | |
| | 3,937,315 | | | Wells Fargo — Grand Cayman, 0.150% due 9/1/16 | | | 3,937,315 | |
| | | | | | | | |
| | | | TOTAL TIME DEPOSITS
(Cost — $29,382,453) | | | 29,382,453 | |
| | | | | | | | |
| | | | TOTAL SHORT-TERM INVESTMENTS
(Cost — $47,173,301) | | | 47,173,301 | |
| | | | | | | | |
| | | | TOTAL INVESTMENTS — 100.2%
(Cost — $1,347,669,338#) | | | 1,712,521,622 | |
| | | | | | | | |
| | | | Liabilities in Excess of Other Assets — (0.2)% | | | (3,135,701 | ) |
| | | | | | | | |
| | | | TOTAL NET ASSETS — 100.0% | | $ | 1,709,385,921 | |
| | | | | | | | |
| * | Non-income producing security. |
| (a) | All or a portion of this security is on loan (See Note 1). |
| (b) | Inclusive of all short term holdings, including collateral received from securities lending activities. Excluding such collateral, the percentage of portfolio holdings would be 1.7%. |
| (c) | Represents investment of collateral received from securities lending transactions. |
| (d) | Affiliated security (See Note 2). |
| # | Aggregate cost for federal income tax purposes is $1,367,199,809. |
| | |
Abbreviations used in this schedule: |
| ADR | | — American Depositary Receipts |
| PLC | | — PublicLimitedCompany |
See Notes to Financial Statements.
54
| | | | |
| Summary of Investments by Security Sector^ | | | |
Information Technology | | | 22.7 | % |
Financials | | | 16.7 | |
Health Care | | | 14.9 | |
Consumer Discretionary | | | 11.8 | |
Consumer Staples | | | 9.3 | |
Industrials | | | 8.3 | |
Energy | | | 6.6 | |
Materials | | | 2.9 | |
Telecommunication Services | | | 2.0 | |
Utilities | | | 2.0 | |
Short-Term Investments | | | 2.8 | |
| | | | |
| | | 100.0 | % |
| | | | |
| ^ | As a percentage of total investments. |
See Notes to Financial Statements.
55
| | | | | | | | |
| Small-Mid Cap Equity Fund | |
| | |
| Shares/Units | | | Security | | Value | |
| COMMON STOCKS — 96.5% | |
| CONSUMER DISCRETIONARY — 13.8% | |
| Auto Components — 0.5% | |
| | 3,735 | | | American Axle & Manufacturing Holdings Inc.* | | $ | 64,018 | |
| | 2,572 | | | Cooper Tire & Rubber Co. | | | 87,422 | |
| | 724 | | | Cooper-Standard Holding Inc.* | | | 71,712 | |
| | 7,016 | | | Dana Inc. | | | 101,171 | |
| | 1,233 | | | Dorman Products Inc.* | | | 77,765 | |
| | 1,117 | | | Drew Industries Inc. | | | 113,767 | |
| | 1,480 | | | Federal-Mogul Holdings Corp.* | | | 13,512 | |
| | 1,136 | | | Fox Factory Holding Corp.* | | | 23,583 | |
| | 13,350 | | | Gentex Corp. | | | 237,497 | |
| | 1,688 | | | Gentherm Inc.* | | | 55,653 | |
| | 12,600 | | | Goodyear Tire & Rubber Co. (The) | | | 369,810 | |
| | 901 | | | Horizon Global Corp.* | | | 16,056 | |
| | 3,500 | | | Lear Corp. | | | 407,015 | |
| | 664 | | | Metaldyne Performance Group Inc. | | | 10,538 | |
| | 2,378 | | | Modine Manufacturing Co.* | | | 25,468 | |
| | 915 | | | Motorcar Parts of America Inc.* | | | 26,013 | |
| | 1,440 | | | Spartan Motors Inc. | | | 14,198 | |
| | 971 | | | Standard Motor Products Inc. | | | 43,511 | |
| | 1,297 | | | Stoneridge Inc.* | | | 22,477 | |
| | 127 | | | Strattec Security Corp. | | | 5,320 | |
| | 1,229 | | | Superior Industries International Inc. | | | 35,776 | |
| | 2,664 | | | Tenneco Inc.* | | | 148,731 | |
| | 1,045 | | | Tower International Inc. | | | 25,394 | |
| | 208 | | | Unique Fabricating Inc.(a) | | | 2,619 | |
| | 1,614 | | | Visteon Corp. | | | 114,110 | |
| | 421 | | | Workhorse Group Inc.*(a) | | | 3,452 | |
| | | | | | | | |
| | | | Total Auto Components | | | 2,116,588 | |
| | | | | | | | |
| Automobiles — 0.1% | |
| | 2,272 | | | Thor Industries Inc. | | | 184,373 | |
| | 1,223 | | | Winnebago Industries Inc. | | | 29,438 | |
| | | | | | | | |
| | | | Total Automobiles | | | 213,811 | |
| | | | | | | | |
| Distributors — 0.3% | |
| | 2,153 | | | Core-Mark Holding Co., Inc. | | | 82,137 | |
| | 27,762 | | | LKQ Corp.* | | | 1,001,931 | |
| | 1,919 | | | Pool Corp. | | | 193,570 | |
| | 241 | | | Weyco Group Inc. | | | 6,150 | |
| | | | | | | | |
| | | | Total Distributors | | | 1,283,788 | |
| | | | | | | | |
| Diversified Consumer Services — 0.9% | |
| | 826 | | | American Public Education Inc.* | | | 17,074 | |
| | 3,956 | | | Apollo Education Group Inc.* | | | 35,090 | |
| | 460 | | | Ascent Capital Group Inc., Class A Shares* | | | 10,677 | |
| | 638 | | | Bridgepoint Education Inc.* | | | 4,626 | |
| | 28,238 | | | Bright Horizons Family Solutions Inc.* | | | 1,924,702 | |
| | 206 | | | Cambium Learning Group Inc.* | | | 991 | |
| | 560 | | | Capella Education Co. | | | 32,995 | |
| | 3,053 | | | Career Education Corp.* | | | 19,967 | |
| | 821 | | | Carriage Services Inc., Class A Shares | | | 19,244 | |
| | 3,704 | | | Chegg Inc.*(a) | | | 24,928 | |
| | 367 | | | Collectors Universe Inc. | | | 7,024 | |
| | 2,902 | | | DeVry Education Group Inc. | | | 66,862 | |
| | 204 | | | Graham Holdings Co., Class B Shares | | | 100,031 | |
See Notes to Financial Statements.
56
| | | | | | | | |
| Small-Mid Cap Equity Fund | |
| | |
| Shares/Units | | | Security | | Value | |
| CONSUMER DISCRETIONARY — 13.8% — (continued) | |
| Diversified Consumer Services — 0.9% — (continued) | |
| | 2,104 | | | Grand Canyon Education Inc.* | | $ | 87,379 | |
| | 10,666 | | | H&R Block Inc. | | | 231,026 | |
| | 5,842 | | | Houghton Mifflin Harcourt Co.* | | | 93,180 | |
| | 1,716 | | | K12 Inc.* | | | 20,506 | |
| | 299 | | | Liberty Tax Inc. | | | 4,063 | |
| | 4,153 | | | LifeLock Inc.* | | | 69,106 | |
| | 82,127 | | | Regis Corp.* | | | 1,032,336 | |
| | 8,937 | | | Service Corp. International | | | 236,294 | |
| | 6,446 | | | ServiceMaster Global Holdings Inc.* | | | 240,500 | |
| | 2,363 | | | Sotheby’s(a) | | | 93,693 | |
| | 521 | | | Strayer Education Inc.* | | | 25,362 | |
| | 1,152 | | | Weight Watchers International Inc.*(a) | | | 12,108 | |
| | | | | | | | |
| | | | Total Diversified Consumer Services | | | 4,409,764 | |
| | | | | | | | |
| Hotels, Restaurants & Leisure — 2.2% | |
| | 51,840 | | | Aramark | | | 1,966,291 | |
| | 3,982 | | | Belmond Ltd., Class A Shares* | | | 44,479 | |
| | 51 | | | Biglari Holdings Inc.* | | | 22,470 | |
| | 1,061 | | | BJ’s Restaurants Inc.* | | | 42,143 | |
| | 5,347 | | | Bloomin’ Brands Inc. | | | 104,480 | |
| | 896 | | | Bob Evans Farms Inc. | | | 36,736 | |
| | 366 | | | Bojangles’ Inc.* | | | 5,911 | |
| | 3,866 | | | Boyd Gaming Corp.* | | | 75,387 | |
| | 2,615 | | | Brinker International Inc. | | | 140,452 | |
| | 893 | | | Buffalo Wild Wings Inc.* | | | 144,845 | |
| | 2,111 | | | Caesars Acquisition Co., Class A Shares* | | | 25,691 | |
| | 2,610 | | | Caesars Entertainment Corp.*(a) | | | 16,495 | |
| | 1,631 | | | Carrols Restaurant Group Inc.* | | | 21,953 | |
| | 1,025 | | | Century Casinos Inc.* | | | 6,550 | |
| | 2,109 | | | Cheesecake Factory Inc. (The) | | | 108,424 | |
| | 1,534 | | | Choice Hotels International Inc. | | | 74,384 | |
| | 635 | | | Churchill Downs Inc. | | | 94,856 | |
| | 25,001 | | | Chuy’s Holdings Inc.*(a) | | | 757,030 | |
| | 3,157 | | | ClubCorp Holdings Inc. | | | 45,303 | |
| | 910 | | | Cracker Barrel Old Country Store Inc.(a) | | | 138,420 | |
| | 23,098 | | | Dave & Buster’s Entertainment Inc.* | | | 1,072,902 | |
| | 1,025 | | | Del Frisco’s Restaurant Group Inc.* | | | 15,426 | |
| | 1,061 | | | Del Taco Restaurants Inc.* | | | 11,915 | |
| | 3,437 | | | Denny’s Corp.* | | | 35,917 | |
| | 1,898 | | | Diamond Resorts International Inc.* | | | 57,339 | |
| | 820 | | | DineEquity Inc. | | | 63,952 | |
| | 2,371 | | | Domino’s Pizza Inc. | | | 354,630 | |
| | 4,335 | | | Dunkin’ Brands Group Inc. | | | 212,198 | |
| | 1,128 | | | El Pollo Loco Holdings Inc.*(a) | | | 15,363 | |
| | 1,389 | | | Eldorado Resorts Inc.* | | | 19,390 | |
| | 60 | | | Empire Resorts Inc.* | | | 1,010 | |
| | 3,444 | | | Extended Stay America Inc. | | | 48,733 | |
| | 1,322 | | | Fiesta Restaurant Group Inc.* | | | 33,394 | |
| | 348 | | | Fogo De Chao Inc.* | | | 4,270 | |
| | 573 | | | Golden Entertainment Inc. | | | 7,174 | |
| | 728 | | | Habit Restaurants Inc. (The), Class A Shares*(a) | | | 11,153 | |
| | 1,131 | | | Hyatt Hotels Corp., Class A Shares* | | | 60,486 | |
| | 4,393 | | | International Game Technology PLC | | | 100,292 | |
| | 1,193 | | | International Speedway Corp., Class A Shares | | | 39,715 | |
| | 5,260 | | | Interval Leisure Group Inc. | | | 91,524 | |
See Notes to Financial Statements.
57
| | | | | | | | |
| Small-Mid Cap Equity Fund | |
| | |
| Shares/Units | | | Security | | Value | |
| CONSUMER DISCRETIONARY — 13.8% — (continued) | |
| Hotels, Restaurants & Leisure — 2.2% — (continued) | |
| | 782 | | | Intrawest Resorts Holdings Inc.* | | $ | 11,667 | |
| | 29,309 | | | Isle of Capri Casinos Inc.* | | | 508,511 | |
| | 603 | | | J Alexander’s Holdings Inc.* | | | 6,012 | |
| | 1,539 | | | Jack in the Box Inc. | | | 153,069 | |
| | 521 | | | Jamba Inc.*(a) | | | 5,694 | |
| | 368 | | | Kona Grill Inc.*(a) | | | 4,891 | |
| | 3,996 | | | La Quinta Holdings Inc.* | | | 46,154 | |
| | 1,033 | | | Lindblad Expeditions Holdings Inc.* | | | 9,700 | |
| | 584 | | | Luby’s Inc.* | | | 2,628 | |
| | 972 | | | Marcus Corp. (The) | | | 22,939 | |
| | 1,045 | | | Marriott Vacations Worldwide Corp. | | | 80,569 | |
| | 10,760 | | | MGM Resorts International* | | | 257,056 | |
| | 464 | | | Monarch Casino & Resort Inc.* | | | 11,039 | |
| | 149 | | | Nathan’s Famous Inc.* | | | 7,347 | |
| | 502 | | | Noodles & Co., Class A Shares* | | | 3,283 | |
| | 1,059 | | | Panera Bread Co., Class A Shares* | | | 229,962 | |
| | 1,276 | | | Papa John’s International Inc. | | | 95,483 | |
| | 3,560 | | | Penn National Gaming Inc.* | | | 50,481 | |
| | 2,683 | | | Pinnacle Entertainment Inc.* | | | 32,303 | |
| | 787 | | | Planet Fitness Inc., Class A Shares*(a) | | | 17,039 | |
| | 1,006 | | | Popeyes Louisiana Kitchen Inc.* | | | 54,857 | |
| | 1,098 | | | Potbelly Corp.* | | | 14,230 | |
| | 657 | | | Red Lion Hotels Corp.* | | | 4,297 | |
| | 615 | | | Red Robin Gourmet Burgers Inc.* | | | 30,910 | |
| | 1,514 | | | Red Rock Resorts Inc., Class A Shares(a) | | | 34,126 | |
| | 4,748 | | | Royal Caribbean Cruises Ltd. | | | 337,630 | |
| | 2,263 | | | Ruby Tuesday Inc.* | | | 6,879 | |
| | 1,430 | | | Ruth’s Hospitality Group Inc. | | | 21,393 | |
| | 2,587 | | | Scientific Games Corp., Class A Shares*(a) | | | 21,343 | |
| | 3,247 | | | SeaWorld Entertainment Inc.(a) | | | 42,243 | |
| | 778 | | | Shake Shack Inc., Class A Shares*(a) | | | 27,463 | |
| | 3,362 | | | Six Flags Entertainment Corp. | | | 163,965 | |
| | 2,165 | | | Sonic Corp. | | | 62,114 | |
| | 436 | | | Speedway Motorsports Inc. | | | 7,800 | |
| | 3,095 | | | Texas Roadhouse Inc., Class A Shares | | | 137,016 | |
| | 11,520 | | | Vail Resorts Inc. | | | 1,825,114 | |
| | 10,125 | | | Wendy’s Co. (The) | | | 103,174 | |
| | 703 | | | Wingstop Inc. | | | 21,294 | |
| | 945 | | | Zoe’s Kitchen Inc.*(a) | | | 25,732 | |
| | | | | | | | |
| | | | Total Hotels, Restaurants & Leisure | | | 10,626,490 | |
| | | | | | | | |
| Household Durables — 2.2% | |
| | 455 | | | Bassett Furniture Industries Inc. | | | 11,266 | |
| | 1,590 | | | Beazer Homes USA Inc.* | | | 17,887 | |
| | 3,575 | | | CalAtlantic Group Inc. | | | 130,452 | |
| | 390 | | | Cavco Industries Inc.* | | | 40,782 | |
| | 766 | | | Century Communities Inc.* | | | 15,083 | |
| | 315 | | | CSS Industries Inc. | | | 8,023 | |
| | 1,202 | | | Ethan Allen Interiors Inc. | | | 40,219 | |
| | 286 | | | Flexsteel Industries Inc. | | | 13,571 | |
| | 4,760 | | | GoPro Inc., Class A Shares*(a) | | | 69,734 | |
| | 868 | | | Green Brick Partners Inc.* | | | 6,892 | |
| | 9,816 | | | Harman International Industries Inc. | | | 831,317 | |
| | 1,321 | | | Helen of Troy Ltd.* | | | 119,339 | |
| | 604 | | | Hooker Furniture Corp. | | | 14,049 | |
See Notes to Financial Statements.
58
| | | | | | | | |
| Small-Mid Cap Equity Fund | |
| | |
| Shares/Units | | | Security | | Value | |
| CONSUMER DISCRETIONARY — 13.8% — (continued) | |
| Household Durables — 2.2% — (continued) | |
| | 6,700 | | | Hovnanian Enterprises Inc., Class A Shares*(a) | | $ | 12,194 | |
| | 42,563 | | | Installed Building Products Inc.* | | | 1,420,753 | |
| | 7,637 | | | iRobot Corp.* | | | 304,411 | |
| | 4,070 | | | KB Home | | | 63,899 | |
| | 2,253 | | | La-Z-Boy Inc. | | | 60,087 | |
| | 6,284 | | | Leggett & Platt Inc. | | | 329,784 | |
| | 8,615 | | | Lennar Corp., Class A Shares | | | 407,489 | |
| | 459 | | | Lennar Corp., Class B Shares | | | 17,437 | |
| | 719 | | | LGI Homes Inc.*(a) | | | 27,624 | |
| | 1,046 | | | Libbey Inc. | | | 18,546 | |
| | 440 | | | Lifetime Brands Inc. | | | 5,905 | |
| | 1,118 | | | M/I Homes Inc.* | | | 25,870 | |
| | 1,960 | | | MDC Holdings Inc. | | | 51,176 | |
| | 1,788 | | | Meritage Homes Corp.* | | | 64,189 | |
| | 14,452 | | | Mohawk Industries Inc.* | | | 3,075,097 | |
| | 215 | | | NACCO Industries Inc., Class A Shares | | | 14,306 | |
| | 522 | | | New Home Co., Inc. (The)* | | | 5,664 | |
| | 167 | | | NVR Inc.* | | | 281,696 | |
| | 16,463 | | | PulteGroup Inc. | | | 351,814 | |
| | 1,449 | | | Taylor Morrison Home Corp., Class A Shares* | | | 25,560 | |
| | 2,538 | | | Tempur Sealy International Inc.* | | | 199,030 | |
| | 7,402 | | | Toll Brothers Inc.* | | | 230,128 | |
| | 45,243 | | | TopBuild Corp.* | | | 1,543,691 | |
| | 7,095 | | | TRI Pointe Group Inc.* | | | 96,208 | |
| | 2,387 | | | Tupperware Brands Corp. | | | 156,420 | |
| | 624 | | | UCP Inc., Class A Shares* | | | 5,267 | |
| | 651 | | | Universal Electronics Inc.* | | | 48,194 | |
| | 995 | | | WCI Communities Inc.* | | | 18,726 | |
| | 1,277 | | | William Lyon Homes, Class A Shares*(a) | | | 22,028 | |
| | 1,043 | | | ZAGG Inc.* | | | 7,583 | |
| | | | | | | | |
| | | | Total Household Durables | | | 10,209,390 | |
| | | | | | | | |
| Internet & Catalog Retail — 0.5% | |
| | 938 | | | 1-800-Flowers.com Inc., Class A Shares* | | | 8,667 | |
| | 35,063 | | | Blue Nile Inc. | | | 1,208,271 | |
| | 474 | | | Duluth Holdings Inc., Class B Shares*(a) | | | 14,367 | |
| | 4,981 | | | Etsy Inc.* | | | 67,044 | |
| | 3,455 | | | Expedia Inc. | | | 377,010 | |
| | 885 | | | FTD Cos., Inc.* | | | 20,798 | |
| | 379 | | | Gaia Inc., Class A Shares* | | | 3,005 | |
| | 17,441 | | | Groupon Inc., Class A Shares*(a) | | | 92,961 | |
| | 1,447 | | | HSN Inc. | | | 60,456 | |
| | 647 | | | Lands’ End Inc.*(a) | | | 11,387 | |
| | 3,398 | | | Liberty TripAdvisor Holdings Inc., Class A Shares* | | | 70,712 | |
| | 6,328 | | | Liberty Ventures, Series A* | | | 243,881 | |
| | 1,429 | | | Nutrisystem Inc. | | | 41,184 | |
| | 662 | | | Overstock.com Inc.* | | | 10,201 | |
| | 1,003 | | | PetMed Express Inc.(a) | | | 20,220 | |
| | 1,633 | | | Shutterfly Inc.* | | | 82,009 | |
| | 1,454 | | | Wayfair Inc., Class A Shares*(a) | | | 55,994 | |
| | | | | | | | |
| | | | Total Internet & Catalog Retail | | | 2,388,167 | |
| | | | | | | | |
| Leisure Products — 0.5% | |
| | 482 | | | Arctic Cat Inc. | | | 6,830 | |
| | 40,024 | | | Brunswick Corp. | | | 1,840,704 | |
See Notes to Financial Statements.
59
| | | | | | | | |
| Small-Mid Cap Equity Fund | |
| | |
| Shares/Units | | | Security | | Value | |
| CONSUMER DISCRETIONARY — 13.8% — (continued) | |
| Leisure Products — 0.5% — (continued) | |
| | 4,577 | | | Callaway Golf Co. | | $ | 52,269 | |
| | 544 | | | Escalade Inc. | | | 6,599 | |
| | 826 | | | JAKKS Pacific Inc.* | | | 7,607 | |
| | 220 | | | Johnson Outdoors Inc., Class A Shares | | | 7,403 | |
| | 878 | | | Malibu Boats Inc., Class A Shares* | | | 12,020 | |
| | 612 | | | Marine Products Corp. | | | 5,453 | |
| | 472 | | | MCBC Holdings Inc. | | | 5,636 | |
| | 1,428 | | | Nautilus Inc.* | | | 33,258 | |
| | 1,668 | | | Performance Sports Group Ltd.*(a) | | | 4,520 | |
| | 2,849 | | | Polaris Industries Inc.(a) | | | 246,837 | |
| | 2,530 | | | Smith & Wesson Holding Corp.* | | | 71,220 | |
| | 896 | | | Sturm Ruger & Co., Inc. | | | 54,916 | |
| | 2,865 | | | Vista Outdoor Inc.* | | | 114,084 | |
| | | | | | | | |
| | | | Total Leisure Products | | | 2,469,356 | |
| | | | | | | | |
| Media — 1.5% | |
| | 999 | | | AMC Entertainment Holdings Inc., Class A Shares(a) | | | 30,380 | |
| | 2,837 | | | AMC Networks Inc., Class A Shares* | | | 154,163 | |
| | 225 | | | Cable One Inc. | | | 121,752 | |
| | 1,190 | | | Carmike Cinemas Inc.* | | | 38,187 | |
| | 3,020 | | | Central European Media Enterprises Ltd., Class A Shares*(a) | | | 7,127 | |
| | 4,981 | | | Cinemark Holdings Inc. | | | 192,516 | |
| | 1,440 | | | Clear Channel Outdoor Holdings Inc., Class A Shares | | | 9,720 | |
| | 56 | | | Daily Journal Corp.* | | | 12,993 | |
| | 1,197 | | | Entercom Communications Corp., Class A Shares | | | 16,411 | |
| | 3,206 | | | Entravision Communications Corp., Class A Shares | | | 24,109 | |
| | 1,482 | | | Eros International PLC* | | | 24,764 | |
| | 2,916 | | | EW Scripps Co. (The), Class A Shares* | | | 49,543 | |
| | 5,715 | | | Gannett Co., Inc. | | | 68,180 | |
| | 2,205 | | | Global Eagle Entertainment Inc.* | | | 18,346 | |
| | 3,135 | | | Gray Television Inc.* | | | 35,206 | |
| | 199 | | | Hemisphere Media Group Inc., Class A Shares*(a) | | | 2,653 | |
| | 17,062 | | | IMAX Corp.* | | | 520,220 | |
| | 19,059 | | | Interpublic Group of Cos., Inc. (The) | | | 441,025 | |
| | 2,111 | | | John Wiley & Sons Inc., Class A Shares | | | 122,712 | |
| | 312 | | | Liberty Braves Group, Class A Shares* | | | 5,245 | |
| | 1,561 | | | Liberty Braves Group, Class C Shares* | | | 25,694 | |
| | 1,179 | | | Liberty Media Group LLC, Class A Shares* | | | 25,231 | |
| | 2,158 | | | Liberty Media Group LLC, Class C Shares* | | | 45,879 | |
| | 4,389 | | | Lions Gate Entertainment Corp.(a) | | | 91,993 | |
| | 6,200 | | | Live Nation Entertainment Inc.* | | | 165,664 | |
| | 681 | | | Loral Space & Communications Inc.* | | | 24,829 | |
| | 7,419 | | | Madison Square Garden Co. (The), Class A Shares* | | | 1,340,242 | |
| | 2,540 | | | MDC Partners Inc., Class A Shares | | | 31,344 | |
| | 5,120 | | | Media General Inc.* | | | 90,470 | |
| | 1,744 | | | Meredith Corp. | | | 92,502 | |
| | 2,920 | | | MSG Networks Inc., Class A Shares* | | | 51,042 | |
| | 2,849 | | | National CineMedia Inc. | | | 42,593 | |
| | 1,832 | | | New Media Investment Group Inc. | | | 29,275 | |
| | 5,798 | | | New York Times Co. (The), Class A Shares | | | 75,026 | |
| | 24,084 | | | Nexstar Broadcasting Group Inc., Class A Shares(a) | | | 1,269,708 | |
| | 943 | | | Radio One Inc., Class D Shares* | | | 3,263 | |
| | 846 | | | Reading International Inc., Class A Shares* | | | 11,446 | |
| | 3,881 | | | Regal Entertainment Group, Class A Shares(a) | | | 82,976 | |
| | 152 | | | Saga Communications Inc., Class A Shares | | | 6,182 | |
See Notes to Financial Statements.
60
| | | | | | | | |
| Small-Mid Cap Equity Fund | |
| | |
| Shares/Units | | | Security | | Value | |
| CONSUMER DISCRETIONARY — 13.8% — (continued) | |
| Media — 1.5% — (continued) | |
| | 576 | | | Salem Media Group Inc.* | | $ | 3,623 | |
| | 1,265 | | | Scholastic Corp. | | | 50,929 | |
| | 3,076 | | | Sinclair Broadcast Group Inc., Class A Shares | | | 87,604 | |
| | 40,841 | | | Starz, Class A Shares* | | | 1,273,831 | |
| | 10,312 | | | TEGNA Inc. | | | 208,921 | |
| | 4,867 | | | Time Inc. | | | 68,625 | |
| | 542 | | | Townsquare Media Inc., Class A Shares* | | | 5,284 | |
| | 3,690 | | | Tribune Media Co., Class A Shares | | | 140,515 | |
| | 1,310 | | | tronc Inc.(a) | | | 22,204 | |
| | 1,744 | | | World Wrestling Entertainment Inc., Class A Shares(a) | | | 36,223 | |
| | | | | | | | |
| | | | Total Media | | | 7,298,370 | |
| | | | | | | | |
| Multiline Retail — 0.5% | |
| | 2,093 | | | Big Lots Inc. | | | 103,227 | |
| | 882 | | | Dillard’s Inc., Class A Shares | | | 53,132 | |
| | 14,807 | | | Dollar General Corp. | | | 1,086,982 | |
| | 11,922 | | | Dollar Tree Inc.* | | | 985,949 | |
| | 1,786 | | | Fred’s Inc., Class A Shares | | | 20,200 | |
| | 14,675 | | | JC Penney Co., Inc.*(a) | | | 138,385 | |
| | 1,007 | | | Ollie’s Bargain Outlet Holdings Inc.*(a) | | | 25,598 | |
| | 591 | | | Sears Holdings Corp.*(a) | | | 8,138 | |
| | 2,436 | | | Tuesday Morning Corp.* | | | 16,248 | |
| | | | | | | | |
| | | | Total Multiline Retail | | | 2,437,859 | |
| | | | | | | | |
| Specialty Retail — 2.5% | |
| | 3,073 | | | Aaron’s Inc. | | | 74,858 | |
| | 3,181 | | | Abercrombie & Fitch Co., Class A Shares | | | 56,431 | |
| | 3,730 | | | Advance Auto Parts Inc. | | | 587,027 | |
| | 7,869 | | | American Eagle Outfitters Inc. | | | 145,891 | |
| | 323 | | | America’s Car-Mart Inc.* | | | 12,642 | |
| | 958 | | | Asbury Automotive Group Inc.* | | | 51,464 | |
| | 8,138 | | | Ascena Retail Group Inc.* | | | 66,243 | |
| | 3,101 | | | AutoNation Inc.* | | | 146,832 | |
| | 1,751 | | | Barnes & Noble Education Inc.* | | | 19,594 | |
| | 3,092 | | | Barnes & Noble Inc. | | | 35,434 | |
| | 682 | | | Big 5 Sporting Goods Corp. | | | 8,532 | |
| | 615 | | | Boot Barn Holdings Inc.*(a) | | | 7,614 | |
| | 1,428 | | | Buckle Inc. (The) | | | 36,800 | |
| | 571 | | | Build-A-Bear Workshop Inc.* | | | 6,624 | |
| | 3,333 | | | Burlington Stores Inc.* | | | 270,706 | |
| | 2,373 | | | Cabela’s Inc.* | | | 116,253 | |
| | 1,964 | | | Caleres Inc. | | | 50,946 | |
| | 1,179 | | | Cato Corp. (The), Class A Shares | | | 40,416 | |
| | 6,094 | | | Chico’s FAS Inc. | | | 77,272 | |
| | 875 | | | Children’s Place Inc. (The) | | | 71,225 | |
| | 564 | | | Citi Trends Inc. | | | 11,026 | |
| | 945 | | | Conn’s Inc.*(a) | | | 6,417 | |
| | 932 | | | Container Store Group Inc. (The)*(a) | | | 4,958 | |
| | 3,549 | | | CST Brands Inc. | | | 169,678 | |
| | 1,308 | | | Destination XL Group Inc.* | | | 6,056 | |
| | 4,149 | | | Dick’s Sporting Goods Inc. | | | 243,131 | |
| | 3,153 | | | DSW Inc., Class A Shares | | | 75,514 | |
| | 32,447 | | | Express Inc.* | | | 383,848 | |
| | 1,940 | | | Finish Line Inc. (The), Class A Shares | | | 46,696 | |
| | 2,531 | | | Five Below Inc.* | | | 112,781 | |
See Notes to Financial Statements.
61
| | | | | | | | |
| Small-Mid Cap Equity Fund | |
| | |
| Shares/Units | | | Security | | Value | |
| CONSUMER DISCRETIONARY — 13.8% — (continued) | |
| Specialty Retail — 2.5% — (continued) | |
| | 6,402 | | | Foot Locker Inc. | | $ | 420,227 | |
| | 1,933 | | | Francesca’s Holdings Corp.* | | | 26,385 | |
| | 4,871 | | | GameStop Corp., Class A Shares(a) | | | 138,288 | |
| | 972 | | | Genesco Inc.* | | | 70,606 | |
| | 20,956 | | | GNC Holdings Inc., Class A Shares | | | 440,705 | |
| | 964 | | | Group 1 Automotive Inc. | | | 57,204 | |
| | 2,806 | | | Guess? Inc. | | | 46,664 | |
| | 806 | | | Haverty Furniture Cos., Inc. | | | 16,120 | |
| | 1,045 | | | Hibbett Sports Inc.*(a) | | | 40,097 | |
| | 609 | | | Kirkland’s Inc.* | | | 7,631 | |
| | 1,115 | | | Lithia Motors Inc., Class A Shares | | | 92,289 | |
| | 1,365 | | | Lumber Liquidators Holdings Inc.*(a) | | | 21,512 | |
| | 1,266 | | | MarineMax Inc.* | | | 25,105 | |
| | 773 | | | Mattress Firm Holding Corp.* | | | 49,433 | |
| | 4,419 | | | Michaels Cos., Inc. (The)* | | | 105,879 | |
| | 1,459 | | | Monro Muffler Brake Inc. | | | 82,302 | |
| | 1,763 | | | Murphy USA Inc.* | | | 128,911 | |
| | 25,200 | | | New York & Co., Inc.* | | | 56,700 | |
| | 101,278 | | | Office Depot Inc. | | | 372,703 | |
| | 2,315 | | �� | O’Reilly Automotive Inc.* | | | 648,084 | |
| | 837 | | | Outerwall Inc. | | | 43,491 | |
| | 1,232 | | | Party City Holdco Inc.* | | | 21,461 | |
| | 1,799 | | | Penske Automotive Group Inc. | | | 81,495 | |
| | 4,101 | | | Pier 1 Imports Inc.(a) | | | 18,906 | |
| | 2,354 | | | Rent-A-Center Inc. | | | 28,766 | |
| | 7,698 | | | Restoration Hardware Holdings Inc.*(a) | | | 259,654 | |
| | 69,358 | | | Ross Stores Inc. | | | 4,316,842 | |
| | 6,959 | | | Sally Beauty Holdings Inc.* | | | 189,424 | |
| | 749 | | | Sears Hometown and Outlet Stores Inc.* | | | 4,928 | |
| | 18,942 | | | Select Comfort Corp.* | | | 497,228 | |
| | 652 | | | Shoe Carnival Inc. | | | 19,338 | |
| | 1,287 | | | Sonic Automotive Inc., Class A Shares | | | 21,930 | |
| | 1,100 | | | Sportsman’s Warehouse Holdings Inc.* | | | 11,275 | |
| | 1,154 | | | Stage Stores Inc. | | | 6,209 | |
| | 30,559 | | | Staples Inc. | | | 261,585 | |
| | 1,574 | | | Stein Mart Inc. | | | 12,655 | |
| | 2,242 | | | Tailored Brands Inc. | | | 29,550 | |
| | 1,634 | | | Tile Shop Holdings Inc.* | | | 25,409 | |
| | 727 | | | Tilly’s Inc., Class A Shares* | | | 6,354 | |
| | 4,272 | | | Urban Outfitters Inc.* | | | 153,151 | |
| | 1,088 | | | Vitamin Shoppe Inc.* | | | 30,159 | |
| | 682 | | | West Marine Inc.* | | | 6,295 | |
| | 4,196 | | | Williams-Sonoma Inc. | | | 220,877 | |
| | 109 | | | Winmark Corp. | | | 11,292 | |
| | 808 | | | Zumiez Inc.*(a) | | | 13,494 | |
| | | | | | | | |
| | | | Total Specialty Retail | | | 12,081,522 | |
| | | | | | | | |
| Textiles, Apparel & Luxury Goods — 2.1% | |
| | 35,265 | | | Carter’s Inc. | | | 3,360,402 | |
| | 1,244 | | | Columbia Sportswear Co. | | | 69,875 | |
| | 36,467 | | | Crocs Inc.* | | | 315,075 | |
| | 488 | | | Culp Inc. | | | 15,474 | |
| | 7,926 | | | Deckers Outdoor Corp.* | | | 517,964 | |
| | 428 | | | Delta Apparel Inc.* | | | 7,567 | |
| | 1,928 | | | Fossil Group Inc.* | | | 55,064 | |
See Notes to Financial Statements.
62
| | | | | | | | |
| Small-Mid Cap Equity Fund | |
| | |
| Shares/Units | | | Security | | Value | |
| CONSUMER DISCRETIONARY — 13.8% — (continued) | |
| Textiles, Apparel & Luxury Goods — 2.1% — (continued) | |
| | 2,019 | | | G-III Apparel Group Ltd.* | | $ | 63,740 | |
| | 65,909 | | | Hanesbrands Inc. | | | 1,749,225 | |
| | 1,912 | | | Iconix Brand Group Inc.*(a) | | | 16,061 | |
| | 6,079 | | | Kate Spade & Co.* | | | 113,434 | |
| | 9,040 | | | lululemon athletica Inc.* | | | 691,650 | |
| | 715 | | | Movado Group Inc. | | | 16,230 | |
| | 699 | | | Oxford Industries Inc. | | | 43,625 | |
| | 489 | | | Perry Ellis International Inc.* | | | 9,115 | |
| | 21,923 | | | PVH Corp. | | | 2,362,422 | |
| | 1,751 | | | Sequential Brands Group Inc.*(a) | | | 12,765 | |
| | 6,221 | | | Skechers U.S.A. Inc., Class A Shares* | | | 151,233 | |
| | 2,917 | | | Steven Madden Ltd.* | | | 102,358 | |
| | 332 | | | Superior Uniform Group Inc. | | | 5,637 | |
| | 809 | | | Unifi Inc.* | | | 21,058 | |
| | 1,040 | | | Vera Bradley Inc.* | | | 15,558 | |
| | 939 | | | Vince Holding Corp.*(a) | | | 6,592 | |
| | 4,583 | | | Wolverine World Wide Inc. | | | 109,580 | |
| | | | | | | | |
| | | | Total Textiles, Apparel & Luxury Goods | | | 9,831,704 | |
| | | | | | | | |
| | | | TOTAL CONSUMER DISCRETIONARY | | | 65,366,809 | |
| | | | | | | | |
| CONSUMER STAPLES — 2.4% | |
| Beverages — 0.3% | |
| | 420 | | | Boston Beer Co., Inc. (The), Class A Shares* | | | 76,713 | |
| | 11,948 | | | Brown-Forman Corp., Class B Shares | | | 580,075 | |
| | 218 | | | Coca-Cola Bottling Co. Consolidated | | | 32,765 | |
| | 663 | | | Craft Brew Alliance Inc.* | | | 13,161 | |
| | 581 | | | MGP Ingredients Inc. | | | 23,205 | |
| | 4,695 | | | Monster Beverage Corp.* | | | 722,514 | |
| | 570 | | | National Beverage Corp.* | | | 28,346 | |
| | 1,068 | | | Primo Water Corp.* | | | 12,368 | |
| | | | | | | | |
| | | | Total Beverages | | | 1,489,147 | |
| | | | | | | | |
| Food & Staples Retailing — 0.8% | |
| | 1,253 | | | Andersons Inc. (The) | | | 46,298 | |
| | 1,841 | | | Casey’s General Stores Inc. | | | 241,742 | |
| | 782 | | | Chefs’ Warehouse Inc. (The)* | | | 8,618 | |
| | 639 | | | Ingles Markets Inc., Class A Shares | | | 24,173 | |
| | 77,368 | | | Kroger Co. (The) | | | 2,475,002 | |
| | 321 | | | Natural Grocers by Vitamin Cottage Inc.* | | | 3,964 | |
| | 1,742 | | | Performance Food Group Co.* | | | 44,769 | |
| | 933 | | | PriceSmart Inc. | | | 77,934 | |
| | 48,835 | | | Rite Aid Corp.* | | | 367,728 | |
| | 986 | | | Smart & Final Stores Inc.* | | | 12,601 | |
| | 1,753 | | | SpartanNash Co. | | | 56,131 | |
| | 6,694 | | | Sprouts Farmers Market Inc.* | | | 150,816 | |
| | 12,401 | | | SUPERVALU Inc.* | | | 67,957 | |
| | 2,351 | | | United Natural Foods Inc.* | | | 107,206 | |
| | 2,200 | | | US Foods Holding Corp.* | | | 53,350 | |
| | 271 | | | Village Super Market Inc., Class A Shares | | | 8,669 | |
| | 503 | | | Weis Markets Inc. | | | 25,623 | |
| | | | | | | | |
| | | | Total Food & Staples Retailing | | | 3,772,581 | |
| | | | | | | | |
| Food Products — 0.8% | |
| | 205 | | | Alico Inc. | | | 5,756 | |
| | 1,311 | | | Amplify Snack Brands Inc.* | | | 22,195 | |
See Notes to Financial Statements.
63
| | | | | | | | |
| Small-Mid Cap Equity Fund | |
| | |
| Shares/Units | | | Security | | Value | |
| CONSUMER STAPLES — 2.4% — (continued) | |
| Food Products — 0.8% — (continued) | |
| | 3,098 | | | B&G Foods Inc. | | $ | 147,093 | |
| | 2,843 | | | Blue Buffalo Pet Products Inc.* | | | 73,293 | |
| | 713 | | | Calavo Growers Inc. | | | 42,031 | |
| | 1,434 | | | Cal-Maine Foods Inc.(a) | | | 65,878 | |
| | 7,769 | | | Darling Ingredients Inc.* | | | 109,388 | |
| | 4,272 | | | Dean Foods Co. | | | 73,521 | |
| | 410 | | | Farmer Brothers Co.* | | | 13,128 | |
| | 8,250 | | | Flowers Foods Inc. | | | 123,007 | |
| | 1,514 | | | Fresh Del Monte Produce Inc. | | | 88,069 | |
| | 1,174 | | | Freshpet Inc.*(a) | | | 12,339 | |
| | 4,820 | | | Hain Celestial Group Inc. (The)* | | | 177,135 | |
| | 3,399 | | | Ingredion Inc. | | | 465,527 | |
| | 1,017 | | | Inventure Foods Inc.*(a) | | | 9,855 | |
| | 709 | | | J&J Snack Foods Corp. | | | 86,498 | |
| | 406 | | | John B Sanfilippo & Son Inc. | | | 20,877 | |
| | 881 | | | Lancaster Colony Corp. | | | 118,521 | |
| | 1,251 | | | Landec Corp.* | | | 16,213 | |
| | 83 | | | Lifeway Foods Inc.* | | | 1,029 | |
| | 432 | | | Limoneira Co. | | | 7,176 | |
| | 6,171 | | | Mead Johnson Nutrition Co., Class A Shares | | | 524,967 | |
| | 1,018 | | | Omega Protein Corp.* | | | 25,664 | |
| | 2,756 | | | Pilgrim’s Pride Corp. | | | 63,608 | |
| | 5,459 | | | Pinnacle Foods Inc. | | | 276,498 | |
| | 3,025 | | | Post Holdings Inc.* | | | 256,460 | |
| | 977 | | | Sanderson Farms Inc.(a) | | | 94,017 | |
| | 13 | | | Seaboard Corp.* | | | 42,055 | |
| | 283 | | | Seneca Foods Corp., Class A Shares* | | | 8,349 | |
| | 3,815 | | | Snyder’s-Lance Inc. | | | 134,822 | |
| | 749 | | | Tootsie Roll Industries Inc.(a) | | | 28,529 | |
| | 2,614 | | | TreeHouse Foods Inc.* | | | 247,624 | |
| | 8,258 | | | WhiteWave Foods Co. (The), Class A Shares* | | | 457,741 | |
| | | | | | | | |
| | | | Total Food Products | | | 3,838,863 | |
| | | | | | | | |
| Household Products — 0.3% | |
| | 391 | | | Central Garden & Pet Co.* | | | 10,041 | |
| | 31,240 | | | Central Garden & Pet Co., Class A Shares* | | | 757,570 | |
| | 2,916 | | | Energizer Holdings Inc. | | | 144,109 | |
| | 5,601 | | | HRG Group Inc.* | | | 90,568 | |
| | 189 | | | Oil-Dri Corp. of America | | | 7,142 | |
| | 419 | | | Orchids Paper Products Co. | | | 11,724 | |
| | 1,156 | | | Spectrum Brands Holdings Inc.(a) | | | 155,135 | |
| | 660 | | | WD-40 Co. | | | 78,111 | |
| | | | | | | | |
| | | | Total Household Products | | | 1,254,400 | |
| | | | | | | | |
| Personal Products — 0.2% | |
| | 20,891 | | | Avon Products Inc. | | | 119,079 | |
| | 2,227 | | | Coty Inc., Class A Shares(a) | | | 60,018 | |
| | 2,801 | | | Edgewell Personal Care Co.* | | | 224,108 | |
| | 1,064 | | | Elizabeth Arden Inc.* | | | 14,853 | |
| | 3,501 | | | Herbalife Ltd.*(a) | | | 212,686 | |
| | 786 | | | Inter Parfums Inc. | | | 26,858 | |
| | 720 | | | Lifevantage Corp.* | | | 8,827 | |
| | 495 | | | Medifast Inc. | | | 18,201 | |
| | 391 | | | Natural Health Trends Corp.(a) | | | 12,567 | |
| | 462 | | | Nature’s Sunshine Products Inc. | | | 6,278 | |
See Notes to Financial Statements.
64
| | | | | | | | |
| Small-Mid Cap Equity Fund | |
| | |
| Shares/Units | | | Security | | Value | |
| CONSUMER STAPLES — 2.4% — (continued) | |
| Personal Products — 0.2% — (continued) | |
| | 2,619 | | | Nu Skin Enterprises Inc., Class A Shares(a) | | $ | 151,588 | |
| | 347 | | | Nutraceutical International Corp.* | | | 8,789 | |
| | 560 | | | Revlon Inc., Class A Shares* | | | 20,266 | |
| | 1,153 | | | Synutra International Inc.* | | | 4,520 | |
| | 239 | | | USANA Health Sciences Inc.* | | | 32,681 | |
| | | | | | | | |
| | | | Total Personal Products | | | 921,319 | |
| | | | | | | | |
| Tobacco — 0.0% | |
| | 434 | | | Alliance One International Inc.* | | | 9,214 | |
| | 290 | | | Turning Point Brands Inc.* | | | 3,750 | |
| | 1,051 | | | Universal Corp. | | | 63,238 | |
| | 4,167 | | | Vector Group Ltd. | | | 92,966 | |
| | | | | | | | |
| | | | Total Tobacco | | | 169,168 | |
| | | | | | | | |
| | | | TOTAL CONSUMER STAPLES | | | 11,445,478 | |
| | | | | | | | |
| ENERGY — 2.6% | |
| Energy Equipment & Services — 0.7% | |
| | 3,198 | | | Archrock Inc. | | | 35,242 | |
| | 3,068 | | | Atwood Oceanics Inc.(a) | | | 24,237 | |
| | 1,586 | | | Bristow Group Inc.(a) | | | 18,096 | |
| | 815 | | | CARBO Ceramics Inc. | | | 10,212 | |
| | 1,334 | | | Dawson Geophysical Co.* | | | 9,618 | |
| | 3,159 | | | Diamond Offshore Drilling Inc.(a) | | | 58,347 | |
| | 1,813 | | | Dril-Quip Inc.* | | | 100,748 | |
| | 14,419 | | | Ensco PLC, Class A Shares | | | 109,440 | |
| | 852 | | | Era Group Inc.* | | | 6,211 | |
| | 1,474 | | | Exterran Corp.* | | | 20,828 | |
| | 3,752 | | | Fairmount Santrol Holdings Inc.* | | | 27,877 | |
| | 10,777 | | | FMC Technologies Inc.* | | | 303,911 | |
| | 2,824 | | | Forum Energy Technologies Inc.* | | | 49,618 | |
| | 1,536 | | | Frank’s International NV(a) | | | 17,649 | |
| | 684 | | | Geospace Technologies Corp.*(a) | | | 12,086 | |
| | 4,639 | | | Helix Energy Solutions Group Inc.* | | | 34,793 | |
| | 1,107 | | | Hornbeck Offshore Services Inc.*(a) | | | 6,055 | |
| | 1,645 | | | Independence Contract Drilling Inc.* | | | 8,291 | |
| | 1,374 | | | Matrix Service Co.* | | | 25,405 | |
| | 43,670 | | | McDermott International Inc.* | | | 228,394 | |
| | 13,185 | | | Nabors Industries Ltd. | | | 131,059 | |
| | 578 | | | Natural Gas Services Group Inc.* | | | 13,664 | |
| | 4,074 | | | Newpark Resources Inc.* | | | 28,762 | |
| | 11,317 | | | Noble Corp. PLC | | | 65,186 | |
| | 4,684 | | | Oceaneering International Inc. | | | 124,220 | |
| | 2,406 | | | Oil States International Inc.* | | | 74,634 | |
| | 5,656 | | | Parker Drilling Co.* | | | 12,160 | |
| | 6,900 | | | Patterson-UTI Energy Inc. | | | 134,481 | |
| | 474 | | | PHI Inc.* | | | 8,831 | |
| | 2,834 | | | Pioneer Energy Services Corp.* | | | 9,437 | |
| | 503 | | | RigNet Inc.* | | | 6,348 | |
| | 5,926 | | | Rowan Cos. PLC, Class A Shares | | | 73,838 | |
| | 2,763 | | | RPC Inc.*(a) | | | 42,357 | |
| | 750 | | | SEACOR Holdings Inc.* | | | 44,085 | |
| | 17,410 | | | Seadrill Ltd.*(a) | | | 41,958 | |
| | 7,189 | | | Superior Energy Services Inc. | | | 120,991 | |
| | 2,401 | | | Tesco Corp. | | | 16,351 | |
| | 72,906 | | | TETRA Technologies Inc.* | | | 441,081 | |
See Notes to Financial Statements.
65
| | | | | | | | |
| Small-Mid Cap Equity Fund | |
| | |
| Shares/Units | | | Security | | Value | |
| ENERGY — 2.6% — (continued) | |
| Energy Equipment & Services — 0.7% — (continued) | |
| | 2,042 | | | Tidewater Inc.(a) | | $ | 6,677 | |
| | 16,567 | | | Transocean Ltd.*(a) | | | 160,700 | |
| | 2,408 | | | Unit Corp.* | | | 41,153 | |
| | 3,030 | | | US Silica Holdings Inc. | | | 118,928 | |
| | 42,616 | | | Weatherford International PLC* | | | 233,110 | |
| | 1,549 | | | Willbros Group Inc.* | | | 3,005 | |
| | | | | | | | |
| | | | Total Energy Equipment & Services | | | 3,060,074 | |
| | | | | | | | |
| Oil, Gas & Consumable Fuels — 1.9% | |
| | 8,211 | | | Abraxas Petroleum Corp.* | | | 11,495 | |
| | 128 | | | Adams Resources & Energy Inc. | | | 4,749 | |
| | 1,574 | | | Alon USA Energy Inc. | | | 12,875 | |
| | 1,580 | | | Ardmore Shipping Corp.(a) | | | 11,408 | |
| | 2,552 | | | Bill Barrett Corp.* | | | 16,945 | |
| | 1,621 | | | California Resources Corp.(a) | | | 16,097 | |
| | 5,890 | | | Callon Petroleum Co.* | | | 85,700 | |
| | 19,742 | | | Carrizo Oil & Gas Inc.* | | | 755,921 | |
| | 29,184 | | | Chesapeake Energy Corp.* | | | 185,318 | |
| | 309 | | | Clayton Williams Energy Inc.* | | | 19,501 | |
| | 4,039 | | | Clean Energy Fuels Corp.*(a) | | | 17,650 | |
| | 21,266 | | | Cobalt International Energy Inc.* | | | 25,519 | |
| | 3,374 | | | Concho Resources Inc.* | | | 435,921 | |
| | 10,933 | | | CONSOL Energy Inc. | | | 199,418 | |
| | 1,308 | | | Contango Oil & Gas Co.* | | | 12,635 | |
| | 620 | | | CVR Energy Inc.(a) | | | 9,046 | |
| | 2,892 | | | Delek US Holdings Inc. | | | 50,755 | |
| | 16,617 | | | Denbury Resources Inc.*(a) | | | 51,180 | |
| | 4,260 | | | DHT Holdings Inc. | | | 18,361 | |
| | 3,771 | | | Diamondback Energy Inc.* | | | 359,188 | |
| | 1,467 | | | Dorian LPG Ltd.* | | | 7,819 | |
| | 277 | | | Earthstone Energy Inc.* | | | 2,698 | |
| | 3,183 | | | Eclipse Resources Corp.* | | | 10,854 | |
| | 4,689 | | | Energen Corp. | | | 269,617 | |
| | 2,248 | | | EP Energy Corp., Class A Shares*(a) | | | 9,262 | |
| | 401 | | | Erin Energy Corp.*(a) | | | 914 | |
| | 1,777 | | | Evolution Petroleum Corp. | | | 10,076 | |
| | 7,330 | | | EXCO Resources Inc.*(a) | | | 7,477 | |
| | 3,174 | | | Frontline Ltd.(a) | | | 24,281 | |
| | 2,077 | | | GasLog Ltd. | | | 28,247 | |
| | 1,881 | | | Gener8 Maritime Inc.*(a) | | | 9,424 | |
| | 4,181 | | | Golar LNG Ltd.(a) | | | 87,090 | |
| | 1,683 | | | Green Plains Inc. | | | 40,863 | |
| | 6,169 | | | Gulfport Energy Corp.* | | | 176,433 | |
| | 7,708 | | | HollyFrontier Corp. | | | 199,483 | |
| | 51 | | | Isramco Inc.* | | | 3,998 | |
| | 1,109 | | | Jones Energy Inc., Class A Shares*(a) | | | 3,072 | |
| | 8,309 | | | Kosmos Energy Ltd.* | | | 51,599 | |
| | 7,027 | | | Laredo Petroleum Inc.*(a) | | | 86,292 | |
| | 4,053 | | | Matador Resources Co.* | | | 93,016 | |
| | 4,958 | | | Memorial Resource Development Corp.* | | | 71,395 | |
| | 7,879 | | | Murphy Oil Corp. | | | 210,527 | |
| | 43,600 | | | Navigator Holdings Ltd.*(a) | | | 306,944 | |
| | 3,788 | | | Navios Maritime Acquisition Corp. | | | 5,493 | |
| | 9,559 | | | Newfield Exploration Co.* | | | 414,478 | |
| | 4,175 | | | Nordic American Tankers Ltd.(a) | | | 42,835 | |
See Notes to Financial Statements.
66
| | | | | | | | |
| Small-Mid Cap Equity Fund | |
| | |
| Shares/Units | | | Security | | Value | |
| ENERGY — 2.6% — (continued) | |
| Oil, Gas & Consumable Fuels — 1.9% — (continued) | |
| | 2,554 | | | Northern Oil and Gas Inc.*(a) | | $ | 8,275 | |
| | 8,585 | | | Oasis Petroleum Inc.* | | | 81,386 | |
| | 1,628 | | | Overseas Shipholding Group Inc., Class A Shares | | | 17,648 | |
| | 1,384 | | | Pacific Ethanol Inc.* | | | 8,941 | |
| | 1,092 | | | Panhandle Oil and Gas Inc., Class A Shares | | | 18,892 | |
| | 1,547 | | | Par Pacific Holdings Inc.* | | | 18,936 | |
| | 7,888 | | | Parsley Energy Inc., Class A Shares* | | | 267,009 | |
| | 4,678 | | | PBF Energy Inc., Class A Shares | | | 102,448 | |
| | 2,281 | | | PDC Energy Inc.* | | | 151,458 | |
| | 11,331 | | | Pioneer Natural Resources Co. | | | 2,028,816 | |
| | 11,487 | | | QEP Resources Inc. | | | 219,402 | |
| | 1,869 | | | Renewable Energy Group Inc.* | | | 16,765 | |
| | 296 | | | REX American Resources Corp.* | | | 23,810 | |
| | 1,973 | | | Ring Energy Inc.* | | | 19,572 | |
| | 3,853 | | | RSP Permian Inc.* | | | 150,460 | |
| | 2,632 | | | Sanchez Energy Corp.*(a) | | | 22,609 | |
| | 8,174 | | | Scorpio Tankers Inc. | | | 39,971 | |
| | 2,568 | | | SemGroup Corp., Class A Shares | | | 79,865 | |
| | 2,848 | | | Ship Finance International Ltd.(a) | | | 42,976 | |
| | 4,132 | | | SM Energy Co. | | | 156,520 | |
| | 23,449 | | | Southwestern Energy Co.* | | | 326,176 | |
| | 8,930 | | | Synergy Resources Corp.* | | | 58,492 | |
| | 7,406 | | | Targa Resources Corp. | | | 322,753 | |
| | 1,854 | | | Teekay Corp.(a) | | | 13,404 | |
| | 5,986 | | | Teekay Tankers Ltd., Class A Shares | | | 15,623 | |
| | 1,911 | | | W&T Offshore Inc.* | | | 3,268 | |
| | 3,826 | | | Western Refining Inc. | | | 96,262 | |
| | 808 | | | Westmoreland Coal Co.* | | | 6,197 | |
| | 9,656 | | | Whiting Petroleum Corp.*(a) | | | 70,392 | |
| | 3,292 | | | World Fuel Services Corp. | | | 146,757 | |
| | 15,952 | | | WPX Energy Inc.* | | | 191,424 | |
| | | | | | | | |
| | | | Total Oil, Gas & Consumable Fuels | | | 9,200,376 | |
| | | | | | | | |
| | | | TOTAL ENERGY | | | 12,260,450 | |
| | | | | | | | |
| FINANCIALS — 17.6% | |
| Banks — 5.5% | |
| | 701 | | | 1st Source Corp. | | | 24,808 | |
| | 321 | | | Access National Corp. | | | 7,152 | |
| | 203 | | | ACNB Corp.(a) | | | 5,522 | |
| | 499 | | | Allegiance Bancshares Inc.* | | | 13,099 | |
| | 285 | | | American National Bankshares Inc. | | | 7,629 | |
| | 1,584 | | | Ameris Bancorp | | | 55,155 | |
| | 308 | | | Ames National Corp. | | | 8,384 | |
| | 512 | | | Arrow Financial Corp. | | | 16,599 | |
| | 7,077 | | | Associated Banc-Corp. | | | 140,408 | |
| | 959 | | | Atlantic Capital Bancshares Inc.* | | | 14,778 | |
| | 2,253 | | | Banc of California Inc. | | | 50,287 | |
| | 352 | | | BancFirst Corp. | | | 24,147 | |
| | 1,413 | | | Banco Latinoamericano de Comercio Exterior SA, Class E Shares | | | 40,822 | |
| | 1,875 | | | Bancorp Inc. (The)* | | | 11,606 | |
| | 4,182 | | | BancorpSouth Inc. | | | 104,132 | |
| | 1,976 | | | Bank of Hawaii Corp. | | | 142,351 | |
| | 285 | | | Bank of Marin Bancorp | | | 13,885 | |
| | 4,134 | | | Bank of the Ozarks Inc. | | | 161,970 | |
See Notes to Financial Statements.
67
| | | | | | | | |
| Small-Mid Cap Equity Fund | |
| | |
| Shares/Units | | | Security | | Value | |
| FINANCIALS — 17.6% — (continued) | |
| Banks — 5.5% — (continued) | |
| | 105,029 | | | BankUnited Inc. | | $ | 3,376,682 | |
| | 228 | | | Bankwell Financial Group Inc. | | | 5,114 | |
| | 1,490 | | | Banner Corp. | | | 65,977 | |
| | 209 | | | Bar Harbor Bankshares | | | 7,691 | |
| | 1,435 | | | Berkshire Hills Bancorp Inc. | | | 40,022 | |
| | 1,311 | | | Blue Hills Bancorp Inc. | | | 19,337 | |
| | 1,892 | | | BNC Bancorp | | | 46,486 | |
| | 1,215 | | | BOK Financial Corp.(a) | | | 83,920 | |
| | 3,801 | | | Boston Private Financial Holdings Inc. | | | 48,957 | |
| | 778 | | | Bridge Bancorp Inc. | | | 23,192 | |
| | 3,497 | | | Brookline Bancorp Inc. | | | 41,754 | |
| | 743 | | | Bryn Mawr Bank Corp. | | | 23,902 | |
| | 116 | | | C&F Financial Corp. | | | 4,931 | |
| | 485 | | | Camden National Corp. | | | 22,426 | |
| | 944 | | | Capital Bank Financial Corp., Class A Shares | | | 29,557 | |
| | 423 | | | Capital City Bank Group Inc. | | | 5,918 | |
| | 1,457 | | | Cardinal Financial Corp. | | | 39,120 | |
| | 397 | | | Carolina Financial Corp. | | | 8,516 | |
| | 1,909 | | | Cascade Bancorp* | | | 11,492 | |
| | 3,490 | | | Cathay General Bancorp | | | 109,656 | |
| | 2,355 | | | CenterState Banks Inc. | | | 42,343 | |
| | 1,569 | | | Central Pacific Financial Corp. | | | 40,151 | |
| | 311 | | | Central Valley Community Bancorp | | | 4,777 | |
| | 157 | | | Century Bancorp Inc., Class A Shares | | | 6,889 | |
| | 1,795 | | | Chemical Financial Corp.(a) | | | 82,983 | |
| | 124 | | | Chemung Financial Corp. | | | 3,643 | |
| | 44,536 | | | CIT Group Inc. | | | 1,642,488 | |
| | 396 | | | Citizens & Northern Corp. | | | 8,562 | |
| | 676 | | | City Holding Co. | | | 34,199 | |
| | 486 | | | CNB Financial Corp. | | | 9,793 | |
| | 1,980 | | | CoBiz Financial Inc. | | | 25,997 | |
| | 229 | | | Codorus Valley Bancorp Inc. | | | 4,765 | |
| | 2,733 | | | Columbia Banking System Inc. | | | 90,298 | |
| | 11,200 | | | Comerica Inc. | | | 529,648 | |
| | 3,971 | | | Commerce Bancshares Inc. | | | 201,250 | |
| | 2,013 | | | Community Bank System Inc. | | | 95,517 | |
| | 797 | | | Community Trust Bancorp Inc. | | | 29,377 | |
| | 485 | | | CommunityOne Bancorp* | | | 6,538 | |
| | 1,219 | | | ConnectOne Bancorp Inc. | | | 21,686 | |
| | 133 | | | County Bancorp Inc. | | | 2,793 | |
| | 756 | | | CU Bancorp* | | | 18,295 | |
| | 13,755 | | | Cullen/Frost Bankers Inc.(a) | | | 1,002,739 | |
| | 1,186 | | | Customers Bancorp Inc.* | | | 31,714 | |
| | 4,722 | | | CVB Financial Corp. | | | 84,004 | |
| | 1,435 | | | Eagle Bancorp Inc.* | | | 74,276 | |
| | 42,004 | | | East West Bancorp Inc. | | | 1,560,029 | |
| | 497 | | | Enterprise Bancorp Inc. | | | 12,341 | |
| | 879 | | | Enterprise Financial Services Corp. | | | 27,073 | |
| | 172 | | | Equity Bancshares Inc., Class A Shares* | | | 4,161 | |
| | 264 | | | Farmers Capital Bank Corp. | | | 7,894 | |
| | 1,496 | | | Farmers National Banc Corp. | | | 14,915 | |
| | 20,323 | | | FCB Financial Holdings Inc., Class A Shares* | | | 778,371 | |
| | 987 | | | Fidelity Southern Corp. | | | 17,717 | |
| | 590 | | | Financial Institutions Inc. | | | 15,859 | |
| | 5,368 | | | First Bancorp* | | | 26,303 | |
See Notes to Financial Statements.
68
| | | | | | | | |
| Small-Mid Cap Equity Fund | |
| | |
| Shares/Units | | | Security | | Value | |
| FINANCIALS — 17.6% — (continued) | |
| Banks — 5.5% — (continued) | |
| | 1,068 | | | First Bancorp | | $ | 21,414 | |
| | 362 | | | First Bancorp Inc. | | | 8,149 | |
| | 1,358 | | | First Busey Corp. | | | 31,709 | |
| | 306 | | | First Business Financial Services Inc. | | | 6,971 | |
| | 356 | | | First Citizens BancShares Inc., Class A Shares | | | 101,428 | |
| | 4,082 | | | First Commonwealth Financial Corp. | | | 41,677 | |
| | 712 | | | First Community Bancshares Inc. | | | 17,067 | |
| | 912 | | | First Community Financial Partners Inc.* | | | 8,153 | |
| | 572 | | | First Connecticut Bancorp Inc. | | | 10,021 | |
| | 2,856 | | | First Financial Bancorp | | | 62,261 | |
| | 3,000 | | | First Financial Bankshares Inc.(a) | | | 109,860 | |
| | 447 | | | First Financial Corp. | | | 18,273 | |
| | 414 | | | First Financial Northwest Inc. | | | 5,428 | |
| | 670 | | | First Foundation Inc.* | | | 16,783 | |
| | 10,954 | | | First Horizon National Corp. | | | 168,473 | |
| | 168 | | | First Internet Bancorp | | | 4,007 | |
| | 918 | | | First Interstate BancSystem Inc., Class A Shares | | | 28,219 | |
| | 1,903 | | | First Merchants Corp. | | | 51,666 | |
| | 189 | | | First Mid-Illinois Bancshares Inc. | | | 4,719 | |
| | 3,948 | | | First Midwest Bancorp Inc. | | | 77,262 | |
| | 630 | | | First NBC Bank Holding Co.* | | | 8,228 | |
| | 825 | | | First Northwest Bancorp* | | | 10,857 | |
| | 711 | | | First of Long Island Corp. (The) | | | 23,321 | |
| | 33,477 | | | First Republic Bank | | | 2,576,390 | |
| | 1,339 | | | Flushing Financial Corp. | | | 31,051 | |
| | 9,874 | | | FNB Corp. | | | 123,326 | |
| | 387 | | | Franklin Financial Network Inc.* | | | 13,448 | |
| | 8,052 | | | Fulton Financial Corp. | | | 116,432 | |
| | 600 | | | German American Bancorp Inc. | | | 22,116 | |
| | 3,579 | | | Glacier Bancorp Inc. | | | 107,155 | |
| | 506 | | | Great Southern Bancorp Inc. | | | 21,298 | |
| | 2,758 | | | Great Western Bancorp Inc. | | | 94,434 | |
| | 1,248 | | | Green Bancorp Inc.* | | | 12,730 | |
| | 842 | | | Guaranty Bancorp | | | 15,560 | |
| | 3,650 | | | Hancock Holding Co. | | | 119,099 | |
| | 1,584 | | | Hanmi Financial Corp. | | | 41,548 | |
| | 1,004 | | | Heartland Financial USA Inc. | | | 36,465 | |
| | 1,535 | | | Heritage Commerce Corp. | | | 17,637 | |
| | 1,566 | | | Heritage Financial Corp. | | | 28,940 | |
| | 851 | | | Heritage Oaks Bancorp | | | 6,868 | |
| | 3,693 | | | Hilltop Holdings Inc.* | | | 83,610 | |
| | 5,705 | | | Home BancShares Inc. | | | 133,497 | |
| | 1,042 | | | HomeTrust Bancshares Inc.* | | | 19,923 | |
| | 6,127 | | | Hope Bancorp Inc. | | | 105,384 | |
| | 626 | | | Horizon Bancorp | | | 17,534 | |
| | 133,317 | | | Huntington Bancshares Inc. | | | 1,334,503 | |
| | 1,941 | | | IBERIABANK Corp. | | | 133,483 | |
| | 2,397 | | | Independent Bank Corp. | | | 83,466 | |
| | 496 | | | Independent Bank Group Inc. | | | 21,784 | |
| | 2,551 | | | International Bancshares Corp. | | | 75,637 | |
| | 14,060 | | | Investors Bancorp Inc. | | | 172,235 | |
| | 1,711 | | | Lakeland Bancorp Inc. | | | 23,355 | |
| | 1,119 | | | Lakeland Financial Corp. | | | 40,105 | |
| | 284 | | | LCNB Corp. | | | 4,996 | |
| | 2,066 | | | LegacyTexas Financial Group Inc. | | | 62,662 | |
See Notes to Financial Statements.
69
| | | | | | | | |
| Small-Mid Cap Equity Fund | |
| | |
| Shares/Units | | | Security | | Value | |
| FINANCIALS — 17.6% — (continued) | |
| Banks — 5.5% — (continued) | |
| | 749 | | | Live Oak Bancshares Inc. | | $ | 10,606 | |
| | 960 | | | Macatawa Bank Corp. | | | 7,469 | |
| | 1,214 | | | MainSource Financial Group Inc. | | | 29,294 | |
| | 3,306 | | | MB Financial Inc. | | | 129,529 | |
| | 806 | | | MBT Financial Corp. | | | 6,835 | |
| | 704 | | | Mercantile Bank Corp. | | | 18,867 | |
| | 159 | | | Merchants Bancshares Inc. | | | 5,279 | |
| | 171 | | | Middleburg Financial Corp. | | | 4,870 | |
| | 133 | | | Midland States Bancorp Inc. | | | 3,237 | |
| | 501 | | | MidWestOne Financial Group Inc. | | | 14,940 | |
| | 358 | | | Mutual First Financial Inc. | | | 9,931 | |
| | 1,188 | | | National Bank Holdings Corp., Class A Shares | | | 28,441 | |
| | 226 | | | National Bankshares Inc. | | | 8,109 | |
| | 439 | | | National Commerce Corp.* | | | 11,818 | |
| | 1,981 | | | NBT Bancorp Inc. | | | 63,966 | |
| | 435 | | | Nicolet Bankshares Inc.* | | | 16,282 | |
| | 432 | | | Northrim BanCorp Inc. | | | 11,102 | |
| | 2,088 | | | OFG Bancorp | | | 22,780 | |
| | 273 | | | Old Line Bancshares Inc. | | | 5,280 | |
| | 6,466 | | | Old National Bancorp | | | 91,559 | |
| | 1,029 | | | Old Second Bancorp Inc. | | | 8,397 | |
| | 787 | | | Opus Bank | | | 27,482 | |
| | 419 | | | Orrstown Financial Services Inc. | | | 8,543 | |
| | 858 | | | Pacific Continental Corp. | | | 14,157 | |
| | 487 | | | Pacific Mercantile Bancorp* | | | 3,740 | |
| | 1,397 | | | Pacific Premier Bancorp Inc.* | | | 37,705 | |
| | 5,638 | | | PacWest Bancorp | | | 244,182 | |
| | 618 | | | Park National Corp. | | | 59,112 | |
| | 2,860 | | | Park Sterling Corp. | | | 24,253 | |
| | 853 | | | Peapack Gladstone Financial Corp. | | | 17,043 | |
| | 251 | | | Penns Woods Bancorp Inc. | | | 11,089 | |
| | 898 | | | Peoples Bancorp Inc. | | | 21,345 | |
| | 385 | | | Peoples Financial Services Corp. | | | 14,799 | |
| | 14,477 | | | People’s United Financial Inc. | | | 235,251 | |
| | 641 | | | People’s Utah Bancorp | | | 12,615 | |
| | 2,036 | | | Pinnacle Financial Partners Inc. | | | 115,421 | |
| | 4,855 | | | Popular Inc. | | | 190,850 | |
| | 612 | | | Preferred Bank | | | 21,451 | |
| | 264 | | | Premier Financial Bancorp Inc. | | | 4,414 | |
| | 3,725 | | | PrivateBancorp Inc. | | | 171,164 | |
| | 3,152 | | | Prosperity Bancshares Inc. | | | 174,841 | |
| | 665 | | | QCR Holdings Inc. | | | 20,761 | |
| | 1,915 | | | Renasant Corp. | | | 67,887 | |
| | 354 | | | Republic Bancorp Inc., Class A Shares | | | 11,332 | |
| | 910 | | | Republic First Bancorp Inc.* | | | 3,731 | |
| | 1,585 | | | S&T Bancorp Inc. | | | 45,569 | |
| | 1,098 | | | Sandy Spring Bancorp Inc. | | | 34,620 | |
| | 1,589 | | | Seacoast Banking Corp. of Florida* | | | 26,139 | |
| | 1,071 | | | ServisFirst Bancshares Inc. | | | 56,131 | |
| | 308 | | | Shore Bancshares Inc. | | | 3,582 | |
| | 401 | | | Sierra Bancorp | | | 7,310 | |
| | 7,694 | | | Signature Bank* | | | 938,745 | |
| | 1,376 | | | Simmons First National Corp., Class A Shares | | | 69,061 | |
| | 1,113 | | | South State Corp. | | | 84,577 | |
| | 257 | | | Southern First Bancshares Inc.* | | | 7,283 | |
See Notes to Financial Statements.
70
| | | | | | | | |
| Small-Mid Cap Equity Fund | |
| | |
| Shares/Units | | | Security | | Value | |
| FINANCIALS — 17.6% — (continued) | |
| Banks — 5.5% — (continued) | |
| | 360 | | | Southern National Bancorp of Virginia Inc. | | $ | 4,471 | |
| | 1,125 | | | Southside Bancshares Inc. | | | 36,956 | |
| | 984 | | | Southwest Bancorp Inc. | | | 19,267 | |
| | 1,632 | | | State Bank Financial Corp. | | | 37,634 | |
| | 5,976 | | | Sterling Bancorp | | | 106,672 | |
| | 977 | | | Stock Yards Bancorp Inc. | | | 31,176 | |
| | 668 | | | Stonegate Bank | | | 21,750 | |
| | 524 | | | Suffolk Bancorp | | | 18,523 | |
| | 323 | | | Summit Financial Group Inc. | | | 6,276 | |
| | 488 | | | Sun Bancorp Inc. | | | 11,146 | |
| | 2,465 | | | SVB Financial Group* | | | 273,763 | |
| | 6,008 | | | Synovus Financial Corp. | | | 198,745 | |
| | 2,839 | | | Talmer Bancorp Inc., Class A Shares | | | 66,035 | |
| | 52,461 | | | TCF Financial Corp. | | | 768,554 | |
| | 11,984 | | | Texas Capital Bancshares Inc.* | | | 629,400 | |
| | 676 | | | Tompkins Financial Corp. | | | 49,977 | |
| | 2,589 | | | Towne Bank | | | 61,592 | |
| | 960 | | | TriCo Bancshares | | | 25,958 | |
| | 1,240 | | | TriState Capital Holdings Inc.* | | | 18,557 | |
| | 761 | | | Triumph Bancorp Inc.* | | | 14,550 | |
| | 3,167 | | | Trustmark Corp. | | | 89,816 | |
| | 2,112 | | | UMB Financial Corp. | | | 128,410 | |
| | 48,480 | | | Umpqua Holdings Corp. | | | 796,042 | |
| | 2,029 | | | Union Bankshares Corp. | | | 56,467 | |
| | 178 | | | Union Bankshares Inc. | | | 6,061 | |
| | 3,089 | | | United Bankshares Inc.(a) | | | 121,707 | |
| | 3,312 | | | United Community Banks Inc. | | | 69,486 | |
| | 1,184 | | | Univest Corp. of Pennsylvania | | | 27,635 | |
| | 11,591 | | | Valley National Bancorp | | | 111,853 | |
| | 553 | | | Veritex Holdings Inc.* | | | 9,484 | |
| | 689 | | | Washington Trust Bancorp Inc. | | | 29,041 | |
| | 323 | | | WashingtonFirst Bankshares Inc. | | | 8,033 | |
| | 4,309 | | | Webster Financial Corp. | | | 166,457 | |
| | 1,667 | | | WesBanco Inc. | | | 54,561 | |
| | 724 | | | West Bancorporation Inc. | | | 14,212 | |
| | 1,142 | | | Westamerica Bancorporation | | | 58,059 | |
| | 4,451 | | | Western Alliance Bancorp* | | | 170,117 | |
| | 2,435 | | | Wintrust Financial Corp. | | | 135,337 | |
| | 4,208 | | | Xenith Bankshares Inc.* | | | 9,847 | |
| | 2,474 | | | Yadkin Financial Corp. | | | 64,571 | |
| | 192 | | | Your Community Bankshares Inc. | | | 7,494 | |
| | 9,574 | | | Zions Bancorporation | | | 292,869 | |
| | | | | | | | |
| | | | Total Banks | | | 26,072,726 | |
| | | | | | | | |
| Capital Markets — 1.9% | |
| | 1,757 | | | Artisan Partners Asset Management Inc., Class A Shares | | | 45,946 | |
| | 296 | | | Associated Capital Group Inc., Class A Shares | | | 9,738 | |
| | 304 | | | B. Riley Financial Inc. | | | 2,894 | |
| | 89,974 | | | BGC Partners Inc., Class A Shares | | | 789,072 | |
| | 825 | | | Calamos Asset Management Inc., Class A Shares | | | 5,767 | |
| | 965 | | | Cohen & Steers Inc. | | | 40,655 | |
| | 4,582 | | | Cowen Group Inc., Class A Shares*(a) | | | 17,183 | |
| | 150 | | | Diamond Hill Investment Group Inc. | | | 28,403 | |
| | 28,455 | | | E*Trade Financial Corp.* | | | 750,643 | |
| | 5,222 | | | Eaton Vance Corp. | | | 209,037 | |
See Notes to Financial Statements.
71
| | | | | | | | |
| Small-Mid Cap Equity Fund | |
| | |
| Shares/Units | | | Security | | Value | |
| FINANCIALS — 17.6% — (continued) | |
| Capital Markets — 1.9% — (continued) | |
| | 1,847 | | | Evercore Partners Inc., Class A Shares | | $ | 94,640 | |
| | 424 | | | FBR & Co. | | | 5,991 | |
| | 4,487 | | | Federated Investors Inc., Class B Shares | | | 144,930 | |
| | 2,538 | | | Financial Engines Inc. | | | 81,140 | |
| | 2,187 | | | GAIN Capital Holdings Inc. | | | 14,062 | |
| | 241 | | | GAMCO Investors Inc., Class A Shares | | | 7,391 | |
| | 68,254 | | | Greenhill & Co., Inc. | | | 1,565,747 | |
| | 198 | | | Hennessy Advisors Inc. | | | 6,732 | |
| | 630 | | | Houlihan Lokey Inc., Class A Shares | | | 15,599 | |
| | 746 | | | INTL. FCStone Inc.* | | | 26,871 | |
| | 1,292 | | | Investment Technology Group Inc. | | | 19,871 | |
| | 6,799 | | | Janus Capital Group Inc. | | | 101,101 | |
| | 2,567 | | | KCG Holdings Inc., Class A Shares* | | | 37,093 | |
| | 3,970 | | | Ladenburg Thalmann Financial Services Inc.*(a) | | | 9,091 | |
| | 6,057 | | | Lazard Ltd., Class A Shares | | | 224,291 | |
| | 5,041 | | | Legg Mason Inc. | | | 174,368 | |
| | 4,121 | | | LPL Financial Holdings Inc.(a) | | | 122,517 | |
| | 909 | | | Manning & Napier Inc., Class A Shares | | | 6,981 | |
| | 151 | | | Medley Management Inc., Class A Shares | | | 1,098 | |
| | 943 | | | Moelis & Co., Class A Shares | | | 25,414 | |
| | 8,865 | | | NorthStar Asset Management Group Inc. | | | 110,192 | |
| | 1,960 | | | OM Asset Management PLC | | | 26,460 | |
| | 494 | | | Oppenheimer Holdings Inc., Class A Shares | | | 7,939 | |
| | 710 | | | Piper Jaffray Cos.* | | | 31,510 | |
| | 888 | | | PJT Partners Inc., Class A Shares(a) | | | 21,907 | |
| | 678 | | | Pzena Investment Management Inc., Class A Shares | | | 5,261 | |
| | 23,149 | | | Raymond James Financial Inc. | | | 1,346,577 | |
| | 888 | | | Safeguard Scientifics Inc.* | | | 12,521 | |
| | 52,449 | | | SEI Investments Co. | | | 2,417,899 | |
| | 236 | | | Silvercrest Asset Management Group Inc., Class A Shares | | | 2,924 | |
| | 3,025 | | | Stifel Financial Corp.* | | | 119,034 | |
| | 1,172 | | | Virtu Financial Inc., Class A Shares | | | 19,115 | |
| | 289 | | | Virtus Investment Partners Inc.(a) | | | 26,357 | |
| | 3,787 | | | Waddell & Reed Financial Inc., Class A Shares | | | 70,438 | |
| | 373 | | | Westwood Holdings Group Inc. | | | 18,669 | |
| | 33,448 | | | WisdomTree Investments Inc.(a) | | | 351,204 | |
| | | | | | | | |
| | | | Total Capital Markets | | | 9,172,273 | |
| | | | | | | | |
| Consumer Finance — 0.2% | |
| | 1,147 | | | Cash America International Inc. | | | 49,929 | |
| | 390 | | | Credit Acceptance Corp.*(a) | | | 77,864 | |
| | 1,043 | | | Encore Capital Group Inc.*(a) | | | 22,487 | |
| | 1,135 | | | Enova International Inc.* | | | 10,885 | |
| | 2,458 | | | EZCORP Inc., Class A Shares* | | | 25,440 | |
| | 1,277 | | | First Cash Financial Services Inc. | | | 66,046 | |
| | 1,945 | | | Green Dot Corp., Class A Shares* | | | 45,124 | |
| | 15,530 | | | LendingClub Corp.*(a) | | | 84,017 | |
| | 15,736 | | | Navient Corp. | | | 226,284 | |
| | 958 | | | Nelnet Inc., Class A Shares | | | 33,913 | |
| | 2,490 | | | OneMain Holdings Inc., Class A Shares* | | | 77,215 | |
| | 2,151 | | | PRA Group Inc.* | | | 68,789 | |
| | 435 | | | Regional Management Corp.* | | | 9,405 | |
| | 4,943 | | | Santander Consumer USA Holdings Inc.* | | | 62,183 | |
| | 20,265 | | | SLM Corp.* | | | 150,265 | |
See Notes to Financial Statements.
72
| | | | | | | | |
| Small-Mid Cap Equity Fund | |
| | |
| Shares/Units | | | Security | | Value | |
| FINANCIALS — 17.6% — (continued) | |
| Consumer Finance — 0.2% — (continued) | |
| | 256 | | | World Acceptance Corp.*(a) | | $ | 12,316 | |
| | | | | | | | |
| | | | Total Consumer Finance | | | 1,022,162 | |
| | | | | | | | |
| Diversified Financial Services — 0.8% | |
| | 209 | | | BBX Capital Corp., Class A Shares* | | | 4,144 | |
| | 3,884 | | | CBOE Holdings Inc. | | | 266,792 | |
| | 1,901 | | | FactSet Research Systems Inc. | | | 338,435 | |
| | 3,257 | | | FNFV Group* | | | 41,983 | |
| | 6,078 | | | MarketAxess Holdings Inc. | | | 1,024,386 | |
| | 507 | | | Marlin Business Services Corp. | | | 9,532 | |
| | 5,760 | | | Moody’s Corp. | | | 626,054 | |
| | 877 | | | Morningstar Inc. | | | 72,852 | |
| | 4,327 | | | MSCI Inc., Class A Shares | | | 389,949 | |
| | 15,732 | | | Nasdaq Inc. | | | 1,120,276 | |
| | 955 | | | NewStar Financial Inc.* | | | 10,763 | |
| | 2,236 | | | On Deck Capital Inc.*(a) | | | 14,154 | |
| | 972 | | | PICO Holdings Inc.* | | | 10,711 | |
| | 545 | | | Resource America Inc., Class A Shares | | | 5,319 | |
| | 1,343 | | | Tiptree Financial Inc., Class A Shares | | | 7,333 | |
| | | | | | | | |
| | | | Total Diversified Financial Services | | | 3,942,683 | |
| | | | | | | | |
| Insurance — 2.5% | |
| | 597 | | | Alleghany Corp.* | | | 320,111 | |
| | 4,200 | | | Allied World Assurance Co. Holdings AG | | | 170,352 | |
| | 376 | | | Ambac Financial Group Inc.* | | | 6,821 | |
| | 4,036 | | | American Equity Investment Life Holding Co. | | | 71,114 | |
| | 3,382 | | | American Financial Group Inc. | | | 254,157 | |
| | 386 | | | American National Insurance Co. | | | 45,093 | |
| | 976 | | | AMERISAFE Inc. | | | 58,570 | |
| | 4,355 | | | AmTrust Financial Services Inc. | | | 115,364 | |
| | 13,258 | | | Aon PLC | | | 1,476,278 | |
| | 5,481 | | | Arch Capital Group Ltd.* | | | 443,632 | |
| | 1,458 | | | Argo Group International Holdings Ltd. | | | 82,727 | |
| | 8,335 | | | Arthur J. Gallagher & Co. | | | 411,832 | |
| | 2,948 | | | Aspen Insurance Holdings Ltd. | | | 135,490 | |
| | 2,973 | | | Assurant Inc. | | | 266,232 | |
| | 6,452 | | | Assured Guaranty Ltd. | | | 179,172 | |
| | 777 | | | Atlas Financial Holdings Inc.* | | | 13,621 | |
| | 4,409 | | | Axis Capital Holdings Ltd. | | | 250,740 | |
| | 732 | | | Baldwin & Lyons Inc., Class B Shares | | | 18,476 | |
| | 631 | | | Blue Capital Reinsurance Holdings Ltd.* | | | 10,979 | |
| | 5,557 | | | Brown & Brown Inc. | | | 208,221 | |
| | 2,198 | | | Citizens Inc., Class A Shares*(a) | | | 23,914 | |
| | 8,482 | | | CNO Financial Group Inc. | | | 137,832 | |
| | 639 | | | Crawford & Co., Class B Shares | | | 7,246 | |
| | 758 | | | Donegal Group Inc., Class A Shares | | | 12,196 | |
| | 702 | | | eHealth Inc.* | | | 7,890 | |
| | 620 | | | EMC Insurance Group Inc. | | | 17,267 | |
| | 1,196 | | | Employers Holdings Inc. | | | 36,442 | |
| | 3,096 | | | Endurance Specialty Holdings Ltd. | | | 203,872 | |
| | 558 | | | Enstar Group Ltd.* | | | 92,957 | |
| | 1,156 | | | Erie Indemnity Co., Class A Shares | | | 117,947 | |
| | 1,967 | | | Everest Re Group Ltd. | | | 380,378 | |
| | 471 | | | FBL Financial Group Inc., Class A Shares | | | 31,143 | |
| | 718 | | | Federated National Holding Co. | | | 13,118 | |
See Notes to Financial Statements.
73
| | | | | | | | |
| Small-Mid Cap Equity Fund | |
| | |
| Shares/Units | | | Security | | Value | |
| FINANCIALS — 17.6% — (continued) | |
| Insurance — 2.5% — (continued) | |
| | 616 | | | Fidelity & Guaranty Life(a) | | $ | 14,661 | |
| | 5,145 | | | First American Financial Corp. | | | 221,698 | |
| | 27,052 | | | FNF Group | | | 1,019,590 | |
| | 18,723 | | | Genworth Financial Inc., Class A Shares* | | | 88,560 | |
| | 566 | | | Global Indemnity PLC, Class A Shares* | | | 16,329 | |
| | 1,579 | | | Greenlight Capital Re Ltd., Class A Shares* | | | 33,870 | |
| | 890 | | | Hallmark Financial Services Inc.* | | | 9,407 | |
| | 2,071 | | | Hanover Insurance Group Inc. (The) | | | 161,952 | |
| | 467 | | | HCI Group Inc. | | | 14,846 | |
| | 1,334 | | | Heritage Insurance Holdings Inc. | | | 18,302 | |
| | 2,066 | | | Horace Mann Educators Corp. | | | 75,512 | |
| | 451 | | | Independence Holding Co. | | | 7,915 | |
| | 581 | | | Infinity Property & Casualty Corp. | | | 48,955 | |
| | 117 | | | Investors Title Co.* | | | 11,473 | |
| | 769 | | | James River Group Holdings Ltd. | | | 28,099 | |
| | 1,995 | | | Kemper Corp. | | | 74,713 | |
| | 101,614 | | | Maiden Holdings Ltd. | | | 1,403,289 | |
| | 6,319 | | | MBIA Inc.* | | | 50,931 | |
| | 2,501 | | | National General Holdings Corp. | | | 56,998 | |
| | 395 | | | National Interstate Corp. | | | 12,849 | |
| | 114 | | | National Western Life Group Inc., Class A Shares | | | 22,117 | |
| | 607 | | | Navigators Group Inc. (The) | | | 57,034 | |
| | 11,838 | | | Old Republic International Corp. | | | 227,645 | |
| | 1,291 | | | OneBeacon Insurance Group Ltd., Class A Shares | | | 18,281 | |
| | 596 | | | Patriot National Inc.* | | | 5,275 | |
| | 2,218 | | | Primerica Inc. | | | 126,271 | |
| | 2,595 | | | ProAssurance Corp. | | | 142,777 | |
| | 3,080 | | | Reinsurance Group of America Inc., Class A Shares | | | 330,546 | |
| | 1,610 | | | RenaissanceRe Holdings Ltd. | | | 192,717 | |
| | 1,861 | | | RLI Corp. | | | 132,094 | |
| | 697 | | | Safety Insurance Group Inc. | | | 46,316 | |
| | 2,135 | | | Selective Insurance Group Inc. | | | 85,186 | |
| | 858 | | | State Auto Financial Corp. | | | 19,700 | |
| | 1,466 | | | State National Cos., Inc. | | | 14,909 | |
| | 883 | | | Stewart Information Services Corp. | | | 40,424 | |
| | 3,391 | | | Third Point Reinsurance Ltd.* | | | 44,151 | |
| | 5,658 | | | Torchmark Corp. | | | 365,959 | |
| | 667 | | | Trupanion Inc.*(a) | | | 10,025 | |
| | 1,122 | | | United Fire Group Inc. | | | 48,482 | |
| | 883 | | | United Insurance Holdings Corp. | | | 13,907 | |
| | 1,586 | | | Universal Insurance Holdings Inc.(a) | | | 39,301 | |
| | 3,643 | | | Validus Holdings Ltd. | | | 185,028 | |
| | 228 | | | White Mountains Insurance Group Ltd. | | | 187,877 | |
| | 10,198 | | | WMIH Corp.*(a) | | | 25,393 | |
| | 4,694 | | | WR Berkley Corp. | | | 278,683 | |
| | | | | | | | |
| | | | Total Insurance | | | 11,651,231 | |
| | | | | | | | |
| Real Estate Investment Trusts (REITs) — 5.3% | |
| | 3,747 | | | Acadia Realty Trust | | | 138,414 | |
| | 1,210 | | | AG Mortgage Investment Trust Inc. | | | 19,142 | |
| | 1,081 | | | Agree Realty Corp. | | | 51,877 | |
| | 102 | | | Alexander’s Inc. | | | 43,861 | |
| | 3,640 | | | Alexandria Real Estate Equities Inc. | | | 400,728 | |
| | 2,316 | | | Altisource Residential Corp. | | | 25,407 | |
| | 1,896 | | | American Assets Trust Inc. | | | 83,993 | |
See Notes to Financial Statements.
74
| | | | | | | | |
| Small-Mid Cap Equity Fund | |
| | |
| Shares/Units | | | Security | | Value | |
| FINANCIALS — 17.6% — (continued) | |
| Real Estate Investment Trusts (REITs) — 5.3% — (continued) | |
| | 6,245 | | | American Campus Communities Inc. | | $ | 312,937 | |
| | 15,752 | | | American Capital Agency Corp. | | | 304,171 | |
| | 2,252 | | | American Capital Mortgage Investment Corp. | | | 38,408 | |
| | 7,963 | | | American Homes 4 Rent, Class A Shares | | | 174,151 | |
| | 4,508 | | | Anworth Mortgage Asset Corp. | | | 22,044 | |
| | 7,363 | | | Apartment Investment & Management Co., Class A Shares | | | 332,660 | |
| | 3,166 | | | Apollo Commercial Real Estate Finance Inc. | | | 51,606 | |
| | 1,697 | | | Apollo Residential Mortgage Inc. | | | 23,147 | |
| | 7,866 | | | Apple Hospitality REIT Inc.(a) | | | 154,331 | |
| | 1,158 | | | Ares Commercial Real Estate Corp. | | | 14,556 | |
| | 1,832 | | | Armada Hoffler Properties Inc. | | | 25,245 | |
| | 1,731 | | | ARMOUR Residential REIT Inc.(a) | | | 38,497 | |
| | 1,057 | | | Ashford Hospitality Prime Inc. | | | 16,394 | |
| | 127,766 | | | Ashford Hospitality Trust Inc. | | | 890,529 | |
| | 759 | | | Bluerock Residential Growth REIT Inc., Class A Shares | | | 10,171 | |
| | 8,450 | | | Brandywine Realty Trust | | | 136,298 | |
| | 9,119 | | | Brixmor Property Group Inc. | | | 260,439 | |
| | 4,090 | | | Camden Property Trust | | | 358,979 | |
| | 4,700 | | | Capstead Mortgage Corp. | | | 46,624 | |
| | 4,018 | | | Care Capital Properties Inc. | | | 120,500 | |
| | 3,049 | | | CareTrust REIT Inc. | | | 45,308 | |
| | 2,065 | | | CatchMark Timber Trust Inc., Class A Shares | | | 24,161 | |
| | 8,020 | | | CBL & Associates Properties Inc. | | | 114,445 | |
| | 3,736 | | | Cedar Realty Trust Inc. | | | 28,282 | |
| | 1,841 | | | Chatham Lodging Trust | | | 38,164 | |
| | 2,857 | | | Chesapeake Lodging Trust | | | 72,796 | |
| | 9,040 | | | Chimera Investment Corp. | | | 149,070 | |
| | 1,126 | | | City Office REIT Inc. | | | 14,593 | |
| | 5,382 | | | Colony Capital Inc., Class A Shares | | | 99,406 | |
| | 3,117 | | | Colony Starwood Homes(a) | | | 96,627 | |
| | 5,838 | | | Columbia Property Trust Inc. | | | 137,660 | |
| | 22,206 | | | Communications Sales & Leasing Inc. | | | 692,827 | |
| | 18,733 | | | Community Healthcare Trust Inc. | | | 430,297 | |
| | 592 | | | CorEnergy Infrastructure Trust Inc.(a) | | | 17,417 | |
| | 1,572 | | | CoreSite Realty Corp. | | | 122,647 | |
| | 4,499 | | | Corporate Office Properties Trust | | | 128,311 | |
| | 5,523 | | | Corrections Corp. of America | | | 87,981 | |
| | 9,921 | | | Cousins Properties Inc. | | | 109,329 | |
| | 8,438 | | | CubeSmart | | | 232,298 | |
| | 3,364 | | | CyrusOne Inc. | | | 171,026 | |
| | 7,370 | | | CYS Investments Inc. | | | 64,930 | |
| | 4,308 | | | DCT Industrial Trust Inc. | | | 209,843 | |
| | 14,381 | | | DDR Corp. | | | 271,945 | |
| | 9,516 | | | DiamondRock Hospitality Co. | | | 100,774 | |
| | 6,664 | | | Douglas Emmett Inc. | | | 250,300 | |
| | 16,442 | | | Duke Realty Corp. | | | 462,349 | |
| | 3,509 | | | DuPont Fabros Technology Inc. | | | 148,782 | |
| | 1,820 | | | Dynex Capital Inc. | | | 13,377 | |
| | 1,583 | | | Easterly Government Properties Inc. | | | 30,853 | |
| | 1,486 | | | EastGroup Properties Inc. | | | 109,043 | |
| | 3,472 | | | Education Realty Trust Inc. | | | 157,316 | |
| | 5,863 | | | Empire State Realty Trust Inc., Class A Shares | | | 125,879 | |
| | 3,011 | | | EPR Properties | | | 235,822 | |
| | 5,858 | | | Equity Commonwealth* | | | 183,297 | |
| | 3,602 | | | Equity LifeStyle Properties Inc. | | | 279,263 | |
See Notes to Financial Statements.
75
| | | | | | | | |
| Small-Mid Cap Equity Fund | |
| | |
| Shares/Units | | | Security | | Value | |
| FINANCIALS — 17.6% — (continued) | |
| Real Estate Investment Trusts (REITs) — 5.3% — (continued) | |
| | 4,364 | | | Equity One Inc. | | $ | 135,459 | |
| | 546 | | | Farmland Partners Inc.(a) | | | 6,361 | |
| | 6,418 | | | FelCor Lodging Trust Inc. | | | 45,632 | |
| | 5,526 | | | First Industrial Realty Trust Inc. | | | 158,983 | |
| | 2,736 | | | First Potomac Realty Trust | | | 27,552 | |
| | 10,856 | | | Forest City Realty Trust Inc., Class A Shares | | | 256,853 | |
| | 26,819 | | | Four Corners Property Trust Inc. | | | 555,421 | |
| | 4,969 | | | Franklin Street Properties Corp. | | | 62,411 | |
| | 8,887 | | | Gaming and Leisure Properties Inc. | | | 304,024 | |
| | 3,471 | | | GEO Group Inc. (The) | | | 69,559 | |
| | 1,327 | | | Getty Realty Corp. | | | 31,224 | |
| | 969 | | | Gladstone Commercial Corp. | | | 17,442 | |
| | 8,187 | | | Global Net Lease Inc. | | | 67,952 | |
| | 20,142 | | | Gramercy Property Trust | | | 194,975 | |
| | 816 | | | Great Ajax Corp. | | | 11,187 | |
| | 1,823 | | | Hannon Armstrong Sustainable Infrastructure Capital Inc. | | | 43,716 | |
| | 5,322 | | | Healthcare Realty Trust Inc. | | | 186,589 | |
| | 6,479 | | | Healthcare Trust of America Inc., Class A Shares | | | 218,601 | |
| | 1,973 | | | Hersha Hospitality Trust, Class A Shares | | | 38,552 | |
| | 4,565 | | | Highwoods Properties Inc. | | | 242,128 | |
| | 7,529 | | | Hospitality Properties Trust | | | 229,559 | |
| | 87,899 | | | Host Hotels & Resorts Inc. | | | 1,566,360 | |
| | 4,431 | | | Hudson Pacific Properties Inc. | | | 148,306 | |
| | 2,239 | | | Independence Realty Trust Inc. | | | 21,159 | |
| | 1,949 | | | InfraREIT Inc. | | | 36,836 | |
| | 5,521 | | | Invesco Mortgage Capital Inc. | | | 86,901 | |
| | 5,831 | | | Investors Real Estate Trust(a) | | | 38,718 | |
| | 12,268 | | | Iron Mountain Inc. | | | 471,214 | |
| | 3,469 | | | iStar Inc.* | | | 37,500 | |
| | 4,346 | | | Kilroy Realty Corp. | | | 315,650 | |
| | 3,975 | | | Kite Realty Group Trust | | | 114,798 | |
| | 1,818 | | | Ladder Capital Corp., Class A Shares | | | 24,143 | |
| | 3,914 | | | Lamar Advertising Co., Class A Shares | | | 243,960 | |
| | 5,072 | | | LaSalle Hotel Properties | | | 142,320 | |
| | 11,134 | | | Lexington Realty Trust | | | 120,136 | |
| | 6,976 | | | Liberty Property Trust | | | 287,620 | |
| | 2,166 | | | Life Storage Inc. | | | 194,940 | |
| | 1,797 | | | LTC Properties Inc. | | | 93,300 | |
| | 4,373 | | | Mack-Cali Realty Corp. | | | 121,394 | |
| | 11,236 | | | Medical Properties Trust Inc. | | | 171,574 | |
| | 17,717 | | | MFA Financial Inc. | | | 136,775 | |
| | 3,609 | | | Mid-America Apartment Communities Inc. | | | 339,210 | |
| | 3,284 | | | Monmouth Real Estate Investment Corp. | | | 45,976 | |
| | 8,139 | | | Monogram Residential Trust Inc. | | | 85,622 | |
| | 3,984 | | | National Health Investors Inc. | | | 319,836 | |
| | 6,821 | | | National Retail Properties Inc. | | | 341,732 | |
| | 25,282 | | | National Storage Affiliates Trust | | | 513,477 | |
| | 11,401 | | | New Residential Investment Corp. | | | 163,604 | |
| | 3,753 | | | New Senior Investment Group Inc. | | | 46,500 | |
| | 5,257 | | | New York Mortgage Trust Inc. | | | 31,752 | |
| | 7,954 | | | New York REIT Inc. | | | 76,836 | |
| | 867 | | | NexPoint Residential Trust Inc. | | | 18,129 | |
| | 2,858 | | | NorthStar Realty Europe Corp. | | | 29,266 | |
| | 8,597 | | | NorthStar Realty Finance Corp. | | | 114,684 | |
| | 8,728 | | | Omega Healthcare Investors Inc.(a) | | | 315,954 | |
See Notes to Financial Statements.
76
| | | | | | | | |
| Small-Mid Cap Equity Fund | |
| | |
| Shares/Units | | | Security | | Value | |
| FINANCIALS — 17.6% — (continued) | |
| Real Estate Investment Trusts (REITs) — 5.3% — (continued) | |
| | 772 | | | One Liberty Properties Inc. | | $ | 18,721 | |
| | 885 | | | Orchid Island Capital Inc., Class A Shares | | | 9,284 | |
| | 6,557 | | | Outfront Media Inc. | | | 146,352 | |
| | 673 | | | Owens Realty Mortgage Inc. | | | 11,441 | |
| | 8,668 | | | Paramount Group Inc. | | | 156,024 | |
| | 4,036 | | | Parkway Properties Inc. | | | 72,648 | |
| | 3,414 | | | Pebblebrook Hotel Trust | | | 102,557 | |
| | 3,283 | | | Pennsylvania Real Estate Investment Trust | | | 82,370 | |
| | 3,304 | | | PennyMac Mortgage Investment Trust | | | 50,353 | |
| | 6,458 | | | Physicians Realty Trust | | | 138,266 | |
| | 6,692 | | | Piedmont Office Realty Trust Inc., Class A Shares | | | 144,614 | |
| | 2,455 | | | Post Properties Inc. | | | 162,717 | |
| | 1,949 | | | Potlatch Corp. | | | 73,809 | |
| | 1,225 | | | Preferred Apartment Communities Inc., Class A Shares | | | 16,954 | |
| | 915 | | | PS Business Parks Inc. | | | 101,364 | |
| | 2,270 | | | QTS Realty Trust Inc., Class A Shares | | | 123,011 | |
| | 2,891 | | | RAIT Financial Trust | | | 9,078 | |
| | 3,835 | | | Ramco-Gershenson Properties Trust | | | 74,514 | |
| | 5,870 | | | Rayonier Inc. | | | 161,601 | |
| | 3,635 | | | Redwood Trust Inc. | | | 53,798 | |
| | 4,863 | | | Regency Centers Corp. | | | 391,666 | |
| | 1,455 | | | Resource Capital Corp. | | | 19,308 | |
| | 5,072 | | | Retail Opportunity Investments Corp. | | | 113,156 | |
| | 11,338 | | | Retail Properties of America Inc., Class A Shares | | | 192,746 | |
| | 3,167 | | | Rexford Industrial Realty Inc. | | | 70,719 | |
| | 5,792 | | | RLJ Lodging Trust | | | 135,185 | |
| | 2,059 | | | Ryman Hospitality Properties Inc. | | | 111,104 | |
| | 3,116 | | | Sabra Health Care REIT Inc. | | | 79,396 | |
| | 490 | | | Saul Centers Inc. | | | 32,477 | |
| | 3,074 | | | Select Income REIT | | | 83,889 | |
| | 11,207 | | | Senior Housing Properties Trust | | | 250,364 | |
| | 1,174 | | | Seritage Growth Properties, Class A Shares(a) | | | 52,243 | |
| | 1,563 | | | Silver Bay Realty Trust Corp. | | | 29,744 | |
| | 22,962 | | | Spirit Realty Capital Inc. | | | 304,246 | |
| | 3,304 | | | STAG Industrial Inc. | | | 82,038 | |
| | 10,912 | | | Starwood Property Trust Inc. | | | 249,885 | |
| | 7,201 | | | STORE Capital Corp. | | | 213,366 | |
| | 4,212 | | | Summit Hotel Properties Inc. | | | 60,232 | |
| | 2,991 | | | Sun Communities Inc. | | | 228,871 | |
| | 10,272 | | | Sunstone Hotel Investors Inc. | | | 142,678 | |
| | 4,439 | | | Tanger Factory Outlet Centers Inc. | | | 180,401 | |
| | 2,780 | | | Taubman Centers Inc. | | | 215,923 | |
| | 2,150 | | | Terreno Realty Corp. | | | 57,534 | |
| | 2,348 | | | Tier REIT Inc. | | | 37,615 | |
| | 16,605 | | | Two Harbors Investment Corp. | | | 147,784 | |
| | 1,398 | | | UMH Properties Inc. | | | 16,552 | |
| | 70 | | | Universal Health Realty Income Trust | | | 4,311 | |
| | 4,261 | | | Urban Edge Properties | | | 122,120 | |
| | 1,048 | | | Urstadt Biddle Properties Inc., Class A Shares | | | 23,800 | |
| | 8,831 | | | Washington Prime Group Inc.* | | | 121,338 | |
| | 3,453 | | | Washington Real Estate Investment Trust | | | 112,222 | |
| | 5,539 | | | Weingarten Realty Investors | | | 228,484 | |
| | 2,078 | | | Western Asset Mortgage Capital Corp.(a) | | | 21,985 | |
| | 1,279 | | | Whitestone REIT, Class B Shares | | | 18,533 | |
See Notes to Financial Statements.
77
| | | | | | | | |
| Small-Mid Cap Equity Fund | |
| | |
| Shares/Units | | | Security | | Value | |
| FINANCIALS — 17.6% — (continued) | |
| Real Estate Investment Trusts (REITs) — 5.3% — (continued) | |
| | 4,893 | | | WP Carey Inc. | | $ | 326,118 | |
| | 5,016 | | | Xenia Hotels & Resorts Inc. | | | 84,469 | |
| | | | | | | | |
| | | | Total Real Estate Investment Trusts (REITs) | | | 25,543,867 | |
| | | | | | | | |
| Real Estate Management & Development — 0.8% | |
| | 2,245 | | | Alexander & Baldwin Inc. | | | 90,092 | |
| | 569 | | | Altisource Portfolio Solutions SA* | | | 18,538 | |
| | 554 | | | AV Homes Inc.* | | | 8,404 | |
| | 88,375 | | | CBRE Group Inc., Class A Shares* | | | 2,641,529 | |
| | 170 | | | Consolidated-Tomoka Land Co. | | | 8,964 | |
| | 1,717 | | | Forestar Group Inc.*(a) | | | 21,548 | |
| | 249 | | | FRP Holdings Inc.* | | | 8,381 | |
| | 1,752 | | | HFF Inc., Class A Shares | | | 46,971 | |
| | 1,740 | | | Howard Hughes Corp. (The)* | | | 205,703 | |
| | 2,143 | | | Jones Lang LaSalle Inc. | | | 250,195 | |
| | 3,899 | | | Kennedy-Wilson Holdings Inc. | | | 86,012 | |
| | 781 | | | Marcus & Millichap Inc.* | | | 20,345 | |
| | 826 | | | RE/MAX Holdings Inc., Class A Shares | | | 34,395 | |
| | 6,933 | | | Realogy Holdings Corp. | | | 186,082 | |
| | 376 | | | RMR Group Inc. (The), Class A Shares | | | 14,495 | |
| | 206 | | | Stratus Properties Inc.* | | | 3,912 | |
| | 661 | | | Tejon Ranch Co.* | | | 15,692 | |
| | 1,059 | | | Trinity Place Holdings Inc.*(a) | | | 9,001 | |
| | | | | | | | |
| | | | Total Real Estate Management & Development | | | 3,670,259 | |
| | | | | | | | |
| Thrifts & Mortgage Finance — 0.6% | |
| | 4,280 | | | Astoria Financial Corp. | | | 65,484 | |
| | 1,678 | | | Bank Mutual Corp. | | | 13,088 | |
| | 626 | | | BankFinancial Corp. | | | 7,725 | |
| | 726 | | | Bear State Financial Inc. | | | 6,795 | |
| | 3,395 | | | Beneficial Bancorp Inc. | | | 51,197 | |
| | 2,793 | | | BofI Holding Inc.*(a) | | | 60,049 | |
| | 295 | | | BSB Bancorp Inc.* | | | 7,139 | |
| | 5,950 | | | Capitol Federal Financial Inc. | | | 85,561 | |
| | 534 | | | Charter Financial Corp. | | | 7,022 | |
| | 981 | | | Clifton Bancorp Inc. | | | 14,568 | |
| | 1,633 | | | Dime Community Bancshares Inc. | | | 28,839 | |
| | 526 | | | ESSA Bancorp Inc.* | | | 7,232 | |
| | 41,428 | | | Essent Group Ltd.* | | | 1,101,156 | |
| | 4,903 | | | EverBank Financial Corp. | | | 94,089 | |
| | 422 | | | Federal Agricultural Mortgage Corp., Class C Shares | | | 17,293 | |
| | 387 | | | First Defiance Financial Corp. | | | 17,605 | |
| | 1,072 | | | Flagstar Bancorp Inc.* | | | 30,102 | |
| | 181 | | | Greene County Bancorp Inc. | | | 2,995 | |
| | 52 | | | Hingham Institution for Savings | | | 6,756 | |
| | 377 | | | Home Bancorp Inc. | | | 10,873 | |
| | 1,187 | | | HomeStreet Inc.* | | | 30,933 | |
| | 439 | | | Impac Mortgage Holdings Inc.*(a) | | | 7,314 | |
| | 4,620 | | | Kearny Financial Corp. | | | 63,248 | |
| | 393 | | | Lake Sunapee Bank Group(a) | | | 7,043 | |
| | 310 | | | LendingTree Inc.* | | | 30,070 | |
| | 2,487 | | | Meridian Bancorp Inc. | | | 38,847 | |
| | 385 | | | Meta Financial Group Inc. | | | 23,697 | |
| | 16,444 | | | MGIC Investment Corp.* | | | 133,032 | |
| | 1,450 | | | Nationstar Mortgage Holdings Inc.*(a) | | | 23,026 | |
See Notes to Financial Statements.
78
| | | | | | | | |
| Small-Mid Cap Equity Fund | |
| | |
| Shares/Units | | | Security | | Value | |
| FINANCIALS — 17.6% — (continued) | |
| Thrifts & Mortgage Finance — 0.6% — (continued) | |
| | 2,521 | | | NMI Holdings Inc., Class A Shares* | | $ | 20,017 | |
| | 1,837 | | | Northfield Bancorp Inc. | | | 29,190 | |
| | 4,665 | | | Northwest Bancshares Inc. | | | 72,401 | |
| | 979 | | | OceanFirst Financial Corp. | | | 19,404 | |
| | 5,003 | | | Ocwen Financial Corp.* | | | 17,811 | |
| | 1,810 | | | Oritani Financial Corp. | | | 29,087 | |
| | 2,417 | | | PHH Corp.* | | | 36,980 | |
| | 186 | | | Provident Bancorp Inc.* | | | 2,937 | |
| | 415 | | | Provident Financial Holdings Inc. | | | 7,926 | |
| | 2,852 | | | Provident Financial Services Inc. | | | 61,518 | |
| | 10,331 | | | Radian Group Inc. | | | 141,638 | |
| | 855 | | | SI Financial Group Inc. | | | 11,517 | |
| | 211 | | | Southern Missouri Bancorp Inc | | | 5,174 | |
| | 291 | | | Territorial Bancorp Inc. | | | 8,311 | |
| | 2,822 | | | TFS Financial Corp. | | | 51,191 | |
| | 4,553 | | | TrustCo Bank Corp. NY | | | 32,508 | |
| | 2,449 | | | United Community Financial Corp. | | | 15,943 | |
| | 2,613 | | | United Financial Bancorp Inc. | | | 36,556 | |
| | 1,265 | | | Walker & Dunlop Inc.* | | | 33,522 | |
| | 1,407 | | | Walter Investment Management Corp.*(a) | | | 5,318 | |
| | 4,267 | | | Washington Federal Inc. | | | 113,075 | |
| | 1,097 | | | Waterstone Financial Inc. | | | 18,539 | |
| | 847 | | | Westfield Financial Inc.* | | | 6,412 | |
| | 1,339 | | | WSFS Financial Corp. | | | 52,087 | |
| | | | | | | | |
| | | | Total Thrifts & Mortgage Finance | | | 2,821,840 | |
| | | | | | | | |
| | | | TOTAL FINANCIALS | | | 83,897,041 | |
| | | | | | | | |
| HEALTH CARE — 13.4% | |
| Biotechnology — 2.8% | |
| | 4,558 | | | ACADIA Pharmaceuticals Inc.*(a) | | | 146,449 | |
| | 20,876 | | | Acceleron Pharma Inc.* | | | 626,489 | |
| | 5,426 | | | Achillion Pharmaceuticals Inc.* | | | 44,819 | |
| | 26,997 | | | Acorda Therapeutics Inc.* | | | 650,088 | |
| | 907 | | | Adamas Pharmaceuticals Inc.* | | | 12,399 | |
| | 1,587 | | | Aduro Biotech Inc.*(a) | | | 22,361 | |
| | 1,745 | | | Advaxis Inc.*(a) | | | 20,120 | |
| | 1,281 | | | Adverum Biotechnologies Inc.* | | | 4,586 | |
| | 3,576 | | | Agenus Inc.* | | | 22,135 | |
| | 1,329 | | | Agios Pharmaceuticals Inc.*(a) | | | 48,960 | |
| | 1,275 | | | Aimmune Therapeutics Inc.* | | | 18,832 | |
| | 1,800 | | | Akebia Therapeutics Inc.* | | | 14,634 | |
| | 15,383 | | | Alder Biopharmaceuticals Inc.*(a) | | | 507,178 | |
| | 26,536 | | | Alkermes PLC* | | | 1,161,481 | |
| | 3,562 | | | Alnylam Pharmaceuticals Inc.* | | | 248,806 | |
| | 1,744 | | | AMAG Pharmaceuticals Inc.* | | | 41,560 | |
| | 6,810 | | | Amicus Therapeutics Inc.* | | | 45,559 | |
| | 1,344 | | | Anavex Life Sciences Corp.* | | | 4,113 | |
| | 1,733 | | | Anthera Pharmaceuticals Inc.* | | | 4,991 | |
| | 694 | | | Applied Genetic Technologies Corp.* | | | 8,869 | |
| | 808 | | | Aptevo Therapeutics Inc.* | | | 2,198 | |
| | 1,549 | | | Ardelyx Inc.*(a) | | | 15,444 | |
| | 12,389 | | | Arena Pharmaceuticals Inc.* | | | 19,203 | |
| | 533 | | | Argos Therapeutics Inc.*(a) | | | 2,638 | |
| | 108,042 | | | ARIAD Pharmaceuticals Inc.* | | | 1,117,154 | |
See Notes to Financial Statements.
79
| | | | | | | | |
| Small-Mid Cap Equity Fund | |
| | |
| Shares/Units | | | Security | | Value | |
| HEALTH CARE — 13.4% — (continued) | |
| Biotechnology — 2.8% — (continued) | |
| | 6,695 | | | Array Biopharma Inc.* | | $ | 22,964 | |
| | 2,987 | | | Arrowhead Pharmaceuticals Inc.* | | | 20,700 | |
| | 1,258 | | | Asterias Biotherapeutics Inc.* | | | 3,510 | |
| | 1,035 | | | Atara Biotherapeutics Inc.*(a) | | | 20,224 | |
| | 2,968 | | | Athersys Inc.* | | | 5,669 | |
| | 179 | | | Avexis Inc.*(a) | | | 6,326 | |
| | 1,222 | | | Axovant Sciences Ltd.* | | | 20,053 | |
| | 1,044 | | | Bellicum Pharmaceuticals Inc.*(a) | | | 17,978 | |
| | 3,646 | | | BioCryst Pharmaceuticals Inc.* | | | 14,985 | |
| | 7,684 | | | BioMarin Pharmaceutical Inc.* | | | 721,451 | |
| | 297 | | | BioSpecifics Technologies Corp.* | | | 10,867 | |
| | 3,583 | | | BioTime Inc.*(a) | | | 10,534 | |
| | 1,760 | | | Bluebird Bio Inc.* | | | 86,838 | |
| | 961 | | | Blueprint Medicines Corp.*(a) | | | 26,793 | |
| | 971 | | | Cara Therapeutics Inc.* | | | 5,263 | |
| | 4,142 | | | Celldex Therapeutics Inc.*(a) | | | 13,751 | |
| | 623 | | | Cellular Biomedicine Group Inc.* | | | 8,703 | |
| | 3,464 | | | Cepheid* | | | 118,884 | |
| | 1,063 | | | ChemoCentryx Inc.*(a) | | | 5,315 | |
| | 1,919 | | | Chimerix Inc.* | | | 9,230 | |
| | 364 | | | Cidara Therapeutics Inc.*(a) | | | 4,211 | |
| | 1,533 | | | Clovis Oncology Inc.*(a) | | | 37,972 | |
| | 1,369 | | | Coherus Biosciences Inc.*(a) | | | 40,755 | |
| | 913 | | | Concert Pharmaceuticals Inc.* | | | 8,874 | |
| | 238 | | | Corvus Pharmaceuticals Inc.* | | | 3,249 | |
| | 4,288 | | | Curis Inc.*(a) | | | 7,547 | |
| | 1,672 | | | Cytokinetics Inc.*(a) | | | 20,181 | |
| | 1,025 | | | CytomX Therapeutics Inc.* | | | 12,023 | |
| | 2,487 | | | CytRx Corp.*(a) | | | 1,397 | |
| | 504 | | | Dimension Therapeutics Inc.*(a) | | | 2,994 | |
| | 1,782 | | | Dynavax Technologies Corp.*(a) | | | 27,906 | |
| | 443 | | | Eagle Pharmaceuticals Inc.*(a) | | | 26,469 | |
| | 594 | | | Edge Therapeutics Inc.* | | | 5,281 | |
| | 260 | | | Editas Medicine Inc.* | | | 4,373 | |
| | 150 | | | Eiger BioPharmaceuticals Inc.* | | | 2,238 | |
| | 1,495 | | | Emergent BioSolutions Inc.* | | | 39,842 | |
| | 765 | | | Enanta Pharmaceuticals Inc.* | | | 16,822 | |
| | 1,788 | | | Epizyme Inc.*(a) | | | 13,070 | |
| | 506 | | | Esperion Therapeutics Inc.*(a) | | | 5,450 | |
| | 5,008 | | | Exact Sciences Corp.*(a) | | | 92,498 | |
| | 10,783 | | | Exelixis Inc.* | | | 120,230 | |
| | 2,445 | �� | | FibroGen Inc.* | | | 42,323 | |
| | 1,255 | | | Five Prime Therapeutics Inc.* | | | 55,195 | |
| | 1,075 | | | Flexion Therapeutics Inc.* | | | 17,931 | |
| | 1,120 | | | Fortress Biotech Inc.* | | | 3,058 | |
| | 597 | | | Foundation Medicine Inc.* | | | 12,250 | |
| | 6,703 | | | Galena Biopharma Inc.* | | | 2,710 | |
| | 881 | | | Genomic Health Inc.* | | | 23,320 | |
| | 7,242 | | | Geron Corp.*(a) | | | 19,481 | |
| | 811 | | | Global Blood Therapeutics Inc.* | | | 13,779 | |
| | 467 | | | GlycoMimetics Inc.* | | | 3,460 | |
| | 5,125 | | | Halozyme Therapeutics Inc.*(a) | | | 50,225 | |
| | 1,533 | | | Heron Therapeutics Inc.*(a) | | | 28,514 | |
| | 3,326 | | | Idera Pharmaceuticals Inc.*(a) | | | 6,353 | |
| | 1,538 | | | Ignyta Inc.* | | | 8,474 | |
See Notes to Financial Statements.
80
| | | | | | | | |
| Small-Mid Cap Equity Fund | |
| | |
| Shares/Units | | | Security | | Value | |
| HEALTH CARE — 13.4% — (continued) | |
| Biotechnology — 2.8% — (continued) | |
| | 513 | | | Immune Design Corp.* | | $ | 3,617 | |
| | 4,218 | | | ImmunoGen Inc.*(a) | | | 11,853 | |
| | 3,644 | | | Immunomedics Inc.*(a) | | | 10,094 | |
| | 12,123 | | | Incyte Corp.* | | | 983,175 | |
| | 1,944 | | | Infinity Pharmaceuticals Inc.* | | | 2,955 | |
| | 685 | | | Inotek Pharmaceuticals Corp.*(a) | | | 4,863 | |
| | 3,283 | | | Inovio Pharmaceuticals Inc.*(a) | | | 30,105 | |
| | 2,889 | | | Insmed Inc.* | | | 37,413 | |
| | 1,137 | | | Insys Therapeutics Inc.*(a) | | | 16,225 | |
| | 401 | | | Intellia Therapeutics Inc.*(a) | | | 7,799 | |
| | 783 | | | Intercept Pharmaceuticals Inc.*(a) | | | 116,127 | |
| | 2,608 | | | Intrexon Corp.* | | | 65,826 | |
| | 1,162 | | | Invitae Corp.* | | | 9,122 | |
| | 5,741 | | | Ionis Pharmaceuticals Inc.*(a) | | | 170,221 | |
| | 6,158 | | | Ironwood Pharmaceuticals Inc., Class A Shares* | | | 82,148 | |
| | 3,007 | | | Juno Therapeutics Inc.*(a) | | | 88,947 | |
| | 909 | | | Karyopharm Therapeutics Inc.* | | | 9,045 | |
| | 3,746 | | | Keryx Biopharmaceuticals Inc.* | | | 15,359 | |
| | 1,874 | | | Kite Pharma Inc.*(a) | | | 107,980 | |
| | 732 | | | La Jolla Pharmaceutical Co.* | | | 11,968 | |
| | 1,922 | | | Lexicon Pharmaceuticals Inc.*(a) | | | 26,677 | |
| | 899 | | | Ligand Pharmaceuticals Inc.* | | | 92,876 | |
| | 2,516 | | | Lion Biotechnologies Inc.*(a) | | | 20,027 | |
| | 652 | | | Loxo Oncology Inc.* | | | 17,956 | |
| | 1,484 | | | MacroGenics Inc.* | | | 44,238 | |
| | 12,990 | | | MannKind Corp.* | | | 10,405 | |
| | 1,487 | | | Medgenics Inc.*(a) | | | 8,327 | |
| | 1,120 | | | MediciNova Inc.* | | | 6,597 | |
| | 131,962 | | | Merrimack Pharmaceuticals Inc.*(a) | | | 609,664 | |
| | 4,751 | | | MiMedx Group Inc.*(a) | | | 34,397 | |
| | 941 | | | Minerva Neurosciences Inc.* | | | 11,499 | |
| | 394 | | | Mirati Therapeutics Inc.* | | | 1,990 | |
| | 3,029 | | | Momenta Pharmaceuticals Inc.* | | | 36,409 | |
| | 14,860 | | | Myriad Genetics Inc.* | | | 302,550 | |
| | 580 | | | NantKwest Inc.* | | | 4,692 | |
| | 1,178 | | | Natera Inc.*(a) | | | 11,721 | |
| | 26,688 | | | Neurocrine Biosciences Inc.* | | | 1,293,300 | �� |
| | 863 | | | NewLink Genetics Corp.*(a) | | | 8,785 | |
| | 12,789 | | | Novavax Inc.*(a) | | | 87,477 | |
| | 1,075 | | | OncoMed Pharmaceuticals Inc.* | | | 10,739 | |
| | 1,447 | | | Ophthotech Corp.* | | | 76,416 | |
| | 15,437 | | | OPKO Health Inc.*(a) | | | 140,477 | |
| | 3,615 | | | Organovo Holdings Inc.*(a) | | | 13,954 | |
| | 1,123 | | | Osiris Therapeutics Inc.* | | | 5,626 | |
| | 1,185 | | | Otonomy Inc.* | | | 19,493 | |
| | 1,596 | | | OvaScience Inc.*(a) | | | 9,720 | |
| | 8,620 | | | PDL BioPharma Inc. | | | 25,084 | |
| | 879 | | | Pfenex Inc.* | | | 6,355 | |
| | 3,427 | | | PharmAthene Inc.*(a) | | | 8,910 | |
| | 2,295 | | | Portola Pharmaceuticals Inc., Class A Shares* | | | 46,726 | |
| | 3,378 | | | Progenics Pharmaceuticals Inc.* | | | 21,214 | |
| | 234 | | | Proteostasis Therapeutics Inc.*(a) | | | 3,349 | |
| | 9,682 | | | Prothena Corp. PLC*(a) | | | 483,906 | |
| | 1,751 | | | PTC Therapeutics Inc.* | | | 14,376 | |
| | 1,174 | | | Puma Biotechnology Inc.*(a) | | | 69,442 | |
See Notes to Financial Statements.
81
| | | | | | | | |
| Small-Mid Cap Equity Fund | |
| | |
| Shares/Units | | | Security | | Value | |
| HEALTH CARE — 13.4% — (continued) | |
| Biotechnology — 2.8% — (continued) | |
| | 1,503 | | | Radius Health Inc.*(a) | | $ | 82,425 | |
| | 4,015 | | | Raptor Pharmaceutical Corp.* | | | 29,912 | |
| | 1,017 | | | REGENXBIO Inc.*(a) | | | 11,909 | |
| | 1,594 | | | Regulus Therapeutics Inc.*(a) | | | 5,053 | |
| | 1,588 | | | Repligen Corp.* | | | 49,212 | |
| | 1,636 | | | Retrophin Inc.* | | | 26,209 | |
| | 4,759 | | | Rigel Pharmaceuticals Inc.* | | | 16,038 | |
| | 1,235 | | | Sage Therapeutics Inc.*(a) | | | 45,905 | |
| | 2,879 | | | Sangamo BioSciences Inc.* | | | 12,351 | |
| | 1,980 | | | Sarepta Therapeutics Inc.*(a) | | | 51,619 | |
| | 4,586 | | | Seattle Genetics Inc.* | | | 204,306 | |
| | 934 | | | Seres Therapeutics Inc.*(a) | | | 9,779 | |
| | 1,185 | | | Sorrento Therapeutics Inc.*(a) | | | 7,892 | |
| | 914 | | | Spark Therapeutics Inc.* | | | 51,714 | |
| | 3,808 | | | Spectrum Pharmaceuticals Inc.* | | | 20,220 | |
| | 629 | | | Stemline Therapeutics Inc.* | | | 5,145 | |
| | 256 | | | Syndax Pharmaceuticals Inc.* | | | 3,630 | |
| | 8,528 | | | Synergy Pharmaceuticals Inc.*(a) | | | 40,337 | |
| | 2,963 | | | Synthetic Biologics Inc.*(a) | | | 4,859 | |
| | 464 | | | T2 Biosystems Inc.*(a) | | | 3,081 | |
| | 1,269 | | | TESARO Inc.*(a) | | | 107,472 | |
| | 1,887 | | | TG Therapeutics Inc.*(a) | | | 11,982 | |
| | 277 | | | Tobira Therapeutics Inc.* | | | 1,360 | |
| | 140 | | | Tokai Pharmaceuticals Inc.* | | | 154 | |
| | 2,233 | | | Trevena Inc.* | | | 15,140 | |
| | 1,224 | | | Trovagene Inc.*(a) | | | 6,010 | |
| | 1,712 | | | Ultragenyx Pharmaceutical Inc.* | | | 112,855 | |
| | 2,099 | | | United Therapeutics Corp.* | | | 256,666 | |
| | 1,796 | | | Vanda Pharmaceuticals Inc.* | | | 27,622 | |
| | 1,405 | | | Versartis Inc.* | | | 17,422 | |
| | 1,011 | | | Vitae Pharmaceuticals Inc.* | | | 6,986 | |
| | 817 | | | Vital Therapies Inc.* | | | 4,681 | |
| | 401 | | | Voyager Therapeutics Inc.* | | | 4,880 | |
| | 134 | | | vTv Therapeutics Inc., Class A Shares* | | | 757 | |
| | 905 | | | XBiotech Inc.* | | | 11,747 | |
| | 1,473 | | | Xencor Inc.* | | | 31,124 | |
| | 926 | | | Zafgen Inc.* | | | 2,769 | |
| | 5,493 | | | ZIOPHARM Oncology Inc.*(a) | | | 27,849 | |
| | | | | | | | |
| | | | Total Biotechnology | | | 13,440,847 | |
| | | | | | | | |
| Health Care Equipment & Supplies — 4.7% | |
| | 1,018 | | | Abaxis Inc. | | | 51,043 | |
| | 1,890 | | | ABIOMED Inc.* | | | 222,907 | |
| | 91,899 | | | Accuray Inc.*(a) | | | 489,822 | |
| | 4,111 | | | Alere Inc.* | | | 160,863 | |
| | 10,393 | | | Align Technology Inc.* | | | 965,510 | |
| | 4,986 | | | Analogic Corp. | | | 443,754 | |
| | 1,254 | | | AngioDynamics Inc.* | | | 20,741 | |
| | 647 | | | Anika Therapeutics Inc.* | | | 30,564 | |
| | 1,450 | | | AtriCure Inc.* | | | 22,316 | |
| | 68 | | | Atrion Corp. | | | 30,730 | |
| | 379 | | | Avinger Inc.* | | | 1,546 | |
| | 931 | | | AxoGen Inc.* | | | 8,388 | |
| | 16,404 | | | Becton Dickinson and Co. | | | 2,906,953 | |
| | 1,693 | | | Cantel Medical Corp. | | | 128,008 | |
See Notes to Financial Statements.
82
| | | | | | | | |
| Small-Mid Cap Equity Fund | |
| | |
| Shares/Units | | | Security | | Value | |
| HEALTH CARE — 13.4% — (continued) | |
| Health Care Equipment & Supplies — 4.7% — (continued) | |
| | 1,470 | | | Cardiovascular Systems Inc.* | | $ | 35,971 | |
| | 4,771 | | | Cerus Corp.* | | | 30,200 | |
| | 1,766 | | | ConforMIS Inc.*(a) | | | 14,163 | |
| | 1,274 | | | CONMED Corp. | | | 51,979 | |
| | 9,737 | | | Cooper Cos., Inc. (The) | | | 1,810,303 | |
| | 2,051 | | | Corindus Vascular Robotics Inc.*(a) | | | 2,400 | |
| | 5,699 | | | CR Bard Inc. | | | 1,258,567 | |
| | 1,496 | | | CryoLife Inc. | | | 23,861 | |
| | 536 | | | Cutera Inc.* | | | 5,842 | |
| | 1,103 | | | Cynosure Inc., Class A Shares* | | | 57,455 | |
| | 8,185 | | | DexCom Inc.* | | | 745,572 | |
| | 6,576 | | | Edwards Lifesciences Corp.* | | | 757,292 | |
| | 3,729 | | | Endologix Inc.*(a) | | | 45,345 | |
| | 408 | | | Entellus Medical Inc.* | | | 7,707 | |
| | 504 | | | Exactech Inc.* | | | 14,006 | |
| | 1,742 | | | GenMark Diagnostics Inc.* | | | 14,842 | |
| | 843 | | | Glaukos Corp.* | | | 25,155 | |
| | 3,289 | | | Globus Medical Inc., Class A Shares* | | | 76,404 | |
| | 52,130 | | | Haemonetics Corp.* | | | 1,937,151 | |
| | 2,223 | | | Halyard Health Inc.* | | | 81,028 | |
| | 3,108 | | | Hill-Rom Holdings Inc. | | | 184,336 | |
| | 13,275 | | | Hologic Inc.* | | | 510,026 | |
| | 694 | | | ICU Medical Inc.* | | | 86,590 | |
| | 4,212 | | | IDEXX Laboratories Inc.* | | | 474,608 | |
| | 758 | | | Inogen Inc.* | | | 43,979 | |
| | 2,746 | | | Insulet Corp.* | | | 116,238 | |
| | 1,392 | | | Integer Holdings Corp.* | | | 33,686 | |
| | 18,132 | | | Integra LifeSciences Holdings Corp.* | | | 1,566,967 | |
| | 1,480 | | | Invacare Corp. | | | 17,568 | |
| | 1,623 | | | InVivo Therapeutics Holdings Corp.* | | | 11,426 | |
| | 191 | | | iRadimed Corp.* | | | 3,566 | |
| | 267 | | | IRIDEX Corp.* | | | 3,986 | |
| | 1,307 | | | K2M Group Holdings Inc.* | | | 20,807 | |
| | 690 | | | LeMaitre Vascular Inc. | | | 12,682 | |
| | 26,016 | | | Masimo Corp.* | | | 1,538,586 | |
| | 1,954 | | | Meridian Bioscience Inc. | | | 38,005 | |
| | 2,012 | | | Merit Medical Systems Inc.* | | | 48,771 | |
| | 1,513 | | | Natus Medical Inc.* | | | 58,871 | |
| | 1,739 | | | Neogen Corp.* | | | 102,705 | |
| | 1,137 | | | Nevro Corp.* | | | 107,367 | |
| | 2,542 | | | Novocure Ltd.*(a) | | | 19,523 | |
| | 2,353 | | | NuVasive Inc.* | | | 154,051 | |
| | 2,989 | | | NxStage Medical Inc.* | | | 68,329 | |
| | 2,654 | | | OraSure Technologies Inc.* | | | 22,745 | |
| | 881 | | | Orthofix International NV* | | | 39,742 | |
| | 1,124 | | | Oxford Immunotec Global PLC* | | | 11,645 | |
| | 1,205 | | | Penumbra Inc.* | | | 85,025 | |
| | 1,276 | | | Quidel Corp.* | | | 27,779 | |
| | 6,601 | | | ResMed Inc. | | | 440,221 | |
| | 2,194 | | | Rockwell Medical Inc.* | | | 15,928 | |
| | 2,217 | | | RTI Surgical Inc.* | | | 7,117 | |
| | 192 | | | Second Sight Medical Products Inc.* | | | 643 | |
| | 755 | | | Senseonics Holdings Inc.*(a) | | | 3,020 | |
| | 2,004 | | | Spectranetics Corp. (The)* | | | 49,318 | |
| | 1,988 | | | STAAR Surgical Co.* | | | 17,455 | |
See Notes to Financial Statements.
83
| | | | | | | | |
| Small-Mid Cap Equity Fund | |
| | |
| Shares/Units | | | Security | | Value | |
| HEALTH CARE — 13.4% — (continued) | |
| Health Care Equipment & Supplies — 4.7% — (continued) | |
| | 14,066 | | | STERIS PLC | | $ | 994,185 | |
| | 635 | | | Surmodics Inc.* | | | 18,078 | |
| | 732 | | | Tandem Diabetes Care Inc.* | | | 5,219 | |
| | 5,529 | | | Teleflex Inc. | | | 1,012,305 | |
| | 4,101 | | | TransEnterix Inc.* | | | 5,618 | |
| | 1 | | | Unilife Corp.* | | | 3 | |
| | 192 | | | Utah Medical Products Inc. | | | 12,098 | |
| | 783 | | | Vascular Solutions Inc.* | | | 37,717 | |
| | 800 | | | Veracyte Inc.* | | | 4,504 | |
| | 3,424 | | | West Pharmaceutical Services Inc. | | | 280,186 | |
| | 57,836 | | | Wright Medical Group NV* | | | 1,432,019 | |
| | 1,670 | | | Zeltiq Aesthetics Inc.*(a) | | | 63,660 | |
| | | | | | | | |
| | | | Total Health Care Equipment & Supplies | | | 22,287,291 | |
| | | | | | | | |
| Health Care Providers & Services — 2.1% | |
| | 454 | | | AAC Holdings Inc.*(a) | | | 8,880 | |
| | 3,492 | | | Acadia Healthcare Co., Inc.* | | | 178,755 | |
| | 1,435 | | | Aceto Corp. | | | 28,973 | |
| | 331 | | | Addus HomeCare Corp.* | | | 7,937 | |
| | 693 | | | Adeptus Health Inc., Class A Shares*(a) | | | 29,494 | |
| | 1,664 | | | Air Methods Corp.* | | | 58,539 | |
| | 463 | | | Almost Family Inc.* | | | 17,052 | |
| | 1,316 | | | Amedisys Inc.* | | | 63,339 | |
| | 409 | | | American Renal Associates Holdings Inc.*(a) | | | 8,683 | |
| | 2,287 | | | AMN Healthcare Services Inc.* | | | 82,858 | |
| | 32,104 | | | Amsurg Corp.* | | | 2,084,192 | |
| | 3,048 | | | BioScrip Inc.* | | | 7,864 | |
| | 1,312 | | | BioTelemetry Inc.* | | | 24,233 | |
| | 8,846 | | | Brookdale Senior Living Inc.* | | | 152,240 | |
| | 1,464 | | | Capital Senior Living Corp.* | | | 25,166 | |
| | 762 | | | Chemed Corp. | | | 102,817 | |
| | 820 | | | Civitas Solutions Inc.* | | | 14,908 | |
| | 5,461 | | | Community Health Systems Inc.*(a) | | | 58,323 | |
| | 497 | | | CorVel Corp.* | | | 19,105 | |
| | 1,622 | | | Cross Country Healthcare Inc.* | | | 19,740 | |
| | 2,128 | | | Diplomat Pharmacy Inc.* | | | 66,585 | |
| | 2,402 | | | Ensign Group Inc. (The) | | | 45,134 | |
| | 8,895 | | | Envision Healthcare Holdings Inc.* | | | 190,887 | |
| | 2,272 | | | Genesis Healthcare Inc., Class A Shares* | | | 5,476 | |
| | 2,039 | | | HealthEquity Inc.* | | | 66,390 | |
| | 4,208 | | | HealthSouth Corp. | | | 171,308 | |
| | 54,746 | | | Healthways Inc.* | | | 1,369,197 | |
| | 3,933 | | | Kindred Healthcare Inc. | | | 43,420 | |
| | 9,859 | | | Laboratory Corp. of America Holdings* | | | 1,349,993 | |
| | 478 | | | Landauer Inc. | | | 22,715 | |
| | 777 | | | LHC Group Inc.* | | | 27,630 | |
| | 1,936 | | | LifePoint Health Inc.* | | | 109,578 | |
| | 4,362 | | | MEDNAX Inc.* | | | 286,889 | |
| | 5,858 | | | Molina Healthcare Inc.* | | | 315,219 | |
| | 594 | | | National HealthCare Corp. | | | 38,598 | |
| | 412 | | | National Research Corp., Class A Shares | | | 6,522 | |
| | 2,889 | | | Nobilis Health Corp.*(a) | | | 10,111 | |
| | 2,939 | | | Owens & Minor Inc. | | | 101,013 | |
| | 3,961 | | | Patterson Cos., Inc. | | | 182,206 | |
| | 1,490 | | | PharMerica Corp.* | | | 37,637 | |
See Notes to Financial Statements.
84
| | | | | | | | |
| Small-Mid Cap Equity Fund | |
| | |
| Shares/Units | | | Security | | Value | |
| HEALTH CARE — 13.4% — (continued) | |
| Health Care Providers & Services — 2.1% — (continued) | |
| | 2,212 | | | Premier Inc., Class A Shares* | | $ | 70,010 | |
| | 604 | | | Providence Service Corp. (The)* | | | 28,466 | |
| | 1,714 | | | Quorum Health Corp.* | | | 10,541 | |
| | 1,992 | | | RadNet Inc.* | | | 13,466 | |
| | 5,274 | | | Select Medical Holdings Corp.* | | | 62,655 | |
| | 851 | | | Surgery Partners Inc.*(a) | | | 16,390 | |
| | 1,339 | | | Surgical Care Affiliates Inc.* | | | 55,234 | |
| | 26,984 | | | Team Health Holdings Inc.* | | | 898,567 | |
| | 1,012 | | | Teladoc Inc.*(a) | | | 18,044 | |
| | 3,832 | | | Tenet Healthcare Corp.* | | | 91,585 | |
| | 1,225 | | | Triple-S Management Corp., Class B Shares* | | | 26,815 | |
| | 2,610 | | | Universal American Corp. | | | 18,688 | |
| | 6,405 | | | Universal Health Services Inc., Class B Shares | | | 771,995 | |
| | 622 | | | US Physical Therapy Inc. | | | 39,217 | |
| | 175 | | | USMD Holdings Inc.*(a) | | | 3,878 | |
| | 3,672 | | | VCA Inc.* | | | 260,014 | |
| | 2,096 | | | WellCare Health Plans Inc.* | | | 236,219 | |
| | | | | | | | |
| | | | Total Health Care Providers & Services | | | 10,061,390 | |
| | | | | | | | |
| Health Care Technology — 0.7% | |
| | 66,299 | | | Allscripts Healthcare Solutions Inc.* | | | 855,920 | |
| | 1,835 | | | athenahealth Inc.* | | | 224,659 | |
| | 1,750 | | | Castlight Health Inc., Class B Shares*(a) | | | 7,315 | |
| | 7,353 | | | Cerner Corp.* | | | 474,563 | |
| | 596 | | | Computer Programs & Systems Inc. | | | 15,389 | |
| | 584 | | | Cotiviti Holdings Inc.* | | | 19,412 | |
| | 736 | | | Evolent Health Inc., Class A Shares*(a) | | | 18,304 | |
| | 1,169 | | | HealthStream Inc.* | | | 31,084 | |
| | 3,975 | | | HMS Holdings Corp.* | | | 86,695 | |
| | 658 | | | Imprivata Inc.* | | | 12,640 | |
| | 2,749 | | | Inovalon Holdings Inc., Class A Shares*(a) | | | 43,159 | |
| | 2,612 | | | Medidata Solutions Inc.* | | | 141,309 | |
| | 21,632 | | | Omnicell Inc.* | | | 812,931 | |
| | 1,094 | | | Press Ganey Holdings Inc.* | | | 44,077 | |
| | 2,537 | | | Quality Systems Inc. | | | 29,860 | |
| | 4,584 | | | Veeva Systems Inc., Class A Shares* | | | 187,577 | |
| | 1,069 | | | Vocera Communications Inc.* | | | 17,425 | |
| | | | | | | | |
| | | | Total Health Care Technology | | | 3,022,319 | |
| | | | | | | | |
| Life Sciences Tools & Services — 2.0% | |
| | 1,041 | | | Accelerate Diagnostics Inc.*(a) | | | 22,777 | |
| | 45,183 | | | Agilent Technologies Inc. | | | 2,122,697 | |
| | 1,113 | | | Albany Molecular Research Inc.*(a) | | | 16,495 | |
| | 987 | | | Bio-Rad Laboratories Inc., Class A Shares* | | | 146,875 | |
| | 1,745 | | | Bio-Techne Corp. | | | 183,836 | |
| | 20,592 | | | Bruker Corp. | | | 460,437 | |
| | 1,479 | | | Cambrex Corp.* | | | 63,346 | |
| | 18,331 | | | Charles River Laboratories International Inc.* | | | 1,525,323 | |
| | 992 | | | ChromaDex Corp.* | | | 3,264 | |
| | 2,035 | | | Enzo Biochem Inc.* | | | 11,315 | |
| | 28,741 | | | Fluidigm Corp.*(a) | | | 261,831 | |
| | 21,655 | | | ICON PLC, ADR* | | | 1,662,887 | |
| | 3,528 | | | Illumina Inc.* | | | 593,904 | |
| | 1,959 | | | INC Research Holdings Inc., Class A Shares* | | | 85,471 | |
| | 18,904 | | | Luminex Corp.* | | | 398,307 | |
See Notes to Financial Statements.
85
| | | | | | | | |
| Small-Mid Cap Equity Fund | |
| | |
| Shares/Units | | | Security | | Value | |
| HEALTH CARE — 13.4% — (continued) | |
| Life Sciences Tools & Services — 2.0% — (continued) | |
| | 748 | | | NanoString Technologies Inc.* | | $ | 12,088 | |
| | 2,589 | | | NeoGenomics Inc.* | | | 20,816 | |
| | 3,765 | | | Pacific Biosciences of California Inc.*(a) | | | 31,362 | |
| | 15,078 | | | PAREXEL International Corp.* | | | 1,025,756 | |
| | 5,145 | | | PerkinElmer Inc. | | | 273,971 | |
| | 1,137 | | | PRA Health Sciences Inc.* | | | 57,475 | |
| | 10,812 | | | QIAGEN NV* | | | 286,626 | |
| | 3,911 | | | Quintiles Transnational Holdings Inc.* | | | 302,320 | |
| | 3,728 | | | VWR Corp.* | | | 104,048 | |
| | | | | | | | |
| | | | Total Life Sciences Tools & Services | | | 9,673,227 | |
| | | | | | | | |
| Pharmaceuticals — 1.1% | |
| | 1,313 | | | AcelRx Pharmaceuticals Inc.*(a) | | | 4,136 | |
| | 500 | | | Aclaris Therapeutics Inc.*(a) | | | 10,080 | |
| | 1,175 | | | Aerie Pharmaceuticals Inc.* | | | 22,748 | |
| | 585 | | | Agile Therapeutics Inc.* | | | 4,235 | |
| | 4,001 | | | Akorn Inc.* | | | 107,707 | |
| | 1,650 | | | Amphastar Pharmaceuticals Inc.* | | | 31,350 | |
| | 1,683 | | | Ampio Pharmaceuticals Inc.* | | | 1,391 | |
| | 391 | | | ANI Pharmaceuticals Inc.*(a) | | | 23,358 | |
| | 1,663 | | | Aratana Therapeutics Inc.* | | | 14,751 | |
| | 419 | | | Axsome Therapeutics Inc.*(a) | | | 3,034 | |
| | 3,188 | | | Bio-Path Holdings Inc.*(a) | | | 4,878 | |
| | 211,480 | | | Cardiome Pharma Corp.* | | | 630,210 | |
| | 4,732 | | | Catalent Inc.* | | | 119,388 | |
| | 2,091 | | | Cempra Inc.*(a) | | | 45,877 | |
| | 568 | | | Collegium Pharmaceutical Inc.*(a) | | | 4,731 | |
| | 3,316 | | | Corcept Therapeutics Inc.* | | | 17,674 | |
| | 2,851 | | | Depomed Inc.* | | | 57,847 | |
| | 1,179 | | | Dermira Inc.* | | | 36,596 | |
| | 4,782 | | | Durect Corp.* | | | 7,986 | |
| | 800 | | | Egalet Corp.* | | | 5,488 | |
| | 9,745 | | | Endo International PLC* | | | 201,722 | |
| | 1,819 | | | Endocyte Inc.*(a) | | | 5,421 | |
| | 386 | | | Flex Pharma Inc.*(a) | | | 4,273 | |
| | 315 | | | Heska Corp.* | | | 17,190 | |
| | 7,659 | | | Horizon Pharma PLC* | | | 143,989 | |
| | 3,458 | | | Impax Laboratories Inc.* | | | 83,649 | |
| | 3,735 | | | Innoviva Inc.(a) | | | 41,421 | |
| | 1,177 | | | Intersect ENT Inc.* | | | 18,550 | |
| | 1,625 | | | Intra-Cellular Therapies Inc., Class A Shares* | | | 65,553 | |
| | 1,277 | | | Lannett Co., Inc.* | | | 43,239 | |
| | 660 | | | Lipocine Inc.* | | | 2,224 | |
| | 3,214 | | | Medicines Co. (The)* | | | 125,892 | |
| | 571 | | | MyoKardia Inc.* | | | 12,493 | |
| | 47,652 | | | Nektar Therapeutics* | | | 850,588 | |
| | 483 | | | Neos Therapeutics Inc.* | | | 3,149 | |
| | 668 | | | Ocular Therapeutix Inc.*(a) | | | 4,269 | |
| | 2,071 | | | Omeros Corp.*(a) | | | 22,243 | |
| | 24,596 | | | Pacira Pharmaceuticals Inc.* | | | 974,740 | |
| | 909 | | | Paratek Pharmaceuticals Inc.* | | | 12,244 | |
| | 850 | | | Phibro Animal Health Corp., Class A Shares | | | 20,630 | |
| | 2,525 | | | Prestige Brands Holdings Inc.* | | | 121,528 | |
| | 218 | | | Reata Pharmaceuticals Inc., Class A Shares*(a) | | | 4,157 | |
| | 1,872 | | | Relypsa Inc.* | | | 59,885 | |
See Notes to Financial Statements.
86
| | | | | | | | |
| Small-Mid Cap Equity Fund | |
| | |
| Shares/Units | | | Security | | Value | |
| HEALTH CARE — 13.4% — (continued) | |
| Pharmaceuticals — 1.1% — (continued) | |
| | 933 | | | Revance Therapeutics Inc.*(a) | | $ | 13,109 | |
| | 2,547 | | | SciClone Pharmaceuticals Inc.* | | | 25,648 | |
| | 952 | | | Sucampo Pharmaceuticals Inc., Class A Shares* | | | 10,434 | |
| | 2,187 | | | Supernus Pharmaceuticals Inc.* | | | 46,758 | |
| | 2,095 | | | Teligent Inc.*(a) | | | 15,545 | |
| | 1,504 | | | Tetraphase Pharmaceuticals Inc.* | | | 5,715 | |
| | 6,940 | | | TherapeuticsMD Inc.*(a) | | | 47,747 | |
| | 1,724 | | | Theravance Biopharma Inc.*(a) | | | 48,893 | |
| | 644 | | | Titan Pharmaceuticals Inc.* | | | 3,619 | |
| | 373 | | | WaVe Life Sciences Ltd.*(a) | | | 9,303 | |
| | 19,517 | | | Zoetis Inc., Class A Shares | | | 997,319 | |
| | 1,306 | | | Zogenix Inc.* | | | 11,388 | |
| | | | | | | | |
| | | | Total Pharmaceuticals | | | 5,227,992 | |
| | | | | | | | |
| | | | TOTAL HEALTH CARE | | | 63,713,066 | |
| | | | | | | | |
| INDUSTRIALS — 19.5% | |
| Aerospace & Defense — 2.5% | |
| | 1,514 | | | AAR Corp. | | | 37,260 | |
| | 2,752 | | | Aerojet Rocketdyne Holdings Inc.* | | | 49,453 | |
| | 19,724 | | | Aerovironment Inc.* | | | 487,972 | |
| | 365 | | | American Science & Engineering Inc. | | | 13,432 | |
| | 945 | | | Astronics Corp.* | | | 42,346 | |
| | 4,840 | | | B/E Aerospace Inc. | | | 244,662 | |
| | 4,457 | | | BWX Technologies Inc. | | | 172,976 | |
| | 1,181 | | | Cubic Corp. | | | 55,294 | |
| | 2,093 | | | Curtiss-Wright Corp. | | | 188,161 | |
| | 2,975 | | | DigitalGlobe Inc.* | | | 80,593 | |
| | 440 | | | Ducommun Inc.* | | | 10,446 | |
| | 807 | | | Engility Holdings Inc.* | | | 24,210 | |
| | 1,398 | | | Esterline Technologies Corp.* | | | 107,576 | |
| | 908 | | | HEICO Corp. | | | 61,708 | |
| | 15,431 | | | HEICO Corp., Class A Shares | | | 877,715 | |
| | 87,873 | | | Hexcel Corp. | | | 3,941,104 | |
| | 2,201 | | | Huntington Ingalls Industries Inc. | | | 363,539 | |
| | 75,221 | | | KEYW Holding Corp. (The)*(a) | | | 749,953 | |
| | 2,539 | | | KLX Inc.* | | | 94,806 | |
| | 1,970 | | | Kratos Defense & Security Solutions Inc.* | | | 13,751 | |
| | 44,565 | | | Mercury Systems Inc.* | | | 1,010,734 | |
| | 1,507 | | | Moog Inc., Class A Shares* | | | 88,898 | |
| | 222 | | | National Presto Industries Inc. | | | 19,372 | |
| | 2,747 | | | Orbital ATK Inc. | | | 207,206 | |
| | 377 | | | Sparton Corp.* | | | 8,637 | |
| | 27,608 | | | Spirit AeroSystems Holdings Inc., Class A Shares* | | | 1,264,999 | |
| | 2,429 | | | TASER International Inc.* | | | 65,777 | |
| | 6,320 | | | Teledyne Technologies Inc.* | | | 677,125 | |
| | 15,200 | | | Textron Inc. | | | 620,920 | |
| | 2,307 | | | Triumph Group Inc. | | | 73,501 | |
| | 531 | | | Vectrus Inc.* | | | 17,916 | |
| | | | | | | | |
| | | | Total Aerospace & Defense | | | 11,672,042 | |
| | | | | | | | |
| Air Freight & Logistics — 0.1% | |
| | 2,296 | | | Air Transport Services Group Inc.* | | | 33,246 | |
| | 1,116 | | | Atlas Air Worldwide Holdings Inc.* | | | 41,448 | |
| | 1,331 | | | Echo Global Logistics Inc.* | | | 34,340 | |
| | 1,375 | | | Forward Air Corp. | | | 63,360 | |
See Notes to Financial Statements.
87
| | | | | | | | |
| Small-Mid Cap Equity Fund | |
| | |
| Shares/Units | | | Security | | Value | |
| INDUSTRIALS — 19.5% — (continued) | |
| Air Freight & Logistics — 0.1% — (continued) | |
| | 1,557 | | | Hub Group Inc., Class A Shares* | | $ | 63,448 | |
| | 407 | | | Park-Ohio Holdings Corp. | | | 15,010 | |
| | 1,739 | | | Radiant Logistics Inc.* | | | 5,078 | |
| | 4,653 | | | XPO Logistics Inc.*(a) | | | 166,577 | |
| | | | | | | | |
| | | | Total Air Freight & Logistics | | | 422,507 | |
| | | | | | | | |
| Airlines — 0.5% | |
| | 5,673 | | | Alaska Air Group Inc. | | | 383,098 | |
| | 609 | | | Allegiant Travel Co., Class A Shares | | | 84,188 | |
| | 1,475 | | | Copa Holdings SA, Class A Shares | | | 112,734 | |
| | 2,469 | | | Hawaiian Holdings Inc.* | | | 115,994 | |
| | 15,309 | | | JetBlue Airways Corp.* | | | 244,178 | |
| | 2,309 | | | SkyWest Inc. | | | 65,183 | |
| | 25,378 | | | Spirit Airlines Inc.* | | | 1,014,866 | |
| | 8,329 | | | United Continental Holdings Inc.* | | | 419,865 | |
| | 949 | | | Virgin America Inc.*(a) | | | 52,850 | |
| | | | | | | | |
| | | | Total Airlines | | | 2,492,956 | |
| | | | | | | | |
| Building Products — 1.6% | |
| | 1,856 | | | AAON Inc. | | | 52,525 | |
| | 1,580 | | | Advanced Drainage Systems Inc. | | | 36,545 | |
| | 4,534 | | | Allegion PLC | | | 322,911 | |
| | 11,396 | | | American Woodmark Corp.* | | | 991,452 | |
| | 10,284 | | | AO Smith Corp. | | | 992,200 | |
| | 1,323 | | | Apogee Enterprises Inc. | | | 64,033 | |
| | 1,050 | | | Armstrong Flooring Inc.* | | | 21,651 | |
| | 2,199 | | | Armstrong World Industries Inc.* | | | 95,591 | |
| | 3,910 | | | Builders FirstSource Inc.* | | | 53,723 | |
| | 1,094 | | | Caesarstone Ltd.* | | | 43,016 | |
| | 1,606 | | | Continental Building Products Inc.* | | | 35,669 | |
| | 636 | | | CSW Industrials Inc.* | | | 20,530 | |
| | 7,264 | | | Fortune Brands Home & Security Inc. | | | 461,700 | |
| | 1,488 | | | Gibraltar Industries Inc.* | | | 56,782 | |
| | 1,372 | | | Griffon Corp. | | | 23,489 | |
| | 882 | | | Insteel Industries Inc. | | | 29,371 | |
| | 1,881 | | | Lennox International Inc. | | | 302,973 | |
| | 1,441 | | | Masonite International Corp.* | | | 96,158 | |
| | 93,975 | | | NCI Building Systems Inc.* | | | 1,422,782 | |
| | 497 | | | Nortek Inc.*(b) | | | 42,742 | |
| | 14,377 | | | Owens Corning | | | 789,585 | |
| | 680 | | | Patrick Industries Inc.* | | | 43,540 | |
| | 2,441 | | | PGT Inc.* | | | 29,072 | |
| | 100,964 | | | Ply Gem Holdings Inc.* | | | 1,410,467 | |
| | 1,708 | | | Quanex Building Products Corp. | | | 33,016 | |
| | 1,935 | | | Simpson Manufacturing Co., Inc. | | | 84,908 | |
| | 1,387 | | | Trex Co., Inc.* | | | 85,911 | |
| | 930 | | | Universal Forest Products Inc. | | | 101,509 | |
| | 4,169 | | | USG Corp.* | | | 114,356 | |
| | | | | | | | |
| | | | Total Building Products | | | 7,858,207 | |
| | | | | | | | |
| Commercial Services & Supplies — 2.2% | |
| | 2,601 | | | ABM Industries Inc. | | | 99,956 | |
| | 4,855 | | | ACCO Brands Corp.* | | | 48,550 | |
| | 344 | | | Aqua Metals Inc.*(a) | | | 3,179 | |
| | 1,684 | | | ARC Document Solutions Inc.* | | | 5,692 | |
See Notes to Financial Statements.
88
| | | | | | | | |
| Small-Mid Cap Equity Fund | |
| | |
| Shares/Units | | | Security | | Value | |
| INDUSTRIALS — 19.5% — (continued) | |
| Commercial Services & Supplies — 2.2% — (continued) | |
| | 2,223 | | | Brady Corp., Class A Shares | | $ | 74,448 | |
| | 2,100 | | | Brink’s Co. (The) | | | 76,650 | |
| | 1,823 | | | Casella Waste Systems Inc., Class A Shares* | | | 16,571 | |
| | 1,470 | | | CECO Environmental Corp. | | | 16,155 | |
| | 12,980 | | | Cintas Corp. | | | 1,525,280 | |
| | 15,888 | | | Clean Harbors Inc.* | | | 759,446 | |
| | 4,657 | | | Copart Inc.* | | | 237,600 | |
| | 132,138 | | | Covanta Holding Corp. | | | 1,967,535 | |
| | 2,309 | | | Deluxe Corp. | | | 157,405 | |
| | 1,125 | | | Ennis Inc. | | | 18,653 | |
| | 1,696 | | | Essendant Inc. | | | 32,852 | |
| | 912 | | | G&K Services Inc., Class A Shares | | | 88,765 | |
| | 3,287 | | | Healthcare Services Group Inc. | | | 132,696 | |
| | 607 | | | Heritage-Crystal Clean Inc.* | | | 8,383 | |
| | 2,812 | | | Herman Miller Inc. | | | 101,429 | |
| | 2,134 | | | HNI Corp. | | | 119,163 | |
| | 157,684 | | | InnerWorkings Inc.* | | | 1,398,657 | |
| | 2,987 | | | Interface Inc., Class A Shares | | | 52,810 | |
| | 22,448 | | | KAR Auction Services Inc. | | | 949,101 | |
| | 1,941 | | | Kimball International Inc., Class B Shares | | | 24,166 | |
| | 2,210 | | | Knoll Inc. | | | 58,477 | |
| | 1,527 | | | Matthews International Corp., Class A Shares | | | 93,926 | |
| | 1,052 | | | McGrath RentCorp | | | 33,633 | |
| | 2,036 | | | Mobile Mini Inc. | | | 60,876 | |
| | 1,457 | | | MSA Safety Inc. | | | 84,870 | |
| | 645 | | | Multi-Color Corp. | | | 43,105 | |
| | 8,978 | | | Pitney Bowes Inc. | | | 168,427 | |
| | 1,401 | | | Quad/Graphics Inc. | | | 37,953 | |
| | 4,526 | | | Rollins Inc. | | | 128,991 | |
| | 9,904 | | | RR Donnelley & Sons Co. | | | 169,358 | |
| | 805 | | | SP Plus Corp.* | | | 20,125 | |
| | 3,957 | | | Steelcase Inc., Class A Shares | | | 59,118 | |
| | 1,324 | | | Team Inc.* | | | 42,064 | |
| | 2,714 | | | Tetra Tech Inc. | | | 95,804 | |
| | 845 | | | TRC Cos., Inc.* | | | 6,439 | |
| | 706 | | | UniFirst Corp. | | | 90,643 | |
| | 1,005 | | | US Ecology Inc. | | | 45,084 | |
| | 941 | | | Viad Corp. | | | 33,650 | |
| | 484 | | | VSE Corp. | | | 15,928 | |
| | 14,317 | | | Waste Connections Inc. | | | 1,094,248 | |
| | 2,107 | | | West Corp. | | | 49,367 | |
| | | | | | | | |
| | | | Total Commercial Services & Supplies | | | 10,347,228 | |
| | | | | | | | |
| Construction & Engineering — 1.9% | |
| | 7,284 | | | AECOM* | | | 224,566 | |
| | 1,595 | | | Aegion Corp., Class A Shares* | | | 29,539 | |
| | 881 | | | Ameresco Inc., Class A Shares* | | | 4,211 | |
| | 669 | | | Argan Inc. | | | 31,985 | |
| | 4,987 | | | Chicago Bridge & Iron Co. NV | | | 148,513 | |
| | 1,699 | | | Comfort Systems USA Inc. | | | 48,235 | |
| | 1,438 | | | Dycom Industries Inc.* | | | 116,651 | |
| | 22,789 | | | EMCOR Group Inc. | | | 1,304,898 | |
| | 23,355 | | | Granite Construction Inc. | | | 1,121,040 | |
| | 130,868 | | | Great Lakes Dredge & Dock Corp.* | | | 505,151 | |
| | 1,060 | | | HC2 Holdings Inc.*(a) | | | 5,077 | |
See Notes to Financial Statements.
89
| | | | | | | | |
| Small-Mid Cap Equity Fund | |
| | |
| Shares/Units | | | Security | | Value | |
| INDUSTRIALS — 19.5% — (continued) | |
| Construction & Engineering — 1.9% — (continued) | |
| | 299 | | | IES Holdings Inc.* | | $ | 4,954 | |
| | 58,970 | | | Jacobs Engineering Group Inc.* | | | 3,107,129 | |
| | 51,484 | | | KBR Inc. | | | 755,785 | |
| | 105,413 | | | Layne Christensen Co.*(a) | | | 947,663 | |
| | 3,121 | | | MasTec Inc.* | | | 91,914 | |
| | 750 | | | MYR Group Inc.* | | | 21,750 | |
| | 340 | | | NV5 Global Inc.* | | | 10,394 | |
| | 1,240 | | | Orion Group Holdings Inc.* | | | 7,390 | |
| | 1,832 | | | Primoris Services Corp. | | | 35,211 | |
| | 6,938 | | | Quanta Services Inc.* | | | 178,515 | |
| | 1,878 | | | Tutor Perini Corp.* | | | 43,551 | |
| | 4,254 | | | Valmont Industries Inc. | | | 555,019 | |
| | | | | | | | |
| | | | Total Construction & Engineering | | | 9,299,141 | |
| | | | | | | | |
| Electrical Equipment — 0.5% | |
| | 328 | | | Allied Motion Technologies Inc. | | | 7,390 | |
| | 340 | | | American Superconductor Corp.* | | | 2,407 | |
| | 6,719 | | | AZZ Inc. | | | 446,343 | |
| | 2,237 | | | Babcock & Wilcox Enterprises Inc.* | | | 36,575 | |
| | 935 | | | Encore Wire Corp. | | | 36,203 | |
| | 748 | | | Energous Corp.* | | | 13,464 | |
| | 2,061 | | | EnerSys | | | 145,053 | |
| | 979 | | | FuelCell Energy Inc.* | | | 5,051 | |
| | 3,087 | | | Generac Holdings Inc.* | | | 115,145 | |
| | 2,218 | | | General Cable Corp. | | | 35,776 | |
| | 2,598 | | | Hubbell Inc., Class B Shares | | | 281,389 | |
| | 1,036 | | | LSI Industries Inc. | | | 10,495 | |
| | 9,596 | | | Plug Power Inc.*(a) | | | 14,874 | |
| | 30,857 | | | Powell Industries Inc. | | | 1,226,566 | |
| | 81 | | | Power Solutions International Inc.* | | | 943 | |
| | 144 | | | Preformed Line Products Co. | | | 6,316 | |
| | 2,127 | | | Regal Beloit Corp. | | | 130,449 | |
| | 3,053 | | | SolarCity Corp.* | | | 63,075 | |
| | 2,938 | | | Sunrun Inc.* | | | 17,863 | |
| | 1,619 | | | Thermon Group Holdings Inc.* | | | 30,486 | |
| | 637 | | | Vicor Corp.* | | | 6,950 | |
| | | | | | | | |
| | | | Total Electrical Equipment | | | 2,632,813 | |
| | | | | | | | |
| Industrial Conglomerates — 0.8% | |
| | 17,485 | | | Carlisle Cos., Inc. | | | 1,833,477 | |
| | 1,665 | | | Raven Industries Inc. | | | 40,859 | |
| | 9,917 | | | Roper Technologies Inc. | | | 1,760,764 | |
| | | | | | | | |
| | | | Total Industrial Conglomerates | | | 3,635,100 | |
| | | | | | | | |
| Machinery — 4.8% | |
| | 2,727 | | | Actuant Corp., Class A Shares | | | 64,984 | |
| | 3,299 | | | AGCO Corp. | | | 160,133 | |
| | 440 | | | Alamo Group Inc. | | | 28,521 | |
| | 1,333 | | | Albany International Corp., Class A Shares | | | 56,426 | |
| | 6,675 | | | Allison Transmission Holdings Inc. | | | 185,165 | |
| | 1,159 | | | Altra Industrial Motion Corp. | | | 32,684 | |
| | 357 | | | American Railcar Industries Inc.(a) | | | 14,801 | |
| | 885 | | | Astec Industries Inc. | | | 52,029 | |
| | 2,365 | | | Barnes Group Inc. | | | 97,769 | |
| | 330 | | | Blue Bird Corp.*(a) | | | 4,782 | |
See Notes to Financial Statements.
90
| | | | | | | | |
| Small-Mid Cap Equity Fund | |
| | |
| Shares/Units | | | Security | | Value | |
| INDUSTRIALS — 19.5% — (continued) | |
| Machinery — 4.8% — (continued) | |
| | 2,079 | | | Briggs & Stratton Corp. | | $ | 39,522 | |
| | 1,424 | | | Chart Industries Inc.* | | | 42,891 | |
| | 759 | | | CIRCOR International Inc. | | | 44,827 | |
| | 2,248 | | | CLARCOR Inc. | | | 147,177 | |
| | 4,715 | | | Colfax Corp.* | | | 139,941 | |
| | 996 | | | Columbus McKinnon Corp. | | | 17,490 | |
| | 2,330 | | | Crane Co. | | | 149,866 | |
| | 6,010 | | | Donaldson Co., Inc. | | | 225,675 | |
| | 1,095 | | | Douglas Dynamics Inc. | | | 35,128 | |
| | 782 | | | Dynamic Materials Corp. | | | 8,602 | |
| | 1,692 | | | Energy Recovery Inc.*(a) | | | 20,439 | |
| | 1,006 | | | EnPro Industries Inc. | | | 54,223 | |
| | 1,186 | | | ESCO Technologies Inc. | | | 53,512 | |
| | 462 | | | ExOne Co. (The)* | | | 6,223 | |
| | 2,951 | | | Federal Signal Corp. | | | 38,688 | |
| | 6,165 | | | Flowserve Corp. | | | 298,201 | |
| | 2,167 | | | Franklin Electric Co., Inc. | | | 82,888 | |
| | 494 | | | FreightCar America Inc. | | | 7,114 | |
| | 303 | | | Gencor Industries Inc.* | | | 3,469 | |
| | 985 | | | Global Brass & Copper Holdings Inc. | | | 27,649 | |
| | 796 | | | Gorman-Rupp Co. (The) | | | 21,619 | |
| | 2,638 | | | Graco Inc. | | | 194,341 | |
| | 362 | | | Graham Corp. | | | 6,918 | |
| | 1,305 | | | Greenbrier Cos., Inc. (The)(a) | | | 44,226 | |
| | 678 | | | Hardinge Inc. | | | 7,166 | |
| | 119,643 | | | Harsco Corp. | | | 1,190,448 | |
| | 2,775 | | | Hillenbrand Inc. | | | 89,216 | |
| | 240 | | | Hurco Cos., Inc. | | | 6,482 | |
| | 476 | | | Hyster-Yale Materials Handling Inc. | | | 24,623 | |
| | 26,667 | | | IDEX Corp. | | | 2,491,764 | |
| | 14,927 | | | ITT Inc. | | | 540,059 | |
| | 24,743 | | | John Bean Technologies Corp. | | | 1,699,349 | |
| | 4,660 | | | Joy Global Inc. | | | 127,125 | |
| | 485 | | | Kadant Inc. | | | 26,015 | |
| | 3,728 | | | Kennametal Inc. | | | 104,235 | |
| | 2,903 | | | Lincoln Electric Holdings Inc. | | | 184,515 | |
| | 525 | | | Lindsay Corp.(a) | | | 37,779 | |
| | 760 | | | Lydall Inc.* | | | 36,510 | |
| | 333,795 | | | Manitowoc Co., Inc. (The) | | | 1,635,595 | |
| | 22,410 | | | Manitowoc Foodservice Inc.* | | | 361,473 | |
| | 40,426 | | | Meritor Inc.* | | | 450,750 | |
| | 2,690 | | | Middleby Corp. (The)* | | | 344,724 | |
| | 750 | | | Milacron Holdings Corp.* | | | 12,953 | |
| | 563 | | | Miller Industries Inc. | | | 12,448 | |
| | 2,711 | | | Mueller Industries Inc. | | | 93,692 | |
| | 106,895 | | | Mueller Water Products Inc., Class A Shares | | | 1,292,361 | |
| | 2,333 | | | Navistar International Corp.*(a) | | | 32,755 | |
| | 1,160 | | | NN Inc. | | | 20,590 | |
| | 2,709 | | | Nordson Corp. | | | 267,460 | |
| | 170 | | | Omega Flex Inc. | | | 6,509 | |
| | 3,451 | | | Oshkosh Corp. | | | 186,112 | |
| | 1,151 | | | Proto Labs Inc.* | | | 62,983 | |
| | 1,074 | | | RBC Bearings Inc.* | | | 84,943 | |
| | 3,913 | | | Rexnord Corp.* | | | 86,516 | |
| | 17,362 | | | Snap-on Inc. | | | 2,661,421 | |
See Notes to Financial Statements.
91
| | | | | | | | |
| Small-Mid Cap Equity Fund | |
| | |
| Shares/Units | | | Security | | Value | |
| INDUSTRIALS — 19.5% — (continued) | |
| Machinery — 4.8% — (continued) | |
| | 2,018 | | | SPX Corp.* | | $ | 38,221 | |
| | 52,464 | | | SPX FLOW Inc.* | | | 1,542,966 | |
| | 585 | | | Standex International Corp. | | | 49,251 | |
| | 1,050 | | | Sun Hydraulics Corp. | | | 32,361 | |
| | 574 | | | Supreme Industries Inc., Class A Shares | | | 9,896 | |
| | 810 | | | Tennant Co. | | | 52,431 | |
| | 5,016 | | | Terex Corp. | | | 121,788 | |
| | 3,326 | | | Timken Co. (The) | | | 112,652 | |
| | 2,231 | | | Titan International Inc. | | | 20,503 | |
| | 2,531 | | | Toro Co. (The) | | | 245,887 | |
| | 2,082 | | | TriMas Corp.* | | | 39,933 | |
| | 7,118 | | | Trinity Industries Inc. | | | 173,822 | |
| | 13,800 | | | Twin Disc Inc. | | | 179,262 | |
| | 3,166 | | | Wabash National Corp.* | | | 44,166 | |
| | 2,499 | | | WABCO Holdings Inc.* | | | 266,793 | |
| | 31,406 | | | Wabtec Corp. | | | 2,406,014 | |
| | 1,309 | | | Watts Water Technologies Inc., Class A Shares | | | 84,300 | |
| | 8,077 | | | Woodward Inc. | | | 506,589 | |
| | 8,482 | | | Xylem Inc. | | | 431,395 | |
| | | | | | | | |
| | | | Total Machinery | | | 22,944,724 | |
| | | | | | | | |
| Marine — 0.3% | |
| | 1,126 | | | Costamare Inc.(a) | | | 9,909 | |
| | 42,700 | | | Danaos Corp.* | | | 137,921 | |
| | 3,005 | | | Kirby Corp.* | | | 156,561 | |
| | 29,677 | | | Matson Inc. | | | 1,145,235 | |
| | 2,909 | | | Scorpio Bulkers Inc.* | | | 10,036 | |
| | | | | | | | |
| | | | Total Marine | | | 1,459,662 | |
| | | | | | | | |
| Professional Services — 1.4% | |
| | 721 | | | Acacia Research Corp. | | | 4,312 | |
| | 1,943 | | | Advisory Board Co. (The)* | | | 81,897 | |
| | 359 | | | Barrett Business Services Inc. | | | 16,751 | |
| | 2,680 | | | CBIZ Inc.* | | | 30,311 | |
| | 14,724 | | | CEB Inc. | | | 886,385 | |
| | 365 | | | CRA International Inc.* | | | 9,899 | |
| | 1,737 | | | Dun & Bradstreet Corp. (The) | | | 239,098 | |
| | 13,305 | | | Equifax Inc. | | | 1,754,930 | |
| | 1,196 | | | Exponent Inc. | | | 60,314 | |
| | 449 | | | Franklin Covey Co.* | | | 7,292 | |
| | 1,961 | | | FTI Consulting Inc.* | | | 86,853 | |
| | 559 | | | GP Strategies Corp.* | | | 13,360 | |
| | 934 | | | Heidrick & Struggles International Inc. | | | 17,456 | |
| | 1,829 | | | Hill International Inc.* | | | 8,011 | |
| | 18,423 | | | Huron Consulting Group Inc.* | | | 1,158,070 | |
| | 886 | | | ICF International Inc.* | | | 37,079 | |
| | 636 | | | IDI Inc.* | | | 3,091 | |
| | 753 | | | Insperity Inc. | | | 49,359 | |
| | 1,361 | | | Kelly Services Inc., Class A Shares | | | 26,022 | |
| | 1,132 | | | Kforce Inc. | | | 21,904 | |
| | 2,668 | | | Korn/Ferry International | | | 63,605 | |
| | 3,390 | | | ManPowerGroup Inc. | | | 242,249 | |
| | 46,279 | | | Mistras Group Inc.* | | | 1,086,168 | |
| | 2,245 | | | Navigant Consulting Inc.* | | | 44,092 | |
| | 2,385 | | | On Assignment Inc.* | | | 89,938 | |
See Notes to Financial Statements.
92
| | | | | | | | |
| Small-Mid Cap Equity Fund | |
| | |
| Shares/Units | | | Security | | Value | |
| INDUSTRIALS — 19.5% — (continued) | |
| Professional Services — 1.4% — (continued) | |
| | 1,645 | | | Resources Connection Inc. | | $ | 24,823 | |
| | 6,055 | | | Robert Half International Inc. | | | 232,088 | |
| | 2,221 | | | RPX Corp.* | | | 23,254 | |
| | 2,613 | | | TransUnion* | | | 86,203 | |
| | 1,911 | | | TriNet Group Inc.* | | | 40,131 | |
| | 1,935 | | | TrueBlue Inc.* | | | 42,280 | |
| | 1,715 | | | WageWorks Inc.* | | | 105,970 | |
| | | | | | | | |
| | | | Total Professional Services | | | 6,593,195 | |
| | | | | | | | |
| Road & Rail — 1.2% | |
| | 295 | | | AMERCO | | | 101,394 | |
| | 1,277 | | | ArcBest Corp. | | | 23,382 | |
| | 25,587 | | | Avis Budget Group Inc.* | | | 924,458 | |
| | 1,469 | | | Celadon Group Inc. | | | 11,473 | |
| | 438 | | | Covenant Transportation Group Inc., Class A Shares* | | | 8,445 | |
| | 2,705 | | | Genesee & Wyoming Inc., Class A Shares* | | | 183,913 | |
| | 2,248 | | | Heartland Express Inc. | | | 42,779 | |
| | 3,448 | | | Hertz Global Holdings Inc.* | | | 169,849 | |
| | 12,360 | | | JB Hunt Transport Services Inc. | | | 981,260 | |
| | 3,195 | | | Knight Transportation Inc. | | | 89,780 | |
| | 1,999 | | | Landstar System Inc. | | | 138,391 | |
| | 18,881 | | | Marten Transport Ltd. | | | 407,263 | |
| | 3,194 | | | Old Dominion Freight Line Inc.* | | | 227,189 | |
| | 43 | | | PAM Transportation Services Inc.* | | | 851 | |
| | 1,683 | | | Roadrunner Transportation Systems Inc.* | | | 14,036 | |
| | 31,682 | | | Ryder System Inc. | | | 2,075,805 | |
| | 1,249 | | | Saia Inc.* | | | 38,007 | |
| | 3,531 | | | Swift Transportation Co., Class A Shares* | | | 65,712 | |
| | 346 | | | Universal Logistics Holdings Inc. | | | 4,678 | |
| | 357 | | | USA Truck Inc.* | | | 3,963 | |
| | 2,136 | | | Werner Enterprises Inc. | | | 49,299 | |
| | 1,466 | | | YRC Worldwide Inc.* | | | 16,991 | |
| | | | | | | | |
| | | | Total Road & Rail | | | 5,578,918 | |
| | | | | | | | |
| Trading Companies & Distributors — 1.6% | |
| | 4,604 | | | Air Lease Corp., Class A Shares | | | 135,265 | |
| | 2,205 | | | Aircastle Ltd. | | | 47,738 | |
| | 1,694 | | | Applied Industrial Technologies Inc. | | | 80,499 | |
| | 20,795 | | | Beacon Roofing Supply Inc.* | | | 956,154 | |
| | 2,599 | | | BMC Stock Holdings Inc.* | | | 51,824 | |
| | 705 | | | CAI International Inc.* | | | 5,619 | |
| | 662 | | | DXP Enterprises Inc.* | | | 18,596 | |
| | 1,898 | | | GATX Corp.(a) | | | 83,227 | |
| | 330 | | | GMS Inc.* | | | 8,075 | |
| | 1,548 | | | H&E Equipment Services Inc. | | | 24,660 | |
| | 43,787 | | | HD Supply Holdings Inc.* | | | 1,581,149 | |
| | 1,200 | | | Herc Holdings Inc.* | | | 40,572 | |
| | 1,254 | | | Kaman Corp. | | | 56,292 | |
| | 403 | | | Lawson Products Inc.* | | | 6,847 | |
| | 4,454 | | | MRC Global Inc.* | | | 65,340 | |
| | 2,254 | | | MSC Industrial Direct Co., Inc., Class A Shares | | | 164,632 | |
| | 564 | | | Neff Corp., Class A Shares* | | | 5,296 | |
| | 5,080 | | | NOW Inc.* | | | 104,851 | |
| | 41,799 | | | Rush Enterprises Inc., Class A Shares* | | | 993,980 | |
| | 276 | | | Rush Enterprises Inc., Class B Shares* | | | 6,596 | |
See Notes to Financial Statements.
93
| | | | | | | | |
| Small-Mid Cap Equity Fund | |
| | |
| Shares/Units | | | Security | | Value | |
| INDUSTRIALS — 19.5% — (continued) | |
| Trading Companies & Distributors — 1.6% — (continued) | |
| | 11,170 | | | SiteOne Landscape Supply Inc.* | | $ | 427,141 | |
| | 901 | | | Textainer Group Holdings Ltd. | | | 8,010 | |
| | 690 | | | Titan Machinery Inc.*(a) | | | 7,390 | |
| | 1,991 | | | Triton International Ltd | | | 30,303 | |
| | 4,197 | | | United Rentals Inc.* | | | 345,455 | |
| | 16,246 | | | Univar Inc.* | | | 336,130 | |
| | 407 | | | Veritiv Corp.* | | | 20,879 | |
| | 11,483 | | | Watsco Inc. | | | 1,697,876 | |
| | 2,016 | | | WESCO International Inc.* | | | 125,315 | |
| | 283 | | | Willis Lease Finance Corp.* | | | 7,242 | |
| | | | | | | | |
| | | | Total Trading Companies & Distributors | | | 7,442,953 | |
| | | | | | | | |
| Transportation Infrastructure — 0.1% | |
| | 3,568 | | | Macquarie Infrastructure Corp. | | | 285,226 | |
| | 2,583 | | | Wesco Aircraft Holdings Inc.* | | | 35,490 | |
| | | | | | | | |
| | | | Total Transportation Infrastructure | | | 320,716 | |
| | | | | | | | |
| | | | TOTAL INDUSTRIALS | | | 92,700,162 | |
| | | | | | | | |
| INFORMATION TECHNOLOGY — 18.8% | |
| Communications Equipment — 1.6% | |
| | 2,243 | | | ADTRAN Inc. | | | 41,226 | |
| | 1,111 | | | Aerohive Networks Inc.* | | | 7,366 | |
| | 846 | | | Applied Optoelectronics Inc.*(a) | | | 14,255 | |
| | 1,859 | | | Arista Networks Inc.* | | | 148,125 | |
| | 87,736 | | | ARRIS International PLC* | | | 2,462,750 | |
| | 429 | | | Bel Fuse Inc., Class B Shares | | | 9,854 | |
| | 570 | | | Black Box Corp. | | | 7,952 | |
| | 55,980 | | | Brocade Communications Systems Inc. | | | 502,701 | |
| | 1,603 | | | CalAmp Corp.* | | | 23,372 | |
| | 2,086 | | | Calix Inc.* | | | 15,520 | |
| | 66,887 | | | Ciena Corp.* | | | 1,434,726 | |
| | 411 | | | Clearfield Inc.* | | | 7,447 | |
| | 6,103 | | | CommScope Holding Co., Inc.* | | | 180,466 | |
| | 1,124 | | | Comtech Telecommunications Corp. | | | 14,488 | |
| | 1,211 | | | Digi International Inc.* | | | 13,890 | |
| | 2,154 | | | EchoStar Corp., Class A Shares* | | | 83,489 | |
| | 754 | | | EMCORE Corp. | | | 3,740 | |
| | 5,526 | | | Extreme Networks Inc.* | | | 21,717 | |
| | 5,077 | | | Finisar Corp.* | | | 107,531 | |
| | 3,947 | | | Harmonic Inc.* | | | 17,130 | |
| | 68,871 | | | Infinera Corp.* | | | 590,913 | |
| | 1,644 | | | InterDigital Inc. | | | 117,398 | |
| | 2,908 | | | Ixia* | | | 33,529 | |
| | 659 | | | KVH Industries Inc.* | | | 5,668 | |
| | 2,382 | | | Lumentum Holdings Inc.* | | | 83,656 | |
| | 1,520 | | | NETGEAR Inc.* | | | 86,640 | |
| | 4,254 | | | NetScout Systems Inc.* | | | 125,833 | |
| | 4,632 | | | Oclaro Inc.* | | | 36,500 | |
| | 1,560 | | | Plantronics Inc. | | | 79,014 | |
| | 6,395 | | | Polycom Inc.* | | | 79,554 | |
| | 3,042 | | | ShoreTel Inc.* | | | 24,397 | |
| | 301 | | | Silicom Ltd. | | | 12,314 | |
| | 46,957 | | | Sonus Networks Inc.* | | | 404,769 | |
| | 1,201 | | | Ubiquiti Networks Inc.*(a) | | | 61,731 | |
| | 2,106 | | | ViaSat Inc.* | | | 158,034 | |
See Notes to Financial Statements.
94
| | | | | | | | |
| Small-Mid Cap Equity Fund | |
| | |
| Shares/Units | | | Security | | Value | |
| INFORMATION TECHNOLOGY — 18.8% — (continued) | |
| Communications Equipment — 1.6% — (continued) | |
| | 53,656 | | | Viavi Solutions Inc.* | | $ | 417,444 | |
| | | | | | | | |
| | | | Total Communications Equipment | | | 7,435,139 | |
| | | | | | | | |
| Electronic Equipment, Instruments & Components — 2.5% | |
| | 597 | | | Agilysys Inc.* | | | 6,597 | |
| | 9,078 | | | Amphenol Corp., Class A Shares | | | 565,650 | |
| | 1,370 | | | Anixter International Inc.* | | | 87,598 | |
| | 4,317 | | | Arrow Electronics Inc.* | | | 284,188 | |
| | 6,052 | | | Avnet Inc. | | | 252,247 | |
| | 2,325 | | | AVX Corp. | | | 31,946 | |
| | 641 | | | Badger Meter Inc. | | | 42,300 | |
| | 1,991 | | | Belden Inc. | | | 148,509 | |
| | 2,320 | | | Benchmark Electronics Inc.* | | | 55,958 | |
| | 7,662 | | | CDW Corp. | | | 342,108 | |
| | 3,870 | | | Cognex Corp. | | | 192,571 | |
| | 1,145 | | | Coherent Inc.* | | | 120,431 | |
| | 1,111 | | | Control4 Corp.* | | | 12,277 | |
| | 1,410 | | | CTS Corp. | | | 27,185 | |
| | 1,833 | | | Daktronics Inc. | | | 17,469 | |
| | 2,401 | | | Dolby Laboratories Inc., Class A Shares | | | 117,505 | |
| | 857 | | | DTS Inc. | | | 28,675 | |
| | 1,120 | | | Electro Scientific Industries Inc.* | | | 6,238 | |
| | 285 | | | ePlus Inc.* | | | 25,795 | |
| | 1,615 | | | Fabrinet* | | | 62,694 | |
| | 734 | | | FARO Technologies Inc.* | | | 23,928 | |
| | 1,944 | | | FEI Co. | | | 206,978 | |
| | 5,968 | | | Fitbit Inc., Class A Shares* | | | 92,385 | |
| | 6,562 | | | FLIR Systems Inc. | | | 202,306 | |
| | 22,976 | | | II-VI Inc.* | | | 486,861 | |
| | 6,878 | | | Ingram Micro Inc., Class A Shares | | | 240,455 | |
| | 1,711 | | | Insight Enterprises Inc.* | | | 52,357 | |
| | 4,076 | | | InvenSense Inc., Class A Shares*(a) | | | 30,325 | |
| | 1,680 | | | IPG Photonics Corp.* | | | 146,126 | |
| | 16,879 | | | Itron Inc.* | | | 803,947 | |
| | 8,928 | | | Jabil Circuit Inc. | | | 189,184 | |
| | 85,304 | | | Keysight Technologies Inc.* | | | 2,595,801 | |
| | 1,224 | | | Kimball Electronics Inc.* | | | 14,835 | |
| | 4,107 | | | Knowles Corp.*(a) | | | 57,087 | |
| | 1,047 | | | Littelfuse Inc. | | | 132,760 | |
| | 46,721 | | | Maxwell Technologies Inc.*(a) | | | 236,876 | |
| | 139 | | | Mesa Laboratories Inc. | | | 15,618 | |
| | 1,687 | | | Methode Electronics Inc. | | | 61,829 | |
| | 740 | | | MTS Systems Corp. | | | 36,815 | |
| | 4,932 | | | National Instruments Corp. | | | 137,800 | |
| | 1,381 | | | Novanta Inc.* | | | 23,325 | |
| | 34,450 | | | Orbotech Ltd.* | | | 984,581 | |
| | 7,814 | | | OSI Systems Inc.* | | | 524,007 | |
| | 999 | | | Park Electrochemical Corp. | | | 16,523 | |
| | 478 | | | PC Connection Inc. | | | 12,461 | |
| | 1,572 | | | Plexus Corp.* | | | 72,548 | |
| | 1,285 | | | Radisys Corp.* | | | 6,309 | |
| | 1,240 | | | Rofin-Sinar Technologies Inc.* | | | 39,692 | |
| | 826 | | | Rogers Corp.* | | | 46,182 | |
| | 3,451 | | | Sanmina Corp.* | | | 90,692 | |
| | 1,179 | | | ScanSource Inc.* | | | 40,334 | |
See Notes to Financial Statements.
95
| | | | | | | | |
| Small-Mid Cap Equity Fund | |
| | |
| Shares/Units | | | Security | | Value | |
| INFORMATION TECHNOLOGY — 18.8% — (continued) | |
| Electronic Equipment, Instruments & Components — 2.5% — (continued) | |
| | 1,387 | | | SYNNEX Corp. | | $ | 147,258 | |
| | 642 | | | Systemax Inc. | | | 5,200 | |
| | 1,657 | | | Tech Data Corp.* | | | 123,016 | |
| | 11,954 | | | Trimble Navigation Ltd.* | | | 327,540 | |
| | 3,388 | | | TTM Technologies Inc.* | | | 36,353 | |
| | 10,830 | | | Universal Display Corp.* | | | 623,700 | |
| | 20,878 | | | VeriFone Systems Inc.* | | | 414,637 | |
| | 6,357 | | | Vishay Intertechnology Inc. | | | 90,015 | |
| | 461 | | | Vishay Precision Group Inc.* | | | 7,039 | |
| | 2,478 | | | Zebra Technologies Corp., Class A Shares* | | | 173,361 | |
| | | | | | | | |
| | | | Total Electronic Equipment, Instruments & Components | | | 11,996,987 | |
| | | | | | | | |
| Internet Software & Services — 1.1% | |
| | 1,709 | | | 2U Inc.* | | | 60,396 | |
| | 1,710 | | | Actua Corp.* | | | 17,408 | |
| | 438 | | | Alarm.com Holdings Inc.*(a) | | | 12,014 | |
| | 934 | | | Amber Road Inc.* | | | 9,798 | |
| | 1,921 | | | Angie’s List Inc.* | | | 19,517 | |
| | 764 | | | Apigee Corp.*(a) | | | 11,697 | |
| | 285 | | | Appfolio Inc., Class A Shares* | | | 5,250 | |
| | 258 | | | Autobytel Inc.* | | | 4,231 | |
| | 37,394 | | | Bankrate Inc.* | | | 293,169 | |
| | 3,781 | | | Bazaarvoice Inc.* | | | 15,124 | |
| | 580 | | | Benefitfocus Inc.*(a) | | | 23,426 | |
| | 1,807 | | | Blucora Inc.* | | | 18,702 | |
| | 2,221 | | | Box Inc., Class A Shares* | | | 30,517 | |
| | 1,464 | | | Brightcove Inc.* | | | 18,871 | |
| | 762 | | | Carbonite Inc.* | | | 10,638 | |
| | 755 | | | Care.com Inc.* | | | 7,905 | |
| | 1,202 | | | ChannelAdvisor Corp.* | | | 14,965 | |
| | 1,184 | | | Cimpress NV* | | | 117,536 | |
| | 652 | | | CommerceHub Inc., Series A* | | | 9,643 | |
| | 1,305 | | | CommerceHub Inc., Series C* | | | 19,223 | |
| | 2,238 | | | comScore Inc.* | | | 69,042 | |
| | 2,387 | | | Cornerstone OnDemand Inc.* | | | 104,837 | |
| | 8,422 | | | CoStar Group Inc.* | | | 1,745,459 | |
| | 1,480 | | | Cvent Inc.* | | | 48,366 | |
| | 2,559 | | | DHI Group Inc.* | | | 19,807 | |
| | 4,768 | | | EarthLink Holdings Corp. | | | 30,372 | |
| | 2,694 | | | Endurance International Group Holdings Inc.*(a) | | | 21,417 | |
| | 1,936 | | | Envestnet Inc.* | | | 76,491 | |
| | 1,517 | | | Everyday Health Inc.* | | | 11,620 | |
| | 1,569 | | | Five9 Inc.* | | | 23,519 | |
| | 479 | | | Global Sources Ltd.* | | | 3,990 | |
| | 2,186 | | | GoDaddy Inc., Class A Shares* | | | 70,783 | |
| | 2,684 | | | Gogo Inc.*(a) | | | 32,825 | |
| | 3,822 | | | GrubHub Inc.*(a) | | | 155,059 | |
| | 1,321 | | | GTT Communications Inc.* | | | 28,045 | |
| | 2,035 | | | Hortonworks Inc.*(a) | | | 16,219 | |
| | 3,337 | | | IAC/InterActiveCorp. | | | 195,915 | |
| | 2,648 | | | inContact Inc.* | | | 36,781 | |
| | 524 | | | Instructure Inc.* | | | 12,539 | |
| | 2,008 | | | IntraLinks Holdings Inc.* | | | 19,156 | |
| | 2,223 | | | j2 Global Inc. | | | 151,542 | |
| | 2,946 | | | Limelight Networks Inc.* | | | 5,244 | |
See Notes to Financial Statements.
96
| | | | | | | | |
| Small-Mid Cap Equity Fund | |
| | |
| Shares/Units | | | Security | | Value | |
| INFORMATION TECHNOLOGY — 18.8% — (continued) | |
| Internet Software & Services — 1.1% — (continued) | |
| | 1,072 | | | Liquidity Services Inc.* | | $ | 10,720 | |
| | 2,599 | | | LivePerson Inc.* | | | 20,246 | |
| | 1,194 | | | LogMeIn Inc. | | | 99,699 | |
| | 1,380 | | | Marchex Inc., Class B Shares* | | | 3,809 | |
| | 1,403 | | | Match Group Inc.* | | | 22,715 | |
| | 2,129 | | | MeetMe Inc.* | | | 12,263 | |
| | 791 | | | MINDBODY Inc., Class A Shares* | | | 13,724 | |
| | 4,379 | | | Monster Worldwide Inc.* | | | 16,027 | |
| | 1,015 | | | New Relic Inc.* | | | 37,251 | |
| | 2,975 | | | NIC Inc. | | | 68,366 | |
| | 383 | | | Numerex Corp., Class A Shares* | | | 2,869 | |
| | 10,490 | | | Pandora Media Inc.*(a) | | | 146,860 | |
| | 1,174 | | | Q2 Holdings Inc.* | | | 33,248 | |
| | 1,618 | | | QuinStreet Inc.* | | | 4,951 | |
| | 2,915 | | | Quotient Technology Inc.*(a) | | | 37,778 | |
| | 5,114 | | | Rackspace Hosting Inc.* | | | 160,835 | |
| | 1,166 | | | RealNetworks Inc.* | | | 5,585 | |
| | 303 | | | Reis Inc. | | | 5,909 | |
| | 1,869 | | | RetailMeNot Inc.* | | | 21,138 | |
| | 344 | | | Rightside Group Ltd.* | | | 3,244 | |
| | 880 | | | Shutterstock Inc.*(a) | | | 51,022 | |
| | 773 | | | SPS Commerce Inc.* | | | 50,461 | |
| | 757 | | | Stamps.com Inc.*(a) | | | 73,217 | |
| | 831 | | | TechTarget Inc.* | | | 6,698 | |
| | 2,624 | | | TrueCar Inc.*(a) | | | 25,322 | |
| | 1,940 | | | Web.com Group Inc.* | | | 33,872 | |
| | 1,752 | | | WebMD Health Corp., Class A Shares* | | | 90,351 | |
| | 1,073 | | | Xactly Corp.* | | | 14,947 | |
| | 1,221 | | | XO Group Inc.* | | | 22,759 | |
| | 3,248 | | | Yelp Inc., Class A Shares* | | | 124,983 | |
| | 2,424 | | | Zillow Group Inc., Class A Shares*(a) | | | 82,004 | |
| | 4,873 | | | Zillow Group Inc., Class C Shares*(a) | | | 164,951 | |
| | | | | | | | |
| | | | Total Internet Software & Services | | | 5,066,882 | |
| | | | | | | | |
| IT Services — 4.1% | |
| | 40,172 | | | Acxiom Corp.* | | | 1,044,070 | |
| | 652 | | | ALJ Regional Holdings Inc.* | | | 2,980 | |
| | 2,942 | | | Alliance Data Systems Corp.* | | | 601,874 | |
| | 1,143 | | | Black Knight Financial Services Inc., Class A Shares* | | | 44,600 | |
| | 2,581 | | | Blackhawk Network Holdings Inc., Class A Shares* | | | 88,399 | |
| | 5,432 | | | Booz Allen Hamilton Holding Corp., Class A Shares | | | 164,916 | |
| | 5,599 | | | Broadridge Financial Solutions Inc. | | | 388,011 | |
| | 1,154 | | | CACI International Inc., Class A Shares* | | | 114,661 | |
| | 2,141 | | | Cardtronics PLC, Class A Shares* | | | 96,152 | |
| | 505 | | | Cass Information Systems Inc. | | | 28,911 | |
| | 4,242 | | | Convergys Corp. | | | 126,539 | |
| | 33,337 | | | CoreLogic Inc.* | | | 1,367,484 | |
| | 1,498 | | | CSG Systems International Inc. | | | 65,493 | |
| | 7,802 | | | CSRA Inc. | | | 198,093 | |
| | 792 | | | Datalink Corp.* | | | 7,714 | |
| | 6,257 | | | DST Systems Inc. | | | 760,288 | |
| | 2,288 | | | EPAM Systems Inc.* | | | 156,064 | |
| | 59,050 | | | Euronet Worldwide Inc.* | | | 4,582,871 | |
| | 2,936 | | | EVERTEC Inc. | | | 50,088 | |
| | 1,534 | | | ExlService Holdings Inc.* | | | 78,510 | |
See Notes to Financial Statements.
97
| | | | | | | | |
| Small-Mid Cap Equity Fund | |
| | |
| Shares/Units | | | Security | | Value | |
| INFORMATION TECHNOLOGY — 18.8% — (continued) | |
| IT Services — 4.1% — (continued) | |
| | 490 | | | Forrester Research Inc. | | $ | 20,080 | |
| | 10,214 | | | Gartner Inc.* | | | 929,474 | |
| | 27,337 | | | Genpact Ltd.* | | | 646,793 | |
| | 19,153 | | | Global Payments Inc. | | | 1,454,670 | |
| | 1,037 | | | Hackett Group Inc. (The) | | | 16,955 | |
| | 1,769 | | | Information Services Group Inc.* | | | 6,722 | |
| | 18,500 | | | InterXion Holding NV* | | | 690,050 | |
| | 10,822 | | | Jack Henry & Associates Inc. | | | 944,436 | |
| | 6,344 | | | Leidos Holdings Inc. | | | 256,995 | |
| | 2,467 | | | Lionbridge Technologies Inc.* | | | 12,014 | |
| | 1,144 | | | ManTech International Corp., Class A Shares | | | 45,806 | |
| | 3,057 | | | MAXIMUS Inc. | | | 179,813 | |
| | 40,340 | | | MoneyGram International Inc.* | | | 293,272 | |
| | 231 | | | NCI Inc., Class A Shares | | | 2,786 | |
| | 33,700 | | | NeuStar Inc., Class A Shares*(a) | | | 856,317 | |
| | 1,683 | | | Perficient Inc.* | | | 33,610 | |
| | 940 | | | PFSweb Inc.* | | | 9,071 | |
| | 2,390 | | | Planet Payment Inc.* | | | 8,580 | |
| | 29,589 | | | Sabre Corp. | | | 832,930 | |
| | 2,015 | | | Science Applications International Corp. | | | 128,577 | |
| | 3,090 | | | ServiceSource International Inc.* | | | 15,635 | |
| | 2,361 | | | Square Inc., Class A Shares* | | | 28,781 | |
| | 1,928 | | | Sykes Enterprises Inc.* | | | 56,355 | |
| | 1,580 | | | Syntel Inc.* | | | 72,949 | |
| | 854 | | | TeleTech Holdings Inc. | | | 24,211 | |
| | 6,184 | | | Teradata Corp.* | | | 196,218 | |
| | 5,424 | | | Travelport Worldwide Ltd. | | | 74,472 | |
| | 2,436 | | | Unisys Corp.* | | | 24,604 | |
| | 16,854 | | | Vantiv Inc., Class A Shares* | | | 905,734 | |
| | 1,387 | | | Virtusa Corp.* | | | 36,381 | |
| | 1,841 | | | WEX Inc.* | | | 182,830 | |
| | 17,140 | | | WNS Holdings Ltd., ADR* | | | 502,716 | |
| | | | | | | | |
| | | | Total IT Services | | | 19,457,555 | |
| | | | | | | | |
| Semiconductors & Semiconductor Equipment — 3.2% | |
| | 251 | | | Acacia Communications Inc.*(a) | | | 28,024 | |
| | 1,849 | | | Advanced Energy Industries Inc.* | | | 81,264 | |
| | 30,947 | | | Advanced Micro Devices Inc.* | | | 229,008 | |
| | 891 | | | Alpha & Omega Semiconductor Ltd.* | | | 18,773 | |
| | 1,506 | | | Ambarella Inc.* | | | 108,492 | |
| | 4,668 | | | Amkor Technology Inc.* | | | 42,479 | |
| | 3,850 | | | Applied Micro Circuits Corp.* | | | 26,873 | |
| | 1,358 | | | Axcelis Technologies Inc.* | | | 15,929 | |
| | 3,341 | | | Brooks Automation Inc. | | | 42,130 | |
| | 1,086 | | | Cabot Microelectronics Corp. | | | 53,996 | |
| | 3,054 | | | Cavium Inc.* | | | 170,047 | |
| | 13,690 | | | CEVA Inc.* | | | 430,961 | |
| | 2,955 | | | Cirrus Logic Inc.* | | | 149,966 | |
| | 1,375 | | | Cohu Inc. | | | 14,946 | |
| | 4,704 | | | Cree Inc.* | | | 112,943 | |
| | 54,775 | | | Cypress Semiconductor Corp. | | | 653,466 | |
| | 1,720 | | | Diodes Inc.* | | | 35,415 | |
| | 791 | | | DSP Group Inc.* | | | 9,128 | |
| | 6,661 | | | Entegris Inc.* | | | 113,504 | |
| | 1,871 | | | Exar Corp.* | | | 17,026 | |
See Notes to Financial Statements.
98
| | | | | | | | |
| Small-Mid Cap Equity Fund | |
| | |
| Shares/Units | | | Security | | Value | |
| INFORMATION TECHNOLOGY — 18.8% — (continued) | |
| Semiconductors & Semiconductor Equipment — 3.2% — (continued) | |
| | 5,531 | | | Fairchild Semiconductor International Inc., Class A Shares* | | $ | 110,067 | |
| | 3,598 | | | First Solar Inc.* | | | 136,076 | |
| | 49,691 | | | FormFactor Inc.* | | | 514,302 | |
| | 3,371 | | | GigPeak Inc.* | | | 6,338 | �� |
| | 10,657 | | | Inphi Corp.* | | | 458,997 | |
| | 6,343 | | | Integrated Device Technology Inc.* | | | 127,431 | |
| | 6,262 | | | Intersil Corp., Class A Shares | | | 123,612 | |
| | 1,239 | | | IXYS Corp. | | | 14,397 | |
| | 3,077 | | | Kopin Corp.* | | | 6,646 | |
| | 10,328 | | | Lam Research Corp. | | | 963,809 | |
| | 5,913 | | | Lattice Semiconductor Corp.* | | | 36,365 | |
| | 15,964 | | | MACOM Technology Solutions Holdings Inc.* | | | 657,717 | |
| | 19,109 | | | Marvell Technology Group Ltd. | | | 236,952 | |
| | 2,717 | | | MaxLinear Inc., Class A Shares* | | | 52,085 | |
| | 14,400 | | | Mellanox Technologies Ltd.* | | | 631,296 | |
| | 42,295 | | | Microsemi Corp.* | | | 1,690,108 | |
| | 2,513 | | | MKS Instruments Inc. | | | 122,484 | |
| | 18,596 | | | Monolithic Power Systems Inc. | | | 1,426,685 | |
| | 1,210 | | | Nanometrics Inc.* | | | 24,611 | |
| | 1,517 | | | NeoPhotonics Corp.* | | | 22,649 | |
| | 260 | | | NVE Corp. | | | 15,093 | |
| | 6,260 | | | NXP Semiconductors NV* | | | 551,005 | |
| | 19,677 | | | ON Semiconductor Corp.* | | | 212,512 | |
| | 1,232 | | | PDF Solutions Inc.* | | | 20,636 | |
| | 3,215 | | | Photronics Inc.* | | | 30,735 | |
| | 1,267 | | | Power Integrations Inc. | | | 73,993 | |
| | 18,787 | | | Qorvo Inc.* | | | 1,078,937 | |
| | 81,881 | | | Rambus Inc.* | | | 1,131,595 | |
| | 15,746 | | | Rudolph Technologies Inc.* | | | 276,185 | |
| | 3,140 | | | Semtech Corp.* | | | 83,524 | |
| | 1,790 | | | Sigma Designs Inc.* | | | 13,443 | |
| | 1,940 | | | Silicon Laboratories Inc.* | | | 111,162 | |
| | 2,834 | | | SunPower Corp., Class A Shares* | | | 28,227 | |
| | 1,743 | | | Synaptics Inc.* | | | 99,299 | |
| | 9,653 | | | Teradyne Inc. | | | 203,292 | |
| | 2,267 | | | Tessera Technologies Inc. | | | 76,035 | |
| | 1,249 | | | Ultra Clean Holdings Inc.* | | | 9,080 | |
| | 44,876 | | | Ultratech Inc.* | | | 1,122,349 | |
| | 28,119 | | | Veeco Instruments Inc.* | | | 553,101 | |
| | 2,704 | | | Xcerra Corp.* | | | 15,845 | |
| | | | | | | | |
| | | | Total Semiconductors & Semiconductor Equipment | | | 15,423,045 | |
| | | | | | | | |
| Software — 5.8% | |
| | 4,055 | | | 8x8 Inc.* | | | 53,810 | |
| | 2,148 | | | A10 Networks Inc.* | | | 21,158 | |
| | 5,458 | | | ACI Worldwide Inc.* | | | 104,248 | |
| | 32,002 | | | Activision Blizzard Inc. | | | 1,323,923 | |
| | 1,467 | | | American Software Inc., Class A Shares | | | 15,271 | |
| | 4,176 | | | ANSYS Inc.* | | | 397,096 | |
| | 3,924 | | | Aspen Technology Inc.* | | | 178,385 | |
| | 1,182 | | | Atlassian Corp. PLC, Class A Shares* | | | 34,845 | |
| | 2,095 | | | AVG Technologies NV* | | | 52,082 | |
| | 963 | | | Barracuda Networks Inc.* | | | 22,342 | |
| | 2,228 | | | Blackbaud Inc. | | | 150,100 | |
| | 1,864 | | | Bottomline Technologies de Inc.* | | | 43,040 | |
See Notes to Financial Statements.
99
| | | | | | | | |
| Small-Mid Cap Equity Fund | |
| | |
| Shares/Units | | | Security | | Value | |
| INFORMATION TECHNOLOGY — 18.8% — (continued) | |
| Software — 5.8% — (continued) | |
| | 30,058 | | | BroadSoft Inc.* | | $ | 1,373,951 | |
| | 88,468 | | | Cadence Design Systems Inc.* | | | 2,250,626 | |
| | 2,575 | | | Callidus Software Inc.* | | | 49,749 | |
| | 25,313 | | | CDK Global Inc. | | | 1,467,648 | |
| | 17,538 | | | CommVault Systems Inc.* | | | 903,909 | |
| | 64,986 | | | Covisint Corp.* | | | 144,269 | |
| | 459 | | | Digimarc Corp.*(a) | | | 16,579 | |
| | 1,167 | | | Ebix Inc.(a) | | | 66,519 | |
| | 22,623 | | | Electronic Arts Inc.* | | | 1,837,666 | |
| | 1,549 | | | Ellie Mae Inc.* | | | 151,601 | |
| | 1,037 | | | EnerNOC Inc.* | | | 5,921 | |
| | 1,032 | | | Epiq Systems Inc. | | | 16,945 | |
| | 738 | | | Exa Corp.* | | | 11,719 | |
| | 5,249 | | | Fair Isaac Corp. | | | 671,557 | |
| | 7,211 | | | FireEye Inc.* | | | 103,550 | |
| | 1,853 | | | Fleetmatics Group PLC* | | | 110,939 | |
| | 71,237 | | | Fortinet Inc.* | | | 2,574,505 | |
| | 1,516 | | | Gigamon Inc.* | | | 67,007 | |
| | 1,175 | | | Globant SA* | | | 45,884 | |
| | 5,035 | | | Glu Mobile Inc.*(a) | | | 11,832 | |
| | 750 | | | Guidance Software Inc.*(a) | | | 4,463 | |
| | 3,449 | | | Guidewire Software Inc.* | | | 212,217 | |
| | 1,362 | | | HubSpot Inc.* | | | 75,918 | |
| | 1,331 | | | Imperva Inc.* | | | 59,908 | |
| | 2,609 | | | Infoblox Inc.* | | | 55,989 | |
| | 838 | | | Interactive Intelligence Group Inc.* | | | 50,154 | |
| | 2,767 | | | Jive Software Inc.* | | | 11,677 | |
| | 3,414 | | | Manhattan Associates Inc.* | | | 206,615 | |
| | 5,064 | | | Mentor Graphics Corp. | | | 121,587 | |
| | 445 | | | MicroStrategy Inc., Class A Shares* | | | 74,222 | |
| | 1,176 | | | Mitek Systems Inc.*(a) | | | 9,138 | |
| | 1,515 | | | MobileIron Inc.* | | | 4,560 | |
| | 9,385 | | | Mobileye NV* | | | 458,833 | |
| | 975 | | | Model N Inc.* | | | 10,452 | |
| | 1,837 | | | Monotype Imaging Holdings Inc. | | | 38,761 | |
| | 1,892 | | | NetSuite Inc.* | | | 206,039 | |
| | 65,166 | | | Nuance Communications Inc.* | | | 950,120 | |
| | 844 | | | Park City Group Inc.*(a) | | | 8,178 | |
| | 2,071 | | | Paycom Software Inc.* | | | 106,325 | |
| | 1,057 | | | Paylocity Holding Corp.* | | | 47,597 | |
| | 1,744 | | | Pegasystems Inc. | | | 44,908 | |
| | 2,343 | | | Progress Software Corp.* | | | 67,970 | |
| | 7,457 | | | Proofpoint Inc.* | | | 573,816 | |
| | 1,163 | | | PROS Holdings Inc.* | | | 22,888 | |
| | 5,414 | | | PTC Inc.* | | | 231,015 | |
| | 367 | | | QAD Inc., Class A Shares | | | 8,503 | |
| | 1,263 | | | Qualys Inc.* | | | 43,447 | |
| | 6,882 | | | Rapid7 Inc.*(a) | | | 123,670 | |
| | 2,543 | | | RealPage Inc.* | | | 65,457 | |
| | 13,287 | | | Red Hat Inc.* | | | 969,685 | |
| | 2,753 | | | RingCentral Inc., Class A Shares* | | | 60,428 | |
| | 699 | | | Rosetta Stone Inc.* | | | 6,179 | |
| | 53,000 | | | Rovi Corp.* | | | 1,084,910 | |
| | 1,908 | | | Rubicon Project Inc. (The)* | | | 16,218 | |
| | 1,140 | | | Sapiens International Corp. NV | | | 15,333 | |
See Notes to Financial Statements.
100
| | | | | | | | |
| Small-Mid Cap Equity Fund | |
| | |
| Shares/Units | | | Security | | Value | |
| INFORMATION TECHNOLOGY — 18.8% — (continued) | |
| Software — 5.8% — (continued) | |
| | 56,800 | | | Seachange International Inc.* | | $ | 165,856 | |
| | 208 | | | SecureWorks Corp., Class A Shares* | | | 2,954 | |
| | 40,504 | | | Silver Spring Networks Inc.* | | | 552,880 | |
| | 6,227 | | | Splunk Inc.* | | | 362,660 | |
| | 7,988 | | | SS&C Technologies Holdings Inc. | | | 263,205 | |
| | 1,942 | | | Synchronoss Technologies Inc.* | | | 81,078 | |
| | 7,156 | | | Synopsys Inc.* | | | 424,279 | |
| | 2,622 | | | Tableau Software Inc., Class A Shares* | | | 152,155 | |
| | 3,950 | | | Take-Two Interactive Software Inc.* | | | 171,706 | |
| | 1,521 | | | Tangoe Inc.* | | | 14,130 | |
| | 1,707 | | | Telenav Inc.* | | | 9,952 | |
| | 4,637 | | | TiVo Inc.* | | | 49,199 | |
| | 1,184 | | | TubeMogul Inc.*(a) | | | 10,751 | |
| | 1,575 | | | Tyler Technologies Inc.* | | | 258,221 | |
| | 9,292 | | | Ultimate Software Group Inc. (The)* | | | 1,941,470 | |
| | 501 | | | Varonis Systems Inc.* | | | 14,805 | |
| | 1,514 | | | VASCO Data Security International Inc.* | | | 27,600 | |
| | 33,538 | | | Verint Systems Inc.* | | | 1,144,317 | |
| | 1,760 | | | VirnetX Holding Corp.*(a) | | | 4,664 | |
| | 1,080 | | | Workiva Inc., Class A Shares*(a) | | | 19,289 | |
| | 43,770 | | | Zendesk Inc.* | | | 1,336,736 | |
| | 2,104 | | | Zix Corp.* | | | 8,016 | |
| | 34,455 | | | Zynga Inc., Class A Shares* | | | 94,062 | |
| | | | | | | | |
| | | | Total Software | | | 27,435,841 | |
| | | | | | | | |
| Technology Hardware, Storage & Peripherals — 0.5% | |
| | 5,020 | | | 3D Systems Corp.*(a) | | | 72,790 | |
| | 1,660 | | | Avid Technology Inc.* | | | 14,923 | |
| | 778 | | | CPI Card Group Inc.(a) | | | 4,295 | |
| | 1,965 | | | Cray Inc.* | | | 44,998 | |
| | 3,246 | | | Diebold Inc. | | | 91,083 | |
| | 913 | | | Eastman Kodak Co.* | | | 14,142 | |
| | 31,932 | | | Electronics for Imaging Inc.* | | | 1,503,359 | |
| | 1,538 | | | Immersion Corp.* | | | 11,150 | |
| | 2,913 | | | Lexmark International Inc., Class A Shares | | | 104,315 | |
| | 5,882 | | | NCR Corp.* | | | 199,106 | |
| | 2,977 | | | Nimble Storage Inc.*(a) | | | 24,471 | |
| | 3,014 | | | Pure Storage Inc., Class A Shares*(a) | | | 35,294 | |
| | 138,800 | | | Quantum Corp.* | | | 88,999 | |
| | 1,854 | | | Silicon Graphics International Corp.* | | | 14,294 | |
| | 2,275 | | | Stratasys Ltd.* | | | 48,548 | |
| | 1,900 | | | Super Micro Computer Inc.* | | | 41,097 | |
| | 1,374 | | | USA Technologies Inc.* | | | 6,843 | |
| | | | | | | | |
| | | | Total Technology Hardware, Storage & Peripherals | | | 2,319,707 | |
| | | | | | | | |
| | | | TOTAL INFORMATION TECHNOLOGY | | | 89,135,156 | |
| | | | | | | | |
| MATERIALS — 5.9% | |
| Chemicals — 2.3% | |
| | 1,308 | | | A Schulman Inc. | | | 33,354 | |
| | 1,201 | | | AgroFresh Solutions Inc.*(a) | | | 7,290 | |
| | 24,334 | | | Albemarle Corp. | | | 1,945,990 | |
| | 1,267 | | | American Vanguard Corp. | | | 21,349 | |
| | 2,942 | | | Ashland Inc. | | | 344,449 | |
| | 7,801 | | | Axalta Coating Systems Ltd.* | | | 223,265 | |
| | 1,500 | | | Balchem Corp. | | | 105,045 | |
See Notes to Financial Statements.
101
| | | | | | | | |
| Small-Mid Cap Equity Fund | |
| | |
| Shares/Units | | | Security | | Value | |
| MATERIALS — 5.9% — (continued) | |
| Chemicals — 2.3% — (continued) | |
| | 2,899 | | | Cabot Corp. | | $ | 144,544 | |
| | 2,478 | | | Calgon Carbon Corp. | | | 35,931 | |
| | 324 | | | Chase Corp. | | | 20,856 | |
| | 8,661 | | | Chemours Co. (The) | | | 114,239 | |
| | 77,052 | | | Chemtura Corp.* | | | 2,310,789 | |
| | 1,153 | | | Codexis Inc.* | | | 4,808 | |
| | 3,826 | | | Ferro Corp.* | | | 51,039 | |
| | 2,655 | | | Flotek Industries Inc.*(a) | | | 41,153 | |
| | 1,322 | | | FutureFuel Corp. | | | 15,454 | |
| | 3,331 | | | GCP Applied Technologies Inc.* | | | 97,465 | |
| | 436 | | | Hawkins Inc. | | | 19,044 | |
| | 2,346 | | | HB Fuller Co. | | | 111,388 | |
| | 9,460 | | | Huntsman Corp. | | | 163,563 | |
| | 2,024 | | | Ingevity Corp.* | | | 89,825 | |
| | 5,474 | | | Innophos Holdings Inc. | | | 231,112 | |
| | 1,097 | | | Innospec Inc. | | | 65,030 | |
| | 340 | | | KMG Chemicals Inc. | | | 9,540 | |
| | 920 | | | Koppers Holdings Inc.* | | | 30,029 | |
| | 1,444 | | | Kraton Performance Polymers Inc.* | | | 52,071 | |
| | 1,013 | | | Kronos Worldwide Inc.(a) | | | 9,006 | |
| | 973 | | | LSB Industries Inc.*(a) | | | 11,676 | |
| | 1,647 | | | Minerals Technologies Inc. | | | 116,229 | |
| | 349 | | | NewMarket Corp. | | | 151,449 | |
| | 7,836 | | | Olin Corp. | | | 169,571 | |
| | 2,035 | | | OMNOVA Solutions Inc.* | | | 20,350 | |
| | 7,755 | | | Platform Specialty Products Corp.*(a) | | | 70,183 | |
| | 38,264 | | | PolyOne Corp. | | | 1,318,960 | |
| | 596 | | | Quaker Chemical Corp. | | | 59,600 | |
| | 2,150 | | | Rayonier Advanced Materials Inc. | | | 26,445 | |
| | 6,174 | | | RPM International Inc. | | | 336,668 | |
| | 2,144 | | | Scotts Miracle-Gro Co. (The), Class A Shares | | | 177,523 | |
| | 2,103 | | | Sensient Technologies Corp. | | | 154,003 | |
| | 4,300 | | | Sherwin-Williams Co. (The) | | | 1,219,953 | |
| | 953 | | | Stepan Co. | | | 66,958 | |
| | 3,199 | | | TerraVia Holdings Inc.* | | | 8,477 | |
| | 1,070 | | | Trecora Resources* | | | 11,684 | |
| | 1,189 | | | Tredegar Corp. | | | 22,401 | |
| | 1,338 | | | Trinseo SA | | | 77,417 | |
| | 3,109 | | | Tronox Ltd., Class A Shares | | | 28,385 | |
| | 1,313 | | | Valhi Inc.* | | | 3,348 | |
| | 3,720 | | | Valspar Corp. (The) | | | 392,125 | |
| | 1,838 | | | Westlake Chemical Corp. | | | 95,245 | |
| | 3,345 | | | WR Grace & Co. | | | 261,345 | |
| | | | | | | | |
| | | | Total Chemicals | | | 11,097,623 | |
| | | | | | | | |
| Construction Materials — 0.6% | |
| | 14,588 | | | Eagle Materials Inc. | | | 1,172,438 | |
| | 39,542 | | | Headwaters Inc.* | | | 716,897 | |
| | 3,976 | | | Martin Marietta Materials Inc. | | | 727,727 | |
| | 3,692 | | | Summit Materials Inc., Class A Shares* | | | 72,880 | |
| | 126 | | | United States Lime & Minerals Inc. | | | 8,080 | |
| | 714 | | | US Concrete Inc.* | | | 37,856 | |
| | | | | | | | |
| | | | Total Construction Materials | | | 2,735,878 | |
| | | | | | | | |
See Notes to Financial Statements.
102
| | | | | | | | |
| Small-Mid Cap Equity Fund | |
| | |
| Shares/Units | | | Security | | Value | |
| MATERIALS — 5.9% — (continued) | |
| Containers & Packaging — 1.5% | |
| | 189 | | | AEP Industries Inc. | | $ | 20,903 | |
| | 2,927 | | | AptarGroup Inc. | | | 228,248 | |
| | 16,816 | | | Avery Dennison Corp. | | | 1,302,231 | |
| | 4,465 | | | Bemis Co., Inc. | | | 234,859 | |
| | 52,165 | | | Berry Plastics Group Inc.* | | | 2,367,769 | |
| | 26,511 | | | Crown Holdings Inc.* | | | 1,437,692 | |
| | 15,271 | | | Graphic Packaging Holding Co. | | | 218,986 | |
| | 1,173 | | | Greif Inc., Class A Shares | | | 50,005 | |
| | 292 | | | Greif Inc., Class B Shares | | | 16,352 | |
| | 1,136 | | | Multi Packaging Solutions International Ltd.* | | | 15,927 | |
| | 854 | | | Myers Industries Inc. | | | 12,255 | |
| | 7,717 | | | Owens-Illinois Inc.* | | | 138,366 | |
| | 4,440 | | | Packaging Corp. of America | | | 349,117 | |
| | 9,327 | | | Sealed Air Corp. | | | 439,582 | |
| | 1,953 | | | Silgan Holdings Inc. | | | 93,978 | |
| | 4,710 | | | Sonoco Products Co. | | | 242,753 | |
| | 377 | | | UFP Technologies Inc.* | | | 9,365 | |
| | | | | | | | |
| | | | Total Containers & Packaging | | | 7,178,388 | |
| | | | | | | | |
| Metals & Mining — 1.4% | |
| | 11,645 | | | AK Steel Holding Corp.*(a) | | | 51,937 | |
| | 5,159 | | | Allegheny Technologies Inc.(a) | | | 88,013 | |
| | 230 | | | Ampco-Pittsburgh Corp. | | | 2,484 | |
| | 2,198 | | | Carpenter Technology Corp. | | | 79,743 | |
| | 2,595 | | | Century Aluminum Co.* | | | 16,297 | |
| | 76,863 | | | Cliffs Natural Resources Inc.* | | | 438,119 | |
| | 7,707 | | | Coeur Mining Inc.* | | | 98,187 | |
| | 5,426 | | | Commercial Metals Co. | | | 84,212 | |
| | 1,605 | | | Compass Minerals International Inc. | | | 119,621 | |
| | 3,346 | | | Ferroglobe PLC | | | 27,604 | |
| | 2,477 | | | Gold Resource Corp. | | | 12,930 | |
| | 50 | | | Handy & Harman Ltd.* | | | 1,117 | |
| | 576 | | | Haynes International Inc. | | | 21,249 | |
| | 18,023 | | | Hecla Mining Co.(a) | | | 100,568 | |
| | 630 | | | Kaiser Aluminum Corp. | | | 53,695 | |
| | 938 | | | Materion Corp. | | | 27,521 | |
| | 372 | | | Olympic Steel Inc. | | | 7,191 | |
| | 1,358 | | | Real Industry Inc.* | | | 9,329 | |
| | 37,449 | | | Reliance Steel & Aluminum Co. | | | 2,699,324 | |
| | 3,064 | | | Royal Gold Inc. | | | 224,652 | |
| | 704 | | | Ryerson Holding Corp.* | | | 8,511 | |
| | 76,771 | | | Schnitzer Steel Industries Inc., Class A Shares | | | 1,441,759 | |
| | 11,140 | | | Steel Dynamics Inc. | | | 274,267 | |
| | 5,740 | | | Stillwater Mining Co.* | | | 72,611 | |
| | 2,992 | | | SunCoke Energy Inc. | | | 19,508 | |
| | 14,246 | | | Tahoe Resources Inc. | | | 185,768 | |
| | 2,033 | | | TimkenSteel Corp.* | | | 20,025 | |
| | 7,322 | | | United States Steel Corp. | | | 142,340 | |
| | 2,119 | | | Worthington Industries Inc. | | | 90,905 | |
| | | | | | | | |
| | | | Total Metals & Mining | | | 6,419,487 | |
| | | | | | | | |
| Paper & Forest Products — 0.1% | |
| | 1,812 | | | Boise Cascade Co.* | | | 47,547 | |
| | 834 | | | Clearwater Paper Corp.* | | | 51,766 | |
| | 543 | | | Deltic Timber Corp. | | | 38,515 | |
See Notes to Financial Statements.
103
| | | | | | | | |
| Small-Mid Cap Equity Fund | |
| | |
| Shares/Units | | | Security | | Value | |
| MATERIALS — 5.9% — (continued) | |
| Paper & Forest Products — 0.1% — (continued) | |
| | 2,958 | | | Domtar Corp. | | $ | 110,392 | |
| | 4,025 | | | KapStone Paper and Packaging Corp. | | | 70,478 | |
| | 6,830 | | | Louisiana-Pacific Corp.* | | | 133,048 | |
| | 769 | | | Neenah Paper Inc. | | | 61,851 | |
| | 1,989 | | | PH Glatfelter Co. | | | 44,096 | |
| | 1,399 | | | Schweitzer-Mauduit International Inc. | | | 54,953 | |
| | | | | | | | |
| | | | Total Paper & Forest Products | | | 612,646 | |
| | | | | | | | |
| | | | TOTAL MATERIALS | | | 28,044,022 | |
| | | | | | | | |
| TELECOMMUNICATION SERVICES — 0.6% | |
| Diversified Telecommunication Services — 0.5% | |
| | 519 | | | ATN International Inc. | | | 33,911 | |
| | 10,246 | | | Cincinnati Bell Inc.* | | | 42,828 | |
| | 19,849 | | | Cogent Communications Holdings Inc. | | | 705,433 | |
| | 2,377 | | | Consolidated Communications Holdings Inc. | | | 57,167 | |
| | 932 | | | FairPoint Communications Inc.* | | | 12,992 | |
| | 55,501 | | | Frontier Communications Corp.(a) | | | 255,305 | |
| | 1,326 | | | General Communication Inc., Class A Shares* | | | 18,431 | |
| | 18,269 | | | Globalstar Inc.*(a) | | | 28,500 | |
| | 275 | | | Hawaiian Telcom Holdco Inc.* | | | 6,155 | |
| | 992 | | | IDT Corp., Class B Shares | | | 14,771 | |
| | 1,625 | | | Inteliquent Inc. | | | 27,040 | |
| | 1,074 | | | Intelsat SA* | | | 2,900 | |
| | 3,818 | | | Iridium Communications Inc.*(a) | | | 31,804 | |
| | 841 | | | Lumos Networks Corp.* | | | 11,564 | |
| | 2,911 | | | ORBCOMM Inc.* | | | 28,964 | |
| | 447 | | | pdvWireless Inc.* | | | 11,439 | |
| | 5,181 | | | SBA Communications Corp., Class A Shares* | | | 591,411 | |
| | 414 | | | Straight Path Communications Inc., Class B Shares*(a) | | | 9,812 | |
| | 8,790 | | | Vonage Holdings Corp.* | | | 51,070 | |
| | 4,420 | | | Windstream Holdings Inc.(a) | | | 37,614 | |
| | 7,777 | | | Zayo Group Holdings Inc.* | | | 225,611 | |
| | | | | | | | |
| | | | Total Diversified Telecommunication Services | | | 2,204,722 | |
| | | | | | | | |
| Wireless Telecommunication Services — 0.1% | |
| | 1,780 | | | Boingo Wireless Inc.* | | | 15,130 | |
| | 3,036 | | | NII Holdings Inc.* | | | 10,110 | |
| | 2,231 | | | Shenandoah Telecommunications Co. | | | 57,381 | |
| | 903 | | | Spok Holdings Inc. | | | 14,945 | |
| | 13,219 | | | Telephone & Data Systems Inc. | | | 368,413 | |
| | 6,830 | | | United States Cellular Corp.* | | | 254,213 | |
| | | | | | | | |
| | | | Total Wireless Telecommunication Services | | | 720,192 | |
| | | | | | | | |
| | | | TOTAL TELECOMMUNICATION SERVICES | | | 2,924,914 | |
| | | | | | | | |
| UTILITIES — 1.9% | |
| Electric Utilities — 0.6% | |
| | 2,340 | | | ALLETE Inc. | | | 138,762 | |
| | 10,758 | | | Alliant Energy Corp. | | | 408,266 | |
| | 1,923 | | | El Paso Electric Co. | | | 87,862 | |
| | 2,075 | | | Empire District Electric Co. (The) | | | 70,177 | |
| | 615 | | | Genie Energy Ltd., Class B Shares* | | | 3,924 | |
| | 7,351 | | | Great Plains Energy Inc. | | | 199,653 | |
| | 5,067 | | | Hawaiian Electric Industries Inc. | | | 152,061 | |
| | 2,354 | | | IDACORP Inc. | | | 179,069 | |
See Notes to Financial Statements.
104
| | | | | | | | |
| Small-Mid Cap Equity Fund | |
| | |
| Shares/Units | | | Security | | Value | |
| UTILITIES — 1.9% — (continued) | |
| Electric Utilities — 0.6% — (continued) | |
| | 7,120 | | | ITC Holdings Corp. | | $ | 321,966 | |
| | 1,656 | | | MGE Energy Inc. | | | 90,981 | |
| | 9,519 | | | OGE Energy Corp. | | | 296,326 | |
| | 1,799 | | | Otter Tail Corp. | | | 61,598 | |
| | 5,231 | | | Pinnacle West Capital Corp. | | | 392,534 | |
| | 3,767 | | | PNM Resources Inc. | | | 119,753 | |
| | 4,202 | | | Portland General Electric Co. | | | 176,946 | |
| | 251 | | | Spark Energy Inc., Class A Shares | | | 7,276 | |
| | 6,701 | | | Westar Energy Inc., Class A Shares | | | 368,153 | |
| | | | | | | | |
| | | | Total Electric Utilities | | | 3,075,307 | |
| | | | | | | | |
| Gas Utilities — 0.5% | |
| | 4,767 | | | Atmos Energy Corp. | | | 351,328 | |
| | 692 | | | Chesapeake Utilities Corp. | | | 44,046 | |
| | 397 | | | Delta Natural Gas Co., Inc.(a) | | | 9,877 | |
| | 3,615 | | | National Fuel Gas Co. | | | 206,272 | |
| | 4,033 | | | New Jersey Resources Corp. | | | 135,670 | |
| | 1,269 | | | Northwest Natural Gas Co. | | | 75,797 | |
| | 2,458 | | | ONE Gas Inc. | | | 150,503 | |
| | 3,816 | | | Piedmont Natural Gas Co., Inc. | | | 229,342 | |
| | 8,352 | | | Questar Corp. | | | 208,884 | |
| | 3,783 | | | South Jersey Industries Inc. | | | 112,280 | |
| | 2,222 | | | Southwest Gas Corp. | | | 155,140 | |
| | 2,097 | | | Spire Inc. | | | 135,676 | |
| | 8,165 | | | UGI Corp. | | | 371,344 | |
| | 2,369 | | | WGL Holdings Inc. | | | 148,868 | |
| | | | | | | | |
| | | | Total Gas Utilities | | | 2,335,027 | |
| | | | | | | | |
| Independent Power and Renewable Electricity Producers ��� 0.5% | |
| | 112,583 | | | Atlantic Power Corp. | | | 290,464 | |
| | 2,813 | | | Atlantica Yield PLC(a) | | | 53,194 | |
| | 17,082 | | | Calpine Corp.* | | | 213,183 | |
| | 27,473 | | | Dynegy Inc.* | | | 348,083 | |
| | 48,540 | | | NRG Energy Inc. | | | 587,819 | |
| | 1,588 | | | NRG Yield Inc., Class A Shares | | | 25,551 | |
| | 3,090 | | | NRG Yield Inc., Class C Shares(a) | | | 52,036 | |
| | 14,657 | | | Ormat Technologies Inc. | | | 709,399 | |
| | 3,144 | | | Pattern Energy Group Inc., Class A Shares | | | 74,827 | |
| | 3,965 | | | Talen Energy Corp.* | | | 54,757 | |
| | 4,599 | | | TerraForm Global Inc., Class A Shares(a) | | | 16,648 | |
| | 4,029 | | | TerraForm Power Inc., Class A Shares*(a) | | | 51,732 | |
| | 1,359 | | | Vivint Solar Inc.* | | | 4,322 | |
| | | | | | | | |
| | | | Total Independent Power and Renewable Electricity Producers | | | 2,482,015 | |
| | | | | | | | |
| Multi-Utilities — 0.2% | |
| | 2,948 | | | Avista Corp. | | | 119,748 | |
| | 2,441 | | | Black Hills Corp. | | | 142,823 | |
| | 9,266 | | | MDU Resources Group Inc. | | | 218,399 | |
| | 2,298 | | | NorthWestern Corp. | | | 132,870 | |
| | 685 | | | Unitil Corp. | | | 27,085 | |
| | 3,958 | | | Vectren Corp. | | | 193,586 | |
| | | | | | | | |
| | | | Total Multi-Utilities | | | 834,511 | |
| | | | | | | | |
| Water Utilities — 0.1% | |
| | 1,709 | | | American States Water Co. | | | 66,617 | |
| | 8,440 | | | Aqua America Inc. | | | 256,660 | |
See Notes to Financial Statements.
105
| | | | | | | | |
| Small-Mid Cap Equity Fund | |
| | |
| Shares/Units | | | Security | | Value | |
| UTILITIES — 1.9% — (continued) | |
| Water Utilities — 0.1% — (continued) | |
| | 427 | | | Artesian Resources Corp., Class A Shares | | $ | 11,730 | |
| | 2,240 | | | California Water Service Group | | | 68,297 | |
| | 483 | | | Connecticut Water Service Inc. | | | 22,397 | |
| | 557 | | | Consolidated Water Co., Ltd. | | | 7,063 | |
| | 370 | | | Global Water Resources Inc. | | | 2,953 | |
| | 713 | | | Middlesex Water Co. | | | 23,793 | |
| | 766 | | | SJW Corp. | | | 32,700 | |
| | 595 | | | York Water Co. (The) | | | 16,838 | |
| | | | | | | | |
| | | | Total Water Utilities | | | 509,048 | |
| | | | | | | | |
| | | | TOTAL UTILITIES | | | 9,235,908 | |
| | | | | | | | |
| | | | TOTAL COMMON STOCKS
(Cost — $397,824,303) | | | 458,723,006 | |
| | | | | | | | |
| PREFERRED STOCK — 0.1% | |
| UTILITIES — 0.1% | |
| Independent Power and Renewable Electricity Producers — 0.1% | |
| | 3,400 | | | Dynegy Inc., 7.000%
(Cost — $361,119) | | | 292,825 | |
| | | | | | | | |
| RIGHT — 0.0% | |
| ENERGY — 0.0% | |
| Oil, Gas & Consumable Fuels – 0.0% | |
| | 1,547 | | | Par Pacific Holdings Inc.*
(Cost — $0) | | | 60 | |
| | | | | | | | |
| | | | TOTAL INVESTMENTS BEFORE SHORT-TERM INVESTMENTS
(Cost — $398,185,422) | | | 459,015,891 | |
| | | | | | | | |
| | |
Face
Amount | | | | | | |
| SHORT-TERM INVESTMENTS (c) — 6.4% | |
| MONEY MARKET FUND — 3.9% | |
| $ | 18,447,756 | | | Invesco STIT — Government & Agency Portfolio(d)
(Cost — $18,447,756) | | | 18,447,756 | |
| | | | | | | | |
| TIME DEPOSITS — 2.5% | |
| | 1,538,403 | | | ANZ National Bank — London, 0.150% due 9/1/16 | | | 1,538,403 | |
| | 2,823,962 | | | Banco Santander SA — Frankfurt, 0.150% due 9/1/16 | | | 2,823,962 | |
| | 3,116,996 | | | BNP Paribas — Paris, 0.150% due 9/1/16 | | | 3,116,996 | |
| | 3,314,730 | | | Citibank N.A. — Puerto Rico, 0.150% due 9/1/16 | | | 3,314,730 | |
| | 976,777 | | | JPMorgan Chase & Co. — New York, 0.150% due 9/1/16 | | | 976,777 | |
| | | | | | | | |
| | | | TOTAL TIME DEPOSITS
(Cost — $11,770,868) | | | 11,770,868 | |
| | | | | | | | |
| | | | TOTAL SHORT-TERM INVESTMENTS
(Cost — $30,218,624) | | | 30,218,624 | |
| | | | | | | | |
| | | | TOTAL INVESTMENTS — 103.0%
(Cost — $428,404,046#) | | | 489,234,515 | |
| | | | | | | | |
| | | | Liabilities in Excess of Other Assets — (3.0)% | | | (14,042,558 | ) |
| | | | | | | | |
| | | | TOTAL NET ASSETS — 100.0% | | $ | 475,191,957 | |
| | | | | | | | |
| * | Non-income producing security. |
| (a) | All or a portion of this security is on loan (See Note 1). |
| (b) | Security is valued in good faith at fair value by or under the direction of the Board of Trustees. |
See Notes to Financial Statements.
106
| | | | |
| Small-Mid Cap Equity Fund |
| (c) | Inclusive of all short term holdings, including collateral received from securities lending activities. Excluding such collateral, the percentage of portfolio holdings would be 2.5%. |
| (d) | Represents investment of collateral received from securities lending transactions. |
| # | Aggregate cost for federal income tax purposes is $437,648,360. |
| | |
Abbreviations used in this schedule: |
| ADR | | — American Depositary Receipts |
| PLC | | — Public Limited Company |
| | | | |
| Summary of Investments by Security Sector^ | | | |
Industrials | | | 19.0 | % |
Information Technology | | | 18.2 | |
Financials | | | 17.2 | |
Consumer Discretionary | | | 13.4 | |
Health Care | | | 13.0 | |
Materials | | | 5.7 | |
Energy | | | 2.5 | |
Consumer Staples | | | 2.3 | |
Utilities | | | 1.9 | |
Telecommunication Services | | | 0.6 | |
Short-Term Investments | | | 6.2 | |
| | | | |
| | | 100.0 | % |
| | | | |
| ^ | As a percentage of total investments. |
See Notes to Financial Statements.
107
| | | | | | | | |
| International Equity Fund | | | |
| | |
| Shares/Units | | | Security | | Value | |
| COMMON STOCKS — 97.0% | |
| Australia — 3.7% | |
| | 15,014 | | | AGL Energy Ltd. | | $ | 209,353 | |
| | 51,890 | | | Alumina Ltd. | | | 51,827 | |
| | 26,157 | | | Amcor Ltd. | | | 313,480 | |
| | 66,472 | | | AMP Ltd. | | | 261,529 | |
| | 24,955 | | | APA Group | | | 172,839 | |
| | 11,712 | | | Aristocrat Leisure Ltd. | | | 132,634 | |
| | 4,233 | | | ASX Ltd. | | | 162,798 | |
| | 44,841 | | | Aurizon Holdings Ltd. | | | 147,865 | |
| | 46,200 | | | AusNet Services, Class Miscella Shares | | | 59,587 | |
| | 64,258 | | | Australia & New Zealand Banking Group Ltd. | | | 1,300,534 | |
| | 7,822 | | | Bank of Queensland Ltd. | | | 61,970 | |
| | 9,646 | | | Bendigo & Adelaide Bank Ltd. | | | 79,670 | |
| | 70,473 | | | BHP Billiton Ltd. | | | 1,056,853 | |
| | 313,744 | | | BHP Billiton PLC | | | 4,026,658 | |
| | 15,955 | | | Boral Ltd. | | | 78,930 | |
| | 369,653 | | | Brambles Ltd. | | | 3,411,566 | |
| | 5,975 | | | Caltex Australia Ltd. | | | 152,116 | |
| | 12,360 | | | Challenger Ltd. | | | 85,479 | |
| | 79,144 | | | CIMIC Group Ltd. | | | 1,762,485 | |
| | 12,314 | | | Coca-Cola Amatil Ltd. | | | 90,549 | |
| | 1,191 | | | Cochlear Ltd. | | | 125,953 | |
| | 37,608 | | | Commonwealth Bank of Australia | | | 2,028,603 | |
| | 9,818 | | | Computershare Ltd. | | | 72,672 | |
| | 7,831 | | | Crown Resorts Ltd. | | | 77,133 | |
| | 75,905 | | | CSL Ltd. | | | 6,155,597 | |
| | 20,826 | | | Dexus Property Group, REIT | | | 151,894 | |
| | 1,325 | | | Domino’s Pizza Enterprises Ltd. | | | 75,071 | |
| | 52,790 | | | DUET Group | | | 104,373 | |
| | 1,174 | | | Flight Centre Travel Group Ltd. | | | 32,451 | |
| | 33,660 | | | Fortescue Metals Group Ltd. | | | 123,007 | |
| | 38,549 | | | Goodman Group, REIT | | | 219,270 | |
| | 39,039 | | | GPT Group (The), REIT | | | 156,136 | |
| | 11,799 | | | Harvey Norman Holdings Ltd. | | | 47,607 | |
| | 37,138 | | | Healthscope Ltd. | | | 85,193 | |
| | 35,780 | | | Incitec Pivot Ltd. | | | 76,202 | |
| | 52,430 | | | Insurance Australia Group Ltd. | | | 219,281 | |
| | 11,699 | | | LendLease Group | | | 120,929 | |
| | 6,856 | | | Macquarie Group Ltd. | | | 413,525 | |
| | 59,111 | | | Medibank Pvt Ltd. | | | 119,165 | |
| | 79,210 | | | Mirvac Group, REIT | | | 138,229 | |
| | 58,098 | | | National Australia Bank Ltd. | | | 1,187,440 | |
| | 16,776 | | | Newcrest Mining Ltd.* | | | 278,782 | |
| | 29,688 | | | Oil Search Ltd. | | | 149,271 | |
| | 7,776 | | | Orica Ltd. | | | 85,936 | |
| | 41,003 | | | Origin Energy Ltd. | | | 160,799 | |
| | 5,056 | | | Platinum Asset Management Ltd. | | | 20,336 | |
| | 11,181 | | | Qantas Airways Ltd.* | | | 27,241 | |
| | 31,184 | | | QBE Insurance Group Ltd. | | | 231,324 | |
| | 3,266 | | | Ramsay Health Care Ltd. | | | 202,947 | |
| | 1,123 | | | REA Group Ltd. | | | 49,442 | |
| | 34,240 | | | Santos Ltd. | | | 113,299 | |
| | 118,661 | | | Scentre Group, REIT | | | 442,649 | |
| | 6,903 | | | SEEK Ltd. | | | 83,057 | |
| | 133,346 | | | Sonic Healthcare Ltd. | | | 2,297,368 | |
| | 114,144 | | | South32 Ltd.* | | | 163,754 | |
See Notes to Financial Statements.
108
| | | | | | | | |
| International Equity Fund | | | |
| | |
| Shares/Units | | | Security | | Value | |
| Australia — 3.7% — (continued) | |
| | 51,151 | | | Stockland, REIT | | $ | 186,045 | |
| | 29,171 | | | Suncorp Group Ltd. | | | 277,561 | |
| | 23,775 | | | Sydney Airport | | | 129,802 | |
| | 18,149 | | | Tabcorp Holdings Ltd. | | | 67,825 | |
| | 31,071 | | | Tatts Group Ltd. | | | 88,720 | |
| | 596,979 | | | Telstra Corp., Ltd. | | | 2,354,460 | |
| | 7,182 | | | TPG Telecom Ltd. | | | 65,676 | |
| | 44,998 | | | Transurban Group | | | 386,989 | |
| | 15,863 | | | Treasury Wine Estates Ltd. | | | 133,587 | |
| | 71,933 | | | Vicinity Centres, REIT | | | 178,617 | |
| | 10,682 | | | Vocus Communications Ltd. | | | 61,545 | |
| | 24,803 | | | Wesfarmers Ltd. | | | 788,561 | |
| | 311,867 | | | Westfield Corp., REIT | | | 2,390,178 | |
| | 198,741 | | | Westpac Banking Corp. | | | 4,374,977 | |
| | 16,658 | | | Woodside Petroleum Ltd. | | | 356,617 | |
| | 28,128 | | | Woolworths Ltd. | | | 499,117 | |
| | | | | | | | |
| | | | Total Australia | | | 41,994,935 | |
| | | | | | | | |
| Austria — 0.1% | |
| | 1,554 | | | ANDRITZ AG | | | 79,430 | |
| | 6,128 | | | Erste Group Bank AG | | | 172,713 | |
| | 3,518 | | | OMV AG | | | 98,602 | |
| | 2,665 | | | Raiffeisen Bank International AG* | | | 37,978 | |
| | 2,848 | | | Voestalpine AG | | | 94,288 | |
| | | | | | | | |
| | | | Total Austria | | | 483,011 | |
| | | | | | | | |
| Belgium — 1.3% | |
| | 4,281 | | | Ageas | | | 148,255 | |
| | 28,770 | | | Anheuser-Busch InBev SA/NV | | | 3,567,351 | |
| | 1,507 | | | Colruyt SA | | | 82,790 | |
| | 1,697 | | | Groupe Bruxelles Lambert SA | | | 149,078 | |
| | 91,420 | | | KBC Group NV* | | | 5,423,807 | |
| | 3,140 | | | Proximus SADP | | | 96,146 | |
| | 1,720 | | | Solvay SA | | | 189,197 | |
| | 1,184 | | | Telenet Group Holding NV* | | | 55,580 | |
| | 35,237 | | | UCB SA | | | 2,896,917 | |
| | 27,684 | | | Umicore SA(a) | | | 1,635,344 | |
| | | | | | | | |
| | | | Total Belgium | | | 14,244,465 | |
| | | | | | | | |
| Brazil — 0.1% | |
| | 181,000 | | | Embraer SA | | | 803,099 | |
| | | | | | | | |
| Canada — 2.1% | |
| | 54,945 | | | Alimentation Couche-Tard Inc., Class B Shares | | | 2,833,884 | |
| | 15,581 | | | CCL Industries Inc., Class B Shares | | | 2,973,609 | |
| | 90,181 | | | Cenovus Energy Inc. | | | 1,303,283 | |
| | 73,512 | | | Dollarama Inc. | | | 5,432,460 | |
| | 106,723 | | | Goldcorp Inc. | | | 1,624,550 | |
| | 181,213 | | | Hudson’s Bay Co. | | | 2,500,014 | |
| | 24,700 | | | Manulife Financial Corp. | | | 336,994 | |
| | 106,650 | | | Saputo Inc. | | | 3,546,189 | |
| | 68,708 | | | Toronto-Dominion Bank (The) | | | 3,066,381 | |
| | | | | | | | |
| | | | Total Canada | | | 23,617,364 | |
| | | | | | | | |
| Chile — 0.0% | |
| | 7,906 | | | Antofagasta PLC | | | 51,415 | |
| | | | | | | | |
See Notes to Financial Statements.
109
| | | | | | | | |
| International Equity Fund | | | |
| | |
| Shares/Units | | | Security | | Value | |
| China — 1.6% | |
| | 34,167 | | | Alibaba Group Holding Ltd., ADR* | | $ | 3,320,691 | |
| | 26,100 | | | Baidu Inc., ADR* | | | 4,464,927 | |
| | 4,778,500 | | | CNOOC Ltd. | | | 5,786,256 | |
| | 51,067 | | | JD.com Inc., ADR* | | | 1,297,612 | |
| | 103,100 | | | Tencent Holdings Ltd. | | | 2,672,583 | |
| | 44,900 | | | Yangzijiang Shipbuilding Holdings Ltd. | | | 25,161 | |
| | | | | | | | |
| | | | Total China | | | 17,567,230 | |
| | | | | | | | |
| Denmark — 1.4% | |
| | 85 | | | AP Moeller — Maersk AS, Class A Shares | | | 121,447 | |
| | 156 | | | AP Moeller — Maersk AS, Class B Shares | | | 233,445 | |
| | 2,327 | | | Carlsberg AS, Class B Shares | | | 218,454 | |
| | 2,164 | | | Chr Hansen Holding AS | | | 131,150 | |
| | 37,837 | | | Coloplast AS, Class B Shares | | | 2,881,761 | |
| | 15,261 | | | Danske Bank AS | | | 448,769 | |
| | 4,172 | | | DSV AS | | | 207,263 | |
| | 1,213 | | | Genmab AS* | | | 194,344 | |
| | 3,639 | | | ISS AS | | | 147,572 | |
| | 105,823 | | | Novo Nordisk AS, Class B Shares | | | 4,967,879 | |
| | 69,947 | | | Novozymes AS, Class B Shares | | | 3,040,995 | |
| | 2,511 | | | Pandora AS | | | 312,991 | |
| | 17,496 | | | TDC AS* | | | 96,850 | |
| | 2,644 | | | Tryg AS | | | 52,830 | |
| | 4,843 | | | Vestas Wind Systems AS | | | 403,215 | |
| | 110,766 | | | William Demant Holding AS* | | | 2,315,726 | |
| | | | | | | | |
| | | | Total Denmark | | | 15,774,691 | |
| | | | | | | | |
| Finland — 0.7% | |
| | 3,087 | | | Elisa OYJ | | | 108,549 | |
| | 9,911 | | | Fortum OYJ | | | 152,913 | |
| | 7,526 | | | Kone OYJ, Class B Shares | | | 377,940 | |
| | 2,538 | | | Metso OYJ | | | 70,986 | |
| | 2,888 | | | Neste OYJ | | | 120,219 | |
| | 660,412 | | | Nokia OYJ | | | 3,709,561 | |
| | 54,025 | | | Nokian Renkaat OYJ | | | 1,949,250 | |
| | 2,362 | | | Orion OYJ, Class B Shares | | | 89,386 | |
| | 9,619 | | | Sampo OYJ, Class A Shares | | | 412,638 | |
| | 11,740 | | | Stora Enso OYJ, Class R Shares | | | 103,545 | |
| | 12,140 | | | UPM-Kymmene OYJ | | | 243,642 | |
| | 3,167 | | | Wartsila OYJ Abp | | | 130,168 | |
| | | | | | | | |
| | | | Total Finland | | | 7,468,797 | |
| | | | | | | | |
| France — 10.4% | |
| | 3,739 | | | Accor SA | | | 141,492 | |
| | 557 | | | Aeroports de Paris | | | 57,537 | |
| | 7,582 | | | Air Liquide SA | | | 832,841 | |
| | 66,347 | | | Airbus Group SE | | | 3,870,895 | |
| | 3,245 | | | Alstom SA* | | | 85,963 | |
| | 43,244 | | | Amundi SA(b) | | | 2,097,677 | |
| | 1,409 | | | Arkema SA | | | 125,840 | |
| | 1,869 | | | Atos SE | | | 184,186 | |
| | 42,753 | | | AXA SA | | | 900,491 | |
| | 188,950 | | | BNP Paribas SA | | | 9,646,180 | |
| | 17,241 | | | Bollore SA | | | 62,355 | |
| | 4,391 | | | Bouygues SA | | | 139,436 | |
| | 5,480 | | | Bureau Veritas SA | | | 117,654 | |
| | 3,633 | | | Capgemini SA | | | 354,916 | |
See Notes to Financial Statements.
110
| | | | | | | | |
| International Equity Fund | | | |
| | |
| Shares/Units | | | Security | | Value | |
| France — 10.4% — (continued) | |
| | 12,283 | | | Carrefour SA | | $ | 309,775 | |
| | 1,178 | | | Casino Guichard Perrachon SA | | | 58,331 | |
| | 1,201 | | | Christian Dior SA | | | 208,006 | |
| | 10,502 | | | Cie de Saint-Gobain | | | 460,802 | |
| | 4,010 | | | Cie Générale des Établissements Michelin | | | 426,994 | |
| | 3,469 | | | CNP Assurances | | | 55,920 | |
| | 23,354 | | | Credit Agricole SA | | | 221,481 | |
| | 100,368 | | | Danone SA | | | 7,638,523 | |
| | 40,407 | | | Dassault Systemes | | | 3,409,295 | |
| | 130,322 | | | Edenred | | | 2,842,792 | |
| | 1,223 | | | Eiffage SA | | | 95,788 | |
| | 6,391 | | | Electricite de France SA | | | 81,959 | |
| | 422,046 | | | Engie SA | | | 6,745,099 | |
| | 45,732 | | | Essilor International SA | | | 5,807,233 | |
| | 803 | | | Eurazeo SA | | | 48,731 | |
| | 3,760 | | | Eutelsat Communications SA | | | 73,181 | |
| | 685 | | | Fonciere Des Regions, REIT | | | 64,087 | |
| | 881 | | | Gecina SA, REIT | | | 137,953 | |
| | 9,865 | | | Groupe Eurotunnel SE, Class Registered Shares | | | 108,599 | |
| | 7,792 | | | Hermes International | | | 3,295,533 | |
| | 893 | | | ICADE, REIT | | | 69,000 | |
| | 12,002 | | | Iliad SA | | | 2,478,506 | |
| | 871 | | | Imerys SA | | | 61,472 | |
| | 1,168 | | | Ingenico Group SA | | | 126,020 | |
| | 1,522 | | | JCDecaux SA | | | 52,367 | |
| | 1,679 | | | Kering | | | 319,029 | |
| | 4,697 | | | Klepierre, REIT | | | 220,492 | |
| | 3,086 | | | Lagardere SCA | | | 75,376 | |
| | 111,181 | | | Legrand SA | | | 6,662,680 | |
| | 5,580 | | | L’Oréal SA | | | 1,055,887 | |
| | 21,709 | | | LVMH Moët Hennessy Louis Vuitton SE | | | 3,680,774 | |
| | 19,498 | | | Natixis SA | | | 86,515 | |
| | 43,755 | | | Orange SA | | | 669,706 | |
| | 21,126 | | | Pernod Ricard SA | | | 2,428,683 | |
| | 10,331 | | | Peugeot SA* | | | 152,810 | |
| | 4,210 | | | Publicis Groupe SA | | | 313,038 | |
| | 446 | | | Remy Cointreau SA | | | 38,960 | |
| | 4,110 | | | Renault SA | | | 337,216 | |
| | 6,307 | | | Rexel SA | | | 101,451 | |
| | 6,966 | | | Safran SA | | | 487,173 | |
| | 89,354 | | | Sanofi | | | 6,898,718 | |
| | 212,990 | | | Schneider Electric SE | | | 14,518,468 | |
| | 3,292 | | | SCOR SE | | | 97,090 | |
| | 28,375 | | | SEB SA | | | 3,778,952 | |
| | 2,298 | | | SFR Group SA | | | 61,217 | |
| | 603 | | | Societe BIC SA | | | 88,081 | |
| | 16,870 | | | Societe Generale SA | | | 615,114 | |
| | 2,009 | | | Sodexo SA | | | 233,053 | |
| | 7,170 | | | Suez | | | 108,772 | |
| | 248,160 | | | Technicolor SA | | | 1,612,809 | |
| | 22,185 | | | Technip SA | | | 1,313,006 | |
| | 2,338 | | | Thales SA | | | 202,764 | |
| | 228,030 | | | TOTAL SA | | | 10,884,123 | |
| | 2,173 | | | Unibail-Rodamco SE, REIT | | | 597,488 | |
| | 81,861 | | | Valeo SA | | | 4,245,648 | |
| | 9,909 | | | Veolia Environnement SA | | | 210,901 | |
See Notes to Financial Statements.
111
| | | | | | | | |
| International Equity Fund | | | |
| | |
| Shares/Units | | | Security | | Value | |
| France — 10.4% — (continued) | |
| | 11,033 | | | Vinci SA | | $ | 837,029 | |
| | 25,618 | | | Vivendi SA | | | 497,407 | |
| | 679 | | | Wendel SA | | | 77,352 | |
| | 5,007 | | | Zodiac Aerospace | | | 114,138 | |
| | | | | | | | |
| | | | Total France | | | 117,116,830 | |
| | | | | | | | |
| Germany — 8.9% | |
| | 20,955 | | | adidas AG | | | 3,480,963 | |
| | 10,066 | | | Allianz SE, Class Registered Shares | | | 1,497,952 | |
| | 1,019 | | | Axel Springer SE | | | 51,940 | |
| | 67,921 | | | BASF SE | | | 5,524,231 | |
| | 97,048 | | | Bayer AG, Class Registered Shares | | | 10,393,331 | |
| | 65,155 | | | Bayerische Motoren Werke AG | | | 5,669,898 | |
| | 2,218 | | | Beiersdorf AG | | | 206,382 | |
| | 109,545 | | | Brenntag AG | | | 5,964,378 | |
| | 22,546 | | | Commerzbank AG | | | 159,014 | |
| | 34,043 | | | Continental AG | | | 7,136,707 | |
| | 1,548 | | | Covestro AG(b) | | | 80,639 | |
| | 21,207 | | | Daimler AG, Class Registered Shares | | | 1,468,200 | |
| | 29,742 | | | Deutsche Bank AG, Class Registered Shares* | | | 440,205 | |
| | 4,251 | | | Deutsche Boerse AG* | | | 363,960 | |
| | 5,048 | | | Deutsche Lufthansa AG, Class Registered Shares | | | 58,811 | |
| | 21,369 | | | Deutsche Post AG, Class Registered Shares | | | 677,006 | |
| | 262,322 | | | Deutsche Telekom AG, Class Registered Shares | | | 4,377,298 | |
| | 7,442 | | | Deutsche Wohnen AG | | | 280,196 | |
| | 43,289 | | | E.ON SE | | | 399,113 | |
| | 3,035 | | | Evonik Industries AG | | | 102,049 | |
| | 897 | | | Fraport AG Frankfurt Airport Services Worldwide | | | 50,049 | |
| | 37,850 | | | Fresenius Medical Care AG & Co. KGaA | | | 3,350,094 | |
| | 9,038 | | | Fresenius SE & Co. KGaA | | | 659,612 | |
| | 77,380 | | | GEA Group AG | | | 4,154,223 | |
| | 1,327 | | | Hannover Rueck SE | | | 135,906 | |
| | 29,791 | | | HeidelbergCement AG | | | 2,773,412 | |
| | 2,300 | | | Henkel AG & Co. KGaA | | | 258,150 | |
| | 469 | | | Hochtief AG | | | 63,085 | |
| | 1,424 | | | HUGO BOSS AG | | | 86,958 | |
| | 360,545 | | | Infineon Technologies AG | | | 6,070,952 | |
| | 4,116 | | | K+S AG, Class Registered Shares | | | 86,188 | |
| | 1,972 | | | Lanxess AG | | | 105,284 | |
| | 41,060 | | | Linde AG | | | 7,033,910 | |
| | 755 | | | MAN SE | | | 78,546 | |
| | 2,950 | | | Merck KGaA | | | 311,203 | |
| | 3,888 | | | METRO AG | | | 115,392 | |
| | 3,685 | | | Muenchener Rueckversicherungs-Gesellschaft AG in Muenchen, Class Registered Shares | | | 665,977 | |
| | 1,919 | | | OSRAM Licht AG | | | 100,545 | |
| | 64,826 | | | ProSiebenSat.1 Media SE | | | 2,787,631 | |
| | 10,626 | | | RWE AG* | | | 174,271 | |
| | 169,088 | | | SAP SE | | | 14,886,676 | |
| | 16,849 | | | Siemens AG, Class Registered Shares | | | 2,012,455 | |
| | 28,855 | | | Symrise AG | | | 2,130,605 | |
| | 15,015 | | | Telefonica Deutschland Holding AG | | | 61,694 | |
| | 7,946 | | | ThyssenKrupp AG | | | 185,700 | |
| | 10,234 | | | TUI AG | | | 143,299 | |
| | 47,598 | | | United Internet AG, Class Registered Shares | | | 1,957,212 | |
| | 715 | | | Volkswagen AG | | | 103,943 | |
| | 10,117 | | | Vonovia SE | | | 393,886 | |
See Notes to Financial Statements.
112
| | | | | | | | |
| International Equity Fund | | | |
| | |
| Shares/Units | | | Security | | Value | |
| Germany — 8.9% — (continued) | |
| | 1,861 | | | Zalando SE*(b) | | $ | 71,310 | |
| | | | | | | | |
| | | | Total Germany | | | 99,340,441 | |
| | | | | | | | |
| Hong Kong — 2.7% | |
| | 970,600 | | | AIA Group Ltd. | | | 6,114,218 | |
| | 5,200 | | | ASM Pacific Technology Ltd. | | | 40,428 | |
| | 25,600 | | | Bank of East Asia Ltd. (The) | | | 103,143 | |
| | 672,500 | | | BOC Hong Kong Holdings Ltd. | | | 2,345,907 | |
| | 34,000 | | | Cathay Pacific Airways Ltd. | | | 48,815 | |
| | 15,000 | | | Cheung Kong Infrastructure Holdings Ltd. | | | 125,683 | |
| | 60,500 | | | Cheung Kong Property Holdings Ltd. | | | 423,372 | |
| | 731,377 | | | China Merchants Holdings International Co., Ltd. | | | 2,077,167 | |
| | 647,000 | | | China Mobile Ltd. | | | 7,964,515 | |
| | 60,000 | | | CK Hutchison Holdings Ltd. | | | 769,271 | |
| | 36,500 | | | CLP Holdings Ltd. | | | 373,676 | |
| | 44,000 | | | First Pacific Co. | | | 32,891 | |
| | 51,000 | | | Galaxy Entertainment Group Ltd. | | | 165,441 | |
| | 48,000 | | | Hang Lung Properties Ltd. | | | 109,133 | |
| | 17,200 | | | Hang Seng Bank Ltd. | | | 301,092 | |
| | 24,000 | | | Henderson Land Development Co., Ltd. | | | 140,289 | |
| | 64,000 | | | HK Electric Investments & HK Electric Investments Ltd.(b) | | | 59,976 | |
| | 66,000 | | | HKT Trust & HKT Ltd., Class Miscella Shares | | | 90,813 | |
| | 168,000 | | | Hong Kong & China Gas Co., Ltd. | | | 320,493 | |
| | 24,800 | | | Hong Kong Exchanges & Clearing Ltd. | | | 605,924 | |
| | 26,400 | | | Hongkong Land Holdings Ltd. | | | 171,094 | |
| | 14,000 | | | Hysan Development Co., Ltd. | | | 67,605 | |
| | 5,400 | | | Jardine Matheson Holdings Ltd. | | | 323,063 | |
| | 87,740 | | | Jardine Strategic Holdings Ltd. | | | 2,826,938 | |
| | 14,500 | | | Kerry Properties Ltd. | | | 42,048 | |
| | 122,000 | | | Li & Fung Ltd. | | | 62,524 | |
| | 375,000 | | | Link REIT | | | 2,726,164 | |
| | 4,151 | | | Melco Crown Entertainment Ltd., ADR | | | 53,880 | |
| | 34,000 | | | MTR Corp., Ltd. | | | 185,481 | |
| | 120,000 | | | New World Development Co., Ltd. | | | 150,191 | |
| | 188,400 | | | Noble Group Ltd.* | | | 16,409 | |
| | 33,000 | | | NWS Holdings Ltd. | | | 58,862 | |
| | 90,000 | | | PCCW Ltd. | | | 57,073 | |
| | 32,000 | | | Power Assets Holdings Ltd. | | | 306,040 | |
| | 26,000 | | | Shangri-La Asia Ltd. | | | 28,155 | |
| | 66,000 | | | Sino Land Co., Ltd. | | | 112,677 | |
| | 43,000 | | | SJM Holdings Ltd. | | | 26,994 | |
| | 32,000 | | | Sun Hung Kai Properties Ltd. | | | 449,037 | |
| | 11,500 | | | Swire Pacific Ltd., Class A Shares | | | 127,028 | |
| | 24,600 | | | Swire Properties Ltd. | | | 69,193 | |
| | 30,000 | | | Techtronic Industries Co., Ltd. | | | 121,324 | |
| | 127,000 | | | WH Group Ltd.(b) | | | 99,848 | |
| | 31,000 | | | Wharf Holdings Ltd. (The) | | | 218,327 | |
| | 17,000 | | | Wheelock & Co., Ltd. | | | 97,046 | |
| | 15,500 | | | Yue Yuen Industrial Holdings Ltd. | | | 65,844 | |
| | | | | | | | |
| | | | Total Hong Kong | | | 30,675,092 | |
| | | | | | | | |
| India — 0.6% | |
| | 87,569 | | | HDFC Bank Ltd. | | | 1,687,198 | |
| | 73,934 | | | Hero MotoCorp Ltd. | | | 3,907,004 | |
| | 193,140 | | | ICICI Bank Ltd., ADR | | | 1,481,384 | |
| | | | | | | | |
| | | | Total India | | | 7,075,586 | |
| | | | | | | | |
See Notes to Financial Statements.
113
| | | | | | | | |
| International Equity Fund | | | |
| | |
| Shares/Units | | | Security | | Value | |
| Ireland — 1.1% | |
| | 3,664 | | | AerCap Holdings NV* | | $ | 146,450 | |
| | 653,723 | | | Bank of Ireland* | | | 147,578 | |
| | 18,129 | | | CRH PLC | | | 614,676 | |
| | 2,004 | | | DCC PLC | | | 182,862 | |
| | 171,476 | | | Experian PLC | | | 3,417,158 | |
| | 245,962 | | | James Hardie Industries PLC, CDI | | | 3,996,413 | |
| | 35,643 | | | Kerry Group PLC, Class A Shares | | | 3,029,361 | |
| | 1,823 | | | Paddy Power Betfair PLC | | | 218,341 | |
| | | | | | | | |
| | | | Total Ireland | | | 11,752,839 | |
| | | | | | | | |
| Israel — 0.6% | |
| | 968 | | | Azrieli Group Ltd. | | | 42,282 | |
| | 23,446 | | | Bank Hapoalim BM | | | 125,754 | |
| | 30,542 | | | Bank Leumi Le-Israel BM* | | | 114,322 | |
| | 44,036 | | | Bezeq Israeli Telecommunication Corp., Ltd. | | | 88,371 | |
| | 35,624 | | | Check Point Software Technologies Ltd.* | | | 2,733,786 | |
| | 10,541 | | | Israel Chemicals Ltd. | | | 44,590 | |
| | 3,160 | | | Mizrahi Tefahot Bank Ltd. | | | 38,105 | |
| | 3,764 | | | Mobileye NV* | | | 184,022 | |
| | 1,306 | | | Nice Ltd. | | | 89,184 | |
| | 349 | | | Taro Pharmaceutical Industries Ltd.* | | | 44,183 | |
| | 19,826 | | | Teva Pharmaceutical Industries Ltd. | | | 1,000,772 | |
| | 49,980 | | | Teva Pharmaceutical Industries Ltd., ADR | | | 2,518,492 | |
| | | | | | | | |
| | | | Total Israel | | | 7,023,863 | |
| | | | | | | | |
| Italy — 0.7% | |
| | 25,485 | | | Assicurazioni Generali SpA | | | 325,267 | |
| | 9,377 | | | Atlantia SpA | | | 240,736 | |
| | 170,711 | | | Enel SpA | | | 752,141 | |
| | 55,036 | | | Eni SpA | | | 831,763 | |
| | 2,450 | | | EXOR SpA | | | 100,988 | |
| | 2,780 | | | Ferrari NV | | | 134,107 | |
| | 1,714,310 | | | Intesa Sanpaolo SpA | | | 4,052,038 | |
| | 3,721 | | | Luxottica Group SpA | | | 179,312 | |
| | 12,861 | | | Mediobanca SpA | | | 94,935 | |
| | 12,094 | | | Poste Italiane SpA(b) | | | 84,589 | |
| | 4,483 | | | Prysmian SpA | | | 110,982 | |
| | 132,760 | | | Saipem SpA* | | | 61,084 | |
| | 56,268 | | | Snam SpA | | | 312,413 | |
| | 368,810 | | | Telecom Italia SpA* | | | 310,402 | |
| | 37,641 | | | Terna Rete Elettrica Nazionale SpA | | | 194,794 | |
| | 109,995 | | | UniCredit SpA | | | 281,481 | |
| | 19,741 | | | Unione di Banche Italiane SpA | | | 52,862 | |
| | 27,779 | | | UnipolSai SpA | | | 46,560 | |
| | | | | | | | |
| | | | Total Italy | | | 8,166,454 | |
| | | | | | | | |
| Japan — 15.9% | |
| | 40,200 | | | ABC-Mart Inc. | | | 2,525,672 | |
| | 8,800 | | | Acom Co., Ltd.* | | | 42,164 | |
| | 14,100 | | | Aeon Co., Ltd. | | | 194,005 | |
| | 2,200 | | | AEON Financial Service Co., Ltd. | | | 40,551 | |
| | 2,500 | | | Aeon Mall Co., Ltd. | | | 35,212 | |
| | 3,000 | | | Air Water Inc. | | | 55,519 | |
| | 4,100 | | | Aisin Seiki Co., Ltd. | | | 193,834 | |
| | 12,000 | | | Ajinomoto Co., Inc. | | | 254,610 | |
| | 4,000 | | | Alfresa Holdings Corp. | | | 74,737 | |
| | 4,000 | | | Alps Electric Co., Ltd. | | | 90,364 | |
See Notes to Financial Statements.
114
| | | | | | | | |
| International Equity Fund | | | |
| | |
| Shares/Units | | | Security | | Value | |
| Japan — 15.9% — (continued) | |
| | 7,100 | | | Amada Holdings Co., Ltd. | | $ | 74,332 | |
| | 25,000 | | | ANA Holdings Inc. | | | 68,025 | |
| | 26,000 | | | Aozora Bank Ltd. | | | 92,044 | |
| | 22,000 | | | Asahi Glass Co., Ltd. | | | 140,102 | |
| | 66,800 | | | Asahi Group Holdings Ltd. | | | 2,187,845 | |
| | 29,000 | | | Asahi Kasei Corp. | | | 244,798 | |
| | 3,400 | | | Asics Corp. | | | 68,999 | |
| | 46,600 | | | Astellas Pharma Inc. | | | 712,467 | |
| | 4,300 | | | Bandai Namco Holdings Inc. | | | 117,556 | |
| | 7,000 | | | Bank of Kyoto Ltd. (The) | | | 50,684 | |
| | 1,400 | | | Benesse Holdings Inc. | | | 32,299 | |
| | 79,800 | | | Bridgestone Corp. | | | 2,745,199 | |
| | 5,100 | | | Brother Industries Ltd. | | | 85,719 | |
| | 1,700 | | | Calbee Inc. | | | 61,741 | |
| | 23,500 | | | Canon Inc. | | | 673,666 | |
| | 5,000 | | | Casio Computer Co., Ltd. | | | 70,717 | |
| | 3,200 | | | Central Japan Railway Co. | | | 526,003 | |
| | 15,000 | | | Chiba Bank Ltd. (The) | | | 88,985 | |
| | 14,200 | | | Chubu Electric Power Co., Inc. | | | 191,378 | |
| | 5,300 | | | Chugai Pharmaceutical Co., Ltd. | | | 166,383 | |
| | 3,600 | | | Chugoku Bank Ltd. (The) | | | 44,385 | |
| | 6,400 | | | Chugoku Electric Power Co., Inc. (The) | | | 76,883 | |
| | 27,500 | | | Concordia Financial Group Ltd.* | | | 142,047 | |
| | 3,300 | | | Credit Saison Co., Ltd. | | | 56,859 | |
| | 2,100 | | | CYBERDYNE Inc.*(a) | | | 33,094 | |
| | 12,000 | | | Dai Nippon Printing Co., Ltd. | | | 122,132 | |
| | 6,300 | | | Daicel Corp. | | | 80,467 | |
| | 23,300 | | | Dai-ichi Life Insurance Co., Ltd. (The) | | | 324,734 | |
| | 13,700 | | | Daiichi Sankyo Co., Ltd. | | | 314,561 | |
| | 21,700 | | | Daikin Industries Ltd. | | | 2,010,979 | |
| | 1,600 | | | Daito Trust Construction Co., Ltd. | | | 235,228 | |
| | 12,800 | | | Daiwa House Industry Co., Ltd. | | | 330,829 | |
| | 30 | | | Daiwa House Residential Investment Corp., REIT, Class A Shares | | | 84,613 | |
| | 36,000 | | | Daiwa Securities Group Inc. | | | 210,586 | |
| | 10,800 | | | Denso Corp. | | | 446,592 | |
| | 4,900 | | | Dentsu Inc. | | | 269,797 | |
| | 2,500 | | | Don Quijote Holdings Co., Ltd. | | | 81,758 | |
| | 100,600 | | | East Japan Railway Co. | | | 8,622,297 | |
| | 5,800 | | | Eisai Co., Ltd. | | | 338,376 | |
| | 3,300 | | | Electric Power Development Co., Ltd. | | | 80,619 | |
| | 1,800 | | | FamilyMart Co., Ltd. | | | 128,950 | |
| | 14,100 | | | FANUC Corp. | | | 2,405,130 | |
| | 1,200 | | | Fast Retailing Co., Ltd. | | | 422,071 | |
| | 12,000 | | | Fuji Electric Co., Ltd. | | | 54,802 | |
| | 13,000 | | | Fuji Heavy Industries Ltd. | | | 515,788 | |
| | 9,800 | | | FUJIFILM Holdings Corp. | | | 368,583 | |
| | 40,000 | | | Fujitsu Ltd. | | | 203,376 | |
| | 17,000 | | | Fukuoka Financial Group Inc. | | | 72,062 | |
| | 9,200 | | | GungHo Online Entertainment Inc. | | | 21,890 | |
| | 8,900 | | | Hachijuni Bank Ltd. (The) | | | 47,106 | |
| | 4,600 | | | Hakuhodo DY Holdings Inc. | | | 50,017 | |
| | 3,000 | | | Hamamatsu Photonics KK | | | 94,489 | |
| | 5,200 | | | Hankyu Hanshin Holdings Inc. | | | 167,983 | |
| | 400 | | | Hikari Tsushin Inc. | | | 35,977 | |
| | 5,400 | | | Hino Motors Ltd. | | | 59,898 | |
| | 700 | | | Hirose Electric Co., Ltd. | | | 89,897 | |
See Notes to Financial Statements.
115
| | | | | | | | |
| International Equity Fund | | | |
| | |
| Shares/Units | | | Security | | Value | |
| Japan — 15.9% — (continued) | |
| | 11,000 | | | Hiroshima Bank Ltd. (The) | | $ | 45,885 | |
| | 1,600 | | | Hisamitsu Pharmaceutical Co., Inc. | | | 71,664 | |
| | 2,300 | | | Hitachi Chemical Co., Ltd. | | | 49,632 | |
| | 2,300 | | | Hitachi Construction Machinery Co., Ltd. | | | 43,132 | |
| | 1,500 | | | Hitachi High-Technologies Corp. | | | 55,658 | |
| | 1,602,000 | | | Hitachi Ltd. | | | 7,690,798 | |
| | 4,600 | | | Hitachi Metals Ltd. | | | 55,725 | |
| | 4,000 | | | Hokuriku Electric Power Co. | | | 47,825 | |
| | 35,900 | | | Honda Motor Co., Ltd. | | | 1,104,683 | |
| | 1,100 | | | Hoshizaki Corp. | | | 88,000 | |
| | 82,300 | | | Hoya Corp. | | | 3,192,286 | |
| | 6,300 | | | Hulic Co., Ltd. | | | 59,744 | |
| | 2,000 | | | Idemitsu Kosan Co., Ltd. | | | 36,487 | |
| | 32,000 | | | IHI Corp. | | | 97,914 | |
| | 3,200 | | | Iida Group Holdings Co., Ltd. | | | 59,995 | |
| | 20,700 | | | Inpex Corp. | | | 178,732 | |
| | 7,100 | | | Isetan Mitsukoshi Holdings Ltd. | | | 64,715 | |
| | 12,700 | | | Isuzu Motors Ltd. | | | 146,320 | |
| | 33,400 | | | ITOCHU Corp. | | | 394,375 | |
| | 5,200 | | | Iyo Bank Ltd. (The) | | | 33,562 | |
| | 5,100 | | | J Front Retailing Co., Ltd. | | | 57,647 | |
| | 172,500 | | | Japan Airlines Co., Ltd. | | | 5,252,206 | |
| | 1,000 | | | Japan Airport Terminal Co. Ltd. | | | 39,473 | |
| | 11,300 | | | Japan Exchange Group Inc. | | | 176,774 | |
| | 8,600 | | | Japan Post Bank Co., Ltd. | | | 101,172 | |
| | 10,500 | | | Japan Post Holdings Co., Ltd. | | | 137,654 | |
| | 19 | | | Japan Prime Realty Investment Corp., REIT | | | 84,018 | |
| | 28 | | | Japan Real Estate Investment Corp. | | | 164,570 | |
| | 56 | | | Japan Retail Fund Investment Corp., REIT | | | 125,756 | |
| | 112,800 | | | Japan Tobacco Inc. | | | 4,372,917 | |
| | 11,200 | | | JFE Holdings Inc. | | | 174,148 | |
| | 4,500 | | | JGC Corp. | | | 71,453 | |
| | 13,000 | | | Joyo Bank Ltd. (The) | | | 51,699 | |
| | 4,100 | | | JSR Corp. | | | 60,027 | |
| | 4,800 | | | JTEKT Corp. | | | 74,725 | |
| | 46,600 | | | JX Holdings Inc. | | | 174,327 | |
| | 20,000 | | | Kajima Corp. | | | 134,453 | |
| | 3,100 | | | Kakaku.com Inc. | | | 51,867 | |
| | 5,000 | | | Kamigumi Co., Ltd. | | | 43,334 | |
| | 6,000 | | | Kaneka Corp. | | | 48,947 | |
| | 17,000 | | | Kansai Electric Power Co., Inc. (The)* | | | 145,331 | |
| | 4,700 | | | Kansai Paint Co., Ltd. | | | 103,664 | |
| | 11,200 | | | Kao Corp. | | | 582,402 | |
| | 30,000 | | | Kawasaki Heavy Industries Ltd. | | | 87,983 | |
| | 474,600 | | | KDDI Corp. | | | 13,895,498 | |
| | 11,000 | | | Keihan Holdings Co., Ltd. | | | 71,388 | |
| | 10,000 | | | Keikyu Corp. | | | 92,646 | |
| | 12,000 | | | Keio Corp. | | | 100,518 | |
| | 6,000 | | | Keisei Electric Railway Co., Ltd. | | | 71,901 | |
| | 10,900 | | | Keyence Corp. | | | 7,647,613 | |
| | 3,000 | | | Kikkoman Corp. | | | 94,446 | |
| | 39,000 | | | Kintetsu Group Holdings Co., Ltd. | | | 148,607 | |
| | 18,500 | | | Kirin Holdings Co., Ltd. | | | 300,739 | |
| | 66,000 | | | Kobe Steel Ltd. | | | 61,324 | |
| | 2,400 | | | Koito Manufacturing Co., Ltd. | | | 114,395 | |
| | 257,000 | | | Komatsu Ltd. | | | 5,626,137 | |
See Notes to Financial Statements.
116
| | | | | | | | |
| International Equity Fund | | | |
| | |
| Shares/Units | | | Security | | Value | |
| Japan — 15.9% — (continued) | |
| | 2,000 | | | Konami Holdings Corp. | | $ | 70,721 | |
| | 9,600 | | | Konica Minolta Inc. | | | 86,604 | |
| | 700 | | | Kose Corp. | | | 62,828 | |
| | 267,400 | | | Kubota Corp. | | | 3,926,926 | |
| | 7,700 | | | Kuraray Co., Ltd. | | | 110,131 | |
| | 2,200 | | | Kurita Water Industries Ltd. | | | 50,210 | |
| | 7,200 | | | Kyocera Corp. | | | 339,433 | |
| | 5,700 | | | Kyowa Hakko Kirin Co., Ltd. | | | 80,589 | |
| | 9,500 | | | Kyushu Electric Power Co., Inc.* | | | 88,516 | |
| | 7,200 | | | Kyushu Financial Group Inc. | | | 42,715 | |
| | 1,400 | | | Lawson Inc. | | | 98,268 | |
| | 20,200 | | | LINE Corp.*(a) | | | 860,904 | |
| | 5,700 | | | LIXIL Group Corp. | | | 115,078 | |
| | 4,200 | | | M3 Inc. | | | 125,732 | |
| | 1,100 | | | Mabuchi Motor Co., Ltd. | | | 58,325 | |
| | 2,400 | | | Makita Corp. | | | 172,491 | |
| | 35,100 | | | Marubeni Corp. | | | 175,123 | |
| | 4,500 | | | Marui Group Co., Ltd. | | | 54,905 | |
| | 1,200 | | | Maruichi Steel Tube Ltd. | | | 41,442 | |
| | 12,300 | | | Mazda Motor Corp. | | | 203,170 | |
| | 1,500 | | | McDonald’s Holdings Co. Japan Ltd. | | | 41,423 | |
| | 3,700 | | | Medipal Holdings Corp. | | | 58,285 | |
| | 2,500 | | | MEIJI Holdings Co., Ltd. | | | 225,007 | |
| | 7,300 | | | Minebea Co., Ltd. | | | 74,224 | |
| | 1,200 | | | Miraca Holdings Inc. | | | 56,735 | |
| | 29,200 | | | Mitsubishi Chemical Holdings Corp. | | | 184,532 | |
| | 33,300 | | | Mitsubishi Corp. | | | 694,520 | |
| | 43,000 | | | Mitsubishi Electric Corp. | | | 562,102 | |
| | 28,000 | | | Mitsubishi Estate Co., Ltd. | | | 530,046 | |
| | 8,000 | | | Mitsubishi Gas Chemical Co., Inc. | | | 54,170 | |
| | 73,000 | | | Mitsubishi Heavy Industries Ltd. | | | 318,211 | |
| | 3,000 | | | Mitsubishi Logistics Corp. | | | 46,296 | |
| | 24,000 | | | Mitsubishi Materials Corp. | | | 67,819 | |
| | 14,800 | | | Mitsubishi Motors Corp. | | | 67,709 | |
| | 5,000 | | | Mitsubishi Tanabe Pharma Corp. | | | 92,813 | |
| | 280,900 | | | Mitsubishi UFJ Financial Group Inc. | | | 1,533,752 | |
| | 10,300 | | | Mitsubishi UFJ Lease & Finance Co., Ltd. | | | 48,346 | |
| | 37,600 | | | Mitsui & Co., Ltd. | | | 500,915 | |
| | 20,000 | | | Mitsui Chemicals Inc. | | | 95,834 | |
| | 20,000 | | | Mitsui Fudosan Co., Ltd. | | | 431,265 | |
| | 24,000 | | | Mitsui OSK Lines Ltd. | | | 55,511 | |
| | 1,000 | | | Mixi Inc. | | | 35,432 | |
| | 520,800 | | | Mizuho Financial Group Inc. | | | 905,515 | |
| | 11,400 | | | MS&AD Insurance Group Holdings Inc. | | | 325,848 | |
| | 4,300 | | | Murata Manufacturing Co., Ltd. | | | 579,082 | |
| | 2,400 | | | Nabtesco Corp. | | | 61,685 | |
| | 20,000 | | | Nagoya Railroad Co., Ltd. | | | 98,047 | |
| | 56,000 | | | NEC Corp. | | | 142,542 | |
| | 3,700 | | | Nexon Co., Ltd. | | | 50,719 | |
| | 5,600 | | | NGK Insulators Ltd. | | | 121,639 | |
| | 3,900 | | | NGK Spark Plug Co., Ltd. | | | 73,041 | |
| | 4,000 | | | NH Foods Ltd. | | | 87,610 | |
| | 4,500 | | | NHK Spring Co., Ltd. | | | 42,408 | |
| | 51,100 | | | Nidec Corp. | | | 4,606,685 | |
| | 196,000 | | | Nikon Corp.(a) | | | 2,879,629 | |
| | 2,500 | | | Nintendo Co., Ltd. | | | 548,750 | |
See Notes to Financial Statements.
117
| | | | | | | | |
| International Equity Fund | | | |
| | |
| Shares/Units | | | Security | | Value | |
| Japan — 15.9% — (continued) | |
| | 31 | | | Nippon Building Fund Inc., REIT | | $ | 189,696 | |
| | 9,000 | | | Nippon Electric Glass Co., Ltd. | | | 45,220 | |
| | 18,000 | | | Nippon Express Co., Ltd. | | | 85,332 | |
| | 3,500 | | | Nippon Paint Holdings Co., Ltd. | | | 125,571 | |
| | 35 | | | Nippon Prologis REIT Inc. | | | 83,990 | |
| | 18,000 | | | Nippon Steel & Sumitomo Metal Corp. | | | 382,056 | |
| | 121,000 | | | Nippon Telegraph & Telephone Corp. | | | 5,298,787 | |
| | 34,000 | | | Nippon Yusen KK | | | 61,865 | |
| | 54,800 | | | Nissan Motor Co., Ltd. | | | 538,320 | |
| | 4,300 | | | Nisshin Seifun Group Inc. | | | 60,851 | |
| | 1,300 | | | Nissin Foods Holdings Co., Ltd. | | | 72,159 | |
| | 1,900 | | | Nitori Holdings Co., Ltd. | | | 192,050 | |
| | 3,600 | | | Nitto Denko Corp. | | | 245,874 | |
| | 2,000 | | | NOK Corp. | | | 40,658 | |
| | 78,600 | | | Nomura Holdings Inc. | | | 369,971 | |
| | 104,300 | | | Nomura Real Estate Holdings Inc. | | | 1,701,618 | |
| | 77 | | | Nomura Real Estate Master Fund Inc., REIT | | | 127,062 | |
| | 2,600 | | | Nomura Research Institute Ltd. | | | 87,695 | |
| | 9,400 | | | NSK Ltd. | | | 97,009 | |
| | 2,700 | | | NTT Data Corp. | | | 140,732 | |
| | 30,300 | | | NTT DOCOMO Inc. | | | 765,201 | |
| | 2,600 | | | NTT Urban Development Corp. | | | 23,868 | |
| | 14,100 | | | Obayashi Corp. | | | 130,270 | |
| | 1,600 | | | Obic Co., Ltd. | | | 82,046 | |
| | 13,000 | | | Odakyu Electric Railway Co., Ltd. | | | 133,550 | |
| | 18,000 | | | Oji Holdings Corp. | | | 72,446 | |
| | 6,200 | | | Olympus Corp. | | | 203,118 | |
| | 4,100 | | | Omron Corp. | | | 139,269 | |
| | 9,400 | | | Ono Pharmaceutical Co., Ltd. | | | 244,791 | |
| | 800 | | | Oracle Corp. Japan | | | 46,579 | |
| | 4,700 | | | Oriental Land Co., Ltd. | | | 275,403 | |
| | 232,000 | | | ORIX Corp. | | | 3,338,580 | |
| | 42,000 | | | Osaka Gas Co., Ltd. | | | 165,487 | |
| | 1,100 | | | Otsuka Corp. | | | 46,635 | |
| | 73,600 | | | Otsuka Holdings Co., Ltd. | | | 3,192,122 | |
| | 49,100 | | | Panasonic Corp. | | | 504,325 | |
| | 2,200 | | | Park24 Co., Ltd. | | | 64,359 | |
| | 500 | | | Pola Orbis Holdings Inc. | | | 39,954 | |
| | 20,000 | | | Rakuten Inc. | | | 252,310 | |
| | 6,100 | | | Recruit Holdings Co., Ltd. | | | 232,051 | |
| | 47,500 | | | Resona Holdings Inc. | | | 217,515 | |
| | 14,200 | | | Ricoh Co., Ltd. | | | 128,200 | |
| | 800 | | | Rinnai Corp. | | | 75,073 | |
| | 1,900 | | | Rohm Co., Ltd. | | | 95,069 | |
| | 500 | | | Ryohin Keikaku Co., Ltd. | | | 90,240 | |
| | 900 | | | Sankyo Co., Ltd. | | | 31,250 | |
| | 164,100 | | | Santen Pharmaceutical Co., Ltd | | | 2,067,179 | |
| | 4,900 | | | SBI Holdings Inc. | | | 58,232 | |
| | 4,700 | | | Secom Co., Ltd. | | | 357,033 | |
| | 4,000 | | | Sega Sammy Holdings Inc. | | | 54,666 | |
| | 3,700 | | | Seibu Holdings Inc. | | | 60,805 | |
| | 6,000 | | | Seiko Epson Corp. | | | 115,105 | |
| | 242,600 | | | Sekisui Chemical Co., Ltd. | | | 3,393,770 | |
| | 192,200 | | | Sekisui House Ltd. | | | 3,098,120 | |
| | 16,600 | | | Seven & i Holdings Co., Ltd. | | | 700,366 | |
| | 13,000 | | | Seven Bank Ltd. | | | 46,015 | |
See Notes to Financial Statements.
118
| | | | | | | | |
| International Equity Fund | | | |
| | |
| Shares/Units | | | Security | | Value | |
| Japan — 15.9% — (continued) | |
| | 29,000 | | | Sharp Corp.* | | $ | 40,118 | |
| | 3,800 | | | Shikoku Electric Power Co., Inc. | | | 36,244 | |
| | 5,000 | | | Shimadzu Corp. | | | 78,289 | |
| | 500 | | | Shimamura Co., Ltd. | | | 57,870 | |
| | 1,600 | | | Shimano Inc. | | | 232,838 | |
| | 12,000 | | | Shimizu Corp. | | | 107,124 | |
| | 8,600 | | | Shin-Etsu Chemical Co., Ltd. | | | 632,065 | |
| | 38,000 | | | Shinsei Bank Ltd. | | | 60,644 | |
| | 6,800 | | | Shionogi & Co., Ltd. | | | 303,828 | |
| | 8,200 | | | Shiseido Co., Ltd. | | | 206,331 | |
| | 13,000 | | | Shizuoka Bank Ltd. (The) | | | 107,185 | |
| | 4,200 | | | Showa Shell Sekiyu KK | | | 35,831 | |
| | 14,200 | | | SMC Corp. | | | 4,005,412 | |
| | 21,200 | | | SoftBank Group Corp. | | | 1,385,645 | |
| | 1,600 | | | Sohgo Security Services Co., Ltd. | | | 80,021 | |
| | 7,700 | | | Sompo Japan Nipponkoa Holdings Inc. | | | 247,135 | |
| | 27,800 | | | Sony Corp. | | | 893,892 | |
| | 3,800 | | | Sony Financial Holdings Inc. | | | 52,262 | |
| | 3,300 | | | Stanley Electric Co., Ltd. | | | 84,410 | |
| | 1,300 | | | Start Today Co., Ltd. | | | 60,235 | |
| | 34,000 | | | Sumitomo Chemical Co., Ltd. | | | 156,009 | |
| | 26,500 | | | Sumitomo Corp. | | | 287,687 | |
| | 3,600 | | | Sumitomo Dainippon Pharma Co., Ltd. | | | 60,319 | |
| | 16,200 | | | Sumitomo Electric Industries Ltd. | | | 240,490 | |
| | 12,000 | | | Sumitomo Heavy Industries Ltd. | | | 59,009 | |
| | 11,000 | | | Sumitomo Metal Mining Co., Ltd. | | | 139,427 | |
| | 344,600 | | | Sumitomo Mitsui Financial Group Inc. | | | 12,076,778 | |
| | 75,000 | | | Sumitomo Mitsui Trust Holdings Inc. | | | 268,818 | |
| | 8,000 | | | Sumitomo Realty & Development Co., Ltd. | | | 211,408 | |
| | 3,700 | | | Sumitomo Rubber Industries Ltd. | | | 54,923 | |
| | 800 | | | Sundrug Co., Ltd. | | | 58,003 | |
| | 67,400 | | | Suntory Beverage & Food Ltd. | | | 2,675,856 | |
| | 3,800 | | | Suruga Bank Ltd. | | | 90,487 | |
| | 1,700 | | | Suzuken Co., Ltd. | | | 49,323 | |
| | 76,000 | | | Suzuki Motor Corp. | | | 2,522,070 | |
| | 3,600 | | | Sysmex Corp. | | | 232,336 | |
| | 12,500 | | | T&D Holdings Inc. | | | 142,846 | |
| | 26,000 | | | Taiheiyo Cement Corp. | | | 79,014 | |
| | 23,000 | | | Taisei Corp. | | | 173,063 | |
| | 800 | | | Taisho Pharmaceutical Holdings Co., Ltd. | | | 73,356 | |
| | 2,900 | | | Taiyo Nippon Sanso Corp. | | | 29,466 | |
| | 7,000 | | | Takashimaya Co., Ltd. | | | 51,258 | |
| | 15,700 | | | Takeda Pharmaceutical Co., Ltd. | | | 692,041 | |
| | 2,800 | | | TDK Corp. | | | 200,576 | |
| | 20,000 | | | Teijin Ltd. | | | 74,698 | |
| | 7,700 | | | Terumo Corp. | | | 299,687 | |
| | 2,500 | | | THK Co., Ltd. | | | 49,052 | |
| | 21,000 | | | Tobu Railway Co., Ltd. | | | 101,964 | |
| | 2,500 | | | Toho Co., Ltd. | | | 72,919 | |
| | 9,000 | | | Toho Gas Co., Ltd. | | | 76,517 | |
| | 10,100 | | | Tohoku Electric Power Co., Inc. | | | 126,690 | |
| | 15,100 | | | Tokio Marine Holdings Inc. | | | 594,081 | |
| | 35,400 | | | Tokyo Electric Power Co. Holdings Inc.* | | | 142,799 | |
| | 3,400 | | | Tokyo Electron Ltd. | | | 312,808 | |
| | 45,000 | | | Tokyo Gas Co., Ltd. | | | 193,085 | |
| | 4,500 | | | Tokyo Tatemono Co., Ltd. | | | 52,902 | |
See Notes to Financial Statements.
119
| | | | | | | | |
| International Equity Fund | | | |
| | |
| Shares/Units | | | Security | | Value | |
| Japan — 15.9% — (continued) | |
| | 23,000 | | | Tokyu Corp. | | $ | 171,755 | |
| | 11,000 | | | Tokyu Fudosan Holdings Corp. | | | 61,316 | |
| | 7,000 | | | TonenGeneral Sekiyu KK | | | 64,642 | |
| | 11,000 | | | Toppan Printing Co., Ltd. | | | 98,115 | |
| | 32,000 | | | Toray Industries Inc. | | | 308,472 | |
| | 87,000 | | | Toshiba Corp. | | | 275,501 | |
| | 3,100 | | | TOTO Ltd. | | | 117,816 | |
| | 3,500 | | | Toyo Seikan Group Holdings Ltd. | | | 64,947 | |
| | 1,900 | | | Toyo Suisan Kaisha Ltd. | | | 77,827 | |
| | 1,400 | | | Toyoda Gosei Co., Ltd. | | | 32,279 | |
| | 3,500 | | | Toyota Industries Corp. | | | 167,680 | |
| | 58,800 | | | Toyota Motor Corp. | | | 3,554,565 | |
| | 5,000 | | | Toyota Tsusho Corp. | | | 114,475 | |
| | 2,400 | | | Trend Micro Inc. | | | 84,945 | |
| | 800 | | | Tsuruha Holdings Inc. | | | 78,260 | |
| | 8,700 | | | Unicharm Corp. | | | 211,393 | |
| | 65 | | | United Urban Investment Corp., REIT | | | 115,787 | |
| | 4,600 | | | USS Co., Ltd. | | | 73,565 | |
| | 3,600 | | | West Japan Railway Co. | | | 206,224 | |
| | 604,400 | | | Yahoo Japan Corp. | | | 2,466,022 | |
| | 1,900 | | | Yakult Honsha Co., Ltd. | | | 83,863 | |
| | 13,400 | | | Yamada Denki Co., Ltd. | | | 62,741 | |
| | 4,000 | | | Yamaguchi Financial Group Inc. | | | 42,251 | |
| | 3,600 | | | Yamaha Corp. | | | 116,874 | |
| | 6,100 | | | Yamaha Motor Co., Ltd. | | | 125,216 | |
| | 7,700 | | | Yamato Holdings Co., Ltd. | | | 181,034 | |
| | 2,900 | | | Yamazaki Baking Co., Ltd. | | | 65,932 | |
| | 5,400 | | | Yaskawa Electric Corp. | | | 79,649 | |
| | 4,900 | | | Yokogawa Electric Corp. | | | 62,836 | |
| | 2,400 | | | Yokohama Rubber Co., Ltd. (The) | | | 39,041 | |
| | | | | | | | |
| | | | Total Japan | | | 178,793,299 | |
| | | | | | | | |
| Jersey, Channel Islands — 0.0% | |
| | 2,025 | | | Randgold Resources Ltd., ADR | | | 190,067 | |
| | | | | | | | |
| Jordan — 0.0% | |
| | 3,532 | | | Hikma Pharmaceuticals PLC | | | 99,467 | |
| | | | | | | | |
| Luxembourg — 0.4% | |
| | 259,461 | | | ArcelorMittal* | | | 1,532,488 | |
| | 1,422 | | | Millicom International Cellular SA, ADR | | | 72,897 | |
| | 890 | | | RTL Group SA | | | 74,990 | |
| | 115,593 | | | SES SA, ADR, Class A Shares | | | 2,659,188 | |
| | 11,131 | | | Tenaris SA | | | 152,956 | |
| | | | | | | | |
| | | | Total Luxembourg | | | 4,492,519 | |
| | | | | | | | |
| Macau — 0.0% | |
| | 20,400 | | | MGM China Holdings Ltd. | | | 31,322 | |
| | 52,400 | | | Sands China Ltd. | | | 205,179 | |
| | 33,600 | | | Wynn Macau Ltd. | | | 46,617 | |
| | | | | | | | |
| | | | Total Macau | | | 283,118 | |
| | | | | | | | |
| Mexico — 0.2% | |
| | 4,727 | | | Fresnillo PLC | | | 99,821 | |
| | 72,170 | | | Grupo Televisa SAB, ADR | | | 1,972,406 | |
| | | | | | | | |
| | | | Total Mexico | | | 2,072,227 | |
| | | | | | | | |
See Notes to Financial Statements.
120
| | | | | | | | |
| International Equity Fund | | | |
| | |
| Shares/Units | | | Security | | Value | |
| Netherlands — 5.5% | |
| | 138,948 | | | Aalberts Industries NV | | $ | 4,664,094 | |
| | 117,972 | | | ABN AMRO Group NV, Dutch Certificate, GDR(b) | | | 2,428,672 | |
| | 38,153 | | | Aegon NV | | | 156,768 | |
| | 156,332 | | | Akzo Nobel NV | | | 10,568,457 | |
| | 8,352 | | | Altice NV, Class A Shares* | | | 139,274 | |
| | 1,924 | | | Altice NV, Class B Shares* | | | 32,028 | |
| | 55,075 | | | ASML Holding NV | | | 5,868,382 | |
| | 46,271 | | | Boskalis Westminster | | | 1,655,691 | |
| | 39,044 | | | Gemalto NV | | | 2,722,942 | |
| | 2,131 | | | Heineken Holding NV | | | 171,545 | |
| | 47,405 | | | Heineken NV | | | 4,241,834 | |
| | 268,893 | | | ING Groep NV | | | 3,371,134 | |
| | 28,220 | | | Koninklijke Ahold Delhaize NV | | | 676,736 | |
| | 3,878 | | | Koninklijke DSM NV | | | 270,411 | |
| | 76,432 | | | Koninklijke KPN NV | | | 250,081 | |
| | 20,508 | | | Koninklijke Philips NV | | | 596,306 | |
| | 56,518 | | | Koninklijke Vopak NV | | | 2,870,436 | |
| | 6,719 | | | NN Group NV | | | 200,298 | |
| | 6,485 | | | NXP Semiconductors NV* | | | 570,810 | |
| | 2,036 | | | OCI NV* | | | 35,713 | |
| | 475,890 | | | PostNL NV* | | | 2,085,927 | |
| | 4,607 | | | QIAGEN NV* | | | 122,018 | |
| | 2,781 | | | Randstad Holding NV | | | 131,523 | |
| | 296,108 | | | Royal Dutch Shell PLC, Class A Shares | | | 7,264,926 | |
| | 415,679 | | | Royal Dutch Shell PLC, Class B Shares | | | 10,606,936 | |
| | 6,463 | | | Wolters Kluwer NV | | | 271,680 | |
| | | | | | | | |
| | | | Total Netherlands | | | 61,974,622 | |
| | | | | | | | |
| New Zealand — 0.1% | |
| | 20,404 | | | Auckland International Airport Ltd. | | | 111,007 | |
| | 16,758 | | | Contact Energy Ltd. | | | 63,242 | |
| | 16,231 | | | Fletcher Building Ltd. | | | 124,808 | |
| | 15,884 | | | Mercury NZ Ltd. | | | 36,550 | |
| | 28,934 | | | Meridian Energy Ltd. | | | 60,896 | |
| | 7,999 | | | Ryman Healthcare Ltd. | | | 55,671 | |
| | 38,054 | | | Spark New Zealand Ltd. | | | 105,065 | |
| | | | | | | | |
| | | | Total New Zealand | | | 557,239 | |
| | | | | | | | |
| Norway — 0.7% | |
| | 170,997 | | | DNB ASA | | | 2,080,590 | |
| | 4,271 | | | Gjensidige Forsikring ASA | | | 73,378 | |
| | 8,424 | | | Marine Harvest ASA* | | | 130,154 | |
| | 286,370 | | | Norsk Hydro ASA | | | 1,218,239 | |
| | 18,251 | | | Orkla ASA | | | 167,064 | |
| | 1,822 | | | Schibsted ASA, Class A Shares | | | 57,895 | |
| | 2,230 | | | Schibsted ASA, Class B Shares | | | 64,537 | |
| | 214,071 | | | Statoil ASA | | | 3,364,857 | |
| | 15,992 | | | Telenor ASA | | | 279,050 | |
| | 4,178 | | | Yara International ASA | | | 148,400 | |
| | | | | | | | |
| | | | Total Norway | | | 7,584,164 | |
| | | | | | | | |
| Portugal — 0.0% | |
| | 50,100 | | | EDP — Energias de Portugal SA | | | 168,325 | |
| | 8,038 | | | Jeronimo Martins SGPS SA | | | 129,920 | |
| | | | | | | | |
| | | | Total Portugal | | | 298,245 | |
| | | | | | | | |
See Notes to Financial Statements.
121
| | | | | | | | |
| International Equity Fund | | | |
| | |
| Shares/Units | | | Security | | Value | |
| Singapore — 0.4% | |
| | 51,800 | | | Ascendas Real Estate Investment Trust | | $ | 92,971 | |
| | 53,100 | | | CapitaLand Commercial Trust, REIT | | | 60,147 | |
| | 58,300 | | | CapitaLand Ltd. | | | 131,039 | |
| | 59,100 | | | CapitaLand Mall Trust, REIT | | | 93,525 | |
| | 9,300 | | | City Developments Ltd. | | | 57,984 | |
| | 48,100 | | | ComfortDelGro Corp., Ltd. | | | 99,775 | |
| | 149,984 | | | DBS Group Holdings Ltd. | | | 1,645,988 | |
| | 132,000 | | | Genting Singapore PLC | | | 69,553 | |
| | 60,300 | | | Global Logistic Properties Ltd. | | | 80,191 | |
| | 158,600 | | | Golden Agri-Resources Ltd. | | | 41,791 | |
| | 111,700 | | | Hutchison Port Holdings Trust | | | 47,874 | |
| | 2,200 | | | Jardine Cycle & Carriage Ltd. | | | 68,390 | |
| | 35,000 | | | Keppel Corp., Ltd. | | | 132,656 | |
| | 68,800 | | | Oversea-Chinese Banking Corp., Ltd. | | | 432,601 | |
| | 21,700 | | | Sembcorp Industries Ltd. | | | 43,190 | |
| | 30,400 | | | Sembcorp Marine Ltd. | | | 28,365 | |
| | 11,900 | | | Singapore Airlines Ltd. | | | 91,580 | |
| | 17,400 | | | Singapore Exchange Ltd. | | | 96,348 | |
| | 37,500 | | | Singapore Technologies Engineering Ltd. | | | 88,678 | |
| | 176,900 | | | Singapore Telecommunications Ltd. | | | 520,813 | |
| | 13,800 | | | StarHub Ltd. | | | 37,019 | |
| | 58,600 | | | Suntec Real Estate Investment Trust | | | 71,904 | |
| | 28,000 | | | United Overseas Bank Ltd. | | | 369,108 | |
| | 11,700 | | | UOL Group Ltd. | | | 47,655 | |
| | 43,100 | | | Wilmar International Ltd. | | | 97,306 | |
| | | | | | | | |
| | | | Total Singapore | | | 4,546,451 | |
| | | | | | | | |
| South Africa — 0.2% | |
| | 12,803 | | | Investec PLC | | | 76,068 | |
| | 7,828 | | | Mediclinic International PLC | | | 105,311 | |
| | 8,211 | | | Mondi PLC | | | 167,047 | |
| | 178,031 | | | SPAR Group Ltd. (The) | | | 2,317,110 | |
| | | | | | | | |
| | | | Total South Africa | | | 2,665,536 | |
| | | | | | | | |
| South Korea — 1.6% | |
| | 26,115 | | | KT&G Corp. | | | 2,736,667 | |
| | 2,666 | | | NAVER Corp. | | | 2,016,952 | |
| | 4,574 | | | Samsung Electronics Co., Ltd. | | | 6,631,459 | |
| | 32,639 | | | SK Telecom Co., Ltd. | | | 6,372,284 | |
| | | | | | | | |
| | | | Total South Korea | | | 17,757,362 | |
| | | | | | | | |
| Spain — 3.1% | |
| | 15,590 | | | Abertis Infraestructuras SA | | | 241,883 | |
| | 4,599 | | | ACS Actividades de Construccion y Servicios SA | | | 130,269 | |
| | 1,563 | | | Aena SA(b) | | | 221,400 | |
| | 92,263 | | | Amadeus IT Holding SA, Class A Shares | | | 4,246,572 | |
| | 722,004 | | | Banco Bilbao Vizcaya Argentaria SA | | | 4,483,041 | |
| | 119,225 | | | Banco de Sabadell SA | | | 161,833 | |
| | 74,069 | | | Banco Popular Espanol SA | | | 100,319 | |
| | 320,003 | | | Banco Santander SA | | | 1,432,311 | |
| | 106,472 | | | Bankia SA | | | 89,981 | |
| | 17,624 | | | Bankinter SA | | | 129,592 | |
| | 1,394,868 | | | CaixaBank SA | | | 3,769,076 | |
| | 95,168 | | | Cellnex Telecom SA(b) | | | 1,660,928 | |
| | 14,683 | | | Distribuidora Internacional de Alimentacion SA | | | 89,971 | |
| | 7,975 | | | Endesa SA | | | 162,853 | |
| | 11,582 | | | Ferrovial SA | | | 228,292 | |
See Notes to Financial Statements.
122
| | | | | | | | |
| International Equity Fund | | | |
| | |
| Shares/Units | | | Security | | Value | |
| Spain — 3.1% — (continued) | |
| | 8,849 | | | Gas Natural SDG SA | | $ | 182,979 | |
| | 154,085 | | | Grifols SA | | | 3,269,310 | |
| | 120,253 | | | Iberdrola SA | | | 792,485 | |
| | 156,375 | | | Industria de Diseno Textil SA | | | 5,552,726 | |
| | 27,471 | | | Mapfre SA | | | 74,505 | |
| | 524,944 | | | Prosegur Cia de Seguridad SA | | | 3,526,108 | |
| | 112,271 | | | Red Electrica Corp. SA | | | 2,420,043 | |
| | 25,361 | | | Repsol SA | | | 341,735 | |
| | 99,522 | | | Telefonica SA | | | 1,005,946 | |
| | 4,867 | | | Zardoya Otis SA | | | 45,937 | |
| | | | | | | | |
| | | | Total Spain | | | 34,360,095 | |
| | | | | | | | |
| Sweden — 1.8% | |
| | 45,547 | | | Alfa Laval AB | | | 706,911 | |
| | 189,729 | | | Assa Abloy AB, Class B Shares | | | 3,839,649 | |
| | 126,623 | | | Atlas Copco AB, Class A Shares | | | 3,588,023 | |
| | 8,595 | | | Atlas Copco AB, Class B Shares | | | 220,776 | |
| | 6,002 | | | Boliden AB | | | 127,002 | |
| | 5,196 | | | Electrolux AB, Series B | | | 135,257 | |
| | 4,155 | | | Getinge AB, Class B Shares | | | 81,001 | |
| | 20,911 | | | Hennes & Mauritz AB, Class B Shares | | | 636,951 | |
| | 62,290 | | | Hexagon AB, Class B Shares | | | 2,538,921 | |
| | 9,209 | | | Husqvarna AB, Class B Shares | | | 79,592 | |
| | 1,751 | | | ICA Gruppen AB | | | 59,945 | |
| | 3,545 | | | Industrivarden AB, Class C Shares | | | 64,547 | |
| | 10,158 | | | Investor AB, Class B Shares | | | 358,013 | |
| | 5,157 | | | Kinnevik AB, Class B Shares | | | 126,878 | |
| | 4,143 | | | Lundin Petroleum AB* | | | 72,877 | |
| | 66,899 | | | Nordea Bank AB | | | 653,445 | |
| | 22,812 | | | Sandvik AB | | | 247,472 | |
| | 6,780 | | | Securitas AB, Class B Shares | | | 118,043 | |
| | 32,412 | | | Skandinaviska Enskilda Banken AB, Class A Shares | | | 316,576 | |
| | 7,342 | | | Skanska AB, Class B Shares | | | 160,833 | |
| | 8,436 | | | SKF AB, Class B Shares | | | 142,065 | |
| | 13,569 | | | Svenska Cellulosa AB SCA, Class B Shares | | | 416,756 | |
| | 33,164 | | | Svenska Handelsbanken AB, Class A Shares | | | 427,635 | |
| | 20,052 | | | Swedbank AB, Class A Shares | | | 460,780 | |
| | 54,712 | | | Swedish Match AB | | | 1,951,952 | |
| | 6,718 | | | Tele2 AB, Class B Shares | | | 55,860 | |
| | 262,806 | | | Telefonaktiebolaget LM Ericsson, Class B Shares | | | 1,872,640 | |
| | 57,883 | | | Telia Co. AB | | | 261,285 | |
| | 34,417 | | | Volvo AB, Class B Shares | | | 369,790 | |
| | | | | | | | |
| | | | Total Sweden | | | 20,091,475 | |
| | | | | | | | |
| Switzerland — 10.6% | |
| | 148,026 | | | ABB Ltd., Class Registered Shares* | | | 3,210,964 | |
| | 2,275 | | | Actelion Ltd., Class Registered Shares* | | | 379,034 | |
| | 40,129 | | | Adecco Group AG, Class Registered Shares | | | 2,309,776 | |
| | 169,390 | | | Aryzta AG* | | | 6,755,965 | |
| | 1,088 | | | Baloise Holding AG, Class Registered Shares | | | 129,588 | |
| | 2,227 | | | Barry Callebaut AG, Class Registered Shares* | | | 2,865,940 | |
| | 22 | | | Chocoladefabriken Lindt & Spruengli AG | | | 127,474 | |
| | 2 | | | Chocoladefabriken Lindt & Spruengli AG, Class Registered Shares | | | 137,744 | |
| | 122,330 | | | Cie Financiere Richemont SA, Class Registered Shares | | | 7,059,082 | |
| | 217,891 | | | Clariant AG, Class Registered Shares* | | | 3,797,695 | |
| | 3,797 | | | Coca-Cola HBC AG* | | | 83,517 | |
See Notes to Financial Statements.
123
| | | | | | | | |
| International Equity Fund | | | |
| | |
| Shares/Units | | | Security | | Value | |
| Switzerland — 10.6% — (continued) | |
| | 41,196 | | | Credit Suisse Group AG, Class Registered Shares* | | $ | 536,303 | |
| | 1,078 | | | Dufry AG, Class Registered Shares* | | | 126,222 | |
| | 182 | | | EMS-Chemie Holding AG, Class Registered Shares | | | 96,883 | |
| | 2,071 | | | Galenica AG, Class Registered Shares | | | 2,401,631 | |
| | 830 | | | Geberit AG, Class Registered Shares | | | 362,105 | |
| | 208 | | | Givaudan SA, Class Registered Shares | | | 430,039 | |
| | 269,480 | | | Glencore PLC, Class Registered Shares* | | | 616,728 | |
| | 5,140 | | | Julius Baer Group Ltd.* | | | 215,833 | |
| | 1,206 | | | Kuehne + Nagel International AG, Class Registered Shares | | | 168,469 | |
| | 10,039 | | | LafargeHolcim Ltd., Class Registered Shares* | | | 532,536 | |
| | 32,291 | | | Lonza Group AG, Class Registered Shares* | | | 6,124,558 | |
| | 163,346 | | | Nestlé SA, Class Registered Shares | | | 13,020,303 | |
| | 142,736 | | | Novartis AG, Class Registered Shares | | | 11,235,494 | |
| | 836 | | | Pargesa Holding SA | | | 57,689 | |
| | 391 | | | Partners Group Holding AG | | | 179,423 | |
| | 82,042 | | | Roche Holding AG | | | 20,021,917 | |
| | 8,329 | | | Schindler Holding AG | | | 1,568,630 | |
| | 439 | | | Schindler Holding AG, Class Registered Shares | | | 82,893 | |
| | 1,012 | | | SGS SA, Class Registered Shares | | | 2,222,537 | |
| | 694 | | | Sika AG | | | 3,309,355 | |
| | 19,396 | | | Sonova Holding AG, Class Registered Shares | | | 2,682,880 | |
| | 13,691 | | | STMicroelectronics NV | | | 102,605 | |
| | 677 | | | Swatch Group AG (The) | | | 174,466 | |
| | 1,189 | | | Swatch Group AG (The), Class Registered Shares | | | 60,482 | |
| | 700 | | | Swiss Life Holding AG, Class Registered Shares* | | | 175,286 | |
| | 1,506 | | | Swiss Prime Site AG, Class Registered Shares* | | | 132,520 | |
| | 7,398 | | | Swiss Re AG | | | 625,213 | |
| | 581 | | | Swisscom AG, Class Registered Shares | | | 277,781 | |
| | 5,990 | | | Syngenta AG, Class Registered Shares | | | 2,609,643 | |
| | 59,609 | | | Temenos Group AG, Class Registered Shares* | | | 3,468,951 | |
| | 353,924 | | | UBS Group AG, Class Registered Shares | | | 5,126,823 | |
| | 56,203 | | | Wolseley PLC | | | 3,235,402 | |
| | 39,066 | | | Zurich Insurance Group AG* | | | 9,999,232 | |
| | | | | | | | |
| | | | Total Switzerland | | | 118,837,611 | |
| | | | | | | | |
| Taiwan — 0.1% | |
| | 170,000 | | | Taiwan Semiconductor Manufacturing Co., Ltd. | | | 945,550 | |
| | | | | | | | |
| Thailand — 0.3% | |
| | 2,126,700 | | | CP ALL PCL | | | 3,822,901 | |
| | | | | | | | |
| United Kingdom — 18.5% | |
| | 20,315 | | | 3i Group PLC | | | 164,631 | |
| | 19,035 | | | Aberdeen Asset Management PLC | | | 80,239 | |
| | 4,368 | | | Admiral Group PLC | | | 117,782 | |
| | 100,833 | | | Aggreko PLC | | | 1,351,756 | |
| | 30,230 | | | Anglo American PLC* | | | 310,000 | |
| | 145,512 | | | ARM Holdings PLC | | | 3,225,648 | |
| | 10,633 | | | Ashtead Group PLC | | | 177,045 | |
| | 7,527 | | | Associated British Foods PLC | | | 301,371 | |
| | 27,844 | | | AstraZeneca PLC | | | 1,797,700 | |
| | 20,834 | | | Auto Trader Group PLC(b) | | | 102,326 | |
| | 37,105 | | | AVEVA Group PLC | | | 930,959 | |
| | 1,877,684 | | | Aviva PLC | | | 10,619,319 | |
| | 5,553 | | | Babcock International Group PLC | | | 76,279 | |
| | 69,859 | | | BAE Systems PLC | | | 494,334 | |
| | 942,692 | | | Balfour Beatty PLC* | | | 3,495,077 | |
See Notes to Financial Statements.
124
| | | | | | | | |
| International Equity Fund | | | |
| | |
| Shares/Units | | | Security | | Value | |
| United Kingdom — 18.5% — (continued) | |
| | 4,243,802 | | | Barclays PLC | | $ | 9,657,317 | |
| | 21,151 | | | Barratt Developments PLC | | | 137,942 | |
| | 2,701 | | | Berkeley Group Holdings PLC | | | 95,144 | |
| | 415,329 | | | BP PLC | | | 2,330,687 | |
| | 225,231 | | | British American Tobacco PLC | | | 13,998,599 | |
| | 20,654 | | | British Land Co. PLC (The), REIT | | | 180,718 | |
| | 679,420 | | | BT Group PLC | | | 3,456,504 | |
| | 135,504 | | | Bunzl PLC | | | 4,197,401 | |
| | 328,475 | | | Burberry Group PLC | | | 5,639,786 | |
| | 165,717 | | | Capita PLC | | | 2,252,795 | |
| | 116,230 | | | Centrica PLC | | | 355,584 | |
| | 24,080 | | | CNH Industrial NV | | | 176,072 | |
| | 993,980 | | | Cobham PLC | | | 2,115,774 | |
| | 4,659 | | | Coca-Cola European Partners PLC* | | | 178,938 | |
| | 36,213 | | | Compass Group PLC | | | 686,857 | |
| | 2,698 | | | Croda International PLC | | | 117,525 | |
| | 407,551 | | | Diageo PLC | | | 11,300,392 | |
| | 58,122 | | | Dignity PLC | | | 2,053,300 | |
| | 28,818 | | | Direct Line Insurance Group PLC | | | 139,815 | |
| | 20,077 | | | Dixons Carphone PLC | | | 98,047 | |
| | 602,436 | | | Domino’s Pizza Group PLC | | | 2,841,370 | |
| | 3,168 | | | asyJet PLC | | | 46,083 | |
| | 255,013 | | | Essentra PLC | | | 1,727,876 | |
| | 19,884 | | | Fiat Chrysler Automobiles NV | | | 137,943 | |
| | 32,697 | | | G4S PLC | | | 99,352 | |
| | 37,750 | | | GKN PLC | | | 154,575 | |
| | 526,448 | | | GlaxoSmithKline PLC | | | 11,345,482 | |
| | 15,765 | | | Hammerson PLC, REIT | | | 120,609 | |
| | 5,304 | | | Hargreaves Lansdown PLC | | | 92,316 | |
| | 433,579 | | | HSBC Holdings PLC | | | 3,215,851 | |
| | 487,255 | | | ICAP PLC | | | 3,069,093 | |
| | 5,990 | | | IMI PLC | | | 83,203 | |
| | 20,999 | | | Imperial Brands PLC | | | 1,103,021 | |
| | 145,828 | | | Inmarsat PLC | | | 1,477,746 | |
| | 3,967 | | | InterContinental Hotels Group PLC | | | 170,327 | |
| | 19,881 | | | International Consolidated Airlines Group SA | | | 99,965 | |
| | 74,484 | | | Intertek Group PLC | | | 3,422,371 | |
| | 21,956 | | | Intu Properties PLC, REIT | | | 91,332 | |
| | 76,436 | | | ITV PLC | | | 202,178 | |
| | 27,320 | | | J Sainsbury PLC | | | 86,341 | |
| | 4,289 | | | Johnson Matthey PLC | | | 188,467 | |
| | 47,580 | | | Kingfisher PLC | | | 232,143 | |
| | 17,648 | | | Land Securities Group PLC, REIT | | | 254,788 | |
| | 125,409 | | | Legal & General Group PLC | | | 347,952 | |
| | 12,402,113 | | | Lloyds Banking Group PLC | | | 9,704,615 | |
| | 7,034 | | | London Stock Exchange Group PLC | | | 254,968 | |
| | 37,827 | | | Marks & Spencer Group PLC | | | 171,944 | |
| | 18,948 | | | Meggitt PLC | | | 116,654 | |
| | 14,209 | | | Merlin Entertainments PLC(b) | | | 89,839 | |
| | 82,497 | | | National Grid PLC | | | 1,136,987 | |
| | 3,018 | | | Next PLC | | | 219,782 | |
| | 110,314 | | | Old Mutual PLC | | | 281,619 | |
| | 18,835 | | | Pearson PLC | | | 214,476 | |
| | 7,112 | | | Persimmon PLC | | | 171,140 | |
| | 5,413 | | | Petrofac Ltd. | | | 59,234 | |
| | 3,048 | | | Provident Financial PLC | | | 120,494 | |
See Notes to Financial Statements.
125
| | | | | | | | |
| International Equity Fund | | | |
| | |
| Shares/Units | | | Security | | Value | |
| United Kingdom — 18.5% — (continued) | |
| | 615,426 | | | Prudential PLC | | $ | 11,100,135 | |
| | 85,927 | | | Reckitt Benckiser Group PLC | | | 8,310,385 | |
| | 307,553 | | | RELX NV | | | 5,460,974 | |
| | 24,386 | | | RELX PLC | | | 463,399 | |
| | 9,820 | | | Rio Tinto Ltd. | | | 349,359 | |
| | 27,237 | | | Rio Tinto PLC | | | 817,778 | |
| | 273,223 | | | Rolls-Royce Holdings PLC* | | | 2,765,177 | |
| | 73,654 | | | Royal Bank of Scotland Group PLC* | | | 195,845 | |
| | 429,659 | | | Royal Mail PLC | | | 2,902,810 | |
| | 21,468 | | | RSA Insurance Group PLC | | | 140,062 | |
| | 21,420 | | | SABMiller PLC | | | 1,237,665 | |
| | 23,772 | | | Sage Group PLC (The) | | | 226,969 | |
| | 2,961 | | | Schroders PLC | | | 108,518 | |
| | 15,357 | | | Segro PLC, REIT | | | 91,738 | |
| | 5,107 | | | Severn Trent PLC | | | 159,987 | |
| | 198,983 | | | Sky PLC | | | 2,222,690 | |
| | 19,723 | | | Smith & Nephew PLC | | | 318,556 | |
| | 8,858 | | | Smiths Group PLC | | | 156,249 | |
| | 54,720 | | | Spectris PLC | | | 1,392,543 | |
| | 240,559 | | | SSE PLC | | | 4,758,664 | |
| | 11,556 | | | St. James’s Place PLC | | | 149,188 | |
| | 72,200 | | | Standard Chartered PLC* | | | 609,644 | |
| | 44,265 | | | Standard Life PLC | | | 212,294 | |
| | 9,760 | | | Tate & Lyle PLC | | | 94,132 | |
| | 69,007 | | | Taylor Wimpey PLC | | | 146,938 | |
| | 174,735 | | | Tesco PLC* | | | 382,608 | |
| | 145,329 | | | Travis Perkins PLC | | | 3,180,297 | |
| | 148,547 | | | Tullett Prebon PLC | | | 744,632 | |
| | 35,878 | | | Unilever NV, Dutch Certificate | | | 1,648,341 | |
| | 173,387 | | | Unilever PLC | | | 8,047,271 | |
| | 14,739 | | | United Utilities Group PLC | | | 188,430 | |
| | 4,575,784 | | | Vodafone Group PLC | | | 13,806,943 | |
| | 53,024 | | | Weir Group PLC (The) | | | 1,049,446 | |
| | 68,864 | | | Whitbread PLC | | | 3,774,518 | |
| | 620,491 | | | William Hill PLC | | | 2,598,758 | |
| | 46,201 | | | WM Morrison Supermarkets PLC | | | 119,626 | |
| | 378,574 | | | Worldpay Group PLC*(b) | | | 1,486,749 | |
| | 28,516 | | | WPP PLC | | | 659,047 | |
| | | | | | | | |
| | | | Total United Kingdom | | | 207,644,164 | |
| | | | | | | | |
| United States — 1.6% | |
| | 77,870 | | | Carnival Corp. | | | 3,722,186 | |
| | 170,419 | | | Carnival PLC | | | 8,180,302 | |
| | 611,100 | | | Samsonite International SA | | | 1,933,838 | |
| | 71,949 | | | Shire PLC | | | 4,493,898 | |
| | | | | | | | |
| | | | Total United States | | | 18,330,224 | |
| | | | | | | | |
| | | | TOTAL COMMON STOCKS
(Cost — $1,037,459,230) | | | 1,088,502,448 | |
| | | | | | | | |
| PREFERRED STOCKS — 1.2% | |
| Brazil — 0.2% | |
| | 113,800 | | | Telefonica Brasil SA, Class Preferred Shares | | | 1,715,641 | |
| | | | | | | | |
| Germany — 1.0% | |
| | 1,201 | | | Bayerische Motoren Werke AG, Class Preferred Shares | | | 90,018 | |
| | 1,592 | | | FUCHS PETROLUB SE, Class Preferred Shares | | | 72,567 | |
See Notes to Financial Statements.
126
| | | | | | | | |
| International Equity Fund | | | |
| | |
| Shares/Units | | | Security | | Value | |
| Germany — 1.0% — (continued) | |
| | 3,953 | | | Henkel AG & Co. KgaA, Class Preferred Shares | | $ | 519,716 | |
| | 3,307 | | | Porsche Automobil Holding SE, Class Preferred Shares | | | 167,652 | |
| | 3,572 | | | Schaeffler AG, Class Preferred Shares | | | 55,426 | |
| | 76,464 | | | Volkswagen AG, Class Preferred Shares, 1.800% | | | 10,622,558 | |
| | | | | | | | |
| | | | Total Germany | | | 11,527,937 | |
| | | | | | | | |
| | | | TOTAL PREFERRED STOCKS
(Cost — $12,254,366) | | | 13,243,578 | |
| | | | | | | | |
| | | | TOTAL INVESTMENTS BEFORE SHORT-TERM INVESTMENTS
(Cost — $1,049,713,596) | | | 1,101,746,026 | |
| | | | | | | | |
| | |
Face
Amount† | | | | | | |
| SHORT-TERM INVESTMENTS (c) — 2.0% | |
| MONEY MARKET FUND — 0.4% | |
| $ | 4,174,893 | | | Invesco STIT — Government & Agency Portfolio(d)
(Cost — $4,174,893) | | | 4,174,893 | |
| | | | | | | | |
| TIME DEPOSITS — 1.6% | |
| | 61,367 | AUD | | ANZ National Bank — London, 0.689% due 9/1/16 | | | 46,120 | |
| | 5,631,433 | | | Banco Santander SA — Frankfurt, 0.150% due 9/1/16 | | | 5,631,433 | |
| | | | BBH — Grand Cayman: | | | | |
| | 10,308 | CHF | | (1.450)% due 9/1/16 | | | 10,481 | |
| | 59,662 | SEK | | (1.115)% due 9/1/16 | | | 6,970 | |
| | 2,217 | EUR | | (0.540)% due 9/1/16 | | | 2,473 | |
| | 33,764 | DKK | | (0.450)% due 9/1/16 | | | 5,061 | |
| | 89 | JPY | | (0.390)% due 9/1/16 | | | 1 | |
| | 229,456 | HKD | | 0.005% due 9/1/16 | | | 29,578 | |
| | 4,218 | SGD | | 0.010% due 9/1/16 | | | 3,096 | |
| | 1 | CAD | | 0.050% due 9/1/16 | | | 1 | |
| | 2 | GBP | | 0.050% due 9/1/16 | | | 3 | |
| | 36,062 | NOK | | 0.084% due 9/1/16 | | | 4,328 | |
| | 9,624,812 | | | 0.150% due 9/1/16 | | | 9,624,812 | |
| | 20,431 | AUD | | 0.689% due 9/1/16 | | | 15,355 | |
| | 415 | NZD | | 1.250% due 9/1/16 | | | 301 | |
| | | | BNP Paribas — Paris: | | | | |
| | 38,129 | EUR | | (0.540)% due 9/1/16 | | | 42,536 | |
| | 20,626 | GBP | | 0.050% due 9/1/16 | | | 27,085 | |
| | 36,086 | | | 0.150% due 9/1/16 | | | 36,086 | |
| | 5,933,440 | JPY | | Sumitomo — Tokyo, (0.390)% due 9/1/16 | | | 57,342 | |
| | 2,590,480 | | | Wells Fargo — Grand Cayman, 0.150% due 9/1/16 | | | 2,590,480 | |
| | | | | | | | |
| | | | TOTAL TIME DEPOSITS
(Cost — $18,133,542) | | | 18,133,542 | |
| | | | | | | | |
| | | | TOTAL SHORT-TERM INVESTMENTS
(Cost — $22,308,435) | | | 22,308,435 | |
| | | | | | | | |
| | | | TOTAL INVESTMENTS — 100.2%
(Cost — $1,072,022,031#) | | | 1,124,054,461 | |
| | | | | | | | |
| | | | Liabilities in Excess of Other Assets — (0.2)% | | | (1,711,437 | ) |
| | | | | | | | |
| | | | TOTAL NET ASSETS — 100.0% | | $ | 1,122,343,024 | |
| | | | | | | | |
| † | Amount denominated in U.S. dollars, unless otherwise noted |
| * | Non-income producing security. |
| (a) | All or a portion of this security is on loan (See Note 1). |
See Notes to Financial Statements.
127
| | | | |
| International Equity Fund |
| (b) | Restricted security that may be sold to “qualified institutional buyers” pursuant to the conditions of Rule 144A under the Securities Act of 1933, as amended. This security has been deemed liquid pursuant to guidelines approved by the Board of Trustees, unless otherwise noted. |
| (c) | Inclusive of all short term holdings, including collateral received from securities lending activities. Excluding such collateral, the percentage of portfolio holdings would be 1.6%. |
| (d) | Represents investment of collateral received from securities lending transactions. |
| # | Aggregate cost for federal income tax purposes is $1,094,894,766. |
| | |
Abbreviations used in this schedule: |
| ADR | | — American Depositary Receipts |
| CDI | | — Clearing House Electronics System (CHESS) Depositary Interest |
| GDR | | — Global Depositary Receipt |
| PCL | | — Public Company Limited |
| PLC | | — Public Limited Company |
| REIT | | — Real Estate Investment Trust |
| | |
Currency Abbreviations used in this schedule: |
| AUD | | — Australian Dollar |
| CAD | | — Canadian Dollar |
| CHF | | — Swiss Franc |
| DKK | | — Danish Krone |
| EUR | | — Euro |
| GBP | | — British Pound |
| HKD | | — Hong Kong Dollar |
| JPY | | — Japanese Yen |
| NOK | | — Norwegian Krone |
| NZD | | — New Zealand Dollar |
| SEK | | — Swedish Krona |
| SGD | | — Singapore Dollar |
| | | | |
| Summary of Investments by Security Sector^ | |
Financials | | | 16.7 | % |
Industrials | | | 16.0 | |
Consumer Discretionary | | | 13.7 | |
Health Care | | | 11.6 | |
Consumer Staples | | | 11.3 | |
Information Technology | | | 9.5 | |
Materials | | | 6.5 | |
Telecommunication Services | | | 6.4 | |
Energy | | | 4.3 | |
Utilities | | | 2.0 | |
Short-Term Investments | | | 2.0 | |
| | | | |
| | | 100.0 | % |
| | | | |
| ^ | As a percentage of total investments. |
See Notes to Financial Statements.
128
| | | | | | | | |
| Emerging Markets Equity Fund | |
| | |
| Shares/Units | | | Security | | Value | |
| COMMON STOCKS — 94.5% | |
| Argentina — 0.7% | |
| | 44,050 | | | Grupo Supervielle SA, ADR* | | $ | 619,343 | |
| | 135,133 | | | YPF SA, ADR | | | 2,295,910 | |
| | | | | | | | |
| | | | Total Argentina | | | 2,915,253 | |
| | | | | | | | |
| Brazil — 7.4% | |
| | 4,700 | | | AES Tiete Energia SA | | | 24,303 | |
| | 119,200 | | | Ambev SA | | | 708,265 | |
| | 488,771 | | | Ambev SA, ADR | | | 2,898,412 | |
| | 24,597 | | | Banco Bradesco SA | | | 221,625 | |
| | 678,785 | | | Banco do Brasil SA | | | 4,878,114 | |
| | 10,500 | | | Banco Santander Brasil SA | | | 73,736 | |
| | 677,256 | | | BB Seguridade Participações SA | | | 6,112,741 | |
| | 43,736 | | | BM&FBovespa SA — Bolsa de Valores Mercadorias e Futuros | | | 242,538 | |
| | 14,500 | | | BR Malls Participações SA* | | | 55,402 | |
| | 15,400 | | | BRF SA | | | 256,774 | |
| | 565,500 | | | CCR SA | | | 2,987,144 | |
| | 5,700 | | | CETIP SA — Mercados Organizados | | | 77,126 | |
| | 8,600 | | | Cia de Saneamento Basico do Estado de Sao Paulo | | | 78,261 | |
| | 15,800 | | | Cia Siderurgica Nacional SA* | | | 42,073 | |
| | 426,325 | | | Cielo SA | | | 4,433,996 | |
| | 3,100 | | | Cosan SA Indústria e Comércio | | | 36,110 | |
| | 5,100 | | | CPFL Energia SA | | | 36,715 | |
| | 79,100 | | | CVC Brasil Operadora e Agencia de Viagens SA | | | 549,841 | |
| | 7,900 | | | Duratex SA | | | 21,256 | |
| | 7,700 | | | EDP — Energias do Brasil SA | | | 34,094 | |
| | 16,900 | | | Embraer SA | | | 74,986 | |
| | 4,100 | | | Engie Brasil Energia SA | | | 49,510 | |
| | 5,000 | | | Equatorial Energia SA | | | 78,290 | |
| | 6,300 | | | Fibria Celulose SA | | | 42,934 | |
| | 8,800 | | | Hypermarcas SA | | | 71,116 | |
| | 18,100 | | | JBS SA | | | 70,054 | |
| | 14,000 | | | Klabin SA | | | 73,692 | |
| | 34,900 | | | Kroton Educacional SA | | | 149,125 | |
| | 130,978 | | | Localiza Rent a Car SA | | | 1,634,766 | |
| | 4,800 | | | Lojas Americanas SA | | | 20,763 | |
| | 16,200 | | | Lojas Renner SA | | | 128,561 | |
| | 900 | | | M Dias Branco SA | | | 33,719 | |
| | 2,000 | | | Multiplan Empreendimentos Imobiliarios SA | | | 36,109 | |
| | 86,100 | | | Natura Cosméticos SA | | | 830,702 | |
| | 6,700 | | | Odontoprev SA | | | 26,450 | |
| | 32,000 | | | Ouro Fino Saude Animal Participacoes SA(a) | | | 376,511 | |
| | 75,200 | | | Petroleo Brasileiro SA* | | | 343,210 | |
| | 2,900 | | | Porto Seguro SA | | | 24,738 | |
| | 5,500 | | | Qualicorp SA | | | 38,623 | |
| | 5,800 | | | Raia Drogasil SA | | | 107,177 | |
| | 20,300 | | | Rumo Logistica Operadora Multimodal SA* | | | 45,256 | |
| | 78,500 | | | Smiles SA | | | 1,222,594 | |
| | 4,500 | | | Sul America SA | | | 22,753 | |
| | 21,500 | | | TIM Participações SA | | | 55,320 | |
| | 3,100 | | | TOTVS SA | | | 28,796 | |
| | 2,400 | | | Transmissora Alianca de Energia Eletrica SA | | | 17,240 | |
| | 9,172 | | | Ultrapar Participações SA | | | 211,376 | |
| | 32,500 | | | Vale SA | | | 170,467 | |
| | 230,700 | | | Valid Solucoes e Servicos de Seguranca em Meios de Pagamento e Identificacao SA | | | 2,045,095 | |
| | 14,300 | | | WEG SA | | | 73,190 | |
| | | | | | | | |
| | | | Total Brazil | | | 31,871,649 | |
| | | | | | | | |
See Notes to Financial Statements.
129
| | | | | | | | |
| Emerging Markets Equity Fund | |
| | |
| Shares/Units | | | Security | | Value | |
| Chile — 0.2% | |
| | 64,048 | | | AES Gener SA | | $ | 25,456 | |
| | 65,824 | | | Aguas Andinas SA, Class A Shares | | | 39,213 | |
| | 622,256 | | | Banco de Chile | | | 69,024 | |
| | 948 | | | Banco de Credito e Inversiones | | | 41,957 | |
| | 1,670,620 | | | Banco Santander Chile | | | 87,818 | |
| | 32,110 | | | Cencosud SA | | | 94,428 | |
| | 3,735 | | | Cia Cervecerias Unidas SA | | | 39,487 | |
| | 199,393 | | | Colbun SA | | | 42,218 | |
| | 82,440 | | | Empresa Nacional de Electricidad SA | | | 61,821 | |
| | 3,852 | | | Empresa Nacional de Telecomunicaciones SA* | | | 36,362 | |
| | 31,738 | | | Empresas CMPC SA | | | 63,005 | |
| | 11,495 | | | Empresas COPEC SA | | | 100,060 | |
| | 82,610 | | | Endesa Americas SA | | | 36,866 | |
| | 494,680 | | | Enersis Americas SA | | | 82,033 | |
| | 498,330 | | | Enersis Chile SA | | | 53,160 | |
| | 3,934,534 | | | Itau CorpBanca | | | 33,734 | |
| | 7,569 | | | Latam Airlines Group SA* | | | 59,622 | |
| | 15,303 | | | SACI Falabella | | | 108,254 | |
| | | | | | | | |
| | | | Total Chile | | | 1,074,518 | |
| | | | | | | | |
| China — 19.1% | |
| | 25,000 | | | 3SBio Inc.*(b) | | | 25,508 | |
| | 1,930 | | | 58.com Inc., ADR* | | | 87,815 | |
| | 207,763 | | | AAC Technologies Holdings Inc. | | | 2,365,330 | |
| | 622,000 | | | Agricultural Bank of China Ltd., Class H Shares(c) | | | 255,110 | |
| | 46,000 | | | Air China Ltd., Class H Shares(c) | | | 33,965 | |
| | 55,841 | | | Alibaba Group Holding Ltd., ADR* | | | 5,427,187 | |
| | 100,000 | | | Aluminum Corp. of China Ltd., Class H Shares*(c) | | | 37,509 | |
| | 31,000 | | | Anhui Conch Cement Co., Ltd., Class H Shares(c) | | | 86,879 | |
| | 25,000 | | | ANTA Sports Products Ltd. | | | 67,481 | |
| | 53,000 | | | AviChina Industry & Technology Co., Ltd., Class H Shares(c) | | | 38,940 | |
| | 39,809 | | | Baidu Inc., ADR* | | | 6,810,126 | |
| | 2,009,000 | | | Bank of China Ltd., Class H Shares(c) | | | 900,484 | |
| | 222,000 | | | Bank of Communications Co., Ltd., Class H Shares(c) | | | 170,827 | |
| | 38,000 | | | Beijing Capital International Airport Co., Ltd., Class H Shares(c) | | | 42,814 | |
| | 160,000 | | | Belle International Holdings Ltd. | | | 103,585 | |
| | 16,000 | | | BYD Co., Ltd., Class H Shares*(c) | | | 111,048 | |
| | 267,000 | | | CGN Power Co,. Ltd., Class H Shares(b)(c) | | | 77,175 | |
| | 221,000 | | | China Cinda Asset Management Co., Ltd., Class H Shares(c) | | | 74,801 | |
| | 226,000 | | | China CITIC Bank Corp., Ltd., Class H Shares(c) | | | 148,672 | |
| | 52,000 | | | China Coal Energy Co., Ltd., Class H Shares*(c) | | | 24,772 | |
| | 112,000 | | | China Communications Construction Co., Ltd., Class H Shares(c) | | | 121,677 | |
| | 60,000 | | | China Communications Services Corp., Ltd., Class H Shares(c) | | | 35,229 | |
| | 34,000 | | | China Conch Venture Holdings Ltd. | | | 65,276 | |
| | 10,214,380 | | | China Construction Bank Corp., Class H Shares(c) | | | 7,610,065 | |
| | 65,000 | | | China COSCO Holdings Co., Ltd., Class H Shares*(c) | | | 21,552 | |
| | 79,000 | | | China Everbright Bank Co., Ltd., Class H Shares(c) | | | 37,305 | |
| | 104,000 | | | China Evergrande Group | | | 71,690 | |
| | 74,500 | | | China Galaxy Securities Co., Ltd., Class H Shares(c) | | | 69,708 | |
| | 102,000 | | | China Huishan Dairy Holdings Co., Ltd. | | | 39,157 | |
| | 196,000 | | | China Life Insurance Co., Ltd., Class H Shares(c) | | | 468,142 | |
| | 52,100 | | | China Lodging Group Ltd., ADR | | | 2,325,223 | |
| | 80,000 | | | China Longyuan Power Group Corp., Ltd., Class H Shares(c) | | | 67,090 | |
| | 1,930,000 | | | China Maple Leaf Educational Systems Ltd. | | | 1,445,407 | |
| | 1,413,000 | | | China Medical System Holdings Ltd. | | | 2,367,768 | |
| | 69,000 | | | China Mengniu Dairy Co., Ltd. | | | 130,603 | |
See Notes to Financial Statements.
130
| | | | | | | | |
| Emerging Markets Equity Fund | |
| | |
| Shares/Units | | | Security | | Value | |
| China — 19.1% — (continued) | |
| | 98,500 | | | China Merchants Bank Co., Ltd., Class H Shares(c) | | $ | 238,754 | |
| | 149,000 | | | China Minsheng Banking Corp., Ltd., Class H Shares(c) | | | 159,638 | |
| | 74,000 | | | China National Building Material Co., Ltd., Class H Shares(c) | | | 33,258 | |
| | 46,000 | | | China Oilfield Services Ltd., Class H Shares(c) | | | 35,839 | |
| | 66,600 | | | China Pacific Insurance Group Co., Ltd., Class H Shares(c) | | | 233,380 | |
| | 666,000 | | | China Petroleum & Chemical Corp., Class H Shares(c) | | | 477,145 | |
| | 50,000 | | | China Railway Construction Corp., Ltd., Class H Shares(c) | | | 61,029 | |
| | 101,000 | | | China Railway Group Ltd., Class H Shares(c) | | | 74,588 | |
| | 841,000 | | | China Shenhua Energy Co., Ltd., Class H Shares(c) | | | 1,503,259 | |
| | 95,000 | | | China Shipping Container Lines Co., Ltd., Class H Shares*(c) | | | 19,782 | |
| | 46,000 | | | China Southern Airlines Co., Ltd., Class H Shares(c) | | | 27,192 | |
| | 352,000 | | | China Telecom Corp., Ltd., Class H Shares(c) | | | 181,331 | |
| | 33,200 | | | China Vanke Co., Ltd., Class H Shares(c) | | | 84,897 | |
| | 21,700 | | | Chongqing Changan Automobile Co., Ltd., Class B Shares | | | 33,009 | |
| | 64,000 | | | Chongqing Rural Commercial Bank Co., Ltd., Class H Shares(c) | | | 37,053 | |
| | 54,500 | | | CITIC Securities Co., Ltd., Class H Shares(c) | | | 121,463 | |
| | 1,848,442 | | | CNOOC Ltd. | | | 2,238,267 | |
| | 142,000 | | | Country Garden Holdings Co., Ltd. | | | 72,004 | |
| | 105,000 | | | CRRC Corp., Ltd., Class H Shares(c) | | | 93,675 | |
| | 104,000 | | | CSPC Pharmaceutical Group Ltd. | | | 100,948 | |
| | 8,875 | | | Ctrip.com International Ltd., ADR* | | | 420,231 | |
| | 68,000 | | | Dongfeng Motor Group Co., Ltd., Class H Shares(c) | | | 72,486 | |
| | 20,000 | | | ENN Energy Holdings Ltd. | | | 111,933 | |
| | 65,500 | | | Fosun International Ltd. | | | 90,433 | |
| | 1,732,000 | | | Fu Shou Yuan International Group Ltd. | | | 1,067,121 | |
| | 135,000 | | | Geely Automobile Holdings Ltd. | | | 107,922 | |
| | 34,400 | | | GF Securities Co., Ltd., Class H Shares(c) | | | 74,676 | |
| | 313,000 | | | GOME Electrical Appliances Holding Ltd. | | | 37,051 | |
| | 78,500 | | | Great Wall Motor Co., Ltd., Class H Shares(c) | | | 75,921 | |
| | 52,000 | | | Guangzhou Automobile Group Co., Ltd., Class H Shares(c) | | | 71,429 | |
| | 24,400 | | | Guangzhou R&F Properties Co., Ltd., Class H Shares(c) | | | 41,202 | |
| | 16,000 | | | Haitian International Holdings Ltd. | | | 32,205 | |
| | 77,600 | | | Haitong Securities Co., Ltd., Class H Shares(c) | | | 134,664 | |
| | 18,500 | | | Hengan International Group Co., Ltd. | | | 156,174 | |
| | 42,000 | | | Huadian Power International Corp., Ltd., Class H Shares(c) | | | 18,746 | |
| | 108,000 | | | Huaneng Power International Inc., Class H Shares(c) | | | 65,704 | |
| | 100,000 | | | Huaneng Renewables Corp., Ltd., Class H Shares(c) | | | 37,051 | |
| | 36,800 | | | Huatai Securities Co., Ltd., Class H Shares(b)(c) | | | 77,642 | |
| | 1,899,000 | | | Industrial & Commercial Bank of China Ltd., Class H Shares(c) | | | 1,202,991 | |
| | 196,028 | | | JD.com Inc., ADR* | | | 4,981,071 | |
| | 30,000 | | | Jiangsu Expressway Co., Ltd., Class H Shares(c) | | | 42,128 | |
| | 32,000 | | | Jiangxi Copper Co., Ltd., Class H Shares(c) | | | 36,870 | |
| | 20,000 | | | Kingsoft Corp., Ltd. | | | 40,838 | |
| | 27,929 | | | Kweichow Moutai Co., Ltd., Class A Shares | | | 1,294,519 | |
| | 182,000 | | | Lenovo Group Ltd. | | | 122,305 | |
| | 37,000 | | | Longfor Properties Co., Ltd. | | | 59,503 | |
| | 33,500 | | | Luye Pharma Group Ltd.* | | | 21,254 | |
| | 25,972 | | | NetEase Inc., ADR | | | 5,505,285 | |
| | 19,500 | | | New China Life Insurance Co., Ltd., Class H Shares(c) | | | 78,915 | |
| | 3,358 | | | New Oriental Education & Technology Group Inc., ADR | | | 132,574 | |
| | 176,000 | | | People’s Insurance Co. Group of China Ltd. (The), Class H Shares(c) | | | 70,573 | |
| | 554,000 | | | PetroChina Co., Ltd., Class H Shares(c) | | | 367,327 | |
| | 1,584,000 | | | Phoenix Healthcare Group Co., Ltd. | | | 2,768,386 | |
| | 118,000 | | | PICC Property & Casualty Co., Ltd., Class H Shares(c) | | | 194,392 | |
| | 131,500 | | | Ping An Insurance Group Co. of China Ltd., Class H Shares(c) | | | 678,044 | |
| | 898 | | | Qunar Cayman Islands Ltd., ADR* | | | 26,689 | |
See Notes to Financial Statements.
131
| | | | | | | | |
| Emerging Markets Equity Fund | |
| | |
| Shares/Units | | | Security | | Value | |
| China — 19.1% — (continued) | |
| | 692,000 | | | Semiconductor Manufacturing International Corp.* | | $ | 75,497 | |
| | 48,000 | | | Shandong Weigao Group Medical Polymer Co., Ltd., Class H Shares(c) | | | 31,018 | |
| | 72,000 | | | Shanghai Electric Group Co., Ltd., Class H Shares*(a)(c) | | | 31,936 | |
| | 10,000 | | | Shanghai Fosun Pharmaceutical Group Co., Ltd., Class H Shares(c) | | | 28,953 | |
| | 400,000 | | | Shanghai International Airport Co., Ltd., Class A Shares | | | 1,658,340 | |
| | 23,100 | | | Shanghai Lujiazui Finance & Trade Zone Development Co., Ltd., Class B Shares | | | 38,494 | |
| | 17,400 | | | Shanghai Pharmaceuticals Holding Co., Ltd., Class H Shares(c) | | | 47,645 | |
| | 262,000 | | | Shenzhou International Group Holdings Ltd. | | | 1,720,475 | |
| | 92,000 | | | Shui On Land Ltd. | | | 26,100 | |
| | 76,000 | | | Sino-Ocean Group Holding Ltd. | | | 35,152 | |
| | 31,500 | | | Sinopec Engineering Group Co., Ltd., Class H Shares(c) | | | 26,056 | |
| | 88,000 | | | Sinopec Shanghai Petrochemical Co., Ltd., Class H Shares(c) | | | 45,075 | |
| | 454,000 | | | Sinopharm Group Co., Ltd., Class H Shares(c) | | | 2,318,140 | |
| | 51,000 | | | Sinotrans Ltd., Class H Shares(c) | | | 25,244 | |
| | 52,500 | | | SOHO China Ltd. | | | 31,285 | |
| | 7,062 | | | SouFun Holdings Ltd., ADR* | | | 31,779 | |
| | 47,000 | | | Sunac China Holdings Ltd. | | | 32,653 | |
| | 25,061 | | | TAL Education Group, ADR* | | | 1,497,645 | |
| | 361,131 | | | Tencent Holdings Ltd. | | | 9,361,325 | |
| | 50,000 | | | Tingyi Cayman Islands Holding Corp. | | | 46,164 | |
| | 23,000 | | | TravelSky Technology Ltd., Class H Shares(c) | | | 49,830 | |
| | 10,000 | | | Tsingtao Brewery Co., Ltd., Class H Shares(c) | | | 33,448 | |
| | 10,139 | | | Vipshop Holdings Ltd., ADR* | | | 143,568 | |
| | 145,000 | | | Want Want China Holdings Ltd. | | | 95,342 | |
| | 1,245,600 | | | Weichai Power Co., Ltd., Class H Shares(c) | | | 1,572,048 | |
| | 5,032,000 | | | Xinyi Solar Holdings Ltd.* | | | 2,065,256 | |
| | 46,000 | | | Yanzhou Coal Mining Co., Ltd., Class H Shares(c) | | | 26,193 | |
| | 724 | | | YY Inc., ADR* | | | 37,250 | |
| | 36,000 | | | Zhejiang Expressway Co., Ltd., Class H Shares(c) | | | 40,046 | |
| | 721,000 | | | Zhengzhou Yutong Bus Co., Ltd., Class A Shares | | | 2,329,621 | |
| | 14,000 | | | Zhuzhou CRRC Times Electric Co., Ltd. | | | 74,266 | |
| | 146,000 | | | Zijin Mining Group Co., Ltd., Class H Shares(c) | | | 48,514 | |
| | 19,000 | | | ZTE Corp., Class H Shares(c) | | | 25,666 | |
| | | | | | | | |
| | | | Total China | | | 81,558,710 | |
| | | | | | | | |
| Colombia — 0.1% | |
| | 11,531 | | | Cementos Argos SA | | | 45,778 | |
| | 2,169 | | | Corp. Financiera Colombiana SA | | | 28,431 | |
| | 123,625 | | | Ecopetrol SA* | | | 54,902 | |
| | 7,386 | | | Grupo Argos SA | | | 49,003 | |
| | 5,939 | | | Grupo de Inversiones Suramericana SA | | | 77,207 | |
| | 9,779 | | | Interconexion Electrica SA ESP | | | 32,571 | |
| | | | | | | | |
| | | | Total Colombia | | | 287,892 | |
| | | | | | | | |
| Czech Republic — 0.0% | |
| | 4,079 | | | CEZ AS | | | 71,232 | |
| | 1,924 | | | Komercní Banka AS | | | 65,128 | |
| | 1,576 | | | O2 Czech Republic AS | | | 14,732 | |
| | | | | | | | |
| | | | Total Czech Republic | | | 151,092 | |
| | | | | | | | |
| Egypt — 0.7% | |
| | 720,598 | | | Commercial International Bank Egypt SAE, Class Registered Shares, GDR | | | 3,030,081 | |
| | | | | | | | |
| Georgia — 0.6% | |
| | 63,000 | | | BGEO Group PLC | | | 2,381,684 | |
| | | | | | | | |
See Notes to Financial Statements.
132
| | | | | | | | |
| Emerging Markets Equity Fund | |
| | |
| Shares/Units | | | Security | | Value | |
| Greece — 0.1% | |
| | 34,948 | | | Alpha Bank AE* | | $ | 67,134 | |
| | 46,981 | | | Eurobank Ergasias SA* | | | 28,066 | |
| | 847 | | | FF Group* | | | 20,522 | |
| | 6,204 | | | Hellenic Telecommunications Organization SA | | | 58,875 | |
| | 2,580 | | | JUMBO SA | | | 31,529 | |
| | 138,699 | | | National Bank of Greece SA* | | | 32,545 | |
| | 5,636 | | | OPAP SA | | | 47,314 | |
| | 165,662 | | | Piraeus Bank SA* | | | 27,015 | |
| | 1,168 | | | Titan Cement Co. SA | | | 27,110 | |
| | | | | | | | |
| | | | Total Greece | | | 340,110 | |
| | | | | | | | |
| Hong Kong — 4.5% | |
| | 284,000 | | | AIA Group Ltd. | | | 1,789,036 | |
| | 82,000 | | | Alibaba Health Information Technology Ltd.* | | | 50,939 | |
| | 290,000 | | | Alibaba Pictures Group Ltd.* | | | 59,725 | |
| | 13,000 | | | Beijing Enterprises Holdings Ltd. | | | 74,453 | |
| | 3,684,000 | | | Beijing Enterprises Water Group Ltd. | | | 2,563,420 | |
| | 76,000 | | | Brilliance China Automotive Holdings Ltd. | | | 86,702 | |
| | 62,000 | | | China Everbright International Ltd. | | | 79,132 | |
| | 24,000 | | | China Everbright Ltd. | | | 49,693 | |
| | 44,000 | | | China Gas Holdings Ltd. | | | 74,660 | |
| | 94,000 | | | China Jinmao Holdings Group Ltd. | | | 29,265 | |
| | 32,000 | | | China Merchants Holdings International Co., Ltd. | | | 90,882 | |
| | 156,000 | | | China Mobile Ltd. | | | 1,920,347 | |
| | 88,737 | | | China Mobile Ltd., ADR | | | 5,387,223 | |
| | 100,000 | | | China Overseas Land & Investment Ltd. | | | 329,465 | |
| | 84,000 | | | China Power International Development Ltd. | | | 31,724 | |
| | 40,000 | | | China Resources Beer Holdings Co., Ltd. | | | 92,373 | |
| | 22,000 | | | China Resources Gas Group Ltd. | | | 73,571 | |
| | 70,000 | | | China Resources Land Ltd. | | | 196,360 | |
| | 48,000 | | | China Resources Power Holdings Co., Ltd. | | | 82,685 | |
| | 46,000 | | | China State Construction International Holdings Ltd. | | | 54,776 | |
| | 40,800 | | | China Taiping Insurance Holdings Co., Ltd.* | | | 81,553 | |
| | 152,000 | | | China Unicom Hong Kong Ltd. | | | 171,651 | |
| | 110,000 | | | CITIC Ltd. | | | 173,009 | |
| | 42,000 | | | COSCO SHIPPING Ports Ltd. | | | 45,399 | |
| | 50,000 | | | Far East Horizon Ltd. | | | 46,610 | |
| | 226,000 | | | Galaxy Entertainment Group Ltd. | | | 733,133 | |
| | 329,000 | | | GCL-Poly Energy Holdings Ltd. | | | 46,416 | |
| | 72,000 | | | Guangdong Investment Ltd. | | | 111,181 | |
| | 32,000 | | | Haier Electronics Group Co., Ltd. | | | 53,541 | |
| | 1,654,431 | | | Huabao International Holdings Ltd.* | | | 636,487 | |
| | 82,000 | | | Kunlun Energy Co., Ltd. | | | 60,089 | |
| | 1,870,000 | | | Man Wah Holdings Ltd. | | | 1,268,204 | |
| | 41,000 | | | Nine Dragons Paper Holdings Ltd. | | | 32,862 | |
| | 13,000 | | | Shanghai Industrial Holdings Ltd. | | | 33,797 | |
| | 31,000 | | | Shimao Property Holdings Ltd. | | | 43,101 | |
| | 112,000 | | | Sino Biopharmaceutical Ltd. | | | 71,717 | |
| | 60,000 | | | Sun Art Retail Group Ltd. | | | 38,648 | |
| | 670,500 | | | Techtronic Industries Co., Ltd. | | | 2,711,597 | |
| | | | | | | | |
| | | | Total Hong Kong | | | 19,475,426 | |
| | | | | | | | |
| Hungary — 1.2% | |
| | 928 | | | MOL Hungarian Oil & Gas PLC | | | 57,945 | |
| | 123,576 | | | OTP Bank PLC | | | 3,230,905 | |
| | 83,531 | | | Richter Gedeon Nyrt | | | 1,713,836 | |
| | | | | | | | |
| | | | Total Hungary | | | 5,002,686 | |
| | | | | | | | |
See Notes to Financial Statements.
133
| | | | | | | | |
| Emerging Markets Equity Fund | |
| | |
| Shares/Units | | | Security | | Value | |
| India — 8.0% | |
| | 1,137 | | | ACC Ltd. | | $ | 29,065 | |
| | 20,916 | | | Adani Ports & Special Economic Zone Ltd. | | | 81,927 | |
| | 17,264 | | | Ambuja Cements Ltd. | | | 72,500 | |
| | 1,939 | | | Apollo Hospitals Enterprise Ltd. | | | 39,110 | |
| | 28,672 | | | Ashok Leyland Ltd. | | | 37,272 | |
| | 7,256 | | | Asian Paints Ltd. | | | 125,658 | |
| | 6,644 | | | Aurobindo Pharma Ltd. | | | 78,255 | |
| | 284,159 | | | Axis Bank Ltd. | | | 2,528,453 | |
| | 86,308 | | | Axis Bank Ltd., Class Registered Shares, GDR | | | 3,888,373 | |
| | 2,121 | | | Bajaj Auto Ltd. | | | 94,079 | |
| | 407 | | | Bajaj Finance Ltd. | | | 66,964 | |
| | 2,647 | | | Bharat Forge Ltd. | | | 33,532 | |
| | 14,824 | | | Bharat Heavy Electricals Ltd. | | | 30,615 | |
| | 4,385 | | | Bharat Petroleum Corp., Ltd. | | | 39,249 | |
| | 25,305 | | | Bharti Airtel Ltd. | | | 125,558 | |
| | 14,409 | | | Bharti Infratel Ltd. | | | 75,423 | |
| | 190 | | | Bosch Ltd. | | | 68,676 | |
| | 323,174 | | | Cadila Healthcare Ltd. | | | 1,852,264 | |
| | 11,420 | | | Cairn India Ltd. | | | 33,909 | |
| | 72,855 | | | Cholamandalam Investment and Finance Co., Ltd. | | | 1,260,426 | |
| | 8,741 | | | Cipla Ltd.* | | | 74,997 | |
| | 17,538 | | | Coal India Ltd. | | | 87,572 | |
| | 841 | | | Container Corp. Of India Ltd. | | | 17,593 | |
| | 13,307 | | | Dabur India Ltd. | | | 57,865 | |
| | 780,000 | | | Dish TV India Ltd.* | | | 1,146,758 | |
| | 2,013 | | | Divi’s Laboratories Ltd. | | | 39,610 | |
| | 2,984 | | | Dr Reddy’s Laboratories Ltd. | | | 136,887 | |
| | 308 | | | Eicher Motors Ltd. | | | 103,998 | |
| | 603,000 | | | Fortis Healthcare Ltd.* | | | 1,600,337 | |
| | 8,018 | | | GAIL India Ltd. | | | 45,759 | |
| | 256 | | | GlaxoSmithKline Consumer Healthcare Ltd. | | | 23,997 | |
| | 3,495 | | | Glenmark Pharmaceuticals Ltd. | | | 43,816 | |
| | 3,003 | | | Godrej Consumer Products Ltd. | | | 68,033 | |
| | 6,303 | | | Havells India Ltd. | | | 39,397 | |
| | 14,240 | | | HCL Technologies Ltd. | | | 165,364 | |
| | 94,000 | | | HDFC Bank Ltd. | | | 1,811,105 | |
| | 1,260 | | | Hero MotoCorp Ltd. | | | 66,584 | |
| | 28,229 | | | Hindalco Industries Ltd. | | | 66,758 | |
| | 16,456 | | | Hindustan Unilever Ltd. | | | 224,750 | |
| | 39,667 | | | Housing Development Finance Corp., Ltd. | | | 833,442 | |
| | 27,881 | | | ICICI Bank Ltd. | | | 107,359 | |
| | 32,040 | | | Idea Cellular Ltd. | | | 44,685 | |
| | 7,459 | | | Indiabulls Housing Finance Ltd. | | | 90,957 | |
| | 46,441 | | | Infosys Ltd. | | | 715,715 | |
| | 85,609 | | | ITC Ltd. | | | 332,834 | |
| | 2,138 | | | JSW Steel Ltd. | | | 55,780 | |
| | 7,998 | | | Larsen & Toubro Ltd. | | | 180,223 | |
| | 135,539 | | | LIC Housing Finance Ltd. | | | 1,154,129 | |
| | 5,580 | | | Lupin Ltd. | | | 123,483 | |
| | 7,018 | | | Mahindra & Mahindra Financial Services Ltd. | | | 37,368 | |
| | 9,418 | | | Mahindra & Mahindra Ltd. | | | 202,289 | |
| | 11,385 | | | Marico Ltd. | | | 49,550 | |
| | 2,669 | | | Maruti Suzuki India Ltd. | | | 201,091 | |
| | 7,974 | | | Motherson Sumi Systems Ltd. | | | 38,164 | |
| | 584 | | | Nestle India Ltd. | | | 56,593 | |
| | 41,679 | | | NTPC Ltd. | | | 98,910 | |
See Notes to Financial Statements.
134
| | | | | | | | |
| Emerging Markets Equity Fund | |
| | |
| Shares/Units | | | Security | | Value | |
| India — 8.0% — (continued) | |
| | 21,700 | | | Oil & Natural Gas Corp., Ltd. | | $ | 76,634 | |
| | 38,373 | | | Phoenix Mills Ltd. (The) | | | 227,625 | |
| | 1,959 | | | Piramal Enterprises Ltd. | | | 53,614 | |
| | 16,158 | | | Power Finance Corp., Ltd. | | | 29,919 | |
| | 35,000 | | | Reliance Industries Ltd. | | | 546,964 | |
| | 211 | | | Shree Cement Ltd. | | | 53,803 | |
| | 3,722 | | | Shriram Transport Finance Co., Ltd. | | | 68,385 | |
| | 1,788 | | | Siemens Ltd. | | | 33,720 | |
| | 39,231 | | | State Bank of India | | | 146,947 | |
| | 155,000 | | | Strides Shasun Ltd. | | | 2,195,048 | |
| | 24,404 | | | Sun Pharmaceutical Industries Ltd. | | | 281,311 | |
| | 23,878 | | | Syngene International Ltd.(b) | | | 168,948 | |
| | 12,832 | | | Tata Consultancy Services Ltd. | | | 481,269 | |
| | 39,921 | | | Tata Motors Ltd. | | | 321,577 | |
| | 9,692 | | | Tata Motors Ltd., Class A Shares | | | 49,614 | |
| | 28,154 | | | Tata Power Co., Ltd. | | | 33,090 | |
| | 7,620 | | | Tata Steel Ltd. | | | 41,967 | |
| | 5,846 | | | Tech Mahindra Ltd. | | | 41,064 | |
| | 7,849 | | | Titan Co., Ltd. | | | 49,119 | |
| | 283,000 | | | TVS Motor Co., Ltd. | | | 1,378,366 | |
| | 896 | | | UltraTech Cement Ltd. | | | 53,843 | |
| | 1,653 | | | United Spirits Ltd.* | | | 56,946 | |
| | 8,964 | | | UPL Ltd. | | | 85,228 | |
| | 144,000 | | | VA Tech Wabag Ltd. | | | 1,224,974 | |
| | 26,211 | | | Vedanta Ltd. | | | 66,399 | |
| | 15,561 | | | Wipro Ltd. | | | 113,564 | |
| | 275,864 | | | Yes Bank Ltd. | | | 5,677,027 | |
| | 14,516 | | | Zee Entertainment Enterprises Ltd. | | | 117,160 | |
| | | | | | | | |
| | | | Total India | | | 34,379,185 | |
| | | | | | | | |
| Indonesia — 4.0% | |
| | 363,400 | | | Adaro Energy Tbk PT | | | 31,412 | |
| | 44,800 | | | AKR Corporindo Tbk PT | | | 22,504 | |
| | 4,630,500 | | | Astra International Tbk PT | | | 2,840,097 | |
| | 312,500 | | | Bank Central Asia Tbk PT | | | 354,120 | |
| | 11,823 | | | Bank CIMB Niaga Tbk PT* | | | 744 | |
| | 84,900 | | | Bank Danamon Indonesia Tbk PT | | | 26,119 | |
| | 3,712,862 | | | Bank Mandiri Persero Tbk PT | | | 3,142,818 | |
| | 188,600 | | | Bank Negara Indonesia Persero Tbk PT | | | 83,379 | |
| | 280,500 | | | Bank Rakyat Indonesia Persero Tbk PT | | | 246,253 | |
| | 192,800 | | | Bumi Serpong Damai Tbk PT | | | 31,171 | |
| | 186,200 | | | Charoen Pokphand Indonesia Tbk PT | | | 52,266 | |
| | 184,100 | | | Global Mediacom Tbk PT | | | 12,355 | |
| | 12,100 | | | Gudang Garam Tbk PT | | | 58,683 | |
| | 235,900 | | | Hanjaya Mandala Sampoerna Tbk PT | | | 69,622 | |
| | 37,200 | | | Indocement Tunggal Prakarsa Tbk PT | | | 49,580 | |
| | 58,600 | | | Indofood CBP Sukses Makmur Tbk PT | | | 44,031 | |
| | 110,900 | | | Indofood Sukses Makmur Tbk PT | | | 66,182 | |
| | 51,500 | | | Jasa Marga Persero Tbk PT | | | 18,843 | |
| | 531,900 | | | Kalbe Farma Tbk PT | | | 71,894 | |
| | 2,559,900 | | | Link Net Tbk PT | | | 856,681 | |
| | 464,800 | | | Lippo Karawaci Tbk PT | | | 38,507 | |
| | 1,052,178 | | | Matahari Department Store Tbk PT | | | 1,582,130 | |
| | 125,600 | | | Media Nusantara Citra Tbk PT | | | 18,176 | |
| | 275,400 | | | Perusahaan Gas Negara Persero Tbk | | | 62,565 | |
| | 1,684,600 | | | Semen Indonesia Persero Tbk PT | | | 1,255,045 | |
See Notes to Financial Statements.
135
| | | | | | | | |
| Emerging Markets Equity Fund | |
| | |
| Shares/Units | | | Security | | Value | |
| Indonesia — 4.0% — (continued) | |
| | 254,000 | | | Summarecon Agung Tbk PT | | $ | 33,424 | |
| | 147,100 | | | Surya Citra Media Tbk PT | | | 33,557 | |
| | 1,277,687 | | | Telekomunikasi Indonesia Persero Tbk PT | | | 401,058 | |
| | 73,025 | | | Telekomunikasi Indonesia Persero Tbk PT, ADR(d) | | | 4,548,727 | |
| | 60,800 | | | Tower Bersama Infrastructure Tbk PT | | | 25,504 | |
| | 38,700 | | | Unilever Indonesia Tbk PT | | | 133,076 | |
| | 512,678 | | | United Tractors Tbk PT | | | 723,371 | |
| | 119,000 | | | Waskita Karya Persero Tbk PT | | | 24,859 | |
| | 94,700 | | | XL Axiata Tbk PT* | | | 20,267 | |
| | | | | | | | |
| | | | Total Indonesia | | | 16,979,020 | |
| | | | | | | | |
| Jordan — 0.4% | |
| | 62,000 | | | Hikma Pharmaceuticals PLC | | | 1,746,024 | |
| | | | | | | | |
| Kenya — 0.5% | |
| | 11,000,000 | | | Safaricom Ltd. | | | 2,198,834 | |
| | | | | | | | |
| Macau — 0.0% | |
| | 53,400 | | | Wynn Macau Ltd. | | | 74,089 | |
| | | | | | | | |
| Malaysia — 1.0% | |
| | 31,600 | | | AirAsia Bhd | | | 23,426 | |
| | 25,600 | | | Alliance Financial Group Bhd | | | 24,825 | |
| | 46,100 | | | AMMB Holdings Bhd | | | 49,980 | |
| | 38,800 | | | Astro Malaysia Holdings Bhd | | | 28,256 | |
| | 67,000 | | | Axiata Group Bhd | | | 90,752 | |
| | 18,800 | | | Berjaya Sports Toto Bhd | | | 15,553 | |
| | 107,653 | | | British American Tobacco Malaysia Bhd | | | 1,308,291 | |
| | 75,500 | | | CIMB Group Holdings Bhd | | | 89,669 | |
| | 78,500 | | | Dialog Group Bhd | | | 29,760 | |
| | 88,600 | | | DiGi.Com Bhd | | | 109,815 | |
| | 32,100 | | | Felda Global Ventures Holdings Bhd | | | 17,963 | |
| | 42,500 | | | Gamuda Bhd | | | 51,187 | |
| | 56,600 | | | Genting Bhd | | | 108,855 | |
| | 74,700 | | | Genting Malaysia Bhd | | | 81,950 | |
| | 5,900 | | | Genting Plantations Bhd | | | 15,402 | |
| | 14,100 | | | HAP Seng Consolidated Bhd | | | 27,093 | |
| | 16,500 | | | Hartalega Holdings Bhd | | | 17,817 | |
| | 16,600 | | | Hong Leong Bank Bhd | | | 53,438 | |
| | 5,900 | | | Hong Leong Financial Group Bhd | | | 23,354 | |
| | 72,200 | | | IHH Healthcare Bhd | | | 116,663 | |
| | 72,500 | | | IJM Corp. Bhd | | | 61,383 | |
| | 56,900 | | | IOI Corp. Bhd | | | 62,020 | |
| | 39,000 | | | IOI Properties Group Bhd | | | 24,268 | |
| | 10,800 | | | Kuala Lumpur Kepong Bhd | | | 62,787 | |
| | 8,600 | | | Lafarge Malaysia Bhd | | | 16,995 | |
| | 86,600 | | | Malayan Banking Bhd | | | 166,994 | |
| | 18,900 | | | Malaysia Airports Holdings Bhd | | | 29,368 | |
| | 47,600 | | | Maxis Bhd | | | 73,786 | |
| | 28,400 | | | MISC Bhd | | | 53,030 | |
| | 60,500 | | | Petronas Chemicals Group Bhd | | | 99,687 | |
| | 5,000 | | | Petronas Dagangan Bhd | | | 28,821 | |
| | 17,400 | | | Petronas Gas Bhd | | | 95,063 | |
| | 12,000 | | | PPB Group Bhd | | | 47,526 | |
| | 68,900 | | | Public Bank Bhd | | | 336,628 | |
| | 20,300 | | | RHB Bank Bhd | | | 25,038 | |
| | 83,200 | | | SapuraKencana Petroleum Bhd* | | | 32,541 | |
| | 63,800 | | | Sime Darby Bhd | | | 124,286 | |
See Notes to Financial Statements.
136
| | | | | | | | |
| Emerging Markets Equity Fund | |
| | |
| Shares/Units | | | Security | | Value | |
| Malaysia — 1.0% — (continued) | |
| | 28,900 | | | Telekom Malaysia Bhd | | $ | 48,775 | |
| | 85,500 | | | Tenaga Nasional Bhd | | | 311,467 | |
| | 11,800 | | | UMW Holdings Bhd | | | 16,167 | |
| | 25,800 | | | Westports Holdings Bhd | | | 28,333 | |
| | 109,000 | | | YTL Corp. Bhd | | | 45,231 | |
| | 52,300 | | | YTL Power International Bhd | | | 19,228 | |
| | | | | | | | |
| | | | Total Malaysia | | | 4,093,471 | |
| | | | | | | | |
| Malta — 0.0% | |
| | 8,548 | | | Brait SE* | | | 67,850 | |
| | | | | | | | |
| Mexico — 3.8% | |
| | 71,300 | | | Alfa SAB de CV, Class A Shares | | | 116,021 | |
| | 794,600 | | | América Móvil SAB de CV, Series L | | | 474,521 | |
| | 196,131 | | | América Móvil SAB de CV, Class L Shares, ADR | | | 2,347,688 | |
| | 10,600 | | | Arca Continental SAB de CV | | | 66,187 | |
| | 353,700 | | | Cemex SAB de CV* | | | 293,042 | |
| | 12,600 | | | Coca-Cola Femsa SAB de CV, Series L | | | 94,059 | |
| | 545,000 | | | Concentradora Hipotecaria SAPI de CV, REIT | | | 776,708 | |
| | 4,730 | | | El Puerto de Liverpool SAB de CV, Class C1 Shares | | | 51,543 | |
| | 64,800 | | | Fibra Uno Administracion SA de CV, REIT | | | 125,431 | |
| | 46,400 | | | Fomento Economico Mexicano SAB de CV | | | 425,187 | |
| | 19,540 | | | Fomento Económico Mexicano SAB de CV, ADR | | | 1,788,887 | |
| | 24,800 | | | Gentera SAB de CV | | | 48,466 | |
| | 5,475 | | | Gruma SAB de CV, Class B Shares | | | 72,792 | |
| | 9,086 | | | Grupo Aeroportuario del Pacifico SAB de CV, Class B Shares | | | 90,353 | |
| | 5,255 | | | Grupo Aeroportuario del Sureste SAB de CV, Class B Shares | | | 80,031 | |
| | 41,400 | | | Grupo Bimbo SAB de CV, Series A | | | 117,915 | |
| | 14,300 | | | Grupo Carso SAB de CV, Series A1 | | | 58,325 | |
| | 8,600 | | | Grupo Comercial Chedraui SA de CV | | | 20,987 | |
| | 63,100 | | | Grupo Financiero Banorte SAB de CV, Class O Shares | | | 340,079 | |
| | 59,000 | | | Grupo Financiero Inbursa SA, Class O Shares | | | 102,909 | |
| | 4,266 | | | Grupo Financiero Santander Mexico SAB de CV, Class B Shares, ADR | | | 40,826 | |
| | 46,200 | | | Grupo Financiero Santander Mexico SAB de CV, Class B Shares | | | 88,297 | |
| | 15,700 | | | Grupo Lala SAB de CV, Class B Shares | | | 32,894 | |
| | 776,035 | | | Grupo México SAB de CV, Series B | | | 1,940,397 | |
| | 61,700 | | | Grupo Televisa SAB | | | 336,668 | |
| | 3,515 | | | Industrias Peñoles SAB de CV | | | 81,287 | |
| | 742,800 | | | Kimberly-Clark de México SAB de CV, Class A Shares | | | 1,776,716 | |
| | 26,500 | | | Mexichem SAB de CV | | | 61,216 | |
| | 19,800 | | | OHL Mexico SAB de CV* | | | 27,965 | |
| | 970,000 | | | PLA Administradora Industrial S de RL de CV, REIT* | | | 1,620,191 | |
| | 6,730 | | | Promotora y Operadora de Infraestructura SAB de CV | | | 80,706 | |
| | 530,000 | | | Qualitas Controladora SAB de CV | | | 789,434 | |
| | 625,000 | | | Unifin Financiera SAB de CV SOFOM ENR | | | 1,809,027 | |
| | 132,771 | | | Wal-Mart de Mexico SAB de CV | | | 303,315 | |
| | | | | | | | |
| | | | Total Mexico | | | 16,480,070 | |
| | | | | | | | |
| Netherlands — 0.1% | |
| | 73,421 | | | Steinhoff International Holdings NV | | | 441,034 | |
| | | | | | | | |
| Pakistan — 0.9% | |
| | 637,900 | | | Habib Bank Ltd. | | | 1,321,631 | |
| | 633,162 | | | Oil & Gas Development Co., Ltd. | | | 852,096 | |
| | 947,416 | | | Pakistan Petroleum Ltd. | | | 1,477,104 | |
| | | | | | | | |
| | | | Total Pakistan | | | 3,650,831 | |
| | | | | | | | |
See Notes to Financial Statements.
137
| | | | | | | | |
| Emerging Markets Equity Fund | |
| | |
| Shares/Units | | | Security | | Value | |
| Peru — 1.1% | |
| | 4,824 | | | Cia de Minas Buenaventura SAA, ADR* | | $ | 59,625 | |
| | 28,050 | | | Credicorp Ltd. | | | 4,394,874 | |
| | 2,150 | | | Southern Copper Corp. | | | 55,513 | |
| | | | | | | | |
| | | | Total Peru | | | 4,510,012 | |
| | | | | | | | |
| Philippines — 1.5% | |
| | 49,060 | | | Aboitiz Equity Ventures Inc. | | | 78,815 | |
| | 37,300 | | | Aboitiz Power Corp. | | | 35,904 | |
| | 52,800 | | | Alliance Global Group Inc. | | | 18,432 | |
| | 6,250 | | | Ayala Corp. | | | 117,205 | |
| | 185,100 | | | Ayala Land Inc. | | | 152,833 | |
| | 18,090 | | | Bank of the Philippine Islands | | | 40,906 | |
| | 41,600 | | | BDO Unibank Inc. | | | 101,875 | |
| | 101,900 | | | DMCI Holdings Inc. | | | 25,105 | |
| | 238,200 | | | Energy Development Corp. | | | 29,226 | |
| | 845 | | | Globe Telecom Inc. | | | 35,692 | |
| | 1,980 | | | GT Capital Holdings Inc. | | | 65,171 | |
| | 12,950 | | | International Container Terminal Services Inc. | | | 23,293 | |
| | 72,360 | | | JG Summit Holdings Inc. | | | 120,780 | |
| | 10,760 | | | Jollibee Foods Corp. | | | 56,499 | |
| | 284,600 | | | Megaworld Corp. | | | 28,726 | |
| | 331,200 | | | Metro Pacific Investments Corp. | | | 49,114 | |
| | 16,230 | | | Metropolitan Bank & Trust Co. | | | 29,039 | |
| | 48,776 | | | PLDT Inc., ADR(d) | | | 1,881,778 | |
| | 2,465 | | | PLDT Inc. | | | 96,148 | |
| | 41,400 | | | Robinsons Land Corp. | | | 28,293 | |
| | 1,695,000 | | | Robinsons Retail Holdings Inc. | | | 3,052,504 | |
| | 5,740 | | | Security Bank Corp. | | | 26,260 | |
| | 6,080 | | | SM Investments Corp. | | | 88,541 | |
| | 208,700 | | | SM Prime Holdings Inc. | | | 133,408 | |
| | 22,070 | | | Universal Robina Corp. | | | 88,427 | |
| | | | | | | | |
| | | | Total Philippines | | | 6,403,974 | |
| | | | | | | | |
| Poland — 0.3% | |
| | 2,267 | | | Alior Bank SA* | | | 30,953 | |
| | 839 | | | Bank Handlowy w Warszawie SA | | | 15,649 | |
| | 15,277 | | | Bank Millennium SA* | | | 22,666 | |
| | 3,992 | | | Bank Pekao SA | | | 134,381 | |
| | 873 | | | Bank Zachodni WBK SA | | | 71,825 | |
| | 673 | | | CCC SA | | | 31,386 | |
| | 4,756 | | | Cyfrowy Polsat SA* | | | 29,979 | |
| | 5,619 | | | Enea SA* | | | 14,196 | |
| | 6,104 | | | Energa SA | | | 12,672 | |
| | 1,916 | | | Eurocash SA | | | 21,110 | |
| | 1,123 | | | Grupa Azoty SA | | | 18,452 | |
| | 2,342 | | | Grupa Lotos SA* | | | 17,440 | |
| | 3,524 | | | KGHM Polska Miedz SA | | | 66,162 | |
| | 32 | | | LPP SA | | | 36,879 | |
| | 371 | | | mBank SA* | | | 37,058 | |
| | 16,889 | | | Orange Polska SA | | | 23,277 | |
| | 21,259 | | | PGE Polska Grupa Energetyczna SA | | | 62,906 | |
| | 8,104 | | | Polski Koncern Naftowy ORLEN SA | | | 135,117 | |
| | 44,416 | | | Polskie Gornictwo Naftowe i Gazownictwo SA | | | 60,675 | |
| | 22,047 | | | Powszechna Kasa Oszczednosci Bank Polski SA* | | | 150,233 | |
| | 14,150 | | | Powszechny Zaklad Ubezpieczen SA | | | 100,280 | |
| | 14,745 | | | Synthos SA* | | | 14,656 | |
See Notes to Financial Statements.
138
| | | | | | | | |
| Emerging Markets Equity Fund | |
| | |
| Shares/Units | | | Security | | Value | |
| Poland — 0.3% — (continued) | |
| | 26,657 | | | Tauron Polska Energia SA* | | $ | 18,985 | |
| | | | | | | | |
| | | | Total Poland | | | 1,126,937 | |
| | | | | | | | |
| Qatar — 0.2% | |
| | 2,726 | | | Barwa Real Estate Co. | | | 27,325 | |
| | 4,362 | | | Commercial Bank QSC (The) | | | 50,314 | |
| | 20,281 | | | Ezdan Holding Group QSC | | | 104,667 | |
| | 3,938 | | | Industries Qatar QSC | | | 120,973 | |
| | 9,762 | | | Masraf Al Rayan QSC | | | 101,875 | |
| | 2,090 | | | Ooredoo QSC | | | 58,943 | |
| | 737 | | | Qatar Electricity & Water Co. QSC | | | 43,702 | |
| | 7,216 | | | Qatar Gas Transport Co., Ltd. | | | 49,538 | |
| | 3,073 | | | Qatar Insurance Co. SAQ | | | 73,157 | |
| | 1,581 | | | Qatar Islamic Bank SAQ | | | 48,107 | |
| | 5,413 | | | Qatar National Bank SAQ | | | 242,248 | |
| | 9,071 | | | Vodafone Qatar QSC* | | | 29,645 | |
| | | | | | | | |
| | | | Total Qatar | | | 950,494 | |
| | | | | | | | |
| Romania — 0.0% | |
| | 6,036 | | | New Europe Property Investments PLC | | | 67,127 | |
| | | | | | | | |
| Russia — 5.2% | |
| | 1,141,826 | | | Alrosa PJSC | | | 1,315,303 | |
| | 312,146 | | | Gazprom PJSC* | | | 644,409 | |
| | 562,499 | | | Gazprom PJSC, ADR | | | 2,277,017 | |
| | 10,749 | | | Lukoil PJSC | | | 479,004 | |
| | 66,380 | | | Lukoil PJSC, ADR | | | 2,979,418 | |
| | 14,400 | | | Magnit PJSC | | | 2,260,608 | |
| | 45,814 | | | Magnit PJSC, Class Registered Shares, GDR | | | 1,808,212 | |
| | 2,368 | | | MegaFon PJSC, Class Registered Shares, GDR | | | 24,056 | |
| | 1,399 | | | MMC Norilsk Nickel PJSC | | | 204,836 | |
| | 320,409 | | | Mobile TeleSystems PJSC, ADR(d) | | | 2,604,925 | |
| | 34,460 | | | Moscow Exchange MICEX-RTS PJSC | | | 66,987 | |
| | 2,301 | | | Novatek OJSC, Class Registered Shares, GDR | | | 248,248 | |
| | 2,462 | | | PhosAgro PJSC, Class Registered Shares, GDR | | | 33,007 | |
| | 29,370 | | | Rosneft PJSC | | | 154,873 | |
| | 23,120 | | | Rostelecom PJSC | | | 29,066 | |
| | 2,938,000 | | | RusHydro PJSC | | | 35,794 | |
| | 2,599,191 | | | Sberbank of Russia PJSC | | | 5,705,858 | |
| | 5,290 | | | Severstal PJSC | | | 60,856 | |
| | 4,280 | | | Sistema PJSC FC, Class Registered Shares, GDR | | | 36,313 | |
| | 181,300 | | | Surgutneftegas OJSC | | | 86,506 | |
| | 1 | | | T PLUS PJSC* | | | 1 | |
| | 39,238 | | | Tatneft PJSC | | | 190,732 | |
| | 131,070,000 | | | VTB Bank PJSC | | | 137,361 | |
| | 31,000 | | | Yandex NV, Class A Shares* | | | 683,240 | |
| | | | | | | | |
| | | | Total Russia | | | 22,066,630 | |
| | | | | | | | |
| South Africa — 6.9% | |
| | 1,362 | | | Anglo American Platinum Ltd.* | | | 36,662 | |
| | 10,268 | | | AngloGold Ashanti Ltd.* | | | 167,167 | |
| | 8,644 | | | Aspen Pharmacare Holdings Ltd.* | | | 207,038 | |
| | 10,729 | | | Barclays Africa Group Ltd. | | | 108,858 | |
| | 73,831 | | | Bid Corp., Ltd.* | | | 1,358,913 | |
| | 77,399 | | | Bidvest Group Ltd. (The) | | | 801,008 | |
| | 1,019 | | | Capitec Bank Holdings Ltd. | | | 40,429 | |
| | 5,703 | | | Coronation Fund Managers Ltd. | | | 27,057 | |
See Notes to Financial Statements.
139
| | | | | | | | |
| Emerging Markets Equity Fund | |
| | |
| Shares/Units | | | Security | | Value | |
| South Africa — 6.9% — (continued) | |
| | 8,972 | | | Discovery Ltd. | | $ | 73,223 | |
| | 3,612 | | | Exxaro Resources Ltd. | | | 18,473 | |
| | 90,163 | | | FirstRand Ltd. | | | 270,727 | |
| | 24,223 | | | Fortress Income Fund Ltd., Class A Shares | | | 27,090 | |
| | 19,183 | | | Fortress Income Fund Ltd. | | | 44,488 | |
| | 5,307 | | | Foschini Group Ltd. (The) | | | 47,242 | |
| | 19,690 | | | Gold Fields Ltd. | | | 99,604 | |
| | 51,801 | | | Growthpoint Properties Ltd., REIT | | | 89,647 | |
| | 6,123 | | | Hyprop Investments Ltd., REIT | | | 53,546 | |
| | 15,793 | | | Impala Platinum Holdings Ltd.* | | | 60,694 | |
| | 149,445 | | | Imperial Holdings Ltd. | | | 1,605,155 | |
| | 6,258 | | | Investec Ltd. | | | 36,606 | |
| | 2,924 | | | Liberty Holdings Ltd. | | | 22,429 | |
| | 1,011,492 | | | Life Healthcare Group Holdings Ltd. | | | 2,649,624 | |
| | 2,726 | | | Massmart Holdings Ltd. | | | 23,998 | |
| | 26,001 | | | MMI Holdings Ltd. | | | 39,911 | |
| | 2,995 | | | Mondi Ltd. | | | 60,540 | |
| | 6,081 | | | Mr Price Group Ltd. | | | 76,381 | |
| | 43,659 | | | MTN Group Ltd. | | | 357,034 | |
| | 43,195 | | | Naspers Ltd., Class N Shares | | | 7,072,939 | |
| | 95,083 | | | Nedbank Group Ltd. | | | 1,337,864 | |
| | 24,015 | | | Netcare Ltd. | | | 53,715 | |
| | 6,133 | | | Pick n Pay Stores Ltd. | | | 30,626 | |
| | 3,220 | | | Pioneer Foods Group Ltd. | | | 37,253 | |
| | 611,491 | | | PPC Ltd.(d) | | | 247,188 | |
| | 2,310 | | | PSG Group Ltd. | | | 29,537 | |
| | 16,688 | | | Rand Merchant Investment Holdings Ltd. | | | 47,489 | |
| | 110,364 | | | Redefine Properties Ltd., REIT | | | 82,765 | |
| | 12,196 | | | Remgro Ltd. | | | 208,988 | |
| | 7,284 | | | Resilient REIT Ltd. | | | 58,443 | |
| | 50,000 | | | Rhodes Food Group Pty Ltd. | | | 90,048 | |
| | 17,802 | | | RMB Holdings Ltd. | | | 71,174 | |
| | 347,282 | | | Sanlam Ltd. | | | 1,477,323 | |
| | 13,685 | | | Sappi Ltd.* | | | 67,495 | |
| | 14,553 | | | Sasol Ltd. | | | 366,084 | |
| | 224,040 | | | Shoprite Holdings Ltd. | | | 2,875,348 | |
| | 18,532 | | | Sibanye Gold Ltd. | | | 71,736 | |
| | 114,673 | | | Spar Group Ltd. (The) | | | 1,492,492 | |
| | 170,303 | | | Standard Bank Group Ltd. | | | 1,545,546 | |
| | 6,698 | | | Telkom SA SOC Ltd. | | | 27,717 | |
| | 4,122 | | | Tiger Brands Ltd. | | | 107,050 | |
| | 600,000 | | | Transaction Capital Ltd. | | | 454,878 | |
| | 11,189 | | | Truworths International Ltd. | | | 57,975 | |
| | 9,195 | | | Tsogo Sun Holdings Ltd. | | | 18,963 | |
| | 150,565 | | | Vodacom Group Ltd. | | | 1,566,669 | |
| | 290,163 | | | Woolworths Holdings Ltd. | | | 1,593,480 | |
| | | | | | | | |
| | | | Total South Africa | | | 29,494,329 | |
| | | | | | | | |
| South Korea — 10.8% | |
| | 815 | | | Amorepacific Corp. | | | 281,570 | |
| | 706 | | | AMOREPACIFIC Group | | | 91,693 | |
| | 251 | | | BGF retail Co., Ltd. | | | 45,528 | |
| | 6,659 | | | BNK Financial Group Inc. | | | 52,741 | |
| | 1,902 | | | Celltrion Inc.* | | | 181,915 | |
| | 1,752 | | | Cheil Worldwide, Inc. | | | 24,876 | |
| | 200 | | | CJ CheilJedang Corp. | | | 69,461 | |
See Notes to Financial Statements.
140
| | | | | | | | |
| Emerging Markets Equity Fund | |
| | |
| Shares/Units | | | Security | | Value | |
| South Korea — 10.8% — (continued) | |
| | 369 | | | CJ Corp. | | $ | 62,764 | |
| | 479 | | | CJ E&M Corp. | | | 29,842 | |
| | 174 | | | CJ Korea Express Corp.* | | | 31,202 | |
| | 47,109 | | | Coway Co., Ltd. | | | 3,518,044 | |
| | 706 | | | Daelim Industrial Co., Ltd. | | | 51,198 | |
| | 3,187 | | | Daewoo Engineering & Construction Co., Ltd.* | | | 17,352 | |
| | 4,444 | | | DGB Financial Group Inc. | | | 36,216 | |
| | 1,253 | | | Dongbu Insurance Co., Ltd. | | | 75,398 | |
| | 890 | | | Dongsuh Cos., Inc. | | | 24,602 | |
| | 1,210 | | | Doosan Heavy Industries & Construction Co., Ltd. | | | 29,915 | |
| | 497 | | | E-MART Inc. | | | 69,871 | |
| | 1,257 | | | GS Engineering & Construction Corp.* | | | 32,293 | |
| | 1,305 | | | GS Holdings Corp. | | | 57,392 | |
| | 684 | | | GS Retail Co., Ltd. | | | 28,877 | |
| | 7,502 | | | Hana Financial Group Inc. | | | 196,831 | |
| | 1,885 | | | Hankook Tire Co., Ltd. | | | 94,281 | |
| | 132 | | | Hanmi Pharm Co., Ltd. | | | 70,141 | |
| | 294 | | | Hanmi Science Co., Ltd. | | | 35,249 | |
| | 4,728 | | | Hanon Systems | | | 49,469 | |
| | 268 | | | Hanssem Co., Ltd. | | | 35,301 | |
| | 2,668 | | | Hanwha Chemical Corp. | | | 61,171 | |
| | 1,147 | | | Hanwha Corp. | | | 37,635 | |
| | 293,755 | | | Hanwha Life Insurance Co., Ltd. | | | 1,485,807 | |
| | 844 | | | Hotel Shilla Co., Ltd. | | | 51,278 | |
| | 534 | | | Hyosung Corp. | | | 63,112 | |
| | 389 | | | Hyundai Department Store Co., Ltd. | | | 43,663 | |
| | 1,430 | | | Hyundai Development Co- Engineering & Construction | | | 59,717 | |
| | 1,836 | | | Hyundai Engineering & Construction Co., Ltd. | | | 63,376 | |
| | 476 | | | Hyundai Glovis Co., Ltd. | | | 78,193 | |
| | 1,058 | | | Hyundai Heavy Industries Co., Ltd.* | | | 130,256 | |
| | 1,582 | | | Hyundai Marine & Fire Insurance Co., Ltd. | | | 47,863 | |
| | 14,676 | | | Hyundai Mobis Co., Ltd. | | | 3,405,682 | |
| | 3,878 | | | Hyundai Motor Co. | | | 462,335 | |
| | 2,041 | | | Hyundai Steel Co. | | | 93,565 | |
| | 416 | | | Hyundai Wia Corp. | | | 33,885 | |
| | 6,416 | | | Industrials Bank of Korea | | | 67,598 | |
| | 760 | | | Kakao Corp. | | | 55,388 | |
| | 2,983 | | | Kangwon Land Inc. | | | 105,075 | |
| | 83,061 | | | KB Financial Group Inc. | | | 2,890,887 | |
| | 148 | | | KCC Corp. | | | 54,306 | |
| | 571 | | | KEPCO Plant Service & Engineering Co., Ltd. | | | 32,920 | |
| | 6,677 | | | Kia Motors Corp. | | | 250,701 | |
| | 1,483 | | | Korea Aerospace Industries Ltd. | | | 112,492 | |
| | 6,493 | | | Korea Electric Power Corp. | | | 337,133 | |
| | 714 | | | Korea Gas Corp. | | | 27,027 | |
| | 993 | | | Korea Investment Holdings Co., Ltd. | | | 35,592 | |
| | 216 | | | Korea Zinc Co., Ltd. | | | 92,536 | |
| | 930 | | | Korean Air Lines Co., Ltd.* | | | 26,302 | |
| | 15,260 | | | KT&G Corp. | | | 1,599,140 | |
| | 465 | | | Kumho Petrochemical Co., Ltd. | | | 28,689 | |
| | 1,173 | | | LG Chem Ltd. | | | 283,991 | |
| | 2,407 | | | LG Corp. | | | 141,037 | |
| | 5,884 | | | LG Display Co., Ltd. | | | 157,989 | |
| | 2,689 | | | LG Electronics Inc. | | | 124,124 | |
| | 2,704 | | | LG Household & Health Care Ltd. | | | 2,301,441 | |
| | 360 | | | LG Innotek Co., Ltd. | | | 26,589 | |
See Notes to Financial Statements.
141
| | | | | | | | |
| Emerging Markets Equity Fund | |
| | |
| Shares/Units | | | Security | | Value | |
| South Korea — 10.8% — (continued) | |
| | 5,455 | | | LG Uplus Corp. | | $ | 56,878 | |
| | 390 | | | Lotte Chemical Corp. | | | 93,392 | |
| | 16 | | | Lotte Chilsung Beverage Co., Ltd. | | | 21,497 | |
| | 145 | | | Lotte Confectionery Co., Ltd. | | | 22,004 | |
| | 280 | | | Lotte Shopping Co., Ltd. | | | 50,702 | |
| | 4,565 | | | Mirae Asset Daewoo Co., Ltd. | | | 32,557 | |
| | 1,882 | | | Mirae Asset Securities Co., Ltd. | | | 39,636 | |
| | 2,898 | | | NAVER Corp. | | | 2,192,471 | |
| | 443 | | | NCSoft Corp. | | | 107,026 | |
| | 3,589 | | | NH Investment & Securities Co., Ltd. | | | 32,515 | |
| | 423 | | | OCI Co., Ltd.* | | | 33,080 | |
| | 91 | | | Orion Corp. | | | 60,556 | |
| | 31 | | | Ottogi Corp. | | | 19,418 | |
| | 1,156 | | | Paradise Co., Ltd. | | | 17,359 | |
| | 1,764 | | | POSCO | | | 364,034 | |
| | 1,157 | | | Posco Daewoo Corp. | | | 23,677 | |
| | 482 | | | S-1 Corp. | | | 44,474 | |
| | 1,919 | | | Samsung C&T Corp. | | | 260,399 | |
| | 884 | | | Samsung Card Co., Ltd. | | | 34,971 | |
| | 1,420 | | | Samsung Electro-Mechanics Co., Ltd. | | | 67,655 | |
| | 8,538 | | | Samsung Electronics Co., Ltd. | | | 12,378,530 | |
| | 841 | | | Samsung Fire & Marine Insurance Co., Ltd. | | | 202,330 | |
| | 3,810 | | | Samsung Heavy Industries Co., Ltd.* | | | 33,013 | |
| | 1,775 | | | Samsung Life Insurance Co., Ltd. | | | 163,222 | |
| | 1,391 | | | Samsung SDI Co., Ltd. | | | 143,633 | |
| | 880 | | | Samsung SDS Co., Ltd. | | | 125,592 | |
| | 1,462 | | | Samsung Securities Co., Ltd. | | | 45,964 | |
| | 111,391 | | | Shinhan Financial Group Co., Ltd. | | | 4,080,172 | |
| | 188 | | | Shinsegae Inc. . | | | 34,289 | |
| | 1,158 | | | SK Holdings Co., Ltd. | | | 219,029 | |
| | 108,271 | | | SK Hynix Inc. | | | 3,540,098 | |
| | 1,637 | | | SK Innovation Co., Ltd. | | | 212,275 | |
| | 3,204 | | | SK Networks Co., Ltd. | | | 18,163 | |
| | 514 | | | SK Telecom Co., Ltd. | | | 100,351 | |
| | 1,140 | | | S-Oil Corp. | | | 71,948 | |
| | 18,250 | | | Soulbrain Co., Ltd. | | | 1,011,025 | |
| | 7,823 | | | Woori Bank | | | 74,353 | |
| | 197 | | | Yuhan Corp. | | | 50,683 | |
| | | | | | | | |
| | | | Total South Korea | | | 46,241,488 | |
| | | | | | | | |
| Spain — 0.6% | |
| | 142,000 | | | CIE Automotive SA | | | 2,700,651 | |
| | | | | | | | |
| Switzerland — 0.7% | |
| | 39,600 | | | Luxoft Holding Inc., Class A Shares* | | | 2,031,876 | |
| | 49,800 | | | Wizz Air Holdings PLC*(b) | | | 1,046,862 | |
| | | | | | | | |
| | | | Total Switzerland | | | 3,078,738 | |
| | | | | | | | |
| Taiwan — 8.0% | |
| | 74,000 | | | Acer Inc.* | | | 33,129 | |
| | 2,064,090 | | | Advanced Semiconductor Engineering Inc. | | | 2,537,529 | |
| | 8,000 | | | Advantech Co., Ltd. | | | 65,020 | |
| | 208,300 | | | Aerospace Industrial Development Corp. | | | 293,246 | |
| | 60,000 | | | Asia Cement Corp. | | | 53,522 | |
| | 54,000 | | | Asia Pacific Telecom Co., Ltd.* | | | 18,176 | |
| | 18,000 | | | Asustek Computer Inc. | | | 151,298 | |
| | 219,000 | | | AU Optronics Corp. | | | 85,542 | |
See Notes to Financial Statements.
142
| | | | | | | | |
| Emerging Markets Equity Fund | |
| | |
| Shares/Units | | | Security | | Value | |
| Taiwan — 8.0% — (continued) | |
| | 372,000 | | | Basso Industry Corp. | | $ | 1,316,362 | |
| | 4,000 | | | Casetek Holdings Ltd. | | | 14,008 | |
| | 17,000 | | | Catcher Technology Co., Ltd. | | | 121,831 | |
| | 206,000 | | | Cathay Financial Holding Co., Ltd. | | | 260,371 | |
| | 26,000 | | | Chailease Holding Co., Ltd. | | | 44,850 | |
| | 125,080 | | | Chang Hwa Commercial Bank Ltd. | | | 62,808 | |
| | 49,000 | | | Cheng Shin Rubber Industry Co., Ltd. | | | 103,930 | |
| | 13,000 | | | Chicony Electronics Co., Ltd. | | | 32,113 | |
| | 67,000 | | | China Airlines Ltd. | | | 19,420 | |
| | 345,000 | | | China Development Financial Holding Corp. | | | 87,060 | |
| | 88,000 | | | China Life Insurance Co., Ltd. | | | 77,891 | |
| | 298,000 | | | China Steel Corp. | | | 206,641 | |
| | 96,000 | | | Chunghwa Telecom Co., Ltd. | | | 344,796 | |
| | 108,000 | | | Compal Electronics Inc. | | | 63,857 | |
| | 411,000 | | | CTBC Financial Holding Co., Ltd. | | | 237,731 | |
| | 49,000 | | | Delta Electronics Inc. | | | 254,130 | |
| | 199,000 | | | E.Sun Financial Holding Co., Ltd. | | | 111,971 | |
| | 5,000 | | | Eclat Textile Co., Ltd. | | | 62,773 | |
| | 51,450 | | | Eva Airways Corp. | | | 23,747 | |
| | 44,000 | | | Evergreen Marine Corp. Taiwan Ltd.* | | | 16,611 | |
| | 82,000 | | | Far Eastern New Century Corp. | | | 60,449 | |
| | 41,000 | | | Far EasTone Telecommunications Co., Ltd. | | | 95,166 | |
| | 8,000 | | | Feng TAY Enterprise Co., Ltd. | | | 37,977 | |
| | 243,485 | | | First Financial Holding Co., Ltd. | | | 124,946 | |
| | 81,000 | | | Formosa Chemicals & Fibre Corp. | | | 210,388 | |
| | 29,000 | | | Formosa Petrochemical Corp. | | | 84,685 | |
| | 104,000 | | | Formosa Plastics Corp. | | | 256,612 | |
| | 20,000 | | | Formosa Taffeta Co., Ltd. | | | 19,320 | |
| | 23,000 | | | Foxconn Technology Co., Ltd.* | | | 64,399 | |
| | 168,000 | | | Fubon Financial Holding Co., Ltd. | | | 237,231 | |
| | 7,000 | | | Giant Manufacturing Co., Ltd. | | | 44,798 | |
| | 1,000 | | | Hermes Microvision Inc. | | | 42,869 | |
| | 21,000 | | | Highwealth Construction Corp. | | | 32,569 | |
| | 5,100 | | | Hiwin Technologies Corp. | | | 26,309 | |
| | 1,070,750 | | | Hon Hai Precision Industry Co., Ltd. | | | 2,970,018 | |
| | 6,000 | | | Hotai Motor Co., Ltd. | | | 66,184 | |
| | 17,000 | | | HTC Corp.* | | | 45,442 | |
| | 186,912 | | | Hua Nan Financial Holdings Co., Ltd. | | | 96,210 | |
| | 227,000 | | | Innolux Corp. | | | 80,087 | |
| | 66,000 | | | Inotera Memories Inc.* | | | 55,756 | |
| | 63,000 | | | Inventec Corp. | | | 46,776 | |
| | 13,541 | | | Largan Precision Co., Ltd. | | | 1,513,219 | |
| | 53,264 | | | Lite-On Technology Corp. | | | 80,452 | |
| | 38,000 | | | MediaTek Inc. | | | 297,776 | |
| | 275,000 | | | Mega Financial Holding Co., Ltd. | | | 186,974 | |
| | 5,000 | | | Merida Industry Co., Ltd. | | | 20,250 | |
| | 120,000 | | | Nan Ya Plastics Corp. | | | 228,733 | |
| | 17,000 | | | Nanya Technology Corp. | | | 20,104 | |
| | 4,000 | | | Nien Made Enterprise Co., Ltd. | | | 45,307 | |
| | 15,000 | | | Novatek Microelectronics Corp. | | | 51,313 | |
| | 4,000 | | | OBI Pharma Inc.* | | | 50,048 | |
| | 49,000 | | | Pegatron Corp. | | | 117,195 | |
| | 4,000 | | | Phison Electronics Corp. | | | 28,928 | |
| | 56,000 | | | Pou Chen Corp. | | | 81,011 | |
| | 17,000 | | | Powertech Technology Inc. | | | 44,068 | |
| | 136,000 | | | Poya International Co., Ltd. | | | 2,033,542 | |
See Notes to Financial Statements.
143
| | | | | | | | |
| Emerging Markets Equity Fund | |
| | |
| Shares/Units | | | Security | | Value | |
| Taiwan — 8.0% — (continued) | |
| | 14,539 | | | President Chain Store Corp. | | $ | 115,167 | |
| | 68,000 | | | Quanta Computer Inc. | | | 125,672 | |
| | 11,000 | | | Realtek Semiconductor Corp. | | | 44,019 | |
| | 21,000 | | | Ruentex Development Co., Ltd.* | | | 24,593 | |
| | 14,000 | | | Ruentex Industries Ltd. | | | 21,696 | |
| | 209,000 | | | Shin Kong Financial Holding Co., Ltd.* | | | 45,781 | |
| | 55,000 | | | Siliconware Precision Industries Co., Ltd. | | | 82,024 | |
| | 7,000 | | | Simplo Technology Co., Ltd. | | | 22,962 | |
| | 258,300 | | | SinoPac Financial Holdings Co., Ltd. | | | 75,549 | |
| | 9,990 | | | Standard Foods Corp. | | | 24,619 | |
| | 35,700 | | | Synnex Technology International Corp. | | | 37,701 | |
| | 4,000 | | | TaiMed Biologics Inc.* | | | 24,721 | |
| | 217,689 | | | Taishin Financial Holding Co., Ltd. | | | 82,220 | |
| | 97,000 | | | Taiwan Business Bank* | | | 25,899 | |
| | 84,000 | | | Taiwan Cement Corp. | | | 95,287 | |
| | 195,810 | | | Taiwan Cooperative Financial Holding Co., Ltd. | | | 86,008 | |
| | 19,000 | | | Taiwan Fertilizer Co., Ltd. | | | 25,067 | |
| | 42,000 | | | Taiwan Mobile Co., Ltd. | | | 147,402 | |
| | 2,903,132 | | | Taiwan Semiconductor Manufacturing Co., Ltd. | | | 16,147,392 | |
| | 48,000 | | | Teco Electric and Machinery Co., Ltd. | | | 40,305 | |
| | 6,000 | | | Transcend Information Inc. | | | 17,304 | |
| | 122,000 | | | Uni-President Enterprises Corp. | | | 230,217 | |
| | 307,000 | | | United Microelectronics Corp. | | | 111,228 | |
| | 23,000 | | | Vanguard International Semiconductor Corp. | | | 43,025 | |
| | 62,824 | | | Wistron Corp. | | | 46,098 | |
| | 38,000 | | | WPG Holdings Ltd. | | | 45,150 | |
| | 243,000 | | | Yuanta Financial Holding Co., Ltd. | | | 86,168 | |
| | 22,000 | | | Yulon Motor Co., Ltd. | | | 19,030 | |
| | 10,000 | | | Zhen Ding Technology Holding Ltd. | | | 19,997 | |
| | | | | | | | |
| | | | Total Taiwan | | | 34,109,775 | |
| | | | | | | | |
| Thailand — 2.3% | |
| | 26,300 | | | Advanced Info Service PCL, NVDR | | | 125,406 | |
| | 10,800 | | | Airports of Thailand PCL, NVDR | | | 125,249 | |
| | 6,400 | | | Bangkok Bank PCL, Class Registered Shares | | | 31,266 | |
| | 97,700 | | | Bangkok Dusit Medical Services PCL, NVDR | | | 66,296 | |
| | 173,300 | | | Bangkok Expressway & Metro PCL, NVDR | | | 38,464 | |
| | 39,300 | | | Banpu PCL, NVDR | | | 17,774 | |
| | 24,800 | | | BEC World PCL, NVDR | | | 16,044 | |
| | 149,400 | | | BTS Group Holdings PCL, NVDR | | | 39,017 | |
| | 9,000 | | | Bumrungrad Hospital PCL, NVDR | | | 44,123 | |
| | 33,700 | | | Central Pattana PCL, NVDR | | | 58,525 | |
| | 68,400 | | | Charoen Pokphand Foods PCL, NVDR | | | 64,206 | |
| | 2,259,700 | | | CP ALL PCL, NVDR | | | 4,057,693 | |
| | 12,600 | | | Delta Electronics Thailand PCL, NVDR | | | 26,930 | |
| | 3,400 | | | Electricity Generating PCL, NVDR | | | 19,394 | |
| | 28,000 | | | Energy Absolute PCL, NVDR | | | 20,397 | |
| | 13,000 | | | Glow Energy PCL, NVDR | | | 29,984 | |
| | 99,300 | | | Home Product Center PCL, NVDR | | | 31,197 | |
| | 36,400 | | | Indorama Ventures PCL, NVDR | | | 33,528 | |
| | 254,400 | | | IRPC PCL, NVDR | | | 35,485 | |
| | 237,300 | | | Kasikornbank PCL | | | 1,352,726 | |
| | 89,600 | | | Krung Thai Bank PCL, NVDR | | | 49,098 | |
| | 54,200 | | | Minor International PCL, NVDR | | | 64,334 | |
| | 374,464 | | | PTT Exploration & Production PCL | | | 878,579 | |
| | 35,200 | | | PTT Exploration & Production PCL, NVDR | | | 81,944 | |
See Notes to Financial Statements.
144
| | | | | | | | |
| Emerging Markets Equity Fund | |
| | |
| Shares/Units | | | Security | | Value | |
| Thailand — 2.3% — (continued) | |
| | 52,500 | | | PTT Global Chemical PCL, NVDR | | $ | 92,072 | |
| | 25,300 | | | PTT PCL, NVDR | | | 253,670 | |
| | 12,600 | | | Robinson Department Store PCL, NVDR | | | 23,174 | |
| | 106,300 | | | Siam Cement PCL (The), Class Registered Shares | | | 1,625,200 | |
| | 2,800 | | | Siam Cement PCL, NVDR | | | 42,858 | |
| | 39,500 | | | Siam Commercial Bank PCL (The), NVDR | | | 181,988 | |
| | 20,700 | | | Thai Oil PCL, NVDR | | | 42,216 | |
| | 48,400 | | | Thai Union Group PCL, NVDR | | | 29,992 | |
| | 338,600 | | | TMB Bank PCL, NVDR | | | 22,063 | |
| | 253,200 | | | True Corp. PCL, NVDR | | | 59,158 | |
| | | | | | | | |
| | | | Total Thailand | | | 9,680,050 | |
| | | | | | | | |
| Turkey — 3.2% | |
| | 785,872 | | | Akbank TAS | | | 2,078,978 | |
| | 5,229 | | | Anadolu Efes Biracilik Ve Malt Sanayii AS | | | 32,445 | |
| | 5,951 | | | Arcelik AS | | | 42,561 | |
| | 117,000 | | | AvivaSA Emeklilik ve Hayat AS | | | 751,791 | |
| | 5,364 | | | BIM Birlesik Magazalar AS | | | 91,968 | |
| | 1,916 | | | Coca-Cola Icecek AS | | | 23,944 | |
| | 47,768 | | | Emlak Konut Gayrimenkul Yatirim Ortakligi AS, REIT | | | 47,021 | |
| | 35,358 | | | Eregli Demir ve Celik Fabrikalari TAS | | | 53,176 | |
| | 1,752 | | | Ford Otomotiv Sanayi AS | | | 19,012 | |
| | 23,168 | | | Haci Ömer Sabanci Holding AS | | | 71,100 | |
| | 392,716 | | | KOC Holding AS | | | 1,705,851 | |
| | 16,988 | | | Petkim Petrokimya Holding AS | | | 26,262 | |
| | 4,165 | | | TAV Havalimanlari Holding AS | | | 16,118 | |
| | 172,122 | | | Tofas Turk Otomobil Fabrikasi AS | | | 1,266,443 | |
| | 60,139 | | | Tüpras Türkiye Petrol Rafinerileri AS | | | 1,176,363 | |
| | 14,117 | | | Turk Hava Yollari AO* | | | 24,466 | |
| | 228,048 | | | Türk Telekomunikasyon AS | | | 458,330 | |
| | 517,861 | | | Turkcell Iletisim Hizmetleri AS | | | 1,739,293 | |
| | 58,362 | | | Türkiye Garanti Bankasi AS | | | 150,487 | |
| | 16,010 | | | Türkiye Halk Bankasi AS | | | 48,099 | |
| | 872,679 | | | Türkiye Is Bankasi, Class C Shares | | | 1,419,935 | |
| | 5,600,000 | | | Turkiye Sinai Kalkinma Bankasi AS | | | 2,561,499 | |
| | 18,216 | | | Türkiye Sise ve Cam Fabrikalari AS | | | 21,054 | |
| | 19,105 | | | Türkiye Vakiflar Bankasi TAO, Class D Shares | | | 28,106 | |
| | 3,889 | | | Ulker Biskuvi Sanayi AS | | | 27,261 | |
| | 22,103 | | | Yapi ve Kredi Bankasi AS* | | | 27,021 | |
| | | | | | | | |
| | | | Total Turkey | | | 13,908,584 | |
| | | | | | | | |
| United Arab Emirates — 0.2% | |
| | 49,559 | | | Abu Dhabi Commercial Bank PJSC | | | 86,627 | |
| | 79,701 | | | Aldar Properties PJSC | | | 59,894 | |
| | 57,148 | | | Arabtec Holding PJSC* | | | 22,722 | |
| | 4,206 | | | DP World Ltd. | | | 77,814 | |
| | 50,379 | | | Dubai Financial Market PJSC | | | 18,315 | |
| | 31,535 | | | Dubai Islamic Bank PJSC | | | 46,880 | |
| | 49,119 | | | Emaar Malls Group PJSC | | | 36,878 | |
| | 88,548 | | | Emaar Properties PJSC | | | 171,183 | |
| | 44,012 | | | Emirates Telecommunications Group Co. PJSC | | | 236,415 | |
| | 22,832 | | | First Gulf Bank PJSC | | | 72,836 | |
| | 17,176 | | | National Bank of Abu Dhabi PJSC | | | 42,657 | |
| | | | | | | | |
| | | | Total United Arab Emirates | | | 872,221 | |
| | | | | | | | |
See Notes to Financial Statements.
145
| | | | | | | | |
| Emerging Markets Equity Fund | |
| | |
| Shares/Units | | | Security | | Value | |
| United Kingdom — 0.2% | |
| | 275,000 | | | International Personal Finance PLC | | $ | 981,286 | |
| | | | | | | | |
| | | | TOTAL COMMON STOCKS
(Cost — $372,599,769) | | | 404,391,805 | |
| | | | | | | | |
| PREFERRED STOCKS — 2.2% | |
| Brazil — 1.0% | |
| | 70,200 | | | Banco Bradesco SA, Class Preferred Shares | | | 631,651 | |
| | 3,900 | | | Braskem SA, Class Preferred A Shares | | | 29,114 | |
| | 5,700 | | | Centrais Eletricas Brasileiras SA, Class Preferred B Shares* | | | 50,300 | |
| | 4,000 | | | Cia Brasileira de Distribuicao, Class Preferred Shares | | | 62,372 | |
| | 19,100 | | | Cia Energetica de Minas Gerais, Class Preferred Shares | | | 51,747 | |
| | 4,800 | | | Cia Energetica de Sao Paulo, Class Preferred B Shares | | | 20,049 | |
| | 2,600 | | | Cia Paranaense de Energia, Class Preferred B Shares | | | 26,534 | |
| | 23,200 | | | Gerdau SA, Class Preferred Shares | | | 65,226 | |
| | 191,900 | | | Itaú Unibanco Holding SA, Class Preferred Shares | | | 2,130,143 | |
| | 98,500 | | | Itausa — Investimentos Itau SA, Class Preferred Shares | | | 262,288 | |
| | 14,800 | | | Lojas Americanas SA, Class Preferred Shares | | | 88,122 | |
| | 104,812 | | | Petroleo Brasileiro SA, Class Preferred Shares* | | | 417,022 | |
| | 10,200 | | | Suzano Papel e Celulose SA, Class Preferred A Shares | | | 32,214 | |
| | 11,300 | | | Telefonica Brasil SA, Class Preferred Shares | | | 170,358 | |
| | 48,700 | | | Vale SA, Class Preferred Shares | | | 218,194 | |
| | | | | | | | |
| | | | Total Brazil | | | 4,255,334 | |
| | | | | | | | |
| Chile — 0.0% | |
| | 6,556 | | | Embotelladora Andina SA, Class Preferred B Shares | | | 23,477 | |
| | 2,428 | | | Sociedad Quimica y Minera de Chile SA, Class Preferred B Shares | | | 61,773 | |
| | | | | | | | |
| | | | Total Chile | | | 85,250 | |
| | | | | | | | |
| Colombia — 0.4% | |
| | 163,000 | | | Banco Davivienda SA, Class Preferred Shares | | | 1,600,222 | |
| | 11,482 | | | Bancolombia SA, Class Preferred Shares | | | 112,413 | |
| | 88,943 | | | Grupo Aval Acciones y Valores SA, Class Preferred Shares | | | 37,405 | |
| | 2,555 | | | Grupo de Inversiones Suramericana SA, Class Preferred Shares | | | 32,837 | |
| | | | | | | | |
| | | | Total Colombia | | | 1,782,877 | |
| | | | | | | | |
| Russia — 0.0% | |
| | 175,600 | | | Surgutneftegaz OJSC, Class Preferred Shares | | | 87,950 | |
| | 39 | | | Transneft PJSC, Class Preferred Shares | | | 92,416 | |
| | | | | | | | |
| | | | Total Russia | | | 180,366 | |
| | | | | | | | |
| South Korea — 0.8% | |
| | 226 | | | Amorepacific Corp., Class Preferred Shares | | | 44,607 | |
| | 1,530 | | | Hyundai Motor Co., Class Preferred Shares | | | 135,354 | |
| | 194 | | | LG Chem, Ltd., Class Preferred Shares | | | 31,277 | |
| | 52 | | | LG Household & Health Care Ltd., Class Preferred Shares | | | 26,514 | |
| | 2,499 | | | Samsung Electronics Co., Ltd., Class Preferred Shares | | | 2,960,462 | |
| | | | | | | | |
| | | | Total South Korea | | | 3,198,214 | |
| | | | | | | | |
| | | | TOTAL PREFERRED STOCKS
(Cost — $8,974,027) | | | 9,502,041 | |
| | | | | | | | |
| RIGHTS — 0.0% | |
| Brazil — 0.0% | |
| | 150 | | | AES Tiete Energia SA* | | | 192 | |
| | | | | | | | |
| South Africa — 0.0% | |
| | 978,782 | | | PPC Ltd.* | | | 131,765 | |
| | | | | | | | |
See Notes to Financial Statements.
146
| | | | | | | | |
| Emerging Markets Equity Fund | |
| | |
| Shares/Units | | | Security | | Value | |
| South Korea — 0.0% | |
| | 296 | | | Hanwha Corp.*(a) | | $ | — | |
| | | | | | | | |
| | | | TOTAL RIGHTS
(Cost — $536,386) | | | 131,957 | |
| | | | | | | | |
| | | | TOTAL INVESTMENTS BEFORE SHORT-TERM INVESTMENTS
(Cost — $382,110,182) | | | 414,025,803 | |
| | | | | | | | |
| | |
Face
Amount† | | | | | | |
| SHORT-TERM INVESTMENTS (e) — 4.1% | |
| MONEY MARKET FUND — 0.9% | |
| $ | 3,683,541 | | | Invesco STIT — Government & Agency Portfolio(f)
(Cost — $3,683,541) | | | 3,683,541 | |
| | | | | | | | |
| TIME DEPOSITS — 3.2% | |
| | 1,768,875 | | | ANZ National Bank — London, 0.150% due 9/1/16 | | | 1,768,875 | |
| | | | BBH — Grand Cayman: | | | | |
| | 62,384 | HKD | | 0.005% due 9/1/16 | | | 8,042 | |
| | 18 | GBP | | 0.050% due 9/1/16 | | | 23 | |
| | 8 | ZAR | | 6.440% due 9/1/16 | | | 1 | |
| | | | BNP Paribas — Paris: | | | | |
| | 28,023 | EUR | | (0.540)% due 9/1/16 | | | 31,262 | |
| | 5,874,991 | | | 0.150% due 9/1/16 | | | 5,874,991 | |
| | 726,206 | | | Citibank N.A. — Puerto Rico, 0.150% due 9/1/16 | | | 726,206 | |
| | 1,163,569 | HKD | | HSBC Bank — Hong Kong, 0.005% due 9/1/16 | | | 149,992 | |
| | 52,336 | SGD | | HSBC Bank — Singapore, 0.010% due 9/1/16 | | | 38,413 | |
| | 1,049,462 | ZAR | | HSBC Bank PLC — London, 6.440% due 9/1/16 | | | 71,354 | |
| | 4,984,804 | | | Skandinaviska Enskilda Banken AB — Stockholm, 0.150% due 9/1/16 | | | 4,984,804 | |
| | | | | | | | |
| | | | TOTAL TIME DEPOSITS
(Cost — $13,653,963) | | | 13,653,963 | |
| | | | | | | | |
| | | | TOTAL SHORT-TERM INVESTMENTS
(Cost — $17,337,504) | | | 17,337,504 | |
| | | | | | | | |
| | | | TOTAL INVESTMENTS — 100.8%
(Cost — $399,447,686#) | | | 431,363,307 | |
| | | | | | | | |
| | | | Liabilities in Excess of Other Assets — (0.8)% | | | (3,309,431 | ) |
| | | | | | | | |
| | | | TOTAL NET ASSETS — 100.0% | | $ | 428,053,876 | |
| | | | | | | | |
| † | Amount denominated in U.S. dollars, unless otherwise noted |
| * | Non-income producing security. |
| (a) | Security is valued in good faith at fair value by or under the direction of the Board of Trustees. |
| (b) | Restricted security that may be sold to “qualified institutional buyers” pursuant to the conditions of Rule 144A under the Securities Act of 1933, as amended. This security has been deemed liquid pursuant to guidelines approved by the Board of Trustees, unless otherwise noted. |
| (c) | Security trades on the Hong Kong exchange. |
| (d) | All or a portion of this security is on loan (See Note 1). |
| (e) | Inclusive of all short term holdings, including collateral received from securities lending activities. Excluding such collateral, the percentage of portfolio holdings would be 3.2% |
| (f) | Represents investment of collateral received from securities lending transactions. |
| # | Aggregate cost for federal income tax purposes is $411,633,468. |
See Notes to Financial Statements.
147
| | | | |
| Emerging Markets Equity Fund |
| | |
Abbreviations used in this schedule: |
| ADR | | — American Depositary Receipts |
| GDR | | — Global Depositary Receipt |
| NVDR | | — Non Voting Depository Receipt |
| PCL | | — Public Company Limited |
| PLC | | — Public Limited Company |
| REIT | | — Real Estate Investment Trust |
| | | | |
| Summary of Investments by Security Sector^ | | | |
Financials | | | 26.1 | % |
Information Technology | | | 20.4 | |
Consumer Discretionary | | | 13.5 | |
Consumer Staples | | | 8.7 | |
Telecommunication Services | | | 6.9 | |
Energy | | | 5.3 | |
Industrials | | | 5.1 | |
Health Care | | | 5.1 | |
Materials | | | 3.3 | |
Utilities | | | 1.6 | |
Short-Term Investments | | | 4.0 | |
| | | | |
| | | 100.0 | % |
| | | | |
| ^ | As a percentage of total investments. |
At August 31, 2016, Emerging Markets Equity Fund had open exchange traded futures contracts as described below.
The unrealized appreciation (depreciation) on the open contracts reflected in the accompanying financial statements were as follows:
| | | | | | | | | | | | | | | | |
| Open Futures Contracts | | Number of
Contracts | | | Expiration
Date
(Month/Year) | | | Market Value | | | Unrealized
(Depreciation) | |
Contracts to Buy: | | | | | | | | | | | | | | | | |
E-mini MSCI Emerging Markets Index September Futures | | | 20 | | | | 9/16 | | | $ | 887,900 | | | $ | (12,626 | ) |
| | | | | | | | | | | | | | | | |
| | |
Currency Abbreviations used in this schedule: |
| EUR | | — Euro |
| GBP | | — British Pound |
| HKD | | — Hong Kong Dollar |
| SGD | | — Singapore Dollar |
| ZAR | | — South African Rand |
See Notes to Financial Statements.
148
| | | | | | | | | | |
| Core Fixed Income Fund | |
| | | |
Face
Amount/Units† | | | Rating†† | | Security | | Value | |
| CORPORATE BONDS & NOTES — 27.6% | |
| Aerospace & Defense — 0.3% | |
| $ | 35,000 | | | BBB+ | | BAE Systems Holdings Inc., Company Guaranteed Notes, 3.850% due 12/15/25(a) | | $ | 37,381 | |
| | 30,000 | | | A+ | | General Dynamics Corp., Company Guaranteed Notes, 2.125% due 8/15/26 | | | 29,689 | |
| | | | | | Harris Corp., Senior Unsecured Notes: | | | | |
| | 120,000 | | | BBB- | | 4.854% due 4/27/35 | | | 134,647 | |
| | 148,000 | | | BBB- | | 5.054% due 4/27/45 | | | 173,678 | |
| | | | | | Lockheed Martin Corp., Senior Unsecured Notes: | | | | |
| | 30,000 | | | BBB+ | | 3.100% due 1/15/23 | | | 31,716 | |
| | 170,000 | | | BBB+ | | 3.550% due 1/15/26 | | | 185,109 | |
| | 45,000 | | | BBB+ | | 3.600% due 3/1/35 | | | 46,609 | |
| | 172,000 | | | BBB+ | | 4.500% due 5/15/36 | | | 199,754 | |
| | 50,000 | | | BBB | | Northrop Grumman Corp., Senior Unsecured Notes, 3.850% due 4/15/45 | | | 53,536 | |
| | | | | | United Technologies Corp.: | | | | |
| | 910,000 | | | BBB+ | | Junior Subordinated Notes, step bond to yield, 1.778% due 5/4/18 | | | 916,664 | |
| | 80,000 | | | A- | | Senior Unsecured Notes, 4.500% due 6/1/42 | | | 95,070 | |
| | | | | | | | | | |
| | | | | | Total Aerospace & Defense | | | 1,903,853 | |
| | | | | | | | | | |
| Airlines — 0.6% | |
| | 599,336 | | | A | | American Airlines Class A Pass Through Trust, Series 2013-2, Pass Thru Certificates, 4.950% due 1/15/23 | | | 656,272 | |
| | 323,764 | | | BBB- | | American Airlines Class B Pass Through Trust, Series 2013-1, Pass Thru Certificates, 5.625% due 1/15/21(a) | | | 337,929 | |
| | 291,777 | | | BBB- | | American Airlines Class B Pass Through Trust, Series 2013-2, Pass Thru Certificates, 5.600% due 7/15/20(a) | | | 306,002 | |
| | 216,418 | | | A | | Continental Airlines Inc. Class A-1 Pass Through Trust, Series 1999-2, Pass Thru Certificates, 7.256% due 3/15/20 | | | 232,649 | |
| | 630,601 | | | A | | Delta Air Lines Class A Pass Through Trust, Series 2009-1, Pass Thru Certificates, 7.750% due 12/17/19 | | | 716,835 | |
| | 625,000 | | | BBB+ | | JetBlue Airways G-2 Pass Through Trust, Series 2004-2, Pass Thru Certificates, 1.267% due 11/15/16(b) | | | 620,312 | |
| | 287,569 | | | BBB | | Northwest Airlines Inc. Class A-1 Pass Through Trust, Pass Thru Certificates, 7.041% due 4/1/22 | | | 328,188 | |
| | 218,596 | | | A+ | | UAL Pass Through Trust, Series 2009-1, Pass Thru Certificates, 10.400% due 11/1/16 | | | 221,317 | |
| | 25,724 | | | A | | UAL Pass Through Trust, Series 2009-2A, Pass Thru Certificates, 9.750% due 1/15/17 | | | 26,464 | |
| | 508,829 | | | A | | US Airways Pass Through Trust, Series 2001-1G, Pass Thru Certificates, 7.076% due 3/20/21 | | | 550,171 | |
| | | | | | | | | | |
| | | | | | Total Airlines | | | 3,996,139 | |
| | | | | | | | | | |
| Automobiles — 0.1% | |
| | 21,000 | | | BBB | | Delphi Corp., Company Guaranteed Notes, 4.150% due 3/15/24 | | | 22,476 | |
| | 120,000 | | | BBB | | Ford Motor Co., Senior Unsecured Notes, 4.750% due 1/15/43 | | | 130,317 | |
| | | | | | General Motors Co., Senior Unsecured Notes: | | | | |
| | 260,000 | | | BBB- | | 6.250% due 10/2/43 | | | 312,741 | |
| | 455,000 | | | BBB- | | 5.200% due 4/1/45 | | | 486,297 | |
| | | | | | | | | | |
| | | | | | Total Automobiles | | | 951,831 | |
| | | | | | | | | | |
| Banks — 5.0% | |
| | 728,000 | | | AAA | | Bank Nederlandse Gemeenten NV, Senior Unsecured Notes, 1.125% due 5/25/18(a) | | | 728,827 | |
| | | | | | Bank of America Corp.: | | | | |
| | | | | | Senior Unsecured Notes: | | | | |
| | 850,000 | | | Baa1(c) | | 8.950% due 5/18/17(b) | | | 848,121 | |
| | 1,584,000 | | | Baa1(c) | | 9.570% due 6/6/17(b) | | | 1,576,799 | |
| | 70,000 | | | BBB+ | | 5.750% due 12/1/17 | | | 73,634 | |
| | 139,000 | | | BBB+ | | 2.000% due 1/11/18 | | | 139,912 | |
| | 280,000 | | | BBB+ | | 5.650% due 5/1/18 | | | 298,180 | |
| | 108,000 | | | BBB+ | | 1.950% due 5/12/18 | | | 108,847 | |
See Notes to Financial Statements.
149
| | | | | | | | | | |
| Core Fixed Income Fund | |
| | | |
Face
Amount/Units† | | | Rating†† | | Security | | Value | |
| Banks — 5.0% — (continued) | |
| $ | 262,000 | | | BBB+ | | 2.600% due 1/15/19 | | $ | 268,025 | |
| | 173,000 | | | BBB+ | | 2.250% due 4/21/20 | | | 174,788 | |
| | 400,000 | | | BBB+ | | 5.000% due 5/13/21 | | | 449,268 | |
| | 300,000 | | | BBB+ | | 3.300% due 1/11/23 | | | 312,254 | |
| | 490,000 | | | BBB+ | | 4.125% due 1/22/24 | | | 534,859 | |
| | 630,000 | | | BBB+ | | 4.000% due 4/1/24 | | | 682,671 | |
| | 594,000 | | | BBB+ | | 3.875% due 8/1/25 | | | 637,969 | |
| | 270,000 | | | BBB+ | | 3.500% due 4/19/26 | | | 282,631 | |
| | 170,000 | | | BBB+ | | 5.000% due 1/21/44 | | | 204,605 | |
| | 270,000 | | | BBB+ | | 4.875% due 4/1/44 | | | 318,461 | |
| | | | | | Subordinated Notes: | | | | |
| | 990,000 | | | BBB | | 4.200% due 8/26/24 | | | 1,052,642 | |
| | 610,000 | | | BBB | | 4.000% due 1/22/25 | | | 637,291 | |
| | 400,000 | | | BBB | | 3.950% due 4/21/25 | | | 417,407 | |
| | 20,000 | | | BBB | | 4.450% due 3/3/26 | | | 21,580 | |
| | | | | | Bank of America NA: | | | | |
| | 390,000 | | | A | | Senior Unsecured Notes, 1.650% due 3/26/18 | | | 391,973 | |
| | 300,000 | | | BBB+ | | Subordinated Notes, 6.100% due 6/15/17 | | | 311,284 | |
| | 195,000 | | | A+ | | Bank of Montreal, Senior Unsecured Notes, 1.500% due 7/18/19 | | | 195,010 | |
| | 100,000 | | | BBB- | | Barclays Bank PLC, Subordinated Notes, 5.140% due 10/14/20 | | | 108,251 | |
| | | | | | Barclays PLC: | | | | |
| | | | | | Senior Unsecured Notes: | | | | |
| | 380,000 | | | BBB | | 3.200% due 8/10/21 | | | 382,762 | |
| | 260,000 | | | BBB | | 4.375% due 1/12/26 | | | 271,947 | |
| | | | | | Subordinated Notes: | | | | |
| | 200,000 | | | BB+ | | 4.375% due 9/11/24 | | | 203,007 | |
| | 200,000 | | | BB+ | | 5.200% due 5/12/26 | | | 208,815 | |
| | | | | | BNP Paribas SA: | | | | |
| | 260,000 | | | A | | Senior Unsecured Notes, 2.375% due 9/14/17 | | | 262,615 | |
| | 200,000 | | | BBB+ | | Subordinated Notes, 4.375% due 5/12/26(a) | | | 207,364 | |
| | | | | | Capital One Financial Corp.: | | | | |
| | 560,000 | | | BBB | | Senior Unsecured Notes, 3.500% due 6/15/23 | | | 586,296 | |
| | | | | | Subordinated Notes: | | | | |
| | 180,000 | | | BBB- | | 4.200% due 10/29/25 | | | 188,531 | |
| | 250,000 | | | BBB- | | 3.750% due 7/28/26 | | | 251,706 | |
| | 800,000 | | | BBB- | | Chase Capital III, Limited Guaranteed Notes, 1.392% due 3/1/27(b) | | | 702,000 | |
| | | | | | CIT Group Inc., Senior Unsecured Notes: | | | | |
| | 290,000 | | | BB+ | | 6.625% due 4/1/18(a) | | | 309,720 | |
| | 300,000 | | | BB+ | | 5.000% due 8/15/22 | | | 318,750 | |
| | 15,000 | | | BBB+ | | Citizens Financial Group Inc., Senior Unsecured Notes, 2.375% due 7/28/21 | | | 15,105 | |
| | | | | | Cooperatieve Rabobank UA: | | | | |
| | 340,000 | | | BBB+ | | Bank Guaranteed Notes, 4.375% due 8/4/25 | | | 361,670 | |
| | | | | | Company Guaranteed Notes: | | | | |
| | 160,000 | | | A+ | | 3.375% due 1/19/17 | | | 161,457 | |
| | 310,000 | | | BBB+ | | 4.625% due 12/1/23 | | | 336,617 | |
| | 320,000 | | | BBB- | | Junior Subordinated Notes, 11.000%(a)(b)(d) | | | 391,800 | |
| | 320,000 | | | A+ | | Senior Unsecured Notes, 2.500% due 1/19/21 | | | 329,133 | |
| | 450,000 | | | BBB | | Credit Agricole SA, Subordinated Notes, 4.375% due 3/17/25(a) | | | 464,644 | |
| | 750,000 | | | A | | Credit Suisse AG, Senior Unsecured Notes, 1.700% due 4/27/18 | | | 750,721 | |
| | | | | | Credit Suisse Group Funding Guernsey Ltd., Company Guaranteed Notes: | | | | |
| | 505,000 | | | BBB+ | | 2.750% due 3/26/20 | | | 506,646 | |
| | 250,000 | | | BBB+ | | 3.125% due 12/10/20 | | | 253,914 | |
| | 320,000 | | | BBB+ | | 4.550% due 4/17/26(a) | | | 338,907 | |
| | 195,000 | | | BBB+ | | Deutsche Bank AG, Senior Unsecured Notes, 2.850% due 5/10/19 | | | 195,850 | |
See Notes to Financial Statements.
150
| | | | | | | | | | |
| Core Fixed Income Fund | |
| | | |
Face
Amount/Units† | | | Rating†† | | Security | | Value | |
| Banks — 5.0% — (continued) | |
| | | | | | Discover Bank/Greenwood DE, Senior Unsecured Notes: | | | | |
| $ | 900,000 | | | BBB | | 2.600% due 11/13/18 | | $ | 913,960 | |
| | 250,000 | | | BBB | | 3.100% due 6/4/20 | | | 257,558 | |
| | 1,510,000 | | | BBB- | | HBOS PLC, Subordinated Notes, 6.750% due 5/21/18(a) | | | 1,619,605 | |
| | | | | | HSBC Holdings PLC: | | | | |
| | 210,000 | | | Baa3(c) | | Junior Subordinated Notes, 6.375%(b)(d) | | | 207,900 | |
| | | | | | Subordinated Notes: | | | | |
| | 390,000 | | | BBB+ | | 4.250% due 8/18/25 | | | 405,811 | |
| | 390,000 | | | BBB+ | | 6.500% due 9/15/37 | | | 507,276 | |
| | 200,000 | | | BBB+ | | 5.250% due 3/14/44 | | | 229,571 | |
| | | | | | HSBC USA Inc., Senior Unsecured Notes: | | | | |
| | 385,000 | | | A | | 2.350% due 3/5/20 | | | 387,622 | |
| | 185,000 | | | A | | 2.750% due 8/7/20 | | | 189,175 | |
| | 335,000 | | | A | | ING Bank NV, Senior Unsecured Notes, 1.800% due 3/16/18(a) | | | 336,726 | |
| | 810,000 | | | BB | | Intesa Sanpaolo SpA, Subordinated Notes, 5.017% due 6/26/24(a) | | | 765,853 | |
| | 525,000 | | | A | | Lloyds Bank PLC, Company Guaranteed Notes, 1.750% due 5/14/18 | | | 524,880 | |
| | | | | | Lloyds Banking Group PLC, Subordinated Notes: | | | | |
| | 245,000 | | | BBB- | | 4.582% due 12/10/25(a) | | | 251,984 | |
| | 201,000 | | | BBB- | | 4.650% due 3/24/26 | | | 209,185 | |
| | 480,000 | | | BBB- | | M&T Bank Corp., Junior Subordinated Notes, 6.875%(d) | | | 484,200 | |
| | 530,000 | | | A | | Macquarie Bank Ltd., Senior Unsecured Notes, 1.364% due 10/27/17(a)(b) | | | 530,153 | |
| | 300,000 | | | A- | | Nordea Bank AB, Subordinated Notes, 4.875% due 5/13/21(a) | | | 332,246 | |
| | 470,000 | | | Aaa(c) | | Royal Bank of Canada, Covered Notes, 2.200% due 9/23/19 | | | 479,620 | |
| | | | | | Royal Bank of Scotland Group PLC: | | | | |
| | 250,000 | | | BBB- | | Senior Unsecured Notes, 6.400% due 10/21/19 | | | 277,718 | |
| | | | | | Subordinated Notes: | | | | |
| | 30,000 | | | BB | | 6.125% due 12/15/22 | | | 32,111 | |
| | 320,000 | | | BB | | 6.100% due 6/10/23 | | | 340,459 | |
| | 152,000 | | | BB | | 6.000% due 12/19/23 | | | 161,115 | |
| | 110,000 | | | BB | | 5.125% due 5/28/24 | | | 111,545 | |
| | 70,000 | | | BB+ | | Royal Bank of Scotland NV, Company Guaranteed Notes, 4.650% due 6/4/18 | | | 72,011 | |
| | | | | | Santander Holdings USA Inc., Senior Unsecured Notes: | | | | |
| | 219,000 | | | BBB+ | | 3.450% due 8/27/18 | | | 224,498 | |
| | 160,000 | | | BBB+ | | 2.700% due 5/24/19 | | | 161,944 | |
| | 55,000 | | | BBB+ | | 2.650% due 4/17/20 | | | 55,586 | |
| | 120,000 | | | BBB+ | | 4.500% due 7/17/25 | | | 125,934 | |
| | 180,000 | | | BBB | | Santander UK Group Holdings PLC, Senior Unsecured Notes, 2.875% due 10/16/20 | | | 181,640 | |
| | | | | | Santander UK PLC: | | | | |
| | 900,000 | | | A | | Senior Unsecured Notes, 1.650% due 9/29/17 | | | 901,272 | |
| | 170,000 | | | BBB- | | Subordinated Notes, 7.950% due 10/26/29 | | | 215,890 | |
| | 600,000 | | | BBB- | | Standard Chartered PLC, Subordinated Notes, 5.700% due 3/26/44(a) | | | 671,652 | |
| | 470,000 | | | BBB | | Wachovia Capital Trust III, Limited Guaranteed Notes, 5.570%(b)(d) | | | 473,231 | |
| | | | | | Wells Fargo & Co.: | | | | |
| | 60,000 | | | BBB | | Junior Subordinated Notes, 5.875%(b)(d) | | | 66,342 | |
| | | | | | Senior Unsecured Notes: | | | | |
| | 249,000 | | | A | | 2.600% due 7/22/20 | | | 256,492 | |
| | 235,000 | | | A | | 2.550% due 12/7/20 | | | 241,861 | |
| | 41,000 | | | A | | 3.550% due 9/29/25 | | | 43,965 | |
| | 925,000 | | | A | | 3.000% due 4/22/26 | | | 950,225 | |
| | 134,000 | | | A | | 3.900% due 5/1/45 | | | 142,559 | |
| | | | | | Subordinated Notes: | | | | |
| | 330,000 | | | A- | | 3.450% due 2/13/23 | | | 346,439 | |
| | 169,000 | | | A- | | 4.480% due 1/16/24 | | | 187,475 | |
| | 580,000 | | | A- | | 4.300% due 7/22/27 | | | 641,691 | |
| | 30,000 | | | A- | | 5.375% due 11/2/43 | | | 36,125 | |
See Notes to Financial Statements.
151
| | | | | | | | | | |
| Core Fixed Income Fund | |
| | | |
Face
Amount/Units† | | | Rating†† | | Security | | Value | |
| Banks — 5.0% — (continued) | |
| $ | 110,000 | | | A- | | 5.606% due 1/15/44 | | $ | 137,708 | |
| | 250,000 | | | A- | | 4.650% due 11/4/44 | | | 275,163 | |
| | 450,000 | | | A- | | 4.900% due 11/17/45 | | | 515,238 | |
| | 320,000 | | | A- | | 4.400% due 6/14/46 | | | 342,497 | |
| | 250,000 | | | A | | Wells Fargo Bank NA, Subordinated Notes, 6.000% due 11/15/17 | | | 263,571 | |
| | 100,000 | | | BBB | | Wells Fargo Capital X, Limited Guaranteed Notes, 5.950% due 12/15/36 | | | 111,000 | |
| | 380,000 | | | AA- | | Westpac Banking Corp., Senior Unsecured Notes, 4.875% due 11/19/19 | | | 417,023 | |
| | | | | | | | | | |
| | | | | | Total Banks | | | 36,390,571 | |
| | | | | | | | | | |
| Beverages — 1.0% | |
| | | | | | Anheuser-Busch InBev Finance Inc., Company Guaranteed Notes: | | | | |
| | 212,000 | | | A- | | 2.650% due 2/1/21 | | | 218,842 | |
| | 660,000 | | | A- | | 3.300% due 2/1/23 | | | 693,666 | |
| | 2,063,000 | | | A- | | 3.650% due 2/1/26 | | | 2,204,891 | |
| | 145,000 | | | A- | | 4.700% due 2/1/36 | | | 168,814 | |
| | 969,000 | | | A- | | 4.900% due 2/1/46 | | | 1,180,237 | |
| | | | | | Anheuser-Busch InBev Worldwide Inc., Company Guaranteed Notes: | | | | |
| | 290,000 | | | A- | | 5.000% due 4/15/20 | | | 322,216 | |
| | 200,000 | | | A- | | 2.500% due 7/15/22 | | | 204,287 | |
| | 60,000 | | | A- | | 3.750% due 7/15/42 | | | 61,574 | |
| | 545,000 | | | A- | | Coca-Cola Femsa SAB de CV, Company Guaranteed Notes, 4.625% due 2/15/20 | | | 591,769 | |
| | 275,000 | | | BB+ | | Constellation Brands Inc., Company Guaranteed Notes, 6.000% due 5/1/22 | | | 320,375 | |
| | 173,000 | | | A- | | Diageo Capital PLC, Company Guaranteed Notes, 4.828% due 7/15/20 | | | 193,808 | |
| | 160,000 | | | A- | | Diageo Investment Corp., Company Guaranteed Notes, 2.875% due 5/11/22 | | | 167,682 | |
| | 275,000 | | | BB- | | DS Services of America Inc., Secured Notes, 10.000% due 9/1/21(a) | | | 310,062 | |
| | | | | | Molson Coors Brewing Co., Company Guaranteed Notes: | | | | |
| | 50,000 | | | BBB- | | 3.500% due 5/1/22(e) | | | 53,483 | |
| | 40,000 | | | BBB- | | 3.000% due 7/15/26 | | | 40,594 | |
| | 30,000 | | | BBB- | | 4.200% due 7/15/46 | | | 31,827 | |
| | 250,000 | | | A | | PepsiCo Inc., Senior Unsecured Notes, 7.900% due 11/1/18 | | | 285,947 | |
| | | | | | Pernod Ricard SA, Senior Unsecured Notes: | | | | |
| | 200,000 | | | BBB- | | 2.950% due 1/15/17(a) | | | 201,315 | |
| | 190,000 | | | BBB- | | 4.450% due 1/15/22(a) | | | 209,525 | |
| | | | | | | | | | |
| | | | | | Total Beverages | | | 7,460,914 | |
| | | | | | | | | | |
| Biotechnology — 0.3% | |
| | | | | | Amgen Inc., Senior Unsecured Notes: | | | | |
| | 70,000 | | | A | | 3.625% due 5/22/24 | | | 75,662 | |
| | 54,000 | | | A | | 4.563% due 6/15/48(a) | | | 58,540 | |
| | 173,000 | | | A | | 4.663% due 6/15/51(a) | | | 186,361 | |
| | | | | | Biogen Inc., Senior Unsecured Notes: | | | | |
| | 60,000 | | | A- | | 3.625% due 9/15/22 | | | 64,312 | |
| | 20,000 | | | A- | | 5.200% due 9/15/45 | | | 24,233 | |
| | | | | | Celgene Corp., Senior Unsecured Notes: | | | | |
| | 60,000 | | | BBB+ | | 3.550% due 8/15/22 | | | 63,965 | |
| | 310,000 | | | BBB+ | | 3.875% due 8/15/25 | | | 335,702 | |
| | 460,000 | | | BBB+ | | 5.000% due 8/15/45 | | | 534,146 | |
| | | | | | Gilead Sciences Inc., Senior Unsecured Notes: | | | | |
| | 330,000 | | | A | | 3.700% due 4/1/24 | | | 357,949 | |
| | 160,000 | | | A | | 3.650% due 3/1/26 | | | 173,790 | |
| | 85,000 | | | A | | 4.800% due 4/1/44 | | | 98,534 | |
| | 415,000 | | | A | | 4.750% due 3/1/46 | | | 484,136 | |
| | | | | | | | | | |
| | | | | | Total Biotechnology | | | 2,457,330 | |
| | | | | | | | | | |
See Notes to Financial Statements.
152
| | | | | | | | | | |
| Core Fixed Income Fund | |
| | | |
Face
Amount/Units† | | | Rating†† | | Security | | Value | |
| Capital Markets — 0.8% | |
| $ | 40,000 | | | A | | Ameriprise Financial Inc., Senior Unsecured Notes, 2.875% due 9/15/26 | | $ | 40,269 | |
| | 50,000 | | | BBB+ | | Bank of America Corp., Senior Unsecured Notes, 6.875% due 4/25/18 | | | 54,223 | |
| | 195,000 | | | A | | Bank of New York Mellon Corp. (The), Senior Unsecured Notes, 3.400% due 5/15/24 | | | 210,809 | |
| | 21,000 | | | BB | | Goldman Sachs Capital II, Limited Guaranteed Notes, 4.000%(b)(d) | | | 17,477 | |
| | | | | | Goldman Sachs Group Inc. (The): | | | | |
| | | | | | Senior Unsecured Notes: | | | | |
| | 225,000 | | | BBB+ | | 2.375% due 1/22/18 | | | 227,996 | |
| | 950,000 | | | BBB+ | | 6.150% due 4/1/18 | | | 1,017,885 | |
| | 389,000 | | | BBB+ | | 2.900% due 7/19/18 | | | 399,094 | |
| | 34,000 | | | BBB+ | | 2.625% due 1/31/19 | | | 34,907 | |
| | 150,000 | | | BBB+ | | 7.500% due 2/15/19 | | | 170,937 | |
| | 257,000 | | | BBB+ | | 2.550% due 10/23/19 | | | 263,408 | |
| | 810,000 | | | BBB+ | | 6.000% due 6/15/20 | | | 925,617 | |
| | 40,000 | | | BBB+ | | 5.250% due 7/27/21 | | | 45,489 | |
| | 320,000 | | | BBB+ | | 3.750% due 2/25/26 | | | 339,683 | |
| | 210,000 | | | BBB+ | | 6.250% due 2/1/41 | | | 278,850 | |
| | 75,000 | | | BBB+ | | 4.800% due 7/8/44 | | | 85,849 | |
| | 200,000 | | | BBB+ | | 4.750% due 10/21/45 | | | 229,804 | |
| | | | | | Subordinated Notes: | | | | |
| | 310,000 | | | BBB- | | 4.250% due 10/21/25 | | | 329,722 | |
| | 560,000 | | | BBB- | | 6.750% due 10/1/37 | | | 716,409 | |
| | 500,000 | | | BBB- | | 5.150% due 5/22/45 | | | 552,626 | |
| | 650,000 | | | NR | | Lehman Brothers Holdings Inc., Subordinated Notes, 6.750% due 12/28/17(f)(o) | | | — | |
| | | | | | | | | | |
| | | | | | Total Capital Markets | | | 5,941,054 | |
| | | | | | | | | | |
| Chemicals — 0.2% | |
| | 100,000 | | | BB- | | Axiall Corp., Company Guaranteed Notes, 4.875% due 5/15/23 | | | 105,250 | |
| | | | | | CF Industries Inc., Company Guaranteed Notes: | | | | |
| | 30,000 | | | BBB- | | 5.150% due 3/15/34 | | | 29,836 | |
| | 130,000 | | | BBB- | | 5.375% due 3/15/44 | | | 126,712 | |
| | 16,000 | | | BBB | | Dow Chemical Co. (The), Senior Unsecured Notes, 4.375% due 11/15/42 | | | 16,614 | |
| | 230,000 | | | BB- | | Eagle Spinco Inc., Company Guaranteed Notes, 4.625% due 2/15/21 | | | 241,788 | |
| | 80,000 | | | BBB | | Eastman Chemical Co., Senior Unsecured Notes, 3.800% due 3/15/25 | | | 84,767 | |
| | 110,000 | | | A- | | Ecolab Inc., Senior Unsecured Notes, 4.350% due 12/8/21 | | | 123,769 | |
| | 51,000 | | | BBB | | LYB International Finance BV, Company Guaranteed Notes, 4.875% due 3/15/44 | | | 55,776 | |
| | 200,000 | | | BBB | | LyondellBasell Industries NV, Senior Unsecured Notes, 6.000% due 11/15/21 | | | 233,686 | |
| | | | | | Monsanto Co., Senior Unsecured Notes: | | | | |
| | 60,000 | | | BBB+ | | 3.375% due 7/15/24 | | | 62,408 | |
| | 30,000 | | | BBB+ | | 4.400% due 7/15/44 | | | 31,346 | |
| | 200,000 | | | BBB- | | OCP SA, Senior Unsecured Notes, 4.500% due 10/22/25(a) | | | 204,983 | |
| | 60,000 | | | BBB+ | | Potash Corp. of Saskatchewan Inc., Senior Unsecured Notes, 4.875% due 3/30/20 | | | 65,593 | |
| | 23,000 | | | A- | | PPG Industries Inc., Senior Unsecured Notes, 6.650% due 3/15/18 | | | 24,642 | |
| | | | | | | | | | |
| | | | | | Total Chemicals | | | 1,407,170 | |
| | | | | | | | | | |
| Commercial Services & Supplies — 0.2% | |
| | 125,000 | | | BB+ | | IHS Markit Ltd., Company Guaranteed Notes, 5.000% due 11/1/22(a) | | | 133,437 | |
| | 460,000 | | | AAA | | Northwestern University, Unsecured Notes, 3.688% due 12/1/38 | | | 510,492 | |
| | | | | | Republic Services Inc., Senior Unsecured Notes: | | | | |
| | 150,000 | | | BBB+ | | 3.200% due 3/15/25 | | | 157,147 | |
| | 20,000 | | | BBB+ | | 2.900% due 7/1/26 | | | 20,434 | |
| | 210,000 | | | BB- | | United Rentals North America Inc., Company Guaranteed Notes, 5.750% due 11/15/24 | | | 220,500 | |
| | | | | | Waste Management Inc., Company Guaranteed Notes: | | | | |
| | 40,000 | | | A- | | 4.600% due 3/1/21 | | | 44,476 | |
| | 100,000 | | | A- | | 3.500% due 5/15/24 | | | 108,202 | |
| | 70,000 | | | A- | | 7.375% due 5/15/29 | | | 99,860 | |
See Notes to Financial Statements.
153
| | | | | | | | | | |
| Core Fixed Income Fund | |
| | | |
Face
Amount/Units† | | | Rating†† | | Security | | Value | |
| Commercial Services & Supplies — 0.2% — (continued) | |
| $ | 150,000 | | | B+ | | West Corp., Company Guaranteed Notes, 5.375% due 7/15/22(a) | | $ | 146,812 | |
| | | | | | | | | | |
| | | | | | Total Commercial Services & Supplies | | | 1,441,360 | |
| | | | | | | | | | |
| Consumer Finance — 0.6% | |
| | 330,000 | | | A- | | Daimler Finance North America LLC, Company Guaranteed Notes, 2.625% due 9/15/16(a) | | | 329,976 | |
| | | | | | Ford Motor Credit Co. LLC, Senior Unsecured Notes: | | | | |
| | 500,000 | | | BBB | | 1.461% due 3/27/17 | | | 500,543 | |
| | 500,000 | | | BBB | | 6.625% due 8/15/17 | | | 523,991 | |
| | 500,000 | | | BBB | | 1.724% due 12/6/17 | | | 500,989 | |
| | 320,000 | | | BBB | | 8.125% due 1/15/20 | | | 379,410 | |
| | 390,000 | | | BBB | | 3.200% due 1/15/21 | | | 402,964 | |
| | | | | | General Motors Financial Co., Inc., Company Guaranteed Notes: | | | | |
| | 175,000 | | | BBB- | | 3.250% due 5/15/18 | | | 178,469 | |
| | 300,000 | | | BBB- | | 3.150% due 1/15/20 | | | 306,704 | |
| | 219,000 | | | BBB- | | 3.200% due 7/6/21 | | | 222,820 | |
| | 170,000 | | | BBB- | | 3.450% due 4/10/22 | | | 173,501 | |
| | | | | | Hyundai Capital America, Senior Unsecured Notes: | | | | |
| | 100,000 | | | A- | | 2.125% due 10/2/17(a) | | | 100,702 | |
| | 75,000 | | | A- | | 2.400% due 10/30/18(a) | | | 76,154 | |
| | 65,000 | | | A- | | 2.500% due 3/18/19(a) | | | 66,268 | |
| | 230,000 | | | A- | | 3.000% due 10/30/20(a) | | | 238,840 | |
| | 360,000 | | | BB- | | Navient Corp., Senior Unsecured Notes, 8.000% due 3/25/20 | | | 391,500 | |
| | 210,000 | | | AA- | | Toyota Motor Credit Corp., Senior Unsecured Notes, 1.250% due 10/5/17 | | | 210,590 | |
| | | | | | | | | | |
| | | | | | Total Consumer Finance | | | 4,603,421 | |
| | | | | | | | | | |
| Containers & Packaging — 0.1% | |
| | 200,000 | | | B+ | | Ardagh Packaging Finance PLC/Ardagh Holdings USA Inc., Senior Secured Notes, 3.653% due 12/15/19(a)(b) | | | 202,500 | |
| | 120,000 | | | BBB | | WestRock MWV LLC, Company Guaranteed Notes, 8.200% due 1/15/30 | | | 165,569 | |
| | | | | | WestRock RKT Co., Company Guaranteed Notes: | | | | |
| | 100,000 | | | BBB | | 3.500% due 3/1/20 | | | 104,150 | |
| | 39,000 | | | BBB | | 4.900% due 3/1/22 | | | 43,400 | |
| | 20,000 | | | BBB | | 4.000% due 3/1/23 | | | 21,196 | |
| | | | | | | | | | |
| | | | | | Total Containers & Packaging | | | 536,815 | |
| | | | | | | | | | |
| Diversified Financial Services — 3.1% | |
| | 72,000 | | | BBB+ | | American Express Co., Senior Unsecured Notes, 2.650% due 12/2/22 | | | 74,003 | |
| | | | | | Bear Stearns Cos. LLC (The), Company Guaranteed Notes: | | | | |
| | 20,000 | | | A- | | 6.400% due 10/2/17 | | | 21,073 | |
| | 2,280,000 | | | A- | | 7.250% due 2/1/18 | | | 2,462,790 | |
| | 600,000 | | | BBB+ | | Capital One Bank USA NA, Senior Unsecured Notes, 1.200% due 2/13/17 | | | 600,107 | |
| | 975,000 | | | AAA | | CDP Financial Inc., Company Guaranteed Notes, 4.400% due 11/25/19(a) | | | 1,065,386 | |
| | | | | | Citigroup Inc.: | | | | |
| | 530,000 | | | BB+ | | Junior Subordinated Notes, 5.950%(b)(d) | | | 548,219 | |
| | | | | | Senior Unsecured Notes: | | | | |
| | 750,000 | | | BBB+ | | 1.800% due 2/5/18 | | | 753,137 | |
| | 500,000 | | | BBB+ | | 2.500% due 9/26/18 | | | 509,147 | |
| | 104,000 | | | BBB+ | | 8.125% due 7/15/39 | | | 164,776 | |
| | 280,000 | | | BBB+ | | 4.650% due 7/30/45 | | | 320,642 | |
| | | | | | Subordinated Notes: | | | | |
| | 280,000 | | | BBB | | 4.400% due 6/10/25 | | | 297,534 | |
| | 250,000 | | | BBB | | 5.500% due 9/13/25 | | | 283,951 | |
| | 890,000 | | | BBB | | 4.300% due 11/20/26 | | | 937,388 | |
| | 340,000 | | | BBB | | 4.450% due 9/29/27 | | | 359,460 | |
| | 30,000 | | | BBB | | 6.625% due 6/15/32 | | | 37,691 | |
See Notes to Financial Statements.
154
| | | | | | | | | | |
| Core Fixed Income Fund | |
| | | |
Face
Amount/Units† | | | Rating†† | | Security | | Value | |
| Diversified Financial Services — 3.1% — (continued) | |
| $ | 100,000 | | | BBB | | 6.675% due 9/13/43 | | $ | 135,189 | |
| | 370,000 | | | BBB | | 5.300% due 5/6/44 | | | 430,297 | |
| | 100,000 | | | A- | | Farmers Exchange Capital, Subordinated Notes, 7.200% due 7/15/48(a) | | | 127,422 | |
| | 900,000 | | | A- | | Farmers Exchange Capital II, Subordinated Notes, 6.151% due 11/1/53(a)(b) | | | 978,709 | |
| | | | | | GE Capital International Funding Co. Unlimited Co., Company Guaranteed Notes: | | | | |
| | 607,000 | | | AA+ | | 2.342% due 11/15/20 | | | 625,552 | |
| | 601,000 | | | AA+ | | 4.418% due 11/15/35 | | | 688,818 | |
| | 340,000 | | | A- | | HSBC Finance Corp., Subordinated Notes, 6.676% due 1/15/21 | | | 392,754 | |
| | 270,000 | | | BB | | ILFC E-Capital Trust II, Limited Guaranteed Notes, 4.230% due 12/21/65(a)(b) | | | 220,050 | |
| | | | | | International Lease Finance Corp., Senior Secured Notes: | | | | |
| | 880,000 | | | BBB- | | 6.750% due 9/1/16(a) | | | 957,000 | |
| | 1,090,000 | | | BBB- | | 7.125% due 9/1/18(a) | | | 1,201,823 | |
| | | | | | John Deere Capital Corp., Senior Unsecured Notes: | | | | |
| | 90,000 | | | A | | 2.250% due 4/17/19 | | | 92,485 | |
| | 70,000 | | | A | | 1.700% due 1/15/20 | | | 70,804 | |
| | | | | | JPMorgan Chase & Co.: | | | | |
| | | | | | Senior Unsecured Notes: | | | | |
| | 295,000 | | | A- | | 6.000% due 1/15/18 | | | 313,188 | |
| | 69,000 | | | A- | | 1.800% due 1/25/18 | | | 69,478 | |
| | 230,000 | | | A- | | 1.700% due 3/1/18 | | | 231,142 | |
| | 195,000 | | | A- | | 2.200% due 10/22/19 | | | 198,483 | |
| | 200,000 | | | A- | | 2.250% due 1/23/20 | | | 202,898 | |
| | 555,000 | | | A- | | 2.750% due 6/23/20 | | | 571,879 | |
| | 90,000 | | | A- | | 4.400% due 7/22/20 | | | 98,171 | |
| | 200,000 | | | A- | | 2.550% due 3/1/21 | | | 204,430 | |
| | 400,000 | | | A- | | 3.300% due 4/1/26 | | | 415,478 | |
| | 380,000 | | | A- | | 2.950% due 10/1/26 | | | 383,929 | |
| | | | | | Subordinated Notes: | | | | |
| | 480,000 | | | BBB+ | | 6.125% due 6/27/17 | | | 498,528 | |
| | 270,000 | | | BBB+ | | 3.875% due 9/10/24 | | | 285,697 | |
| | 259,000 | | | BBB+ | | 4.250% due 10/1/27 | | | 280,555 | |
| | 290,000 | | | BBB+ | | 4.950% due 6/1/45 | | | 336,374 | |
| | 900,000 | | | BBB- | | JPMorgan Chase Capital XXIII, Limited Guaranteed Notes, 1.817% due 5/15/47(b) | | | 700,875 | |
| | 30,000 | | | A | | KKR Group Finance Co. II LLC, Company Guaranteed Notes, 5.500% due 2/1/43(a) | | | 32,403 | |
| | 294,030 | | | BBB- | | Pipeline Funding Co. LLC, Senior Secured Notes, 7.500% due 1/15/30(a) | | | 349,591 | |
| | 950,000 | | | AA- | | Protective Life Global Funding, Senior Secured Notes, 1.208% due 6/8/18(a)(b) | | | 952,190 | |
| | 100,000 | | | BB | | Quicken Loans Inc., Company Guaranteed Notes, 5.750% due 5/1/25(a) | | | 100,280 | |
| | | | | | State Street Corp.: | | | | |
| | 430,000 | | | BBB | | Junior Subordinated Notes, 4.956% due 3/15/18 | | | 450,280 | |
| | | | | | Senior Unsecured Notes: | | | | |
| | 30,000 | | | A | | 2.550% due 8/18/20 | | | 31,106 | |
| | 25,000 | | | A | | 1.950% due 5/19/21 | | | 25,266 | |
| | 60,000 | | | A | | 2.650% due 5/19/26 | | | 61,539 | |
| | 267,791 | | | Baa1(c) | | SteelRiver Transmission Co. LLC, Senior Secured Notes, 4.710% due 6/30/17(a) | | | 271,140 | |
| | 25,000 | | | BBB- | | Synchrony Financial, Senior Unsecured Notes, 2.700% due 2/3/20 | | | 25,234 | |
| | 230,000 | | | A- | | UBS Group Funding Jersey Ltd., Company Guaranteed Notes, 4.125% due 9/24/25(a) | | | 242,797 | |
| | | | | | Visa Inc., Senior Unsecured Notes: | | | | |
| | 220,000 | | | A+ | | 3.150% due 12/14/25 | | | 234,901 | |
| | 237,000 | | | A+ | | 4.150% due 12/14/35 | | | 272,930 | |
| | 278,000 | | | A+ | | 4.300% due 12/14/45 | | | 329,979 | |
| | | | | | | | | | |
| | | | | | Total Diversified Financial Services | | | 22,526,948 | |
| | | | | | | | | | |
| Diversified Telecommunication Services — 1.2% | |
| | | | | | AT&T Inc., Senior Unsecured Notes: | | | | |
| | 260,000 | | | BBB+ | | 5.500% due 2/1/18 | | | 274,849 | |
See Notes to Financial Statements.
155
| | | | | | | | | | |
| Core Fixed Income Fund | |
| | | |
Face
Amount/Units† | | | Rating†† | | Security | | Value | |
| Diversified Telecommunication Services — 1.2% — (continued) | |
| $ | 54,000 | | | BBB+ | | 2.375% due 11/27/18 | | $ | 55,148 | |
| | 10,000 | | | BBB+ | | 5.800% due 2/15/19 | | | 11,020 | |
| | 53,000 | | | BBB+ | | 2.300% due 3/11/19 | | | 54,120 | |
| | 265,000 | | | BBB+ | | 2.450% due 6/30/20 | | | 270,739 | |
| | 98,000 | | | BBB+ | | 4.600% due 2/15/21 | | | 107,904 | |
| | 400,000 | | | BBB+ | | 3.800% due 3/15/22 | | | 429,944 | |
| | 365,000 | | | BBB+ | | 3.000% due 6/30/22 | | | 376,857 | |
| | 620,000 | | | BBB+ | | 3.400% due 5/15/25 | | | 640,012 | |
| | 245,000 | | | BBB+ | | 4.500% due 5/15/35 | | | 260,241 | |
| | 5,000 | | | BBB+ | | 5.350% due 9/1/40 | | | 5,733 | |
| | 100,000 | | | BBB+ | | 5.550% due 8/15/41 | | | 118,537 | |
| | 70,000 | | | BBB+ | | 4.300% due 12/15/42 | | | 70,430 | |
| | 110,000 | | | BBB+ | | 4.800% due 6/15/44 | | | 117,379 | |
| | 195,000 | | | BBB+ | | 4.350% due 6/15/45 | | | 197,390 | |
| | 650,000 | | | BBB+ | | 4.750% due 5/15/46 | | | 697,535 | |
| | 464,000 | | | BBB | | CC Holdings GS V LLC/Crown Castle GS III Corp., Senior Secured Notes, 3.849% due 4/15/23 | | | 500,061 | |
| | | | | | Verizon Communications Inc., Senior Unsecured Notes: | | | | |
| | 1,142,000 | | | BBB+ | | 5.150% due 9/15/23 | | | 1,338,456 | |
| | 214,000 | | | BBB+ | | 6.400% due 9/15/33 | | | 280,406 | |
| | 646,000 | | | BBB+ | | 4.400% due 11/1/34 | | | 689,087 | |
| | 200,000 | | | BBB+ | | 4.272% due 1/15/36 | | | 211,568 | |
| | 858,000 | | | BBB+ | | 6.550% due 9/15/43 | | | 1,169,457 | |
| | 85,000 | | | BBB+ | | 4.862% due 8/21/46 | | | 94,429 | |
| | 75,000 | | | BBB+ | | 5.012% due 8/21/54 | | | 83,039 | |
| | 164,000 | | | B | | SBA Communications Corp., Senior Unsecured Notes, 4.875% due 9/1/24(a) | | | 166,665 | |
| | 520,000 | | | B | | Virgin Media Finance PLC, Company Guaranteed Notes, 6.000% due 10/15/24(a) | | | 544,050 | |
| | 200,000 | | | BB- | | Virgin Media Secured Finance PLC, Senior Secured Notes, 5.250% due 1/15/26(a) | | | 205,500 | |
| | | | | | | | | | |
| | | | | | Total Diversified Telecommunication Services | | | 8,970,556 | |
| | | | | | | | | | |
| Electric Utilities — 2.0% | |
| | 275,000 | | | A- | | Berkshire Hathaway Energy Co., Senior Unsecured Notes, 6.500% due 9/15/37 | | | 383,397 | |
| | 650,000 | | | BBB- | | Cleco Corporate Holdings LLC, Senior Secured Notes, 3.743% due 5/1/26(a) | | | 684,585 | |
| | 215,000 | | | BBB+ | | Cleveland Electric Illuminating Co. (The), Senior Secured Notes, 7.880% due 11/1/17 | | | 229,740 | |
| | | | | | CMS Energy Corp., Senior Unsecured Notes: | | | | |
| | 30,000 | | | BBB | | 3.000% due 5/15/26 | | | 30,688 | |
| | 140,000 | | | BBB | | 4.875% due 3/1/44 | | | 167,569 | |
| | | | | | DTE Electric Co., General Refinance Mortgage: | | | | |
| | 170,000 | | | A | | 3.700% due 3/15/45 | | | 184,081 | |
| | 85,000 | | | A | | 3.700% due 6/1/46 | | | 91,875 | |
| | 500,000 | | | A | | Duke Energy Carolinas LLC, 1st Mortgage Notes, 4.250% due 12/15/41 | | | 571,309 | |
| | 240,000 | | | BBB+ | | Duke Energy Corp., Senior Unsecured Notes, 3.550% due 9/15/21 | | | 257,739 | |
| | 195,000 | | | A | | Duke Energy Florida LLC, 1st Mortgage Notes, 5.900% due 3/1/33 | | | 246,003 | |
| | 750,000 | | | BBB- | | Duquesne Light Holdings Inc., Senior Unsecured Notes, 6.400% due 9/15/20(a) | | | 851,858 | |
| | 175,000 | | | BBB | | Edison International, Senior Unsecured Notes, 2.950% due 3/15/23 | | | 180,287 | |
| | | | | | Emera US Finance LP, Company Guaranteed Notes: | | | | |
| | 15,000 | | | BBB | | 2.150% due 6/15/19(a) | | | 15,164 | |
| | 40,000 | | | BBB | | 3.550% due 6/15/26(a) | | | 42,219 | |
| | 120,000 | | | BBB | | 4.750% due 6/15/46(a) | | | 132,685 | |
| | 35,000 | | | BBB | | Entergy Corp., Senior Unsecured Notes, 2.950% due 9/1/26 | | | 35,398 | |
| | 920,000 | | | A | | Entergy Texas Inc., 1st Mortgage Notes, 7.125% due 2/1/19 | | | 1,035,336 | |
| | | | | | Exelon Corp., Senior Unsecured Notes: | | | | |
| | 755,000 | | | BBB- | | 1.550% due 6/9/17 | | | 756,600 | |
| | 175,000 | | | BBB- | | 2.850% due 6/15/20 | | | 181,496 | |
| | 5,000 | | | BBB- | | 2.450% due 4/15/21 | | | 5,088 | |
See Notes to Financial Statements.
156
| | | | | | | | | | |
| Core Fixed Income Fund | |
| | | |
Face
Amount/Units† | | | Rating†† | | Security | | Value | |
| Electric Utilities — 2.0% — (continued) | |
| $ | 10,000 | | | BBB- | | 3.400% due 4/15/26 | | $ | 10,557 | |
| | 200,000 | | | BBB- | | 4.950% due 6/15/35 | | | 231,947 | |
| | 143,000 | | | BBB- | | 5.625% due 6/15/35 | | | 174,890 | |
| | | | | | FirstEnergy Corp., Senior Unsecured Notes: | | | | |
| | 80,000 | | | BB+ | | 2.750% due 3/15/18 | | | 80,842 | |
| | 1,130,000 | | | BB+ | | 7.375% due 11/15/31 | | | 1,479,580 | |
| | | | | | Florida Power & Light Co., 1st Mortgage Notes: | | | | |
| | 55,000 | | | A | | 4.950% due 6/1/35 | | | 68,438 | |
| | 275,000 | | | A | | 5.950% due 2/1/38 | | | 382,775 | |
| | 188,967 | | | BBB- | | Indiantown Cogeneration LP, 1st Mortgage Notes, 9.770% due 12/15/20(f) | | | 206,008 | |
| | 350,000 | | | BB+ | | IPALCO Enterprises Inc., Senior Secured Notes, 5.000% due 5/1/18 | | | 369,250 | |
| | 700,000 | | | BBB- | | Jersey Central Power & Light Co., Senior Unsecured Notes, 4.700% due 4/1/24(a) | | | 767,038 | |
| | 775,000 | | | BBB+ | | KCP&L Greater Missouri Operations Co., Senior Unsecured Notes, 8.270% due 11/15/21 | | | 960,928 | |
| | 400,000 | | | A+ | | MidAmerican Energy Co., 1st Mortgage Notes, 4.250% due 5/1/46 | | | 469,541 | |
| | 487,147 | | | B- | | Miran Mid-Atlantic Series C Pass Through Trust, Pass Thru Certificates, 10.060% due 12/30/28 | | | 378,148 | |
| | 200,000 | | | BBB+ | | NiSource Finance Corp., Company Guaranteed Notes, 5.250% due 2/15/43 | | | 244,312 | |
| | 610,000 | | | BBB+ | | Pacific Gas & Electric Co., Senior Unsecured Notes, 6.050% due 3/1/34 | | | 824,456 | |
| | 235,000 | | | A+ | | PacifiCorp, 1st Mortgage Notes, 4.100% due 2/1/42 | | | 264,389 | |
| | 500,000 | | | BBB+ | | Public Service Co. of New Mexico, Senior Unsecured Notes, 7.950% due 5/15/18 | | | 550,317 | |
| | 500,000 | | | A | | Public Service Electric & Gas Co., 1st Mortgage Notes, 4.000% due 6/1/44 | | | 565,664 | |
| | | | | | Virginia Electric & Power Co., Senior Unsecured Notes: | | | | |
| | 125,000 | | | BBB+ | | 6.000% due 5/15/37 | | | 169,641 | |
| | 25,000 | | | BBB+ | | 6.350% due 11/30/37 | | | 35,119 | |
| | 250,000 | | | BBB+ | | 4.000% due 1/15/43 | | | 275,963 | |
| | | | | | | | | | |
| | | | | | Total Electric Utilities | | | 14,592,920 | |
| | | | | | | | | | |
| Electrical Equipment — 0.0% | |
| | 20,000 | | | A | | ABB Finance USA Inc., Company Guaranteed Notes, 4.375% due 5/8/42 | | | 23,245 | |
| | | | | | | | | | |
| Electronic Equipment, Instruments & Components — 0.0% | |
| | 10,000 | | | BBB- | | Avnet, Inc., Senior Unsecured Notes, 4.625% due 4/15/26 | | | 10,415 | |
| | 303,000 | | | BBB- | | Jabil Circuit Inc., Senior Unsecured Notes, 8.250% due 3/15/18 | | | 330,649 | |
| | | | | | | | | | |
| | | | | | Total Electronic Equipment, Instruments & Components | | | 341,064 | |
| | | | | | | | | | |
| Energy Equipment & Services — 0.1% | |
| | 350,000 | | | BBB- | | Boardwalk Pipelines LP, Company Guaranteed Notes, 4.950% due 12/15/24 | | | 361,854 | |
| | 400,000 | | | A+ | | Sinopec Group Overseas Development 2014 Ltd., Company Guaranteed Notes, 4.375% due 4/10/24(a) | | | 444,096 | |
| | | | | | Williams Partners LP/ACMP Finance Corp., Senior Unsecured Notes: | | | | |
| | 180,000 | | | BBB- | | 6.125% due 7/15/22 | | | 187,171 | |
| | 30,000 | | | BBB- | | 4.875% due 3/15/24 | | | 30,759 | |
| | | | | | | | | | |
| | | | | | Total Energy Equipment & Services | | | 1,023,880 | |
| | | | | | | | | | |
| Food & Staples Retailing — 0.3% | |
| | | | | | CVS Health Corp., Senior Unsecured Notes: | | | | |
| | 550,000 | | | BBB+ | | 1.900% due 7/20/18 | | | 557,164 | |
| | 5,000 | | | BBB+ | | 2.800% due 7/20/20 | | | 5,215 | |
| | 340,000 | | | BBB+ | | 2.750% due 12/1/22 | | | 351,886 | |
| | 195,000 | | | BBB+ | | 3.875% due 7/20/25 | | | 215,362 | |
| | 390,000 | | | BBB+ | | 2.875% due 6/1/26 | | | 400,694 | |
| | 50,000 | | | BBB+ | | 5.300% due 12/5/43 | | | 62,751 | |
| | 140,000 | | | BBB+ | | 5.125% due 7/20/45 | | | 175,280 | |
| | 199,201 | | | BBB+ | | CVS Pass-Through Trust, Pass Thru Certificates, 6.036% due 12/10/28 | | | 233,135 | |
| | | | | | | | | | |
| | | | | | Total Food & Staples Retailing | | | 2,001,487 | |
| | | | | | | | | | |
See Notes to Financial Statements.
157
| | | | | | | | | | |
| Core Fixed Income Fund | |
| | | |
Face
Amount/Units† | | | Rating†† | | Security | | Value | |
| Food Products — 0.3% | |
| $ | 125,000 | | | BB- | | Aramark Services Inc., Company Guaranteed Notes, 5.125% due 1/15/24(a) | | $ | 129,922 | |
| | | | | | Kraft Heinz Foods Co.: | | | | |
| | | | | | Company Guaranteed Notes: | | | | |
| | 130,000 | | | BBB- | | 3.950% due 7/15/25 | | | 141,739 | |
| | 90,000 | | | BBB- | | 5.000% due 7/15/35 | | | 106,307 | |
| | 90,000 | | | BBB- | | 5.200% due 7/15/45 | | | 108,483 | |
| | 525,000 | | | BBB- | | 4.375% due 6/1/46 | | | 570,326 | |
| | 96,000 | | | BBB- | | Secured Notes, 4.875% due 2/15/25(a) | | | 105,904 | |
| | 220,000 | | | BBB | | Mondelez International Inc., Senior Unsecured Notes, 4.000% due 2/1/24 | | | 243,291 | |
| | 125,000 | | | BB | | TreeHouse Foods Inc., Company Guaranteed Notes, 6.000% due 2/15/24(a) | | | 136,562 | |
| | 40,000 | | | BBB | | Tyson Foods Inc., Company Guaranteed Notes, 5.150% due 8/15/44 | | | 48,752 | |
| | | | | | WM Wrigley Jr Co., Senior Unsecured Notes: | | | | |
| | 50,000 | | | A- | | 2.400% due 10/21/18(a) | | | 50,877 | |
| | 140,000 | | | A- | | 2.900% due 10/21/19(a) | | | 145,302 | |
| | | | | | | | | | |
| | | | | | Total Food Products | | | 1,787,465 | |
| | | | | | | | | | |
| Health Care Equipment & Supplies — 0.3% | |
| | 400,000 | | | AA- | | Baylor Scott & White Holdings, Unsecured Notes, 4.185% due 11/15/45 | | | 452,934 | |
| | | | | | Becton Dickinson & Co., Senior Unsecured Notes: | | | | |
| | 130,000 | | | BBB+ | | 3.734% due 12/15/24 | | | 141,611 | |
| | 60,000 | | | BBB+ | | 4.685% due 12/15/44 | | | 69,946 | |
| | 65,000 | | | BBB- | | Boston Scientific Corp., Senior Unsecured Notes, 3.850% due 5/15/25 | | | 69,828 | |
| | | | | | Medtronic Inc., Company Guaranteed Notes: | | | | |
| | 165,000 | | | A | | 3.625% due 3/15/24 | | | 181,009 | |
| | 645,000 | | | A | | 3.500% due 3/15/25 | | | 700,357 | |
| | 80,000 | | | A | | 5.550% due 3/15/40 | | | 103,510 | |
| | 80,000 | | | A | | 4.625% due 3/15/45 | | | 96,061 | |
| | | | | | St Jude Medical Inc., Senior Unsecured Notes: | | | | |
| | 120,000 | | | A- | | 3.250% due 4/15/23 | | | 123,985 | |
| | 13,000 | | | A- | | 4.750% due 4/15/43 | | | 14,044 | |
| | | | | | Stryker Corp., Senior Unsecured Notes: | | | | |
| | 20,000 | | | A | | 3.500% due 3/15/26 | | | 21,306 | |
| | 30,000 | | | A | | 4.625% due 3/15/46 | | | 34,342 | |
| | | | | | | | | | |
| | | | | | Total Health Care Equipment & Supplies | | | 2,008,933 | |
| | | | | | | | | | |
| Health Care Providers & Services — 0.6% | |
| | | | | | Aetna Inc., Senior Unsecured Notes: | | | | |
| | 40,000 | | | A- | | 1.900% due 6/7/19 | | | 40,400 | |
| | 165,000 | | | A- | | 2.400% due 6/15/21 | | | 167,720 | |
| | 40,000 | | | A- | | 2.800% due 6/15/23 | | | 40,990 | |
| | 240,000 | | | A- | | 3.200% due 6/15/26 | | | 244,493 | |
| | 165,000 | | | A- | | 4.125% due 11/15/42 | | | 173,801 | |
| | | | | | Anthem Inc., Senior Unsecured Notes: | | | | |
| | 30,000 | | | A | | 5.875% due 6/15/17 | | | 31,069 | |
| | 410,000 | | | A | | 3.125% due 5/15/22 | | | 426,729 | |
| | 530,000 | | | A | | 3.300% due 1/15/23 | | | 555,943 | |
| | 60,000 | | | A | | 4.650% due 8/15/44 | | | 66,827 | |
| | 30,000 | | | A- | | Catholic Health Initiatives, Secured Notes, 4.350% due 11/1/42 | | | 29,984 | |
| | 260,000 | | | B+ | | DaVita HealthCare Partners Inc., Company Guaranteed Notes, 5.000% due 5/1/25 | | | 264,160 | |
| | 20,000 | | | BB+ | | Fresenius Medical Care US Finance Inc., Company Guaranteed Notes, 5.750% due 2/15/21(a) | | | 22,800 | |
| | | | | | HCA Inc.: | | | | |
| | 210,000 | | | B+ | | Company Guaranteed Notes, 7.500% due 2/15/22 | | | 239,925 | |
| | | | | | Senior Secured Notes: | | | | |
| | 410,000 | | | BBB- | | 6.500% due 2/15/20 | | | 454,075 | |
| | 180,000 | | | BBB- | | 5.250% due 4/15/25 | | | 193,275 | |
See Notes to Financial Statements.
158
| | | | | | | | | | |
| Core Fixed Income Fund | |
| | | |
Face
Amount/Units† | | | Rating†† | | Security | | Value | |
| Health Care Providers & Services — 0.6% — (continued) | |
| | | | | | Humana Inc., Senior Unsecured Notes: | | | | |
| $ | 60,000 | | | A- | | 3.150% due 12/1/22 | | $ | 62,508 | |
| | 70,000 | | | A- | | 4.625% due 12/1/42 | | | 75,177 | |
| | 10,000 | | | CCC+ | | Tenet Healthcare Corp., Senior Unsecured Notes, 8.125% due 4/1/22 | | | 10,175 | |
| | | | | | UnitedHealth Group Inc., Senior Unsecured Notes: | | | | |
| | 460,000 | | | A+ | | 3.375% due 11/15/21 | | | 495,205 | |
| | 160,000 | | | A+ | | 3.350% due 7/15/22 | | | 172,488 | |
| | 170,000 | | | A+ | | 4.625% due 7/15/35 | | | 202,116 | |
| | 152,000 | | | A+ | | 4.250% due 3/15/43 | | | 173,237 | |
| | | | | | | | | | |
| | | | | | Total Health Care Providers & Services | | | 4,143,097 | |
| | | | | | | | | | |
| Hotels, Restaurants & Leisure — 0.1% | |
| | 130,000 | | | B- | | 1011778 BC ULC/New Red Finance Inc., Secured Notes, 6.000% due 4/1/22(a) | | | 136,338 | |
| | 300,000 | | | BB | | Churchill Downs Inc., Company Guaranteed Notes, 5.375% due 12/15/21 | | | 313,500 | |
| | | | | | McDonald’s Corp., Senior Unsecured Notes: | | | | |
| | 170,000 | | | BBB+ | | 3.700% due 1/30/26 | | | 183,858 | |
| | 180,000 | | | BBB+ | | 4.600% due 5/26/45 | | | 204,711 | |
| | | | | | | | | | |
| | | | | | Total Hotels, Restaurants & Leisure | | | 838,407 | |
| | | | | | | | | | |
| Household Durables — 0.1% | |
| | | | | | Newell Brands Inc., Senior Unsecured Notes: | | | | |
| | 70,000 | | | BBB- | | 3.150% due 4/1/21 | | | 73,157 | |
| | 221,000 | | | BBB- | | 3.850% due 4/1/23 | | | 236,457 | |
| | 133,000 | | | BBB- | | 4.200% due 4/1/26 | | | 145,475 | |
| | 110,000 | | | BBB- | | 5.500% due 4/1/46 | | | 136,579 | |
| | 150,000 | | | BB- | | Taylor Morrison Communities Inc./Monarch Communities Inc., Company Guaranteed Notes, 5.250% due 4/15/21(a) | | | 154,875 | |
| | | | | | | | | | |
| | | | | | Total Household Durables | | | 746,543 | |
| | | | | | | | | | |
| Household Products — 0.0% | |
| | 225,000 | | | B+ | | Reynolds Group Issuer Inc./Reynolds Group Issuer LLC/Reynolds Group Issuer Lu, Senior Secured Notes, 5.750% due 10/15/20 | | | 232,594 | |
| | | | | | | | | | |
| Independent Power and Renewable Electricity Producers — 0.0% | |
| | 90,000 | | | BB | | AES Corp., Senior Unsecured Notes, 4.875% due 5/15/23 | | | 91,575 | |
| | | | | | | | | | |
| Industrial Conglomerates — 0.4% | |
| | | | | | Eaton Corp., Company Guaranteed Notes: | | | | |
| | 80,000 | | | A- | | 1.500% due 11/2/17 | | | 80,305 | |
| | 458,000 | | | A- | | 2.750% due 11/2/22 | | | 473,802 | |
| | 310,000 | | | A- | | 4.150% due 11/2/42 | | | 341,632 | |
| | | | | | General Electric Co.: | | | | |
| | | | | | Senior Unsecured Notes: | | | | |
| | 72,000 | | | AA+ | | 4.650% due 10/17/21 | | | 82,271 | |
| | 1,025,000 | | | AA+ | | 1.297% due 8/15/36(b) | | | 874,232 | |
| | 122,000 | | | AA+ | | 6.150% due 8/7/37 | | | 171,360 | |
| | 228,000 | | | AA+ | | 6.875% due 1/10/39 | | | 348,404 | |
| | 190,000 | | | AA+ | | 4.500% due 3/11/44 | | | 225,057 | |
| | 141,000 | | | AA | | Subordinated Notes, 5.300% due 2/11/21 | | | 162,419 | |
| | | | | | | | | | |
| | | | | | Total Industrial Conglomerates | | | 2,759,482 | |
| | | | | | | | | | |
| Insurance — 0.9% | |
| | | | | | American International Group Inc., Senior Unsecured Notes: | | | | |
| | 330,000 | | | A- | | 4.875% due 6/1/22 | | | 370,219 | |
| | 207,000 | | | A- | | 3.900% due 4/1/26 | | | 217,948 | |
| | 195,000 | | | A- | | 4.375% due 1/15/55 | | | 191,855 | |
| | 400,000 | | | AA | | Berkshire Hathaway Finance Corp., Company Guaranteed Notes, 4.400% due 5/15/42 | | | 465,305 | |
See Notes to Financial Statements.
159
| | | | | | | | | | |
| Core Fixed Income Fund | |
| | | |
Face
Amount/Units† | | | Rating†† | | Security | | Value | |
| Insurance — 0.9% — (continued) | |
| | | | | | Berkshire Hathaway Inc., Senior Unsecured Notes: | | | | |
| $ | 45,000 | | | AA | | 2.750% due 3/15/23 | | $ | 46,842 | �� |
| | 380,000 | | | AA | | 3.125% due 3/15/26 | | | 403,725 | |
| | | | | | Chubb INA Holdings Inc., Company Guaranteed Notes: | | | | |
| | 60,000 | | | A | | 2.300% due 11/3/20 | | | 61,785 | |
| | 80,000 | | | A | | 3.350% due 5/3/26 | | | 86,036 | |
| | 44,000 | | | BBB+ | | Hartford Financial Services Group Inc. (The), Senior Unsecured Notes, 4.300% due 4/15/43 | | | 44,253 | |
| | 605,000 | | | AA | | Jackson National Life Global Funding, Senior Secured Notes, 1.875% due 10/15/18(a) | | | 611,440 | |
| | | | | | Marsh & McLennan Cos., Inc., Senior Unsecured Notes: | | | | |
| | 10,000 | | | A- | | 3.500% due 3/10/25 | | | 10,540 | |
| | 11,000 | | | A- | | 3.750% due 3/14/26 | | | 11,876 | |
| | | | | | MetLife Inc.: | | | | |
| | 1,070,000 | | | BBB | | Junior Subordinated Notes, 6.400% due 12/15/36 | | | 1,204,285 | |
| | 70,000 | | | A- | | Senior Unsecured Notes, 4.050% due 3/1/45 | | | 69,882 | |
| | 850,000 | | | A- | | Nationwide Mutual Insurance Co., Subordinated Notes, 2.943% due 12/15/24(a)(b) | | | 843,736 | |
| | | | | | Principal Financial Group Inc., Company Guaranteed Notes: | | | | |
| | 35,000 | | | BBB+ | | 3.125% due 5/15/23 | | | 35,899 | |
| | 10,000 | | | BBB+ | | 4.625% due 9/15/42 | | | 10,829 | |
| | 550,000 | | | A+ | | Principal Life Global Funding II, Senior Secured Notes, 3.000% due 4/18/26(a) | | | 563,640 | |
| | 140,000 | | | A | | Prudential Financial Inc., Senior Unsecured Notes, 7.375% due 6/15/19 | | | 161,256 | |
| | 230,000 | | | AA- | | Swiss Re Treasury US Corp., Company Guaranteed Notes, 2.875% due 12/6/22(a) | | | 232,352 | |
| | | | | | Teachers Insurance & Annuity Association of America, Subordinated Notes: | | | | |
| | 230,000 | | | AA- | | 6.850% due 12/16/39(a) | | | 318,179 | |
| | 300,000 | | | AA- | | 4.900% due 9/15/44(a) | | | 343,184 | |
| | 39,000 | | | BBB | | Voya Financial Inc., Company Guaranteed Notes, 2.900% due 2/15/18 | | | 39,790 | |
| | | | | | | | | | |
| | | | | | Total Insurance | | | 6,344,856 | |
| | | | | | | | | | |
| Internet & Catalog Retail — 0.1% | |
| | | | | | Amazon.com Inc., Senior Unsecured Notes: | | | | |
| | 99,000 | | | AA- | | 4.800% due 12/5/34 | | | 119,270 | |
| | 177,000 | | | AA- | | 4.950% due 12/5/44 | | | 223,499 | |
| | 590,000 | | | B+ | | Netflix Inc., Senior Unsecured Notes, 5.500% due 2/15/22 | | | 637,200 | |
| | | | | | | | | | |
| | | | | | Total Internet & Catalog Retail | | | 979,969 | |
| | | | | | | | | | |
| Life Sciences Tools & Services — 0.1% | |
| | 415,000 | | | BBB | | Thermo Fisher Scientific Inc., Senior Unsecured Notes, 3.600% due 8/15/21 | | | 441,944 | |
| | | | | | | | | | |
| Media — 1.2% | |
| | | | | | 21st Century Fox America Inc., Company Guaranteed Notes: | | | | |
| | 30,000 | | | BBB+ | | 4.500% due 2/15/21 | | | 33,408 | |
| | 125,000 | | | BBB+ | | 8.500% due 2/23/25 | | | 170,500 | |
| | 115,000 | | | BBB+ | | 3.700% due 10/15/25 | | | 125,791 | |
| | 25,000 | | | BBB+ | | 6.200% due 12/15/34 | | | 31,920 | |
| | 10,000 | | | BBB+ | | 6.900% due 8/15/39 | | | 13,621 | |
| | 125,000 | | | BB+ | | CCO Holdings LLC/CCO Holdings Capital Corp., Senior Unsecured Notes, 5.750% due 2/15/26(a) | | | 134,063 | |
| | | | | | Charter Communications Operating LLC/Charter Communications Operating Capital, Senior Secured Notes: | | | | |
| | 705,000 | | | BBB | | 3.579% due 7/23/20(a) | | | 738,387 | |
| | 125,000 | | | BBB | | 4.464% due 7/23/22(a) | | | 135,811 | |
| | 356,000 | | | BBB | | 4.908% due 7/23/25(a) | | | 393,516 | �� |
| | 240,000 | | | BBB | | 6.384% due 10/23/35(a) | | | 287,799 | |
| | 359,000 | | | BBB | | 6.484% due 10/23/45(a) | | | 442,784 | |
| | 160,000 | | | A- | | Comcast Cable Communications Holdings Inc., Company Guaranteed Notes, 9.455% due 11/15/22 | | | 225,168 | |
See Notes to Financial Statements.
160
| | | | | | | | | | |
| Core Fixed Income Fund | |
| | | |
Face
Amount/Units† | | | Rating†† | | Security | | Value | |
| Media — 1.2% — (continued) | |
| | | | | | Comcast Corp., Company Guaranteed Notes: | | | | |
| $ | 30,000 | | | A- | | 5.875% due 2/15/18 | | $ | 32,054 | |
| | 430,000 | | | A- | | 5.700% due 5/15/18 | | | 463,303 | |
| | 30,000 | | | A- | | 1.625% due 1/15/22 | | | 29,844 | |
| | 35,000 | | | A- | | 2.350% due 1/15/27 | | | 34,738 | |
| | 179,000 | | | A- | | 4.400% due 8/15/35 | | | 205,659 | |
| | 80,000 | | | A- | | 6.500% due 11/15/35 | | | 112,972 | |
| | 55,000 | | | A- | | 3.200% due 7/15/36 | | | 55,022 | |
| | 40,000 | | | A- | | 6.450% due 3/15/37 | | | 56,265 | |
| | 20,000 | | | A- | | 6.950% due 8/15/37 | | | 29,537 | |
| | 40,000 | | | A- | | 6.550% due 7/1/39 | | | 57,717 | |
| | 61,000 | | | A- | | 4.650% due 7/15/42 | | | 71,719 | |
| | | | | | Cox Communications Inc., Senior Unsecured Notes: | | | | |
| | 72,000 | | | BBB | | 8.375% due 3/1/39(a) | | | 92,659 | |
| | 10,000 | | | BBB | | 4.700% due 12/15/42(a) | | | 9,308 | |
| | 225,000 | | | B- | | CSC Holdings LLC, Senior Unsecured Notes, 8.625% due 2/15/19 | | | 252,563 | |
| | | | | | Discovery Communications LLC, Company Guaranteed Notes: | | | | |
| | 3,000 | | | BBB- | | 5.050% due 6/1/20 | | | 3,305 | |
| | 40,000 | | | BBB- | | 3.450% due 3/15/25 | | | 39,426 | |
| | 235,000 | | | BBB- | | 4.900% due 3/11/26 | | | 255,291 | |
| | 94,000 | | | BBB- | | 4.875% due 4/1/43 | | | 89,167 | |
| | | | | | DISH DBS Corp., Company Guaranteed Notes: | | | | |
| | 20,000 | | | B+ | | 5.125% due 5/1/20 | | | 20,750 | |
| | 80,000 | | | B+ | | 6.750% due 6/1/21 | | | 86,150 | |
| | 150,000 | | | B+ | | 5.875% due 7/15/22 | | | 153,375 | |
| | 150,000 | | | B+ | | 5.875% due 11/15/24 | | | 148,500 | |
| | 171,000 | | | A- | | NBCUniversal Media LLC, Company Guaranteed Notes, 4.450% due 1/15/43 | | | 195,828 | |
| | 125,000 | | | B+ | | Nexstar Broadcasting Inc., Company Guaranteed Notes, 6.125% due 2/15/22(a) | | | 130,000 | |
| | | | | | SFR Group SA, Senior Secured Notes: | | | | |
| | 200,000 | | | B+ | | 6.000% due 5/15/22(a) | | | 205,150 | |
| | 380,000 | | | B+ | | 6.250% due 5/15/24(a) | | | 384,275 | |
| | | | | | Time Warner Cable Inc., Senior Secured Notes: | | | | |
| | 410,000 | | | BBB | | 8.250% due 4/1/19 | | | 474,314 | |
| | 200,000 | | | BBB | | 5.000% due 2/1/20 | | | 218,125 | |
| | 140,000 | | | BBB | | 4.125% due 2/15/21 | | | 149,180 | |
| | 385,000 | | | BBB | | 4.000% due 9/1/21 | | | 411,025 | |
| | 90,000 | | | BBB | | 7.300% due 7/1/38 | | | 117,253 | |
| | 120,000 | | | BBB | | 5.875% due 11/15/40 | | | 134,318 | |
| | 180,000 | | | BBB | | 5.500% due 9/1/41 | | | 196,187 | |
| | 40,000 | | | BBB | | Time Warner Entertainment Co. LP, Senior Secured Notes, 8.375% due 7/15/33 | | | 54,821 | |
| | | | | | Time Warner Inc., Company Guaranteed Notes: | | | | |
| | 60,000 | | | BBB | | 4.700% due 1/15/21 | | | 67,021 | |
| | 110,000 | | | BBB | | 4.750% due 3/29/21 | | | 123,527 | |
| | 290,000 | | | BBB | | 7.700% due 5/1/32 | | | 415,627 | |
| | 30,000 | | | BBB | | 6.250% due 3/29/41 | | | 39,618 | |
| | | | | | Viacom Inc., Senior Unsecured Notes: | | | | |
| | 40,000 | | | BBB- | | 4.250% due 9/1/23 | | | 42,547 | |
| | 10,000 | | | BBB- | | 3.875% due 4/1/24 | | | 10,399 | |
| | 110,000 | | | BBB- | | 4.850% due 12/15/34 | | | 111,392 | |
| | | | | | | | | | |
| | | | | | Total Media | | | 8,512,699 | |
| | | | | | | | | | |
| Metals & Mining — 0.4% | |
| | | | | | ArcelorMittal, Senior Unsecured Notes: | | | | |
| | 70,000 | | | BB | | 6.500% due 3/1/21 | | | 76,300 | |
| | 30,000 | | | BB | | 8.000% due 10/15/39 | | | 32,400 | |
See Notes to Financial Statements.
161
| | | | | | | | | | |
| Core Fixed Income Fund | |
| | | |
Face
Amount/Units† | | | Rating†† | | Security | | Value | |
| Metals & Mining — 0.4% — (continued) | |
| $ | 107,000 | | | BBB- | | Barrick Gold Corp., Senior Unsecured Notes, 4.100% due 5/1/23 | | $ | 115,358 | |
| | | | | | Barrick North America Finance LLC, Company Guaranteed Notes: | | | | |
| | 140,000 | | | BBB- | | 4.400% due 5/30/21 | | | 153,246 | |
| | 70,000 | | | BBB- | | 5.700% due 5/30/41 | | | 81,241 | |
| | | | | | BHP Billiton Finance USA Ltd., Company Guaranteed Notes: | | | | |
| | 300,000 | | | A | | 6.500% due 4/1/19 | | | 337,324 | |
| | 150,000 | | | A | | 5.000% due 9/30/43 | | | 179,550 | |
| | 310,000 | | | BBB+ | | 6.750% due 10/19/75(a)(b) | | | 354,563 | |
| | | | | | Freeport-McMoRan Inc., Company Guaranteed Notes: | | | | |
| | 30,000 | | | BB | | 4.000% due 11/14/21 | | | 27,600 | |
| | 10,000 | | | BB | | 5.450% due 3/15/43 | | | 7,700 | |
| | 330,000 | | | BBB- | | Glencore Finance Canada Ltd., Company Guaranteed Notes, 2.700% due 10/25/17(a) | | | 331,802 | |
| | 310,000 | | | A- | | Rio Tinto Finance USA Ltd., Company Guaranteed Notes, 9.000% due 5/1/19 | | | 369,096 | |
| | 660,000 | | | BBB | | Southern Copper Corp., Senior Unsecured Notes, 5.250% due 11/8/42 | | | 631,778 | |
| | 260,000 | | | BBB- | | Vale Overseas Ltd., Company Guaranteed Notes, 6.875% due 11/21/36 | | | 259,272 | |
| | | | | | | | | | |
| | | | | | Total Metals & Mining | | | 2,957,230 | |
| | | | | | | | | | |
| Oil, Gas & Consumable Fuels — 2.5% | |
| | 140,000 | | | BBB | | Anadarko Finance Co., Company Guaranteed Notes, 7.500% due 5/1/31 | | | 170,248 | |
| | | | | | Anadarko Petroleum Corp., Senior Unsecured Notes: | | | | |
| | 105,000 | | | BBB | | 6.375% due 9/15/17 | | | 109,866 | |
| | 70,000 | | | BBB | | 4.850% due 3/15/21 | | | 74,593 | |
| | 200,000 | | | BBB | | 3.450% due 7/15/24 | | | 195,168 | |
| | 53,000 | | | BBB | | 5.550% due 3/15/26 | | | 58,722 | |
| | 98,000 | | | BBB | | 6.450% due 9/15/36 | | | 113,467 | |
| | 150,000 | | | BBB | | 4.500% due 7/15/44 | | | 137,270 | |
| | | | | | Apache Corp., Senior Unsecured Notes: | | | | |
| | 43,000 | | | BBB | | 6.000% due 1/15/37 | | | 49,568 | |
| | 289,000 | | | BBB | | 5.100% due 9/1/40 | | | 302,587 | |
| | 78,000 | | | BBB | | 4.750% due 4/15/43 | | | 81,105 | |
| | | | | | BP Capital Markets PLC, Company Guaranteed Notes: | | | | |
| | 110,000 | | | A- | | 3.245% due 5/6/22 | | | 116,597 | |
| | 300,000 | | | A- | | 3.506% due 3/17/25 | | | 320,105 | |
| | 9,000 | | | D | | California Resources Corp., Company Guaranteed Notes, 5.500% due 9/15/21 | | | 4,680 | |
| | | | | | Canadian Natural Resources Ltd., Senior Unsecured Notes: | | | | |
| | 34,000 | | | BBB+ | | 3.900% due 2/1/25 | | | 34,337 | |
| | 80,000 | | | BBB+ | | 6.250% due 3/15/38 | | | 88,204 | |
| | 330,000 | | | AA- | | Chevron Corp., Senior Unsecured Notes, 2.954% due 5/16/26 | | | 344,596 | |
| | 530,000 | | | A+ | | CNOOC Finance 2015 USA LLC, Company Guaranteed Notes, 3.500% due 5/5/25 | | | 553,474 | |
| | | | | | Concho Resources Inc., Company Guaranteed Notes: | | | | |
| | 90,000 | | | BB+ | | 6.500% due 1/15/22 | | | 94,050 | |
| | 20,000 | | | BB+ | | 5.500% due 10/1/22 | | | 20,800 | |
| | 180,000 | | | A- | | ConocoPhillips, Company Guaranteed Notes, 6.000% due 1/15/20 | | | 203,746 | |
| | 30,000 | | | BB+ | | Continental Resources Inc., Company Guaranteed Notes, 4.500% due 4/15/23 | | | 28,425 | |
| | | | | | Devon Energy Corp., Senior Unsecured Notes: | | | | |
| | 294,000 | | | BBB | | 3.250% due 5/15/22 | | | 292,322 | |
| | 170,000 | | | BBB | | 5.850% due 12/15/25 | | | 191,363 | |
| | 190,000 | | | BBB | | 5.600% due 7/15/41 | | | 190,569 | |
| | 29,000 | | | BBB | | 5.000% due 6/15/45 | | | 27,920 | |
| | 75,000 | | | BBB+ | | Dominion Gas Holdings LLC, Senior Unsecured Notes, 4.600% due 12/15/44 | | | 81,788 | |
| | | | | | Ecopetrol SA, Senior Unsecured Notes: | | | | |
| | 95,000 | | | BBB | | 4.125% due 1/16/25 | | | 92,150 | |
| | 650,000 | | | BBB | | 5.875% due 5/28/45 | | | 611,650 | |
| | 285,000 | | | BBB- | | El Paso Natural Gas Co. LLC, Company Guaranteed Notes, 8.625% due 1/15/22 | | | 356,248 | |
See Notes to Financial Statements.
162
| | | | | | | | | | |
| Core Fixed Income Fund | |
| | | |
Face
Amount/Units† | | | Rating†† | | Security | | Value | |
| Oil, Gas & Consumable Fuels — 2.5% — (continued) | |
| | | | | | Enbridge Energy Partners LP, Senior Unsecured Notes: | | | | |
| $ | 21,000 | | | BBB | | 5.875% due 10/15/25 | | $ | 23,431 | |
| | 13,000 | | | BBB | | 7.375% due 10/15/45 | | | 16,085 | |
| | 30,000 | | | BBB+ | | Enbridge Inc., Senior Unsecured Notes, 3.500% due 6/10/24 | | | 29,183 | |
| | | | | | Energy Transfer Partners LP, Senior Unsecured Notes: | | | | |
| | 10,000 | | | BBB- | | 4.900% due 2/1/24 | | | 10,401 | |
| | 29,000 | | | BBB- | | 4.050% due 3/15/25 | | | 29,029 | |
| | 178,000 | | | BBB- | | 4.750% due 1/15/26 | | | 187,179 | |
| | 500,000 | | | BBB- | | 8.250% due 11/15/29 | | | 622,556 | |
| | 90,000 | | | BBB- | | 4.900% due 3/15/35 | | | 87,015 | |
| | 75,000 | | | BBB- | | 6.500% due 2/1/42 | | | 81,227 | |
| | 80,000 | | | BBB- | | Ensco PLC, Senior Unsecured Notes, 4.700% due 3/15/21(e) | | | 69,240 | |
| | | | | | Enterprise Products Operating LLC, Company Guaranteed Notes: | | | | |
| | 130,000 | | | BBB+ | | 6.300% due 9/15/17 | | | 136,400 | |
| | 60,000 | | | BBB+ | | 3.700% due 2/15/26 | | | 62,702 | |
| | 30,000 | | | BBB+ | | 4.900% due 5/15/46 | | | 32,228 | |
| | | | | | EOG Resources Inc., Senior Unsecured Notes: | | | | |
| | 125,000 | | | BBB+ | | 2.450% due 4/1/20 | | | 127,420 | |
| | 78,000 | | | BBB+ | | 4.150% due 1/15/26 | | | 86,146 | |
| | 140,000 | | | CCC+ | | EP Energy LLC/Everest Acquisition Finance Inc., Company Guaranteed Notes, 6.375% due 6/15/23 | | | 77,350 | |
| | | | | | Exxon Mobil Corp., Senior Unsecured Notes: | | | | |
| | 240,000 | | | AA+ | | 3.043% due 3/1/26 | | | 255,155 | |
| | 70,000 | | | AA+ | | 4.114% due 3/1/46 | | | 80,490 | |
| | 298,000 | | | BB | | Freeport-McMoran Oil & Gas LLC/FCX Oil & Gas Inc., Company Guaranteed Notes, 6.125% due 6/15/19 | | | 302,470 | |
| | | | | | Halliburton Co., Senior Unsecured Notes: | | | | |
| | 220,000 | | | BBB+ | | 3.800% due 11/15/25 | | | 227,691 | |
| | 20,000 | | | BBB+ | | 4.850% due 11/15/35 | | | 21,533 | |
| | 140,000 | | | BBB+ | | 5.000% due 11/15/45 | | | 154,746 | |
| | 10,000 | | | BBB- | | Hess Corp., Senior Unsecured Notes, 7.300% due 8/15/31 | | | 11,638 | |
| | | | | | Kerr-McGee Corp., Company Guaranteed Notes: | | | | |
| | 200,000 | | | BBB | | 6.950% due 7/1/24 | | | 234,378 | |
| | 75,000 | | | BBB | | 7.875% due 9/15/31 | | | 91,056 | |
| | | | | | Kinder Morgan Energy Partners LP, Company Guaranteed Notes: | | | | |
| | 120,000 | | | BBB- | | 6.850% due 2/15/20 | | | 135,100 | |
| | 460,000 | | | BBB- | | 6.500% due 4/1/20 | | | 514,672 | |
| | 50,000 | | | BBB- | | 4.300% due 5/1/24 | | | 51,623 | |
| | 200,000 | | | BBB- | | 5.400% due 9/1/44 | | | 202,870 | |
| | 105,000 | | | BBB- | | Kinder Morgan Inc., Company Guaranteed Notes, 5.050% due 2/15/46 | | | 101,118 | |
| | 60,000 | | | BBB- | | Marathon Oil Corp., Senior Unsecured Notes, 3.850% due 6/1/25 | | | 56,215 | |
| | 80,000 | | | BBB | | Marathon Petroleum Corp., Senior Unsecured Notes, 4.750% due 9/15/44 | | | 73,701 | |
| | | | | | MPLX LP, Company Guaranteed Notes: | | | | |
| | 140,000 | | | BBB- | | 5.500% due 2/15/23(a) | | | 145,406 | |
| | 210,000 | | | BBB- | | 4.875% due 6/1/25(a) | | | 214,705 | |
| | | | | | Noble Energy Inc., Senior Unsecured Notes: | | | | |
| | 60,000 | | | BBB | | 4.150% due 12/15/21 | | | 63,674 | |
| | 160,000 | | | BBB | | 3.900% due 11/15/24 | | | 163,714 | |
| | 110,000 | | | BBB | | 5.250% due 11/15/43 | | | 111,507 | |
| | | | | | Occidental Petroleum Corp., Senior Unsecured Notes: | | | | |
| | 100,000 | | | A | | 3.125% due 2/15/22 | | | 105,454 | |
| | 90,000 | | | A | | 3.400% due 4/15/26 | | | 95,326 | |
| | 90,000 | | | A | | 4.625% due 6/15/45 | | | 103,548 | |
| | 1,000,000 | | | BBB- | | Panhandle Eastern Pipe Line Co. LP, Senior Unsecured Notes, 8.125% due 6/1/19 | | | 1,127,865 | |
| | 1,090,000 | | | B+ | | Petrobras Global Finance BV, Company Guaranteed Notes, 5.375% due 1/27/21 | | | 1,053,212 | |
See Notes to Financial Statements.
163
| | | | | | | | | | |
| Core Fixed Income Fund | |
| | | |
Face
Amount/Units† | | | Rating†† | | Security | | Value | |
| Oil, Gas & Consumable Fuels — 2.5% — (continued) | |
| $ | 93,000 | | | A- | | Petro-Canada, Senior Unsecured Notes, 6.800% due 5/15/38 | | $ | 124,889 | |
| | | | | | Petroleos Mexicanos, Company Guaranteed Notes: | | | | |
| | 400,000 | | | BBB+ | | 6.000% due 3/5/20 | | | 438,700 | |
| | 930,000 | | | BBB+ | | 3.500% due 1/30/23 | | | 906,099 | |
| | 32,000 | | | BBB+ | | 6.875% due 8/4/26(a) | | | 37,280 | |
| | 29,000 | | | BBB+ | | 6.625% due 6/15/35 | | | 31,543 | |
| | 220,000 | | | BBB+ | | 6.500% due 6/2/41 | | | 234,322 | |
| | 280,000 | | | BBB+ | | 6.375% due 1/23/45 | | | 296,268 | |
| | 23,000 | | | BBB- | | Pioneer Natural Resources Co., Senior Unsecured Notes, 4.450% due 1/15/26 | | | 25,090 | |
| | | | | | Plains All American Pipeline LP/PAA Finance Corp., Senior Unsecured Notes: | | | | |
| | 90,000 | | | BBB | | 3.650% due 6/1/22 | | | 91,142 | |
| | 35,000 | | | BBB | | 4.650% due 10/15/25 | | | 36,406 | |
| | | | | | Pride International Inc., Company Guaranteed Notes: | | | | |
| | 50,000 | | | BBB- | | 8.500% due 6/15/19 | | | 52,937 | |
| | 40,000 | | | BBB- | | 6.875% due 8/15/20 | | | 39,346 | |
| | 120,000 | | | BB+ | | QEP Resources Inc., Senior Unsecured Notes, 6.875% due 3/1/21 | | | 126,060 | |
| | | | | | Range Resources Corp., Company Guaranteed Notes: | | | | |
| | 260,000 | | | BB+ | | 5.000% due 3/15/23 | | | 258,050 | |
| | 50,000 | | | BB+ | | 4.875% due 5/15/25 | | | 48,500 | |
| | | | | | Schlumberger Holdings Corp., Senior Unsecured Notes: | | | | |
| | 170,000 | | | AA- | | 3.000% due 12/21/20(a) | | | 177,140 | |
| | 120,000 | | | AA- | | 4.000% due 12/21/25(a) | | | 131,207 | |
| | 20,000 | | | AA- | | Schlumberger Norge AS, Company Guaranteed Notes, 4.200% due 1/15/21(a) | | | 21,793 | |
| | 20,000 | | | BB | | SESI LLC, Company Guaranteed Notes, 7.125% due 12/15/21 | | | 19,600 | |
| | | | | | Shell International Finance BV, Company Guaranteed Notes: | | | | |
| | 180,000 | | | A | | 4.375% due 3/25/20 | | | 197,424 | |
| | 260,000 | | | A | | 2.875% due 5/10/26 | | | 267,953 | |
| | 90,000 | | | A | | 4.125% due 5/11/35 | | | 98,851 | |
| | 104,000 | | | A | | 4.550% due 8/12/43 | | | 117,360 | |
| | 220,000 | | | A | | 4.375% due 5/11/45 | | | 244,087 | |
| | 40,000 | | | A | | 4.000% due 5/10/46 | | | 42,027 | |
| | | | | | Southern Natural Gas Co. LLC, Company Guaranteed Notes: | | | | |
| | 40,000 | | | BBB- | | 5.900% due 4/1/17(a) | | | 41,015 | |
| | 58,000 | | | BBB- | | 8.000% due 3/1/32 | | | 74,235 | |
| | 35,000 | | | BBB | | Sunoco Logistics Partners Operations LP, Company Guaranteed Notes, 5.350% due 5/15/45 | | | 36,314 | |
| | 800,000 | | | BBB | | Texas Eastern Transmission LP, Senior Unsecured Notes, 2.800% due 10/15/22(a) | | | 799,958 | |
| | 280,000 | | | BBB- | | Transcontinental Gas Pipe Line Co. LLC, Senior Unsecured Notes, 7.850% due 2/1/26(a) | | | 362,807 | |
| | | | | | Whiting Petroleum Corp., Company Guaranteed Notes: | | | | |
| | 30,000 | | | B+ | | 5.000% due 3/15/19 | | | 27,900 | |
| | 60,000 | | | B+ | | 6.250% due 4/1/23(e) | | | 52,800 | |
| | | | | | Williams Cos., Inc. (The), Senior Unsecured Notes: | | | | |
| | 103,000 | | | BB | | 7.875% due 9/1/21 | | | 120,510 | |
| | 166,000 | | | BB | | 8.750% due 3/15/32 | | | 205,840 | |
| | | | | | | | | | |
| | | | | | Total Oil, Gas & Consumable Fuels | | | 18,107,530 | |
| | | | | | | | | | |
| Paper & Forest Products — 0.1% | |
| | 110,000 | | | BBB- | | Celulosa Arauco y Constitucion SA, Senior Unsecured Notes, 4.750% due 1/11/22 | | | 118,747 | |
| | | | | | Georgia-Pacific LLC, Senior Unsecured Notes: | | | | |
| | 40,000 | | | A+ | | 3.600% due 3/1/25(a) | | | 43,006 | |
| | 60,000 | | | A+ | | 7.750% due 11/15/29 | | | 86,799 | |
| | | | | | International Paper Co., Senior Unsecured Notes: | | | | |
| | 249,000 | | | BBB | | 3.650% due 6/15/24 | | | 263,368 | |
| | 33,000 | | | BBB | | 4.800% due 6/15/44 | | | 35,161 | |
| | | | | | | | | | |
| | | | | | Total Paper & Forest Products | | | 547,081 | |
| | | | | | | | | | |
See Notes to Financial Statements.
164
| | | | | | | | | | |
| Core Fixed Income Fund | |
| | | |
Face
Amount/Units† | | | Rating†† | | Security | | Value | |
| Pharmaceuticals — 1.1% | |
| | | | | | AbbVie Inc., Senior Unsecured Notes: | | | | |
| $ | 600,000 | | | A- | | 1.750% due 11/6/17 | | $ | 602,924 | |
| | 30,000 | | | A- | | 2.300% due 5/14/21 | | | 30,346 | |
| | 280,000 | | | A- | | 2.900% due 11/6/22 | | | 288,251 | |
| | 122,000 | | | A- | | 2.850% due 5/14/23 | | | 124,085 | |
| | 100,000 | | | A- | | 3.600% due 5/14/25 | | | 106,021 | |
| | 40,000 | | | A- | | 3.200% due 5/14/26 | | | 41,069 | |
| | 217,000 | | | A- | | 4.500% due 5/14/35 | | | 236,072 | |
| | 60,000 | | | A- | | 4.300% due 5/14/36 | | | 63,622 | |
| | 39,000 | | | A- | | 4.400% due 11/6/42 | | | 41,732 | |
| | 389,000 | | | A- | | 4.450% due 5/14/46 | | | 419,524 | |
| | | | | | Actavis Funding SCS, Company Guaranteed Notes: | | | | |
| | 200,000 | | | BBB | | 2.350% due 3/12/18 | | | 202,410 | |
| | 455,000 | | | BBB | | 3.000% due 3/12/20 | | | 470,182 | |
| | 100,000 | | | BBB | | 3.450% due 3/15/22 | | | 104,870 | |
| | 480,000 | | | BBB | | 3.800% due 3/15/25 | | | 508,061 | |
| | 400,000 | | | BBB | | 4.550% due 3/15/35 | | | 432,139 | |
| | 519,000 | | | BBB | | 4.750% due 3/15/45 | | | 571,634 | |
| | 200,000 | | | A- | | AstraZeneca PLC, Senior Unsecured Notes, 3.375% due 11/16/25 | | | 214,726 | |
| | | | | | Baxalta Inc., Company Guaranteed Notes: | | | | |
| | 70,000 | | | BBB- | | 2.875% due 6/23/20 | | | 71,238 | |
| | 77,000 | | | BBB- | | 4.000% due 6/23/25 | | | 81,922 | |
| | 34,000 | | | BBB- | | 5.250% due 6/23/45 | | | 40,034 | |
| | 270,000 | | | A+ | | GlaxoSmithKline Capital PLC, Company Guaranteed Notes, 2.850% due 5/8/22 | | | 284,838 | |
| | | | | | Johnson & Johnson, Senior Unsecured Notes: | | | | |
| | 30,000 | | | AAA | | 3.550% due 3/1/36 | | | 33,852 | |
| | 25,000 | | | AAA | | 3.700% due 3/1/46 | | | 29,018 | |
| | 100,000 | | | AA | | Merck & Co., Inc., Senior Unsecured Notes, 2.750% due 2/10/25 | | | 104,679 | |
| | 95,000 | | | BBB- | | Mylan Inc., Company Guaranteed Notes, 5.400% due 11/29/43 | | | 107,032 | |
| | | | | | Mylan NV, Company Guaranteed Notes: | | | | |
| | 155,000 | | | BBB- | | 3.950% due 6/15/26(a) | | | 160,147 | |
| | 60,000 | | | BBB- | | 5.250% due 6/15/46(a) | | | 66,121 | |
| | | | | | Pfizer Inc., Senior Unsecured Notes: | | | | |
| | 160,000 | | | AA | | 3.400% due 5/15/24 | | | 175,487 | |
| | 40,000 | | | AA | | 4.300% due 6/15/43 | | | 45,800 | |
| | 30,000 | | | AA | | 4.400% due 5/15/44 | | | 35,102 | |
| | 125,000 | | | BB+ | | Quintiles Transnational Corp., Company Guaranteed Notes, 4.875% due 5/15/23(a) | | | 130,625 | |
| | 125,000 | | | BBB | | Teva Pharmaceutical Finance Co. BV, Company Guaranteed Notes, 2.950% due 12/18/22 | | | 128,449 | |
| | | | | | Teva Pharmaceutical Finance Netherlands III BV, Company Guaranteed Notes: | | | | |
| | 115,000 | | | BBB | | 1.400% due 7/20/18 | | | 114,842 | |
| | 700,000 | | | BBB | | 2.800% due 7/21/23 | | | 704,868 | |
| | 30,000 | | | BBB | | 3.150% due 10/1/26 | | | 30,271 | |
| | 25,000 | | | BBB | | 4.100% due 10/1/46 | | | 25,633 | |
| | | | | | Valeant Pharmaceuticals International Inc., Company Guaranteed Notes: | | | | |
| | 350,000 | | | B- | | 5.500% due 3/1/23(a) | | | 307,125 | |
| | 515,000 | | | B- | | 6.125% due 4/15/25(a) | | | 453,844 | |
| | 130,000 | | | AA | | Wyeth LLC, Company Guaranteed Notes, 5.950% due 4/1/37 | | | 174,518 | |
| | | | | | | | | | |
| | | | | | Total Pharmaceuticals | | | 7,763,113 | |
| | | | | | | | | | |
| Real Estate Investment Trusts (REITs) — 1.2% | |
| | 700,000 | | | BBB- | | Alexandria Real Estate Equities Inc., Company Guaranteed Notes, 2.750% due 1/15/20 | | | 708,647 | |
| | | | | | American Tower Corp., Senior Unsecured Notes: | | | | |
| | 141,000 | | | BBB- | | 3.300% due 2/15/21 | | | 147,516 | |
| | 128,000 | | | BBB- | | 4.000% due 6/1/25 | | | 137,251 | |
| | 140,000 | | | A- | | AvalonBay Communities Inc., Senior Unsecured Notes, 3.450% due 6/1/25 | | | 147,684 | |
See Notes to Financial Statements.
165
| | | | | | | | | | |
| Core Fixed Income Fund | |
| | | |
Face
Amount/Units† | | | Rating†† | | Security | | Value | |
| Real Estate Investment Trusts (REITs) — 1.2% — (continued) | |
| | | | | | Crown Castle International Corp., Senior Unsecured Notes: | | | | |
| $ | 10,000 | | | BBB- | | 3.400% due 2/15/21 | | $ | 10,491 | |
| | 15,000 | | | BBB- | | 3.700% due 6/15/26 | | | 15,768 | |
| | 600,000 | | | BBB- | | DDR Corp., Senior Unsecured Notes, 7.500% due 4/1/17 | | | 619,218 | |
| | 653,000 | | | BBB | | Duke Realty LP, Company Guaranteed Notes, 6.500% due 1/15/18 | | | 695,401 | |
| | 80,000 | | | A- | | ERP Operating LP, Senior Unsecured Notes, 4.500% due 7/1/44 | | | 90,824 | |
| | 555,000 | | | BBB | | HCP Inc., Senior Unsecured Notes, 4.250% due 11/15/23 | | | 586,038 | |
| | 670,000 | | | BBB | | Highwoods Realty LP, Senior Unsecured Notes, 5.850% due 3/15/17 | | | 684,015 | |
| | 120,000 | | | BBB | | Host Hotels & Resorts LP, Senior Unsecured Notes, 4.750% due 3/1/23 | | | 129,425 | |
| | 750,000 | | | BBB+ | | Kimco Realty Corp., Senior Unsecured Notes, 4.300% due 2/1/18 | | | 773,303 | |
| | 300,000 | | | BBB | | Liberty Property LP, Senior Unsecured Notes, 6.625% due 10/1/17 | | | 314,981 | |
| | 80,000 | | | A | | Simon Property Group LP, Senior Unsecured Notes, 3.375% due 3/15/22 | | | 85,343 | |
| | 400,000 | | | BBB- | | SL Green Realty Corp., Company Guaranteed Notes, 7.750% due 3/15/20 | | | 465,499 | |
| | 125,000 | | | BBB+ | | Ventas Realty LP, Company Guaranteed Notes, 3.750% due 5/1/24 | | | 131,400 | |
| | 1,240,000 | | | BBB+ | | Ventas Realty LP/Ventas Capital Corp., Company Guaranteed Notes, 2.700% due 4/1/20 | | | 1,268,937 | |
| | 654,000 | | | BBB+ | | WEA Finance LLC/Westfield UK & Europe Finance PLC, Company Guaranteed Notes, 2.700% due 9/17/19(a) | | | 670,215 | |
| | 695,000 | | | BBB | | Welltower Inc., Senior Unsecured Notes, 4.950% due 1/15/21 | | | 765,787 | |
| | | | | | | | | | |
| | | | | | Total Real Estate Investment Trusts (REITs) | | | 8,447,743 | |
| | | | | | | | | | |
| Road & Rail — 0.1% | |
| | | | | | Burlington Northern Santa Fe LLC, Senior Unsecured Notes: | | | | |
| | 150,000 | | | A | | 4.375% due 9/1/42 | | | 172,550 | |
| | 4,000 | | | A | | 4.550% due 9/1/44 | | | 4,740 | |
| | 10,000 | | | A | | 3.900% due 8/1/46 | | | 10,899 | |
| | | | | | Union Pacific Corp., Senior Unsecured Notes: | | | | |
| | 64,000 | | | A | | 4.163% due 7/15/22 | | | 72,159 | |
| | 42,000 | | | A | | 2.750% due 4/15/23 | | | 43,808 | |
| | 64,000 | | | A | | 3.875% due 2/1/55 | | | 67,345 | |
| | | | | | | | | | |
| | | | | | Total Road & Rail | | | 371,501 | |
| | | | | | | | | | |
| Semiconductors & Semiconductor Equipment — 0.1% | |
| | | | | | Intel Corp., Senior Unsecured Notes: | | | | |
| | 70,000 | | | A+ | | 3.700% due 7/29/25 | | | 78,074 | |
| | 50,000 | | | A+ | | 4.900% due 7/29/45 | | | 60,905 | |
| | 6,000 | | | BBB | | KLA-Tencor Corp., Senior Unsecured Notes, 4.650% due 11/1/24 | | | 6,612 | |
| | | | | | Lam Research Corp., Senior Unsecured Notes: | | | | |
| | 14,000 | | | BBB | | 2.800% due 6/15/21 | | | 14,370 | |
| | 53,000 | | | BBB | | 3.450% due 6/15/23 | | | 54,445 | |
| | 32,000 | | | BBB | | 3.900% due 6/15/26 | | | 33,505 | |
| | | | | | QUALCOMM Inc., Senior Unsecured Notes: | | | | |
| | 85,000 | | | A+ | | 3.450% due 5/20/25 | | | 91,895 | |
| | 48,000 | | | A+ | | 4.800% due 5/20/45 | | | 54,867 | |
| | | | | | | | | | |
| | | | | | Total Semiconductors & Semiconductor Equipment | | | 394,673 | |
| | | | | | | | | | |
| Software — 0.7% | |
| | | | | | Activision Blizzard Inc., Company Guaranteed Notes: | | | | |
| | 120,000 | | | BBB- | | 5.625% due 9/15/21(a) | | | 125,550 | |
| | 460,000 | | | BBB- | | 6.125% due 9/15/23(a) | | | 505,425 | |
| | | | | | Fidelity National Information Services Inc., Company Guaranteed Notes: | | | | |
| | 35,000 | | | BBB | | 3.500% due 4/15/23 | | | 36,904 | |
| | 29,000 | | | BBB | | 5.000% due 10/15/25 | | | 33,347 | |
| | | | | | First Data Corp., Senior Secured Notes: | | | | |
| | 136,000 | | | BB | | 5.375% due 8/15/23(a) | | | 141,610 | |
| | 225,000 | | | BB | | 5.000% due 1/15/24(a) | | | 229,781 | |
See Notes to Financial Statements.
166
| | | | | | | | | | |
| Core Fixed Income Fund | |
| | | |
Face
Amount/Units† | | | Rating†† | | Security | | Value | |
| Software — 0.7% — (continued) | |
| | | | | | Microsoft Corp., Senior Unsecured Notes: | | | | |
| $ | 80,000 | | | AAA | | 1.550% due 8/8/21 | | $ | 79,959 | |
| | 195,000 | | | AAA | | 2.650% due 11/3/22 | | | 204,107 | |
| | 105,000 | | | AAA | | 2.000% due 8/8/23 | | | 104,927 | |
| | 110,000 | | | AAA | | 3.125% due 11/3/25 | | | 117,599 | |
| | 575,000 | | | AAA | | 2.400% due 8/8/26 | | | 578,795 | |
| | 45,000 | | | AAA | | 3.500% due 2/12/35 | | | 46,675 | |
| | 90,000 | | | AAA | | 3.450% due 8/8/36 | | | 92,724 | |
| | 350,000 | | | AAA | | 3.750% due 2/12/45 | | | 365,911 | |
| | 300,000 | | | AAA | | 4.450% due 11/3/45 | | | 348,563 | |
| | 70,000 | | | AAA | | 3.700% due 8/8/46 | | | 72,932 | |
| | 80,000 | | | AAA | | 3.950% due 8/8/56 | | | 84,575 | |
| | | | | | Oracle Corp., Senior Unsecured Notes: | | | | |
| | 220,000 | | | AA- | | 1.200% due 10/15/17 | | | 220,685 | |
| | 175,000 | | | AA- | | 2.800% due 7/8/21 | | | 183,472 | |
| | 510,000 | | | AA- | | 2.400% due 9/15/23 | | | 515,102 | |
| | 193,000 | | | AA- | | 3.400% due 7/8/24 | | | 207,313 | |
| | 305,000 | | | AA- | | 2.650% due 7/15/26 | | | 308,193 | |
| | 170,000 | | | AA- | | 4.500% due 7/8/44 | | | 192,191 | |
| | 120,000 | | | AA- | | 4.000% due 7/15/46 | | | 126,704 | |
| | | | | | | | | | |
| | | | | | Total Software | | | 4,923,044 | |
| | | | | | | | | | |
| Specialty Retail — 0.4% | |
| | 61,000 | | | BBB | | Dollar General Corp., Senior Unsecured Notes, 4.150% due 11/1/25 | | | 66,864 | |
| | 160,000 | | | BB- | | Dollar Tree Inc., Company Guaranteed Notes, 5.750% due 3/1/23 | | | 173,000 | |
| | | | | | Lowe’s Cos., Inc., Senior Unsecured Notes: | | | | |
| | 45,000 | | | A- | | 2.500% due 4/15/26 | | | 45,713 | |
| | 12,000 | | | A- | | 4.250% due 9/15/44 | | | 13,590 | |
| | 41,000 | | | A- | | 3.700% due 4/15/46 | | | 42,958 | |
| | | | | | Walgreens Boots Alliance Inc., Senior Unsecured Notes: | | | | |
| | 35,000 | | | BBB | | 2.600% due 6/1/21 | | | 35,844 | |
| | 20,000 | | | BBB | | 3.100% due 6/1/23 | | | 20,670 | |
| | 1,055,000 | | | BBB | | 3.450% due 6/1/26 | | | 1,100,533 | |
| | 75,000 | | | BBB | | 4.800% due 11/18/44 | | | 84,554 | |
| | 45,000 | | | BBB | | 4.650% due 6/1/46 | | | 49,904 | |
| | | | | | Wal-Mart Stores Inc., Senior Unsecured Notes: | | | | |
| | 300,000 | | | AA | | 3.250% due 10/25/20 | | | 323,878 | |
| | 71,000 | | | AA | | 6.500% due 8/15/37 | | | 105,469 | |
| | 50,000 | | | AA | | 4.000% due 4/11/43 | | | 57,022 | |
| | 475,000 | | | AA | | 4.750% due 10/2/43 | | | 598,512 | |
| | 73,000 | | | AA | | 4.300% due 4/22/44 | | | 87,496 | |
| | | | | | | | | | |
| | | | | | Total Specialty Retail | | | 2,806,007 | |
| | | | | | | | | | |
| Technology Hardware, Storage & Peripherals — 0.3% | |
| | | | | | Apple Inc., Senior Unsecured Notes: | | | | |
| | 103,000 | | | AA+ | | 2.850% due 5/6/21 | | | 108,787 | |
| | 280,000 | | | AA+ | | 2.450% due 8/4/26 | | | 281,106 | |
| | 150,000 | | | AA+ | | 4.500% due 2/23/36 | | | 173,681 | |
| | 75,000 | | | AA+ | | 3.450% due 2/9/45 | | | 73,954 | |
| | 305,000 | | | AA+ | | 4.375% due 5/13/45 | | | 343,012 | |
| | 40,000 | | | AA+ | | 4.650% due 2/23/46 | | | 46,900 | |
| | 40,000 | | | AA+ | | 3.850% due 8/4/46 | | | 41,854 | |
| | | | | | Diamond 1 Finance Corp./Diamond 2 Finance Corp., Senior Secured Notes: | | | | |
| | 400,000 | | | BBB- | | 3.480% due 6/1/19(a) | | | 411,871 | |
| | 330,000 | | | BBB- | | 4.420% due 6/15/21(a) | | | 345,425 | |
See Notes to Financial Statements.
167
| | | | | | | | | | |
| Core Fixed Income Fund | |
| | | |
Face
Amount/Units† | | | Rating†† | | Security | | Value | |
| Technology Hardware, Storage & Peripherals — 0.3% — (continued) | |
| $ | 40,000 | | | BBB- | | 5.450% due 6/15/23(a) | | $ | 42,707 | |
| | 80,000 | | | BBB- | | 6.020% due 6/15/26(a) | | | 85,750 | |
| | 30,000 | | | BBB- | | 8.100% due 7/15/36(a) | | | 34,940 | |
| | 15,000 | | | BBB- | | 8.350% due 7/15/46(a) | | | 17,533 | |
| | 150,000 | | | AA- | | International Business Machines Corp., Senior Unsecured Notes, 2.875% due 11/9/22 | | | 157,968 | |
| | | | | | | | | | |
| | | | | | Total Technology Hardware, Storage & Peripherals | | | 2,165,488 | |
| | | | | | | | | | |
| Tobacco — 0.4% | |
| | | | | | Altria Group Inc., Company Guaranteed Notes: | | | | |
| | 260,000 | | | A- | | 9.250% due 8/6/19 | | | 317,781 | |
| | 130,000 | | | A- | | 4.750% due 5/5/21 | | | 147,866 | |
| | 150,000 | | | A- | | 9.950% due 11/10/38 | | | 273,825 | |
| | 290,000 | | | A- | | 10.200% due 2/6/39 | | | 541,993 | |
| | 202,000 | | | A- | | 5.375% due 1/31/44 | | | 262,942 | |
| | | | | | Philip Morris International Inc., Senior Unsecured Notes: | | | | |
| | 190,000 | | | A | | 2.900% due 11/15/21 | | | 200,167 | |
| | 180,000 | | | A | | 4.500% due 3/20/42 | | | 207,510 | |
| | | | | | Reynolds American Inc., Company Guaranteed Notes: | | | | |
| | 10,000 | | | BBB | | 8.125% due 6/23/19 | | | 11,753 | |
| | 61,000 | | | BBB | | 3.250% due 6/12/20 | | | 64,193 | |
| | 50,000 | | | BBB | | 4.450% due 6/12/25 | | | 56,222 | |
| | 571,000 | | | BBB | | 5.850% due 8/15/45 | | | 745,507 | |
| | | | | | | | | | |
| | | | | | Total Tobacco | | | 2,829,759 | |
| | | | | | | | | | |
| Transportation — 0.0% | |
| | | | | | FedEx Corp., Company Guaranteed Notes: | | | | |
| | 135,000 | | | BBB | | 3.875% due 8/1/42 | | | 136,838 | |
| | 49,000 | | | BBB | | 4.100% due 2/1/45 | | | 51,361 | |
| | | | | | | | | | |
| | | | | | Total Transportation | | | 188,199 | |
| | | | | | | | | | |
| Wireless Telecommunication Services — 0.3% | |
| | 300,000 | | | BB- | | Altice US Finance I Corp., Senior Secured Notes, 5.375% due 7/15/23(a) | | | 315,000 | |
| | 330,000 | | | A- | | América Móvil SAB de CV, Company Guaranteed Notes, 5.000% due 3/30/20 | | | 365,225 | |
| | 300,000 | | | BBB- | | Bharti Airtel Ltd., Senior Unsecured Notes, 4.375% due 6/10/25(a) | | | 317,482 | |
| | 50,000 | | | BBB+ | | GTE Corp., Company Guaranteed Notes, 6.940% due 4/15/28 | | | 65,614 | |
| | 220,000 | | | B | | Sprint Capital Corp., Company Guaranteed Notes, 8.750% due 3/15/32 | | | 219,450 | |
| | 250,000 | | | BB- | | Sprint Communications Inc., Company Guaranteed Notes, 9.000% due 11/15/18(a) | | | 276,250 | |
| | | | | | Sprint Corp., Company Guaranteed Notes: | | | | |
| | 20,000 | | | B | | 7.250% due 9/15/21 | | | 19,875 | |
| | 40,000 | | | B | | 7.875% due 9/15/23 | | | 39,079 | |
| | 290,000 | | | B | | 7.625% due 2/15/25 | | | 276,769 | |
| | | | | | Telefónica Emisiones SAU, Company Guaranteed Notes: | | | | |
| | 70,000 | | | BBB | | 5.877% due 7/15/19 | | | 77,914 | |
| | 80,000 | | | BBB | | 5.134% due 4/27/20 | | | 88,848 | |
| | | | | | T-Mobile USA Inc., Company Guaranteed Notes: | | | | |
| | 275,000 | | | BB | | 6.250% due 4/1/21 | | | 288,062 | |
| | 25,000 | | | BB | | 6.731% due 4/28/22 | | | 26,375 | |
| | | | | | | | | | |
| | | | | | Total Wireless Telecommunication Services | | | 2,375,943 | |
| | | | | | | | | | |
| | | | | | TOTAL CORPORATE BONDS & NOTES
(Cost — $187,358,519) | | | 199,335,433 | |
| | | | | | | | | | |
| U.S. GOVERNMENT AGENCIES & OBLIGATIONS — 27.4% | |
| U.S. GOVERNMENT OBLIGATIONS — 26.4% | |
| | | | | | U.S. Treasury Bonds: | | | | |
| | 690,000 | | | | | 3.750% due 8/15/41 | | | 904,183 | |
| | 3,190,000 | | | | | 3.125% due 11/15/41 | | | 3,789,060 | |
See Notes to Financial Statements.
168
| | | | | | | | | | |
| Core Fixed Income Fund | |
| | | |
Face
Amount/Units† | | | | | Security | | Value | |
| U.S. GOVERNMENT OBLIGATIONS — 26.4% — (continued) | |
| $ | 1,665,000 | | | | | 3.125% due 2/15/42 | | $ | 1,979,822 | |
| | 100,000 | | | | | 3.125% due 2/15/43 | | | 118,904 | |
| | 990,000 | | | | | 3.750% due 11/15/43 | | | 1,315,018 | |
| | 415,000 | | | | | 3.125% due 8/15/44 | | | 494,450 | |
| | 16,300,000 | | | | | 3.000% due 5/15/45 | | | 18,980,910 | |
| | 625,000 | | | | | 2.875% due 8/15/45 | | | 710,937 | |
| | 5,370,000 | | | | | 3.000% due 11/15/45 | | | 6,259,197 | |
| | 2,770,000 | | | | | 2.500% due 2/15/46 | | | 2,927,380 | |
| | 14,665,000 | | | | | 2.500% due 5/15/46 | | | 15,521,993 | |
| | 2,170,000 | | | | | 2.250% due 8/15/46 | | | 2,178,478 | |
| | | | | | U.S. Treasury Inflation Indexed Bonds: | | | | |
| | 609,797 | | | | | 1.750% due 1/15/28 | | | 710,673 | |
| | 292,182 | | | | | 2.125% due 2/15/40 | | | 391,492 | |
| | 661,373 | | | | | 0.750% due 2/15/42 | | | 686,130 | |
| | 1,897,830 | | | | | 1.375% due 2/15/44 | | | 2,268,813 | |
| | 2,584,590 | | | | | 0.750% due 2/15/45 | | | 2,691,160 | |
| | 2,238,016 | | | | | 1.000% due 2/15/46 | | | 2,497,494 | |
| | | | | | U.S. Treasury Inflation Indexed Notes: | | | | |
| | 3,034,748 | | | | | 0.375% due 7/15/23 | | | 3,115,999 | |
| | 485,524 | | | | | 0.625% due 1/15/24 | | | 505,256 | |
| | 773,422 | | | | | 0.250% due 1/15/25 | | | 781,197 | |
| | 2,424,162 | | | | | 0.375% due 7/15/25 | | | 2,481,789 | |
| | 2,566,483 | | | | | 0.625% due 1/15/26 | | | 2,678,987 | |
| | | | | | U.S. Treasury Notes: | | | | |
| | 70,000 | | | | | 0.750% due 6/30/17 | | | 70,069 | |
| | 240,000 | | | | | 0.625% due 11/30/17 | | | 239,728 | |
| | 190,000 | | | | | 0.875% due 5/31/18 | | | 190,312 | |
| | 7,465,000 | | | | | 0.750% due 7/31/18 | | | 7,458,587 | |
| | 9,180,000 | | | | | 0.750% due 8/31/18 | | | 9,171,398 | |
| | 11,695,000 | | | | | 0.875% due 6/15/19 | | | 11,687,924 | |
| | 265,000 | | | | | 0.750% due 7/15/19 | | | 263,866 | |
| | 20,000 | | | | | 1.625% due 7/31/19 | | | 20,406 | |
| | 580,000 | | | | | 1.375% due 3/31/20 | | | 586,967 | |
| | 4,610,000 | | | | | 1.625% due 6/30/20 | | | 4,704,362 | |
| | 870,000 | | | | | 2.000% due 9/30/20 | | | 900,331 | |
| | 150,000 | | | | | 1.375% due 10/31/20 | | | 151,491 | |
| | 1,390,000 | | | | | 1.375% due 1/31/21 | | | 1,402,787 | |
| | 5,335,000 | | | | | 1.250% due 3/31/21 | | | 5,353,443 | |
| | 2,625,000 | | | | | 1.375% due 4/30/21 | | | 2,648,124 | |
| | 5,545,000 | | | | | 1.125% due 6/30/21 | | | 5,528,975 | |
| | 29,610,000 | | | | | 1.125% due 7/31/21(e) | | | 29,514,004 | |
| | 400,000 | | | | | 1.750% due 3/31/22 | | | 409,625 | |
| | 16,875,000 | | | | | 1.500% due 3/31/23 | | | 16,969,584 | |
| | 1,127,000 | | | | | 1.625% due 4/30/23 | | | 1,141,880 | |
| | 1,160,000 | | | | | 1.625% due 5/31/23 | | | 1,175,202 | |
| | 6,100,000 | | | | | 1.375% due 6/30/23 | | | 6,080,102 | |
| | 1,935,000 | | | | | 1.250% due 7/31/23 | | | 1,912,022 | |
| | 4,900,000 | | | | | 1.375% due 8/31/23 | | | 4,879,141 | |
| | 3,970,000 | | | | | 1.625% due 5/15/26 | | | 3,985,662 | |
| | 50,000 | | | | | 1.500% due 8/15/26 | | | 49,684 | |
| | | | | | | | | | |
| | | | | | TOTAL U.S. GOVERNMENT OBLIGATIONS | | | 190,484,998 | |
| | | | | | | | | | |
| U.S. GOVERNMENT AGENCIES — 1.0% | |
| | | | | | Federal Home Loan Bank (FHLB): | | | | |
| | 875,000 | | | | | 1.125% due 7/14/21 | | | 867,284 | |
See Notes to Financial Statements.
169
| | | | | | | | | | |
| Core Fixed Income Fund | |
| | | |
Face
Amount/Units† | | | | | Security | | Value | |
| U.S. GOVERNMENT AGENCIES — 1.0% — (continued) | |
| $ | 345,000 | | | | | 4.000% due 9/1/28 | | $ | 412,373 | |
| | 1,520,000 | | | | | step bond to yield, 1.250% due 6/28/30 | | | 1,522,816 | |
| | 810,000 | | | | | Federal Home Loan Mortgage Corp. (FHLMC), 1.250% due 10/2/19 | | | 815,517 | |
| | | | | | Federal National Mortgage Association (FNMA): | | | | |
| | 650,000 | | | | | zero coupon, due 10/9/19 | | | 623,101 | |
| | 250,000 | | | | | 1.250% due 8/17/21 | | | 249,013 | |
| | 405,000 | | | | | 7.125% due 1/15/30 | | | 636,401 | |
| | | | | | Federal National Mortgage Association (FNMA), Principal Strip: | | | | |
| | 575,000 | | | | | due 1/15/30(j) | | | 409,881 | |
| | 595,000 | | | | | due 5/15/30(j) | | | 421,983 | |
| | | | | | Residual Funding Corp., Principal Strip: | | | | |
| | 1,030,000 | | | | | due 10/15/19(j) | | | 994,659 | |
| | 240,000 | | | | | due 7/15/20(j) | | | 227,858 | |
| | | | | | | | | | |
| | | | | | TOTAL U.S. GOVERNMENT AGENCIES | | | 7,180,886 | |
| | | | | | | | | | |
| | | | | | TOTAL U.S. GOVERNMENT AGENCIES & OBLIGATIONS
(Cost — $190,393,440) | | | 197,665,884 | |
| | | | | | | | | | |
| MORTGAGE-BACKED SECURITIES — 24.6% | |
| FHLMC — 6.1% | |
| | | | | | Federal Home Loan Mortgage Corp. (FHLMC): | | | | |
| | 5,631 | | | | | 8.500% due 11/1/16 — 7/1/17 | | | 5,643 | |
| | 724 | | | | | 8.000% due 1/1/17 — 6/1/17 | | | 725 | |
| | 32,410 | | | | | 2.625% due 12/1/34(b) | | | 34,607 | |
| | 21,969 | | | | | 2.770% due 1/1/35(b) | | | 23,326 | |
| | 40,678 | | | | | 2.543% due 2/1/37(b) | | | 42,444 | |
| | 70,847 | | | | | 2.250% due 5/1/37(b) | | | 72,994 | |
| | 86,345 | | | | | 2.995% due 5/1/37(b) | | | 92,261 | |
| | 40,195 | | | | | 3.099% due 3/1/41(b) | | | 42,270 | |
| | 115,903 | | | | | 2.037% due 7/1/42(b) | | | 121,338 | |
| | | | | | Gold: | | | | |
| | 329,969 | | | | | 6.000% due 5/1/17 — 6/1/39 | | | 372,262 | |
| | 657 | | | | | 8.500% due 2/1/18 | | | 661 | |
| | 1,026,324 | | | | | 5.000% due 6/1/21 — 6/1/41 | | | 1,140,933 | |
| | 10,339,274 | | | | | 4.000% due 10/1/25 — 2/1/46 | | | 11,184,140 | |
| | 84,353 | | | | | 4.500% due 4/1/29 | | | 92,238 | |
| | 1,175,975 | | | | | 5.500% due 1/1/30 — 2/1/40 | | | 1,317,077 | |
| | 9,513,309 | | | | | 3.000% due 3/1/31 — 9/1/46 | | | 9,898,273 | |
| | 316,432 | | | | | 6.500% due 8/1/37 — 9/1/39 | | | 366,847 | |
| | 29,509 | | | | | 7.000% due 3/1/39 | | | 34,405 | |
| | 17,733,185 | | | | | 3.500% due 12/1/42 — 4/1/46 | | | 18,794,456 | |
| | 300,000 | | | | | 3.500% due 9/1/46(g) | | | 315,949 | |
| | | | | | | | | | |
| | | | | | TOTAL FHLMC | | | 43,952,849 | |
| | | | | | | | | | |
| FNMA — 15.3% | |
| | | | | | Federal National Mortgage Association (FNMA): | | | | |
| | 1,732,505 | | | | | 5.500% due 11/1/16 — 5/1/40 | | | 1,961,776 | |
| | 158 | | | | | 8.500% due 4/1/17 | | | 161 | |
| | 13,995,275 | | | | | 4.000% due 10/1/19 — 4/1/45 | | | 15,156,766 | |
| | 1,035,000 | | | | | 4.399% due 2/1/20 | | | 1,126,321 | |
| | 1,145,000 | | | | | 3.459% due 11/1/20 | | | 1,228,957 | |
| | 482,729 | | | | | 3.540% due 11/1/20 | | | 518,447 | |
| | 187,935 | | | | | 6.000% due 9/1/21 — 10/1/35 | | | 215,100 | |
| | 1,152,734 | | | | | 3.650% due 11/1/21 | | | 1,254,480 | |
| | 2,419,556 | | | | | 5.000% due 6/1/22 — 5/1/42 | | | 2,691,673 | |
| | 6,280,277 | | | | | 4.500% due 3/1/24 — 10/1/44 | | | 6,898,472 | |
See Notes to Financial Statements.
170
| | | | | | | | | | |
| Core Fixed Income Fund | |
| | | |
Face
Amount/Units† | | | | | Security | | Value | |
| FNMA — 15.3% — (continued) | |
| $ | 24,946,426 | | | | | 3.500% due 11/1/25 — 6/1/46 | | $ | 26,508,194 | |
| | 1,478,431 | | | | | 2.964% due 5/1/27 | | | 1,572,880 | |
| | 3,595,116 | | | | | 2.500% due 11/1/27 — 10/1/42 | | | 3,706,011 | |
| | 8,815,174 | | | | | 3.000% due 12/1/27 — 4/1/45 | | | 9,235,864 | |
| | 525,000 | | | | | 3.010% due 4/1/28 | | | 560,752 | |
| | 545,000 | | | | | 3.050% due 4/1/28 | | | 584,247 | |
| | 6,310,000 | | | | | 2.500% due 9/1/31 — 10/1/44(g) | | | 6,516,625 | |
| | 11,680,000 | | | | | 3.000% due 9/1/31 — 10/1/46(g) | | | 12,109,805 | |
| | 275,000 | | | | | 3.200% due 3/1/31 | | | 297,861 | |
| | 2,800,000 | | | | | 3.500% due 9/1/31(g) | | | 2,956,789 | |
| | 268,785 | | | | | 2.654% due 3/1/34(b) | | | 280,640 | |
| | 76,245 | | | | | 2.495% due 12/1/34(b) | | | 80,348 | |
| | 6,744 | | | | | 2.497% due 12/1/34(b) | | | 7,129 | |
| | 70,318 | | | | | 2.835% due 9/1/35(b) | | | 74,655 | |
| | 79,884 | | | | | 2.354% due 10/1/35(b) | | | 83,317 | |
| | 127,274 | | | | | 2.454% due 10/1/35(b) | | | 133,025 | |
| | 21,594 | | | | | 2.337% due 11/1/35(b) | | | 22,523 | |
| | 24,097 | | | | | 2.392% due 11/1/35(b) | | | 25,125 | |
| | 20,921 | | | | | 2.395% due 11/1/35(b) | | | 21,952 | |
| | 23,028 | | | | | 2.409% due 11/1/35(b) | | | 24,054 | |
| | 64,147 | | | | | 2.415% due 11/1/35(b) | | | 66,948 | |
| | 25,842 | | | | | 2.428% due 11/1/35(b) | | | 27,001 | |
| | 275,373 | | | | | 2.471% due 1/1/36(b) | | | 290,437 | |
| | 95,462 | | | | | 2.373% due 9/1/36(b) | | | 100,877 | |
| | 29,917 | | | | | 2.743% due 12/1/36(b) | | | 31,794 | |
| | 91,507 | | | | | 7.000% due 4/1/37 | | | 104,344 | |
| | 149,670 | | | | | 2.336% due 5/1/37(b) | | | 158,448 | |
| | 545,792 | | | | | 6.500% due 9/1/37 — 5/1/40 | | | 628,415 | |
| | 57,174 | | | | | 2.922% due 2/1/41(b) | | | 59,683 | |
| | 126,580 | | | | | 2.979% due 7/1/41(b) | | | 133,416 | |
| | 137,794 | | | | | 2.022% due 7/1/42(b) | | | 144,428 | |
| | 25,016 | | | | | 2.233% due 7/1/42(b) | | | 25,974 | |
| | 700,000 | | | | | 5.000% due 9/1/46(g) | | | 775,906 | |
| | 2,600,000 | | | | | 4.000% due 10/1/46(g) | | | 2,783,168 | |
| | 3,400,000 | | | | | 4.000% due 9/1/46(g) | | | 3,642,516 | |
| | 5,385,000 | | | | | 4.500% due 9/1/46(g) | | | 5,883,113 | |
| | | | | | | | | | |
| | | | | | TOTAL FNMA | | | 110,710,417 | |
| | | | | | | | | | |
| GNMA — 3.2% | |
| | | | | | Government National Mortgage Association (GNMA): | | | | |
| | 419 | | | | | 8.500% due 5/15/17 | | | 421 | |
| | 94 | | | | | 9.500% due 8/15/17 | | | 94 | |
| | 73,799 | | | | | 6.000% due 12/15/33 — 1/15/38 | | | 85,139 | |
| | 871,527 | | | | | 5.000% due 10/15/34 — 9/15/40 | | | 979,080 | |
| | 76,333 | | | | | 5.500% due 5/15/37 — 6/15/38 | | | 86,304 | |
| | 120,815 | | | | | 6.500% due 1/15/38 — 10/15/38 | | | 142,062 | |
| | 226,329 | | | | | 4.500% due 3/15/41 | | | 252,429 | |
| | 852,464 | | | | | 4.000% due 6/15/41 — 11/15/45 | | | 928,132 | |
| | | | | | Government National Mortgage Association II (GNMA): | | | | |
| | 227 | | | | | 8.500% due 1/20/17 | | | 228 | |
| | 1,558 | | | | | 9.000% due 4/20/17 — 11/20/21 | | | 1,685 | |
| | 182,291 | | | | | 6.000% due 7/20/37 — 11/20/40 | | | 210,301 | |
| | 1,912,305 | | | | | 4.500% due 1/20/40 — 3/20/46 | | | 2,088,800 | |
| | 361,859 | | | | | 5.000% due 7/20/40 — 9/20/41 | | | 402,099 | |
| | 1,356,586 | | | | | 4.000% due 11/20/40 — 1/20/46 | | | 1,452,751 | |
See Notes to Financial Statements.
171
| | | | | | | | | | |
| Core Fixed Income Fund | |
| | | |
Face
Amount/Units† | | | Rating†† | | Security | | Value | |
| GNMA — 3.2% — (continued) | |
| $ | 4,095,757 | | | | | 3.000% due 1/20/43 — 8/20/46 | | $ | 4,298,350 | |
| | 5,400,392 | | | | | 3.500% due 6/20/43 — 4/20/46 | | | 5,742,449 | |
| | 3,860,000 | | | | | 3.000% due 9/20/45(g) | | | 4,044,254 | |
| | 1,900,000 | | | | | 3.500% due 9/20/45(g) | | | 2,016,820 | |
| | | | | | | | | | |
| | | | | | TOTAL GNMA | | | 22,731,398 | |
| | | | | | | | | | |
| | | | | | TOTAL MORTGAGE-BACKED SECURITIES
(Cost — $174,869,097) | | | 177,394,664 | |
| | | | | | | | | | |
| COLLATERALIZED MORTGAGE OBLIGATIONS — 12.0% | |
| | 270,000 | | | AAA | | 225 Liberty Street Trust, Series 2016-225L, Class A, 3.597% due 2/10/36(a) | | | 296,220 | |
| | 2,800,000 | | | CCC | | Accredited Mortgage Loan Trust, Series 2007-1, Class A4, 0.744% due 2/25/37(b) | | | 2,341,825 | |
| | 16,146 | | | AAA | | ACE Securities Corp. Home Equity Loan Trust, Series 2004-SD1, Class A1, 1.014% due
11/25/33(b) | | | 16,150 | |
| | 105,205 | | | CC | | AFC Home Equity Loan Trust, Series 1999-2, Class 2A, 1.174% due 6/25/29(b) | | | 90,798 | |
| | 829,005 | | | Ca(c) | | Alternative Loan Trust Resecuritization, Series 2008-2R, Class 3A1, 6.000% due 8/25/37 | | | 682,512 | |
| | 1,426,389 | | | CCC | | Asset Backed Securities Corp. Home Equity Loan Trust, Series 2007-HE1, Class A1B, 0.674% due 12/25/36(b) | | | 1,324,089 | |
| | 480,000 | | | AA- | | BAMLL Commercial Mortgage Securities Trust, Series 2015-200P, Class B, 3.490% due 4/14/33(a) | | | 505,442 | |
| | | | | | Banc of America Commercial Mortgage Trust: | | | | |
| | 229,190 | | | AA+ | | Series 2007-2, Class A4, 5.791% due 4/10/49(b) | | | 231,057 | |
| | 771,402 | | | AA | | Series 2008-1, Class A1A, 6.392% due 2/10/51(b) | | | 801,213 | |
| | 240,000 | | | B+ | | Series 2008-1, Class AJ, 6.479% due 2/10/51(b) | | | 238,739 | |
| | 88,413 | | | AA+ | | Banc of America Mortgage Trust, Series 2004-F, Class 1A1, 3.164% due 7/25/34(b) | | | 90,068 | |
| | 418,866 | | | A+ | | Bayview Commercial Asset Trust, Series 2007-3, Class A1, 0.764% due 7/25/37(a)(b) | | | 358,029 | |
| | 5,448 | | | AAA | | Bayview Financial Mortgage Pass-Through Trust, Series 2004-A, Class A, 1.168% due 2/28/44(b) | | | 5,458 | |
| | 523,157 | | | NR | | BCAP LLC, Series 2013-RR1, Class 6A1, 3.032% due 5/26/36(a)(b) | | | 523,656 | |
| | | | | | Bear Stearns Adjustable Rate Mortgage Trust: | | | | |
| | 135,662 | | | A+ | | Series 2005-2, Class A2, 2.924% due 3/25/35(b) | | | 137,045 | |
| | 468,987 | | | D(h) | | Series 2007-3, Class 1A1, 3.418% due 5/25/47(b) | | | 425,359 | |
| | | | | | Bear Stearns ALT-A Trust: | | | | |
| | 300,127 | | | BBB+ | | Series 2004-7, Class 2A1, 3.035% due 8/25/34(b) | | | 301,784 | |
| | 228,271 | | | CCC | | Series 2005-2, Class 2A4, 2.851% due 4/25/35(b) | | | 219,650 | |
| | 189,539 | | | B | | Series 2005-4, Class 23A2, 2.952% due 5/25/35(b) | | | 186,618 | |
| | 733,881 | | | CCC | | Bear Stearns Asset Backed Securities Trust, Series 2005-AC6, Class 1A3, 5.500% due 9/25/35(b) | | | 733,202 | |
| | 565,000 | | | BBB | | Bear Stearns Commercial Mortgage Securities Trust, Series 2007-PW18, Class AM, 6.084% due 6/11/50(b) | | | 585,472 | |
| | 322,574 | | | BBB | | Bear Stearns Structured Products Trust, Series 2007-EMX1, Class A1, 1.524% due
3/25/37(a)(b) | | | 320,266 | |
| | 648,357 | | | BB | | Bravo Mortgage Asset Trust, Series 2006-1A, Class A2, 0.764% due 7/25/36(a)(b) | | | 631,915 | |
| | 1,600,444 | | | BB+ | | Centex Home Equity Loan Trust, Series 2006-A, Class AV4, 0.774% due 6/25/36(b) | | | 1,559,852 | |
| | 545,000 | | | AAA | | CGRBS Commercial Mortgage Trust, Series 2013-VN05, Class A, 3.369% due 3/13/35(a) | | | 582,201 | |
| | 750 | | | AAA | | Chase Funding Trust, Series 2002-2, Class 2A1, 1.024% due 5/25/32(b) | | | 685 | |
| | 238,608 | | | BB | | Chase Mortgage Finance Trust, Series 2007-A1, Class 5A1, 3.068% due 2/25/37(b) | | | 236,446 | |
| | | | | | Chevy Chase Funding LLC Mortgage-Backed Certificates: | | | | |
| | 894,489 | | | A+ | | Series 2004-2A, Class A1, 0.794% due 5/25/35(a)(b) | | | 807,997 | |
| | 2,623,199 | | | CCC | | Series 2004-2A, Class B1, 0.940% due 5/25/35(a)(b) | | | 1,908,139 | |
| | | | | | Citigroup Commercial Mortgage Trust: | | | | |
| | 270,000 | | | Aaa(c) | | Series 2013-375P, Class A, 3.251% due 5/10/35(a) | | | 287,684 | |
| | 300,000 | | | BB(h) | | Series 2014-GC19, Class E, 4.563% due 3/10/47(a)(b) | | | 195,927 | |
| | 140,000 | | | Aa1(c) | | Series 2014-GC25, Class AS, 4.017% due 10/10/47 | | | 153,898 | |
| | 420,000 | | | BBB-(h) | | Series 2015-GC33, Class D, 3.172% due 9/10/58 | | | 300,876 | |
| | 770,000 | | | CCC | | Citigroup Mortgage Loan Trust Inc., Series 2006-WFH2, Class M1, 0.794% due 8/25/36(b) | | | 634,418 | |
See Notes to Financial Statements.
172
| | | | | | | | | | |
| Core Fixed Income Fund | |
| | | |
Face
Amount/Units† | | | Rating†† | | Security | | Value | |
| | | | | | Citigroup/Deutsche Bank Commercial Mortgage Trust: | | | | |
| $ | 202,837 | | | Caa3(c) | | Series 2006-CD2, Class AJ, 5.563% due 1/15/46(b) | | $ | 173,547 | |
| | 60,000 | | | B- | | Series 2006-CD3, Class AJ, 5.688% due 10/15/48 | | | 35,700 | |
| | 9,230 | | | Caa3(c) | | Series 2007-CD4, Class AJ, 5.398% due 12/11/49(b) | | | 7,392 | |
| | 50,000 | | | Aa1(c) | | COBALT CMBS Commercial Mortgage Trust, Series 2007-C2, Class AMFX, 5.526% due 4/15/47(b) | | | 50,818 | |
| | 400,000 | | | Aa2(c) | | Colony Mortgage Capital Ltd., Series 2014-FL2, Class B, 2.962% due 11/10/31(a)(b) | | | 401,574 | |
| | 557,155 | | | AA+ | | Commercial Mortgage Loan Trust, Series 2008-LS1, Class A1A, 6.296% due 12/10/49(b) | | | 578,999 | |
| | | | | | Commercial Mortgage Trust: | | | | |
| | 440,000 | | | Aa1(c) | | Series 2006-C8, Class AM, 5.347% due 12/10/46 | | | 442,725 | |
| | 281,309 | | | AAA | | Series 2007-C9, Class A4, 6.007% due 12/10/49(b) | | | 288,623 | |
| | 436,607 | | | Aaa(c) | | Series 2012-LC4, Class A2, 2.256% due 12/10/44 | | | 437,367 | |
| | 265,000 | | | AAA(h) | | Series 2013-300P, Class A1, 4.353% due 8/10/30(a) | | | 300,544 | |
| | 190,000 | | | AA-(h) | | Series 2013-300P, Class B, 4.540% due 8/10/30(a)(b) | | | 212,873 | |
| | 260,000 | | | BB | | Series 2013-CR9, Class E, 4.398% due 7/10/45(a)(b) | | | 203,598 | |
| | 40,000 | | | Aa3(c) | | Series 2013-CR12, Class B, 4.762% due 10/10/46(b) | | | 45,379 | |
| | 20,000 | | | A3(c) | | Series 2013-CR12, Class C, 5.253% due 10/10/46(b) | | | 22,136 | |
| | 265,000 | | | AAA(h) | | Series 2014-277P, Class A, 3.732% due 8/10/49(a)(b) | | | 290,364 | |
| | 210,000 | | | A-(h) | | Series 2014-CR21, Class C, 4.565% due 12/10/47(b) | | | 223,114 | |
| | 345,000 | | | Aaa(c) | | Series 2014-LC17, Class A5, 3.917% due 10/10/47 | | | 385,687 | |
| | 290,000 | | | AAA(h) | | Series 2015-3BP, Class A, 3.178% due 2/10/35(a) | | | 308,874 | |
| | 5,361,529 | | | Aa1(c) | | Series 2015-CR25, Class XA, 1.119% due 8/10/48(b)(i) | | | 345,437 | |
| | 270,000 | | | AAA | | Series 2016-787S, Class A, 3.545% due 2/10/36(a) | | | 295,278 | |
| | 1,600,000 | | | BB- | | Core Industrial Trust, Series 2015-TEXW, Class E, 3.977% due 2/10/34(a)(b) | | | 1,555,445 | |
| | | | | | Countrywide Alternative Loan Trust: | | | | |
| | 465,714 | | | CCC | | Series 2005-24, Class 4A1, 0.751% due 7/20/35(b) | | | 417,067 | |
| | 663,897 | | | D | | Series 2006-OA17, Class 1A1A, 0.707% due 12/20/46(b) | | | 488,535 | |
| | | | | | Countrywide Asset-Backed Certificates: | | | | |
| | 4,680 | | | AAA | | Series 2002-3, Class 1A1, 1.264% due 5/25/32(b) | | | 4,487 | |
| | 282,973 | | | CCC | | Series 2006-SD3, Class A1, 0.854% due 7/25/36(a)(b) | | | 232,312 | |
| | 971,968 | | | CCC | | Series 2007-4, Class A4W, 5.231% due 4/25/47 | | | 942,575 | |
| | 407,663 | | | AA | | Series 2007-13, Class 2A2, 1.324% due 10/25/47(b) | | | 367,439 | |
| | | | | | Countrywide Home Loan Mortgage Pass Through Trust: | | | | |
| | 169,443 | | | D | | Series 2005-11, Class 3A3, 2.425% due 4/25/35(b) | | | 116,574 | |
| | 69,272 | | | NR | | Series 2005-11, Class 6A1, 1.124% due 3/25/35(b) | | | 62,409 | |
| | | | | | Credit Suisse Commercial Mortgage Capital Trust: | | | | |
| | 5,094,902 | | | Caa3(c) | | Series 2006-7, Class 3A2, 6.676% due 8/25/36(b)(f)(i) | | | 1,272,065 | |
| | 290,000 | | | B- | | Series 2014-USA, Class F, 4.373% due 9/15/37(a) | | | 236,112 | |
| | 1,198,479 | | | NR | | Series 2015-5R, Class 1A1, 1.066% due 9/27/46(a) | | | 1,156,158 | |
| | | | | | Credit Suisse Commercial Mortgage Trust: | | | | |
| | 133,008 | | | Caa2(c) | | Series 2006-C3, Class AJ, 6.393% due 6/15/38(b) | | | 81,800 | |
| | 40,000 | | | B- | | Series 2006-C5, Class AJ, 5.373% due 12/15/39 | | | 34,558 | |
| | 385,000 | | | BBB | | Series 2006-C5, Class AM, 5.343% due 12/15/39 | | | 386,430 | |
| | 310,000 | | | BBB- | | Series 2007-C2, Class AM, 5.615% due 1/15/49(b) | | | 313,732 | |
| | | | | | Credit Suisse First Boston Mortgage Securities Corp.: | | | | |
| | 359,941 | | | AA+ | | Series 2004-AR7, Class 2A1, 3.173% due 11/25/34(b) | | | 371,953 | |
| | 297,706 | | | BBB | | Series 2005-6, Class 8A1, 4.500% due 7/25/20 | | | 300,192 | |
| | 295,000 | | | Aaa(c) | | Credit Suisse USA CSAIL Commercial Mortgage Trust, Series 2015-C1, Class A4, 3.505% due 4/15/50 | | | 321,215 | |
| | 102,428 | | | CCC | | Downey Savings & Loan Association Mortgage Loan Trust, Series 2004-AR2, Class A2B, 1.314% due 11/19/44(b) | | | 89,962 | |
| | 650,000 | | | AAA | | Dryden XXV Senior Loan Fund, Series 2012-25A, Class A, 2.060% due 1/15/25(a)(b) | | | 649,996 | |
| | | | | | EMC Mortgage Loan Trust: | | | | |
| | 2,618 | | | BBB(h) | | Series 2002-B, Class A1, 1.521% due 2/25/41(a)(b) | | | 2,568 | |
| | 14,967 | | | BBB- | | Series 2003-A, Class A1, 1.074% due 8/25/40(a)(b) | | | 13,986 | |
| | 655,120 | | | B- | | Equifirst Mortgage Loan Trust, Series 2003-2, Class M2, 3.074% due 9/25/33(b) | | | 630,382 | |
See Notes to Financial Statements.
173
| | | | | | | | | | |
| Core Fixed Income Fund | |
| | | |
Face
Amount/Units† | | | Rating†† | | Security | | Value | |
| $ | 276,813 | | | AAA | | Extended Stay America Trust, Series 2013-ESH7, Class A27, 2.958% due 12/5/31(a) | | $ | 277,355 | |
| | | | | | Federal Home Loan Mortgage Corp. (FHLMC), REMICS: | | | | |
| | 8,053 | | | NR | | Series 1865, Class DA, 28.224% due 2/15/24(b)(i) | | | 7,049 | |
| | 132,247 | | | NR | | Series 3451, Class SB, 5.522% due 5/15/38(b)(i) | | | 16,894 | |
| | 159,255 | | | NR | | Series 3621, Class SB, 5.722% due 1/15/40(b)(i) | | | 28,127 | |
| | 555,000 | | | NR | | Series 3743, Class PB, 4.500% due 10/15/40 | | | 661,205 | |
| | 2,056,772 | | | NR | | Series 3866, Class SA, 5.442% due 5/15/41(b)(i) | | | 260,450 | |
| | 789,926 | | | NR | | Series 3947, Class SG, 5.442% due 10/15/41(b)(i) | | | 125,525 | |
| | 67,406 | | | NR | | Series 4076, Class SW, 5.542% due 7/15/42(b)(i) | | | 16,518 | |
| | 64,735 | | | NR | | Series 4136, Class SE, 5.642% due 11/15/42(b)(i) | | | 12,260 | |
| | 69,633 | | | NR | | Series 4136, Class SJ, 5.642% due 11/15/42(b)(i) | | | 12,424 | |
| | 583,945 | | | NR | | Series 4203, Class PS, 5.742% due 9/15/42(b)(i) | | | 107,057 | |
| | 323,827 | | | NR | | Series 4210, Class Z, 3.000% due 5/15/43 | | | 321,099 | |
| | 331,741 | | | NR | | Series 4239, Class IO, 3.500% due 6/15/27(i) | | | 36,347 | |
| | 267,518 | | | NR | | Series 4316, Class XZ, 4.500% due 3/15/44 | | | 323,325 | |
| | 168,894 | | | NR | | Series 4335, Class SW, 5.492% due 5/15/44(b)(i) | | | 31,005 | |
| | 171,173 | | | NR | | Series R007, Class ZA, 6.000% due 5/15/36 | | | 194,218 | |
| | | | | | Federal National Mortgage Association (FNMA), ACES: | | | | |
| | 513,065 | | | NR | | Series 2006-M2, Class A2A, 5.271% due 10/25/32(b) | | | 568,712 | |
| | 20,874,964 | | | NR | | Series 2013-M7, Class X2, 0.303% due 12/27/22(b)(i) | | | 242,797 | |
| | 385,776 | | | NR | | Series 2014-M12, Class FA, 0.773% due 10/25/21(b) | | | 386,162 | |
| | 100,000 | | | NR | | Series 2015-M7, Class AB2, 2.502% due 12/25/24 | | | 102,631 | |
| | 6,567,683 | | | NR | | Series 2015-M7, Class X2, 0.628% due 12/25/24(b)(i) | | | 244,154 | |
| | 21,489,518 | | | NR | | Series 2015-M8, Class X2, 0.279% due 1/25/25(b)(i) | | | 278,612 | |
| | 190,000 | | | NR | | Series 2016-M5, Class A2, 2.469% due 4/25/26 | | | 195,729 | |
| | 400,000 | | | NR | | Series 2016-M7, Class A2, 2.499% due 9/25/26 | | | 407,184 | |
| | | | | | Federal National Mortgage Association (FNMA), Grantor Trust: | | | | |
| | 105,236 | | | NR | | Series 2000-T6, Class A3, 4.195% due 6/25/30(b) | | | 108,975 | |
| | 7,161 | | | NR | | Series 2002-T6, Class A1, 3.310% due 2/25/32 | | | 7,223 | |
| | | | | | Federal National Mortgage Association (FNMA), Interest Strip: | | | | |
| | 261,091 | | | NR | | Series 409, Class C13, 3.500% due 11/25/41(i) | | | 36,448 | |
| | 491,950 | | | NR | | Series 409, Class C18, 4.000% due 4/25/42(i) | | | 80,547 | |
| | 77,524 | | | NR | | Series 409, Class C22, 4.500% due 11/25/39(i) | | | 11,946 | |
| | | | | | Federal National Mortgage Association (FNMA), REMICS: | | | | |
| | 53,468 | | | NR | | Series 2004-38, Class FK, 0.874% due 5/25/34(b) | | | 53,368 | |
| | 322,703 | | | NR | | Series 2005-117, Class LC, 5.500% due 11/25/35 | | | 348,726 | |
| | 1,188,261 | | | NR | | Series 2006-51, Class SP, 6.126% due 3/25/36(b)(i) | | | 211,559 | |
| | 584,671 | | | NR | | Series 2007-68, Class SC, 6.176% due 7/25/37(b)(i) | | | 113,762 | |
| | 1,217,802 | | | NR | | Series 2008-18, Class SM, 6.476% due 3/25/38(b)(i) | | | 208,724 | |
| | 674,752 | | | NR | | Series 2011-87, Class SG, 6.026% due 4/25/40(b)(i) | | | 110,550 | |
| | 383,793 | | | NR | | Series 2011-90, Class QI, 5.000% due 5/25/34(i) | | | 31,018 | |
| | 770,000 | | | NR | | Series 2011-131, Class PB, 4.500% due 12/25/41 | | | 892,877 | |
| | 233,031 | | | NR | | Series 2012-46, Class BA, 6.000% due 5/25/42 | | | 266,577 | |
| | 362,493 | | | NR | | Series 2012-51, Class B, 7.000% due 5/25/42 | | | 423,068 | |
| | 52,813 | | | NR | | Series 2012-70, Class YS, 6.126% due 2/25/41(b)(i) | | | 6,613 | |
| | 269,841 | | | NR | | Series 2012-74, Class SA, 6.126% due 3/25/42(b)(i) | | | 49,022 | |
| | 44,974 | | | NR | | Series 2012-75, Class AO, zero coupon, due 3/25/42(j) | | | 40,955 | |
| | 439,041 | | | NR | | Series 2012-118, Class CI, 3.500% due 12/25/39(i) | | | 43,754 | |
| | 71,189 | | | NR | | Series 2012-128, Class SL, 5.626% due 11/25/42(b)(i) | | | 14,482 | |
| | 141,209 | | | NR | | Series 2012-128, Class SQ, 5.626% due 11/25/42(b)(i) | | | 30,461 | |
| | 196,545 | | | NR | | Series 2012-133, Class CS, 5.626% due 12/25/42(b)(i) | | | 35,157 | |
| | 68,114 | | | NR | | Series 2012-133, Class SA, 5.626% due 12/25/42(b)(i) | | | 12,929 | |
| | 820,213 | | | NR | | Series 2013-9, Class BC, 6.500% due 7/25/42 | | | 948,825 | |
| | 649,603 | | | NR | | Series 2013-9, Class CB, 5.500% due 4/25/42 | | | 734,248 | |
| | 417,450 | | | NR | | Series 2013-10, Class JS, 5.626% due 2/25/43(b)(i) | | | 76,862 | |
| | 409,949 | | | NR | | Series 2013-10, Class SJ, 5.626% due 2/25/43(b)(i) | | | 91,048 | |
See Notes to Financial Statements.
174
| | | | | | | | | | |
| Core Fixed Income Fund | |
| | | |
Face
Amount/Units† | | | Rating†† | | Security | | Value | |
| | | | | | FHLMC Multifamily Structured Pass Through Certificates: | | | | |
| $ | 261,218 | | | AAA(h) | | Series K016, Class X1, 1.701% due 10/25/21(b)(i) | | $ | 17,141 | |
| | 190,000 | | | AAA(h) | | Series K043, Class A2, 3.062% due 12/25/24 | | | 205,395 | |
| | 168,162 | | | AAA(h) | | Series K053, Class A2, 2.995% due 12/25/25 | | | 181,492 | |
| | 655,000 | | | NR | | Series K151, Class A3, 3.511% due 4/25/30 | | | 734,570 | |
| | 995,474 | | | Aa2(c) | | Series KF02, Class A2, 1.074% due 7/25/20(b) | | | 997,352 | |
| | 315,000 | | | NR | | Series KSCT, Class A2, 4.285% due 1/25/20 | | | 344,073 | |
| | 805,000 | | | AAA | | Ford Credit Floorplan Master Owner Trust, Series 2012-5, Class A, 1.490% due 9/15/19 | | | 807,540 | |
| | 565,000 | | | AAA | | Four Times Square Trust Commercial Mortgage Pass Through Certificates, Series 2006-4TS, Class A, 5.401% due 12/13/28(a) | | | 637,171 | |
| | 60,000 | | | BBB+(h) | | FREMF Mortgage Trust, Series 2015-K47, Class B, 3.724% due 6/25/48(a)(b) | | | 59,606 | |
| | | | | | GAHR Commercial Mortgage Trust, Series 2015-NRF: | | | | |
| | 648,997 | | | AAA | | Class AFL1, 1.808% due 12/15/34(a)(b) | | | 652,592 | |
| | 505,000 | | | BBB- | | Class DFX, 3.495% due 12/15/34(a)(b) | | | 508,722 | |
| | 194,098 | | | BB+ | | GE Business Loan Trust, Series 2006-1A, Class C, 0.928% due 5/15/34(a)(b) | | | 164,714 | |
| | 74,218 | | | A+ | | GMAC Home Equity Notes Loan Trust, Series 2004-VF1, Class A1, 1.238% due 2/25/31(a)(b) | | | 73,855 | |
| | | | | | Government National Mortgage Association (GNMA): | | | | |
| | 2,411,340 | | | NR | | Series 2008-51, Class GS, 5.723% due 6/16/38(b)(i) | | | 539,608 | |
| | 47,532 | | | NR | | Series 2010-31, Class GS, 5.988% due 3/20/39(b)(i) | | | 3,126 | |
| | 145,468 | | | NR | | Series 2010-85, Class HS, 6.138% due 1/20/40(b)(i) | | | 15,714 | |
| | 31,868 | | | NR | | Series 2010-107, Class SG, 5.638% due 2/20/38(b)(i) | | | 1,183 | |
| | 3,603,975 | | | NR | | Series 2013-85, Class IA, 0.753% due 3/16/47(b)(i) | | | 171,652 | |
| | 2,444,950 | | | NR | | Series 2014-105, Class IO, 1.085% due 6/16/54(b)(i) | | | 167,353 | |
| | 182,001 | | | NR | | Series 2015-167, Class OI, 4.000% due 4/16/45(i) | | | 37,774 | |
| | 350,000 | | | Aa2(c) | | GS Mortgage Securities Corp. II, Series 2015-GC30, Class AS, 3.777% due 5/10/50 | | | 379,011 | |
| | | | | | GS Mortgage Securities Trust: | | | | |
| | 632,224 | | | BBB- | | Series 2007-GG10, Class A1A, 5.988% due 8/10/45(b) | | | 644,538 | |
| | 5,485,920 | | | Aa1(c) | | Series 2015-GS1, Class XA, 0.987% due 11/10/48(b)(i) | | | 329,800 | |
| | | | | | Harborview Mortgage Loan Trust: | | | | |
| | 390,450 | | | BBB+ | | Series 2004-5, Class 2A6, 2.785% due 6/19/34(b) | | | 389,117 | |
| | 143,511 | | | WD(h) | | Series 2006-2, Class 1A, 3.087% due 2/25/36(b) | | | 118,253 | |
| | 287,975 | | | A+ | | HSI Asset Securitization Corp. Trust, Series 2006-OPT1, Class 2A3, 0.714% due 12/25/35(b) | | | 286,009 | |
| | 2,402 | | | AA+ | | Impac CMB Trust, Series 2003-1, Class 1A1, 1.324% due 3/25/33(b) | | | 2,337 | |
| | 75,916 | | | D | | Indymac Index Mortgage Loan Trust, Series 2005-AR15, Class A2, 3.020% due 9/25/35(b) | | | 64,029 | |
| | 1,178,478 | | | CCC | | IXIS Real Estate Capital Trust, Series 2006-HE2, Class A3, 0.684% due 8/25/36(b) | | | 459,564 | |
| | | | | | JPMBB Commercial Mortgage Securities Trust: | | | | |
| | 80,000 | | | A3(c) | | Series 2013-C15, Class C, 5.215% due 11/15/45(b) | | | 89,281 | |
| | 40,000 | | | Aa3(c) | | Series 2013-C17, Class B, 5.050% due 1/15/47(b) | | | 46,023 | |
| | 350,000 | | | BB(h) | | Series 2014-C23, Class E, 3.364% due 9/15/47(a)(b) | | | 233,580 | |
| | 240,000 | | | A3(c) | | Series 2014-C24, Class C, 4.573% due 11/15/47(b) | | | 256,423 | |
| | 120,000 | | | Aaa(c) | | Series 2015-C31, Class A3, 3.801% due 8/15/48 | | | 133,036 | |
| | | | | | JPMorgan Chase Commercial Mortgage Securities Trust: | | | | |
| | 21,687 | | | AA+ | | Series 2006-LDP9, Class A3, 5.336% due 5/15/47 | | | 21,738 | |
| | 960,000 | | | CCC | | Series 2007-CB18, Class AJ, 5.502% due 6/12/47(b) | | | 852,840 | |
| | 390,000 | | | BBB- | | Series 2007-CB20, Class AM, 6.089% due 2/12/51(b) | | | 404,443 | |
| | 3,532 | | | AAA | | Series 2011-C3, Class A2, 3.673% due 2/15/46(a) | | | 3,534 | |
| | 814,352 | | | AAA | | Series 2011-C4, Class A3, 4.106% due 7/15/46(a) | | | 846,548 | |
| | 140,000 | | | Aaa(c) | | Series 2011-C5, Class A3, 4.171% due 8/15/46 | | | 152,563 | |
| | 175,000 | | | Aaa(c) | | Series 2011-C5, Class AS, 5.508% due 8/15/46(a)(b) | | | 201,029 | |
| | 370,000 | | | Aa2(c) | | Series 2011-C5, Class B, 5.508% due 8/15/46(a)(b) | | | 421,791 | |
| | 2,190,663 | | | Aaa(c) | | Series 2012-CBX, Class XA, 1.838% due 6/15/45(b)(i) | | | 138,266 | |
| | 460,000 | | | AA | | Series 2012-HSBC, Class C, 4.021% due 7/5/32(a) | | | 474,340 | |
| | 650,000 | | | AA- | | Series 2014-FL6, Class B, 2.788% due 11/15/31(a)(b) | | | 638,533 | |
| | 150,000 | | | A- | | Series 2014-PHH, Class C, 2.608% due 8/15/27(a)(b) | | | 149,617 | |
| | 300,000 | | | AAA | | Series 2015-SGP, Class A, 2.208% due 7/15/36(a)(b) | | | 302,665 | |
| | 647,617 | | | Aa1(c) | | JPMorgan Trust, Series 2015-5, Class A9, 2.897% due 5/25/45(a)(b) | | | 644,844 | |
See Notes to Financial Statements.
175
| | | | | | | | | | |
| Core Fixed Income Fund | |
| | | |
Face
Amount/Units† | | | Rating†† | | Security | | Value | |
| | | | | | LB-UBS Commercial Mortgage Trust: | | | | |
| $ | 710,000 | | | AA- | | Series 2006-C7, Class AM, 5.378% due 11/15/38 | | $ | 711,256 | |
| | 500,000 | | | BB | | Series 2007-C6, Class AM, 6.114% due 7/15/40(b) | | | 513,482 | |
| | 160,000 | | | A- | | Series 2007-C7, Class AM, 6.365% due 9/15/45(b) | | | 167,383 | |
| | 97,580 | | | D | | Lehman XS Trust, Series 2005-7N, Class 1A1B, 0.824% due 12/25/35(b) | | | 61,232 | |
| | 630,000 | | | AAA | | Limerock CLO II Ltd., Series 2014-2A, Class A, 2.179% due 4/18/26(a)(b) | | | 630,013 | |
| | 372,610 | | | AAA | | Lone Star Portfolio Trust, Series 2015-LSP, Class A1A2, 2.308% due 9/15/28(a)(b) | | | 378,779 | |
| | 760,000 | | | Aaa(c) | | Magnetite IX Ltd., Series 2014-9A, Class A1, 2.135% due 7/25/26(a)(b) | | | 759,988 | |
| | 174,693 | | | A+ | | MASTR Adjustable Rate Mortgages Trust, Series 2004-13, Class 3A7, 3.028% due 11/21/34(b) | | | 178,733 | |
| | 574,161 | | | AA+ | | MASTR Seasoned Securitization Trust, Series 2005-1, Class 4A1, 2.759% due 10/25/32(b) | | | 574,950 | |
| | 371,524 | | | CCC | | Merrill Lynch First Franklin Mortgage Loan Trust, Series 2007-4, Class 2A4, 0.774% due 7/25/37(b) | | | 242,429 | |
| | | | | | Merrill Lynch Mortgage Investors Trust: | | | | |
| | 52,977 | | | A+ | | Series 2004-A3, Class 4A3, 3.170% due 5/25/34(b) | | | 52,604 | |
| | 801,999 | | | BBB | | Series 2005-2, Class 2A, 2.710% due 10/25/35(b) | | | 804,175 | |
| | 823,599 | | | AA+ | | Mid-State Capital Corp. Trust, Series 2004-1, Class A, 6.005% due 8/15/37 | | | 900,784 | |
| | | | | | ML-CFC Commercial Mortgage Trust: | | | | |
| | 291,000 | | | Caa1(c) | | Series 2007-5, Class AJ, 5.450% due 8/12/48(b) | | | 238,980 | |
| | 260,000 | | | CCC | | Series 2007-9, Class AJ, 6.193% due 9/12/49(b) | | | 211,048 | |
| | 17,068 | | | AAA | | Morgan Stanley ABS Capital I Inc. Trust, Series 2004-SD3, Class A, 0.984% due 6/25/34(a)(b)(q) | | | 17,120 | |
| | | | | | Morgan Stanley Bank of America Merrill Lynch Trust: | | | | |
| | 30,000 | | | Aaa(c) | | Series 2013-C10, Class A4, 4.219% due 7/15/46(b)(q) | | | 33,790 | |
| | 500,000 | | | Aaa(c) | | Series 2013-C13, Class A4, 4.039% due 11/15/46(q) | | | 562,320 | |
| | | | | | Morgan Stanley Capital I Trust: | | | | |
| | 723,126 | | | AAA | | Series 2007-HQ11, Class A4FL, 0.653% due 2/12/44(b)(q) | | | 719,858 | |
| | 200,000 | | | A | | Series 2007-IQ14, Class A4, 5.692% due 4/15/49(b)(q) | | | 202,432 | |
| | 1,940,000 | | | CCC | | Park Place Securities Inc. Asset-Backed Pass-Through Certificates, Series 2005-WHQ4, Class M2, 1.014% due 9/25/35(b) | | | 1,647,843 | |
| | | | | | PFS Financing Corp.: | | | | |
| | 540,000 | | | AAA | | Series 2014-BA, Class A, 1.108% due 10/15/19(a)(b) | | | 537,909 | |
| | 635,000 | | | AAA | | Series 2015-AA, Class A, 1.128% due 4/15/20(a)(b) | | | 630,039 | |
| | 1,778,348 | | | A | | Popular ABS Mortgage Pass-Through Trust, Series 2006-C, Class A4, 0.774% due 7/25/36(b) | | | 1,727,985 | |
| | | | | | Prime Mortgage Trust: | | | | |
| | 147,548 | | | CCC | | Series 2006-DR1, Class 1A1, 5.500% due 5/25/35(a) | | | 148,030 | |
| | 49,813 | | | CCC | | Series 2006-DR1, Class 1A2, 6.000% due 5/25/35(a) | | | 50,024 | |
| | 1,211,456 | | | CCC | | Series 2006-DR1, Class 2A1, 5.500% due 5/25/35(a) | | | 1,134,964 | |
| | | | | | RAMP Trust: | | | | |
| | 3,907 | | | CCC | | Series 2003-RS4, Class AIIB, 1.184% due 5/25/33(b) | | | 3,462 | |
| | 675,773 | | | AA | | Series 2003-RS9, Class AI6A, step bond to yield, 5.829% due 10/25/33 | | | 720,207 | |
| | 915,000 | | | AAA | | RBS Commercial Funding Inc. Trust, Series 2013-GSP, Class A, 3.961% due 1/13/32(a)(b) | | | 1,009,958 | |
| | 23,650 | | | D | | Reperforming Loan REMIC Trust, Series 2004-R2, Class 1AF1, 0.944% due 11/25/34(a)(b) | | | 20,108 | |
| | 354,059 | | | Caa2(c) | | Residential Asset Securitization Trust, Series 2005-A15, Class 1A4, 5.750% due 2/25/36 | | | 334,044 | |
| | 640,000 | | | AAA | | SCG Trust, Series 2013-SRP1, Class A, 1.908% due 11/15/26(a)(b) | | | 640,033 | |
| | 182,153 | | | NR | | Small Business Administration Participation Certificates, Series 2013-20J, Class 1, 3.370% due 10/1/33 | | | 193,895 | |
| | 1,000,000 | | | BBB | | Solarcity Lmc Series VI LLC, Series 2016-A, Class A, 4.800% due 9/20/48(a) | | | 970,719 | |
| | 341,722 | | | BBB+ | | Structured Adjustable Rate Mortgage Loan Trust, Series 2004-16, Class 1A2, 2.950% due 11/25/34(b) | | | 341,841 | |
| | 189,396 | | | AA+ | | Structured Asset Mortgage Investments II Trust, Series 2005-AR5, Class A3, 0.764% due 7/19/35(b) | | | 183,849 | |
| | | | | | Structured Asset Securities Corp.: | | | | |
| | 165,000 | | | CCC | | Series 2005-RF3, Class 1A, 0.874% due 6/25/35(a)(b) | | | 133,250 | |
| | 68,653 | | | AA+ | | Series 2007-BC4, Class A3, 0.774% due 11/25/37(b) | | | 68,759 | |
| | 611,732 | | | Aaa(c) | | Towd Point Mortgage Trust, Series 2016-3, Class A1, 2.250% due 8/25/55(a)(b) | | | 612,064 | |
| | 100,000 | | | AAA | | VNDO Mortgage Trust, Series 2012-6AVE, Class A, 2.996% due 11/15/30(a) | | | 105,257 | |
See Notes to Financial Statements.
176
| | | | | | | | | | |
| Core Fixed Income Fund | |
| | | |
Face
Amount/Units† | | | Rating†† | | Security | | Value | |
| $ | 485,000 | | | B | | Wachovia Bank Commercial Mortgage Trust, Series 2007-C32, Class AMFX, 5.703% due 6/15/49(a) | | $ | 494,505 | |
| | 100,000 | | | AAA | | Waldorf Astoria Boca Raton Trust, Series 2016-BOCA, Class A, 1.858% due 6/15/29(a)(b) | | | 100,047 | |
| | | | | | WaMu Mortgage Pass Through Certificates Trust: | | | | |
| | 20,993 | | | BBB+ | | Series 2004-AR11, Class A, 2.713% due 10/25/34(b) | | | 21,166 | |
| | 83,466 | | | BBB+ | | Series 2004-AR12, Class A2A, 0.914% due 10/25/44(b) | | | 80,919 | |
| | 689,939 | | | B- | | Series 2005-AR4, Class A5, 2.784% due 4/25/35(b) | | | 684,965 | |
| | 263,572 | | | AA+ | | Series 2005-AR11, Class A1A, 0.844% due 8/25/45(b) | | | 245,903 | |
| | 253,326 | | | BBB- | | Series 2005-AR19, Class A1A2, 0.814% due 12/25/45(b) | | | 233,806 | |
| | 1,346,892 | | | B+ | | Series 2006-AR3, Class A1A, 1.489% due 2/25/46(b) | | | 1,234,242 | |
| | 659,928 | | | CCC | | Series 2006-AR13, Class 2A, 2.190% due 10/25/46(b) | | | 593,239 | |
| | 341,602 | | | D | | Series 2007-HY4, Class 4A1, 2.496% due 9/25/36(b) | | | 306,805 | |
| | 773,049 | | | Ca(c) | | Series 2007-OA2, Class 2A, 1.189% due 1/25/47(b) | | | 563,391 | |
| | | | | | Wells Fargo Commercial Mortgage Trust: | | | | |
| | 120,000 | | | Aa3(c) | | Series 2013-LC12, Class B, 4.433% due 7/15/46(b) | | | 133,645 | |
| | 1,000,000 | | | Aa2(c) | | Series 2015-C28, Class AS, 3.872% due 5/15/48 | | | 1,096,444 | |
| | 150,000 | | | Aaa(c) | | Series 2015-LC20, Class A5, 3.184% due 4/15/50 | | | 159,222 | |
| | 960,000 | | | Aaa(c) | | Series 2015-NXS1, Class A5, 3.148% due 5/15/48 | | | 1,019,880 | |
| | 310,000 | | | A-(h) | | Series 2015-NXS1, Class C, 3.848% due 5/15/48(b) | | | 312,894 | |
| | 330,000 | | | BBB-(h) | | Series 2015-NXS1, Class D, 4.241% due 5/15/48(b) | | | 276,090 | |
| | | | | | Wells Fargo Mortgage Backed Securities Trust: | | | | |
| | 495,753 | | | Caa1(c) | | Series 2006-12, Class A3, 6.000% due 10/25/36 | | | 483,683 | |
| | 236,915 | | | CCC | | Series 2006-AR2, Class 2A1, 2.870% due 3/25/36(b) | | | 233,364 | |
| | 67,871 | | | Caa2(c) | | Series 2006-AR7, Class 2A4, 3.087% due 5/25/36(b) | | | 64,763 | |
| | | | | | WF-RBS Commercial Mortgage Trust: | | | | |
| | 205,000 | | | Aaa(c) | | Series 2011-C2, Class A4, 4.869% due 2/15/44(a)(b) | | | 229,707 | |
| | 915,184 | | | Aaa(c) | | Series 2011-C4, Class A3, 4.394% due 6/15/44(a) | | | 959,208 | |
| | 1,874,955 | | | Aaa(c) | | Series 2012-C7, Class XA, 1.663% due 6/15/45(a)(b)(i) | | | 122,344 | |
| | 145,000 | | | Aaa(c) | | Series 2013-C14, Class A4, 3.073% due 6/15/46 | | | 153,770 | |
| | 2,570,650 | | | Aaa(c) | | Series 2014-C20, Class XA, 1.348% due 5/15/47(b)(i) | | | 152,548 | |
| | 240,000 | | | BBB-(h) | | Series 2014-C22, Class D, 4.056% due 9/15/57(a)(b) | | | 188,470 | |
| | | | | | | | | | |
| | | | | | TOTAL COLLATERALIZED MORTGAGE OBLIGATIONS
(Cost — $89,547,388) | | | 86,984,235 | |
| | | | | | | | | | |
| SOVEREIGN BONDS — 2.8% | |
| Brazil — 0.4% | |
| | 656,000 | BRL | | BB | | Brazil Notas do Tesouro Nacional Serie B, 6.000% due 8/15/50 | | | 610,485 | |
| | 4,266,000 | BRL | | BB | | Brazil Notas do Tesouro Nacional Serie F, 10.000% due 1/1/17 | | | 1,330,049 | |
| | | | | | Federative Republic of Brazil: | | | | |
| | 280,000 | | | BB | | 4.875% due 1/22/21 | | | 298,200 | |
| | 400,000 | | | BB | | 5.000% due 1/27/45 | | | 374,000 | |
| | | | | | | | | | |
| | | | | | Total Brazil | | | 2,612,734 | |
| | | | | | | | | | |
| Canada — 0.1% | |
| | 152,000 | | | AA- | | Province of Manitoba Canada, 3.050% due 5/14/24 | | | 163,884 | |
| | 895,000 | | | A+ | | Province of Ontario Canada, 1.250% due 6/17/19 | | | 893,865 | |
| | | | | | | | | | |
| | | | | | Total Canada | | | 1,057,749 | |
| | | | | | | | | | |
| China — 0.0% | |
| | | | | | China Government Bonds: | | | | |
| | 1,000,000 | CNH | | Aa3(c) | | 3.380% due 11/21/24 | | | 152,517 | |
| | 1,000,000 | CNH | | Aa3(c) | | 3.390% due 5/21/25 | | | 152,391 | |
| | | | | | | | | | |
| | | | | | Total China | | | 304,908 | |
| | | | | | | | | | |
| Colombia — 0.1% | |
| | 370,000 | | | BBB | | Colombia Government International Bond, 5.625% due 2/26/44 | | | 428,738 | |
| | | | | | | | | | |
| Indonesia — 0.1% | |
| | 500,000 | | | BB+ | | Indonesia Government International Bond, 3.750% due 4/25/22 | | | 528,297 | |
| | | | | | | | | | |
See Notes to Financial Statements.
177
| | | | | | | | | | |
| Core Fixed Income Fund | |
| | | |
Face
Amount/Units† | | | Rating†† | | Security | | Value | |
| Mexico — 1.0% | |
| | | | | | Mexican Bonos: | | | | |
| | 2,118,000 | MXN | | A | | 8.000% due 6/11/20 | | $ | 122,274 | |
| | 30,492,700 | MXN | | A | | 6.500% due 6/9/22 | | | 1,689,965 | |
| | 15,120,000 | MXN | | A | | 10.000% due 12/5/24 | | | 1,029,465 | |
| | 46,325,700 | MXN | | A | | 7.750% due 11/13/42 | | | 2,910,170 | |
| | | | | | Mexico Government International Bonds: | | | | |
| $ | 61,000 | | | BBB+ | | 3.500% due 1/21/21 | | | 65,346 | |
| | 174,000 | | | BBB+ | | 3.625% due 3/15/22 | | | 185,963 | |
| | 78,000 | | | BBB+ | | 6.050% due 1/11/40 | | | 101,205 | |
| | 828,000 | | | BBB+ | | 4.750% due 3/8/44 | | | 913,905 | |
| | 300,000 | | | BBB+ | | 5.550% due 1/21/45 | | | 370,875 | |
| | | | | | | | | | |
| | | | | | Total Mexico | | | 7,389,168 | |
| | | | | | | | | | |
| Panama — 0.0% | |
| | 200,000 | | | BBB | | Panama Government International Bond, 4.000% due 9/22/24 | | | 220,500 | |
| | | | | | | | | | |
| Peru — 0.1% | |
| | | | | | Peruvian Government International Bonds: | | | | |
| | 218,000 | | | BBB+ | | 4.125% due 8/25/27 | | | 248,520 | |
| | 60,000 | | | BBB+ | | 6.550% due 3/14/37 | | | 84,900 | |
| | 170,000 | | | BBB+ | | 5.625% due 11/18/50 | | | 224,400 | |
| | | | | | | | | | |
| | | | | | Total Peru | | | 557,820 | |
| | | | | | | | | | |
| Poland — 0.5% | |
| | | | | | Poland Government Bonds: | | | | |
| | 570,000 | PLN | | A- | | 2.000% due 4/25/21 | | | 145,536 | |
| | 8,160,000 | PLN | | A- | | 3.250% due 7/25/25 | | | 2,183,380 | |
| | 1,760,000 | PLN | | A- | | 2.500% due 7/25/26 | | | 441,204 | |
| | 610,000 | | | BBB+ | | Poland Government International Bond, 4.000% due 1/22/24 | | | 678,224 | |
| | | | | | | | | | |
| | | | | | Total Poland | | | 3,448,344 | |
| | | | | | | | | | |
| Russia — 0.4% | |
| | | | | | Russian Federal Bonds — OFZ: | | | | |
| | 22,990,000 | RUB | | BBB- | | 7.000% due 8/16/23 | | | 332,298 | |
| | 6,950,000 | RUB | | NR | | 7.750% due 9/16/26 | | | 104,300 | |
| | 31,310,000 | RUB | | BBB- | | 8.150% due 2/3/27 | | | 484,365 | |
| | 78,320,000 | RUB | | BBB- | | 7.050% due 1/19/28 | | | 1,115,757 | |
| | | | | | Russian Foreign Bonds — Eurobonds: | | | | |
| | 200,000 | | | BB+ | | 4.875% due 9/16/23(a) | | | 219,126 | |
| | 339,565 | | | BB+ | | step bond to yield, 7.500% due 3/31/30 | | | 413,420 | |
| | 39,550 | | | BB+ | | step bond to yield, 7.500% due 3/31/30(a) | | | 48,152 | |
| | | | | | | | | | |
| | | | | | Total Russia | | | 2,717,418 | |
| | | | | | | | | | |
| Turkey — 0.1% | |
| | | | | | Turkey Government International Bonds: | | | | |
| | 280,000 | | | Baa3(c) | | 7.375% due 2/5/25 | | | 337,455 | |
| | 310,000 | | | Baa3(c) | | 4.250% due 4/14/26 | | | 305,824 | |
| | | | | | | | | | |
| | | | | | Total Turkey | | | 643,279 | |
| | | | | | | | | | |
| Uruguay — 0.0% | |
| | | | | | Uruguay Government International Bonds: | | | | |
| | 70,000 | | | BBB | | 4.500% due 8/14/24 | | | 78,470 | |
| | 210,000 | | | BBB | | 4.375% due 10/27/27 | | | 228,900 | |
| | | | | | | | | | |
| | | | | | Total Uruguay | | | 307,370 | |
| | | | | | | | | | |
| | | | | | TOTAL SOVEREIGN BONDS
(Cost — $22,005,661) | | | 20,216,325 | |
| | | | | | | | | | |
See Notes to Financial Statements.
178
| | | | | | | | | | |
| Core Fixed Income Fund | |
| | | |
Face
Amount/Units† | | | Rating†† | | Security | | Value | |
| ASSET-BACKED SECURITIES — 2.3% | |
| Automobiles — 0.3% | |
| $ | 170,000 | | | AAA | | AmeriCredit Automobile Receivables Trust, Series 2016-2, Class A3, 1.600% due 11/9/20 | | $ | 170,295 | |
| | 290,000 | | | AAA | | Drive Auto Receivables Trust, Series 2016-BA, Class A3, 1.670% due 7/15/19(a) | | | 289,870 | |
| | 1,380,000 | | | Aaa(c) | | Hertz Vehicle Financing LLC, Series 2013-1A, Class A2, 1.830% due 8/25/19(a) | | | 1,373,199 | |
| | 100,000 | | | AAA | | Hyundai Floorplan Master Owner Trust, Series 2016-1A, Class A2, 1.810% due 3/15/21(a) | | | 100,244 | |
| | | | | | | | | | |
| | | | | | Total Automobiles | | | 1,933,608 | |
| | | | | | | | | | |
| Credit Cards — 0.4% | |
| | 635,000 | | | AAA | | BA Credit Card Trust, Series 2014-A3, Class A, 0.798% due 1/15/20(b) | | | 635,833 | |
| | 740,000 | | | AAA | | Capital One Multi-Asset Execution Trust, Series 2016-A4, Class A4, 1.330% due 6/15/22 | | | 740,041 | |
| | 590,000 | | | AAA | | Chase Issuance Trust, Series 2015-A1, Class A1, 0.828% due 2/18/20(b) | | | 591,450 | |
| | 635,000 | | | AAA | | Citibank Credit Card Issuance Trust, Series 2008-A2, Class A2, 1.671% due 1/23/20(b) | | | 643,775 | |
| | 645,000 | | | AAA | | Discover Card Execution Note Trust, Series 2016-A1, Class A1, 1.640% due 7/15/21 | | | 650,192 | |
| | | | | | | | | | |
| | | | | | Total Credit Cards | | | 3,261,291 | |
| | | | | | | | | | |
| Student Loans — 1.6% | |
| | 528,126 | | | AA+ | | CIT Education Loan Trust, Series 2007-1, Class A, 0.730% due 3/25/42(a)(b) | | | 484,241 | |
| | 850,000 | | | AA+ | | EFS Volunteer LLC, Series 2010-1, Class A2, 1.565% due 10/25/35(a)(b) | | | 834,033 | |
| | | | | | Navient Private Education Loan Trust: | | | | |
| | 630,000 | | | AAA | | Series 2014-AA, Class A2B, 1.758% due 2/15/29(a)(b) | | | 628,725 | |
| | 232,914 | | | AAA | | Series 2014-CTA, Class A, 1.208% due 9/16/24(a)(b) | | | 231,803 | |
| | | | | | SLM Private Education Loan Trust: | | | | |
| | 107,361 | | | AAA | | Series 2012-A, Class A1, 1.908% due 8/15/25(a)(b) | | | 107,590 | |
| | 687,989 | | | AAA | | Series 2012-C, Class A2, 3.310% due 10/15/46(a) | | | 700,791 | |
| | 631,642 | | | AAA | | Series 2012-D, Class A2, 2.950% due 2/15/46(a) | | | 640,033 | |
| | 76,384 | | | AAA | | Series 2012-E, Class A1, 1.258% due 10/16/23(a)(b) | | | 76,321 | |
| | | | | | SLM Student Loan Trust: | | | | |
| | 1,220,000 | | | AAA | | Series 2003-11, Class A6, 1.403% due 12/15/25(a)(b) | | | 1,206,002 | |
| | 1,400,000 | | | AAA | | Series 2004-1, Class A4, 0.975% due 10/27/25(b) | | | 1,336,129 | |
| | 412,328 | | | AAA | | Series 2004-8A, Class A5, 1.215% due 4/25/24(a)(b) | | | 409,935 | |
| | 880,000 | | | AA+ | | Series 2005-5, Class A5, 1.465% due 10/25/40(b) | | | 807,073 | |
| | 866,988 | | | AAA | | Series 2005-6, Class A5B, 1.915% due 7/27/26(b) | | | 869,761 | |
| | 1,006,798 | | | AAA | | Series 2011-2, Class A1, 1.124% due 11/25/27(b) | | | 1,003,610 | |
| | | | | | SMB Private Education Loan Trust: | | | | |
| | 514,651 | | | AAA | | Series 2015-B, Class A1, 1.208% due 2/15/23(a)(b) | | | 515,226 | |
| | 680,000 | | | AAA | | Series 2015-B, Class A2A, 2.980% due 7/15/27(a) | | | 698,536 | |
| | 545,000 | | | AAA | | Series 2015-C, Class A3, 2.458% due 8/16/32(a)(b) | | | 559,999 | |
| | 100,000 | | | Aaa(c) | | Series 2016-A, Class A2A, 2.700% due 5/15/31(a) | | | 100,896 | |
| | | | | | | | | | |
| | | | | | Total Student Loans | | | 11,210,704 | |
| | | | | | | | | | |
| | | | | | TOTAL ASSET-BACKED SECURITIES
(Cost — $16,411,737) | | | 16,405,603 | |
| | | | | | | | | | |
| MUNICIPAL BONDS — 0.8% | |
| California — 0.2% | |
| | 80,000 | | | AA- | | California Health Facilities Financing Authority, Revenue Bonds, Sutter Health Project, Series A, 5.000% due 8/15/52 | | | 94,572 | |
| | | | | | State of California, GO: | | | | |
| | 100,000 | | | AA- | | 5.000% due 12/1/37 | | | 105,231 | |
| | 150,000 | | | AA- | | 5.000% due 9/1/42 | | | 180,426 | |
| | | | | | University of California, Revenue Bonds: | | | | |
| | 400,000 | | | AA | | Series AJ 4.601% due 5/15/31 | | | 467,496 | |
| | 90,000 | | | AA- | | Series G 5.000% due 5/15/37 | | | 107,773 | |
| | 25,000 | | | AA | | Series AD 4.858% due 5/15/12 | | | 28,647 | |
| | 266,000 | | | AA | | Series AQ 4.767% due 5/15/15 | | | 296,194 | |
| | | | | | | | | | |
| | | | | | Total California | | | 1,280,339 | |
| | | | | | | | | | |
See Notes to Financial Statements.
179
| | | | | | | | | | |
| Core Fixed Income Fund | |
| | | |
Face
Amount/Units† | | | Rating†† | | Security | | Value | |
| Delaware — 0.0% | |
| $ | 300,000 | | | AA+ | | Northstar Education Finance Inc., Revenue Bonds, Student Loan Asset Backed Notes, Series 2007-1, GTDSTD-Insured, 1.522% due 1/29/46(b) | | $ | 267,981 | |
| | | | | | | | | | |
| Illinois — 0.1% | |
| | 280,000 | | | BBB+ | | State of Illinois, GO, 5.500% due 7/1/24 | | | 327,760 | |
| | | | | | | | | | |
| Massachusetts — 0.1% | |
| | 185,000 | | | AA- | | Massachusetts Development Finance Agency, Revenue Bonds, Series M-4, 5.000% due 7/1/44 | | | 215,973 | |
| | 100,000 | | | AA+ | | Massachusetts School Building Authority, Revenue Bonds, Series B, 5.000% due 10/15/41 | | | 118,011 | |
| | | | | | | | | | |
| | | | | | Total Massachusetts | | | 333,984 | |
| | | | | | | | | | |
| Minnesota — 0.0% | |
| | 325,000 | | | AA+ | | Northstar Education Finance Inc., Revenue Bonds, Student Loan Asset Backed Notes, Series 2007-1, GTDSTD-Insured, 1.322% due 1/29/46(b) | | | 290,312 | |
| | | | | | | | | | |
| Missouri — 0.0% | |
| | 100,000 | | | AAA | | Metropolitan St Louis Sewer District, Revenue Bonds, Series A, 5.000% due 5/1/42 | | | 118,185 | |
| | | | | | | | | | |
| Nevada — 0.1% | |
| | 435,000 | | | AA | | Las Vegas Valley Water District, GO, Series B, 5.000% due 6/1/37 | | | 518,107 | |
| | | | | | | | | | |
| New Jersey — 0.0% | |
| | 165,000 | | | A- | | New Jersey Transportation Trust Fund Authority, Revenue Bonds, Series AA, 5.000% due 6/15/36 | | | 185,196 | |
| | | | | | | | | | |
| New York — 0.2% | |
| | 500,000 | | | AA | | City of New York, GO, Series G-1, 5.968% due 3/1/36 | | | 687,500 | |
| | 80,000 | | | AAA | | New York City Transitional Finance Authority Future Tax Secured Revenue, Revenue Bonds, Series A, 5.000% due 11/1/42 | | | 96,273 | |
| | | | | | New York City Water & Sewer System, Revenue Bonds: | | | | |
| | 300,000 | | | AA+ | | Series CC 5.882% due 6/15/44 | | | 442,878 | |
| | 120,000 | | | AA+ | | Series BB 5.000% due 6/15/47 | | | 142,764 | |
| | 270,000 | | | AAA | | New York State Urban Development Corp., Revenue Bonds, Series E, 5.000% due 3/15/24 | | | 333,634 | |
| | | | | | | | | | |
| | | | | | Total New York | | | 1,703,049 | |
| | | | | | | | | | |
| Texas — 0.0% | |
| | 235,000 | | | A+ | | Dallas/Fort Worth International Airport, Revenue Bonds, Series A, 5.000% due 11/1/45(k) | | | 261,860 | |
| | | | | | | | | | |
| Virginia — 0.1% | |
| | 297,259 | | | AAA | | Virginia Housing Development Authority, Revenue Bonds, Series C, 6.000% due 6/25/34 | | | 314,143 | |
| | | | | | | | | | |
| | | | | | TOTAL MUNICIPAL BONDS
(Cost — $5,175,829) | | | 5,600,916 | |
| | | | | | | | | | |
| SENIOR LOANS — 0.2% | |
| | 45,113 | | | NR | | Berry Plastics Corp., (Restricted), 3.750% due 10/1/22 | | | 45,182 | |
| | 299,250 | | | NR | | Charter Communications Operating LLC, (Restricted), 3.500% due 1/24/23 | | | 301,223 | |
| | 204,225 | | | NR | | Gardner Denver Inc., (Restricted), 4.250% due 7/30/20 | | | 194,493 | |
| | 17,093 | | | NR | | Hilton Worldwide Finance LLC, (Restricted), 3.500% due 10/26/20 | | | 17,173 | |
| | 175,177 | | | NR | | Hilton Worldwide Holdings LLC, (Restricted), 3.096% due 10/25/23 | | | 176,293 | |
| | 203,175 | | | NR | | Michaels Stores Inc., (Restricted), 3.750% due 1/28/20 | | | 204,304 | |
| | 307,658 | | | NR | | Party City Holdings Inc., (Restricted), 4.472% due 8/19/22 | | | 308,595 | |
| | | | | | | | | | |
| | | | | | TOTAL SENIOR LOANS
(Cost — $1,253,029) | | | 1,247,263 | |
| | | | | | | | | | |
See Notes to Financial Statements.
180
| | | | | | | | | | |
| Core Fixed Income Fund | |
| | | |
| Shares/Units | | | | | Security | | Value | |
| PREFERRED STOCK — 0.0% | |
| FINANCIALS — 0.0% | |
| Banks — 0.0% | |
| | 10,300 | | | | | GMAC Capital Trust I, 6.602%(b)
(Cost — $255,440) | | $ | 260,178 | |
| | | | | | | | | | |
| | | |
Number of
Contracts | | | | | | | | |
| PURCHASED OPTIONS — 0.0% | |
| United States — 0.0% | |
| | 44 | | | | | U.S. Treasury 5-Year Note September Futures, Call @ $121.25, expires 9/2/2016, GSC | | | 10,313 | |
| | 53 | | | | | U.S. Treasury 10-Year Note October Futures, Call @ $131.25, expires 9/23/2016, GSC | | | 24,844 | |
| | 18 | | | | | U.S. Treasury 10-Year Note October Futures, Put @ $130.50, expires 9/23/2016, GSC | | | 8,437 | |
| | 19 | | | | | U.S. Treasury 10-Year Note September Futures, Call @ $131.50, expires 9/2/2016, GSC | | | 2,078 | |
| | | | | | | | | | |
| | | | | | Total United States | | | 45,672 | |
| | | | | | | | | | |
| | | | | | TOTAL PURCHASED OPTIONS
(Cost — $43,717) | | | 45,672 | |
| | | | | | | | | | |
| | | | | | TOTAL INVESTMENTS BEFORE SHORT-TERM INVESTMENTS
(Cost — $687,313,857) | | | 705,156,173 | |
| | | | | | | | | | |
| | | |
Face
Amount† | | | | | | | | |
| SHORT-TERM INVESTMENTS (m) — 10.3% | |
| MONEY MARKET FUND — 2.8% | |
| $ | 20,555,472 | | | | | Invesco STIT — Government & Agency Portfolio(n)
(Cost — $20,555,472) | | | 20,555,472 | |
| | | | | | | | | | |
| REPURCHASE AGREEMENT — 1.2% | |
| | 8,500,000 | | | | | Merrill Lynch & Pierce, Fenner & Smith Inc. repurchase agreement dated 8/31/16, 0.300% due 9/1/16, Proceeds at maturity — $8,500,071; (Fully collateralized by U.S. Treasury Note, 1.625%, due 4/30/23; Market Valued — $8,735,296)(p) | | | | |
| | | | | | (Cost — $8,500,000) | | | 8,500,000 | |
| | | | | | | | | | |
| TIME DEPOSITS — 1.2% | |
| | 3,168,256 | | | | | ANZ National Bank — London, 0.150% due 9/1/16 | | | 3,168,256 | |
| | 1,660,145 | | | | | Banco Santander SA — Frankfurt, 0.150% due 9/1/16 | | | 1,660,145 | |
| | 3,321,960 | | | | | BBH — Grand Cayman, 0.150% due 9/1/16 | | | 3,321,960 | |
| | | | | | BNP Paribas — Paris: | | | | |
| | 71,086 | EUR | | | | (0.540)% due 9/1/16 | | | 79,304 | |
| | 202,660 | | | | | 0.150% due 9/1/16 | | | 202,660 | |
| | | | | | | | | | |
| | | | | | TOTAL TIME DEPOSITS
(Cost — $8,432,325) | | | 8,432,325 | |
| | | | | | | | | | |
| U.S. GOVERNMENT OBLIGATIONS — 5.1% | |
| | | | | | U.S. Treasury Bills: | | | | |
| | 10,965,000 | | | | | 0.271% due 9/1/16(p) | | | 10,965,000 | |
| | 6,545,000 | | | | | 0.254% due 9/15/16(l)(p) | | | 6,544,353 | |
| | 19,000 | | | | | 0.230% due 9/29/16(p) | | | 18,996 | |
| | 5,360,000 | | | | | 0.338% due 10/6/16(p) | | | 5,358,242 | |
| | 8,305,000 | | | | | 0.336% due 10/13/16(p) | | | 8,301,749 | |
See Notes to Financial Statements.
181
| | | | | | | | | | |
| Core Fixed Income Fund | |
| | | |
Face
Amount† | | | | | Security | | Value | |
| U.S. GOVERNMENT OBLIGATIONS — 5.1% — (continued) | |
| $ | 5,690,000 | | | | | 0.304% due 10/20/16(p) | | $ | 5,687,646 | |
| | | | | | | | | | |
| | | | | | TOTAL U.S. GOVERNMENT OBLIGATIONS
(Cost — $36,875,986) | | | 36,875,986 | |
| | | | | | | | | | |
| | | | | | TOTAL SHORT-TERM INVESTMENTS
(Cost — $74,363,783) | | | 74,363,783 | |
| | | | | | | | | | |
| | | | | | TOTAL INVESTMENTS — 108.0%
(Cost — $761,677,640#) | | | 779,519,956 | |
| | | | | | | | | | |
| | | | | | Liabilities in Excess of Other Assets — (8.0)% | | | (57,421,962 | ) |
| | | | | | | | | | |
| | | | | | TOTAL NET ASSETS — 100.0% | | $ | 722,097,994 | |
| | | | | | | | | | |
| † | Amount denominated in U.S. dollars, unless otherwise noted. |
| †† | All ratings are by Standard & Poor’s Rating Service, unless otherwise noted. All ratings are unaudited. |
| (a) | Restricted security that may be sold to “qualified institutional buyers” pursuant to the conditions of Rule 144A under the Securities Act of 1933, as amended. This security has been deemed liquid pursuant to guidelines approved by the Board of Trustees, unless otherwise noted. |
| (b) | Variable rate security. Interest rate disclosed is that which was in effect at August 31, 2016. |
| (c) | Rating by Moody’s Investors Service. All ratings are unaudited. |
| (d) | Security is perpetual in nature and has no stated maturity date. |
| (e) | All or a portion of this security is on loan (See Note 1). |
| (g) | This security is traded on a TBA basis (see Note 1). |
| (h) | Rating by Fitch Ratings Service. All ratings are unaudited. |
| (i) | Interest only security. |
| (j) | Principal only security. |
| (k) | Income from this issue is considered a preference item for purposes of calculating the alternative minimum tax (AMT). |
| (l) | All or a portion of this security is held at the broker as collateral for open futures contracts. |
| (m) | Inclusive of all short term holdings, including collateral received from securities lending activities. Excluding such collateral, the percentage of portfolio holdings would be 7.5%. |
| (n) | Represents investment of collateral received from securities lending transactions. |
| (o) | Security is valued in good faith at fair value by or under the direction of the Board of Trustees. |
| (p) | Rate shown represents yield-to-maturity. |
| (q) | Affiliated security (See Note 2). |
| # | Aggregate cost for federal income tax purposes is $764,980,419. |
| | |
Abbreviations used in this schedule: |
| ABS | | — Asset-Based Security |
| ACES | | — Alternative Credit Enhancement Securities |
| CLO | | — Collateralized Loan Obligation |
| GO | | — General Obligation |
| GTDSTD | | — Guaranteed Student Loans |
| MASTR | | — Mortgage Asset Securitization Transactions Inc. |
| PLC | | — Public Limited Company |
| REMICS | | — Real Estate Mortgage Investment Conduit |
See Notes to Financial Statements.
182
| | | | |
Summary of Investments by Security Type^ | |
Corporate Bonds & Notes | | | 25.6 | % |
U.S. Government Agencies & Obligations | | | 25.3 | |
Mortgage-Backed Securities | | | 22.8 | |
Collateralized Mortgage Obligations | | | 11.2 | |
Sovereign Bonds | | | 2.6 | |
Asset-Backed Securities | | | 2.1 | |
Municipal Bonds | | | 0.7 | |
Senior Loans | | | 0.2 | |
Preferred Stock | | | 0.0 | * |
Purchased Options | | | 0.0 | * |
Short-Term Investments | | | 9.5 | |
| | | | |
| | | 100.0 | % |
| | | | |
| ^ | As a percentage of total investments. |
| * | Position represents less than 0.1% |
Schedule of Options Contracts Written
| | | | | | | | | | | | | | | | | | | | |
| | | | | |
Number of
Contracts | | | Security Name | | Counterparty | | | Expiration Date | | | Strike Price | | | Value | |
| United States | | | | | | | | | | | | | | | | |
| | 44 | | | U.S. Treasury 5-Year Note November Futures, Call | | | GSC | | | | 10/21/16 | | | $ | 122.25 | | | $ | 7,219 | |
| | 80 | | | U.S. Treasury 10-Year Note November Futures, Call | | | GSC | | | | 10/21/16 | | | | 132.50 | | | | 25,000 | |
| | 36 | | | U.S. Treasury 10-Year Note October Futures, Put | | | GSC | | | | 9/23/16 | | | | 128.50 | | | | 2,813 | |
| | 18 | | | U.S. Treasury Bond December Futures, Call | | | GSC | | | | 11/25/16 | | | | 178.00 | | | | 14,906 | |
| | | | | | | | | | | | | | | | | | | | |
| | | | TOTAL OPTIONS CONTRACTS WRITTEN
(Premiums received — $57,218) | | | | | | | | | | | | | | $ | 49,938 | |
| | | | | | | | | | | | | | | | | | | | |
During the year ended August 31, 2016, options contracts written transactions for Core Fixed Income Fund were as follows:
| | | | | | | | |
| | | Notional
Amount/
Number of
Contracts | | | Premiums
Received | |
Options contracts written, outstanding at August 31, 2015 | | | 5,470,630 | | | $ | 420,248 | |
Options written | | | 2,503 | | | | 724,853 | |
Options closed | | | (5,471,327 | ) | | | (622,474 | ) |
Options expired | | | (1,628 | ) | | | (465,409 | ) |
| | | | | | | | |
Options contracts written, outstanding at August 31, 2016 | | | 178 | | | $ | 57,218 | |
| | | | | | | | |
See Notes to Financial Statements.
183
Schedule of Forward Sale Commitments
| | | | | | | | |
| | |
Face
Amount | | | Security | | Value | |
| $ | 4,500,000 | | | Federal National Mortgage Association (FNMA) | | | | |
| | | | 3.500% due 10/1/46(a) | | $ | 4,736,777 | |
| | | | | | | | |
| | | | TOTAL OPEN FORWARD SALE COMMITMENTS
(Proceeds — $4,736,777) | | $ | 4,736,777 | |
| | | | | | | | |
| (a) | This security is traded on a TBA basis (see Note 1). |
At August 31, 2016, Core Fixed Income Fund had open exchange traded futures contracts as described below.
The unrealized appreciation (depreciation) on the open contracts reflected in the accompanying financial statements were as follows:
| | | | | | | | | | | | | | | | |
| Open Futures Contracts | | Number of
Contracts | | | Expiration
Date
(Month/Year) | | | Market Value | | | Unrealized
Appreciation/
(Depreciation) | |
Contracts to Buy: | | | | | | | | | | | | | | | | |
90-Day Eurodollar December Futures | | | 119 | | | | 12/17 | | | $ | 29,416,800 | | | $ | (88 | ) |
U.S. Treasury 2-Year Note December Futures | | | 26 | | | | 12/16 | | | | 5,676,125 | | | | (3,949 | ) |
U.S. Treasury 5-Year Note December Futures | | | 620 | | | | 12/16 | | | | 75,175,000 | | | | (83,613 | ) |
| | | | | | | | | | | | | | | | |
| | | | | | | | | | | | | | | (87,650 | ) |
| | | | | | | | | | | | | | | | |
Contracts to Sell: | | | | | | | | | | | | | | | | |
90-Day Eurodollar December Futures | | | 127 | | | | 12/19 | | | | 31,313,438 | | | | 7,938 | |
Euro FX Currency September Futures | | | 6 | | | | 9/16 | | | | 837,488 | | | | 20,325 | |
Euro-Bobl September Futures | | | 7 | | | | 9/16 | | | | 1,043,231 | | | | (8,434 | ) |
Euro-Bund September Futures | | | 43 | | | | 9/16 | | | | 8,029,352 | | | | (160,658 | ) |
Japan Government 10-Year Bond September Futures | | | 3 | | | | 9/16 | | | | 4,389,756 | | | | 15,076 | |
U.S. Treasury 10-Year Note December Futures | | | 315 | | | | 12/16 | | | | 41,240,391 | | | | 52,938 | |
U.S. Treasury Long Bond December Futures | | | 57 | | | | 12/16 | | | | 9,711,375 | | | | (24,641 | ) |
U.S. Ultra Long Bond December Futures | | | 19 | | | | 12/16 | | | | 2,743,125 | | | | (1,891 | ) |
U.S. Ultra Long Bond December Futures | | | 48 | | | | 12/16 | | | | 8,998,500 | | | | 3,344 | |
| | | | | | | | | | | | | | | | |
| | | | | | | | | | | | | | | (96,003 | ) |
| | | | | | | | | | | | | | | | |
Net Unrealized Depreciation on Open Exchange Traded Futures Contracts | | | | | | | | | | | | | | $ | (183,653 | ) |
| | | | | | | | | | | | | | | | |
At August 31, 2016, Core Fixed Income Fund had deposited cash of $933,381 with a broker or brokers as margin collateral on open exchange traded futures contracts.
See Notes to Financial Statements.
184
At August 31, 2016, Core Fixed Income Fund had open forward foreign currency contracts as described below.
The unrealized appreciation (depreciation) on the open contracts reflected in the accompanying financial statements were as follows:
| | | | | | | | | | | | | | | | | | | | |
| Foreign Currency | | Local Currency | | | Counterparty | | | Market
Value | | | Settlement
Date | | | Unrealized
Appreciation/
(Depreciation) | |
Contracts to Buy: | | | | | | | | | | | | | | | | | | | | |
Brazilian Real | | | 2,430,000 | | | | CITI | | | $ | 742,926 | | | | 10/14/16 | | | $ | (16,038 | ) |
British Pound | | | 346,000 | | | | CITI | | | | 454,800 | | | | 10/14/16 | | | | 6,019 | |
Canadian Dollar | | | 4,000 | | | | CITI | | | | 3,051 | | | | 10/14/16 | | | | (36 | ) |
Euro | | | 3,397,095 | | | | BCLY | | | | 3,796,837 | | | | 10/14/16 | | | | 31,429 | |
Euro | | | 697,800 | | | | CITI | | | | 779,911 | | | | 10/14/16 | | | | (10,953 | ) |
Euro | | | 1,420,000 | | | | CITI | | | | 1,587,094 | | | | 10/14/16 | | | | (21,908 | ) |
Indian Rupee | | | 148,150,000 | | | | BCLY | | | | 2,195,823 | | | | 10/14/16 | | | | 21,464 | |
Indian Rupee | | | 148,150,000 | | | | CITI | | | | 2,195,823 | | | | 10/14/16 | | | | 32,023 | |
Indian Rupee | | | 17,800,000 | | | | CITI | | | | 263,825 | | | | 10/14/16 | | | | (192 | ) |
Indonesian Rupiah | | | 8,162,370,000 | | | | BOA | | | | 611,299 | | | | 10/14/16 | | | | (8,236 | ) |
| | | | | | | | | | | | | | | | | | | | |
| | | | | | | | | | | | | | | | | | | 33,572 | |
| | | | | | | | | | | | | | | | | | | | |
Contracts to Sell: | | | | | | | | | | | | | | | | | | | | |
Brazilian Real | | | 2,430,000 | | | | CITI | | | | 742,926 | | | | 10/14/16 | | | | (28,115 | ) |
Chinese Onshore Renminbi | | | 21,675,000 | | | | BCLY | | | | 3,238,052 | | | | 10/14/16 | | | | (19,311 | ) |
Chinese Onshore Renminbi | | | 5,143,047 | | | | BCLY | | | | 768,325 | | | | 10/14/16 | | | | 1,073 | |
Chinese Onshore Renminbi | | | 9,660,000 | | | | CITI | | | | 1,443,118 | | | | 10/14/16 | | | | (6,473 | ) |
Euro | | | 1,045,683 | | | | BOA | | | | 1,168,730 | | | | 10/14/16 | | | | (10,736 | ) |
Euro | | | 6,186,000 | | | | CITI | | | | 6,913,918 | | | | 10/14/16 | | | | (60,139 | ) |
Indian Rupee | | | 148,150,000 | | | | CITI | | | | 2,195,823 | | | | 10/14/16 | | | | (20,186 | ) |
Japanese Yen | | | 161,010,000 | | | | BOA | | | | 1,558,976 | | | | 10/14/16 | | | | 48,359 | |
Japanese Yen | | | 202,967,102 | | | | CITI | | | | 1,965,225 | | | | 10/14/16 | | | | 58,880 | |
Mexican Peso | | | 30,570,000 | | | | CITI | | | | 1,619,002 | | | | 10/14/16 | | | | (10,901 | ) |
Polish Zloty | | | 2,597,000 | | | | BCLY | | | | 663,899 | | | | 10/14/16 | | | | (15,250 | ) |
| | | | | | | | | | | | | | | | | | | | |
| | | | | | | | | | | | | | | | | | | (62,799 | ) |
| | | | | | | | | | | | | | | | | | | | |
Net Unrealized Depreciation on Open Forward Foreign Currency Contracts | | | | | | | | | | | | | | | | | | $ | (29,227 | ) |
| | | | | | | | | | | | | | | | | | | | |
At August 31, 2016, Core Fixed Income Fund held the following Centrally Cleared Interest Rate Swap Contracts:
| | | | | | | | | | | | | | | | | | | | | | |
Pay/Receive
Floating Rate | | Floating Rate Index | | Fixed
Rate | | | Maturity
Date | | | Counterparty | | | Notional Amount | | | Unrealized
(Depreciation) | |
Receive | | 3-Month USD-LIBOR | | | 2.750% | | | | 02/17/2042 | | | | CITI | | | USD | 1,545,000 | | | $ | (345,343 | ) |
Receive | | 3-Month USD-LIBOR | | | 3.676% | | | | 11/15/2043 | | | | CITI | | | USD | 910,000 | | | | (407,172 | ) |
| | | | | | | | | | | | | | | | | | | | | | |
| | | | | | | | | | | | | | | | | | | | $ | (752,515 | ) |
| | | | | | | | | | | | | | | | | | | | | | |
At August 31, 2016, Core Fixed Income Fund deposited cash collateral with brokers in the amount of $241,360 for open centrally cleared swap contracts.
See Notes to Financial Statements.
185
| | | | | | |
Currency Abbreviations used in this schedule: | | Counterparty Abbreviations used in this schedule: |
| BRL | | — Brazilian Real | | BCLY | | — Barclays Bank PLC |
| CNH | | — Chinese Offshore Renminbi | | BOA | | — Bank of America |
| EUR | | — Euro | | CITI | | — Citigroup Global Markets Inc. |
| MXN | | — Mexican Peso | | GSC | | — Goldman Sachs & Co. |
| PLN | | — Polish Zloty | | | | |
| RUB | | — Russian Ruble | | | | |
See pages 250 and 251 for definitions of ratings.
See Notes to Financial Statements.
186
| | | | | | | | | | |
| High Yield Fund | |
| | | |
Face
Amount/Units† | | | Rating†† | | Security | | Value | |
| CORPORATE BONDS & NOTES — 95.5% | |
| Aerospace & Defense — 0.3% | |
| $ | 610,000 | | | BB- | | CBC Ammo LLC/CBC FinCo Inc., Senior Unsecured Notes, 7.250% due 11/15/21(a) | | $ | 570,350 | |
| | 310,000 | | | B | | LMI Aerospace Inc., Secured Notes, 7.375% due 7/15/19 | | | 316,975 | |
| | | | | | | | | | |
| | | | | | Total Aerospace & Defense | | | 887,325 | |
| | | | | | | | | | |
| Airlines — 1.5% | |
| | 625,000 | | | B | | Air Canada, Company Guaranteed Notes, 7.750% due 4/15/21(a) | | | 661,719 | |
| | 265,653 | | | BBB- | | American Airlines Class B Pass Through Trust, Series 2013-1, Pass Thru Certificates, 5.625% due 1/15/21(a) | | | 277,275 | |
| | 946,305 | | | BBB- | | American Airlines Class B Pass Through Trust, Series 2013-2, Pass Thru Certificates, 5.600% due 7/15/20(a) | | | 992,437 | |
| | 40,000 | | | BB | | American Airlines Class C Pass Through Trust, Series 2013-1, Pass Thru Certificates, 6.125% due 7/15/18(a) | | | 41,800 | |
| | 635,000 | | | BB- | | American Airlines Group Inc., Company Guaranteed Notes, 5.500% due 10/1/19(a) | | | 658,019 | |
| | 414,206 | | | BB+ | | Continental Airlines Class B Pass Through Trust, Series 2007-1, Pass Thru Certificates, 6.903% due 4/19/22 | | | 442,683 | |
| | 23,119 | | | BBB | | Continental Airlines Class B Pass Through Trust, Series 2012-2, Pass Thru Certificates, 5.500% due 10/29/20 | | | 24,420 | |
| | 44,338 | | | BBB | | Delta Air Lines Class B Pass Through Trust, Series 2007-1, Pass Thru Certificates, 8.021% due 8/10/22 | | | 50,766 | |
| | 37,075 | | | A- | | Delta Air Lines Class B Pass Through Trust, Series 2009-1, Pass Thru Certificates, 9.750% due 12/17/16 | | | 38,226 | |
| | 155,317 | | | BBB- | | United Airlines Class B Pass Through Trust, Series 2013-1, Pass Thru Certificates, 5.375% due 8/15/21 | | | 162,112 | |
| | 380,699 | | | BBB | | United Airlines Class B Pass Through Trust, Series 2014-1, Pass Thru Certificates, 4.750% due 4/11/22 | | | 388,789 | |
| | 256,756 | | | BBB- | | United Airlines Class B Pass Through Trust, Series 2014-2, Pass Thru Certificates, 4.625% due 9/3/22 | | | 259,644 | |
| | 364,482 | | | BBB- | | US Airways Class B Pass Through Trust, Series 2012-2, Pass Thru Certificates, 6.750% due 6/3/21 | | | 397,742 | |
| | 1,216,000 | | | CCC+ | | VistaJet Malta Finance PLC/VistaJet Co. Finance LLC, Company Guaranteed Notes, 7.750% due 6/1/20(a)(b) | | | 535,040 | |
| | | | | | | | | | |
| | | | | | Total Airlines | | | 4,930,672 | |
| | | | | | | | | | |
| Automobiles — 2.0% | |
| | 410,000 | | | (P)BB | | Adient Global Holdings Ltd., Company Guaranteed Notes, 4.875% due 8/15/26(a) | | | 416,663 | |
| | | | | | American Axle & Manufacturing Inc., Company Guaranteed Notes: | | | | |
| | 440,000 | | | BB- | | 5.125% due 2/15/19 | | | 448,134 | |
| | 400,000 | | | BB- | | 6.625% due 10/15/22 | | | 428,500 | |
| | 230,000 | | | BB- | | Deck Chassis Acquisition Inc., Secured Notes, 10.000% due 6/15/23(a) | | | 243,800 | |
| | 950,000 | | | BB | | Fiat Chrysler Automobiles NV, Senior Unsecured Notes, 5.250% due 4/15/23(c) | | | 983,487 | |
| | | | | | General Motors Co., Senior Unsecured Notes: | | | | |
| | 70,000 | | | BBB- | | 6.600% due 4/1/36 | | | 86,574 | |
| | 560,000 | | | BBB- | | 5.200% due 4/1/45 | | | 598,520 | |
| | 360,000 | | | BBB- | | 6.750% due 4/1/46 | | | 463,729 | |
| | 1,400,000 | | | BB | | Goodyear Tire & Rubber Co. (The), Company Guaranteed Notes, 5.125% due 11/15/23 | | | 1,470,000 | |
| | 389,639 | | | B+ | | Schaeffler Holding Finance BV, Senior Secured Notes, 6.875% (6.875% cash or 7.625% PIK) due 8/15/18(a)(d) | | | 400,354 | |
| | 860,000 | | | BB+ | | ZF North America Capital Inc., Company Guaranteed Notes, 4.750% due 4/29/25(a) | | | 915,900 | |
| | | | | | | | | | |
| | | | | | Total Automobiles | | | 6,455,661 | |
| | | | | | | | | | |
| Banks — 3.3% | |
| | | | | | Bank of America Corp., Junior Subordinated Notes: | | | | |
| | 260,000 | | | BB+ | | 5.200%(e)(f) | | | 255,567 | |
| | 2,150,000 | | | BB+ | | 6.500%(e)(f) | | | 2,346,402 | |
See Notes to Financial Statements.
187
| | | | | | | | | | |
| High Yield Fund | |
| | | |
Face
Amount/Units† | | | Rating†† | | Security | | Value | |
| Banks — 3.3% — (continued) | |
| $ | 200,000 | | | BB+ | | Barclays Bank PLC, Subordinated Notes, 7.625% due 11/21/22 | | $ | 224,975 | |
| | 200,000 | | | B+ | | Barclays PLC, Junior Subordinated Notes, 8.250%(e)(f) | | | 205,599 | |
| | 450,000 | | | BBB- | | BNP Paribas SA, Junior Subordinated Notes, 7.625%(a)(e)(f) | | | 474,300 | |
| | | | | | CIT Group Inc., Senior Unsecured Notes: | | | | |
| | 400,000 | | | BB+ | | 5.500% due 2/15/19(a) | | | 424,500 | |
| | 730,000 | | | BB+ | | 5.375% due 5/15/20 | | | 782,012 | |
| | 30,000 | | | BB+ | | 5.000% due 8/15/22 | | | 31,875 | |
| | 1,560,000 | | | BB+ | | 5.000% due 8/1/23 | | | 1,657,500 | |
| | | | | | Credit Agricole SA, Junior Subordinated Notes: | | | | |
| | 450,000 | | | BB+ | | 8.125%(a)(e)(f) | | | 484,803 | |
| | 210,000 | | | BB+ | | 8.375%(a)(e)(f) | | | 238,392 | |
| | 1,000,000 | | | BB | | Credit Suisse Group AG, Junior Subordinated Notes, 6.250%(a)(e)(f) | | | 981,870 | |
| | 310,000 | | | Baa3(g) | | HSBC Holdings PLC, Junior Subordinated Notes, 6.375%(e)(f) | | | 306,900 | |
| | 170,000 | | | BBB- | | M&T Bank Corp., Junior Subordinated Notes, 6.875%(f) | | | 171,488 | |
| | 785,000 | | | B | | Provident Funding Associates LP/PFG Finance Corp., Company Guaranteed Notes, 6.750% due 6/15/21(a) | | | 779,112 | |
| | | | | | Royal Bank of Scotland Group PLC: | | | | |
| | 700,000 | | | B | | Junior Subordinated Notes, 8.625%(e)(f) | | | 714,875 | |
| | 620,000 | | | BB | | Subordinated Notes, 6.000% due 12/19/23 | | | 657,180 | |
| | | | | | | | | | |
| | | | | | Total Banks | | | 10,737,350 | |
| | | | | | | | | | |
| Beverages — 1.2% | | | | |
| | 510,000 | | | B- | | Beverages & More Inc., Senior Secured Notes, 10.000% due 11/15/18(a) | | | 476,212 | |
| | 370,000 | | | B- | | Carolina Beverage Group LLC/Carolina Beverage Group Finance Inc., Senior Secured Notes, 10.625% due 8/1/18(a) | | | 342,250 | |
| | | | | | Constellation Brands Inc., Company Guaranteed Notes: | | | | |
| | 270,000 | | | BB+ | | 4.250% due 5/1/23 | | | 289,406 | |
| | 370,000 | | | BB+ | | 4.750% due 11/15/24 | | | 405,150 | |
| | 830,000 | | | BB+ | | 4.750% due 12/1/25 | | | 907,294 | |
| | 630,000 | | | B- | | Cott Beverages Inc., Company Guaranteed Notes, 5.375% due 7/1/22 | | | 652,838 | |
| | 680,000 | | | BB- | | DS Services of America Inc., Secured Notes, 10.000% due 9/1/21(a) | | | 766,700 | |
| | | | | | | | | | |
| | | | | | Total Beverages | | | 3,839,850 | |
| | | | | | | | | | |
| Biotechnology — 0.1% | |
| | 320,000 | | | B+ | | AMAG Pharmaceuticals Inc., Company Guaranteed Notes, 7.875% due 9/1/23(a) | | | 316,400 | |
| | | | | | | | | | |
| Building Products — 0.9% | |
| | 180,000 | | | B+ | | Builders FirstSource Inc., Senior Secured Notes, 5.625% due 9/1/24(a) | | | 184,050 | |
| | 950,000 | | | BB- | | Griffon Corp., Company Guaranteed Notes, 5.250% due 3/1/22 | | | 958,312 | |
| | 240,000 | | | B | | Hardwoods Acquisition Inc., Senior Secured Notes, 7.500% due 8/1/21(a) | | | 166,800 | |
| | | | | | Standard Industries Inc., Senior Unsecured Notes: | | | | |
| | 130,000 | | | BBB- | | 5.125% due 2/15/21(a) | | | 137,963 | |
| | 180,000 | | | BBB- | | 5.500% due 2/15/23(a) | | | 191,925 | |
| | 500,000 | | | BBB- | | 5.375% due 11/15/24(a) | | | 534,375 | |
| | 340,000 | | | BB | | USG Corp., Company Guaranteed Notes, 5.875% due 11/1/21(a) | | | 358,275 | |
| | 450,000 | | | B | | Woodside Homes Co. LLC/Woodside Homes Finance Inc., Company Guaranteed Notes, 6.750% due 12/15/21(a) | | | 421,875 | |
| | | | | | | | | | |
| | | | | | Total Building Products | | | 2,953,575 | |
| | | | | | | | | | |
| Chemicals — 0.8% | |
| | 440,000 | | | B+ | | Axalta Coating Systems LLC, Company Guaranteed Notes, 4.875% due 8/15/24(a) | | | 459,800 | |
| | 500,000 | | | BB- | | Axiall Corp., Company Guaranteed Notes, 4.875% due 5/15/23 | | | 526,250 | |
| | 380,000 | | | B- | | Eco Services Operations LLC/Eco Finance Corp., Senior Unsecured Notes, 8.500% due 11/1/22(a) | | | 395,200 | |
| | 90,000 | | | BB | | Hercules Inc., Junior Subordinated Notes, 6.500% due 6/30/29 | | | 77,493 | |
| | 185,000 | | | BB | | Olin Corp., Company Guaranteed Notes, 9.750% due 10/15/23(a) | | | 220,150 | |
See Notes to Financial Statements.
188
| | | | | | | | | | |
| High Yield Fund | |
| | | |
Face
Amount/Units† | | | Rating†† | | Security | | Value | |
| Chemicals — 0.8% — (continued) | |
| $ | 385,000 | | | B+ | | Platform Specialty Products Corp. Senior Unsecured Notes, 6.500% due 2/1/22(a) | | $ | 366,712 | |
| | 170,000 | | | B+ | | PQ Corp., Senior Secured Notes, 6.750% due 11/15/22(a) | | | 180,625 | |
| | 450,000 | | | (P)B+ | | Valvoline Inc., Company Guaranteed Notes, 5.500% due 7/15/24(a) | | | 473,400 | |
| | | | | | | | | | |
| | | | | | Total Chemicals | | | 2,699,630 | |
| | | | | | | | | | |
| Commercial Services & Supplies — 3.5% | |
| | | | | | ADT Corp. (The), Senior Secured Notes: | | | | |
| | 300,000 | | | BB- | | 6.250% due 10/15/21 | | | 330,000 | |
| | 165,000 | | | BB- | | 3.500% due 7/15/22 | | | 158,812 | |
| | 530,000 | | | BB- | | 4.125% due 6/15/23 | | | 522,050 | |
| | 500,000 | | | BB- | | 4.875% due 7/15/32(a) | | | 432,500 | |
| | 1,300,000 | | | B | | Ahern Rentals Inc., Secured Notes, 7.375% due 5/15/23(a)(b) | | | 897,000 | |
| | | | | | Ashtead Capital Inc., Secured Notes: | | | | |
| | 460,000 | | | BB | | 6.500% due 7/15/22(a) | | | 487,600 | |
| | 380,000 | | | BB | | 5.625% due 10/1/24(a) | | | 401,375 | |
| | 110,000 | | | CCC+ | | Garda World Security Corp., Company Guaranteed Notes, 7.250% due 11/15/21(a) | | | 100,925 | |
| | 360,000 | | | B | | GFL Environmental Inc., Senior Unsecured Notes, 9.875% due 2/1/21(a) | | | 394,200 | |
| | 924,000 | | | BB- | | H&E Equipment Services Inc., Company Guaranteed Notes, 7.000% due 9/1/22(c) | | | 979,440 | |
| | 790,000 | | | B- | | Jaguar Holding Co. II/Pharmaceutical Product Development LLC, Company Guaranteed Notes, 6.375% due 8/1/23(a) | | | 829,500 | |
| | 440,000 | | | CCC | | Modular Space Corp., Secured Notes, 10.250% due 1/31/19(a) | | | 182,600 | |
| | 500,000 | | | CCC+ | | Monitronics International Inc., Company Guaranteed Notes, 9.125% due 4/1/20 | | | 465,000 | |
| | 100,000 | | | B- | | NES Rentals Holdings Inc., Secured Notes, 7.875% due 5/1/18(a) | | | 98,000 | |
| | 850,000 | | | B- | | Prime Security Services Borrower LLC/Prime Finance Inc., Secured Notes, 9.250% due 5/15/23(a) | | | 927,563 | |
| | 110,000 | | | B- | | StoneMor Partners LP/Cornerstone Family Services of West Virginia Subsidiary, Company Guaranteed Notes, 7.875% due 6/1/21 | | | 111,650 | |
| | | | | | UR Financing Escrow Corp., Company Guaranteed Notes: | | | | |
| | 610,000 | | | BB- | | 7.625% due 4/15/22 | | | 653,462 | |
| | 500,000 | | | BB- | | 5.750% due 11/15/24 | | | 525,000 | |
| | 350,000 | | | BB- | | 5.500% due 7/15/25 | | | 362,250 | |
| | 400,000 | | | BB- | | 5.875% due 9/15/26 | | | 418,000 | |
| | 2,185,000 | | | B+ | | West Corp., Company Guaranteed Notes, 5.375% due 7/15/22(a) | | | 2,138,569 | |
| | | | | | | | | | |
| | | | | | Total Commercial Services & Supplies | | | 11,415,496 | |
| | | | | | | | | | |
| Communications Equipment — 0.1% | |
| | | | | | CommScope Inc.: | | | | |
| | 295,000 | | | B | | Company Guaranteed Notes, 5.500% due 6/15/24(a) | | | 310,856 | |
| | 60,000 | | | BB | | Senior Secured Notes, 4.375% due 6/15/20(a) | | | 62,250 | |
| | | | | | | | | | |
| | | | | | Total Communications Equipment | | | 373,106 | |
| | | | | | | | | | |
| Construction Materials — 0.6% | |
| | 380,000 | | | BBB | | Eagle Materials Inc., Company Guaranteed Notes, 4.500% due 8/1/26 | | | 387,333 | |
| | 598,995 | | | B- | | Michael Baker Holdings LLC/Michael Baker Finance Corp., Senior Unsecured Notes, 8.875% (8.875% cash or 9.625% PIK) due 4/15/19(a)(d) | | | 541,342 | |
| | 150,000 | | | B+ | | Michael Baker International LLC/CDL Acquisition Co., Inc., Senior Secured Notes, 8.250% due 10/15/18(a) | | | 151,125 | |
| | 860,000 | | | BB- | | US Concrete Inc., Company Guaranteed Notes, 6.375% due 6/1/24 | | | 898,700 | |
| | | | | | | | | | |
| | | | | | Total Construction Materials | | | 1,978,500 | |
| | | | | | | | | | |
| Consumer Finance — 2.0% | |
| | | | | | Ally Financial Inc.: | | | | |
| | | | | | Company Guaranteed Notes: | | | | |
| | 209,000 | | | BB+ | | 8.000% due 3/15/20 | | | 240,873 | |
| | 224,000 | | | BB+ | | 7.500% due 9/15/20 | | | 258,160 | |
| | 335,000 | | | BB+ | | 8.000% due 11/1/31 | | | 421,262 | |
See Notes to Financial Statements.
189
| | | | | | | | | | |
| High Yield Fund | |
| | | |
Face
Amount/Units† | | | Rating†† | | Security | | Value | |
| Consumer Finance — 2.0% — (continued) | |
| $ | 1,400,000 | | | BB+ | | Senior Unsecured Notes, 5.125% due 9/30/24(c) | | $ | 1,519,875 | |
| | | | | | Subordinated Notes: | | | | |
| | 150,000 | | | BB- | | 8.000% due 12/31/18 | | | 167,062 | |
| | 1,340,000 | | | BB- | | 5.750% due 11/20/25 | | | 1,430,450 | |
| | 640,000 | | | BB | | Credit Acceptance Corp., Company Guaranteed Notes, 6.125% due 2/15/21 | | | 646,400 | |
| | 170,000 | | | BB | | First Cash Financial Services Inc., Company Guaranteed Notes, 6.750% due 4/1/21 | | | 176,800 | |
| | | | | | Navient Corp., Senior Unsecured Notes: | | | | |
| | 120,000 | | | BB- | | 8.450% due 6/15/18 | | | 131,100 | |
| | 300,000 | | | BB- | | 8.000% due 3/25/20 | | | 326,250 | |
| | 400,000 | | | BB- | | 5.000% due 10/26/20 | | | 403,000 | |
| | 140,000 | | | BB- | | 5.875% due 3/25/21 | | | 142,450 | |
| | 260,000 | | | BB- | | 6.625% due 7/26/21 | | | 268,775 | |
| | 380,000 | | | BB- | | 5.875% due 10/25/24 | | | 360,050 | |
| | | | | | | | | | |
| | | | | | Total Consumer Finance | | | 6,492,507 | |
| | | | | | | | | | |
| Containers & Packaging — 1.0% | |
| | | | | | Ardagh Packaging Finance PLC/Ardagh Holdings USA Inc.: | | | | |
| | 830,000 | | | CCC+ | | Company Guaranteed Notes, 7.250% due 5/15/24(a) | | | 887,062 | |
| | 580,000 | | | B+ | | Senior Secured Notes, 4.625% due 5/15/23(a) | | | 593,050 | |
| | 307,412 | | | B3(g) | | Senior Unsecured Notes, 7.000% due 11/15/20(a) | | | 308,565 | |
| | 390,000 | | | CCC | | BWAY Holding Co., Senior Unsecured Notes, 9.125% due 8/15/21(a) | | | 400,725 | |
| | 230,000 | | | B- | | Coveris Holdings SA, Company Guaranteed Notes, 7.875% due 11/1/19(a) | | | 235,750 | |
| | | | | | Pactiv LLC, Senior Unsecured Notes: | | | | |
| | 190,000 | | | CCC+ | | 7.950% due 12/15/25 | | | 208,050 | |
| | 680,000 | | | CCC+ | | 8.375% due 4/15/27 | | | 753,100 | |
| | | | | | | | | | |
| | | | | | Total Containers & Packaging | | | 3,386,302 | |
| | | | | | | | | | |
| Diversified Consumer Services — 0.4% | |
| | | | | | Service Corp. International, Senior Unsecured Notes: | | | | |
| | 250,000 | | | BB | | 7.625% due 10/1/18 | | | 280,950 | |
| | 900,000 | | | BB | | 5.375% due 5/15/24 | | | 969,750 | |
| | 130,000 | | | BB | | 7.500% due 4/1/27 | | | 152,750 | |
| | | | | | | | | | |
| | | | | | Total Diversified Consumer Services | | | 1,403,450 | |
| | | | | | | | | | |
| Diversified Financial Services — 2.9% | |
| | | | | | AerCap Ireland Capital Ltd./AerCap Global Aviation Trust, Company Guaranteed Notes: | | | | |
| | 280,000 | | | BBB- | | 4.500% due 5/15/21 | | | 296,450 | |
| | 410,000 | | | BBB- | | 4.625% due 7/1/22 | | | 436,650 | |
| | 220,000 | | | B+ | | Ausdrill Finance Pty Ltd., Company Guaranteed Notes, 6.875% due 11/1/19(a) | | | 218,350 | |
| | 900,000 | | | BB+ | | Case New Holland Industrial Inc., Company Guaranteed Notes, 7.875% due 12/1/17 | | | 969,750 | |
| | 2,990,000 | | | BB+ | | Citigroup Inc., Junior Subordinated Notes, 5.950%(e)(f) | | | 3,092,781 | |
| | 190,000 | | | Caa3(g) | | Compiler Finance Sub Inc., Senior Unsecured Notes, 7.000% due 5/1/21(a)(b) | | | 89,300 | |
| | 410,000 | | | B- | | Globe Luxembourg SCA, Senior Secured Notes, 9.625% due 5/1/18(a) | | | 364,900 | |
| | 500,000 | | | BB | | ILFC E-Capital Trust I, Limited Guaranteed Notes, 3.980% due 12/21/65(a)(e) | | | 400,500 | |
| | | | | | International Lease Finance Corp., Senior Unsecured Notes: | | | | |
| | 370,000 | | | BBB- | | 8.250% due 12/15/20 | | | 444,000 | |
| | 155,000 | | | BBB- | | 8.625% due 1/15/22 | | | 193,169 | |
| | 120,000 | | | CCC+ | | Jack Cooper Holdings Corp., Senior Secured Notes, 9.250% due 6/1/20 | | | 88,200 | |
| | 740,000 | | | B- | | KCA Deutag UK Finance PLC, Senior Secured Notes, 7.250% due 5/15/21(a) | | | 597,550 | |
| | 530,000 | | | CCC+ | | OPE KAG Finance Sub Inc., Senior Unsecured Notes, 7.875% due 7/31/23(a) | | | 506,150 | |
| | 1,440,000 | | | BB | | Quicken Loans Inc., Company Guaranteed Notes, 5.750% due 5/1/25(a) | | | 1,444,032 | |
| | 90,000 | | | CCC+ | | SPL Logistics Escrow LLC/SPL Logistics Finance Corp., Senior Secured Notes, 8.875% due 8/1/20(a) | | | 69,300 | |
| | 390,000 | | | B | | TMX Finance LLC/TitleMax Finance Corp., Senior Secured Notes, 8.500% due 9/15/18(a) | | | 307,612 | |
| | | | | | | | | | |
| | | | | | Total Diversified Financial Services | | | 9,518,694 | |
| | | | | | | | | | |
See Notes to Financial Statements.
190
| | | | | | | | | | |
| High Yield Fund | |
| | | |
Face
Amount/Units† | | | Rating†† | | Security | | Value | |
| Diversified Telecommunication Services — 4.4% | |
| | | | | | CenturyLink Inc., Senior Unsecured Notes: | | | | |
| $ | 465,000 | | | BB | | 5.625% due 4/1/20 | | $ | 496,969 | |
| | 620,000 | | | BB | | 6.450% due 6/15/21 | | | 669,212 | |
| | 430,000 | | | BB | | 5.800% due 3/15/22 | | | 446,490 | |
| | 150,000 | | | BB | | 6.750% due 12/1/23 | | | 158,438 | |
| | 830,000 | | | B | | Cincinnati Bell Inc., Company Guaranteed Notes, 8.375% due 10/15/20 | | | 859,569 | |
| | 35,000 | | | BB- | | Cincinnati Bell Telephone Co. LLC, Company Guaranteed Notes, 6.300% due 12/1/28 | | | 33,381 | |
| | 550,000 | | | B- | | Cogent Communications Finance Inc., Company Guaranteed Notes, 5.625% due 4/15/21(a) | | | 562,375 | |
| | 625,000 | | | B- | | Gogo Intermediate Holdings LLC/Gogo Finance Co., Inc., Senior Secured Notes, 12.500% due 7/1/22(a) | | | 667,969 | |
| | | | | | Intelsat Jackson Holdings SA: | | | | |
| | | | | | Company Guaranteed Notes: | | | | |
| | 1,245,000 | | | CCC | | 7.250% due 4/1/19 | | | 1,003,781 | |
| | 350,000 | | | CCC | | 7.500% due 4/1/21 | | | 265,125 | |
| | 680,000 | | | CCC | | 5.500% due 8/1/23 | | | 467,500 | |
| | 700,000 | | | B- | | Senior Secured Notes, 8.000% due 2/15/24(a) | | | 706,125 | |
| | 770,000 | | | CC | | Intelsat Luxembourg SA, Company Guaranteed Notes, 7.750% due 6/1/21 | | | 231,000 | |
| | | | | | Level 3 Financing Inc., Company Guaranteed Notes: | | | | |
| | 500,000 | | | B+ | | 5.375% due 8/15/22 | | | 524,450 | |
| | 30,000 | | | B+ | | 5.625% due 2/1/23 | | | 31,538 | |
| | 770,000 | | | B+ | | 5.125% due 5/1/23 | | | 802,725 | |
| | 500,000 | | | B+ | | 5.250% due 3/15/26(a) | | | 519,375 | |
| | 800,000 | | | BB+ | | Telecom Italia SpA/Milano, Senior Unsecured Notes, 5.303% due 5/30/24(a) | | | 827,000 | |
| | | | | | Virgin Media Finance PLC, Company Guaranteed Notes: | | | | |
| | 885,000 | | | B | | 6.375% due 4/15/23(a) | | | 946,950 | |
| | 470,000 | | | B | | 6.000% due 10/15/24(a) | | | 491,737 | |
| | | | | | Virgin Media Secured Finance PLC, Senior Secured Notes: | | | | |
| | 260,000 | | | BB- | | 5.500% due 1/15/25(a) | | | 268,125 | |
| | 500,000 | | | BB- | | 5.500% due 8/15/26(a) | | | 523,750 | |
| | | | | | Windstream Services LLC, Company Guaranteed Notes: | | | | |
| | 810,000 | | | B+ | | 7.750% due 10/15/20(c) | | | 830,250 | |
| | 1,275,000 | | | B+ | | 7.750% due 10/1/21 | | | 1,278,188 | |
| | 650,000 | | | B+ | | 7.500% due 6/1/22(c) | | | 628,875 | |
| | 50,000 | | | B+ | | 7.500% due 4/1/23(c) | | | 47,812 | |
| | | | | | | | | | |
| | | | | | Total Diversified Telecommunication Services | | | 14,288,709 | |
| | | | | | | | | | |
| Electric Utilities — 1.2% | |
| | | | | | Calpine Corp.: | | | | |
| | 50,000 | | | BB | | Senior Secured Notes, 5.250% due 6/1/26(a) | | | 50,875 | |
| | | | | | Senior Unsecured Notes: | | | | |
| | 610,000 | | | B | | 5.375% due 1/15/23 | | | 613,428 | |
| | 640,000 | | | B | | 5.750% due 1/15/25 | | | 640,000 | |
| | | | | | Dynegy Inc., Company Guaranteed Notes: | | | | |
| | 310,000 | | | B+ | | 6.750% due 11/1/19 | | | 319,300 | |
| | 305,000 | | | B+ | | 7.375% due 11/1/22 | | | 302,713 | |
| | 2,968 | | | B- | | FPL Energy National Wind Portfolio LLC, Senior Secured Notes, 6.125% due 3/25/19(a) | | | 2,990 | |
| | 818,407 | | | B- | | Miran Mid-Atlantic Series C Pass Through Trust, Pass Thru Certificates, 10.060% due 12/30/28 | | | 635,289 | |
| | 1,640,000 | | | B- | | NRG REMA LLC, Pass Thru Certificates, 9.681% due 7/2/26 | | | 1,314,050 | |
| | | | | | | | | | |
| | | | | | Total Electric Utilities | | | 3,878,645 | |
| | | | | | | | | | |
| Electronic Equipment, Instruments & Components — 0.6% | |
| | 500,000 | | | BB- | | CDW LLC/CDW Finance Corp., Company Guaranteed Notes, 5.000% due 9/1/23 | | | 519,375 | |
| | | | | | Hornbeck Offshore Services Inc., Company Guaranteed Notes: | | | | |
| | 225,000 | | | B- | | 1.500% due 9/1/19 | | | 119,953 | |
See Notes to Financial Statements.
191
| | | | | | | | | | |
| High Yield Fund | |
| | | |
Face
Amount/Units† | | | Rating†† | | Security | | Value | |
| Electronic Equipment, Instruments & Components — 0.6% — (continued) | |
| $ | 500,000 | | | B- | | 5.000% due 3/1/21 | | $ | 288,750 | |
| | 55,000 | | | B | | International Wire Group Holdings Inc., Secured Notes, 8.500% due 10/15/17(a) | | | 55,431 | |
| | 250,000 | | | B | | Radio Systems Corp., Secured Notes, 8.375% due 11/1/19(a)(b) | | | 261,875 | |
| | 300,000 | | | BB+ | | Sanmina Corp., Senior Secured Notes, 4.375% due 6/1/19(a) | | | 313,875 | |
| | | | | | WESCO Distribution Inc., Company Guaranteed Notes: | | | | |
| | 300,000 | | | BB- | | 5.375% due 12/15/21 | | | 311,250 | |
| | 230,000 | | | BB- | | 5.375% due 6/15/24(a) | | | 235,750 | |
| | | | | | | | | | |
| | | | | | Total Electronic Equipment, Instruments & Components | | | 2,106,259 | |
| | | | | | | | | | |
| Energy Equipment & Services — 1.5% | |
| | 430,000 | | | BBB- | | Access Midstream Partners LP, Senior Unsecured Notes, 4.875% due 3/15/24 | | | 440,876 | |
| | | | | | CGG SA, Company Guaranteed Notes: | | | | |
| | 520,000 | | | CCC | | 6.500% due 6/1/21 | | | 257,400 | |
| | 200,000 | | | CCC | | 6.875% due 1/15/22 | | | 99,000 | |
| | 400,000 | | | NR | | Helix Energy Solutions Group Inc., Senior Unsecured Notes, 3.250% due 3/15/32 | | | 375,000 | |
| | 445,000 | | | B- | | Pioneer Energy Services Corp., Company Guaranteed Notes, 6.125% due 3/15/22(b) | | | 295,925 | |
| | | | | | Targa Resources Partners LP/Targa Resources Partners Finance Corp., Company Guaranteed Notes: | | | | |
| | 130,000 | | | BB- | | 6.625% due 10/1/20 | | | 135,038 | |
| | 1,060,000 | | | BB- | | 6.875% due 2/1/21 | | | 1,102,400 | |
| | 326,000 | | | BB- | | 6.375% due 8/1/22 | | | 338,225 | |
| | 490,000 | | | BB- | | 5.250% due 5/1/23 | | | 499,800 | |
| | 380,000 | | | BB- | | Trinidad Drilling Ltd., Company Guaranteed Notes, 7.875% due 1/15/19(a) | | | 351,500 | |
| | 780,000 | | | B+ | | Unit Corp., Company Guaranteed Notes, 6.625% due 5/15/21 | | | 653,250 | |
| | | | | | Williams Partners LP, Senior Unsecured Notes: | | | | |
| | 225,000 | | | BBB- | | 6.300% due 4/15/40 | | | 246,394 | |
| | 220,000 | | | BBB- | | 5.100% due 9/15/45(a) | | | 216,487 | |
| | | | | | | | | | |
| | | | | | Total Energy Equipment & Services | | | 5,011,295 | |
| | | | | | | | | | |
| Food Products — 1.7% | |
| | 440,000 | | | CCC+ | | Dole Food Co., Inc., Senior Secured Notes, 7.250% due 5/1/19(a) | | | 449,900 | |
| | | | | | JBS USA LLC/JBS USA Finance Inc.: | | | | |
| | 440,000 | | | BB | | Company Guaranteed Notes, 7.250% due 6/1/21(a) | | | 457,600 | |
| | 990,000 | | | BB | | Senior Unsecured Notes, 5.875% due 7/15/24(a) | | | 1,027,125 | |
| | | | | | Kraft Heinz Foods Co.: | | | | |
| | 170,000 | | | BBB- | | Company Guaranteed Notes, 7.125% due 8/1/39(a) | | | 246,253 | |
| | 132,000 | | | BBB- | | Secured Notes, 4.875% due 2/15/25(a) | | | 145,618 | |
| | 430,000 | | | BB | | Pilgrim’s Pride Corp., Company Guaranteed Notes, 5.750% due 3/15/25(a) | | | 446,125 | |
| | 560,000 | | | B | | Post Holdings Inc., Company Guaranteed Notes, 5.000% due 8/15/26(a) | | | 560,000 | |
| | 2,350,000 | | | CCC+ | | Simmons Foods Inc., Secured Notes, 7.875% due 10/1/21(a)(b) | | | 2,326,500 | |
| | | | | | | | | | |
| | | | | | Total Food Products | | | 5,659,121 | |
| | | | | | | | | | |
| Health Care Equipment & Supplies — 1.3% | |
| | 200,000 | | | B- | | ConvaTec Finance International SA, Company Guaranteed Notes, 8.250% (8.250% cash or 9.000% PIK) due 1/15/19(a)(d) | | | 200,352 | |
| | | | | | DJO Finance LLC/DJO Finance Corp., Secured Notes: | | | | |
| | 60,000 | | | CCC | | 10.750% due 4/15/20(a) | | | 49,200 | |
| | 920,000 | | | CCC+ | | 8.125% due 6/15/21(a) | | | 814,200 | |
| | 260,000 | | | CCC+ | | Greatbatch Ltd., Company Guaranteed Notes, 9.125% due 11/1/23(a) | | | 260,325 | |
| | 290,000 | | | CCC- | | Immucor Inc., Company Guaranteed Notes, 11.125% due 8/15/19 | | | 274,050 | |
| | | | | | Kinetic Concepts Inc./KCI USA Inc.: | | | | |
| | 900,000 | | | B- | | Secured Notes, 10.500% due 11/1/18 | | | 929,250 | |
| | 360,000 | | | BB- | | Senior Secured Notes, 7.875% due 2/15/21(a) | | | 389,700 | |
| | | | | | Mallinckrodt International Finance SA, Company Guaranteed Notes: | | | | |
| | 80,000 | | | B | | 3.500% due 4/15/18 | | | 80,500 | |
| | 350,000 | | | B | | 4.750% due 4/15/23 | | | 326,594 | |
See Notes to Financial Statements.
192
| | | | | | | | | | |
| High Yield Fund | |
| | | |
Face
Amount/Units† | | | Rating†† | | Security | | Value | |
| Health Care Equipment & Supplies — 1.3% — (continued) | |
| $ | 1,020,000 | | | B- | | Universal Hospital Services Inc., Secured Notes, 7.625% due 8/15/20 | | $ | 981,750 | |
| | | | | | | | | | |
| | | | | | Total Health Care Equipment & Supplies | | | 4,305,921 | |
| | | | | | | | | | |
| Health Care Providers & Services — 4.6% | |
| | | | | | Acadia Healthcare Co., Inc., Company Guaranteed Notes: | | | | |
| | 695,000 | | | B | | 5.125% due 7/1/22 | | | 696,738 | |
| | 106,000 | | | B | | 5.625% due 2/15/23 | | | 108,385 | |
| | 680,000 | | | B- | | Amsurg Corp., Company Guaranteed Notes, 5.625% due 7/15/22 | | | 704,650 | |
| | | | | | Centene Corp., Senior Unsecured Notes: | | | | |
| | 210,000 | | | BB | | 5.625% due 2/15/21 | | | 223,913 | |
| | 1,520,000 | | | BB | | 6.125% due 2/15/24 | | | 1,660,600 | |
| | 630,000 | | | BB- | | CHS/Community Health Systems Inc., Senior Secured Notes, 5.125% due 8/1/21 | | | 622,913 | |
| | | | | | DaVita HealthCare Partners Inc., Company Guaranteed Notes: | | | | |
| | 300,000 | | | B+ | | 5.125% due 7/15/24 | | | 310,312 | |
| | 100,000 | | | B+ | | 5.000% due 5/1/25 | | | 101,600 | |
| | 940,000 | | | NR | | Escrow Magellan Health, (Restricted), 9.750% due 5/15/20(b)(h) | | | — | |
| | | | | | Fresenius Medical Care US Finance II Inc., Company Guaranteed Notes: | | | | |
| | 270,000 | | | BB+ | | 5.875% due 1/31/22(a) | | | 308,475 | |
| | 300,000 | | | BB+ | | 4.750% due 10/15/24(a) | | | 322,500 | |
| | | | | | HCA Inc.: | | | | |
| | | | | | Company Guaranteed Notes: | | | | |
| | 495,000 | | | B+ | | 7.500% due 2/15/22 | | | 565,537 | |
| | 915,000 | | | B+ | | 5.375% due 2/1/25 | | | 943,594 | |
| | 60,000 | | | B+ | | 7.690% due 6/15/25 | | | 68,250 | |
| | 350,000 | | | B+ | | 5.875% due 2/15/26 | | | 370,563 | |
| | | | | | Senior Secured Notes: | | | | |
| | 580,000 | | | BBB- | | 4.750% due 5/1/23 | | | 608,275 | |
| | 450,000 | | | BBB- | | 5.000% due 3/15/24 | | | 478,125 | |
| | 810,000 | | | BBB- | | 5.250% due 4/15/25 | | | 869,737 | |
| | 160,000 | | | BBB- | | 5.250% due 6/15/26 | | | 171,400 | |
| | | | | | HealthSouth Corp., Company Guaranteed Notes: | | | | |
| | 290,000 | | | B+ | | 5.125% due 3/15/23 | | | 295,075 | |
| | 750,000 | | | B+ | | 5.750% due 9/15/25 | | | 788,438 | |
| | 760,000 | | | CCC+ | | IASIS Healthcare LLC/IASIS Capital Corp., Company Guaranteed Notes, 8.375% due 5/15/19 | | | 692,550 | |
| | 1,090,000 | | | B- | | MPH Acquisition Holdings LLC, Senior Unsecured Notes, 7.125% due 6/1/24(a) | | | 1,174,475 | |
| | 970,000 | | | B- | | Select Medical Corp., Company Guaranteed Notes, 6.375% due 6/1/21(c) | | | 976,062 | |
| | | | | | Tenet Healthcare Corp., Senior Unsecured Notes: | | | | |
| | 1,815,000 | | | CCC+ | | 8.125% due 4/1/22 | | | 1,846,762 | |
| | 60,000 | | | CCC+ | | 6.750% due 6/15/23 | | | 57,225 | |
| | | | | | | | | | |
| | | | | | Total Health Care Providers & Services | | | 14,966,154 | |
| | | | | | | | | | |
| Hotels, Restaurants & Leisure — 5.2% | |
| | | | | | 1011778 BC ULC/New Red Finance Inc.: | | | | |
| | 410,000 | | | B- | | Secured Notes, 6.000% due 4/1/22(a) | | | 429,987 | |
| | 446,000 | | | B+ | | Senior Secured Notes, 4.625% due 1/15/22(a) | | | 462,725 | |
| | 220,000 | | | B | | AMC Entertainment Inc., Company Guaranteed Notes, 5.750% due 6/15/25 | | | 226,618 | |
| | 156,909 | | | NR | | Bossier Casino Venture Holdco Inc., Senior Secured Notes, 14.000% (0.000% cash or 14.000% PIK) due 2/9/18(a)(b)(d)(h) | | | 156,909 | |
| | | | | | Boyd Gaming Corp., Company Guaranteed Notes: | | | | |
| | 710,000 | | | B | | 9.000% due 7/1/20 | | | 741,950 | |
| | 630,000 | | | B | | 6.375% due 4/1/26(a) | | | 674,100 | |
| | 560,000 | | | BBB- | | Brunswick Corp., Company Guaranteed Notes, 4.625% due 5/15/21(a) | | | 575,400 | |
| | | | | | Caesars Entertainment Resort Properties LLC/Caesars Entertainment Resort Properties Finance Inc.: | | | | |
| | 570,000 | | | CCC- | | Secured Notes, 11.000% due 10/1/21 | | | 590,662 | |
See Notes to Financial Statements.
193
| | | | | | | | | | |
| High Yield Fund | |
| | | |
Face
Amount/Units† | | | Rating†† | | Security | | Value | |
| Hotels, Restaurants & Leisure — 5.2% — (continued) | |
| $ | 860,000 | | | CCC+ | | Senior Secured Notes, 8.000% due 10/1/20 | | $ | 877,200 | |
| | 700,000 | | | B | | Carrols Restaurant Group Inc., Secured Notes, 8.000% due 5/1/22 | | | 764,750 | |
| | 160,000 | | | CCC+ | | CEC Entertainment Inc., Company Guaranteed Notes, 8.000% due 2/15/22 | | | 160,800 | |
| | 550,000 | | | BB | | Churchill Downs Inc., Company Guaranteed Notes, 5.375% due 12/15/21(a) | | | 574,750 | |
| | 490,000 | | | B- | | Eldorado Resorts Inc., Company Guaranteed Notes, 7.000% due 8/1/23 | | | 519,400 | |
| | | | | | GLP Capital LP/GLP Financing II Inc., Company Guaranteed Notes: | | | | |
| | 730,000 | | | BB+ | | 4.875% due 11/1/20 | | | 784,750 | |
| | 630,000 | | | BB+ | | 5.375% due 4/15/26 | | | 689,850 | |
| | 170,000 | | | B- | | Greektown Holdings LLC/Greektown Mothership Corp., Senior Secured Notes, 8.875% due 3/15/19(a) | | | 180,200 | |
| | 720,000 | | | BB+ | | Hilton Worldwide Finance LLC/Hilton Worldwide Finance Corp., Company Guaranteed Notes, 5.625% due 10/15/21 | | | 744,994 | |
| | 160,000 | | | CCC+ | | Landry’s Holdings II Inc., Senior Unsecured Notes, 10.250% due 1/1/18(a) | | | 163,200 | |
| | 565,000 | | | B- | | Landry’s Inc., Company Guaranteed Notes, 9.375% due 5/1/20(a) | | | 595,369 | |
| | | | | | MGM Resorts International, Company Guaranteed Notes: | | | | |
| | 350,000 | | | BB- | | 6.625% due 12/15/21 | | | 394,625 | |
| | 710,000 | | | BB- | | 7.750% due 3/15/22 | | | 827,150 | |
| | 350,000 | | | BB- | | 6.000% due 3/15/23(c) | | | 380,835 | |
| | 920,000 | | | BB- | | 4.625% due 9/1/26 | | | 915,400 | |
| | | | | | NCL Corp., Ltd., Senior Unsecured Notes: | | | | |
| | 750,000 | | | BB | | 5.250% due 11/15/19(a) | | | 765,937 | |
| | 140,000 | | | BB | | 4.625% due 11/15/20(a) | | | 142,225 | |
| | 517,593 | | | NR | | New Cotai LLC/New Cotai Capital Corp., Senior Secured Notes, 10.625% (0.000% cash or 10.625% PIK) due 5/1/19(a)(b)(d) | | | 253,621 | |
| | 540,000 | | | CCC | | PF Chang’s China Bistro Inc., Company Guaranteed Notes, 10.250% due 6/30/20(a)(b) | | | 517,050 | |
| | 500,000 | | | CCC+ | | Scientific Games Corp., Company Guaranteed Notes, 8.125% due 9/15/18 | | | 503,125 | |
| | | | | | Scientific Games International Inc.: | | | | |
| | 465,000 | | | CCC+ | | Company Guaranteed Notes, 6.250% due 9/1/20(b) | | | 348,750 | |
| | 760,000 | | | B+ | | Senior Secured Notes, 7.000% due 1/1/22(a) | | | 811,300 | |
| | 580,000 | | | BB+ | | Speedway Motorsports Inc., Company Guaranteed Notes, 5.125% due 2/1/23 | | | 601,750 | |
| | | | | | Viking Cruises Ltd., Senior Unsecured Notes: | | | | |
| | 120,000 | | | B | | 8.500% due 10/15/22(a) | | | 106,200 | |
| | 430,000 | | | B | | 6.250% due 5/15/25(a) | | | 341,850 | |
| | | | | | | | | | |
| | | | | | Total Hotels, Restaurants & Leisure | | | 16,823,432 | |
| | | | | | | | | | |
| Household Durables — 1.8% | |
| | 140,000 | | | B- | | Beazer Homes USA Inc., Company Guaranteed Notes, 9.125% due 5/15/19 | | | 141,925 | |
| | | | | | CalAtlantic Group Inc., Company Guaranteed Notes: | | | | |
| | 350,000 | | | BB | | 6.250% due 12/15/21 | | | 385,875 | |
| | 155,000 | | | BB | | 5.250% due 6/1/26 | | | 157,713 | |
| | 530,000 | | | BB | | Lennar Corp., Company Guaranteed Notes, 4.875% due 12/15/23 | | | 557,825 | |
| | | | | | PulteGroup Inc., Company Guaranteed Notes: | | | | |
| | 30,000 | | | BB+ | | 4.250% due 3/1/21 | | | 31,669 | |
| | 350,000 | | | BB+ | | 5.500% due 3/1/26 | | | 376,250 | |
| | 610,000 | | | CCC+ | | Serta Simmons Bedding LLC, Senior Unsecured Notes, 8.125% due 10/1/20(a) | | | 637,069 | |
| | | | | | Shea Homes LP/Shea Homes Funding Corp., Company Guaranteed Notes: | | | | |
| | 170,000 | | | B+ | | 5.875% due 4/1/23(a) | | | 174,250 | |
| | 430,000 | | | B+ | | 6.125% due 4/1/25(a) | | | 437,525 | |
| | 1,165,000 | | | BB- | | Taylor Morrison Communities Inc./Monarch Communities Inc., Company Guaranteed Notes, 5.250% due 4/15/21(a) | | | 1,202,862 | |
| | | | | | Toll Brothers Finance Corp., Company Guaranteed Notes: | | | | |
| | 60,000 | | | BB+ | | 4.000% due 12/31/18 | | | 62,625 | |
| | 60,000 | | | BB+ | | 6.750% due 11/1/19 | | | 67,950 | |
| | | | | | William Lyon Homes Inc., Company Guaranteed Notes: | | | | |
| | 500,000 | | | B- | | 5.750% due 4/15/19 | | | 511,250 | |
See Notes to Financial Statements.
194
| | | | | | | | | | |
| High Yield Fund | |
| | | |
Face
Amount/Units† | | | Rating†† | | Security | | Value | |
| Household Durables — 1.8% — (continued) | |
| $ | 925,000 | | | B- | | 8.500% due 11/15/20 | | $ | 978,187 | |
| | 60,000 | | | B- | | 7.000% due 8/15/22 | | | 62,250 | |
| | | | | | | | | | |
| | | | | | Total Household Durables | | | 5,785,225 | |
| | | | | | | | | | |
| Household Products — 2.2% | |
| | 650,000 | | | B+ | | Brookfield Residential Properties Inc., Company Guaranteed Notes, 6.375% due 5/15/25(a) | | | 646,750 | |
| | 540,000 | | | BB- | | Central Garden & Pet Co., Company Guaranteed Notes, 6.125% due 11/15/23 | | | 582,525 | |
| | 1,340,000 | | | B | | Century Intermediate Holding Co. 2, Senior Unsecured Notes, 9.750% (0.000% cash or 9.750% PIK) due 2/15/19(a)(d) | | | 1,371,825 | |
| | | | | | Reynolds Group Issuer Inc./Reynolds Group Issuer LLC/Reynolds Group Issuer Lu: | | | | |
| | | | | | Company Guaranteed Notes: | | | | |
| | 340,000 | | | CCC+ | | 9.875% due 8/15/19 | | | 350,200 | |
| | 680,000 | | | CCC+ | | 7.000% due 7/15/24(a) | | | 729,725 | |
| | | | | | Senior Secured Notes: | | | | |
| | 1,250,000 | | | B+ | | 5.750% due 10/15/20 | | | 1,292,187 | |
| | 130,000 | | | B+ | | 5.125% due 7/15/23(a) | | | 135,038 | |
| | | | | | Spectrum Brands Inc., Company Guaranteed Notes: | | | | |
| | 220,000 | | | BB- | | 6.125% due 12/15/24 | | | 238,425 | |
| | 1,253,000 | | | BB- | | 5.750% due 7/15/25 | | | 1,364,204 | |
| | 530,000 | | | CCC+ | | Sun Products Corp. (The), Senior Unsecured Notes, 7.750% due 3/15/21(a) | | | 550,537 | |
| | | | | | | | | | |
| | | | | | Total Household Products | | | 7,261,416 | |
| | | | | | | | | | |
| Independent Power and Renewable Electricity Producers — 1.3% | |
| | | | | | AES Corp., Senior Unsecured Notes: | | | | |
| | 650,000 | | | BB | | 4.875% due 5/15/23 | | | 661,375 | |
| | 40,000 | | | BB | | 5.500% due 3/15/24 | | | 41,700 | |
| | 110,000 | | | BB | | 5.500% due 4/15/25 | | | 113,349 | |
| | | | | | NRG Energy Inc., Company Guaranteed Notes: | | | | |
| | 600,000 | | | BB- | | 7.875% due 5/15/21 | | | 628,500 | |
| | 545,000 | | | BB- | | 6.250% due 7/15/22 | | | 559,306 | |
| | 510,000 | | | BB- | | 6.625% due 3/15/23 | | | 522,750 | |
| | 450,000 | | | BB- | | 7.250% due 5/15/26(a) | | | 469,575 | |
| | 650,000 | | | BB- | | 6.625% due 1/15/27(a) | | | 652,028 | |
| | 470,000 | | | B+ | | Red Oak Power LLC, Senior Secured Notes, 9.200% due 11/30/29 | | | 488,800 | |
| | | | | | | | | | |
| | | | | | Total Independent Power and Renewable Electricity Producers | | | 4,137,383 | |
| | | | | | | | | | |
| Industrial Conglomerates — 0.2% | |
| | | | | | American Builders & Contractors Supply Co., Inc., Senior Unsecured Notes: | | | | |
| | 370,000 | | | BB | | 5.625% due 4/15/21(a) | | | 385,725 | |
| | 250,000 | | | BB | | 5.750% due 12/15/23(a) | | | 265,000 | |
| | | | | | | | | | |
| | | | | | Total Industrial Conglomerates | | | 650,725 | |
| | | | | | | | | | |
| Insurance — 1.1% | |
| | 580,000 | | | BBB- | | American Equity Investment Life Holding Co., Senior Unsecured Notes, 6.625% due 7/15/21 | | | 611,900 | |
| | | | | | CNO Financial Group Inc., Senior Unsecured Notes: | | | | |
| | 90,000 | | | BB+ | | 4.500% due 5/30/20 | | | 91,350 | |
| | 970,000 | | | BB+ | | 5.250% due 5/30/25 | | | 967,575 | |
| | 500,000 | | | BB- | | Fidelity & Guaranty Life Holdings Inc., Senior Unsecured Notes, 6.375% due 4/1/21(a) | | | 501,250 | |
| | | | | | Genworth Holdings Inc., Company Guaranteed Notes: | | | | |
| | 250,000 | | | B | | 7.700% due 6/15/20 | | | 248,750 | |
| | 500,000 | | | B | | 4.900% due 8/15/23 | | | 410,000 | |
| | 585,000 | | | CCC+ | | HUB International Ltd., Senior Unsecured Notes, 7.875% due 10/1/21(a) | | | 599,625 | |
| | | | | | | | | | |
| | | | | | Total Insurance | | | 3,430,450 | |
| | | | | | | | | | |
See Notes to Financial Statements.
195
| | | | | | | | | | |
| High Yield Fund | |
| | | |
Face
Amount/Units† | | | Rating†† | | Security | | Value | |
| Internet Software & Services — 1.7% | |
| $ | 490,000 | | | CCC+ | | Ancestry.com Holdings LLC, Senior Unsecured Notes, 9.625% (9.625% cash or 10.375% PIK) due 10/15/18(a)(d) | | $ | 499,800 | |
| | 70,000 | | | CCC+ | | Ancestry.com Inc., Company Guaranteed Notes, 11.000% due 12/15/20 | | | 75,425 | |
| | 700,000 | | | B+ | | Cogent Communications Group Inc., Senior Secured Notes, 5.375% due 3/1/22(a) | | | 724,500 | |
| | 650,000 | | | BB | | CyrusOne LP/CyrusOne Finance Corp., Company Guaranteed Notes, 6.375% due 11/15/22 | | | 693,875 | |
| | | | | | EarthLink Holdings Corp.: | | | | |
| | 301,000 | | | CCC+ | | Company Guaranteed Notes, 8.875% due 5/15/19 | | | 308,901 | |
| | 555,000 | | | B+ | | Senior Secured Notes, 7.375% due 6/1/20 | | | 583,444 | |
| | 750,000 | | | BB+ | | Equinix Inc., Senior Unsecured Notes, 5.875% due 1/15/26 | | | 818,902 | |
| | | | | | Match Group Inc., Senior Unsecured Notes: | | | | |
| | 555,000 | | | BB- | | 6.750% due 12/15/22 | | | 592,463 | |
| | 240,000 | | | BB- | | 6.375% due 6/1/24 | | | 262,200 | |
| | | | | | Netflix Inc., Senior Unsecured Notes: | | | | |
| | 500,000 | | | B+ | | 5.750% due 3/1/24 | | | 542,500 | |
| | 300,000 | | | B+ | | 5.875% due 2/15/25 | | | 327,000 | |
| | | | | | | | | | |
| | | | | | Total Internet Software & Services | | | 5,429,010 | |
| | | | | | | | | | |
| Leisure Products — 0.1% | |
| | 240,000 | | | B | | Downstream Development Authority of the Quapaw Tribe of Oklahoma, Senior Secured Notes, 10.500% due 7/1/19(a) | | | 247,800 | |
| | | | | | | | | | |
| Machinery — 0.3% | |
| | 630,000 | | | CCC+ | | DH Services Luxembourg Sarl, Company Guaranteed Notes, 7.750% due 12/15/20(a) | | | 660,713 | |
| | 350,000 | | | BB- | | Harsco Corp., Senior Unsecured Notes, 5.750% due 5/15/18 | | | 355,757 | |
| | | | | | | | | | |
| | | | | | Total Machinery | | | 1,016,470 | |
| | | | | | | | | | |
| Media — 9.0% | |
| | | | | | Altice Financing SA, Senior Secured Notes: | | | | |
| | 540,000 | | | BB- | | 6.625% due 2/15/23(a) | | | 564,300 | |
| | 370,000 | | | BB- | | 7.500% due 5/15/26(a) | | | 390,350 | |
| | 705,000 | | | B | | Altice Luxembourg SA, Company Guaranteed Notes, 7.625% due 2/15/25(a) | | | 727,031 | |
| | 685,000 | | | CCC+ | | Cablevision Systems Corp., Senior Unsecured Notes, 5.875% due 9/15/22 | | | 647,325 | |
| | 160,000 | | | BB | | Carmike Cinemas Inc., Secured Notes, 6.000% due 6/15/23(a) | | | 168,800 | |
| | | | | | CCO Holdings LLC/CCO Holdings Capital Corp., Senior Unsecured Notes: | | | | |
| | 320,000 | | | BB+ | | 5.125% due 2/15/23 | | | 336,800 | |
| | 780,000 | | | BB+ | | 5.875% due 4/1/24(a) | | | 842,400 | |
| | 1,380,000 | | | BB+ | | 5.750% due 2/15/26(a) | | | 1,480,050 | |
| | 500,000 | | | B- | | Cequel Communications Holdings I LLC/Cequel Capital Corp., Senior Unsecured Notes, 6.375% due 9/15/20(a) | | | 518,750 | |
| | | | | | Charter Communications Operating LLC/Charter Communications Operating Capital, Senior Secured Notes: | | | | |
| | 720,000 | | | BBB | | 4.908% due 7/23/25(a) | | | 795,875 | |
| | 220,000 | | | BBB | | 6.484% due 10/23/45(a) | | | 271,344 | |
| | 1,065,000 | | | B- | | Clear Channel Worldwide Holdings Inc., Company Guaranteed Notes, 7.625% due 3/15/20 | | | 1,078,312 | |
| | | | | | CSC Holdings LLC: | | | | |
| | 1,210,000 | | | BB- | | Company Guaranteed Notes, 6.625% due 10/15/25(a) | | | 1,317,388 | |
| | | | | | Senior Unsecured Notes: | | | | |
| | 780,000 | | | B- | | 6.750% due 11/15/21 | | | 834,600 | |
| | 425,000 | | | B- | | 10.125% due 1/15/23(a) | | | 486,359 | |
| | 200,000 | | | B- | | 10.875% due 10/15/25(a) | | | 235,000 | |
| | | | | | DISH DBS Corp., Company Guaranteed Notes: | | | | |
| | 270,000 | | | B+ | | 7.875% due 9/1/19 | | | 301,725 | |
| | 270,000 | | | B+ | | 5.125% due 5/1/20 | | | 280,125 | |
| | 930,000 | | | B+ | | 6.750% due 6/1/21 | | | 1,001,494 | |
| | 620,000 | | | B+ | | 5.875% due 7/15/22 | | | 633,950 | |
| | 240,000 | | | B+ | | 5.875% due 11/15/24 | | | 237,600 | |
See Notes to Financial Statements.
196
| | | | | | | | | | |
| High Yield Fund | |
| | | |
Face
Amount/Units† | | | Rating†† | | Security | | Value | |
| Media — 9.0% — (continued) | |
| $ | 690,000 | | | B+ | | 7.750% due 7/1/26(a) | | $ | 737,948 | |
| | 380,000 | | | B- | | DISH Network Corp., Senior Unsecured Notes, 3.375% due 8/15/26(a) | | | 398,288 | |
| | 500,000 | | | CCC | | Gibson Brands Inc., Senior Secured Notes, 8.875% due 8/1/18(a) | | | 390,000 | |
| | 490,000 | | | B+ | | Gray Television Inc., Company Guaranteed Notes, 5.875% due 7/15/26(a) | | | 512,050 | |
| | | | | | iHeartCommunications Inc.: | | | | |
| | 275,831 | | | CC | | Company Guaranteed Notes, 14.000% (12.000% cash or 2.000% PIK) due 2/1/21(d) | | | 113,091 | |
| | 1,240,000 | | | CCC | | Senior Secured Notes, 9.000% due 12/15/19 | | | 1,007,500 | |
| | 540,000 | | | CC | | Senior Unsecured Notes, 10.000% due 1/15/18 | | | 338,850 | |
| | 245,000 | | | BB- | | Lamar Media Corp., Company Guaranteed Notes, 5.750% due 2/1/26(a) | | | 265,825 | |
| | 480,991 | | | CC | | LBI Media Inc., Secured Notes, 13.500% (4.250% cash or 9.250% PIK) due 4/15/20(a)(b)(d) | | | 406,437 | |
| | 705,000 | | | B- | | Lee Enterprises Inc., Senior Secured Notes, 9.500% due 3/15/22(a) | | | 733,200 | |
| | 570,000 | | | B+ | | Media General Financing, Company Guaranteed Notes, 5.875% due 11/15/22 | | | 605,625 | |
| | 30,000 | | | CCC+ | | MHGE Parent LLC/MHGE Parent Finance Inc., Senior Unsecured Notes, 8.500% due 8/1/19(a) | | | 30,525 | |
| | 660,000 | | | B | | Midcontinent Communications & Midcontinent Finance Corp., Company Guaranteed Notes, 6.250% due 8/1/21(a) | | | 694,650 | |
| | 935,000 | | | B+ | | Nexstar Broadcasting Inc., Company Guaranteed Notes, 6.875% due 11/15/20 | | | 977,075 | |
| | 130,000 | | | BB- | | Outfront Media Capital LLC/Outfront Media Capital Corp., Company Guaranteed Notes, 5.250% due 2/15/22 | | | 136,663 | |
| | | | | | Radio One Inc.: | | | | |
| | 1,480,000 | | | CCC | | Company Guaranteed Notes, 9.250% due 2/15/20(a)(b) | | | 1,406,000 | |
| | 710,000 | | | B | | Senior Secured Notes, 7.375% due 4/15/22(a) | | | 722,425 | |
| | | | | | SFR Group SA, Senior Secured Notes: | | | | |
| | 550,000 | | | B+ | | 6.000% due 5/15/22(a) | | | 564,163 | |
| | 1,705,000 | | | B+ | | 6.250% due 5/15/24(a) | | | 1,724,181 | |
| | 1,040,000 | | | B+ | | 7.375% due 5/1/26(a) | | | 1,075,100 | |
| | | | | | Sinclair Television Group Inc., Company Guaranteed Notes: | | | | |
| | 790,000 | | | B+ | | 5.375% due 4/1/21 | | | 822,587 | |
| | 290,000 | | | B+ | | 5.625% due 8/1/24(a) | | | 302,789 | |
| | 465,000 | | | BB- | | Time Inc., Company Guaranteed Notes, 5.750% due 4/15/22(a) | | | 460,931 | |
| | 300,000 | | | BBB | | Time Warner Cable Inc., Senior Secured Notes, 7.300% due 7/1/38 | | | 390,843 | |
| | 900,000 | | | B+ | | Univision Communications Inc., Senior Secured Notes, 5.125% due 2/15/25(a) | | | 943,875 | |
| | 340,000 | | | BBB- | | Viacom Inc., Senior Unsecured Notes, 4.375% due 3/15/43 | | | 309,135 | |
| | | | | | | | | | |
| | | | | | Total Media | | | 29,219,334 | |
| | | | | | | | | | |
| Metals & Mining — 2.4% | |
| | | | | | Alcoa Inc., Senior Unsecured Notes: | | | | |
| | 20,000 | | | BBB- | | 5.125% due 10/1/24 | | | 21,200 | |
| | 740,000 | | | BBB- | | 5.950% due 2/1/37 | | | 750,871 | |
| | | | | | Anglo American Capital PLC, Company Guaranteed Notes: | | | | |
| | 680,000 | | | BB | | 3.625% due 5/14/20(a) | | | 676,600 | |
| | 360,000 | | | BB | | 4.875% due 5/14/25(a) | | | 362,700 | |
| | 500,000 | | | BB | | ArcelorMittal, Senior Unsecured Notes, 7.250% due 2/25/22(c) | | | 565,000 | |
| | 345,000 | | | BB- | | Coeur Mining Inc., Company Guaranteed Notes, 7.875% due 2/1/21 | | | 342,412 | |
| | 770,000 | | | BB+ | | FMG Resources August 2006 Pty Ltd., Senior Secured Notes, 9.750% due 3/1/22(a) | | | 893,200 | |
| | | | | | Freeport-McMoRan Inc., Company Guaranteed Notes: | | | | |
| | 855,000 | | | BB | | 3.100% due 3/15/20 | | | 790,875 | |
| | 260,000 | | | BB | | 3.550% due 3/1/22(c) | | | 228,150 | |
| | 130,000 | | | BB | | 3.875% due 3/15/23 | | | 112,125 | |
| | 930,000 | | | BB | | 5.450% due 3/15/43 | | | 716,100 | |
| | 181,051 | | | NR | | Midwest Vanadium Pty Ltd., Senior Secured Notes, 11.500% due 2/15/18(a)(b)(i) | | | 3,168 | |
| | | | | | Mirabela Nickel Ltd.: | | | | |
| | 300,991 | | | NR | | Secured Notes, 9.500% (0.000% cash or 9.500% PIK) due 6/24/19(a)(b)(d) | | | 21,069 | |
| | 1,151 | | | NR | | Subordinated Notes, 1.000% due 9/10/44(a)(b)(h) | | | — | |
See Notes to Financial Statements.
197
| | | | | | | | | | |
| High Yield Fund | |
| | | |
Face
Amount/Units† | | | Rating†† | | Security | | Value | |
| Metals & Mining — 2.4% — (continued) | |
| | | | | | Teck Resources Ltd., Company Guaranteed Notes: | | | | |
| $ | 390,000 | | | B+ | | 3.000% due 3/1/19 | | $ | 380,250 | |
| | 400,000 | | | BB- | | 8.000% due 6/1/21(a) | | | 432,750 | |
| | 230,000 | | | BB- | | 8.500% due 6/1/24(a) | | | 259,325 | |
| | | | | | United States Steel Corp., Senior Unsecured Notes: | | | | |
| | 490,000 | | | B | | 7.375% due 4/1/20(c) | | | 486,019 | |
| | 335,000 | | | B | | 7.500% due 3/15/22 | | | 327,253 | |
| | 465,000 | | | B | | Zekelman Industries Inc., Senior Secured Notes, 9.875% due 6/15/23(a) | | | 498,713 | |
| | | | | | | | | | |
| | | | | | Total Metals & Mining | | | 7,867,780 | |
| | | | | | | | | | |
| Multiline Retail — 0.2% | |
| | 605,000 | | | B- | | JC Penney Corp., Inc., Company Guaranteed Notes, 8.125% due 10/1/19 | | | 654,156 | |
| | | | | | | | | | |
| Oil, Gas & Consumable Fuels — 15.0% | |
| | 395,000 | | | CCC+ | | Alta Mesa Holdings LP/Alta Mesa Finance Services Corp., Company Guaranteed Notes, 9.625% due 10/15/18 | | | 353,525 | |
| | | | | | Antero Resources Corp., Company Guaranteed Notes: | | | | |
| | 495,000 | | | BB | | 5.375% due 11/1/21 | | | 498,094 | |
| | 635,000 | | | BB | | 5.125% due 12/1/22 | | | 630,237 | |
| | 430,000 | | | CCC | | Approach Resources Inc., Company Guaranteed Notes, 7.000% due 6/15/21(b) | | | 321,425 | |
| | | | | | Berry Petroleum Co. LLC, Senior Unsecured Notes: | | | | |
| | 310,000 | | | NR | | 6.750% due 11/1/20(i) | | | 162,750 | |
| | 790,000 | | | NR | | 6.375% due 9/15/22(i) | | | 414,750 | |
| | 365,000 | | | CCC | | Bill Barrett Corp., Company Guaranteed Notes, 7.000% due 10/15/22 | | | 268,275 | |
| | 1,020,000 | | | B- | | Blue Racer Midstream LLC/Blue Racer Finance Corp., Company Guaranteed Notes, 6.125% due 11/15/22(a) | | | 986,850 | |
| | | | | | California Resources Corp.: | | | | |
| | | | | | Company Guaranteed Notes: | | | | |
| | 4,000 | | | D | | 5.500% due 9/15/21 | | | 2,080 | |
| | 8,000 | | | D | | 6.000% due 11/15/24 | | | 3,900 | |
| | 30,000 | | | CCC+ | | Secured Notes, 8.000% due 12/15/22(a) | | | 20,400 | |
| | 290,000 | | | B+ | | Calumet Specialty Products Partners LP/Calumet Finance Corp., Senior Secured Notes, 11.500% due 1/15/21(a) | | | 332,775 | |
| | | | | | Carrizo Oil & Gas Inc., Company Guaranteed Notes: | | | | |
| | 920,000 | | | B+ | | 7.500% due 9/15/20 | | | 947,600 | |
| | 430,000 | | | B+ | | 6.250% due 4/15/23(c) | | | 426,775 | |
| | | | | | Chesapeake Energy Corp., Company Guaranteed Notes: | | | | |
| | 20,000 | | | D | | 3.930% due 4/15/19(e) | | | 18,200 | |
| | 425,000 | | | CC | | 6.625% due 8/15/20 | | | 380,375 | |
| | 120,000 | | | CC | | 6.875% due 11/15/20 | | | 105,900 | |
| | 130,000 | | | D | | 6.125% due 2/15/21 | | | 109,200 | |
| | 10,000 | | | D | | 5.375% due 6/15/21 | | | 7,950 | |
| | 120,000 | | | D | | 4.875% due 4/15/22 | | | 92,400 | |
| | 850,000 | | | CC | | 5.750% due 3/15/23 | | | 656,094 | |
| | 470,000 | | | B+ | | Cloud Peak Energy Resources LLC/Cloud Peak Energy Finance Corp., Company Guaranteed Notes, 6.375% due 3/15/24 | | | 242,050 | |
| | | | | | Comstock Resources Inc.: | | | | |
| | 95,000 | | �� | D | | Company Guaranteed Notes, 7.750% due 4/1/19 | | | 64,600 | |
| | | | | | Secured Notes: | | | | |
| | 290,000 | | | NR | | 7.750% (0.000% cash or 7.750% PIK) due 4/1/19 | | | 197,200 | |
| | 515,000 | | | NR | | 10.000% (10.000% cash or 12.250% PIK) due 3/15/20 | | | 476,375 | |
| | 195,000 | | | B | | Senior Secured Notes, 10.000% due 3/15/20(a) | | | 180,375 | |
| | | | | | Concho Resources Inc., Company Guaranteed Notes: | | | | |
| | 100,000 | | | BB+ | | 6.500% due 1/15/22 | | | 104,500 | |
| | 340,000 | | | BB+ | | 5.500% due 4/1/23 | | | 352,750 | |
See Notes to Financial Statements.
198
| | | | | | | | | | |
| High Yield Fund | |
| | | |
Face
Amount/Units† | | | Rating†† | | Security | | Value | |
| Oil, Gas & Consumable Fuels — 15.0% — (continued) | |
| | | | | | Continental Resources Inc., Company Guaranteed Notes: | | | | |
| $ | 320,000 | | | BB+ | | 5.000% due 9/15/22 | | $ | 311,200 | |
| | 60,000 | | | BB+ | | 4.500% due 4/15/23 | | | 56,850 | |
| | 430,000 | | | BB+ | | 4.900% due 6/1/44 | | | 361,200 | |
| | | | | | Crestwood Midstream Partners LP/Crestwood Midstream Finance Corp., Company Guaranteed Notes: | | | | |
| | 80,000 | | | BB- | | 6.000% due 12/15/20 | | | 79,200 | |
| | 880,000 | | | BB- | | 6.125% due 3/1/22 | | | 860,200 | |
| | 270,000 | | | BB- | | 6.250% due 4/1/23 | | | 264,600 | |
| | 350,000 | | | B+ | | CrownRock LP/CrownRock Finance Inc., Senior Unsecured Notes, 7.750% due 2/15/23(a) | | | 373,625 | |
| | 410,000 | | | B- | | CSI Compressco LP/CSI Compressco Finance Inc., Company Guaranteed Notes, 7.250% due 8/15/22 | | | 371,050 | |
| | | | | | DCP Midstream LLC: | | | | |
| | 915,000 | | | B+ | | Junior Subordinated Notes, 5.850% due 5/21/43(a)(b)(e) | | | 704,550 | |
| | | | | | Senior Unsecured Notes: | | | | |
| | 345,000 | | | BB | | 9.750% due 3/15/19(a) | | | 385,969 | |
| | 115,000 | | | BB | | 5.350% due 3/15/20(a)(b) | | | 117,300 | |
| | 200,000 | | | BB | | 4.750% due 9/30/21(a)(b) | | | 198,000 | |
| | 410,000 | | | BB | | 6.750% due 9/15/37(a) | | | 399,750 | |
| | | | | | DCP Midstream Operating LP, Company Guaranteed Notes: | | | | |
| | 290,000 | | | BB | | 4.950% due 4/1/22 | | | 293,625 | |
| | 345,000 | | | BB | | 3.875% due 3/15/23(b) | | | 329,475 | |
| | | | | | Ecopetrol SA, Senior Unsecured Notes: | | | | |
| | 54,000 | | | BBB | | 5.875% due 9/18/23 | | | 58,792 | |
| | 10,000 | | | BBB | | 4.125% due 1/16/25 | | | 9,700 | |
| | 330,000 | | | B- | | Endeavor Energy Resources LP/EER Finance Inc., Senior Unsecured Notes, 7.000% due 8/15/21(a) | | | 332,475 | |
| | | | | | Ensco PLC, Senior Unsecured Notes: | | | | |
| | 60,000 | | | BBB- | | 4.700% due 3/15/21(c) | | | 51,930 | |
| | 70,000 | | | BBB- | | 5.200% due 3/15/25 | | | 50,575 | |
| | 1,150,000 | | | BBB- | | 5.750% due 10/1/44 | | | 713,000 | |
| | | | | | EP Energy LLC/Everest Acquisition Finance Inc., Company Guaranteed Notes: | | | | |
| | 380,000 | | | CCC+ | | 9.375% due 5/1/20 | | | 247,000 | |
| | 360,000 | | | CCC+ | | 7.750% due 9/1/22 | | | 198,900 | |
| | 480,000 | | | CCC+ | | 6.375% due 6/15/23 | | | 265,200 | |
| | 130,000 | | | CCC+ | | EV Energy Partners LP/EV Energy Finance Corp., Company Guaranteed Notes, 8.000% due 4/15/19 | | | 81,250 | |
| | 390,000 | | | B- | | Extraction Oil & Gas Holdings LLC/Extraction Finance Corp., Senior Unsecured Notes, 7.875% due 7/15/21(a) | | | 395,850 | |
| | | | | | Freeport-McMoran Oil & Gas LLC/FCX Oil & Gas Inc., Company Guaranteed Notes: | | | | |
| | 390,000 | | | BB | | 6.125% due 6/15/19 | | | 395,850 | |
| | 110,000 | | | BB | | 6.750% due 2/1/22 | | | 110,550 | |
| | 1,420,000 | | | BB | | 6.875% due 2/15/23 | | | 1,388,050 | |
| | 745,000 | | | CC | | Gastar Exploration Inc., Secured Notes, 8.625% due 5/15/18 | | | 626,731 | |
| | 340,000 | | | B+ | | Genesis Energy LP/Genesis Energy Finance Corp., Company Guaranteed Notes, 6.000% due 5/15/23 | | | 340,000 | |
| | | | | | Gulfport Energy Corp., Company Guaranteed Notes: | | | | |
| | 230,000 | | | B+ | | 7.750% due 11/1/20 | | | 240,350 | |
| | 425,000 | | | B+ | | 6.625% due 5/1/23 | | | 438,813 | |
| | 525,000 | | | CCC+ | | Halcon Resources Corp., Secured Notes, 8.625% due 2/1/20(a)(c)(i) | | | 501,375 | |
| | 150,000 | | | BB | | Holly Energy Partners LP/Holly Energy Finance Corp., Company Guaranteed Notes, 6.000% due 8/1/24(a) | | | 153,750 | |
| | 375,000 | | | Caa2(g) | | Jones Energy Holdings LLC/Jones Energy Finance Corp., Company Guaranteed Notes, 6.750% due 4/1/22 | | | 324,375 | |
| | 10,000 | | | BBB- | | Kinder Morgan Inc., Company Guaranteed Notes, 7.800% due 8/1/31 | | | 12,272 | |
See Notes to Financial Statements.
199
| | | | | | | | | | |
| High Yield Fund | |
| | | |
Face
Amount/Units† | | | Rating†† | | Security | | Value | |
| Oil, Gas & Consumable Fuels — 15.0% — (continued) | |
| $ | 190,000 | | | B- | | Laredo Petroleum Inc., Company Guaranteed Notes, 7.375% due 5/1/22(c) | | $ | 192,850 | |
| | | | | | MEG Energy Corp., Company Guaranteed Notes: | | | | |
| | 110,000 | | | BB- | | 6.500% due 3/15/21(a) | | | 90,750 | |
| | 360,000 | | | BB- | | 6.375% due 1/30/23(a) | | | 282,600 | |
| | 110,000 | | | BB- | | 7.000% due 3/31/24(a) | | | 89,100 | |
| | 355,000 | | | B | | Memorial Resource Development Corp., Company Guaranteed Notes, 5.875% due 7/1/22 | | | 359,438 | |
| | 210,000 | | | NR | | Milagro Oil & Gas Inc., Secured Notes, 10.500% due 5/15/16(h)(i) | | | 54,749 | |
| | | | | | MPLX LP, Company Guaranteed Notes: | | | | |
| | 495,000 | | | BBB- | | 5.500% due 2/15/23(a) | | | 514,117 | |
| | 1,015,000 | | | BBB- | | 4.500% due 7/15/23(a) | | | 1,026,655 | |
| | 850,000 | | | BBB- | | 4.875% due 6/1/25(a) | | | 869,043 | |
| | 830,000 | | | D | | Murray Energy Corp., Secured Notes, 11.250% due 4/15/21(a) | | | 369,350 | |
| | 230,000 | | | BB+ | | Newfield Exploration Co., Senior Unsecured Notes, 5.375% due 1/1/26 | | | 232,300 | |
| | | | | | NGL Energy Partners LP/NGL Energy Finance Corp., Company Guaranteed Notes: | | | | |
| | 585,000 | | | BB- | | 5.125% due 7/15/19 | | | 551,363 | |
| | 400,000 | | | BB- | | 6.875% due 10/15/21 | | | 374,000 | |
| | | | | | NGPL PipeCo LLC, Senior Secured Notes: | | | | |
| | 160,000 | | | BB- | | 7.119% due 12/15/17(a) | | | 167,800 | |
| | 1,065,000 | | | BB- | | 7.768% due 12/15/37(a) | | | 1,148,869 | |
| | | | | | Noble Holding International Ltd., Company Guaranteed Notes: | | | | |
| | 150,000 | | | BB+ | | 4.625% due 3/1/21 | | | 126,015 | |
| | 345,000 | | | BB+ | | 3.950% due 3/15/22 | | | 263,062 | |
| | | | | | Oasis Petroleum Inc., Company Guaranteed Notes: | | | | |
| | 360,000 | | | B+ | | 6.875% due 3/15/22(c) | | | 336,600 | |
| | 600,000 | | | B+ | | 6.875% due 1/15/23(c) | | | 556,500 | |
| | 200,000 | | | B- | | Pacific Drilling V Ltd., Senior Secured Notes, 7.250% due 12/1/17(a) | | | 79,000 | |
| | 100,000 | | | B- | | Parsley Energy LLC/Parsley Finance Corp., Company Guaranteed Notes, 7.500% due 2/15/22(a) | | | 106,000 | |
| | 600,000 | | | BBB- | | PBF Holding Co. LLC/PBF Finance Corp., Senior Secured Notes, 7.000% due 11/15/23(a) | | | 573,300 | |
| | 200,000 | | | B+ | | Petrobras Global Finance BV, Company Guaranteed Notes, 4.375% due 5/20/23 | | | 174,922 | |
| | 815,000 | | | CC | | PetroQuest Energy Inc., Secured Notes, 10.000% due 2/15/21(a) | | | 590,875 | |
| | 390,000 | | | BBB- | | Pride International Inc., Company Guaranteed Notes, 7.875% due 8/15/40 | | | 289,575 | |
| | | | | | QEP Resources Inc., Senior Unsecured Notes: | | | | |
| | 120,000 | | | BB+ | | 6.875% due 3/1/21 | | | 126,060 | |
| | 490,000 | | | BB+ | | 5.250% due 5/1/23 | | | 482,650 | |
| | | | | | Range Resources Corp., Company Guaranteed Notes: | | | | |
| | 70,000 | | | BB+ | | 5.000% due 3/15/23 | | | 69,475 | |
| | 450,000 | | | BB+ | | 4.875% due 5/15/25 | | | 436,500 | |
| | 70,000 | | | BBB- | | Regency Energy Partners LP/Regency Energy Finance Corp., Company Guaranteed Notes, 6.500% due 7/15/21 | | | 72,277 | |
| | 1,110,000 | | | Ca(g) | | Resolute Energy Corp., Company Guaranteed Notes, 8.500% due 5/1/20 | | | 1,004,550 | |
| | | | | | Rice Energy Inc., Company Guaranteed Notes: | | | | |
| | 880,000 | | | B- | | 6.250% due 5/1/22 | | | 906,400 | |
| | 150,000 | | | B- | | 7.250% due 5/1/23 | | | 157,500 | |
| | | | | | Rockies Express Pipeline LLC, Senior Unsecured Notes: | | | | |
| | 865,000 | | | BB+ | | 5.625% due 4/15/20(a) | | | 909,331 | |
| | 300,000 | | | BB+ | | 7.500% due 7/15/38(a) | | | 312,000 | |
| | 1,575,000 | | | BB+ | | 6.875% due 4/15/40(a)(b) | | | 1,598,625 | |
| | 590,000 | | | B | | Rose Rock Midstream LP/Rose Rock Finance Corp., Company Guaranteed Notes, 5.625% due 11/15/23 | | | 539,850 | |
| | 480,000 | | | B+ | | RSP Permian Inc., Company Guaranteed Notes, 6.625% due 10/1/22 | | | 501,600 | |
| | | | | | Sabine Pass Liquefaction LLC, Senior Secured Notes: | | | | |
| | 630,000 | | | BB+ | | 5.625% due 2/1/21 | | | 664,650 | |
| | 725,000 | | | BB+ | | 6.250% due 3/15/22 | | | 779,375 | |
| | 370,000 | | | BB+ | | 5.625% due 4/15/23 | | | 391,275 | |
See Notes to Financial Statements.
200
| | | | | | | | | | |
| High Yield Fund | |
| | | |
Face
Amount/Units† | | | Rating†† | | Security | | Value | |
| Oil, Gas & Consumable Fuels — 15.0% — (continued) | |
| $ | 510,000 | | | BB+ | | 5.750% due 5/15/24 | | $ | 544,425 | |
| | | | | | Sanchez Energy Corp., Company Guaranteed Notes: | | | | |
| | 680,000 | | | B- | | 7.750% due 6/15/21 | | | 595,000 | |
| | 925,000 | | | B- | | 6.125% due 1/15/23(c) | | | 735,375 | |
| | 385,000 | | | BB | | SESI LLC, Company Guaranteed Notes, 7.125% due 12/15/21 | | | 377,300 | |
| | 190,000 | | | B | | Shelf Drilling Holdings Ltd., Secured Notes, 8.625% due 11/1/18(a) | | | 155,325 | |
| | 360,000 | | | B+ | | SM Energy Co., Senior Unsecured Notes, 5.625% due 6/1/25 | | | 338,400 | |
| | 400,000 | | | BBB- | | Southern Natural Gas Co. LLC, Company Guaranteed Notes, 8.000% due 3/1/32 | | | 511,962 | |
| | | | | | Summit Midstream Holdings LLC/Summit Midstream Finance Corp., Company Guaranteed Notes: | | | | |
| | 10,000 | | | B | | 7.500% due 7/1/21 | | | 10,200 | |
| | 520,000 | | | B | | 5.500% due 8/15/22 | | | 493,350 | |
| | 645,000 | | | BB- | | Sunoco LP/Sunoco Finance Corp., Company Guaranteed Notes, 5.500% due 8/1/20(a) | | | 655,546 | |
| | 470,000 | | | B- | | Teine Energy Ltd., Senior Unsecured Notes, 6.875% due 9/30/22(a) | | | 473,525 | |
| | | | | | Tesoro Logistics LP/Tesoro Logistics Finance Corp., Company Guaranteed Notes: | | | | |
| | 100,000 | | | BB | | 5.500% due 10/15/19 | | | 107,000 | |
| | 50,000 | | | BB | | 6.125% due 10/15/21 | | | 52,469 | |
| | 140,000 | | | BB | | 6.375% due 5/1/24 | | | 150,150 | |
| | | | | | Transocean Inc., Company Guaranteed Notes: | | | | |
| | 690,000 | | | BB- | | 8.125% due 12/15/21(c) | | | 650,325 | |
| | 330,000 | | | BB- | | 9.000% due 7/15/23(a) | | | 319,275 | |
| | 575,000 | | | B | | Western Refining Inc., Company Guaranteed Notes, 6.250% due 4/1/21 | | | 562,062 | |
| | | | | | Whiting Petroleum Corp., Company Guaranteed Notes: | | | | |
| | 90,000 | | | B+ | | 5.750% due 3/15/21(c) | | | 81,112 | |
| | 300,000 | | | B+ | | 6.250% due 4/1/23(c) | | | 264,000 | |
| | | | | | Williams Cos., Inc. (The), Senior Unsecured Notes: | | | | |
| | 130,000 | | | BB | | 3.700% due 1/15/23 | | | 126,750 | |
| | 170,000 | | | BB | | 4.550% due 6/24/24 | | | 174,675 | |
| | 450,000 | | | BB | | 7.500% due 1/15/31 | | | 517,500 | |
| | 770,000 | | | BB | | 5.750% due 6/24/44 | | | 795,025 | |
| | | | | | WPX Energy Inc., Senior Unsecured Notes: | | | | |
| | 910,000 | | | B | | 6.000% due 1/15/22(c) | | | 889,525 | |
| | 350,000 | | | B | | 8.250% due 8/1/23(c) | | | 365,750 | |
| | | | | | | | | | |
| | | | | | Total Oil, Gas & Consumable Fuels | | | 48,717,764 | |
| | | | | | | | | | |
| Personal Products — 0.2% | |
| | 630,000 | | | B+ | | Revlon Consumer Products Corp., Company Guaranteed Notes, 5.750% due 2/15/21 | | | 647,325 | |
| | | | | | | | | | |
| Pharmaceuticals — 2.3% | |
| | 690,000 | | | CCC- | | BioScrip Inc., Company Guaranteed Notes, 8.875% due 2/15/21 | | | 653,775 | |
| | 420,000 | | | CCC+ | | DPx Holdings BV, Senior Unsecured Notes, 7.500% due 2/1/22(a) | | | 447,901 | |
| | | | | | Endo Ltd./Endo Finance LLC/Endo Finco Inc., Company Guaranteed Notes: | | | | |
| | 200,000 | | | B | | 6.000% due 7/15/23(a) | | | 182,500 | |
| | 700,000 | | | B | | 6.000% due 2/1/25(a) | | | 624,750 | |
| | 320,000 | | | B+ | | Grifols Worldwide Operations Ltd., Company Guaranteed Notes, 5.250% due 4/1/22(a) | | | 336,000 | |
| | | | | | Valeant Pharmaceuticals International Inc., Company Guaranteed Notes: | | | | |
| | 655,000 | | | B- | | 5.375% due 3/15/20(a) | | | 620,612 | |
| | 170,000 | | | B- | | 7.000% due 10/1/20(a) | | | 166,600 | |
| | 1,065,000 | | | B- | | 6.375% due 10/15/20(a) | | | 1,022,400 | |
| | 700,000 | | | B- | | 7.500% due 7/15/21(a) | | | 690,592 | |
| | 740,000 | | | B- | | 5.625% due 12/1/21(a) | | | 671,550 | |
| | 950,000 | | | B- | | 5.500% due 3/1/23(a) | | | 833,625 | |
| | 1,200,000 | | | B- | | 6.125% due 4/15/25(a) | | | 1,057,500 | |
| | | | | | | | | | |
| | | | | | Total Pharmaceuticals | | | 7,307,805 | |
| | | | | | | | | | |
See Notes to Financial Statements.
201
| | | | | | | | | | |
| High Yield Fund | |
| | | |
Face
Amount/Units† | | | Rating†† | | Security | | Value | |
| Real Estate Investment Trusts (REITs) — 2.6% | |
| $ | 715,000 | | | B- | | Ashton Woods USA LLC/Ashton Woods Finance Co., Senior Unsecured Notes, 6.875% due 2/15/21(a) | | $ | 686,400 | |
| | 200,000 | | | BBB- | | Care Capital Properties LP, Company Guaranteed Notes, 5.125% due 8/15/26(a) | | | 202,296 | |
| | | | | | Communications Sales & Leasing Inc./CSL Capital LLC: | | | | |
| | 130,000 | | | B- | | Company Guaranteed Notes, 8.250% due 10/15/23 | | | 136,175 | |
| | 190,000 | | | BB- | | Senior Secured Notes, 6.000% due 4/15/23(a) | | | 198,075 | |
| | | | | | Corrections Corp. of America, Company Guaranteed Notes: | | | | |
| | 1,200,000 | | | BB | | 5.000% due 10/15/22(c) | | | 1,119,000 | |
| | 330,000 | | | BB | | 4.625% due 5/1/23(c) | | | 295,350 | |
| | 610,000 | | | BB- | | CTR Partnership LP/CareTrust Capital Corp., Company Guaranteed Notes, 5.875% due 6/1/21 | | | 625,250 | |
| | 610,000 | | | BB- | | ESH Hospitality Inc., Company Guaranteed Notes, 5.250% due 5/1/25(a) | | | 612,861 | |
| | 875,000 | | | B+ | | FelCor Lodging LP, Senior Secured Notes, 5.625% due 3/1/23 | | | 903,437 | |
| | 510,000 | | | B+ | | GEO Group Inc. (The), Company Guaranteed Notes, 5.125% due 4/1/23 | | | 457,725 | |
| | 860,000 | | | BB- | | Iron Mountain Inc., Company Guaranteed Notes, 6.000% due 10/1/20(a) | | | 915,909 | |
| | 600,000 | | | B | | Isle of Capri Casinos Inc., Company Guaranteed Notes, 8.875% due 6/15/20 | | | 629,250 | |
| | | | | | MGP Escrow Issuer LLC, Company Guaranteed Notes: | | | | |
| | 500,000 | | | BB- | | 5.625% due 5/1/24(a) | | | 543,750 | |
| | 390,000 | | | BB- | | 4.500% due 9/1/26(a) | | | 391,706 | |
| | | | | | MPT Operating Partnership LP/MPT Finance Corp., Company Guaranteed Notes: | | | | |
| | 140,000 | | | BBB- | | 6.375% due 3/1/24 | | | 154,350 | |
| | 220,000 | | | BBB- | | 5.250% due 8/1/26 | | | 234,300 | |
| | | | | | | | | | |
| | | | | | Total Real Estate Investment Trusts (REITs) | | | 8,105,834 | |
| | | | | | | | | | |
| Real Estate Management & Development — 0.5% | |
| | 850,000 | | | BB- | | Greystar Real Estate Partners LLC, Senior Secured Notes, 8.250% due 12/1/22(a) | | | 905,250 | |
| | 785,000 | | | B+ | | Realogy Group LLC/Realogy Co.-Issuer Corp., Company Guaranteed Notes, 5.250% due 12/1/21(a) | | | 826,213 | |
| | | | | | | | | | |
| | | | | | Total Real Estate Management & Development | | | 1,731,463 | |
| | | | | | | | | | |
| Semiconductors & Semiconductor Equipment — 0.7% | |
| | | | | | Micron Technology Inc., Senior Unsecured Notes: | | | | |
| | 255,000 | | | BB | | 5.875% due 2/15/22 | | | 258,506 | |
| | 795,000 | | | BB | | 5.250% due 8/1/23(a) | | | 773,137 | |
| | 200,000 | | | BB | | 5.500% due 2/1/25 | | | 194,750 | |
| | 400,000 | | | BB | | 5.625% due 1/15/26(a) | | | 384,000 | |
| | 475,000 | | | BB+ | | Qorvo Inc., Company Guaranteed Notes, 6.750% due 12/1/23(a) | | | 518,938 | |
| | | | | | | | | | |
| | | | | | Total Semiconductors & Semiconductor Equipment | | | 2,129,331 | |
| | | | | | | | | | |
| Software — 1.3% | |
| | 370,000 | | | BBB- | | Activision Blizzard Inc., Company Guaranteed Notes, 6.125% due 9/15/23(a) | | | 406,537 | |
| | | | | | First Data Corp.: | | | | |
| | 1,560,000 | | | B | | Company Guaranteed Notes, 7.000% due 12/1/23(a) | | | 1,639,950 | |
| | 480,000 | | | B | | Secured Notes, 5.750% due 1/15/24(a) | | | 493,200 | |
| | 725,000 | | | BB | | Senior Secured Notes, 5.000% due 1/15/24(a) | | | 740,406 | |
| | 270,000 | | | CCC+ | | Interface Security Systems Holdings Inc./Interface Security Systems LLC, Secured Notes, 9.250% due 1/15/18 | | | 275,063 | |
| | 505,000 | | | BB- | | Nuance Communications Inc., Company Guaranteed Notes 5.375% due 8/15/20(a) | | | 518,256 | |
| | | | | | | | | | |
| | | | | | Total Software | | | 4,073,412 | |
| | | | | | | | | | |
| Specialty Retail — 1.7% | |
| | 360,000 | | | BB | | CST Brands Inc., Company Guaranteed Notes, 5.000% due 5/1/23 | | | 382,500 | |
| | 850,000 | | | BB- | | Dollar Tree Inc., Company Guaranteed Notes, 5.750% due 3/1/23 | | | 919,063 | |
| | | | | | GameStop Corp., Company Guaranteed Notes: | | | | |
| | 270,000 | | | BB+ | | 5.500% due 10/1/19(a) | | | 276,075 | |
| | 250,000 | | | BB+ | | 6.750% due 3/15/21(a) | | | 253,750 | |
See Notes to Financial Statements.
202
| | | | | | | | | | |
| High Yield Fund | |
| | | |
Face
Amount/Units† | | | Rating†† | | Security | | Value | |
| Specialty Retail — 1.7% — (continued) | |
| | | | | | Guitar Center Inc.: | | | | |
| $ | 650,000 | | | CCC | | Company Guaranteed Notes, 9.625% due 4/15/20(a) | | $ | 481,000 | |
| | 140,000 | | | B- | | Senior Secured Notes, 6.500% due 4/15/19(a) | | | 125,300 | |
| | | | | | L Brands Inc.: | | | | |
| | | | | | Company Guaranteed Notes: | | | | |
| | 200,000 | | | BB+ | | 7.000% due 5/1/20 | | | 231,250 | |
| | 420,000 | | | BB+ | | 6.625% due 4/1/21 | | | 487,200 | |
| | 360,000 | | | BB+ | | 6.875% due 11/1/35 | | | 395,100 | |
| | 220,000 | | | BB- | | Senior Unsecured Notes, 6.950% due 3/1/33 | | | 233,750 | |
| | | | | | Neiman Marcus Group Ltd. LLC, Company Guaranteed Notes: | | | | |
| | 520,000 | | | CCC | | 8.000% due 10/15/21(a) | | | 447,564 | |
| | 310,000 | | | CCC | | 8.750% (8.750% cash or 9.500% PIK) due 10/15/21(a)(d) | | | 253,425 | |
| | 715,000 | | | B- | | PetSmart Inc., Senior Unsecured Notes, 7.125% due 3/15/23(a) | | | 753,431 | |
| | 330,000 | | | BB+ | | Sally Holdings LLC/Sally Capital Inc., Company Guaranteed Notes, 5.625% due 12/1/25 | | | 359,040 | |
| | | | | | | | | | |
| | | | | | Total Specialty Retail | | | 5,598,448 | |
| | | | | | | | | | |
| Technology Hardware, Storage & Peripherals — 2.5% | |
| | | | | | Diamond 1 Finance Corp./Diamond 2 Finance Corp.: | | | | |
| | 250,000 | | | BB | | Company Guaranteed Notes, 7.125% due 6/15/24(a) | | | 271,160 | |
| | | | | | Senior Secured Notes: | | | | |
| | 200,000 | | | BBB- | | 6.020% due 6/15/26(a) | | | 214,375 | |
| | 2,090,000 | | | BBB- | | 8.100% due 7/15/36(a) | | | 2,434,169 | |
| | 230,000 | | | BBB- | | 8.350% due 7/15/46(a) | | | 268,842 | |
| | 440,000 | | | BB | | Senior Unsecured Notes, 5.875% due 6/15/21(a) | | | 465,426 | |
| | | | | | Seagate HDD Cayman, Company Guaranteed Notes: | | | | |
| | 605,000 | | | BBB- | | 4.875% due 6/1/27 | | | 531,330 | |
| | 790,000 | | | BBB- | | 5.750% due 12/1/34 | | | 656,687 | |
| | | | | | Western Digital Corp.: | | | | |
| | 1,955,000 | | | BB+ | | Company Guaranteed Notes, 10.500% due 4/1/24(a) | | | 2,214,038 | |
| | 960,000 | | | BBB- | | Senior Secured Notes, 7.375% due 4/1/23(a) | | | 1,044,000 | |
| | | | | | | | | | |
| | | | | | Total Technology Hardware, Storage & Peripherals | | | 8,100,027 | |
| | | | | | | | | | |
| Textiles, Apparel & Luxury Goods — 0.5% | |
| | | | | | Hanesbrands Inc., Company Guaranteed Notes: | | | | |
| | 140,000 | | | BB | | 4.625% due 5/15/24(a) | | | 147,175 | |
| | 130,000 | | | BB | | 4.875% due 5/15/26(a) | | | 136,500 | |
| | 500,000 | | | BBu | | Levi Strauss & Co., Senior Unsecured Notes, 5.000% due 5/1/25 | | | 521,250 | |
| | 710,000 | | | BB+ | | William Carter Co. (The), Company Guaranteed Notes, 5.250% due 8/15/21 | | | 751,713 | |
| | | | | | | | | | |
| | | | | | Total Textiles, Apparel & Luxury Goods | | | 1,556,638 | |
| | | | | | | | | | |
| Tobacco — 0.2% | |
| | 835,000 | | | CCC- | | Alliance One International Inc., Secured Notes, 9.875% due 7/15/21 | | | 746,281 | |
| | | | | | | | | | |
| Transportation Infrastructure — 2.5% | |
| | 505,000 | | | BB+ | | Aircastle Ltd., Senior Unsecured Notes, 7.625% due 4/15/20 | | | 585,169 | |
| | 945,000 | | | B- | | Con-Way Inc., Senior Unsecured Notes, 7.250% due 1/15/18 | | | 970,987 | |
| | 260,000 | | | B | | CTP Transportation Products LLC/CTP Finance Inc., Senior Secured Notes, 8.250% due 12/15/19(a) | | | 201,500 | |
| | 460,000 | | | B+ | | Eletson Holdings Inc., Senior Secured Notes, 9.625% due 1/15/22(a)(b) | | | 338,100 | |
| | 670,000 | | | B+ | | Flexi-Van Leasing Inc., Company Guaranteed Notes, 7.875% due 8/15/18(a) | | | 606,350 | |
| | 560,000 | | | B | | Florida East Coast Holdings Corp., Senior Secured Notes, 6.750% due 5/1/19(a) | | | 579,600 | |
| | | | | | Fly Leasing Ltd., Senior Unsecured Notes: | | | | |
| | 335,000 | | | BB | | 6.750% due 12/15/20 | | | 345,469 | |
| | 540,000 | | | BB | | 6.375% due 10/15/21 | | | 548,100 | |
| | 888,000 | | | B- | | Gardner Denver Inc., Senior Unsecured Notes, 6.875% due 8/15/21(a) | | | 823,620 | |
See Notes to Financial Statements.
203
| | | | | | | | | | |
| High Yield Fund | |
| | | |
Face
Amount/Units† | | | Rating†† | | Security | | Value | |
| Transportation Infrastructure — 2.5% — (continued) | |
| $ | 740,000 | | | B+ | | Navios Maritime Acquisition Corp./Navios Acquisition Finance US Inc., Senior Secured Notes, 8.125% due 11/15/21(a) | | $ | 566,100 | |
| | 389,887 | | | CCC- | | Neovia Logistics Intermediate Holdings LLC/Logistics Intermediate Finance Corp., Senior Unsecured Notes, 10.000% (10.000% cash or 10.750% PIK) due 2/15/18(a)(d) | | | 218,337 | |
| | 330,000 | | | Caa3(g) | | Ultrapetrol Bahamas Ltd., Senior Secured Notes, 8.875% due 6/15/21(b)(i) | | | 67,650 | |
| | 710,000 | | | B | | Watco Cos. LLC/Watco Finance Corp., Company Guaranteed Notes, 6.375% due 4/1/23(a) | | | 715,325 | |
| | 405,000 | | | CCC+ | | WaveDivision Escrow LLC/WaveDivision Escrow Corp., Senior Unsecured Notes, 8.125% due 9/1/20(a) | | | 423,225 | |
| | | | | | XPO Logistics Inc., Company Guaranteed Notes: | | | | |
| | 180,000 | | | B | | 7.875% due 9/1/19(a) | | | 187,208 | |
| | 350,000 | | | B | | 6.500% due 6/15/22(a) | | | 365,312 | |
| | 500,000 | | | B | | 6.125% due 9/1/23(a) | | | 515,000 | |
| | | | | | | | | | |
| | | | | | Total Transportation Infrastructure | | | 8,057,052 | |
| | | | | | | | | | |
| Wireless Telecommunication Services — 4.1% | |
| | | | | | Frontier Communications Corp., Senior Unsecured Notes: | | | | |
| | 685,000 | | | BB- | | 8.875% due 9/15/20 | | | 749,219 | |
| | 300,000 | | | BB- | | 9.250% due 7/1/21 | | | 325,875 | |
| | 340,000 | | | BB- | | 10.500% due 9/15/22 | | | 371,238 | |
| | 730,000 | | | BB- | | 7.625% due 4/15/24 | | | 689,850 | |
| | 525,000 | | | BB- | | 6.875% due 1/15/25 | | | 473,156 | |
| | 915,000 | | | BB- | | 11.000% due 9/15/25 | | | 991,631 | |
| | 560,000 | | | D | | Oi Brasil Holdings Cooperatief UA, Senior Unsecured Notes, 5.750% due 2/10/22(a)(i) | | | 147,000 | |
| | 1,860,000 | | | B | | Sprint Capital Corp., Company Guaranteed Notes, 8.750% due 3/15/32 | | | 1,855,350 | |
| | | | | | Sprint Communications Inc.: | | | | |
| | | | | | Company Guaranteed Notes: | | | | |
| | 2,065,000 | | | BB- | | 9.000% due 11/15/18(a) | | | 2,281,825 | |
| | 235,000 | | | BB- | | 7.000% due 3/1/20(a) | | | 253,212 | |
| | | | | | Senior Unsecured Notes: | | | | |
| | 835,000 | | | B | | 7.000% due 8/15/20 | | | 826,650 | |
| | 975,000 | | | B | | 11.500% due 11/15/21 | | | 1,101,750 | |
| | | | | | Sprint Corp., Company Guaranteed Notes: | | | | |
| | 1,880,000 | | | B | | 7.250% due 9/15/21 | | | 1,868,250 | |
| | 290,000 | | | B | | 7.875% due 9/15/23 | | | 283,327 | |
| | | | | | T-Mobile USA Inc., Company Guaranteed Notes: | | | | |
| | 300,000 | | | BB | | 6.000% due 3/1/23 | | | 319,137 | |
| | 750,000 | | | BB | | 6.500% due 1/15/26 | | | 823,594 | |
| | | | | | | | | | |
| | | | | | Total Wireless Telecommunication Services | | | 13,361,064 | |
| | | | | | | | | | |
| | | | | | TOTAL CORPORATE BONDS & NOTES
(Cost — $304,601,069) | | | 310,260,247 | |
| | | | | | | | | | |
| SENIOR LOANS — 0.5% | |
| | 340,000 | | | NR | | AP NMT Acquisition BV, (Restricted), 10.000% due 8/13/22(b) | | | 238,850 | |
| | 424,151 | | | NR | | Hercules Offshore Inc., (Restricted), 10.500% due 5/6/20(b)(i) | | | 255,903 | |
| | 277,200 | | | NR | | Lantheus Medical Imaging, (Restricted), 7.000% due 6/30/22 | | | 265,419 | |
| | 175,368 | | | NR | | Murray Energy Corp., (Restricted), 8.250% due 4/16/20 | | | 146,345 | |
| | 129,674 | | | NR | | Panda Temple Power II LLC, (Restricted), 7.250% due 4/3/19 | | | 120,597 | |
| | 316,000 | | | NR | | Panda Temple Power LLC, (Restricted), 7.250% due 3/6/22 | | | 282,820 | |
| | 345,333 | | | NR | | Radnet Management Inc., (Restricted), 8.000% due 3/25/21 | | | 336,700 | |
| | | | | | | | | | |
| | | | | | TOTAL SENIOR LOANS (Cost — $1,805,330) | | | 1,646,634 | |
| | | | | | | | | | |
| COLLATERALIZED MORTGAGE OBLIGATIONS — 0.2% | |
| | 300,000 | | | NR | | Commercial Mortgage Trust, Series 2015-LC21, Class E, 3.250% due 7/10/48(a) | | | 164,334 | |
| | 200,000 | | | NR | | JPMBB Commercial Mortgage Securities Trust, Series 2015-C31, Class E, 4.772% due 8/15/48(a)(e) | | | 150,003 | |
See Notes to Financial Statements.
204
| | | | | | | | | | |
| High Yield Fund | |
| | | |
Face
Amount/Units† | | | Rating†† | | Security | | Value | |
| $ | 300,000 | | | NR | | Wells Fargo Commercial Mortgage Trust, Series 2015-C28, Class E, 3.000% due 5/15/48(a) | | $ | 158,810 | |
| | | | | | | | | | |
| | | | | | TOTAL COLLATERALIZED MORTGAGE OBLIGATIONS
(Cost — $524,489) | | | 473,147 | |
| | | | | | | | | | |
| | | |
| Shares/Units | | | | | | | | |
| PREFERRED STOCK — 0.3% | |
| FINANCIALS — 0.3% | |
| Banks — 0.3% | |
| | 39,709 | | | | | GMAC Capital Trust I, 6.602%(e)
(Cost — $937,614) | | | 1,003,049 | |
| | | | | | | | | | |
| COMMON STOCKS — 0.3% | |
| CONSUMER DISCRETIONARY — 0.0% | |
| Hotels, Restaurants & Leisure — 0.0% | |
| | 9,953 | | | | | Bossier Casino Venture Holdco Inc., (Restricted)*(a)(b)(h) | | | 90,174 | |
| | | | | | | | | | |
| ENERGY — 0.3% | |
| Energy Equipment & Services — 0.1% | |
| | 18,163 | | | | | DeepOcean Group Holdings AS, (Restricted)*(b)(h) | | | 125,507 | |
| | 17,453 | | | | | Hercules Offshore Inc.* | | | 23,125 | |
| | | | | | | | | | |
| | | | | | Total Energy Equipment & Services | | | 148,632 | |
| | | | | | | | | | |
| Oil, Gas & Consumable Fuels — 0.2% | |
| | 24,451 | | | | | Magnum Hunter Resources Corp., (Restricted)*(b) | | | 305,638 | |
| | 347 | | | | | Southwestern Energy Co. | | | 4,827 | |
| | 53,668 | | | | | Whiting Petroleum Corp.* | | | 391,239 | |
| | | | | | | | | | |
| | | | | | Total Oil, Gas & Consumable Fuels | | | 701,704 | |
| | | | | | | | | | |
| | | | | | TOTAL ENERGY | | | 850,336 | |
| | | | | | | | | | |
| FINANCIALS — 0.0% | |
| Diversified Financial Services — 0.0% | |
| | 559 | | | | | Jack Cooper Holdings Corp., Class B Shares*(a)(b)(h) | | | — | |
| | | | | | | | | | |
| MATERIALS — 0.0% | |
| Metals & Mining — 0.0% | |
| | 353,070 | AUD | | | | Mirabela Nickel Ltd.*(b)(h) | | | — | |
| | | | | | | | | | |
| | | | | | TOTAL COMMON STOCKS
(Cost — $2,579,899) | | | 940,510 | |
| | | | | | | | | | |
| CONVERTIBLE PREFERRED STOCK — 0.1% | |
| ENERGY — 0.1% | |
| Oil, Gas & Consumable Fuels — 0.1% | |
| | 10,400 | | | | | Southwestern Energy Co., 6.250%
(Cost — $345,351) | | | 334,880 | |
| | | | | | | | | | |
| | | | | | TOTAL INVESTMENTS BEFORE SHORT-TERM INVESTMENTS
(Cost — $310,793,752) | | | 314,658,467 | |
| | | | | | | | | | |
| | |
Face
Amount | | | | | | |
| SHORT-TERM INVESTMENTS (j) — 6.0% | |
| MONEY MARKET FUND — 4.2% | |
| $ | 13,683,734 | | | | | Invesco STIT — Government & Agency Portfolio(k)
(Cost — $13,683,734) | | | 13,683,734 | |
| | | | | | | | | | |
See Notes to Financial Statements.
205
| | | | | | | | | | |
| High Yield Fund | |
| | | |
Face
Amount | | | | | Security | | Value | |
| TIME DEPOSITS — 1.8% | |
| $ | 2,045,399 | | | | | Banco Santander SA — Frankfurt, 0.150% due 9/1/16 | | $ | 2,045,399 | |
| | 3,895,156 | | | | | Citibank N.A. — Puerto Rico, 0.150% due 9/1/16 | | | 3,895,156 | |
| | | | | | | | | | |
| | | | | | TOTAL TIME DEPOSITS
(Cost — $5,940,555) | | | 5,940,555 | |
| | | | | | | | | | |
| | | | | | TOTAL SHORT-TERM INVESTMENTS
(Cost — $19,624,289) | | | 19,624,289 | |
| | | | | | | | | | |
| | | | | | TOTAL INVESTMENTS — 102.9%
(Cost — $330,418,041#) | | | 334,282,756 | |
| | | | | | | | | | |
| | | | | | Liabilities in Excess of Other Assets — (2.9)% | | | (9,500,551 | ) |
| | | | | | | | | | |
| | | | | | TOTAL NET ASSETS — 100.0% | | $ | 324,782,205 | |
| | | | | | | | | | |
| † | Amount denominated in U.S. dollars, unless otherwise noted. |
| †† | All ratings are by Standard & Poor’s Rating Service, unless otherwise noted. All ratings are unaudited. |
| * | Non-income producing security. |
| (a) | Restricted security that may be sold to “qualified institutional buyers” pursuant to the conditions of Rule 144A under the Securities Act of 1933, as amended. This security has been deemed liquid pursuant to guidelines approved by the Board of Trustees, unless otherwise noted. |
| (c) | All or a portion of this security is on loan (See Note 1). |
| (d) | Payment in-kind security for which part of the income earned may be paid as additional principal. At the option of the issuer. |
| (e) | Variable rate security. Interest rate disclosed is that which was in effect at August 31, 2016. |
| (f) | Security is perpetual in nature and has no stated maturity date. |
| (g) | Rating by Moody’s Investors Service. All ratings are unaudited. |
| (h) | Security is valued in good faith at fair value by or under the direction of the Board of Trustees. |
| (i) | Security is currently in default. |
| (j) | Inclusive of all short term holdings, including collateral received from securities lending activities. Excluding such collateral, the percentage of portfolio holdings would be 1.8%. |
| (k) | Represents investment of collateral received from securities lending transactions. |
| # | Aggregate cost for federal income tax purposes is $332,396,012. |
| | |
Abbreviations used in this schedule: |
| PLC | | — Public Limited Company |
See pages 250 and 251 for definitions of ratings.
| | | | |
| Summary of Investments by Security Type^ | | | |
Corporate Bonds & Notes | | | 92.8 | % |
Senior Loans | | | 0.5 | |
Preferred Stocks | | | 0.3 | |
Common Stocks | | | 0.3 | |
Collateralized Mortgage Obligations | | | 0.1 | |
Convertible Preferred Stocks | | | 0.1 | |
Short-Term Investments | | | 5.9 | |
| | | | |
| | | 100.0 | % |
| | | | |
| ^ | As a percentage of total investments. |
See Notes to Financial Statements.
206
| | | | | | | | | | |
| International Fixed Income Fund | |
| | | |
Face
Amount/Units† | | | | | Security | | Value | |
| SOVEREIGN BONDS — 41.3% | |
| Brazil — 2.7% | |
| | 17,100,000 | BRL | | | | Brazil Letras do Tesouro Nacional, zero coupon, due 10/1/16 — 7/1/17 | | $ | 5,079,582 | |
| | | | | | | | | | |
| Canada — 4.4% | |
| | | | | | Province of Alberta Canada: | | | | |
| | 900,000 | CAD | | | | 1.250% due 6/1/20 | | | 689,745 | |
| | 900,000 | CAD | | | | 2.350% due 6/1/25 | | | 711,441 | |
| | | | | | Province of Ontario Canada: | | | | |
| | 1,500,000 | CAD | | | | 4.200% due 6/2/20(a) | | | 1,273,384 | |
| | 3,100,000 | CAD | | | | 3.150% due 6/2/22(a) | | | 2,597,120 | |
| | 1,900,000 | CAD | | | | 2.600% due 6/2/25(a) | | | 1,546,256 | |
| | 800,000 | CAD | | | | 2.400% due 6/2/26 | | | 638,481 | |
| | 1,100,000 | CAD | | | | Province of Quebec Canada, 3.750% due 9/1/24 | | | 967,639 | |
| | | | | | | | | | |
| | | | | | Total Canada | | | 8,424,066 | |
| | | | | | | | | | |
| France — 2.6% | |
| | 2,800,000 | EUR | | | | France Government Bond OAT, 3.250% due 5/25/45 | | | 4,912,205 | |
| | | | | | | | | | |
| Germany — 2.5% | |
| | 2,300,000 | EUR | | | | Bundesrepublik Deutschland, 4.250% due 7/4/39 | | | 4,795,514 | |
| | | | | | | | | | |
| Greece — 0.4% | |
| | 300,000 | EUR | | | | Athens Urban Transportation Organisation, 4.851% due 9/19/16 | | | 333,227 | |
| | 47,000,000 | JPY | | | | Hellenic Republic Government International Bond, 3.800% due 8/8/17 | | | 436,047 | |
| | | | | | | | | | |
| | | | | | Total Greece | | | 769,274 | |
| | | | | | | | | | |
| Ireland — 0.8% | |
| | 1,000,000 | EUR | | | | Ireland Government Bond, 5.400% due 3/13/25 | | | 1,591,130 | |
| | | | | | | | | | |
| Italy — 3.0% | |
| | | | | | Italy Buoni Poliennali Del Tesoro: | | | | |
| | 900,000 | EUR | | | | 0.450% due 6/1/21 | | | 1,014,194 | |
| | 1,000,000 | EUR | | | | 4.750% due 9/1/44(b) | | | 1,739,419 | |
| | 700,000 | EUR | | | | 3.250% due 9/1/46(b) | | | 972,815 | |
| | 700,000 | EUR | | | | 2.700% due 3/1/47(b) | | | 868,242 | |
| | 700,000 | GBP | | | | Italy Government International Bond, 6.000% due 8/4/28 | | | 1,230,771 | |
| | | | | | | | | | |
| | | | | | Total Italy | | | 5,825,441 | |
| | | | | | | | | | |
| Japan — 9.4% | |
| $ | 400,000 | | | | | Japan Bank for International Cooperation, 1.875% due 7/21/26 | | | 399,156 | |
| | 800,000 | | | | | Japan Finance Organization for Municipalities, 2.125% due 4/13/21(b) | | | 809,061 | |
| | | | | | Japan Government Thirty Year Bond: | | | | |
| | 210,000,000 | JPY | | | | 1.700% due 9/20/44 | | | 2,726,061 | |
| | 330,000,000 | JPY | | | | 1.400% due 9/20/45 | | | 4,051,344 | |
| | | | | | Japan Government Twenty Year Bond: | | | | |
| | 630,000,000 | JPY | | | | 1.000% due 12/20/35 | | | 6,881,810 | |
| | 280,000,000 | JPY | | | | 0.400% due 3/20/36 | | | 2,750,305 | |
| | 400,000 | | | | | Tokyo Metropolitan Government, 2.000% due 5/17/21(b) | | | 403,333 | |
| | | | | | | | | | |
| | | | | | Total Japan | | | 18,021,070 | |
| | | | | | | | | | |
| New Zealand — 0.1% | |
| | 300,000 | NZD | | | | New Zealand Government Bond, 5.500% due 4/15/23 | | | 265,584 | |
| | | | | | | | | | |
| Poland — 0.4% | |
| | 2,700,000 | PLN | | | | Poland Government Bond, 3.250% due 7/25/25 | | | 722,442 | |
| | | | | | | | | | |
| Slovenia — 3.0% | |
| | | | | | Slovenia Government International Bond: | | | | |
| | 500,000 | | | | | 4.750% due 5/10/18 | | | 526,360 | |
See Notes to Financial Statements.
207
| | | | | | | | | | |
| International Fixed Income Fund | |
| | | |
Face
Amount/Units† | | | | | Security | | Value | |
| Slovenia — 3.0% — (continued) | |
| $ | 800,000 | | | | | 4.125% due 2/18/19 | | $ | 844,528 | |
| | 400,000 | | | | | 5.500% due 10/26/22 | | | 463,093 | |
| | 2,500,000 | | | | | 5.850% due 5/10/23 | | | 2,965,995 | |
| | 900,000 | | | | | 5.250% due 2/18/24 | | | 1,042,906 | |
| | | | | | | | | | |
| | | | | | Total Slovenia | | | 5,842,882 | |
| | | | | | | | | | |
| Spain — 4.6% | |
| | | | | | Autonomous Community of Catalonia: | | | | |
| | 700,000 | EUR | | | | 4.300% due 11/15/16 | | | 784,858 | |
| | 200,000 | EUR | | | | 4.750% due 6/4/18 | | | 231,345 | |
| | 500,000 | EUR | | | | 4.950% due 2/11/20 | | | 588,512 | |
| | 500,000 | EUR | | | | Autonomous Community of Madrid Spain, 4.125% due 5/21/24 | | | 689,718 | |
| | | | | | Spain Government Bond: | | | | |
| | 3,550,000 | EUR | | | | 2.750% due 10/31/24(b) | | | 4,574,207 | |
| | 1,500,000 | EUR | | | | 2.900% due 10/31/46(b) | | | 1,976,028 | |
| | | | | | | | | | |
| | | | | | Total Spain | | | 8,844,668 | |
| | | | | | | | | | |
| United Kingdom — 7.4% | |
| | | | | | United Kingdom Gilt: | | | | |
| | 2,500,000 | GBP | | | | 3.250% due 1/22/44 | | | 4,801,310 | |
| | 4,600,000 | GBP | | | | 3.500% due 1/22/45 | | | 9,293,257 | |
| | | | | | | | | | |
| | | | | | Total United Kingdom | | | 14,094,567 | |
| | | | | | | | | | |
| | | | | | TOTAL SOVEREIGN BONDS
(Cost — $71,040,570) | | | 79,188,425 | |
| | | | | | | | | | |
| CORPORATE BONDS & NOTES — 31.6% | |
| Austria — 0.1% | |
| | 200,000 | EUR | | | | Heta Asset Resolution AG, Senior Unsecured Notes, 0.149% due 12/31/23(c) | | | 194,114 | |
| | | | | | | | | | |
| Canada — 0.3% | |
| | 500,000 | | | | | Royal Bank of Canada, Covered Notes, 2.300% due 3/22/21 | | | 511,126 | |
| | | | | | | | | | |
| Cayman Islands — 0.3% | |
| | 800,000 | | | | | US Capital Funding II Ltd./US Capital Funding II Corp., Asset Backed, 1.507% due 8/1/34(b)(d) | | | 544,000 | |
| | | | | | | | | | |
| Denmark — 13.8% | |
| | 1,100,000 | DKK | | | | BRFkredit AS, Covered Notes, 3.000% due 10/1/47 | | | 170,138 | |
| | | | | | Nordea Kredit Realkreditaktieselskab, Covered Notes: | | | | |
| | 6,200,000 | DKK | | | | 2.000% due 4/1/17 | | | 942,734 | |
| | 500,000 | DKK | | | | 2.500% due 10/1/37 | | | 77,294 | |
| | 783,767 | DKK | | | | 3.000% due 10/1/47 | | | 121,472 | |
| | | | | | Nykredit Realkredit AS, Covered Notes: | | | | |
| | 46,000,000 | DKK | | | | 1.000% due 10/1/16 | | | 6,958,387 | |
| | 9,100,000 | DKK | | | | 2.000% due 4/1/17 | | | 1,382,613 | |
| | 4,400,000 | DKK | | | | 1.000% due 10/1/17 | | | 669,174 | |
| | 9,538,713 | DKK | | | | 2.000% due 10/1/37 | | | 1,452,625 | |
| | 4,638,898 | DKK | | | | 2.500% due 10/1/37 | | | 716,806 | |
| | 13,290,096 | DKK | | | | 2.500% due 10/1/47 | | | 2,019,929 | |
| | 13,701,103 | DKK | | | | 3.000% due 10/1/47 | | | 2,125,523 | |
| | | | | | Realkredit Danmark AS, Covered Notes: | | | | |
| | 13,800,000 | DKK | | | | 1.000% due 1/1/17 | | | 2,079,600 | |
| | 7,800,000 | DKK | | | | 1.000% due 4/1/17 | | | 1,178,863 | |
| | 32,700,000 | DKK | | | | 2.000% due 4/1/17 | | | 4,970,904 | |
| | 1,781,572 | DKK | | | | 2.000% due 10/1/37 | | | 270,510 | |
| | 4,598,874 | DKK | | | | 2.500% due 10/1/37 | | | 711,035 | |
| | 1,600,000 | DKK | | | | 2.500% due 10/1/47 | | | 243,959 | |
See Notes to Financial Statements.
208
| | | | | | | | | | |
| International Fixed Income Fund | |
| | | |
Face
Amount/Units† | | | | | Security | | Value | |
| Denmark — 13.8% — (continued) | |
| | 2,785,036 | DKK | | | | 3.000% due 10/1/47 | | $ | 429,970 | |
| | | | | | | | | | |
| | | | | | Total Denmark | | | 26,521,536 | |
| | | | | | | | | | |
| France — 0.8% | |
| $ | 1,200,000 | | | | | Credit Agricole SA, Senior Unsecured Notes, 1.201% due 6/12/17(b)(d) | | | 1,199,796 | |
| | 400,000 | | | | | Dexia Credit Local SA, Government Liquid Guaranteed Notes, 1.242% due 3/23/18(b)(d) | | | 401,092 | |
| | | | | | | | | | |
| | | | | | Total France | | | 1,600,888 | |
| | | | | | | | | | |
| Germany — 1.0% | |
| | 2,400,000 | NZD | | | | Landwirtschaftliche Rentenbank, Government Guaranteed Notes, 4.750% due 3/12/19 | | | 1,840,902 | |
| | | | | | | | | | |
| Greece — 0.1% | |
| | 200,000 | EUR | | | | Hellenic Railways Organization SA, Government Guaranteed Notes, 4.028% due 3/17/17 | | | 218,658 | |
| | | | | | | | | | |
| Italy — 2.2% | |
| | | | | | Banca Carige SpA, Covered Notes: | | | | |
| | 900,000 | EUR | | | | 3.750% due 11/25/16 | | | 1,011,764 | |
| | 400,000 | EUR | | | | 3.875% due 10/24/18 | | | 476,219 | |
| | | | | | Banca Monte dei Paschi di Siena SpA, Covered Notes: | | | | |
| | 800,000 | EUR | | | | 4.875% due 9/15/16 | | | 962,522 | |
| | 500,000 | EUR | | | | 5.000% due 2/9/18 | | | 594,398 | |
| | 500,000 | | | | | Intesa Sanpaolo SpA, Subordinated Notes, 5.710% due 1/15/26(b) | | | 491,056 | |
| | 400,000 | GBP | | | | Telecom Italia SpA/Milano, Senior Unsecured Notes, 6.375% due 6/24/19 | | | 588,955 | |
| | | | | | | | | | |
| | | | | | Total Italy | | | 4,124,914 | |
| | | | | | | | | | |
| Jersey Channel Islands — 0.2% | |
| | 200,000 | GBP | | | | HBOS Capital Funding LP, Company Guaranteed Notes, 9.540%(d)(e) | | | 285,303 | |
| | | | | | | | | | |
| Luxembourg — 0.7% | |
| | 600,000 | EUR | | | | Commerzbank Finance & Covered Bond SA, Covered Notes, 4.250% due 6/4/18 | | | 717,876 | |
| | 500,000 | EUR | | | | Wind Acquisition Finance SA, Secured Notes, 7.000% due 4/23/21 | | | 582,204 | |
| | | | | | | | | | |
| | | | | | Total Luxembourg | | | 1,300,080 | |
| | | | | | | | | | |
| Netherlands — 1.2% | |
| | 700,000 | CAD | | | | Bank Nederlandse Gemeenten NV, Senior Unsecured Notes, 2.125% due 10/1/19(b) | | | 545,949 | |
| | 600,000 | | | | | ING Bank NV, Covered Notes, 2.625% due 12/5/22(b) | | | 621,914 | |
| | | | | | Petrobras Global Finance BV, Company Guaranteed Notes: | | | | |
| | 500,000 | | | | | 7.875% due 3/15/19(f) | | | 534,850 | |
| | 600,000 | | | | | 8.375% due 5/23/21 | | | 647,070 | |
| | | | | | | | | | |
| | | | | | Total Netherlands | | | 2,349,783 | |
| | | | | | | | | | |
| Norway — 0.3% | |
| | | | | | Eksportfinans ASA, Senior Unsecured Notes: | | | | |
| | 100,000 | CHF | | | | 2.875% due 11/16/16 | | | 102,298 | |
| | 500,000 | | | | | 5.500% due 6/26/17 | | | 514,370 | |
| | | | | | | | | | |
| | | | | | Total Norway | | | 616,668 | |
| | | | | | | | | | |
| Portugal — 0.2% | |
| | | | | | Banco Espirito Santo SA, Senior Unsecured Notes: | | | | |
| | 200,000 | EUR | | | | 4.750% due 1/15/18 | | | 54,664 | |
| | 200,000 | EUR | | | | 4.000% due 1/21/19 | | | 54,664 | |
| | 300,000 | EUR | | | | Novo Banco SA, Senior Unsecured Notes, 5.000% due 4/4/19 | | | 236,791 | |
| | | | | | | | | | |
| | | | | | Total Portugal | | | 346,119 | |
| | | | | | | | | | |
| Spain — 1.3% | |
| | 1,600,000 | EUR | | | | Banco Popular Espanol SA, Junior Subordinated Notes, 8.250%(d)(e) | | | 1,643,056 | |
| | 900,000 | EUR | | | | Banco Santander SA, Junior Subordinated Notes, 6.250%(d)(e) | | | 915,057 | |
| | | | | | | | | | |
| | | | | | Total Spain | | | 2,558,113 | |
| | | | | | | | | | |
See Notes to Financial Statements.
209
| | | | | | | | | | |
| International Fixed Income Fund | |
| | | |
Face
Amount/Units† | | | | | Security | | Value | |
| Supranational — 1.0% | |
| | 1,400,000 | NZD | | | | Asian Development Bank, Senior Unsecured Notes, 4.625% due 3/6/19 | | $ | 1,071,454 | |
| | | | | | European Investment Bank, Senior Unsecured Notes: | | | | |
| | 500,000 | AUD | | | | 0.500% due 6/21/23 | | | 324,024 | |
| | 800,000 | AUD | | | | 0.500% due 8/10/23 | | | 510,814 | |
| | | | | | | | | | |
| | | | | | Total Supranational | | | 1,906,292 | |
| | | | | | | | | | |
| Sweden — 0.5% | |
| | 8,000,000 | SEK | | | | Stadshypotek AB, Covered Notes, 2.500% due 9/18/19 | | | 1,012,618 | |
| | | | | | | | | | |
| Switzerland — 0.4% | |
| | | | | | UBS AG, Subordinated Notes: | | | | |
| $ | 250,000 | | | | | 7.625% due 8/17/22 | | | 293,525 | |
| | 400,000 | | | | | 5.125% due 5/15/24 | | | 420,067 | |
| | | | | | | | | | |
| | | | | | Total Switzerland | | | 713,592 | |
| | | | | | | | | | |
| United Kingdom — 2.8% | |
| | | | | | Barclays Bank PLC, Subordinated Notes: | | | | |
| | 400,000 | | | | | 7.625% due 11/21/22 | | | 449,950 | |
| | 1,600,000 | | | | | 7.750% due 4/10/23(d) | | | 1,698,000 | |
| | 600,000 | | | | | Barclays PLC, Senior Unsecured Notes, 2.917% due 8/10/21(d) | | | 612,933 | |
| | 400,000 | GBP | | | | Co-operative Group Holdings 2011 Ltd., Company Guaranteed Notes, step bond to yield, 6.875% due 7/8/20 | | | 609,319 | |
| | 500,000 | | | | | HBOS PLC, Subordinated Notes, 6.750% due 5/21/18(b) | | | 536,293 | |
| | 100,000 | GBP | | | | Legal & General Group PLC, Subordinated Notes, 5.500% due 6/27/64(d) | | | 143,297 | |
| | 200,000 | GBP | | | | Lloyds Banking Group PLC, Junior Subordinated Notes, 7.625%(d)(e) | | | 271,822 | |
| | 500,000 | | | | | Santander UK Group Holdings PLC, Subordinated Notes, 4.750% due 9/15/25(b) | | | 504,024 | |
| | 400,000 | GBP | | | | Virgin Media Secured Finance PLC, Senior Secured Notes, 4.875% due 1/15/27 | | | 552,180 | |
| | | | | | | | | | |
| | | | | | Total United Kingdom | | | 5,377,818 | |
| | | | | | | | | | |
| United States — 4.4% | |
| | 300,000 | | | | | Ally Financial Inc., Senior Unsecured Notes, 3.250% due 9/29/17 | | | 303,375 | |
| | 300,000 | EUR | | | | American International Group Inc., Senior Unsecured Notes, 1.500% due 6/8/23 | | | 350,938 | |
| | 300,000 | | | | | Anheuser-Busch InBev Finance Inc., Company Guaranteed Notes, 3.300% due 2/1/23 | | | 315,303 | |
| | | | | | Charter Communications Operating LLC/Charter Communications Operating Capital, Senior Secured Notes: | | | | |
| | 600,000 | | | | | 3.579% due 7/23/20(b) | | | 628,414 | |
| | 700,000 | | | | | 4.464% due 7/23/22(b) | | | 760,544 | |
| | 400,000 | | | | | Ford Motor Credit Co. LLC, Senior Unsecured Notes, 5.875% due 8/2/21 | | | 460,688 | |
| | 200,000 | | | | | International Lease Finance Corp., Senior Secured Notes, 6.750% due 9/1/16(b) | | | 222,125 | |
| | 1,200,000 | | | | | JPMorgan Chase & Co., Senior Unsecured Notes, 1.265% due 4/25/18(d) | | | 1,201,973 | |
| | 1,300,000 | | | | | Lehman Brothers Holdings Inc., Senior Unsecured Notes, 0.000% due 12/30/16(c) | | | 95,225 | |
| | 1,000,000 | | | | | Santander Holdings USA Inc., Senior Unsecured Notes, 2.275% due 11/24/17(d) | | | 1,006,332 | |
| | 1,000,000 | | | | | Starwood Hotels & Resorts Worldwide Inc., Senior Unsecured Notes, 6.750% due 5/15/18 | | | 1,085,120 | |
| | 400,000 | | | | | T-Mobile USA Inc., Company Guaranteed Notes, 6.375% due 3/1/25 | | | 431,500 | |
| | 1,100,000 | | | | | UnitedHealth Group Inc., Senior Unsecured Notes, 3.750% due 7/15/25 | | | 1,220,734 | |
| | 200,000 | | | | | Wells Fargo & Co., Senior Unsecured Notes, 2.550% due 12/7/20 | | | 205,839 | |
| | 200,000 | | | | | Zimmer Biomet Holdings Inc., Senior Unsecured Notes, 3.150% due 4/1/22 | | | 206,756 | |
| | | | | | | | | | |
| | | | | | Total United States | | | 8,494,866 | |
| | | | | | | | | | |
| | | | | | TOTAL CORPORATE BONDS & NOTES
(Cost — $61,850,175) | | | 60,517,390 | |
| | | | | | | | | | |
| COLLATERALIZED MORTGAGE OBLIGATIONS — 14.8% | |
| | | | | | ALBA PLC: | | | | |
| | 523,056 | GBP | | | | Series 2007-1, Class A3, 0.749% due 3/17/39(d) | | | 622,825 | |
| | 580,085 | GBP | | | | Series 2015-1, Class A, 1.523% due 4/24/49(d) | | | 757,577 | |
| | 1,000,000 | | | | | Ares XXV CLO Ltd., Series 2012-3A, Class AR, 1.835% due 1/17/24(b)(c)(d) | | | 1,000,000 | |
See Notes to Financial Statements.
210
| | | | | | | | | | |
| International Fixed Income Fund | |
| | | |
Face
Amount/Units† | | | | | Security | | Value | |
| $ | 318,931 | | | | | Atrium CDO Corp., Series 7A, Class AR, 1.918% due 11/16/22(b)(d) | | $ | 319,383 | |
| | 1,199,754 | | | | | Banc of America Alternative Loan Trust, Series 2006-3, Class 5CB1, 6.500% due 4/25/36 | | | 1,010,587 | |
| | 51,326 | | | | | Banc of America Funding Trust, Series 2006-A, Class 1A1, 2.869% due 2/20/36(d) | | | 50,467 | |
| | 51,757 | | | | | Banc of America Mortgage Trust, Series 2003-F, Class 3A1, 3.248% due 7/25/33(d) | | | 51,862 | |
| | 236,250 | | | | | Banc of America Re-REMIC Trust, Series 2010-UB5, Class A4A, 5.673% due 2/17/51(b)(d) | | | 238,840 | |
| | | | | | Bear Stearns Adjustable Rate Mortgage Trust: | | | | |
| | 8,700 | | | | | Series 2003-5, Class 1A2, 2.943% due 8/25/33(d) | | | 8,622 | |
| | 17,723 | | | | | Series 2003-7, Class 6A, 2.865% due 10/25/33(d) | | | 17,850 | |
| | 48,802 | | | | | Series 2004-2, Class 22A, 3.124% due 5/25/34(d) | | | 47,266 | |
| | 10,547 | | | | | Series 2004-2, Class 23A, 2.973% due 5/25/34(d) | | | 9,792 | |
| | 21,197 | | | | | Series 2005-2, Class A2, 2.924% due 3/25/35(d) | | | 21,413 | |
| | 147,741 | | | | | Bear Stearns Structured Products Inc. Trust, Series 2007-R6, Class 1A1, 2.988% due 1/26/36(d) | | | 116,230 | |
| | 205,335 | EUR | | | | Casa d’este Finance SRL, Series 1, Class A2, 0.087% due 9/15/40(d) | | | 226,614 | |
| | 552,066 | EUR | | | | Claris ABS SRL, Series 2011-1, Class A, 0.208% due 10/31/60(d) | | | 614,379 | |
| | | | | | Countrywide Alternative Loan Trust: | | | | |
| | 7,585 | | | | | Series 2004-J5, Class 2A1, 1.204% due 8/25/34(d) | | | 7,487 | |
| | 12,736 | | | | | Series 2005-21CB, Class A3, 5.250% due 6/25/35 | | | 11,551 | |
| | 43,663 | | | | | Series 2007-7T2, Class A9, 6.000% due 4/25/37 | | | 30,165 | |
| | 78,221 | | | | | Series 2007-11T1, Class A12, 0.874% due 5/25/37(d) | | | 43,299 | |
| | 35,395 | | | | | Series 2007-16CB, Class 5A1, 6.250% due 8/25/37 | | | 30,251 | |
| | 1,122,444 | | | | | Countrywide Asset-Backed Certificates, Series 2007-13, Class 1A, 1.364% due 10/25/47(c)(d) | | | 965,241 | |
| | | | | | Countrywide Home Loan Mortgage Pass Through Trust: | | | | |
| | 7,395 | | | | | Series 2004-12, Class 11A1, 3.178% due 8/25/34(d) | | | 6,344 | |
| | 140,972 | | | | | Series 2005-2, Class 1A1, 1.164% due 3/25/35(d) | | | 111,978 | |
| | 13,312 | | | | | Series 2005-3, Class 2A1, 0.814% due 4/25/35(d) | | | 10,753 | |
| | 125,656 | | | | | Series 2005-9, Class 1A3, 0.754% due 5/25/35(d) | | | 104,887 | |
| | 36,295 | | | | | Series 2005-11, Class 3A1, 2.425% due 4/25/35(d) | | | 29,589 | |
| | 55,958 | | | | | Series 2005-HYB9, Class 3A2A, 2.592% due 2/20/36(d) | | | 49,301 | |
| | 15,780 | | | | | Credit Suisse First Boston Mortgage Securities Corp., Series 2003-AR20, Class 2A1, 2.965% due 8/25/33(d) | | | 15,729 | |
| | 1,071,758 | | | | | Credit Suisse Mortgage Capital Certificates, Series 2007-NC1, Class 2A1, 1.124% due 9/25/37(d) | | | 979,631 | |
| | 45,755 | | | | | Credit Suisse Mortgage Capital Trust, Series 2007-5R, Class A5, 6.500% due 7/26/36 | | | 26,364 | |
| | 205,095 | | | | | CSAB Mortgage Backed Trust, Series 2006-4, Class A6A, step bond to yield, 5.684% due 12/25/36 | | | 104,327 | |
| | 435,692 | | | | | CWABS Asset-Backed Certificates Trust, Series 2006-18, Class 2A2, 0.684% due 3/25/37(d) | | | 422,662 | |
| | 659,175 | GBP | | | | DECO 12-UK 4 PLC, Series 2007-C4X, Class A1, 0.668% due 1/27/20(d) | | | 847,989 | |
| | 993,267 | | | | | Deutsche Alternative-A Securities Mortgage Loan Trust, Series 2007-3, Class 2A1, 1.274% due 10/25/47(d) | | | 770,012 | |
| | 306,726 | GBP | | | | Eurohome UK Mortgages PLC, Series 2007-1, Class A, 0.722% due 6/15/44(d) | | | 371,114 | |
| | | | | | Eurosail-UK PLC: | | | | |
| | 143,059 | GBP | | | | Series 2007-4X, Class A2A, 0.874% due 6/13/45(d) | | | 187,419 | |
| | 500,000 | GBP | | | | Series 2007-4X, Class A3, 1.524% due 6/13/45(c)(d) | | | 598,928 | |
| | 442,691 | GBP | | | | Series 2007-6NCX, Class A2A, 1.274% due 9/13/45(d) | | | 577,158 | |
| | | | | | Federal Home Loan Mortgage Corp. (FHLMC): | | | | |
| | 44,328 | | | | | Series T-35, Class A, 0.804% due 9/25/31(d) | | | 43,795 | |
| | 65,499 | | | | | Series T-62, Class 1A1, 1.689% due 10/25/44(d) | | | 66,844 | |
| | | | | | Federal Home Loan Mortgage Corp. (FHLMC), REMICS: | | | | |
| | 63,303 | | | | | Series 2391, Class FJ, 1.008% due 4/15/28(d) | | | 63,584 | |
| | 95,903 | | | | | Series 2614, Class SJ, 18.266% due 5/15/33(d) | | | 135,494 | |
| | 471,092 | | | | | Series 4579, Class FD, 0.817% due 1/15/38(d) | | | 468,936 | |
| | 471,092 | | | | | Series 4579, Class SD, 1.957% due 1/15/38(d)(g) | | | 28,650 | |
| | 11,381 | | | | | Federal National Mortgage Association (FNMA), Grantor Trust, Series 2004-T3, Class 1A1, 6.000% due 2/25/44 | | | 13,085 | |
See Notes to Financial Statements.
211
| | | | | | | | | | |
| International Fixed Income Fund | |
| | | |
Face
Amount/Units† | | | | | Security | | Value | |
| | | | | | Federal National Mortgage Association (FNMA), REMICS: | | | | |
| $ | 9,050 | | | | | Series 2003-34, Class A1, 6.000% due 4/25/43 | | $ | 9,989 | |
| | 408 | | | | | Series 2005-120, Class NF, 0.624% due 1/25/21(d) | | | 408 | |
| | 26,769 | | | | | Series 2006-48, Class TF, 0.924% due 6/25/36(d) | | | 26,725 | |
| | 197,051 | | | | | Series 2009-104, Class FA, 1.324% due 12/25/39(d) | | | 199,638 | |
| | 914,763 | | | | | Series 2010-46, Class WF, 1.274% due 5/25/40(d) | | | 925,413 | |
| | 151,139 | | | | | Series 2013-130, Class FB, 0.974% due 1/25/44(d) | | | 151,154 | |
| | 78,937 | | | | | Federal National Mortgage Association (FNMA), Whole Loan, Series 2004-W12, Class 1A1, 6.000% due 7/25/44 | | | 91,996 | |
| | 457,775 | | | | | First Franklin Mortgage Loan Trust, Series 2005-FF9, Class A4, 0.884% due 10/25/35(d) | | | 433,879 | |
| | 430,938 | EUR | | | | German Residential Funding Ltd., Series 2013-2, Class A, 0.702% due 11/27/24(d) | | | 483,549 | |
| | 137,611 | EUR | | | | Giovecca Mortgages SRL, Series 2011-1, Class A, 0.303% due 4/23/48(d) | | | 153,378 | |
| | 91,397 | | | | | GMACM Mortgage Loan Trust, Series 2005-AR6, Class 3A1, 3.096% due 11/19/35(d) | | | 85,270 | |
| | 500,265 | | | | | Government National Mortgage Association, Series 2016-H15, Class FA, 1.268% due 7/20/66(d) | | | 501,164 | |
| | 19,520 | | | | | GSR Mortgage Loan Trust, Series 2003-1, Class A2, 2.220% due 3/25/33(d) | | | 19,269 | |
| | | | | | Harborview Mortgage Loan Trust: | | | | |
| | 44,670 | | | | | Series 2003-1, Class A, 2.894% due 5/19/33(d) | | | 43,923 | |
| | 36,675 | | | | | Series 2005-2, Class 2A1A, 0.734% due 5/19/35(d) | | | 30,734 | |
| | 86,380 | | | | | Series 2005-3, Class 2A1A, 0.754% due 6/19/35(d) | | | 77,137 | |
| | 131,503 | | | | | Series 2006-SB1, Class A1A, 1.339% due 12/19/36(d) | | | 110,832 | |
| | 171,724 | | | | | Series 2007-1, Class 2A1A, 0.644% due 3/19/37(d) | | | 146,395 | |
| | | | | | JPMorgan Mortgage Trust: | | | | |
| | 8,596 | | | | | Series 2003-A2, Class 3A1, 2.503% due 11/25/33(d) | | | 8,207 | |
| | 3,853 | | | | | Series 2005-A1, Class 6T1, 3.070% due 2/25/35(d) | | | 3,675 | �� |
| | 143,906 | | | | | JPMorgan Resecuritization Trust, Series 2009-7, Class 17A1, 5.595% due 7/27/37(b)(d) | | | 143,021 | |
| | | | | | Ludgate Funding PLC: | | | | |
| | 737,683 | GBP | | | | Series 2006-1X, Class A2A, 0.778% due 12/1/60(d) | | | 884,495 | |
| | 708,084 | GBP | | | | Series 2007-1, Class A2A, 0.683% due 1/1/61(d) | | | 841,377 | |
| | | | | | Merrill Lynch Mortgage Investors Trust: | | | | |
| | 12,198 | | | | | Series 2003-A2, Class 1A1, 2.625% due 2/25/33(d) | | | 11,751 | |
| | 49,817 | | | | | Series 2005-2, Class 1A, 2.228% due 10/25/35(d) | | | 48,306 | |
| | 6,733 | | | | | Merrill Lynch Mortgage Trust, Series 2007-C1, Class ASB, 6.023% due 6/12/50(d) | | | 6,729 | |
| | 38,703 | GBP | | | | Money Partners Securities 4 PLC, Series 4X, Class A1A, 0.952% due 3/15/40(d) | | | 48,049 | |
| | 1,600,000 | | | | | Neuberger Berman CLO XII Ltd., Series 2012-12A, Class A2RR, 1.931% due 7/25/23(b)(d) | | | 1,599,324 | |
| | 700,000 | GBP | | | | Newgate Funding, Series 2007-1X, Class A3, 0.748% due 12/1/50(d) | | | 816,425 | |
| | 421,304 | | | | | Octagon Investment Partners XII Ltd., Series 2012-1A, Class AR, 2.048% due 5/5/23(b)(d) | | | 420,125 | |
| | 767,595 | GBP | | | | Paragon Mortgages No 13 PLC, Series 13X, Class A1, 0.768% due 1/15/39(d) | | | 929,359 | |
| | | | | | Puma Finance Pty Ltd.: | | | | |
| | 305,340 | AUD | | | | Series 2014-1, Class A, 2.555% due 5/13/45(d) | | | 228,639 | |
| | 292,740 | AUD | | | | Series 2014-2, Class A, 2.425% due 10/18/45(d) | | | 218,227 | |
| | 452,118 | | | | | RAAC Trust, Series 2007-SP3, Class A1, 1.724% due 9/25/47(d) | | | 440,909 | |
| | | | | | RALI Trust: | | | | |
| | 81,526 | | | | | Series 2007-QO2, Class A1, 0.674% due 2/25/47(d) | | | 47,342 | |
| | 557,221 | | | | | Series 2007-QS1, Class 1A1, 6.000% due 1/25/37 | | | 467,216 | |
| | | | | | Residential Asset Securitization Trust: | | | | |
| | 26,307 | | | | | Series 2005-A15, Class 5A1, 5.750% due 2/25/36 | | | 20,621 | |
| | 61,179 | | | | | Series 2006-R1, Class A2, 0.924% due 1/25/46(d) | | | 29,352 | |
| | 517,985 | GBP | | | | Residential Mortgage Securities 28 PLC, Series 28, Class A, 1.722% due 6/15/46(d) | | | 678,355 | |
| | 351,611 | GBP | | | | ResLoC UK PLC, Series 2007-1X, Class A3B, 0.732% due 12/15/43(d) | | | 418,208 | |
| | | | | | RMAC Securities No 1 PLC: | | | | |
| | 330,106 | GBP | | | | Series 2006-NS1X, Class A2A, 0.724% due 6/12/44(d) | | | 394,526 | |
| | 617,043 | GBP | | | | Series 2006-NS3X, Class A2A, 0.724% due 6/12/44(d) | | | 731,797 | |
| | 623,533 | | | | | Soundview Home Loan Trust, Series 2006-3, Class A3, 0.684% due 11/25/36(d) | | | 540,509 | |
| | | | | | Structured Adjustable Rate Mortgage Loan Trust: | | | | |
| | 13,516 | | | | | Series 2004-1, Class 4A1, 3.062% due 2/25/34(d) | | | 13,495 | |
See Notes to Financial Statements.
212
| | | | | | | | | | |
| International Fixed Income Fund | |
| | | |
Face
Amount/Units† | | | | | Security | | Value | |
| $ | 52,485 | | | | | Series 2004-4, Class 3A2, 2.990% due 4/25/34(d) | | $ | 52,206 | |
| | 70,158 | | | | | Series 2004-19, Class 2A1, 1.889% due 1/25/35(d) | | | 55,144 | |
| | | | | | Structured Asset Mortgage Investments II Trust: | | | | |
| | 81,636 | | | | | Series 2005-AR2, Class 2A1, 0.754% due 5/25/45(d) | | | 71,926 | |
| | 92,671 | | | | | Series 2005-AR8, Class A1A, 0.804% due 2/25/36(d) | | | 76,770 | |
| | 62,402 | | | | | Series 2006-AR5, Class 1A1, 0.734% due 5/25/36(d) | | | 48,812 | |
| | 334,967 | | | | | Series 2007-AR4, Class A3, 0.744% due 9/25/47(d) | | | 272,983 | |
| | 146,400 | | | | | Series 2007-AR6, Class A1, 1.989% due 8/25/47(d) | | | 121,024 | |
| | 103,649 | | | | | Structured Asset Securities Corp. Trust, Series 2005-10, Class 4A1, 5.500% due 12/25/34 | | | 102,898 | |
| | 7,145 | | | | | Wachovia Bank Commercial Mortgage Trust, Series 2006-C28, Class A4, 5.572% due 10/15/48 | | | 7,138 | |
| | | | | | WaMu Mortgage Pass Through Certificates Trust: | | | | |
| | 18,818 | | | | | Series 2002-AR9, Class 1A, 1.844% due 8/25/42(d) | | | 18,037 | |
| | 6,846 | | | | | Series 2003-AR5, Class A7, 2.821% due 6/25/33(d) | | | 6,922 | |
| | 439,805 | | | | | Series 2003-AR9, Class 2A, 2.755% due 9/25/33(d) | | | 432,074 | |
| | 577,217 | | | | | Series 2004-AR1, Class A, 2.771% due 3/25/34(d) | | | 579,673 | |
| | 70,684 | | | | | Series 2005-AR13, Class A1A1, 0.814% due 10/25/45(d) | | | 67,324 | |
| | 114,770 | | | | | Series 2006-AR13, Class 2A, 2.190% due 10/25/46(d) | | | 103,172 | |
| | 534,806 | | | | | Series 2007-OA3, Class 2A1A, 1.249% due 4/25/47(d) | | | 478,568 | |
| | 283 | | | | | Washington Mutual Mortgage Loan Trust, Series 2001-7, Class A, 1.663% due 5/25/41(d) | | | 279 | |
| | 31,281 | | | | | Washington Mutual Mortgage Pass-Through Certificates WMALT, Series 2006-AR5, Class 3A, 1.429% due 7/25/46(d) | | | 21,070 | |
| | 187,033 | | | | | Washington Mutual MSC Mortgage Pass-Through Certificates Trust, Series 2002-AR3, Class 1A7, 2.672% due 12/25/32(d) | | | 186,045 | |
| | | | | | | | | | |
| | | | | | TOTAL COLLATERALIZED MORTGAGE OBLIGATIONS
(Cost — $30,871,913) | | | 28,419,231 | |
| | | | | | | | | | |
| U.S. GOVERNMENT OBLIGATIONS — 7.5% | |
| | 200,000 | | | | | U.S. Treasury Bonds, 2.500% due 2/15/45(h) | | | 211,266 | |
| | | | | | U.S. Treasury Inflation Indexed Bonds: | | | | |
| | 253,783 | | | | | 0.125% due 7/15/24 | | | 255,122 | |
| | 6,716,556 | | | | | 0.250% due 1/15/25(a) | | | 6,784,078 | |
| | 4,053,606 | | | | | 2.375% due 1/15/25(a)(h)(i) | | | 4,800,552 | |
| | | | | | U.S. Treasury Notes: | | | | |
| | 900,000 | | | | | 2.000% due 2/15/25(h)(i) | | | 933,556 | |
| | 1,400,000 | | | | | 1.625% due 5/15/26(a) | | | 1,405,523 | |
| | | | | | | | | | |
| | | | | | TOTAL U.S. GOVERNMENT OBLIGATIONS
(Cost — $14,216,372) | | | 14,390,097 | |
| | | | | | | | | | |
| MORTGAGE-BACKED SECURITIES — 7.3% | |
| CMHC — 0.4% | |
| | | | | | Canadian Mortgage and Housing Corp. (CMHC): | | | | |
| | 259,091 | CAD | | | | 0.978% due 6/1/20(c) | | | 195,815 | |
| | 625,249 | CAD | | | | 1.178% due 7/1/20(c) | | | 474,898 | |
| | 183,181 | CAD | | | | 1.178% due 8/1/20(c) | | | 139,103 | |
| | | | | | | | | | |
| | | | | | TOTAL CMHC | | | 809,816 | |
| | | | | | | | | | |
| FHLMC — 0.5% | |
| | | | | | Federal National Mortgage Corp. (FHLMC), Gold: | | | | |
| | 1,000,000 | | | | | 3.000% due 10/1/46(j) | | | 1,035,508 | |
| | | | | | | | | | |
| | | | | | TOTAL FHLMC | | | 1,035,508 | |
| | | | | | | | | | |
| FNMA — 5.8% | |
| | | | | | Federal National Mortgage Association (FNMA): | | | | |
| | 562,162 | | | | | 5.700% due 8/1/18(d) | | | 591,194 | |
| | 91,627 | | | | | 3.000% due 1/1/22 | | | 97,237 | |
| | 786,018 | | | | | 2.500% due 8/1/28 | | | 815,471 | |
| | 83,770 | | | | | 2.717% due 11/1/34(d) | | | 88,650 | |
See Notes to Financial Statements.
213
| | | | | | | | | | |
| International Fixed Income Fund | |
| | | |
Face
Amount/Units† | | | | | Security | | Value | |
| FNMA — 5.8% — (continued) | |
| $ | 133,589 | | | | | 6.500% due 8/1/37 | | $ | 154,278 | |
| | 9,000,000 | | | | | 3.000% due 11/1/47(j) | | | 9,301,640 | |
| | | | | | | | | | |
| | | | | | TOTAL FNMA | | | 11,048,470 | |
| | | | | | | | | | |
| GNMA — 0.6% | |
| | | | | | Government National Mortgage Association II (GNMA): | | | | |
| | 10,239 | | | | | 6.000% due 9/20/38 | | | 11,144 | |
| | 1,000,000 | | | | | 3.000% due 10/1/43(j) | | | 1,045,644 | |
| | | | | | | | | | |
| | | | | | TOTAL GNMA | | | 1,056,788 | |
| | | | | | | | | | |
| | | | | | TOTAL MORTGAGE-BACKED SECURITIES
(Cost — $13,853,416) | | | 13,950,582 | |
| | | | | | | | | | |
| ASSET-BACKED SECURITIES — 0.4% | |
| Automobiles — 0.3% | |
| | 500,000 | | | | | Chrysler Capital Auto Receivables Trust, Series 2016-AA, Class A2, 1.470% due 4/15/19(b) | | | 500,456 | |
| | | | | | | | | | |
| Student Loans — 0.1% | |
| | 168,295 | | | | | Massachusetts Educational Financing Authority, Series 2008-1, Class A1, 1.665% due 4/25/38(d) | | | 166,347 | |
| | | | | | | | | | |
| | | | | | TOTAL ASSET-BACKED SECURITIES
(Cost — $668,295) | | | 666,803 | |
| | | | | | | | | | |
| | | |
Notional
Amount†/
Number of
Contracts | | | | | | | | |
| PURCHASED OPTIONS — 0.1% | |
| Germany — 0.0% | |
| | 61 | EUR | | | | Euro-Bobl December Futures, Put @ $128.25, expires 11/25/2016, GSC | | | 340 | |
| | 94 | EUR | | | | Euro-Schatz December Futures, Put @ $111.50, expires 11/25/2016, GSC | | | 524 | |
| | | | | | | | | | |
| | | | | | Total Germany | | | 864 | |
| | | | | | | | | | |
| United States — 0.1% | |
| | 70,300,000 | | | | | OTC 1-Year Swaption, 3-Month USD-LIBOR, Put @ 1.250%, expires 12/27/2016, CITI | | | 28,085 | |
| | 39,200,000 | | | | | OTC 1-Year Swaption, 3-Month USD-LIBOR, Put @ 1.100%, expires 1/9/2017, GSC | | | 35,511 | |
| | 50,000,000 | JPY | | | | OTC 10-Year Swaption, 3-Month JPY-LIBOR, Put @ 0.400%, expires 3/3/2017, JPM | | | 1,857 | |
| | 1,100,000 | GBP | | | | OTC British Pound versus U.S. Dollar, Put @ $1.25, expires 10/10/2016, SCB | | | 2,369 | |
| | 1,200,000 | GBP | | | | OTC British Pound versus U.S. Dollar, Put @ $1.34, expires 9/28/2016, BOA | | | 36,388 | |
| | 823,000 | EUR | | | | OTC Euro versus U.S. Dollar, Put @ $1.10, expires 9/26/2016, SCB | | | 3,771 | |
| | 1,177,000 | EUR | | | | OTC Euro versus U.S. Dollar, Put @ $1.10, expires 9/26/2016, DUB | | | 5,393 | |
| | 400,000 | | | | | OTC U.S. Dollar versus Brazilian Real, Call @ BRL3.61, expires 6/29/2017, DUB | | | 20,578 | |
| | 400,000 | | | | | OTC U.S. Dollar versus Brazilian Real, Put @ BRL3.61, expires 6/29/2017, DUB | | | 30,692 | |
| | 54,000 | | | | | OTC U.S. Dollar versus Chinese Onshore Renminbi, Call @ CNY6.52, expires 10/31/2016, SCB | | | 51,185 | |
| | 1,100,000 | | | | | OTC U.S. Dollar versus Mexican Peso, Put @ MXN18.10, expires 9/13/2016, BOA | | | 596 | |
| | 500,000 | | | | | OTC U.S. Dollar versus Singapore Dollar, Call @ SGD1.35, expires 9/15/2016, HSBC | | | 4,542 | |
| | 500,000 | | | | | OTC U.S. Dollar versus Singapore Dollar, Put @ SGD1.35, expires 9/15/2016, HSBC | | | 1,298 | |
| | 100 | | | | | U.S. Treasury 10-Year Note October Futures, Put @ $115.00, expires 9/23/2016, GSC | | | — | |
| | 100 | | | | | U.S. Treasury 10-Year Note October Futures, Put @ $115.50, expires 9/23/2016, GSC | | | — | |
| | | | | | | | | | |
| | | | | | Total United States | | | 222,265 | |
| | | | | | | | | | |
| | | | | | TOTAL PURCHASED OPTIONS
(Cost — $250,563) | | | 223,129 | |
| | | | | | | | | | |
| | | | | | TOTAL INVESTMENTS BEFORE SHORT-TERM INVESTMENTS
(Cost — $192,751,304) | | | 197,355,657 | |
| | | | | | | | | | |
See Notes to Financial Statements.
214
| | | | | | | | | | |
| International Fixed Income Fund | |
| | | |
Face
Amount† | | | | | Security | | Value | |
| SHORT-TERM INVESTMENTS (k) — 16.8% | |
| MONEY MARKET FUND — 0.3% | |
| $ | 557,865 | | | | | Invesco STIT — Government & Agency Portfolio(l)
(Cost — $557,865) | | $ | 557,865 | |
| | | | | | | | | | |
| SOVEREIGN BONDS — 13.8% | |
| Czech Republic — 0.3% | |
| | 13,000,000 | CZK | | | | Czech Republic Ministry of Finance Bill, (0.150)% due 9/30/16(c)(m) | | | 537,211 | |
| | | | | | | | | | |
| Japan — 13.5% | |
| | | | | | Japan Treasury Discount Bill: | | | | |
| | 650,000,000 | JPY | | | | (0.323)% due 10/11/16(m) | | | 6,286,824 | |
| | 670,000,000 | JPY | | | | (0.296)% due 10/17/16(m) | | | 6,479,727 | |
| | 590,000,000 | JPY | | | | (0.269)% due 10/24/16(m) | | | 5,705,681 | |
| | 380,000,000 | JPY | | | | (0.234)% due 11/21/16(m) | | | 3,674,529 | |
| | 280,000,000 | JPY | | | | (0.228)% due 11/28/16(m) | | | 2,707,504 | |
| | 100,000,000 | JPY | | | | (0.240)% due 2/10/17(m) | | | 967,586 | |
| | | | | | | | | | |
| | | | | | Total Japan | | | 25,821,851 | |
| | | | | | | | | | |
| | | | | | TOTAL SOVEREIGN BONDS
(Cost — $26,486,398) | | | 26,359,062 | |
| | | | | | | | | | |
| TIME DEPOSITS — 1.6% | |
| | 153,868 | CAD | | | | Bank of Montreal — London, 0.050% due 9/1/16 | | | 117,345 | |
| | | | | | BBH — Grand Cayman: | | | | |
| | 42,953 | CHF | | | | (1.450)% due 9/1/16 | | | 43,673 | |
| | 53,134 | SEK | | | | (1.115)% due 9/1/16 | | | 6,207 | |
| | 857 | DKK | | | | (0.450)% due 9/1/16 | | | 128 | |
| | 372 | SGD | | | | 0.010% due 9/1/16 | | | 273 | |
| | 136,000 | NOK | | | | 0.084% due 9/1/16 | | | 16,322 | |
| | 129 | | | | | 0.150% due 9/1/16 | | | 129 | |
| | 23,543 | AUD | | | | 0.689% due 9/1/16 | | | 17,694 | |
| | 634 | NZD | | | | 1.250% due 9/1/16 | | | 460 | |
| | | | | | BNP Paribas — Paris: | | | | |
| | 1,019,360 | EUR | | | | (0.540)% due 9/1/16 | | | 1,137,198 | |
| | 275,119 | GBP | | | | 0.050% due 9/1/16 | | | 361,273 | |
| | 1,107,770 | | | | | 0.150% due 9/1/16 | | | 1,107,770 | |
| | 1,028,227 | ZAR | | | | HSBC Bank PLC — London, 6.440% due 9/1/16 | | | 69,910 | |
| | 31,645,367 | JPY | | | | Sumitomo — Tokyo, (0.390)% due 9/1/16 | | | 305,826 | |
| | | | | | | | | | |
| | | | | | TOTAL TIME DEPOSITS
(Cost — $3,184,208) | | | 3,184,208 | |
| | | | | | | | | | |
| U.S. GOVERNMENT AGENCIES — 0.2% | |
| | | | | | Federal Home Loan Bank Discount Notes: | | | | |
| | 100,000 | | | | | 0.295% due 10/12/16(m) | | | 99,967 | |
| | 300,000 | | | | | 0.295% due 10/14/16(m) | | | 299,894 | |
| | | | | | | | | | |
| | | | | | TOTAL U.S. GOVERNMENT AGENCIES
(Cost — $399,861) | | | 399,861 | |
| | | | | | | | | | |
| U.S. GOVERNMENT OBLIGATIONS — 0.9% | |
| | | | | | U.S. Treasury Bills: | | | | |
| | 410,000 | | | | | 0.228% due 10/6/16(h)(m) | | | 409,909 | |
| | 562,000 | | | | | 0.266% due 11/3/16(h)(m) | | | 561,739 | |
See Notes to Financial Statements.
215
| | | | | | | | | | |
| International Fixed Income Fund | |
| | | |
Face
Amount† | | | | | Security | | Value | |
| U.S. GOVERNMENT OBLIGATIONS — 0.9% — (continued) | |
| $ | 800,000 | | | | | 0.466% due 3/2/17(h)(m) | | $ | 798,119 | |
| | | | | | | | | | |
| | | | | | TOTAL U.S. GOVERNMENT OBLIGATIONS
(Cost — $1,769,767) | | | 1,769,767 | |
| | | | | | | | | | |
| | | | | | TOTAL SHORT-TERM INVESTMENTS
(Cost — $32,398,099) | | | 32,270,763 | |
| | | | | | | | | | |
| | | | | | TOTAL INVESTMENTS — 119.8%
(Cost — $225,149,403#) | | | 229,626,420 | |
| | | | | | | | | | |
| | | | | | Liabilities in Excess of Other Assets — (19.8)% | | | (37,953,803 | ) |
| | | | | | | | | | |
| | | | | | TOTAL NET ASSETS — 100.0% | | $ | 191,672,617 | |
| | | | | | | | | | |
| † | Face amount denominated in U.S. dollars, unless otherwise noted. |
| (a) | Position, or portion thereof, has been segregated to collateralize reverse repurchase agreement. |
| (b) | Restricted security that may be sold to “qualified institutional buyers” pursuant to the conditions of Rule 144A under the Securities Act of 1933, as amended. This security has been deemed liquid pursuant to guidelines approved by the Board of Trustees, unless otherwise noted. |
| (d) | Variable rate security. Interest rate disclosed is that which was in effect at August 31, 2016. |
| (e) | Security is perpetual in nature and has no stated maturity date. |
| (f) | All or a portion of this security is on loan (see Note 1). |
| (g) | Interest only security. |
| (h) | All or a portion of this security is held at the broker as collateral for open OTC derivative instruments. |
| (i) | All or a portion of this security is held at the broker as collateral for open centrally cleared swap contracts. |
| (j) | This security is traded on a TBA basis (see Note 1). |
| (k) | Inclusive of all short term holdings, including collateral received from securities lending activities. Excluding such collateral, the percentage of portfolio holdings would be 16.5%. |
| (l) | Represents investment of collateral received from securities lending transactions. |
| (m) | Rate shown represents yield-to-maturity. |
| # | Aggregate cost for federal income tax purposes is $228,402,122. |
| | |
Abbreviations used in this schedule: |
| ABS | | — Asset-Based Security |
| CDO | | — Collateralized Debt Obligation |
| CLO | | — Collateralized Loan Obligation |
| OTC | | — Over the Counter |
| PLC | | — Public Limited Company |
| REMICS | | — Real Estate Mortgage Investment Conduit |
| | | | |
| Summary of Investments by Security Type^ | | | |
Sovereign Bonds | | | 34.5 | % |
Corporate Bonds & Notes | | | 26.3 | |
Collateralized Mortgage Obligations | | | 12.4 | |
U.S. Government Obligations | | | 6.3 | |
Mortgage-Backed Securities | | | 6.1 | |
Asset-Backed Securities | | | 0.3 | |
Purchased Options | | | 0.1 | |
Short-Term Investments | | | 14.0 | |
| | | | |
| | | 100.0 | % |
| | | | |
| ^ | As a percentage of total investments. |
See Notes to Financial Statements.
216
| | | | | | |
| International Fixed Income Fund |
Schedule of Options Contracts Written
| | | | | | | | | | | | | | | | | | | | |
Notional
Amount | | | Security Name | | Counterparty | | | Expiration
Date | | | Strike Price/
Exercise Rate | | | Value | |
| United States | | | | | | | | | | | | | | | | |
| | 320,000,000 | JPY | | 2-Year Swaption, 3-Month JPY-LIBOR, Put | | | JPM | | | | 3/7/19 | | | | 0.00 | | | $ | 1,970 | |
| | 500,000 | EUR | | Markit iTraxx Europe Series 25 5-Year Index, Call | | | BCLY | | | | 9/21/16 | | | $ | 0.65 | | | | 265 | |
| | 2,400,000 | EUR | | Markit iTraxx Europe Series 25 5-Year Index, Call | | | BCLY | | | | 10/19/16 | | | | 0.60 | | | | 960 | |
| | 300,000 | GBP | | OTC British Pound versus U.S. Dollar, Call | | | BNP | | | | 9/26/16 | | | | 1.37 | | | | 268 | |
| | 300,000 | GBP | | OTC British Pound versus U.S. Dollar, Put | | | BNP | | | | 9/26/16 | | | | 1.37 | | | | 18,252 | |
| | 300,000 | GBP | | OTC British Pound versus U.S. Dollar, Call | | | BOA | | | | 9/26/16 | | | | 1.38 | | | | 182 | |
| | 300,000 | GBP | | OTC British Pound versus U.S. Dollar, Put | | | BOA | | | | 9/26/16 | | | | 1.38 | | | | 20,421 | |
| | 1,200,000 | GBP | | OTC British Pound versus U.S. Dollar, Put | | | BOA | | | | 9/28/16 | | | | 1.26 | | | | 2,162 | |
| | 1,200,000 | GBP | | OTC British Pound versus U.S. Dollar, Put | | | BOA | | | | 9/28/16 | | | | 1.30 | | | | 12,126 | |
| | 1,100,000 | GBP | | OTC British Pound versus U.S. Dollar, Call | | | SCB | | | | 10/10/16 | | | | 1.35 | | | | 4,960 | |
| | 823,000 | EUR | | OTC Euro versus U.S. Dollar, Put | | | SCB | | | | 9/26/16 | | | | 1.05 | | | | 171 | |
| | 1,177,000 | EUR | | OTC Euro versus U.S. Dollar, Put | | | DUB | | | | 9/26/16 | | | | 1.05 | | | | 244 | |
| | 823,000 | EUR | | OTC Euro versus U.S. Dollar, Call | | | SCB | | | | 9/26/16 | | | | 1.14 | | | | 1,681 | |
| | 1,177,000 | EUR | | OTC Euro versus U.S. Dollar, Call | | | DUB | | | | 9/26/16 | | | | 1.14 | | | | 2,404 | |
| | 2,300,000 | | | OTC U.S. Dollar versus Brazilian Real, Call | | | GSC | | | | 11/28/16 | | | BRL | 3.50 | | | | 36,579 | |
| | 700,000 | | | OTC U.S. Dollar versus Brazilian Real, Call | | | DUB | | | | 6/28/18 | | | BRL | 3.89 | | | | 60,111 | |
| | 700,000 | | | OTC U.S. Dollar versus Brazilian Real, Put | | | DUB | | | | 6/28/18 | | | BRL | 3.89 | | | | 76,600 | |
| | 1,300,000 | | | OTC U.S. Dollar versus Chinese Onshore Renminbi, Call | | | SOG | | | | 11/1/16 | | | CNY | 7.00 | | | | 1,058 | |
| | 400,000 | | | OTC U.S. Dollar versus Korean Won, Put | | | UBS | | | | 1/17/17 | | | KRW | 1,145.00 | | | | 17,516 | |
| | 300,000 | | | OTC U.S. Dollar versus Korean Won, Put | | | SOG | | | | 1/19/17 | | | KRW | 1,145.00 | | | | 13,137 | |
| | 1,100,000 | | | OTC U.S. Dollar versus Mexican Peso, Put | | | BOA | | | | 9/13/16 | | | MXN | 17.70 | | | | 77 | |
| | | | | | | | | | | | | | | | | | | | |
| | | | TOTAL OPTIONS CONRACTS WRITTEN
(Premiums received — $369,190) | | | | | | | | | | | | | | $ | 271,144 | |
| | | | | | | | | | | | | | | | | | | | |
During the year ended August 31, 2016, options contracts written transactions for International Fixed Income Fund was as follows:
| | | | | | | | |
| | | Notional
Amount/
Number of
Contracts | | | Premiums
Received | |
Options contracts written, outstanding at August 31, 2015 | | | 14,355,600 | | | $ | 63,177 | |
Options written | | | 465,535,135 | | | | 1,199,760 | |
Options closed | | | (39,564,735 | ) | | | (324,943 | ) |
Options expired | | | (101,926,000 | ) | | | (568,804 | ) |
| | | | | | | | |
Options contracts written, outstanding at August 31, 2016 | | | 338,400,000 | | | $ | 369,190 | |
| | | | | | | | |
See Notes to Financial Statements.
217
| | | | | | |
| International Fixed Income Fund |
Schedule of Reverse Repurchase Agreements
| | | | | | | | |
| | |
Face
Amount | | | Security | | Value | |
| | | | Royal Bank of Scotland PLC: | | | | |
| $ | 1,214,000 | | | 0.640% due 10/11/16 | | $ | 1,214,000 | |
| | 712,976 | | | 0.640% due 10/24/16 | | | 712,976 | |
| | 1,063,125 | | | 0.650% due 10/24/16 | | | 1,063,125 | |
| | | | Merrill Lynch & Pierce, Fenner & Smith Inc.: | | | | |
| | 1,415,750 | | | 0.500% due 9/6/16 | | | 1,415,750 | |
| | 2,035,375 | CAD | | 0.800% due 9/9/16 | | | 1,552,240 | |
| | 2,349,375 | CAD | | 0.900% due 10/13/16 | | | 1,791,707 | |
| | 2,756,250 | CAD | | 0.900% due 10/14/16 | | | 2,102,002 | |
| | | | Scotia Capital (USA) Inc.: | | | | |
| | 6,756,750 | | | 0.600% due 10/5/16 | | | 6,756,750 | |
| | | | | | | | |
| | | | TOTAL REVERSE REPURCHASE AGREEMENTS
(Proceeds — $16,686,500) | | $ | 16,608,550 | |
| | | | | | | | |
For the year ended August 31, 2016, the average borrowing and interest rate under the reverse repurchase agreements were $6,454,279 and 0.470% respectively.
Schedule of Forward Sale Commitments
| | | | | | | | |
| | |
Face
Amount | | | Security | | Value | |
| | | | Federal National Mortgage Association (FNMA): | | | | |
| $ | 2,000,000 | | | 4.000% due 9/1/46(a) | | $ | 2,142,656 | |
| | 3,000,000 | | | 4.500% due 10/1/46(a) | | | 3,274,336 | |
| | | | | | | | |
| | | | TOTAL OPEN FORWARD SALE COMMITMENTS
(Proceeds — $5,412,773) | | $ | 5,416,992 | |
| | | | | | | | |
| (a) | This security is traded on a TBA basis (see Note 1). |
At August 31, 2016, International Fixed Income Fund had open exchange traded futures contracts as described below.
The unrealized appreciation (depreciation) on the open contracts reflected in the accompanying financial statements were as follows:
| | | | | | | | | | | | | | | | |
| Open Futures Contracts | | Number of
Contracts | | | Expiration
Date
(Month/Year) | | | Market Value | | | Unrealized
Appreciation/
(Depreciation) | |
Contracts to Buy: | | | | | | | | | | | | | | | | |
Australian Government 10-Year Bond September Futures | | | 23 | | | | 9/16 | | | $ | 2,383,585 | | | $ | 30,887 | |
Euro-Bobl September Futures | | | 61 | | | | 9/16 | | | | 9,091,013 | | | | 92,550 | |
Euro-BTP September Futures | | | 64 | | | | 9/16 | | | | 10,388,467 | | | | 263,527 | |
Euro-Bund September Futures | | | 4 | | | | 9/16 | | | | 746,917 | | | | 5,087 | |
Euro-OAT September Futures | | | 77 | | | | 9/16 | | | | 13,855,004 | | | | 389,991 | |
Euro-Schatz Note September Futures | | | 94 | | | | 9/16 | | | | 11,746,085 | | | | 21,498 | |
See Notes to Financial Statements.
218
| | | | | | |
| International Fixed Income Fund |
| | | | | | | | | | | | | | | | |
| Open Futures Contracts | | Number of
Contracts | | | Expiration
Date
(Month/Year) | | | Market Value | | | Unrealized
Appreciation/
(Depreciation) | |
Japan Government 10-Year Bond September Futures | | | 7 | | | | 9/16 | | | $ | 10,242,764 | | | $ | (50,544 | ) |
U.S. Treasury 5-Year Note December Futures | | | 158 | | | | 12/16 | | | | 19,157,500 | | | | (36,958 | ) |
U.S. Treasury 10-Year Note December Futures | | | 289 | | | | 12/16 | | | | 37,836,422 | | | | (108,230 | ) |
U.S. Treasury Ultra Long Bond December Futures | | | 32 | | | | 12/16 | | | | 5,999,000 | | | | (5,748 | ) |
United Kingdom Treasury 10-Year Gilt December Futures | | | 32 | | | | 12/16 | | | | 5,526,996 | | | | 9,875 | |
| | | | | | | | | | | | | | | | |
| | | | | | | | | | | | | | | 611,935 | |
| | | | | | | | | | | | | | | | |
Contracts to Sell: | | | | | | | | | | | | | | | | |
90-Day Eurodollar December Futures | | | 135 | | | | 12/17 | | | | 33,372,000 | | | | (55,318 | ) |
90-Day Eurodollar March Futures | | | 16 | | | | 3/18 | | | | 3,954,200 | | | | (7,685 | ) |
Canada Government 10-Year Bond December Futures | | | 15 | | | | 12/16 | | | | 1,678,970 | | | | (1,853 | ) |
Euro-BONO Spanish Government September Futures | | | 2 | | | | 9/16 | | | | 323,903 | | | | (12,495 | ) |
Euro-Buxl 30-Year Bond September Futures | | | 7 | | | | 9/16 | | | | 1,507,019 | | | | (104,175 | ) |
U.S. Treasury Long Bond December Futures | | | 55 | | | | 12/16 | | | | 9,370,625 | | | | 23,203 | |
| | | | | | | | | | | | | | | | |
| | | | | | | | | | | | | | | (158,323 | ) |
| | | | | | | | | | | | | | | | |
Net Unrealized Appreciation on Open Exchange Traded Futures Contracts | | | | | | | | | | | | | | $ | 453,612 | |
| | | | | | | | | | | | | | | | |
At August 31, 2016, International Fixed Income Fund had deposited cash of $1,100,000 with a broker or brokers as margin collateral on open exchange traded futures contracts.
At August 31, 2016, International Fixed Income Fund had open forward foreign currency contracts as described below.
The unrealized appreciation (depreciation) on the open contracts reflected in the accompanying financial statements were as follows:
| | | | | | | | | | | | | | | | | | | | |
| Foreign Currency | | Local Currency | | | Counterparty | | | Market
Value | | | Settlement
Date | | | Unrealized
Appreciation/
(Depreciation) | |
Contracts to Buy: | | | | | | | | | | | | | | | | | | | | |
Australian Dollar | | | 595,000 | | | | JPM | | | $ | 447,172 | | | | 9/2/16 | | | $ | (5,343 | ) |
Australian Dollar | | | 1,824,000 | | | | JPM | | | | 1,370,827 | | | | 9/2/16 | | | | (18,485 | ) |
Australian Dollar | | | 472,000 | | | | JPM | | | | 354,731 | | | | 9/2/16 | | | | (2,457 | ) |
Australian Dollar | | | 440,000 | | | | GSC | | | | 330,582 | | | | 9/14/16 | | | | 4,039 | |
Australian Dollar | | | 58,011 | | | | GSC | | | | 43,585 | | | | 9/14/16 | | | | 345 | |
Brazilian Real | | | 9,824,696 | | | | DUB | | | | 3,042,031 | | | | 9/2/16 | | | | 119,580 | |
Brazilian Real | | | 712,731 | | | | DUB | | | | 220,684 | | | | 9/2/16 | | | | (1,316 | ) |
Brazilian Real | | | 794,168 | | | | DUB | | | | 245,899 | | | | 9/2/16 | | | | 899 | |
Brazilian Real | | | 6,101,805 | | | | BOA | | | | 1,871,327 | | | | 10/4/16 | | | | 3,733 | |
Brazilian Real | | | 2,100,000 | | | | DUB | | | | 644,037 | | | | 10/4/16 | | | | 5,987 | |
Brazilian Real | | | 315,000 | | | | DUB | | | | 96,606 | | | | 10/4/16 | | | | 24,025 | |
Brazilian Real | | | 3,900,000 | | | | JPM | | | | 1,196,068 | | | | 10/4/16 | | | | 83,055 | |
Brazilian Real | | | 288,800 | | | | DUB | | | | 82,128 | | | | 7/3/17 | | | | 2,128 | |
Brazilian Real | | | 400,000 | | | | BNP | | | | 113,696 | | | | 7/5/17 | | | | 27,582 | |
British Pound | | | 22,774,547 | | | | BOA | | | | 29,906,382 | | | | 9/2/16 | | | | (201,570 | ) |
British Pound | | | 208,000 | | | | JPM | | | | 273,135 | | | | 9/2/16 | | | | (168 | ) |
See Notes to Financial Statements.
219
| | | | | | |
| International Fixed Income Fund |
| | | | | | | | | | | | | | | | | | | | |
| Foreign Currency | | Local Currency | | | Counterparty | | | Market
Value | | | Settlement
Date | | | Unrealized
Appreciation/
(Depreciation) | |
Canadian Dollar | | | 10,939,448 | | | | BOA | | | $ | 8,342,763 | | | | 9/2/16 | | | $ | (130,861 | ) |
Canadian Dollar | | | 2,000,000 | | | | JPM | | | | 1,525,262 | | | | 9/2/16 | | | | (12,727 | ) |
Canadian Dollar | | | 2,300,000 | | | | GSC | | | | 1,754,429 | | | | 10/13/16 | | | | (31,938 | ) |
Canadian Dollar | | | 2,700,000 | | | | GSC | | | | 2,059,558 | | | | 10/14/16 | | | | (40,726 | ) |
Chinese Offshore Renminbi | | | 733,244 | | | | SCB | | | | 109,353 | | | | 10/20/16 | | | | (1,956 | ) |
Chinese Offshore Renminbi | | | 2,948,060 | | | | SCB | | | | 439,661 | | | | 10/20/16 | | | | (7,862 | ) |
Chinese Offshore Renminbi | | | 5,962,382 | | | | SCB | | | | 889,204 | | | | 10/20/16 | | | | (15,901 | ) |
Chinese Offshore Renminbi | | | 4,964,110 | | | | SCB | | | | 740,326 | | | | 10/20/16 | | | | (13,239 | ) |
Chinese Onshore Renminbi | | | 2,956,800 | | | | BNP | | | | 441,652 | | | | 10/20/16 | | | | (6,348 | ) |
Chinese Onshore Renminbi | | | 3,568,977 | | | | CITI | | | | 533,092 | | | | 10/20/16 | | | | (11,665 | ) |
Euro | | | 1,913,000 | | | | BNP | | | | 2,134,142 | | | | 9/2/16 | | | | 1,126 | |
Euro | | | 132,000 | | | | GSC | | | | 147,259 | | | | 9/2/16 | | | | 734 | |
Euro | | | 960,000 | | | | HSBC | | | | 1,070,976 | | | | 9/2/16 | | | | (15,805 | ) |
Euro | | | 1,166,000 | | | | HSBC | | | | 1,300,789 | | | | 9/2/16 | | | | (3,570 | ) |
Euro | | | 107,000 | | | | SCB | | | | 119,369 | | | | 9/2/16 | | | | (1,258 | ) |
Euro | | | 651,000 | | | | UBS | | | | 726,255 | | | | 9/2/16 | | | | (9,299 | ) |
Euro | | | 759,000 | | | | BNP | | | | 847,958 | | | | 10/4/16 | | | | 882 | |
Indian Rupee | | | 31,971,480 | | | | GSC | | | | 471,756 | | | | 11/10/16 | | | | 756 | |
Indian Rupee | | | 22,790,880 | | | | HSBC | | | | 336,291 | | | | 11/10/16 | | | | 291 | |
Japanese Yen | | | 294,900,000 | | | | BCLY | | | | 2,849,964 | | | | 9/2/16 | | | | (85,919 | ) |
Japanese Yen | | | 51,700,000 | | | | UBS | | | | 499,638 | | | | 9/2/16 | | | | (8,317 | ) |
Japanese Yen | | | 160,700,000 | | | | HSBC | | | | 1,555,351 | | | | 10/4/16 | | | | (19,063 | ) |
Korean Won | | | 255,484,000 | | | | SCB | | | | 228,885 | | | | 11/10/16 | | | | (991 | ) |
Mexican Peso | | | 11,593,718 | | | | BNP | | | | 613,642 | | | | 10/20/16 | | | | (26,061 | ) |
New Taiwan Dollar | | | 4,555,265 | | | | BCLY | | | | 143,780 | | | | 11/10/16 | | | | 780 | |
New Taiwan Dollar | | | 6,000,960 | | | | DUB | | | | 189,412 | | �� | | 11/10/16 | | | | 1,412 | |
New Taiwan Dollar | | | 1,190,730 | | | | DUB | | | | 37,584 | | | | 11/10/16 | | | | (416 | ) |
New Taiwan Dollar | | | 2,413,950 | | | | HSBC | | | | 76,193 | | | | 11/10/16 | | | | (807 | ) |
New Taiwan Dollar | | | 6,271,412 | | | | SOG | | | | 197,948 | | | | 11/10/16 | | | | 1,948 | |
New Taiwan Dollar | | | 5,763,945 | | | | UBS | | | | 181,931 | | | | 11/10/16 | | | | 931 | |
New Zealand Dollar | | | 4,445,135 | | | | JPM | | | | 3,225,390 | | | | 9/2/16 | | | | (29,117 | ) |
Russian Ruble | | | 62,941,823 | | | | JPM | | | | 959,637 | | | | 9/15/16 | | | | (2,056 | ) |
Russian Ruble | | | 21,685,544 | | | | SCB | | | | 327,933 | | | | 10/18/16 | | | | (2,237 | ) |
Russian Ruble | | | 28,598,000 | | | | CITI | | | | 422,938 | | | | 1/25/17 | | | | 27,938 | |
Russian Ruble | | | 22,064,320 | | | | HSBC | | | | 325,665 | | | | 2/3/17 | | | | 21,665 | |
Singapore Dollar | | | 64,056 | | | | BCLY | | | | 47,014 | | | | 9/15/16 | | | | 14 | |
Singapore Dollar | | | 36,613 | | | | BCLY | | | | 26,873 | | | | 9/15/16 | | | | (127 | ) |
Singapore Dollar | | | 47,569 | | | | BCLY | | | | 34,914 | | | | 9/15/16 | | | | (86 | ) |
Singapore Dollar | | | 46,394 | | | | BCLY | | | | 34,052 | | | | 9/15/16 | | | | 52 | |
Singapore Dollar | | | 88,604 | | | | BCLY | | | | 65,031 | | | | 9/15/16 | | | | (969 | ) |
Singapore Dollar | | | 54,047 | | | | BCLY | | | | 39,668 | | | | 9/15/16 | | | | (332 | ) |
Singapore Dollar | | | 89,129 | | | | BOA | | | | 65,417 | | | | 9/15/16 | | | | (583 | ) |
Singapore Dollar | | | 221,061 | | | | BOA | | | | 162,249 | | | | 9/15/16 | | | | 249 | |
Singapore Dollar | | | 1,340 | | | | BOA | | | | 983 | | | | 9/15/16 | | | | (17 | ) |
See Notes to Financial Statements.
220
| | | | | | |
| International Fixed Income Fund |
| | | | | | | | | | | | | | | | | | | | |
| Foreign Currency | | Local Currency | | | Counterparty | | | Market
Value | | | Settlement
Date | | | Unrealized
Appreciation/
(Depreciation) | |
Singapore Dollar | | | 43,143 | | | | BOA | | | $ | 31,666 | | | | 9/15/16 | | | $ | (334 | ) |
Singapore Dollar | | | 169,697 | | | | BOA | | | | 124,551 | | | | 9/15/16 | | | | (1,449 | ) |
Singapore Dollar | | | 85,532 | | | | BOA | | | | 62,777 | | | | 9/15/16 | | | | (223 | ) |
Singapore Dollar | | | 88,921 | | | | BOA | | | | 65,265 | | | | 9/15/16 | | | | (735 | ) |
Singapore Dollar | | | 33,548 | | | | BOA | | | | 24,623 | | | | 9/15/16 | | | | (377 | ) |
Singapore Dollar | | | 176,550 | | | | BOA | | | | 129,581 | | | | 9/15/16 | | | | (419 | ) |
Singapore Dollar | | | 124,650 | | | | HSBC | | | | 91,488 | | | | 9/15/16 | | | | (512 | ) |
Singapore Dollar | | | 72,950 | | | | HSBC | | | | 53,542 | | | | 9/15/16 | | | | (458 | ) |
Singapore Dollar | | | 259,703 | | | | HSBC | | | | 190,612 | | | | 9/15/16 | | | | (908 | ) |
Singapore Dollar | | | 130,186 | | | | HSBC | | | | 95,551 | | | | 9/15/16 | | | | (449 | ) |
Singapore Dollar | | | 65,112 | | | | HSBC | | | | 47,790 | | | | 9/15/16 | | | | (210 | ) |
Singapore Dollar | | | 432,701 | | | | UBS | | | | 317,585 | | | | 9/15/16 | | | | (1,415 | ) |
Singapore Dollar | | | 33,574 | | | | UBS | | | | 24,642 | | | | 9/15/16 | | | | (358 | ) |
Singapore Dollar | | | 1,090,000 | | | | SOG | | | | 799,883 | | | | 11/10/16 | | | | (12,640 | ) |
Swedish Krona | | | 2,885,000 | | | | GSC | | | | 337,033 | | | | 9/2/16 | | | | 130 | |
Swedish Krona | | | 14,200,000 | | | | JPM | | | | 1,658,879 | | | | 9/2/16 | | | | 7,310 | |
Swiss Franc | | | 256,000 | | | | GSC | | | | 260,295 | | | | 9/2/16 | | | | (858 | ) |
Swiss Franc | | | 347,000 | | | | GSC | | | | 352,822 | | | | 9/2/16 | | | | (3,946 | ) |
Swiss Franc | | | 585,000 | | | | JPM | | | | 594,814 | | | | 9/2/16 | | | | (10,247 | ) |
Swiss Franc | | | 358,000 | | | | JPM | | | | 364,006 | | | | 9/2/16 | | | | (7,171 | ) |
Swiss Franc | | | 342,000 | | | | UBS | | | | 347,738 | | | | 9/2/16 | | | | (2,678 | ) |
| | | | | | | | | | | | | | | | | | | | |
| | | | | | | | | | | | | | | | | | | (417,388 | ) |
| | | | | | | | | | | | | | | | | | | | |
Contracts to Sell: | | | | | | | | | | | | | | | | | | | | |
Australian Dollar | | | 5,877,150 | | | | SCB | | | | 4,416,970 | | | | 9/2/16 | | | | 14,624 | |
Australian Dollar | | | 50,000 | | | | BOA | | | | 37,566 | | | | 9/14/16 | | | | (395 | ) |
Australian Dollar | | | 239,000 | | | | HSBC | | | | 179,566 | | | | 9/14/16 | | | | (1,828 | ) |
Australian Dollar | | | 50,000 | | | | UBS | | | | 37,566 | | | | 9/14/16 | | | | (191 | ) |
Australian Dollar | | | 195,000 | | | | UBS | | | | 146,508 | | | | 9/14/16 | | | | 1,098 | |
Brazilian Real | | | 880,380 | | | | BOA | | | | 272,593 | | | | 9/2/16 | | | | (4,593 | ) |
Brazilian Real | | | 6,101,805 | | | | BOA | | | | 1,889,309 | | | | 9/2/16 | | | | (3,999 | ) |
Brazilian Real | | | 1,098,987 | | | | BOA | | | | 340,281 | | | | 9/2/16 | | | | (9,972 | ) |
Brazilian Real | | | 1,743,524 | | | | DUB | | | | 539,849 | | | | 9/2/16 | | | | (7,849 | ) |
Brazilian Real | | | 1,494,400 | | | | GSC | | | | 462,713 | | | | 9/2/16 | | | | 4,287 | |
Brazilian Real | | | 9,500,000 | | | | BCLY | | | | 2,913,500 | | | | 10/4/16 | | | | (437,285 | ) |
Brazilian Real | | | 2,100,000 | | | | BOA | | | | 644,037 | | | | 10/4/16 | | | | (98,866 | ) |
Brazilian Real | | | 315,000 | | | | DUB | | | | 96,606 | | | | 10/4/16 | | | | (9,955 | ) |
Brazilian Real | | | 5,600,000 | | | | JPM | | | | 1,717,432 | | | | 10/4/16 | | | | (263,075 | ) |
Brazilian Real | | | 400,000 | | | | BNP | | | | 113,696 | | | | 7/5/17 | | | | 27,283 | |
Brazilian Real | | | 1,900,000 | | | | HSBC | | | | 540,057 | | | | 7/5/17 | | | | (33,025 | ) |
Brazilian Real | | | 4,000,000 | | | | JPM | | | | 1,136,961 | | | | 7/5/17 | | | | (68,357 | ) |
British Pound | | | 127,000 | | | | BCLY | | | | 166,770 | | | | 9/2/16 | | | | (2,702 | ) |
British Pound | | | 1,179,000 | | | | GSC | | | | 1,548,203 | | | | 9/2/16 | | | | 6,153 | |
British Pound | | | 237,000 | | | | GSC | | | | 311,216 | | | | 9/2/16 | | | | (2,221 | ) |
British Pound | | | 972,000 | | | | GSC | | | | 1,276,381 | | | | 9/2/16 | | | | (13,001 | ) |
See Notes to Financial Statements.
221
| | | | | | |
| International Fixed Income Fund |
| | | | | | | | | | | | | | | | | | | | |
| Foreign Currency | | Local Currency | | | Counterparty | | | Market
Value | | | Settlement
Date | | | Unrealized
Appreciation/
(Depreciation) | |
British Pound | | | 155,000 | | | | HSBC | | | $ | 203,538 | | | | 9/2/16 | | | $ | (2,363 | ) |
British Pound | | | 997,000 | | | | JPM | | | | 1,309,210 | | | | 9/2/16 | | | | (8,223 | ) |
British Pound | | | 18,437,547 | | | | SCB | | | | 24,211,253 | | | | 9/2/16 | | | | (8,193 | ) |
British Pound | | | 653,000 | | | | UBS | | | | 857,487 | | | | 9/2/16 | | | | (4,574 | ) |
British Pound | | | 225,000 | | | | UBS | | | | 295,459 | | | | 9/2/16 | | | | 640 | |
British Pound | | | 22,774,547 | | | | BOA | | | | 29,930,593 | | | | 10/4/16 | | | | 201,272 | |
Canadian Dollar | | | 11,603,448 | | | | HSBC | | | | 8,849,150 | | | | 9/2/16 | | | | (32,610 | ) |
Canadian Dollar | | | 115,000 | | | | JPM | | | | 87,703 | | | | 9/2/16 | | | | (54 | ) |
Canadian Dollar | | | 1,221,000 | | | | SCB | | | | 931,173 | | | | 9/2/16 | | | | 2,667 | |
Canadian Dollar | | | 10,939,448 | | | | BOA | | | | 8,344,201 | | | | 10/4/16 | | | | 130,177 | |
Chinese Offshore Renminbi | | | 733,577 | | | | SCB | | | | 109,403 | | | | 10/20/16 | | | | 2,049 | |
Chinese Offshore Renminbi | | | 4,963,735 | | | | SCB | | | | 740,270 | | | | 10/20/16 | | | | 13,867 | |
Chinese Offshore Renminbi | | | 5,959,204 | | | | SCB | | | | 888,730 | | | | 10/20/16 | | | | 16,649 | |
Chinese Offshore Renminbi | | | 2,948,060 | | | | SCB | | | | 439,661 | | | | 10/20/16 | | | | 8,236 | |
Chinese Offshore Renminbi | | | 14,378,423 | | | | HSBC | | | | 2,143,921 | | | | 10/24/16 | | | | 12,508 | |
Chinese Onshore Renminbi | | | 2,953,888 | | | | BNP | | | | 441,217 | | | | 10/20/16 | | | | 6,783 | |
Chinese Onshore Renminbi | | | 3,570,600 | | | | CITI | | | | 533,335 | | | | 10/20/16 | | | | 12,712 | |
Czech Koruna | | | 13,019,584 | | | | HSBC | | | | 537,822 | | | | 9/30/16 | | | | 4,864 | |
Danish Krone | | | 620,000 | | | | BOA | | | | 93,064 | | | | 10/3/16 | | | | 127 | |
Danish Krone | | | 43,880,000 | | | | HSBC | | | | 6,586,548 | | | | 10/3/16 | | | | (11,288 | ) |
Danish Krone | | | 11,606,360 | | | | JPM | | | | 1,742,157 | | | | 10/3/16 | | | | (5,198 | ) |
Danish Krone | | | 24,827,000 | | | | JPM | | | | 3,726,623 | | | | 10/3/16 | | | | 43,040 | |
Danish Krone | | | 2,165,000 | | | | JPM | | | | 324,974 | | | | 10/3/16 | | | | 612 | |
Danish Krone | | | 1,720,000 | | | | JPM | | | | 258,178 | | | | 10/3/16 | | | | (2,021 | ) |
Danish Krone | | | 1,915,000 | | | | JPM | | | | 287,449 | | | | 10/3/16 | | | | (2,169 | ) |
Danish Krone | | | 5,100,000 | | | | JPM | | | | 765,529 | | | | 10/3/16 | | | | 16,440 | |
Danish Krone | | | 4,800,000 | | | | JPM | | | | 720,498 | | | | 10/3/16 | | | | 12,070 | |
Danish Krone | | | 6,510,000 | | | | JPM | | | | 977,175 | | | | 10/3/16 | | | | (10,999 | ) |
Danish Krone | | | 13,955,000 | | | | UBS | | | | 2,103,606 | | | | 1/3/17 | | | | 18,499 | |
Danish Krone | | | 7,050,000 | | | | BOA | | | | 1,067,673 | | | | 4/3/17 | | | | 2,288 | |
Danish Krone | | | 6,950,000 | | | | UBS | | | | 1,052,529 | | | | 4/3/17 | | | | 3,480 | |
Danish Krone | | | 41,375,000 | | | | BOA | | | | 6,296,779 | | | | 7/3/17 | | | | (43,945 | ) |
Euro | | | 26,984,563 | | | | BOA | | | | 30,103,966 | | | | 9/2/16 | | | | (383,978 | ) |
Euro | | | 756,000 | | | | GSC | | | | 843,393 | | | | 9/2/16 | | | | 1,719 | |
Euro | | | 6,231,313 | | | | BNP | | | | 6,961,645 | | | | 10/4/16 | | | | 5,679 | |
Euro | | | 16,580,249 | | | | BOA | | | | 18,523,514 | | | | 10/4/16 | | | | 40,230 | |
Japanese Yen | | | 37,500,000 | | | | BCLY | | | | 362,406 | | | | 9/2/16 | | | | (3,937 | ) |
Japanese Yen | | | 2,192,600,000 | | | | UBS | | | | 21,189,659 | | | | 9/2/16 | | | | (223,892 | ) |
Japanese Yen | | | 1,883,500,000 | | | | UBS | | | | 18,229,645 | | | | 10/4/16 | | | | 196,462 | |
Japanese Yen | | | 127,300,000 | | | | UBS | | | | 1,232,086 | | | | 10/4/16 | | | | 14,254 | |
Japanese Yen | | | 650,000,000 | | | | GSC | | | | 6,292,856 | | | | 10/11/16 | | | | 157,643 | |
Japanese Yen | | | 670,000,000 | | | | GSC | | | | 6,488,042 | | | | 10/17/16 | | | | (109,526 | ) |
Japanese Yen | | | 590,000,000 | | | | JPM | | | | 5,714,954 | | | | 10/24/16 | | | | (180,076 | ) |
Japanese Yen | | | 88,000,000 | | | | GSC | | | | 853,392 | | | | 11/21/16 | | | | 29,213 | |
See Notes to Financial Statements.
222
| | | | | | |
| International Fixed Income Fund |
| | | | | | | | | | | | | | | | | | | | |
| Foreign Currency | | Local Currency | | | Counterparty | | | Market
Value | | | Settlement
Date | | | Unrealized
Appreciation/
(Depreciation) | |
Japanese Yen | | | 292,000,000 | | | | HSBC | | | $ | 2,831,709 | | | | 11/21/16 | | | $ | 94,559 | |
Japanese Yen | | | 280,000,000 | | | | GSC | | | | 2,716,138 | | | | 11/28/16 | | | | 81,931 | |
Japanese Yen | | | 100,000,000 | | | | GSC | | | | 973,686 | | | | 2/10/17 | | | | 16,403 | |
Korean Won | | | 766,227,703 | | | | SOG | | | | 686,455 | | | | 11/10/16 | | | | 2,227 | |
New Taiwan Dollar | | | 56,093,085 | | | | UBS | | | | 1,770,498 | | | | 11/10/16 | | | | (9,333 | ) |
New Zealand Dollar | | | 4,445,135 | | | | BCLY | | | | 3,225,390 | | | | 9/2/16 | | | | (73,878 | ) |
New Zealand Dollar | | | 4,445,135 | | | | JPM | | | | 3,220,956 | | | | 10/4/16 | | | | 29,114 | |
Polish Zloty | | | 2,892,133 | | | | BOA | | | | 738,994 | | | | 11/10/16 | | | | 531 | |
Russian Ruble | | | 41,256,278 | | | | DUB | | | | 629,010 | | | | 9/15/16 | | | | 472 | |
Russian Ruble | | | 21,685,544 | | | | SCB | | | | 330,627 | | | | 9/15/16 | | | | 2,178 | |
Singapore Dollar | | | 29,645 | | | | BCLY | | | | 21,759 | | | | 9/15/16 | | | | 241 | |
Singapore Dollar | | | 42,165 | | | | BCLY | | | | 30,947 | | | | 9/15/16 | | | | 53 | |
Singapore Dollar | | | 25,613 | | | | BCLY | | | | 18,799 | | | | 9/15/16 | | | | 201 | |
Singapore Dollar | | | 111,060 | | | | BCLY | | | | 81,513 | | | | 9/15/16 | | | | 487 | |
Singapore Dollar | | | 92,356 | | | | BCLY | | | | 67,786 | | | | 9/15/16 | | | | 1,214 | |
Singapore Dollar | | | 41,744 | | | | BCLY | | | | 30,638 | | | | 9/15/16 | | | | 362 | |
Singapore Dollar | | | 183,944 | | | | BCLY | | | | 135,007 | | | | 9/15/16 | | | | 1,993 | |
Singapore Dollar | | | 25,654 | | | | BCLY | | | | 18,829 | | | | 9/15/16 | | | | 171 | |
Singapore Dollar | | | 73,811 | | | | BNP | | | | 54,175 | | | | 9/15/16 | | | | 825 | |
Singapore Dollar | | | 69,148 | | | | BOA | | | | 50,752 | | | | 9/15/16 | | | | 248 | |
Singapore Dollar | | | 66,601 | | | | BOA | | | | 48,883 | | | | 9/15/16 | | | | 117 | |
Singapore Dollar | | | 25,458 | | | | BOA | | | | 18,685 | | | | 9/15/16 | | | | 315 | |
Singapore Dollar | | | 41,512 | | | | BOA | | | | 30,468 | | | | 9/15/16 | | | | 532 | |
Singapore Dollar | | | 44,322 | | | | BOA | | | | 32,531 | | | | 9/15/16 | | | | 469 | |
Singapore Dollar | | | 241,956 | | | | JPM | | | | 177,586 | | | | 9/15/16 | | | | 2,414 | |
Singapore Dollar | | | 75,002 | | | | JPM | | | | 55,049 | | | | 9/15/16 | | | | 952 | |
Singapore Dollar | | | 77,768 | | | | UBS | | | | 57,079 | | | | 9/15/16 | | | | 922 | |
Singapore Dollar | | | 72,603 | | | | UBS | | | | 53,288 | | | | 9/15/16 | | | | 712 | |
Singapore Dollar | | | 81,120 | | | | UBS | | | | 59,539 | | | | 9/15/16 | | | | 461 | |
Singapore Dollar | | | 115,953 | | | | WBC | | | | 85,105 | | | | 9/15/16 | | | | 895 | |
Singapore Dollar | | | 82,181 | | | | WBC | | | | 60,317 | | | | 9/15/16 | | | | 683 | |
Singapore Dollar | | | 4,928,487 | | | | HSBC | | | | 3,616,710 | | | | 11/10/16 | | | | 57,893 | |
Swedish Krona | | | 2,225,000 | | | | GSC | | | | 259,930 | | | | 9/2/16 | | | | (181 | ) |
Swedish Krona | | | 9,330,000 | | | | GSC | | | | 1,089,953 | | | | 9/2/16 | | | | (11,236 | ) |
Swedish Krona | | | 2,985,000 | | | | GSC | | | | 348,715 | | | | 9/2/16 | | | | 3,140 | |
Swedish Krona | | | 5,180,000 | | | | JPM | | | | 605,140 | | | | 9/2/16 | | | | 5,397 | |
Swedish Krona | | | 3,045,000 | | | | JPM | | | | 355,724 | | | | 9/2/16 | | | | 712 | |
Swedish Krona | | | 3,255,000 | | | | JPM | | | | 380,257 | | | | 9/2/16 | | | | 1,192 | |
Swiss Franc | | | 1,650,000 | | | | JPM | | | | 1,677,682 | | | | 9/2/16 | | | | 2,054 | |
Swiss Franc | | | 398,000 | | | | JPM | | | | 404,677 | | | | 9/2/16 | | | | 6,853 | |
| | | | | | | | | | | | | | | | | | | | |
| | | | | | | | | | | | | | | | | | | (758,440 | ) |
| | | | | | | | | | | | | | | | | | | | |
Net Unrealized Depreciation on Open Forward Foreign Currency Contracts | | | | | | | | | | | | | | | | | | $ | (1,175,828 | ) |
| | | | | | | | | | | | | | | | | | | | |
See Notes to Financial Statements.
223
| | | | | | |
| International Fixed Income Fund |
At August 31, 2016 International Fixed Income Fund had cash collateral from broker in the amount of $300,000 for open forward foreign currency contracts.
At August 31, 2016, International Fixed Income Fund held the following Centrally Cleared Interest Rate Swap Contracts:
| | | | | | | | | | | | | | | | | | | | | | |
Pay/Receive
Floating Rate | | Floating Rate Index | | Fixed
Rate | | | Maturity
Date | | | Counterparty | | | Notional Amount | | | Unrealized
Appreciation/
(Depreciation) | |
| Pay | | 28-Day MXN TIIE Banxico | | | 5.095% | | | | 02/02/2021 | | | | CITI | | | MXN | 44,800,000 | | | $ | (30,910 | ) |
| Pay | | 28-Day MXN TIIE Banxico | | | 5.825% | | | | 01/12/2023 | | | | CITI | | | MXN | 6,800,000 | | | | (2,930 | ) |
| Receive | | 3-Month Canadian Bank Bill | | | 2.200% | | | | 06/16/2026 | | | | CITI | | | CAD | 2,900,000 | | | | (66,123 | ) |
| Pay | | 3-Month SEK-STIBOR | | | 1.000% | | | | 03/18/2025 | | | | CITI | | | SEK | 3,800,000 | | | | 25,789 | |
| Pay | | 3-Month USD-LIBOR | | | 1.035% | | | | 12/15/2021 | | | | CITI | | | USD | 700,000 | | | | (1,886 | ) |
| Receive | | 3-Month USD-LIBOR | | | 1.250% | | | | 06/15/2018 | | | | CITI | | | USD | 13,400,000 | | | | 7,357 | |
| Receive | | 3-Month USD-LIBOR | | | 1.250% | | | | 12/21/2018 | | | | CITI | | | USD | 3,100,000 | | | | 7,149 | |
| Receive | | 3-Month USD-LIBOR | | | 1.500% | | | | 12/16/2017 | | | | CITI | | | USD | 1,900,000 | | | | (6,865 | ) |
| Receive | | 3-Month USD-LIBOR | | | 1.750% | | | | 12/21/2026 | | | | CITI | | | USD | 17,900,000 | | | | (575 | ) |
| Receive | | 3-Month USD-LIBOR | | | 1.768% | | | | 12/15/2046 | | | | CITI | | | USD | 1,200,000 | | | | (43,937 | ) |
| Receive | | 3-Month USD-LIBOR | | | 2.038% | | | | 08/31/2022 | | | | CITI | | | USD | 5,100,000 | | | | (108,598 | ) |
| Receive | | 3-Month USD-LIBOR | | | 2.098% | | | | 07/01/2041 | | | | CITI | | | USD | 4,600,000 | | | | (35,976 | ) |
| Receive | | 3-Month USD-LIBOR | | | 2.250% | | | | 12/16/2022 | | | | CITI | | | USD | 28,700,000 | | | | (1,804,958 | ) |
| Receive | | 3-Month USD-LIBOR | | | 2.250% | | | | 06/15/2026 | | | | CITI | | | USD | 400,000 | | | | (14,311 | ) |
| Receive | | 3-Month USD-LIBOR | | | 2.250% | | | | 12/21/2046 | | | | CITI | | | USD | 200,000 | | | | (8,454 | ) |
| Receive | | 3-Month USD-LIBOR | | | 2.500% | | | | 12/16/2025 | | | | CITI | | | USD | 9,000,000 | | | | (550,953 | ) |
| Pay | | 3-Month ZAR-SAJIBOR | | | 8.500% | | | | 03/15/2027 | | | | CITI | | | ZAR | 5,200,000 | | | | 213 | |
| Pay | | 3-Month ZAR-SAJIBOR | | | 8.750% | | | | 03/16/2021 | | | | CITI | | | ZAR | 15,700,000 | | | | 32,736 | |
| Pay | | 6-Month EURIBOR | | | 0.000% | | | | 09/21/2021 | | | | CITI | | | EUR | 9,200,000 | | | | 119,802 | |
| Receive | | 6-Month EURIBOR | | | 0.010% | | | | 09/21/2018 | | | | CITI | | | EUR | 6,100,000 | | | | (9,766 | ) |
| Pay | | 6-Month EURIBOR | | | 0.750% | | | | 09/21/2026 | | | | CITI | | | EUR | 8,200,000 | | | | 157,011 | |
| Receive | | 6-Month EURIBOR | | | 1.250% | | | | 03/15/2047 | | | | CITI | | | EUR | 1,250,000 | | | | (42,261 | ) |
| Receive | | 6-Month GBP-LIBOR | | | 1.050% | | | | 09/05/2046 | | | | CITI | | | GBP | 500,000 | | | | (35,765 | ) |
| Receive | | 6-Month GBP-LIBOR | | | 1.250% | | | | 09/21/2021 | | | | CITI | | | GBP | 3,000,000 | | | | 5,042 | |
| Receive | | 6-Month GBP-LIBOR | | | 1.500% | | | | 09/21/2026 | | | | CITI | | | GBP | 1,000,000 | | | | (16,413 | ) |
| Receive | | 6-Month GBP-LIBOR | | | 1.500% | | | | 03/15/2047 | | | | CITI | | | GBP | 900,000 | | | | (69,002 | ) |
| Receive | | 6-Month GBP-LIBOR | | | 1.750% | | | | 09/16/2018 | | | | CITI | | | GBP | 4,400,000 | | | | (77,959 | ) |
| Receive | | 6-Month GBP-LIBOR | | | 1.750% | | | | 03/15/2047 | | | | CITI | | | GBP | 700,000 | | | | (70,275 | ) |
| Pay | | 6-Month JPY-LIBOR | | | 0.000% | | | | 09/20/2026 | | | | CITI | | | JPY | 260,000,000 | | | | (384 | ) |
| Pay | | 6-Month JPY-LIBOR | | | 0.150% | | | | 03/22/2018 | | | | CITI | | | JPY | 2,310,000,000 | | | | 103,950 | |
| Pay | | 6-Month JPY-LIBOR | | | 0.300% | | | | 03/18/2026 | | | | CITI | | | JPY | 3,210,000,000 | | | | 7,014 | |
| Receive | | 6-Month JPY-LIBOR | | | 0.500% | | | | 09/18/2022 | | | | CITI | | | JPY | 430,000,000 | | | | (9,725 | ) |
| Receive | | 6-Month JPY-LIBOR | | | 0.500% | | | | 09/20/2046 | | | | CITI | | | JPY | 90,000,000 | | | | 3,148 | |
| Pay | | 6-Month JPY-LIBOR | | | 1.500% | | | | 06/19/2033 | | | | CITI | | | JPY | 150,000,000 | | | | 189,393 | |
| Receive | | 6-Month JPY-LIBOR | | | 1.500% | | | | 12/20/2044 | | | | CITI | | | JPY | 100,000,000 | | | | (223,649 | ) |
| Receive | | 6-Month JPY-LIBOR | | | 1.500% | | | | 12/21/2045 | | | | CITI | | | JPY | 160,000,000 | | | | 167,452 | |
| | | | | | | | | | | | | | | | | | | | | | |
| | | | | | | | | | | | | | | | | | | | $ | (2,405,619 | ) |
| | | | | | | | | | | | | | | | | | | | | | |
See Notes to Financial Statements.
224
| | | | | | |
| International Fixed Income Fund |
At August 31, 2016, International Fixed Income Fund held the following OTC Volatility Swap Contracts:
| | | | | | | | | | | | | | | | | | | | | | | | | | | | | | | | | | |
Pay/Receive
Volatility* | | Reference Obligation | | Fixed
Rate | | | Maturity
Date | | | Counterparty | | | Notional
Amount | | | Market Value | | | Upfront
Premiums Paid | | | Unrealized Appreciation/
(Depreciation | |
| Pay | | EUR vs. CHF spot exchange rate | | | 8.500% | | | | 09/14/2016 | | | | DUB | | | | CHF | | | | 200,000 | | | $ | 7,803 | | | $ | — | | | $ | 7,803 | |
| Pay | | EUR vs. CHF spot exchange rate | | | 8.400% | | | | 12/06/2016 | | | | DUB | | | | CHF | | | | 100,000 | | | | 3,297 | | | | — | | | | 3,297 | |
| Pay | | EUR vs. CHF spot exchange rate | | | 7.250% | | | | 01/03/2017 | | | | DUB | | | | CHF | | | | 300,000 | | | | 5,707 | | | | — | | | | 5,707 | |
| Pay | | EUR vs. CHF spot exchange rate | | | 6.850% | | | | 01/05/2017 | | | | UBS | | | | CHF | | | | 200,000 | | | | 2,805 | | | | — | | | | 2,805 | |
| Pay | | EUR vs. CHF spot exchange rate | | | 8.500% | | | | 03/22/2017 | | | | DUB | | | | CHF | | | | 400,000 | | | | 11,035 | | | | — | | | | 11,035 | |
| Pay | | EUR vs. CHF spot exchange rate | | | 8.150% | | | | 03/30/2017 | | | | DUB | | | | CHF | | | | 200,000 | | | | 4,567 | | | | — | | | | 4,567 | |
| Receive | | USD vs. CHF spot exchange rate | | | 10.000% | | | | 09/14/2016 | | | | DUB | | | | CHF | | | | 200,000 | | | | (3,215 | ) | | | — | | | | (3,215 | ) |
| Receive | | USD vs. CHF spot exchange rate | | | 10.800% | | | | 12/06/2016 | | | | DUB | | | | CHF | | | | 100,000 | | | | (1,782 | ) | | | — | | | | (1,782 | ) |
| Receive | | USD vs. CHF spot exchange rate | | | 9.250% | | | | 01/03/2017 | | | | DUB | | | | CHF | | | | 300,000 | | | | (1,809 | ) | | | — | | | | (1,809 | ) |
| Receive | | USD vs. CHF spot exchange rate | | | 8.750% | | | | 01/05/2017 | | | | UBS | | | | CHF | | | | 200,000 | | | | (96 | ) | | | — | | | | (96 | ) |
| Receive | | USD vs. CHF spot exchange rate | | | 10.300% | | | | 03/22/2017 | | | | DUB | | | | CHF | | | | 400,000 | | | | (5,998 | ) | | | — | | | | (5,998 | ) |
| Receive | | USD vs. CHF spot exchange rate | | | 10.050% | | | | 03/30/2017 | | | | DUB | | | | CHF | | | | 200,000 | | | | (2,588 | ) | | | — | | | | (2,588 | ) |
| | | | | | | | | | | | | | | | | | | | | | | | | | | | | | | | | | |
| | | | | | | | | | | | | | | | | | | | | | | | $ | 19,726 | | | $ | — | | | $ | 19,726 | |
| | | | | | | | | | | | | | | | | | | | | | | | | | | | | | | | | | |
| * | Fund will pay or receive the volatility of the reference asset depending on whether the realized volatility of the reference asset exceeds or is less than the fixed rate. For contracts where the Fund has elected to receive the volatility of the reference asset, it will receive a net payment of the difference between the realized volatility and the fixed rate multiplied by the notional amount if the realized volatility exceeds the fixed rate; the Fund will make a net payment of the absolute value of the difference of the realized volatility and the fixed rate multiplied by the notional amount if the realized volatility is less than the fixed rate. For contracts where the Fund has elected to pay the volatility of the reference asset, it will make a net payment of the difference between the realized volatility and the fixed rate multiplied by the notional amount if the realized volatility exceeds the fixed rate; the Fund will receive a net payment of the absolute value of the difference of the realized and the fixed rate multiplied by the notional amount if the realized volatility is less than the fixed rate. |
At August 31, 2016, International Fixed Income Fund held the following OTC and Centrally Cleared Credit Default Swap Contracts:
OTC Credit Default Swaps on Corporate and Sovereign Issues — Buy Protection (1)
| | | | | | | | | | | | | | | | | | | | | | | | | | | | | | | | |
| Reference Obligation | | Fixed Deal
(Pay) Rate | | | Maturity
Date | | | Counterparty | | | Implied Credit
Spread at
8/31/16 (2) | | | Notional
Amount (3) | | | Market
Value | | | Upfront
Premiums
Paid/ (Received) | | | Unrealized
Appreciation/
(Depreciation) | |
Altria Group Inc., A- | | | (1.000% | ) | | | 12/20/2020 | | | | BCLY | | | | 0.242% | | | USD | 100,000 | | | $ | (3,413 | ) | | $ | (3,398 | ) | | $ | (15 | ) |
Altria Group Inc., A- | | | (1.000% | ) | | | 12/20/2020 | | | | CITI | | | | 0.242% | | | USD | 200,000 | | | | (6,826 | ) | | | (6,699 | ) | | | (127 | ) |
Altria Group Inc., A- | | | (1.000% | ) | | | 12/20/2020 | | | | GSC | | | | 0.242% | | | USD | 100,000 | | | | (3,413 | ) | | | (3,290 | ) | | | (123 | ) |
Altria Group Inc., A- | | | (1.000% | ) | | | 12/20/2020 | | | | JPM | | | | 0.242% | | | USD | 100,000 | | | | (3,413 | ) | | | (3,230 | ) | | | (183 | ) |
Barclays Bank PLC, BBB- | | | (1.000% | ) | | | 06/20/2021 | | | | JPM | | | | 2.024% | | | EUR | 600,000 | | | | 30,582 | | | | 34,494 | | | | (3,912 | ) |
Basf Se, A | | | (1.000% | ) | | | 12/20/2020 | | | | GSC | | | | 0.373% | | | EUR | 100,000 | | | | (3,267 | ) | | | (2,041 | ) | | | (1,226 | ) |
Bat Netherlands Finance BV, A- | | | (1.000% | ) | | | 12/20/2020 | | | | GSC | | | | 0.437% | | | EUR | 100,000 | | | | (2,951 | ) | | | (2,407 | ) | | | (544 | ) |
Bat Netherlands Finance BV, A- | | | (1.000% | ) | | | 12/20/2020 | | | | JPM | | | | 0.437% | | | EUR | 100,000 | | | | (2,951 | ) | | | (2,223 | ) | | | (728 | ) |
Bayer AG, A- | | | (1.000% | ) | | | 12/20/2020 | | | | BCLY | | | | 0.504% | | | EUR | 100,000 | | | | (2,620 | ) | | | (2,249 | ) | | | (371 | ) |
Bayer AG, A- | | | (1.000% | ) | | | 12/20/2020 | | | | CITI | | | | 0.504% | | | EUR | 100,000 | | | | (2,620 | ) | | | (2,110 | ) | | | (510 | ) |
See Notes to Financial Statements.
225
| | | | | | |
| International Fixed Income Fund |
| | | | | | | | | | | | | | | | | | | | | | | | | | | | | | | | |
| Reference Obligation | | Fixed Deal
(Pay) Rate | | | Maturity
Date | | | Counterparty | | | Implied Credit
Spread at
8/31/16 (2) | | | Notional
Amount (3) | | | Market
Value | | | Upfront
Premiums
Paid/ (Received) | | | Unrealized
Appreciation/
(Depreciation) | |
Cleveland Electric, BBB- | | | (0.940% | ) | | | 06/20/2017 | | | | RBS | | | | 0.163% | | | USD | 1,000,000 | | | $ | (8,192 | ) | | $ | — | | | $ | (8,192 | ) |
Intesa Sanpaolo SpA, BBB- | | | (1.000% | ) | | | 03/20/2026 | | | | SOG | | | | 3.163% | | | USD | 500,000 | | | | 83,047 | | | | 72,420 | | | | 10,627 | |
Koninklijke Dsm NV, A- | | | (1.000% | ) | | | 12/20/2020 | | | | BNP | | | | 0.281% | | | EUR | 100,000 | | | | (3,723 | ) | | | (2,300 | ) | | | (1,423 | ) |
Koninklijke Dsm NV, A- | | | (1.000% | ) | | | 12/20/2020 | | | | CITI | | | | 0.281% | | | EUR | 100,000 | | | | (3,723 | ) | | | (2,249 | ) | | | (1,474 | ) |
Koninklijke Dsm NV, A- | | | (1.000% | ) | | | 12/20/2020 | | | | GSC | | | | 0.281% | | | EUR | 100,000 | | | | (3,723 | ) | | | (2,193 | ) | | | (1,530 | ) |
Pfizer Inc., AA | | | (1.000% | ) | | | 12/20/2020 | | | | JPM | | | | 0.229% | | | USD | 300,000 | | | | (10,406 | ) | | | (11,215 | ) | | | 809 | |
Reynolds American Inc., BBB | | | (1.000% | ) | | | 12/20/2020 | | | | BCLY | | | | 0.320% | | | USD | 100,000 | | | | (3,079 | ) | | | (2,770 | ) | | | (309 | ) |
Reynolds American Inc., BBB | | | (1.000% | ) | | | 12/20/2020 | | | | BOA | | | | 0.320% | | | USD | 100,000 | | | | (3,079 | ) | | | (2,866 | ) | | | (213 | ) |
Reynolds American Inc., BBB | | | (1.000% | ) | | | 12/20/2020 | | | | GSC | | | | 0.320% | | | USD | 300,000 | | | | (9,237 | ) | | | (9,178 | ) | | | (59 | ) |
Starwood Hotels & Resorts Worldwide Inc., BBB | | | (1.490% | ) | | | 06/20/2018 | | | | BOA | | | | 0.100% | | | USD | 1,000,000 | | | | (28,144 | ) | | | — | | | | (28,144 | ) |
Teliasonera AB, A- | | | (1.000% | ) | | | 12/20/2020 | | | | BNP | | | | 0.407% | | | EUR | 100,000 | | | | (3,097 | ) | | | (858 | ) | | | (2,239 | ) |
UBS AG/Stamford CT, BBB+ | | | (1.000% | ) | | | 06/20/2024 | | | | BNP | | | | 1.656% | | | USD | 400,000 | | | | 17,693 | | | | 22,279 | | | | (4,586 | ) |
UBS AG/Stamford CT, BBB+ | | | (1.000% | ) | | | 06/20/2018 | | | | GSC | | | | 0.947% | | | USD | 700,000 | | | | (2,086 | ) | | | 3,328 | | | | (5,414 | ) |
United Utilities PLC, BBB- | | | (1.000% | ) | | | 12/20/2020 | | | | GSC | | | | 0.581% | | | EUR | 100,000 | | | | (2,250 | ) | | | (213 | ) | | | (2,037 | ) |
United Utilities PLC, BBB- | | | (1.000% | ) | | | 12/20/2020 | | | | SOG | | | | 0.581% | | | EUR | 100,000 | | | | (2,250 | ) | | | — | | | | (2,250 | ) |
Unitedhealth Group Inc., A+ | | | (1.000% | ) | | | 12/20/2020 | | | | CITI | | | | 0.292% | | | USD | 200,000 | | | | (6,392 | ) | | | (6,191 | ) | | | (201 | ) |
Unitedhealth Group Inc., A+ | | | (1.000% | ) | | | 12/20/2020 | | | | JPM | | | | 0.292% | | | USD | 100,000 | | | | (3,196 | ) | | | (3,049 | ) | | | (147 | ) |
UST Inc., A- | | | (0.720% | ) | | | 03/20/2018 | | | | GSC | | | | 0.080% | | | USD | 500,000 | | | | (5,713 | ) | | | — | | | | (5,713 | ) |
Veolia Environnement SA, BBB | | | (1.000% | ) | | | 12/20/2020 | | | | BNP | | | | 0.470% | | | EUR | 100,000 | | | | (2,789 | ) | | | (588 | ) | | | (2,201 | ) |
Wind Acquisition Finance SA, B | | | (5.000% | ) | | | 06/20/2021 | | | | JPM | | | | 2.478% | | | EUR | 300,000 | | | | (41,900 | ) | | | (7,366 | ) | | | (34,534 | ) |
| | | | | | | | | | | | | | | | | | | | | | | | | | | | | | | | |
| | | | | | | | | | | | | | | | | | | | | | $ | (43,131 | ) | | $ | 53,838 | | | $ | (96,969 | ) |
| | | | | | | | | | | | | | | | | | | | | | | | | | | | | | | | |
See Notes to Financial Statements.
226
| | | | | | |
| International Fixed Income Fund |
OTC Credit Default Swaps on Corporate and Sovereign Issues — Sell Protection (4)
| | | | | | | | | | | | | | | | | | | | | | | | | | | | | | | | |
| Reference Obligation | | Fixed Deal
(Pay) Rate | | | Maturity
Date | | | Counterparty | | | Implied Credit
Spread at
8/31/16 (2) | | | Notional
Amount (3) | | | Market
Value | | | Upfront
Premiums
(Received) | | | Unrealized
Appreciation | |
Barclays Bank PLC, A- | | | 1.000% | | | | 06/20/2017 | | | | BNP | | | | 0.579% | | | | EUR 100,000 | | | $ | 607 | | | $ | — | | | $ | 607 | |
Barclays Bank PLC, A- | | | 1.000% | | | | 06/20/2021 | | | | GSC | | | | 0.889% | | | | EUR 200,000 | | | | 1,633 | | | | — | | | | 1,633 | |
Barclays Bank PLC, BBB- | | | 1.000% | | | | 06/20/2017 | | | | BNP | | | | 0.932% | | | | EUR 400,000 | | | | 1,151 | | | | (4,231 | ) | | | 5,382 | |
Tesco PLC, BB+ | | | 1.000% | | | | 12/20/2020 | | | | CITI | | | | 1.982% | | | | EUR 300,000 | | | | (13,033 | ) | | | (25,496 | ) | | | 12,463 | |
Tesco PLC, BB+ | | | 1.000% | | | | 12/20/2020 | | | | JPM | | | | 1.982% | | | | EUR 300,000 | | | | (13,033 | ) | | | (23,754 | ) | | | 10,721 | |
Tesco PLC, BB+ | | | 1.000% | | | | 12/20/2020 | | | | SOG | | | | 1.982% | | | | EUR 900,000 | | | | (39,099 | ) | | | (77,336 | ) | | | 38,237 | |
Tesco PLC, BB+ | | | 1.000% | | | | 06/20/2021 | | | | BCLY | | | | 2.168% | | | | EUR 300,000 | | | | (17,331 | ) | | | (24,350 | ) | | | 7,019 | |
Volkswagen International Finance, BBB+ | | | 1.000% | | | | 12/20/2016 | | | | BOA | | | | 0.157% | | | | EUR 200,000 | | | | 1,032 | | | | (1,677 | ) | | | 2,709 | |
| | | | | | | | | | | | | | | | | | | | | | | | | | | | | | | | |
| | | | | | | | | | | | | | | | | | | | | | $ | (78,073 | ) | | $ | (156,844 | ) | | $ | 78,771 | |
| | | | | | | | | | | | | | | | | | | | | | | | | | | | | | | | |
Centrally Cleared — Credit Default Swaps on Indexes — Buy Protection (1)
| | | | | | | | | | | | | | | | | | | | | | | | |
| Reference Obligation | | Fixed Deal
(Pay) Rate | | | Maturity
Date | | | Counterparty | | | Implied Credit
Spread at
8/31/16 (2) | | | Notional
Amount (3) | | | Unrealized
Appreciation/
(Depreciation) | |
Markit CDX North America Investment Grade Series 26 5-Year Index | | | (1.000% | ) | | | 06/20/2021 | | | | CITI | | | | 0.728% | | | USD | 15,000,000 | | | $ | (19,461 | ) |
Markit iTraxx Europe Senior Financials Series 25 5-Year Index | | | (1.000% | ) | | | 06/20/2021 | | | | CITI | | | | 0.688% | | | EUR | 17,200,000 | | | | (55,757 | ) |
Markit iTraxx Europe Senior Financials Series 25 5-Year Index | | | (1.000% | ) | | | 06/20/2021 | | | | CITI | | | | 0.908% | | | EUR | 4,900,000 | | | | 19,888 | |
| | | | | | | | | | | | | | | | | | | | | | | | |
| | | | | | | | | | | | | | | | | | | | | | $ | (55,330 | ) |
| | | | | | | | | | | | | | | | | | | | | | | | |
At August 31, 2016, International Fixed Income Fund held the following OTC Cross Currency Swap Contracts:
| | | | | | | | | | | | | | | | | | | | | | | | | | | | | | |
| Counterparty Pay | | Counterparty Receive | | Maturity
Date (5) | | | Counterparty | | | Notional
Amount of
Currency
Received (6)
(amounts
below are in
000’s) | | | Notional
Amount of
Currency
Delivered (6)
(amounts
below are in
000’s) | | | Market
Value | | | Upfront
Premiums
Paid/ (Received) | | | Unrealized
Appreciation/
(Depreciation) | |
Floating rate equal to 3-Month USD-LIBOR based on the notional amount of currency received | | Floating rate equal to 3-Month EURIBOR less 0.500% based on the notional amount of currency delivered | | | 09/21/2021 | | | | BNP | | | | USD 2,602 | | | | EUR 2,400 | | | $ | 72,900 | | | $ | 81,240 | | | $ | (8,340 | ) |
Floating rate equal to 3-Month USD-LIBOR based on the notional amount of currency received | | Floating rate equal to 3-Month EURIBOR less 0.500% based on the notional amount of currency delivered | | | 09/21/2026 | | | | BNP | | | | USD 3,686 | | | | EUR 3,400 | | | | 114,823 | | | | 1,359 | | | | 113,464 | |
Floating rate equal to 3-Month USD-LIBOR based on the notional amount of currency received | | Floating rate equal to 3-Month GBP-LIBOR less 0.150% based on the notional amount of currency delivered | | | 03/15/2019 | | | | BOA | | | | USD 5,838 | | | | GBP 4,100 | | | | (453,075 | ) | | | 11,465 | | | | (464,540 | ) |
See Notes to Financial Statements.
227
| | | | | | |
| International Fixed Income Fund |
| | | | | | | | | | | | | | | | | | | | | | | | | | | | | | |
| Counterparty Pay | | Counterparty Receive | | Maturity
Date (5) | | | Counterparty | | | Notional
Amount of
Currency
Received (6)
(amounts
below are in
000’s) | | | Notional
Amount of
Currency
Delivered (6)
(amounts
below are in
000’s) | | | Market
Value | | | Upfront
Premiums
Paid/ (Received) | | | Unrealized
Appreciation/
(Depreciation) | |
Floating rate equal to 3-Month USD-LIBOR based on the notional amount of currency received | | Floating rate equal to 3-Month EURIBOR less 0.500% based on the notional amount of currency delivered | | | 09/21/2021 | | | | BOA | | | | USD 4,228 | | | | EUR 3,900 | | | $ | 118,463 | | | $ | 1,170 | | | $ | 117,293 | |
Floating rate equal to 3-Month USD-LIBOR based on the notional amount of currency received | | Floating rate equal to 3-Month GBP-LIBOR less 0.140% based on the notional amount of currency delivered | | | 03/15/2019 | | | | CITI | | | | USD 3,525 | | | | GBP 2,500 | | | | (241,045 | ) | | | 12,570 | | | | (253,615 | ) |
Floating rate equal to 3-Month JPY- LIBOR less 0.760% based on the notional amount of currency received | | Floating rate equal to 3-Month USD-LIBOR based on the notional amount of currency delivered | | | 09/19/2018 | | | | DUB | | | | JPY 470,000 | | | | USD 4,434 | | | | (109,183 | ) | | | (16,585 | ) | | | (92,598 | ) |
Floating rate equal to 3-Month USD-LIBOR based on the notional amount of currency received | | Floating rate equal to 3-Month EURIBOR less 0.500% based on the notional amount of currency delivered | | | 09/21/2021 | | | | DUB | | | | USD 2,385 | | | | EUR 2,200 | | | | 66,825 | | | | 42,645 | | | | 24,180 | |
Floating rate equal to 3-Month USD-LIBOR based on the notional amount of currency received | | Floating rate equal to 3-Month EURIBOR less 0.478% based on the notional amount of currency delivered | | | 03/15/2022 | | | | DUB | | | | USD 1,576 | | | | EUR 1,400 | | | | (13,342 | ) | | | 1,315 | | | | (14,657 | ) |
Floating rate equal to 3-Month USD-LIBOR based on the notional amount of currency received | | Floating rate equal to 3-Month EURIBOR less 0.500% based on the notional amount of currency delivered | | | 09/21/2026 | | | | DUB | | | | USD 563 | | | | EUR 500 | | | | (4,114 | ) | | | 1,050 | | | | (5,164 | ) |
Floating rate equal to 3-Month USD-LIBOR based on the notional amount of currency received | | Floating rate equal to 3-Month CAD-LIBOR less 0.123% based on the notional amount of currency delivered | | | 12/21/2018 | | | | GSC | | | | USD 1,911 | | | | CAD 2,500 | | | | (4,086 | ) | | | 3,073 | | | | (7,159 | ) |
Floating rate equal to 3-Month USD-LIBOR based on the notional amount of currency received | | Floating rate equal to 3-Month CAD-LIBOR less 0.125% based on the notional amount of currency delivered | | | 12/21/2018 | | | | GSC | | | | USD 1,988 | | | | CAD 2,600 | | | | (4,347 | ) | | | (5,567 | ) | | | 1,220 | |
See Notes to Financial Statements.
228
| | | | | | |
| International Fixed Income Fund |
| | | | | | | | | | | | | | | | | | | | | | | | | | | | | | |
| Counterparty Pay | | Counterparty Receive | | Maturity
Date (5) | | | Counterparty | | | Notional
Amount of
Currency
Received (6)
(amounts
below are in
000’s) | | | Notional
Amount of
Currency
Delivered (6)
(amounts
below are in
000’s) | | | Market
Value | | | Upfront
Premiums
Paid/ (Received) | | | Unrealized
Appreciation/
(Depreciation) | |
Floating rate equal to 3-Month USD-LIBOR based on the notional amount of currency received | | Floating rate equal to 3-Month GBP-LIBOR less 0.120% based on the notional amount of currency delivered | | | 03/15/2019 | | | | GSC | | | | USD 6,218 | | | | GBP 4,300 | | | $ | (567,311 | ) | | $ | (39,800 | ) | | $ | (527,511 | ) |
Floating rate equal to 3-Month USD-LIBOR based on the notional amount of currency received | | Floating rate equal to 3-Month EURIBOR less 0.420% based on the notional amount of currency delivered | | | 09/21/2026 | | | | GSC | | | | USD 217 | | | | EUR 200 | | | | 8,625 | | | | 7,890 | | | | 735 | |
Floating rate equal to 3-Month JPY- LIBOR less 0.755% based on the notional amount of currency received | | Floating rate equal to 3-Month USD-LIBOR based on the notional amount of currency delivered | | | 09/21/2018 | | | | UBS | | | | JPY 250,000 | | | | USD 2,478 | | | | 60,874 | | | | 106,572 | | | | (45,698 | ) |
| | | | | | | | | | | | | | | | | | | | | | | | | | | | | | |
| | | | | | | | | | | | | | | | | | | | $ | (953,993 | ) | | $ | 208,397 | | | $ | (1,162,390 | ) |
| | | | | | | | | | | | | | | | | | | | | | | | | | | | | | |
| (1) | If the Fund is a buyer of protection and a credit event occurs, as defined under the terms of that particular swap agreement, the Fund will either (i) receive from the seller of protection an amount equal to the notional amount of the swap and deliver the reference obligation or underlying securities comprising the referenced index or (ii) receive a net settlement amount in the form of cash or securities equal to the notional amount of the swap less the recovery value of the reference obligation or underlying securities comprising the referenced index. |
| (2) | Implied credit spreads, represented in absolute terms, utilized in determining the market value of credit default swap agreements on corporate issues or sovereign issues of an emerging country as of period end serve as an indicator of the current status of the payment/performance risk and represent the likelihood or risk of default for the credit derivative. The implied credit spread of a particular referenced entity reflects the cost of buying/selling protection and may include upfront payments required to be made to enter into the agreement. Wider credit spreads represent a deterioration of the referenced entity’s credit soundness and a greater likelihood or risk of default or other credit event occurring as defined under the terms of the agreement. A credit spread identified as ‘‘Defaulted’’ indicates a credit event has occurred for the referenced entity or obligation. |
| (3) | The maximum potential amount the Fund could be required to make as a seller of credit protection or receive as a buyer of credit protection if a credit event occurs as defined under the terms of that particular swap agreement. |
| (4) | If the Fund is a seller of protection and a credit event occurs, as defined under the terms of that particular swap agreement, the Fund will either (i) pay to the buyer of protection an amount equal to the notional amount of the swap and take delivery of the referenced obligation or underlying securities comprising the referenced index or (ii) pay a net settlement amount in the form of cash or securities equal to the notional amount of the swap less the recovery value of the referenced obligation or underlying securities comprising the referenced index. |
| (5) | At the maturity date, the notional amount of the currency received will be exchanged back for the notional amount of the currency delivered. |
| (6) | The notional amounts to be received or delivered may be determined and exchanged at a future date, based on the effective date of the cross-currency swap. |
At August 31, 2016, International Fixed Income Fund deposited cash collateral with brokers in the amount of $2,321,000 for open centrally cleared swap contracts.
At August 31, 2016, International Fixed Income Fund had cash collateral from brokers in the amount of $250,000 for open OTC swap contracts.
See Notes to Financial Statements.
229
| | | | | | |
| International Fixed Income Fund |
| | | | | | |
Currency Abbreviations used in this schedule: | | Counterparty Abbreviations used in this schedule: |
| AUD | | — Australian Dollar | | BCLY | | — Barclays Bank PLC |
| BRL | | — Brazilian Real | | BNP | | — BNP Paribas SA |
| CAD | | — Canadian Dollar | | BOA | | — Bank of America |
| CHF | | — Swiss Franc | | CITI | | — Citigroup Global Markets Inc. |
| CNY | | — Chinese Yuan Renminbi | | DUB | | — Deutsche Bank AG |
| CZK | | — Czech Koruna | | GSC | | — Goldman Sachs & Co. |
| DKK | | — Danish Krone | | HSBC | | — HSBC Bank USA |
| EUR | | — Euro | | JPM | | — JPMorgan Chase & Co. |
| GBP | | — British Pound | | RBS | | — Royal Bank of Scotland PLC |
| JPY | | — Japanese Yen | | SCB | | — Standard Chartered Bank |
| KRW | | — South Korean Won | | SOG | | — Societe Generale SA |
| MXN | | — Mexican Peso | | UBS | | — UBS Securities LLC |
| NOK | | — Norwegian Krone | | WBC | | — Westpac Banking Corp. |
| NZD | | — New Zealand Dollar | | | | |
| PLN | | — Polish Zloty | | | | |
| SEK | | — Swedish Krona | | | | |
| SGD | | — Singapore Dollar | | | | |
| ZAR | | — South African Rand | | | | |
See Notes to Financial Statements.
230
| | | | | | | | | | |
| Municipal Bond Fund | |
| | | |
Face
Amount | | | Rating†† | | Security | | Value | |
| MUNICIPAL BONDS — 95.8% | | | | |
| California — 18.0% | |
| $ | 1,000,000 | | | AA+ | | California Infrastructure & Economic Development Bank, Revenue Bonds, Bay Area Toll Bridges, Series A, Prerefunded 1/1/28 @ 100, AMBAC-Insured, 5.000% due 7/1/36(a) | | $ | 1,345,810 | |
| | 1,500,000 | | | AA- | | California State University, Revenue Bonds, Systemwide, Series A, 4.000% due 11/1/37 | | | 1,709,820 | |
| | 1,050,000 | | | AA- | | California Statewide Communities Development Authority, Revenue Bonds, Sutter Health Project, Series A, 5.500% due 8/15/26 | | | 1,233,950 | |
| | 2,000,000 | | | AA- | | Garden Grove Unified School District, GO, 2010 Election, Series C, 5.000% due 8/1/35 | | | 2,448,540 | |
| | 2,000,000 | | | A3(b) | | Kaweah Delta Health Care District, Revenue Bonds, Series B, 4.000% due 6/1/45 | | | 2,139,920 | |
| | 1,500,000 | | | AA | | Los Angeles Harbor Department, AMT, Port of Los Angeles, Revenue Bonds, Refunding Series A, 5.000% due 8/1/36(c) | | | 1,787,520 | |
| | 1,500,000 | | | A+ | | San Diego County, CA, Regional Airport Authority, Revenue Bonds, Series A, 5.000% due 7/1/43 | | | 1,765,605 | |
| | | | | | | | | | |
| | | | | | Total California | | | 12,431,165 | |
| | | | | | | | | | |
| Colorado — 11.5% | |
| | 1,435,000 | | | AA | | City of Colorado Springs, CO, Utilities System Revenue, Revenue Bonds, System Improvement, Series B-2, 5.000% due 11/15/38 | | | 1,742,348 | |
| | | | | | Colorado Health Facilities Authority, Revenue Bonds: | | | | |
| | 1,000,000 | | | A- | | Catholic Health Initiatives, Series A, 5.250% due 2/1/31 | | | 1,127,750 | |
| | 1,500,000 | | | AA- | | Sisters of Charity of Leavenworth Inc., Series A, 5.000% due 1/1/44 | | | 1,730,925 | |
| | 1,000,000 | | | AAA | | Colorado Water Resources & Power Development Authority, Revenue Bonds, Revolving Fund, Series A, 5.500% due 9/1/22 | | | 1,247,660 | |
| | 2,000,000 | | | AA- | | University of Colorado Hospital Authority, Revenue Bonds, Series A, 4.000% due 11/15/36 | | | 2,143,740 | |
| | | | | | | | | | |
| | | | | | Total Colorado | | | 7,992,423 | |
| | | | | | | | | | |
| District of Colombia — 2.6% | |
| | 1,500,000 | | | AAA | | District of Columbia, Revenue Bonds, Income Tax Revenue, Series A, 5.000% due 12/1/28 | | | 1,792,620 | |
| | | | | | | | | | |
| Florida — 1.6% | |
| | 1,000,000 | | | A+ | | City of Jacksonville, FL, Revenue Bonds, Better Jacksonville, Prerefunded 10/1/18 @ 100, 5.000% due 10/1/21(a) | | | 1,088,400 | |
| | | | | | | | | | |
| Georgia — 2.9% | |
| | 1,800,000 | | | A | | Municipal Electric Authority of Georgia, Revenue Bonds, Series B, 5.000% due 1/1/20 | | | 2,038,896 | |
| | | | | | | | | | |
| Illinois — 8.1% | |
| | | | | | Illinois Finance Authority, Revenue Bonds: | | | | |
| | 1,235,000 | | | AA | | Advocate Health Care, 4.000% due 6/1/47 | | | 1,312,990 | |
| | 1,000,000 | | | AAA | | Northwestern University, 5.000% due 12/1/28 | | | 1,322,880 | |
| | 1,000,000 | | | A | | Bradley University Projects, Series A, XLCA-Insured, 5.000% due 8/1/34 | | | 1,032,720 | |
| | 600,000 | | | A | | DePaul University, 5.000% due 10/1/36 | | | 726,840 | |
| | 1,095,000 | | | A2(b) | | DePaul University, Series A, 5.375% due 10/1/19 | | | 1,239,091 | |
| | | | | | | | | | |
| | | | | | Total Illinois | | | 5,634,521 | |
| | | | | | | | | | |
| Massachusetts — 3.6% | |
| | 1,000,000 | | | AA+ | | Massachusetts Bay Transportation Authority, Revenue Bonds, Series A, 5.250% due 7/1/34 | | | 1,418,390 | |
| | 1,000,000 | | | A2(b) | | Massachusetts Health & Educational Facilities Authority, Revenue Bonds, Northeastern University, Series R, 5.000% due 10/1/28 | | | 1,082,360 | |
| | | | | | | | | | |
| | | | | | Total Massachusetts | | | 2,500,750 | |
| | | | | | | | | | |
| New Jersey — 2.4% | |
| | 1,340,000 | | | A2(b) | | Manalapan-Englishtown Regional Board of Education, GO, FGIC & NPFG-Insured, 5.750% due 12/1/22 | | | 1,683,254 | |
| | | | | | | | | | |
See Notes to Financial Statements.
231
| | | | | | | | | | |
| Municipal Bond Fund | |
| | | |
Face
Amount | | | Rating†† | | Security | | Value | |
| North Carolina — 3.2% | |
| $ | 2,000,000 | | | AAApre(d) | | North Carolina Eastern Municipal Power Agency, Revenue Bonds, Series B, Prerefunded 1/1/19 @ 100, 5.000% due 1/1/26(a) | | $ | 2,194,580 | |
| | | | | | | | | | |
| Ohio — 3.0% | |
| | 1,500,000 | | | AA | | Cincinnati City School District, GO, Refunding Classroom Construction, ACG-ICC FGIC Insured, 5.250% due 12/1/31 | | | 2,075,340 | |
| | | | | | | | | | |
| Oregon — 2.3% | |
| | 1,330,000 | | | Aa2(b) | | Washington & Clackamas Counties School District No. 23J Tigard-Tualatin, GO, NPFG-Insured, 5.000% due 6/15/22 | | | 1,609,500 | |
| | | | | | | | | | |
| Pennsylvania — 3.3% | |
| | 2,000,000 | | | A+ | | Monroeville Finance Authority, University of Pittsburgh Medical Center, Revenue Bonds, Series B, 5.000% due 7/1/39 | | | 2,313,000 | |
| | | | | | | | | | |
| South Carolina — 2.7% | |
| | 1,535,000 | | | Aa3(b) | | Clemson University, Revenue Bonds, 5.000% due 5/1/29 | | | 1,889,585 | |
| | | | | | | | | | |
| South Dakota — 2.3% | |
| | 1,500,000 | | | Aa2(b) | | City of Sioux Falls, SD, Sales Tax, Revenue Bonds, Series A-1, NPFG-Insured, 4.750% due 11/15/36 | | | 1,564,260 | |
| | | | | | | | | | |
| Tennessee — 4.1% | |
| | 1,000,000 | | | BBB+ | | Knox County Health Educational & Housing Facility Board, Revenue Bonds, University Health System, 5.250% due 4/1/36 | | | 1,022,850 | |
| | 1,700,000 | | | Aa2(b) | | Tennessee Housing Development Agency, Revenue Bonds, Series A, 3.850% due 1/1/35 | | | 1,805,638 | |
| | | | | | | | | | |
| | | | | | Total Tennessee | | | 2,828,488 | |
| | | | | | | | | | |
| Texas — 11.3% | |
| | 1,000,000 | | | AA | | City of Waxahachie, TX, GO, Series A, Prerefunded 8/1/17 @ 100, AGM-Insured, 5.000% due 8/1/25(a) | | | 1,039,830 | |
| | 1,000,000 | | | AAA | | North East, TX, Independent School District, GO, PSF-GTD-Insured, 5.250% due 2/1/30 | | | 1,373,330 | |
| | 2,000,000 | | | AA | | Round Rock, TX, Independent School District, GO, 5.000% due 8/1/33 | | | 2,166,080 | |
| | 1,000,000 | | | AA | | Texas State Technical College, Revenue Bonds, AGM-Insured, 4.000% due 10/15/33 | | | 1,122,780 | |
| | 1,575,000 | | | AAA | | Texas Transportation Commission State Highway Fund, Revenue Bonds, 5.250% due 4/1/26 | | | 2,093,049 | |
| | | | | | | | | | |
| | | | | | Total Texas | | | 7,795,069 | |
| | | | | | | | | | |
| Utah — 3.3% | |
| | 2,000,000 | | | AA | | Utah State University, Revenue Bonds, Student Building Fee, Series B, 5.000% due 12/1/44 | | | 2,310,820 | |
| | | | | | | | | | |
| Virginia — 2.7% | |
| | 1,825,000 | | | AA+ | | City of Lynchburg, VA, GO, 3.000% due 2/1/34 | | | 1,879,367 | |
| | | | | | | | | | |
| Washington — 2.4% | |
| | 1,500,000 | | | A | | Washington Health Care Facilities Authority, Revenue Bonds, PeaceHealth, Series A, 5.000% due 11/1/18 | | | 1,628,565 | |
| | | | | | | | | | |
| Wisconsin — 4.5% | |
| | 1,500,000 | | | AA+ | | Wisconsin Department of Transportation, Revenue Bonds, Series I, FGIC & NPFG-Insured, 5.000% due 7/1/20 | | | 1,734,660 | |
| | 1,300,000 | | | A+ | | Wisconsin Health & Educational Facilities Authority, Revenue Bonds, Aspirus Inc. Obligation Group, 4.000% due 8/15/40 | | | 1,361,659 | |
| | | | | | | | | | |
| | | | | | Total Wisconsin | | | 3,096,319 | |
| | | | | | | | | | |
| | | | | | TOTAL MUNICIPAL BONDS
(Cost — $60,375,444) | | | 66,346,922 | |
| | | | | | | | | | |
See Notes to Financial Statements.
232
| | | | | | | | | | |
| Municipal Bond Fund | |
| | | |
Face
Amount | | | | | Security | | Value | |
| SHORT-TERM INVESTMENTS — 3.6% | |
| TIME DEPOSITS — 3.6% | |
| $ | 1,372,209 | | | | | ANZ National Bank — London, 0.150% due 9/1/16 | | $ | 1,372,209 | |
| | 1,100,919 | | | | | BNP Paribas — Paris, 0.150% due 9/1/16 | | | 1,100,919 | |
| | | | | | | | | | |
| | | | | | TOTAL SHORT-TERM INVESTMENTS
(Cost — $2,473,128) | | | 2,473,128 | |
| | | | | | | | | | |
| | | | | | TOTAL INVESTMENTS — 99.4%
(Cost — $62,848,572#) | | | 68,820,050 | |
| | | | | | | | | | |
| | | | | | Other Assets in Excess of Liabilities — 0.6% | | | 392,060 | |
| | | | | | | | | | |
| | | | | | TOTAL NET ASSETS — 100.0% | | $ | 69,212,110 | |
| | | | | | | | | | |
| †† | All ratings are by Standard & Poor’s Rating Service, unless otherwise noted. All ratings are unaudited. |
| (a) | Pre-refunded bonds are escrowed with government obligations and/or government agency securities and are considered by the Manager to be triple-A rated even if the issuer has not applied for new ratings. |
| (b) | Rating by Moody’s Investors Service. All ratings are unaudited. |
| (c) | Income from this issue is considered a preference item for purposes of calculating the alternative minimum tax (AMT). |
| (d) | Rating by Fitch Ratings Service. All ratings are unaudited. |
| # | Aggregate cost for federal income tax purposes is $62,848,572. |
| | |
Abbreviations used in this schedule: |
| AGM | | — Assured Guaranty Municipal Corp. |
| AMBAC | | — American Bond Assurance Corporation |
| FGIC | | — Financial Guarantee Insurance Company |
| GO | | — General Obligation |
| NPFG | | — National Public Finance Guarantee Corp. |
| PSF-GTD | | — Permanent School Fund Guaranteed |
| XLCA | | — XL Capital Assurance Inc. |
See pages 250 and 251 for definitions of ratings.
| | | | |
| Summary of Investments by Industry^ | | | |
Education | | | 34.6 | % |
Health Care Providers & Services | | | 21.5 | |
General Obligation | | | 12.8 | |
Transportation | | | 10.1 | |
Power | | | 6.1 | |
Airport | | | 2.6 | |
Single Family Housing | | | 2.6 | |
Utilities | | | 2.5 | |
Water and Sewer | | | 1.8 | |
Development | | | 1.8 | |
Short-Term Investments | | | 3.6 | |
| | | | |
| | | 100.0 | % |
| | | | |
| ^ | As a percentage of total investments. |
See Notes to Financial Statements.
233
| | | | | | | | | | |
| Inflation-Linked Fixed Income Fund | |
| | | |
Face
Amount/Units† | | | Rating†† | | Security | | Value | |
| U.S. GOVERNMENT OBLIGATIONS — 117.3% | |
| | | | | | U.S. Treasury Bonds: | | | | |
| $ | 400,000 | | | | | 2.500% due 2/15/46 | | $ | 422,727 | |
| | 500,000 | | | | | 2.500% due 5/15/46(a) | | | 529,219 | |
| | | | | | U.S. Treasury Inflation Indexed Bonds: | | | | |
| | 5,869,417 | | | | | 2.375% due 1/15/25 | | | 6,950,957 | |
| | 13,412,520 | | | | | 3.625% due 4/15/28(a) | | | 18,484,786 | |
| | 14,224,356 | | | | | 2.500% due 1/15/29(a) | | | 18,013,624 | |
| | 4,460,800 | | | | | 2.125% due 2/15/40 | | | 5,976,981 | |
| | 8,087,757 | | | | | 1.375% due 2/15/44 | | | 9,668,727 | |
| | 4,343,786 | | | | | 1.000% due 2/15/46 | | | 4,847,409 | |
| | | | | | U.S. Treasury Inflation Indexed Notes: | | | | |
| | 38,685,283 | | | | | 0.125% due 4/15/18(a) | | | 38,879,173 | |
| | 13,259,556 | | | | | 0.125% due 4/15/19 | | | 13,380,749 | |
| | 21,820,736 | | | | | 0.125% due 4/15/20(a) | | | 22,041,584 | |
| | 2,951,018 | | | | | 1.250% due 7/15/20(b) | | | 3,127,167 | |
| | 406,395 | | | | | 0.625% due 7/15/21(b) | | | 422,332 | |
| | 26,106,500 | | | | | 0.125% due 1/15/23(a) | | | 26,285,956 | |
| | 5,344,470 | | | | | 0.375% due 7/15/23 | | | 5,487,563 | |
| | 203,532 | | | | | 0.250% due 1/15/25(b) | | | 205,578 | |
| | 121,970 | | | | | 0.375% due 7/15/25(b) | | | 124,870 | |
| | 9,129,780 | | | | | 0.625% due 1/15/26 | | | 9,529,993 | |
| | | | | | U.S. Treasury Notes: | | | | |
| | 210,000 | | | | | 2.000% due 2/15/25(b) | | | 217,830 | |
| | 2,100,000 | | | | | 1.625% due 5/15/26(a) | | | 2,108,284 | |
| | | | | | | | | | |
| | | | | | TOTAL U.S. GOVERNMENT OBLIGATIONS
(Cost — $182,030,510) | | | 186,705,509 | |
| | | | | | | | | | |
| SOVEREIGN BONDS — 8.7% | |
| Brazil — 4.7% | |
| | 26,300,000 | BRL | | Ba2(c) | | Brazil Letras do Tesouro Nacional, zero coupon, due 4/1/17 | | | 7,555,970 | |
| | | | | | | | | | |
| France — 2.1% | |
| | | | | | France Government Bond OAT Inflation Linked Bonds: | | | | |
| | 2,328,583 | EUR | | Aa2u(c) | | 2.250% due 7/25/20 | | | 2,953,635 | |
| | 214,732 | EUR | | Aa2u(c) | | 1.850% due 7/25/27 | | | 310,435 | |
| | | | | | | | | | |
| | | | | | Total France | | | 3,264,070 | |
| | | | | | | | | | |
| Italy — 0.9% | |
| | | | | | Italy Buoni Poliennali Del Tesoro Inflation Linked Bonds: | | | | |
| | 1,088,140 | EUR | | Baa2u(c) | | 2.100% due 9/15/21 | | | 1,354,441 | |
| | 100,934 | EUR | | Baa2u(c) | | 2.350% due 9/15/24(d) | | | 131,588 | |
| | | | | | | | | | |
| | | | | | Total Italy | | | 1,486,029 | |
| | | | | | | | | | |
| United Kingdom — 1.0% | |
| | | | | | United Kingdom Gilt Inflation Linked Bonds: | | | | |
| | 390,712 | GBP | | Aa1u(c) | | 0.125% due 3/22/24 | | | 613,919 | |
| | 550,157 | GBP | | Aa1u(c) | | 0.125% due 3/22/26 | | | 891,422 | |
| | 10,206 | GBP | | Aa1u(c) | | 0.125% due 3/22/46 | | | 23,271 | |
| | | | | | | | | | |
| | | | | | Total United Kingdom | | | 1,528,612 | |
| | | | | | | | | | |
| | | | | | TOTAL SOVEREIGN BONDS
(Cost — $13,803,909) | | | 13,834,681 | |
| | | | | | | | | | |
| COLLATERALIZED MORTGAGE OBLIGATIONS — 6.3% | |
| | 9,106 | | | BBB+ | | American Home Mortgage Investment Trust, Series 2005-2, Class 4A1, 2.592%
due 9/25/45(e) | | | 8,853 | |
| | | | | | Banc of America Funding Trust: | | | | |
| | 514,363 | | | Ba3(c) | | Series 2004-1, Class 4A1, 6.000% due 3/25/34 | | | 564,806 | |
See Notes to Financial Statements.
234
| | | | | | | | | | |
| Inflation-Linked Fixed Income Fund | |
| | | |
Face
Amount/Units† | | | Rating†† | | Security | | Value | |
| $ | 115,324 | | | AAA | | Series 2005-B, Class 3A1B, 0.822% due 4/20/35(e) | | $ | 110,938 | |
| | 60,832 | | | BBB+ | | Bear Stearns Adjustable Rate Mortgage Trust, Series 2003-3, Class 3A2, 3.008% due 5/25/33(e) | | | 60,725 | |
| | 800,000 | | | AAA | | CIFC Funding 2012-I Ltd., Series 2012-1A, Class A1R2, 1.920% due 8/14/24(d)(e)(f) | | | 799,906 | |
| | 18,567 | | | BB | | Citigroup Mortgage Loan Trust Inc., Series 2004-HYB2, Class 2A, 2.887% due 3/25/34(e) | | | 18,403 | |
| | 95,007 | | | AA(g) | | Credit Suisse Mortgage Capital Certificates, Series 2009-3R, Class 28A1, 3.157% due 8/27/37(d)(e) | | | 95,103 | |
| | 700,000 | | | B- | | First NLC Trust, Series 2005-4, Class A4, 0.914% due 2/25/36(e) | | | 619,892 | |
| | 8,802 | | | AA+ | | HarborView Mortgage Loan Trust, Series 2005-9, Class 2A1A, 0.852% due 6/20/35(e) | | | 8,084 | |
| | 132,728 | | | B- | | IndyMac INDX Mortgage Loan Trust, Series 2005-16IP, Class A1, 1.164% due 7/25/45(e) | | | 109,602 | |
| | 32,561 | | | AA+ | | MRFC Mortgage Pass Through Trust, Series 2000-TBC2, Class A1, 0.988% due 6/15/30(e) | | | 31,090 | |
| | 270,491 | | | NR | | NYMT Residential, Series 2016-RP1A, Class A, step bond to yield, 4.000% due 3/25/21(d) | | | 270,357 | |
| | 600,000 | | | A+ | | Option One Mortgage Loan Asset-Backed Certificates Trust, Series 2005-4, Class M1, 0.964% due 11/25/35(e) | | | 589,473 | |
| | 600,000 | | | B- | | RASC Trust, Series 2006-KS3, Class M1, 0.854% due 4/25/36(e) | | | 492,448 | |
| | 420,458 | | | AAA | | RBSSP Resecuritization Trust, Series 2009-12, Class 17A1, 2.553% due 10/25/35(d)(e) | | | 424,814 | |
| | 830,096 | | | B | | Sequoia Mortgage Trust, Series 6, Class A, 1.154% due 4/19/27(e) | | | 777,505 | |
| | 650,000 | | | B- | | Specialty Underwriting & Residential Finance Trust, Series 2005-AB1, Class M2, 1.199% due 3/25/36(e) | | | 600,925 | |
| | 364,716 | | | BBB | | Structured Asset Investment Loan Trust, Series 2003-BC13, Class 1A3, 1.524% due 11/25/33(e) | | | 335,181 | |
| | 89,652 | | | CCC | | Thornburg Mortgage Securities Trust, Series 2006-4, Class A2B, 2.868% due 7/25/36(e) | | | 86,854 | |
| | 797,958 | | | NR | | US Residential Opportunity Fund III Trust, Series 2016-1III, Class A, 3.475% due 7/27/36(d) | | | 800,313 | |
| | 555,179 | | | NR | | Vericrest Opportunity Loan Trust, Series 2016-NPL3, Class A1, step bond to yield, 4.250% due 3/26/46(d) | | | 562,389 | |
| | 541,438 | | | NR | | VOLT XLII LLC, Series 2016-NPL2, Class A1, step bond to yield, 4.250% due 3/26/46(d) | | | 548,121 | |
| | 938,400 | | | NR | | VOLT XLV LLC, Series 2016-NPL5, Class A1, step bond to yield, 4.000% due 5/25/46(d) | | | 947,775 | |
| | | | | | WaMu Mortgage Pass Through Certificates Trust: | | | | |
| | 27,879 | | | Baa1(c) | | Series 2002-AR2, Class A, 1.940% due 2/27/34(e) | | | 27,369 | |
| | 10,903 | | | A | | Series 2002-AR17, Class 1A, 1.689% due 11/25/42(e) | | | 10,142 | |
| | 650,290 | | | AA | | Series 2005-AR13, Class A1A1, 0.814% due 10/25/45(e) | | | 619,378 | |
| | 233,770 | | | BBB | | Series 2005-AR15, Class A1A1, 0.784% due 11/25/45(e) | | | 219,668 | |
| | 315,290 | | | A+ | | Series 2006-AR1, Class 2A1A, 1.559% due 1/25/46(e) | | | 303,947 | |
| | 6,782 | | | A+ | | Wells Fargo Mortgage Backed Securities Trust, Series 2004-E, Class A2, 3.082% due 5/25/34(e) | | | 6,861 | |
| | | | | | | | | | |
| | | | | | TOTAL COLLATERALIZED MORTGAGE OBLIGATIONS
(Cost — $9,930,640) | | | 10,050,922 | |
| | | | | | | | | | |
| CORPORATE BONDS & NOTES — 3.8% | |
| Automobliles — 0.5% | |
| | 800,000 | | | BBB+ | | Volkswagen Group of America Finance LLC, Company Guaranteed Notes, 1.251% due 11/20/17(d)(e) | | | 797,344 | |
| | | | | | | | | | |
| Banks — 1.3% | |
| | | | | | CIT Group Inc., Senior Unsecured Notes: | | | | |
| | 100,000 | | | BB+ | | 4.250% due 8/15/17 | | | 102,000 | |
| | 300,000 | | | BB+ | | 3.875% due 2/19/19 | | | 307,407 | |
| | 100,000 | GBP | | BBB+ | | HSBC Holdings PLC, Subordinated Notes, 6.000% due 3/29/40 | | | 179,998 | |
| | | | | | Realkredit Danmark AS, Covered Notes: | | | | |
| | 1,000,000 | DKK | | AAA | | 1.000% due 1/1/17 | | | 150,696 | |
| | 1,300,000 | DKK | | AAA | | 1.000% due 4/1/17 | | | 196,477 | |
| | 400,000 | DKK | | AAA | | 2.000% due 4/1/17 | | | 60,806 | |
| | 700,000 | | | BBB+ | | Santander Holdings USA Inc., Senior Unsecured Notes, 2.275% due 11/24/17(e) | | | 704,432 | |
| | 400,000 | | | Aaa(c) | | Toronto-Dominion Bank (The), Covered Notes, 2.250% due 3/15/21(d) | | | 408,112 | |
| | | | | | | | | | |
| | | | | | Total Banks | | | 2,109,928 | |
| | | | | | | | | | |
See Notes to Financial Statements.
235
| | | | | | | | | | |
| Inflation-Linked Fixed Income Fund | |
| | | |
Face
Amount/Units† | | | Rating†† | �� | Security | | Value | |
| Consumer Finance — 0.4% | |
| $ | 600,000 | | | BB+ | | Ally Financial Inc., Company Guaranteed Notes, 2.750% due 1/30/17 | | $ | 600,902 | |
| | | | | | | | | | |
| Diversified Financial Services — 1.0% | |
| | 600,000 | | | BBB- | | International Lease Finance Corp., Senior Unsecured Notes, 6.250% due 5/15/19 | | | 654,420 | |
| | 200,000 | | | BB- | | Navient Corp., Senior Unsecured Notes, 5.500% due 1/15/19 | | | 206,000 | |
| | 700,000 | | | B | | Springleaf Finance Corp., Company Guaranteed Notes, 5.250% due 12/15/19 | | | 718,375 | |
| | | | | | | | | | |
| | | | | | Total Diversified Financial Services | | | 1,578,795 | |
| | | | | | | | | | |
| Electric Utilities — 0.1% | |
| | 100,000 | | | BBB+ | | E.ON International Finance BV, Company Guaranteed Notes, 5.800% due 4/30/18(d) | | | 106,733 | |
| | | | | | | | | | |
| Food Products — 0.0% | |
| | 100,000 | | | A- | | Wesfarmers Ltd., Company Guaranteed Notes, 1.874% due 3/20/18(d) | | | 100,214 | |
| | | | | | | | | | |
| Media — 0.1% | |
| | 100,000 | | | BBB | | Time Warner Cable Inc., Senior Secured Notes, 6.750% due 7/1/18 | | | 109,049 | |
| | | | | | | | | | |
| Metals & Mining — 0.0% | |
| | 100,000 | | | BBB+ | | Goldcorp Inc., Senior Unsecured Notes, 2.125% due 3/15/18 | | | 100,315 | |
| | | | | | | | | | |
| Oil, Gas & Consumable Fuels — 0.3% | |
| | 400,000 | | | B+ | | Petrobras Global Finance BV, Company Guaranteed Notes, 8.375% due 5/23/21 | | | 431,380 | |
| | | | | | | | | | |
| Transportation Infrastructure — 0.1% | |
| | 100,000 | EUR | | NR | | Hellenic Railways Organization SA, Government Guaranteed Notes, 4.028% due 3/17/17 | | | 109,329 | |
| | | | | | | | | | |
| | | | | | TOTAL CORPORATE BONDS & NOTES
(Cost — $5,913,719) | | | 6,043,989 | |
| | | | | | | | | | |
| MORTGAGE-BACKED SECURITIES — 2.6% | |
| FNMA — 2.6% | |
| | | | | | Federal National Mortgage Association (FNMA): | | | | |
| | 3,000,000 | | | | | 3.500% due 9/1/46(h) | | | 3,161,602 | |
| | 1,000,000 | | | | | 3.000% due 10/1/46(h) | | | 1,035,703 | |
| | | | | | | | | | |
| | | | | | TOTAL MORTGAGE-BACKED SECURITIES
(Cost — $4,191,406) | | | 4,197,305 | |
| | | | | | | | | | |
| | | |
Notional
Amount†/
Number of
Contracts | | | | | | | | |
| PURCHASED OPTIONS—0.2% | |
| United Kingdom — 0.0% | |
| | 40 | GBP | | | | Option on 3-Month Sterling June Futures, Put @ $98.50, expires 6/21/2017, CSFB | | | — | |
| | | | | | | | | | |
| United States — 0.2% | |
| | 7,100,000 | | | | | 10-Year Swaption, 3-Month USD-LIBOR, Put @ 2.765%, expires 7/16/2018, JPM | | | 57,845 | |
| | 800,000 | | | | | 30-Year Swaption, 3-Month USD-LIBOR, Call @ 2.150%, expires 6/15/2018, DUB | | | 115,529 | |
| | 800,000 | | | | | 30-Year Swaption, 3-Month USD-LIBOR, Put @ 2.150%, expires 6/15/2018, DUB | | | 42,595 | |
| | 267 | | | | | Option on 3-Month Eurodollar December Futures, Put @ $99.00, expires 12/19/2016, CSFB | | | 36,712 | |
| | | | | | | | | | |
| | | | | | Total United States | | | 252,681 | |
| | | | | | | | | | |
| | | | | | TOTAL PURCHASED OPTIONS
(Cost — $261,109) | | | 252,681 | |
| | | | | | | | | | |
| | | | | | TOTAL INVESTMENTS BEFORE SHORT-TERM INVESTMENTS
(Cost — $216,131,293) | | | 221,085,087 | |
| | | | | | | | | | |
See Notes to Financial Statements.
236
| | | | | | | | | | |
| Inflation-Linked Fixed Income Fund | |
| | | |
Face
Amount† | | | | | Security | | Value | |
| SHORT-TERM INVESTMENTS — 0.6% | |
| TIME DEPOSITS — 0.3% | |
| | | | | | Banco Santander SA — Frankfurt: | | | | |
| | 39,268 | EUR | | | | (0.540%) due 9/1/16 | | $ | 43,808 | |
| $ | 385,953 | | | | | 0.150% due 9/1/16 | | | 385,953 | |
| | | | | | BBH — Grand Cayman: | | | | |
| | 4,585 | DKK | | | | (0.450%) due 9/1/16 | | | 687 | |
| | 13,053 | GBP | | | | 0.050% due 9/1/16 | | | 17,140 | |
| | 291 | AUD | | | | 0.689% due 9/1/16 | | | 219 | |
| | 2 | NZD | | | | 1.250% due 9/1/16 | | | 1 | |
| | 6,955,287 | JPY | | | | Sumitomo — Tokyo, (0.390)% due 9/1/16 | | | 67,217 | |
| | | | | | | | | | |
| | | | | | TOTAL TIME DEPOSITS
(Cost — $515,025) | | | 515,025 | |
| | | | | | | | | | |
| U.S. GOVERNMENT AGENCIES — 0.3% | |
| | | | | | Federal Home Loan Bank Discount Notes: | | | | |
| | 200,000 | | | | | 0.295% due 10/14/16(i) | | | 199,930 | |
| | 200,000 | | | | | 0.295% due 10/21/16(i) | | | 199,918 | |
| | | | | | | | | | |
| | | | | | TOTAL U.S. GOVERNMENT AGENCIES
(Cost — $399,848) | | | 399,848 | |
| | | | | | | | | | |
| | | | | | TOTAL SHORT-TERM INVESTMENTS
(Cost — $914,873) | | | 914,873 | |
| | | | | | | | | | |
| | | | | | TOTAL INVESTMENTS — 139.5%
(Cost — $217,046,166#) | | | 221,999,960 | |
| | | | | | | | | | |
| | | | | | Liabilities in Excess of Other Assets — (39.5)% | | | (62,812,262 | ) |
| | | | | | | | | | |
| | | | | | TOTAL NET ASSETS — 100.0% | | $ | 159,187,698 | |
| | | | | | | | | | |
| † | Face amount denominated in U.S. dollars, unless otherwise noted. |
| †† | All ratings are by Standard & Poor’s Rating Service, unless otherwise noted. All ratings are unaudited. |
| (a) | Position, or portion thereof, has been segregated to collateralize reverse repurchase agreement. |
| (b) | All or a portion of this security is held at the broker as collateral for open OTC derivative instruments. |
| (c) | Rating by Moody’s Investors Service. All ratings are unaudited. |
| (d) | Restricted security that may be sold to “qualified institutional buyers” pursuant to the conditions of Rule 144A under the Securities Act of 1933, as amended. This security has been deemed liquid pursuant to guidelines approved by the Board of Trustees, unless otherwise noted. |
| (e) | Variable rate security. Interest rate disclosed is that which was in effect at August 31, 2016. |
| (f) | Security is valued in good faith at fair value by or under the direction of the Board of Trustees. |
| (g) | Rating by Fitch Ratings Service. All ratings are unaudited. |
| (h) | This security is traded on a TBA basis (see Note 1). |
| (i) | Rate shown represents yield-to-maturity. |
| # | Aggregate cost for federal income tax purposes is $218,406,686. |
| | | | |
Abbreviations used in this schedule: |
| | OTC | | — Over the Counter |
| | PLC | | — Public Limited Company |
See Notes to Financial Statements.
237
| | | | | | |
| Inflation-Linked Fixed Income Fund |
| | | | |
| Summary of Investments by Security Type^ | | | |
U.S. Government Obligations | | | 84.1 | % |
Sovereign Bonds | | | 6.3 | |
Collateralized Mortgage Obligations | | | 4.5 | |
Corporate Bonds & Notes | | | 2.7 | |
Mortgage-Backed Securities | | | 1.9 | |
Purchased Options | | | 0.1 | |
Short-Term Investments | | | 0.4 | |
| | | | |
| | | 100.0 | % |
| | | | |
| ^ | As a percentage of total investments. |
Schedule of Options Contracts Written
| | | | | | | | | | | | | | | | | | | | |
| | | | | |
Notional
Amount/
Number of Contracts | | | Security Name | | Counterparty | | | Expiration Date | | | Strike Price | | | Value | |
| United Kingdom | | | | | | | | | |
| | 40 | GBP | | 3- Month Sterling June Futures, Put | | | CSFB | | | | 6/21/17 | | | $ | 98.00 | | | $ | — | |
| United States | | | | | | | | | |
| | 300,000 | EUR | | Markit iTraxx Europe Series 25 5-Year Index, Call | | | BCLY | | | | 9/21/16 | | | | 0.65 | | | | 159 | |
| | 680,000 | EUR | | OTC Euro versus U.S. Dollar, Call | | | JPM | | | | 9/15/16 | | | | 1.17 | | | | 39 | |
| | 780,000 | EUR | | OTC Euro versus U.S. Dollar, Put | | | SCB | | | | 11/16/16 | | | | 1.09 | | | | 6,061 | |
| | 301,000 | EUR | | OTC Euro versus U.S. Dollar, Call | | | JPM | | | | 11/16/16 | | | | 1.15 | | | | 1,652 | |
| | 400,000 | | | OTC U.S. Dollar versus Japanese Yen, Put | | | BNP | | | | 9/15/16 | | | JPY | 101.20 | | | | 853 | |
| | 250,000 | | | OTC U.S. Dollar versus Japanese Yen, Call | | | DUB | | | | 9/22/16 | | | JPY | 110.00 | | | | 152 | |
| | 650,000 | | | OTC U.S. Dollar versus Mexican Peso, Put | | | JPM | | | | 10/14/16 | | | MXN | 17.80 | | | | 1,124 | |
| | 8 | | | US Treasury 10-Year Note October Futures, Put | | | CSFB | | | | 9/23/16 | | | | 130.00 | | | | 2,500 | |
| | 8 | | | US Treasury 10-Year Note October Futures, Call | | | CSFB | | | | 9/23/16 | | | | 131.50 | | | | 3,000 | |
| | | | | | | | | | | | | | | | | | | | |
| | | | Total United States | | | | | | | | | | | | | | | 15,540 | |
| | | | | | | | | | | | | | | | | | | | |
| | | | TOTAL OPTIONS CONRACTS WRITTEN
(Premiums received — $33,665) | | | | | | | | | | | | | | $ | 15,540 | |
| | | | | | | | | | | | | | | | | | | | |
During the period ended August 31, 2016, options contracts written transactions for Inflation-Linked Fixed Income Fund was as follows:
| | | | | | | | |
| | | Notional Amounts/
Number of
Contracts | | | Premiums
Received | |
Options contracts written, outstanding at March 8, 2016* | | $ | — | | | $ | — | |
Options written | | | 13,921,114 | | | | 90,242 | |
Options closed | | | (2,320,058 | ) | | | (32,217 | ) |
Options expired | | | (8,240,000 | ) | | | (24,360 | ) |
| | | | | | | | |
Options contracts written, outstanding at August 31, 2016 | | $ | 3,361,056 | | | $ | 33,665 | |
| | | | | | | | |
See Notes to Financial Statements.
238
| | | | | | |
| Inflation-Linked Fixed Income Fund |
Schedule of Reverse Repurchase Agreements
| | | | | | | | |
| | |
Face
Amount | | | Security | | Value | |
| | | | Royal Bank of Scotland PLC: | | | | |
| $ | 5,649,750 | | | 0.610% due 10/12/16 | | $ | 5,649,750 | |
| | 3,258,875 | | | 0.610% due 10/13/16 | | | 3,258,875 | |
| | 837,000 | | | 0.610% due 10/14/16 | | | 837,000 | |
| | 1,678,000 | | | 0.640% due 10/17/16 | | | 1,678,000 | |
| | 618,000 | | | 0.650% due 10/17/16 | | | 618,000 | |
| | 2,415,000 | | | 0.610% due 10/18/16 | | | 2,415,000 | |
| | 14,175,000 | | | 0.650% due 10/24/16 | | | 14,175,000 | |
| | | | Merrill Lynch & Pierce, Fenner & Smith Inc.: | | | | |
| | 530,625 | | | 0.300% due 9/2/16 | | | 530,625 | |
| | 2,118,375 | | | 0.400% due 9/7/16 | | | 2,118,375 | |
| | 141,750 | | | 0.650% due 10/18/16 | | | 141,750 | |
| | 26,218,750 | | | 0.630% due 10/21/16 | | | 26,218,750 | |
| | | | | | | | |
| | | | TOTAL REVERSE REPURCHASE AGREEMENTS
(Proceeds — $57,641,125) | | $ | 57,641,125 | |
| | | | | | | | |
For the period ended August 31, 2016, the average borrowing and interest rate under the reverse repurchase agreements were $19,018,630 and 0.590%, respectively.
At August 31, 2016, Inflation-Linked Fixed Income Fund had open exchange traded futures contracts as described below.
The unrealized appreciation (depreciation) on the open contracts reflected in the accompanying financial statements were as follows:
| | | | | | | | | | | | | | | | |
| Open Futures Contracts | | Number of
Contracts | | | Expiration
Date
(Month/Year) | | | Market Value | | | Unrealized
Appreciation/
(Depreciation) | |
Contracts to Buy: | | | | | | | | | | | | | | | | |
90-Day Eurodollar December Futures | | | 40 | | | | 12/16 | | | $ | 9,905,000 | | | $ | (5,754 | ) |
Euro-Bund September Futures | | | 3 | | | | 9/16 | | | | 560,187 | | | | 5,009 | |
U.S. Treasury 10-Year Note December Futures | | | 19 | | | | 12/16 | | | | 2,487,516 | | | | 6,065 | |
| | | | | | | | | | | | | | | | |
| | | | | | | | | | | | | | | 5,320 | |
| | | | | | | | | | | | | | | | |
Contracts to Sell: | | | | | | | | | | | | | | | | |
90-Day Eurodollar December Futures | | | 53 | | | | 12/17 | | | | 13,101,600 | | | | 20,095 | |
Euro-Bobl September Futures | | | 23 | | | | 9/16 | | | | 3,427,759 | | | | (33,702 | ) |
Euro-BTP September Futures | | | 5 | | | | 9/16 | | | | 811,599 | | | | (6,839 | ) |
Euro-OAT September Futures | | | 2 | | | | 9/16 | | | | 359,870 | | | | (7,575 | ) |
U.S. Treasury 5-Year Note December Futures | | | 48 | | | | 12/16 | | | | 5,820,000 | | | | 11,625 | |
United Kingdom Treasury 10-Year GILT December Futures | | | 9 | | | | 12/16 | | | | 1,554,468 | | | | (2,784 | ) |
| | | | | | | | | | | | | | | | |
| | | | | | | | | | | | | | | (19,180 | ) |
| | | | | | | | | | | | | | | | |
Net Unrealized Depreciation on Open Exchange Traded Futures Contracts | | | | | | | | | | | | | | $ | (13,860 | ) |
| | | | | | | | | | | | | | | | |
At August 31, 2016, Inflation-Linked Fixed Income Fund had deposited cash of $138,000 with a broker or brokers as margin collateral on open exchange traded futures contracts.
See Notes to Financial Statements.
239
| | | | | | |
| Inflation-Linked Fixed Income Fund |
At August 31, 2016, Inflation-Linked Fixed Income Fund had open forward foreign currency contracts as described below.
The unrealized appreciation (depreciation) on the open contracts reflected in the accompanying financial statements were as follows:
| | | | | | | | | | | | | | | | | | | | |
| Foreign Currency | | Local Currency | | | Counterparty | | | Market Value | | | Settlement Date | | | Unrealized
Appreciation/
(Depreciation) | |
Contracts to Buy: | | | | | | | | | | | | | | | | | | | | |
Brazilian Real | | | 1,800,000 | | | | BNP | | | $ | 552,032 | | | | 10/4/16 | | | $ | 12,948 | |
Brazilian Real | | | 2,600,000 | | | | BNP | | | | 797,379 | | | | 10/4/16 | | | | 11,406 | |
Brazilian Real | | | 20,300,000 | | | | JPM | | | | 6,225,690 | | | | 10/4/16 | | | | 92,759 | |
Euro | | | 201,000 | | | | BNP | | | | 224,236 | | | | 9/2/16 | | | | 118 | |
Euro | | | 235,000 | | | | HSBC | | | | 262,166 | | | | 9/2/16 | | | | (719 | ) |
Indian Rupee | | | 53,328,000 | | | | BCLY | | | | 786,882 | | | | 11/10/16 | | | | (363 | ) |
Mexican Peso | | | 14,382,868 | | | | BNP | | | | 761,268 | | | | 10/20/16 | | | | (32,331 | ) |
| | | | | | | | | | | | | | | | | | | | |
| | | | | | | | | | | | | | | | | | | 83,818 | |
| | | | | | | | | | | | | | | | | | | | |
Contracts to Sell: | | | | | | | | | | | | | | | | | | | | |
Australian Dollar | | | 183,000 | | | | JPM | | | | 137,534 | | | | 9/2/16 | | | | 3,486 | |
Brazilian Real | | | 24,700,000 | | | | BNP | | | | 7,575,100 | | | | 10/4/16 | | | | (898,522 | ) |
Brazilian Real | | | 2,800,000 | | | | BNP | | | | 814,419 | | | | 4/4/17 | | | | (11,137 | ) |
Brazilian Real | | | 1,900,000 | | | | BNP | | | | 552,641 | | | | 4/4/17 | | | | (12,454 | ) |
Brazilian Real | | | 21,600,000 | | | | JPM | | | | 6,282,660 | | | | 4/4/17 | | | | (91,509 | ) |
British Pound | | | 877,000 | | | | JPM | | | | 1,153,431 | | | | 11/14/16 | | | | (13,602 | ) |
British Pound | | | 467,000 | | | | SCB | | | | 614,199 | | | | 11/14/16 | | | | (7,239 | ) |
Danish Krone | | | 1,730,000 | | | | HSBC | | | | 259,679 | | | | 10/3/16 | | | | (2,828 | ) |
Danish Krone | | | 1,010,000 | | | | BNP | | | | 152,249 | | | | 1/3/17 | | | | 2,356 | |
Euro | | | 6,338,000 | | | | BNP | | | | 7,070,670 | | | | 9/2/16 | | | | (37,936 | ) |
Euro | | | 5,902,000 | | | | BNP | | | | 6,593,736 | | | | 10/4/16 | | | | 5,379 | |
Japanese Yen | | | 32,000,000 | | | | JPM | | | | 309,253 | | | | 9/2/16 | | | | 3,614 | |
| | | | | | | | | | | | | | | | | | | | |
| | | | | | | | | | | | | | | | | | | (1,060,392 | ) |
| | | | | | | | | | | | | | | | | | | | |
Net Unrealized Depreciation on Open Forward Foreign Currency Contracts | | | | | | | | | | | | | | | | | | $ | (976,574 | ) |
| | | | | | | | | | | | | | | | | | | | |
At August 31, 2016, Inflation-Linked Fixed Income Fund held the following Centrally Cleared Interest Rate Swap Contracts:
| | | | | | | | | | | | | | | | | | | | | | |
Pay/Receive
Floating Rate | | Floating Rate Index | | Fixed
Rate | | | Maturity
Date | | | Counterparty | | | Notional
Amount | | | Unrealized
(Depreciation) | |
| Receive | | 6-Month JPY-LIBOR | | | 1.500% | | | | 12/21/2045 | | | | CSFB | | | JPY | 45,000,000 | | | $ | (23,260 | ) |
| Receive | | 3-Month USD-LIBOR | | | 1.750% | | | | 12/21/2026 | | | | CSFB | | | USD | 2,000,000 | | | | (21,114 | ) |
| Receive | | 3-Month USD-LIBOR | | | 2.500% | | | | 02/22/2026 | | | | CSFB | | | USD | 32,200,000 | | | | (711,950 | ) |
| Receive | | 6-Month GBP-LIBOR | | | 1.750% | | | | 03/15/2047 | | | | CSFB | | | GBP | 50,000 | | | | (5,690 | ) |
| | | | | | | | | | | | | | | | | | | | | | |
| | | | | | | | | | | | | | | | | | | | $ | (762,014 | ) |
| | | | | | | | | | | | | | | | | | | | | | |
See Notes to Financial Statements.
240
| | | | | | |
| Inflation-Linked Fixed Income Fund |
At August 31, 2016, Inflation-Linked Fixed Income Fund held the following OTC Inflation Rate Swap Contracts:
| | | | | | | | | | | | | | | | | | | | | | | | | | | | | | |
Pay/Receive
Floating Rate | | Floating Rate Index | | Fixed
Rate | | | Maturity
Date | | | Counterparty | | | Notional
Amount | | | Market Value | | | Upfront
Premiums
Paid/
(Received) | | | Unrealized
Appreciation/
(Depreciation) | |
| Pay | | 2-Year EUR Inflation Linked | | | 0.830% | | | | 05/15/2018 | | | | DUB | | | EUR | 1,100,000 | | | $ | (2,589 | ) | | $ | — | | | $ | (2,589 | ) |
| Receive | | 5-Year EUR Inflation Linked | | | 0.806% | | | | 04/15/2021 | | | | BNP | | | EUR | 1,000,000 | | | | 1,896 | | | | — | | | | 1,896 | |
| Receive | | 5-Year EUR Inflation Linked | | | 0.875% | | | | 05/15/2021 | | | | DUB | | | EUR | 800,000 | | | | (100 | ) | | | — | | | | (100 | ) |
| Receive | | 10-Year EUR Inflation Linked | | | 1.090% | | | | 06/15/2026 | | | | BNP | | | EUR | 100,000 | | | | (419 | ) | | | 33 | | | | (452 | ) |
| Receive | | 10-Year EUR Inflation Linked | | | 1.090% | | | | 06/15/2026 | | | | DUB | | | EUR | 100,000 | | | | (419 | ) | | | (191 | ) | | | (228 | ) |
| Receive | | 10-Year EUR Inflation Linked | | | 1.114% | | | | 08/15/2026 | | | | BNP | | | EUR | 400,000 | | | | 148 | | | | — | | | | 148 | |
| Pay | | 10-Year EUR Inflation Linked | | | 1.178% | | | | 05/15/2026 | | | | DUB | | | EUR | 200,000 | | | | 2,541 | | | | (61 | ) | | | 2,602 | |
| Receive | | 15-Year GBP Inflation Linked | | | 3.140% | | | | 07/15/2031 | | | | DUB | | | GBP | 2,900,000 | | | | (56,708 | ) | | | 72,457 | | | | (129,165 | ) |
| Receive | | 1-Year USD Inflation Linked | | | 1.550% | | | | 01/15/2017 | | | | JPM | | | USD | 3,000,000 | | | | 2,716 | | | | — | | | | 2,716 | |
| Pay | | 5-Year USD Inflation Linked | | | 1.550% | | | | 07/26/2021 | | | | JPM | | | USD | 400,000 | | | | 302 | | | | — | | | | 302 | |
| Pay | | 10-Year USD Inflation Linked | | | 1.730% | | | | 07/26/2026 | | | | JPM | | | USD | 400,000 | | | | (1,329 | ) | | | — | | | | (1,329 | ) |
| Receive | | 10-Year USD Inflation Linked | | | 1.762% | | | | 08/30/2026 | | | | JPM | | | USD | 1,500,000 | | | | 3,014 | | | | — | | | | 3,014 | |
| | | | | | | | | | | | | | | | | | | | | | | | | | | | | | |
| | | | | | | | | | | | | | | | | | | | $ | (50,947 | ) | | $ | 72,238 | | | $ | (123,185 | ) |
| | | | | | | | | | | | | | | | | | | | | | | | | | | | | | |
At August 31, 2016, Inflation-Linked Fixed Income Fund held the following OTC and Centrally Cleared Credit Default Swap Contracts:
OTC Credit Default Swaps on Corporate and Sovereign Issues — Sell Protection (1)
| | | | | | | | | | | | | | | | | | | | | | | | | | | | | | | | |
| Reference Obligation | | Fixed Deal
Received Rate | | | Maturity
Date | | | Counterparty | | | Implied Credit
Spread at
8/31/16 (2) | | | Notional
Amount (3) | | | Market
Value | | | Upfront
Premiums
(Received) | | | Unrealized
Appreciation | |
Brazil Government International Bond, BB | | | 1.000% | | | | 06/20/2021 | | | | DUB | | | | 2.553% | | | | USD 100,000 | | | $ | (6,751 | ) | | $ | (8,609 | ) | | $ | 1,858 | |
Brazil Government International Bond, BB | | | 1.000% | | | | 06/20/2021 | | | | HSBC | | | | 2.553% | | | | USD 800,000 | | | | (54,014 | ) | | | (55,500 | ) | | | 1,486 | |
Mexico Government International Bond, BBB+ | | | 1.000% | | | | 06/20/2021 | | | | DUB | | | | 1.360% | | | | USD 200,000 | | | | (2,903 | ) | | | (4,828 | ) | | | 1,925 | |
Russian Foreign Bond — Eurobond, BB+ | | | 1.000% | | | | 06/20/2021 | | | | JPM | | | | 2.173% | | | | USD 100,000 | | | | (5,103 | ) | | | (6,134 | ) | | | 1,031 | |
| | | | | | | | | | | | | | | | | | | | | | | | | | | | | | | | |
| | | | | | | | | | | | | | | | | | | | | | $ | (68,771 | ) | | $ | (75,071 | ) | | $ | 6,300 | |
| | | | | | | | | | | | | | | | | | | | | | | | | | | | | | | | |
Centrally Cleared — Credit Default Swaps on Indexes — Buy Protection (4)
| | | | | | | | | | | | | | | | | | | | | | | | |
| Reference Obligation | | Fixed Deal
(Pay) Rate | | | Maturity
Date | | | Counterparty | | | Implied Credit
Spread at
8/31/16 (2) | | | Notional
Amount (3) | | | Unrealized
(Depreciation) | |
CDX.IG-26 5-Year Index | | | (1.000% | ) | | | 06/20/2021 | | | | CSFB | | | | 0.000% | | | | USD 1,000,000 | | | $ | (2,630 | ) |
| | | | | | | | | | | | | | | | | | | | | | | | |
| (1) | If the Fund is a seller of protection and a credit event occurs, as defined under the terms of that particular swap agreement, the Fund will either (i) pay to the buyer of protection an amount equal to the notional amount of the swap and take delivery of the referenced obligation or underlying securities comprising the referenced index or (ii) pay a net settlement amount in the form of cash or securities equal to the notional amount of the swap less the recovery value of the referenced obligation or underlying securities comprising the referenced index. |
See Notes to Financial Statements.
241
| | | | | | |
| Inflation-Linked Fixed Income Fund |
| (2) | Implied credit spreads, represented in absolute terms, utilized in determining the market value of credit default swap agreements on corporate issues or sovereign issues of an emerging country as of period end serve as an indicator of the current status of the payment/performance risk and represent the likelihood or risk of default for the credit derivative. The implied credit spread of a particular referenced entity reflects the cost of buying/selling protection and may include upfront payments required to be made to enter into the agreement. Wider credit spreads represent a deterioration of the referenced entity’s credit soundness and a greater likelihood or risk of default or other credit event occurring as defined under the terms of the agreement. A credit spread identified as ‘‘Defaulted’’ indicates a credit event has occurred for the referenced entity or obligation. |
| (3) | The maximum potential amount the Fund could be required to make as a seller of credit protection or receive as a buyer of credit protection if a credit event occurs as defined under the terms of that particular swap agreement. |
| (4) | If the Fund is a buyer of protection and a credit event occurs, as defined under the terms of that particular swap agreement, the Fund will either (i) receive from the seller of protection an amount equal to the notional amount of the swap and deliver the reference obligation or underlying securities comprising the referenced index or (ii) receive a net settlement amount in the form of cash or securities equal to the notional amount of the swap less the recovery value of the reference obligation or underlying securities comprising the referenced index. |
At August 31, 2016, Inflation-Linked Fixed Income Fund deposited cash collateral with brokers in the amount of $802,000 for open centrally cleared swap contracts.
At August 31, 2016, Inflation-Linked Fixed Income Fund had cash collateral from brokers in the amount of $360,000 for open OTC swap contracts.
| | | | | | |
Currency Abbreviations used in this schedule: | | Counterparty Abbreviations used in this schedule: |
| AUD | | — Australian Dollar | | BCLY | | — Barclays Bank PLC |
| BRL | | — Brazilian Real | | BNP | | — BNP Paribas SA |
| DKK | | — Danish Krone | | CITI | | — Citigroup Global Markets Inc. |
| EUR | | — Euro | | CSFB | | — Credit Suisse Securities (USA) LLC |
| GBP | | — British Pound | | DUB | | — Deutsche Bank AG |
| JPY | | — Japanese Yen | | HSBC | | — HSBC Bank USA |
| MXN | | — Mexican Peso | | JPM | | — JPMorgan Chase & Co. |
| NZD | | — New Zealand Dollar | | SCB | | — Standard Chartered Bank |
| | | | | | |
See pages 250 and 251 for definitions of ratings.
See Notes to Financial Statements.
242
| | | | | | | | | | |
| Ultra-Short Term Fixed Income Fund | |
| | | |
Face
Amount/Units† | | | Rating†† | | Security | | Value | |
| CORPORATE BONDS & NOTES — 68.6% | |
| Airlines — 0.9% | |
| $ | 474,356 | | | BBB+ | | Northwest Airlines Inc. Class G-2 Pass Through Trust, Series 2002-1, Pass Thru Certificates, 6.264% due 11/20/21 | | $ | 515,839 | |
| | 958,809 | | | A | | UAL Pass Through Trust, Series 2009-2A, Pass Thru Certificates, 9.750% due 1/15/17 | | | 986,374 | |
| | | | | | | | | �� | |
| | | | | | Total Airlines | | | 1,502,213 | |
| | | | | | | | | | |
| Automobiles — 1.5% | |
| | 1,500,000 | | | A- | | Aviation Capital Group Corp., Senior Unsecured Notes, 4.625% due 1/31/18(a)(b) | | | 1,561,875 | |
| | 900,000 | | | BBB- | | Penske Truck Leasing Co. LP/PTL Finance Corp., Senior Unsecured Notes, 3.750% due 5/11/17(a) | | | 913,975 | |
| | | | | | | | | | |
| | | | | | Total Automobiles | | | 2,475,850 | |
| | | | | | | | | | |
| Banks — 20.5% | |
| | 1,000,000 | | | A- | | American Express Centurion Bank, Senior Unsecured Notes, 5.950% due 6/12/17 | | | 1,036,133 | |
| | | | | | Bank of America Corp., Senior Unsecured Notes: | | | | |
| | 1,300,000 | | | BBB+ | | 6.875% due 4/25/18 | | | 1,409,811 | |
| | 1,000,000 | | | BBB+ | | 5.650% due 5/1/18 | | | 1,064,930 | |
| | 2,500,000 | | | Aaa(c) | | Bank of Nova Scotia (The), Covered Notes, 1.950% due 1/30/17(a) | | | 2,510,735 | |
| | 400,000 | | | AAA | | Bank of Scotland PLC, Covered Notes, 5.250% due 2/21/17 | | | 408,070 | |
| | 2,500,000 | | | A | | BPCE SA, Company Guaranteed Notes, 1.252% due 6/23/17(d) | | | 2,504,280 | |
| | | | | | CIT Group Inc., Senior Unsecured Notes: | | | | |
| | 200,000 | | | BB+ | | 4.250% due 8/15/17 | | | 204,000 | |
| | 800,000 | | | BB+ | | 5.250% due 3/15/18 | | | 836,000 | |
| | 800,000 | | | BB+ | | 5.500% due 2/15/19(a) | | | 849,000 | |
| | | | | | Credit Suisse AG, Senior Unsecured Notes: | | | | |
| | 2,000,000 | | | A | | 1.442% due 1/29/18(d) | | | 2,002,852 | |
| | 1,250,000 | | | A | | 1.700% due 4/27/18 | | | 1,251,201 | |
| | 2,600,000 | | | AA | | Dexia Credit Local SA, Government Liquid Guaranteed Notes, 1.242% due 3/23/18(a)(d) | | | 2,607,101 | |
| | 300,000 | | | A | | HSBC Holdings PLC, Senior Unsecured Notes, 2.901% due 3/8/21(d) | | | 313,901 | |
| | 2,000,000 | | | A | | HSBC USA Inc., Senior Unsecured Notes, 1.700% due 3/5/18 | | | 2,003,010 | |
| | 500,000 | | | A | | ING Bank NV, Senior Unsecured Notes, 1.777% due 3/22/19(a)(d) | | | 507,471 | |
| | 1,500,000 | | | BBB- | | Intesa Sanpaolo SpA, Company Guaranteed Notes, 2.375% due 1/13/17 | | | 1,502,919 | |
| | | | | | Lloyds Bank PLC, Company Guaranteed Notes: | | | | |
| | 200,000 | | | A | | 1.175% due 3/16/18(d) | | | 199,592 | |
| | 1,250,000 | | | A | | 1.750% due 5/14/18 | | | 1,249,715 | |
| | 1,400,000 | | | BBB- | | Rabobank Capital Funding Trust III, Company Guaranteed Notes, 5.254% (a)(d)(e) | | | 1,401,148 | |
| | 19,000,000 | DKK | | AAA | | Realkredit Danmark AS, Covered Notes, 2.000% due 1/1/17 | | | 2,870,220 | |
| | 800,000 | | | BB+ | | Royal Bank of Scotland PLC (The), Subordinated Notes, 9.500% due 3/16/22(d) | | | 830,199 | |
| | 2,800,000 | | | BBB+ | | Santander Holdings USA Inc., Senior Unsecured Notes, 2.275% due 11/24/17(d) | | | 2,817,730 | |
| | 1,400,000 | | | A+ | | Shinhan Bank, Senior Unsecured Notes, 4.375% due 7/27/17(a) | | | 1,437,090 | |
| | 1,300,000 | | | A+ | | Suncorp-Metway Ltd., Senior Unsecured Notes, 1.700% due 3/28/17(a) | | | 1,303,199 | |
| | 200,000 | | | A+ | | UBS AG, Senior Unsecured Notes, 1.340% due 3/26/18(d) | | | 200,694 | |
| | | | | | | | | | |
| | | | | | Total Banks | | | 33,321,001 | |
| | | | | | | | | | |
| Beverages — 0.6% | |
| | 1,000,000 | | | A- | | SABMiller Holdings Inc., Company Guaranteed Notes, 1.447% due 8/1/18(a)(b)(d) | | | 1,000,124 | |
| | | | | | | | | | |
| Building Products — 0.9% | |
| | 1,400,000 | | | B+ | | USG Corp., Senior Unsecured Notes, 9.500% due 1/15/18 | | | 1,540,000 | |
| | | | | | | | | | |
| Capital Market — 2.0% | |
| | 2,285,000 | | | BBB+ | | Goldman Sachs Group Inc. (The), Senior Unsecured Notes, 1.853% due 9/15/20(d) | | | 2,310,279 | |
| | 1,000,000 | | | A- | | UBS Group Funding Jersey Ltd., Company Guaranteed Notes, 2.453% due 4/14/21(a)(d) | | | 1,016,242 | |
| | | | | | | | | | |
| | | | | | Total Capital Market | | | 3,326,521 | |
| | | | | | | | | | |
| Commercial Services & Supplies — 0.5% | |
| | 800,000 | | | BBB+ | | ERAC USA Finance LLC, Company Guaranteed Notes, 6.375% due 10/15/17(a) | | | 841,649 | |
| | | | | | | | | | |
See Notes to Financial Statements.
243
| | | | | | | | | | |
| Ultra-Short Term Fixed Income Fund | |
| | | |
Face
Amount/Units† | | | Rating†† | | Security | | Value | |
| Consumer Finance — 9.5% | |
| $ | 100,000 | | | BB+ | | Ally Financial Inc., Senior Unsecured Notes, 2.750% due 1/30/17 | | $ | 100,150 | |
| | | | | | Daimler Finance North America LLC, Company Guaranteed Notes: | | | | |
| | 1,900,000 | | | A- | | 1.375% due 8/1/17(a) | | | 1,904,385 | |
| | 1,000,000 | | | A- | | 1.469% due 8/3/17(a)(d) | | | 1,003,494 | |
| | | | | | Ford Motor Credit Co. LLC, Senior Unsecured Notes: | | | | |
| | 800,000 | | | BBB | | 1.270% due 3/27/17(d) | | | 800,622 | |
| | 1,420,000 | | | BBB | | 1.181% due 9/8/17(d) | | | 1,418,137 | |
| | 900,000 | | | BBB | | 2.375% due 1/16/18 | | | 909,008 | |
| | | | | | General Motors Financial Co., Inc., Company Guaranteed Notes: | | | | |
| | 1,400,000 | | | BBB- | | 4.750% due 8/15/17 | | | 1,442,685 | |
| | 1,500,000 | | | BBB- | | 6.750% due 6/1/18 | | | 1,624,528 | |
| | 1,300,000 | | | A- | | Hyundai Capital Services Inc., Senior Unsecured Notes, 3.500% due 9/13/17(a) | | | 1,327,343 | |
| | | | | | Nissan Motor Acceptance Corp., Senior Unsecured Notes: | | | | |
| | 2,000,000 | | | A- | | 1.456% due 4/6/18(a)(d) | | | 1,999,840 | |
| | 350,000 | | | A- | | 1.671% due 3/8/19(a)(d) | | | 351,552 | |
| | 1,000,000 | | | BBB | | RCI Banque SA, Senior Unsecured Notes, 3.500% due 4/3/18(a) | | | 1,028,892 | |
| | 1,000,000 | | | BBB+ | | Volkswagen Group of America Finance LLC, Company Guaranteed Notes, 1.187% due 5/23/17(a)(d) | | | 997,835 | |
| | 500,000 | | | BBB+ | | Volkswagen International Finance NV, Company Guaranteed Notes, 1.241% due 11/18/16(a)(d) | | | 499,945 | |
| | | | | | | | | | |
| | | | | | Total Consumer Finance | | | 15,408,416 | |
| | | | | | | | | | |
| Diversified Financial Services — 8.3% | |
| | 1,250,000 | | | A- | | American Express Credit Corp., Senior Unsecured Notes, 1.558% due 11/5/18(d) | | | 1,258,539 | |
| | | | | | Bear Stearns Cos. LLC (The), Company Guaranteed Notes: | | | | |
| | 1,100,000 | | | A- | | 6.400% due 10/2/17 | | | 1,158,998 | |
| | 500,000 | | | A- | | 7.250% due 2/1/18 | | | 540,086 | |
| | 90,000 | | | A3(c) | | 4.650% due 7/2/18 | | | 95,066 | |
| | 2,100,000 | | | BBB+ | | Citigroup Inc., Senior Unsecured Notes, 2.031% due 10/26/20(d) | | | 2,114,049 | |
| | | | | | International Lease Finance Corp.: | | | | |
| | 600,000 | | | BBB- | | Senior Secured Notes, 7.125% due 9/1/18(a) | | | 661,554 | |
| | | | | | Senior Unsecured Notes: | | | | |
| | 500,000 | | | BBB- | | 8.750% due 3/15/17 | | | 518,800 | |
| | 400,000 | | | BBB- | | 6.250% due 5/15/19 | | | 436,280 | |
| | | | | | LeasePlan Corp. NV, Senior Unsecured Notes: | | | | |
| | 800,000 | | | BBB- | | 3.000% due 10/23/17(a) | | | 807,749 | |
| | 200,000 | | | BBB- | | 2.500% due 5/16/18(a) | | | 201,043 | |
| | 2,300,000 | | | BBB | | Macquarie Group Ltd., Senior Unsecured Notes, 1.759% due 1/31/17(a)(d) | | | 2,303,142 | |
| | 1,200,000 | | | NR | | Mitsubishi UFJ Lease & Finance Co., Ltd., Senior Unsecured Notes, 1.736% due 2/20/19(d) | | | 1,197,886 | |
| | | | | | Navient Corp., Senior Unsecured Notes: | | | | |
| | 500,000 | | | BB- | | 6.000% due 1/25/17 | | | 507,990 | |
| | 700,000 | | | BB- | | 5.500% due 1/15/19 | | | 721,000 | |
| | 900,000 | | | BBB+ | | Nomura Holdings Inc., Senior Unsecured Notes, 2.000% due 9/13/16 | | | 902,900 | |
| | | | | | | | | | |
| | | | | | Total Diversified Financial Services | | | 13,425,082 | |
| | | | | | | | | | |
| Diversified Telecommunication Services — 1.4% | |
| | 800,000 | | | BBB+ | | AT&T Inc., Senior Unsecured Notes, 1.561% due 6/30/20(d) | | | 807,954 | |
| | 1,400,000 | | | BBB | | Telefonica Emisiones SAU, Company Guaranteed Notes, 6.221% due 7/3/17 | | | 1,455,194 | |
| | | | | | | | | | |
| | | | | | Total Diversified Telecommunication Services | | | 2,263,148 | |
| | | | | | | | | | |
| Electric Utilities — 2.8% | |
| | 1,400,000 | | | A- | | Abu Dhabi National Energy Co. PJSC, Senior Unsecured Notes, 5.875% due 10/27/16 | | | 1,433,600 | |
| | 1,650,000 | | | BBB | | Appalachian Power Co., Senior Unsecured Notes, 5.000% due 6/1/17 | | | 1,693,509 | |
| | 1,300,000 | | | BBB | | CMS Energy Corp., Senior Unsecured Notes, 6.550% due 7/17/17 | | | 1,358,761 | |
| | | | | | | | | | |
| | | | | | Total Electric Utilities | | | 4,485,870 | |
| | | | | | | | | | |
See Notes to Financial Statements.
244
| | | | | | | | | | |
| Ultra-Short Term Fixed Income Fund | |
| | | |
Face
Amount/Units† | | | Rating†† | | Security | | Value | |
| Energy Equipment & Services — 1.8% | |
| $ | 400,000 | | | BBB- | | Energy Transfer Partners LP, Senior Unsecured Notes, 6.125% due 2/15/17 | | $ | 408,103 | |
| | 1,000,000 | | | BBB- | | Hiland Partners LP/Hiland Partners Finance Corp., Company Guaranteed Notes, 7.250% due 10/1/20(a) | | | 1,037,500 | |
| | 1,400,000 | | | BBB | | Plains All American Pipeline LP/PAA Finance Corp., Senior Unsecured Notes, 6.125% due 1/15/17 | | | 1,423,068 | |
| | | | | | | | | | |
| | | | | | Total Energy Equipment & Services | | | 2,868,671 | |
| | | | | | | | | | |
| Health Care Providers & Services — 0.9% | |
| | 1,500,000 | | | A | | Anthem Inc., Senior Unsecured Notes, 2.375% due 2/15/17 | | | 1,507,219 | |
| | | | | | | | | | |
| Hotels, Restaurants & Leisure — 1.5% | |
| | 800,000 | | | BB- | | MGM Resorts International, Company Guaranteed Notes, 8.625% due 2/1/19 | | | 909,000 | |
| | 1,500,000 | | | BBB- | | Wyndham Worldwide Corp., Senior Unsecured Notes, 2.950% due 3/1/17 | | | 1,508,586 | |
| | | | | | | | | | |
| | | | | | Total Hotels, Restaurants & Leisure | | | 2,417,586 | |
| | | | | | | | | | |
| Insurance — 0.8% | | | | |
| | | | | | American International Group Inc., Senior Unsecured Notes: | | | | |
| | 700,000 | | | A- | | 6.400% due 12/15/20 | | | 824,861 | |
| | 500,000 | | | A- | | 3.300% due 3/1/21 | | | 525,440 | |
| | | | | | | | | | |
| | | | | | Total Insurance | | | 1,350,301 | |
| | | | | | | | | | |
| Media — 1.9% | | | | |
| | 1,400,000 | | | BBB | | Time Warner Cable Inc., Senior Secured Notes, 6.750% due 7/1/18 | | | 1,526,685 | |
| | 1,500,000 | | | BBB- | | Viacom, Inc., Senior Unsecured Notes, 2.200% due 4/1/19 | | | 1,505,866 | |
| | | | | | | | | | |
| | | | | | Total Media | | | 3,032,551 | |
| | | | | | | | | | |
| Metals & Mining — 0.4% | | | | |
| | 700,000 | | | BBB+ | | Goldcorp Inc., Senior Unsecured Notes, 2.125% due 3/15/18 | | | 702,203 | |
| | | | | | | | | | |
| Oil, Gas & Consumable Fuels — 8.0% | | | | |
| | 1,500,000 | | | A- | | BP Capital Markets PLC, Company Guaranteed Notes, 1.317% due 5/10/18(d) | | | 1,506,495 | |
| | 1,800,000 | | | A+ | | CNOOC Nexen Finance 2014 ULC, Company Guaranteed Notes, 1.625% due 4/30/17 | | | 1,803,280 | |
| | | | | | ConocoPhillips, Company Guaranteed Notes: | | | | |
| | 1,000,000 | | | A- | | 5.750% due 2/1/19 | | | 1,094,526 | |
| | 1,000,000 | | | A- | | 1.717% due 5/15/22(d) | | | 977,533 | |
| | 1,000,000 | | | BBB- | | Kinder Morgan Inc., Company Guaranteed Notes, 7.000% due 6/15/17 | | | 1,038,168 | |
| | 1,600,000 | | | BBB+ | | National Grid North America Inc., Senior Unsecured Notes, 1.451% due 8/21/17(d) | | | 1,596,307 | |
| | 1,200,000 | | | BBB+ | | Petroleos Mexicanos, Company Guaranteed Notes, 5.750% due 3/1/18 | | | 1,264,200 | |
| | 1,400,000 | | | BBB- | | Pioneer Natural Resources Co., Senior Unsecured Notes, 6.650% due 3/15/17 | | | 1,431,815 | |
| | 800,000 | | | AA- | | Schlumberger Investment SA, Company Guaranteed Notes, 1.950% due 9/14/16(a) | | | 802,152 | |
| | 400,000 | | | BBB- | | Southern Natural Gas Co. LLC, Company Guaranteed Notes, 5.900% due 4/1/17(a) | | | 410,154 | |
| | 1,100,000 | | | A+ | | Statoil ASA, Company Guaranteed Notes, 0.992% due 11/9/17(d) | | | 1,100,264 | |
| | | | | | | | | | |
| | | | | | Total Oil, Gas & Consumable Fuels | | | 13,024,894 | |
| | | | | | | | | | |
| Pharmaceuticals — 2.2% | |
| | 2,200,000 | | | BBB | | Actavis Funding SCS, Company Guaranteed Notes, 1.850% due 3/1/17 | | | 2,206,052 | |
| | 1,300,000 | | | BBB- | | Baxalta Inc., Company Guaranteed Notes, 1.427% due 6/22/18(d) | | | 1,295,600 | |
| | | | | | | | | | |
| | | | | | Total Pharmaceuticals | | | 3,501,652 | |
| | | | | | | | | | |
| Technology Hardware, Storage & Peripherals — 0.8% | |
| | 1,200,000 | | | BBB- | | Diamond 1 Finance Corp./Diamond 2 Finance Corp., Senior Secured Notes, 3.480% due 6/1/19(a) | | | 1,235,614 | |
| | | | | | | | | | |
| Tobacco — 0.8% | |
| | 1,300,000 | | | BBB | | Reynolds American Inc., Company Guaranteed Notes, 2.300% due 6/12/18 | | | 1,321,003 | |
| | | | | | | | | | |
| Transportation Infrastructure — 0.3% | |
| | 400,000 | | | BBB- | | Asciano Finance Ltd., Company Guaranteed Notes, 5.000% due 4/7/18(a)(b) | | | 414,041 | |
| | | | | | | | | | |
See Notes to Financial Statements.
245
| | | | | | | | | | |
| Ultra-Short Term Fixed Income Fund | |
| | | |
Face
Amount/Units† | | | Rating†† | | Security | | Value | |
| Wireless Telecommunication Services — 0.3% | |
| $ | 500,000 | | | B | | Sprint Communications Inc., Senior Unsecured Notes, 8.375% due 8/15/17 | | $ | 522,005 | |
| | | | | | | | | | |
| | | | | | TOTAL CORPORATE BONDS & NOTES
(Cost — $110,961,373) | | | 111,487,614 | |
| | | | | | | | | | |
| COLLATERALIZED MORTGAGE OBLIGATIONS — 17.2% | |
| | 179,144 | | | AAA | | American Home Mortgage Investment Trust, Series 2004-4, Class 2A1, 1.104% due 2/25/45(d) | | | 176,392 | |
| | 770,048 | | | AAA | | AMMC CLO X Ltd., Series 2012-10A, Class A, 2.155% due 4/11/22(a)(d) | | | 772,421 | |
| | 1,200,000 | | | (P)AAA | | Ares XXV CLO Ltd., Series 2012-3A, Class AR, 1.835% due 1/17/24(a)(b)(d) | | | 1,200,000 | |
| | 1,000,000 | | | AAA | | BAMLL Commercial Mortgage Securities Trust, Series 2015-ASHF, Class A, 1.728% due 1/15/28(a)(d) | | | 1,001,302 | |
| | 1,596,019 | | | AA+ | | Bear Stearns ALT-A Trust, Series 2004-10, Class 2A1, 1.184% due 9/25/34(d) | | | 1,528,495 | |
| | 777,937 | | | AAA | | CD Commercial Mortgage Trust, Series 2007-CD4, Class A1A, 5.289% due 12/11/49(d) | | | 784,820 | |
| | 1,300,000 | | | A+ | | Citigroup Commercial Mortgage Trust, Series 2007-C6, Class A4FL, 0.808%
due 12/10/49(a)(d) | | | 1,288,581 | |
| | 399,305 | | | Aaa(c) | | Colony Starwood Homes Trust, Series 2016-1A, Class A, 2.007% due 7/17/33(a)(d) | | | 401,975 | |
| | 555,618 | | | Aa2(c) | | Credit Suisse Commercial Mortgage Trust, Series 2007-C1, Class A1A, 5.361% due 2/15/40 | | | 558,981 | |
| | 700,000 | | | A | | Eagle I Ltd., Series 2014-1A, Class A1, 2.570% due 12/15/39(a)(b) | | | 692,782 | |
| | 1,137,835 | | | AAA | | Flatiron CLO Ltd., Series 2011-1A, Class A, 2.230% due 1/15/23(a)(d) | | | 1,139,503 | |
| | 457,242 | | | AAA | | FNBA Mortgage Loan Trust, Series 2004-AR1, Class A2, 0.914% due 8/19/34(d) | | | 446,334 | |
| | 1,000,000 | | | AAA | | Fortress Credit BSL Ltd., Series 2013-1A, Class A, 1.868% due 1/19/25(a)(d) | | | 997,174 | |
| | 500,000 | | | NR | | GCAT LLC, Series 2016-1, Class A1, step bond to yield, 4.500% due 3/25/21(a) | | | 503,377 | |
| | 2,958,328 | | | NR | | Government National Mortgage Association (GNMA), Series 2016-H06, Class FD, 1.388% due 7/20/65(d) | | | 2,982,650 | |
| | 400,000 | | | AAA | | JMP Credit Advisors CLO II Ltd., Series 2013-1A, Class A, 1.860% due 4/30/23(a)(b)(d) | | | 399,084 | |
| | 1,024,652 | | | AA+ | | JP Morgan Chase Commercial Mortgage Securities Trust, Series 2007-CB18, Class A4, 5.440% due 6/12/47 | | | 1,032,186 | |
| | 1,118,119 | | | A | | Morgan Stanley Capital I Trust, Series 2007-IQ14, Class A1A, 5.665% due 4/15/49(d)(h) | | | 1,138,622 | |
| | 1,500,000 | | | AAA | | Neuberger Berman CLO XII Ltd., Series 2012-12A, Class A2RR, 1.931% due 7/25/23(a)(d) | | | 1,499,367 | |
| | 800,000 | | | AAA | | Palmer Square Loan Funding Ltd., Series 2016-2A, Class A1, 1.980% due 6/21/24(a)(d) | | | 800,033 | |
| | 1,182,038 | | | AAA | | RBSSP Resecuritization Trust, Series 2009-12, Class 16A1, 2.670% due 10/25/35(a)(d) | | | 1,195,524 | |
| | 1,289,065 | | | AAA | | Telos CLO Ltd., Series 2016-7A, Class A, 2.329% due 4/17/25(a)(d) | | | 1,292,301 | |
| | 925,299 | | | NR | | Vericrest Opportunity Loan Trust, Series 2016-NPL3, Class A1, step bond to yield, 4.250% due 3/26/46(a) | | | 937,315 | |
| | 1,500,000 | | | NR | | VOLT XLVIII LLC, Series 2016-NPL8, Class A1, step bond to yield, 3.500% due 7/25/46(a) | | | 1,502,649 | |
| | | | | | Wachovia Bank Commercial Mortgage Trust: | | | | |
| | 811,360 | | | AAA | | Series 2007-C31, Class A4, 5.509% due 4/15/47 | | | 820,391 | |
| | 1,300,000 | | | A+ | | Series 2007-C32, Class A4FL, 0.682% due 6/15/49(a)(d) | | | 1,284,078 | |
| | 1,653,997 | | | AA | | WaMu Mortgage Pass Through Certificates Trust, Series 2005-AR13, Class A1A1, 0.814% due 10/25/45(d) | | | 1,575,374 | |
| | | | | | | | | | |
| | | | | | TOTAL COLLATERALIZED MORTGAGE OBLIGATIONS
(Cost — $27,828,224) | | | 27,951,711 | |
| | | | | | | | | | |
| U.S. GOVERNMENT OBLIGATION — 6.8% | |
| | 10,910,368 | | | | | U.S. Treasury Inflation Indexed Notes, 0.125% due 4/15/20
(Cost — $11,142,395) | | | 11,020,792 | |
| | | | | | | | | | |
| SOVEREIGN BONDS — 5.4% | |
| Japan — 1.9% | |
| | 3,000,000 | | | A+ | | Japan Finance Organization for Municipalities, 2.500% due 9/12/18(a) | | | 3,053,679 | |
| | | | | | | | | | |
| South Korea — 3.5% | |
| | 3,000,000 | | | AA | | Export-Import Bank of Korea, 1.423% due 1/14/17(d) | | | 3,004,464 | |
| | 1,400,000 | | | AA | | Korea Development Bank (The), 2.250% due 8/7/17 | | | 1,410,927 | |
| | 1,300,000 | | | AA | | Korea Land & Housing Corp., 1.875% due 8/2/17(a) | | | 1,305,135 | |
| | | | | | | | | | |
| | | | | | Total South Korea | | | 5,720,526 | |
| | | | | | | | | | |
| | | | | | TOTAL SOVEREIGN BONDS
(Cost — $8,782,695) | | | 8,774,205 | |
| | | | | | | | | | |
See Notes to Financial Statements.
246
| | | | | | | | | | |
| Ultra-Short Term Fixed Income Fund | |
| | | |
Face
Amount/Units† | | | Rating†† | | Security | | Value | |
| SENIOR LOAN — 0.7% | |
| $ | 1,200,000 | | | NR | | Energy Future Intermediate Holding Co. LLC, 4.250% due 12/19/16
(Cost — $1,200,000) | | $ | 1,206,450 | |
| | | | | | | | | | |
| CERTIFICATE OF DEPOSIT — 0.6% | |
| | 1,000,000 | | | | | Sumitomo Mitsui Banking Corp.(d)
(Cost — $997,460) | | | 993,500 | |
| | | | | | | | | | |
| ASSET-BACKED SECURITY — 0.3% | |
| Student Loans — 0.3% | |
| | 400,000 | | | Aaa(c) | | Navient Student Loan Trust, Series 2016-5A, Class A, 1.737% due 6/25/65
(Cost — $400,000)(a)(d) | | | 400,499 | |
| | | | | | | | | | |
| | | | | | TOTAL INVESTMENTS BEFORE SHORT-TERM INVESTMENTS
(Cost — $161,312,147) | | | 161,834,771 | |
| | | | | | | | | | |
| | | |
Face
Amount† | | | | | | | | |
| SHORT-TERM INVESTMENTS — 12.1% | |
| COMMERCIAL PAPER — 1.7% | |
| | 500,000 | | | | | Eni Finance USA Inc., 1.730% due 7/14/17(f) | | | 492,539 | |
| | 1,300,000 | | | | | Thermo Fisher Scientific Inc., 1.556% due 10/11/16(f) | | | 1,297,761 | |
| | 1,000,000 | | | | | Thomson Reuters Corp., 1.052% due 10/17/16(f) | | | 998,658 | |
| | | | | | | | | | |
| | | | | | TOTAL COMMERCIAL PAPER
(Cost — $2,788,958) | | | 2,788,958 | |
| | | | | | | | | | |
| REPURCHASE AGREEMENT — 1.2% | |
| $ | 1,900,000 | | | | | Nomura Securities Fixed Income repurchase agreement dated 8/31/16, 0.540% due 9/1/16, Proceeds at maturity - $1,900,029; (Fully collateralized by U.S. Treasury Note, 1.175%, due 1/31/23; Market Valued - $1,938,138)(f)
(Cost — $1,900,000) | | | 1,900,000 | |
| | | | | | | | | | |
| TIME DEPOSITS — 0.4% | |
| | | | | | BBH — Grand Cayman: | | | | |
| | 4,643 | DKK | | | | (0.450%) due 9/1/16 | | | 696 | |
| | 39,018 | JPY | | | | (0.390%) due 9/1/16 | | | 377 | |
| | 610 | CAD | | | | 0.050% due 9/1/16 | | | 465 | |
| | 324 | AUD | | | | 0.689% due 9/1/16 | | | 243 | |
| | | | | | BNP Paribas — Paris: | | | | |
| | 68,483 | EUR | | | | (0.540%) due 9/1/16 | | | 76,400 | |
| | 503,425 | | | | | 0.150% due 9/1/16 | | | 503,425 | |
| | | | | | | | | | |
| | | | | | TOTAL TIME DEPOSITS
(Cost — $581,606) | | | 581,606 | |
| | | | | | | | | | |
| U.S. GOVERNMENT OBLIGATIONS — 8.8% | |
| | | | | | U.S. Treasury Bills: | | | | |
| | 31,000 | | | | | 0.301% due 10/13/16(f)(g) | | | 30,989 | |
| | 14,300,000 | | | | | 0.264% due 11/3/16(f) | | | 14,293,399 | |
| | | | | | | | | | |
| | | | | | TOTAL U.S. GOVERNMENT OBLIGATIONS
(Cost — $14,324,388) | | | 14,324,388 | |
| | | | | | | | | | |
| | | | | | TOTAL SHORT-TERM INVESTMENTS
(Cost — $19,594,952) | | | 19,594,952 | |
| | | | | | | | | | |
| | | | | | TOTAL INVESTMENTS — 111.7%
(Cost — $180,907,099#) | | | 181,429,723 | |
| | | | | | | | | | |
| | | | | | Liabilities in Excess of Other Assets — (11.7)% | | | (18,975,991 | ) |
| | | | | | | | | | |
| | | | | | TOTAL NET ASSETS — 100.0% | | $ | 162,453,732 | |
| | | | | | | | | | |
See Notes to Financial Statements.
247
| | | | | | |
| Ultra-Short Term Fixed Income Fund |
| † | Face amount denominated in U.S. dollars, unless otherwise noted. |
| †† | All ratings are by Standard & Poor’s Rating Service, unless otherwise noted. All ratings are unaudited. |
| (a) | Restricted security that may be sold to “qualified institutional buyers” pursuant to the conditions of Rule 144A under the Securities Act of 1933, as amended. This security has been deemed liquid pursuant to guidelines approved by the Board of Trustees, unless otherwise noted. |
| (c) | Rating by Moody’s Investors Service. All ratings are unaudited. |
| (d) | Variable rate security. Interest rate disclosed is that which was in effect at August 31, 2016. |
| (e) | Security is perpetual in nature and has no stated maturity date. |
| (f) | Rate shown represents yield-to-maturity. |
| (g) | All or a portion of this security is held at the broker as collateral for open OTC derivative instruments. |
| (h) | Affiliated security (See Note 2). |
| # | Aggregate cost for federal income tax purposes is $181,246,695. |
| | |
Abbreviations used in this schedule: |
| CLO | | — Collateralized Loan Obligation |
| OTC | | — Over The Counter |
| PLC | | — Public Limited Company |
| | | | |
| Summary of Investments by Security Type^ | |
Corporate Bonds & Notes | | | 61.5 | % |
Collateralized Mortgage Obligations | | | 15.4 | |
U.S. Government Obligations | | | 6.1 | |
Sovereign Bonds | | | 4.8 | |
Senior Loans | | | 0.7 | |
Certificate of Deposits | | | 0.5 | |
Asset-Backed Securities | | | 0.2 | |
Short-Term Investments | | | 10.8 | |
| | | | |
| | | 100.0 | % |
| | | | |
| ^ | As a percentage of total investments. |
At August 31, 2016, Ultra-Short Term Fixed Income Fund had open exchange traded futures contracts as described below.
The unrealized appreciation (depreciation) on the open contracts reflected in the accompanying financial statements were as follows:
| | | | | | | | | | | | | | | | |
| Open Futures Contracts | | Number of
Contracts | | | Expiration
Date
(Month/Year) | | | Market Value | | | Unrealized
Appreciation/
(Depreciation) | |
Contracts to Sell: | | | | | | | | | | | | | | | | |
90-Day Eurodollar December Futures | | | 191 | | | | 12/19 | | | $ | 47,093,438 | | | $ | (89,689 | ) |
90-Day Eurodollar March Futures | | | 118 | | | | 3/18 | | | | 29,162,225 | | | | 41,300 | |
90-Day Eurodollar March Futures | | | 50 | | | | 3/19 | | | | 12,341,250 | | | | (53,125 | ) |
U.S. Treasury 5-Year Note December Futures | | | 135 | | | | 12/16 | | | | 16,368,750 | | | | 32,695 | |
| | | | | | | | | | | | | | | | |
| | | | | | | | | | | | | | $ | (68,819 | ) |
| | | | | | | | | | | | | | | | |
At August 31, 2016, Ultra-Short Term Fixed Income Fund had deposited cash of $325,000 with a broker or brokers as margin collateral on open exchange traded futures contracts.
See Notes to Financial Statements.
248
| | | | | | |
| Ultra-Short Term Fixed Income Fund |
At August 31, 2016, Ultra-Short Term Fixed Income Fund had open forward foreign currency contracts as described below.
The unrealized appreciation (depreciation) on the open contracts reflected in the accompanying financial statements were as follows:
| | | | | | | | | | | | | | | | | | | | |
| Foreign Currency | | Local Currency | | | Counterparty | | | Market Value | | | Settlement Date | | | Unrealized
Appreciation/
(Depreciation) | |
Contracts to Buy: | | | | | | | | | | | | | | | | | | | | |
Canadian Dollar | | | 944,000 | | | | SCB | | | $ | 719,924 | | | | 9/2/16 | | | $ | (4,590 | ) |
| | | | | | | | | | | | | | | | | | | | |
Contracts to Sell: | | | | | | | | | | | | | | | | | | | | |
Australian Dollar | | | 3,254,000 | | | | JPM | | | | 2,445,543 | | | | 9/2/16 | | | | 61,993 | |
Australian Dollar | | | 841,000 | | | | JPM | | | | 632,053 | | | | 9/2/16 | | | | 17,353 | |
Canadian Dollar | | | 4,123,000 | | | | JPM | | | | 3,144,328 | | | | 9/2/16 | | | | (13,932 | ) |
Canadian Dollar | | | 3,179,000 | | | | SCB | | | | 2,424,822 | | | | 10/4/16 | | | | 1,706 | |
Danish Krone | | | 400,000 | | | | HSBC | | | | 60,297 | | | | 1/3/17 | | | | 1,106 | |
Danish Krone | | | 19,000,000 | | | | HSBC | | | | 2,864,099 | | | | 1/3/17 | | | | (7,983 | ) |
Euro | | | 3,699,000 | | | | BNP | | | | 4,126,603 | | | | 9/2/16 | | | | (22,141 | ) |
Euro | | | 3,699,000 | | | | BNP | | | | 4,132,536 | | | | 10/4/16 | | | | 3,371 | |
Japanese Yen | | | 3,700,000 | | | | JPM | | | | 35,757 | | | | 9/2/16 | | | | 418 | |
| | | | | | | | | | | | | | | | | | | | |
| | | | | | | | | | | | | | | | | | | 41,891 | |
| | | | | | | | | | | | | | | | | | | | |
Net Unrealized Appreciation on Open Forward Foreign Currency Contracts | | | | | | | | | | | | | | | | | | $ | 37,301 | |
| | | | | | | | | | | | | | | | | | | | |
| | | | | | |
Currency Abbreviations used in this schedule: | | Counterparty Abbreviations used in this schedule: |
AUD | | — Australian Dollar | | BNP | | — BNP Paribas SA |
CAD | | — Canadian Dollar | | HSBC | | — HSBC Bank USA |
DKK | | — Danish Krone | | JPM | | — JPMorgan Chase & Co. |
EUR | | — Euro | | SCB | | — Standard Chartered Bank |
JPY | | — Japanese Yen | | | | |
See pages 250 and 251 for definitions of ratings.
See Notes to Financial Statements.
249
The definitions of the applicable rating symbols are set forth below:
Standard & Poor’s Ratings Service (“Standard & Poor’s”) — Ratings from “AA” to “CCC” may be modified by the addition of a plus (+) or minus (-) sign to show relative standings within the major rating categories.
| | |
| AAA | | — Bonds rated “AAA” have the highest rating assigned by Standard & Poor’s. Capacity to pay interest and repay principal is extremely strong. |
| AA | | — Bonds rated “AA” have a very strong capacity to pay interest and repay principal and differ from the highest rated issues only in a small degree. |
| A | | — Bonds rated “A” have a strong capacity to pay interest and repay principal although they are somewhat more susceptible to the adverse effects of changes in circumstances and economic conditions than debt in higher rated categories. |
| BBB | | — Bonds rated “BBB” are regarded as having an adequate capacity to pay interest and repay principal. Whereas they normally exhibit adequate protection parameters, adverse economic conditions or changing circumstances are more likely to lead to a weakened capacity to pay interest and repay principal for bonds in this category than in higher rated categories. |
| BB, B, CCC, CC and C | | — Bonds rated “BB”, “B”, “CCC”, “CC” and “C” are regarded, on balance, as predominantly speculative with respect to capacity to pay interest and repay principal in accordance with the terms of the obligation. “BB” represents the lowest degree of speculation and “C” the highest degree of speculation. While such bonds will likely have some quality and protective characteristics, these are outweighed by large uncertainties or major risk exposures to adverse conditions. |
| D | | — Bonds rated “D” are in default and payment of interest and/or repayment of principal is in arrears. |
| P | | — Preliminary rating. |
| u | | — The upgrade state defines bonds that have recently been upgraded into higher rating categories. |
Moody’s Investors Service (“Moody’s”) — Numerical modifiers 1, 2 and 3 may be applied to each generic rating from “Aa” to “Caa,” where 1 is the highest and 3 the lowest ranking within its generic category.
| | |
| Aaa | | — Bonds rated “Aaa” are judged to be of the best quality. They carry the smallest degree of investment risk and are generally referred to as “gilt edge.” Interest payments are protected by a large or by an exceptionally stable margin and principal is secure. While the various protective elements are likely to change, such changes as can be visualized are most unlikely to impair the fundamentally strong position of such issues. |
| Aa | | — Bonds rated “Aa” are judged to be of high quality by all standards. Together with the “Aaa” group they comprise what are generally known as high grade bonds. They are rated lower than the best bonds because margins of protection may not be as large as in “Aaa” securities or fluctuation of protective elements may be of greater amplitude or there may be other elements present which make the long-term risks appear somewhat larger than in “Aaa” securities. |
| A | | — Bonds rated “A” possess many favorable investment attributes and are to be considered as upper medium grade obligations. Factors giving security to principal and interest are considered adequate but elements may be present which suggest a susceptibility to impairment some time in the future. |
| Baa | | — Bonds rated “Baa” are considered as medium grade obligations, i.e., they are neither highly protected nor poorly secured. Interest payments and principal security appear adequate for the present but certain protective elements may be lacking or may be characteristically unreliable over any great length of time. Such bonds lack outstanding investment characteristics and in fact have speculative characteristics as well. |
| Ba | | — Bonds rated “Ba” are judged to have speculative elements; their future cannot be considered as well assured. Often the protection of interest and principal payments may be very moderate and therefore not well safeguarded during both good and bad times over the future. Uncertainty of position characterizes bonds in this class. |
| B | | — Bonds rated “B” generally lack characteristics of desirable investments. Assurance of interest and principal payments or of maintenance of other terms of the contract over any long period of time may be small. |
| Caa | | — Bonds rated “Caa” are of poor standing. These may be in default, or present elements of danger may exist with respect to principal or interest. |
| Ca | | — Bonds rated “Ca” represent obligations which are speculative in a high degree. Such issues are often in default or have other marked short-comings. |
| C | | — Bonds rated “C” are the lowest class of bonds and issues so rated can be regarded as having extremely poor prospects of ever attaining any real investment standing. |
| e | | — Expected. |
| u | | — Upgraded |
Fitch Ratings Service (“Fitch”) — Ratings from “AA” to “CCC” may be modified by the addition of a plus (+) or minus (-) sign to show relative standings within the major rating categories.
| | |
| AAA | | — Bonds rated “AAA” have the highest rating assigned by Fitch. Capacity to pay interest and repay principal is extremely strong. |
| AAApre | | — Stable Outlook rating is based on the pledge of securities in the escrow deposit fund securing the bonds and reflects the lien of the refunded bondholders on the escrow trust funds and that all amounts have been invested in direct non-callable obligations of the United States. |
| AA | | — Bonds rated “AA” have a very strong capacity to pay interest and repay principal and differ from the highest rated issues only in a small degree. |
| A | | — Bonds rated “A” have a strong capacity to pay interest and repay principal although they are somewhat more susceptible to the adverse effects of changes in circumstances and economic conditions than debt in higher rated categories. |
| BBB | | — Bonds rated “BBB” are regarded as having an adequate capacity to pay interest and repay principal. Whereas they normally exhibit adequate protection parameters, adverse economic conditions or changing circumstances are more likely to lead to a weakened capacity to pay interest and repay principal for bonds in this category than in higher rated categories. |
250
| | |
| BB, B, CCC, CC and C | | — Bonds rated “BB”, “B”, “CCC”, “CC” and “C” are regarded, on balance, as predominantly speculative with respect to capacity to pay interest and repay principal in accordance with the terms of the obligation. “BB” represents a lower degree of speculation than “B”, and “CC” the highest degree of speculation. While such bonds will likely have some quality and protective characteristics, these are outweighed by large uncertainties or major risk exposures to adverse conditions. |
| D | | — Bonds rated “D” are in default and payment of interest and/or repayment of principal is in arrears. |
| NR | | — Indicates that the bond is not rated by Standard & Poor’s, Moody’s, or Fitch. |
| WD | | — Indicates that the bonds rating has been withdrawn and the issuer is no longer rated by Standard & Poor’s, Moody’s or Fitch. |
Short-Term Security Ratings
| | |
| SP-1 | | — Standard & Poor’s highest rating indicating very strong or strong capacity to pay principal and interest; those issues determined to possess overwhelming safety characteristics are denoted with a plus (+) sign. |
| A-1 | | — Standard & Poor’s highest commercial paper and variable-rate demand obligation (VRDO) rating indicating that the degree of safety regarding timely payment is either overwhelming or very strong; those issues determined to possess overwhelming safety characteristics are denoted with a plus (+) sign. |
| VMIG 1 | | — Moody’s highest rating for issues having a demand feature — VRDO. |
| MIG1 | | — Moody’s highest rating for short-term municipal obligations. |
| P-1 | | — Moody’s highest rating for commercial paper and for VRDO prior to the advent of the VMIG 1 rating. |
| F-1 | | — Fitch’s highest rating indicating the strongest capacity for timely payment of financial commitments; those issues determined to possess overwhelming strong credit feature are denoted with a plus (+) sign. |
251
| | |
| | | |
| Statements of Assets and Liabilities | | |
| | | | | | | | | | | | | | | | |
| | |
Large Cap
Equity
Fund | | | Small-Mid
Cap Equity
Fund | | | International
Equity
Fund | | | | |
| ASSETS: | | | | | | | | | | | | | | | | |
Unaffiliated investments, at value1,3 | | $ | 1,710,678,332 | | | $ | 489,234,515 | | | $ | 1,124,054,461 | | | | | |
Affiliated investments, at value2 | | | 1,843,290 | | | | — | | | | — | | | | | |
Foreign currency, at value4 | | | — | | | | 12,348 | | | | 197,019 | | | | | |
Cash | | | 6,957,753 | | | | 2,358,366 | | | | 69,334 | | | | | |
Receivable for securities sold | | | 10,039,997 | | | | 5,493,376 | | | | 682,135 | | | | | |
Dividends and interest receivable from unaffiliated investments | | | 2,987,458 | | | | 368,969 | | | | 4,269,306 | | | | | |
Dividends and interest receivable from affiliated investments | | | — | | | | — | | | | — | | | | | |
Receivable for Fund shares sold | | | 3,027,004 | | | | 1,145,674 | | | | 2,791,085 | | | | | |
Unrealized appreciation on open forward foreign currency contracts (Note 1) | | | — | | | | — | | | | — | | | | | |
Variation margin on open future contracts (Note 1) | | | — | | | | — | | | | — | | | | | |
Variation margin on open swap contracts (Note 1) | | | — | | | | — | | | | — | | | | | |
Swap contracts, at value (Note 1) | | | — | | | | — | | | | — | | | | | |
Deposits with counterparty | | | — | | | | — | | | | — | | | | | |
Foreign capital gains tax receivable | | | — | | | | — | | | | — | | | | | |
Prepaid expenses | | | 37,618 | | | | 22,608 | | | | 30,139 | | | | | |
Organizational expenses | | | — | | | | — | | | | — | | | | | |
Other assets | | | — | | | | — | | | | — | | | | | |
| | | | | | | | | | | | | | | | |
Total Assets | | | 1,735,571,452 | | | | 498,635,856 | | | | 1,132,093,479 | | | | | |
| | | | | | | | | | | | | | | | |
| LIABILITIES: | | | | | | | | | | | | | | | | |
Payable for reverse repurchase agreements | | | — | | | | — | | | | — | | | | | |
Payable for collateral received from securities on loan | | | 17,790,848 | | | | 18,447,756 | | | | 4,174,893 | | | | | |
Payable for Fund shares repurchased | | | 4,697,628 | | | | 1,341,543 | | | | 3,370,063 | | | | | |
Payable for securities purchased | | | 2,776,675 | | | | 3,313,233 | | | | 1,193,426 | | | | | |
Investment management fee payable | | | 568,732 | | | | 201,854 | | | | 555,535 | | | | | |
Transfer agent fees payable | | | 77,263 | | | | 16,153 | | | | 54,930 | | | | | |
Interest expense payable | | | — | | | | — | | | | — | | | | | |
Custody fee payable | | | 212,826 | | | | 51,037 | | | | 295,283 | | | | | |
Trustees’ fees payable | | | 4,503 | | | | 411 | | | | 2,724 | | | | | |
Variation margin on open future contracts (Note 1) | | | — | | | | — | | | | — | | | | | |
Due to custodian4 | | | — | | | | — | | | | — | | | | | |
Forward sale commitments, at value5 (Note 1) | | | — | | | | — | | | | — | | | | | |
Options contracts written, at value6 (Note 1) | | | — | | | | — | | | | — | | | | | |
Swap contracts, at value (Note 1) | | | — | | | �� | — | | | | — | | | | | |
Unrealized depreciation on open forward foreign currency contracts (Note 1) | | | — | | | | — | | | | — | | | | | |
Deposits from counterparty | | | — | | | | — | | | | — | | | | | |
Foreign capital gains tax payable | | | — | | | | — | | | | 28,227 | | | | | |
Distributions payable | | | — | | | | — | | | | — | | | | | |
Accrued expenses | | | 57,056 | | | | 71,912 | | | | 75,374 | | | | | |
Other liabilities | | | — | | | | — | | | | — | | | | | |
| | | | | | | | | | | | | | | | |
Total Liabilities | | | 26,185,531 | | | | 23,443,899 | | | | 9,750,455 | | | | | |
| | | | | | | | | | | | | | | | |
| Total Net Assets | | $ | 1,709,385,921 | | | $ | 475,191,957 | | | $ | 1,122,343,024 | | | | | |
| | | | | | | | | | | | | | | | |
| NET ASSETS: | | | | | | | | | | | | | | | | |
Par value (Note 4) | | $ | 100,207 | | | $ | 27,306 | | | $ | 103,603 | | | | | |
Paid-in capital in excess of par value | | | 1,341,901,623 | | | | 415,336,243 | | | | 1,374,935,964 | | | | | |
Undistributed net investment income | | | 14,971,956 | | | | 723,744 | | | | 25,314,228 | | | | | |
Accumulated net realized gain (loss) on investments, futures contracts, options contracts written, forward sale commitments, swap contracts and foreign currency transactions | | | (12,440,149 | ) | | | (1,725,730 | ) | | | (329,936,552 | ) | | | | |
Net unrealized appreciation (depreciation) on investments, futures contracts, options contracts written, forward sale commitments, swap contracts and foreign currency transactions | | | 364,852,284 | | | | 60,830,394 | | | | 51,925,781 | | | | | |
| | | | | | | | | | | | | | | | |
| Total Net Assets | | $ | 1,709,385,921 | | | $ | 475,191,957 | | | $ | 1,122,343,024 | | | | | |
| | | | | | | | | | | | | | | | |
| Shares Outstanding | | | 100,207,243 | | | | 27,305,829 | | | | 103,603,425 | | | | | |
| | | | | | | | | | | | | | | | |
| Net Asset Value | | $ | 17.06 | | | $ | 17.40 | | | $ | 10.83 | | | | | |
| | | | | | | | | | | | | | | | |
| 1 Unaffiliated investments, at cost | | $ | 1,346,280,316 | | | $ | 428,404,046 | | | $ | 1,072,022,031 | | | | | |
| | | | | | | | | | | | | | | | |
| 2 Affiliated investments, at cost | | $ | 1,389,022 | | | $ | — | | | $ | — | | | | | |
| | | | | | | | | | | | | | | | |
| 3 Includes securities on loan | | $ | 17,248,178 | | | $ | 17,872,527 | | | $ | 3,917,121 | | | | | |
| | | | | | | | | | | | | | | | |
| 4 Foreign currency/Due to custodian, at cost | | $ | — | | | $ | 12,424 | | | $ | 199,606 | | | | | |
| | | | | | | | | | | | | | | | |
| 5 Proceeds | | $ | — | | | $ | — | | | $ | — | | | | | |
| | | | | | | | | | | | | | | | |
| 6 Premiums received | | $ | — | | | $ | — | | | $ | — | | | | | |
| | | | | | | | | | | | | | | | |
See Notes to Financial Statements.
252
| | | | | | | | | | | | | | | | | | | | | | | | | | | | | | |
| | | | Emerging
Markets
Equity
Fund | | | Core Fixed
Income
Fund | | | High Yield
Fund | | | International
Fixed
Income
Fund | | | Municipal
Bond
Fund | | | Inflation-Linked
Fixed Income
Fund | | | Ultra-Short Term
Fixed Income
Fund | |
| | | | | | | | | | | | | | | | | | | | | | | | | | | | | | |
| | | | $ | 431,363,307 | | | $ | 777,984,436 | | | $ | 334,282,756 | | | $ | 229,626,420 | | | $ | 68,820,050 | | | $ | 221,999,960 | | | $ | 180,291,101 | |
| | | | | — | | | | 1,535,520 | | | | — | | | | — | | | | — | | | | — | | | | 1,138,622 | |
| | | | | 929,886 | | | | 571,312 | | | | — | | | | 56,778 | | | | — | | | | 9,843 | | | | — | |
| | | | | 2,402 | | | | 2,152 | | | | — | | | | 3,410 | | | | 382 | | | | 688,107 | | | | 1,052,611 | |
| | | | | 1,141,018 | | | | 34,546,683 | | | | 1,731,967 | | | | 52,225,480 | | | | — | | | | 4,445,760 | | | | 1,905,164 | |
| | | | | 474,050 | | | | 3,964,272 | | | | 5,869,913 | | | | 1,323,411 | | | | 621,986 | | | | 406,560 | | | | 1,002,299 | |
| | | | | — | | | | 2,963 | | | | — | | | | — | | | | — | | | | — | | | | 5,278 | |
| | | | | 883,034 | | | | 2,569,765 | | | | 849,748 | | | | 360,351 | | | | 174,107 | | | | 769,262 | | | | 768,054 | |
| | | | | — | | | | 199,247 | | | | — | | | | 1,664,139 | | | | — | | | | 132,066 | | | | 85,947 | |
| | | | | 43,972 | | | | 133,660 | | | | — | | | | — | | | | — | | | | 162 | | | | — | |
| | | | | — | | | | 23,840 | | | | — | | | | 229,810 | | | | — | | | | 135,992 | | | | 90,354 | |
| | | | | — | | | | — | | | | — | | | | 613,469 | | | | — | | | | 10,617 | | | | — | |
| | | | | — | | | | 1,174,741 | | | | — | | | | 3,421,000 | | | | — | | | | 940,000 | | | | 325,000 | |
| | | | | 127,446 | | | | — | | | | — | | | | — | | | | — | | | | — | | | | — | |
| | | | | 18,109 | | | | 24,494 | | | | 15,260 | | | | 16,754 | | | | 13,661 | | | | — | | | | — | |
| | | | | — | | | | — | | | | — | | | | — | | | | — | | | | 52,453 | | | | 51,140 | |
| | | | | — | | | | — | | | | — | | | | — | | | | — | | | | 3,230 | | | | 1,753 | |
| | | | | | | | | | | | | | | | | | | | | | | | | | | | | | |
| | | | | 434,983,224 | | | | 822,733,085 | | | | 342,749,644 | | | | 289,541,022 | | | | 69,630,186 | | | | 229,594,012 | | | | 186,717,323 | |
| | | | | | | | | | | | | | | | | | | | | | | | | | | | | | |
| | | | | | | | | | | | | | | | | | | | | | | | | | | | | | |
| | | | | — | | | | — | | | | — | | | | 16,608,550 | | | | — | | | | 57,641,125 | | | | — | |
| | | | | 3,683,541 | | | | 20,555,472 | | | | 13,683,734 | | | | 557,865 | | | | — | | | | — | | | | — | |
| | | | | 1,195,815 | | | | 1,563,785 | | | | 866,670 | | | | 375,669 | | | | 327,772 | | | | 552,477 | | | | 358,059 | |
| | | | | 1,517,226 | | | | 72,874,500 | | | | 3,148,342 | | | | 69,298,611 | | | | — | | | | 10,414,002 | | | | 23,720,663 | |
| | | | | 218,111 | | | | 242,372 | | | | 141,335 | | | | 74,237 | | | | 24,758 | | | | 64,219 | | | | 65,849 | |
| | | | | 14,223 | | | | 31,492 | | | | 5,537 | | | | 7,054 | | | | 2,469 | | | | — | | | | — | |
| | | | | — | | | | — | | | | — | | | | 3,673 | | | | — | | | | 32,090 | | | | — | |
| | | | | 185,463 | | | | 265,904 | | | | 84,016 | | | | 137,953 | | | | 39,120 | | | | 81,799 | | | | 64,134 | |
| | | | | 561 | | | | 23,162 | | | | 4,459 | | | | 510 | | | | 2,514 | | | | 298 | | | | 275 | |
| | | | | — | | | | — | | | | — | | | | 21,811 | | | | — | | | | — | | | | 1,197 | |
| | | | | — | | | | — | | | | 2,449 | | | | — | | | | — | | | | — | | | | 23 | |
| | | | | — | | | | 4,736,777 | | | | — | | | | 5,416,992 | | | | — | | | | — | | | | — | |
| | | | | — | | | | 49,938 | | | | — | | | | 271,144 | | | | — | | | | 15,540 | | | | — | |
| | | | | — | | | | — | | | | — | | | | 1,668,940 | | | | — | | | | 130,335 | | | | — | |
| | | | | — | | | | 228,474 | | | | — | | | | 2,839,967 | | | | — | | | | 1,108,640 | | | | 48,646 | |
| | | | | — | | | | — | | | | — | | | | 550,000 | | | | — | | | | 360,000 | | | | — | |
| | | | | — | | | | — | | | | — | | | | — | | | | — | | | | — | | | | — | |
| | | | | — | | | | 3,295 | | | | 2,997 | | | | — | | | | 227 | | | | 2,231 | | | | 852 | |
| | | | | 114,408 | | | | 59,920 | | | | 27,900 | | | | 35,429 | | | | 21,216 | | | | — | | | | 3,893 | |
| | | | | — | | | | — | | | | — | | | | — | | | | — | | | | 3,558 | | | | — | |
| | | | | | | | | | | | | | | | | | | | | | | | | | | | | | |
| | | | | 6,929,348 | | | | 100,635,091 | | | | 17,967,439 | | | | 97,868,405 | | | | 418,076 | | | | 70,406,314 | | | | 24,263,591 | |
| | | | | | | | | | | | | | | | | | | | | | | | | | | | | | |
| | | | $ | 428,053,876 | | | $ | 722,097,994 | | | $ | 324,782,205 | | | $ | 191,672,617 | | | $ | 69,212,110 | | | $ | 159,187,698 | | | $ | 162,453,732 | |
| | | | | | | | | | | | | | | | | | | | | | | | | | | | | | |
| | | | | | | | | | | | | | | | | | | | | | | | | | | | | | |
| | | | $ | 34,630 | | | $ | 85,821 | | | $ | 85,966 | | | $ | 24,599 | | | $ | 6,972 | | | $ | 15,560 | | | $ | 16,244 | |
| | | | | 460,807,379 | | | | 704,073,662 | | | | 368,213,518 | | | | 194,929,453 | | | | 61,127,763 | | | | 156,461,818 | | | | 162,419,628 | |
| | | | | 3,798,997 | | | | 19,773 | | | | 1,054,862 | | | | 3,221,895 | | | | 441,601 | | | | 952,322 | | | | 211,814 | |
| | | | | (68,482,585 | ) | | | 1,051,165 | | | | (48,436,856 | ) | | | (7,559,908 | ) | | | 1,664,296 | | | | (1,340,422 | ) | | | (679,754 | ) |
| | | | | 31,895,455 | | | | 16,867,573 | | | | 3,864,715 | | | | 1,056,578 | | | | 5,971,478 | | | | 3,098,420 | | | | 485,800 | |
| | | | | | | | | | | | | | | | | | | | | | | | | | | | | | |
| | | | $ | 428,053,876 | | | $ | 722,097,994 | | | $ | 324,782,205 | | | $ | 191,672,617 | | | $ | 69,212,110 | | | $ | 159,187,698 | | | $ | 162,453,732 | |
| | | | | | | | | | | | | | | | | | | | | | | | | | | | | | |
| | | | | 34,629,729 | | | | 85,821,441 | | | | 85,965,952 | | | | 24,598,661 | | | | 6,971,699 | | | | 15,560,346 | | | | 16,243,634 | |
| | | | | | | | | | | | | | | | | | | | | | | | | | | | | | |
| | | | $ | 12.36 | | | $ | 8.41 | | | $ | 3.78 | | | $ | 7.79 | | | $ | 9.93 | | | $ | 10.23 | | | $ | 10.00 | |
| | | | | | | | | | | | | | | | | | | | | | | | | | | | | | |
| | | | $ | 399,447,686 | | | $ | 760,203,103 | | | $ | 330,418,041 | | | $ | 225,149,403 | | | $ | 62,848,572 | | | $ | 217,046,166 | | | $ | 179,757,489 | |
| | | | | | | | | | | | | | | | | | | | | | | | | | | | | | |
| | | | $ | — | | | $ | 1,474,537 | | | $ | — | | | $ | — | | | $ | — | | | $ | — | | | $ | 1,149,610 | |
| | | | | | | | | | | | | | | | | | | | | | | | | | | | | | |
| | | | $ | 3,491,623 | | | $ | 20,108,393 | | | $ | 13,202,348 | | | $ | 529,502 | | | $ | — | | | $ | — | | | $ | — | |
| | | | | | | | | | | | | | | | | | | | | | | | | | | | | | |
| | | | $ | 952,577 | | | $ | 585,665 | | | $ | — | | | $ | 59,352 | | | $ | — | | | $ | 12,181 | | | $ | 107 | |
| | | | | | | | | | | | | | | | | | | | | | | | | | | | | | |
| | | | $ | — | | | $ | 4,736,777 | | | $ | — | | | $ | 5,412,773 | | | $ | — | | | $ | — | | | $ | — | |
| | | | | | | | | | | | | | | | | | | | | | | | | | | | | | |
| | | | $ | — | | | $ | 57,218 | | | $ | — | | | $ | 369,190 | | | $ | — | | | $ | 33,665 | | | $ | — | |
| | | | | | | | | | | | | | | | | | | | | | | | | | | | | | |
See Notes to Financial Statements.
253
| | |
| For the Year/Period Ended August 31, 2016 | | |
| | | | | | | | | | | | | | | | |
| | | ��
Large Cap
Equity
Fund | | | Small-Mid
Cap Equity
Fund | | | International
Equity
Fund | | | | |
| INVESTMENT INCOME: | | | | | | | | | | | | | | | | |
| | | | |
Dividends | | $ | 26,073,807 | * | | $ | 3,352,101 | | | $ | 36,056,862 | | | | | |
Interest | | | 45,185 | | | | 15,762 | | | | 32,722 | | | | | |
Income from securities lending | | | 138,846 | | | | 128,570 | | | | 515,695 | | | | | |
Less: Foreign taxes withheld (see Note 1q) | | | (79,033 | ) | | | (1,441 | ) | | | (2,758,850 | ) | | | | |
Income from security litigation | | | — | | | | — | | | | — | | | | | |
| | | | | | | | | | | | | | | | |
Total Investment Income | | | 26,178,805 | | | | 3,494,992 | | | | 33,846,429 | | | | | |
| | | | | | | | | | | | | | | | |
| | | | |
| EXPENSES: | | | | | | | | | | | | | | | | |
| | | | |
Investment management fee (Note 2) | | | 9,454,293 | | | | 2,614,414 | | | | 8,545,945 | | | | | |
Transfer agent fees | | | 185,413 | | | | 39,187 | | | | 161,090 | | | | | |
Custody fees | | | 561,674 | | | | 208,110 | | | | 772,531 | | | | | |
Trustees’ fees | | | 214,177 | | | | 43,440 | | | | 170,599 | | | | | |
Shareholder reports | | | 235,467 | | | | 192,743 | | | | 147,052 | | | | | |
Insurance | | | 59,267 | | | | 9,913 | | | | 47,983 | | | | | |
Audit and tax | | | 74,607 | | | | 50,758 | | | | 77,617 | | | | | |
Legal fees | | | 95,224 | | | | 60,545 | | | | 66,199 | | | | | |
Registration fees | | | 22,067 | | | | 20,031 | | | | 22,230 | | | | | |
Organizational expenses | | | — | | | | — | | | | — | | | | | |
Miscellaneous expense | | | 9,875 | | | | 2,790 | | | | 42,706 | | | | | |
Interest expense | | | — | | | | — | | | | — | | | | | |
| | | | | | | | | | | | | | | | |
Total Expenses | | | 10,912,064 | | | | 3,241,931 | | | | 10,053,952 | | | | | |
Less: Fee waivers and/or expense reimbursement (Note 2) | | | (2,119,869 | ) | | | (662,103 | ) | | | (831,707 | ) | | | | |
| | | | | | | | | | | | | | | | |
Net Expenses | | | 8,792,195 | | | | 2,579,828 | | | | 9,222,245 | | | | | |
| | | | | | | | | | | | | | | | |
Net Investment Income (Loss) | | $ | 17,386,610 | | | $ | 915,164 | | | $ | 24,624,184 | | | | | |
| | | | | | | | | | | | | | | | |
| | | | |
| REALIZED AND UNREALIZED GAIN (LOSS) ON INVESTMENTS, FUTURES CONTRACTS, OPTIONS CONTRACTS WRITTEN, FORWARD SALE COMMITMENTS, SWAP CONTRACTS AND FOREIGN CURRENCY TRANSACTIONS (NOTES 1 AND 3): | | | | | | | | | | | | | | | | |
| | | | |
Net Realized Gain (Loss) From: | | | | | | | | | | | | | | | | |
| | | | |
Unaffiliated investments | | $ | 195,024,317 | | | $ | 1,824,831 | | | $ | (86,693,648 | )(a) | | | | |
Affiliated investments | | | 49,946 | | | | — | | | | — | | | | | |
Futures contracts | | | — | | | | — | | | | — | | | | | |
Options contracts written | | | — | | | | — | | | | — | | | | | |
Forward sale commitments | | | — | | | | — | | | | — | | | | | |
Swap contracts | | | — | | | | — | | | | — | | | | | |
Foreign currency transactions | | | — | | | | 12,514 | | | | (61,493 | ) | | | | |
| | | | | | | | | | | | | | | | |
Net Realized Gain (Loss) | | | 195,074,263 | | | | 1,837,345 | | | | (86,755,141 | ) | | | | |
| | | | | | | | | | | | | | | | |
Change in Net Unrealized Appreciation (Depreciation) From: | | | | | | | | | | | | | | | | |
| | | | |
Unaffiliated investments | | | (4,667,199 | ) | | | 25,124,589 | | | | 90,869,749 | (b) | | | | |
Affiliated investments | | | 454,268 | | | | — | | | | — | | | | | |
Futures contracts | | | — | | | | — | | | | — | | | | | |
Options contracts written | | | — | | | | — | | | | — | | | | | |
Forward sale commitments | | | — | | | | — | | | | — | | | | | |
Swap contracts | | | — | | | | — | | | | — | | | | | |
Foreign currency transactions | | | — | | | | (75 | ) | | | 44,895 | | | | | |
| | | | | | | | | | | | | | | | |
Change in Net Unrealized Appreciation (Depreciation): | | | (4,212,931 | ) | | | 25,124,514 | | | | 90,914,644 | | | | | |
| | | | | | | | | | | | | | | | |
Net Gain (Loss) on Investments, Futures Contracts, Options Contracts Written, Forward Sale Commitments, Swap Contracts and Foreign Currency Transactions | | | 190,861,332 | | | | 26,961,859 | | | | 4,159,503 | | | | | |
| | | | | | | | | | | | | | | | |
Total Increase (Decrease) in Net Assets From Operations | | $ | 208,247,942 | | | $ | 27,877,023 | | | $ | 28,783,687 | | | | | |
| | | | | | | | | | | | | | | | |
| (a) | Includes foreign capital gains tax of $1,073 and $18,717 for International Equity Fund and Emerging Markets Equity Fund, respectively. |
| (b) | Net increase (decrease) in accrued foreign capital gains taxes of $34,574 and $71,587 for International Equity Fund and Emerging Markets Equity Fund, respectively. |
| (c) | The period from Fund inception (March 8, 2016) through the period end August 31, 2016. |
| * | Includes affiliated income of $21,818, $81,569, $16,808 for Large Cap Equity Fund, Core Fixed Income Fund and Ultra-Short Term Fixed Income Fund, respectively. |
See Notes to Financial Statements.
254
| | | | | | | | | | | | | | | | | | | | | | | | | | | | | | |
| | | | Emerging
Markets
Equity
Fund | | | Core Fixed
Income
Fund | | | High Yield
Fund | | | International
Fixed
Income
Fund | | | Municipal
Bond
Fund | | | Inflation-Linked
Fixed Income
Fund(c) | | | Ultra-Short Term
Fixed Income
Fund(c) | |
| | | | | | | | | | | | | | | | | | | | | | | | | | | | | | |
| | | | | | | |
| | | | $ | 9,151,973 | | | $ | 54,635 | | | $ | 180,583 | | | $ | — | | | $ | — | | | $ | — | | | $ | — | |
| | | | | 19,486 | | | | 22,989,809 | * | | | 17,514,261 | | | | 5,273,134 | | | | 2,729,093 | | | | 2,512,698 | | | | 1,642,621 | * |
| | | | | 98,477 | | | | 13,453 | | | | 45,173 | | | | 679 | | | | — | | | | — | | | | — | |
| | | | | (900,689 | ) | | | — | | | | — | | | | — | | | | — | | | | — | | | | — | |
| | | | | — | | | | 5,756 | | | | — | | | | — | | | | — | | | | — | | | | — | |
| | | | | | | | | | | | | | | | | | | | | | | | | | | | | | |
| | | | | 8,369,247 | | | | 23,063,653 | | | | 17,740,017 | | | | 5,273,813 | | | | 2,729,093 | | | | 2,512,698 | | | | 1,642,621 | |
| | | | | | | | | | | | | | | | | | | | | | | | | | | | | | |
| | | | | | | |
| | | | | | | | | | | | | | | | | | | | | | | | | | | | | | |
| | | | | | | |
| | | | | 3,565,427 | | | | 3,119,334 | | | | 1,796,611 | | | | 1,036,306 | | | | 308,418 | | | | 322,510 | | | | 367,346 | |
| | | | | 47,371 | | | | 100,627 | | | | 28,930 | | | | 24,870 | | | | 9,866 | | | | 3,272 | | | | 3,841 | |
| | | | | 541,963 | | | | 637,739 | | | | 214,518 | | | | 383,017 | | | | 96,270 | | | | 90,450 | | | | 74,126 | |
| | | | | 52,227 | | | | 125,693 | | | | 37,584 | | | | 27,631 | | | | 12,669 | | | | 11,986 | | | | 13,953 | |
| | | | | 106,090 | | | | 84,371 | | | | 74,659 | | | | 68,919 | | | | 9,909 | | | | 13,416 | | | | 13,015 | |
| | | | | 17,783 | | | | 35,702 | | | | 10,387 | | | | 9,585 | | | | 3,425 | | | | — | | | | — | |
| | | | | 82,131 | | | | 120,686 | | | | 60,908 | | | | 116,777 | | | | 47,541 | | | | 35,185 | | | | 26,741 | |
| | | | | 31,420 | | | | 46,015 | | | | 20,518 | | | | 26,437 | | | | 19,906 | | | | 19,449 | | | | 19,767 | |
| | | | | 19,526 | | | | 18,993 | | | | 17,313 | | | | 18,169 | | | | 16,511 | | | | 7,228 | | | | 5,337 | |
| | | | | — | | | | — | | | | — | | | | — | | | | — | | | | 31,983 | | | | 29,407 | |
| | | | | 19,872 | | | | 29,864 | | | | 4,808 | | | | 5,314 | | | | 707 | | | | 25,706 | | | | 41,999 | |
| | | | | — | | | | — | | | | — | | | | 80,596 | | | | — | | | | 120,989 | | | | 14,297 | |
| | | | | | | | | | | | | | | | | | | | | | | | | | | | | | |
| | | | | 4,483,810 | | | | 4,319,024 | | | | 2,266,236 | | | | 1,797,621 | | | | 525,222 | | | | 682,174 | | | | 609,829 | |
| | | | | (687,223 | ) | | | (131,067 | ) | | | (476,000 | ) | | | (68,390 | ) | | | — | | | | (27,508 | ) | | | (30,315 | ) |
| | | | | | | | | | | | | | | | | | | | | | | | | | | | | | |
| | | | | 3,796,587 | | | | 4,187,957 | | | | 1,790,236 | | | | 1,729,231 | | | | 525,222 | | | | 654,666 | | | | 579,514 | |
| | | | | | | | | | | | | | | | | | | | | | | | | | | | | | |
| | | | $ | 4,572,660 | | | $ | 18,875,696 | | | $ | 15,949,781 | | | $ | 3,544,582 | | | $ | 2,203,871 | | | $ | 1,858,032 | | | $ | 1,063,107 | |
| | | | | | | | | | | | | | | | | | | | | | | | | | | | | | |
| | | | | | | |
| | | | | | | | | | | | | | | | | | | | | | | | | | | | | | |
| | | | | | | |
| | | | | | | | | | | | | | | | | | | | | | | | | | | | | | |
| | | | | | | |
| | | | $ | (30,395,583 | )(a) | | $ | 8,394,907 | | | $ | (24,162,069 | ) | | $ | (4,284,315 | ) | | $ | 1,682,257 | | | $ | 927,029 | | | $ | (154,658 | ) |
| | | | | — | | | | 107,613 | | | | — | | | | — | | | | — | | | | — | | | | — | |
| | | | | (5,343 | ) | | | (981,727 | ) | | | — | | | | 3,231,862 | | | | — | | | | (147,870 | ) | | | (180,731 | ) |
| | | | | — | | | | 787,451 | | | | — | | | | 760,036 | | | | — | | | | 48,589 | | | | — | |
| | | | | — | | | | (224,109 | ) | | | — | | | | 534,963 | | | | — | | | | 24,238 | | | | 8,717 | |
| | | | | — | | | | (160,736 | ) | | | — | | | | (1,841,669 | ) | | | — | | | | (26,241 | ) | | | 16,072 | |
| | | | | (332,790 | ) | | | (864,383 | ) | | | — | | | | 2,844,700 | | | | — | | | | 69,188 | | | | 198,346 | |
| | | | | | | | | | | | | | | | | | | | | | | | | | | | | | |
| | | | | (30,733,716 | ) | | | 7,059,016 | | | | (24,162,069 | ) | | | 1,245,577 | | | | 1,682,257 | | | | 894,933 | | | | (112,254 | ) |
| | | | | | | | | | | | | | | | | | | | | | | | | | | | | | |
| | | | | | | | | | | | | | | | | | | | | | | | | | | | | | |
| | | | | | | |
| | | | | 73,479,244 | (b) | | | 17,254,904 | | | | 20,646,286 | | | | 15,800,223 | | | | 612,192 | | | | 4,953,794 | | | | 533,612 | |
| | | | | — | | | | 70,235 | | | | — | | | | — | | | | — | | | | — | | | | (10,988 | ) |
| | | | | (12,626 | ) | | | 221,887 | | | | — | | | | 495,035 | | | | — | | | | (13,860 | ) | | | (68,819 | ) |
| | | | | — | | | | (226,170 | ) | | | — | | | | 151,595 | | | | — | | | | 18,125 | | | | — | |
| | | | | — | | | | — | | | | — | | | | 37,054 | | | | — | | | | — | | | | — | |
| | | | | — | | | | (517,410 | ) | | | — | | | | (3,256,587 | ) | | | — | | | | (881,529 | ) | | | — | |
| | | | | 34,189 | | | | 324,066 | | | | — | | | | 587,510 | | | | — | | | | (978,110 | ) | | | 31,995 | |
| | | | | | | | | | | | | | | | | | | | | | | | | | | | | | |
| | | | | 73,500,807 | | | | 17,127,512 | | | | 20,646,286 | | | | 13,814,830 | | | | 612,192 | | | | 3,098,420 | | | | 485,800 | |
| | | | | | | | | | | | | | | | | | | | | | | | | | | | | | |
| | | | | | | |
| | | | | 42,767,091 | | | | 24,186,528 | | | | (3,515,783 | ) | | | 15,060,407 | | | | 2,294,449 | | | | 3,993,353 | | | | 373,546 | |
| | | | | | | | | | | | | | | | | | | | | | | | | | | | | | |
| | | | $ | 47,339,751 | | | $ | 43,062,224 | | | $ | 12,433,998 | | | $ | 18,604,989 | | | $ | 4,498,320 | | | $ | 5,851,385 | | | $ | 1,436,653 | |
| | | | | | | | | | | | | | | | | | | | | | | | | | | | | | |
See Notes to Financial Statements.
255
| | |
| | | |
| Statements of Changes in Net Assets | | |
| | |
| For the Year Ended August 31, 2016 and August 31, 2015 | | |
| | | | | | | | | | | | |
| | | Large Cap Equity Fund | | | | |
| | | 2016 | | | 2015 | | | | |
| OPERATIONS: | | | | | | | | | | | | |
| | | |
Net investment income (loss) | | $ | 17,386,610 | | | $ | 6,030,269 | | | | | |
Net realized gain (loss) | | | 195,074,263 | | | | 316,791,624 | | | | | |
Change in unrealized appreciation (depreciation) | | | (4,212,931 | ) | | | (232,169,926 | ) | | | | |
Net Increase from payments by affiliates | | | — | | | | 28,721 | | | | | |
| | | | | | | | | | | | |
Increase (Decrease) in Net Assets From Operations | | | 208,247,942 | | | | 90,680,688 | | | | | |
| | | | | | | | | | | | |
| DISTRIBUTIONS TO SHAREHOLDERS FROM (NOTE 1): | | | | | | | | | | | | |
| | | |
Net investment income | | | (7,025,138 | ) | | | (5,468,121 | ) | | | | |
Net realized gains | | | (301,650,427 | ) | | | (191,632,667 | ) | | | | |
| | | | | | | | | | | | |
Decrease in Net Assets From Distributions to Shareholders | | | (308,675,565 | ) | | | (197,100,788 | ) | | | | |
| | | | | | | | | | | | |
| FUND SHARE TRANSACTIONS (NOTE 4): | | | | | | | | | | | | |
| | | |
Net proceeds from sale of shares | | | 78,704,964 | | | | 56,762,414 | | | | | |
Reinvestment of distributions | | | 308,666,437 | | | | 197,093,781 | | | | | |
Cost of shares repurchased | | | (903,883,177 | ) | | | (574,838,838 | ) | | | | |
Issued in connection with tax-free reorganization (see Note 8) | | | 973,690,395 | | | | — | | | | | |
| | | | | | | | | | | | |
Increase (Decrease) in Net Assets From Fund Share Transactions | | | 457,178,619 | | | | (320,982,643 | ) | | | | |
| | | | | | | | | | | | |
Increase (Decrease) in Net Assets | | | 356,750,996 | | | | (427,402,743 | ) | | | | |
| NET ASSETS: | | | | | | | | | | | | |
| | | |
Beginning of year | | | 1,352,634,925 | | | | 1,780,037,668 | | | | | |
| | | | | | | | | | | | |
End of year*† | | $ | 1,709,385,921 | | | $ | 1,352,634,925 | | | | | |
| | | | | | | | | | | | |
* Includes undistributed net investment income of: | | $ | 14,971,956 | | | $ | 5,820,229 | | | | | |
| | | | | | | | | | | | |
† Includes accumulated net investment loss of: | | $ | — | | | $ | — | | | | | |
| | | | | | | | | | | | |
See Notes to Financial Statements.
256
| | | | | | | | | | | | | | | | | | | | | | | | | | |
| | | | Small-Mid Cap Equity Fund | | | International Equity Fund | | | Emerging Markets Equity Fund | |
| | | | 2016 | | | 2015 | | | 2016 | | | 2015 | | | 2016 | | | 2015 | |
| | | | | | | | | | | | | | | | | | | | | | | | | | |
| | | | | | |
| | | | $ | 915,164 | | | $ | (1,269,060 | ) | | $ | 24,624,184 | | | $ | 20,394,083 | | | $ | 4,572,660 | | | $ | 5,489,235 | |
| | | | | 1,837,345 | | | | 53,507,287 | | | | (86,755,141 | ) | | | 981,593 | | | | (30,733,716 | ) | | | (24,232,285 | ) |
| | | | | 25,124,514 | | | | (27,186,435 | ) | | | 90,914,644 | | | | (122,703,100 | ) | | | 73,500,807 | | | | (109,468,421 | ) |
| | | | | — | | | | 161,664 | | | | — | | | | 2,972,363 | | | | — | | | | — | |
| | | | | | | | | | | | | | | | | | | | | | | | | | |
| | | | | 27,877,023 | | | | 25,213,456 | | | | 28,783,687 | | | | (98,355,061 | ) | | | 47,339,751 | | | | (128,211,471 | ) |
| | | | | | | | | | | | | | | | | | | | | | | | | | |
| | | | | | | | | | | | | | | | | | | | | | | | | | |
| | | | | | |
| | | | | — | | | | — | | | | (19,988,419 | ) | | | (19,199,386 | ) | | | (6,232,037 | ) | | | (5,156,168 | ) |
| | | | | (52,617,603 | ) | | | (60,598,970 | ) | | | — | | | | — | | | | — | | | | — | |
| | | | | | | | | | | | | | | | | | | | | | | | | | |
| | | | | (52,617,603 | ) | | | (60,598,970 | ) | | | (19,988,419 | ) | | | (19,199,386 | ) | | | (6,232,037 | ) | | | (5,156,168 | ) |
| | | | | | | | | | | | | | | | | | | | | | | | | | |
| | | | | | | | | | | | | | | | | | | | | | | | | | |
| | | | | | |
| | | | | 160,893,040 | | | | 12,063,989 | | | | 402,909,238 | | | | 301,685,675 | | | | 120,366,330 | | | | 265,692,576 | |
| | | | | 52,615,219 | | | | 60,596,534 | | | | 19,988,419 | | | | 19,199,115 | | | | 6,232,035 | | | | 5,156,168 | |
| | | | | (129,465,575 | ) | | | (105,041,718 | ) | | | (511,193,040 | ) | | | (150,715,859 | ) | | | (203,472,381 | ) | | | (59,051,423 | ) |
| | | | | 187,304,118 | | | | — | | | | — | | | | — | | | | — | | | | — | |
| | | | | | | | | | | | | | | | | | | | | | | | | | |
| | | | | 271,346,802 | | | | (32,381,195 | ) | | | (88,295,383 | ) | | | 170,168,931 | | | | (76,874,016 | ) | | | 211,797,321 | |
| | | | | | | | | | | | | | | | | | | | | | | | | | |
| | | | | 246,606,222 | | | | (67,766,709 | ) | | | (79,500,115 | ) | | | 52,614,484 | | | | (35,766,302 | ) | | | 78,429,682 | |
| | | | | | | | | | | | | | | | | | | | | | | | | | |
| | | | | | |
| | | | | 228,585,735 | | | | 296,352,444 | | | | 1,201,843,139 | | | | 1,149,228,655 | | | | 463,820,178 | | | | 385,390,496 | |
| | | | | | | | | | | | | | | | | | | | | | | | | | |
| | | | $ | 475,191,957 | | | $ | 228,585,735 | | | $ | 1,122,343,024 | | | $ | 1,201,843,139 | | | $ | 428,053,876 | | | $ | 463,820,178 | |
| | | | | | | | | | | | | | | | | | | | | | | | | | |
| | | | $ | 723,744 | | | $ | 7,013 | | | $ | 25,314,228 | | | $ | 20,123,723 | | | $ | 3,798,997 | | | $ | 5,001,354 | |
| | | | | | | | | | | | | | | | | | | | | | | | | | |
| | | | $ | — | | | $ | — | | | $ | — | | | $ | — | | | $ | — | | | $ | — | |
| | | | | | | | | | | | | | | | | | | | | | | | | | |
See Notes to Financial Statements.
257
| | |
| | | |
| Statements of Changes in Net Assets | | |
| | |
| For the Year/Period Ended August 31, 2016 and August 31, 2015 | | |
| | | | | | | | | | | | |
| | | Core Fixed
Income Fund | | | | |
| | | 2016 | | | 2015 | | | | |
| OPERATIONS: | | | | | | | | | | | | |
| | | |
Net investment income | | $ | 18,875,696 | | | $ | 16,779,482 | | | | | |
Net realized gain (loss) | | | 7,059,016 | | | | 14,471,866 | | | | | |
Change in unrealized appreciation (depreciation) | | | 17,127,512 | | | | (23,332,245 | ) | | | | |
| | | | | | | | | | | | |
Increase (Decrease) in Net Assets From Operations | | | 43,062,224 | | | | 7,919,103 | | | | | |
| | | | | | | | | | | | |
| DISTRIBUTIONS TO SHAREHOLDERS FROM (NOTE 1): | | | | | | | | | | | | |
| | | |
Net investment income | | | (21,187,856 | ) | | | (20,111,155 | ) | | | | |
Net realized gains | | | (6,236,992 | ) | | | (10,910,011 | ) | | | | |
| | | | | | | | | | | | |
Decrease in Net Assets From Distributions to Shareholders | | | (27,424,848 | ) | | | (31,021,166 | ) | | | | |
| | | | | | | | | | | | |
| FUND SHARE TRANSACTIONS (NOTE 4): | | | | | | | | | | | | |
| | | |
Net proceeds from sale of shares | | | 204,302,357 | | | | 171,980,043 | | | | | |
Reinvestment of distributions | | | 27,421,877 | | | | 31,021,046 | | | | | |
Cost of shares repurchased | | | (384,592,902 | ) | | | (119,670,967 | ) | | | | |
| | | | | | | | | | | | |
Increase (Decrease) in Net Assets From Fund Share Transactions | | | (152,868,668 | ) | | | 83,330,122 | | | | | |
| | | | | | | | | | | | |
Increase (Decrease) in Net Assets | | | (137,231,292 | ) | | | 60,228,059 | | | | | |
| NET ASSETS: | | | | | | | | | | | | |
| | | |
Beginning of year/period | | | 859,329,286 | | | | 799,101,227 | | | | | |
| | | | | | | | | | | | |
End of year/period*† | | $ | 722,097,994 | | | $ | 859,329,286 | | | | | |
| | | | | | | | | | | | |
* Includes undistributed net investment income of: | | $ | 19,773 | | | $ | 1,719,200 | | | | | |
| | | | | | | | | | | | |
† Includes accumulated net investment loss of: | | $ | — | | | $ | — | | | | | |
| | | | | | | | | | | | |
| (a) | The period from Fund inception (March 8, 2016) through the period end August 31, 2016. |
See Notes to Financial Statements.
258
| | | | | | | | | | | | | | | | | | | | | | | | | | | | | | | | | | | | | | | | | | |
| | | | High Yield Fund | | | International Fixed
Income Fund | | | Municipal Bond Fund | | | Inflation-Linked Fixed
Income Fund | | | Ultra-Short Term Fixed
Income Fund | |
| | | | 2016 | | | 2015 | | | 2016 | | | 2015 | | | 2016 | | | 2015 | | | 2016(a) | | | 2015 | | | 2016(a) | | | 2015 | |
| | | | | | | | | | | | | | | | | | | | | | | | | | | | | | | | | | | | | | | | | | |
| | | | | | | | | | |
| | | | $ | 15,949,781 | | | $ | 14,427,244 | | | $ | 3,544,582 | | | $ | 4,113,727 | | | $ | 2,203,871 | | | $ | 2,368,031 | | | $ | 1,858,032 | | | $ | — | | | $ | 1,063,107 | | | $ | — | |
| | | | | (24,162,069 | ) | | | (7,826,144 | ) | | | 1,245,577 | | | | 22,831,389 | | | | 1,682,257 | | | | 270,815 | | | | 894,933 | | | | — | | | | (112,254 | ) | | | — | |
| | | | | 20,646,286 | | | | (22,807,926 | ) | | | 13,814,830 | | | | (24,472,307 | ) | | | 612,192 | | | | (863,716 | ) | | | 3,098,420 | | | | — | | | | 485,800 | | | | — | |
| | | | | | | | | | | | | | | | | | | | | | | | | | | | | | | | | | | | | | | | | | |
| | | | | 12,433,998 | | | | (16,206,826 | ) | | | 18,604,989 | | | | 2,472,809 | | | | 4,498,320 | | | | 1,775,130 | | | | 5,851,385 | | | | — | | | | 1,436,653 | | | | — | |
| | | | | | | | | | | | | | | | | | | | | | | | | | | | | | | | | | | | | | | | | | |
| | | | | | | | | | | | | | | | | | | | | | | | | | | | | | | | | | | | | | | | | | |
| | | | | | | | | | |
| | | | | (16,980,249 | ) | | | (16,219,271 | ) | | | (14,225,200 | ) | | | (15,363,960 | ) | | | (2,193,237 | ) | | | (2,367,911 | ) | | | (3,176,335 | ) | | | — | | | | (1,418,793 | ) | | | — | |
| | | | | — | | | | — | | | | — | | | | — | | | | (180,832 | ) | | | (413,482 | ) | | | — | | | | — | | | | — | | | | — | |
| | | | | | | | | | | | | | | | | | | | | | | | | | | | | | | | | | | | | | | | | | |
| | | | | (16,980,249 | ) | | | (16,219,271 | ) | | | (14,225,200 | ) | | | (15,363,960 | ) | | | (2,374,069 | ) | | | (2,781,393 | ) | | | (3,176,335 | ) | | | — | | | | (1,418,793 | ) | | | — | |
| | | | | | | | | | | | | | | | | | | | | | | | | | | | | | | | | | | | | | | | | | |
| | | | | | | | | | | | | | | | | | | | | | | | | | | | | | | | | | | | | | | | | | |
| | | | | | | | | | |
| | | | | 138,664,513 | | | | 50,918,165 | | | | 48,037,831 | | | | 17,549,096 | | | | 18,229,393 | | | | 18,847,119 | | | | 168,452,906 | | | | — | | | | 177,291,553 | | | | — | |
| | | | | 16,977,875 | | | | 16,219,472 | | | | 14,225,200 | | | | 15,363,812 | | | | 2,373,871 | | | | 2,781,435 | | | | 3,174,104 | | | | — | | | | 1,417,941 | | | | — | |
| | | | | (80,651,570 | ) | | | (37,897,221 | ) | | | (98,005,036 | ) | | | (64,240,826 | ) | | | (38,612,137 | ) | | | (13,088,377 | ) | | | (15,114,362 | ) | | | — | | | | (16,273,622 | ) | | | — | |
| | | | | | | | | | | | | | | | | | | | | | | | | | | | | | | | | | | | | | | | | | |
| | | | | 74,990,818 | | | | 29,240,416 | | | | (35,742,005 | ) | | | (31,327,918 | ) | | | (18,008,873 | ) | | | 8,540,177 | | | | 156,512,648 | | | | — | | | | 162,435,872 | | | | — | |
| | | | | | | | | | | | | | | | | | | | | | | | | | | | | | | | | | | | | | | | | | |
| | | | | 70,444,567 | | | | (3,185,681 | ) | | | (31,362,216 | ) | | | (44,219,069 | ) | | | (15,884,622 | ) | | | 7,533,914 | | | | 159,187,698 | | | | — | | | | 162,453,732 | | | | — | |
| | | | | | | | | | | | | | | | | | | | | | | | | | | | | | | | | | | | | | | | | | |
| | | | | | | | | | |
| | | | | 254,337,638 | | | | 257,523,319 | | | | 223,034,833 | | | | 267,253,902 | | | | 85,096,732 | | | | 77,562,818 | | | | — | | | | — | | | | — | | | | — | |
| | | | | | | | | | | | | | | | | | | | | | | | | | | | | | | | | | | | | | | | | | |
| | | | $ | 324,782,205 | | | $ | 254,337,638 | | | $ | 191,672,617 | | | $ | 223,034,833 | | | $ | 69,212,110 | | | $ | 85,096,732 | | | $ | 159,187,698 | | | $ | — | | | $ | 162,453,732 | | | $ | — | |
| | | | | | | | | | | | | | | | | | | | | | | | | | | | | | | | | | | | | | | | | | |
| | | | $ | 1,054,862 | | | $ | 996,361 | | | $ | 3,221,895 | | | $ | 15,513,237 | | | $ | 441,601 | | | $ | 430,967 | | | $ | 952,322 | | | $ | — | | | $ | 211,814 | | | $ | — | |
| | | | | | | | | | | | | | | | | | | | | | | | | | | | | | | | | | | | | | | | | | |
| | | | $ | — | | | $ | — | | | $ | — | | | $ | — | | | $ | — | | | $ | — | | | $ | — | | | $ | — | | | $ | — | | | $ | — | |
| | | | | | | | | | | | | | | | | | | | | | | | | | | | | | | | | | | | | | | | | | |
See Notes to Financial Statements.
259
| | |
| For the Period Ended August 31, 2016 | | |
| | | | | | | | |
| | | Inflation-Linked
Fixed Income
Fund | | | | |
Cash Flows used in Operating Activities: | | | | | | | | |
Net increase in net assets from operations | | $ | 5,851,385 | | | | | |
Adjustments to reconcile net increase in net assets from operations to net cash and foreign currency from operating activities: | | | | | | | | |
Purchases of long-term investments | | | (377,354,000 | ) | | | | |
Proceeds from the sale and maturity of long-term investments | | | 163,737,056 | | | | | |
Purchases of short-term investments, net | | | (914,873 | ) | | | | |
Net payments on forward sale commitments | | | 1,929 | | | | | |
Decrease to the principal amount of inflation-indexed bonds | | | (2,751,998 | ) | | | | |
Change in net unrealized appreciation from unaffiliated investments | | | (4,953,794 | ) | | | | |
Change in net unrealized appreciation from options contracts written | | | (18,125 | ) | | | | |
Change in net unrealized depreciation from OTC swap contracts | | | 116,885 | | | | | |
Change in net unrealized depreciation from centrally cleared swap contracts | | | 764,644 | | | | | |
Net amortization (accretion) of premiums (discounts) of investments | | | (319,386 | ) | | | | |
Net realized gain from unaffiliated investments | | | (927,029 | ) | | | | |
Net realized gain on options contracts written | | | (48,589 | ) | | | | |
Proceeds from swap contracts | | | 741,776 | | | | | |
Payments to cover option contracts written | | | (56,577 | ) | | | | |
Increase in Variation Margin on futures contracts | | | (162 | ) | | | | |
Increase in receivable for securities sold | | | (4,445,760 | ) | | | | |
Increase in Variation Margin on Centrally Cleared Swap contracts | | | (135,992 | ) | | | | |
Increase in dividends and interest receivable | | | (406,560 | ) | | | | |
Increase in deposits with counterparty | | | (940,000 | ) | | | | |
Increase in OTC swap contracts, at value | | | (10,617 | ) | | | | |
Increase in organizational expenses | | | (52,453 | ) | | | | |
Increase in unrealized appreciation on open forward foreign currency contracts | | | (132,066 | ) | | | | |
Increase in other assets | | | (3,230 | ) | | | | |
Increase in payable for securities purchased | | | 10,414,002 | | | | | |
Increase in deposits from counterparty | | | 360,000 | | | | | |
Increase in investment management fee payable | | | 64,219 | | | | | |
Increase in interest expense payable | | | 32,090 | | | | | |
Increase in OTC swap contracts, at value | | | 130,335 | | | | | |
Increase in custody fee payable | | | 81,799 | | | | | |
Increase in trustees’ fees payable | | | 298 | | | | | |
Increase in unrealized depreciation on open forward foreign currency contracts | | | 1,108,640 | | | | | |
Increase in accrued expenses | | | 3,558 | | | | | |
| | | | | | | | |
Net cash and foreign currency used in operating activities | | | (210,062,595 | ) | | | | |
| | | | | | | | |
| | |
Cash Flows Provided by Financing Activities: | | | | | | | | |
Proceeds from reverse repurchase agreements | | | 57,641,125 | | | | | |
Proceeds from sale of shares | | | 167,683,644 | | | | | |
Cost of shares repurchased | | | (14,561,885 | ) | | | | |
Distributions to shareholders | | | (3,176,335 | ) | | | | |
Reinvestment of distributions | | | 3,176,335 | | | | | |
| | | | | | | | |
Net cash and foreign currency provided by financing activities | | | 210,762,884 | | | | | |
| | | | | | | | |
| | |
Effect of Foreign Exchange Fluctuations on Cash: | | | | | | | | |
Effect of foreign exchange fluctuations on cash | | | (2,339 | ) | | | | |
| | | | | | | | |
| | |
Cash and Foreign Currency: | | | | | | | | |
Cash and foreign currency at beginning of the period | | | — | | | | | |
| | | | | | | | |
Cash and foreign currency at end of the period | | $ | 697,950 | | | | | |
| | | | | | | | |
| | |
Non-Cash Financing Activities: | | | | | | | | |
| | | | | | | | |
Reinvestment of distributions | | $ | — | | | | | |
| | | | | | | | |
See Notes to Financial Statements.
260
For a share of beneficial interest outstanding throughout each year ended August 31, unless otherwise noted:
| | | | | | | | | | | | | | | | | | | | |
| Large Cap Equity Fund | | | | | | | | | | | | | | | |
| | | 2016 | | | 2015 | | | 2014 | | | 2013 | | | 2012 | |
Net asset value, Beginning of Year | | $ | 20.63 | | | $ | 22.19 | | | $ | 19.29 | | | $ | 16.39 | | | $ | 14.24 | |
| | | | | | | | | | | | | | | | | | | | |
| Income from Operations: | | | | | | | | | | | | | | | | | | | | |
Net investment income(1) | | | 0.19 | | | | 0.08 | | | | 0.07 | | | | 0.11 | | | | 0.06 | |
Net realized and unrealized gain | | | 1.15 | | | | 0.87 | | | | 4.47 | | | | 2.85 | | | | 2.17 | |
| | | | | | | | | | | | | | | | | | | | |
Total Income from Operations | | | 1.34 | | | | 0.95 | | | | 4.54 | | | | 2.96 | | | | 2.23 | |
| | | | | | | | | | | | | | | | | | | | |
| Less Distributions From: | | | | | | | | | | | | | | | | | | | | |
Net investment income | | | (0.11 | ) | | | (0.07 | ) | | | (0.11 | ) | | | (0.06 | ) | | | (0.08 | ) |
Net realized gain | | | (4.80 | ) | | | (2.44 | ) | | | (1.53 | ) | | | — | | | | — | |
| | | | | | | | | | | | | | | | | | | | |
Total Distributions | | | (4.91 | ) | | | (2.51 | ) | | | (1.64 | ) | | | (0.06 | ) | | | (0.08 | ) |
| | | | | | | | | | | | | | | | | | | | |
Net Asset Value, End of Year | | $ | 17.06 | | | $ | 20.63 | | | $ | 22.19 | | | $ | 19.29 | | | $ | 16.39 | |
| | | | | | | | | | | | | | | | | | | | |
Total Return(2) | | | 7.08 | % | | | 4.39 | %(4) | | | 24.35 | % | | | 18.11 | % | | | 15.71 | % |
Net Assets, End of Year (millions) | | $ | 1,709 | | | $ | 1,353 | | | $ | 1,780 | | | $ | 1,571 | | | $ | 1,566 | |
| Ratios to Average Net Assets: | | | | | | | | | | | | | | | | | | | | |
Gross expenses | | | 0.69 | % | | | 0.68 | % | | | 0.67 | % | | | 0.69 | % | | | 0.69 | % |
Net expenses(3) | | | 0.56 | | | | 0.68 | | | | 0.67 | | | | 0.69 | | | | 0.69 | |
Net investment income | | | 1.10 | | | | 0.36 | | | | 0.33 | | | | 0.60 | | | | 0.40 | |
Portfolio Turnover Rate | | | 105 | % | | | 66 | % | | | 56 | % | | | 57 | % | | | 66 | % |
| (1) | Per share amounts have been calculated using the average shares method. |
| (2) | Performance figures may reflect fee waivers and/or expense reimbursements and assume reinvestment of dividend distribution. In the absence of fee waivers and/or expense reimbursements, the total return would have been lower. Applicable advisory program charges, which may be up to 2.50%, are not reflected in the performance data and would reduce the total returns. Past performance is no guarantee of future results. |
| (3) | Reflects fee waivers and/or expense reimbursements. |
| (4) | The Manager contributed a non-recourse voluntary reimbursement to Large Cap Equity Fund (formerly Large Capitalization Growth Fund). The effect of the reimbursement is reflected in the Fund’s total return above. Without this reimbursement, the impact was less than 0.00% to the total return for Large Cap Equity Fund. |
See Notes to Financial Statements.
261
For a share of beneficial interest outstanding throughout each year ended August 31, unless otherwise noted:
| | | | | | | | | | | | | | | | | | | | |
| Small-Mid Cap Equity Fund | | | | | | | | | | | | | | | |
| | | 2016 | | | 2015 | | | 2014 | | | 2013 | | | 2012 | |
Net asset value, Beginning of Year | | $ | 24.39 | | | $ | 28.53 | | | $ | 25.22 | | | $ | 19.81 | | | $ | 17.76 | |
| | | | | | | | | | | | | | | | | | | | |
| Income (Loss) from Operations: | | | | | | | | | | | | | | | | | | | | |
Net investment income (loss)(1) | | | 0.05 | | | | (0.12 | ) | | | (0.12 | ) | | | (0.00 | )(2) | | | (0.07 | ) |
Net realized and unrealized gain (loss) | | | (1.22 | ) | | | 1.93 | | | | 4.36 | | | | 5.41 | | | | 2.12 | |
| | | | | | | | | | | | | | | | | | | | |
Total Income (Loss) from Operations | | | (1.17 | ) | | | 1.81 | | | | 4.24 | | | | 5.41 | | | | 2.05 | |
| | | | | | | | | | | | | | | | | | | | |
| Less Distributions From: | | | | | | | | | | | | | | | | | | | | |
Net realized gain | | | (5.82 | ) | | | (5.95 | ) | | | (0.93 | ) | | | — | | | | — | |
| | | | | | | | | | | | | | | | | | | | |
Total Distributions | | | (5.82 | ) | | | (5.95 | ) | | | (0.93 | ) | | | — | | | | — | |
| | | | | | | | | | | | | | | | | | | | |
Net Asset Value, End of Year | | $ | 17.40 | | | $ | 24.39 | | | $ | 28.53 | | | $ | 25.22 | | | $ | 19.81 | |
| | | | | | | | | | | | | | | | | | | | |
Total Return(3) | | | (5.51 | )% | | | 7.36 | %(4) | | | 16.91 | % | | | 27.31 | % | | | 11.54 | % |
Net Assets, End of Year (millions) | | $ | 475 | | | $ | 229 | | | $ | 296 | | | $ | 311 | | | $ | 247 | |
| Ratios to Average Net Assets: | | | | | | | | | | | | | | | | | | | | |
Gross expenses | | | 0.99 | % | | | 0.93 | % | | | 0.92 | % | | | 0.97 | % | | | 0.98 | % |
Net expenses(5) | | | 0.79 | | | | 0.93 | | | | 0.92 | | | | 0.97 | | | | 0.97 | |
Net investment income (loss) | | | 0.28 | | | | (0.45 | ) | | | (0.42 | ) | | | (0.02 | ) | | | (0.40 | ) |
Portfolio Turnover Rate | | | 151 | % | | | 89 | % | | | 80 | % | | | 90 | % | | | 68 | % |
| (1) | Per share amounts have been calculated using the average shares method. |
| (2) | Amounts represent less than $(0.01) per share. |
| (3) | Performance figures may reflect fee waivers and/or expense reimbursements and assume reinvestment of dividend distribution. In the absence of fee waivers and/or expense reimbursements, the total return would have been lower. Applicable advisory program charges, which may be up to 2.50%, are not reflected in the performance data and would reduce the total returns. Past performance is no guarantee of future results. |
| (4) | The Manager contributed a non-recourse voluntary reimbursement to Small-Mid Cap Equity Fund (formerly Small Capitalization Growth Fund). The effect of the reimbursement is reflected in the Fund’s total return above. Without this reimbursement, the total return for Small-Mid Cap Equity Fund was 7.27%. |
| (5) | Reflects fee waivers and/or expense reimbursements. |
| | | | | | | | | | | | | | | | | | | | |
| International Equity Fund | |
| | | 2016 | | | 2015 | | | 2014 | | | 2013 | | | 2012 | |
Net asset value, Beginning of Year | | $ | 10.91 | | | $ | 12.03 | | | $ | 10.92 | | | $ | 9.58 | | | $ | 9.77 | |
| | | | | | | | | | | | | | | | | | | | |
| Income (Loss) from Operations: | | | | | | | | | | | | | | | | | | | | |
Net investment income(1) | | | 0.21 | | | | 0.21 | | | | 0.22 | | | | 0.20 | | | | 0.17 | |
Net realized and unrealized gain (loss) | | | (0.10 | ) | | | (1.13 | ) | | | 1.03 | | | | 1.27 | | | | (0.18 | ) |
| | | | | | | | | | | | | | | | | | | | |
Total Income (Loss) from Operations | | | 0.11 | | | | (0.92 | ) | | | 1.25 | | | | 1.47 | | | | (0.01 | ) |
| | | | | | | | | | | | | | | | | | | | |
| Less Distributions From: | | | | | | | | | | | | | | | | | | | | |
Net investment income | | | (0.19 | ) | | | (0.20 | ) | | | (0.14 | ) | | | (0.13 | ) | | | (0.18 | ) |
| | | | | | | | | | | | | | | | | | | | |
Total Distributions | | | (0.19 | ) | | | (0.20 | ) | | | (0.14 | ) | | | (0.13 | ) | | | (0.18 | ) |
| | | | | | | | | | | | | | | | | | | | |
Net Asset Value, End of Year | | $ | 10.83 | | | $ | 10.91 | | | $ | 12.03 | | | $ | 10.92 | | | $ | 9.58 | |
| | | | | | | | | | | | | | | | | | | | |
Total Return(2) | | | 0.96 | % | | | (7.68 | )%(4) | | | 11.45 | % | | | 15.47 | % | | | (0.06 | )% |
Net Assets, End of Year (millions) | | $ | 1,122 | | | $ | 1,202 | | | $ | 1,149 | | | $ | 773 | | | $ | 444 | |
| Ratios to Average Net Assets: | | | | | | | | | | | | | | | | | | | | |
Gross expenses | | | 0.82 | % | | | 0.81 | % | | | 0.81 | % | | | 0.84 | % | | | 0.91 | % |
Net expenses(3) | | | 0.76 | | | | 0.79 | | | | 0.77 | | | | 0.83 | | | | 0.90 | |
Net investment income | | | 2.02 | | | | 1.80 | | | | 1.83 | | | | 1.88 | | | | 1.80 | |
Portfolio Turnover Rate | | | 64 | % | | | 80 | % | | | 95 | % | | | 63 | % | | | 75 | % |
| (1) | Per share amounts have been calculated using the average shares method. |
| (2) | Performance figures may reflect fee waivers and/or expense reimbursements and assume reinvestment of dividend distribution. In the absence of fee waivers and/or expense reimbursements, the total return would have been lower. Applicable advisory program charges, which may be up to 2.50%, are not reflected in the performance data and would reduce the total returns. Past performance is no guarantee of future results. |
| (3) | Reflects fee waivers and/or expense reimbursements. |
| (4) | The Manager contributed a non-recourse voluntary reimbursement to International Equity Fund (formerly International Equity Investments). The effect of the reimbursement is reflected in the Fund’s total return above. Without this reimbursement, the total return for International Equity Fund was (7.94)%. |
See Notes to Financial Statements.
262
For a share of beneficial interest outstanding throughout each year ended August 31, unless otherwise noted:
| | | | | | | | | | | | | | | | | | | | |
| Emerging Markets Equity Fund | |
| | | 2016 | | | 2015 | | | 2014 | | | 2013 | | | 2012 | |
Net asset value, Beginning of Year | | $ | 10.87 | | | $ | 14.54 | | | $ | 13.67 | | | $ | 14.46 | | | $ | 15.85 | |
| | | | | | | | | | | | | | | | | | | | |
| Income (Loss) from Operations: | | | | | | | | | | | | | | | | | | | | |
Net investment income(1) | | | 0.13 | | | | 0.17 | | | | 0.20 | | | | 0.21 | | | | 0.29 | |
Net realized and unrealized gain (loss) | | | 1.51 | | | | (3.64 | ) | | | 2.36 | | | | (0.69 | ) | | | (1.33 | ) |
| | | | | | | | | | | | | | | | | | | | |
Total Income (Loss) from Operations | | | 1.64 | | | | (3.47 | ) | | | 2.56 | | | | (0.48 | ) | | | (1.04 | ) |
| | | | | | | | | | | | | | | | | | | | |
| Less Distributions From: | | | | | | | | | | | | | | | | | | | | |
Net investment income | | | (0.15 | ) | | | (0.20 | ) | | | (0.29 | ) | | | (0.31 | ) | | | (0.35 | ) |
Net realized gain | | | — | | | | — | | | | (1.40 | ) | | | — | | | | — | |
| | | | | | | | | | | | | | | | | | | | |
Total Distributions | | | (0.15 | ) | | | (0.20 | ) | | | (1.69 | ) | | | (0.31 | ) | | | (0.35 | ) |
| | | | | | | | | | | | | | | | | | | | |
Net Asset Value, End of Year | | $ | 12.36 | | | $ | 10.87 | | | $ | 14.54 | | | $ | 13.67 | | | $ | 14.46 | |
| | | | | | | | | | | | | | | | | | | | |
Total Return(2) | | | 15.31 | % | | | (24.08 | )% | | | 19.97 | % | | | (3.54 | )% | | | (6.52 | )% |
Net Assets, End of Year (millions) | | $ | 428 | | | $ | 464 | | | $ | 385 | | | $ | 414 | | | $ | 695 | |
| Ratios to Average Net Assets: | | | | | | | | | | | | | | | | | | | | |
Gross expenses | | | 1.13 | % | | | 1.08 | % | | | 1.09 | % | | | 1.10 | % | | | 1.06 | % |
Net expenses(3) | | | 0.96 | | | | 0.96 | | | | 0.99 | | | | 0.99 | | | | 0.93 | |
Net investment income | | | 1.15 | | | | 1.34 | | | | 1.49 | | | | 1.39 | | | | 1.98 | |
Portfolio Turnover Rate | | | 99 | % | | | 41 | % | | | 29 | % | | | 89 | % | | | 40 | % |
| (1) | Per share amounts have been calculated using the average shares method. |
| (2) | Performance figures may reflect fee waivers and/or expense reimbursements and assume reinvestment of dividend distribution. In the absence of fee waivers and/or expense reimbursements, the total return would have been lower. Applicable advisory program charges, which may be up to 2.50%, are not reflected in the performance data and would reduce the total returns. Past performance is no guarantee of future results. |
| (3) | Reflects fee waivers and/or expense reimbursements. |
| | | | | | | | | | | | | | | | | | | | |
| Core Fixed Income Fund | | | | | | | | | | | | | | | |
| | | 2016 | | | 2015 | | | 2014 | | | 2013 | | | 2012 | |
Net asset value, Beginning of Year | | $ | 8.23 | | | $ | 8.44 | | | $ | 8.17 | | | $ | 8.87 | | | $ | 8.58 | |
| | | | | | | | | | | | | | | | | | | | |
| Income (Loss) from Operations: | | | | | | | | | | | | | | | | | | | | |
Net investment income(1) | | | 0.20 | | | | 0.17 | | | | 0.18 | | | | 0.20 | | | | 0.25 | |
Net realized and unrealized gain (loss) | | | 0.27 | | | | (0.06 | ) | | | 0.31 | | | | (0.30 | ) | | | 0.38 | |
| | | | | | | | | | | | | | | | | | | | |
Total Income (Loss) from Operations | | | 0.47 | | | | 0.11 | | | | 0.49 | | | | (0.10 | ) | | | 0.63 | |
| | | | | | | | | | | | | | | | | | | | |
| Less Distributions From: | | | | | | | | | | | | | | | | | | | | |
Net investment income | | | (0.23 | ) | | | (0.20 | ) | | | (0.22 | ) | | | (0.24 | ) | | | (0.27 | ) |
Net realized gain | | | (0.06 | ) | | | (0.12 | ) | | | — | | | | (0.36 | ) | | | (0.07 | ) |
| | | | | | | | | | | | | | | | | | | | |
Total Distributions | | | (0.29 | ) | | | (0.32 | ) | | | (0.22 | ) | | | (0.60 | ) | | | (0.34 | ) |
| | | | | | | | | | | | | | | | | | | | |
Net Asset Value, End of Year | | $ | 8.41 | | | $ | 8.23 | | | $ | 8.44 | | | $ | 8.17 | | | $ | 8.87 | |
| | | | | | | | | | | | | | | | | | | | |
Total Return(2) | | | 5.84 | % | | | 1.35 | % | | | 6.10 | % | | | (1.31 | )% | | | 7.58 | % |
Net Assets, End of Year (millions) | | $ | 722 | | | $ | 859 | | | $ | 799 | | | $ | 937 | | | $ | 1,022 | |
| Ratios to Average Net Assets: | | | | | | | | | | | | | | | | | | | | |
Gross expenses | | | 0.55 | %(3) | | | 0.54 | %(3) | | | 0.53 | %(3) | | | 0.54 | %(3) | | | 0.52 | % |
Net expenses(4) | | | 0.54 | (3) | | | 0.55 | (3) | | | 0.53 | (3) | | | 0.54 | (3) | | | 0.52 | |
Net investment income | | | 2.42 | | | | 2.06 | | | | 2.19 | | | | 2.30 | | | | 2.85 | |
Portfolio Turnover Rate | | | 245 | % | | | 326 | % | | | 446 | % | | | 421 | % | | | 429 | % |
| (1) | Per share amounts have been calculated using the average shares method. |
| (2) | Performance figures may reflect fee waivers and/or expense reimbursements and assume reinvestment of dividend distribution. In the absence of fee waivers and/or expense reimbursements, the total return would have been lower. Applicable advisory program charges, which may be up to 2.50%, are not reflected in the performance data and would reduce the total returns. Past performance is no guarantee of future results. |
| (3) | Ratio includes interest expense on forward sale commitments and reverse repurchase agreements which represents less than 0.01%. |
| (4) | Reflects fee waivers and/or expense reimbursements. |
See Notes to Financial Statements.
263
For a share of beneficial interest outstanding throughout each year ended August 31, unless otherwise noted:
| | | | | | | | | | | | | | | | | | | | |
| High Yield Fund | |
| | | 2016 | | | 2015 | | | 2014 | | | 2013 | | | 2012 | |
Net asset value, Beginning of Year | | $ | 3.88 | | | $ | 4.41 | | | $ | 4.27 | | | $ | 4.24 | | | $ | 4.15 | |
| | | | | | | | | | | | | | | | | | | | |
| Income (Loss) from Operations: | | | | | | | | | | | | | | | | | | | | |
Net investment income(1) | | | 0.23 | | | | 0.24 | | | | 0.24 | | | | 0.27 | | | | 0.29 | |
Net realized and unrealized gain (loss) | | | (0.09 | ) | | | (0.50 | ) | | | 0.17 | | | | 0.07 | | | | 0.16 | |
| | | | | | | | | | | | | | | | | | | | |
Total Income (Loss) from Operations | | | 0.14 | | | | (0.26 | ) | | | 0.41 | | | | 0.34 | | | | 0.45 | |
| | | | | | | | | | | | | | | | | | | | |
| Less Distributions From: | | | | | | | | | | | | | | | | | | | | |
Net investment income | | | (0.24 | ) | | | (0.27 | ) | | | (0.27 | ) | | | (0.31 | ) | | | (0.36 | ) |
| | | | | | | | | | | | | | | | | | | | |
Total Distributions | | | (0.24 | ) | | | (0.27 | ) | | | (0.27 | ) | | | (0.31 | ) | | | (0.36 | ) |
| | | | | | | | | | | | | | | | | | | | |
Net Asset Value, End of Year | | $ | 3.78 | | | $ | 3.88 | | | $ | 4.41 | | | $ | 4.27 | | | $ | 4.24 | |
| | | | | | | | | | | | | | | | | | | | |
Total Return(2) | | | 4.02 | % | | | (6.14 | )% | | | 9.75 | % | | | 8.07 | % | | | 11.57 | % |
Net Assets, End of Year (millions) | | $ | 325 | | | $ | 254 | | | $ | 258 | | | $ | 111 | | | $ | 269 | |
| Ratios to Average Net Assets: | | | | | | | | | | | | | | | | | | | | |
Gross expenses | | | 0.88 | % | | | 0.90 | % | | | 0.92 | % | | | 0.93 | % | | | 0.97 | % |
Net expenses(3) | | | 0.70 | | | | 0.74 | | | | 0.76 | | | | 0.78 | | | | 0.81 | |
Net investment income | | | 6.21 | | | | 5.74 | | | | 5.53 | | | | 6.25 | | | | 7.58 | |
Portfolio Turnover Rate | | | 64 | % | | | 42 | % | | | 57 | % | | | 86 | % | | | 101 | % |
| (1) | Per share amounts have been calculated using the average shares method. |
| (2) | Performance figures may reflect fee waivers and/or expense reimbursements and assume reinvestment of dividend distribution. In the absence of fee waivers and/or expense reimbursements, the total return would have been lower. Applicable advisory program charges, which may be up to 2.50%, are not reflected in the performance data and would reduce the total returns. Past performance is no guarantee of future results. |
| (3) | Reflects fee waivers and/or expense reimbursements. |
| | | | | | | | | | | | | | | | | | | | |
| International Fixed Income Fund | | | | | | | | | | | | | | | |
| | | 2016 | | | 2015 | | | 2014 | | | 2013 | | | 2012 | |
Net asset value, Beginning of Year | | $ | 7.61 | | | $ | 8.04 | | | $ | 8.02 | | | $ | 8.56 | | | $ | 7.99 | |
| | | | | | | | | | | | | | | | | | | | |
| Income (Loss) from Operations: | | | | | | | | | | | | | | | | | | | | |
Net investment income(1) | | | 0.13 | | | | 0.13 | | | | 0.16 | | | | 0.18 | | | | 0.19 | |
Net realized and unrealized gain (loss) | | | 0.56 | | | | (0.09 | ) | | | 0.40 | | | | (0.23 | ) | | | 0.41 | |
| | | | | | | | | | | | | | | | | | | | |
Total Income (Loss) from Operations | | | 0.69 | | | | 0.04 | | | | 0.56 | | | | (0.05 | ) | | | 0.60 | |
| | | | | | | | | | | | | | | | | | | | |
| Less Distributions From: | | | | | | | | | | | | | | | | | | | | |
Net investment income | | | (0.51 | ) | | | (0.47 | ) | | | (0.54 | ) | | | (0.49 | ) | | | (0.03 | ) |
| | | | | | | | | | | | | | | | | | | | |
Total Distributions | | | (0.51 | ) | | | (0.47 | ) | | | (0.54 | ) | | | (0.49 | ) | | | (0.03 | ) |
| | | | | | | | | | | | | | | | | | | | |
Net Asset Value, End of Year | | $ | 7.79 | | | $ | 7.61 | | | $ | 8.04 | | | $ | 8.02 | | | $ | 8.56 | |
| | | | | | | | | | | | | | | | | | | | |
Total Return(2) | | | 9.56 | % | | | 0.44 | % | | | 7.36 | % | | | (0.77 | )% | | | 7.53 | % |
Net Assets, End of Year (millions) | | $ | 192 | | | $ | 223 | | | $ | 267 | | | $ | 317 | | | $ | 431 | |
| Ratios to Average Net Assets: | | | | | | | | | | | | | | | | | | | | |
Gross expenses | | | 0.87 | %(3) | | | 0.87 | %(3) | | | 0.76 | %(3) | | | 0.69 | %(3) | | | 0.64 | % |
Net expenses | | | 0.83 | (3)(4) | | | 0.87 | (3) | | | 0.76 | (3) | | | 0.69 | (3) | | | 0.63 | (4) |
Net investment income | | | 1.71 | | | | 1.61 | | | | 2.00 | | | | 2.12 | | | | 2.25 | |
Portfolio Turnover Rate | | | 199 | % | | | 416 | % | | | 397 | % | | | 198 | % | | | 223 | % |
| (1) | Per share amounts have been calculated using the average shares method. |
| (2) | Performance figures may reflect fee waivers and/or expense reimbursements and assume reinvestment of dividend distribution. In the absence of fee waivers and/or expense reimbursements, the total return would have been lower. Applicable advisory program charges, which may be up to 2.50%, are not reflected in the performance data and would reduce the total returns. Past performance is no guarantee of future results. |
| (3) | Ratio includes interest expense on forward sale commitments and reverse repurchase agreements which represents 0.04%, 0.10%, 0.04% and less than 0.01%, respectively. |
| (4) | Reflects fee waivers and/or expense reimbursements. |
See Notes to Financial Statements.
264
For a share of beneficial interest outstanding throughout each year / period end August 31, unless otherwise noted:
| | | | | | | | | | | | | | | | | | | | |
| Municipal Bond Fund | | | | | | | | | | | | | | | |
| | | 2016 | | | 2015 | | | 2014 | | | 2013 | | | 2012 | |
Net asset value, Beginning of Year | | $ | 9.65 | | | $ | 9.76 | | | $ | 9.21 | | | $ | 9.88 | | | $ | 9.48 | |
| | | | | | | | | | | | | | | | | | | | |
| Income (Loss) from Operations: | | | | | | | | | | | | | | | | | | | | |
Net investment income(1) | | | 0.28 | | | | 0.28 | | | | 0.29 | | | | 0.29 | | | | 0.28 | |
Net realized and unrealized gain (loss) | | | 0.30 | | | | (0.06 | ) | | | 0.55 | | | | (0.67 | ) | | | 0.40 | |
| | | | | | | | | | | | | | | | | | | | |
Total Income (Loss) from Operations | | | 0.58 | | | | 0.22 | | | | 0.84 | | | | (0.38 | ) | | | 0.68 | |
| | | | | | | | | | | | | | | | | | | | |
| Less Distributions From: | | | | | | | | | | | | | | | | | | | | |
Net investment income | | | (0.28 | ) | | | (0.28 | ) | | | (0.29 | ) | | | (0.29 | ) | | | (0.28 | ) |
Net realized gain | | | (0.02 | ) | | | (0.05 | ) | | | — | | | | — | | | | — | |
| | | | | | | | | | | | | | | | | | | | |
Total Distributions | | | (0.30 | ) | | | (0.33 | ) | | | (0.29 | ) | | | (0.29 | ) | | | (0.28 | ) |
| | | | | | | | | | | | | | | | | | | | |
Net Asset Value, End of Year | | $ | 9.93 | | | $ | 9.65 | | | $ | 9.76 | | | $ | 9.21 | | | $ | 9.88 | |
| | | | | | | | | | | | | | | | | | | | |
Total Return(2) | | | 6.14 | % | | | 2.32 | % | | | 9.24 | % | | | (4.01 | )% | | | 7.23 | % |
Net Assets, End of Year (millions) | | $ | 69 | | | $ | 85 | | | $ | 78 | | | $ | 80 | | | $ | 89 | |
| Ratios to Average Net Assets: | | | | | | | | | | | | | | | | | | | | |
Gross expenses | | | 0.68 | % | | | 0.66 | % | | | 0.59 | % | | | 0.61 | % | | | 0.57 | % |
Net expenses | | | 0.68 | | | | 0.66 | | | | 0.59 | | | | 0.61 | | | | 0.57 | |
Net investment income | | | 2.87 | | | | 2.91 | | | | 3.03 | | | | 2.92 | | | | 2.83 | |
Portfolio Turnover Rate | | | 16 | % | | | 8 | % | | | 19 | % | | | 9 | % | | | 26 | % |
| (1) | Per share amounts have been calculated using the average shares method. |
| (2) | Performance figures may reflect fee waivers and/or expense reimbursements and assume reinvestment of dividend distribution. In the absence of fee waivers and/or expense reimbursements, the total return would have been lower. Applicable advisory program charges, which may be up to 2.50%, are not reflected in the performance data and would reduce the total returns. Past performance is no guarantee of future results. |
| | | | |
| Inflation-Linked Fixed Income Fund | | | |
| | | 2016(1) | |
Net asset value, Beginning of Period | | $ | 10.00 | |
| | | | |
| Income from Operations: | | | | |
Net investment income(2) | | | 0.14 | |
Net realized and unrealized gain | | | 0.32 | |
| | | | |
Total Income from Operations | | | 0.46 | |
| | | | |
| Less Distributions From: | | | | |
Net investment income | | | (0.23 | ) |
| | | | |
Total Distributions | | | (0.23 | ) |
| | | | |
Net Asset Value, End of Period | | $ | 10.23 | |
| | | | |
Total Return(3) | | | 4.59 | % |
Net Assets, End of Period (millions) | | $ | 159 | |
| Ratios to Average Net Assets: | | | | |
Gross expenses | | | 1.03 | %(4)(5) |
Net expenses | | | 0.99 | (4)(5)(6) |
Net investment income | | | 2.91 | (5) |
Portfolio Turnover Rate | | | 35 | % |
| (1) | For the period from Fund inception (March 8, 2016) through the period end August 31, 2016. |
| (2) | Per share amounts have been calculated using the average shares method. |
| (3) | Performance figures may reflect fee waivers and/or expense reimbursements and assume reinvestment of dividend distribution. In the absence of fee waivers and/or expense reimbursements, the total return would have been lower. Applicable advisory program charges, which may be up to 2.50%, are not reflected in the performance data and would reduce the total returns. Past performance is no guarantee of future results. |
| (4) | Ratio includes interest expense on forward sale commitments and reverse repurchase agreements which represents 0.19% (annualized). |
| (6) | Reflects fee waivers and/or expense reimbursements. |
See Notes to Financial Statements.
265
For a share of beneficial interest outstanding throughout each period end August 31, unless otherwise noted:
| | | | |
| Ultra-Short Term Fixed Income Fund | |
| | | 2016(1) | |
Net asset value, Beginning of Period | | $ | 10.00 | |
| | | | |
| Income from Operations: | | | | |
Net investment income(2) | | | 0.07 | |
Net realized and unrealized gain | | | 0.02 | |
| | | | |
Total Income from Operations | | | 0.09 | |
| | | | |
| Less Distributions From: | | | | |
Net investment income | | | (0.09 | ) |
| | | | |
Total Distributions | | | (0.09 | ) |
| | | | |
Net Asset Value, End of Period | | $ | 10.00 | |
| | | | |
Total Return(3) | | | 0.89 | % |
Net Assets, End of Period (millions) | | $ | 162 | |
| Ratios to Average Net Assets: | | | | |
Gross expenses | | | 0.81 | %(4)(5) |
Net expenses | | | 0.77 | (4)(5)(6) |
Net investment income | | | 1.47 | (5) |
Portfolio Turnover Rate | | | 100 | % |
| (1) | For the period from Fund inception (March 8, 2016) through the period end August 31, 2016. |
| (2) | Per share amounts have been calculated using the average shares method. |
| (3) | Performance figures may reflect fee waivers and/or expense reimbursements and assume reinvestment of dividend distribution. In the absence of fee waivers and/or expense reimbursements, the total return would have been lower. Applicable advisory program charges, which may be up to 2.50%, are not reflected in the performance data and would reduce the total returns. Past performance is no guarantee of future results. |
| (4) | Ratio includes interest expense on forward sale commitments and reverse repurchase agreements which represents 0.02% (annualized). |
| (6) | Reflects fee waivers and/or expense reimbursements. |
See Notes to Financial Statements.
266
| | |
| | | |
| Notes to Financial Statements | | |
1. Organization and Significant Accounting Policies
The Consulting Group Capital Markets Funds (“Trust”) is organized as a Massachusetts business trust and registered under the Investment Company Act of 1940, as amended (“1940 Act”), as an open-end management investment company. The Trust currently consists of Large Cap Equity Fund (formerly known as Large Capitalization Growth Investments), Small-Mid Cap Equity Fund (formerly known as Small Capitalization Growth Investments), International Equity Fund (formerly known as International Equity Investments), Emerging Markets Equity Fund (formerly known as Emerging Markets Equity Investments), Core Fixed Income Fund (formerly known as Core Fixed Income Investments), High Yield Fund (formerly known as High Yield Investments), International Fixed Income Fund (formerly known as International Fixed Income Investments), Municipal Bond Fund (formerly known as Municipal Bond Investments), Inflation-Linked Fixed Income Fund (Fund inception March 8, 2016) and Ultra-Short Term Fixed Income Fund (Fund inception March 8, 2016) (individually, a “Fund” and collectively, the “Funds”). Each Fund is a diversified series of the Trust, except for International Fixed Income Investments, which is non-diversified.
The Money Market Fund terminated operations on April 8, 2016, and has had no operations since then other than the settlement of receivables and payables. The net assets of the Money Market Fund, including these remaining balances, were liquidated and distributed to participants.
The following is a summary of significant accounting policies consistently followed by the Funds which are in conformity with accounting principles generally accepted in the United States of America (“GAAP”). Estimates and assumptions are required to be made by management regarding assets, liabilities and changes in net assets resulting from operations when financial statements are prepared. Changes in the economic environment, financial markets and any other parameters used in determining these estimates could cause actual results to differ. The Funds are investment companies and follow the accounting and reporting guidance of the Financial Accounting Standards Board (“FASB”) Accounting Standards Codification Topic 946 — Investment Companies.
(a) Investment Valuation. Equity securities for each Fund for which market quotations are readily available and are traded on an exchange are valued at the closing sale price or official closing price on the exchange on which such security is principally traded. In the event there are no sales that day, such securities are valued at the mean between the bid and ask prices. For securities that are primarily traded on foreign exchanges, these values are converted to U.S. dollars using the current exchange rates as of the close of the New York Stock Exchange (“NYSE”).
Exchange-traded purchased and written options and futures contracts are valued at the last sale price (closing price) in the market where such contracts are principally traded or, if no sales are reported, the bid price. Swaps for which quotations are available on an automated basis from approved third-party pricing services are valued using those automated third-party pricing service quotations. Forward foreign currency contracts are valued using the official closing price for such contracts on the NYSE.
Portfolio securities traded in the over-the-counter market for which market quotations are readily available are valued at the last sales price that day. In the event there are no sales that day, such securities are valued at the mean between the bid and ask prices. Investments in registered open-end management investment companies are valued at reported net asset value per share.
Debt obligations that will mature in 60 days or less are valued at amortized cost, which approximates market value. Debt obligations that will mature in more than 60 days are valued using valuations furnished by an approved third-party pricing service; such valuations are determined by the third-party pricing service based upon its analysis of a variety of factors, including transactions in debt obligations, quotations from bond dealers, market transactions in comparable securities and its analysis of various relationships between securities, prices or yields of securities with similar characteristics, benchmark curves or information pertaining to the issuer, and as well as industry and economic events.
Overnight repurchase agreements and repurchase agreements maturing in seven days or less are valued at cost. Term repurchase agreements maturing in more than seven days are valued at the average of the bid quotations obtained daily from at least two recognized purchasers of such term repurchase agreements selected by Consulting Group Advisory Services, LLC (“CGAS”) (the “Manager”).
The Board of Trustees (the “Board”) has ultimate responsibility for ensuring the Funds’ investments are valued appropriately. The Board has delegated primary responsibility for determining or causing to be determined the value of the Funds’ investments (including any fair valuation) to the Manager pursuant to valuation policies and procedures approved by the Board. When market quotations are not readily available or are determined to be unreliable, investments are valued at fair value as determined in good
267
| | |
| | | |
| Notes to Financial Statements | | |
faith by the valuation committee established by the Manager in accordance with such procedures under the oversight of the Board. Circumstances that may indicate that market quotations are not readily available or are unreliable include, but are not limited to, such instances when the value of a security has been significantly affected by events after the close of the exchange or market on which the security is principally traded, and before the applicable Fund calculates its Net Asset Value (NAV).
Each business day, Emerging Markets Equity Fund and International Equity Fund use a Board-approved third-party pricing service to assist with the valuation of foreign equity securities. Events occurring after the close of trading on foreign exchanges may result in adjustments to the valuation of foreign securities to reflect market trading that occurs after the close of the applicable foreign markets of comparable securities or other instruments that have a strong correlation to the fair-valued securities to more accurately reflect their fair value as of the close of regular trading on the NYSE.
The Funds disclose the fair value of their investments in a hierarchy that prioritizes the inputs to valuation techniques used to measure the fair value. The hierarchy prioritizes inputs to valuation methods and requires disclosure of the fair value hierarchy, separately for each major category of assets and liabilities that segregates fair value measurements into levels (Level 1, 2, and 3). The three levels of the fair value hierarchy are as follows:
Level 1 – unadjusted quoted prices in active markets for identical securities.
Level 2 – significant observable inputs (including quoted prices for similar securities, interest rates, prepayment speeds, credit risk, etc.)
Level 3 – significant unobservable inputs (including assumptions made by the Board or persons acting at their direction that are used in determining the fair value of investments.)
The inputs or methodology used for valuing securities are not necessarily an indication of the risk associated with investing in those securities. The following are certain inputs and techniques that the Funds generally use to evaluate how to classify each major category of assets and liabilities in accordance with GAAP.
Fixed income securities including corporate, convertible and municipal bonds and notes, U.S. government agencies, U.S. treasury obligations, sovereign bonds, bank loans, convertible preferred securities and non-U.S. bonds are normally valued by third-party pricing service providers that use broker quotations, reported trades or valuation estimates from their internal pricing models. The service providers’ internal models use inputs that are observable such as issuer details, interest rates, yield curves, prepayment speeds, credit risks/spreads, default rates and quoted prices for similar assets. Securities that use similar valuation techniques and inputs as described above are categorized as Level 2 of the fair value hierarchy. To the extent that these inputs are significant and unobservable, the values are categorized as Level 3 of the fair value hierarchy.
Mortgage-related and asset-backed securities are usually issued as separate tranches, or classes, of securities within each deal. These securities are also normally valued by third-party pricing service providers that use broker-dealer quotations or valuation estimates from their internal pricing models. The pricing models for these securities usually consider tranche-level attributes, current market data, estimated cash flows and market-based yield spreads for each tranche, and incorporate deal collateral performance, as available. Mortgage-related and asset-backed securities and the related forward sales commitments that use similar valuation techniques and inputs as described above are categorized as Level 2 of the fair value hierarchy. To the extent that these inputs are significant and unobservable, the values are categorized as Level 3 of the fair value hierarchy.
Common stocks, preferred stocks, rights, warrants, exchange-traded funds and financial derivative instruments, such as futures contracts or options contracts that are traded on a national securities exchange, are categorized as Level 1 of the fair value hierarchy, to the extent these securities are actively traded and valuation adjustments are not applied.
Valuation adjustments may be applied to certain securities that are solely traded on a foreign exchange to account for the market movement between the close of the foreign market and the NYSE close. Securities using these valuation adjustments are categorized as Level 2 of the fair value hierarchy. Preferred securities and other equities traded on inactive markets or valued by reference to similar instruments are also categorized as Level 2 of the fair value hierarchy.
Investments in registered open-end investment management companies are valued based upon the NAVs of such investments and are categorized as Level 1 of the fair value hierarchy.
Short-term investments having a maturity of 60 days or less are generally valued at amortized cost which approximates fair market value. These investments are categorized as Level 2 of the fair value hierarchy.
268
| | |
| | | |
| Notes to Financial Statements | | |
Over-the-counter financial derivative instruments, such as foreign currency contracts, forward foreign currency contracts, options contracts, or swap contracts, derive their value from underlying asset prices, indices, reference rates, and other inputs or a combination of these factors. These contracts are normally valued on the basis of broker dealer quotations or by third-party pricing service providers. Depending on the product and the terms of the transaction, the value of financial derivatives can be estimated by a third-party pricing service provider using a series of techniques, including simulation pricing models. The pricing models use inputs that are observed from actively quoted markets such as issuer details, indices, spreads, interest rates, yield curves, dividends and exchange rates. Financial derivatives that use similar valuation techniques and inputs as described above are categorized as Level 2 of the fair value hierarchy. To the extent that these inputs are significant and unobservable, the values are categorized as Level 3 of the fair value hierarchy.
Centrally cleared swaps listed or traded on a multilateral or trade facility platform, such as a registered exchange, are valued at the daily settlement price determined by the respective exchange. For centrally cleared credit default swaps the clearing facility requires its members to provide actionable levels across complete term structures. These levels along with external third party prices are used to produce daily settlement prices. Centrally cleared interest rate swaps are valued using a pricing model that references the underlying rates including the overnight index swap rate and London Interbank Offered Rate (“LIBOR”) forward rate to produce the daily settlement price. These securities are categorized as Level 2 of the fair value hierarchy.
The Funds’ policy is to recognize transfers between levels at the end of the reporting period. In some instances, the inputs used to measure fair value might fall in different levels of the fair value hierarchy. The level in the fair value hierarchy within which the fair value measurement in its entirety falls is determined based on the lowest level input that is significant to the fair value measurement in its entirety. Because of the inherent uncertainties of valuation, the values reflected in the financial statements may materially differ from the value received upon actual sale of those investments.
The following table summarizes the valuation of each Fund’s assets and liabilities using the fair value hierarchy:
| | | | | | | | | | | | | | | | |
| | | Total Fair Value at
August 31, 2016 | | | Unadjusted Quoted Prices
in Active Markets
for Identical Investments
(Level 1) | | | Significant Observable
Inputs (Level 2) | | | Significant
Unobservable
Inputs (Level 3) | |
| Large Cap Equity Fund | | | | | | | | | | | | | | | | |
Investments, at value | | | | | | | | | | | | | | | | |
Common Stocks: | | | | | | | | | | | | | | | | |
Consumer Discretionary | | $ | 201,664,102 | | | $ | 201,664,102 | | | $ | — | | | $ | — | |
Consumer Staples | | | 158,719,120 | | | | 158,719,120 | | | | — | | | | — | |
Energy | | | 113,792,599 | | | | 113,792,599 | | | | — | | | | — | |
Financials | | | 219,968,881 | | | | 219,968,881 | | | | — | | | | — | |
Health Care | | | 254,649,525 | | | | 254,649,525 | | | | — | | | | — | |
Industrials | | | 142,425,267 | | | | 142,425,267 | | | | — | | | | — | |
Information Technology | | | 388,563,076 | | | | 388,563,076 | | | | — | | | | — | |
Materials | | | 50,238,804 | | | | 50,238,804 | | | | — | | | | — | |
Telecommunication Services | | | 35,089,881 | | | | 35,089,881 | | | | — | | | | — | |
Utilities | | | 34,434,957 | | | | 34,434,957 | | | | — | | | | — | |
Closed End Mutual Fund Security: | | | | | | | | | | | | | | | | |
Financials | | | 65,802,109 | | | | 65,802,109 | | | | — | | | | — | |
Short-Term Investments: | | | | | | | | | | | | | | | | |
Money Market Fund | | | 17,790,848 | | | | 17,790,848 | | | | — | | | | — | |
Time Deposits | | | 29,382,453 | | | | — | | | | 29,382,453 | | | | — | |
| | | | | | | | | | | | | | | | |
| Total Investments, at value | | $ | 1,712,521,622 | | | $ | 1,683,139,169 | | | $ | 29,382,453 | | | $ | — | |
| | | | | | | | | | | | | | | | |
269
| | |
| | | |
| Notes to Financial Statements | | |
| | | | | | | | | | | | | | | | |
| | | Total Fair Value at
August 31, 2016 | | | Unadjusted Quoted Prices
in Active Markets
for Identical Investments
(Level 1) | | | Significant Observable
Inputs (Level 2) | | | Significant
Unobservable
Inputs (Level 3) | |
| Small-Mid Cap Equity Fund | | | | | | | | | | | | | | | | |
Investments, at value | | | | | | | | | | | | | | | | |
Common Stocks: | | | | | | | | | | | | | | | | |
Consumer Discretionary | | $ | 65,366,809 | | | $ | 65,366,809 | | | $ | — | | | $ | — | |
Consumer Staples | | | 11,445,478 | | | | 11,445,478 | | | | — | | | | — | |
Energy | | | 12,260,450 | | | | 12,260,450 | | | | — | | | | — | |
Financials | | | 83,897,041 | | | | 83,897,041 | | | | — | | | | — | |
Health Care | | | 63,713,066 | | | | 63,713,066 | | | | — | | | | — | |
Industrials | | | 92,700,162 | | | | 92,657,420 | | | | — | | | | 42,742 | |
Information Technology | | | 89,135,156 | | | | 89,135,156 | | | | — | | | | — | |
Materials | | | 28,044,022 | | | | 28,044,022 | | | | — | | | | — | |
Telecommunication Services | | | 2,924,914 | | | | 2,924,914 | | | | — | | | | — | |
Utilities | | | 9,235,908 | | | | 9,235,908 | | | | — | | | | — | |
Preferred Stock: | | | | | | | | | | | | | | | | |
Utilities | | | 292,825 | | | | 292,825 | | | | — | | | | — | |
Right: | | | | | | | | | | | | | | | | |
Energy | | | 60 | | | | 60 | | | | — | | | | — | |
Short-Term Investments: | | | | | | | | | | | | | | | | |
Money Market Fund | | | 18,447,756 | | | | 18,447,756 | | | | — | | | | — | |
Time Deposits | | | 11,770,868 | | | | — | | | | 11,770,868 | | | | — | |
| | | | | | | | | | | | | | | | |
| Total Investments, at value | | $ | 489,234,515 | | | $ | 477,420,905 | | | $ | 11,770,868 | | | $ | 42,742 | |
| | | | | | | | | | | | | | | | |
| International Equity Fund | | | | | | | | | | | | | | | | |
Investments, at value | | | | | | | | | | | | | | | | |
Common Stocks: | | | | | | | | | | | | | | | | |
France | | $ | 117,116,830 | | | $ | — | | | $ | 117,116,830 | | | $ | — | |
Germany | | | 99,340,441 | | | | — | | | | 99,340,441 | | | | — | |
Japan | | | 178,793,299 | | | | — | | | | 178,793,299 | | | | — | |
Netherlands | | | 61,974,622 | | | | 570,810 | | | | 61,403,812 | | | | — | |
Switzerland | | | 118,837,611 | | | | — | | | | 118,837,611 | | | | — | |
United Kingdom | | | 207,644,164 | | | | — | | | | 207,644,164 | | | | — | |
Other Countries* | | | 304,795,481 | | | | 46,360,482 | | | | 258,434,999 | | | | — | |
Preferred Stocks: | | | | | | | | | | | | | | | | |
Brazil | | | 1,715,641 | | | | 1,715,641 | | | | — | | | | — | |
Germany | | | 11,527,937 | | | | — | | | | 11,527,937 | | | | — | |
Short-Term Investments: | | | | | | | | | | | | | | | | |
Money Market Fund | | | 4,174,893 | | | | 4,174,893 | | | | — | | | | — | |
Time Deposits | | | 18,133,542 | | | | — | | | | 18,133,542 | | | | — | |
| | | | | | | | | | | | | | | | |
| Total Investments, at value | | $ | 1,124,054,461 | | | $ | 52,821,826 | | | $ | 1,071,232,635 | | | $ | — | |
| | | | | | | | | | | | | | | | |
| Emerging Markets Equity Fund | | | | | | | | | | | | | | | | |
Investments, at value | | | | | | | | | | | | | | | | |
Common Stocks: | | | | | | | | | | | | | | | | |
Brazil | | $ | 31,871,649 | | | $ | 31,495,138 | | | $ | — | | | $ | 376,511 | |
China | | | 81,558,710 | | | | 27,426,443 | | | | 54,132,267 | | | | — | |
India | | | 34,379,185 | | | | — | | | | 34,379,185 | | | | — | |
Russia | | | 22,066,630 | | | | 3,288,166 | | | | 18,778,464 | | | | — | |
South Africa | | | 29,494,329 | | | | — | | | | 29,494,329 | | | | — | |
270
| | |
| | | |
| Notes to Financial Statements | | |
| | | | | | | | | | | | | | | | |
| | | Total Fair Value at
August 31, 2016 | | | Unadjusted Quoted Prices
in Active Markets
for Identical Investments
(Level 1) | | | Significant Observable
Inputs (Level 2) | | | Significant
Unobservable
Inputs (Level 3) | |
South Korea | | $ | 46,241,488 | | | $ | — | | | $ | 46,241,488 | | | $ | — | |
Taiwan | | | 34,109,775 | | | | — | | | | 34,109,775 | | | | — | |
Other Countries* | | | 124,670,039 | | | | 39,117,349 | | | | 85,552,690 | | | | — | |
Preferred Stocks: | | | | | | | | | | | | | | | | |
Brazil | | | 4,255,334 | | | | 4,255,334 | | | | — | | | | — | |
Chile | | | 85,250 | | | | 85,250 | | | | — | | | | — | |
Colombia | | | 1,782,877 | | | | 1,782,877 | | | | — | | | | — | |
Russia | | | 180,366 | | | | — | | | | 180,366 | | | | — | |
South Korea | | | 3,198,214 | | | | — | | | | 3,198,214 | | | | — | |
Rights: | | | | | | | | | | | | | | | | |
Brazil | | | 192 | | | | 192 | | | | — | | | | — | |
South Africa | | | 131,765 | | | | 131,765 | | | | — | | | | — | |
South Korea | | | — | ** | | | — | | | | — | | | | — | ** |
Short-Term Investments: | | | | | | | | | | | | | | | | |
Money Market Fund | | | 3,683,541 | | | | 3,683,541 | | | | — | | | | — | |
Time Deposits | | | 13,653,963 | | | | — | | | | 13,653,963 | | | | — | |
| | | | | | | | | | | | | | | | |
| Total Investments, at value | | $ | 431,363,307 | | | $ | 111,266,055 | | | $ | 319,720,741 | | | $ | 376,511 | |
| | | | | | | | | | | | | | | | |
| Other Financial Instruments — Liabilities | | | | | | | | | | | | | | | | |
Futures Contract | | $ | (12,626 | ) | | $ | (12,626 | ) | | $ | — | | | $ | — | |
| | | | | | | | | | | | | | | | |
| Total Other Financial Instruments — Liabilities | | $ | (12,626 | ) | | $ | (12,626 | ) | | $ | — | | | $ | — | |
| | | | | | | | | | | | | | | | |
| Core Fixed Income Fund | | | | | | | | | | | | | | | | |
Investments, at value | | | | | | | | | | | | | | | | |
Corporate Bonds & Notes | | $ | 199,335,433 | ** | | $ | — | | | $ | 199,335,433 | | | $ | — | ** |
U.S. Government Agencies & Obligations | | | 197,665,884 | | | | — | | | | 197,665,884 | | | | — | |
Mortgage-Backed Securities | | | 177,394,664 | | | | — | | | | 177,394,664 | | | | — | |
Collateralized Mortgage Obligations | | | 86,984,235 | | | | — | | | | 86,984,235 | | | | — | |
Sovereign Bonds | | | 20,216,325 | | | | — | | | | 20,216,325 | | | | — | |
Asset-Backed Securities | | | 16,405,603 | | | | — | | | | 16,405,603 | | | | — | |
Municipal Bonds | | | 5,600,916 | | | | — | | | | 5,600,916 | | | | — | |
Senior Loans | | | 1,247,263 | | | | — | | | | 1,247,263 | | | | — | |
Preferred Stock: | | | | | | | | | | | | | | | | |
Financials | | | 260,178 | | | | 260,178 | | | | — | | | | — | |
Purchased Options | | | 45,672 | | | | 45,672 | | | | — | | | | — | |
Short-Term Investments: | | | | | | | | | | | | | | | | |
Money Market Fund | | | 20,555,472 | | | | 20,555,472 | | | | — | | | | — | |
Repurchase Agreement | | | 8,500,000 | | | | — | | | | 8,500,000 | | | | — | |
Time Deposits | | | 8,432,325 | | | | — | | | | 8,432,325 | | | | — | |
U.S. Government Obligations | | | 36,875,986 | | | | — | | | | 36,875,986 | | | | — | |
| | | | | | | | | | | | | | | | |
| Total Investments, at value | | $ | 779,519,956 | ** | | $ | 20,861,322 | | | $ | 758,658,634 | | | $ | — | ** |
| | | | | | | | | | | | | | | | |
| Other Financial Instruments — Assets | | | | | | | | | | | | | | | | |
Futures Contracts | | $ | 99,621 | | | $ | 99,621 | | | $ | — | | | $ | — | |
Forward Foreign Currency Contracts | | | 199,247 | | | | — | | | | 199,247 | | | | — | |
| | | | | | | | | | | | | | | | |
| Total Other Financial Instruments — Assets | | $ | 298,868 | | | $ | 99,621 | | | $ | 199,247 | | | $ | — | |
| | | | | | | | | | | | | | | | |
| Other Financial Instruments — Liabilities | | | | | | | | | | | | | | | | |
Options Contracts Written | | $ | (49,938 | ) | | $ | (49,938 | ) | | $ | — | | | $ | — | |
Forward Sale Commitments | | | (4,736,777 | ) | | | — | | | | (4,736,777 | ) | | | — | |
Futures Contracts | | | (283,274 | ) | | | (283,274 | ) | | | — | | | | — | |
Forward Foreign Currency Contracts | | | (228,474 | ) | | | — | | | | (228,474 | ) | | | — | |
Centrally Cleared Interest Rate Swaps | | | (752,515 | ) | | | — | | | | (752,515 | ) | | | — | |
| | | | | | | | | | | | | | | | |
| Total Other Financial Instruments — Liabilities | | $ | (6,050,978 | ) | | $ | (333,212 | ) | | $ | (5,717,766 | ) | | $ | — | |
| | | | | | | | | | | | | | | | |
271
| | |
| | | |
| Notes to Financial Statements | | |
| | | | | | | | | | | | | | | | |
| | | Total Fair Value at
August 31, 2016 | | | Unadjusted Quoted Prices
in Active Markets
for Identical Investments
(Level 1) | | | Significant Observable
Inputs (Level 2) | | | Significant
Unobservable
Inputs (Level 3) | |
| High Yield Fund | | | | | | | | | | | | | | | | |
Investments, at value | | | | | | | | | | | | | | | | |
Corporate Bonds & Notes | | $ | 310,260,247 | ** | | $ | — | | | $ | 310,048,589 | | | $ | 211,658 | ** |
Senior Loans | | | 1,646,634 | | | | — | | | | 1,646,634 | | | | — | |
Collateralized Mortgage Obligations | | | 473,147 | | | | — | | | | 473,147 | | | | — | |
Preferred Stock: | | | | | | | | | | | | | | | | |
Financials | | | 1,003,049 | | | | 1,003,049 | | | | — | | | | — | |
Common Stocks: | | | | | | | | | | | | | | | | |
Consumer Discretionary | | | 90,174 | | | | — | | | | — | | | | 90,174 | |
Energy | | | 850,336 | | | | 419,191 | | | | 305,638 | | | | 125,507 | |
Financials | | | — | ** | | | — | | | | — | | | | — | ** |
Materials | | | — | ** | | | — | | | | — | | | | — | ** |
Convertible Preferred Stock: | | | | | | | | | | | | | | | | |
Energy | | | 334,880 | | | | 334,880 | | | | — | | | | — | |
Short-Term Investments: | | | | | | | | | | | | | | | | |
Money Market Fund | | | 13,683,734 | | | | 13,683,734 | | | | — | | | | — | |
Time Deposits | | | 5,940,555 | | | | — | | | | 5,940,555 | | | | — | |
| | | | | | | | | | | | | | | | |
| Total Investments, at value | | $ | 334,282,756 | ** | | $ | 15,440,854 | | | $ | 318,414,563 | | | $ | 427,339 | ** |
| | | | | | | | | | | | | | | | |
| International Fixed Income Fund | | | | | | | | | | | | | | | | |
Investments, at value | | | | | | | | | | | | | | | | |
Sovereign Bonds: | | | | | | | | | | | | | | | | |
Japan | | $ | 18,021,070 | | | $ | — | | | $ | 18,021,070 | | | $ | — | |
United Kingdom | | | 14,094,567 | | | | — | | | | 14,094,567 | | | | — | |
Other Countries* | | | 47,072,788 | | | | — | | | | 47,072,788 | | | | — | |
Corporate Bonds & Notes: | | | | | | | | | | | | | | | | |
Denmark | | | 26,521,536 | | | | — | | | | 26,521,536 | | | | — | |
Other Countries* | | | 33,995,854 | | | | — | | | | 33,995,854 | | | | — | |
Collateralized Mortgage Obligations | | | 28,419,231 | | | | — | | | | 28,419,231 | | | | — | |
U.S. Government Obligations | | | 14,390,097 | | | | — | | | | 14,390,097 | | | | — | |
Mortgage-Backed Securities: | | | | | | | | | | | | | | | | |
FNMA | | | 11,048,470 | | | | — | | | | 11,048,470 | | | | — | |
Other Securities*** | | | 2,902,112 | | | | — | | | | 2,902,112 | | | | — | |
Asset-Backed Securities | | | 666,803 | | | | — | | | | 666,803 | | | | — | |
Purchased Options | | | 223,129 | | | | 864 | | | | 222,265 | | | | — | |
Short-Term Investments: | | | | | | | | | | | | | | | | |
Money Market Fund | | | 557,865 | | | | 557,865 | | | | — | | | | — | |
Sovereign Bonds: | | | | | | | | | | | | | | | | |
Japan | | | 25,821,851 | | | | — | | | | 25,821,851 | | | | — | |
Other Countries* | | | 537,211 | | | | — | | | | 537,211 | | | | — | |
Time Deposits | | | 3,184,208 | | | | — | | | | 3,184,208 | | | | — | |
U.S. Government Agencies | | | 399,861 | | | | — | | | | 399,861 | | | | — | |
U.S. Government Obligations | | | 1,769,767 | | | | — | | | | 1,769,767 | | | | — | |
| | | | | | | | | | | | | | | | |
| Total Investments, at value | | $ | 229,626,420 | | | $ | 558,729 | | | $ | 229,067,691 | | | $ | — | |
| | | | | | | | | | | | | | | | |
| Other Financial Instruments — Assets | | | | | | | | | | | | | | | | |
Futures Contracts | | $ | 836,618 | | | $ | 836,618 | | | $ | — | | | $ | — | |
Forward Foreign Currency Contracts | | | 1,664,139 | | | | — | | | | 1,664,139 | | | | — | |
Centrally Cleared Interest Rate Swaps | | | 826,056 | | | | — | | | | 826,056 | | | | — | |
OTC Volatility Swaps | | | 35,214 | | | | — | | | | 35,214 | | | | — | |
OTC Credit Default Swaps | | | 90,207 | | | | — | | | | 90,207 | | | | — | |
Centrally Cleared Credit Default Swaps | | | 19,888 | | | | — | | | | 19,888 | | | | — | |
OTC Cross Currency Swaps | | | 256,892 | | | | — | | | | 256,892 | | | | — | |
| | | | | | | | | | | | | | | | |
| Total Other Financial Instruments — Assets | | $ | 3,729,014 | | | $ | 836,618 | | | $ | 2,892,396 | | | $ | — | |
| | | | | | | | | | | | | | | | |
272
| | |
| | | |
| Notes to Financial Statements | | |
| | | | | | | | | | | | | | | | |
| | | Total Fair Value at
August 31, 2016 | | | Unadjusted Quoted Prices
in Active Markets
for Identical Investments
(Level 1) | | | Significant Observable
Inputs (Level 2) | | | Significant
Unobservable
Inputs (Level 3) | |
| Other Financial Instruments — Liabilities | | | | | | | | | | | | | | | | |
Options Contracts Written | | $ | (271,144 | ) | | $ | — | | | $ | (271,144 | ) | | $ | — | |
Reverse Repurchase Agreements | | | (16,608,550 | ) | | | — | | | | (16,608,550 | ) | | | — | |
Forward Sale Commitments | | | (5,416,992 | ) | | | — | | | | (5,416,992 | ) | | | — | |
Futures Contracts | | | (383,006 | ) | | | (383,006 | ) | | | — | | | | — | |
Forward Foreign Currency Contracts | | | (2,839,967 | ) | | | — | | | | (2,839,967 | ) | | | — | |
Centrally Cleared Interest Rate Swaps | | | (3,231,675 | ) | | | — | | | | (3,231,675 | ) | | | — | |
OTC Volatility Swaps | | | (15,488 | ) | | | — | | | | (15,488 | ) | | | — | |
OTC Credit Default Swaps | | | (108,405 | ) | | | — | | | | (108,405 | ) | | | — | |
Centrally Cleared Credit Default Swaps | | | (75,218 | ) | | | — | | | | (75,218 | ) | | | — | |
OTC Cross Currency Swaps | | | (1,419,282 | ) | | | — | | | | (1,419,282 | ) | | | — | |
| | | | | | | | | | | | | | | | |
| Total Other Financial Instruments — Liabilities | | $ | (30,369,727 | ) | | $ | (383,006 | ) | | $ | (29,986,721 | ) | | $ | — | |
| | | | | | | | | | | | | | | | |
| Municipal Bond Fund | | | | | | | | | | | | | | | | |
Investments, at value | | | | | | | | | | | | | | | | |
Municipal Bonds | | $ | 66,346,922 | | | $ | — | | | $ | 66,346,922 | | | $ | — | |
Short-Term Investments: | | | | | | | | | | | | | | | | |
Time Deposits | | | 2,473,128 | | | | — | | | | 2,473,128 | | | | — | |
| | | | | | | | | | | | | | | | |
| Total Investments, at value | | $ | 68,820,050 | | | $ | — | | | $ | 68,820,050 | | | $ | — | |
| | | | | | | | | | | | | | | | |
| Inflation-Linked Fixed Income Fund | | | | | | | | | | | | | | | | |
Investments, at value | | | | | | | | | | | | | | | | |
U.S. Government Obligations | | $ | 186,705,509 | | | $ | — | | | $ | 186,705,509 | | | $ | — | |
Sovereign Bonds | | | 13,834,681 | | | | — | | | | 13,834,681 | | | | — | |
Collateralized Mortgage Obligations | | | 10,050,922 | | | | — | | | | 9,251,016 | | | | 799,906 | |
Corporate Bonds & Notes | | | 6,043,989 | | | | — | | | | 6,043,989 | | | | — | |
Mortgage-Backed Securities | | | 4,197,305 | | | | — | | | | 4,197,305 | | | | — | |
Purchased Options | | | 252,681 | | | | 36,712 | | | | 215,969 | | | | — | |
Short-Term Investments: | | | | | | | | | |
Time Deposits | | | 515,025 | | | | — | | | | 515,025 | | | | — | |
U.S. Government Agencies | | | 399,848 | | | | — | | | | 399,848 | | | | — | |
| | | | | | | | | | | | | | | | |
Total Investments, at value | | $ | 221,999,960 | | | $ | 36,712 | | | $ | 221,163,342 | | | $ | 799,906 | |
| | | | | | | | | | | | | | | | |
| Other Financial Instruments — Assets | | | | | | | | | | | | | | | | |
Futures Contracts | | $ | 42,794 | | | $ | 42,794 | | | $ | — | | | $ | — | |
Forward Foreign Currency Contracts | | | 132,066 | | | | — | | | | 132,066 | | | | — | |
OTC Inflation Rate Swaps | | | 10,678 | | | | — | | | | 10,678 | | | | — | |
OTC Credit Default Swaps | | | 6,300 | | | | — | | | | 6,300 | | | | — | |
| | | | | | | | | | | | | | | | |
Total Other Financial Instruments — Assets | | $ | 191,838 | | | $ | 42,794 | | | $ | 149,044 | | | $ | — | |
| | | | | | | | | | | | | | | | |
| Other Financial Instruments — Liabilities | | | | | | | | | | | | | | | | |
Options Contracts Written | | $ | (15,540 | ) | | $ | (5,500 | ) | | $ | (10,040 | ) | | $ | — | |
Reverse Repurchase Agreements | | | (57,641,125 | ) | | | — | | | | (57,641,125 | ) | | | — | |
Futures Contracts | | | (56,654 | ) | | | (56,654 | ) | | | — | | | | — | |
Forward Foreign Currency Contracts | | | (1,108,640 | ) | | | — | | | | (1,108,640 | ) | | | — | |
Centrally Cleared Interest Rate Swaps | | | (762,014 | ) | | | — | | | | (762,014 | ) | | | — | |
OTC Inflation Rate Swaps | | | (133,863 | ) | | | — | | | | (133,863 | ) | | | — | |
Centrally Cleared Credit Default Swap | | | (2,630 | ) | | | — | | | | (2,630 | ) | | | — | |
| | | | | | | | | | | | | | | | |
Total Other Financial Instruments — Liabilities | | $ | (59,720,466 | ) | | $ | (62,154 | ) | | $ | (59,658,312 | ) | | $ | — | |
| | | | | | | | | | | | | | | | |
| Ultra-Short Term Fixed Income Fund | | | | | | | | | | | | | | | | |
Investments, at value | | | | | | | | | | | | | | | | |
Corporate Bonds & Notes | | $ | 111,487,614 | | | $ | — | | | $ | 111,487,614 | | | $ | — | |
Collateralized Mortgage Obligations | | | 27,951,711 | | | | — | | | | 27,951,711 | | | | — | |
273
| | |
| | | |
| Notes to Financial Statements | | |
| | | | | | | | | | | | | | | | |
| | | Total Fair Value at
August 31, 2016 | | | Unadjusted Quoted Prices
in Active Markets
for Identical Investments
(Level 1) | | | Significant Observable
Inputs (Level 2) | | | Significant
Unobservable
Inputs (Level 3) | |
U.S. Government Obligation | | $ | 11,020,792 | | | $ | — | | | $ | 11,020,792 | | | $ | — | |
Sovereign Bonds | | | 8,774,205 | | | | — | | | | 8,774,205 | | | | — | |
Senior Loan | | | 1,206,450 | | | | — | | | | 1,206,450 | | | | — | |
Certificate of Deposit | | | 993,500 | | | | — | | | | 993,500 | | | | — | |
Asset-Backed Security | | | 400,499 | | | | — | | | | 400,499 | | | | — | |
Short-Term Investments: | | | | | | | | | |
Commercial Paper | | | 2,788,958 | | | | — | | | | 2,788,958 | | | | — | |
Repurchase Agreement | | | 1,900,000 | | | | — | | | | 1,900,000 | | | | — | |
Time Deposits | | | 581,606 | | | | — | | | | 581,606 | | | | — | |
U.S. Government Obligations | | | 14,324,388 | | | | — | | | | 14,324,388 | | | | — | |
| | | | | | | | | | | | | | | | |
Total Investments, at value | | $ | 181,429,723 | | | $ | — | | | $ | 181,429,723 | | | $ | — | |
| | | | | | | | | | | | | | | | |
| Other Financial Instruments — Assets | | | | | | | | | | | | | | | | |
Futures Contracts | | $ | 73,995 | | | $ | 73,995 | | | $ | — | | | $ | — | |
Forward Foreign Currency Contracts | | | 85,947 | | | | — | | | | 85,947 | | | | — | |
| | | | | | | | | | | | | | | | |
Total Other Financial Instruments — Assets | | $ | 159,942 | | | $ | 73,995 | | | $ | 85,947 | | | $ | — | |
| | | | | | | | | | | | | | | | |
| Other Financial Instruments — Liabilities | | | | | | | | | | | | | | | | |
Futures Contracts | | $ | (142,814 | ) | | $ | (142,814 | ) | | $ | — | | | $ | — | |
Forward Foreign Currency Contracts | | | (48,646 | ) | | | — | | | | (48,646 | ) | | | — | |
| | | | | | | | | | | | | | | | |
Total Other Financial Instruments — Liabilities | | $ | (191,460 | ) | | $ | (142,814 | ) | | $ | (48,646 | ) | | $ | — | |
| | | | | | | | | | | | | | | | |
| * | Other Countries represents Countries that are individually less than 5% of Net Assets. |
| ** | Includes securities that are fair valued by the Board at $0. |
| *** | Other Securities represents other categories that are individually less than 5% of Net Assets. |
The level classification by major category of investments is the same as the category presentation in the Schedules of Investments.
As of the year end August 31, 2016, there were no transfers from Level 1 to Level 3 and from Level 1 to Level 2. Core Fixed Income Fund had a transfer from Level 3 to Level 2 of $401,574 and High Yield Fund had transfer from Level 2 to Level 3 of $54,749.
The following is a reconciliation of assets for which significant unobservable inputs (Level 3) were used in determining fair value during the year September 1, 2015, through August 31, 2016:
| | | | | | | | | | | | | | | | | | | | |
| | | Total | | | Collateralized
Mortgage
Obligations | | | Common
Stocks | | | Corporate
Bonds &
Notes | | | Rights | |
| Small-Mid Cap Equity Fund | | | | | | | | | | | | | | | | | | | | |
Balance as of August 31, 2015 | | $ | — | | | $ | — | | | $ | — | | | $ | — | | | $ | — | |
Total realized gain (loss) | | | — | | | | — | | | | — | | | | — | | | | — | |
Change in unrealized appreciation (depreciation) | | | 16,406 | | | | — | | | | 16,406 | | | | — | | | | — | |
Purchases | | | 26,336 | | | | — | | | | 26,336 | | | | — | | | | — | |
(Sales) | | | — | | | | — | | | | — | | | | — | | | | — | |
Transfers In | | | — | | | | — | | | | — | | | | — | | | | — | |
Transfers Out | | | — | | | | — | | | | — | | | | — | | | | — | |
| | | | | | | | | | | | | | | | | | | | |
Balance as of August 31, 2016 | | $ | 42,742 | | | $ | — | | | $ | 42,742 | | | $ | — | | | $ | — | |
| | | | | | | | | | | | | | | | | | | | |
| Change in unrealized appreciation (depreciation) from Investments held as of August 31, 2016 | | $ | 16,406 | | | $ | — | | | $ | 16,406 | | | $ | — | | | $ | — | |
| | | | | | | | | | | | | | | | | | | | |
| | | | | |
| Emerging Markets Equity Fund | | | | | | | | | | | | | | | | | | | | |
Balance as of August 31, 2015 | | $ | — | | | $ | — | | | $ | — | | | $ | — | | | $ | — | |
Total realized gain (loss) | | | — | | | | — | | | | — | | | | — | | | | — | |
Change in unrealized appreciation (depreciation) | | | (23,437 | ) | | | — | | | | (23,437 | ) | | | — | | | | — | |
274
| | |
| | | |
| Notes to Financial Statements | | |
| | | | | | | | | | | | | | | | | | | | |
| | | Total | | | Collateralized
Mortgage
Obligations | | | Common
Stocks | | | Corporate
Bonds &
Notes | | | Rights | |
Purchases | | $ | 399,948 | * | | $ | — | | | $ | 399,948 | | | $ | — | | | $ | — | * |
(Sales) | | | — | | | | — | | | | — | | | | — | | | | — | |
Transfers In | | | — | | | | — | | | | — | | | | — | | | | — | |
Transfers Out | | | — | | | | — | | | | — | | | | — | | | | — | |
| | | | | | | | | | | | | | | | | | | | |
Balance as of August 31, 2016 | | $ | 376,511 | * | | $ | — | | | $ | 376,511 | | | $ | — | | | $ | — | * |
| | | | | | | | | | | | | | | | | | | | |
| Change in unrealized appreciation (depreciation) from Investments held as of August 31, 2016 | | $ | (23,437 | ) | | $ | — | | | $ | (23,437 | ) | | $ | — | | | $ | — | |
| | | | | | | | | | | | | | | | | | | | |
| | | | | |
| Core Fixed Income Fund | | | | | | | | | | | | | | | | | | | | |
Balance as of August 31, 2015 | | $ | 398,508 | * | | $ | 398,508 | | | $ | — | | | $ | — | * | | $ | — | |
Total realized gain (loss) | | | — | | | | — | | | | — | | | | — | | | | — | |
Change in unrealized appreciation (depreciation) | | | 3,066 | | | | 3,066 | | | | — | | | | — | | | | — | |
Purchases | | | — | | | | — | | | | — | | | | — | | | | — | |
(Sales) | | | — | | | | — | | | | — | | | | — | | | | — | |
Transfers In | | | — | | | | — | | | | — | | | | — | | | | — | |
Transfers Out | | | (401,574 | ) | | | (401,574 | ) | | | — | | | | — | | | | — | |
| | | | | | | | | | | | | | | | | | | | |
Balance as of August 31, 2016 | | $ | — | * | | $ | — | | | $ | — | | | $ | — | * | | $ | — | |
| | | | | | | | | | | | | | | | | | | | |
| Change in unrealized appreciation (depreciation) from Investments held as of August 31, 2016 | | $ | — | | | $ | — | | | $ | — | | | $ | — | | | $ | — | |
| | | | | | | | | | | | | | | | | | | | |
| | | | | |
| High Yield Fund | | | | | | | | | | | | | | | | | | | | |
Balance as of August 31, 2015 | | $ | 385,004 | * | | $ | — | | | $ | 254,136 | * | | $ | 130,868 | * | | $ | — | |
Total realized gain (loss) | | | 15,197 | | | | — | | | | 17,926 | | | | (2,729 | ) | | | — | |
Accrued discounts (premiums) | | | 3,805 | | | | — | | | | — | | | | 3,805 | | | | — | |
Change in unrealized appreciation (depreciation) | | | 89,456 | | | | — | | | | 85,140 | | | | 4,316 | | | | — | |
Purchases | | | 20,677 | | | | — | | | | — | | | | 20,677 | | | | — | |
(Sales) | | | (141,549 | ) | | | — | | | | (141,521 | ) | | | (28 | ) | | | — | |
Transfers In | | | 54,749 | | | | — | | | | — | | | | 54,749 | | | | — | |
Transfers Out | | | — | | | | — | | | | — | | | | — | | | | — | |
| | | | | | | | | | | | | | | | | | | | |
Balance as of August 31, 2016 | | $ | 427,339 | * | | $ | — | | | $ | 215,681 | * | | $ | 211,658 | * | | $ | — | |
| | | | | | | | | | | | | | | | | | | | |
| Change in unrealized appreciation (depreciation) from Investments held as of August 31, 2016 | | $ | 74,051 | | | $ | — | | | $ | 77,745 | | | $ | (3,694 | ) | | $ | — | |
| | | | | | | | | | | | | | | | | | | | |
| | | | | |
| Inflation-Linked Fixed Income Fund | | | | | | | | | | | | | | | | | | | | |
Balance as of March 8, 2016** | | $ | — | | | $ | — | | | $ | — | | | $ | — | | | $ | — | |
Total realized gain (loss) | | | — | | | | — | | | | — | | | | — | | | | — | |
Change in unrealized appreciation (depreciation) | | | (94 | ) | | | (94 | ) | | | — | | | | — | | | | — | |
Purchases | | | 800,000 | | | | 800,000 | | | | — | | | | — | | | | — | |
(Sales) | | | — | | | | — | | | | — | | | | — | | | | — | |
Transfers In | | | — | | | | — | | | | — | | | | — | | | | — | |
Transfers Out | | | — | | | | — | | | | — | | | | — | | | | — | |
| | | | | | | | | | | | | | | | | | | | |
Balance as of August 31, 2016 | | $ | 799,906 | | | $ | 799,906 | | | $ | — | | | $ | — | | | $ | — | |
| | | | | | | | | | | | | | | | | | | | |
| Change in unrealized appreciation (depreciation) from Investments held as of August 31, 2016 | | $ | (94 | ) | | $ | (94 | ) | | $ | — | | | $ | — | | | $ | — | |
| | | | | | | | | | | | | | | | | | | | |
| * | Includes securities that are fair valued at $0. |
275
| | |
| | | |
| Notes to Financial Statements | | |
(b) Accounting for Derivative Instruments. Derivative instruments require enhanced disclosures regarding a Fund’s credit derivatives holdings, including credit default swaps, credit spread options, and hybrid financial instruments containing embedded credit derivatives.
All open derivative positions at year end for each Fund are disclosed in the Fund’s Schedule of Investments.
Certain Funds may use derivative instruments including futures, options, forward foreign currency contracts, swaptions and swap contracts as part of their investment strategies. Following is a description of these derivative instruments, including the primary underlying risk exposures related to each instrument type:
(i) Futures Contracts. Certain Funds may enter into futures contracts, to the extent permitted by their investment policies and objectives, for bonafide hedging and other permissible risk management purposes including protecting against anticipated changes in the value of securities a Fund intends to purchase. Upon entering into a futures contract, a Fund is required to deposit cash or securities as initial margin. Additional securities are also segregated as collateral up to the current market value of the futures contracts. Subsequent payments, known as variation margin, are made or received by the Fund, depending on the fluctuation in the value of the underlying financial instruments and are reported on the Statements of Assets and Liabilities. The Fund recognizes an unrealized gain or loss equal to the variation margin. When futures contracts are closed, a realized gain or loss is recognized which is equal to the difference between the proceeds from (or cost of) the closing transactions and the Fund’s basis in the contracts.
The risks associated with entering into futures contracts include the possibility that a change in the value of the contract may not correlate with the changes in the value of the underlying instruments. In addition, investing in futures contracts involves the risk that the Fund could lose more than the original margin deposit due to subsequent payments that may be required for a futures transaction.
(ii) Options Written. Certain Funds may write options to manage exposure to certain changes in the market. When a Fund writes an option, an amount equal to the premium received by the Fund is recorded as a liability, the value of which is marked-to-market daily to reflect the current market value of the option written. If the option expires, the Fund realizes a gain from investments equal to the amount of the premium received. When a written call option is exercised, the premium received is added to the proceeds from the sale of the underlying security in determining whether the Fund has a realized gain or loss. When a written put option is exercised, the amount of the premium received reduces the cost of the security purchased by the Fund.
When writing a covered call option, a Fund may forego the opportunity of profit if the market price of the underlying security increases more than the premium received and the option is exercised. When writing a put option, a Fund may incur a loss if the market price of the underlying security decreases more than the premium received and the option is exercised. In addition, there is the risk that the Fund may not be able to enter into a closing transaction because of an illiquid secondary market.
(iii) Purchased Options. Certain Funds may purchase options to manage exposure to certain changes in the market. A Fund will normally purchase call options in anticipation of an increase in the market value of securities of the type in which they may invest, an amount equal to the value is recorded as an asset. The purchase of a call option will entitle a Fund, in return for the premium paid, to purchase specified securities at a specified price during the option period. A Fund will ordinarily realize a gain if, during the option period, the value of such securities exceeded the sum of the exercise price, the premium paid and transaction costs; otherwise, the Fund will realize a loss equal to the amount of the premium paid on the purchase of the call option.
A Fund will normally purchase put options in anticipation of a decline in the market value of securities in its portfolio (“protective puts”) or in securities in which it may invest. The purchase of a put option will entitle the Fund, in exchange for the premium paid, to sell specified securities at a specified price during the option period. The purchase of protective puts is designed to offset or hedge against a decline in the market value of the Fund’s securities. Put options may also be purchased by a Fund for the purpose of affirmatively benefiting from a decline in the price of securities which it does not own. The Fund will ordinarily realize a gain if, during the option period, the value of the underlying securities decreased below the exercise price sufficiently to more than cover the premium and transaction costs; otherwise the Fund will realize a loss equal to the amount of the premium paid on the purchase of the put option. Gains and losses on the purchase of protective put options would tend to be offset by countervailing changes in the value of the underlying portfolio securities.
276
| | |
| | | |
| Notes to Financial Statements | | |
(iv) Forward Foreign Currency Contracts. Certain Funds may enter into forward foreign currency contracts to hedge against foreign currency exchange rate risk on their non-U.S. dollar denominated securities or to facilitate settlement of foreign currency denominated portfolio transactions. A forward foreign currency contract is an agreement between two parties to buy and sell a currency at a set price on a future date. The contract is marked-to-market daily and the change in value is recorded by a Fund as an unrealized gain or loss. When a forward foreign currency contract is extinguished, through either delivery or offset by entering into another forward foreign currency contract, the Fund records a realized gain or loss equal to the difference between the value of the contract at the time it was opened and the value of the contract at the time it was extinguished.
Forward foreign currency contracts involve elements of market risk in excess of the amounts reflected in the Statements of Assets and Liabilities. The Fund bears the risk of an unfavorable change in the foreign exchange rate underlying the forward foreign currency contract. Risks may also arise upon entering into these contracts from the potential inability of the counterparties to meet the terms of their contracts.
(v) Swaptions. Swaptions contracts entered into by the Funds typically represent an option that gives the purchaser the right, but not the obligation, to enter into a swap contract on a future date. Certain Funds may purchase swaptions to manage exposure to fluctuations in interest rates and to enhance portfolio yield. Changes in the value of purchased swaptions are reported as net change in unrealized appreciation or depreciation on the Statements of Operations and Changes in Net Assets Gain or loss is recognized when the swaptions contract expires or is closed as net realized gain or loss on the Statements of Operations and Changes in Net Assets. Details of purchased swaptions contracts held at year/period end are included on the Fund’s Schedule of Investments under the caption “Purchased Options”.
Certain Funds may write swaption contracts to manage exposure to fluctuations in interest rates and to enhance portfolio yield. Swaption contracts written by a Fund represent an option that obligates the writer upon exercise by the purchaser, to enter into a previously agreed upon swap contract on a future date. If a written call swaption is exercised, the writer will enter into a swap and is obligated to pay the fixed rate and receive a floating rate in exchange. If a written put swaption is exercised, the writer will enter a swap and is obligated to pay the floating rate and receive a fixed rate in exchange.
When a Fund writes a swaption, the premium received is recorded as a liability in the Statements of Assets and Liabilities and is subsequently adjusted to the current market value of the swaption. Changes in the value of the swaption are reported as unrealized gains or losses in the Statements of Operations. A gain or loss is recognized when the swaption contract expires or is closed. Premiums received from writing swaptions that expire or are exercised are treated by the Fund as realized gains from investments. The difference between the premium and the amount paid on effecting a closing purchase transaction is also treated as a realized gain or, if the premium received is less than the amount paid for the closing purchase, as a realized loss.
Entering into a swaption contract involves, to varying degrees, the elements of credit, market and interest rate risk, associated with both option contracts and swap contracts. To reduce credit risk from potential counterparty default, a Fund only enters into swaption contracts with counterparties that meet certain standards of creditworthiness. A Fund bears the market risk arising from any change in index values or interest rates.
(vi) Swap Contracts. Swaps involve the exchange by a Fund with another party of the respective amounts payable with respect to a notional principal amount related to one or more indices. Certain Funds may enter into these transactions to preserve a return or spread on a particular investment or portion of its assets, as a duration management technique or to protect against any increase in the price of securities the Fund anticipates purchasing at a later date. Certain Funds may also use these transactions for speculative purposes, such as to obtain the price performance of a security without actually purchasing the security in circumstances where, for example, the subject security is illiquid, is unavailable for direct investment or available only on less attractive terms.
Swaps are marked-to-market daily based upon quotations from market makers and the change, if any, is recorded as change in unrealized appreciation or depreciation in the Statements of Operations. Net receipts or payments of interest are recorded as realized gains or losses, respectively. Gains and losses are realized upon termination of a swap contract. An upfront payment received by the Fund, is recorded as a liability on the Fund’s books. An upfront payment made by the Fund is recorded as an asset on the Fund’s books. Any upfront payments paid or received upon entering a swap contract to compensate for differences between stated terms of the agreement and prevailing market conditions (e.g. credit spreads, interest rates or other factors) are recorded as a realized gain or loss at the termination of the swap.
277
| | |
| | | |
| Notes to Financial Statements | | |
Swaps have risks associated with them, including possible default by the counterparty to the transaction, illiquidity and, where swaps are used as hedges, the risk that the use of a swap could result in losses greater than if the swap had not been employed. This risk is mitigated by the posting of collateral by the counterparty to the Fund to cover the Fund’s exposure to the counterparty. Such amounts are reported on the Statements of Assets and Liabilities as deposits with counterparties.
(vii) Credit Default Swaps. Certain Funds may enter into credit default swap contracts for investment purposes, to manage their credit risk or to add leverage. As a seller in a credit default swap contract, a Fund is required to pay the notional or other agreed-upon value to the counterparty in the event of a default by a third party, such as a U.S. or foreign corporate issuer, on the referenced debt obligation. In return, the Fund receives from the counterparty a periodic stream of payments over the term of the contract provided that no event of default has occurred. If no default occurs, the Fund keeps the stream of payments and has no payment obligations. Such periodic payments are accrued daily and accounted for as realized gains.
Certain Funds may also purchase credit default swap contracts in order to hedge against the risk of default by debt securities held in their portfolios. In these cases a Fund functions as the counterparty referenced in the preceding paragraph. As a purchaser of a credit default swap contract, the Fund receives the notional or other agreed upon value from the counterparty in the event of a default by a third party, such as a U.S. or foreign corporate issuer, on the referenced debt obligation. In return, the Fund makes periodic payments to the counterparty over the term of the contract provided no event of default has occurred. Such periodic payments are accrued daily and accounted for as realized losses.
For a credit default swap sold by a Fund, payment of the agreed upon amount made by the Fund in the event of default of the referenced debt obligation is recorded as the cost of the referenced debt obligation received. For a credit default swap purchased by a Fund, the agreed upon amount received by the Fund in the event of default of the referenced debt obligation is recorded as proceeds from sale/delivery of the referenced debt obligation and the resulting gain or loss realized on the referenced debt obligation is recorded as such by the Fund.
Entering into credit default swaps involves, to varying degrees, elements of credit and market risk in excess of the related amounts recognized on the Statements of Assets and Liabilities. Such risks involve the possibility that there will be no liquid market for these agreements, that the counterparty to the agreements may default on its obligation to perform or disagree as to the meaning of the contractual terms in the agreements, and that there will be unfavorable changes in net interest rates. As privately negotiated transactions, swaps may involve risk, which is the risk that the swap contracts fail to contemplate a particular outcome or that the parties disagree about the proper interpretation of a transaction term.
(viii) Interest Rate Swaps. Certain Funds may enter into interest rate swaps for investment purposes to manage exposure to fluctuations in interest rates or to add leverage. Interest rate swaps represent an agreement between two counterparties to exchange cash flows based on the difference in the fixed interest rate and the floating interest rate, applied to the notional principal amount for a specified period. The payment flows are usually netted against each other, with the difference being paid by one party to the other. Once the payments are settled in cash, the net amount is recorded as realized gain or loss from swap contracts on the Statements of Operations. The Funds settle accrued net receivable or payable under the swap contracts on a periodic basis.
The primary risk associated with interest rate swaps is that unfavorable changes in interest rates could adversely impact a Fund.
(ix) Centrally Cleared Swaps. Certain clearinghouses currently offer clearing for limited types of derivatives transactions, principally credit and interest derivatives. In a centrally cleared derivative transaction, a Fund typically enters into the transaction with financial institution counterparty, and performance of the transaction is effectively guaranteed by a central clearinghouse, thereby reducing or eliminating the Fund’s exposure to the credit risk of the original counterparty. The Fund typically will be required to post specified levels of margin with the clearinghouse or at the instruction of the clearinghouse. The margin required by a clearinghouse may be greater than the margin the Fund would be required to post in an uncleared derivative transaction. Daily changes in valuation of centrally cleared swaps, if any, are recorded as variation margin receivable or payable on swap contracts for the change in value as appropriate on the Statements of Assets and Liabilities. Only a limited number of derivative transactions are currently eligible for clearing by clearinghouses.
(x) Cross-Currency Swaps. Certain Funds may enter into cross-currency swaps to gain or mitigate exposure to currency risk. Cross-currency swaps involve two parties exchanging two different currencies with an agreement to reverse the exchange at a
278
| | |
| | | |
| Notes to Financial Statements | | |
later date at specific exchange rates. The exchange of currencies at the inception date of the contract takes place at the current spot rate. The re-exchange at maturity may take place at the same exchange rate, a specified rate, or the then current spot rate. Interest payments, if applicable, are made between the parties based on interest rates available in the two currencies at the inception of the contract. The terms of cross-currency swap contracts may extend for many years. Cross-currency swaps are usually negotiated with commercial and investment banks. Some cross-currency swaps may not provide for exchanging principal cash flows, but only for exchanging interest cash flows.
(xi) Volatility Swap Contracts. A volatility swap is an agreement between counterparties to exchange periodic payments based on the measured volatility of a reference security, index, currency or other reference investment over a specified time frame. One cash flow is typically based on the realized volatility of the reference investment as measured by changes in its price or level over the specified time period while the other cash flow is based on a specified rate representing expected volatility for the reference investment at the time the swap is executed, or the measured volatility of a different reference investment over the specified time period. The appreciation or depreciation on a volatility swap will typically depend on the magnitude of the reference investment’s volatility, or size of the movements in its price, over the specified time period, rather than general directional increases or decreases in its price.
Volatility swaps are less standard in structure than other types of swaps and provide pure, or isolated, exposure to volatility risk of the specific underlying reference investment. Volatility swaps are typically used to speculate on future volatility levels, to trade the spread between realized and expected volatility, or to decrease the volatility exposure of investments held by the Fund.
Variance swaps are a type of volatility swap where counterparties agree to exchange periodic payments based on the measured variance (or the volatility squared) of a reference security, index, or other reference investment over a specified time period. At payment date, a net cash flow will be exchanged based on the difference between the realized variance of the reference investment over the specified time period and the specified rate representing expected variance for the reference investment at the time the swap is executed multiplied by the notional amount of the contract.
(xii) Inflation Rate Swap Contracts. The Fund may enter into inflation rate swap contracts to attempt to hedge against inflation. Pursuant to the inflation rate swap agreement, the Fund negotiates with a counterparty to exchange a periodic stream of payments, based on a benchmark inflation index. One cash flow stream will typically be a floating rate payment linked to the specified inflation index while the other is typically a fixed interest rate.
Inflation rate swaps are normally issued on a zero coupon basis where all payments compound during the life of the contract and are netted upon the termination or maturity of the contract. Final payments received or paid by the Fund are recorded as realized gains or losses in the Statement of Operations. Inflation rate swap contracts are subject to movements in interest rates.
The following is a summary of the fair valuations of the Funds’ derivative instruments categorized by risk exposure at August 31, 2016:
International Equity Fund
| | | | | | | | | | | | | | | | | | | | |
Effect of Derivative Instruments on the Statements of Operations as of August 31, 2016 | |
| | | | | |
| Location | | Interest rate
risk | | | Foreign
exchange risk | | | Credit
risk | | | Equity
risk | | | Total | |
| Realized gain/(loss) on derivatives recognized in income (d) | | | | | | | | | | | | | | | | | | | | |
Net realized gain (loss) on forward foreign currency contracts | | $ | — | | | | $ (634 | ) | | $ | — | | | $ | — | | | | $ (634 | ) |
| | | | | | | | | | | | | | | | | | | | |
| | $ | — | | | | $ (634 | ) | | $ | — | | | $ | — | | | | $ (634 | ) |
| | | | | | | | | | | | | | | | | | | | |
279
| | |
| | | |
| Notes to Financial Statements | | |
Emerging Markets Equity Fund
| | | | | | | | | | | | | | | | | | | | |
Fair Values of Derivative Instruments on the Statements of Assets and Liabilities as of August 31, 2016 | |
| | | | | |
| Location | | Interest rate
risk | | | Foreign
exchange
risk | | | Credit
risk | | | Equity
risk | | | Total | |
| Liability derivatives | | | | | | | | | | | | | | | | | | | | |
Unrealized depreciation on open futures contracts (b) | | $ | — | | | $ | — | | | $ | — | | | $ | 12,626 | | | $ | 12,626 | |
| | | | | | | | | | | | | | | | | | | | |
| | $ | — | | | $ | — | | | $ | — | | | $ | 12,626 | | | $ | 12,626 | |
| | | | | | | | | | | | | | | | | | | | |
| | | | | | | | | | | | | | | | | | | | |
Effect of Derivative Instruments on the Statements of Operations as of August 31, 2016 | |
| | | | | |
| Location | | Interest rate
risk | | | Foreign
exchange
risk | | | Credit
risk | | | Equity
risk | | | Total | |
| Realized gain/(loss) on derivatives recognized in income (d) | | | | | | | | | | | | | | | | | | | | |
Net realized gain (loss) on futures contracts | | | $ — | | | $ | — | | | $ | — | | | $ | (5,343 | ) | | $ | (5,343 | ) |
Net realized gain (loss) on forward foreign currency contracts | | | — | | | | 101,939 | | | | — | | | | — | | | | 101,939 | |
| | | | | | | | | | | | | | | | | | | | |
| | | $ — | | | $ | 101,939 | | | $ | — | | | $ | (5,343 | ) | | $ | 96,596 | |
| | | | | | | | | | | | | | | | | | | | |
Core Fixed Income Fund
| | | | | | | | | | | | | | | | | | | | |
Fair Values of Derivative Instruments on the Statements of Assets and Liabilities as of August 31, 2016 | |
| | | | | |
| Location | | Interest rate
risk | | | Foreign
exchange
risk | | | Credit
risk | | | Equity
risk | | | Total | |
| Asset derivatives | | | | | | | | | | | | | | | | | | | | |
Purchased options (c) | | $ | 45,672 | | | $ | — | | | $ | — | | | $ | — | | | $ | 45,672 | |
Unrealized appreciation on open futures contracts (b) | | | 79,296 | | | | 20,325 | | | | — | | | | — | | | | 99,621 | |
Unrealized appreciation on forward foreign currency contracts (c) | | | — | | | | 199,247 | | | | — | | | | — | | | | 199,247 | |
| | | | | | | | | | | | | | | | | | | | |
| | $ | 124,968 | | | $ | 219,572 | | | $ | — | | | $ | — | | | $ | 344,540 | |
| | | | | | | | | | | | | | | | | | | | |
| Liability derivatives | | | | | | | | | | | | | | | | | | | | |
Options contracts written outstanding (a) | | $ | 49,938 | | | $ | — | | | $ | — | | | $ | — | | | $ | 49,938 | |
Unrealized depreciation on open futures contracts (b) | | | 283,274 | | | | — | | | | — | | | | — | | | | 283,274 | |
Unrealized depreciation on forward foreign currency contracts (a) | | | — | | | | 228,474 | | | | — | | | | — | | | | 228,474 | |
Unrealized depreciation on centrally cleared swaps (f) | | | 752,515 | | | | — | | | | — | | | | — | | | | 752,515 | |
| | | | | | | | | | | | | | | | | | | | |
| | $ | 1,085,727 | | | $ | 228,474 | | | $ | — | | | $ | — | | | $ | 1,314,201 | |
| | | | | | | | | | | | | | | | | | | | |
| | | | | | | | | | | | | | | | | | | | |
Effect of Derivative Instruments on the Statements of Operations as of August 31, 2016 | |
| | | | | |
| Location | | Interest rate
risk | | | Foreign
exchange
risk | | | Credit
risk | | | Equity
risk | | | Total | |
| Realized gain/(loss) on derivatives recognized in income (d) | | | | | | | | | | | | | | | | | | | | |
Net realized gain (loss) on purchased options | | $ | (1,150,577 | ) | | $ | — | | | $ | — | | | $ | — | | | $ | (1,150,577 | ) |
Net realized gain (loss) on futures contracts | | | (967,289 | ) | | | (14,438 | ) | | | — | | | | — | | | | (981,727 | ) |
Net realized gain (loss) on options written | | | 787,451 | | | | — | | | | — | | | | — | | | | 787,451 | |
Net realized gain (loss) on swaps contracts | | | (160,736 | ) | | | — | | | | — | | | | — | | | | (160,736 | ) |
Net realized gain (loss) on forward foreign currency contracts | | | — | | | | (795,259 | ) | | | — | | | | — | | | | (795,259 | ) |
| | | | | | | | | | | | | | | | | | | | |
| | $ | (1,491,151 | ) | | $ | (809,697 | ) | | $ | — | | | $ | — | | | $ | (2,300,848 | ) |
| | | | | | | | | | | | | | | | | | | | |
| Change in unrealized appreciation (depreciation) on derivatives recognized in income (e) | | | | | | | | | | | | | | | | | | | | |
Net change in unrealized appreciation (depreciation) on purchased options | | $ | 86,916 | | | $ | — | | | $ | — | | | $ | — | | | $ | 86,916 | |
280
| | |
| | | |
| Notes to Financial Statements | | |
| | | | | | | | | | | | | | | | | | | | |
Effect of Derivative Instruments on the Statements of Operations as of August 31, 2016 | |
| | | | | |
| Location | | Interest
rate risk | | | Foreign
exchange
risk | | | Credit
risk | | | Equity
risk | | | Total | |
Net change in unrealized appreciation (depreciation) on futures contracts | | $ | 193,612 | | | $ | 28,275 | | | $ | — | | | $ | — | | | $ | 221,887 | |
Net change in unrealized appreciation (depreciation) on options contracts written | | | (226,170 | ) | | | — | | | | — | | | | — | | | | (226,170 | ) |
Net change in unrealized appreciation (depreciation) on swaps contracts | | | (517,410 | ) | | | — | | | | — | | | | — | | | | (517,410 | ) |
Net change in unrealized appreciation (depreciation) on forward foreign currency contracts | | | — | | | | 335,343 | | | | — | | | | — | | | | 335,343 | |
| | | | | | | | | | | | | | | | | | | | |
| | $ | (463,052 | ) | | $ | 363,618 | | | $ | — | | | $ | — | | | $ | (99,434 | ) |
| | | | | | | | | | | | | | | | | | | | |
International Fixed Income Fund
| | | | | | | | | | | | | | | | | | | | |
Fair Values of Derivative Instruments on the Statements of Assets and Liabilities as of August 31, 2016 | |
| | | | | |
| Location | | Interest rate
risk | | | Foreign
exchange
risk | | | Credit
risk | | | Equity
risk | | | Total | |
| Asset derivatives | | | | | | | | | | | | | | | | | | | | |
Purchased options (c) | | $ | 66,317 | | | $ | 156,812 | | | $ | — | | | $ | — | | | $ | 223,129 | |
Unrealized appreciation on open futures contracts (b) | | | 836,618 | | | | — | | | | — | | | | — | | | | 836,618 | |
Unrealized appreciation on forward foreign currency contracts (c) | | | — | | | | 1,664,139 | | | | — | | | | — | | | | 1,664,139 | |
Unrealized appreciation on centrally cleared swaps (f) | | | 826,056 | | | | — | | | | 19,888 | | | | — | | | | 845,944 | |
Unrealized appreciation on open swaps (c) | | | — | | | | 292,106 | | | | 90,207 | | | | — | | | | 382,313 | |
| | | | | | | | | | | | | | | | | | | | |
| | $ | 1,728,991 | | | $ | 2,113,057 | | | $ | 110,095 | | | $ | — | | | $ | 3,952,143 | |
| | | | | | | | | | | | | | | | | | | | |
| Liability derivatives | | | | | | | | | | | | | | | | | | | | |
Options contracts written outstanding (a) | | $ | 1,970 | | | $ | 267,949 | | | $ | 1,225 | | | $ | — | | | $ | 271,144 | |
Unrealized depreciation on open futures contracts (b) | | | 383,006 | | | | — | | | | — | | | | — | | | | 383,006 | |
Unrealized depreciation on forward foreign currency contracts (a) | | | — | | | | 2,839,967 | | | | — | | | | — | | | | 2,839,967 | |
Unrealized depreciation on centrally cleared swaps (f) | | | 3,231,675 | | | | — | | | | 75,218 | | | | — | | | | 3,306,893 | |
Unrealized depreciation on open swaps (a) | | | — | | | | 1,434,770 | | | | 108,405 | | | | — | | | | 1,543,175 | |
| | | | | | | | | | | | | | | | | | | | |
| | $ | 3,616,651 | | | $ | 4,542,686 | | | $ | 184,848 | | | $ | — | | | $ | 8,344,185 | |
| | | | | | | | | | | | | | | | | | | | |
| | | | | | | | | | | | | | | | | | | | |
Effect of Derivative Instruments on the Statements of Operations as of August 31, 2016 | |
| | | | | |
| Location | | Interest rate
risk | | | Foreign
exchange
risk | | | Credit
risk | | | Equity
risk | | | Total | |
| Realized gain/(loss) on derivatives recognized in income (d) | | | | | | | | | | | | | | | | | | | | |
Net realized gain (loss) on purchased options | | $ | (59,712 | ) | | $ | (344,356 | ) | | $ | — | | | $ | — | | | $ | (404,068 | ) |
Net realized gain (loss) on futures contracts | | | 3,231,862 | | | | — | | | | — | | | | — | | | | 3,231,862 | |
Net realized gain (loss) on options written | | | 212,589 | | | | 423,798 | | | | 123,649 | | | | — | | | | 760,036 | |
Net realized gain (loss) on swaps contracts | | | (2,228,721 | ) | | | 310,045 | | | | 77,007 | | | | — | | | | (1,841,669 | ) |
Net realized gain (loss) on forward foreign currency contracts | | | — | | | | 1,983,533 | | | | — | | | | — | | | | 1,983,533 | |
| | | | | | | | | | | | | | | | | | | | |
| | $ | 1,156,018 | | | $ | 2,373,020 | | | $ | 200,656 | | | $ | — | | | $ | 3,729,694 | |
| | | | | | | | | | | | | | | | | | | | |
| Change in unrealized appreciation (depreciation) on derivatives recognized in income (e) | | | | | | | | | | | | | | | | | | | | |
Net change in unrealized appreciation (depreciation) on purchased options | | $ | 17,597 | | | $ | (44,615 | ) | | $ | — | | | $ | — | | | $ | (27,018 | ) |
Net change in unrealized appreciation (depreciation) on futures contracts | | | 495,035 | | | | — | | | | — | | | | — | | | | 495,035 | |
Net change in unrealized appreciation (depreciation) on options contracts written | | | 62,353 | | | | 101,669 | | | | (12,427 | ) | | | — | | | | 151,595 | |
281
| | |
| | | |
| Notes to Financial Statements | | |
| | | | | | | | | | | | | | | | | | | | |
Effect of Derivative Instruments on the Statements of Operations as of August 31, 2016 | |
| | | | | |
| Location | | Interest rate
risk | | | Foreign
exchange
risk | | | Credit
risk | | | Equity
risk | | | Total | |
Net change in unrealized appreciation (depreciation) on swaps contracts | | $ | (1,332,359 | ) | | $ | (1,747,517 | ) | | $ | (176,711 | ) | | $ | — | | | $ | (3,256,587 | ) |
Net change in unrealized appreciation (depreciation) on forward foreign currency contracts | | | — | | | | (410,015 | ) | | | — | | | | — | | | | (410,015 | ) |
| | | | | | | | | | | | | | | | | | | | |
| | $ | (757,374 | ) | | $ | (2,100,478 | ) | | $ | (189,138 | ) | | $ | — | | | $ | (3,046,990 | ) |
| | | | | | | | | | | | | | | | | | | | |
Inflation-Linked Fixed Income Fund
| | | | | | | | | | | | | | | | | | | | |
Fair Values of Derivative Instruments on the Statements of Assets and Liabilities as of August 31, 2016 | |
| | | | | |
| Location | | Interest rate
risk | | | Foreign
exchange
risk | | | Credit
risk | | | Equity
risk | | | Total | |
| Asset derivatives | | | | | | | | | | | | | | | | | | | | |
Purchased options (c) | | $ | 252,681 | | | $ | — | | | $ | — | | | $ | — | | | $ | 252,681 | |
Unrealized appreciation on open futures contracts (b) | | | 42,794 | | | | — | | | | — | | | | — | | | | 42,794 | |
Unrealized appreciation on forward foreign currency contracts (c) | | | — | | | | 132,066 | | | | — | | | | — | | | | 132,066 | |
Unrealized appreciation on open swaps (c) | | | 10,678 | | | | — | | | | 6,300 | | | | — | | | | 16,978 | |
| | | | | | | | | | | | | | | | | | | | |
| | $ | 306,153 | | | $ | 132,066 | | | $ | 6,300 | | | $ | — | | | $ | 444,519 | |
| | | | | | | | | | | | | | | | | | | | |
| Liability derivatives | | | | | | | | | | | | | | | | | | | | |
Options contracts written outstanding (a) | | $ | 5,500 | | | $ | 9,881 | | | $ | 159 | | | $ | — | | | $ | 15,540 | |
Unrealized depreciation on open futures contracts (b) | | | 56,654 | | | | — | | | | — | | | | — | | | | 56,654 | |
Unrealized depreciation on forward foreign currency contracts (a) | | | — | | | | 1,108,640 | | | | — | | | | — | | | | 1,108,640 | |
Unrealized depreciation on centrally cleared swaps (f) | | | 762,014 | | | | — | | | | 2,630 | | | | — | | | | 764,644 | |
Unrealized depreciation on open swaps (a) | | | 133,863 | | | | — | | | | — | | | | — | | | | 133,863 | |
| | | | | | | | | | | | | | | | | | | | |
| | $ | 958,031 | | | $ | 1,118,521 | | | $ | 2,789 | | | $ | — | | | $ | 2,079,341 | |
| | | | | | | | | | | | | | | | | | | | |
| | | | | | | | | | | | | | | | | | | | |
Effect of Derivative Instruments on the Statements of Operations as of August 31, 2016 | |
| | | | | |
| Location | | Interest rate
risk | | | Foreign
exchange
risk | | | Credit
risk | | | Equity
risk | | | Total | |
| Realized gain/(loss) on derivatives recognized in income (d) | | | | | | | | | | | | | | | | | | | | |
Net realized gain (loss) on purchased options | | $ | (6,897 | ) | | $ | (1,778 | ) | | $ | — | | | $ | — | | | $ | (8,675 | ) |
Net realized gain (loss) on futures contracts | | | (147,870 | ) | | | — | | | | — | | | | — | | | | (147,870 | ) |
Net realized gain (loss) on options written | | | 20,145 | | | | 16,263 | | | | 12,181 | | | | — | | | | 48,589 | |
Net realized gain (loss) on swaps contracts | | | (23,529 | ) | | | — | | | | (2,712 | ) | | | — | | | | (26,241 | ) |
Net realized gain (loss) on forward foreign currency contracts | | | — | | | | 93,909 | | | | — | | | | — | | | | 93,909 | |
| | | | | | | | | | | | | | | | | | | | |
| | $ | (158,151 | ) | | $ | 108,394 | | | $ | 9,469 | | | $ | — | | | $ | (40,288 | ) |
| | | | | | | | | | | | | | | | | | | | |
| Change in unrealized appreciation (depreciation) on derivatives recognized in income (e) | | | | | | | | | | | | | | | | | | | | |
Net change in unrealized appreciation (depreciation) on purchased options | | $ | (8,428 | ) | | $ | — | | | $ | — | | | $ | — | | | $ | (8,428 | ) |
Net change in unrealized appreciation (depreciation) on futures contracts | | | (13,860 | ) | | | — | | | | — | | | | — | | | | (13,860 | ) |
Net change in unrealized appreciation (depreciation) on options contracts written | | | 787 | | | | 17,280 | | | | 58 | | | | — | | | | 18,125 | |
Net change in unrealized appreciation (depreciation) on swaps contracts | | | (885,199 | ) | | | — | | | | 3,670 | | | | — | | | | (881,529 | ) |
Net change in unrealized appreciation (depreciation) on forward foreign currency contracts | | | — | | | | (976,574 | ) | | | — | | | | — | | | | (976,574 | ) |
| | | | | | | | | | | | | | | | | | | | |
| | $ | (906,700 | ) | | $ | (959,294 | ) | | $ | 3,728 | | | $ | — | | | $ | (1,862,266 | ) |
| | | | | | | | | | | | | | | | | | | | |
282
| | |
| | | |
| Notes to Financial Statements | | |
Ultra-Short Term Fixed Income Fund
| | | | | | | | | | | | | | | | | | | | |
Fair Values of Derivative Instruments on the Statements of Assets and Liabilities as of August 31, 2016 | |
| | | | | |
| Location | | Interest rate
risk | | | Foreign
exchange
risk | | | Credit
risk | | | Equity
risk | | | Total | |
| Asset derivatives | | | | | | | | | | | | | | | | | | | | |
Unrealized appreciation on open futures contracts (b) | | $ | 73,995 | | | $ | — | | | $ | — | | | $ | — | | | $ | 73,995 | |
Unrealized appreciation on forward foreign currency contracts (c) | | | — | | | | 85,947 | | | | — | | | | — | | | | 85,947 | |
| | | | | | | | | | | | | | | | | | | | |
| | $ | 73,995 | | | $ | 85,947 | | | $ | — | | | $ | — | | | $ | 159,942 | |
| | | | | | | | | | | | | | | | | | | | |
| Liability derivatives | | | | | | | | | | | | | | | | | | | | |
Unrealized depreciation on open futures contracts (b) | | $ | 142,814 | | | $ | — | | | $ | — | | | $ | — | | | $ | 142,814 | |
Unrealized depreciation on forward foreign currency contracts (a) | | | — | | | | 48,646 | | | | — | | | | — | | | | 48,646 | |
| | | | | | | | | | | | | | | | | | | | |
| | $ | 142,814 | | | $ | 48,646 | | | $ | — | | | $ | — | | | $ | 191,460 | |
| | | | | | | | | | | | | | | | | | | | |
| | | | | | | | | | | | | | | | | | | | |
Effect of Derivative Instruments on the Statements of Operations as of August 31, 2016 | |
| | | | | |
| Location | | Interest rate
risk | | | Foreign
exchange
risk | | | Credit
risk | | | Equity
risk | | | Total | |
| Realized gain/(loss) on derivatives recognized in income (d) | | | | | | | | | | | | | | | | | | | | |
Net realized gain (loss) on futures contracts | | $ | (180,731 | ) | | $ | — | | | $ | — | | | $ | — | | | $ | (180,731 | ) |
Net realized gain (loss) on swaps contracts | | | 16,072 | | | | — | | | | — | | | | — | | | | 16,072 | |
Net realized gain (loss) on forward foreign currency contracts | | | — | | | | 64,087 | | | | — | | | | — | | | | 64,087 | |
| | | | | | | | | | | | | | | | | | | | |
| | $ | (164,659 | ) | | $ | 64,087 | | | $ | — | | | $ | — | | | $ | (100,572 | ) |
| | | | | | | | | | | | | | | | | | | | |
| Change in unrealized appreciation (depreciation) on derivatives recognized in income (e) | | | | | | | | | | | | | | | | | | | | |
Net change in unrealized appreciation (depreciation) on futures contracts | | $ | (68,819 | ) | | $ | — | | | $ | — | | | $ | — | | | $ | (68,819 | ) |
Net change in unrealized appreciation (depreciation) on forward foreign currency contracts | | | — | | | | 37,301 | | | | — | | | | — | | | | 37,301 | |
| | | | | | | | | | | | | | | | | | | | |
| | $ | (68,819 | ) | | $ | 37,301 | | | $ | — | | | $ | — | | | $ | (31,518 | ) |
| | | | | | | | | | | | | | | | | | | | |
| (a) | Statements of Assets and Liabilities location: Unrealized depreciation on open forward foreign currency contracts, unrealized depreciation on open swap contracts or options contracts written, at value. |
| (b) | Only variation margin, if any, is reported within the Statements of Assets and Liabilities. Cumulative appreciation (depreciation) on futures contracts is reported in the “Open Futures Contracts” table in the Fund’s Schedule of Investments. |
| (c) | Statements of Assets and Liabilities location: Investments, at value or unrealized appreciation on open forward foreign currency contracts or unrealized appreciation on open swap contracts. |
| (d) | Statements of Operations location: Net realized gain (loss) from investments, foreign currency transactions, futures contracts, options contracts written or swap contracts. |
| (e) | Statements of Operations location: Change in net unrealized appreciation (depreciation) from investments, foreign currency transactions, futures contracts, options contracts written or swap contracts. |
| (f) | Only variation margin, if any, is reported within the Statements of Assets and Liabilities. Cumulative appreciation (depreciation) on centrally cleared swaps is reported in the “Open Swap Contracts” table in the Fund’s Schedule of Investments. |
283
| | |
| | | |
| Notes to Financial Statements | | |
The average notional amounts of futures contracts, swaps contracts and forward foreign currency contracts, and the average market value of options contracts written and purchased options outstanding during the year/period ended August 31, 2016 were as follows:
International Equity Fund
| | | | | | | | | | | | | | | | | | | | |
| | | Interest rate
risk | | | Foreign
exchange
risk | | | Credit
risk | | | Equity
risk | | | Total | |
Forward foreign currency contracts | | $ | — | | | $ | 2,627 | | | $ | — | | | $ | — | | | $ | 2,627 | |
Emerging Markets Equity Fund
| | | | | | | | | | | | | | | | | | | | |
| | | Interest rate
risk | | | Foreign
exchange
risk | | | Credit
risk | | | Equity
risk | | | Total | |
Futures contracts | | $ | — | | | $ | — | | | $ | — | | | $ | 69,271 | | | $ | 69,271 | |
Forward foreign currency contracts | | | — | | | | 55,299 | | | | — | | | | — | | | | 55,299 | |
Core Fixed Income Fund
| | | | | | | | | | | | | | | | | | | | |
| | | Interest rate
risk | | | Foreign
exchange
risk | | | Credit
risk | | | Equity
risk | | | Total | |
Purchased options | | $ | 85,568 | | | $ | — | | | $ | — | | | $ | — | | | $ | 85,568 | |
Futures contracts | | | 285,062,994 | | | | 835,995 | | | | — | | | | — | | | | 285,898,989 | |
Option contracts written | | | 75,298 | | | | — | | | | — | | | | — | | | | 75,298 | |
Swap contracts | | | 2,729,615 | | | | — | | | | — | | | | — | | | | 2,729,615 | |
Forward foreign currency contracts | | | — | | | | 33,376,289 | | | | — | | | | — | | | | 33,376,289 | |
International Fixed Income Fund
| | | | | | | | | | | | | | | | | | | | |
| | | Interest rate
risk | | | Foreign
exchange
risk | | | Credit
risk | | | Equity
risk | | | Total | |
Purchased options | | $ | 10,744 | | | $ | 111,454 | | | $ | — | | | $ | — | | | $ | 122,198 | |
Futures contracts | | | 155,965,799 | | | | — | | | | — | | | | — | | | | 155,965,799 | |
Option contracts written | | | 68,195 | | | | 159,406 | | | | 15,490 | | | | — | | | | 243,091 | |
Swap contracts | | | 249,754,513 | | | | 60,003,957 | | | | 42,674,254 | | | | — | | | | 352,432,724 | |
Forward foreign currency contracts | | | — | | | | 444,532,008 | | | | — | | | | — | | | | 444,532,008 | |
Inflation-Linked Fixed Income Fund
| | | | | | | | | | | | | | | | | | | | |
| | | Interest rate
risk | | | Foreign
exchange
risk | | | Credit
risk | | | Equity
risk | | | Total | |
Purchased options | | $ | 109,513 | | | $ | 526 | | | $ | — | | | $ | — | | | $ | 110,039 | |
Futures contracts | | | 16,849,206 | | | | — | | | | — | | | | — | | | | 16,849,206 | |
Option contracts written | | | 2,933 | | | | 12,357 | | | | 971 | | | | — | | | | 16,261 | |
Swap contracts | | | 33,291,460 | | | | — | | | | 600,000 | | | | — | | | | 33,891,460 | |
Forward foreign currency contracts | | | — | | | | 19,649,345 | | | | — | | | | — | | | | 19,649,345 | |
Ultra-Short Term Fixed Income Fund
| | | | | | | | | | | | | | | | | | | | |
| | | Interest rate
risk | | | Foreign
exchange
risk | | | Credit
risk | | | Equity
risk | | | Total | |
Futures contracts | | $ | 95,922,222 | | | $ | — | | | $ | — | | | $ | — | | | $ | 95,922,222 | |
Swap contracts | | | 10,641,840 | | | | — | | | | — | | | | — | | | | 10,641,840 | |
Forward foreign currency contracts | | | — | | | | 24,385,027 | | | | — | | | | — | | | | 24,385,027 | |
284
| | |
| | | |
| Notes to Financial Statements | | |
(c) Repurchase Agreements. When entering into repurchase agreements, it is the Funds’ policy that their custodian or a third party custodian takes possession of the underlying collateral securities, the market value of which at least equals the principal amount of the repurchase transaction, including accrued interest. To the extent that any repurchase transaction exceeds one business day, the value of the collateral is marked-to-market daily to ensure the adequacy of the collateral. If the seller defaults and the market value of the collateral declines or if bankruptcy proceedings are commenced with respect to the seller of the security, realization of the collateral by the Funds may be delayed or limited.
(d) Stripped Securities. Certain Funds may invest in “Stripped Securities”, a term used collectively for stripped fixed income securities. Stripped Securities can be principal-only securities (“PO”), which are debt obligations that have been stripped of interest coupons, or interest-only securities (“IO”), which are interest coupons that have been stripped from debt obligations. As is the case with all securities, the market value of Stripped Securities will fluctuate in response to changes in economic conditions, interest rates and the market’s perception of the securities. However, fluctuations in response to interest rates may be greater in Stripped Securities than for debt obligations of comparable maturities that pay interest currently. The amount of fluctuation increases with a longer period of maturity. The yield-to-maturity on an IO is sensitive to the rate of principal repayments (including prepayments) on the related underlying debt obligation and principal payments may have a material effect on yield to maturity. If the underlying debt obligation experiences greater than anticipated prepayments of principal, the Fund may not fully recoup its initial investment in the IO.
(e) Time Deposits. Certain Funds may purchase overnight time deposits issued by offshore branches of U.S. banks that meet credit and risk standards established by the custodian and approved by the Board.
(f) Lending of Portfolio Securities. The Trust has an agreement with its custodian, whereby the custodian, as agent, may lend securities owned by the Funds to brokers, dealers and other financial organizations that have been approved as borrowers by the Funds. The custodian enters into agreements with the borrowers. Loans of securities by a Fund are collateralized by cash, U.S. government securities or irrevocable performance letters of credit issued by banks approved by the Funds. All non-cash collateral is received, held and administered by the custodian in an applicable custody account or other account established for the purpose of holding collateral for each Fund. Cash collateral received by the Funds as a result of securities lending activities is invested in an unaffiliated registered money market fund, and is recorded as Payable for collateral received from securities on loan within the Statements of Assets and Liabilities. Securities lending income represents the income earned on investing cash collateral plus any premium payments that may be received on the loan of certain types of securities, less fees and expenses associated with the loan. Each Fund maintains the risk of any market loss on its securities on loan as well as the potential loss on investments purchased with cash collateral received from its securities lending. The custodian has the right under its agreement with the borrowers to recover any loaned securities from the borrower on demand. Additionally, the Funds are exposed to risks that a borrower may not provide additional collateral when required or return loaned securities when due. If the borrower fails to return the securities, the custodian will use the collateral to purchase replacement securities. The custodian is responsible for any shortfall in collateral value under certain circumstances. See Note 1 (u).
The following table presents securities on loan that are subject to enforceable netting arrangements as of August 31, 2016.
Gross Amounts Not Offset in the Statements of Assets and Liabilities
| | | | | | | | | | | | | | | | |
| | | Gross Asset Amount
Presented in Statements
of Assets and Liabilities (a) | | | Financial
Instrument | | | Collateral
Received (b)(c) | | | Net Amount
(Not Less than $0) | |
Large Cap Equity Fund | | $ | 17,248,178 | | | $ | — | | | $ | (17,248,178 | ) | | $ | — | |
Small-Mid Cap Equity Fund | | | 17,872,527 | | | | — | | | | (17,872,527 | ) | | | — | |
International Equity Fund | | | 3,917,121 | | | | — | | | | (3,917,121 | ) | | | — | |
Emerging Markets Equity Fund | | | 3,491,623 | | | | — | | | | (3,491,623 | ) | | | — | |
Core Fixed Income Fund | | | 20,108,393 | | | | — | | | | (20,108,393 | ) | | | — | |
High Yield Fund | | | 13,202,348 | | | | — | | | | (13,202,348 | ) | | | — | |
International Fixed Income Fund | | | 529,502 | | | | — | | | | (529,502 | ) | | | — | |
| (a) | Represents market value of securities on loan at period end. |
| (b) | The Funds received cash collateral of $17,790,848, $18,447,756, $4,174,893, $3,683,541, $20,555,472, $13,683,734 and $557,865, respectively, which was subsequently invested in Invesco STIT — Government & Agency Portfolio as reported in the Schedules of Investments. |
| (c) | The actual collateral received could be greater than the amount shown here due to overcollateralization. |
285
| | |
| | | |
| Notes to Financial Statements | | |
The Funds have adopted the disclosure provisions of FASB Accounting Standards Update No. 2014-11 (“ASU No. 2014-11”), “Transfers & Servicing (Topic 860): Repurchase-to-Maturity Transactions, Repurchase Financings, and Disclosures”. ASU No. 2014-11 is intended to provide increased transparency about the types of collateral pledged in securities lending transactions and other similar transactions that are accounted for as secured borrowing.
The following table displays a breakdown of transactions accounted for as secured borrowings, the gross obligations by class of collateral pledged, and the remaining contractual maturity of those transactions as of August 31, 2016.
| | | | | | | | | | | | | | | | | | | | |
| | | Remaining Contractual Maturity of the Agreements
As of August 31, 2016 | |
| | | Overnight and
Continuous | | | < 30 days | | | Between 30 & 90
days | | | > 90 days | | | Total | |
| Large Cap Equity Fund | | | | | | | | | | | | | | | | | | | | |
| Securities Lending Transactions | | | | | | | | | | | | | | | | | | | | |
Common Stocks | | $ | 17,790,848 | | | $ | — | | | $ | — | | | $ | — | | | $ | 17,790,848 | |
| | | | | | | | | | | | | | | | | | | | |
Total Borrowings | | $ | 17,790,848 | | | $ | — | | | $ | — | | | $ | — | | | $ | 17,790,848 | |
| | | | | | | | | | | | | | | | | | | | |
Gross amount of recognized liabilities for securities lending transactions | | | $ | — | | | $ | — | | | $ | 17,790,848 | |
| | | | | | | | | | | | | |
| | | | | |
| Small-Mid Cap Equity Fund | | | | | | | | | | | | | | | | | | | | |
| Securities Lending Transactions | | | | | | | | | | | | | | | | | | | | |
Common Stocks | | $ | 18,447,756 | | | $ | — | | | $ | — | | | $ | — | | | $ | 18,447,756 | |
| | | | | | | | | | | | | | | | | | | | |
Total Borrowings | | $ | 18,447,756 | | | $ | — | | | $ | — | | | $ | — | | | $ | 18,447,756 | |
| | | | | | | | | | | | | | | | | | | | |
Gross amount of recognized liabilities for securities lending transactions | | | $ | — | | | $ | — | | | $ | 18,447,756 | |
| | | | | | | | | | | | | |
| | | | | |
| International Equity Fund | | | | | | | | | | | | | | | | | | | | |
| Securities Lending Transactions | | | | | | | | | | | | | | | | | | | | |
Common Stocks | | $ | 4,174,893 | | | $ | — | | | $ | — | | | $ | — | | | $ | 4,174,893 | |
| | | | | | | | | | | | | | | | | | | | |
Total Borrowings | | $ | 4,174,893 | | | $ | — | | | $ | — | | | $ | — | | | $ | 4,174,893 | |
| | | | | | | | | | | | | | | | | | | | |
Gross amount of recognized liabilities for securities lending transactions | | | $ | — | | | $ | — | | | $ | 4,174,893 | |
| | | | | | | | | | | | | |
| | | | | |
| Emerging Markets Equity Fund | | | | | | | | | | | | | | | | | | | | |
| Securities Lending Transactions | | | | | | | | | | | | | | | | | | | | |
Common Stocks | | $ | 3,683,541 | | | $ | — | | | $ | — | | | $ | — | | | $ | 3,683,541 | |
| | | | | | | | | | | | | | | | | | | | |
Total Borrowings | | $ | 3,683,541 | | | $ | — | | | $ | — | | | $ | — | | | $ | 3,683,541 | |
| | | | | | | | | | | | | | | | | | | | |
Gross amount of recognized liabilities for securities lending transactions | | | $ | — | | | $ | — | | | $ | 3,683,541 | |
| | | | | | | | | | | | | |
| | | | | |
| Core Fixed Income Fund | | | | | | | | | | | | | | | | | | | | |
| Securities Lending Transactions | | | | | | | | | | | | | | | | | | | | |
Corporate Securities | | $ | 180,472 | | | $ | — | | | $ | — | | | $ | — | | | $ | 180,472 | |
Government Securities | | | 20,375,000 | | | | — | | | | — | | | | — | | | | 20,375,000 | |
| | | | | | | | | | | | | | | | | | | | |
Total Borrowings | | $ | 20,555,472 | | | $ | — | | | $ | — | | | $ | — | | | $ | 20,555,472 | |
| | | | | | | | | | | | | | | | | | | | |
Gross amount of recognized liabilities for securities lending transactions | | | $ | — | | | $ | — | | | $ | 20,555,472 | |
| | | | | | | | | | | | | |
| | | | | |
| High Yield Fund | | | | | | | | | | | | | | | | | | | | |
| Securities Lending Transactions | | | | | | | | | | | | | | | | | | | | |
Corporate Securities | | $ | 13,683,734 | | | $ | — | | | $ | — | | | $ | — | | | $ | 13,683,734 | |
| | | | | | | | | | | | | | | | | | | | |
Total Borrowings | | $ | 13,683,734 | | | $ | — | | | $ | — | | | $ | — | | | $ | 13,683,734 | |
| | | | | | | | | | | | | | | | | | | | |
Gross amount of recognized liabilities for securities lending transactions | | | $ | — | | | $ | — | | | $ | 13,683,734 | |
| | | | | | | | | | | | | |
| | | | | |
| International Fixed Income Fund | | | | | | | | | | | | | | | | | | | | |
| Securities Lending Transactions | | | | | | | | | | | | | | | | | | | | |
Corporate Securities | | $ | 557,865 | | | $ | — | | | $ | — | | | $ | — | | | $ | 557,865 | |
| | | | | | | | | | | | | | | | | | | | |
286
| | |
| | | |
| Notes to Financial Statements | | |
| | | | | | | | | | | | | | | | | | | | |
| | | Remaining Contractual Maturity of the Agreements
As of August 31, 2016 | |
| | | Overnight and
Continuous | | | < 30 days | | | Between 30 & 90
days | | | > 90 days | | | Total | |
| International Fixed Income Fund | | | | | | | | | | | | | | | | | | | | |
Reverse Repurchase Agreements Transactions | | | | | | | | | | | | | | | | | | | | |
Sovereign Bonds | | $ | — | | | $ | 1,552,240 | | | $ | 3,893,708 | | | $ | — | | | $ | 5,445,948 | |
U.S. Government Obligations | | | — | | | | 1,415,750 | | | | 9,746,852 | | | | — | | | | 11,162,602 | |
| | | | | | | | | | | | | | | | | | | | |
Total Borrowings | | $ | 557,865 | | | $ | 2,967,990 | | | $ | 13,640,560 | | | $ | — | | | $ | 17,166,415 | |
| | | | | | | | | | | | | | | | | | | | |
Gross amount of recognized liabilities for securities lending transactions and reverse repurchase agreements transactions | | | $ | — | | | $ | — | | | $ | 17,166,415 | |
| | | | | | | | | | | | | |
| | | | | |
| Inflation-Linked Fixed Income Fund | | | | | | | | | | | | | | | | | | | | |
Reverse Repurchase Agreements Transactions | | | | | | | | | | | | | | | | | | | | |
U.S. Government Obligations | | $ | — | | | $ | 57,641,125 | | | $ | — | | | $ | — | | | $ | 57,641,125 | |
| | | | | | | | | | | | | | | | | | | | |
Total Borrowings | | $ | — | | | $ | 57,641,125 | | | $ | — | | | $ | — | | | $ | 57,641,125 | |
| | | | | | | | | | | | | | | | | | | | |
Gross amount of recognized liabilities for reverse repurchase agreements transactions | | | $ | — | | | $ | — | | | $ | 57,641,125 | |
| | | | | | | | | | | | | |
(g) To-Be-Announced Purchase and Sale Commitments. Certain Funds may trade securities on a to-be-announced (“TBA”) basis. In a TBA transaction, a Fund commits to purchasing or selling securities which have not yet been issued by the issuer and for which specific information is not known, such as the face amount and maturity date and the underlying pool of investments in U.S. government agency mortgage pass-through transactions. Securities purchased on a TBA basis are not settled until they are delivered to the Fund, normally 15 to 45 days later. Beginning on the date the Fund enters into a TBA transaction, cash, U.S. government securities or other liquid high-grade debt obligations are segregated in an amount equal in value to the purchase price of the TBA security. These transactions are marked-to-market on a daily basis and are subject to market fluctuations. Realized gains or losses on TBA purchase commitments are included in Net realized gain (loss) on investments on the Statements of Operations. Any fluctuation in the value of the purchased TBA commitments is included in Net change in unrealized appreciation (depreciation) on investments on the Statements of Operations.
Additionally, when a Fund sells TBA securities without already owning or having the right to obtain the deliverable securities (an uncovered forward commitment to sell), it incurs a risk of loss because it could have to purchase the securities at a price that is higher than the price at which it sold them. A Fund may be unable to purchase the deliverable securities if the corresponding market is illiquid.
TBA securities subject to a forward commitment to sell at period end are included at the end of the Fund’s Schedule of Investments under the caption “Schedule of Forward Sale Commitments”. The proceeds and value of these commitments are recorded as Forward Sale Commitments at value in the Statements of Assets and Liabilities.
(h) Short Sales of Securities. A short sale is a transaction in which a Fund sells securities it does not own in anticipation of a decline in the market price of the securities. To complete a short sale, the Fund may arrange through a broker to borrow the securities to be delivered to the buyer. The proceeds received by the Fund for the short sale are retained by the broker until the Fund replaces the borrowed securities. In borrowing the securities to be delivered to the buyer, the Fund becomes obligated to replace the securities borrowed at their market price at the time of replacement, whatever that price may be.
The risk of engaging in short sale transactions is that selling short magnifies the potential for loss to a Fund. The larger the Fund’s short position, the greater the potential loss. If a security sold short increases in price, the Fund may have to cover its short position at a higher price than the short sale price, resulting in a loss. To borrow the security, the Fund also may be required to pay a premium, which could decrease the proceeds of the security sold short. The amount of any gain will be decreased, and the amount of any loss increased, by the amount of the premium, dividends, interest or expenses the Fund may be required to pay in connection with the short sale. In addition, because the Fund’s loss on a short sale arises from increases in the value of the security sold short, such loss is unlimited.
(i) Mortgage Dollar Rolls. Certain Funds may sell mortgage-backed securities for delivery in the current month and simultaneously contract to repurchase substantially similar (same type, coupon and maturity) securities to settle on a specific future
287
| | |
| | | |
| Notes to Financial Statements | | |
date at an agreed upon price. Pools of mortgage securities are used to collateralize mortgage dollar roll transactions and may have different prepayment histories than those sold. During the period between the sale and the repurchase, a Fund forgoes principal and interest paid on the securities sold. Proceeds of the sale will be invested in short-term instruments and the income from these investments, together with any additional fee income received on a sale, is intended to generate income for a Fund. A Fund accounts for mortgage dollar roll transactions as purchases and sales and realizes the gain or loss at the time the transaction is entered into on these transactions. If certain criteria are met, these dollar roll transactions may be considered financing transactions, whereby the difference in the sale price and the future purchase price is recorded as an adjustment to interest income.
Mortgage dollar roll transactions involve the risk that the market value of the securities a Fund is obligated to repurchase under the agreement may decline below the repurchase price of those securities. If investment performance of securities purchased with proceeds from these transactions does not exceed the income, capital appreciation and gain or loss that would have been realized on the securities sold as part of the dollar roll, the use of this technique will adversely impact the investment performance of a Fund. In the event the buyer of securities under a mortgage dollar roll files for bankruptcy or becomes insolvent, the Fund’s use of proceeds of the dollar roll may be restricted pending a determination by the other party, or its trustee or receiver, whether to enforce the Fund’s obligation to repurchase the securities.
(j) Credit and Market Risk. Certain Funds invest in high yield instruments that are subject to certain credit and market risks. The yields of high yield obligations reflect, among other things, perceived credit and market risks. Each Fund’s investment in securities rated below investment grade typically involve risks not associated with higher rated securities, including, among others, greater risk related to timely and ultimate payment of interest and principal, greater market price volatility and less liquid secondary market trading.
(k) Foreign Investment and Currency Risks. Certain Funds’ investments in foreign securities may involve risks not present in domestic investments. Because securities may be denominated in foreign currencies and may require settlement in foreign currencies and pay interest or dividends in foreign currencies, changes in the relationship of these foreign currencies to the U.S. dollar can significantly affect the value of the investments and earnings of a Fund. Foreign investments may also subject the Fund to foreign government exchange restrictions, expropriation, taxation or other political, social or economic developments, all of which affect the market and/or credit risk of the investments.
(l) Emerging Markets Risk. In addition to foreign investment and currency risks, which tend to be amplified in emerging markets, emerging markets may experience rising interest rates, or, more significantly, rapid inflation or hyperinflation. The economies of emerging market countries may grow at slower rates than expected or suffer a downturn or recession. Emerging market securities may present market, credit, liquidity, legal, political and other risks different from, or greater than, the risks of investing in developed foreign countries.
(m) Volatility Risk. Volatility risk refers to the magnitude of the movement, but not the direction of the movement, in a financial instrument’s price over a defined time period. Large increases or decreases in a financial instrument’s price over a relative time period typically indicate greater volatility risk, while small increases or decreases in its price typically indicate lower volatility risk.
(n) Security Transactions and Investment Income. Security transactions are accounted for on a trade date basis. Interest income, adjusted for amortization of premium and accretion of discount, is recorded on an accrual basis. Dividend income is recorded on the ex-dividend date. Foreign dividend income is recorded on the ex-dividend date or as soon as practical after a Fund determines the existence of a dividend declaration after exercising reasonable due diligence. The cost of investments sold is determined by use of the specific identification method. To the extent any issuer defaults on an expected interest payment, the Trust’s policy is to generally halt any additional “interest income accruals and accretion” and consider the Fund’s ability to realize interest accrued up to the date of default.
(o) Foreign Currency Translation. Investment securities and other assets and liabilities denominated in foreign currencies are translated into U.S. dollar amounts based upon prevailing exchange rates on the date of valuation. Purchases and sales of investment securities and income and expense items denominated in foreign currencies are translated into U.S. dollar amounts based upon prevailing exchange rates on the respective dates of such transactions.
288
| | |
| | | |
| Notes to Financial Statements | | |
The Funds do not isolate that portion of the results of operations resulting from changes in foreign exchange rates on investments from the fluctuations arising from changes in market prices of securities held. Such fluctuations are included with the net realized and unrealized gain or loss on investments in the Statements of Operations.
Net realized foreign exchange gains or losses arise from sales of foreign currencies, including gains and losses on forward foreign currency contracts, currency gains or losses realized between the trade and settlement dates on securities transactions and the difference between the amounts of dividends, interest and foreign withholding taxes recorded on the Funds’ books and the U.S. dollar equivalent of the amounts actually received or paid. Net unrealized foreign exchange gains and losses arise from changes in the fair values of assets and liabilities, other than investments in securities, at the date of valuation, resulting from changes in exchange rates.
Foreign security and currency transactions may involve certain considerations and risks not typically associated with those of U.S. dollar denominated transactions as a result of, among other factors, the possibility of lower levels of governmental supervision and regulation of foreign securities markets and the possibility of political or economic instability.
(p) Distributions to Shareholders. Distributions from net investment income for Large Cap Equity Fund, Small-Mid Cap Equity Fund, International Equity Fund, Emerging Markets Equity Fund and International Fixed Income Fund, if any, are declared and paid on an annual basis. Distributions from net investment income for Core Fixed Income Fund, High Yield Fund, Municipal Bond Fund, Inflation-Linked Fixed Income Fund and Ultra-Short Term Fixed Income Fund, if any, are declared and paid on a monthly basis.
The Funds intend to satisfy conditions that will enable interest from municipal securities, which are exempt from regular federal income tax and from designated state income taxes, to retain such tax-exempt status when distributed to the shareholders of the Funds. Distributions of net realized gains to shareholders of the Funds, if any, are taxable and are declared at least annually. Distributions to shareholders of the Funds are recorded on the ex-dividend date and are determined in accordance with income tax regulations, which may differ from GAAP.
(q) Federal and Other Taxes. It is the Trust’s policy to comply with the federal income and excise tax requirements of the Internal Revenue Code of 1986, as amended, applicable to regulated investment companies. Accordingly, each Fund intends to distribute substantially all of its income and net realized gains on investments, if any, to shareholders each year. Therefore, no federal income tax provision is required in the Funds’ financial statements. Under the applicable foreign tax laws, a withholding tax may be imposed on interest, dividends and capital gains at various rates.
Management has reviewed the tax positions and has concluded that no liability for unrecognized tax benefits should be recorded related to uncertain tax positions taken on returns filed for open tax years or expected to be taken in 2016 tax returns. Each Fund’s federal tax returns for the prior three fiscal years remain subject to examination by the Internal Revenue Service.
(r) Reclassification. GAAP requires that certain components of net assets be adjusted to reflect permanent differences between financial and tax reporting. These reclassifications have no effect on net assets or net asset values per share.
| | | | | | | | | | | | | | | | |
| Fund | | | | | Undistributed
(Dividend in
excess of) Net
Investment Income | | | Undistributed Realized Gains/ (Accumulated Net Realized Losses) | | | Paid-in Capital | |
Large Cap Equity Fund | | | (a),(h) | | | $ | (1,209,745 | ) | | $ | (183,440,513 | ) | | $ | 184,650,258 | |
Small-Mid Cap Equity Fund | | | (a),(b),(c),(h) | | | | (198,433 | ) | | | (2,808,385 | ) | | | 3,006,818 | |
International Equity Fund | | | (c),(g) | | | | 554,740 | | | | (554,740 | ) | | | — | |
Emerging Markets Equity Fund | | | (c),(g) | | | | 457,020 | | | | (452,159 | ) | | | (4,861 | ) |
Core Fixed Income Fund | | | (d),(e),(g),(h) | | | | 612,733 | | | | (2,358,593 | ) | | | 1,745,860 | |
High Yield Fund | | | (d),(f) | | | | 1,088,969 | | | | (1,088,969 | ) | | | — | |
Municipal Bond Fund | | | (h) | | | | — | | | | (17,904 | ) | | | 17,904 | |
International Fixed Income Fund | | | (c),(d),(g) | | | | (1,610,724 | ) | | | 1,610,724 | | | | — | |
Inflation-Linked Fixed Income Fund | | | (d),(e),(g) | | | | 2,270,625 | | | | (2,235,355 | ) | | | (35,270 | ) |
Ultra-Short Term Fixed Income Fund | | | (d),(g) | | | | 567,500 | | | | (567,500 | ) | | | — | |
| (a) | Reclassifications are primarily due to book/tax differences in the treatment of distributions from real estate investment trusts. |
289
| | |
| | | |
| Notes to Financial Statements | | |
| (b) | Reclassifications are primarily due to a tax net operating loss. |
| (c) | Reclassifications are primarily due to foreign currency transactions treated as ordinary income for tax purposes, and book/tax differences in the treatment of passive foreign investment companies. |
| (d) | Reclassifications are primarily due to differences between book and tax amortization of premium on fixed income securities. |
| (e) | Reclassifications are primarily due to distribution reclass. |
| (f) | Reclassifications are primarily due to defaulted bond interest reclass. |
| (g) | Reclassifications are primarily due to foreign currency transactions treated as ordinary income for tax purposes. |
| (h) | Reclassifications are primarily due to use of tax equalization |
(s) Restricted Securities. All Funds may invest in non-publicly traded securities, commonly called restricted securities. Restricted securities may be less liquid than publicly-traded securities. Although certain restricted securities may be resold in privately negotiated transactions, the values realized from these sales could be less than originally paid by a Fund. Certain restricted securities may be deemed liquid by the Manager and/or Sub-adviser pursuant to the procedures approved by the Board. The value of restricted securities is determined as described in Note 1(a).
(t) Reverse Repurchase Agreements. Certain Funds may each enter into reverse repurchase agreements with the financial institutions with which it may enter into repurchase agreements. Under a reverse repurchase agreement, a Fund sells securities to a financial institution and agrees to repurchase them at a mutually agreed upon date, price and rate of interest. During the period between the sale and repurchase, the Fund would not be entitled to principal and interest paid on the securities sold by the Fund. The Fund, however, would seek to achieve gains derived from the difference between the current sale price and the forward price for the future purchase as well as the interest earned on the proceeds on the initial sale. Reverse repurchase agreements will be viewed as borrowings by a Fund for the purpose of calculating the Fund’s indebtedness and will have the effect of leveraging the Fund’s assets.
(u) Indemnification. In the normal course of business, the Funds may enter into contracts that provide certain indemnifications. The Funds’ maximum exposure under these arrangements is dependent on future claims that may be made against the Funds and, therefore, cannot be estimated; however, based on experience, risk of loss from such claims is considered remote.
(v) Senior Floating-Rate Loans. Interests in senior floating-rate loans (Senior Loans) for which reliable market quotations are readily available are valued generally at the average mean of bid and ask quotations obtained from a third party pricing service. Other Senior Loans are valued at fair value by the investment adviser under procedures approved by the Trustees. In fair valuing a Senior Loan, the investment adviser utilizes one or more of the valuation techniques described in (i) through (iii) below to assess the likelihood that the borrower will make a full repayment of the loan underlying such Senior Loan relative to yields on other Senior Loans issued by companies of comparable credit quality. If the investment adviser believes that there is a reasonable likelihood of full repayment, the investment adviser will determine fair value using a matrix pricing approach that considers the yield on the Senior Loan. If the investment adviser believes there is not a reasonable likelihood of full repayment, the investment adviser will determine fair value using analyses that include, but are not limited to: (i) a comparison of the value of the borrower’s outstanding equity and debt to that of comparable public companies; (ii) a discounted cash flow analysis; or (iii) when the investment adviser believes it is likely that a borrower will be liquidated or sold, an analysis of the terms of such liquidation or sale. In certain cases, the investment adviser will use a combination of analytical methods to determine fair value, such as when only a portion of a borrower’s assets are likely to be sold. In conducting its assessment and analyses for purposes of determining fair value of a Senior Loan, the investment adviser will use its discretion and judgment in considering and appraising relevant factors. Fair value determinations are made by the portfolio managers of the Fund based on information available to such managers. The portfolio managers of other funds managed by the investment adviser that invest in Senior Loans may not possess the same information about a Senior Loan borrower as the portfolio managers of the Fund. At times, the fair value of a Senior Loan determined by the portfolio managers of other funds managed by the investment adviser that invest in Senior Loans may vary from the fair value of the same Senior Loan determined by the portfolio managers of the Fund. The fair value of each Senior Loan is periodically reviewed and approved by the investment adviser’s Valuation Committee and by the Trustees based upon procedures approved by the Trustees. Junior Loans (i.e., subordinated loans and second lien loans) are valued in the same manner as Senior Loans.
(w) Disclosure about Offsetting Assets and Liabilities. In order to better define contractual rights under derivative contracts and to secure rights that will help the Funds mitigate their counterparty risk, a sub-adviser may, on behalf of the Funds, enter into an International Swaps and Derivatives Association, Inc. Master Agreement (“ISDA Master Agreement”) or similar agreement with its derivative contract counterparties. An ISDA Master Agreement is a bilateral agreement between the Funds and a counterparty
290
| | |
| | | |
| Notes to Financial Statements | | |
that governs OTC derivatives and foreign exchange contracts and typically contains, among other things, collateral posting terms and netting provisions in the event of a default and/or termination event. The ISDA Master Agreement gives a Fund the right, upon an event of default by the applicable counterparty or a termination of the agreement, to close out all transactions traded under such agreement and to net amounts owed under each transaction to one net amount payable by one party to the other. Absent an event of default by the counterparty or a termination of the agreement, the ISDA Master Agreement does not result in an offset of reported amounts of assets and liabilities in the Statements of Assets and Liabilities across the transactions between the Funds and the applicable counterparty. The right to offset and net payments across all transactions traded under the ISDA Master Agreement could result in a reduction of the Funds’ credit risk to such counterparty equal to any amounts payable by the Funds under the applicable transactions, if any. The enforceability of the right to offset may vary by jurisdiction.
Cash collateral that has been received or pledged to cover obligations under derivative contracts, if any, will be reported separately in the Statements of Assets and Liabilities. Generally the amount of collateral due from or to a counterparty is subject to a minimum transfer threshold amount before a transfer is required, which may vary by counterparty. Collateral pledged for the benefit of the Fund and/or counterparty is held in segregated accounts by the Fund’s custodian and cannot be sold, re-pledged, assigned or otherwise used while pledged. The portion of such collateral representing cash, if any, is reflected as deposits with counterparties and, in the case of cash pledged by counterparty for the benefit of the Fund, a corresponding liability in the Statements of Assets and Liabilities. Securities pledged by the Fund as collateral, if any, are identified as such in the Schedule of Investments. The carrying amount of such deposits due to brokers at August 31, 2016 approximated their fair value. If measured at fair value, such deposits would have been considered as Level 2 in the fair value hierarchy (see Note 1(a)).
Repurchase agreements and reverse repurchase agreements may be entered into by the Funds under Master Repurchase Agreements (“MRA”) which permit a Fund, under certain circumstances including an event of default (such as bankruptcy or insolvency), to offset payables and/or receivables under the MRA with collateral held and/or posted to the counterparty and create one single net payment due to or from a Fund. However, bankruptcy or insolvency laws of a particular jurisdiction may impose restrictions on or prohibitions against such a right of offset in the event of the MRA counterparty’s bankruptcy or insolvency. The Fund’s repurchase agreements as of August 31, 2016 are shown on a gross basis and the required offsetting disclosures are shown in the Schedules of Investments. The value of the related collateral exceeded the value of the repurchase agreements as of August 31, 2016.
For financial reporting purposes, the Funds do not offset financial assets and financial liabilities that are subject to master netting arrangements or similar agreements on the Statements of Assets and Liabilities.
The following table presents the Funds’ gross and net amounts of assets and liabilities, by derivative type, available for offset under a master netting agreement, or similar agreement as of August 31, 2016.
| | | | | | | | |
| | | Assets | | | Liabilities | |
| Derivative Instruments (a) | | Gross Amounts of
Recognized Assets
Presented in the
Statements of
Assets and Liabilities | | | Gross Amounts of
Recognized Liabilities
Presented in the
Statements of
Assets and Liabilities | |
| Core Fixed Income Fund: | | | | | | | | |
Forward foreign currency contracts | | $ | 199,247 | | | $ | 228,474 | |
| | | | | | | | |
Total Derivative Instruments, subject to master netting arrangement or similar arrangement | | $ | 199,247 | | | $ | 228,474 | |
| | | | | | | | |
| International Fixed Income Fund: | | | | | | | | |
Forward foreign currency contracts | | $ | 1,664,139 | | | $ | 2,839,967 | |
Options contract | | | 222,265 | | | | 271,144 | |
Swap contracts (b) | | | 382,313 | | | | 1,543,175 | |
| | | | | | | | |
Total Derivative Instruments, subject to master netting arrangement or similar arrangement | | $ | 2,268,717 | | | $ | 4,654,286 | |
| | | | | | | | |
291
| | |
| | | |
| Notes to Financial Statements | | |
| | | | | | | | |
| | | Assets | | | Liabilities | |
| Derivative Instruments (a) | | Gross Amounts of
Recognized Assets
Presented in the
Statements of
Assets and Liabilities | | | Gross Amounts of
Recognized Liabilities
Presented in the
Statements of
Assets and Liabilities | |
| Inflation-Linked Fixed Income Fund: | | | | | | | | |
Forward foreign currency contracts | | $ | 132,066 | | | $ | 1,108,640 | |
Options contracts | | | 215,969 | | | | 10,040 | |
Swap contracts (b) | | | 16,978 | | | | 133,863 | |
| | | | | | | | |
Total Derivative Instruments, subject to master netting arrangement or similar arrangement | | $ | 365,013 | | | $ | 1,252,543 | |
| | | | | | | | |
| Ultra-Short Term Fixed Income Fund: | | | | | | | | |
Forward foreign currency contracts | | $ | 85,947 | | | $ | 48,646 | |
| | | | | | | | |
Total Derivative Instruments, subject to master netting arrangement or similar arrangement | | $ | 85,947 | | | $ | 48,646 | |
| | | | | | | | |
| (a) | Excludes exchange-traded derivatives. |
| (b) | The total value of the net amounts of assets and liabilities is comprised of Swap contracts, at value on the Statements of Assets and Liabilities less the net value of the Upfront premiums paid (received) disclosed in the Fund’s Schedules of Investments. |
The following table presents the Funds’ derivative assets and liabilities by counterparty net of amounts available for offset under master netting or similar agreements, and net of related collateral received or pledged as of August 31, 2016.
| | | | | | | | | | | | | | | | |
| Counterparty | | Gross amounts
of Recognized
Assets
presented in the
Statements of
Assets and
Liabilities | | | Financial
Instruments
Available for
Offset (a) | | | Collateral
Received (e) | | | Net Amount (b) | |
| Core Fixed Income Fund | | | | | | | | | | | | | | | | |
| Over-the-counter | | | | | | | | | | | | | | | | |
Bank of America | | $ | 48,359 | | | $ | (18,972 | ) | | $ | — | | | $ | 29,387 | |
Barclays Bank PLC | | | 53,966 | | | | (34,561 | ) | | | — | | | | 19,405 | |
Citigroup Global Markets Inc. | | | 96,922 | | | | (96,922 | ) | | | — | | | | — | |
| | | | | | | | | | | | | | | | |
Total Over-the-counter derivative instruments | | $ | 199,247 | | | $ | (150,455 | ) | | $ | — | | | $ | 48,792 | |
| | | | | | | | | | | | | | | | |
| | | | |
| Counterparty | | Gross amounts
of Recognized
Liabilities
presented in the
Statements of
Assets and
Liabilities | | | Financial
Instruments
Available for
Offset (c) | | | Collateral
Pledged (e) | | | Net Amount (d) | |
| Core Fixed Income Fund | | | | | | | | | | | | | | | | |
| Over-the-counter | | | | | | | | | | | | | | | | |
Bank of America | | $ | 18,972 | | | $ | (18,972 | ) | | $ | — | | | $ | — | |
Barclays Bank PLC | | | 34,561 | | | | (34,561 | ) | | | — | | | | — | |
Citigroup Global Markets Inc. | | | 174,941 | | | | (96,922 | ) | | | — | | | | 78,019 | |
| | | | | | | | | | | | | | | | |
Total Over-the-counter derivative instruments | | $ | 228,474 | | | $ | (150,455 | ) | | $ | — | | | $ | 78,019 | |
| | | | | | | | | | | | | | | | |
292
| | |
| | | |
| Notes to Financial Statements | | |
| | | | | | | | | | | | | | | | |
| | | | |
| Counterparty | | Gross amounts
of Recognized
Assets
presented in the
Statements of
Assets and
Liabilities | | | Financial
Instruments
Available for
Offset (a) | | | Collateral
Received (e) | | | Net Amount (b) | |
| International Fixed Income Fund | | | | | | | | | | | | | | | | |
| Over-the-counter | | | | | | | | | | | | | | | | |
Bank of America | | $ | 537,274 | | | $ | (537,274 | ) | | $ | — | | | $ | — | |
Barclays Bank PLC | | | 12,587 | | | | (12,587 | ) | | | — | | | | — | |
BNP Paribas SA | | | 189,613 | | | | (69,718 | ) | | | (119,895 | ) | | | — | |
Citigroup Global Markets Inc. | | | 81,198 | | | | (81,198 | ) | | | — | | | | — | |
Deutsche Bank AG | | | 267,755 | | | | (267,755 | ) | | | — | | | | — | |
Goldman Sachs & Co. | | | 345,592 | | | | (345,592 | ) | | | — | | | | — | |
HSBC Bank USA | | | 197,620 | | | | (122,896 | ) | | | — | | | | 74,724 | |
JPMorgan Chase & Co. | | | 224,602 | | | | (224,602 | ) | | | — | | | | — | |
Royal Bank of Scotland PLC | | | — | | | | — | | | | — | | | | — | |
Societe Generale SA | | | 53,039 | | | | (29,085 | ) | | | — | | | | 23,954 | |
Standard Chartered Bank | | | 117,595 | | | | (58,449 | ) | | | — | | | | 59,146 | |
UBS Securities LLC | | | 240,264 | | | | (240,264 | ) | | | — | | | | — | |
Westpac Banking Corp | | | 1,578 | | | | — | | | | — | | | | 1,578 | |
| | | | | | | | | | | | | | | | |
Total Over-the-counter derivative instruments | | $ | 2,268,717 | | | $ | (1,989,420 | ) | | $ | (119,895 | ) | | $ | 159,402 | |
| | | | | | | | | | | | | | | | |
| | | | |
| Counterparty | | Gross amounts
of Recognized
Liabilities
presented in the
Statements of
Assets and
Liabilities | | | Financial
Instruments
Available for
Offset (c) | | | Collateral
Pledged (e) | | | Net Amount (d) | |
| International Fixed Income Fund | | | | | | | | | | | | | | | | |
| Over-the-counter | | | | | | | | | | | | | | | | |
Bank of America | | $ | 1,410,181 | | | $ | (537,274 | ) | | $ | — | | | $ | 872,907 | |
Barclays Bank PLC | | | 607,155 | | | | (12,587 | ) | | | — | | | | 594,568 | |
BNP Paribas SA | | | 69,718 | | | | (69,718 | ) | | | — | | | | — | |
Citigroup Global Markets Inc. | | | 267,592 | | | | (81,198 | ) | | | — | | | | 186,394 | |
Deutsche Bank AG | | | 286,706 | | | | (267,755 | ) | | | — | | | | 18,951 | |
Goldman Sachs & Co. | | | 801,528 | | | | (345,592 | ) | | | — | | | | 455,936 | |
HSBC Bank USA | | | 122,896 | | | | (122,896 | ) | | | — | | | | — | |
JPMorgan Chase & Co. | | | 669,417 | | | | (224,602 | ) | | | — | | | | 444,815 | |
Royal Bank of Scotland PLC | | | 8,192 | | | | — | | | | — | | | | 8,192 | |
Societe Generale SA | | | 29,085 | | | | (29,085 | ) | | | — | | | | — | |
Standard Chartered Bank | | | 58,449 | | | | (58,449 | ) | | | — | | | | — | |
UBS Securities LLC | | | 323,367 | | | | (240,264 | ) | | | — | | | | 83,103 | |
Westpac Banking Corp | | | — | | | | — | | | | — | | | | — | |
| | | | | | | | | | | | | | | | |
Total Over-the-counter derivative instruments | | $ | 4,654,286 | | | $ | (1,989,420 | ) | | $ | — | | | $ | 2,664,866 | |
| | | | | | | | | | | | | | | | |
293
| | |
| | | |
| Notes to Financial Statements | | |
| | | | | | | | | | | | | | | | |
| Counterparty | | Gross amounts
of Recognized
Assets
presented in the
Statements of
Assets and
Liabilities | | | Financial
Instruments
Available for
Offset (a) | | | Collateral
Received (e) | | | Net Amount (b) | |
| Inflation-Linked Fixed Income Fund | | | | | | | | | | | | | | | | |
| Over-the-counter | | | | | | | | | | | | | | | | |
Barclays Bank PLC | | $ | — | | | $ | — | | | $ | — | | | $ | — | |
BNP Paribas SA | | | 34,251 | | | | (34,251 | ) | | | — | | | | — | |
Deutsche Bank AG | | | 164,509 | | | | (132,234 | ) | | | (32,275 | ) | | | — | |
HSBC Bank USA | | | 1,486 | | | | (1,486 | ) | | | — | | | | — | |
JPMorgan Chase & Co. | | | 164,767 | | | | (109,255 | ) | | | (30,000 | ) | | | 25,512 | |
Standard Chartered Bank | | | — | | | | — | | | | — | | | | — | |
| | | | | | | | | | | | | | | | |
Total Over-the-counter derivative instruments | | $ | 365,013 | | | $ | (277,226 | ) | | $ | (62,275 | ) | | $ | 25,512 | |
| | | | | | | | | | | | | | | | |
| | | | |
| Counterparty | | Gross amounts
of Recognized
Liabilities
presented in the
Statements of
Assets and
Liabilities | | | Financial
Instruments
Available for
Offset (c) | | | Collateral
Pledged (e) | | | Net Amount (d) | |
| Inflation-Linked Fixed Income Fund | | | | | | | | | | | | | | | | |
| Over-the-counter | | | | | | | | | | | | | | | | |
Barclays Bank PLC | | $ | 522 | | | $ | — | | | $ | — | | | $ | 522 | |
BNP Paribas SA | | | 993,685 | | | | (34,251 | ) | | | — | | | | 959,434 | |
Deutsche Bank AG | | | 132,234 | | | | (132,234 | ) | | | — | | | | — | |
HSBC Bank USA | | | 3,547 | | | | (1,486 | ) | | | — | | | | 2,061 | |
JPMorgan Chase & Co. | | | 109,255 | | | | (109,255 | ) | | | — | | | | — | |
Standard Chartered Bank | | | 13,300 | | | | — | | | | — | | | | 13,300 | |
| | | | | | | | | | | | | | | | |
Total Over-the-counter derivative instruments | | $ | 1,252,543 | | | $ | (277,226 | ) | | $ | — | | | $ | 975,317 | |
| | | | | | | | | | | | | | | | |
| | | | |
| Counterparty | | Gross amounts
of Recognized
Assets
presented in the
Statements of
Assets and
Liabilities | | | Financial
Instruments
Available for
Offset (a) | | | Collateral
Received (e) | | | Net Amount (b) | |
| Ultra-Short Term Fixed Income Fund | | | | | | | | | | | | | | | | |
| Over-the-counter | | | | | | | | | | | | | | | | |
BNP Paribas SA | | $ | 3,371 | | | $ | (3,371 | ) | | $ | — | | | $ | — | |
HSBC Bank USA | | | 1,106 | | | | (1,106 | ) | | | — | | | | — | |
JPMorgan Chase & Co. | | | 79,764 | | | | (13,932 | ) | | | — | | | | 65,832 | |
Standard Chartered Bank | | | 1,706 | | | | (1,706 | ) | | | — | | | | — | |
| | | | | | | | | | | | | | | | |
Total Over-the-counter derivative instruments | | $ | 85,947 | | | $ | (20,115 | ) | | $ | — | | | $ | 65,832 | |
| | | | | | | | | | | | | | | | |
294
| | |
| | | |
| Notes to Financial Statements | | |
| | | | | | | | | | | | | | | | |
| Counterparty | | Gross amounts
of Recognized
Liabilities
presented in the
Statements of
Assets and
Liabilities | | | Financial
Instruments
Available
for Offset
(c) | | | Collateral
Pledged (e) | | | Net Amount (d) | |
| Ultra-Short Term Fixed Income Fund | | | | | | | | | | | | | | | | |
| Over-the-counter | | | | | | | | | | | | | | | | |
BNP Paribas SA | | $ | 22,141 | | | $ | (3,371 | ) | | $ | — | | | $ | 18,770 | |
HSBC Bank USA | | | 7,983 | | | | (1,106 | ) | | | — | | | | 6,877 | |
JPMorgan Chase & Co. | | | 13,932 | | | | (13,932 | ) | | | — | | | | — | |
Standard Chartered Bank | | | 4,590 | | | | (1,706 | ) | | | — | | | | 2,884 | |
| | | | | | | | | | | | | | | | |
Total Over-the-counter derivative instruments | | $ | 48,646 | | | $ | (20,115 | ) | | $ | — | | | $ | 28,531 | |
| | | | | | | | | | | | | | | | |
| (a) | Represents the amount of assets that could be offset by liabilities with the same counterparty under master netting or similar agreements that are not offset on the Statements of Assets and Liabilities. |
| (b) | Net amount represents the new amount receivable from the counterparty in the event of default. |
| (c) | Represents the amount of liabilities that could be offset by assets with the same counterparty under master netting or similar agreements that are not offset on the Statements of Assets and Liabilities. |
| (d) | Net amount represents the net amount payable to the counterparty in the event of default. |
| (e) | In some instances, the actual collateral received and/or pledged may be more than the amount shown here due to overcollateralization. |
2. Investment Management Agreement and Other Transactions with Affiliates
CGAS, a business of Morgan Stanley Smith Barney Holdings LLC (“MSSBH”), serves as the investment manager to the Funds. The Manager selects and oversees professional money managers who are responsible for investing the assets of the Funds (each a “Sub-adviser,” and collectively the “Sub-advisers”). Each Fund pays the Manager an investment management fee calculated daily at an annual rate based on each Fund’s average daily net assets and paid monthly in arrears. The Manager pays each Sub-adviser a sub-advisory fee from its investment management fees.
Effective January 1, 2016, CGAS has contractually agreed to waive fees and reimburse expenses for a period of one year in order to keep the Fund’s management fee from exceeding 0.20% more than the total amount of sub-advisory fees paid by CGAS. This contractual waiver and reimbursement will only apply if the Fund’s total operating costs exceed the total amount of sub-advisory fees paid by CGAS plus 0.20%, and will not affect the Fund’s total operating costs if they are less than such amount. This fee waiver and reimbursement agreement shall remain in effect until January 1, 2017. The agreement may be amended or terminated only with the consent of the Board.
The maximum allowable investment management fee represents the total amount that could be charged to each Fund. The aggregate fees paid by the Manager to each Fund’s Sub-advisers and the fees retained by the Manager for the year/period ended August 31, 2016 are indicated below:
| | | | | | | | | | | | |
| Fund | | Subadvisory
Fee | | | Consulting Group
Advisory Services LLC
Fee | | | Maximum
Allowable Annual
Management Fee | |
Large Cap Equity Fund | | | 0.28 | % | | | 0.19 | % | | | 0.60 | % |
Small-Mid Cap Equity Fund | | | 0.38 | % | | | 0.23 | % | | | 0.80 | % |
International Equity Fund | | | 0.40 | % | | | 0.23 | % | | | 0.70 | % |
Emerging Markets Equity Fund | | | 0.49 | % | | | 0.24 | % | | | 0.90 | % |
Core Fixed Income Fund | | | 0.19 | % | | | 0.19 | % | | | 0.40 | % |
High Yield Fund | | | 0.30 | % | | | 0.22 | % | | | 0.70 | % |
International Fixed Income Fund | | | 0.25 | % | | | 0.22 | % | | | 0.50 | % |
Municipal Bond Fund | | | 0.20 | % | | | 0.20 | % | | | 0.40 | % |
Inflation-Linked Fixed Income Fund | | | 0.12 | % | | | 0.10 | % | | | 0.50 | % |
Ultra-Short Term Fixed Income Fund | | | 0.12 | % | | | 0.10 | % | | | 0.50 | % |
295
| | |
| | | |
| Notes to Financial Statements | | |
The Manager has agreed to waive and/or reimburse a portion of its fee. For the year/period ended August 31, 2016, the amounts waived and/or reimbursed by the Manager were as follows:
| | | | |
| Fund | | Amounts waived
and/or reimbursed | |
Large Cap Equity Fund | | $ | 2,119,869 | |
Small-Mid Cap Equity Fund | | | 662,103 | |
International Equity Fund | | | 831,707 | |
Emerging Markets Fund | | | 687,223 | |
Core Fixed Income Fund | | | 131,067 | |
High Yield Fund | | | 476,000 | |
International Fixed Income Fund | | | 68,390 | |
Municipal Bond Fund | | | — | |
Inflation-Linked Fixed Income Fund | | | 27,508 | |
Ultra-Short Term Fixed Income Fund | | | 30,315 | |
Brown Brothers Harriman & Co. (“BBH”) serves as the Trust’s administrator. For its administrative services, BBH receives an annual asset based fee of 0.0250% of the Trust’s assets up to $5 billion, 0.02% on assets between $5 billion and $8 billion and 0.0175% on assets in excess of $8 billion, plus out-of-pocket expenses. The fee is calculated and allocated daily based on the relative assets of each Fund.
For the year/period ended August 31, 2016, Morgan Stanley & Co. Incorporated (“MS&Co.”), and its affiliates, including MSSBH, Morgan Stanley Smith Barney LLC, the Trust’s distributor, received brokerage commissions of:
| | | | |
| Fund | | Commision
Dollars to MS&Co. | |
Large Cap Equity Fund | | $ | 20,770 | |
Small-Mid Cap Equity Fund | | | 388 | |
International Equity Fund | | | 3,967 | |
Emerging Markets Equity Fund | | | 8,675 | |
Core Fixed Income Fund | | | — | |
High Yield Fund | | | — | |
International Fixed Income Fund | | | — | |
Municipal Bond Fund | | | — | |
Inflation-Linked Fixed Income Fund | | | — | |
Ultra-Short Term Fixed Income Fund | | | — | |
Officers of the Trust do not receive compensation directly from the Trust. The Funds may bear a portion of the annual compensation of the Fund’s Chief Compliance Officer.
For the year/period ended August 31, 2016, the Funds assumes the following to be affiliated issuers:
Large Cap Equity Fund
| | | | | | | | | | | | | | | | |
| Underlying Security | | Number of Shares held
at August 31, 2015 | | | Shares purchased | | | Shares sold | | | Number of Shares held
at August 31, 2016 | |
Morgan Stanley | | | — | | | | 81,022 | | | | (23,527 | ) | | | 57,495 | |
| | | | |
| Underlying Security | | Net Realized Gain/(Loss)
on Sales of Affiliated
Investment | | | Capital Gain Distribution
from Affiliated
Investments | | | Dividend/Interest Income
from Affiliated
Investments | | | Ending Value at
August 31, 2016 | |
Morgan Stanley | | $ | 49,946 | | | $ | — | | | $ | 21,818 | | | $ | 1,843,290 | |
296
| | |
| | | |
| Notes to Financial Statements | | |
Core Fixed Income Fund
| | | | | | | | | | | | | | | | |
| Underlying Security | | Face Amount held at
August 31, 2015 | | | Face Amount purchased | | | Face Amount sold* | | | Face Amount held at
August 31, 2016 | |
Morgan Stanley ABS Capital I Inc. Trust, Series 2004-SD3, Class A, 0.984% due 6/25/34 | | $ | 82,241 | | | $ | — | | | $ | (65,173 | ) | | $ | 17,068 | |
Morgan Stanley Bank of America Merrill Lynch Trust: | | | | | | | | | | | | | | | | |
Series 2013-C10, Class A4, 4.219% due 7/15/46 | | | 30,000 | | | | — | | | | — | | | | 30,000 | |
Series 2013-C13, Class A4, 4.039% due 11/15/46 | | | 500,000 | | | | — | | | | — | | | | 500,000 | |
Morgan Stanley Capital I Trust: | | | | | | | | | | | | | | | | |
Series 2007-HQ11, Class A4FL, 0.653% due 2/12/44 | | | 880,000 | | | | — | | | | (156,874 | ) | | | 723,126 | |
Series 2007-HQ12, Class A5, 5.861% due 4/12/49 | | | 73,572 | | | | — | | | | (73,572 | ) | | | — | |
Series 2007-HQ13, Class A3, 5.569% due 12/15/44 | | | 650,000 | | | | — | | | | (650,000 | ) | | | — | |
Series 2007-IQ13, Class A1A, 5.312% due 3/15/44 | | | 379,657 | | | | — | | | | (379,657 | ) | | | — | |
Series 2007-IQ14, Class A1A, 5.665% due 4/15/49 | | | 304,479 | | | | — | | | | (304,479 | ) | | | — | |
Series 2007-IQ14, Class A4, 5.692% due 4/15/49 | | | 200,000 | | | | — | | | | — | | | | 200,000 | |
Series 2007-T25, Class A3, 5.514% due 11/12/49 | | | 516,359 | | | | — | | | | (516,359 | ) | | | — | |
| | | | |
| Underlying Security | | Net Realized Gain/(Loss)
on Sales of Affiliated
Investment | | | Capital Gain Distribution
from Affiliated
Investments | | | Dividend/Interest Income
from Affiliated
Investments | | | Ending Value at
August 31, 2016 | |
Morgan Stanley ABS Capital I Inc. Trust, Series 2004-SD3, Class A, 0.984% due 6/25/34 | | $ | — | | | $ | — | | | $ | 3,910 | | | $ | 17,120 | |
Morgan Stanley Bank of America Merrill Lynch Trust: | | | | | | | | | | | | | | | | |
Series 2013-C10, Class A4, 4.219% due 7/15/46 | | | — | | | | — | | | | 1,248 | | | | 33,790 | |
Series 2013-C13, Class A4, 4.039% due 11/15/46 | | | — | | | | — | | | | 20,195 | | | | 562,320 | |
Morgan Stanley Capital I Trust: | | | | | | | | | | | | | | | | |
Series 2007-HQ11, Class A4FL, 0.653% due 2/12/44 | | | — | | | | — | | | | 5,998 | | | | 719,858 | |
Series 2007-HQ12, Class A5, 5.861% due 4/12/49 | | | — | | | | — | | | | — | | | | — | |
Series 2007-HQ13, Class A3, 5.569% due 12/15/44 | | | (20,709 | ) | | | — | | | | 14,092 | | | | — | |
Series 2007-IQ13, Class A1A, 5.312% due 3/15/44 | | | (31,146 | ) | | | — | | | | 8,712 | | | | — | |
Series 2007-IQ14, Class A1A, 5.665% due 4/15/49 | | | (16,477 | ) | | | — | | | | 10,258 | | | | — | |
Series 2007-IQ14, Class A4, 5.692% due 4/15/49 | | | — | | | | — | | | | 11,483 | | | | 202,432 | |
Series 2007-T25, Class A3, 5.514% due 11/12/49 | | | (39,281 | ) | | | — | | | | 5,673 | | | | — | |
| | | | | | | | | | | | | | | | |
| | $ | (107,613 | ) | | $ | — | | | $ | 81,569 | | | $ | 1,535,520 | |
| | | | | | | | | | | | | | | | |
297
| | |
| | | |
| Notes to Financial Statements | | |
Ultra-Short Term Fixed Income Fund
| | | | | | | | | | | | | | | | |
| Underlying Security | | Face Amount held at
August 31, 2015 | | | Face Amount purchased | | | Face Amount sold* | | | Face Amount held at
August 31, 2016 | |
Morgan Stanley Capital I Trust, Series 2007-IQ14, Class A1A, 5.665% due 4/15/49 | | $ | — | | | $ | 1,121,831 | | | $ | (3,712 | ) | | $ | 1,118,119 | |
| | | | |
| Underlying Security | | Net Realized Gain/(Loss)
on Sales of Affiliated
Investment | | | Capital Gain Distribution
from Affiliated
Investments | | | Dividend/Interest Income
from Affiliated
Investments | | | Ending Value at
August 31, 2016 | |
Morgan Stanley Capital I Trust, Series 2007-IQ14, Class A1A, 5.665% due 4/15/49 | | $ | — | | | $ | — | | | $ | 16,808 | | | $ | 1,138,622 | |
| * | Includes Paydown transactions which are not recognized as a true sales. |
3. Investments
During the year/period ended August 31, 2016, the aggregate cost of purchases and proceeds from sales of investments (excluding short-term investments) for each Fund were as follows:
| | | | | | | | | | | | | | | | |
| Fund | | Investments | | | U.S. Government Agencies &
Obligations | |
| | | Purchases | | | Sales | | | Purchases | | | Sales | |
Large Cap Equity Fund | | $ | 1,581,002,498 | | | $ | 2,342,558,575 | | | $ | — | | | $ | — | |
Small-Mid Cap Equity Fund | | | 514,382,841 | | | | 470,007,070 | | | | — | | | | — | |
International Equity Fund | | | 762,809,642 | | | | 829,872,801 | | | | — | | | | — | |
Emerging Markets Fund | | | 379,153,554 | | | | 444,279,398 | | | | — | | | | — | |
Core Fixed Income Fund | | | 110,594,970 | | | | 198,463,985 | | | | 1,750,204,020 | | | | 1,797,354,552 | |
High Yield Fund | | | 242,921,727 | | | | 155,914,330 | | | | — | | | | — | |
International Fixed Income Fund | | | 135,406,754 | | | | 172,208,603 | | | | 257,967,003 | | | | 255,561,469 | |
Municipal Bond Fund | | | 11,873,746 | | | | 28,513,938 | | | | — | | | | — | |
Inflation-Linked Fixed Income Fund | | | 24,954,566 | | | | 3,796,093 | | | | 237,784,933 | | | | 53,165,956 | |
Ultra-Short Term Fixed Income Fund | | | 170,428,916 | | | | 52,194,673 | | | | 74,377,563 | | | | 56,173,769 | |
At August 31, 2016, the aggregate gross unrealized appreciation and depreciation of investments for federal income tax purposes were as follows:
| | | | | | | | | | | | |
| Fund | | Gross
Unrealized
Appreciation | | | Gross
Unrealized
(Depreciation) | | | Net Unrealized
Appreciation
(Depreciation) | |
Large Cap Equity Fund | | $ | 382,340,937 | | | $ | (37,019,165 | ) | | $ | 345,321,772 | |
Small-Mid Cap Equity Fund | | | 69,665,736 | | | | (18,079,581 | ) | | | 51,586,155 | |
International Equity Fund | | | 136,115,720 | | | | (106,956,025 | ) | | | 29,159,695 | |
Emerging Markets Equity Fund | | | 54,465,178 | | | | (34,735,339 | ) | | | 19,729,839 | |
Core Fixed Income Fund | | | 28,986,982 | | | | (14,447,445 | ) | | | 14,539,537 | |
High Yield Fund | | | 12,262,292 | | | | (10,375,548 | ) | | | 1,886,744 | |
Municipal Bond Fund | | | 5,971,478 | | | | — | | | | 5,971,478 | |
International Fixed Income Fund | | | 14,603,545 | | | | (13,379,247 | ) | | | 1,224,298 | |
Inflation-Linked Fixed Income Fund | | | 5,444,658 | | | | (1,851,384 | ) | | | 3,593,274 | |
Ultra-Short Term Fixed Income Fund | | | 1,027,388 | | | | (844,360 | ) | | | 183,028 | |
4. Shares of Beneficial Interest
At August 31, 2016, the Trust had an unlimited number of units of beneficial interest (shares) authorized with a par value of $0.001 per share. At August 31, 2016, Trustees and executive officers of the Trust as a group owned of record less than 1% of the outstanding shares of the Trust.
298
| | |
| | | |
| Notes to Financial Statements | | |
Transactions in shares of each Fund were as follows:
| | | | | | | | |
| | | Year ended
August 31,
2016 | | | Year ended
August 31,
2015 | |
| Large Cap Equity Fund | | | | | | | | |
Shares sold | | | 4,877,921 | | | | 2,671,031 | |
Shares issued on reinvestment | | | 18,527,397 | | | | 9,623,720 | |
Shares repurchased | | | (56,108,836 | ) | | | (26,936,640 | ) |
Shares issued from reorganization | | | 67,349,198 | | | | — | |
| | | | | | | | |
Net Increase (Decrease) | | | 34,645,680 | | | | (14,641,889 | ) |
| | | | | | | | |
| | |
| Small-Mid Cap Equity Fund | | | | | | | | |
Shares sold | | | 9,809,644 | | | | 470,258 | |
Shares issued on reinvestment | | | 2,932,844 | | | | 2,605,182 | |
Shares repurchased | | | (7,747,278 | ) | | | (4,089,603 | ) |
Shares issued from reorganization | | | 12,937,939 | | | | — | |
| | | | | | | | |
Net Increase (Decrease) | | | 17,933,149 | | | | (1,014,163 | ) |
| | | | | | | | |
| | |
| International Equity Fund | | | | | | | | |
Shares sold | | | 39,982,337 | | | | 26,104,331 | |
Shares issued on reinvestment | | | 1,835,484 | | | | 1,708,106 | |
Shares repurchased | | | (48,415,840 | ) | | | (13,141,629 | ) |
| | | | | | | | |
Net Increase (Decrease) | | | (6,598,019 | ) | | | 14,670,808 | |
| | | | | | | | |
| | |
| Emerging Markets Equity Fund | | | | | | | | |
Shares sold | | | 10,381,452 | | | | 20,448,565 | |
Shares issued on reinvestment | | | 578,111 | | | | 404,405 | |
Shares repurchased | | | (19,017,755 | ) | | | (4,665,904 | ) |
| | | | | | | | |
Net Increase (Decrease) | | | (8,058,192 | ) | | | 16,187,066 | |
| | | | | | | | |
| | |
| Core Fixed Income Fund | | | | | | | | |
Shares sold | | | 24,744,796 | | | | 20,409,102 | |
Shares issued on reinvestment | | | 3,338,003 | | | | 3,721,496 | |
Shares repurchased | | | (46,711,235 | ) | | | (14,329,013 | ) |
| | | | | | | | |
Net Increase (Decrease) | | | (18,628,436 | ) | | | 9,801,585 | |
| | | | | | | | |
| | |
| High Yield Fund | | | | | | | | |
Shares sold | | | 38,015,916 | | | | 12,354,121 | |
Shares issued on reinvestment | | | 4,650,646 | | | | 3,939,050 | |
Shares repurchased | | | (22,192,736 | ) | | | (9,157,485 | ) |
| | | | | | | | |
Net Increase | | | 20,473,826 | | | | 7,135,686 | |
| | | | | | | | |
| | |
| International Fixed Income Fund | | | | | | | | |
Shares sold | | | 6,460,124 | | | | 2,234,773 | |
Shares issued on reinvestment | | | 1,970,249 | | | | 1,997,895 | |
Shares repurchased | | | (13,124,472 | ) | | | (8,199,895 | ) |
| | | | | | | | |
Net Decrease | | | (4,694,099 | ) | | | (3,967,227 | ) |
| | | | | | | | |
| | |
| Municipal Bond Fund | | | | | | | | |
Shares sold | | | 1,858,467 | | | | 1,931,227 | |
Shares issued on reinvestment | | | 242,808 | | | | 285,810 | |
Shares repurchased | | | (3,943,837 | ) | | | (1,345,964 | ) |
| | | | | | | | |
Net Increase (Decrease) | | | (1,842,562 | ) | | | 871,073 | |
| | | | | | | | |
299
| | |
| | | |
| Notes to Financial Statements | | |
| | | | | | | | |
| | | | | | Period ended
August 31,
2016* | |
| Inflation-Linked Fixed Income Fund | | | | | | | | |
Shares sold | | | | | | | 16,725,951 | |
Shares issued on reinvestment | | | | | | | 309,874 | |
Shares repurchased | | | | | | | (1,475,479 | ) |
| | | | | | | | |
Net Increase | | | | | | | 15,560,346 | |
| | | | | | | | |
| | |
| Ultra-Short Term Fixed Income Fund | | | | | | | | |
Shares sold | | | | | | | 17,727,847 | |
Shares issued on reinvestment | | | | | | | 141,795 | |
Shares repurchased | | | | | | | (1,626,008 | ) |
| | | | | | | | |
Net Increase | | | | | | | 16,243,634 | |
| | | | | | | | |
| * | The values shown represent the period from Fund’s inception (March 8, 2016) through the period end August 31, 2016. |
5. Dividend and Tax Components of Capital
The tax character of distributions paid during the fiscal year ended August 31, 2016, were as follows:
| | | | | | | | | | | | | | | | |
| | | Large
Cap Equity
Fund | | | Small-Mid
Cap Equity
Fund | | | International
Equity
Fund | | | Emerging
Markets Equity
Fund | |
Distributions paid from: | | | | | | | | | | | | | | | | |
Tax Exempt | | $ | — | | | $ | — | | | $ | — | | | $ | — | |
Tax Return of Capital | | | — | | | | — | | | | — | | | | — | |
Ordinary Income | | | 7,025,138 | | | | 6,608,449 | | | | 19,988,419 | | | | 6,232,037 | |
Net Long-term Capital Gains | | | 301,650,427 | | | | 46,009,154 | | | | — | | | | — | |
| | | | | | | | | | | | | | | | |
Total Distributions Paid | | $ | 308,675,565 | | | $ | 52,617,603 | | | $ | 19,988,419 | | | $ | 6,232,037 | |
| | | | | | | | | | | | | | | | |
| | | | |
| | | Core Fixed
Income
Fund | | | High Yield
Fund | | | Municipal Bond
Fund | | | International
Fixed Income
Fund | |
Distributions paid from: | | | | | | | | | | | | | | | | |
Tax Exempt | | $ | — | | | $ | — | | | $ | 2,173,031 | | | $ | — | |
Tax Return of Capital | | | — | | | | — | | | | — | | | | — | |
Ordinary Income | | | 23,117,412 | | | | 16,980,249 | | | | 20,206 | | | | 14,225,200 | |
Net Long-term Capital Gains | | | 4,307,436 | | | | — | | | | 180,832 | | | | — | |
| | | | | | | | | | | | | | | | |
Total Distributions Paid | | $ | 27,424,848 | | | $ | 16,980,249 | | | $ | 2,374,069 | | | $ | 14,225,200 | |
| | | | | | | | | | | | | | | | |
| | | | |
| | | Inflation-Linked
Fixed Income
Fund | | | Ultra-Short Term
Fixed Income
Fund | | | | | | | |
Distributions paid from: | | | | | | | | | | | | | | | | |
Tax Exempt | | $ | — | | | $ | — | | | | | | | | | |
Tax Return of Capital | | | — | | | | — | | | | | | | | | |
Ordinary Income | | | 3,176,335 | | | | 1,418,793 | | | | | | | | | |
Net Long-term Capital Gains | | | — | | | | — | | | | | | | | | |
| | | | | | | | | | | | | | | | |
Total Distributions Paid | | $ | 3,176,335 | | | $ | 1,418,793 | | | | | | | | | |
| | | | | | | | | | | | | | | | |
300
| | |
| | | |
| Notes to Financial Statements | | |
As of August 31, 2016, the components of accumulated earnings on a tax basis were as follows:
| | | | | | | | | | | | | | | | |
| | | | |
| | | Large Cap Equity
Fund | | | Small-Mid Cap Equity
Fund | | | International Equity Fund | | | Emerging Markets Equity Fund | |
Undistributed ordinary income - net | | $ | 14,824,964 | | | $ | 548,137 | | | $ | 25,314,262 | | | $ | 3,786,330 | |
Undistributed long-term capital gains - net | | | 31,555,069 | | | | 7,694,191 | | | | — | | | | — | |
| | | | | | | | | | | | | | | | |
Total Undistributed earnings | | | 46,380,033 | | | | 8,242,328 | | | | 25,314,262 | | | | 3,786,330 | |
Capital Loss Carryforward | | | (24,317,714 | ) | | | — | | | | (307,063,817 | ) | | | (56,296,803 | ) |
Current Year Late Year Loss Deferral | | | — | | | | — | | | | — | | | | — | |
Other book/tax temporary differences | | | (19,530,512 | ) | | | (9,244,314 | )(e) | | | (22,872,769 | )(b) | | | (12,173,115 | )(b) |
Unrealized appreciation (depreciation) | | | 364,852,284 | | | | 60,830,394 | | | | 51,925,781 | | | | 31,895,455 | |
| | | | | | | | | | | | | | | | |
Total accumulated earnings/(losses) - net | | $ | 367,384,091 | | | $ | 59,828,408 | | | $ | (252,696,543 | ) | | $ | (32,788,133 | ) |
| | | | | | | | | | | | | | | | |
| | | | |
| | | Core Fixed
Income
Fund | | | High Yield
Fund | | | Municipal Bond
Fund | | | International
Fixed Income
Fund | |
Undistributed ordinary income - net | | $ | 4,153,843 | | | $ | 1,054,862 | | | $ | 146,258 | | | $ | 1,937,934 | |
Undistributed long-term capital gains - net | | | — | | | | — | | | | 1,518,038 | | | | — | |
Undistributed Tax Exempt Income - net | | | — | | | | — | | | | 441,829 | | | | — | |
| | | | | | | | | | | | | | | | |
Total Undistributed earnings | | | 4,153,843 | | | | 1,054,862 | | | | 2,106,125 | | | | 1,937,934 | |
Capital Loss Carryforward | | | — | | | | (46,458,885 | ) | | | — | | | | (4,292,447 | ) |
Current Year Late Year Loss Deferral | | | — | | | | — | | | | — | | | | — | |
Other book/tax temporary differences | | | (3,082,905 | )(f) | | | (1,977,971 | )(h) | | | (228 | ) | | | (1,983,500 | )(f) |
Unrealized appreciation (depreciation) | | | 16,867,573 | | | | 3,864,715 | | | | 5,971,478 | | | | 1,056,578 | |
Tax Exempt Spillback | | | — | | | | — | | | | — | | | | — | |
| | | | | | | | | | | | | | | | |
Total accumulated earnings/(losses) - net | | $ | 17,938,511 | | | $ | (43,517,279 | ) | | $ | 8,077,375 | | | $ | (3,281,435 | ) |
| | | | | | | | | | | | | | | | |
| | | | |
| | | Inflation-
Linked Fixed
Income Fund | | | Ultra-Short
Term Fixed
Income Fund | | | | | | | |
Undistributed ordinary income - net | | $ | — | | | $ | 250,887 | | | | | | | | | |
Undistributed long-term capital gains - net | | $ | — | | | $ | — | | | | | | | | | |
| | | | | | | | | | | | | | | | |
Total Undistributed earnings | | $ | — | | | $ | 250,887 | | | | | | | | | |
Capital Loss Carryforward | | $ | — | | | $ | (408,977 | ) | | | | | | | | |
Other book/tax temporary differences | | $ | (388,100 | )(f) | | $ | (309,850 | )(f) | | | | | | | | |
Unrealized appreciation (depreciation) | | $ | 3,098,420 | | | $ | 485,800 | | | | | | | | | |
| | | | | | | | | | | | | | | | |
Total accumulated earnings/(losses) - net | | $ | 2,710,320 | | | $ | 17,860 | | | | | | | | | |
| | | | | | | | | | | | | | | | |
As of August 31, 2016, there were no significant differences between the book and tax components of net assets for Municipal Bond Fund.
| (a) | The difference between book-basis and tax-basis unrealized appreciation (depreciation) is attributable primarily to the tax deferral of losses on wash sales. |
| (b) | The difference between book-basis and tax-basis unrealized appreciation (depreciation) is attributable primarily to the tax deferral of losses on wash sales, the realization for tax purposes of unrealized gains on investments in passive foreign investment companies. |
| (c) | The difference between book-basis and tax-basis unrealized appreciation (depreciation) is attributable primarily to the tax deferral of losses on wash sales and tax cost adjustments related to ROC dividends received. |
| (d) | The difference between book-basis and tax-basis unrealized appreciation (depreciation) is attributable primarily to the tax deferral of losses on wash sales and tax cost adjustments related to ROC dividends received and real estate investments. |
| (e) | The difference between book-basis and tax-basis unrealized appreciation (depreciation) is attributable primarily to the tax deferral of losses on wash sales, tax cost adjustments related to ROC dividends received and real estate investments, and the realization for tax purposes of unrealized gains on investments in passive foreign investment companies. |
| (f) | The difference between book-basis and tax-basis unrealized appreciation (depreciation) is attributable primarily to the tax deferral of losses on wash sales and the difference between book and tax amortization methods for premiums on fixed income securities. |
301
| | |
| | | |
| Notes to Financial Statements | | |
| (g) | The difference between book-basis and tax-basis unrealized appreciation (depreciation) is attributable primarily to distribution payables. |
| (h) | The difference between book-basis and tax-basis unrealized appreciation (depreciation) is attributable primarily to the tax deferral of losses on wash sales and interest accrual on defaulted bonds. |
| (i) | The difference between book-basis and tax-basis unrealized appreciation (depreciation) is attributable primarily to the tax deferral of losses on wash sales, tax cost adjustments related to ROC dividends received and real estate investments, and partnerships. |
6. Capital Loss Carry Forward
Under the Regulated Investment Company Modernization Act of 2010 (the “Act”), the Funds are permitted to carry forward capital losses incurred in taxable years beginning after December 22, 2010, for an unlimited period. However, any losses incurred during those future taxable years will be required to be utilized prior to the losses incurred in pre-enactment taxable years. As a result of this, pre-enactment capital loss carryforwards may be more likely to expire unused.
As of August 31, 2016, the Funds had the following net capital loss carryforwards remaining:
| | | | | | | | | | | | | | | | | | | | |
| Year of Expiration | | Large Cap Equity Fund* | | | Small-Mid Cap Equity Fund | | | International
Equity
Fund | | | Emerging Markets Equity
Fund | | | Core Fixed Income Fund | |
8/31/2016 | | $ | — | | | $ | — | | | $ | — | | | $ | — | | | $ | — | |
8/31/2017 | | | 24,317,714 | ** | | | — | | | | — | | | | — | | | | — | |
8/31/2018 | | | — | | | | — | | | | 234,746,051 | | | | — | | | | — | |
8/31/2019 | | | — | | | | — | | | | — | | | | — | | | | — | |
Non-expiring: | | | | | | | | | | | | | | | | | | | | |
Short-Term | | | — | | | | — | | | | 22,648,825 | | | | 37,722,592 | | | | — | |
Long-Term | | | — | | | | — | | | | 49,668,941 | | | | 18,574,211 | | | | — | |
| | | | | | | | | | | | | | | | | | | | |
| | $ | 110,142,882 | | | $ | — | | | $ | 307,063,817 | | | $ | 56,296,803 | | | $ | — | |
| | | | | | | | | | | | | | | | | | | | |
| | | | | |
| Year of Expiration | | High Yield
Fund | | | Municipal Bond
Fund | | | International Fixed Income Fund | | | Inflation-Linked Fixed Income Fund | | | Ultra-Short Term Fixed Income Fund | |
8/31/2016 | | $ | — | | | $ | — | | | $ | — | | | $ | — | | | $ | — | |
8/31/2017 | | | 6,697,249 | | | | — | | | | — | | | | — | | | | — | |
8/31/2018 | | | 5,672,191 | | | | — | | | | 4,292,447 | | | | — | | | | — | |
Non-expiring: | | | | | | | | | | | | | | | | | | | | |
Short-Term | | | 11,642,155 | | | | — | | | | — | | | | — | | | | 118,065 | |
Long-Term | | | 22,447,290 | | | | — | | | | — | | | | — | | | | 290,912 | |
| | | | | | | | | | | | | | | | | | | | |
| | $ | 46,458,885 | | | $ | — | | | $ | 4,292,447 | | | $ | — | | | $ | 408,977 | |
| | | | | | | | | | | | | | | | | | | | |
These amounts will be available to offset any future taxable capital gains.
| * | Detail of Capital Loss Carryovers from February 5, 2016 merger with Large Cap Value Investments: |
| | | | | | | | | | | | |
| Year of Expiration | | | | | Caploss Utilized In
Current Year | | | Remaining Capital
Loss Carryforward | |
8/31/2017 | | $ | 128,547,419 | | | $ | 104,229,705 | | | $ | 24,317,714 | |
Non-expiring: | | | | | | | | | | | | |
Short-Term | | | 5,878,796 | | | | 5,878,796 | | | | — | |
Long-Term | | | — | | | | — | | | | — | |
| | | | | | | | | | | | |
| | $ | 134,426,215 | | | $ | 110,108,501 | | | $ | 24,317,714 | |
| | | | | | | | | | | | |
| ** | The capital loss carryovers for the Large Cap Equity Investments are subject to certain limitations upon availability, to offset future gains, pursuant to Section 381 of the Internal Revenue Code. |
302
| | |
| | | |
| Notes to Financial Statements | | |
7. Recent Accounting Pronouncements
In January 2016, the FASB issued ASU 2016-01, Financial Instruments — Overall (Subtopic 825-10): Recognition and Measurement of Financial Assets and Financial Liabilities. The update intends to enhance the reporting model for financial instruments to provide users of financial instruments with more decision-useful information and addresses certain aspects of the recognition, measurement, presentation, and disclosure of financial instruments. The ASU will also address measurement of credit losses on financial assets. ASU 2016-01 is effective for fiscal years beginning after 15 December 2017, including interim periods within those fiscal years. Early application is permitted. At this time, it is not anticipated that these changes will have an impact on the financial statements.
8. Reorganization
On October 6, 2015, the Board of Large Capitalization Value Equity Investments (“Large Cap Value”) and Large Capitalization Growth Investments (“Large Cap Growth”) approved the reorganization of Large Cap Value into Large Cap Growth, pursuant to which Large Cap Growth would continue as the surviving fund (the “Reorganization”). On February 5, 2016 (“Closing Date”), Large Capitalization Value Equity Fund was reorganized into Large Cap Growth. Subsequent to the Closing Date Large Cap Growth was renamed to Large Cap Equity Fund. The purpose of this transaction was to combine two funds with similar investment objectives and strategies.
This tax-free reorganization was accomplished by exchanging the assets and liabilities of Large Cap Value for shares of Large Cap Growth. Shareowners holding shares of Large Cap Value received shares of Large Cap in the reorganization. The investment portfolio of Large Cap Value, with an aggregate value of $926,372,833 and an identified cost of $913,396,269 at February 5, 2016, was the principal asset acquired by Large Cap Growth.
For financial reporting purposes, assets received and shares issued by the Large Cap were recorded at net asset value, however, the cost basis of the investments received from Large Cap Value was carried forward to align ongoing reporting of Large Cap Growth’s realized and unrealized gains and losses with amounts distributable to shareowners for tax reporting purposes.
| | | | | | | | | | | | |
| | | Large
Capitalization Value Investments (Pre-Reorganization) | | | Large
Capitalization Growth Investments (Pre-Reorganization) | | | Large Cap Equity Investments (Post-Reorganization) | |
Net Assets | | $ | 973,690,395 | | | $ | 913,232,958 | | | $ | 1,886,923,353 | |
Shares Outstanding | | | 88,422,838 | | | | 63,167,892 | | | | 130,517,090 | |
| | | | | | | | |
| | | Exchange Ratio | | | Shares Issued In Reorganization | |
| | | 0.7617 | | | | 67,349,198 | |
| | | | | | | | |
| | | Unrealized Appreciation (Depreciation) on Closing Date | | | Accumulated Gain (Loss) on Closing Date | |
Large Capitalization Value Fund | | $ | 12,976,564 | | | $ | (144,954,736 | ) |
Large Capitalization Growth Fund | | $ | 196,511,875 | | | $ | 335,434,156 | |
Assuming the Reorganization had been completed on September 1, 2015, the beginning of the Large Cap Growth’s current fiscal period, the pro forma results of operations for the period ended August 31, 2016, are as follows:
| | | | |
Net investment income | | $ | 26,590,469 | |
Net realized and unrealized gain | | | 70,789,807 | |
| | | | |
Increase in net assets from operations | | $ | 97,380,276 | |
On October 6, 2015, the Board of Trustees of Small Capitalization Value Equity Investments (“Small-Mid Cap Value”) and Small Capitalization Growth Investments (“Small-Mid Cap Growth”) approved the reorganization of Small-Mid Cap Value into Small-Mid Cap Growth, pursuant to which Small-Mid Cap Growth would continue as the surviving fund (the “Reorganization”). On
303
| | |
| | | |
| Notes to Financial Statements | | |
February 5, 2016 (“Closing Date”), Small-Mid Cap Value was reorganized into Small-Mid Cap Growth. Subsequent to the Closing Date Small-Mid Cap Growth was renamed to Small-Mid Cap Equity Fund. The purpose of this transaction was to combine two funds with similar investment objectives and strategies.
This tax-free reorganization was accomplished by exchanging the assets and liabilities of Small-Mid Cap Value for shares of Small-Mid Cap Growth. Shareowners holding shares of Small-Mid Cap Value received shares of Small-Mid Cap in the reorganization. The investment portfolio of Small-Mid Cap Value, with an aggregate value of $175,768,641 and an identified cost of $178,133,527 at February 5, 2016, was the principal asset acquired by Small-Mid Cap Growth.
For financial reporting purposes, assets received and shares issued by the Small-Mid Cap were recorded at net asset value, however, the cost basis of the investments received from Small-Mid Cap Value was carried forward to align ongoing reporting of Small-Mid Cap Growth realized and unrealized gains and losses with amounts distributable to shareowners for tax reporting purposes.
| | | | | | | | | | | | |
| | | Small Capitalization Value Investments (Pre-Reorganization) | | | Small Capitalization Growth Investments (Pre-Reorganization) | | | Small-Mid Cap
Equity Investments (Post-Reorganization) | |
Net Assets | | $ | 187,304,118 | | | $ | 174,076,542 | | | $ | 361,380,660 | |
Shares Outstanding | | | 19,634,932 | | | | 12,024,251 | | | | 24,962,190 | |
| | | | | | | | |
| | | Exchange Ratio | | | Shares Issued In Reorganization | |
| | | 0.6589 | | | | 12,937,939 | |
| | | | | | | | |
| | | Unrealized Appreciation (Depreciation) on Closing Date | | | Accumulated Gain (Loss) on Closing Date | |
Small Capitalization Value Fund | | $ | (2,364,886 | ) | | $ | 26,692,117 | |
Small Capitalization Growth Fund | | $ | (3,715,701 | ) | | $ | 47,577,318 | |
Assuming the Reorganization had been completed on September 1, 2015, the beginning of the Small-Mid Cap Growth’s current fiscal period, the pro forma results of operations for the period ended August 31, 2016, are as follows:
| | | | |
Net investment income | | $ | 1,927,010 | |
Net realized and unrealized gain | | | 3,319,796 | |
| | | | |
Increase in net assets from operations | | $ | 5,246,806 | |
9. Subsequent Events
Management has evaluated subsequent events after the balance sheet date through the date that the financial statements were issued and has not identified any additional events or transactions that would require recognition or disclosure in the financial statements other than the distribution information below.
Subsequent to August 31, 2016, the Funds made the following distributions:
| | | | | | | | | | | | | | | | |
| Record Date Payable Date | | Core Fixed Income
Fund | | | High Yield
Fund | | | Municipal Bond
Fund | | | Ultra-Short Term
Fixed Income Fund | |
9/01/16-9/30/16 | | $ | 0.016620 | | | $ | 0.020169 | | | $ | 0.021392 | | | $ | 0.018395 | |
304
| | |
| | | |
Report of Independent Registered Public
Accounting Firm | | |
To the Board of Trustees and Shareholders of
Consulting Group Capital Markets Funds:
We have audited the accompanying statements of assets and liabilities, including the schedules of investments of Large Cap Equity Fund (formerly, Large Capitalization Growth Investments), Small-Mid Cap Equity Fund (formerly, Small Capitalization Growth Investments), International Equity Fund (formerly, International Equity Investments), Emerging Markets Equity Fund (formerly, Emerging Markets Equity Investments), Core Fixed Income Fund (formerly, Core Fixed Income Investments), High Yield Fund (formerly, High Yield Investments), International Fixed Income Fund (formerly, International Fixed Income Investments), Municipal Bond Fund (formerly, Municipal Bond Investments), as of August 31, 2016, and the related statements of operations for the year then ended, the statements of changes in net assets for each of the two years in the period then ended, and the financial highlights for each of the five years in the period then ended. We have audited the accompanying statements of assets and liabilities, including the schedules of investments of Inflation-Linked Fixed Income Fund and Ultra-Short Term Fixed Income Fund as of August 31, 2016, and the related statements of operations, changes in net assets, cash flows for Inflation-Linked Fixed Income Fund and financial highlights for the period from March 8, 2016 (commencement of operation) to August 31, 2016. Each of the funds comprise the Capital Group Capital Markets Funds (collectively the “Funds”). These financial statements and financial highlights are the responsibility of the Funds’ management. Our responsibility is to express an opinion on these financial statements and financial highlights based on our audits.
We conducted our audits in accordance with the standards of the Public Company Accounting Oversight Board (United States). Those standards require that we plan and perform the audit to obtain reasonable assurance about whether the financial statements and financial highlights are free of material misstatement. The Funds are not required to have, nor were we engaged to perform, an audit of their internal control over financial reporting. Our audits included consideration of internal control over financial reporting as a basis for designing audit procedures that are appropriate in the circumstances, but not for the purpose of expressing an opinion on the effectiveness of the Funds’ internal control over financial reporting. Accordingly, we express no such opinion. An audit also includes examining, on a test basis, evidence supporting the amounts and disclosures in the financial statements, assessing the accounting principles used and significant estimates made by management, as well as evaluating the overall financial statement presentation. Our procedures included confirmation of securities owned as of August 31, 2016, by correspondence with the custodian and brokers; where replies were not received from brokers, we performed other auditing procedures. We believe that our audits provide a reasonable basis for our opinion.
In our opinion, the financial statements and financial highlights referred to above present fairly, in all material respects, the financial position of each of the Funds constituting the Consulting Group Capital Markets Funds as of August 31, 2016, the results of their operations, the changes in their net assets, the cash flows for Inflation-Linked Fixed Income Fund, and the financial highlights for each of the periods presented in conformity with accounting principles generally accepted in the United States of America.
DELOITTE & TOUCHE LLP
Boston, Massachusetts
October 31, 2016
305
| | |
| | | |
Board Approval of Management Agreement and Investment
Advisory Agreements | | |
Approval of Management Agreement and Subadvisory Agreements
The Consulting Group Capital Markets Funds (“Trust” and, each series thereof a “Fund”) and Consulting Group Advisory Services LLC (“Manager”), a business of Morgan Stanley Smith Barney Holdings LLC, have entered into an investment management agreement (“Management Agreement”). Pursuant to the Management Agreement, the Manager serves as “manager of managers” for the Trust and selects and oversees professional money managers (each, a “Sub-adviser” and collectively, the “Sub-advisers”) who are responsible for investing the portion of assets of the Funds allocated to them pursuant to investment advisory agreements (the “Subadvisory Agreements” and, together with the Management Agreement, the “Agreements”) between the Manager and each of the Sub-advisers.
The Investment Company Act of 1940, as amended (the “1940 Act”), requires that the Agreements be approved initially, as well as annually thereafter, by the Trust’s Board of Trustees (“Board”) and by a majority of the Trustees who are not “interested persons” (as defined in the 1940 Act) of any party to the Agreements (“Independent Trustees”), by vote cast in person at a meeting called for the purpose of voting on such approval. In connection with their consideration of the approval of the Agreements, the Independent Trustees must request and evaluate such information as may reasonably be necessary to make a reasonable business judgment with respect to the approval of the Agreements, and the Manager and Sub-advisers are required to provide such information.
At an in-person meeting held on May 25-26, 2016, the Board, including a majority of the Independent Trustees, approved the continuance of the Agreements for an annual period. Both in connection with the meeting specifically held to address the continuance of the Agreements and at other meetings during the course of the year, the Independent Trustees requested and received information from the Manager and the Sub-advisers that they deemed reasonably necessary for their review of the Agreements and the performance of the Manager and Sub-advisers under the Agreements. The Independent Trustees were assisted in their review by Fund counsel and independent legal counsel (“Independent Counsel”) and met with Independent Counsel in executive sessions separate from representatives of the Manager and the Sub-advisers. The Independent Trustees also were assisted in their review by an independent analyst of investment company contract review processes. In addition to the Management Agreement, the Board approved the Subadvisory Agreements with the following Sub-advisers on behalf of the indicated Fund:
| | |
Sub-adviser Name | | Fund(s) |
| |
| BlackRock Financial Management, Inc. | | ¨ Core Fixed Income Fund ¨ Large Cap Equity Fund1 ¨ Small-Mid Cap Equity Fund2 ¨ International Equity Fund3 ¨ Emerging Markets Equity Fund4 |
| |
| Causeway Capital Management LLC | | ¨ International Equity Fund |
| |
| Columbia Management Investment Advisers | | ¨ Large Cap Equity Fund5 |
| |
| Delaware Management Company | | ¨ Large Cap Equity Fund |
| |
| Frontier Capital Management Co., LLC | | ¨ Small-Mid Cap Equity Fund |
| |
| Hahn Capital Management, LLC | | ¨ Small-Mid Cap Equity Fund6 |
| |
| Lazard Asset Management LLC | | ¨ Large Cap Growth Fund7 ¨ Emerging Markets Equity Fund |
| |
| Lyrical Asset Management LP | | ¨ Large Cap Equity Fund |
| |
| McDonnell Investment Management, LLC | | ¨ Municipal Bond Fund |
| |
| Metropolitan West Asset Management LLC | | ¨ Core Fixed Income Fund |
| |
| Neuberger Berman LLC | | ¨ Small-Mid Cap Equity Fund8 |
| |
| OppenheimerFunds, Inc. | | ¨ International Equity Fund |
| |
| Pacific Investment Management Company LLC | | ¨ International Fixed Income Fund ¨ Inflation-Linked Fixed Income Fund9 ¨ Ultra-Short Fixed Income Fund10 |
306
| | |
| | | |
Board Approval of Management Agreement and Investment
Advisory Agreements | | |
| | |
Sub-adviser Name | | Fund(s) |
| |
| PENN Capital Management Co., Inc. | | ¨ High Yield Fund |
| |
| Rutabaga Capital Management LLC | | ¨ Small-Mid Cap Equity Fund |
| |
| Schroder Investment Management North America Inc. | | ¨ International Equity Fund |
| |
| Schroder Investment Management North America Ltd. (delegation agreement) | |
¨ International Equity Fund |
| |
| Van Eck Associates Corporation | | ¨ Emerging Markets Equity Fund11 |
| |
| Wedgewood Partners, Inc. | | ¨ Large Cap Equity Fund12 |
| |
| Western Asset Management Company | | ¨ Core Fixed Income Fund ¨ High Yield Fund |
| |
| Westfield Capital Management Co., L.P. | | ¨ Small-Mid Cap Equity Fund |
| 1 | Approval of Subadvisory Agreement for initial two-year period occurred on December 17, 2015. Subadvisory Agreement is dated February 22, 2016. |
| 2 | Approval of Subadvisory Agreement for initial two-year period occurred on December 17, 2015. Subadvisory Agreement is dated February 22, 2016. |
| 3 | Approval of Subadvisory Agreement for initial two-year period occurred on May 26, 2016. Subadvisory Agreement is dated July 15, 2016. |
| 4 | Approval of Subadvisory Agreement for initial two-year period occurred on May 26, 2016. Subadvisory Agreement is dated July 15, 2016. |
| 5 | Approval of Subadvisory Agreement for initial two-year period occurred on December 17, 2015. Subadvisory Agreement is dated February 22, 2016. |
| 6 | Approval of Subadvisory Agreement for initial two-year period occurred on December 17, 2015. Subadvisory Agreement is dated February 22, 2016. |
| 7 | Approval of Subadvisory Agreement for initial two-year period occurred on December 17, 2015. Subadvisory Agreement is dated February 22, 2016. |
| 8 | Approval of Subadvisory Agreement for initial two-year period occurred on December 17, 2015. Subadvisory Agreement is dated February 22, 2016. |
| 9 | Approval of Subadvisory Agreement for initial two-year period occurred on December 17, 2015. Subadvisory Agreement is dated January 20, 2016 |
| 10 | Approval of Subadvisory Agreement for initial two-year period occurred on December 17, 2015. Subadvisory Agreement is dated January 20, 2016. |
| 11 | Approval of Subadvisory Agreement for initial two-year period occurred on May 26, 2016. Subadvisory Agreement is dated July 20, 2016. |
| 12 | Approval of Subadvisory Agreement for initial two-year period occurred on December 17, 2015. Subadvisory Agreement is dated February 22, 2016. |
In voting to approve the Agreements, the Independent Trustees considered whether the approval of the Agreements would be in the best interests of the respective Fund and its shareholders, an evaluation based on several factors including those discussed below.
Nature, Extent and Quality of the Services Provided Under the Agreements
The Board received and considered information regarding the nature, extent and quality of services provided to the Funds by the Manager and the Sub-advisers under the Management Agreement and the Subadvisory Agreements, respectively, during the meeting and during the past year, as applicable. The Independent Trustees considered information regarding the process by which the Manager selected and recommended the Sub-advisers for Board approval and the Manager’s supervisory activities over the Sub-advisers. The Independent Trustees noted that the Manager monitors and evaluates the performance of each Fund’s Sub-advisers, including the Sub-advisers’ compliance with the investment objective, policies, and restrictions of the relevant Fund. The Board also received a description of the administrative and other services rendered to the Trust and its shareholders during the past year. The Board noted information received at regular meetings throughout the year related to the services rendered by the Manager about the management of the Trust’s affairs and its role in coordinating the activities of the Sub-advisers and the Trust’s other service providers. The Board considered each Sub-adviser’s specific responsibilities in all aspects of the day-to-day management of the portion of the respective Fund’s assets allocated to it, as well as the qualifications, experience and responsibilities of the persons serving as the portfolio managers for the segment of the Fund’s assets managed by the respective Sub-adviser, and other key personnel at the Sub-adviser. The Board specifically took into account each Sub-adviser’s investment process and capabilities, evaluating, if applicable, how the Sub-adviser complemented each of the other Sub-advisers to the respective Fund.
The Independent Trustees also discussed the acceptability of the terms of the Sub-Advisory Agreements. The Independent Trustees considered the Manager’s favorable assessment of the nature and quality of the sub-advisory services provided to the Funds by the Sub-advisers. The Board also reviewed information received from the Manager and the Trust’s Chief Compliance Officer regarding the Trust’s compliance policies and procedures established pursuant to Rule 38a-1 under the 1940 Act and those of each Sub-adviser.
307
| | |
| | | |
Board Approval of Management Agreement and Investment
Advisory Agreements | | |
During the course of the year and at the meeting, the Board reviewed the qualifications, backgrounds and responsibilities of the Trust’s senior personnel and the portfolio management team primarily responsible for the management of the Funds. The Board also considered the Manager’s and the Sub-advisers’ brokerage policies and practices, transaction execution standards, policies and practices regarding soft dollars, and quality controls applicable to brokerage allocation procedures.
The Board concluded that, overall, the nature, extent and quality of services provided (and expected to be provided) under the Management Agreement and the Subadvisory Agreements were adequate and appropriate.
Fund Performance
As to each Fund, the Board received and considered performance information provided by Lipper, Inc. (“Lipper”), an independent provider of investment company data, for the Fund and for all retail and institutional funds, regardless of asset size or primary channel of distribution, in the Fund’s Lipper category (the “Performance Universe”). As to each Fund, the Board was provided with a description of the methodology Lipper used to determine the similarity of the Funds with the funds included in the Performance Universe. The Board also noted that it had received and discussed with advisory personnel of the Trust at periodic intervals throughout the year information on the investment performance of each Fund in comparison to similar mutual funds and benchmark performance indices. In addition, as to each Sub-adviser, the Board received and considered performance information provided by the Manager for the Sub-adviser managing the portion of the respective Fund’s assets allocated to it. The information comparing each Fund’s performance to that of its Performance Universe was for the one-, three-, five- and ten-year periods ended March 31, 2016. The Board noted that the Core Fixed Income Fund performed better than the median performance of the funds in its Performance Universe for each period, but that the Small-Mid Cap Equity Fund performed below the median performance of the funds in its Performance Universe for each period. It was noted that the comparative information for the Small-Mid Cap Equity Fund reflected the period prior to the fund merger and, therefore, was a comparison of the fund’s prior growth strategy with a group of small cap core funds. The Board also noted that the Large Cap Equity Fund and the International Equity Fixed Income Fund performed at or above the median performance of the funds in their respective Performance Universes for each period, except the one-year period. It was noted that the comparative information for the Large Cap Equity Fund reflected the period prior to the fund merger and, therefore, was a comparison of the fund’s prior growth strategy with a group of large cap core funds. The Board further noted that the International Equity Fund and the Emerging Markets Equity Fund performed better than the median performance of the funds in their respective Performance Universes for the one-year period, but that the Funds performed at or below the median performance of the funds in the Performance Universe for the remaining periods. The Board also noted the High Yield Fund and the Muni Bond Fund performed at or below the median performance of the funds in their respective Performance Universes for each of the periods noted. The Independent Trustees and representatives of the Manager then discussed management’s efforts to improve the performance of those Funds underperforming their peer groups and benchmarks, and the Board noted the positive results of changes in Sub-advisers and fund mergers, as reflected in the improved one-year performance. During the discussion, the Trustees and representatives of the Manager considered the Funds’ performance in light of overall financial market conditions and the nature of the investment objectives and strategies of certain Funds, prospectus disclosure regarding the risks involved with such strategies and investor expectations.
Based on its review, as to each Fund, the Board was generally satisfied with the overall performance of the Fund and with the efforts of the Manager and respective Sub-advisers to continue to improve performance. The Trustees determined to continue to evaluate the Funds’ performance and to continue to periodically review Fund performance with the Manager.
Management Fees and Expense Ratios
As to each Fund, the Board reviewed and considered the contractual management fees (“Contractual Management Fees”) payable by the Fund to the Manager in light of the nature, extent and quality of the management and subadvisory services provided by the Manager and the Sub-advisers, respectively. The Board also reviewed and considered whether fee waiver and/or expense reimbursement arrangements are currently in place for a Fund and considered the actual fee rate (after taking any such waivers and reimbursements into account) (“Actual Management Fee”) and whether any fee waivers and expense reimbursements could be discontinued. The Board noted that the compensation paid to the Sub-advisers is paid by the Manager, not the Funds, and, accordingly, that the retention of the Sub-advisers does not increase the fees or expenses otherwise incurred by the Fund and its shareholders. The Board also reviewed with management the scope of services provided to the Fund by the Manager, noting that the Funds are provided with regulatory compliance services, office facilities and Trust officers (including the Trust’s chief financial,
308
| | |
| | | |
Board Approval of Management Agreement and Investment
Advisory Agreements | | |
chief legal and chief compliance officers), and that the Manager coordinates and oversees the provision of services to each Fund by other fund service providers, including the Sub-Advisers. The Board also considered and discussed information about the Sub-advisers’ fees and comparable information for other subadvised funds and accounts managed by the Sub-advisers.
Additionally, the Board received and considered information comparing each Funds’ Contractual Management Fees and Actual Management Fees and the Fund’s actual total expenses with those of a group of funds selected by Lipper as comparable to the particular Fund (the “Expense Group”) and a broader group of retail no-load funds selected by Lipper (the “Expense Universe”). This information showed that each Fund’s Contractual Management Fee, except for that of the High Yield Fund, which was slightly higher than the median, was lower than the median Contractual Management Fee for the funds in the applicable Expense Group, and that each Fund’s Actual Management Fee was lower than the average Actual Management Fee for the funds in the applicable Expense Universe. The Independent Trustees also noted that the Lipper expense information showed that each Fund’s actual total expense ratio, except for the Municipal Bond Fund, which was slightly higher than the median, was lower than the median of the total expense ratios of the funds in the applicable Expense Group. The Lipper expense information also showed that each Fund’s actual total expense ratio was lower than the average total expense ratios of the funds in the applicable Expense Universe.
The Board determined that, as to each Fund, the management fee paid by the Fund to the Manager and the sub-advisory fees paid by the Manager to the Sub-advisers were reasonable in light of comparative performance and expense information and the nature, extent and quality of the services provided to the Fund under the Agreements.
Manager Profitability
The Board received and considered a profitability analysis of the Manager and its affiliates in providing services to the Funds. In addition, the Board received information with respect to the Manager’s allocation methodologies used in preparing this profitability data. To the extent available, the Board also reviewed information provided by the Sub-advisers with respect to the relevant Sub-adviser’s profitability in providing subadvisory services to the Funds. The Board also noted the profitability percentage ranges determined by appropriate court cases to be reasonable given the services rendered to investment companies. As to each Fund, the Board determined that the Manager’s profitability was not excessive in light of the nature, extent and quality of the services provided to the Fund.
Economies of Scale
As to each Fund, the Board considered information regarding whether there have been economies of scale with respect to the management of the Fund, whether the Fund has appropriately benefited from any economies of scale and whether there is potential for realization of any further economies of scale. The Board considered the various ways economies of scale could be realized and shared with Fund investors, and whether economies of scale in the provision of services to the Fund were being passed along to the shareholders. As to each Fund, the Board also noted that to the extent the Fund’s assets increase over time, the Fund and its shareholders should realize economics of scale as certain expenses, such as fixed fund fees, become a smaller percentage of overall assets. The Board noted that it appeared that the benefits of any economies of scale also would be appropriately shared with shareholders through increased investment in fund management resources.
Other Benefits to the Manager and the Sub-advisers
As to each Fund, the Board considered other benefits received by the Manager, the Sub-advisers and their affiliates as a result of their relationship with the Funds, including soft dollar arrangements, receipt of brokerage and the opportunity to offer additional products and services to Fund shareholders.
In light of the Manager’s costs of providing investment management and other services to the Funds and the Manager’s ongoing commitment to the Funds and each Sub-adviser’s day-to-day management of the portion of the respective Fund’s assets allocated to it, the profits and ancillary benefits that the Manager, the Sub-advisers and their affiliates received were considered reasonable.
Based on their discussions and considerations, including those described above, the Board approved the Management Agreement and the Subadvisory Agreements to continue for another year. No single factor reviewed by the Board was identified by the Board as the principal factor in determining whether to approve the Management Agreement and the Subadvisory Agreements.
309
Trustees and Officers of the Trust
The Trust’s Board of Trustees (“Board” or “Trustees”) is responsible for overseeing the Trust’s management and operations. The Board approves all significant agreements between the Trust and the companies that furnish services to the Funds, including agreements with the Trust’s distributor, Sub-advisers, custodian, transfer agent and administrator. The Board elects officers who are responsible for the day-to-day operations of the Trust and the Funds and who execute policies authorized by the Board.
Consulting Group Advisory Services LLC (“CGAS” or “Manager”), a business of Morgan Stanley Smith Barney Holdings LLC (“MSSB Holdings”), serves as the investment adviser for each Fund. The Funds employ a “multi-manager” strategy. The Manager selects and oversees professional money managers (each a “Sub-adviser”) who are responsible for investing the assets of the Funds allocated to them. In addition to investment management services, the Manager monitors and supervises the services provided to the Trust by its administrator. The Manager also is responsible for conducting all operations of the Trust, except those operations contracted to the Sub-advisers, the custodian, the transfer agent and the administrator.
The names of the Trustees and officers of the Trust, their addresses and years of birth, together with information as to their principal business occupations and, for the Trustees, other board memberships they have held during the past five years, are set forth below. The executive officers of the Trust are employees of organizations that provide services to the Funds.
| | | | | | | | | | | | |
Name, Address and
Date of Birth | | Position(s)
Held with
Trust | | Term of
Office
and
Length
of Time
Served* | | Principal Occupation(s)
During Past Five Years | | Number of
Funds
in Fund
Complex
Overseen by
Trustee | | | Other Board
Memberships
Held During Past
Five Years by
Trustee |
| | | | |
INDEPENDENT TRUSTEES | | | | | | | | | | |
| | | | | |
John J. Murphy Murphy Capital Management, Inc. 268 Main Street Gladstone, NJ 07934 Birth Year: 1944 | | Chairman and Trustee | | Since 2002 (Chairman since 2010) | | Founder and Senior Principal, Murphy Capital Management (investment management) (1983-present) | | | 10 | | | Trustee, Legg Mason Partners Equity Trust (2007-present); Trustee, UBS Funds (2009-present); and Director, Fort Dearborn Income Securities (2013-present) |
| | | | | |
Adela Cepeda A.C. Advisory, Inc. 150 North Wacker Drive, Suite 2160 Chicago, IL 60606 Birth Year: 1958 | | Trustee | | Since 2008 | | President, A.C. Advisory, Inc. (1995-October 2016); and Managing Director, Public Financial Management, Inc. (October 2016-present) | | | 10 | | | Director, BMO Financial Corp. (2012-present); Trustee, Mercer Funds (2005-present); Trustee, UBS Funds (2004-present); Director, Fort Dearborn Income Securities (2000-present); formerly, Director, Amalgamated Bank of Chicago (2003-2012); and formerly, Director, Municipal Securities Rulemaking Board (2010-2012) |
310
| | | | | | | | | | | | |
Name, Address and
Date of Birth | | Position(s)
Held with
Trust | | Term of
Office
and
Length
of Time
Served* | | Principal Occupation(s)
During Past Five Years | | Number of
Funds
in Fund
Complex
Overseen by
Trustee | | | Other Board
Memberships
Held During Past
Five Years by
Trustee |
| | | | | |
W. Thomas Matthews 453 Banks Mill Road Aiken, SC 29801 Birth Year: 1949 | | Trustee | | Since 2009 (Interested Trustee from 2006-2009) | | Retired; Advisor, Smith Barney (2005-2007) | | | 10 | | | Chairman Emeritus, Congressional Medal of Honor Foundation (2009-present), formerly Treasurer (2009-2016); and Director, America’s Warrior Partnership (2013-present), formerly Chairman (2013-2016) |
| | | | | |
Mark J. Reed North American Management 1 North Brentwood Blvd., Suite 1510 St. Louis, MO 63105 Birth Year: 1964 | | Trustee | | Since 2007 | | Principal and Portfolio Manager, North American Management Corp. (2013-present); and Managing Director and Chief Compliance Officer, Bush O’Donnell Investment Advisors, Inc. (1988-2013) | | | 10 | | | None |
| | | | | |
Eric T. McKissack, CFA® Channing Capital Management, LLC 10 S. LaSalle Street, Suite 2401 Chicago, IL 60603 Birth Year: 1953 | | Trustee | | Since 2013 | | Founder and Chief Executive Officer, Channing Capital Management, LLC (investment management) (2004-present) | | | 10 | | | Trustee and Chairman, FlexShares Funds (2011-present); Trustee, The Art Institute of Chicago (2001-present); Director, Rehabilitation Institute of Chicago (2000-present); and Director, Urban Gateways (1995-present); and formerly, Director, ICMA Retirement Corp. (2005-2012) |
| | | | |
INTERESTED TRUSTEE | | | | | | | | | | |
| | | | | |
David Berdon** Morgan Stanley 522 Fifth Avenue, 12th Floor, New York, NY 10036 Birth Year: 1970 | | Trustee and Chief Executive Officer and President | | Since August 2015 | | Managing Director, Morgan Stanley (2013-present); Managing Director, Goldman Sachs (2001-2013) | | | 10 | | | None |
311
| | | | | | |
Name, Address and
Date of Birth | | Position(s)
Held with
Trust | | Term of Office***
and Length of
Time Served | | Principal Occupation(s) During Past Five Years |
| | |
OFFICERS | | | | |
| | | |
Francis Smith Morgan Stanley 522 Fifth Avenue, 4th Floor New York, NY 10036 Birth Year: 1965 | | Chief Financial Officer (“CFO”) and Treasurer | | Since 2014 | | Executive Director, Morgan Stanley (2001-present); Treasurer and Principal Financial Officer of various Morgan Stanley Funds (2003-present) |
| | | |
Eric Metallo Morgan Stanley 485 Lexington Ave, 11th Floor New York, NY 10017 Birth Year: 1976 | | Chief Legal Officer and Secretary | | Since August 2015 | | Executive Director, Morgan Stanley Wealth Management (2014-present); Senior Vice President and Associate General Counsel, Pine Bridge Investments (2011-2014); Corporate Counsel, Franklin Templeton Investments (2006-2011) |
| | | |
Philip Stack Morgan Stanley 2000 Westchester Avenue, 3rd Floor Purchase, NY 10577 Birth Year: 1964 | | Chief Compliance Officer | | Since 2013 | | Executive Director, Morgan Stanley (2015-Present); Vice President, Morgan Stanley (2013-2015); Vice President Corporate Audit Group – Compliance, Morgan Stanley (2012-2013); Vice President, Director of Investment Compliance and Risk Management, Gannett Welsh & Kotler (2008-2012) |
| | | |
Donna Marley Morgan Stanley Delaware Corporate Center II 2 Righter Parkway, 3rd Floor Wilmington, DE 19803 Birth Year: 1955 | | Chief Administrative Officer Chief Operating Officer | | Since August 2015 2011-2015 | | Executive Director, Morgan Stanley (2009-present); Director, Consulting Group Product Governance, Morgan Stanley (2011-present); Director, Consulting Group Risk Management, Morgan Stanley (2009-2011) |
| | | |
Robert Garcia Morgan Stanley 522 Fifth Avenue, 12th Floor New York, NY 10036 Birth Year: 1983 | | Chief Operating Officer Investment Officer Co-Chief Operating Officer | | Since May 2016 Since July 2015 August 2015-May 2016 | | Executive Director and Head of Portfolio Operations, Morgan Stanley (2016-present); Head of Packaged Digital Solutions, Morgan Stanley (2015-present); Head of Strategy and Development- Global Investment Solutions, Morgan Stanley (2013-2015); Overlay Portfolio Manager, Morgan Stanley (2009-2013) |
| | | |
Franceen Jansen Morgan Stanley 522 Fifth Avenue, 12th Floor New York, NY 10036 Birth Year: 1959 | | Investment Officer | | Since August 2015 | | Executive Director, Morgan Stanley (2010-present) |
312
| | | | | | |
Name, Address and
Date of Birth | | Position(s)
Held with
Trust | | Term of Office***
and Length of
Time Served | | Principal Occupation(s) During Past Five Years |
| | | |
Brian Mulley Morgan Stanley 522 Fifth Avenue, 11th Floor New York, NY 10036 Birth Year: 1977 | | Investment Officer | | Since August 2015 | | Investment Analyst, Executive Director, Morgan Stanley (2005-present) |
| | | |
Paul Ricciardelli Morgan Stanley 522 Fifth Avenue, 14th Floor New York, NY 10036 Birth Year: 1969 | | Investment Officer | | Since August 2015 | | Head of Manager Solutions, Morgan Stanley (2015-present); Head of IAR/GIMA, Morgan Stanley (2011- present); Director, Investment Management and Guidance, Merrill Lynch (1999-2011) |
| | | |
Matthew Rizzo Morgan Stanley Delaware Corporate Center II 2 Righter Parkway, 3rd Floor Wilmington, DE 19803 Birth Year: 1970 | | Investment Officer | | Since August 2015 | | Executive Director, Manager Solutions, Morgan Stanley (2015- present); Head of Investment Strategy and Content, Morgan Stanley (2012-2015); Senior Analyst, Morgan Stanley Smith Barney (2006-2012) |
| | | |
Sukru Saman Morgan Stanley 522 5th Avenue, 12th Floor New York, NY 10036 Birth Year: 1972 | | Investment Officer | | Since August 2015 | | Investment Officer, Morgan Stanley Wealth Management (2013-present); Due Diligence Analyst, Morgan Stanley Wealth Management (2009-2013) |
| | | |
Lisa Shalett Morgan Stanley 522 Fifth Avenue, 12th Floor New York, NY 10036 Birth Year: 1963 | | Investment Officer | | Since August 2015 | | Head of Investment and Portfolio Strategies, Morgan Stanley (2013-present); Chief Investment Officer, Bank of America/Merrill Lynch (2011-2013); Head of Alliance Growth Equities, Alliance Bernstein (1995-2010) |
| | | |
Drew Soffer Morgan Stanley Delaware Corporate Center II 2 Righter Parkway, 3rd Floor Wilmington, DE 19803 Birth Year: 1967 | | Investment Officer | | Since August 2015 | | Executive Director, Morgan Stanley (2011-present) |
| | | |
Michael Wilson Morgan Stanley 522 Fifth Avenue, 4th Floor New York, NY 10036 Birth Year: 1967 | | Investment Officer | | Since August 2015 | | Managing Director, Chief Investment Officer, Morgan Stanley Wealth Management (2012-present); Managing Director, Head of Content Distribution Institutional Equities Division, Morgan Stanley (2009-2012) |
313
| | | | | | |
Name, Address and
Date of Birth | | Position(s)
Held with
Trust | | Term of Office***
and Length of
Time Served | | Principal Occupation(s) During Past Five Years |
| | | |
Anthony Scaturro Morgan Stanley 485 Lexington Ave, 11th Floor New York, NY 10017 Birth Year: 1974 | | Anti-Money Laundering (“AML”) Compliance Officer | | Since August 2015 | | AML Compliance Officer, Morgan Stanley (2014-present); Field Compliance Officer, Morgan Stanley (2009-2014) |
| | | |
James J. Tracy Morgan Stanley 2000 Westchester Avenue Purchase, NY 10577 Birth Year: 1957 | | Product Management Officer Trustee Chief Executive Officer and President | | Since May 2016 2013-2015 2013-2015 | | Managing Director, Director of Consulting Group Wealth Advisory Solutions (2012-present); Director, Morgan Stanley (2012-present); Managing Director, Director of National Sales and Business Development, Morgan Stanley (2011-2012); Managing Director and Chief Operating Officer of Distribution and Development for Global Wealth Management, Morgan Stanley (2010-2011) |
| | | |
Katen Rubeo Morgan Stanley 2000 Westchester Avenue Purchase, NY 10577 Birth Year: 1983 | | Product Management Officer | | Since May 2016 | | Head of Strategic Initiatives for Consulting Group and Practice Management, Morgan Stanley (2016-Present); Head of Business Control for Consulting Group, Morgan Stanley (2015-2016); Head of Consulting Group Advisor, Morgan Stanley (2011-2015) |
| | | |
Steven Ross Morgan Stanley 522 Fifth Avenue, 4th Floor New York, NY 10036 Birth Year: 1971 | | Assistant Treasurer | | Since 2014 | | Executive Director, Morgan Stanley (2013-present); Vice President, Morgan Stanley (2005-2013) |
| | | |
Robert Creaney Morgan Stanley One Financial Place 440 South LaSalle Street 39th Floor Chicago, IL 60605 Birth Year: 1974 | | Assistant Treasurer | | Since 2014 | | Executive Director, Morgan Stanley (1997-present) |
| | | |
Michael Conklin Morgan Stanley One Financial Place 440 South LaSalle Street 39th Floor Chicago, IL 60605 Birth Year: 1977 | | Assistant Treasurer | | Since 2014 | | Vice President, Morgan Stanley (2013-present); Vice President, First Trust Portfolios (2009-2013) |
314
| | | | | | |
Name, Address and
Date of Birth | | Position(s)
Held with
Trust | | Term of Office***
and Length of
Time Served | | Principal Occupation(s) During Past Five Years |
| | | |
Suzan M. Barron Brown Brothers Harriman & Co. (“BBH&Co.”) 50 Post Office Square Boston, MA 02110 Birth Year: 1964 | | Assistant Secretary | | Since 2011 | | Practice Lead for Portfolio Compliance, Fund Administration, BBH&Co. (2015-present); Senior Vice President and Senior Investor Services Counsel, Corporate Secretary and Regulatory Support Practice of Fund Administration, BBH&Co. (2005-present) |
| * | Each Trustee remains in office until he or she resigns, retires or is removed. |
| ** | Mr. Berdon is an “interested person” of the Trust as defined in the 1940 Act because of his position with Morgan Stanley. |
| *** | The President, Treasurer and Secretary hold office until their respective successors are chosen and qualified or until he or she sooner dies, resigns, is removed or becomes disqualified. Each of the other officers serves at the pleasure of the Board. |
Board Composition and Leadership Structure
Currently, five of the six Trustees on the Board (83%) are not “interested persons” (as defined in the 1940 Act) of the Trust and as such are not affiliated with the Manager or any Sub-adviser (“Independent Trustees”). The Board has appointed Mr. Murphy, an Independent Trustee, to serve as Chairman of the Board. There are two primary committees of the Board: the Audit Committee and the Corporate Governance and Nominating Committee. Each Committee is chaired by an Independent Trustee and comprised solely of Independent Trustees. The Board has determined that this leadership structure is appropriate given the specific characteristics and circumstances of the Trust and in light of the services that the Manager and its affiliates and the Sub-advisers provide to the Trust and potential conflicts of interest that could arise from these relationships. The Board believes that the existing Board structure is appropriate because, among other things, it allows the Independent Trustees to exercise independent business judgment in evaluating the Trust’s management and service providers.
Board Oversight of Risk Management
The Board considers risk management issues as part of its general oversight responsibilities. As is the case with virtually all investment companies (as distinguished from operating companies), service providers to the Trust, primarily the Manager and its affiliates and the Sub-advisers, have responsibility for the day-to-day management of the Funds, which includes responsibility for risk management (including management of investment performance and investment risk, valuation risk, issuer and counterparty credit risk, compliance risk and operational risk). As part of its oversight, the Board, acting at its scheduled meetings, or the Chairman of the Board or the appropriate Committee, acting between Board meetings, regularly interacts with and receives reports from senior personnel of service providers, including the Manager’s investment officers, the Trust’s and the Manager’s Chief Compliance Officer (“CCO”) and the Sub-advisers’ portfolio management personnel. The Board’s Audit Committee meets during its scheduled meetings, and between meetings the Audit Committee chair maintains contact, with the Trust’s independent registered public accounting firm and the Trust’s Chief Financial Officer. The Board receives periodic presentations from senior personnel of the Manager or its affiliates regarding investment performance of the Funds and the applicable investment risk management process. The Board also receives periodic presentations from senior personnel of the Manager or its affiliates and the Sub-advisers regarding risk management generally, as well as periodic presentations regarding specific operational, compliance or investment areas, such as business continuity, anti-money laundering, cybersecurity, personal trading, valuation, credit, investment research, portfolio trading and transactions, and securities lending. The Board has adopted policies and procedures designed to address certain risks to the Funds. In addition, the Manager and other service providers to the Trust have adopted a variety of policies, procedures and controls designed to address particular risks to the Funds. Different processes, procedures and controls are employed with respect to different types of risks. However, it is not possible to eliminate all of the risks applicable to the Funds. The Board also receives reports from counsel to the Trust or counsel to the Manager and the Independent Trustees’ own independent legal counsel regarding regulatory compliance and governance matters. The Board’s oversight role does not make the Board a guarantor of the Funds’ investments or activities.
315
Individual Trustee Qualifications
The Board believes that each Trustee’s experience, qualifications, attributes or skills on an individual basis and in combination with those of the other Trustees lead to the conclusion that the Board possesses the requisite attributes and skills to effectively oversee the management of the Trust and the interests of Fund shareholders. The Board believes that the significance of each Trustee’s experience, qualifications, attributes or skills is an individual matter (meaning that experience that is important for one Trustee may not have the same value for another) and that these factors are best evaluated at the Board level, with no single Trustee, or particular factor, being indicative of Board effectiveness. However, the Board believes that Trustees must have the ability to critically review, evaluate, question and discuss information provided to them, and to interact effectively with Trust management, service providers and counsel, in order to exercise effective business judgment in the performance of their duties. The Board believes that the Trustees satisfy this standard. Experience relevant to having this ability may be achieved through a Trustee’s educational background; business, professional training or practice (e.g., accounting or law), public service or academic positions; experience from service as a board member (including the Board of the Trust) or as an executive of investment funds, public companies or significant private or not-for-profit entities or other organizations; and/or other life experiences. The charter for the Board’s Corporate Governance and Nominating Committee contains certain other factors considered by the Committee in identifying and evaluating potential nominees to the Board. The Board noted that most of the Trustees had experience serving as directors on the boards of operating companies and/or other investment companies. The Board considered that Ms. Cepeda and Messrs. Matthews, Murphy, McKissack and Reed have or had careers in the financial services or investment management industries, including holding executive positions in companies engaged in these industries, which allows these Trustees to bring valuable, relevant experience as members of the Board. Mr. Berdon has substantial experience as an executive and financial officer in leadership roles with Morgan Stanley and affiliated entities.
Board Committees
The Trust has an Audit Committee and a Corporate Governance and Nominating Committee. The members of the Audit Committee and the Corporate Governance and Nominating Committee consist of all the Independent Trustees of the Trust, namely Ms. Cepeda and Messrs. Matthews, Murphy, McKissack and Reed. The Board also at times may constitute other committees of the Board to assist in the evaluation of specific matters.
The Audit Committee oversees each Fund’s audit, accounting and financial reporting policies and practices and its internal controls. The Audit Committee approves, and recommends to the Board for its ratification, the selection, appointment, retention or termination of the Trust’s independent registered public accounting firm and approves the compensation of the independent registered public accounting firm. The Audit Committee also approves all audit and permissible non-audit services provided to each Fund by the independent registered public accounting firm and all permissible non-audit services provided by the Trust’s independent registered public accounting firm to the Manager and any affiliated service providers if the engagement relates directly to Fund operations and financial reporting. The Audit Committee met two times during the Trust’s most recent fiscal year.
The Corporate Governance and Nominating Committee is charged with overseeing the Board governance matters and related Trustee practices, including selecting and nominating persons for election or appointment by the Board as Independent Trustees of the Trust. The Corporate Governance and Nominating Committee will consider nominees recommended by the Funds’ shareholders if a vacancy occurs. Shareholders who wish to recommend a nominee should send nominations to the Trust’s Secretary. The Corporate Governance and Nominating Committee also considers and recommends to the Board the appropriate compensation for serving as a Trustee on the Board. The Corporate Governance and Nominating Committee met three times during the Trust’s most recent fiscal year.
316
| | |
| | | |
| Important Tax Information | | |
The following information is provided with respect to the distributions paid during the taxable year/period ended August 31, 2016:
| | | | | | | | | | | | | | | | | | | | |
| | | Large Cap
Equity Fund | | | Small-Mid Cap
Equity Fund | | | International
Equity Fund | | | Emerging
Markets
Equity Fund | | | High Yield
Fund | |
Record Date | | | 12/4/2015 | | | | 12/4/2015 | | | | 12/4/2015 | | | | 12/4/2015 | | | | Monthly | |
Payable Date | | | 12/7/2015 | | | | 12/7/2015 | | | | 12/7/2015 | | | | 12/7/2015 | | | | Monthly | |
Ordinary Income: | | | | | | | | | | | | | | | | | | | | |
Qualified Dividend Income for Individuals | | | 100 | % | | | 4.88 | % | | | 100 | % | | | 80.46 | % | | | — | |
Dividends Qualifying for the Dividends Received | | | | | | | | | | | | | | | | | | | | |
Deduction for Corporations | | | 100 | % | | | 4.78 | % | | | — | | | | 0.98 | % | | | — | |
Foreign Source Income | | | — | | | | — | | | | 95.15 | % | | | 97.06 | % | | | — | |
Foreign Tax Paid Per Share | | | — | | | | — | | | | 0.01890 | | | | 0.02413 | | | | — | |
Long-Term Capital Gain Dividend | | | 4.80011 | | | | 5.09118 | | | | — | | | | — | | | | — | |
| | | | | |
| | | Core Fixed
Income Fund | | | International
Fixed
Income Fund | | | Municipal
Bond Fund | | | Inflation-Linked
Fixed
Income Fund | | | Ultra-Short
Term Fixed
Income Fund | |
Record Date | | | Monthly | | | | 12/4/2015 | | | | Monthly | | | | Monthly | | | | Monthly | |
Payable Date | | | Monthly | | | | 12/7/2015 | | | | Monthly | | | | Monthly | | | | Monthly | |
Ordinary Income: | | | | | | | | | | | | | | | | | | | | |
Qualified Dividend Income for Individuals | | | — | | | | — | | | | — | | | | — | | | | — | |
Dividends Qualifying for the Dividends Received | | | | | | | | | | | | | | | | | | | | |
Deduction for Corporations | | | — | | | | — | | | | — | | | | — | | | | — | |
Interest from Tax-Exempt Obligations | | | — | | | | — | | | | 100 | % | | | — | | | | — | |
Interest from Federal Obligations | | | 32.74 | % | | | 15.86 | % | | | — | | | | — | | | | — | |
Long-Term Capital Gain Dividend | | | 0.04365 | | | | — | | | | 0.02149 | | | | — | | | | — | |
| * | Expressed as a percentage of the cash distribution grossed-up for foreign taxes. |
The law varies in each state as to whether and what percentage of dividend income attributable to Federal obligations is exempt from state income tax. We recommend that you consult with your tax adviser to determine if any portion of the dividends you received is exempt from state income taxes.
The foreign taxes paid represent taxes incurred by the Fund on income received by the Fund from foreign sources. Foreign taxes paid may be included in taxable income with an offsetting deduction from gross income or may be taken as a credit for taxes paid to foreign governments. You should consult your tax adviser regarding the appropriate treatment of foreign taxes paid.
Please retain this information for your records.
317
MORGAN STANLEY SMITH BARNEY LLC
Distributor
CONSULTING GROUP ADVISORY SERVICES LLC
Investment Adviser
This report is submitted for the general information of the shareholders of Consulting Group Capital Markets Funds. It is not authorized for distribution to prospective investors unless accompanied or preceded by a current Prospectus for the Trust which contains information concerning the Trust’s Investment policies, charges and expenses as well as other pertinent information.
The Funds file their complete schedule of portfolio holdings with the Securities and Exchange Commission (“SEC”) for the first and third quarters of each fiscal year on Form N-Q. The Funds’ Forms N-Q are available on the SEC’s website at www.sec.gov. The Funds’ Forms N-Q may be reviewed and copied at the SEC’s Public Reference Room in Washington D.C., and information on the operation of the Public Reference Room may be obtained by calling 1-800-SEC-0330. To obtain information on Form N-Q from the Funds, shareholders can call 1-888-454-3965 (“ask for Consulting Group”).
Information on how the Funds voted proxies relating to portfolio securities during the most recent 12-month period ended June 30 and a description of the policies and procedures that the Funds use to determine how to vote proxies relating to portfolio securities is available (1) without charge, upon request, by calling 1-888-454-3965 (ask for “Consulting Group”), (2) on the Funds’ website at www.morganstanley.com/cgcm and (3) on the SEC’s website at www.sec.gov.
© 2016 Morgan Stanley Smith Barney LLC (“Morgan Stanley”). Consulting Group Advisory Services LLC (“CGAS”) is a business of Morgan Stanley. Securities are offered through Morgan Stanley.
Consulting Group Capital Markets Funds
2000 Westchester Avenue
Purchase, NY 10577
ITEM 2. CODE OF ETHICS.
As of the period ended August 31, 2016 (“Reporting Period”), the Registrant has adopted a code of ethics (“Code”) that applies to the Registrant’s principal executive officer, principal financial officer, principal accounting officer or controller, or persons performing similar functions, regardless of whether these individuals are employed by the Registrant or a third party. The Registrant has not amended any provision in its Code that relates to an element of the Code’s definitions enumerated in paragraph (b) of Item 2 of this Form N-CSR. A copy of this Code is filed as an Exhibit to this Form N-CSR pursuant to Item 12(a)(1).
The Registrant has not granted any waiver, including any implicit waiver, from a provision of its Code to the Registrant’s principal executive officer, principal financial officer, principal accounting officer or controller, or persons performing similar functions, regardless of whether these individuals are employed by the Registrant or a third party.
ITEM 3. AUDIT COMMITTEE FINANCIAL EXPERT.
The Board of Trustees of the Registrant has determined that Mark J. Reed possesses the attributes identified in Instruction (b) of Item 3 to Form N-CSR to qualify as an “audit committee financial expert,” and has designated Mr. Reed as the Registrant’s audit committee financial expert. Mr. Reed is an “independent” Trustee pursuant to paragraph (a)(2) of Item 3 to Form N-CSR.
ITEM 4. PRINCIPAL ACCOUNTANT FEES AND SERVICES.
AUDIT FEES –
(a) Audit Fees. The aggregate fees billed for each of the last two fiscal years ended August 31, 2016 and August 31, 2015 for professional services rendered by the Registrant’s principal accountant (“Auditor”) for the audit of the Registrant’s annual financial statements, or services that are normally provided by the Auditor in connection with the statutory and regulatory filings or engagements for each of the last two fiscal years, were $527,300 in 2016 and $531,100 in 2015.
(b) Audit-Related Fees. The aggregate fees billed for each of the last two fiscal years ended August 31, 2016, and August 31, 2015, for assurance and related services by the Auditor that were reasonably related to the performance of the audit of the Registrant’s financial statements and were not reported under paragraph (a) of this Item 4, were $0 in 2016 and $0 in 2015.
(c) Tax Fees. The aggregate fees billed for each of the last two fiscal years ended August 31, 2016 and August 31, 2015 for professional services rendered by the Auditor for tax compliance, tax advice and tax planning (“Tax Services”) were $87,165 in 2016 and $90,880 in 2015. These services consisted of (i) review or preparation of U.S. federal, state, local and excise tax returns; (ii) U.S. federal, state and local tax planning, advice and assistance regarding statutory, regulatory or administrative developments, and (iii) tax advice regarding tax qualification matters and/or treatment of various financial instruments held or proposed to be acquired or held.
(d) All Other Fees. The aggregate fees billed for each of the last two fiscal years ended August 31, 2016, and August 31, 2015, for products and services provided by the Auditor to the Registrant, other than the services reported in paragraphs (a) through (c) of this Item 4, were $0 for 2016 and $0 for 2015.
(e)(1) The Charter for the Audit Committee (“Committee”) of the Consulting Group Capital Markets Funds provides that the Committee may delegate its responsibility to approve any such audit and permissible non-audit services to a sub-committee consisting of the Chairperson of the Committee (“Chairperson”) and at least one other member of the Committee as the Chairperson, from time to time, may determine and appoint, and such sub-committee shall report to the Committee, at its next meeting after the sub-committee’s meeting, its decision(s). From year to year, and at such other times as the Committee deems appropriate, the Committee shall report to the Board whether this system of approval has been effective and
efficient or whether this Charter should be amended to allow for pre-approval pursuant to such policies and procedures as the Committee shall approve, including the delegation of some or all of the Committee’s pre-approval responsibilities to other persons (other than the Adviser or the Trust’s officers).
(e)(2) The percentage of services described in each of paragraphs (b) through (d) of this Item that were approved by the audit committee pursuant to paragraph (c)(7)(i)(c) of Rule 2-01 of Regulation S-X, with respect to: Audit-Related Fees were 0% for 2016 and 0% for 2015; Tax Fees were 0% for 2016 and 0% for 2015; and Other Fees were 0% for 2016 and 0% for 2015.
(f) Not Applicable.
(g) Aggregate non-audit fees billed by the Auditor for services rendered to the Registrant and the Registrant’s investment adviser (not including any sub-adviser whose role is primarily portfolio management as is subcontracted with or overseen by another investment adviser), and any entity controlling, controlled by, or under common control with the adviser that provides ongoing services to the Registrant of each of the last two fiscal years of the Registrant (“Service Affiliates”) were $5,000 for 2016 and $0 in 2015.
(h) The Registrant’s Audit Committee has considered whether the provision of non-audit services that were rendered to Service Affiliates that were not pre-approved pursuant to paragraph (c)(7)ii of Rule 2-01 of Regulation S-X is compatible with maintaining the Auditor’s independence.
ITEM 5. AUDIT COMMITTEE OF LISTED REGISTRANTS.
Not Applicable.
ITEM 6. INVESTMENTS.
A Schedule of Investments in securities of unaffiliated issuers as of the close of the Reporting Period is included as part of the report to shareholders filed under Item 1 of this Form N-CSR.
ITEM 7. DISCLOSURE OF PROXY VOTING POLICIES AND PROCEDURES FOR CLOSED-END MANAGEMENT INVESTMENT COMPANIES.
Not Applicable.
ITEM 8. PORTFOLIO MANAGERS OF CLOSED-END MANAGEMENT INVESTMENT COMPANIES.
Not Applicable.
ITEM 9. PURCHASES OF EQUITY SECURITIES BY CLOSED-END MANAGEMENT INVESTMENT COMPANIES AND AFFILIATED PURCHASERS.
Not Applicable.
ITEM 10. SUBMISSION OF MATTERS TO A VOTE OF SECURITY HOLDERS.
There have been no material changes to the procedures by which the shareholders may recommend nominees to the Registrant’s board of directors, where those changes were implemented after the Registrant last provided disclosure in response to the requirements of Item 407(c)(2)(iv) of Regulation S-K (as required by Item 22(b)(15) of Schedule 14A (17 CFR 240.14a-101)), or this Item.
ITEM 11. CONTROLS AND PROCEDURES.
(a) The Registrant’s principal executive officer and principal financial officer, or persons performing similar functions, have concluded that the Registrant’s disclosure controls and procedures (as defined in Rule 30a-3(c) under the Investment Company Act of 1940, as amended (17 CFR 270.30a-3(c)) were
effective, as of a date within 90 days of the filing date of this report, based on his evaluation of these disclosure controls and procedures as required by Rule 30a-3(b) under the Investment Company Act of 1940, as amended (17 CFR 270.30a-3(b)), and Rules 13a-15(b) or 15d-15(b) under the Securities Exchange Act of 1934, as amended (17 CFR 240.13a-15(b) or 240.15d-15(b)).
(b) There were no changes in the Registrant’s internal control over financial reporting (as defined in Rule 30a-3(d) under the Investment Company Act of 1940, as amended (17 CFR 270.30a-3(d)), that occurred during the Registrant’s second fiscal quarter of the period covered by this report that has materially affected, or is reasonably likely to materially affect, the Registrant’s internal control over financial reporting.
ITEM 12. EXHIBITS.
(a)(1) Code of ethics, or any amendment thereto, that is the subject of disclosure required by Item 2 is attached hereto.
(a)(2) Certifications pursuant to Rule 30a-2(a) under the Investment Company Act of 1940, as amended (17 CFR 270.30a-2(a)) are attached hereto.
(a)(3) Not Applicable.
(b) Certifications pursuant to 18 U.S.C. Section 1350 as adopted pursuant to Section 906 of the Sarbanes-Oxley Act of 2002 are attached hereto.
SIGNATURES
Pursuant to the requirements of the Securities Exchange Act of 1934 and the Investment Company Act of 1940, the Registrant has duly caused this Report to be signed on its behalf by the undersigned, thereunto duly authorized.
| | |
| Consulting Group Capital Markets Funds |
| |
| By: | | /s/ David Berdon |
| | David Berdon |
| | Chief Executive Officer Consulting Group Capital Markets Funds |
|
| Date: November 4, 2016 |
Pursuant to the requirements of the Securities Exchange Act of 1934 and the Investment Company Act of 1940, this report has been signed below by the following persons on behalf of the Registrant and in the capacities and on the dates indicated.
| | |
| By: | | /s/ David Berdon |
| | David Berdon Chief Executive Officer Consulting Group Capital Markets Funds |
|
| Date: November 4, 2016 |
| | |
| Consulting Group Capital Markets Funds |
| |
| By: | | /s/ Francis Smith |
| | Francis Smith Chief Financial Officer Consulting Group Capital Markets Funds |
|
| Date: November 4, 2016 |