UNITED STATES
SECURITIES AND EXCHANGE COMMISSION
Washington, D.C. 20549
FORM N-CSR
CERTIFIED SHAREHOLDER REPORT OF REGISTERED
MANAGEMENT INVESTMENT COMPANIES
Investment Company Act file number: 811-06318
CONSULTING GROUP CAPITAL MARKETS FUNDS
(Exact name of registrant as specified in charter)
2000 Westchester Avenue
Purchase, NY 10577
(Address of principal executive offices)(Zip code)
CT Corp
155 Federal Street Suite 700
Boston, MA 02110
(Name and address of agent for service)
Registrant’s telephone number, including area code: (888) 454-3965
Date of fiscal year end: August 31
Date of reporting period: August 31, 2014
Form N-CSR is to be used by management investment companies to file reports with the Commission not later than 10 days after the transmission to stockholders of any report that is required to be transmitted to stockholders under Rule 30e-1 under the Investment Company Act of 1940 (17 CFR 270.30e-1). The Commission may use the information provided on Form N-CSR in its regulatory, disclosure review, inspection, and policymaking rules.
A registrant is required to disclose the information specified by Form N-CSR, and the Commission will make this information public. A registrant is not required to respond to the collection of information contained in Form N-CSR unless the Form displays a currently valid Office of Management and Budget (“OMB”) control number. Please direct comments concerning the accuracy of the information collection burden estimate and any suggestions for reducing the burden to Secretary, Securities and Exchange Commission, 450 Fifth Street, NW, Washington, DC 20549-0609. The OMB has reviewed this collection of information under clearance requirements of 44 U.S.C. § 3507.
ITEM 1. REPORTS TO STOCKHOLDERS

Consulting Group
Capital Markets Funds
Annual Report
| Ÿ | | Large Capitalization Growth Investments |
| Ÿ | | Large Capitalization Value Equity Investments |
| Ÿ | | Small Capitalization Growth Investments |
| Ÿ | | Small Capitalization Value Equity Investments |
| Ÿ | | International Equity Investments |
| Ÿ | | Emerging Markets Equity Investments |
| Ÿ | | Core Fixed Income Investments |
| Ÿ | | International Fixed Income Investments |
| Ÿ | | Municipal Bond Investments |
| Ÿ | | Money Market Investments |
INVESTMENT PRODUCTS: NOT FDIC INSURED • NO BANK GUARANTEE • MAY LOSE VALUE
Table of Contents
Consulting Group
Capital Markets Funds
DEAR SHAREHOLDER,
Given the finish to last year, investors were operating under the assumption that better than expected economic growth and higher long-term interest rates would be the base case for 2014. Unfortunately, on the economic front, this calendar year got off to a weak start, owing in part to harsh winter weather, but incoming data though the spring and summer months returned activity more in line with recent trends. Looking ahead, the U.S. economy is projected to produce a growth rate for 2014 as a whole that is little changed from last year’s +2.2% experience.
Divergent economic prospects around the globe produced somewhat mixed results for equity markets in the annual reporting period ended August 31, 2014. With U.S. interest rates, especially for longer-dated maturities, moving lower, a key headwind for the emerging markets (EM) was removed, and resulted in EM equity returns outpacing its global counterparts. On the flip side, continued economic concerns and uncertainty regarding the Ukraine/Russia situation weighed on the Euro Zone, as core countries such as Germany and France underperformed, accordingly. Domestically, U.S. equity markets continued their upward ascent through the reporting period. Advances were essentially broadly-based across economic sectors, and reversing last years’ experience, equity investments in large-cap companies outperformed stocks of riskier small capitalization companies.
The bond market has put in an unexpected performance thus far in 2014. Unlike last year’s ‘temper tantrum’ sell-off, longer-dated rates have actually come down significantly with the U.S. Treasury 10-year yield falling almost 70 basis points from the 2013 year-end tally. In anticipation of an eventual U.S. Federal Reserve (“FED”) rate hike, perhaps by mid-2015, short-term rates have underperformed and moved very little, flattening the yield curve (the difference between short and long-term rates) as a result. With the latest round of Quantitative Easing (QE3) expected to end in October, the fixed income markets have shifted their focus to the potential timing for what is being called ‘lift-off’ or the FED’s first rate hike. In terms of domestic fixed income, positive year-to-date returns have been recorded among all broad categories, with Investment Grade Corporates and Municipals registering the top performances. Along the same lines as the equity markets, EM debt was the outperformer on the international stage. Euro Zone sovereign debt markets, especially for periphery countries like Spain and Italy, have rallied considerably as the European Central Bank (ECB) has stepped up their easing campaign.
Consulting Group Capital Markets (CGCM) Funds
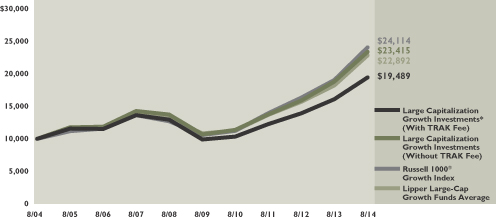
Large Capitalization Growth Investments posted a total return of +24.4% in the yearly fiscal period ended August 31, 2014, lower than the +26.3% total return results of the Russell 1000® Growth Index i and below the +25.1% performance of the average mutual fund included in Lipper’s Large-Cap Growth investment category ii. An underweight exposure to the Consumer Staples sector and an overweight allocation to the Health Care sector, combined with positive stock selections in the Health Care (pharmaceuticals) sector, contributed to relative returns, but were not enough to counter detracting contributions from investments in the Financials (diversified financial services), Materials (chemicals), and Information Technology (internet software & services) sectors, which unfavorably affected performance in the twelve-month period.
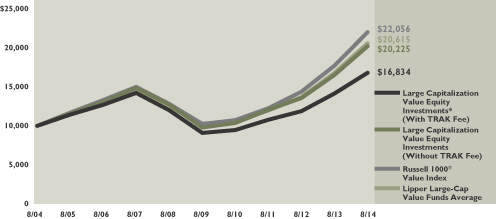
Large Capitalization Value Equity registered a gain of +22.4% in the fiscal year, trailing the +24.4% advance of the Russell 1000 Value® Index iii and the average +22.8% rise in the performance of mutual funds included in the Lipper Large-Cap Value investment category iv. An overweight allocation to the Information Technology sector, in addition to, favorable security picks in the Energy (oil, gas & consumable fuels) and Health Care (pharmaceuticals) sectors benefitted relative performance, but were offset by negative contributions from stock picks in the Consumer Discretionary (specialty retail) and Information Technology (electronic equipment instruments & components) sectors, which subtracted from returns in the annual period.
I
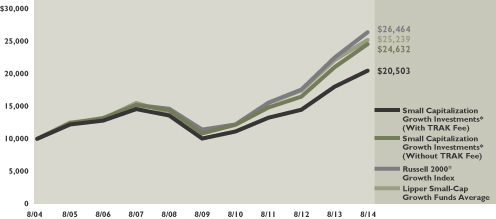
Small Capitalization Growth Investments climbed +16.9% over the yearly performance period, as compared to the +17.3% increase of the Russell 2000 Growth® Index v and the +14.0% return of the average mutual fund included in the Lipper Small-Cap Growth investment category vi. Contributions from positive stock selections in the Health Care (pharmaceuticals, health care equipment & supplies) and Materials (paper & forest products) sectors enhanced returns in the one-year period. On the other hand, detracting contributions from an exposure to cash and stock picks in the Information Technology (software) and Consumer Staples (food & staples retailing) sectors hurt relative performance.
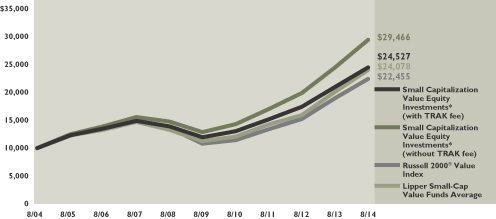
Small Capitalization Value Investments generated an advance of +20.2% in the annual reporting period ended August 31, 2014. Absolute performance exceeded the +18.1% increase in the returns of the Russell 2000® Value Index vii and the +19.3% gain of the average mutual fund included in Lipper’s Small-Cap Value investment category viii. Stock selections in an array of economic sectors including Industrials (trading companies & distributors, commercial services & supplies), Materials (metals & mining), Energy (oil, gas & consumable fuels), Information Technology (software), and Consumer Staples (food products) were behind relative returns in the twelve-month period. Sector positioning, including an underweight allocation to the Financials sector as well as an overweight exposure to the Industrials and Materials sectors, also added value in the period and positively affected relative performance.
International Equity Investments rose +11.5%, as compared to the +16.4% return of the MSCI EAFE® Index (Net) ix and the +15.6% increase in the performance of the average mutual fund included in Lipper’s International Large-Cap Core investment category x. Favorable stock selections in the U.S. as well as Japan and in the Health Care (pharmaceuticals) sector aided relative returns over the fiscal annual period. Conversely, sector positioning, including an overweight allocation to the Consumer Discretionary sector as well as an exposure to cash, in addition to, unsuccessful stock picks in the Information Technology (internet software & services) and Financials (banks) sectors detracted from relative performance results. At the same time, country security holdings in the United Kingdom and Germany combined with an overweight position in the U.S. as well as Canada, and an underweight allocation to Spain, also hindered relative returns. On a separate note, asset management changes were made in the line-up of investment managers of the fund as OppenheimerFunds, Inc. and Causeway Capital Management LLC commenced as new sub-advisers during the fiscal year.
Emerging Markets Equity Investments registered twelve-month performance of +20.0%, in-line with the +20.0% return of the MSCI Emerging Markets Index (Net) xi and ahead of the +18.9% advance of the average mutual fund included in Lipper’s Emerging Markets investment category xii. An overweight exposure to India and Brazil and an underweight allocation to Chile, in addition to, positive stock picks in the Financials (banks), Health Care (pharmaceuticals), and Consumer Staples (beverages) sectors benefited relative performance in the twelve-month period ended August 31, 2014. A selective underweight allocation to the Materials sector, combined with individual holdings in India, Taiwan, and Hong Kong also boosted relative returns during the fiscal year. In contrast, from a sector perspective, an overweight allocation to Consumer Staples and an underweight position in Information Technology, in addition to, selective detracting security holdings in the Energy (energy equipment & services) and Industrials (construction & engineering) sectors, hampered relative returns in the one-year period. Negative contributions from an overweight exposure to Russia and country security positions in Russia, the U.S., South Africa, and China additionally hurt relative performance.
Core Fixed Income ascended +6.1% in the fiscal year, exceeding the +5.7% return of its market benchmark, the Barclays Capital U.S. Aggregate BondTM Index xiii, and in-line with the +6.1% rise for the average mutual fund included in Lipper’s Core Bond investment category xiv. Favorable contributions from investment grade and high yield sector selections benefited relative performance, offsetting declines from interest rate management (duration, yield curve positioning) and individual security selections, which diminished relative returns in the period.
High Yield Investments experienced an increase of +9.8% in the annual fiscal reporting period, below the +10.6% advance of the Barclays Capital U.S. High Yield Index xv, but ahead of the +9.3% average return of mutual funds included in Lipper’s High Yield investment category xvi. Bond selections, namely in Telecommunications and Energy, contributed positively to excess returns in the fiscal year. At the same time, however, interest rate management (yield curve positioning) and sector selections, on the aggregate, generally subtracted from yearly performance.
II
International Fixed Income Investments’ fiscal year return advanced +7.4%, as compared to the +7.9% return of the Citigroup Non-USD World Government Bond Index (USD) Hedged xvii and the +7.8% gain for the average mutual fund included in Lipper’s International Income investment category xviii. Contributions from country allocations particularly investments in emerging markets debt, currency decisions, and an exposure to investment grade corporates, high yield, and mortgage-backed securities aided results, although interest rate management (duration, yield curve positioning) and individual bond picks detracted from relative returns in the yearly period.
Municipal Bond Investments twelve-month performance of +9.2% in the fiscal period ended August 31, 2014 fell short of the +10.1% return of the Barclays Capital U.S. Municipal Bond Index xix as well as the +11.1% increase in the average mutual fund included in Lipper’s General & Insured Municipal Debt investment category xx. Positioning along the yield curve and an emphasis on higher credit quality issues affected relative performance during the year. In the yearly time period, long maturity municipals were typically the best performers, and additionally, lower-rated municipal debt generally outperformed their higher-rated counterparts.
Additional information regarding the investment managers of the CGCM Funds and commentary specific to each individual sub-adviser is available in the Annual Report following this Shareholder Letter.
Equity and fixed income investors in the CGCM Funds, by and large, finished the fiscal year ended August 31, 2014, in positive territory, but the path towards achieving absolute total return gains was not a straight line. Global macro events sent the markets on a challenging expedition as both stocks and bonds experienced intervals of volatility during the annual reporting period. As past history has shown, unpredictable periods of stock and bond price gyrations can and do occur periodically during a market cycle. These unforeseen instances serve as a reminder of how important it is for investors to maintain a balanced, diversified portfolio and a long-term perspective, consistent with individual goals, time horizons, and risk tolerances. Market participants are encouraged to review personal investment plans periodically and discuss particular individual investment concerns and needs with your Financial Advisor.
We thank you for your continued confidence in Morgan Stanley Wealth Management and support as shareholders of the CGCM Funds.
Sincerely,

James J. Tracy
Chief Executive Officer
October 30, 2014
III
The performance shown represents past performance. Past performance is no guarantee of future results and current performance may be higher or lower than the performance shown above. Principal value and investment returns will fluctuate so that an investor’s shares, when redeemed, may be worth more or less than their original cost. The returns shown do not reflect the deduction of taxes that a shareholder would pay on fund distributions or the redemption of fund shares. To obtain performance data current to the most recent month-end, please visit our website at https://morganstanley.com/cgcm.
Shares of the Funds are available to participants in certain investment advisory programs sponsored by Morgan Stanley, including TRAK® CGCM, Select UMA, Consulting Group Advisor and Portfolio Management. The services offered through these programs may provide investors with asset allocation recommendations, which are implemented through the Funds. Under an investment advisory program, an investor typically pays an advisory fee that may vary based on a number of factors. The maximum shareholder fee (in addition to annual fund operating expenses) for assets invested in the Consulting Group Capital Markets Funds (“Trust”) through the TRAK® CGCM or Consulting Group Advisor investment advisory programs is 2.00% of average quarter-end net assets. The maximum shareholder fee (in addition to annual fund operating expenses) for assets invested in the Trust through the Select UMA and the Portfolio Management investment advisory programs is 2.50% and 3.00% of average quarter-end net assets, respectively. The maximum shareholder fees vary between the investment advisory programs because of differences in the services provided through the programs and other factors. Investors existing prior to April 1, 2010, will be assessed a maximum shareholder fee (in addition to annual fund operating expenses) for all assets invested in the Trust under TRAK® CGCM of 1.50% of average quarter-end net assets. These fees may be reduced in certain circumstances. These fees may be paid either by redemption of shares of the Funds or by a separate payment.
All index performance reflects no deduction for fees, expenses or taxes. Please note an investor cannot invest directly in an index.
RISKS: Certain of the Funds may invest in derivatives, such as options and futures, which can be illiquid, may disproportionately increase losses, and have a potentially large impact on Fund performance. Foreign securities are subject to certain risks of overseas investing including currency fluctuations and changes in political and economic conditions, which could result in significant market fluctuations. These risks are magnified in emerging or developing markets. Investments in small or medium-capitalization companies may involve a higher degree of risk and volatility than investments in larger, more established companies. Certain of the Funds may invest in high yield bonds, which involve greater credit and liquidity risks than investment grade bonds.
| i. | The Russell 1000® Growth Index measures the performance of those Russell 1000 companies with higher price-to-book ratios and higher forecasted growth values. Because the index is not a managed portfolio, there are no advisory fees or internal management expenses reflected in the index’s performance. Please note that an investor cannot invest directly in an index. |
| ii. | The Lipper Large-Cap Growth Funds Average is an equally weighted average of all active funds available within the investment category. The classification includes funds that, by portfolio practice, invest at least 75% of their equity assets in companies with market capitalizations (on a three-year weighted basis) above Lipper’s USDE large-cap floor. Large-cap growth funds typically have above-average characteristics compared to the S&P 500 Index. The total return of the Lipper Funds Average does not include the effect of sales charges. Please note that an investor cannot invest directly in a mutual funds classification average or an index. |
| iii. | The Russell 1000® Value Index measures the performance of those Russell 1000 Index companies with lower price-to-book ratios and lower forecasted growth values. Because the index is not a managed portfolio, there are no advisory fees or internal management expenses reflected in the index’s performance. Please note that an investor cannot invest directly in an index. |
| iv. | The Lipper Large-Cap Value Funds Average is an equally weighted average of all active funds available within the investment category. The classification includes funds that, by portfolio practice, invest at least 75% of their equity assets in companies with market capitalizations (on a three-year weighted basis) above Lipper’s USDE large-cap floor. Large-cap value funds typically have below-average characteristics compared to the S&P 500 Index. The total return of the Lipper Funds Average does not include the effect of sales charges. Please note that an investor cannot invest directly in a mutual funds classification average or an index. |
| v. | The Russell 2000® Growth Index measures the performance of those Russell 2000 companies with higher price-to-book ratios and higher forecasted growth values. Because the index is not a managed portfolio, there are no advisory fees or internal management expenses reflected in the index’s performance. Please note that an investor cannot invest directly in an index. |
| vi. | The Lipper Small-Cap Growth Funds Average is an equally weighted average of all active funds available within the investment category. The classification includes funds that, by portfolio practice, invest at least 75% of their equity assets in companies with market capitalizations (on a three-year weighted basis) below Lipper’s USDE small-cap ceiling. Small-cap growth funds typically have above-average characteristics compared to the S&P SmallCap 600 Index. The total return of the Lipper Funds Average does not include the effect of sales charges. Please note that an investor cannot invest directly in a mutual funds classification average or an index. |
| vii. | The Russell 2000® Value Index measures the performance of those Russell 2000 Index companies with lower price-to-book ratios and lower forecasted growth values. Because the index is not a managed portfolio, there are no advisory fees or internal management expenses reflected in the index’s performance. Please note that an investor cannot invest directly in an index. |
| viii. | The Lipper Small-Cap Value Funds Average is an equally weighted average of all active funds available within the investment category. The classification includes funds that, by portfolio practice, invest at least 75% of their equity assets in companies with market capitalizations (on a three-year weighted basis) below Lipper’s USDE small-cap ceiling. Small-cap growth funds typically have below-average characteristics compared to the S&P SmallCap 600 Index. The total return of the Lipper Funds Average does not include the effect of sales charges. Please note that an investor cannot invest directly in a mutual funds classification average or an index. |
| ix. | The Morgan Stanley Capital International Europe, Australasia, Far East (MSCI EAFE®) Index (Net) is a free float-adjusted market capitalization index that is designed to measure the equity market performance of developed markets, excluding the U.S. & Canada. The MSCI EAFE Index consists of the following 21 developed market country indexes: Australia, Austria, Belgium, Denmark, Finland, France, Germany, Hong Kong, Ireland, Israel, Italy, Japan, the Netherlands, New Zealand, Norway, Portugal, Singapore, Spain, Sweden, Switzerland, and the United Kingdom. Net total return indexes reinvest dividends after the deduction of withholding taxes, using (for international indexes) a tax rate applicable to non-resident institutional investors who do not benefit from double taxation treaties. Because the index is not a managed portfolio, there are no advisory fees or internal management expenses reflected in the index’s performance. Please note that an investor cannot invest directly in an index. |
| x. | The Lipper International Large-Cap Core Funds Average is an equally weighted average of all active funds available within the investment category. The classification includes funds that, by portfolio practice, invest at least 75% of their equity assets in companies outside of the U.S. with market capitalizations (on a three-year weighted basis) above Lipper’s international large-cap floor. International large-cap core funds typically have average characteristics |
IV
| | compared to their large-cap-specific subset of the MSCI EAFE® Index. The total return of the Lipper Funds Average does not include the effect of sales charges. Please note that an investor cannot invest directly in a mutual funds classification average or an index. |
| xi. | The MSCI Emerging Markets Index is a free float-adjusted market capitalization index that is designed to measure equity market performance of emerging markets. The MSCI Emerging Markets Index (Net) consists of the following 21 emerging market country indexes: Brazil, Chile, China, Colombia, Czech Republic, Egypt, Greece, Hungary, India, Indonesia, Korea, Malaysia, Mexico, Peru, Philippines, Poland, Russia, South Africa, Taiwan, Thailand, and Turkey. Net total return indexes reinvest dividends after the deduction of withholding taxes, using (for international indexes) a tax rate applicable to non-resident institutional investors who do not benefit from double taxation treaties. Because the index is not a managed portfolio, there are no advisory fees or internal management expenses reflected in the index’s performance. Please note that an investor cannot invest directly in an index. |
| xii. | The Lipper Emerging Markets Funds Average is an equally weighted average of all active funds available within the investment category. The classification includes funds that seek long-term capital appreciation by investing at least 65% of total assets in emerging market equity securities, where “emerging market” is defined by a country’s GNP per capita or other economic measures. The total return of the Lipper Funds Average does not include the effect of sales charges. Please note that an investor cannot invest directly in a mutual funds classification average or an index. |
| xiii. | The Barclays Capital U.S. Aggregate BondTM Index is a broad-based index that measures the investment grade, U.S. dollar-denominated, fixed-rate taxable bond market, including Treasuries, government-related and corporate securities, MBS (agency fixed-rate and hybrid ARM passthroughs), ABS, and CMBS. Because the index is not a managed portfolio, there are no advisory fees or internal management expenses reflected in the index’s performance. Please note that an investor cannot invest directly in an index. |
| xiv. | The Lipper Core Bond Funds Average is an equally weighted average of all active funds available within the investment category. The classification includes funds that invest at least 85% of their assets in domestic investment-grade debt issues (rated in top four grades) with any remaining in investment in non-benchmark sectors such as high-yield, global and emerging market debt. These funds maintain dollar-weighted average maturities of five to ten years. The total return of the Lipper Funds Average does not include the effect of sales charges. Please note that an investor cannot invest directly in a mutual funds classification average or an index. |
| xv. | The Barclays Capital U.S. Corporate High-Yield Index measures the market of U.S. dollar-denominated, non-investment grade, fixed rate, taxable corporate bonds. Because the index is not a managed portfolio, there are no advisory fees or internal management expenses reflected in the index’s performance. Please note that an investor cannot invest directly in an index. |
| xvi. | The Lipper High Yield Funds Average is an equally weighted average of all active funds available within the investment category. The classification includes funds that aim at high (relative) current yield from fixed income securities, have no quality or maturity restrictions, and tend to invest in lower grade debt issues. The total return of the Lipper Funds Average does not include the effect of sales charges. Please note that an investor cannot invest directly in a mutual funds classification average or an index. |
| xvii. | The Citigroup Non-USD World Government Bond Index (USD) Hedged and Unhedged are each sub-indices of the Citigroup World Government Bond Index (“WGBI”), which is comprised of the global sovereign debt of over 20 countries representative in the Americas, EMEA, EMU, Asia Pacific, and Japan regions. The Non-U.S. Dollar WGBI includes all WGBI markets except the United States and is stated in U.S. dollar hedged or unhedged base currency terms. Because the index is not a managed portfolio, there are no advisory fees or internal management expenses reflected in the index’s performance. Please note that an investor cannot invest directly in an index. |
| xviii. | The Lipper International Income Funds Average is an equally weighted average of all active funds available within the investment category. The classification includes funds that state in their prospectus that they invest primarily in U.S. dollar and non-U.S. dollar debt securities of issuers located in at least three countries, excluding the United States, except in periods of market weakness. The total return of the Lipper Funds Average does not include the effect of sales charges. Please note that an investor cannot invest directly in a mutual funds classification average or an index. |
| xix. | The Barclays Capital U.S. Municipal Index covers the U.S. dollar-denominated long-term tax exempt bond market. The index has four main sectors: state and local general obligation bonds, revenue bonds, insured bonds, and prerefunded bonds. Because the index is not a managed portfolio, there are no advisory fees or internal management expenses reflected in the index’s performance. Please note that an investor cannot invest directly in an index. |
| xx. | The Lipper General & Insured Municipal Debt Funds Average is an equally weighted average of all active funds available within the investment category. The classification includes funds that either invest primarily in municipal debt issues rated in the top four credit ratings or invest primarily in municipal debt issues insured as to timely payment. The total return of the Lipper Funds Average does not include the effect of sales charges. Please note that an investor cannot invest directly in a mutual funds classification average or an index. |
V
| | | | |
Performance of the Consulting Group Capital Markets Funds For the Year Ended August 31, 2014†* | | | |
| |
| Large Capitalization Growth Investments | | | 24.35 | % |
Russell 1000® Growth Index (1) | | | 26.29 | |
| |
| Large Capitalization Value Equity Investments | | | 22.37 | |
Russell 1000® Value Index (2) | | | 24.43 | |
| |
| Small Capitalization Growth Investments | | | 16.91 | |
Russell 2000® Growth Index (3) | | | 17.30 | |
| |
| Small Capitalization Value Equity Investments | | | 20.17 | |
Russell 2000® Value Index (4) | | | 18.10 | |
| |
| International Equity Investments | | | 11.45 | |
The Morgan Stanley Capital International Europe, Australasia, Far East (MSCI EAFE®) Index (Net) (5) | | | 16.43 | |
| |
| Emerging Markets Equity Investments | | | 19.97 | |
MSCI Emerging Markets Index (Net) (6) | | | 19.98 | |
| |
| Core Fixed Income Investments | | | 6.10 | |
Barclays Capital U.S. Aggregate BondTM Index (7) | | | 5.66 | |
| |
| High Yield Investments | | | 9.75 | |
Barclays Capital U.S. Corporate High-Yield Index (8) | | | 10.58 | |
| |
| International Fixed Income Investments | | | 7.36 | |
Citigroup Non-USD World Government Bond Index (USD) Hedged (9) | | | 7.85 | |
| |
| Municipal Bond Investments | | | 9.24 | |
Barclays Capital U.S. Municipal Index (10) | | | 10.14 | |
| |
| Money Market Investments** | | | 0.00 | |
90-day Treasury Bill Index | | | 0.04 | |
See pages 27 through 29 for all footnotes.
VI

Large Capitalization Growth Investments
|
| ABOUTTHE SUBADVISERS |
Ÿ Jackson Square Partners, LLC (“JSP”) |
| JSP invests primarily in common stocks of large capitalization growth-oriented companies that JSP believes have long-term capital appreciation potential and are expected to grow faster than the U.S. economy. Using a bottom up approach, JSP seeks to select securities of companies that it believes have attractive end market potential, dominant business models and strong free cash flow generation that are attractively priced compared to the intrinsic value of the securities. JSP also considers a company’s operational efficiencies, management’s plans for capital allocation and the company’s shareholder orientation. |
|
Ÿ Wells Capital Management, Inc. (“Wells”) |
| Wells employs both proprietary screens and intensive grassroots research in order to identify high-growth companies expected to outperform their peers. Wells’ philosophy is firmly rooted in the belief that successful investing is the result of focusing on companies with favorable underlying fundamentals, strong growth potential and solid management teams. Security selection is based on fundamental research. This research process works to “surround” an investment by focusing on the company’s financials and verifying fundamentals with the management team, mid-level employees, customers, competitors, suppliers and/or distributors. |
|
Ÿ Westfield Capital Management Company, L.P. (“Westfield”) |
| Westfield uses an active management style and favors investing in earnings growth stocks given a conviction that stock prices follow earnings progress and that they offer the best opportunity for superior real rates of return. Westfield believes that reasonably priced stocks with high earnings potential are best identified through in-depth, fundamental research. |
For the period of September 1, 2013, through August 31, 2014, the Sub-advisers for CGCM Large Capitalization Growth Investments (“Fund”) were Jackson Square Partners, LLC (“JSP”) (formerly, Delaware Investments Fund Advisers), Wells Capital Management, Inc. (“Wells”), Westfield Capital Management Company, L.P. (“Westfield”) and Frontier Capital Management Co., LLC (“Frontier”).
The portion of the Fund managed by JSP underperformed the Fund’s market index benchmark, the Russell 1000® Growth Index, for the year ended August 31, 2014. Strong stock selection in the Health Care and Consumer Staples sectors was overshadowed by weak relative performance in the Financial Services and Materials & Processing sectors. Additionally, the strategy sold a long term holding within the Technology sector and the resulting relative underweight to this strong performing stock further detracted from performance. Shifts in market sentiment during the period suggest that many investors appear to be struggling with accurately predicting the pace of global economic recovery and are assessing factors that threaten economic fundamentals (for example, central bank actions and fiscal policy debates across the globe). In such an uncertain macroeconomic environment, JSP believes the quality of a company’s business model, competitive position, and management may prove to be of utmost importance. Regardless of the economic outcome, JSP remains consistent in their long-term investment philosophy: In wanting to own what are viewed as strong secular-growth companies with solid business models and competitive positions that can grow market share and have the potential to deliver shareholder value in a variety of market environments.
The portion of the Fund managed by Wells underperformed the Fund’s market index benchmark, the Russell 1000® Growth Index, for the year ended August 31, 2014. In contrast to 2013’s fundamentally driven equity market, mixed economic data and a number of geopolitical events have led to increased uncertainty and reduced investor risk tolerances thus far in 2014. A profound “risk off” trade became evident in March and April as higher growth, higher valuation stocks sold off sharply in favor of the perceived safety of low valuation and higher dividend yielding equities. Wells used this volatility to increase the earnings quality and near term earnings visibility of the portfolio. Wells has reduced exposure to “longer duration” growth stocks while maintaining the growth profile and high active share. As is typically the case with a fundamentally based, bottom-up manager, security selection was the primary determinant of absolute and relative returns. While they represented a small absolute weight within the portfolio, holdings within the Consumer Staples sector proved to be a significant contributor to returns as strength was visible within the beverage industry. Positioning with the Health Care sector remains focused on firms that are “saving lives or saving dollars”. Given the significant innovation implicit in the bio-pharma industry, these stocks were a focal point within the sector and a significant contributor to returns over the past year. Security selection within the Technology sector also proved additive to returns as holdings within the Information Technology services and Internet Software & Services industries displayed considerable strength. Unfortunately, this strength was overshadowed by disappointing security selection within the Consumer Discretionary sector. A combination of weather related weakness and company specific issues weighed on returns within the specialty retail industry. Positioning
1
|
Ÿ Frontier Capital Management Co., LLC (“Frontier”) |
| Frontier is a research-driven firm specializing in the management of growth-oriented U.S. equity portfolios. Frontier believes that growth must be purchased at a reasonable price and that fundamental, bottom-up research is the cornerstone to adding value. The firm’s philosophy since its founding in 1980 is that stock prices ultimately follow earnings growth. Frontier believes that there are three key drivers of long-term, consistent performance and look for companies that possess, improving business models; unrecognized earnings power; and attractive valuations. |
within the Financials sector also detracted from returns as weakness was apparent among bank holdings.
The portion of the Fund managed by Westfield performed in-line with the Fund’s market index benchmark, the Russell 1000® Growth Index, for the year ended August 31, 2014. The U.S. stock market posted double-digit gains during the trailing twelve-month period, reaching all-time highs in August. Employment levels and participation are strengthening and U.S. housing — a source of concern at the beginning of the summer — has stabilized and improved. The Consumer Discretionary sector was the biggest driver of relative returns. The underweight of the sector helped, but it was positive stock selection, particularly within the casino & gaming and internet retail sub-industries, that led to the majority of incremental gains. Investments in Health Care and Energy also augmented relative performance. Information Technology and Materials were the only meaningful detractors from performance. As has often been the case, the many reasons to feel positive about the economy and the markets are tempered by mitigating factors. Manufacturing data in both Europe and China weakened considerably, capital spending in the Middle East is being delayed, and Russia’s economy remains a risk. While Russia’s economic and political woes should not have an immediate impact on the U.S., they pose a potential hit to the Eurozone economy, and in turn, to earnings of U.S. multinationals. In recognition of these factors, Westfield is reassessing its investments with global exposure and reallocating funds to those areas that benefit the most from continued strength within domestic economy.
The portion of the Fund managed by Frontier emphasizes mid-cap growth stocks. Frontier’s relative performance was driven by strength in Technology, Financial Services and Energy. The best performing stock in technology was a semiconductors company which benefitted from strong demand for an array of wireless devices. Within Financials, a data systems company continued to capitalize on its big data capabilities and deliver solid results. In Energy, a resources company has consistently over delivered with its production and reserve growth profile. Offsetting these areas was the Consumer sector, where an investment in a vitamin store underperformed after reporting disappointing same store sales metrics. After strong gains over the past several years, Frontier is not surprised to see the market consolidate given international tensions as well as a pending inflection in Federal Reserve policy. Taking a longer term perspective, Frontier sees ample reasons to be positive about the domestic economy. Five years into a recovery that has been largely consumer and government driven, Frontier believes fundamentals support renewed capital spending that in time will benefit sectors such as Technology, Industrials and Energy infrastructure, all areas where they are overweight. Frontier continues to be watchful of international developments and expects to make adjustments accordingly.
2
The following graph depicts the performance of Large Capitalization Growth Investments vs. the Russell 1000® Growth Index1 and the Lipper Large-Cap Growth Funds Average.11
|
HISTORICAL PERFORMANCE FOR THE TEN-YEAR PERIOD ENDED AUGUST 31, 2014 LARGE CAPITALIZATION GROWTH INVESTMENTS Comparison of $10,000 Investment in the Portfolio with the Russell 1000® Growth Index and the Lipper Large-Cap Growth investment category |
The performance shown above and below represents past performance. Past performance is no guarantee of future results and current performance may be higher or lower than the performance shown above and below. Performance figures may reflect voluntary fee waivers and/or expense reimbursements. In the absence of voluntary fee waivers and/or expense reimbursements, the total return would have been lower. Principal value and investment returns will fluctuate and investors’ shares, when redeemed, may be worth more or less than their original cost. To obtain performance data current to the most recent month-end, please visit our website at www.morganstanley.com/cgcm.
The graph above and returns shown below do not reflect the deduction of taxes that a shareholder would pay on fund distributions or the redemption of fund shares.
| | | | | | | | | | | | | | | | | | | | | | |
| | | LARGE CAPITALIZATION GROWTH INVESTMENTS Average Annual Total Returns for the Period Ended August 31, 2014† |
| | | | | Without
Annual
Advisory
Program
Fee | | With
Annual
Advisory
Program
Fee* | | Russell
1000
Growth
Index*** | | Lipper
Large-Cap
Growth
Funds
Average*** |
| | Since inception (11/18/1991) | | | | 8.26 | % | | | | 6.49 | % | | | | 8.87 | % | | | | 8.72 | % |
| | 10 year | | | | 8.88 | | | | | 6.90 | | | | | 9.20 | | | | | 8.55 | |
| | 5 year | | | | 16.90 | | | | | 14.39 | | | | | 17.82 | | | | | 16.07 | |
| | 3 year | | | | 19.32 | | | | | 16.52 | | | | | 19.95 | | | | | 18.56 | |
| | | 1 year | | | | 24.35 | | | | | 20.82 | | | | | 26.29 | | | | | 25.06 | |
| | *** | | Inception returns of the market indices and Lipper investment category averages are calculated from the end of the inception month. |
See pages 27 through 29 for all footnotes.
3
Large Capitalization Value Equity Investments
|
| ABOUTTHE SUBADVISERS |
Ÿ Cambiar Investors, LLC (“Cambiar”) |
| Cambiar utilizes a bottom-up process that seeks to identify companies that are attractively priced, demonstrate positive developments not yet recognized by the market and offer significant appreciation potential within a one- to two-year time frame. |
|
Ÿ NFJ Investment Group, LLC (“NFJ”) |
| The NFJ investment process initially screens for positive fundamentals by applying a screen over a universe of approximately 800 stocks in order to identify companies with positive fundamental characteristics. After the screen has been applied, NFJ then conducts in-depth research and analysis by reviewing each of the remaining 150-200 possible investments for low price-to-earnings multiples, high dividend yields, positive prospective earnings and quality operations. As part of the portfolio construction process, industry concentration is mitigated by avoiding overexposure to any one sector by restricting the number of stocks held within a single industry. The portfolio generally holds 40 to 50 companies. NFJ’s process involves regular portfolio and universe monitoring for buy and sell candidates. NFJ continually repeats its research process in order to identify new buy and sell candidates. The sell discipline is an important part of NFJ’s process. A stock is sold when an alternative stock with equally strong fundamentals demonstrates a substantially lower price-to-earnings ratio, and/or a substantially higher dividend yield. |
|
Ÿ HGK Asset Management, Inc. (“HGK”) |
| HGK invests in undervalued securities through disciplined, fundamentally driven quantitative and qualitative security analysis. This analysis is coupled with a risk adverse approach to portfolio construction. HGK’s value driven domestic equity investment process has been employed in its current form since 1991. The equity team screens for disciplined companies with improving cash flows selling below their discounted present value. Rigorous qualitative fundamental analysis is applied to make the final security selection. During this analysis, the equity team focuses on undervalued companies that operate from a position of competitive advantage and whose management teams understand the principles of shareholder wealth creation. |
For the period from September 1, 2013, through August 31, 2014, the Sub-advisers for Large Capitalization Value Equity Investments (“Fund”) were Cambiar Investors, LLC (“Cambiar”), NFJ Investment Group, LLC (“NFJ”), HGK Asset Management, Inc. (“HGK”) and Artisan Partners Limited Partnership (“Artisan”).
The portion of the Fund managed by Cambiar underperformed the Fund’s market index benchmark, the Russell 1000® Value Index, for the year ended August 31, 2014. One result of the rising tide investment environment over the past year has been a lack of differentiation at the sector level; i.e., the market has been tightly correlated. As we progress in the economic cycle, security selection in the context of company specific fundamentals and tight adherence to valuation should be more relevant to forward outperformance — a potentially good backdrop for stock picking managers such as Cambiar. For the trailing twelve months, Cambiar’s Energy positions comprised the strongest value-add. Cambiar has been constructive on energy services companies that have high exposure to North America land projects, where volumes continue to move higher and pricing has stabilized. The expectation for pricing to increase will be another important earnings driver for these companies. Related beneficiaries from increased energy production in the U.S. include refineries as well as chemical companies, which can take advantage of lower input costs to increase margins as well as raise market share. Although positive on an absolute basis, Cambiar’s holdings in the Consumer Discretionary and Technology sectors were unable to keep pace with the benchmark, and subsequently a source of relative underperformance. Holdings in the Industrials sector were another source of modest underperformance; after maintaining an overweight allocation to industrials coming out of the 2008-09 financial crisis, Cambiar has been a net seller of industrials over the past year. While many forecast that industrial companies are poised to benefit from an expected uptick in capital spending, such optimism appears to be largely reflected in the multiples of which many of these stocks are trading — not an overly attractive investment profile in Cambiar’s opinion.
The portion of the Fund managed by NFJ performed in-line with the Fund’s market index benchmark, the Russell 1000® Value Index, for the year ended August 31, 2014. The twelve-month reporting period was a generally positive market environment, punctuated by two negative months — January of 2014 and July of 2014 — and the U.S. Federal Reserve (“FED”) tapering quantitative easing. The reporting period opened with investors braced for tighter U.S. monetary policy in the fall of 2013, followed by the realization of that policy shift toward the end of that year. The FED incrementally pulled back its monthly stimulus and closed out the reporting period with the purchase of $35 billion in agency mortgage-based and longer-term Treasury securities beginning in July. Relative returns were due to positive sector weight deviations offset by a small cash position and slightly negative stock selection. Issue selection was strongest in the Industrials and Health Care sectors, while the strategy’s Consumer Discretionary and Materials holdings lagged those sectors within the benchmark. The strategy’s overweight in Information Technology and Materials boosted performance, along with an underweight in the Utilities sector. Within the benchmark, the Information Technology and Materials sectors generated the strongest absolute returns, gaining 41% and 30%, respectively over the trailing one-year period. Conversely, Utilities was the third weakest economic sector, after Telecommunication Services and Consumer Staples. The
4
|
Ÿ Artisan Partners Limited Partnership (“Artisan”) |
| The Artisan mid-cap value strategy employs a bottom-up investment process to construct a diversified portfolio of U.S. mid-cap value companies that Artisan’s mid-cap value investment team believes are undervalued, in solid financial condition and have attractive business economics. Artisan believes companies with these characteristics are less likely to experience eroding values over the long-term. |
Fund’s underweight position in Health Care and overweight in Energy were headwinds, and failed to keep pace with the benchmark’s total return during the reporting period.
The portion of the Fund managed by HGK outperformed the Fund’s market index benchmark, the Russell 1000® Value Index, for the fiscal year ended August 31, 2014. The fiscal year provided strongly positive equity returns as the global economy accelerated in the face of recession in Europe, slow growth in emerging markets, instability in the Middle East and prospects for less accommodative monetary policy. In spite of these headwinds, economic data surprised to the upside with the U.S. leading global economic recovery. Outperformance for the fiscal year can be attributed to strong security selection driven by bottom up stock picking as well as effective sector allocation. The strongest stock picks were in the Health Care, Staples and Technology Sectors. The strongest sector allocation was a result of being underweighted in the Financial Services sector. Conversely, on a relative basis, security selection in the Consumer Discretionary and Energy sectors were the largest detractors, as HGK’s holdings provided strongly positive returns but trailed the benchmark’s sector return. Despite the market rally during the period, HGK believes there are many opportunities for capital appreciation in the equity market for investors utilizing a disciplined valuation method. The most pronounced opportunity lies in the valuation disconnect between companies that have intelligently invested in preparation for a better economic environment and those who have cut costs too aggressively. HGK’s valuation work suggests that the market is discounting these strong operators, providing them with a number of opportunities. HGK continues to maintain a well-diversified portfolio and utilize its rigorous quantitative and qualitative analysis to find value in all economic sectors.
The portion of the Fund managed by Artisan emphasizes mid-cap value stocks. U.S. mid-cap stocks were aided by ongoing liquidity from the U.S. Federal Reserve (“FED”) and continued growth in the U.S. economy. Inflation remained tame, providing the FED with more leeway to keep short-term interest rates low for longer. Relative returns were held back by select holdings in the Consumer Discretionary and Technology sectors. Additionally, a cash position was a meaningful drag on performance. In the Consumer Discretionary sector, key detractors included handbags designer, a home goods retailer, and a toy company. The returns in the Technology sector were held back by a phone number database administrator. On the positive side, the Energy and Consumer Staples sectors were sources of outperformance and the portfolio benefited from a low weighting in the Utilities sector. With the market moving up faster than underlying business fundamentals over the past two years, finding attractive value opportunities has become more challenging for the Artisan investment team. At present, the team is a bit wary about current risk/reward dynamics priced into the market. That could change if business performance surprises to the upside or a bit of risk aversion creeps back into the market. Regardless, Artisan believes its focus on cash-producing businesses in sound financial condition, selling at undemanding valuations should continue to serve the portfolio well.
5
The following graph depicts the performance of the Large Capitalization Value Equity Investments vs. the Russell 1000® Value Index2 and the Lipper Large-Cap Value Funds Average.12
|
HISTORICAL PERFORMANCE FOR THE TEN-YEAR PERIOD ENDED AUGUST 31, 2014 LARGE CAPITALIZATION VALUE EQUITY INVESTMENTS Comparison of $10,000 Investment in the Portfolio with the Russell 1000® Value Index and the Lipper Large-Cap Value investment category |
The performance shown above and below represents past performance. Past performance is no guarantee of future results and current performance may be higher or lower than the performance shown above and below. Performance figures may reflect voluntary fee waivers and/or expense reimbursements. In the absence of voluntary fee waivers and/or expense reimbursements, the total return would have been lower. Principal value and investment returns will fluctuate and investors’ shares, when redeemed, may be worth more or less than their original cost. To obtain performance data current to the most recent month-end, please visit our website at www.morganstanley.com/cgcm.
The graph above and returns shown below do not reflect the deduction of taxes that a shareholder would pay on fund distributions or the redemption of fund shares.
| | | | | | | | | | | | | | | | | | | | | | |
| | | LARGE CAPITALIZATION VALUE EQUITY INVESTMENTS Average Annual Total Returns for the Period Ended August 31, 2014† |
| | | | | Without
Annual
Advisory
Program
Fee | | With
Annual
Advisory
Program
Fee* | | Russell
1000
Value
Index*** | | Lipper
Large-Cap
Value
Funds
Average*** |
| | Since inception (11/18/1991) | | | | 8.26 | % | | | | 6.49 | % | | | | 10.76 | % | | | | 9.74 | % |
| | 10 year | | | | 7.29 | | | | | 5.34 | | | | | 8.23 | | | | | 7.43 | |
| | 5 year | | | | 15.57 | | | | | 13.09 | | | | | 16.62 | | | | | 14.86 | |
| | 3 year | | | | 18.76 | | | | | 15.97 | | | | | 21.57 | | | | | 19.73 | |
| | | 1 year | | | | 22.37 | | | | | 18.90 | | | | | 24.43 | | | | | 22.77 | |
| | *** | | Inception returns of the market indices and Lipper investment category averages are calculated from the end of the inception month. |
See pages 27 through 29 for all footnotes.
6
Small Capitalization Growth Investments
|
| ABOUTTHE SUBADVISERS |
Ÿ Wall Street Associates (“Wall Street”) |
| Wall Street follows a bottom-up investment style. It looks for companies with superior earnings growth, strong balance sheets, attractive valuations and potentially positive earnings surprises. |
|
Ÿ Westfield Capital Management Company, L.P. (“Westfield”) |
| Westfield favors investing in earnings growth stocks given a conviction that stock prices follow earnings progress and that they offer the best opportunity for superior real rates of return. Reasonably priced stocks of companies with high foreseen earnings potential are best identified through in-depth, fundamental research. It is Westfield’s belief that the small capitalization portion of the market is under-researched, and therefore less efficient, than the large capitalization sector. |
For the period of September 1, 2013, through August 31, 2014, the Sub-advisers for the CGCM Small Capitalization Growth Investments (“Fund”) were Wall Street Associates (“Wall Street”), and Westfield Capital Management Company, L.P. (“Westfield”).
The portion of the Fund managed by Wall Street underperformed the Fund’s market index benchmark, the Russell 2000® Growth Index, for the year ended August 31, 2014. Stocks produced strong double-digit returns for the year ended August 31, 2014, although it was not a straight upwards move. As the fiscal year began, U.S. equity markets were in recovery mode following a mid-summer pullback. Investor’s confidence and tolerance for risk increased and stocks rallied fiercely into year-end 2013. Small cap stocks then had a bumpy ride from February through May, as investors violently rotated away from stocks that were small in size as well as those with high growth characteristics, due to fears of imminent U.S. Federal Reserve (“FED”) tapering and unrest in Russia and Ukraine. Hardest hit were those stocks with the highest revenue growth rates, particularly Technology and Biotechnology stocks. Those groups have since rallied back from correction territory on improving economic news and solid second quarter earnings reports. The Health Care sector provided the greatest contribution to portfolio return, driven by investments in medical equipment, instrumentation and pharmaceutical companies. Investments in the Energy and Materials sectors added significantly to portfolio returns. The producer durables and financial services groups were also additive to results. The largest detractor from performance for the period was the Technology sector, particularly software stocks. Consumer Discretionary stocks produced lackluster results for the period and were a drag on performance. Wall Street anticipates market levels will be higher over the next twelve-months, driven by earnings growth and continued improvement in the domestic economy. Risk control and stock selection are critically important and the asset manager continues to actively manage exposures and construct portfolios with companies experiencing sustainable long-term earnings growth rates.
The portion of the Fund managed by Westfield outperformed the Fund’s market index benchmark, the Russell 2000® Growth Index, for the year ended August 31, 2014. The U.S. stock market posted double-digit gains during the trailing twelve-month period, reaching all-time highs in August. Its advance, however, was not uniform, with small capitalization stocks correcting sharply in March-April and again in July. Small cap valuations did become extended by the end of 2013. However, Westfield believes the performance divergence between small and large caps over the spring and summer was primarily due to investors assessing emerging geopolitical and macroeconomic risks and preferring the relative safety and liquidity of larger cap stocks. The outperformance was fairly broad-based, with seven economic sectors generating incremental gains. Investments within Health Care drove most of the upside. Westfield continues to carry a substantial overweight in the Health Care sector and favors high quality names within biotechnology and pharmaceuticals. They have also been increasingly enthusiastic about growth prospects within the Contract Research Organization segment of the life sciences tools industry. The Materials sector also contributed significantly to performance results. The portfolio’s active exposure to Materials increased during the period; however, this overweight is not an expression of an overly bullish macro viewpoint, it is built upon their analysis
7
The following graph depicts the performance of Small Capitalization Growth Investments vs. the Russell 2000® Growth Index3 and the Lipper Small-Cap Growth Funds Average.13
of stock-specific risk/reward opportunities. The Industrials sector was the only meaningful detractor from relative results, held back by stock-specific weakness within office services & supplies. Westfield was pleased that the Russell 2000® Growth Index of small capitalization stocks outperformed broad market benchmarks in August. There are good reasons for the strength of domestic equities. Most of the economic news in the United States is positive and this dynamic tends to favor smaller, U.S.-centric companies. As economic growth in the U.S. accelerates, Westfield feels comfortable that they can identify more appreciation potential in individual small cap stocks.
|
HISTORICAL PERFORMANCE FOR THE TEN-YEAR PERIOD ENDED AUGUST 31, 2014 SMALL CAPITALIZATION GROWTH INVESTMENTS Comparison of $10,000 Investment in the Portfolio with the Russell 2000® Growth Index and the Lipper Small-Cap Growth investment category |
The performance shown above and below represents past performance. Past performance is no guarantee of future results and current performance may be higher or lower than the performance shown above and below. Performance figures may reflect voluntary fee waivers and/or expense reimbursements. In the absence of voluntary fee waivers and/or expense reimbursements, the total return would have been lower. Principal value and investment returns will fluctuate and investors’ shares, when redeemed, may be worth more or less than their original cost. To obtain performance data current to the most recent month-end, please visit our website at www.morganstanley.com/cgcm.
The graph above and returns shown below do not reflect the deduction of taxes that a shareholder would pay on fund distributions or the redemption of fund shares.
| | | | | | | | | | | | | | | | | | | | | | |
| | | SMALL CAPITALIZATION GROWTH INVESTMENTS Average Annual Total Returns for the Period Ended August 31, 2014† |
| | | | | Without
Annual
Advisory
Program
Fee | | With
Annual
Advisory
Program
Fee* | | Russell
2000
Growth
Index*** | | Lipper
Small-Cap
Growth
Funds
Average*** |
| | Since inception (11/18/1991) | | | | 9.58 | % | | | | 7.79 | % | | | | 7.92 | % | | | | 10.18 | % |
| | 10 year | | | | 9.43 | | | | | 7.44 | | | | | 10.22 | | | | | 9.60 | |
| | 5 year | | | | 17.80 | | | | | 15.28 | | | | | 18.29 | | | | | 17.77 | |
| | 3 year | | | | 18.39 | | | | | 15.61 | | | | | 19.21 | | | | | 17.54 | |
| | | 1 year | | | | 16.91 | | | | | 13.59 | | | | | 17.30 | | | | | 14.00 | |
| | *** | | Inception returns of the market indices and Lipper investment category averages are calculated from the end of the inception month. |
See pages 27 through 29 for all footnotes.
8
Small Capitalization Value Equity Investments
|
| ABOUTTHE SUBADVISERS |
Ÿ Rutabaga Capital Management LLC (“Rutabaga”) |
| Rutabaga focuses exclusively on micro- and small capitalization stocks and looks to unearth uncommon or currently out-of-favor stocks. The firm’s analysts employ extensive bottom-up fundamental research to identify high quality companies with catalysts to increase margins and intrinsic value but are neglected or misperceived by the market. |
|
Ÿ NFJ Investment Group LLC (“NFJ”) |
| NFJ employs an active management style that invests in a diversified portfolio of small capitalization common stocks that it believes are undervalued in the marketplace generally and within their respective industries. NFJ also considers valuation factors such as price-to-book, price-to-cash flow, dividend policy and industry outlook in selecting stocks for investment. |
|
Ÿ Delaware Investments Fund Advisers (“Delaware”) |
| Delaware will invest, under normal market conditions, at least 80% of its net assets, plus any borrowings for investment purposes, in the equity securities of small capitalization companies or in other investments with similar economic characteristics. Delaware will consider small capitalization companies to be companies with market capitalizations not exceeding $3 billion or the highest month-end market capitalization value of any stock in the Russell 2000® Index for the previous twelve months, whichever is greater. Securities of companies whose market capitalizations no longer meet this definition after purchase still will be considered to be securities of small capitalization companies for purpose of the investment policy. The size of the companies in the Index change with market conditions and the composition of the Index. |
For the period September 1, 2013, through August 31, 2014, the Sub-advisers for CGCM Small Capitalization Value Equity Investments (“Fund”) were Rutabaga Capital Management LLC (“Rutabaga”), NFJ Investment Group LLC (“NFJ”), and Delaware Investments Fund Advisers (“Delaware”).
The portion of the Fund managed by Rutabaga outperformed the Fund’s market index benchmark, the Russell 2000® Value Index, for the year ended August 31, 2014. Sector allocation was a slight headwind as Rutabaga held exposure to the top two performing sectors, Energy and Health Care, and were overweight in the worst performing sector, Consumer Discretionary. The investment manager’s top three performing stocks benefitted from improving commodity prices (particularly, silicon prices), increasing construction activity, and a buy-out by a competitor for a reasonable premium. Only two stocks significantly underperformed during the twelve-month period, and in both cases, new management teams are in place with credible turnaround strategies. Rutabaga remains committed to finding companies that are neglected and attractively valued and that possess internal catalysts to grow their earnings faster than other investors are expecting.
The portion of the Fund managed by NFJ outperformed the Fund’s market index benchmark, the Russell 2000® Value Index, for the year ended August 31, 2014. The twelve-month reporting period was a generally positive market environment, punctuated by three sharply negative months — January of 2014, April of 2014, and July of 2014 — and the U.S. Federal Reserve (“FED”) tapering quantitative easing. A hallmark of the NFJ investment process is downside protection and during those three down months, the strategy outperformed the Russell 2000® Value Index. The reporting period opened with investors braced for tighter U.S. monetary policy in the fall of 2013, followed by the realization of that policy shift toward the end of that year. The FED incrementally pulled back its monthly stimulus and closed out the reporting period with the purchase of $35 billion in agency mortgage-based and longer-term Treasury securities beginning in July. Within the benchmark, the more defensive Health Care and Utilities economic sectors, followed by Materials and Industrials names appreciated over the trailing one-year period. Laggards included Telecommunications Services stocks, the only sector to fall to a loss during the period, as well as the benchmark’s Consumer Staples and Consumer Discretionary companies. Strong absolute and relative performance was due to positive stock selection and sector allocation, albeit to a lesser degree. Issue selection was strongest in Consumer Staples and Energy, while stock picks lagged in the Consumer Discretionary and Information Technology sectors. The strategy’s overweight positions in Materials and Industrials, and underweight in Financials boosted returns. Conversely, an overweight in Consumer Staples dampened relative performance.
The portion of the Fund managed by Delaware outperformed the Fund’s market index benchmark, the Russell 2000® Value Index, for the year ended August 31, 2014. Economic growth remained modest for the fifth consecutive year with gross domestic product (GDP) growth averaging between 2.0% – 2.5%, although the quarterly variation was wide. The continued modest growth rate enabled the FED to maintain an extremely accommodative monetary policy accompanied by very low interest rates. Corporate balance sheets remained in excellent shape and share
9
The following graph depicts the performance of Small Capitalization Value Equity Investments vs. the Russell 2000® Value Index4 and the Lipper Small-Cap Value Funds Average.14
buybacks and increasing dividends continued at strong levels while merger and acquisition activity also increased. All of these appear to be indications that corporations are more confident in the economy and their ability to return excess capital to shareholders. With interest rates remaining very low and the FED continuing an extremely accommodative monetary policy, the equity markets enjoyed strong returns with most sectors within the small-cap value index having returns in excess of 15%.
From a performance standpoint, strong stock selection in the Capital Spending, Energy, and Technology sectors were major factors in outperforming on a relative basis, and offset the negative impact from underweighting Real Estate Investment Trusts (REITs). Individual stock selection contributed the majority of outperformance for the portfolio while sector allocations also had an overall positive impact on performance.
|
HISTORICAL PERFORMANCE FOR THE TEN-YEAR PERIOD ENDED AUGUST 31, 2014 SMALL CAPITALIZATION VALUE EQUITY INVESTMENTS Comparison of $10,000 Investment in the Portfolio with the Russell 2000® Value Index and the Lipper Small-Cap Value investment category |
The performance shown above and below represents past performance. Past performance is no guarantee of future results and current performance may be higher or lower than the performance shown above and below. Performance figures may reflect voluntary fee waivers and/or expense reimbursements. In the absence of voluntary fee waivers and/or expense reimbursements, the total return would have been lower. Principal value and investment returns will fluctuate and investors’ shares, when redeemed, may be worth more or less than their original cost. To obtain performance data current to the most recent month-end, please visit our website at www.morganstanley.com/cgcm.
The graph above and returns shown below do not reflect the deduction of taxes that a shareholder would pay on fund distributions or the redemption of fund shares.
| | | | | | | | | | | | | | | | | | | | | | |
| | | SMALL CAPITALIZATION VALUE EQUITY INVESTMENTS Average Annual Total Returns for the Period Ended August 31, 2014† |
| | | | | Without
Annual
Advisory
Program
Fee | | With
Annual
Advisory
Program
Fee* | | Russell
2000
Value
Index*** | | Lipper
Small-Cap
Value
Funds
Average*** |
| | Since inception (11/18/1991) | | | | 11.05 | % | | | | 9.23 | % | | | | 11.98 | % | | | | 11.24 | % |
| | 10 year | | | | 11.41 | | | | | 9.38 | | | | | 8.43 | | | | | 9.12 | |
| | 5 year | | | | 17.95 | | | | | 15.42 | | | | | 15.74 | | | | | 16.47 | |
| | 3 year | | | | 20.05 | | | | | 17.23 | | | | | 18.78 | | | | | 19.08 | |
| | | 1 year | | | | 20.17 | | | | | 16.76 | | | | | 18.10 | | | | | 19.30 | |
| | *** | | Inception returns of the market indices and Lipper investment category averages are calculated from the end of the inception month. |
See pages 27 through 29 for all footnotes.
10
International Equity Investments
|
| ABOUTTHE SUBADVISERS |
Ÿ Schroder Investment Management North America, Inc. (“Schroders”) |
| Schroders uses a bottom-up growth oriented approach towards stock selection and employs a fundamental, research driven process to identify quality growth companies with attractive medium-term growth and valuation, quality management and financial position, and a sustainable competitive advantage. Schroders’ “best ideas” portfolio blends both core and opportunistic holdings. |
|
Ÿ Philadelphia International Advisors LP (“PIA”) |
| PIA utilizes a fundamental bottom-up process and quantitative screening in its approach to international investing. It selects stocks to buy and sell by evaluating a company’s growth outlook and market valuation based on traditional value characteristics, positive company-specific catalysts and other operating and financial conditions. It selects countries primarily by evaluating a country’s valuation ratios such as price-to-earnings and dividend yield, prospective economic growth, government policies and other factors. |
|
Ÿ OppenheimerFunds, Inc. (“OFI”) |
| OFI’s Global Equity team seeks to generate alpha through high conviction decisions driven by fundamental bottom-up analysis. Several secular growth themes are used as a way to focus attention on segments of the global marketplace that may grow faster than world GDP. The team’s investment process is driven by a number of very powerful, long-term economic, demographic and technological forces summarized as MANTRA® — Mass Affluence, New Technologies, Restructuring and Aging. The portfolio managers utilize a bottom-up, fundamental investment approach, and seek to invest initially in high-quality companies that are temporarily out of favor; trading at attractive valuations; and which demonstrate sustainable, above-average growth potential over a three- to five-year time horizon. The process is index agnostic, searching for companies with high growth rates and high quality balance sheets with minimal focus with respect to region or country, sector or security. |
|
Ÿ Causeway Capital Management LLC (“Causeway”) |
Causeway’s international developed market investment philosophy is based on a long-term value strategy and the investment team applies an active, bottom-up, research-intensive approach towards stock selection. |
For the period September 1, 2013, through August 31, 2014, the Sub-advisers for CGCM International Equity Investments (“Fund”) were Schroder Investment Management North America Inc. (“Schroders”) and Philadelphia International Advisors LP (“PIA”), while OppenheimerFunds, Inc. (“OFI”) began on May 23, 2014 and Causeway Capital Management LLC (“Causeway”) began on August 20, 2014.
The portion of the Fund managed by Schroders outperformed the Fund’s market index benchmark, the MSCI EAFE® Index (Net), for the year ended August 31, 2014. International equity markets were positive over the year, supported by low volatility and central bank accommodation. The modest recovery in the global economy continued to support solid cash flow generation and healthy earnings growth for most companies. Diverging growth within regions and central bank action were central themes. While the U.S. economic recovery prompted concerns about policy tightening, a slowing eurozone battling persistently low inflation prompted policy loosening in Europe. Geopolitical tension in the Ukraine and Middle East also dominated sentiment and affected energy prices. Stock selection was the main driver behind relative performance, particularly in the Health Care sector where Schroders’ positions in U.K. companies that were at the centre of intense merger and acquisition speculation were beneficial. Holdings in the Industrial sector also added to returns, especially in Canada. On a regional basis, Schroders’ stock selection within Japan was especially beneficial as a number of their positions overcame the market weakness related to the consumption tax increase in April. The rally in peripheral Europe hurt performance, as a result of a significant underweight allocation given a cautious view on risk, valuations and growth within that region. Schroders continues to pursue companies with strong business models that are also supported by longer-term secular growth trends. One example is an exposure to the growth in mobile services and internet connectivity, which remains in the early stages. Overall, Schroders remains focused on identifying companies with attractive growth in earnings that is underestimated by the market.
The portion of the Fund managed by PIA outperformed the Fund’s market index benchmark, the MSCI EAFE® Index (Net), for the year ended August 31, 2014. Despite some geo-political tensions out of the Ukraine and Middle East, optimism in the global economic recovery, assurances from central bankers, and increased merger and acquisition activity helped push global equities higher during the period. All sectors posted positive returns for the period with the more defensive Health Care, Telecommunications, and Utilities leading the way. With the exception of Japan, which underperformed early in 2014 due to the consumption tax hike, all major non-U.S. regions posted double-digit returns for the period in U.S. dollar terms. The portfolio’s allocation to international small cap securities was the greatest driver of outperformance as stock selection was quite strong within Industrials, Financials, and Consumer Discretionary. Amongst larger capitalization holdings, stock selection in Materials and Health Care also positively impacted net returns. Stock selection within the Energy sector was the largest detractor as select holdings underperformed the market. The portfolio’s underweight to the Telecommunications sector also modestly weighed on relative returns. Regionally, strong selection in Japanese and Continental European holdings (namely within
11
|
| Causeway’s investment approach seeks to identify under-priced stocks of high quality companies believed to be exhibiting superior financial strength as compared to peers. In addition to fundamental analysis, quantitative research is considered an integral part of the process and is used for screenings of investment candidates as well as risk management. Portfolio managers work as a team to make investment decisions and are supported by the firm’s dedicated fundamental and quantitative research analysts. Analysts and portfolio managers are assigned global industry-specific research responsibilities. Fundamental research is further organized into four research clusters: financials/materials, consumer/energy, industrials/manufacturing, and health care/technology. Causeway’s unconstrained, international established market value equity approach invests in a variety of market capitalization ranges, but primarily in large- and mid-capitalization non-U.S. developed market companies. Causeway can also invest in small-cap issues and less developed emerging markets. Value-driven security characteristics may include low price/earnings ratio, low price/book ratio, low price/cash flow ratio and high dividend yield, but may also include out-of-favor companies that may have high rates of growth of earnings. Sector and regional weights are byproducts of the investment process. |
France, Sweden, Italy, and the Netherlands) generated positive gains while select emerging market stocks were a slight detraction.
Since inception encompassing the period May 23, 2014 through August 31, 2014, the portion of the Fund managed by OFI underperformed the Fund’s market index benchmark, the MSCI EAFE® Index (Net). Economic instability in the world’s emerging markets and growing geopolitical tensions in Ukraine and the Middle East led to a choppy market environment during the period. Macroeconomic factors such as these tend to introduce market volatility, creating risk on/risk off market environments, which also tend to obscure fundamentals. The portfolio outperformed in Consumer Staples as a result of stock selection activities. The portfolio underperformed in the Industrials, Consumer Discretionary and Health Care sectors. Underperformance in the Industrials and Health Care sectors was largely attributable to stock selection, while Consumer Discretionary was due to stock selection and overweight sector exposure. The portfolio’s country and regional allocations are a rolled up reflection of the portfolio’s individual stock selections. That being said, the portfolio’s exposure to Germany outperformed in regards to relative stock selection and an underweight exposure. A relative overweight to Thailand also benefited results. The portfolio’s stock selection in Japan, Italy, France and Switzerland detracted from relative results, as well as overweights to Switzerland and France and an underweight to Japan. The period featured a combination of factors that did not favor the portfolio’s emphasis on high quality, durable, growth stocks. However, the portfolio’s managers have observed other periods where lower quality, more cyclically geared business models have made significant advances. They typically do not last long.
12
The following graph depicts the performance of International Equity Investments vs. the Morgan Stanley Capital International Europe, Australasia, Far East (MSCI EAFE®) Index (Net)5 and the Lipper International Large-Cap Core Funds Average.15
|
HISTORICAL PERFORMANCE FOR THE TEN-YEAR PERIOD ENDED AUGUST 31, 2014 INTERNATIONAL EQUITY INVESTMENTS Comparison of $10,000 Investment in the Portfolio with the Morgan Stanley Capital International Europe, Australasia,
Far East (MSCI EAFE®) Index (Net) and the Lipper International Large-Cap Core investment category |
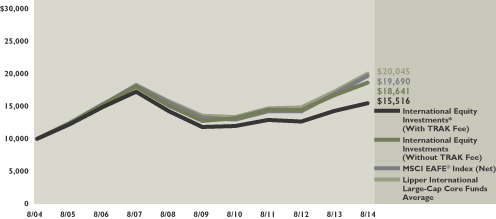
The performance shown above and below represents past performance. Past performance is no guarantee of future results and current performance may be higher or lower than the performance shown above and below. Performance figures may reflect voluntary fee waivers and/or expense reimbursements. In the absence of voluntary fee waivers and/or expense reimbursements, the total return would have been lower. Principal value and investment returns will fluctuate and investors’ shares, when redeemed, may be worth more or less than their original cost. To obtain performance data current to the most recent month-end, please visit our website at www.morganstanley.com/cgcm.
The graph above and returns shown below do not reflect the deduction of taxes that a shareholder would pay on fund distributions or the redemption of fund shares.
| | | | | | | | | | | | | | | | | | | | | | |
| | | INTERNATIONAL EQUITY INVESTMENTS Average Annual Total Returns for the Period Ended
August 31, 2014† | | | | |
| | | | | Without
Annual
Advisory
Program
Fee | | With
Annual
Advisory
Program
Fee* | | MSCI
EAFE
Index
(Net)*** | | Lipper
International
Large-Cap
Core Funds
Average*** |
| | Since inception (11/18/1991) | | | | 5.79 | % | | | | 4.06 | % | | | | 6.03 | % | | | | 7.74 | % |
| | 10 year | | | | 6.42 | | | | | 4.49 | | | | | 7.01 | | | | | 7.10 | |
| | 5 year | | | | 7.83 | | | | | 5.52 | | | | | 8.21 | | | | | 7.73 | |
| | 3 year | | | | 8.74 | | | | | 6.19 | | | | | 11.36 | | | | | 10.37 | |
| | | 1 year | | | | 11.45 | | | | | 8.29 | | | | | 16.43 | | | | | 15.58 | |
| | *** | | Inception returns of the market indices and Lipper investment category averages are calculated from the end of the inception month. |
See pages 27 through 29 for all footnotes.
13
Emerging Markets Equity Investments
|
| ABOUTTHE SUB ADVISERS |
Ÿ Vontobel Asset Management, Inc. (“Vontobel”) |
| Vontobel, is a global investment management firm dedicated exclusively to managing long-only global equity portfolios. Vontobel’s investment philosophy is based on a conviction that long-term, stable and superior earnings growth drives long-term investment returns and risk-adjusted outperformance. Vontobel practices a fundamental bottom-up approach that integrates elements of growth investing (growth and stability of earnings) with a strict valuation discipline in a longer term context. |
|
Ÿ Lazard Asset Management, LLC (“Lazard”) |
| Lazard, an indirect, wholly-owned subsidiary of Lazard Ltd., is known for its global perspective on investing and years of experience with global, regional and domestic portfolios. With more than 300 investment personnel worldwide, Lazard offers investors of all types an array of equity, fixed income, and alternative investment solutions from its network of local offices in ten different countries. Its team-based approach to portfolio management helps Lazard to deliver robust and consistent performance over time, and strong client relationships allow them to understand how to employ their capabilities to its clients’ advantage. |
| Lazard manages a relative value strategy (“Value Strategy”) and a relative growth strategy (“Growth Strategy”) and invests primarily in equity securities, principally common stocks, of non-U.S. companies whose principal activities are located in emerging or developing market countries. In the Value Strategy, assets are invested in companies that are believed to be undervalued based on their earnings, cash flow or asset values. In the Growth Strategy, Lazard employs a relative growth investment philosophy that is based on value creation through a process of bottom-up stock selection. Lazard’s approach consists of an analytical framework, accounting validation, fundamental analysis and portfolio construction parameters and its selection process focuses on growth and considers the sustainability of growth and the trade off between valuation and growth. The percentage of the Fund’s assets allocated to Lazard is 33% to the Value Strategy and 33% to the Growth Strategy. |
For the period September 1, 2013, through August 31, 2014, the Sub-advisers for the CGCM Emerging Markets Equity Investments (“Fund”) were Vontobel Asset Management, Inc. (“Vontobel”) and Lazard Asset Management LLC (“Lazard”). Lazard manages two strategies for the Fund, an emerging markets equity value strategy (“Lazard Value Strategy”) and a developing markets equity strategy (“Lazard Growth Strategy”).
The portion of the Fund managed by Vontobel outperformed the Fund’s market index benchmark, the MSCI Emerging Markets Index (Net), for the year ended August 31, 2014. On a sector level, the Financials and Health Care sectors contributed positively to relative performance, supported by Vontobel’s stock selection within both sectors. The portfolio’s underweight exposure to the Information Technology sector and stock selection in Utilities were the leading detractors from performance for the period. Despite macro volatility this year, including Russia/Ukraine, a coup in Thailand, increasing troubles in the Middle East, etc., all major markets had positive returns. While Vontobel monitors these global risks as they can lead to oil price shocks, the asset manager continues to spend the majority of time focused on businesses, their growth prospects and specific risks. Vontobel remains excited about the earnings outlook for the companies held, and the portfolio is positioned to perform in a variety of market environments. Over a full market cycle, the team believes that the stocks held should perform regardless of ever present macro risks as emerging markets continue to develop, as innovations continue to come to market, and as consumers continue to strive to better their lives.
The Lazard Value Strategy outperformed the Fund’s market index benchmark, the MSCI Emerging Markets Index (Net), for the year ended August 31, 2014. Over the twelve-month period ended August 31, 2014, the MSCI Emerging Markets (EM) Index increased by almost 20% in U.S. dollar terms. All Asian markets rose during the twelve-month period. Apart from Chile, where volatile copper prices hurt the currency, all Latin American equity markets recorded gains. Outside of Russia, the only eastern European market to perform poorly was Hungary. Strong stock selection in the Financial sector contributed to the outperformance. From a regional perspective, strong stock selection within South Korea and Brazil as well as an overweight exposure to Brazil benefited, while stock selection in South Africa, an overweight exposure to Russia, and an underweight exposure to India detracted from performance.
The Lazard Growth Strategy underperformed the Fund’s market index benchmark, the MSCI Emerging Markets Index (Net), for the year ended August 31, 2014. Stock selection in the Consumer Discretionary and Financials sector benefited, while stock selection in the Energy, Information Technology, and Industrials sectors hurt performance. An underweight exposure to the Consumer Staples and Telecommunication services sectors as well as an overweight exposure to the Health Care sector added value. However, an underweight exposure to the Information Technology sector hurt performance. From a regional perspective, stock selection in Taiwan, India, Indonesia, and Colombia helped performance while stock selection in Brazil, Russia, and China detracted value. An underweight exposure to Chile and Malaysia and an overweight exposure to India added value. In contrast, an
14
The following graph depicts the performance of Emerging Markets Equity Investments vs. the MSCI Emerging Markets Index (Net)6 and the Lipper Emerging Markets Funds Average.16
underweight exposure to South Africa as well as an overweight exposure to Russia hurt performance.
|
HISTORICAL PERFORMANCE FOR THE TEN-YEAR PERIOD ENDED AUGUST 31, 2014 EMERGING MARKETS EQUITY INVESTMENTS Comparison of $10,000 Investment in the Portfolio with the MSCI Emerging Markets Index (Net)
and the Lipper Emerging Markets investment category |
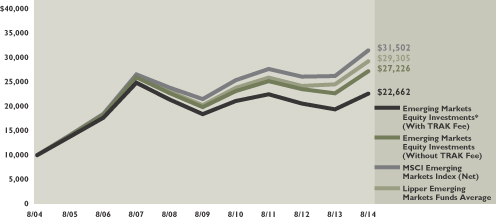
The performance shown above and below represents past performance. Past performance is no guarantee of future results and current performance may be higher or lower than the performance shown above and below. Performance figures may reflect voluntary fee waivers and/or expense reimbursements. In the absence of voluntary fee waivers and/or expense reimbursements, the total return would have been lower. Principal value and investment returns will fluctuate and investors’ shares, when redeemed, may be worth more or less than their original cost. To obtain performance data current to the most recent month-end, please visit our website at www.morganstanley.com/cgcm.
The graph above and returns shown below do not reflect the deduction of taxes that a shareholder would pay on fund distributions or the redemption of fund shares.
| | | | | | | | | | | | | | | | | | | | | | |
| | | EMERGING MARKETS EQUITY INVESTMENTS Average Annual Total Returns for the Period Ended
August 31, 2014† | | | | |
| | | | | Without
Annual
Advisory
Program
Fee | | With
Annual
Advisory
Program
Fee* | | MSCI
Emerging
Markets
Index
(Net)*** | | Lipper
Emerging
Markets
Funds
Average*** |
| | Since inception (4/20/1994) | | | | 5.48 | % | | | | 3.74 | % | | | | N/A | | | | | 6.62 | % |
| | 10 year | | | | 10.53 | | | | | 8.52 | | | | | 12.16 | % | | | | 11.21 | |
| | 5 year | | | | 6.52 | | | | | 4.24 | | | | | 7.90 | | | | | 7.47 | |
| | 3 year | | | | 2.65 | | | | | 0.24 | | | | | 4.35 | | | | | 4.07 | |
| | | 1 year | | | | 19.97 | | | | | 16.57 | | | | | 19.98 | | | | | 18.93 | |
| | *** | | Inception returns of the market indices and Lipper investment category averages are calculated from the end of the inception month. |
See pages 27 through 29 for all footnotes.
15
Core Fixed Income Investments
|
| ABOUTTHE SUBADVISERS |
Ÿ BlackRock Financial Management, Inc. (“BlackRock”) |
| BlackRock employs a relative value approach which entails portfolio duration within a narrow range and value added through sector and sub-sector rotation within Investment grade fixed income sectors. BlackRock evaluates securities within a risk management framework which consists of determining interest rate risk, yield curve risk, cash flow risk, credit risk and liquidity risk of securities. |
|
Ÿ Pacific Investment Management Company LLC (“PIMCO”) |
| PIMCO employs “top-down” and “bottom-up” investment techniques. It implements the following “top-down” strategies: duration and volatility analysis, sector evaluation and yield curve shape analysis. PIMCO also employs the following “bottom-up” strategies: credit analysis, quantitative research, issue selection and cost-effective trading. |
|
Ÿ Western Asset Management Company (“Western”) |
| Western emphasizes three key strategies to enhance total return: (i) adjusting the allocation among the key sectors of the fixed-income market depending on its forecast of relative values; (ii) tracking the duration of the overall portfolio so that it falls within a narrow band relative to the benchmark index, with adjustment made to reflect its long-term outlook for interest rates; and (iii) purchasing undervalued securities in each of the key sectors of the bond market while keeping overall quality high. |
|
Ÿ Metropolitan West Asset Management LLC (“MetWest”) |
| MetWest seeks to achieve consistent outperformance through the measured and diversified application of five fixed income management strategies, including: (i) duration management; (ii) yield curve positioning; (iii) sector allocation; (iv) security selection; and (v) opportunistic execution. Predicated on a long-term economic outlook, MetWest employs a value-oriented approach to managing fixed income that recognizes the periodic inefficient nature of over-the-counter markets and the mean-reverting characteristics of the investable universe. |
For the period September 1, 2013, through August 31, 2014, the Sub-advisers for CGCM Core Fixed Income Investments (“Fund”) were BlackRock Financial Management, Inc. (“BlackRock”), Pacific Investment Management Company LLC (“PIMCO”), Western Asset Management Company (“Western”) and Metropolitan West Asset Management LLC (“MetWest”).
The portion of the Fund managed by BlackRock outperformed the Fund’s market index benchmark, the Barclays Capital U.S. Aggregate BondTM Index, for the year ended August 31, 2014. During the period, low volatility and tight spread levels in the fixed income markets led BlackRock to utilize interest rate and yield curve positioning as the primary drivers of alpha generation (excess returns versus the benchmark). BlackRock opportunistically employed yield curve steepening and flattening strategies during the fiscal year and performance was primarily augmented by the flattening trades as the long end of the yield curve significantly outperformed the short and intermediate ends of the curve. Security selection in corporate bonds also meaningfully contributed to relative outperformance. A strategy of rotating in and out of high beta credit, in addition to, participation in the Verizon debt offering both proved to be beneficial to returns. Moreover, an overweight to securitized sectors, particularly commercial mortgage backed securities (“CMBS”), supplemented returns as investors’ appetite for yield drove spreads in these sectors to tighten. Detracting from relative performance was the portfolio’s allocation to corporate bonds. Throughout the period, an underweight to corporates was maintained which dragged on returns as corporate spreads tightened in-line with other spread sectors.
The portion of the Fund managed by PIMCO underperformed the Fund’s market index benchmark, the Barclays Capital U.S. Aggregate BondTM Index, for the year ended August 31, 2014. An average underweight to U.S. duration detracted from performance as rates fell across the curve. Additionally, a short to the long-end of the curve was negative for performance as long-end rates outperformed short and intermediate rates. Exposure to European peripheral duration, namely Spanish and Italian rates, was positive for performance as yields fell in these countries. An underweight to investment grade credit detracted from returns, as the sector outperformed Treasury securities of similar duration; this was partially offset by positive security selection of bonds issued by financial companies. An overall underweight to Agency mortgage-backed securities (“MBS”) detracted for performance as the sector outperformed like-duration Treasuries during the period. Additionally, an out-of-index allocation to non-Agency mortgages contributed to returns as the sector outperformed on positive supply technicals. A tactical allocation to high yield credit was positive for performance as investor sought higher yielding assets. The New Neutral reflects global aggregate demand that is still insufficient to absorb bountiful aggregate supply, five years after the financial crisis and despite extraordinary monetary policies. While PIMCO anticipates an upward path for interest rates, the market (and the U.S. Federal Reserve’s (“FED”)) expectations for future interest rates are likely too aggressive. PIMCO strategies will emphasize diverse sources of potential return, beyond traditional interest rate duration.
16
The portion of the Fund managed by Western outperformed the Fund’s market index benchmark, the Barclays Capital U.S. Aggregate BondTM Index, for the year ended August 31, 2014. The economic environment over the period can be characterized as one of sluggish but continued growth given the tepid economic recovery. Unemployment moved closer to the FED’s target over the period and inflation showed signs of picking up in the middle of 2014. This type of slow growth environment is, nonetheless, generally supportive of spread product. Holdings of non-agency mortgage backed securities added to performance due to the combination of price improvements, continued coupon payments and principal paydowns as investors continued to seek this higher yielding, low duration sector. Exposure to agency mortgages was also additive over the year. Tactical duration positioning moderately benefited as a sustained broad-based increase in yields, which the market generally expected, failed to materialize. An emphasis on longer-dated yields generated positive results as the yield curve tended to flatten. Holdings of investment grade credit were rewarded as spreads ground tighter over the period. High yield bonds also benefited as yield-seeking investors helped push sector prices higher. Despite some volatility in early 2014, emerging market bonds produced positive performance over the twelve months. Non-U.S. developed market bonds also contributed as did short exposures to the Japanese yen and to the Euro as these currencies fell versus the U.S. Dollar.
The portion of the Fund managed by MetWest outperformed the Fund’s market index benchmark, the Barclays Capital U.S. Aggregate BondTM Index, for the year ended August 31, 2014. Outperformance was driven by sector allocation and security selection via extensive bottom-up analysis. The portfolio remained underweight in U.S. Treasuries in favor of fixed income spread sectors that outpaced comparable Treasuries on a duration-adjusted basis. Non-agency residential mortgage-backed securities (“RMBS”) were significant drivers of outperformance, as fundamentals continued to improve and home prices edged higher. An allocation to commercial MBS also contributed to outperformance as the sector benefited from rising real estate prices. Despite the relative underweight position in outperforming investment grade corporates, issue selection among banking, Real Estate Investment Trusts, insurance, and electric credits was additive as the Financial and Utility sectors tightened by 43 and 40 basis points, respectively. Certain Industrial credits backed by tangible assets such as airline Enhanced Equipment Trust Certificates also contributed to outperformance despite a relative underweight to Industrials. A small allocation to high yield corporates also contributed on the margin as the sector was one of the best performing in the fixed income universe during this period. Duration in the portfolio was maintained at approximately one-year short of the Barclays Capital Bond Index which detracted from returns as U.S. Treasury rates fell.
17
The following graph depicts the performance of Core Fixed Income Investments vs. the Barclays Capital U.S. Aggregate BondTM Index7 and the Lipper Core Bond Funds Average.17
|
HISTORICAL PERFORMANCE FOR THE TEN-YEAR PERIOD ENDED AUGUST 31, 2014 CORE FIXED INCOME INVESTMENTS Comparison of $10,000 Investment in the Portfolio with the Barclays Capital U.S. Aggregate BondTM Index and the Lipper Core Bond Funds Average |

The performance shown above and below represents past performance. Past performance is no guarantee of future results and current performance may be higher or lower than the performance shown above and below. Performance figures may reflect voluntary fee waivers and/or expense reimbursements. In the absence of voluntary fee waivers and/or expense reimbursements, the total return would have been lower. Principal value and investment returns will fluctuate and investors’ shares, when redeemed, may be worth more or less than their original cost. To obtain performance data current to the most recent month-end, please visit our website at www.morganstanley.com/cgcm.
The graph above and returns shown below do not reflect the deduction of taxes that a shareholder would pay on fund distributions or the redemption of fund shares.
| | | | | | | | | | | | | | | | | | | | | | |
| | | CORE FIXED INCOME INVESTMENTS Average Annual Total Returns for the Period Ended August 31, 2014† | | |
| | | | | Without
Annual
Advisory
Program
Fee | | With
Annual
Advisory
Program
Fee* | | Barclays
Capital
U.S.
Aggregate
Bond
Index*** | | Lipper
Core Bond
Funds
Average*** |
| | Since inception (11/18/1991) | | | | 5.84 | % | | | | 4.11 | % | | | | 6.15 | % | | | | 6.00 | % |
| | 10 year | | | | 5.39 | | | | | 3.48 | | | | | 4.72 | | | | | 4.35 | |
| | 5 year | | | | 5.74 | | | | | 3.48 | | | | | 4.48 | | | | | 5.13 | |
| | 3 year | | | | 4.05 | | | | | 1.61 | | | | | 2.91 | | | | | 3.48 | |
| | | 1 year | | | | 6.10 | | | | | 3.09 | | | | | 5.66 | | | | | 6.12 | |
| | *** | | Inception returns of the market indices and Lipper investment category averages are calculated from the end of the inception month. |
See pages 27 through 29 for all footnotes.
18
High Yield Investments
|
| ABOUTTHE SUBADVISERS |
Ÿ PENN Capital Management Co., Inc. (“PENN Capital”) |
| PENN Capital’s initial universe is well-defined and includes all domestic, corporate cash paying dollar denominated bond issues that have spread-to-treasury and yield characteristics that are consistent with or wider than the single-B credit tier. PENN Capital’s investment team determines sectors/industries that may offer relative value based on its macro-economic outlook. The team will review and evaluate the economic cycle, business environment, industry/sectors and interest rates. PENN Capital then scans this group for companies with spreads to treasury that are wider than comparable companies, industry averages and historical averages. The team analyzes the liquidity outlook of the company through qualitative research, including bank loan facility analysis, covenant review analysis and asset value analysis. After the high yield bond universe has been narrowed and potential relative value is identified, the team performs its qualitative research to confirm or justify the credit’s value. The team determines whether or not the credit is suitable for the portfolio given its impact on PENN Capital’s current industry weightings and the diversification it brings to the basket of credits currently held within an industry. |
|
Ÿ Western Asset Management Company (“Western”) |
| Western combines traditional analysis with innovative technology applied to all sectors of the market. Western believes inefficiencies exist in the fixed-income market and attempts to add incremental value by exploiting these inefficiencies across all eligible market sectors. The key areas of focus are: (i) sector and sub-sector allocation; (ii) issue selection; (iii) duration; and (iv) term structure. |
For the period September 1, 2013, through August 31, 2014, the Sub-advisers for CGCM High Yield Investments (“Fund”) were PENN Capital Management Co., Inc. (“PENN Capital”) and Western Asset Management. Company (“Western”).
The portion of the Fund managed by PENN Capital slightly underperformed the Fund’s market index benchmark, the Barclays Capital U.S. High Yield Index, for the year ended August 31, 2014. Going into this past year PENN Capital’s expectation and outlook was for “coupon-like” returns. Performance has so far exceeded that expectation, as the U.S. Federal Reserve (“FED”) and capital markets have remained accommodating to the sector. Primary drivers of performance were an overweight to Energy and credit selection with continued positive data points on U.S. Shale plays, an overweight to Media where there is consolidation in the sector and favorable industry fundamentals, good security selection in CCC credit within the bucket, including a number of distressed situations where investors are being compensated in lower segments of the market, and good security selection in Gaming which saw success in small regional credits but avoiding a large leverage buy out as the sector continues to struggle to grow into its capital structure. Detractors were an underweight to Financial Services and a shorter duration bias, which included no exposure to long-dated European bank paper which rallied with sovereign yields.
The portion of the Fund managed by Western outperformed the Fund’s market index benchmark, the Barclays Capital U.S. High Yield Index, for the year ended August 31, 2014. Quality positioning was marginally additive for the period. An overweight to the best performing ratings segment of the market, CCCs also benefitted results. Though CCCs are at the riskier end of the spectrum, Western believed that CCCs would perform well based on a belief that default rates would remain below the long term average given strong fundamentals, conservative management teams and a minimal amount of near term maturities. At the same time, Western was underweight BB-rated issues, which outperformed broad high yield market due to their greater sensitivity to interest rate changes than their B and CCC counterparts. Sector allocations negatively impacted relative returns. Western was underweight a number of outperforming sectors, including Technology, the top performing sector, and Communications. Additionally, an overweight to Transportation, lagged. Western did however, maintain an overweight to the outperforming Energy sector and an underweight to the bottom performing Consumer Cyclical sector. Issue selection added to outperformance for the year. A wireless provider, packaging company, and electric utility all outperformed and boosted performance. Exposure to a few underperforming issuers detracted.
19
The following graph depicts the performance of High Yield Investments vs. the Barclays Capital U.S. Corporate High-Yield Index8 and the Lipper High Yield Funds Average.18
|
HISTORICAL PERFORMANCE FOR THE TEN-YEAR PERIOD ENDED AUGUST 31, 2014 HIGH YIELD INVESTMENTS Comparison of $10,000 Investment in the Portfolio with the Barclays Capital U.S. Corporate High-Yield Index and the Lipper High Yield Funds Average |
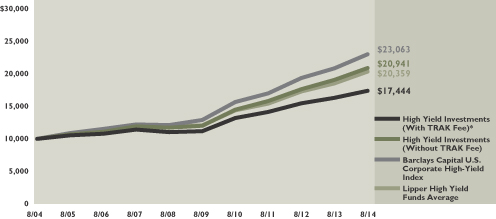
The performance shown above and below represents past performance. Past performance is no guarantee of future results and current performance may be higher or lower than the performance shown above and below. Performance figures may reflect voluntary fee waivers and/or expense reimbursements. In the absence of voluntary fee waivers and/or expense reimbursements, the total return would have been lower. Principal value and investment returns will fluctuate and investors’ shares, when redeemed, may be worth more or less than their original cost. To obtain performance data current to the most recent month-end, please visit our website at www.morganstanley.com/cgcm.
The graph above and returns shown below do not reflect the deduction of taxes that a shareholder would pay on fund distributions or the redemption of fund shares.
| | | | | | | | | | | | | | | | | | | | | | |
| | | HIGH YIELD INVESTMENTS Average Annual Total Returns for the Period Ended
August 31, 2014† | | | | |
| | | | | Without
Annual
Advisory
Program
Fee | | With
Annual
Advisory
Program
Fee* | | Barclays
Capital
U.S.
Corporate
High Yield
Index*** | | Lipper
High Yield
Funds
Average*** |
| | Since inception 7/13/1998 | | | | 5.12 | % | | | | 3.35 | % | | | | 7.12 | % | | | | 5.94 | % |
| | 10 year | | | | 7.67 | | | | | 5.72 | | | | | 8.72 | | | | | 7.33 | |
| | 5 year | | | | 11.67 | | | | | 9.29 | | | | | 12.28 | | | | | 10.95 | |
| | 3 year | | | | 9.78 | | | | | 7.22 | | | | | 10.64 | | | | | 9.56 | |
| | | 1 year | | | | 9.75 | | | | | 6.65 | | | | | 10.58 | | | | | 9.27 | |
| | *** | | Inception returns of the market indices and Lipper investment category averages are calculated from the end of the inception month. |
See pages 27 through 29 for all footnotes.
20
International Fixed Income Investments
|
| ABOUTTHE SUBADVISER |
Ÿ Pacific Investment Management Company LLC (“PIMCO”) |
| PIMCO’s total return approach focuses on both capital appreciation and income while managing overall risk. PIMCO employs a core philosophy toward managing global bonds focusing on both economic and credit fundamentals as key determinants of value in fixed income markets, limiting volatility with respect to the benchmark market index. |
For the period September 1, 2013, through August 31, 2014, the Sub-adviser for CGCM International Fixed Income Investments (“Fund”) was Pacific Investment Management Company LLC (“PIMCO”). PIMCO manages a developed market Fixed Income strategy (“PIMCO DM Strategy”) and an emerging market debt strategy (“PIMCO EMD Strategy”) for the Fund.
The PIMCO DM Strategy outperformed the Citigroup Non-USD WGBI (USD) Hedged on a gross total return basis for the year ended August 31, 2014. Exposure to U.S. duration during the period was positive for performance as U.S. rates fell across the curve. Non-U.S. duration positioning was negative for performance driven by an underweight to core European rates which fell over the year. Additionally, an underweight to U.K. duration detracted from returns as rates fell in this region as well. Modest exposure to Agency mortgage-backed securities (“MBS”) contributed to performance as the sector outperformed like-duration Treasuries due to positive supply technicals. Out-of-benchmark positions within investment grade and high yield credit contributed to performance as these sectors outperformed as investors sought higher yielding assets. An allocation to non-Agency MBS was positive for performance as these securities benefitted from the ongoing housing recovery and strong demand. Lastly, holdings of municipal bonds and emerging market quasi-sovereign debt contributed to performance. PIMCO expects steady, though moderated global growth over the next year as the global economy continues on the path of a steady — albeit moderate and multi-speed — recovery. The consistent rise in asset prices in combination with fading near-term fiscal uncertainties will drive global aggregate demand growth forward, adding stability to the global recovery. And yet, growth trends will continue to diverge across countries and regions. As trends continue to diverge, PIMCO will seek to capitalize on country differentiation and emphasize diverse sources of potential return.
The PIMCO EMD Strategy also outperformed in the year ended August 31, 2014. The portfolio’s overweight to Latin American duration, especially Mexico, was positive for performance as the central bank cut rates and yields fell alongside global yields. An underweight to Turkish rates contributed to performance as the central bank hiked rates in order to stem currency outflows and correct imbalances. Less exposure to Hungarian rates detracted from returns as the central bank embarked on a rate cutting cycle. Lastly, an overweight to the Brazilian real benefited performance as the real appreciated versus the U.S. dollar. PIMCO remains optimistic about global growth in 2014; optimistic that self-reinforcing dynamics in U.S. and Europe will support expansion, while growth in the U.S. and China will underpin stability in Emerging Markets (“EM”). PIMCO expects country and corporate differentiation to figure prominently across EM given different initial conditions and idiosyncratic stresses. While generally constructive on EM assets, elevated volatility may persist amid geopolitical events, changes in developed market central bank policies, and developments relating to the Chinese economy.
21
The following graph depicts the performance of International Fixed Income Investments vs. the Citigroup Non-USD World Government Bond Index (USD) — Hedged,9 and Lipper International Income Funds Average.19
|
HISTORICAL PERFORMANCE FOR THE TEN-YEAR PERIOD ENDED AUGUST 31, 2014
INTERNATIONAL FIXED INCOME INVESTMENTS Comparison of $10,000 and (Hedge and C.P. group) Investment in the Portfolio with the Citigroup Non-USD World Government Bond Index (USD) Hedged, and the Lipper International Income investment category |
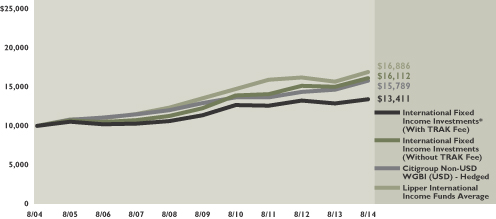
The performance shown above and below represents past performance. Past performance is no guarantee of future results and current performance may be higher or lower than the performance shown above and below. Performance figures may reflect voluntary fee waivers and/or expense reimbursements. In the absence of voluntary fee waivers and/or expense reimbursements, the total return would have been lower. Principal value and investment returns will fluctuate and investors’ shares, when redeemed, may be worth more or less than their original cost. To obtain performance data current to the most recent month-end, please visit our website at www.morganstanley.com/cgcm.
The graph above and returns shown below do not reflect the deduction of taxes that a shareholder would pay on fund distributions or the redemption of fund shares.
| | | | | | | | | | | | | | | | | | | | | | |
| | | INTERNATIONAL FIXED INCOME
INVESTMENTS Average Annual Total Returns for the Period Ended
August 31, 2014† | | | | |
| | | | | Without
Annual
Advisory
Program
Fee | | With
Annual
Advisory
Program
Fee* | | Citigroup
Non-USD
WGBI
(USD)
Hedged*** | | Lipper
International
Income
Funds
Average*** |
| | Since inception (11/18/1991) | | | | 6.17 | % | | | | 4.43 | % | | | | 6.42 | % | | | | 6.24 | % |
| | 10 year | | | | 4.88 | | | | | 2.98 | | | | | 4.67 | | | | | 5.26 | |
| | 5 year | | | | 5.65 | | | | | 3.38 | | | | | 4.12 | | | | | 4.32 | |
| | 3 year | | | | 4.63 | | | | | 2.17 | | | | | 4.99 | | | | | 1.76 | |
| | | 1 year | | | | 7.36 | | | | | 4.31 | | | | | 7.85 | | | | | 7.81 | |
| | *** | | Inception returns of the market indices and Lipper investment category averages are calculated from the end of the inception month. |
See pages 27 through 29 for all footnotes.
22
Municipal Bond Investments
|
| ABOUTTHE SUBADVISER |
Ÿ McDonnell Investment Management, LLC (“McDonnell”) |
| McDonnell employs a value-added approach to active municipal bond management utilizing a team oriented philosophy. This approach attempts to maximize after-tax total returns while reducing the volatility in relative rates of return. By limiting dependence on market timing and tightly controlling duration, McDonnell reduces the portfolio’s exposure to interest rate relative risk. McDonnell utilizes extensive internal research to identify relative value opportunities among sectors and securities and to control credit risk. Additionally, McDonnell seeks to exploit yield curve anomalies through quantitative analysis of historical spreads and future expectations. |
For the period September 1, 2013, through August 31, 2014, the Sub-adviser for CGCM Municipal Bond Investments (“Fund”) was McDonnell Investment Management, LLC (“McDonnell”).
The Fund managed by McDonnell trailed the Fund’s market index benchmark, the Barclays Capital U.S. Municipal Bond Index, for the year ended August 31, 2014. Markets staged an about-face as the higher rates brought on by last year’s ‘taper-tantrum’ enticed fixed-income investors back into the market. Domestic bond markets rallied sharply and yield curves flattened significantly amid a persistent reach for yield on the part of investors. The reach for yield has been a global phenomenon and domestically, the appetite for income has targeted a shrinking bond market. Of the major fixed income market sectors, only the corporate market has experienced robust issuance. The U.S. bond market in aggregate, is on pace to register its lowest annual issuance total in the last ten years. Amid the clamor for yield, municipals and most major taxable spread sectors strongly outperformed Treasuries across the yield curve.
For the period, AAA municipal yields declined by nearly 90 basis points in the 10-year area and 140 basis points on the long-end of the curve. Retail mutual fund redemptions, which were an important negative influence on market performance last year, stopped and steady inflows returned for much of the past year. Quality spreads tightened, with lower quality bonds outperforming higher quality bonds amid the stretch for yield. Most state and local issuers continued to experience improving credit fundamentals, as the economic recovery bolstered tax receipts and a recovering housing market helped revive property valuations. Some issuers however, continue to struggle with higher leverage and weaker regional economic prospects. In addition to a strengthening of demand, supply continued to constrict as state and local issuers scaled back issuance for the second consecutive year despite sharply lower rates. Supply constrained conditions have been a supportive market factor throughout the past year.
On the central bank front, Ben Bernanke passed the baton to new U.S. Federal Reserve (“FED”) Chairwoman, Janet Yellen. Some analysts are now expecting an imminent shift away from accommodation towards tightening, but with inflation still below the FED target, near-deflationary conditions in Europe, and disappointing wage growth domestically, FED policy is expected to focus on expanding and extending the recovery going forward. The FED is expected to conclude its last round of quantitative easing this year, and begin to transition to a less accommodative rate posture, perhaps in 2015, if inflation remains near its 2% target and labor market conditions continue to improve. If growth falters, or geopolitical developments worsen, a change in policy may be forestalled until 2016.
As we approach the interregnum between ultra-accommodative monetary policy and an eventual shift toward policy ‘normalization’, the critical issue facing investors will be how will interest rate markets react, and how will higher risk asset markets react? And how will relative valuation metrics evolve? It is worth noting that risk markets, notably equity and high yield markets, have been the biggest beneficiaries of quantitative easing to date. It will also be of critical importance to evaluate the potential ramifications to global economic growth as the market is weaned off extraordinary monetary accommodation.
23
The following graph depicts the performance of Municipal Bond Investments vs. the Barclays Capital U.S. Municipal Bond Index10 and the Lipper General & Insured Municipal Debt Funds Average.20
McDonnell is relatively sanguine on the outlook for fixed-income. They do not see the current dynamic changing over the near-term. The market continues to be well-bid with not enough supply. Appetite for spread product exceeds available supply. McDonnell does not expect to see sharply higher rates anytime on the near term horizon. Lack of sufficient supply and strong demand for incremental yield has stood the bond market in relatively good stead following last year’s retreat. McDonnell expects a relatively benign environment over the near term.
|
HISTORICAL PERFORMANCE FOR THE TEN-YEAR PERIOD ENDED AUGUST 31, 2014 MUNICIPAL BOND INVESTMENTS Comparison of $10,000 Investment in the Portfolio with the Barclays Capital U.S. Municipal Bond Index and the Lipper General & Insured Municipal Debt investment category |
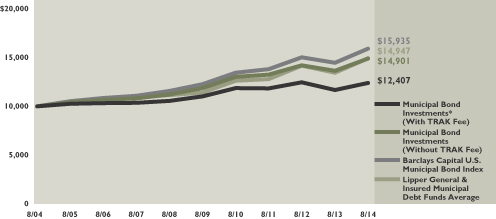
The performance shown above and below represents past performance. Past performance is no guarantee of future results and current performance may be higher or lower than the performance shown above and below. Performance figures may reflect voluntary fee waivers and/or expense reimbursements. In the absence of voluntary fee waivers and/or expense reimbursements, the total return would have been lower. Principal value and investment returns will fluctuate and investors’ shares, when redeemed, may be worth more or less than their original cost. To obtain performance data current to the most recent month-end, please visit our website at www.morganstanley.com/cgcm.
The graph above and returns shown below do not reflect the deduction of taxes that a shareholder would pay on fund distributions or the redemption of fund shares.
| | | | | | | | | | | | | | | | | | | | | | |
| | | MUNICIPAL BOND INVESTMENTS Average Annual Total Returns for the Period Ended August 31, 2014† |
| | | | | Without
Annual
Advisory
Program
Fee | | With
Annual
Advisory
Program
Fee* | | Barclay's
Capital
U.S.
Municipal
Bond
Index*** | | Lipper
General &
Insured
Municipal
Debt
Funds
Average*** |
| | Since inception (11/18/1991) | | | | 5.05 | % | | | | 3.33 | % | | | | 5.87 | % | | | | 5.35 | % |
| | 10 year | | | | 4.07 | | | | | 2.18 | | | | | 4.77 | | | | | 4.08 | |
| | 5 year | | | | 4.62 | | | | | 2.38 | | | | | 5.39 | | | | | 5.61 | |
| | 3 year | | | | 3.98 | | | | | 1.55 | | | | | 4.88 | | | | | 5.46 | |
| | | 1 year | | | | 9.24 | | | | | 6.15 | | | | | 10.14 | | | | | 11.14 | |
| | *** | | Inception returns of the market indices and Lipper investment category averages are calculated from the end of the inception month. |
See pages 27 through 29 for all footnotes.
24
Money Market Investments
|
| ABOUTTHE SUBADVISER |
Ÿ The Dreyfus Corporation (“Dreyfus”) |
| Dreyfus’ approach to managing money market funds is to seek current yields consistent with the preservation of principal and the maintenance of liquidity. Dreyfus invests in a diversified portfolio of high quality, short-term debt securities with maturities of 397 days or less. The Fund is positioned based on Dreyfus’ view of the economy, yield curve analysis, anticipated changes in monetary policy, and the future path of interest rates. |
For the period of September 1, 2013, through August 31, 2014, the Sub-adviser for CGCM Money Market Investments (“Fund”) was The Dreyfus Corporation (“Dreyfus”).
The Fund managed by Dreyfus maintained a goal of maximum current income consistent with the maintenance of liquidity and preservation of capital. Dreyfus intends to follow a long-held conservative credit philosophy. As such, the Fund is structured with a diversified mix of short-term fixed income instruments issued by high quality borrowers.
Economic activity in the U.S. continues to exhibit moderate strength. Second quarter GDP rebounded to a larger than expected gain of 4.2% following the 2.1% fall seen during the first quarter of the year. Monthly employment gains have remained above 200,000 although the unemployment rate ticked up to 6.2% in July as some previously discouraged workers rejoined the labor pool. Housing and auto sales have also remained firm reflecting confidence on the part of consumers
Following its July 30th meeting, the U.S. Federal Reserve (“FED”), announced that it would continue to wind down its bond purchase program. At the same time, the FED indicated that it would look at a range of labor market indicators in assessing the underlying condition of the labor market. This will give the FED a broader view in conducting monetary policy instead of a narrow focus on the unemployment rate itself. While any move to raise the federal funds rate is unlikely for the remainder of this year, there have been numerous comments from various FED officials that a rate increase could come sooner than the markets currently believe.
25
| | | | | | | | | | | | | | | | | | | | | | |
| | | MONEY MARKET INVESTMENTS Average Annual Total Returns for the Period Ended
August 31, 2014† | | | | |
| | | | | Without
Annual
Advisory
Program
Fee | | With
Annual
Advisory
Program
Fee* | | 90-day
Treasury
Bill
Index*** | | Lipper
Money
Market
Funds
Average*** |
| | Since inception (11/18/1991) | | | | 2.73 | % | | | | 1.04 | % | | | | 2.76 | % | | | | 2.71 | % |
| | 10 year | | | | 1.54 | | | | | (0.32 | ) | | | | 1.46 | | | | | 1.39 | |
| | 5 year | | | | 0.18 | | | | | (1.97 | ) | | | | 0.08 | | | | | 0.02 | |
| | 3 year | | | | 0.01 | | | | | (2.34 | ) | | | | 0.06 | | | | | 0.01 | |
| | | 1 year | | | | 0.00 | | | | | (2.83 | ) | | | | 0.04 | | | | | 0.01 | |
Performance figures may reflect voluntary fee waivers and/or expense reimbursements. In the absence of voluntary fee waivers and/or expense reimbursements, the total return would have been lower.
The returns shown do not reflect the deduction of taxes that a shareholder would pay on fund distributions or the redemption of fund shares.
RISKS: An investment in a money market fund is neither insured nor guaranteed by the FDIC or any other government agency. Although the Fund seeks to preserve the value of your investment at one dollar per share, it is possible to lose money by investing in the Fund.
| | *** | | Inception returns of the market indices and Lipper investment category averages are calculated from the end of the inception month. |
See pages 27 through 29 for all footnotes.
26
FOOTNOTES
| † | | All figures represent past performance and are not a guarantee of future results. Investment return and principal value of an investment will fluctuate so that an investor’s shares, when redeemed, may be worth more or less than their original cost. The returns shown do not reflect the deduction of taxes that a shareholder would pay on fund distributions or the redemptions of fund shares. Performance figures may reflect fee waivers and/or expense reimbursements. In the absence of fee waivers and/or expense reimbursements, the total return would have been lower. To obtain performance data current to the most recent month-end, please visit our website at https://www.morganstanley.com/cgcm. |
| * | | The Funds are available only to investors participating in Morgan Stanley approved advisory programs. These programs charge an annual fee, which may be up to 3.00%, depending on the particular program in which you invest. |
| ** | | Consulting Group Advisory Services, LLC (“CGAS”), a business of Morgan Stanley Smith Barney Holdings LLC (“MSSBH”), voluntarily waived and/or reimbursed certain fees or expense to maintain a positive net yield. |
| 1. | | The Russell 1000® Growth Index measures the performance of those Russell 1000 companies with higher price-to-book ratios and higher forecasted growth values. Because the index is not a managed portfolio, there are no advisory fees or internal management expenses reflected in the index’s performance. Please note that an investor cannot invest directly in an index. |
| 2. | | The Russell 1000® Value Index measures the performance of those Russell 1000 Index companies with lower price-to-book ratios and lower forecasted growth values. Because the index is not a managed portfolio, there are no advisory fees or internal management expenses reflected in the index’s performance. Please note that an investor cannot invest directly in an index. |
| 3. | | The Russell 2000® Growth Index measures the performance of those Russell 2000 companies with higher price-to-book ratios and higher forecasted growth values. Because the index is not a managed portfolio, there are no advisory fees or internal management expenses reflected in the index’s performance. Please note that an investor cannot invest directly in an index. |
| 4. | | The Russell 2000® Value Index measures the performance of those Russell 2000 Index companies with lower price-to-book ratios and lower forecasted growth values. Because the index is not a managed portfolio, there are no advisory fees or internal management expenses reflected in the index’s performance. Please note that an investor cannot invest directly in an index. |
| 5. | | The Morgan Stanley Capital International Europe, Australasia, Far East (MSCI EAFE®) Index (Net) is a free float-adjusted market capitalization index that is designed to measure the equity market performance of developed markets, excluding the U.S. & Canada. The Index consists of the following 21 developed market country indexes: Australia, Austria, Belgium, Denmark, Finland, France, Germany, Hong Kong, Ireland, Israel, Italy, Japan, the Netherlands, New Zealand, Norway, Portugal, Singapore, Spain, Sweden, Switzerland, and the United Kingdom. Net total return indexes reinvest dividends after the deduction of withholding taxes, using (for international indexes) a tax rate applicable to non-resident institutional investors who do not benefit from double taxation treaties. Because the index is not a managed portfolio, there are no advisory fees or internal management expenses reflected in the index’s performance. Please note that an investor cannot invest directly in an index. |
| 6. | | The MSCI Emerging Markets Index (Net) is a free float-adjusted market capitalization index that is designed to measure equity market performance of emerging markets. The Index consists of the following 21 emerging market country indexes: Brazil, Chile, China, Colombia, Czech Republic, Egypt, Greece, Hungary, India, Indonesia, Korea, Malaysia, Mexico, Peru, Philippines, Poland, Russia, South Africa, Taiwan, Thailand, and Turkey. Net total return indexes reinvest dividends after the deduction of withholding taxes, using (for international indexes) a tax rate applicable to non-resident institutional investors who do not benefit from double taxation treaties. Because the index is not a managed portfolio, there are no advisory fees or internal management expenses reflected in the index’s performance. Please note that an investor cannot invest directly in an index. |
27
| 7. | | The Barclays Capital U.S. Aggregate BondTM Index is a broad-based index that measures the investment grade, U.S. dollar-denominated, fixed-rate taxable bond market, including Treasuries, government-related and corporate securities, MBS (agency fixed-rate and hybrid ARM passthroughs), ABS, and CMBS. Because the index is not a managed portfolio, there are no advisory fees or internal management expenses reflected in the index’s performance. Please note that an investor cannot invest directly in an index. |
| 8. | | The Barclays Capital U.S. Corporate High-Yield Index measures the market of U.S. dollar-denominated, non-investment grade, fixed rate, taxable corporate bonds. Because the index is not a managed portfolio, there are no advisory fees or internal management expenses reflected in the index’s performance. Please note that an investor cannot invest directly in an index. |
| 9. | | The Citigroup Non-USD World Government Bond Index (USD) Hedged and Unhedged are each sub-indices of the Citigroup World Government Bond Index (WGBI), which is comprised of the global sovereign debt of over 20 countries representative in the Americas, EMEA, EMU, Asia Pacific, and Japan regions. The Non-U.S. Dollar WGBI includes all WGBI markets except the United States and is stated in U.S. dollar hedged or unhedged base currency terms. Because the index is not a managed portfolio, there are no advisory fees or internal management expenses reflected in the index’s performance. Please note that an investor cannot invest directly in an index. |
| 10. | | The Barclays Capital U.S. Municipal Bond Index covers the U.S. dollar-denominated long-term tax exempt bond market. The index has four main sectors: state and local general obligation bonds, revenue bonds, insured bonds, and prerefunded bonds. Because the index is not a managed portfolio, there are no advisory fees or internal management expenses reflected in the index’s performance. Please note that an investor cannot invest directly in an index. |
| 11. | | The Lipper Large-Cap Growth Funds Average is an equally weighted average of all active funds available within the investment category. The classification includes funds that, by portfolio practice, invest at least 75% of their equity assets in companies with market capitalizations (on a three-year weighted basis) above Lipper’s USDE large-cap floor. Large-cap growth funds typically have above-average characteristics compared to the S&P 500 Index. The total return of the Lipper Funds Average does not include the effect of sales charges. Please note that an investor cannot invest directly in a mutual funds classification average or an index. |
| 12. | | The Lipper Large-Cap Value Funds Average is an equally weighted average of all active funds available within the investment category. The classification includes funds that, by portfolio practice, invest at least 75% of their equity assets in companies with market capitalizations (on a three-year weighted basis) above Lipper’s USDE large-cap floor. Large-cap value funds typically have below-average characteristics compared to the S&P 500 Index. The total return of the Lipper Funds Average does not include the effect of sales charges. Please note that an investor cannot invest directly in a mutual funds classification average or an index. |
| 13. | | The Lipper Small-Cap Growth Funds Average is an equally weighted average of all active funds available within the investment category. The classification includes funds that, by portfolio practice, invest at least 75% of their equity assets in companies with market capitalizations (on a three-year weighted basis) below Lipper’s USDE small-cap ceiling. Small-cap growth funds typically have above-average characteristics compared to the S&P SmallCap 600 Index. The total return of the Lipper Funds Average does not include the effect of sales charges. Please note that an investor cannot invest directly in a mutual funds classification average or an index. |
| 14. | | The Lipper Small-Cap Value Funds Average is an equally weighted average of all active funds available within the investment category. The classification includes funds that, by portfolio practice, invest at least 75% of their equity assets in companies with market capitalizations (on a three-year weighted basis) below Lipper’s USDE small-cap ceiling. Small-cap growth funds typically have below-average characteristics compared to the S&P SmallCap 600 Index. The total return of the Lipper Funds Average does not include the effect of sales charges. Please note that an investor cannot invest directly in a mutual funds classification average or an index. |
28
| 15. | | The Lipper International Large-Cap Core Funds Average is an equally weighted average of all active funds available within the investment category. The classification includes funds that, by portfolio practice, invest at least 75% of their equity assets in companies outside of the U.S. with market capitalizations (on a three-year weighted basis) above Lipper’s international large-cap floor. International large-cap core funds typically have average characteristics compared to their large-cap-specific subset of the MSCI EAFE® Index. The total return of the Lipper Funds Average does not include the effect of sales charges. Please note that an investor cannot invest directly in a mutual funds classification average or an index. |
| 16. | | The Lipper Emerging Markets Funds Average is an equally weighted average of all active funds available within the investment category. The classification includes funds that seek long-term capital appreciation by investing at least 65% of total assets in emerging market equity securities, where “emerging market” is defined by a country’s GNP per capita or other economic measures. The total return of the Lipper Funds Average does not include the effect of sales charges. Please note that an investor cannot invest directly in a mutual funds classification average or an index. |
| 17. | | The Lipper Core Bond Funds Average is an equally weighted average of all active funds available within the investment category. The classification includes funds that invest at least 85% of their assets in domestic investment-grade debt issues (rated in top four grades) with any remaining in investment in non-benchmark sectors such as high-yield, global and emerging market debt. These funds maintain dollar-weighted average maturities of five to ten years. The total return of the Lipper Funds Average does not include the effect of sales charges. Please note that an investor cannot invest directly in a mutual funds classification average or an index. |
| 18. | | The Lipper High Yield Funds Average is an equally weighted average of all active funds available within the investment category. The classification includes funds that aim at high (relative) current yield from fixed income securities, have no quality or maturity restrictions, and tend to invest in lower grade debt issues. The total return of the Lipper Funds Average does not include the effect of sales charges. Please note that an investor cannot invest directly in a mutual funds classification average or an index. |
| 19. | | The Lipper International Income Funds Average is an equally weighted average of all active funds available within the investment category. The classification includes funds that state in their prospectus that they invest primarily in U.S. dollar and non-U.S. dollar debt securities of issuers located in at least three countries, excluding the United States, except in periods of market weakness. The total return of the Lipper Funds Average does not include the effect of sales charges. Please note that an investor cannot invest directly in a mutual funds classification average or an index. |
| 20. | | The Lipper General & Insured Municipal Debt Funds Average is an equally weighted average of all active funds available within the investment category. The classification includes funds that either invest primarily in municipal debt issues rated in the top four credit ratings or invest primarily in municipal debt issues insured as to timely payment. The total return of the Lipper Funds Average does not include the effect of sales charges. Please note that an investor cannot invest directly in a mutual funds classification average or an index. |
29
Example
As a shareholder of a Fund, you may incur two types of costs: (1) annual advisory program fees, which may be up to 3.00% depending on the particular program through which you invest; and (2) ongoing costs, including management fees and other Fund expenses. This example is intended to help you understand your ongoing costs (in dollars) of investing in a Fund and to compare these costs with the ongoing costs of investing in other mutual funds. This example is based on an investment of $1,000 invested on March 1, 2014 and held for the six months ended August 31, 2014.
Actual Expenses
The table below titled “Based on Actual Total Return” provides information about actual account values and actual expenses. You may use the information provided in this table, together with the amount you invested, to estimate the expenses that you paid over the period. To estimate the expenses you paid on your account during this period, divide your account value by $1,000 (for example, an $8,600 account value divided by $1,000 = 8.6), then multiply the result by the number under the heading entitled “Expenses Paid During the Period”.
| | | | | | | | | | | | | | | | | | | | | | | | | |
| Based on Actual Total Return(1) |
| | | | | |
| Fund | | Total Return
Without
Annual
Advisory
Program
Fees(2) | | Beginning
Account
Value | | Ending
Account
Value | | Annualized
Expense
Ratios(3) | | Expense
Paid During
the Period(4) |
Large Capitalization Growth Investments | | | | 3.31 | % | | | $ | 1,000.00 | | | | $ | 1,033.10 | | | | | 0.66 | % | | | $ | 3.39 | |
Large Capitalization Value Equity Investments | | | | 9.28 | % | | | | 1,000.00 | | | | | 1,092.80 | | | | | 0.66 | % | | | | 3.47 | |
Small Capitalization Growth Investments | | | | -5.31 | % | | | | 1,000.00 | | | | | 946.90 | | | | | 0.89 | % | | | | 4.37 | |
Small Capitalization Value Equity Investments | | | | 3.80 | % | | | | 1,000.00 | | | | | 1,038.00 | | | | | 0.88 | % | | | | 4.54 | |
International Equity Investments | | | | -0.66 | % | | | | 1,000.00 | | | | | 993.40 | | | | | 0.76 | % | | | | 3.81 | |
Emerging Markets Equity Investments | | | | 16.41 | % | | | | 1,000.00 | | | | | 1,164.10 | | | | | 0.93 | % | | | | 5.08 | |
Core Fixed Income Investments | | | | 2.78 | % | | | | 1,000.00 | | | | | 1,027.80 | | | | | 0.51 | % | | | | 2.58 | |
High Yield Investments | | | | 2.62 | % | | | | 1,000.00 | | | | | 1,026.20 | | | | | 0.76 | % | | | | 3.86 | |
International Fixed Income Investments | | | | 4.69 | % | | | | 1,000.00 | | | | | 1,046.90 | | | | | 0.71 | % | | | | 3.67 | |
Municipal Bond Investments | | | | 3.69 | % | | | | 1,000.00 | | | | | 1,036.90 | | | | | 0.58 | % | | | | 2.97 | |
Money Market Investments | | | | 0.00 | %(5) | | | | 1,000.00 | | | | | 1,000.00 | | | | | 0.12 | % | | | | 0.61 | |
| (1) | | For the six months ended August 31, 2014. |
| (2) | | Assumes reinvestment of all distributions, including returns of capital, if any, at net asset value and does not reflect the deduction of the applicable advisory program charge, which may be up to 3.00% depending on the particular program through which you invest. Total return is not annualized as it may not be representative of the total return for the year. Performance figure may reflect fee waivers and/or expense reimbursements. Past performance is no guarantee of future results. In the absence of fee waivers and/or expense reimbursements, the total return would have been lower. |
| (3) | | Annualized Expense Ratios are based on the most recent 6 month expense ratios, which may differ from net expense ratios in the Financial Highlights. |
| (4) | | Expenses (net of fee waivers and/or expense reimbursements) are equal to each Fund’s respective annualized expense ratio multiplied by the average account value over the period, multiplied by the number of days (184 days) in the most recent fiscal half-year, then divided by 365 (to reflect the one-half year period). |
| (5) | | CGAS, a business of MSSBH, voluntarily waived and/or reimbursed certain fees or expense to maintain a positive net yield. |
30
Hypothetical Example for Comparison Purposes
The table below titled “Based on Hypothetical Total Return” provides information about hypothetical account values and hypothetical expenses based on each Fund’s actual expense ratio and an assumed rate of return of 5.00% per year before expenses, which is not each Fund’s actual return. The hypothetical account values and expenses may not be used to estimate the actual ending account balances or expenses you paid for the period. You may use the information provided in this table to compare the ongoing costs of investing in each Fund and other funds. To do so, compare the 5.00% hypothetical example relating to a Fund with the 5.00% hypothetical examples that appear in the shareholder reports of the other funds.
Please note that the expenses shown in the table below are meant to highlight your ongoing costs only and do not reflect any advisory program annual fees. Therefore, the table is useful in comparing ongoing costs only, and will not help you determine the relative total costs of owning different funds. In addition, if these advisory program annual fees were included, your costs would have been higher.
| | | | | | | | | | | | | | | | | | | | | | | | | |
| Based on Hypothetical Total Return(1) |
| | | | | |
| Fund | | Hypothetical
Annualized
Total Return | | Beginning
Account
Value | | Ending
Account
Value | | Annualized
Expense
Ratios(2) | | Expense
Paid During
the Period(3) |
Large Capitalization Growth Investments | | | | 5.00 | % | | | $ | 1,000.00 | | | | $ | 1,025.17 | | | | | 0.66 | % | | | $ | 3.37 | |
Large Capitalization Value Equity Investments | | | | 5.00 | % | | | | 1,000.00 | | | | | 1,025.17 | | | | | 0.66 | % | | | | 3.36 | |
Small Capitalization Growth Investments | | | | 5.00 | % | | | | 1,000.00 | | | | | 1,025.16 | | | | | 0.89 | % | | | | 4.55 | |
Small Capitalization Value Equity Investments | | | | 5.00 | % | | | | 1,000.00 | | | | | 1,025.16 | | | | | 0.88 | % | | | | 4.51 | |
International Equity Investments | | | | 5.00 | % | | | | 1,000.00 | | | | | 1,025.17 | | | | | 0.76 | % | | | | 3.87 | |
Emerging Markets Equity Investments | | | | 5.00 | % | | | | 1,000.00 | | | | | 1,025.16 | | | | | 0.93 | % | | | | 4.75 | |
Core Fixed Income Investments | | | | 5.00 | % | | | | 1,000.00 | | | | | 1,025.18 | | | | | 0.51 | % | | | | 2.58 | |
High Yield Investments | | | | 5.00 | % | | | | 1,000.00 | | | | | 1,025.17 | | | | | 0.76 | % | | | | 3.86 | |
International Fixed Income Investments | | | | 5.00 | % | | | | 1,000.00 | | | | | 1,025.17 | | | | | 0.71 | % | | | | 3.63 | |
Municipal Bond Investments | | | | 5.00 | % | | | | 1,000.00 | | | | | 1,025.18 | | | | | 0.58 | % | | | | 2.95 | |
Money Market Investments | | | | 5.00 | % | | | | 1,000.00 | | | | | 1,025.20 | | | | | 0.12 | % | | | | 0.62 | |
| (1) | | For the six months ended August 31, 2014. |
| (2) | | Annualized Expense Ratios are based on the most recent 6 month expense ratios, which may differ from net expense ratios in the Financial Highlights. |
| (3) | | Expenses (net of fee waivers and/or expense reimbursements) are equal to each Fund’s respective annualized expense ratio multiplied by the average account value over the period, multiplied by the number of days (184 days) in the most recent fiscal half-year, then divided by 365 (to reflect the one-half year period). |
31
| | | | | | | | |
| Large Capitalization Growth Investments | |
| | |
| Shares/Units | | | Security | | Value | |
| COMMON STOCKS — 97.4% | |
| CONSUMER DISCRETIONARY — 18.3% | |
| Auto Components — 0.8% | |
| | 166,280 | | | Delphi Automotive PLC | | $ | 11,569,762 | |
| | 33,330 | | | TRW Automotive Holdings Corp.* | | | 3,209,346 | |
| | | | | | | | |
| | | | Total Auto Components | | | 14,779,108 | |
| | | | | | | | |
| Automobiles — 0.1% | |
| | 17,980 | | | Harley-Davidson Inc. | | | 1,142,808 | |
| | | | | | | | |
| Distributors — 0.1% | |
| | 81,750 | | | LKQ Corp.* | | | 2,321,700 | |
| | | | | | | | |
| Diversified Consumer Services — 0.1% | |
| | 34,070 | | | Bright Horizons Family Solutions Inc.* | | | 1,385,627 | |
| | | | | | | | |
| Hotels, Restaurants & Leisure — 2.1% | |
| | 14,820 | | | Chipotle Mexican Grill Inc., Class A Shares* | | | 10,057,593 | |
| | 30,360 | | | Dunkin’ Brands Group Inc. | | | 1,321,874 | |
| | 119,400 | | | Las Vegas Sands Corp. | | | 7,941,294 | |
| | 72,000 | | | MGM Resorts International* | | | 1,761,840 | |
| | 77,700 | | | Starbucks Corp. | | | 6,045,837 | |
| | 28,890 | | | Starwood Hotels & Resorts Worldwide Inc. | | | 2,442,361 | |
| | 104,800 | | | Yum! Brands Inc. | | | 7,590,664 | |
| | | | | | | | |
| | | | Total Hotels, Restaurants & Leisure | | | 37,161,463 | |
| | | | | | | | |
| Household Durables — 0.1% | |
| | 15,000 | | | Harman International Industries Inc. | | | 1,726,200 | |
| | | | | | | | |
| Internet & Catalog Retail — 5.1% | |
| | 40,800 | | | Amazon.com Inc.* | | | 13,832,832 | |
| | 753,225 | | | Liberty Interactive Corp., Class A Shares* | | | 22,235,202 | |
| | 20,780 | | | NetFlix Inc.* | | | 9,925,359 | |
| | 35,815 | | | Priceline Group Inc. (The)* | | | 44,564,963 | |
| | | | | | | | |
| | | | Total Internet & Catalog Retail | | | 90,558,356 | |
| | | | | | | | |
| Media — 4.8% | |
| | 265,530 | | | Comcast Corp., Class A Shares | | | 14,532,457 | |
| | 87,461 | | | Discovery Communications Inc., Class A Shares* | | | 3,823,795 | |
| | 280,520 | | | Discovery Communications Inc., Class C Shares* | | | 12,053,944 | |
| | 53,720 | | | Imax Corp. (a)* | | | 1,489,119 | |
| | 325,800 | | | Liberty Global PLC, Class C Shares* | | | 13,660,794 | |
| | 112,100 | | | Time Warner Inc. | | | 8,635,063 | |
| | 587,000 | | | Twenty-First Century Fox Inc., Class A Shares | | | 20,791,540 | |
| | 122,540 | | | Walt Disney Co. (The) | | | 11,013,895 | |
| | | | | | | | |
| | | | Total Media | | | 86,000,607 | |
| | | | | | | | |
| Specialty Retail — 3.2% | |
| | 14,640 | | | Advance Auto Parts Inc. | | | 1,997,189 | |
| | 30,400 | | | DSW Inc., Class A Shares | | | 940,576 | |
| | 123,300 | | | Home Depot Inc. (The) | | | 11,528,550 | |
| | 305,600 | | | L Brands Inc. | | | 19,512,560 | |
| | 11,900 | | | O’Reilly Automotive Inc.* | | | 1,856,162 | |
| | 276,050 | | | Sally Beauty Holdings Inc.* | | | 7,696,274 | |
| | 13,020 | | | Tiffany & Co. | | | 1,314,239 | |
| | 206,335 | | | TJX Cos., Inc. (The) | | | 12,299,629 | |
| | | | | | | | |
| | | | Total Specialty Retail | | | 57,145,179 | |
| | | | | | | | |
| Textiles, Apparel & Luxury Goods — 1.9% | | | | |
| | 277,450 | | | NIKE Inc., Class B Shares | | | 21,793,698 | |
See Notes to Financial Statements.
32
| | | | | | | | |
| Large Capitalization Growth Investments | |
| | |
| Shares/Units | | | Security | | Value | |
| CONSUMER DISCRETIONARY — 18.3% — (continued) | |
| Textiles, Apparel & Luxury Goods — 1.9% — (continued) | | | | |
| | 176,620 | | | V.F. Corp. | | $ | 11,324,874 | |
| | | | | | | | |
| | | | Total Textiles, Apparel & Luxury Goods | | | 33,118,572 | |
| | | | | | | | |
| | | | TOTAL CONSUMER DISCRETIONARY | | | 325,339,620 | |
| | | | | | | | |
| CONSUMER STAPLES — 4.4% | |
| Beverages — 1.1% | |
| | 21,835 | | | Brown-Forman Corp., Class B Shares | | | 2,023,231 | |
| | 191,300 | | | Constellation Brands Inc., Class A Shares* | | | 16,660,317 | |
| | | | | | | | |
| | | | Total Beverages | | | 18,683,548 | |
| | | | | | | | |
| Food & Staples Retailing — 1.9% | |
| | 86,350 | | | Costco Wholesale Corp. | | | 10,455,258 | |
| | 382,725 | | | Walgreen Co. | | | 23,162,517 | |
| | | | | | | | |
| | | | Total Food & Staples Retailing | | | 33,617,775 | |
| | | | | | | | |
| Food Products — 0.9% | |
| | 104,256 | | | Hershey Co. (The) | | | 9,531,084 | |
| | 10,600 | | | Mead Johnson Nutrition Co., Class A Shares | | | 1,013,360 | |
| | 162,965 | | | Mondelez International Inc., Class A Shares | | | 5,897,703 | |
| | | | | | | | |
| | | | Total Food Products | | | 16,442,147 | |
| | | | | | | | |
| Personal Products — 0.5% | |
| | 116,550 | | | Estee Lauder Cos., Inc. (The), Class A Shares | | | 8,954,537 | |
| | | | | | | | |
| | | | TOTAL CONSUMER STAPLES | | | 77,698,007 | |
| | | | | | | | |
| ENERGY — 7.8% | |
| Energy Equipment & Services — 2.1% | |
| | 31,210 | | | Cameron International Corp.* | | | 2,319,839 | |
| | 329,500 | | | Halliburton Co. | | | 22,277,495 | |
| | 146,530 | | | National Oilwell Varco Inc. | | | 12,664,588 | |
| | | | | | | | |
| | | | Total Energy Equipment & Services | | | 37,261,922 | |
| | | | | | | | |
| Oil, Gas & Consumable Fuels — 5.7% | |
| | 96,200 | | | Antero Resources Corp.* | | | 5,565,170 | |
| | 69,020 | | | Cabot Oil & Gas Corp. | | | 2,314,931 | |
| | 48,730 | | | Carrizo Oil & Gas Inc.* | | | 3,056,346 | |
| | 16,500 | | | Concho Resources Inc.* | | | 2,343,660 | |
| | 19,280 | | | Continental Resources Inc.(a)* | | | 3,109,671 | |
| | 242,150 | | | EOG Resources Inc. | | | 26,607,442 | |
| | 58,000 | | | EP Energy Corp., Class A Shares(a)* | | | 1,121,140 | |
| | 259,700 | | | Kinder Morgan Inc.(a) | | | 10,455,522 | |
| | 40,200 | | | Pioneer Natural Resources Co. | | | 8,387,730 | |
| | 206,560 | | | SandRidge Energy Inc.(a)* | | | 1,082,374 | |
| | 230,000 | | | Suncor Energy Inc. | | | 9,450,700 | |
| | 173,190 | | | Valero Energy Corp. | | | 9,376,507 | |
| | 309,100 | | | Williams Cos., Inc. (The) | | | 18,372,904 | |
| | | | | | | | |
| | | | Total Oil, Gas & Consumable Fuels | | | 101,244,097 | |
| | | | | | | | |
| | | | TOTAL ENERGY | | | 138,506,019 | |
| | | | | | | | |
| FINANCIALS — 6.1% | | | | |
| Banks — 1.2% | |
| | 163,800 | | | First Republic Bank | | | 8,009,820 | |
| | 166,060 | | | JPMorgan Chase & Co. | | | 9,872,267 | |
| | 17,870 | | | Signature Bank* | | | 2,116,880 | |
| | 13,723 | | | SVB Financial Group* | | | 1,527,644 | |
| | | | | | | | |
| | | | Total Banks | | | 21,526,611 | |
| | | | | | | | |
See Notes to Financial Statements.
33
| | | | | | | | |
| Large Capitalization Growth Investments | |
| | |
| Shares/Units | | | Security | | Value | |
| FINANCIALS — 6.1% — (continued) | | | | |
| Capital Markets — 1.3% | | | | |
| | 48,300 | | | Affiliated Managers Group Inc.* | | $ | 10,198,545 | |
| | 66,210 | | | E*Trade Financial Corp.* | | | 1,473,835 | |
| | 45,650 | | | Raymond James Financial Inc. | | | 2,494,316 | |
| | 119,220 | | | State Street Corp. | | | 8,587,416 | |
| | 55,100 | | | WisdomTree Investments Inc.(a)* | | | 651,833 | |
| | | | | | | | |
| | | | Total Capital Markets | | | 23,405,945 | |
| | | | | | | | |
| Consumer Finance — 0.6% | |
| | 118,100 | | | American Express Co. | | | 10,575,855 | |
| | | | | | | | |
| Diversified Financial Services — 1.3% | |
| | 121,675 | | | Intercontinental Exchange Inc. | | | 22,996,575 | |
| | | | | | | | |
| Insurance — 0.3% | |
| | 27,130 | | | Allied World Assurance Co. Holdings AG | | | 1,003,539 | |
| | 30,700 | | | Aon PLC | | | 2,675,812 | |
| | 34,100 | | | Arthur J. Gallagher & Co. | | | 1,610,543 | |
| | | | | | | | |
| | | | Total Insurance | | | 5,289,894 | |
| | | | | | | | |
| Real Estate Investment Trusts (REITs) — 1.4% | |
| | 309,000 | | | Crown Castle International Corp. | | | 24,568,590 | |
| | | | | | | | |
| | | | TOTAL FINANCIALS | | | 108,363,470 | |
| | | | | | | | |
| HEALTH CARE — 16.4% | |
| Biotechnology — 4.8% | |
| | 59,000 | | | Alkermes PLC* | | | 2,639,070 | |
| | 28,000 | | | Biogen Idec Inc.* | | | 9,605,120 | |
| | 752,574 | | | Celgene Corp.* | | | 71,509,581 | |
| | 37,030 | | | Incyte Corp. Ltd.* | | | 2,007,026 | |
| | | | | | | | |
| | | | Total Biotechnology | | | 85,760,797 | |
| | | | | | | | |
| Health Care Equipment & Supplies — 0.9% | |
| | 96,280 | | | Cooper Cos., Inc. (The) | | | 15,696,528 | |
| | | | | | | | |
| Health Care Providers & Services — 1.6% | |
| | 144,029 | | | Cardinal Health Inc. | | | 10,614,937 | |
| | 26,400 | | | Centene Corp.* | | | 2,062,632 | |
| | 12,800 | | | Humana Inc. | | | 1,647,872 | |
| | 57,900 | | | McKesson Corp. | | | 11,292,237 | |
| | 38,750 | | | MEDNAX Inc.* | | | 2,218,438 | |
| | | | | | | | |
| | | | Total Health Care Providers & Services | | | 27,836,116 | |
| | | | | | | | |
| Health Care Technology — 0.1% | |
| | 72,000 | | | Allscripts Healthcare Solutions Inc.* | | | 1,063,800 | |
| | 18,000 | | | Cerner Corp.* | | | 1,037,880 | |
| | | | | | | | |
| | | | Total Health Care Technology | | | 2,101,680 | |
| | | | | | | | |
| Life Sciences Tools & Services — 1.1% | |
| | 13,270 | | | Covance Inc.* | | | 1,100,083 | |
| | 14,610 | | | Illumina Inc.* | | | 2,620,450 | |
| | 138,700 | | | Thermo Fisher Scientific Inc. | | | 16,673,127 | |
| | | | | | | | |
| | | | Total Life Sciences Tools & Services | | | 20,393,660 | |
| | | | | | | | |
| Pharmaceuticals — 7.9% | |
| | 480,980 | | | AbbVie Inc. | | | 26,588,574 | |
| | 73,130 | | | Actavis PLC* | | | 16,599,047 | |
| | 165,625 | | | Allergan Inc. | | | 27,109,500 | |
| | 149,250 | | | Endo International PLC* | | | 9,508,718 | |
See Notes to Financial Statements.
34
| | | | | | | | |
| Large Capitalization Growth Investments | |
| | |
| Shares/Units | | | Security | | Value | |
| HEALTH CARE — 16.4% — (continued) | |
| Pharmaceuticals — 7.9% — (continued) | |
| | 77,315 | | | Jazz Pharmaceuticals PLC* | | $ | 12,596,160 | |
| | 34,700 | | | Mylan Inc.* | | | 1,686,420 | |
| | 337,550 | | | Novo Nordisk AS, ADR | | | 15,513,798 | |
| | 91,528 | | | Perrigo Co. PLC | | | 13,613,875 | |
| | 323,800 | | | Teva Pharmaceutical Industries Ltd., ADR | | | 17,005,976 | |
| | | | | | | | |
| | | | Total Pharmaceuticals | | | 140,222,068 | |
| | | | | | | | |
| | | | TOTAL HEALTH CARE | | | 292,010,849 | |
| | | | | | | | |
| INDUSTRIALS — 9.3% | |
| Aerospace & Defense — 1.7% | |
| | 37,640 | | | B/E Aerospace Inc.* | | | 3,189,614 | |
| | 82,943 | | | Precision Castparts Corp. | | | 20,243,069 | |
| | 67,475 | | | United Technologies Corp. | | | 7,285,950 | |
| | | | | | | | |
| | | | Total Aerospace & Defense | | | 30,718,633 | |
| | | | | | | | |
| Airlines — 0.7% | |
| | 74,200 | | | American Airlines Group Inc. | | | 2,887,122 | |
| | 180,900 | | | Delta Air Lines Inc. | | | 7,160,022 | |
| | 33,900 | | | Spirit Airlines Inc.* | | | 2,386,221 | |
| | | | | | | | |
| | | | Total Airlines | | | 12,433,365 | |
| | | | | | | | |
| Commercial Services & Supplies — 0.9% | |
| | 43,000 | | | Copart Inc.* | | | 1,480,490 | |
| | 40,800 | | | KAR Auction Services Inc. | | | 1,230,528 | |
| | 8,840 | | | Stericycle Inc.* | | | 1,050,634 | |
| | 273,910 | | | Tyco International Ltd. | | | 12,221,864 | |
| | | | | | | | |
| | | | Total Commercial Services & Supplies | | | 15,983,516 | |
| | | | | | | | |
| Construction & Engineering — 0.1% | |
| | 29,730 | | | Jacobs Engineering Group Inc.* | | | 1,602,744 | |
| | 40,500 | | | MasTec Inc.* | | | 1,235,250 | |
| | | | | | | | |
| | | | Total Construction & Engineering | | | 2,837,994 | |
| | | | | | | | |
| Electrical Equipment — 0.6% | |
| | 196,970 | | | AMETEK Inc. | | | 10,427,592 | |
| | | | | | | | |
| Industrial Conglomerates — 0.5% | |
| | 110,620 | | | Danaher Corp. | | | 8,474,598 | |
| | | | | | | | |
| Machinery — 2.5% | |
| | 95,550 | | | Caterpillar Inc. | | | 10,421,638 | |
| | 65,900 | | | Cummins Inc. | | | 9,562,749 | |
| | 189,240 | | | Ingersoll-Rand PLC | | | 11,392,248 | |
| | 111,920 | | | PACCAR Inc. | | | 7,029,695 | |
| | 14,280 | | | Pall Corp. | | | 1,204,804 | |
| | 27,050 | | | Pentair PLC | | | 1,841,294 | |
| | 31,480 | | | Wabtec Corp. | | | 2,624,173 | |
| | | | | | | | |
| | | | Total Machinery | | | 44,076,601 | |
| | | | | | | | |
| Marine — 0.2% | |
| | 28,140 | | | Kirby Corp.* | | | 3,356,821 | |
| | | | | | | | |
| Professional Services — 0.7% | |
| | 29,790 | | | IHS Inc., Class A Shares* | | | 4,244,181 | |
| | 168,020 | | | Nielsen NV | | | 7,895,260 | |
| | | | | | | | |
| | | | Total Professional Services | | | 12,139,441 | |
| | | | | | | | |
See Notes to Financial Statements.
35
| | | | | | | | |
| Large Capitalization Growth Investments | |
| | |
| Shares/Units | | | Security | | Value | |
| INDUSTRIALS — 9.3% — (continued) | |
| Road & Rail — 1.3% | | | | |
| | 51,200 | | | Canadian Pacific Railway Ltd. | | $ | 10,270,720 | |
| | 318,360 | | | CSX Corp. | | | 9,840,508 | |
| | 24,250 | | | Genesee & Wyoming Inc., Class A Shares* | | | 2,384,502 | |
| | 21,910 | | | J.B. Hunt Transport Services Inc. | | | 1,655,300 | |
| | | | | | | | |
| | | | Total Road & Rail | | | 24,151,030 | |
| | | | | | | | |
| Trading Companies & Distributors — 0.1% | |
| | 18,780 | | | WESCO International Inc.(a)* | | | 1,577,332 | |
| | | | | | | | |
| | | | TOTAL INDUSTRIALS | | | 166,176,923 | |
| | | | | | | | |
| INFORMATION TECHNOLOGY — 30.0% | |
| Communications Equipment — 1.9% | |
| | 439,040 | | | QUALCOMM Inc. | | | 33,410,944 | |
| | | | | | | | |
| Electronic Equipment, Instruments & Components — 0.7% | |
| | 28,170 | | | Amphenol Corp., Class A Shares | | | 2,901,792 | |
| | 148,300 | | | TE Connectivity Ltd. | | | 9,295,444 | |
| | | | | | | | |
| | | | Total Electronic Equipment, Instruments & Components | | | 12,197,236 | |
| | | | | | | | |
| Internet Software & Services — 9.5% | |
| | 27,790 | | | Akamai Technologies Inc.* | | | 1,679,072 | |
| | 58,950 | | | Baidu Inc., ADR* | | | 12,645,954 | |
| | 424,775 | | | eBay Inc.* | | | 23,575,012 | |
| | 83,400 | | | Equinix Inc.* | | | 18,202,884 | |
| | 402,090 | | | Facebook Inc., Class A Shares* | | | 30,084,374 | |
| | 70,558 | | | Google Inc., Class A Shares* | | | 41,090,157 | |
| | 62,033 | | | Google Inc., Class C Shares* | | | 35,458,063 | |
| | 93,255 | | | Yelp Inc., Class A Shares(a)* | | | 7,686,077 | |
| | | | | | | | |
| | | | Total Internet Software & Services | | | 170,421,593 | |
| | | | | | | | |
| IT Services — 6.0% | |
| | 10,640 | | | Alliance Data Systems Corp.* | | | 2,815,770 | |
| | 22,770 | | | Gartner Inc.* | | | 1,698,414 | |
| | 29,350 | | | Global Payments Inc. | | | 2,134,332 | |
| | 40,455 | | | International Business Machines Corp. | | | 7,779,496 | |
| | 24,460 | | | Jack Henry & Associates Inc. | | | 1,414,033 | |
| | 340,825 | | | MasterCard Inc., Class A Shares | | | 25,837,943 | |
| | 252,100 | | | Vantiv Inc., Class A Shares* | | | 7,885,688 | |
| | 97,188 | | | VeriFone Systems Inc.* | | | 3,393,805 | |
| | 247,105 | | | Visa Inc., Class A Shares | | | 52,514,755 | |
| | 13,620 | | | WEX Inc.* | | | 1,547,913 | |
| | | | | | | | |
| | | | Total IT Services | | | 107,022,149 | |
| | | | | | | | |
| Semiconductors & Semiconductor Equipment — 1.0% | |
| | 34,600 | | | Avago Technologies Ltd., Class A Shares | | | 2,840,314 | |
| | 139,410 | | | Lam Research Corp. | | | 10,024,973 | |
| | 63,750 | | | NXP Semiconductor NV* | | | 4,368,150 | |
| | 17,920 | | | Xilinx Inc. | | | 757,120 | |
| | | | | | | | |
| | | | Total Semiconductors & Semiconductor Equipment | | | 17,990,557 | |
| | | | | | | | |
| Software — 6.7% | |
| | 342,775 | | | Adobe Systems Inc.* | | | 24,645,522 | |
| | 166,400 | | | Cadence Design Systems Inc.* | | | 2,935,296 | |
| | 99,300 | | | Electronic Arts Inc.* | | | 3,757,512 | |
| | 58,800 | | | Fortinet Inc.* | | | 1,517,628 | |
| | 194,250 | | | Intuit Inc. | | | 16,157,715 | |
See Notes to Financial Statements.
36
| | | | | | | | |
| Large Capitalization Growth Investments | |
| | |
| Shares/Units | | | Security | | Value | |
| INFORMATION TECHNOLOGY — 30.0% — (continued) | |
| Software — 6.7% — (continued) | |
| | 685,875 | | | Microsoft Corp. | | $ | 31,159,301 | |
| | 277,660 | | | Oracle Corp. | | | 11,531,220 | |
| | 377,140 | | | Salesforce.com Inc.* | | | 22,285,203 | |
| | 74,800 | | | ServiceNow Inc.* | | | 4,572,524 | |
| | 151,500 | | | Zynga Inc., Class A Shares* | | | 438,592 | |
| | | | | | | | |
| | | | Total Software | | | 119,000,513 | |
| | | | | | | | |
| Technology Hardware, Storage & Peripherals — 4.2% | |
| | 605,045 | | | Apple Inc. | | | 62,017,113 | |
| | 320,810 | | | EMC Corp. | | | 9,473,519 | |
| | 32,100 | | | SanDisk Corp. | | | 3,144,516 | |
| | | | | | | | |
| | | | Total Technology Hardware, Storage & Peripherals | | | 74,635,148 | |
| | | | | | | | |
| | | | TOTAL INFORMATION TECHNOLOGY | | | 534,678,140 | |
| | | | | | | | |
| MATERIALS — 3.7% | |
| Chemicals — 3.5% | |
| | 143,320 | | | Celanese Corp., Series A, Class A Shares | | | 8,963,233 | |
| | 17,420 | | | Cytec Industries Inc. | | | 1,794,957 | |
| | 150,523 | | | FMC Corp. | | | 9,955,591 | |
| | 191,310 | | | Monsanto Co. | | | 22,125,001 | |
| | 46,250 | | | PPG Industries Inc. | | | 9,521,025 | |
| | 6,610 | | | Sherwin-Williams Co. (The) | | | 1,441,707 | |
| | 109,450 | | | Syngenta AG, ADR(a) | | | 7,892,440 | |
| | | | | | | | |
| | | | Total Chemicals | | | 61,693,954 | |
| | | | | | | | |
| Construction Materials — 0.2% | |
| | 33,800 | | | Eagle Materials Inc. | | | 3,444,558 | |
| | | | | | | | |
| | | | TOTAL MATERIALS | | | 65,138,512 | |
| | | | | | | | |
| TELECOMMUNICATION SERVICES — 1.4% | |
| Diversified Telecommunication Services — 0.6% | |
| | 44,530 | | | Cogent Communications Holdings Inc. | | | 1,543,410 | |
| | 207,200 | | | Verizon Communications Inc. | | | 10,322,704 | |
| | | | | | | | |
| | | | Total Diversified Telecommunication Services | | | 11,866,114 | |
| | | | | | | | |
| Wireless Telecommunication Services — 0.8% | |
| | 125,102 | | | SBA Communications Corp., Class A Shares* | | | 13,797,499 | |
| | | | | | | | |
| | | | TOTAL TELECOMMUNICATION SERVICES | | | 25,663,613 | |
| | | | | | | | |
| | | | TOTAL COMMON STOCKS
(Cost — $1,145,316,576) | | | 1,733,575,153 | |
| | | | | | | | |
| | |
Face
Amount | | | | | | |
| SHORT-TERM INVESTMENTS (b) — 4.1% | |
| MONEY MARKET FUND — 1.5% | |
| $ | 27,461,626 | | | Invesco STIT — Government & Agency Portfolio(c)
(Cost — $27,461,626) | | | 27,461,626 | |
| | | | | | | | |
| TIME DEPOSITS — 2.6% | |
| | 8,089,014 | | | Banco Santander SA — Frankfurt, 0.030% due 9/2/14 | | | 8,089,014 | |
| | 4,095,816 | | | DNB ASA — Oslo, 0.030% due 9/2/14 | | | 4,095,816 | |
| | 1,720,168 | | | JPMorgan Chase & Co. — Nassau, 0.030% due 9/2/14 | | | 1,720,168 | |
See Notes to Financial Statements.
37
| | | | | | | | |
| Large Capitalization Growth Investments | |
| | |
Face
Amount | | | Security | | Value | |
| TIME DEPOSITS — 2.6% — (continued) | |
| $ | 32,282,238 | | | Wells Fargo — Grand Cayman, 0.030% due 9/2/14 | | $ | 32,282,238 | |
| | | | | | | | |
| | | | TOTAL TIME DEPOSITS
(Cost — $46,187,236) | | | 46,187,236 | |
| | | | | | | | |
| | | | TOTAL SHORT-TERM INVESTMENTS
(Cost — $73,648,862) | | | 73,648,862 | |
| | | | | | | | |
| | | | TOTAL INVESTMENTS — 101.5%
(Cost — $1,218,965,438#) | | | 1,807,224,015 | |
| | | | | | | | |
| | | | Liabilities in Excess of Other Assets — (1.5)% | | | (27,186,347 | ) |
| | | | | | | | |
| | | | TOTAL NET ASSETS — 100.0% | | $ | 1,780,037,668 | |
| | | | | | | | |
| * | | Non-income producing security. |
| (a) | | All or a portion of this security is on loan (See Note 1). |
| (b) | | Inclusive of all short term holdings, including collateral received from securities lending activities. Not including such collateral, the percentage of portfolio holdings would be 2.6%. |
| (c) | | Represents investment of collateral received from securities lending transactions. |
| # | | Aggregate cost for federal income tax purposes is $1,232,802,212. |
| | |
Abbreviations used in this schedule: |
| ADR | | — American Depositary Receipts |
| PLC | | — Public Limited Company |
| | | | |
| Summary of Investments by Security Sector^ | | | |
Information Technology | | | 29.6 | % |
Consumer Discretionary | | | 18.0 | |
Health Care | | | 16.2 | |
Industrials | | | 9.2 | |
Energy | | | 7.7 | |
Financials | | | 6.0 | |
Consumer Staples | | | 4.3 | |
Materials | | | 3.6 | |
Telecommunication Services | | | 1.4 | |
Short-Term Investments | | | 4.0 | |
| | | | |
| | | 100.0 | % |
| | | | |
| ^ | | As a percentage of total investments. |
See Notes to Financial Statements.
38
| | | | | | | | |
| Large Capitalization Value Equity Investments | |
| | |
| Shares/Units | | | Security | | Value | |
| COMMON STOCKS — 96.3% | |
| CONSUMER DISCRETIONARY — 10.5% | |
| Automobiles — 2.0% | |
| | 1,661,500 | | | Ford Motor Co. | | $ | 28,926,715 | |
| | | | | | | | |
| Diversified Consumer Services — 0.2% | |
| | 82,609 | | | H&R Block Inc. | | | 2,769,880 | |
| | | | | | | | |
| Hotels, Restaurants & Leisure — 1.2% | |
| | 208,000 | | | Carnival Corp. | | | 7,879,040 | |
| | 406,000 | | | MGM Resorts International* | | | 9,934,820 | |
| | | | | | | | |
| | | | Total Hotels, Restaurants & Leisure | | | 17,813,860 | |
| | | | | | | | |
| Household Durables — 1.5% | |
| | 600,000 | | | Sony Corp., ADR | | | 11,466,000 | |
| | 64,800 | | | Whirlpool Corp. | | | 9,915,696 | |
| | | | | | | | |
| | | | Total Household Durables | | | 21,381,696 | |
| | | | | | | | |
| Internet & Catalog Retail — 0.1% | |
| | 73,245 | | | Liberty Interactive Corp., Class A Shares* | | | 2,162,192 | |
| | | | | | | | |
| Leisure Products — 0.7% | |
| | 311,726 | | | Mattel Inc. | | | 10,751,430 | |
| | | | | | | | |
| Media — 1.9% | |
| | 257,500 | | | Comcast Corp., Class A Shares | | | 14,092,975 | |
| | 70,744 | | | Gannett Co., Inc. | | | 2,388,317 | |
| | 32,858 | | | Omnicom Group Inc. | | | 2,366,105 | |
| | 251,600 | | | Twenty-First Century Fox Inc., Class A Shares | | | 8,911,672 | |
| | | | | | | | |
| | | | Total Media | | | 27,759,069 | |
| | | | | | | | |
| Multiline Retail — 1.9% | |
| | 164,924 | | | Kohl’s Corp. | | | 9,695,882 | |
| | 97,200 | | | Macy’s Inc. | | | 6,054,588 | |
| | 30,618 | | | Nordstrom Inc. | | | 2,120,297 | |
| | 163,000 | | | Target Corp. | | | 9,791,410 | |
| | | | | | | | |
| | | | Total Multiline Retail | | | 27,662,177 | |
| | | | | | | | |
| Specialty Retail — 0.2% | |
| | 38,191 | | | Bed Bath & Beyond Inc.* | | | 2,454,154 | |
| | | | | | | | |
| Textiles, Apparel & Luxury Goods — 0.8% | |
| | 49,947 | | | Coach Inc. | | | 1,839,548 | |
| | 154,820 | | | V.F. Corp. | | | 9,927,058 | |
| | | | | | | | |
| | | | Total Textiles, Apparel & Luxury Goods | | | 11,766,606 | |
| | | | | | | | |
| | | | TOTAL CONSUMER DISCRETIONARY | | | 153,447,779 | |
| | | | | | | | |
| CONSUMER STAPLES — 5.1% | |
| Beverages — 0.7% | |
| | 141,400 | | | Molson Coors Brewing Co., Class B Shares | | | 10,456,530 | |
| | | | | | | | |
| Food & Staples Retailing — 2.0% | |
| | 226,577 | | | CVS Caremark Corp. | | | 18,001,543 | |
| | 80,134 | | | Kroger Co. (The) | | | 4,085,231 | |
| | 105,600 | | | Wal-Mart Stores Inc. | | | 7,972,800 | |
| | | | | | | | |
| | | | Total Food & Staples Retailing | | | 30,059,574 | |
| | | | | | | | |
| Food Products — 1.2% | |
| | 207,949 | | | Archer-Daniels-Midland Co. | | | 10,368,337 | |
| | 65,500 | | | J.M. Smucker Co. (The) | | | 6,720,300 | |
| | | | | | | | |
| | | | Total Food Products | | | 17,088,637 | |
| | | | | | | | |
See Notes to Financial Statements.
39
| | | | | | | | |
| Large Capitalization Value Equity Investments | |
| | |
| Shares/Units | | | Security | | Value | |
| CONSUMER STAPLES — 5.1% — (continued) | |
| Household Products — 1.2% | |
| | 84,777 | | | Kimberly-Clark Corp. | | $ | 9,155,916 | |
| | 95,000 | | | Procter & Gamble Co. (The) | | | 7,895,450 | |
| | | | | | | | |
| | | | Total Household Products | | | 17,051,366 | |
| | | | | | | | |
| | | | TOTAL CONSUMER STAPLES | | | 74,656,107 | |
| | | | | | | | |
| ENERGY — 14.9% | |
| Energy Equipment & Services — 3.5% | |
| | 308,306 | | | Ensco PLC, Class A Shares | | | 15,563,287 | |
| | 138,000 | | | Halliburton Co. | | | 9,330,180 | |
| | 155,970 | | | McDermott International Inc.*(a) | | | 1,122,984 | |
| | 279,300 | | | National Oilwell Varco Inc. | | | 24,139,899 | |
| | 59,978 | | | Patterson-UTI Energy Inc. | | | 2,071,640 | |
| | | | | | | | |
| | | | Total Energy Equipment & Services | | | 52,227,990 | |
| | | | | | | | |
| Oil, Gas & Consumable Fuels — 11.4% | |
| | 130,000 | | | Anadarko Petroleum Corp. | | | 14,649,700 | |
| | 170,328 | | | Chevron Corp. | | | 22,048,959 | |
| | 389,951 | | | ConocoPhillips | | | 31,671,820 | |
| | 163,136 | | | Denbury Resources Inc. | | | 2,809,202 | |
| | 13,347 | | | Hess Corp. | | | 1,349,382 | |
| | 679,361 | | | Marathon Oil Corp. | | | 28,322,560 | |
| | 188,130 | | | Murphy Oil Corp. | | | 11,752,481 | |
| | 83,800 | | | Occidental Petroleum Corp. | | | 8,692,574 | |
| | 111,300 | | | Royal Dutch Shell PLC, Class A Shares, ADR | | | 9,011,961 | |
| | 33,090 | | | SM Energy Co. | | | 2,946,334 | |
| | 43,182 | | | Southwestern Energy Co.* | | | 1,778,235 | |
| | 250,300 | | | Total SA, ADR(a) | | | 16,509,788 | |
| | 287,000 | | | Valero Energy Corp. | | | 15,538,180 | |
| | | | | | | | |
| | | | Total Oil, Gas & Consumable Fuels | | | 167,081,176 | |
| | | | | | | | |
| | | | TOTAL ENERGY | | | 219,309,166 | |
| | | | | | | | |
| FINANCIALS — 21.0% | |
| Banks — 6.2% | |
| | 252,000 | | | BB&T Corp. | | | 9,407,160 | |
| | 143,000 | | | Citigroup Inc. | | | 7,385,950 | |
| | 353,800 | | | Fifth Third Bancorp | | | 7,219,289 | |
| | 506,910 | | | JPMorgan Chase & Co. | | | 30,135,799 | |
| | 12,771 | | | M&T Bank Corp.(a) | | | 1,578,879 | |
| | 93,800 | | | PNC Financial Services Group Inc. | | | 7,949,550 | |
| | 970,000 | | | Regions Financial Corp. | | | 9,845,500 | |
| | 328,900 | | | Wells Fargo & Co. | | | 16,918,616 | |
| | | | | | | | |
| | | | Total Banks | | | 90,440,743 | |
| | | | | | | | |
| Capital Markets — 2.9% | |
| | 74,400 | | | Ameriprise Financial Inc. | | | 9,356,544 | |
| | 192,600 | | | Franklin Resources Inc. | | | 10,885,752 | |
| | 52,802 | | | Goldman Sachs Group Inc. (The) | | | 9,457,367 | |
| | 19,132 | | | Northern Trust Corp. | | | 1,326,804 | |
| | 168,269 | | | State Street Corp. | | | 12,120,416 | |
| | | | | | | | |
| | | | Total Capital Markets | | | 43,146,883 | |
| | | | | | | | |
| Consumer Finance — 2.7% | |
| | 244,000 | | | Capital One Financial Corp. | | | 20,022,640 | |
| | 498,618 | | | Navient Corp. | | | 8,945,207 | |
| | 425,000 | | | Synchrony Financial* | | | 10,960,750 | |
| | | | | | | | |
| | | | Total Consumer Finance | | | 39,928,597 | |
| | | | | | | | |
See Notes to Financial Statements.
40
| | | | | | | | |
| Large Capitalization Value Equity Investments | |
| | |
| Shares/Units | | | Security | | Value | |
| FINANCIALS — 21.0% — (continued) | |
| Diversified Financial Services — 0.1% | |
| | 10,549 | | | Intercontinental Exchange Inc. | | $ | 1,993,761 | |
| | | | | | | | |
| Insurance — 8.8% | |
| | 95,500 | | | ACE Ltd. | | | 10,154,515 | |
| | 7,823 | | | Alleghany Corp.* | | | 3,372,730 | |
| | 48,894 | | | Allied World Assurance Co. Holdings AG | | | 1,808,589 | |
| | 376,968 | | | Allstate Corp. (The) | | | 23,179,762 | |
| | 209,400 | | | American International Group Inc. | | | 11,738,964 | |
| | 28,714 | | | Aon PLC | | | 2,502,712 | |
| | 44,698 | | | Arch Capital Group Ltd.* | | | 2,484,315 | |
| | 277,500 | | | Hartford Financial Services Group Inc. | | | 10,281,375 | |
| | 46,075 | | | Loews Corp. | | | 2,015,321 | |
| | 719,116 | | | MetLife Inc. | | | 39,364,410 | |
| | 87,205 | | | Progressive Corp. (The) | | | 2,181,869 | |
| | 42,828 | | | Torchmark Corp. | | | 2,336,267 | |
| | 96,500 | | | Travelers Cos., Inc. (The) | | | 9,139,515 | |
| | 188,000 | | | Willis Group Holdings PLC | | | 7,890,360 | |
| | | | | | | | |
| | | | Total Insurance | | | 128,450,704 | |
| | | | | | | | |
| Real Estate Investment Trusts (REITs) — 0.3% | |
| | 84,463 | | | American Capital Agency Corp. | | | 1,997,550 | |
| | 89,688 | | | Hatteras Financial Corp. | | | 1,784,791 | |
| | | | | | | | |
| | | | Total Real Estate Investment Trusts (REITs) | | | 3,782,341 | |
| | | | | | | | |
| | | | TOTAL FINANCIALS | | | 307,743,029 | |
| | | | | | | | |
| HEALTH CARE — 12.6% | |
| Health Care Equipment & Supplies — 2.5% | |
| | 248,500 | | | Abbott Laboratories | | | 10,496,640 | |
| | 249,500 | | | Baxter International Inc. | | | 18,707,510 | |
| | 3,408 | | | Becton Dickinson and Co. | | | 399,315 | |
| | 107,484 | | | St. Jude Medical Inc. | | | 7,049,876 | |
| | | | | | | | |
| | | | Total Health Care Equipment & Supplies | | | 36,653,341 | |
| | | | | | | | |
| Health Care Providers & Services — 3.2% | |
| | 116,000 | | | Aetna Inc. | | | 9,527,080 | |
| | 44,934 | | | Cigna Corp. | | | 4,250,756 | |
| | 149,000 | | | Express Scripts Holding Co.* | | | 11,015,570 | |
| | 150,984 | | | UnitedHealth Group Inc. | | | 13,087,293 | |
| | 81,000 | | | WellPoint Inc. | | | 9,437,310 | |
| | | | | | | | |
| | | | Total Health Care Providers & Services | | | 47,318,009 | |
| | | | | | | | |
| Life Sciences Tools & Services — 0.7% | |
| | 176,000 | | | Agilent Technologies Inc. | | | 10,060,160 | |
| | | | | | | | |
| Pharmaceuticals — 6.2% | |
| | 177,950 | | | Eli Lilly & Co. | | | 11,310,502 | |
| | 150,700 | | | GlaxoSmithKline PLC, ADR(a) | | | 7,399,370 | |
| | 193,165 | | | Johnson & Johnson | | | 20,037,006 | |
| | 451,240 | | | Merck & Co., Inc. | | | 27,124,036 | |
| | 108,000 | | | Novartis AG, ADR | | | 9,702,720 | |
| | 246,800 | | | Pfizer Inc. | | | 7,253,452 | |
| | 153,400 | | | Teva Pharmaceutical Industries Ltd., ADR | | | 8,056,568 | |
| | | | | | | | |
| | | | Total Pharmaceuticals | | | 90,883,654 | |
| | | | | | | | |
| | | | TOTAL HEALTH CARE | | | 184,915,164 | |
| | | | | | | | |
See Notes to Financial Statements.
41
| | | | | | | | |
| Large Capitalization Value Equity Investments | |
| | |
| Shares/Units | | | Security | | Value | |
| INDUSTRIALS — 8.3% | |
| Aerospace & Defense — 3.0% | |
| | 94,150 | | | General Dynamics Corp. | | $ | 11,603,987 | |
| | 98,000 | | | Honeywell International Inc. | | | 9,332,540 | |
| | 12,457 | | | L-3 Communications Holdings Inc. | | | 1,369,647 | |
| | 54,900 | | | Lockheed Martin Corp. | | | 9,552,600 | |
| | 72,400 | | | Northrop Grumman Corp. | | | 9,210,728 | |
| | 26,619 | | | Rockwell Collins Inc. | | | 2,049,131 | |
| | | | | | | | |
| | | | Total Aerospace & Defense | | | 43,118,633 | |
| | | | | | | | |
| Commercial Services & Supplies — 0.1% | |
| | 40,996 | | | Republic Services Inc., Class A Shares | | | 1,612,373 | |
| | | | | | | | |
| Construction & Engineering — 0.8% | |
| | 140,200 | | | Fluor Corp. | | | 10,359,378 | |
| | 28,913 | | | Jacobs Engineering Group Inc.* | | | 1,558,700 | |
| | | | | | | | |
| | | | Total Construction & Engineering | | | 11,918,078 | |
| | | | | | | | |
| Electrical Equipment — 0.8% | |
| | 152,500 | | | Emerson Electric Co. | | | 9,763,050 | |
| | 17,191 | | | Hubbell Inc., Class B Shares | | | 2,078,392 | |
| | | | | | | | |
| | | | Total Electrical Equipment | | | 11,841,442 | |
| | | | | | | | |
| Industrial Conglomerates — 1.0% | |
| | 95,152 | | | Danaher Corp. | | | 7,289,595 | |
| | 303,200 | | | General Electric Co. | | | 7,877,136 | |
| | | | | | | | |
| | | | Total Industrial Conglomerates | | | 15,166,731 | |
| | | | | | | | |
| Machinery — 1.7% | |
| | 97,800 | | | Dover Corp. | | | 8,593,686 | |
| | 32,298 | | | Joy Global Inc.(a) | | | 2,039,619 | |
| | 35,873 | | | Kennametal Inc. | | | 1,607,469 | |
| | 142,800 | | | Stanley Black & Decker Inc. | | | 13,066,200 | |
| | | | | | | | |
| | | | Total Machinery | | | 25,306,974 | |
| | | | | | | | |
| Professional Services — 0.2% | |
| | 24,618 | | | Manpowergroup Inc. | | | 1,909,864 | |
| | 11,108 | | | Towers Watson & Co., Class A Shares | | | 1,217,770 | |
| | | | | | | | |
| | | | Total Professional Services | | | 3,127,634 | |
| | | | | | | | |
| Road & Rail — 0.7% | |
| | 89,443 | | | Norfolk Southern Corp. | | | 9,570,401 | |
| | 10,572 | | | Ryder System Inc. | | | 955,074 | |
| | | | | | | | |
| | | | Total Road & Rail | | | 10,525,475 | |
| | | | | | | | |
| | | | TOTAL INDUSTRIALS | | | 122,617,340 | |
| | | | | | | | |
| INFORMATION TECHNOLOGY — 13.8% | |
| Communications Equipment — 1.6% | |
| | 612,881 | | | Cisco Systems Inc. | | | 15,315,896 | |
| | 120,600 | | | Harris Corp. | | | 8,609,634 | |
| | | | | | | | |
| | | | Total Communications Equipment | | | 23,925,530 | |
| | | | | | | | |
| Electronic Equipment, Instruments & Components — 0.8% | |
| | 61,833 | | | Arrow Electronics Inc.* | | | 3,849,104 | |
| | 81,243 | | | Avnet Inc. | | | 3,616,126 | |
| | 92,751 | | | FLIR Systems Inc. | | | 3,134,056 | |
| | 27,495 | | | Ingram Micro Inc., Class A Shares* | | | 792,681 | |
| | | | | | | | |
| | | | Total Electronic Equipment, Instruments & Components | | | 11,391,967 | |
| | | | | | | | |
See Notes to Financial Statements.
42
| | | | | | | | |
| Large Capitalization Value Equity Investments | |
| | |
| Shares/Units | | | Security | | Value | |
| INFORMATION TECHNOLOGY — 13.8% — (continued) | |
| Internet Software & Services — 1.8% | |
| | 182,000 | | | eBay Inc.* | | $ | 10,101,000 | |
| | 24,000 | | | Google Inc., Class A Shares* | | | 13,976,640 | |
| | 30,784 | | | IAC/InterActiveCorp | | | 2,142,259 | |
| | | | | | | | |
| | | | Total Internet Software & Services | | | 26,219,899 | |
| | | | | | | | |
| IT Services — 2.3% | |
| | 209,500 | | | Amdocs Ltd. | | | 9,867,450 | |
| | 41,425 | | | NeuStar Inc., Class A Shares*(a) | | | 1,221,624 | |
| | 57,852 | | | Teradata Corp.* | | | 2,642,101 | |
| | 312,000 | | | Vantiv Inc., Class A Shares* | | | 9,759,360 | |
| | 121,775 | | | Western Union Co. (The) | | | 2,127,409 | |
| | 634,200 | | | Xerox Corp. | | | 8,758,302 | |
| | | | | | | | |
| | | | Total IT Services | | | 34,376,246 | |
| | | | | | | | |
| Semiconductors & Semiconductor Equipment — 2.5% | |
| | 69,245 | | | Analog Devices Inc. | | | 3,539,804 | |
| | 610,000 | | | Intel Corp. | | | 21,301,200 | |
| | 34,660 | | | KLA-Tencor Corp. | | | 2,648,717 | |
| | 38,837 | | | Lam Research Corp. | | | 2,792,769 | |
| | 194,300 | | | Micron Technology Inc.* | | | 6,334,180 | |
| | | | | | | | |
| | | | Total Semiconductors & Semiconductor Equipment | | | 36,616,670 | |
| | | | | | | | |
| Software — 3.4% | |
| | 430,000 | | | Activision Blizzard Inc. | | | 10,122,200 | |
| | 258,400 | | | CA Inc. | | | 7,297,216 | |
| | 475,542 | | | Microsoft Corp. | | | 21,603,873 | |
| | 238,889 | | | Oracle Corp. | | | 9,921,060 | |
| | 35,396 | | | Synopsys Inc.* | | | 1,447,697 | |
| | | | | | | | |
| | | | Total Software | | | 50,392,046 | |
| | | | | | | | |
| Technology Hardware, Storage & Peripherals — 1.4% | |
| | 669,500 | | | EMC Corp. | | | 19,770,335 | |
| | 12,329 | | | Lexmark International Inc., Class A Shares | | | 623,354 | |
| | | | | | | | |
| | | | Total Technology Hardware, Storage & Peripherals | | | 20,393,689 | |
| | | | | | | | |
| | | | TOTAL INFORMATION TECHNOLOGY | | | 203,316,047 | |
| | | | | | | | |
| MATERIALS — 4.0% | |
| Chemicals — 1.2% | |
| | 185,000 | | | Dow Chemical Co. (The) | | | 9,906,750 | |
| | 123,700 | | | EI du Pont de Nemours & Co. | | | 8,177,807 | |
| | | | | | | | |
| | | | Total Chemicals | | | 18,084,557 | |
| | | | | | | | |
| Metals & Mining — 1.6% | |
| | 267,500 | | | Barrick Gold Corp. | | | 4,919,325 | |
| | 275,755 | | | Freeport-McMoRan Inc. | | | 10,029,209 | |
| | 403,515 | | | Kinross Gold Corp.* | | | 1,589,849 | |
| | 136,100 | | | Nucor Corp. | | | 7,392,952 | |
| | | | | | | | |
| | | | Total Metals & Mining | | | 23,931,335 | |
| | | | | | | | |
| Paper & Forest Products — 1.2% | |
| | 353,200 | | | International Paper Co. | | | 17,112,540 | |
| | | | | | | | |
| | | | TOTAL MATERIALS | | | 59,128,432 | |
| | | | | | | | |
| TELECOMMUNICATION SERVICES — 3.1% | |
| Diversified Telecommunication Services — 3.1% | |
| | 472,900 | | | AT&T Inc. | | | 16,532,584 | |
| | 268,000 | | | CenturyLink Inc. | | | 10,985,320 | |
See Notes to Financial Statements.
43
| | | | | | | | |
| Large Capitalization Value Equity Investments | |
| | |
| Shares/Units | | | Security | | Value | |
| TELECOMMUNICATION SERVICES — 3.1% — (continued) | |
| Diversified Telecommunication Services — 3.1% — (continued) | |
| | 372,200 | | | Verizon Communications Inc. | | $ | 18,543,004 | |
| | | | | | | | |
| | | | TOTAL TELECOMMUNICATION SERVICES | | | 46,060,908 | |
| | | | | | | | |
| UTILITIES — 3.0% | |
| Electric Utilities — 2.3% | |
| | 325,850 | | | American Electric Power Co., Inc. | | | 17,498,145 | |
| | 55,173 | | | Edison International | | | 3,262,931 | |
| | 131,995 | | | Entergy Corp. | | | 10,217,733 | |
| | 64,909 | | | Xcel Energy Inc. | | | 2,080,334 | |
| | | | | | | | |
| | | | Total Electric Utilities | | | 33,059,143 | |
| | | | | | | | |
| Multi-Utilities — 0.7% | |
| | 241,500 | | | Public Service Enterprise Group Inc. | | | 9,029,685 | |
| | 25,630 | | | SCANA Corp. | | | 1,331,222 | |
| | | | | | | | |
| | | | Total Multi-Utilities | | | 10,360,907 | |
| | | | | | | | |
| | | | TOTAL UTILITIES | | | 43,420,050 | |
| | | | | | | | |
| | | | TOTAL COMMON STOCKS
(Cost — $1,026,392,841) | | | 1,414,614,022 | |
| | | | | | | | |
| | |
Face
Amount | | | | | | |
| SHORT-TERM INVESTMENTS (b) — 4.6% | |
| MONEY MARKET FUND — 1.1% | |
| $ | 16,233,890 | | | Invesco STIT — Government & Agency Portfolio(c)
(Cost — $16,233,890) | | | 16,233,890 | |
| | | | | | | | |
| TIME DEPOSITS — 3.5% | |
| | 17,003,177 | | | Banco Santander SA — Frankfurt, 0.030% due 9/2/14 | | | 17,003,177 | |
| | 12,398,532 | | | Bank of New York Mellon — Grand Cayman, 0.030% due 9/2/14 | | | 12,398,532 | |
| | 16,713,866 | | | BNP Paribas — Grand Cayman, 0.030% due 9/2/14 | | | 16,713,866 | |
| | 2,720,112 | | | Deutsche Bank — Grand Cayman, 0.030% due 9/2/14 | | | 2,720,112 | |
| | 1,779,459 | | | Wells Fargo — Grand Cayman, 0.030% due 9/2/14 | | | 1,779,459 | |
| | | | | | | | |
| | | | TOTAL TIME DEPOSITS
(Cost — $50,615,146) | | | 50,615,146 | |
| | | | | | | | |
| | | | TOTAL SHORT-TERM INVESTMENTS
(Cost — $66,849,036) | | | 66,849,036 | |
| | | | | | | | |
| | | | TOTAL INVESTMENTS — 100.9%
(Cost — $1,093,241,877#) | | | 1,481,463,058 | |
| | | | | | | | |
| | | | Liabilities in Excess of Other Assets — (0.9)% | | | (13,874,973 | ) |
| | | | | | | | |
| | | | TOTAL NET ASSETS — 100.0% | | $ | 1,467,588,085 | |
| | | | | | | | |
| * | | Non-income producing security. |
| (a) | | All or a portion of this security is on loan (See Note 1). |
| (b) | | Inclusive of all short term holdings, including collateral received from securities lending activities. Not including such collateral, the percentage of portfolio holdings would be 3.5%. |
| (c) | | Represents investment of collateral received from securities lending transactions. |
| # | | Aggregate cost for federal income tax purposes is $1,102,279,997. |
| | |
Abbreviations used in this schedule: |
| ADR | | — American Depositary Receipts |
| PLC | | — Public Limited Company |
See Notes to Financial Statements.
44
| | | | |
| Large Capitalization Value Equity Investments |
| | | | |
Summary of Investments by Security Sector^ | | | |
Financials | | | 20.8 | % |
Energy | | | 14.8 | |
Information Technology | | | 13.7 | |
Health Care | | | 12.5 | |
Consumer Discretionary | | | 10.4 | |
Industrials | | | 8.3 | |
Consumer Staples | | | 5.1 | |
Materials | | | 4.0 | |
Telecommunication Services | | | 3.1 | |
Utilities | | | 2.9 | |
Short-Term Investments | | | 4.4 | |
| | | | |
| | | 100.0 | % |
| | | | |
| ^ | | As a percentage of total investments. |
See Notes to Financial Statements.
45
| | | | | | | | |
| Small Capitalization Growth Investments | |
| | |
| Shares/Units | | | Security | | Value | |
| COMMON STOCKS — 96.5% | |
| CONSUMER DISCRETIONARY — 14.6% | |
| Auto Components — 0.5% | |
| | 24,500 | | | Tenneco Inc.* | | $ | 1,569,960 | |
| | | | | | | | |
| Distributors — 0.5% | |
| | 31,400 | | | Core-Mark Holding Co., Inc. | | | 1,512,224 | |
| | | | | | | | |
| Diversified Consumer Services — 1.1% | |
| | 45,190 | | | Bright Horizons Family Solutions Inc.(a)* | | | 1,837,877 | |
| | 35,140 | | | Sotheby’s | | | 1,434,064 | |
| | | | | | | | |
| | | | Total Diversified Consumer Services | | | 3,271,941 | |
| | | | | | | | |
| Hotels, Restaurants & Leisure — 3.1% | |
| | 112,070 | | | Del Frisco’s Restaurant Group Inc.* | | | 2,480,109 | |
| | 16,370 | | | Extended Stay America Inc. | | | 390,588 | |
| | 42,300 | | | Fiesta Restaurant Group Inc.* | | | 2,076,507 | |
| | 44,800 | | | Popeyes Louisiana Kitchen Inc.* | | | 1,796,480 | |
| | 19,200 | | | Red Robin Gourmet Burgers Inc.* | | | 1,019,520 | |
| | 18,500 | | | Vail Resorts Inc. | | | 1,470,565 | |
| | | | | | | | |
| | | | Total Hotels, Restaurants & Leisure | | | 9,233,769 | |
| | | | | | | | |
| Household Durables — 0.6% | |
| | 203,200 | | | Standard Pacific Corp.* | | | 1,700,784 | |
| | | | | | | | |
| Internet & Catalog Retail — 1.2% | |
| | 43,940 | | | HomeAway Inc.* | | | 1,458,808 | |
| | 43,420 | | | Shutterfly Inc.* | | | 2,214,854 | |
| | | | | | | | |
| | | | Total Internet & Catalog Retail | | | 3,673,662 | |
| | | | | | | | |
| Leisure Products — 0.3% | |
| | 36,660 | | | Malibu Boats Inc., Class A Shares* | | | 762,895 | |
| | | | | | | | |
| Media — 1.0% | |
| | 112,580 | | | Cumulus Media Inc., Class A Shares* | | | 516,742 | |
| | 35,303 | | | MDC Partners Inc., Class A Shares | | | 773,136 | |
| | 34,400 | | | Rentrak Corp.* | | | 1,756,464 | |
| | | | | | | | |
| | | | Total Media | | | 3,046,342 | |
| | | | | | | | |
| Multiline Retail — 0.5% | |
| | 39,600 | | | Burlington Stores Inc.* | | | 1,412,532 | |
| | | | | | | | |
| Specialty Retail — 5.3% | |
| | 51,070 | | | Abercrombie & Fitch Co., Class A Shares(a) | | | 2,134,726 | |
| | 26,370 | | | Asbury Automotive Group Inc.* | | | 1,837,462 | |
| | 45,600 | | | Finish Line Inc. (The), Class A Shares | | | 1,351,128 | |
| | 25,630 | | | Five Below Inc.* | | | 1,039,553 | |
| | 23,480 | | | Lithia Motors Inc., Class A Shares | | | 2,052,621 | |
| | 24,200 | | | Men’s Wearhouse Inc. (The) | | | 1,307,526 | |
| | 34,400 | | | Penske Automotive Group Inc. | | | 1,650,168 | |
| | 50,660 | | | Restoration Hardware Holdings Inc.(a)* | | | 4,248,854 | |
| | | | | | | | |
| | | | Total Specialty Retail | | | 15,622,038 | |
| | | | | | | | |
| Textiles, Apparel & Luxury Goods — 0.5% | |
| | 94,590 | | | Crocs Inc.* | | | 1,461,415 | |
| | | | | | | | |
| | | | TOTAL CONSUMER DISCRETIONARY | | | 43,267,562 | |
| | | | | | | | |
| CONSUMER STAPLES — 2.3% | |
| Beverages — 0.5% | |
| | 6,700 | | | Boston Beer Co., Inc. (The), Class A Shares* | | | 1,480,566 | |
| | | | | | | | |
See Notes to Financial Statements.
46
| | | | | | | | |
| Small Capitalization Growth Investments | |
| | |
| Shares/Units | | | Security | | Value | |
| CONSUMER STAPLES — 2.3% — (continued) | |
| Food & Staples Retailing — 0.4% | | | | |
| | 18,500 | | | Casey’s General Stores Inc. | | $ | 1,326,265 | |
| | | | | | | | |
| Food Products — 1.4% | |
| | 54,250 | | | B&G Foods Inc., Class A Shares | | | 1,638,350 | |
| | 10,900 | | | J&J Snack Foods Corp. | | | 1,032,339 | |
| | 17,500 | | | TreeHouse Foods Inc.* | | | 1,444,100 | |
| | | | | | | | |
| | | | Total Food Products | | | 4,114,789 | |
| | | | | | | | |
| | | | TOTAL CONSUMER STAPLES | | | 6,921,620 | |
| | | | | | | | |
| ENERGY — 6.8% | |
| Energy Equipment & Services — 3.3% | |
| | 99,000 | | | Basic Energy Services Inc.* | | | 2,396,790 | |
| | 45,700 | | | C&J Energy Services Inc.* | | | 1,311,133 | |
| | 40,870 | | | Oil States International Inc.* | | | 2,638,159 | |
| | 29,000 | | | RigNet Inc.* | | | 1,353,430 | |
| | 57,730 | | | Superior Energy Services Inc. | | | 2,069,043 | |
| | | | | | | | |
| | | | Total Energy Equipment & Services | | | 9,768,555 | |
| | | | | | | | |
| Oil, Gas & Consumable Fuels — 3.5% | |
| | 40,200 | | | Green Plains Inc. | | | 1,796,538 | |
| | 47,690 | | | Navigator Holdings Ltd.* | | | 1,406,378 | |
| | 129,880 | | | Synergy Resources Corp.* | | | 1,748,185 | |
| | 58,570 | | | Tesoro Corp. | | | 3,791,822 | |
| | 35,680 | | | Western Refining Inc. | | | 1,660,190 | |
| | | | | | | | |
| | | | Total Oil, Gas & Consumable Fuels | | | 10,403,113 | |
| | | | | | | | |
| | | | TOTAL ENERGY | | | 20,171,668 | |
| | | | | | | | |
| FINANCIALS — 7.0% | |
| Banks — 1.4% | |
| | 65,820 | | | East West Bancorp Inc. | | | 2,293,169 | |
| | 28,000 | | | Texas Capital Bancshares Inc.* | | | 1,511,440 | |
| | 23,300 | | | Tristate Capital Holdings Inc.* | | | 222,049 | |
| | | | | | | | |
| | | | Total Banks | | | 4,026,658 | |
| | | | | | | | |
| Capital Markets — 2.1% | |
| | 127,180 | | | BGC Partners Inc., Class A Shares | | | 962,753 | |
| | 27,300 | | | LPL Financial Holdings Inc. | | | 1,329,237 | |
| | 43,130 | | | Stifel Financial Corp.* | | | 2,065,064 | |
| | 8,300 | | | Virtus Investment Partners Inc. | | | 1,856,627 | |
| | | | | | | | |
| | | | Total Capital Markets | | | 6,213,681 | |
| | | | | | | | |
| Consumer Finance — 0.6% | |
| | 30,000 | | | Portfolio Recovery Associates Inc.(a)* | | | 1,704,900 | |
| | | | | | | | |
| Insurance — 1.0% | |
| | 143,990 | | | CNO Financial Group Inc. | | | 2,570,221 | |
| | 21,070 | | | National General Holdings Corp.(a) | | | 394,641 | |
| | | | | | | | |
| | | | Total Insurance | | | 2,964,862 | |
| | | | | | | | |
| Real Estate Investment Trusts (REITs) — 0.9% | |
| | 44,900 | | | Pebblebrook Hotel Trust | | | 1,739,426 | |
| | 76,700 | | | Strategic Hotels & Resorts Inc.* | | | 911,196 | |
| | | | | | | | |
| | | | Total Real Estate Investment Trusts (REITs) | | | 2,650,622 | |
| | | | | | | | |
| Real Estate Management & Development — 1.0% | |
| | 74,050 | | | Alexander & Baldwin Inc. | | | 3,028,645 | |
| | | | | | | | |
| | | | TOTAL FINANCIALS | | | 20,589,368 | |
| | | | | | | | |
See Notes to Financial Statements.
47
| | | | | | | | |
| Small Capitalization Growth Investments | |
| | |
| Shares/Units | | | Security | | Value | |
| HEALTH CARE — 22.2% | | | | |
| Biotechnology — 6.8% | |
| | 53,670 | | | ACADIA Pharmaceuticals Inc.* | | $ | 1,287,007 | |
| | 74,590 | | | Aegerion Pharmaceuticals Inc.(a)* | | | 2,278,725 | |
| | 23,680 | | | AMAG Pharmaceuticals Inc.* | | | 535,878 | |
| | 48,780 | | | Anacor Pharmaceuticals Inc.* | | | 1,136,086 | |
| | 91,800 | | | Arrowhead Research Corp.(a)* | | | 1,337,526 | |
| | 30,200 | | | Cepheid* | | | 1,208,906 | |
| | 97,920 | | | ChemoCentryx Inc.(a)* | | | 500,371 | |
| | 19,500 | | | Clovis Oncology Inc.(a)* | | | 927,420 | |
| | 57,830 | | | Cubist Pharmaceuticals Inc.* | | | 3,992,005 | |
| | 1,110,320 | | | Dynavax Technologies Corp.(a)* | | | 1,576,654 | |
| | 25,900 | | | Isis Pharmaceuticals Inc.(a)* | | | 1,055,684 | |
| | 67,090 | | | Prothena Corp. PLC* | | | 1,536,361 | |
| | 53,180 | | | PTC Therapeutics Inc.* | | | 1,683,679 | |
| | 4,300 | | | Puma Biotechnology Inc.* | | | 1,120,193 | |
| | | | | | | | |
| | | | Total Biotechnology | | | 20,176,495 | |
| | | | | | | | |
| Health Care Equipment & Supplies — 6.5% | |
| �� | 25,200 | | | Align Technology Inc.* | | | 1,372,392 | |
| | 128,000 | | | AtriCure Inc.* | | | 1,986,560 | |
| | 24,900 | | | Cyberonics Inc.* | | | 1,429,011 | |
| | 63,372 | | | LDR Holding Corp.(a)* | | | 1,715,480 | |
| | 73,470 | | | Masimo Corp.* | | | 1,648,667 | |
| | 31,200 | | | Neogen Corp.* | | | 1,313,520 | |
| | 87,000 | | | Novadaq Technologies Inc.* | | | 1,136,220 | |
| | 101,200 | | | Spectranetics Corp. (The)* | | | 2,872,056 | |
| | 28,670 | | | STERIS Corp. | | | 1,613,834 | |
| | 82,630 | | | Wright Medical Group Inc.* | | | 2,465,679 | |
| | 80,675 | | | Zeltiq Aesthetics Inc.(a)* | | | 1,694,982 | |
| | | | | | | | |
| | | | Total Health Care Equipment & Supplies | | | 19,248,401 | |
| | | | | | | | |
| Health Care Providers & Services — 3.5% | |
| | 126,940 | | | ExamWorks Group Inc.* | | | 4,182,673 | |
| | 17,545 | | | MWI Veterinary Supply Inc.* | | | 2,492,267 | |
| | 63,270 | | | Team Health Holdings Inc.* | | | 3,702,561 | |
| | | | | | | | |
| | | | Total Health Care Providers & Services | | | 10,377,501 | |
| | | | | | | | |
| Health Care Technology — 0.8% | |
| | 48,400 | | | Medidata Solutions Inc.* | | | 2,252,536 | |
| | | | | | | | |
| Life Sciences Tools & Services — 1.5% | |
| | 47,500 | | | Fluidigm Corp.* | | | 1,292,950 | |
| | 64,860 | | | ICON PLC* | | | 3,213,164 | |
| | | | | | | | |
| | | | Total Life Sciences Tools & Services | | | 4,506,114 | |
| | | | | | | | |
| Pharmaceuticals — 3.1% | |
| | 79,100 | | | Akorn Inc.* | | | 3,086,482 | |
| | 54,790 | | | Aratana Therapeutics Inc.(a)* | | | 636,660 | |
| | 94,460 | | | Flamel Technologies SA, ADR* | | | 1,416,900 | |
| | 26,600 | | | Pacira Pharmaceuticals Inc.* | | | 2,879,716 | |
| | 55,594 | | | Revance Therapeutics Inc.* | | | 1,298,120 | |
| | | | | | | | |
| | | | Total Pharmaceuticals | | | 9,317,878 | |
| | | | | | | | |
| | | | TOTAL HEALTH CARE | | | 65,878,925 | |
| | | | | | | | |
| INDUSTRIALS — 18.7% | |
| Aerospace & Defense — 0.8% | |
| | 56,610 | | | Hexcel Corp.* | | | 2,331,766 | |
| | | | | | | | |
See Notes to Financial Statements.
48
| | | | | | | | |
| Small Capitalization Growth Investments | |
| | |
| Shares/Units | | | Security | | Value | |
| INDUSTRIALS — 18.7% — (continued) | |
| Air Freight & Logistics — 1.4% | | | | |
| | 30,700 | | | Forward Air Corp. | | $ | 1,421,103 | |
| | 90,720 | | | XPO Logistics Inc.(a)* | | | 2,809,598 | |
| | | | | | | | |
| | | | Total Air Freight & Logistics | | | 4,230,701 | |
| | | | | | | | |
| Airlines — 1.3% | |
| | 306,450 | | | JetBlue Airways Corp.(a)* | | | 3,747,884 | |
| | | | | | | | |
| Building Products — 0.6% | |
| | 86,688 | | | NCI Building Systems Inc.* | | | 1,730,292 | |
| | | | | | | | |
| Commercial Services & Supplies — 2.7% | |
| | 46,850 | | | Civeo Corp. | | | 1,190,458 | |
| | 50,330 | | | Herman Miller Inc. | | | 1,495,808 | |
| | 144,090 | | | Interface Inc., Class A Shares | | | 2,453,853 | |
| | 35,800 | | | Mobile Mini Inc. | | | 1,402,286 | |
| | 95,420 | | | Steelcase Inc., Class A Shares | | | 1,498,094 | |
| | | | | | | | |
| | | | Total Commercial Services & Supplies | | | 8,040,499 | |
| | | | | | | | |
| Construction & Engineering — 0.9% | |
| | 142,400 | | | Furmanite Corp.* | | | 1,294,416 | |
| | 48,700 | | | Primoris Services Corp. | | | 1,414,248 | |
| | | | | | | | |
| | | | Total Construction & Engineering | | | 2,708,664 | |
| | | | | | | | |
| Electrical Equipment — 0.5% | |
| | 20,630 | | | Power Solutions International Inc.(a)* | | | 1,410,061 | |
| | | | | | | | |
| Machinery — 2.2% | |
| | 41,400 | | | Albany International Corp., Class A Shares | | | 1,555,398 | |
| | 34,100 | | | ITT Corp. | | | 1,632,026 | |
| | 129,100 | | | Wabash National Corp.* | | | 1,825,474 | |
| | 19,500 | | | Wabtec Corp. | | | 1,625,520 | |
| | | | | | | | |
| | | | Total Machinery | | | 6,638,418 | |
| | | | | | | | |
| Professional Services — 3.4% | |
| | 27,900 | | | Advisory Board Co. (The)* | | | 1,383,840 | |
| | 27,590 | | | Corporate Executive Board Co. (The) | | | 1,818,733 | |
| | 51,303 | | | Huron Consulting Group Inc.* | | | 3,102,805 | |
| | 69,100 | | | On Assignment Inc.* | | | 2,042,596 | |
| | 39,000 | | | WageWorks Inc.* | | | 1,609,140 | |
| | | | | | | | |
| | | | Total Professional Services | | | 9,957,114 | |
| | | | | | | | |
| Road & Rail — 3.4% | |
| | 11,070 | | | ArcBest Corp. | | | 397,413 | |
| | 27,695 | | | Genesee & Wyoming Inc., Class A Shares* | | | 2,723,249 | |
| | 21,775 | | | Old Dominion Freight Line Inc.* | | | 1,451,739 | |
| | 41,900 | | | Roadrunner Transportation Systems Inc.* | | | 1,055,042 | |
| | 30,950 | | | Saia Inc.* | | | 1,469,197 | |
| | 62,100 | | | Swift Transportation Co., Class A Shares* | | | 1,315,278 | |
| | 71,260 | | | Werner Enterprises Inc. | | | 1,774,374 | |
| | | | | | | | |
| | | | Total Road & Rail | | | 10,186,292 | |
| | | | | | | | |
| Trading Companies & Distributors — 1.5% | |
| | 30,530 | | | Rush Enterprises Inc., Class A Shares(a)* | | | 1,119,535 | |
| | 35,730 | | | Watsco Inc. | | | 3,304,668 | |
| | | | | | | | |
| | | | Total Trading Companies & Distributors | | | 4,424,203 | |
| | | | | | | | |
| | | | TOTAL INDUSTRIALS | | | 55,405,894 | |
| | | | | | | | |
See Notes to Financial Statements.
49
| | | | | | | | |
| Small Capitalization Growth Investments | |
| | |
| Shares/Units | | | Security | | Value | |
| INFORMATION TECHNOLOGY — 18.8% | | | | |
| Communications Equipment — 1.7% | |
| | 70,800 | | | Ciena Corp.* | | $ | 1,464,852 | |
| | 47,700 | | | Radware Ltd.* | | | 826,641 | |
| | 47,170 | | | Riverbed Technology Inc.* | | | 888,683 | |
| | 134,430 | | | Ruckus Wireless Inc.* | | | 1,869,921 | |
| | | | | | | | |
| | | | Total Communications Equipment | | | 5,050,097 | |
| | | | | | | | |
| Electronic Equipment, Instruments & Components — 1.4% | |
| | 61,160 | | | Benchmark Electronics Inc.* | | | 1,506,371 | |
| | 16,900 | | | IPG Photonics Corp.(a)* | | | 1,160,692 | |
| | 15,100 | | | Littelfuse Inc. | | | 1,387,841 | |
| | | | | | | | |
| | | | Total Electronic Equipment, Instruments & Components | | | 4,054,904 | |
| | | | | | | | |
| Internet Software & Services — 3.3% | | | | |
| | 51,700 | | | Amber Road Inc.(a)* | | | 775,500 | |
| | 35,600 | | | comScore Inc.* | | | 1,363,836 | |
| | 53,740 | | | Cornerstone OnDemand Inc.* | | | 2,012,025 | |
| | 9,165 | | | CoStar Group Inc.* | | | 1,326,634 | |
| | 34,692 | | | Envestnet Inc.* | | | 1,596,179 | |
| | 28,820 | | | Rackspace Hosting Inc.* | | | 997,172 | |
| | 30,332 | | | SPS Commerce Inc.* | | | 1,696,772 | |
| | | | | | | | |
| | | | Total Internet Software & Services | | | 9,768,118 | |
| | | | | | | | |
| IT Services — 2.9% | |
| | 62,600 | | | Acxiom Corp.* | | | 1,160,917 | |
| | 30,200 | | | Euronet Worldwide Inc.* | | | 1,609,660 | |
| | 59,840 | | | InterXion Holding NV* | | | 1,650,986 | |
| | 37,060 | | | WEX Inc.* | | | 4,211,869 | |
| | | | | | | | |
| | | | Total IT Services | | | 8,633,432 | |
| | | | | | | | |
| Semiconductors & Semiconductor Equipment — 3.2% | |
| | 128,550 | | | Atmel Corp.* | | | 1,138,953 | |
| | 48,520 | | | Cavium Inc.* | | | 2,725,854 | |
| | 67,540 | | | Fairchild Semiconductor International Inc., Class A Shares* | | | 1,185,327 | |
| | 43,800 | | | Monolithic Power Systems Inc. | | | 2,092,764 | |
| | 157,300 | | | ON Semiconductor Corp.* | | | 1,535,248 | |
| | 32,740 | | | Ultratech Inc.* | | | 846,656 | |
| | | | | | | | |
| | | | Total Semiconductors & Semiconductor Equipment | | | 9,524,802 | |
| | | | | | | | |
| Software — 5.4% | |
| | 32,590 | | | A10 Networks Inc.(a)* | | | 379,999 | |
| | 31,500 | | | Aspen Technology Inc.* | | | 1,294,335 | |
| | 76,750 | | | Cadence Design Systems Inc.* | | | 1,353,870 | |
| | 90,080 | | | Callidus Software Inc.* | | | 1,034,119 | |
| | 108,260 | | | Fortinet Inc.* | | | 2,794,191 | |
| | 31,700 | | | Guidewire Software Inc.* | | | 1,443,935 | |
| | 45,100 | | | Manhattan Associates Inc.* | | | 1,302,488 | |
| | 40,742 | | | Proofpoint Inc.* | | | 1,624,791 | |
| | 56,660 | | | QLIK Technologies Inc.* | | | 1,599,512 | |
| | 22,170 | | | Ultimate Software Group Inc. (The)* | | | 3,258,768 | |
| | | | | | | | |
| | | | Total Software | | | 16,086,008 | |
| | | | | | | | |
| Technology Hardware, Storage & Peripherals — 0.9% | |
| | 39,060 | | | Electronics for Imaging Inc.* | | | 1,720,202 | |
| | 36,900 | | | Nimble Storage Inc.* | | | 997,776 | |
| | | | | | | | |
| | | | Total Technology Hardware, Storage & Peripherals | | | 2,717,978 | |
| | | | | | | | |
| | | | TOTAL INFORMATION TECHNOLOGY | | | 55,835,339 | |
| | | | | | | | |
See Notes to Financial Statements.
50
| | | | | | | | |
| Small Capitalization Growth Investments | |
| | |
| Shares/Units | | | Security | | Value | |
| MATERIALS — 4.6% | | | | |
| Chemicals — 2.7% | |
| | 85,080 | | | Chemtura Corp.* | | $ | 2,100,625 | |
| | 122,970 | | | PolyOne Corp. | | | 4,822,884 | |
| | 57,340 | | | Trinseo SA* | | | 1,127,304 | |
| | | | | | | | |
| | | | Total Chemicals | | | 8,050,813 | |
| | | | | | | | |
| Metals & Mining — 1.1% | |
| | 94,460 | | | Horsehead Holding Corp.* | | | 1,907,148 | |
| | 27,790 | | | TimkenSteel Corp. | | | 1,327,806 | |
| | | | | | | | |
| | | | Total Metals & Mining | | | 3,234,954 | |
| | | | | | | | |
| Paper & Forest Products — 0.8% | |
| | 72,240 | | | KapStone Paper and Packaging Corp.* | | | 2,220,657 | |
| | | | | | | | |
| | | | TOTAL MATERIALS | | | 13,506,424 | |
| | | | | | | | |
| TELECOMMUNICATION SERVICES — 1.5% | |
| Diversified Telecommunication Services — 1.3% | |
| | 107,010 | | | Cogent Communications Holdings Inc. | | | 3,708,967 | |
| | | | | | | | |
| Wireless Telecommunication Services — 0.2% | |
| | 54,100 | | | RingCentral Inc., Class A Shares(a)* | | | 726,563 | |
| | | | | | | | |
| | | | TOTAL TELECOMMUNICATION SERVICES | | | 4,435,530 | |
| | | | | | | | |
| | | | TOTAL COMMON STOCKS
(Cost — $220,755,129) | | | 286,012,330 | |
| | | | | | | | |
| | |
Face
Amount | | | | | | |
| SHORT-TERM INVESTMENTS (b) — 13.0% | | | | |
| MONEY MARKET FUND — 9.4% | |
| $ | 27,854,226 | | | Invesco STIT — Government & Agency Portfolio(c)
(Cost — $27,854,226) | | | 27,854,226 | |
| | | | | | | | |
| TIME DEPOSITS — 3.6% | |
| | 5,801,776 | | | ANZ National Bank — London, 0.030% due 9/2/14 | | | 5,801,776 | |
| | 2,005,738 | | | Banco Santander SA — Frankfurt, 0.030% due 9/2/14 | | | 2,005,738 | |
| | 2,729,715 | | | Bank of New York Mellon — Grand Cayman, 0.030% due 9/2/14 | | | 2,729,715 | |
| | | | | | | | |
| | | | TOTAL TIME DEPOSITS
(Cost — $10,537,229) | | | 10,537,229 | |
| | | | | | | | |
| | | | TOTAL SHORT-TERM INVESTMENTS
(Cost — $38,391,455) | | | 38,391,455 | �� |
| | | | | | | | |
| | | | TOTAL INVESTMENTS — 109.5%
(Cost — $259,146,584#) | | | 324,403,785 | |
| | | | | | | | |
| | | | Liabilities in Excess of Other Assets — (9.5)% | | | (28,051,341 | ) |
| | | | | | | | |
| | | | TOTAL NET ASSETS — 100.0% | | $ | 296,352,444 | |
| | | | | | | | |
| * | | Non-income producing security. |
| (a) | | All or a portion of this security is on loan (See Note 1). |
| (b) | | Inclusive of all short term holdings, including collateral received from securities lending activities. Not including such collateral, the percentage of portfolio holdings would be 3.6%. |
| (c) | | Represents investment of collateral received from securities lending transactions. |
| # | | Aggregate cost for federal income tax purposes is $259,676,403. |
See Notes to Financial Statements.
51
| | | | |
| Small Capitalization Growth Investments |
| | |
Abbreviations used in this schedule: |
| ADR | | — American Depositary Receipts |
| PLC | | — Public Limited Company |
| | | | |
| Summary of Investments by Security Sector^ | | | |
Health Care | | | 20.3 | % |
Information Technology | | | 17.2 | |
Industrials | | | 17.1 | |
Consumer Discretionary | | | 13.3 | |
Financials | | | 6.4 | |
Energy | | | 6.2 | |
Materials | | | 4.2 | |
Consumer Staples | | | 2.1 | |
Telecommunication Services | | | 1.4 | |
Short-Term Investments | | | 11.8 | |
| | | | |
| | | 100.0 | % |
| | | | |
| ^ | | As a percentage of total investments. |
See Notes to Financial Statements.
52
| | | | | | | | |
| Small Capitalization Value Equity Investments | |
| | |
| Shares/Units | | | Security | | Value | |
| COMMON STOCKS — 94.9% | |
| CONSUMER DISCRETIONARY — 12.0% | |
| Auto Components — 1.9% | |
| | 77,400 | | | Dana Holding Corp. | | $ | 1,798,002 | |
| | 206,417 | | | Modine Manufacturing Co.* | | | 2,935,250 | |
| | 16,950 | | | Standard Motor Products Inc. | | | 637,489 | |
| | | | | | | | |
| | | | Total Auto Components | | | 5,370,741 | |
| | | | | | | | |
| Automobiles — 1.3% | |
| | 72,422 | | | Thor Industries Inc. | | | 3,889,786 | |
| | | | | | | | |
| Distributors — 0.1% | |
| | 3,340 | | | Core-Mark Holding Co., Inc. | | | 160,855 | |
| | | | | | | | |
| Diversified Consumer Services — 1.7% | |
| | 252,489 | | | Regis Corp. | | | 3,815,109 | |
| | 55,700 | | | Service Corp. International | | | 1,234,869 | |
| | | | | | | | |
| | | | Total Diversified Consumer Services | | | 5,049,978 | |
| | | | | | | | |
| Hotels, Restaurants & Leisure — 2.0% | |
| | 11,500 | | | Brinker International Inc. | | | 562,350 | |
| | 21,100 | | | Cheesecake Factory Inc. (The) | | | 948,445 | |
| | 8,800 | | | Cracker Barrel Old Country Store Inc. | | | 883,608 | |
| | 25,606 | | | International Game Technology | | | 431,717 | |
| | 60,504 | | | International Speedway Corp., Class A Shares | | | 2,026,279 | |
| | 35,400 | | | Texas Roadhouse Inc., Class A Shares | | | 941,286 | |
| | | | | | | | |
| | | | Total Hotels, Restaurants & Leisure | | | 5,793,685 | |
| | | | | | | | |
| Household Durables — 0.4% | |
| | 30,400 | | | Meritage Homes Corp.* | | | 1,254,608 | |
| | | | | | | | |
| Leisure Products — 1.1% | |
| | 16,400 | | | Arctic Cat Inc. | | | 607,128 | |
| | 37,029 | | | Brunswick Corp. | | | 1,592,247 | |
| | 17,451 | | | Sturm Ruger & Co., Inc.(a) | | | 879,705 | |
| | | | | | | | |
| | | | Total Leisure Products | | | 3,079,080 | |
| | | | | | | | |
| Media — 0.9% | |
| | 30,097 | | | Cinemark Holdings Inc. | | | 1,062,123 | |
| | 30,995 | | | Meredith Corp. | | | 1,443,747 | |
| | | | | | | | |
| | | | Total Media | | | 2,505,870 | |
| | | | | | | | |
| Specialty Retail — 2.1% | |
| | 11,100 | | | Asbury Automotive Group Inc.* | | | 773,448 | |
| | 21,000 | | | Buckle Inc. (The)(a) | | | 1,032,780 | |
| | 21,757 | | | Cato Corp. (The), Class A Shares | | | 754,315 | |
| | 21,300 | | | Finish Line Inc. (The), Class A Shares | | | 631,119 | |
| | 9,300 | | | Genesco Inc.* | | | 737,490 | |
| | 11,500 | | | Group 1 Automotive Inc. | | | 921,840 | |
| | 11,700 | | | Guess? Inc. | | | 274,248 | |
| | 32,500 | | | Pier 1 Imports Inc. | | | 512,200 | |
| | 22,900 | | | Stage Stores Inc. | | | 400,063 | |
| | | | | | | | |
| | | | Total Specialty Retail | | | 6,037,503 | |
| | | | | | | | |
| Textiles, Apparel & Luxury Goods — 0.5% | |
| | 8,100 | | | Hanesbrands Inc. | | | 831,708 | |
| | 21,300 | | | Steven Madden Ltd.* | | | 723,987 | |
| | | | | | | | |
| | | | Total Textiles, Apparel & Luxury Goods | | | 1,555,695 | |
| | | | | | | | |
| | | | TOTAL CONSUMER DISCRETIONARY | | | 34,697,801 | |
| | | | | | | | |
See Notes to Financial Statements.
53
| | | | | | | | |
| Small Capitalization Value Equity Investments | |
| | |
| Shares/Units | | | Security | | Value | |
| CONSUMER STAPLES — 3.8% | |
| Food & Staples Retailing — 0.9% | |
| | 16,050 | | | Andersons Inc. (The) | | $ | 1,103,758 | |
| | 6,378 | | | Casey’s General Stores Inc. | | | 457,239 | |
| | 20,000 | | | Weis Markets Inc. | | | 859,000 | |
| | | | | | | | |
| | | | Total Food & Staples Retailing | | | 2,419,997 | |
| | | | | | | | |
| Food Products — 1.4% | |
| | 13,700 | | | Cal-Maine Foods Inc. | | | 1,083,807 | |
| | 13,300 | | | Ingredion Inc. | | | 1,060,808 | |
| | 5,000 | | | J&J Snack Foods Corp. | | | 473,550 | |
| | 18,700 | | | Pinnacle Foods Inc. | | | 605,132 | |
| | 9,681 | | | Sanderson Farms Inc. | | | 903,431 | |
| | | | | | | | |
| | | | Total Food Products | | | 4,126,728 | |
| | | | | | | | |
| Household Products — 1.2% | |
| | 137,600 | | | Central Garden & Pet Co.* | | | 1,212,256 | |
| | 260,793 | | | Central Garden & Pet Co., Class A Shares* | | | 2,349,745 | |
| | | | | | | | |
| | | | Total Household Products | | | 3,562,001 | |
| | | | | | | | |
| Tobacco — 0.3% | |
| | 16,700 | | | Universal Corp.(a) | | | 881,092 | |
| | | | | | | | |
| | | | TOTAL CONSUMER STAPLES | | | 10,989,818 | |
| | | | | | | | |
| ENERGY — 5.4% | |
| Energy Equipment & Services — 2.3% | |
| | 12,200 | | | Bristow Group Inc. | | | 890,356 | |
| | 3,660 | | | Gulfmark Offshore Inc., Class A Shares | | | 147,168 | |
| | 70,800 | | | Helix Energy Solutions Group Inc.* | | | 1,934,256 | |
| | 50,000 | | | Patterson-UTI Energy Inc. | | | 1,727,000 | |
| | 76,500 | | | Precision Drilling Corp. | | | 972,315 | |
| | 17,400 | | | Tidewater Inc. | | | 885,138 | |
| | | | | | | | |
| | | | Total Energy Equipment & Services | | | 6,556,233 | |
| | | | | | | | |
| Oil, Gas & Consumable Fuels — 3.1% | |
| | 19,100 | | | CVR Energy Inc.(a) | | | 947,933 | |
| | 18,700 | | | Jones Energy Inc., Class A Shares* | | | 359,414 | |
| | 31,276 | | | LinnCo LLC(a) | | | 983,630 | |
| | 880 | | | Parsley Energy Inc., Class A Shares* | | | 19,290 | |
| | 48,076 | | | Ship Finance International Ltd.(a) | | | 951,424 | |
| | 41,100 | | | Stone Energy Corp.* | | | 1,446,309 | |
| | 22,798 | | | Western Refining Inc. | | | 1,060,791 | |
| | 25,400 | | | Whiting Petroleum Corp.* | | | 2,353,564 | |
| | 22,300 | | | World Fuel Services Corp. | | | 989,674 | |
| | | | | | | | |
| | | | Total Oil, Gas & Consumable Fuels | | | 9,112,029 | |
| | | | | | | | |
| | | | TOTAL ENERGY | | | 15,668,262 | |
| | | | | | | | |
| FINANCIALS — 21.5% | |
| Banks — 7.6% | |
| | 24,400 | | | Bank of Hawaii Corp. | | | 1,416,420 | |
| | 62,600 | | | Boston Private Financial Holdings Inc. | | | 759,964 | |
| | 34,500 | | | Community Bank System Inc. | | | 1,219,230 | |
| | 25,700 | | | CVB Financial Corp. | | | 399,378 | |
| | 70,485 | | | East West Bancorp Inc. | | | 2,455,697 | |
| | 50,300 | | | First Financial Bancorp | | | 835,483 | |
| | 34,900 | | | First Interstate Bancsystem Inc., Class A Shares | | | 925,548 | |
| | 44,500 | | | First Midwest Bancorp Inc. | | | 749,825 | |
See Notes to Financial Statements.
54
| | | | | | | | |
| Small Capitalization Value Equity Investments | |
| | |
| Shares/Units | | | Security | | Value | |
| FINANCIALS — 21.5% — (continued) | |
| Banks — 7.6% — (continued) | |
| | 75,900 | | | First Niagara Financial Group Inc. | | $ | 660,330 | |
| | 46,378 | | | FirstMerit Corp. | | | 799,325 | |
| | 74,396 | | | Fulton Financial Corp. | | | 858,158 | |
| | 45,541 | | | Hancock Holding Co. | | | 1,513,783 | |
| | 28,800 | | | Independent Bank Corp. | | | 1,060,128 | |
| | 61,041 | | | National Penn Bancshares Inc. | | | 610,410 | |
| | 42,400 | | | NBT Bancorp Inc. | | | 1,018,024 | |
| | 67,600 | | | Old National Bancorp | | | 884,884 | |
| | 23,505 | | | S&T Bancorp Inc. | | | 586,215 | |
| | 92,602 | | | Susquehanna Bancshares Inc. | | | 955,653 | |
| | 35,206 | | | Trustmark Corp. | | | 835,614 | |
| | 40,954 | | | Umpqua Holdings Corp. | | | 715,466 | |
| | 58,705 | | | Webster Financial Corp. | | | 1,731,797 | |
| | 28,800 | | | WesBanco Inc. | | | 894,240 | |
| | | | | | | | |
| | | | Total Banks | | | 21,885,572 | |
| | | | | | | | |
| Capital Markets — 0.6% | |
| | 1,200 | | | Artisan Partners Asset Management Inc., Class A Shares | | | 66,576 | |
| | 21,900 | | | Main Street Capital Corp. | | | 713,064 | |
| | 17,500 | | | Stifel Financial Corp.* | | | 837,900 | |
| | | | | | | | |
| | | | Total Capital Markets | | | 1,617,540 | |
| | | | | | | | |
| Consumer Finance — 0.3% | |
| | 20,200 | | | Cash America International Inc. | | | 901,728 | |
| | | | | | | | |
| Insurance — 6.6% | |
| | 24,363 | | | Allied World Assurance Co. Holdings AG | | | 901,188 | |
| | 16,900 | | | American Financial Group Inc. | | | 1,013,493 | |
| | 77,147 | | | AMERISAFE Inc. | | | 2,910,756 | |
| | 33,000 | | | First American Financial Corp. | | | 935,550 | |
| | 14,700 | | | Infinity Property & Casualty Corp. | | | 1,005,186 | |
| | 283,914 | | | Maiden Holdings Ltd. | | | 3,452,394 | |
| | 28,500 | | | Montpelier Re Holdings Ltd. | | | 896,325 | |
| | 64,178 | | | National Interstate Corp. | | | 1,796,984 | |
| | 24,200 | | | Platinum Underwriters Holdings Ltd. | | | 1,511,774 | |
| | 22,300 | | | ProAssurance Corp. | | | 1,030,260 | |
| | 49,800 | | | Selective Insurance Group Inc. | | | 1,193,706 | |
| | 9,300 | | | StanCorp Financial Group Inc. | | | 609,336 | |
| | 42,700 | | | Symetra Financial Corp. | | | 1,039,318 | |
| | 20,846 | | | Validus Holdings Ltd. | | | 815,287 | |
| | | | | | | | |
| | | | Total Insurance | | | 19,111,557 | |
| | | | | | | | |
| Real Estate Investment Trusts (REITs) — 5.5% | |
| | 31,500 | | | Altisource Residential Corp. | | | 773,010 | |
| | 64,236 | | | Ashford Hospitality Prime Inc. | | | 1,039,981 | |
| | 234,683 | | | Ashford Hospitality Trust Inc. | | | 2,719,976 | |
| | 51,406 | | | Associated Estates Realty Corp. | | | 951,011 | |
| | 31,500 | | | Blackstone Mortgage Trust Inc., Class A Shares | | | 915,075 | |
| | 65,264 | | | Brandywine Realty Trust | | | 1,045,529 | |
| | 46,100 | | | Education Realty Trust Inc. | | | 502,029 | |
| | 69,000 | | | Franklin Street Properties Corp. | | | 838,350 | |
| | 28,900 | | | Healthcare Realty Trust Inc. | | | 721,344 | |
| | 24,900 | | | Highwoods Properties Inc. | | | 1,059,495 | |
| | 89,200 | | | Lexington Realty Trust | | | 970,496 | |
| | 20,200 | | | Omega Healthcare Investors Inc.(a) | | | 760,934 | |
| | 37,500 | | | Ramco-Gershenson Properties Trust | | | 636,000 | |
See Notes to Financial Statements.
55
| | | | | | | | |
| Small Capitalization Value Equity Investments | |
| | |
| Shares/Units | | | Security | | Value | |
| FINANCIALS — 21.5% — (continued) | |
| Real Estate Investment Trusts (REITs) — 5.5% — (continued) | |
| | 61,317 | | | Retail Properties of America Inc., Class A Shares | | $ | 970,035 | |
| | 28,023 | | | Starwood Property Trust Inc. | | | 668,349 | |
| | 50,400 | | | Summit Hotel Properties Inc. | | | 551,880 | |
| | 29,700 | | | Washington Real Estate Investment Trust | | | 825,066 | |
| | | | | | | | |
| | | | Total Real Estate Investment Trusts (REITs) | | | 15,948,560 | |
| | | | | | | | |
| Real Estate Management & Development — 0.3% | |
| | 21,500 | | | Alexander & Baldwin Inc. | | | 879,350 | |
| | | | | | | | |
| Thrifts & Mortgage Finance — 0.6% | |
| | 40,600 | | | Home Loan Servicing Solutions Ltd. | | | 889,140 | |
| | 38,500 | | | Washington Federal Inc. | | | 837,375 | |
| | | | | | | | |
| | | | Total Thrifts & Mortgage Finance | | | 1,726,515 | |
| | | | | | | | |
| | | | TOTAL FINANCIALS | | | 62,070,822 | |
| | | | | | | | |
| HEALTH CARE — 5.1% | |
| Health Care Equipment & Supplies — 3.7% | |
| | 1,520 | | | Analogic Corp. | | | 109,744 | |
| | 6,400 | | | Cooper Cos., Inc. (The) | | | 1,043,392 | |
| | 14,600 | | | Haemonetics Corp.* | | | 521,074 | |
| | 203,090 | | | Invacare Corp. | | | 3,115,401 | |
| | 44,300 | | | STERIS Corp. | | | 2,493,647 | |
| | 17,100 | | | Teleflex Inc. | | | 1,872,108 | |
| | 34,205 | | | West Pharmaceutical Services Inc. | | | 1,485,523 | |
| | | | | | | | |
| | | | Total Health Care Equipment & Supplies | | | 10,640,889 | |
| | | | | | | | |
| Health Care Providers & Services — 1.1% | |
| | 26,050 | | | Owens & Minor Inc.(a) | | | 896,120 | |
| | 74,800 | | | Select Medical Holdings Corp. | | | 1,048,696 | |
| | 27,700 | | | VCA Inc.* | | | 1,128,775 | |
| | | | | | | | |
| | | | Total Health Care Providers & Services | | | 3,073,591 | |
| | | | | | | | |
| Life Sciences Tools & Services — 0.3% | |
| | 22,300 | | | PerkinElmer Inc. | | | 1,000,155 | |
| | | | | | | | |
| | | | TOTAL HEALTH CARE | | | 14,714,635 | |
| | | | | | | | |
| INDUSTRIALS — 24.6% | |
| Aerospace & Defense — 1.4% | |
| | 35,700 | | | AAR Corp. | | | 988,890 | |
| | 7,000 | | | Alliant Techsystems Inc. | | | 882,000 | |
| | 6,100 | | | Curtiss-Wright Corp. | | | 438,224 | |
| | 14,400 | | | Elbit Systems Ltd.(a) | | | 862,128 | |
| | 13,500 | | | Triumph Group Inc. | | | 936,495 | |
| | | | | | | | |
| | | | Total Aerospace & Defense | | | 4,107,737 | |
| | | | | | | | |
| Building Products — 1.5% | |
| | 216,309 | | | NCI Building Systems Inc.* | | | 4,317,528 | |
| | | | | | | | |
| Commercial Services & Supplies — 4.8% | |
| | 354,653 | | | ACCO Brands Corp.* | | | 2,741,468 | |
| | 18,200 | | | Brink’s Co. (The) | | | 498,316 | |
| | 56,400 | | | Ennis Inc. | | | 813,852 | |
| | 409,800 | | | InnerWorkings Inc.* | | | 3,552,966 | |
| | 29,600 | | | Knoll Inc. | | | 541,384 | |
| | 8,900 | | | UniFirst Corp. | | | 862,855 | |
| | 15,100 | | | United Stationers Inc. | | | 613,815 | |
See Notes to Financial Statements.
56
| | | | | | | | |
| Small Capitalization Value Equity Investments | |
| | |
| Shares/Units | | | Security | | Value | |
| INDUSTRIALS — 24.6% — (continued) | |
| Commercial Services & Supplies — 4.8% — (continued) | |
| | 145,760 | | | Viad Corp. | | $ | 3,197,974 | |
| | 36,996 | | | West Corp. | | | 1,097,301 | |
| | | | | | | | |
| | | | Total Commercial Services & Supplies | | | 13,919,931 | |
| | | | | | | | |
| Construction & Engineering — 2.5% | |
| | 5,700 | | | Granite Construction Inc. | | | 201,039 | |
| | 159,164 | | | Great Lakes Dredge & Dock Corp.* | | | 1,212,830 | |
| | 302,501 | | | Layne Christensen Co.*(a) | | | 3,442,461 | |
| | 46,900 | | | MasTec Inc.* | | | 1,430,450 | |
| | 29,150 | | | Primoris Services Corp. | | | 846,516 | |
| | | | | | | | |
| | | | Total Construction & Engineering | | | 7,133,296 | |
| | | | | | | | |
| Electrical Equipment — 2.7% | |
| | 18,300 | | | AZZ Inc. | | | 848,022 | |
| | 28,100 | | | Babcock & Wilcox Co. (The) | | | 816,305 | |
| | 13,600 | | | EnerSys | | | 874,344 | |
| | 386,994 | | | GrafTech International Ltd.*(a) | | | 3,378,458 | |
| | 15,000 | | | Regal-Beloit Corp. | | | 1,066,050 | |
| | 29,900 | | | Thermon Group Holdings Inc.* | | | 811,785 | |
| | | | | | | | |
| | | | Total Electrical Equipment | | | 7,794,964 | |
| | | | | | | | |
| Machinery — 9.2% | |
| | 24,700 | | | Actuant Corp., Class A Shares | | | 833,131 | |
| | 33,075 | | | Altra Industrial Motion Corp. | | | 1,100,074 | |
| | 24,400 | | | Barnes Group Inc. | | | 835,456 | |
| | 153,976 | | | Briggs & Stratton Corp.(a) | | | 3,101,077 | |
| | 2,989 | | | CIRCOR International Inc. | | | 212,787 | |
| | 14,100 | | | Crane Co. | | | 981,219 | |
| | 176,074 | | | Douglas Dynamics Inc. | | | 3,510,916 | |
| | 10,900 | | | EnPro Industries Inc.* | | | 740,110 | |
| | 132,345 | | | Harsco Corp. | | | 3,202,749 | |
| | 46,900 | | | ITT Corp. | | | 2,244,634 | |
| | 119,155 | | | John Bean Technologies Corp. | | | 3,461,453 | |
| | 20,400 | | | Kennametal Inc. | | | 914,124 | |
| | 370,192 | | | Mueller Water Products Inc., Class A Shares | | | 3,416,872 | |
| | 25,150 | | | Trinity Industries Inc. | | | 1,216,757 | |
| | 6,400 | | | Valmont Industries Inc.(a) | | | 900,800 | |
| | | | | | | | |
| | | | Total Machinery | | | 26,672,159 | |
| | | | | | | | |
| Marine — 0.5% | |
| | 6,600 | | | Kirby Corp.* | | | 787,314 | |
| | 21,000 | | | Matson Inc. | | | 566,790 | |
| | | | | | | | |
| | | | Total Marine | | | 1,354,104 | |
| | | | | | | | |
| Road & Rail — 0.6% | |
| | 16,450 | | | Saia Inc.* | | | 780,881 | |
| | 36,200 | | | Werner Enterprises Inc. | | | 901,380 | |
| | | | | | | | |
| | | | Total Road & Rail | | | 1,682,261 | |
| | | | | | | | |
| Trading Companies & Distributors — 1.4% | |
| | 13,165 | | | GATX Corp. | | | 872,445 | |
| | 34,764 | | | H&E Equipment Services Inc. | | | 1,422,195 | |
| | 18,800 | | | TAL International Group Inc.*(a) | | | 830,960 | |
| | 8,200 | | | United Rentals Inc.* | | | 964,730 | |
| | | | | | | | |
| | | | Total Trading Companies & Distributors | | | 4,090,330 | |
| | | | | | | | |
| | | | TOTAL INDUSTRIALS | | | 71,072,310 | |
| | | | | | | | |
See Notes to Financial Statements.
57
| | | | | | | | |
| Small Capitalization Value Equity Investments | |
| | |
| Shares/Units | | | Security | | Value | |
| INFORMATION TECHNOLOGY — 7.3% | |
| Communications Equipment — 0.9% | |
| | 14,100 | | | Black Box Corp. | | $ | 333,465 | |
| | 103,100 | | | Brocade Communications Systems Inc. | | | 1,087,705 | |
| | 41,200 | | | CommScope Holding Co., Inc.* | | | 1,061,312 | |
| | | | | | | | |
| | | | Total Communications Equipment | | | 2,482,482 | |
| | | | | | | | |
| Electronic Equipment, Instruments & Components — 1.6% | |
| | 57,400 | | | AVX Corp. | | | 790,972 | |
| | 14,300 | | | Belden Inc. | | | 1,044,901 | |
| | 18,400 | | | Tech Data Corp.* | | | 1,242,000 | |
| | 97,700 | | | Vishay Intertechnology Inc. | | | 1,563,200 | |
| | | | | | | | |
| | | | Total Electronic Equipment, Instruments & Components | | | 4,641,073 | |
| | | | | | | | |
| Internet Software & Services — 0.3% | |
| | 17,900 | | | j2 Global Inc.(a) | | | 956,755 | |
| | | | | | | | |
| IT Services — 0.6% | |
| | 41,500 | | | Booz Allen Hamilton Holding Corp., Class A Shares | | | 920,470 | |
| | 34,300 | | | CSG Systems International Inc. | | | 950,796 | |
| | | | | | | | |
| | | | Total IT Services | | | 1,871,266 | |
| | | | | | | | |
| Semiconductors & Semiconductor Equipment — 1.5% | |
| | 27,000 | | | Cirrus Logic Inc.* | | | 652,860 | |
| | 126,600 | | | ON Semiconductor Corp.* | | | 1,235,616 | |
| | 95,800 | | | RF Micro Devices Inc.* | | | 1,194,626 | |
| | 57,500 | | | Teradyne Inc.(a) | | | 1,183,925 | |
| | | | | | | | |
| | | | Total Semiconductors & Semiconductor Equipment | | | 4,267,027 | |
| | | | | | | | |
| Software — 2.1% | |
| | 107,900 | | | Compuware Corp. | | | 1,008,865 | |
| | 42,749 | | | Mentor Graphics Corp. | | | 932,356 | |
| | 24,300 | | | NetScout Systems Inc.* | | | 1,119,501 | |
| | 33,300 | | | PTC Inc.* | | | 1,288,377 | |
| | 42,800 | | | Synopsys Inc.* | | | 1,750,520 | |
| | | | | | | | |
| | | | Total Software | | | 6,099,619 | |
| | | | | | | | |
| Technology Hardware, Storage & Peripherals — 0.3% | |
| | 20,430 | | | Electronics for Imaging Inc.* | | | 899,737 | |
| | | | | | | | |
| | | | TOTAL INFORMATION TECHNOLOGY | | | 21,217,959 | |
| | | | | | | | |
| MATERIALS — 12.5% | |
| Chemicals — 5.0% | |
| | 17,500 | | | Albemarle Corp. | | | 1,112,650 | |
| | 19,800 | | | Cabot Corp. | | | 1,084,644 | |
| | 72,400 | | | Chemtura Corp.* | | | 1,787,556 | |
| | 13,500 | | | Cytec Industries Inc. | | | 1,391,040 | |
| | 35,000 | | | HB Fuller Co. | | | 1,646,400 | |
| | 14,400 | | | Innophos Holdings Inc. | | | 837,360 | |
| | 212,800 | | | Intrepid Potash Inc.*(a) | | | 3,262,224 | |
| | 14,700 | | | Methanex Corp. | | | 982,254 | |
| | 60,035 | | | Olin Corp. | | | 1,638,355 | |
| | 23,800 | | | Rayonier Advanced Materials Inc.*(a) | | | 790,398 | |
| | | | | | | | |
| | | | Total Chemicals | | | 14,532,881 | |
| | | | | | | | |
| Construction Materials — 1.3% | |
| | 286,688 | | | Headwaters Inc.* | | | 3,724,077 | |
| | | | | | | | |
See Notes to Financial Statements.
58
| | | | | | | | |
| Small Capitalization Value Equity Investments | |
| | |
| Shares/Units | | | Security | | Value | |
| MATERIALS — 12.5% — (continued) | |
| Containers & Packaging — 1.3% | |
| | 48,500 | | | Berry Plastics Group Inc.* | | $ | 1,169,335 | |
| | 16,400 | | | Rock-Tenn Co., Class A Shares | | | 806,224 | |
| | 18,400 | | | Silgan Holdings Inc. | | | 926,440 | |
| | 22,100 | | | Sonoco Products Co. | | | 909,636 | |
| | | | | | | | |
| | | | Total Containers & Packaging | | | 3,811,635 | |
| | | | | | | | |
| Metals & Mining — 4.3% | |
| | 49,600 | | | Commercial Metals Co. | | | 857,088 | |
| | 166,354 | | | Globe Specialty Metals Inc. | | | 3,416,911 | |
| | 61,900 | | | HudBay Minerals Inc. | | | 627,047 | |
| | 18,700 | | | Kaiser Aluminum Corp. | | | 1,506,285 | |
| | 13,500 | | | Royal Gold Inc. | | | 1,049,625 | |
| | 32,500 | | | Ryerson Holding Corp.* | | | 355,875 | |
| | 134,700 | | | Schnitzer Steel Industries Inc., Class A Shares(a) | | | 3,729,843 | |
| | 43,200 | | | Steel Dynamics Inc. | | | 1,003,968 | |
| | | | | | | | |
| | | | Total Metals & Mining | | | 12,546,642 | |
| | | | | | | | |
| Paper & Forest Products — 0.6% | |
| | 35,600 | | | P.H. Glatfelter Co. | | | 887,508 | |
| | 17,352 | | | Schweitzer-Mauduit International Inc. | | | 743,360 | |
| | | | | | | | |
| | | | Total Paper & Forest Products | | | 1,630,868 | |
| | | | | | | | |
| | | | TOTAL MATERIALS | | | 36,246,103 | |
| | | | | | | | |
| TELECOMMUNICATION SERVICES — 0.2% | |
| Diversified Telecommunication Services — 0.2% | |
| | 39,300 | | | Premiere Global Services Inc.* | | | 517,581 | |
| | | | | | | | |
| UTILITIES — 2.5% | |
| Electric Utilities — 0.9% | |
| | 42,892 | | | El Paso Electric Co. | | | 1,687,371 | |
| | 34,400 | | | Great Plains Energy Inc. | | | 883,048 | |
| | | | | | | | |
| | | | Total Electric Utilities | | | 2,570,419 | |
| | | | | | | | |
| Gas Utilities — 1.0% | |
| | 18,900 | | | Laclede Group Inc. (The) | | | 934,605 | |
| | 22,300 | | | Southwest Gas Corp. | | | 1,164,283 | |
| | 17,500 | | | UGI Corp. | | | 927,150 | |
| | | | | | | | |
| | | | Total Gas Utilities | | | 3,026,038 | |
| | | | | | | | |
| Multi-Utilities — 0.6% | |
| | 15,500 | | | Black Hills Corp. | | | 832,815 | |
| | 18,300 | | | NorthWestern Corp. | | | 883,524 | |
| | | | | | | | |
| | | | Total Multi-Utilities | | | 1,716,339 | |
| | | | | | | | |
| | | | TOTAL UTILITIES | | | 7,312,796 | |
| | | | | | | | |
| | | | TOTAL COMMON STOCKS
(Cost — $195,805,712) | | | 274,508,087 | |
| | | | | | | | |
| EXCHANGE-TRADED SECURITIES — 0.1% | |
| FINANCIALS — 0.1% | |
| Capital Markets — 0.1% | |
| | 30,300 | | | Central Fund of Canada Ltd., Class A Shares
(Cost — $440,088) | | | 418,443 | |
| | | | | | | | |
| | | | TOTAL INVESTMENTS BEFORE SHORT-TERM INVESTMENTS
(Cost — $196,245,800) | | | 274,926,530 | |
| | | | | | | | |
See Notes to Financial Statements.
59
| | | | | | | | |
| Small Capitalization Value Equity Investments | |
| | |
Face
Amount | | | Security | | Value | |
| SHORT-TERM INVESTMENTS (b) — 12.4% | |
| MONEY MARKET FUND — 7.2% | |
| $ | 20,876,827 | | | Invesco STIT — Government & Agency Portfolio(c)
(Cost — $20,876,827) | | $ | 20,876,827 | |
| | | | | | | | |
| TIME DEPOSITS — 5.2% | |
| | 4,829,231 | | | ANZ National Bank — London, 0.030% due 9/2/14 | | | 4,829,231 | |
| | 8,469,792 | | | Banco Santander SA — Frankfurt, 0.030% due 9/2/14 | | | 8,469,792 | |
| | 1,771,153 | | | Wells Fargo — Grand Cayman, 0.030% due 9/2/14 | | | 1,771,153 | |
| | | | | | | | |
| | | | TOTAL TIME DEPOSITS
(Cost — $15,070,176) | | | 15,070,176 | |
| | | | | | | | |
| | | | TOTAL SHORT-TERM INVESTMENTS
(Cost — $35,947,003) | | | 35,947,003 | |
| | | | | | | | |
| | | | TOTAL INVESTMENTS — 107.4%
(Cost — $232,192,803#) | | | 310,873,533 | |
| | | | | | | | |
| | | | Liabilities in Excess of Other Assets — (7.4)% | | | (21,499,176 | ) |
| | | | | | | | |
| | | | TOTAL NET ASSETS — 100.0% | | $ | 289,374,357 | |
| | | | | | | | |
| * | | Non-income producing security. |
| (a) | | All or a portion of this security is on loan (See Note 1). |
| (b) | | Inclusive of all short term holdings, including collateral received from securities lending activities. Not including such collateral, the percentage of portfolio holdings would be 5.2%. |
| (c) | | Represents investment of collateral received from securities lending transactions. |
| # | | Aggregate cost for federal income tax purposes is $233,389,251. |
| | | | |
| Summary of Investments by Security Sector^ | | | |
Industrials | | | 22.9 | % |
Financials | | | 20.1 | |
Materials | | | 11.7 | |
Consumer Discretionary | | | 11.2 | |
Information Technology | | | 6.8 | |
Energy | | | 5.0 | |
Health Care | | | 4.7 | |
Consumer Staples | | | 3.5 | |
Utilities | | | 2.3 | |
Telecommunication Services | | | 0.2 | |
Short-Term Investments | | | 11.6 | |
| | | | |
| | | 100.0 | % |
| | | | |
| ^ | | As a percentage of total investments. |
See Notes to Financial Statements.
60
| | | | | | | | |
| International Equity Investments | |
| | |
| Shares/Units | | | Security | | Value | |
| COMMON STOCKS — 95.1% | |
| Australia — 3.8% | |
| | 149,685 | | | Abacus Property Group REIT | | $ | 377,751 | |
| | 358,302 | | | Amcor Ltd. | | | 3,831,803 | |
| | 482,363 | | | Arrium Ltd. | | | 355,822 | |
| | 331,070 | | | Atlas Iron Ltd. | | | 176,887 | |
| | 17,721 | | | Ausdrill Ltd. | | | 21,646 | |
| | 125,512 | | | Australia & New Zealand Banking Group Ltd. | | | 3,927,873 | |
| | 28,042 | | | Bank of Queensland Ltd. | | | 329,821 | |
| | 279,072 | | | Beach Energy Ltd. | | | 423,728 | |
| | 18,018 | | | Bentham IMF Ltd. | | | 33,502 | |
| | 385,919 | | | BHP Billiton PLC | | | 12,221,530 | |
| | 322,119 | | | Brambles Ltd. | | | 2,864,026 | |
| | 14,277 | | | Challenger Ltd. | | | 104,805 | |
| | 36,032 | | | CSL Ltd. | | | 2,488,652 | |
| | 99,572 | | | Decmil Group Ltd. | | | 188,008 | |
| | 562,265 | | | Downer EDI Ltd. | | | 2,559,450 | |
| | 57,919 | | | DUET Group | | | 132,062 | |
| | 51,722 | | | Evolution Mining Ltd. | | | 36,845 | |
| | 450,275 | | | Fairfax Media Ltd. | | | 364,267 | |
| | 954,107 | | | Grange Resources Ltd. | | | 147,769 | |
| | 14,947 | | | GUD Holdings Ltd. | | | 109,780 | |
| | 8,214 | | | IOOF Holdings Ltd. | | | 72,421 | |
| | 76,112 | | | Leighton Holdings Ltd. | | | 1,596,840 | |
| | 20,450 | | | MACA Ltd. | | | 41,057 | |
| | 1 | | | Matrix Composites & Engineering Ltd.* | | | 1 | |
| | 147,006 | | | Mount Gibson Iron Ltd. | | | 95,099 | |
| | 108,326 | | | National Australia Bank Ltd. | | | 3,569,869 | |
| | 383,754 | | | NRW Holdings Ltd. | | | 374,908 | |
| | 4,753 | | | Panoramic Resources Ltd.* | | | 3,528 | |
| | 29,178 | | | Primary Health Care Ltd. | | | 123,323 | |
| | 194,392 | | | Seven West Media Ltd. | | | 337,690 | |
| | 47,920 | | | Sigma Pharmaceuticals Ltd. | | | 37,039 | |
| | 101,796 | | | Sonic Healthcare Ltd. | | | 1,678,426 | |
| | 241,146 | | | STW Communications Group Ltd. | | | 292,968 | |
| | 926,905 | | | Toll Holdings Ltd. | | | 5,181,148 | |
| | | | | | | | |
| | | | Total Australia | | | 44,100,344 | |
| | | | | | | | |
| Austria — 0.2% | |
| | 27,322 | | | Austria Technologie & Systemtechnik AG | | | 315,814 | |
| | 12,384 | | | EVN AG | | | 167,671 | |
| | 109 | | | Oesterreichische Post AG | | | 5,107 | |
| | 28,638 | | | S IMMO AG* | | | 220,410 | |
| | 9,634 | | | Schoeller-Bleckmann Oilfield Equipment AG | | | 1,014,032 | |
| | | | | | | | |
| | | | Total Austria | | | 1,723,034 | |
| | | | | | | | |
| Belgium — 1.1% | |
| | 16,286 | | | Anheuser-Busch InBev NV | | | 1,812,377 | |
| | 758 | | | Barco NV | | | 53,757 | |
| | 55,453 | | | Delhaize Group SA | | | 3,867,366 | |
| | 585 | | | Elia System Operator SA | | | 28,557 | |
| | 35,182 | | | KBC Groep NV* | | | 2,009,410 | |
| | 9,088 | | | NV Bekaert SA | | | 338,122 | |
| | 18,389 | | | Recticel SA | | | 174,042 | |
| | 48,076 | | | UCB SA | | | 4,659,121 | |
| | | | | | | | |
| | | | Total Belgium | | | 12,942,752 | |
| | | | | | | | |
See Notes to Financial Statements.
61
| | | | | | | | |
| International Equity Investments | |
| | |
| Shares/Units | | | Security | | Value | |
| Bermuda — 0.0% | |
| | 51,594 | | | Catlin Group Ltd. | | $ | 440,003 | |
| | | | | | | | |
| Brazil — 0.6% | |
| | 270,100 | | | AMBEV SA | | | 1,966,030 | |
| | 158,700 | | | Embraer SA | | | 1,545,648 | |
| | 296,610 | | | Vale SA, Class B Shares, ADR | | | 3,455,507 | |
| | | | | | | | |
| | | | Total Brazil | | | 6,967,185 | |
| | | | | | | | |
| Canada — 1.7% | |
| | 11,371 | | | Canadian Pacific Railway Ltd. | | | 2,280,693 | |
| | 32,655 | | | Dollarama Inc. | | | 2,783,877 | |
| | 39,400 | | | Imperial Oil Ltd. | | | 2,099,447 | |
| | 24,651 | | | Methanex Corp. | | | 1,650,438 | |
| | 23,831 | | | Saputo Inc. | | | 1,451,565 | |
| | 139,341 | | | Suncor Energy Inc. | | | 5,727,116 | |
| | 65,023 | | | Toronto-Dominion Bank (The) | | | 3,428,251 | |
| | | | | | | | |
| | | | Total Canada | | | 19,421,387 | |
| | | | | | | | |
| China — 1.2% | |
| | 6,963,000 | | | Agricultural Bank of China Ltd., Class H Shares(a) | | | 3,223,854 | |
| | 3,554,500 | | | China Railway Construction Corp., Ltd., Class H Shares(a) | | | 3,404,069 | |
| | 3,005,500 | | | CNOOC Ltd. | | | 6,021,377 | |
| | 17,490 | | | Ctrip.com International Ltd., ADR* | | | 1,122,333 | |
| | | | | | | | |
| | | | Total China | | | 13,771,633 | |
| | | | | | | | |
| Denmark — 1.0% | |
| | 4,126 | | | DFDS AS | | | 351,458 | |
| | 6,024 | | | NKT Holding AS | | | 355,211 | |
| | 130,637 | | | Novo Nordisk AS, Class B Shares | | | 5,978,888 | |
| | 1,773 | | | PER Aarsleff AS, Class B Shares | | | 331,626 | |
| | 1,689 | | | Schouw & Co. | | | 81,046 | |
| | 2,495 | | | Solar AS, Class B Shares | | | 154,145 | |
| | 2,998 | | | Spar Nord Bank AS | | | 32,031 | |
| | 352,270 | | | TDC AS | | | 3,027,239 | |
| | 17,632 | | | William Demant Holding AS* | | | 1,362,788 | |
| | | | | | | | |
| | | | Total Denmark | | | 11,674,432 | |
| | | | | | | | |
| Finland — 0.5% | |
| | 10,953 | | | Atria PLC, Class A Shares | | | 102,980 | |
| | 36,809 | | | Citycon OYJ | | | 135,583 | |
| | 16,122 | | | Cramo OYJ | | | 288,805 | |
| | 10,695 | | | Kesko OYJ, Class B Shares | | | 391,816 | |
| | 43,401 | | | Metsa Board OYJ | | | 198,703 | |
| | 590,684 | | | Nokia OYJ(b) | | | 4,971,104 | |
| | 2,800 | | | Technopolis OYJ | | | 15,536 | |
| | 1,090 | | | Tieto OYJ | | | 29,684 | |
| | | | | | | | |
| | | | Total Finland | | | 6,134,211 | |
| | | | | | | | |
| France — 10.9% | |
| | 46,479 | | | Acanthe Developpement SA REIT(b) | | | 25,660 | |
| | 45,097 | | | Accor SA | | | 2,193,279 | |
| | 32,857 | | | Airbus Group NV | | | 2,023,489 | |
| | 6,346 | | | Altamir | | | 96,334 | |
| | 29,170 | | | Arkema SA | | | 2,193,080 | |
| | 283,290 | | | AXA SA | | | 7,026,885 | |
| | 173,439 | | | BNP Paribas SA | | | 11,725,822 | |
| | 2,104 | | | Boiron SA | | | 184,061 | |
| | 1,052 | | | Caisse Regionale de Credit Agricole Mutuel Nord de France | | | 22,366 | |
See Notes to Financial Statements.
62
| | | | | | | | |
| International Equity Investments | |
| | |
| Shares/Units | | | Security | | Value | |
| France — 10.9% — (continued) | |
| | 34,312 | | | Casino Guichard Perrachon SA | | $ | 4,098,396 | |
| | 8,860 | | | Cegid Group | | | 341,025 | |
| | 46,783 | | | Cie de Saint-Gobain | | | 2,379,496 | |
| | 46,089 | | | Credit Agricole SA | | | 683,537 | |
| | 26,388 | | | Danone SA | | | 1,843,010 | |
| | 32,300 | | | Dassault Systemes | | | 2,141,416 | |
| | 71,963 | | | Edenred | | | 2,136,369 | |
| | 1,174 | | | Eiffage SA | | | 76,130 | |
| | 48,730 | | | Essilor International SA | | | 5,174,480 | |
| | 45 | | | Euler Hermes Group | | | 5,124 | |
| | 307,189 | | | GDF Suez | | | 7,580,341 | |
| | 5,432 | | | Guerbet | | | 247,420 | |
| | 5,750 | | | Iliad SA | | | 1,266,065 | |
| | 16,075 | | | Jacquet Metal Service | | | 334,852 | |
| | 22,954 | | | Kering | | | 4,864,939 | |
| | 8,263 | | | Korian-Medica | | | 289,129 | |
| | 110,402 | | | Legrand SA | | | 6,107,192 | |
| | 15,517 | | | L’Oréal SA | | | 2,569,718 | |
| | 20,326 | | | LVMH Moët Hennessy Louis Vuitton SA | | | 3,527,670 | |
| | 2,232 | | | Maisons France Confort SA | | | 96,882 | |
| | 2,981 | | | Nexity SA | | | 121,909 | |
| | 224,921 | | | Orange SA | | | 3,410,109 | |
| | 6,110 | | | Orpea | | | 403,298 | |
| | 12,843 | | | Pernod Ricard SA | | | 1,514,855 | |
| | 1,213 | | | Rallye SA | | | 57,972 | |
| | 65,287 | | | Safran SA | | | 4,280,571 | |
| | 849 | | | Saft Groupe SA | | | 31,083 | |
| | 85,784 | | | Sanofi | | | 9,414,501 | |
| | 124,022 | | | Schneider Electric SE | | | 10,483,490 | |
| | 20,228 | | | SEB SA | | | 1,593,120 | |
| | 57,153 | | | Societe Generale SA | | | 2,895,960 | |
| | 2,213 | | | Sopra Group SA | | | 210,254 | |
| | 201,105 | | | Suez Environnement Co. | | | 3,712,337 | |
| | 72,446 | | | Technip SA | | | 6,712,733 | |
| | 122,295 | | | Total SA | | | 8,074,611 | |
| | 6,132 | | | Valeo SA | | | 742,608 | |
| | | | | | | | |
| | | | Total France | | | 124,913,578 | |
| | | | | | | | |
| Georgia — 0.0% | |
| | 2,871 | | | Bank of Georgia Holdings PLC | | | 118,091 | |
| | | | | | | | |
| Germany — 9.8% | |
| | 8,225 | | | Aareal Bank AG | | | 368,391 | |
| | 29,356 | | | Adidas AG | | | 2,201,033 | |
| | 38,331 | | | Allianz SE, Class Registered Shares | | | 6,539,749 | |
| | 537 | | | Aurubis AG | | | 26,390 | |
| | 49,417 | | | BASF SE | | | 5,086,523 | |
| | 65,264 | | | Bayer AG, Class Registered Shares | | | 8,755,942 | |
| | 48,292 | | | Bayerische Motoren Werke AG | | | 5,624,167 | |
| | 3,649 | | | Bilfinger SE | | | 277,701 | |
| | 31,257 | | | Borussia Dortmund GmbH & Co. KGaA | | | 196,417 | |
| | 37,432 | | | Brenntag AG | | | 1,983,150 | |
| | 851 | | | Cewe Stiftung & Co. KGAA | | | 56,951 | |
| | 15,763 | | | CompuGroup Medical AG | | | 395,083 | |
| | 27,961 | | | Continental AG | | | 5,973,695 | |
| | 79,416 | | | Daimler AG, Class Registered Shares | | | 6,498,002 | |
| | 64,615 | | | Deutsche Bank AG, Class Registered Shares | | | 2,212,260 | |
See Notes to Financial Statements.
63
| | | | | | | | |
| International Equity Investments | |
| | |
| Shares/Units | | | Security | | Value | |
| Germany — 9.8% — (continued) | |
| | 6,614 | | | Deutsche Beteiligungs AG | | $ | 188,654 | |
| | 207,160 | | | Deutsche Telekom AG, Class Registered Shares | | | 3,100,126 | |
| | 95,681 | | | DMG MORI SEIKI AG | | | 2,751,040 | |
| | 9,914 | | | Freenet AG | | | 265,253 | |
| | 68,819 | | | GEA Group AG | | | 3,115,302 | |
| | 3,345 | | | Grammer AG | | | 147,003 | |
| | 29,210 | | | Hannover Rueck SE | | | 2,426,931 | |
| | 47,704 | | | HeidelbergCement AG | | | 3,604,346 | |
| | 5,155 | | | Leoni AG | | | 317,980 | |
| | 17,461 | | | Linde AG | | | 3,459,448 | |
| | 113,230 | | | Metro AG* | | | 3,978,718 | |
| | 54,792 | | | Rheinmetall AG | | | 2,966,860 | |
| | 2,905 | | | SAF-Holland SA | | | 40,227 | |
| | 138,051 | | | SAP SE | | | 10,744,852 | |
| | 60,514 | | | Siemens AG, Class Registered Shares | | | 7,584,330 | |
| | 9,125 | | | Sixt SE | | | 336,972 | |
| | 35,766 | | | Software AG | | | 923,571 | |
| | 82,443 | | | Stada Arzneimittel AG | | | 3,292,435 | |
| | 29,157 | | | Symrise AG | | | 1,558,245 | |
| | 203,000 | | | Telefonica Deutschland Holding AG | | | 1,544,816 | |
| | 22,767 | | | TUI AG | | | 331,600 | |
| | 57,894 | | | United Internet AG, Class Registered Shares | | | 2,489,258 | |
| | 32,648 | | | Volkswagen AG | | | 7,319,023 | |
| | 15,987 | | | VTG AG | | | 302,819 | |
| | 16,167 | | | Wacker Neuson SE | | | 347,063 | |
| | 65,202 | | | Wincor Nixdorf AG | | | 3,473,372 | |
| | | | | | | | |
| | | | Total Germany | | | 112,805,698 | |
| | | | | | | | |
| Hong Kong — 2.5% | |
| | 789,200 | | | AIA Group Ltd. | | | 4,297,600 | |
| | 632,000 | | | Century City International Holdings Ltd. | | | 50,544 | |
| | 476,000 | | | China Merchants Holdings International Co., Ltd. | | | 1,570,104 | |
| | 401,000 | | | China Mobile Ltd. | | | 4,993,257 | |
| | 14,336 | | | Dah Sing Banking Group Ltd. | | | 25,752 | |
| | 243,500 | | | Dickson Concepts International Ltd. | | | 137,930 | |
| | 140,000 | | | Emperor Entertainment Hotel Ltd. | | | 45,337 | |
| | 1,198,000 | | | Emperor International Holdings Ltd. | | | 290,485 | |
| | 760,000 | | | Get Nice Holdings Ltd. | | | 38,725 | |
| | 314,000 | | | Hongkong Land Holdings Ltd. | | | 2,150,717 | |
| | 574,000 | | | Hsin Chong Construction Group Ltd. | | | 77,009 | |
| | 97,610 | | | Jardine Strategic Holdings Ltd. | | | 3,552,592 | |
| | 753,000 | | | Kerry Properties Ltd. | | | 2,789,498 | |
| | 251,000 | | | Link REIT (The) | | | 1,489,529 | |
| | 675,000 | | | Luk Fook Holdings International Ltd. | | | 2,115,691 | |
| | 1,204,000 | | | Pacific Andes International Holdings Ltd. | | | 52,811 | |
| | 316,000 | | | Paliburg Holdings Ltd. | | | 109,310 | |
| | 101,000 | | | Prosperity REIT | | | 33,749 | |
| | 54,000 | | | Regal Hotels International Holdings Ltd. | | | 32,540 | |
| | 475,000 | | | Regal Real Estate Investment Trust | | | 135,395 | |
| | 248,000 | | | Samson Holding Ltd. | | | 32,621 | |
| | 746,000 | | | SITC International Holdings Co., Ltd. | | | 331,993 | |
| | 52,000 | | | Sitoy Group Holdings Ltd. | | | 36,864 | |
| | 1,399,000 | | | SJM Holdings Ltd. | | | 3,521,425 | |
| | 78,000 | | | Sunlight Real Estate Investment Trust | | | 32,707 | |
| | 66,000 | | | Texwinca Holdings Ltd. | | | 60,121 | |
| | 977,200 | | | VST Holdings Ltd. | | | 249,582 | |
See Notes to Financial Statements.
64
| | | | | | | | |
| International Equity Investments | |
| | |
| Shares/Units | | | Security | | Value | |
| Hong Kong — 2.5% — (continued) | |
| | 54,000 | | | Xinyi Glass Holdings Ltd. | | $ | 34,017 | |
| | | | | | | | |
| | | | Total Hong Kong | | | 28,287,905 | |
| | | | | | | | |
| India — 0.6% | |
| | 34,290 | | | ICICI Bank Ltd., ADR | | | 1,834,515 | |
| | 4,293 | | | Infosys Ltd. | | | 255,531 | |
| | 62,510 | | | Infosys Ltd., ADR(b) | | | 3,719,345 | |
| | 90,424 | | | Zee Entertainment Enterprises Ltd. | | | 409,890 | |
| | | | | | | | |
| | | | Total India | | | 6,219,281 | |
| | | | | | | | |
| Ireland — 0.7% | |
| | 39,772 | | | Aer Lingus Group PLC | | | 70,984 | |
| | 349,820 | | | C&C Group PLC | | | 1,983,497 | |
| | 148,908 | | | Experian PLC | | | 2,590,408 | |
| | 8,216 | | | Henderson Group PLC | | | 31,666 | |
| | 157,097 | | | James Hardie Industries PLC | | | 1,881,207 | |
| | 18,200 | | | Ryanair Holdings PLC, ADR* | | | 999,180 | |
| | 7,189 | | | Smurfit Kappa Group PLC | | | 162,809 | |
| | 123,151 | | | Total Produce PLC | | | 162,084 | |
| | | | | | | | |
| | | | Total Ireland | | | 7,881,835 | |
| | | | | | | | |
| Isle of Man — 0.0% | |
| | 23,051 | | | Playtech PLC | | | 275,550 | |
| | | | | | | | |
| Israel — 0.6% | |
| | 8,211 | | | Africa Israel Properties Ltd.* | | | 144,782 | |
| | 2,352 | | | AL-ROV Israel Ltd.* | | | 76,285 | |
| | 54,644 | | | Check Point Software Technologies Ltd.* | | | 3,880,817 | |
| | 10,763 | | | Clal Insurance Enterprises Holdings Ltd.* | | | 197,524 | |
| | 36,065 | | | Discount Investment Corp., Class Registered Shares* | | | 297,098 | |
| | 3,602 | | | Jerusalem Economy Ltd. | | | 30,316 | |
| | 498 | | | Norstar Holdings Inc. | | | 13,664 | |
| | 25,522 | | | Phoenix Holdings Ltd. (The) | | | 87,762 | |
| | 43,264 | | | Teva Pharmaceutical Industries Ltd., ADR | | | 2,272,225 | |
| | | | | | | | |
| | | | Total Israel | | | 7,000,473 | |
| | | | | | | | |
| Italy — 1.6% | |
| | 205,978 | | | A2A SpA | | | 225,925 | |
| | 7,469 | | | ACEA SpA | | | 101,370 | |
| | 47,353 | | | Ascopiave SpA | | | 120,024 | |
| | 10,856 | | | Astaldi SpA | | | 95,398 | |
| | 16,080 | | | ASTM SpA | | | 219,467 | |
| | 6,517 | | | Banca Carige SpA* | | | 1,042 | |
| | 1,579 | | | Banca IFIS SpA | | | 31,830 | |
| | 23,129 | | | Cairo Communication SpA | | | 181,634 | |
| | 37,381 | | | DiaSorin SpA | | | 1,474,477 | |
| | 594,194 | | | Enel SpA | | | 3,148,328 | |
| | 21,232 | | | ERG SpA | | | 297,711 | |
| | 5,674 | | | GTECH SpA(b) | | | 135,230 | |
| | 106,294 | | | Immobiliare Grande Distribuzione REIT | | | 156,191 | |
| | 847,851 | | | Intesa Sanpaolo SpA | | | 2,528,693 | |
| | 57,499 | | | Iren SpA | | | 81,292 | |
| | 12,028 | | | Italmobiliare SpA | | | 295,455 | |
| | 16,887 | | | Luxottica Group SpA | | | 902,231 | |
| | 325,600 | | | Prada SpA(b) | | | 2,309,466 | |
| | 86,182 | | | Saipem SpA* | | | 2,047,854 | |
| | 1,614,328 | | | Telecom Italia SpA* | | | 1,861,785 | |
See Notes to Financial Statements.
65
| | | | | | | | |
| International Equity Investments | |
| | |
| Shares/Units | | | Security | | Value | |
| Italy — 1.6% — (continued) | |
| | 101,323 | | | Trevi Finanziaria Industriale SpA | | $ | 723,094 | |
| | 37,629 | | | Unipol Gruppo Finanziario SpA | | | 205,613 | |
| | 58,873 | | | Yoox SpA* | | | 1,522,257 | |
| | | | | | | | |
| | | | Total Italy | | | 18,666,367 | |
| | | | | | | | |
| Japan — 13.9% | |
| | 232,000 | | | Achilles Corp. | | | 323,855 | |
| | 40,700 | | | Airport Facilities Co., Ltd. | | | 282,857 | |
| | 576,000 | | | Asahi Kasei Corp. | | | 4,614,370 | |
| | 36,300 | | | ASKA Pharmaceutical Co., Ltd. | | | 487,668 | |
| | 287,700 | | | Astellas Pharma Inc. | | | 4,149,642 | |
| | 105,000 | | | Bank of Saga Ltd. (The) | | | 241,396 | |
| | 13,700 | | | Benesse Holdings Inc. | | | 485,642 | |
| | 117,600 | | | Bridgestone Corp. | | | 4,039,529 | |
| | 87,500 | | | Brother Industries Ltd. | | | 1,701,745 | |
| | 93,000 | | | Central Glass Co., Ltd. | | | 345,698 | |
| | 11,300 | | | Chori Co., Ltd. | | | 139,886 | |
| | 26,100 | | | Cleanup Corp. | | | 240,764 | |
| | 11,500 | | | Corona Corp., Class A Shares | | | 133,693 | |
| | 13,000 | | | Dainichiseika Color & Chemicals Manufacturing Co., Ltd. | | | 66,390 | |
| | 2,000 | | | Daishi Bank Ltd. (The) | | | 7,181 | |
| | 135,000 | | | Daiwa House Industry Co., Ltd. | | | 2,557,064 | |
| | 45,500 | | | DCM Holdings Co., Ltd. | | | 309,123 | |
| | 42,700 | | | Disco Corp. | | | 2,733,580 | |
| | 42,300 | | | EDION Corp. | | | 267,876 | |
| | 126,000 | | | Eighteenth Bank Ltd. (The) | | | 337,585 | |
| | 97,000 | | | Electric Power Development Co., Ltd. | | | 3,175,825 | |
| | 10,900 | | | FANUC Corp. | | | 1,826,112 | |
| | 600 | | | Fukuda Denshi Co., Ltd. | | | 35,784 | |
| | 48,000 | | | Fuso Pharmaceutical Industries Ltd. | | | 146,378 | |
| | 119 | | | Global One Real Estate Investment Corp. REIT | | | 350,673 | |
| | 76,000 | | | Gunze Ltd. | | | 214,689 | |
| | 19,200 | | | Hakuto Co., Ltd. | | | 197,458 | |
| | 52 | | | Hankyu REIT Inc., Class A Shares | | | 308,997 | |
| | 76,000 | | | Hanwa Co., Ltd. | | | 300,008 | |
| | 394 | | | Heiwa Real Estate REIT Inc. | | | 338,162 | |
| | 115,000 | | | Higashi-Nippon Bank Ltd. (The) | | | 306,883 | |
| | 1,832,000 | | | Hitachi Ltd. | | | 13,828,260 | |
| | 100,800 | | | Honda Motor Co., Ltd. | | | 3,421,781 | |
| | 64,200 | | | Hoya Corp. | | | 2,075,938 | |
| | 35,300 | | | Inabata & Co., Ltd. | | | 351,029 | |
| | 2,900 | | | Itochu-Shokuhin Co., Ltd. | | | 101,974 | |
| | 32,700 | | | Japan Airlines Co., Ltd. | | | 1,841,133 | |
| | 80,000 | | | Japan Pulp & Paper Co., Ltd. | | | 252,412 | |
| | 41,000 | | | Japan Vilene Co., Ltd. | | | 230,225 | |
| | 74,000 | | | JGC Corp. | | | 2,144,409 | |
| | 79,000 | | | J-Oil Mills Inc. | | | 262,209 | |
| | 15,500 | | | Kaga Electronics Co., Ltd. | | | 197,007 | |
| | 60,000 | | | Kandenko Co., Ltd. | | | 323,399 | |
| | 185,000 | | | Kanematsu Corp. | | | 309,826 | |
| | 137,200 | | | KDDI Corp. | | | 7,925,065 | |
| | 43,100 | | | Keihin Corp. | | | 608,182 | |
| | 4,000 | | | Keyence Corp. | | | 1,709,548 | |
| | 3,700 | | | Kissei Pharmaceutical Co., Ltd. | | | 92,362 | |
| | 27,400 | | | Kiyo Bank Ltd. (The) | | | 395,542 | |
| | 31,100 | | | Kohnan Shoji Co., Ltd. | | | 326,988 | |
See Notes to Financial Statements.
66
| | | | | | | | |
| International Equity Investments | |
| | |
| Shares/Units | | | Security | | Value | |
| Japan — 13.9% — (continued) | |
| | 91,100 | | | Komatsu Ltd. | | $ | 2,064,944 | |
| | 11,500 | | | Konoike Transport Co., Ltd. | | | 247,038 | |
| | 171,000 | | | Kurabo Industries Ltd. | | | 302,818 | |
| | 82,000 | | | Kyodo Printing Co., Ltd. | | | 302,214 | |
| | 300 | | | Kyokuto Securities Co., Ltd. | | | 5,150 | |
| | 300 | | | KYORIN Holdings Inc. | | | 6,727 | |
| | 34,000 | | | Kyudenko Corp. | | | 396,220 | |
| | 2,600 | | | Macnica Inc. | | | 84,476 | |
| | 488,000 | | | Marubeni Corp. | | | 3,526,777 | |
| | 9,400 | | | Melco Holdings Inc. | | | 204,653 | |
| | 146 | | | MID REIT Inc., Class A Shares | | | 350,326 | |
| | 132,000 | | | Mie Bank Ltd. (The) | | | 312,381 | |
| | 137,800 | | | Mitsubishi Corp. | | | 2,853,420 | |
| | 20,000 | | | Mitsui Home Co., Ltd. | | | 95,604 | |
| | 104,000 | | | Morinaga & Co., Ltd. | | | 221,015 | |
| | 98,000 | | | Morinaga Milk Industry Co., Ltd. | | | 341,717 | |
| | 72,200 | | | MS&AD Insurance Group Holdings Inc. | | | 1,631,425 | |
| | 164,100 | | | Nabtesco Corp. | | | 3,782,344 | |
| | 2,000 | | | Nice Holdings Inc. | | | 4,119 | |
| | 19,300 | | | Nidec Corp. | | | 1,232,347 | |
| | 211,000 | | | Nikon Corp. | | | 3,067,682 | |
| | 118,000 | | | Nippon Beet Sugar Manufacturing Co., Ltd. | | | 220,315 | |
| | 16,000 | | | Nippon Flour Mills Co., Ltd. | | | 80,500 | |
| | 238,700 | | | Nippon Light Metal Holdings Co., Ltd. | | | 381,403 | |
| | 21,300 | | | Nippon Paper Industries Co., Ltd.(b) | | | 343,940 | |
| | 104,320 | | | Nippon Steel & Sumikin Bussan Corp. | | | 408,642 | |
| | 81,900 | | | Nippon Telegraph & Telephone Corp. | | | 5,496,216 | |
| | 387,700 | | | Nissan Motor Co., Ltd. | | | 3,718,444 | |
| | 54,000 | | | Nisshin Oillio Group Ltd. (The) | | | 190,469 | |
| | 32,000 | | | Nissin Corp. | | | 88,111 | |
| | 7,000 | | | Nissin Kogyo Co., Ltd.* | | | 126,398 | |
| | 109,050 | | | NKSJ Holdings Inc. | | | 2,639,323 | |
| | 80 | | | Nomura Real Estate Office Fund Inc. REIT | | | 370,810 | |
| | 92,000 | | | NS United Kaiun Kaisha Ltd. | | | 238,747 | |
| | 14,900 | | | Omron Corp. | | | 646,564 | |
| | 28,700 | | | Onoken Co., Ltd. | | | 323,670 | |
| | 1,600 | | | Open House Co., Ltd. | | | 30,626 | |
| | 14,500 | | | Otsuka Kagu Ltd. | | | 145,103 | |
| | 23,000 | | | Paltac Corp. | | | 294,237 | |
| | 20,200 | | | Paris Miki Holdings Inc. | | | 93,719 | |
| | 11,400 | | | Ryosan Co., Ltd. | | | 251,119 | |
| | 17,700 | | | Ryoyo Electro Corp. | | | 196,122 | |
| | 113,000 | | | Sakai Chemical Industry Co., Ltd. | | | 348,050 | |
| | 32,200 | | | Sanoh Industrial Co., Ltd. | | | 225,829 | |
| | 22,500 | | | Sanshin Electronics Co., Ltd. | | | 179,304 | |
| | 44,500 | | | SCSK Corp. | | | 1,272,685 | |
| | 10,500 | | | Seiko Epson Corp. | | | 532,647 | |
| | 286,000 | | | Sekisui Chemical Co., Ltd. | | | 3,377,484 | |
| | 254,400 | | | Sekisui House Ltd. | | | 3,194,040 | |
| | 66,000 | | | Sekisui Plastics Co., Ltd. | | | 186,135 | |
| | 26,700 | | | Senshukai Co., Ltd. | | | 221,665 | |
| | 78,100 | | | Seven & I Holdings Co., Ltd. | | | 3,137,118 | |
| | 49,500 | | | Shin-Etsu Chemical Co., Ltd. | | | 3,076,098 | |
| | 22,900 | | | Shinko Shoji Co., Ltd. | | | 209,340 | |
| | 91,000 | | | Showa Sangyo Co., Ltd. | | | 336,948 | |
| | 16,600 | | | SMC Corp. | | | 4,337,025 | |
See Notes to Financial Statements.
67
| | | | | | | | |
| International Equity Investments | |
| | |
| Shares/Units | | | Security | | Value | |
| Japan — 13.9% — (continued) | |
| | 12,000 | | | SMK Corp. | | $ | 61,819 | |
| | 226,100 | | | Sojitz Corp. | | | 373,818 | |
| | 329,900 | | | Sumitomo Mitsui Financial Group Inc. | | | 13,344,056 | |
| | 5,000 | | | Sumitomo Seika Chemicals Co., Ltd. | | | 31,342 | |
| | 61,400 | | | Suntory Beverage & Food Ltd. | | | 2,253,391 | |
| | 62,300 | | | Suzuki Motor Corp. | | | 2,028,028 | |
| | 3,000 | | | Takiron Co., Ltd. | | | 14,985 | |
| | 10,000 | | | Tochigi Bank Ltd. (The) | | | 41,096 | |
| | 14,300 | | | Tokai Rubber Industries Ltd. | | | 135,953 | |
| | 38,000 | | | Tokyo Energy & Systems Inc. | | | 258,405 | |
| | 1,115,000 | | | Toshiba Corp. | | | 4,921,981 | |
| | 39,000 | | | Toyo Kohan Co., Ltd. | | | 216,569 | |
| | 58,000 | | | Toyo Tire & Rubber Co., Ltd. | | | 947,415 | |
| | 126,900 | | | Toyota Motor Corp. | | | 7,240,858 | |
| | 42,000 | | | Uchida Yoko Co., Ltd. | | | 179,844 | |
| | 36,900 | | | Vital KSK Holdings Inc. | | | 326,012 | |
| | 500,100 | | | Yahoo Japan Corp. | | | 2,018,567 | |
| | 50,000 | | | Yurtec Corp. | | | 272,366 | |
| | | | | | | | |
| | | | Total Japan | | | 159,682,550 | |
| | | | | | | | |
| Jersey, Channel Islands — 0.1% | |
| | 301,967 | | | Highland Gold Mining Ltd. | | | 350,492 | |
| | 34,143 | | | Phoenix Group Holdings | | | 419,704 | |
| | | | | | | | |
| | | | Total Jersey, Channel Islands | | | 770,196 | |
| | | | | | | | |
| Luxembourg — 0.2% | |
| | 3,665 | | | APERAM* | | | 118,417 | |
| | 61,534 | | | SES SA, ADR | | | 2,278,938 | |
| | | | | | | | |
| | | | Total Luxembourg | | | 2,397,355 | |
| | | | | | | | |
| Mexico — 0.3% | |
| | 199,214 | | | Grupo Financiero Banorte SAB de CV, Class O Shares | | | 1,405,189 | |
| | 63,240 | | | Grupo Televisa SAB, ADR | | | 2,344,307 | |
| | | | | | | | |
| | | | Total Mexico | | | 3,749,496 | |
| | | | | | | | |
| Netherlands — 5.2% | |
| | 94,606 | | | Aalberts Industries NV | | | 2,623,373 | |
| | 973 | | | Accell Group | | | 17,535 | |
| | 94,373 | | | Akzo Nobel NV | | | 6,680,528 | |
| | 1,301 | | | ASM International NV | | | 50,535 | |
| | 13,535 | | | ASML Holding NV | | | 1,295,419 | |
| | 13,733 | | | BE Semiconductor Industries NV | | | 242,318 | |
| | 10,140 | | | BinckBank NV | | | 111,014 | |
| | 166,684 | | | Delta Lloyd NV | | | 4,017,294 | |
| | 20,682 | | | Gemalto NV(b) | | | 2,025,663 | |
| | 30,751 | | | Heineken NV | | | 2,342,532 | |
| | 733,493 | | | ING Groep NV* | | | 10,104,213 | |
| | 55,937 | | | Koninklijke Boskalis Westminster NV | | | 3,220,359 | |
| | 29,303 | | | Koninklijke DSM NV | | | 1,957,504 | |
| | 51,586 | | | Koninklijke Vopak NV | | | 2,645,949 | |
| | 319,031 | | | PostNL NV* | | | 1,599,010 | |
| | 527,171 | | | Reed Elsevier NV | | | 12,030,647 | |
| | 172,163 | | | Royal Dutch Shell PLC, Class A Shares | | | 6,961,773 | |
| | 823 | | | SBM Offshore NV* | | | 12,609 | |
| | 45,928 | | | Unilever NV | | | 1,909,866 | |
| | 10,228 | | | USG People NV | | | 132,056 | |
| | 2,044 | | | Vastned Retail NV REIT | | | 99,541 | |
See Notes to Financial Statements.
68
| | | | | | | | |
| International Equity Investments | |
| | |
| Shares/Units | | | Security | | Value | |
| Netherlands — 5.2% — (continued) | |
| | 96 | | | Wereldhave NV REIT | | $ | 8,840 | |
| | | | | | | | |
| | | | Total Netherlands | | | 60,088,578 | |
| | | | | | | | |
| New Zealand — 0.1% | |
| | 145,479 | | | Air New Zealand Ltd. | | | 267,294 | |
| | 117,391 | | | Chorus Ltd. | | | 172,238 | |
| | 19,534 | | | Goodman Property Trust REIT | | | 18,388 | |
| | 230,228 | | | New Zealand Oil & Gas Ltd. | | | 149,284 | |
| | 5,515 | | | SKY Network Television Ltd. | | | 30,449 | |
| | 10,957 | | | SKYCITY Entertainment Group Ltd. | | | 34,653 | |
| | 5,973 | | | Warehouse Group Ltd. (The) | | | 15,496 | |
| | | | | | | | |
| | | | Total New Zealand | | | 687,802 | |
| | | | | | | | |
| Norway — 1.5% | |
| | 780 | | | Aker ASA, Class A Shares | | | 28,783 | |
| | 25,633 | | | Atea ASA | | | 311,760 | |
| | 51,091 | | | Austevoll Seafood ASA | | | 325,420 | |
| | 39,435 | | | Borregaard ASA | | | 275,862 | |
| | 273,640 | | | BW Offshore Ltd. | | | 379,524 | |
| | 301,054 | | | DNB ASA | | | 5,643,731 | |
| | 167,570 | | | Kvaerner ASA | | | 288,386 | |
| | 535 | | | Leroy Seafood Group ASA | | | 19,806 | |
| | 285,227 | | | Petroleum Geo-Services ASA | | | 2,159,704 | |
| | 11,215 | | | SpareBank 1 SMN | | | 105,148 | |
| | 134,915 | | | Statoil ASA | | | 3,797,275 | |
| | 4,903 | | | Storebrand ASA* | | | 27,276 | |
| | 155,569 | | | Telenor ASA | | | 3,573,974 | |
| | | | | | | | |
| | | | Total Norway | | | 16,936,649 | |
| | | | | | | | |
| Portugal — 0.0% | |
| | 33,477 | | | NOS SGPS | | | 195,616 | |
| | 8,756 | | | REN — Redes Energeticas Nacionais SGPS SA | | | 31,265 | |
| | 67,873 | | | Sonae SGPS SA | | | 103,450 | |
| | | | | | | | |
| | | | Total Portugal | | | 330,331 | |
| | | | | | | | |
| Singapore — 1.3% | |
| | 258,000 | | | Ascott Residence Trust REIT | | | 255,178 | |
| | 245,000 | | | Asian Pay Television Trust | | | 175,583 | |
| | 138,000 | | | Cambridge Industrial Trust REIT | | | 77,890 | |
| | 6,759 | | | Cape PLC | | | 34,874 | |
| | 531,000 | | | Chip Eng Seng Corp., Ltd. | | | 378,276 | |
| | 574,000 | | | DBS Group Holdings Ltd. | | | 8,234,325 | |
| | 170,000 | | | Frasers Commercial Trust REIT | | | 190,561 | |
| | 297,000 | | | Hong Fok Corp., Ltd. | | | 236,583 | |
| | 1,154,000 | | | k1 Ventures Ltd. | | | 180,929 | |
| | 307,000 | | | Religare Health Trust | | | 224,883 | |
| | 6,000 | | | Sabana Shari’ah Compliant Industrial Real Estate Investment Trust | | | 4,829 | |
| | 952,000 | | | Sembcorp Industries Ltd. | | | 3,902,421 | |
| | 408,000 | | | Sembcorp Marine Ltd. | | | 1,293,704 | |
| | 29,000 | | | United Engineers Ltd. | | | 66,176 | |
| | 8,000 | | | Venture Corp., Ltd. | | | 51,439 | |
| | | | | | | | |
| | | | Total Singapore | | | 15,307,651 | |
| | | | | | | | |
| South Korea — 2.0% | |
| | 25,020 | | | Hankook Tire Co., Ltd.* | | | 1,297,754 | |
| | 8,181 | | | Hyundai Motor Co. | | | 1,880,307 | |
| | 68,025 | | | KB Financial Group Inc. | | | 2,781,738 | |
See Notes to Financial Statements.
69
| | | | | | | | |
| International Equity Investments | |
| | |
| Shares/Units | | | Security | | Value | |
| South Korea — 2.0% — (continued) | |
| | 13,556 | | | Kia Motors Corp. | | $ | 818,635 | |
| | 53,586 | | | Korea Electric Power Corp. | | | 2,241,053 | |
| | 35,011 | | | KT&G Corp. | | | 3,277,311 | |
| | 19,219 | | | LG Corp. | | | 1,345,177 | |
| | 23,885 | | | POSCO, ADR | | | 1,977,678 | |
| | 2,509 | | | Samsung Electronics Co., Ltd. | | | 3,056,025 | |
| | 17,315 | | | SK Telecom Co., Ltd. | | | 4,670,025 | |
| | | | | | | | |
| | | | Total South Korea | | | 23,345,703 | |
| | | | | | | | |
| Spain — 2.1% | |
| | 74,693 | | | ACS Actividades de Construccion y Servicios SA | | | 3,151,069 | |
| | 69,468 | | | Amadeus IT Holding SA, Class A Shares | | | 2,587,061 | |
| | 97,960 | | | Banco Bilbao Vizcaya Argentaria SA | | | 1,187,505 | |
| | 4,040 | | | Bankinter SA | | | 33,519 | |
| | 3,198 | | | Bolsas y Mercados Españoles SA | | | 132,374 | |
| | 788 | | | Carbures Europe SA* | | | 21,720 | |
| | 28,802 | | | Cie Automotive SA | | | 404,335 | |
| | 188 | | | Construcciones y Auxiliar de Ferrocarriles SA | | | 74,428 | |
| | 2,570 | | | Corp Financiera Alba SA | | | 152,644 | |
| | 12,168 | | | Ebro Foods SA | | | 246,319 | |
| | 57,478 | | | Grifols SA | | | 2,680,676 | |
| | 2,919 | | | Grupo Catalana Occidente SA | | | 98,882 | |
| | 141,391 | | | Inditex SA | | | 4,098,253 | |
| | 169,874 | | | Indra Sistemas SA | | | 2,557,917 | |
| | 57,897 | | | Papeles y Cartones de Europa SA | | | 371,470 | |
| | 382,211 | | | Prosegur Cia de Seguridad SA | | | 2,592,453 | |
| | 36,729 | | | Técnicas Reunidas SA | | | 2,011,825 | |
| | 101,740 | | | Telefonica SA | | | 1,615,125 | |
| | | | | | | | |
| | | | Total Spain | | | 24,017,575 | |
| | | | | | | | |
| Sweden — 1.2% | |
| | 92,021 | | | Atlas Copco AB, Class A Shares | | | 2,686,628 | |
| | 3 | | | Axfood AB | | | 150 | |
| | 19,693 | | | B&B Tools AB, Class B Shares | | | 413,523 | |
| | 11,518 | | | Bilia AB, Class A Shares | | | 308,026 | |
| | 2,287 | | | BillerudKorsnas AB | | | 33,165 | |
| | 39,141 | | | Bure Equity AB | | | 169,994 | |
| | 5,826 | | | Gunnebo AB | | | 34,742 | |
| | 63,303 | | | Hexagon AB, Class B Shares | | | 2,076,256 | |
| | 1,680 | | | Holmen AB, Class B Shares | | | 53,704 | |
| | 69,789 | | | Klovern AB | | | 362,144 | |
| | 19,181 | | | Kungsleden AB | | | 130,404 | |
| | 29,562 | | | Meda AB, Class A Shares | | | 398,470 | |
| | 130 | | | NCC AB, Class A Shares | | | 4,199 | |
| | 51,618 | | | Peab AB | | | 370,035 | |
| | 7,690 | | | Ratos AB, Class B Shares | | | 62,451 | |
| | 9,137 | | | SSAB AB, Class B Shares* | | | 76,182 | |
| | 115,737 | | | Svenska Cellulosa AB SCA, Class B Shares | | | 2,789,099 | |
| | 40,324 | | | Swedish Match AB | | | 1,349,625 | |
| | 189,800 | | | Telefonaktiebolaget LM Ericsson, Class B Shares | | | 2,373,554 | |
| | | | | | | | |
| | | | Total Sweden | | | 13,692,351 | |
| | | | | | | | |
| Switzerland — 10.8% | |
| | 89,193 | | | ABB Ltd., Class Registered Shares* | | | 2,024,659 | |
| | 40,229 | | | Adecco SA, Class Registered Shares* | | | 3,048,508 | |
| | 31,442 | | | Aryzta AG* | | | 2,875,757 | |
| | 175 | | | Autoneum Holding AG* | | | 30,185 | |
See Notes to Financial Statements.
70
| | | | | | | | |
| International Equity Investments | |
| | |
| Shares/Units | | | Security | | Value | |
| Switzerland — 10.8% — (continued) | |
| | 1,630 | | | Barry Callebaut AG, Class Registered Shares* | | $ | 2,000,418 | |
| | 9,825 | | | BKW AG | | | 355,552 | |
| | 26,103 | | | Cie Financiere Richemont SA, Class Registered Shares | | | 2,491,061 | |
| | 112,685 | | | Clariant AG, Class Registered Shares* | | | 1,986,284 | |
| | 245,800 | | | Credit Suisse Group AG, Class Registered Shares* | | | 6,948,392 | |
| | 131,150 | | | Ferrexpo PLC | | | 287,320 | |
| | 2,110 | | | Galenica AG, Class Registered Shares | | | 2,000,617 | |
| | 515 | | | GAM Holding AG* | | | 10,021 | |
| | 11 | | | Georg Fischer AG, Class Registered Shares* | | | 7,286 | |
| | 1,577 | | | Givaudan SA, Class Registered Shares* | | | 2,620,972 | |
| | 845 | | | Helvetia Holding AG, Class Registered Shares | | | 420,710 | |
| | 18,852 | | | Kudelski SA | | | 281,523 | |
| | 135 | | | Kuoni Reisen Holding AG, Class Registered Shares* | | | 39,781 | |
| | 25,602 | | | Logitech International SA, Class Registered Shares | | | 352,138 | |
| | 81,154 | | | Lonza Group, Class Registered Shares* | | | 9,299,486 | |
| | 102,995 | | | Nestlé SA, Class Registered Shares | | | 8,001,512 | |
| | 217 | | | Nobel Biocare Holding AG, Class Registered Shares* | | | 3,956 | |
| | 219,872 | | | Novartis AG, Class Registered Shares | | | 19,750,897 | |
| | 78,161 | | | Roche Holding AG | | | 22,823,272 | |
| | 1,016 | | | SGS SA, Class Registered Shares | | | 2,257,001 | |
| | 1,421 | | | Siegfried Holding AG, Class Registered Shares* | | | 246,946 | |
| | 605 | | | Sika AG | | | 2,289,659 | |
| | 15,902 | | | Sonova Holding AG, Class Registered Shares | | | 2,545,752 | |
| | 4,270 | | | Swatch Group AG (The) | | | 2,318,351 | |
| | 15,330 | | | Syngenta AG, Class Registered Shares | | | 5,522,579 | |
| | 40,157 | | | Temenos Group AG, Class Registered Shares | | | 1,554,666 | |
| | 386,034 | | | UBS AG, Class Registered Shares* | | | 6,931,350 | |
| | 1,294 | | | Valiant Holding AG, Class Registered Shares | | | 121,041 | |
| | 1,446 | | | Valora Holding AG, Class Registered Shares* | | | 334,018 | |
| | 484 | | | Vontobel Holding AG, Class Registered Shares | | | 17,932 | |
| | 50,041 | | | Wolseley PLC | | | 2,688,682 | |
| | 32,459 | | | Zurich Insurance Group AG* | | | 9,800,052 | |
| | | | | | | | |
| | | | Total Switzerland | | | 124,288,336 | |
| | | | | | | | |
| Taiwan — 0.2% | |
| | 510,000 | | | Taiwan Semiconductor Manufacturing Co., Ltd. | | | 2,128,756 | |
| | | | | | | | |
| Thailand — 0.6% | |
| | 1,876,100 | | | CP ALL PCL | | | 2,790,504 | |
| | 229,600 | | | Kasikornbank PCL, NVDR | | | 1,617,910 | |
| | 1,107,800 | | | PTT Global Chemical PCL | | | 2,168,076 | |
| | | | | | | | |
| | | | Total Thailand | | | 6,576,490 | |
| | | | | | | | |
| United Kingdom — 18.3% | |
| | 71,635 | | | Afren PLC* | | | 116,037 | |
| | 61,904 | | | African Barrick Gold PLC | | | 239,935 | |
| | 80,834 | | | Aggreko PLC | | | 2,283,127 | |
| | 48,494 | | | Amlin PLC | | | 362,131 | |
| | 1,396 | | | Anglo Pacific Group PLC | | | 3,756 | |
| | 176,529 | | | ARM Holdings PLC | | | 2,852,711 | |
| | 43,290 | | | AstraZeneca PLC | | | 3,296,876 | |
| | 34,462 | | | Aveva Group PLC | | | 1,204,911 | |
| | 384,076 | | | Aviva PLC | | | 3,322,625 | |
| | 127,219 | | | Avocet Mining PLC*(b) | | | 15,539 | |
| | 64,786 | | | Balfour Beatty PLC | | | 261,039 | |
| | 2,538,580 | | | Barclays PLC | | | 9,458,520 | |
| | 80,625 | | | Barratt Developments PLC | | | 495,312 | |
See Notes to Financial Statements.
71
| | | | | | | | |
| International Equity Investments | |
| | |
| Shares/Units | | | Security | | Value | |
| United Kingdom — 18.3% — (continued) | |
| | 16,726 | | | Bellway PLC | | $ | 442,785 | |
| | 12,435 | | | Berkeley Group Holdings PLC | | | 495,281 | |
| | 707,775 | | | BG Group PLC | | | 14,114,808 | |
| | 837,231 | | | BP PLC | | | 6,676,259 | |
| | 91,464 | | | British American Tobacco PLC | | | 5,395,120 | |
| | 167,336 | | | British Sky Broadcasting Group PLC | | | 2,426,488 | |
| | 335,386 | | | Britvic PLC | | | 3,819,363 | |
| | 871,401 | | | BT Group PLC, Class A Shares | | | 5,599,116 | |
| | 97,838 | | | Bunzl PLC | | | 2,672,616 | |
| | 115,969 | | | Burberry Group PLC | | | 2,733,283 | |
| | 409,395 | | | Cable & Wireless Communications PLC | | | 336,783 | |
| | 119,096 | | | Capita PLC | | | 2,425,029 | |
| | 71,091 | | | Carillion PLC | | | 397,330 | |
| | 65,101 | | | Chesnara PLC | | | 358,381 | |
| | 3,240 | | | Close Brothers Group PLC | | | 72,766 | |
| | 33,437 | | | Computacenter PLC | | | 345,240 | |
| | 336,282 | | | Debenhams PLC | | | 370,665 | |
| | 160,503 | | | Diageo PLC | | | 4,727,618 | |
| | 56,506 | | | Dignity PLC | | | 1,341,292 | |
| | 187,705 | | | Domino’s Pizza Group PLC | | | 1,843,953 | |
| | 12,630 | | | Drax Group PLC | | | 131,601 | |
| | 2,324 | | | DS Smith PLC | | | 10,956 | |
| | 619 | | | easyJet PLC | | | 13,717 | |
| | 235,804 | | | Essentra PLC | | | 3,354,755 | |
| | 201,651 | | | Evraz PLC | | | 377,522 | |
| | 171,904 | | | Firstgroup PLC* | | | 362,680 | |
| | 13,768 | | | Galliford Try PLC | | | 295,906 | |
| | 39,762 | | | Greggs PLC | | | 360,820 | |
| | 29,587 | | | Halfords Group PLC | | | 234,383 | |
| | 23,995 | | | Helical Bar PLC | | | 134,070 | |
| | 135,866 | | | Home Retail Group PLC | | | 413,280 | |
| | 1,720,410 | | | HSBC Holdings PLC | | | 18,607,091 | |
| | 9,646 | | | Hunting PLC | | | 142,351 | |
| | 382,714 | | | ICAP PLC | | | 2,407,109 | |
| | 519 | | | Immunodiagnostic Systems Holdings PLC | | | 4,088 | |
| | 202,388 | | | Inmarsat PLC | | | 2,351,698 | |
| | 672,850 | | | International Consolidated Airlines Group SA* | | | 4,035,076 | |
| | 33,169 | | | Interserve PLC | | | 364,503 | |
| | 56,253 | | | Intertek Group PLC | | | 2,614,049 | |
| | 667,547 | | | ITV PLC | | | 2,339,985 | |
| | 61,840 | | | Kingfisher PLC | | | 311,687 | |
| | 22,475 | | | Laird PLC | | | 108,696 | |
| | 2,836 | | | Lancashire Holdings Ltd. | | | 29,492 | |
| | 5,700 | | | Liberty Global PLC, Class A Shares*(b) | | | 248,919 | |
| | 13,690 | | | Liberty Global PLC, Class C Shares* | | | 574,022 | |
| | 3,216,244 | | | Lloyds Banking Group PLC* | | | 4,073,027 | |
| | 159,263 | | | Londonmetric Property PLC REIT | | | 371,368 | |
| | 251,545 | | | Man Group PLC | | | 494,459 | |
| | 5,558 | | | Mapeley Ltd.*(c)(d) | | | 0 | |
| | 46,520 | | | Marston’s PLC | | | 114,357 | |
| | 6,294 | | | Mitie Group PLC | | | 32,987 | |
| | 23,462 | | | Morgan Sindall Group PLC | | | 327,011 | |
| | 84,851 | | | National Express Group PLC | | | 360,764 | |
| | 5,941 | | | Pennon Group PLC | | | 80,207 | |
| | 1,897 | | | Persimmon PLC* | | | 41,708 | |
| | 1,138,209 | | | Premier Oil PLC | | | 6,579,999 | |
See Notes to Financial Statements.
72
| | | | | | | | |
| International Equity Investments | |
| | |
| Shares/Units | | | Security | | Value | |
| United Kingdom — 18.3% — (continued) | |
| | 201,120 | | | Prudential PLC | | $ | 4,840,963 | |
| | 72,343 | | | Quindell PLC(b) | | | 204,340 | |
| | 44,016 | | | Reckitt Benckiser Group PLC | | | 3,833,583 | |
| | 5,764 | | | Redrow PLC | | | 26,220 | |
| | 218,865 | | | Rexam PLC | | | 1,840,497 | |
| | 199,990 | | | Rio Tinto PLC | | | 10,715,923 | |
| | 341,872 | | | Rolls-Royce Holdings PLC* | | | 5,798,546 | |
| | 479,495 | | | Royal Bank of Scotland Group PLC* | | | 2,889,967 | |
| | 160,116 | | | Royal Mail PLC | | | 1,185,620 | |
| | 95,019 | | | Safestore Holdings PLC REIT | | | 338,359 | |
| | 195,187 | | | Sage Group PLC (The) | | | 1,275,313 | |
| | 10,749 | | | Savills PLC | | | 114,774 | |
| | 131,841 | | | Scottish & Southern Energy PLC | | | 3,321,232 | |
| | 291,307 | | | Smith & Nephew PLC | | | 5,051,778 | |
| | 46,092 | | | Soco International PLC* | | | 323,632 | |
| | 15,870 | | | Spectris PLC | | | 512,601 | |
| | 275,803 | | | Spirit Pub Co. PLC | | | 344,294 | |
| | 25,319 | | | St. Ives PLC | | | 91,401 | |
| | 264,000 | | | Standard Chartered PLC(b) | | | 5,353,002 | |
| | 163,049 | | | Stobart Group Ltd. | | | 339,542 | |
| | 17,319 | | | Synergy Health PLC | | | 430,895 | |
| | 92,624 | | | Telecity Group PLC | | | 1,139,085 | |
| | 97,867 | | | TT Electronics PLC | | | 275,964 | |
| | 123,685 | | | Tullett Prebon PLC | | | 555,474 | |
| | 124,675 | | | Unilever PLC | | | 5,498,120 | |
| | 32,013 | | | Vesuvius PLC | | | 247,115 | |
| | 2,660,373 | | | Vodafone Group PLC | | | 9,148,848 | |
| | 125,636 | | | Weir Group PLC (The) | | | 5,517,831 | |
| | 469,166 | | | William Hill PLC | | | 2,725,742 | |
| | 435 | | | Workspace Group PLC REIT | | | 4,483 | |
| | 131,992 | | | WPP PLC | | | 2,767,177 | |
| | 115,520 | | | Xchanging PLC | | | 352,939 | |
| | | | | | | | |
| | | | Total United Kingdom | | | 209,876,298 | |
| | | | | | | | |
| United States — 0.5% | |
| | 59,047 | | | APR Energy PLC(b) | | | 503,244 | |
| | 64,840 | | | Carnival Corp. | | | 2,456,139 | |
| | 69,957 | | | Carnival PLC | | | 2,615,883 | |
| | | | | | | | |
| | | | Total United States | | | 5,575,266 | |
| | | | | | | | |
| | | | TOTAL COMMON STOCKS
(Cost — $1,009,675,894) | | | 1,092,795,142 | |
| | | | | | | | |
| WARRANTS — 0.3% | |
| Luxembourg — 0.3% | |
| | 1,089,623 | | | Idea Cellular Ltd., (Restricted), expires 3/13/17*(e)
(Cost — $2,345,728) | | | 2,898,397 | |
| | | | | | | | |
| RIGHTS — 0.0% | |
| Germany — 0.0% | |
| | 31,257 | | | Borussia Dortmund GmbH & Co. KGaA, expires 9/8/14*(c) | | | 1,718 | |
| | | | | | | | |
| Portugal — 0.0% | |
| | 23,313 | | | Mota-Engil Africa SGPA SA, expires 12/31/14*(c) | | | 10,505 | |
| | | | | | | | |
| | | | TOTAL RIGHTS
(Cost — $0) | | | 12,223 | |
| | | | | | | | |
See Notes to Financial Statements.
73
| | | | | | | | |
| International Equity Investments | |
| | |
| Shares/Units | | | Security | | Value | |
| PREFERRED STOCKS — 0.0% | |
| Germany — 0.0% | |
| | 63 | | | Draegerwerk AG & Co. KGaA, 1.060% | | $ | 5,969 | |
| | 1,953 | | | Villeroy & Boch AG, 3.215% | | | 32,907 | |
| | | | | | | | |
| | | | Total Germany | | | 38,876 | |
| | | | | | | | |
| Italy — 0.0% | |
| | 63,113 | | | Unipol Gruppo Finanziario SpA, 5.340% | | | 316,666 | |
| | | | | | | | |
| | | | TOTAL PREFERRED STOCKS
(Cost — $282,445) | | | 355,542 | |
| | | | | | | | |
| | | | TOTAL INVESTMENTS BEFORE SHORT-TERM INVESTMENTS
(Cost — $1,012,304,067) | | | 1,096,061,304 | |
| | | | | | | | |
| | |
Face
Amount† | | | | | | |
| SHORT-TERM INVESTMENTS (f) — 5.5% | |
| MONEY MARKET FUND — 1.1% | |
| $ | 12,670,056 | | | Invesco STIT — Government & Agency Portfolio(g)
(Cost — $12,670,056) | | | 12,670,056 | |
| | | | | | | | |
| TIME DEPOSITS — 4.4% | |
| | 42,939,930 | | | ANZ National Bank — London, 0.030% due 9/2/14 | | | 42,939,930 | |
| | | | BBH — Grand Cayman: | | | | |
| | 298,053 | CHF | | 0.001% due 9/1/14 | | | 324,783 | |
| | 118,080 | HKD | | 0.005% due 9/1/14 | | | 15,236 | |
| | 24,070 | SGD | | 0.005% due 9/1/14 | | | 19,275 | |
| | 398 | JPY | | 0.005% due 9/1/14 | | | 4 | |
| | 58,587 | SEK | | 0.022% due 9/1/14 | | | 8,396 | |
| | 3 | GBP | | 0.082% due 9/1/14 | | | 5 | |
| | 11 | AUD | | 1.874% due 9/1/14 | | | 10 | |
| | | | DNB — Oslo: | | | | |
| | 170,307 | NOK | | 0.526% due 9/1/14 | | | 27,522 | |
| | 6,939,110 | | | 0.030% due 9/2/14 | | | 6,939,110 | |
| | | | Wells Fargo — Grand Cayman: | | | | |
| | 205,945 | EUR | | (0.030)% due 9/1/14 | | | 270,704 | |
| | 30,418 | GBP | | 0.082% due 9/1/14 | | | 50,442 | |
| | | | | | | | |
| | | | TOTAL TIME DEPOSITS
(Cost — $50,595,417) | | | 50,595,417 | |
| | | | | | | | |
| | | | TOTAL SHORT-TERM INVESTMENTS
(Cost — $63,265,473) | | | 63,265,473 | |
| | | | | | | | |
| | | | TOTAL INVESTMENTS — 100.9%
(Cost — $1,075,569,540#) | | | 1,159,326,777 | |
| | | | | | | | |
| | | | Liabilities in Excess of Other Assets — (0.9)% | | | (10,098,122 | ) |
| | | | | | | | |
| | | | TOTAL NET ASSETS — 100.0% | | $ | 1,149,228,655 | |
| | | | | | | | |
| * | | Non-income producing security. |
| (a) | | Security trades on the Hong Kong exchange. |
| (b) | | All or a portion of this security is on loan (See Note 1). |
| (c) | | Security is valued in good faith at fair value by or under the direction of the Board of Trustees. |
| (e) | | Restricted security that may be sold to “qualified institutional buyers” pursuant to the conditions of Rule 144A under the Securities Act of 1933, as amended. This security has been deemed liquid pursuant to guidelines approved by the Board of Trustees, unless otherwise noted. |
| (f) | | Inclusive of all short term holdings, including collateral received from securities lending activities. Not including such collateral, the percentage of portfolio holdings would be 4.4%. |
See Notes to Financial Statements.
74
| | | | |
| International Equity Investments |
| (g) | | Represents investment of collateral received from securities lending transactions. |
| † | | Face amount denominated in U.S. dollars, unless otherwise noted. |
| # | | Aggregate cost for federal income tax purposes is $1,081,920,441. |
| | |
Abbreviations used in this schedule: |
| ADR | | — American Depositary Receipts |
| NVDR | | — Non Voting Depository Receipt |
| PCL | | — Public Company Limited |
| PLC | | — Public Limited Company |
| REIT | | — Real Estate Investment Trust |
| | |
Currency Abbreviations used in this schedule: |
| AUD | | — Australian Dollar |
| CHF | | — Swiss Franc |
| EUR | | — Euro |
| GBP | | — British Pound |
| HKD | | — Hong Kong Dollar |
| JPY | | — Japanese Yen |
| NOK | | — Norwegian Krone |
| SEK | | — Swedish Krona |
| SGD | | — Singapore Dollar |
| | | | |
| Summary of Investments by Security Sector^ | | | |
Financials | | | 18.0 | % |
Industrials | | | 15.3 | |
Consumer Discretionary | | | 13.0 | |
Health Care | | | 10.5 | |
Materials | | | 8.1 | |
Information Technology | | | 7.9 | |
Consumer Staples | | | 7.3 | |
Energy | | | 6.8 | |
Telecommunication Services | | | 5.5 | |
Utilities | | | 2.2 | |
Short-Term Investments | | | 5.4 | |
| | | | |
| | | 100.0 | % |
| | | | |
| ^ | | As a percentage of total investments. |
See Notes to Financial Statements.
75
| | | | | | | | |
| Emerging Markets Equity Investments | |
| | |
| Shares/Units | | | Security | | Value | |
| COMMON STOCKS — 96.7% | |
| Argentina — 0.4% | |
| | 45,979 | | | YPF SA, ADR | | $ | 1,519,146 | |
| | | | | | | | |
| Brazil — 15.2% | |
| | 771,755 | | | AMBEV SA, ADR | | | 5,626,094 | |
| | 119,100 | | | Banco Bradesco SA, ADR | | | 2,172,384 | |
| | 454,385 | | | Banco do Brasil SA | | | 7,099,797 | |
| | 302,066 | | | BB Seguridade Participações SA | | | 4,820,970 | |
| | 460,070 | | | BM&FBovespa SA | | | 2,773,548 | |
| | 307,472 | | | CCR SA | | | 2,781,782 | |
| | 144,200 | | | Cia Energética de Minas Gerais, ADR(a) | | | 1,238,678 | |
| | 331,228 | | | Cielo SA | | | 6,206,411 | |
| | 135,900 | | | Cyrela Brazil Realty SA Empreendimentos e Participações | | | 861,152 | |
| | 252,100 | | | EDP — Energias do Brasil SA | | | 1,272,124 | |
| | 180,800 | | | Estacio Participações SA | | | 2,400,332 | |
| | 291,400 | | | Gerdau SA, ADR | | | 1,687,206 | |
| | 51,626 | | | Grupo BTG Pactual | | | 866,831 | |
| | 171,126 | | | Itaú Unibanco Holding SA, ADR | | | 3,080,268 | |
| | 40,900 | | | Kroton Educacional SA | | | 1,224,617 | |
| | 122,200 | | | Localiza Rent a Car SA | | | 2,174,591 | |
| | 67,600 | | | Natura Cosméticos SA | | | 1,237,982 | |
| | 118,100 | | | Petróleo Brasileiro SA, ADR | | | 2,457,661 | |
| | 328,344 | | | Souza Cruz SA | | | 3,073,254 | |
| | 26,290 | | | Ultrapar Participações SA | | | 677,281 | |
| | 201,200 | | | Vale SA, Class B Shares, ADR(a) | | | 2,627,672 | |
| | 181,700 | | | Via Varejo SA* | | | 2,028,490 | |
| | | | | | | | |
| | | | Total Brazil | | | 58,389,125 | |
| | | | | | | | |
| China — 10.6% | |
| | 129,000 | | | AAC Technologies Holdings Inc. | | | 840,020 | |
| | 4,329,000 | | | Agricultural Bank of China Ltd., Class H Shares(b) | | | 2,004,317 | |
| | 499,500 | | | Anhui Conch Cement Co., Ltd., Class H Shares(a)(b) | | | 1,803,769 | |
| | 1,584,000 | | | Anton Oilfield Services Group(a) | | | 680,297 | |
| | 8,445 | | | Autohome Inc., ADR(a)* | | | 401,898 | |
| | 34,462 | | | Baidu Inc., ADR* | | | 7,392,788 | |
| | 8,916 | | | Bitauto Holdings Ltd., ADR* | | | 783,092 | |
| | 6,275,380 | | | China Construction Bank Corp., Class H Shares(b) | | | 4,648,928 | |
| | 755,500 | | | China Merchants Bank Co., Ltd., Class H Shares(b) | | | 1,440,030 | |
| | 3,140,000 | | | China National Materials Co., Ltd., Class H Shares(b) | | | 756,744 | |
| | 660,000 | | | China Oilfield Services Ltd., Class H Shares(b) | | | 1,944,917 | |
| | 381,500 | | | China Shenhua Energy Co., Ltd., Class H Shares(b) | | | 1,100,911 | |
| | 1,096,000 | | | CNOOC Ltd. | | | 2,195,784 | |
| | 38,900 | | | NetEase Inc., ADR | | | 3,424,756 | |
| | 53,500 | | | New Oriental Education & Technology Group Inc., ADR | | | 1,220,335 | |
| | 333,500 | | | Ping An Insurance Group Co. of China Ltd., Class H Shares(b) | | | 2,714,126 | |
| | 43,080 | | | SouFun Holdings Ltd., ADR(a) | | | 497,143 | |
| | 128,760 | | | Tencent Holdings Ltd. | | | 2,100,665 | |
| | 130,823 | | | Tsingtao Brewery Co., Ltd., Class H Shares(b) | | | 995,685 | |
| | 226,800 | | | Weichai Power Co., Ltd., Class H Shares(b) | | | 917,039 | |
| | 608,000 | | | Zhuzhou CSR Times Electric Co., Ltd., Class H Shares(b) | | | 2,098,966 | |
| | 1,256,600 | | | Zoomlion Heavy Industry Science & Technology Co., Ltd., Class H Shares(b) | | | 777,015 | |
| | | | | | | | |
| | | | Total China | | | 40,739,225 | |
| | | | | | | | |
| Colombia — 2.3% | |
| | 33,100 | | | Bancolombia SA, ADR(a) | | | 2,094,568 | |
| | 328,600 | | | Pacific Rubiales Energy Corp. | | | 6,848,292 | |
| | | | | | | | |
| | | | Total Colombia | | | 8,942,860 | |
| | | | | | | | |
See Notes to Financial Statements.
76
| | | | | | | | |
| Emerging Markets Equity Investments | |
| | |
| Shares/Units | | | Security | | Value | |
| Cyprus — 0.5% | |
| | 36,290 | | | Eurasia Drilling Co., Ltd., Class Registered Shares, GDR | | $ | 1,048,296 | |
| | 115,535 | | | Globaltrans Investment PLC, Class Registered Shares, GDR | | | 1,057,612 | |
| | | | | | | | |
| | | | Total Cyprus | | | 2,105,908 | |
| | | | | | | | |
| Egypt — 0.4% | |
| | 215,731 | | | Commercial International Bank Egypt SAE, Class Registered Shares, GDR | | | 1,370,118 | |
| | | | | | | | |
| Greece — 0.5% | |
| | 885,172 | | | Piraeus Bank SA* | | | 1,753,686 | |
| | | | | | | | |
| Hong Kong — 4.5% | |
| | 54,313 | | | China Mobile Ltd., ADR | | | 3,382,614 | |
| | 1,769,000 | | | China State Construction International Holdings Ltd. | | | 2,852,081 | |
| | 38,850 | | | Dairy Farm International Holdings Ltd. | | | 403,869 | |
| | 258,264 | | | Galaxy Entertainment Group Ltd. | | | 1,943,437 | |
| | 1,660,200 | | | Huabao International Holdings Ltd. | | | 1,210,849 | |
| | 285,734 | | | Link REIT (The) | | | 1,695,653 | |
| | 379,460 | | | Power Assets Holdings Ltd. | | | 3,451,603 | |
| | 757,000 | | | Techtronic Industries Co. | | | 2,312,984 | |
| | | | | | | | |
| | | | Total Hong Kong | | | 17,253,090 | |
| | | | | | | | |
| Hungary — 0.3% | |
| | 67,063 | | | OTP Bank PLC | | | 1,159,048 | |
| | | | | | | | |
| India — 13.5% | |
| | 182,856 | | | Adani Ports & Special Economic Zone Ltd. | | | 861,373 | |
| | 80,443 | | | Asian Paints Ltd. | | | 832,469 | |
| | 160,518 | | | Aurobindo Pharma Ltd. | | | 2,172,710 | |
| | 178,305 | | | Axis Bank Ltd. | | | 1,172,816 | |
| | 60,575 | | | Axis Bank Ltd., Class Registered Shares, GDR | | | 2,016,584 | |
| | 186,633 | | | Cipla Ltd. | | | 1,593,540 | |
| | 23,161 | | | Colgate-Palmolive India Ltd. | | | 590,147 | |
| | 130,543 | | | Glenmark Pharmaceuticals Ltd. | | | 1,547,154 | |
| | 213,100 | | | Havells India Ltd. | | | 1,002,623 | |
| | 49,170 | | | HCL Technologies Ltd. | | | 1,327,300 | |
| | 381,648 | | | HDFC Bank Ltd. | | | 5,317,345 | |
| | 39,200 | | | HDFC Bank Ltd., ADR | | | 1,947,848 | |
| | 260,959 | | | Hindustan Unilever Ltd. | | | 3,194,095 | |
| | 348,468 | | | Housing Development Finance Corp. | | | 6,183,571 | |
| | 57,800 | | | ICICI Bank Ltd., ADR | | | 3,092,300 | |
| | 933,789 | | | ITC Ltd. | | | 5,495,287 | |
| | 63,323 | | | Kotak Mahindra Bank Ltd. | | | 1,088,251 | |
| | 7,674 | | | Nestle India Ltd. | | | 770,266 | |
| | 208,824 | | | Power Grid Corp. of India Ltd. | | | 444,343 | |
| | 86,735 | | | Reliance Industries Ltd. | | | 1,440,148 | |
| | 120,881 | | | Shriram Transport Finance Co., Ltd. | | | 1,819,321 | |
| | 221,247 | | | Sun Pharmaceutical Industries Ltd. | | | 3,123,921 | |
| | 51,393 | | | Tata Consultancy Services Ltd. | | | 2,139,624 | |
| | 52,700 | | | Tata Motors Ltd., ADR(a) | | | 2,539,613 | |
| | 46,400 | | | Westlife Development Ltd.* | | | 257,522 | |
| | | | | | | | |
| | | | Total India | | | 51,970,171 | |
| | | | | | | | |
| Indonesia — 4.1% | |
| | 2,201,100 | | | Astra International Tbk PT | | | 1,425,502 | |
| | 1,270,534 | | | Bank Central Asia Tbk PT | | | 1,216,986 | |
| | 2,325,262 | | | Bank Mandiri Persero Tbk PT | | | 2,062,834 | |
| | 1,856,200 | | | Bank Rakyat Indonesia Persero Tbk PT | | | 1,767,247 | |
| | 497,218 | | | Matahari Department Store Tbk PT | | | 692,078 | |
| | 739,600 | | | Semen Indonesia Persero Tbk PT | | | 1,026,467 | |
See Notes to Financial Statements.
77
| | | | | | | | |
| Emerging Markets Equity Investments | |
| | |
| Shares/Units | | | Security | | Value | |
| Indonesia — 4.1% — (continued) | |
| | 10,198,324 | | | Telekomunikasi Indonesia Persero Tbk PT | | $ | 2,336,877 | |
| | 62,600 | | | Telekomunikasi Indonesia Persero Tbk PT, ADR(a) | | | 2,883,356 | |
| | 462,111 | | | Unilever Indonesia Tbk PT | | | 1,226,204 | |
| | 694,578 | | | United Tractors Tbk PT | | | 1,315,807 | |
| | | | | | | | |
| | | | Total Indonesia | | | 15,953,358 | |
| | | | | | | | |
| Jersey, Channel Islands — 0.4% | |
| | 10,117 | | | Randgold Resources Ltd. | | | 852,343 | |
| | 9,797 | | | Randgold Resources Ltd., ADR | | | 824,417 | |
| | | | | | | | |
| | | | Total Jersey, Channel Islands | | | 1,676,760 | |
| | | | | | | | |
| Luxembourg — 0.1% | |
| | 20,688 | | | Oriflame Cosmetics SA(a) | | | 395,705 | |
| | | | | | | | |
| Macau — 1.8% | |
| | 786,593 | | | Sands China Ltd. | | | 5,112,741 | |
| | 433,000 | | | Wynn Macau Ltd. | | | 1,648,310 | |
| | | | | | | | |
| | | | Total Macau | | | 6,761,051 | |
| | | | | | | | |
| Malaysia — 1.6% | |
| | 80,286 | | | British American Tobacco Malaysia Bhd | | | 1,831,781 | |
| | 894,100 | | | Genting Malaysia Bhd | | | 1,279,465 | |
| | 567,699 | | | Malayan Banking Bhd | | | 1,819,011 | |
| | 206,800 | | | Public Bank Bhd | | | 1,265,181 | |
| | | | | | | | |
| | | | Total Malaysia | | | 6,195,438 | |
| | | | | | | | |
| Mexico — 5.0% | |
| | 4,433 | | | Coca-Cola Femsa SAB de CV, ADR(a) | | | 481,734 | |
| | 260,515 | | | Fibra Uno Administracion SA de CV, REIT | | | 939,024 | |
| | 28,256 | | | Fomento Económico Mexicano SAB de CV, ADR | | | 2,738,289 | |
| | 846,300 | | | Genomma Lab Internacional SAB de CV, Class B Shares* | | | 2,274,102 | |
| | 284,100 | | | Grupo Financiero Banorte SAB de CV, Class O Shares | | | 2,003,946 | |
| | 99,778 | | | Grupo Financiero Santander Mexico SAB de CV, ADR | | | 1,502,657 | |
| | 300,571 | | | Grupo México SAB de CV, Class B Shares | | | 1,095,825 | |
| | 54,314 | | | Grupo Televisa SAB, ADR | | | 2,013,420 | |
| | 64,527 | | | Industrias Peñoles SAB de CV | | | 1,644,057 | |
| | 379,000 | | | Kimberly-Clark de México SAB de CV, Class A Shares | | | 1,018,125 | |
| | 1,320,174 | | | Wal-Mart de Mexico SAB de CV, Class V Shares | | | 3,587,857 | |
| | | | | | | | |
| | | | Total Mexico | | | 19,299,036 | |
| | | | | | | | |
| Netherlands — 0.6% | |
| | 83,686 | | | Yandex NV, Class A Shares(a)* | | | 2,379,193 | |
| | | | | | | | |
| Pakistan — 0.6% | |
| | 378,462 | | | Oil & Gas Development Co., Ltd. | | | 970,167 | |
| | 609,316 | | | Pakistan Petroleum Ltd. | | | 1,334,894 | |
| | | | | | | | |
| | | | Total Pakistan | | | 2,305,061 | |
| | | | | | | | |
| Peru — 0.5% | |
| | 12,700 | | | Credicorp Ltd. | | | 1,969,389 | |
| | | | | | | | |
| Philippines — 0.6% | |
| | 32,300 | | | Philippine Long Distance Telephone Co., ADR(a) | | | 2,449,632 | |
| | | | | | | | |
| Poland — 0.2% | |
| | 89,373 | | | Eurocash SA(a) | | | 963,011 | |
| | | | | | | | |
| Russia — 5.4% | |
| | 927,257 | | | Alrosa AO* | | | 1,062,738 | |
| | 356,617 | | | Gazprom OAO, ADR | | | 2,555,082 | |
| | 18,121 | | | Lukoil OAO, ADR | | | 1,010,472 | |
See Notes to Financial Statements.
78
| | | | | | | | |
| Emerging Markets Equity Investments | |
| | |
| Shares/Units | | | Security | | Value | |
| Russia — 5.4% — (continued) | |
| | 1,377 | | | Magnit OJSC, Class Registered Shares, GDR | | $ | 80,173 | |
| | 15,873 | | | Magnit OJSC, GDR(c) | | | 923,809 | |
| | 25,000 | | | Mail.ru Group Ltd., Class Registered Shares, GDR* | | | 671,615 | |
| | 49,725 | | | MegaFon OAO, GDR(c) | | | 1,407,217 | |
| | 139,600 | | | Mobile Telesystems OJSC, ADR | | | 2,575,620 | |
| | 14,241 | | | NovaTek OAO, Class Registered Shares, GDR | | | 1,434,301 | |
| | 2,530,788 | | | Sberbank of Russia* | | | 4,996,466 | |
| | 155,375 | | | TMK OAO, Class Registered Shares, GDR | | | 1,516,770 | |
| | 135,633 | | | X5 Retail Group NV, Class Registered Shares, GDR* | | | 2,570,638 | |
| | | | | | | | |
| | | | Total Russia | | | 20,804,901 | |
| | | | | | | | |
| Singapore — 0.3% | |
| | 85,611 | | | DBS Group Holdings Ltd. | | | 1,228,134 | |
| | | | | | | | |
| South Africa — 4.9% | |
| | 40,070 | | | Bidvest Group Ltd. (The) | | | 1,058,022 | |
| | 80,330 | | | Exxaro Resources Ltd.(a) | | | 1,138,621 | |
| | 59,407 | | | Imperial Holdings Ltd. | | | 1,061,227 | |
| | 55,653 | | | MTN Group Ltd. | | | 1,259,969 | |
| | 15,615 | | | Naspers Ltd., Class N Shares | | | 1,989,461 | |
| | 47,368 | | | Nedbank Group Ltd. | | | 1,017,736 | |
| | 322,862 | | | PPC Ltd. | | | 1,003,338 | |
| | 96,644 | | | Remgro Ltd. | | | 2,211,084 | |
| | 181,654 | | | Sanlam Ltd. | | | 1,126,477 | |
| | 132,226 | | | Shoprite Holdings Ltd. | | | 1,831,949 | |
| | 155,524 | | | Standard Bank Group Ltd. | | | 2,017,101 | |
| | 36,583 | | | Tiger Brands Ltd. | | | 1,055,470 | |
| | 82,351 | | | Vodacom Group Ltd. | | | 992,472 | |
| | 129,458 | | | Woolworths Holdings Ltd. | | | 966,422 | |
| | | | | | | | |
| | | | Total South Africa | | | 18,729,349 | |
| | | | | | | | |
| South Korea — 7.6% | |
| | 12,992 | | | Coway Co., Ltd. | | | 1,090,389 | |
| | 29,921 | | | Halla Visteon Climate Control Corp.(a) | | | 1,590,687 | |
| | 258,300 | | | Hanwha Life Insurance Co., Ltd. | | | 1,773,403 | |
| | 8,167 | | | Hyundai Mobis Co., Ltd. | | | 2,369,612 | |
| | 62,702 | | | KB Financial Group Inc. | | | 2,564,066 | |
| | 31,435 | | | Kia Motors Corp. | | | 1,898,333 | |
| | 59,060 | | | Korea Aerospace Industries Ltd. | | | 2,093,904 | |
| | 22,371 | | | KT&G Corp. | | | 2,094,105 | |
| | 1,180 | | | Orion Corp. | | | 1,016,456 | |
| | 5,743 | | | Samsung Electronics Co., Ltd. | | | 6,995,119 | |
| | 69,675 | | | Shinhan Financial Group Co., Ltd. | | | 3,601,638 | |
| | 47,124 | | | SK Hynix Inc.* | | | 2,113,276 | |
| | | | | | | | |
| | | | Total South Korea | | | 29,200,988 | |
| | | | | | | | |
| Spain — 0.6% | |
| | 230,596 | | | Cemex Latam Holdings SA* | | | 2,284,915 | |
| | | | | | | | |
| Taiwan — 4.3% | |
| | 145,100 | | | Catcher Technology Co., Ltd.* | | | 1,470,833 | |
| | 153,401 | | | Hiwin Technologies Corp. | | | 1,500,243 | |
| | 314,054 | | | Hon Hai Precision Industry Co., Ltd., Class Registered Shares, GDR | | | 2,107,625 | |
| | 159,000 | | | MediaTek Inc. | | | 2,658,515 | |
| | 218,795 | | | President Chain Store Corp. | | | 1,658,998 | |
| | 616,000 | | | Taiwan Semiconductor Manufacturing Co., Ltd. | | | 2,571,204 | |
| | 219,115 | | | Taiwan Semiconductor Manufacturing Co., Ltd., ADR | | | 4,588,268 | |
| | | | | | | | |
| | | | Total Taiwan | | | 16,555,686 | |
| | | | | | | | |
See Notes to Financial Statements.
79
| | | | | | | | |
| Emerging Markets Equity Investments | |
| | |
| Shares/Units | | | Security | | Value | |
| Thailand — 2.6% | |
| | 150,500 | | | Advanced Info Service PCL | | $ | 984,954 | |
| | 182,400 | | | Bangkok Bank PCL, Class Registered Shares | | | 1,171,117 | |
| | 1,969,800 | | | CP ALL PCL | | | 2,929,873 | |
| | 185,600 | | | Kasikornbank PCL | | | 1,313,240 | |
| | 213,664 | | | PTT Exploration & Production PCL | | | 1,100,602 | |
| | 85,300 | | | Siam Cement PCL (The), Class Registered Shares | | | 1,175,054 | |
| | 2,627,400 | | | Thai Beverage PCL | | | 1,493,956 | |
| | | | | | | | |
| | | | Total Thailand | | | 10,168,796 | |
| | | | | | | | |
| Turkey — 3.3% | |
| | 325,824 | | | Akbank TAS | | | 1,247,568 | |
| | 306,861 | | | Aselsan Elektronik Sanayi Ve Ticaret AS | | | 1,367,622 | |
| | 13,290 | | | Coca-Cola Icecek AS | | | 313,065 | |
| | 854,505 | | | Emlak Konut Gayrimenkul Yatirim Ortakligi AS, REIT | | | 1,071,985 | |
| | 101,336 | | | Ford Otomotiv Sanayi AS* | | | 1,333,200 | |
| | 432,388 | | | KOC Holding AS | | | 2,206,445 | |
| | 241,856 | | | TAV Havalimanlari Holding AS | | | 2,005,759 | |
| | 246,914 | | | Turkcell Iletisim Hizmetleri AS* | | | 1,449,733 | |
| | 656,102 | | | Türkiye Is Bankasi, Class C Shares | | | 1,701,995 | |
| | | | | | | | |
| | | | Total Turkey | | | 12,697,372 | |
| | | | | | | | |
| United Kingdom — 3.4% | |
| | 125,558 | | | British American Tobacco PLC | | | 7,382,389 | |
| | 104,139 | | | SABMiller PLC | | | 5,710,895 | |
| | | | | | | | |
| | | | Total United Kingdom | | | 13,093,284 | |
| | | | | | | | |
| United States — 0.6% | |
| | 23,800 | | | First Cash Financial Services Inc.* | | | 1,374,688 | |
| | 21,800 | | | Freeport-McMoRan Inc. | | | 792,866 | |
| | | | | | | | |
| | | | Total United States | | | 2,167,554 | |
| | | | | | | | |
| | | | TOTAL COMMON STOCKS
(Cost — $304,235,890) | | | 372,480,990 | |
| | | | | | | | |
| PREFERRED STOCKS — 0.9% | |
| Brazil — 0.9% | |
| | 405,953 | | | Itausa — Investimentos Itau SA, 0.594% | | | 1,975,970 | |
| | 835,200 | | | Marcopolo SA, 0.816% | | | 1,622,399 | |
| | | | | | | | |
| | | | Total Brazil | | | 3,598,369 | |
| | | | | | | | |
| India — 0.0% | |
| | 1,910,034 | | | Zee Entertainment Enterprises Ltd.* | | | 25,879 | |
| | | | | | | | |
| | | | TOTAL PREFERRED STOCKS
(Cost — $3,736,542) | | | 3,624,248 | |
| | | | | | | | |
| | | | TOTAL INVESTMENTS BEFORE SHORT-TERM INVESTMENTS
(Cost — $307,972,432) | | | 376,105,238 | |
| | | | | | | | |
| | |
Face
Amount | | | | | | |
| SHORT-TERM INVESTMENTS (d) — 7.2% | |
| MONEY MARKET FUND — 4.7% | |
| $ | 17,939,497 | | | Invesco STIT — Government & Agency Portfolio(e)
(Cost — $17,939,497) | | | 17,939,497 | |
| | | | | | | | |
See Notes to Financial Statements.
80
| | | | | | | | |
| Emerging Markets Equity Investments | |
| | |
Face
Amount† | | | Security | | Value | |
| TIME DEPOSITS — 2.5% | |
| $ | 5,406,693 | | | ANZ National Bank — London, 0.030% due 9/2/14 | | $ | 5,406,693 | |
| | | | BBH — Grand Cayman: | | | | |
| | 11,615 | EUR | | (0.030)% due 9/1/14 | | | 15,267 | |
| | 1,668 | HKD | | 0.005% due 9/1/14 | | | 215 | |
| | 32 | GBP | | 0.082% due 9/1/14 | | | 54 | |
| | 4,359,205 | | | JPMorgan Chase & Co. — Nassau, 0.030% due 9/2/14 | | | 4,359,205 | |
| | | | | | | | |
| | | | TOTAL TIME DEPOSITS
(Cost — $9,781,434) | | | 9,781,434 | |
| | | | | | | | |
| | | | TOTAL SHORT-TERM INVESTMENTS
(Cost — $27,720,931) | | | 27,720,931 | |
| | | | | | | | |
| | | | TOTAL INVESTMENTS — 104.8%
(Cost — $335,693,363#) | | | 403,826,169 | |
| | | | | | | | |
| | | | Liabilities in Excess of Other Assets — (4.8)% | | | (18,435,673 | ) |
| | | | | | | | |
| | | | TOTAL NET ASSETS — 100.0% | | $ | 385,390,496 | |
| | | | | | | | |
| * | | Non-income producing security. |
| (a) | | All or a portion of this security is on loan (See Note 1). |
| (b) | | Security trades on the Hong Kong exchange. |
| (c) | | Restricted security that may be sold to “qualified institutional buyers” pursuant to the conditions of Rule 144A under the Securities Act of 1933, as amended. This security has been deemed liquid pursuant to guidelines approved by the Board of Trustees, unless otherwise noted. |
| (d) | | Inclusive of all short term holdings, including collateral received from securities lending activities. Not including such collateral, the percentage of portfolio holdings would be 2.5%. |
| (e) | | Represents investment of collateral received from securities lending transactions. |
| † | | Face amount denominated in U.S. dollars, unless otherwise noted. |
| # | | Aggregate cost for federal income tax purposes is $344,973,844. |
| | |
Abbreviations used in this schedule: |
| ADR | | — American Depositary Receipts |
| GDR | | — Global Depositary Receipts |
| PCL | | — Public Company Limited |
| PLC | | — Public Limited Company |
| REIT | | — Real Estate Investment Trust |
| | |
Currency Abbreviations used in this schedule: |
| EUR | | — Euro |
| GBP | | — British Pound |
| HKD | | — Hong Kong Dollar |
| | | | |
| Summary of Investments by Security Sector^ | | | |
Financials | | | 26.6 | % |
Consumer Staples | | | 15.5 | |
Information Technology | | | 12.5 | |
Consumer Discretionary | | | 9.7 | |
Energy | | | 7.7 | |
Industrials | | | 6.9 | |
Materials | | | 5.1 | |
Telecommunication Services | | | 4.9 | |
Health Care | | | 2.7 | |
Utilities | | | 1.6 | |
Short-Term Investments | | | 6.8 | |
| | | | |
| | | 100.0 | % |
| | | | |
| ^ | | As a percentage of total investments. |
See Notes to Financial Statements.
81
| | | | | | | | | | |
| Core Fixed Income Investments | |
| | | |
Face
Amount/Units† | | | Rating†† | | Security | | Value | |
| CORPORATE BONDS & NOTES — 30.6% | |
| Aerospace & Defense — 0.1% | |
| $ | 79,000 | | | A- | | Precision Castparts Corp., Senior Unsecured Notes, 3.900% due 1/15/43 | | $ | 78,687 | |
| | | | | | United Technologies Corp., Senior Unsecured Notes: | | | | |
| | 95,000 | | | A | | 3.100% due 6/1/22 | | | 97,103 | |
| | 310,000 | | | A | | 4.500% due 6/1/42 | | | 335,105 | |
| | | | | | | | | | |
| | | | | | Total Aerospace & Defense | | | 510,895 | |
| | | | | | | | | | |
| Airlines — 0.5% | |
| | 707,976 | | | A- | | American Airlines Class A Pass Through Trust Series 2013-2, Equipment Trust, 4.950% due 1/15/23 | | | 762,844 | |
| | 137,009 | | | BBB+ | | Continental Airlines Inc. Class A Pass Through Trust, Series 1998-1, Pass Thru Certificates, 6.648% due 9/15/17 | | | 145,915 | |
| | 314,186 | | | BBB+ | | Continental Airlines Inc. Class A-1 Pass Through Trust, Series 1999-2, Pass Thru Certificates, 7.256% due 3/15/20 | | | 355,816 | |
| | 906,364 | | | A | | Delta Air Lines Class A Pass Through Trust, Series 2009-1, Pass Thru Certificates, 7.750% due 12/17/19 | | | 1,061,579 | |
| | 403,216 | | | BBB | | JetBlue Airways G-1 Pass Through Trust, Series 2004-2, Pass Thru Certificates, 0.609% due 8/15/16(a) | | | 399,183 | |
| | 625,000 | | | BBB- | | JetBlue Airways G-2 Pass Through Trust, Series 2004-2, Pass Thru Certificates, 0.684% due 11/15/16(a) | | | 606,250 | |
| | 308,553 | | | A+ | | Northwest Airlines Inc. Class A-1 Pass Through Trust, Series 2001-1, Pass Thru Certificates, 7.041% due 4/1/22 | | | 364,864 | |
| | 511,563 | | | BBB+ | | UAL Pass Through Trust, Series 2009-1, Pass Thru Certificates, 10.400% due 11/1/16 | | | 570,393 | |
| | 59,360 | | | BBB+ | | UAL Pass Through Trust, Series 2009-2A, Pass Thru Certificates, 9.750% due 1/15/17 | | | 67,225 | |
| | | | | | | | | | |
| | | | | | Total Airlines | | | 4,334,069 | |
| | | | | | | | | | |
| Automobiles — 1.0% | |
| | | | | | Daimler Finance North America LLC, Company Guaranteed Notes: | | | | |
| | 300,000 | | | A- | | 2.300% due 1/9/15(b) | | | 302,032 | |
| | 1,400,000 | | | A- | | 1.650% due 4/10/15(b) | | | 1,409,911 | |
| | 1,800,000 | | | A- | | 1.300% due 7/31/15(b) | | | 1,812,994 | |
| | 330,000 | | | A- | | 2.625% due 9/15/16(b) | | | 340,575 | |
| | 600,000 | | | A- | | 2.950% due 1/11/17(b) | | | 623,517 | |
| | 320,000 | | | BBB- | | Ford Motor Co., Senior Unsecured Notes, 4.750% due 1/15/43 | | | 336,265 | |
| | | | | | Volkswagen International Finance NV, Company Guaranteed Notes: | | | | |
| | 2,200,000 | | | A- | | 1.625% due 3/22/15(b) | | | 2,215,312 | |
| | 900,000 | | | A- | | 2.875% due 4/1/16(b) | | | 929,917 | |
| | | | | | | | | | |
| | | | | | Total Automobiles | | | 7,970,523 | |
| | | | | | | | | | |
| Banks — 6.1% | |
| | 1,400,000 | | | A | | Abbey National Treasury Services PLC, Company Guaranteed Notes, 3.875% due 11/10/14(b) | | | 1,409,517 | |
| | 200,000 | | | AA- | | ANZ New Zealand International Ltd., Company Guaranteed Notes, 1.850% due 10/15/15(b) | | | 202,715 | |
| | 800,000 | | | A | | Banco Santander Chile, Senior Unsecured Notes, 1.134% due 4/11/17(a)(b) | | | 802,977 | |
| | | | | | Bank of America Corp.: | | | | |
| | | | | | Senior Unsecured Notes: | | | | |
| | 620,000 | | | A- | | 1.500% due 10/9/15 | | | 625,914 | |
| | 495,000 | | | A- | | 3.750% due 7/12/16 | | | 519,152 | |
| | 230,000 | | | A- | | 6.500% due 8/1/16 | | | 252,922 | |
| | 600,000 | | | A- | | 5.625% due 10/14/16 | | | 654,697 | |
| | 850,000 | | | Baa2(c) | | 8.950% due 5/18/17(a) | | | 943,168 | |
| | 1,584,000 | | | Baa2(c) | | 9.570% due 6/6/17(a) | | | 1,809,973 | |
| | 80,000 | | | A- | | 5.750% due 12/1/17 | | | 89,814 | |
| | 3,250,000 | | | A- | | 5.650% due 5/1/18 | | | 3,658,015 | |
| | 500,000 | | | A- | | 5.000% due 5/13/21 | | | 559,882 | |
| | 100,000 | | | A- | | 5.700% due 1/24/22 | | | 116,332 | |
See Notes to Financial Statements.
82
| | | | | | | | | | |
| Core Fixed Income Investments | |
| | | |
Face
Amount/Units† | | | Rating†† | | Security | | Value | |
| Banks — 6.1% — (continued) | |
| $ | 830,000 | | | A- | | 3.300% due 1/11/23 | | $ | 823,994 | |
| | 490,000 | | | A- | | 4.125% due 1/22/24 | | | 509,924 | |
| | 585,000 | | | A- | | 4.000% due 4/1/24 | | | 603,804 | |
| | 480,000 | | | A- | | 5.000% due 1/21/44 | | | 523,600 | |
| | 270,000 | | | A- | | 4.875% due 4/1/44 | | | 290,014 | |
| | 270,000 | | | BBB+ | | Subordinated Notes, 4.200% due 8/26/24 | | | 274,408 | |
| | 300,000 | | | A- | | Bank of America NA, Subordinated Notes, 6.100% due 6/15/17 | | | 336,007 | |
| | 780,000 | | | Aaa(c) | | Bank of Nova Scotia (The), Covered Notes, 1.650% due 10/29/15(b) | | | 791,146 | |
| | 200,000 | | | A- | | Bank One Corp., Subordinated Notes, 4.900% due 4/30/15 | | | 205,676 | |
| | | | | | Barclays Bank PLC: | | | | |
| | 375,000 | | | A | | Senior Unsecured Notes, 3.750% due 5/15/24 | | | 383,885 | |
| | 100,000 | | | BBB | | Subordinated Notes, 5.140% due 10/14/20 | | | 109,304 | |
| | 320,000 | | | A+ | | BNP Paribas SA, Senior Unsecured Notes, 2.375% due 9/14/17 | | | 327,265 | |
| | 800,000 | | | A | | BPCE SA, Company Guaranteed Notes, 0.801% due 11/18/16(a) | | | 803,749 | |
| | 315,000 | | | Baa2(c) | | Caixa Economica Federal, Senior Unsecured Notes, 2.375% due 11/6/17(b) | | | 307,030 | |
| | 644,000 | | | BBB | | Capital One Financial Corp., Senior Unsecured Notes, 3.500% due 6/15/23 | | | 649,569 | |
| | 800,000 | | | BBB | | Chase Capital III, Limited Guaranteed Notes, 0.784% due 3/1/27(a) | | | 709,000 | |
| | | | | | Cooperatieve Centrale Raiffeisen-Boerenleenbank BA: | | | | |
| | | | | | Company Guaranteed Notes: | | | | |
| | 200,000 | | | AA- | | 3.375% due 1/19/17 | | | 211,004 | |
| | 310,000 | | | A | | 4.625% due 12/1/23 | | | 330,260 | |
| | 400,000 | | | A- | | Junior Subordinated Notes, 11.000%(a)(b)(d) | | | 531,000 | |
| | 660,000 | | | BBB- | | Credit Agricole SA, Junior Subordinated Notes, 9.750%(d) | | | 677,985 | |
| | | | | | Credit Suisse, Subordinated Notes: | | | | |
| | 471,000 | | | BBB+ | | 6.000% due 2/15/18 | | | 532,303 | |
| | 300,000 | | | BBB+ | | 5.400% due 1/14/20 | | | 338,278 | |
| | 770,000 | | | Aaa(c) | | Credit Suisse AG, Covered Notes, 2.600% due 5/27/16(b) | | | 795,612 | |
| | 1,510,000 | | | BBB- | | HBOS PLC, Subordinated Notes, 6.750% due 5/21/18(b) | | | 1,733,105 | |
| | 1,600,000 | | | A | | HSBC Bank USA NA, Subordinated Notes, 6.000% due 8/9/17 | | | 1,806,019 | |
| | 770,000 | | | A | | ING Bank NV, Senior Unsecured Notes, 3.750% due 3/7/17(b) | | | 813,516 | |
| | | | | | Intesa Sanpaolo SpA, Company Guaranteed Notes: | | | | |
| | 700,000 | | | BBB | | 3.125% due 1/15/16 | | | 718,397 | |
| | 810,000 | | | BBB- | | 5.017% due 6/26/24(b) | | | 819,152 | |
| | | | | | Lloyds Bank PLC: | | | | |
| | 210,000 | | | BBB | | Company Guaranteed Notes, 6.500% due 9/14/20(b) | | | 245,480 | |
| | 2,300,000 | | | BBB- | | Junior Subordinated Notes, 12.000%(a)(b)(d) | | | 3,392,500 | |
| | 600,000 | | | BBB | | M&T Bank Corp., Junior Subordinated Notes, 6.875%(d) | | | 615,568 | |
| | 300,000 | | | A | | Nordea Bank AB, Subordinated Notes, 4.875% due 5/13/21(b) | | | 328,525 | |
| | | | | | Royal Bank of Scotland Group PLC: | | | | |
| | 1,040,000 | | | BB | | Junior Subordinated Notes, 7.648%(a)(d) | | | 1,232,400 | |
| | | | | | Senior Unsecured Notes: | | | | |
| | 1,070,000 | | | BBB+ | | 2.550% due 9/18/15 | | | 1,089,116 | |
| | 300,000 | | | BBB+ | | 6.400% due 10/21/19 | | | 353,179 | |
| | | | | | Subordinated Notes: | | | | |
| | 130,000 | | | BB+ | | 6.125% due 12/15/22 | | | 142,390 | |
| | 320,000 | | | BB+ | | 6.100% due 6/10/23 | | | 349,938 | |
| | 220,000 | | | BB+ | | 6.000% due 12/19/23 | | | 239,587 | |
| | 465,000 | | | BB+ | | 5.125% due 5/28/24 | | | 475,161 | |
| | 90,000 | | | BBB- | | Royal Bank of Scotland NV, Company Guaranteed Notes, 4.650% due 6/4/18 | | | 95,225 | |
| | 700,000 | | | A- | | Royal Bank of Scotland PLC (The), Company Guaranteed Notes, 4.875% due 3/16/15 | | | 715,728 | |
| | 219,000 | | | BBB | | Santander Holdings USA Inc., Senior Unsecured Notes, 3.450% due 8/27/18 | | | 230,077 | |
| | 200,000 | | | BBB+ | | Santander U.S. Debt SAU, Company Guaranteed Notes, 3.724% due 1/20/15(b) | | | 201,991 | |
| | 220,000 | | | BBB+ | | Societe Generale SA, Subordinated Notes, 5.000% due 1/17/24(b) | | | 230,805 | |
| | 330,000 | | | A- | | Standard Chartered PLC, Subordinated Notes, 5.700% due 3/26/44(b) | | | 365,349 | |
| | 460,000 | | | A | | UBS AG, Senior Unsecured Notes, 3.875% due 1/15/15 | | | 465,933 | |
See Notes to Financial Statements.
83
| | | | | | | | | | |
| Core Fixed Income Investments | |
| | | |
Face
Amount/Units† | | | Rating†† | | Security | | Value | |
| Banks — 6.1% — (continued) | |
| $ | 300,000 | | | BBB- | | VTB Bank OJSC Via VTB Capital SA, Senior Unsecured Notes, 6.465% due 3/4/15(b)(e) | | $ | 303,114 | |
| | 630,000 | | | BBB+ | | Wachovia Capital Trust III, Limited Guaranteed Notes, 5.570%(a)(d) | | | 620,550 | |
| | | | | | Wells Fargo & Co.: | | | | |
| | 4,200,000 | | | A+ | | Senior Unsecured Notes, 0.534% due 6/2/17(a) | | | 4,202,864 | |
| | | | | | Subordinated Notes: | | | | |
| | 330,000 | | | A | | 3.450% due 2/13/23 | | | 332,650 | |
| | 299,000 | | | A | | 4.480% due 1/16/24 | | | 320,986 | |
| | 100,000 | | | A | | 4.100% due 6/3/26 | | | 102,437 | |
| | 175,000 | | | A | | 5.375% due 11/2/43 | | | 199,937 | |
| | 170,000 | | | A | | 5.606% due 1/15/44 | | | 200,366 | |
| | 250,000 | | | A+ | | Wells Fargo Bank NA, Subordinated Notes, 6.000% due 11/15/17 | | | 284,533 | |
| | 210,000 | | | BBB+ | | Wells Fargo Capital X, Limited Guaranteed Notes, 5.950% due 12/15/36 | | | 215,250 | |
| | | | | | Westpac Banking Corp.: | | | | |
| | | | | | Covered Notes: | | | | |
| | 1,075,000 | | | Aaa(c) | | 1.375% due 7/17/15(b) | | | 1,084,442 | |
| | 685,000 | | | Aaa(c) | | 2.000% due 5/21/19(b) | | | 686,274 | |
| | 480,000 | | | AA- | | Senior Unsecured Notes, 4.875% due 11/19/19 | | | 542,636 | |
| | | | | | | | | | |
| | | | | | Total Banks | | | 48,465,075 | |
| | | | | | | | | | |
| Beverages — 0.9% | |
| | | | | | Anheuser-Busch InBev Worldwide Inc., Company Guaranteed Notes: | | | | |
| | 1,200,000 | | | A | | 4.125% due 1/15/15 | | | 1,216,257 | |
| | 620,000 | | | A | | 5.000% due 4/15/20 | | | 702,497 | |
| | 585,000 | | | A | | 2.500% due 7/15/22 | | | 574,310 | |
| | 545,000 | | | A- | | Coca-Cola Femsa SAB de CV, Company Guaranteed Notes, 4.625% due 2/15/20 | | | 600,230 | |
| | 213,000 | | | A- | | Diageo Capital PLC, Company Guaranteed Notes, 4.828% due 7/15/20 | | | 240,154 | |
| | 200,000 | | | A- | | Diageo Investment Corp., Company Guaranteed Notes, 2.875% due 5/11/22 | | | 200,340 | |
| | 2,400,000 | | | A- | | Foster’s Finance Corp., Company Guaranteed Notes, 4.875% due 10/1/14(b)(e) | | | 2,408,193 | |
| | 120,000 | | | BBB+ | | Heineken NV, Senior Unsecured Notes, 1.400% due 10/1/17(b) | | | 119,663 | |
| | 50,000 | | | BBB+ | | Molson Coors Brewing Co., Company Guaranteed Notes, 3.500% due 5/1/22 | | | 51,474 | |
| | | | | | PepsiCo Inc., Senior Unsecured Notes: | | | | |
| | 450,000 | | | A- | | 0.700% due 8/13/15 | | | 451,882 | |
| | 310,000 | | | A- | | 7.900% due 11/1/18 | | | 382,643 | |
| | | | | | Pernod-Ricard SA, Senior Unsecured Notes: | | | | |
| | 200,000 | | | BBB- | | 2.950% due 1/15/17(b) | | | 207,164 | |
| | 390,000 | | | BBB- | | 4.450% due 1/15/22(b) | | | 419,891 | |
| | | | | | | | | | |
| | | | | | Total Beverages | | | 7,574,698 | |
| | | | | | | | | | |
| Biotechnology — 0.1% | |
| | | | | | Amgen Inc., Senior Unsecured Notes: | | | | |
| | 110,000 | | | A | | 3.625% due 5/22/24 | | | 112,079 | |
| | 120,000 | | | A | | 5.150% due 11/15/41 | | | 133,278 | |
| | 150,000 | | | A | | 5.375% due 5/15/43 | | | 173,137 | |
| | 250,000 | | | A- | | Gilead Sciences Inc., Senior Unsecured Notes, 3.700% due 4/1/24 | | | 261,245 | |
| | | | | | | | | | |
| | | | | | Total Biotechnology | | | 679,739 | |
| | | | | | | | | | |
| Capital Markets — 1.3% | |
| | 345,000 | | | A+ | | Bank of New York Mellon Corp. (The), Senior Unsecured Notes, 3.400% due 5/15/24 | | | 353,978 | |
| | 450,000 | | | BB+ | | Goldman Sachs Capital II, Limited Guaranteed Notes, 4.000%(a)(d) | | | 357,750 | |
| | | | | | Goldman Sachs Group Inc. (The), Senior Unsecured Notes: | | | | |
| | 1,400,000 | | | A- | | 5.500% due 11/15/14 | | | 1,414,438 | |
| | 1,100,000 | | | A- | | 5.125% due 1/15/15 | | | 1,118,764 | |
| | 1,200,000 | | | A- | | 3.300% due 5/3/15 | | | 1,222,865 | |
| | 515,000 | | | A- | | 3.700% due 8/1/15 | | | 529,686 | |
| | 800,000 | | | A- | | 6.250% due 9/1/17 | | | 905,766 | |
| | 225,000 | | | A- | | 2.375% due 1/22/18 | | | 228,719 | |
See Notes to Financial Statements.
84
| | | | | | | | | | |
| Core Fixed Income Investments | |
| | | |
Face
Amount/Units† | | | Rating†† | | Security | | Value | |
| Capital Markets — 1.3% — (continued) | |
| $ | 950,000 | | | A- | | 6.150% due 4/1/18 | | $ | 1,082,946 | |
| | 624,000 | | | A- | | 2.900% due 7/19/18 | | | 642,047 | |
| | 150,000 | | | A- | | 7.500% due 2/15/19 | | | 181,461 | |
| | 1,060,000 | | | A- | | 6.000% due 6/15/20 | | | 1,235,006 | |
| | 40,000 | | | A- | | 5.250% due 7/27/21 | | | 45,118 | |
| | 630,000 | | | A- | | 6.250% due 2/1/41 | | | 792,124 | |
| | 650,000 | | | NR | | Lehman Brothers Holdings Inc., Subordinated Notes, 6.750% due 12/28/17(e)(f)(q) | | | 0 | |
| | | | | | | | | | |
| | | | | | Total Capital Markets | | | 10,110,668 | |
| | | | | | | | | | |
| Chemicals — 0.1% | |
| | 160,000 | | | BB | | Eagle Spinco Inc., Company Guaranteed Notes, 4.625% due 2/15/21 | | | 161,000 | |
| | 140,000 | | | BBB+ | | Ecolab Inc., Senior Unsecured Notes, 4.350% due 12/8/21 | | | 153,779 | |
| | 200,000 | | | BBB | | LyondellBasell Industries NV, Senior Unsecured Notes, 6.000% due 11/15/21 | | | 239,431 | |
| | 60,000 | | | A- | | Potash Corp. of Saskatchewan Inc., Senior Unsecured Notes, 4.875% due 3/30/20 | | | 67,908 | |
| | 190,000 | | | A- | | PPG Industries Inc., Senior Unsecured Notes, 6.650% due 3/15/18 | | | 220,900 | |
| | | | | | | | | | |
| | | | | | Total Chemicals | | | 843,018 | |
| | | | | | | | | | |
| Commercial Services & Supplies — 0.1% | |
| | | | | | Waste Management Inc., Company Guaranteed Notes: | | | | |
| | 40,000 | | | A- | | 4.600% due 3/1/21 | | | 44,675 | |
| | 110,000 | | | A- | | 3.500% due 5/15/24 | | | 112,132 | |
| | 70,000 | | | A- | | 7.375% due 5/15/29 | | | 94,283 | |
| | 150,000 | | | B+ | | West Corp., Company Guaranteed Notes, 5.375% due 7/15/22(b) | | | 146,250 | |
| | | | | | | | | | |
| | | | | | Total Commercial Services & Supplies | | | 397,340 | |
| | | | | | | | | | |
| Consumer Finance — 1.3% | |
| | | | | | Ally Financial Inc., Company Guaranteed Notes: | | | | |
| | 1,900,000 | | | BB | | 8.300% due 2/12/15 | | | 1,960,563 | |
| | 200,000 | | | BB | | 8.000% due 3/15/20 | | | 243,500 | |
| | | | | | Ford Motor Credit Co. LLC, Senior Unsecured Notes: | | | | |
| | 200,000 | | | BBB- | | 2.750% due 5/15/15 | | | 203,060 | |
| | 695,000 | | | BBB- | | 12.000% due 5/15/15 | | | 749,849 | |
| | 1,300,000 | | | BBB- | | 5.625% due 9/15/15 | | | 1,364,436 | |
| | 1,425,000 | | | BBB- | | 1.700% due 5/9/16 | | | 1,440,950 | |
| | 700,000 | | | BBB- | | 0.684% due 11/8/16(a) | | | 700,063 | |
| | 500,000 | | | BBB- | | 6.625% due 8/15/17 | | | 571,440 | |
| | 225,000 | | | BBB- | | 1.724% due 12/6/17 | | | 224,787 | |
| | 610,000 | | | BBB- | | 8.125% due 1/15/20 | | | 775,299 | |
| | 100,000 | | | BBB+ | | Hyundai Capital America, Senior Unsecured Notes, 2.125% due 10/2/17(b) | | | 101,453 | |
| | | | | | Navient LLC, Senior Unsecured Notes: | | | | |
| | 1,100,000 | | | BB | | 6.000% due 1/25/17 | | | 1,185,250 | |
| | 360,000 | | | BB | | 8.000% due 3/25/20 | | | 416,700 | |
| | 100,000 | DKK | | AAA | | Nykredit Realkredit AS, Covered Notes, 2.000% due 4/1/15 | | | 17,826 | |
| | 200,000 | DKK | | AAA | | Realkredit Danmark AS, Covered Notes, 2.000% due 4/1/15 | | | 35,660 | |
| | 410,000 | | | AA- | | Toyota Motor Credit Corp., Senior Unsecured Notes, 1.250% due 10/5/17 | | | 409,458 | |
| | | | | | | | | | |
| | | | | | Total Consumer Finance | | | 10,400,294 | |
| | | | | | | | | | |
| Containers & Packaging — 0.0% | |
| | 170,000 | | | BB+ | | Ball Corp., Company Guaranteed Notes, 5.750% due 5/15/21 | | | 180,200 | |
| | | | | | Rock-Tenn Co., Company Guaranteed Notes: | | | | |
| | 120,000 | | | BBB | | 3.500% due 3/1/20 | | | 124,259 | |
| | 20,000 | | | BBB | | 4.000% due 3/1/23 | | | 20,668 | |
| | | | | | | | | | |
| | | | | | Total Containers & Packaging | | | 325,127 | |
| | | | | | | | | | |
See Notes to Financial Statements.
85
| | | | | | | | | | |
| Core Fixed Income Investments | |
| | | |
Face
Amount/Units† | | | Rating†† | | Security | | Value | |
| Diversified Financial Services — 4.2% | |
| | | | | | American Express Co.: | | | | |
| $ | 72,000 | | | BBB+ | | Senior Unsecured Notes, 2.650% due 12/2/22 | | $ | 70,740 | |
| | 310,000 | | | BBB- | | Subordinated Notes, 6.800% due 9/1/66(a) | | | 337,125 | |
| | 415,000 | | | AAA | | Asian Development Bank, Senior Unsecured Notes, 0.750% due 1/11/17 | | | 415,234 | |
| | 1,200,000 | | | BB(g) | | Astoria Depositor Corp., Pass Thru Certificates, 8.144% due 5/1/21(b) | | | 1,266,000 | |
| | | | | | Bear Stearns Cos. LLC (The), Senior Unsecured Notes: | | | | |
| | 20,000 | | | A | | 6.400% due 10/2/17 | | | 22,843 | |
| | 2,280,000 | | | A | | 7.250% due 2/1/18 | | | 2,687,753 | |
| | 400,000 | | | A+ | | Caisse Centrale Desjardins, Senior Unsecured Notes, 2.650% due 9/16/15(b) | | | 408,873 | |
| | 1,400,000 | | | AAA | | CDP Financial Inc., Company Guaranteed Notes, 4.400% due 11/25/19(b) | | | 1,554,983 | |
| | | | | | Citigroup Inc.: | | | | |
| | | | | | Senior Unsecured Notes: | | | | |
| | 2,085,000 | | | A- | | 1.250% due 1/15/16 | | | 2,096,388 | |
| | 1,200,000 | | | A- | | 1.194% due 7/25/16(a) | | | 1,212,123 | |
| | 500,000 | | | A- | | 2.500% due 9/26/18 | | | 508,071 | |
| | | | | | Subordinated Notes: | | | | |
| | 1,400,000 | | | BBB+ | | 5.000% due 9/15/14 | | | 1,401,984 | |
| | 200,000 | | | BBB+ | | 4.875% due 5/7/15 | | | 205,658 | |
| | 250,000 | | | BBB+ | | 5.500% due 9/13/25 | | | 280,678 | |
| | 30,000 | | | BBB+ | | 6.625% due 6/15/32 | | | 36,522 | |
| | 280,000 | | | BBB+ | | 6.675% due 9/13/43 | | | 357,415 | |
| | 100,000 | | | A- | | Farmers Exchange Capital, Subordinated Notes, 7.200% due 7/15/48(b) | | | 131,765 | |
| | 1,200,000 | | | A- | | Farmers Exchange Capital II, Subordinated Notes, 6.151% due 11/1/53(a)(b) | | | 1,380,354 | |
| | 240,000 | | | Aaa(c) | | FMS Wertmanagement AoeR, Government Guaranteed Notes, 1.125% due 9/5/17 | | | 240,357 | |
| | | | | | General Electric Capital Corp.: | | | | |
| | | | | | Senior Unsecured Notes: | | | | |
| | 820,000 | | | AA+ | | 5.625% due 5/1/18 | | | 933,723 | |
| | 90,000 | | | AA+ | | 5.550% due 5/4/20 | | | 104,710 | |
| | 250,000 | | | AA+ | | 4.650% due 10/17/21 | | | 280,519 | |
| | 1,025,000 | | | AA+ | | 0.714% due 8/15/36(a) | | | 885,447 | |
| | 425,000 | | | AA+ | | 6.150% due 8/7/37 | | | 543,039 | |
| | 160,000 | | | AA+ | | 6.875% due 1/10/39 | | | 222,312 | |
| | | | | | Subordinated Notes: | | | | |
| | 170,000 | | | AA | | 5.300% due 2/11/21 | | | 195,194 | |
| | 710,000 | | | AA- | | 6.375% due 11/15/67(a) | | | 789,094 | |
| | 430,000 | | | A- | | HSBC Finance Corp., Senior Subordinated Notes, 6.676% due 1/15/21 | | | 516,798 | |
| | 130,000 | | | BBB- | | Icahn Enterprises LP/Icahn Enterprises Finance Corp., Company Guaranteed Notes, 5.875% due 2/1/22 | | | 136,175 | |
| | 270,000 | | | B+ | | ILFC E-Capital Trust II, Limited Guaranteed Notes, 6.250% due 12/21/65(a)(b) | | | 269,325 | |
| | | | | | International Lease Finance Corp.: | | | | |
| | | | | | Senior Secured Notes: | | | | |
| | 500,000 | | | BBB- | | 6.500% due 9/1/14(b) | | | 500,000 | |
| | 880,000 | | | BBB- | | 6.750% due 9/1/16(b) | | | 964,700 | |
| | 590,000 | | | BBB- | | 7.125% due 9/1/18(b) | | | 678,500 | |
| | 565,000 | | | BB+ | | Senior Unsecured Notes, 8.625% due 9/15/15 | | | 607,022 | |
| | | | | | John Deere Capital Corp., Senior Unsecured Notes: | | | | |
| | 130,000 | | | A | | 2.250% due 4/17/19 | | | 132,070 | |
| | 70,000 | | | A | | 1.700% due 1/15/20 | | | 68,768 | |
| | | | | | JPMorgan Chase & Co.: | | | | |
| | | | | | Senior Unsecured Notes: | | | | |
| | 1,400,000 | | | A | | 3.400% due 6/24/15 | | | 1,432,304 | |
| | 1,800,000 | | | A | | 1.100% due 10/15/15 | | | 1,808,548 | |
| | 480,000 | | | A | | 3.450% due 3/1/16 | | | 498,778 | |
| | 745,000 | | | A | | 2.000% due 8/15/17 | | | 756,696 | |
| | 295,000 | | | A | | 6.000% due 1/15/18 | | | 335,341 | |
See Notes to Financial Statements.
86
| | | | | | | | | | |
| Core Fixed Income Investments | |
| | | |
Face
Amount/Units† | | | Rating†† | | Security | | Value | |
| Diversified Financial Services — 4.2% — (continued) | |
| $ | 90,000 | | | A | | 4.400% due 7/22/20 | | $ | 98,176 | |
| | 1,005,000 | | | A | | 3.625% due 5/13/24 | | | 1,026,017 | |
| | | | | | Subordinated Notes: | | | | |
| | 170,000 | | | A- | | 5.150% due 10/1/15 | | | 177,831 | |
| | 630,000 | | | A- | | 6.125% due 6/27/17 | | | 707,489 | |
| | 200,000 | | | A- | | 3.375% due 5/1/23 | | | 197,186 | |
| | 400,000 | | | A | | Unsecured Notes, 0.784% due 4/25/18(a) | | | 402,230 | |
| | 900,000 | | | BBB | | JPMorgan Chase Capital XXIII, Limited Guaranteed Notes, 1.234% due 5/15/47(a) | | | 746,550 | |
| | 500,000 | | | BBB- | | Pipeline Funding Co. LLC, Senior Secured Notes, 7.500% due 1/15/30(b) | | | 639,610 | |
| | 335,000 | | | A+ | | Prudential Holdings LLC, Senior Secured Notes, 8.695% due 12/18/23(b) | | | 427,308 | |
| | | | | | State Street Corp.: | | | | |
| | 470,000 | | | BBB+ | | Junior Subordinated Notes, 4.956% due 3/15/18 | | | 513,796 | |
| | 250,000 | | | A | | Senior Subordinated Notes, 3.100% due 5/15/23 | | | 247,361 | |
| | 303,938 | | | Baa2(c) | | SteelRiver Transmission Co. LLC, Senior Secured Notes, 4.710% due 6/30/17(b) | | | 321,477 | |
| | 750,000 | | | A | | ZFS Finance USA Trust II, Junior Subordinated Notes, 6.450% due 12/15/65(a)(b) | | | 808,125 | |
| | | | | | | | | | |
| | | | | | Total Diversified Financial Services | | | 33,587,085 | |
| | | | | | | | | | |
| Diversified Telecommunication Services — 1.2% | |
| | | | | | AT&T Inc., Senior Unsecured Notes: | | | | |
| | 570,000 | | | A- | | 5.100% due 9/15/14 | | | 570,844 | |
| | 330,000 | | | A- | | 5.500% due 2/1/18 | | | 372,541 | |
| | 10,000 | | | A- | | 5.800% due 2/15/19 | | | 11,619 | |
| | 70,000 | | | A- | | 4.300% due 12/15/42 | | | 68,337 | |
| | 220,000 | | | A- | | 4.350% due 6/15/45 | | | 215,125 | |
| | 220,000 | | | BBB+ | | Deutsche Telekom International Finance BV, Company Guaranteed Notes, 5.750% due 3/23/16 | | | 236,429 | |
| | | | | | Intelsat Jackson Holdings SA, Company Guaranteed Notes: | | | | |
| | 120,000 | | | B+ | | 8.500% due 11/1/19 | | | 126,300 | |
| | 60,000 | | | B+ | | 7.500% due 4/1/21 | | | 65,175 | |
| | 300,000 | | | B+ | | 5.500% due 8/1/23 | | | 300,000 | |
| | | | | | Verizon Communications Inc., Senior Unsecured Notes: | | | | |
| | 1,800,000 | | | BBB+ | | 0.700% due 11/2/15 | | | 1,802,990 | |
| | 1,100,000 | | | BBB+ | | 2.500% due 9/15/16 | | | 1,134,742 | |
| | 40,000 | | | BBB+ | | 6.350% due 4/1/19 | | | 47,075 | |
| | 100,000 | | | BBB+ | | 3.450% due 3/15/21 | | | 103,812 | |
| | 1,992,000 | | | BBB+ | | 5.150% due 9/15/23 | | | 2,256,976 | |
| | 253,000 | | | BBB+ | | 4.150% due 3/15/24 | | | 268,020 | |
| | 284,000 | | | BBB+ | | 6.400% due 9/15/33 | | | 359,122 | |
| | 703,000 | | | BBB+ | | 6.550% due 9/15/43 | | | 906,786 | |
| | 294,000 | | | BBB+ | | 4.862% due 8/21/46(b) | | | 309,452 | |
| | 307,000 | | | BBB+ | | 5.012% due 8/21/54(b) | | | 321,727 | |
| | 34,000 | | | A- | | Vodafone Group PLC, Senior Unsecured Notes, 4.375% due 2/19/43 | | | 33,251 | |
| | | | | | | | | | |
| | | | | | Total Diversified Telecommunication Services | | | 9,510,323 | |
| | | | | | | | | | |
| Electric Utilities — 1.4% | |
| | | | | | Berkshire Hathaway Energy Co., Senior Unsecured Notes: | | | | |
| | 250,000 | | | BBB+ | | 5.950% due 5/15/37 | | | 311,353 | |
| | 275,000 | | | BBB+ | | 6.500% due 9/15/37 | | | 364,028 | |
| | 36,000 | | | BB | | Calpine Corp., Senior Secured Notes, 7.875% due 1/15/23(b) | | | 40,140 | |
| | 215,000 | | | BBB+ | | Cleveland Electric Illuminating Co. (The), Senior Secured Notes, 7.880% due 11/1/17 | | | 256,103 | |
| | | | | | Dominion Resources Inc., Senior Unsecured Notes: | | | | |
| | 105,000 | | | BBB+ | | 7.195% due 9/15/14 | | | 105,218 | |
| | 390,000 | | | BBB+ | | 5.200% due 8/15/19 | | | 444,197 | |
| | 110,000 | | | BBB | | Duke Energy Corp., Senior Unsecured Notes, 3.550% due 9/15/21 | | | 116,024 | |
| | 195,000 | | | A | | Duke Energy Florida Inc., 1st Mortgage Notes, 5.900% due 3/1/33 | | | 241,742 | |
See Notes to Financial Statements.
87
| | | | | | | | | | |
| Core Fixed Income Investments | |
| | | |
Face
Amount/Units† | | | Rating†† | | Security | | Value | |
| Electric Utilities — 1.4% — (continued) | |
| $ | 750,000 | | | BBB- | | Duquesne Light Holdings Inc., Senior Unsecured Notes, 6.400% due 9/15/20(b) | | $ | 888,675 | |
| | 920,000 | | | A- | | Entergy Texas Inc., 1st Mortgage Notes, 7.125% due 2/1/19 | | | 1,109,421 | |
| | 105,000 | | | BBB- | | Exelon Corp., Senior Unsecured Notes, 5.625% due 6/15/35 | | | 121,710 | |
| | | | | | FirstEnergy Corp., Senior Unsecured Notes: | | | | |
| | 100,000 | | | BB+ | | 2.750% due 3/15/18 | | | 101,217 | |
| | 930,000 | | | BB+ | | 7.375% due 11/15/31 | | | 1,132,435 | |
| | 55,000 | | | A | | Florida Power & Light Co., 1st Mortgage Notes, 4.950% due 6/1/35 | | | 64,223 | |
| | 364,312 | | | BBB- | | Indiantown Cogeneration LP, 1st Mortgage Notes, 9.770% due 12/15/20 | | | 415,244 | |
| | | | | | IPALCO Enterprises Inc., Senior Secured Notes: | | | | |
| | 750,000 | | | BB+ | | 7.250% due 4/1/16(b) | | | 811,875 | |
| | 350,000 | | | BB+ | | 5.000% due 5/1/18 | | | 372,750 | |
| | 775,000 | | | BBB+ | | KCP&L Greater Missouri Operations Co., Senior Unsecured Notes, 8.270% due 11/15/21 | | | 982,356 | |
| | 487,147 | | | BB- | | Mirant Mid Atlantic Series C Pass Through Trust, Pass Thru Certificates, 10.060% due 12/30/28 | | | 549,867 | |
| | 250,000 | | | BBB | | Ohio Power Co., Senior Unsecured Notes, 6.050% due 5/1/18 | | | 287,177 | |
| | 80,000 | | | A | | Oncor Electric Delivery Co. LLC, Senior Secured Notes, 7.000% due 9/1/22 | | | 103,183 | |
| | 370,000 | | | BBB | | Pacific Gas & Electric Co., Senior Unsecured Notes, 6.050% due 3/1/34 | | | 465,156 | |
| | 235,000 | | | A | | PacifiCorp, 1st Mortgage Notes, 4.100% due 2/1/42 | | | 242,318 | |
| | 500,000 | | | BBB- | | PNM Resources Inc., Senior Unsecured Notes, 9.250% due 5/15/15 | | | 528,958 | |
| | 500,000 | | | BBB | | Public Service Co. of New Mexico, Senior Unsecured Notes, 7.950% due 5/15/18 | | | 601,166 | |
| | 200,000 | | | A- | | Texas-New Mexico Power Co., 1st Mortgage Notes, 6.950% due 4/1/43(b) | | | 274,156 | |
| | | | | | Virginia Electric & Power Co., Senior Unsecured Notes: | | | | |
| | 125,000 | | | A- | | 6.000% due 5/15/37 | | | 161,544 | |
| | 25,000 | | | A- | | 6.350% due 11/30/37 | | | 33,959 | |
| | 250,000 | | | A- | | 4.000% due 1/15/43 | | | 251,555 | |
| | | | | | | | | | |
| | | | | | Total Electric Utilities | | | 11,377,750 | |
| | | | | | | | | | |
| Electrical Equipment — 0.0% | |
| | 30,000 | | | A | | ABB Finance USA Inc., Company Guaranteed Notes, 4.375% due 5/8/42 | | | 31,687 | |
| | | | | | | | | | |
| Electronic Equipment, Instruments & Components — 0.0% | |
| | 303,000 | | | BBB- | | Jabil Circuit Inc., Senior Unsecured Notes, 8.250% due 3/15/18 | | | 358,298 | |
| | | | | | | | | | |
| Energy Equipment & Services — 0.1% | |
| | | | | | Access Midstream Partners LP/ACMP Finance Corp., Company Guaranteed Notes: | | | | |
| | 60,000 | | | BB+ | | 5.875% due 4/15/21 | | | 64,050 | |
| | 180,000 | | | BB+ | | 6.125% due 7/15/22 | | | 196,650 | |
| | 30,000 | | | BB+ | | 4.875% due 3/15/24 | | | 31,620 | |
| | 400,000 | | | A+ | | Sinopec Group Overseas Development 2014 Ltd., Company Guaranteed Notes, 4.375% due 4/10/24(b) | | | 421,486 | |
| | | | | | | | | | |
| | | | | | Total Energy Equipment & Services | | | 713,806 | |
| | | | | | | | | | |
| Food & Staples Retailing — 0.3% | |
| | | | | | CVS Caremark Corp., Senior Unsecured Notes: | | | | |
| | 1,600,000 | | | BBB+ | | 3.250% due 5/18/15 | | | 1,631,952 | |
| | 420,000 | | | BBB+ | | 2.750% due 12/1/22 | | | 411,925 | |
| | 275,020 | | | BBB+ | | CVS Pass-Through Trust, Pass Thru Certificates, 6.036% due 12/10/28 | | | 319,765 | |
| | 90,000 | | | BBB | | Kroger Co. (The), Company Guaranteed Notes, 6.900% due 4/15/38 | | | 120,470 | |
| | | | | | | | | | |
| | | | | | Total Food & Staples Retailing | | | 2,484,112 | |
| | | | | | | | | | |
| Food Products — 0.7% | |
| | 2,200,000 | | | BBB- | | ConAgra Foods Inc., Senior Unsecured Notes, 0.603% due 7/21/16(a) | | | 2,202,669 | |
| | 180,000 | | | BB- | | HJ Heinz Co., Secured Notes, 4.250% due 10/15/20 | | | 182,700 | |
| | 2,500,000 | | | BBB | | Kraft Foods Group Inc., Senior Unsecured Notes, 1.625% due 6/4/15 | | | 2,522,237 | |
| | | | | | Mondelez International Inc., Senior Unsecured Notes: | | | | |
| | 348,000 | | | BBB- | | 5.375% due 2/10/20 | | | 398,562 | |
| | 270,000 | | | BBB- | | 4.000% due 2/1/24 | | | 284,402 | |
See Notes to Financial Statements.
88
| | | | | | | | | | |
| Core Fixed Income Investments | |
| | | |
Face
Amount/Units† | | | Rating†† | | Security | | Value | |
| Food Products — 0.7% — (continued) | |
| | | | | | Wm Wrigley Jr Co., Senior Unsecured Notes: | | | | |
| $ | 50,000 | | | A- | | 2.400% due 10/21/18(b) | | $ | 50,875 | |
| | 180,000 | | | A- | | 2.900% due 10/21/19(b) | | | 184,787 | |
| | 60,000 | | | A- | | 3.375% due 10/21/20(b) | | | 62,004 | |
| | | | | | | | | | |
| | | | | | Total Food Products | | | 5,888,236 | |
| | | | | | | | | | |
| Health Care Equipment & Supplies — 0.4% | |
| | 185,000 | | | A- | | Baxter International Inc., Senior Unsecured Notes, 3.200% due 6/15/23 | | | 185,964 | |
| | 2,900,000 | | | A | | Covidien International Finance SA, Company Guaranteed Notes, 1.350% due 5/29/15 | | | 2,919,775 | |
| | | | | | Medtronic Inc., Senior Unsecured Notes: | | | | |
| | 150,000 | | | AA- | | 4.450% due 3/15/20 | | | 166,837 | |
| | 100,000 | | | AA- | | 5.550% due 3/15/40 | | | 121,857 | |
| | | | | | | | | | |
| | | | | | Total Health Care Equipment & Supplies | | | 3,394,433 | |
| | | | | | | | | | |
| Health Care Providers & Services — 0.7% | |
| | 30,000 | | | A+ | | Catholic Health Initiatives, Secured Notes, 4.350% due 11/1/42 | | | 29,921 | |
| | 560,000 | | | B- | | CHS/Community Health Systems Inc., Company Guaranteed Notes, 8.000% due 11/15/19 | | | 610,400 | |
| | 20,000 | | | B+ | | DaVita HealthCare Partners Inc., Company Guaranteed Notes, 5.125% due 7/15/24 | | | 20,325 | |
| | | | | | Fresenius Medical Care US Finance Inc., Company Guaranteed Notes: | | | | |
| | 120,000 | | | BB+ | | 6.500% due 9/15/18(b) | | | 134,400 | |
| | 20,000 | | | BB+ | | 5.750% due 2/15/21(b) | | | 21,800 | |
| | | | | | HCA Inc., Company Guaranteed Notes: | | | | |
| | 600,000 | | | B- | | 6.375% due 1/15/15 | | | 610,500 | |
| | 120,000 | | | B- | | 7.190% due 11/15/15 | | | 127,500 | |
| | 29,000 | | | B- | | 6.500% due 2/15/16 | | | 30,849 | |
| | 210,000 | | | B- | | 7.500% due 2/15/22 | | | 245,175 | |
| | | | | | Humana Inc., Senior Unsecured Notes: | | | | |
| | 400,000 | | | BBB+ | | 6.450% due 6/1/16 | | | 437,622 | |
| | 60,000 | | | BBB+ | | 3.150% due 12/1/22 | | | 60,042 | |
| | 70,000 | | | BBB+ | | 4.625% due 12/1/42 | | | 71,564 | |
| | 1,000,000 | | | AA | | Providence Health & Services Obligated Group, Unsecured Notes, 1.185% due 10/1/17(a) | | | 1,006,781 | |
| | 76,000 | | | AA | | Roche Holdings Inc., Company Guaranteed Notes, 6.000% due 3/1/19(b) | | | 88,861 | |
| | 705,000 | | | A | | UnitedHealth Group Inc., Senior Unsecured Notes, 3.375% due 11/15/21 | | | 736,795 | |
| | | | | | WellPoint Inc., Senior Unsecured Notes: | | | | |
| | 80,000 | | | A- | | 1.250% due 9/10/15 | | | 80,515 | |
| | 30,000 | | | A- | | 5.875% due 6/15/17 | | | 33,593 | |
| | 510,000 | | | A- | | 3.125% due 5/15/22 | | | 511,553 | |
| | 530,000 | | | A- | | 3.300% due 1/15/23 | | | 532,306 | |
| | 120,000 | | | A- | | 4.650% due 8/15/44 | | | 124,492 | |
| | | | | | | | | | |
| | | | | | Total Health Care Providers & Services | | | 5,514,994 | |
| | | | | | | | | | |
| Hotels, Restaurants & Leisure — 0.2% | |
| | 390,000 | | | B | | Hilton Worldwide Finance LLC/Hilton Worldwide Finance Corp., Company Guaranteed Notes, 5.625% due 10/15/21(b) | | | 414,131 | |
| | | | | | MGM Resorts International, Company Guaranteed Notes: | | | | |
| | 500,000 | | | B+ | | 6.875% due 4/1/16 | | | 538,750 | |
| | 700,000 | | | B+ | | 7.500% due 6/1/16 | | | 763,000 | |
| | | | | | | | | | |
| | | | | | Total Hotels, Restaurants & Leisure | | | 1,715,881 | |
| | | | | | | | | | |
| Household Durables — 0.0% | |
| | | | | | Taylor Morrison Communities Inc./Monarch Communities Inc., Company Guaranteed Notes: | | | | |
| | 80,000 | | | BB- | | 7.750% due 4/15/20(b) | | | 87,000 | |
| | 150,000 | | | BB- | | 5.250% due 4/15/21(b) | | | 152,250 | |
| | | | | | | | | | |
| | | | | | Total Household Durables | | | 239,250 | |
| | | | | | | | | | |
See Notes to Financial Statements.
89
| | | | | | | | | | |
| Core Fixed Income Investments | |
| | | |
Face
Amount/Units† | | | Rating†† | | Security | | Value | |
| Household Products — 0.0% | |
| | | | | | Reynolds Group Issuer Inc./Reynolds Group Issuer LLC/Reynolds Group Issuer Lu, Senior Secured Notes: | | | | |
| $ | 100,000 | | | B+ | | 7.125% due 4/15/19 | | $ | 104,125 | |
| | 200,000 | | | B+ | | 7.875% due 8/15/19 | | | 217,500 | |
| | | | | | | | | | |
| | | | | | Total Household Products | | | 321,625 | |
| | | | | | | | | | |
| Independent Power and Renewable Electricity Producers — 0.1% | |
| | | | | | AES Corp., Senior Unsecured Notes: | | | | |
| | 40,000 | | | BB- | | 7.750% due 10/15/15 | | | 42,600 | |
| | 60,000 | | | BB- | | 7.375% due 7/1/21 | | | 69,000 | |
| | 90,000 | | | BB- | | 4.875% due 5/15/23 | | | 88,875 | |
| | 195,000 | | | BBB | | Exelon Generation Co. LLC, Senior Unsecured Notes, 4.250% due 6/15/22 | | | 203,932 | |
| | | | | | | | | | |
| | | | | | Total Independent Power and Renewable Electricity Producers | | | 404,407 | |
| | | | | | | | | | |
| Industrial Conglomerates — 0.2% | |
| | | | | | Eaton Corp., Company Guaranteed Notes: | | | | |
| | 80,000 | | | A- | | 1.500% due 11/2/17 | | | 80,089 | |
| | 320,000 | | | A- | | 2.750% due 11/2/22 | | | 313,333 | |
| | 160,000 | | | A- | | 4.150% due 11/2/42 | | | 159,912 | |
| | | | | | General Electric Co., Senior Unsecured Notes: | | | | |
| | 170,000 | | | AA+ | | 0.850% due 10/9/15 | | | 170,788 | |
| | 245,000 | | | AA+ | | 2.700% due 10/9/22 | | | 242,358 | |
| | 220,000 | | | AA+ | | 4.500% due 3/11/44 | | | 240,446 | |
| | | | | | | | | | |
| | | | | | Total Industrial Conglomerates | | | 1,206,926 | |
| | | | | | | | | | |
| Insurance — 0.8% | |
| | | | | | American International Group Inc., Senior Unsecured Notes: | | | | |
| | 400,000 | | | A- | | 5.450% due 5/18/17 | | | 443,601 | |
| | 330,000 | | | A- | | 4.875% due 6/1/22 | | | 370,997 | |
| | 90,000 | | | AA | | Berkshire Hathaway Finance Corp., Company Guaranteed Notes, 4.300% due 5/15/43 | | | 92,507 | |
| | 80,000 | | | BBB- | | Genworth Holdings Inc., Company Guaranteed Notes, 4.800% due 2/15/24 | | | 84,221 | |
| | 90,000 | | | BBB | | Hartford Financial Services Group Inc. (The), Senior Unsecured Notes, 4.300% due 4/15/43 | | | 89,219 | |
| | 870,000 | | | BBB | | MetLife Inc., Junior Subordinated Notes, 6.400% due 12/15/36 | | | 985,275 | |
| | | | | | Metropolitan Life Global Funding I: | | | | |
| | 350,000 | | | AA- | | Secured Notes, 1.500% due 1/10/18(b) | | | 349,107 | |
| | 1,100,000 | | | AA- | | Senior Secured Notes, 1.700% due 6/29/15(b)(e) | | | 1,112,219 | |
| | 850,000 | | | A- | | Nationwide Mutual Insurance Co., Subordinated Notes, 5.810% due 12/15/24(a)(b) | | | 860,625 | |
| | 625,000 | | | AA+ | | New York Life Global Funding, Secured Notes, 0.800% due 2/12/16(b) | | | 627,181 | |
| | | | | | Prudential Financial Inc., Senior Unsecured Notes: | | | | |
| | 200,000 | | | A | | 3.875% due 1/14/15 | | | 202,415 | |
| | 390,000 | | | A | | 7.375% due 6/15/19 | | | 480,128 | |
| | 230,000 | | | AA- | | Swiss Re Treasury US Corp., Company Guaranteed Notes, 2.875% due 12/6/22(b) | | | 223,960 | |
| | 290,000 | | | AA- | | Teachers Insurance & Annuity Association of America, Subordinated Notes, 6.850% due 12/16/39(b) | | | 392,091 | |
| | 50,000 | | | BBB- | | Voya Financial Inc., Company Guaranteed Notes, 2.900% due 2/15/18 | | | 51,782 | |
| | | | | | | | | | |
| | | | | | Total Insurance | | | 6,365,328 | |
| | | | | | | | | | |
| Life Sciences Tools & Services — 0.0% | |
| | | | | | Thermo Fisher Scientific Inc., Senior Unsecured Notes: | | | | |
| | 120,000 | | | BBB | | 3.600% due 8/15/21 | | | 125,076 | |
| | 20,000 | | | BBB | | 5.300% due 2/1/44 | | | 22,869 | |
| | | | | | | | | | |
| | | | | | Total Life Sciences Tools & Services | | | 147,945 | |
| | | | | | | | | | |
| Machinery — 0.0% | |
| | 280,000 | | | BBB- | | AGCO Corp., Senior Unsecured Notes, 5.875% due 12/1/21 | | | 321,304 | |
| | | | | | | | | | |
See Notes to Financial Statements.
90
| | | | | | | | | | |
| Core Fixed Income Investments | |
| | | |
Face
Amount/Units† | | | Rating†† | | Security | | Value | |
| Media — 1.8% | |
| | | | | | 21st Century Fox America Inc., Company Guaranteed Notes: | | | | |
| $ | 200,000 | | | BBB+ | | 5.300% due 12/15/14 | | $ | 202,834 | |
| | 30,000 | | | BBB+ | | 4.500% due 2/15/21 | | | 33,045 | |
| | 125,000 | | | BBB+ | | 8.500% due 2/23/25 | | | 167,503 | |
| | 25,000 | | | BBB+ | | 6.200% due 12/15/34 | | | 31,047 | |
| | 10,000 | | | BBB+ | | 6.900% due 8/15/39 | | | 13,296 | |
| | | | | | CCO Holdings LLC/CCO Holdings Capital Corp., Company Guaranteed Notes: | | | | |
| | 130,000 | | | B | | 7.000% due 1/15/19 | | | 136,656 | |
| | 555,000 | | | B | | 8.125% due 4/30/20 | | | 596,625 | |
| | 45,000 | | | B | | 6.500% due 4/30/21 | | | 47,981 | |
| | 200,000 | | | A- | | Comcast Cable Communications Holdings Inc., Company Guaranteed Notes, 9.455% due 11/15/22 | | | 291,368 | |
| | | | | | Comcast Corp., Company Guaranteed Notes: | | | | |
| | 30,000 | | | A- | | 5.875% due 2/15/18 | | | 34,384 | |
| | 540,000 | | | A- | | 5.700% due 5/15/18 | | | 617,942 | |
| | 170,000 | | | A- | | 4.200% due 8/15/34 | | | 175,276 | |
| | 80,000 | | | A- | | 6.500% due 11/15/35 | | | 105,566 | |
| | 50,000 | | | A- | | 6.950% due 8/15/37 | | | 69,085 | |
| | 90,000 | | | A- | | 6.550% due 7/1/39 | | | 120,656 | |
| | 185,000 | | | A- | | 4.650% due 7/15/42 | | | 198,490 | |
| | 85,000 | | | A- | | 4.750% due 3/1/44 | | | 93,428 | |
| | | | | | Cox Communications Inc., Senior Unsecured Notes: | | | | |
| | 170,000 | | | BBB | | 8.375% due 3/1/39(b) | | | 248,679 | |
| | 10,000 | | | BBB | | 4.700% due 12/15/42(b) | | | 10,005 | |
| | | | | | DIRECTV Holdings LLC/DIRECTV Financing Co., Inc., Company Guaranteed Notes: | | | | |
| | 620,000 | | | BBB | | 3.500% due 3/1/16 | | | 644,337 | |
| | 271,000 | | | BBB | | 3.800% due 3/15/22 | | | 282,913 | |
| | | | | | Discovery Communications LLC, Company Guaranteed Notes: | | | | |
| | 2,700,000 | | | BBB | | 3.700% due 6/1/15 | | | 2,764,705 | |
| | 24,000 | | | BBB | | 4.875% due 4/1/43 | | | 25,188 | |
| | | | | | DISH DBS Corp., Company Guaranteed Notes: | | | | |
| | 850,000 | | | BB- | | 6.625% due 10/1/14 | | | 854,250 | |
| | 900,000 | | | BB- | | 7.750% due 5/31/15 | | | 945,000 | |
| | 20,000 | | | BB- | | 5.125% due 5/1/20 | | | 20,550 | |
| | 80,000 | | | BB- | | 6.750% due 6/1/21 | | | 89,696 | |
| | 60,000 | | | BB- | | 5.875% due 7/15/22 | | | 63,822 | |
| | 900,000 | | | A- | | NBCUniversal Enterprise Inc., Company Guaranteed Notes, 0.771% due 4/15/16(a)(b) | | | 902,372 | |
| | 220,000 | | | A- | | NBCUniversal Media LLC, Company Guaranteed Notes, 4.450% due 1/15/43 | | | 231,195 | |
| | 200,000 | | | B+ | | Numericable Group SA, Senior Secured Notes, 6.000% due 5/15/22(b) | | | 206,250 | |
| | 44,000 | | | BBB+ | | Omnicom Group Inc., Company Guaranteed Notes, 5.900% due 4/15/16 | | | 47,505 | |
| | 598,000 | | | A- | | Scripps Networks Interactive Inc., Senior Unsecured Notes, 2.700% due 12/15/16 | | | 620,225 | |
| | | | | | Time Warner Cable Inc., Company Guaranteed Notes: | | | | |
| | 510,000 | | | BBB | | 8.250% due 4/1/19 | | | 642,228 | |
| | 170,000 | | | BBB | | 6.550% due 5/1/37 | | | 218,517 | |
| | 60,000 | | | BBB | | 5.875% due 11/15/40 | | | 72,530 | |
| | 40,000 | | | BBB | | 5.500% due 9/1/41 | | | 46,470 | |
| | 80,000 | | | BBB | | Time Warner Entertainment Co. LP, Company Guaranteed Notes, 8.375% due 7/15/33 | | | 120,628 | |
| | | | | | Time Warner Inc., Company Guaranteed Notes: | | | | |
| | 1,100,000 | | | BBB | | 3.150% due 7/15/15 | | | 1,125,531 | |
| | 100,000 | | | BBB | | 4.700% due 1/15/21 | | | 110,636 | |
| | 110,000 | | | BBB | | 4.750% due 3/29/21 | | | 122,093 | |
| | 370,000 | | | BBB | | 7.700% due 5/1/32 | | | 523,754 | |
| | 30,000 | | | BBB | | 6.250% due 3/29/41 | | | 36,839 | |
| | | | | | Univision Communications Inc., Senior Secured Notes: | | | | |
| | 160,000 | | | B+ | | 7.875% due 11/1/20(b) | | | 175,200 | |
| | 100,000 | | | B+ | | 5.125% due 5/15/23(b) | | | 105,250 | |
See Notes to Financial Statements.
91
| | | | | | | | | | |
| Core Fixed Income Investments | |
| | | |
Face
Amount/Units† | | | Rating†† | | Security | | Value | |
| Media — 1.8% — (continued) | |
| $ | 150,000 | | | BBB | | Viacom Inc., Senior Unsecured Notes, 4.250% due 9/1/23 | | $ | 158,185 | |
| | 110,000 | | | BBB | | WPP Finance UK, Company Guaranteed Notes, 8.000% due 9/15/14 | | | 110,250 | |
| | | | | | | | | | |
| | | | | | Total Media | | | 14,459,985 | |
| | | | | | | | | | |
| Metals & Mining — 1.1% | |
| | 740,000 | | | BBB | | Barrick Gold Corp., Senior Unsecured Notes, 4.100% due 5/1/23 | | | 751,853 | |
| | 200,000 | | | BBB | | Barrick North America Finance LLC, Company Guaranteed Notes, 4.400% due 5/30/21 | | | 210,715 | |
| | | | | | BHP Billiton Finance USA Ltd., Company Guaranteed Notes: | | | | |
| | 370,000 | | | A+ | | 6.500% due 4/1/19 | | | 443,547 | |
| | 240,000 | | | A+ | | 5.000% due 9/30/43 | | | 275,454 | |
| | | | | | Cliffs Natural Resources Inc., Senior Unsecured Notes: | | | | |
| | 340,000 | | | BBB- | | 4.200% due 1/15/18(h) | | | 342,658 | |
| | 60,000 | | | BBB- | | 4.800% due 10/1/20(h) | | | 57,056 | |
| | 100,000 | | | AA- | | Corp. Nacional del Cobre de Chile, Senior Unsecured Notes, 4.750% due 10/15/14(b) | | | 100,414 | |
| | | | | | FMG Resources August 2006 Pty Ltd., Company Guaranteed Notes: | | | | |
| | 110,000 | | | BB | | 6.875% due 2/1/18(b) | | | 115,947 | |
| | 180,000 | | | BB | | 6.875% due 4/1/22(b) | | | 196,762 | |
| | 10,000 | | | BBB | | Freeport-McMoRan Inc., Company Guaranteed Notes, 2.375% due 3/15/18 | | | 10,145 | |
| | | | | | Glencore Finance Canada Ltd., Company Guaranteed Notes: | | | | |
| | 2,100,000 | | | BBB | | 2.850% due 11/10/14(b) | | | 2,108,599 | |
| | 320,000 | | | BBB | | 2.050% due 10/23/15(b) | | | 323,617 | |
| | 280,000 | | | BBB | | 2.700% due 10/25/17(b) | | | 287,541 | |
| | 470,000 | | | A- | | Rio Tinto Finance USA Ltd., Company Guaranteed Notes, 9.000% due 5/1/19 | | | 612,246 | |
| | 175,000 | | | A- | | Rio Tinto Finance USA PLC, Company Guaranteed Notes, 4.125% due 8/21/42 | | | 172,763 | |
| | 660,000 | | | BBB | | Southern Copper Corp., Senior Unsecured Notes, 5.250% due 11/8/42 | | | 646,041 | |
| | | | | | Vale Overseas Ltd., Company Guaranteed Notes: | | | | |
| | 1,642,000 | | | A- | | 4.375% due 1/11/22 | | | 1,722,261 | |
| | 260,000 | | | A- | | 6.875% due 11/21/36 | | | 307,801 | |
| | | | | | | | | | |
| | | | | | Total Metals & Mining | | | 8,685,420 | |
| | | | | | | | | | |
| Oil, Gas & Consumable Fuels — 3.1% | |
| | 140,000 | | | BBB- | | Anadarko Finance Co., Company Guaranteed Notes, 7.500% due 5/1/31 | | | 194,816 | |
| | | | | | Anadarko Petroleum Corp., Senior Unsecured Notes: | | | | |
| | 308,000 | | | BBB- | | 5.950% due 9/15/16 | | | 338,331 | |
| | 827,000 | | | BBB- | | 6.375% due 9/15/17 | | | 943,656 | |
| | 170,000 | | | BBB- | | 6.450% due 9/15/36 | | | 218,752 | |
| | 540,000 | | | A- | | Apache Corp., Senior Unsecured Notes, 5.625% due 1/15/17 | | | 596,218 | |
| | 90,000 | | | BB | | Atwood Oceanics Inc., Senior Unsecured Notes, 6.500% due 2/1/20 | | | 95,850 | |
| | | | | | BP Capital Markets PLC, Company Guaranteed Notes: | | | | |
| | 225,000 | | | A | | 4.742% due 3/11/21 | | | 252,559 | |
| | 360,000 | | | A | | 3.245% due 5/6/22 | | | 367,985 | |
| | 160,000 | | | A | | 2.750% due 5/10/23 | | | 155,882 | |
| | 225,000 | | | BBB+ | | Cameron International Corp., Senior Unsecured Notes, 7.000% due 7/15/38 | | | 301,399 | |
| | 300,000 | | | BB+ | | Chesapeake Energy Corp., Company Guaranteed Notes, 6.875% due 11/15/20 | | | 349,500 | |
| | | | | | Concho Resources Inc., Company Guaranteed Notes: | | | | |
| | 90,000 | | | BB+ | | 6.500% due 1/15/22 | | | 99,000 | |
| | 50,000 | | | BB+ | | 5.500% due 10/1/22 | | | 53,750 | |
| | 230,000 | | | A | | ConocoPhillips, Company Guaranteed Notes, 6.000% due 1/15/20 | | | 273,367 | |
| | 170,000 | | | BB | | Consol Energy Inc., Company Guaranteed Notes, 6.375% due 3/1/21 | | | 181,050 | |
| | | | | | Continental Resources Inc., Company Guaranteed Notes: | | | | |
| | 120,000 | | | BBB- | | 4.500% due 4/15/23 | | | 129,814 | |
| | 145,000 | | | BBB- | | 4.900% due 6/1/44(b) | | | 153,804 | |
| | 290,000 | | | BBB+ | | Devon Energy Corp., Senior Unsecured Notes, 5.600% due 7/15/41 | | | 341,537 | |
| | 220,000 | | | BBB | | Ecopetrol SA, Senior Unsecured Notes, 5.875% due 5/28/45 | | | 238,361 | |
| | 430,000 | | | BBB- | | El Paso Natural Gas Co. LLC, Senior Unsecured Notes, 8.625% due 1/15/22 | | | 561,246 | |
See Notes to Financial Statements.
92
| | | | | | | | | | |
| Core Fixed Income Investments | |
| | | |
Face
Amount/Units† | | | Rating†† | | Security | | Value | |
| Oil, Gas & Consumable Fuels — 3.1% — (continued) | |
| $ | 460,000 | | | BBB | | El Paso Pipeline Partners Operating Co. LLC, Company Guaranteed Notes, 6.500% due 4/1/20 | | $ | 537,365 | |
| | | | | | Energy Transfer Partners LP, Senior Unsecured Notes: | | | | |
| | 500,000 | | | BBB- | | 8.250% due 11/15/29 | | | 715,608 | |
| | 158,000 | | | BBB- | | 6.500% due 2/1/42 | | | 190,492 | |
| | | | | | Enterprise Products Operating LLC, Company Guaranteed Notes: | | | | |
| | 900,000 | | | BBB+ | | 3.700% due 6/1/15 | | | 920,861 | |
| | 160,000 | | | BBB+ | | 6.300% due 9/15/17 | | | 183,060 | |
| | 100,000 | | | BBB+ | | 5.700% due 2/15/42 | | | 119,639 | |
| | 190,000 | | | BBB+ | | 5.100% due 2/15/45 | | | 210,217 | |
| | 600,000 | | | BBB- | | Gazprom OAO Via Gaz Capital SA, Senior Unsecured Notes, 4.950% due 5/23/16 | | | 611,442 | |
| | | | | | Hess Corp., Senior Unsecured Notes: | | | | |
| | 50,000 | | | BBB | | 7.875% due 10/1/29 | | | 70,164 | |
| | 160,000 | | | BBB | | 7.300% due 8/15/31 | | | 217,428 | |
| | 75,000 | | | BBB- | | Kerr-McGee Corp., Company Guaranteed Notes, 7.875% due 9/15/31 | | | 107,182 | |
| | 290,000 | | | BB- | | Key Energy Services Inc., Company Guaranteed Notes, 6.750% due 3/1/21 | | | 295,800 | |
| | 170,000 | | | BBB | | Kinder Morgan Energy Partners LP, Senior Unsecured Notes, 6.850% due 2/15/20 | | | 202,867 | |
| | 190,000 | | | BB | | Kinder Morgan Finance Co. LLC, Company Guaranteed Notes, 6.000% due 1/15/18(b) | | | 212,562 | |
| | 140,000 | | | BB | | MarkWest Energy Partners LP/MarkWest Energy Finance Corp., Company Guaranteed Notes, 4.500% due 7/15/23 | | | 142,975 | |
| | 580,000 | | | BBB- | | Newfield Exploration Co., Senior Unsecured Notes, 5.625% due 7/1/24 | | | 641,596 | |
| | | | | | Noble Energy Inc., Senior Unsecured Notes: | | | | |
| | 70,000 | | | BBB | | 4.150% due 12/15/21 | | | 75,371 | |
| | 265,000 | | | BBB | | 5.250% due 11/15/43 | | | 297,426 | |
| | 280,000 | | | A | | Occidental Petroleum Corp., Senior Unsecured Notes, 3.125% due 2/15/22 | | | 285,442 | |
| | 1,000,000 | | | BBB- | | Panhandle Eastern Pipeline Co. LP, Senior Unsecured Notes, 8.125% due 6/1/19 | | | 1,227,944 | |
| | 60,000 | | | BB- | | Peabody Energy Corp., Company Guaranteed Notes, 6.250% due 11/15/21(h) | | | 60,000 | |
| | 169,000 | | | BB | | Penn Virginia Resource Partners LP/Penn Virginia Resource Finance Corp., Company Guaranteed Notes, 8.375% due 6/1/20 | | | 188,858 | |
| | 2,110,000 | | | BBB- | | Petrobras International Finance Co., Company Guaranteed Notes, 5.375% due 1/27/21 | | | 2,235,123 | |
| | | | | | Petroleos Mexicanos, Company Guaranteed Notes: | | | | |
| | 1,250,000 | | | BBB+ | | 3.500% due 1/30/23 | | | 1,241,875 | |
| | 150,000 | | | BBB+ | | 4.875% due 1/18/24 | | | 163,575 | |
| | 29,000 | | | BBB+ | | 6.625% due 6/15/35 | | | 35,887 | |
| | 380,000 | | | BBB+ | | 6.375% due 1/23/45(b) | | | 460,750 | |
| | | | | | Plains Exploration & Production Co., Company Guaranteed Notes: | | | | |
| | 298,000 | | | BBB | | 6.125% due 6/15/19 | | | 329,662 | |
| | 53,000 | | | BBB | | 6.875% due 2/15/23 | | | 61,679 | |
| | | | | | QEP Resources Inc., Senior Unsecured Notes: | | | | |
| | 140,000 | | | BB+ | | 6.875% due 3/1/21 | | | 157,500 | |
| | 50,000 | | | BB+ | | 5.250% due 5/1/23 | | | 50,875 | |
| | | | | | Range Resources Corp., Company Guaranteed Notes: | | | | |
| | 30,000 | | | BB | | 5.000% due 8/15/22 | | | 32,063 | |
| | 120,000 | | | BB | | 5.000% due 3/15/23 | | | 128,100 | |
| | 360,000 | | | BB | | Regency Energy Partners LP/Regency Energy Finance Corp., Company Guaranteed Notes, 6.875% due 12/1/18 | | | 376,650 | |
| | 140,000 | | | CCC+ | | Samson Investment Co., Company Guaranteed Notes, 9.750% due 2/15/20 | | | 143,500 | |
| | 330,000 | | | AA- | | Schlumberger Investment SA, Company Guaranteed Notes, 3.300% due 9/14/21(b) | | | 345,404 | |
| | 60,000 | | | AA- | | Schlumberger Norge AS, Company Guaranteed Notes, 4.200% due 1/15/21(b) | | | 66,077 | |
| | 435,000 | | | BBB- | | SESI LLC, Company Guaranteed Notes, 7.125% due 12/15/21 | | | 492,638 | |
| | | | | | Shell International Finance BV, Company Guaranteed Notes: | | | | |
| | 500,000 | | | AA | | 0.303% due 11/10/15(a) | | | 500,392 | |
| | 400,000 | | | AA | | 0.444% due 11/15/16(a) | | | 401,628 | |
| | 360,000 | | | AA | | 4.375% due 3/25/20 | | | 402,686 | |
| | | | | | Southern Natural Gas Co. LLC, Senior Unsecured Notes: | | | | |
| | 40,000 | | | BBB | | 5.900% due 4/1/17(b) | | | 44,548 | |
| | 58,000 | | | BBB | | 8.000% due 3/1/32 | | | 77,375 | |
See Notes to Financial Statements.
93
| | | | | | | | | | |
| Core Fixed Income Investments | |
| | | |
Face
Amount/Units† | | | Rating†† | | Security | | Value | |
| Oil, Gas & Consumable Fuels — 3.1% — (continued) | |
| $ | 575,000 | | | AA- | | Statoil ASA, Company Guaranteed Notes, 1.200% due 1/17/18 | | $ | 571,796 | |
| | 1,300,000 | | | BBB+ | | Suncor Energy Inc., Senior Unsecured Notes, 6.850% due 6/1/39 | | | 1,769,113 | |
| | 125,000 | | | A- | | TransCanada PipeLines Ltd., Senior Unsecured Notes, 3.750% due 10/16/23 | | | 130,902 | |
| | | | | | Transocean Inc., Company Guaranteed Notes: | | | | |
| | 223,000 | | | BBB- | | 5.050% due 12/15/16 | | | 240,699 | |
| | 220,000 | | | BBB- | | 6.375% due 12/15/21 | | | 249,364 | |
| | 35,000 | | | BBB- | | Weatherford International Ltd., Company Guaranteed Notes, 5.950% due 4/15/42 | | | 40,462 | |
| | | | | | Williams Cos., Inc. (The), Senior Unsecured Notes: | | | | |
| | 343,000 | | | BB+ | | 7.875% due 9/1/21 | | | 423,141 | |
| | 166,000 | | | BB+ | | 8.750% due 3/15/32 | | | 215,989 | |
| | | | | | | | | | |
| | | | | | Total Oil, Gas & Consumable Fuels | | | 24,750,629 | |
| | | | | | | | | | |
| Paper & Forest Products — 0.0% | |
| | 340,000 | | | BBB- | | Celulosa Arauco y Constitucion SA, Senior Unsecured Notes, 4.750% due 1/11/22 | | | 352,990 | |
| | | | | | | | | | |
| Pharmaceuticals — 0.4% | |
| | | | | | AbbVie Inc., Senior Unsecured Notes: | | | | |
| | 440,000 | | | A | | 1.750% due 11/6/17 | | | 442,659 | |
| | 150,000 | | | A | | 2.900% due 11/6/22 | | | 147,740 | |
| | 235,000 | | | A | | 4.400% due 11/6/42 | | | 237,341 | |
| | | | | | Actavis Funding SCS, Company Guaranteed Notes: | | | | |
| | 90,000 | | | BBB- | | 3.850% due 6/15/24(b) | | | 91,222 | |
| | 80,000 | | | BBB- | | 4.850% due 6/15/44(b) | | | 82,631 | |
| | 140,000 | | | BBB- | | Actavis Inc., Senior Unsecured Notes, 4.625% due 10/1/42 | | | 140,038 | |
| | 780,000 | | | A+ | | GlaxoSmithKline Capital PLC, Company Guaranteed Notes, 2.850% due 5/8/22 | | | 776,790 | |
| | | | | | Pfizer Inc., Senior Unsecured Notes: | | | | |
| | 155,000 | | | AA | | 3.400% due 5/15/24 | | | 158,800 | |
| | 130,000 | | | AA | | 7.200% due 3/15/39 | | | 187,992 | |
| | 40,000 | | | AA | | 4.300% due 6/15/43 | | | 41,321 | |
| | 165,000 | | | AA | | 4.400% due 5/15/44 | | | 173,358 | |
| | 240,000 | | | AA | | Wyeth LLC, Company Guaranteed Notes, 5.950% due 4/1/37 | | | 301,960 | |
| | 60,000 | | | BBB- | | Zoetis Inc., Senior Unsecured Notes, 3.250% due 2/1/23 | | | 60,132 | |
| | | | | | | | | | |
| | | | | | Total Pharmaceuticals | | | 2,841,984 | |
| | | | | | | | | | |
| Real Estate Investment Trusts (REITs) — 1.1% | |
| | | | | | ARC Properties Operating Partnership LP/Clark Acquisition LLC, Company Guaranteed Notes: | | | | |
| | 1,000,000 | | | BBB- | | 2.000% due 2/6/17(b) | | | 1,002,123 | |
| | 350,000 | | | BBB- | | 4.600% due 2/6/24(b) | | | 360,998 | |
| | 110,000 | | | BBB+ | | AvalonBay Communities Inc., Senior Unsecured Notes, 2.850% due 3/15/23 | | | 107,217 | |
| | 100,000 | | | A- | | Boston Properties LP, Senior Unsecured Notes, 3.850% due 2/1/23 | | | 104,273 | |
| | 700,000 | | | BBB | | Duke Realty LP, Company Guaranteed Notes, 6.500% due 1/15/18 | | | 796,590 | |
| | 80,000 | | | BBB+ | | ERP Operating LP, Senior Unsecured Notes, 4.500% due 7/1/44 | | | 81,797 | |
| | | | | | HCP Inc., Senior Unsecured Notes: | | | | |
| | 500,000 | | | BBB+ | | 6.000% due 1/30/17 | | | 555,802 | |
| | 775,000 | | | BBB+ | | 2.625% due 2/1/20 | | | 774,088 | |
| | | | | | Health Care REIT Inc., Senior Unsecured Notes: | | | | |
| | 1,395,000 | | | BBB | | 4.950% due 1/15/21 | | | 1,554,929 | |
| | 425,000 | | | BBB | | 6.500% due 3/15/41 | | | 551,288 | |
| | 600,000 | | | BBB- | | Healthcare Realty Trust Inc., Senior Unsecured Notes, 6.500% due 1/17/17 | | | 667,443 | |
| | 140,000 | | | A | | Simon Property Group LP, Senior Unsecured Notes, 3.750% due 2/1/24 | | | 145,847 | |
| | 400,000 | | | BBB- | | SL Green Realty Corp./SL Green Operating Partnership/Reckson Operating Part, Senior Unsecured Notes, 7.750% due 3/15/20 | | | 481,495 | |
| | 1,240,000 | | | BBB+ | | Ventas Realty LP/Ventas Capital Corp., Company Guaranteed Notes, 2.700% due 4/1/20 | | | 1,237,550 | |
| | | | | | | | | | |
| | | | | | Total Real Estate Investment Trusts (REITs) | | | 8,421,440 | |
| | | | | | | | | | |
See Notes to Financial Statements.
94
| | | | | | | | | | |
| Core Fixed Income Investments | |
| | | |
Face
Amount/Units† | | | Rating†† | | Security | | Value | |
| Road & Rail — 0.3% | |
| | | | | | Burlington Northern Santa Fe LLC, Senior Unsecured Notes: | | | | |
| $ | 150,000 | | | BBB+ | | 4.375% due 9/1/42 | | $ | 151,729 | |
| | 105,000 | | | BBB+ | | 4.550% due 9/1/44 | | | 109,484 | |
| | 1,700,000 | | | BBB- | | Penske Truck Leasing Co. LP/PTL Finance Corp., Unsecured Notes, 3.125% due 5/11/15(b) | | | 1,728,572 | |
| | 84,000 | | | A | | Union Pacific Corp., Senior Unsecured Notes, 4.163% due 7/15/22 | | | 92,408 | |
| | | | | | | | | | |
| | | | | | Total Road & Rail | | | 2,082,193 | |
| | | | | | | | | | |
| Software — 0.1% | |
| | 120,000 | | | BB+ | | Activision Blizzard Inc., Company Guaranteed Notes, 5.625% due 9/15/21(b) | | | 130,050 | |
| | | | | | First Data Corp.: | | | | |
| | | | | | Company Guaranteed Notes: | | | | |
| | 30,000 | | | B- | | 12.625% due 1/15/21 | | | 36,750 | |
| | 52,000 | | | CCC+ | | 11.750% due 8/15/21 | | | 61,750 | |
| | 136,000 | | | BB- | | Senior Secured Notes, 6.750% due 11/1/20(b) | | | 147,560 | |
| | | | | | Oracle Corp., Senior Unsecured Notes: | | | | |
| | 280,000 | | | A+ | | 1.200% due 10/15/17 | | | 279,115 | |
| | 100,000 | | | A+ | | 4.500% due 7/8/44 | | | 106,024 | |
| | | | | | | | | | |
| | | | | | Total Software | | | 761,249 | |
| | | | | | | | | | |
| Specialty Retail — 0.2% | |
| | 100,000 | | | A- | | Lowe’s Cos, Inc., Senior Unsecured Notes, 4.650% due 4/15/42 | | | 108,550 | |
| | | | | | QVC Inc., Senior Secured Notes: | | | | |
| | 385,000 | | | BBB- | | 7.500% due 10/1/19(b) | | | 401,894 | |
| | 554,000 | | | BBB- | | 7.375% due 10/15/20(b) | | | 592,334 | |
| | | | | | Wal-Mart Stores Inc., Senior Unsecured Notes: | | | | |
| | 700,000 | | | AA | | 3.250% due 10/25/20 | | | 737,535 | |
| | 115,000 | | | AA | | 4.300% due 4/22/44 | | | 121,041 | |
| | | | | | | | | | |
| | | | | | Total Specialty Retail | | | 1,961,354 | |
| | | | | | | | | | |
| Technology Hardware, Storage & Peripherals — 0.1% | |
| | 390,000 | | | AA+ | | Apple Inc., Senior Unsecured Notes, 2.850% due 5/6/21 | | | 397,443 | |
| | | | | | | | | | |
| Tobacco — 0.4% | |
| | | | | | Altria Group Inc., Company Guaranteed Notes: | | | | |
| | 89,000 | | | BBB+ | | 9.700% due 11/10/18 | | | 115,588 | |
| | 260,000 | | | BBB+ | | 9.250% due 8/6/19 | | | 342,378 | |
| | 230,000 | | | BBB+ | | 4.750% due 5/5/21 | | | 256,588 | |
| | 150,000 | | | BBB+ | | 9.950% due 11/10/38 | | | 255,584 | |
| | 90,000 | | | BBB+ | | 10.200% due 2/6/39 | | | 156,278 | |
| | 160,000 | | | BBB+ | | 5.375% due 1/31/44 | | | 178,398 | |
| | | | | | Lorillard Tobacco Co., Company Guaranteed Notes: | | | | |
| | 10,000 | | | BBB- | | 8.125% due 6/23/19 | | | 12,444 | |
| | 280,000 | | | BBB- | | 3.750% due 5/20/23 | | | 278,965 | |
| | | | | | Philip Morris International Inc., Senior Unsecured Notes: | | | | |
| | 240,000 | | | A | | 2.900% due 11/15/21 | | | 244,696 | |
| | 315,000 | | | A | | 4.500% due 3/20/42 | | | 328,068 | |
| | 120,000 | | | A | | 4.125% due 3/4/43 | | | 118,060 | |
| | | | | | Reynolds American Inc., Company Guaranteed Notes: | | | | |
| | 200,000 | | | BBB- | | 1.050% due 10/30/15 | | | 200,238 | |
| | 300,000 | | | BBB- | | 6.750% due 6/15/17 | | | 341,371 | |
| | 120,000 | | | BBB- | | 3.250% due 11/1/22 | | | 117,676 | |
| | 97,000 | | | BBB- | | 6.150% due 9/15/43 | | | 113,439 | |
| | | | | | | | | | |
| | | | | | Total Tobacco | | | 3,059,771 | |
| | | | | | | | | | |
| Wireless Telecommunication Services — 0.2% | |
| | 330,000 | | | A- | | América Móvil SAB de CV, Company Guaranteed Notes, 5.000% due 3/30/20 | | | 366,835 | |
| | 50,000 | | | BBB+ | | GTE Corp., Company Guaranteed Notes, 6.940% due 4/15/28 | | | 62,317 | |
See Notes to Financial Statements.
95
| | | | | | | | | | |
| Core Fixed Income Investments | |
| | | |
Face
Amount/Units† | | | Rating†† | | Security | | Value | |
| Wireless Telecommunication Services — 0.2% — (continued) | |
| $ | 70,000 | | | BBB+ | | Rogers Communications Inc., Company Guaranteed Notes, 6.750% due 3/15/15 | | $ | 72,303 | |
| | 470,000 | | | BB- | | Sprint Capital Corp., Company Guaranteed Notes, 8.750% due 3/15/32 | | | 526,400 | |
| | 110,000 | | | BB- | | Sprint Corp., Company Guaranteed Notes, 7.875% due 9/15/23(b) | | | 118,250 | |
| | 20,000 | | | BB+ | | Telecom Italia Capital SA, Company Guaranteed Notes, 7.175% due 6/18/19 | | | 22,875 | |
| | | | | | Telefónica Emisiones SAU, Company Guaranteed Notes: | | | | |
| | 500,000 | | | BBB | | 3.992% due 2/16/16 | | | 522,137 | |
| | 70,000 | | | BBB | | 5.877% due 7/15/19 | | | 80,784 | |
| | 110,000 | | | BBB | | 5.134% due 4/27/20 | | | 122,692 | |
| | | | | | | | | | |
| | | | | | Total Wireless Telecommunication Services | | | 1,894,593 | |
| | | | | | | | | | |
| | | | | | TOTAL CORPORATE BONDS & NOTES
(Cost — $230,896,863) | | | 244,863,887 | |
| | | | | | | | | | |
| MORTGAGE-BACKED SECURITIES — 22.6% | |
| FHLMC — 3.5% | |
| | | | | | Federal Home Loan Mortgage Corp. (FHLMC): | | | | |
| | 857 | | | | | 9.500% due 6/1/16 | | | 861 | |
| | 30,481 | | | | | 8.500% due 11/1/16 — 7/1/17 | | | 30,648 | |
| | 8,935 | | | | | 8.000% due 1/1/17 — 6/1/17 | | | 9,071 | |
| | 41,369 | | | | | 2.375% due 12/1/34(a) | | | 44,200 | |
| | 41,566 | | | | | 2.522% due 1/1/35(a) | | | 44,634 | |
| | 319,552 | | | | | 2.361% due 3/1/36(a) | | | 342,195 | |
| | 41,347 | | | | | 1.945% due 2/1/37(a) | | | 43,653 | |
| | 92,331 | | | | | 1.836% due 5/1/37(a) | | | 96,864 | |
| | 103,573 | | | | | 2.495% due 5/1/37(a) | | | 110,522 | |
| | 74,731 | | | | | 3.144% due 3/1/41(a) | | | 78,380 | |
| | 200,223 | | | | | 2.030% due 7/1/42(a) | | | 207,287 | |
| | | | | | Gold: | | | | |
| | 1,122,579 | | | | | 6.000% due 5/1/16 — 6/1/39 | | | 1,244,281 | |
| | 2,305,942 | | | | | 5.500% due 2/1/17 — 2/1/40 | | | 2,544,222 | |
| | 3,777 | | | | | 8.500% due 2/1/18 | | | 3,866 | |
| | 1,121,039 | | | | | 5.000% due 6/1/21 — 4/1/41 | | | 1,237,808 | |
| | 11,248,837 | | | | | 4.000% due 10/1/25 — 8/1/43 | | | 11,973,513 | |
| | 1,272,926 | | | | | 4.500% due 4/1/29 — 7/1/41 | | | 1,390,582 | |
| | 729,044 | | | | | 6.500% due 8/1/37 — 9/1/39 | | | 821,381 | |
| | 53,321 | | | | | 7.000% due 3/1/39 | | | 59,305 | |
| | 3,293,431 | | | | | 3.500% due 12/1/42 — 5/1/43 | | | 3,391,039 | |
| | 1,720,345 | | | | | 3.000% due 2/1/43 — 7/1/43 | | | 1,717,713 | |
| | 600,000 | | | | | 3.000% due 9/1/44(i) | | | 597,375 | |
| | 600,000 | | | | | 3.500% due 9/15/44(i) | | | 616,725 | |
| | 1,000,000 | | | | | 4.500% due 10/15/44(i) | | | 1,077,110 | |
| | | | | | | | | | |
| | | | | | TOTAL FHLMC | | | 27,683,235 | |
| | | | | | | | | | |
| FNMA — 16.1% | |
| | | | | | Federal National Mortgage Association (FNMA): | | | | |
| | 3,201,044 | | | | | 5.500% due 12/1/15 — 5/1/40 | | | 3,574,902 | |
| | 971 | | | | | 8.500% due 4/1/17 | | | 1,032 | |
| | 3,305 | | | | | 8.000% due 8/1/17 | | | 3,318 | |
| | 1,075,409 | | | | | 5.179% due 5/1/19 | | | 1,213,144 | |
| | 13,524,191 | | | | | 4.000% due 10/1/19 — 6/1/44 | | | 14,394,850 | |
| | 1,035,000 | | | | | 4.400% due 2/1/20 | | | 1,146,485 | |
| | 1,009,193 | | | | | 4.772% due 2/1/20 | | | 1,127,451 | |
| | 1,172,320 | | | | | 4.666% due 7/1/20 | | | 1,308,851 | |
| | 1,145,000 | | | | | 3.459% due 11/1/20 | | | 1,221,841 | |
| | 1,255,963 | | | | | 3.976% due 11/1/20 | | | 1,374,083 | |
| | 977,625 | | | | | 6.000% due 9/1/21 — 12/1/38 | | | 1,101,407 | |
See Notes to Financial Statements.
96
| | | | | | | | | | |
| Core Fixed Income Investments | |
| | | |
Face
Amount/Units† | | | | | Security | | Value | |
| FNMA — 16.1% — (continued) | |
| $ | 1,196,799 | | | | | 3.650% due 11/1/21 | | $ | 1,283,873 | |
| | 48 | | | | | 9.500% due 11/1/21 | | | 48 | |
| | 2,392,844 | | | | | 5.000% due 12/1/21 — 5/1/42 | | | 2,620,394 | |
| | 470,000 | | | | | 2.830% due 6/1/22 | | | 480,108 | |
| | 1,183,794 | | | | | 2.646% due 10/1/22 | | | 1,190,208 | |
| | 6,791,529 | | | | | 4.500% due 3/1/24 — 3/1/44 | | | 7,364,899 | |
| | 21,164,755 | | | | | 3.500% due 11/1/25 — 8/1/44 | | | 21,991,552 | |
| | 219,100 | | | | | 7.000% due 9/1/26 — 4/1/37 | | | 246,899 | |
| | 3,363,577 | | | | | 2.500% due 11/1/27 — 10/1/42 | | | 3,349,108 | |
| | 7,544,950 | | | | | 3.000% due 11/1/28 — 6/1/43 | | | 7,677,944 | |
| | 1,885,000 | | | | | 2.500% due 9/1/29(i) | | | 1,910,919 | |
| | 8,340,000 | | | | | 3.500% due 9/25/29 — 9/14/44(i) | | | 8,635,680 | |
| | 8,680,000 | | | | | 3.000% due 9/25/29 — 9/15/44(i) | | | 8,755,817 | |
| | 42,516 | | | | | 2.690% due 3/1/30(a) | | | 42,732 | |
| | 470,394 | | | | | 2.175% due 3/1/34(a) | | | 502,808 | |
| | 105,932 | | | | | 2.244% due 12/1/34(a) | | | 113,620 | |
| | 9,594 | | | | | 2.257% due 12/1/34(a) | | | 10,281 | |
| | 122,363 | | | | | 2.133% due 9/1/35(a) | | | 130,163 | |
| | 122,188 | | | | | 2.079% due 10/1/35(a) | | | 127,703 | |
| | 174,459 | | | | | 2.144% due 10/1/35(a) | | | 184,189 | |
| | 133,559 | | | | | 2.041% due 11/1/35(a) | | | 141,107 | |
| | 33,218 | | | | | 2.093% due 11/1/35(a) | | | 35,143 | |
| | 31,159 | | | | | 2.098% due 11/1/35(a) | | | 33,053 | |
| | 90,238 | | | | | 2.099% due 11/1/35(a) | | | 94,387 | |
| | 40,168 | | | | | 2.111% due 11/1/35(a) | | | 42,691 | |
| | 29,716 | | | | | 2.114% due 11/1/35(a) | | | 31,433 | |
| | 37,916 | | | | | 2.119% due 11/1/35(a) | | | 40,519 | |
| | 418,554 | | | | | 2.250% due 1/1/36(a) | | | 446,565 | |
| | 213,811 | | | | | 2.337% due 9/1/36(a) | | | 229,319 | |
| | 46,900 | | | | | 2.374% due 12/1/36(a) | | | 50,298 | |
| | 241,792 | | | | | 1.783% due 5/1/37(a) | | | 258,554 | |
| | 1,044,940 | | | | | 6.500% due 9/1/37 — 5/1/40 | | | 1,179,923 | |
| | 112,123 | | | | | 2.897% due 2/1/41(a) | | | 118,179 | |
| | 276,775 | | | | | 3.247% due 7/1/41(a) | | | 293,096 | |
| | 229,306 | | | | | 2.018% due 7/1/42(a) | | | 238,469 | |
| | 56,050 | | | | | 2.296% due 7/1/42(a) | | | 58,182 | |
| | 12,255,000 | | | | | 4.000% due 9/1/44 — 10/1/44(i) | | | 12,986,599 | |
| | 13,000,000 | | | | | 5.000% due 9/1/44 — 10/1/44(i) | | | 14,316,051 | |
| | 3,520,000 | | | | | 4.500% due 9/25/44(i) | | | 3,802,700 | |
| | 1,000,000 | | | | | 5.500% due 10/1/44(i) | | | 1,110,344 | |
| | | | | | | | | | |
| | | | | | TOTAL FNMA | | | 128,592,921 | |
| | | | | | | | | | |
| GNMA — 3.0% | |
| | | | | | Government National Mortgage Association (GNMA): | | | | |
| | 1,362 | | | | | 9.500% due 12/15/16 — 8/15/17 | | | 1,368 | |
| | 7,843 | | | | | 8.500% due 5/15/17 — 5/15/30 | | | 8,393 | |
| | 3,026 | | | | | 9.000% due 8/15/30 — 9/15/30 | | | 3,261 | |
| | 7,809 | | | | | 4.500% due 9/15/33 | | | 8,565 | |
| | 160,845 | | | | | 6.000% due 12/15/33 — 5/15/38 | | | 182,176 | |
| | 246,487 | | | | | 6.500% due 1/15/34 — 10/15/38 | | | 279,211 | |
| | 1,264,445 | | | | | 5.000% due 10/15/34 — 9/15/40 | | | 1,395,363 | |
| | 151,890 | | | | | 5.500% due 5/15/37 — 6/15/38 | | | 168,603 | |
| | 786,827 | | | | | 4.000% due 6/15/41 — 7/15/41 | | | 842,803 | |
| | | | | | Government National Mortgage Association (GNMA) II: | | | | |
| | 3,816 | | | | | 8.500% due 1/20/17 | | | 4,013 | |
See Notes to Financial Statements.
97
| | | | | | | | | | |
| Core Fixed Income Investments | |
| | | |
Face
Amount/Units† | | | | | Security | | Value | |
| GNMA — 3.0% — (continued) | |
| $ | 4,251 | | | | | 9.000% due 4/20/17 — 11/20/21 | | $ | 4,605 | |
| | 84,034 | | | | | 1.625% due 2/20/26 — 10/20/27(a) | | | 86,631 | |
| | 933 | | | | | 8.000% due 3/20/30 | | | 1,130 | |
| | 27,553 | | | | | 2.000% due 5/20/30(a) | | | 28,910 | |
| | 312,505 | | | | | 6.000% due 7/20/37 — 11/20/40 | | | 353,333 | |
| | 4,504,268 | | | | | 4.500% due 1/20/40 — 10/20/41 | | | 4,914,436 | |
| | 615,914 | | | | | 5.000% due 7/20/40 — 9/20/41 | | | 683,611 | |
| | 754,691 | | | | | 4.000% due 11/20/40 — 7/20/42 | | | 805,764 | |
| | 469,262 | | | | | 3.000% due 1/20/43 | | | 477,023 | |
| | 1,986,767 | | | | | 3.500% due 6/20/43 — 11/20/43 | | | 2,069,999 | |
| | 5,500,000 | | | | | 4.000% due 9/1/44(i) | | | 5,861,797 | |
| | 640,000 | | | | | 3.000% due 9/15/44(i) | | | 649,250 | |
| | 5,060,000 | | | | | 3.500% due 9/20/44(i) | | | 5,263,191 | |
| | | | | | | | | | |
| | | | | | TOTAL GNMA | | | 24,093,436 | |
| | | | | | | | | | |
| | | | | | TOTAL MORTGAGE-BACKED SECURITIES
(Cost — $177,395,198) | | | 180,369,592 | |
| | | | | | | | | | |
| U.S. GOVERNMENT & AGENCY OBLIGATIONS — 18.5% | |
| U.S. GOVERNMENT OBLIGATIONS — 16.9% | |
| | | | | | U.S. Treasury Bonds: | | | | |
| | 1,555,000 | | | | | 6.250% due 5/15/30 | | | 2,263,010 | |
| | 1,665,000 | | | | | 3.125% due 2/15/42 | | | 1,688,283 | |
| | 990,000 | | | | | 3.750% due 11/15/43 | | | 1,120,479 | |
| | 19,635,000 | | | | | 3.625% due 2/15/44 | | | 21,738,085 | |
| | 2,845,000 | | | | | 3.375% due 5/15/44 | | | 3,009,253 | |
| | 4,770,000 | | | | | 3.125% due 8/15/44 | | | 4,809,501 | |
| | | | | | U.S. Treasury Inflation Indexed Bonds: | | | | |
| | 3,287,544 | | | | | 2.375% due 1/15/25 | | | 3,987,945 | |
| | 796,383 | | | | | 1.750% due 1/15/28 | | | 927,848 | |
| | 288,915 | | | | | 2.125% due 2/15/40 | | | 378,513 | |
| | 653,976 | | | | | 0.750% due 2/15/42 | | | 640,003 | |
| | 2,837,909 | | | | | 1.375% due 2/15/44 | | | 3,241,869 | |
| | | | | | U.S. Treasury Inflation Indexed Notes: | | | | |
| | 511,774 | | | | | 1.625% due 1/15/15 | | | 514,253 | |
| | 417,928 | | | | | 0.500% due 4/15/15 | | | 420,083 | |
| | 1,206,764 | | | | | 0.125% due 4/15/17 | | | 1,235,189 | |
| | 3,860,160 | | | | | 0.125% due 4/15/19 | | | 3,930,728 | |
| | 3,922,416 | | | | | 1.125% due 1/15/21(j) | | | 4,209,243 | |
| | 5,897,136 | | | | | 0.125% due 1/15/22 | | | 5,909,573 | |
| | 826,064 | | | | | 0.125% due 1/15/23 | | | 821,094 | |
| | 7,722,242 | | | | | 0.375% due 7/15/23 | | | 7,862,810 | |
| | 500,525 | | | | | 0.625% due 1/15/24 | | | 518,317 | |
| | 963,629 | | | | | 0.125% due 7/15/24 | | | 954,972 | |
| | | | | | U.S. Treasury Notes: | | | | |
| | 110,000 | | | | | 0.250% due 10/31/15 | | | 110,107 | |
| | 4,755,000 | | | | | 0.500% due 7/31/16 | | | 4,757,972 | |
| | 7,140,000 | | | | | 0.500% due 8/31/16 | | | 7,141,392 | |
| | 70,000 | | | | | 0.750% due 6/30/17 | | | 69,713 | |
| | 8,655,000 | | | | | 0.875% due 7/15/17 | | | 8,646,882 | |
| | 945,000 | | | | | 0.875% due 8/15/17 | | | 943,561 | |
| | 50,000 | | | | | 0.750% due 10/31/17 | | | 49,527 | |
| | 780,000 | | | | | 2.625% due 1/31/18 | | | 817,903 | |
| | 2,540,000 | | | | | 1.375% due 9/30/18 | | | 2,536,330 | |
| | 655,000 | | | | | 1.250% due 11/30/18 | | | 649,192 | |
| | 1,690,000 | | | | | 1.500% due 12/31/18 | | | 1,690,527 | |
See Notes to Financial Statements.
98
| | | | | | | | | | |
| Core Fixed Income Investments | |
| | | |
Face
Amount/Units† | | | Rating†† | | Security | | Value | |
| U.S. GOVERNMENT OBLIGATIONS — 16.9% — (continued) | |
| $ | 2,300,000 | | | | | 1.625% due 3/31/19 | | $ | 2,306,918 | |
| | 1,060,000 | | | | | 3.125% due 5/15/19 | | | 1,134,159 | |
| | 20,000 | | | | | 1.500% due 5/31/19 | | | 19,913 | |
| | 2,825,000 | | | | | 1.625% due 7/31/19 | | | 2,825,551 | |
| | 7,450,000 | | | | | 1.625% due 8/31/19 | | | 7,449,128 | |
| | 2,630,000 | | | | | 2.125% due 1/31/21 | | | 2,656,608 | |
| | 1,130,000 | | | | | 2.250% due 7/31/21 | | | 1,145,890 | |
| | 4,305,000 | | | | | 2.000% due 8/31/21 | | | 4,292,554 | |
| | 14,775,000 | | | | | 2.500% due 5/15/24 | | | 14,987,391 | |
| | 30,000 | | | | | 2.375% due 8/15/24 | | | 30,082 | |
| | 435,000 | | | | | U.S. Treasury STRIPS Coupon, zero coupon bond to yield, 3.090% due 11/15/27(k) | | | 300,980 | |
| | 510,000 | | | | | U.S. Treasury STRIPS Principal, zero coupon bond to yield, 2.623% due 11/15/27(k) | | | 357,870 | |
| | | | | | | | | | |
| | | | | | TOTAL U.S. GOVERNMENT OBLIGATIONS | | | 135,101,201 | |
| | | | | | | | | | |
| U.S. GOVERNMENT AGENCIES — 1.6% | |
| | | | | | Federal Farm Credit Banks: | | | | |
| | 1,260,000 | | | | | 0.176% due 9/14/16(a) | | | 1,261,350 | |
| | 1,250,000 | | | | | 0.210% due 2/27/17(a) | | | 1,252,015 | |
| | | | | | Federal Home Loan Bank (FHLB): | | | | |
| | 1,280,000 | | | | | 0.220% due 10/7/15(a) | | | 1,281,130 | |
| | 1,270,000 | | | | | step bond to yield, 0.750% due 5/26/28 | | | 1,260,347 | |
| | 345,000 | | | | | 4.000% due 9/1/28 | | | 372,259 | |
| | | | | | Federal Home Loan Mortgage Corp. (FHLMC): | | | | |
| | 467,000 | | | | | 0.400% due 3/15/16 | | | 466,932 | |
| | 810,000 | | | | | 1.250% due 10/2/19 | | | 788,515 | |
| | 2,800,000 | | | | | 2.375% due 1/13/22 | | | 2,816,808 | |
| | 2,000 | | | | | 5.625% due 11/23/35(j) | | | 2,117 | |
| | | | | | Federal National Mortgage Association (FNMA): | | | | |
| | 1,275,000 | | | | | 0.500% due 10/22/15 | | | 1,279,211 | |
| | 820,000 | | | | | 0.750% due 1/30/17 | | | 819,570 | |
| | 650,000 | | | | | 0.000% due 10/9/19 | | | 576,048 | |
| | 405,000 | | | | | 7.125% due 1/15/30 | | | 603,457 | |
| | | | | | | | | | |
| | | | | | TOTAL U.S. GOVERNMENT AGENCIES | | | 12,779,759 | |
| | | | | | | | | | |
| | | | | | TOTAL U.S. GOVERNMENT & AGENCY OBLIGATIONS
(Cost — $144,607,210) | | | 147,880,960 | |
| | | | | | | | | | |
| COLLATERALIZED MORTGAGE OBLIGATIONS — 13.8% | |
| | 2,800,000 | | | CCC | | Accredited Mortgage Loan Trust, Series 2007-1, Class A4, 0.375% due 2/25/37(a) | | | 2,027,976 | |
| | 67,181 | | | AAA | | ACE Securities Corp. Home Equity Loan Trust, Series 2004-SD1, Class A1, 0.645% due 11/25/33(a) | | | 66,230 | |
| | | | | | Adjustable Rate Mortgage Trust: | | | | |
| | 1,533,618 | | | D | | Series 2005-10, Class 3A11, 4.919% due 1/25/36(a) | | | 1,425,349 | |
| | 1,975,121 | | | D | | Series 2005-10, Class 3A31, 4.919% due 1/25/36(a) | | | 1,835,610 | |
| | 130,664 | | | CC | | AFC Home Equity Loan Trust, Series 1999-2, Class 2A, 0.805% due 6/25/29(a) | | | 113,000 | |
| | 802,562 | | | CCC | | American Home Mortgage Assets Trust, Series 2006-1, Class 2A1, 0.345% due 5/25/46(a) | | | 610,795 | |
| | 805,000 | | | AAA | | AMMC CLO XIII Ltd, Series 2013-13A, Class A1L, 1.683% due 1/26/26(a)(b) | | | 803,182 | |
| | 612,463 | | | BBB+ | | Asset Backed Funding Certificates, Series 2004-OPT5, Class A1, 0.855% due 6/25/34(a) | | | 575,328 | |
| | | | | | Asset Backed Securities Corp. Home Equity Loan Trust: | | | | |
| | 42,845 | | | AAA | | Series 2004-HE6, Class A1, 0.705% due 9/25/34(a) | | | 42,928 | |
| | 1,956,000 | | | BBB- | | Series 2005-HE5, Class M3, 0.875% due 6/25/35(a) | | | 1,834,104 | |
| | 2,000,000 | | | B+ | | Series 2006-HE3, Class A5, 0.425% due 3/25/36(a) | | | 1,540,922 | |
| | 2,354,472 | | | AAA | | Avoca CLO III PLC, Series III-X, Class A, 0.655% due 9/15/21(a) | | | 3,082,725 | |
| | | | | | Banc of America Commercial Mortgage Trust: | | | | |
| | 40,000 | | | BBB- | | Series 2006-5, Class AM, 5.448% due 9/10/47 | | | 42,725 | |
| | 89,971 | | | Aaa(c) | | Series 2007-1, Class A3, 5.449% due 1/15/49 | | | 89,969 | |
See Notes to Financial Statements.
99
| | | | | | | | | | |
| Core Fixed Income Investments | |
| | | |
Face
Amount/Units† | | | Rating†† | | Security | | Value | |
| $ | 240,000 | | | B+ | | Series 2008-1, Class AJ, 6.484% due 2/10/51(a) | | $ | 256,021 | |
| | | | | | Banc of America Funding Corp.: | | | | |
| | 920 | | | AA+ | | Series 2003-1, Class A1, 6.000% due 5/20/33 | | | 967 | |
| | 239,022 | | | A+ | | Series 2006-G, Class 2A3, 0.326% due 7/20/36(a) | | | 239,102 | |
| | 144,399 | | | AA+ | | Banc of America Mortgage Trust, Series 2004-F, Class 1A1, 2.498% due 7/25/34(a) | | | 146,372 | |
| | 568,512 | | | A+ | | Bayview Commercial Asset Trust, Series 2007-3, Class A1, 0.395% due 7/25/37(a)(b) | | | 514,647 | |
| | 101,771 | | | AAA | | Bayview Financial Acquisition Trust, Series 2004-A, Class A, 0.831% due 2/28/44(a) | | | 101,185 | |
| | 1,078,421 | | | NR | | BCAP LLC, Series 2013-RR1, Class 6A1, 2.672% due 5/26/36(a)(b) | | | 1,084,101 | |
| | | | | | Bear Stearns Adjustable Rate Mortgage Trust: | | | | |
| | 6,787 | | | AA+ | | Series 2002-11, Class 1A1, 2.308% due 2/25/33(a) | | | 6,570 | |
| | 212,606 | | | A+ | | Series 2005-2, Class A2, 2.528% due 3/25/35(a) | | | 215,731 | |
| | 253,363 | | | CCC | | Series 2005-4, Class 3A1, 2.503% due 8/25/35(a) | | | 229,987 | |
| | 628,085 | | | D(g) | | Series 2007-3, Class 1A1, 2.935% due 5/25/47(a) | | | 536,812 | |
| | | | | | Bear Stearns ALT-A Trust: | | | | |
| | 440,634 | | | A+ | | Series 2004-7, Class 2A1, 2.468% due 8/25/34(a) | | | 447,446 | |
| | 327,847 | | | CCC | | Series 2005-2, Class 2A4, 2.598% due 4/25/35(a) | | | 317,171 | |
| | 272,405 | | | B | | Series 2005-4, Class 23A2, 2.538% due 5/25/35(a) | | | 275,666 | |
| | | | | | Bear Stearns Asset Backed Securities Trust: | | | | |
| | 1,041,168 | | | B- | | Series 2005-AC6, Class 1A3, 5.500% due 9/25/35(a) | | | 1,083,850 | |
| | 405,645 | | | AAA | | Series 2005-TC2, Class A3, 0.525% due 8/25/35(a) | | | 403,454 | |
| | 518,671 | | | CCC | | Series 2007-HE7, Class 1A1, 1.155% due 10/25/37(a) | | | 487,931 | |
| | | | | | Bear Stearns Commercial Mortgage Securities Trust: | | | | |
| | 210,000 | | | A- | | Series 2005-PW10, Class AM, 5.449% due 12/11/40(a) | | | 219,414 | |
| | 100,000 | | | B | | Series 2007-PW17, Class AJ, 6.084% due 6/11/50(a) | | | 101,901 | |
| | 580,335 | | | BBB | | Bear Stearns Structured Products Trust, Series 2007-EMX1, Class A1, 1.155% due 3/25/37(a)(b) | | | 570,293 | |
| | 725,000 | | | AAA | | BlueMountain CLO Ltd., Series 2013-4A, Class A, 1.734% due 4/15/25(a)(b) | | | 725,046 | |
| | | | | | CD Commercial Mortgage Trust: | | | | |
| | 210,000 | | | B- | | Series 2006-CD2, Class AJ, 5.566% due 1/15/46(a) | | | 196,984 | |
| | 120,000 | | | B+ | | Series 2006-CD3, Class AJ, 5.688% due 10/15/48 | | | 116,924 | |
| | 170,000 | | | CCC+ | | Series 2007-CD4, Class AJ, 5.398% due 12/11/49(a) | | | 143,958 | |
| | 50,000 | | | BBB | | Series 2007-CD5, Class AMA, 6.321% due 11/15/44(a) | | | 55,725 | |
| | 824,139 | | | AAA | | Cent CLO Ltd., Series 2013-19A, Class A1A, 1.564% due 10/29/25(a)(b) | | | 819,037 | |
| | 1,700,000 | �� | | BB+ | | Centex Home Equity Loan Trust, Series 2006-A, Class AV4, 0.405% due 6/25/36(a) | | | 1,535,709 | |
| | 750 | | | AAA | | Chase Funding Trust, Series 2002-2, Class 2A1, 0.655% due 5/25/32(a) | | | 726 | |
| | 417,594 | | | BB | | Chase Mortgage Finance Trust, Series 2007-A1, Class 5A1, 2.477% due 2/25/37(a) | | | 417,321 | |
| | 900,000 | | | AAA | | CIFC Funding Ltd., Series 2012-1AR, Class A1R, 1.382% due 8/14/24(a)(b) | | | 900,033 | |
| | 770,000 | | | CCC | | Citigroup Mortgage Loan Trust Inc., Series 2006-WFH2, Class M1, 0.425% due 8/25/36(a) | | | 627,048 | |
| | 50,000 | | | Aa2(c) | | COBALT CMBS Commercial Mortgage Trust, Series 2007-C2, Class AMFX, 5.526% due 4/15/47(a) | | | 54,575 | |
| | 605,985 | | | AA+ | | Commercial Mortgage Loan Trust, Series 2008-LS1, Class A1A, 6.212% due 12/10/49(a) | | | 674,617 | |
| | | | | | Commercial Mortgage Pass Through Certificates: | | | | |
| | 496,000 | | | BBB- | | Series 2006-C7, Class AM, 5.970% due 6/10/46(a) | | | 531,053 | |
| | 376,000 | | | B3(c) | | Series 2006-C8, Class AJ, 5.377% due 12/10/46 | | | 377,822 | |
| | 440,000 | | | Aa3(c) | | Series 2006-C8, Class AM, 5.347% due 12/10/46 | | | 475,804 | |
| | 40,000 | | | Aa3(c) | | Series 2013-CR12, Class B, 4.762% due 10/10/46(a) | | | 43,074 | |
| | 20,000 | | | A3(c) | | Series 2013-CR12, Class C, 5.255% due 10/10/46(a) | | | 21,495 | |
| | 145,300 | | | AAA | | Series 2014-CR16, Class A4, 4.051% due 4/10/47 | | | 154,952 | |
| | | | | | Countrywide Alternative Loan Trust: | | | | |
| | 502,487 | | | CCC | | Series 2005-24, Class 4A1, 0.386% due 7/20/35(a) | | | 440,424 | |
| | 340,146 | | | CCC | | Series 2005-27, Class 2A3, 1.677% due 8/25/35(a) | | | 306,071 | |
| | 1,223,714 | | | CCC | | Series 2005-62, Class 1A1, 0.455% due 12/25/35(a) | | | 1,051,793 | |
| | 941,118 | | | CCC | | Series 2006-OA17, Class 1A1A, 0.351% due 12/20/46(a) | | | 734,033 | |
| | 663,391 | | | Ca(c) | | Series 2006-OA9, Class 2A1A, 0.366% due 7/20/46(a) | | | 460,751 | |
| | | | | | Countrywide Asset-Backed Certificates: | | | | |
| | 5,025 | | | AAA | | Series 2002-3, Class 1A1, 0.895% due 5/25/32(a) | | | 4,794 | |
See Notes to Financial Statements.
100
| | | | | | | | | | |
| Core Fixed Income Investments | |
| | | |
Face
Amount/Units† | | | Rating†† | | Security | | Value | |
| $ | 12,759 | | | AA+ | | Series 2003-BC2, Class 2A1, 0.755% due 6/25/33(a) | | $ | 10,941 | |
| | 21,495 | | | BB+ | | Series 2005-4, Class AF3, 4.456% due 10/25/35(a) | | | 21,584 | |
| | 508,289 | | | CCC | | Series 2006-SD3, Class A1, 0.485% due 7/25/36(a)(b) | | | 375,648 | |
| | 584,457 | | | AA | | Series 2007-13, Class 2A2, 0.955% due 10/25/47(a) | | | 531,412 | |
| | | | | | Countrywide Home Loan Mortgage Pass Through Trust: | | | | |
| | 214,568 | | | D | | Series 2005-11, Class 3A3, 2.506% due 4/25/35(a) | | | 159,742 | |
| | 92,917 | | | NR | | Series 2005-11, Class 6A1, 0.755% due 3/25/35(a) | | | 84,685 | |
| | | | | | Credit Suisse First Boston Mortgage Securities Corp.: | | | | |
| | 546,871 | | | AA+ | | Series 2004-AR7, Class 2A1, 2.697% due 11/25/34(a) | | | 554,247 | |
| | 404,107 | | | D | | Series 2005-10, Class 5A6, 5.500% due 11/25/35 | | | 357,854 | |
| | 536,014 | | | BB+ | | Series 2005-6, Class 8A1, 4.500% due 7/25/20 | | | 545,127 | |
| | | | | | Credit Suisse Mortgage Trust: | | | | |
| | 385,000 | | | BBB | | Series 2006-C5, Class AM, 5.343% due 12/15/39 | | | 414,392 | |
| | 275,747 | | | Aaa(c) | | Series 2007-C1, Class AAB, 5.336% due 2/15/40 | | | 288,169 | |
| | 310,000 | | | BBB- | | Series 2007-C2, Class AM, 5.615% due 1/15/49(a) | | | 338,030 | |
| | 2,375,250 | | | Aaa(c) | | Series 2010-UD1, Class A, 5.930% due 12/16/49(a)(b) | | | 2,519,582 | |
| | 325,954 | | | A+ | | Credit-Based Asset Servicing and Securitization LLC, Series 2004-CB4, Class A5, step bond to yield, 6.280% due 5/25/35 | | | 327,148 | |
| | 194,241 | | | NR | | DBRR Trust, Series 2013-EZ2, Class A, 0.853% due 2/25/45(a)(b) | | | 194,054 | |
| | 136,034 | | | CCC | | Downey Savings & Loan Association Mortgage Loan Trust, Series 2004-AR2, Class A2B, 0.956% due 11/19/44(a) | | | 119,506 | |
| | 650,000 | | | AAA | | Dryden XXV Senior Loan Fund, Series 2012-25A, Class A, 1.614% due 1/15/25(a)(b) | | | 647,004 | |
| | | | | | EMC Mortgage Loan Trust: | | | | |
| | 4,329 | | | BB(g) | | Series 2002-B, Class A1, 0.805% due 2/25/41(a)(b) | | | 4,223 | |
| | 21,812 | | | BBB- | | Series 2003-A, Class A1, 0.705% due 8/25/40(a)(b) | | | 19,592 | |
| | 882,945 | | | BB+ | | Equifirst Mortgage Loan Trust, Series 2003-2, Class M2, 2.705% due 9/25/33(a) | | | 843,284 | |
| | 598,058 | | | NR | | Federal Home Loan Mortgage Corp. (FHLMC), Series T-61, Class 1A1, 1.522% due 7/25/44(a) | | | 620,551 | |
| | | | | | Federal Home Loan Mortgage Corp. (FHLMC), REMICS: | | | | |
| | 8,053 | | | NR | | Series 1865, Class DA, 28.322% due 2/15/24(a)(l) | | | 7,459 | |
| | 6,580 | | | AAA(g) | | Series 2808, Class FT, 0.505% due 4/15/33(a) | | | 6,582 | |
| | 1,947,322 | | | NR | | Series 3349, Class AS, 6.345% due 7/15/37(a)(l) | | | 330,120 | |
| | 278,729 | | | NR | | Series 3451, Class SB, 5.875% due 5/15/38(a)(l) | | | 32,403 | |
| | 261,690 | | | NR | | Series 3621, Class SB, 6.075% due 1/15/40(a)(l) | | | 35,722 | |
| | 555,000 | | | NR | | Series 3743, Class PB, 4.500% due 10/15/40 | | | 630,630 | |
| | 3,489,738 | | | NR | | Series 3866, Class SA, 5.795% due 5/15/41(a)(l) | | | 532,824 | |
| | 1,184,199 | | | NR | | Series 3947, Class SG, 5.795% due 10/15/41(a)(l) | | | 221,434 | |
| | 301,817 | | | NR | | Series 3997, Class SK, 6.445% due 11/15/41(a)(l) | | | 57,429 | |
| | 86,109 | | | NR | | Series 4076, Class SW, 5.895% due 7/15/42(a)(l) | | | 18,268 | |
| | 85,407 | | | NR | | Series 4097, Class ST, 5.895% due 8/15/42(a)(l) | | | 19,445 | |
| | 85,950 | | | NR | | Series 4136, Class SE, 5.995% due 11/15/42(a)(l) | | | 17,177 | |
| | 89,626 | | | NR | | Series 4136, Class SJ, 5.995% due 11/15/42(a)(l) | | | 19,772 | |
| | 88,922 | | | NR | | Series 4136, Class SQ, 5.995% due 11/15/42(a)(l) | | | 20,042 | |
| | 622,900 | | | NR | | Series 4150, Class BU, 4.000% due 2/15/42 | | | 664,679 | |
| | 801,971 | | | NR | | Series 4203, Class PS, 6.095% due 9/15/42(a)(l) | | | 156,556 | |
| | 103,816 | | | NR | | Series 4206, Class CZ, 3.000% due 5/15/43 | | | 87,297 | |
| | 304,992 | | | NR | | Series 4210, Class Z, 3.000% due 5/15/43 | | | 259,219 | |
| | 206,598 | | | NR | | Series 4226, Class GZ, 3.000% due 7/15/43 | | | 178,173 | |
| | 506,226 | | | NR | | Series 4239, Class IO, 3.500% due 6/15/27(l) | | | 64,754 | |
| | 99,269 | | | NR | | Series 4335, Class SW, 5.845% due 5/15/44(a)(l) | | | 22,217 | |
| | 296,703 | | | NR | | Series R007, Class ZA, 6.000% due 5/15/36 | | | 334,145 | |
| | | | | | Federal National Mortgage Association (FNMA): | | | | |
| | 711,334 | | | NR | | Series 2012-M12, Class 1A, 2.935% due 8/25/22(a) | | | 728,847 | |
| | 22,347,574 | | | NR | | Series 2013-M7, Class X2, 0.336% due 12/27/22(a)(l) | | | 329,169 | |
| | 1,029,156 | | | NR | | Series 2014-M8, Class FA, 0.402% due 5/25/18(a) | | | 1,030,625 | |
| | | | | | Federal National Mortgage Association (FNMA), Grantor Trust: | | | | |
| | 144,707 | | | NR | | Series 2000-T6, Class A3, 3.981% due 1/25/28(a) | | | 153,602 | |
See Notes to Financial Statements.
101
| | | | | | | | | | |
| Core Fixed Income Investments | |
| | | |
Face
Amount/Units† | | | Rating†† | | Security | | Value | |
| $ | 29,306 | | | NR | | Series 2002-T6, Class A1, 3.310% due 2/25/32 | | $ | 30,045 | |
| | | | | | Federal National Mortgage Association (FNMA), Interest Strip: | | | | |
| | 361,032 | | | NR | | Series 409, Class C13, 3.500% due 11/25/41(l) | | | 72,519 | |
| | 733,072 | | | NR | | Series 409, Class C18, 4.000% due 4/25/42(l) | | | 156,892 | |
| | 137,827 | | | NR | | Series 409, Class C22, 4.500% due 11/25/39(l) | | | 27,069 | |
| | 575,000 | | | Aaa(c) | | Federal National Mortgage Association (FNMA), Principal Strip, 4.138% due 1/15/30(m) | | | 339,688 | |
| | | | | | Federal National Mortgage Association (FNMA), REMICS: | | | | |
| | 24,814 | | | NR | | Series 2000-34, Class F, 0.605% due 10/25/30(a) | | | 25,057 | |
| | 64,079 | | | NR | | Series 2002-34, Class FE, 0.555% due 5/18/32(a) | | | 64,594 | |
| | 85,758 | | | NR | | Series 2004-38, Class FK, 0.505% due 5/25/34(a) | | | 85,835 | |
| | 7,925 | | | NR | | Series 2004-88, Class HA, 6.500% due 7/25/34 | | | 8,187 | |
| | 548,769 | | | NR | | Series 2005-117, Class LC, 5.500% due 11/25/35 | | | 599,864 | |
| | 4,950 | | | NR | | Series 2005-64, Class EA, 5.250% due 6/25/32 | | | 4,950 | |
| | 2,010,575 | | | NR | | Series 2006-51, Class SP, 6.495% due 3/25/36(a)(l) | | | 290,961 | |
| | 1,097,112 | | | NR | | Series 2007-68, Class SC, 6.545% due 7/25/37(a)(l) | | | 181,388 | |
| | 2,065,977 | | | NR | | Series 2008-18, Class SM, 6.845% due 3/25/38(a)(l) | | | 338,040 | |
| | 290,998 | | | NR | | Series 2010-142, Class SM, 6.375% due 12/25/40(a)(l) | | | 41,545 | |
| | 940,112 | | | NR | | Series 2011-87, Class SG, 6.395% due 4/25/40(a)(l) | | | 161,313 | |
| | 682,656 | | | NR | | Series 2011-90, Class QI, 5.000% due 5/25/34(l) | | | 86,956 | |
| | 611,155 | | | NR | | Series 2012-118, Class CI, 3.500% due 12/25/39(l) | | | 94,939 | |
| | 90,845 | | | NR | | Series 2012-128, Class SL, 5.995% due 11/25/42(a)(l) | | | 21,134 | |
| | 178,770 | | | NR | | Series 2012-128, Class SQ, 5.995% due 11/25/42(a)(l) | | | 40,653 | |
| | 261,162 | | | NR | | Series 2012-133, Class CS, 5.995% due 12/25/42(a)(l) | | | 56,297 | |
| | 89,742 | | | NR | | Series 2012-133, Class SA, 5.995% due 12/25/42(a)(l) | | | 18,760 | |
| | 441,999 | | | NR | | Series 2012-46, Class BA, 6.000% due 5/25/42 | | | 492,650 | |
| | 653,910 | | | NR | | Series 2012-51, Class B, 7.000% due 5/25/42 | | | 742,768 | |
| | 78,293 | | | NR | | Series 2012-70, Class YS, 6.495% due 2/25/41(a)(l) | | | 13,951 | |
| | 415,032 | | | NR | | Series 2012-74, Class SA, 6.495% due 3/25/42(a)(l) | | | 73,853 | |
| | 69,172 | | | NR | | Series 2012-75, Class AO, 0.398% due 3/25/42(m) | | | 63,857 | |
| | 257,721 | | | NR | | Series 2012-93, Class SG, 5.945% due 9/25/42(a)(l) | | | 56,048 | |
| | 522,055 | | | NR | | Series 2013-10, Class JS, 5.995% due 2/25/43(a)(l) | | | 111,480 | |
| | 543,620 | | | NR | | Series 2013-10, Class SJ, 5.995% due 2/25/43(a)(l) | | | 120,296 | |
| | 92,300 | | | NR | | Series 2013-67, Class KS, 5.945% due 7/25/43(a)(l) | | | 20,974 | |
| | 1,474,355 | | | NR | | Series 2013-9, Class BC, 6.500% due 7/25/42 | | | 1,644,218 | |
| | 1,074,658 | | | NR | | Series 2013-9, Class CB, 5.500% due 4/25/42 | | | 1,202,467 | |
| | | | | | FHLMC Multifamily Structured Pass Through Certificates: | | | | |
| | 1,633,587 | | | NR | | Series K007, Class X1, 1.361% due 4/25/20(a)(l) | | | 81,562 | |
| | 1,118,143 | | | AAA(g) | | Series K016, Class X1, 1.725% due 10/25/21(a)(l) | | | 101,454 | |
| | 729,286 | | | AAA(g) | | Series K017, Class X1, 1.586% due 12/25/21(a)(l) | | | 60,448 | |
| | 1,483,568 | | | AAA(g) | | Series K021, Class X1, 1.641% due 6/25/22(a)(l) | | | 139,349 | |
| | 406,102 | | | Aaa(c) | | Series K024, Class X1, 1.021% due 9/25/22(a)(l) | | | 23,363 | |
| | 620,000 | | | Aaa(c) | | Flatiron CLO Ltd., Series 2013-1A, Class A1, 1.633% due 1/17/26(a)(b) | | | 618,188 | |
| | 805,000 | | | AAA | | Ford Credit Floorplan Master Owner Trust, Series 2012-5, Class A, 1.490% due 9/15/19 | | | 804,994 | |
| | 420,308 | | | A+ | | GMAC Mortgage Corp. Loan Trust, Series 2004-VF1, Class A1, 0.905% due 2/25/31(a)(b) | | | 405,333 | |
| | | | | | Government National Mortgage Association (GNMA): | | | | |
| | 50,237 | | | NR | | Series 2000-35, Class F, 0.705% due 12/16/25(a) | | | 50,667 | |
| | 47,548 | | | NR | | Series 2002-21, Class FV, 0.555% due 3/16/32(a) | | | 47,489 | |
| | 3,354,730 | | | NR | | Series 2008-51, Class GS, 6.075% due 6/16/38(a)(l) | | | 499,190 | |
| | 95,381 | | | NR | | Series 2010-107, Class SG, 5.995% due 2/20/38(a)(l) | | | 9,664 | |
| | 104,526 | | | NR | | Series 2010-31, Class GS, 6.345% due 3/20/39(a)(l) | | | 13,663 | |
| | 273,557 | | | NR | | Series 2010-85, Class HS, 6.495% due 1/20/40(a)(l) | | | 48,995 | |
| | 680,827 | | | NR | | Series 2012-100, Class IO, 0.827% due 8/16/52(a)(l) | | | 44,481 | |
| | 539,017 | | | NR | | Series 2013-152, Class HS, 6.545% due 6/20/43(a)(l) | | | 110,078 | |
| | 263,257 | | | NR | | Series 2013-153, Class AB, 2.900% due 6/16/44(a) | | | 271,726 | |
| | 646,389 | | | NR | | Series 2013-154, Class AB, 2.900% due 2/16/44(a) | | | 665,033 | |
| | 3,956,057 | | | NR | | Series 2013-85, Class IA, 0.834% due 3/16/47(a)(l) | | | 251,726 | |
See Notes to Financial Statements.
102
| | | | | | | | | | |
| Core Fixed Income Investments | |
| | | |
Face
Amount/Units† | | | Rating†† | | Security | | Value | |
| | 447,501 | GBP | | A | | Granite Mortgages PLC, Series 2004-3, Class 3A2, 0.934% due 9/20/44(a) | | $ | 739,493 | |
| $ | 90,000 | | | BB+ | | Greenwich Capital Commercial Funding Corp., Series 2006-GG7, Class AM, 6.014% due 7/10/38(a) | | | 96,752 | |
| | | | | | GS Mortgage Securities Corp. II: | | | | |
| | 779,699 | | | AAA | | Series 2005-GG4, Class A4, 4.761% due 7/10/39 | | | 792,646 | |
| | 1,218,418 | | | AAA | | Series 2005-GG4, Class A4A, 4.751% due 7/10/39 | | | 1,232,243 | |
| | | | | | GS Mortgage Securities Trust: | | | | |
| | 638,853 | | | BBB- | | Series 2007-GG10, Class A1A, 5.991% due 8/10/45(a) | | | 706,297 | |
| | 705,000 | | | Aaa(c) | | Series 2011-GC5, Class A4, 3.707% due 8/10/44 | | | 746,719 | |
| | 1,023,616 | | | Aaa(c) | | Series 2012-GC6, Class A1, 1.282% due 1/10/45 | | | 1,029,510 | |
| | 150,872 | | | CCC | | GSMPS Mortgage Loan Trust, Series 2005-RP3, Class 1AF, 0.505% due 9/25/35(a)(b) | | | 130,073 | |
| | 178,612 | | | A+ | | GSR Mortgage Loan Trust, Series 2005-AR6, Class 2A1, 2.663% due 9/25/35(a) | | | 180,564 | |
| | | | | | Harborview Mortgage Loan Trust: | | | | |
| | 586,866 | | | BBB+ | | Series 2004-5, Class 2A6, 2.163% due 6/19/34(a) | | | 589,423 | |
| | 179,026 | | | NR | | Series 2006-2, Class 1A, 2.695% due 2/25/36(a) | | | 145,458 | |
| | 828,518 | | | A+ | | HSBC Home Equity Loan Trust, Series 2007-3, Class APT, 1.356% due 11/20/36(a) | | | 830,480 | |
| | 827,281 | | | BBB+ | | HSI Asset Securitization Corp. Trust, Series 2006-OPT1, Class 2A3, 0.345% due 12/25/35(a) | | | 812,639 | |
| | 3,782 | | | AA+ | | Impac CMB Trust, Series 2003-1, Class 1A1, 0.955% due 3/25/33(a) | | | 3,793 | |
| | | | | | Indymac Index Mortgage Loan Trust: | | | | |
| | 97,886 | | | CCC | | Series 2004-AR15, Class 1A1, 2.717% due 2/25/35(a) | | | 85,858 | |
| | 108,310 | | | CCC | | Series 2005-AR15, Class A2, 4.552% due 9/25/35(a) | | | 96,559 | |
| | 650,000 | | | AAA | | ING Investment Management CLO Ltd., Series 2012-4A, Class A1, 1.624% due 10/15/23(a)(b) | | | 648,263 | |
| | 1,304,624 | | | CCC | | IXIS Real Estate Capital Trust, Series 2006-HE2, Class A3, 0.315% due 8/25/36(a) | | | 683,591 | |
| | | | | | JPMBB Commercial Mortgage Securities Trust: | | | | |
| | 80,000 | | | A3(c) | | Series 2013-C15, Class C, 5.251% due 11/15/45(a) | | | 86,160 | |
| | 40,000 | | | Aa3(c) | | Series 2013-C17, Class B, 5.050% due 1/15/47(a) | | | 43,444 | |
| | | | | | JPMorgan Chase Commercial Mortgage Securities Trust: | | | | |
| | 34,565 | | | AA | | Series 2006-LDP9, Class A3, 5.336% due 5/15/47 | | | 37,210 | |
| | 832,092 | | | AAA | | Series 2007-C1, Class ASB, 5.857% due 2/15/51 | | | 881,611 | |
| | 738,226 | | | AA | | Series 2007-CB18, Class A1A, 5.431% due 6/12/47(a) | | | 801,053 | |
| | 1,060,000 | | | B- | | Series 2007-CB18, Class AJ, 5.502% due 6/12/47(a) | | | 1,044,143 | |
| | 390,000 | | | BBB- | | Series 2007-CB20, Class AM, 6.082% due 2/12/51(a) | | | 436,152 | |
| | 1,090,000 | | | AAA | | Series 2011-C3, Class A3, 4.388% due 2/15/46(b) | | | 1,183,150 | |
| | 140,000 | | | Aaa(c) | | Series 2011-C5, Class A3, 4.171% due 8/15/46 | | | 152,264 | |
| | 175,000 | | | Aaa(c) | | Series 2011-C5, Class AS, 5.500% due 8/15/46(a)(b) | | | 202,297 | |
| | 2,643,027 | | | Aaa(c) | | Series 2012-CBX, Class XA, 1.935% due 6/15/45(a)(l) | | | 221,905 | |
| | 460,000 | | | AA | | Series 2012-HSBC, Class C, 4.021% due 7/5/32(b) | | | 476,872 | |
| | 69,759 | | | BBB+ | | JPMorgan Mortgage Trust, Series 2005-A1, Class 6T1, 2.734% due 2/25/35(a) | | | 69,362 | |
| | | | | | LB-UBS Commercial Mortgage Trust: | | | | |
| | 190,000 | | | AA- | | Series 2006-C1, Class AM, 5.217% due 2/15/31(a) | | | 199,981 | |
| | 360,000 | | | A+ | | Series 2006-C7, Class AM, 5.378% due 11/15/38 | | | 388,355 | |
| | 160,000 | | | A- | | Series 2007-C7, Class AM, 6.370% due 9/15/45(a) | | | 181,227 | |
| | | | | | Lehman XS Trust: | | | | |
| | 201,915 | | | CCC | | Series 2005-5N, Class 1A1, 0.455% due 11/25/35(a) | | | 180,075 | |
| | 137,677 | | | D | | Series 2005-7N, Class 1A1B, 0.455% due 12/25/35(a) | | | 81,112 | |
| | 630,000 | | | AAA | | Limerock CLO II Ltd., Series 2014-2A, Class A, 1.734% due 4/18/26(a)(b) | | | 629,996 | |
| | | | | | MASTR Adjustable Rate Mortgages Trust: | | | | |
| | 1,290,345 | | | A+ | | Series 2004-13, Class 3A7, 2.636% due 11/21/34(a) | | | 1,321,684 | |
| | 107,666 | | | AA+ | | Series 2004-4, Class 4A1, 2.371% due 5/25/34(a) | | | 106,064 | |
| | 698,684 | | | AA+ | | MASTR Seasoned Securitization Trust, Series 2005-1, Class 4A1, 2.436% due 10/25/32(a) | | | 709,152 | |
| | 450,585 | | | CCC | | Merrill Lynch First Franklin Mortgage Loan Trust, Series 2007-4, Class 2A4, 0.405% due 7/25/37(a) | | | 299,163 | |
| | | | | | Merrill Lynch Mortgage Investors Trust: | | | | |
| | 84,796 | | | A+ | | Series 2004-A3, Class 4A3, 2.578% due 5/25/34(a) | | | 85,083 | |
| | 991,436 | | | AAA | | Series 2006-FF1, Class A2C, 0.355% due 8/25/36(a) | | | 976,097 | |
See Notes to Financial Statements.
103
| | | | | | | | | | |
| Core Fixed Income Investments | |
| | | |
Face
Amount/Units† | | | Rating†† | | Security | | Value | |
| $ | 160,253 | | | Aaa(c) | | Merrill Lynch Mortgage Trust, Series 2004-KEY2, Class A4, 4.864% due 8/12/39(a) | | $ | 160,112 | |
| | 994,220 | | | AAA | | Mid-State Capital Corp. Trust, Series 2004-1, Class A, 6.005% due 8/15/37 | | | 1,048,278 | |
| | 47,932 | | | B1(c) | | MLCC Mortgage Investors, Inc., Series 2005-1, Class 2A1, 2.127% due 4/25/35(a) | | | 46,012 | |
| | | | | | ML-CFC Commercial Mortgage Trust: | | | | |
| | 475,819 | | | AAA | | Series 2006-4, Class A1A, 5.166% due 12/12/49 | | | 509,640 | |
| | 291,000 | | | D | | Series 2007-5, Class AJ, 5.450% due 8/12/48(a) | | | 280,070 | |
| | 260,000 | | | B- | | Series 2007-9, Class AJ, 6.193% due 9/12/49(a) | | | 253,202 | |
| | 158,600 | | | AAA | | Morgan Stanley ABS Capital I Inc. Trust, Series 2004-SD3, Class A, 0.615% due 6/25/34(a)(b) | | | 159,070 | |
| | | | | | Morgan Stanley Bank of America Merrill Lynch Trust: | | | | |
| | 30,000 | | | Aaa(c) | | Series 2013-C10, Class A4, 4.218% due 7/15/46(a) | | | 32,200 | |
| | 500,000 | | | Aaa(c) | | Series 2013-C13, Class A4, 4.039% due 11/15/46 | | | 532,083 | |
| | | | | | Morgan Stanley Capital I Trust: | | | | |
| | 480,000 | | | BBB | | Series 2007-HQ12, Class A5, 5.773% due 4/12/49(a) | | | 517,526 | |
| | 394,431 | | | AAA | | Series 2007-IQ13, Class A1A, 5.312% due 3/15/44 | | | 428,154 | |
| | 312,162 | | | A | | Series 2007-IQ14, Class A1A, 5.665% due 4/15/49(a) | | | 341,431 | |
| | 200,000 | | | A | | Series 2007-IQ14, Class A4, 5.692% due 4/15/49(a) | | | 218,745 | |
| | 528,705 | | | Aaa(c) | | Series 2007-T25, Class A3, 5.514% due 11/12/49(a) | | | 572,157 | |
| | 1,794,824 | | | AA+ | | New Century Home Equity Loan Trust, Series 2005-3, Class M1, 0.635% due 7/25/35(a) | | | 1,788,689 | |
| | 650,000 | | | AAA | | OHA Credit Partners VII Ltd., Series 2012-7A, Class A, 1.652% due 11/20/23(a)(b) | | | 648,621 | |
| | 1,930 | | | A+ | | Option One Mortgage Loan Trust, Series 2002-6, Class A2, 0.955% due 11/25/32(a) | | | 1,813 | |
| | 1,205,000 | | | BBB | | Park Place Securities Inc. Asset-Backed Pass-Through Certificates, Series 2005-WCW2, Class M1, 0.655% due 7/25/35(a) | | | 1,191,119 | |
| | 1,787,000 | | | BBB+ | | Popular ABS Mortgage Pass-Through Trust, Series 2006-C, Class A4, 0.405% due 7/25/36(a) | | | 1,688,583 | |
| | | | | | Prime Mortgage Trust: | | | | |
| | 265,134 | | | CCC | | Series 2006-DR1, Class 1A1, 5.500% due 5/25/35(b) | | | 277,844 | |
| | 107,229 | | | CCC | | Series 2006-DR1, Class 1A2, 6.000% due 5/25/35(b) | | | 113,290 | |
| | 1,417,581 | | | CCC | | Series 2006-DR1, Class 2A1, 5.500% due 5/25/35(b) | | | 1,431,733 | |
| | 100,371 | | | AA+ | | RALI Trust, Series 2005-QA1, Class A1, 0.455% due 1/25/35(a) | | | 97,629 | |
| | | | | | RAMP Trust: | | | | |
| | 4,940 | | | CCC | | Series 2003-RS4, Class AIIB, 0.815% due 5/25/33(a) | | | 4,417 | |
| | 1,012,916 | | | AA | | Series 2003-RS9, Class AI6A, step bond to yield, 6.006% due 10/25/33 | | | 1,073,050 | |
| | 939 | | | AAA | | Series 2004-RZ1, Class AI7, 4.030% due 1/25/33(a) | | | 941 | |
| | 230,000 | | | AAA | | RBS Commercial Funding Inc. Trust, Series 2013-GSP, Class A, 3.961% due 1/13/32(a)(b) | | | 242,115 | |
| | | | | | Reperforming Loan REMIC Trust: | | | | |
| | 38,380 | | | CCC | | Series 2004-R2, Class 1AF1, 0.575% due 11/25/34(a)(b) | | | 33,991 | |
| | 315,849 | | | CC | | Series 2005-R1, Class 1AF1, 0.515% due 3/25/35(a)(b) | | | 283,860 | |
| | 519,151 | | | Caa2(c) | | Residential Asset Securitization Trust, Series 2005-A15, Class 1A4, 5.750% due 2/25/36 | | | 493,913 | |
| | 640,000 | | | AAA | | SCG Trust, Series 2013-SRP1, Class A, 1.555% due 11/15/26(a)(b) | | | 642,668 | |
| | | | | | Small Business Administration Participation Certificates: | | | | |
| | 15,926 | | | NR | | Series 1995-20J, Class 1, 6.850% due 10/1/15 | | | 16,303 | |
| | 31,511 | | | NR | | Series 1995-20K, Class 1, 6.650% due 11/1/15 | | | 32,310 | |
| | 29,810 | | | NR | | Series 1996-20G, Class 1, 7.700% due 7/1/16 | | | 30,993 | |
| | 247,878 | | | NR | | Series 1999-20L, Class 1, 7.190% due 12/1/19 | | | 269,718 | |
| | 126,897 | | | NR | | Series 2000-20A, Class 1, 7.590% due 1/1/20 | | | 139,370 | |
| | 380,654 | | | NR | | Series 2002-20K, Class 1, 5.080% due 11/1/22 | | | 410,073 | |
| | 160,859 | | | BBB+ | | Structured Adjustable Rate Mortgage Loan Trust, Series 2004-16, Class 1A2, 2.463% due 11/25/34(a) | | | 160,798 | |
| | 872,861 | | | AAA | | Structured Asset Investment Loan Trust, Series 2004-BNC1, Class A2, 1.155% due 9/25/34(a) | | | 851,418 | |
| | 293,891 | | | AA+ | | Structured Asset Mortgage Investments II Trust, Series 2005-AR5, Class A3, 0.406% due 7/19/35(a) | | | 286,202 | |
| | | | | | Structured Asset Securities Corp. | | | | |
| | 217,111 | | | CC | | Series 2005-RF3, Class 1A, 0.505% due 6/25/35(a)(b) | | | 177,267 | |
| | 514,852 | | | BB | | Series 2007-BC4, Class A3, 0.405% due 11/25/37(a) | | | 505,566 | |
| | 4,329 | | | NR | | Series 2002-14A, Class 2A1, 2.125% due 7/25/32(a) | | | 4,012 | |
| | 82,418 | | | NR | | U.S. Small Business Administration, Series 2005-P10A, Class 1, 4.638% due 2/10/15 | | | 83,822 | |
| | 300,000 | | | AA+ | | Venture VIII CDO Ltd., Series 2007-8A, Class A2A, 0.452% due 7/22/21(a)(b) | | | 296,367 | |
See Notes to Financial Statements.
104
| | | | | | | | | | |
| Core Fixed Income Investments | |
| | | |
Face
Amount/Units† | | | Rating†† | | Security | | Value | |
| $ | 100,000 | | | AAA | | VNDO Mortgage Trust, Series 2012-6AVE, Class A, 2.996% due 11/15/30(b) | | $ | 99,234 | |
| | | | | | Wachovia Bank Commercial Mortgage Trust: | | | | |
| | 190,000 | | | B+ | | Series 2006-C28, Class AJ, 5.632% due 10/15/48(a) | | | 195,370 | |
| | 50,000 | | | BB | | Series 2007-C30, Class AM, 5.383% due 12/15/43 | | | 53,827 | |
| | | | | | WaMu Mortgage Pass Through Certificates Trust: | | | | |
| | 30,642 | | | BBB+ | | Series 2004-AR11, Class A, 2.432% due 10/25/34(a) | | | 30,874 | |
| | 117,072 | | | BBB+ | | Series 2004-AR12, Class A2A, 0.578% due 10/25/44(a) | | | 114,311 | |
| | 344,882 | | | AA+ | | Series 2005-AR11, Class A1A, 0.475% due 8/25/45(a) | | | 331,879 | |
| | 611,069 | | | AA+ | | Series 2005-AR13, Class A1A1, 0.445% due 10/25/45(a) | | | 586,908 | |
| | 335,158 | | | BBB- | | Series 2005-AR19, Class A1A2, 0.445% due 12/25/45(a) | | | 318,457 | |
| | 1,000,000 | | | B- | | Series 2005-AR4, Class A5, 2.372% due 4/25/35(a) | | | 988,722 | |
| | 2,334,211 | | | BBB | | Series 2006-AR1, Class 2A1A, 1.187% due 1/25/46(a) | | | 2,274,927 | |
| | 864,347 | | | CCC | | Series 2006-AR13, Class 2A, 2.168% due 10/25/46(a) | | | 815,943 | |
| | 465,675 | | | CCC | | Series 2007-HY4, Class 4A1, 2.099% due 9/25/36(a) | | | 415,396 | |
| | 1,216,185 | | | CCC | | Series 2007-OA6, Class 1A, 0.927% due 7/25/47(a) | | | 1,066,226 | |
| | 923,586 | | | Ca(c) | | Washington Mutual Alternative, Series 2007-OA2, Class 2A, 0.817% due 1/25/47(a) | | | 680,174 | |
| | 120,000 | | | Aa3(c) | | Wells Fargo Commercial Mortgage Trust, Series 2013-LC12, Class B, 4.438% due 7/15/46(a) | | | 125,681 | |
| | | | | | Wells Fargo Mortgage Backed Securities Trust: | | | | |
| | 954,458 | | | Caa1(c) | | Series 2006-12, Class A3, 6.000% due 10/25/36 | | | 938,138 | |
| | 384,039 | | | CCC | | Series 2006-AR2, Class 2A1, 2.615% due 3/25/36(a) | | | 385,476 | |
| | 98,817 | | | Caa2(c) | | Series 2006-AR7, Class 2A4, 2.613% due 5/25/36(a) | | | 92,649 | |
| | | | | | WF-RBS Commercial Mortgage Trust: | | | | |
| | 795,000 | | | Aaa(c) | | Series 2011-C2, Class A2, 3.791% due 2/15/44(b) | | | 820,881 | |
| | 1,050,000 | | | Aaa(c) | | Series 2011-C4, Class A3, 4.394% due 6/15/44(b) | | | 1,140,218 | |
| | 1,035,000 | | | Aaa(c) | | Series 2011-C5, Class A4, 3.667% due 11/15/44 | | | 1,091,080 | |
| | 1,993,718 | | | Aaa(c) | | Series 2012-C7, Class XA, 1.735% due 6/15/45(a)(b)(l) | | | 182,709 | |
| | 145,000 | | | Aaa(c) | | Series 2013-C14, Class A4, 3.073% due 6/15/46 | | | 144,898 | |
| | | | | | | | | | |
| | | | | | TOTAL COLLATERALIZED MORTGAGE OBLIGATIONS
(Cost — $109,158,789) | | | 110,286,375 | |
| | | | | | | | | | |
| SOVEREIGN BONDS — 6.0% | |
| Brazil — 0.4% | |
| | 656,000 | BRL | | BBB+ | | Brazil Notas do Tesouro Nacional Serie B, 6.000% due 8/15/50 | | | 778,008 | |
| | 3,634,000 | BRL | | BBB+ | | Brazil Notas do Tesouro Nacional Serie F, 10.000% due 1/1/17 | | | 1,610,915 | |
| | | | | | Brazilian Government International Bond: | | | | |
| | 317,000 | | | Baa2(c) | | 4.875% due 1/22/21 | | | 349,968 | |
| | 290,000 | | | BBB- | | 4.250% due 1/7/25 | | | 301,962 | |
| | | | | | | | | | |
| | | | | | Total Brazil | | | 3,040,853 | |
| | | | | | | | | | |
| Canada — 0.0% | |
| | 152,000 | | | AA | | Province of Manitoba Canada, 3.050% due 5/14/24 | | | 155,108 | |
| | | | | | | | | | |
| Colombia — 0.1% | |
| | | | | | Colombia Government International Bond: | | | | |
| | 335,000 | | | BBB | | 4.000% due 2/26/24 | | | 350,913 | |
| | 370,000 | | | BBB | | 5.625% due 2/26/44 | | | 431,050 | |
| | | | | | | | | | |
| | | | | | Total Colombia | | | 781,963 | |
| | | | | | | | | | |
| Italy — 2.3% | |
| | | | | | Italy Buoni Poliennali Del Tesoro: | | | | |
| | 300,000 | EUR | | Baa2(c) | | 3.750% due 8/1/15 | | | 406,763 | |
| | 2,000,000 | EUR | | Baa2(c) | | 3.000% due 11/1/15 | | | 2,710,790 | |
| | 300,000 | EUR | | Baa2(c) | | 2.750% due 12/1/15 | | | 406,635 | |
| | 1,700,000 | EUR | | Baa2(c) | | 3.750% due 4/15/16 | | | 2,356,315 | |
| | 100,000 | EUR | | Baa2(c) | | 2.250% due 5/15/16 | | | 135,747 | |
| | 900,000 | EUR | | Baa2(c) | | 4.750% due 9/15/16 | | | 1,286,826 | |
| | 800,000 | EUR | | Baa2(c) | | 1.150% due 5/15/17 | | | 1,066,687 | |
See Notes to Financial Statements.
105
| | | | | | | | | | |
| Core Fixed Income Investments | |
| | | |
Face
Amount/Units† | | | Rating†† | | Security | | Value | |
| Italy — 2.3% — (continued) | |
| | 1,700,000 | EUR | | Baa2(c) | | 4.750% due 6/1/17 | | $ | 2,485,272 | |
| | 1,030,000 | EUR | | Baa2(c) | | 3.750% due 5/1/21 | | | 1,531,391 | |
| | 4,400,000 | EUR | | Baa2(c) | | Italy Certificati di Credito del Tesoro Zero Coupon, 0.057% due 4/29/16 | | | 5,746,681 | |
| | | | | | | | | | |
| | | | | | Total Italy | | | 18,133,107 | |
| | | | | | | | | | |
| Japan — 0.1% | |
| $ | 800,000 | | | AA- | | Japan Bank for International Cooperation, 2.875% due 2/2/15 | | | 808,969 | |
| | | | | | | | | | |
| Mexico — 1.3% | |
| | | | | | Mexican Bonos: | | | | |
| | 50,350,000 | MXN | | A | | 9.500% due 12/18/14 | | | 3,931,490 | |
| | 2,118,000 | MXN | | A | | 8.000% due 6/11/20 | | | 186,349 | |
| | 13,542,700 | MXN | | A | | 6.500% due 6/9/22 | | | 1,100,758 | |
| | 3,469,300 | MXN | | A | | 8.500% due 11/18/38 | | | 327,273 | |
| | 40,195,700 | MXN | | A | | 7.750% due 11/13/42 | | | 3,520,616 | |
| | | | | | Mexico Government International Bond: | | | | |
| | 226,000 | | | BBB+ | | 3.625% due 3/15/22 | | | 235,831 | |
| | 78,000 | | | BBB+ | | 6.050% due 1/11/40 | | | 97,890 | |
| | 828,000 | | | BBB+ | | 4.750% due 3/8/44 | | | 872,712 | |
| | | | | | | | | | |
| | | | | | Total Mexico | | | 10,272,919 | |
| | | | | | | | | | |
| New Zealand — 0.1% | |
| | 1,060,000 | NZD | | AA+ | | New Zealand Government Bond, 3.000% due 4/15/20 | | | 842,747 | |
| | | | | | | | | | |
| Norway — 0.1% | |
| | 1,270,000 | | | AAA | | Kommunalbanken AS, 1.125% due 5/23/18(b) | | | 1,256,561 | |
| | | | | | | | | | |
| Poland — 0.1% | |
| | 610,000 | | | A- | | Poland Government International Bond, 4.000% due 1/22/24 | | | 642,403 | |
| | | | | | | | | | |
| Russia — 0.0% | |
| | | | | | Russian Foreign Bond — Eurobond: | | | | |
| | 47,950 | | | BBB- | | step bond to yield, 7.500% due 3/31/30(b) | | | 53,464 | |
| | 411,685 | | | BBB- | | step bond to yield, 7.500% due 3/31/30 | | | 459,029 | |
| | | | | | | | | | |
| | | | | | Total Russia | | | 512,493 | |
| | | | | | | | | | |
| South Africa — 0.1% | |
| | 520,000 | | | BBB- | | South Africa Government International Bond, 5.875% due 9/16/25 | | | 589,940 | |
| | | | | | | | | | |
| Spain — 1.3% | |
| | | | | | Spain Government Bond: | | | | |
| | 2,100,000 | EUR | | BBB | | 3.750% due 10/31/15 | | | 2,875,314 | |
| | 1,300,000 | EUR | | BBB | | 3.300% due 7/30/16 | | | 1,807,351 | |
| | 900,000 | EUR | | BBB | | 4.250% due 10/31/16 | | | 1,282,472 | |
| | 2,500,000 | EUR | | BBB | | 2.100% due 4/30/17 | | | 3,426,771 | |
| | 500,000 | EUR | | BBB | | 5.500% due 7/30/17 | | | 751,241 | |
| | | | | | | | | | |
| | | | | | Total Spain | | | 10,143,149 | |
| | | | | | | | | | |
| Supranational — 0.0% | |
| | 400,000 | | | AAA | | International Bank for Reconstruction & Development, 0.750% due 12/15/16 | | | 400,604 | |
| | | | | | | | | | |
| Turkey — 0.1% | |
| | 600,000 | | | Baa3(c) | | Turkey Government International Bond, 5.750% due 3/22/24 | | | 669,300 | |
| | | | | | | | | | |
| | | | | | TOTAL SOVEREIGN BONDS
(Cost — $48,569,124) | | | 48,250,116 | |
| | | | | | | | | | |
See Notes to Financial Statements.
106
| | | | | | | | | | |
| Core Fixed Income Investments | |
| | | |
Face
Amount/Units† | | | Rating†† | | Security | | Value | |
| ASSET-BACKED SECURITIES — 1.8% | |
| Automobiles — 0.3% | |
| $ | 845,000 | | | AAA | | Chrysler Capital Auto Receivables Trust, Series 2013-BA, Class A3, 0.850% due 5/15/18(b) | | $ | 847,154 | |
| | 1,463,010 | | | AAA | | Santander Drive Auto Receivables Trust, Series 2014-3, Class A1, 0.250% due 6/15/15 | | | 1,463,029 | |
| | | | | | | | | | |
| | | | | | Total Automobiles | | | 2,310,183 | |
| | | | | | | | | | |
| Student Loans — 1.5% | |
| | 675,595 | | | AA+ | | CIT Education Loan Trust, Series 2007-1, Class A, 0.323% due 3/25/42(a)(b) | | | 646,943 | |
| | 850,000 | | | AA+ | | EFS Volunteer LLC, Series 2010-1, Class A2, 1.084% due 10/25/35(a)(b) | | | 860,569 | |
| | 625,000 | | | AAA | | Navient Student Loan Trust, Series 2014-CTA, Class A, 0.884% due 9/16/24(a)(b) | | | 625,389 | |
| | 500,000 | | | AA+ | | Nelnet Education Loan Funding Inc., Series 2004-2A, Class A5C, 1.090% due 2/25/39(a) | | | 473,910 | |
| | | | | | SLM Private Education Loan Trust: | | | | |
| | 1,233,656 | | | AAA | | Series 2010-A, Class 2A, 3.405% due 5/16/44(a)(b) | | | 1,314,277 | |
| | 502,268 | | | AAA | | Series 2012-A, Class A1, 1.555% due 8/15/25(a)(b) | | | 508,726 | |
| | 705,000 | | | AAA | | Series 2012-C, Class A2, 3.310% due 10/15/46(b) | | | 736,159 | |
| | 680,000 | | | AAA | | Series 2012-D, Class A2, 2.950% due 2/15/46(b) | | | 703,845 | |
| | 472,686 | | | AAA | | Series 2012-E, Class A1, 0.905% due 10/16/23(a)(b) | | | 474,686 | |
| | | | | | SLM Student Loan Trust: | | | | |
| | 1,220,000 | | | AAA | | Series 2003-11, Class A6, 0.981% due 12/15/25(a)(b) | | | 1,219,738 | |
| | 165,908 | | | AA+ | | Series 2003-4, Class A5A, 0.981% due 3/15/33(a)(b) | | | 165,908 | |
| | 1,400,000 | | | AAA | | Series 2004-1, Class A4, 0.494% due 10/27/25(a) | | | 1,381,458 | |
| | 703,347 | | | AAA | | Series 2004-8A, Class A5, 0.734% due 4/25/24(a)(b) | | | 706,839 | |
| | 880,000 | | | AA+ | | Series 2005-5, Class A5, 0.984% due 10/25/40(a) | | | 864,670 | |
| | 1,070,000 | | | AAA | | Series 2005-6, Class A6, 0.374% due 10/27/31(a) | | | 1,045,515 | |
| | | | | | | | | | |
| | | | | | Total Student Loans | | | 11,728,632 | |
| | | | | | | | | | |
| | | | | | TOTAL ASSET-BACKED SECURITIES
(Cost — $13,736,135) | | | 14,038,815 | |
| | | | | | | | | | |
| MUNICIPAL BONDS — 0.9% | |
| California — 0.1% | |
| | 80,000 | | | AA- | | California Health Facilities Financing Authority, Revenue Bonds, Sutter Health Project, Series A, 5.000% due 8/15/52 | | | 87,922 | |
| | | | | | State of California, GO: | | | | |
| | 100,000 | | | A | | 5.000% due 12/1/37 | | | 109,805 | |
| | 150,000 | | | A | | 5.000% due 9/1/42 | | | 167,004 | |
| | 90,000 | | | AA- | | University of California, Revenue Bonds, Series G, 5.000% due 5/15/37 | | | 101,232 | |
| | | | | | | | | | |
| | | | | | Total California | | | 465,963 | |
| | | | | | | | | | |
| Delaware — 0.0% | |
| | 300,000 | | | AA+ | | Northstar Education Finance Inc., Revenue Bonds, Series 2007-1, GTDSTD-Insured, 1.248% due 1/29/46(a) | | | 282,248 | |
| | | | | | | | | | |
| Illinois — 0.3% | |
| | | | | | State of Illinois, GO: | | | | |
| | 500,000 | | | A- | | 4.350% due 6/1/18 | | | 526,325 | |
| | 410,000 | | | A- | | 5.877% due 3/1/19 | | | 458,983 | |
| | 240,000 | | | A- | | 4.950% due 6/1/23 | | | 255,799 | |
| | 280,000 | | | A- | | 5.500% due 7/1/24 | | | 319,446 | |
| | 640,000 | | | A- | | 5.100% due 6/1/33 | | | 636,128 | |
| | | | | | | | | | |
| | | | | | Total Illinois | | | 2,196,681 | |
| | | | | | | | | | |
| Massachusetts — 0.0% | |
| | 185,000 | | | AA | | Massachusetts Development Finance Agency, Revenue Bonds, Series M-4, 5.000% due 7/1/44 | | | 207,696 | |
| | 100,000 | | | AA+ | | Massachusetts School Building Authority, Revenue Bonds, Series B, 5.000% due 10/15/41 | | | 112,997 | |
| | | | | | | | | | |
| | | | | | Total Massachusetts | | | 320,693 | |
| | | | | | | | | | |
See Notes to Financial Statements.
107
| | | | | | | | | | |
| Core Fixed Income Investments | |
| | | |
Face
Amount/Units† | | | Rating†† | | Security | | Value | |
| Minnesota — 0.0% | |
| $ | 325,000 | | | AA+ | | Northstar Education Finance Inc., Revenue Bonds, Series 2007-1, GTDSTD-Insured, 1.048% due 1/29/46(a) | | $ | 305,765 | |
| | | | | | | | | | |
| Missouri — 0.0% | |
| | 175,000 | | | AAA | | Metropolitan St Louis Sewer District, Revenue Bonds, Series A, 5.000% due 5/1/42 | | | 198,014 | |
| | | | | | | | | | |
| Nevada — 0.1% | |
| | 435,000 | | | AA+ | | Las Vegas Valley Water District, GO, Series B, 5.000% due 6/1/37 | | | 488,614 | |
| | | | | | | | | | |
| New Jersey — 0.0% | |
| | 165,000 | | | A | | New Jersey Transportation Trust Fund Authority, Revenue Bonds, Series AA, 5.000% due 6/15/36 | | | 179,913 | |
| | | | | | | | | | |
| New York — 0.1% | |
| | 80,000 | | | AAA | | New York City Transitional Finance Authority Future Tax Secured Revenue, Bonds, Series A, 5.000% due 11/1/42 | | | 90,535 | |
| | | | | | New York City Water & Sewer System, Revenue Bonds: | | | | |
| | 120,000 | | | AA+ | | Series BB, 5.000% due 6/15/47 | | | 133,201 | |
| | 115,000 | | | AA+ | | Series CC, 5.000% due 6/15/47 | | | 128,306 | |
| | 270,000 | | | AAA | | New York State Urban Development Corp., Revenue Bonds, Series E, 5.000% due 3/15/24 | | | 326,870 | |
| | | | | | | | | | |
| | | | | | Total New York | | | 678,912 | |
| | | | | | | | | | |
| Ohio — 0.1% | |
| | 1,000,000 | | | B- | | Buckeye Tobacco Settlement Financing Authority, Revenue Bonds, Series A-2, 5.750% due 6/1/34 | | | 800,170 | |
| | | | | | | | | | |
| Texas — 0.1% | |
| | 670,000 | | | AA+ | | City of Houston TX, GO, Series A, 6.290% due 3/1/32 | | | 844,455 | |
| | 235,000 | | | A+ | | Dallas/Fort Worth International Airport, Revenue Bonds, Series A, 5.000% due 11/1/45(n) | | | 249,020 | |
| | | | | | | | | | |
| | | | | | Total Texas | | | 1,093,475 | |
| | | | | | | | | | |
| Virginia — 0.1% | |
| | 416,306 | | | AAA | | Virginia Housing Development Authority, Revenue Bonds, Series C, 6.000% due 6/25/34 | | | 452,779 | |
| | | | | | | | | | |
| | | | | | TOTAL MUNICIPAL BONDS
(Cost — $7,231,243) | | | 7,463,227 | |
| | | | | | | | | | |
| SENIOR LOANS — 0.1% | |
| | 208,425 | | | NR | | Gardner Denver Inc., 4.250% due 7/30/20 | | | 208,461 | |
| | 92,368 | | | NR | | Hilton Worldwide Finance LLC, 3.500% due 10/26/20 | | | 91,936 | |
| | 207,375 | | | NR | | Michaels Stores Inc., 3.750% due 1/28/20 | | | 205,486 | |
| | 113,604 | | | NR | | Sungard Data Systems Inc., 4.000% due 3/8/20 | | | 113,651 | |
| | | | | | | | | | |
| | | | | | TOTAL SENIOR LOANS
(Cost — $623,593) | | | 619,534 | |
| | | | | | | | | | |
| | | |
| Shares/Units | | | | | | | | |
| PREFERRED STOCK — 0.1% | |
| FINANCIALS — 0.1% | |
| Banks — 0.1% | |
| | 30,275 | | | | | GMAC Capital Trust I, 8.125%(a)
(Cost — $751,009) | | | 813,792 | |
| | | | | | | | | | |
| COMMON STOCKS — 0.0% | |
| CONSUMER DISCRETIONARY — 0.0% | |
| Automobiles — 0.0% | | | | | | |
| | 107 | | | | | General Motors Co. | | | 3,724 | |
| | 506 | | | | | Motors Liquidation Co. GUC Trust* | | | 12,913 | |
| | | | | | | | | | |
| | | | | | TOTAL COMMON STOCKS
(Cost — $0) | | | 16,637 | |
| | | | | | | | | | |
See Notes to Financial Statements.
108
| | | | | | | | | | |
| Core Fixed Income Investments | |
| | | |
| Shares/Units | | | | | Security | | Value | |
| WARRANTS — 0.0% | |
| CONSUMER DISCRETIONARY — 0.0% | |
| Automobiles — 0.0% | |
| | 97 | | | | | General Motors Co., expires 7/10/16* | | $ | 2,404 | |
| | 97 | | | | | General Motors Co., expires 7/10/19* | | | 1,624 | |
| | | | | | | | | | |
| | | | | | TOTAL WARRANTS
(Cost — $0) | | | 4,028 | |
| | | | | | | | | | |
| CONVERTIBLE PREFERRED STOCK — 0.0% | |
| CONSUMER DISCRETIONARY — 0.0% | |
| Automobiles — 0.0% | |
| | 20,000 | | | | | General Motors Corp., 0.000%*(e)(f)
(Cost — $0) | | | 0 | |
| | | | | | | | | | |
| | | |
Notional
Amount/
Number of
Contracts | | | | | | | | |
| PURCHASED OPTIONS — 0.0% | |
| United States — 0.0% | |
| | 40 | | | | | 2-Year Eurodollar Mid-Curve September Futures, Put @ $98.00, expires 09/12/2014, WAM | | | 750 | |
| | 3,350,000 | | | | | Swaption, 3-Month USD-LIBOR, Put @ $4.50, expires 03/15/2018, BCLY | | | 120,282 | |
| | 2,190,000 | | | | | Swaption, 3-Month USD-LIBOR, Put @ $4.50, expires 04/09/2018, BCLY | | | 80,159 | |
| | 1,450,000 | | | | | Swaption, 3-Month USD-LIBOR, Put @ $4.50, expires 01/14/2019, BCLY | | | 40,949 | |
| | | | | | | | | | |
| | | | | | TOTAL PURCHASED OPTIONS
(Cost — $482,358) | | | 242,140 | |
| | | | | | | | | | |
| | | | | | TOTAL INVESTMENTS BEFORE SHORT-TERM INVESTMENTS
(Cost — $733,451,522) | | | 754,849,103 | |
| | | | | | | | | | |
| | | |
Face
Amount† | | | | | | | | |
| SHORT-TERM INVESTMENTS (o) — 15.6% | |
| CERTIFICATES OF DEPOSIT — 0.1% | |
| | | | | | Credit Suisse: | | | | |
| $ | 100,000 | | | | | 0.462% due 3/17/15(a) | | | 100,000 | |
| | 1,000,000 | | | | | 0.474% due 4/10/15(a) | | | 1,000,000 | |
| | | | | | | | | | |
| | | | | | TOTAL CERTIFICATES OF DEPOSIT
(Cost — $1,100,000) | | | 1,100,000 | |
| | | | | | | | | | |
| COMMERCIAL PAPER — 1.0% | |
| | | | | | ENI Finance USA Inc.: | | | | |
| | 1,100,000 | | | | | 0.573% due 5/15/15(k) | | | 1,095,542 | |
| | 1,100,000 | | | | | 0.583% due 5/22/15(k) | | | 1,095,339 | |
| | 1,500,000 | | | | | Macquarie Bank Ltd., 0.556% due 10/28/14(b)(k) | | | 1,500,000 | |
| | 2,155,000 | | | | | National Rural Utilities Cooperative Finance Corp., 0.090% due 9/19/14(k) | | | 2,154,903 | |
| | 2,155,000 | | | | | RBS Holdings USA Inc., 0.190% due 10/27/14(k) | | | 2,154,363 | |
| | | | | | | | | | |
| | | | | | TOTAL COMMERCIAL PAPER
(Cost — $8,000,147) | | | 8,000,147 | |
| | | | | | | | | | |
| CORPORATE NOTE — 0.3% | |
| | 2,100,000 | | | | | BellSouth Corp., 4.182% due 4/26/15(b)(e)
(Cost — $2,149,482) | | | 2,136,752 | |
| | | | | | | | | | |
| MONEY MARKET FUND — 0.0% | |
| | 262,624 | | | | | Invesco STIT — Government & Agency Portfolio(p)
(Cost — $262,624) | | | 262,624 | |
| | | | | | | | | | |
See Notes to Financial Statements.
109
| | | | | | | | | | |
| Core Fixed Income Investments | |
| | | |
Face
Amount† | | | | | Security | | Value | |
| REPURCHASE AGREEMENTS — 2.9% | |
| $ | 3,600,000 | | | | | Barclays Capital Inc. repurchase agreement dated 08/29/14, 0.070% due 9/2/14, Proceeds at maturity — $3,600,021; (Fully collateralized by U.S. Treasury Note, 0.625% due 11/30/2017; Market Value — $3,673,681)(k) | | $ | 3,600,000 | |
| | 19,200,000 | | | | | Merrill Lynch repurchase agreement dated 08/29/14, 0.030% due 9/2/14, Proceeds at maturity — $19,200,048; (Fully collateralized by U.S. Treasury Note, 2.625% due 11/15/2020; Market Value — $19,724,898)(k) | | | 19,200,000 | |
| | | | | | | | | | |
| | | | | | TOTAL REPURCHASE AGREEMENTS
(Cost — $22,800,000) | | | 22,800,000 | |
| | | | | | | | | | |
| SOVEREIGN BONDS — 1.2% | |
| | | | | | Mexico Cetes: | | | | |
| | 352,000,000 | MXN | | | | 2.907% due 9/25/14(k) | | | 2,688,050 | |
| | 82,000,000 | MXN | | | | 2.890% due 11/13/14(k) | | | 623,750 | |
| | 22,000,000 | MXN | | | | 2.890% due 12/11/14(k) | | | 166,974 | |
| | 120,000,000 | MXN | | | | 3.045% due 12/24/14(k) | | | 909,427 | |
| | 390,000,000 | MXN | | | | 3.000% due 1/8/15(k) | | | 2,952,380 | |
| | 66,000,000 | MXN | | | | 2.945% due 1/22/15(k) | | | 499,137 | |
| | 182,000,000 | MXN | | | | 2.960% due 2/5/15(k) | | | 1,374,764 | |
| | | | | | | | | | |
| | | | | | TOTAL SOVEREIGN BONDS
(Cost — $9,236,930) | | | 9,214,482 | |
| | | | | | | | | | |
| TIME DEPOSITS — 6.3% | |
| | 1,257,642 | | | | | ANZ National Bank — London, 0.030% due 9/2/14 | | | 1,257,642 | |
| | 17,977,104 | | | | | Banco Santander SA — Frankfurt, 0.030% due 9/2/14 | | | 17,977,104 | |
| | 862,592 | | | | | Bank of New York Mellon — Grand Cayman, 0.030% due 9/2/14 | | | 862,592 | |
| | | | | | BBH — Grand Cayman: | | | | |
| | 758 | EUR | | | | (0.030%) due 9/1/14 | | | 997 | |
| | 387 | DKK | | | | 0.000% due 9/1/14 | | | 68 | |
| | 11,402 | JPY | | | | 0.005% due 9/1/14 | | | 110 | |
| | 303 | AUD | | | | 1.874% due 9/1/14 | | | 283 | |
| | | | | | Wells Fargo — Grand Cayman: | | | | |
| | 1,956,031 | EUR | | | | (0.030%) due 9/1/14 | | | 2,571,106 | |
| | 57,563 | GBP | | | | 0.082% due 9/1/14 | | | 95,457 | |
| | 27,924,243 | | | | | 0.030% due 9/2/14 | | | 27,924,243 | |
| | | | | | | | | | |
| | | | | | TOTAL TIME DEPOSITS
(Cost — $50,689,602) | | | 50,689,602 | |
| | | | | | | | | | |
| U.S. GOVERNMENT AGENCIES — 3.8% | |
| | | | | | Federal Home Loan Bank (FHLB), Discount Notes: | | | | |
| | 1,300,000 | | | | | 0.077% due 9/19/14(k) | | | 1,299,950 | |
| | 3,040,000 | | | | | 0.080% due 9/24/14(k) | | | 3,039,845 | |
| | 2,940,000 | | | | | 0.075% due 10/10/14(k) | | | 2,939,761 | |
| | 1,480,000 | | | | | 0.080% due 10/15/14(k) | | | 1,479,855 | |
| | 3,575,000 | | | | | 0.090% due 10/21/14(k) | | | 3,574,553 | |
| | 6,595,000 | | | | | 0.071% due 10/29/14(k) | | | 6,594,259 | |
| | | | | | Federal Home Loan Mortgage Corp. (FHLMC), Discount Notes: | | | | |
| | 1,729,000 | | | | | 0.065% due 11/17/14(k) | | | 1,728,760 | |
| | 9,590,000 | | | | | 0.065% due 11/24/14(k) | | | 9,588,545 | |
| | | | | | | | | | |
| | | | | | TOTAL U.S. GOVERNMENT AGENCIES
(Cost — $30,245,528) | | | 30,245,528 | |
| | | | | | | | | | |
| | | | | | TOTAL SHORT-TERM INVESTMENTS
(Cost — $124,484,313) | | | 124,449,135 | |
| | | | | | | | | | |
| | | | | | TOTAL INVESTMENTS — 110.0%
(Cost — $857,935,835#) | | | 879,298,238 | |
| | | | | | | | | | |
| | | | | | Liabilities in Excess of Other Assets — (10.0)% | | | (80,197,011 | ) |
| | | | | | | | | | |
| | | | | | TOTAL NET ASSETS — 100.0% | | $ | 799,101,227 | |
| | | | | | | | | | |
See Notes to Financial Statements.
110
| | | | | | |
| Core Fixed Income Investments |
| † | | Face amount denominated in U.S. dollars, unless otherwise noted. |
| †† | | All ratings are by Standard & Poor’s Rating Service, unless otherwise noted. All ratings are unaudited. |
| * | | Non-income producing security. |
| (a) | | Variable rate security. Interest rate disclosed is that which was in effect at August 31, 2014. |
| (b) | | Restricted security that may be sold to “qualified institutional buyers” pursuant to the conditions of Rule 144A under the Securities Act of 1933, as amended. This security has been deemed liquid pursuant to guidelines approved by the Board of Trustees, unless otherwise noted. |
| (c) | | Rating by Moody’s Investors Service. All ratings are unaudited. |
| (d) | | Security is perpetual in nature and has no stated maturity date. |
| (f) | | Security is valued in good faith at fair value by or under the direction of the Board of Trustees. |
| (g) | | Rating by Fitch Ratings Service. All ratings are unaudited. |
| (h) | | All or a portion of this security is on loan (See Note 1). |
| (i) | | This security is traded on a TBA basis (see Note 1). |
| (j) | | All or a portion of this security is held at the broker as collateral for open futures or swap contracts. |
| (k) | | Rate shown represents yield-to-maturity. |
| (l) | | Interest only security. |
| (m) | | Principal only security. |
| (n) | | Income from this issue is considered a preference item for purposes of calculating the alternative minimum tax (AMT). |
| (o) | | Inclusive of all short term holdings, including collateral received from securities lending activities. Not including such collateral, the percentage of portfolio holdings would be 15.6%. |
| (p) | | Represents investment of collateral received from securities lending transactions. |
| (q) | | Security is currently in default. |
| # | | Aggregate cost for federal income tax purposes is $861,719,692. |
| | |
Abbreviations used in this schedule: |
| CDO | | — Collateralized Debt Obligation |
| CLO | | — Collateralized Loan Obligation |
| GO | | — General Obligation |
| GTDSTD | | — Guaranteed Student Loans |
| MASTR | | — Mortgage Asset Securitization Transactions Inc. |
| PLC | | — Public Limited Company |
| REMICS | | — Real Estate Mortgage Investment Conduit |
| STRIPS | | — Separate Trading of Registered Interest and Principals |
| | |
Currency Abbreviations used in this schedule: |
| AUD | | — Australian Dollar |
| BRL | | — Brazilian Real |
| DKK | | — Danish Krone |
| EUR | | — Euro |
| GBP | | — British Pound |
| JPY | | — Japanese Yen |
| MXN | | — Mexican Peso |
| NZD | | — New Zealand Dollar |
| | |
Counterparty Abbreviations used in this schedule: |
| BCLY | | — Barclays Bank PLC |
| BOA | | — Bank of America |
| DUB | | — Deutsche Bank AG |
| GSC | | — Goldman Sachs & Co. |
| JPM | | — JPMorgan Chase & Co. |
| RBS | | — Royal Bank of Scotland PLC |
| UBS | | — UBS Securities LLC |
See pages 148 and 149 for definition of ratings.
See Notes to Financial Statements.
111
| | | | | | |
| Core Fixed Income Investments |
| | | | |
| Summary of Investments by Security Type^ | | | |
Corporate Bonds & Notes | | | 27.8 | % |
Mortgage-Backed Securities | | | 20.5 | |
U.S. Government & Agency Obligations | | | 16.8 | |
Collateralized Mortgage Obligations | | | 12.5 | |
Sovereign Bonds | | | 5.5 | |
Asset-Backed Securities | | | 1.6 | |
Municipal Bonds | | | 0.9 | |
Preferred Stock | | | 0.1 | |
Senior Loans | | | 0.1 | |
Purchased Options | | | 0.0 | ** |
Common Stocks | | | 0.0 | ** |
Warrants | | | 0.0 | ** |
Convertible Preferred Stock | | | 0.0 | ** |
Short-Term Investments | | | 14.2 | |
| | | | |
| | | 100.0 | % |
| | | | |
| ^ | | As a percentage of total investments. |
| ** | | Position represents less than 0.1%. |
Schedule of Options Contracts Written
| | | | | | | | | | | | | | | | | | | | |
| | | | | |
Notional
Amount/
Number of
Contracts | | | Security Name | | Counterparty | | | Expiration Date | | | Strike Price | | | Value | |
| United
States |
| | | | | | | | | | | | | | | | | | |
| | 40 | | | 2-Year Eurodollar Mid-Curve September Futures, Put | | | GSC | | | | 9/12/14 | | | $ | 97.50 | | | $ | 250 | |
| | 5,000,000 | | | Swaption, 3-Month USD-LIBOR, Call | | | RBS | | | | 9/2/14 | | | | 2.50 | | | | 9,130 | |
| | 1,000,000 | | | Swaption, 3-Month USD-LIBOR, Call | | | RBS | | | | 9/2/14 | | | | 2.55 | | | | 5,002 | |
| | 4,500,000 | | | Swaption, 3-Month USD-LIBOR, Put | | | JPM | | | | 11/17/14 | | | | 2.80 | | | | 17,072 | |
| | 3,700,000 | | | Swaption, 3-Month USD-LIBOR, Put | | | DUB | | | | 11/17/14 | | | | 2.85 | | | | 10,912 | |
| | 2,100,000 | EUR | | Swaption, 6-Month EURIBOR, Call | | | GSC | | | | 1/20/15 | | | | 1.20 | | | | 38,721 | |
| | 2,100,000 | EUR | | Swaption, 6-Month EURIBOR, Put | | | GSC | | | | 1/20/15 | | | | 1.60 | | | | 5,879 | |
| | 3,700,000 | | | Swaption, 3-Month USD-LIBOR, Call | | | DUB | | | | 11/17/14 | | | | 1.65 | | | | 5,598 | |
| | 1,000,000 | | | Swaption, 3-Month USD-LIBOR, Call | | | JPM | | | | 11/17/14 | | | | 1.70 | | | | 2,109 | |
| | 1,000,000 | | | Swaption, 3-Month USD-LIBOR, Put | | | JPM | | | | 11/17/14 | | | | 2.05 | | | | 3,143 | |
| | 700,000 | | | Swaption, 3-Month USD-LIBOR, Call | | | DUB | | | | 12/2/14 | | | | 1.70 | | | | 1,606 | |
| | 700,000 | | | Swaption, 3-Month USD-LIBOR, Put | | | DUB | | | | 12/2/14 | | | | 2.05 | | | | 2,833 | |
| | 200,000 | | | OTC U.S. Dollar versus Japanese Yen, Put | | | BCLY | | | | 11/10/14 | | | | 97.00 | | | | 93 | |
| | 400,000 | | | OTC U.S. Dollar versus Japanese Yen, Put | | | BOA | | | | 11/10/14 | | | | 97.00 | | | | 186 | |
| | 200,000 | | | OTC U.S. Dollar versus Japanese Yen, Put | | | UBS | | | | 11/10/14 | | | | 98.00 | | | | 146 | |
| | 100,000 | | | OTC U.S. Dollar versus Japanese Yen, Put | | | BOA | | | | 2/18/19 | | | | 80.00 | | | | 3,581 | |
| | 6,000,000 | | | Swaption, 3-Month USD-LIBOR, Put | | | RBS | | | | 9/2/14 | | | | 3.03 | | | | 1 | |
| | 6,700,000 | | | Swaption, 3-Month USD-LIBOR, Put | | | RBS | | | | 9/21/15 | | | | 2.50 | | | | 85,940 | |
| | 5,470,000 | | | Swaption, 3-Month USD-LIBOR, Put | | | BCLY | | | | 1/14/19 | | | | 5.00 | | | | 59,223 | |
| | 13 | | | U.S. Treasury Long Bond October Futures, Call | | | GSC | | | | 9/26/14 | | | | 144.00 | | | | 2,844 | |
| | 25 | | | U.S. Treasury Long Bond September Futures, Call | | | GSC | | | | 9/26/14 | | | | 126.50 | | | | 8,984 | |
| | | | | | | | | | | | | | | | | | | | |
| | | | TOTAL OPTIONS CONRACTS WRITTEN
(Premiums received —$500,810) | | | | | | | | | | | | | | $ | 263,253 | |
| | | | | | | | | | | | | | | | | | | | |
For details of other financial instruments held by this Fund, refer to Note 3.
See Notes to Financial Statements.
112
| | | | | | | | | | |
| High Yield Investments | |
| | | |
Face
Amount/Units | | | Rating†† | | Security | | Value | |
| CORPORATE BONDS & NOTES — 90.4% | |
| Aerospace & Defense — 1.4% | |
| $ | 130,000 | | | B+ | | Alliant Techsystems Inc., Company Guaranteed Notes, 5.250% due 10/1/21(a) | | $ | 133,250 | |
| | 480,000 | | | BB- | | CBC Ammo LLC/CBC FinCo Inc., Senior Unsecured Notes, 7.250% due 11/15/21(a) | | | 483,600 | |
| | 460,000 | | | B | | Ducommun Inc., Company Guaranteed Notes, 9.750% due 7/15/18 | | | 504,850 | |
| | 611,000 | | | B | | Erickson Inc., Secured Notes, 8.250% due 5/1/20(c) | | | 609,473 | |
| | 200,000 | | | B- | | GenCorp Inc., Secured Notes, 7.125% due 3/15/21 | | | 216,500 | |
| | 180,000 | | | B | | LMI Aerospace Inc., Senior Secured Notes, 7.375% due 7/15/19(a) | | | 183,150 | |
| | | | | | TransDigm Inc., Company Guaranteed Notes: | | | | |
| | 710,000 | | | CCC+ | | 7.500% due 7/15/21 | | | 779,225 | |
| | 500,000 | | | CCC+ | | 6.000% due 7/15/22(a) | | | 509,375 | |
| | 130,000 | | | BB- | | Triumph Group Inc., Company Guaranteed Notes, 5.250% due 6/1/22(a) | | | 130,162 | |
| | | | | | | | | | |
| | | | | | Total Aerospace & Defense | | | 3,549,585 | |
| | | | | | | | | | |
| Airlines — 1.2% | |
| | 810,000 | | | B-(b) | | Air Canada, Company Guaranteed Notes, 7.750% due 4/15/21(a) | | | 852,525 | |
| | 301,521 | | | BB+e(b) | | American Airlines 2013-1 Class B Pass Through Trust, Pass Thru Certificates, 5.625% due 1/15/21 | | | 313,582 | |
| | 40,000 | | | B+(b) | | American Airlines 2013-1 Class C Pass Through Trust, Pass Thru Certificates, 6.125% due 7/15/18 | | | 42,100 | |
| | 469,143 | | | BB+ | | American Airlines 2013-2 Class B Pass Through Trust, Equipment Trust, 5.600% due 7/15/20 | | | 486,736 | |
| | 127,819 | | | B+ | | Continental Airlines 2007-1 Class B Pass Through Trust, Pass Thru Certificates, 6.903% due 4/19/22 | | | 138,211 | |
| | 28,533 | | | BBB- | | Continental Airlines 2012-2 Class B Pass Through Trust, Pass Thru Certificates, 5.500% due 10/29/20 | | | 30,388 | |
| | 55,912 | | | BB+ | | Delta Air Lines 2007-1 Class B Pass Through Trust, Pass Thru Certificates, 8.021% due 8/10/22 | | | 65,070 | |
| | 45,704 | | | BBB+ | | Delta Air Lines 2009-1 Series B Pass Through Trust, Pass Thru Certificates, 9.750% due 12/17/16 | | | 51,702 | |
| | 30,000 | | | BBB | | Delta Air Lines 2010-1 Class B Pass Through Trust, Pass Thru Certificates, 6.375% due 1/2/16(a) | | | 31,800 | |
| | 420,000 | | | BB+ | | United Airlines 2014-1 Class B Pass Through Trust, Pass Thru Certificates, 4.750% due 4/11/22 | | | 424,200 | |
| | 270,000 | | | BB+ | | United Airlines 2014-2 Class B Pass Through Trust, Pass Thru Certificates, 4.625% due 9/3/22 | | | 270,000 | |
| | 220,661 | | | BB | | US Airways 2012-2 Class B Pass Through Trust, Pass Thru Certificates, 6.750% due 6/3/21 | | | 239,970 | |
| | 190,000 | | | BB | | US Airways 2013-1 Class B Pass Through Trust, Pass Thru Certificates, 5.375% due 11/15/21 | | | 196,175 | |
| | | | | | | | | | |
| | | | | | Total Airlines | | | 3,142,459 | |
| | | | | | | | | | |
| Auto Components — 0.8% | |
| | 180,000 | | | B+ | | American Axle & Manufacturing Inc., Company Guaranteed Notes, 6.625% due 10/15/22 | | | 194,400 | |
| | 950,000 | | | B | | Chrysler Group LLC/CG Co.-Issuer Inc., Secured Notes, 8.250% due 6/15/21 | | | 1,066,375 | |
| | 340,000 | | | CCC+ | | Jaguar Holding Co. I, Senior Unsecured Notes, 9.375% (9.375% cash or 10.125% PIK)
due 10/15/17(a)(d) | | | 350,625 | |
| | 440,000 | | | B | | Schaeffler Holding Finance BV, Senior Secured Notes, 6.875% (6.875% cash or 7.625% PIK)
due 8/15/18(a)(d) | | | 465,850 | |
| | | | | | | | | | |
| | | | | | Total Auto Components | | | 2,077,250 | |
| | | | | | | | | | |
| Banks — 2.8% | |
| | 440,000 | | | BB+ | | Bank of America Corp., Junior Subordinated Notes, 5.200%(e)(f) | | | 426,250 | |
| | 200,000 | | | BB+ | | Barclays Bank PLC, Subordinated Notes, 7.625% due 11/21/22 | | | 225,000 | |
| | | | | | CIT Group Inc., Senior Unsecured Notes: | | | | |
| | 100,000 | | | BB- | | 5.375% due 5/15/20 | | | 108,625 | |
| | 30,000 | | | BB- | | 5.000% due 8/15/22 | | | 31,763 | |
| | 1,250,000 | | | BB- | | 5.000% due 8/1/23 | | | 1,308,125 | |
| | 210,000 | | | BBB- | | Credit Agricole SA, Junior Subordinated Notes, 8.375%(a)(e)(f) | | | 244,912 | |
| | 170,000 | | | BBB | | M&T Bank Corp., Junior Subordinated Notes, 6.875%(f) | | | 174,411 | |
| | 625,000 | | | B+ | | Popular Inc., Senior Unsecured Notes, 7.000% due 7/1/19 | | | 631,250 | |
See Notes to Financial Statements.
113
| | | | | | | | | | |
| High Yield Investments | |
| | | |
Face
Amount/Units | | | Rating†† | | Security | | Value | |
| Banks — 2.8% — (continued) | |
| | | | | | Provident Funding Associates LP/PFG Finance Corp.: | | | | |
| $ | 785,000 | | | B+ | | Company Guaranteed Notes, 6.750% due 6/15/21(a) | | $ | 793,831 | |
| | 560,000 | | | B+ | | Senior Unsecured Notes, 10.125% due 2/15/19(a) | | | 605,500 | |
| | 620,000 | | | BB+ | | Royal Bank of Scotland Group PLC, Subordinated Notes, 6.000% due 12/19/23 | | | 675,201 | |
| | | | | | Synovus Financial Corp.: | | | | |
| | 1,360,000 | | | BB- | | Senior Unsecured Notes, 7.875% due 2/15/19 | | | 1,543,600 | |
| | 440,000 | | | B+ | | Subordinated Notes, 5.125% due 6/15/17 | | | 453,200 | |
| | | | | | | | | | |
| | | | | | Total Banks | | | 7,221,668 | |
| | | | | | | | | | |
| Beverages — 0.4% | |
| | 170,000 | | | CCC+ | | Beverages & More Inc., Senior Secured Notes, 10.000% due 11/15/18(a) | | | 162,988 | |
| | 270,000 | | | B- | | Carolina Beverage Group LLC/Carolina Beverage Group Finance Inc., Senior Secured Notes, 10.625% due 8/1/18(a) | | | 276,750 | |
| | 270,000 | | | BB+ | | Constellation Brands Inc., Company Guaranteed Notes, 4.250% due 5/1/23 | | | 273,375 | |
| | 370,000 | | | B- | | Crestview DS Merger Sub II Inc., Secured Notes, 10.000% due 9/1/21 | | | 419,950 | |
| | | | | | | | | | |
| | | | | | Total Beverages | | | 1,133,063 | |
| | | | | | | | | | |
| Building Products — 0.4% | |
| | 500,000 | | | BB- | | Griffon Corp., Company Guaranteed Notes, 5.250% due 3/1/22 | | | 496,875 | |
| | 240,000 | | | B | | Hardwoods Acquisition Inc., Secured Notes, 7.500% due 8/1/21(a) | | | 244,800 | |
| | 390,000 | | | B | | Woodside Homes Co. LLC/Woodside Homes Finance Inc., Company Guaranteed Notes, 6.750% due 12/15/21(a) | | | 394,875 | |
| | | | | | | | | | |
| | | | | | Total Building Products | | | 1,136,550 | |
| | | | | | | | | | |
| Chemicals — 1.9% | |
| | 610,000 | | | B- | | Amsurg Corp., Company Guaranteed Notes, 5.625% due 7/15/22(a) | | | 626,775 | |
| | 500,000 | | | BB | | Axiall Corp., Company Guaranteed Notes, 4.875% due 5/15/23 | | | 502,500 | |
| | 90,000 | | | B+ | | Hercules Inc., Junior Subordinated Notes, 6.500% due 6/30/29 | | | 83,142 | |
| | 400,000 | | | B- | | Hexion US Finance Corp., Senior Secured Notes, 6.625% due 4/15/20 | | | 423,000 | |
| | 200,000 | | | CCC+ | | Hexion US Finance Corp./Hexion Nova Scotia Finance ULC, Senior Secured Notes, 8.875% due 2/1/18 | | | 208,000 | |
| | 670,000 | | | NR | | Momentive Performance Materials Inc., Senior Secured Notes, 8.875% due 10/15/20(g) | | | 629,800 | |
| | 645,000 | | | B | | Rentech Nitrogen Partners LP/Rentech Nitrogen Finance Corp., Secured Notes, 6.500% due 4/15/21(a) | | | 643,387 | |
| | 1,310,000 | | | B | | TPC Group Inc., Senior Secured Notes, 8.750% due 12/15/20(a) | | | 1,450,825 | |
| | 280,000 | | | BB- | | Tronox Finance LLC, Company Guaranteed Notes, 6.375% due 8/15/20 | | | 289,800 | |
| | | | | | | | | | |
| | | | | | Total Chemicals | | | 4,857,229 | |
| | | | | | | | | | |
| Commercial Services & Supplies — 4.0% | |
| | 435,000 | | | B | | Ahern Rentals Inc., Secured Notes, 9.500% due 6/15/18(a) | | | 479,588 | |
| | 460,000 | | | BB- | | Ashtead Capital Inc., Secured Notes, 6.500% due 7/15/22(a) | | | 502,550 | |
| | | | | | Cenveo Corp.: | | | | |
| | 1,600,000 | | | CCC | | Company Guaranteed Notes, 11.500% due 5/15/17 | | | 1,684,000 | |
| | 470,000 | | | B | | Senior Secured Notes, 6.000% due 8/1/19(a) | | | 466,475 | |
| | 425,000 | | | CCC+ | | DynCorp International Inc., Company Guaranteed Notes, 10.375% due 7/1/17 | | | 404,812 | |
| | 744,000 | | | B+ | | H&E Equipment Services Inc., Company Guaranteed Notes, 7.000% due 9/1/22 | | | 816,540 | |
| | 100,000 | | | BB+ | | JM Huber Corp., Senior Unsecured Notes, 9.875% due 11/1/19(a) | | | 113,000 | |
| | 320,000 | | | B- | | Modular Space Corp., Secured Notes, 10.250% due 1/31/19(a) | | | 332,800 | |
| | 680,000 | | | CCC+ | | Monitronics International Inc., Company Guaranteed Notes, 9.125% due 4/1/20 | | | 731,000 | |
| | 110,000 | | | CCC+ | | NES Rentals Holdings Inc., Secured Notes, 7.875% due 5/1/18(a) | | | 117,425 | |
| | 315,000 | | | B- | | Park-Ohio Industries Inc., Company Guaranteed Notes, 8.125% due 4/1/21 | | | 347,287 | |
| | 700,000 | | | B | | Safway Group Holding LLC/Safway Finance Corp., Secured Notes, 7.000% due 5/15/18(a) | | | 740,250 | |
| | 135,000 | | | BB- | | Sotheby’s, Company Guaranteed Notes, 5.250% due 10/1/22(a) | | | 132,300 | |
| | 110,000 | | | B- | | StoneMor Partners LP/Cornerstone Family Services of WV, Company Guaranteed Notes, 7.875% due 6/1/21(a) | | | 116,600 | |
See Notes to Financial Statements.
114
| | | | | | | | | | |
| High Yield Investments | |
| | | |
Face
Amount/Units | | | Rating†† | | Security | | Value | |
| Commercial Services & Supplies — 4.0% — (continued) | |
| | | | | | United Rentals North America Inc., Company Guaranteed Notes: | | | | |
| $ | 200,000 | | | BB- | | 7.375% due 5/15/20 | | $ | 219,000 | |
| | 1,345,000 | | | BB- | | 7.625% due 4/15/22 | | | 1,516,488 | |
| | 820,000 | | | BB- | | 5.750% due 11/15/24 | | | 861,000 | |
| | 620,000 | | | B+ | | West Corp., Company Guaranteed Notes, 5.375% due 7/15/22(a) | | | 604,500 | |
| | | | | | | | | | |
| | | | | | Total Commercial Services & Supplies | | | 10,185,615 | |
| | | | | | | | | | |
| Communications Equipment — 0.2% | |
| | | | | | CommScope Inc., Company Guaranteed Notes: | | | | |
| | 235,000 | | | B+ | | 5.000% due 6/15/21(a) | | | 239,700 | |
| | 235,000 | | | B+ | | 5.500% due 6/15/24(a) | | | 240,288 | |
| | | | | | | | | | |
| | | | | | Total Communications Equipment | | | 479,988 | |
| | | | | | | | | | |
| Construction Materials — 0.6% | |
| | 700,000 | | | B- | | Michael Baker Holdings LLC/Michael Baker Finance Corp., Senior Unsecured Notes, 8.875% (8.875% cash or 9.625% PIK) due 4/15/19(a)(d) | | | 696,500 | |
| | 400,000 | | | B+ | | Michael Baker International LLC/CDL Acquisition Co., Inc., Senior Secured Notes, 8.250% due 10/15/18(a) | | | 414,000 | |
| | 430,000 | | | B | | US Concrete Inc., Senior Secured Notes, 8.500% due 12/1/18 | | | 466,550 | |
| | | | | | | | | | |
| | | | | | Total Construction Materials | | | 1,577,050 | |
| | | | | | | | | | |
| Consumer Finance — 0.4% | |
| | | | | | Ally Financial Inc., Company Guaranteed Notes: | | | | |
| | 105,000 | | | BB | | 5.500% due 2/15/17 | | | 112,284 | |
| | 365,000 | | | BB | | 8.000% due 3/15/20 | | | 444,388 | |
| | 130,000 | | | BB | | 7.500% due 9/15/20 | | | 156,000 | |
| | 200,000 | | | BB+ | | Dufry Finance SCA, Company Guaranteed Notes, 5.500% due 10/15/20(a) | | | 209,010 | |
| | 120,000 | | | BB | | Navient LLC, Senior Unsecured Notes, 8.450% due 6/15/18 | | | 139,944 | |
| | | | | | | | | | |
| | | | | | Total Consumer Finance | | | 1,061,626 | |
| | | | | | | | | | |
| Containers & Packaging — 1.4% | |
| | 260,000 | | | CCC+ | | Ardagh Finance Holdings SA, Senior Unsecured Notes, 8.625% (0.000% cash or 8.625% PIK) due 6/15/19(a)(d) | | | 270,725 | |
| | | | | | Ardagh Packaging Finance PLC/Ardagh Holdings USA Inc.: | | | | |
| | | | | | Company Guaranteed Notes: | | | | |
| | 200,000 | | | CCC+ | | 6.250% due 1/31/19(a) | | | 202,500 | |
| | 700,000 | | | CCC+ | | 6.750% due 1/31/21(a) | | | 715,750 | |
| | 350,000 | | | B+ | | Senior Secured Notes, 3.232% due 12/15/19(a)(e) | | | 349,125 | |
| | 730,000 | | | CCC+ | | Beverage Packaging Holdings Luxembourg II SA/Beverage Packaging Holdings II Is, Company Guaranteed Notes, 6.000% due 6/15/17(a) | | | 742,775 | |
| | 340,000 | | | CCC | | BWAY Holding Co., Senior Unsecured Notes, 9.125% due 8/15/21(a) | | | 350,200 | |
| | 110,000 | | | BB+ | | Graphic Packaging International Inc., Company Guaranteed Notes, 4.750% due 4/15/21 | | | 112,750 | |
| | | | | | Pactiv LLC, Company Guaranteed Notes: | | | | |
| | 50,000 | | | CCC+ | | 7.950% due 12/15/25 | | | 54,125 | |
| | 560,000 | | | CCC+ | | 8.375% due 4/15/27 | | | 609,000 | |
| | 210,000 | | | B+ | | Plastipak Holdings Inc., Senior Unsecured Notes, 6.500% due 10/1/21(a) | | | 220,500 | |
| | | | | | | | | | |
| | | | | | Total Containers & Packaging | | | 3,627,450 | |
| | | | | | | | | | |
| Diversified Consumer Services — 0.1% | |
| | 130,000 | | | BB- | | Service Corp. International, Senior Unsecured Notes, 7.500% due 4/1/27 | | | 143,975 | |
| | | | | | | | | | |
| Diversified Financial Services — 2.4% | |
| | 280,000 | | | BB+ | | AerCap Ireland Capital Ltd./AerCap Global Aviation Trust, Company Guaranteed Notes, 4.500% due 5/15/21(a) | | | 286,286 | |
| | 320,000 | | | Caa1(h) | | Compiler Finance Sub Inc., Senior Unsecured Notes, 7.000% due 5/1/21(a) | | | 307,200 | |
| | 610,000 | | | BB+ | | Denali Borrower LLC/Denali Finance Corp., Senior Secured Notes, 5.625% due 10/15/20(a) | | | 645,075 | |
| | 410,000 | | | B | | Globe Luxembourg SCA, Senior Secured Notes, 9.625% due 5/1/18(a) | | | 453,050 | |
| | 500,000 | | | B+ | | ILFC E-Capital Trust I, Limited Guaranteed Notes, 5.020% due 12/21/65(a)(e) | | | 485,000 | |
See Notes to Financial Statements.
115
| | | | | | | | | | |
| High Yield Investments | |
| | | |
Face
Amount/Units | | | Rating†† | | Security | | Value | |
| Diversified Financial Services — 2.4% — (continued) | |
| | | | | | International Lease Finance Corp., Senior Unsecured Notes: | | | | |
| $ | 520,000 | | | BB+ | | 8.250% due 12/15/20 | | $ | 637,000 | |
| | 755,000 | | | BB+ | | 8.625% due 1/15/22 | | | 950,356 | |
| | 660,000 | | | CCC+ | | Jack Cooper Holdings Corp., Senior Secured Notes, 9.250% due 6/1/20(a) | | | 720,225 | |
| | 740,000 | | | B | | KCA Deutag UK Finance PLC, Senior Secured Notes, 7.250% due 5/15/21(a) | | | 743,700 | |
| | 400,000 | | | CCC | | Nuveen Investments Inc., Senior Unsecured Notes, 9.500% due 10/15/20(a) | | | 468,936 | |
| | 160,000 | | | B | | SPL Logistics Escrow LLC/SPL Logistics Finance Corp., Senior Secured Notes, 8.875% due 8/1/20(a) | | | 178,000 | |
| | 260,000 | | | B | | TMX Finance LLC/TitleMax Finance Corp., Senior Secured Notes, 8.500% due 9/15/18(a) | | | 276,250 | |
| | | | | | | | | | |
| | | | | | Total Diversified Financial Services | | | 6,151,078 | |
| | | | | | | | | | |
| Diversified Telecommunication Services — 5.0% | |
| | | | | | CenturyLink Inc., Senior Unsecured Notes: | | | | |
| | 120,000 | | | BB | | 6.450% due 6/15/21 | | | 132,000 | |
| | 380,000 | | | BB | | 6.750% due 12/1/23(c) | | | 422,037 | |
| | 741,000 | | | CCC+ | | Cincinnati Bell Inc., Company Guaranteed Notes, 8.750% due 3/15/18 | | | 777,124 | |
| | 35,000 | | | BB- | | Cincinnati Bell Telephone Co. LLC, Company Guaranteed Notes, 6.300% due 12/1/28 | | | 33,862 | |
| | 550,000 | | | B- | | Cogent Communications Finance Inc., Company Guaranteed Notes, 5.625% due 4/15/21(a) | | | 550,000 | |
| | 635,000 | | | B | | Gates Global LLC/Gates Global Co., Company Guaranteed Notes, 6.000% due 7/15/22(a) | | | 631,825 | |
| | | | | | Intelsat Jackson Holdings SA, Company Guaranteed Notes: | | | | |
| | 60,000 | | | B+ | | 7.250% due 10/15/20 | | | 64,350 | |
| | 150,000 | | | B+ | | 7.500% due 4/1/21 | | | 162,937 | |
| | 755,000 | | | B- | | 6.625% due 12/15/22 | | | 792,750 | |
| | 1,000,000 | | | B+ | | 5.500% due 8/1/23 | | | 1,000,000 | |
| | | | | | Intelsat Luxembourg SA, Company Guaranteed Notes: | | | | |
| | 595,000 | | | B- | | 7.750% due 6/1/21 | | | 629,956 | |
| | 770,000 | | | B- | | 8.125% due 6/1/23 | | | 837,375 | |
| | 725,000 | | | B | | Level 3 Escrow II Inc., Company Guaranteed Notes, 5.375% due 8/15/22(a) | | | 730,438 | |
| | | | | | Level 3 Financing Inc., Company Guaranteed Notes: | | | | |
| | 210,000 | | | B- | | 7.000% due 6/1/20 | | | 227,325 | |
| | 1,140,000 | | | B- | | 8.625% due 7/15/20 | | | 1,268,250 | |
| | 130,000 | | | B- | | 6.125% due 1/15/21(a) | | | 137,638 | |
| | | | | | tw telecom holdings Inc., Company Guaranteed Notes: | | | | |
| | 200,000 | | | BB- | | 5.375% due 10/1/22 | | | 218,250 | |
| | 190,000 | | | BB- | | 5.375% due 10/1/22 | | | 207,338 | |
| | 680,000 | | | BB- | | 6.375% due 9/1/23 | | | 770,100 | |
| | 340,000 | | | BB | | UPCB Finance V Ltd., Senior Secured Notes, 7.250% due 11/15/21(a) | | | 374,000 | |
| | 430,000 | | | BB | | VimpelCom Holdings BV, Company Guaranteed Notes, 5.950% due 2/13/23(a) | | | 389,623 | |
| | 685,000 | | | B | | Virgin Media Finance PLC, Company Guaranteed Notes, 6.375% due 4/15/23(a) | | | 732,950 | |
| | 260,000 | | | BB- | | Virgin Media Secured Finance PLC, Senior Secured Notes, 5.500% due 1/15/25(a) | | | 268,450 | |
| | | | | | Windstream Corp., Company Guaranteed Notes: | | | | |
| | 650,000 | | | B | | 7.500% due 6/1/22 | | | 709,312 | |
| | 650,000 | | | B | | 7.500% due 4/1/23 | | | 695,500 | |
| | | | | | | | | | |
| | | | | | Total Diversified Telecommunication Services | | | 12,763,390 | |
| | | | | | | | | | |
| Electric Utilities — 1.5% | |
| | 20,000 | | | B | | Atlantic Power Corp., Company Guaranteed Notes, 9.000% due 11/15/18 | | | 20,950 | |
| | | | | | Calpine Corp.: | | | | |
| | | | | | Senior Secured Notes: | | | | |
| | 315,000 | | | BB | | 6.000% due 1/15/22(a) | | | 340,987 | |
| | 380,000 | | | BB | | 5.875% due 1/15/24(a) | | | 408,500 | |
| | | | | | Senior Unsecured Notes: | | | | |
| | 590,000 | | | B | | 5.375% due 1/15/23 | | | 596,638 | |
| | 240,000 | | | B | | 5.750% due 1/15/25 | | | 242,700 | |
| | 4,522 | | | B- | | FPL Energy National Wind Portfolio LLC, Senior Secured Notes, 6.125% due 3/25/19(a) | | | 4,499 | |
See Notes to Financial Statements.
116
| | | | | | | | | | |
| High Yield Investments | |
| | | |
Face
Amount/Units | | | Rating†† | | Security | | Value | |
| Electric Utilities — 1.5% — (continued) | |
| | | | | | GenOn REMA LLC, Pass Thru Certificates: | | | | |
| $ | 70,770 | | | B+ | | 9.237% due 7/2/17 | | $ | 75,547 | |
| | 1,110,000 | | | B+ | | 9.681% due 7/2/26 | | | 1,209,900 | |
| | 430,000 | | | CCC+ | | Illinois Power Generating Co., Senior Unsecured Notes, 7.000% due 4/15/18 | | | 420,325 | |
| | 60,987 | | | NR | | Midwest Generation LLC, Pass Thru Certificates, 8.560% due 1/2/16 | | | 62,512 | |
| | 477,404 | | | BB- | | Mirant Mid Atlantic Series C Pass Through Trust, Pass Thru Certificates, 10.060% due 12/30/28 | | | 538,870 | |
| | | | | | | | | | |
| | | | | | Total Electric Utilities | | | 3,921,428 | |
| | | | | | | | | | |
| Electronic Equipment, Instruments & Components — 0.9% | |
| | 95,000 | | | B | | International Wire Group Holdings Inc., Secured Notes, 8.500% due 10/15/17(a) | | | 102,837 | |
| | 20,000 | | | B- | | Kemet Corp., Senior Secured Notes, 10.500% due 5/1/18 | | | 21,100 | |
| | 250,000 | | | B | | Radio Systems Corp., Secured Notes, 8.375% due 11/1/19(a) | | | 275,938 | |
| | 730,000 | | | B+ | | Viasystems Inc., Senior Secured Notes, 7.875% due 5/1/19(a) | | | 759,200 | |
| | 1,050,000 | | | B+ | | WESCO Distribution Inc., Company Guaranteed Notes, 5.375% due 12/15/21 | | | 1,068,375 | |
| | | | | | | | | | |
| | | | | | Total Electronic Equipment, Instruments & Components | | | 2,227,450 | |
| | | | | | | | | | |
| Energy Equipment & Services — 2.7% | |
| | | | | | Access Midstream Partners LP/ACMP Finance Corp., Company Guaranteed Notes: | | | | |
| | 520,000 | | | BB+ | | 5.875% due 4/15/21 | | | 555,100 | |
| | 230,000 | | | BB+ | | 6.125% due 7/15/22 | | | 251,275 | |
| | 750,000 | | | BB+ | | 4.875% due 5/15/23 | | | 793,125 | |
| | | | | | Atlas Pipeline Partners LP/Atlas Pipeline Finance Corp., Company Guaranteed Notes: | | | | |
| | 130,000 | | | B+ | | 6.625% due 10/1/20 | | | 137,800 | |
| | 350,000 | | | B+ | | 4.750% due 11/15/21 | | | 340,375 | |
| | 110,000 | | | B+ | | 5.875% due 8/1/23 | | | 112,200 | |
| | 520,000 | | | B+ | | Cie Générale de Géophysique — Veritas, Company Guaranteed Notes, 6.500% due 6/1/21 | | | 483,600 | |
| | 130,000 | | | NR | | Dynegy Roseton LLC/Dynegy Danskammer LLC Pass Through Trust, Series B, Pass Thru Certificates, 7.670% due 11/8/16(g)(i)(j) | | | 0 | |
| | 700,000 | | | B | | First Wind Capital LLC, Senior Secured Notes, 10.250% due 6/1/18(a) | | | 749,000 | |
| | 400,000 | | | CCC+ | | Foresight Energy LLC/Foresight Energy Corp., Senior Unsecured Notes, 7.875% due 8/15/21(a) | | | 427,000 | |
| | 410,000 | | | B | | GenOn Energy Inc., Senior Unsecured Notes, 9.500% due 10/15/18 | | | 437,675 | |
| | 350,000 | | | BB | | McDermott International Inc., Secured Notes, 8.000% due 5/1/21(a) | | | 364,000 | |
| | 485,000 | | | CCC+ | | Ocean Rig UDW Inc., Senior Unsecured Notes, 7.250% due 4/1/19(a) | | | 485,000 | |
| | 250,000 | | | B+ | | Parker Drilling Co., Company Guaranteed Notes, 6.750% due 7/15/22(a) | | | 260,625 | |
| | 790,000 | | | B+ | | Pioneer Energy Services Corp., Company Guaranteed Notes, 6.125% due 3/15/22(a) | | | 805,800 | |
| | 70,000 | | | BB | | Regency Energy Partners LP/Regency Energy Finance Corp., Company Guaranteed Notes, 6.500% due 7/15/21 | | | 76,300 | |
| | | | | | Targa Resources Partners LP/Targa Resources Partners Finance Corp., Company Guaranteed Notes: | | | | |
| | 326,000 | | | BB+ | | 6.375% due 8/1/22 | | | 355,340 | |
| | 140,000 | | | BB+ | | 5.250% due 5/1/23 | | | 148,050 | |
| | 40,000 | | | BB+ | | 4.250% due 11/15/23 | | | 40,100 | |
| | 240,000 | | | B- | | Westmoreland Coal Co./Westmoreland Partners, Senior Secured Notes, 10.750% due 2/1/18 | | | 256,500 | |
| | | | | | | | | | |
| | | | | | Total Energy Equipment & Services | | | 7,078,865 | |
| | | | | | | | | | |
| Food Products — 1.6% | |
| | 484,000 | | | CCC+ | | Big Heart Pet Brands, Company Guaranteed Notes, 7.625% due 2/15/19 | | | 500,335 | |
| | 451,000 | | | B | | Chiquita Brands International Inc./Chiquita Brands LLC, Senior Secured Notes, 7.875% due 2/1/21 | | | 494,973 | |
| | 585,000 | | | CCC+ | | Diamond Foods Inc., Company Guaranteed Notes, 7.000% due 3/15/19(a) | | | 601,819 | |
| | 350,000 | | | CCC+ | | Dole Food Co., Inc., Senior Secured Notes, 7.250% due 5/1/19(a) | | | 353,062 | |
| | 310,000 | | | CCC+ | | Hearthside Group Holdings LLC/Hearthside Finance Co., Company Guaranteed Notes, 6.500% due 5/1/22(a) | | | 310,775 | |
| | 470,000 | | | BB- | | HJ Heinz Co., Secured Notes, 4.250% due 10/15/20 | | | 477,050 | |
See Notes to Financial Statements.
117
| | | | | | | | | | |
| High Yield Investments | |
| | | |
Face
Amount/Units | | | Rating†† | | Security | | Value | |
| Food Products — 1.6% — (continued) | |
| $ | 550,000 | | | CCC | | Simmons Foods Inc., Secured Notes, 10.500% due 11/1/17(a) | | $ | 587,125 | |
| | 450,000 | | | BB- | | Smithfield Foods Inc., Senior Unsecured Notes, 5.875% due 8/1/21(a) | | | 482,625 | |
| | 224,000 | | | B+ | | Wells Enterprises Inc., Senior Secured Notes, 6.750% due 2/1/20(a) | | | 234,640 | |
| | | | | | | | | | |
| | | | | | Total Food Products | | | 4,042,404 | |
| | | | | | | | | | |
| Gas Utilities — 0.1% | |
| | 310,000 | | | NR | | New Gulf Resources LLC/NGR Finance Corp., Senior Secured Notes, 11.750% due 5/15/19 | | | 319,688 | |
| | | | | | | | | | |
| Health Care Equipment & Supplies — 1.2% | |
| | 1,070,000 | | | CCC+ | | Alere Inc., Company Guaranteed Notes, 6.500% due 6/15/20 | | | 1,087,387 | |
| | 200,000 | | | B- | | ConvaTec Finance International SA, Senior Unsecured Notes, 8.250% (8.250% cash or
9.000% PIK) due 1/15/19(a)(d) | | | 206,125 | |
| | | | | | DJO Finance LLC/DJO Finance Corp., Company Guaranteed Notes: | | | | |
| | 80,000 | | | CCC | | 9.750% due 10/15/17 | | | 83,800 | |
| | 520,000 | | | CCC+ | | 9.875% due 4/15/18 | | | 558,350 | |
| | 395,000 | | | CCC+ | | Kinetic Concepts Inc./KCI USA Inc., Company Guaranteed Notes, 12.500% due 11/1/19 | | | 451,781 | |
| | 190,000 | | | BB | | Teleflex Inc., Company Guaranteed Notes, 5.250% due 6/15/24(a) | | | 194,038 | |
| | 420,000 | | | B | | Universal Hospital Services Inc., Secured Notes, 7.625% due 8/15/20 | | | 422,100 | |
| | | | | | | | | | |
| | | | | | Total Health Care Equipment & Supplies | | | 3,003,581 | |
| | | | | | | | | | |
| Health Care Providers & Services — 2.9% | |
| | | | | | Acadia Healthcare Co., Inc., Company Guaranteed Notes: | | | | |
| | 97,000 | | | B | | 12.875% due 11/1/18 | | | 113,732 | |
| | 390,000 | | | B | | 6.125% due 3/15/21 | | | 413,400 | |
| | 380,000 | | | B | | 5.125% due 7/1/22(a) | | | 385,700 | |
| | 355,000 | | | B- | | CHS/Community Health Systems Inc., Company Guaranteed Notes, 6.875% due 2/1/22(a) | | | 378,963 | |
| | 460,000 | | | B- | | ExamWorks Group Inc., Company Guaranteed Notes, 9.000% due 7/15/19 | | | 499,100 | |
| | 480,000 | | | BB+ | | Fresenius Medical Care US Finance II Inc., Company Guaranteed Notes, 5.875% due 1/31/22(a) | | | 530,400 | |
| | | | | | HCA Inc.: | | | | |
| | | | | | Company Guaranteed Notes: | | | | |
| | 570,000 | | | B- | | 5.875% due 5/1/23 | | | 608,475 | |
| | 60,000 | | | B- | | 7.690% due 6/15/25 | | | 66,900 | |
| | 1,030,000 | | | BB | | Senior Secured Notes, 5.000% due 3/15/24 | | | 1,051,887 | |
| | 620,000 | | | CCC+ | | IASIS Healthcare LLC/IASIS Capital Corp., Company Guaranteed Notes, 8.375% due 5/15/19 | | | 658,750 | |
| | 690,000 | | | B- | | MedImpact Holdings Inc., Senior Secured Notes, 10.500% due 2/1/18(a) | | | 747,788 | |
| | 455,000 | | | B- | | Select Medical Corp., Company Guaranteed Notes, 6.375% due 6/1/21 | | | 475,191 | |
| | | | | | Tenet Healthcare Corp., Senior Unsecured Notes: | | | | |
| | 160,000 | | | CCC+ | | 8.000% due 8/1/20 | | | 173,200 | |
| | 960,000 | | | CCC+ | | 8.125% due 4/1/22 | | | 1,107,600 | |
| | 295,000 | | | CCC+ | | 6.875% due 11/15/31 | | | 290,575 | |
| | | | | | | | | | |
| | | | | | Total Health Care Providers & Services | | | 7,501,661 | |
| | | | | | | | | | |
| Hotels, Restaurants & Leisure — 4.9% | |
| | 670,000 | | | B- | | AMC Entertainment Inc., Company Guaranteed Notes, 9.750% due 12/1/20 | | | 755,425 | |
| | | | | | Bossier Casino Venture Holdco Inc., Senior Secured Notes: | | | | |
| | 55,948 | | | NR | | 11.000% due 2/9/18(i)(j) | | | 54,760 | |
| | 181,080 | | | NR | | 14.000% (0.000% cash or 14.000% PIK) due 2/9/18(a)(d)(i)(j) | | | 174,958 | |
| | 620,000 | | | CCC+ | | Boyd Gaming Corp., Company Guaranteed Notes, 9.000% due 7/1/20 | | | 668,825 | |
| | 60,000 | | | B- | | Burger King Capital Holdings LLC/Burger King Capital Finance Inc., Company Guaranteed Notes, step bond to yield, 0.000% due 4/15/19(a) | | | 56,100 | |
| | | | | | Caesars Entertainment Operating Co., Inc., Senior Secured Notes: | | | | |
| | 58,000 | | | CCC- | | 11.250% due 6/1/17 | | | 47,995 | |
| | 860,000 | | | CCC- | | 9.000% due 2/15/20 | | | 692,581 | |
| | | | | | Caesars Entertainment Resort Properties LLC/Caesars Entertainment Resort Properties Finance Inc.: | | | | |
| | 110,000 | | | CCC- | | Secured Notes, 11.000% due 10/1/21(a) | | | 112,063 | |
See Notes to Financial Statements.
118
| | | | | | | | | | |
| High Yield Investments | |
| | | |
Face
Amount/Units | | | Rating†† | | Security | | Value | |
| Hotels, Restaurants & Leisure — 4.9% — (continued) | |
| $ | 260,000 | | | CCC+ | | Senior Secured Notes, 8.000% due 10/1/20(a) | | $ | 259,350 | |
| | 230,000 | | | B- | | Carrols Restaurant Group Inc., Secured Notes, 11.250% due 5/15/18 | | | 253,000 | |
| | 150,000 | | | CCC+ | | CEC Entertainment Inc., Senior Unsecured Notes, 8.000% due 2/15/22(a) | | | 153,000 | |
| | 845,000 | | | CCC+ | | Golden Nugget Escrow Inc., Senior Unsecured Notes, 8.500% due 12/1/21(a) | | | 886,194 | |
| | 170,000 | | | B- | | Greektown Holdings LLC/Greektown Mothership Corp., Senior Secured Notes, 8.875% due 3/15/19(a) | | | 175,100 | |
| | 1,110,000 | | | B | | Hilton Worldwide Finance LLC/Hilton Worldwide Finance Corp., Company Guaranteed Notes, 5.625% due 10/15/21(a) | | | 1,178,681 | |
| | 250,000 | | | CCC+ | | Isle of Capri Casinos Inc., Company Guaranteed Notes, 8.875% due 6/15/20 | | | 270,000 | |
| | 470,000 | | | CCC+ | | Landry’s Holdings II Inc., Senior Unsecured Notes, 10.250% due 1/1/18(a) | | | 492,325 | |
| | 565,000 | | | CCC+ | | Landry’s Inc., Senior Unsecured Notes, 9.375% due 5/1/20(a) | | | 610,200 | |
| | 400,000 | | | B+ | | Marina District Finance Co., Inc., Senior Secured Notes, 9.875% due 8/15/18 | | | 422,500 | |
| | 280,000 | | | BB- | | MCE Finance Ltd., Company Guaranteed Notes, 5.000% due 2/15/21(a) | | | 280,000 | |
| | | | | | MGM Resorts International, Company Guaranteed Notes: | | | | |
| | 1,125,000 | | | B+ | | 6.625% due 12/15/21 | | | 1,257,188 | |
| | 700,000 | | | B+ | | 7.750% due 3/15/22 | | | 820,750 | |
| | 320,000 | | | CCC | | Mohegan Tribal Gaming Authority, Company Guaranteed Notes, 9.750% due 9/1/21(c) | | | 345,600 | |
| | 425,000 | | | B- | | MTR Gaming Group Inc., Secured Notes, 11.500% due 8/1/19 | | | 477,062 | |
| | 50,000 | | | BB- | | NCL Corp. Ltd., Company Guaranteed Notes, 5.000% due 2/15/18 | | | 51,375 | |
| | 635,000 | | | CCC | | PF Chang’s China Bistro Inc., Company Guaranteed Notes, 10.250% due 6/30/20(a) | | | 654,050 | |
| | 455,000 | | | B | | Pinnacle Entertainment Inc., Company Guaranteed Notes, 7.750% due 4/1/22 | | | 493,675 | |
| | 180,000 | | | B- | | Regal Entertainment Group, Senior Unsecured Notes, 5.750% due 3/15/22 | | | 185,400 | |
| | | | | | Scientific Games International Inc., Company Guaranteed Notes: | | | | |
| | 150,000 | | | B- | | 6.250% due 9/1/20 | | | 131,250 | |
| | 435,000 | | | B- | | 6.625% due 5/15/21(a) | | | 380,081 | |
| | 300,000 | | | B- | | Seven Seas Cruises S de RL LLC, Secured Notes, 9.125% due 5/15/19 | | | 325,500 | |
| | | | | | | | | | |
| | | | | | Total Hotels, Restaurants & Leisure | | | 12,664,988 | |
| | | | | | | | | | |
| Household Durables — 1.7% | |
| | 545,000 | | | B- | | K Hovnanian Enterprises Inc., Senior Secured Notes, 7.250% due 10/15/20(a) | | | 588,600 | |
| | 610,000 | | | CCC+ | | Serta Simmons Holdings LLC, Senior Unsecured Notes, 8.125% due 10/1/20(a) | | | 660,325 | |
| | 700,000 | | | B | | Shea Homes LP/Shea Homes Funding Corp., Senior Secured Notes, 8.625% due 5/15/19 | | | 759,500 | |
| | 350,000 | | | B+ | | Standard Pacific Corp., Company Guaranteed Notes, 6.250% due 12/15/21 | | | 372,750 | |
| | 905,000 | | | BB- | | Taylor Morrison Communities Inc./Monarch Communities Inc., Company Guaranteed Notes, 5.250% due 4/15/21(a) | | | 918,575 | |
| | | | | | Toll Brothers Finance Corp., Company Guaranteed Notes: | | | | |
| | 60,000 | | | BB+ | | 4.000% due 12/31/18 | | | 61,200 | |
| | 60,000 | | | BB+ | | 6.750% due 11/1/19 | | | 68,850 | |
| | 535,000 | | | B- | | William Lyon Homes Inc., Company Guaranteed Notes, 8.500% due 11/15/20 | | | 593,850 | |
| | 250,000 | | | B3(h) | | WLH PNW Finance Corp., Senior Unsecured Notes, 7.000% due 8/15/22(a) | | | 258,437 | |
| | | | | | | | | | |
| | | | | | Total Household Durables | | | 4,282,087 | |
| | | | | | | | | | |
| Household Products — 1.8% | |
| | 80,000 | | | B- | | American Achievement Corp., Secured Notes, 10.875% due 4/15/16(a) | | | 82,200 | |
| | 40,000 | | | B | | American Greetings Corp., Company Guaranteed Notes, 7.375% due 12/1/21 | | | 42,700 | |
| | 400,000 | | | B- | | Century Intermediate Holding Co. 2, Senior Unsecured Notes, 9.750% (0.000% cash or
9.750% PIK) due 2/15/19(a)(d) | | | 428,000 | |
| | | | | | Reynolds Group Issuer Inc./Reynolds Group Issuer LLC/Reynolds Group Issuer Lu: | | | | |
| | | | | | Company Guaranteed Notes: | | | | |
| | 640,000 | | | CCC+ | | 9.000% due 4/15/19 | | | 675,200 | |
| | 795,000 | | | CCC+ | | 9.875% due 8/15/19 | | | 885,431 | |
| | 1,600,000 | | | B+ | | Senior Secured Notes, 5.750% due 10/15/20 | | | 1,680,000 | |
| | | | | | Spectrum Brands Inc., Company Guaranteed Notes: | | | | |
| | 110,000 | | | B | | 6.375% due 11/15/20 | | | 118,800 | |
| | 780,000 | | | B | | 6.625% due 11/15/22 | | | 848,250 | |
| | | | | | | | | | |
| | | | | | Total Household Products | | | 4,760,581 | |
| | | | | | | | | | |
See Notes to Financial Statements.
119
| | | | | | | | | | |
| High Yield Investments | |
| | | |
Face
Amount/Units | | | Rating†† | | Security | | Value | |
| Independent Power and Renewable Electricity Producers — 1.1% | |
| | | | | | AES Corp., Senior Unsecured Notes: | | | | |
| $ | 400,000 | | | BB- | | 4.875% due 5/15/23 | | $ | 395,000 | |
| | 150,000 | | | BB- | | 5.500% due 3/15/24 | | | 153,375 | |
| | | | | | NRG Energy Inc., Company Guaranteed Notes: | | | | |
| | 155,000 | | | BB- | | 7.875% due 5/15/21 | | | 170,887 | |
| | 1,100,000 | | | BB- | | 6.250% due 7/15/22(a) | | | 1,157,750 | |
| | 450,000 | | | BB- | | 6.250% due 5/1/24(a) | | | 466,875 | |
| | 370,000 | | | B+ | | Red Oak Power LLC, Senior Secured Notes, 9.200% due 11/30/29 | | | 414,400 | |
| | | | | | | | | | |
| | | | | | Total Independent Power and Renewable Electricity Producers | | | 2,758,287 | |
| | | | | | | | | | |
| Industrial Conglomerates — 1.1% | |
| | 370,000 | | | B | | American Builders & Contractors Supply Co., Inc., Senior Unsecured Notes, 5.625% due 4/15/21(a) | | | 377,400 | |
| | 1,020,000 | | | CCC+ | | HD Supply Inc., Company Guaranteed Notes, 7.500% due 7/15/20 | | | 1,101,600 | |
| | 260,000 | | | BB- | | LKQ Corp., Company Guaranteed Notes, 4.750% due 5/15/23 | | | 255,450 | |
| | | | | | SunGard Data Systems Inc., Company Guaranteed Notes: | | | | |
| | 605,000 | | | B- | | 6.625% due 11/1/19 | | | 636,762 | |
| | 500,000 | | | B | | 7.625% due 11/15/20 | | | 540,625 | |
| | | | | | | | | | |
| | | | | | Total Industrial Conglomerates | | | 2,911,837 | |
| | | | | | | | | | |
| Insurance — 0.4% | |
| | 500,000 | | | BB- | | Fidelity & Guaranty Life Holdings Inc., Senior Unsecured Notes, 6.375% due 4/1/21(a) | | | 537,500 | |
| | 525,000 | | | CCC+ | | Hockey Merger Sub 2 Inc., Senior Unsecured Notes, 7.875% due 10/1/21(a) | | | 555,188 | |
| | | | | | | | | | |
| | | | | | Total Insurance | | | 1,092,688 | |
| | | | | | | | | | |
| Internet Software & Services — 1.1% | |
| | 70,000 | | | CCC+ | | Ancestry.com Inc., Company Guaranteed Notes, 11.000% due 12/15/20 | | | 81,025 | |
| | 267,000 | | | BB- | | Bankrate Inc., Company Guaranteed Notes, 6.125% due 8/15/18(a) | | | 276,345 | |
| | 285,000 | | | B+ | | Cogent Communications Holdings Inc., Senior Secured Notes, 8.375% due 2/15/18(a) | | | 302,100 | |
| | 450,000 | | | B+ | | CyrusOne LP/CyrusOne Finance Corp., Company Guaranteed Notes, 6.375% due 11/15/22 | | | 478,125 | |
| | | | | | EarthLink Holdings Corp.: | | | | |
| | 655,000 | | | CCC+ | | Company Guaranteed Notes, 8.875% due 5/15/19(c) | | | 673,012 | |
| | 555,000 | | | B+ | | Senior Secured Notes, 7.375% due 6/1/20 | | | 586,913 | |
| | 370,000 | | | B | | Zayo Group LLC/Zayo Capital Inc., Senior Secured Notes, 8.125% due 1/1/20 | | | 400,525 | |
| | | | | | | | | | |
| | | | | | Total Internet Software & Services | | | 2,798,045 | |
| | | | | | | | | | |
| Leisure Products — 0.2% | |
| | 160,000 | | | CCC+ | | 24 Hour Holdings III LLC, Company Guaranteed Notes, 8.000% due 6/1/22(a) | | | 156,000 | |
| | 240,000 | | | B | | Downstream Development Authority of the Quapaw Tribe of Oklahoma, Senior Secured Notes, 10.500% due 7/1/19(a) | | | 255,600 | |
| | | | | | | | | | |
| | | | | | Total Leisure Products | | | 411,600 | |
| | | | | | | | | | |
| Machinery — 1.6% | |
| | 930,000 | | | CCC+ | | DH Services Luxembourg Sarl, Company Guaranteed Notes, 7.750% due 12/15/20(a) | | | 995,100 | |
| | 139,000 | | | B | | Mcron Finance Sub LLC/Mcron Finance Corp., Senior Secured Notes, 8.375% due 5/15/19(a) | | | 151,162 | |
| | 425,000 | | | B- | | Milacron LLC/Mcron Finance Corp., Company Guaranteed Notes, 7.750% due 2/15/21(a) | | | 460,063 | |
| | 357,000 | | | B | | Mueller Water Products Inc., Company Guaranteed Notes, 7.375% due 6/1/17 | | | 364,140 | |
| | 650,000 | | | CCC- | | Navistar International Corp., Company Guaranteed Notes, 8.250% due 11/1/21 | | | 676,812 | |
| | 880,000 | | | BB | | Terex Corp., Company Guaranteed Notes, 6.000% due 5/15/21 | | | 937,200 | |
| | 520,000 | | | B | | Xerium Technologies Inc., Company Guaranteed Notes, 8.875% due 6/15/18 | | | 552,175 | |
| | | | | | | | | | |
| | | | | | Total Machinery | | | 4,136,652 | |
| | | | | | | | | | |
| Media — 7.7% | |
| | 510,000 | | | (P)B | | Altice SA, Senior Secured Notes, 7.750% due 5/15/22(a) | | | 543,150 | |
| | 60,000 | | | BB | | Carmike Cinemas Inc., Secured Notes, 7.375% due 5/15/19 | | | 64,875 | |
See Notes to Financial Statements.
120
| | | | | | | | | | |
| High Yield Investments | |
| | | |
Face
Amount/Units | | | Rating†† | | Security | | Value | |
| Media — 7.7% — (continued) | |
| | | | | | CBS Outdoor Americas Capital LLC/CBS Outdoor Americas Capital Corp., Company Guaranteed Notes: | | | | |
| $ | 130,000 | | | BB- | | 5.250% due 2/15/22(a) | | $ | 133,250 | |
| | 130,000 | | | BB- | | 5.625% due 2/15/24(a) | | | 134,225 | |
| | | | | | CCO Holdings LLC/CCO Holdings Capital Corp., Company Guaranteed Notes: | | | | |
| | 120,000 | | | B | | 8.125% due 4/30/20 | | | 129,000 | |
| | 800,000 | | | B | | 6.500% due 4/30/21 | | | 853,000 | |
| | 500,000 | | | B | | 6.625% due 1/31/22 | | | 538,725 | |
| | 1,680,000 | | | CCC+ | | Clear Channel Communications Inc., Senior Secured Notes, 9.000% due 3/1/21 | | | 1,749,300 | |
| | | | | | Clear Channel Worldwide Holdings Inc., Company Guaranteed Notes: | | | | |
| | 865,000 | | | B | | 7.625% due 3/15/20 | | | 929,675 | |
| | 190,000 | | | B | | 6.500% due 11/15/22 | | | 203,650 | |
| | 205,000 | | | B+ | | Crown Media Holdings Inc., Company Guaranteed Notes, 10.500% due 7/15/19 | | | 229,344 | |
| | 500,000 | | | BB | | CSC Holdings LLC, Senior Unsecured Notes, 8.625% due 2/15/19 | | | 589,375 | |
| | 1,645,000 | | | CCC+ | | Cumulus Media Holdings Inc., Company Guaranteed Notes, 7.750% due 5/1/19 | | | 1,712,856 | |
| | | | | | DISH DBS Corp., Company Guaranteed Notes: | | | | |
| | 1,225,000 | | | BB- | | 7.875% due 9/1/19 | | | 1,424,062 | |
| | 410,000 | | | BB- | | 5.875% due 7/15/22 | | | 436,117 | |
| | 370,000 | | | B- | | Entercom Radio LLC, Company Guaranteed Notes, 10.500% due 12/1/19 | | | 415,325 | |
| | 200,000 | | | B- | | Gibson Brands Inc., Senior Secured Notes, 8.875% due 8/1/18(a) | | | 203,000 | |
| | 1,015,000 | | | B | | Gray Television Inc., Company Guaranteed Notes, 7.500% due 10/1/20 | | | 1,075,900 | |
| | 160,000 | | | B- | | Harron Communications LP/Harron Finance Corp., Senior Unsecured Notes, 9.125% due 4/1/20(a) | | | 180,400 | |
| | | | | | LBI Media Inc.: | | | | |
| | 397,575 | | | C | | Secured Notes, 13.500% due 4/15/20(a) | | | 417,454 | |
| | 355,000 | | | CCC- | | Senior Secured Notes, 10.000% due 4/15/19(a) | | | 376,300 | |
| | 725,000 | | | B- | | Lee Enterprises Inc., Senior Secured Notes, 9.500% due 3/15/22(a) | | | 768,500 | |
| | 385,000 | | | B+ | | LIN Television Corp., Company Guaranteed Notes, 8.375% due 4/15/18 | | | 403,047 | |
| | 40,000 | | | B+ | | McGraw-Hill Global Education Holdings LLC/McGraw-Hill Global Education Finance, Senior Secured Notes, 9.750% due 4/1/21 | | | 45,400 | |
| | 300,000 | | | B- | | MDC Partners Inc., Company Guaranteed Notes, 6.750% due 4/1/20(a) | | | 315,000 | |
| | 30,000 | | | B- | | MHGE Parent LLC/MHGE Parent Finance Inc., Senior Unsecured Notes, 8.500% due 8/1/19(a) | | | 29,588 | |
| | 660,000 | | | B- | | Midcontinent Communications & Midcontinent Finance Corp., Company Guaranteed Notes, 6.250% due 8/1/21(a) | | | 684,750 | |
| | 200,000 | | | B+ | | Nara Cable Funding Ltd., Senior Secured Notes, 8.875% due 12/1/18(a) | | | 212,250 | |
| | 610,000 | | | B | | Nexstar Broadcasting Inc., Company Guaranteed Notes, 6.875% due 11/15/20 | | | 649,650 | |
| | 400,000 | | | B+ | | Numericable Group SA, Senior Secured Notes, 6.000% due 5/15/22(a) | | | 412,500 | |
| | 150,000 | | | B- | | Ono Finance II PLC, Company Guaranteed Notes, 10.875% due 7/15/19(a) | | | 162,930 | |
| | 1,480,000 | | | CCC | | Radio One Inc., Senior Subordinated Notes, 9.250% due 2/15/20(a) | | | 1,546,600 | |
| | 150,000 | | | B+ | | Sinclair Television Group Inc., Company Guaranteed Notes, 5.375% due 4/1/21 | | | 153,750 | |
| | 215,000 | | | BBB- | | Sirius XM Radio Inc., Senior Secured Notes, 5.250% due 8/15/22(a) | | | 230,050 | |
| | 495,000 | | | B- | | SiTV LLC/SiTV Finance Inc., Senior Secured Notes, 10.375% due 7/1/19(a) | | | 498,712 | |
| | | | | | Univision Communications Inc.: | | | | |
| | 780,000 | | | CCC+ | | Company Guaranteed Notes, 8.500% due 5/15/21(a) | | | 858,000 | |
| | | | | | Senior Secured Notes: | | | | |
| | 100,000 | | | B+ | | 6.875% due 5/15/19(a) | | | 106,250 | |
| | 130,000 | | | B+ | | 7.875% due 11/1/20(a) | | | 142,350 | |
| | 310,000 | | | B | | WMG Acquisition Corp., Company Guaranteed Notes, 6.750% due 4/15/22(a) | | | 308,450 | |
| | | | | | | | | | |
| | | | | | Total Media | | | 19,866,760 | |
| | | | | | | | | | |
| Metals & Mining — 2.5% | |
| | | | | | ArcelorMittal, Senior Unsecured Notes: | | | | |
| | 80,000 | | | BB+ | | 6.000% due 3/1/21 | | | 86,500 | |
| | 500,000 | | | BB+ | | 6.750% due 2/25/22 | | | 560,600 | |
See Notes to Financial Statements.
121
| | | | | | | | | | |
| High Yield Investments | |
| | | |
Face
Amount/Units | | | Rating†† | | Security | | Value | |
| Metals & Mining — 2.5% — (continued) | |
| $ | 270,000 | | | B- | | Barminco Finance Pty Ltd., Company Guaranteed Notes, 9.000% due 6/1/18(a) | | $ | 246,038 | |
| | 395,000 | | | B+ | | Coeur Mining Inc., Company Guaranteed Notes, 7.875% due 2/1/21 | | | 397,716 | |
| | 360,000 | | | (P)CCC+ | | Essar Steel Minnesota LLC, Senior Secured Notes, 11.500% due 5/15/20(a) | | | 370,350 | |
| | | | | | FMG Resources August 2006 Pty Ltd., Company Guaranteed Notes: | | | | |
| | 80,000 | | | BB | | 6.000% due 4/1/17(a) | | | 83,650 | |
| | 300,000 | | | BB | | 6.875% due 2/1/18(a) | | | 316,218 | |
| | 735,000 | | | BB | | 8.250% due 11/1/19(a) | | | 807,581 | |
| | 700,000 | | | BB | | 6.875% due 4/1/22(a) | | | 765,188 | |
| | 200,000 | | | B | | Global Brass & Copper Inc., Senior Secured Notes, 9.500% due 6/1/19 | | | 225,750 | |
| | 320,000 | | | B- | | Horsehead Holding Corp., Senior Secured Notes, 10.500% due 6/1/17(a) | | | 366,000 | |
| | 190,000 | | | NR | | Midwest Vanadium Pty Ltd., Senior Secured Notes, 11.500% due 2/15/18(a)(g)(j) | | | 37,050 | |
| | 250,000 | | | NR | | Mirabela Nickel Ltd., Senior Secured Notes, 9.500% due 6/20/19(i)(j) | | | 250,000 | |
| | 85,000 | | | CCC | | Molycorp Inc., Senior Secured Notes, 10.000% due 6/1/20(c) | | | 71,187 | |
| | 160,000 | | | B | | Prince Mineral Holding Corp., Senior Secured Notes, 12.000% due 12/15/19(a) | | | 180,000 | |
| | 300,000 | | | B- | | Ryerson Inc./Joseph T Ryerson & Son Inc., Senior Secured Notes, 9.000% due 10/15/17 | | | 320,250 | |
| | 220,000 | | | B- | | St Barbara Ltd., Senior Secured Notes, 8.875% due 4/15/18(a) | | | 180,400 | |
| | 540,000 | | | BB+ | | Steel Dynamics Inc., Company Guaranteed Notes, 7.625% due 3/15/20 | | | 573,750 | |
| | | | | | Thompson Creek Metals Co., Inc.: | | | | |
| | 490,000 | | | CCC | | Company Guaranteed Notes, 12.500% due 5/1/19 | | | 556,150 | |
| | 30,000 | | | B+ | | Senior Secured Notes, 9.750% due 12/1/17 | | | 33,862 | |
| | | | | | | | | | |
| | | | | | Total Metals & Mining | | | 6,428,240 | |
| | | | | | | | | | |
| Multiline Retail — 0.7% | |
| | | | | | JCPenney Corp. Inc., Company Guaranteed Notes: | | | | |
| | 760,000 | | | CCC- | | 6.875% due 10/15/15(c) | | | 786,600 | |
| | 940,000 | | | CCC- | | 7.950% due 4/1/17 | | | 991,700 | |
| | | | | | | | | | |
| | | | | | Total Multiline Retail | | | 1,778,300 | |
| | | | | | | | | | |
| Oil, Gas & Consumable Fuels — 17.2% | |
| | 465,000 | | | B | | Alpha Natural Resources Inc., Secured Notes, 7.500% due 8/1/20(a) | | | 449,888 | |
| | 300,000 | | | CCC | | American Eagle Energy Corp., Senior Secured Notes, 11.000% due 9/1/19(a) | | | 300,375 | |
| | 680,000 | | | NR | | American Energy —Utica LLC, Unsecured Notes, 3.500% (3.500% cash or 3.500%-6.500% PIK) due 3/1/21(a)(d) | | | 795,600 | |
| | 90,000 | | | BB- | | Antero Resources Finance Corp., Company Guaranteed Notes, 5.375% due 11/1/21 | | | 93,038 | |
| | | | | | Arch Coal Inc., Company Guaranteed Notes: | | | | |
| | 170,000 | | | CCC+ | | 7.000% due 6/15/19(c) | | | 121,762 | |
| | 60,000 | | | CCC+ | | 9.875% due 6/15/19 | | | 48,900 | |
| | 450,000 | | | BB | | Atwood Oceanics Inc., Senior Unsecured Notes, 6.500% due 2/1/20 | | | 479,250 | |
| | 425,000 | | | B+ | | Basic Energy Services Inc., Company Guaranteed Notes, 7.750% due 10/15/22 | | | 465,375 | |
| | | | | | Berry Petroleum Co. LLC, Senior Unsecured Notes: | | | | |
| | 30,000 | | | BB- | | 6.750% due 11/1/20 | | | 31,575 | |
| | 280,000 | | | BB- | | 6.375% due 9/15/22 | | | 293,300 | |
| | | | | | Calumet Specialty Products Partners LP/Calumet Finance Corp., Company Guaranteed Notes: | | | | |
| | 20,000 | | | B+ | | 9.625% due 8/1/20 | | | 22,700 | |
| | 420,000 | | | B+ | | 7.625% due 1/15/22 | | | 441,000 | |
| | | | | | Chaparral Energy Inc., Company Guaranteed Notes: | | | | |
| | 175,000 | | | B- | | 8.250% due 9/1/21 | | | 189,656 | |
| | 970,000 | | | B- | | 7.625% due 11/15/22 | | | 1,046,388 | |
| | | | | | Chesapeake Energy Corp., Company Guaranteed Notes: | | | | |
| | 150,000 | | | BB+ | | 6.875% due 11/15/20 | | | 174,750 | |
| | 550,000 | | | BB+ | | 6.125% due 2/15/21 | | | 625,625 | |
| | 690,000 | | | BB- | | Cloud Peak Energy Resources LLC/Cloud Peak Energy Finance Corp., Company Guaranteed Notes, 6.375% due 3/15/24 | | | 717,600 | |
| | 295,000 | | | B- | | Comstock Resources Inc., Company Guaranteed Notes, 9.500% due 6/15/20 | | | 333,350 | |
| | 430,000 | | | BB+ | | Concho Resources Inc., Company Guaranteed Notes, 5.500% due 4/1/23 | | | 461,175 | �� |
See Notes to Financial Statements.
122
| | | | | | | | | | |
| High Yield Investments | |
| | | |
Face
Amount/Units | | | Rating†† | | Security | | Value | |
| Oil, Gas & Consumable Fuels — 17.2% — (continued) | |
| | | | | | CONSOL Energy Inc., Company Guaranteed Notes: | | | | |
| $ | 290,000 | | | BB | | 8.250% due 4/1/20 | | $ | 309,937 | |
| | 220,000 | | | BB | | 5.875% due 4/15/22(a) | | | 230,725 | |
| | | | | | Crestwood Midstream Partners LP/Crestwood Midstream Finance Corp., Company Guaranteed Notes: | | | | |
| | 190,000 | | | BB | | 6.000% due 12/15/20 | | | 198,075 | |
| | 170,000 | | | NR | | 6.125% due 3/1/22 | | | 176,800 | |
| | 270,000 | | | B+ | | CVR Refining LLC/Coffeyville Finance Inc., Secured Notes, 6.500% due 11/1/22 | | | 281,475 | |
| | 1,095,000 | | | B | | Drill Rigs Holdings Inc., Senior Secured Notes, 6.500% due 10/1/17(a) | | | 1,133,325 | |
| | 64,000 | | | BBB | | Ecopetrol SA, Senior Unsecured Notes, 5.875% due 9/18/23 | | | 73,440 | |
| | 10,000 | | | BB | | El Paso Corp., Company Guaranteed Notes, 7.800% due 8/1/31 | | | 12,450 | |
| | 460,000 | | | B- | | EV Energy Partners LP/EV Energy Finance Corp., Company Guaranteed Notes, 8.000% due 4/15/19 | | | 478,400 | |
| | 710,000 | | | CCC+ | | EXCO Resources Inc., Company Guaranteed Notes, 8.500% due 4/15/22 | | | 723,277 | |
| | 380,000 | | | B- | | FTS International Inc., Senior Secured Notes, 6.250% due 5/1/22(a) | | | 390,450 | |
| | 670,000 | | | B- | | Gastar Exploration Inc., Secured Notes, 8.625% due 5/15/18 | | | 696,800 | |
| | 775,000 | | | NR | | Goodrich Petroleum Corp., Company Guaranteed Notes, 5.000% due 10/1/32 | | | 899,484 | |
| | 640,000 | | | B- | | Gulfport Energy Corp., Company Guaranteed Notes, 7.750% due 11/1/20(a) | | | 691,200 | |
| | | | | | Halcon Resources Corp., Company Guaranteed Notes: | | | | |
| | 170,000 | | | CCC+ | | 9.750% due 7/15/20 | | | 184,025 | |
| | 1,410,000 | | | CCC+ | | 8.875% due 5/15/21 | | | 1,491,075 | |
| | | | | | Hercules Offshore Inc., Company Guaranteed Notes: | | | | |
| | 935,000 | | | B | | 10.250% due 4/1/19(a) | | | 1,019,150 | |
| | 270,000 | | | B | | 8.750% due 7/15/21(a) | | | 274,050 | |
| | 870,000 | | | B | | 7.500% due 10/1/21(a) | | | 826,500 | |
| | | | | | Hiland Partners LP/Hiland Partners Finance Corp., Company Guaranteed Notes: | | | | |
| | 340,000 | | | B | | 7.250% due 10/1/20(a) | | | 368,050 | |
| | 200,000 | | | B | | 5.500% due 5/15/22(a) | | | 202,500 | |
| | 880,000 | | | BB- | | Key Energy Services Inc., Company Guaranteed Notes, 6.750% due 3/1/21 | | | 897,600 | |
| | 660,000 | | | BB | | Kinder Morgan Inc., Senior Unsecured Notes, 5.625% due 11/15/23(a) | | | 730,950 | |
| | 40,000 | | | B | | Kodiak Oil & Gas Corp., Company Guaranteed Notes, 5.500% due 2/1/22 | | | 42,400 | |
| | 220,000 | | | B+ | | Linn Energy LLC/Linn Energy Finance Corp., Company Guaranteed Notes, 6.500% due 5/15/19 | | | 227,562 | |
| | 120,000 | | | CCC+ | | Lonestar Resources America Inc., Senior Unsecured Notes, 8.750% due 4/15/19(a) | | | 122,400 | |
| | 200,000 | | | BBB- | | Lukoil International Finance BV, Company Guaranteed Notes, 6.125% due 11/9/20(a) | | | 201,032 | |
| | 1,670,000 | | | CCC | | Magnum Hunter Resources Corp., Company Guaranteed Notes, 9.750% due 5/15/20 | | | 1,828,650 | |
| | | | | | MarkWest Energy Partners LP/MarkWest Energy Finance Corp., Company Guaranteed Notes: | | | | |
| | 94,000 | | | BB | | 6.250% due 6/15/22 | | | 101,520 | |
| | 280,000 | | | BB | | 4.500% due 7/15/23 | | | 285,950 | |
| | | | | | MEG Energy Corp., Company Guaranteed Notes: | | | | |
| | 360,000 | | | BB | | 6.375% due 1/30/23(a) | | | 383,400 | |
| | 400,000 | | | BB | | 7.000% due 3/31/24(a) | | | 436,000 | |
| | 210,000 | | | NR | | Milagro Oil & Gas Inc., Secured Notes, 10.500% due 5/15/16(g) | | | 168,000 | |
| | 120,000 | | | BB | | Murphy Oil USA Inc., Company Guaranteed Notes, 6.000% due 8/15/23 | | | 127,800 | |
| | 610,000 | | | B- | | Murray Energy Corp., Senior Secured Notes, 9.500% due 12/5/20(a) | | | 674,050 | |
| | 130,000 | | | B | | Natural Resource Partners LP/NRP Finance Corp., Senior Unsecured Notes, 9.125% due 10/1/18 | | | 136,825 | |
| | 500,000 | | | BB- | | NGL Energy Partners LP/NGL Energy Finance Corp., Company Guaranteed Notes, 5.125% due 7/15/19(a) | | | 507,500 | |
| | 200,000 | | | B- | | NGPL PipeCo LLC, Senior Secured Notes, 9.625% due 6/1/19(a) | | | 219,500 | |
| | 525,000 | | | B- | | Offshore Group Investment Ltd., Senior Secured Notes, 7.500% due 11/1/19 | | | 539,437 | |
| | 745,000 | | | B+ | | Pacific Drilling SA, Senior Secured Notes, 5.375% due 6/1/20(a) | | | 730,100 | |
| | 320,000 | | | CCC+ | | Parsley Energy LLC/Parsley Finance Corp., Senior Unsecured Notes, 7.500% due 2/15/22(a) | | | 340,800 | |
| | | | | | Peabody Energy Corp., Company Guaranteed Notes: | | | | |
| | 600,000 | | | BB- | | 6.250% due 11/15/21(c) | | | 600,000 | |
| | 270,000 | | | BB- | | 7.875% due 11/1/26 | | | 279,450 | |
See Notes to Financial Statements.
123
| | | | | | | | | | |
| High Yield Investments | |
| | | |
Face
Amount/Units | | | Rating†† | | Security | | Value | |
| Oil, Gas & Consumable Fuels — 17.2% — (continued) | |
| $ | 50,000 | | | BB | | Penn Virginia Resource Partners LP/Penn Virginia Resource Finance Corp., Company Guaranteed Notes, 6.500% due 5/15/21 | | $ | 54,125 | |
| | 200,000 | | | BBB- | | Petrobras Global Finance BV, Company Guaranteed Notes, 4.375% due 5/20/23 | | | 197,836 | |
| | 620,000 | | | B | | PetroQuest Energy Inc., Company Guaranteed Notes, 10.000% due 9/1/17 | | | 652,550 | |
| | 520,000 | | | Ba3(h) | | Puma International Financing SA, Company Guaranteed Notes, 6.750% due 2/1/21(a) | | | 539,604 | |
| | | | | | QEP Resources Inc., Senior Unsecured Notes: | | | | |
| | 400,000 | | | BB+ | | 5.375% due 10/1/22 | | | 411,500 | |
| | 560,000 | | | BB+ | | 5.250% due 5/1/23 | | | 569,800 | |
| | 290,000 | | | CCC- | | Quicksilver Resources Inc., Company Guaranteed Notes, 11.000% due 7/1/21 | | | 253,750 | |
| | | | | | Regency Energy Partners LP/Regency Energy Finance Corp., Company Guaranteed Notes: | | | | |
| | 260,000 | | | BB | | 5.875% due 3/1/22 | | | 280,800 | |
| | 230,000 | | | BB | | 5.000% due 10/1/22 | | | 238,050 | |
| | 400,000 | | | CCC+ | | Resolute Energy Corp., Company Guaranteed Notes, 8.500% due 5/1/20 | | | 414,000 | |
| | 265,000 | | | B- | | Rex Energy Corp., Company Guaranteed Notes, 8.875% due 12/1/20 | | | 291,500 | |
| | 865,000 | | | CCC+ | | Rice Energy Inc., Company Guaranteed Notes, 6.250% due 5/1/22(a) | | | 888,788 | |
| | | | | | Rockies Express Pipeline LLC, Senior Unsecured Notes: | | | | |
| | 370,000 | | | BB | | 6.850% due 7/15/18(a) | | | 401,450 | |
| | 365,000 | | | BB | | 6.000% due 1/15/19(a) | | | 389,637 | |
| | 725,000 | | | BB | | 5.625% due 4/15/20(a) | | | 768,500 | |
| | 1,110,000 | | | BB | | 6.875% due 4/15/40(a) | | | 1,187,700 | |
| | 210,000 | | | B | | Rose Rock Midstream LP/Rose Rock Finance Corp., Company Guaranteed Notes, 5.625% due 7/15/22(a) | | | 214,725 | |
| | | | | | Sabine Pass Liquefaction LLC, Senior Secured Notes: | | | | |
| | 890,000 | | | BB+ | | 5.625% due 2/1/21 | | | 943,400 | |
| | 725,000 | | | BB+ | | 6.250% due 3/15/22(a) | | | 787,531 | |
| | 370,000 | | | BB+ | | 5.625% due 4/15/23 | | | 386,650 | |
| | 100,000 | | | (P)BB+ | | 5.750% due 5/15/24(a) | | | 104,125 | |
| | 1,000,000 | | | CCC+ | | Samson Investment Co., Company Guaranteed Notes, 9.750% due 2/15/20 | | | 1,025,000 | |
| | | | | | Sanchez Energy Corp., Company Guaranteed Notes: | | | | |
| | 845,000 | | | B- | | 7.750%due6/15/21 | | | 942,175 | |
| | 535,000 | | | B- | | 6.125%due1/15/23(a) | | | 555,063 | |
| | 240,000 | | | B+ | | Shelf Drilling Holdings Ltd., Secured Notes, 8.625% due 11/1/18(a) | | | 256,800 | |
| | 330,000 | | | B- | | Sidewinder Drilling Inc., Senior Unsecured Notes, 9.750% due 11/15/19(a) | | | 333,300 | |
| | | | | | Suburban Propane Partners LP/Suburban Energy Finance Corp., Senior Unsecured Notes: | | | | |
| | 230,000 | | | BB- | | 7.375% due 3/15/20 | | | 242,650 | |
| | 280,000 | | | BB- | | 5.500% due 6/1/24 | | | 280,000 | |
| | | | | | Summit Midstream Holdings LLC/Summit Midstream Finance Corp., Company Guaranteed Notes: | | | | |
| | 80,000 | | | B | | 7.500% due 7/1/21 | | | 88,400 | |
| | 370,000 | | | B | | 5.500% due 8/15/22 | | | 378,325 | |
| | 90,000 | | | B+ | | SunCoke Energy Partners LP/SunCoke Energy Partners Finance Corp., Company Guaranteed Notes, 7.375% due 2/1/20(a) | | | 96,750 | |
| | 750,000 | | | CCC+ | | Talos Production LLC/Talos Production Finance Inc., Company Guaranteed Notes, 9.750% due 2/15/18(a) | | | 783,750 | |
| | 1,085,000 | | | CCC+ | | Triangle USA Petroleum Corp., Senior Unsecured Notes, 6.750% due 7/15/22(a) | | | 1,114,838 | |
| | 300,000 | | | BB | | Ultra Petroleum Corp., Senior Unsecured Notes, 5.750% due 12/15/18(a) | | | 310,125 | |
| | 575,000 | | | B+ | | Western Refining Inc., Company Guaranteed Notes, 6.250% due 4/1/21 | | | 600,875 | |
| | | | | | | | | | |
| | | | | | Total Oil, Gas & Consumable Fuels | | | 44,317,493 | |
| | | | | | | | | | |
| Paper & Forest Products — 1.6% | |
| | 690,000 | | | CCC+ | | Appvion Inc., Secured Notes, 9.000% due 6/1/20(a) | | | 620,138 | |
| | 260,000 | | | B | | Cascades Inc., Senior Unsecured Notes, 5.500% due 7/15/22(a) | | | 259,025 | |
| | 160,000 | | | BB | | Clearwater Paper Corp., Company Guaranteed Notes, 4.500% due 2/1/23 | | | 156,000 | |
| | 200,000 | | | B- | | Exopack Holdings SA, Company Guaranteed Notes, 7.875% due 11/1/19(a) | | | 213,500 | |
| | 800,000 | | | BB- | | Resolute Forest Products Inc., Company Guaranteed Notes, 5.875% due 5/15/23 | | | 774,000 | |
See Notes to Financial Statements.
124
| | | | | | | | | | |
| High Yield Investments | |
| | | |
Face
Amount/Units | | | Rating†† | | Security | | Value | |
| Paper & Forest Products — 1.6% — (continued) | |
| | | | | | Verso Paper Holdings LLC/Verso Paper Inc., Senior Secured Notes,: | | | | |
| $ | 480,000 | | | CC | | 11.750% due 1/15/19(c) | | $ | 506,400 | |
| | 1,569,000 | | | C | | 11.750% due 1/15/19(c) | | | 1,478,782 | |
| | | | | | | | | | |
| | | | | | Total Paper & Forest Products | | | 4,007,845 | |
| | | | | | | | | | |
| Personal Products — 0.4% | |
| | 90,000 | | | BB- | | First Quality Finance Co., Inc., Senior Unsecured Notes, 4.625% due 5/15/21(a) | | | 85,725 | |
| | 835,000 | | | B | | Revlon Consumer Products Corp., Company Guaranteed Notes, 5.750% due 2/15/21 | | | 851,700 | |
| | | | | | | | | | |
| | | | | | Total Personal Products | | | 937,425 | |
| | | | | | | | | | |
| Pharmaceuticals — 1.1% | |
| | 200,000 | | | B+ | | Grifols Worldwide Operations Ltd., Senior Unsecured Notes, 5.250% due 4/1/22(a) | | | 206,000 | |
| | 420,000 | | | CCC+ | | JLL/Delta Dutch Newco BV, Senior Unsecured Notes, 7.500% due 2/1/22(a) | | | 429,975 | |
| | 790,000 | | | B- | | Lantheus Medical Imaging Inc., Company Guaranteed Notes, 9.750% due 5/15/17 | | | 802,837 | |
| | 260,000 | | | B | | Salix Pharmaceuticals Ltd., Company Guaranteed Notes, 6.000% due 1/15/21(a) | | | 282,750 | |
| | | | | | Valeant Pharmaceuticals International, Company Guaranteed Notes: | | | | |
| | 760,000 | | | B | | 6.375% due 10/15/20(a) | | | 798,000 | |
| | 270,000 | | | B | | 7.250% due 7/15/22(a) | | | 289,913 | |
| | | | | | | | | | |
| | | | | | Total Pharmaceuticals | | | 2,809,475 | |
| | | | | | | | | | |
| Real Estate Investment Trusts (REITs) — 1.0% | |
| | 330,000 | | | B- | | Ashton Woods USA LLC/Ashton Woods Finance Co., Senior Unsecured Notes, 6.875% due 2/15/21(a) | | | 326,700 | |
| | 50,000 | | | BB+ | | Corrections Corp. of America, Company Guaranteed Notes, 4.125% due 4/1/20 | | | 49,813 | |
| | 420,000 | | | B+ | | CTR Partnership LP/CareTrust Capital Corp., Company Guaranteed Notes, 5.875% due 6/1/21(a) | | | 428,400 | |
| | 700,000 | | | B- | | Felcor Lodging LP, Senior Secured Notes, 5.625% due 3/1/23 | | | 712,250 | |
| | | | | | iStar Financial Inc., Senior Unsecured Notes: | | | | |
| | 410,000 | | | B+ | | 9.000% due 6/1/17 | | | 461,250 | |
| | 580,000 | | | B+ | | 5.000% due 7/1/19 | | | 582,900 | |
| | | | | | | | | | |
| | | | | | Total Real Estate Investment Trusts (REITs) | | | 2,561,313 | |
| | | | | | | | | | |
| Real Estate Management & Development — 0.3% | |
| | 770,000 | | | B | | Howard Hughes Corp. (The), Senior Unsecured Notes, 6.875% due 10/1/21(a) | | | 819,088 | |
| | | | | | | | | | |
| Software — 1.8% | |
| | 120,000 | | | BB | | ACI Worldwide Inc., Company Guaranteed Notes, 6.375% due 8/15/20(a) | | | 125,700 | |
| | | | | | Activision Blizzard Inc., Company Guaranteed Notes: | | | | |
| | 80,000 | | | BB+ | | 5.625% due 9/15/21(a) | | | 86,700 | |
| | 600,000 | | | BB+ | | 6.125% due 9/15/23(a) | | | 661,500 | |
| | 160,000 | | | BB- | | Audatex North America Inc., Company Guaranteed Notes, 6.000% due 6/15/21(a) | | | 170,400 | |
| | 650,000 | | | CCC+ | | BMC Software Finance Inc., Senior Unsecured Notes, 8.125% due 7/15/21(a) | | | 659,750 | |
| | 380,000 | | | CCC+ | | BMC Software Inc., Senior Unsecured Notes, 7.250% due 6/1/18 | | | 384,750 | |
| | | | | | First Data Corp.: | | | | |
| | | | | | Company Guaranteed Notes: | | | | |
| | 345,000 | | | B- | | 12.625% due 1/15/21 | | | 422,625 | |
| | 595,000 | | | CCC+ | | 11.750% due 8/15/21 | | | 706,562 | |
| | | | | | Secured Notes: | | | | |
| | 155,000 | | | B- | | 8.250% due 1/15/21(a) | | | 169,725 | |
| | 240,000 | | | B- | | 8.750% (8.750% cash or 10.000% PIK) due 1/15/22(a)(d) | | | 264,000 | |
| | 39,958 | | | NR | | First Data Holdings Inc., Senior Unsecured Notes, 14.500% (0.000% cash or 14.500% PIK)
due 9/24/19(a)(d) | | | 45,452 | |
| | 170,000 | | | B- | | Interactive Data Corp., Company Guaranteed Notes, 5.875% due 4/15/19(a) | | | 170,213 | |
| | 440,000 | | | B- | | Interface Security Systems Holdings Inc./Interface Security Systems LLC, Senior Secured Notes, 9.250% due 1/15/18 | | | 455,400 | |
| | 415,000 | | | BB- | | Nuance Communications Inc., Company Guaranteed Notes, 5.375% due 8/15/20(a) | | | 419,150 | |
| | | | | | | | | | |
| | | | | | Total Software | | | 4,741,927 | |
| | | | | | | | | | |
See Notes to Financial Statements.
125
| | | | | | | | | | |
| High Yield Investments | |
| | | |
Face
Amount/Units | | | Rating†† | | Security | | Value | |
| Specialty Retail — 1.8% | |
| $ | 490,000 | | | B- | | Bon-Ton Department Stores Inc. (The), Secured Notes, 8.000% due 6/15/21(c) | | $ | 460,600 | |
| | 70,000 | | | CCC+ | | Chinos Intermediate Holdings A Inc., Senior Unsecured Notes, 7.750% (7.750% cash or 8.500% PIK) due 5/1/19(a)(d) | | | 68,600 | |
| | 360,000 | | | BB | | CST Brands Inc., Company Guaranteed Notes, 5.000% due 5/1/23 | | | 361,800 | |
| | 380,000 | | | B | | Edcon Proprietary Ltd., Senior Secured Notes, 9.500% due 3/1/18(a) | | | 359,100 | |
| | 170,000 | | | BB- | | First Cash Financial Services Inc., Company Guaranteed Notes, 6.750% due 4/1/21(a) | | | 180,200 | |
| | 230,000 | | | BB | | Group 1 Automotive Inc., Company Guaranteed Notes, 5.000% due 6/1/22(a) | | | 229,425 | |
| | 860,000 | | | CCC | | Guitar Center Inc., Company Guaranteed Notes, 9.625% due 4/15/20(a) | | | 722,400 | |
| | 610,000 | | | B- | | Men’s Wearhouse Inc. (The), Company Guaranteed Notes, 7.000% due 7/1/22(a) | | | 642,025 | |
| | 770,000 | | | CCC+ | | Neiman Marcus Group Ltd. Inc., Company Guaranteed Notes, 8.750% (8.750% cash or 9.500% PIK) due 10/15/21(a)(d) | | | 841,225 | |
| | 725,000 | | | CCC+ | | Spencer Spirit Holdings Inc., Senior Unsecured Notes, 9.000% (9.000% cash or 9.750% PIK)
due 5/1/18(a)(d) | | | 737,688 | |
| | | | | | | | | | |
| | | | | | Total Specialty Retail | | | 4,603,063 | |
| | | | | | | | | | |
| Technology Hardware, Storage & Peripherals — 0.4% | |
| | 115,000 | | | B+ | | Dell Inc., Senior Unsecured Notes, 5.400% due 9/10/40 | | | 95,450 | |
| | 790,000 | | | BB | | NCR Corp., Company Guaranteed Notes, 6.375% due 12/15/23 | | | 857,150 | |
| | | | | | | | | | |
| | | | | | Total Technology Hardware, Storage & Peripherals | | | 952,600 | |
| | | | | | | | | | |
| Textiles, Apparel & Luxury Goods — 0.4% | |
| | 210,000 | | | B- | | Empire Today LLC/Empire Today Finance Corp., Senior Secured Notes, 11.375% due 2/1/17(a) | | | 213,675 | |
| | | | | | Quiksilver Inc./QS Wholesale Inc.: | | | | |
| | 410,000 | | | CCC | | Company Guaranteed Notes, 10.000% due 8/1/20 | | | 328,000 | |
| | 350,000 | | | CCC+ | | Senior Secured Notes, 7.875% due 8/1/18(a) | | | 331,625 | |
| | 180,000 | | | BB+ | | William Carter Co. (The), Company Guaranteed Notes, 5.250% due 8/15/21 | | | 189,000 | |
| | | | | | | | | | |
| | | | | | Total Textiles, Apparel & Luxury Goods | | | 1,062,300 | |
| | | | | | | | | | |
| Tobacco — 0.1% | |
| | 370,000 | | | B- | | Alliance One International Inc., Secured Notes, 9.875% due 7/15/21 | | | 371,850 | |
| | | | | | | | | | |
| Transportation Infrastructure — 2.9% | |
| | | | | | Aircastle Ltd., Senior Unsecured Notes: | | | | |
| | 270,000 | | | BB+ | | 6.250% due 12/1/19 | | | 293,625 | |
| | 505,000 | | | BB+ | | 7.625% due 4/15/20 | | | 582,164 | |
| | 360,000 | | | B- | | CMA CGM SA, Senior Unsecured Notes, 8.500% due 4/15/17(a) | | | 370,800 | |
| | 190,000 | | | B+ | | CTP Transportation Products LLC/CTP Finance Inc., Senior Secured Notes, 8.250% due 12/15/19(a) | | | 205,200 | |
| | 325,000 | | | B | | Eletson Holdings, Senior Secured Notes, 9.625% due 1/15/22(a) | | | 334,750 | |
| | 470,000 | | | B+ | | Flexi-Van Leasing Inc., Company Guaranteed Notes, 7.875% due 8/15/18(a) | | | 498,200 | |
| | 1,000,000 | | | B | | Florida East Coast Holdings Corp., Senior Secured Notes, 6.750% due 5/1/19(a) | | | 1,057,500 | |
| | 930,000 | | | B- | | Gardner Denver Inc., Senior Unsecured Notes, 6.875% due 8/15/21(a) | | | 988,125 | |
| | 255,000 | | | BB- | | Gulfmark Offshore Inc., Senior Unsecured Notes, 6.375% due 3/15/22 | | | 258,187 | |
| | 402,000 | | | B3(h) | | Horizon Lines LLC, Senior Secured Notes, 11.000% due 10/15/16 | | | 404,010 | |
| | 370,000 | | | CCC+ | | Neovia Logistics Intermediate Holdings LLC/Logistics Intermediate Finance Corp., Senior Unsecured Notes, 10.000% (10.000% cash or 10.750% PIK) due 2/15/18(a)(d) | | | 382,025 | |
| | 320,000 | | | CCC+ | | syncreon Group BV/syncreon Global Finance US Inc., Company Guaranteed Notes, 8.625% due 11/1/21(a) | | | 318,400 | |
| | 330,000 | | | B | | Ultrapetrol Bahamas Ltd., Senior Secured Notes, 8.875% due 6/15/21 | | | 353,513 | |
| | 670,000 | | | CCC+ | | Watco Cos LLC/Watco Finance Corp., Company Guaranteed Notes, 6.375% due 4/1/23(a) | | | 688,425 | |
| | 405,000 | | | B- | | WaveDivision Escrow LLC/WaveDivision Escrow Corp., Senior Unsecured Notes, 8.125% due 9/1/20(a) | | | 443,475 | |
| | 230,000 | | | B- | | XPO Logistics Inc., Senior Unsecured Notes, 7.875% due 9/1/19(a) | | | 240,350 | |
| | | | | | | | | | |
| | | | | | Total Transportation Infrastructure | | | 7,418,749 | |
| | | | | | | | | | |
| Wireless Telecommunication Services — 2.7% | |
| | 800,000 | | | BB- | | Crown Castle International Corp., Senior Unsecured Notes, 5.250% due 1/15/23 | | | 830,248 | |
| | 130,000 | | | BB | | MetroPCS Wireless Inc., Company Guaranteed Notes, 7.875% due 9/1/18 | | | 135,736 | |
See Notes to Financial Statements.
126
| | | | | | | | | | |
| High Yield Investments | |
| | | |
Face
Amount/Units | | | Rating†† | | Security | | Value | |
| Wireless Telecommunication Services — 2.7% — (continued) | |
| $ | 430,000 | | | BB+ | | Softbank Corp., Company Guaranteed Notes, 4.500% due 4/15/20(a) | | $ | 439,137 | |
| | | | | | Sprint Capital Corp., Company Guaranteed Notes: | | | | |
| | 750,000 | | | BB- | | 6.875% due 11/15/28 | | | 735,000 | |
| | 1,765,000 | | | BB- | | 8.750% due 3/15/32 | | | 1,976,800 | |
| | | | | | Sprint Communications Inc.: | | | | |
| | 420,000 | | | BB+ | | Company Guaranteed Notes, 9.000% due 11/15/18(a) | | | 500,325 | |
| | | | | | Senior Unsecured Notes: | | | | |
| | 305,000 | | | BB- | | 7.000% due 8/15/20 | | | 327,112 | |
| | 475,000 | | | BB- | | 11.500% due 11/15/21 | | | 622,250 | |
| | | | | | Sprint Corp., Company Guaranteed Notes: | | | | |
| | 1,140,000 | | | BB- | | 7.875% due 9/15/23(a) | | | 1,225,500 | |
| | 10,000 | | | BB- | | 7.125% due 6/15/24(a) | | | 10,238 | |
| | 215,000 | | | B- | | Syniverse Holdings Inc., Company Guaranteed Notes, 9.125% due 1/15/19 | | | 228,169 | |
| | | | | | | | | | |
| | | | | | Total Wireless Telecommunication Services | | | 7,030,515 | |
| | | | | | | | | | |
| | | | | | TOTAL CORPORATE BONDS & NOTES
(Cost — $226,731,714) | | | 232,726,761 | |
| | | | | | | | | | |
| SENIOR LOANS — 0.4% | |
| | 370,000 | | | NR | | AP NMT Acquisition B.V., 10.000% due 8/11/22 | | | 340,622 | |
| | 220,000 | | | NR | | CRC Health Corp., 9.000% due 9/28/21 | | | 222,338 | |
| | 150,000 | | | NR | | Gymboree Corp., 5.000% due 2/23/18 | | | 119,750 | |
| | 370,000 | | | NR | | Radnet Inc., 8.000% due 3/25/21 | | | 371,850 | |
| | | | | | | | | | |
| | | | | | TOTAL SENIOR LOANS
(Cost — $1,071,063) | | | 1,054,560 | |
| | | | | | | | | | |
| | | |
| Shares/Units | | | | | | | | |
| COMMON STOCKS — 0.3% | |
| CONSUMER DISCRETIONARY — 0.0% | |
| Hotels, Restaurants & Leisure — 0.0% | |
| | 9,953 | | | | | Bossier Casino Venture Holdco Inc. (Restricted)(a)(i)(j)* | | | 19,906 | |
| | | | | | | | | | |
| ENERGY — 0.2% | |
| Energy Equipment & Services — 0.2% | |
| | 18,163 | | | | | DeepOcean Group Holdings AS (Restricted)(a)(i)(j)* | | | 514,885 | |
| | | | | | | | | | |
| Oil, Gas & Consumable Fuels — 0.0% | |
| | 1,463 | | | | | Halcon Resources Corp.* | | | 8,046 | |
| | | | | | | | | | |
| | | | | | TOTAL ENERGY | | | 522,931 | |
| | | | | | | | | | |
| FINANCIALS — 0.1% | |
| Real Estate Management & Development — 0.1% | |
| | 2,876 | | | | | Realogy Holdings Corp.* | | | 117,254 | |
| | | | | | | | | | |
| HEALTH CARE — 0.0% | |
| Health Care Providers & Services — 0.0% | |
| | 1,400 | | | | | Physiotherapy Associates Holdings Inc.(i)(j)* | | | 67,200 | |
| | | | | | | | | | |
| INDUSTRIALS — 0.0% | |
| Transportation Infrastructure — 0.0% | |
| | 135,004 | �� | | | | Horizon Lines Inc. (Restricted), Class A Shares(a)* | | | 54,002 | |
| | | | | | | | | | |
| MATERIALS — 0.0% | |
| Metals & Mining — 0.0% | |
| | 353,070 | | | | | Mirabela Nickel Ltd.* | | | 29,681 | |
| | | | | | | | | | |
| | | | | | TOTAL COMMON STOCKS
(Cost — $1,019,668) | | | 810,974 | |
| | | | | | | | | | |
See Notes to Financial Statements.
127
| | | | | | | | | | |
| High Yield Investments | |
| | | |
| Shares/Units | | | | | Security | | Value | |
| PREFERRED STOCKS — 0.3% | |
| FINANCIALS — 0.3% | |
| Banks — 0.3% | |
| | 25,509 | | | | | GMAC Capital Trust I, 8.125%(e) | | $ | 685,682 | |
| | | | | | | | | | |
| Consumer Finance — 0.0% | |
| | 125 | | | | | Ally Financial Inc., 7.000%(a) | | | 126,301 | |
| | | | | | | | | | |
| | | | | | TOTAL PREFERRED STOCKS
(Cost — $686,996) | | | 811,983 | |
| | | | | | | | | | |
| CONVERTIBLE PREFERRED STOCK — 0.2% | |
| ENERGY — 0.2% | |
| Oil, Gas & Consumable Fuels — 0.2% | |
| | 525 | | | | | Halcon Resources Corp., 5.750%*
(Cost — $443,135) | | | 507,413 | |
| | | | | | | | | | |
| WARRANTS — 0.1% | |
| FINANCIALS — 0.1% | |
| Diversified Financial Services — 0.1% | | | | |
| | | | | | Jack Cooper Holdings Corp., expires: | | | | |
| | 376 | | | | | 12/15/17(a)* | | | 58,280 | |
| | 183 | | | | | 5/6/18(a)* | | | 28,365 | |
| | | | | | | | | | |
| | | | | | TOTAL WARRANTS
(Cost — $19,405) | | | 86,645 | |
| | | | | | | | | | |
| | | | | | TOTAL INVESTMENTS BEFORE SHORT-TERM INVESTMENTS
(Cost — $229,971,981) | | | 235,998,336 | |
| | | | | | | | | | |
| | | |
Face
Amount | | | | | | | | |
| SHORT-TERM INVESTMENTS (k) — 12.2% | |
| MONEY MARKET FUND — 2.4% | |
| $ | 6,217,477 | | | | | Invesco STIT — Government & Agency Portfolio(l)
(Cost — $6,217,477) | | | 6,217,477 | |
| | | | | | | | | | |
| TIME DEPOSITS — 9.8% | |
| | 9,369,941 | | | | | ANZ National Bank — London, 0.030% due 9/2/14 | | | 9,369,941 | |
| | 5,414,668 | | | | | Bank of New York Mellon — Grand Cayman, 0.030% due 9/2/14 | | | 5,414,668 | |
| | 6,050,329 | | | | | BNP Paribas — Grand Cayman, 0.030% due 9/2/14 | | | 6,050,329 | |
| | 4,390,175 | | | | | JPMorgan Chase & Co. — Nassau, 0.030% due 9/2/14 | | | 4,390,175 | |
| | | | | | | | | | |
| | | | | | TOTAL TIME DEPOSITS
(Cost — $25,225,113) | | | 25,225,113 | |
| | | | | | | | | | |
| | | | | | TOTAL SHORT-TERM INVESTMENTS
(Cost — $31,442,590) | | | 31,442,590 | |
| | | | | | | | | | |
| | | | | | TOTAL INVESTMENTS — 103.9%
(Cost — $261,414,571#) | | | 267,440,926 | |
| | | | | | | | | | |
| | | | | | Liabilities in Excess of Other Assets — (3.9)% | | | (9,917,607 | ) |
| | | | | | | | | | |
| | | | | | TOTAL NET ASSETS — 100.0% | | $ | 257,523,319 | |
| | | | | | | | | | |
| †† | | All ratings are by Standard & Poor’s Rating Service, unless otherwise noted. All ratings are unaudited. |
| * | | Non-income producing security. |
| (a) | | Restricted security that may be sold to “qualified institutional buyers” pursuant to the conditions of Rule 144A under the Securities Act of 1933, as amended. This security has been deemed liquid pursuant to guidelines approved by the Board of Trustees, unless otherwise noted. |
| (b) | | Rating by Fitch Ratings Service. All ratings are unaudited. |
| (c) | | All or a portion of this security is on loan (See Note 1). |
See Notes to Financial Statements.
128
| (d) | | Payment in-kind security for which part of the income earned may be paid as additional principal. The rates shown reflect the rate paid if in cash or if paid as additional principal. |
| (e) | | Variable rate security. Interest rate disclosed is that which was in effect at August 31, 2014. |
| (f) | | Security is perpetual in nature and has no stated maturity date. |
| (g) | | Security is currently in default. |
| (h) | | Rating by Moody’s Investors Service. All ratings are unaudited. |
| (i) | | Security is valued in good faith at fair value by or under the direction of the Board of Trustees. |
| (k) | | Inclusive of all short term holdings, including collateral received from securities lending activities. Not including such collateral, the percentage of portfolio holdings would be 9.8%. |
| (l) | | Represents investment of collateral received from securities lending transactions. |
| # | | Aggregate cost for federal income tax purposes is $262,750,595. |
| | |
Abbreviations used in this schedule: |
| PLC | | — Public Limited Company |
| | | | |
| Summary of Investments by Security Type^ | | | |
Corporate Bonds & Notes | | | 87.0 | % |
Senior Loans | | | 0.4 | |
Preferred Stocks | | | 0.3 | |
Common Stocks | | | 0.3 | |
Convertible Preferred Stock | | | 0.2 | |
Warrants | | | 0.0 | ** |
Short-Term Investments | | | 11.8 | |
| | | | |
| | | 100.0 | % |
| | | | |
| ^ | | As a percentage of total investments. |
| ** | | Position represents less than 0.1% |
See pages 148 and 149 for definitions of ratings.
See Notes to Financial Statements.
129
| | | | | | | | |
| International Fixed Income Investments | |
| | |
Face Amount/
Units† | | | Security | | Value | |
| SOVEREIGN BONDS — 48.9% | |
| Australia — 0.3% | |
| | 900,000 | AUD | | Queensland Treasury Corp., 4.250% due 7/21/23(a)(b) | | $ | 875,014 | |
| | | | | | | | |
| Belgium — 1.6% | |
| | 3,000,000 | EUR | | Belgium Government Bond, 3.250% due 9/28/16(a) | | | 4,211,309 | |
| | | | | | | | |
| Brazil — 1.5% | |
| | | | Brazil Letras do Tesouro Nacional: | | | | |
| | 4,600,000 | BRL | | 0.000% due 1/1/17 — 7/1/18 | | | 1,550,813 | |
| | | | Brazil Notas do Tesouro Nacional Serie F: | | | | |
| | 5,454,000 | BRL | | 10.000% due 1/1/21 — 1/1/25 | | | 2,334,094 | |
| | | | | | | | |
| | | | Total Brazil | | | 3,884,907 | |
| | | | | | | | |
| Canada — 3.1% | |
| | | | Province of Ontario Canada: | | | | |
| $ | 1,000,000 | | | 1.000% due 7/22/16 | | | 1,007,029 | |
| | 1,500,000 | CAD | | 4.200% due 6/2/20 | | | 1,534,383 | |
| | 3,100,000 | CAD | | 3.150% due 6/2/22 | | | 2,979,295 | |
| | 700,000 | CAD | | 3.450% due 6/2/45 | | | 641,304 | |
| | | | Province of Quebec Canada: | | | | |
| | 1,100,000 | CAD | | 3.750% due 9/1/24 | | | 1,086,496 | |
| | 900,000 | CAD | | 5.000% due 12/1/38 | | | 1,022,238 | |
| | | | | | | | |
| | | | Total Canada | | | 8,270,745 | |
| | | | | | | | |
| Colombia — 0.4% | |
| | | | Colombia Government International Bond: | | | | |
| | 100,000 | | | 2.031% due 11/16/15(c) | | | 101,500 | |
| | 66,000,000 | COP | | 9.850% due 6/28/27 | | | 45,610 | |
| | | | Colombian TES: | | | | |
| | 447,000,000 | COP | | 5.000% due 11/21/18 | | | 228,911 | |
| | 517,900,000 | COP | | 7.000% due 5/4/22 | | | 281,254 | |
| | 170,000,000 | COP | | 10.000% due 7/24/24 | | | 111,327 | |
| | 180,000,000 | COP | | 7.500% due 8/26/26 | | | 99,620 | |
| | 259,000,000 | COP | | 6.000% due 4/28/28 | | | 125,482 | |
| | | | | | | | |
| | | | Total Colombia | | | 993,704 | |
| | | | | | | | |
| France — 4.5% | |
| | 1,200,000 | | | Caisse d’Amortissement de la Dette Sociale, 3.375% due 3/20/24(a) | | | 1,267,639 | |
| | | | France Government Bond OAT: | | | | |
| | 600,000 | EUR | | 1.750% due 5/25/23 — 11/25/24 | | | 835,485 | |
| | 6,200,000 | EUR | | 3.250% due 5/25/45 | | | 9,975,668 | |
| | | | | | | | |
| | | | Total France | | | 12,078,792 | |
| | | | | | | | |
| Germany — 0.7% | |
| | 800,000 | EUR | | Bundesrepublik Deutschland, 6.250% due 1/4/30 | | | 1,758,103 | |
| | | | | | | | |
| Indonesia — 0.6% | |
| | | | Indonesia Treasury Bond: | | | | |
| | 200,000,000 | IDR | | 7.875% due 4/15/19 | | | 17,100 | |
| | 1,723,000,000 | IDR | | 8.250% due 7/15/21 — 6/15/32 | | | 143,923 | |
| | 3,902,000,000 | IDR | | 7.000% due 5/15/22 — 5/15/27 | | | 299,876 | |
| | 2,702,000,000 | IDR | | 12.900% due 6/15/22 | | | 292,402 | |
| | 100,000,000 | IDR | | 10.250% due 7/15/22 | | | 9,620 | |
| | 300,000,000 | IDR | | 5.625% due 5/15/23 | | | 21,921 | |
| | 3,197,000,000 | IDR | | 8.375% due 3/15/24 — 9/15/26 | | | 276,538 | |
| | 1,948,000,000 | IDR | | 9.000% due 3/15/29 | | | 172,466 | |
| | 181,000,000 | IDR | | 10.500% due 8/15/30 | | | 17,898 | |
See Notes to Financial Statements.
130
| | | | | | | | |
| International Fixed Income Investments | |
| | |
Face Amount/
Units† | | | Security | | Value | |
| Indonesia — 0.6% — (continued) | |
| | 3,760,000,000 | IDR | | 9.500% due 7/15/31 | | $ | 345,766 | |
| | 672,000,000 | IDR | | 6.375% due 4/15/42 | | | 42,539 | |
| | | | | | | | |
| | | | Total Indonesia | | | 1,640,049 | |
| | | | | | | | |
| Italy — 10.9% | |
| | | | Italy Buoni Poliennali Del Tesoro: | | | | |
| | 2,700,000 | EUR | | 5.500% due 11/1/22 | | | 4,455,149 | |
| | 9,200,000 | EUR | | 4.500% due 5/1/23 — 3/1/24 | | | 14,328,898 | |
| | 5,500,000 | EUR | | 3.750% due 9/1/24 | | | 8,073,625 | |
| | 1,400,000 | EUR | | 4.750% due 9/1/44(a)(b) | | | 2,221,148 | |
| | 100,000 | EUR | | 4.750% due 9/1/28(a) | | | 158,410 | |
| | | | | | | | |
| | | | Total Italy | | | 29,237,230 | |
| | | | | | | | |
| Japan — 2.6% | |
| | | | Japan Government Thirty Year Bond: | | | | |
| | 600,000,000 | JPY | | 2.500% due 9/20/35 — 6/20/36 | | | 6,907,514 | |
| | | | | | | | |
| Malaysia — 0.6% | |
| | | | Malaysia Government Bond: | | | | |
| | 1,500,000 | MYR | | 4.012% due 9/15/17 | | | 482,757 | |
| | 680,000 | MYR | | 3.260% due 3/1/18 | | | 213,565 | |
| | 1,300,000 | MYR | | 5.734% due 7/30/19 | | | 449,839 | |
| | 220,000 | MYR | | 4.378% due 11/29/19 | | | 71,929 | |
| | 1,190,000 | MYR | | 4.160% due 7/15/21 | | | 385,151 | |
| | 300,000 | MYR | | 4.498% due 4/15/30 | | | 98,032 | |
| | | | | | | | |
| | | | Total Malaysia | | | 1,701,273 | |
| | | | | | | | |
| Mexico — 0.4% | |
| | | | Mexican Bonos: | | | | |
| | 900,000 | MXN | | 9.500% due 12/18/14 | | | 70,275 | |
| | 700,000 | MXN | | 8.000% due 6/11/20 | | | 61,588 | |
| | 1,600,000 | MXN | | 6.500% due 6/10/21 | | | 130,998 | |
| | 170,000 | MXN | | 8.500% due 5/31/29 | | | 15,858 | |
| | 5,100,000 | MXN | | 7.750% due 5/29/31 — 11/23/34 | | | 445,149 | |
| | 3,600,000 | MXN | | 10.000% due 11/20/36 | | | 385,391 | |
| | | | | | | | |
| | | | Total Mexico | | | 1,109,259 | |
| | | | | | | | |
| Netherlands — 1.6% | |
| | | | Netherlands Government Bond: | | | | |
| | 3,100,000 | EUR | | 0.750% due 4/15/15 | | | 4,093,971 | |
| | 200,000 | EUR | | 3.250% due 7/15/15(a) | | | 270,291 | |
| | | | | | | | |
| | | | Total Netherlands | | | 4,364,262 | |
| | | | | | | | |
| New Zealand — 0.1% | |
| | 400,000 | NZD | | New Zealand Government Bond, 5.500% due 4/15/23 | | | 369,339 | |
| | | | | | | | |
| Nigeria — 0.2% | |
| | | | Nigeria Government Bond: | | | | |
| | 2,000,000 | NGN | | 4.000% due 4/23/15 | | | 11,854 | |
| | 13,100,000 | NGN | | 15.100% due 4/27/17 | | | 88,162 | |
| | 13,400,000 | NGN | | 16.000% due 6/29/19 | | | 97,242 | |
| | 4,800,000 | NGN | | 7.000% due 10/23/19 | | | 24,802 | |
| | 24,400,000 | NGN | | 16.390% due 1/27/22 | | | 184,737 | |
| | | | | | | | |
| | | | Total Nigeria | | | 406,797 | |
| | | | | | | | |
| Norway — 0.8% | |
| | 12,300,000 | NOK | | Norway Government Bond, 5.000% due 5/15/15 | | | 2,037,908 | |
| | | | | | | | |
See Notes to Financial Statements.
131
| | | | | | | | |
| International Fixed Income Investments | |
| | |
Face Amount/
Units† | | | Security | | Value | |
| Peru — 0.1% | |
| | | | Peruvian Government International Bond: | | | | |
| | 280,000 | PEN | | 7.840% due 8/12/20(b) | | $ | 114,427 | |
| | 40,000 | PEN | | 7.840% due 8/12/20(a)(b) | | | 16,347 | |
| | 100,000 | PEN | | 8.200% due 8/12/26(b) | | | 43,639 | |
| | 460,000 | PEN | | 6.950% due 8/12/31 | | | 177,471 | |
| | 40,000 | PEN | | 6.950% due 8/12/31(a)(b) | | | 15,432 | |
| | | | | | | | |
| | | | Total Peru | | | 367,316 | |
| | | | | | | | |
| Poland — 0.7% | |
| | | | Poland Government Bond: | | | | |
| | 610,000 | PLN | | 5.250% due 10/25/17 — 10/25/20 | | | 209,005 | |
| | 200,000 | PLN | | 3.750% due 4/25/18 | | | 65,348 | |
| | 900,000 | PLN | | 2.500% due 7/25/18 | | | 281,352 | |
| | 1,600,000 | PLN | | 5.500% due 10/25/19 | | | 569,578 | |
| | 2,000,000 | PLN | | 5.750% due 10/25/21 — 9/23/22 | | | 741,869 | |
| | | | | | | | |
| | | | Total Poland | | | 1,867,152 | |
| | | | | | | | |
| Qatar — 1.2% | |
| $ | 2,775,000 | | | Qatar Government International Bond, 5.250% due 1/20/20(a) | | | 3,180,844 | |
| | | | | | | | |
| Romania — 0.2% | |
| | | | Romania Government Bond: | | | | |
| | 100,000 | RON | | 5.800% due 10/26/15 | | | 31,134 | |
| | 500,000 | RON | | 5.750% due 1/27/16 — 4/29/20 | | | 161,467 | |
| | 300,000 | RON | | 5.900% due 7/26/17 | | | 96,968 | |
| | 400,000 | RON | | 4.750% due 6/24/19 | | | 126,625 | |
| | 100,000 | RON | | 5.950% due 6/11/21 | | | 33,369 | |
| | | | | | | | |
| | | | Total Romania | | | 449,563 | |
| | | | | | | | |
| Russia — 0.3% | |
| | | | Russian Federal Bond — OFZ: | | | | |
| | 2,600,000 | RUB | | 6.200% due 1/31/18 | | | 63,587 | |
| | 3,500,000 | RUB | | 7.500% due 3/15/18 — 2/27/19 | | | 88,211 | |
| | 1,100,000 | RUB | | 6.700% due 5/15/19 | | | 26,487 | |
| | 2,700,000 | RUB | | 6.800% due 12/11/19 | | | 65,167 | |
| | 9,700,000 | RUB | | 7.600% due 4/14/21 — 7/20/22 | | | 233,299 | |
| | 4,500,000 | RUB | | 7.050% due 1/19/28 | | | 98,587 | |
| | 10,000,000 | RUB | | Russian Foreign Bond — Eurobond, 7.850% due 3/10/18 | | | 255,590 | |
| | | | | | | | |
| | | | Total Russia | | | 830,928 | |
| | | | | | | | |
| Slovenia — 1.3% | |
| | | | Slovenia Government International Bond: | | | | |
| | 800,000 | EUR | | 4.700% due 11/1/16(a) | | | 1,135,159 | |
| | 300,000 | EUR | | 1.750% due 10/9/17 | | | 404,763 | |
| | 400,000 | EUR | | 4.375% due 2/6/19 | | | 593,311 | |
| | 400,000 | | | 5.500% due 10/26/22 | | | 443,300 | |
| | 700,000 | | | 5.250% due 2/18/24 | | | 763,000 | |
| | | | | | | | |
| | | | Total Slovenia | | | 3,339,533 | |
| | | | | | | | |
| South Africa — 1.2% | |
| | | | South Africa Government Bond: | | | | |
| | 18,800,000 | ZAR | | 8.250% due 9/15/17 — 3/31/32 | | | 1,835,491 | |
| | 1,500,000 | ZAR | | 8.000% due 12/21/18 — 1/31/30 | | | 144,949 | |
| | 7,700,000 | ZAR | | 7.250% due 1/15/20 | | | 719,209 | |
| | 100,000 | ZAR | | 7.750% due 2/28/23 | | | 9,391 | |
| | 800,000 | ZAR | | 10.500% due 12/21/26 | | | 89,545 | |
| | 4,000,000 | ZAR | | 7.000% due 2/28/31 | | | 328,358 | |
See Notes to Financial Statements.
132
| | | | | | | | |
| International Fixed Income Investments | |
| | |
Face Amount/
Units† | | | Security | | Value | |
| South Africa — 1.2% — (continued) | |
| | 100,000 | ZAR | | 6.250% due 3/31/36 | | $ | 7,262 | |
| | 600,000 | ZAR | | 8.500% due 1/31/37 | | | 55,222 | |
| | 300,000 | ZAR | | 6.500% due 2/28/41 | | | 21,955 | |
| | | | | | | | |
| | | | Total South Africa | | | 3,211,382 | |
| | | | | | | | |
| South Korea — 0.9% | |
| $ | 2,200,000 | | | Export-Import Bank of Korea, 5.000% due 4/11/22 | | | 2,494,694 | |
| | | | | | | | |
| Spain — 9.0% | |
| | 100,000 | EUR | | Junta de Castilla y Leon, 6.505% due 3/1/19 | | | 162,159 | |
| | | | Spain Government Bond: | | | | |
| | 3,700,000 | EUR | | 5.400% due 1/31/23(a) | | | 6,194,936 | |
| | 10,200,000 | EUR | | 3.800% due 4/30/24(a) | | | 15,368,221 | |
| | 300,000 | EUR | | 2.750% due 10/31/24(a) | | | 412,880 | |
| | 1,250,000 | EUR | | Xunta de Galicia, 6.964% due 12/28/17 | | | 1,963,460 | |
| | | | | | | | |
| | | | Total Spain | | | 24,101,656 | |
| | | | | | | | |
| Thailand — 0.1% | |
| | | | Thailand Government Bond: | | | | |
| | 3,000,000 | THB | | 3.650% due 12/17/21 | | | 96,014 | |
| | 9,505,072 | THB | | 1.250% due 3/12/28 | | | 275,086 | |
| | | | | | | | |
| | | | Total Thailand | | | 371,100 | |
| | | | | | | | |
| Turkey — 0.5% | |
| | | | Turkey Government Bond: | | | | |
| | 200,000 | TRY | | 6.300% due 2/14/18 | | | 86,198 | |
| | 900,000 | TRY | | 8.800% due 11/14/18 — 9/27/23 | | | 414,935 | |
| | 100,000 | TRY | | 10.400% due 3/27/19 | | | 49,114 | |
| | 1,103,304 | TRY | | 3.000% due 1/6/21 — 8/2/23 | | | 547,187 | |
| | 300,000 | TRY | | 7.100% due 3/8/23 | | | 124,023 | |
| | | | | | | | |
| | | | Total Turkey | | | 1,221,457 | |
| | | | | | | | |
| United Kingdom — 3.5% | |
| | | | United Kingdom Gilt: | | | | |
| | 1,200,000 | GBP | | 4.250% due 12/7/40 | | | 2,475,140 | |
| | 2,800,000 | GBP | | 3.250% due 1/22/44 | | | 4,911,271 | |
| | 1,100,000 | GBP | | 3.500% due 1/22/45 | | | 2,028,725 | |
| | | | | | | | |
| | | | Total United Kingdom | | | 9,415,136 | |
| | | | | | | | |
| | | | TOTAL SOVEREIGN BONDS
(Cost — $126,229,467) | | | 130,696,966 | |
| | | | | | | | |
| CORPORATE BONDS & NOTES — 21.4% | |
| Bermuda — 0.3% | |
| | 700,000 | | | Ooredoo International Finance Ltd., Company Guaranteed Notes, 4.750% due 2/16/21 | | | 768,250 | |
| | | | | | | | |
| Cayman Islands — 0.8% | |
| | 900,000 | | | IPIC GMTN Ltd., Company Guaranteed Notes, 5.500% due 3/1/22(a) | | | 1,047,375 | |
| | 1,000,000 | | | QNB Finance Ltd., Company Guaranteed Notes, 3.375% due 2/22/17 | | | 1,046,040 | |
| | | | | | | | |
| | | | Total Cayman Islands | | | 2,093,415 | |
| | | | | | | | |
| Colombia — 0.1% | |
| | 324,000,000 | COP | | Empresas Publicas de Medellin ESP, Senior Unsecured Notes, 8.375% due 2/1/21 | | | 179,615 | |
| | 95,000,000 | COP | | Financiera de Desarrollo Territorial SA Findeter, Senior Unsecured Notes, 7.875% due
8/12/24(a)(b) | | | 51,045 | |
| | | | | | | | |
| | | | Total Colombia | | | 230,660 | |
| | | | | | | | |
| France — 0.8% | |
| | 1,000,000 | | | BPCE SA, Company Guaranteed Notes, 0.862% due 6/17/17(c) | | | 1,000,412 | |
| | 1,200,000 | | | Credit Agricole SA, Senior Unsecured Notes, 0.775% due 6/12/17(a)(c) | | | 1,202,966 | |
| | | | | | | | |
| | | | Total France | | | 2,203,378 | |
| | | | | | | | |
See Notes to Financial Statements.
133
| | | | | | | | |
| International Fixed Income Investments | |
| | |
Face Amount/
Units† | | | Security | | Value | |
| Germany — 5.3% | |
| | 400,000 | GBP | | FMS Wertmanagement AoeR, Government Guaranteed Notes, 0.750% due 12/15/17 | | $ | 647,797 | |
| | 6,400,000 | EUR | | KFW, Government Guaranteed Notes, 3.625% due 1/20/20 | | | 9,878,910 | |
| | 4,300,000 | NZD | | Landwirtschaftliche Rentenbank, Government Guaranteed Notes, 4.750% due 3/12/19 | | | 3,636,328 | |
| | | | | | | | |
| | | | Total Germany | | | 14,163,035 | |
| | | | | | | | |
| Ireland — 1.7% | |
| | 2,400,000 | EUR | | Depfa ACS Bank, Covered Notes, 3.875% due 11/14/16 | | | 3,392,779 | |
| | 500,000 | EUR | | German Postal Pensions Securitisation 2 PLC, Government Guaranteed Notes, 4.250% due 1/18/17 | | | 719,790 | |
| | 11,200,000 | RUB | | Novatek OAO via Novatek Finance Ltd., Senior Unsecured Notes, 7.750% due 2/21/17(a)(b) | | | 281,779 | |
| | 9,500,000 | RUB | | Russian Railways via RZD Capital PLC, Senior Unsecured Notes, 8.300% due 4/2/19 | | | 234,462 | |
| | | | | | | | |
| | | | Total Ireland | | | 4,628,810 | |
| | | | | | | | |
| Italy — 1.4% | |
| | | | Banca Carige SpA, Covered Notes: | | | | |
| | 700,000 | EUR | | 3.750% due 11/25/16 | | | 970,318 | |
| | 200,000 | EUR | | 3.875% due 10/24/18 | | | 284,711 | |
| | | | Banca Monte dei Paschi di Siena SpA, Covered Notes: | | | | |
| | 800,000 | EUR | | 4.875% due 9/15/16 | | | 1,134,871 | |
| | 500,000 | EUR | | 5.000% due 2/9/18 | | | 739,371 | |
| | 400,000 | EUR | | Banco Popolare SC, Senior Unsecured Notes, 3.500% due 3/14/19 | | | 545,265 | |
| | | | | | | | |
| | | | Total Italy | | | 3,674,536 | |
| | | | | | | | |
| Jersey Channel Islands — 0.1% | |
| | 200,000 | GBP | | HBOS Capital Funding LP, Company Guaranteed Notes, 9.540%(c)(d) | | | 363,886 | |
| | | | | | | | |
| Luxembourg — 0.4% | |
| | 400,000 | EUR | | Fiat Finance & Trade SA, Company Guaranteed Notes, 7.625% due 9/15/14 | | | 526,874 | |
| | 7,000,000 | RUB | | Russian Agricultural Bank OJSC Via RSHB Capital SA, Senior Unsecured Notes, 8.700% due 3/17/16 | | | 181,144 | |
| | 10,000,000 | RUB | | Sberbank of Russia Via SB Capital SA, Senior Unsecured Notes, 7.000% due 1/31/16 | | | 257,618 | |
| | | | | | | | |
| | | | Total Luxembourg | | | 965,636 | |
| | | | | | | | |
| Mexico — 0.0% | |
| | 100,000 | MXN | | Petroleos Mexicanos, Company Guaranteed Notes, 9.150% due 3/28/16 | | | 8,582 | |
| | | | | | | | |
| Netherlands — 0.3% | |
| | 250,000 | EUR | | GMAC International Finance BV, Company Guaranteed Notes, 7.500% due 4/21/15 | | | 341,551 | |
| $ | 500,000 | | | SABIC Capital I BV, Company Guaranteed Notes, 3.000% due 11/2/15 | | | 512,672 | |
| | | | | | | | |
| | | | Total Netherlands | | | 854,223 | |
| | | | | | | | |
| Norway — 0.6% | |
| | | | Eksportfinans ASA, Senior Unsecured Notes: | | | | |
| | 900,000 | | | 2.375% due 5/25/16 | | | 903,330 | |
| | 100,000 | CHF | | 2.875% due 11/16/16 | | | 111,747 | |
| | 500,000 | | | 5.500% due 6/26/17 | | | 539,375 | |
| | | | | | | | |
| | | | Total Norway | | | 1,554,452 | |
| | | | | | | | |
| Qatar — 0.4% | |
| | 850,000 | | | Ras Laffan Liquefied Natural Gas Co., Ltd. III, Senior Secured Notes, 6.750% due 9/30/19 | | | 1,029,562 | |
| | | | | | | | |
| South Korea — 0.9% | |
| | | | Korea Development Bank (The), Senior Unsecured Notes: | | | | |
| | 1,500,000 | | | 1.170% due 8/20/15(a)(b) | | | 1,511,447 | |
| | 850,000 | | | 4.000% due 9/9/16 | | | 898,660 | |
| | | | | | | | |
| | | | Total South Korea | | | 2,410,107 | |
| | | | | | | | |
| Spain — 1.2% | |
| | 400,000 | EUR | | AyT Cedulas Cajas IX Fondo de Titulizacion de Activos, Covered Notes, 3.750% due 3/31/15 | | | 535,319 | |
See Notes to Financial Statements.
134
| | | | | | | | |
| International Fixed Income Investments | |
| | |
Face Amount/
Units† | | | Security | | Value | |
| Spain — 1.2% — (continued) | |
| | | | Banco Popular Espanol SA, Covered Notes: | | | | |
| | 500,000 | EUR | | 4.000% due 10/18/16 | | $ | 702,485 | |
| | 700,000 | EUR | | 4.125% due 3/30/17 | | | 997,016 | |
| | 300,000 | EUR | | 3.500% due 9/11/17 | | | 425,273 | |
| | 100,000 | EUR | | Cedulas TDA 6 Fondo de Titulizacion de Activos, Covered Notes, 3.875% due 5/23/25 | | | 144,388 | |
| | 400,000 | EUR | | Santander International Debt SAU, Company Guaranteed Notes, 4.500% due 5/18/15 | | | 540,914 | |
| | | | | | | | |
| | | | Total Spain | | | 3,345,395 | |
| | | | | | | | |
| United Kingdom — 1.5% | |
| | 900,000 | GBP | | Barclays Bank PLC, Junior Subordinated Notes, 14.000%(c)(d) | | | 2,007,372 | |
| $ | 500,000 | | | HBOS PLC, Subordinated Notes, 6.750% due 5/21/18(a) | | | 573,876 | |
| | 300,000 | GBP | | LBG Capital No.2 PLC, Company Guaranteed Notes, 15.000% due 12/21/19 | | | 716,386 | |
| | 600,000 | | | Standard Chartered PLC, Senior Unsecured Notes, 5.500% due 11/18/14(a) | | | 606,870 | |
| | 100,000 | | | Tate & Lyle International Finance PLC, Company Guaranteed Notes, 5.000% due 11/15/14(a)(b) | | | 100,818 | |
| | | | | | | | |
| | | | Total United Kingdom | | | 4,005,322 | |
| | | | | | | | |
| United States — 5.6% | |
| | | | Ally Financial Inc.: | | | | |
| | | | Company Guaranteed Notes: | | | | |
| | 100,000 | | | 2.434% due 12/1/14(c) | | | 100,014 | |
| | 300,000 | | | 6.750% due 12/1/14 | | | 304,500 | |
| | 300,000 | | | 8.300% due 2/12/15 | | | 309,563 | |
| | 300,000 | | | 4.625% due 6/26/15 | | | 308,250 | |
| | 200,000 | | | 3.500% due 7/18/16 | | | 205,500 | |
| | 100,000 | | | Senior Unsecured Notes, 6.750% due 12/1/14 | | | 101,375 | |
| | 441,000 | GBP | | American International Group Inc., Senior Unsecured Notes, 6.765% due 11/15/17 | | | 834,320 | |
| | 800,000 | EUR | | BA Covered Bond Issuer, Covered Notes, 4.250% due 4/5/17 | | | 1,156,807 | |
| | 900,000 | EUR | | Bank of America Corp., Subordinated Notes, 0.849% due 5/23/17(c) | | | 1,182,863 | |
| | 200,000 | | | CIT Group Inc., Senior Unsecured Notes, 4.750% due 2/15/15(a) | | | 202,875 | |
| | | | DISH DBS Corp., Company Guaranteed Notes: | | | | |
| | 200,000 | | | 6.625% due 10/1/14 | | | 201,000 | |
| | 100,000 | | | 7.750% due 5/31/15 | | | 105,000 | |
| | 200,000 | | | 7.125% due 2/1/16 | | | 214,000 | |
| | 400,000 | | | Ford Motor Credit Co. LLC, Senior Unsecured Notes, 8.700% due 10/1/14 | | | 402,472 | |
| | 500,000 | AUD | | Goldman Sachs Group Inc. (The), Senior Unsecured Notes, 3.165% due 4/12/16(c) | | | 466,063 | |
| | | | HCA Inc., Company Guaranteed Notes: | | | | |
| | 400,000 | | | 6.375% due 1/15/15 | | | 407,000 | |
| | 100,000 | | | 6.500% due 2/15/16 | | | 106,375 | |
| | | | International Lease Finance Corp.: | | | | |
| | | | Senior Secured Notes: | | | | |
| | 200,000 | | | 6.500% due 9/1/14(a) | | | 200,000 | |
| | 200,000 | | | 6.750% due 9/1/16(a) | | | 219,250 | |
| | | | Senior Unsecured Notes: | | | | |
| | 400,000 | | | 4.875% due 4/1/15 | | | 408,750 | |
| | 200,000 | | | 8.625% due 9/15/15 | | | 214,875 | |
| | 100,000 | | | 5.750% due 5/15/16 | | | 106,188 | |
| | 1,200,000 | | | JPMorgan Chase & Co., Unsecured Notes, 0.784% due 4/25/18(c) | | | 1,206,691 | |
| | 1,300,000 | | | Lehman Brothers Holdings Inc., Senior Unsecured Notes, 0.000% due 12/30/16 | | | 258,375 | |
| | | | MGM Resorts International, Company Guaranteed Notes: | | | | |
| | 750,000 | | | 6.625% due 7/15/15 | | | 783,750 | |
| | 200,000 | | | 7.500% due 6/1/16 | | | 218,000 | |
| | | | Navient LLC, Senior Unsecured Notes: | | | | |
| | 200,000 | | | 5.050% due 11/14/14 | | | 201,875 | |
| | 500,000 | | | 5.000% due 4/15/15 | | | 511,875 | |
| | 100,000 | | | 3.875% due 9/10/15 | | | 102,280 | |
| | 600,000 | | | Springleaf Finance Corp., Company Guaranteed Notes, 5.400% due 12/1/15 | | | 624,750 | |
See Notes to Financial Statements.
135
| | | | | | | | |
| International Fixed Income Investments | |
| | |
Face Amount/
Units† | | | Security | | Value | |
| United States — 5.6% — (continued) | |
| $ | 1,000,000 | | | Starwood Hotels & Resorts Worldwide Inc., Senior Unsecured Notes, 6.750% due 5/15/18 | | $ | 1,168,530 | |
| | 100,000 | | | Time Warner Cable Inc., Company Guaranteed Notes, 5.850% due 5/1/17 | | | 111,727 | |
| | 500,000 | | | UST LLC, Senior Unsecured Notes, 5.750% due 3/1/18 | | | 566,768 | |
| | 1,300,000 | | | Verizon Communications Inc., Senior Unsecured Notes, 1.764% due 9/15/16(c) | | | 1,335,918 | |
| | | | | | | | |
| | | | Total United States | | | 14,847,579 | |
| | | | | | | | |
| | | | TOTAL CORPORATE BONDS & NOTES
(Cost — $55,325,498) | | | 57,146,828 | |
| | | | | | | | |
| COLLATERALIZED MORTGAGE OBLIGATIONS — 7.6% | |
| | 600,000 | | | Atrium CDO Corp., Series 7AR, Class AR, 1.338% due 11/16/22(a)(b)(c) | | | 600,000 | |
| | 79,300 | | | Banc of America Funding Corp., Series 2006-A, Class 1A1, step bond to yield, 2.639% due 2/20/36(c) | | | 79,296 | |
| | 279,251 | | | Banc of America Large Loan Inc., Series 2010-UB5, Class A4A, 5.676% due 2/17/51(a)(c) | | | 299,310 | |
| | 87,096 | | | Banc of America Mortgage Trust, Series 2003-F, Class 3A1, 2.623% due 7/25/33(c) | | | 88,033 | |
| | 4,214 | | | BCAP LLC Trust, Series 2010-RR1, Class 1A1, 3.190% due 3/26/37(a)(c) | | | 4,261 | |
| | | | Bear Stearns Adjustable Rate Mortgage Trust: | | | | |
| | 15,325 | | | Series 2003-5, Class 1A2, 2.475% due 8/25/33(c) | | | 15,462 | |
| | 17,102 | | | Series 2003-7, Class 6A, 2.518% due 10/25/33(c) | | | 17,360 | |
| | 70,953 | | | Series 2004-2, Class 22A, 2.654% due 5/25/34(c) | | | 68,880 | |
| | 15,051 | | | Series 2004-2, Class 23A, 2.483% due 5/25/34(c) | | | 14,207 | |
| | 33,220 | | | Series 2005-2, Class A2, 2.528% due 3/25/35(c) | | | 33,708 | |
| | 196,133 | | | Bear Stearns Structured Products Inc., Series 2007-R6, Class 1A1, 3.577% due 1/26/36(c) | | | 155,002 | |
| | 860,319 | EUR | | Claris ABS, Series 2011-1, Class A, 0.794% due 10/31/60(c) | | | 1,103,973 | |
| | 1,200,000 | | | Commercial Mortgage Pass-Through Certificates, Series 2014-KYO, Class A, 1.057% due 6/11/27(a)(c) | | | 1,202,544 | |
| | | | Countrywide Alternative Loan Trust: | | | | |
| | 17,638 | | | Series 2005-21CB, Class A3, 5.250% due 6/25/35 | | | 16,650 | |
| | 59,027 | | | Series 2007-7T2, Class A9, 6.000% due 4/25/37 | | | 46,490 | |
| | 99,930 | | | Series 2007-11T1, Class A12, 0.505% due 5/25/37(c) | | | 69,991 | |
| | 47,542 | | | Series 2007-16CB, Class 5A1, 6.250% due 8/25/37 | | | 39,926 | |
| | | | Countrywide Home Loan Mortgage Pass Through Trust: | | | | |
| | 8,701 | | | Series 2004-12, Class 11A1, 2.620% due 8/25/34(c) | | | 7,779 | |
| | 208,929 | | | Series 2005-2, Class 1A1, 0.475% due 3/25/35(c) | | | 161,336 | |
| | 24,229 | | | Series 2005-3, Class 2A1, 0.445% due 4/25/35(c) | | | 19,995 | |
| | 164,554 | | | Series 2005-9, Class 1A3, 0.385% due 5/25/35(c) | | | 142,326 | |
| | 48,395 | | | Series 2005-11, Class 3A1, 2.506% due 4/25/35(c) | | | 44,242 | |
| | 82,856 | | | Series 2005-HYB9, Class 3A2A, 2.313% due 2/20/36(c) | | | 76,999 | |
| | 25,705 | | | Credit Suisse First Boston Mortgage Securities Corp., Series 2003-AR20, Class 2A1, 2.472% due 8/25/33(c) | | | 25,671 | |
| | 50,832 | | | Credit Suisse Mortgage Trust, Series 2007-5R, Class A5, 6.500% due 7/26/36 | | | 29,722 | |
| | 236,338 | | | CSAB Mortgage Backed Trust, Series 2006-4, Class A6A, step bond to yield, 5.684% due 12/25/36 | | | 158,806 | |
| | 686,667 | GBP | | DECO 12-UK 4 PLC, Series 2007-C4X, Class A1, 0.718% due 1/27/20(c) | | | 1,118,773 | |
| | 352,540 | GBP | | Eurohome UK Mortgages PLC, Series 2007-1, Class A, 0.708% due 6/15/44(c) | | | 557,106 | |
| | 817,235 | GBP | | Eurosail-UK PLC, Series 2007-6NCX, Class A2A, 1.252% due 9/13/45(c) | | | 1,345,056 | |
| | | | Federal Home Loan Mortgage Corp. (FHLMC): | | | | |
| | 59,058 | | | Series T-35, Class A, 0.435% due 9/25/31(c) | | | 55,333 | |
| | 86,252 | | | Series T-62, Class 1A1, 1.322% due 10/25/44(c) | | | 87,995 | |
| | | | Federal Home Loan Mortgage Corp. (FHLMC), REMICS: | | | | |
| | 97,340 | | | Series 2391, Class FJ, 0.655% due 4/15/28(c) | | | 98,449 | |
| | 164,453 | | | Series 2614, Class SJ, 19.236% due 5/15/33(b)(c) | | | 228,999 | |
| | 2,908 | | | Series 3037, Class BC, 4.500% due 2/15/20 | | | 2,911 | |
| | 87,121 | | | Series 3174, Class FM, 0.395% due 5/15/36(c) | | | 87,075 | |
| | 14,220 | | | Federal National Mortgage Association (FNMA), Grantor Trust, Series 2004-T3, Class 1A1, 6.000% due 2/25/44 | | | 16,150 | |
| | | | Federal National Mortgage Association (FNMA), REMICS: | | | | |
| | 11,645 | | | Series 2003-34, Class A1, 6.000% due 4/25/43 | | | 12,923 | |
| | 5,225 | | | Series 2005-120, Class NF, 0.255% due 1/25/21(c) | | | 5,223 | |
See Notes to Financial Statements.
136
| | | | | | | | |
| International Fixed Income Investments | |
| | |
Face Amount/
Units† | | | Security | | Value | |
| $ | 98,439 | | | Federal National Mortgage Association (FNMA), Whole Loan, Series 2004-W12, Class 1A1, 6.000% due 7/25/44 | | $ | 110,970 | |
| | 368,678 | EUR | | Giovecca Mortgages SRL, Series 2011-1, Class A, 0.804% due 4/23/48(c) | | | 480,237 | |
| | 8,631 | | | GSR Mortgage Loan Trust, Series 2003-1, Class A2, 1.871% due 3/25/33(c) | | | 8,554 | |
| | | | Harborview Mortgage Loan Trust: | | | | |
| | 26,509 | | | Series 2003-1, Class A, 2.482% due 5/19/33(c) | | | 26,775 | |
| | 45,879 | | | Series 2005-2, Class 2A1A, 0.376% due 5/19/35(c) | | | 40,814 | |
| | 117,973 | | | Series 2005-3, Class 2A1A, 0.396% due 6/19/35(c) | | | 107,557 | |
| | 155,068 | | | Series 2006-SB1, Class A1A, 0.967% due 12/19/36(c) | | | 128,003 | |
| | 700,000 | | | Hewett’s Island CDO Ltd., Series 2007-6X, Class B, 0.682% due 6/9/19(c) | | | 690,495 | |
| | | | JPMorgan Mortgage Trust: | | | | |
| | 14,984 | | | Series 2003-A2, Class 3A1, 1.990% due 11/25/33(c) | | | 15,043 | |
| | 6,976 | | | Series 2005-A1, Class 6T1, 2.734% due 2/25/35(c) | | | 6,936 | |
| | 219,292 | | | JPMorgan Resecuritization Trust, Series 2009-7, Class 17A1, 5.624% due 7/27/37(a)(c) | | | 218,344 | |
| | 668,478 | EUR | | Leo-Mesdag BV, Series 2006-1, Class A, 0.550% due 8/29/19(c) | | | 866,599 | |
| | 347,480 | EUR | | Lunet RMBS BV, Series 2013-1, Class A1, 0.711% due 12/26/45(c) | | | 458,307 | |
| | | | Merrill Lynch Mortgage Investors Trust: | | | | |
| | 16,385 | | | Series 2003-A2, Class 1A1, 2.220% due 2/25/33(c) | | | 15,862 | |
| | 75,731 | | | Series 2005-2, Class 1A, 1.572% due 10/25/35(c) | | | 74,915 | |
| | 299,512 | | | Merrill Lynch Mortgage Trust, Series 2007-C1, Class ASB, 6.009% due 6/12/50(c) | | | 313,136 | |
| | 1,200,000 | | | Neuberger Berman CLO XII Ltd., Series 2012-12AR, Class A2R, 1.384% due 7/25/23(a)(c) | | | 1,199,378 | |
| | 700,000 | GBP | | Newgate Funding PLC, Series 2007-1X, Class A3, 0.691% due 12/1/50(c) | | | 1,064,693 | |
| | | | Puma Finance Pty. Ltd.: | | | | |
| | 619,290 | AUD | | Series 2014-1, Class A, 3.535% due 5/13/45 | | | 580,466 | |
| | 583,440 | AUD | | Series 2014-2, Class A, 3.423% due 10/18/45(c) | | | 544,979 | |
| | 101,304 | | | Series G5, Class A1, 0.374% due 2/21/38(a)(c) | | | 100,535 | |
| | 139,076 | AUD | | Series P11, Class BA, 3.035% due 8/22/37(c) | | | 130,456 | |
| | 600,000 | | | Octagon Investment Partners XII Ltd., Series 2012-1AR, Class AR, 1.508% due 5/5/23(a)(c) | | | 599,997 | |
| | 95,352 | | | RALI Trust, Series 2007-QO2, Class A1, 0.305% due 2/25/47(c) | | | 56,918 | |
| | | | Residential Asset Securitization Trust: | | | | |
| | 36,105 | | | Series 2005-A15, Class 5A1, 5.750% due 2/25/36 | | | 30,581 | |
| | 75,499 | | | Series 2006-R1, Class A2, 0.555% due 1/25/46(c) | | | 41,191 | |
| | 731,232 | GBP | | RMAC Securities Holdings Ltd., Series 2006-NS3X, Class A2A, 0.685% due 6/12/44(c) | | | 1,137,121 | |
| | | | Structured Adjustable Rate Mortgage Loan Trust: | | | | |
| | 19,908 | | | Series 2004-1, Class 4A1, 2.476% due 2/25/34(c) | | | 20,271 | |
| | 90,625 | | | Series 2004-4, Class 3A2, 2.456% due 4/25/34(c) | | | 91,067 | |
| | 84,516 | | | Series 2004-19, Class 2A1, 1.518% due 1/25/35(c) | | | 69,475 | |
| | | | Structured Asset Mortgage Investments II Trust: | | | | |
| | 104,936 | | | Series 2005-AR2, Class 2A1, 0.385% due 5/25/45(c) | | | 95,929 | |
| | 116,736 | | | Series 2005-AR8, Class A1A, 0.435% due 2/25/36(c) | | | 98,016 | |
| | 74,178 | | | Series 2006-AR5, Class 1A1, 0.365% due 5/25/46(c) | | | 56,838 | |
| | 200,000 | | | Series 2007-AR4, Class A3, 0.375% due 9/25/47(c) | | | 160,462 | |
| | 172,996 | | | Series 2007-AR6, Class A1, 1.617% due 8/25/47(c) | | | 155,945 | |
| | 229,661 | | | Structured Asset Securities Corp. Trust, Series 2005-10, Class 4A1, 5.500% due 12/25/34 | | | 231,634 | |
| | 148,033 | AUD | | Torrens Trust, Series 2007-1, Class A, 3.048% due 10/19/38(c) | | | 137,037 | |
| | | | Wachovia Bank Commercial Mortgage Trust: | | | | |
| | 900,000 | | | Series 2006-C23, Class A5, 5.416% due 1/15/45(c) | | | 947,612 | |
| | 468,097 | | | Series 2006-C28, Class A4, 5.572% due 10/15/48 | | | 502,877 | |
| | | | WaMu Mortgage Pass Through Certificates Trust: | | | | |
| | 23,917 | | | Series 2002-AR9, Class 1A, 1.517% due 8/25/42(c) | | | 23,214 | |
| | 9,899 | | | Series 2003-AR5, Class A7, 2.443% due 6/25/33(c) | | | 10,081 | |
| | 92,586 | | | Series 2005-AR13, Class A1A1, 0.445% due 10/25/45(c) | | | 88,925 | |
| | 150,321 | | | Series 2006-AR13, Class 2A, 2.168% due 10/25/46(c) | | | 141,903 | |
| | 1,898 | | | Washington Mutual Mortgage Loan Trust, Series 2001-7, Class A, 1.318% due 5/25/41(c) | | | 1,904 | |
| | 39,878 | | | Washington Mutual Mortgage Pass-Through Certificates WMALT, Series 2006-AR5, Class 3A, 1.057% due 7/25/46(c) | | | 24,259 | |
See Notes to Financial Statements.
137
| | | | | | | | |
| International Fixed Income Investments | |
| | |
Face Amount/
Units† | | | Security | | Value | |
| $ | 233,592 | | | Washington Mutual MSC Mortgage Pass-Through Certificates Trust, Series 2002-AR3, Class 1A7, 2.205% due 12/25/32(c) | | $ | 234,989 | |
| | | | | | | | |
| | | | TOTAL COLLATERALIZED MORTGAGE OBLIGATIONS
(Cost — $20,120,137) | | | 20,279,262 | |
| | | | | | | | |
| MORTGAGE-BACKED SECURITIES — 6.3% | |
| FNMA — 6.3% | |
| | | | Federal National Mortgage Association (FNMA): | | | | |
| | 579,532 | | | 5.700% due 8/1/18(c) | | | 623,373 | |
| | 95,468 | | | 3.000% due 1/1/22 | | | 98,730 | |
| | 973,992 | | | 2.500% due 8/1/28 | | | 990,865 | |
| | 9,000,000 | | | 3.500% due 9/25/29(e) | | | 9,511,875 | |
| | 130,409 | | | 2.485% due 11/1/34(c) | | | 140,052 | |
| | 193,967 | | | 6.500% due 8/1/37 | | | 222,601 | |
| | 5,000,000 | | | 3.500% due 11/1/44(e) | | | 5,272,656 | |
| | | | | | | | |
| | | | TOTAL FNMA | | | 16,860,152 | |
| | | | | | | | |
| GNMA — 0.0% | |
| | | | Government National Mortgage Association II (GNMA): | | | | |
| | 21,857 | | | 6.000% due 9/20/38 | | | 23,390 | |
| | | | | | | | |
| | | | TOTAL MORTGAGE-BACKED SECURITIES
(Cost — $16,725,340) | | | 16,883,542 | |
| | | | | | | | |
| U.S. GOVERNMENT & AGENCY OBLIGATIONS — 3.3% | |
| U.S. GOVERNMENT OBLIGATIONS — 3.3% | |
| | | | U.S. Treasury Bonds: | | | | |
| | 900,000 | | | 3.750% due 11/15/43 | | | 1,018,617 | |
| | 1,000,000 | | | 3.625% due 2/15/44 | | | 1,107,109 | |
| | 700,000 | | | 3.125% due 8/15/44 | | | 705,797 | |
| | | | U.S. Treasury Inflation Indexed Bonds: | | | | |
| | 4,517,010 | | | 0.125% due 7/15/24(f) | | | 4,476,430 | |
| | 102,267 | | | 1.375% due 2/15/44 | | | 116,824 | |
| | | | U.S. Treasury Notes: | | | | |
| | 384,000 | | | 0.250% due 8/31/14 | | | 384,000 | |
| | 900,000 | | | 2.750% due 11/15/23 | | | 934,558 | |
| | | | | | | | |
| | | | TOTAL U.S. GOVERNMENT & AGENCY OBLIGATIONS
(Cost — $8,628,773) | | | 8,743,335 | |
| | | | | | | | |
| MUNICIPAL BONDS — 0.8% | |
| United States — 0.8% | |
| | 1,500,000 | | | Missouri Joint Municipal Electric Utility Commission, Power Project Revenue Bonds, 6.890% due 1/1/42 | | | 1,896,045 | |
| | 300,000 | | | School District of Philadelphia (The), Build America General Obligation Bonds, 6.765% due 6/1/40 | | | 322,830 | |
| | | | | | | | |
| | | | TOTAL MUNICIPAL BONDS
(Cost — $1,800,000) | | | 2,218,875 | |
| | | | | | | | |
| ASSET-BACKED SECURITIES — 0.6% | |
| Automobiles — 0.5% | |
| | 1,312,427 | | | Motor PLC, Series 2014-1A, Class A1, 0.635% due 8/25/21(a)(c) | | | 1,317,891 | |
| | | | | | | | |
| Student Loans — 0.1% | |
| | 266,365 | | | Massachusetts Educational Financing Authority, Series 2008-1, Class A1, 1.184% due 4/25/38(c) | | | 267,675 | |
| | 59,691 | | | South Carolina Student Loan Corp., Series 2008-1, Class A2, 0.777% due 3/1/18(c) | | | 59,761 | |
| | | | | | | | |
| | | | Total Student Loans | | | 327,436 | |
| | | | | | | | |
| | | | TOTAL ASSET-BACKED SECURITIES
(Cost — $1,638,482) | | | 1,645,327 | |
| | | | | | | | |
See Notes to Financial Statements.
138
| | | | | | | | |
| International Fixed Income Investments | |
| | |
Notional
Amount† | | | Security | | Value | |
| PURCHASED OPTIONS — 0.0% | |
| United States — 0.0% | |
| $ | 210,000 | | | OTC U.S. Dollar versus Chinese Offshore Renminbi, Call @ $6.37, expires 03/03/2015, UBS | | $ | 508 | |
| | 210,000 | | | OTC U.S. Dollar versus Chinese Onshore Renminbi, Put @ $6.05, expires 03/03/2015, UBS | | | 74 | |
| | 120,000 | | | OTC U.S. Dollar versus Japanese Yen, Call @ $105.00, expires 11/20/2014, BCLY | | | 874 | |
| | | | | | | | |
| | | | TOTAL PURCHASED OPTIONS
(Cost — $5,322) | | | 1,456 | |
| | | | | | | | |
| | | | TOTAL INVESTMENTS BEFORE SHORT-TERM INVESTMENTS
(Cost — $230,473,019) | | | 237,615,591 | |
| | | | | | | | |
| | |
Face
Amount† | | | | | | |
| SHORT-TERM INVESTMENTS — 22.4% | |
| REPURCHASE AGREEMENTS — 13.9% | |
| | 25,900,000 | | | Banc of America repurchase agreement dated 08/29/14, 0.080% due 9/2/14, Proceeds at maturity - $25,900,230; (Fully collateralized by U.S. Treasury Note, 2.625% due 12/31/2014; Market Value - $26,438,351)(g) | | | 25,900,000 | |
| | 2,800,000 | | | Barclays Capital Inc. repurchase agreement dated 08/29/14, 0.070% due 9/2/14, Proceeds at maturity - $2,800,022; (Fully collateralized by U.S. Treasury Note, 0.625% due 11/30/2017; Market Value - $2,856,869)(g) | | | 2,800,000 | |
| | 8,300,000 | | | Citigroup Inc. repurchase agreement dated 08/29/14, 0.080% due 9/2/14, Proceeds at maturity - $8,300,074; (Fully collateralized by U.S. Treasury Note, 1.500% due 7/31/2016; Market Value - $8,476,756)(g) | | | 8,300,000 | |
| | 100,000 | | | Deutsche Bank Securities Inc. repurchase agreement dated 08/29/14, 0.080% due 9/2/14, Proceeds at maturity - $100,001; (Fully collateralized by U.S. Treasury Note TIPS, 0.125% due 4/15/2018; Market Value - $102,202)(g) | | | 100,000 | |
| | | | | | | | |
| | | | TOTAL REPURCHASE AGREEMENTS
(Cost — $37,100,000) | | | 37,100,000 | |
| | | | | | | | |
| SOVEREIGN BONDS — 1.5% | |
| | 100,000 | MYR | | Bank Negara Malaysia Monetary Notes, 3.024% due 10/21/14(g) | | | 31,601 | |
| | | | Hellenic Republic Treasury Bill: | | | | |
| | 500,000 | EUR | | 1.796% due 9/19/14(g) | | | 656,638 | |
| | 2,700,000 | EUR | | 1.746% due 11/14/14(g) | | | 3,536,331 | |
| | 2,000,000 | MXN | | Mexico Cetes, 2.930% due 10/30/14(g) | | | 15,229 | |
| | | | | | | | |
| | | | TOTAL SOVEREIGN BONDS
(Cost — $4,315,952) | | | 4,239,799 | |
| | | | | | | | |
| TIME DEPOSITS — 6.5% | |
| | 32,312 | AUD | | ANZ National Bank — London, 1.874% due 9/1/14 | | | 30,181 | |
| | 178,771 | | | Banco Santander SA — Frankfurt, 0.030% due 9/2/14 | | | 178,771 | |
| | | | BBH — Grand Cayman: | | | | |
| | 63 | DKK | | 0.000% due 9/1/14 | | | 11 | |
| | 998 | CHF | | 0.001% due 9/1/14 | | | 1,088 | |
| | 1,810 | SGD | | 0.005% due 9/1/14 | | | 1,449 | |
| | 109,451,303 | JPY | | 0.005% due 9/1/14 | | | 1,052,366 | |
| | 50 | GBP | | 0.082% due 9/1/14 | | | 83 | |
| | 127 | AUD | | 1.874% due 9/1/14 | | | 119 | |
| | 439 | NZD | | 2.350% due 9/1/14 | | | 367 | |
| | 100,027 | ZAR | | 4.200% due 9/1/14 | | | 9,388 | |
| | 591,175 | | | BNP Paribas — Grand Cayman, 0.030% due 9/2/14 | | | 591,175 | |
| | | | Wells Fargo — Grand Cayman: | | | | |
| | 10,079,154 | EUR | | (0.030)% due 9/1/14 | | | 13,248,544 | |
| | 78,214 | GBP | | 0.082% due 9/1/14 | | | 129,703 | |
| | 2,033,515 | | | 0.030% due 9/2/14 | | | 2,033,515 | |
See Notes to Financial Statements.
139
| | | | | | | | |
| International Fixed Income Investments | |
| | |
Face
Amount† | | | Security | | Value | |
| TIME DEPOSITS — 6.5% — (continued) | |
| | 79,090 | CAD | | 0.229% due 9/2/14 | | $ | 72,836 | |
| | | | | | | | |
| | | | TOTAL TIME DEPOSITS
(Cost — $17,349,596) | | | 17,349,596 | |
| | | | | | | | |
| U.S. GOVERNMENT AGENCIES — 0.1% | |
| | | | Federal Home Loan Bank Discount Notes: | | | | |
| | 100,000 | | | 0.065% due 9/19/14 | | | 99,997 | |
| | 100,000 | | | 0.077% due 10/17/14 | | | 99,990 | |
| | 100,000 | | | 0.100% due 1/26/15 | | | 99,959 | |
| | | | | | | | |
| | | | TOTAL U.S. GOVERNMENT AGENCIES
(Cost — $299,946) | | | 299,946 | |
| | | | | | | | |
| U.S. GOVERNMENT OBLIGATIONS — 0.4% | |
| | | | U.S. Treasury Bills: | | | | |
| | 300,000 | | | 0.055% due 10/23/14(f)(g) | | | 299,976 | |
| | 500,000 | | | 0.045% due 11/13/14(f)(g) | | | 499,954 | |
| | 148,000 | | | 0.042% due 11/28/14(f)(g) | | | 147,985 | |
| | | | | | | | |
| | | | TOTAL U.S. GOVERNMENT OBLIGATIONS
(Cost — $947,915) | | | 947,915 | |
| | | | | | | | |
| | | | TOTAL SHORT-TERM INVESTMENTS
(Cost — $60,013,409) | | | 59,937,256 | |
| | | | | | | | |
| | | | TOTAL INVESTMENTS — 111.3%
(Cost — $290,486,428#) | | | 297,552,847 | |
| | | | | | | | |
| | | | Liabilities in Excess of Other Assets — (11.3)% | | | (30,298,945 | ) |
| | | | | | | | |
| | | | TOTAL NET ASSETS — 100.0% | | $ | 267,253,902 | |
| | | | | | | | |
| † | | Face amount denominated in U.S. dollars, unless otherwise noted. |
| (a) | | Restricted security that may be sold to “qualified institutional buyers” pursuant to the conditions of Rule 144A under the Securities Act of 1933, as amended. This security has been deemed liquid pursuant to guidelines approved by the Board of Trustees, unless otherwise noted. |
| (c) | | Variable rate security. Interest rate disclosed is that which was in effect at August 31, 2014. |
| (d) | | Security is perpetual in nature and has no stated maturity date. |
| (e) | | This security is traded on a TBA basis (see Note 1). |
| (f) | | All or a portion of this security is held at the broker as collateral for open futures or swap contracts. |
| (g) | | Rate shown represents yield-to-maturity. |
| # | | Aggregate cost for federal income tax purposes is $294,782,369. |
| | |
Abbreviations used in this schedule: |
| CDO | | — Collateralized Debt Obligation |
| GMTN | | — Global Medium Term Note |
| OTC | | — Over The Counter |
| PLC | | — Public Limited Company |
| REMICS | | — Real Estate Mortgage Investment Conduits |
See Notes to Financial Statements.
140
| | | | |
| International Fixed Income Investments |
| | |
Currency Abbreviations used in this schedule: |
| AUD | | — Australian Dollar |
| BRL | | — Brazilian Real |
| CAD | | — Canadian Dollar |
| CHF | | — Swiss Franc |
| COP | | — Colombian Peso |
| DKK | | — Danish Krone |
| EUR | | — Euro |
| GBP | | — British Pound |
| IDR | | — Indonesian Rupiah |
| JPY | | — Japanese Yen |
| MXN | | — Mexican Peso |
| MYR | | — Malaysian Ringgit |
| NGN | | — Nigerian Naira |
| NOK | | — Norwegian Krone |
| NZD | | — New Zealand Dollar |
| PEN | | — Peruvian Sol |
| PLN | | — Polish Zloty |
| RON | | — Romanian New Leu |
| RUB | | — Russian Ruble |
| SGD | | — Singapore Dollar |
| THB | | — Thai Baht |
| TRY | | — Turkish Lira |
| ZAR | | — South African Rand |
| | |
Counterparty Abbreviations used in this schedule: |
| BCLY | | — Barclays Bank PLC |
| BOA | | — Bank of America |
| CSFB | | —Credit Suisse Securities (USA) LLC |
| JPM | | — JPMorgan Chase & Co. |
| MLP | | —Merrill Lynch, Pierce, Fenner & Smith Inc. |
| UBS | | — UBS Securities LLC |
| | | | |
| Summary of Investments by Security Type^ | | | |
Sovereign Bonds | | | 43.9 | % |
Corporate Bonds & Notes | | | 19.2 | |
Collateralized Mortgage Obligations | | | 6.8 | |
Mortgage-Backed Securities | | | 5.7 | |
U.S. Government & Agency Obligations | | | 3.0 | |
Municipal Bonds | | | 0.8 | |
Asset-Backed Securities | | | 0.6 | |
Purchased Options | | | 0.0 | ** |
Short-Term Investments | | | 20.0 | |
| | | | |
| | | 100.0 | % |
| | | | |
| ^ | | As a percentage of total investments. |
| ** | | Position represents less than 0.1%. |
See Notes to Financial Statements.
141
| | | | |
| International Fixed Income Investments |
Schedule of Options Contracts Written
| | | | | | | | | | | | | | | | | | | | |
| | | | | |
Notional
Amount/
Number of
Contracts | | | Security Name | | Counterparty | | | Expiration Date | | | Strike Price | | | Value | |
| Germany | |
| | 20 | | | Euro-Bund October Futures, Put | | | MLP | | | | 9/26/14 | | | $ | 147.00 | | | $ | 2,366 | |
| | 2 | | | Euro-Bund October Futures, Put | | | UBS | | | | 9/26/14 | | | | 147.00 | | | | 237 | |
| | 18 | | | Euro-Bund October Futures, Put | | | CSFB | | | | 9/26/14 | | | | 147.50 | | | | 3,312 | |
| | 26 | | | Euro-Bund October Futures, Put | | | CSFB | | | | 9/26/14 | | | | 148.00 | | | | 7,177 | |
| | 17 | | | Euro-Bund October Futures, Put | | | CSFB | | | | 9/26/14 | | | | 148.50 | | | | 7,151 | |
| | 20 | | | Euro-Bund October Futures, Call | | | MLP | | | | 9/26/14 | | | | 151.00 | | | | 6,046 | |
| | 2 | | | Euro-Bund October Futures, Call | | | UBS | | | | 9/26/14 | | | | 151.00 | | | | 605 | |
| | | | | | | | | | | | | | | | | | | | |
| | | | Total Germany | | | | | | | | | | | | | | | 26,894 | |
| | | | | | | | | | | | | | | | | | | | |
| United States | |
| $ | 100,000 | | | CDX.HY-22 Index, Put | | | BOA | | | | 10/15/14 | | | | 99.00 | | | | 15 | |
| | 700,000 | AUD | | OTC AUD versus U.S. Dollar, Call | | | BOA | | | | 11/26/14 | | | | 0.95 | | | | 3,302 | |
| | 1,200,000 | AUD | | OTC AUD versus U.S. Dollar, Call | | | UBS | | | | 11/26/14 | | | | 0.95 | | | | 6,121 | |
| | 58,000 | | | OTC U.S. Dollar versus Brazilian Real, Call | | | BOA | | | | 6/15/15 | | | | 2.64 | | | | 1,120 | |
| | 210,000 | | | OTC U.S. Dollar versus Chinese Offshore Renminbi, Put | | | UBS | | | | 3/3/15 | | | | 6.04 | | | | 105 | |
| | 210,000 | | | OTC U.S. Dollar versus Chinese Onshore Renminbi, Call | | | UBS | | | | 3/3/15 | | | | 6.32 | | | | 386 | |
| | 24,000 | | | OTC U.S. Dollar versus Indian Rupee, Call | | | UBS | | | | 6/1/15 | | | | 68.00 | | | | 275 | |
| | 120,000 | | | OTC U.S. Dollar versus Japanese Yen, Put | | | BCLY | | | | 11/20/14 | | | | 95.00 | | | | 35 | |
| | 46,000 | | | OTC U.S. Dollar versus Japanese Yen, Put | | | JPM | | | | 2/18/16 | | | | 91.00 | | | | 472 | |
| | 1,200,000 | | | OTC U.S. Dollar versus Japanese Yen, Put | | | BOA | | | | 2/28/19 | | | | 80.00 | | | | 43,493 | |
| | 80,000 | | | OTC U.S. Dollar versus Korean Won, Put | | | UBS | | | | 10/16/14 | | | | 1,013.00 | | | | 530 | |
| | 80,000 | | | OTC U.S. Dollar versus Korean Won, Call | | | UBS | | | | 10/16/14 | | | | 1,062.00 | | | | 82 | |
| | 100,000 | | | OTC U.S. Dollar versus Mexican Peso, Put | | | BOA | | | | 11/19/14 | | | | 12.85 | | | | 365 | |
| | | | | | | | | | | | | | | | | | | | |
| | | | Total United States | | | | | | | | | | | | | | | 56,301 | |
| | | | | | | | | | | | | | | | | | | | |
| | | | TOTAL OPTIONS CONTRACTS WRITTEN
(Premiums received — $109,364) | | | | | | | | | | | | | | $ | 83,195 | |
| | | | | | | | | | | | | | | | | | | | |
Schedule of Forward Sale Commitments
| | | | | | | | |
| | |
Face
Amount | | | Security | | Value | |
| | | | Federal National Mortgage Association (FNMA) | | | | |
| $ | 4,000,000 | | | 4.500% due 9/25/44(a) | | $ | 4,321,250 | |
| | 10,000,000 | | | 4.500% due 10/1/44(a) | | | 10,776,758 | |
| | | | | | | | |
| | | | TOTAL OPEN FORWARD SALE COMMITMENTS
(Proceeds — $15,078,594) | | $ | 15,098,008 | |
| | | | | | | | |
| (a) | | This security is traded on a TBA basis (see Note 1). |
For details of other financial instruments held by this Fund, refer to Note 3.
See Notes to Financial Statements.
142
| | | | | | | | | | |
| Municipal Bond Investments | |
| | | |
Face
Amount | | | Rating†† | | Security | | Value | |
| MUNICIPAL BONDS — 98.1% | |
| California — 12.4% | |
| $ | 1,000,000 | | | AA+ | | California Infrastructure & Economic Development Bank, Revenue Bonds, Bay Area Toll Bridges, Series A, Prerefunded 1/1/28 @ 100, AMBAC-Insured, 5.000% due 7/1/36(a) | | $ | 1,297,640 | |
| | 1,050,000 | | | AA- | | California Statewide Communities Development Authority, Revenue Bonds, Sutter Health Project, Series A, 5.500% due 8/15/26 | | | 1,249,899 | |
| | 2,000,000 | | | AA- | | Garden Grove Unified School District, GO, 2010 Election, Series C, 5.000% due 8/1/35 | | | 2,262,160 | |
| | 1,500,000 | | | A+ | | San Diego County, CA, Regional Airport Authority, Revenue Bonds, Series A, 5.000% due 7/1/43 | | | 1,657,500 | |
| | 1,500,000 | | | A+ | | San Francisco, CA, City & County Airports Commission, Revenue Bonds, Series C-2, 5.000% due 5/1/21 | | | 1,744,140 | |
| | 1,230,000 | | | Aa1(b) | | Santa Monica-Malibu, CA, Unified School District, GO, Election of 2006, Series A, Prerefunded 8/1/17 @ 100, FGIC & NPFG-Insured, 5.000% due 8/1/26(a) | | | 1,391,142 | |
| | | | | | | | | | |
| | | | | | Total California | | | 9,602,481 | |
| | | | | | | | | | |
| Colorado — 13.0% | |
| | 1,435,000 | | | AA | | City of Colorado Springs CO Utilities System Revenue, Revenue Bonds, System Improvement, Series B-2, 5.000% due 11/15/38 | | | 1,633,202 | |
| | 2,165,000 | | | AA+ | | City of Longmont, CO, Revenue Bonds, 5.250% due 5/15/17 | | | 2,389,684 | |
| | | | | | Colorado Health Facilities Authority, Revenue Bonds: | | | | |
| | 1,000,000 | | | A+ | | Catholic Health Initiatives, 5.250% due 2/1/31 | | | 1,131,510 | |
| | 1,500,000 | | | AA- | | Sisters of Charity of Leavenworth, Inc., 5.000% due 1/1/44 | | | 1,671,315 | |
| | 1,000,000 | | | AAA | | Colorado Water Resources & Power Development Authority, Revenue Bonds, Revolving Fund, Series A, 5.500% due 9/1/22 | | | 1,255,630 | |
| | 2,000,000 | | | A+ | | University of Colorado Hospital Authority, Revenue Bonds, Series A, 4.000% due 11/15/36 | | | 2,029,260 | |
| | | | | | | | | | |
| | | | | | Total Colorado | | | 10,110,601 | |
| | | | | | | | | | |
| District of Colombia — 3.8% | |
| | 2,500,000 | | | AAA | | District of Columbia, Revenue Bonds, Income Tax Revenue, Series A, 5.000% due 12/1/28 | | | 2,911,550 | |
| | | | | | | | | | |
| Florida — 2.9% | |
| | 1,000,000 | | | A | | City of Jacksonville FL, Revenue Bonds, Better Jacksonville, 5.000% due 10/1/21 | | | 1,127,700 | |
| | 1,000,000 | | | A+ | | County of Miami-Dade, FL — Water & Sewer System Revenue, Revenue Bonds, XLCA-Insured, 5.000% due 10/1/21 | | | 1,130,250 | |
| | | | | | | | | | |
| | | | | | Total Florida | | | 2,257,950 | |
| | | | | | | | | | |
| Georgia — 5.7% | |
| | 2,000,000 | | | AA | | Augusta GA Water & Sewerage Revenue, Revenue Bonds, AGM-Insured, 5.000% due 10/1/21 | | | 2,277,440 | |
| | 1,800,000 | | | A | | Municipal Electric Authority of Georgia, Revenue Bonds, Series B, 5.000% due 1/1/20 | | | 2,119,212 | |
| | | | | | | | | | |
| | | | | | Total Georgia | | | 4,396,652 | |
| | | | | | | | | | |
| Illinois — 3.0% | |
| | | | | | Illinois Finance Authority, Revenue Bonds: | | | | |
| | 1,000,000 | | | A | | Bradley University Projects, XLCA-Insured, 5.000% due 8/1/34 | | | 1,033,550 | |
| | 1,095,000 | | | A2(b) | | DePaul University, Series A, 5.375% due 10/1/19 | | | 1,281,139 | |
| | | | | | | | | | |
| | | | | | Total Illinois | | | 2,314,689 | |
| | | | | | | | | | |
| Kansas — 1.4% | |
| | 1,065,000 | | | AA+ | | Kansas Development Finance Authority, Revenue Bonds, Kansas Transition Revolving Fund, 5.000% due 10/1/20 | | | 1,114,310 | |
| | | | | | | | | | |
| Massachusetts — 3.1% | |
| | 1,000,000 | | | AAA | | Massachusetts Bay Transportation Authority, Revenue Bonds, Series A, 5.250% due 7/1/34 | | | 1,292,280 | |
| | 1,000,000 | | | A2(b) | | Massachusetts Health & Educational Facilities Authority, Revenue Bonds, Northeastern University, Series R, 5.000% due 10/1/28 | | | 1,104,030 | |
| | | | | | | | | | |
| | | | | | Total Massachusetts | | | 2,396,310 | |
| | | | | | | | | | |
See Notes to Financial Statements.
143
| | | | | | | | | | |
| Municipal Bond Investments | |
| | | |
Face
Amount | | | Rating†† | | Security | | Value | |
| Michigan — 2.4% | |
| $ | 1,750,000 | | | AA | | Kalamazoo Hospital Finance Authority, Revenue Bonds, Bronson Hospital, Series A, AGM-Insured, 5.000% due 5/15/26 | | $ | 1,869,018 | |
| | | | | | | | | | |
| Minnesota — 0.1% | |
| | 71,689 | | | AA+ | | Minneapolis & St. Paul, MN, Housing Finance Board, Revenue Bonds, CityLiving Home Programs, Series A-3, GNMA & FNMA-Insured, 5.700% due 4/1/27 | | | 72,626 | |
| | | | | | | | | | |
| New Jersey — 4.2% | |
| | 1,340,000 | | | Aa3(b) | | Manalapan-Englishtown Regional Board of Education, GO, FGIC & NPFG-Insured, 5.750% due 12/1/22 | | | 1,673,807 | |
| | 1,500,000 | | | A+ | | New Jersey Health Care Facilities Financing Authority, Revenue Bonds, AtlantiCare Regional Medical Centre, 5.000% due 7/1/27 | | | 1,598,655 | |
| | | | | | | | | | |
| | | | | | Total New Jersey | | | 3,272,462 | |
| | | | | | | | | | |
| North Carolina — 2.9% | |
| | 2,000,000 | | | A- | | North Carolina Eastern Municipal Power Agency, Revenue Bonds, Series B, 5.000% due 1/1/26 | | | 2,228,020 | |
| | | | | | | | | | |
| Oregon — 3.5% | |
| | 1,000,000 | | | AA- | | Port of Portland, OR, Revenue Bonds, Portland International Project, Series C, 5.000% due
7/1/16(c) | | | 1,082,790 | |
| | 1,330,000 | | | Aa2(b) | | Washington & Clackamas Counties School District No. 23J Tigard-Tualatin, GO, NPFG-Insured, 5.000% due 6/15/22 | | | 1,612,931 | |
| | | | | | | | | | |
| | | | | | Total Oregon | | | 2,695,721 | |
| | | | | | | | | | |
| Pennsylvania — 2.9% | |
| | 2,000,000 | | | A+ | | Monroeville Finance Authority, Revenue Bonds, Series B, 5.000% due 7/1/39 | | | 2,232,420 | |
| | | | | | | | | | |
| South Dakota — 2.0% | |
| | 1,500,000 | | | Aa2(b) | | City of Sioux Falls, SD, Sales Tax, Revenue Bonds, Series A-1, NPFG-Insured, 4.750% due 11/15/36 | | | 1,588,800 | |
| | | | | | | | | | |
| Tennessee — 1.3% | |
| | 1,000,000 | | | BBB+ | | Knox County Health Educational & Housing Facility Board, Revenue Bonds, University Health System, 5.250% due 4/1/36 | | | 1,025,830 | |
| | | | | | | | | | |
| Texas — 16.9% | |
| | 1,000,000 | | | AA | | City of Waxahachie, TX, GO, Series A, AGM-Insured, 5.000% due 8/1/25 | | | 1,105,860 | |
| | 2,000,000 | | | AAA | | Keller, TX, Independent School District, GO, PSF-GTD-Insured, 4.750% due 8/15/32 | | | 2,159,620 | |
| | 2,500,000 | | | AAA | | North East, TX, Independent School District, GO, PSF-GTD-Insured, 5.250% due 2/1/30 | | | 3,214,975 | |
| | 2,000,000 | | | AA | | Round Rock, TX, Independent School District, GO, 5.000% due 8/1/33 | | | 2,237,240 | |
| | | | | | Texas Transportation Commission State Highway Fund, Revenue Bonds: | | | | |
| | 1,000,000 | | | AAA | | 5.000% due 4/1/27 | | | 1,103,850 | |
| | 2,575,000 | | | AAA | | 5.250% due 4/1/26 | | | 3,309,776 | |
| | | | | | | | | | |
| | | | | | Total Texas | | | 13,131,321 | |
| | | | | | | | | | |
| Utah — 2.9% | |
| | 2,000,000 | | | AA | | Utah State University of Agriculture & Applied Science, Revenue Bonds, Student Building Fee, Series B, 5.000% due 12/1/44 | | | 2,227,340 | |
| | | | | | | | | | |
| Washington — 8.1% | |
| | 2,000,000 | | | AA+ | | King County, School District No. 210 Federal Way, GO, FGIC & NPFG-Insured, 5.000% due 12/1/23 | | | 2,240,220 | |
| | 2,000,000 | | | AA+ | | State of Washington, GO, Series A, 5.000% due 7/1/22 | | | 2,296,200 | |
| | 1,500,000 | | | A | | Washington Health Care Facilities Authority, Revenue Bonds, Series A, 5.000% due 11/1/18 | | | 1,737,780 | |
| | | | | | | | | | |
| | | | | | Total Washington | | | 6,274,200 | |
| | | | | | | | | | |
| Wisconsin — 5.6% | |
| | 2,500,000 | | | AA+ | | Wisconsin Department of Transportation, Revenue Bonds, Series I, FGIC & NPFG-Insured, 5.000% due 7/1/20 | | | 2,990,875 | |
See Notes to Financial Statements.
144
| | | | | | | | | | |
| Municipal Bond Investments | |
| | | |
Face
Amount | | | Rating†† | | Security | | Value | |
| Wisconsin — 5.6% — (continued) | |
| $ | 1,340,000 | | | BBB | | Wisconsin Health & Educational Facilities Authority, Revenue Bonds, Divine Savior Health Care, Inc., 5.500% due 5/1/26 | | $ | 1,375,550 | |
| | | | | | | | | | |
| | | | | | Total Wisconsin | | | 4,366,425 | |
| | | | | | | | | | |
| | | | | | TOTAL MUNICIPAL BONDS
(Cost — $69,865,724) | | | 76,088,726 | |
| | | | | | | | | | |
| SHORT-TERM INVESTMENTS — 1.1% | |
| TIME DEPOSITS — 1.1% | |
| | 93,989 | | | | | Bank of New York Mellon — Grand Cayman, 0.030% due 9/2/14 | | | 93,989 | |
| | 789,517 | | | | | BNP Paribas — Grand Cayman, 0.030% due 9/2/14 | | | 789,517 | |
| | | | | | | | | | |
| | | | | | TOTAL SHORT-TERM INVESTMENTS
(Cost — $883,506) | | | 883,506 | |
| | | | | | | | | | |
| | | | | | TOTAL INVESTMENTS — 99.2%
(Cost — $70,749,230#) | | | 76,972,232 | |
| | | | | | | | | | |
| | | | | | Other Assets in Excess of Liabilities — 0.8% | | | 590,586 | |
| | | | | | | | | | |
| | | | | | TOTAL NET ASSETS — 100.0% | | $ | 77,562,818 | |
| | | | | | | | | | |
| †† | | All ratings are by Standard & Poor’s Rating Service, unless otherwise noted. All ratings are unaudited. |
| (a) | | Pre-refunded bonds are escrowed with government obligations and/or government agency securities and are considered by the Manager to be triple-A rated even if the issuer has not applied for new ratings. |
| (b) | | Rating by Moody’s Investors Service. All ratings are unaudited. |
| (c) | | Income from this issue is considered a preference item for purposes of calculating the alternative minimum tax (AMT). |
| # | | Aggregate cost for federal income tax purposes is $70,749,230. |
| | |
Abbreviations used in this schedule: |
| AGM | | — Assured Guaranty Municipal Corp. |
| AMBAC | | — American Bond Assurance Corporation |
| FGIC | | — Financial Guarantee Insurance Company |
| FNMA | | — Federal National Mortgage Association |
| GNMA | | — Government National Mortgage Association |
| GO | | — General Obligation |
| NPFG | | — National Public Finance Guarantee Corp. |
| PSF-GTD | | — Permanent School Fund Guaranteed |
| XLCA | | — XL Capital Assurance Inc. |
See pages 148 and 149 for definitions of ratings.
See Notes to Financial Statements.
145
| | | | | | |
| Municipal Bond Investments |
| | | | |
| Summary of Investments by Industry^ | | | |
Education | | | 29.2 | % |
Health Care Providers & Services | | | 19.1 | |
General Obligation | | | 16.6 | |
Transportation | | | 11.3 | |
Water and Sewer | | | 6.1 | |
Airport | | | 5.8 | |
Power | | | 5.6 | |
Utilities | | | 2.1 | |
Development | | | 1.6 | |
Public Facilities | | | 1.4 | |
Single Family Housing | | | 0.1 | |
Short-Term Investments | | | 1.1 | |
| | | | |
| | | 100.0 | % |
| | | | |
| ^ | | As a percentage of total investments. |
See Notes to Financial Statements.
146
| | | | | | | | | | |
| Money Market Investments | |
| | | |
Face
Amount | | | | | Security | | Value | |
| SHORT-TERM INVESTMENTS — 98.0% | |
| CERTIFICATES OF DEPOSIT — 19.4% | |
| $ | 10,000,000 | | | | | Bank of Montreal/Chicago IL, 0.239% due 8/7/15 | | $ | 10,000,000 | |
| | 10,000,000 | | | | | Citibank, N.A. New York, 0.200% due 11/19/14 | | | 10,000,000 | |
| | 10,000,000 | | | | | Mizuho Bank LTD, 0.190% due 10/8/14 | | | 10,000,000 | |
| | 10,000,000 | | | | | Nordea Bank Finland PLC, 0.210% due 9/5/14 | | | 10,000,000 | |
| | 10,000,000 | | | | | Norinchukin Bank, 0.210% due 11/14/14 | | | 10,000,000 | |
| | 10,000,000 | | | | | Skandinaviska Enskilda Banken AB, 0.250% due 2/26/15 | | | 10,000,000 | |
| | 5,000,000 | | | | | Sumitomo Mitsui Banking Corp., 0.250% due 9/12/14 | | | 5,000,000 | |
| | | | | | | | | | |
| | | | | | TOTAL CERTIFICATES OF DEPOSIT
(Cost — $65,000,000) | | | 65,000,000 | |
| | | | | | | | | | |
| COMMERCIAL PAPER — 56.4% | |
| | 12,000,000 | | | | | Alpine Securitization Corp., 0.220% due 10/20/14(a)(b) | | | 11,996,407 | |
| | 15,000,000 | | | | | Autobahn Funding Co. LLC, 0.060% due 9/2/14(a)(b) | | | 14,999,975 | |
| | 14,000,000 | | | | | Barclays U.S. Funding Corp., 0.080% due 9/2/14(b) | | | 13,999,969 | |
| | 12,000,000 | | | | | BNP Paribas Finance Inc., 0.230% due 10/15/14(b) | | | 11,996,627 | |
| | 12,000,000 | | | | | Coca-Cola Co., 0.160% due 12/1/14(a)(b) | | | 11,995,147 | |
| | 5,000,000 | | | | | Collateralized Commercial Paper Co. LLC, 0.250% due 11/18/14(b) | | | 4,997,292 | |
| | 15,000,000 | | | | | Credit Agricole North America Inc., 0.080% due 9/2/14(b) | | | 14,999,967 | |
| | 12,000,000 | | | | | General Electric Capital Corp., 0.230% due 1/30/15(b) | | | 11,988,423 | |
| | 14,000,000 | | | | | Lloyds Bank PLC, 0.040% due 9/2/14(b) | | | 13,999,984 | |
| | 15,000,000 | | | | | National Australia Funding Delaware Inc., 0.035% due 9/2/14(a)(b) | | | 14,999,985 | |
| | 15,000,000 | | | | | Natixis U.S. Finance Company, LLC, 0.080% due 9/2/14(b) | | | 14,999,967 | |
| | 12,000,000 | | | | | Old Line Funding Corp., 0.170% due 11/18/14(a)(b) | | | 11,995,580 | |
| | 11,000,000 | | | | | Rabobank USA Financial Corp., 0.215% due 10/15/14(b) | | | 10,997,109 | |
| | 10,000,000 | | | | | Swedbank, 0.250% due 2/2/15(b) | | | 9,989,305 | |
| | 15,000,000 | | | | | Toyota Motor Credit Corp., 0.140% due 11/25/14(b) | | | 14,995,042 | |
| | | | | | | | | | |
| | | | | | TOTAL COMMERCIAL PAPER
(Cost — $188,950,779) | | | 188,950,779 | |
| | | | | | | | | | |
| TIME DEPOSITS — 0.2% | |
| | 500,295 | | | | | ANZ National Bank — London, 0.030% due 9/2/14 | | | 500,295 | |
| | 87,375 | | | | | Banco Santander SA — Frankfurt, 0.030% due 9/2/14 | | | 87,375 | |
| | | | | | | | | | |
| | | �� | | | TOTAL TIME DEPOSITS
(Cost — $587,670) | | | 587,670 | |
| | | | | | | | | | |
| U.S. GOVERNMENT AGENCY — 2.9% | |
| | 9,635,000 | | | | | Federal Home Loan Bank (FHLB), Discount Notes, 0.000% due 9/2/14(b) | | | | |
| | | | | | (Cost — $9,635,000) | | | 9,635,000 | |
| | | | | | | | | | |
| U.S. GOVERNMENT OBLIGATIONS — 19.1% | |
| | 50,000,000 | | | | | U.S. Treasury Bills, 0.015% due 9/4/14(b) | | | 49,999,938 | |
| | 14,000,000 | | | | | U.S. Treasury Notes, 2.375% due 10/31/14 | | | 14,053,031 | |
| | | | | | | | | | |
| | | | | | TOTAL U.S. GOVERNMENT OBLIGATIONS
(Cost — $64,052,969) | | | 64,052,969 | |
| | | | | | | | | | |
| | | | | | TOTAL INVESTMENTS — 98.0%
(Cost — $328,226,418#) | | | 328,226,418 | |
| | | | | | | | | | |
| | | | | | Cash and Other Assets in Excess of Liabilities — 2.0% | | | 6,713,031 | |
| | | | | | | | | | |
| | | | | | TOTAL NET ASSETS — 100.0% | | $ | 334,939,449 | |
| | | | | | | | | | |
| (a) | | Restricted security that may be sold to “qualified institutional buyers” pursuant to the conditions of Rule 144A under the Securities Act of 1933, as amended. This security has been deemed liquid pursuant to guidelines approved by the Board of Trustees, unless otherwise noted. |
| (b) | | Rate shown represents yield-to-maturity. |
| # | | Aggregate cost for federal income tax purposes is $328,226,418. |
See Notes to Financial Statements.
147
The definitions of the applicable rating symbols are set forth below:
Standard & Poor’s Ratings Service (“Standard & Poor’s”) — Ratings from “AA” to “CCC” may be modified by the addition of a plus (+) or minus (-) sign to show relative standings within the major rating categories.
| | |
| AAA | | — Bonds rated “AAA” have the highest rating assigned by Standard & Poor’s. Capacity to pay interest and repay principal is extremely strong. |
| AA | | — Bonds rated “AA” have a very strong capacity to pay interest and repay principal and differ from the highest rated issues only in a small degree. |
| A | | — Bonds rated “A” have a strong capacity to pay interest and repay principal although they are somewhat more susceptible to the adverse effects of changes in circumstances and economic conditions than debt in higher rated categories. |
| BBB | | — Bonds rated “BBB” are regarded as having an adequate capacity to pay interest and repay principal. Whereas they normally exhibit adequate protection parameters, adverse economic conditions or changing circumstances are more likely to lead to a weakened capacity to pay interest and repay principal for bonds in this category than in higher rated categories. |
| BB, B, CCC, CC and C | | — Bonds rated “BB”, “B”, “CCC”, “CC” and “C” are regarded, on balance, as predominantly speculative with respect to capacity to pay interest and repay principal in accordance with the terms of the obligation. “BB” represents the lowest degree of speculation and “C” the highest degree of speculation. While such bonds will likely have some quality and protective characteristics, these are outweighed by large uncertainties or major risk exposures to adverse conditions. |
| D | | — Bonds rated “D” are in default and payment of interest and/or repayment of principal is in arrears. |
| P | | — Preliminary rating |
Moody’s Investors Service (“Moody’s”) — Numerical modifiers 1, 2 and 3 may be applied to each generic rating from “Aa” to “Caa,” where 1 is the highest and 3 the lowest ranking within its generic category.
| | |
| Aaa | | — Bonds rated “Aaa” are judged to be of the best quality. They carry the smallest degree of investment risk and are generally referred to as “gilt edge.” Interest payments are protected by a large or by an exceptionally stable margin and principal is secure. While the various protective elements are likely to change, such changes as can be visualized are most unlikely to impair the fundamentally strong position of such issues. |
| Aa | | — Bonds rated “Aa” are judged to be of high quality by all standards. Together with the “Aaa” group they comprise what are generally known as high grade bonds. They are rated lower than the best bonds because margins of protection may not be as large as in “Aaa” securities or fluctuation of protective elements may be of greater amplitude or there may be other elements present which make the long-term risks appear somewhat larger than in “Aaa” securities. |
| A | | — Bonds rated “A” possess many favorable investment attributes and are to be considered as upper medium grade obligations. Factors giving security to principal and interest are considered adequate but elements may be present which suggest a susceptibility to impairment some time in the future. |
| Baa | | — Bonds rated “Baa” are considered as medium grade obligations, i.e., they are neither highly protected nor poorly secured. Interest payments and principal security appear adequate for the present but certain protective elements may be lacking or may be characteristically unreliable over any great length of time. Such bonds lack outstanding investment characteristics and in fact have speculative characteristics as well. |
| Ba | | — Bonds rated “Ba” are judged to have speculative elements; their future cannot be considered as well assured. Often the protection of interest and principal payments may be very moderate and therefore not well safeguarded during both good and bad times over the future. Uncertainty of position characterizes bonds in this class. |
| B | | — Bonds rated “B” generally lack characteristics of desirable investments. Assurance of interest and principal payments or of maintenance of other terms of the contract over any long period of time may be small. |
| Caa | | — Bonds rated “Caa” are of poor standing. These may be in default, or present elements of danger may exist with respect to principal or interest. |
| Ca | | — Bonds rated “Ca” represent obligations which are speculative in a high degree. Such issues are often in default or have other marked short- comings. |
| C | | — Bonds rated “C” are the lowest class of bonds and issues so rated can be regarded as having extremely poor prospects of ever attaining any real investment standing. |
Fitch Ratings Service (“Fitch”) — Ratings from “AA” to “CCC” may be modified by the addition of a plus (+) or minus (-) sign to show relative standings within the major rating categories. Ratings may be modified by the addition of an “e” to signify expected rating.
| | |
| AAA | | — Bonds rated “AAA” have the highest rating assigned by Fitch. Capacity to pay interest and repay principal is extremely strong. |
| AA | | — Bonds rated “AA” have a very strong capacity to pay interest and repay principal and differ from the highest rated issues only in a small degree. |
| A | | — Bonds rated “A” have a strong capacity to pay interest and repay principal although they are somewhat more susceptible to the adverse effects of changes in circumstances and economic conditions than debt in higher rated categories. |
| BBB | | — Bonds rated “BBB” are regarded as having an adequate capacity to pay interest and repay principal. Whereas they normally exhibit adequate protection parameters, adverse economic conditions or changing circumstances are more likely to lead to a weakened capacity to pay interest and repay principal for bonds in this category than in higher rated categories. |
| BB, B, CCC, CC and C | | — Bonds rated “BB”, “B”, “CCC”, “CC” and “C” are regarded, on balance, as predominantly speculative with respect to capacity to pay interest and repay principal in accordance with the terms of the obligation. “BB” represents a lower degree of speculation than “B”, and “CC” the highest degree of speculation. While such bonds will likely have some quality and protective characteristics, these are outweighed by large uncertainties or major risk exposures to adverse conditions. |
| D | | — Bonds rated “D” are in default and payment of interest and/or repayment of principal is in arrears. |
| NR | | — Indicates that the bond is not rated by Standard & Poor’s, Moody’s, or Fitch. |
148
Short-Term Security Ratings
| | |
| SP-1 | | — Standard & Poor’s highest rating indicating very strong or strong capacity to pay principal and interest; those issues determined to possess overwhelming safety characteristics are denoted with a plus (+) sign. |
| A-1 | | — Standard & Poor’s highest commercial paper and variable-rate demand obligation (VRDO) rating indicating that the degree of safety regarding timely payment is either overwhelming or very strong; those issues determined to possess overwhelming safety characteristics are denoted with a plus (+) sign. |
| VMIG 1 | | — Moody’s highest rating for issues having a demand feature — VRDO. |
| MIG1 | | — Moody’s highest rating for short-term municipal obligations. |
| P-1 | | — Moody’s highest rating for commercial paper and for VRDO prior to the advent of the VMIG 1 rating. |
| F-1 | | — Fitch’s highest rating indicating the strongest capacity for timely payment of financial commitments; those issues determined to possess overwhelming strong credit feature are denoted with a plus (+) sign. |
149
| | |
| | | |
| Statements of Assets and Liabilities | | |
| | | | | | | | | | | | | | |
| | | Large
Capitalization
Growth
Investments | | | Large
Capitalization
Value Equity
Investments | | | Small
Capitalization
Growth
Investments | | | |
| ASSETS: | | | | | | | | | | | | | | |
Investments, at value1,2 | | $ | 1,807,224,015 | | | $ | 1,481,463,058 | | | $ | 324,403,785 | | | |
Repurchase Agreements1 | | | — | | | | — | | | | — | | | |
Foreign currency, at value3 | | | — | | | | — | | | | — | | | |
Cash | | | 1,414 | | | | 1,492 | | | | 402 | | | |
Receivable for securities sold | | | 2,814,489 | | | | 4,619,995 | | | | 767,366 | | | |
Dividends and interest receivable | | | 1,447,369 | | | | 4,180,054 | | | | 145,270 | | | |
Receivable for manager waiver | | | — | | | | — | | | | — | | | |
Receivable for Fund shares sold | | | 1,495,525 | | | | 877,835 | | | | 68,991 | | | |
Unrealized appreciation on open forward foreign currency contracts (Notes 1 and 3) | | | — | | | | — | | | | — | | | |
Variation margin on open future contracts (Notes 1 and 3) | | | — | | | | — | | | | — | | | |
Variation margin on open centrally cleared swap contracts (Notes 1 and 3) | | | — | | | | — | | | | — | | | |
Swap contracts, at value (Notes 1 and 3) | | | — | | | | — | | | | — | | | |
Deposits with counterparty | | | — | | | | — | | | | — | | | |
Prepaid expenses | | | 11,243 | | | | 14,801 | | | | 11,308 | | | |
| | | | | | | | | | | | | | |
Total Assets | | | 1,812,994,055 | | | | 1,491,157,235 | | | | 325,397,122 | | | |
| | | | | | | | | | | | | | |
| LIABILITIES: | | | | | | | | | | | | | | |
Payable for collateral received from securities on loan | | | 27,461,626 | | | | 16,233,890 | | | | 27,854,226 | | | |
Payable for Fund shares repurchased | | | 2,861,042 | | | | 2,542,176 | | | | 457,569 | | | |
Payable for securities purchased | | | 1,493,929 | | | | 3,797,984 | | | | 418,700 | | | |
Investment management fee payable | | | 855,039 | | | | 751,918 | | | | 194,321 | | | |
Transfer agent fees payable | | | 19,909 | | | | 13,039 | | | | 2,848 | | | |
Custody fee payable | | | 119,393 | | | | 91,814 | | | | 26,798 | | | |
Trustees’ fees payable | | | 61,899 | | | | 44,481 | | | | 11,173 | | | |
Due to custodian | | | — | | | | — | | | | — | | | |
Variation margin on open future contracts (Notes 1 and 3) | | | — | | | | — | | | | — | | | |
Forward sale commitments, at value (proceeds received)4 (Note 1) | | | — | | | | — | | | | — | | | |
Options contracts written, at value (premiums received)5 (Note 1 and 3) | | | — | | | | — | | | | — | | | |
Swap contracts, at value (Notes 1 and 3) | | | — | | | | — | | | | — | | | |
Unrealized depreciation on open forward foreign currency contracts (Notes 1 and 3) | | | — | | | | — | | | | — | | | |
Deposits from counterparty | | | — | | | | — | | | | — | | | |
Foreign capital gains tax payable | | | — | | | | — | | | | — | | | |
Distributions payable | | | — | | | | — | | | | — | | | |
Accrued expenses | | | 83,550 | | | | 93,848 | | | | 79,043 | | | |
| | | | | | | | | | | | | | |
Total Liabilities | | | 32,956,387 | | | | 23,569,150 | | | | 29,044,678 | | | |
| | | | | | | | | | | | | | |
| Total Net Assets | | $ | 1,780,037,668 | | | $ | 1,467,588,085 | | | $ | 296,352,444 | | | |
| | | | | | | | | | | | | | |
| NET ASSETS: | | | | | | | | | | | | | | |
Par value (Note 4) | | $ | 80,203 | | | $ | 108,428 | | | $ | 10,387 | | | |
Paid-in capital in excess of par value | | | 1,034,051,957 | | | | 1,349,527,877 | | | | 171,015,851 | | | |
Accumulated net investment loss | | | — | | | | — | | | | — | | | |
Undistributed net investment income | | | 5,267,734 | | | | 15,727,510 | | | | 68,774 | | | |
Accumulated net realized gain (loss) on investments, futures contracts, options contracts written, forward sale commitments, swap contracts and foreign currency transactions | | | 152,379,197 | | | | (285,996,911 | ) | | | 60,000,231 | | | |
Net unrealized appreciation on investments, futures contracts, options contracts written, forward sale commitments, swap contracts and foreign currency transactions | | | 588,258,577 | | | | 388,221,181 | | | | 65,257,201 | | | |
| | | | | | | | | | | | | | |
| Total Net Assets | | $ | 1,780,037,668 | | | $ | 1,467,588,085 | | | $ | 296,352,444 | | | |
| | | | | | | | | | | | | | |
| Shares Outstanding | | | 80,203,452 | | | | 108,427,671 | | | | 10,386,843 | | | |
| | | | | | | | | | | | | | |
| Net Asset Value | | $ | 22.19 | | | $ | 13.54 | | | $ | 28.53 | | | |
| | | | | | | | | | | | | | |
1 Investments, at cost | | $ | 1,218,965,438 | | | $ | 1,093,241,877 | | | $ | 259,146,584 | | | |
| | | | | | | | | | | | | | |
2 Includes securities on loan | | $ | 27,118,272 | | | $ | 15,981,887 | | | $ | 27,269,421 | | | |
| | | | | | | | | | | | | | |
3 Foreign currency, at cost | | $ | — | | | $ | — | | | $ | — | | | |
| | | | | | | | | | | | | | |
4 Proceeds received | | $ | — | | | $ | — | | | $ | — | | | |
| | | | | | | | | | | | | | |
5 Premiums received | | $ | — | | | $ | — | | | $ | — | | | |
| | | | | | | | | | | | | | |
| * | | Value represents amortized cost. |
See Notes to Financial Statements.
150
| | | | | | | | | | | | | | | | | | | | | | | | | | | | | | | | |
| | | Small
Capitalization
Value Equity
Investments | | | International
Equity
Investments | | | Emerging
Markets
Equity
Investments | | | Core Fixed
Income
Investments | | | High Yield
Investments | | | International
Fixed
Income
Investments | | | Municipal
Bond
Investments | | | Money
Market
Investments | |
| | | | | | | | | | | | | | | | | | | | | | | | | | | | | | | | |
| | $ | 310,873,533 | | | $ | 1,159,326,777 | | | $ | 403,826,169 | | | $ | 879,298,238 | | | $ | 267,440,926 | | | $ | 260,452,847 | | | $ | 76,972,232 | | | $ | 328,226,418 | * |
| | | — | | | | — | | | | — | | | | — | | | | — | | | | 37,100,000 | | | | — | | | | — | |
| | | — | | | | 266,602 | | | | 418,103 | | | | 520,128 | | | | — | | | | 253,820 | | | | — | | | | — | |
| | | 355 | | | | 1,477 | | | | 557 | | | | — | | | | 534 | | | | 98,691 | | | | 56 | | | | 2 | |
| | | 285,179 | | | | 4,204,279 | | | | 282,540 | | | | 31,239,202 | | | | — | | | | 32,955,706 | | | | — | | | | — | |
| | | 295,942 | | | | 3,184,407 | | | | 629,035 | | | | 4,583,657 | | | | 4,496,385 | | | | 2,655,257 | | | | 797,616 | | | | 135,590 | |
| | | — | | | | — | | | | — | | | | — | | | | — | | | | — | | | | — | | | | 33,650 | |
| | | 123,108 | | | | 1,294,142 | | | | 200,118 | | | | 370,997 | | | | 504,708 | | | | 241,572 | | | | 25,678 | | | | 7,453,610 | |
| | | — | | | | — | | | | — | | | | 1,945,328 | | | | — | | | | 4,552,534 | | | | — | | | | — | |
| | | — | | | | — | | | | — | | | | 116,355 | | | | — | | | | — | | | | — | | | | — | |
| | | — | | | | — | | | | — | | | | 46,124 | | | | — | | | | 11,296 | | | | — | | | | — | |
| | | — | | | | — | | | | — | | | | 440,308 | | | | — | | | | 289,303 | | | | — | | | | — | |
| | | — | | | | — | | | | — | | | | 597,438 | | | | — | | | | 314,406 | | | | — | | | | — | |
| | | 10,210 | | | | 13,557 | | | | 7,930 | | | | 13,926 | | | | 9,048 | | | | 9,633 | | | | 9,127 | | | | 11,761 | |
| | | | | | | | | | | | | | | | | | | | | | | | | | | | | | | | |
| | | 311,588,327 | | | | 1,168,291,241 | | | | 405,364,452 | | | | 919,171,701 | | | | 272,451,601 | | | | 338,935,065 | | | | 77,804,709 | | | | 335,861,031 | |
| | | | | | | | | | | | | | | | | | | | | | | | | | | | | | | | |
| | | | | | | | | | | | | | | | | | | | | | | | | | | | | | | | |
| | | 20,876,827 | | | | 12,670,056 | | | | 17,939,497 | | | | 262,624 | | | | 6,217,477 | | | | — | | | | — | | | | — | |
| | | 440,135 | | | | 1,963,886 | | | | 691,714 | | | | 1,806,866 | | | | 442,977 | | | | 461,566 | | | | 178,175 | | | | 787,316 | |
| | | 601,816 | | | | 3,586,839 | | | | 510,595 | | | | 115,474,708 | | | | 8,049,168 | | | | 51,276,711 | | | | — | | | | — | |
| | | 190,739 | | | | 600,426 | | | | 263,905 | | | | 288,837 | | | | 106,147 | | | | 112,639 | | | | 28,109 | | | | 22,147 | |
| | | 5,080 | | | | 14,727 | | | | 5,001 | | | | 10,195 | | | | 2,660 | | | | 2,997 | | | | 786 | | | | 3,080 | |
| | | 24,638 | | | | 138,376 | | | | 106,438 | | | | 158,746 | | | | 44,169 | | | | 61,103 | | | | 9,598 | | | | 27,128 | |
| | | 8,053 | | | | 15,085 | | | | 36,860 | | | | 46,394 | | | | 8,663 | | | | 17,764 | | | | 4,625 | | | | 15,171 | |
| | | — | | | | — | | | | — | | | | 134,491 | | | | — | | | | — | | | | — | | | | — | |
| | | — | | | | — | | | | — | | | | — | | | | — | | | | 62,210 | | | | — | | | | — | |
| | | — | | | | — | | | | — | | | | — | | | | — | | | | 15,098,008 | | | | — | | | | — | |
| | | — | | | | — | | | | — | | | | 263,253 | | | | — | | | | 83,195 | | | | — | | | | — | |
| | | — | | | | — | | | | — | | | | 209,910 | | | | — | | | | 126,433 | | | | — | | | | — | |
| | | | | | | | |
| | | — | | | | — | | | | — | | | | 489,951 | | | | — | | | | 1,489,655 | | | | — | | | | — | |
| | | — | | | | — | | | | — | | | | 824,441 | | | | — | | | | 2,820,000 | | | | — | | | | — | |
| | | — | | | | 4,648 | | | | 249,341 | | | | — | | | | — | | | | — | | | | — | | | | — | |
| | | — | | | | — | | | | — | | | | 311 | | | | 974 | | | | — | | | | 72 | | | | 27 | |
| | | 66,682 | | | | 68,543 | | | | 170,605 | | | | 99,747 | | | | 56,047 | | | | 68,882 | | | | 20,526 | | | | 66,713 | |
| | | | | | | | | | | | | | | | | | | | | | | | | | | | | | | | |
| | | 22,213,970 | | | | 19,062,586 | | | | 19,973,956 | | | | 120,070,474 | | | | 14,928,282 | | | | 71,681,163 | | | | 241,891 | | | | 921,582 | |
| | | | | | | | | | | | | | | | | | | | | | | | | | | | | | | | |
| | $ | 289,374,357 | | | $ | 1,149,228,655 | | | $ | 385,390,496 | | | $ | 799,101,227 | | | $ | 257,523,319 | | | $ | 267,253,902 | | | $ | 77,562,818 | | | $ | 334,939,449 | |
| | | | | | | | | | | | | | | | | | | | | | | | | | | | | | | | |
| | | | | | | | | | | | | | | | | | | | | | | | | | | | | | | | |
| | $ | 18,592 | | | $ | 95,531 | | | $ | 26,501 | | | $ | 94,648 | | | $ | 58,356 | | | $ | 33,260 | | | $ | 7,943 | | | $ | 334,939 | |
| | | 187,908,844 | | | | 1,293,070,488 | | | | 325,897,064 | | | | 771,847,063 | | | | 264,009,894 | | | | 261,990,715 | | | | 70,577,584 | | | | 334,603,920 | |
| | | — | | | | — | | | | — | | | | (610,826 | ) | | | — | | | | — | | | | — | | | | — | |
| | | 2,256,118 | | | | 18,978,024 | | | | 4,504,889 | | | | — | | | | 1,103,560 | | | | 4,713,483 | | | | 340,817 | | | | 228 | |
| | | | | | | | |
| | | 20,510,073 | | | | (246,629,625 | ) | | | (12,901,027 | ) | | | 4,698,036 | | | | (13,674,846 | ) | | | (11,197,611 | ) | | | 413,472 | | | | 362 | |
| | | | | | | | |
| | | 78,680,730 | | | | 83,714,237 | | | | 67,863,069 | | | | 23,072,306 | | | | 6,026,355 | | | | 11,714,055 | | | | 6,223,002 | | | | — | |
| | | | | | | | | | | | | | | | | | | | | | | | | | | | | | | | |
| | $ | 289,374,357 | | | $ | 1,149,228,655 | | | $ | 385,390,496 | | | $ | 799,101,227 | | | $ | 257,523,319 | | | $ | 267,253,902 | | | $ | 77,562,818 | | | $ | 334,939,449 | |
| | | | | | | | | | | | | | | | | | | | | | | | | | | | | | | | |
| | | 18,591,824 | | | | 95,530,636 | | | | 26,500,855 | | | | 94,648,292 | | | | 58,356,440 | | | | 33,259,987 | | | | 7,943,188 | | | | 334,939,396 | |
| | | | | | | | | | | | | | | | | | | | | | | | | | | | | | | | |
| | $ | 15.56 | | | $ | 12.03 | | | $ | 14.54 | | | $ | 8.44 | | | $ | 4.41 | | | $ | 8.04 | | | $ | 9.76 | | | $ | 1.00 | |
| | | | | | | | | | | | | | | | | | | | | | | | | | | | | | | | |
| | $ | 232,192,803 | | | $ | 1,075,569,540 | | | $ | 335,693,363 | | | $ | 857,935,835 | | | $ | 261,414,571 | | | $ | 290,486,428 | | | $ | 70,749,230 | | | $ | 328,226,418 | |
| | | | | | | | | | | | | | | | | | | | | | | | | | | | | | | | |
| | $ | 20,408,215 | | | $ | 11,879,912 | | | $ | 17,379,982 | | | $ | 255,191 | | | $ | 6,000,383 | | | $ | — | | | $ | — | | | $ | — | |
| | | | | | | | | | | | | | | | | | | | | | | | | | | | | | | | |
| | $ | — | | | $ | 270,461 | | | $ | 418,954 | | | $ | 562,716 | | | $ | — | | | $ | 265,546 | | | $ | — | | | $ | — | |
| | | | | | | | | | | | | | | | | | | | | | | | | | | | | | | | |
| | $ | — | | | $ | — | | | $ | — | | | $ | — | | | $ | — | | | $ | 15,078,594 | | | $ | — | | | $ | — | |
| | | | | | | | | | | | | | | | | | | | | | | | | | | | | | | | |
| | $ | — | | | $ | — | | | $ | — | | | $ | 500,810 | | | $ | — | | | $ | 109,364 | | | $ | — | | | $ | — | |
| | | | | | | | | | | | | | | | | | | | | | | | | | | | | | | | |
See Notes to Financial Statements.
151
| | |
| For the Year Ended August 31, 2014 | | |
| | | | | | | | | | | | | | |
| | | Large
Capitalization
Growth Investments | | | Large
Capitalization
Value Equity
Investments | | | Small
Capitalization
Growth
Investments | | | |
| INVESTMENT INCOME: | | | | | | | | | | | | | | |
| | | | |
Dividends | | $ | 16,456,475 | | | $ | 31,661,329 | | | $ | 1,107,441 | | | |
Interest | | | 13,977 | | | | 21,035 | | | | 3,872 | | | |
Income from securities lending | | | 144,902 | | | | 69,468 | | | | 412,565 | | | |
Miscellaneous income | | | — | | | | — | | | | — | | | |
Less: Foreign taxes withheld (See Note 1p) | | | (251,303 | ) | | | (310,781 | ) | | | (7,129 | ) | | |
| | | | | | | | | | | | | | |
Total Investment Income | | | 16,364,051 | | | | 31,441,051 | | | | 1,516,749 | | | |
| | | | | | | | | | | | | | |
| | | | |
| EXPENSES: | | | | | | | | | | | | | | |
| | | | |
Investment management fee (Note 2) | | | 9,833,111 | | | | 8,156,686 | | | | 2,426,596 | | | |
Transfer agent fees | | | 126,715 | | | | 93,623 | | | | — | | | |
Custody fees | | | 437,935 | | | | 357,549 | | | | 102,438 | | | |
Trustees’ fees | | | 313,641 | | | | 235,023 | | | | 57,286 | | | |
Shareholder reports | | | 101,245 | | | | 111,195 | | | | 111,667 | | | |
Insurance | | | 62,551 | | | | 57,734 | | | | 13,517 | | | |
Audit and tax | | | 60,603 | | | | 56,429 | | | | 46,642 | | | |
Legal fees | | | 13,972 | | | | 18,308 | | | | 16,011 | | | |
Registration fees | | | 19,982 | | | | 19,704 | | | | 19,479 | | | |
Miscellaneous expenses | | | 43,197 | | | | 32,420 | | | | 7,291 | | | |
Interest Expense | | | — | | | | — | | | | — | | | |
| | | | | | | | | | | | | | |
Total Expenses | | | 11,012,952 | | | | 9,138,671 | | | | 2,800,927 | | | |
Less: Fee waivers and/or expense reimbursement (Note 2) | | | — | | | | (9,389 | ) | | | (18,015 | ) | | |
| | | | | | | | | | | | | | |
Net Expenses | | | 11,012,952 | | | | 9,129,282 | | | | 2,782,912 | | | |
| | | | | | | | | | | | | | |
Net Investment Income (Loss) | | $ | 5,351,099 | | | $ | 22,311,769 | | | $ | (1,266,163 | ) | | |
| | | | | | | | | | | | | | |
| | | | |
| REALIZED AND UNREALIZED GAIN (LOSS) ON INVESTMENTS, FUTURES CONTRACTS, OPTIONS CONTRACTS WRITTEN, FORWARD SALE COMMITMENTS, SWAP CONTRACTS AND FOREIGN CURRENCY TRANSACTIONS (NOTES 1 AND 3): | | | | | | | | | | | | | | |
| | | | |
Net Realized Gain (Loss) From: | | | | | | | | | | | | | | |
| | | | |
Investments | | $ | 243,561,466 | | | $ | 84,435,975 | | | $ | 63,068,296 | | | |
Futures contracts | | | — | | | | — | | | | — | | | |
Options contracts written | | | — | | | | — | | | | — | | | |
Forward sale commitments | | | — | | | | — | | | | — | | | |
Swap contracts | | | — | | | | — | | | | — | | | |
Foreign currency transactions | | | — | | | | — | | | | — | | | |
| | | | | | | | | | | | | | |
Net Realized Gain (Loss) | | | 243,561,466 | | | | 84,435,975 | | | | 63,068,296 | | | |
| | | | | | | | | | | | | | |
Change in Net Unrealized Appreciation (Depreciation) From: | | | | | | | | | | | | | | |
| | | | |
Investments | | | 99,840,581 | | | | 161,259,541 | | | | (13,698,980 | ) | | |
Futures contracts | | | — | | | | — | | | | — | | | |
Options contracts written | | | — | | | | — | | | | — | | | |
Forward sale commitments | | | — | | | | — | | | | — | | | |
Swap contracts | | | — | | | | — | | | | — | | | |
Foreign currency transactions | | | — | | | | — | | | | — | | | |
| | | | | | | | | | | | | | |
Change in Net Unrealized Appreciation (Depreciation) | | | 99,840,581 | | | | 161,259,541 | | | | (13,698,980 | ) | | |
| | | | | | | | | | | | | | |
Net Gain on Investments, Futures Contracts, Options Contracts Written, Forward Sale Commitments, Swap Contracts and Foreign Currency Transactions | | | 343,402,047 | | | | 245,695,516 | | | | 49,369,316 | | | |
| | | | | | | | | | | | | | |
Total Increase in Net Assets From Operations | | $ | 348,753,146 | | | $ | 268,007,285 | | | $ | 48,103,153 | | | |
| | | | | | | | | | | | | | |
| (a) | | Includes foreign capital gains tax of $3,220 and $390,414 for International Equity Investments and Emerging Markets Equity Investments, respectively. |
| (b) | | Net increase in accrued foreign capital gains taxes of $4,648 and $249,341 for International Equity Investments and Emerging Markets Equity Investments, respectively. |
See Notes to Financial Statements.
152
| | | | | | | | | | | | | | | | | | | | | | | | | | | | | | | | |
| | | Small
Capitalization
Value Equity
Investments | | | International
Equity
Investments | | | Emerging
Markets
Equity
Investments | | | Core Fixed
Income
Investments | | | High Yield
Investments | | | International
Fixed
Income
Investments | | | Municipal
Bond
Investments | | | Money
Market
Investments | |
| | | | | | | | | | | | | | | | | | | | | | | | | | | | | | | | |
| | | | | | | | |
| | $ | 6,291,291 | | | $ | 28,977,225 | | | $ | 10,431,330 | | | $ | 61,560 | | | $ | 65,152 | | | $ | — | | | $ | — | | | $ | — | |
| | | 4,021 | | | | 19,697 | | | | 5,062 | | | | 24,346,042 | | | | 11,938,394 | | | | 7,592,122 | | | | 3,023,682 | | | | 440,177 | |
| | | 127,183 | | | | 660,371 | | | | 163,225 | | | | 20,017 | | | | 49,892 | | | | — | | | | — | | | | — | |
| | | — | | | | — | | | | 3,351 | | | | — | | | | — | | | | — | | | | — | | | | — | |
| | | (10,133 | ) | | | (2,030,047 | ) | | | (834,834 | ) | | | — | | | | — | | | | — | | | | — | | | | — | |
| | | | | | | | | | | | | | | | | | | | | | | | | | | | | | | | |
| | | 6,412,362 | | | | 27,627,246 | | | | 9,768,134 | | | | 24,427,619 | | | | 12,053,438 | | | | 7,592,122 | | | | 3,023,682 | | | | 440,177 | |
| | | | | | | | | | | | | | | | | | | | | | | | | | | | | | | | |
| | | | | | | | |
| | | | | | | | | | | | | | | | | | | | | | | | | | | | | | | | |
| | | | | | | | |
| | | 2,150,608 | | | | 7,445,240 | | | | 3,553,322 | | | | 3,595,540 | | | | 1,341,493 | | | | 1,373,587 | | | | 333,712 | | | | 272,130 | |
| | | 1,906 | | | | 85,493 | | | | 15,577 | | | | 59,800 | | | | 14,085 | | | | 18,610 | | | | 8,591 | | | | 41,389 | |
| | | 96,587 | | | | 565,133 | | | | 386,718 | | | | 626,563 | | | | 179,071 | | | | 245,247 | | | | 38,469 | | | | 124,361 | |
| | | 45,299 | | | | 147,654 | | | | 106,158 | | | | 190,559 | | | | 32,663 | | | | 67,128 | | | | 17,113 | | | | 72,643 | |
| | | 95,073 | | | | 174,830 | | | | 134,573 | | | | 78,329 | | | | 82,045 | | | | 104,145 | | | | 4,928 | | | | 111,523 | |
| | | 8,564 | | | | 32,283 | | | | 22,223 | | | | 48,198 | | | | 9,253 | | | | 21,702 | | | | 4,264 | | | | 18,402 | |
| | | 47,205 | | | | 54,766 | | | | 54,685 | | | | 97,562 | | | | 67,552 | | | | 97,095 | | | | 53,121 | | | | 46,858 | |
| | | 13,101 | | | | 14,341 | | | | 11,710 | | | | 17,153 | | | | 13,315 | | | | 13,988 | | | | 13,062 | | | | 17,068 | |
| | | 18,416 | | | | 18,624 | | | | 19,865 | | | | 19,781 | | | | 19,307 | | | | 18,966 | | | | 17,352 | | | | 18,162 | |
| | | — | | | | 36,722 | | | | 13,638 | | | | 33,080 | | | | 4,765 | | | | 8,978 | | | | 2,477 | | | | 16,010 | |
| | | — | | | | — | | | | — | | | | 2,431 | | | | — | | | | 121,506 | | | | — | | | | — | |
| | | | | | | | | | | | | | | | | | | | | | | | | | | | | | | | |
| | | 2,476,759 | | | | 8,575,086 | | | | 4,318,469 | | | | 4,768,996 | | | | 1,763,549 | | | | 2,090,952 | | | | 493,089 | | | | 738,546 | |
| | | (19,793 | ) | | | (402,938 | ) | | | (427,618 | ) | | | (26,474 | ) | | | (304,141 | ) | | | — | | | | — | | | | (301,225 | ) |
| | | | | | | | | | | | | | | | | | | | | | | | | | | | | | | | |
| | | 2,456,966 | | | | 8,172,148 | | | | 3,890,851 | | | | 4,742,522 | | | | 1,459,408 | | | | 2,090,952 | | | | 493,089 | | | | 437,321 | |
| | | | | | | | | | | | | | | | | | | | | | | | | | | | | | | | |
| | $ | 3,955,396 | | | $ | 19,455,098 | | | $ | 5,877,283 | | | $ | 19,685,097 | | | $ | 10,594,030 | | | $ | 5,501,170 | | | $ | 2,530,593 | | | $ | 2,856 | |
| | | | | | | | | | | | | | | | | | | | | | | | | | | | | | | | |
| | | | | | | | |
| | | | | | | | | | | | | | | | | | | | | | | | | | | | | | | | |
| | | | | | | | |
| | | | | | | | | | | | | | | | | | | | | | | | | | | | | | | | |
| | | | | | | | |
| | $ | 27,330,782 | | | $ | 78,239,077 | (a) | | $ | (3,582,037 | )(a) | | $ | 14,042,780 | | | $ | 2,500,347 | | | $ | (2,674,756 | ) | | $ | 513,812 | | | $ | 362 | |
| | | — | | | | — | | | | — | | | | 859,011 | | | | — | | | | 514,310 | | | | — | | | | — | |
| | | — | | | | — | | | | — | | | | 671,890 | | | | — | | | | 733,309 | | | | — | | | | — | |
| | | — | | | | — | | | | — | | | | (292,754 | ) | | | — | | | | 20,302 | | | | — | | | | — | |
| | | — | | | | — | | | | — | | | | (1,150,996 | ) | | | — | | | | (1,434,098 | ) | | | — | | | | — | |
| | | — | | | | (833,120 | ) | | | (473,747 | ) | | | (917,124 | ) | | | — | | | | (98,775 | ) | | | — | | | | — | |
| | | | | | | | | | | | | | | | | | | | | | | | | | | | | | | | |
| | | 27,330,782 | | | | 77,405,957 | | | | (4,055,784 | ) | | | 13,212,807 | | | | 2,500,347 | | | | (2,939,708 | ) | | | 513,812 | | | | 362 | |
| | | | | | | | | | | | | | | | | | | | | | | | | | | | | | | | |
| | | | | | | | | | | | | | | | | | | | | | | | | | | | | | | | |
| | | | | | | | |
| | | 15,264,896 | | | | 467,865 | (b) | | | 72,629,952 | (b) | | | 17,874,262 | | | | 3,431,312 | | | | 12,143,068 | | | | 4,358,889 | | | | — | |
| | | — | | | | — | | | | — | | | | 482,547 | | | | — | | | | 91,836 | | | | — | | | | — | |
| | | — | | | | — | | | | — | | | | 1,129,549 | | | | — | | | | 83,223 | | | | — | | | | — | |
| | | — | | | | — | | | | — | | | | (6,250 | ) | | | — | | | | (19,414 | ) | | | — | | | | — | |
| | | — | | | | — | | | | — | | | | (396,014 | ) | | | — | | | | 1,156,623 | | | | — | | | | — | |
| | | — | | | | 36,693 | | | | 22,858 | | | | 2,177,290 | | | | — | | | | 3,305,228 | | | | — | | | | — | |
| | | | | | | | | | | | | | | | | | | | | | | | | | | | | | | | |
| | | 15,264,896 | | | | 504,558 | | | | 72,652,810 | | | | 21,261,384 | | | | 3,431,312 | | | | 16,760,564 | | | | 4,358,889 | | | | — | |
| | | | | | | | | | | | | | | | | | | | | | | | | | | | | | | | |
| | | 42,595,678 | | | | 77,910,515 | | | | 68,597,026 | | | | 34,474,191 | | | | 5,931,659 | | | | 13,820,856 | | | | 4,872,701 | | | | 362 | |
| | | | | | | | | | | | | | | | | | | | | | | | | | | | | | | | |
| | $ | 46,551,074 | | | $ | 97,365,613 | | | $ | 74,474,309 | | | $ | 54,159,288 | | | $ | 16,525,689 | | | $ | 19,322,026 | | | $ | 7,403,294 | | | $ | 3,218 | |
| | | | | | | | | | | | | | | | | | | | | | | | | | | | | | | | |
See Notes to Financial Statements.
153
| | |
| | | |
| Statements of Changes in Net Assets | | |
| | |
| For the Years Ended August 31, 2014 and August 31, 2013 | | |
| | | | | | | | | | | | | | | | | | |
| | | Large Capitalization
Growth Investments | | | Large Capitalization
Value Equity Investments | | | |
| | | 2014 | | | 2013 | | | 2014 | | | 2013 | | | |
| OPERATIONS: | | | | | | | | | | | | | | | | | | |
| | | | | |
Net investment income (loss) | | $ | 5,351,099 | | | $ | 9,465,318 | | | $ | 22,311,769 | | | $ | 22,943,966 | | | |
Net realized gain (loss) | | | 243,561,466 | | | | 183,416,620 | | | | 84,435,975 | | | | 129,862,707 | | | |
Change in unrealized appreciation (depreciation) | | | 99,840,581 | | | | 72,677,231 | | | | 161,259,541 | | | | 65,206,087 | | | |
| | | | | | | | | | | | | | | | | | |
Increase (Decrease) in Net Assets From Operations | | | 348,753,146 | | | | 265,559,169 | | | | 268,007,285 | | | | 218,012,760 | | | |
| | | | | | | | | | | | | | | | | | |
| DISTRIBUTIONS TO SHAREHOLDERS FROM (NOTE 1): | | | | | | | | | | | | | | | | | | |
| | | | | |
Net investment income | | | (8,223,919 | ) | | | (5,601,128 | ) | | | (20,452,719 | ) | | | (23,555,726 | ) | | |
Net realized gains | | | (116,252,191 | ) | | | — | | | | — | | | | — | | | |
| | | | | | | | | | | | | | | | | | |
Decrease in Net Assets From Distributions to Shareholders | | | (124,476,110 | ) | | | (5,601,128 | ) | | | (20,452,719 | ) | | | (23,555,726 | ) | | |
| | | | | | | | | | | | | | | | | | |
| FUND SHARE TRANSACTIONS (NOTE 4): | | | | | | | | | | | | | | | | | | |
| | | | | |
Net proceeds from sale of shares | | | 264,426,959 | | | | 134,372,225 | | | | 292,776,028 | | | | 73,006,249 | | | |
Reinvestment of distributions | | | 124,471,782 | | | | 5,601,128 | | | | 20,452,110 | | | | 23,555,726 | | | |
Cost of shares repurchased | | | (403,721,008 | ) | | | (395,306,238 | ) | | | (197,456,038 | ) | | | (273,972,124 | ) | | |
| | | | | | | | | | | | | | | | | | |
Increase (Decrease) in Net Assets From Fund Share Transactions | | | (14,822,267 | ) | | | (255,332,885 | ) | | | 115,772,100 | | | | (177,410,149 | ) | | |
| | | | | | | | | | | | | | | | | | |
Increase (Decrease) in Net Assets | | | 209,454,769 | | | | 4,625,156 | | | | 363,326,666 | | | | 17,046,885 | | | |
| NET ASSETS: | | | | | | | | | | | | | | | | | | |
| | | | | |
Beginning of year | | | 1,570,582,899 | | | | 1,565,957,743 | | | | 1,104,261,419 | | | | 1,087,214,534 | | | |
| | | | | | | | | | | | | | | | | | |
End of year*† | | $ | 1,780,037,668 | | | $ | 1,570,582,899 | | | $ | 1,467,588,085 | | | $ | 1,104,261,419 | | | |
| | | | | | | | | | | | | | | | | | |
* Includes undistributed net investment income of: | | $ | 5,267,734 | | | $ | 10,220,866 | | | $ | 15,727,510 | | | $ | 14,064,799 | | | |
| | | | | | | | | | | | | | | | | | |
† Includes accumulated net investment loss of: | | | — | | | | — | | | | — | | | | — | | | |
| | | | | | | | | | | | | | | | | | |
See Notes to Financial Statements.
154
| | | | | | | | | | | | | | | | | | | | | | | | | | | | | | | | |
| | | Small Capitalization
Growth Investments | | | Small Capitalization
Value Equity Investments | | | International Equity
Investments | | | Emerging Markets
Equity Investments | |
| | | 2014 | | | 2013 | | | 2014 | | | 2013 | | | 2014 | | | 2013 | | | 2014 | | | 2013 | |
| | | | | | | | | | | | | | | | | | | | | | | | | | | | | | | | |
| | | | | | | | |
| | $ | (1,266,163 | ) | | $ | (58,593 | ) | | $ | 3,955,396 | | | $ | 2,647,639 | | | $ | 19,455,098 | | | $ | 12,009,564 | | | $ | 5,877,283 | | | $ | 8,004,204 | |
| | | 63,068,296 | | | | 34,748,733 | | | | 27,330,782 | | | | 24,552,285 | | | | 77,405,957 | | | | 24,813,200 | | | | (4,055,784 | ) | | | 110,205,082 | |
| | | (13,698,980 | ) | | | 28,699,201 | | | | 15,264,896 | | | | 13,849,901 | | | | 504,558 | | | | 44,648,934 | | | | 72,652,810 | | | | (107,543,763 | ) |
| | | | | | | | | | | | | | | | | | | | | | | | | | | | | | | | |
| | | 48,103,153 | | | | 63,389,341 | | | | 46,551,074 | | | | 41,049,825 | | | | 97,365,613 | | | | 81,471,698 | | | | 74,474,309 | | | | 10,665,523 | |
| | | | | | | | | | | | | | | | | | | | | | | | | | | | | | | | |
| | | | | | | | | | | | | | | | | | | | | | | | | | | | | | | | |
| | | | | | | | |
| | | — | | | | — | | | | (2,812,824 | ) | | | (3,090,609 | ) | | | (12,213,953 | ) | | | (7,126,143 | ) | | | (7,358,901 | ) | | | (12,983,437 | ) |
| | | (9,799,673 | ) | | | — | | | | (25,261,304 | ) | | | (14,843,814 | ) | | | — | | | | — | | | | (35,690,720 | ) | | | — | |
| | | | | | | | | | | | | | | | | | | | | | | | | | | | | | | | |
| | | (9,799,673 | ) | | | — | | | | (28,074,128 | ) | | | (17,934,423 | ) | | | (12,213,953 | ) | | | (7,126,143 | ) | | | (43,049,621 | ) | | | (12,983,437 | ) |
| | | | | | | | | | | | | | | | | | | | | | | | | | | | | | | | |
| | | | | | | | | | | | | | | | | | | | | | | | | | | | | | | | |
| | | | | | | | |
| | | 21,521,048 | | | | 59,723,778 | | | | 55,462,187 | | | | 30,122,460 | | | | 378,960,260 | | | | 358,939,193 | | | | 58,269,385 | | | | 39,842,401 | |
| | | 9,799,293 | | | | — | | | | 28,051,943 | | | | 17,919,874 | | | | 12,213,598 | | | | 7,126,143 | | | | 43,048,055 | | | | 12,983,295 | |
| | | (84,369,249 | ) | | | (59,429,537 | ) | | | (31,495,843 | ) | | | (47,176,340 | ) | | | (99,745,558 | ) | | | (111,325,601 | ) | | | (161,548,624 | ) | | | (331,513,597 | ) |
| | | | | | | | | | | | | | | | | | | | | | | | | | | | | | | | |
| | | (53,048,908 | ) | | | 294,241 | | | | 52,018,287 | | | | 865,994 | | | | 291,428,300 | | | | 254,739,735 | | | | (60,231,184 | ) | | | (278,687,901 | ) |
| | | | | | | | | | | | | | | | | | | | | | | | | | | | | | | | |
| | | (14,745,428 | ) | | | 63,683,582 | | | | 70,495,233 | | | | 23,981,396 | | | | 376,579,960 | | | | 329,085,290 | | | | (28,806,496 | ) | | | (281,005,815 | ) |
| | | | | | | | | | | | | | | | | | | | | | | | | | | | | | | | |
| | | | | | | | |
| | | 311,097,872 | | | | 247,414,290 | | | | 218,879,124 | | | | 194,897,728 | | | | 772,648,695 | | | | 443,563,405 | | | | 414,196,992 | | | | 695,202,807 | |
| | | | | | | | | | | | | | | | | | | | | | | | | | | | | | | | |
| | $ | 296,352,444 | | | $ | 311,097,872 | | | $ | 289,374,357 | | | $ | 218,879,124 | | | $ | 1,149,228,655 | | | $ | 772,648,695 | | | $ | 385,390,496 | | | $ | 414,196,992 | |
| | | | | | | | | | | | | | | | | | | | | | | | | | | | | | | | |
| | $ | 68,774 | | | | — | | | $ | 2,256,118 | | | $ | 1,334,676 | | | $ | 18,978,024 | | | $ | 12,218,852 | | | $ | 4,504,889 | | | $ | 6,894,132 | |
| | | | | | | | | | | | | | | | | | | | | | | | | | | | | | | | |
| | | — | | | $ | (486,519 | ) | | | — | | | | — | | | | — | | | | — | | | | — | | | | — | |
| | | | | | | | | | | | | | | | | | | | | | | | | | | | | | | | |
See Notes to Financial Statements.
155
| | |
| | | |
| Statements of Changes in Net Assets | | |
| | |
| For the Years Ended August 31, 2014 and August 31, 2013 | | |
| | | | | | | | | | |
| | | Core
Fixed Income
Investments | | | |
| | | 2014 | | | 2013 | | | |
| OPERATIONS: | | | | | | | | | | |
| | | |
Net investment income (loss) | | $ | 19,685,097 | | | $ | 22,498,421 | | | |
Net realized gain (loss) | | | 13,212,807 | | | | 4,235,038 | | | |
Change in unrealized appreciation (depreciation) | | | 21,261,384 | | | | (38,997,617 | ) | | |
| | | | | | | | | | |
Increase (Decrease) in Net Assets From Operations | | | 54,159,288 | | | | (12,264,158 | ) | | |
| | | | | | | | | | |
| DISTRIBUTIONS TO SHAREHOLDERS FROM (NOTE 1): | | | | | | | | | | |
| | | |
Net investment income | | | (23,795,682 | ) | | | (26,773,961 | ) | | |
Net realized gains | | | — | | | | (38,639,965 | ) | | |
| | | | | | | | | | |
Decrease in Net Assets From Distributions to Shareholders | | | (23,795,682 | ) | | | (65,413,926 | ) | | |
| | | | | | | | | | |
| FUND SHARE TRANSACTIONS (NOTE 4): | | | | | | | | | | |
| | | |
Net proceeds from sale of shares | | | 101,726,242 | | | | 170,652,182 | | | |
Reinvestment of distributions | | | 23,795,267 | | | | 65,397,402 | | | |
Cost of shares repurchased | | | (293,591,431 | ) | | | (243,195,580 | ) | | |
| | | | | | | | | | |
Increase (Decrease) in Net Assets From Fund Share Transactions | | | (168,069,922 | ) | | | (7,145,996 | ) | | |
| | | | | | | | | | |
Increase (Decrease) in Net Assets | | | (137,706,316 | ) | | | (84,824,080 | ) | | |
| NET ASSETS: | | | | | | | | | | |
| | | |
Beginning of year | | | 936,807,543 | | | | 1,021,631,623 | | | |
| | | | | | | | | | |
End of year*† | | $ | 799,101,227 | | | $ | 936,807,543 | | | |
| | | | | | | | | | |
* Includes undistributed net investment income of: | | | — | | | $ | 512,255 | | | |
| | | | | | | | | | |
† Includes accumulated net investment loss of: | | $ | (610,826 | ) | | | — | | | |
| | | | | | | | | | |
See Notes to Financial Statements.
156
| | | | | | | | | | | | | | | | | | | | | | | | | | | | | | | | |
| | | High Yield
Investments | | | International
Fixed Income
Investments | | | Municipal Bond
Investments | | | Money Market
Investments | |
| | | 2014 | | | 2013 | | | 2014 | | | 2013 | | | 2014 | | | 2013 | | | 2014 | | | 2013 | |
| | | | | | | | | | | | | | | | | | | | | | | | | | | | | | | | |
| | | | | | | | |
| | $ | 10,594,030 | | | $ | 11,779,632 | | | $ | 5,501,170 | | | $ | 8,231,018 | | | $ | 2,530,593 | | | $ | 2,483,016 | | | $ | 2,856 | | | $ | 5,387 | |
| | | 2,500,347 | | | | 10,012,143 | | | | (2,939,708 | ) | | | 10,717,583 | | | | 513,812 | | | | 199,808 | | | | 362 | | | | 328 | |
| | | 3,431,312 | | | | (3,126,858 | ) | | | 16,760,564 | | | | (18,602,429 | ) | | | 4,358,889 | | | | (5,961,745 | ) | | | — | | | | — | |
| | | | | | | | | | | | | | | | | | | | | | | | | | | | | | | | |
| | | 16,525,689 | | | | 18,664,917 | | | | 19,322,026 | | | | 346,172 | | | | 7,403,294 | | | | (3,278,921 | ) | | | 3,218 | | | | 5,715 | |
| | | | | | | | | | | | | | | | | | | | | | | | | | | | | | | | |
| | | | | | | | | | | | | | | | | | | | | | | | | | | | | | | | |
| | | | | | | | |
| | | (11,814,472 | ) | | | (12,727,727 | ) | | | (17,201,477 | ) | | | (24,541,825 | ) | | | (2,531,172 | ) | | | (2,482,909 | ) | | | (2,854 | ) | | | (6,099 | ) |
| | | — | | | | — | | | | — | | | | — | | | | — | | | | — | | | | — | | | | — | |
| | | | | | | | | | | | | | | | | | | | | | | | | | | | | | | | |
| | | (11,814,472 | ) | | | (12,727,727 | ) | | | (17,201,477 | ) | | | (24,541,825 | ) | | | (2,531,172 | ) | | | (2,482,909 | ) | | | (2,854 | ) | | | (6,099 | ) |
| | | | | | | | | | | | | | | | | | | | | | | | | | | | | | | | |
| | | | | | | | | | | | | | | | | | | | | | | | | | | | | | | | |
| | | | | | | | |
| | | 155,615,893 | | | | 16,513,218 | | | | 41,475,314 | | | | 45,186,681 | | | | 18,631,793 | | | | 18,485,316 | | | | 178,917,685 | | | | 395,768,819 | |
| | | 11,813,241 | | | | 12,723,271 | | | | 17,200,635 | | | | 24,541,825 | | | | 2,530,949 | | | | 2,482,991 | | | | 2,840 | | | | 6,078 | |
| | | (25,374,912 | ) | | | (193,159,311 | ) | | | (111,017,975 | ) | | | (159,207,232 | ) | | | (28,873,453 | ) | | | (23,525,763 | ) | | | (310,888,302 | ) | | | (166,920,974 | ) |
| | | | | | | | | | | | | | | | | | | | | | | | | | | | | | | | |
| | | 142,054,222 | | | | (163,922,822 | ) | | | (52,342,026 | ) | | | (89,478,726 | ) | | | (7,710,711 | ) | | | (2,557,456 | ) | | | (131,967,777 | ) | | | 228,853,923 | |
| | | | | | | | | | | | | | | | | | | | | | | | | | | | | | | | |
| | | 146,765,439 | | | | (157,985,632 | ) | | | (50,221,477 | ) | | | (113,674,379 | ) | | | (2,838,589 | ) | | | (8,319,286 | ) | | | (131,967,413 | ) | | | 228,853,539 | |
| | | | | | | | | | | | | | | | | | | | | | | | | | | | | | | | |
| | | | | | | | |
| | | 110,757,880 | | | | 268,743,512 | | | | 317,475,379 | | | | 431,149,758 | | | | 80,401,407 | | | | 88,720,693 | | | | 466,906,862 | | | | 238,053,323 | |
| | | | | | | | | | | | | | | | | | | | | | | | | | | | | | | | |
| | $ | 257,523,319 | | | $ | 110,757,880 | | | $ | 267,253,902 | | | $ | 317,475,379 | | | $ | 77,562,818 | | | $ | 80,401,407 | | | $ | 334,939,449 | | | $ | 466,906,862 | |
| | | | | | | | | | | | | | | | | | | | | | | | | | | | | | | | |
| | $ | 1,103,560 | | | $ | 1,029,608 | | | $ | 4,713,483 | | | $ | 17,497,740 | | | $ | 340,817 | | | $ | 144,233 | | | $ | 228 | | | $ | 5,411 | |
| | | | | | | | | | | | | | | | | | | | | | | | | | | | | | | | |
| | | — | | | | — | | | | — | | | | — | | | | — | | | | — | | | | — | | | | — | |
| | | | | | | | | | | | | | | | | | | | | | | | | | | | | | | | |
See Notes to Financial Statements.
157
For a share of beneficial interest outstanding throughout each year ended August 31, unless otherwise noted:
| | | | | | | | | | | | | | | | | | | | |
| Large Capitalization Growth Investments | |
| | | 2014 | | | 2013 | | | 2012 | | | 2011 | | | 2010 | |
Net asset value, Beginning of Year | | $ | 19.29 | | | $ | 16.39 | | | $ | 14.24 | | | $ | 11.80 | | | $ | 11.15 | |
| | | | | | | | | | | | | | | | | | | | |
| Income from Operations: | | | | | | | | | | | | | | | | | | | | |
Net investment income(1) | | | 0.07 | | | | 0.11 | | | | 0.06 | | | | 0.07 | | | | 0.03 | |
Net realized and unrealized gain | | | 4.47 | | | | 2.85 | | | | 2.17 | | | | 2.40 | | | | 0.68 | |
| | | | | | | | | | | | | | | | | | | | |
Total Income from Operations | | | 4.54 | | | | 2.96 | | | | 2.23 | | | | 2.47 | | | | 0.71 | |
| | | | | | | | | | | | | | | | | | | | |
| Less Distributions From: | | | | | | | | | | | | | | | | | | | | |
Net investment income | | | (0.11 | ) | | | (0.06 | ) | | | (0.08 | ) | | | (0.03 | ) | | | (0.06 | ) |
Net realized gain | | | (1.53 | ) | | | — | | | | — | | | | — | | | | — | |
| | | | | | | | | | | | | | | | | | | | |
Total Distributions | | | (1.64 | ) | | | (0.06 | ) | | | (0.08 | ) | | | (0.03 | ) | | | (0.06 | ) |
| | | | | | | | | | | | | | | | | | | | |
Net Asset Value, End of Year | | $ | 22.19 | | | $ | 19.29 | | | $ | 16.39 | | | $ | 14.24 | | | $ | 11.80 | |
| | | | | | | | | | | | | | | | | | | | |
Total Return(2) | | | 24.35 | % | | | 18.11 | % | | | 15.71 | % | | | 20.89 | % | | | 6.30 | % |
Net Assets, End of Year (millions) | | $ | 1,780 | | | $ | 1,571 | | | $ | 1,566 | | | $ | 1,738 | | | $ | 1,495 | |
| Ratios of Average Net Assets: | | | | | | | | | | | | | | | | | | | | |
Gross expenses | | | 0.67 | % | | | 0.69 | % | | | 0.69 | % | | | 0.68 | % | | | 0.70 | % |
Net expenses | | | 0.67 | | | | 0.69 | | | | 0.69 | | | | 0.68 | | | | 0.70 | (3) |
Net investment income | | | 0.33 | | | | 0.60 | | | | 0.40 | | | | 0.47 | | | | 0.22 | |
Portfolio Turnover Rate | | | 56 | % | | | 57 | % | | | 66 | % | | | 76 | % | | | 92 | % |
| (1) | | Per share amounts have been calculated using the average shares method. |
| (2) | | Performance figures may reflect fee waivers and/or expense reimbursements and assume reinvestment of dividend distribution. In the absence of fee waivers and/or expense reimbursements, the total return would have been lower. Applicable advisory program charges, which may be up to 3.00%, are not reflected in the performance data and would reduce the total returns. Past performance is no guarantee of future results. |
| (3) | | Reflects fee waivers and/or expense reimbursements. |
| | | | | | | | | | | | | | | | | | | | |
| Large Capitalization Value Equity Investments | |
| | | 2014 | | | 2013 | | | 2012 | | | 2011 | | | 2010 | |
Net asset value, Beginning of Year | | $ | 11.24 | | | $ | 9.44 | | | $ | 8.58 | | | $ | 7.54 | | | $ | 7.34 | |
| | | | | | | | | | | | | | | | | | | | |
| Income from Operations: | | | | | | | | | | | | | | | | | | | | |
Net investment income(1) | | | 0.20 | | | | 0.21 | | | | 0.19 | | | | 0.17 | | | | 0.19 | |
Net realized and unrealized gain | | | 2.29 | | | | 1.80 | | | | 0.87 | | | | 1.07 | | | | 0.23 | |
| | | | | | | | | | | | | | | | | | | | |
Total Income from Operations | | | 2.49 | | | | 2.01 | | | | 1.06 | | | | 1.24 | | | | 0.42 | |
| | | | | | | | | | | | | | | | | | | | |
| Less Distributions From: | | | | | | | | | | | | | | | | | | | | |
Net investment income | | | (0.19 | ) | | | (0.21 | ) | | | (0.20 | ) | | | (0.20 | ) | | | (0.22 | ) |
| | | | | | | | | | | | | | | | | | | | |
Total Distributions | | | (0.19 | ) | | | (0.21 | ) | | | (0.20 | ) | | | (0.20 | ) | | | (0.22 | ) |
| | | | | | | | | | | | | | | | | | | | |
Net Asset Value, End of Year | | $ | 13.54 | | | $ | 11.24 | | | $ | 9.44 | | | $ | 8.58 | | | $ | 7.54 | |
| | | | | | | | | | | | | | | | | | | | |
Total Return(2) | | | 22.37 | % | | | 21.71 | % | | | 12.50 | % | | | 16.46 | % | | | 5.67 | % |
Net Assets, End of Year (millions) | | $ | 1,468 | | | $ | 1,104 | | | $ | 1,087 | | | $ | 1,220 | | | $ | 1,102 | |
| Ratios of Average Net Assets: | | | | | | | | | | | | | | | | | | | | |
Gross expenses | | | 0.67 | % | | | 0.70 | % | | | 0.69 | % | | | 0.68 | % | | | 0.69 | % |
Net expenses | | | 0.67 | (3) | | | 0.70 | | | | 0.69 | | | | 0.68 | | | | 0.69 | (3) |
Net investment income | | | 1.64 | | | | 2.07 | | | | 2.15 | | | | 1.95 | | | | 2.43 | |
Portfolio Turnover Rate | | | 24 | % | | | 48 | % | | | 32 | % | | | 38 | % | | | 104 | % |
| (1) | | Per share amounts have been calculated using the average shares method. |
| (2) | | Performance figures may reflect fee waivers and/or expense reimbursements and assume reinvestment of dividend distribution. In the absence of fee waivers and/or expense reimbursements, the total return would have been lower. Applicable advisory program charges, which may be up to 3.00%, are not reflected in the performance data and would reduce the total returns. Past performance is no guarantee of future results. |
| (3) | | Reflects fee waivers and/or expense reimbursements. |
See Notes to Financial Statements.
158
For a share of beneficial interest outstanding throughout each year ended August 31, unless otherwise noted:
| | | | | | | | | | | | | | | | | | | | |
| Small Capitalization Growth Investments | |
| | | 2014 | | | 2013 | | | 2012 | | | 2011 | | | 2010 | |
Net asset value, Beginning of Year | | $ | 25.22 | | | $ | 19.81 | | | $ | 17.76 | | | $ | 14.62 | | | $ | 12.99 | |
| | | | | | | | | | | | | | | | | | | | |
| Income (Loss) from Operations: | | | | | | | | | | | | | | | | | | | | |
Net investment loss(1) | | | (0.12 | ) | | | (0.00 | )(2) | | | (0.07 | ) | | | (0.07 | ) | | | (0.09 | ) |
Net realized and unrealized gain | | | 4.36 | | | | 5.41 | | | | 2.12 | | | | 3.21 | | | | 1.72 | |
| | | | | | | | | | | | | | | | | | | | |
Total Income from Operations | | | 4.24 | | | | 5.41 | | | | 2.05 | | | | 3.14 | | | | 1.63 | |
| | | | | | | | | | | | | | | | | | | | |
| Less Distributions From: | | | | | | | | | | | | | | | | | | | | |
Net realized gain | | | (0.93 | ) | | | — | | | | — | | | | — | | | | — | |
| | | | | | | | | | | | | | | | | | | | |
Total Distributions | | | (0.93 | ) | | | — | | | | — | | | | — | | | | — | |
| | | | | | | | | | | | | | | | | | | | |
Net Asset Value, End of Year | | $ | 28.53 | | | $ | 25.22 | | | $ | 19.81 | | | $ | 17.76 | | | $ | 14.62 | |
| | | | | | | | | | | | | | | | | | | | |
Total Return(3) | | | 16.91 | % | | | 27.31 | % | | | 11.54 | % | | | 21.48 | % | | | 12.55 | % |
Net Assets, End of Year (millions) | | $ | 296 | | | $ | 311 | | | $ | 247 | | | $ | 278 | | | $ | 262 | |
| Ratios of Average Net Assets: | | | | | | | | | | | | | | | | | | | | |
Gross expenses | | | 0.92 | % | | | 0.97 | % | | | 0.98 | % | | | 0.95 | % | | | 0.99 | % |
Net expenses(4) | | | 0.92 | | | | 0.97 | | | | 0.97 | | | | 0.93 | | | | 0.98 | |
Net investment loss | | | (0.42 | ) | | | (0.02 | ) | | | (0.40 | ) | | | (0.37 | ) | | | (0.56 | ) |
Portfolio Turnover Rate | | | 80 | % | | | 90 | % | | | 68 | % | | | 73 | % | | | 84 | % |
| (1) | | Per share amounts have been calculated using the average shares method. |
| (2) | | Amounts represent less than $(0.01) per share. |
| (3) | | Performance figures may reflect fee waivers and/or expense reimbursements and assume reinvestment of dividend distribution. In the absence of fee waivers and/or expense reimbursements, the total return would have been lower. Applicable advisory program charges, which may be up to 3.00%, are not reflected in the performance data and would reduce the total returns. Past performance is no guarantee of future results. |
| (4) | | Reflects fee waivers and/or expense reimbursements. |
| | | | | | | | | | | | | | | | | | | | |
| Small Capitalization Value Equity Investments | |
| | | 2014 | | | 2013 | | | 2012 | | | 2011 | | | 2010 | |
Net asset value, Beginning of Year | | $ | 14.45 | | | $ | 12.97 | | | $ | 11.20 | | | $ | 9.57 | | | $ | 8.67 | |
| | | | | | | | | | | | | | | | | | | | |
| Income from Operations: | | | | | | | | | | | | | | | | | | | | |
Net investment income(1) | | | 0.22 | | | | 0.18 | | | | 0.11 | | | | 0.10 | | | | 0.08 | |
Net realized and unrealized gain | | | 2.58 | | | | 2.59 | | | | 1.77 | | | | 1.68 | | | | 0.90 | |
| | | | | | | | | | | | | | | | | | | | |
Total Income from Operations | | | 2.80 | | | | 2.77 | | | | 1.88 | | | | 1.78 | | | | 0.98 | |
| | | | | | | | | | | | | | | | | | | | |
| Less Distributions From: | | | | | | | | | | | | | | | | | | | | |
Net investment income | | | (0.17 | ) | | | (0.22 | ) | | | (0.11 | ) | | | (0.15 | ) | | | (0.08 | ) |
Net realized gain | | | (1.52 | ) | | | (1.07 | ) | | | — | | | | — | | | | — | |
| | | | | | | | | | | | | | | | | | | | |
Total Distributions | | | (1.69 | ) | | | (1.29 | ) | | | (0.11 | ) | | | (0.15 | ) | | | (0.08 | ) |
| | | | | | | | | | | | | | | | | | | | |
Net Asset Value, End of Year | | $ | 15.56 | | | $ | 14.45 | | | $ | 12.97 | | | $ | 11.20 | | | $ | 9.57 | |
| | | | | | | | | | | | | | | | | | | | |
Total Return(2) | | | 20.17 | % | | | 23.18 | % | | | 16.93 | % | | | 18.52 | % | | | 11.35 | % |
Net Assets, End of Year (millions) | | $ | 289 | | | $ | 219 | | | $ | 195 | | | $ | 223 | | | $ | 203 | |
| Ratios of Average Net Assets: | | | | | | | | | | | | | | | | | | | | |
Gross expenses | | | 0.92 | % | | | 1.00 | % | | | 0.99 | % | | | 0.98 | % | | | 0.98 | % |
Net expenses(3) | | | 0.91 | | | | 0.99 | | | | 0.98 | | | | 0.95 | | | | 0.97 | |
Net investment income | | | 1.47 | | | | 1.29 | | | | 0.91 | | | | 0.85 | | | | 0.86 | |
Portfolio Turnover Rate | | | 31 | % | | | 32 | % | | | 24 | % | | | 36 | % | | | 25 | % |
| (1) | | Per share amounts have been calculated using the average shares method. |
| (2) | | Performance figures may reflect fee waivers and/or expense reimbursements and assume reinvestment of dividend distribution. In the absence of fee waivers and/or expense reimbursements, the total return would have been lower. Applicable advisory program charges, which may be up to 3.00%, are not reflected in the performance data and would reduce the total returns. Past performance is no guarantee of future results. |
| (3) | | Reflects fee waivers and/or expense reimbursements. |
See Notes to Financial Statements.
159
For a share of beneficial interest outstanding throughout each year ended August 31, unless otherwise noted:
| | | | | | | | | | | | | | | | | | | | |
| International Equity Investments | |
| | | 2014 | | | 2013 | | | 2012 | | | 2011 | | | 2010 | |
Net asset value, Beginning of Year | | $ | 10.92 | | | $ | 9.58 | | | $ | 9.77 | | | $ | 9.02 | | | $ | 8.97 | |
| | | | | | | | | | | | | | | | | | | | |
| Income (Loss) from Operations: | | | | | | | | | | | | | | | | | | | | |
Net investment income(1) | | | 0.22 | | | | 0.20 | | | | 0.17 | | | | 0.15 | | | | 0.14 | |
Net realized and unrealized gain (loss) | | | 1.03 | | | | 1.27 | | | | (0.18 | ) | | | 0.76 | | | | 0.15 | |
| | | | | | | | | | | | | | | | | | | | |
Total Income (Loss) from Operations | | | 1.25 | | | | 1.47 | | | | (0.01 | ) | | | 0.91 | | | | 0.29 | |
| | | | | | | | | | | | | | | | | | | | |
| Less Distributions From: | | | | | | | | | | | | | | | | | | | | |
Net investment income | | | (0.14 | ) | | | (0.13 | ) | | | (0.18 | ) | | | (0.16 | ) | | | (0.24 | ) |
| | | | | | | | | | | | | | | | | | | | |
Total Distributions | | | (0.14 | ) | | | (0.13 | ) | | | (0.18 | ) | | | (0.16 | ) | | | (0.24 | ) |
| | | | | | | | | | | | | | | | | | | | |
Net Asset Value, End of Year | | $ | 12.03 | | | $ | 10.92 | | | $ | 9.58 | | | $ | 9.77 | | | $ | 9.02 | |
| | | | | | | | | | | | | | | | | | | | |
Total Return(2) | | | 11.45 | % | | | 15.47 | % | | | (0.06 | )% | | | 9.97 | % | | | 3.12 | % |
Net Assets, End of Year (millions) | | $ | 1,149 | | | $ | 773 | | | $ | 444 | | | $ | 536 | | | $ | 795 | |
| Ratios of Average Net Assets: | | | | | | | | | | | | | | | | | | | | |
Gross expenses | | | 0.81 | % | | | 0.84 | % | | | 0.91 | % | | | 0.84 | % | | | 0.85 | % |
Net expenses(3) | | | 0.77 | | | | 0.83 | | | | 0.90 | | | | 0.82 | | | | 0.84 | |
Net investment income | | | 1.83 | | | | 1.88 | | | | 1.80 | | | | 1.41 | | | | 1.52 | |
Portfolio Turnover Rate | | | 95 | % | | | 63 | % | | | 75 | % | | | 70 | % | | | 73 | % |
| (1) | | Per share amounts have been calculated using the average shares method. |
| (2) | | Performance figures may reflect fee waivers and/or expense reimbursements and assume reinvestment of dividend distribution. In the absence of fee waivers and/or expense reimbursements, the total return would have been lower. Applicable advisory program charges, which may be up to 3.00%, are not reflected in the performance data and would reduce the total returns. Past performance is no guarantee of future results. |
| (3) | | Reflects fee waivers and/or expense reimbursements. |
| | | | | | | | | | | | | | | | | | | | |
| Emerging Markets Equity Investments | |
| | | 2014 | | | 2013 | | | 2012 | | | 2011 | | | 2010 | |
Net asset value, Beginning of Year | | $ | 13.67 | | | $ | 14.46 | | | $ | 15.85 | | | $ | 14.79 | | | $ | 12.80 | |
| | | | | | | | | | | | | | | | | | | | |
| Income (Loss) from Operations: | | | | | | | | | | | | | | | | | | | | |
Net investment income(1) | | | 0.20 | | | | 0.21 | | | | 0.29 | | | | 0.31 | | | | 0.23 | |
Net realized and unrealized gain (loss) | | | 2.36 | | | | (0.69 | ) | | | (1.33 | ) | | | 0.99 | | | | 1.90 | |
| | | | | | | | | | | | | | | | | | | | |
Total Income (Loss) from Operations | | | 2.56 | | | | (0.48 | ) | | | (1.04 | ) | | | 1.30 | | | | 2.13 | |
| | | | | | | | | | | | | | | | | | | | |
| Less Distributions From: | | | | | | | | | | | | | | | | | | | | |
Net investment income | | | (0.29 | ) | | | (0.31 | ) | | | (0.35 | ) | | | (0.24 | ) | | | (0.14 | ) |
Net realized gain | | | (1.40 | ) | | | — | | | | — | | | | — | | | | — | |
| | | | | | | | | | | | | | | | | | | | |
Total Distributions | | | (1.69 | ) | | | (0.31 | ) | | | (0.35 | ) | | | (0.24 | ) | | | (0.14 | ) |
| | | | | | | | | | | | | | | | | | | | |
Net Asset Value, End of Year | | $ | 14.54 | | | $ | 13.67 | | | $ | 14.46 | | | $ | 15.85 | | | $ | 14.79 | |
| | | | | | | | | | | | | | | | | | | | |
Total Return(2) | | | 19.97 | % | | | (3.54 | )% | | | (6.52 | )% | | | 8.67 | % | | | 16.69 | % |
Net Assets, End of Year (millions) | | $ | 385 | | | $ | 414 | | | $ | 695 | | | $ | 841 | | | $ | 809 | |
| Ratios of Average Net Assets: | | | | | | | | | | | | | | | | | | | | |
Gross expenses | | | 1.09 | % | | | 1.10 | % | | | 1.06 | % | | | 1.05 | % | | | 1.08 | % |
Net expenses(3) | | | 0.99 | | | | 0.99 | | | | 0.93 | | | | 0.91 | | | | 0.94 | |
Net investment income | | | 1.49 | | | | 1.39 | | | | 1.98 | | | | 1.87 | | | | 1.57 | |
Portfolio Turnover Rate | | | 29 | % | | | 89 | % | | | 40 | % | | | 42 | % | | | 53 | % |
| (1) | | Per share amounts have been calculated using the average shares method. |
| (2) | | Performance figures may reflect fee waivers and/or expense reimbursements and assume reinvestment of dividend distribution. In the absence of fee waivers and/or expense reimbursements, the total return would have been lower. Applicable advisory program charges, which may be up to 3.00%, are not reflected in the performance data and would reduce the total returns. Past performance is no guarantee of future results. |
| (3) | | Reflects fee waivers and/or expense reimbursements. |
See Notes to Financial Statements.
160
For a share of beneficial interest outstanding throughout each year ended August 31, unless otherwise noted:
| | | | | | | | | | | | | | | | | | | | |
| Core Fixed Income Investments | |
| | | 2014 | | | 2013 | | | 2012 | | | 2011 | | | 2010 | |
Net asset value, Beginning of Year | | $ | 8.17 | | | $ | 8.87 | | | $ | 8.58 | | | $ | 8.81 | | | $ | 8.25 | |
| | | | | | | | | | | | | | | | | | | | |
| Income (Loss) from Operations: | | | | | | | | | | | | | | | | | | | | |
Net investment income(1) | | | 0.18 | | | | 0.20 | | | | 0.25 | | | | 0.28 | | | | 0.32 | |
Net realized and unrealized gain (loss) | | | 0.31 | | | | (0.30 | ) | | | 0.38 | | | | 0.05 | | | | 0.71 | |
| | | | | | | | | | | | | | | | | | | | |
Total Income (Loss) from Operations | | | 0.49 | | | | (0.10 | ) | | | 0.63 | | | | 0.33 | | | | 1.03 | |
| | | | | | | | | | | | | | | | | | | | |
| Less Distributions From: | | | | | | | | | | | | | | | | | | | | |
Net investment income | | | (0.22 | ) | | | (0.24 | ) | | | (0.27 | ) | | | (0.29 | ) | | | (0.33 | ) |
Net realized gain | | | — | | | | (0.36 | ) | | | (0.07 | ) | | | (0.27 | ) | | | (0.14 | ) |
| | | | | | | | | | | | | | | | | | | | |
Total Distributions | | | (0.22 | ) | | | (0.60 | ) | | | (0.34 | ) | | | (0.56 | ) | | | (0.47 | ) |
| | | | | | | | | | | | | | | | | | | | |
Net Asset Value, End of Year | | $ | 8.44 | | | $ | 8.17 | | | $ | 8.87 | | | $ | 8.58 | | | $ | 8.81 | |
| | | | | | | | | | | | | | | | | | | | |
Total Return(2) | | | 6.10 | % | | | (1.31 | )% | | | 7.58 | % | | | 3.93 | % | | | 12.93 | % |
Net Assets, End of Year (millions) | | $ | 799 | | | $ | 937 | | | $ | 1,022 | | | $ | 1,067 | | | $ | 1,001 | |
| Ratios of Average Net Assets: | | | | | | | | | | | | | | | | | | | | |
Gross expenses | | | 0.53 | %(3) | | | 0.54 | %(3) | | | 0.52 | % | | | 0.52 | % | | | 0.53 | %(3) |
Net expenses(4) | | | 0.53 | (3) | | | 0.54 | (3) | | | 0.52 | | | | 0.52 | | | | 0.53 | (3) |
Net investment income | | | 2.19 | | | | 2.30 | | | | 2.85 | | | | 3.23 | | | | 3.79 | |
Portfolio Turnover Rate | | | 446 | % | | | 421 | % | | | 429 | % | | | 390 | % | | | 257 | % |
| (1) | | Per share amounts have been calculated using the average shares method. |
| (2) | | Performance figures may reflect fee waivers and/or expense reimbursements and assume reinvestment of dividend distribution. In the absence of fee waivers and/or expense reimbursements, the total return would have been lower. Applicable advisory program charges, which may be up to 3.00%, are not reflected in the performance data and would reduce the total returns. Past performance is no guarantee of future results. |
| (3) | | Ratio includes interest expense on forward sale commitments and reverse repurchase agreements which represents less than 0.01%. |
| (4) | | Reflects fee waivers and/or expense reimbursements. |
| | | | | | | | | | | | | | | | | | | | |
| High Yield Investments | |
| | | 2014 | | | 2013 | | | 2012 | | | 2011 | | | 2010 | |
Net asset value, Beginning of Year | | $ | 4.27 | | | $ | 4.24 | | | $ | 4.15 | | | $ | 4.14 | | | $ | 3.77 | |
| | | | | | | | | | | | | | | | | | | | |
| Income from Operations: | | | | | | | | | | | | | | | | | | | | |
Net investment income(1) | | | 0.24 | | | | 0.27 | | | | 0.29 | | | | 0.36 | | | | 0.37 | |
Net realized and unrealized gain | | | 0.17 | | | | 0.07 | | | | 0.16 | | | | 0.02 | | | | 0.38 | |
| | | | | | | | | | | | | | | | | | | | |
Total Income from Operations | | | 0.41 | | | | 0.34 | | | | 0.45 | | | | 0.38 | | | | 0.75 | |
| | | | | | | | | | | | | | | | | | | | |
| Less Distributions From: | | | | | | | | | | | | | | | | | | | | |
Net investment income | | | (0.27 | ) | | | (0.31 | ) | | | (0.36 | ) | | | (0.37 | ) | | | (0.38 | ) |
| | | | | | | | | | | | | | | | | | | | |
Total Distributions | | | (0.27 | ) | | | (0.31 | ) | | | (0.36 | ) | | | (0.37 | ) | | | (0.38 | ) |
| | | | | | | | | | | | | | | | | | | | |
Net Asset Value, End of Year | | $ | 4.41 | | | $ | 4.27 | | | $ | 4.24 | | | $ | 4.15 | | | $ | 4.14 | |
| | | | | | | | | | | | | | | | | | | | |
Total Return(2) | | | 9.75 | % | | | 8.07 | % | | | 11.57 | % | | | 9.01 | % | | | 20.41 | % |
Net Assets, End of Year (millions) | | $ | 258 | | | $ | 111 | | | $ | 269 | | | $ | 198 | | | $ | 190 | |
| Ratios of Average Net Assets: | | | | | | | | | | | | | | | | | | | | |
Gross expenses | | | 0.92 | % | | | 0.93 | % | | | 0.97 | % | | | 0.88 | % | | | 0.95 | % |
Net expenses(3) | | | 0.76 | | | | 0.78 | | | | 0.81 | | | | 0.72 | | | | 0.79 | |
Net investment income | | | 5.53 | | | | 6.25 | | | | 7.58 | | | | 8.26 | | | | 9.06 | |
Portfolio Turnover Rate | | | 57 | % | | | 86 | % | | | 101 | % | | | 62 | % | | | 74 | % |
| (1) | | Per share amounts have been calculated using the average shares method. |
| (2) | | Performance figures may reflect fee waivers and/or expense reimbursements and assume reinvestment of dividend distribution. In the absence of fee waivers and/or expense reimbursements, the total return would have been lower. Applicable advisory program charges, which may be up to 3.00%, are not reflected in the performance data and would reduce the total returns. Past performance is no guarantee of future results. |
| (3) | | Reflects fee waivers and/or expense reimbursements. |
See Notes to Financial Statements.
161
For a share of beneficial interest outstanding throughout each year ended August 31, unless otherwise noted:
| | | | | | | | | | | | | | | | | | | | |
| International Fixed Income Investments | |
| | | 2014 | | | 2013 | | | 2012 | | | 2011 | | | 2010 | |
Net asset value, Beginning of Year | | $ | 8.02 | | | $ | 8.56 | | | $ | 7.99 | | | $ | 8.41 | | | $ | 7.77 | |
| | | | | | | | | | | | | | | | | | | | |
| Income (Loss) from Operations: | | | | | | | | | | | | | | | | | | | | |
Net investment income(1) | | | 0.16 | | | | 0.18 | | | | 0.19 | | | | 0.23 | | | | 0.19 | |
Net realized and unrealized gain (loss) | | | 0.40 | | | | (0.23 | ) | | | 0.41 | | | | (0.15 | ) | | | 0.83 | |
| | | | | | | | | | | | | | | | | | | | |
Total Income (Loss) from Operations | | | 0.56 | | | | (0.05 | ) | | | 0.60 | | | | 0.08 | | | | 1.02 | |
| | | | | | | | | | | | | | | | | | | | |
| Less Distributions From: | | | | | | | | | | | | | | | | | | | | |
Net investment income | | | (0.54 | ) | | | (0.49 | ) | | | (0.03 | ) | | | (0.50 | ) | | | (0.38 | ) |
| | | | | | | | | | | | | | | | | | | | |
Total Distributions | | | (0.54 | ) | | | (0.49 | ) | | | (0.03 | ) | | | (0.50 | ) | | | (0.38 | ) |
| | | | | | | | | | | | | | | | | | | | |
Net Asset Value, End of Year | | $ | 8.04 | | | $ | 8.02 | | | $ | 8.56 | | | $ | 7.99 | | | $ | 8.41 | |
| | | | | | | | | | | | | | | | | | | | |
Total Return(2) | | | 7.36 | % | | | (0.77 | )% | | | 7.53 | % | | | 1.21 | % | | | 13.55 | % |
Net Assets, End of Year (millions) | | $ | 267 | | | $ | 317 | | | $ | 431 | | | $ | 227 | | | $ | 220 | |
| Ratios of Average Net Assets: | | | | | | | | | | | | | | | | | | | | |
Gross expenses | | | 0.76 | %(3) | | | 0.69 | %(3) | | | 0.64 | % | | | 0.72 | % | | | 0.79 | % |
Net expenses | | | 0.76 | (3) | | | 0.69 | (3) | | | 0.63 | (4) | | | 0.72 | (4) | | | 0.79 | |
Net investment income | | | 2.00 | | | | 2.12 | | | | 2.25 | | | | 2.86 | | | | 2.44 | |
Portfolio Turnover Rate | | | 397 | % | | | 198 | % | | | 223 | % | | | 150 | % | | | 93 | % |
| (1) | | Per share amounts have been calculated using the average shares method. |
| (2) | | Performance figures may reflect fee waivers and/or expense reimbursements and assume reinvestment of dividend distribution. In the absence of fee waivers and/or expense reimbursements, the total return would have been lower. Applicable advisory program charges, which may be up to 3.00%, are not reflected in the performance data and would reduce the total returns. Past performance is no guarantee of future results. |
| (3) | | Ratio includes interest expense on forward sale commitments and reverse repurchase agreements which represents 0.04% and less than 0.01%, respectively. |
| (4) | | Reflects fee waivers and/or expense reimbursements. |
| | | | | | | | | | | | | | | | | | | | |
| Municipal Bond Investments | |
| | | 2014 | | | 2013 | | | 2012 | | | 2011 | | | 2010 | |
Net asset value, Beginning of Year | | $ | 9.21 | | | $ | 9.88 | | | $ | 9.48 | | | $ | 9.63 | | | $ | 9.09 | |
| | | | | | | | | | | | | | | | | | | | |
| Income (Loss) from Operations: | | | | | | | | | | | | | | | | | | | | |
Net investment income(1) | | | 0.29 | | | | 0.29 | | | | 0.28 | | | | 0.30 | | | | 0.31 | |
Net realized and unrealized gain (loss) | | | 0.55 | | | | (0.67 | ) | | | 0.40 | | | | (0.15 | ) | | | 0.54 | |
| | | | | | | | | | | | | | | | | | | | |
Total Income (Loss) from Operations | | | 0.84 | | | | (0.38 | ) | | | 0.68 | | | | 0.15 | | | | 0.85 | |
| | | | | | | | | | | | | | | | | | | | |
| Less Distributions From: | | | | | | | | | | | | | | | | | | | | |
Net investment income | | | (0.29 | ) | | | (0.29 | ) | | | (0.28 | ) | | | (0.30 | ) | | | (0.31 | ) |
| | | | | | | | | | | | | | | | | | | | |
Total Distributions | | | (0.29 | ) | | | (0.29 | ) | | | (0.28 | ) | | | (0.30 | ) | | | (0.31 | ) |
| | | | | | | | | | | | | | | | | | | | |
Net Asset Value, End of Year | | $ | 9.76 | | | $ | 9.21 | | | $ | 9.88 | | | $ | 9.48 | | | $ | 9.63 | |
| | | | | | | | | | | | | | | | | | | | |
Total Return(2) | | | 9.24 | % | | | (4.01 | )% | | | 7.23 | % | | | 1.71 | % | | | 9.59 | % |
Net Assets, End of Year (millions) | | $ | 78 | | | $ | 80 | | | $ | 89 | | | $ | 88 | | | $ | 92 | |
| Ratios of Average Net Assets: | | | | | | | | | | | | | | | | | | | | |
Gross expenses | | | 0.59 | % | | | 0.61 | % | | | 0.57 | % | | | 0.58 | % | | | 0.62 | % |
Net expenses | | | 0.59 | | | | 0.61 | | | | 0.57 | | | | 0.58 | | | | 0.62 | |
Net investment income | | | 3.03 | | | | 2.92 | | | | 2.83 | | | | 3.27 | | | | 3.39 | |
Portfolio Turnover Rate | | | 19 | % | | | 9 | % | | | 26 | % | | | 20 | % | | | 2 | % |
| (1) | | Per share amounts have been calculated using the average shares method. |
| (2) | | Performance figures may reflect fee waivers and/or expense reimbursements and assume reinvestment of dividend distribution. In the absence of fee waivers and/or expense reimbursements, the total return would have been lower. Applicable advisory program charges, which may be up to 3.00%, are not reflected in the performance data and would reduce the total returns. Past performance is no guarantee of future results. |
See Notes to Financial Statements.
162
For a share of beneficial interest outstanding throughout each year ended August 31, unless otherwise noted:
| | | | | | | | | | | | | | | | | | | | |
| Money Market Investments | |
| | | 2014 | | | 2013 | | | 2012 | | | 2011 | | | 2010 | |
Net asset value, Beginning of Year | | $ | 1.00 | | | $ | 1.00 | | | $ | 1.00 | | | $ | 1.00 | | | $ | 1.00 | |
| | | | | | | | | | | | | | | | | | | | |
| Income from Operations: | | | | | | | | | | | | | | | | | | | | |
Net investment income(1) | | | 0.00 | (2) | | | 0.00 | (2) | | | 0.00 | (2) | | | 0.00 | (2) | | | 0.00 | (2) |
Net realized and unrealized gain | | | 0.00 | (2) | | | 0.00 | (2) | | | 0.00 | (2) | | | 0.00 | (2) | | | 0.01 | |
| | | | | | | | | | | | | | | | | | | | |
Total Income from Operations | | | 0.00 | (2) | | | 0.00 | (2) | | | 0.00 | (2) | | | 0.00 | (2) | | | 0.01 | |
| | | | | | | | | | | | | | | | | | | | |
| Less Distributions From: | | | | | | | | | | | | | | | | | | | | |
Net investment income | | | (0.00 | )(3) | | | (0.00 | )(3) | | | (0.00 | )(3) | | | (0.00 | )(3) | | | (0.00 | )(3) |
Net realized gain | | | — | | | | — | | | | — | | | | (0.00 | )(3) | | | (0.01 | ) |
| | | | | | | | | | | | | | | | | | | | |
Total Distributions | | | (0.00 | )(3) | | | (0.00 | )(3) | | | (0.00 | )(3) | | | (0.00 | )(3) | | | (0.01 | ) |
| | | | | | | | | | | | | | | | | | | | |
Net Asset Value, End of Year | | $ | 1.00 | | | $ | 1.00 | | | $ | 1.00 | | | $ | 1.00 | | | $ | 1.00 | |
| | | | | | | | | | | | | | | | | | | | |
Total Return(5) | | | 0.00 | % | | | 0.00 | % | | | 0.02 | % | | | 0.01 | % | | | 0.85 | % |
Net Assets, End of Year (millions) | | $ | 335 | | | $ | 467 | | | $ | 238 | | | $ | 119 | | | $ | 125 | |
| Ratios of Average Net Assets: | | | | | | | | | | | | | | | | | | | | |
Gross expenses | | | 0.23 | % | | | 0.21 | % | | | 0.23 | % | | | 0.29 | % | | | 0.34 | % |
Net expenses(6) | | | 0.13 | | | | 0.16 | | | | 0.22 | | | | 0.21 | | | | 0.27 | |
Net investment income | | | 0.00 | (4) | | | 0.00 | (4) | | | 0.03 | | | | 0.00 | (4) | | | 0.01 | |
| (1) | | Per share amounts have been calculated using the average shares method. |
| (2) | | Amounts represent less than $0.01 per share. |
| (3) | | Amounts represent less than $(0.01) per share. |
| (4) | | Amounts represent less than 0.01% per share. |
| (5) | | Performance figures may reflect fee waivers and/or expense reimbursements and assume reinvestment of dividend distribution. In the absence of fee waivers and/or expense reimbursements, the total return would have been lower. Applicable advisory program charges, which may be up to 3.00%, are not reflected in the performance data and would reduce the total returns. Past performance is no guarantee of future results. |
| (6) | | Reflects fee waivers and/or expense reimbursements. |
See Notes to Financial Statements.
163
| | |
| | | |
| Notes to Financial Statements | | |
1. Organization and Significant Accounting Policies
The Consulting Group Capital Markets Funds (“Trust”) is organized as a Massachusetts business trust and registered under the Investment Company Act of 1940, as amended (“1940 Act”), as an open-end management investment company. The Trust currently consists of Large Capitalization Growth Investments, Large Capitalization Value Equity Investments, Small Capitalization Growth Investments, Small Capitalization Value Equity Investments, International Equity Investments, Emerging Markets Equity Investments, Core Fixed Income Investments, High Yield Investments, International Fixed Income Investments, Municipal Bond Investments and Money Market Investments (individually, a “Fund” and collectively, the “Funds”). Each Fund is a diversified series of the Trust, except for International Fixed Income Investments, which is non-diversified.
The following is a summary of significant accounting policies consistently followed by the Funds which are in conformity with accounting principles generally accepted in the United States of America (“GAAP”). Estimates and assumptions are required to be made by management regarding assets, liabilities and changes in net assets resulting from operations when financial statements are prepared. Changes in the economic environment, financial markets and any other parameters used in determining these estimates could cause actual results to differ.
(a) Investment Valuation. Portfolio securities of Money Market Investments are valued at amortized cost, which approximates market value. Equity securities for each Fund (other than Money Market Investments) for which market quotations are readily available and are traded on an exchange are valued at the closing sale price or official closing price on the exchange on which such security is principally traded. In the event there are no sales that day, such securities are valued at the mean between the bid and ask prices. For securities that are primarily traded on foreign exchanges, these values are converted to U.S. dollars using the current exchange rates as of the close of the London Stock Exchange.
Exchange-traded purchased and written options and futures contracts are valued at the last sale price (closing price) in the market where such contracts are principally traded or, if no sales are reported, the bid price. Swaps for which quotations are available on an automated basis from approved third-party pricing services are valued using those automated third-party pricing service quotations. Foreign currency contracts are valued using the official closing price for such contracts on the London Stock Exchange.
Portfolio securities traded in the over-the-counter market for which market quotations are readily available are valued at the last sales price that day. In the event there are no sales that day, such securities are valued at the mean between the bid and ask prices. Investments in registered open-end management investment companies are valued at reported net asset value per share.
Debt obligations that will mature in 60 days or less are valued at amortized cost, which approximates market value. Debt obligations that will mature in more than 60 days are valued using valuations furnished by an approved third-party pricing service; such valuations are determined by the third-party pricing service based upon its analysis of a variety of factors, including transactions in debt obligations, quotations from bond dealers, market transactions in comparable securities and its analysis of various relationships between securities, prices or yields of securities with similar characteristics, benchmark curves or information pertaining to the issuer, and as well as industry and economic events.
Overnight repurchase agreements and repurchase agreements maturing in seven days or less are valued at cost. Term repurchase agreements maturing in more than seven days are valued at the average of the bid quotations obtained daily from at least two recognized purchasers of such term repurchase agreements selected by Consulting Group Advisory Services, LLC (“CGAS”) (the “Manager”).
The Board of Trustees (the “Board”) has ultimate responsibility for ensuring the Funds’ investments are valued appropriately. The Board has delegated primary responsibility for determining or causing to be determined the value of the Funds’ investments (including any fair valuation) to the Manager pursuant to valuation policies and procedures approved by the Board. When market quotations are not readily available or are determined to be unreliable, investments are valued at fair value as determined in good faith by the valuation committee established by the Manager in accordance with such procedures under the oversight of the Board. Circumstances that may indicate that market quotations are not readily available or are unreliable include, but are not limited to, such instances when the value of a security has been significantly affected by events after the close of the exchange or market on which the security is principally traded, and before the applicable Fund calculates its NAV.
Each business day, Emerging Markets Equity Investments and International Equity Investments use a Board-approved third-party pricing service to assist with the valuation of foreign equity securities. Events occurring after the close of trading on foreign
164
| | |
| | | |
| Notes to Financial Statements | | |
exchanges may result in adjustments to the valuation of foreign securities to reflect market trading that occurs after the close of the applicable foreign markets of comparable securities or other instruments that have a strong correlation to the fair-valued securities to more accurately reflect their fair value as of the close of regular trading on the NYSE.
The Funds disclose the fair value of their investments in a hierarchy that prioritizes the inputs to valuation techniques used to measure the fair value. The hierarchy prioritizes inputs to valuation methods and requires disclosure of the fair value hierarchy, separately for each major category of assets and liabilities, that segregates fair value measurements into levels (Level 1, 2, and 3). The three levels of the fair value hierarchy are as follows:
Level 1 – unadjusted quoted prices in active markets for identical securities.
Level 2 – significant observable inputs (including quoted prices for similar securities, interest rates, prepayment speeds, credit risk, etc.)
Level 3 – significant unobservable inputs (including assumptions made by the Board or persons acting at their direction that are used in determining the fair value of investments.)
The inputs or methodology used for valuing securities are not necessarily an indication of the risk associated with investing in those securities. The following are certain inputs and techniques that the Funds generally use to evaluate how to classify each major category of assets and liabilities in accordance with GAAP.
Fixed income securities including corporate, convertible and municipal bonds and notes, U.S. government agencies, U.S. treasury obligations, sovereign bonds, bank loans, convertible preferred securities and non-U.S. bonds are normally valued by third-party pricing service providers that use broker-dealer quotations, reported trades or valuation estimates from their internal pricing models. The service providers’ internal models use inputs that are observable such as issuer details, interest rates, yield curves, prepayment speeds, credit risks/spreads, default rates and quoted prices for similar assets. Securities that use similar valuation techniques and inputs as described above are categorized as Level 2 of the fair value hierarchy. To the extent that these inputs are significant and unobservable, the values are categorized as Level 3 of the fair value hierarchy.
Mortgage-related and asset-backed securities are usually issued as separate tranches, or classes, of securities within each deal. These securities are also normally valued by third-party pricing service providers that use broker-dealer quotations or valuation estimates from their internal pricing models. The pricing models for these securities usually consider tranche-level attributes, current market data, estimated cash flows and market-based yield spreads for each tranche, and incorporate deal collateral performance, as available. Mortgage-related and asset-backed securities and the related forward sales commitments that use similar valuation techniques and inputs as described above are categorized as Level 2 of the fair value hierarchy. To the extent that these inputs are significant and unobservable, the values are categorized as Level 3 of the fair value hierarchy.
Common stocks, preferred stocks, rights, warrants, exchange-traded funds and financial derivative instruments, such as futures contracts or options contracts that are traded on a national securities exchange, are categorized as Level 1 of the fair value hierarchy, to the extent these securities are actively traded and valuation adjustments are not applied.
Valuation adjustments may be applied to certain securities that are solely traded on a foreign exchange to account for the market movement between the close of the foreign market and the NYSE close. Securities using these valuation adjustments are categorized as Level 2 of the fair value hierarchy. Preferred securities and other equities traded on inactive markets or valued by reference to similar instruments are also categorized as Level 2 of the fair value hierarchy.
Investments in registered open-end investment management companies are valued based upon the NAVs of such investments and are categorized as Level 1 of the fair value hierarchy.
Short-term investments having a maturity of 60 days or less are generally valued at amortized cost which approximates fair market value. These investments are categorized as Level 2 of the fair value hierarchy.
Over-the-counter financial derivative instruments, such as foreign currency contracts, forward foreign currency contracts, options contracts, or swap contracts, derive their value from underlying asset prices, indices, reference rates, and other inputs or a combination of these factors. These contracts are normally valued on the basis of broker dealer quotations or by third-party pricing
165
| | |
| | | |
| Notes to Financial Statements | | |
service providers. Depending on the product and the terms of the transaction, the value of financial derivatives can be estimated by a third-party pricing service provider using a series of techniques, including simulation pricing models. The pricing models use inputs that are observed from actively quoted markets such as issuer details, indices, spreads, interest rates, yield curves, dividends and exchange rates. Financial derivatives that use similar valuation techniques and inputs as described above are categorized as Level 2 of the fair value hierarchy. To the extent that these inputs are significant and unobservable, the values are categorized as Level 3 of the fair value hierarchy.
Centrally cleared swaps listed or traded on a multilateral or trade facility platform, such as a registered exchange, are valued at the daily settlement price determined by the respective exchange. For centrally cleared credit default swaps the clearing facility requires its members to provide actionable levels across complete term structures. These levels along with external third party prices are used to produce daily settlement prices. Centrally cleared interest rate swaps are valued using a pricing model that references the underlying rates including the overnight index swap rate and London Interbank Offered Rate (“LIBOR”) forward rate to produce the daily settlement price. These securities are categorized as Level 2 of the fair value hierarchy.
The Funds’ policy is to recognize transfers between levels at the end of the reporting period. In some instances, the inputs used to measure fair value might fall in different levels of the fair value hierarchy. The level in the fair value hierarchy within which the fair value measurement in its entirety falls is determined based on the lowest level input that is significant to the fair value measurement in its entirety. Because of the inherent uncertainties of valuation, the values reflected in the financial statements may materially differ from the value received upon actual sale of those investments.
The following table summarizes the valuation of each Fund’s assets and liabilities using the fair value hierarchy:
| | | | | | | | | | | | | | | | |
| | | Total Fair Value at
August 31, 2014 | | | Unadjusted Quoted Prices
in Active Markets
for Identical Investments
(Level 1) | | | Significant Observable
Inputs (Level 2) | | | Significant
Unobservable
Inputs (Level 3) | |
| Large Capitalization Growth Investments | | | | | | | | | | | | | | | | |
Investments, at value | | | | | | | | | | | | | | | | |
Common Stocks: | | | | | | | | | | | | | | | | |
Consumer Discretionary | | $ | 325,339,620 | | | $ | 325,339,620 | | | $ | — | | | $ | — | |
Consumer Staples | | | 77,698,007 | | | | 77,698,007 | | | | — | | | | — | |
Energy | | | 138,506,019 | | | | 138,506,019 | | | | — | | | | — | |
Financials | | | 108,363,470 | | | | 108,363,470 | | | | — | | | | — | |
Health Care | | | 292,010,849 | | | | 292,010,849 | | | | — | | | | — | |
Industrials | | | 166,176,923 | | | | 166,176,923 | | | | — | | | | — | |
Information Technology | | | 534,678,140 | | | | 534,678,140 | | | | — | | | | — | |
Materials | | | 65,138,512 | | | | 65,138,512 | | | | — | | | | — | |
Telecommunication Services | | | 25,663,613 | | | | 25,663,613 | | | | — | | | | — | |
Short-Term Investments: | | | | | | | | | | | | | | | | |
Money Market Fund | | | 27,461,626 | | | | 27,461,626 | | | | — | | | | — | |
Time Deposits | | | 46,187,236 | | | | — | | | | 46,187,236 | | | | — | |
| | | | | | | | | | | | | | | | |
| Total Investments, at value | | $ | 1,807,224,015 | | | $ | 1,761,036,779 | | | $ | 46,187,236 | | | $ | — | |
| | | | | | | | | | | | | | | | |
| Large Capitalization Value Equity Investments | | | | | | | | | | | | | | | | |
Investments, at value | | | | | | | | | | | | | | | | |
Common Stocks: | | | | | | | | | | | | | | | | |
Consumer Discretionary | | $ | 153,447,779 | | | $ | 153,447,779 | | | $ | — | | | $ | — | |
Consumer Staples | | | 74,656,107 | | | | 74,656,107 | | | | — | | | | — | |
Energy | | | 219,309,166 | | | | 219,309,166 | | | | — | | | | — | |
Financials | | | 307,743,029 | | | | 307,743,029 | | | | — | | | | — | |
Health Care | | | 184,915,164 | | | | 184,915,164 | | | | — | | | | — | |
Industrials | | | 122,617,340 | | | | 122,617,340 | | | | — | | | | — | |
166
| | |
| | | |
| Notes to Financial Statements | | |
| | | | | | | | | | | | | | | | |
| | | Total Fair Value at
August 31, 2014 | | | Unadjusted Quoted Prices
in Active Markets
for Identical Investments
(Level 1) | | | Significant Observable
Inputs (Level 2) | | | Significant
Unobservable
Inputs (Level 3) | |
Information Technology | | $ | 203,316,047 | | | $ | 203,316,047 | | | $ | — | | | $ | — | |
Materials | | | 59,128,432 | | | | 59,128,432 | | | | — | | | | — | |
Telecommunication Services | | | 46,060,908 | | | | 46,060,908 | | | | — | | | | — | |
Utilities | | | 43,420,050 | | | | 43,420,050 | | | | — | | | | — | |
Short-Term Investments: | | | | | | | | | | | | | | | | |
Money Market Fund | | | 16,233,890 | | | | 16,233,890 | | | | — | | | | — | |
Time Deposits | | | 50,615,146 | | | | — | | | | 50,615,146 | | | | — | |
| | | | | | | | | | | | | | | | |
| Total Investments, at value | | $ | 1,481,463,058 | | | $ | 1,430,847,912 | | | $ | 50,615,146 | | | $ | — | |
| | | | | | | | | | | | | | | | |
| Small Capitalization Growth Investments | | | | | | | | | | | | | | | | |
Investments, at value | | | | | | | | | | | | | | | | |
Common Stocks: | | | | | | | | | | | | | | | | |
Consumer Discretionary | | $ | 43,267,562 | | | $ | 43,267,562 | | | $ | — | | | $ | — | |
Consumer Staples | | | 6,921,620 | | | | 6,921,620 | | | | — | | | | — | |
Energy | | | 20,171,668 | | | | 20,171,668 | | | | — | | | | — | |
Financials | | | 20,589,368 | | | | 20,589,368 | | | | — | | | | — | |
Health Care | | | 65,878,925 | | | | 65,878,925 | | | | — | | | | — | |
Industrials | | | 55,405,894 | | | | 55,405,894 | | | | — | | | | — | |
Information Technology | | | 55,835,339 | | | | 55,835,339 | | | | — | | | | — | |
Materials | | | 13,506,424 | | | | 13,506,424 | | | | — | | | | — | |
Telecommunication Services | | | 4,435,530 | | | | 4,435,530 | | | | — | | | | — | |
Short-Term Investments: | | | | | | | | | | | | | | | | |
Money Market Fund | | | 27,854,226 | | | | 27,854,226 | | | | — | | | | — | |
Time Deposits | | | 10,537,229 | | | | — | | | | 10,537,229 | | | | — | |
| | | | | | | | | | | | | | | | |
| Total Investments, at value | | $ | 324,403,785 | | | $ | 313,866,556 | | | $ | 10,537,229 | | | $ | — | |
| | | | | | | | | | | | | | | | |
| Small Capitalization Value Equity Investments | | | | | | | | | | | | | | | | |
Investments, at value | | | | | | | | | | | | | | | | |
Common Stocks: | | | | | | | | | | | | | | | | |
Consumer Discretionary | | $ | 34,697,801 | | | $ | 34,697,801 | | | $ | — | | | $ | — | |
Consumer Staples | | | 10,989,818 | | | | 10,989,818 | | | | — | | | | — | |
Energy | | | 15,668,262 | | | | 15,668,262 | | | | — | | | | — | |
Financials | | | 62,070,822 | | | | 62,070,822 | | | | — | | | | — | |
Health Care | | | 14,714,635 | | | | 14,714,635 | | | | — | | | | — | |
Industrials | | | 71,072,310 | | | | 71,072,310 | | | | — | | | | — | |
Information Technology | | | 21,217,959 | | | | 21,217,959 | | | | — | | | | — | |
Materials | | | 36,246,103 | | | | 36,246,103 | | | | — | | | | — | |
Telecommunication Services | | | 517,581 | | | | 517,581 | | | | — | | | | — | |
Utilities | | | 7,312,796 | | | | 7,312,796 | | | | — | | | | — | |
Exchange-Traded Securities: | | | | | | | | | | | | | | | | |
Financials | | | 418,443 | | | | 418,443 | | | | — | | | | — | |
Short-Term Investments: | | | | | | | | | | | | | | | | |
Money Market Fund | | | 20,876,827 | | | | 20,876,827 | | | | — | | | | — | |
Time Deposits | | | 15,070,176 | | | | — | | | | 15,070,176 | | | | — | |
| | | | | | | | | | | | | | | | |
| Total Investments, at value | | $ | 310,873,533 | | | $ | 295,803,357 | | | $ | 15,070,176 | | | $ | — | |
| | | | | | | | | | | | | | | | |
167
| | |
| | | |
| Notes to Financial Statements | | |
| | | | | | | | | | | | | | | | |
| | | Total Fair Value at
August 31, 2014 | | | Unadjusted Quoted Prices
in Active Markets
for Identical Investments
(Level 1) | | | Significant Observable
Inputs (Level 2) | | | Significant
Unobservable
Inputs (Level 3) | |
| International Equity Investments | | | | | | | | | | | | | | | | |
Investments, at value | | | | | | | | | | | | | | | | |
Common Stocks: | | | | | | | | | | | | | | | | |
France | | $ | 124,913,578 | | | $ | — | | | $ | 124,913,578 | | | $ | — | |
Germany | | | 112,805,698 | | | | — | | | | 112,805,698 | | | | — | |
Japan | | | 159,682,550 | | | | 126,398 | | | | 159,556,152 | | | | — | |
Netherlands | | | 60,088,578 | | | | — | | | | 60,088,578 | | | | — | |
Switzerland | | | 124,288,336 | | | | — | | | | 124,288,336 | | | | — | |
United Kingdom | | | 209,876,298 | * | | | 822,941 | | | | 209,053,357 | | | | — | * |
Other Countries** | | | 301,140,104 | | | | 49,698,054 | | | | 251,442,050 | | | | — | |
Warrants: | | | | | | | | | | | | | | | | |
Luxembourg | | | 2,898,397 | | | | — | | | | 2,898,397 | | | | — | |
Rights: | | | | | | | | | | | | | | | | |
Germany | | | 1,718 | | | | — | | | | 1,718 | | | | — | |
Portugal | | | 10,505 | | | | — | | | | — | | | | 10,505 | |
Preferred Stocks: | | | | | | | | | | | | | | | | |
Germany | | | 38,876 | | | | — | | | | 38,876 | | | | — | |
Italy | | | 316,666 | | | | — | | | | 316,666 | | | | — | |
Short-Term Investments: | | | | | | | | | | | | | | | | |
Money Market Fund | | | 12,670,056 | | | | 12,670,056 | | | | — | | | | — | |
Time Deposits | | | 50,595,417 | | | | — | | | | 50,595,417 | | | | — | |
| | | | | | | | | | | | | | | | |
| Total — Investments, at value | | $ | 1,159,326,777 | * | | $ | 63,317,449 | | | $ | 1,095,998,823 | | | $ | 10,505 | * |
| | | | | | | | | | | | | | | | |
| Emerging Markets Equity Investments*** | | | | | | | | | | | | | | | | |
Investments, at value | | | | | | | | | | | | | | | | |
Common Stocks: | | | | | | | | | | | | | | | | |
Brazil | | $ | 58,389,125 | | | $ | 58,389,125 | | | $ | — | | | $ | — | |
China | | | 40,739,225 | | | | 13,720,012 | | | | 27,019,213 | | | | — | |
India | | | 51,970,171 | | | | 7,579,761 | | | | 44,390,410 | | | | — | |
Mexico | | | 19,299,036 | | | | 19,299,036 | | | | — | | | | — | |
Russia | | | 20,804,901 | | | | 8,495,895 | † | | | 12,309,006 | | | | — | |
South Korea | | | 29,200,988 | | | | — | | | | 29,200,988 | | | | — | |
Other Countries** | | | 152,077,544 | | | | 33,391,344 | | | | 118,686,200 | | | | — | |
Preferred Stocks: | | | | | | | | | | | | | | | | |
Brazil | | | 3,598,369 | | | | 3,598,369 | | | | — | | | | — | |
India | | | 25,879 | | | | 25,879 | | | | — | | | | — | |
Short-Term Investments: | | | | | | | | | | | | | | | | |
Money Market Fund | | | 17,939,497 | | | | 17,939,497 | | | | — | | | | — | |
Time Deposits | | | 9,781,434 | | | | — | | | | 9,781,434 | | | | — | |
| | | | | | | | | | | | | | | | |
| Total — Investments, at value | | $ | 403,826,169 | | | $ | 162,438,918 | | | $ | 241,387,251 | | | $ | — | |
| | | | | | | | | | | | | | | | |
| Core Fixed Income Investments | | | | | | | | | | | | | | | | |
Investments, at value | | | | | | | | | | | | | | | | |
Corporate Bonds & Notes | | $ | 244,863,887 | * | | $ | — | | | $ | 244,863,887 | | | $ | — | * |
Mortgage-Backed Securities | | | 180,369,592 | | | | — | | | | 180,369,592 | | | | — | |
U.S. Government & Agency Obligations | | | 147,880,960 | | | | — | | | | 147,880,960 | | | | — | |
Collateralized Mortgage Obligations | | | 110,286,375 | | | | — | | | | 110,286,375 | | | | — | |
Sovereign Bonds | | | 48,250,116 | | | | — | | | | 48,250,116 | | | | — | |
168
| | |
| | | |
| Notes to Financial Statements | | |
| | | | | | | | | | | | | | | | |
| | | Total Fair Value at
August 31, 2014 | | | Unadjusted Quoted Prices
in Active Markets
for Identical Investments
(Level 1) | | | Significant Observable
Inputs (Level 2) | | | Significant
Unobservable
Inputs (Level 3) | |
Asset-Backed Securities | | $ | 14,038,815 | | | $ | — | | | $ | 14,038,815 | | | $ | — | |
Municipal Bonds | | | 7,463,227 | | | | — | | | | 7,463,227 | | | | — | |
Senior Loans | | | 619,534 | | | | — | | | | 619,534 | | | | — | |
Preferred Stock: | | | | | | | | | | | | | | | | |
Financials | | | 813,792 | | | | 813,792 | | | | — | | | | — | |
Common Stocks: | | | | | | | | | | | | | | | | |
Consumer Discretionary | | | 16,637 | | | | 16,637 | | | | — | | | | — | |
Warrants: | | | | | | | | | | | | | | | | |
Consumer Discretionary | | | 4,028 | | | | 4,028 | | | | — | | | | — | |
Convertible Preferred Stock: | | | | | | | | | | | | | | | | |
Consumer Discretionary | | | — | * | | | — | | | | — | | | | — | * |
Purchased Options | | | 242,140 | | | | 750 | | | | 241,390 | | | | — | |
Short-Term Investments: | | | | | | | | | | | | | | | | |
Certificates of Deposit | | | 1,100,000 | | | | — | | | | 1,100,000 | | | | — | |
Commercial Paper | | | 8,000,147 | | | | — | | | | 8,000,147 | | | | — | |
Corporate Note | | | 2,136,752 | | | | — | | | | 2,136,752 | | | | — | |
Money Market Fund | | | 262,624 | | | | 262,624 | | | | — | | | | — | |
Repurchase Agreements | | | 22,800,000 | | | | — | | | | 22,800,000 | | | | — | |
Sovereign Bonds | | | 9,214,482 | | | | — | | | | 9,214,482 | | | | — | |
Time Deposits | | | 50,689,602 | | | | — | | | | 50,689,602 | | | | — | |
U.S. Government Agencies | | | 30,245,528 | | | | — | | | | 30,245,528 | | | | — | |
| | | | | | | | | | | | | | | | |
| Total Investments, at value | | $ | 879,298,238 | * | | $ | 1,097,831 | | | $ | 878,200,407 | | | $ | — | * |
| | | | | | | | | | | | | | | | |
| Other Financial Instruments | | | | | | | | | | | | | | | | |
Options Contracts Written | | $ | (263,253 | ) | | $ | (12,078 | ) | | $ | (251,175 | ) | | $ | — | |
Futures Contracts | | | 146,659 | | | | 146,659 | | | | — | | | | — | |
Forward Foreign Currency Contracts | | | 1,455,377 | | | | — | | | | 1,455,377 | | | | — | |
OTC Interest Rate Swaps | | | 87,481 | | | | — | | | | 87,481 | | | | — | |
Centrally Cleared Interest Rate Swaps | | | (368,529 | ) | | | — | | | | (368,529 | ) | | | — | |
OTC Credit Default Swaps | | | 142,917 | | | | — | | | | 142,917 | | | | — | |
| | | | | | | | | | | | | | | | |
| Total Other Financial Instruments | | $ | 1,200,652 | | | $ | 134,581 | | | $ | 1,066,071 | | | $ | — | |
| | | | | | | | | | | | | | | | |
| High Yield Investments | | | | | | | | | | | | | | | | |
Investments, at value | | | | | | | | | | | | | | | | |
Corporate Bonds & Notes | | $ | 232,726,761 | * | | $ | — | | | $ | 232,247,043 | | | $ | 479,718 | * |
Senior Loans | | | 1,054,560 | | | | — | | | | 1,054,560 | | | | — | |
Common Stocks: | | | | | | | | | | | | | | | | |
Consumer Discretionary | | | 19,906 | | | | — | | | | — | | | | 19,906 | |
Energy | | | 522,931 | | | | 8,046 | | | | — | | | | 514,885 | |
Financials | | | 117,254 | | | | 117,254 | | | | — | | | | — | |
Health Care | | | 67,200 | | | | — | | | | — | | | | 67,200 | |
Industrials | | | 54,002 | | | | 54,002 | | | | — | | | | — | |
Materials | | | 29,681 | | | | 29,681 | | | | — | | | | — | |
Preferred Stocks: | | | | | | | | | | | | | | | | |
Financials | | | 811,983 | | | | 811,983 | | | | — | | | | — | |
Convertible Preferred Stock: | | | | | | | | | | | | | | | | |
Energy | | | 507,413 | | | | 507,413 | | | | — | | | | — | |
169
| | |
| | | |
| Notes to Financial Statements | | |
| | | | | | | | | | | | | | | | |
| | | Total Fair Value at
August 31, 2014 | | | Unadjusted Quoted Prices
in Active Markets
for Identical Investments
(Level 1) | | | Significant Observable
Inputs (Level 2) | | | Significant
Unobservable
Inputs (Level 3) | |
Warrants: | | | | | | | | | | | | | | | | |
Financials | | $ | 86,645 | | | $ | 86,645 | | | $ | — | | | $ | — | |
Short-Term Investments: | | | | | | | | | | | | | | | | |
Money Market Fund | | | 6,217,477 | | | | 6,217,477 | | | | — | | | | — | |
Time Deposits | | | 25,225,113 | | | | — | | | | 25,225,113 | �� | | | — | |
| | | | | | | | | | | | | | | | |
| Total Investments, at value | | $ | 267,440,926 | * | | $ | 7,832,501 | | | $ | 258,526,716 | | | $ | 1,081,709 | * |
| | | | | | | | | | | | | | | | |
| International Fixed Income Investments | | | | | | | | | | | | | | | | |
Investments, at value | | | | | | | | | | | | | | | | |
Sovereign Bonds | | | | | | | | | | | | | | | | |
Italy | | $ | 29,237,230 | | | $ | — | | | $ | 29,237,230 | | | $ | — | |
Spain | | | 24,101,656 | | | | — | | | | 24,101,656 | | | | — | |
Other Countries** | | | 77,358,080 | | | | — | | | | 77,358,080 | | | | — | |
Corporate Bonds & Notes | | | | | | | | | | | | | | | | |
Germany | | | 14,163,035 | | | | — | | | | 14,163,035 | | | | — | |
United States | | | 14,847,579 | | | | — | | | | 14,847,579 | | | | — | |
Other Countries** | | | 28,136,214 | | | | — | | | | 28,136,214 | | | | — | |
Collateralized Mortgage Obligations | | | 20,279,262 | | | | — | | | | 20,279,262 | | | | — | |
Mortgage-Backed Securities | | | 16,883,542 | | | | — | | | | 16,883,542 | | | | — | |
U.S. Government & Agency Obligations | | | 8,743,335 | | | | — | | | | 8,743,335 | | | | — | |
Municipal Bonds | | | 2,218,875 | | | | — | | | | 2,218,875 | | | | — | |
Asset-Backed Securities | | | 1,645,327 | | | | — | | | | 1,645,327 | | | | — | |
Purchased Options | | | 1,456 | | | | — | | | | 1,456 | | | | — | |
Short-Term Investments: | | | | | | | | | | | | | | | | |
Repurchase Agreements | | | 37,100,000 | | | | — | | | | 37,100,000 | | | | — | |
Sovereign Bonds | | | 4,239,799 | | | | — | | | | 4,239,799 | | | | — | |
Time Deposits | | | 17,349,596 | | | | — | | | | 17,349,596 | | | | — | |
U.S. Government Agencies | | | 299,946 | | | | — | | | | 299,946 | | | | — | |
U.S. Government Obligations | | | 947,915 | | | | — | | | | 947,915 | | | | — | |
| | | | | | | | | | | | | | | | |
| Total — Investments, at value | | $ | 297,552,847 | | | $ | — | | | $ | 297,552,847 | | | $ | — | |
| | | | | | | | | | | | | | | | |
| Other Financial Instruments | | | | | | | | | | | | | | | | |
Options Contracts Written | | $ | (83,195 | ) | | $ | (26,894 | ) | | $ | (56,301 | ) | | $ | — | |
Forward Sale Commitments | | | (15,098,008 | ) | | | — | | | | (15,098,008 | ) | | | — | |
Futures Contracts | | | 369,460 | | | | 369,460 | | | | — | | | | — | |
Forward Foreign Currency Contracts | | | 3,062,879 | | | | — | | | | 3,062,879 | | | | — | |
OTC Interest Rate Swaps | | | 85,299 | | | | — | | | | 85,299 | | | | — | |
Centrally Cleared Interest Rate Swaps | | | 605,462 | | | | — | | | | 605,462 | | | | — | |
OTC Credit Default Swaps | | | 116,632 | | | | — | | | | 116,632 | | | | — | |
OTC Cross Currency Swaps | | | (39,061 | ) | | | — | | | | (39,061 | ) | | | — | |
| | | | | | | | | | | | | | | | |
| Total Other Financial Instruments | | $ | (10,980,532 | ) | | $ | 342,566 | | | $ | (11,323,098 | ) | | $ | — | |
| | | | | | | | | | | | | | | | |
| Municipal Bond Investments | | | | | | | | | | | | | | | | |
Investments, at value | | | | | | | | | | | | | | | | |
Municipal Bonds | | $ | 76,088,726 | | | $ | — | | | $ | 76,088,726 | | | $ | — | |
Short-Term Investments: | | | | | | | | | | | | | | | | |
Time Deposits | | | 883,506 | | | | — | | | | 883,506 | | | | — | |
| | | | | | | | | | | | | | | | |
| Total Investments, at value | | $ | 76,972,232 | | | $ | — | | | $ | 76,972,232 | | | $ | — | |
| | | | | | | | | | | | | | | | |
170
| | |
| | | |
| Notes to Financial Statements | | |
| | | | | | | | | | | | | | | | |
| | | Total Fair Value at
August 31, 2014 | | | Unadjusted Quoted Prices
in Active Markets
for Identical Investments
(Level 1) | | | Significant Observable
Inputs (Level 2) | | | Significant
Unobservable
Inputs (Level 3) | |
| Money Market Investments | | | | | | | | | | | | | | | | |
Investments, at value | | | | | | | | | | | | | | | | |
Short-Term Investments: | | | | | | | | | | | | | | | | |
Certificates of Deposit | | $ | 65,000,000 | | | $ | — | | | $ | 65,000,000 | | | $ | — | |
Commercial Paper | | | 188,950,779 | | | | — | | | | 188,950,779 | | | | — | |
Time Deposits | | | 587,670 | | | | — | | | | 587,670 | | | | — | |
U.S. Government Agency | | | 9,635,000 | | | | — | | | | 9,635,000 | | | | — | |
U.S. Government Obligations | | | 64,052,969 | | | | — | | | | 64,052,969 | | | | — | |
| | | | | | | | | | | | | | | | |
| Total Investments, at value | | $ | 328,226,418 | | | $ | — | | | $ | 328,226,418 | | | $ | — | |
| | | | | | | | | | | | | | | | |
| * | | Includes securities that are fair valued at $0. |
| ** | | Other Countries represents Countries that are individually less than 5% of Total Net Assets. |
| *** | | Includes $28,840,083 for Emerging Markets Equity Investments that was classified as Level 1 at August 31, 2013 and is now classified as Level 2 due to application of a fair value adjustment by the fair valuation pricing service for such securities at August 31, 2014 that was not required at August 31, 2013. |
| † | | Includes a security valued at $4,996,466 for Emerging Markets Equity Investments that transferred from Level 2 to Level 1. This change was the result of active trading and volume on the exchange at August 31, 2014. |
The level classification by major category of investments is the same as the category presentation in the Schedules of Investments.
During the year ended August 31, 2014, there were no transfers from Level 2 to Level 3. International Fixed Income Investments had a transfer from Level 3 to Level 2 of $299,310. The transfer was primarily due to security quotes not being readily available in an actively traded market and no available third-party vendor prices were available at August 31, 2013.
The following is a reconciliation of assets for which significant unobservable inputs (Level 3) were used in determining fair value during the year September 1, 2013, through August 31, 2014:
| | | | | | | | | | | | | | | | | | | | | | | | | | | | |
| | | Total | | | Collateralized
Mortgage
Obligations | | | Common
Stocks | | | Corporate
Bonds &
Notes | | | Convertible
Preferred
Stocks | | | Rights | | | Credit
Default
Swaps | |
| International Equity Investments | | | | | | | | | | | | | | | | | | | | | | | | | | | | |
Balance as of August 31, 2013 | | $ | — | * | | $ | — | | | $ | — | * | | $ | — | | | $ | — | | | $ | — | | | $ | — | |
Total realized gain (loss) | | | (97,506 | ) | | | — | | | | (97,506 | ) | | | — | | | | — | | | | — | | | | — | |
Change in unrealized appreciation (depreciation) | | | 108,013 | | | | — | | | | 97,508 | | | | — | | | | — | | | | 10,505 | | | | — | |
Purchases | | | — | | | | — | | | | — | | | | — | | | | — | | | | — | | | | — | |
(Sales) | | | (2 | ) | | | — | | | | (2 | ) | | | — | | | | — | | | | — | | | | — | |
Transfers In | | | — | | | | — | | | | — | | | | — | | | | — | | | | — | | | | — | |
Transfers Out | | | — | | | | — | | | | — | | | | — | | | | — | | | | — | | | | — | |
| | | | | | | | | | | | | | | | | | | | | | | | | | | | |
Balance as of August 31, 2014 | | $ | 10,505 | * | | $ | — | | | $ | — | * | | $ | — | | | $ | — | | | $ | 10,505 | | | $ | — | |
| | | | | | | | | | | | | | | | | | | | | | | | | | | | |
| Change in unrealized appreciation (depreciation) from Investments held as of August 31, 2014 | | $ | 10,505 | | | $ | — | | | $ | — | | | $ | — | | | $ | — | | | $ | 10,505 | | | $ | — | |
| | | | | | | | | | | | | | | | | | | | | | | | | | | | |
| | | | | | | |
| Emerging Markets Equity Investments | | | | | | | | | | | | | | | | | | | | | | | | | | | | |
Balance as of August 31, 2013 | | $ | 36,647 | | | $ | — | | | $ | — | | | $ | — | | | $ | — | | | $ | 36,647 | | | $ | — | |
Total realized gain (loss) | | | 60,410 | | | | — | | | | — | | | | — | | | | — | | | | 60,410 | | | | — | |
171
| | |
| | | |
| Notes to Financial Statements | | |
| | | | | | | | | | | | | | | | | | | | | | | | | | | | |
| | | Total | | | Collateralized
Mortgage
Obligations | | | Common
Stocks | | | Corporate
Bonds &
Notes | | | Convertible
Preferred
Stocks | | | Rights | | | Credit
Default
Swaps | |
Change in unrealized appreciation (depreciation) | | $ | (36,647 | ) | | $ | — | | | $ | — | | | $ | — | | | $ | — | | | $ | (36,647 | ) | | $ | — | |
Purchases | | | — | | | | — | | | | — | | | | — | | | | — | | | | — | | | | — | |
(Sales) | | | (60,410 | ) | | | — | | | | — | | | | — | | | | — | | | | (60,410 | ) | | | — | |
Transfers In | | | — | | | | — | | | | — | | | | — | | | | — | | | | — | | | | — | |
Transfers Out | | | — | | | | — | | | | — | | | | — | | | | — | | | | — | | | | — | |
| | | | | | | | | | | | | | | | | | | | | | | | | | | | |
Balance as of August 31, 2014 | | $ | — | | | $ | — | | | $ | — | | | $ | — | | | $ | — | | | $ | — | | | $ | — | |
| | | | | | | | | | | | | | | | | | | | | | | | | | | | |
| Change in unrealized appreciation (depreciation) from Investments held as of August 31, 2014 | | $ | — | | | $ | — | | | $ | — | | | $ | — | | | $ | — | | | $ | — | | | $ | — | |
| | | | | | | | | | | | | | | | | | | | | | | | | | | | |
| | | | | | | |
| Core Fixed Income Investments | | | | | | | | | | | | | | | | | | | | | | | | | | | | |
Balance as of August 31, 2013 | | $ | 129,981 | * | | $ | — | | | $ | — | | | $ | — | * | | $ | — | * | | $ | — | | | $ | 129,981 | |
Total realized gain (loss) | | | (14,800 | ) | | | — | | | | — | | | | — | | | | — | | | | — | | | | (14,800 | ) |
Change in unrealized appreciation (depreciation) | | | (127,181 | ) | | | — | | | | — | | | | — | | | | — | | | | — | | | | (127,181 | ) |
Purchases | | | — | | | | — | | | | — | | | | — | | | | — | | | | — | | | | — | |
(Sales) | | | 12,000 | | | | — | | | | — | | | | — | | | | — | | | | — | | | | 12,000 | |
Transfers In | | | — | | | | — | | | | — | | | | — | | | | — | | | | — | | | | — | |
Transfers Out | | | — | | | | — | | | | — | | | | — | | | | — | | | | — | | | | — | |
| | | | | | | | | | | | | | | | | | | | | | | | | | | | |
Balance as of August 31, 2014 | | $ | — | * | | $ | — | | | $ | — | | | $ | — | * | | $ | — | * | | $ | — | | | $ | — | |
| | | | | | | | | | | | | | | | | | | | | | | | | | | | |
| Change in unrealized appreciation (depreciation) from Investments held as of August 31, 2014 | | $ | — | | | $ | — | | | $ | — | | | $ | — | | | $ | — | | | $ | — | | | $ | — | |
| | | | | | | | | | | | | | | | | | | | | | | | | | | | |
| | | | | | | |
| High Yield Investments | | | | | | | | | | | | | | | | | | | | | | | | | | | | |
Balance as of August 31, 2013 | | $ | 684,318 | | | $ | — | | | $ | 529,923 | | | $ | 154,395 | | | $ | — | | | $ | — | | | $ | — | |
Total realized gain (loss) | | | 1,594 | | | | — | | | | — | | | | 1,594 | | | | — | | | | — | | | | — | |
Accrued discounts (premiums) | | | 2,700 | | | | — | | | | — | | | | 2,700 | | | | — | | | | — | | | | — | |
Change in unrealized appreciation (depreciation) | | | (56,579 | ) | | | — | | | | (51,528 | ) | | | (5,051 | ) | | | — | | | | — | | | | — | |
Purchases | | | 451,271 | | | | — | | | | 123,596 | | | | 327,675 | | | | — | | | | — | | | | — | |
(Sales) | | | (1,595 | ) | | | — | | | | — | | | | (1,595 | ) | | | — | | | | — | | | | — | |
Transfers In | | | — | | | | — | | | | — | | | | — | | | | — | | | | — | | | | — | |
Transfers Out | | | — | | | | — | | | | — | | | | — | | | | — | | | | — | | | | — | |
| | | | | | | | | | | | | | | | | | | | | | | | | | | | |
Balance as of August 31, 2014 | | $ | 1,081,709 | * | | $ | — | | | $ | 601,991 | | | $ | 479,718 | * | | $ | — | | | $ | — | | | $ | — | |
| | | | | | | | | | | | | | | | | | | | | | | | | | | | |
| Change in unrealized appreciation (depreciation) from Investments held as of August 31, 2014 | | $ | (54,305 | ) | | $ | — | | | $ | (51,528 | ) | | $ | (2,777 | ) | | $ | — | | | $ | — | | | $ | — | |
| | | | | | | | | | | | | | | | | | | | | | | | | | | | |
172
| | |
| | | |
| Notes to Financial Statements | | |
| | | | | | | | | | | | | | | | | | | | | | | | | | | | |
| | | Total | | | Collateralized
Mortgage
Obligations | | | Common
Stocks | | | Corporate
Bonds &
Notes | | | Convertible
Preferred
Stocks | | | Rights | | | Credit
Default
Swaps | |
| International Fixed Income Investments | | | | | | | | | | | | | | | | | | | | | | | | | | | | |
Balance as of August 31, 2013 | | $ | 329,172 | | | $ | 329,172 | | | $ | — | | | $ | — | | | $ | — | | | $ | — | | | $ | — | |
Total realized gain (loss) | | | (1,255 | ) | | | (1,255 | ) | | | — | | | | — | | | | — | | | | — | | | | — | |
Accrued discounts (premiums) | | | — | | | | — | | | | — | | | | — | | | | — | | | | — | | | | — | |
Change in unrealized appreciation (depreciation) | | | (7,858 | ) | | | (7,858 | ) | | | — | | | | — | | | | — | | | | — | | | | — | |
Purchases | | | — | | | | — | | | | — | | | | — | | | | — | | | | — | | | | — | |
(Sales) | | | — | | | | — | | | | — | | | | — | | | | — | | | | — | | | | — | |
(Paydowns) | | | (20,749 | ) | | | (20,749 | ) | | | — | | | | — | | | | — | | | | — | | | | — | |
Transfers In | | | — | | | | — | | | | — | | | | — | | | | — | | | | — | | | | — | |
Transfers Out | | | (299,310 | ) | | | (299,310 | ) | | | — | | | | — | | | | — | | | | — | | | | — | |
| | | | | | | | | | | | | | | | | | | | | | | | | | | | |
Balance as of August 31, 2014 | | $ | — | | | $ | — | | | $ | — | | | $ | — | | | $ | — | | | $ | — | | | $ | — | |
| | | | | | | | | | | | | | | | | | | | | | | | | | | | |
| Change in unrealized appreciation (depreciation) from Investments held as of August 31, 2014 | | $ | — | | | $ | — | | | $ | — | | | $ | — | | | $ | — | | | $ | — | | | $ | — | |
| | | | | | | | | | | | | | | | | | | | | | | | | | | | |
| * | | Includes securities that are fair valued at $0. |
(b) Accounting for Derivative Instruments. Derivative instruments require enhanced disclosures regarding a Fund’s credit derivatives holdings, including credit default swaps, credit spread options, and hybrid financial instruments containing embedded credit derivatives.
All open derivative positions at year end for each Fund are disclosed in Note 3 or in the Fund’s Schedule of Investments.
Certain Funds may use derivative instruments including futures, options, forward foreign currency contracts, swaptions and swap contracts as part of their investment strategies. Following is a description of these derivative instruments, including the primary underlying risk exposures related to each instrument type:
(i) Futures Contracts. Certain Funds may enter into futures contracts, to the extent permitted by their investment policies and objectives, for bonafide hedging and other permissible risk management purposes including protecting against anticipated changes in the value of securities a Fund intends to purchase. Upon entering into a futures contract, a Fund is required to deposit cash or securities as initial margin. Additional securities are also segregated as collateral up to the current market value of the futures contracts. Subsequent payments, known as variation margin, are made or received by the Fund, depending on the fluctuation in the value of the underlying financial instruments. The Fund recognizes an unrealized gain or loss equal to the variation margin. When futures contracts are closed, a realized gain or loss is recognized which is equal to the difference between the proceeds from (or cost of) the closing transactions and the Fund’s basis in the contracts.
The risks associated with entering into futures contracts include the possibility that a change in the value of the contract may not correlate with the changes in the value of the underlying instruments. In addition, investing in futures contracts involves the risk that the Fund could lose more than the original margin deposit due to subsequent payments that may be required for a futures transaction.
(ii) Options Written. Certain Funds may write options to manage exposure to certain changes in the market. When a Fund writes an option, an amount equal to the premium received by the Fund is recorded as a liability, the value of which is marked-to-market daily to reflect the current market value of the option written. If the option expires, the Fund realizes a gain from investments equal to the amount of the premium received. When a written call option is exercised, the premium received is added to the proceeds from the sale of the underlying security in determining whether the Fund has a realized gain
173
| | |
| | | |
| Notes to Financial Statements | | |
or loss. When a written put option is exercised, the amount of the premium received reduces the cost of the security purchased by the Fund.
When writing a covered call option, a Fund may forego the opportunity of profit if the market price of the underlying security increases more than the premium received and the option is exercised. When writing a put option, a Fund may incur a loss if the market price of the underlying security decreases more than the premium received and the option is exercised. In addition, there is the risk that the Fund may not be able to enter into a closing transaction because of an illiquid secondary market.
(iii) Purchased Options. Certain Funds may purchase options to manage exposure to certain changes in the market. A Fund will normally purchase call options in anticipation of an increase in the market value of securities of the type in which they may invest, an amount equal to the value is recorded as an asset. The purchase of a call option will entitle a Fund, in return for the premium paid, to purchase specified securities at a specified price during the option period. A Fund will ordinarily realize a gain if, during the option period, the value of such securities exceeded the sum of the exercise price, the premium paid and transaction costs; otherwise, the Fund will realize a loss equal to the amount of the premium paid on the purchase of the call option.
A Fund will normally purchase put options in anticipation of a decline in the market value of securities in its portfolio (“protective puts”) or in securities in which it may invest. The purchase of a put option will entitle the Fund, in exchange for the premium paid, to sell specified securities at a specified price during the option period. The purchase of protective puts is designed to offset or hedge against a decline in the market value of the Fund’s securities. Put options may also be purchased by a Fund for the purpose of affirmatively benefiting from a decline in the price of securities which it does not own. The Fund will ordinarily realize a gain if, during the option period, the value of the underlying securities decreased below the exercise price sufficiently to more than cover the premium and transaction costs; otherwise the Fund will realize a loss equal to the amount of the premium paid on the purchase of the put option. Gains and losses on the purchase of protective put options would tend to be offset by countervailing changes in the value of the underlying portfolio securities.
(iv) Forward Foreign Currency Contracts. Certain Funds may enter into forward foreign currency contracts to hedge against foreign currency exchange rate risk on their non-U.S. dollar denominated securities or to facilitate settlement of foreign currency denominated portfolio transactions. A forward foreign currency contract is an agreement between two parties to buy and sell a currency at a set price on a future date. The contract is marked-to-market daily and the change in value is recorded by a Fund as an unrealized gain or loss. When a forward foreign currency contract is extinguished, through either delivery or offset by entering into another forward foreign currency contract, the Fund records a realized gain or loss equal to the difference between the value of the contract at the time it was opened and the value of the contract at the time it was extinguished.
Forward foreign currency contracts involve elements of market risk in excess of the amounts reflected in the Statements of Assets and Liabilities. The Fund bears the risk of an unfavorable change in the foreign exchange rate underlying the forward foreign currency contract. Risks may also arise upon entering into these contracts from the potential inability of the counterparties to meet the terms of their contracts.
(v) Swaptions. Swaptions contracts entered into by the Funds typically represent an option that gives the purchaser the right, but not the obligation, to enter into a swap contract on a future date. Certain Funds may purchase swaptions to manage exposure to fluctuations in interest rates and to enhance portfolio yield. Changes in the value of purchased swaptions are reported as “Net change in unrealized appreciation (depreciation) from Investments” on the Statement of Operations and Changes in Net Assets. Gain or loss is recognized when the swaptions contract expires or is closed as “Net realized gain (loss) from Investments” on the Statement of Operations and Changes in Net Assets. Details of purchased swaptions contracts held at year end are included on the Fund’s Schedule of Investments under the caption “Purchased Options”.
Certain Funds may write swaption contracts to manage exposure to fluctuations in interest rates and to enhance portfolio yield. Swaption contracts written by a Fund represent an option that obligates the writer upon exercise by the purchaser, to enter into a previously agreed upon swap contract on a future date. If a written call swaption is exercised, the writer will enter into a swap and is obligated to pay the fixed rate and receive a floating rate in exchange. If a written put swaption is exercised, the writer will enter a swap and is obligated to pay the floating rate and receive a fixed rate in exchange.
174
| | |
| | | |
| Notes to Financial Statements | | |
When a Fund writes a swaption, the premium received is recorded as a liability in the Statements of Assets and Liabilities and is subsequently adjusted to the current market value of the swaption. Changes in the value of the swaption are reported as unrealized gains or losses in the Statements of Operations. A gain or loss is recognized when the swaption contract expires or is closed. Premiums received from writing swaptions that expire or are exercised are treated by the Fund as realized gains from investments. The difference between the premium and the amount paid on effecting a closing purchase transaction is also treated as a realized gain or, if the premium received is less than the amount paid for the closing purchase, as a realized loss.
Entering into a swaption contract involves, to varying degrees, the elements of credit, market and interest rate risk, associated with both option contracts and swap contracts. To reduce credit risk from potential counterparty default, a Fund only enters into swaption contracts with counterparties that meet certain standards of creditworthiness. A Fund bears the market risk arising from any change in index values or interest rates.
(vi) Swap Contracts. Swaps involve the exchange by a Fund with another party of the respective amounts payable with respect to a notional principal amount related to one or more indices. Certain Funds may enter into these transactions to preserve a return or spread on a particular investment or portion of its assets, as a duration management technique or to protect against any increase in the price of securities the Fund anticipates purchasing at a later date. Certain Funds may also use these transactions for speculative purposes, such as to obtain the price performance of a security without actually purchasing the security in circumstances where, for example, the subject security is illiquid, is unavailable for direct investment or available only on less attractive terms.
Swaps are marked-to-market daily based upon quotations from market makers and the change, if any, is recorded as change in unrealized appreciation or depreciation in the Statements of Operations. Net receipts or payments of interest are recorded as realized gains or losses, respectively. Gains and losses are realized upon termination of a swap contract. An upfront payment received by the Fund, is recorded as a liability on the Fund’s books. An upfront payment made by the Fund is recorded as an asset on the Fund’s books. Any upfront payments paid or received upon entering a swap contract to compensate for differences between stated terms of the agreement and prevailing market conditions (e.g. credit spreads, interest rates or other factors) are recorded as a realized gain or loss at the termination of the swap.
Swaps have risks associated with them, including possible default by the counterparty to the transaction, illiquidity and, where swaps are used as hedges, the risk that the use of a swap could result in losses greater than if the swap had not been employed. This risk is mitigated by the posting of collateral by the counterparty to the Fund to cover the Fund’s exposure to the counterparty.
(vii) Credit Default Swaps. Certain Funds may enter into credit default swap contracts for investment purposes, to manage their credit risk or to add leverage. As a seller in a credit default swap contract, a Fund is required to pay the notional or other agreed-upon value to the counterparty in the event of a default by a third party, such as a U.S. or foreign corporate issuer, on the referenced debt obligation. In return, the Fund receives from the counterparty a periodic stream of payments over the term of the contract provided that no event of default has occurred. If no default occurs, the Fund keeps the stream of payments and has no payment obligations. Such periodic payments are accrued daily and accounted for as realized gains.
Certain Funds may also purchase credit default swap contracts in order to hedge against the risk of default by debt securities held in their portfolios. In these cases a Fund functions as the counterparty referenced in the preceding paragraph. As a purchaser of a credit default swap contract, the Fund receives the notional or other agreed upon value from the counterparty in the event of a default by a third party, such as a U.S. or foreign corporate issuer, on the referenced debt obligation. In return, the Fund makes periodic payments to the counterparty over the term of the contract provided no event of default has occurred. Such periodic payments are accrued daily and accounted for as realized losses.
For a credit default swap sold by a Fund, payment of the agreed upon amount made by the Fund in the event of default of the referenced debt obligation is recorded as the cost of the referenced debt obligation received. For a credit default swap purchased by a Fund, the agreed upon amount received by the Fund in the event of default of the referenced debt obligation is recorded as proceeds from sale/delivery of the referenced debt obligation and the resulting gain or loss realized on the referenced debt obligation is recorded as such by the Fund.
Entering into credit default swaps involves, to varying degrees, elements of credit, market and documentation risk in excess of the related amounts recognized on the Statements of Assets and Liabilities. Such risks involve the possibility that there will be no
175
| | |
| | | |
| Notes to Financial Statements | | |
liquid market for these agreements, that the counterparty to the agreements may default on its obligation to perform or disagree as to the meaning of the contractual terms in the agreements, and that there will be unfavorable changes in net interest rates. As privately negotiated transactions, swaps may involve documentation risk, which is the risk that the swap contracts fail to contemplate a particular outcome or that the parties disagree about the proper interpretation of a transaction term.
(viii) Interest Rate Swaps. Certain Funds may enter into interest rate swaps for investment purposes to manage exposure to fluctuations in interest rates or to add leverage. Interest rate swaps represent an agreement between two counterparties to exchange cash flows based on the difference in the fixed interest rate and the floating interest rate, applied to the notional principal amount for a specified period. The payment flows are usually netted against each other, with the difference being paid by one party to the other. Once the payments are settled in cash, the net amount is recorded as realized gain or loss from swap contracts on the Statements of Operations. The Funds settle accrued net receivable or payable under the swap contracts on a periodic basis.
The primary risk associated with interest rate swaps is that unfavorable changes in interest rates could adversely impact a Fund.
(ix) Centrally Cleared Swaps. Certain clearinghouses currently offer clearing for limited types of derivatives transactions, principally credit and interest derivatives. In a cleared derivative transaction, a Fund typically enters into the transaction with a financial institution counterparty, and performance of the transaction is effectively guaranteed by a central clearinghouse, thereby reducing or eliminating the Fund’s exposure to the credit risk of the original counterparty. The Fund typically will be required to post specified levels of margin with the clearinghouse or at the instruction of the clearinghouse; the margin required by a clearinghouse may be greater than the margin the Fund would be required to post in an uncleared derivative transaction. Daily changes in valuation of centrally cleared swaps, if any, are recorded as variation margin receivable or payable on swap contracts for the change in value as appropriate on the Statements of Assets and Liabilities. Only a limited number of derivative transactions are currently eligible for clearing by clearinghouses.
(x) Cross-Currency Swaps. Certain Funds may enter into cross-currency swaps to gain or mitigate exposure to currency risk. Cross-currency swaps involve two parties exchanging two different currencies with an agreement to reverse the exchange at a later date at specific exchange rates. The exchange of currencies at the inception date of the contract takes place at the current spot rate. The re-exchange at maturity may take place at the same exchange rate, a specified rate, or the then current spot rate. Interest payments, if applicable, are made between the parties based on interest rates available in the two currencies at the inception of the contract. The terms of cross-currency swap contracts may extend for many years. Cross-currency swaps are usually negotiated with commercial and investment banks. Some cross-currency swaps may not provide for exchanging principal cash flows, but only for exchanging interest cash flows.
The following is a summary of the fair valuations of the Funds’ derivative instruments categorized by risk exposure at August 31, 2014:
International Equity Investments
| | | | | | | | | | | | | | | | | | | | |
Effect of Derivative Instruments on the Statements of Operations for the Year Ended August 31, 2014: | |
| | | | | |
| Location | | Interest rate
risk | | | Foreign
exchange
risk | | | Credit
risk | | | Equity
risk | | | Total | |
| Realized gain/(loss) on derivatives recognized in income (d) | | | | | | | | | | | | | | | | | | | | |
Net realized gain (loss) on forward foreign currency contracts | | $ | — | | | $ | (715,718 | ) | | $ | — | | | $ | — | | | $ | (715,718 | ) |
| | | | | | | | | | | | | | | | | | | | |
| | $ | — | | | $ | (715,718 | ) | | $ | — | | | $ | — | | | $ | (715,718 | ) |
| | | | | | | | | | | | | | | | | | | | |
| Change in unrealized appreciation (depreciation) on derivatives recognized in income (e) | | | | | | | | | | | | | | | | | | | | |
Net change in unrealized appreciation (depreciation) on forward foreign currency contracts | | $ | — | | | $ | 64,274 | | | $ | — | | | $ | — | | | $ | 64,274 | |
| | | | | | | | | | | | | | | | | | | | |
| | $ | — | | | $ | 64,274 | | | $ | — | | | $ | — | | | $ | 64,274 | |
| | | | | | | | | | | | | | | | | | | | |
176
| | |
| | | |
| Notes to Financial Statements | | |
Emerging Markets Equity Investments
| | | | | | | | | | | | | | | | | | | | |
Effect of Derivative Instruments on the Statements of Operations for the Year Ended August 31, 2014: | |
| | | | | |
| Location | | Interest rate
risk | | | Foreign
exchange
risk | | | Credit
risk | | | Equity
risk | | | Total | |
| Realized gain/(loss) on derivatives recognized in income (d) | | | | | | | | | | | | | | | | | | | | |
Net realized gain (loss) on forward foreign currency contracts | | $ | — | | | $ | (68,975 | ) | | $ | — | | | $ | — | | | $ | (68,975 | ) |
| | | | | | | | | | | | | | | | | | | | |
| | $ | — | | | $ | (68,975 | ) | | $ | — | | | $ | — | | | $ | (68,975 | ) |
| | | | | | | | | | | | | | | | | | | | |
Core Fixed Income Investments
| | | | | | | | | | | | | | | | | | | | |
Fair Values of Derivative Instruments on the Statements of Assets and Liabilities as of August 31, 2014: | |
| | | | | |
| Location | | Interest rate
risk | | | Foreign
exchange
risk | | | Credit
risk | | | Equity
risk | | | Total | |
| Asset derivatives | | | | | | | | | | | | | | | | | | | | |
Purchased Options (c) | | $ | 242,140 | | | $ | — | | | $ | — | | | $ | — | | | $ | 242,140 | |
Unrealized appreciation on open futures contracts (b) | | | 506,337 | | | | 38,481 | | | | — | | | | — | | | | 544,818 | |
Unrealized appreciation on forward foreign currency contracts (c) | | | — | | | | 1,945,328 | | | | — | | | | — | | | | 1,945,328 | |
Unrealized appreciation on centrally cleared swaps (f) | | | 97,437 | | | | — | | | | — | | | | — | | | | 97,437 | |
Swap contracts, at value (c) | | | 241,443 | | | | — | | | | 198,865 | | | | — | | | | 440,308 | |
| | | | | | | | | | | | | | | | | | | | |
| | $ | 1,087,357 | | | $ | 1,983,809 | | | $ | 198,865 | | | $ | — | | | $ | 3,270,031 | |
| | | | | | | | | | | | | | | | | | | | |
| Liability derivatives | | | | | | | | | | | | | | | | | | | | |
Options contracts written outstanding (a) | | $ | 259,247 | | | $ | 4,006 | | | $ | — | | | $ | — | | | $ | 263,253 | |
Unrealized depreciation on open futures contracts (b) | | | 398,159 | | | | — | | | | — | | | | — | | | | 398,159 | |
Unrealized depreciation on forward foreign currency contracts (a) | | | — | | | | 489,951 | | | | — | | | | — | | | | 489,951 | |
Unrealized depreciation on centrally cleared swaps (f) | | | 465,966 | | | | — | | | | — | | | | — | | | | 465,966 | |
Swap contracts, at value (a) | | | 153,962 | | | | — | | | | 55,948 | | | | — | | | | 209,910 | |
| | | | | | | | | | | | | | | | | | | | |
| | $ | 1,277,334 | | | $ | 493,957 | | | $ | 55,948 | | | $ | — | | | $ | 1,827,239 | |
| | | | | | | | | | | | | | | | | | | | |
| | | | | | | | | | | | | | | | | | | | |
Effect of Derivative Instruments on the Statements of Operations for the Year Ended August 31, 2014: | |
| | | | | |
| Location | | Interest rate
risk | | | Foreign
exchange
risk | | | Credit
risk | | | Equity
risk | | | Total | |
| Realized gain/(loss) on derivatives recognized in income (d) | | | | | | | | | | | | | | | | | | | | |
Net realized gain (loss) on purchased options | | $ | (571 | ) | | $ | — | | | $ | — | | | $ | — | | | $ | (571 | ) |
Net realized gain (loss) on futures contracts | | | 859,011 | | | | — | | | | — | | | | — | | | | 859,011 | |
Net realized gain (loss) on options written | | | 669,675 | | | | — | | | | 2,215 | | | | — | | | | 671,890 | |
Net realized gain (loss) on swaps contracts | | | (1,358,196 | ) | | | — | | | | 207,200 | | | | — | | | | (1,150,996 | ) |
Net realized gain (loss) on forward foreign currency contracts | | | — | | | | (808,633 | ) | | | — | | | | — | | | | (808,633 | ) |
| | | | | | | | | | | | | | | | | | | | |
| | $ | 169,919 | | | $ | (808,633 | ) | | $ | 209,415 | | | $ | — | | | $ | (429,299 | ) |
| | | | | | | | | | | | | | | | | | | | |
| Change in unrealized appreciation (depreciation) on derivatives recognized in income (e) | | | | | | | | | | | | | | | | | | | | |
Net change in unrealized appreciation (depreciation) on purchased options | | $ | (310,146 | ) | | $ | — | | | $ | — | | | $ | — | | | $ | (310,146 | ) |
Net change in unrealized appreciation (depreciation) on futures contracts | | | 444,066 | | | | 38,481 | | | | — | | | | — | | | | 482,547 | |
Net change in unrealized appreciation (depreciation) on options contracts written | | | 1,126,748 | | | | 2,801 | | | | — | | | | — | | | | 1,129,549 | |
Net change in unrealized appreciation (depreciation) on swaps contracts | | | (523,492 | ) | | | — | | | | 127,478 | | | | — | | | | (396,014 | ) |
Net change in unrealized appreciation (depreciation) on forward foreign currency contracts | | | — | | | | 2,194,473 | | | | — | | | | — | | | | 2,194,473 | |
| | | | | | | | | | | | | | | | | | | | |
| | $ | 737,176 | | | $ | 2,235,755 | | | $ | 127,478 | | | $ | — | | | $ | 3,100,409 | |
| | | | | | | | | | | | | | | | | | | | |
177
| | |
| | | |
| Notes to Financial Statements | | |
International Fixed Income Investments
| | | | | | | | | | | | | | | | | | | | |
Fair Values of Derivative Instruments on the Statements of Assets and Liabilities as of August 31, 2014: | |
| | | | | |
| Location | | Interest rate
risk | | | Foreign
exchange
risk | | | Credit
risk | | | Equity
risk | | | Total | |
| Asset derivatives | | | | | | | | | | | | | | | | | | | | |
Purchased Options (c) | | $ | — | | | $ | 1,456 | | | $ | — | | | $ | — | | | $ | 1,456 | |
Unrealized appreciation on futures contracts (b) | | | 520,495 | | | | — | | | | — | | | | — | | | | 520,495 | |
Unrealized appreciation on forward foreign currency contracts (c) | | | — | | | | 4,552,534 | | | | — | | | | — | | | | 4,552,534 | |
Unrealized appreciation on centrally cleared swaps (f) | | | 1,586,864 | | | | — | | | | — | | | | — | | | | 1,586,864 | |
Swap contracts, at value (c) | | | 90,377 | | | | — | | | | 198,926 | | | | — | | | | 289,303 | |
| | | | | | | | | | | | | | | | | | | | |
| | $ | 2,197,736 | | | $ | 4,553,990 | | | $ | 198,926 | | | $ | — | | | $ | 6,950,652 | |
| | | | | | | | | | | | | | | | | | | | |
| Liability derivatives | | | | | | | | | | | | | | | | | | | | |
Options contracts written outstanding (a) | | $ | 26,894 | | | $ | 56,286 | | | $ | 15 | | | $ | — | | | $ | 83,195 | |
Unrealized depreciation on futures contracts (b) | | | 151,035 | | | | — | | | | — | | | | — | | | | 151,035 | |
Unrealized depreciation on forward foreign currency contracts (a) | | | — | | | | 1,489,655 | | | | — | | | | — | | | | 1,489,655 | |
Unrealized depreciation on centrally cleared swaps (f) | | | 981,402 | | | | — | | | | — | | | | — | | | | 981,402 | |
Swap contracts, at value (a) | | | 5,078 | | | | 39,061 | | | | 82,294 | | | | — | | | | 126,433 | |
| | | | | | | | | | | | | | | | | | | | |
| | $ | 1,164,409 | | | $ | 1,585,002 | | | $ | 82,309 | | | $ | — | | | $ | 2,831,720 | |
| | | | | | | | | | | | | | | | | | | | |
| | | | | | | | | | | | | | | | | | | | |
Effect of Derivative Instruments on the Statements of Operations for the Year Ended August 31, 2014: | |
| | | | | |
| Location | | Interest rate
risk | | | Foreign
exchange
risk | | | Credit
risk | | | Equity
risk | | | Total | |
| Realized gain/(loss) on derivatives recognized in income (d) | | | | | | | | | | | | | | | | | | | | |
Net realized gain (loss) on purchased options | | $ | (184,620 | ) | | $ | (592 | ) | | $ | — | | | $ | — | | | $ | (185,212 | ) |
Net realized gain (loss) on futures contracts | | | 514,310 | | | | — | | | | — | | | | — | | | | 514,310 | |
Net realized gain (loss) on options contracts written | | | 655,432 | | | | 77,877 | | | | — | | | | — | | | | 733,309 | |
Net realized gain (loss) on swaps contracts | | | (1,571,873 | ) | | | — | | | | 137,775 | | | | — | | | | (1,434,098 | ) |
Net realized gain (loss) on forward foreign currency contracts | | | — | | | | 179,499 | | | | — | | | | — | | | | 179,499 | |
| | | | | | | | | | | | | | | | | | | | |
| | $ | (586,751 | ) | | $ | 256,784 | | | $ | 137,775 | | | $ | — | | | $ | (192,192 | ) |
| | | | | | | | | | | | | | | | | | | | |
| Change in unrealized appreciation (depreciation) on derivatives recognized in income (e) | | | | | | | | | | | | | | | | | | | | |
Net change in unrealized appreciation (depreciation) on purchased options | | $ | (2,350 | ) | | $ | (3,866 | ) | | $ | — | | | $ | — | | | $ | (6,216 | ) |
Net change in unrealized appreciation (depreciation) on futures contracts | | | 91,836 | | | | — | | | | — | | | | — | | | | 91,836 | |
Net change in unrealized appreciation (depreciation) on options contracts written | | | 67,476 | | | | 15,445 | | | | 302 | | | | — | | | | 83,223 | |
Net change in unrealized appreciation (depreciation) on swaps contracts | | | 972,658 | | | | (16,119 | ) | | | 200,084 | | | | — | | | | 1,156,623 | |
Net change in unrealized appreciation (depreciation) on forward foreign currency contracts | | | — | | | | 3,317,065 | | | | — | | | | — | | | | 3,317,065 | |
| | | | | | | | | | | | | | | | | | | | |
| | $ | 1,129,620 | | | $ | 3,312,525 | | | $ | 200,386 | | | $ | — | | | $ | 4,642,531 | |
| | | | | | | | | | | | | | | | | | | | |
| (a) | | Statements of Assets and Liabilities location: Unrealized depreciation on open forward foreign currency contracts, unrealized depreciation on open swap contracts or options contracts written, at value. |
| (b) | | Only variation margin, if any, is reported within the Statements of Assets and Liabilities. Cumulative appreciation (depreciation) on futures contracts is reported in the “Open Futures Contracts” table (see Note 3). |
| (c) | | Statements of Assets and Liabilities location: Investments, at value or unrealized appreciation on open forward foreign currency contracts or unrealized appreciation on open swap contracts. |
| (d) | | Statements of Operations location: Net realized gain (loss) from investments, foreign currency transactions, futures contracts, options contracts written or swap contracts. |
178
| | |
| | | |
| Notes to Financial Statements | | |
| (e) | | Statements of Operations location: Change in net unrealized appreciation (depreciation) from investments, foreign currency transactions, futures contracts, options contracts written or swap contracts. |
| (f) | | Only variation margin, if any, is reported within the Statements of Assets and Liabilities. Cumulative appreciation (depreciation) on centrally cleared swaps is reported in the “Open Swap Contracts” table (see Note 3). |
The average notional amounts of futures contracts, swaps contracts and forward foreign currency contracts, and the average market value of options contracts written and purchased options outstanding during the year ended August 31, 2014, were as follows:
International Equity Investments
| | | | | | | | | | | | | | | | | | | | |
| | | Interest rate
risk | | | Foreign
exchange
risk | | | Credit
risk | | | Equity
risk | | | Total | |
Forward foreign currency contracts | | $ | — | | | $ | 35,738,269 | | | $ | — | | | $ | — | | | $ | 35,738,269 | |
Emerging Markets Equity Investments
| | | | | | | | | | | | | | | | | | | | |
| | | Interest rate
risk | | | Foreign
exchange
risk | | | Credit
risk | | | Equity
risk | | | Total | |
Forward foreign currency contracts | | $ | — | | | $ | 13,603 | | | $ | — | | | $ | — | | | $ | 13,603 | |
Core Fixed Income Investments
| | | | | | | | | | | | | | | | | | | | |
| | | Interest rate
risk | | | Foreign
exchange
risk | | | Credit
risk | | | Equity
risk | | | Total | |
Purchased options | | $ | 400,496 | | | $ | — | | | $ | — | | | $ | — | | | $ | 400,496 | |
Futures contracts | | | 355,994,192 | | | | 556,098 | | | | — | | | | — | | | | 356,550,290 | |
Option contracts written | | | 444,586 | | | | 2,431 | | | | 294 | | | | — | | | | 447,311 | |
Swap contracts | | | 84,993,846 | | | | — | | | | 25,915,385 | | | | — | | | | 110,909,231 | |
Forward foreign currency contracts | | | — | | | | 98,925,781 | | | | — | | | | — | | | | 98,925,781 | |
International Fixed Income Investments
| | | | | | | | | | | | | | | | | | | | |
| | | Interest rate
risk | | | Foreign
exchange
risk | | | Credit
risk | | | Equity
risk | | | Total | |
Purchased options | | $ | 51,597 | | | $ | 2,315 | | | $ | — | | | $ | — | | | $ | 53,912 | |
Futures contracts | | | 108,947,112 | | | | — | | | | — | | | | — | | | | 108,947,112 | |
Option contracts written | | | 86,048 | | | | 21,219 | | | | 37 | | | | — | | | | 107,304 | |
Swap contracts | | | 3,047,730,769 | | | | 1,092,005 | | | | 24,334,615 | | | | — | | | | 3,073,157,389 | |
Forward foreign currency contracts | | | — | | | | 509,272,676 | | | | — | | | | — | | | | 509,272,676 | |
(c) Repurchase Agreements. When entering into repurchase agreements, it is the Funds’ policy that their custodian or a third party custodian takes possession of the underlying collateral securities, the market value of which at least equals the principal amount of the repurchase transaction, including accrued interest. To the extent that any repurchase transaction exceeds one business day, the value of the collateral is marked-to-market daily to ensure the adequacy of the collateral. If the seller defaults and the market value of the collateral declines or if bankruptcy proceedings are commenced with respect to the seller of the security, realization of the collateral by the Funds may be delayed or limited.
(d) Stripped Securities. Certain Funds may invest in “Stripped Securities”, a term used collectively for stripped fixed income securities. Stripped Securities can be principal-only securities (“PO”), which are debt obligations that have been stripped of interest coupons, or interest-only securities (“IO”), which are interest coupons that have been stripped from debt obligations. As is the case with all securities, the market value of Stripped Securities will fluctuate in response to changes in economic conditions, interest rates and the market’s perception of the securities. However, fluctuations in response to interest rates may be greater in Stripped
179
| | |
| | | |
| Notes to Financial Statements | | |
Securities than for debt obligations of comparable maturities that pay interest currently. The amount of fluctuation increases with a longer period of maturity.
The yield-to-maturity on an IO is sensitive to the rate of principal repayments (including prepayments) on the related underlying debt obligation and principal payments may have a material effect on yield to maturity. If the underlying debt obligation experiences greater than anticipated prepayments of principal, the Fund may not fully recoup its initial investment in the IO.
(e) Time Deposits. Certain Funds may purchase overnight time deposits issued by offshore branches of U.S. banks that meet credit and risk standards established by the custodian and approved by the Funds.
(f) Lending of Portfolio Securities. The Trust has an agreement with its custodian whereby the custodian, as agent, may lend securities owned by the Funds to brokers, dealers and other financial organizations that have been approved as borrowers by the Funds. The custodian enters into agreements with the borrowers. Loans of securities by a Fund are collateralized by cash, U.S. government securities or irrevocable performance letters of credit issued by banks approved by the Funds. Such collateral is maintained at all times in an amount at least equal to the current market value of the loaned securities, plus a margin which varies depending on the type of securities loaned. All non-cash collateral is received, held and administered by the custodian in an applicable custody account or other account established for the purpose of holding collateral for each Fund. Cash collateral received by the Funds as a result of securities lending activities is invested in an unaffiliated registered money market fund, and is recorded as Payable for collateral received from securities on loan within the Statements of Assets and Liabilities. Securities lending income represents the income earned on investing cash collateral plus any premium payments that may be received on the loan of certain types of securities, less fees and expenses associated with the loan. Each Fund maintains the risk of any market loss on its securities on loan as well as the potential loss on investments purchased with cash collateral received from its securities lending. The custodian has the right under its agreement with the borrowers to recover any loaned securities from the borrower on demand. Additionally, the Funds are exposed to risks that a borrower may not provide additional collateral when required or return loaned securities when due. If the borrower fails to return the securities, the custodian will use the collateral to purchase replacement securities. The custodian is responsible for any shortfall in collateral value under certain circumstances. See Note 1(u).
The following table presents financial instruments that are subject to enforceable netting arrangements as of August 31, 2014.
Gross Amounts Not Offset in the Statements of Assets and Liabilities
| | | | | | | | | | | | | | | | |
| Funds | | Gross Asset Amount
Presented in Statements
of Assets and Liabilities (a) | | | Financial
Instrument | | | Collateral
Received (b)(c) | | | Net Amount
(Not Less than $0) | |
Large Capitalization Growth Investments | | $ | 27,118,272 | | | | — | | | $ | (27,118,272 | ) | | $ | 0 | |
Large Capitalization Value Equity Investments | | | 15,981,887 | | | | — | | | | (15,981,887 | ) | | | 0 | |
Small Capitalization Growth Investments | | | 27,269,421 | | | | — | | | | (27,269,421 | ) | | | 0 | |
Small Capitalization Value Equity Investments | | | 20,408,215 | | | | — | | | | (20,408,215 | ) | | | 0 | |
International Equity Investments | | | 11,879,912 | | | | — | | | | (11,879,912 | ) | | | 0 | |
Emerging Markets Equity Investments | | | 17,379,982 | | | | — | | | | (17,379,982 | ) | | | 0 | |
Core Fixed Income Investments | | | 255,191 | | | | — | | | | (255,191 | ) | | | 0 | |
High Yield Investments | | | 6,000,383 | | | | — | | | | (6,000,383 | ) | | | 0 | |
| (a) | | Represents market value of securities on loan at period end. |
| (b) | | The Funds received cash collateral of $27,461,626, $16,233,890, $27,854,226, $20,876,827, $12,670,056, $17,939,497, $262,624 and $6,217,477, respectively, which was subsequently invested in Invesco STIT — Government & Agency Portfolio as reported in the Schedules of Investments. |
| (c) | | The actual collateral received is greater than the amount shown here due to overcollateralization. |
(g) To-Be-Announced Purchase and Sale Commitments. Certain Funds may trade securities on a to-be-announced (“TBA”) basis. In a TBA transaction, a Fund commits to purchasing or selling securities which have not yet been issued by the issuer and for which specific information is not known, such as the face amount and maturity date and the underlying pool of investments in U.S. government agency mortgage pass-through transactions. Securities purchased on a TBA basis are not settled until they are delivered to the Fund, normally 15 to 45 days later. Beginning on the date the Fund enters into a TBA transaction, cash, U.S. government securities or other liquid high-grade debt obligations are segregated in an amount equal in value to the purchase price of the TBA security. These transactions are marked-to-market on a daily basis and are subject to market fluctuations. Realized gains or losses on TBA purchase commitments are included in “Net realized gain (loss) on investments” on the Statements of
180
| | |
| | | |
| Notes to Financial Statements | | |
Operations. Any fluctuation in the value of the purchased TBA commitments is included in “Net change in unrealized appreciation (depreciation) on investments” on the Statements of Operations.
Additionally, when a Fund sells TBA securities without already owning or having the right to obtain the deliverable securities (an uncovered forward commitment to sell), it incurs a risk of loss because it could have to purchase the securities at a price that is higher than the price at which it sold them. A Fund may be unable to purchase the deliverable securities if the corresponding market is illiquid.
TBA securities subject to a forward commitment to sell at period end are included at the end of the Schedule of Investments under the caption “Schedule of Forward Sale Commitments”. The proceeds and value of these commitments are recorded as Forward Sale Commitments at value in the Statements of Assets and Liabilities.
(h) Short Sales of Securities. A short sale is a transaction in which a Fund sells securities it does not own in anticipation of a decline in the market price of the securities. To complete a short sale, the Fund may arrange through a broker to borrow the securities to be delivered to the buyer. The proceeds received by the Fund for the short sale are retained by the broker until the Fund replaces the borrowed securities. In borrowing the securities to be delivered to the buyer, the Fund becomes obligated to replace the securities borrowed at their market price at the time of replacement, whatever that price may be.
The risk of engaging in short sale transactions is that selling short magnifies the potential for loss to a Fund. The larger the Fund’s short position, the greater the potential loss. If a security sold short increases in price, the Fund may have to cover its short position at a higher price than the short sale price, resulting in a loss. To borrow the security, the Fund also may be required to pay a premium, which could decrease the proceeds of the security sold short. The amount of any gain will be decreased, and the amount of any loss increased, by the amount of the premium, dividends, interest or expenses the Fund may be required to pay in connection with the short sale. In addition, because the Fund’s loss on a short sale arises from increases in the value of the security sold short, such loss is unlimited.
(i) Mortgage Dollar Rolls. Certain Funds may sell mortgage-backed securities for delivery in the current month and simultaneously contract to repurchase substantially similar (same type, coupon and maturity) securities to settle on a specific future date at an agreed upon price. Pools of mortgage securities are used to collateralize mortgage dollar roll transactions and may have different prepayment histories than those sold. During the period between the sale and the repurchase, a Fund forgoes principal and interest paid on the securities sold. Proceeds of the sale will be invested in short-term instruments and the income from these investments, together with any additional fee income received on a sale, is intended to generate income for a Fund. A Fund accounts for mortgage dollar roll transactions as purchases and sales and realizes the gain or loss at the time the transaction is entered into on these transactions. If certain criteria are met, these dollar roll transactions may be considered financing transactions, whereby the difference in the sales price and the future purchase price is recorded as an adjustment to interest income.
Mortgage dollar roll transactions involve the risk that the market value of the securities a Fund is obligated to repurchase under the agreement may decline below the repurchase price of those securities. If investment performance of securities purchased with proceeds from these transactions does not exceed the income, capital appreciation and gain or loss that would have been realized on the securities sold as part of the dollar roll, the use of this technique will adversely impact the investment performance of a Fund. In the event the buyer of securities under a mortgage dollar roll files for bankruptcy or becomes insolvent, the Fund’s use of proceeds of the dollar roll may be restricted pending a determination by the other party, or its trustee or receiver, whether to enforce the Fund’s obligation to repurchase the securities.
(j) Credit and Market Risk. Certain Funds invest in high yield instruments that are subject to certain credit and market risks. The yields of high yield obligations reflect, among other things, perceived credit and market risks. Each Fund’s investment in securities rated below investment grade typically involve risks not associated with higher rated securities, including, among others, greater risk related to timely and ultimate payment of interest and principal, greater market price volatility and less liquid secondary market trading.
(k) Foreign Investment and Currency Risks. Certain Funds’ investments in foreign securities may involve risks not present in domestic investments. Because securities may be denominated in foreign currencies and may require settlement in foreign currencies and pay interest or dividends in foreign currencies, changes in the relationship of these foreign currencies to the U.S. dollar can significantly affect the value of the investments and earnings of a Fund. Foreign investments may also subject the Fund
181
| | |
| | | |
| Notes to Financial Statements | | |
to foreign government exchange restrictions, expropriation, taxation or other political, social or economic developments, all of which affect the market and/or credit risk of the investments.
(l) Emerging Markets Risk. In addition to foreign investment and currency risks, which tend to be amplified in emerging markets, emerging markets may experience rising interest rates, or, more significantly, rapid inflation or hyperinflation. The economies of emerging market countries may grow at slower rates than expected or suffer a downturn or recession. Emerging market securities may present market, credit, liquidity, legal, political and other risks different from, or greater than, the risks of investing in developed foreign countries.
(m) Security Transactions and Investment Income. Security transactions are accounted for on a trade date basis. Interest income, adjusted for amortization of premium and accretion of discount, is recorded on an accrual basis. Dividend income is recorded on the ex-dividend date. Foreign dividend income is recorded on the ex-dividend date or as soon as practical after a Fund determines the existence of a dividend declaration after exercising reasonable due diligence. The cost of investments sold is determined by use of the specific identification method. To the extent any issuer defaults on an expected interest payment, the Trust’s policy is to generally halt any additional “interest income accruals and accretion” and consider the Fund’s ability to realize interest accrued up to the date of default.
(n) Foreign Currency Translation. Investment securities and other assets and liabilities denominated in foreign currencies are translated into U.S. dollar amounts based upon prevailing exchange rates on the date of valuation. Purchases and sales of investment securities and income and expense items denominated in foreign currencies are translated into U.S. dollar amounts based upon prevailing exchange rates on the respective dates of such transactions.
The Funds do not isolate that portion of the results of operations resulting from changes in foreign exchange rates on investments from the fluctuations arising from changes in market prices of securities held. Such fluctuations are included with the net realized and unrealized gain or loss on investments in the Statements of Operations.
Net realized foreign exchange gains or losses arise from sales of foreign currencies, including gains and losses on forward foreign currency contracts, currency gains or losses realized between the trade and settlement dates on securities transactions and the difference between the amounts of dividends, interest and foreign withholding taxes recorded on the Funds’ books and the U.S. dollar equivalent of the amounts actually received or paid. Net unrealized foreign exchange gains and losses arise from changes in the fair values of assets and liabilities, other than investments in securities, at the date of valuation, resulting from changes in exchange rates.
Foreign security and currency transactions may involve certain considerations and risks not typically associated with those of U.S. dollar denominated transactions as a result of, among other factors, the possibility of lower levels of governmental supervision and regulation of foreign securities markets and the possibility of political or economic instability.
(o) Distributions to Shareholders. Distributions from net investment income for Large Capitalization Growth Investments, Large Capitalization Value Equity Investments, Small Capitalization Growth Investments, Small Capitalization Value Equity Investments, International Equity Investments, Emerging Markets Equity Investments and International Fixed Income Investments, if any, are declared and paid on an annual basis. Distributions from net investment income for Core Fixed Income Investments, High Yield Investments and Municipal Bond Investments, if any, are declared and paid on a monthly basis. Distributions on the shares of Money Market Investments are declared each business day to shareholders of record that day, and are paid on the last business day of the month.
The Funds intend to satisfy conditions that will enable interest from municipal securities, which are exempt from regular federal income tax and from designated state income taxes, to retain such tax-exempt status when distributed to the shareholders of the Funds. Distributions of net realized gains to shareholders of the Funds, if any, are taxable and are declared at least annually. Distributions to shareholders of the Funds are recorded on the ex-dividend date and are determined in accordance with income tax regulations, which may differ from GAAP.
(p) Federal and Other Taxes. It is the Trust’s policy to comply with the federal income and excise tax requirements of the Internal Revenue Code of 1986, as amended, applicable to regulated investment companies. Accordingly, each Fund intends to distribute substantially all of its income and net realized gains on investments, if any, to shareholders each year. Therefore, no federal income tax provision is required in the Funds’ financial statements. Under the applicable foreign tax laws, a withholding tax may be imposed on interest, dividends and capital gains at various rates.
182
| | |
| | | |
| Notes to Financial Statements | | |
Management has reviewed the tax positions and has concluded that no liability for unrecognized tax benefits should be recorded related to uncertain tax positions taken on returns filed for open tax years or expected to be taken in 2014 tax returns. Each Fund’s federal tax returns for the prior three fiscal years remain subject to examination by the Internal Revenue Service.
(q) Reclassification. GAAP requires that certain components of net assets be adjusted to reflect permanent differences between financial and tax reporting. These reclassifications have no effect on net assets or net asset values per share.
| | | | | | | | | | | | | | |
| Fund | | | | Undistributed
(Dividend in
excess of) Net
Investment Income | | | Undistributed
Realized Gains/
(Accumulated Net
Realized Losses) | | | Paid-in Capital | |
Large Capitalization Growth Investments | | (a) | | $ | (2,080,312 | ) | | $ | 2,080,312 | | | $ | — | |
Large Capitalization Value Equity Investments | | (a) | | $ | (196,339 | ) | | $ | 127,595 | | | $ | 68,744 | |
Small Capitalization Growth Investments | | (a),(b) | | $ | 1,821,456 | | | $ | (1,821,456 | ) | | $ | — | |
Small Capitalization Value Equity Investments | | (a) | | $ | (221,130 | ) | | $ | 221,130 | | | $ | — | |
International Equity Investments | | (c) | | $ | (481,973 | ) | | $ | 481,973 | | | $ | — | |
Emerging Markets Equity Investments | | (h) | | $ | (907,625 | ) | | $ | 271,199 | | | $ | 636,426 | |
Core Fixed Income Investments | | (d),(g) | | $ | 2,987,504 | | | $ | (2,987,504 | ) | | $ | — | |
High Yield Investments | | (d),(f) | | $ | 1,294,394 | | | $ | (1,294,394 | ) | | $ | — | |
International Fixed Income Investments | | (d),(g) | | $ | (1,083,950 | ) | | $ | 1,083,950 | | | $ | — | |
Municipal Bond Investments | | (e) | | $ | 197,163 | | | $ | (197,163 | ) | | $ | — | |
Money Market Investments | | (e) | | $ | (5,185 | ) | | $ | (328 | ) | | $ | 5,513 | |
| (a) | | Reclassifications are primarily due to book/tax differences in the treatment of distributions from real estate investment trusts and return of capital dividends received. |
| (b) | | Reclassifications are primarily due to a tax net operating loss. |
| (c) | | Reclassifications are primarily due to foreign currency transactions treated as ordinary income for tax purposes, and book/tax differences in the treatment of passive foreign investment companies. |
| (d) | | Reclassifications are primarily due to differences between book and tax amortization of premium on fixed income securities. |
| (e) | | Reclassifications are primarily due to distribution reclass. |
| (f) | | Reclassifications are primarily due to defaulted bond interest reclass. |
| (g) | | Reclassifications are primarily due to foreign currency transactions treated as ordinary income for tax purposes. |
| (h) | | Reclassifications are primarily due to foreign currency transactions treated as ordinary income, and foreign capital gain expense transactions treated as ordinary for tax purposes. |
(r) Restricted Securities. All Funds may invest in non-publicly traded securities, commonly called restricted securities. Restricted securities may be less liquid than publicly-traded securities. Although certain restricted securities may be resold in privately negotiated transactions, the values realized from these sales could be less than originally paid by a Fund. Certain restricted securities may be deemed liquid by the Manager and/or Sub-adviser pursuant to procedures approved by the Board. The value of restricted securities is determined as described in Note 1(a).
(s) Reverse Repurchase Agreements. Certain Funds may each enter into reverse repurchase agreements with the financial institutions with which it may enter into repurchase agreements. Under a reverse repurchase agreement, a Fund sells securities to a financial institution and agrees to repurchase them at a mutually agreed upon date, price and rate of interest. During the period between the sale and repurchase, the Fund would not be entitled to principal and interest paid on the securities sold by the Fund. The Fund, however, would seek to achieve gains derived from the difference between the current sale price and the forward price for the future purchase as well as the interest earned on the proceeds on the initial sale. Reverse repurchase agreements will be viewed as borrowings by a Fund for the purpose of calculating the Fund’s indebtedness and will have the effect of leveraging the Fund’s assets.
(t) Indemnification. In the normal course of business, the Trust may enter into contracts that provide certain indemnifications. The Funds’ maximum exposure under these arrangements is dependent on future claims that may be made against the Funds and, therefore, cannot be estimated; however, based on experience, risk of loss from such claims is considered remote.
(u) Disclosure about Offsetting Assets and Liabilities. In December 2011, the Financial Accounting Standards Board issued an Accounting Standards Update (“ASU”) No. 2011-11 “Disclosures about Offsetting Assets and Liabilities” (“ASU 2011-11”) which requires an entity to disclose information about offsetting and related arrangements to enable users of that entity’s financial statements to understand the effect of those arrangements on its financial position. ASU 2011-11 was amended by ASU No. 2013-01 “Clarifying the Scope of Disclosures about Offsetting Assets and Liabilities” (“ASU 2013-01”) to clarify the investments and transactions that are
183
| | |
| | | |
| Notes to Financial Statements | | |
subject to disclosure. The scope of the disclosure requirements is limited to derivative instruments, repurchase agreements and reverse repurchase agreements, and securities borrowing and securities lending transactions that are offset either in accordance with other requirements of GAAP or subject to an enforceable master netting arrangement or similar agreement. The Funds’ adopted ASU 2011-11 for the current reporting period. For financial reporting purposes, the Funds do not offset financial assets and financial liabilities that are subject to master netting arrangements or similar agreements on the Statements of Assets and Liabilities.
Repurchase agreements and reverse repurchase agreements may be entered into by the Funds under Master Repurchase Agreements (“MRA”) which permit a Fund, under certain circumstances including an event of default (such as bankruptcy or insolvency), to offset payables and/or receivables under the MRA with collateral held and/or posted to the counterparty and create one single net payment due to or from a Fund. However, bankruptcy or insolvency laws of a particular jurisdiction may impose restrictions on or prohibitions against such a right of offset in the event of the MRA counterparty’s bankruptcy or insolvency. The Fund’s repurchase agreements as of August 31, 2014 are shown on a gross basis and the required disclosures under ASU 2011-11 are shown in the Schedules of Investments. The value of the related collateral exceeded the value of the repurchase agreements as of August 31, 2014.
For derivatives traded under an International Swaps and Derivatives Association, Inc. Master Agreement (“ISDA Master Agreement”) or similar master agreement, the collateral requirements are netted across all transactions traded under such agreement and one amount is posted from one party to the other to collateralize such obligations. The ISDA Master Agreement gives each party to the agreement the right to terminate all transactions traded under such agreement if there is a certain deterioration in the credit quality of the other party. The ISDA Master Agreement gives a Fund the right, upon an event of default by the applicable counterparty or a termination of the agreement, to close out all transactions traded under such agreement and to net amounts owed under each transaction to one net amount payable by one party to the other. Absent an event of default by the counterparty or a termination of the agreement, the Funds do not offset amounts of reported assets and liabilities in the Statements of Assets and Liabilities across transactions between a Fund and the applicable counterparty. The enforceability of the right to offset may vary by jurisdiction. Cash collateral that has been received or pledged to cover obligations under derivative contracts, if any, will be reported separately in the Statements of Assets and Liabilities. Generally the amount of collateral due from or to a counterparty is subject to a minimum transfer threshold amount before a transfer is required, which may vary by counterparty. Collateral pledged for the benefit of the Fund and/or counterparty is held in segregated accounts by the Fund’s custodian and cannot be sold, re-pledged, assigned or otherwise used while pledged. The portion of such collateral representing cash, if any, is reflected as deposits with counterparties and, in the case of cash pledged by a counterparty for the benefit of the Fund, a corresponding liability in the Statements of Assets and Liabilities. Securities pledged by the Fund as collateral, if any, are identified as such in the Schedule of Investments. The carrying amount of such deposits due to brokers at August 31, 2014 approximated their fair value. If measured at fair value, such deposits would have been considered as Level 2 in the fair value hierarchy (see Note 1(a)).
The following table presents the Funds’ gross amounts of assets and liabilities, by derivative type, available for offset under a master netting agreement, or similar agreement as of August 31, 2014.
| | | | | | | | | | |
| | | Derivative Instruments
as of August 31, 2014 | |
| | | Assets | | | | | Liabilities | |
| | | Gross Amounts
of Recognized
Assets
Presented in the
Statements of
Assets and
Liabilities | | | | | Gross Amounts
of Recognized
Liabilities
Presented in the
Statements of
Assets and
Liabilities | |
| Core Fixed Income Investments | | | | | | | | | | |
Forward foreign currency contracts | | $ | 1,945,328 | | | | | $ | 489,951 | |
Options contracts (a) | | | 241,390 | | | | | | 251,175 | |
Swap contracts (a)(b) | | | 473,375 | | | | | | 189,529 | |
| | | | | | | | | | |
| Total Derivative Instruments, subject to master netting arrangement or similar arrangement | | $ | 2,660,093 | | | | | $ | 930,655 | |
| | | | | | | | | | |
184
| | |
| | | |
| Notes to Financial Statements | | |
| | | | | | | | | | |
| | | Derivative Instruments
as of August 31, 2014 | |
| | | Assets | | | | | Liabilities | |
| | | Gross Amounts
of Recognized
Assets
Presented in the
Statements of
Assets and
Liabilities | | | | | Gross Amounts
of Recognized
Liabilities
Presented in the
Statements of
Assets and
Liabilities | |
| International Fixed Income Investments | | | | | | | | | | |
Forward foreign currency contracts | | $ | 4,552,534 | | | | | $ | 1,489,655 | |
Options contracts (a) | | | 1,456 | | | | | | 56,301 | |
Swap contracts (a)(b) | | | 719,081 | | | | | | 94,824 | |
| | | | | | | | | | |
| Total Derivative Instruments, subject to master netting arrangement or similar arrangement | | $ | 5,273,071 | | | | | $ | 1,640,780 | |
| | | | | | | | | | |
| (a) | | Excludes exchange-traded derivatives. |
| (b) | | The total value of the net amounts of assets and liabilities is comprised of Swap contracts, at value on the Statements of Assets and Liabilities less the net value of the Upfront premiums paid (received) disclosed in the Notes to Financial Statements (Note 3). |
The following table presents the Funds’ derivative assets and liabilities by counterparty net of amounts available for offset under master netting or similar agreements, and net of related collateral received or pledged as of August 31, 2014:
| | | | | | | | | | | | | | | | |
| Counterparty | | Gross amounts
of Recognized
Assets
presented in the
Statements of
Assets and
Liabilities | | | Financial
Instruments
Available for
Offset (a) | | | Collateral
Received (e) | | | Net Amount (b) | |
| Core Fixed Income Investments | | | | | | | | | | | | | | | | |
| Over-the-counter | | | | | | | | | | | | | | | | |
Bank of America | | $ | 437,563 | | | $ | (77,264 | ) | | $ | — | | | $ | 360,299 | |
Barclays Bank PLC | | | 525,231 | | | | (267,983 | ) | | | — | | | | 257,248 | |
BNP Paribas SA | | | 35,607 | | | | (35,607 | ) | | | — | | | | — | |
Citigroup Global Markets Inc. | | | 826,956 | | | | (15,763 | ) | | | (660,000 | ) | | | 151,193 | |
Credit Suisse Securities (USA) LLC | | | 129,197 | | | | — | | | | — | | | | 129,197 | |
Deutsche Bank AG | | | 68,513 | | | | (31,775 | ) | | | — | | | | 36,738 | |
Goldman Sachs & Co. | | | 139,341 | | | | (139,341 | ) | | | — | | | | — | |
HSBC Bank USA | | | 12,884 | | | | (12,884 | ) | | | — | | | | — | |
JPMorgan Chase & Co. | | | 403,334 | | | | (100,164 | ) | | | (130,000 | ) | | | 173,170 | |
UBS Securities LLC | | | 81,467 | | | | (13,678 | ) | | | — | | | | 67,789 | |
| | | | | | | | | | | | | | | | |
| Total Over-the-counter derivative instruments | | $ | 2,660,093 | | | $ | (694,459 | ) | | $ | (790,000 | ) | | $ | 1,175,634 | |
| | | | | | | | | | | | | | | | |
| | | | |
| Counterparty | | Gross amounts
of Recognized
Liabilities
presented in the
Statements of
Assets and
Liabilities | | | Financial
Instruments
Available for
Offset (c) | | | Collateral
Pledged (e) | | | Net Amount (d) | |
| Core Fixed Income Investments | | | | | | | | | | | | | | | | |
| Over-the-counter | | | | | | | | | | | | | | | | |
Bank of America | | $ | 77,264 | | | $ | (77,264 | ) | | $ | — | | | $ | — | |
Barclays Bank PLC | | | 267,983 | | | | (267,983 | ) | | | — | | | | — | |
BNP Paribas SA | | | 114,338 | | | | (35,607 | ) | | | — | | | | 78,731 | |
185
| | |
| | | |
| Notes to Financial Statements | | |
| | | | | | | | | | | | | | | | |
| Counterparty | | Gross amounts
of Recognized
Liabilities
presented in the
Statements of
Assets and
Liabilities | | | Financial
Instruments
Available for
Offset (c) | | | Collateral
Pledged (e) | | | Net Amount (d) | |
Citigroup Global Markets Inc. | | $ | 15,763 | | | $ | (15,763 | ) | | $ | — | | | $ | — | |
Deutsche Bank AG | | | 31,775 | | | | (31,775 | ) | | | — | | | | — | |
Goldman Sachs & Co. | | | 179,110 | | | | (139,341 | ) | | | — | | | | 39,769 | |
HSBC Bank USA | | | 30,507 | | | | (12,884 | ) | | | — | | | | 17,623 | |
JPMorgan Chase & Co. | | | 100,164 | | | | (100,164 | ) | | | — | | | | — | |
Royal Bank of Scotland PLC | | | 100,073 | | | | — | | | | — | | | | 100,073 | |
UBS Securities LLC | | | 13,678 | | | | (13,678 | ) | | | — | | | | — | |
| | | | | | | | | | | | | | | | |
| Total Over-the-counter derivative instruments | | $ | 930,655 | | | $ | (694,459 | ) | | $ | — | | | $ | 236,196 | |
| | | | | | | | | | | | | | | | |
| | | | |
| Counterparty | | Gross amounts
of Recognized
Assets
presented in the
Statements of
Assets and
Liabilities | | | Financial
Instruments
Available for
Offset (a) | | | Collateral
Received (e) | | | Net Amount (b) | |
| International Fixed Income Investments | | | | | | | | | | | | | | | | |
| Over-the-counter | | | | | | | | | | | | | | | | |
Bank of America | | $ | 1,311,496 | | | $ | (129,769 | ) | | $ | (950,000 | ) | | $ | 231,727 | |
Barclays Bank PLC | | | 147,230 | | | | (147,230 | ) | | | — | | | | — | |
BNP Paribas SA | | | 1,063,671 | | | | (165,778 | ) | | | (270,000 | ) | | | 627,893 | |
Citigroup Global Markets Inc. | | | 1,514,249 | | | | (197,009 | ) | | | (1,140,000 | ) | | | 177,240 | |
Deutsche Bank AG | | | 179,488 | | | | (49,620 | ) | | | (129,868 | ) | | | — | |
Goldman Sachs & Co. | | | 388,008 | | | | (329,582 | ) | | | — | | | | 58,426 | |
HSBC Bank USA | | | 119,700 | | | | (60,668 | ) | | | — | | | | 59,032 | |
JPMorgan Chase & Co. | | | 143,022 | | | | (143,022 | ) | | | — | | | | — | |
Royal Bank of Scotland PLC | | | 69,260 | | | | (16,349 | ) | | | (10,000 | ) | | | 42,911 | |
Societe Generale SA | | | 28,343 | | | | (28,293 | ) | | | — | | | | 50 | |
UBS Securities LLC | | | 308,604 | | | | (28,298 | ) | | | (260,000 | ) | | | 20,306 | |
| | | | | | | | | | | | | | | | |
| Total Over-the-counter derivative instruments | | $ | 5,273,071 | | | $ | (1,295,618 | ) | | $ | (2,759,868 | ) | | $ | 1,217,585 | |
| | | | | | | | | | | | | | | | |
| | | | |
| Counterparty | | Gross amounts
of Recognized
Liabilities
presented in the
Statements of
Assets and
Liabilities | | | Financial
Instruments
Available for
Offset (c) | | | Collateral
Pledged (e) | | | Net Amount (d) | |
| International Fixed Income Investments | | | | | | | | | | | | | | | | |
| Over-the-counter | | | | | | | | | | | | | | | | |
Bank of America | | $ | 129,769 | | | $ | (129,769 | ) | | $ | — | | | $ | — | |
Barclays Bank PLC | | | 268,048 | | | | (147,230 | ) | | | — | | | | 120,818 | |
BNP Paribas SA | | | 165,778 | | | | (165,778 | ) | | | — | | | | — | |
Citigroup Global Markets Inc. | | | 197,009 | | | | (197,009 | ) | | | — | | | | — | |
Deutsche Bank AG | | | 49,620 | | | | (49,620 | ) | | | — | | | | — | |
Goldman Sachs & Co. | | | 329,582 | | | | (329,582 | ) | | | — | | | | — | |
HSBC Bank USA | | | 60,668 | | | | (60,668 | ) | | | — | | | | — | |
JPMorgan Chase & Co. | | | 367,366 | | | | (143,022 | ) | | | — | | | | 224,344 | |
Royal Bank of Scotland PLC | | | 16,349 | | | | (16,349 | ) | | | — | | | | — | |
186
| | |
| | | |
| Notes to Financial Statements | | |
| | | | | | | | | | | | | | | | |
| Counterparty | | Gross amounts
of Recognized
Liabilities
presented in the
Statements of
Assets and
Liabilities | | | Financial
Instruments
Available for
Offset (c) | | | Collateral
Pledged (e) | | | Net Amount (d) | |
Societe Generale SA | | $ | 28,293 | | | $ | (28,293 | ) | | $ | — | | | $ | — | |
UBS Securities LLC | | | 28,298 | | | | (28,298 | ) | | | — | | | | — | |
| | | | | | | | | | | | | | | | |
| Total Over-the-counter derivative instruments | | $ | 1,640,780 | | | $ | (1,295,618 | ) | | $ | — | | | $ | 345,162 | |
| | | | | | | | | | | | | | | | |
| (a) | | Represents the amount of assets that could be offset by liabilities with the same counterparty under master netting or similar agreements that are not offset on the Statements of Assets and Liabilities. |
| (b) | | Net amount represents the net amount receivable from the counterparty in the event of default. |
| (c) | | Represents the amount of liabilities that could be offset by assets with the same counterparty under master netting or similar agreements that are not offset on the Statements of Assets and Liabilities. |
| (d) | | Net amount represents the net amount payable to the counterparty in the event of default. |
| (e) | | In some instances, the actual collateral received and/or pledged may be more than the amount shown here due to over collateralization. |
2. Investment Management Agreement and Other Transactions with Affiliates
CGAS, a business of MSSBH, serves as the investment manager to the Funds. The Manager selects and oversees professional money managers who are responsible for investing the assets of the Funds (each a “Sub-adviser,” and collectively the “Sub-advisers”). Each Fund pays the Manager an investment management fee calculated daily at an annual rate based on each Fund’s average daily net assets and paid monthly in arrears. The Manager pays each Sub-adviser a subadvisory fee from its investment management fees.
The maximum allowable investment management fee represents the total amount that could be charged to each Fund. The aggregate fees paid by the Manager to each Fund’s Sub-advisers and the fees retained by the Manager for the year ended August 31, 2014, are indicated below:
| | | | | | | | | | | | |
| Fund | | Subadvisory
Fee | | | Consulting Group
Advisory Services LLC
Fee | | | Maximum
Allowable Annual
Management Fee | |
Large Capitalization Growth Investments | | | 0.37 | % | | | 0.23 | % | | | 0.60 | % |
Large Capitalization Value Equity Investments | | | 0.30 | % | | | 0.30 | % | | | 0.60 | % |
Small Capitalization Growth Investments | | | 0.49 | % | | | 0.30 | % | | | 0.80 | % |
Small Capitalization Value Equity Investments | | | 0.49 | % | | | 0.30 | % | | | 0.80 | % |
International Equity Investments | | | 0.36 | % | | | 0.30 | % | | | 0.70 | % |
Emerging Markets Equity Investments | | | 0.49 | % | | | 0.30 | % | | | 0.90 | % |
Core Fixed Income Investments | | | 0.20 | % | | | 0.20 | % | | | 0.40 | % |
High Yield Investments | | | 0.29 | % | | | 0.25 | % | | | 0.70 | % |
International Fixed Income Investments | | | 0.27 | % | | | 0.23 | % | | | 0.50 | % |
Municipal Bond Investments | | | 0.20 | % | | | 0.20 | % | | | 0.40 | % |
Money Market Investments * | | | 0.08 | % | | | 0.00 | % | | | 0.08 | % |
| * | | The Manager voluntarily waived and/or reimbursed certain fees or expense to maintain a positive yield. For the year ended August 31, 2014, the Manager reimbursed the Fund $301,225. |
The Manager has agreed to waive and/or reimburse a portion of its fee. For the year ended August 31, 2014, the amounts waived and/or reimbursed by the Manager were as follows:
| | | | |
| Fund | | | |
Large Capitalization Value Equity Investments | | $ | 9,389 | |
Small Capitalization Growth Investments | | | 18,015 | |
Small Capitalization Value Equity Investments | | | 19,793 | |
International Equity Investments | | | 402,938 | |
187
| | |
| | | |
| Notes to Financial Statements | | |
| | | | |
| Fund | | | |
Emerging Markets Equity Investments | | $ | 427,618 | |
Core Fixed Income Investments | | | 26,474 | |
High Yield Investments | | | 304,141 | |
Brown Brothers Harriman & Co. (“BBH”) serves as the Trust’s administrator. For its administrative services, BBH receives an annual asset based fee of 0.0250% of the Trust’s assets up to $5 billion, 0.02% on assets between $5 billion and $8 billion and 0.0175% on assets in excess of $8 billion, plus out-of-pocket expenses. The fee is calculated and allocated daily based on the relative assets of each Fund.
For the year ended August 31, 2014, Morgan Stanley & Co. Incorporated (“MS&Co.”), and its affiliates, including Morgan Stanley Smith Barney LLC, the Trust’s distributor, and Citigroup Global Markets Inc. (“CGMI”), received brokerage commissions of:
| | | | | | | | | | | | |
| Fund | | Commission
Dollars to CGMI | | | Commission
Dollars to MS&Co. | | | Commission
Aggregate | |
Large Capitalization Growth Investments | | $ | 18,850 | | | $ | 13,755 | | | $ | 32,605 | |
Large Capitalization Value Equity Investments | | | 8,219 | | | | 7,830 | | | | 16,049 | |
Small Capitalization Growth Investments | | | 8,877 | | | | 3,246 | | | | 12,123 | |
Small Capitalization Value Equity Investments | | | 865 | | | | 354 | | | | 1,219 | |
International Equity Investments | | | 131,171 | | | | 21,731 | | | | 152,902 | |
Emerging Markets Equity Investments | | | 20,847 | | | | — | | | | 20,847 | |
All officers, with the exception of the Funds’ Chief Compliance Officer (“CCO”), do not receive compensation directly from the Trust. The Funds bear a portion of the CCO’s annual compensation.
3. Investments
During the year ended August 31, 2014, the aggregate cost of purchases and proceeds from sales of investments (excluding short-term investments) for each Fund were as follows:
| | | | | | | | | | | | | | | | |
| | | Investments | | | US Government & Agency
Obligations | |
| | | Purchases | | | Sales | | | Purchases | | | Sales | |
Large Capitalization Growth Investments | | $ | 904,187,454 | | | $ | 1,066,912,419 | | | $ | — | | | $ | — | |
Large Capitalization Value Equity Investments | | | 412,483,522 | | | | 308,758,818 | | | | — | | | | — | |
Small Capitalization Growth Investments | | | 232,754,603 | | | | 296,030,377 | | | | — | | | | — | |
Small Capitalization Value Equity Investments | | | 99,629,607 | | | | 77,509,444 | | | | — | | | | — | |
International Equity Investments | | | 1,230,791,910 | | | | 944,106,681 | | | | — | | | | — | |
Emerging Markets Equity Investments | | | 112,608,880 | | | | 202,598,196 | | | | — | | | | — | |
Core Fixed Income Investments | | | 219,761,415 | | | | 235,436,514 | | | | 3,695,891,715 | | | | 3,897,613,310 | |
High Yield Investments | | | 225,879,120 | | | | 101,553,549 | | | | — | | | | — | |
International Fixed Income Investments | | | 231,441,967 | | | | 248,379,765 | | | | 761,873,561 | | | | 814,712,793 | |
Municipal Bond Investments | | | 14,883,860 | | | | 18,674,465 | | | | — | | | | — | |
At August 31, 2014, the aggregate gross unrealized appreciation and depreciation of investments for federal income tax purposes were as follows:
Unrealized Appreciation (Depreciation)
| | | | | | | | | | | | |
| Fund | | Gross
Unrealized
Appreciation | | | Gross
Unrealized
(Depreciation) | | | Net Unrealized
Appreciation
(Depreciation) | |
Large Capitalization Growth Investments | | $ | 580,151,150 | | | $ | (5,729,347 | ) | | $ | 574,421,803 | |
Large Capitalization Value Equity Investments | | | 389,142,501 | | | | (9,959,440 | ) | | | 379,183,061 | |
Small Capitalization Growth Investments | | | 71,539,422 | | | | (6,812,040 | ) | | | 64,727,382 | |
188
| | |
| | | |
| Notes to Financial Statements | | |
| | | | | | | | | | | | |
| Fund | | Gross
Unrealized
Appreciation | | | Gross
Unrealized
(Depreciation) | | | Net
Unrealized
Appreciation
(Depreciation) | |
Small Capitalization Value Equity Investments | | $ | 82,345,213 | | | $ | (4,860,931 | ) | | $ | 77,484,282 | |
International Equity Investments | | | 126,375,900 | | | | (48,969,564 | ) | | | 77,406,336 | |
Emerging Markets Equity Investments | | | 85,870,103 | | | | (27,017,778 | ) | | | 58,852,325 | |
Core Fixed Income Investments | | | 28,117,548 | | | | (10,539,002 | ) | | | 17,578,546 | |
High Yield Investments | | | 7,951,081 | | | | (3,260,750 | ) | | | 4,690,331 | |
International Fixed Income Investments | | | 14,031,125 | | | | (11,260,647 | ) | | | 2,770,478 | |
Municipal Bond Investments | | | 6,223,048 | | | | (46 | ) | | | 6,223,002 | |
At August 31, 2014, Core Fixed Income Investments and International Fixed Income Investments had open exchange traded futures contracts as described below. The unrealized gain (loss) on the open contracts reflected in the accompanying financial statements were as follows:
Core Fixed Income Investments
| | | | | | | | | | | | | | | | |
| Open Futures Contracts | | Number of
Contracts | | | Expiration
Date | | | Market Value | | | Unrealized
Gain (Loss) | |
Contracts to Buy: | | | | | | | | | | | | | | | | |
90-Day Eurodollar December Futures | | | 612 | | | | 12/15 | | | $ | 151,477,650 | | | $ | 53,062 | |
90-Day Eurodollar December Futures | | | 4 | | | | 12/16 | | | | 979,750 | | | | 350 | |
90-Day Eurodollar June Futures | | | 78 | | | | 6/16 | | | | 19,206,525 | | | | 111,870 | |
90-Day Eurodollar March Futures | | | 169 | | | | 3/16 | | | | 41,726,100 | | | | 91,299 | |
90-Day Eurodollar March Futures | | | 4 | | | | 3/17 | | | | 977,750 | | | | 600 | |
90-Day Eurodollar September Futures | | | 10 | | | | 9/16 | | | | 2,455,625 | | | | (2,890 | ) |
U.S. Treasury 5-Year Note December Futures | | | 408 | | | | 12/14 | | | | 48,485,064 | | | | 143,436 | |
U.S. Treasury 10-Year Note December Futures | | | 208 | | | | 12/14 | | | | 26,162,500 | | | | 69,876 | |
U.S. Treasury Long Bond December Futures | | | 36 | | | | 12/14 | | | | 5,043,375 | | | | 35,719 | |
| | | | | | | | | | | | | | | | |
| | | | | | | | | | | | | | | 503,322 | |
| | | | | | | | | | | | | | | | |
Contracts to Sell: | | | | | | | | | | | | | | | | |
90-Day Eurodollar December Futures | | | 42 | | | | 12/16 | | | | 10,287,375 | | | | 125 | |
90-Day Eurodollar June Futures | | | 67 | | | | 6/18 | | | | 16,266,762 | | | | (82,913 | ) |
Euro FX Currency September Futures | | | 6 | | | | 9/14 | | | | 985,125 | | | | 38,481 | |
Euro-Bobl September Futures | | | 40 | | | | 9/14 | | | | 6,794,655 | | | | (55,259 | ) |
Euro-Bund September Futures | | | 12 | | | | 9/14 | | | | 2,390,301 | | | | (104,104 | ) |
U.S. Treasury 2-Year Note December Futures | | | 3 | | | | 12/14 | | | | 657,141 | | | | (469 | ) |
U.S. Treasury 5-Year Note December Futures | | | 87 | | | | 12/14 | | | | 10,338,727 | | | | (31,266 | ) |
U.S. Treasury 10-Year Note December Futures | | | 72 | | | | 12/14 | | | | 9,056,250 | | | | (31,101 | ) |
U.S. Treasury Long Bond December Futures | | | 29 | | | | 12/14 | | | | 4,062,719 | | | | (27,813 | ) |
U.S. Treasury Ultra Bond December Futures | | | 19 | | | | 12/14 | | | | 2,954,500 | | | | (62,344 | ) |
| | | | | | | | | | | | | | | | |
| | | | | | | | | | | | | | | (356,663 | ) |
| | | | | | | | | | | | | | | | |
Net Unrealized Gain on Open Futures Contracts | | | | | | | | | | | | | | $ | 146,659 | |
| | | | | | | | | | | | | | | | |
189
| | |
| | | |
| Notes to Financial Statements | | |
International Fixed Income Investments
| | | | | | | | | | | | | | | | |
| Open Futures Contracts | | Number of
Contracts | | | Expiration
Date | | | Market Value | | | Unrealized
Gain (Loss) | |
Contracts to Buy: | | | | | | | | | | | | | | | | |
3-Month EURIBOR June Futures | | | 69 | | | | 6/15 | | | $ | 22,647,053 | | | $ | 14,738 | |
3-Month EURIBOR September Futures | | | 28 | | | | 9/15 | | | | 9,189,189 | | | | 5,225 | |
90-Day Sterling Interest Rate September Futures | | | 13 | | | | 9/14 | | | | 2,679,243 | | | | 1,482 | |
Australia Government 3-Year Bond September Futures | | | 26 | | | | 9/14 | | | | 2,663,139 | | | | 736 | |
Australia Government 10-Year Bond September Futures | | | 11 | | | | 9/14 | | | | 1,263,588 | | | | 49,064 | |
Euro-BTP September Futures | | | 66 | | | | 9/14 | | | | 11,323,093 | | | | 334,882 | |
Euro-Bund September Futures | | | 28 | | | | 9/14 | | | | 5,577,369 | | | | 42,904 | |
U.S. Treasury 10-Year Note December Futures | | | 1 | | | | 12/14 | | | | 125,781 | | | | 336 | |
U.S. Treasury Long Bond December Futures | | | 71 | | | | 12/14 | | | | 9,946,656 | | | | 49,570 | |
United Kingdom Long Gilt September Futures | | | 51 | | | | 12/14 | | | | 9,602,452 | | | | 21,558 | |
| | | | | | | | | | | | | | | | |
| | | | | | | | | | | | | | | 520,495 | |
| | | | | | | | | | | | | | | | |
Contracts to Sell: | | | | | | | | | | | | | | | | |
10-Year USD Deliverable Interest Rate Swap September Futures | | | 6 | | | | 9/14 | | | | 640,594 | | | | (16,125 | ) |
90-Day Sterling Interest Rate September Futures | | | 14 | | | | 9/15 | | | | 2,865,459 | | | | (3,773 | ) |
Canada Government 10-Year Bond December Futures | | | 88 | | | | 12/14 | | | | 11,129,567 | | | | (81,762 | ) |
U.S. Treasury 5-Year Note December Futures | | | 44 | | | | 12/14 | | | | 5,228,781 | | | | (13,406 | ) |
U.S. Treasury 10-Year Note December Futures | | | 82 | | | | 12/14 | | | | 10,314,063 | | | | (35,969 | ) |
| | | | | | | | | | | | | | | | |
| | | | | | | | | | | | | | | (151,035 | ) |
| | | | | | | | | | | | | | | | |
Net Unrealized Gain on Open Futures Contracts | | | | | | | | | | | | | | $ | 369,460 | |
| | | | | | | | | | | | | | | | |
At August 31, 2014, Core Fixed Income Investments had deposited $535,793 with a broker or brokers as margin collateral on open exchange traded futures contracts.
At August 31, 2014, International Fixed Income Investments had deposited $30,500 with a broker or brokers as margin collateral on open exchange traded futures contracts.
During the year ended August 31, 2014, options contracts written transactions for Core Fixed Income Investments and International Fixed Income Investments were as follows:
| | | | | | | | |
| Core Fixed Income Investments | | Number of
Contracts | | | Premiums
Received | |
Options contracts written, outstanding at August 31, 2013 | | | 98,760,000 | | | $ | 563,861 | |
Options written | | | 82,670,808 | | | | 807,136 | |
Options closed | | | (11,300,575 | ) | | | (251,890 | ) |
Options expired | | | (125,560,155 | ) | | | (618,297 | ) |
| | | | | | | | |
Options contracts written, outstanding at August 31, 2014 | | | 44,570,078 | | | $ | 500,810 | |
| | | | | | | | |
| | |
| International Fixed Income Investments | | Number of
Contracts | | | Premiums
Received | |
Options contracts written, outstanding at August 31, 2013 | | | 36,200,000 | | | $ | 285,984 | |
Options written | | | 110,718,384 | | | | 567,899 | |
Options closed | | | (27,711,177 | ) | | | (94,616 | ) |
Options expired | | | (115,079,102 | ) | | | (649,903 | ) |
| | | | | | | | |
Options contracts written, outstanding at August 31, 2014 | | | 4,128,105 | | | $ | 109,364 | |
| | | | | | | | |
190
| | |
| | | |
| Notes to Financial Statements | | |
At August 31, 2014, Core Fixed Income Investments and International Fixed Income Investments had open forward foreign currency contracts as described below. The unrealized gain (loss) on the open contracts reflected in the accompanying financial statements were as follows:
Core Fixed Income Investments
| | | | | | | | | | | | | | | | | | | | |
| Foreign Currency | | Local Currency | | | Counterparty | | | Market Value | | | Settlement Date | | | Unrealized
Gain (Loss) | |
Contracts to Buy: | | | | | | | | | | | | | | | | | | | | |
Brazilian Real | | | 675,450 | | | | GSC | | | $ | 301,628 | | | | 9/3/14 | | | $ | 34 | |
Brazilian Real | | | 675,450 | | | | UBS | | | | 301,628 | | | | 9/3/14 | | | | 3,745 | |
British Pound | | | 650,000 | | | | BOA | | | | 1,077,522 | | | | 10/16/14 | | | | (17,078 | ) |
British Pound | | | 600,000 | | | | CITI | | | | 994,635 | | | | 10/16/14 | | | | (15,763 | ) |
Euro | | | 761,000 | | | | BCLY | | | | 1,000,297 | | | | 9/3/14 | | | | (11,050 | ) |
Euro | | | 294,000 | | | | BNP | | | | 386,448 | | | | 9/3/14 | | | | (8,619 | ) |
Euro | | | 2,008,000 | | | | BNP | | | | 2,639,417 | | | | 9/3/14 | | | | (40,114 | ) |
Euro | | | 493,995 | | | | BOA | | | | 649,332 | | | | 9/3/14 | | | | (8,668 | ) |
Euro | | | 22,619,005 | | | | GSC | | | | 29,731,570 | | | | 9/3/14 | | | | (120,993 | ) |
Euro | | | 313,000 | | | | BCLY | | | | 411,489 | | | | 10/2/14 | | | | (1,253 | ) |
Euro | | | 103,000 | | | | BNP | | | | 135,410 | | | | 10/2/14 | | | | (568 | ) |
Euro | | | 104,000 | | | | HSBC | | | | 136,725 | | | | 10/2/14 | | | | (387 | ) |
Euro | | | 1,300,000 | | | | BCLY | | | | 1,709,236 | | | | 10/16/14 | | | | (61,237 | ) |
Euro | | | 2,031,000 | | | | JPM | | | | 2,671,058 | | | | 11/20/14 | | | | (28,366 | ) |
Euro | | | 414,000 | | | | BCLY | | | | 545,504 | | | | 6/15/15 | | | | (9,656 | ) |
Euro | | | 720,000 | | | | BCLY | | | | 948,703 | | | | 6/15/15 | | | | (15,432 | ) |
Euro | | | 2,499,000 | | | | BNP | | | | 3,292,790 | | | | 6/15/15 | | | | (60,011 | ) |
Euro | | | 1,039,000 | | | | JPM | | | | 1,369,031 | | | | 6/15/15 | | | | (20,216 | ) |
Euro | | | 1,242,000 | | | | JPM | | | | 1,636,512 | | | | 6/15/15 | | | | (27,619 | ) |
Euro | | | 108,000 | | | | BOA | | | | 143,705 | | | | 6/13/16 | | | | (2,154 | ) |
Euro | | | 477,000 | | | | DUB | | | | 634,699 | | | | 6/13/16 | | | | (10,014 | ) |
Japanese Yen | | | 54,904,278 | | | | BOA | | | | 527,900 | | | | 9/3/14 | | | | (6,100 | ) |
Japanese Yen | | | 172,295,722 | | | | GSC | | | | 1,656,610 | | | | 9/3/14 | | | | 1,830 | |
Mexican Peso | | | 7,781,340 | | | | GSC | | | | 594,576 | | | | 9/23/14 | | | | (2,084 | ) |
Mexican Peso | | | 3,869,530 | | | | GSC | | | | 295,672 | | | | 9/23/14 | | | | (537 | ) |
Mexican Peso | | | 8,612,955 | | | | BNP | | | | 654,532 | | | | 12/18/14 | | | | 10,573 | |
Mexican Peso | | | 10,688,000 | | | | GSC | | | | 812,223 | | | | 12/18/14 | | | | 12,223 | |
Mexican Peso | | | 5,192,480 | | | | JPM | | | | 394,597 | | | | 12/18/14 | | | | (1,639 | ) |
Mexican Peso | | | 2,670,740 | | | | UBS | | | | 202,960 | | | | 12/18/14 | | | | 2,960 | |
| | | | | | | | | | | | | | | | | | | | |
| | | | | | | | | | | | | | | | | | | (438,193 | ) |
| | | | | | | | | | | | | | | | | | | | |
Contracts to Sell: | | | | | | | | | | | | | | | | | | | | |
Brazilian Real | | | 675,450 | | | | GSC | | | | 301,627 | | | | 9/3/14 | | | | (1,947 | ) |
Brazilian Real | | | 675,450 | | | | UBS | | | | 301,628 | | | | 9/3/14 | | | | (34 | ) |
Brazilian Real | | | 675,450 | | | | UBS | | | | 299,091 | | | | 10/2/14 | | | | (3,625 | ) |
British Pound | | | 497,000 | | | | BCLY | | | | 824,124 | | | | 9/11/14 | | | | 10,095 | |
British Pound | | | 650,000 | | | | BOA | | | | 1,077,522 | | | | 10/16/14 | | | | 34,623 | |
British Pound | | | 600,000 | | | | CITI | | | | 994,636 | | | | 10/16/14 | | | | 32,222 | |
Danish Krone | | | 306,000 | | | | HSBC | | | | 54,097 | | | | 4/1/15 | | | | 655 | |
Euro | | | 150,000 | | | | BCLY | | | | 197,168 | | | | 9/3/14 | | | | 4,404 | |
Euro | | | 108,000 | | | | BOA | | | | 141,961 | | | | 9/3/14 | | | | 2,543 | |
Euro | | | 25,441,000 | | | | CITI | | | | 33,440,943 | | | | 9/3/14 | | | | 753,669 | |
Euro | | | 477,000 | | | | DUB | | | | 626,993 | | | | 9/3/14 | | | | 11,948 | |
191
| | |
| | | |
| Notes to Financial Statements | | |
| | | | | | | | | | | | | | | | | | | | |
| Foreign Currency | | Local Currency | | | Counterparty | | | Market Value | | | Settlement Date | | | Unrealized
Gain (Loss) | |
Euro | | | 22,619,000 | | | | GSC | | | $ | 29,736,331 | | | | 10/2/14 | | | $ | 120,568 | |
Euro | | | 4,065,683 | | | | BOA | | | | 5,345,545 | | | | 10/16/14 | | | | 190,569 | |
Euro | | | 2,649,729 | | | | CSFB | | | | 3,483,854 | | | | 10/16/14 | | | | 129,197 | |
Euro | | | 2,050,000 | | | | JPM | | | | 2,695,333 | | | | 10/16/14 | | | | 99,463 | |
Euro | | | 651,000 | | | | BCLY | | | | 857,785 | | | | 6/15/15 | | | | 26,670 | |
Euro | | | 761,000 | | | | BCLY | | | | 1,002,726 | | | | 6/15/15 | | | | 10,471 | |
Euro | | | 499,000 | | | | BNP | | | | 657,504 | | | | 6/15/15 | | | | 19,235 | |
Euro | | | 1,140,000 | | | | BOA | | | | 1,502,113 | | | | 6/15/15 | | | | 47,865 | |
Euro | | | 832,000 | | | | CITI | | | | 1,096,279 | | | | 6/15/15 | | | | 41,065 | |
Euro | | | 2,031,000 | | | | JPM | | | | 2,676,132 | | | | 6/15/15 | | | | 27,156 | |
Euro | | | 700,000 | | | | BOA | | | | 923,098 | | | | 8/7/15 | | | | 13,059 | |
Euro | | | 100,000 | | | | DUB | | | | 131,871 | | | | 8/7/15 | | | | 1,922 | |
Euro | | | 1,220,000 | | | | BOA | | | | 1,623,340 | | | | 6/13/16 | | | | 48,768 | |
Euro | | | 1,140,000 | | | | BOA | | | | 1,516,892 | | | | 6/13/16 | | | | 39,402 | |
Euro | | | 378,000 | | | | BOA | | | | 502,970 | | | | 6/13/16 | | | | 13,435 | |
Euro | | | 984,000 | | | | DUB | | | | 1,309,317 | | | | 6/13/16 | | | | 37,976 | |
Euro | | | 700,000 | | | | BCLY | | | | 931,816 | | | | 6/27/16 | | | | 30,719 | |
Euro | | | 633,000 | | | | BOA | | | | 842,629 | | | | 6/27/16 | | | | 28,901 | |
Japanese Yen | | | 10,200,000 | | | | GSC | | | | 98,072 | | | | 9/3/14 | | | | 1,623 | |
Japanese Yen | | | 217,000,000 | | | | UBS | | | | 2,086,438 | | | | 9/3/14 | | | | 21,709 | |
Japanese Yen | | | 172,295,722 | | | | GSC | | | | 1,656,979 | | | | 10/2/14 | | | | (1,857 | ) |
Japanese Yen | | | 132,400,000 | | | | BCLY | | | | 1,273,435 | | | | 10/16/14 | | | | 31,268 | |
Japanese Yen | | | 260,360,000 | | | | JPM | | | | 2,504,166 | | | | 10/16/14 | | | | 57,474 | |
Japanese Yen | | | 10,148,120 | | | | BOA | | | | 97,954 | | | | 8/7/15 | | | | 2,046 | |
Japanese Yen | | | 61,181,100 | | | | HSBC | | | | 590,544 | | | | 8/7/15 | | | | 9,456 | |
Mexican Peso | | | 34,943,200 | | | | BNP | | | | 2,669,676 | | | | 9/25/14 | | | | (2,182 | ) |
Mexican Peso | | | 694,979 | | | | GSC | | | | 52,928 | | | | 11/13/14 | | | | (281 | ) |
Mexican Peso | | | 7,445,608 | | | | GSC | | | | 567,037 | | | | 11/13/14 | | | | (4,871 | ) |
Mexican Peso | | | 2,179,876 | | | | GSC | | | | 165,733 | | | | 12/11/14 | | | | (197 | ) |
Mexican Peso | | | 7,769,226 | | | | BOA | | | | 590,414 | | | | 12/18/14 | | | | 586 | |
Mexican Peso | | | 18,598,952 | | | | DUB | | | | 1,413,408 | | | | 12/18/14 | | | | 1,069 | |
Mexican Peso | | | 9,925,012 | | | | DUB | | | | 754,241 | | | | 12/18/14 | | | | 2,239 | |
Mexican Peso | | | 20,418,645 | | | | DUB | | | | 1,551,693 | | | | 12/18/14 | | | | 4,606 | |
Mexican Peso | | | 3,111,810 | | | | GSC | | | | 236,478 | | | | 12/18/14 | | | | (1,671 | ) |
Mexican Peso | | | 11,819,055 | | | | BNP | | | | 897,828 | | | | 12/24/14 | | | | (780 | ) |
Mexican Peso | | | 38,417,337 | | | | BNP | | | | 2,915,517 | | | | 1/8/15 | | | | 5,287 | |
Mexican Peso | | | 5,033,888 | | | | BNP | | | | 381,679 | | | | 1/22/15 | | | | (1,404 | ) |
Mexican Peso | | | 789,647 | | | | BNP | | | | 59,872 | | | | 1/22/15 | | | | (295 | ) |
Mexican Peso | | | 691,168 | | | | GSC | | | | 52,405 | | | | 1/22/15 | | | | (72 | ) |
Mexican Peso | | | 5,916,907 | | | | BNP | | | | 448,225 | | | | 2/5/15 | | | | (365 | ) |
Mexican Peso | | | 12,030,283 | | | | DUB | | | | 911,335 | | | | 2/5/15 | | | | (812 | ) |
| | | | | | | | | | | | | | | | | | | | |
| | | | | | | | | | | | | | | | | | | 1,893,570 | |
| | | | | | | | | | | | | | | | | | | | |
Net Unrealized Gain on Open Forward Foreign Currency Contracts | | | | | | | | | | | | | | | | | | $ | 1,455,377 | |
| | | | | | | | | | | | | | | | | | | | |
192
| | |
| | | |
| Notes to Financial Statements | | |
International Fixed Income Investments
| | | | | | | | | | | | | | | | | | | | |
| Foreign Currency | | Local Currency | | | Counterparty | | | Market Value | | | Settlement Date | | | Unrealized
Gain (Loss) | |
Contracts to Buy: | | | | | | | | | | | | | | | | | | | | |
Australian Dollar | | | 5,997,204 | | | | SOG | | | $ | 5,601,686 | | | | 9/3/14 | | | $ | 28,343 | |
Brazilian Real | | | 1,776,502 | | | | BCLY | | | | 793,312 | | | | 9/3/14 | | | | 89 | |
Brazilian Real | | | 112,950 | | | | BOA | | | | 50,439 | | | | 9/3/14 | | | | 483 | |
Brazilian Real | | | 112,950 | | | | DUB | | | | 50,439 | | | | 9/3/14 | | | | 6 | |
Brazilian Real | | | 102,598 | | | | JPM | | | | 45,816 | | | | 9/3/14 | | | | 804 | |
Brazilian Real | | | 270,193 | | | | UBS | | | | 120,657 | | | | 9/3/14 | | | | 1,498 | |
Brazilian Real | | | 597,731 | | | | UBS | | | | 266,921 | | | | 9/3/14 | | | | 1,074 | |
Brazilian Real | | | 423,000 | | | | UBS | | | | 188,894 | | | | 9/3/14 | | | | 769 | |
Brazilian Real | | | 382,980 | | | | UBS | | | | 171,023 | | | | 9/3/14 | | | | 2,049 | |
Brazilian Real | | | 220,609 | | | | JPM | | | | 97,687 | | | | 10/2/14 | | | | 517 | |
British Pound | | | 140,000 | | | | BCLY | | | | 232,162 | | | | 9/3/14 | | | | (5,643 | ) |
British Pound | | | 10,025,000 | | | | BOA | | | | 16,624,463 | | | | 9/3/14 | | | | (646 | ) |
British Pound | | | 223,000 | | | | DUB | | | | 369,801 | | | | 9/3/14 | | | | (39 | ) |
Canadian Dollar | | | 452,000 | | | | BOA | | | | 416,121 | | | | 9/18/14 | | | | 3,562 | |
Chilean Peso | | | 52,486,100 | | | | BNP | | | | 88,448 | | | | 11/6/14 | | | | (1,866 | ) |
Chilean Peso | | | 16,383,150 | | | | UBS | | | | 27,608 | | | | 11/6/14 | | | | (515 | ) |
Chinese Onshore Renminbi | | | 14,100,000 | | | | JPM | | | | 2,249,560 | | | | 9/8/15 | | | | (46,857 | ) |
Colombian Peso | | | 453,116,500 | | | | BCLY | | | | 235,067 | | | | 10/16/14 | | | | (2,789 | ) |
Colombian Peso | | | 82,914,750 | | | | BCLY | | | | 43,014 | | | | 10/16/14 | | | | 14 | |
Colombian Peso | | | 30,308,800 | | | | BNP | | | | 15,724 | | | | 10/16/14 | | | | (276 | ) |
Colombian Peso | | | 32,317,000 | | | | BNP | | | | 16,765 | | | | 10/16/14 | | | | (235 | ) |
Colombian Peso | | | 71,772,720 | | | | BNP | | | | 37,234 | | | | 10/16/14 | | | | (766 | ) |
Colombian Peso | | | 109,839,000 | | | | BNP | | | | 56,982 | | | | 10/16/14 | | | | (18 | ) |
Colombian Peso | | | 39,616,500 | | | | BOA | | | | 20,552 | | | | 10/16/14 | | | | (448 | ) |
Colombian Peso | | | 9,489,500 | | | | BOA | | | | 4,923 | | | | 10/16/14 | | | | (77 | ) |
Colombian Peso | | | 68,238,000 | | | | BOA | | | | 35,400 | | | | 10/16/14 | | | | (600 | ) |
Colombian Peso | | | 142,080,000 | | | | DUB | | | | 73,708 | | | | 10/16/14 | | | | (1,292 | ) |
Colombian Peso | | | 76,459,670 | | | | DUB | | | | 39,666 | | | | 10/16/14 | | | | (1,334 | ) |
Colombian Peso | | | 405,987,000 | | | | DUB | | | | 210,617 | | | | 10/16/14 | | | | (1,165 | ) |
Colombian Peso | | | 104,445,000 | | | | DUB | | | | 54,184 | | | | 10/16/14 | | | | (816 | ) |
Colombian Peso | | | 131,307,000 | | | | DUB | | | | 68,119 | | | | 10/16/14 | | | | (881 | ) |
Euro | | | 16,412,000 | | | | BCLY | | | | 21,572,767 | | | | 9/3/14 | | | | (208,017 | ) |
Euro | | | 1,336,000 | | | | BNP | | | | 1,756,106 | | | | 9/3/14 | | | | (26,690 | ) |
Euro | | | 859,000 | | | | BNP | | | | 1,129,113 | | | | 9/3/14 | | | | (19,699 | ) |
Euro | | | 43,184,046 | | | | CITI | | | | 56,763,305 | | | | 9/3/14 | | | | (162,294 | ) |
Euro | | | 1,036,000 | | | | DUB | | | | 1,361,771 | | | | 9/3/14 | | | | (5,277 | ) |
Euro | | | 1,834,000 | | | | DUB | | | | 2,410,703 | | | | 9/3/14 | | | | (21,337 | ) |
Euro | | | 45,700,954 | | | | GSC | | | | 60,071,656 | | | | 9/3/14 | | | | (244,463 | ) |
Euro | | | 1,145,000 | | | | GSC | | | | 1,505,046 | | | | 9/3/14 | | | | (29,168 | ) |
Euro | | | 2,158,000 | | | | HSBC | | | | 2,836,584 | | | | 9/3/14 | | | | (42,985 | ) |
Euro | | | 1,817,000 | | | | JPM | | | | 2,388,357 | | | | 9/3/14 | | | | (25,973 | ) |
Euro | | | 868,000 | | | | JPM | | | | 1,140,944 | | | | 9/3/14 | | | | (20,358 | ) |
Euro | | | 2,649,000 | | | | JPM | | | | 3,481,980 | | | | 9/3/14 | | | | (53,754 | ) |
Euro | | | 411,000 | | | | BCLY | | | | 540,326 | | | | 10/2/14 | | | | (1,645 | ) |
Hungarian Forint | | | 81,137,871 | | | | JPM | | | | 338,017 | | | | 10/30/14 | | | | (14,848 | ) |
Indian Rupee | | | 1,224,800 | | | | BCLY | | | | 20,025 | | | | 10/15/14 | | | | 25 | |
193
| | |
| | | |
| Notes to Financial Statements | | |
| | | | | | | | | | | | | | | | | | | | |
| Foreign Currency | | Local Currency | | | Counterparty | | | Market Value | | | Settlement Date | | | Unrealized
Gain (Loss) | |
Indian Rupee | | | 4,905,600 | | | | BOA | | | $ | 80,207 | | | | 10/15/14 | | | $ | 207 | |
Indian Rupee | | | 11,042,430 | | | | UBS | | | | 180,544 | | | | 10/15/14 | | | | (866 | ) |
Indonesian Rupiah | | | 889,077,025 | �� | | | HSBC | | | | 75,891 | | | | 9/16/14 | | | | 64 | |
Indonesian Rupiah | | | 137,909,596 | | | | UBS | | | | 11,772 | | | | 9/16/14 | | | | 78 | |
Indonesian Rupiah | | | 122,066,667 | | | | BCLY | | | | 10,366 | | | | 10/15/14 | | | | 81 | |
Israeli New Shekel | | | 213,000 | | | | DUB | | | | 59,620 | | | | 9/8/14 | | | | (1,994 | ) |
Japanese Yen | | | 538,200,000 | | | | BNP | | | | 5,174,751 | | | | 9/3/14 | | | | (110,082 | ) |
Japanese Yen | | | 31,800,000 | | | | DUB | | | | 305,754 | | | | 9/3/14 | | | | (989 | ) |
Japanese Yen | | | 2,291,793,000 | | | | GSC | | | | 22,035,412 | | | | 9/3/14 | | | | 24,338 | |
Japanese Yen | | | 256,700,000 | | | | JPM | | | | 2,468,151 | | | | 9/3/14 | | | | (42,193 | ) |
Japanese Yen | | | 83,200,000 | | | | JPM | | | | 799,961 | | | | 9/3/14 | | | | (3,408 | ) |
Korean Won | | | 87,653,400 | | | | DUB | | | | 86,256 | | | | 10/15/14 | | | | 34 | |
Malaysian Ringgit | | | 165,620 | | | | BCLY | | | | 52,370 | | | | 10/15/14 | | | | 370 | |
Malaysian Ringgit | | | 1,096,300 | | | | DUB | | | | 346,654 | | | | 10/15/14 | | | | (222 | ) |
Malaysian Ringgit | | | 54,800 | | | | DUB | | | | 17,328 | | | | 10/15/14 | | | | 82 | |
Malaysian Ringgit | | | 1,744,098 | | | | UBS | | | | 551,490 | | | | 10/15/14 | | | | 4,922 | |
Mexican Peso | | | 1,917,586 | | | | BNP | | | | 146,240 | | | | 10/22/14 | | | | 460 | |
Mexican Peso | | | 11,847,839 | | | | BNP | | | | 900,364 | | | | 12/18/14 | | | | (1,813 | ) |
Mexican Peso | | | 3,149,520 | | | | BNP | | | | 239,344 | | | | 12/18/14 | | | | (656 | ) |
Mexican Peso | | | 7,540,314 | | | | BNP | | | | 573,018 | | | | 12/18/14 | | | | 9,256 | |
New Zealand Dollar | | | 1,766,000 | | | | BOA | | | | 1,477,171 | | | | 9/3/14 | | | | (27,488 | ) |
Nigerian Naira | | | 230,300 | | | | JPM | | | | 1,419 | | | | 9/5/14 | | | | 0 | |
Peruvian Sol | | | 83,579 | | | | DUB | | | | 29,298 | | | | 9/25/14 | | | | (298 | ) |
Philippine Peso | | | 3,722,510 | | | | BCLY | | | | 85,146 | | | | 10/15/14 | | | | (854 | ) |
Philippine Peso | | | 1,114,950 | | | | DUB | | | | 25,503 | | | | 10/15/14 | | | | 15 | |
Polish Zloty | | | 2,587,068 | | | | BCLY | | | | 804,237 | | | | 10/30/14 | | | | (33,612 | ) |
Polish Zloty | | | 96,467 | | | | DUB | | | | 29,988 | | | | 10/30/14 | | | | (12 | ) |
Romanian New Leu | | | 100,569 | | | | DUB | | | | 29,993 | | | | 10/15/14 | | | | (7 | ) |
South African Rand | | | 284,393 | | | | BCLY | | | | 26,507 | | | | 10/15/14 | | | | 507 | |
South African Rand | | | 1,160,000 | | | | HSBC | | | | 108,120 | | | | 10/15/14 | | | | 844 | |
South African Rand | | | 271,000 | | | | HSBC | | | | 25,259 | | | | 10/15/14 | | | | 355 | |
South African Rand | | | 811,114 | | | | HSBC | | | | 75,602 | | | | 10/15/14 | | | | 602 | |
South African Rand | | | 284,848 | | | | HSBC | | | | 26,550 | | | | 10/15/14 | | | | 550 | |
South African Rand | | | 75,558 | | | | JPM | | | | 7,043 | | | | 10/15/14 | | | | 43 | |
South African Rand | | | 305,200 | | | | JPM | | | | 28,447 | | | | 10/15/14 | | | | 447 | |
South African Rand | | | 1,299,600 | | | | JPM | | | | 121,132 | | | | 10/15/14 | | | | 1,132 | |
Swiss Franc | | | 70,000 | | | | BNP | | | | 76,334 | | | | 11/13/14 | | | | (662 | ) |
Swiss Franc | | | 430,000 | | | | GSC | | | | 468,909 | | | | 11/13/14 | | | | (6,035 | ) |
Thai Baht | | | 1,279,600 | | | | DUB | | | | 39,993 | | | | 10/15/14 | | | | (7 | ) |
Thai Baht. | | | 639,200 | | | | HSBC | | | | 19,978 | | | | 10/15/14 | | | | (22 | ) |
Thai Baht | | | 319,300 | | | | HSBC | | | | 9,979 | | | | 10/15/14 | | | | (21 | ) |
Thai Baht | | | 1,078,700 | | | | JPM | | | | 33,714 | | | | 10/15/14 | | | | 89 | |
Thai Baht | | | 28,330,885 | | | | UBS | | | | 885,462 | | | | 10/15/14 | | | | 7,203 | |
Thai Baht | | | 1,596,000 | | | | UBS | | | | 49,882 | | | | 10/15/14 | | | | (118 | ) |
Thai Baht | | | 638,800 | | | | UBS | | | | 19,965 | | | | 10/15/14 | | | | (35 | ) |
Turkish Lira | | | 306,000 | | | | BNP | | | | 140,276 | | | | 10/15/14 | | | | (273 | ) |
Turkish Lira | | | 2,027,810 | | | | JPM | | | | 929,586 | | | | 10/15/14 | | | | (4,200 | ) |
Turkish Lira | | | 2,027,810 | | | | JPM | | | | 929,586 | | | | 10/15/14 | | | | (1,157 | ) |
| | | | | | | | | | | | | | | | | | | | |
| | | | | | | | | | | | | | | | | | | (1,088,883 | ) |
| | | | | | | | | | | | | | | | | | | | |
194
| | |
| | | |
| Notes to Financial Statements | | |
| | | | | | | | | | | | | | | | | | | | |
| Foreign Currency | | Local Currency | | | Counterparty | | | Market Value | | | Settlement Date | | | Unrealized
Gain (Loss) | |
Contracts to Sell: | | | | | | | | | | | | | | | | | | | | |
Australian Dollar | | | 70,204 | | | | BNP | | | $ | 65,574 | | | | 9/3/14 | | | $ | (574 | ) |
Australian Dollar | | | 1,895,000 | | | | GSC | | | | 1,770,024 | | | | 9/3/14 | | | | (5,436 | ) |
Australian Dollar | | | 901,000 | | | | HSBC | | | | 841,578 | | | | 9/3/14 | | | | (2,105 | ) |
Australian Dollar | | | 926,000 | | | | HSBC | | | | 864,929 | | | | 9/3/14 | | | | (3,315 | ) |
Australian Dollar | | | 2,205,000 | | | | JPM | | | | 2,059,579 | | | | 9/3/14 | | | | (16,861 | ) |
Australian Dollar | | | 5,997,204 | | | | SOG | | | | 5,590,375 | | | | 10/2/14 | | | | (28,293 | ) |
Brazilian Real | | | 430,987 | | | | BCLY | | | | 192,461 | | | | 9/3/14 | | | | (2,461 | ) |
Brazilian Real | | | 66,000 | | | | BCLY | | | | 29,473 | | | | 9/3/14 | | | | (983 | ) |
Brazilian Real | | | 520,515 | | | | BCLY | | | | 232,440 | | | | 9/3/14 | | | | (1,521 | ) |
Brazilian Real | | | 759,000 | | | | BCLY | | | | 338,937 | | | | 9/3/14 | | | | (7,424 | ) |
Brazilian Real | | | 112,950 | | | | BOA | | | | 50,439 | | | | 9/3/14 | | | | (6 | ) |
Brazilian Real | | | 112,950 | | | | DUB | | | | 50,439 | | | | 9/3/14 | | | | (439 | ) |
Brazilian Real | | | 102,598 | | | | JPM | | | | 45,816 | | | | 9/3/14 | | | | (5 | ) |
Brazilian Real | | | 1,673,904 | | | | UBS | | | | 747,495 | | | | 9/3/14 | | | | (83 | ) |
Brazilian Real | | | 67,725 | | | | BCLY | | | | 29,989 | | | | 10/2/14 | | | | 11 | |
Brazilian Real | | | 112,950 | | | | BOA | | | | 50,014 | | | | 10/2/14 | | | | (463 | ) |
Brazilian Real | | | 270,193 | | | | UBS | | | | 119,642 | | | | 10/2/14 | | | | (1,450 | ) |
Brazilian Real | | | 382,980 | | | | UBS | | | | 169,585 | | | | 10/2/14 | | | | (1,975 | ) |
Brazilian Real | | | 342,280 | | | | BOA | | | | 147,726 | | | | 1/5/15 | | | | 274 | |
Brazilian Real | | | 92,706 | | | | JPM | | | | 40,011 | | | | 1/5/15 | | | | (1,065 | ) |
Brazilian Real | | | 235,750 | | | | JPM | | | | 101,748 | | | | 1/5/15 | | | | (1,748 | ) |
Brazilian Real | | | 180,683 | | | | JPM | | | | 77,982 | | | | 1/5/15 | | | | (836 | ) |
Brazilian Real | | | 1,113,209 | | | | UBS | | | | 480,455 | | | | 1/5/15 | | | | (12,031 | ) |
Brazilian Real | | | 26,625 | | | | BCLY | | | | 11,234 | | | | 4/2/15 | | | | (233 | ) |
Brazilian Real | | | 577,136 | | | | JPM | | | | 243,520 | | | | 4/2/15 | | | | (5,477 | ) |
Brazilian Real | | | 217,174 | | | | DUB | | | | 90,831 | | | | 5/5/15 | | | | (6,834 | ) |
British Pound | | | 1,326,000 | | | | BCLY | | | | 2,198,907 | | | | 9/3/14 | | | | 35,577 | |
British Pound | | | 764,000 | | | | BCLY | | | | 1,266,942 | | | | 9/3/14 | | | | 18,422 | |
British Pound | | | 331,000 | | | | BOA | | | | 548,898 | | | | 9/3/14 | | | | 6,383 | |
British Pound | | | 1,020,000 | | | | CITI | | | | 1,691,467 | | | | 9/3/14 | | | �� | 38,577 | |
British Pound | | | 1,270,000 | | | | DUB | | | | 2,106,041 | | | | 9/3/14 | | | | 37,424 | |
British Pound | | | 297,000 | | | | DUB | | | | 492,515 | | | | 9/3/14 | | | | 11,166 | |
British Pound | | | 592,000 | | | | HSBC | | | | 981,714 | | | | 9/3/14 | | | | 20,403 | |
British Pound | | | 1,714,000 | | | | HSBC | | | | 2,842,328 | | | | 9/3/14 | | | | 59,176 | |
British Pound | | | 407,000 | | | | HSBC | | | | 674,928 | | | | 9/3/14 | | | | 9,600 | |
British Pound | | | 856,000 | | | | HSBC | | | | 1,419,505 | | | | 9/3/14 | | | | 3,274 | |
British Pound | | | 1,811,000 | | | | JPM | | | | 3,003,182 | | | | 9/3/14 | | | | 71,379 | |
British Pound | | | 1,289,000 | | | | BNP | | | | 2,137,068 | | | | 10/2/14 | | | | 1,025 | |
British Pound | | | 10,025,000 | | | | BOA | | | | 16,620,714 | | | | 10/2/14 | | | | 736 | |
Canadian Dollar | | | 881,053 | | | | CITI | | | | 811,395 | | | | 9/2/14 | | | | 605 | |
Canadian Dollar | | | 6,024,000 | | | | CITI | | | | 5,545,833 | | | | 9/18/14 | | | | (13,055 | ) |
Canadian Dollar | | | 1,351,000 | | | | HSBC | | | | 1,243,762 | | | | 9/18/14 | | | | 1,539 | |
Canadian Dollar | | | 740,000 | | | | HSBC | | | | 681,261 | | | | 9/18/14 | | | | (2,022 | ) |
Canadian Dollar | | | 575,000 | | | | HSBC | | | | 529,358 | | | | 9/18/14 | | | | (3,076 | ) |
Canadian Dollar | | | 767,000 | | | | JPM | | | | 706,117 | | | | 9/18/14 | | | | (2,832 | ) |
Canadian Dollar | | | 1,511,672 | | | | BCLY | | | | 1,391,232 | | | | 10/2/14 | | | | (486 | ) |
Chilean Peso | | | 31,514,400 | | | | BNP | | | | 53,107 | | | | 11/6/14 | | | | 893 | |
Chilean Peso | | | 4,666,800 | | | | BOA | | | | 7,864 | | | | 11/6/14 | | | | 136 | |
195
| | |
| | | |
| Notes to Financial Statements | | |
| | | | | | | | | | | | | | | | | | | | |
| Foreign Currency | | Local Currency | | | Counterparty | | | Market Value | | | Settlement Date | | | Unrealized
Gain (Loss) | |
Chinese Onshore Renminbi | | | 14,100,000 | | | | JPM | | | $ | 2,249,560 | | | | 9/8/15 | | | $ | (117,557 | ) |
Colombian Peso | | | 96,619,500 | | | | BCLY | | | | 50,124 | | | | 10/16/14 | | | | 876 | |
Colombian Peso | | | 300,285,753 | | | | DUB | | | | 155,782 | | | | 10/16/14 | | | | (2,489 | ) |
Colombian Peso | | | 280,920,381 | | | | DUB | | | | 145,736 | | | | 10/16/14 | | | | (818 | ) |
Colombian Peso | | | 226,558,250 | | | | DUB | | | | 117,534 | | | | 10/16/14 | | | | 2,202 | |
Euro | | | 1,805,000 | | | | BCLY | | | | 2,372,584 | | | | 9/3/14 | | | | 43,711 | |
Euro | | | 1,291,000 | | | | BCLY | | | | 1,696,956 | | | | 9/3/14 | | | | 30,030 | |
Euro | | | 21,473,000 | | | | BNP | | | | 28,225,202 | | | | 9/3/14 | | | | 499,080 | |
Euro | | | 1,023,000 | | | | BNP | | | | 1,344,684 | | | | 9/3/14 | | | | 29,989 | |
Euro | | | 44,431,000 | | | | BOA | | | | 58,402,364 | | | | 9/3/14 | | | | 1,298,327 | |
Euro | | | 44,314,000 | | | | CITI | | | | 58,248,574 | | | | 9/3/14 | | | | 1,312,766 | |
Euro | | | 107,000 | | | | DUB | | | | 140,646 | | | | 9/3/14 | | | | 2,786 | |
Euro | | | 729,000 | | | | DUB | | | | 958,235 | | | | 9/3/14 | | | | 22,711 | |
Euro | | | 816,000 | | | | DUB | | | | 1,072,592 | | | | 9/3/14 | | | | 20,654 | |
Euro | | | 674,000 | | | | GSC | | | | 885,940 | | | | 9/3/14 | | | | 19,822 | |
Euro | | | 424,000 | | | | GSC | | | | 557,327 | | | | 9/3/14 | | | | 10,926 | |
Euro | | | 1,912,000 | | | | JPM | | | | 2,513,230 | | | | 9/3/14 | | | | 53,527 | |
Euro | | | 752,000 | | | | BNP | | | | 988,625 | | | | 10/2/14 | | | | 3,274 | |
Euro | | | 43,184,000 | | | | CITI | | | | 56,772,348 | | | | 10/2/14 | | | | 162,301 | |
Euro | | | 45,701,000 | | | | GSC | | | | 60,081,351 | | | | 10/2/14 | | | | 243,603 | |
Euro | | | 1,424,000 | | | | GSC | | | | 1,872,078 | | | | 10/2/14 | | | | 7,949 | |
Euro | | | 2,346,000 | | | | HSBC | | | | 3,084,196 | | | | 10/2/14 | | | | 8,737 | |
Euro | | | 39,000 | | | | BNP | | | | 51,291 | | | | 11/20/14 | | | | 940 | |
Euro | | | 9,000 | | | | BOA | | | | 11,837 | | | | 11/20/14 | | | | 223 | |
Hungarian Forint | | | 4,799,896 | | | | DUB | | | | 19,996 | | | | 10/30/14 | | | | 4 | |
Indonesian Rupiah | | | 260,268,202 | | | | DUB | | | | 22,216 | | | | 9/16/14 | | | | (427 | ) |
Indonesian Rupiah | | | 308,594,635 | | | | DUB | | | | 26,207 | | | | 10/15/14 | | | | (121 | ) |
Indonesian Rupiah | | | 23,580,000 | | | | DUB | | | | 2,003 | | | | 10/15/14 | | | | (3 | ) |
Indonesian Rupiah | | | 212,310,000 | | | | UBS | | | | 18,030 | | | | 10/15/14 | | | | (30 | ) |
Israeli New Shekel | | | 213,000 | | | | BCLY | | | | 59,621 | | | | 9/5/14 | | | | 2,542 | |
Israeli New Shekel | | | 212,251 | | | | JPM | | | | 59,411 | | | | 9/8/14 | | | | 2,589 | |
Japanese Yen | | | 214,500,000 | | | | BNP | | | | 2,062,401 | | | | 9/3/14 | | | | 31,835 | |
Japanese Yen | | | 451,100,000 | | | | GSC | | | | 4,337,291 | | | | 9/3/14 | | | | 25 | |
Japanese Yen | | | 2,504,293,000 | | | | UBS | | | | 24,078,583 | �� | | | 9/3/14 | | | | 250,531 | |
Japanese Yen | | | 31,800,000 | | | | UBS | | | | 305,755 | | | | 9/3/14 | | | | 3,181 | |
Japanese Yen | | | 193,600,000 | | | | BNP | | | | 1,861,864 | | | | 10/2/14 | | | | 2,069 | |
Japanese Yen | | | 31,800,000 | | | | DUB | | | | 305,822 | | | | 10/2/14 | | | | 1,005 | |
Japanese Yen | | | 2,291,793,000 | | | | GSC | | | | 22,040,320 | | | | 10/2/14 | | | | (24,700 | ) |
Malaysian Ringgit | | | 105,963 | | | | DUB | | | | 33,506 | | | | 10/15/14 | | | | (506 | ) |
Malaysian Ringgit | | | 63,260 | | | | UBS | | | | 20,003 | | | | 10/15/14 | | | | (3 | ) |
Malaysian Ringgit | | | 99,219 | | | | UBS | | | | 31,373 | | | | 10/15/14 | | | | (435 | ) |
Mexican Peso | | | 1,501,813 | | | | JPM | | | | 114,754 | | | | 9/23/14 | | | | 783 | |
Mexican Peso | | | 198,738 | | | | BNP | | | | 15,149 | | | | 10/30/14 | | | | (163 | ) |
Mexican Peso | | | 536,586 | | | | BCLY | | | | 40,777 | | | | 12/18/14 | | | | 223 | |
Mexican Peso | | | 933,479 | | | | BNP | | | | 70,938 | | | | 12/18/14 | | | | (535 | ) |
Mexican Peso | | | 405,341 | | | | DUB | | | | 30,803 | | | | 12/18/14 | | | | 197 | |
Mexican Peso | | | 263,420 | | | | DUB | | | | 20,018 | | | | 12/18/14 | | | | (18 | ) |
Mexican Peso | | | 144,056 | | | | DUB | | | | 10,947 | | | | 12/18/14 | | | | 53 | |
Mexican Peso | | | 706,249 | | | | HSBC | | | | 53,671 | | | | 12/18/14 | | | | 329 | |
196
| | |
| | | |
| Notes to Financial Statements | | |
| | | | | | | | | | | | | | | | | | | | |
| Foreign Currency | | Local Currency | | | Counterparty | | | Market Value | | | Settlement Date | | | Unrealized
Gain (Loss) | |
Mexican Peso | | | 778,000 | | | | UBS | | | $ | 59,123 | | | | 12/18/14 | | | $ | (36 | ) |
New Zealand Dollar | | | 2,183,000 | | | | DUB | | | | 1,825,970 | | | | 9/3/14 | | | | 19,763 | |
Nigerian Naira | | | 332,400 | | | | HSBC | | | | 2,047 | | | | 9/5/14 | | | | (47 | ) |
Nigerian Naira | | | 230,300 | | | | JPM | | | | 1,411 | | | | 10/2/14 | | | | (2 | ) |
Norwegian Krone | | | 12,779,000 | | | | CITI | | | | 2,059,746 | | | | 11/13/14 | | | | (21,660 | ) |
Peruvian Sol | | | 50,544 | | | | BCLY | | | | 17,718 | | | | 9/25/14 | | | | 282 | |
Polish Zloty | | | 31,523 | | | | BCLY | | | | 9,800 | | | | 10/30/14 | | | | 200 | |
Polish Zloty | | | 15,504 | | | | BCLY | | | | 4,820 | | | | 10/30/14 | | | | 180 | |
Polish Zloty | | | 15,504 | | | | DUB | | | | 4,820 | | | | 10/30/14 | | | | 180 | |
Polish Zloty | | | 25,210 | | | | JPM | | | | 7,837 | | | | 10/30/14 | | | | 163 | |
Romanian New Leu | | | 76,000 | | | | BCLY | | | | 22,646 | | | | 10/30/14 | | | | 146 | |
Romanian New Leu | | | 172,251 | | | | DUB | | | | 51,326 | | | | 10/30/14 | | | | 638 | |
Russian Ruble | | | 1,894,395 | | | | BCLY | | | | 50,738 | | | | 10/2/14 | | | | 262 | |
Russian Ruble | | | 1,825,495 | | | | HSBC | | | | 48,893 | | | | 10/2/14 | | | | 107 | |
Russian Ruble | | | 1,166,640 | | | | BCLY | | | | 31,137 | | | | 10/15/14 | | | | 863 | |
Russian Ruble | | | 581,880 | | | | BCLY | | | | 15,530 | | | | 10/15/14 | | | | 470 | |
Russian Ruble | | | 1,166,560 | | | | HSBC | | | | 31,134 | | | | 10/15/14 | | | | 866 | |
South African Rand | | | 225,656 | | | | BCLY | | | | 21,033 | | | | 10/15/14 | | | | (33 | ) |
South African Rand | | | 426,999 | | | | BCLY | | | | 39,799 | | | | 10/15/14 | | | | (799 | ) |
South African Rand | | | 2,246,000 | | | | BCLY | | | | 209,343 | | | | 10/15/14 | | | | (1,226 | ) |
South African Rand | | | 764,000 | | | | DUB | | | | 71,210 | | | | 10/15/14 | | | | (280 | ) |
South African Rand | | | 429,440 | | | | DUB | | | | 40,027 | | | | 10/15/14 | | | | (27 | ) |
South African Rand | | | 194,000 | | | | HSBC | | | | 18,082 | | | | 10/15/14 | | | | (247 | ) |
South African Rand | | | 216,860 | | | | HSBC | | | | 20,213 | | | | 10/15/14 | | | | (213 | ) |
South African Rand | | | 525,922 | | | | JPM | | | | 49,020 | | | | 10/15/14 | | | | (20 | ) |
South African Rand | | | 873,000 | | | | JPM | | | | 81,369 | | | | 10/15/14 | | | | 912 | |
South African Rand | | | 3,714,224 | | | | JPM | | | | 346,192 | | | | 10/15/14 | | | | (7,726 | ) |
South African Rand | | | 2,471,000 | | | | JPM | | | | 230,314 | | | | 10/15/14 | | | | 2,262 | |
South African Rand | | | 1,109,000 | | | | JPM | | | | 103,367 | | | | 10/15/14 | | | | 1,166 | |
South African Rand | | | 279,126 | | | | JPM | | | | 26,017 | | | | 10/15/14 | | | | (17 | ) |
Swiss Franc | | | 290,000 | | | | BCLY | | | | 316,240 | | | | 11/13/14 | | | | 4,585 | |
Swiss Franc | | | 121,000 | | | | HSBC | | | | 131,948 | | | | 11/13/14 | | | | 1,730 | |
Swiss Franc | | | 968,000 | | | | JPM | | | | 1,055,590 | | | | 11/13/14 | | | | 3,604 | |
Swiss Franc | | | 2,237,000 | | | | UBS | | | | 2,439,415 | | | | 11/13/14 | | | | 36,717 | |
Thai Baht | | | 1,044,354 | | | | BCLY | | | | 32,640 | | | | 10/15/14 | | | | 98 | |
Thai Baht | | | 2,247,700 | | | | HSBC | | | | 70,250 | | | | 10/15/14 | | | | (250 | ) |
Thai Baht | | | 960,450 | | �� | | UBS | | | | 30,018 | | | | 10/15/14 | | | | (18 | ) |
Turkish Lira | | | 2,027,810 | | | | HSBC | | | | 929,587 | | | | 10/15/14 | | | | (6,365 | ) |
Turkish Lira | | | 54,474 | | | | HSBC | | | | 24,972 | | | | 10/15/14 | | | | 28 | |
| | | | | | | | | | | | | | | | | | | | |
| | | | | | | | | | | | | | | | | | | 4,151,762 | |
| | | | | | | | | | | | | | | | | | | | |
Net Unrealized Gain on Open Forward Foreign Currency Contracts | | | | | | | | | | | | | | | | | | $ | 3,062,879 | |
| | | | | | | | | | | | | | | | | | | | |
197
| | |
| | | |
| Notes to Financial Statements | | |
At August 31, 2014, Core Fixed Income Investments held the following OTC interest rate swap contracts:
| | | | | | | | | | | | | | | | | | | | | | | | | | | | | | |
Pay/Receive
Floating Rate | | Floating Rate Index | | Fixed
Rate | | | Maturity
Date | | | Counterparty | | | Notional
Amount | | | Market
Value | | | Upfront
Premiums
Paid/
(Received) | | | Unrealized
Appreciation/
(Depreciation) | |
| Pay | | BRL-CDI-Compounded | | | 8.075% | | | | 01/02/2015 | | | | HSBC | | | | BRL 2,700,000 | | | $ | (24,928 | ) | | $ | 5,192 | | | $ | (30,120 | ) |
| Pay | | BRL-CDI-Compounded | | | 8.440% | | | | 01/02/2015 | | | | BOA | | | | BRL 3,500,000 | | | | (18,106 | ) | | | 21,391 | | | | (39,497 | ) |
| Pay | | BRL-CDI-Compounded | | | 8.560% | | | | 01/02/2015 | | | | UBS | | | | BRL 1,300,000 | | | | (9,820 | ) | | | 53 | | | | (9,873 | ) |
| Pay | | BRL-CDI-Compounded | | | 9.930% | | | | 01/02/2015 | | | | UBS | | | | BRL 5,000,000 | | | | 53,173 | | | | 120 | | | | 53,053 | |
| Pay | | 28-Day MXN TIIE Banxico | | | 5.700% | | | | 01/18/2019 | | | | BOA | | | | MXN 3,000,000 | | | | 8,317 | | | | (807 | ) | | | 9,124 | |
| Pay | | 28-Day MXN TIIE Banxico | | | 5.700% | | | | 01/18/2019 | | | | DUB | | | | MXN 1,000,000 | | | | 2,772 | | | | (417 | ) | | | 3,189 | |
| Pay | | 28-Day MXN TIIE Banxico | | | 5.700% | | | | 01/18/2019 | | | | GSC | | | | MXN 1,000,000 | | | | 2,772 | | | | (291 | ) | | | 3,063 | |
| Pay | | 28-Day MXN TIIE Banxico | | | 5.700% | | | | 01/18/2019 | | | | JPM | | | | MXN 1,000,000 | | | | 2,772 | | | | (341 | ) | | | 3,113 | |
| Pay | | 28-Day MXN TIIE Banxico | | | 6.810% | | | | 06/19/2034 | | | | DUB | | | | MXN 2,000,000 | | | | 2,478 | | | | (1,788 | ) | | | 4,266 | |
| Receive | | 3-Month USD-LIBOR | | | 2.417% | | | | 11/15/2027 | | | | BCLY | | | | USD 595,000 | | | | 7,162 | | | | — | | | | 7,162 | |
| Receive | | 3-Month USD-LIBOR | | | 2.750% | | | | 02/17/2042 | | | | BCLY | | | | USD 1,545,000 | | | | 87,329 | | | | — | | | | 87,329 | |
| Pay | | 3-Month USD-LIBOR | | | 2.805% | | | | 04/09/2026 | | | | BCLY | | | | USD 2,970,000 | | | | (53,733 | ) | | | — | | | | (53,733 | ) |
| Receive | | 3-Month USD-LIBOR | | | 3.125% | | | | 04/09/2046 | | | | BCLY | | | | USD 1,340,000 | | | | 40,908 | | | | — | | | | 40,908 | |
| Pay | | 3-Month USD-LIBOR | | | 3.145% | | | | 03/15/2026 | | | | BCLY | | | | USD 2,620,000 | | | | 33,760 | | | | — | | | | 33,760 | |
| Receive | | 3-Month USD-LIBOR | | | 3.490% | | | | 03/15/2046 | | | | BCLY | | | | USD 1,170,000 | | | | (47,375 | ) | | | — | | | | (47,375 | ) |
| | | | | | | | | | | | | | | | | | | | | | | | | | | | | | |
| | | | | | | | | | | | | | | | | | | | $ | 87,481 | | | $ | 23,112 | | | $ | 64,369 | |
| | | | | | | | | | | | | | | | | | | | | | | | | | | | | | |
At August 31, 2014, Core Fixed Income Investments held the following centrally cleared interest rate swap contracts:
| | | | | | | | | | | | | | | | | | | | | | |
Pay/Receive
Floating Rate | | Floating Rate Index | | Fixed
Rate | | | Maturity
Date | | | Counterparty | | | Notional
Amount | | | Unrealized
Appreciation/
(Depreciation) | |
| Pay | | 28-Day MXN TIIE Banxico | | | 6.810% | | | | 06/19/2034 | | | | BCLY | | | | MXN 29,000,000 | | | $ | 31,414 | |
| Pay | | 3-Month USD-LIBOR | | | 3.000% | | | | 09/21/2017 | | | | BCLY | | | | USD 45,500,000 | | | | 63,359 | |
| Receive | | 3-Month USD-LIBOR | | | 3.000% | | | | 06/19/2043 | | | | BCLY | | | | USD 7,400,000 | | | | (345,942 | ) |
| Receive | | 3-Month USD-LIBOR | | | 3.676% | | | | 11/15/2043 | | | | CITI | | | | USD 910,000 | | | | (120,024 | ) |
| Pay | | 3-Month USD-LIBOR | | | 4.000% | | | | 06/19/2024 | | | | BCLY | | | | USD 200,000 | | | | 2,664 | |
| | | | | | | | | | | | | | | | | | | | | | |
| | | | | | | | | | | | | | | | | | | | $ | (368,529 | ) |
| | | | | | | | | | | | | | | | | | | | | | |
At August 31, 2014, Core Fixed Income Investments held the following OTC credit default swap contracts:
OTC Credit Default Swaps on Corporate and Sovereign Issues—Sell Protection (2)
| | | | | | | | | | | | | | | | | | | | | | | | | | | | | | | | |
| Reference Obligation | | Fixed Deal
(Pay) Rate | | | Maturity
Date | | | Counterparty | | | Implied
Credit Spread at
8/31/14 (3) | | | Notional
Amount (4) | | | Market
Value | | | Upfront
Premiums
Paid/
(Received) | | | Unrealized
Appreciation/
(Depreciation) | |
Brazilian Government International, BBB- | | | 1.000% | | | | 09/20/2016 | | | | JPM | | | | 0.589% | | | | USD 5,800,000 | | | $ | 61,037 | | | $ | (81,072 | ) | | $ | 142,109 | |
Italy Government International, BBB | | | 1.000% | | | | 09/20/2016 | | | | BNP | | | | 0.497% | | | | USD 300,000 | | | | 3,722 | | | | 3,210 | | | | 512 | |
Italy Government International, BBB | | | 1.000% | | | | 06/20/2019 | | | | DUB | | | | 0.952% | | | | USD 100,000 | | | | 423 | | | | (727 | ) | | | 1,150 | |
Italy Government International, BBB | | | 1.000% | | | | 06/20/2019 | | | | BCLY | | | | 0.952% | | | | USD 100,000 | | | | 423 | | | | (632 | ) | | | 1,055 | |
Metlife Inc., A- | | | 1.000% | | | | 06/20/2017 | | | | DUB | | | | 0.301% | | | | USD 900,000 | | | | 19,480 | | | | 19,332 | | | | 148 | |
Mexican Government International Bond, BBB+ | | | 1.000% | | | | 09/20/2016 | | | | JPM | | | | 0.289% | | | | USD 5,800,000 | | | | 97,214 | | | | 23,195 | | | | 74,019 | |
Mexican Government International Bond, BBB+ | | | 1.000% | | | | 09/20/2019 | | | | HSBC | | | | 0.702% | | | | USD 300,000 | | | | 4,970 | | | | 2,197 | | | | 2,773 | |
Mexican Government International Bond, BBB+ | | | 1.000% | | | | 09/20/2019 | | | | BOA | | | | 0.702% | | | | USD 700,000 | | | | 11,596 | | | | 4,954 | | | | 6,642 | |
Russian Foreign Bond-Eurobon, BBB- | | | 1.000% | | | | 09/20/2019 | | | | BCLY | | | | 2.559% | | | | USD 800,000 | | | | (55,948 | ) | | | (47,017 | ) | | | (8,931 | ) |
| | | | | | | | | | | | | | | | | | | | | | | | | | | | | | | | |
| | | | | | | | | | | | | | | | | | | | | | $ | 142,917 | | | $ | (76,560 | ) | | $ | 219,477 | |
| | | | | | | | | | | | | | | | | | | | | | | | | | | | | | | | |
198
| | |
| | | |
| Notes to Financial Statements | | |
At August 31, 2014, International Fixed Income Investments held the following OTC interest rate swap contracts:
| | | | | | | | | | | | | | | | | | | | | | | | | | | | | | |
Pay/Receive
Floating Rate | | Floating Rate Index | | Fixed Rate | | | Maturity
Date | | | Counterparty | | | Notional Amount | | | Market
Value | | | Upfront
Premiums
Paid/
(Received) | | | Unrealized Appreciation/
(Depreciation) | |
| Pay | | 6-Month Australian Bank Bill | | | 3.750% | | | | 03/15/2018 | | | | DUB | | | | AUD 1,900,000 | | | $ | 54,754 | | | $ | (831 | ) | | $ | 55,585 | |
| Pay | | BRL-CDI-Compounded | | | 11.320% | | | | 01/04/2016 | | | | BCLY | | | | BRL 900,000 | | | | 4,124 | | | | 4,411 | | | | (287 | ) |
| Pay | | BRL-CDI-Compounded | | | 11.320% | | | | 01/04/2016 | | | | BNP | | | | BRL 1,000,000 | | | | 4,583 | | | | 3,738 | | | | 845 | |
| Pay | | BRL-CDI-Compounded | | | 11.320% | | | | 01/04/2016 | | | | HSBC | | | | BRL 600,000 | | | | 2,749 | | | | 2,604 | | | | 145 | |
| Receive | | BRL-CDI-Compounded | | | 11.510% | | | | 01/04/2021 | | | | BNP | | | | BRL 200,000 | | | | (1,470 | ) | | | — | | | | (1,470 | ) |
| Receive | | BRL-CDI-Compounded | | | 12.250% | | | | 01/02/2017 | | | | UBS | | | | BRL 300,000 | | | | (3,608 | ) | | | (404 | ) | | | (3,204 | ) |
| Pay | | Colombia IBR Overnight Interbank Reference Rate | | | 5.310% | | | | 08/29/2019 | | | | BOA | | | | COP 200,000,000 | | | | 350 | | | | — | | | | 350 | |
| Pay | | Colombia IBR Overnight Interbank Reference Rate | | | 6.200% | | | | 03/21/2024 | | | | HSBC | | | | COP 120,000,000 | | | | 980 | | | | — | | | | 980 | |
| Pay | | 28-Day MXN TIIE Banxico | | | 6.000% | | | | 09/02/2022 | | | | HSBC | | | | MXN 7,400,000 | | | | 9,833 | | | | (344 | ) | | | 10,177 | |
| Pay | | 28-Day MXN TIIE Banxico | | | 7.380% | | | | 02/09/2029 | | | | JPM | | | | MXN 500,000 | | | | 3,594 | | | | (11 | ) | | | 3,605 | |
| Pay | | 6-Month Thailand Fixing Rate | | | 3.410% | | | | 01/15/2021 | | | | DUB | | | | THB 4,200,000 | | | | 3,364 | | | | — | | | | 3,364 | |
| Pay | | 6-Month Thailand Fixing Rate | | | 3.410% | | | | 01/21/2021 | | | | DUB | | | | THB 750,000 | | | | 592 | | | | — | | | | 592 | |
| Pay | | 3-Month ZAR-SAJIBOR | | | 8.000% | | | | 12/18/2023 | | | | BCLY | | | | ZAR 3,400,000 | | | | 5,454 | | | | (113 | ) | | | 5,567 | |
| | | | | | | | | | | | | | | | | | | | | | | | | | | | | | |
| | | | | | | | | | | | | | | | | | | | $ | 85,299 | | | $ | 9,050 | | | $ | 76,249 | |
| | | | | | | | | | | | | | | | | | | | | | | | | | | | | | |
At August 31, 2014, International Fixed Income Investments held the following centrally cleared interest rate swap contracts:
| | | | | | | | | | | | | | | | | | | | | | |
Pay/ Receive
Floating Rate | | Floating Rate Index | | Fixed
Rate | | | Maturity
Date | | | Counterparty | | | Notional Amount | | | Unrealized
Appreciation/
(Depreciation) | |
| Receive | | 6-Month EURIBOR | | | 2.000% | | | | 09/17/2024 | | | | BCLY | | | | EUR 3,200,000 | | | $ | (192,151 | ) |
| Receive | | 6-Month EURIBOR | | | 2.000% | | | | 09/17/2024 | | | | CITI | | | | EUR 2,400,000 | | | | (157,884 | ) |
| Receive | | 6-Month EURIBOR | | | 2.750% | | | | 09/17/2044 | | | | BCLY | | | | EUR 600,000 | | | | (130,844 | ) |
| Receive | | 6-Month GBP-LIBOR | | | 1.750% | | | | 12/17/2016 | | | | BCLY | | | | GBP 16,800,000 | | | | (119,255 | ) |
| Receive | | 6-Month GBP-LIBOR | | | 1.750% | | | | 12/17/2016 | | | | UBS | | | | GBP 6,200,000 | | | | (47,575 | ) |
| Pay | | 6-Month JPY-LIBOR | | | 1.500% | | | | 06/19/2033 | | | | BCLY | | | | JPY 3,380,000,000 | | | | 1,506,743 | |
| Receive | | 3-Month USD-LIBOR | | | 0.750% | | | | 06/19/2017 | | | | BCLY | | | | USD 1,600,000 | | | | 643 | |
| Receive | | 3-Month USD-LIBOR | | | 1.000% | | | | 09/17/2016 | | | | BCLY | | | | USD 9,800,000 | | | | (4,114 | ) |
| Receive | | 3-Month USD-LIBOR | | | 1.200% | | | | 07/15/2015 | | | | UBS | | | | USD 1,100,000 | | | | (10,031 | ) |
| Receive | | 3-Month USD-LIBOR | | | 1.250% | | | | 03/18/2017 | | | | BCLY | | | | USD 10,800,000 | | | | (25,788 | ) |
| Receive | | 3-Month USD-LIBOR | | | 1.250% | | | | 06/17/2017 | | | | BCLY | | | | USD 24,800,000 | | | | 43,942 | |
| Receive | | 3-Month USD-LIBOR | | | 1.500% | | | | 06/19/2020 | | | | BCLY | | | | USD 1,600,000 | | | | 35,536 | |
| Receive | | 3-Month USD-LIBOR | | | 2.500% | | | | 06/18/2021 | | | | CITI | | | | USD 7,600,000 | | | | (180,069 | ) |
| Receive | | 3-Month USD-LIBOR | | | 2.750% | | | | 06/19/2043 | | | | CSFB | | | | USD 100,000 | | | | (12,952 | ) |
| Receive | | 3-Month USD-LIBOR | | | 3.750% | | | | 06/18/2044 | | | | CITI | | | | USD 700,000 | | | | (100,739 | ) |
| | | | | | | | | | | | | | | | | | | | | | |
| | | | | | | | | | | | | | | | | | | | $ | 605,462 | |
| | | | | | | | | | | | | | | | | | | | | | |
At August 31, 2014, International Fixed Income Investments held the following OTC credit default swap contracts:
OTC Credit Default Swaps on Corporate and Sovereign Issues—Buy Protection (1)
| | | | | | | | | | | | | | | | | | | | | | | | | | | | | | | | |
| Reference Obligation | | Fixed Deal
(Pay) Rate | | | Maturity
Date | | | Counterparty | | | Implied
Credit
Spread at
8/31/14 (3) | | | Notional
Amount (4) | | | Market
Value | | | Upfront
Premiums
Received | | | Unrealized
Appreciation/
(Depreciation) | |
American General Finance Corp., B- | | | (1.820% | ) | | | 12/20/2017 | | | | RBS | | | | 1.935% | | | | USD 1,000,000 | | | $ | (45 | ) | | $ | — | | | $ | (45 | ) |
First Energy, BBB- | | | (0.940% | ) | | | 06/20/2017 | | | | RBS | | | | 0.426% | | | | USD 1,000,000 | | | | (16,304 | ) | | | — | | | | (16,304 | ) |
Macy’s Retail Holdings Inc., BBB+, | | | (5.000% | ) | | | 09/20/2014 | | | | BNP | | | | 0.065% | | | | USD 650,000 | | | | (8,550 | ) | | | (67,378 | ) | | | 58,828 | |
Marsh & McLennan Cos., Inc., A-, | | | (0.670% | ) | | | 09/20/2014 | | | | DUB | | | | 0.032% | | | | USD 1,000,000 | | | | (1,748 | ) | | | — | | | | (1,748 | ) |
199
| | |
| | | |
| Notes to Financial Statements | | |
| | | | | | | | | | | | | | | | | | | | | | | | | | | | | | | | |
| Reference Obligation | | Fixed Deal
(Pay) Rate | | | Maturity
Date | | | Counterparty | | | Implied
Credit
Spread at
8/31/14 (3) | | | Notional
Amount (4) | | | Market
Value | | | Upfront
Premiums
Received | | | Unrealized
Appreciation/
(Depreciation) | |
Starwood Hotels & Resorts World, BBB, | | | (1.490% | ) | | | 06/20/2018 | | | | BOA | | | | 0.395% | | | | USD 1,000,000 | | | $ | (44,166 | ) | | $ | — | | | $ | (44,166 | ) |
Tate & Lyle International Finance PLC, BBB, | | | (0.510% | ) | | | 12/20/2014 | | | | DUB | | | | 0.074% | | | | USD 100,000 | | | | (240 | ) | | | — | | | | (240 | ) |
UST Inc., BBB+ | | | (0.720% | ) | | | 03/20/2018 | | | | GSC | | | | 0.125% | | | | USD 500,000 | | | | (11,241 | ) | | | — | | | | (11,241 | ) |
| | | | | | | | | | | | | | | | | | | | | | | | | | | | | | | | |
| | | | | | | | | | | | | | | | | | | | | | $ | (82,294 | ) | | $ | (67,378 | ) | | $ | (14,916 | ) |
| | | | | | | | | | | | | | | | | | | | | | | | | | | | | | | | |
OTC Credit Default Swaps on Corporate and Sovereign Issues—Sell Protection (2)
| | | | | | | | | | | | | | | | | | | | | | | | | | | | | | | | |
| Reference Obligation | | Fixed Deal
(Pay) Rate | | | Maturity
Date | | | Counterparty | | | Implied
Credit
Spread at
8/31/14 (3) | | | Notional
Amount (4) | | | Market
Value | | | Upfront
Premiums
Paid/
(Received) | | | Unrealized
Appreciation | |
Brazilian Government International Bond, BBB-, | | | 1.000% | | | | 03/20/2015 | | | | HSBC | | | | 0.351% | | | | USD 100,000 | | | $ | 568 | | | $ | 457 | | | $ | 111 | |
Colombia Government International, BBB, | | | 1.000% | | | | 03/20/2016 | | | | DUB | | | | 0.298% | | | | USD 100,000 | | | | 1,306 | | | | 601 | | | | 705 | |
Colombia Government International, BBB, | | | 1.000% | | | | 06/20/2019 | | | | BCLY | | | | 0.755% | | | | USD 100,000 | | | | 1,343 | | | | 439 | | | | 904 | |
Italy Government International, BBB, | | | 1.000% | | | | 03/20/2018 | | | | BNP | | | | 0.770% | | | | USD 5,700,000 | | | | 57,340 | | | | (358,205 | ) | | | 415,545 | |
Italy Government International, BBB, | | | 1.000% | | | | 09/20/2019 | | | | DUB | | | | 0.980% | | | | USD 300,000 | | | | 902 | | | | 580 | | | | 322 | |
Italy Government International, BBB, | | | 1.000% | | | | 09/20/2019 | | | | BNP | | | | 0.980% | | | | USD 300,000 | | | | 902 | | | | 581 | | | | 321 | |
Italy Government International, BBB, | | | 1.000% | | | | 09/20/2019 | | | | BCLY | | | | 0.980% | | | | USD 300,000 | | | | 901 | | | | 580 | | | | 321 | |
Italy Government International, BBB, | | | 1.000% | | | | 09/20/2019 | | | | HSBC | | | | 0.980% | | | | USD 100,000 | | | | 301 | | | | 218 | | | | 83 | |
Japan Government 20-Year Bond, AA-, | | | 1.000% | | | | 03/20/2016 | | | | GSC | | | | 0.113% | | | | USD 3,100,000 | | | | 49,514 | | | | (31,831 | ) | | | 81,345 | |
Japan Government 20-Year Bond, AA-, | | | 1.000% | | | | 03/20/2016 | | | | RBS | | | | 0.113% | | | | USD 5,000,000 | | | | 79,861 | | | | 10,601 | | | | 69,260 | |
South Africa Government International, BBB-, | | | 1.000% | | | | 06/20/2015 | | | | BOA | | | | 0.361% | | | | USD 400,000 | | | | 2,901 | | | | 2,329 | | | | 572 | |
South Africa Government International, BBB-, | | | 1.000% | | | | 09/20/2015 | | | | BOA | | | | 0.411% | | | | USD 100,000 | | | | 833 | | | | 590 | | | | 243 | |
U.S. Treasury Notes, AA+, | | | 0.250% | | | | 06/20/2016 | | | | BNP | | | | 0.144% | | | | EUR 700,000 | | | | 2,254 | | | | (7,057 | ) | | | 9,311 | |
| | | | | | | | | | | | | | | | | | | | | | | | | | | | | | | | |
| | | | | | | | | | | | | | | | | | | | | | $ | 198,926 | | | $ | (380,117 | ) | | $ | 579,043 | |
| | | | | | | | | | | | | | | | | | | | | | | | | | | | | | | | |
At August 31, 2014, International Fixed Income Investments held the following OTC cross currency swap contracts:
OTC Cross-Currency Swaps
| | | | | | | | | | | | | | | | | | | | | | | | | | | | | | |
| Counterparty Receive | | Counterparty Pay | | Counterparty | | | Maturity
Date (5) | | | Notional
Amount of
Currency
Received (6) | | | Notional
Amount of
Currency
Delivered (6) | | | Market
Value | | | Upfront
Premiums
Paid/
(Received) | | | Unrealized
Depreciation | |
Floating rate equal to 3-Month USD- LIBOR based on
the notional amount of
currency received | | Floating rate equal to EURIBOR based on the notional amount of currency delivered | | | BOA | | | | 12/17/19 | | | | EUR 2,400 | | | $ | 3,162 | | | $ | (7,340 | ) | | $ | 240 | | | $ | (7,580 | ) |
Floating rate equal to 3-Month USD- LIBOR based on
the notional amount of
currency received | | Floating rate equal to EURIBOR based on the notional amount of currency delivered | | | GSC | | | | 12/17/19 | | | | EUR 3,900 | | | $ | 5,139 | | | | (12,708 | ) | | | (4,169 | ) | | | (8,539 | ) |
200
| | |
| | | |
| Notes to Financial Statements | | |
| | | | | | | | | | | | | | | | | | | | | | | | | | | | | | |
| Counterparty Receive | | Counterparty Pay | | Counterparty | | | Maturity
Date (5) | | | Notional
Amount of
Currency
Received (6) | | | Notional
Amount of
Currency
Delivered (6) | | | Market
Value | | | Upfront
Premiums
Paid/
(Received) | | | Unrealized
Depreciation | |
Floating rate equal to 3-Month USD- LIBOR based on
the notional amount of
currency received | | Floating rate equal to EURIBOR based on the notional amount of currency delivered | | | BNP | | | | 12/17/19 | | |
| EUR
4,500 |
| | $ | 5,934 | | | $ | (19,013 | ) | | $ | (19,013 | ) | | $ | — | |
| | | | | | | | | | | | | | | | | | | | | | | | | | | | | | |
| | | | | | | | | | | | | | | | | | | | $ | (39,061 | ) | | $ | (22,942 | ) | | $ | (16,119 | ) |
| | | | | | | | | | | | | | | | | | | | | | | | | | | | | | |
| (1) | | If the Fund is a buyer of protection and a credit event occurs, as defined under the terms of that particular swap contract, the Fund will either (i) receive from the seller of protection an amount equal to the notional amount of the swap and deliver the reference obligation or underlying securities comprising the referenced index or (ii) receive a net settlement amount in the form of cash or securities equal to the notional amount of the swap less the recovery value of the reference obligation or underlying securities comprising the referenced index. |
| (2) | | If the Fund is a seller of protection and a credit event occurs, as defined under the terms of that particular swap contract, the Fund will either (i) pay to the buyer of protection an amount equal to the notional amount of the swap and take delivery of the referenced obligation or underlying securities comprising the referenced index or (ii) pay a net settlement amount in the form of cash or securities equal to the notional amount of the swap less the recovery value of the referenced obligation or underlying securities comprising the referenced index. |
| (3) | | Implied credit spreads, represented in absolute terms, utilized in determining the market value of credit default swap contracts on corporate issues or sovereign issues as of period end serve as an indicator of the current status of the payment/performance risk and represent the likelihood or risk of default for the credit derivative. The implied credit spread of a particular referenced entity reflects the cost of buying/selling protection and may include upfront payments required to be made to enter into the agreement. Wider credit spreads represent a deterioration of the referenced entity’s credit soundness and a greater likelihood or risk of default or other credit event occurring as defined under the terms of the agreement. A credit spread identified as “Defaulted” indicates a credit event has occurred for the referenced entity or obligation. |
| (4) | | The maximum potential amount the Fund could be required to pay as a seller of credit protection or receive as a buyer of credit protection if a credit event occurs as defined under the terms of that particular swap contract. |
| (5) | | At the maturity date, the notional amount of the currency received will be exchanged back for the notional amount of the currency delivered. |
| (6) | | The notional amounts to be received or delivered may be determined and exchanged at a future date, based on the effective date of the cross-currency swap. |
| | | | | | |
Currency Abbreviations used in this schedule: | | | | |
| AUD | | Australian Dollar | | | | |
| BRL | | Brazilian Real | | | | |
| COP | | Colombian Peso | | | | |
| EUR | | Euro | | | | |
| GBP | | British Pound | | | | |
| JPY | | Japanese Yen | | | | |
| MXN | | Mexican Peso | | | | |
| THB | | Thai Baht | | | | |
| ZAR | | South African Rand | | | | |
| | | | | | |
Counterparty Abbreviations used in this schedule: | | | | |
| BCLY | | Barclays Bank PLC | | | | |
| BNP | | BNP Paribas SA | | | | |
| BOA | | Bank of America | | | | |
| CITI | | Citigroup Global Markets Inc. | | | | |
| CSFB | | Credit Suisse Securities (USA) LLC | | | | |
| DUB | | Deutsche Bank AG | | | | |
| GSC | | Goldman Sachs & Co. | | | | |
| HSBC | | HSBC Bank USA | | | | |
| JPM | | JPMorgan Chase & Co. | | | | |
| MSC | | Morgan Stanley & Co., Inc. | | | | |
| RBS | | Royal Bank of Scotland PLC | | | | |
| SOG | | Societe Generale SA | | | | |
| UBS | | UBS Securities LLC | | | | |
201
| | |
| | | |
| Notes to Financial Statements | | |
At August 31, 2014, Core Fixed Income Investments and International Fixed Income Investments deposited cash collateral with brokers in the amount of $61,645 and $283,906, respectively, for open centrally cleared interest rate swap contracts. These amounts are disclosed within “Deposits with counterparty” within the Statements of Assets and Liabilities for the respective Funds.
4. Shares of Beneficial Interest
At August 31, 2014, the Trust had an unlimited number of units of beneficial interest (shares) authorized with a par value of $0.001 per share. At August 31, 2014, Trustees and executive officers of the Trust as a group owned of record less than 1% of the outstanding shares of the Trust.
Transactions in shares of each Fund were as follows:
| | | | | | | | |
| | | Year Ended
August 31,
2014 | | | Year Ended
August 31,
2013 | |
| Large Capitalization Growth Investments | | | | | | | | |
Shares sold | | | 12,366,557 | | | | 7,817,522 | |
Shares issued on reinvestment | | | 6,165,022 | | | | 340,287 | |
Shares repurchased | | | (19,735,817 | ) | | | (22,273,346 | ) |
| | | | | | | | |
Net Decrease | | | (1,204,238 | ) | | | (14,115,537 | ) |
| | | | | | | | |
| | |
| Large Capitalization Value Equity Investments | | | | | | | | |
Shares sold | | | 24,022,081 | | | | 7,239,697 | |
Shares issued on reinvestment | | | 1,691,655 | | | | 2,503,265 | |
Shares repurchased | | | (15,551,093 | ) | | | (26,679,654 | ) |
| | | | | | | | |
Net Increase (Decrease) | | | 10,162,643 | | | | (16,936,692 | ) |
| | | | | | | | |
| | |
| Small Capitalization Growth Investments | | | | | | | | |
Shares sold | | | 771,083 | | | | 2,648,785 | |
Shares issued on reinvestment | | | 353,254 | | | | — | |
Shares repurchased | | | (3,073,273 | ) | | | (2,801,061 | ) |
| | | | | | | | |
Net Decrease | | | (1,948,936 | ) | | | (152,276 | ) |
| | | | | | | | |
| | |
| Small Capitalization Value Equity Investments | | | | | | | | |
Shares sold | | | 3,589,353 | | | | 2,153,631 | |
Shares issued on reinvestment | | | 1,929,295 | | | | 1,461,654 | |
Shares repurchased | | | (2,077,176 | ) | | | (3,493,405 | ) |
| | | | | | | | |
Net Increase | | | 3,441,472 | | | | 121,880 | |
| | | | | | | | |
| | |
| International Equity Investments | | | | | | | | |
Shares sold | | | 32,103,189 | | | | 34,257,114 | |
Shares issued on reinvestment | | | 1,034,174 | | | | 704,164 | |
Shares repurchased | | | (8,350,211 | ) | | | (10,538,080 | ) |
| | | | | | | | |
Net Increase | | | 24,787,152 | | | | 24,423,198 | |
| | | | | | | | |
| | |
| Emerging Markets Equity Investments | | | | | | | | |
Shares sold | | | 4,170,124 | | | | 2,636,648 | |
Shares issued on reinvestment | | | 3,256,283 | | | | 851,922 | |
Shares repurchased | | | (11,227,992 | ) | | | (21,256,178 | ) |
| | | | | | | | |
Net Decrease | | | (3,801,585 | ) | | | (17,767,608 | ) |
| | | | | | | | |
202
| | |
| | | |
| Notes to Financial Statements | | |
| | | | | | | | |
| | | Year Ended
August 31,
2014 | | | Year Ended
August 31,
2013 | |
| Core Fixed Income Investments | | | | | | | | |
Shares sold | | | 12,310,395 | | | | 20,001,580 | |
Shares issued on reinvestment | | | 2,856,005 | | | | 7,622,446 | |
Shares repurchased | | | (35,172,048 | ) | | | (28,098,176 | ) |
| | | | | | | | |
Net Decrease | | | (20,005,648 | ) | | | (474,150 | ) |
| | | | | | | | |
| | |
| High Yield Investments | | | | | | | | |
Shares sold | | | 35,494,848 | | | | 3,801,205 | |
Shares issued on reinvestment | | | 2,684,815 | | | | 2,938,436 | |
Shares repurchased | | | (5,764,894 | ) | | | (44,232,029 | ) |
| | | | | | | | |
Net Increase (Decrease) | | | 32,414,769 | | | | (37,492,388 | ) |
| | | | | | | | |
| | |
| International Fixed Income Investments | | | | | | | | |
Shares sold | | | 5,244,975 | | | | 5,390,247 | |
Shares issued on reinvestment | | | 2,272,211 | | | | 2,978,377 | |
Shares repurchased | | | (13,828,448 | ) | | | (19,172,473 | ) |
| | | | | | | | |
Net Decrease | | | (6,311,262 | ) | | | (10,803,849 | ) |
| | | | | | | | |
| | |
| Municipal Bond Investments | | | | | | | | |
Shares sold | | | 1,965,811 | | | | 1,883,009 | |
Shares issued on reinvestment | | | 264,973 | | | | 254,965 | |
Shares repurchased | | | (3,019,390 | ) | | | (2,389,727 | ) |
| | | | | | | | |
Net Decrease | | | (788,606 | ) | | | (251,753 | ) |
| | | | | | | | |
| | |
| Money Market Investments | | | | | | | | |
Shares sold | | | 178,917,685 | | | | 395,768,819 | |
Shares issued on reinvestment | | | 2,839 | | | | 6,078 | |
Shares repurchased | | | (310,888,303 | ) | | | (166,920,974 | ) |
| | | | | | | | |
Net Increase (Decrease) | | | (131,967,779 | ) | | | 228,853,923 | |
| | | | | | | | |
5. Dividends and Tax Components of Capital
The tax character of distributions paid during the fiscal year ended August 31, 2014, were as follows:
| | | | | | | | | | | | | | | | |
| | | Large
Capitalization
Growth
Investments | | | Large
Capitalization
Value Equity
Investments | | | Small
Capitalization
Growth
Investments | | | Small
Capitalization
Value Equity
Investments | |
Distributions paid from: | | | | | | | | | | | | | | | | |
Ordinary Income | | $ | 18,292,797 | | | $ | 20,452,719 | | | $ | — | | | $ | 5,180,816 | |
Net Long-term Capital Gains | | | 106,183,313 | | | | — | | | | 9,799,673 | | | | 22,893,312 | |
| | | | | | | | | | | | | | | | |
Total Distributions Paid | | $ | 124,476,110 | | | $ | 20,452,719 | | | $ | 9,799,673 | | | $ | 28,074,128 | |
| | | | | | | | | | | | | | | | |
| | | | |
| | | International
Equity
Investments | | | Emerging
Markets
Equity
Investments | | | Core Fixed
Income
Investments | | | High Yield
Investments | |
Distributions paid from: | | | | | | | | | | | | | | | | |
Ordinary Income | | $ | 12,213,953 | | | $ | 7,358,901 | | | $ | 23,795,682 | | | $ | 11,814,472 | |
Net Long-term Capital Gains | | | — | | | | 35,690,720 | | | | — | | | | — | |
| | | | | | | | | | | | | | | | |
Total Distributions Paid | | $ | 12,213,953 | | | $ | 43,049,621 | | | $ | 23,795,682 | | | $ | 11,814,472 | |
| | | | | | | | | | | | | | | | |
203
| | |
| | | |
| Notes to Financial Statements | | |
| | | | | | | | | | | | | | |
| | | | |
| | | | | International
Fixed Income
Investments | | | Municipal
Bond
Investments | | | Money
Market
Investments | |
Distributions paid from: | | | | | | | | | | | | |
Tax Exempt | | $ | — | | | $ | 2,330,869 | | | $ | — | |
Ordinary Income | | | 17,201,477 | | | | 3,140 | | | | 2,854 | |
Net Long-term Capital Gains | | | — | | | | 197,163 | | | | — | |
| | | | | | | | | | | | | | |
Total Distributions Paid | | $ | 17,201,477 | | | $ | 2,531,172 | | | $ | 2,854 | |
| | | | | | | | | | | | | | |
The tax character of distributions paid during the fiscal year ended August 31, 2013, were as follows:
| | | | | | | | | | | | | | | | |
| | | Large
Capitalization
Growth
Investments | | | Large
Capitalization
Value Equity
Investments | | | Small
Capitalization
Growth
Investments | | | Small
Capitalization
Value Equity
Investments | |
Distributions paid from: | | | | | | | | | | | | | | | | |
Ordinary Income | | $ | 5,601,128 | | | $ | 23,555,726 | | | $ | — | | | $ | 3,413,990 | |
Net Long-term Capital Gains | | | — | | | | — | | | | — | | | | 14,520,433 | |
| | | | | | | | | | | | | | | | |
Total Distributions Paid | | $ | 5,601,128 | | | $ | 23,555,726 | | | $ | — | | | $ | 17,934,423 | |
| | | | | | | | | | | | | | | | |
| | | | |
| | | International
Equity
Investments | | | Emerging
Markets
Equity
Investments | | | Core Fixed
Income
Investments | | | High Yield
Investments | |
Distributions paid from: | | | | | | | | | | | | | | | | |
Ordinary Income | | $ | 7,126,143 | | | $ | 12,983,437 | | | $ | 51,413,363 | | | $ | 12,727,727 | |
Net Long-term Capital Gains | | | — | | | | — | | | | 14,000,563 | | | | — | |
| | | | | | | | | | | | | | | | |
Total Distributions Paid | | $ | 7,126,143 | | | $ | 12,983,437 | | | $ | 65,413,926 | | | $ | 12,727,727 | |
| | | | | | | | | | | | | | | | |
| | | | |
| | | | | | International
Fixed Income
Investments | | | Municipal
Bond
Investments | | | Money
Market
Investments | |
Distributions paid from: | | | | | | | | | | | | | |
Tax Exempt | | | $ | — | | | $ | 2,480,043 | | | $ | — | |
Ordinary Income | | | | 24,541,825 | | | | 2,866 | | | | 6,099 | |
Net Long-term Capital Gains | | | | — | | | | — | | | | — | |
| | | | | | | | | | | | | | | | |
Total Distributions Paid | | | $ | 24,541,825 | | | $ | 2,482,909 | | | $ | 6,099 | |
| | | | | | | | | | | | | | | | |
As of August 31, 2014, the components of accumulated earnings on a tax basis were as follows:
| | | | | | | | | | | | | | | | |
| | | Large
Capitalization
Growth
Investments | | | Large
Capitalization
Value Equity
Investments | | | Small
Capitalization
Growth
Investments | | | Small
Capitalization
Value Equity
Investments | |
Undistributed ordinary income - net | | $ | 34,452,858 | | | $ | 15,619,058 | | | $ | 15,724,774 | | | $ | 3,908,353 | |
Undistributed long-term capital gains - net | | | 137,030,847 | | | | — | | | | 44,874,050 | | | | 20,054,286 | |
| | | | | | | | | | | | | | | | |
Total Undistributed earnings | | | 171,483,705 | | | | 15,619,058 | | | | 60,598,824 | | | | 23,962,639 | |
Capital Loss Carryforward | | | — | | | | (276,781,593 | ) | | | — | | | | — | |
Current Year Late Year Loss Deferral | | | — | | | | — | | | | — | | | | — | |
Other book/tax temporary differences | | | (13,836,774 | )(c) | | | (9,106,864 | )(d) | | | (529,819 | )(e) | | | (1,196,448 | )(e) |
Unrealized appreciation (depreciation) | | | 588,258,577 | | | | 388,221,181 | | | | 65,257,201 | | | | 78,680,730 | |
| | | | | | | | | | | | | | | | |
Total accumulated earnings/(losses) - net | | $ | 745,905,508 | | | $ | 117,951,782 | | | $ | 125,326,206 | | | $ | 101,446,921 | |
| | | | | | | | | | | | | | | | |
204
| | |
| | | |
| Notes to Financial Statements | | |
| | | | | | | | | | | | | | | | |
| | | | |
| | | International
Equity
Investments | | | Emerging
Markets
Equity
Investments | | | Core Fixed
Income
Investments | | | High Yield
Investments | |
Undistributed ordinary income - net | | $ | 19,199,324 | | | $ | 5,041,603 | | | $ | 3,965,722 | | | $ | 1,134,178 | |
Undistributed long-term capital gains - net | | | — | | | | — | | | | 5,688,406 | | | | — | |
| | | | | | | | | | | | | | | | |
Total Undistributed earnings | | | 19,199,324 | | | | 5,041,603 | | | | 9,654,128 | | | | 1,134,178 | |
Capital Loss Carryforward | | | (240,498,962 | ) | | | — | | | | — | | | | (12,369,440 | ) |
Current Year Late Year Loss Deferral | | | — | | | | (4,157,103 | ) | | | — | | | | — | |
Other book/tax temporary differences | | | (6,351,964 | )(b) | | | (9,280,638 | )(b) | | | (5,566,918 | )(f) | | | (1,336,024 | )(a) |
Unrealized appreciation (depreciation) | | | 83,714,236 | | | | 67,863,069 | | | | 23,072,306 | | | | 6,026,355 | |
| | | | | | | | | | | | | | | | |
Total accumulated earnings/(losses) - net | | $ | (143,937,366 | ) | | $ | 59,466,931 | | | $ | 27,159,516 | | | $ | (6,544,931 | ) |
| | | | | | | | | | | | | | | | |
| | | | |
| | | | | | International
Fixed Income
Investments | | | Municipal
Bond
Investments | | | Money
Market
Investments | |
Undistributed ordinary income - net | | | $ | 8,311,422 | | | $ | — | | | $ | 590 | |
Undistributed long-term capital gains - net | | | | — | | | | 413,472 | | | | — | |
Undistributed Tax Exempt Income - net | | | | — | | | | 340,745 | | | | — | |
| | | | | | | | | | | | | | | | |
Total Undistributed earnings | | | | 8,311,422 | | | | 754,217 | | | | 590 | |
Capital Loss Carryforward | | | | (5,158,213 | ) | | | — | | | | — | |
Current Year Late Year Loss Deferral | | | | (1,756,973 | ) | | | — | | | | — | |
Other book/tax temporary differences | | | | (7,880,364 | )(f) | | | 72 | (a) | | | — | |
Unrealized appreciation (depreciation) | | | | 11,714,055 | | | | 6,223,002 | | | | — | |
| | | | | | | | | | | | | | | | |
Total accumulated earnings/(losses) - net | | | $ | 5,229,927 | | | $ | 6,977,291 | | | $ | 590 | |
| | | | | | | | | | | | | | | | |
As of August 31, 2014, there were no significant differences between the book and tax components of net assets for Money Market Investments.
| (a) | | The difference between book-basis and tax-basis unrealized appreciation (depreciation) is attributable primarily to the tax deferral of losses on wash sales. |
| (b) | | The difference between book-basis and tax-basis unrealized appreciation (depreciation) is attributable primarily to the tax deferral of losses on wash sales, the realization for tax purposes of unrealized gains on investments in passive foreign investment companies. |
| (c) | | The difference between book-basis and tax-basis unrealized appreciation (depreciation) is attributable primarily to the tax deferral of losses on wash sales and tax cost adjustments related to ROC dividends received. |
| (d) | | The difference between book-basis and tax-basis unrealized appreciation (depreciation) is attributable primarily to the tax deferral of losses on wash sales and tax cost adjustments related to ROC dividends received and real estate investments. |
| (e) | | The difference between book-basis and tax-basis unrealized appreciation (depreciation) is attributable primarily to the tax deferral of losses on wash sales, tax cost adjustments related to ROC dividends received and real estate investments, and the realization for tax purposes of unrealized gains on investments in passive foreign investment companies. |
| (f) | | The difference between book-basis and tax-basis unrealized appreciation (depreciation) is attributable primarily to the tax deferral of losses on wash sales and the difference between book and tax amortization methods for premiums on fixed income securities. |
6. Capital Loss Carry Forward
Under the Regulated Investment Company Modernization Act of 2010 (the “Act”), the Funds are permitted to carry forward capital losses incurred in taxable years beginning after December 22, 2010, for an unlimited period. However, any losses incurred during those future taxable years will be required to be utilized prior to the losses incurred in pre-enactment taxable years. As a result of this, pre-enactment capital loss carryforwards may be more likely to expire unused.
205
| | |
| | | |
| Notes to Financial Statements | | |
As of August 31, 2014, the Funds had the following net capital loss carryforwards remaining:
| | | | | | | | | | | | | | | | | | | | | | | | |
| Year of Expiration | | Large
Capitalization
Growth
Investments | | | Large
Capitalization
Value Equity
Investments | | | Small
Capitalization
Growth
Investments | | | Small
Capitalization
Value Equity
Investments | | | International
Equity
Investments | | | Emerging
Markets
Equity
Investments | |
8/31/2014 | | $ | — | | | $ | — | | | $ | — | | | $ | — | | | $ | — | | | $ | — | |
8/31/2015 | | | — | | | | — | | | | — | | | | — | | | | — | | | | — | |
8/31/2016 | | | — | | | | — | | | | — | | | | — | | | | — | | | | — | |
8/31/2017 | | | — | | | | — | | | | — | | | | — | | | | — | | | | — | |
8/31/2018 | | | — | | | | 276,781,593 | | | | — | | | | — | | | | 240,498,962 | | | | — | |
8/31/2019 | | | — | | | | — | | | | — | | | | — | | | | — | | | | — | |
8/31/2020 | | | — | | | | — | | | | — | | | | — | | | | — | | | | — | |
8/31/2021 | | | — | | | | — | | | | — | | | | — | | | | — | | | | — | |
Non-expiring: | | | | | | | | | | | | | | | | | | | | | | | | |
Short-Term | | | — | | | | — | | | | — | | | | — | | | | — | | | | — | |
Long-Term | | | — | | | | — | | | | — | | | | — | | | | — | | | | — | |
| | | | | | | | | | | | | | | | | | | | | | | | |
| | $ | — | | | $ | 276,781,593 | | | $ | — | | | $ | — | | | $ | 240,498,962 | | | $ | — | |
| | | | | | | | | | | | | | | | | | | | | | | | |
| | | | | | |
| Year of Expiration | | | | | Core Fixed
Income
Investments | | | High Yield
Investments | | | International
Fixed Income
Investments | | | Municipal
Bond
Investments | | | Money
Market
Investments | |
8/31/2014 | | | $ | — | | | $ | — | | | $ | — | | | $ | — | | | $ | — | |
8/31/2015 | | | | — | | | | — | | | | — | | | | — | | | | — | |
8/31/2016 | | | | — | | | | — | | | | — | | | | — | | | | — | |
8/31/2017 | | | | — | | | | 6,697,249 | | | | — | | | | — | | | | — | |
8/31/2018 | | | | — | | | | 5,672,191 | | | | 4,975,707 | | | | — | | | | — | |
8/31/2019 | | | | — | | | | — | | | | — | | | | — | | | | — | |
8/31/2020 | | | | — | | | | — | | | | — | | | | — | | | | — | |
8/31/2021 | | | | — | | | | — | | | | — | | | | — | | | | — | |
Non-expiring: | | | | | | | | | | | | | | | | | | | | | |
Short-Term | | | | — | | | | — | | | | — | | | | — | | | | — | |
Long-Term | | | | — | | | | — | | | | 182,506 | | | | — | | | | — | |
| | | | | | | | | | | | | | | | | | | | | | | | |
| | | $ | — | | | $ | 12,369,440 | | | $ | 5,158,213 | | | $ | — | | | $ | — | |
| | | | | | | | | | | | | | | | | | | | | | | | |
These amounts will be available to offset any future taxable capital gains.
During the year ended August 31, 2014 the Large Capitalization Value Equity Investments, International Equity Investments and High Yield Investments utilized $81,393,931, $73,229,834 and $1,816,911 capital loss carryforwards, respectively.
7. Recent Accounting Pronouncements
In June 2013, FASB issued an update (‘‘ASU 2013-08’’) to ASC Topic 946, Financial Services — Investment Companies (‘‘Topic 946’’). ASU 2013-08 amends the guidance in Topic 946 for determining whether an entity qualifies as an investment company and requires certain additional disclosures. ASU 2013-08 is effective for interim and annual reporting periods in fiscal years that begin after December 15, 2013. Management is currently evaluating the impact, if any, of ASU 2013-08 on the Funds’ financial statements.
8. Subsequent Events
Management has evaluated subsequent events after the balance sheet date through the date that the financial statements were issued and has not identified any additional events or transactions that would require recognition or disclosure in the financial statements other than the distribution information below.
Subsequent to August 31, 2014, the Funds made the following distributions:
| | | | | | | | | | | | | | | | |
| Record Date Payable Date | | Core Fixed Income
Investments | | | High Yield
Investments | | | Municipal Bond
Investments | | | Money Market
Investments | |
9/29/14-9/30/14 | | $ | 0.017626 | | | $ | 0.021900 | | | $ | 0.025197 | | | $ | 0.0000008 | |
206
| | |
| | | |
Report of Independent Registered Public
Accounting Firm | | |
To the Board of Trustees and Shareholders of
Consulting Group Capital Markets Funds
We have audited the accompanying statements of assets and liabilities, including the schedules of investments, of Consulting Group Capital Markets Funds, comprised of Large Capitalization Growth Investments, Large Capitalization Value Equity Investments, Small Capitalization Growth Investments, Small Capitalization Value Equity Investments, International Equity Investments, Emerging Markets Equity Investments, Core Fixed Income Investments, High Yield Investments, International Fixed Income Investments, Municipal Bond Investments and Money Market Investments (the “Funds”), as of August 31, 2014, and the related statements of operations for the year then ended, the statements of changes in net assets for each of the two years in the period then ended, and the financial highlights for each of the five years in the period then ended. These financial statements and financial highlights are the responsibility of the Funds’ management. Our responsibility is to express an opinion on these financial statements and financial highlights based on our audits.
We conducted our audits in accordance with the standards of the Public Company Accounting Oversight Board (United States). Those standards require that we plan and perform the audit to obtain reasonable assurance about whether the financial statements and financial highlights are free of material misstatement. The Funds are not required to have, nor were we engaged to perform, an audit of their internal control over financial reporting. Our audits included consideration of internal control over financial reporting as a basis for designing audit procedures that are appropriate in the circumstances, but not for the purpose of expressing an opinion on the effectiveness of the Funds’ internal control over financial reporting. Accordingly, we express no such opinion. An audit also includes examining, on a test basis, evidence supporting the amounts and disclosures in the financial statements, assessing the accounting principles used and significant estimates made by management, as well as evaluating the overall financial statement presentation. Our procedures included confirmation of securities owned as of August 31, 2014, by correspondence with the custodian and brokers; where replies were not received from brokers, we performed other auditing procedures. We believe that our audits provide a reasonable basis for our opinion.
In our opinion, the financial statements and financial highlights referred to above present fairly, in all material respects, the financial position of each of the Funds constituting the Consulting Group Capital Markets Funds as of August 31, 2014, the results of their operations for the year then ended, the changes in their net assets for each of the two years in the period then ended, and the financial highlights for each of the five years in the period then ended, in conformity with accounting principles generally accepted in the United States of America.
DELOITTE & TOUCHE LLP
Boston, Massachusetts
October 30, 2014
207
|
| |
| Board Approval of Management Agreement and Investment Advisory Agreements |
Approval of Management Agreement and Subadvisory Agreements
The Consulting Group Capital Markets Funds (“Trust” and, each series thereof a “Fund”) and Consulting Group Advisory Services LLC (“Manager”), a business of Morgan Stanley Smith Barney Holdings LLC, have entered into an investment management agreement (“Management Agreement”). Pursuant to the Management Agreement, the Manager serves as “manager of managers” for the Trust and selects and oversees professional money managers (each, a “Sub-adviser” and collectively, the “Sub-advisers”) who are responsible for investing the portion of assets of the Funds allocated to them pursuant to investment advisory agreements (the “Subadvisory Agreements” and, together with the Management Agreement, the “Agreements”) between the Manager and each of the Sub-advisers.
The Investment Company Act of 1940, as amended (the “1940 Act”), requires that the Agreements be approved initially, as well as annually thereafter, by the Trust’s Board of Trustees (“Board”) and by a majority of the Trustees who are not “interested persons” (as defined in the 1940 Act) of any party to the Agreements (“Independent Trustees”), by vote cast in person at a meeting called for the purpose of voting on such approval. In connection with their consideration of the approval of the Agreements, the Independent Trustees must request and evaluate such information as may reasonably be necessary to make a reasonable business judgment with respect to the approval of the Agreements, and the Manager and Sub-advisers are required to provide such information.
At an in-person meeting held on May 28-29, 2014, the Board, including a majority of the Independent Trustees, approved the continuance of the Agreements for an annual period. Both in connection with the meeting specifically held to address the continuance of the Agreements and at other meetings during the course of the year, the Independent Trustees requested and received information from the Manager and the Sub-advisers that they deemed reasonably necessary for their review of the Agreements and the performance of the Manager and Sub-advisers under the Agreements. The Independent Trustees were assisted in their review by Fund counsel and independent legal counsel (“Independent Counsel”) and met with Independent Counsel in executive sessions separate from representatives of the Manager and the Sub-Advisers. In addition to the Management Agreement, the Board approved the Subadvisory Agreements with the following Sub-advisers on behalf of the indicated Fund:
| | |
Sub-adviser Name | | Fund(s) |
| |
Artisan Partners Limited Partnership | | ¨ Large Cap Value Equity Investments |
| |
BlackRock Financial Management, Inc. | | ¨ Core Fixed Income Investments |
| |
Cambiar Investors, LLC | | ¨ Large Cap Value Equity Investments |
| |
Delaware Management Company | | ¨ Small Cap Value Equity Investments |
| |
The Dreyfus Corporation | | ¨ Money Market Investments |
| |
Frontier Capital Management Co., LLC | | ¨ Large Cap Growth Investments |
| |
HGK Asset Management Inc. | | ¨ Large Cap Value Equity Investments |
| |
Lazard Asset Management LLC | | ¨ Emerging Markets Equity Investments |
| |
Marsico Capital Management, LLC | | ¨ International Equity Investments |
| |
McDonnell Investment Management, LLC | | ¨ Municipal Bond Investments |
| |
Metropolitan West Asset Management LLC | | ¨ Core Fixed Income Investments |
| |
NFJ Investment Group LLC | | ¨ Large Cap Value Equity Investments ¨ Small Cap Value Equity Investments |
| |
Pacific Investment Management Company LLC | | ¨ Core Fixed Income Investments ¨ International Fixed Income Investments |
| |
PENN Capital Management Co., Inc. | | ¨ High Yield Investments |
| |
Philadelphia International Advisors LP | | ¨ International Equity Investments |
| |
Rutabaga Capital Management LLC | | ¨ Small Cap Value Equity Investments |
208
| | |
| | | |
| Board Approval of Management Agreement and Investment Advisory Agreements | | |
| | |
Sub-adviser Name | | Fund(s) |
| |
Schroder Investment Management North America Inc. | | ¨ International Equity Investments |
| |
Schroder Investment Management North America Ltd. | | ¨ International Equity Investments |
| |
Vontobel Asset Management, Inc. | | ¨ Emerging Markets Equity Investments |
| |
Wall Street Associates LLC | | ¨ Small Cap Growth Investments |
| |
Wells Capital Management Inc. | | ¨ Large Cap Growth Investments |
| |
Western Asset Management Company | | ¨ Core Fixed Income Investments ¨ High Yield Investments |
| |
Westfield Capital Management Company, LLC | | ¨ Large Cap Growth Investments ¨ Small Cap Growth Investments |
In their consideration of the continuance of the Agreements, the Board considered all factors that it believed to be relevant, including the factors described below. No single factor reviewed by the Board was identified by the Board as the principal factor in determining whether to approve the Agreements.
Nature, Extent and Quality of the Services Provided Under the Agreements
The Board received and considered information regarding the nature, extent and quality of services provided to the Funds by the Manager and the Sub-advisers under the Management Agreement and the Subadvisory Agreements, respectively, during the meeting and during the past year. The Independent Trustees considered information regarding the process by which the Manager selected and recommended the Sub-advisers for Board approval and the Manager’s supervisory activities over the Sub-advisers. The Independent Trustees noted that the Manager monitors and evaluates the performance of each Fund’s Sub-advisers, including the Sub-advisers’ compliance with the investment objective, policies, and restrictions of the relevant Fund. The Board also received a description of the administrative and other services rendered to the Trust and its shareholders during the past year. The Board noted information received at regular meetings throughout the year related to the services rendered by the Manager about the management of the Trust’s affairs and its role in coordinating the activities of the Sub-advisers and the Trust’s other service providers. The Board considered each Sub-adviser’s specific responsibilities in all aspects of day-to-day management of the portion of the respective Fund’s assets allocated to it, as well as the qualifications, experience and responsibilities of the persons serving as the portfolio managers for the segment of the Fund’s assets managed by the respective Sub-adviser, and other key personnel at the Sub-adviser. The Board specifically took into account each Sub-adviser’s investment process and capabilities, evaluating, if applicable, how the Sub-adviser complemented each of the other Sub-advisers to the respective Fund.
The Independent Trustees also discussed the acceptability of the terms of the Sub-Advisory Agreements. The Independent Trustees also considered the Manager’s favorable assessment of the nature and quality of the sub-advisory services provided to the Funds by the Sub-advisers. The Board also reviewed information received from the Manager and the Trust’s Chief Compliance Officer regarding the Trust’s compliance policies and procedures established pursuant to Rule 38a-1 under the 1940 Act and those of each Sub-adviser.
During the course of the year and at the meeting, the Board reviewed the qualifications, backgrounds and responsibilities of the Trust’s senior personnel and the portfolio management team primarily responsible for the management of the Funds. The Board also considered the Manager’s and the Sub-advisers’ brokerage policies and practices, transaction execution standards, policies and practices regarding soft dollars, and quality controls applicable to brokerage allocation procedures.
The Board concluded that, overall, the nature, extent and quality of services provided (and expected to be provided) under the Management Agreement and the Subadvisory Agreements were adequate and appropriate.
Fund Performance
As to each Fund, the Board received and considered performance information provided by Lipper, Inc. (“Lipper”), an independent provider of investment company data, for the Fund and for all retail and institutional funds, regardless of asset size or primary channel of distribution, in the Fund’s Lipper category (the “Performance Universe”). As to each Fund, the Board was provided
209
|
| |
| Board Approval of Management Agreement and Investment Advisory Agreements |
with a description of the methodology Lipper used to determine the similarity of the Funds with the funds included in the Performance Universe. The Board also noted that it had received and discussed with advisory personnel of the Trust at periodic intervals throughout the year information on the investment performance of each Fund in comparison to similar mutual funds and benchmark performance indices. In addition, as to each Sub-adviser, the Board received and considered performance information provided by the Manager for the Sub-adviser managing the portion of the respective Fund’s assets allocated to it. The information comparing each Fund’s performance to that of its Performance Universe was for the one-, three-, five- and ten-year periods ended March 31, 2014. The Board noted that each of Large Cap Growth Investments and High Yield Investments performed better than the median performance of the funds in the Performance Universe for each period, each of Small Cap Value Equity Investments, Core Fixed Income Investments, International Fixed Income Investments and Money Market Investments performed below the median performance of the funds in the Performance Universe for the one-year period but better than the median performance of the funds in the Performance Universe for each other period, Small Cap Growth Investments performed better than the median performance of the funds in the Performance Universe for each period except the ten-year period, Municipal Bond Investments performed better than the median performance of the funds in the Performance Universe for the one- and ten-year periods and below the median performance of the funds in the Performance Universe for the three- and five-year periods, Large Cap Value Equity Investments performed better than the median performance of the funds in the Performance Universe for the five-year period but below the median performance of the funds in the Performance Universe for each other period, and each of International Equity Investments and Emerging Markets Equity Investments performed below the median performance of the funds in the Performance Universe for each period. The Independent Trustees and representatives of the Manager then discussed the reasons for certain Fund’s underperformance versus the relevant Performance Universe during certain periods under review and actions taken or proposed, as applicable, to improve performance going forward. During the discussion, the Trustees and representatives of the Manager considered the Funds’ performance in light of overall financial market conditions and the nature of the investment objectives and strategies of certain Funds, prospectus disclosure regarding the risks involved with such strategies and investor expectations.
Based on its review, as to each Fund, the Board was generally satisfied with the overall performance of the Fund and with the efforts of the Manager and respective Sub-advisers to continue to improve performance. The Trustees determined to continue to evaluate the Funds’ performance and directed the Independent Trustees’ Performance Committee to continue to periodically review Fund performance with the Manager and report to the full Board.
Management Fees and Expense Ratios
As to each Fund, the Board reviewed and considered the contractual management fees (“Contractual Management Fees”) payable by the Fund to the Manager in light of the nature, extent and quality of the management and subadvisory services provided by the Manager and the Sub-advisers, respectively. The Board also reviewed and considered whether fee waiver and/or expense reimbursement arrangements are currently in place for a Fund and considered the actual fee rate (after taking any such waivers and reimbursements into account) (“Actual Management Fee”) and whether any fee waivers and expense reimbursements could be discontinued. The Board noted that the compensation paid to the Sub-advisers is paid by the Manager, not the Funds, and, accordingly, that the retention of the Sub-advisers does not increase the fees or expenses otherwise incurred by the Fund and its shareholders. The Board also reviewed with management the scope of services provided to the Fund by the Manager, noting that the Funds are provided with regulatory compliance services, office facilities and Trust officers (including the Trust’s chief financial, chief legal and chief compliance officers), and that the Manager coordinates and oversees the provision of services to each Fund by other fund service providers, including the Sub-Advisers. The Board also considered and discussed information about the Sub-advisers’ fees and comparable information for other subadvised funds and accounts managed by the Sub-advisers.
Additionally, the Board received and considered information comparing each Funds’ Contractual Management Fees and Actual Management Fees and the Fund’s actual total expenses with those of a group of funds selected by Lipper as comparable to the particular Fund (the “Expense Group”) and a broader group of retail no-load funds selected by Lipper (the “Expense Universe”). This information showed that each Fund’s Contractual Management Fee, except for that of High Yield Investments, was lower than the median Contractual Management Fee for the funds in the applicable Expense Group, and that each Fund’s Actual Management Fee, except for that of Fixed Income Investments and High Yield Investments, was lower than the average Actual Management Fee for the funds in the Expense Universe. The Independent Trustees noted that the Actual Management Fee for each of Fixed Income Investments and High Yield Investments were at the median Actual Management Fee for the funds in the
210
| | |
| | | |
| Board Approval of Management Agreement and Investment Advisory Agreements | | |
applicable Expense Group. This information also showed that each Fund’s actual total expense ratio, except for Money Market Investments, was lower than, and Money Market Investments was at, the median of the total expense ratios of the funds in the applicable Expense Group and the average actual total expense ratio for the funds in the applicable Expense Universe.
The Board determined that, as to each Fund, the management fee paid by the Fund to the Manager and the sub-advisory fees paid by the Manager to the Sub-advisers were reasonable in light of comparative performance and expense information and the nature, extent and quality of the services provided to the Fund under the Agreements.
Manager Profitability
The Board received and considered a profitability analysis of the Manager and its affiliates in providing services to the Funds. In addition, the Board received information with respect to the Manager’s allocation methodologies used in preparing this profitability data. To the extent available, the Board also reviewed information provided by the Sub-advisers with respect to the relevant Sub-adviser’s profitability in providing subadvisory services to the Funds. The Board also noted the profitability percentage ranges determined by appropriate court cases to be reasonable given the services rendered to investment companies. As to each Fund, the Board determined that the Manager’s profitability was not excessive in light of the nature, extent and quality of the services provided to the Fund.
Economies of Scale
As to each Fund, the Board considered information regarding whether there have been economies of scale with respect to the management of the Fund, whether the Fund has appropriately benefited from any economies of scale and whether there is potential for realization of any further economies of scale. The Board considered the various ways economies of scale could be realized and shared with Fund investors, and whether economies of scale in the provision of services to the Fund were being passed along to the shareholders. As to each Fund, the Board also noted that to the extent the Fund’s assets increase over time, the Fund and its shareholders should realize economics of scale as certain expenses, such as fixed fund fees, become a smaller percentage of overall assets. The Board noted that it appeared that the benefits of any economies of scale also would be appropriately shared with shareholders through increased investment in fund management resources.
Other Benefits to the Manager and the Sub-advisers
As to each Fund, the Board considered other benefits received by the Manager, the Sub-advisers and their affiliates as a result of their relationship with the Funds, including soft dollar arrangements, receipt of brokerage and the opportunity to offer additional products and services to Fund shareholders.
In light of the Manager’s costs of providing investment management and other services to the Funds and the Manager’s ongoing commitment to the Funds and each Sub-adviser’s costs of providing day-to-day management of the portion of the respective Fund’s assets allocated to it, the profits and ancillary benefits that the Manager, the Sub-advisers and their affiliates received were considered reasonable.
******
At an in-person meeting of the Board of Trustees of the Trust held on March 19-20, 2014 (“March Meeting”), the Manager recommended and the Board, including all of the Independent Trustees, approved an Investment Advisory Agreement (“Causeway Advisory Agreement”) between the Manager and Causeway Capital Management (“Causeway”), pursuant to which Causeway provides day-to-day management of an allocated portion of the assets of International Equity Investments (“International Equity Fund”).
In determining whether to approve the Causeway Advisory Agreement, the Board considered the due diligence materials prepared by the Manager and other information, which included: (i) a copy of the Causeway Advisory Agreement; (ii) information regarding the process by which the Manager selected and recommended Causeway for Board approval; (iii) information regarding the nature, extent and quality of the services Causeway would provide to the International Equity Fund; (iv) information regarding Causeway’s investment management business, personnel, and operations; (v) information regarding Causeway’s brokerage and trading policies and practices; (vi) information regarding the sub-investment advisory fee to be paid to Causeway; (vii) information regarding
211
| | |
| | | |
| Board Approval of Management Agreement and Investment Advisory Agreements | | |
Causeway’s compliance program; (viii) information regarding Causeway’s historical performance returns managing investment mandates similar to International Equity Fund’s investment mandate with respect to the portion of the Fund’s assets to be allocated to Causeway, with such performance compared to a relevant index; and (ix) information regarding Causeway’s financial condition. The Independent Trustees also considered whether there were any ancillary benefits that may accrue to Causeway as a result of its relationship with International Equity Fund. The materials and information were provided in advance of and at the March Meeting. Representatives from Causeway also made a presentation to and responded to questions from the Board. The Independent Trustees were assisted in their review by Fund counsel and Independent Counsel and met with Independent Counsel in executive sessions separate from representatives of the Manager and Causeway.
The Independent Trustees concluded that the nature, extent and quality of the sub-investment advisory services expected to be provided by Causeway were adequate and appropriate in light of Causeway’s experience in managing international equity assets, Causeway’s portfolio management and research resources to be applied in managing a portion of International Equity Fund’s assets, and the Manager’s recommendation to engage Causeway, and supported a decision to approve the Causeway Advisory Agreement.
Because Causeway was a newly-appointed sub-adviser for the International Equity Fund, the Independent Trustees could not consider its investment performance in managing a portion of the Fund’s portfolio as a factor in evaluating the Causeway Advisory Agreement during the March Meeting. However, the Independent Trustees did review Causeway’s historical performance record in managing other portfolios that were comparable to the International Equity Fund with respect to its investment mandate. The Independent Trustees also discussed with representatives of Adviser and Causeway the investment strategies to be employed by Causeway in the management of its portion of the Fund’s assets. The Independent Trustees noted Causeway’s reputation and experience with respect to international equity investing, the portfolio manager’s experience in selecting international value stocks, and the Manager’s experience and reputation in selecting, evaluating, and overseeing investment managers. The Independent Trustees determined that these factors supported a decision to approve the Causeway Advisory Agreement.
The Board considered the proposed fee payable under the Causeway Advisory Agreement, noting that the proposed fee would be paid by the Manager and, thus, would not impact the fees paid by the International Equity Fund. The Board recognized that, because Causeway’s fee would be paid by the Manager, and not the International Equity Fund, an analysis of profitability was more appropriate in the context of the Board’s consideration of the Management Agreement between the Trust and the Manager and, therefore, the Board received and considered a profitability analysis of the Manager with respect to the proposed addition of Causeway as an additional sub-adviser for the International Equity Fund. The Independent Trustees concluded that the proposed fee payable to Causeway by the Manager with respect to the assets to be allocated to Causeway was reasonable and appropriate and the Manager’s profitability was not excessive in light of the nature, extent and quality of the services to be provided to the International Equity Fund by Causeway.
The Independent Trustees recognized that because the proposed fee payable to Causeway would be paid by the Manager, and not International Equity Fund, and, thus, would not impact the fees paid by International Equity Fund, an analysis of economies of scale was more appropriate in the context of the Board’s consideration of the Management Agreement between the Trust and the Manager. Accordingly, considerations of economies of scale with respect to Causeway were not relevant to the Independent Trustees’ determination to approve the Causeway Advisory Agreement. The Independent Trustees also concluded that any benefits that were expected to accrue to Causeway by virtue of its relationship with International Equity Fund were reasonable.
After consideration of the factors discussed above, with no single factor identified as the principal factor, the Independent Trustees approved the Causeway Advisory Agreement. The Causeway Advisory Agreement became effective on May 22, 2014.
******
Due to a change in the ownership structure of Wall Street Associates LLC (“Wall Street”) that occurred on March 5, 2014 (the “Wall Street Transaction”), the original Investment Advisory Agreement (“Initial Wall Street Advisory Agreement”) between the Manager and Wall Street, pursuant to which Wall Street managed an allocated portion of the assets of Small Capitalization Growth Investments (“Small Cap Growth Fund”), was terminated in accordance with its terms and the provisions of the 1940 Act. To enable Wall Street to provide uninterrupted sub-investment advisory services to the Small Cap Growth Fund, at the March Meeting, the Manager recommended and the Board, including all of the Independent Trustees, approved a new Investment Advisory Agreement (“Current Wall Street Advisory Agreement”) between the Manager and Wall Street. The Board noted that the Current Wall Street Advisory Agreement is substantially the same in all material respects as the Initial Advisory Agreement.
212
| | |
| | | |
| Board Approval of Management Agreement and Investment Advisory Agreements | | |
In determining whether to approve the Current Wall Street Advisory Agreement at the March Meeting, the Board considered materials prepared in connection with the May 29-30, 2013 Board meeting and the March Meeting and other information, which included: (i) a copy of the Current Wall Street Advisory Agreement; (ii) information regarding the process by which the Manager initially recommended Wall Street for Board approval and the Manager’s rationale for retaining Wall Street following the closing of the Wall Street Transaction; (iii) information regarding the nature, extent and quality of the services that Wall Street provided to the Small Cap Growth Fund; (iv) information regarding Wall Street’s investment management business, personnel, and operations, which were expected to remain substantially the same after the Wall Street Transaction; (v) information regarding Wall Street’s brokerage and trading policies and practices; (vi) information regarding the level of sub-investment advisory fees charged by Wall Street; (vii) information regarding Wall Street’s compliance program; (viii) information regarding Wall Street’s historical performance returns managing its allocated portion of the Small Cap Growth Fund’s assets and information comparing that performance to a relevant index; and (ix) information regarding Wall Street’s financial condition. The Independent Trustees were assisted in their review by Fund counsel and Independent Counsel and met with Independent Counsel in executive sessions separate from representatives of the Manager.
The Independent Trustees concluded that the nature, extent and quality of the sub-investment advisory services provided by Wall Street under the Initial Wall Street Advisory Agreement, as well as Wall Street’s ability to continue to render such services pursuant to the Current Wall Street Advisory Agreement, based on its experience, operations and resources, were adequate and appropriate for the Small Cap Growth Fund in light of the Fund’s investment objective, and supported a decision to approve the Current Wall Street Advisory Agreement.
The Independent Trustees concluded that Wall Street’s historical performance record in managing its allocated portion of the Small Cap Growth Fund’s assets and similar products, when viewed together with the other factors considered by the Board, supported a decision to approve the Current Wall Street Advisory Agreement.
The Independent Trustees noted that the fee paid to Wall Street would be paid by the Manager, and not Small Cap Growth Fund, and, thus, would not impact the fees paid by Small Cap Growth Fund. The Independent Trustees also noted that the fee payable to Wall Street by the Manager, and the scope of services that Wall Street is required to provide in managing its allocated portion of the Small Cap Growth Fund’s assets, are substantially the same under the Current Wall Street Advisory Agreement and the Initial Wall Street Advisory Agreement. The Independent Trustees concluded that the fee payable to Wall Street by the Manager with respect to the assets to be allocated to Wall Street was reasonable and appropriate. The Independent Trustees recognized that, because Wall Street’s fee would continue to be paid by the Manager, and not Small Cap Growth Fund, an analysis of economies of scale and profitability was more appropriate in the context of the Board’s consideration of the Management Agreement between the Trust and the Manager. Accordingly, considerations of profitability and economies of scale with respect to Wall Street were not relevant to the Independent Trustees’ determination to approve the Current Wall Street Advisory Agreement. The Independent Trustees also concluded that any benefits that had accrued and were expected to accrue to Wall Street by virtue of its relationship with Small Cap Growth Fund were reasonable.
After consideration of the factors discussed above, with no single factor identified as the principal factor, the Independent Trustees approved the Current Wall Street Advisory Agreement. The Current Wall Street Advisory Agreement was re-approved for an annual period by the Board at the May 28-29, 2014 Board meeting.
******
As a result of a joint venture between Delaware Investments Fund Advisers (“Delaware”) and its San Francisco-based Focus Growth team, which created Jackson Square Partners (“Jackson Square”) on May 1, 2014 (the “Jackson Square Transaction”), the original Investment Advisory Agreement (“Initial Delaware Advisory Agreement”) between the Manager and Delaware, pursuant to which Delaware managed an allocated portion of the assets of Large Capitalization Growth Investments (“Large Cap Growth Fund”), was terminated in accordance with its terms and the provisions of the 1940 Act. To enable Jackson Square to provide uninterrupted sub-investment advisory services to the Large Cap Growth Fund, at the March Meeting, the Manager recommended and the Board, including all of the Independent Trustees, approved a temporary Investment Advisory Agreement (“Temporary Jackson Square Advisory Agreement”) between the Manager and Jackson Square. The Board noted that the Temporary Jackson Square Advisory Agreement is substantially the same in all material respects as the Initial Delaware Advisory Agreement and would be effective for approximately 150 days to enable the Manager to conduct additional due diligence following the completion
213
| | |
| | | |
| Board Approval of Management Agreement and Investment Advisory Agreements | | |
of the Jackson Square Transaction. At an in-person meeting of the Board of Trustees of the Trust held on August 27-28, 2014 (“August Meeting”), the Manager recommended and the Board, including all of the Independent Trustees, approved for an annual period a new Investment Advisory Agreement (“Current Jackson Square Advisory Agreement”) between the Manager and Jackson Square.
In determining whether to approve the Current Jackson Square Advisory Agreement, the Board considered materials prepared in connection with the March Meeting, the May 28-29, 2014 Board meeting, the August Meeting and other information, which included: (i) a copy of the Current Jackson Square Advisory Agreement; (ii) information regarding the process by which the Manager initially recommended Jackson Square for Board approval and the Manager’s rationale for retaining Jackson Square following the closing of the Jackson Square Transaction; (iii) information regarding the nature, extent and quality of the services that Jackson Square provided to the Large Cap Growth Fund; (iv) information regarding Jackson Square’s investment management business, personnel, and operations, which were expected to remain substantially the same after the Jackson Square Transaction; (v) information regarding Jackson Square’s brokerage and trading policies and practices; (vi) information regarding the level of sub-investment advisory fees charged by Jackson Square; (vii) information regarding Jackson Square’s compliance program, including third-party compliance services provided to Jackson Square; (viii) information regarding Delaware’s and Jackson Square’s historical performance returns managing the allocated portion of the Large Cap Growth Fund’s assets and information comparing that performance to a relevant index; and (ix) information regarding Jackson Square’s financial condition. Representatives from Jackson Square also made presentations to and responded to questions from the Board at both the March Meeting and August Meeting. The Independent Trustees were assisted in their review by Fund counsel and Independent Counsel and met with Independent Counsel in executive sessions separate from representatives of the Manager and Jackson Square.
The Independent Trustees concluded that the nature, extent and quality of the sub-investment advisory services provided by Delaware under the Initial Delaware Advisory Agreement, as well as Jackson Square’s ability to continue to render such services pursuant to the Current Jackson Square Advisory Agreement, based on its experience, operations and resources, were adequate and appropriate for the Large Cap Growth Fund in light of the Fund’s investment objective, and supported a decision to approve the Current Jackson Square Advisory Agreement.
The Independent Trustees concluded that the Focus Growth team’s (currently at Jackson Square) historical performance record in managing its allocated portion of the Large Cap Growth Fund’s assets and similar products, when viewed together with the other factors considered by the Board, supported a decision to approve the Current Jackson Square Advisory Agreement.
The Independent Trustees noted that the fee paid to Jackson Square would be paid by the Manager, and not Large Cap Growth Fund, and, thus, would not impact the fees paid by Large Cap Growth Fund. The Independent Trustees also noted that the fee payable to Jackson Square by the Manager, and the scope of services that Jackson Square is required to provide in managing its allocated portion of the Large Cap Growth Fund’s assets, are substantially the same under the Current Jackson Square Advisory Agreement and the Initial Delaware Advisory Agreement with Delaware. The Independent Trustees concluded that the fee payable to Jackson Square by the Manager with respect to the assets to be allocated to Jackson Square was reasonable and appropriate.
The Independent Trustees recognized that, because Jackson Square’s fee would continue to be paid by the Manager, and not Large Cap Growth Fund, an analysis of economies of scale and profitability was more appropriate in the context of the Board’s consideration of the Management Agreement between the Trust and the Manager. Accordingly, considerations of profitability and economies of scale with respect to Jackson Square were not relevant to the Independent Trustees’ determination to approve the Current Jackson Square Advisory Agreement. The Independent Trustees also concluded that any benefits that had accrued and were expected to accrue to Jackson Square by virtue of its relationship with Large Cap Growth Fund were reasonable.
After consideration of the factors discussed above, with no single factor identified as the principal factor, the Independent Trustees approved the Current Jackson Square Advisory Agreement.
******
214
Trustees and Officers of the Trust
Overall responsibility for management and supervision of the Trust rests with the Board of Trustees. The Trustees approve all significant agreements between the Trust and the companies that furnish services to the Funds, including agreements with the Funds’ distributor, investment advisers, custodian, transfer agent and administrator. The day-to-day operations of the Funds are delegated to the Funds’ Manager, Consulting Group Advisory Services LLC (“CGAS”), a business of Morgan Smith Barney Holdings LLC.
The names of the Trustees and officers of the Trust, together with information as to their principal business occupations, are set forth below. The officers of the Trust are employees of organizations that provide services to the Funds. Each Trustee who is an “interested person” of the Trust, as defined in the Investment Company Act of 1940, as amended (“1940 Act”), is indicated by a double asterisk.
| | | | | | | | | | |
Name, Address and
Date of Birth | | Position(s)
Held with
Trust | | Term of Office
and
Length
of Time
Served* | | Principal Occupation(s)
During Past Five Years | | Number of
Funds
in Fund
Complex
Overseen by
Trustee | | Other Board
Memberships
Held During Past
Five Years by
Trustee |
| | | |
INDEPENDENT TRUSTEES | | | | | | |
| | | | | |
John J. Murphy Murphy Capital Management, Inc. 268 Main Street Gladstone, NJ 07934 Birth Year: 1944 | | Chairman and Trustee | | Since 2002 (Chairman since 2010) | | Founder and Senior Principal, Murphy Capital Management (investment management) (1983-present) | | 11 | | Trustee, Legg Mason Partners Equity Trust (52 funds, 2007-present); Trustee, UBS Funds (35 funds, 2009-present); Fort Dearborn Income Securities (2013-present); and formerly, Nicholas Applegate Funds (12 funds) (2005-2010) |
| | | | | |
Adela Cepeda c/o Morgan Stanley 2000 Westchester Avenue Purchase, NY 10577 Birth Year: 1958 | | Trustee | | Since 2008 | | President, A.C. Advisory, Inc. (1995-present) | | 11 | | Director, BMO Financial Corp. (2012-present); Trustee, Mercer Funds (9 funds, 2005-present); Trustee, UBS Funds (35 funds, 2004-present); Director, Fort Dearborn Income Securities (2000-present); Director, Amalgamated Bank of Chicago (2003-2012); and formerly, Director, Municipal Securities Rulemaking Board (2010-2012) |
| | | | | |
W. Thomas Matthews 453 Banks Mill Road Aiken, SC 29801 Birth Year: 1949 | | Trustee | | Since 2009 (Interested Trustee from 2006-2009) | | Retired; Advisor, Smith Barney (2005-2007) | | 11 | | Co-Treasurer, Congressional Medal of Honor Foundation (2009-present); Chairman, Congressional Medal of Honor Foundation (2005-2009); Chairman, Augusta Warrior Project (2013-present) |
215
| | | | | | | | | | |
Name, Address and
Date of Birth | | Position(s)
Held with
Trust | | Term of Office
and
Length
of Time
Served* | | Principal Occupation(s)
During Past Five Years | | Number of
Funds
in Fund
Complex
Overseen by
Trustee | | Other Board
Memberships
Held During Past
Five Years by
Trustee |
| | | | | |
Mark J. Reed North American Management 231 S. Bemiston, Suite 800 Clayton, MO 63105 Birth Year: 1964 | | Trustee | | Since 2007 | | Principal & Portfolio Manager, North American Management Corp. (2013-present); Managing Director and Chief Compliance Officer, Bush O’Donnell Investment Advisors, Inc., (1988-2013) | | 11 | | None |
| | | | | |
Eric T. McKissack, CFA® Channing Capital Management, LLC 10 S. LaSalle Street Chicago, IL 60603 Birth Year: 1953 | | Trustee | | Since 2013 | | Founder and Chief Executive Officer, Channing Capital Management, LLC (investment management) (2004-present) | | 11 | | Trustee and Chairman, FlexShares Funds (2011-present); Trustee, The Art Institute of Chicago (2001-present); Director, Rehabilitation Institute of Chicago (2000-present); and Director, Urban Gateways (1995-present); formerly, Director, ICMA Retirement Corp. (2005-2012) |
216
| | | | | | | | | | |
Name, Address and
Date of Birth | | Position(s)
Held with
Trust | | Term of Office
and
Length
of Time
Served* | | Principal Occupation(s)
During Past Five Years | | Number of
Funds
in Fund
Complex
Overseen by
Trustee | | Other Board
Memberships
Held During Past
Five Years by
Trustee |
| | | |
INTERESTED TRUSTEE | | | | | | |
| | | | | |
James J. Tracy** Morgan Stanley 2000 Westchester Avenue Purchase, NY 10577 Birth Year: 1957 | | Trustee Chief Executive Officer and President | | Since 2013 Since 2013, previously, 2007-2010 | | Managing Director, Director of Consulting Group Wealth Advisory Solutions, Morgan Stanley (2012-present); Managing Director, Director of National Sales and Business Development, Morgan Stanley (2011-2012); Managing Director and Chief Operating Officer of Distribution and Development for Global Wealth Management, Morgan Stanley (2010-2011); Managing Director, Director of Consulting Group (2009-2010); Executive Vice President and Director of Business Development for Citi Global Wealth Management and the Director of Smith Barney’s Investment Advisory Services (2008-2009) | | 11 | | None |
217
| | | | | | |
Name, Address and
Date of Birth | | Position(s)
Held with
Trust | | Term of Office***
and Length of
Time Served | | Principal Occupation(s) During Past Five Years |
| |
OFFICERS | | |
| | | |
Francis Smith Morgan Stanley 522 Fifth Avenue, 4th Fl. New York, NY 10036 Birth Year: 1965 | | Chief Financial Officer and Treasurer | | Since 2014 | | Executive Director, Morgan Stanley (2001-present); Treasurer (2003-present) and Principal Financial Officer (2003-present) of various Morgan Stanley Funds |
| | | |
Paul F. Gallagher Morgan Stanley Delaware Corporate Center II 2 Righter Parkway, 3rd Fl. Wilmington, DE 19803 Birth Year: 1959 | | Chief Legal Officer and Secretary | | Since 2007 | | Executive Director, Counsel, Morgan Stanley (2011-present); Executive Director and Associate General Counsel, Morgan Stanley (2009-2011) |
| | | |
Philip Stack Morgan Stanley 2000 Westchester Avenue Purchase, NY 10577 Birth Year: 1964 | | Chief Compliance Officer | | Since 2013 | | Vice President, Morgan Stanley (2013-present); Vice President Corporate Audit Group – Compliance, Morgan Stanley (2012-2013); and Vice President, Director of Investment Compliance and Risk Management, Gannett Welsh & Kotler (2008-2012) |
| | | |
Donna Marley Morgan Stanley Delaware Corporate Center II 2 Righter Parkway, 3rd Fl. Wilmington, DE 19803 Birth Year: 1955 | | Chief Operating Officer | | Since 2011 | | Executive Director, Morgan Stanley (2009-present); Director of Consulting Group Product Governance, Morgan Stanley (2011-present); Director, Consulting Group Risk Management, Morgan Stanley (2009-2011) |
| | | |
Charles P. Graves, III Morgan Stanley 2000 Westchester Avenue Purchase, NY 10577 Birth Year: 1962 | | Chief Administrative Officer | | Since 2011 | | Executive Director, Head of Global Investment Solutions, Morgan Stanley (2013-Present); Director of Third Party Programs, Consulting Group, Morgan Stanley (2011-2013); and Director, Senior Portfolio Manager, Private Portfolio Group, Morgan Stanley (2008-2011) |
| | | |
Vincenzo Alomia, CIMA® Morgan Stanley 2000 Westchester Avenue Purchase, NY 10577 Birth Year: 1967 | | Investment Officer | | Since 2009 | | Executive Director, Senior Portfolio Manager, Portfolio Advisory Services (“PAS”), Morgan Stanley (2012-present); Vice President, Senior Portfolio Manager, PAS, Morgan Stanley (2009-present); Vice President, Portfolio Construction, PAS, Morgan Stanley (2007-2008) |
| | | |
Jason B. Moore Morgan Stanley Delaware Corporate Center II 2 Righter Parkway, 3rd Fl. Wilmington, DE 19803 Birth Year: 1972 | | Investment Officer | | Since 2011 | | Managing Director, Morgan Stanley (2012-present); Executive Director, Morgan Stanley (2011-2012); Managing Director, Bank of America Merrill Lynch (2010-2011); and Executive Director, Morgan Stanley (2007-2010) |
218
| | | | | | |
Name, Address and
Date of Birth | | Position(s)
Held with
Trust | | Term of Office***
and Length of
Time Served | | Principal Occupation(s) During Past Five Years |
| | | |
Franco Piarulli, CIMA® Morgan Stanley 2000 Westchester Avenue Purchase, NY 10577 Birth Year: 1970 | | Investment Officer | | Since 2011 | | Managing Director, Morgan Stanley (2013-present); Executive Director, Senior Portfolio Manager & Director of Portfolio Construction, PAS, Morgan Stanley (2009-2013) |
| | | |
Jay T. Shearon Morgan Stanley Delaware Corporate Center II 2 Righter Parkway, 3rd Fl. Wilmington, DE 19803 Birth Year: 1972 | | Investment Officer | | Since 2007 | | Executive Director, Morgan Stanley (2012-present); Vice President, Morgan Stanley (2009-2012) |
| | | |
Joel W. Stickney Morgan Stanley 2000 Westchester Avenue Purchase, NY 10577 Birth Year: 1971 | | Investment Officer | | Since 2013 | | Executive Director, Director of Third Party-Managed Programs, Morgan Stanley (2013-present); Director of Business Development, Consulting Group, Morgan Stanley (2012-2013); Chief Operating Officer, Consulting Group, Morgan Stanley (2010-2012); Director of Business Planning & Strategy, Investment Products & Services, Morgan Stanley (2009-2010) |
| | | |
Roger Paradiso Morgan Stanley 2000 Westchester Avenue Purchase, NY 10577 Birth Year: 1966 | | Investment Officer | | Since 2014 | | Managing Director, Morgan Stanley Consulting Group, Investment Solutions and Portfolio Development (2008-present) |
| | | |
Baha Sarana Morgan Stanley 485 Lexington Avenue New York, NY 10172 Birth Year: 1977 | | Anti-Money Laundering (“AML”) Compliance Officer | | Since 2014 | | Executive Director and Head of AML, Morgan Stanley Wealth Management (2014-present); Executive Director and Deputy Head of AML, Morgan Stanley Wealth Management (2013-2014); Executive Director and Director of AML Investigation, Morgan Stanley Wealth Management (2009-2013) |
| | | |
Steven Ross Morgan Stanley 522 Fifth Avenue, 4th Floor New York, NY 10036 Birth Year: 1971 | | Assistant Treasurer | | Since 2014 | | Executive Director, Morgan Stanley (2013-present); Vice President, Morgan Stanley (2005-2013) |
| | | |
Suzan M. Barron Brown Brothers Harriman & Co. (“BBH&Co.”) 50 Post Office Square Boston, MA 02110 Birth Year: 1964 | | Assistant Secretary | | Since 2011 | | Senior Vice President and Senior Investor Services Counsel, Corporate Secretary and Regulatory Support Practice of Fund Administration, BBH&Co. (2005-present) |
| * | | Each Trustee remains in office until they resign, retire or are removed. |
| ** | | Mr. Tracy is an “interested person” of the Trust as defined in the 1940 Act because of his position with Morgan Stanley. |
| *** | | The President, Treasurer and Secretary hold office until their respective successors are chosen and qualified or until he or she sooner dies, resigns, is removed or becomes disqualified. Each of the other officers serves at the pleasure of the Board. |
219
| | |
| | | |
| Important Tax Information | | |
The following information is provided with respect to the distributions paid during the taxable year ended August 31, 2014:
| | | | | | | | | | | | | | | | | | | | |
| | | Large
Capitalization
Growth
Investments | | | Large
Capitalization
Value Equity
Investments | | | Small
Capitalization
Value Equity
Investments | | | International
Equity
Investments | | | Emerging
Markets
Equity
Investments | |
Record Date: | | | 12/5/2013 | | | | 12/5/2013 | | | | 12/5/2013 | | | | 12/5/2013 | | | | 12/5/2013 | |
Payable Date: | | | 12/9/2013 | | | | 12/9/2013 | | | | 12/9/2013 | | | | 12/9/2013 | | | | 12/9/2013 | |
Ordinary Income: | | | | | | | | | | | | | | | | | | | | |
Qualified Dividend Income for Individuals | | | 82.92 | % | | | 100.00 | % | | | 59.61 | % | | | 77.42 | % | | | 92.28 | % |
Dividends Qualifying for the Dividends Received | | | | | | | | | | | | | | | | | | | | |
Deduction for Corporations | | | 74.01 | % | | | 100.00 | % | | | 59.26 | % | | | — | | | | — | |
Foreign Source Income | | | — | | | | — | | | | — | | | | 98.81 | %* | | | 96.42 | %* |
Foreign Tax Paid Per Share | | | — | | | | — | | | | — | | | $ | 0.01162 | | | $ | 0.04827 | |
Long-Term Capital Gain Dividend | | | — | | | | — | | | | — | | | | — | | | | — | |
| | | | | |
| | | Core Fixed
Income
Investments | | | High Yield
Investments | | | International
Fixed Income
Investments | | | Municipal
Bond
Investments | | | Money
Market
Investments | |
Record Date: | | | 12/5/2013 | | | | 12/5/2013 | | | | Monthly | | | | Monthly | | | | Monthly | |
Payable Date: | | | 12/9/2013 | | | | 12/9/2013 | | | | Monthly | | | | Monthly | | | | Monthly | |
Ordinary Income: | | | | | | | | | | | | | | | | | | | | |
Qualified Dividend Income for Individuals | | | — | | | | — | | | | — | | | | — | | | | — | |
Dividends Qualifying for the Dividends Received | | | | | | | | | | | | | | | | | | | | |
Deduction for Corporations | | | — | | | | — | | | | — | | | | — | | | | — | |
Interest from Tax-Exempt Obligations | | | — | | | | — | | | | — | | | | 100.00 | % | | | — | |
Interest from Federal Obligations | | | 37.48 | % | | | — | | | | 16.08 | % | | | — | | | | 12.51 | % |
Long-Term Capital Gain Dividend | | $ | 0.1101 | | | | — | | | | — | | | | — | | | | — | |
| * | | Expressed as a percentage of the cash distribution grossed-up for foreign taxes. |
The law varies in each state as to whether and what percentage of dividend income attributable to Federal obligations is exempt from state income tax. We recommend that you consult with your tax adviser to determine if any portion of the dividends you received is exempt from state income taxes.
The foreign taxes paid represent taxes incurred by the Fund on income received by the Fund from foreign sources. Foreign taxes paid may be included in taxable income with an offsetting deduction from gross income or may be taken as a credit for taxes paid to foreign governments. You should consult your tax adviser regarding the appropriate treatment of foreign taxes paid.
Please retain this information for your records.
220
MORGAN STANLEY SMITH BARNEY LLC
Distributor
CONSULTING GROUP ADVISORY SERVICES LLC
Investment Adviser
This report is submitted for the general information of the shareholders of Consulting Group Capital Markets Funds. It is not authorized for distribution to prospective investors unless accompanied or preceded by a current Prospectus for the Trust which contains information concerning the Trust’s Investment policies, charges and expenses as well as other pertinent information.
The Funds file their complete schedule of portfolio holdings with the Securities and Exchange Commission (“SEC”) for the first and third quarters of each fiscal year on Form N-Q. The Funds’ Forms N-Q are available on the SEC’s website at www.sec.gov. The Funds’ Forms N-Q may be reviewed and copied at the SEC’s Public Reference Room in Washington D.C., and information on the operation of the Public Reference Room may be obtained by calling 1-800-SEC-0330. To obtain information on Form N-Q from the Funds, shareholders can call 1-888-454-3965 (“ask for Consulting Group”).
Information on how the Funds voted proxies relating to portfolio securities during the most recent 12-month period ended June 30 and a description of the policies and procedures that the Funds use to determine how to vote proxies relating to portfolio securities is available (1) without charge, upon request, by calling 1-888-454-3965 (ask for “Consulting Group”), (2) on the Funds’ website at www.morganstanley.com/cgcm and (3) on the SEC’s website at www.sec.gov.
© 2014 Morgan Stanley Smith Barney LLC (“Morgan Stanley”). Consulting Group Advisory Services LLC (“CGAS”) is a business of Morgan Stanley. Securities are offered through Morgan Stanley.
Consulting Group Capital Markets Funds
2000 Westchester Avenue
Purchase, NY 10577
ITEM 2. CODE OF ETHICS.
As of the period ended August 31, 2014 (“Reporting Period”), the Registrant has adopted a code of ethics (“Code”) that applies to the Registrant’s principal executive officer, principal financial officer, principal accounting officer or controller, or persons performing similar functions, regardless of whether these individuals are employed by the Registrant or a third party. The Registrant has not amended any provision in its Code that relates to an element of the Code’s definitions enumerated in paragraph (b) of Item 2 of this Form N-CSR. A copy of this Code is filed as an Exhibit to this Form N-CSR pursuant to Item 12(a)(1).
The Registrant has not granted any waiver, including any implicit waiver, from a provision of its Code to the Registrant’s principal executive officer, principal financial officer, principal accounting officer or controller, or persons performing similar functions, regardless of whether these individuals are employed by the Registrant or a third party.
ITEM 3. AUDIT COMMITTEE FINANCIAL EXPERT.
The Board of Trustees of the Registrant has determined that Mark J. Reed possesses the attributes identified in Instruction (b) of Item 3 to Form N-CSR to qualify as an “audit committee financial expert,” and has designated Mr. Reed as the Registrant’s audit committee financial expert. Mr. Reed is an “independent” Trustee pursuant to paragraph (a)(2) of Item 3 to Form N-CSR.
ITEM 4. PRINCIPAL ACCOUNTANT FEES AND SERVICES.
AUDIT FEES –
(a) Audit Fees. The aggregate fees billed for each of the last two fiscal years ended August 31, 2014 and August 31, 2013 for professional services rendered by the Registrant’s principal accountant (“Auditor”) for the audit of the Registrant’s annual financial statements, or services that are normally provided by the Auditor in connection with the statutory and regulatory filings or engagements for each of the last two fiscal years, were $523,600 in 2014 and $484,750 in 2013.
(b) Audit-Related Fees. The aggregate fees billed for each of the last two fiscal years ended August 31, 2014, and August 31, 2013, for assurance and related services by the Auditor that were reasonably related to the performance of the audit of the Registrant’s financial statements and were not reported under paragraph (a) of this Item 4, were $0 in 2014 and $0 in 2013.
(c) Tax Fees. The aggregate fees billed for each of the last two fiscal years ended August 31, 2014 and August 31, 2013 for professional services rendered by the Auditor for tax compliance, tax advice and tax planning (“Tax Services”) were $90,880 in 2014 and $89,530 in 2013. These services consisted of (i) review or preparation of U.S. federal, state, local and excise tax returns; (ii) U.S. federal, state and local tax planning, advice and assistance regarding statutory, regulatory or administrative developments, and (iii) tax advice regarding tax qualification matters and/or treatment of various financial instruments held or proposed to be acquired or held.
(d) All Other Fees. The aggregate fees billed for each of the last two fiscal years ended August 31, 2014, and August 31, 2013, for products and services provided by the Auditor to the Registrant, other than the services reported in paragraphs (a) through (c) of this Item 4, were $0 for 2014 and $0 for 2013.
(e)(1) The Charter for the Audit Committee (“Committee”) of the Consulting Group Capital Markets Funds provides that the Committee may delegate its responsibility to approve any such audit and permissible non-audit services to a sub-committee consisting of the Chairperson of the Committee (“Chairperson”) and at least one other member of the Committee as the Chairperson, from time to time, may determine and appoint, and such sub-committee shall report to the Committee, at its next meeting after the sub-committee’s meeting, its decision(s). From year to year, and at such other times as the Committee deems
appropriate, the Committee shall report to the Board whether this system of approval has been effective and efficient or whether this Charter should be amended to allow for pre-approval pursuant to such policies and procedures as the Committee shall approve, including the delegation of some or all of the Committee’s pre-approval responsibilities to other persons (other than the Adviser or the Trust’s officers).
(e)(2) The percentage of services described in each of paragraphs (b) through (d) of this Item that were approved by the audit committee pursuant to paragraph (c)(7)(i)(c) of Rule 2-01 of Regulation S-X, with respect to: Audit-Related Fees were 0% for 2014 and 0% for 2013; Tax Fees were 0% for 2014 and 0% for 2013; and Other Fees were 0% for 2014 and 0% for 2013.
(f) Not Applicable.
(g) Aggregate non-audit fees billed by the Auditor for services rendered to the Registrant and the Registrant’s investment adviser (not including any sub-adviser whose role is primarily portfolio management as is subcontracted with or overseen by another investment adviser), and any entity controlling, controlled by, or under common control with the adviser that provides ongoing services to the Registrant of each of the last two fiscal years of the Registrant (“Service Affiliates”) were $0 for 2014 and $0 in 2013.
(h) The Registrant’s Audit Committee has considered whether the provision of non-audit services that were rendered to Service Affiliates that were not pre-approved pursuant to paragraph (c)(7)ii of Rule 2-01 of Regulation S-X is compatible with maintaining the Auditor’s independence.
ITEM 5. AUDIT COMMITTEE OF LISTED REGISTRANTS.
Not Applicable.
ITEM 6. INVESTMENTS.
A Schedule of Investments in securities of unaffiliated issuers as of the close of the Reporting Period is included as part of the report to shareholders filed under Item 1 of this Form N-CSR.
ITEM 7. DISCLOSURE OF PROXY VOTING POLICIES AND PROCEDURES FOR CLOSED-END MANAGEMENT INVESTMENT COMPANIES.
Not Applicable.
ITEM 8. PORTFOLIO MANAGERS OF CLOSED-END MANAGEMENT INVESTMENT COMPANIES.
Not Applicable.
ITEM 9. PURCHASES OF EQUITY SECURITIES BY CLOSED-END MANAGEMENT INVESTMENT COMPANIES AND AFFILIATED PURCHASERS.
Not Applicable.
ITEM 10. SUBMISSION OF MATTERS TO A VOTE OF SECURITY HOLDERS.
There have been no material changes to the procedures by which the shareholders may recommend nominees to the Registrant’s board of directors, where those changes were implemented after the Registrant last provided disclosure in response to the requirements of Item 407(c)(2)(iv) of Regulation S-K (as required by Item 22(b)(15) of Schedule 14A (17 CFR 240.14a-101)), or this Item.
ITEM 11. CONTROLS AND PROCEDURES.
(a) The Registrant’s principal executive officer and principal financial officer, or persons performing similar functions, have concluded that the Registrant’s disclosure controls and procedures (as defined in Rule 30a-3(c) under the Investment Company Act of 1940, as amended (17 CFR 270.30a-3(c)) were effective, as of a date within 90 days of the filing date of this report, based on his evaluation of these disclosure controls and procedures as required by Rule 30a-3(b) under the Investment Company Act of 1940, as amended (17 CFR 270.30a-3(b)), and Rules 13a-15(b) or 15d-15(b) under the Securities Exchange Act of 1934, as amended (17 CFR 240.13a-15(b) or 240.15d-15(b)).
(b) There were no changes in the Registrant’s internal control over financial reporting (as defined in Rule 30a-3(d) under the Investment Company Act of 1940, as amended (17 CFR 270.30a-3(d)), that occurred during the Registrant’s second fiscal quarter of the period covered by this report that has materially affected, or is reasonably likely to materially affect, the Registrant’s internal control over financial reporting.
ITEM 12. EXHIBITS.
(a)(1) Code of ethics, or any amendment thereto, that is the subject of disclosure required by Item 2 is attached hereto.
(a)(2) Certifications pursuant to Rule 30a-2(a) under the Investment Company Act of 1940, as amended (17 CFR 270.30a-2(a)) are attached hereto.
(a)(3) Not Applicable.
(b) Certifications pursuant to 18 U.S.C. Section 1350 as adopted pursuant to Section 906 of the Sarbanes-Oxley Act of 2002 are attached hereto.
SIGNATURES
Pursuant to the requirements of the Securities Exchange Act of 1934 and the Investment Company Act of 1940, the Registrant has duly caused this Report to be signed on its behalf by the undersigned, thereunto duly authorized.
| | |
| Consulting Group Capital Markets Funds |
| |
| By: | | /s/ James J. Tracy |
| | James J. Tracy |
| | Chief Executive Officer |
| | Consulting Group Capital Markets Funds |
| |
| Date: | | November 10, 2014 |
Pursuant to the requirements of the Securities Exchange Act of 1934 and the Investment Company Act of 1940, this report has been signed below by the following persons on behalf of the Registrant and in the capacities and on the dates indicated.
| | |
| By: | | /s/ James J. Tracy |
| | James J. Tracy |
| | Chief Executive Officer |
| | Consulting Group Capital Markets Funds |
| |
| Date: | | November 10, 2014 |
| | |
| Consulting Group Capital Markets Funds |
| |
| By: | | /s/ Francis Smith |
| | Francis Smith |
| | Chief Financial Officer |
| | Consulting Group Capital Markets Funds |
| |
| Date: | | November 10, 2014 |