UNITED STATES SECURITIES AND EXCHANGE COMMISSION
Washington, D.C. 20549
FORM N-CSR
CERTIFIED SHAREHOLDER REPORT OF REGISTERED MANAGEMENT
INVESTMENT COMPANIES
| Investment Company Act file number: | 811-06322 |
| | |
| Exact name of registrant as specified in charter: | Delaware Pooled® Trust |
| | |
| Address of principal executive offices: | 2005 Market Street |
| | Philadelphia, PA 19103 |
| | |
| Name and address of agent for service: | David F. Connor, Esq. |
| | 2005 Market Street |
| | Philadelphia, PA 19103 |
| | |
| Registrant’s telephone number, including area code: | (800) 523-1918 |
| | |
| Date of fiscal year end: | October 31 |
| | |
| Date of reporting period: | October 31, 2010 |
Item 1. Reports to Stockholders

| Annual report 2010 |
| |
| October 31, 2010 |
| | | |
| | | |
| U.S. equities | | International equities |
| The Large-Cap Value Equity Portfolio | | The International Equity Portfolio |
| The Select 20 Portfolio | | The Labor Select International Equity Portfolio |
| The Large-Cap Growth Equity Portfolio | | The Emerging Markets Portfolio |
| The Focus Smid-Cap Growth Equity Portfolio | | The Emerging Markets Portfolio II |
| The Real Estate Investment Trust Portfolio II | | The Global Real Estate Securities Portfolio |
| The Delaware Macquarie Real Estate Portfolio | | |
| | | International fixed income |
| U.S. fixed income | | The Global Fixed Income Portfolio |
| The Core Focus Fixed Income Portfolio | | The International Fixed Income Portfolio |
| The High-Yield Bond Portfolio | | |
| The Core Plus Fixed Income Portfolio | | |
| Contents | | |
| | | |
| Portfolio objectives | | 2 |
| The Large-Cap Value Equity Portfolio | | 4 |
| The Select 20 Portfolio | | 8 |
| The Large-Cap Growth Equity Portfolio | | 12 |
| The Focus Smid-Cap Growth Equity Portfolio | | 16 |
| The Real Estate Investment Trust Portfolio II | | 20 |
| The Core Focus Fixed Income Portfolio | | 25 |
| The High-Yield Bond Portfolio | | 28 |
| The Core Plus Fixed Income Portfolio | | 32 |
| The International Equity Portfolio | | 36 |
| The Labor Select International Equity Portfolio | | 40 |
| The Emerging Markets Portfolio | | 44 |
| The Global Real Estate Securities Portfolio | | 48 |
| The Global Fixed Income Portfolio | | 52 |
| The International Fixed Income Portfolio | | 56 |
| Disclosure of Portfolio expenses | | 60 |
| Sector allocations, security types, country allocations, | | |
| and top 10 holdings | | 62 |
| Financial statements | | 74 |
| Financial highlights | | 129 |
| Notes to financial statements | | 146 |
| Report of independent registered | | |
| public accounting firm | | 171 |
| Other Portfolio information | | 172 |
| Board of trustees/directors and officers addendum | | 182 |
Delaware Pooled® Trust
Delaware Pooled Trust, based in Philadelphia, is a registered investment company that offers no-load, open-end equity and fixed income mutual funds to institutional and high net worth individual investors. Delaware Management Company, a series of Delaware Management Business Trust, serves as investment advisor for the Portfolios. Mondrian Investment Partners Limited serves as investment sub-advisor for International Equity,* Labor Select International Equity, Emerging Markets,* Global Fixed Income,* and International Fixed Income Portfolios.* The Delaware Macquarie Real Estate Portfolio is closed to new investors. The Delaware Macquarie Real Estate Portfolio and The Emerging Markets Portfolio II each have fewer than six months of audited financial statements and accordingly, there is no portfolio management review section for those Portfolios. Shareholder services
Delaware Investments provides its Delaware Pooled Trust shareholders with annual and semiannual reports, monthly account reports, and other communications. A dedicated shareholder services staff is available to assist with account questions and provide net asset values of the Delaware Pooled Trust Portfolios weekdays from 9 a.m. to 5 p.m. Eastern time. Shareholders may call 800 231-8002 or write to: Client Services, Delaware Pooled Trust, 2005 Market Street, Philadelphia, PA 19103.
|
The performance quoted in this report represents past performance and does not guarantee future results. Investment return and principal value of an investment will fluctuate so that shares, when redeemed, may be worth more or less than their original cost. Current performance may be lower or higher than the performance quoted. Performance data current to the most recent month end may be obtained by calling 800 231-8002 or visiting www.delawareinvestments.com/institutional/performance. Carefully consider the Portfolios’ investment objectives, risk factors, charges, and expenses before investing. This and other important information can be found in the Portfolios’ prospectus, which may be obtained by calling 800 231-8002. Investors should read the prospectus carefully before investing. Performance includes reinvestment of all distributions.
Funds are not FDIC insured and are not guaranteed. It is possible to lose the principal amount invested. Mutual fund advisory services are provided by Delaware Management Company, a series of Delaware Management Business Trust (DMBT), which is a registered investment advisor. Delaware Investments is the marketing name of Delaware Management Holdings, Inc. (DMHI) and its subsidiaries. |
| *Closed to new investors. | |
| ©2010 Delaware Management Holdings, Inc. | 2010 Annual report • Delaware Pooled Trust |
| All third-party trademarks cited are the property of their respective owners. | |
1
Portfolio objectives
The Large-Cap Value Equity Portfolio seeks long-term capital appreciation. The Portfolio invests primarily in securities of large-capitalization companies that we believe have long-term capital appreciation potential. The Portfolio currently defines large-capitalization stocks as those with market capitalizations of $5 billion or greater at the time of purchase. Typically, we seek to select securities that we believe are undervalued in relation to their intrinsic value as indicated by multiple factors.
The Select 20 Portfolio seeks long-term capital appreciation. The Portfolio seeks to achieve its objective by investing in a portfolio of twenty (20) securities, primarily common stocks of companies that we believe have long-term capital appreciation potential and are expected to grow faster than the U.S. economy.
The Large-Cap Growth Equity Portfolio seeks capital appreciation. The Portfolio invests primarily in common stocks of growth-oriented companies that we believe have long-term capital appreciation potential and expect to grow faster than the U.S. economy. For purposes of the Portfolio, we generally consider large-capitalization companies to be those that, at the time of purchase, have total market capitalizations within the range of market capitalizations of companies in the Russell 1000® Growth Index.
The Focus Smid-Cap Growth Equity Portfolio seeks long-term capital appreciation. The Portfolio invests primarily in common stocks of growth-oriented companies that we believe have long-term capital appreciation potential and expect to grow faster than the U.S. economy. For purposes of the Portfolio, we will generally consider companies that, at the time of purchase, have total market capitalizations within the range of market capitalizations of companies in the Russell 2500™ Growth Index.
The Real Estate Investment Trust Portfolio II seeks maximum long-term total return, with capital appreciation as a secondary objective. The Portfolio invests primarily in securities of companies principally engaged in the real estate industry.
The Core Focus Fixed Income Portfolio seeks maximum long-term total return, consistent with reasonable risk. The Portfolio will invest primarily in a diversified portfolio of investment grade, fixed income obligations, including securities issued or guaranteed by the U.S. government, its agencies or instrumentalities (U.S. government securities), mortgage-backed securities, asset-backed securities, corporate bonds, and other fixed income securities.
The High-Yield Bond Portfolio seeks high total return. The Portfolio will primarily invest its assets at the time of purchase in: (1) corporate bonds rated BB or lower by Standard & Poor’s (S&P) or similarly rated by another nationally recognized statistical rating organization (NRSRO); (2) securities issued or guaranteed by the U.S. government, its agencies or instrumentalities; or (3) commercial paper of companies rated A-1 or A-2 by S&P, rated P-1 or P-2 by Moody’s Investors Service, Inc., or unrated but considered to be of comparable quality.
The Core Plus Fixed Income Portfolio seeks maximum long-term total return, consistent with reasonable risk. The Portfolio allocates its investments principally among three sectors of the fixed income securities markets: U.S. investment grade sector, U.S. high yield sector, and international sector.
The International Equity Portfolio seeks maximum long-term total return. The Portfolio invests primarily in equity securities of companies that are organized, have a majority of their assets, or derive most of their operating income outside the United States, and that, in our opinion, are undervalued at the time of purchase based on our fundamental analysis. Investments will be made mainly in marketable securities of companies in developed countries. The International Equity Portfolio is presently closed to new investors.
The Labor Select International Equity Portfolio seeks maximum long-term total return. The Portfolio invests primarily in equity securities of companies that are organized, have a majority of their assets, or derive most of their operating income outside of the United States, and that, in our opinion, are undervalued at the time of purchase based on the rigorous fundamental analysis that we employ. In addition to following these quantitative guidelines, we will select securities of issuers that present certain characteristics that are compatible or operate in accordance with certain investment policies or restrictions followed by organized labor.
The Emerging Markets Portfolio seeks long-term capital appreciation. The Portfolio, an international fund, generally invests in equity securities of companies that are organized in, have a majority of their assets in, or derive a majority of their operating income from emerging countries. The Emerging Markets Portfolio is presently closed to new investors.
The Emerging Markets Portfolio II seeks long-term capital appreciation. The Portfolio invests primarily in equity securities of issuers from emerging or developing foreign countries. Under normal market conditions, at least 80% of the Portfolio’s total assets will be invested in equity securities of issuers from countries whose economies are considered to be emerging. The Portfolio’s investment manager considers an “emerging country” to be any country that is: (1) generally recognized to be an emerging or developing country by the international financial community, including the World Bank and the International Finance Corporation; (2) classified by the United Nations as developing; or (3) included in the International Finance Corporation Free Ind ex or the Morgan Stanley Capital International Emerging Markets Index.
2010 Annual report • Delaware Pooled Trust
2
The Global Real Estate Securities Portfolio seeks maximum long-term total return through a combination of current income and capital appreciation. Under normal circumstances, the Portfolio will invest at least 80% of its net assets in securities issued by U.S. and non-U.S. companies in the real estate and real estate–related sectors. The Portfolio may invest in companies across all market capitalizations and may invest its assets in securities of companies located in emerging market countries. Under normal circumstances, the Portfolio will invest at least 40% of its total assets in securities of non-U.S. issuers.
The Delaware Macquarie Real Estate Portfolio seeks maximum long-term total return, through a combination of current income and capital appreciation. The Portfolio invests primarily in securities of companies principally engaged in the real estate industry. The Delaware Macquarie Real Estate Portfolio is presently closed to new investors.
The Global Fixed Income Portfolio seeks current income consistent with the preservation of principal. The Portfolio invests primarily in fixed income securities that may also provide the potential for capital appreciation. The Portfolio is a global fund that invests in issuers located throughout the world. The Global Fixed Income Portfolio is presently closed to new investors.
The International Fixed Income Portfolio seeks current income consistent with the preservation of principal. The Portfolio invests primarily in fixed income securities that may also provide the potential for capital appreciation. The Portfolio is an international fund that invests primarily in issuers that are organized, have a majority of their assets, or derive most of their operating income outside of the United States. The International Fixed Income Portfolio is presently closed to new investors.
Carefully consider the Portfolios’ investment objectives, risk factors, charges, and expenses before investing. This and other information can be found in Portfolios’ prospectus and, if available, their summary prospectus, which may be obtained by visiting www.delawareinvestments.com or calling 800 231-8002. Investors should read the prospectus and, if available, the summary prospectus carefully before investing.
The Portfolios of Delaware Pooled® Trust (DPT) are designed exclusively for institutional investors and high net worth individuals.
International investments entail risks not ordinarily associated with U.S. investments including fluctuation in currency values, differences in accounting principles, or economic or political instability in other nations. Investing in emerging markets can be riskier than investing in established foreign markets due to increased volatility and lower trading volume.
Narrowly focused investments may exhibit higher volatility than investments in multiple industry sectors.
REIT investments are subject to many of the risks associated with direct real estate ownership, including changes in economic conditions, credit risk, and interest rate fluctuations.
A REIT fund’s tax status as a regulated investment company could be jeopardized if it holds real estate directly, as a result of defaults, or receives rental income from real estate holdings.
The Portfolios’ share prices and yields will fluctuate in response to movements in stock prices.
Fixed income securities and bond funds can lose value, and investors can lose principal, as interest rates rise. They also may be affected by economic conditions that hinder an issuer’s ability to make interest and principal payments on its debt.
The Portfolios may also be subject to prepayment risk, the risk that the principal of a fixed income security that is held by the Portfolios may be prepaid prior to maturity, potentially forcing the Portfolios to reinvest that money at a lower interest rate.
Securities in the lowest of the rating categories considered to be investment grade (that is, Baa or BBB) have some speculative characteristics.
High yielding, noninvestment grade bonds (junk bonds) involve higher risk than investment grade bonds.
The high yield secondary market is particularly susceptible to liquidity problems when institutional investors, such as mutual funds and certain other financial institutions, temporarily stop buying bonds for regulatory, financial, or other reasons. In addition, a less liquid secondary market makes it more difficult for a Portfolio to obtain precise valuations of the high yield securities in its portfolio.
Because the Portfolios expect to hold a concentrated portfolio of a limited number of securities, the Portfolios’ risk is increased because each investment has a greater effect on the Portfolios’ overall performance.
The Real Estate Investment Trust II, The Global Real Estate Securities, The Delaware Macquarie Real Estate, The Select 20, The Global Fixed Income, and The International Fixed Income Portfolios are considered “nondiversified” as defined in the Investment Company Act of 1940. “Nondiversified” Portfolios may allocate more of their net assets to investments in single securities than “diversified” Portfolios. Resulting adverse effects may subject these Portfolios to greater risks and volatility.
2010 Annual report • Delaware Pooled Trust
3
Portfolio management review
Delaware Pooled® Trust — The Large-Cap Value Equity Portfolio
October 31, 2010
For the fiscal year ended Oct. 31, 2010, Delaware Pooled Trust — The Large-Cap Value Equity Portfolio returned +16.80% at net asset value (NAV) with all distributions reinvested. The Portfolio outperformed its benchmark, the Russell 1000® Value Index, which returned +15.71% during the same time frame. Complete annualized performance for The Large-Cap Value Equity Portfolio is shown in the table on page 6.
Although U.S. stock prices finished the annual fiscal period ended Oct. 31, 2010, on an upswing and achieved solid gains overall, these results masked the stock market’s fluctuating performance during that time span.
As the reporting period began, many equity investors remained optimistic about the U.S. economic recovery. Stock prices, which began a long rally back in March 2009, continued to climb through late April 2010 when investor sentiment abruptly reversed course due to several factors, including:
- Worries about the financial health of certain European governments, especially Greece
- The uncertain economic effects of the Gulf of Mexico oil spill
- New economic data showing a more vulnerable U.S. economy
Against this backdrop, stocks turned in sluggish results through the rest of the spring and summer of 2010. However, a strong rebound in early fall propelled equity values upward during the last three months of the Portfolio’s fiscal year.
In this environment, the Portfolio enjoyed good results in absolute terms, as well as relative to its benchmark, the Russell 1000 Value Index. From a sector perspective, the biggest source of outperformance came from strategic allocations within the underperforming energy and financials sectors. Among energy stocks, the Portfolio was helped by having less exposure than the benchmark to this lagging group, while a few well-chosen energy stocks actually boosted returns. In financials, the main source of our outperformance compared with the benchmark index was the Portfolio’s significant underweighting in this group, which, despite generating a positive return of about 6% overall, was the index’s weakest-performing sector during the fiscal year.
One of the top individual contributors to the Portfolio’s performance was chemical company E.I. du Pont de Nemours (DuPont), which enjoyed favorable returns. DuPont, a broadly diversified business with global scope, benefited from continued strength in pricing and healthy demand for its industrial products.
Another noteworthy contributor to the Portfolio’s performance was Xerox, a manufacturer of printers and copiers and a provider of document-oriented products and services. The company’s business fundamentals were somewhat weaker than the stocks we typically invest in, but this was helpful during the market’s rally in the first half of the fiscal period, when lower-quality companies gained considerably from the improvement in investor sentiment.
In contrast, the Portfolio’s unfavorable positioning in the consumer staples and consumer discretionary sectors was a source of underperformance. In addition to some disappointing stock selection in both groups, the Portfolio was underweighted in the outperforming consumer discretionary sector and significantly overexposed to consumer staples stocks, which trailed the benchmark index.
One of the Portfolio’s weakest performers during the fiscal year came from consumer staples: CVS Caremark, a drug-store chain and pharmacy-benefits manager. One of the company’s chief competitors, Walgreens, threatened to terminate its relationship and stop accepting prescriptions
The views expressed are current as of the date of this report and are subject to change.
2010 Annual report • Delaware Pooled Trust
4
managed by CVS subsidiary Caremark; although the disagreement was eventually settled, CVS’s stock never fully recovered. We continue to hold CVS in the Portfolio because we believe it is attractively valued and should benefit from an eventual pickup in prescription drug use.
In the healthcare sector, Quest Diagnostics was another disappointing stock within the Portfolio. Among Quest’s laboratory testing services is pre-employment testing — a business that slowed down for the company in concert with the decelerating job market. Against this backdrop, Quest forecasted slower-than-anticipated revenues for its 2010 fiscal year. We still have a positive outlook for Quest and therefore continue to hold the stock in our Portfolio. In our view, the company has strong cash flow and should benefit from higher testing volumes due to an aging population in the United States.
We continued to adhere to our bottom-up stock selection process during the reporting period, meaning we chose to invest in stocks one at a time, based on our assessment of their individual characteristics. We continued to favor stocks with consistent earnings and relatively healthy balance sheets — the types of stocks that, since the market’s April 2010 peak, have generally enjoyed better performance than their lower-quality counterparts.
While changes to the Portfolio were relatively modest during the reporting period, we did sell a handful of stocks when we felt they had reached or come close to our target price, and we replaced them with securities that we felt offered significantly better value potential.
For example, within the consumer discretionary sector, we sold our position in toy manufacturer Mattel because the company had achieved our objectives over the past several years. We felt it now offered more downside risk than upside potential, and we used the proceeds of our sale to add a position in cable television provider Comcast, whose shares we felt were extremely inexpensive relative to their long-term performance prospects.
Similarly, we sold the Portfolio’s stake in food-products business H.J. Heinz, which was originally purchased when the company was seeking to turn around its declining business. As Heinz gradually improved its profit margins and earnings, the stock performed well, leading us to exchange our position for a company we felt offered better long-term value: Williams Companies, a natural gas exploration and production firm that we felt was well priced and stood to benefit from long-term trends favoring demand for natural gas.
At period end, we continued to focus on, in our view, financially secure, attractively valued companies, which we saw as well positioned to withstand the potential risks in the economic environment. Accordingly, we were significantly overweighted relative to the benchmark index in defensive sectors such as healthcare while de-emphasizing more economically sensitive groups. These included financial stocks, whose future earnings power we see as diminished, and consumer discretionary holdings, which we believe could be challenged by high unemployment and sluggish consumer spending trends.
2010 Annual report • Delaware Pooled Trust
5
Performance summary
Delaware Pooled® Trust — The Large-Cap Value Equity Portfolio
The performance data quoted represent past performance; past performance does not guarantee future results. Investment return and principal value will fluctuate so your shares, when redeemed, may be worth more or less than their original cost. Current performance may be lower or higher than the performance data quoted. Please obtain the performance data for the most recent month end by calling 800 231-8002 or visiting our Web site at www.delawareinvestments.com.
Carefully consider the Portfolio’s investment objectives, risk factors, charges, and expenses before investing. This and other information can be found in the Portfolio’s prospectus and, if available, its summary prospectus, which may be obtained by visiting www.delawareinvestments.com or calling 800 231-8002. Investors should read the prospectus and, if available, the summary prospectus carefully before investing.
| Portfolio performance | | | | | | | | | | |
| Average annual total returns | | | | | | | | | | |
| Periods ended Oct. 31, 2010 | | 1 year | | 3 years | | 5 years | | 10 years | | Lifetime |
| | | +16.80% | | -6.95% | | +1.40% | | +2.79% | | +8.50% |
| Portfolio profile |
| Oct. 31, 2010 |
| |
| Total net assets |
| $6.6 million |
| |
| Number of holdings |
| 34 |
| Inception date |
| Feb. 3, 1992 |
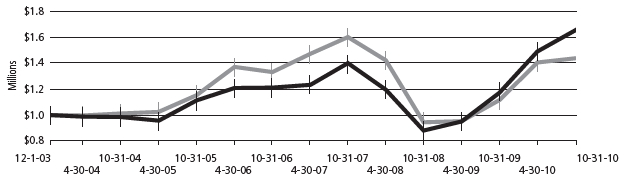
Growth of $1,000,000
| | | | Starting value (Oct. 31, 2000) | | Ending value (Oct. 31, 2010) |
| The Large-Cap Value Equity Portfolio | | $1,000,000 | | $1,316,578 |
| Russell 1000® Value Index | | $1,000,000 | | $1,298,137 |
2010 Annual report • Delaware Pooled Trust
6
The performance graph assumes $1 million invested on Oct. 31, 2000, and includes reinvestment of all distributions. The performance graph does not reflect the deduction of taxes the shareholder would pay on Portfolio distributions or redemptions of Portfolio shares.
Total return assumes reinvestment of dividends and capital gains, but does not reflect reductions for taxes. Returns and share values will fluctuate so that shares, when redeemed, may be worth more or less than their original cost.
The most recent prospectus designated the Portfolio’s total operating expenses as 0.98%. Management has contractually agreed to reimburse certain expenses and/or waive its management fees from Feb. 28, 2010, through Feb. 28, 2011, in order to prevent total annual Portfolio operating expenses from exceeding, in an aggregate amount, 0.70% of the Portfolio’s average daily net assets, as described in the most recent prospectus.
Expense limitations were in effect during the period shown. Performance would have been lower had the expense limitations not been in effect.
The Russell 1000 Value Index measures the performance of the large-cap value segment of the U.S. equity universe. It includes those Russell 1000 companies with lower price-to-book ratios and lower forecasted growth values.
Index performance returns do not reflect any management fees, transaction costs, or expenses. Indices are unmanaged and one cannot invest directly in an index.
Past performance is not a guarantee of future results.
2010 Annual report • Delaware Pooled Trust
7
Portfolio management review
Delaware Pooled® Trust — The Select 20 Portfolio
October 31, 2010
For its fiscal year ended Oct. 31, 2010, Delaware Pooled Trust — The Select 20 Portfolio returned +21.29% at net asset value (NAV) with all distributions reinvested, surpassing the +20.48% return of the benchmark Russell 3000® Growth Index. Complete annualized performance for The Select 20 Portfolio is shown in the table on page 10.
At the start of the Portfolio’s fiscal year, the economy seemed to have put recession in the rearview mirror, but troubling and often contradictory signs remained. Analysts welcomed favorable corporate earnings but worried about real revenue growth; mergers and acquisitions and share buybacks seemed to be back in vogue but corporations still had plenty of “cash-on-the-sidelines”; the Federal Reserve stayed creative with nontraditional stimuli but high unemployment continued to limit consumer activity, and analysts wondered if the recovery was artificial. Despite the uncertainties, investor sentiment was generally quite favorable, which gave equities a boost.
In reality, 12 short months later, very little has changed. The economy experienced a solid growth rate in the fourth quarter 2009, though it has slowed in the months that followed as a weak labor market maintained a tight grip on consumer activity. Corporate earnings have been well received by many investors but analysts hoped to see more signs of revenue growth. At the end of the fiscal year, an estimated $1 trillion remained in cash on balance sheets.
The Fed kept interest rates low for an “extended period,” while debating another bond-buying plan to stimulate growth (source: Bloomberg). China surpassed Japan as the world’s second-largest economy and reined in stimuli to prevent its economy from overheating. Meanwhile, Europe struggled with a sovereign debt crisis that brought controversial government austerity plans and citizen protests.
Through it all, investors generally remained quite positive and equities even gained momentum in the final two months of the fiscal year. Of course, some speed bumps occurred along the way, including a 1,000-point move in the Dow Jones Industrial Average in a matter of minutes one day in May 2010; and a devastating oil spill in the Gulf of Mexico threatened to hinder growth throughout several regions and economic sectors. Yet by fiscal year-end, despite the ongoing uncertainties, the major equity U.S. indices had produced double-digit returns.
Throughout the Portfolio’s fiscal year, we remained consistent in our investment philosophy and management. We sought what, in our view, were high-quality companies that we believed had solid cash flows and strong competitive positions, and that we believe are run by experienced management teams capable of guiding their operations through good times and bad.
Apple was the Portfolio’s top contributor during the Portfolio’s fiscal year. The company has bucked virtually every macroeconomic and consumer spending trend with its unique product offerings. The four key product lines (Mac desktops and laptops, iPod, iPhone, and now the iPad) have proven highly popular and, in our view, the iPhone and iPad are fitting perfectly into the huge secular growth area of wireless proliferation. Of note, Apple is very much a niche company globally and we believe still has tremendous growth potential in fast-growing markets outside of the United States.
Online travel company priceline.com was another contributor during the fiscal year. Its “name your own price” business strategy has proven even more successful lately as it fulfills the consumer’s hearty appetite for value in these economic times. Additionally, priceline.com’s European hotel-booking subsidiary is ranked number one in market share in this high-margin, fast-growing business sector (source: Bloomberg).
The views expressed are current as of the date of this report and are subject to change.
2010 Annual report • Delaware Pooled Trust
8
Medco Health Solutions dropped during the fiscal year and was among the largest detractors to the Portfolio. The pharmaceutical-benefits manager creates outsourced prescription drug programs and other services for companies and their employees. Its business model fits the cost-cutting mood of corporate America and underscores the true benefits of outsourcing. During the June 2010 quarter, management reported disappointing results and guidance, yet we still believe in the company’s fundamentals.
Symantec was another disappointment during the period. We had been encouraged by management’s commitment to grow its core software security business internally, but noted a shift in philosophy when it acquired a security and certification company. We became concerned that management had changed its strategic direction to growth through acquisition, and therefore, we sold our position during the period. As a general rule, we prefer internal growth through business reinvestment over acquisition strategies.
Looking ahead, we still see legacy effects of the 2008 financial debacle and economic downturn that may hinder growth in the future. We do not anticipate a post-recessionary boom and expect a flat-to-moderate growth cycle with ongoing shifts in investor sentiment. While macroeconomic factors cannot be avoided these days, we are not taking on more cyclical risk based on forecasts and trends. As bottom-up stock pickers, we understand that fundamentals still matter and we will seek companies that we believe have secular growth characteristics, superior business models, and strong competitive positions that may lead to performance in a variety of market environments.
2010 Annual report • Delaware Pooled Trust
9
Performance summary
Delaware Pooled® Trust — The Select 20 Portfolio
The performance data quoted represent past performance; past performance does not guarantee future results. Investment return and principal value will fluctuate so your shares, when redeemed, may be worth more or less than their original cost. Current performance may be lower or higher than the performance data quoted. Please obtain the performance data for the most recent month end by calling 800 231-8002 or visiting our Web site at www.delawareinvestments.com.
Carefully consider the Portfolio’s investment objectives, risk factors, charges, and expenses before investing. This and other information can be found in the Portfolio’s prospectus and, if available, its summary prospectus, which may be obtained by visiting www.delawareinvestments.com or calling 800 231-8002. Investors should read the prospectus and, if available, the summary prospectus carefully before investing.
| Portfolio performance | | | | | | | | | | |
| Average annual total returns | | | | | | | | | | |
| Periods ended Oct. 31, 2010 | | 1 year | | 3 years | | 5 years | | 10 years | | Lifetime |
| | | +21.29% | | -4.14% | | +1.60% | | -3.64% | | -3.16% |
| Portfolio profile |
| Oct. 31, 2010 |
| |
| Total net assets |
| $11.5 million |
| |
| Number of holdings |
| 20 |
| Inception date |
| March 31, 2000 |
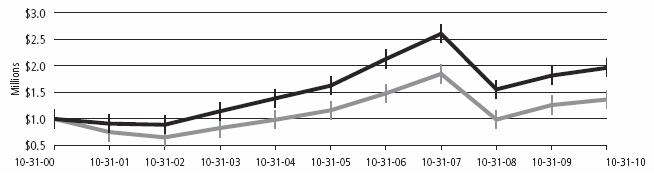
Growth of $1,000,000
| | | | Starting value (Oct. 31, 2000) | | Ending value (Oct. 31, 2010) |
| Russell 3000 Growth Index | | $1,000,000 | | $796,654 |
| The Select 20 Portfolio | | $1,000,000 | | $690,054 |
2010 Annual report • Delaware Pooled Trust
10
The performance graph assumes $1 million invested on Oct. 31, 2000, and includes reinvestment of all distributions. The performance graph does not reflect the deduction of taxes the shareholder would pay on Portfolio distributions or redemptions of Portfolio shares.
Total return assumes reinvestment of dividends and capital gains, but does not reflect reductions for taxes. Returns and share values will fluctuate so that shares, when redeemed, may be worth more or less than their original cost.
The most recent prospectus designated the Portfolio’s total operating expenses as 1.18%. Management has contractually agreed to reimburse certain expenses and/or waive its management fees from Feb. 28, 2010, through Feb. 28, 2011, in order to prevent total annual Portfolio operating expenses from exceeding, in an aggregate amount, 0.89% of the Portfolio’s average daily net assets, as described in the most recent prospectus.
Expense limitations were in effect during the period shown. Performance would have been lower had the expense limitations not been in effect.
The Russell 3000 Growth Index measures the performance of the broad growth segment of the U.S. equity universe. It includes those Russell 3000 companies with higher price-to-book ratios and higher forecasted growth values.
The Dow Jones Industrial Average is an often-quoted market indicator that comprises 30 widely held blue-chip stocks.
Index performance returns do not reflect any management fees, transaction costs, or expenses. Indices are unmanaged and one cannot invest directly in an index.
Past performance is not a guarantee of future results.
“Nondiversified” Portfolios may allocate more of their net assets to investments in single securities than “diversified” Portfolios. Resulting adverse effects may subject these Portfolios to greater risks and volatility.
Because the Portfolio expects to hold a concentrated portfolio of a limited number of securities, the Portfolio’s risk is increased because each investment has a greater effect on the Portfolio’s overall performance.
Investments in small and/or medium-sized companies typically exhibit greater risk and higher volatility than larger, more established companies.
Instances of high double-digit returns are unusual, cannot be sustained, and were primarily achieved during favorable market conditions.
2010 Annual report • Delaware Pooled Trust
11
Portfolio management review
Delaware Pooled® Trust — The Large-Cap Growth Equity Portfolio
October 31, 2010
Delaware Pooled Trust — The Large-Cap Growth Equity Portfolio returned +21.35% at net asset value (NAV) with all distributions reinvested for the fiscal year ended Oct. 31, 2010. The Portfolio’s benchmark, the Russell 1000 Growth Index, returned +19.65% for the same period. Complete annualized performance for The Large-Cap Growth Equity Portfolio is shown in the table on page 14.
During the first half of the Portfolio’s fiscal year, the market generally appeared to gain steam as investor sentiment rose in anticipation of improving economic fundamentals. In early 2010, positive housing and industrial-production data emerged, helping to support the market’s upward trend. Investor optimism quickly waned in late April 2010, however, as the sovereign debt crisis in Europe sparked a broad market selloff. This news, combined with decelerating economic growth in China and weak U.S. economic data, contributed to a sharp drop in investor sentiment. (Source: Bloomberg.)
During the latter half of the Portfolio’s fiscal year, the market was characterized by several sharp swings, investor pessimism, and lingering macroeconomic concerns. Despite moves away from the market’s bottom in 2008, economic fundamentals still did not show any meaningful improvement. Cyclical stocks, such as those in the energy and industrial sectors as well as those tied to commodity prices, generally performed well during the fiscal year.
Priceline.com was the top contributor to the Portfolio’s overall return during the fiscal year. The company’s strong earning reports during the period supported our view that the company’s core North American business and rapidly growing European hotel-booking business were largely unaffected by sovereign crisis concerns. Despite general investor concerns surrounding global economic and fiscal headwinds, we believe investors may be underestimating what we view as the powerful cash economics of the company’s business, and we continue to hold the stock.
Novo Nordisk was another contributor to the Portfolio’s overall performance. The company experienced continued success in rolling out its latest diabetes drug, Victoza, which was approved by the U.S. Food and Drug Administration in January 2010. We think the initial stages of the product launch look promising in terms of market share growth, and we believe it could enhance the company’s position as one of the leading global franchises in diabetes treatment.
VeriSign also had a positive effect on overall return. Many investors seemed encouraged by the company’s increased focus on its domain-name listing business, which we believe is its primary driver of shareholder value. As part of that increased focus, the company sold a security business late in the fiscal year to a competitor — a transaction that was generally well received by the market.
Medco Health Solutions was one of the Portfolio’s largest detractors for the fiscal year. Investor concerns about the sustainability of the company’s generic drug cycle and whether there was sufficient growth in other product areas hurt the stock’s overall performance. Nonetheless, the company is developing other products and offerings that we believe may increase customer retention and bolster the company’s value proposition for new business opportunities. We believe the stock’s performance was likely the result of an overreaction by investors and therefore we continue to hold the stock.
Walgreens also lagged during the Portfolio’s fiscal year. The company engaged in a very public and confrontational negotiation with CVS Caremark, one of its partners in drug distribution and a competitor to Walgreens in drug retailing. While the negotiation was eventually settled in June 2010, the details of their business relationship are unknown. While the incident was unfortunate and hurt the stock temporarily in the last few months of the fiscal year, we believe it doesn’t materially impair the long-term value of Walgreens’ business model or competitive position.
The views expressed are current as of the date of this report and are subject to change.
2010 Annual report • Delaware Pooled Trust
12
Symantec also hurt the Portfolio’s overall performance. The stock suffered, in our view, because weak macroeconomic conditions created an environment of dampened spending growth in enterprise storage management and security. We sold the position because management seemed to lessen its focus on its core business, software security and storage, in favor of business acquisition.
Although the U.S. equity market posted a positive return during the last three months of the Portfolio’s fiscal year, significant month-to-month volatility demonstrates to us that many investors are still uncertain about the future growth prospects of the global economy. While fundamentals may still be trending in a slightly positive direction (from a very low base during the global financial crisis in 2008–2009), we don’t believe we are entering into a typical post-recessionary boom cycle. Rather, we believe the lingering effects of the credit crisis could lead to moderate growth, at best, and are likely to continue to result in often-conflicting economic data points and a variety of company fundamental outcomes dependent on the quality of a company’s business model, competitive position, and management.
Regardless of the economic outcome, we remain consistent in our long-term investment philosophy: We want to own what we believe to be strong secular-growth companies with solid business models and competitive positions that we believe can grow market share and deliver shareholder value in a variety of market environments.
2010 Annual report • Delaware Pooled Trust
13
Performance summary
Delaware Pooled® Trust — The Large-Cap Growth Equity Portfolio
The performance data quoted represent past performance; past performance does not guarantee future results. Investment return and principal value will fluctuate so your shares, when redeemed, may be worth more or less than their original cost. Current performance may be lower or higher than the performance data quoted. Please obtain the performance data for the most recent month end by calling 800 231-8002 or visiting our Web site at www.delawareinvestments.com.
Carefully consider the Portfolio’s investment objectives, risk factors, charges, and expenses before investing. This and other information can be found in the Portfolio’s prospectus and, if available, its summary prospectus, which may be obtained by visiting www.delawareinvestments.com or calling 800 231-8002. Investors should read the prospectus and, if available, the summary prospectus carefully before investing.
| Portfolio performance | | | | | | |
| Average annual total returns | | | | | | |
| Periods ended Oct. 31, 2010 | | 1 year | | 3 years | | Lifetime |
| | | +21.35% | | -5.01% | | +1.28% |
| Portfolio profile |
| Oct. 31, 2010 |
| |
| Total net assets |
| $244.1 million |
| |
| Number of holdings |
| 29 |
| |
| Inception date |
| Nov. 1, 2005 |
Growth of $1,000,000
| | | | Starting value (Nov. 1, 2005) | | Ending value (Oct. 31, 2010) |
| Russell 1000® Growth Index | | $1,000,000 | | $1,176,721 |
| The Large-Cap Growth Equity Portfolio | | $1,000,000 | | $1,065,754 |
2010 Annual report • Delaware Pooled Trust
14
The performance graph assumes $1 million invested on Nov. 1, 2005, and includes reinvestment of all distributions. The performance graph does not reflect the deduction of taxes the shareholder would pay on Portfolio distributions or redemptions of Portfolio shares.
Total return assumes reinvestment of dividends and capital gains, but does not reflect reductions for taxes. Returns and share values will fluctuate so that shares, when redeemed, may be worth more or less than their original cost.
The most recent prospectus designated the Portfolio’s total operating expenses as 0.66%. Management has contractually agreed to reimburse certain expenses and/or waive its management fees from Feb. 28, 2010, through Feb. 28, 2011, in order to prevent total annual Portfolio operating expenses from exceeding, in an aggregate amount, 0.65% of the Portfolio’s average daily net assets, as described in the most recent prospectus.
Expense limitations were in effect during the period shown. Performance would have been lower had the expense limitations not been in effect.
The Russell 1000 Growth Index measures the performance of the large-cap growth segment of the U.S. equity universe. It includes those Russell 1000 companies with higher price-to-book ratios and higher forecasted growth values.
Index performance returns do not reflect any management fees, transaction costs, or expenses. Indices are unmanaged and one cannot invest directly in an index.
Past performance is not a guarantee of future results.
Because the Portfolio expects to hold a concentrated portfolio of a limited number of securities, the Portfolio’s risk is increased because each investment has a greater effect on the Portfolio’s overall performance.
Instances of high double-digit returns are unusual, cannot be sustained, and were primarily achieved during favorable market conditions.
2010 Annual report • Delaware Pooled Trust
15
Portfolio management review
Delaware Pooled® Trust — The Focus Smid-Cap Growth Equity Portfolio
October 31, 2010
For its fiscal year ended Oct. 31, 2010, Delaware Pooled Trust — The Focus Smid-Cap Growth Equity Portfolio returned +41.10% at net asset value with all distributions reinvested, far surpassing the +28.75% return of the benchmark Russell 2500 Growth Index. Complete annualized performance for The Focus Smid-Cap Growth Equity Portfolio is shown in the table on page 18.
At the start of the Portfolio’s fiscal year, the economy seemed to have put recession in the rearview mirror, but troubling and often contradictory signs remained. Analysts welcomed favorable corporate earnings but worried about real revenue growth; mergers and acquisitions and share buybacks seemed to be back in vogue but corporations still had plenty of “cash-on-the-sidelines”; the Federal Reserve stayed creative with nontraditional stimuli but high unemployment continued to limit consumer activity, and analysts wondered if the recovery was artificial. Despite the uncertainties, investor sentiment was generally quite favorable, enough to give equities a boost.
In reality, 12 short months later, very little has changed. The economy experienced a solid growth rate in the fourth quarter of 2009 (GDP +5%), though it slowed in the months that followed as a weak labor market maintained a tight grip on consumer activity. Corporate earnings have been well received by many investors but analysts hoped to see more signs of revenue growth. At the end of the fiscal year, an estimated $1 trillion remained in cash on balance sheets.
The Fed kept interest rates low for an “extended period,” while debating another bond-buying plan to stimulate growth (source: Bloomberg). China surpassed Japan as the world’s second-largest economy and reined in stimuli to prevent its economy from overheating. Meanwhile, Europe struggled with a sovereign debt crisis that brought controversial government austerity plans and citizen protests.
Through it all, investors generally remained quite positive and equities even gained momentum in the final two months of the fiscal year. Of course, some speed bumps occurred along the way, including a 1,000-point move in the Dow Jones Industrial Average in a matter of minutes one day in May 2010; and a devastating oil spill in the Gulf of Mexico threatened to hinder growth throughout several regions and economic sectors. Yet by fiscal year-end, despite the ongoing uncertainties, the major equity indices had produced double-digit returns.
Throughout the year, we remained consistent in our investment philosophy and management. We sought high-quality companies that we believed had solid cash flows and strong competitive positions and that we believe are run by experienced management teams capable of guiding their operations through good times and bad.
Netflix was the best performer within the Portfolio during the period. The company has long been the market leader in mail-order DVD distribution and was continuing to grow its dominant share even before rival Blockbuster’s recent bankruptcy filing. More significantly, Netflix has looked to the future and is transitioning to a new online offering as a complement to its traditional DVD-by-mail service. The company has developed an effective model for online distribution through key partnerships with gaming console companies and other consumer electronics manufacturers. Customer retention has been a key to success as current subscribers can also access the new, efficient distribution method.
Online travel company priceline.com was among the Portfolio’s top contributors during the fiscal year. Its “name your own price” business strategy has proven even more successful lately as it fulfills the consumer’s hearty appetite for value in these economic times. Additionally, priceline.com’s European hotel-booking subsidiary is ranked number one in market share in this high margin, fast-growing business sector (source: Bloomberg). We sold the stock during the Portfolio’s fiscal year because
The views expressed are current as of the date of this report and are subject to change.
2010 Annual report • Delaware Pooled Trust
16
its market capitalization increased above our threshold of $10 billion. We are still believers in the company’s story and own the stock in our other strategies that allow for larger-market-cap stock holdings.
The Portfolio also suffered some setbacks from holdings that underperformed. Strayer Education was the Portfolio’s worst performer on both an absolute and relative basis. The for-profit educational institute has struggled with the rest of the industry as consumer groups have raised concerns about lending practices and the government contemplates enhanced scrutiny and regulations. Many of its students qualify for government loans and some analysts fear that high default rates from non-credit-worthy borrowers may lead to another subprime-like debacle. The possibility of new regulations has led to greater uncertainty over the entire for-profit education industry and related companies have been hurt. We do not believe the government will stand in the way of individua ls accessing education. As long-term investors, we feel that Strayer should be a survivor and industry leader as reforms are implemented.
OptionsXpress was another poor performer on a relative basis, even though the stock actually increased during the period. The online brokerage company focuses on options trading for retail (individual) investors. Despite the surge in U.S. equities, retail activity has been slow as individuals often seek the safe haven of fixed income and cash equivalents (as opposed to options and other derivatives) during uncertain times. Fewer transactions means lower trading revenues. Still, we like the company’s cash metrics and long-term fundamentals and are willing to maintain our relatively small position in the near future.
Looking ahead, we still see legacy effects of the 2008 financial debacle and economic downturn that may hinder growth in the future. We do not anticipate a post-recessionary boom and expect a flat-to-moderate growth cycle with ongoing shifts in investor sentiment. While macroeconomic factors cannot be avoided these days, we are not taking on more cyclical risk based on forecasts and trends. As bottom-up stock pickers, we understand that fundamentals still matter and we will seek companies that we believe have secular growth characteristics, superior business models, and strong competitive positions that may lead to performance in a variety of market environments.
2010 Annual report • Delaware Pooled Trust
17
Performance summary
Delaware Pooled® Trust — The Focus Smid-Cap Growth Equity Portfolio
The performance data quoted represent past performance; past performance does not guarantee future results. Investment return and principal value will fluctuate so your shares, when redeemed, may be worth more or less than their original cost. Current performance may be lower or higher than the performance data quoted. Please obtain the performance data for the most recent month end by calling 800 231-8002 or visiting our Web site at www.delawareinvestments.com.
Carefully consider the Portfolio’s investment objectives, risk factors, charges, and expenses before investing. This and other information can be found in the Portfolio’s prospectus and, if available, its summary prospectus, which may be obtained by visiting www.delawareinvestments.com or calling 800 231-8002. Investors should read the prospectus and, if available, the summary prospectus carefully before investing.
| Portfolio performance | | | | | | | | |
| Average annual total returns | | | | | | | | |
| Periods ended Oct. 31, 2010 | | 1 year | | 3 years | | 5 years | | Lifetime |
| | | +41.10% | | +5.66% | | +8.24% | | +7.54% |
| | | | | | | | | |
| Portfolio profile | | | | | | | | |
| Oct. 31, 2010 | | | | | | | | |
| Total net assets |
| $4.6 million |
| |
| Number of holdings |
| 30 |
| Inception date |
| Dec. 1, 2003 |
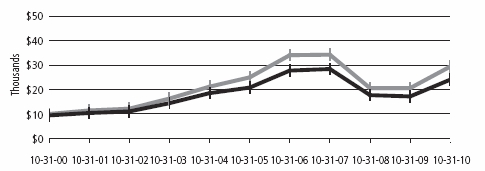
Growth of $1,000,000
| | | | Starting value (Dec. 1, 2003) | | Ending value (Oct. 31, 2010) |
| The Focus Smid-Cap Growth Equity Portfolio | | $1,000,000 | | $1,653,319 |
| Russell 2500 Growth Index | | $1,000,000 | | $1,438,164 |
2010 Annual report • Delaware Pooled Trust
18
The performance graph assumes $1 million invested on Dec. 1, 2003, and includes reinvestment of all distributions. The performance graph does not reflect the deduction of taxes the shareholder would pay on Portfolio distributions or redemptions of Portfolio shares.
Total return assumes reinvestment of dividends and capital gains, but does not reflect reductions for taxes. Returns and share values will fluctuate so that shares, when redeemed, may be worth more or less than their original cost.
The most recent prospectus designated the Portfolio’s total operating expenses as 1.48%. Management has contractually agreed to waive all or a portion of its management fees from Feb. 28, 2010, through Feb. 28, 2011, in order to prevent total annual Portfolio operating expenses from exceeding 0.92% of the Portfolio’s average daily net assets, as described in the most recent prospectus.
Expense limitations were in effect during the period shown. Performance would have been lower had the expense limitations not been in effect.
The Russell 2500 Growth Index measures the performance of the small- to mid-cap growth segment of the U.S. equity universe. It includes those Russell 2500 companies with higher price-to-book ratios and higher forecasted growth values.
The Dow Jones Industrial Average is an often-quoted market indicator that comprises 30 widely held blue-chip stocks.
Index performance returns do not reflect any management fees, transaction costs, or expenses. Indices are unmanaged and one cannot invest directly in an index.
Past performance is not a guarantee of future results.
Investments in small and/or medium-sized companies typically exhibit greater risk and higher volatility than larger, more established companies.
Instances of high double-digit returns are unusual, cannot be sustained, and were primarily achieved during favorable market conditions.
Because the Portfolio expects to hold a concentrated portfolio of a limited number of securities, the Portfolio’s risk is increased because each investment has a greater effect on the Portfolio’s overall performance.
2010 Annual report • Delaware Pooled Trust
19
Portfolio management review
Delaware Pooled® Trust — The Real Estate Investment Trust Portfolio II
October 31, 2010
For its fiscal year ended Oct. 31, 2010, Delaware Pooled Trust — The Real Estate Investment Trust Portfolio II gained 39.51% (at net asset value, with all distributions reinvested). In comparison, the Portfolio’s benchmark, the FTSE NAREIT Equity REITs Index, rose 42.81% during the same time span. Complete annualized performance for The Real Estate Investment Trust Portfolio II is shown in the table on page 22.
Investors in U.S. real estate securities enjoyed strong results during the Portfolio’s fiscal year, despite a significant downturn between late April and August 2010, when concerns about European government debt levels and the potential for a U.S. economic slowdown were most pronounced.
In our view, one of the leading factors boosting stock prices of real estate investment trusts (REITs) was the healthy availability of credit. Precisely the opposite conditions were present during the credit crisis of late 2007 through early 2009, when REIT performance suffered because lenders were unwilling to finance companies that held too much debt.
Throughout the Portfolio’s fiscal year, we sought ways to position the Portfolio to take advantage of promising opportunities, given prevailing market conditions. In the early part of the Portfolio’s fiscal year, for example, REIT values were accelerating along with optimism about economic growth and the availability of credit. We added to the Portfolio’s investments in a handful of companies that we felt would benefit significantly in such an environment, while de-emphasizing those we felt would not fare as well.
Beginning in the spring of 2010, as the sovereign debt crisis unfolded in Greece and threatened to distress the global economy, we gradually positioned the Portfolio more defensively by focusing on stocks with solid balance sheets and attractive performance prospects, as we felt these types of holdings would be less dependent on a recovering economy.
Although this defensive positioning was helpful while market conditions worsened, in retrospect the Portfolio would have been better served had we adopted a more aggressive posture in the fiscal year’s final few months. When market conditions turned upward in August 2010, we did not pivot quickly enough to capture the full upside potential.
The apartment sector was a source of positive results for the Portfolio during the fiscal year. The Portfolio’s performance was supported by good stock selection as well as an overweight position relative to the benchmark index in this sector, as apartment companies benefited from their relatively short lease durations and therefore were quick to recover when credit conditions improved.
The Portfolio’s top contributor in the apartment sector was Apartment Investment & Management Company, whose shares rose significantly to more than 90% during the fiscal year, partly due to the company’s success in improving its balance sheet. Other helpful performers in the Portfolio included Equity Residential, the country’s largest apartment owner and a beneficiary of the broad trends favoring apartment companies.
An emphasis on the strong-performing regional malls sector was also helpful, with a number of companies in this group profiting from the gradual improvement in consumer spending. Among the Portfolio’s leading relative contributors in this sector were Macerich and CBL. Both of these stocks were hampered by concerns about their debt levels during the credit crisis but succeeded in fixing their balance sheets.
The Portfolio’s underweight position in the troubled industrials group, especially being underexposed to ProLogis, was another positive factor. This stock, which had a fairly meaningful weighting within the benchmark index, advanced during the fiscal year but significantly lagged the benchmark’s impressive results.
The views expressed are current as of the date of this report and are subject to change.
2010 Annual report • Delaware Pooled Trust
20
In contrast, security selection within the healthcare sector was a source of underperformance, as this relatively defensive group failed to keep pace with the benchmark. We opted to limit our exposure to medical-office-property company Health Care REIT in favor of Healthcare Realty Trust, a stock we felt offered better prospects. Unfortunately, this approach did not work out well during the fiscal year. As of this writing, we continue to feel that the company’s shares are appropriate investments for the Portfolio, and we continue to hold them.
The Portfolio’s relative underweighting within the lodging sector was a modest impediment as the sector outpaced the benchmark overall. A position in Chesapeake Lodging Trust was a noteworthy disappointment, while a position in Gaylord Entertainment, a hospitality and entertainment company, did relatively well. Gaylord was added to the Portfolio after its stock price dropped as a result of concerns about the financial effect of flooding in Memphis, home to one of its largest properties. When the damage proved less severe than many investors had expected, the stock recovered. As the Portfolio& #8217;s fiscal year progressed, Chesapeake and Gaylord became candidates for removal from the Portfolio, and both positions were completely liquidated by the end of the period.
At the end of the Portfolio’s fiscal year, we maintained a slight relative overweight in apartment and mall companies, while remaining underweight in lodging, office, healthcare, and industrial REITs. In our view, REIT prices have become fairly high, and we feel it is not prudent to remain aggressively positioned, in light of a potential shift in the market environment. For example, rising Treasury yields could increase the cost of financing and lead to some headwinds for real estate stocks. We continue to watch market conditions closely and believe we are poised to make the Portfolio holdings somewhat more defensive if the market backdrop weakens.
2010 Annual report • Delaware Pooled Trust
21
Performance summary
Delaware Pooled® Trust — The Real Estate Investment Trust Portfolio II
The performance data quoted represent past performance; past performance does not guarantee future results. Investment return and principal value will fluctuate so your shares, when redeemed, may be worth more or less than their original cost. Current performance may be lower or higher than the performance data quoted. Please obtain the performance data for the most recent month end by calling 800 231-8002 or visiting our Web site at www.delawareinvestments.com.
Carefully consider the Portfolio’s investment objectives, risk factors, charges, and expenses before investing. This and other information can be found in the Portfolio’s prospectus and, if available, its summary prospectus, which may be obtained by visiting www.delawareinvestments.com or calling 800 231-8002. Investors should read the prospectus and, if available, the summary prospectus carefully before investing.
| Portfolio performance | | | | | | | | | |
| Average annual total returns | | | | | | | | | |
| Periods ended Oct. 31, 2010 | 1 year | | 3 years | | 5 years | | 10 years | | Lifetime |
| | +39.51% | | -5.20% | | +3.22% | | +10.15% | | +8.37% |
| Portfolio profile |
| Oct. 31, 2010 |
| |
| Total net assets |
| $2.8 million |
| |
| Number of holdings |
| 55 |
| Inception date |
| Nov. 4, 1997 |
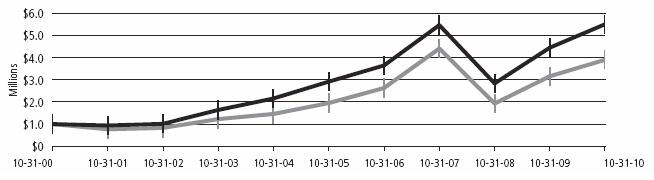
Growth of $1,000,000
| | | | Starting value (Oct. 31, 2000) | | Ending value (Oct. 31, 2010) |
| FTSE NAREIT Equity REITs Index | | $1,000,000 | | $2,936,925 |
| The Real Estate Investment Trust Portfolio II | | $1,000,000 | | $2,629,910 |
2010 Annual report • Delaware Pooled Trust
22
The performance graph assumes $1 million invested on Oct. 31, 2000, and includes reinvestment of all distributions. The performance graph does not reflect the deduction of taxes the shareholder would pay on Portfolio distributions or redemptions of Portfolio shares.
Total return assumes reinvestment of dividends and capital gains, but does not reflect reductions for taxes. Returns and share values will fluctuate so that shares, when redeemed, may be worth more or less than their original cost.
The most recent prospectus designated the Portfolio’s total operating expenses as 1.53%. Management has contractually agreed to reimburse certain expenses and/or waive its management fees from Feb. 28, 2010, through Feb. 28, 2011, in order to prevent total annual Portfolio operating expenses from exceeding, in an aggregate amount, 0.95% of the Portfolio’s average daily net assets, as described in the most recent prospectus.
Expense limitations were in effect during the period shown. Performance would have been lower had the expense limitations not been in effect.
The FTSE NAREIT Equity REITs Index measures the performance of all publicly traded equity real estate investment trusts traded on U.S. exchanges.
Index performance returns do not reflect any management fees, transaction costs, or expenses. Indices are unmanaged and one cannot invest directly in an index.
Past performance is not a guarantee of future results.
“Nondiversified” Portfolios may allocate more of their net assets to investments in single securities than “diversified” Portfolios. Resulting adverse effects may subject these Portfolios to greater risks and volatility.
Narrowly focused investments may exhibit higher volatility than investments in multiple industry sectors.
REIT investments are subject to many of the risks associated with direct real estate ownership, including changes in economic conditions, credit risk, and interest rate fluctuations. A REIT fund’s tax status as a regulated investment company could be jeopardized if it holds real estate directly, as a result of defaults, or receives rental income from real estate holdings.
Instances of high double-digit returns are unusual, cannot be sustained, and were primarily achieved during favorable market conditions.
2010 Annual report • Delaware Pooled Trust
23
Portfolio management review
Delaware Pooled® Trust — The Core Focus Fixed Income Portfolio
October 31, 2010
When the Portfolio’s fiscal year began, financial markets were bolstered by a broad-based sense of optimism about the economy:
- On the heels of the U.S. economy’s first quarterly expansion in more than a year, gross domestic product growth in the fourth quarter of 2009 showed continued improvements, even strength. Annualized GDP expansion of 5.0% during those three months represented the fastest quarterly growth for the U.S. economy since early 2006. (Source: U.S. Commerce Department.)
As the fiscal year progressed, however, indications began to mount that the U.S. economic environment was slowing once again. For example:
- Unemployment in the United States remained stubbornly high. The jobless rate hovered between 9.5% and 10% through the entire fiscal year.
- The rate of expansion in GDP decreased rather rapidly during the first half of 2010. This trend led some economists to worry about the potential for a “double-dip” recession.
- The European debt crisis, which began in the spring of 2010, threatened to spread beyond Greece and ensnare other vulnerable economies across the developed world.
- The U.S. housing market, weighed down by significant foreclosure activity and declining sales, continued to struggle.
Source: Bloomberg
Despite these considerable economic headwinds, the fiscal year was largely a favorable time for the fixed income market as accommodative monetary policy from the Federal Reserve combined with still considerable value within many areas of the corporate bond market and a strong demand for yield in light of low interest rates all bode well for fixed income investors.
Against this backdrop, Delaware Pooled Trust — The Core Focus Fixed Income Portfolio returned +8.46% at net asset value (NAV) with all distributions reinvested for the fiscal year ended Oct. 31, 2010. The Portfolio’s benchmark, the Barclays Capital U.S. Aggregate Index, returned +8.01% for the same time period. Complete annualized performance for The Core Focus Fixed Income Portfolio is shown in the table on page 26.
The Portfolio’s continued overweight in investment grade corporate bonds, an emphasis on BBB and A-rated issues, and security selection in general, each aided relative returns during the fiscal year. Among investment grade U.S. corporate bonds, we concluded that the BBB and A-rated area generally offered the best risk-reward trade-off and emphasized Portfolio positions in those categories. It’s important to note, however, that these bonds, which are considered medium-grade, experienced down periods during the year when investors made efforts to move toward higher-quality bonds.
The Portfolio generally remained underweight in government-backed or agency mortgage-backed securities (MBS), as we believed that these securities remained expensive for much of the fiscal year. This positioning benefited Portfolio performance, as these areas underperformed the benchmark during the fiscal year.
Detractors from the Portfolio’s relative performance came from overweights in asset-backed securities and commercial mortgage-backed securities (particularly during the latter parts of the period). This happened despite the Portfolio’s bias toward higher-quality commercial mortgage-backed securities.
We believe the coming months will likely be characterized by much economic uncertainty, as periods of improving growth can be quickly followed by slowdowns and investors continue to demonstrate a pattern of rapidly changing attitudes toward risk. Within this difficult environment, we believe that our focus on in-depth security research, applied across a well-diversified global range of investment opportunities, may put the Portfolio in a position to accommodate the ongoing tests that will likely face the U.S. economy during the next several years. Building a Portfolio that combines our best research ideas with a modestly defensive bias seems most appropriate to us at this time.
The views expressed are current as of the date of this report and are subject to change.
2010 Annual report • Delaware Pooled Trust
��
25
Performance summary
Delaware Pooled® Trust — The Core Focus Fixed Income Portfolio
The performance data quoted represent past performance; past performance does not guarantee future results. Investment return and principal value will fluctuate so your shares, when redeemed, may be worth more or less than their original cost. Current performance may be lower or higher than the performance data quoted. Please obtain the performance data for the most recent month end by calling 800 231-8002 or visiting our Web site at www.delawareinvestments.com.
Carefully consider the Portfolio’s investment objectives, risk factors, charges, and expenses before investing. This and other information can be found in the Portfolio’s prospectus and, if available, its summary prospectus, which may be obtained by visiting www.delawareinvestments.com or calling 800 231-8002. Investors should read the prospectus and, if available, the summary prospectus carefully before investing.
| Portfolio performance | | | | | | | | |
| Average annual total returns | | | | | | | | |
| Periods ended Oct. 31, 2010 | | 1 year | | 3 years | | 5 years | | Lifetime |
| | | +8.46% | | +6.95% | | +6.12% | | +5.69% |
| Portfolio profile |
| Oct. 31, 2010 |
| |
| Total net assets |
| $19.2 million |
| Inception date |
| June 30, 2004 |
Growth of $1,000,000
| | | | | Starting value (June 30, 2004) | | Ending value (Oct. 31, 2010) |
| | Barclays Capital U.S. Aggregate Index | | $1,000,000 | | $1,438,083 |
| | The Core Focus Fixed Income Portfolio | | $1,000,000 | | $1,419,899 |
2010 Annual report • Delaware Pooled Trust
26
The performance graph assumes $1 million invested on June 30, 2004, and includes reinvestment of all distributions. The performance graph does not reflect the deduction of taxes the shareholder would pay on Portfolio distributions or redemptions of Portfolio shares.
Total return assumes reinvestment of dividends and capital gains, but does not reflect reductions for taxes. Returns and share values will fluctuate so that shares, when redeemed, may be worth more or less than their original cost.
The most recent prospectus designated the Portfolio’s total operating expenses for shares as 0.71%. Management has contractually agreed to reimburse certain expenses and/or waive its management fees from Feb. 28, 2010, through Feb. 28, 2011, in order to prevent total annual Portfolio operating expenses from exceeding, in an aggregate amount, 0.43% of the Portfolio’s average daily net assets, as described in the most recent prospectus.
Expense limitations were in effect during the period shown. Performance would have been lower had the expense limitation not been in effect.
The Barclays Capital U.S. Aggregate Index measures the performance of more than 8,000 publicly issued investment grade (Baa3/BBB- or better) corporate, U.S. government, mortgage- and asset-backed securities with at least one year to maturity and at least $250 million par amount outstanding.
Index performance returns do not reflect any management fees, transaction costs or expenses. Indices are unmanaged and one cannot invest directly in an index.
Past performance is not a guarantee of future results.
The letter ratings are provided by S&P and describe the creditworthiness of the underlying bonds in the portfolio and generally range from AAA (highest quality) to CCC (lowest; highly speculative).
Securities in the lowest of the rating categories considered to be investment grade (that is, Baa or BBB) have some speculative characteristics.
Fixed income securities and bond funds can lose value, and investors can lose principal, as interest rates rise. They also may be affected by economic conditions that hinder an issuer’s ability to make interest and principal payments on its debt.
The Portfolio may also be subject to prepayment risk, the risk that the principal of a fixed income security that is held by the Portfolio may be prepaid prior to maturity, potentially forcing the Portfolio to reinvest that money at a lower interest rate.
The Portfolio may be invested in foreign corporate bonds, which have special risks not ordinarily associated with domestic investments, such as currency fluctuations, economic and political change, and different accounting standards. The Portfolio may invest in derivatives, which may involve additional expenses and are subject to risk, including the risk that an underlying security or securities index moves in the opposite direction from what the portfolio manager anticipated. A derivative transaction depends upon the counterparties’ ability to fulfill their contractual obligations.
Diversification may not protect against market risk.
The Portfolio may experience portfolio turnover in excess of 100%, which could result in higher transaction costs and tax liability.
2010 Annual report • Delaware Pooled Trust
27
Portfolio management review
Delaware Pooled® Trust — The High-Yield Bond Portfolio
October 31, 2010
Delaware Pooled Trust — The High-Yield Bond Portfolio returned +20.85% with all distributions reinvested for the fiscal year ended Oct. 31, 2010. For the same period, the BofA Merrill Lynch U.S. High Yield Constrained Index returned +19.08%. Complete annualized performance for The High-Yield Bond Portfolio is shown in the table on page 30.
As the Portfolio’s fiscal year began, the U.S. economy was still in the process of recovering from the worst recession since the 1930s. While high yield bonds usually underperform Treasurys during economic downturns, the near-panic conditions that infected markets during the global financial crisis had caused credit spreads (the yield differential between government and corporate bonds of similar maturities) to widen to virtually unprecedented levels (it’s important to remember that as yields rise, prices decline). Spreads eventually moderated as financial conditions improved, sparking strong rallies in the high yield sector. Favorable sentiment toward fixed income was also aided by the sovereign debt crisis in the euro zone, attempts by the Chinese government to cool its overheated property sector, and by fears of a double-dip recession in major industrialized economies. Those factors implied an extended period of low interest rates while virtually eliminating inflation as an immediate threat. (Source: Moody’s.)
Though default rates among high yield bonds rose when conditions worsened (mostly before the start of the fiscal period), they never soared to the stratospheric levels that many investors had once feared, because most companies had gone into full survival mode as the recession deepened. With new issuance at a standstill during the credit crunch — thus cutting off fresh sources of capital — many businesses were forced to cut expenses to the bone. The repair of corporate finances received a further boost when the new-issuance market revived, allowing companies to pay-down or refinance their debt. The ensuing rebound in corporate profitability — and the accompanying drop in default rates to around 3% by the end of the fiscal year — reflected major fortifications to company balance sheets. (Source: Bloomberg.)
At the beginning of the Portfolio’s fiscal year, we sought to position the Portfolio to benefit from snap-back rallies in sectors that we believed had sustained the most damage during the preceding selloff. Specifically, we had taken large overweight positions in CCC and B-rated bonds from economically sensitive sectors such as basic materials. Meanwhile, we underweighted higher-rated BB securities and bonds from defensive industries such as energy, healthcare, and utilities. Those credit and sector allocation decisions contributed to the Portfolio’s relative performance, since total returns from lower-rated credits beat their higher-quality cousins by a wide margin during the period.
Performing highly detailed, bottom-up credit research remained vital to exploiting opportunities among lower-rated securities. Though we were overweight in CCC bonds during the entire fiscal year, we identified several issuers from that category that our analysis flagged as improperly rated. In a typical recession, it has been our experience that national rating agencies often apply a broad brush and quickly downgrade large amounts of debt, causing those bonds to lag. Once a recovery begins, rating agencies are generally slower to issue upgrades as conditions improve. Normally, the CCC sector (the most speculative area of the high yield market) is the last to be rerated. In functioning as our own credit rating agency, in essence, we found several companies that were rated CCC by the national credit rating agencies had made significant improvements to their balance sheets and appeared to deserve a higher rating. As that rerating process pla yed out in several instances, those bonds outperformed.
Meanwhile, two allocation decisions detracted from relative performance. We retained an overweight position in telecommunications companies. This area lagged the benchmark during the fiscal year because the sector was deemed too conservative in an environment that favored speculative debt. We also sustained some underperformance by underweighting debt of insurance and real estate companies, both of which were viewed as distressed industries that had become generally oversold during the recession.
The views expressed are current as of the date of this report and are subject to change.
2010 Annual report • Delaware Pooled Trust
28
Looking ahead, we think the high yield market should perform reasonably well even if consumer spending is slow to bounce back, which we believe is likely. Corporate cash flows have improved, the new-issuance market is vibrant, and out-of-court restructurings could continue to avert defaults. In fact, we recently lowered our default projection for high yield bonds in 2010 from 5% to 3%. Though high yield sustained an outflow of funds in the latter part of the fiscal year, we believe the resulting widening of credit spreads could actually make the sector more attractive over the long term, assuming economic conditions gradually stabilize. In our view, the main risk to our relatively optimistic outlook for high yield lies in the potential for a freeze in liquidity and new issuance if the macroeconomic environment deteriorates.
2010 Annual report • Delaware Pooled Trust
29
Performance summary
Delaware Pooled® Trust — The High-Yield Bond Portfolio
The performance data quoted represent past performance; past performance does not guarantee future results. Investment return and principal value will fluctuate so your shares, when redeemed, may be worth more or less than their original cost. Current performance may be lower or higher than the performance data quoted. Please obtain the performance data for the most recent month end by calling 800 231-8002 or visiting our Web site at www.delawareinvestments.com.
Carefully consider the Portfolio’s investment objectives, risk factors, charges, and expenses before investing. This and other information can be found in the Portfolio’s prospectus and, if available, its summary prospectus, which may be obtained by visiting www.delawareinvestments.com or calling 800 231-8002. Investors should read the prospectus and, if available, the summary prospectus carefully before investing.
| Portfolio performance | | | | | | | | | | |
| Average annual total returns | | | | | | | | | | |
| Periods ended Oct. 31, 2010 | | 1 year | | 3 years | | 5 years | | 10 years | | Lifetime |
| | | +20.85% | | +9.80% | | +9.52% | | +9.48% | | +8.25% |
| Portfolio profile |
| Oct. 31, 2010 |
| |
| Total net assets |
| $29.4 million |
| |
| Number of holdings |
| 236 |
| Inception date |
| Dec. 2, 1996 |
Growth of $1,000,000
| | | | | Starting value (Oct. 31, 2000) | | Ending value (Oct. 31, 2010) |
| | The High-Yield Bond Portfolio | | $1,000,000 | | $2,474,002 |
| | BofA Merrill Lynch U.S. High Yield Constrained Index | | $1,000,000 | | $2,260,151 |
2010 Annual report • Delaware Pooled Trust
30
The performance graph assumes $1 million invested on Oct. 31, 2000, and includes reinvestment of all distributions. The performance graph does not reflect the deduction of taxes the shareholder would pay on Portfolio distributions or redemptions of Portfolio shares.
Total return assumes reinvestment of dividends and capital gains, but does not reflect reductions for taxes. Returns and share values will fluctuate so that shares, when redeemed, may be worth more or less than their original cost.
The most recent prospectus designated the Portfolio’s total operating expenses as 0.78%. Management has contractually agreed to reimburse certain expenses and/or waive its management fees from Feb. 28, 2010, through Feb. 28, 2011, in order to prevent total annual Portfolio operating expenses from exceeding, in an aggregate amount, 0.59% of the Portfolio’s average daily net assets, as described in the most recent prospectus. Expense limitations were in effect during the period shown. Performance would have been lower had the expense limitations not been in effect.
The BofA Merrill Lynch U.S. High Yield Constrained Index, formerly the Merrill Lynch U.S. High Yield Master II Constrained Index, tracks the performance of U.S. dollar–denominated high yield corporate debt publicly issued in the U.S. domestic market, but caps individual issuer exposure at 2% of the benchmark.
Index performance returns do not reflect any management fees, transaction costs or expenses. Indices are unmanaged and one cannot invest directly in an index.
Past performance is not a guarantee of future results.
The letter ratings are provided by S&P and describe the creditworthiness of the underlying bonds in the portfolio and generally range from AAA (highest quality) to CCC (lowest; highly speculative).
Securities in the lowest of the rating categories considered to be investment grade (that is, Baa or BBB) have some speculative characteristics.
Fixed income securities and bond funds can lose value, and investors can lose principal, as interest rates rise. They also may be affected by economic conditions that hinder an issuer’s ability to make interest and principal payments on its debt.
The Portfolio may also be subject to prepayment risk, the risk that the principal of a fixed income security that is held by the Portfolio may be prepaid prior to maturity, potentially forcing the Portfolio to reinvest that money at a lower interest rate.
High yielding, noninvestment grade bonds (junk bonds) involve higher risk than investment grade bonds. The high yield secondary market is particularly susceptible to liquidity problems when institutional investors, such as mutual funds and certain other financial institutions, temporarily stop buying bonds for regulatory, financial, or other reasons. In addition, a less liquid secondary market makes it more difficult for the Portfolio to obtain precise valuations of the high yield securities in its portfolio.
The Portfolio may invest in derivatives, which may involve additional expenses and are subject to risk, including the risk that an underlying security or securities index moves in the opposite direction from what the portfolio manager anticipated. A derivative transaction depends upon the counterparties’ ability to fulfill their contractual obligations.
International investments entail risks not ordinarily associated with U.S. investments including fluctuation in currency values, differences in accounting principles, or economic or political instability in other nations. Investing in emerging markets can be riskier than investing in established foreign markets due to increased volatility and lower trading volume.
If and when the Portfolio invests in forward foreign currency contracts or uses other investments to hedge against currency risks, the Portfolio will be subject to special risks, including counterparty risk.
The Portfolio may experience portfolio turnover in excess of 100%, which could result in higher transaction costs and tax liability.
Instances of high double-digit returns are unusual, cannot be sustained, and were primarily achieved during favorable market conditions.
2010 Annual report • Delaware Pooled Trust
31
Portfolio management review
Delaware Pooled® Trust — The Core Plus Fixed Income Portfolio
October 31, 2010
When the period began, financial markets were bolstered by a broad-based sense of optimism about the economy:
- On the heels of the U.S. economy’s first quarterly expansion in more than a year, gross domestic product growth in the fourth quarter of 2009 showed continued improvements, even strength. Annualized GDP expansion of 5.0% during those three months represented the fastest quarterly growth for the U.S. economy since early 2006. (Source: U.S. Commerce Department.)
As the Portfolio’s fiscal year progressed, however, indications began to mount that the U.S. economic environment was slowing once again. For example:
- Unemployment in the United States remained stubbornly high. The jobless rate hovered between 9.5% and 10% during the entire fiscal period.
- The rate of expansion in GDP decreased rather rapidly during the first half of 2010. This trend led some economists to worry about the potential for a “double-dip” recession.
- The European debt crisis, which began in the spring of 2010, threatened to spread beyond Greece and ensnare other vulnerable economies across the developed world.
- The U.S. housing market, weighed down by significant foreclosure activity and declining sales, continued to struggle.
Source: Bloomberg
Despite these considerable economic headwinds, the Portfolio’s fiscal year was largely a favorable time period for the fixed income market as accommodative monetary policy from the Federal Reserve combined with still considerable value within many areas of the corporate bond market and a strong demand for yield in light of low interest rates all bode well for fixed income investors.
Against this backdrop, Delaware Pooled Trust — The Core Plus Fixed Income Portfolio returned +12.05% at net asset value (NAV) with all distributions reinvested for the fiscal year ended Oct. 31, 2010. The Portfolio’s benchmark, the Barclays Capital U.S. Aggregate Index, returned +8.01% for the same time period. Complete annualized performance for The Core Plus Fixed Income Portfolio is shown in the table on page 34.
The Portfolio’s continued overweight in investment grade corporate bonds, an emphasis on BBB and A-rated issues, and security selection in general, each aided relative returns during the fiscal year. Among investment grade U.S. corporate bonds, we concluded that the BBB and A-rated area generally offered the best risk-reward trade-off and emphasized Portfolio positions in those categories. Though these bonds, which are considered medium grade, experienced down periods during the fiscal year when many investors moved toward higher-quality bonds, they proved helpful over the entire fiscal year.
Positions in the high yield sector also contributed to Portfolio performance on an absolute basis as high yield bonds experienced a strong rally during the year. High yield bonds benefited from a strong fundamental picture featuring declining default rates as well as a positive technical backdrop, in which high yield bonds were in demand throughout much of the fiscal period. It’s important to note that Portfolio returns within this category were moderated, however, by our emphasis on what we viewed as higher-quality bonds within the high yield sector during a period when total returns from lower-rated credits beat their higher-quality cousins by a wide margin.
The views expressed are current as of the date of this report and are subject to change.
2010 Annual report • Delaware Pooled Trust
32
In addition, performance was affected by the following factors:
- The Portfolio generally remained underweight in government-backed or agency mortgage-backed securities (MBS), as we believed that these securities remained expensive for much of the period. This positioning benefited Portfolio performance, as these areas underperformed the benchmark during the fiscal year.
- Emerging market debt generally made positive contributions within the Portfolio. Notable contributions came from issues in Brazil, Indonesia, and Poland.
- The Portfolio’s currency allocation emphasized commodity-exporting or higher yielding countries such as Norway, Canada, and Australia. While this helped relative performance, an underweight position in the euro zone held back returns.
We believe the coming months will likely be characterized by much economic uncertainty, as periods of improving growth can be quickly followed by slowdowns and investors continue to demonstrate a pattern of rapidly changing attitudes toward risk. Within this difficult environment, we believe that our focus on in-depth security research, applied across a well-diversified global range of investment opportunities, may put the Portfolio in a position to accommodate the ongoing tests that will likely face the U.S. economy during the next several years. We believe that building a Portfolio that combines our best research ideas with a modestly defensive bias seems most appropriate to us at this time.
2010 Annual report • Delaware Pooled Trust
33
Performance summary
Delaware Pooled® Trust — The Core Plus Fixed Income Portfolio
The performance data quoted represent past performance; past performance does not guarantee future results. Investment return and principal value will fluctuate so your shares, when redeemed, may be worth more or less than their original cost. Current performance may be lower or higher than the performance data quoted. Please obtain the performance data for the most recent month end by calling 800 231-8002 or visiting our Web site at www.delawareinvestments.com.
Carefully consider the Portfolio’s investment objectives, risk factors, charges, and expenses before investing. This and other information can be found in the Portfolio’s prospectus and, if available, its summary prospectus, which may be obtained by visiting www.delawareinvestments.com or calling 800 231-8002. Investors should read the prospectus and, if available, the summary prospectus carefully before investing.
| Portfolio performance | | | | | | | | |
| Average annual total returns | | | | | | | | |
| Periods ended Oct. 31, 2010 | | 1 year | | 3 years | | 5 years | | Lifetime |
| | | +12.05% | | +9.83% | | +8.05% | | +7.44% |
| Portfolio profile |
| Oct. 31, 2010 |
| |
| Total net assets |
| $50.3 million |
| |
| Number of holdings |
| 369 |
| Inception date |
| June 28, 2002 |
Growth of $1,000,000
| | | | | Starting value (June 28, 2002) | | Ending value (Oct. 31, 2010) |
| | The Core Plus Fixed Income Portfolio | | $1,000,000 | | $1,820,561 |
| | Barclays Capital U.S. Aggregate Index | | $1,000,000 | | $1,592,843 |
2010 Annual report • Delaware Pooled Trust
34
The performance graph assumes $1 million invested on June 28, 2002, and includes reinvestment of all distributions. The performance graph does not reflect the deduction of taxes the shareholder would pay on Portfolio distributions or redemptions of Portfolio shares.
Total return assumes reinvestment of dividends and capital gains, but does not reflect reductions for taxes. Returns and share values will fluctuate so that shares, when redeemed, may be worth more or less than their original cost.
The most recent prospectus designated the Portfolio’s total operating expenses as 0.61%. Management has contractually agreed to reimburse certain expenses and/or waive its management fees from Feb. 28, 2010, through Feb. 28, 2011, in order to prevent total annual Portfolio operating expenses from exceeding, in an aggregate amount, 0.45% of the Portfolio’s average daily net assets, as described in the most recent prospectus. Expense limitations were in effect during the period shown. Performance would have been lower had the expense limitations not been in effect.
The Barclays Capital U.S. Aggregate Index measures the performance of more than 8,000 publicly issued investment grade (Baa3/BBB- or better) corporate, U.S. government, mortgage- and asset-backed securities with at least one year to maturity and at least $250 million par amount outstanding. Index performance returns do not reflect any management fees, transaction costs, or expenses. Indices are unmanaged and one cannot invest directly in an index.
Past performance is not a guarantee of future results.
The letter ratings are provided by S&P and describe the creditworthiness of the underlying bonds in the portfolio and generally range from AAA (highest quality) to CCC (lowest; highly speculative).
Securities in the lowest of the rating categories considered to be investment grade (that is, Baa or BBB) have some speculative characteristics.
Fixed income securities and bond funds can lose value, and investors can lose principal, as interest rates rise. They also may be affected by economic conditions that hinder an issuer’s ability to make interest and principal payments on its debt.
The Portfolio may also be subject to prepayment risk, the risk that the principal of a fixed income security that is held by the Portfolio may be prepaid prior to maturity, potentially forcing the Portfolio to reinvest that money at a lower interest rate.
High yielding, noninvestment grade bonds (junk bonds) involve higher risk than investment grade bonds. The high yield secondary market is particularly susceptible to liquidity problems when institutional investors, such as mutual funds and certain other financial institutions, temporarily stop buying bonds for regulatory, financial, or other reasons. In addition, a less liquid secondary market makes it more difficult for the Fund to obtain precise valuations of the high yield securities in its portfolio.
The Portfolio may invest in derivatives, which may involve additional expenses and are subject to risk, including the risk that an underlying security or securities index moves in the opposite direction from what the portfolio manager anticipated. A derivative transaction depends upon the counterparties’ ability to fulfill their contractual obligations.
The Portfolio may be invested in foreign corporate bonds, which have special risks not ordinarily associated with domestic investments, such as currency fluctuations, economic and political change, and different accounting standards.
Diversification may not protect against market risk.
The Portfolio may experience portfolio turnover in excess of 100%, which could result in higher transaction costs and tax liability.
2010 Annual report • Delaware Pooled Trust
35
Portfolio management review
Delaware Pooled® Trust — The International Equity Portfolio
October 31, 2010
Delaware Pooled Trust — The International Equity Portfolio returned +8.77% at net asset value (NAV) with all distributions reinvested for the fiscal year ended Oct. 31, 2010. The Portfolio’s benchmark, the MSCI EAFE (Europe, Australasia, Far East) Index (net), returned +8.36% for the same period. Complete annualized performance for The International Equity Portfolio is shown in the table on page 38.
The Portfolio’s fiscal year was one during which economic data were confusing at best. Investors had hoped for evidence of recovery and became slightly euphoric with the announcement of expansive government policies. However, those policies never really produced the jobs or the wealth filtering into consumers’ pockets as intended.
Similarly, sectors did not generally perform in a textbook way during this volatile time period. For instance, in the third calendar quarter of 2010, the benchmark was up 16.5%. With such strong performance, one would normally expect the cyclical sectors to lead the benchmark index’s performance and defensive sectors to lag. In fact, the defensive telecommunications sector was up 20.2% during the quarter while the information technology sector, which is typically considered to be cyclical, was up by only 8.5%. Reviewing the underlying data and looking at country returns, we believe that the dominant focus of market participants involved a country’s level of sovereign risk. As a result, various markets sold off across the board, regardless of underlying stock valuation or profitability. (Source: Bloomberg.)
This pattern appeared to develop at the beginning of the Portfolio’s fiscal year, with the debt restructuring in Dubai. Many investors, ourselves included, grew concerned that high leverage within developed economies had not been reduced but had merely been transferred to sovereign borrowers who had assumed the liabilities of their collapsed private lenders. Thus, after Dubai, many investors began to recognize problems with sovereign debt: first in Greece, followed by Portugal, Spain, Italy, and Ireland. At one point, when it appeared that Germany might not be fully committed to a rescue package for Greece, many investors began to wonder if the euro would survive. This was a serious concern, which resulted in a “fear premium” for affected markets.
Since our strategy utilizes a bottom-up security selection discipline, we did not shun entire markets; instead, we continued to look for undervalued opportunities in every country within our mandate. Even so, the countries furthest from the sovereign debt concerns of Southern Europe generally performed best. With the exception of Japan, the Asia Pacific region was strong. Australia, in particular, stood out: it is the only developed economy to have averted a technical recession. Australia entered the economic crisis in better shape than most countries and had greater flexibility to make accommodative macroeconomic policy adjustments. The Australian central bank’s decision to raise interest rates has strengthened the Australian dollar putting it ahead of the curve relative to other developed economies. Within the Portfolio, an overweight position in Australian holdings had a positive effect on performance relative to its benchmark, bu t it was more than offset by the negative effects of stock selection. On the whole, the Portfolio mildly underperformed the benchmark index in Australia.
By contrast, Spain’s economy has suffered during the Portfolio’s fiscal year. Spain had been one of the fastest-growing euro zone countries over the past decade. However, the financial crisis and the collapse in property and construction industries hit Spain hard. Unemployment rose sharply to around 20%, and the rise in nonperforming loans has taken a heavy toll on Spanish banks. With the government’s fiscal position deteriorating, many investors began to fear that austerity measures could plunge the Spanish economy into a debt-deflation trap. Nonetheless, we retained an overweight position in Spain relative to the benchmark index. While this overweight led to underperformance against the index, we believe we were able to identify specific longer-term investments at attractive valuations.
The views expressed are current as of the date of this report and are subject to change.
2010 Annual report • Delaware Pooled Trust
36
Turning to specific securities, two of our long-term holdings were our best performers during the Portfolio’s fiscal year. Jardine Matheson Holdings is a Hong Kong–based conglomerate with seven subsidiaries concentrated in the fast-growing Asian region. The stock gained more than 50%, based on the company’s strong balance sheet and a 20% dividend increase this year. Another conglomerate, the Australia-based Wesfarmers, returned more than 30%. Investors recognized that Wesfarmers’ acquisition of the Coles Group supermarket chain in 2007 has paid off in the form of improved pr ofitability, and this drove the stock’s strong return.
On the downside, we sustained a significant loss from our exposure to BP, which came off its lowest point, down nearly 50%, to finish with a 25% decline over the 12-month period. When the Deepwater Horizon oil rig exploded on April 20, 2010, we immediately went to work reassessing the current value of the company. It seemed that as fast as information was being made available, many investors were selling the stock, often using short positions. We were not willing to sell while the stock price was plummeting. At the same time, we felt there remained downside risks from litigation, which prevented us from adding to the position. When the well was capped on July 19, 2010, we revisited our model, taking into account both the significant shorter-term costs and the longer-te rm factors such as an increase in capital spending, damage to BP’s reputation, and the negative effect on future production growth. While the fair value of the stock was reduced, in our view, this decline in value was more than discounted by the significant decline in the share price, and we continued to hold the shares at the end of the Portfolio’s fiscal year.
2010 Annual report • Delaware Pooled Trust
37
Performance summary
Delaware Pooled® Trust — The International Equity Portfolio
The performance data quoted represent past performance; past performance does not guarantee future results. Investment return and principal value will fluctuate so your shares, when redeemed, may be worth more or less than their original cost. Current performance may be lower or higher than the performance data quoted. Please obtain the performance data for the most recent month end by calling 800 231-8002 or visiting our Web site at www.delawareinvestments.com.
Carefully consider the Portfolio’s investment objectives, risk factors, charges, and expenses before investing. This and other information can be found in the Portfolio’s prospectus and, if available, its summary prospectus, which may be obtained by visiting www.delawareinvestments.com or calling 800 231-8002. Investors should read the prospectus and, if available, the summary prospectus carefully before investing.
| Portfolio performance | | | | | | | | | | |
| Average annual total returns | | | | | | | | | | |
| Periods ended Oct. 31, 2010 | | 1 year | | 3 years | | 5 years | | 10 years | | Lifetime |
| | | +8.77% | | -9.02% | | +3.86% | | +6.86% | | +8.36% |
| Portfolio profile |
| Oct. 31, 2010 |
| |
| Total net assets |
| $809 million |
| Inception date |
| Feb. 4, 1992 |
Growth of $1,000,000
| | | | Starting value (Oct. 31, 2000) | | Ending value (Oct. 31, 2010) |
| The International Equity Portfolio | | $1,000,000 | | $1,941,160 |
| MSCI EAFE Index (net) | | $1,000,000 | | $1,366,460 |
2010 Annual report • Delaware Pooled Trust
38
The performance graph assumes $1 million invested on Oct. 31, 2000, and includes reinvestment of all distributions. The performance graph does not reflect the deduction of taxes the shareholder would pay on Portfolio distributions or redemptions of Portfolio shares.
Total return assumes reinvestment of dividends and capital gains, but does not reflect reductions for taxes. Returns and share values will fluctuate so that shares, when redeemed, may be worth more or less than their original cost.
The most recent prospectus designated the Portfolio’s total operating expenses as 0.88%. Management has contractually agreed to reimburse certain expenses and/or waive its management fees from Feb. 28, 2010, through Feb. 28, 2011, in order to prevent total annual Portfolio operating expenses from exceeding, in an aggregate amount, 0.90% of the Portfolio’s average daily net assets, as described in the most recent prospectus.
The MSCI EAFE Index measures equity market performance across developed market countries in Europe, Australasia, and the Far East. Index “net” return approximates the minimum possible dividend reinvestment, after deduction of withholding tax at the highest possible rate.
Index performance returns do not reflect any management fees, transaction costs, or expenses. Indices are unmanaged and one cannot invest directly in an index.
Past performance is not a guarantee of future results.
International investments entail risks not ordinarily associated with U.S. investments including fluctuation in currency values, differences in accounting principles, or economic or political instability in other nations. Investing in emerging markets can be riskier than investing in established foreign markets due to increased volatility and lower trading volume.
If and when the Portfolio invests in forward foreign currency contracts or uses other investments to hedge against currency risks, the Portfolio will be subject to special risks, including counterparty risk.
The Portfolio is presently closed to new investors.
2010 Annual report • Delaware Pooled Trust
39
Portfolio management review
Delaware Pooled® Trust — The Labor Select International Equity Portfolio
October 31, 2010
Delaware Pooled Trust — The Labor Select International Equity Portfolio returned +8.00% at net asset value (NAV) with all distributions reinvested for the fiscal year ended Oct. 31, 2010. The Portfolio’s benchmark, the MSCI EAFE (Europe, Australasia, Far East) Index (net), returned +8.36% for the same period. Complete annualized performance for The Labor Select International Equity Portfolio is shown in the table on page 42.
The Portfolio’s fiscal year was one during which economic data were confusing at best. Investors were hoping for evidence of recovery and became slightly euphoric with the announcement of expansive government policies. However, those policies never really produced the jobs or the wealth filtering into consumers’ pockets as intended.
Similarly, sectors did not generally perform in a textbook way during this volatile time period. For instance, in the third calendar quarter of 2010, the benchmark was up 16.5%. With such strong performance, one would normally expect the cyclical sectors to lead the benchmark index’s performance and defensive sectors to lag. In fact, the defensive telecommunications sector was up 20.2% during the quarter while the information technology sector, which is typically considered to be cyclical, was up by only 8.5%. Reviewing the underlying data and looking at country returns, it is our belief that the dominant focus of market participants involved a country’s level of sovereign risk. As a result, various markets sold off across the board, regardless of underlying stock valuation or profitability. (Source: Bloomberg.)
This pattern appeared to develop at the beginning of the Portfolio’s fiscal year, with the debt restructuring in Dubai. Many investors, ourselves included, grew concerned to note that high leverage within developed economies had not been reduced; it had merely been transferred to sovereign borrowers as they have assumed the liabilities of their collapsed private lenders. Thus, after Dubai, many investors began to recognize problems with sovereign debt: first in Greece, followed by Portugal, Spain, Italy, and Ireland. At one point, when it appeared that Germany might not be fully committed to a rescue package for Greece, many investors began to wonder if the euro would survive. This was a serious concern, which resulted in a “fear premium” for affected markets.
Since our strategy utilizes a bottom-up security selection discipline, we did not shun entire markets; instead we continued to look for undervalued opportunities in every country within our mandate. That said, the countries furthest from the sovereign debt concerns of Southern Europe generally performed best. The Asia Pacific region was strong, with the exception of Japan. Australia, in particular, stood out: it is the only developed economy to have averted a technical recession. Australia entered the economic crisis in better shape than most countries and had greater flexibility to make accommodative macroeconomic policy adjustments. The Australian central bank’s decision to raise interest rates has strengthened the Australian dollar putting it ahead of the curve relative to other developed economies. Within the Portfolio, an overweight in Australian holdings had a positive effect on performance relative to its benchmark, but it was more than offset by the negative effects of stock selection. On the whole, the Portfolio mildly underperformed the benchmark index in Australia.
By contrast, Spain’s economy has suffered during the Portfolio’s fiscal year. Spain had been one of the fastest-growing euro zone countries over the past decade. However, the financial crisis and the collapse in property and construction industries hit Spain hard. Unemployment rose sharply to around 20%, and the rise in nonperforming loans has taken a heavy toll on Spanish banks. With the government’s fiscal position deteriorating, many investors began to fear that austerity measures could plunge the Spanish economy into a debt-deflation trap. Nonetheless, we retained an overweight position in Spain relative to the benchmark index. While this overweight led to underperformance against the benchmark index, we believe we were able to identify specific longer-term investments at attractive valuations.
The views expressed are current as of the date of this report and are subject to change.
2010 Annual report • Delaware Pooled Trust
40
Turning to specific securities, two of our long-term holdings were our best performers during the Portfolio’s fiscal year. The Australia-based conglomerate Wesfarmers returned more than 30%. The market recognized that Wesfarmers’ acquisition of the Coles Group supermarket chain in 2007 is paying off in the form of improved profitability. Another Australia-based company, Amcor, is the global leader in PET packaging with significant operations in the United States. It is also the leading supplier in Europe of flexible packaging. Amcor’s success in integrating its acquisition of Alca n led to the stock’s more than 30% return.
On the downside, we sustained a significant loss from our exposure to BP, which came off its lowest point, down nearly 50%, to finish with a 25% decline over the 12-month period. When the Deepwater Horizon oil rig exploded on April 20, 2010, we immediately went to work reassessing the current value of the company. It seemed that as fast as information was being made available, many investors were selling the stock, often using short positions. We were not willing to sell while the stock price was plummeting. At the same time, we felt there remained downside risks from litigation, which prevented us from adding to the position. When the well was capped on July 19, 2010, we revisited our model, taking into account both the significant shorter-term costs and the longer-te rm factors such as an increase in capital spending, damage to BP’s reputation, and the negative effect on future production growth. While the fair value of the stock was reduced, in our view, this decline in value was more than discounted by the significant decline in the share price, and we continued to hold the shares at the end of the Portfolio’s fiscal year.
2010 Annual report • Delaware Pooled Trust
41
Performance summary
Delaware Pooled® Trust — The Labor Select International Equity Portfolio
The performance data quoted represent past performance; past performance does not guarantee future results. Investment return and principal value will fluctuate so your shares, when redeemed, may be worth more or less than their original cost. Current performance may be lower or higher than the performance data quoted. Please obtain the performance data for the most recent month end by calling 800 231-8002 or visiting our Web site at www.delawareinvestments.com.
Carefully consider the Portfolio’s investment objectives, risk factors, charges, and expenses before investing. This and other information can be found in the Portfolio’s prospectus and, if available, its summary prospectus, which may be obtained by visiting www.delawareinvestments.com or calling 800 231-8002. Investors should read the prospectus and, if available, the summary prospectus carefully before investing.
| Portfolio performance | | | | | | | | | | |
| Average annual total returns | | | | | | | | | | |
| Periods ended Oct. 31, 2010 | | 1 year | | 3 years | | 5 years | | 10 years | | Lifetime |
| | | +8.00% | | -9.02% | | +3.83% | | +6.98% | | +8.24% |
| Portfolio profile |
| Oct. 31, 2010 |
| |
| Total net assets |
| $741 million |
| |
| Number of holdings |
| 47 |
| |
| Inception date |
| Dec. 19, 1995 |
Growth of $1,000,000
| | | | Starting value (Oct. 31, 2000) | | Ending value (Oct. 31, 2010) |
| The Labor Select International Equity Portfolio | | $1,000,000 | | $1,964,198 |
| MSCI EAFE Index (net) | | $1,000,000 | | $1,366,460 |
2010 Annual report • Delaware Pooled Trust
42
The performance graph assumes $1 million invested on Oct. 31, 2000, and includes reinvestment of all distributions. The performance graph does not reflect the deduction of taxes the shareholder would pay on Portfolio distributions or redemptions of Portfolio shares.
Total return assumes reinvestment of dividends and capital gains, but does not reflect reductions for taxes. Returns and share values will fluctuate so that shares, when redeemed, may be worth more or less than their original cost.
The most recent prospectus designated the Portfolio’s total operating expenses as 0.88%.
Expense limitations were in effect during the period shown. Performance would have been lower had the expense limitations not been in effect.
The MSCI EAFE Index measures equity market performance across developed market countries in Europe, Australasia, and the Far East. Index “net” return approximates the minimum possible dividend reinvestment, after deduction of withholding tax at the highest possible rate.
Index performance returns do not reflect any management fees, transaction costs, or expenses. Indices are unmanaged and one cannot invest directly in an index.
Past performance is not a guarantee of future results.
International investments entail risks not ordinarily associated with U.S. investments including fluctuation in currency values, differences in accounting principles, or economic or political instability in other nations. Investing in emerging markets can be riskier than investing in established foreign markets due to increased volatility and lower trading volume.
If and when the Portfolio invests in forward foreign currency contracts or uses other investments to hedge against currency risks, the Portfolio will be subject to special risks, including counterparty risk.
2010 Annual report • Delaware Pooled Trust
43
Portfolio management review
Delaware Pooled® Trust — The Emerging Markets Portfolio
October 31, 2010
Note: Regional performance data cited below are based on respective MSCI indices.
During a fiscal year in which developed equity markets offered few truly attractive areas for investment, emerging markets proved to be a bright spot, pulling in considerable capital from investors, and producing sizeable returns. Against this market backdrop, Delaware Pooled Trust — The Emerging Markets Portfolio returned +23.79% at net asset value (NAV) with all distributions reinvested for the fiscal year ended Oct. 31, 2010. The Portfolio’s benchmark, the MSCI Emerging Markets Index (net), returned +23.55% for the same period. Complete annualized performance for The Emerging Markets Portfolio is shown in the table on page 46.
The Portfolio’s fiscal year featured many large, ratcheting swings in volatility, though with more ups than downs. The month of May 2010, for example, saw a loss of 8.75% for the benchmark index. For the months of July and September, though, the pendulum swung heavily into positive territory, with one-month index returns of 8.40% and 11.13%, respectively. The Portfolio’s relative performance has been in character with our expectations, given our generally defensive methodology. In all four months of the fiscal year in which the benchmark index fell, the Portfolio outperformed. When the benchmark rose, which occurred for eight months of the Portfolio’s fiscal year, the Portfolio underperformed six months and outperformed during two months.
In short, we stuck to our disciplined, risk-sensitive valuation process while managing to capture most if not all of the benchmark index’s upside — and slightly outperformed over the entire fiscal year. Certainly, our continuing significant underweight in India made it a challenge to keep pace with the benchmark. Indian markets returned more than 35% for the period. India’s high price-to-earnings ratios, low dividend yields, and, in our view, continuing challenges in improving the infrastructure that is needed to sustain growth, have led us to tread cautiously there.
The China story has been a dramatically different one. Not only has China been successfully implementing some major enhancements to its infrastructure, but it also possesses substantial financing ability. Whereas India’s government is heavily indebted, the Chinese have had plenty to spend on infrastructure. Yet, in contrast with India, China returned just shy of 11% compared to the benchmark’s 23.5% return for the fiscal period.
Although China was not a particularly strong market in overall performance terms during the entire fiscal year, the Portfolio’s best contributing stock was China Yurun Food Group. The company, a pork producer helping to consolidate a fragmented sector while also growing organically as China’s middle class raises the quality and type of pork products in demand, experienced strong earnings growth. Supported by this performance, the share price rose nearly 90% over the fiscal year.
China’s lagging behind the benchmark presented us, as investors looking for value in markets and companies, with the opportunity to put a significant amount of assets to work in what we viewed as attractively priced companies as the year progressed. Having started the Portfolio’s fiscal year somewhat underweight, we are now overweight and substantially invested in China.
In terms of smaller markets, Turkey performed exceptionally well. We believe we were early to recognize that the Turkish government appeared to be running its economy quite sensibly compared with the governments of many countries, and we purchased stocks of Turkish companies at what we viewed as cheap valuations. Having had a very big discount in valuation terms compared to the other emerging markets, Turkey pulled itself up this year to a valuation range more in line with its peers. We remained overweight in Turkey throughout Portfolio’s fiscal year, though we did sell some Turkish stocks in an effort to lock in some gains. Tupras, Turkey’s chief oil refiner, was one of our top five contributors to performance during the fiscal year.
The views expressed are current as of the date of this report and are subject to change.
2010 Annual report • Delaware Pooled Trust
44
Strong returns in Turkey and Poland were the exception, however, among emerging markets in the euro zone, which generally disappointed. Hungary, for example, returned approximately 6%, and the Czech Republic was down 3% for the year. The Czech Republic has a well-managed economy, in our opinion, and we believe it is often unfairly penalized along with the less-well-managed economies in the region. It is a relatively inexpensive market, with a price-to-earnings ratio of approximately 11 and a high dividend yield. CEZ, the Czech Republic’s electric utility, was down more than 10% over the entire fiscal period, and we had a meaningful position in that stock. This loss was mitigated slightly by the company’s good dividend. As of the end of the Portfolio’s fiscal year, we remained overweight in the Czech Republic, a market we believe over time should be differentiated and recognized for its attractive valuations.
Two other holdings that punished the Portfolio were the Taiwanese semiconductor-chip designer for mobile phones, MediaTek, down more than 10% over the period, and Egypt’s Orascom Telecom Holding, down more than 35%. We believe that Orascom’s troubles were outside our forecasting ability: The company is engaged in a dispute with the Algerian government over back taxes, and the share price came under severe pressure. As for MediaTek, we continue to like the company and believe it should sustain its leading position in an attractive niche.
Clearly, one cautionary aspect of the emerging markets landscape is that, as so much investor money has flooded in, we believe it has become a self-perpetuating “success story” in stock market terms. There is a danger that much of this capital is ill informed — placed in these markets simply because of a perceived lack of prospects elsewhere. Yet, based on performance, emerging markets as an asset class was considerably more resilient than the developed markets during the recent financial crisis (source: Lipper). The valuations are not excessively high, and we believe that the growth prospects are still fairly attractive, both when compared with the developed world and in absolute terms. We believe there’s still significant long-term potential to be realized in these markets.
2010 Annual report • Delaware Pooled Trust
45
Performance summary
Delaware Pooled® Trust — The Emerging Markets Portfolio
The performance data quoted represent past performance; past performance does not guarantee future results. Investment return and principal value will fluctuate so your shares, when redeemed, may be worth more or less than their original cost. Current performance may be lower or higher than the performance data quoted. Please obtain the performance data for the most recent month end by calling 800 231-8002 or visiting our Web site at www.delawareinvestments.com.
Carefully consider the Portfolio’s investment objectives, risk factors, charges, and expenses before investing. This and other information can be found in the Portfolio’s prospectus and, if available, its summary prospectus, which may be obtained by visiting www.delawareinvestments.com or calling 800 231-8002. Investors should read the prospectus and, if available, the summary prospectus carefully before investing.
| Portfolio performance | | | | | | | | | | |
| Average annual total returns | | | | | | | | | | |
| Periods ended Oct. 31, 2010 | | 1 year | | 3 years | | 5 years | | 10 years | | Lifetime |
| | | +23.79% | | +0.26% | | +13.59% | | +18.64% | | +10.97% |
| Portfolio profile |
| Oct. 31, 2010 |
| |
| Total net assets |
| $750.2 million |
| |
| Number of holdings |
| 80 |
| |
| Inception date |
| April 16, 1997 |
Growth of $1,000,000
| | | | Starting value (Oct. 31, 2000) | | Ending value (Oct. 31, 2010) |
| The Emerging Markets Portfolio | | $1,000,000 | | $5,526,911 |
| MSCI Emerging Markets Index (net) | | $1,000,000 | | $3,914,501 |
2010 Annual report • Delaware Pooled Trust
46
The performance graph assumes $1 million invested on Oct. 31, 2000, and includes reinvestment of all distributions. The performance graph does not reflect the deduction of taxes the shareholder would pay on Portfolio distributions or redemptions of Portfolio shares.
Total return assumes reinvestment of dividends and capital gains, but does not reflect reductions for taxes. Returns and share values will fluctuate so that shares, when redeemed, may be worth more or less than their original cost.
The most recent prospectus designated the Portfolio’s total operating expenses as 1.16%. The purchase reimbursement fee (0.55%) and redemption reimbursement fee (0.55%) are paid to the Portfolio. The fees are designed to reflect an approximation of the brokerage and other transaction costs associated with the investment of an investor’s purchase amount or the disposition of assets to meet redemptions, and to limit the extent to which the Portfolio (and, indirectly, the Portfolio’s existing shareholders) would have to bear such costs. In lieu of the reimbursement fees, investors in The Emerging Markets Portfolio may be permitted to utilize alternative purchase and redemption methods designed to accomplish the same economic effect as the reimbursement fees. Reimbursement fees applicable to purchases and redemptions of shares of the Portfolio are not reflected in the “Performance of $1,000,000” chart.
Expense limitations were in effect during the period shown. Performance would have been lower had the expense limitations not been in effect.
The MSCI Emerging Markets Index measures equity market performance across emerging market countries worldwide. Index “net” return approximates the minimum possible dividend reinvestment, after deduction of withholding tax at the highest possible rate.
Index performance returns do not reflect any management fees, transaction costs, or expenses. Indices are unmanaged and one cannot invest directly in an index.
Past performance is not a guarantee of future results.
International investments entail risks not ordinarily associated with U.S. investments including fluctuation in currency values, differences in accounting principles, or economic or political instability in other nations. Investing in emerging markets can be riskier than investing in established foreign markets due to increased volatility and lower trading volume.
Fixed income securities and bond funds can lose value, and investors can lose principal, as interest rates rise. They also may be affected by economic conditions that hinder an issuer’s ability to make interest and principal payments on its debt.
The Portfolio may also be subject to prepayment risk, the risk that the principal of a fixed income security that is held by the Portfolio may be prepaid prior to maturity, potentially forcing the Portfolio to reinvest that money at a lower interest rate.
High yielding, noninvestment grade bonds (junk bonds) involve higher risk than investment grade bonds.
If and when the Portfolio invests in forward foreign currency contracts or uses other investments to hedge against currency risks, the Portfolio will be subject to special risks, including counterparty risk.
The Portfolio may invest in derivatives, which may involve additional expenses and are subject to risk, including the risk that an underlying security or securities index moves in the opposite direction from what the portfolio manager anticipated. A derivative transaction depends upon the counterparties’ ability to fulfill their contractual obligations.
Instances of high double-digit returns are unusual, cannot be sustained, and were primarily achieved during favorable market conditions.
The Portfolio is presently closed to new investors.
2010 Annual report • Delaware Pooled Trust
47
Portfolio management review
Delaware Pooled® Trust — The Global Real Estate Securities Portfolio
October 31, 2010
Delaware Pooled Trust — The Global Real Estate Securities Portfolio Original Class shares returned +23.49% (at net asset value, with all distributions reinvested) for the fiscal year ended Oct. 31, 2010. The Portfolio’s benchmark, the FTSE EPRA/NAREIT Global Real Estate Index, returned +24.74% for the same period. Complete annualized performance for The Global Real Estate Securities Portfolio is shown in the table on page 50.
Despite periods of volatility, global real estate markets advanced fairly consistently during the Portfolio’s fiscal year, ending the period with a cumulative advance of more than 20% (as measured by the FTSE EPRA/NAREIT Global Real Estate Index). We believe several conditions helped propel real estate stocks during the year, including low interest rates across the globe, the return of liquidity, and easier access to financing (equity as well as debt). Taken together, these factors supported an environment in which companies repaired balance sheets and generally improved their financial standing.
If there was a notably soft period during the fiscal year, it was during the three months that ended in June 2010. During that time, concerns about sovereign debt, particularly in Europe, caused a significant divergence in market performance across several countries. Another dampener on stock performance was uncertainty about the sustainability of the global economic recovery. In the months that followed, however, stocks rebounded as concerns about sovereign risk abated somewhat. While worries about these events have lessened, we remain cautious because many of the longer-term sovereign issues have not been solved.
As the Portfolio’s fiscal year drew to a close, the investment landscape was mixed. Interest rates were still low, but growth in most developed economies remained weak. Increased liquidity and relatively inexpensive debt continued to be positives, and investors appeared to have healthy appetites for real estate investments. At the same time, however, the macroeconomic environment oscillated between positive and negative momentum, leading us to view the larger picture with caution overall.
Broadly speaking, we believe the Portfolio’s underperformance relative to the FTSE EPRA/NAREIT Global Real Estate Index was explained by the negative effects of our allocations to specific countries, which more than offset the mildly positive effects generated by our individual stock choices.
At the country level, notable underperformance versus the benchmark index was registered in Canada and Hong Kong. In absolute terms, the Portfolio’s Canadian holdings performed well, advancing by nearly 50%, but they nevertheless trailed the strong gains posted by Canadian constituents within that index. Larger Portfolio holdings included RioCan Real Estate Investment Trust, a company that trailed the benchmark index largely on news of a cut in its dividend distribution. We believe many investors interpreted this news too negatively, however, and we took advantage of relatively cheaper pricing to add to the Portfolio’s RioCan shares during the final months of the fiscal year.
In Hong Kong, stock selection was the main performance detractor. We believe this was due to insufficient ownership in Hong Kong–based companies that had direct exposure to Chinese residential markets (Wharf Holdings, a company not held in the Portfolio, was one example). Within the Portfolio, notable detractors from return included Kelly Properties and Shun Tak Holdings, two companies whose operations suffered from lackluster demand in their respective areas of concentration. Both companies were liquidated from the Portfolio before the end of its fiscal year.
Still at the country level, the Portfolio outperformed the benchmark index in both the United Kingdom and the United States. The Portfolio’s U.K. holdings led index constituents by more than seven percentage points for the reporting period, led by contributors such as Derwent London and Great Portland Estates. Both companies have significant presence in London’s desirable West End, and both possess strong balance sheets. Driven by optimistic prospects, shares of both companies reached what we viewed as appropriate selling prices, and both were liquidated from the Portfolio before the en d its fiscal year.
The views expressed are current as of the date of this report and are subject to change.
2010 Annual report • Delaware Pooled Trust
48
In the U.S., meanwhile, Portfolio holdings collectively advanced by more than two percentage points beyond the gains posted by benchmark index constituents. Notable contributors included Gaylord Entertainment, a company that was originally introduced to the Portfolio in May. At the time, one of company’s largest convention-center hotels was temporarily shut down due to flood damage. It was our opinion that investors generally overestimated the effects of the damage, and we purchased the company’s shares at what we believed were favorably discounted prices. Apartment landlord UDR and dat a-center developer DuPont Fabros Technology both outperformed, posting solid gains for the period. We believe there may be strong long-term demand in each company’s industry, potentially setting the stage for long-term growth.
We believe the global economic recovery has reached an interesting point as stimulus measures around the world have wound down, prompting questions about the true growth potential of many economies. In the U.S., growth slowed as the effects of easy money were withdrawn from the economy, prompting calls for a new round of quantitative easing. Globally, other nations have thus far chosen not to increase further stimulus measures, creating significant debate about potential currency manipulation across the globe. While different countries may choose to address the economic growth with different tools, we believe future outperformance is most likely to happen in real estate markets that possess sound fundamental underpinnings, because such markets will stand a better chance of flourishing in the absence of stimulus injections.
As we’ve noted in prior reports, we feel we can deliver competitive returns by identifying situations where the environment is favorable, and finding discounted companies that we believe are able to take advantage of those particular situations. Going forward, we plan to continue focusing within highly specific areas, including, in our view, those in which (1) companies can earn in excess of their cost of capital; (2) supply and demand are out of balance; and (3) valuations reflect substantial discounts.
A final note about possible outcomes at the company level: During the past two years, many overleveraged companies have used the thawing of capital markets to repair their balance sheets; while such repairs were necessary and appropriate, we believe their true costs should be evidenced as stronger-capitalized companies (those that did not pursue dilutive offerings) are rewarded with better growth prospects.
2010 Annual report • Delaware Pooled Trust
49
Performance summary
Delaware Pooled® Trust — The Global Real Estate Securities Portfolio
The performance data quoted represent past performance; past performance does not guarantee future results. Investment return and principal value will fluctuate so your shares, when redeemed, may be worth more or less than their original cost. Current performance may be lower or higher than the performance data quoted. Please obtain the performance data for the most recent month end by calling 800 231-8002 or visiting our Web site at www.delawareinvestments.com.
Carefully consider the Portfolio’s investment objectives, risk factors, charges, and expenses before investing. This and other information can be found in the Portfolio’s prospectus and, if available, its summary prospectus, which may be obtained by visiting www.delawareinvestments.com or calling 800 231-8002. Investors should read the prospectus and, if available, the summary prospectus carefully before investing.
| Portfolio performance | | | | | | |
| Average annual total returns | | | | | | |
| Periods ended Oct. 31, 2010 | | 1 year | | 3 years | | Lifetime |
| Original Class | | +23.49% | | -10.21% | | -6.69% |
| Class P | | +23.26% | | -10.41% | | -6.91% |
| Portfolio profile |
| Oct. 31, 2010 |
| |
| Total net assets |
| $60.3 million |
| Inception date |
| Jan. 10, 2007 |
The Global Real Estate Securities Portfolio offers two classes of shares: Original Class and Class P.
Growth of $1,000,000
| | | | Starting value (Jan. 10, 2007) | | Ending value (Oct. 31, 2010) |
| FTSE EPRA/NAREIT Global Real Estate Index | | $1,000,000 | | $802,821 |
| The Global Real Estate Securities Portfolio (Original Class) | | $1,000,000 | | $768,109 |
2010 Annual report • Delaware Pooled Trust
50
The performance graph assumes $1 million invested on Jan. 10, 2007, and includes reinvestment of all distributions. The performance graph does not reflect the deduction of taxes the shareholder would pay on Portfolio distributions or redemptions of Portfolio shares.
Total return assumes reinvestment of dividends and capital gains, but does not reflect reductions for taxes. Returns and share values will fluctuate so that shares, when redeemed, may be worth more or less than their original cost.
The most recent prospectus designated the Portfolio’s total operating expenses for shares as 1.21%, excluding 12b-1 fees.
Original Class shares are not subject to sales charges or 12b-1 fees and are available to investors investing $1 million in The Global Real Estate Securities Portfolio or in the aggregate across the portfolios comprising Delaware Pooled® Trust, subject to certain exceptions. Class P shares charge a 12b-1 fee of 0.25% but are not subject to sales charges. Class P shares are available to defined contribution plans making a minimum investment of $5 million, subject to certain exceptions. Please see the applicable prospectus for more information concerning the eligibility, fees and expenses for each class.
Expense limitations were in effect during the period shown. Performance would have been lower had the expense limitations not been in effect.
The FTSE EPRA/NAREIT Global Real Estate Index tracks the performance of listed real estate companies and real estate investment trusts (REITs) worldwide.
Index performance returns do not reflect any management fees, transaction costs, or expenses. Indices are unmanaged and one cannot invest directly in an index.
Past performance is not a guarantee of future results.
International investments entail risks not ordinarily associated with U.S. investments including fluctuation in currency values, differences in accounting principles, or economic or political instability in other nations. Investing in emerging markets can be riskier than investing in established foreign markets due to increased volatility and lower trading volume.
“Nondiversified” Portfolios may allocate more of their net assets to investments in single securities than “diversified” Portfolios. Resulting adverse effects may subject these Portfolios to greater risks and volatility.
The Portfolio may experience portfolio turnover in excess of 100%, which could result in higher transaction costs and tax liability.
Narrowly focused investments may exhibit higher volatility than investments in multiple industry sectors.
REIT investments are subject to many of the risks associated with direct real estate ownership, including changes in economic conditions, credit risk, and interest rate fluctuations.
A REIT fund’s tax status as a regulated investment company could be jeopardized if it holds real estate directly, as a result of defaults, or receives rental income from real estate holdings.
Instances of high double-digit returns are unusual, cannot be sustained, and were primarily achieved during favorable market conditions.
2010 Annual report • Delaware Pooled Trust
51
Portfolio management review
Delaware Pooled® Trust — The Global Fixed Income Portfolio
October 31, 2010
The Portfolio’s fiscal year ended Oct. 31, 2010, included a variety of events that caused volatility in international bond markets: Property companies failed in Dubai; the solvency of the Greek government came into question — with Portugal, Italy, Ireland, and Spain seemingly just a step or two behind; floods in Pakistan and fires in Russia’s wheat fields threatened to affect the price of food and clothing worldwide; and elections in Japan and the United Kingdom brought in new leadership, with different policies and priorities, in the world’s second- and third-largest economies. With world markets struggling to recover from the deepest recession in a generation, investors had to factor in the risks presented by historically high levels of debt, as well as the threat of inflation induced by low interest rates and gigantic stimulus programs.
Against this market backdrop, Delaware Pooled Trust — The Global Fixed Income Portfolio returned +10.03% at net asset value (NAV) with all distributions reinvested for the fiscal period. The Portfolio’s benchmark, the Citigroup® World Government Bond Index, returned +6.35% for the same period. Complete annualized performance for The Global Fixed Income Portfolio is shown in the table on page 54.
We believe the Portfolio’s relative outperformance versus its benchmark was based on our disciplined analysis of pricing power parity and prospective real yield of securities within our investment mandate.
Within the Portfolio, one of the key decisions we must make involves the weighting we should assign to U.S. securities. Our analysis showed that inflation in the euro zone would likely be higher than that of the United States during the next two years. In performing our due diligence work, we noted that while U.S. companies had aggressively cut staff, euro zone firms hoarded labor. For example, in Germany, employment has remained broadly stable over the past year — despite the economy shrinking significantly faster than that of the U.S. (a fall of 4.8% versus 2.3%) — due to job-protection laws.
Therefore, in contrast to the U.S., productivity has plunged and unit labor costs have surged, costs that will likely need to be borne solely by companies once the government sponsorship is inevitably withdrawn. We believe these conditions should inevitably raise inflationary pressures across the euro zone.
By contrast, we noted economic conditions suggestive of low inflation (or even a spell of deflation) in the United States: Demand pressures were absent, as suggested by a large negative output gap, as were cost pressures, as evidenced by sharply falling unit labor costs. With U.S. growth likely to be patchy over the next two years, we felt conditions could become even more conducive to low inflation.
We also factored in the risks posed by exposure to Chinese currency. A rise in the renminbi would typically increase China’s export prices and therefore the price of imported Chinese goods. If this occurred, the U.S. would seem to have the most to lose: The U.S. is China’s largest export market, taking nearly 20% of its exports, and China is the U.S.’s largest import supplier, with 16% of total imports. In practice, however, we felt that a rising renminbi would have only a limited effect on U.S. inflation. With the U.S. economy being relatively closed to international trade, import prices typically have a small effect on consumer prices compared to domestic costs, and China is likely to price-to-market for the U.S., helped by productivity increases by China’s export sectors. Therefore, we maintained a slight overweight in U.S. bonds. As it turned out, the U.S. market performed well in local terms, but the position w as somewhat negative for the Portfolio due to U.S. dollar weakness. In addition, the Portfolio’s defensive, shorter-than-benchmark duration detracted slightly from performance.
The sources of the Portfolio’s excess returns were primarily overweight positions in some of the world’s strongest markets during the period. Australia has a relatively healthy government budget with limited debt, which lends qualitative support to our overweight there because
The views expressed are current as of the date of this report and are subject to change.
2010 Annual report • Delaware Pooled Trust
52
of its relatively high prospective real yield. Although Australia’s public finances have fallen into the red over the past year, reflecting subpar gross domestic product growth, its prospective budget deficit of 3–4% of GDP for 2010 is low compared to that of many other developed countries; for example, those for the U.S. and the euro zone are roughly 11% and 7%, respectively. Similarly, Australian government debt is likely to be around 20% of GDP this year, versus roughly 80% in both the U.S. and the euro zone. (Source: Bloomberg.)
In addition, we were willing to venture into weaker economies within the euro zone where we found relatively good value. Ireland is one example. In the wake of market concerns about Greek government debt, the premium investors demanded for holding Irish government bonds over German government bonds rose steeply. In our view, that premium was unwarranted.
We saw value in Italian government bonds as well. Their yield spread over German bunds (German government bonds) also was above their historical norm. Italy’s budget deficit, at 5.5% of GDP, is much lower than that of its peers. It also looks set to fall this year, helped by a return to GDP growth there, which is likely to lead to lower government outlays. Consequently, Italian government debt, although relatively high at more than 120% of GDP, has risen comparatively little in recent years and remains below where it stood when Italy joined the euro zone at its outset in 1999.
2010 Annual report • Delaware Pooled Trust
53
Performance summary
Delaware Pooled® Trust — The Global Fixed Income Portfolio
The performance data quoted represent past performance; past performance does not guarantee future results. Investment return and principal value will fluctuate so your shares, when redeemed, may be worth more or less than their original cost. Current performance may be lower or higher than the performance data quoted. Please obtain the performance data for the most recent month end by calling 800 231-8002 or visiting our Web site at www.delawareinvestments.com.
Carefully consider the Portfolio’s investment objectives, risk factors, charges, and expenses before investing. This and other information can be found in the Portfolio’s prospectus and, if available, its summary prospectus, which may be obtained by visiting www.delawareinvestments.com or calling 800 231-8002. Investors should read the prospectus and, if available, the summary prospectus carefully before investing.
| Portfolio performance | | | | | | | | | | |
| Average annual total returns | | | | | | | | | | |
| Periods ended Oct. 31, 2010 | | 1 year | | 3 years | | 5 years | | 10 years | | Lifetime |
| | | +10.03% | | +10.32% | | +9.04% | | +10.55% | | +8.65% |
| Portfolio profile |
| Oct. 31, 2010 |
| |
| Total net assets |
| $140.3 million |
| Inception date |
| Nov. 30, 1992 |
Growth of $1,000,000
| | | | Starting value (Oct. 31, 2000) | | Ending value (Oct. 31, 2010) |
| The Global Fixed Income Portfolio | | $1,000,000 | | $2,726,553 |
| Citigroup World Government Bond Index | | $1,000,000 | | $2,144,834 |
2010 Annual report • Delaware Pooled Trust
54
The performance graph assumes $1 million invested on Oct. 31, 2000, and includes reinvestment of all distributions. The performance graph does not reflect the deduction of taxes the shareholder would pay on Portfolio distributions or redemptions of Portfolio shares.
Total return assumes reinvestment of dividends and capital gains, but does not reflect reductions for taxes. Returns and share values will fluctuate so that shares, when redeemed, may be worth more or less than their original cost.
The most recent prospectus designated the Portfolio’s total operating expenses as 0.65%. Management has contractually agreed to waive all or a portion of its management fees from Feb. 28, 2010, through Feb. 28, 2011, in order to prevent total annual Portfolio operating expenses from exceeding 0.60% of the Portfolio’s average daily net assets, as described in the most recent prospectus.
Expense limitations were in effect during the period shown. Performance would have been lower had the expense limitations not been in effect.
The Citigroup World Government Bond Index is a market capitalization–weighted benchmark that tracks the performance of 23 world government bond markets. Index performance returns do not reflect any management fees, transaction costs, or expenses. Indices are unmanaged and one cannot invest directly in an index.
Past performance is not a guarantee of future results.
International investments entail risks not ordinarily associated with U.S. investments including fluctuation in currency values, differences in accounting principles, or economic or political instability in other nations. Investing in emerging markets can be riskier than investing in established foreign markets due to increased volatility and lower trading volume.
If and when the Portfolio invests in forward foreign currency contracts or uses other investments to hedge against currency risks, the Portfolio will be subject to special risks, including counterparty risk.
“Nondiversified” Portfolios may allocate more of their net assets to investments in single securities than “diversified” Portfolios. Resulting adverse effects may subject these Portfolios to greater risks and volatility.
The Portfolio may experience portfolio turnover in excess of 100%, which could result in higher transaction costs and tax liability.
Fixed income securities and bond funds can lose value, and investors can lose principal, as interest rates rise. They also may be affected by economic conditions that hinder an issuer’s ability to make interest and principal payments on its debt.
The Portfolio may also be subject to prepayment risk, the risk that the principal of a fixed income security that is held by the Portfolio may be prepaid prior to maturity, potentially forcing the Portfolio to reinvest that money at a lower interest rate.
The Portfolio is presently closed to new investors.
2010 Annual report • Delaware Pooled Trust
55
Portfolio management review
Delaware Pooled® Trust — The International Fixed Income Portfolio
October 31, 2010
The Portfolio’s fiscal year ended Oct. 31, 2010, included a variety of events that caused volatility in international bond markets: Property companies failed in Dubai; the solvency of the Greek government came into question — with Portugal, Italy, Ireland, and Spain seemingly just a step or two behind; floods in Pakistan and fires in Russia’s wheat fields threatened to affect the price of food and clothing worldwide; and elections in Japan and the United Kingdom brought in new leadership, with different policies and priorities, in the world’s second- and third-largest economies. With world markets struggling to recover from the deepest recession in a generation, investors generally had to factor in the risks presented by historically high levels of debt, as well as the threat of inflation induced by low interest rates and gigantic stimulus programs. (Source: Bloomberg.)
Against this market backdrop, Delaware Pooled Trust — The International Fixed Income Portfolio returned +9.33% at net asset value (NAV) with all distributions reinvested for the fiscal year ended Oct. 31, 2010. The Portfolio’s benchmark, the Citigroup® Non-U.S. World Government Bond Index, returned +6.40% for the same period. Complete annualized performance for The International Fixed Income Portfolio is shown in the table on page 58.
We believe the Portfolio’s relative outperformance was based on our disciplined analysis of pricing power parity and prospective real yield of securities within our investment mandate. Two factors stand out as key decisions during the Portfolio’s fiscal year.
First, the Portfolio benefited from an overweight position in Australian and Polish securities. Australia has a relatively healthy government budget with limited debt, which lends qualitative support to our overweight there due to its relatively high prospective real yield. Although Australia’s public finances have fallen into the red over the past year, reflecting subpar gross domestic product (GDP) growth, its prospective budget deficit of 3 4% of GDP for 2010 is low compared to that of many other developed countries; for example, those for the United States and the euro zone are roughly 11% and 7%, respectively. Similarly, Australian government debt is likely to be around 20% of GDP this year, versus roughly 80% in both the U.S. and the euro zone.
Poland was the only member of the European Union to avoid recession during the global downturn. In addition to the country’s stable economic growth, our models responded favorably to the fact that inflation remained under control. Rises in administered prices (set by the government) continue to drop out of the 12-month comparison, causing headline inflation to fall. Surplus capacity and weak unit labor costs also helped curb inflation. That, combined with Poland’s comparatively low government debt (around 60% of GDP versus 100% in the Organization for Economic Cooperation and Development countries as a whole), provided support for the country’s government bond market as well as its currency.
Second, we did a good job managing our exposure to euro zone government bonds as a whole. Euro zone government bonds offered a relatively low prospective real yield, in our opinion, of around 2%. Unit labor costs, which typically constitute a key driver of inflation, are higher in the euro zone than in many other countries, due to weak productivity growth, reflecting little change in employment despite the sharp decline in output. Although inflation in the euro zone still appears very likely to remain low during the next two years — due to much spare capacity — employment costs seem likely to make it higher than it otherwise would be. Within the euro zone, we were willing to venture into weaker economies where we believed value opportunities existed. Ireland is one example. In the wake of market concerns about Greek government debt, the premium that investors demanded for holding Irish government bonds over German government bo nds rose steeply. In our view, that premium was unwarranted.
The views expressed are current as of the date of this report and are subject to change.
2010 Annual report • Delaware Pooled Trust
56
We saw value in Italian government bonds as well. Their yield spread over German bunds (German government bonds) also was above their historical norm. Italy’s budget deficit, at 5.5% of GDP, is much lower than that of its peers. It also looks set to fall this year, helped by a return to GDP growth there, which is likely to lead to lower government outlays. Consequently, Italian government debt, although relatively high at more than 120% of GDP, has risen comparatively little in recent years and remains below where it stood when Italy joined the euro zone at its outset in 1999.
Overall, we believe our strategies worked out well during the Portfolio’s fiscal year. One noteworthy detractor from performance was our decision to maintain a slightly short duration during a strong trading period for bonds. Other detractors from performance included our underweight position in U.K. bonds, which did better than average over the fiscal year, and an underweight position in Canada, which also proved to be a strong market.
2010 Annual report • Delaware Pooled Trust
57
Performance summary
Delaware Pooled® Trust — The International Fixed Income Portfolio
The performance data quoted represent past performance; past performance does not guarantee future results. Investment return and principal value will fluctuate so your shares, when redeemed, may be worth more or less than their original cost. Current performance may be lower or higher than the performance data quoted. Please obtain the performance data for the most recent month end by calling 800 231-8002 or visiting our Web site at www.delawareinvestments.com.
Carefully consider the Portfolio’s investment objectives, risk factors, charges, and expenses before investing. This and other information can be found in the Portfolio’s prospectus and, if available, its summary prospectus, which may be obtained by visiting www.delawareinvestments.com or calling 800 231-8002. Investors should read the prospectus and, if available, the summary prospectus carefully before investing.
| Portfolio performance | | | | | | | | | | |
| Average annual total returns | | | | | | | | | | |
| Periods ended Oct. 31, 2010 | | 1 year | | 3 years | | 5 years | | 10 years | | Lifetime |
| | | +9.33% | | +10.57% | | +9.00% | | +10.42% | | +7.20% |
| Portfolio profile |
| Oct. 31, 2010 |
| |
| Total net assets |
| $21.4 million |
| Inception date |
| April 11, 1997 |
Growth of $1,000,000
| | | | Starting value (Oct. 31, 2000) | | Ending value (Oct. 31, 2010) |
| The International Fixed Income Portfolio | | $1,000,000 | | $2,694,154 |
| Citigroup Non-U.S. World Government Bond Index | | $1,000,000 | | $2,250,275 |
2010 Annual report • Delaware Pooled Trust
58
The performance graph assumes $1 million invested on Oct. 31, 2000, and includes reinvestment of all distributions. The performance graph does not reflect the deduction of taxes the shareholder would pay on Portfolio distributions or redemptions of Portfolio shares.
Total return assumes reinvestment of dividends and capital gains, but does not reflect reductions for taxes. Returns and share values will fluctuate so that shares, when redeemed, may be worth more or less than their original cost.
The most recent prospectus designated the Portfolio’s total operating expenses as 0.79%. Management has contractually agreed to waive all or a portion of its management fees from Feb. 28, 2010, through Feb. 28, 2011, in order to prevent total annual Portfolio operating expenses from exceeding 0.60% of the Portfolio’s average daily net assets, as described in the most recent prospectus.
Expense limitations were in effect during the period shown. Performance would have been lower had the expense limitations not been in effect.
The Citigroup Non-U.S. World Government Bond Index is a market capitalization–weighted benchmark that tracks the performance of 22 world government bond markets.
Index performance returns do not reflect any management fees, transaction costs or expenses. Indices are unmanaged and one cannot invest directly in an index.
Past performance is not a guarantee of future results.
International investments entail risks not ordinarily associated with U.S. investments including fluctuation in currency values, differences in accounting principles, or economic or political instability in other nations. Investing in emerging markets can be riskier than investing in established foreign markets due to increased volatility and lower trading volume.
If and when the Portfolio invests in forward foreign currency contracts or uses other investments to hedge against currency risks, the Portfolio will be subject to special risks, including counterparty risk.
“Nondiversified” Portfolios may allocate more of their net assets to investments in single securities than “diversified” Portfolios. Resulting adverse effects may subject these Portfolios to greater risks and volatility.
The Portfolio may experience portfolio turnover in excess of 100%, which could result in higher transaction costs and tax liability.
Fixed income securities and bond funds can lose value, and investors can lose principal, as interest rates rise. They also may be affected by economic conditions that hinder an issuer’s ability to make interest and principal payments on its debt.
The Portfolio may also be subject to prepayment risk, the risk that the principal of a fixed income security that is held by the Portfolio may be prepaid prior to maturity, potentially forcing the Portfolio to reinvest that money at a lower interest rate.
The Portfolio is presently closed to new investors.
2010 Annual report • Delaware Pooled Trust
59
Disclosure of Portfolio expenses
For the six month period May 1, 2010 to October 31, 2010
As a shareholder of a Portfolio, you incur two types of costs: (1) transaction costs, including reimbursement fees on The Emerging Markets Portfolio; and (2) ongoing costs, including management fees; distribution and/or service (12b-1) fees on Class P shares of The Global Real Estate Securities Portfolio and other Portfolio expenses. The following examples are intended to help you understand your ongoing costs (in dollars) of investing in a Portfolio and to compare these costs with the ongoing costs of investing in other mutual funds.
The Examples are based on an investment of $1,000 invested at the beginning of the period and held for the entire six month period from May 1, 2010 to October 31, 2010.
Actual Expenses
The first section of the table shown, “Actual Portfolio Return,” provides information about actual account values and actual expenses. You may use the information in this table, together with the amount you invested, to estimate the expenses that you paid over the period. Simply divide your account value by $1,000 (for example, an $8,600 account value divided by $1,000 = 8.6), then multiply the result by the number in the first section under the heading entitled “Expenses Paid During Period” to estimate the expenses you paid on your account during the period.
Hypothetical Example for Comparison Purposes
The second section of the table shown, “Hypothetical 5% Return,” provides information about hypothetical account values and hypothetical expenses based on a Portfolio’s actual expense ratio and an assumed rate of return of 5% per year before expenses, which is not the Portfolio’s actual return. The hypothetical account values and expenses may not be used to estimate the actual ending account balance or expenses you paid for the period. You may use this information to compare the ongoing costs of investing in the Portfolio and other funds. To do so, compare this 5% hypothetical example with the 5% hypothetical examples that appear in the shareholder reports of other funds.
Please note that the expenses shown in the table are meant to highlight your ongoing costs only and do not reflect any transactional costs. Therefore, the second section of the table is useful in comparing ongoing costs only, and will not help you determine the relative total costs of owning different funds. In addition, if these transactional costs were included, your costs would have been higher. Certain of the Portfolios’ actual expenses shown in the table reflect fee waivers in effect. The expenses shown in the table assume reinvestment of all dividends and distributions.
In each case, “Expenses Paid During Period” are equal to a Portfolio’s annualized expense ratio, multiplied by the average account value over the period, multiplied by 184/365 (to reflect the one-half year period).
Delaware Pooled® Trust
Expense Analysis of an Investment of $1,000
| | | | | | | | | Expenses |
| | | Beginning | | Ending | | | | Paid During |
| | | Account | | Account | | Annualized | | Period |
| | | Value | | Value | | Expense | | 5/1/10 to |
| | | 5/1/10 | | 10/31/10 | | Ratio | | 10/31/10 |
| Actual Portfolio Return | | | | | | | | | | | | |
| The Large-Cap | | | | | | | | | | | | | | | |
| Value Equity | | | | | | | | | | | | | | | |
| Portfolio | | $ | 1,000.00 | | | $ | 1,039.10 | | | 0.70 | % | | $ | 3.60 | |
| The Select 20 | | | | | | | | | | | | | | | |
| Portfolio | | | 1,000.00 | | | | 1,059.70 | | | 0.89 | % | | | 4.62 | |
| The Large-Cap | | | | | | | | | | | | | | | |
| Growth Equity | | | | | | | | | | | | | | | |
| Portfolio | | | 1,000.00 | | | | 1,057.00 | | | 0.65 | % | | | 3.37 | |
| The Focus Smid-Cap | | | | | | | | | | | | | | | |
| Growth Equity | | | | | | | | | | | | | | | |
| Portfolio | | | 1,000.00 | | | | 1,110.20 | | | 0.92 | % | | | 4.89 | |
| The Real Estate | | | | | | | | | | | | | | | |
| Investment Trust | | | | | | | | | | | | | | | |
| Portfolio II | | | 1,000.00 | | | | 1,056.60 | | | 0.95 | % | | | 4.92 | |
| The Delaware | | | | | | | | | | | | | | | |
| Macquarie Real | | | | | | | | | | | | | | | |
| Estate Portfolio* | | | 1,000.00 | | | | 1,176.50 | | | 0.95 | % | | | 3.51 | |
| The Core Focus | | | | | | | | | | | | | | | |
| Fixed Income | | | | | | | | | | | | | | | |
| Portfolio | | | 1,000.00 | | | | 1,050.10 | | | 0.43 | % | | | 2.22 | |
| The High-Yield | | | | | | | | | | | | | | | |
| Bond Portfolio | | | 1,000.00 | | | | 1,068.50 | | | 0.59 | % | | | 3.08 | |
| The Core Plus | | | | | | | | | | | | | | | |
| Fixed Income | | | | | | | | | | | | | | | |
| Portfolio | | | 1,000.00 | | | | 1,053.00 | | | 0.45 | % | | | 2.33 | |
| The International | | | | | | | | | | | | | | | |
| Equity Portfolio | | | 1,000.00 | | | | 1,069.50 | | | 0.87 | % | | | 4.54 | |
| The Labor Select | | | | | | | | | | | | | | | |
| International Equity | | | | | | | | | | | | | | | |
| Portfolio | | | 1,000.00 | | | | 1,063.50 | | | 0.87 | % | | | 4.53 | |
| The Emerging | | | | | | | | | | | | | | | |
| Markets Portfolio | | | 1,000.00 | | | | 1,117.40 | | | 1.17 | % | | | 6.24 | |
| The Emerging | | | | | | | | | | | | | | | |
| Markets Portfolio II** | | | 1,000.00 | | | | 1,136.50 | | | 1.40 | % | | | 5.37 | |
2010 Annual report • Delaware Pooled Trust
60
| | | | | | | | Expenses |
| | Beginning | | Ending | | | | Paid During |
| | Account | | Account | | Annualized | | Period |
| | Value | | Value | | Expense | | 5/1/10 to |
| | 5/1/10 | | 10/31/10 | | Ratio | | 10/31/10 |
| Actual Portfolio Return (continued) | | | | | |
| The Global Real Estate | | | | | | | |
| Securities Portfolio | | | | | | | | |
| Original Class | $1,000.00 | | $1,100.80 | | 1.27% | | $6.72 | |
| The Global Real | | | | | | | | |
| Estate Securities | | | | | | | | |
| Portfolio Class P | 1,000.00 | | 1,101.00 | | 1.52% | | 8.05 | |
| The Global Fixed | | | | | | | | |
| Income Portfolio | 1,000.00 | | 1,111.30 | | 0.60% | | 3.19 | |
| The International | | | | | | | | |
| Fixed Income | | | | | | | | |
| Portfolio | 1,000.00 | | 1,127.20 | | 0.60% | | 3.22 | |
| Hypothetical 5% Return (5% return before expenses) | | | |
| The Large-Cap | | | | | | | | |
| Value Equity | | | | | | | | |
| Portfolio | $1,000.00 | | $1,021.68 | | 0.70% | | $3.57 | |
| The Select 20 | | | | | | | | |
| Portfolio | 1,000.00 | | 1,020.72 | | 0.89% | | 4.53 | |
| The Large-Cap | | | | | | | | |
| Growth Equity | | | | | | | | |
| Portfolio | 1,000.00 | | 1,021.93 | | 0.65% | | 3.31 | |
| The Focus Smid-Cap | | | | | | | | |
| Growth Equity | | | | | | | | |
| Portfolio | 1,000.00 | | 1,020.57 | | 0.92% | | 4.69 | |
| The Real Estate | | | | | | | | |
| Investment Trust | | | | | | | | |
| Portfolio II | 1,000.00 | | 1,020.42 | | 0.95% | | 4.84 | |
| The Delaware | | | | | | | | |
| Macquarie | | | | | | | | |
| Real Estate | | | | | | | | |
| Portfolio* | 1,000.00 | | 1,020.42 | | 0.95% | | 4.84 | |
| The Core Focus | | | | | | | | |
| Fixed Income | | | | | | | | |
| Portfolio | 1,000.00 | | 1,023.04 | | 0.43% | | 2.19 | |
| The High-Yield | | | | | | | | |
| Bond Portfolio | 1,000.00 | | 1,022.23 | | 0.59% | | 3.01 | |
| The Core Plus | | | | | | | | |
| Fixed Income | | | | | | | | |
| Portfolio | 1,000.00 | | 1,022.94 | | 0.45% | | 2.29 | |
| The International | | | | | | | | |
| Equity Portfolio | 1,000.00 | | 1,020.82 | | 0.87% | | 4.43 | |
| The Labor Select | | | | | | | | |
| International | | | | | | | | |
| Equity Portfolio | 1,000.00 | | 1,020.82 | | 0.87% | | 4.43 | |
| The Emerging | | | | | | | | |
| Markets Portfolio | 1,000.00 | | 1,019.31 | | 1.17% | | 5.96 | |
| The Emerging | | | | | | | | |
| Markets Portfolio II** | 1,000.00 | | 1,018.15 | | 1.40% | | 7.12 | |
| The Global Real Estate | | | | | | | |
| Securities Portfolio | | | | | | | | |
| Original Class | 1,000.00 | | 1,018.80 | | 1.27% | | 6.46 | |
| The Global Real Estate | | | | | | | |
| Securities Portfolio | | | | | | | | |
| Class P | 1,000.00 | | 1,017.54 | | 1.52% | | 7.73 | |
| The Global Fixed | | | | | | | | |
| Income Portfolio | 1,000.00 | | 1,022.18 | | 0.60% | | 3.06 | |
| The International | | | | | | | | |
| Fixed Income | | | | | | | | |
| Portfolio | 1,000.00 | | 1,022.18 | | 0.60% | | 3.06 | |
| * | Commenced operations June 30, 2010. The actual ending account value and the expense paid during the period reflect the shorter period, 124 days. The hypothetical example assumes the entire half year period. |
| ** | Commenced operations June 23, 2010. The actual ending account value and the expense paid during the period reflect the shorter period, 131 days. The hypothetical example assumes the entire half year period. |
2010 Annual report • Delaware Pooled Trust
61
Sector allocations and top 10 holdings
Delaware Pooled® Trust
As of October 31, 2010
Sector designations may be different than the sector designations presented in other Portfolio materials. The sector designations may represent the investment manager’s internal sector classifications, which may result in the sector designations for one portfolio being different than another portfolio’s sector designations.
| The Large-Cap Value Equity Portfolio | | |
| | Percentage |
| Sector | of Net Assets |
| Common Stock | 98.73% | |
| Consumer Discretionary | 6.09% | |
| Consumer Staples | 14.90% | |
| Energy | 15.55% | |
| Financials | 11.63% | |
| Healthcare | 17.80% | |
| Industrials | 5.84% | |
| Information Technology | 12.00% | |
| Materials | 2.94% | |
| Telecommunications | 5.84% | |
| Utilities | 6.14% | |
| Discount Note | 1.09% | |
| Total Value of Securities | 99.82% | |
| Receivables and Other Assets Net of Liabilities | 0.18% | |
| Total Net Assets | 100.00% | |
Holdings are for informational purposes only and are subject to change at any time. They are not a recommendation to buy, sell, or hold any security.
| | Percentage |
| Top 10 Holdings | of Net Assets |
| Williams | 3.53% | |
| National Oilwell Varco | 3.34% | |
| Comcast Class A | 3.34% | |
| Safeway | 3.16% | |
| Marsh & McLennan | 3.15% | |
| Edison International | 3.13% | |
| Xerox | 3.11% | |
| Cardinal Health | 3.10% | |
| Kraft Foods Class A | 3.08% | |
| Archer-Daniels-Midland | 3.08% | |
| The Select 20 Portfolio | | |
| | Percentage |
| Sector | of Net Assets |
| Common Stock² | 92.75% | |
| Consumer Discretionary | 15.48% | |
| Energy | 3.88% | |
| Financial Services | 14.16% | |
| Healthcare | 16.90% | |
| Materials & Processing | 4.64% | |
| Technology | 33.18% | |
| Utilities | 4.51% | |
| Discount Note | 7.31% | |
| Total Value of Securities | 100.06% | |
| Liabilities Net of Receivables and Other Assets | (0.06% | ) |
| Total Net Assets | 100.00% | |
²Narrow industries are utilized for compliance purposes for diversification whereas broad sectors are used for financial reporting.
Holdings are for informational purposes only and are subject to change at any time. They are not a recommendation to buy, sell, or hold any security.
| | Percentage |
| Top 10 Holdings | of Net Assets |
| Apple | 9.06% | |
| Allergan | 6.66% | |
| MasterCard Class A | 5.81% | |
| Crown Castle International | 5.76% | |
| Medco Health Solutions | 5.75% | |
| IntercontinentalExchange | 5.66% | |
| QUALCOMM | 5.51% | |
| priceline.com | 5.01% | |
| Polycom | 4.98% | |
| Google Class A | 4.81% | |
2010 Annual report • Delaware Pooled Trust
62
Delaware Pooled® Trust
As of October 31, 2010
Sector designations may be different than the sector designations presented in other Portfolio materials. The sector designations may represent the investment manager’s internal sector classifications, which may result in the sector designations for one portfolio being different than another portfolio’s sector designations.
| The Large-Cap Growth Equity Portfolio | | |
| | Percentage |
| Sector | of Net Assets |
| Common Stock² | 99.55% | |
| Consumer Discretionary | 16.50% | |
| Consumer Staples | 4.78% | |
| Energy | 3.79% | |
| Financial Services | 18.02% | |
| Healthcare | 14.42% | |
| Materials & Processing | 3.06% | |
| Producer Durables | 3.22% | |
| Technology | 35.76% | |
| Discount Note | 0.58% | |
| Securities Lending Collateral | 15.94% | |
| Total Value of Securities | 116.07% | |
| Obligation to Return Securities Lending Collateral | (16.03% | ) |
| Liabilities Net of Receivables and Other Assets | (0.04% | ) |
| Total Net Assets | 100.00% | |
²Narrow industries are utilized for compliance purposes for diversification whereas broad sectors are used for financial reporting.
Holdings are for informational purposes only and are subject to change at any time. They are not a recommendation to buy, sell, or hold any security.
| | Percentage |
| Top 10 Holdings | of Net Assets |
| Apple | 5.89% | |
| Visa Class A | 5.33% | |
| Intuit | 4.89% | |
| Google Class A | 4.72% | |
| priceline.com | 4.71% | |
| QUALCOMM | 4.70% | |
| Medco Health Solutions | 4.69% | |
| Allergan | 4.65% | |
| Crown Castle International | 4.37% | |
| EOG Resources | 3.80% | |
| The Focus Smid-Cap Growth Equity Portfolio | | |
| | Percentage |
| Sector | of Net Assets |
| Common Stock | 95.20% | |
| Consumer Discretionary | 20.69% | |
| Consumer Staples | 6.66% | |
| Energy | 3.92% | |
| Financial Services | 15.45% | |
| Healthcare | 13.03% | |
| Producer Durables | 7.41% | |
| Technology | 23.64% | |
| Utilities | 4.40% | |
| Discount Note | 5.01% | |
| Total Value of Securities | 100.21% | |
| Liabilities Net of Receivables and Other Assets | (0.21% | ) |
| Total Net Assets | 100.00% | |
Holdings are for informational purposes only and are subject to change at any time. They are not a recommendation to buy, sell, or hold any security.
| | Percentage |
| Top 10 Holdings | of Net Assets |
| SBA Communications Class A | 4.77% | |
| Affiliated Managers Group | 4.64% | |
| j2 Global Communications | 4.40% | |
| Polycom | 4.39% | |
| Perrigo | 4.36% | |
| Strayer Education | 4.32% | |
| Expeditors International of Washington | 4.28% | |
| Weight Watchers International | 4.21% | |
| VeriFone Holdings | 4.11% | |
| Blackbaud | 4.07% | |
2010 Annual report • Delaware Pooled Trust
(continues) 63
Sector allocations and top 10 holdings
Delaware Pooled® Trust
As of October 31, 2010
Sector designations may be different than the sector designations presented in other Portfolio materials. The sector designations may represent the investment manager’s internal sector classifications, which may result in the sector designations for one portfolio being different than another portfolio’s sector designations.
| The Real Estate Investment Trust Portfolio II | | |
| | Percentage |
| Sector | of Net Assets |
| Common Stock | 93.77% | |
| Diversified REITs | 5.35% | |
| Healthcare REITs | 11.71% | |
| Hotel REITs | 4.45% | |
| Industrial REITs | 3.82% | |
| Mall REITs | 14.08% | |
| Manufactured Housing REIT | 1.23% | |
| Multifamily REITs | 16.32% | |
| Office REITs | 10.26% | |
| Office/Industrial REITs | 5.06% | |
| Real Estate Operating Companies | 1.13% | |
| Self-Storage REITs | 6.26% | |
| Shopping Center REITs | 9.00% | |
| Single Tennant REIT | 1.11% | |
| Specialty REITs | 3.99% | |
| Exchange-Traded Fund | 2.78% | |
| Discount Note | 3.83% | |
| Total Value of Securities | 100.38% | |
| Liabilities Net of Receivables and Other Assets | (0.38% | ) |
| Total Net Assets | 100.00% | |
Holdings are for informational purposes only and are subject to change at any time. They are not a recommendation to buy, sell, or hold any security.
| | Percentage |
| Top 10 Holdings | of Net Assets |
| Simon Property Group | 10.04% | |
| Public Storage | 5.69% | |
| Vornado Realty Trust | 4.49% | |
| Boston Properties | 4.10% | |
| Equity Residential | 3.94% | |
| Digital Realty Trust | 3.43% | |
| HCP | 3.42% | |
| Ventas | 3.18% | |
| Host Hotels & Resorts | 2.87% | |
| Macerich | 2.87% | |
| The Delaware Macquarie Real Estate Portfolio | | |
| | Percentage |
| Sector | of Net Assets |
| Common Stock | 97.91% | |
| Diversified REIT | 2.19% | |
| Healthcare REITs | 8.76% | |
| Hotel REITs | 3.94% | |
| Industrial REITs | 1.82% | |
| Mall REITs | 13.13% | |
| Multifamily REITs | 17.72% | |
| Office REITs | 10.88% | |
| Office/Industrial REITs | 6.48% | |
| Real Estate Operating Companies | 11.20% | |
| Self-Storage REITs | 4.36% | |
| Shopping Center REITs | 15.27% | |
| Specialty REIT | 2.16% | |
| Total Value of Securities | 97.91% | |
| Receivables and Other Assets Net of Liabilities | 2.09% | |
| Total Net Assets | 100.00% | |
Holdings are for informational purposes only and are subject to change at any time. They are not a recommendation to buy, sell, or hold any security.
| | Percentage |
| Top 10 Holdings | of Net Assets |
| Simon Property Group | 10.28% | |
| RioCan Real Estate Investment Trust | 6.48% | |
| Equity Residential | 4.40% | |
| Digital Realty Trust | 4.26% | |
| Public Storage | 3.88% | |
| Boston Properties | 3.81% | |
| Host Hotels & Resorts | 3.48% | |
| American Campus Communities | 2.73% | |
| Boardwalk Real Estate Investment Trust | 2.62% | |
| Ventas | 2.48% | |
2010 Annual report • Delaware Pooled Trust
64
Security types
Delaware Pooled® Trust — The Core Focus Fixed Income Portfolio
As of October 31, 2010
Sector designations may be different than the sector designations presented in other Portfolio materials. The sector designations may represent the investment manager’s internal sector classifications, which may result in the sector designations for one portfolio being different than another portfolio’s sector designations.
| | Percentage |
| Security type | of Net Assets |
| Agency Asset-Backed Security | 0.10% | |
| Agency Collateralized Mortgage Obligations | 4.53% | |
| Agency Mortgage-Backed Securities | 33.27% | |
| Commercial Mortgage-Backed Securities | 6.70% | |
| Corporate Bonds | 31.50% | |
| Banking | 7.09% | |
| Basic Industry | 2.07% | |
| Brokerage | 0.58% | |
| Capital Goods | 0.50% | |
| Communications | 3.92% | |
| Consumer Cyclical | 0.47% | |
| Consumer Non-Cyclical | 4.38% | |
| Electric | 3.00% | |
| Energy | 2.58% | |
| Finance Companies | 0.95% | |
| Insurance | 0.81% | |
| Natural Gas | 2.63% | |
| Real Estate | 1.11% | |
| Technology | 0.61% | |
| Transportation | 0.80% | |
| Non-Agency Asset-Backed Securities | 6.64% | |
| Non-Agency Collateralized Mortgage Obligations | 0.48% | |
| Regional Bonds | 2.40% | |
| Sovereign Bonds | 2.92% | |
| Supranational Banks | 0.85% | |
| U.S. Treasury Obligations | 9.21% | |
| Preferred Stock | 0.15% | |
| Discount Note | 25.28% | |
| Securities Lending Collateral | 5.91% | |
| Total Value of Securities | 129.94% | |
| Obligation to Return Securities Lending Collateral | (6.13% | ) |
| Liabilities Net of Receivables and Other Assets | (23.81% | ) |
| Total Net Assets | 100.00% | |
2010 Annual report • Delaware Pooled Trust
(continues) 65
Security types
Delaware Pooled® Trust — The High-Yield Bond Portfolio
As of October 31, 2010
Sector designations may be different than the sector designations presented in other Portfolio materials. The sector designations may represent the investment manager’s internal sector classifications, which may result in the sector designations for one portfolio being different than another portfolio’s sector designations.
| | Percentage |
| Security types | of Net Assets |
| Convertible Bonds | 0.95% | |
| Corporate Bonds | 93.13% | |
| Basic Industry | 9.08% | |
| Brokerage | 1.34% | |
| Capital Goods | 5.89% | |
| Consumer Cyclical | 9.99% | |
| Consumer Non-Cyclical | 9.69% | |
| Energy | 11.00% | |
| Finance & Investments | 7.55% | |
| Media | 7.13% | |
| Real Estate | 0.49% | |
| Services Cyclical | 9.00% | |
| Services Non-Cyclical | 4.76% | |
| Technology & Electronics | 2.90% | |
| Telecommunications | 11.78% | |
| Utilities | 2.53% | |
| Senior Secured Loans | 1.33% | |
| Common Stock | 0.48% | |
| Convertible Preferred Stock | 0.24% | |
| Preferred Stock | 0.60% | |
| Warrants | 0.00% | |
| Discount Note | 3.20% | |
| Securities Lending Collateral | 9.16% | |
| Total Value of Securities | 109.09% | |
| Obligation to Return Securities Lending Collateral | (9.27%) | |
| Receivables and Other Assets Net of Liabilities | 0.18% | |
| Total Net Assets | 100.00% | |
2010 Annual report • Delaware Pooled Trust
66
Delaware Pooled® Trust — The Core Plus Fixed Income Portfolio
As of October 31, 2010
Sector designations may be different than the sector designations presented in other Portfolio materials. The sector designations may represent the investment manager’s internal sector classifications, which may result in the sector designations for one portfolio being different than another portfolio’s sector designations.
| | Percentage |
| Security types | of Net Assets |
| Agency Asset-Backed Securities | 0.26% | |
| Agency Collateralized Mortgage Obligations | 3.55% | |
| Agency Mortgage-Backed Securities | 15.88% | |
| Commercial Mortgage-Backed Securities | 7.39% | |
| Convertible Bonds | 0.54% | |
| Corporate Bonds | 49.01% | |
| Banking | 8.41% | |
| Basic Industries | 4.07% | |
| Brokerage | 1.44% | |
| Capital Goods | 0.96% | |
| Communications | 8.99% | |
| Consumer Cyclical | 1.87% | |
| Consumer Non-Cyclical | 6.96% | |
| Electric | 4.80% | |
| Energy | 4.75% | |
| Finance Companies | 2.19% | |
| Insurance | 0.45% | |
| Natural Gas | 1.69% | |
| Real Estate | 1.32% | |
| Technology | 0.42% | |
| Transportation | 0.69% | |
| Non-Agency Asset-Backed Securities | 4.27% | |
| Non-Agency Collateralized Mortgage Obligations | 1.45% | |
| Regional Bonds | 1.85% | |
| Senior Secured Loans | 3.02% | |
| Sovereign Bonds | 4.51% | |
| Supranational Banks | 1.09% | |
| U.S. Treasury Obligations | 3.52% | |
| Preferred Stock | 0.23% | |
| Discount Note | 16.17% | |
| Securities Lending Collateral | 2.50% | |
| Total Value of Securities | 115.24% | |
| Obligation to Return Securities Lending Collateral | (2.60% | ) |
| Liabilities Net of Receivables and Other Assets | (12.64% | ) |
| Total Net Assets | 100.00% | |
2010 Annual report • Delaware Pooled Trust
67
Country and sector allocations
Delaware Pooled® Trust — The International Equity Portfolio
As of October 31, 2010
Sector designations may be different than the sector designations presented in other Portfolio materials. The sector designations may represent the investment manager’s or sub-advisor’s internal sector classifications, which may result in the sector designations for one portfolio being different than another portfolio’s sector designations.
| | Percentage |
| Country | of Net Assets |
| Common Stock | 99.18% | |
| Australia | 8.98% | |
| Belgium | 0.00% | |
| France | 16.32% | |
| Germany | 5.01% | |
| Hong Kong | 0.90% | |
| Ireland | 1.20% | |
| Italy | 3.85% | |
| Japan | 19.86% | |
| Netherlands | 3.77% | |
| New Zealand | 0.48% | |
| Singapore | 4.15% | |
| Spain | 7.67% | |
| Switzerland | 5.53% | |
| Taiwan | 2.44% | |
| United Kingdom | 19.02% | |
| Discount Note | 0.38% | |
| Securities Lending Collateral | 1.75% | |
| Total Value of Securities | 101.31% | |
| Obligation to Return Securities Lending Collateral | (1.93% | ) |
| Receivables and Other Assets Net of Liabilities | 0.62% | |
| Total Net Assets | 100.00% | |
| | Percentage |
| Sector | of Net Assets |
| Consumer Discretionary | 5.62% | |
| Consumer Staples | 15.99% | |
| Energy | 12.31% | |
| Financials | 13.84% | |
| Healthcare | 15.14% | |
| Industrials | 5.87% | |
| Information Technology | 4.24% | |
| Materials | 1.85% | |
| Telecommunication Services | 18.03% | |
| Utilities | 6.29% | |
| Total | 99.18% | |
2010 Annual report • Delaware Pooled Trust
68
Delaware Pooled® Trust — The Labor Select International Equity Portfolio
As of October 31, 2010
Sector designations may be different than the sector designations presented in other Portfolio materials. The sector designations may represent the investment manager’s or sub-advisor’s internal sector classifications, which may result in the sector designations for one portfolio being different than another portfolio’s sector designations.
| | Percentage |
| Country | of Net Assets |
| Common Stock | 98.28% | |
| Australia | 9.43% | |
| Belgium | 0.00% | |
| France | 14.64% | |
| Germany | 2.92% | |
| Hong Kong | 1.45% | |
| Ireland | 1.27% | |
| Italy | 2.07% | |
| Japan | 20.19% | |
| Netherlands | 4.04% | |
| New Zealand | 0.67% | |
| Singapore | 4.78% | |
| Spain | 8.16% | |
| Switzerland | 5.69% | |
| United Kingdom | 22.97% | |
| Discount Note | 2.03% | |
| Securities Lending Collateral | 1.81% | |
| Total Value of Securities | 102.12% | |
| Obligation to Return Securities Lending Collateral | (1.88% | ) |
| Liabilities Net of Receivables and Other Assets | (0.24% | ) |
| Total Net Assets | 100.00% | |
| | Percentage |
| Sector | of Net Assets |
| Consumer Discretionary | 5.48% | |
| Consumer Staples | 16.28% | |
| Energy | 11.93% | |
| Financials | 15.58% | |
| Healthcare | 15.48% | |
| Industrials | 3.50% | |
| Information Technology | 2.88% | |
| Materials | 2.35% | |
| Telecommunication Services | 17.15% | |
| Utilities | 7.65% | |
| Total | 98.28% | |
2010 Annual report • Delaware Pooled Trust
(continues) 69
Country and sector allocations
Delaware Pooled® Trust — The Emerging Markets Portfolio
As of October 31, 2010
Sector designations may be different than the sector designations presented in other Portfolio materials. The sector designations may represent the investment manager’s or sub-advisor’s internal sector classifications, which may result in the sector designations for one portfolio being different than another portfolio’s sector designations.
| | Percentage |
| Sector | of Net Assets |
| Common Stock | 94.88% | |
| Brazil | 12.87% | |
| Chile | 3.15% | |
| China | 21.44% | |
| Colombia | 1.03% | |
| Czech Republic | 2.64% | |
| Egypt | 0.79% | |
| India | 3.67% | |
| Indonesia | 2.13% | |
| Kazakhstan | 0.83% | |
| Malaysia | 1.08% | |
| Mexico | 5.41% | |
| Peru | 1.61% | |
| Philippines | 1.83% | |
| Poland | 0.93% | |
| Republic of Korea | 4.36% | |
| Russia | 3.08% | |
| South Africa | 6.67% | |
| Taiwan | 11.26% | |
| Thailand | 3.32% | |
| Turkey | 6.78% | |
| Preferred Stock | 4.03% | |
| Discount Note | 1.19% | |
| Securities Lending Collateral | 3.03% | |
| Total Value of Securities | 103.13% | |
| Obligation to Return Securities Lending Collateral | (3.11%) | |
| Liabilities Net of Receivables and Other Assets | (0.02%) | |
| Total Net Assets | 100.00% | |
| Consumer Discretionary | 2.04% | |
| Consumer Staples | 9.89% | |
| Energy | 12.26% | |
| Financials | 24.06% | |
| Industrials | 8.83% | |
| Information Technology | 12.19% | |
| Materials | 6.33% | |
| Telecommunication Services | 11.45% | |
| Utilities | 11.86% | |
| Total | 98.91% | |
2010 Annual report • Delaware Pooled Trust
70
Delaware Pooled® Trust — The Emerging Markets Portfolio II
As of October 31, 2010
Sector designations may be different than the sector designations presented in other Portfolio materials. The sector designations may represent the investment manager’s internal sector classifications, which may result in the sector designations for one portfolio being different than another portfolio’s sector designations.
| | Percentage |
| Country | of Net Assets |
| Common Stock | 98.08% | |
| Argentina | 1.49% | |
| Australia | 0.47% | |
| Brazil | 16.61% | |
| China | 16.82% | |
| Hungary | 0.78% | |
| India | 1.22% | |
| Indonesia | 1.00% | |
| Israel | 0.50% | |
| Malaysia | 2.66% | |
| Mexico | 4.19% | |
| Peru | 1.52% | |
| Philippines | 0.49% | |
| Poland | 3.04% | |
| Republic of Korea | 13.28% | |
| Russia | 5.64% | |
| South Africa | 6.10% | |
| Taiwan | 8.14% | |
| Thailand | 1.89% | |
| Turkey | 3.19% | |
| United Kingdom | 0.51% | |
| United States | 8.54% | |
| Total Value of Securities | 98.08% | |
| Receivables and Other Assets Net of Liabilities | 1.92% | |
| Total Net Assets | 100.00% | |
| | Percentage |
| Sector | of Net Assets |
| Consumer Discretionary | 3.05% | |
| Consumer Staples | 10.45% | |
| Energy | 12.16% | |
| Financials | 20.85% | |
| Industrials | 3.30% | |
| Information Technology | 17.39% | |
| Materials | 12.94% | |
| Telecommunication Services | 13.15% | |
| Utilities | 4.79% | |
| Total | 98.08% | |
2010 Annual report • Delaware Pooled Trust
(continues) 71
Country and sector allocations
Delaware Pooled® Trust — The Global Real Estate Securities Portfolio
As of October 31, 2010
Sector designations may be different than the sector designations presented in other Portfolio materials. The sector designations may represent the investment manager’s internal sector classifications, which may result in the sector designations for one portfolio being different than another portfolio’s sector designations.
| | Percentage |
| Country | of Net Assets |
| Common Stock | 93.62% | |
| Australia | 7.43% | |
| Belgium | 0.73% | |
| Canada | 5.31% | |
| France | 2.88% | |
| Germany | 0.92% | |
| Hong Kong/China | 15.21% | |
| Japan | 9.50% | |
| Netherlands | 2.36% | |
| Singapore | 6.70% | |
| Switzerland | 1.03% | |
| United Kingdom | 4.59% | |
| United States | 36.96% | |
| Preferred Stock | 0.36% | |
| Discount Note | 5.04% | |
| Securities Lending Collateral | 19.06% | |
| Total Value of Securities | 118.08% | |
| Obligation to Return Securities Lending Collateral | (19.72% | ) |
| Receivables and Other Assets Net of Liabilities | 1.64% | |
| Total Net Assets | 100.00% | |
| | Percentage |
| Sector | of Net Assets |
| Diversified REITs | 23.11% | |
| Healthcare REITs | 5.00% | |
| Hotel REITs | 2.42% | |
| Industrial REITs | 2.66% | |
| Mall REITs | 5.76% | |
| Manufactured Housing REITs | 0.53% | |
| Multifamily REITs | 7.20% | |
| Office REITs | 7.13% | |
| Real Estate Operating Companies | 24.76% | |
| Shopping Center REITs | 12.20% | |
| Self-Storage REITs | 3.21% | |
| Total | 93.98% | |
2010 Annual report • Delaware Pooled Trust
72
Country allocations
Delaware Pooled® Trust
As of October 31, 2010
The Global Fixed Income Portfolio
| | Percentage |
| Country | of Net Assets |
| Bonds | 98.00 | % |
| Australia | 6.99 | % |
| Austria | 2.46 | % |
| Denmark | 3.29 | % |
| France | 4.11 | % |
| Germany | 6.85 | % |
| Greece | 2.06 | % |
| Ireland | 4.50 | % |
| Italy | 7.32 | % |
| Japan | 7.59 | % |
| Netherlands | 3.58 | % |
| Norway | 4.70 | % |
| Poland | 3.96 | % |
| Qatar | 1.82 | % |
| Slovenia | 1.11 | % |
| Spain | 5.46 | % |
| Supranational | 10.06 | % |
| United Kingdom | 5.44 | % |
| United States | 16.70 | % |
| Discount Note | 0.83 | % |
| Total Value of Securities | 98.83 | % |
| Receivables and Other Assets Net of Liabilities | 1.17 | % |
| Total Net Assets | 100.00 | % |
The International Fixed Income Portfolio
| | Percentage |
| Country | of Net Assets |
| Bonds | 98.00 | % |
| Australia | 6.85 | % |
| Austria | 2.63 | % |
| Finland | 3.97 | % |
| France | 10.75 | % |
| Germany | 12.20 | % |
| Greece | 1.95 | % |
| Ireland | 4.42 | % |
| Italy | 4.54 | % |
| Japan | 12.86 | % |
| Netherlands | 7.34 | % |
| Norway | 3.31 | % |
| Poland | 3.74 | % |
| Slovenia | 1.73 | % |
| Spain | 2.34 | % |
| Supranational | 13.41 | % |
| United Kingdom | 5.42 | % |
| United States | 0.54 | % |
| Discount Note | 0.59 | % |
| Total Value of Securities | 98.59 | % |
| Receivables and Other Assets Net of Liabilities | 1.41 | % |
| Total Net Assets | 100.00 | % |
2010 Annual report • Delaware Pooled Trust
73
Statements of net assets
Delaware Pooled® Trust — The Large-Cap Value Equity Portfolio
October 31, 2010
| | | Number of | | | |
| | | Shares | | Value |
| Common Stock – 98.73% | | | | |
| Consumer Discretionary – 6.09% | | | | |
| | Comcast Class A | 10,700 | | $ | 220,206 |
| | Lowe’s | 8,500 | | | 181,305 |
| | | | | | 401,511 |
| Consumer Staples – 14.90% | | | | |
| | Archer-Daniels-Midland | 6,100 | | | 203,252 |
| | CVS Caremark | 6,100 | | | 183,732 |
| | Kimberly-Clark | 2,900 | | | 183,686 |
| | Kraft Foods Class A | 6,300 | | | 203,301 |
| | Safeway | 9,100 | | | 208,390 |
| | | | | | 982,361 |
| Energy – 15.55% | | | | |
| | Chevron | 2,300 | | | 190,003 |
| | ConocoPhillips | 3,200 | | | 190,080 |
| | Marathon Oil | 5,400 | | | 192,078 |
| | National Oilwell Varco | 4,100 | | | 220,416 |
| | Williams | 10,800 | | | 232,416 |
| | | | | | 1,024,993 |
| Financials – 11.63% | | | | |
| | Allstate | 5,900 | | | 179,891 |
| | Bank of New York Mellon | 7,200 | | | 180,432 |
| | Marsh & McLennan | 8,300 | | | 207,334 |
| | Travelers | 3,600 | | | 198,720 |
| | | | | | 766,377 |
| Healthcare – 17.80% | | | | |
| | Baxter International | 3,900 | | | 198,510 |
| | Cardinal Health | 5,900 | | | 204,671 |
| | Johnson & Johnson | 3,000 | | | 191,010 |
| | Merck | 5,300 | | | 192,284 |
| | Pfizer | 11,511 | | | 200,291 |
| | Quest Diagnostics | 3,800 | | | 186,732 |
| | | | | | 1,173,498 |
| Industrials – 5.84% | | | | |
| | Northrop Grumman | 3,100 | | | 195,951 |
| | Waste Management | 5,300 | | | 189,316 |
| | | | | | 385,267 |
| Information Technology – 12.00% | | | | |
| | Intel | 9,800 | | | 196,686 |
| | International Business Machines | 1,400 | | | 201,040 |
| † | Motorola | 23,100 | | | 188,265 |
| | Xerox | 17,500 | | | 204,750 |
| | | | | | 790,741 |
| Materials – 2.94% | | | | |
| | duPont (E.I.) deNemours | 4,100 | | | 193,848 |
| | | | | | 193,848 |
| Telecommunications – 5.84% | | | | |
| | AT&T | 6,900 | | | 196,650 |
| | Verizon Communications | 5,800 | | | 188,326 |
| | | | | | 384,976 |
| Utilities – 6.14% | | | | |
| | Edison International | 5,600 | | | 206,640 |
| | Progress Energy | 4,400 | | | 198,000 |
| | | | | | 404,640 |
| Total Common Stock | | | | |
| | (cost $5,823,002) | | | | 6,508,212 |
| | Principal | | | | |
| | Amount | | | | |
| ≠Discount Note – 1.09% | | | | | | |
| Federal Home Loan Bank 0.10% 11/1/10 | $ | 72,001 | | | 72,001 | |
| Total Discount Note | | | | | | |
| (cost $72,001) | | | | | 72,001 | |
| | | | | | | |
| Total Value of Securities – 99.82% | | | | | | |
| (cost $5,895,003) | | | | | 6,580,213 | |
| Receivables and Other Assets | | | | | | |
| Net of Liabilities – 0.18% | | | | | 12,020 | |
| Net Assets Applicable to 435,700 | | | | | | |
| Shares Outstanding; Equivalent to | | | | | | |
| $15.13 Per Share – 100.00% | | | | $ | 6,592,233 | |
| | | | | |
| Components of Net Assets at October 31, 2010: | | | | |
| Shares of beneficial interest | | | | | | |
| (unlimited authorization – no par) | | | | $ | 8,410,122 | |
| Undistributed net investment income | | | | | 187,798 | |
| Accumulated net realized loss on investments | | | | | (2,690,897 | ) |
| Net unrealized appreciation of investments | | | | | 685,210 | |
| Total net assets | | | | $ | 6,592,233 | |
≠The rate shown is the effective yield at time of purchase.
†Non income producing security.
See accompanying Notes, which are an integral part of the financial statements.
2010 Annual report • Delaware Pooled Trust
74
Delaware Pooled® Trust — The Select 20 Portfolio
October 31, 2010
| | | Number of | | | | |
| | | Shares | | Value | |
| Common Stock – 92.75%² | | | | | | |
| Consumer Discretionary – 15.48% | | | | | | |
| † | Apollo Group Class A | | 9,350 | | $ | 350,438 | |
| | Lowe’s | | 20,000 | | | 426,600 | |
| † | priceline.com | | 1,525 | | | 574,635 | |
| | Strayer Education | | 3,025 | | | 422,986 | |
| | | | | | | 1,774,659 | |
| Energy – 3.88% | | | | | | |
| | EOG Resources | | 4,650 | | | 445,098 | |
| | | | | | | 445,098 | |
| Financial Services – 14.16% | | | | | | |
| | Bank of New York Mellon | | 12,300 | | | 308,238 | |
| † | IntercontinentalExchange | | 5,650 | | | 649,016 | |
| | MasterCard Class A | | 2,775 | | | 666,166 | |
| | | | | | | 1,623,420 | |
| Healthcare – 16.90% | | | | | | |
| | Allergan | | 10,550 | | | 763,925 | |
| † | Medco Health Solutions | | 12,550 | | | 659,252 | |
| | Perrigo | | 7,800 | | | 513,864 | |
| | | | | | | 1,937,041 | |
| Materials & Processing – 4.64% | | | | | | |
| | Syngenta ADR | | 9,600 | | | 531,648 | |
| | | | | | | 531,648 | |
| Technology – 33.18% | | | | | | |
| † | Apple | | 3,450 | | | 1,038,001 | |
| † | Crown Castle International | | 15,300 | | | 659,736 | |
| † | Google Class A | | 900 | | | 551,691 | |
| † | Polycom | | 16,900 | | | 570,882 | |
| | QUALCOMM | | 14,000 | | | 631,820 | |
| † | VeriSign | | 10,100 | | | 350,975 | |
| | | | | | | 3,803,105 | |
| Utilities – 4.51% | | | | | | |
| † | j2 Global Communications | | 19,600 | | | 516,460 | |
| | | | | | | 516,460 | |
| Total Common Stock | | | | | | |
| | (cost $8,764,686) | | | | | 10,631,431 | |
| | | | | | | |
| | | Principal | | | | |
| | | Amount | | | | |
| ≠Discount Note – 7.31% | | | | | | |
| | Federal Home Loan Bank | | | | | | |
| | 0.10% 11/1/10 | $ | 838,008 | | | 838,008 | |
| Total Discount Note | | | | | | |
| | (cost $838,008) | | | | | 838,008 | |
| Total Value of Securities – 100.06% | | | | | | |
| | (cost $9,602,694) | | | | | 11,469,439 | |
| Liabilities Net of Receivables and | | | | | | |
| | Other Assets – (0.06%) | | | | | (6,670 | ) |
| Net Assets Applicable to 1,899,180 Shares | | | | | | |
| | Outstanding; Equivalent to $6.04 | | | | | | |
| | Per Share – 100.00% | | | | $ | 11,462,769 | |
| | | | | | | | |
| Components of Net Assets at October 31, 2010: | | | | | | |
| Shares of beneficial interest | | | | | | |
| | (unlimited authorization – no par) | | | | $ | 13,110,587 | |
| Accumulated net realized loss on investments | | | | | (3,514,563 | ) |
| Net unrealized appreciation of investments | | | | | 1,866,745 | |
| Total net assets | | | | $ | 11,462,769 | |
| ² | Narrow industries are utilized for compliance purposes for diversification whereas broad sectors are used for financial reporting. |
| † | Non income producing security. |
| ≠ | The rate shown is the effective yield at the time of purchase. |
ADR – American Depositary Receipts
See accompanying Notes, which are an integral part of the financial statements.
2010 Annual report • Delaware Pooled Trust
(continues) 75
Statements of net assets
Delaware Pooled® Trust — The Large-Cap Growth Equity Portfolio
October 31, 2010
| | | Number of | | | | |
| | | Shares | | Value | |
| Common Stock – 99.55%² | | | | | | |
| Consumer Discretionary – 16.50% | | | | | | |
| † | Apollo Group Class A | | 193,500 | | $ | 7,252,380 | |
| | Lowe’s | | 289,800 | | | 6,181,434 | |
| * | NIKE Class B | | 101,100 | | | 8,233,584 | |
| † | priceline.com | | 30,500 | | | 11,492,705 | |
| * | Staples | | 347,300 | | | 7,109,231 | |
| | | | | | | 40,269,334 | |
| Consumer Staples – 4.78% | | | | | | |
| | Procter & Gamble | | 92,800 | | | 5,899,296 | |
| * | Walgreen | | 170,100 | | | 5,762,988 | |
| | | | | | | 11,662,284 | |
| Energy – 3.79% | | | | | | |
| | EOG Resources | | 96,800 | | | 9,265,696 | |
| | | | | | | 9,265,696 | |
| Financial Services – 18.02% | | | | | | |
| | Bank of New York Mellon | | 246,700 | | | 6,182,302 | |
| | CME Group | | 26,000 | | | 7,530,900 | |
| † | IntercontinentalExchange | | 69,900 | | | 8,029,413 | |
| * | MasterCard Class A | | 38,500 | | | 9,242,310 | |
| * | Visa Class A | | 166,500 | | | 13,015,305 | |
| | | | | | | 44,000,230 | |
| Healthcare – 14.42% | | | | | | |
| | Allergan | | 156,700 | | | 11,346,647 | |
| † | Medco Health Solutions | | 217,800 | | | 11,441,034 | |
| | Novo-Nordisk ADR | | 78,700 | | | 8,247,760 | |
| * | Perrigo | | 63,100 | | | 4,157,028 | |
| | | | | | | 35,192,469 | |
| Materials & Processing – 3.06% | | | | | | |
| | Syngenta ADR | | 135,100 | | | 7,481,838 | |
| | | | | | | 7,481,838 | |
| Producer Durables – 3.22% | | | | | | |
| * | Expeditors International of Washington | | 159,100 | | | 7,853,176 | |
| | | | | | | 7,853,176 | |
| Technology – 35.76% | | | | | | |
| † | Adobe Systems | | 261,400 | | | 7,358,410 | |
| † | Apple | | 47,800 | | | 14,381,586 | |
| † | Crown Castle International | | 247,600 | | | 10,676,512 | |
| † | Google Class A | | 18,800 | | | 11,524,212 | |
| † | Intuit | | 248,700 | | | 11,937,600 | |
| *† | Polycom | | 145,000 | | | 4,898,100 | |
| | QUALCOMM | | 254,400 | | | 11,481,072 | |
| † | Teradata | | 155,800 | | | 6,132,288 | |
| *† | VeriSign | | 256,600 | | | 8,916,850 | |
| | | | | | | 87,306,630 | |
| Total Common Stock | | | | | | |
| | (cost $200,317,392) | | | | | 243,031,657 | |
| | | | | | | | |
| | | Principal | | | | |
| | | Amount | | | |
| ≠Discount Note – 0.58% | | | | | | |
| | Federal Home Loan Bank | | | | | | |
| | 0.10% 11/1/10 | $ | 1,407,013 | | | 1,407,013 | |
| Total Discount Note | | | | | | |
| | (cost $1,407,013) | | | | | 1,407,013 | |
| Total Value of Securities Before Securities | | | | |
| | Lending Collateral – 100.13% | | | | | | |
| | (cost $201,724,405) | | | | | 244,438,670 | |
| | | | | | | | |
| | | | Number of | | | | |
| | | | Shares | | | | |
| Securities Lending Collateral** – 15.94% | | | | |
| Investment Companies | | | | | | |
| | Delaware Investments Collateral | | | | | | |
| | Fund No. 1 | | 38,677,896 | | | 38,677,896 | |
| | BNY Mellon SL DBT II Liquidating Fund | | 238,027 | | | 231,148 | |
| @† | Mellon GSL Reinvestment Trust II | | 224,466 | | | 11,605 | |
| Total Securities Lending Collateral | | | | | | |
| | (cost $39,140,389) | | | | | 38,920,649 | |
| | | | | | | |
| Total Value of Securities – 116.07% | | | | | | |
| | (cost $240,864,794) | | | | | 283,359,319 | © |
| Obligation to Return Securities | | | | | | |
| | Lending Collateral** – (16.03%) | | | | | (39,140,389 | ) |
| Liabilities Net of Receivables and | | | | | | |
| | Other Assets – (0.04%) | | | | | (94,873 | ) |
| Net Assets Applicable to 27,417,432 | | | | | | |
| | Shares Outstanding; Equivalent to | | | | | | |
| | $8.90 Per Share – 100.00% | | | | $ | 244,124,057 | |
| | | | | |
| Components of Net Assets at October 31, 2010: | | | | |
| Shares of beneficial interest | | | | | | |
| | (unlimited authorization – no par) | | | | $ | 283,329,494 | |
| Undistributed net investment income | | | | | 164,775 | |
| Accumulated net realized loss on investments | | | (81,864,737 | ) |
| Net unrealized appreciation of investments | | | | | 42,494,525 | |
| Total net assets | | | | $ | 244,124,057 | |
| ² | Narrow industries are utilized for compliance purposes for diversification whereas broad sectors are used for financial reporting. |
| † | Non income producing security. |
| ≠ | The rate shown is the effective yield at the time of purchase. |
| * | Fully or partially on loan. |
| ** | See Note 9 in “Notes to financial statements.” |
| © | Includes $38,486,445 of securities loaned. |
| @ | Illiquid security. At October 31, 2010, the aggregate amount of illiquid securities was $11,605, which represented 0.00% of the Portfolio’s net assets. See Note 10 in “Notes to financial statements.” |
ADR — American Depositary Receipts
See accompanying Notes, which are an integral part of the financial statements.
2010 Annual report • Delaware Pooled Trust
76
Delaware Pooled® Trust — The Focus Smid-Cap Growth Equity Portfolio
October 31, 2010
| | | Number of | | | | |
| | | Shares | | Value | |
| Common Stock – 95.20% | | | | | | |
| Consumer Discretionary – 20.69% | | | | | | |
| † | DineEquity | | 2,550 | | $ | 113,348 | |
| | Fastenal | | 2,400 | | | 123,552 | |
| | Gentex | | 4,200 | | | 83,916 | |
| † | Interval Leisure Group | | 6,000 | | | 86,100 | |
| † | NetFlix | | 350 | | | 60,725 | |
| | Ritchie Bros Auctioneers | | 4,400 | | | 93,192 | |
| | Strayer Education | | 1,425 | | | 199,257 | |
| | Weight Watchers International | | 5,800 | | | 194,242 | |
| | | | | | | 954,332 | |
| Consumer Staples – 6.66% | | | | | | |
| † | Peet’s Coffee & Tea | | 4,450 | | | 170,212 | |
| † | Whole Foods Market | | 3,450 | | | 137,138 | |
| | | | | | | 307,350 | |
| Energy – 3.92% | | | | | | |
| | Core Laboratories | | 2,325 | | | 180,815 | |
| | | | | | | 180,815 | |
| Financial Services – 15.45% | | | | | | |
| † | Affiliated Managers Group | | 2,500 | | | 214,025 | |
| | Heartland Payment Systems | | 8,700 | | | 124,236 | |
| † | IntercontinentalExchange | | 1,380 | | | 158,521 | |
| † | MSCI Class A | | 2,600 | | | 93,210 | |
| † | optionsXpress Holdings | | 7,700 | | | 122,969 | |
| | | | | | | 712,961 | |
| Healthcare – 13.03% | | | | | | |
| † | ABIOMED | | 7,700 | | | 79,387 | |
| † | athenahealth | | 3,450 | | | 137,897 | |
| | Perrigo | | 3,050 | | | 200,934 | |
| | Techne | | 3,000 | | | 182,760 | |
| | | | | | | 600,978 | |
| Producer Durables – 7.41% | | | | | | |
| | Expeditors International of Washington | | 4,000 | | | 197,440 | |
| | Graco | | 4,200 | | | 144,522 | |
| | | | | | | 341,962 | |
| Technology – 23.64% | | | | | | |
| | Blackbaud | | 7,400 | | | 187,886 | |
| † | Polycom | | 6,000 | | | 202,680 | |
| † | SBA Communications Class A | | 5,600 | | | 219,856 | |
| † | Teradata | | 2,800 | | | 110,208 | |
| † | VeriFone Holdings | | 5,600 | | | 189,448 | |
| † | VeriSign | | 5,200 | | | 180,700 | |
| | | | | | | 1,090,778 | |
| Utilities – 4.40% | | | | | | |
| † | j2 Global Communications | | 7,700 | | | 202,895 | |
| | | | | | | 202,895 | |
| Total Common Stock | | | | | | |
| | (cost $3,379,651) | | | | | 4,392,071 | |
| | | | | | | | |
| | | Principal | | | | |
| | | Amount | | | |
| ≠Discount Note – 5.01% | | | | | | |
| | Federal Home Loan Bank | | | | | | |
| | 0.10% 11/1/10 | $ | 231,002 | | | 231,002 | |
| Total Discount Note | | | | | | |
| | (cost $231,002) | | | | | 231,002 | |
| | | | | | | |
| Total Value of Securities – 100.21% | | | | | | |
| | (cost $3,610,653) | | | | | 4,623,073 | |
| Liabilities Net of Receivables and | | | | | | |
| | Other Assets – (0.21%) | | | | | (9,797 | ) |
| Net Assets Applicable to 375,473 | | | | | | |
| | Shares Outstanding; Equivalent to | | | | | | |
| | $12.29 Per Share – 100.00% | | | | $ | 4,613,276 | |
| | | | | |
| Components of Net Assets at October 31, 2010: | | | | |
| Shares of beneficial interest | | | | | | |
| | (unlimited authorization – no par) | | | | $ | 4,917,957 | |
| Accumulated net realized loss on investments | | | (1,317,101 | ) |
| Net unrealized appreciation of investments | | | | | 1,012,420 | |
| Total net assets | | | | $ | 4,613,276 | |
| ≠ | The rate shown is the effective yield at the time of purchase. |
| † | Non income producing security. |
See accompanying Notes, which are an integral part of the financial statements.
2010 Annual report • Delaware Pooled Trust
(continues) 77
Statements of net assets
Delaware Pooled® Trust — The Real Estate Investment Trust Portfolio II
October 31, 2010
| | | Number of | | | | |
| | | Shares | | Value | |
| Common Stock – 93.77% | | | | | | |
| Diversified REITs – 5.35% | | | | | | |
| | Vornado Realty Trust | | 1,420 | | $ | 124,094 | |
| | Washington Real Estate Investment Trust | | 745 | | | 23,862 | |
| | | | | | | 147,956 | |
| Healthcare REITs – 11.71% | | | | | | |
| | Cogdell Spencer | | 920 | | | 6,044 | |
| | HCP | | 2,630 | | | 94,707 | |
| | Health Care REIT | | 245 | | | 12,520 | |
| | Healthcare Realty Trust | | 970 | | | 23,416 | |
| | Nationwide Health Properties | | 1,475 | | | 60,224 | |
| | Omega Healthcare Investors | | 1,700 | | | 39,100 | |
| | Ventas | | 1,640 | | | 87,838 | |
| | | | | | | 323,849 | |
| Hotel REITs – 4.45% | | | | | | |
| | DiamondRock Hospitality | | 2,615 | | | 27,667 | |
| | Host Hotels & Resorts | | 4,998 | | | 79,418 | |
| | LaSalle Hotel Properties | | 525 | | | 12,437 | |
| † | Strategic Hotel & Resorts | | 765 | | | 3,481 | |
| | | | | | | 123,003 | |
| Industrial REITs – 3.82% | | | | | | |
| | AMB Property | | 1,755 | | | 49,474 | |
| | First Potomac Realty Trust | | 755 | | | 12,442 | |
| | ProLogis | | 3,215 | | | 43,885 | |
| | | | | | | 105,801 | |
| Mall REITs – 14.08% | | | | | | |
| | CBL & Associates Properties | | 1,455 | | | 22,814 | |
| | Macerich | | 1,778 | | | 79,317 | |
| | Simon Property Group | | 2,891 | | | 277,594 | |
| | Taubman Centers | | 210 | | | 9,748 | |
| | | | | | | 389,473 | |
| Manufactured Housing REIT – 1.23% | | | | | | |
| | Equity Lifestyle Properties | | 600 | | | 34,152 | |
| | | | | | | 34,152 | |
| Multifamily REITs – 16.32% | | | | | | |
| | Apartment Investment & Management | | 1,800 | | | 41,958 | |
| | Associated Estates Realty | | 795 | | | 11,043 | |
| | AvalonBay Communities | | 522 | | | 55,494 | |
| | BRE Properties | | 1,095 | | | 47,008 | |
| | Camden Property Trust | | 1,285 | | | 63,723 | |
| † | Campus Crest Communities | | 580 | | | 7,250 | |
| | Colonial Properties Trust | | 1,405 | | | 25,192 | |
| | Equity Residential | | 2,240 | | | 108,930 | |
| | Essex Property Trust | | 459 | | | 51,849 | |
| | UDR | | 1,731 | | | 38,913 | |
| | | | | | | 451,360 | |
| Office REITs – 10.26% | | | | | | |
| | Alexandria Real Estate Equities | | 650 | | | 47,762 | |
| | BioMed Realty Trust | | 1,035 | | | 18,992 | |
| | Boston Properties | | 1,315 | | | 113,340 | |
| | Kilroy Realty | | 815 | | | 27,849 | |
| | Mack-Cali Realty | | 795 | | | 26,696 | |
| | SL Green Realty | | 750 | | | 49,290 | |
| | | | | | | 283,929 | |
| Office/Industrial REITs – 5.06% | | | | | | |
| | Digital Realty Trust | | 1,590 | | | 94,971 | |
| | DuPont Fabros Technology | | 880 | | | 22,088 | |
| | PS Business Parks | | 385 | | | 22,815 | |
| | | | | | | 139,874 | |
| Real Estate Operating Companies – 1.13% | | | | | | |
| | Starwood Hotels & Resorts Worldwide | | 580 | | | 31,401 | |
| | | | | | | 31,401 | |
| Self-Storage REITs – 6.26% | | | | | | |
| | Extra Space Storage | | 985 | | | 15,957 | |
| | Public Storage | | 1,585 | | | 157,264 | |
| | | | | | | 173,221 | |
| Shopping Center REITs – 9.00% | | | | | | |
| | Acadia Realty Trust | | 1,190 | | | 22,705 | |
| | Federal Realty Investment Trust | | 788 | | | 64,600 | |
| | Kimco Realty | | 3,865 | | | 66,595 | |
| | Ramco-Gershenson Properties Trust | | 735 | | | 8,511 | |
| | Regency Centers | | 1,090 | | | 45,976 | |
| | Weingarten Realty Investors | | 1,680 | | | 40,538 | |
| | | | | | | 248,925 | |
| Single Tennant REIT – 1.11% | | | | | | |
| | National Retail Properties | | 1,130 | | | 30,623 | |
| | | | | | | 30,623 | |
| Specialty REITs – 3.99% | | | | | | |
| | Entertainment Properties Trust | | 1,270 | | | 58,712 | |
| | Plum Creek Timber | | 230 | | | 8,473 | |
| | Rayonier | | 825 | | | 43,065 | |
| | | | | | | 110,250 | |
| Total Common Stock (cost $2,275,105) | | | | | 2,593,817 | |
| | | | | | | | |
| Exchange-Traded Fund – 2.78% | | | | | | |
| iShares Dow Jones U.S. Real Estate Index Fund | | 1,400 | | | 76,888 | |
| Total Exchange-Traded Fund (cost $71,462) | | | | | 76,888 | |
| | | | | | | |
| | | Principal | | | | |
| | | Amount | | | | |
| ≠Discount Note – 3.83% | | | | | | |
| Federal Home Loan Bank 0.10% 11/1/10 | $ | 106,001 | | | 106,001 | |
| Total Discount Note (cost $106,001) | | | | | 106,001 | |
| | | | | | | |
| Total Value of Securities – 100.38% | | | | | | |
| | (cost $2,452,568) | | | | | 2,776,706 | |
| Liabilities Net of Receivables and Other | | | | | | |
| | Assets – (0.38%) | | | | | (10,553 | ) |
| Net Assets Applicable to 477,670 Shares | | | | | | |
| | Outstanding; Equivalent to $5.79 | | | | | | |
| | Per Share – 100.00% | | | | $ | 2,766,153 | |
2010 Annual report • Delaware Pooled Trust
78
| | | | |
| Components of Net Assets at October 31, 2010: | | | |
| Shares of beneficial interest | | | |
| (unlimited authorization – no par) | $ | 5,531,147 | |
| Undistributed net investment income | | 29,791 | |
| Accumulated net realized loss on investments | | (3,118,923 | ) |
| Net unrealized appreciation of investments | | 324,138 | |
| Total net assets | $ | 2,766,153 | |
| † | Non income producing security. |
| ≠ | The rate shown is the effective yield at the time of purchase. |
REIT — Real Estate Investment Trust
See accompanying Notes, which are an integral part of the financial statements.
2010 Annual report • Delaware Pooled Trust
(continues) 79
Statements of net assets
Delaware Pooled® Trust — The Delaware Macquarie Real Estate Portfolio
October 31, 2010
| | | Number of | | | |
| | | Shares | | Value |
| Common Stock – 97.91% | | | | |
| Diversified REIT – 2.19% | | | | |
| | Vornado Realty Trust | 590 | | $ | 51,560 |
| | | | | | 51,560 |
| Healthcare REITs – 8.76% | | | | |
| | HCP | 1,240 | | | 44,652 |
| | Health Care REIT | 390 | | | 19,929 |
| | Healthcare Realty Trust | 1,340 | | | 32,348 |
| | Medical Properties Trust | 1,660 | | | 18,575 |
| | Nationwide Health Properties | 790 | | | 32,256 |
| | Ventas | 1,090 | | | 58,381 |
| | | | | | 206,141 |
| Hotel REITs – 3.94% | | | | |
| | DiamondRock Hospitality | 1,010 | | | 10,686 |
| | Host Hotels & Resorts | 5,160 | | | 81,992 |
| | | | | | 92,678 |
| Industrial REITs – 1.82% | | | | |
| | AMB Property | 620 | | | 17,478 |
| | ProLogis | 1,860 | | | 25,389 |
| | | | | | 42,867 |
| Mall REITs – 13.13% | | | | |
| | CBL & Associates Properties | 860 | | | 13,485 |
| | Glimcher Realty Trust | 2,620 | | | 19,676 |
| | Macerich | 760 | | | 33,904 |
| | Simon Property Group | 2,520 | | | 241,970 |
| | | | | | 309,035 |
| Multifamily REITs – 17.72% | | | | |
| | American Campus Communities | 2,030 | | | 64,209 |
| | AvalonBay Communities | 410 | | | 43,587 |
| | Boardwalk Real Estate Investment Trust | 1,470 | | | 61,760 |
| | BRE Properties | 670 | | | 28,763 |
| | Canadian Apartment Properties REIT | 700 | | | 11,963 |
| | Equity Residential | 2,130 | | | 103,581 |
| | Essex Property Trust | 420 | | | 47,443 |
| | Mid-America Apartment Communities | 590 | | | 36,008 |
| | Post Properties | 650 | | | 19,786 |
| | | | | | 417,100 |
| Office REITs – 10.88% | | | | |
| | Alexandria Real Estate Equities | 470 | | | 34,536 |
| | BioMed Realty Trust | 880 | | | 16,148 |
| | Boston Properties | 1,040 | | | 89,637 |
| | Douglas Emmett | 730 | | | 13,096 |
| | Kilroy Realty | 850 | | | 29,045 |
| | Mack-Cali Realty | 940 | | | 31,565 |
| | SL Green Realty | 640 | | | 42,061 |
| | | | | | 256,088 |
| Office/Industrial REITs – 6.48% | | | | |
| | Digital Realty Trust | 1,680 | | | 100,347 |
| | DuPont Fabros Technology | 1,420 | | | 35,642 |
| | Liberty Property Trust | 490 | | | 16,395 |
| | | | | | 152,384 |
| Real Estate Operating Companies – 11.20% | | | | |
| † | American Tower Class A | 690 | | | 35,611 |
| | Brookfield Properties | 3,290 | | | 56,838 |
| | Brookfield Real Estate Services Fund Trust Unit | 920 | | | 11,727 |
| † | CB Richard Ellis Group Class A | 980 | | | 17,983 |
| † | Gaylord Entertainment | 1,700 | | | 56,678 |
| † | Hyatt Hotels | 730 | | | 29,419 |
| | Jones Lang LaSalle | 300 | | | 23,418 |
| † | Orient-Express Hotels Class A | 500 | | | 6,330 |
| | Starwood Hotels & Resorts Worldwide | 470 | | | 25,446 |
| | | | | | 263,450 |
| Self-Storage REITs – 4.36% | | | | |
| | Public Storage | 920 | | | 91,283 |
| | U-Store-It Trust | 1,320 | | | 11,365 |
| | | | | | 102,648 |
| Shopping Center REITs – 15.27% | | | | |
| | Acadia Realty Trust | 910 | | | 17,363 |
| | Developers Diversified Realty | 2,650 | | | 34,185 |
| | Federal Realty Investment Trust | 270 | | | 22,135 |
| | Kimco Realty | 3,380 | | | 58,237 |
| | Kite Realty Group Trust | 2,600 | | | 12,428 |
| | Regency Centers | 1,160 | | | 48,929 |
| | RioCan Real Estate Investment Trust | 6,750 | | | 152,551 |
| | Tanger Factory Outlet Centers | 280 | | | 13,418 |
| | | | | | 359,246 |
| Specialty REIT – 2.16% | | | | |
| | Entertainment Properties Trust | 1,100 | | | 50,853 |
| | | | | | 50,853 |
| | | | | |
| Total Common Stock | | | | |
| | (cost $2,016,668) | | | | 2,304,050 |
| | | | | |
| Total Value of Securities – 97.91% | | | | |
| | (cost $2,016,668) | | | | 2,304,050 |
| Receivables and Other Assets | | | | |
| | Net of Liabilities – 2.09% | | | | 49,267 |
| Net Assets Applicable to 235,296 | | | | |
| | Shares Outstanding; Equivalent to | | | | |
| | $10.00 Per Share – 100.00% | | | $ | 2,353,317 |
| | | | | |
| Components of Net Assets at October 31, 2010: | | | |
| Shares of beneficial interest | | | | |
| | (unlimited authorization – no par) | | | $ | 2,000,017 |
| Undistributed net investment income | | | | 8,482 |
| Accumulated net realized gain on investments | | | | 57,439 |
| Net unrealized appreciation of investments | | | | |
| | and foreign currencies | | | | 287,379 |
| Total net assets | | | $ | 2,353,317 |
†Non income producing security.
REIT — Real Estate Investment Trust
See accompanying Notes, which are an integral part of the financial statements.
2010 Annual report • Delaware Pooled Trust
80
Delaware Pooled® Trust — The Core Focus Fixed Income Portfolio
October 31, 2010
| | | Principal | | Value |
| | | Amount (U.S. $) | | (U.S. $) |
| Agency Asset-Backed Security – 0.10% | | | |
| | Fannie Mae Grantor Trust | | | | | |
| | Series 2003-T4 2A5 | | | | | |
| | 5.407% 9/26/33 | $ | 19,257 | | $ | 18,509 |
| Total Agency Asset-Backed Security | | | | | |
| | (cost $19,070) | | | | | 18,509 |
| | | | |
| Agency Collateralized Mortgage Obligations – 4.53% | | | |
| | Fannie Mae REMICs | | | | | |
| | Series 2002-90 A1 6.50% 6/25/42 | | 2,380 | | | 2,715 |
| | Series 2004-49 EB 5.00% 7/25/24 | | 215,000 | | | 235,701 |
| | Series 2005-110 MB 5.50% 9/25/35 | | 87,602 | | | 97,518 |
| | Series 2010-116 Z 4.00% 10/25/40 | | 35,117 | | | 34,005 |
| | Freddie Mac REMICs | | | | | |
| | Series 3027 DE 5.00% 9/15/25 | | 190,000 | | | 208,756 |
| | Series 3123 HT 5.00% 3/15/26 | | 95,000 | | | 103,754 |
| | Series 3173 PE 6.00% 4/15/35 | | 90,000 | | | 100,270 |
| | Series 3416 GK 4.00% 7/15/22 | | 37,466 | | | 38,972 |
| | GNMA Series 2010-113 KE | | | | | |
| | 4.50% 9/20/40 | | 45,000 | | | 48,735 |
| Total Agency Collateralized | | | | | |
| | Mortgage Obligations | | | | | |
| | (cost $813,567) | | | | | 870,426 |
| | | | |
| Agency Mortgage-Backed Securities – 33.27% | | | |
| | Fannie Mae Relocation 30 yr | | | | | |
| | 5.00% 2/1/36 | | 106,230 | | | 111,912 |
| | Fannie Mae S.F. 15 yr | | | | | |
| | 4.50% 8/1/19 | | 7,475 | | | 7,993 |
| | 4.50% 6/1/23 | | 109,336 | | | 115,953 |
| | 5.00% 1/1/20 | | 7,971 | | | 8,549 |
| | 5.00% 6/1/20 | | 1,803 | | | 1,934 |
| | 5.00% 2/1/21 | | 5,069 | | | 5,418 |
| | 5.50% 4/1/23 | | 225,618 | | | 244,660 |
| | Fannie Mae S.F. 15 yr TBA | | | | | |
| | 4.00% 11/1/25 | | 465,000 | | | 487,087 |
| | 4.50% 11/1/25 | | 905,000 | | | 957,037 |
| | 5.00% 11/1/25 | | 465,000 | | | 495,660 |
| | 5.50% 11/1/25 | | 200,000 | | | 216,688 |
| | Fannie Mae S.F. 30 yr | | | | | |
| | 5.00% 5/1/34 | | 11,195 | | | 11,969 |
| | 5.00% 1/1/35 | | 14,692 | | | 15,707 |
| | 5.00% 5/1/35 | | 29,188 | | | 31,187 |
| | 5.00% 6/1/35 | | 52,780 | | | 56,395 |
| | 5.00% 4/1/36 | | 39,911 | | | 42,544 |
| | 5.00% 12/1/36 | | 204,541 | | | 218,549 |
| | 5.00% 12/1/37 | | 31,163 | | | 33,151 |
| | 5.00% 2/1/38 | | 22,996 | | | 24,458 |
| | 6.00% 10/1/35 | | 15,831 | | | 17,375 |
| | Fannie Mae S.F. 30 yr TBA | | | | | |
| | 4.50% 11/1/40 | | 455,000 | | | 477,607 |
| | 5.00% 11/1/40 | | 200,000 | | | 212,562 |
| | 6.00% 12/1/40 | | 1,230,000 | | | 1,331,858 |
| • | Freddie Mac ARM 5.056% 8/1/38 | | 173,087 | | | 184,833 |
| | Freddie Mac S.F. 15 yr | | | | | |
| | 5.00% 12/1/22 | | 158,822 | | | 169,600 |
| | Freddie Mac S.F. 15 yr TBA | | | | | |
| | 5.00% 11/1/25 | | 180,000 | | | 191,503 |
| | 5.50% 11/1/25 | | 180,000 | | | 194,653 |
| | Freddie Mac S.F. 30 yr | | | | | |
| | 5.00% 3/1/34 | | 33,651 | | | 36,424 |
| | 5.00% 2/1/36 | | 13,821 | | | 14,753 |
| | Freddie Mac S.F. 30 yr TBA | | | | | |
| | 6.00% 11/1/40 | | 365,000 | | | 395,398 |
| | 6.50% 11/1/40 | | 70,000 | | | 77,088 |
| | | | | | |
| Total Agency Mortgage-Backed | | | | | |
| | Securities (cost $6,275,931) | | | | | 6,390,505 |
| | | | |
| Commercial Mortgage-Backed Securities – 6.70% | | | |
| • | Bank of America | | | | | |
| | Commercial Mortgage | | | | | |
| | Series 2004-3 A5 5.413% 6/10/39 | | 15,000 | | | 16,319 |
| | Series 2005-6 A4 5.19% 9/10/47 | | 115,000 | | | 127,003 |
| | Bear Stearns Commercial | | | | | |
| | Mortgage Securities | | | | | |
| | •Series 2005-PW10 A4 | | | | | |
| | 5.405% 12/11/40 | | 50,000 | | | 54,035 |
| | •Series 2005-T20 A4A | | | | | |
| | 5.149% 10/12/42 | | 35,000 | | | 38,497 |
| | •Series 2006-PW12 A4 | | | | | |
| | 5.723% 9/11/38 | | 65,000 | | | 72,715 |
| | Series 2006-PW14 A4 | | | | | |
| | 5.201% 12/11/38 | | 95,000 | | | 103,042 |
| | Series 2007-PW15 A4 | | | | | |
| | 5.331% 2/11/44 | | 60,000 | | | 62,465 |
| •w | Commercial Mortgage Pass Through | | | | | |
| | Certificates Series 2005-C6 A5A | | | | | |
| | 5.116% 6/10/44 | | 75,000 | | | 81,809 |
| • | Credit Suisse Mortgage Capital | | | | | |
| | Certificates Series 2006-C1 AAB | | | | | |
| | 5.547% 2/15/39 | | 30,000 | | | 32,447 |
| | First Union National Bank- | | | | | |
| | Bank of America Commercial | | | | | |
| | Mortgage Trust Series 2001-C1 C | | | | | |
| | 6.403% 3/15/33 | | 30,000 | | | 30,131 |
| | Goldman Sachs Mortgage Securities II | | | | | |
| | Series 2004-GG2 A3 | | | | | |
| | 4.602% 8/10/38 | | 11,325 | | | 11,418 |
| | •Series 2004-GG2 A6 | | | | | |
| | 5.396% 8/10/38 | | 45,000 | | | 49,035 |
| | Series 2005-GG4 A4 | | | | | |
| | 4.761% 7/10/39 | | 160,000 | | | 167,118 |
| | Series 2005-GG4 A4A | | | | | |
| | 4.751% 7/10/39 | | 85,000 | | | 90,675 |
| | •Series 2006-GG6 A4 | | | | | |
| | 5.553% 4/10/38 | | 45,000 | | | 48,821 |
2010 Annual report • Delaware Pooled Trust
(continues) 81
Statements of net assets
Delaware Pooled® Trust — The Core Focus Fixed Income Portfolio
| | | Principal | | Value |
| | | Amount (U.S. $) | | (U.S. $) |
| Commercial Mortgage-Backed Securities (continued) | | | |
| | JPMorgan Chase Commercial | | | | | |
| | Mortgage Securities | | | | | |
| | Series 2002-C1 A3 | | | | | |
| | 5.376% 7/12/37 | $ | 75,000 | | $ | 78,946 |
| | •Series 2005-LDP3 A4A | | | | | |
| | 4.936% 8/15/42 | | 25,000 | | | 27,004 |
| | •Series 2005-LDP4 A4 | | | | | |
| | 4.918% 10/15/42 | | 35,000 | | | 38,006 |
| | •Series 2005-LDP5 A4 | | | | | |
| | 5.198% 12/15/44 | | 20,000 | | | 22,046 |
| | Lehman Brothers-UBS Commercial | | | | | |
| | Mortgage Trust Series 2002-C1 A4 | | | | | |
| | 6.462% 3/15/31 | | 44,336 | | | 46,708 |
| • | Morgan Stanley Capital I | | | | | |
| | Series 2007-T27 A4 | | | | | |
| | 5.649% 6/11/42 | | 80,000 | | | 88,706 |
| Total Commercial Mortgage-Backed | | | | | |
| | Securities (cost $1,123,401) | | | | | 1,286,946 |
| | | | | | |
| Corporate Bonds – 31.50% | | | | | |
| Banking – 7.09% | | | | | |
| # | Bank Nederlandse Gemeenten 144A | | | | | |
| | 1.75% 10/6/15 | | 30,000 | | | 30,103 |
| * | Bank of America 3.70% 9/1/15 | | 35,000 | | | 35,317 |
| | BB&T 5.25% 11/1/19 | | 90,000 | | | 96,839 |
| | City National 5.25% 9/15/20 | | 30,000 | | | 30,917 |
| | Goldman Sachs Group | | | | | |
| | 3.70% 8/1/15 | | 15,000 | | | 15,549 |
| | 5.375% 3/15/20 | | 58,000 | | | 61,482 |
| | JPMorgan Chase 4.40% 7/22/20 | | 100,000 | | | 101,959 |
| | JPMorgan Chase Capital XXV | | | | | |
| | 6.80% 10/1/37 | | 96,000 | | | 95,733 |
| | Oesterreichische Kontrollbank | | | | | |
| | 1.75% 3/11/13 | | 50,000 | | | 51,191 |
| | 1.75% 10/5/15 | | 25,000 | | | 25,133 |
| | 4.875% 2/16/16 | | 90,000 | | | 103,662 |
| | PNC Funding 5.625% 2/1/17 | | 138,000 | | | 151,448 |
| | Rabobank Nederland | | | | | |
| | 2.125% 10/13/15 | | 10,000 | | | 10,092 |
| | •#144A 11.00% 12/29/49 | | 85,000 | | | 113,820 |
| | Rentenbank | | | | | |
| | 3.125% 7/15/15 | | 55,000 | | | 59,074 |
| | *3.25% 3/15/13 | | 45,000 | | | 47,745 |
| | 4.125% 7/15/13 | | 105,000 | | | 114,341 |
| | SVB Financial Group 5.375% 9/15/20 | | 45,000 | | | 45,756 |
| • | USB Capital IX 6.189% 10/29/49 | | 53,000 | | | 42,135 |
| | Wachovia | | | | | |
| | 5.25% 8/1/14 | | 20,000 | | | 21,737 |
| | 5.625% 10/15/16 | | 70,000 | | | 78,123 |
| • | Wells Fargo Capital XIII | | | | | |
| | 7.70% 12/29/49 | | 28,000 | | | 29,190 |
| | | | | | | 1,361,346 |
| Basic Industry – 2.07% | | | | | |
| | Alcoa 6.15% 8/15/20 | | 15,000 | | | 15,862 |
| | ArcelorMittal 9.85% 6/1/19 | | 40,000 | | | 51,677 |
| | Cliffs Natural Resources | | | | | |
| | 4.80% 10/1/20 | | 50,000 | | | 51,045 |
| | 6.25% 10/1/40 | | 10,000 | | | 9,768 |
| | Cytec Industries 8.95% 7/1/17 | | 30,000 | | | 37,685 |
| | Dow Chemical 8.55% 5/15/19 | | 35,000 | | | 45,024 |
| | duPont (E.I.) deNemours | | | | | |
| | 3.625% 1/15/21 | | 25,000 | | | 25,492 |
| # | Georgia-Pacific 144A 5.40% 11/1/20 | | 10,000 | | | 10,150 |
| | International Paper 9.375% 5/15/19 | | 80,000 | | | 105,807 |
| | Reliance Steel & Aluminum | | | | | |
| | 6.85% 11/15/36 | | 31,000 | | | 29,996 |
| | Teck Resources 9.75% 5/15/14 | | 13,000 | | | 16,200 |
| | | | | | | 398,706 |
| Brokerage – 0.58% | | | | | |
| | Jefferies Group | | | | | |
| | 6.25% 1/15/36 | | 10,000 | | | 9,199 |
| | 6.45% 6/8/27 | | 64,000 | | | 62,251 |
| | Lazard Group 6.85% 6/15/17 | | 37,000 | | | 39,768 |
| | | | | | | 111,218 |
| Capital Goods – 0.50% | | | | | |
| | Allied Waste North America | | | | | |
| | 6.875% 6/1/17 | | 45,000 | | | 49,623 |
| | 7.125% 5/15/16 | | 20,000 | | | 21,349 |
| | Arrow Electronics 5.125% 3/1/21 | | 15,000 | | | 14,951 |
| | L-3 Communications 4.75% 7/15/20 | | 10,000 | | | 10,459 |
| | | | | | | 96,382 |
| Communications – 3.92% | | | | | |
| | American Tower 5.05% 9/1/20 | | 45,000 | | | 47,072 |
| # | AT&T 144A 5.35% 9/1/40 | | 20,000 | | | 19,699 |
| | Comcast 5.90% 3/15/16 | | 65,000 | | | 75,936 |
| # | Cox Communications 144A | | | | | |
| | 6.45% 12/1/36 | | 20,000 | | | 21,807 |
| | 6.95% 6/1/38 | | 20,000 | | | 22,797 |
| # | Crown Castle Towers 144A | | | | | |
| | 4.883% 8/15/20 | | 60,000 | | | 61,245 |
| | DIRECTV Holdings/Financing | | | | | |
| | 4.60% 2/15/21 | | 40,000 | | | 41,529 |
| | 7.625% 5/15/16 | | 85,000 | | | 95,309 |
| # | NBC Universal 144A | | | | | |
| | 2.875% 4/1/16 | | 30,000 | | | 30,404 |
| | 4.375% 4/1/21 | | 40,000 | | | 40,941 |
| | Qwest 8.375% 5/1/16 | | 85,000 | | | 102,850 |
| | Telecom Italia Capital | | | | | |
| | 5.25% 10/1/15 | | 43,000 | | | 47,331 |
| | 6.175% 6/18/14 | | 35,000 | | | 39,137 |
| | Verizon Communications | | | | | |
| | 6.40% 2/15/38 | | 40,000 | | | 45,535 |
| # | Vivendi 144A | | | | | |
| | 5.75% 4/4/13 | | 45,000 | | | 49,046 |
| | 6.625% 4/4/18 | | 10,000 | | | 11,608 |
| | | | | | | 752,246 |
2010 Annual report • Delaware Pooled Trust
82
| | | Principal | | Value |
| | | Amount (U.S. $) | | (U.S. $) |
| Corporate Bonds (continued) | | | |
| Consumer Cyclical – 0.47% | | | | | |
| w# | CVS Pass Through Trust 144A | | | | | |
| | 8.353% 7/10/31 | $ | 63,627 | | $ | 79,251 |
| | Wyndham Worldwide 5.75% 2/1/18 | | 10,000 | | | 10,407 |
| | | | | | | 89,658 |
| Consumer Non-Cyclical – 4.38% | | | | | |
| | Abbott Laboratories 4.125% 5/27/20 | | 40,000 | | | 43,148 |
| | Amgen 3.45% 10/1/20 | | 40,000 | | | 40,216 |
| # | Anheuser-Busch InBev Worldwide | | | | | |
| | 144A 5.375% 11/15/14 | | 60,000 | | | 67,846 |
| | Baxter International 4.50% 8/15/19 | | 45,000 | | | 49,682 |
| # | Brambles USA 144A | | | | | |
| | 3.95% 4/1/15 | | 20,000 | | | 20,842 |
| | 5.35% 4/1/20 | | 35,000 | | | 37,302 |
| | CareFusion 6.375% 8/1/19 | | 35,000 | | | 41,549 |
| | Celgene 3.95% 10/15/20 | | 40,000 | | | 39,982 |
| | Covidien International Finance | | | | | |
| | 4.20% 6/15/20 | | 25,000 | | | 26,525 |
| | Genzyme | | | | | |
| | 3.625% 6/15/15 | | 35,000 | | | 37,296 |
| | 5.00% 6/15/20 | | 35,000 | | | 38,697 |
| | Hospira 6.40% 5/15/15 | | 85,000 | | | 99,144 |
| | Kraft Foods 5.375% 2/10/20 | | 5,000 | | | 5,612 |
| | Life Technologies | | | | | |
| | 4.40% 3/1/15 | | 5,000 | | | 5,356 |
| | 6.00% 3/1/20 | | 60,000 | | | 67,545 |
| | Medco Health Solutions | | | | | |
| | 4.125% 9/15/20 | | 45,000 | | | 45,471 |
| | 7.125% 3/15/18 | | 5,000 | | | 6,153 |
| | Pfizer 6.20% 3/15/19 | | 30,000 | | | 36,844 |
| # | Woolworths 144A 4.00% 9/22/20 | | 25,000 | | | 25,618 |
| | Yale University 2.90% 10/15/14 | | 60,000 | | | 64,074 |
| | Zimmer Holdings 4.625% 11/30/19 | | 40,000 | | | 43,230 |
| | | | | | | 842,132 |
| Electric – 3.00% | | | | | |
| | Ameren Illinois 9.75% 11/15/18 | | 110,000 | | | 147,783 |
| # | American Transmission Systems | | | | | |
| | 144A 5.25% 1/15/22 | | 35,000 | | | 38,455 |
| | Commonwealth Edison | | | | | |
| | 4.00% 8/1/20 | | 50,000 | | | 52,219 |
| | 5.80% 3/15/18 | | 5,000 | | | 5,833 |
| | Duke Energy 5.05% 9/15/19 | | 25,000 | | | 27,852 |
| | Duke Energy Carolinas | | | | | |
| | 5.30% 2/15/40 | | 10,000 | | | 10,518 |
| | Exelon Generation | | | | | |
| | 4.00% 10/1/20 | | 45,000 | | | 44,893 |
| | 5.75% 10/1/41 | | 20,000 | | | 19,709 |
| | Indiana Michigan Power | | | | | |
| | 7.00% 3/15/19 | | 15,000 | | | 18,365 |
| | Jersey Central Power & Light | | | | | |
| | 5.625% 5/1/16 | | 5,000 | | | 5,707 |
| | National Rural Utilities | | | | | |
| | Cooperative Finance | | | | | |
| | 1.90% 11/1/15 | | 25,000 | | | 25,075 |
| | Oncor Electric Delivery | | | | | |
| | 7.00% 9/1/22 | | 20,000 | | | 25,030 |
| | #144A 5.00% 9/30/17 | | 25,000 | | | 27,842 |
| | #144A 5.25% 9/30/40 | | 5,000 | | | 4,880 |
| | Pennsylvania Electric 5.20% 4/1/20 | | 35,000 | | | 38,154 |
| | Public Service of Oklahoma | | | | | |
| | 5.15% 12/1/19 | | 45,000 | | | 49,485 |
| | UIL Holdings 4.625% 10/1/20 | | 20,000 | | | 20,015 |
| | Virginia Electric & Power | | | | | |
| | 3.45% 9/1/22 | | 15,000 | | | 14,929 |
| | | | | | | 576,744 |
| Energy – 2.58% | | | | | |
| | Anadarko Petroleum | | | | | |
| | 6.375% 9/15/17 | | 35,000 | | | 38,937 |
| | Nexen 7.50% 7/30/39 | | 35,000 | | | 42,917 |
| | Noble Energy 8.25% 3/1/19 | | 35,000 | | | 45,575 |
| | Noble Holding International | | | | | |
| | 3.45% 8/1/15 | | 25,000 | | | 26,519 |
| | Petrobras International Finance | | | | | |
| | 5.875% 3/1/18 | | 20,000 | | | 22,468 |
| | Pride International 6.875% 8/15/20 | | 55,000 | | | 62,563 |
| | Total Capital 2.30% 3/15/16 | | 75,000 | | | 75,921 |
| | Transocean 6.50% 11/15/20 | | 50,000 | | | 55,822 |
| | Weatherford International Bermuda | | | | | |
| | 5.125% 9/15/20 | | 20,000 | | | 20,978 |
| | 6.75% 9/15/40 | | 35,000 | | | 37,327 |
| # | Woodside Finance 144A | | | | | |
| | 4.50% 11/10/14 | | 50,000 | | | 53,946 |
| | 8.125% 3/1/14 | | 10,000 | | | 11,811 |
| | | | | | | 494,784 |
| Finance Companies – 0.95% | | | | | |
| | General Electric Capital | | | | | |
| | 4.375% 9/16/20 | | 80,000 | | | 80,858 |
| | 6.00% 8/7/19 | | 90,000 | | | 101,850 |
| | | | | | | 182,708 |
| Insurance – 0.81% | | | | | |
| | MetLife 6.40% 12/15/36 | | 115,000 | | | 113,275 |
| | Prudential Financial 3.875% 1/14/15 | | 40,000 | | | 42,263 |
| | | | | | | 155,538 |
| Natural Gas – 2.63% | | | | | |
| • | Enbridge Energy Partners | | | | | |
| | 8.05% 10/1/37 | | 30,000 | | | 30,779 |
| | Energy Transfer Partners | | | | | |
| | 9.70% 3/15/19 | | 50,000 | | | 66,122 |
| | Enterprise Products Operating | | | | | |
| | 9.75% 1/31/14 | | 75,000 | | | 92,608 |
| | Kinder Morgan Energy Partners | | | | | |
| | 6.55% 9/15/40 | | 5,000 | | | 5,376 |
| | 9.00% 2/1/19 | | 40,000 | | | 52,337 |
| # | Midcontinent Express Pipeline 144A | | | | | |
| | 5.45% 9/15/14 | | 40,000 | | | 43,693 |
| | 6.70% 9/15/19 | | 15,000 | | | 16,711 |
| | Plains All American Pipeline | | | | | |
| | 8.75% 5/1/19 | | 35,000 | | | 44,763 |
2010 Annual report • Delaware Pooled Trust
(continues) 83
Statements of net assets
Delaware Pooled® Trust — The Core Focus Fixed Income Portfolio
| | | Principal | | Value |
| | | Amount (U.S. $) | | (U.S. $) |
| Corporate Bonds (continued) | | | |
| Natural Gas (continued) | | | | | |
| # | SEMCO Energy 144A 5.15% 4/21/20 | $ | 55,000 | | $ | 59,767 |
| | Sempra Energy 6.15% 6/15/18 | | 20,000 | | | 23,694 |
| | TransCanada Pipelines | | | | | |
| | 3.80% 10/1/20 | | 20,000 | | | 20,653 |
| | •6.35% 5/15/67 | | 50,000 | | | 47,938 |
| | | | | | | 504,441 |
| Real Estate – 1.11% | | | | | |
| | Developers Diversified Realty | | | | | |
| | 7.50% 4/1/17 | | 10,000 | | | 10,720 |
| | 7.875% 9/1/20 | | 40,000 | | | 43,492 |
| # | Digital Realty Trust 144A | | | | | |
| | 5.875% 2/1/20 | | 20,000 | | | 21,301 |
| | Liberty Property 4.75% 10/1/20 | | 15,000 | | | 15,490 |
| | ProLogis 7.375% 10/30/19 | | 10,000 | | | 11,177 |
| | Regency Centers 5.875% 6/15/17 | | 32,000 | | | 35,183 |
| •# | USB Realty 144A 6.091% 12/29/49 | | 100,000 | | | 76,499 |
| | | | | | | 213,862 |
| Technology – 0.61% | | | | | |
| | National Semiconductor | | | | | |
| | 6.60% 6/15/17 | | 35,000 | | | 40,762 |
| # | Seagate Technology 144A | | | | | |
| | 10.00% 5/1/14 | | 25,000 | | | 30,625 |
| | Symantec 4.20% 9/15/20 | | 45,000 | | | 45,415 |
| | | | | | | 116,802 |
| Transportation – 0.80% | | | | | |
| | Burlington Northern Santa Fe | | | | | |
| | 3.60% 9/1/20 | | 10,000 | | | 10,070 |
| | 4.70% 10/1/19 | | 25,000 | | | 27,369 |
| | Canadian Pacific 4.45% 3/15/23 | | 35,000 | | | 35,873 |
| # | ERAC USA Finance 144A | | | | | |
| | 5.25% 10/1/20 | | 75,000 | | | 80,309 |
| | | | | | | 153,621 |
| Total Corporate Bonds | | | | | |
| | (cost $5,641,619) | | | | | 6,050,188 |
| | | | | |
| Non-Agency Asset-Backed Securities – 6.64% | | | |
| •# | AH Mortgage Advance Trust Series | | | | | |
| | 2009-ADV3 A1 144A | | | | | |
| | 2.207% 10/6/21 | | 35,000 | | | 34,976 |
| | Ally Auto Receivables Trust | | | | | |
| | Series 2010-2 A3 | | | | | |
| | 1.38% 7/15/14 | | 15,000 | | | 15,138 |
| • | Bank of America Credit Card Trust | | | | | |
| | Series 2008-A5 A5 | | | | | |
| | 1.456% 12/16/13 | | 130,000 | | | 130,942 |
| | Capital One Multi-Asset Execution | | | | | |
| | Trust Series 2008-A3 A3 | | | | | |
| | 5.05% 2/15/16 | | 100,000 | | | 109,750 |
| • | Chase Issuance Trust Series 2009-A2 | | | | | |
| | A2 1.806% 4/15/14 | | 100,000 | | | 101,880 |
| • | Citibank Credit Card Issuance Trust | | | | | |
| | Series 2004-C1 C1 0.906% 7/15/13 | | 20,000 | | | 19,847 |
| | Series 2009-A2 A2 1.806% 5/15/14 | | 100,000 | | | 102,007 |
| | CNH Equipment Trust | | | | | |
| | Series 2008-A A4A 4.93% 8/15/14 | | 39,325 | | | 40,326 |
| | Series 2008-B A3A 4.78% 7/16/12 | | 6,078 | | | 6,104 |
| | Series 2009-C A3 1.85% 12/16/13 | | 15,000 | | | 15,164 |
| | Series 2010-A A4 2.49% 1/15/16 | | 45,000 | | | 46,692 |
| | Discover Card Master Trust | | | | | |
| | Series 2008-A4 A4 | | | | | |
| | 5.65% 12/15/15 | | 110,000 | | | 123,160 |
| | •Series 2010-A1 A1 | | | | | |
| | 0.906% 9/15/15 | | 100,000 | | | 100,551 |
| | •Series 2010-A2 A2 | | | | | |
| | 0.836% 3/15/18 | | 175,000 | | | 175,172 |
| •# | Golden Credit Card Trust | | | | | |
| | Series 2008-3 A | | | | | |
| | 144A 1.256% 7/15/17 | | 100,000 | | | 100,500 |
| | John Deere Owner Trust | | | | | |
| | Series 2009-A A4 3.96% 5/16/16 | | 45,000 | | | 47,306 |
| | Series 2010-A A4 2.13% 10/17/16 | | 30,000 | | | 30,962 |
| • | Merrill Auto Trust Securitization | | | | | |
| | Series 2007-1 A4 | | | | | |
| | 0.316% 12/15/13 | | 12,689 | | | 12,649 |
| | Mid-State Trust Series 11 A1 | | | | | |
| | 4.864% 7/15/38 | | 12,056 | | | 12,146 |
| # | Navistar Financial Owner Trust | | | | | |
| | Series 2010-B A3 144A | | | | | |
| | 1.08% 3/18/14 | | 50,000 | | | 50,026 |
| Total Non-Agency Asset-Backed | | | | | |
| | Securities (cost $1,251,039) | | | | | 1,275,298 |
| | |
| Non-Agency Collateralized Mortgage Obligations – 0.48% |
| w# | Countrywide Home Loan Mortgage | | | | | |
| | Pass Through Trust Series 2005-R2 | | | | | |
| | 2A4 144A 8.50% 6/25/35 | | 70,655 | | | 64,427 |
| | Lehman Mortgage Trust | | | | | |
| | Series 2005-2 2A3 | | | | | |
| | 5.50% 12/25/35 | | 17,056 | | | 16,263 |
| •# | MASTR Specialized Loan Trust Series | | | | | |
| | 2005-2 A2 144A | | | | | |
| | 5.006% 7/25/35 | | 12,247 | | | 12,120 |
| Total Non-Agency Collateralized | | | | | |
| | Mortgage Obligations | | | | | |
| | (cost $102,539) | | | | | 92,810 |
| | | | | | |
| Regional Bonds – 2.40%Δ | | | | | |
| Canada – 2.40% | | | | | |
| | British Columbia Province | | | | | |
| | 2.85% 6/15/15 | | 25,000 | | | 26,618 |
| | Nova Scotia Province | | | | | |
| | 2.375% 7/21/15 | | 80,000 | | | 82,595 |
| | Ontario Province | | | | | |
| | 1.875% 9/15/15 | | 40,000 | | | 40,443 |
| | 4.40% 4/14/20 | | 95,000 | | | 104,727 |
2010 Annual report • Delaware Pooled Trust
84
| | | | Principal | | Value | |
| | | | Amount (U.S. $) | | (U.S. $) | |
| Regional Bonds (continued) | | | | | | | | |
| Canada (continued) | | | | | | | | |
| | Quebec Province | | | | | | | | |
| | 3.50% 7/29/20 | | | $ | 50,000 | | $ | 51,123 | |
| | 4.60% 5/26/15 | | | | 50,000 | | | 56,701 | |
| | 5.00% 3/1/16 | | | | 85,000 | | | 98,425 | |
| Total Regional Bonds | | | | | | | | |
| | (cost $442,173) | | | | | | | 460,632 | |
| | | | | | | | | | |
| Sovereign Bonds – 2.92%Δ | | | | | | | | |
| Norway – 2.11% | | | | | | | | |
| | Eksportfinans | | | | | | | | |
| | 1.875% 4/2/13 | | | | 95,000 | | | 97,464 | |
| | 3.00% 11/17/14 | | | | 95,000 | | | 101,110 | |
| | 5.50% 5/25/16 | | | | 90,000 | | | 106,307 | |
| # | Kommunalbanken 144A | | | | | | | | |
| | 1.75% 10/5/15 | | | | 100,000 | | | 100,721 | |
| | | | | | | | | 405,602 | |
| Sweden – 0.81% | | | | | | | | |
| | Svensk Exportkredit 1.75% 10/20/15 | | | | 155,000 | | | 155,389 | |
| | | | | | | | | 155,389 | |
| Total Sovereign Bonds | | | | | | | | |
| | (cost $543,808) | | | | | | | 560,991 | |
| | | | | | | | | | |
| Supranational Banks – 0.85% | | | | | | | | |
| | African Development Bank | | | | | | | | |
| | 3.00% 5/27/14 | | | | 50,000 | | | 53,626 | |
| | European Investment Bank | | | | | | | | |
| | 2.875% 1/15/15 | | | | 20,000 | | | 21,387 | |
| | Inter-American Development Bank | | | | | | | | |
| | 4.25% 9/14/15 | | | | 30,000 | | | 34,143 | |
| | International Finance 3.00% 4/22/14 | | | | 50,000 | | | 53,824 | |
| Total Supranational Banks | | | | | | | | |
| | (cost $159,340) | | | | | | | 162,980 | |
| | | | | | | | | | |
| U.S. Treasury Obligations – 9.21% | | | | | | | | |
| | U.S. Treasury Bond 4.375% 5/15/40 | | | | 375,000 | | | 399,494 | |
| | U.S. Treasury Notes | | | | | | | | |
| | *0.50% 10/15/13 | | | | 820,000 | | | 820,063 | |
| | 1.25% 10/31/15 | | | | 180,000 | | | 180,647 | |
| | *2.625% 8/15/20 | | | | 352,000 | | | 352,385 | |
| | 2.75% 5/31/17 | | | | 15,000 | | | 15,904 | |
| Total U.S. Treasury Obligations | | | | | | | | |
| | (cost $1,799,586) | | | | | | | 1,768,493 | |
| | | | | | | | | | |
| | | | Number of | | | | |
| | | | Shares | | | | |
| Preferred Stock – 0.15% | | | | | | | | |
| • | PNC Financial Services Group 8.25% | | | | 28,000 | | | 29,646 | |
| Total Preferred Stock | | | | | | | | |
| | (cost $25,032) | | | | | | | 29,646 | |
| | | | | | | | | | |
| | | Principal | | | |
| | | Amount (U.S. $) | | | |
| ≠Discount Note – 25.28% | | | | | | | | |
| | Federal Home Loan Bank | | | | | | | | |
| | 0.10% 11/1/10 | | | $4,856,044 | | | 4,856,044 | |
| Total Discount Note | | | | | | | | |
| | (cost $4,856,044) | | | | | | | 4,856,044 | |
| | | | | | |
| Total Value of Securities Before Securities | | | | |
| | Lending Collateral – 124.03% | | | | | | | | |
| | (cost $23,053,149) | | | | | | | 23,823,468 | |
| | | | | | | | | | |
| | | | Number of | | | | |
| | | | Shares | | | | |
| Securities Lending Collateral** – 5.91% | | | | | | | | |
| Investment Companies | | | | | | | | |
| | Delaware Investments Collateral | | | | | | | | |
| | Fund No. 1 | | | 1,088,889 | | | 1,088,889 | |
| | BNY Mellon SL DBT II | | | | | | | | |
| | Liquidating Fund | | | | 45,779 | | | 44,456 | |
| @† | Mellon GSL Reinvestment Trust II | | | | 43,827 | | | 2,266 | |
| Total Securities Lending Collateral | | | | | | | | |
| | (cost $1,178,495) | | | | | | | 1,135,611 | |
| | | | | | | | | | |
| Total Value of Securities – 129.94% | | | | | | | | |
| | (cost $24,231,644) | | | | | | | 24,959,079 | © |
| Obligation to Return Securities | | | | | | | | |
| | Lending Collateral** – (6.13%) | | | | | | | (1,178,495 | ) |
| Liabilities Net of Receivables and | | | | | | | | |
| | Other Assets – (23.81%)z | | | | | | | (4,572,707 | ) |
| Net Assets Applicable to 2,034,674 | | | | | | | | |
| | Shares Outstanding; Equivalent | | | | | | | | |
| | to $9.44 Per Share – 100.00% | | | | | | $ | 19,207,877 | |
| | | | | | |
| Components of Net Assets at October 31, 2010: | | | | |
| Shares of beneficial interest | | | | | | | | |
| | (unlimited authorization – no par) | | | | | | $ | 18,542,141 | |
| Undistributed net investment income | | | | | | | 486,815 | |
| Accumulated net realized loss on investments | | | | | | | (548,948 | ) |
| Net unrealized appreciation of investments | | | | | | | 727,869 | |
| Total net assets | | | | | | $ | 19,207,877 | |
2010 Annual report • Delaware Pooled Trust
(continues) 85
Statements of net assets
Delaware Pooled® Trust — The Core Focus Fixed Income Portfolio
| |
| Δ | Securities have been classified by country of origin. |
| † | Non income producing security. |
| w | Pass Through Agreement. Security represents the contractual right to receive a proportionate amount of underlying payments due to the counterparty pursuant to various agreements related to the rescheduling of obligations and the exchange of certain notes. |
| • | Variable rate security. The rate shown is the rate as of October 31, 2010. Interest rates reset periodically. |
| ≠ | The rate shown is the effective yield at the time of purchase. |
| # | Security exempt from registration under Rule 144A of the Securities Act of 1933, as amended. At October 31, 2010, the aggregate amount of Rule 144A securities was $1,471,088, which represented 7.66% of the Portfolio’s net assets. See Note 10 in “Notes to financial statements.” |
| @ | Illiquid security. At October 31, 2010, the aggregate amount of illiquid securities was $2,266, which represented 0.01% of the Portfolio’s net assets. See Note 10 in “Notes to financial statements.” |
| * | Fully or partially on loan. |
| ** | See Note 9 in “Notes to financial statements.” |
| © | Includes $1,155,402 of securities loaned. |
| z | Of this amount, $5,399,309 represents payable for securities purchased and $714,443 represents receivables for securities sold as of October 31, 2010. |
Summary of Abbreviations:
ARM — Adjustable Rate Mortgage
CDS — Credit Default Swap
GNMA — Government National Mortgage Association
JPMS — JPMorgan Securities
MASTR — Mortgage Asset Securitization Transactions, Inc.
REMIC — Real Estate Mortgage Investment Conduit
S.F. — Single Family
TBA — To be announced
yr — Year
1The following swap contract was outstanding at October 31, 2010:
| Swap Contract | | | | | | | | | |
| CDS Contract | | | | | | | | | |
| | | | | | | Annual | | | | |
| | | Swap & | | Notional | | Protection | | Termination | | Unrealized |
| Counterparty | | Referenced Obligation | | Value | | Payments | | Date | | Appreciation |
| | | Protection Sold / | | | | | | | | |
| | | Moody’s Rating: | | | | | | | | |
| JPMS | | MetLife 5 yr CDS / A | | $20,000 | | 1.00% | | 12/20/14 | | $411 |
The use of swap contracts involves elements of market risk and risks in excess of the amounts recognized in the financial statements. The notional value presented above represents the Portfolio’s total exposure in such contracts, whereas only the net unrealized appreciation is reflected in the Portfolio’s net assets.
1See Note 8 in “Notes to financial statements.”
See accompanying Notes, which are an integral part of the financial statements.
2010 Annual report • Delaware Pooled Trust
86
Delaware Pooled® Trust — The High-Yield Bond Portfolio
October 31, 2010
| | | | Principal | | Value |
| | | | Amount (U.S. $) | | (U.S. $) |
| Convertible Bonds – 0.95% | | | | | | |
| * | Leap Wireless International 4.50% | | | | | | |
| | exercise price $93.21, | | | | | | |
| | expiration date 7/15/14 | | $ | 68,000 | | $ | 61,625 |
| | Level 3 Communications 6.50% | | | | | | |
| | exercise price $1.24, | | | | | | |
| | expiration date 10/1/16 | | | 59,000 | | | 63,204 |
| | Live Nation Entertainment 2.875% | | | | | | |
| | exercise price $27.14, | | | | | | |
| | expiration date 7/14/27 | | | 67,000 | | | 58,123 |
| † | Mirant (Escrow) 2.50% | | | | | | |
| | exercise price $67.95, | | | | | | |
| | expiration date 6/15/21 | | | 20,000 | | | 0 |
| | Standard Pacific 6.00% | | | | | | |
| | exercise price $8.37, | | | | | | |
| | expiration date 10/1/12 | | | 100,000 | | | 97,749 |
| Total Convertible Bonds | | | | | | |
| | (cost $266,777) | | | | | | 280,701 |
| | | | | | | | |
| Corporate Bonds – 93.13% | | | | | | |
| Basic Industry – 9.08% | | | | | | |
| * | AK Steel 7.625% 5/15/20 | | | 125,000 | | | 130,781 |
| # | Algoma Acquisition 144A | | | | | | |
| | 9.875% 6/15/15 | | | 181,000 | | | 167,424 |
| # | Appleton Papers 144A | | | | | | |
| | 10.50% 6/15/15 | | | 109,000 | | | 105,730 |
| | Century Aluminum 8.00% 5/15/14 | | | 103,950 | | | 106,029 |
| # | FMG Resources August 2006 144A | | | | | | |
| | 7.00% 11/1/15 | | | 155,000 | | | 159,650 |
| | 10.625% 9/1/16 | | | 197,000 | | | 291,559 |
| | Hexion US Finance | | | | | | |
| | *9.75% 11/15/14 | | | 143,000 | | | 151,223 |
| | #144A 9.00% 11/15/20 | | | 120,000 | | | 125,100 |
| # | Huntsman International 144A | | | | | | |
| | 8.625% 3/15/21 | | | 60,000 | | | 66,075 |
| | Lyondell Chemical 11.00% 5/1/18 | | | 105,000 | | | 118,125 |
| # | MacDermid 144A 9.50% 4/15/17 | | | 215,000 | | | 230,587 |
| | Millar Western Forest Products | | | | | | |
| | 7.75% 11/15/13 | | | 147,000 | | | 135,240 |
| | Momentive Performance Materials | | | | | | |
| | *11.50% 12/1/16 | | | 137,000 | | | 148,988 |
| | #144A 9.00% 1/15/21 | | | 95,000 | | | 98,800 |
| • | Noranda Aluminum Acquisition PIK | | | | | | |
| | 5.373% 5/15/15 | | | 109,889 | | | 96,153 |
| | Novelis 7.25% 2/15/15 | | | 66,000 | | | 68,393 |
| @= | Port Townsend 7.32% 8/27/12 | | | 11,725 | | | 8,501 |
| | Ryerson | | | | | | |
| | •7.841% 11/1/14 | | | 69,000 | | | 64,860 |
| | 12.00% 11/1/15 | | | 119,000 | | | 124,355 |
| *# | Steel Dynamics 144A | | | | | | |
| | 7.625% 3/15/20 | | | 141,000 | | | 151,928 |
| * | Verso Paper Holdings | | | | | | |
| | 11.375% 8/1/16 | | | 127,000 | | | 122,873 |
| | | | | | | | 2,672,374 |
| Brokerage – 1.34% | | | | | | |
| *# | Cemex Finance 144A | | | | | | |
| | 9.50% 12/14/16 | | | 100,000 | | | 101,500 |
| | E Trade Financial PIK | | | | | | |
| | 12.50% 11/30/17 | | | 253,000 | | | 294,113 |
| | | | | | | | 395,613 |
| Capital Goods – 5.89% | | | | | | |
| # | Associated Materials 144A | | | | | | |
| | 9.125% 11/1/17 | | | 113,000 | | | 118,933 |
| | Casella Waste Systems | | | | | | |
| | 9.75% 2/1/13 | | | 109,000 | | | 110,226 |
| | 11.00% 7/15/14 | | | 94,000 | | | 104,458 |
| # | Cemex Espana Luxembourg 144A | | | | | | |
| | 9.25% 5/12/20 | | | 74,000 | | | 71,595 |
| # | DAE Aviation Holdings 144A | | | | | | |
| | 11.25% 8/1/15 | | | 126,000 | | | 131,828 |
| # | Graham Packaging/GPC Capital I | | | | | | |
| | 144A 8.25% 10/1/18 | | | 137,000 | | | 142,480 |
| | Intertape Polymer 8.50% 8/1/14 | | | 74,000 | | | 62,530 |
| * | Manitowoc 9.50% 2/15/18 | | | 127,000 | | | 137,319 |
| # | Plastipak Holdings 144A | | | | | | |
| | 10.625% 8/15/19 | | | 57,000 | | | 63,555 |
| | Ply Gem Industries 13.125% 7/15/14 | | | 151,000 | | | 162,135 |
| | Pregis 12.375% 10/15/13 | | | 183,000 | | | 188,032 |
| * | RBS Global/Rexnord 11.75% 8/1/16 | | | 148,000 | | | 159,840 |
| | Susser Holdings/Finance | | | | | | |
| | 8.50% 5/15/16 | | | 128,000 | | | 137,120 |
| # | Trimas 144A 9.75% 12/15/17 | | | 106,000 | | | 116,203 |
| # | USG 144A 9.75% 8/1/14 | | | 25,000 | | | 26,250 |
| | | | | | | | 1,732,504 |
| Consumer Cyclical – 9.99% | | | | | | |
| # | Allison Transmission 144A | | | | | | |
| | 11.00% 11/1/15 | | | 146,000 | | | 159,140 |
| | American Axle & Manufacturing | | | | | | |
| | 7.875% 3/1/17 | | | 148,000 | | | 150,405 |
| | ArvinMeritor | | | | | | |
| | 8.125% 9/15/15 | | | 134,000 | | | 140,365 |
| | 10.625% 3/15/18 | | | 74,000 | | | 84,360 |
| | Beazer Homes USA | | | | | | |
| | 8.125% 6/15/16 | | | 97,000 | | | 94,454 |
| | 9.125% 6/15/18 | | | 50,000 | | | 48,875 |
| | Burlington Coat Factory Investment | | | | | | |
| | Holdings 14.50% 10/15/14 | | | 250,000 | | | 268,124 |
| *# | CKE Restaurants 144A | | | | | | |
| | 11.375% 7/15/18 | | | 136,000 | | | 147,390 |
| * | Ford Motor 7.45% 7/16/31 | | | 208,000 | | | 237,120 |
| | Ford Motor Credit 12.00% 5/15/15 | | | 135,000 | | | 173,198 |
| # | Games Merger 144A 11.00% 6/1/18 | | | 126,000 | | | 140,490 |
| * | Goodyear Tire & Rubber | | | | | | |
| | 8.25% 8/15/20 | | | 65,000 | | | 69,550 |
| | Interface | | | | | | |
| | 9.50% 2/1/14 | | | 11,000 | | | 11,385 |
| | 11.375% 11/1/13 | | | 39,000 | | | 45,435 |
2010 Annual report • Delaware Pooled Trust
(continues) 87
Statements of net assets
Delaware Pooled® Trust — The High-Yield Bond Portfolio
| | | | Principal | | Value |
| | | | Amount (U.S. $) | | (U.S. $) |
| Corporate Bonds (continued) | | | | | | |
| Consumer Cyclical (continued) | | | | | | |
| | K Hovnanian Enterprises | | | | | | |
| | 6.25% 1/15/15 | | $ | 118,000 | | $ | 88,500 |
| | 7.50% 5/15/16 | | | 57,000 | | | 39,045 |
| | Landry’s Restaurants | | | | | | |
| | 11.625% 12/1/15 | | | 172,000 | | | 185,330 |
| | M/I Homes | | | | | | |
| | 6.875% 4/1/12 | | | 57,000 | | | 59,850 |
| | #144A 8.625% 11/15/18 | | | 230,000 | | | 230,863 |
| | Norcraft Finance 10.50% 12/15/15 | | | 85,000 | | | 91,163 |
| | Norcraft Holdings/Capital | | | | | | |
| | 9.75% 9/1/12 | | | 124,000 | | | 123,225 |
| * | OSI Restaurant Partners | | | | | | |
| | 10.00% 6/15/15 | | | 126,000 | | | 131,513 |
| | Quiksilver 6.875% 4/15/15 | | | 153,000 | | | 149,940 |
| | Standard Pacific 10.75% 9/15/16 | | | 62,000 | | | 70,060 |
| | | | | | | | 2,939,780 |
| Consumer Non-Cyclical – 9.69% | | | | | | |
| *# | Accellent 144A 10.00% 11/1/17 | | | 85,000 | | | 84,575 |
| | Alere 9.00% 5/15/16 | | | 81,000 | | | 86,873 |
| | Alion Science & Technology PIK | | | | | | |
| | 12.00% 11/1/14 | | | 97,174 | | | 99,239 |
| | Alliance One International | | | | | | |
| | 10.00% 7/15/16 | | | 106,000 | | | 117,130 |
| | Bausch & Lomb 9.875% 11/1/15 | | | 91,000 | | | 99,418 |
| | BioScrip 10.25% 10/1/15 | | | 127,000 | | | 134,938 |
| | Cott Beverages 8.375% 11/15/17 | | | 73,000 | | | 79,570 |
| * | Dean Foods 7.00% 6/1/16 | | | 124,000 | | | 124,620 |
| | Diversey Holdings 10.50% 5/15/20 | | | 247,000 | | | 288,372 |
| # | DJO Finance 144A 9.75% 10/15/17 | | | 145,000 | | | 151,524 |
| # | Lantheus Medical Imaging 144A | | | | | | |
| | 9.75% 5/15/17 | | | 95,000 | | | 99,750 |
| | LVB Acquisition 11.625% 10/15/17 | | | 126,000 | | | 142,537 |
| # | NBTY 144A 9.00% 10/1/18 | | | 191,000 | | | 203,892 |
| # | Novasep Holding 144A | | | | | | |
| | 9.75% 12/15/16 | | | 120,000 | | | 100,800 |
| | Pinnacle Foods Finance | | | | | | |
| | 10.625% 4/1/17 | | | 126,000 | | | 137,655 |
| # | Quintiles Transnational PIK 144A | | | | | | |
| | 9.50% 12/30/14 | | | 58,000 | | | 59,305 |
| # | Reynolds Group Issuer 144A | | | | | | |
| | 9.00% 4/15/19 | | | 130,000 | | | 135,688 |
| | Smithfield Foods 7.75% 7/1/17 | | | 108,000 | | | 111,105 |
| # | Tops Markets 144A | | | | | | |
| | 10.125% 10/15/15 | | | 114,000 | | | 123,833 |
| | United Rentals North America | | | | | | |
| | 8.375% 9/15/20 | | | 30,000 | | | 30,600 |
| # | Viking Acquisition 144A | | | | | | |
| | 9.25% 11/1/18 | | | 155,000 | | | 154,999 |
| # | Viskase 144A 9.875% 1/15/18 | | | 152,000 | | | 161,119 |
| * | Yankee Acquisition 9.75% 2/15/17 | | | 120,000 | | | 125,700 |
| | | | | | | | 2,853,242 |
| Energy – 11.00% | | | | | | |
| # | American Petroleum Tankers 144A | | | | | | |
| | 10.25% 5/1/15 | | | 135,000 | | | 141,075 |
| | Antero Resources Finance | | | | | | |
| | 9.375% 12/1/17 | | | 91,000 | | | 97,143 |
| | Aquilex Holdings 11.125% 12/15/16 | | | 127,000 | | | 121,603 |
| | Chaparral Energy 8.50% 12/1/15 | | | 71,000 | | | 71,178 |
| | Chesapeake Energy | | | | | | |
| | 7.25% 12/15/18 | | | 2,000 | | | 2,195 |
| | 9.50% 2/15/15 | | | 101,000 | | | 117,665 |
| | Complete Production Service | | | | | | |
| | 8.00% 12/15/16 | | | 71,000 | | | 75,083 |
| | Copano Energy/Finance | | | | | | |
| | 7.75% 6/1/18 | | | 90,000 | | | 92,475 |
| * | Crosstex Energy/Finance | | | | | | |
| | 8.875% 2/15/18 | | | 102,000 | | | 110,670 |
| # | Drummond 144A 9.00% 10/15/14 | | | 115,000 | | | 123,625 |
| | Global Geophysical Services | | | | | | |
| | 10.50% 5/1/17 | | | 63,000 | | | 63,945 |
| | Headwaters 11.375% 11/1/14 | | | 115,000 | | | 122,475 |
| # | Helix Energy Solutions Group 144A | | | | | | |
| | 9.50% 1/15/16 | | | 181,000 | | | 188,239 |
| # | Hercules Offshore 144A | | | | | | |
| | 10.50% 10/15/17 | | | 143,000 | | | 111,540 |
| # | Hilcorp Energy I/Finance 144A | | | | | | |
| | 8.00% 2/15/20 | | | 151,000 | | | 160,059 |
| | Holly 9.875% 6/15/17 | | | 96,000 | | | 105,600 |
| | International Coal Group | | | | | | |
| | 9.125% 4/1/18 | | | 127,000 | | | 139,065 |
| | Key Energy Services 8.375% 12/1/14 | | | 114,000 | | | 122,693 |
| # | Linn Energy/Finance 144A | | | | | | |
| | 8.625% 4/15/20 | | | 130,000 | | | 141,050 |
| # | Murray Energy 144A | | | | | | |
| | 10.25% 10/15/15 | | | 126,000 | | | 134,820 |
| # | NFR Energy/Finance 144A | | | | | | |
| | 9.75% 2/15/17 | | | 145,000 | | | 145,544 |
| | OPTI Canada | | | | | | |
| | 7.875% 12/15/14 | | | 129,000 | | | 97,395 |
| | 8.25% 12/15/14 | | | 159,000 | | | 121,238 |
| | PetroHawk Energy 7.875% 6/1/15 | | | 138,000 | | | 146,970 |
| | Petroleum Development | | | | | | |
| | 12.00% 2/15/18 | | | 135,000 | | | 151,874 |
| | Pioneer Drilling 9.875% 3/15/18 | | | 66,000 | | | 69,630 |
| | Quicksilver Resources | | | | | | |
| | 7.125% 4/1/16 | | | 124,000 | | | 119,350 |
| | #SandRidge Energy 144A | | | | | | |
| | *8.75% 1/15/20 | | | 38,000 | | | 39,710 |
| | 9.875% 5/15/16 | | | 97,000 | | | 103,790 |
| | | | | | | | 3,237,699 |
| Finance & Investments – 7.55% | | | | | | |
| | Ally Financial 8.00% 12/31/18 | | | 138,000 | | | 144,210 |
| • | American International Group | | | | | | |
| | 8.175% 5/15/58 | | | 240,000 | | | 257,400 |
| | Express Finance 8.75% 3/1/18 | | | 92,000 | | | 98,440 |
2010 Annual report • Delaware Pooled Trust
88
| | | | Principal | | Value |
| | | | Amount (U.S. $) | | (U.S. $) |
| Corporate Bonds (continued) | | | | | | |
| Finance & Investments (continued) | | | | | | |
| • | Fifth Third Capital Trust IV | | | | | | |
| | 6.50% 4/15/37 | | $ | 165,000 | | $ | 158,400 |
| • | Genworth Financial 6.15% 11/15/66 | | | 287,000 | | | 230,318 |
| •# | HBOS Capital Funding 144A | | | | | | |
| | 6.071% 6/29/49 | | | 176,000 | | | 160,160 |
| •# | ILFC E-Capital Trust II 144A | | | | | | |
| | 6.25% 12/21/65 | | | 250,000 | | | 201,250 |
| •# | Liberty Mutual Group 144A | | | | | | |
| | 7.00% 3/15/37 | | | 176,000 | | | 165,040 |
| | Nuveen Investments | | | | | | |
| | 10.50% 11/15/15 | | | 444,000 | | | 466,200 |
| | #Pinafore 144A 9.00% 10/1/18 | | | 160,000 | | | 172,000 |
| •∏ | XL Group 6.50% 12/31/49 | | | 176,000 | | | 159,280 |
| | Zions Bancorporation | | | | | | |
| | 5.65% 5/15/14 | | | 11,000 | | | 11,004 |
| | | | | | | | 2,223,702 |
| Media – 7.13% | | | | | | |
| | Affinion Group 11.50% 10/15/15 | | | 52,000 | | | 55,380 |
| | Cablevision Systems | | | | | | |
| | *8.00% 4/15/20 | | | 13,000 | | | 14,446 |
| | 8.625% 9/15/17 | | | 47,000 | | | 53,286 |
| # | CCO Holdings/Capital 144A | | | | | | |
| | 7.875% 4/30/18 | | | 32,000 | | | 34,160 |
| | 8.125% 4/30/20 | | | 39,000 | | | 42,315 |
| # | Charter Communications | | | | | | |
| | Operating 144A | | | | | | |
| | 10.875% 9/15/14 | | | 62,000 | | | 70,990 |
| # | Columbus International 144A | | | | | | |
| | 11.50% 11/20/14 | | | 110,000 | | | 123,888 |
| | DISH DBS 7.875% 9/1/19 | | | 111,000 | | | 122,239 |
| # | InVentiv Health 144A | | | | | | |
| | 10.00% 8/15/18 | | | 153,000 | | | 154,530 |
| | MDC Partners 11.00% 11/1/16 | | | 58,000 | | | 64,601 |
| # | Nexstar Broadcasting 144A | | | | | | |
| | 8.875% 4/15/17 | | | 133,000 | | | 141,645 |
| | Nielsen Finance | | | | | | |
| | 11.50% 5/1/16 | | | 21,000 | | | 24,255 |
| | 11.625% 2/1/14 | | | 30,000 | | | 34,650 |
| | #144A 7.75% 10/15/18 | | | 137,000 | | | 142,651 |
| # | Sinclair Television Group 144A | | | | | | |
| | 9.25% 11/1/17 | | | 68,000 | | | 75,140 |
| # | Sitel Finance 144A 11.50% 4/1/18 | | | 127,000 | | | 103,188 |
| *# | Univision Communications 144A | | | | | | |
| | 7.875% 11/1/20 | | | 145,000 | | | 152,975 |
| # | UPC Holding 144A 9.875% 4/15/18 | | | 100,000 | | | 109,750 |
| # | Visant 144A 10.00% 10/1/17 | | | 89,000 | | | 95,008 |
| # | XM Satellite Radio 144A | | | | | | |
| | *7.625% 11/1/18 | | | 130,000 | | | 134,225 |
| | 13.00% 8/1/13 | | | 292,000 | | | 349,669 |
| | | | | | | | 2,098,991 |
| Real Estate – 0.49% | | | | | | |
| | Felcor Lodging 10.00% 10/1/14 | | | 127,000 | | | 143,510 |
| | | | | | | | 143,510 |
| Services Cyclical – 9.00% | | | | | | |
| | AMH Holdings 11.25% 3/1/14 | | | 133,000 | | | 138,786 |
| # | Delta Air Lines 144A | | | | | | |
| | 12.25% 3/15/15 | | | 116,000 | | | 132,675 |
| | DryShips 5.00% 12/1/14 | | | 75,000 | | | 67,313 |
| # | Equinox Holdings 144A | | | | | | |
| | 9.50% 2/1/16 | | | 132,000 | | | 139,260 |
| * | General Maritime 12.00% 11/15/17 | | | 127,000 | | | 131,128 |
| | Harrah’s Operating 10.00% 12/15/18 | | | 273,000 | | | 238,192 |
| # | Icon Health & Fitness 144A | | | | | | |
| | 11.875% 10/15/16 | | | 78,000 | | | 77,415 |
| | Kansas City Southern de Mexico | | | | | | |
| | 8.00% 2/1/18 | | | 84,000 | | | 92,085 |
| | Kansas City Southern Railway | | | | | | |
| | 13.00% 12/15/13 | | | 20,000 | | | 24,300 |
| *# | Marina District Finance 144A | | | | | | |
| | 9.875% 8/15/18 | | | 75,000 | | | 74,438 |
| # | MCE Finance 144A 10.25% 5/15/18 | | | 130,000 | | | 147,388 |
| | MGM Resorts International | | | | | | |
| | 11.125% 11/15/17 | | | 34,000 | | | 39,270 |
| | *11.375% 3/1/18 | | | 353,000 | | | 368,002 |
| | *13.00% 11/15/13 | | | 26,000 | | | 31,038 |
| | Mohegan Tribal Gaming Authority | | | | | | |
| | *6.875% 2/15/15 | | | 34,000 | | | 23,545 |
| | 7.125% 8/15/14 | | | 93,000 | | | 64,170 |
| | NCL 11.75% 11/15/16 | | | 141,000 | | | 163,736 |
| | Peninsula Gaming 10.75% 8/15/17 | | | 135,000 | | | 144,450 |
| | Pinnacle Entertainment | | | | | | |
| | 8.75% 5/15/20 | | | 147,000 | | | 147,551 |
| # | Shingle Springs Tribal Gaming | | | | | | |
| | Authority 144A | | | | | | |
| | 9.375% 6/15/15 | | | 163,000 | | | 111,655 |
| *# | Swift Transportation 144A | | | | | | |
| | 12.50% 5/15/17 | | | 72,000 | | | 74,880 |
| # | United Air Lines 144A | | | | | | |
| | 12.00% 11/1/13 | | | 194,000 | | | 219,219 |
| | | | | | | | 2,650,496 |
| Services Non-Cyclical – 4.76% | | | | | | |
| # | Ashtead Capital 144A | | | | | | |
| | 9.00% 8/15/16 | | | 100,000 | | | 105,750 |
| | Cardtronics 8.25% 9/1/18 | | | 66,000 | | | 70,290 |
| | Community Health Systems | | | | | | |
| | 8.875% 7/15/15 | | | 110,000 | | | 117,975 |
| | HCA 9.25% 11/15/16 | | | 127,000 | | | 137,795 |
| # | Multiplan 144A 9.875% 9/1/18 | | | 143,000 | | | 153,367 |
| # | PHH 144A 9.25% 3/1/16 | | | 136,000 | | | 140,250 |
| # | Radiation Therapy Services 144A | | | | | | |
| | 9.875% 4/15/17 | | | 145,000 | | | 144,275 |
| # | Radnet Management 144A | | | | | | |
| | 10.375% 4/1/18 | | | 127,000 | | | 118,428 |
| * | RSC Equipment Rental/Holdings III | | | | | | |
| | 10.25% 11/15/19 | | | 51,000 | | | 55,718 |
| | Select Medical 7.625% 2/1/15 | | | 95,000 | | | 96,781 |
2010 Annual report • Delaware Pooled Trust
(continues) 89
Statements of net assets
Delaware Pooled® Trust — The High-Yield Bond Portfolio
| | | | Principal | | Value |
| | | | Amount (U.S. $) | | (U.S. $) |
| Corporate Bonds (continued) | | | | | | |
| Services Non-Cyclical (continued) | | | | | | |
| # | ServiceMaster PIK 144A | | | | | | |
| | 10.75% 7/15/15 | | $ | 115,000 | | $ | 123,913 |
| • | US Oncology PIK 6.737% 3/15/12 | | | 139,000 | | | 136,220 |
| | | | | | | | 1,400,762 |
| Technology & Electronics – 2.90% | | | | | | |
| # | Aspect Software 144A | | | | | | |
| | 10.625% 5/15/17 | | | 139,000 | | | 147,861 |
| | First Data 9.875% 9/24/15 | | | 137,000 | | | 116,450 |
| # | International Wire Group 144A | | | | | | |
| | 9.75% 4/15/15 | | | 100,000 | | | 104,500 |
| # | MagnaChip Semiconductor/Finance | | | | | | |
| | 144A 10.50% 4/15/18 | | | 101,000 | | | 108,828 |
| * | NXP BV Funding 9.50% 10/15/15 | | | 200,000 | | | 211,750 |
| | Sanmina-SCI 8.125% 3/1/16 | | | 54,000 | | | 55,755 |
| * | SunGard Data Systems | | | | | | |
| | 10.25% 8/15/15 | | | 104,000 | | | 109,850 |
| | | | | | | | 854,994 |
| Telecommunications – 11.78% | | | | | | |
| @=‡ | Allegiance Telecom 11.75% 2/15/11 | | | 10,000 | | | 0 |
| # | Clearwire Communications/Finance | | | | | | |
| | 144A 12.00% 12/1/15 | | | 440,000 | | | 489,889 |
| | *Cricket Communications | | | | | | |
| | 10.00% 7/15/15 | | | 68,000 | | | 74,800 |
| *# | Digicel Group 144A 10.50% 4/15/18 | | | 200,000 | | | 221,250 |
| | Global Crossing 12.00% 9/15/15 | | | 176,000 | | | 201,960 |
| | GXS Worldwide 9.75% 6/15/15 | | | 121,000 | | | 125,538 |
| | Intelsat 6.50% 11/1/13 | | | 18,000 | | | 18,225 |
| | Intelsat Bermuda | | | | | | |
| | 11.25% 2/4/17 | | | 319,000 | | | 343,323 |
| | PIK 11.50% 2/4/17 | | | 168,176 | | | 182,681 |
| | Level 3 Financing 10.00% 2/1/18 | | | 154,000 | | | 148,225 |
| | *MetroPCS Wireless 7.875% 9/1/18 | | | 66,000 | | | 71,115 |
| | NII Capital 10.00% 8/15/16 | | | 105,000 | | | 119,569 |
| | PAETEC Holding 9.50% 7/15/15 | | | 120,000 | | | 127,500 |
| | Sprint Capital 8.75% 3/15/32 | | | 276,000 | | | 304,290 |
| # | Telcordia Technologies 144A | | | | | | |
| | 11.00% 5/1/18 | | | 220,000 | | | 217,800 |
| | Telesat Canada | | | | | | |
| | 11.00% 11/1/15 | | | 78,000 | | | 87,945 |
| | 12.50% 11/1/17 | | | 92,000 | | | 109,020 |
| | Terremark Worldwide | | | | | | |
| | 12.00% 6/15/17 | | | 105,000 | | | 121,013 |
| | Viasat 8.875% 9/15/16 | | | 58,000 | | | 63,365 |
| | Virgin Media Finance | | | | | | |
| | 8.375% 10/15/19 | | | 100,000 | | | 112,000 |
| * | West 11.00% 10/15/16 | | | 134,000 | | | 145,390 |
| # | Wind Acquisition Finance 144A | | | | | | |
| | 11.75% 7/15/17 | | | 90,000 | | | 103,050 |
| | 12.00% 12/1/15 | | | 75,000 | | | 79,875 |
| | | | | | | | 3,467,823 |
| Utilities – 2.53% | | | | | | |
| | AES | | | | | | |
| | *7.75% 3/1/14 | | | 22,000 | | | 24,145 |
| | *8.00% 6/1/20 | | | 101,000 | | | 113,878 |
| | 9.75% 4/15/16 | | | 14,000 | | | 16,345 |
| | Dynegy Holdings 7.75% 6/1/19 | | | 117,000 | | | 80,438 |
| | Elwood Energy 8.159% 7/5/26 | | | 64,567 | | | 61,015 |
| | Energy Future Intermediate | | | | | | |
| | Holding/EFIH Finance | | | | | | |
| | 10.00% 12/1/20 | | | 152,000 | | | 159,965 |
| # | GenOn Escrow 144A | | | | | | |
| | 9.50% 10/15/18 | | | 95,000 | | | 93,100 |
| | Mirant Americas Generation | | | | | | |
| | 8.50% 10/1/21 | | | 115,000 | | | 113,275 |
| • | Puget Sound Energy 6.974% 6/1/67 | | | 85,000 | | | 82,222 |
| | | | | | | | 744,383 |
| Total Corporate Bonds | | | | | | |
| | (cost $25,618,108) | | | | | | 27,415,873 |
| | | | | | | | |
| «Senior Secured Loans – 1.33% | | | | | | |
| | Chester Downs & Marina | | | | | | |
| | 12.375% 12/31/16 | | | 53,650 | | | 54,634 |
| | Energy Future Holdings Tranche B2 | | | | | | |
| | 3.941% 10/10/14 | | | 254,482 | | | 198,733 |
| | PQ 6.82% 7/30/15 | | | 145,000 | | | 137,279 |
| Total Senior Secured Loans | | | | | | |
| | (cost $367,547) | | | | | | 390,646 |
| | | | | | | | |
| | | | Number of | | | |
| | | | Shares | | | |
| Common Stock – 0.48% | | | | | | |
| † | Alliance HealthCare Service | | | 5,166 | | | 20,354 |
| †=∏ | Avado Brands | | | 121 | | | 0 |
| †= | Calpine Escrow | | | 25,000 | | | 0 |
| †= | Century Communications | | | 60,000 | | | 0 |
| † | DIRECTV Class A | | | 1,200 | | | 52,152 |
| † | Flextronics International | | | 3,700 | | | 26,492 |
| † | GeoEye | | | 450 | | | 19,922 |
| † | Mirant | | | 21 | | | 223 |
| †* | Mobile Mini | | | 1,294 | | | 22,554 |
| †=∏ | PT Holdings | | | 40 | | | 0 |
| † | USGen | | | 20,000 | | | 0 |
| Total Common Stock | | | | | | |
| | (cost $146,461) | | | | | | 141,697 |
| | | | | | | | |
| Convertible Preferred Stock – 0.24% | | | | | | |
| | SandRidge Energy 8.50% | | | | | | |
| | exercise price $8.01, | | | | | | |
| | expiration date 12/31/49 | | | 670 | | | 69,459 |
| Total Convertible Preferred Stock | | | | | | |
| | (cost $56,805) | | | | | | 69,459 |
2010 Annual report • Delaware Pooled Trust
90
| | | | Number of | | Value | |
| | | | Shares | | (U.S. $) | |
| Preferred Stock – 0.60% | | | | | | | |
| # | Ally Financial 144A 7.00% | | | 200 | | $ | 177,750 | |
| †= | Port Townsend | | | 8 | | | 0 | |
| Total Preferred Stock | | | | | | | |
| | (cost $168,420) | | | | | | 177,750 | |
| | | | | | | | | |
| Warrants – 0.00% | | | | | | | |
| | Alion Science & Technology | | | 80 | | | 1 | |
| †= | Port Townsend | | | 8 | | | 0 | |
| Total Warrants (cost $192) | | | | | | 1 | |
| | | | | | | | |
| | | | Principal | | | | |
| | | | Amount (U.S. $) | | | | |
| ≠Discount Note – 3.20% | | | | | | | |
| | Federal Home Loan Bank | | | | | | | |
| | 0.10% 11/1/10 | | $ | 941,008 | | | 941,008 | |
| Total Discount Note (cost $941,008) | | | | | | 941,008 | |
| | | | | | |
| Total Value of Securities Before Securities | | | | |
| | Lending Collateral – 99.93% | | | | | | | |
| | (cost $27,565,318) | | | | | | 29,417,135 | |
| | | | | | | | |
| | | | Number of | | | | |
| | | | Shares | | | | |
| Securities Lending Collateral** – 9.16% | | | | | | | |
| Investment Companies | | | | | | | |
| | Delaware Investments Collateral | | | | | | | |
| | Fund No. 1 | | | 2,659,789 | | | 2,659,789 | |
| | BNY Mellon SL DBT II | | | | | | | |
| | Liquidating Fund | | | 35,792 | | | 34,758 | |
| @† | Mellon GSL Reinvestment Trust II | | | 32,859 | | | 1,699 | |
| Total Securities Lending Collateral | | | | | | | |
| | (cost $2,728,440) | | | | | | 2,696,246 | |
| | | | | | | | | |
| Total Value of Securities – 109.09% | | | | | | | |
| | (cost $30,293,758) | | | | | | 32,113,381 | © |
| Obligation to Return Securities | | | | | | | |
| | Lending Collateral** – (9.27%) | | | | | | (2,728,440 | ) |
| Receivables and Other Assets | | | | | | | |
| | Net of Liabilities – 0.18% | | | | | | 52,025 | |
| Net Assets Applicable to 3,630,167 | | | | | | | |
| | Shares Outstanding; Equivalent to | | | | | | | |
| | $8.11 Per Share – 100.00% | | | | | $ | 29,436,966 | |
| | | | | | |
| Components of Net Assets at October 31, 2010: | | | | |
| Shares of beneficial interest | | | | | | | |
| | (unlimited authorization – no par) | | | | | $ | 29,373,701 | |
| Undistributed net investment income | | | | | | 1,817,897 | |
| Accumulated net realized loss on investments | | | | | | (3,574,255 | ) |
| Net unrealized appreciation of investments | | | | | | 1,819,623 | |
| Total net assets | | | | | $ | 29,436,966 | |
| † | Non income producing security. |
| ‡ | Non income producing security. Security is currently in default. |
| ≠ | The rate shown is the effective yield at the time of purchase. |
| * | Fully or partially on loan. |
| ** | See Note 9 in “Notes to financial statements.” |
| # | Security exempt from registration under Rule 144A of the Securities Act of 1933, as amended. At October 31, 2010, the aggregate amount of Rule 144A securities was $11,347,416 which represented 38.55% of the Portfolio’s net assets. See Note 10 in “Notes to financial statements.” |
| = | Security is being fair valued in accordance with the Portfolio’s fair valuation policy. At October 31, 2010, the aggregate amount of fair valued securities was $8,501, which represented 0.03% of the Portfolio’s net assets. See Note 1 in “Notes to financial statements.” |
| • | Variable rate security. The rate shown is the rate as of October 31, 2010. Interest rates reset periodically. |
| « | Senior Secured Loans generally pay interest at rates which are periodically redetermined by reference to a base lending rate plus a premium. These base lending rates are generally: (i) the prime rate offered by one or more United States banks, (ii) the lending rate offered by one or more European banks such as the London Inter-Bank Offered Rate (LIBOR), and (iii) the certificate of deposit rate. Senior Secured Loans may be subject to restrictions on resale. Stated rate in effect at October 31, 2010. |
| @ | Illiquid security. At October 31, 2010, the aggregate amount of illiquid securities was $10,200, which represented 0.03% of the Portfolio’s net assets. See Note 10 in “Notes to financial statements.” |
| ∏ | Restricted security. These investments are in securities not registered under the Securities Act of 1933, as amended and have certain restrictions on resale which may limit their liquidity. At October 31, 2010, the aggregate amount of restricted securities was $159,280 or 0.54% of the Portfolio’s net assets. See Note 10 in “Notes to financial statements.” |
| © | Includes $2,742,216 of securities loaned. |
PIK – Pay-in-kind
See accompanying Notes, which are an integral part of the financial statements.
2010 Annual report • Delaware Pooled Trust
(continues) 91
Statements of net assets
Delaware Pooled® Trust — The Core Plus Fixed Income Portfolio
October 31, 2010
| | | Principal | | Value |
| | | Amount° | | (U.S. $) |
| Agency Asset-Backed Securities – 0.26% | | | |
| | Fannie Mae Grantor Trust | | | | | | |
| | Series 2003-T4 2A5 | | | | | | |
| | 5.407% 9/26/33 | USD | | 134,798 | | $ | 129,561 |
| Total Agency Asset-Backed | | | | | | |
| | Securities (cost $133,708) | | | | | | 129,561 |
| | | | | | | | |
| Agency Collateralized Mortgage Obligations – 3.55% | | | |
| | Fannie Mae Grantor Trust | | | | | | |
| | Series 2001-T8 A2 | | | | | | |
| | 9.50% 7/25/41 | | | 13,501 | | | 16,678 |
| | Fannie Mae REMICs | | | | | | |
| | Series 2002-90 A1 | | | | | | |
| | 6.50% 6/25/42 | | | 22,211 | | | 25,341 |
| | Series 2002-90 A2 | | | | | | |
| | 6.50% 11/25/42 | | | 53,951 | | | 61,555 |
| | Series 2003-122 AJ | | | | | | |
| | 4.50% 2/25/28 | | | 70,804 | | | 73,184 |
| | Fannie Mae Whole Loan | | | | | | |
| | Series 2004-W11 1A2 | | | | | | |
| | 6.50% 5/25/44 | | | 53,176 | | | 60,139 |
| | Freddie Mac REMICs | | | | | | |
| | Series 1730 Z | | | | | | |
| | 7.00% 5/15/24 | | | 152,866 | | | 177,277 |
| | Series 2326 ZQ | | | | | | |
| | 6.50% 6/15/31 | | | 142,167 | | | 162,249 |
| | Series 2662 MA | | | | | | |
| | 4.50% 10/15/31 | | | 95,598 | | | 100,502 |
| | Series 3022 MB | | | | | | |
| | 5.00% 12/15/28 | | | 171,477 | | | 175,953 |
| | Series 3123 HT | | | | | | |
| | 5.00% 3/15/26 | | | 270,000 | | | 294,879 |
| | Series 3131 MC | | | | | | |
| | 5.50% 4/15/33 | | | 335,000 | | | 363,782 |
| | Series 3656 PM | | | | | | |
| | 5.00% 4/15/40 | | | 125,000 | | | 137,416 |
| | GNMA Series 2010-113 KE | | | | | | |
| | 4.50% 9/20/40 | | | 125,000 | | | 135,376 |
| Total Agency Collateralized | | | | | | |
| | Mortgage Obligations | | | | | | |
| | (cost $1,634,664) | | | | | | 1,784,331 |
| | | | | | | | |
| Agency Mortgage-Backed Securities – 15.88% | | | |
| | Fannie Mae 6.50% 8/1/17 | | | 33,337 | | | 36,514 |
| • | Fannie Mae ARM | | | | | | |
| | 2.627% 8/1/34 | | | 69,983 | | | 73,312 |
| | 5.066% 3/1/38 | | | 166,359 | | | 176,448 |
| | 5.318% 4/1/36 | | | 94,220 | | | 99,455 |
| | Fannie Mae Relocation 30 yr | | | | | | |
| | 5.00% 11/1/33 | | | 21,560 | | | 22,713 |
| | Pool 763656 5.00% 1/1/34 | | | 28,117 | | | 29,621 |
| | Pool 763742 5.00% 1/1/34 | | | 11,109 | | | 11,703 |
| | 5.00% 11/1/34 | | | 55,947 | | | 58,939 |
| | 5.00% 10/1/35 | | | 106,132 | | | 111,808 |
| | 5.00% 1/1/36 | | | 186,520 | | | 196,496 |
| | Fannie Mae S.F. 15 yr | | | | | | |
| | 4.50% 1/1/20 | | | 29,273 | | | 31,301 |
| | 5.00% 7/1/14 | | | 3,335 | | | 3,556 |
| | 5.00% 12/1/16 | | | 4,405 | | | 4,719 |
| | 5.00% 5/1/20 | | | 36,083 | | | 38,813 |
| | 5.00% 7/1/20 | | | 13,359 | | | 14,327 |
| | 5.00% 5/1/21 | | | 8,656 | | | 9,303 |
| | 5.50% 5/1/20 | | | 1,341 | | | 1,457 |
| | 5.50% 6/1/23 | | | 252,565 | | | 273,881 |
| | 6.00% 8/1/22 | | | 138,588 | | | 150,897 |
| | Fannie Mae S.F. 15 yr TBA | | | | | | |
| | 4.00% 11/1/25 | | | 500,000 | | | 523,750 |
| | 4.50% 11/1/25 | | | 855,000 | | | 904,162 |
| | 5.50% 11/1/25 | | | 270,000 | | | 292,528 |
| | Fannie Mae S.F. 20 yr | | | | | | |
| | 5.50% 8/1/28 | | | 387,859 | | | 417,822 |
| | Fannie Mae S.F. 30 yr | | | | | | |
| | 5.00% 3/1/34 | | | 22,899 | | | 24,524 |
| | Pool 808130 5.00% 3/1/35 | | | 39,159 | | | 41,840 |
| | Pool 814334 5.00% 3/1/35 | | | 19,580 | | | 20,933 |
| | 5.00% 5/1/35 | | | 35,924 | | | 38,384 |
| | 5.00% 6/1/35 | | | 52,261 | | | 56,012 |
| | 5.00% 7/1/35 | | | 54,213 | | | 57,926 |
| | 5.00% 12/1/37 | | | 56,093 | | | 59,671 |
| | 5.00% 1/1/38 | | | 95,611 | | | 101,711 |
| | 5.00% 2/1/38 | | | 44,555 | | | 47,388 |
| | 7.00% 12/1/33 | | | 25,183 | | | 28,873 |
| | 7.00% 5/1/35 | | | 4,785 | | | 5,392 |
| | 7.00% 6/1/35 | | | 6,369 | | | 7,176 |
| | 7.00% 12/1/37 | | | 144,167 | | | 162,385 |
| | 7.50% 6/1/31 | | | 3,166 | | | 3,648 |
| | 7.50% 6/1/34 | | | 37,487 | | | 42,755 |
| | Fannie Mae S.F. 30 yr TBA | | | | | | |
| | 4.00% 11/1/40 | | | 730,000 | | | 752,584 |
| | 4.50% 11/1/40 | | | 655,000 | | | 687,546 |
| | 5.50% 11/1/40 | | | 245,000 | | | 262,494 |
| | 6.00% 11/1/40 | | | 560,000 | | | 606,431 |
| • | Freddie Mac ARM 3.283% 4/1/34 | | | 7,118 | | | 7,476 |
| | Freddie Mac Relocation 30 yr | | | | | | |
| | 5.00% 9/1/33 | | | 20,272 | | | 21,359 |
| | Freddie Mac S.F. 15 yr TBA | | | | | | |
| | 5.00% 11/1/25 | | | 500,000 | | | 531,953 |
| | Freddie Mac S.F. 30 yr | | | | | | |
| | 7.00% 11/1/33 | | | 3,255 | | | 3,698 |
| | Freddie Mac S.F. 30 yr TBA | | | | | | |
| | 6.00% 11/1/40 | | | 500,000 | | | 541,641 |
| | GNMA I S.F. 30 yr | | | | | | |
| | 7.00% 12/15/34 | | | 339,904 | | | 386,587 |
| | 7.50% 1/15/30 | | | 1,488 | | | 1,731 |
| | 7.50% 12/15/31 | | | 763 | | | 889 |
| | 7.50% 2/15/32 | | | 723 | | | 842 |
| Total Agency Mortgage-Backed | | | | | | |
| | Securities (cost $7,791,422) | | | | | | 7,987,374 |
2010 Annual report • Delaware Pooled Trust
92
| | | Principal | | Value |
| | | Amount° | | (U.S. $) |
| Commercial Mortgage-Backed Securities – 7.39% | | | |
| # | American Tower Trust Series | | | | | | |
| | 2007-1A AFX 144A | | | | | | |
| | 5.42% 4/15/37 | USD | | 95,000 | | $ | 104,681 |
| • | Bank of America Commercial | | | | | | |
| | Mortgage Securities | | | | | | |
| | Series 2005-1 A5 | | | | | | |
| | 5.158% 11/10/42 | | | 55,000 | | | 60,624 |
| | Bear Stearns Commercial | | | | | | |
| | Mortgage Securities | | | | | | |
| | •Series 2005-PW10 A4 | | | | | | |
| | 5.405% 12/11/40 | | | 155,000 | | | 167,507 |
| | •Series 2005-T20 A4A | | | | | | |
| | 5.149% 10/12/42 | | | 105,000 | | | 115,491 |
| | •Series 2006-PW12 A4 | | | | | | |
| | 5.723% 9/11/38 | | | 45,000 | | | 50,341 |
| | Series 2006-PW14 A4 | | | | | | |
| | 5.201% 12/11/38 | | | 150,000 | | | 162,698 |
| | Series 2007-PW15 A4 | | | | | | |
| | 5.331% 2/11/44 | | | 270,000 | | | 281,092 |
| w | Commercial Mortgage Pass | | | | | | |
| | Through Certificates | | | | | | |
| | •Series 2005-C6 A5A | | | | | | |
| | 5.116% 6/10/44 | | | 160,000 | | | 174,527 |
| | Series 2006-C7 A2 | | | | | | |
| | 5.69% 6/10/46 | | | 158,599 | | | 160,192 |
| • | Credit Suisse Mortgage | | | | | | |
| | Capital Certificates | | | | | | |
| | Series 2006-C1 AAB | | | | | | |
| | 5.547% 2/15/39 | | | 170,000 | | | 183,868 |
| | Goldman Sachs Mortgage | | | | | | |
| | Securities II | | | | | | |
| | •Series 2004-GG2 A6 | | | | | | |
| | 5.396% 8/10/38 | | | 175,000 | | | 190,691 |
| | Series 2005-GG4 A4 | | | | | | |
| | 4.761% 7/10/39 | | | 250,000 | | | 261,120 |
| | Series 2005-GG4 A4A | | | | | | |
| | 4.751% 7/10/39 | | | 140,000 | | | 149,347 |
| | •Series 2006-GG6 A4 | | | | | | |
| | 5.553% 4/10/38 | | | 155,000 | | | 168,162 |
| | #Series 2010-C1 A2 | | | | | | |
| | 4.592% 8/10/43 | | | 100,000 | | | 106,232 |
| • | Greenwich Capital | | | | | | |
| | Commercial Funding | | | | | | |
| | Series 2004-GG1 A7 | | | | | | |
| | 5.317% 6/10/36 | | | 70,000 | | | 76,665 |
| | JPMorgan Chase Commercial | | | | | | |
| | Mortgage Securities | | | | | | |
| | Series 2002-C1 A3 | | | | | | |
| | 5.376% 7/12/37 | | | 115,000 | | | 121,051 |
| | Series 2003-C1 A2 | | | | | | |
| | 4.985% 1/12/37 | | | 114,000 | | | 121,235 |
| | •Series 2005-LDP4 A4 | | | | | | |
| | 4.918% 10/15/42 | | | 110,000 | | | 119,448 |
| | •Series 2005-LDP5 A4 | | | | | | |
| | 5.198% 12/15/44 | | | 55,000 | | | 60,625 |
| | Lehman Brothers-UBS | | | | | | |
| | Commercial Mortgage Trust | | | | | | |
| | Series 2002-C1 A4 | | | | | | |
| | 6.462% 3/15/31 | | | 19,705 | | | 20,759 |
| | Series 2004-C1 A4 | | | | | | |
| | 4.568% 1/15/31 | | | 95,000 | | | 101,196 |
| • | Morgan Stanley Capital I | | | | | | |
| | #Series 1999-FNV1 G | | | | | | |
| | 144A 6.12% 3/15/31 | | | 15,223 | | | 15,567 |
| | Series 2007-T27 A4 | | | | | | |
| | 5.649% 6/11/42 | | | 335,000 | | | 371,459 |
| •# | Morgan Stanley Dean Witter | | | | | | |
| | Capital I Series 2001-TOP1 E | | | | | | |
| | 144A 7.241% 2/15/33 | | | 100,000 | | | 97,790 |
| •# | Nationslink Funding Series | | | | | | |
| | 1998-2 F 144A | | | | | | |
| | 7.105% 8/20/30 | | | 28,309 | | | 30,558 |
| # | OBP Depositor Trust Series | | | | | | |
| | 2010-OBP A 144A | | | | | | |
| | 4.646% 7/15/45 | | | 100,000 | | | 107,303 |
| | Wachovia Bank Commercial | | | | | | |
| | Mortgage Trust Series | | | | | | |
| | 2006-C28 A2 | | | | | | |
| | 5.50% 10/15/48 | | | 135,000 | | | 138,067 |
| Total Commercial Mortgage-Backed | | | | | | |
| | Securities (cost $3,312,060) | | | | | | 3,718,296 |
| | | | | | | | |
| Convertible Bonds – 0.54% | | | | | | |
| Φ | Hologic 2.00% | | | | | | |
| | exercise price $38.59, | | | | | | |
| | expiration date 12/15/37 | | | 120,000 | | | 113,700 |
| | Linear Technology 3.00% | | | | | | |
| | exercise price $45.36, | | | | | | |
| | expiration date 5/1/27 | | | 125,000 | | | 130,000 |
| * | Transocean 1.50% | | | | | | |
| | exercise price $168.61, | | | | | | |
| | expiration date 12/15/37 | | | 30,000 | | | 29,550 |
| Total Convertible Bonds | | | | | | |
| | (cost $247,946) | | | | | | 273,250 |
| | | | | | | | |
| Corporate Bonds – 49.01% | | | | | | |
| Banking – 8.41% | | | | | | |
| # | Bank Nederlandse Gemeenten | | | | | | |
| | 144A 1.75% 10/6/15 | | | 90,000 | | | 90,309 |
| * | Bank of America | | | | | | |
| | 3.70% 9/1/15 | | | 105,000 | | | 105,950 |
| | BB&T 5.25% 11/1/19 | | | 322,000 | | | 346,469 |
| | City National 5.25% 9/15/20 | | | 80,000 | | | 82,446 |
| @# | CoBank 144A | | | | | | |
| | 7.875% 4/16/18 | | | 250,000 | | | 288,507 |
| # | Export-Import Bank of Korea | | | | | | |
| | 144A 5.25% 2/10/14 | | | 420,000 | | | 450,530 |
| | JPMorgan Chase | | | | | | |
| | 4.40% 7/22/20 | | | 150,000 | | | 152,938 |
2010 Annual report • Delaware Pooled Trust
(continues) 93
Statements of net assets
Delaware Pooled® Trust — The Core Plus Fixed Income Portfolio
| | | Principal | | Value |
| | | Amount° | | (U.S. $) |
| Corporate Bonds (continued) | | | | | | |
| Banking (continued) | | | | | | |
| | JPMorgan Chase Capital XXV | | | | | | |
| | 6.80% 10/1/37 | USD | | 295,000 | | $ | 294,180 |
| | KeyBank 5.80% 7/1/14 | | | 250,000 | | | 274,209 |
| | KFW 10.00% 5/15/12 | BRL | | 140,000 | | | 84,253 |
| | Korea Development Bank | | | | | | |
| | 8.00% 1/23/14 | USD | | 200,000 | | | 235,630 |
| | Oesterreichische Kontrollbank | | | | | | |
| | 1.75% 10/5/15 | | | 60,000 | | | 60,319 |
| | PNC Bank 6.875% 4/1/18 | | | 250,000 | | | 294,058 |
| | PNC Funding | | | | | | |
| | 5.125% 2/8/20 | | | 115,000 | | | 125,040 |
| | 5.25% 11/15/15 | | | 135,000 | | | 150,364 |
| | Rabobank | | | | | | |
| | 2.125% 10/13/15 | | | 35,000 | | | 35,323 |
| | •#144A 11.00% 12/29/49 | | | 195,000 | | | 261,116 |
| | Silicon Valley Bank | | | | | | |
| | 5.70% 6/1/12 | | | 274,000 | | | 285,191 |
| • | USB Capital IX | | | | | | |
| | 6.189% 4/15/49 | | | 165,000 | | | 131,175 |
| | Wachovia | | | | | | |
| | 5.25% 8/1/14 | | | 35,000 | | | 38,039 |
| | 5.625% 10/15/16 | | | 165,000 | | | 184,146 |
| • | Wells Fargo Capital XIII | | | | | | |
| | 7.70% 12/29/49 | | | 130,000 | | | 135,525 |
| | Zions Bancorporation | | | | | | |
| | *5.50% 11/16/15 | | | 80,000 | | | 80,217 |
| | 7.75% 9/23/14 | | | 40,000 | | | 42,610 |
| | | | | | | | 4,228,544 |
| Basic Industries – 4.07% | | | | | | |
| | Alcoa 6.15% 8/15/20 | | | 45,000 | | | 47,586 |
| | ArcelorMittal 9.85% 6/1/19 | | | 105,000 | | | 135,651 |
| | Cliffs Natural Resources | | | | | | |
| | 4.80% 10/1/20 | | | 100,000 | | | 102,090 |
| | 6.25% 10/1/40 | | | 45,000 | | | 43,954 |
| # | Codelco 144A 3.75% 11/4/20 | | | 572,000 | | | 561,928 |
| | Cytec Industries | | | | | | |
| | 8.95% 7/1/17 | | | 80,000 | | | 100,494 |
| | Dow Chemical 8.55% 5/15/19 | | | 175,000 | | | 225,118 |
| | duPont (E.I.) deNemours | | | | | | |
| | 3.625% 1/15/21 | | | 70,000 | | | 71,379 |
| # | Georgia-Pacific 144A | | | | | | |
| | 5.40% 11/1/20 | | | 20,000 | | | 20,300 |
| | Hexion Finance Escrow | | | | | | |
| | 8.875% 2/1/18 | | | 85,000 | | | 91,694 |
| | International Paper | | | | | | |
| | 9.375% 5/15/19 | | | 245,000 | | | 324,037 |
| | Reliance Steel & Aluminum | | | | | | |
| | 6.85% 11/15/36 | | | 82,000 | | | 79,343 |
| | Teck Resources 9.75% 5/15/14 | | | 34,000 | | | 42,368 |
| | Vale Overseas | | | | | | |
| | 6.875% 11/21/36 | | | 129,000 | | | 147,321 |
| | 6.875% 11/10/39 | | | 45,000 | | | 51,859 |
| | | | | | | | 2,045,122 |
| Brokerage – 1.44% | | | | | | |
| • | Bear Stearns 5.16% 12/7/12 | AUD | | 110,000 | | | 105,759 |
| | Goldman Sachs Group | | | | | | |
| | 3.70% 8/1/15 | USD | | 15,000 | | | 15,549 |
| | 5.375% 3/15/20 | | | 225,000 | | | 238,506 |
| | Jefferies Group | | | | | | |
| | 6.25% 1/15/36 | | | 10,000 | | | 9,199 |
| | 6.45% 6/8/27 | | | 170,000 | | | 165,353 |
| | Lazard Group | | | | | | |
| | 6.85% 6/15/17 | | | 110,000 | | | 118,230 |
| | 7.125% 5/15/15 | | | 64,000 | | | 70,763 |
| | | | | | | | 723,359 |
| Capital Goods – 0.96% | | | | | | |
| | Allied Waste North America | | | | | | |
| | 6.875% 6/1/17 | | | 125,000 | | | 137,839 |
| | 7.125% 5/15/16 | | | 55,000 | | | 58,711 |
| | Arrow Electronics | | | | | | |
| | 5.125% 3/1/21 | | | 40,000 | | | 39,870 |
| # | BAE Systems Holdings 144A | | | | | | |
| | 4.95% 6/1/14 | | | 25,000 | | | 27,696 |
| | L-3 Communications | | | | | | |
| | 4.75% 7/15/20 | | | 105,000 | | | 109,820 |
| # | Meccanica Holdings USA | | | | | | |
| | 144A 6.25% 7/15/19 | | | 100,000 | | | 111,417 |
| | | | | | | | 485,353 |
| Communications – 8.99% | | | | | | |
| | America Movil 5.00% 3/30/20 | | | 105,000 | | | 115,289 |
| | American Tower 5.05% 9/1/20 | | | 140,000 | | | 146,445 |
| | AT&T | | | | | | |
| | 6.50% 9/1/37 | | | 95,000 | | | 107,047 |
| | #144A 5.35% 9/1/40 | | | 155,000 | | | 152,671 |
| | Comcast 5.90% 3/15/16 | | | 205,000 | | | 239,492 |
| # | Cox Communications 144A | | | | | | |
| | 6.25% 6/1/18 | | | 80,000 | | | 92,537 |
| | 6.45% 12/1/36 | | | 40,000 | | | 43,614 |
| | 6.95% 6/1/38 | | | 50,000 | | | 56,993 |
| # | Crown Castle Towers 144A | | | | | | |
| | 4.883% 8/15/20 | | | 250,000 | | | 255,187 |
| | DirecTV Holdings/Finance | | | | | | |
| | *4.60% 2/15/21 | | | 130,000 | | | 134,970 |
| | 7.625% 5/15/16 | | | 255,000 | | | 285,926 |
| | DISH DBS 7.875% 9/1/19 | | | 115,000 | | | 126,644 |
| | Intelsat Bermuda | | | | | | |
| | 11.25% 2/4/17 | | | 115,000 | | | 123,769 |
| # | NBC Universal 144A | | | | | | |
| | 2.875% 4/1/16 | | | 135,000 | | | 136,820 |
| | 4.375% 4/1/21 | | | 220,000 | | | 225,173 |
| | Qwest 8.375% 5/1/16 | | | 245,000 | | | 296,450 |
| | Rogers Communications | | | | | | |
| | 6.68% 11/4/39 | CAD | | 30,000 | | | 32,531 |
| | Shaw Communication | | | | | | |
| | 6.75% 11/9/39 | CAD | | 43,000 | | | 44,314 |
2010 Annual report • Delaware Pooled Trust
94
| | | Principal | | Value |
| | | Amount° | | (U.S. $) |
| Corporate Bonds (continued) | | | | | | |
| Communications (continued) | | | | | | |
| | Sprint Nextel | | | | | | |
| | 6.00% 12/1/16 | USD | | 55,000 | | $ | 55,275 |
| | 8.375% 8/15/17 | | | 65,000 | | | 71,988 |
| | Symantec 4.20% 9/15/20 | | | 90,000 | | | 90,830 |
| | Telecom Italia Capital | | | | | | |
| | 5.25% 10/1/15 | | | 260,000 | | | 286,185 |
| | 6.175% 6/18/14 | | | 240,000 | | | 268,369 |
| | Telefonica Emisiones | | | | | | |
| | 6.421% 6/20/16 | | | 155,000 | | | 184,692 |
| | Time Warner Cable | | | | | | |
| | 8.25% 4/1/19 | | | 225,000 | | | 293,299 |
| | Verizon Communications | | | | | | |
| | 6.40% 2/15/38 | | | 190,000 | | | 216,289 |
| # | Videotron 144A | | | | | | |
| | 7.125% 1/15/20 | CAD | | 104,000 | | | 107,069 |
| # | Vivendi 144A | | | | | | |
| | 5.75% 4/4/13 | USD | | 205,000 | | | 223,431 |
| | 6.625% 4/4/18 | | | 95,000 | | | 110,280 |
| | | | | | | | 4,523,579 |
| Consumer Cyclical – 1.87% | | | | | | |
| w# | CVS Pass Through Trust | | | | | | |
| | 144A 8.353% 7/10/31 | | | 347,500 | | | 432,835 |
| | Ford Motor Credit | | | | | | |
| | 12.00% 5/15/15 | | | 100,000 | | | 128,295 |
| | Goodyear Tire & Rubber | | | | | | |
| | 8.25% 8/15/20 | | | 95,000 | | | 101,650 |
| | Macy’s Retail Holdings | | | | | | |
| | 5.90% 12/1/16 | | | 82,000 | | | 89,175 |
| | MGM Mirage | | | | | | |
| | 11.125% 11/15/17 | | | 120,000 | | | 138,600 |
| | *13.00% 11/15/13 | | | 15,000 | | | 17,906 |
| | Wyndham Worldwide | | | | | | |
| | 5.75% 2/1/18 | | | 30,000 | | | 31,220 |
| | | | | | | | 939,681 |
| Consumer Non-Cyclical – 6.96% | | | | | | |
| | Abbott Laboratories | | | | | | |
| | 4.125% 5/27/20 | | | 115,000 | | | 124,049 |
| | Amgen 3.45% 10/1/20 | | | 125,000 | | | 125,674 |
| # | Anheuser-Busch InBev | | | | | | |
| | Worldwide 144A | | | | | | |
| | 5.375% 11/15/14 | | | 15,000 | | | 16,962 |
| | Baxter International | | | | | | |
| | 4.50% 8/15/19 | | | 180,000 | | | 198,729 |
| # | Brambles USA 144A | | | | | | |
| | 3.95% 4/1/15 | | | 50,000 | | | 52,106 |
| | 5.35% 4/1/20 | | | 130,000 | | | 138,551 |
| | CareFusion 6.375% 8/1/19 | | | 255,000 | | | 302,715 |
| | Celgene 3.95% 10/15/20 | | | 115,000 | | | 114,949 |
| | Coca-Cola Enterprises | | | | | | |
| | 3.50% 9/15/20 | | | 200,000 | | | 198,099 |
| | Covidien International | | | | | | |
| | Finance 4.20% 6/15/20 | | | 155,000 | | | 164,454 |
| | Genzyme | | | | | | |
| | 3.625% 6/15/15 | | | 235,000 | | | 250,419 |
| | 5.00% 6/15/20 | | | 90,000 | | | 99,507 |
| | HCA PIK 9.625% 11/15/16 | | | 50,000 | | | 54,500 |
| | Hospira 6.40% 5/15/15 | | | 230,000 | | | 268,270 |
| | Kraft Foods 5.375% 2/10/20 | | | 130,000 | | | 145,917 |
| | Life Technologies | | | | | | |
| | 6.00% 3/1/20 | | | 180,000 | | | 202,634 |
| | Medco Health Solutions | | | | | | |
| | 4.125% 9/15/20 | | | 120,000 | | | 121,256 |
| | 7.125% 3/15/18 | | | 70,000 | | | 86,141 |
| | Pfizer 6.20% 3/15/19 | | | 85,000 | | | 104,390 |
| # | PHH 144A 9.25% 3/1/16 | | | 70,000 | | | 72,188 |
| # | Roche Holdings 144A | | | | | | |
| | 6.00% 3/1/19 | | | 190,000 | | | 229,617 |
| # | Woolworths 144A | | | | | | |
| | 4.00% 9/22/20 | | | 65,000 | | | 66,606 |
| | Yale University | | | | | | |
| | 2.90% 10/15/14 | | | 160,000 | | | 170,865 |
| | Zimmer Holdings | | | | | | |
| | 4.625% 11/30/19 | | | 180,000 | | | 194,533 |
| | | | | | | | 3,503,131 |
| Electric – 4.80% | | | | | | |
| * | Ameren Illinois | | | | | | |
| | 9.75% 11/15/18 | | | 310,000 | | | 416,479 |
| # | American Transmission Systems | | | | | | |
| | 144A 5.25% 1/15/22 | | | 145,000 | | | 159,313 |
| # | Centrais Eletricas Brasileiras | | | | | | |
| | 144A 6.875% 7/30/19 | | | 200,000 | | | 239,000 |
| | CMS Energy | | | | | | |
| | 4.25% 9/30/15 | | | 35,000 | | | 35,870 |
| | 6.55% 7/17/17 | | | 55,000 | | | 60,687 |
| | 8.75% 6/15/19 | | | 55,000 | | | 66,300 |
| | Commonwealth Edison | | | | | | |
| | 4.00% 8/1/20 | | | 180,000 | | | 187,990 |
| | 5.80% 3/15/18 | | | 15,000 | | | 17,499 |
| | Duke Energy 5.05% 9/15/19 | | | 60,000 | | | 66,845 |
| | Duke Energy Carolinas | | | | | | |
| | 5.30% 2/15/40 | | | 25,000 | | | 26,296 |
| | Exelon Generation | | | | | | |
| | 4.00% 10/1/20 | | | 115,000 | | | 114,726 |
| | Florida Power 5.65% 6/15/18 | | | 95,000 | | | 112,316 |
| | Indiana Michigan Power | | | | | | |
| | 7.00% 3/15/19 | | | 50,000 | | | 61,216 |
| # | Korea Electric Power 144A | | | | | | |
| | 5.50% 7/21/14 | | | 100,000 | | | 110,311 |
| | National Rural Utilities | | | | | | |
| | Cooperative Finance | | | | | | |
| | 1.90% 11/1/15 | | | 55,000 | | | 55,165 |
| | Oncor Electric Delivery | | | | | | |
| | 7.00% 9/1/22 | | | 45,000 | | | 56,317 |
| | #144A 5.00% 9/30/17 | | | 65,000 | | | 72,390 |
| | #144A 5.25% 9/30/40 | | | 20,000 | | | 19,522 |
2010 Annual report • Delaware Pooled Trust
(continues) 95
Statements of net assets
Delaware Pooled® Trust — The Core Plus Fixed Income Portfolio
| | | Principal | | Value |
| | | Amount° | | (U.S. $) |
| Corporate Bonds (continued) | | | | | | |
| Electric (continued) | | | | | | |
| | Pennsylvania Electric | | | | | | |
| | 5.20% 4/1/20 | USD | | 175,000 | | $ | 190,770 |
| @# | Power Receivables Finance | | | | | | |
| | 144A 6.29% 1/1/12 | | | 22,589 | | | 22,600 |
| | PPL Electric Utilities | | | | | | |
| | 7.125% 11/30/13 | | | 95,000 | | | 111,853 |
| | Public Service of Oklahoma | | | | | | |
| | 5.15% 12/1/19 | | | 115,000 | | | 126,460 |
| | UIL Holdings 4.625% 10/1/20 | | | 50,000 | | | 50,038 |
| | Virginia Electric & Power | | | | | | |
| | 3.45% 9/1/22 | | | 35,000 | | | 34,834 |
| | | | | | | | 2,414,797 |
| Energy – 4.75% | | | | | | |
| | Anadarko Petroleum | | | | | | |
| | 6.375% 9/15/17 | | | 105,000 | | | 116,810 |
| | Chesapeake Energy | | | | | | |
| | 9.50% 2/15/15 | | | 60,000 | | | 69,900 |
| •* | Enbridge Energy Partners | | | | | | |
| | 8.05% 10/1/37 | | | 75,000 | | | 76,946 |
| | Energy Transfer Partners | | | | | | |
| | 9.70% 3/15/19 | | | 160,000 | | | 211,593 |
| *# | ENI 144A 4.15% 10/1/20 | | | 100,000 | | | 103,459 |
| | Nexen 7.50% 7/30/39 | | | 90,000 | | | 110,357 |
| | Noble Energy 8.25% 3/1/19 | | | 120,000 | | | 156,256 |
| | Noble Holding International | | | | | | |
| | 3.45% 8/1/15 | | | 110,000 | | | 116,685 |
| | Pemex Project Funding | | | | | | |
| | Master Trust | | | | | | |
| | 6.625% 6/15/35 | | | 50,000 | | | 55,708 |
| | Petrobras International Finance | | | | | | |
| | 5.75% 1/20/20 | | | 30,000 | | | 33,709 |
| | 5.875% 3/1/18 | | | 20,000 | | | 22,468 |
| | Plains All American Pipeline | | | | | | |
| | 8.75% 5/1/19 | | | 120,000 | | | 153,473 |
| | Pride International | | | | | | |
| | 6.875% 8/15/20 | | | 150,000 | | | 170,625 |
| # | SEMCO Energy 144A | | | | | | |
| | 5.15% 4/21/20 | | | 160,000 | | | 173,868 |
| | Sempra Energy | | | | | | |
| | 6.15% 6/15/18 | | | 65,000 | | | 77,004 |
| | Total Capital 2.30% 3/15/16 | | | 270,000 | | | 273,316 |
| | Transocean 6.50% 11/15/20 | | | 100,000 | | | 111,644 |
| | Weatherford International | | | | | | |
| | 5.125% 9/15/20 | | | 55,000 | | | 57,690 |
| | 6.75% 9/15/40 | | | 65,000 | | | 69,322 |
| | 9.625% 3/1/19 | | | 50,000 | | | 66,131 |
| # | Woodside Finance 144A | | | | | | |
| | 4.50% 11/10/14 | | | 135,000 | | | 145,655 |
| | 8.125% 3/1/14 | | | 15,000 | | | 17,716 |
| | | | | | | | 2,390,335 |
| Finance Companies – 2.19% | | | | | | |
| # | CDP Financial 144A | | | | | | |
| | 4.40% 11/25/19 | | | 250,000 | | | 266,957 |
| # | ERAC USA Finance 144A | | | | | | |
| | 5.25% 10/1/20 | | | 190,000 | | | 203,449 |
| | General Electric Capital | | | | | | |
| | 6.00% 8/7/19 | | | 465,000 | | | 526,225 |
| •# | ILFC E-Capital Trust II 144A | | | | | | |
| | 6.25% 12/21/65 | | | 130,000 | | | 104,650 |
| | | | | | | | 1,101,281 |
| Insurance – 0.45% | | | | | | |
| * | MetLife 6.817% 8/15/18 | | | 35,000 | | | 42,271 |
| | Prudential Financial | | | | | | |
| | 3.875% 1/14/15 | | | 175,000 | | | 184,901 |
| ‡@=w# | Twin Reefs Pass Through | | | | | | |
| | Trust 144A | | | | | | |
| | 0.00% 12/31/49 | | | 300,000 | | | 0 |
| | | | | | | | 227,172 |
| Natural Gas – 1.69% | | | | | | |
| | Enterprise Products Operating | | | | | | |
| | 6.30% 9/15/17 | | | 40,000 | | | 46,747 |
| | 9.75% 1/31/14 | | | 170,000 | | | 209,914 |
| | Kinder Morgan Energy Partners | | | | | | |
| | 5.30% 9/15/20 | | | 80,000 | | | 87,011 |
| | 6.55% 9/15/40 | | | 25,000 | | | 26,879 |
| | 9.00% 2/1/19 | | | 115,000 | | | 150,469 |
| # | Midcontinent Express | | | | | | |
| | Pipeline 144A | | | | | | |
| | 5.45% 9/15/14 | | | 100,000 | | | 109,234 |
| | 6.70% 9/15/19 | | | 45,000 | | | 50,132 |
| | TransCanada Pipelines | | | | | | |
| | 3.80% 10/1/20 | | | 40,000 | | | 41,305 |
| | •6.35% 5/15/67 | | | 135,000 | | | 129,432 |
| | | | | | | | 851,123 |
| Real Estate – 1.32% | | | | | | |
| | Developers Diversified Realty | | | | | | |
| | 7.875% 9/1/20 | | | 160,000 | | | 173,967 |
| | 9.625% 3/15/16 | | | 105,000 | | | 121,588 |
| # | Digital Realty Trust 144A | | | | | | |
| | 5.875% 2/1/20 | | | 50,000 | | | 53,253 |
| | Liberty Property | | | | | | |
| | 4.75% 10/1/20 | | | 35,000 | | | 36,143 |
| | ProLogis 7.375% 10/30/19 | | | 20,000 | | | 22,354 |
| | Regency Centers | | | | | | |
| | 5.875% 6/15/17 | | | 93,000 | | | 102,249 |
| •# | USB Realty 144A | | | | | | |
| | 6.091% 12/22/49 | | | 200,000 | | | 153,000 |
| | | | | | | | 662,554 |
| Technology – 0.42% | | | | | | |
| | National Semiconductor | | | | | | |
| | 6.60% 6/15/17 | | | 115,000 | | | 133,933 |
| # | Seagate Technology 144A | | | | | | |
| | 10.00% 5/1/14 | | | 65,000 | | | 79,625 |
| | | | | | | | 213,558 |
2010 Annual report • Delaware Pooled Trust
96
| | | Principal | | Value |
| | | Amount° | | (U.S. $) |
| Corporate Bonds (continued) | | | | | | |
| Transportation – 0.69% | | | | | | |
| | Burlington Northern Santa Fe | | | | | | |
| | 3.60% 9/1/20 | USD | | 25,000 | | $ | 25,175 |
| | 4.70% 10/1/19 | | | 145,000 | | | 158,741 |
| | 5.65% 5/1/17 | | | 55,000 | | | 63,536 |
| | Canadian Pacific Railway | | | | | | |
| | 4.45% 3/15/23 | | | 95,000 | | | 97,370 |
| | | | | | | | 344,822 |
| Total Corporate Bonds | | | | | | |
| | (cost $23,475,687) | | | | | | 24,654,411 |
| | | | | |
| Non-Agency Asset-Backed Securities – 4.27% | | | |
| •# | AH Mortgage Advance Trust | | | | | | |
| | Series 2009-ADV3 A1 | | | | | | |
| | 144A 2.207% 10/6/21 | | | 95,000 | | | 94,934 |
| | Ally Auto Receivables Trust | | | | | | |
| | Series 2010-2 A3 | | | | | | |
| | 1.38% 7/15/14 | | | 40,000 | | | 40,367 |
| • | American Express Credit | | | | | | |
| | Account Master Trust | | | | | | |
| | Series 2010-1 B | | | | | | |
| | 0.856% 11/16/15 | | | 100,000 | | | 99,877 |
| • | Bank of America Credit Card | | | | | | |
| | Trust Series 2008-A5 A5 | | | | | | |
| | 1.456% 12/16/13 | | | 120,000 | | | 120,870 |
| # | CIT Equipment Collateral 144A | | | | | | |
| | Series 2009-VT1 A3 | | | | | | |
| | 3.07% 8/15/16 | | | 97,582 | | | 98,710 |
| | Series 2010-VT1A A3 | | | | | | |
| | 2.41% 5/15/13 | | | 100,000 | | | 101,059 |
| | Citibank Credit Card | | | | | | |
| | Issuance Trust | | | | | | |
| | •Series 2004-C1 C1 | | | | | | |
| | 0.906% 7/15/13 | | | 50,000 | | | 49,618 |
| | Series 2007-A3 A3 | | | | | | |
| | 6.15% 6/15/39 | | | 125,000 | | | 158,299 |
| • | Citicorp Residential | | | | | | |
| | Mortgage Securities | | | | | | |
| | Series 2006-3 A5 | | | | | | |
| | 5.948% 11/25/36 | | | 300,000 | | | 261,098 |
| | CNH Equipment Trust | | | | | | |
| | •Series 2007-A A4 | | | | | | |
| | 0.296% 9/17/12 | | | 20,487 | | | 20,484 |
| | Series 2008-A A4A | | | | | | |
| | 4.93% 8/15/14 | | | 142,555 | | | 146,180 |
| | Series 2008-B A3A | | | | | | |
| | 4.78% 7/16/12 | | | 7,597 | | | 7,630 |
| | Series 2009-C A3 | | | | | | |
| | 1.85% 12/16/13 | | | 40,000 | | | 40,436 |
| | Discover Card Master Trust | | | | | | |
| | Series 2007-A1 A1 | | | | | | |
| | 5.65% 3/16/20 | | | 150,000 | | | 177,474 |
| | Series 2008-A4 A4 | | | | | | |
| | 5.65% 12/15/15 | | | 100,000 | | | 111,964 |
| # | Dunkin Securitization Series | | | | | | |
| | 2006-1 A2 144A | | | | | | |
| | 5.779% 6/20/31 | | | 150,000 | | | 152,137 |
| | Ford Credit Auto Owner | | | | | | |
| | Trust Series 2010-B B | | | | | | |
| | 2.54% 2/15/16 | | | 100,000 | | | 102,354 |
| • | Ford Credit Floorplan | | | | | | |
| | Master Owner Trust | | | | | | |
| | Series 2009-2 A | | | | | | |
| | 1.806% 9/15/14 | | | 100,000 | | | 101,612 |
| | Harley-Davidson | | | | | | |
| | Motorcycle Trust | | | | | | |
| | #Series 2006-1 A2 144A | | | | | | |
| | 5.04% 10/15/12 | | | 21,121 | | | 21,235 |
| | Series 2009-4 A3 | | | | | | |
| | 1.87% 2/15/14 | | | 100,000 | | | 100,994 |
| | Hyundai Auto Receivables | | | | | | |
| | Trust Series 2007-A A3A | | | | | | |
| | 5.04% 1/17/12 | | | 978 | | | 980 |
| | John Deere Owner Trust | | | | | | |
| | Series 2010-A A4 | | | | | | |
| | 2.13% 10/17/16 | | | 90,000 | | | 92,885 |
| • | Merrill Auto Trust | | | | | | |
| | Securitization Series | | | | | | |
| | 2007-1 A4 | | | | | | |
| | 0.316% 12/15/13 | | | 34,896 | | | 34,786 |
| | Mid-State Trust Series 11 A1 | | | | | | |
| | 4.864% 7/15/38 | | | 14,467 | | | 14,576 |
| Total Non-Agency Asset-Backed | | | | | | |
| | Securities (cost $2,067,070) | | | | | | 2,150,559 |
| | |
| Non-Agency Collateralized Mortgage Obligations – 1.45% |
| | American Home Mortgage | | | | | | |
| | Investment Trust Series | | | | | | |
| | 2005-2 5A1 | | | | | | |
| | 5.064% 9/25/35 | | | 21,660 | | | 20,457 |
| | Bank of America Alternative | | | | | | |
| | Loan Trust | | | | | | |
| | Series 2004-10 1CB1 | | | | | | |
| | 6.00% 11/25/34 | | | 19,312 | | | 19,597 |
| | Series 2005-5 2CB1 | | | | | | |
| | 6.00% 6/25/35 | | | 2,553 | | | 1,941 |
| | Citicorp Mortgage Securities | | | | | | |
| | Series 2006-4 3A1 | | | | | | |
| | 5.50% 8/25/21 | | | 5,605 | | | 5,672 |
| w | Countrywide Home | | | | | | |
| | Loan Mortgage Pass | | | | | | |
| | Through Trust | | | | | | |
| | @Series 2006-17 A5 | | | | | | |
| | 6.00% 12/25/36 | | | 2,825 | | | 2,608 |
| | •Series 2006-HYB1 3A1 | | | | | | |
| | 4.947% 3/20/36 | | | 147,222 | | | 87,513 |
| | First Horizon Asset Securities | | | | | | |
| | Series 2006-3 1A11 | | | | | | |
| | 6.25% 11/25/36 | | | 149,647 | | | 154,216 |
2010 Annual report • Delaware Pooled Trust
(continues) 97
Statements of net assets
Delaware Pooled® Trust — The Core Plus Fixed Income Portfolio
| | | Principal | | Value |
| | | Amount° | | (U.S. $) |
| Non-Agency Collateralized Mortgage Obligations (continued) |
| •# | GSMPS Mortgage Loan Trust | | | | | | |
| | Series 1999-2 A 144A | | | | | | |
| | 8.00% 9/19/27 | USD | | 42,552 | | $ | 44,011 |
| | Lehman Mortgage Trust | | | | | | |
| | Series 2005-2 2A3 | | | | | | |
| | 5.50% 12/25/35 | | | 120,340 | | | 114,744 |
| # | MASTR Reperforming Loan | | | | | | |
| | Trust Series 2005-1 1A5 | | | | | | |
| | 144A 8.00% 8/25/34 | | | 99,887 | | | 101,151 |
| •# | MASTR Specialized Loan | | | | | | |
| | Trust Series 2005-2 A2 | | | | | | |
| | 144A 5.006% 7/25/35 | | | 93,081 | | | 92,116 |
| | Wells Fargo Mortgage | | | | | | |
| | Backed Securities Trust | | | | | | |
| | •Series 2005-AR16 2A1 | | | | | | |
| | 2.968% 10/25/35 | | | 7,254 | | | 6,996 |
| | Series 2006-4 1A8 | | | | | | |
| | 5.75% 4/25/36 | | | 78,057 | | | 76,770 |
| Total Non-Agency Collateralized | | | | | | |
| | Mortgage Obligations | | | | | | |
| | (cost $750,902) | | | | | | 727,792 |
| | | | | | | | |
| Regional Bonds – 1.85%Δ | | | | | | |
| Australia – 0.95% | | | | | | |
| | New South Wales Treasury | | | | | | |
| | 6.00% 5/1/20 | AUD | | 433,000 | | | 433,016 |
| | Queensland Treasury | | | | | | |
| | 6.00% 6/14/21 | AUD | | 42,000 | | | 42,168 |
| | | | | | | | 475,184 |
| Canada – 0.90% | | | | | | |
| | Nova Scotia Province | | | | | | |
| | 2.375% 7/21/15 | USD | | 230,000 | | | 237,459 |
| | Ontario Province | | | | | | |
| | 1.875% 9/15/15 | | | 60,000 | | | 60,665 |
| | *4.40% 4/14/20 | | | 80,000 | | | 88,191 |
| | Quebec Province | | | | | | |
| | 4.50% 12/1/19 | CAD | | 11,000 | | | 11,655 |
| | 4.60% 5/26/15 | USD | | 50,000 | | | 56,701 |
| | | | | | | | 454,671 |
| Total Regional Bonds | | | | | | |
| | (cost $861,712) | | | | | | 929,855 |
| | | | | | | | |
| «Senior Secured Loans – 3.02% | | | | | | |
| | ATI Holdings 7.50% 2/18/16 | | | 114,425 | | | 111,850 |
| | Charter Communications | | | | | | |
| | Operating Tranche B | | | | | | |
| | 8.50% 3/6/14 | | | 130,000 | | | 135,070 |
| | Chester Downs & Marina | | | | | | |
| | 12.375% 12/31/16 | | | 78,625 | | | 80,067 |
| | Community Health Systems | | | | | | |
| | Tranche B | | | | | | |
| | 2.502% 7/25/14 | | | 71,205 | | | 70,166 |
| | Tranche DD | | | | | | |
| | 2.502% 7/25/14 | | | 3,660 | | | 3,607 |
| | Ford Motor Tranche B | | | | | | |
| | 3.03% 12/15/13 | | | 186,505 | | | 184,703 |
| | Gray Television Tranche B | | | | | | |
| | 4.25% 12/31/14 | | | 54,859 | | | 53,370 |
| | Level 3 Communications | | | | | | |
| | Tranche B | | | | | | |
| | 11.50% 3/13/14 | | | 135,000 | | | 146,475 |
| | Newport Television Tranche B | | | | | | |
| | 9.00% 3/14/16 | | | 52,939 | | | 52,836 |
| | Nuveen Investments | | | | | | |
| | 2nd Lien Tranche | | | | | | |
| | 12.50% 7/9/15 | | | 65,000 | | | 70,742 |
| | Rental Services 2nd | | | | | | |
| | Lien Tranche | | | | | | |
| | 4.04% 10/7/13 | | | 100,000 | | | 98,250 |
| | Reynolds Group Holdings | | | | | | |
| | Tranche D | | | | | | |
| | 6.50% 3/16/16 | | | 130,000 | | | 131,246 |
| | Rockwood Specialties Group | | | | | | |
| | Tranche H | | | | | | |
| | 6.00% 5/15/14 | | | 125,635 | | | 126,533 |
| | Texas Competitive Electric | | | | | | |
| | Holdings Tranche B2 | | | | | | |
| | 3.941% 10/10/14 | | | 178,904 | | | 139,712 |
| | Univision Communications | | | | | | |
| | 4.25% 3/29/17 | | | 120,000 | | | 113,550 |
| Total Senior Secured Loans | | | | | | |
| | (cost $1,420,488) | | | | | | 1,518,177 |
| | | | | | | | |
| Sovereign Bonds – 4.51%Δ | | | | | | |
| Australia – 1.24% | | | | | | |
| | Australia Government Bonds | | | | | | |
| | 4.50% 4/15/20 | AUD | | 439,000 | | | 407,368 |
| | 6.00% 2/15/17 | AUD | | 210,000 | | | 215,534 |
| | | | | | | | 622,902 |
| Brazil – 0.65% | | | | | | |
| | Republic of Brazil | | | | | | |
| | 7.125% 1/20/37 | USD | | 60,000 | | | 79,500 |
| | 8.875% 10/14/19 | | | 60,000 | | | 85,500 |
| | 10.25% 1/10/28 | BRL | | 250,000 | | | 159,814 |
| | | | | | | | 324,814 |
| Indonesia – 0.37% | | | | | | |
| | Indonesia Treasury Bonds | | | | | | |
| | 10.50% 8/15/30 | IDR | | 440,000,000 | | | 59,735 |
| | 11.00% 11/15/20 | IDR | | 930,000,000 | | | 129,156 |
| | | | | | | | 188,891 |
| Japan – 0.20% | | | | | | |
| * | Japan Finance | | | | | | |
| | 1.875% 9/24/15 | USD | | 100,000 | | | 101,501 |
| | | | | | | | 101,501 |
| Norway – 1.84% | | | | | | |
| | Eksportfinans 3.00% 11/17/14 | | | 105,000 | | | 111,753 |
| # | Kommunalbanken 144A | | | | | | |
| | 1.75% 10/5/15 | | | 110,000 | | | 110,793 |
2010 Annual report • Delaware Pooled Trust
98
| | | Principal | | Value | |
| | | Amount° | | (U.S. $) | |
| Sovereign Bonds (continued) | | | | | | | |
| Norway (continued) | | | | | | | |
| | Norway Government Bonds | | | | | | | |
| | 4.25% 5/19/17 | NOK | | 1,180,000 | | $ | 218,421 | |
| | 4.50% 5/22/19 | NOK | | 1,547,000 | | | 291,537 | |
| | 5.00% 5/15/15 | NOK | | 1,018,000 | | | 192,400 | |
| | | | | | | | 924,904 | |
| Republic of Korea – 0.21% | | | | | | | |
| *# | Korea Expressway 144A | | | | | | | |
| | 4.50% 3/23/15 | USD | | 100,000 | | | 106,836 | |
| | | | | | | | 106,836 | |
| Turkey – 0.00% | | | | | | | |
| | Turkey Government Bond | | | | | | | |
| | 4.00% 4/29/15 | TRY | | 400 | | | 308 | |
| | | | | | | | 308 | |
| Total Sovereign Bonds | | | | | | | |
| | (cost $2,112,570) | | | | | | 2,270,156 | |
| | | | | | | | | |
| Supranational Banks – 1.09% | | | | | | | |
| | European Investment Bank | | | | | | | |
| | 2.875% 1/15/15 | USD | | 50,000 | | | 53,469 | |
| | Inter-American | | | | | | | |
| | Development Bank | | | | | | | |
| | 4.25% 9/14/15 | | | 55,000 | | | 62,595 | |
| | 5.375% 5/27/14 | AUD | | 170,000 | | | 166,017 | |
| | International Bank for | | | | | | | |
| | Reconstruction & | | | | | | | |
| | Development | | | | | | | |
| | 5.375% 12/15/14 | NZD | | 11,000 | | | 8,645 | |
| | 7.50% 7/30/14 | NZD | | 309,000 | | | 260,153 | |
| Total Supranational Banks | | | | | | | |
| | (cost $494,874) | | | | | | 550,879 | |
| | | | | | | | |
| U.S. Treasury Obligations – 3.52% | | | | | | | |
| ∞ | U.S. Treasury Bond | | | | | | | |
| | 4.375% 5/15/40 | USD | | 810,000 | | | 862,907 | |
| | U.S. Treasury Notes | | | | | | | |
| | *0.50% 10/15/13 | | | 75,000 | | | 75,006 | |
| | 1.25% 10/31/15 | | | 625,000 | | | 627,246 | |
| | 1.875% 9/30/17 | | | 38,000 | | | 37,994 | |
| | *2.625% 8/15/20 | | | 167,000 | | | 167,183 | |
| Total U.S. Treasury Obligations | | | | | | | |
| | (cost $1,786,377) | | | | | | 1,770,336 | |
| | | | | | | |
| | | Number of | | | | |
| | | Shares | | | | |
| Preferred Stock – 0.23% | | | | | | | |
| • | PNC Financial Services Group | | | | | | | |
| | 8.25% | | | 110,000 | | | 116,466 | |
| Total Preferred Stock | | | | | | | |
| | (cost $108,414) | | | | | | 116,466 | |
| | | | | | |
| | | Principal | | | |
| | | Amount° | | | |
| ≠Discount Note – 16.17% | | | | | | | |
| | Federal Home Loan Bank | | | | | | | |
| | 0.10% 11/1/10 | USD | | 8,133,073 | | | 8,133,073 | |
| Total Discount Note | | | | | | | |
| | (cost $8,133,072) | | | | | | 8,133,073 | |
| | | | | | |
| Total Value of Securities Before Securities | | | | |
| | Lending Collateral – 112.74% | | | | | | | |
| | (cost $54,330,966) | | | | | | 56,714,516 | |
| | | | | | | |
| | | Number of | | | | |
| | | Shares | | | | |
| Securities Lending Collateral** – 2.50% | | | | |
| Investment Companies | | | | | | | |
| | Delaware Investments Collateral | | | | | | | |
| | Fund No. 1 | | | 1,199,564 | | | 1,199,564 | |
| | BNY Mellon SL DBT II | | | | | | | |
| | Liquidating Fund | | | 54,933 | | | 53,345 | |
| @†Mellon GSL Reinvestment Trust II | | | 51,711 | | | 2,673 | |
| Total Securities Lending Collateral | | | | | | | |
| | (cost $1,306,208) | | | | | | 1,255,582 | |
| | | | | | | | | |
| Total Value of Securities – 115.24% | | | | | | | |
| | (cost $55,637,174) | | | | | | 57,970,098 | © |
| Obligation to Return Securities | | | | | | | |
| | Lending Collateral** – (2.60%) | | | | | | (1,306,208 | ) |
| Liabilities Net of Receivables and | | | | | | | |
| | Other Assets – (12.64%)z | | | | | | (6,358,431 | ) |
| Net Assets Applicable to 4,967,614 | | | | | | | |
| | Shares Outstanding; Equivalent to | | | | |
| | $10.13 Per Share – 100.00% | | | | | $ | 50,305,459 | |
| | | | | | |
| Components of Net Assets at October 31, 2010: | | | | |
| Shares of beneficial interest | | | | | | | |
| | (unlimited authorization – no par) | | | | | $ | 50,822,246 | |
| Undistributed net investment income | | | | | | 2,294,011 | |
| Accumulated net realized loss on investments | | | (5,195,645 | ) |
| Net unrealized appreciation of investments and | | | | |
| | foreign currencies | | | | | | 2,384,847 | |
| Total net assets | | | | | $ | 50,305,459 | |
°Principal amount is stated in the currency in which each security is denominated.
AUD — Australian Dollar
BRL — Brazilian Real
CAD — Canadian Dollar
CLP — Chilean Peso
EUR — European Monetary Unit
GBP — British Pound Sterling
IDR — Indonesian Rupiah
KRW — South Korean Won
MXN — Mexican Peso
MYR — Malaysian Ringgit
NOK — Norwegian Kroner
NZD — New Zealand Dollar
TRY — Turkish Lira
USD — United States Dollar
2010 Annual report • Delaware Pooled Trust
(continues) 99
Statements of net assets
Delaware Pooled® Trust — The Core Plus Fixed Income Portfolio
| | |
| • | Variable rate security. The rate shown is the rate as of October 31, 2010. Interest rates reset periodically. |
| w | Pass Through Agreement. Security represents the contractual right to receive a proportionate amount of underlying payments due to the counterparty pursuant to various agreements related to the rescheduling of obligations and the exchange of certain notes. |
| # | Security exempt from registration under Rule 144A of the Securities Act of 1933, as amended. At October 31, 2010, the aggregate amount of Rule 144A securities was $7,693,690 which represented 15.29% of the Portfolio’s net assets. See Note 10 in "Notes to financial statements." |
| * | Fully or partially on loan. |
| Φ | Step coupon bond. Coupon decreases periodically based on a predetermined schedule. Stated rate in effect at October 31, 2010. |
| @ | Illiquid security. At October 31, 2010, the aggregate amount of illiquid securities was $316,388 which represented 0.63% of the Portfolio’s net assets. See Note 10 in “Notes to financial statements.” |
| = | Security is being fair valued in accordance with the Portfolio’s fair valuation policy. At October 31, 2010, the aggregate amount of fair valued securities was $0, which represented 0.00% of the Portfolio’s net assets. See Note 1 in "Notes to Financial Statements." |
| ‡ | Non income producing security. Security is currently in default. |
| Δ | Securities have been classified by country of origin. |
| « | Senior Secured Loans generally pay interest at rates which are periodically redetermined by reference to a base lending rate plus a premium. These base lending rates are generally: (i) the prime rate offered by one or more United States banks, (ii) the lending rate offered by one or more European banks such as the London Inter-Bank Offered Rate (LIBOR), and (iii) the certificate of deposit rate. Senior Secured Loans may be subject to restrictions on resale. Stated rate in effect at October 31, 2010. |
| ∞ | Fully or partially pledged as collateral for futures contracts. |
| † | Non income producing security. |
| ≠ | The rate shown is the effective yield at the time of purchase. |
| ** | See Note 9 in “Notes to financial statements.” |
| © | Includes $1,264,622 of securities loaned. |
| z | Of this amount, $7,972,167 represents payable for securities purchased as of October 31, 2010. |
Summary of Abbreviations:
ARM — Adjustable Rate Mortgage
BCLY — Barclays
BOA — Bank of America Securities
CDS — Credit Default Swap
CGM — Citigroup Global Markets
CMB — Chase Manhattan Bank
GNMA — Government National Mortgage Association
GSC — Goldman Sachs & Co.
GSMPS — Goldman Sachs Reperforming Mortgage Securities
HKSB — Hong Kong Shanghai Bank
JPMS — JPMorgan Securities
MASTR — Mortgage Asset Securitization Transactions, Inc.
MSC — Morgan Stanley & Co.
PIK — Pay-in-kind
REMIC — Real Estate Mortgage Investment Conduit
S.F. — Single Family
TBA — To be announced
yr — Year
1The following foreign currency exchange contracts, futures contracts and swap contracts were outstanding at October 31, 2010:
Foreign Currency Exchange Contracts
| | | | | | | | | Unrealized |
| | | Contracts to | | | | Settlement | | Appreciation |
| Counterparty | | | Receive (Deliver) | | In Exchange For | | Date | | (Depreciation) |
| BCLY | | CAD | | (83,503 | ) | | USD | | 81,470 | | | 12/3/10 | | | $ | (336 | ) |
| BCLY | | GBP | | (103,349 | ) | | USD | | 162,413 | | | 12/3/10 | | | | (3,124 | ) |
| BOA | | AUD | | (381,019 | ) | | USD | | 372,744 | | | 12/3/10 | | | | 1,022 | |
| BOA | | CAD | | (214,404 | ) | | USD | | 209,097 | | | 12/3/10 | | | | (950 | ) |
| BOA | | MXN | | 1,102,867 | | | USD | | (88,962 | ) | | 12/3/10 | | | | 125 | |
| BOA | | NOK | | (1,925,219 | ) | | USD | | 329,390 | | | 12/3/10 | | | | 1,402 | |
| CMB | | BRL | | (174,639 | ) | | USD | | 102,548 | | | 12/3/10 | | | | 635 | |
| CMB | | CLP | | 29,655,000 | | | USD | | (60,800 | ) | | 12/3/10 | | | | (40 | ) |
| CMB | | EUR | | (46,836 | ) | | USD | | 65,261 | | | 12/3/10 | | | | 107 | |
| CMB | | MYR | | 705,052 | | | USD | | (226,159 | ) | | 12/3/10 | | | | (59 | ) |
| CMB | | NZD | | (357,116 | ) | | USD | | 266,516 | | | 12/3/10 | | | | (4,952 | ) |
| CMB | | TRY | | 45,177 | | | USD | | (31,537 | ) | | 12/3/10 | | | | (225 | ) |
| GSC | | CAD | | 177,850 | | | USD | | (173,478 | ) | | 12/3/10 | | | | 758 | |
| GSC | | NOK | | (1,084,587 | ) | | USD | | 185,488 | | | 12/3/10 | | | | 713 | |
| HKSB | | AUD | | 51,486 | | | USD | | (50,442 | ) | | 12/3/10 | | | | (212 | ) |
| HKSB | | EUR | | 22,230 | | | USD | | (31,020 | ) | | 12/3/10 | | | | (94 | ) |
| HKSB | | NOK | | (591,238 | ) | | USD | | 101,575 | | | 12/3/10 | | | | 849 | |
| MSC | | AUD | | (871,085 | ) | | USD | | 852,592 | | | 12/3/10 | | | | 2,763 | |
| MSC | | CAD | | (67,770 | ) | | USD | | 66,093 | | | 12/3/10 | | | | (300 | ) |
| MSC | | EUR | | (25,697 | ) | | USD | | 35,807 | | | 12/3/10 | | | | 58 | |
| MSC | | KRW | | 24,558,000 | | | USD | | (21,843 | ) | | 12/3/10 | | | | (37 | ) |
| MSC | | MXN | | 160,797 | | | USD | | (12,968 | ) | | 12/3/10 | | | | 21 | |
| MSC | | MYR | | (690,192 | ) | | USD | | 221,279 | | | 12/3/10 | | | | (56 | ) |
| MSC | | NOK | | 126,940 | | | USD | | (21,734 | ) | | 12/3/10 | | | | (108 | ) |
| MSC | | TRY | | 45,282 | | | USD | | (31,536 | ) | | 12/3/10 | | | | (150 | ) |
| | | | | | | | | | | | | | | | $ | (2,190 | ) |
2010 Annual report • Delaware Pooled Trust
100
| |
| Financial Futures Contracts |
| Contract | | Notional | | Notional | | Expiration | | Unrealized |
| to Sell | | | Proceeds | | Value | | Date | | Appreciation |
| 14 U.S. Treasury | | | | | | | | | | | | | |
| Long Bonds | | $ | 1,858,096 | | $ | 1,833,125 | | 12/21/10 | | | $ | 24,971 | |
| 3 U.S. Ultra Bond | | | 407,049 | | | 404,531 | | 12/21/10 | | | | 2,518 | |
| | | $ | 2,265,145 | | | | | | | | $ | 27,489 | |
| Swap Contracts | | | | | | | | | | | | | | | |
| CDS Contracts | | | | | | | | | | | | | | | |
| | | | | | | | | | Annual | | | | Unrealized |
| | | Swap & | | Notional | | Protection | | Termination | | Appreciation |
| Counterparty | | | Referenced Obligation | | Value | | Payments | | Date | | (Depreciation) |
| | | Protection Purchased: | | | | | | | | | | | | | | | |
| BCLY | | Kingdom of Spain | | | $ | 151,000 | | | 1.00% | | 3/20/15 | | | $ | 4,621 | | |
| | | 5 yr CDS | | | | | | | | | | | | | | | |
| BOA | | Sunoco 5 yr CDS | | | | 45,000 | | | 1.00% | | 12/20/15 | | | | (1,043 | ) | |
| JPMS | | ITRAXX Europe | | | | | | | | | | | | | | | |
| | | Subordinate | | | | | | | | | | | | | | | |
| | | Financials | | | | | | | | | | | | | | | |
| | | 13.1 5 yr CDS | | | | 580,000 | | | 1.00% | | 12/20/15 | | | | 1,909 | | |
| JPMS | | Penney (J.C.) | | | | | | | | | | | | | | | |
| | | 5 yr CDS | | | | 95,000 | | | 1.00% | | 3/20/15 | | | | 4,944 | | |
| JPMS | | Portuguese | | | | | | | | | | | | | | | |
| | | Republic | | | | | | | | | | | | | | | |
| | | 5 yr CDS | | | | 85,000 | | | 1.00% | | 6/20/15 | | | | 8,355 | | |
| JPMS | | Sunoco 5 yr CDS | | | | 85,000 | | | 1.00% | | 3/20/15 | | | | (637 | ) | |
| JPMS | | Viacom 5 yr CDS | | | | 130,000 | | | 1.00% | | 9/20/15 | | | | (1,431 | ) | |
| | | | | | $ | 1,171,000 | | | | | | | | | $ | 16,718 | | |
| | | | | | | | | | | | | | |
| | | Protection Sold/Moody’s Rating: | | | | | | | | | | | |
| BOA | | Valero Energy | | | | | | | | | | | | | | | |
| | | 5 yr CDS/Baa | | | $ | 45,000 | | | 1.00% | | 9/21/15 | | | $ | 542 | | |
| CGM | | MetLife | | | | | | | | | | | | | | | |
| | | 5 yr CDS/A | | | | 55,000 | | | 5.00% | | 9/20/14 | | | | 3,048 | | |
| JPMS | | Comcast 5 yr | | | | | | | | | | | | | | | |
| | | CDS/Baa | | | | 130,000 | | | 1.00% | | 9/20/15 | | | | 2,108 | | |
| JPMS | | MetLife 5 yr CDS/A | | | | 280,000 | | | 1.00% | | 12/20/14 | | | | 5,750 | | |
| JPMS | | Valero Energy 5 yr | | | | | | | | | | | | | | | |
| | | CDS/Baa | | | | 85,000 | | | 1.00% | | 3/20/15 | | | | 350 | | |
| | | | | | $ | 595,000 | | | | | | | | $ | 11,798 | | |
| Total | | | | | | | | | | | | | | $ | 28,516 | | |
The use of foreign currency exchange contracts, futures contracts, and swap contracts involves elements of market risk and risks in excess of the amount recognized in the financial statements. The notional values presented above represent the Portfolio’s total exposure in such contracts, whereas only the net unrealized appreciation (depreciation) is reflected in the Portfolio’s net assets.
1See Note 8 in “Notes to financial statements.”
See accompanying Notes, which are an integral part of the financial statements.
2010 Annual report • Delaware Pooled Trust
(continues) 101
Statements of net assets
Delaware Pooled® Trust — The International Equity Portfolio
October 31, 2010
| | | Number of | | Value |
| | | Shares | | (U.S. $) |
| Common Stock – 99.18%Δ | | | | | |
| Australia – 8.98% | | | | | |
| | Amcor | | 1,881,665 | | $ | 12,388,732 |
| | Foster’s Group | | 2,289,359 | | | 13,099,117 |
| | QBE Insurance Group | | 889,713 | | | 14,975,742 |
| | Telstra | | 6,802,396 | | | 17,794,608 |
| | Wesfarmers | | 443,825 | | | 14,410,516 |
| | | | | | | 72,668,715 |
| Belgium – 0.00% | | | | | |
| û† | Ageas VVPR Strip | | 732,357 | | | 1,019 |
| | | | | | | 1,019 |
| France – 16.32% | | | | | |
| | Carrefour | | 455,894 | | | 24,604,657 |
| | Compagnie de Saint-Gobain | | 245,656 | | | 11,473,474 |
| | France Telecom | | 949,081 | | | 22,804,234 |
| † | GDF Suez | | 162,519 | | | 226 |
| * | Sanofi-Aventis | | 356,210 | | | 24,876,105 |
| | Societe Generale | | 197,596 | | | 11,831,632 |
| * | Total | | 435,394 | | | 23,658,842 |
| * | Vinci | | 238,635 | | | 12,746,318 |
| | | | | | | 131,995,488 |
| Germany – 5.01% | | | | | |
| | Deutsche Telekom | | 1,425,437 | | | 20,631,319 |
| | RWE | | 277,091 | | | 19,894,525 |
| | | | | | | 40,525,844 |
| Hong Kong – 0.90% | | | | | |
| | Hong Kong Electric Holdings | | 1,146,400 | | | 7,284,012 |
| | | | | | | 7,284,012 |
| Ireland – 1.20% | | | | | |
| | Experian | | 835,939 | | | 9,723,316 |
| | | | | | | 9,723,316 |
| Italy – 3.85% | | | | | |
| | ENI | | 726,732 | | | 16,374,451 |
| | Intesa Sanpaolo | | 4,202,373 | | | 14,781,940 |
| | | | | | | 31,156,391 |
| Japan – 19.86% | | | | | |
| | Astellas Pharma | | 592,300 | | | 22,038,727 |
| | Canon | | 478,000 | | | 22,098,552 |
| | Kao | | 875,400 | | | 22,226,337 |
| | KDDI | | 2,434 | | | 13,113,018 |
| | Nitto Denko | | 67,900 | | | 2,539,974 |
| | Sekisui House | | 521,018 | | | 4,901,642 |
| | Seven & I Holdings | | 925,573 | | | 21,544,749 |
| | Takeda Pharmaceutical | | 481,000 | | | 22,536,134 |
| | Tokio Marine Holdings | | 503,552 | | | 14,193,201 |
| | Toyota Motor | | 335,000 | | | 11,902,877 |
| | West Japan Railway | | 965 | | | 3,583,446 |
| | | | | | | 160,678,657 |
| Netherlands – 3.77% | | | | | |
| | ING Groep CVA | | 1,244,842 | | | 13,287,865 |
| | Koninklijke Aholda | | 271,616 | | | 3,753,619 |
| | Reed Elsevier | | 1,034,221 | | | 13,474,965 |
| | | | | | | 30,516,449 |
| New Zealand – 0.48% | | | | | |
| | Telecom Corporation of | | | | | |
| | New Zealand | | 2,500,704 | | | 3,908,144 |
| | | | | | | 3,908,144 |
| Singapore – 4.15% | | | | | |
| | Jardine Matheson Holdings | | 221,215 | | | 9,954,675 |
| | Singapore Telecommunications | | 4,846,602 | | | 11,570,733 |
| | United Overseas Bank | | 834,610 | | | 12,019,726 |
| | | | | | | 33,545,134 |
| Spain – 7.67% | | | | | |
| | Banco Santander | | 850,037 | | | 10,920,241 |
| | Iberdrola | | 2,815,598 | | | 23,745,914 |
| | Telefonica | | 1,013,010 | | | 27,350,237 |
| | | | | | | 62,016,392 |
| Switzerland – 5.53% | | | | | |
| | Novartis | | 495,002 | | | 28,691,760 |
| | Zurich Financial Services | | 65,704 | | | 16,081,375 |
| | | | | | | 44,773,135 |
| Taiwan – 2.44% | | | | | |
| | Chunghwa Telecom ADR | | 322,860 | | | 7,554,924 |
| | Taiwan Semiconductor | | | | | |
| | Manufacturing ADR | | 1,118,932 | | | 12,207,548 |
| | | | | | | 19,762,472 |
| United Kingdom – 19.02% | | | | | |
| | Aviva | | 510,174 | | | 3,255,606 |
| | BG Group | | 765,747 | | | 14,912,259 |
| | BP | | 2,546,473 | | | 17,373,963 |
| | Compass Group | | 1,855,750 | | | 15,222,732 |
| | GlaxoSmithKline | | 1,242,888 | | | 24,313,687 |
| | Royal Dutch Shell Class A | | 842,802 | | | 27,335,076 |
| | Tesco | | 1,214,343 | | | 8,302,676 |
| | Unilever | | 762,670 | | | 21,994,411 |
| | Vodafone Group | | 7,769,850 | | | 21,149,942 |
| | | | | | | 153,860,352 |
| Total Common Stock | | | | | |
| | (cost $765,356,493) | | | | | 802,415,520 |
| | | | Principal | | | |
| | | | Amount (U.S. $) | | | |
| ≠Discount Note – 0.38% | | | | | | |
| | Federal Home Loan Bank | | | | | | |
| | 0.10% 11/1/10 | | $ | 3,065,028 | | | 3,065,028 |
| Total Discount Note | | | | | | |
| | (cost $3,065,028) | | | | | | 3,065,028 |
| Total Value of Securities | | | | | | |
| | Before Securities Lending | | | | | | |
| | Collateral – 99.56% (cost $768,421,521) | | | 805,480,548 |
2010 Annual report • Delaware Pooled Trust
102
| | | Number of | | Value | |
| | | Shares | | (U.S. $) | |
| Securities Lending Collateral** – 1.75% | | | | |
| Investment Companies | | | | | | |
| | Delaware Investments Collateral | | | | | | |
| | Fund No. 1 | | 12,996,043 | | $ | 12,996,043 | |
| | BNY Mellon SL DBT II | | | | | | |
| | Liquidating Fund | | 1,100,565 | | | 1,068,759 | |
| †@ | Mellon GSL Reinvestment Trust II | | 1,507,218 | | | 77,923 | |
| Total Securities Lending Collateral | | | | | | |
| | (cost $15,603,826) | | | | | 14,142,725 | |
| | | | | | | | |
| Total Value of Securities – 101.31% | | | | | | |
| | (cost $784,025,347) | | | | | 819,623,273 | © |
| Obligation to Return Securities | | | | | | |
| | Lending Collateral** – (1.93%) | | | | | (15,603,826 | ) |
| Receivables and Other Assets | | | | | | |
| | Net of Liabilities – 0.62% | | | | | 4,991,683 | |
| Net Assets Applicable to 59,129,845 | | | | | | |
| | Shares Outstanding; Equivalent to | | | | | | |
| | $13.68 Per Share – 100.00% | | | | $ | 809,011,130 | |
| | | | | | |
| Components of Net Assets at October 31, 2010: | | | | |
| Shares of beneficial interest | | | | | | |
| | (unlimited authorization – no par) | | | | $ | 934,550,239 | |
| Undistributed net investment income | | | | | 22,831,559 | |
| Accumulated net realized loss on investments | | | (184,173,076 | ) |
| Net unrealized appreciation of investments | | | | | | |
| | and foreign currencies | | | | | 35,802,408 | |
| Total net assets | | | | $ | 809,011,130 | |
| Δ | Securities have been classified by country of origin. Classification by type of business has been presented on page 68 in “Country and sector allocations.” |
| @ | Illiquid security. At October 31, 2010, the aggregate amount of illiquid securities was $77,923, which represented 0.01% of the Portfolio’s net assets. See Note 10 in “Notes to financial statements.” |
| † | Non income producing security. |
| * | Fully or partially on loan. |
| ≠ | The rate shown is the effective yield at the time of purchase. |
| ** | See Note 9 in “Notes to financial statements.” |
| © | Includes $14,802,432 of securities loaned. |
| û | Dividend coupon which when presented with the corresponding coupon of the share benefits from a reduced withholding tax of 15% (rather than 25%) on dividends paid. |
Summary of Abbreviations:
ADR — American Depositary Receipts
CVA — Dutch Certificate
EUR — European Monetary Unit
GBP — British Pound Sterling
MNB — Mellon National Bank
USD — United States Dollar
VVPR Strip — Dividend Coupon
1The following foreign currency exchange contracts were outstanding at October 31, 2010:
Foreign Currency Exchange Contracts
| | | Contracts to | | | | | | | | | Unrealized |
| | | Receive | | | | | | | Settlement | | Appreciation |
| Counterparty | | | (Deliver) | | In Exchange For | | Date | | (Depreciation) |
| MNB | | EUR | | 965,807 | | | USD | | (1,339,439 | ) | | 11/1/10 | | | $ | 4,626 | | |
| MNB | | EUR | | 220,581 | | | USD | | (305,880 | ) | | 11/2/10 | | | | 1,089 | | |
| MNB | | GBP | | (637,116 | ) | | USD | | 1,014,161 | | | 11/1/10 | | | | (6,572 | ) | |
| MNB | | GBP | | (455,572 | ) | | USD | | 725,451 | | | 11/2/10 | | | | (4,422 | ) | |
| | | | | | | | | | | | | | | | $ | (5,279 | ) | |
The use of foreign currency exchange contracts involves elements of market risk and risks in excess of the amounts recognized in the financial statements. The notional values presented above represent the Portfolio’s total exposure in such contracts, whereas only the net unrealized appreciation (depreciation) is reflected in the Portfolio’s net assets.
1See Note 8 in “Notes to financial statements.”
See accompanying Notes, which are an integral part of the financial statements.
2010 Annual report • Delaware Pooled Trust
(continues) 103
Statements of net assets
Delaware Pooled® Trust — The Labor Select International Equity Portfolio
October 31, 2010
| | | Number of | | Value |
| | | Shares | | (U.S. $) |
| Common Stock – 98.28%Δ | | | | | |
| Australia – 9.43% | | | | | |
| | Amcor | | 2,290,038 | | $ | 15,077,427 |
| | Foster’s Group | | 2,089,660 | | | 11,956,491 |
| | QBE Insurance Group | | 815,268 | | | 13,722,676 |
| | Telstra | | 6,254,325 | | | 16,360,891 |
| | Wesfarmers | | 393,157 | | | 12,765,381 |
| | | | | | | 69,882,866 |
| Belgium – 0.00% | | | | | |
| û† | Ageas VVPR Strip | | 305,506 | | | 425 |
| | | | | | | 425 |
| France – 14.64% | | | | | |
| | Carrefour | | 457,415 | | | 24,686,745 |
| * | France Telecom | | 1,045,138 | | | 25,112,263 |
| † | GDF Suez | | 101,871 | | | 142 |
| * | Sanofi-Aventis | | 318,888 | | | 22,269,705 |
| * | Societe Generale | | 205,871 | | | 12,327,122 |
| * | Total | | 229,588 | | | 12,475,565 |
| * | Vinci | | 217,819 | | | 11,634,463 |
| | | | | | | 108,506,005 |
| Germany – 2.92% | | | | | |
| | RWE | | 300,860 | | | 21,601,087 |
| | | | | | | 21,601,087 |
| Hong Kong – 1.45% | | | | | |
| | Hong Kong Electric Holdings | | 1,689,500 | | | 10,734,769 |
| | | | | | | 10,734,769 |
| Ireland – 1.27% | | | | | |
| | Experian | | 808,986 | | | 9,409,809 |
| | | | | | | 9,409,809 |
| Italy – 2.07% | | | | | |
| | Intesa Sanpaolo | | 4,362,954 | | | 15,346,786 |
| | | | | | | 15,346,786 |
| Japan – 20.19% | | | | | |
| | Astellas Pharma | | 541,300 | | | 20,141,082 |
| | Canon | | 461,900 | | | 21,354,229 |
| | Kao | | 889,900 | | | 22,594,490 |
| | KDDI | | 2,624 | | | 14,136,631 |
| | Nitto Denko | | 62,400 | | | 2,334,232 |
| | Sekisui House | | 582,000 | | | 5,475,350 |
| | Seven & I Holdings | | 966,700 | | | 22,502,070 |
| | Takeda Pharmaceutical | | 461,300 | | | 21,613,136 |
| | Tokio Marine Holdings | | 518,300 | | | 14,608,891 |
| | West Japan Railway | | 1,313 | | | 4,875,715 |
| | | | | | | 149,635,826 |
| Netherlands – 4.04% | | | | | |
| | ING Groep CVA | | 1,122,883 | | | 11,986,034 |
| | Koninklijke Aholda | | 251,291 | | | 3,472,736 |
| | Reed Elsevier | | 1,108,634 | | | 14,444,498 |
| | | | | | | 29,903,268 |
| New Zealand – 0.67% | | | | | |
| | Telecom Corporation of | | | | | |
| | New Zealand | | 3,154,717 | | | 4,930,247 |
| | | | | | | 4,930,247 |
| Singapore – 4.78% | | | | | |
| | Singapore Telecommunications | | 7,310,000 | | | 17,451,827 |
| | United Overseas Bank | | 1,248,219 | | | 17,976,360 |
| | | | | | | 35,428,187 |
| Spain – 8.16% | | | | | |
| | Banco Santander | | 826,816 | | | 10,621,925 |
| | Iberdrola | | 2,884,712 | | | 24,328,801 |
| | Telefonica | | 946,271 | | | 25,548,352 |
| | | | | | | 60,499,078 |
| Switzerland – 5.69% | | | | | |
| | Novartis | | 454,112 | | | 26,321,656 |
| | Zurich Financial Services | | 64,808 | | | 15,862,075 |
| | | | | | | 42,183,731 |
| United Kingdom – 22.97% | | | | | |
| | Aviva | | 466,929 | | | 2,979,644 |
| | BG Group | | 1,075,228 | | | 20,939,133 |
| | BP | | 3,290,193 | | | 22,448,183 |
| | Compass Group | | 2,523,855 | | | 20,703,203 |
| | GlaxoSmithKline | | 1,245,918 | | | 24,372,961 |
| | Royal Dutch Shell Class A | | 1,003,558 | | | 32,548,966 |
| | Unilever | | 786,489 | | | 22,681,320 |
| | Vodafone Group | | 8,634,614 | | | 23,503,875 |
| | | | | | | 170,177,285 |
| Total Common Stock | | | | | |
| | (cost $711,800,275) | | | | | 728,239,369 |
| | | Principal | | | |
| | | Amount (U.S.$) | | | |
| ≠Discount Note – 2.03% | | | | | |
| | Federal Home Loan Bank | | | | | |
| | 0.10% 11/1/10 | $ | 15,024,135 | | | 15,024,135 |
| Total Discount Note | | | | | |
| | (cost $15,024,135) | | | | | 15,024,135 |
| | | | | | |
| Total Value of Securities Before | | | | | |
| | Securities Lending Collateral – 100.31% | | | |
| | (cost $726,824,410) | | | | | 743,263,504 |
2010 Annual report • Delaware Pooled Trust
104
| | | Number of | | Value | |
| | | Shares | | (U.S. $) | |
| Securities Lending Collateral** – 1.81% | | | | |
| Investment Companies | | | | | | |
| | Delaware Investments Collateral | | | | | | |
| | Fund No. 1 | | 12,795,958 | | $ | 12,795,958 | |
| | BNY Mellon SL DBT II | | | | | | |
| | Liquidating Fund | | 619,364 | | | 601,465 | |
| †@ | Mellon GSL Reinvestment Trust II | | 521,358 | | | 26,954 | |
| Total Securities Lending Collateral | | | | | | |
| | (cost $13,936,680) | | | | | 13,424,377 | |
| | | | | | | |
| Total Value of Securities – 102.12% | | | | | | |
| | (cost $740,761,090) | | | | | 756,687,881 | © |
| Obligation to Return Securities | | | | | | |
| | Lending Collateral** – (1.88%) | | | | | (13,936,680 | ) |
| Liabilities Net of Receivables and | | | | | | |
| | Other Assets – (0.24%) | | | | | (1,799,577 | ) |
| Net Assets Applicable to 54,605,804 | | | | | | |
| | Shares Outstanding; Equivalent to | | | | | | |
| | $13.57 Per Share – 100.00% | | | | $ | 740,951,624 | |
| | | | | | | | |
| Components of Net Assets at October 31, 2010: | | | | |
| Shares of beneficial interest | | | | | | |
| | (unlimited authorization – no par) | | | | $ | 809,063,800 | |
| Undistributed net investment income | | | | | 19,978,046 | |
| Accumulated net realized loss on investments | | | (104,192,967 | ) |
| Net unrealized appreciation of investments | | | | | | |
| | and foreign currencies | | | | | 16,102,745 | |
| Total net assets | | | | $ | 740,951,624 | |
| Δ | Securities have been classified by country of origin. Classification by type of business has been presented on page 69 in “Country and sector allocations.” |
| † | Non income producing security. |
| * | Fully or partially on loan. |
| ** | See Note 9 in “Notes to financial statements.” |
| © | Includes $13,265,844 of securities loaned. |
| ≠ | The rate shown is the effective yield at time of purchase. |
| @ | Illiquid security. At October 31, 2010, the aggregate amount of illiquid securities was $26,954, which represented 0.00% of the Portfolio’s net assets. See Note 10 in “Notes to financial statements.” |
| û | Dividend coupon which when presented with the corresponding coupon of the share benefits from a reduced withholding tax of 15% (rather than 25%) on dividends paid. |
Summary of Abbreviations:
AUD — Australian Dollar
CVA — Dutch Certificate
GBP — British Pound Sterling
MNB — Mellon National Bank
USD — United States Dollar
VVPR Strip — Dividend Coupon
1The following foreign currency exchange contracts were outstanding at October 31, 2010:
| Foreign Currency Exchange Contracts | | | | | | | | |
| | | Contracts to | | | | | | Settlement | | Unrealized |
| Counterparty | | | Deliver | | In Exchange For | | Date | | Depreciation |
| MNB | | AUD | | (1,090,837 | ) | | USD | | 1,059,367 | | 11/1/10 | | | $ | (8,999 | ) | |
| MNB | | GBP | | (124,312 | ) | | USD | | 197,879 | | 11/1/10 | | | | (1,282 | ) | |
| MNB | | GBP | | (88,891 | ) | | USD | | 141,549 | | 11/2/10 | | | | (863 | ) | |
| | | | | | | | | | | | | | | $ | (11,144 | ) | |
The use of foreign currency exchange contracts involves elements of market risk and risks in excess of the amounts recognized in the financial statements. The notional values presented above represent the Portfolio’s total exposure in such contracts, whereas only the net unrealized appreciation (depreciation) is reflected in the Portfolio’s net assets.
1See Note 8 in ”Notes to financial statements.”
See accompanying Notes, which are an integral part of the financial statements.
2010 Annual report • Delaware Pooled Trust
(continues) 105
Statements of net assets
Delaware Pooled® Trust — The Emerging Markets Portfolio
October 31, 2010
| | | Number of | | Value |
| | | Shares | | (U.S. $) |
| Common Stock – 94.88%Δ | | | | | |
| Brazil – 12.87% | | | | | |
| @ | AES Tiete | | 147,694 | | $ | 1,725,065 |
| | AmBev ADR | | 64,800 | | | 9,022,752 |
| | Cielo | | 1,554,637 | | | 13,387,863 |
| | Companhia de Concessoes Rodoviarias | | 551,800 | | | 14,920,527 |
| | CPFL Energia | | 423,147 | | | 9,951,864 |
| | Itau Unibanco Holding ADR | | 334,100 | | | 8,205,496 |
| | Redecard | | 960,700 | | | 12,418,171 |
| | Santos Brasil Participacoes | | 232,899 | | | 3,121,383 |
| | Vale ADR | | 829,100 | | | 23,820,043 |
| | | | | | | 96,573,164 |
| Chile – 3.15% | | | | | |
| | Banco Santander ADR | | 40,900 | | | 3,788,976 |
| | Enersis ADR | | 755,900 | | | 17,242,079 |
| # | Inversiones Aguas Metropolitan | | | | | |
| | 144A ADR | | 83,900 | | | 2,606,068 |
| | | | | | | 23,637,123 |
nChina – 21.44% | | | | | |
| * | Beijing Enterprises Holdings | | 1,090,628 | | | 7,464,321 |
| | China BlueChemical Class H | | 7,620,000 | | | 6,026,202 |
| * | China Construction Bank Class H | | 23,422,000 | | | 22,330,409 |
| * | China Gas Holdings | | 10,350,000 | | | 5,915,239 |
| * | China Merchants Holdings International | | 3,322,000 | | | 11,635,839 |
| | China Mobile | | 1,530,000 | | | 15,583,745 |
| * | China Resources Power Holdings | | 6,022,000 | | | 11,591,452 |
| | China Shenhua Energy Class H | | 1,077,500 | | | 4,795,839 |
| | China Shipping Development Class H | | 7,462,000 | | | 10,859,069 |
| | China Yurun Food Group | | 1,010,000 | | | 3,928,592 |
| | CNOOC | | 3,278,000 | | | 6,791,766 |
| | ENN Energy Holdings | | 2,116,000 | | | 6,360,626 |
| | Hengan International Group | | 597,000 | | | 5,622,448 |
| * | Industrial & Commercial Bank of | | | | | |
| | China Class H | | 28,734,281 | | | 23,132,001 |
| | Jiangsu Expressway Class H | | 7,930,000 | | | 9,616,771 |
| * | Tingyi Cayman Islands Holding | | 1,306,000 | | | 3,555,117 |
| | Want Want China Holdings | | 6,134,000 | | | 5,658,197 |
| | | | | | | 160,867,633 |
| Colombia – 1.03% | | | | | |
| | BanColombia ADR | | 115,000 | | | 7,756,750 |
| | | | | | | 7,756,750 |
| Czech Republic – 2.64% | | | | | |
| | CEZ | | 245,557 | | | 10,879,722 |
| | Komercni Banka | | 15,841 | | | 3,594,327 |
| * | Telefonica o2 Czech Republic | | 240,392 | | | 5,291,477 |
| | | | | | | 19,765,526 |
| Egypt – 0.79% | | | | | |
| | MobiNil-Egyptian Mobile Services | | 83,218 | | | 2,494,342 |
| * | Orascom Telecom Holding GDR | | 878,751 | | | 3,408,677 |
| | | | | | | 5,903,019 |
| India – 3.67% | | | | | |
| | Axis Bank | | 270,227 | | | 8,968,244 |
| | HCL Technologies | | 509,268 | | | 4,639,423 |
| | Rural Electrification | | 1,665,810 | | | 13,929,667 |
| | | | | | | 27,537,334 |
| Indonesia – 2.13% | | | | | |
| | Perusahaan Gas Negara | | 35,210,000 | | | 15,955,301 |
| | | | | | | 15,955,301 |
| Kazakhstan – 0.83% | | | | | |
| | KazMunaiGas Exploration | | | | | |
| | Production GDR | | 360,736 | | | 6,204,659 |
| | | | | | | 6,204,659 |
| Malaysia – 1.08% | | | | | |
| | Maxis | | 4,772,800 | | | 8,115,754 |
| | | | | | | 8,115,754 |
| Mexico – 5.41% | | | | | |
| * | Banco Compartamos | | 1,406,000 | | | 9,904,214 |
| * | Grupo Aeroportuario del | | | | | |
| | Pacifico ADR | | 232,400 | | | 8,617,392 |
| | Grupo Mexico Series B | | 3,633,800 | | | 11,966,046 |
| | Grupo Televisa ADR | | 218,500 | | | 4,905,325 |
| | Kimberly-Clark de Mexico Class A | | 829,200 | | | 5,199,914 |
| | | | | | | 40,592,891 |
| Peru – 1.61% | | | | | |
| | Creditcorp | | 95,830 | | | 12,063,080 |
| | | | | | | 12,063,080 |
| Phillippines – 1.83% | | | | | |
| | Philippine Long Distance | | | | | |
| | Telephone ADR | | 221,000 | | | 13,730,730 |
| | | | | | | 13,730,730 |
| Poland – 0.93% | | | | | |
| | Bank Pekao | | 57,181 | | | 3,736,848 |
| | Polska Grupa Energetyczna | | 424,838 | | | 3,263,686 |
| | | | | | | 7,000,534 |
| Republic of Korea – 4.36% | | | | | |
| | KB Financial Group | | 238,911 | | | 10,622,988 |
| | KT&G | | 340,996 | | | 20,954,045 |
| | SK Telecom ADR | | 60,800 | | | 1,120,544 |
| | | | | | | 32,697,577 |
| Russia – 3.08% | | | | | |
| | Gazprom ADR | | 476,927 | | | 10,387,470 |
| | LUKOIL ADR | | 227,864 | | | 12,726,204 |
| | | | | | | 23,113,674 |
| South Africa – 6.67% | | | | | |
| * | African Bank Investments | | 2,687,257 | | | 13,787,100 |
| | Pretoria Portland Cement | | 1,191,965 | | | 5,683,235 |
| | Sasol | | 451,803 | | | 20,342,777 |
| * | Tiger Brands | | 382,532 | | | 10,256,408 |
| | | | | | | 50,069,520 |
| Taiwan – 11.26% | | | | | |
| | Asustek Computer | | 929,984 | | | 7,551,087 |
| * | Chunghwa Telecom | | 1,528,545 | | | 3,576,012 |
2010 Annual report • Delaware Pooled Trust
106
| | | Number of | | Value | |
| | | Shares | | (U.S. $) | |
| Common Stock (continued) | | | | | | |
| Taiwan (continued) | | | | | | |
| | Chunghwa Telecom ADR | | 491,548 | | $ | 11,502,223 | |
| | Far EasTone Telecommunications | | 3,906,765 | | | 5,623,035 | |
| | HTC | | 241,400 | | | 5,450,332 | |
| | Lite-On Technology | | 6,789,598 | | | 8,973,677 | |
| | MediaTek | | 890,644 | | | 11,203,994 | |
| | President Chain Store | | 2,510,715 | | | 9,967,387 | |
| | Taiwan Semiconductor Manufacturing | | 10,042,588 | | | 20,606,912 | |
| | | | | | | 84,454,659 | |
| Thailand – 3.32% | | | | | | |
| | Kasikornbank Foreign | | 1,255,354 | | | 5,283,053 | |
| | Kasikornbank NVDR | | 1,135,000 | | | 4,435,371 | |
| | PTT PCL Foreign | | 1,496,400 | | | 15,143,928 | |
| | | | | | | 24,862,352 | |
| Turkey – 6.78% | | | | | | |
| * | Tofas Turk Otomobil Fabrikasi | | 1,195,923 | | | 6,630,117 | |
| | Tupras Turkiye Petrol Rafine | | 579,787 | | | 15,566,108 | |
| | Turkcell Iletisim Hizmet | | 2,129,465 | | | 15,443,819 | |
| | Turkiye Garanti Bankasi | | 2,151,345 | | | 13,202,117 | |
| | | | | | | 50,842,161 | |
| Total Common Stock | | | | | | |
| | (cost $596,623,634) | | | | | 711,743,441 | |
| | | | | | | | |
| Preferred Stock – 4.03% | | | | | | |
| Brazil – 2.57% | | | | | | |
| | AES Tiete 11.59% | | 253,100 | | | 3,511,145 | |
| | Investimentos Itau 2.50% | | 2,018,116 | | | 15,789,516 | |
| | | | | | | 19,300,661 | |
| Republic of Korea – 1.46% | | | | | | |
| | Hyundai Motor 1.80% | | 67,539 | | | 3,729,810 | |
| | Samsung Electronics 2.09% | | 14,659 | | | 7,208,917 | |
| | | | | | | 10,938,727 | |
| Total Preferred Stock | | | | | | |
| | (cost $21,704,896) | | | | | 30,239,388 | |
| | | Principal | | | |
| | | Amount | | | |
| ≠Discount Note – 1.19% | | | | | |
| | Federal Home Loan Bank | | | | | |
| | 0.10% 11/1/10 | $ | 8,932,080 | | | 8,932,080 |
| Total Discount Note | | | | | |
| | (cost $8,932,080) | | | | | 8,932,080 |
| | | | | | |
| Total Value of Securities Before | | | | | |
| | Securities Lending Collateral – 100.10% | | | |
| | (cost $627,260,610) | | | | | 750,914,909 |
| | | Number of | | | |
| | | Shares | | | |
| Securities Lending Collateral** – 3.03% | | | | | | |
| Investment Companies | | | | | | |
| | Delaware Investments Collateral | | | | | | |
| | Fund No. 1 | | 22,046,929 | | | 22,046,929 | |
| | BNY Mellon SL DBT II | | | | | | |
| | Liquidating Fund | | 661,412 | | | 642,297 | |
| @† | Mellon GSL Reinvestment Trust II | | 575,855 | | | 29,772 | |
| Total Securities Lending Collateral | | | | | | |
| | (cost $23,284,196) | | | | | 22,718,998 | |
| | | | | | | | |
| Total Value of Securities – 103.13% | | | | | | |
| | (cost $650,544,806) | | | | | 773,633,907 | © |
| Obligation to Return Securities | | | | | | |
| | Lending Collateral** – (3.11%) | | | | | (23,284,196 | ) |
| Liabilities Net of Receivables and | | | | | | |
| | Other Assets – (0.02%) | | | | | (159,259 | ) |
| Net Assets Applicable to 65,698,551 | | | | | | |
| | Shares Outstanding; Equivalent to | | | | | | |
| | $11.42 Per Share – 100.00% | | | | $ | 750,190,452 | |
| | | | | | | | |
| Components of Net Assets at October 31, 2010: | | | | |
| Shares of beneficial interest | | | | | | |
| | (unlimited authorization – no par) | | | | $ | 639,917,417 | |
| Undistributed net investment income | | | | | 15,442,928 | |
| Accumulated net realized loss on investments | | | (27,272,045 | ) |
| Net unrealized appreciation of investments | | | | | | |
| | and foreign currencies | | | | | 122,102,152 | |
| Total net assets | | | | $ | 750,190,452 | |
| Δ | Securities have been classified by country of origin. Classification by type of business has been presented on page 70 in “Country and sector allocations.” |
| @ | Illiquid security. At October 31, 2010, the aggregate amount of illiquid securities was $1,754,837, which represented 0.23% of the Portfolio’s net assets. See Note 10 in “Notes to financial statements.” |
| # | Security exempt from registration under Rule 144A of the Securities Act of 1933, as amended. At October 31, 2010, the aggregate amount of Rule 144A securities was $2,606,068, which represented 0.35% of the Portfolio’s net assets. See Note 10 in “Notes to financial statements.” |
| n | Securities listed and traded on the Hong Kong Stock Exchange. These securities have significant business operations in China. |
| * | Fully or partially on loan. |
| ≠ | The rate shown is the effective yield at time of purchase. |
| ** | See Note 9 in “Notes to financial statements.” |
| † | Non income producing security. |
| © | Includes $22,062,908 of securities loaned. |
2010 Annual report • Delaware Pooled Trust
(continues) 107
Statements of net assets
Delaware Pooled® Trust — The Emerging Markets Portfolio
Summary of Abbreviations:
ADR — American Depositary Receipts
GDR — Global Depositary Receipts
HKD — Hong Kong Dollar
MNB — Mellon National Bank
MYR — Malaysian Ringgit
NVDR — Non-Voting Depositary Receipts
TRY — Turkish Lira
TWD — Taiwan Dollar
USD — United States Dollar
ZAR — South African Rand
1The following foreign currency exchange contracts were outstanding at October 31, 2010:
| Foreign Currency Exchange Contracts |
| | | | | | | | | | | | | | | Unrealized |
| | | Contracts to | | | | | | | Settlement | | Appreciation |
| Counterparty | | Receive (Deliver) | | In Exchange For | | Date | | (Depreciation) |
| MNB | | HKD | | 1,028,085 | | | USD | | (132,524 | ) | | 11/1/10 | | | $ | 113 | | |
| MNB | | HKD | | 3,351,101 | | | USD | | (432,082 | ) | | 11/2/10 | | | | 260 | | |
| MNB | | MYR | | (1,170,902 | ) | | USD | | 376,287 | | | 11/1/10 | | | | 87 | | |
| MNB | | TRY | | (872,664 | ) | | USD | | 610,788 | | | 11/1/10 | | | | 2,550 | | |
| MNB | | TWD | | (39,128,165 | ) | | USD | | 1,270,024 | | | 11/1/10 | | | | (8,522 | ) | |
| MNB | | ZAR | | (2,601,237 | ) | | USD | | 372,004 | | | 11/2/10 | | | | 900 | | |
| | | | | | | | | | | | | | | | $ | (4,612 | ) | |
The use of foreign currency exchange contracts involves elements of market risk and risks in excess of the amounts recognized in the financial statements. The notional values presented above represent the Portfolio’s total exposure in such contracts, whereas only the net unrealized appreciation (depreciation) is reflected in the Portfolio’s net assets.
1See Note 8 in ”Notes to financial statements.”
See accompanying Notes, which are an integral part of the financial statements.
2010 Annual report • Delaware Pooled Trust
108
Delaware Pooled® Trust — The Emerging Markets Portfolio II
October 31, 2010
| | | | Number of | | Value | |
| | | | Shares | | (U.S. $) | |
| Common Stock – 98.08%Δ | | | | | | |
| Argentina – 1.49% | | | | | | |
| @ | Cresud ADR | | 6,200 | | $ | 121,954 | |
| @ | IRSA Inversiones y Representaciones ADR | | 3,100 | | | 47,492 | |
| | | | | | | 169,446 | |
| Australia – 0.47% | | | | | | |
| | Alumina ADR | | 6,700 | | | 53,533 | |
| | | | | | | 53,533 | |
| Brazil – 16.61% | | | | | | |
| | All America Latina Logistica | | 4,700 | | | 44,425 | |
| | Banco Bradesco ADR | | 4,730 | | | 98,384 | |
| | Banco Santander Brasil ADR | | 12,800 | | | 184,320 | |
| | Brasil Foods ADR | | 7,000 | | | 102,410 | |
| † | Braskem ADR | | 5,200 | | | 108,420 | |
| | Centrais Eletricas Brasileiras ADR | | 12,800 | | | 178,816 | |
| | Cyrela Brazil Realty | | | | | | |
| | Empreendimentos e Participacoes | | 4,880 | | | 67,067 | |
| † | Fibria Celulose ADR | | 5,300 | | | 95,188 | |
| † | Hypermarcas | | 3,400 | | | 56,160 | |
| | Light | | 4,100 | | | 51,624 | |
| | Petroleo Brasileiro ADR | | 12,000 | | | 409,440 | |
| | Santos Brasil Participacoes | | 6,400 | | | 85,775 | |
| | Vale ADR | | 10,300 | | | 331,042 | |
| | Vivo Participacoes | | 2,600 | | | 74,464 | |
| | | | | | | 1,887,535 | |
| China – 16.82% | | | | | | |
| | Bank of China | | 190,000 | | | 113,736 | |
| | China Construction Bank | | 81,860 | | | 78,045 | |
| | China Mobile ADR | | 4,500 | | | 231,166 | |
| | China Petroleum & Chemical ADR | | 500 | | | 47,655 | |
| | China Telecom | | 62,000 | | | 32,075 | |
| | China Unicom ADR | | 9,000 | | | 126,000 | |
| | CNOOC ADR | | 200 | | | 41,784 | |
| | Datang International | | | | | | |
| | Power Generation | | 118,000 | | | 47,497 | |
| | Fosun International | | 90,000 | | | 73,846 | |
| † | Foxconn International Holdings | | 55,000 | | | 40,587 | |
| | Franshion Properties China | | 100,000 | | | 32,382 | |
| | Guangshen Railway ADR | | 3,900 | | | 79,326 | |
| † | Hollysys Automation Technologies | | 5,200 | | | 65,728 | |
| | Huadian Power International | | 200,000 | | | 45,928 | |
| @ | Huaneng Power International ADR | | 5,300 | | | 121,317 | |
| | Industrial & Commercial | | | | | | |
| | Bank of China | | 131,100 | | | 105,540 | |
| | PetroChina ADR | | 800 | | | 98,360 | |
| † | Shanda Games ADR | | 6,300 | | | 42,210 | |
| † | Shanda Interactive | | | | | | |
| | Entertainment ADR | | 3,000 | | | 121,230 | |
| | Shanghai Forte Land | | 164,000 | | | 48,875 | |
| † | Sina | | 1,500 | | | 84,450 | |
| † | Sohu.com | | 1,900 | | | 141,550 | |
| † | Tianjin Development Holdings | | 56,000 | | | 43,203 | |
| | Tingyi Cayman Islands Holding | | 10,000 | | | 27,221 | |
| | Tsingtao Brewery | | 4,000 | | | 21,390 | |
| | | | | | | 1,911,101 | |
| Hungary – 0.78% | | | | | | |
| | OTP Bank | | 2,973 | | | 88,330 | |
| | | | | | | 88,330 | |
| India – 1.22% | | | | | | |
| # | Reliance Industries GDR 144A | | 2,800 | | | 138,516 | |
| | | | | | | 138,516 | |
| Indonesia – 1.00% | | | | | | |
| | Tambang Batubara Bukit Asam | | 23,000 | | | 50,568 | |
| | United Tractors | | 25,500 | | | 63,340 | |
| | | | | | | 113,908 | |
| Israel – 0.50% | | | | | | |
| | Israel Chemicals | | 3,700 | | | 56,594 | |
| | | | | | | 56,594 | |
| Malaysia – 2.66% | | | | | | |
| @ | Hong Leong Bank | | 16,200 | | | 47,595 | |
| @ | KLCC Property Holdings | | 45,200 | | | 47,946 | |
| | Malayan Banking | | 38,700 | | | 111,957 | |
| † | UEM Land Holdings | | 133,100 | | | 94,980 | |
| | | | | | | 302,478 | |
| Mexico – 4.19% | | | | | | |
| | America Movil Class L ADR | | 900 | | | 51,534 | |
| | Cemex ADR | | 16,300 | | | 142,951 | |
| † | Empresas ICA ADR | | 5,300 | | | 55,862 | |
| | Fomento Economico | | | | | | |
| | Mexicano ADR | | 1,400 | | | 76,874 | |
| | Grupo Televisa ADR | | 4,500 | | | 101,025 | |
| | Wal-Mart de Mexico | | 17,469 | | | 47,808 | |
| | | | | | | 476,054 | |
| Peru – 1.52% | | | | | | |
| | Cia de Minas Buenaventura ADR | | 1,600 | | | 84,864 | |
| | Creditcorp | | 700 | | | 88,116 | |
| | | | | | | 172,980 | |
| Philippines – 0.49% | | | | | | |
| | Philippine Long Distance Telephone ADR | | 900 | | | 55,917 | |
| | | | | | | 55,917 | |
| Poland – 3.04% | | | | | | |
| | Polska Grupa Energetyczna | | 12,510 | | | 96,104 | |
| | Polski Koncern Naftowy Orlen | | 4,282 | | | 60,398 | |
| | Powszechna Kasa Oszczednosci | | | | | | |
| | Bank Polski | | 3,940 | | | 62,194 | |
| | Powszechny Zaklad Ubezpieczen | | 953 | | | 126,398 | |
| | | | | | | 345,094 | |
| Republic of Korea – 13.28% | | | | | | |
| | KB Financial Group ADR | | 5,200 | | | 233,480 | |
| | KT ADR | | 6,100 | | | 126,209 | |
| | KT&G | | 621 | | | 38,160 | |
| | LG Display ADR | | 2,700 | | | 46,467 | |
| | LG Electronics | | 1,245 | | | 109,719 | |
| | LG Uplus | | 11,670 | | | 75,759 | |
| | Lotte Chilsung Beverage | | 165 | | | 113,130 | |
| | Lotte Confectionery | | 70 | | | 76,567 | |
| | POSCO ADR | | 1,000 | | | 103,940 | |
| | Samsung Electronics | | 374 | | | 247,782 | |
2010 Annual report • Delaware Pooled Trust
(continues) 109
Statements of net assets
Delaware Pooled® Trust — The Emerging Markets Portfolio II
| | | | Number of | | Value | |
| | | | Shares | | (U.S. $) | |
| Common Stock (continued) | | | | | | |
| Republic of Korea (continued) | | | | | | |
| | Samsung Life Insurance | | 880 | | $ | 78,648 | |
| | SK Telecom ADR | | 14,100 | | | 259,864 | |
| | | | | | | 1,509,725 | |
| Russia – 5.64% | | | | | | |
| | Gazprom ADR | | 7,300 | | | 158,994 | |
| | LUKOIL ADR | | 1,200 | | | 67,020 | |
| | MMC Norilsk Nickel ADR | | 4,500 | | | 84,267 | |
| † | Rosneft Oil GDR | | 12,900 | | | 89,739 | |
| @ | Sberbank | | 60,580 | | | 200,762 | |
| | VTB Bank GDR | | 6,000 | | | 39,720 | |
| | | | | | | 640,502 | |
| South Africa – 6.10% | | | | | | |
| | ABSA Group | | 2,483 | | | 48,202 | |
| † | Anglo Platinum | | 830 | | | 82,110 | |
| | ArcelorMittal Steel South Africa | | 7,718 | | | 88,637 | |
| | Impala Platinum Holdings | | 1,994 | | | 56,361 | |
| | Sasol ADR | | 2,300 | | | 104,075 | |
| | Standard Bank Group | | 6,020 | | | 88,773 | |
| | Vodacom Group | | 23,447 | | | 225,263 | |
| | | | | | | 693,421 | |
| Taiwan – 8.14% | | | | | | |
| | Asustek Computer | | 20,000 | | | 162,391 | |
| | Cathay Financial Holding | | 36,750 | | | 56,257 | |
| | Chunghwa Telecom ADR | | 3,500 | | | 81,900 | |
| | Fubon Financial Holding | | 65,097 | | | 79,762 | |
| | Hon Hai Precision Industry | | 31,160 | | | 118,104 | |
| | HTC | | 4,200 | | | 94,828 | |
| | MediaTek | | 2,004 | | | 25,210 | |
| | Taiwan Semiconductor | | | | | | |
| | Manufacturing | | 42,000 | | | 86,182 | |
| | Taiwan Semiconductor | | | | | | |
| | Manufacturing ADR | | 9,000 | | | 98,190 | |
| | United Microelectronics | | 258,000 | | | 122,656 | |
| | | | | | | 925,480 | |
| Thailand – 1.89% | | | | | | |
| | Bangkok Bank | | 12,300 | | | 61,212 | |
| | PTT | | 7,700 | | | 77,926 | |
| @ | PTT Exploration & Production | | 5,800 | | | 33,126 | |
| | Siam Cement NVDR | | 4,000 | | | 42,218 | |
| | | | | | | 214,482 | |
| Turkey – 3.19% | | | | | | |
| | Akbank | | 7,956 | | | 49,933 | |
| † | Torunlar Gayrimenkul | | | | | | |
| | Yatirim Ortakligi | | 11,868 | | | 55,864 | |
| | Turk Sise ve Cam Fabrikalari | | 35,449 | | | 66,251 | |
| | Turkcell Iletisim Hizmet ADR | | 8,100 | | | 145,232 | |
| | Turkiye Is Bankasi Class C | | 10,009 | | | 45,020 | |
| | | | | | | 362,300 | |
| United Kingdom – 0.51% | | | | | | |
| | Anglo American ADR | | 2,500 | | | 58,116 | |
| | | | | | | 58,116 | |
| United States – 8.54% | | | | | | |
| | Archer-Daniels-Midland | | 6,900 | | | 229,908 | |
| | Bunge | | 4,500 | | | 270,315 | |
| † | MEMC Electronic Materials | | 9,900 | | | 126,918 | |
| † | Yahoo | | 20,800 | | | 343,408 | |
| | | | | | | 970,549 | |
| Total Common Stock | | | | | | |
| | (cost $9,884,804) | | | | | 11,146,061 | |
| | | | | | | | |
| Total Value of Securities – 98.08% | | | | | | |
| | (cost $9,884,804) | | | | | 11,146,061 | |
| Receivables and Other Assets | | | | | | |
| | Net of Liabilities – 1.92% | | | | | 218,416 | |
| Net Assets Applicable to 1,176,473 Shares | | | | |
| | Outstanding; Equivalent to $9.66 | | | | | | |
| | Per Share – 100.00% | | | | $ | 11,364,477 | |
| | | | | | |
| Components of Net Assets at October 31, 2010: | | | | |
| Shares of beneficial interest | | | | | | |
| | (unlimited authorization – no par) | | | | $ | 10,000,017 | |
| Undistributed net investment income | | | | | 13,320 | |
| Accumulated net realized gain on investments | | | 86,846 | |
| Net unrealized appreciation of investments | | | | | 1,264,294 | |
| Total net assets | | | | $ | 11,364,477 | |
| Δ | Securities have been classified by country of origin. Classification by type of business has been presented on page 71 in “Country and sector allocations.” |
| † | Non income producing security. |
| # | Security exempt from registration under Rule 144A of the Securities Act of 1933, as amended. At October 31, 2010, the aggregate amount of Rule 144A securities was $138,516, which represented 1.22% of the Portfolio’s net assets. See Note 10 in “Notes to financial statements.” |
| @ | Illiquid security. At October 31, 2010, the aggregate amount of illiquid securities was $620,192, which represented 5.46% of the Portfolio’s net assets. See Note 10 in “Notes to financial statements.” |
2010 Annual report • Delaware Pooled Trust
110
| |
Summary of Abbreviations:
ADR — American Depositary Receipts
GDR — Global Depositary Receipts
HKD — Hong Kong Dollar
MNB — Mellon National Bank
NVDR — Non-Voting Depositary Receipts
USD — United States Dollar |
1 The following foreign currency exchange contract was outstanding at October 31, 2010:
| Foreign Currency Exchange Contract | | | | |
| | | Contract to | | | | Settlement | | Unrealized |
| Counterparty | | Deliver | | In Exchange For | | Date | | Depreciation |
| MNB | | HKD (460,577) | | USD 59,379 | | 11/2/10 | | $42 |
The use of foreign currency exchange contracts involves elements of market risk and risks in excess of the amounts recognized in the financial statements. The notional value presented above represents the Portfolio’s total exposure in such contracts, whereas only the net unrealized appreciation (depreciation) is reflected in the Portfolio’s net assets.
1See Note 8 in ”Notes to financial statements.”
See accompanying Notes, which are an integral part of the financial statements.
2010 Annual report • Delaware Pooled Trust
(continues) 111
Statements of net assets
Delaware Pooled® Trust — The Global Real Estate Securities Portfolio
October 31, 2010
| | | | Number of | | Value | |
| | | | Shares | | (U.S. $) | |
| Common Stock – 93.62%Δ | | | | | | |
| Australia – 7.43% | | | | | | |
| | Charter Hall Office REIT | | 69,262 | | $ | 177,792 | |
| * | Commonwealth Property Office Fund | | 462,801 | | | 414,888 | |
| | FKP Property Group | | 169,367 | | | 155,981 | |
| | Goodman Group | | 617,970 | | | 381,437 | |
| | GPT Group | | 98,945 | | | 270,466 | |
| †=@ | GPT Group-In Specie | | 1,337,300 | | | 0 | |
| | Stockland | | 113,359 | | | 418,709 | |
| | Westfield Group | | 219,339 | | | 2,660,431 | |
| | | | | | | 4,479,704 | |
| Belgium – 0.73% | | | | | | |
| | Cofinimmo | | 3,111 | | | 443,782 | |
| | | | | | | 443,782 | |
| Canada – 5.31% | | | | | | |
| | Boardwalk Real Estate Investment Trust | | 10,783 | | | 453,036 | |
| * | Canadian Real Estate Investment Trust | | 26,912 | | | 845,700 | |
| | Dundee Real Estate Investment Trust | | 12,364 | | | 354,106 | |
| | First Capital Realty | | 32,564 | | | 487,550 | |
| * | H&R Real Estate Investment Trust | | 33,671 | | | 674,146 | |
| * | RioCan Real Estate Investment Trust | | 17,066 | | | 385,696 | |
| | | | | | | 3,200,234 | |
| France – 2.88% | | | | | | |
| | Klepierre | | 11,934 | | | 464,209 | |
| * | Unibail-Rodamco | | 6,112 | | | 1,273,359 | |
| | | | | | | 1,737,568 | |
| Germany – 0.92% | | | | | | |
| *@ | Alstria Office REIT | | 39,539 | | | 553,291 | |
| | | | | | | 553,291 | |
| nHong Kong/China – 15.21% | | | | | | |
| * | Champion REIT | | 1,700,155 | | | 936,580 | |
| | China Overseas Land & Investment | | 211,164 | | | 444,054 | |
| | China Resources Land | | 60,000 | | | 118,278 | |
| | Great Eagle Holdings | | 298,000 | | | 891,934 | |
| | Hang Lung Properties | | 187,642 | | | 918,692 | |
| | Henderson Land Development | | 88,655 | | | 629,635 | |
| * | Hongkong Land Holdings | | 205,000 | | | 1,414,500 | |
| | Link REIT | | 194,500 | | | 599,716 | |
| | Renhe Commercial Holdings | | 1,180,000 | | | 225,306 | |
| | Sun Hung Kai Properties | | 174,735 | | | 2,993,685 | |
| | | | | | | 9,172,380 | |
| Japan – 9.50% | | | | | | |
| | Japan Prime Realty Investment | | 129 | | | 320,476 | |
| | Japan Real Estate Investment | | 26 | | | 250,419 | |
| | Japan Retail Fund Investment | | 333 | | | 520,203 | |
| | Mitsubishi Estate | | 95,512 | | | 1,673,670 | |
| * | Mitsui Fudosan | | 85,446 | | | 1,615,154 | |
| | Nippon Accommodations Fund | | 86 | | | 512,484 | |
| | Sumitomo Realty & Development | | 24,900 | | | 542,778 | |
| * | United Urban Investment | | 43 | | | 295,520 | |
| | | | | | | 5,730,704 | |
| Netherlands – 2.36% | | | | | | |
| * | Corio | | 7,817 | | | 574,189 | |
| * | Vastned Retail | | 8,293 | | | 576,492 | |
| * | Wereldhave | | 2,660 | | | 270,462 | |
| | | | | | | 1,421,143 | |
| Singapore – 6.70% | | | | | | |
| | CapitaLand | | 232,145 | | | 697,708 | |
| | CapitaMall Trust | | 465,177 | | | 711,621 | |
| | CDL Hospitality Trusts | | 142,000 | | | 234,783 | |
| | Keppel Land | | 146,913 | | | 502,839 | |
| | Mapletree Logistics Trust | | 914,760 | | | 636,084 | |
| | Parkway Life Real Estate | | | | | | |
| | Investment Trust | | 269,812 | | | 348,131 | |
| | Suntec Real Estate Investment Trust | | 757,712 | | | 913,259 | |
| | | | | | | 4,044,425 | |
| Switzerland – 1.03% | | | | | | |
| | PSP Swiss Property | | 8,096 | | | 621,852 | |
| | | | | | | 621,852 | |
| United Kingdom – 4.59% | | | | | | |
| | British Land | | 108,627 | | | 886,716 | |
| | Hammerson | | 106,488 | | | 714,855 | |
| | Segro | | 83,575 | | | 396,745 | |
| | Shaftesbury | | 107,853 | | | 769,808 | |
| | | | | | | 2,768,124 | |
| United States – 36.96% | | | | | | |
| | Alexandria Real Estate Equities | | 5,912 | | | 434,414 | |
| | Apartment Investment & | | | | | | |
| | Management | | 17,776 | | | 414,359 | |
| * | AvalonBay Communities | | 4,140 | | | 440,123 | |
| | BioMed Realty Trust | | 18,149 | | | 333,034 | |
| * | Boston Properties | | 11,246 | | | 969,293 | |
| * | BRE Properties | | 12,663 | | | 543,623 | |
| | Camden Property Trust | | 13,992 | | | 693,863 | |
| † | Campus Crest Communities | | 4,809 | | | 60,113 | |
| * | CBL & Associates Properties | | 19,111 | | | 299,660 | |
| | Colonial Properties Trust | | 13,845 | | | 248,241 | |
| | DiamondRock Hospitality | | 29,953 | | | 316,903 | |
| * | Digital Realty Trust | | 15,531 | | | 927,667 | |
| * | DuPont Fabros Technology | | 10,322 | | | 259,082 | |
| | Entertainment Properties Trust | | 17,945 | | | 829,597 | |
| | Equity Lifestyle Properties | | 5,577 | | | 317,443 | |
| | Equity Residential | | 18,998 | | | 923,873 | |
| | Extra Space Storage | | 16,651 | | | 269,746 | |
| * | Federal Realty Investment Trust | | 8,515 | | | 698,060 | |
| | First Potomac Realty Trust | | 15,222 | | | 250,859 | |
| *† | Forest City Enterprises Class A | | 31,648 | | | 461,744 | |
| *† | Gaylord Entertainment | | 7,887 | | | 262,953 | |
| | HCP | | 20,204 | | | 727,546 | |
| * | Healthcare Realty Trust | | 7,208 | | | 174,001 | |
| * | Host Hotels & Resorts | | 50,099 | | | 796,073 | |
| * | Kimco Realty | | 29,606 | | | 510,111 | |
| | Lexington Reality Trust | | 28,406 | | | 220,999 | |
| | Macerich | | 12,506 | | | 557,893 | |
| | Nationwide Health Properties | | 18,613 | | | 759,969 | |
| * | Omega Healthcare Investors | | 14,067 | | | 323,541 | |
| | ProLogis | | 34,171 | | | 466,434 | |
| * | Public Storage | | 14,581 | | | 1,446,727 | |
| | Ramco-Gershenson Properties Trust | | 12,718 | | | 147,274 | |
| * | Regency Centers | | 7,200 | | | 303,696 | |
2010 Annual report • Delaware Pooled Trust
112
| | | | Number of | | Value | |
| | | | Shares | | (U.S. $) | |
| Common Stock (continued) | | | | | | | |
| United States (continued) | | | | | | | |
| | Simon Property Group | | | 26,209 | | $ | 2,516,587 | |
| | SL Green Realty | | | 6,165 | | | 405,164 | |
| | Starwood Hotels & Resorts Worldwide | | | 5,059 | | | 273,894 | |
| † | Strategic Hotel & Resorts | | | 24,503 | | | 111,489 | |
| * | Taubman Centers | | | 2,201 | | | 102,170 | |
| | UDR | | | 13,471 | | | 302,828 | |
| * | Ventas | | | 12,743 | | | 682,515 | |
| | Vornado Realty Trust | | | 11,428 | | | 998,693 | |
| * | Washington Real Estate | | | | | | | |
| | Investment Trust | | | 8,303 | | | 265,945 | |
| * | Weingarten Realty Investors | | | 10,101 | | | 243,737 | |
| | | | | | | | 22,291,936 | |
| Total Common Stock | | | | | | | |
| | (cost $48,140,489) | | | | | | 56,465,143 | |
| | | | | | | | | |
| Preferred Stock – 0.36% | | | | | | | |
| * | Public Storage | | | 8,700 | | | 218,457 | |
| Total Preferred Stock (cost $196,961) | | | | | | 218,457 | |
| | | | | | | | | |
| | | | Principal | | | | |
| | | | Amount (U.S. $) | | | | |
| ≠Discount Note – 5.04% | | | | | | | |
| | Federal Home Loan Bank | | | | | | | |
| | 0.10% 11/1/10 | | | $ 3,040,027 | | | 3,040,027 | |
| Total Discount Note | | | | | | | |
| | (cost $3,040,027) | | | | | | 3,040,027 | |
| Total Value of Securities Before Securities | | | | |
| | Lending Collateral – 99.02% | | | | | | | |
| | (cost $51,377,477) | | | | | | 59,723,627 | |
| | | | | | | | | |
| | | | Number of | | | | |
| | | | Shares | | | | |
| Securities Lending Collateral** – 19.06% | | | | |
| Investment Companies | | | | | | | |
| | Delaware Investments Collateral | | | | | | | |
| | Fund No. 1 | | | 11,278,697 | | | 11,278,697 | |
| | BNY Mellon SL DBT II | | | | | | | |
| | Liquidating Fund | | | 201,509 | | | 195,685 | |
| @† | Mellon GSL Reinvestment Trust II | | | 415,589 | | | 21,486 | |
| | | | | | | | |
| Total Securities Lending Collateral | | | | | | | |
| | (cost $11,895,795) | | | | | | 11,495,868 | |
| | | | | | | | | |
| Total Value of Securities – 118.08% | | | | | | | |
| | (cost $63,273,272) | | | | | $ | 71,219,495 | © |
| Obligation to Return Securities | | | | | | | |
| | Lending Collateral** – (19.72%) | | | | | | (11,895,795 | ) |
| Receivables and Other Assets Net of | | | | | | | |
| | Liabilities �� 1.64% | | | | | | 991,395 | |
| Net Assets Applicable to 10,413,677 | | | | | | | |
| | Shares Outstanding – 100.00% | | | | | $ | 60,315,095 | |
| | | | | | | | | |
| Net Asset Value – Delaware Pooled Trust® – | | | | | | | |
| | The Global Real Estate Securities Portfolio | | | | | | | |
| | Original Class ($60,307,473 / 10,412,358 Shares) | | | | | | $5.79 | |
| Net Asset Value – Delaware Pooled Trust – | | | | | | | |
| | The Global Real Estate Securities Portfolio | | | | | | | |
| | Class P ($7,622 / 1,319 Shares) | | | | | | $5.78 | |
| | | | | | | | | |
| Components of Net Assets at October 31, 2010: | | | | | | | |
| Shares of beneficial interest | | | | | | | |
| | (unlimited authorization – no par) | | | | | $ | 164,489,347 | |
| Undistributed net investment income | | | | | | 2,001,250 | |
| Accumulated net realized loss on investments | | | | | | (114,140,020 | ) |
| Net unrealized appreciation of investments | | | | | | | |
| | and foreign currencies | | | | | | 7,964,518 | |
| Total net assets | | | | | $ | 60,315,095 | |
| Δ | Securities have been classified by country of origin. Classification by type of business has been presented on page 72 in “Country and sector allocations.” |
| * | Fully or partially on loan. |
| † | Non income producing security. |
| = | Security is being fair valued in accordance with the Portfolio’s fair valuation policy. At October 31, 2010, the aggregate amount of fair valued securities was $0, which represented 0.00% of the Portfolio’s net assets. See Note 1 in “Notes to financial statements.” |
| @ | Illiquid security. At October 31, 2010, the aggregate amount of illiquid securities was $574,777, which represented 0.95% of the Portfolio’s net assets. See Note 10 in “Notes to financial statements.” |
| n | Securities listed and traded on the Hong Kong Stock Exchange. These securities have significant business operations in China. |
| ≠ | The rate shown is the effective yield at time of purchase. |
| ** | See Note 9 in “Notes to financial statements.” |
| © | Includes $11,121,416 of securities loaned. |
Summary of Abbreviations:
AUD — Australian Dollar
CAD — Canadian Dollar
EUR — European Monetary Unit
MNB — Mellon National Bank
REIT — Real Estate Investment Trust
SGD — Singapore Dollar
USD — United States Dollar
2010 Annual report • Delaware Pooled Trust
(continues) 113
Statements of net assets
Delaware Pooled® Trust — The Global Real Estate Securities Portfolio
| |
1The following foreign currency exchange contracts were outstanding at October 31, 2010: |
| Foreign Currency Exchange Contracts |
| | | Contracts to | | | | | | Settlement | | Unrealized |
| Counterparty | | Receive (Deliver) | | In Exchange For | | Date | | Depreciation |
| MNB | | AUD | (162,940 | ) | | USD | 158,443 | | | 11/3/10 | | | $ | 1,102 | |
| MNB | | CAD | (369,047 | ) | | USD | 359,100 | | | 11/1/10 | | | | 2,721 | |
| MNB | | EUR | (406,562 | ) | | USD | 561,666 | | | 11/2/10 | | | | 4,121 | |
| MNB | | SGD | 124,563 | | | USD | (96,277 | ) | | 11/3/10 | | | | 37 | |
| | | | | | | | | | | | | | $ | 7,981 | |
The use of foreign currency exchange contracts involves elements of market risk and risks in excess of the amounts recognized in the financial statements. The notional values presented above represent the Portfolio’s total exposure in such contracts, whereas only the net unrealized appreciation (depreciation) is reflected in the Portfolio’s net assets.
1See Note 8 in ”Notes to financial statements.”
See accompanying Notes, which are an integral part of the financial statements.
2010 Annual report • Delaware Pooled Trust
114
Delaware Pooled® Trust — The Global Fixed Income Portfolio
October 31, 2010
| | | Principal | | Value |
| | | Amount° | | (U.S. $) |
| Bonds – 98.00% | | | | | | |
| Australia – 6.99% | | | | | | |
| | Australian Government | | | | | | |
| | 5.25% 3/15/19 | AUD | | 5,700,000 | | $ | 5,612,408 |
| | 6.00% 2/15/17 | AUD | | 4,090,000 | | | 4,197,787 |
| | | | | | | | 9,810,195 |
| Austria – 2.46% | | | | | | |
| | Oesterreichische Kontrollbank | | | | | | |
| | 4.875% 2/16/16 | USD | | 3,000,000 | | | 3,455,412 |
| | | | | | | | 3,455,412 |
| Denmark – 3.29% | | | | | | |
| | Kingdom of Denmark | | | | | | |
| | 2.75% 11/15/11 | USD | | 4,500,000 | | | 4,613,355 |
| | | | | | | | 4,613,355 |
| France – 4.11% | | | | | | |
| | Agence Francaise de | | | | | | |
| | Developement | | | | | | |
| | 1.80% 6/19/15 | JPY | | 440,000,000 | | | 5,764,856 |
| | | | | | | | 5,764,856 |
| Germany – 6.85% | | | | | | |
| | KFW 5.25% 7/4/12 | EUR | | 1,850,000 | | | 2,751,114 |
| | Rentenbank | | | | | | |
| | 1.375% 4/25/13 | JPY | | 429,000,000 | | | 5,476,213 |
| | 5.00% 2/15/13 | USD | | 1,260,000 | | | 1,383,878 |
| | | | | | | | 9,611,205 |
| Greece – 2.06% | | | | | | |
| | Hellenic Government | | | | | | |
| | 5.25% 5/18/12 | EUR | | 2,200,000 | | | 2,894,569 |
| | | | | | | | 2,894,569 |
| Ireland – 4.50% | | | | | | |
| | Irish Government | | | | | | |
| | 4.50% 10/18/18 | EUR | | 1,829,000 | | | 2,244,882 |
| | 5.00% 4/18/13 | EUR | | 2,900,000 | | | 4,062,292 |
| | | | | | | | 6,307,174 |
| Italy – 7.32% | | | | | | |
| | Italy Buoni Poliennali Del Tesoro | | | | | | |
| | 4.00% 2/1/37 | EUR | | 3,800,000 | | | 4,794,148 |
| | 4.75% 2/1/13 | EUR | | 1,200,000 | | | 1,767,762 |
| | Republic of Italy | | | | | | |
| | 3.70% 11/14/16 | JPY | | 270,000,000 | | | 3,707,528 |
| | | | | | | | 10,269,438 |
| Japan – 7.59% | | | | | | |
| | Development Bank of Japan | | | | | | |
| | 2.30% 3/19/26 | JPY | | 100,000,000 | | | 1,346,935 |
| | Japan Finance Organization | | | | | | |
| | for Municipal Enterprises | | | | | | |
| | 1.55% 2/21/12 | JPY | | 95,000,000 | | | 1,199,995 |
| | 2.00% 5/9/16 | JPY | | 240,000,000 | | | 3,244,141 |
| | Japan Government | | | | | | |
| | 10 Year Bond | | | | | | |
| | 1.20% 6/20/11 | JPY | | 335,000,000 | | | 4,191,682 |
| | 30 Year Bond | | | | | | |
| | 2.30% 6/20/35 | JPY | | 50,000,000 | | | 665,641 |
| | | | | | | | 10,648,394 |
| Netherlands – 3.58% | | | | | | |
| | Deutsche Telekom | | | | | | |
| | International Finance | | | | | | |
| | 8.75% 6/15/30 | USD | | 758,000 | | | 1,054,524 |
| | ING Bank | | | | | | |
| | 3.90% 3/19/14 | USD | | 1,360,000 | | | 1,484,818 |
| | •6.125% 5/29/23 | EUR | | 896,000 | | | 1,410,415 |
| | Telefonica Europe | | | | | | |
| | 8.25% 9/15/30 | USD | | 818,000 | | | 1,073,191 |
| | | | | | | | 5,022,948 |
| Norway – 4.70% | | | | | | |
| | Eksportfinans 1.60% 3/20/14 | JPY | | 512,000,000 | | | 6,590,003 |
| | | | | | | | 6,590,003 |
| Poland – 3.96% | | | | | | |
| | Poland Government | | | | | | |
| | 5.25% 10/25/17 | PLN | | 16,000,000 | | | 5,553,660 |
| | | | | | | | 5,553,660 |
| Qatar – 1.82% | | | | | | |
| # | Qatar Government | | | | | | |
| | International Bond 144A | | | | | | |
| | 5.25% 1/20/20 | USD | | 2,300,000 | | | 2,547,250 |
| | | | | | | | 2,547,250 |
| Slovenia – 1.11% | | | | | | |
| | Slovenia Government | | | | | | |
| | 4.375% 2/6/19 | EUR | | 1,050,000 | | | 1,556,473 |
| | | | | | | | 1,556,473 |
| Spain – 5.46% | | | | | | |
| | Instituto de Credito Oficial | | | | | | |
| | 1.50% 9/20/12 | JPY | | 150,000,000 | | | 1,835,208 |
| | 5.375% 7/2/12 | USD | | 1,100,000 | | | 1,151,910 |
| | Spanish Government | | | | | | |
| | 4.40% 1/31/15 | EUR | | 2,700,000 | | | 3,981,543 |
| | Telefonica Emisiones | | | | | | |
| | 5.877% 7/15/19 | USD | | 600,000 | | | 688,721 |
| | | | | | | | 7,657,382 |
| Supranational – 10.06% | | | | | | |
| | Asian Development Bank | | | | | | |
| | 2.35% 6/21/27 | JPY | | 270,000,000 | | | 3,679,164 |
| | European Investment Bank | | | | | | |
| | 1.40% 6/20/17 | JPY | | 304,000,000 | | | 3,993,819 |
| | 1.90% 1/26/26 | JPY | | 220,000,000 | | | 2,874,264 |
| | Nordic Investment Bank | | | | | | |
| | 1.70% 4/27/17 | | JPY | | 270,000,000 | | | 3,560,983 |
| | | | | | | | 14,108,230 |
| United Kingdom – 5.44% | | | | | | |
| | HSBC Holdings | | | | | | |
| | 6.25% 3/19/18 | EUR | | 900,000 | | | 1,462,241 |
| • | Lloyds TSB Bank | | | | | | |
| | 5.625% 3/5/18 | EUR | | 1,237,000 | | | 1,778,777 |
| # | Royal Bank of Scotland 144A | | | | | | |
| | 4.875% 8/25/14 | USD | | 2,150,000 | | | 2,303,122 |
| | Standard Chartered Bank | | | | | | |
| | 5.875% 9/26/17 | EUR | | 850,000 | | | 1,324,605 |
| • | Standard Life | | | | | | |
| | 6.375% 7/12/22 | EUR | | 540,000 | | | 765,045 |
| | | | | | | | 7,633,790 |
2010 Annual report • Delaware Pooled Trust
(continues) 115
Statements of net assets
Delaware Pooled® Trust — The Global Fixed Income Portfolio
| | | Principal | | Value | |
| | | Amount° | | (U.S. $) | |
| Bonds (continued) | | | | | | | |
| United States – 16.70% | | | | | | | |
| | Bank of America | | | | | | | |
| | 5.65% 5/1/18 | USD | | 2,000,000 | | $ | 2,108,182 | |
| | 7.625% 6/1/19 | USD | | 425,000 | | | 498,335 | |
| | U.S. Treasury Bonds | | | | | | | |
| | 4.50% 5/15/38 | USD | | 800,000 | | | 873,375 | |
| | 7.50% 11/15/24 | USD | | 240,000 | | | 357,750 | |
| | U.S. Treasury Notes | | | | | | | |
| | 1.875% 8/31/17 | USD | | 1,650,000 | | | 1,652,320 | |
| | 2.375% 3/31/16 | USD | | 4,300,000 | | | 4,532,136 | |
| | 3.625% 8/15/19 | USD | | 2,600,000 | | | 2,852,281 | |
| | 3.75% 11/15/18 | USD | | 3,800,000 | | | 4,238,782 | |
| | 4.00% 8/15/18 | USD | | 5,000,000 | | | 5,677,346 | |
| • | Zurich Finance | | | | | | | |
| | 4.50% 6/15/25 | EUR | | 450,000 | | | 643,067 | |
| | | | | | | | 23,433,574 | |
| Total Bonds | | | | | | | |
| | (cost $121,323,574) | | | | | | 137,477,908 | |
| | | | | | | | | |
| ≠Discount Note – 0.83% | | | | | | | |
| | Federal Home Loan Bank | | | | | | | |
| | 0.10% 11/1/10 | USD | | 1,161,010 | | | 1,161,010 | |
| Total Discount Note | | | | | | | |
| | (cost $1,161,010) | | | | | | 1,161,010 | |
| | | | | | | | | |
| Total Value of Securities – 98.83% | | | | | | | |
| | (cost $122,484,584) | | | | | | 138,638,918 | |
| Receivables and Other Assets | | | | | | | |
| | Net of Liabilities – 1.17% | | | | | | 1,641,712 | |
| Net Assets Applicable to 12,005,390 Shares | | | | |
| | Outstanding; Equivalent to | | | | | | | |
| | $11.68 Per Share – 100.00% | | | | | $ | 140,280,630 | |
| | | | | | | | | |
| Components of Net Assets at October 31, 2010: | | | | | | | |
| Shares of beneficial interest | | | | | | | |
| | (unlimited authorization – no par) | | | | | $ | 120,687,453 | |
| Undistributed net investment income | | | | | | 4,027,932 | |
| Accumulated net realized loss on investments | | | | | | (736,781 | ) |
| Net unrealized appreciation of investments | | | | | | | |
| | and foreign currencies | | | | | | 16,302,026 | |
| Total net assets | | | | | $ | 140,280,630 | |
°Principal amount is stated in the currency in which each security is denominated.
AUD — Australian Dollar
EUR — European Monetary Unit
GBP — British Pound Sterling
JPY — Japanese Yen
PLN — Polish Zloty
USD — United States Dollar
| • | Variable rate security. The rate shown is the rate as of October 31, 2010. Interest rates reset periodically. |
| ≠ | The rate shown is the effective yield at the time of purchase. |
| # | Security exempt from registration under Rule 144A of the Securities Act of 1933, as amended. At October 31, 2010, the aggregate amount of Rule 144A securities was $4,850,372, which represented 3.46% of the Portfolio’s net assets. See Note 10 in “Notes to financial statements.” |
MNB — Mellon National Bank
1The following foreign cross currency exchange contract was outstanding at October 31, 2010:
Foreign Cross Currency Exchange Contracts
| | | | | | | | | Unrealized |
| Counterparty | | Contracts to Deliver | | In Exchange For | | Settlement Date | | Appreciation |
| MNB | | EUR (5,117,379) | | GBP 4,490,500 | | 1/28/11 | | $75,931 |
The use of foreign cross currency exchange contracts involves elements of market risk and risks in excess of the amounts recognized in the financial statements. The notional value presented above represents the Portfolio’s total exposure in such contracts, whereas only the net unrealized appreciation is reflected in the Portfolio’s net assets.
1See Note 8 in “Notes to financial statements.”
See accompanying Notes, which are an integral part of the financial statements.
2010 Annual report • Delaware Pooled Trust
116
Delaware Pooled® Trust — The International Fixed Income Portfolio
October 31, 2010
| | | Principal | | Value |
| | | Amount° | | (U.S. $) |
| Bonds – 98.00% | | | | | | |
| Australia – 6.85% | | | | | | |
| | Australian Government | | | | | | |
| | 5.25% 3/15/19 | AUD | | 1,100,000 | | $ | 1,083,096 |
| | 6.00% 2/15/17 | AUD | | 370,000 | | | 379,751 |
| | | | | | | | 1,462,847 |
| Austria – 2.63% | | | | | | |
| | Republic of Austria | | | | | | |
| | 5.25% 1/4/11 | EUR | | 400,000 | | | 560,699 |
| | | | | | | | 560,699 |
| Finland – 3.97% | | | | | | |
| | Finnish Government | | | | | | |
| | 5.375% 7/4/13 | EUR | | 550,000 | | | 848,007 |
| | | | | | | | 848,007 |
| France – 10.75% | | | | | | |
| | Agence Francaise de | | | | | | |
| | Developement 1.80% 6/19/15 | JPY | | 70,000,000 | | | 917,137 |
| | Dexia Municipal Agency | | | | | | |
| | 1.55% 10/31/13 | JPY | | 5,000,000 | | | 63,155 |
| | 1.80% 5/9/17 | JPY | | 35,000,000 | | | 438,023 |
| | France Government | | | | | | |
| | 5.75% 10/25/32 | EUR | | 460,000 | | | 877,549 |
| | | | | | | | 2,295,864 |
| Germany – 12.20% | | | | | | |
| | Bayerische Landesbank | | | | | | |
| | 1.40% 4/22/13 | JPY | | 28,000,000 | | | 354,575 |
| | Deutschland Republic | | | | | | |
| | 6.50% 7/4/27 | EUR | | 430,000 | | | 872,082 |
| | KFW 5.00% 7/4/11 | EUR | | 340,000 | | �� | 486,056 |
| | Rentenbank 1.375% 4/25/13 | JPY | | 70,000,000 | | | 893,555 |
| | | | | | | | 2,606,268 |
| Greece – 1.95% | | | | | | |
| | Hellenic Republic Government | | | | | | |
| | 4.60% 7/20/18 | EUR | | 440,000 | | | 416,764 |
| | | | | | | | 416,764 |
| Ireland – 4.42% | | | | | | |
| | Irish Government | | | | | | |
| | 4.50% 10/18/18 | EUR | | 120,000 | | | 147,286 |
| | 5.00% 4/18/13 | EUR | | 400,000 | | | 560,316 |
| | 5.40% 3/13/25 | EUR | | 200,000 | | | 235,547 |
| | | | | | | | 943,149 |
| Italy – 4.54% | | | | | | |
| | Italy Buoni Poliennali Del Tesoro | | | | | | |
| | 5.25% 8/1/17 | EUR | | 450,000 | | | 702,024 |
| | Republic of Italy | | | | | | |
| | 4.50% 6/8/15 | JPY | | 19,000,000 | | | 266,957 |
| | | | | | | | 968,981 |
| Japan – 12.86% | | | | | | |
| | Development Bank of Japan | | | | | | |
| | 1.05% 6/20/23 | JPY | | 55,000,000 | | | 662,086 |
| | Japan Finance Organization for | | | | | | |
| | Municipal Enterprises | | | | | | |
| | 1.35% 11/26/13 | JPY | | 63,000,000 | | | 809,827 |
| | 1.55% 2/21/12 | JPY | | 22,000,000 | | | 277,894 |
| | Japan Government | | | | | | |
| | 10 Yr Bond 1.50% 9/20/18 | JPY | | 20,000,000 | | | 265,498 |
| | 20 Yr Bond 1.90% 3/22/21 | JPY | | 54,000,000 | | | 731,127 |
| | | | | | | | 2,746,432 |
| Netherlands – 7.34% | | | | | | |
| | Bank Nederlandse Gemeenten | | | | | | |
| | 1.85% 11/7/16 | JPY | | 72,000,000 | | | 940,390 |
| • | ING Bank 6.125% 5/29/23 | EUR | | 160,000 | | | 251,860 |
| | Netherlands Government | | | | | | |
| | 3.75% 7/15/14 | EUR | | 250,000 | | | 376,009 |
| | | | | | | | 1,568,259 |
| Norway – 3.31% | | | | | | |
| | Eksportfinans | | | | | | |
| | 1.60% 3/20/14 | JPY | | 55,000,000 | | | 707,910 |
| | | | | | | | 707,910 |
| Poland – 3.74% | | | | | | |
| | Poland Government | | | | | | |
| | 5.25% 10/25/17 | PLN | | 1,700,000 | | | 590,076 |
| | 5.75% 9/23/22 | PLN | | 590,000 | | | 207,991 |
| | | | | | | | 798,067 |
| Slovenia – 1.73% | | | | | | |
| | Republic of Slovenia | | | | | | |
| | 4.375% 2/6/19 | EUR | | 250,000 | | | 370,589 |
| | | | | | | | 370,589 |
| Spain – 2.34% | | | | | | |
| | Spanish Government | | | | | | |
| | 4.85% 10/31/20 | EUR | | 340,000 | | | 499,402 |
| | | | | | | | 499,402 |
| Supranational – 13.41% | | | | | | |
| | Asian Development Bank | | | | | | |
| | 2.35% 6/21/27 | JPY | | 60,000,000 | | | 817,592 |
| | European Investment Bank | | | | | | |
| | 1.25% 9/20/12 | JPY | | 57,000,000 | | | 722,863 |
| | 2.15% 1/18/27 | JPY | | 20,000,000 | | | 269,252 |
| | Nordic Investment Bank | | | | | | |
| | 1.70% 4/27/17 | JPY | | 80,000,000 | | | 1,055,105 |
| | | | | | | | 2,864,812 |
| United Kingdom – 5.42% | | | | | | |
| | HSBC Holdings 6.25% 3/19/18 | EUR | | 150,000 | | | 243,707 |
| • | Lloyds TSB Bank 5.625% 3/5/18 | EUR | | 175,000 | | | 251,646 |
| | Royal Bank of Scotland | | | | | | |
| | 5.375% 9/30/19 | EUR | | 200,000 | | | 287,731 |
| | Standard Chartered Bank | | | | | | |
| | 5.875% 9/26/17 | EUR | | 150,000 | | | 233,754 |
| • | Standard Life 6.375% 7/12/22 | EUR | | 100,000 | | | 141,675 |
| | | | | | | | 1,158,513 |
| United States – 0.54% | | | | | | |
| • | Zurich Finance USA | | | | | | |
| | 4.50% 6/15/25 | EUR | | 80,000 | | | 114,323 |
| | | | | | | | 114,323 |
| Total Bonds | | | | | | |
| | (cost $17,904,724) | | | | | | 20,930,886 |
| | | | | | | | |
| ≠Discount Note – 0.59% | | | | | | |
| | Federal Home Loan Bank | | | | | | |
| | 0.10% 11/1/10 | USD | | 126,001 | | | 126,001 |
| Total Discount Note | | | | | | |
| | (cost $126,001) | | | | | | 126,001 |
2010 Annual report • Delaware Pooled Trust
(continues) 117
Statements of net assets
Delaware Pooled® Trust — The International Fixed Income Portfolio
| | |
| Total Value of Securities – 98.59% | | | |
| | (cost $18,030,725) | $ | 21,056,887 | |
| Receivables and Other Assets | | | |
| | Net of Liabilities – 1.41% | | 301,333 | |
| Net Assets Applicable to 1,759,265 | | | |
| | Shares Outstanding; Equivalent to | | | |
| | $12.14 Per Share – 100.00% | $ | 21,358,220 | |
| | | | | |
| Components of Net Assets at October 31, 2010: | | | |
| Shares of beneficial interest | | | |
| | (unlimited authorization – no par) | $ | 18,385,025 | |
| Undistributed net investment income | | 493,474 | |
| Accumulated net realized loss on investments | | (576,024 | ) |
| Net unrealized appreciation of investments | | | |
| | and foreign currencies | | 3,055,745 | |
| Total net assets | $ | 21,358,220 | |
°Principal amount is stated in the currency in which each security is denominated.
AUD — Australian Dollar
EUR — European Monetary Unit
GBP — British Pound Sterling
JPY — Japanese Yen
PLN — Polish Zloty
USD — United States Dollar
| • | Variable rate security. The rate shown is the rate as of October 31, 2010. Interest rates reset periodically. |
| ≠ | The rate shown is the effective yield at the time of purchase. |
Summary of Abbreviations:
MNB — Mellon National Bank
Yr — Year
1 The following foreign cross currency exchange contract was outstanding at October 31, 2010:
| Foreign Cross Currency Exchange Contract |
| | | | | | | Settlement | | Unrealized |
| Counterparty | | Contract to Deliver | | In Exchange For | | Date | | Appreciation |
| MNB | | EUR (1,089,459) | | GBP 956,000 | | 1/28/11 | | $16,165 |
The use of foreign cross currency exchange contracts involves elements of market risk and risks in excess of the amounts recognized in the financial statements. The notional value presented above represents the Portfolio’s total exposure in such contracts, whereas only the net unrealized appreciation (depreciation) is reflected in the Portfolio’s net assets.
1See Note 8 in “Notes to financial statements.”
See accompanying Notes, which are an integral part of the financial statements.
2010 Annual report • Delaware Pooled Trust
118
Statements of operations
Delaware Pooled® Trust
Year Ended October 31, 2010
| | The | | | | | | The | | The |
| | Large-Cap | | The | | Large-Cap | | Focus Smid-Cap |
| | Value Equity | | Select 20 | | Growth Equity | | Growth Equity |
| | Portfolio | | Portfolio | | Portfolio | | Portfolio |
| Investment Income: | | | | | | | | | | | | | | | | | | |
| Dividends | | $ | 322,378 | | | $ | 47,220 | | | | $ | 1,815,022 | | | | $ | 22,616 | |
| Interest | | | 316 | | | | 7,330 | | | | | 1,447 | | | | | 10 | |
| Securities lending income | | | — | | | | — | | | | | 16,233 | | | | | — | |
| Foreign tax withheld | | | — | | | | (1,846 | ) | | | | (43,541 | ) | | | | (345 | ) |
| | | | 322,694 | | | | 52,704 | | | | | 1,789,161 | | | | | 22,281 | |
| Expenses: | | | | | | | | | | | | | | | | | | |
| Management fees | | | 56,148 | | | | 72,984 | | | | | 1,315,358 | | | | | 26,880 | |
| Registration fees | | | 16,815 | | | | 16,404 | | | | | 20,173 | | | | | 2,175 | |
| Audit and tax | | | 11,208 | | | | 11,329 | | | | | 22,434 | | | | | 10,836 | |
| Dues and services | | | 7,112 | | | | 7,337 | | | | | 8,358 | | | | | 2,389 | |
| Dividend disbursing and transfer agent fees and expenses | | | 4,374 | | | | 3,757 | | | | | 21,938 | | | | | 3,920 | |
| Accounting and administration expenses | | | 4,055 | | | | 3,865 | | | | | 94,981 | | | | | 1,423 | |
| Reports and statements to shareholders | | | 1,338 | | | | 1,790 | | | | | 7,480 | | | | | 1,884 | |
| Legal fees | | | 1,015 | | | | 964 | | | | | 22,837 | | | | | 318 | |
| Pricing fees | | | 691 | | | | 702 | | | | | 697 | | | | | 707 | |
| Trustees’ fees | | | 615 | | | | 554 | | | | | 13,842 | | | | | 202 | |
| Insurance fees | | | 426 | | | | 424 | | | | | 10,247 | | | | | 118 | |
| Custodian fees | | | 198 | | | | 564 | | | | | 4,863 | | | | | 745 | |
| Consulting fees | | | 157 | | | | 153 | | | | | 3,319 | | | | | 37 | |
| Trustees' expenses | | | 46 | | | | 41 | | | | | 1,015 | | | | | 12 | |
| | | | 104,198 | | | | 120,868 | | | | | 1,547,542 | | | | | 51,646 | |
| Less fees waived | | | (32,535 | ) | | | (34,142 | ) | | | | — | | | | | (18,668 | ) |
| Less expense paid indirectly | | | — | | | | (1 | ) | | | | (2 | ) | | | | — | |
| | | | | | | | | | | | | | | | | | | |
| Total operating expenses | | | 71,663 | | | | 86,725 | | | | | 1,547,540 | | | | | 32,978 | |
| | | | | | | | | | | | | | | | | | | |
| Net Investment Income (Loss) | | | 251,031 | | | | (34,021 | ) | | | | 241,621 | | | | | (10,697 | ) |
| | | | | | | | | | | | | | | | | | | |
| Net Realized and Unrealized Gain (Loss) | | | | | | | | | | | | | | | | | | |
| on Investments and Foreign Currencies: | | | | | | | | | | | | | | | | | | |
| Net realized gain (loss) on: | | | | | | | | | | | | | | | | | | |
| Investments | | | (282,221 | ) | | | 918,278 | | | | | (2,867,161 | ) | | | | 793,967 | |
| Foreign currencies | | | — | | | | (3,947 | ) | | | | — | | | | | (699 | ) |
| Foreign currency exchange contracts | | | — | | | | — | | | | | — | | | | | (513 | ) |
| Net realized gain (loss) | | | (282,221 | ) | | | 914,331 | | | | | (2,867,161 | ) | | | | 792,755 | |
| Net change in unrealized appreciation/depreciation | | | | | | | | | | | | | | | | | | |
| of investments and foreign currencies | | | 1,308,792 | | | | 947,840 | | | | | 50,038,601 | | | | | 569,157 | |
| Net Realized and Unrealized Gain | | | | | | | | | | | | | | | | | | |
| on Investments and Foreign Currencies | | | 1,026,571 | | | | 1,862,171 | | | | | 47,171,440 | | | | | 1,361,912 | |
| | | | | | | | | | | | | | | | | | | |
| Net Increase In Net Assets | | | | | | | | | | | | | | | | | | |
| Resulting from Operations | | $ | 1,277,602 | | | $ | 1,828,150 | | | | $ | 47,413,061 | | | | $ | 1,351,215 | |
See accompanying Notes, which are an integral part of the financial statements
2010 Annual report • Delaware Pooled Trust
(continues) 119
Statements of operations
Delaware Pooled® Trust
| | The | | The | | | | | | | | |
| | Real Estate | | Delaware | | The | | The |
| | Investment | | Macquarie | | Core Focus | | High-Yield |
| | Trust | | Real Estate | | Fixed Income | | Bond |
| | Portfolio II | | Portfolio* | | Portfolio | | Portfolio |
| Investment Income: | | | | | | | | | | | | | | | |
| Dividends | $ | 107,052 | | | $ | 15,808 | | | $ | 2,929 | | | $ | 16,019 | |
| Interest | | 83 | | | | 53 | | | | 687,271 | | | | 2,251,988 | |
| Securities lending income | | — | | | | — | | | | 2,876 | | | | 11,441 | |
| Foreign tax witheld | | — | | | | (710 | ) | | | — | | | | — | |
| | | 107,135 | | | | 15,151 | | | | 693,076 | | | | 2,279,448 | |
| Expenses: | | | | | | | | | | | | | | | |
| Management fees | | 29,009 | | | | 5,601 | | | | 77,758 | | | | 103,845 | |
| Registration fees | | 14,258 | | | | 8,570 | | | | 19,374 | | | | 13,797 | |
| Audit and tax | | 10,795 | | | | 11,251 | | | | 11,602 | | | | 11,833 | |
| Dues and services | | 6,454 | | | | 1,605 | | | | 5,960 | | | | 5,848 | |
| Dividend disbursing and transfer agent fees and expenses | | 3,917 | | | | 1,152 | | | | 5,071 | | | | 6,419 | |
| Custodian fees | | 1,786 | | | | 990 | | | | 3,599 | | | | 2,367 | |
| Accounting and administration expenses | | 1,537 | | | | 295 | | | | 7,720 | | | | 9,162 | |
| Pricing fees | | 803 | | | | 378 | | | | 11,342 | | | | 10,967 | |
| Legal fees | | 426 | | | | 14,987 | | | | 1,764 | | | | 2,249 | |
| Reports and statements to shareholders | | 335 | | | | 1,079 | | | | 923 | | | | 1,128 | |
| Trustees’ fees | | 233 | | | | 30 | | | | 1,123 | | | | 1,311 | |
| Insurance fees | | 212 | | | | — | | | | 906 | | | | 857 | |
| Consulting fees | | 74 | | | | — | | | | 241 | | | | 330 | |
| Trustees' expenses | | 19 | | | | 2 | | | | 83 | | | | 89 | |
| | | 69,858 | | | | 45,940 | | | | 147,466 | | | | 170,202 | |
| Less fees waived | | (32,987 | ) | | | (38,860 | ) | | | (63,537 | ) | | | (33,981 | ) |
| | | | | | | | | | | | | | | | |
| Total operating expenses | | 36,871 | | | | 7,080 | | | | 83,929 | | | | 136,221 | |
| | | | | | | | | | | | | | | | |
| Net Investment Income | | 70,264 | | | | 8,071 | | | | 609,147 | | | | 2,143,227 | |
| | | | | | | | | | | | | | | | |
| Net Realized and Unrealized Gain (Loss) | | | | | | | | | | | | | | | |
| on Investments and Foreign Currencies: | | | | | | | | | | | | | | | |
| Net realized gain (loss) on: | | | | | | | | | | | | | | | |
| Investments | | 1,591,763 | | | | 58,108 | | | | 714,769 | | | | 1,971,654 | |
| Swap contracts | | — | | | | — | | | | (15,513 | ) | | | (1,365 | ) |
| Foreign currencies | | — | | | | (878 | ) | | | — | | | | — | |
| Foreign currency exchange contracts | | — | | | | 620 | | | | — | | | | — | |
| Net realized gain | | 1,591,763 | | | | 57,850 | | | | 699,256 | | | | 1,970,289 | |
| Net change in unrealized appreciation/depreciation | | | | | | | | | | | | | | | |
| of investments and foreign currencies | | (237,783 | ) | | | 287,379 | | | | 268,406 | | | | 351,969 | |
| Net Realized and Unrealized Gain | | | | | | | | | | | | | | | |
| on Investments and Foreign Currencies | | 1,353,980 | | | | 345,229 | | | | 967,662 | | | | 2,322,258 | |
| | | | | | | | | | | | | | | | |
| Net Increase In Net Assets | | | | | | | | | | | | | | | |
| Resulting from Operations | $ | 1,424,244 | | | $ | 353,300 | | | $ | 1,576,809 | | | $ | 4,465,485 | |
*Commenced operations June 30, 2010.
See accompanying Notes, which are an integral part of the financial statements
2010 Annual report • Delaware Pooled Trust
120
| | | | | | | | | | The | | | | |
| | The | | The | | Labor Select | | The |
| | Core Plus | | International | | International | | Emerging |
| | Fixed Income | | Equity | | Equity | | Markets |
| | Portfolio | | Portfolio | | Portfolio | | Portfolio |
| Investment Income: | | | | | | | | | | | | | | | |
| Dividends | $ | 9,075 | | | $ | 36,217,539 | | | $ | 31,499,706 | | | $ | 26,948,917 | |
| Interest | | 2,726,333 | | | | 5,055 | | | | 14,511 | | | | 10,758 | |
| Securities lending income | | 4,745 | | | | 561,764 | | | | 519,232 | | | | 155,150 | |
| Foreign tax withheld | | (4,062 | ) | | | (2,856,317 | ) | | | (2,421,177 | ) | | | (2,900,898 | ) |
| | | 2,736,091 | | | | 33,928,041 | | | | 29,612,272 | | | | 24,213,927 | |
| Expenses: | | | | | | | | | | | | | | | |
| Management fees | | 224,118 | | | | 6,282,890 | | | | 5,631,260 | | | | 6,470,756 | |
| Accounting and administration expenses | | 20,696 | | | | 332,723 | | | | 298,200 | | | | 256,891 | |
| Pricing fees | | 20,221 | | | | 5,167 | | | | 4,234 | | | | 5,885 | |
| Registration fees | | 18,629 | | | | 13,551 | | | | 20,469 | | | | 32,843 | |
| Custodian fees | | 14,266 | | | | 285,440 | | | | 277,777 | | | | 523,630 | |
| Audit and tax | | 13,399 | | | | 50,074 | | | | 45,345 | | | | 48,318 | |
| Dividend disbursing and transfer agent fees and expenses | | 7,573 | | | | 71,336 | | | | 61,066 | | | | 52,516 | |
| Dues and services | | 6,243 | | | | 11,444 | | | | 9,984 | | | | 9,340 | |
| Legal fees | | 4,681 | | | | 81,962 | | | | 72,233 | | | | 64,871 | |
| Trustees’ fees | | 3,027 | | | | 49,208 | | | | 43,794 | | | | 36,882 | |
| Insurance fees | | 2,265 | | | | 37,034 | | | | 32,253 | | | | 25,454 | |
| Reports and statements to shareholders | | 2,228 | | | | 35,136 | | | | 30,309 | | | | 24,319 | |
| Consulting fees | | 655 | | | | 11,595 | | | | 10,582 | | | | 9,120 | |
| Trustees' expenses | | 230 | | | | 8,794 | | | | 3,148 | | | | 4,927 | |
| | | 338,231 | | | | 7,276,354 | | | | 6,540,654 | | | | 7,565,752 | |
| Less fees waived | | (102,822 | ) | | | — | | | | — | | | | — | |
| Less expense paid indirectly | | (1 | ) | | | (5 | ) | | | (4 | ) | | | (2 | ) |
| | | | | | | | | | | | | | | | |
| Total operating expenses | | 235,408 | | | | 7,276,349 | | | | 6,540,650 | | | | 7,565,750 | |
| | | | | | | | | | | | | | | | |
| Net Investment Income | | 2,500,683 | | | | 26,651,692 | | | | 23,071,622 | | | | 16,648,177 | |
| | | | | | | | | | | | | | | | |
| Net Realized and Unrealized Gain (Loss) | | | | | | | | | | | | | | | |
| on Investments and Foreign Currencies: | | | | | | | | | | | | | | | |
| Net realized gain (loss) on: | | | | | | | | | | | | | | | |
| Investments | | 2,593,247 | | | | (13,717,688 | ) | | | (17,220,194 | ) | | | 23,745,913 | |
| Redemptions in kind* | | — | | | | (3,581,435 | ) | | | — | | | | 4,933,623 | |
| Futures contracts | | 148,121 | | | | — | | | | — | | | | — | |
| Swap contracts | | (54,473 | ) | | | — | | | | — | | | | — | |
| Foreign currencies | | 44,060 | | | | (119,056 | ) | | | 537,674 | | | | (460,157 | ) |
Foreign currency exchange contracts | | (275,409 | ) | | | (134,966 | ) | | | (365,935 | ) | | | (341,630 | ) |
| Net realized gain (loss) | | 2,455,546 | | | | (17,553,145 | ) | | | (17,048,455 | ) | | | 27,877,749 | |
| Net change in unrealized appreciation/depreciation | | | | | | | | | | | | | | | |
| of investments and foreign currencies | | 987,308 | | | | 54,969,318 | | | | 47,866,697 | | | | 102,109,216 | |
| Net Realized and Unrealized Gain | | | | | | | | | | | | | | | |
| on Investments and Foreign Currencies | | 3,442,854 | | | | 37,416,173 | | | | 30,818,242 | | | | 129,986,965 | |
| | | | | | | | | | | | | | | | |
| Net Increase In Net Assets | | | | | | | | | | | | | | | |
| Resulting from Operations | $ | 5,943,537 | | | $ | 64,067,865 | | | $ | 53,889,864 | | | $ | 146,635,142 | |
*See Note 12 in “Notes to financial statements.”
See accompanying Notes, which are an integral part of the financial statements
2010 Annual report • Delaware Pooled Trust
(continues) 121
Statements of operations
Delaware Pooled® Trust
| | | | | | The | | | | | | | | |
| | The | | Global | | The | | The |
| | Emerging | | Real Estate | | Global Fixed | | International |
| | Markets | | Securities | | Income | | Fixed Income |
| | Portfolio II* | | Portfolio | | Portfolio | | Portfolio |
| Investment Income: | | | | | | | | | | | | | | | |
| Dividends | $ | 82,015 | | | $ | 2,304,754 | | | $ | — | | | $ | — | |
| Interest | | — | | | | 5,383 | | | | 4,478,057 | | | | 601,409 | |
| Securities lending income | | — | | | | 42,599 | | | | — | | | | — | |
| Foreign tax withheld | | (8,007 | ) | | | (87,300 | ) | | | — | | | | — | |
| | | 74,008 | | | | 2,265,436 | | | | 4,478,057 | | | | 601,409 | |
| |
| Expenses: | | | | | | | | | | | | | | | |
| Management fees | | 37,232 | | | | 558,387 | | | | 667,552 | | | | 97,738 | |
| Audit and tax | | 11,455 | | | | 14,721 | | | | 17,354 | | | | 11,626 | |
| Registration fees | | 9,948 | | | | 35,307 | | | | 12,279 | | | | 13,694 | |
| Legal fees | | 9,204 | | | | 4,839 | | | | 12,229 | | | | 2,180 | |
| Custodian fees | | 3,429 | | | | 31,516 | | | | 45,662 | | | | 8,090 | |
| Reports and statements to shareholders | | 2,410 | | | | 3,290 | | | | 6,831 | | | | 2,002 | |
| Pricing fees | | 2,388 | | | | 5,767 | | | | 4,183 | | | | 3,794 | |
| Dues and services | | 1,704 | | | | 8,820 | | | | 5,015 | | | | 4,517 | |
| Accounting and administration expenses | | 1,472 | | | | 22,393 | | | | 53,015 | | | | 7,761 | |
| Dividend disbursing and transfer agent fees and expenses | | 1,376 | | | | 13,555 | | | | 13,804 | | | | 5,029 | |
| Trustees' fees | | 173 | | | | 3,256 | | | | 7,731 | | | | 1,124 | |
| Trustees' expenses | | 5 | | | | 910 | | | | 571 | | | | 80 | |
| Consulting fees | | — | | | | 736 | | | | 1,820 | | | | 271 | |
| Insurance fees | | — | | | | 2,203 | | | | 6,597 | | | | 819 | |
| Distribution expenses – Class P | | — | | | | 17 | | | | — | | | | — | |
| | | 80,796 | | | | 705,717 | | | | 854,643 | | | | 158,725 | |
| Less fees waived | | (28,777 | ) | | | — | | | | (50,660 | ) | | | (41,211 | ) |
| Less expense paid indirectly | | — | | | | — | | | | (1 | ) | | | — | |
| |
| Total operating expenses | | 52,019 | | | | 705,717 | | | | 803,982 | | | | 117,514 | |
| |
| Net Investment Income | | 21,989 | | | | 1,559,719 | | | | 3,674,075 | | | | 483,895 | |
| |
| Net Realized and Unrealized Gain (Loss) | | | | | | | | | | | | | �� | | |
| on Investments and Foreign Currencies: | | | | | | | | | | | | | | | |
| Net realized gain (loss) on: | | | | | | | | | | | | | | | |
| Investments | | 86,846 | | | | 6,311,094 | | | | 1,565,092 | | | | 71,313 | |
| Foreign currencies | | 14,823 | | | | 126,681 | | | | 586,973 | | | | 129,778 | |
| Foreign currency exchange contracts | | (23,492 | ) | | | (327,682 | ) | | | 911,781 | | | | 99,616 | |
| Net realized gain | | 78,177 | | | | 6,110,093 | | | | 3,063,846 | | | | 300,707 | |
| Net change in unrealized appreciation/depreciation | | | | | | | | | | | | | | | |
| of investments and foreign currencies | | 1,264,294 | | | | 4,475,820 | | | | 6,182,029 | | | | 1,035,146 | |
| Net Realized and Unrealized Gain | | | | | | | | | | | | | | | |
| on Investments and Foreign Currencies | | 1,342,471 | | | | 10,585,913 | | | | 9,245,875 | | | | 1,335,853 | |
| |
| Net Increase In Net Assets | | | | | | | | | | | | | | | |
| Resulting from Operations | $ | 1,364,460 | | | $ | 12,145,632 | | | $ | 12,919,950 | | | $ | 1,819,748 | |
*Commenced operations June 23, 2010.
See accompanying Notes, which are an integral part of the financial statements
2010 Annual report • Delaware Pooled Trust
122
Statements of changes in net assets
Delaware Pooled® Trust
| | | The | | | | | | | | | | The |
| | | Large-Cap | | The | | Large-Cap |
| | | Value Equity | | Select 20 | | Growth Equity |
| | | Portfolio | | Portfolio | | Portfolio |
| | | Year | | Year | | Year | | Year | | Year | | Year |
| | | Ended | | Ended | | Ended | | Ended | | Ended | | Ended |
| | | 10/31/10 | | 10/31/09 | | 10/31/10 | | 10/31/09 | | 10/31/10 | | 10/31/09 |
| Increase (Decrease) in Net Assets | | | | | | | | | | | | | | | | | | | | | | | | |
| from Operations: | | | | | | | | | | | | | | | | | | | | | | | | |
| Net investment income (loss) | | $ | 251,031 | | | $ | 267,966 | | | $ | (34,021 | ) | | $ | (25,945 | ) | | $ | 241,621 | | | $ | 735,200 | |
| Net realized gain (loss) on investments | | | | | | | | | | | | | | | | | | | | | | | | |
| and foreign currencies | | | (282,221 | ) | | | (737,530 | ) | | | 914,331 | | | | (2,570,253 | ) | | | (2,867,161 | ) | | | (59,658,707 | ) |
| Net change in unrealized appreciation/ | | | | | | | | | | | | | | | | | | | | | | | | |
| depreciation of investments | | | | | | | | | | | | | | | | | | | | | | | | |
| and foreign currencies | | | 1,308,792 | | | | 1,568,873 | | | | 947,840 | | | | 4,572,319 | | | | 50,038,601 | | | | 96,061,499 | |
| Net increase in net assets | | | | | | | | | | | | | | | | | | | | | | | | |
| resulting from operations | | | 1,277,602 | | | | 1,099,309 | | | | 1,828,150 | | | | 1,976,121 | | | | 47,413,061 | | | | 37,137,992 | |
| |
| Dividends and Distributions to | | | | | | | | | | | | | | | | | | | | | | | | |
| Shareholders from: | | | | | | | | | | | | | | | | | | | | | | | | |
| Net investment income | | | (269,213 | ) | | | (237,317 | ) | | | — | | | | (8,262 | ) | | | (554,027 | ) | | | (1,012,945 | ) |
| Return of capital | | | — | | | | — | | | | — | | | | (7,220 | ) | | | — | | | | — | |
| | | | (269,213 | ) | | | (237,317 | ) | | | — | | | | (15,482 | ) | | | (554,027 | ) | | | (1,012,945 | ) |
| Capital Share Transactions: | | | | | | | | | | | | | | | | | | | | | | | | |
| Proceeds from shares sold | | | 2,445,843 | | | | 129,918 | | | | 4,016,982 | | | | 13,741 | | | | 6,352,687 | | | | 18,048,099 | |
| Net asset value of shares issued upon | | | | | | | | | | | | | | | | | | | | | | | | |
| reinvestment of dividends and distributions | | | 236,772 | | | | 210,805 | | | | — | | | | — | | | | 384,354 | | | | 776,299 | |
| | | | 2,682,615 | | | | 340,723 | | | | 4,016,982 | | | | 13,741 | | | | 6,737,041 | | | | 18,824,398 | |
| Cost of shares repurchased | | | (7,203,677 | ) | | | (86,008 | ) | | | (4,586,057 | ) | | | (703,650 | ) | | | (60,488,649 | ) | | | (62,458,425 | ) |
| Increase (decrease) in net assets derived | | | | | | | | | | | | | | | | | | | | | | | | |
| from capital share transactions | | | (4,521,062 | ) | | | 254,715 | | | | (569,075 | ) | | | (689,909 | ) | | | (53,751,608 | ) | | | (43,634,027 | ) |
| |
| Net Increase (Decrease) In Net Assets | | | (3,512,673 | ) | | | 1,116,707 | | | | 1,259,075 | | | | 1,270,730 | | | | (6,892,574 | ) | | | (7,508,980 | ) |
| |
| Net Assets: | | | | | | | | | | | | | | | | | | | | | | | | |
| Beginning of year | | | 10,104,906 | | | | 8,988,199 | | | | 10,203,694 | | | | 8,932,964 | | | | 251,016,631 | | | | 258,525,611 | |
| End of year | | $ | 6,592,233 | | | $ | 10,104,906 | | | $ | 11,462,769 | | | $ | 10,203,694 | | | $ | 244,124,057 | | | $ | 251,016,631 | |
| |
| Undistributed net investment income | | $ | 187,798 | | | $ | 205,980 | | | $ | — | | | $ | — | | | $ | 164,775 | | | $ | 477,181 | |
See accompanying Notes, which are an integral part of the financial statements
2010 Annual report • Delaware Pooled Trust
(continues) 123
Statements of changes in net assets
Delaware Pooled® Trust
| | | | | | | | | | | | | | | | | | | The |
| | | The | | The | | Delaware |
| | | Focus Smid-Cap | | Real Estate | | Macquarie |
| | | Growth Equity | | Investment Trust | | Real Estate |
| | | Portfolio | | Portfolio II | | Portfolio |
| | | Year | | Year | | Year | | Year | | 6/30/10* |
| | | Ended | | Ended | | Ended | | Ended | | to |
| | | 10/31/10 | | 10/31/09 | | 10/31/10 | | 10/31/09 | | 10/31/10 |
| Increase (Decrease) in Net Assets | | | | | | | | | | | | | | | | | | | |
| from Operations: | | | | | | | | | | | | | | | | | | | |
| Net investment income (loss) | | $ | (10,697 | ) | | $ | 6,254 | | | $ | 70,264 | | | $ | 156,684 | | | $ | 8,071 |
| Net realized gain (loss) on investments | | | | | | | | | | | | | | | | | | | |
| and foreign currencies | | | 792,755 | | | | (1,424,073 | ) | | | 1,591,763 | | | | (2,692,436 | ) | | | 57,850 |
| Net change in unrealized appreciation/ | | | | | | | | | | | | | | | | | | | |
| depreciation of investments | | | | | | | | | | | | | | | | | | | |
| and foreign currencies | | | 569,157 | | | | 1,982,627 | | | | (237,783 | ) | | | 2,420,886 | | | | 287,379 |
| Net increase (decrease) in net assets | | | | | | | | | | | | | | | | | | | |
| resulting from operations | | | 1,351,215 | | | | 564,808 | | | | 1,424,244 | | | | (114,866 | ) | | | 353,300 |
| |
| Dividends and Distributions to | | | | | | | | | | | | | | | | | | | |
| Shareholders from: | | | | | | | | | | | | | | | | | | | |
| Net investment income | | | — | | | | (36,642 | ) | | | (148,549 | ) | | | (295,942 | ) | | | — |
| | | | — | | | | (36,642 | ) | | | (148,549 | ) | | | (295,942 | ) | | | — |
| Capital Share Transactions: | | | | | | | | | | | | | | | | | | | |
| Proceeds from shares sold | | | 2,004,183 | | | | 544,671 | | | | — | | | | — | | | | 2,000,017 |
| Net asset value of shares issued upon | | | | | | | | | | | | | | | | | | | |
| reinvestment of dividends and distributions | | | — | | | | 30,427 | | | | 148,549 | | | | 295,942 | | | | — |
| | | | 2,004,183 | | | | 575,098 | | | | 148,549 | | | | 295,942 | | | | 2,000,017 |
| Cost of shares repurchased | | | (2,192,256 | ) | | | (1,957,935 | ) | | | (3,888,879 | ) | | | — | | | | — |
| Increase (decrease) in net assets derived | | | | | | | | | | | | | | | | | | | |
| from capital share transactions | | | (188,073 | ) | | | (1,382,837 | ) | | | (3,740,330 | ) | | | 295,942 | | | | 2,000,017 |
| |
| Net Increase (Decrease) In Net Assets | | | 1,163,142 | | | | (854,671 | ) | | | (2,464,635 | ) | | | (114,866 | ) | | | 2,353,317 |
| |
| Net Assets: | | | | | | | | | | | | | | | | | | | |
| Beginning of period | | | 3,450,134 | | | | 4,304,805 | | | | 5,230,788 | | | | 5,345,654 | | | | — |
| End of period | | $ | 4,613,276 | | | $ | 3,450,134 | | | $ | 2,766,153 | | | $ | 5,230,788 | | | $ | 2,353,317 |
| |
| Undistributed net investment income | | $ | — | | | $ | — | | | $ | 29,791 | | | $ | 108,076 | | | $ | 8,482 |
*Commencement of operations.
See accompanying Notes, which are an integral part of the financial statements
2010 Annual report • Delaware Pooled Trust
124
| | | The | | The | | The |
| | | Core Focus | | High-Yield | | Core Plus |
| | | Fixed Income | | Bond | | Fixed Income |
| | | Portfolio | | Portfolio | | Portfolio |
| | | Year | | Year | | Year | | Year | | Year | | Year |
| | | Ended | | Ended | | Ended | | Ended | | Ended | | Ended |
| | | 10/31/10 | | 10/31/09 | | 10/31/10 | | 10/31/09 | | 10/31/10 | | 10/31/09 |
| Increase (Decrease) in Net Assets | | | | | | | | | | | | | | | | | | | | | | | | |
| from Operations: | | | | | | | | | | | | | | | | | | | | | | | | |
| Net investment income | | $ | 609,147 | | | $ | 1,136,686 | | | $ | 2,143,227 | | | $ | 2,233,999 | | | $ | 2,500,683 | | | $ | 4,334,184 | |
| Net realized gain (loss) on investments | | | | | | | | | | | | | | | | | | | | | | | | |
| and foreign currencies | | | 699,256 | | | | (860,626 | ) | | | 1,970,289 | | | | (2,020,762 | ) | | | 2,455,546 | | | | (2,467,074 | ) |
| Net change in unrealized appreciation/ | | | | | | | | | | | | | | | | | | | | | | | | |
| depreciation of investments | | | | | | | | | | | | | | | | | | | | | | | | |
| and foreign currencies | | | 268,406 | | | | 3,214,236 | | | | 351,969 | | | | 7,482,317 | | | | 987,308 | | | | 13,639,895 | |
| Net increase in net assets | | | | | | | | | | | | | | | | | | | | | | | | |
| resulting from operations | | | 1,576,809 | | | | 3,490,296 | | | | 4,465,485 | | | | 7,695,554 | | | | 5,943,537 | | | | 15,507,005 | |
| |
| Dividends and Distributions to | | | | | | | | | | | | | | | | | | | | | | | | |
| Shareholders from: | | | | | | | | | | | | | | | | | | | | | | | | |
| Net investment income | | | (946,676 | ) | | | (1,521,244 | ) | | | (2,139,650 | ) | | | (1,797,338 | ) | | | (3,595,170 | ) | | | (7,498,499 | ) |
| | | | (946,676 | ) | | | (1,521,244 | ) | | | (2,139,650 | ) | | | (1,797,338 | ) | | | (3,595,170 | ) | | | (7,498,499 | ) |
| Capital Share Transactions: | | | | | | | | | | | | | | | | | | | | | | | | |
| Proceeds from shares sold | | | 421,393 | | | | 2,318,488 | | | | 8,437,231 | | | | 1,629,639 | | | | 3,516,375 | | | | 2,343,320 | |
| Net asset value of shares issued upon | | | | | | | | | | | | | | | | | | | | | | | | |
| reinvestment of dividends and distributions | | | 905,776 | | | | 797,612 | | | | 2,139,649 | | | | 1,797,337 | | | | 3,595,169 | | | | 7,498,498 | |
| | | | 1,327,169 | | | | 3,116,100 | | | | 10,576,880 | | | | 3,426,976 | | | | 7,111,544 | | | | 9,841,818 | |
| Cost of shares repurchased | | | (3,299,702 | ) | | | (14,645,434 | ) | | | (7,082,668 | ) | | | (5,522,499 | ) | | | (12,757,770 | ) | | | (75,743,292 | ) |
| Increase (decrease) in net assets derived | | | | | | | | | | | | | | | | | | | | | | | | |
| from capital share transactions | | | (1,972,533 | ) | | | (11,529,334 | ) | | | 3,494,212 | | | | (2,095,523 | ) | | | (5,646,226 | ) | | | (65,901,474 | ) |
| |
| Net Increase (Decrease) In Net Assets | | | (1,342,400 | ) | | | (9,560,282 | ) | | | 5,820,047 | | | | 3,802,693 | | | | (3,297,859 | ) | | | (57,892,968 | ) |
| |
| Net Assets: | | | | | | | | | | | | | | | | | | | | | | | | |
| Beginning of year | | | 20,550,277 | | | | 30,110,559 | | | | 23,616,919 | | | | 19,814,226 | | | | 53,603,318 | | | | 111,496,286 | |
| End of year | | $ | 19,207,877 | | | $ | 20,550,277 | | | $ | 29,436,966 | | | $ | 23,616,919 | | | $ | 50,305,459 | | | $ | 53,603,318 | |
| |
| Undistributed net investment income | | $ | 486,815 | | | $ | 838,156 | | | $ | 1,817,897 | | | $ | 1,756,679 | | | $ | 2,294,011 | | | $ | 3,580,383 | |
See accompanying Notes, which are an integral part of the financial statements
2010 Annual report • Delaware Pooled Trust
(continues) 125
Statements of changes in net assets
Delaware Pooled® Trust
| | | The | | The | | The |
| | | International | | Labor Select | | Emerging |
| | | Equity | | International Equity | | Markets |
| | | Portfolio | | Portfolio | | Portfolio |
| | | Year | | Year | | Year | | Year | | Year | | Year |
| | �� | Ended | | Ended | | Ended | | Ended | | Ended | | Ended |
| | | 10/31/10 | | 10/31/09 | | 10/31/10 | | 10/31/09 | | 10/31/10 | | 10/31/09 |
| Increase (Decrease) in Net Assets | | | | | | | | | | | | | | | | | | | | | | | | |
| from Operations: | | | | | | | | | | | | | | | | | | | | | | | | |
| Net investment income | | $ | 26,651,692 | | | $ | 28,061,648 | | | $ | 23,071,622 | | | $ | 21,462,006 | | | $ | 16,648,177 | | | $ | 14,098,651 | |
| Net realized gain (loss) on investments | | | | | | | | | | | | | | | | | | | | | | | | |
| and foreign currencies | | | (17,553,145 | ) | | | (176,998,227 | ) | | | (17,048,455 | ) | | | (84,699,421 | ) | | | 27,877,749 | | | | (52,376,198 | ) |
| Net change in unrealized appreciation/ | | | | | | | | | | | | | | | | | | | | | | | | |
| depreciation of investments | | | | | | | | | | | | | | | | | | | | | | | | |
| and foreign currencies | | | 54,969,318 | | | | 272,398,584 | | | | 47,866,697 | | | | 177,115,167 | | | | 102,109,216 | | | | 281,676,826 | |
| Net increase in net assets | | | | | | | | | | | | | | | | | | | | | | | | |
| resulting from operations | | | 64,067,865 | | | | 123,462,005 | | | | 53,889,864 | | | | 113,877,752 | | | | 146,635,142 | | | | 243,399,279 | |
| |
| Dividends and Distributions to | | | | | | | | | | | | | | | | | | | | | | | | |
| Shareholders from: | | | | | | | | | | | | | | | | | | | | | | | | |
| Net investment income | | | (28,823,614 | ) | | | (88,843,079 | ) | | | (22,976,321 | ) | | | (45,431,913 | ) | | | (13,508,314 | ) | | | (18,560,863 | ) |
| Net realized gain on investments | | | — | | | | (115,309,708 | ) | | | — | | | | (21,957,887 | ) | | | — | | | | (77,673,850 | ) |
| | | | (28,823,614 | ) | | | (204,152,787 | ) | | | (22,976,321 | ) | | | (67,389,800 | ) | | | (13,508,314 | ) | | | (96,234,713 | ) |
| Capital Share Transactions: | | | | | | | | | | | | | | | | | | | | | | | | |
| Proceeds from shares sold | | | 64,318,903 | | | | 175,739,074 | | | | 33,763,426 | | | | 57,798,530 | | | | 99,252,230 | | | | 35,854,925 | |
| Purchase reimbursement fees | | | | | | | — | | | | — | | | | — | | | | 549,874 | | | | 175,506 | |
| Net asset value of shares issued | | | | | | | | | | | | | | | | | | | | | | | | |
| upon reinvestment of dividends | | | | | | | | | | | | | | | | | | | | | | | | |
| and distributions | | | 14,979,774 | | | | 117,359,230 | | | | 22,846,615 | | | | 67,389,800 | | | | 13,194,917 | | | | 95,274,293 | |
| | | | 79,298,677 | | | | 293,098,304 | | | | 56,610,041 | | | | 125,188,330 | | | | 112,997,021 | | | | 131,304,724 | |
| Cost of shares repurchased | | | (218,588,260 | ) | | | (386,145,988 | ) | | | (144,289,705 | ) | | | (13,477,969 | ) | | | (94,063,461 | ) | | | (151,006,679 | ) |
| Redemption reimbursement fees | | | — | | | | — | | | | — | | | | — | | | | 491,691 | | | | 783,765 | |
| | | | (218,588,260 | ) | | | (386,145,988 | ) | | | (144,289,705 | ) | | | (13,477,969 | ) | | | (93,571,770 | ) | | | (150,222,914 | ) |
| Increase (decrease) in net assets derived | | | | | | | | | | | | | | | | | | | | | | | | |
| from capital share transactions | | | (139,289,583 | ) | | | (93,047,684 | ) | | | (87,679,664 | ) | | | 111,710,361 | | | | 19,425,251 | | | | (18,918,190 | ) |
| |
| Net Increase (Decrease) In Net Assets | | | (104,045,332 | ) | | | (173,738,466 | ) | | | (56,766,121 | ) | | | 158,198,313 | | | | 152,552,079 | | | | 128,246,376 | |
| |
| Net Assets: | | | | | | | | | | | | | | | | | | | | | | | | |
| Beginning of year | | | 913,056,462 | | | 1,086,794,928 | | | | 797,717,745 | | | | 639,519,432 | | | | 597,638,373 | | | | 469,391,997 | |
| End of year | | $ | 809,011,130 | | | $ | 913,056,462 | | | $ | 740,951,624 | | | $ | 797,717,745 | | | $ | 750,190,452 | | | $ | 597,638,373 | |
| |
| Undistributed net investment income | | $ | 22,831,559 | | | $ | 25,053,862 | | | $ | 19,978,046 | | | $ | 19,711,006 | | | $ | 15,442,928 | | | $ | 13,025,164 | |
See accompanying Notes, which are an integral part of the financial statements
2010 Annual report • Delaware Pooled Trust
126
| | | | | | | The |
| | | The | | Global |
| | | Emerging | | Real Estate |
| | | Markets | | Securities |
| | | Portfolio II | | Portfolio |
| | | 6/23/10* | | Year | | Year |
| | | to | | Ended | | Ended |
| | | 10/31/10 | | 10/31/10 | | 10/31/09 |
| Increase (Decrease) in Net Assets | | | | | | | | | | | | |
| from Operations: | | | | | | | | | | | | |
| Net investment income | | $ | 21,989 | | | $ | 1,559,719 | | | $ | 1,916,944 | |
| Net realized gain (loss) on investments | | | | | | | | | | | | |
| and foreign currencies | | | 78,177 | | | | 6,110,093 | | | | (49,044,649 | ) |
| Net change in unrealized appreciation/ | | | | | | | | | | | | |
| depreciation of investments | | | | | | | | | | | | |
| and foreign currencies | | | 1,264,294 | | | | 4,475,820 | | | | 47,409,914 | |
| Net increase in net assets | | | | | | | | | | | | |
| resulting from operations | | | 1,364,460 | | | | 12,145,632 | | | | 282,209 | |
| |
| Dividends and Distributions to Shareholders from: | | | | | | | | | | | | |
| Net investment income Original Class | | | — | | | | (3,905,697 | ) | | | (169,854 | ) |
| Net investment income Class P | | | — | | | | (444 | ) | | | — | |
| | | | — | | | | (3,906,141 | ) | | | (169,854 | ) |
| Capital Share Transactions: | | | | | | | | | | | | |
| Proceeds from shares sold | | | | | | | | | | | | |
| Original Class | | | 10,000,017 | | | | 16,986,524 | | | | 14,409,334 | |
| Net asset value of shares issued upon | | | | | | | | | | | | |
| reinvestment of dividends and | | | | | | | | | | | | |
| distributions Original Class | | | — | | | | 3,574,567 | | | | 162,140 | |
| Net asset value of shares issued upon | | | | | | | | | | | | |
| reinvestment of dividends and | | | | | | | | | | | | |
| distributions Class P | | | — | | | | 444 | | | | — | |
| | | | 10,000,017 | | | | 20,561,535 | | | | 14,571,474 | |
| Cost of shares repurchased | | | | | | | | | | | | |
| Original Class | | | — | | | | (23,252,817 | ) | | | (47,867,643 | ) |
| Increase (decrease) in net assets derived | | | | | | | | | | | | |
| from capital share transactions | | | 10,000,017 | | | | (2,691,282 | ) | | | (33,296,169 | ) |
| |
| Net Increase (Decrease) In Net Assets | | | 11,364,477 | | | | 5,548,209 | | | | (33,183,814 | ) |
| |
| Net Assets: | | | | | | | | | | | | |
| Beginning of period | | | — | | | | 54,766,886 | | | | 87,950,700 | |
| End of period | | $ | 11,364,477 | | | $ | 60,315,095 | | | $ | 54,766,886 | |
| |
| Undistributed net investment income | | $ | 13,320 | | | $ | 2,001,250 | | | $ | 2,293,265 | |
*Commencement of operations.
See accompanying Notes, which are an integral part of the financial statements
2010 Annual report • Delaware Pooled Trust
(continues) 127
Statements of changes in net assets
Delaware Pooled® Trust
| | | The | | The |
| | | Global | | International |
| | | Fixed Income | | Fixed Income |
| | | Portfolio | | Portfolio |
| | | Year | | Year | | Year | | Year |
| | | Ended | | Ended | | Ended | | Ended |
| | | 10/31/10 | | 10/31/09 | | 10/31/10 | | 10/31/09 |
| Increase in Net Assets from Operations: | | | | | | | | | | | | | | | | |
| Net investment income | | $ | 3,674,075 | | | $ | 4,583,504 | | | $ | 483,895 | | | $ | 1,537,596 | |
| Net realized gain on investments | | | | | | | | | | | | | | | | |
| and foreign currencies | | | 3,063,846 | | | | 5,289,253 | | | | 300,707 | | | | 800,077 | |
| Net change in unrealized appreciation/ | | | | | | | | | | | | | | | | |
| depreciation of investments | | | | | | | | | | | | | | | | |
| and foreign currencies | | | 6,182,029 | | | | 13,784,058 | | | | 1,035,146 | | | | 1,059,368 | |
| Net increase in net assets | | | | | | | | | | | | | | | | |
| resulting from operations | | | 12,919,950 | | | | 23,656,815 | | | | 1,819,748 | | | | 3,397,041 | |
| |
| Dividends and Distributions to Shareholders from: | | | | | | | | | | | | | | | | |
| Net investment income | | | (8,038,391 | ) | | | (31,311,090 | ) | | | (2,076,030 | ) | | | (2,146,073 | ) |
| | | | (8,038,391 | ) | | | (31,311,090 | ) | | | (2,076,030 | ) | | | (2,146,073 | ) |
| Capital Share Transactions: | | | | | | | | | | | | | | | | |
| Proceeds from shares sold | | | 11,960,772 | | | | 12,873,471 | | | | — | | | | — | |
| Net asset value of shares issued upon | | | | | | | | | | | | | | | | |
| reinvestment of dividends and distributions | | | 6,831,379 | | | | 27,155,323 | | | | 2,076,030 | | | | 2,146,072 | |
| | | | 18,792,151 | | | | 40,028,794 | | | | 2,076,030 | | | | 2,146,072 | |
| Cost of shares repurchased | | | (26,597,470 | ) | | | (60,331,787 | ) | | | — | | | | (13,674,014 | ) |
| Increase (decrease) in net assets derived | | | | | | | | | | | | | | | | |
| from capital share transactions | | | (7,805,319 | ) | | | (20,302,993 | ) | | | 2,076,030 | | | | (11,527,942 | ) |
| |
| Net Increase (Decrease) In Net Assets | | | (2,923,760 | ) | | | (27,957,268 | ) | | | 1,819,748 | | | | (10,276,974 | ) |
| |
| Net Assets: | | | | | | | | | | | | | | | | |
| Beginning of year | | | 143,204,390 | | | | 171,161,658 | | | | 19,538,472 | | | | 29,815,446 | |
| End of year | | $ | 140,280,630 | | | $ | 143,204,390 | | | $ | 21,358,220 | | | $ | 19,538,472 | |
| |
| Undistributed net investment income | | $ | 4,027,932 | | | $ | 6,336,270 | | | $ | 493,474 | | | $ | 1,762,634 | |
See accompanying Notes, which are an integral part of the financial statements
2010 Annual report • Delaware Pooled Trust
128
Financial highlights
Delaware Pooled® Trust — The Large-Cap Value Equity Portfolio
Selected data for each share of the Portfolio outstanding throughout each period were as follows:
| | | Year Ended | |
| | | 10/31/10 | | 10/31/09 | | 10/31/08 | | 10/31/07 | | 10/31/06 | |
| Net asset value, beginning of period | | $13.290 | | | $12.190 | | | $22.370 | | | $20.960 | | | $17.330 | | |
| | |
| Income (loss) from investment operations: | | | | | | | | | | | | | | | | |
| Net investment income1 | | 0.343 | | | 0.354 | | | 0.403 | | | 0.439 | | | 0.353 | | |
| Net realized and unrealized gain (loss) on investments | | 1.851 | | | 1.067 | | | (8.186 | ) | | 1.315 | | | 3.531 | | |
| Total from investment operations | | 2.194 | | | 1.421 | | | (7.783 | ) | | 1.754 | | | 3.884 | | |
| | |
| Less dividends and distributions from: | | | | | | | | | | | | | | | | |
| Net investment income | | (0.354 | ) | | (0.321 | ) | | (0.613 | ) | | (0.344 | ) | | (0.254 | ) | |
| Net realized gain on investments | | — | | | — | | | (1.784 | ) | | — | | | — | | |
| Total dividends and distributions | | (0.354 | ) | | (0.321 | ) | | (2.397 | ) | | (0.344 | ) | | (0.254 | ) | |
| | |
| Net asset value, end of period | | $15.130 | | | $13.290 | | | $12.190 | | | $22.370 | | | $20.960 | | |
| | |
| Total return2 | | 16.80% | | | 12.12% | | | (38.48% | ) | | 8.49% | | | 22.66% | | |
| | |
| Ratios and supplemental data: | | | | | | | | | | | | | | | | |
| Net assets, end of period (000 omitted) | | $6,592 | | | $10,105 | | | $8,988 | | | $10,278 | | | $16,317 | | |
| Ratio of expenses to average net assets | | 0.70% | | | 0.69% | | | 0.68% | | | 0.69% | | | 0.68% | | |
| Ratio of expenses to average net assets | | | | | | | | | | | | | | | | |
| prior to fees waived and expense paid indirectly | | 1.02% | | | 0.98% | | | 1.16% | | | 1.00% | | | 1.15% | | |
| Ratio of net investment income to average net assets | | 2.46% | | | 2.99% | | | 2.43% | | | 2.00% | | | 1.88% | | |
| Ratio of net investment income to average net assets | | | | | | | | | | | | | | | | |
| prior to fees waived and expense paid indirectly | | 2.14% | | | 2.70% | | | 1.95% | | | 1.69% | | | 1.41% | | |
| Portfolio turnover | | 42% | | | 26% | | | 34% | | | 14% | | | 109% | | |
1 The average shares outstanding method has been applied for per share information.
2 Total investment return is based on the change in net asset value of a share during the period and assumes reinvestment of dividends and distributions at net asset value. Total investment return during all of the periods shown reflects a waiver by the manager. Performance would have been lower had the waiver not been in effect.
See accompanying Notes, which are an integral part of the financial statements
2010 Annual report • Delaware Pooled Trust
(continues) 129
Financial highlights
Delaware Pooled® Trust — The Select 20 Portfolio
Selected data for each share of the Portfolio outstanding throughout each period were as follows:
| | | Year Ended | |
| | | 10/31/10 | | 10/31/09 | | 10/31/08 | | 10/31/07 | | 10/31/06 | |
| Net asset value, beginning of period | | $4.980 | | | $4.040 | | | $6.880 | | | $5.770 | | | $5.590 | | |
| | |
| Income (loss) from investment operations: | | | | | | | | | | | | | | | | |
| Net investment income (loss)1 | | (0.019 | ) | | (0.012 | ) | | 0.008 | | | (0.016 | ) | | (0.011 | ) | |
| Net realized and unrealized gain (loss) on investments | | | | | | | | | | | | | | | | |
| and foreign currencies | | 1.079 | | | 0.959 | | | (2.848 | ) | | 1.126 | | | 0.191 | | |
| Total from investment operations | | 1.060 | | | 0.947 | | | (2.840 | ) | | 1.110 | | | 0.180 | | |
| | |
| Less dividends and distributions from: | | | | | | | | | | | | | | | | |
| Net investment income | | — | | | (0.004 | ) | | — | | | — | | | — | | |
| Return of capital | | — | | | (0.003 | ) | | — | | | — | | | — | | |
| Total dividends and distributions | | — | | | (0.007 | ) | | — | | | — | | | — | | |
| | |
| Net asset value, end of period | | $6.040 | | | $4.980 | | | $4.040 | | | $6.880 | | | $5.770 | | |
| | |
| Total return2 | | 21.29% | | | 23.51% | | | (41.28% | ) | | 19.24% | | | 3.22% | | |
| | |
| Ratios and supplemental data: | | | | | | | | | | | | | | | | |
| Net assets, end of period (000 omitted) | | $11,463 | | | $10,204 | | | $8,933 | | | $2,633 | | | $7,983 | | |
| Ratio of expenses to average net assets | | 0.89% | | | 0.89% | | | 0.89% | | | 0.90% | | | 0.89% | | |
| Ratio of expenses to average net assets | | | | | | | | | | | | | | | | |
| prior to fees waived and expense paid indirectly | | 1.24% | | | 1.18% | | | 1.64% | | | 1.23% | | | 1.06% | | |
| Ratio of net investment income (loss) to average net assets | | (0.35% | ) | | (0.29% | ) | | 0.15% | | | (0.26% | ) | | (0.20% | ) | |
| Ratio of net investment loss to average net assets | | | | | | | | | | | | | | | | |
| prior to fees waived and expense paid indirectly | | (0.70% | ) | | (0.58% | ) | | (0.60% | ) | | (0.59% | ) | | (0.37% | ) | |
| Portfolio turnover | | 80% | | | 53% | | | 61% | | | 47% | | | 55% | | |
1 The average shares outstanding method has been applied for per share information.
2 Total investment return is based on the change in net asset value of a share during the period and assumes reinvestment of dividends and distributions at net asset value. Total investment return during all of the periods shown reflects a waiver by the manager. Performance would have been lower had the waiver not been in effect.
See accompanying Notes, which are an integral part of the financial statements
2010 Annual report • Delaware Pooled Trust
130
Delaware Pooled® Trust — The Large-Cap Growth Equity Portfolio
Selected data for each share of the Portfolio outstanding throughout each period were as follows:
| | | | | | | | | | | | | | | 11/1/051 | |
| | | Year Ended | | to | |
| | | 10/31/10 | | 10/31/09 | | 10/31/08 | | 10/31/07 | | 10/31/06 | |
| Net asset value, beginning of period | | $7.350 | | | $6.220 | | | $10.560 | | | $8.780 | | | $8.500 | | |
| | |
| Income (loss) from investment operations: | | | | | | | | | | | | | | | | |
| Net investment income2 | | 0.008 | | | 0.020 | | | 0.018 | | | 0.016 | | | 0.008 | | |
| Net realized and unrealized gain (loss) on investments | | | | | | | | | | | | | | | | |
| and foreign currencies | | 1.559 | | | 1.135 | | | (4.256 | ) | | 1.768 | | | 0.277 | | |
| Total from investment operations | | 1.567 | | | 1.155 | | | (4.238 | ) | | 1.784 | | | 0.285 | | |
| | |
| Less dividends and distributions from: | | | | | | | | | | | | | | | | |
| Net investment income | | (0.017 | ) | | (0.025 | ) | | (0.014 | ) | | (0.004 | ) | | (0.005 | ) | |
| Net realized gain on investments | | — | | | — | | | (0.088 | ) | | — | | | — | | |
| Total dividends and distributions | | (0.017 | ) | | (0.025 | ) | | (0.102 | ) | | (0.004 | ) | | (0.005 | ) | |
| | |
| Net asset value, end of period | | $8.900 | | | $7.350 | | | $6.220 | | | $10.560 | | | $8.780 | | |
| | |
| Total return3 | | 21.35% | | | 18.51% | | | (40.50% | ) | | 20.33% | | | 3.35% | | |
| | |
| Ratios and supplemental data: | | | | | | | | | | | | | | | | |
| Net assets, end of period (000 omitted) | | $244,124 | | | $251,017 | | | $258,526 | | | $460,900 | | | $286,848 | | |
| Ratio of expenses to average net assets | | 0.65% | | | 0.65% | | | 0.65% | | | 0.64% | | | 0.65% | | |
| Ratio of expenses to average net assets | | | | | | | | | | | | | | | | |
| prior to fees waived and expense paid indirectly | | 0.65% | | | 0.66% | | | 0.65% | | | 0.64% | | | 0.71% | | |
| Ratio of net investment income to average net assets | | 0.10% | | | 0.32% | | | 0.20% | | | 0.17% | | | 0.10% | | |
| Ratio of net investment income to average net assets | | | | | | | | | | | | | | | | |
| prior to fees waived and expense paid indirectly | | 0.10% | | | 0.31% | | | 0.20% | | | 0.17% | | | 0.04% | | |
| Portfolio turnover | | 22% | | | 30% | | | 38% | | | 25% | | | 25% | | |
1 Date of commencement of operations.
2 The average shares outstanding method has been applied for per share information.
3 Total investment return is based on the change in net asset value of a share during the period and assumes reinvestment of dividends and distributions at net asset value. Total investment return during some of the periods shown reflects a waiver by the manager. Performance would have been lower had the waiver not been in effect.
See accompanying Notes, which are an integral part of the financial statements
2010 Annual report • Delaware Pooled Trust
(continues) 131
Delaware Pooled® Trust — The Focus Smid-Cap Growth Equity Portfolio
Selected data for each share of the Portfolio outstanding throughout each period were as follows:
| | | Year Ended | |
| | | 10/31/10 | | 10/31/09 | | 10/31/08 | | 10/31/07 | | 10/31/06 | |
| Net asset value, beginning of period | | $8.710 | | | $6.580 | | | $11.360 | | | $10.290 | | | $9.460 | | |
| | |
| Income (loss) from investment operations: | | | | | | | | | | | | | | | | |
| Net investment income (loss)1 | | (0.031 | ) | | 0.013 | | | 0.056 | | | 0.018 | | | 0.018 | | |
| Net realized and unrealized gain (loss) on investments | | | | | | | | | | | | | | | | |
| and foreign currencies | | 3.611 | | | 2.173 | | | (4.079 | ) | | 1.527 | | | 0.812 | | |
| Total from investment operations | | 3.580 | | | 2.186 | | | (4.023 | ) | | 1.545 | | | 0.830 | | |
| | |
| Less dividends and distributions from: | | | | | | | | | | | | | | | | |
| Net investment income | | — | | | (0.056 | ) | | (0.031 | ) | | (0.013 | ) | | — | | |
| Net realized gain on investments | | — | | | — | | | (0.726 | ) | | (0.462 | ) | | — | | |
| Total dividends and distributions | | — | | | (0.056 | ) | | (0.757 | ) | | (0.475 | ) | | — | | |
| | |
| Net asset value, end of period | | $12.290 | | | $8.710 | | | $6.580 | | | $11.360 | | | $10.290 | | |
| | |
| Total return2 | | 41.10% | | | 33.07% | | | (37.44% | ) | | 15.77% | | | 8.77% | | |
| | |
| Ratios and supplemental data: | | | | | | | | | | | | | | | | |
| Net assets, end of period (000 omitted) | | $4,613 | | | $3,450 | | | $4,305 | | | $8,781 | | | $6,099 | | |
| Ratio of expenses to average net assets | | 0.92% | | | 0.92% | | | 0.92% | | | 0.93% | | | 0.92% | 3 | |
| Ratio of expenses to average net assets | | | | | | | | | | | | | | | | |
| prior to fees waived and expense paid indirectly | | 1.44% | | | 1.48% | | | 1.12% | | | 1.11% | | | 1.36% | | |
| Ratio of net investment income (loss) to average net assets | | (0.30% | ) | | 0.19% | | | 0.63% | | | 0.18% | | | 0.18% | | |
| Ratio of net investment income (loss) to average net assets | | | | | | | | | | | | | | | | |
| prior to fees waived and expense paid indirectly | | (0.82% | ) | | (0.37% | ) | | 0.43% | | | (0.01% | ) | | (0.26% | ) | |
| Portfolio turnover | | 86% | | | 51% | | | 43% | | | 33% | | | 113% | | |
1 The average shares outstanding method has been applied for per share information.
2 Total investment return is based on the change in net asset value of a share during the period and assumes reinvestment of dividends and distributions at net asset value. Total investment return during all of the periods shown reflects a waiver by the manager. Performance would have been lower had the waiver not been in effect.
3 Ratio for the year ended October 31, 2006, including fees paid indirectly in accordance with Securities and Exchange Commission rules, was 0.98%.
See accompanying Notes, which are an integral part of the financial statements
2010 Annual report • Delaware Pooled Trust
132
Delaware Pooled® Trust — The Real Estate Investment Trust Portfolio II
Selected data for each share of the Portfolio outstanding throughout each period were as follows:
| | | Year Ended | |
| | | 10/31/10 | | 10/31/09 | | 10/31/08 | | 10/31/07 | | 10/31/06 | |
| Net asset value, beginning of period | | $4.260 | | | $4.680 | | | $13.600 | | | $30.730 | | | $26.430 | | |
| | |
| Income (loss) from investment operations: | | | | | | | | | | | | | | | | |
| Net investment income1 | | 0.090 | | | 0.129 | | | 0.157 | | | 0.150 | | | 0.589 | | |
| Net realized and unrealized gain (loss) on investments | | 1.561 | | | (0.290 | ) | | (3.806 | ) | | 0.763 | | | 7.423 | | |
| Total from investment operations | | 1.651 | | | (0.161 | ) | | (3.649 | ) | | 0.913 | | | 8.012 | | |
| | |
| Less dividends and distributions from: | | | | | | | | | | | | | | | | |
| Net investment income | | (0.121 | ) | | (0.259 | ) | | (0.124 | ) | | (0.205 | ) | | (1.101 | ) | |
| Net realized gain on investments | | — | | | — | | | (5.147 | ) | | (17.838 | ) | | (2.611 | ) | |
| Total dividends and distributions | | (0.121 | ) | | (0.259 | ) | | (5.271 | ) | | (18.043 | ) | | (3.712 | ) | |
| | |
| Net asset value, end of period | | $5.790 | | | $4.260 | | | $4.680 | | | $13.600 | | | $30.730 | | |
| | |
| Total return2 | | $39.51% | | | (2.62% | ) | | (37.42% | ) | | 2.41% | | | 34.27% | | |
| | |
| Ratios and supplemental data: | | | | | | | | | | | | | | | | |
| Net assets, end of period (000 omitted) | | $2,766 | | | $5,231 | | | $5,346 | | | $13,789 | | | $25,417 | | |
| Ratio of expenses to average net assets | | 0.95% | | | 0.91% | | | 0.86% | | | 0.88% | | | 0.86% | | |
| Ratio of expenses to average net assets | | | | | | | | | | | | | | | | |
| prior to fees waived and expense paid indirectly | | 1.81% | | | 1.53% | | | 1.20% | | | 0.98% | | | 0.94% | | |
| Ratio of net investment income to average net assets | | 1.82% | | | 3.57% | | | 2.27% | | | 0.97% | | | 2.22% | | |
| Ratio of net investment income to average net assets | | | | | | | | | | | | | | | | |
| prior to fees waived and expense paid indirectly | | 0.96% | | | 2.95% | | | 1.93% | | | 0.87% | | | 2.14% | | |
| Portfolio turnover | | 192% | | | 169% | | | 121% | | | 93% | | | 68% | | |
1 The average shares outstanding method has been applied for per share information.
2 Total investment return is based on the change in net asset value of a share during the period and assumes reinvestment of dividends and distributions at net asset value. Total investment return during all of the periods shown reflects a waiver by the manager. Performance would have been lower had the waiver not been in effect.
See accompanying Notes, which are an integral part of the financial statements
2010 Annual report • Delaware Pooled Trust
(continues) 133
Delaware Pooled® Trust — The Delaware Macquarie Real Estate Portfolio
Selected data for each share of the Portfolio outstanding throughout the period were as follows:
| | | 6/30/101 | |
| | | to | |
| | | 10/31/10 | |
| Net asset value, beginning of period | | $8.500 | | |
| | |
| Income from investment operations: | | | | |
| Net investment income2 | | 0.035 | | |
| Net realized and unrealized gain on investments | | 1.465 | | |
| Total from investment operations | | 1.500 | | |
| | |
| Net asset value, end of period | | $10.000 | | |
| | |
| Total return3 | | 17.65% | | |
| | |
| Ratios and supplemental data: | | | | |
| Net assets, end of period (000 omitted) | | $2,353 | | |
| Ratio of expenses to average net assets | | 0.95% | | |
| Ratio of expenses to average net assets | | | | |
| prior to fees waived and expense paid indirectly | | 6.15% | | |
| Ratio of net investment income to average net assets | | 1.08% | | |
| Ratio of net investment loss to average net assets | | | | |
| prior to fees waived and expense paid indirectly | | (4.12% | ) | |
| Portfolio turnover | | 40% | | |
1 Date of commencement of operations; ratios have been annualized and total return and portfolio turnover have not been annualized.
2 The average shares outstanding method has been applied for per share information.
3 Total investment return is based on the change in net asset value of a share during the period and assumes reinvestment of dividends and distributions at net asset value. Total investment return during the period shown reflects a waiver by the manager. Performance would have been lower had the waiver not been in effect.
See accompanying Notes, which are an integral part of the financial statements
2010 Annual report • Delaware Pooled Trust
134
Delaware Pooled® Trust — The Core Focus Fixed Income Portfolio
Selected data for each share of the Portfolio outstanding throughout each period were as follows:
| | Year Ended |
| | | 10/31/10 | | 10/31/09 | | 10/31/08 | | 10/31/07 | | 10/31/06 | |
| Net asset value, beginning of period | | $9.120 | | | $8.150 | | | $9.140 | | | $9.100 | | | $8.820 | | |
| | | | | | | | | | | | | | | | | |
| Income (loss) from investment operations: | | | | | | | | | | | | | | | | |
| Net investment income1 | | 0.284 | | | 0.414 | | | 0.403 | | | 0.444 | | | 0.405 | | |
| Net realized and unrealized gain (loss) on investments | | | | | | | | | | | | | | | | |
| and foreign currencies | | 0.456 | | | 0.968 | | | (0.753 | ) | | (0.030 | ) | | 0.035 | | |
| Total from investment operations | | 0.740 | | | 1.382 | | | (0.350 | ) | | 0.414 | | | 0.440 | | |
| | | | | | | | | | | | | | | | | |
| Less dividends and distributions from: | | | | | | | | | | | | | | | | |
| Net investment income | | (0.420 | ) | | (0.412 | ) | | (0.640 | ) | | (0.374 | ) | | (0.160 | ) | |
| Total dividends and distributions | | (0.420 | ) | | (0.412 | ) | | (0.640 | ) | | (0.374 | ) | | (0.160 | ) | |
| | | | | | | | | | | | | | | | | |
| Net asset value, end of period | | $9.440 | | | $9.120 | | | $8.150 | | | $9.140 | | | $9.100 | | |
| | | | | | | | | | | | | | | | | |
| Total return2 | | 8.46% | | | 17.41% | | | (4.13% | ) | | 4.70% | | | 5.06% | | |
| | | | | | | | | | | | | | | | | |
| Ratios and supplemental data: | | | | | | | | | | | | | | | | |
| Net assets, end of period (000 omitted) | | $19,208 | | | $20,550 | | | $30,111 | | | $41,311 | | | $53,842 | | |
| Ratio of expenses to average net assets | | 0.43% | | | 0.43% | | | 0.42% | | | 0.37% | | | 0.43% | 3 | |
| Ratio of expenses to average net assets | | | | | | | | | | | | | | | | |
| prior to fees waived and expense paid indirectly | | 0.76% | | | 0.71% | | | 0.63% | | | 0.56% | | | 0.66% | | |
| Ratio of net investment income to average net assets | | 3.13% | | | 4.94% | | | 4.63% | | | 4.96% | | | 4.60% | | |
| Ratio of net investment income to average net assets | | | | | | | | | | | | | | | | |
| prior to fees waived and expense paid indirectly | | 2.80% | | | 4.66% | | | 4.39% | | | 4.75% | | | 4.37% | | |
| Portfolio turnover | | 437% | | | 299% | | | 359% | | | 505% | | | 555% | | |
| 1 The average shares outstanding method has been applied for per share information. |
| 2 Total investment return is based on the change in net asset value of a share during the period and assumes reinvestment of dividends and distributions at net asset value. Total investment return during all of the periods shown reflects a waiver by the manager. Performance would have been lower had the waiver not been in effect. |
| 3 Ratio for the year ended October 31, 2006, including fees paid indirectly in accordance with Securities and Exchange Commission rules, was 0.47%. |
See accompanying Notes, which are an integral part of the financial statements
2010 Annual report • Delaware Pooled Trust
(continues) 135
Financial highlights
Delaware Pooled® Trust — The High-Yield Bond Portfolio
Selected data for each share of the Portfolio outstanding throughout each period were as follows:
| | Year Ended |
| | | 10/31/10 | | 10/31/09 | | 10/31/08 | | 10/31/07 | | 10/31/06 | |
| Net asset value, beginning of period | | $7.350 | | | $5.580 | | | $8.060 | | | $8.160 | | | $7.430 | | |
| | | | | | | | | | | | | | | | | |
| Income (loss) from investment operations: | | | | | | | | | | | | | | | | |
| Net investment income1 | | 0.691 | | | 0.656 | | | 0.590 | | | 0.595 | | | 0.621 | | |
| Net realized and unrealized gain (loss) on investments | | 0.731 | | | 1.634 | | | (2.492 | ) | | (0.062 | ) | | 0.210 | | |
| Total from investment operations | | 1.422 | | | 2.290 | | | (1.902 | ) | | 0.533 | | | 0.831 | | |
| | | | | | | | | | | | | | | | | |
| Less dividends and distributions from: | | | | | | | | | | | | | | | | |
| Net investment income | | (0.662 | ) | | (0.520 | ) | | (0.578 | ) | | (0.633 | ) | | (0.101 | ) | |
| Total dividends and distributions | | (0.662 | ) | | (0.520 | ) | | (0.578 | ) | | (0.633 | ) | | (0.101 | ) | |
| | | | | | | | | | | | | | | | | |
| Net asset value, end of period | | $8.110 | | | $7.350 | | | $5.580 | | | $8.060 | | | $8.160 | | |
| | | | | | | | | | | | | | | | | |
| Total return2 | | 20.85% | | | 46.38% | | | (25.30% | ) | | 6.89% | | | 11.33% | | |
| | | | | | | | | | | | | | | | | |
| Ratios and supplemental data: | | | | | | | | | | | | | | | | |
| Net assets, end of period (000 omitted) | | $29,437 | | | $23,617 | | | $19,814 | | | $21,497 | | | $6,166 | | |
| Ratio of expenses to average net assets | | 0.59% | | | 0.59% | | | 0.54% | | | 0.43% | | | 0.59% | | |
| Ratio of expenses to average net assets | | | | | | | | | | | | | | | | |
| prior to fees waived and expense paid indirectly | | 0.74% | | | 0.78% | | | 0.77% | | | 0.70% | | | 1.03% | | |
| Ratio of net investment income to average net assets | | 9.29% | | | 11.05% | | | 8.25% | | | 7.45% | | | 8.05% | | |
| Ratio of net investment income to average net assets | | | | | | | | | | | | | | | | |
| prior to fees waived and expense paid indirectly | | 9.14% | | | 10.86% | | | 8.02% | | | 7.18% | | | 7.61% | | |
| Portfolio turnover | | 144% | | | 119% | | | 132% | | | 177% | | | 142% | | |
| 1 The average shares outstanding method has been applied for per share information. |
| 2 Total investment return is based on the change in net asset value of a share during the period and assumes reinvestment of dividends and distributions at net asset value. Total investment return during all of the periods shown reflects a waiver by the manager. Performance would have been lower had the waiver not been in effect. |
See accompanying Notes, which are an integral part of the financial statements
2010 Annual report • Delaware Pooled Trust
136
Delaware Pooled® Trust — The Core Plus Fixed Income Portfolio
Selected data for each share of the Portfolio outstanding throughout each period were as follows:
| | Year Ended |
| | | 10/31/10 | | 10/31/09 | | 10/31/08 | | 10/31/07 | | 10/31/06 | |
| Net asset value, beginning of period | | $9.700 | | | $8.290 | | | $9.540 | | | $9.550 | | | $9.260 | | |
| | | | | | | | | | | | | | | | | |
| Income (loss) from investment operations: | | | | | | | | | | | | | | | | |
| Net investment income1 | | 0.463 | | | 0.506 | | | 0.467 | | | 0.495 | | | 0.450 | | |
| Net realized and unrealized gain (loss) on investments | | | | | | | | | | | | | | | | |
| and foreign currencies | | 0.660 | | | 1.474 | | | (0.991 | ) | | (0.065 | ) | | 0.110 | | |
| Total from investment operations | | 1.123 | | | 1.980 | | | (0.524 | ) | | 0.430 | | | 0.560 | | |
| | | | | | | | | | | | | | | | | |
| Less dividends and distributions from: | | | | | | | | | | | | | | | | |
| Net investment income | | (0.693 | ) | | (0.570 | ) | | (0.726 | ) | | (0.440 | ) | | (0.270 | ) | |
| Total dividends and distributions | | (0.693 | ) | | (0.570 | ) | | (0.726 | ) | | (0.440 | ) | | (0.270 | ) | |
| | | | | | | | | | | | | | | | | |
| Net asset value, end of period | | $10.130 | | | $9.700 | | | $8.290 | | | $9.540 | | | $9.550 | | |
| | | | | | | | | | | | | | | | | |
| Total return2 | | 12.05% | | | 25.55% | | | (5.91% | ) | | 4.66% | | | 6.20% | | |
| | | | | | | | | | | | | | | | | |
| Ratios and supplemental data: | | | | | | | | | | | | | | | | |
| Net assets, end of period (000 omitted) | | $50,305 | | | $53,603 | | | $111,496 | | | $190,308 | | | $204,874 | | |
| Ratio of expenses to average net assets | | 0.45% | | | 0.45% | | | 0.42% | | | 0.38% | | | 0.45% | 3 | |
| Ratio of expenses to average net assets | | | | | | | | | | | | | | | | |
| prior to fees waived and expense paid indirectly | | 0.65% | | | 0.61% | | | 0.57% | | | 0.54% | | | 0.56% | | |
| Ratio of net investment income to average net assets | | 4.80% | | | 5.95% | | | 5.19% | | | 5.29% | | | 4.89% | | |
| Ratio of net investment income to average net assets | | | | | | | | | | | | | | | | |
| prior to fees waived and expense paid indirectly | | 4.60% | | | 5.79% | | | 5.03% | | | 5.12% | | | 4.78% | | |
| Portfolio turnover | | 239% | | | 218% | | | 315% | | | 503% | | | 421% | | |
| 1 The average shares outstanding method has been applied for per share information. |
| 2 Total investment return is based on the change in net asset value of a share during the period and assumes reinvestment of dividends and distributions at net asset value. Total investment return during all of the periods shown reflects a waiver by the manager. Performance would have been lower had the waiver not been in effect. |
| 3 Ratio for the year ended October 31, 2006, including fees paid indirectly in accordance with Securities and Exchange Commission rules, was 0.47%. |
See accompanying Notes, which are an integral part of the financial statements
2010 Annual report • Delaware Pooled Trust
(continues) 137
Financial highlights
Delaware Pooled® Trust — The International Equity Portfolio
Selected data for each share of the Portfolio outstanding throughout each period were as follows:
| | Year Ended |
| | | 10/31/10 | | 10/31/09 | | 10/31/08 | | 10/31/07 | | 10/31/06 | |
| Net asset value, beginning of period | | $12.980 | | | $14.480 | | | $27.200 | | | $25.330 | | | $20.460 | | |
| | | | | | | | | | | | | | | | | |
| Income (loss) from investment operations: | | | | | | | | | | | | | | | | |
| Net investment income1 | | 0.406 | | | 0.382 | | | 0.757 | | | 0.680 | | | 0.671 | | |
| Net realized and unrealized gain (loss) on investments | | | | | | | | | | | | | | | | |
| and foreign currencies | | 0.712 | | | 1.296 | | | (10.746 | ) | | 4.632 | | | 5.247 | | |
| Total from investment operations | | 1.118 | | | 1.678 | | | (9.989 | ) | | 5.312 | | | 5.918 | | |
| | | | | | | | | | | | | | | | | |
| Less dividends and distributions from: | | | | | | | | | | | | | | | | |
| Net investment income | | (0.418 | ) | | (1.383 | ) | | (0.574 | ) | | (0.707 | ) | | (0.531 | ) | |
| Net realized gain on investments | | — | | | (1.795 | ) | | (2.157 | ) | | (2.735 | ) | | (0.517 | ) | |
| Total dividends and distributions | | (0.418 | ) | | (3.178 | ) | | (2.731 | ) | | (3.442 | ) | | (1.048 | ) | |
| | | | | | | | | | | | | | | | | |
| Net asset value, end of period | | $13.680 | | | $12.980 | | | $14.480 | | | $27.200 | | | $25.330 | | |
| | | | | | | | | | | | | | | | | |
| Total return2 | | 8.77% | | | 16.11% | | | (40.40% | ) | | 23.35% | | | 30.13% | | |
| | | | | | | | | | | | | | | | | |
| Ratios and supplemental data: | | | | | | | | | | | | | | | | |
| Net assets, end of period (000 omitted) | | $809,011 | | | $913,056 | | | $1,086,795 | | | $2,519,761 | | | $2,167,690 | | |
| Ratio of expenses to average net assets | | 0.87% | | | 0.88% | | | 0.87% | | | 0.88% | | | 0.90% | | |
| Ratio of net investment income to average net assets | | 3.18% | | | 3.35% | | | 3.58% | | | 2.73% | | | 2.98% | | |
| Portfolio turnover | | 18% | | | 18% | | | 9% | | | 17% | | | 19% | | |
| 1 The average shares outstanding method has been applied for per share information. |
| 2 Total investment return is based on the change in net asset value of a share during the period and assumes reinvestment of dividends and distributions at net asset value. |
See accompanying Notes, which are an integral part of the financial statements
2010 Annual report • Delaware Pooled Trust
138
Delaware Pooled® Trust — The Labor Select International Equity Portfolio
Selected data for each share of the Portfolio outstanding throughout each period were as follows:
| | Year Ended |
| | | 10/31/10 | | 10/31/09 | | 10/31/08 | | 10/31/07 | | 10/31/06 | |
| Net asset value, beginning of period | | $12.930 | | | $12.410 | | | $24.530 | | | $22.380 | | | $17.630 | | |
| | | | | | | | | | | | | | | | | |
| Income (loss) from investment operations: | | | | | | | | | | | | | | | | |
| Net investment income1 | | 0.390 | | | 0.364 | | | 0.647 | | | 0.616 | | | 0.612 | | |
| Net realized and unrealized gain (loss) on investments | | | | | | | | | | | | | | | | |
| and foreign currencies | | 0.626 | | | 1.445 | | | (9.221 | ) | | 3.980 | | | 4.701 | | |
| Total from investment operations | | 1.016 | | | 1.809 | | | (8.574 | ) | | 4.596 | | | 5.313 | | |
| | | | | | | | | | | | | | | | | |
| Less dividends and distributions from: | | | | | | | | | | | | | | | | |
| Net investment income | | (0.376 | ) | | (0.869 | ) | | (0.473 | ) | | (0.549 | ) | | (0.454 | ) | |
| Net realized gain on investments | | — | | | (0.420 | ) | | (3.073 | ) | | (1.897 | ) | | (0.109 | ) | |
| Total dividends and distributions | | (0.376 | ) | | (1.289 | ) | | (3.546 | ) | | (2.446 | ) | | (0.563 | ) | |
| | | | | | | | | | | | | | | | | |
| Net asset value, end of period | | $13.570 | | | $12.930 | | | $12.410 | | | $24.530 | | | $22.380 | | |
| | | | | | | | | | | | | | | | | |
| Total return2 | | 8.00% | | | 16.76% | | | (40.31% | ) | | 22.43% | | | 30.91% | | |
| | | | | | | | | | | | | | | | | |
| Ratios and supplemental data: | | | | | | | | | | | | | | | | |
| Net assets, end of period (000 omitted) | | $740,952 | | | $797,718 | | | $639,519 | | | $1,093,092 | | | $955,535 | | |
| Ratio of expenses to average net assets | | 0.87% | | | 0.88% | | | 0.87% | | | 0.88% | | | 0.89% | | |
| Ratio of net investment income to average net assets | | 3.07% | | | 3.26% | | | 3.59% | | | 2.75% | | | 3.09% | | |
| Portfolio turnover | | 13% | | | 11% | | | 10% | | | 28% | | | 21% | | |
| 1 The average shares outstanding method has been applied for per share information. |
| 2 Total investment return is based on the change in net asset value of a share during the period and assumes reinvestment of dividends and distributions at net asset value. |
See accompanying Notes, which are an integral part of the financial statements
2010 Annual report • Delaware Pooled Trust
(continues) 139
Financial highlights
Delaware Pooled® Trust — The Emerging Markets Portfolio
Selected data for each share of the Portfolio outstanding throughout each period were as follows:
| | Year Ended |
| | | 10/31/10 | | 10/31/09 | | 10/31/08 | | 10/31/07 | | 10/31/06 | |
| Net asset value, beginning of period | | $9.430 | | | $7.580 | | | $18.780 | | | $15.360 | | | $17.150 | | |
| | | | | | | | | | | | | | | | | |
| Income (loss) from investment operations: | | | | | | | | | | | | | | | | |
| Net investment income1 | | 0.259 | | | 0.200 | | | 0.347 | | | 0.379 | | | 0.397 | | |
| Net realized and unrealized gain (loss) on investments | | | | | | | | | | | | | | | | |
| and foreign currencies | | 1.926 | | | 3.208 | | | (7.707 | ) | | 6.084 | | | 2.963 | | |
| Total from investment operations | | 2.185 | | | 3.408 | | | (7.360 | ) | | 6.463 | | | 3.360 | | |
| | | | | | | | | | | | | | | | | |
| Less dividends and distributions from: | | | | | | | | | | | | | | | | |
| Net investment income | | (0.212 | ) | | (0.303 | ) | | (0.402 | ) | | (0.369 | ) | | (0.540 | ) | |
| Net realized gain on investments | | — | | | (1.268 | ) | | (3.447 | ) | | (2.727 | ) | | (4.637 | ) | |
| Total dividends and distributions | | (0.212 | ) | | (1.571 | ) | | (3.849 | ) | | (3.096 | ) | | (5.177 | ) | |
| | | | | | | | | | | | | | | | | |
| Reimbursement fees: | | | | | | | | | | | | | | | | |
| Purchase reimbursement fees1,2 | | 0.009 | | | 0.002 | | | 0.002 | | | 0.038 | | | 0.003 | | |
| Redemption reimbursement fees1,2 | | 0.008 | | | 0.011 | | | 0.007 | | | 0.015 | | | 0.024 | | |
| | | 0.017 | | | 0.013 | | | 0.009 | | | 0.053 | | | 0.027 | | |
| | | | | | | | | | | | | | | | | |
| Net asset value, end of period | | $11.420 | | | $9.430 | | | $7.580 | | | $18.780 | | | $15.360 | | |
| | | | | | | | | | | | | | | | | |
| Total return3 | | 23.79% | | | 57.05% | | | (48.23% | ) | | 49.98% | | | 25.12% | | |
| | | | | | | | | | | | | | | | | |
| Ratios and supplemental data: | | | | | | | | | | | | | | | | |
| Net assets, end of period (000 omitted) | | $750,190 | | | $597,638 | | | $469,392 | | | $964,310 | | | $717,464 | | |
| Ratio of expenses to average net assets | | 1.17% | | | 1.16% | | | 1.15% | | | 1.28% | | | 1.27% | | |
| Ratio of net investment income to average net assets | | 2.57% | | | 2.71% | | | 2.66% | | | 2.46% | | | 2.70% | | |
| Portfolio turnover | | 39% | | | 40% | | | 43% | | | 47% | | | 30% | | |
| 1 The average shares outstanding method has been applied for per share information. |
| 2 The Portfolio charges a 0.55% purchase reimbursement fee and a 0.55% redemption reimbursement fee, which are retained by the Portfolio. |
| 3 Total investment return is based on the change in net asset value of a share during the period and assumes reinvestment of dividends and distributions at net asset value. Total investment return does not reflect the purchase reimbursement fee and redemption reimbursement fee. |
See accompanying Notes, which are an integral part of the financial statements
2010 Annual report • Delaware Pooled Trust
140
Delaware Pooled® Trust — The Emerging Markets Portfolio II
Selected data for each share of the Portfolio outstanding throughout the period were as follows:
| | | 6/23/101 | | |
| | | to | | |
| | | 10/31/10 | | |
| Net asset value, beginning of period | | $8.500 | | |
| | | | | |
| Income from investment operations: | | | | |
| Net investment income2 | | 0.019 | | |
| Net realized and unrealized gain on investments | | | | |
| and foreign currencies | | 1.141 | | |
| Total from investment operations | | 1.160 | | |
| | | | | |
| Net asset value, end of period | | $9.660 | | |
| | | | | |
| Total return3 | | 13.65% | | |
| | | | | |
| Ratios and supplemental data: | | | | |
| Net assets, end of period (000 omitted) | | $11,364 | | |
| Ratio of expenses to average net assets | | 1.40% | | |
| Ratio of expenses to average net assets | | | | |
| prior to fees waived and expense paid indirectly | | 2.17% | | |
| Ratio of net investment income to average net assets | | 0.59% | | |
| Ratio of net investment loss to average net assets | | | | |
| prior to fees waived and expense paid indirectly | | (0.18% | ) | |
| Portfolio turnover | | 9% | | |
| 1 Date of commencement of operations; ratios have been annualized and total return and portfolio turnover have not been annualized. |
| 2 The average shares outstanding method has been applied for per share information. |
| 3 Total investment return is based on the change in net asset value of a share during the period and assumes reinvestment of dividends and distributions at net asset value. Total investment return during the period shown reflects a waiver by the manager. Performance would have been lower had the waiver not been in effect. |
See accompanying Notes, which are an integral part of the financial statements
2010 Annual report • Delaware Pooled Trust
(continues) 141
Financial highlights
Delaware Pooled® Trust — The Global Real Estate Securities Portfolio
Selected data for each share of the Portfolio outstanding throughout each period were as follows:
| | Original Class |
| | | | | | | | | | | | 1/10/071 | |
| | | | | | Year Ended | | | | | to | |
| | | 10/31/10 | | 10/31/09 | | 10/31/08 | | 10/31/07 | |
| Net asset value, beginning of period | | $5.050 | | | $4.430 | | | $9.020 | | | $8.500 | |
| | | | | | | | | | | | | |
| Income (loss) from investment operations: | | | | | | | | | | | | |
| Net investment income2 | | 0.142 | | | 0.139 | | | 0.155 | | | 0.118 | |
| Net realized and unrealized gain (loss) on investments | | | | | | | | | | | | |
| and foreign currencies | | 0.971 | | | 0.490 | | | (4.409 | ) | | 0.402 | |
| Total from investment operations | | 1.113 | | | 0.629 | | | (4.254 | ) | | 0.520 | |
| | | | | | | | | | | | | |
| Less dividends and distributions from: | | | | | | | | | | | | |
| Net investment income | | (0.373 | ) | | (0.009 | ) | | (0.336 | ) | | — | |
| Total dividends and distributions | | (0.373 | ) | | (0.009 | ) | | (0.336 | ) | | — | |
| | | | | | | | | | | | | |
| Net asset value, end of period | | $5.790 | | | $5.050 | | | $4.430 | | | $9.020 | |
| | | | | | | | | | | | | |
| Total return3 | | 23.49% | | | 13.75% | | | (48.74% | ) | | 6.12% | |
| | | | | | | | | | | | | |
| Ratios and supplemental data: | | | | | | | | | | | | |
| Net assets, end of period (000 omitted) | | $60,307 | | | $54,761 | | | $87,945 | | | $336,203 | |
| Ratio of expenses to average net assets | | 1.25% | | | 1.07% | | | 1.09% | | | 1.09% | |
| Ratio of expenses to average net assets | | | | | | | | | | | | |
| prior to fees waived and expense paid indirectly | | 1.25% | | | 1.21% | | | 1.12% | | | 1.10% | |
| Ratio of net investment income to average net assets | | 2.77% | | | 3.45% | | | 2.21% | | | 1.71% | |
| Ratio of net investment income to average net assets | | | | | | | | | | | | |
| prior to fees waived and expense paid indirectly | | 2.77% | | | 3.31% | | | 2.17% | | | 1.70% | |
| Portfolio turnover | | 185% | | | 124% | | | 96% | | | 56% | |
| 1 Date of commencement of operations; ratios and portfolio turnover have been annualized and total return has not been annualized. |
| 2 The average shares outstanding method has been applied for per share information. |
| 3 Total investment return is based on the change in net asset value of a share during the period and assumes reinvestment of dividends and distributions at net asset value. Total investment return during all of the periods shown reflects a waiver by the manager. Performance would have been lower had the waiver not been in effect. |
See accompanying Notes, which are an integral part of the financial statements
2010 Annual report • Delaware Pooled Trust
142
Delaware Pooled® Trust — The Global Real Estate Securities Portfolio
Selected data for each share of the Portfolio outstanding throughout each period were as follows:
| | Class P |
| | | | | | | | | | | 1/10/071 | |
| | | | | | Year Ended | | | | | to | |
| | | 10/31/10 | | 10/31/09 | | 10/31/08 | | 10/31/07 | |
| Net asset value, beginning of period | | $5.040 | | | $4.420 | | $9.000 | | | $8.500 | |
| | | | | | | | | | | | |
| Income (loss) from investment operations: | | | | | | | | | | | |
| Net investment income2 | | 0.129 | | | 0.129 | | 0.137 | | | 0.101 | |
| Net realized and unrealized gain (loss) on investments | | | | | | | | | | | |
| and foreign currencies | | 0.973 | | | 0.491 | | (4.402 | ) | | 0.399 | |
| Total from investment operations | | 1.102 | | | 0.620 | | (4.265 | ) | | 0.500 | |
| | | | | | | | | | | | |
| Less dividends and distributions from: | | | | | | | | | | | |
| Net investment income | | (0.362 | ) | | — | | (0.315 | ) | | — | |
| Total dividends and distributions | | (0.362 | ) | | — | | (0.315 | ) | | — | |
| | | | | | | | | | | | |
| Net asset value, end of period | | $5.780 | | | $5.040 | | $4.420 | | | $9.000 | |
| | | | | | | | | | | | |
| Total return3 | | 23.26% | | | 14.03% | | (48.88% | ) | | 5.88% | |
| | | | | | | | | | | | |
| Ratios and supplemental data: | | | | | | | | | | | |
| Net assets, end of period (000 omitted) | | $8 | | | $6 | | $6 | | | $11 | |
| Ratio of expenses to average net assets | | 1.50% | | | 1.32% | | 1.34% | | | 1.34% | |
| Ratio of expenses to average net assets | | | | | | | | | | | |
| prior to fees waived and expense paid indirectly | | 1.50% | | | 1.46% | | 1.37% | | | 1.35% | |
| Ratio of net investment income to average net assets | | 2.52% | | | 3.20% | | 1.96% | | | 1.46% | |
| Ratio of net investment income to average net assets | | | | | | | | | | | |
| prior to fees waived and expense paid indirectly | | 2.52% | | | 3.06% | | 1.92% | | | 1.45% | |
| Portfolio turnover | | 185% | | | 124% | | 96% | | | 56% | |
| 1 Date of commencement of operations; ratios and portfolio turnover have been annualized and total return has not been annualized. |
| 2 The average shares outstanding method has been applied for per share information. |
| 3 Total investment return is based on the change in net asset value of a share during the period and assumes reinvestment of dividends and distributions at net asset value. Total investment return during all of the periods shown reflects a waiver by the manager. Performance would have been lower had the waiver not been in effect. |
See accompanying Notes, which are an integral part of the financial statements
2010 Annual report • Delaware Pooled Trust
(continues) 143
Financial highlights
Delaware Pooled® Trust — The Global Fixed Income Portfolio
Selected data for each share of the Portfolio outstanding throughout each period were as follows:
| | Year Ended |
| | | 10/31/10 | | 10/31/09 | | 10/31/08 | | 10/31/07 | | 10/31/06 | |
| Net asset value, beginning of period | | $11.280 | | | $11.730 | | | $11.820 | | | $11.330 | | | $11.570 | | |
| | | | | | | | | | | | | | | | | |
| Income (loss) from investment operations: | | | | | | | | | | | | | | | | |
| Net investment income1 | | 0.299 | | | 0.324 | | | 0.304 | | | 0.266 | | | 0.244 | | |
| Net realized and unrealized gain on investments | | | | | | | | | | | | | | | | |
| and foreign currencies | | 0.767 | | | 1.494 | | | 0.143 | | | 0.695 | | | 0.358 | | |
| Total from investment operations | | 1.066 | | | 1.818 | | | 0.447 | | | 0.961 | | | 0.602 | | |
| | | | | | | | | | | | | | | | | |
| Less dividends and distributions from: | | | | | | | | | | | | | | | | |
| Net investment income | | (0.666 | ) | | (2.268 | ) | | (0.537 | ) | | (0.471 | ) | | (0.751 | ) | |
| Net realized gain on investments | | — | | | — | | | — | | | — | | | (0.091 | ) | |
| Total dividends and distributions | | (0.666 | ) | | (2.268 | ) | | (0.537 | ) | | (0.471 | ) | | (0.842 | ) | |
| | | | | | | | | | | | | | | | | |
| Net asset value, end of period | | $11.680 | | | $11.280 | | | $11.730 | | | $11.820 | | | $11.330 | | |
| | | | | | | | | | | | | | | | | |
| Total return2 | | 10.03% | | | 17.52% | | | 3.81% | | | 8.80% | | | 5.55% | | |
| | | | | | | | | | | | | | | | | |
| Ratios and supplemental data: | | | | | | | | | | | | | | | | |
| Net assets, end of period (000 omitted) | | $140,281 | | | $143,204 | | | $171,162 | | | $282,899 | | | $275,806 | | |
| Ratio of expenses to average net assets | | 0.60% | | | 0.60% | | | 0.60% | | | 0.61% | | | 0.60% | | |
| Ratio of expenses to average net assets | | | | | | | | | | | | | | | | |
| prior to fees waived and expense paid indirectly | | 0.64% | | | 0.65% | | | 0.62% | | | 0.63% | | | 0.63% | | |
| Ratio of net investment income to average net assets | | 2.75% | | | 3.06% | | | 2.51% | | | 2.38% | | | 2.22% | | |
| Ratio of net investment income to average net assets | | | | | | | | | | | | | | | | |
| prior to fees waived and expense paid indirectly | | 2.71% | | | 3.01% | | | 2.49% | | | 2.36% | | | 2.19% | | |
| Portfolio turnover | | 39% | | | 100% | | | 54% | | | 44% | | | 41% | | |
| 1 The average shares outstanding method has been applied for per share information. |
| 2 Total investment return is based on the change in net asset value of a share during the period and assumes reinvestment of dividends and distributions at net asset value. Total investment return during all of the periods shown reflects a waiver by the manager. Performance would have been lower had the waiver not been in effect. |
See accompanying Notes, which are an integral part of the financial statements
2010 Annual report • Delaware Pooled Trust
144
Delaware Pooled® Trust — The International Fixed Income Portfolio
Selected data for each share of the Portfolio outstanding throughout each period were as follows:
| | Year Ended |
| | | 10/31/10 | | 10/31/09 | | 10/31/08 | | 10/31/07 | | 10/31/06 | |
| Net asset value, beginning of period | | $12.430 | | | $11.570 | | | $11.740 | | | $10.940 | | | $11.200 | | |
| | | | | | | | | | | | | | | | | |
| Income from investment operations: | | | | | | | | | | | | | | | | |
| Net investment income1 | | 0.279 | | | 0.876 | | | 0.265 | | | 0.245 | | | 0.204 | | |
| Net realized and unrealized gain on investments | | | | | | | | | | | | | | | | |
| and foreign currencies | | 0.752 | | | 1.173 | | | 0.189 | | | 0.686 | | | 0.300 | | |
| Total from investment operations | | 1.031 | | | 2.049 | | | 0.454 | | | 0.931 | | | 0.504 | | |
| | | | | | | | | | | | | | | | | |
| Less dividends and distributions from: | | | | | | | | | | | | | | | | |
| Net investment income | | (1.321 | ) | | (1.189 | ) | | (0.624 | ) | | (0.131 | ) | | (0.764 | ) | |
| Total dividends and distributions | | (1.321 | ) | | (1.189 | ) | | (0.624 | ) | | (0.131 | ) | | (0.764 | ) | |
| | | | | | | | | | | | | | | | | |
| Net asset value, end of period | | $12.140 | | | $12.430 | | | $11.570 | | | $11.740 | | | $10.940 | | |
| | | | | | | | | | | | | | | | | |
| Total return2 | | 9.33% | | | 18.86% | | | 4.04% | | | 8.60% | | | 4.77% | | |
| | | | | | | | | | | | | | | | | |
| Ratios and supplemental data: | | | | | | | | | | | | | | | | |
| Net assets, end of period (000 omitted) | | $21,358 | | | $19,538 | | | $29,815 | | | $32,169 | | | $39,273 | | |
| Ratio of expenses to average net assets | | 0.60% | | | 0.60% | | | 0.60% | | | 0.61% | | | 0.60% | | |
| Ratio of expenses to average net assets | | | | | | | | | | | | | | | | |
| prior to fees waived and expense paid indirectly | | 0.81% | | | 0.79% | | | 0.72% | | | 0.72% | | | 0.68% | | |
| Ratio of net investment income to average net assets | | 2.48% | | | 7.73% | | | 2.22% | | | 2.22% | | | 1.92% | | |
| Ratio of net investment income to average net assets | | | | | | | | | | | | | | | | |
| prior to fees waived and expense paid indirectly | | 2.27% | | | 7.54% | | | 2.10% | | | 2.11% | | | 1.84% | | |
| Portfolio turnover | | 31% | | | 98% | | | 26% | | | 49% | | | 38% | | |
| 1 The average shares outstanding method has been applied for per share information. |
| 2 Total investment return is based on the change in net asset value of a share during the period and assumes reinvestment of dividends and distributions at net asset value. Total investment return during all of the periods shown reflects a waiver by the manager. Performance would have been lower had the waiver not been in effect. |
See accompanying Notes, which are an integral part of the financial statements
2010 Annual report • Delaware Pooled Trust
145
Notes to financial statements
Delaware Pooled® Trust
October 31, 2010
Delaware Pooled Trust (Trust) is organized as a Delaware statutory trust and offers 17 separate Portfolios. These financial statements and the related notes pertain to The Large-Cap Value Equity Portfolio, The Select 20 Portfolio, The Large-Cap Growth Equity Portfolio, The Focus Smid-Cap Growth Equity Portfolio, The Real Estate Investment Trust Portfolio II, The Delaware Macquarie Real Estate Portfolio, The Core Focus Fixed Income Portfolio, The High-Yield Bond Portfolio, The Core Plus Fixed Income Portfolio, The International Equity Portfolio, The Labor Select International Equity Portfolio, The Emerging Markets Portfolio, The Emerging Markets Portfolio II, The Global Real Estate Securities Portfolio, The Global Fixed Income Portfolio, and The International Fixed Income Portfolio (each, a Portfolio, or collectively, Portfolios). The Real Estate Investment Trust Portfolio is included in a separate report. The Trust is an open-end investmen t company. Each Portfolio is considered diversified under the Investment Company Act of 1940, as amended, except for The Select 20, The Real Estate Investment Trust II, The Delaware Macquarie Real Estate, The Global Real Estate Securities, The Global Fixed Income and The International Fixed Income Portfolios, which are nondiversified. Each Portfolio offers one class of shares except for The Global Real Estate Securities Portfolio which offers Original Class and Class P shares. The Original Class shares do not carry a 12b-1 fee and the Class P shares carry a 12b-1 fee.
The investment objective of The Large-Cap Value Equity Portfolio is to seek long-term capital appreciation.
The investment objective of The Select 20 Portfolio is to seek long-term capital appreciation.
The investment objective of The Large-Cap Growth Equity Portfolio is to seek capital appreciation.
The investment objective of The Focus Smid-Cap Growth Equity Portfolio is to seek long-term capital appreciation.
The investment objective of The Real Estate Investment Trust Portfolio II is to seek maximum long-term total return, with capital appreciation as a secondary objective.
The investment objective of The Delaware Macquarie Real Estate Portfolio is to seek maximum long-term total return through a combination of current income and capital appreciation.
The investment objective of The Core Focus Fixed Income Portfolio is to seek maximum long-term total return, consistent with reasonable risk.
The investment objective of The High-Yield Bond Portfolio is to seek high total return.
The investment objective of The Core Plus Fixed Income Portfolio is to seek maximum long-term total return, consistent with reasonable risk.
The investment objective of The International Equity Portfolio is to seek maximum long-term total return.
The investment objective of The Labor Select International Equity Portfolio is to seek maximum long-term total return.
The investment objective of The Emerging Markets Portfolio is to seek long-term capital appreciation.
The investment objective of The Emerging Markets Portfolio II is to seek long-term capital appreciation.
The investment objective of The Global Real Estate Securities Portfolio is to seek maximum long-term total return through a combination of current income and capital appreciation.
The investment objective of The Global Fixed Income Portfolio is to seek current income consistent with the preservation of principal.
The investment objective of The International Fixed Income Portfolio is to seek current income consistent with the preservation of principal.
1. Significant Accounting Policies
The following accounting policies are in accordance with U.S. generally accepted accounting principles (U.S. GAAP) and are consistently followed by the Portfolios.
Security Valuation — Equity securities, except those traded on the Nasdaq Stock Market, Inc. (Nasdaq), are valued at the last quoted sales price as of the time of the regular close of the New York Stock Exchange (NYSE) on the valuation date. Securities traded on the Nasdaq are valued in accordance with the Nasdaq Official Closing Price, which may not be the last sales price. If on a particular day an equity security does not trade, then the mean between the bid and ask prices will be used. Securities listed on a foreign exchange are valued at the last quoted sales price on the valuation date. Short-term debt securities are valued at market value. U.S. government and agency securities are valued at the mean between the bid and ask prices. Other debt securities, credit default swap (CDS) contracts and interest rate swap co ntracts are valued by an independent pricing service or broker. To the extent current market prices are not available, the pricing service may take into account developments related to the specific security, as well as transactions in comparable securities. Investment companies are valued at net asset value per share. Foreign currency exchange contracts and foreign cross currency exchange contracts are valued at the mean between the bid and ask prices. Interpolated values are derived when the settlement date of the contract is an interim date for which quotations are not available. Futures contracts and options on futures contracts are valued at the daily quoted settlement prices. Exchange-traded options are valued at the last reported sale price or, if no sales are reported, at the mean between the last reported bid and ask
2010 Annual report • Delaware Pooled Trust
146
prices. Generally, other securities and assets for which market quotations are not readily available are valued at fair value as determined in good faith under the direction of the Trust’s Board of Trustees (Board). In determining whether market quotations are readily available or fair valuation will be used, various factors will be taken into consideration, such as market closures or suspension of trading in a security. The Portfolios may use fair value pricing more frequently for securities traded primarily in non-U.S. markets because, among other things, most foreign markets close well before the Portfolios value their securities generally at 4:00 p.m. Eastern time. The earlier close of these foreign markets gives rise to the possibility that significant events, including broad market moves, government actions or pronouncements, aftermarket trading, or news events may have occurred in the interim. To account for this, the Portfoli os may frequently value foreign securities using fair value prices based on third-party vendor modeling tools (international fair value pricing).
Federal Income Taxes — No provision for federal income taxes has been made as each Portfolio intends to qualify or continue to qualify for federal income tax purposes as a regulated investment company under Subchapter M of the Internal Revenue Code of 1986, as amended, and make the requisite distributions to shareholders. The Portfolios evaluate tax positions taken or expected to be taken in the course of preparing the Portfolios’ tax returns to determine whether the tax positions are “more-likely-than-not” of being sustained by the applicable tax authority. Tax positions not deemed to meet the more-likely-than-not threshold would be recorded as a tax benefit or expense in the current year. Management has analyzed the Portfolios’ tax positions taken on federal income tax returns for all open tax y ears (October 31, 2007 – October 31, 2010, as applicable), and has concluded that no provision for federal income tax is required in the Portfolios’ financial statements.
Class Accounting — Investment income, common expenses and realized and unrealized gain (loss) on investments are allocated to the classes of The Global Real Estate Securities Portfolio on the basis of daily net assets of each class. Distribution expenses relating to a specific class are charged directly to that class.
To Be Announced Trades — The Portfolios may contract to purchase securities for a fixed price at a transaction date beyond the customary settlement period (i.e., “when issued,” “delayed delivery,” “forward commitment,” or “TBA transactions”) consistent with the Portfolios’ ability to manage their investment portfolios and meet redemption requests. These transactions involve a commitment by the Portfolios to purchase securities for a predetermined price or yield with payment and delivery taking place more than three days in the future, or after a period longer than the customary settlement period for that type of security. No interest will be earned by the Portfolios on such purchases until the securities are delivered; however the market value may change prior to deli very.
Foreign Currency Transactions — Transactions denominated in foreign currencies are recorded at the prevailing exchange rates on the valuation date in accordance with the Portfolios’ prospectuses. The value of all assets and liabilities denominated in foreign currencies is translated into U.S. dollars at the exchange rate of such currencies against the U.S. dollar daily. Transaction gains or losses resulting from changes in exchange rates during the reporting period or upon settlement of the foreign currency transaction are reported in operations for the current period. The Portfolios isolate that portion of realized gains and losses on investments in debt securities which is due to changes in foreign exchange rates from that which is due to changes in market prices of debt securities. For foreign equity securities, these changes are included in realized gains (losses) on investments. The Portfolios report certain foreign currency related transactions as components of realized gains (losses) for financial reporting purposes, whereas such components are treated as ordinary income (loss) for federal income tax purposes.
Use of Estimates — The preparation of financial statements in conformity with U.S. GAAP requires management to make estimates and assumptions that affect the reported amounts of assets and liabilities and disclosure of contingent assets and liabilities at the date of the financial statements and the reported amounts of revenues and expenses during the reporting period. Actual results could differ from those estimates and the differences could be material.
Reimbursement Fees — The Emerging Markets Portfolio may charge a 0.55% purchase reimbursement fee and a 0.55% redemption reimbursement fee. These fees are designed to reflect an approximation of the brokerage and other transaction costs associated with the investment of an investor’s purchase amount or the disposition of assets to meet redemptions, and to limit the extent to which the Portfolio (and, indirectly, the Portfolio’s existing shareholders) would have to bear such costs. These fees are accounted for as an addition to paid-in capital for the Portfolio in the statements of changes in net assets.
Other — Expenses directly attributable to the Portfolios are charged directly to the Portfolios. Other expenses common to various funds within the Delaware Investments® Family of Funds are generally allocated amongst such funds on the basis of average net assets. Management fees and some other expenses are paid monthly. Security transactions are recorded on the date the securities are purchased or sold (trade date) for financial reporting purposes. Costs used in calculating realized gains and losses on the sale of investment securities are those of the specific securities sold. Interest income is recorded on the accrual basis. Discounts and premiums on non-convertible bonds are amortized to interest income over the lives of the respective
2010 Annual report • Delaware Pooled Trust
(continues) 147
Notes to financial statements
Delaware Pooled® Trust
1. Significant Accounting Policies (continued)
securities. Dividend income is recorded on the ex-dividend date. Realized gains (losses) on paydowns of mortgage- and asset-backed securities are classified as interest income. Distributions received from investments in Real Estate Investment Trusts (REITs) are recorded as dividend income on the ex-dividend date, subject to reclassification upon notice of the character of such distribution by the issuer. The financial statements reflect an estimate of the reclassification of the distribution character for The Real Estate Investment Trust Portfolio II, The Delaware Macquarie Real Estate Portfolio and The Global Real Estate Securities Portfolio. Foreign dividends are also recorded on the ex-dividend date or as soon after the ex-dividend date that a Portfolio is aware of such dividends, net of all nonrebatable tax withholdings. Withholding taxes on foreign dividends have been recorded in accordance with each Portfolio’s understanding of the applicable country’s tax rules and rates.
Each Portfolio declares and pays dividends from net investment income, if any, annually. All Portfolios declare and pay distributions from net realized gain on investments, if any, annually. Dividends and distributions, if any, are recorded on the ex-dividend date.
Subject to seeking best execution, the Portfolios may direct certain security trades to brokers who have agreed to rebate a portion of the related brokerage commission to each Portfolio in cash. In general, best execution refers to many factors, including the price paid or received for a security, the commission charged, the promptness and reliability of execution, the confidentiality and placement accorded the order, and other factors affecting the overall benefit obtained by the Portfolio on the transaction. Such commission rebates are included in realized gain on investments in the accompanying financial statements. The total commission rebates for the year ended October 31, 2010 are as follows:
| | | Commission Rebates |
| The Large-Cap Value Equity Portfolio | | | $ | 478 | |
| The Select 20 Portfolio | | | | 938 | |
| The Large-Cap Growth Equity Portfolio | | | | 12,974 | |
| The Focus Smid-Cap Growth Equity Portfolio | | | | 244 | |
The Portfolios may receive earnings credits from their custodian when positive cash balances are maintained, which are used to offset custody fees. There were no earnings credits for the year ended October 31, 2010.
The Portfolios may receive earnings credits from their transfer agent when positive cash balances are maintained, which may be used to offset transfer agent fees. The expense paid under this arrangement is included in dividend disbursing and transfer agent fees and expenses on the statements of operations with the corresponding expense offset shown as “expense paid indirectly.”
2. Investment Management, Administration Agreements, and Other Transactions with Affiliates
In accordance with the terms of the investment management agreements, Delaware Management Company (DMC), a series of Delaware Management Business Trust and the investment manager of the Portfolios, will receive an annual fee, which is calculated daily based on the average daily net assets of each Portfolio.
Effective February 28, 2010, DMC has contractually agreed to waive that portion, if any, of its management fees and reimburse each Portfolio (except for The Labor Select International Equity Portfolio, The Emerging Markets Portfolio and The Global Real Estate Securities Portfolio) to the extent necessary to ensure that annual operating expenses, (excluding any 12b-1 plan and certain other expenses) do not exceed specified percentages of average daily net assets of each such Portfolio until February 28, 2011. Prior to February 28, 2010, these expense limitations were voluntary. The expense limitation is effective from June 29, 2010 through June 29, 2011 for The Delaware Macquarie Real Estate Portfolio and April 1, 2010 through March 31, 2011 for The Emerging Markets Portfolio II. For purposes of these waivers and reimbursements, nonroutine expenses may also include such additional costs and expenses as may be agreed upon from time to time b y the Portfolios’ Board and DMC. These expense waivers and reimbursements apply only to expenses paid directly by the Portfolios.
2010 Annual report • Delaware Pooled Trust
148
The management fee rates and the operating expense limitation rates in effect for the year ended October 31, 2010 are as follows:
| | | | | | Contractual |
| | | | | | operating expense |
| | Management | | limitation as |
| | fee as a percentage | | a percentage |
| | of average daily | | of average daily |
| | net assets (per annum) | | net assets (per annum)† |
| The Large-Cap Value Equity Portfolio | | 0.55% | | | | 0.70% | |
| The Select 20 Portfolio | | 0.75% | | | | 0.89% | |
| The Large-Cap Growth Equity Portfolio | | 0.55% | | | | 0.65% | |
| The Focus Smid-Cap Growth Equity Portfolio | | 0.75% | | | | 0.92% | |
| The Real Estate Investment Trust Portfolio II | | 0.75% | | | | 0.95% | |
| The Delaware Macquarie Real Estate Portfolio | | 0.75% | | | | 0.95% | |
| The Core Focus Fixed Income Portfolio | | 0.40% | | | | 0.43% | |
| The High-Yield Bond Portfolio | | 0.45% | | | | 0.59% | |
| The Core Plus Fixed Income Portfolio | | 0.43% | | | | 0.45% | |
| The International Equity Portfolio | | 0.75% | | | | 0.90% | †† |
| The Labor Select International Equity Portfolio | | 0.75% | | | | — | |
| The Emerging Markets Portfolio | | 1.00% | | | | — | |
| The Emerging Markets Portfolio II | | 1.00% | | | | 1.40% | |
| The Global Real Estate Securities Portfolio | | 0.99% | * | | | — | |
| The Global Fixed Income Portfolio | | 0.50% | | | | 0.60% | |
| The International Fixed Income Portfolio | | 0.50% | | | | 0.60% | |
| † | These operating expense limitations exclude certain expenses, such as 12b-1 plan expenses, taxes, interest, inverse floater program expenses, brokerage fees, certain insurance costs, and nonroutine expenses or costs, including, but not limited to, those relating to reorganizations, litigation, conducting shareholder meetings, and liquidations. |
| †† | Effective 11/19/09, DMC voluntarily agreed to implement an expense limitation for The International Equity Portfolio of 0.90% of average daily net assets. Prior to 11/19/09, there was no expense limitation. |
| * | 0.99% on the first $100 million; 0.90% on the next $150 million; 0.80% on assets in excess of $250 million. |
Mondrian Investment Partners Limited (Mondrian) furnishes investment sub-advisory services to The International Equity Portfolio, The Labor Select International Equity Portfolio, The Emerging Markets Portfolio, The Global Fixed Income Portfolio, and The International Fixed Income Portfolio. For these services, DMC, not the Portfolios, pays Mondrian the following percentages of the Portfolios’ average daily net assets.
| | | Sub-advisory fee as a |
| | | percentage of average daily |
| | | net assets (per annum) |
| The International Equity Portfolio | | 0.36% |
| The Labor Select International Equity Portfolio | | 0.30% |
| The Emerging Markets Portfolio | | 0.75% |
| The Global Fixed Income Portfolio | | 0.30% |
| The International Fixed Income Portfolio | | 0.30% |
2010 Annual report • Delaware Pooled Trust
(continues) 149
Notes to financial statements
Delaware Pooled® Trust
2. Investment Management, Administration Agreements, and Other Transactions with Affiliates (continued)
DMC, on behalf of The Delaware Macquarie Real Estate Portfolio, has entered into a sub-advisory agreement with Macquarie Capital Investment Management LLC (MCIM), which is an affiliate of DMC. Both DMC and MCIM are wholly owned subsidiaries of Macquarie. For its sub-advisory services, MCIM receives an asset-based fee from DMC. Such sub-advisory fee is paid by DMC, and not from the assets of the Portfolio.
Delaware Service Company, Inc. (DSC), an affiliate of DMC, provides fund accounting and financial administration oversight services to the Portfolios. For these services, the Portfolios pay DSC fees based on the aggregate daily net assets of the Delaware Investments® Family of Funds at the following annual rate: 0.0050% of the first $30 billion; 0.0045% of the next $10 billion; 0.0040% of the next $10 billion; and 0.0025% of aggregate average daily net assets in excess of $50 billion. The fees payable to DSC under the service agreement described above are allocated among all Funds in the Delaware Investments Family of Funds on a relative net asset value basis. For the year ended October 31, 2010, the Po rtfolios were charged $140,423 for these services.
The Bank of New York Mellon (BNY Mellon) provides custody, fund accounting and financial administration services to the Portfolios.
DSC also provides dividend disbursing and transfer agency services. The Portfolios pay DSC a monthly fee based on the number of shareholder accounts for dividend disbursing and transfer agent services.
Pursuant to a distribution agreement and distribution plan, The Global Real Estate Securities Portfolio pays Delaware Distributors, L.P. (DDLP), the distributor and an affiliate of DMC, an annual distribution and service fee not to exceed 0.25% of the average daily net assets of the Class P shares. Original Class shares pay no distribution and service expenses.
At October 31, 2010, each Portfolio had receivables due from or liabilities payable to affiliates as follows:
| | | | | | | | Dividend | | | | | | | | | | | |
| | | | | | | | disbursing, | | | | | | | | | | | |
| | | | | | | | transfer | | | | | | | | | | | |
| | | | | | | | agent and | | | | | | | | | | | |
| | | | | | | | fund accounting | | | | | | | | Receivable |
| | | | | | | | oversight | | Other expenses | | from DMC |
| | | Investment management | | fees, and | | payable to | | under |
| | | fee payable to | | other expenses | | (receivable from) | | expense limitation |
| | | DMC | | payable to DSC | | DMC and affiliates* | | agreement |
| The Large-Cap Value Equity Portfolio | | | $ | — | | | | $ | 70 | | | | $ | 463 | | | | | $ | 5,346 | |
| The Select 20 Portfolio | | | | — | | | | | 105 | | | | | 508 | | | | | | 2,108 | |
| The Large-Cap Growth Equity Portfolio | | | | 111,815 | | | | | 2,535 | | | | | 2,552 | | | | | | — | |
| The Focus Smid-Cap Growth Equity Portfolio | | | | 589 | | | | | 48 | | | | | 317 | | | | | | — | |
| The Real Estate Investment Trust Portfolio II | | | | — | | | | | 29 | | | | | 5,977 | | | | | | 5,546 | |
| The Delaware Macquarie Real Estate Portfolio | | | | — | | | | | 25 | | | | | 245 | | | | | | 23,080 | |
| The Core Focus Fixed Income Portfolio | | | | — | | | | | 203 | | | | | 533 | | | | | | 3,983 | |
| The High-Yield Bond Portfolio | | | | 8,100 | | | | | 294 | | | | | 615 | | | | | | — | |
| The Core Plus Fixed Income Portfolio | | | | 7,076 | | | | | 533 | | | | | 663 | | | | | | — | |
| The International Equity Portfolio | | | | 513,036 | | | | | 8,528 | | | | | 7,300 | | | | | | — | |
| The Labor Select International Equity Portfolio | | | | 474,285 | | | | | 7,884 | | | | | 7,120 | | | | | | — | |
| The Emerging Markets Portfolio | | | | 644,426 | | | | | 8,034 | | | | | 7,357 | | | | | | — | |
| The Emerging Markets Portfolio II | | | | — | | | | | 120 | | | | | (14,729 | ) | | | | | 6,361 | |
| The Global Real Estate Securities Portfolio | | | | 51,323 | | | | | 646 | | | | | 1,150 | | | | | | — | |
| The Global Fixed Income Portfolio | | | | 55,929 | | | | | 1,484 | | | | | 1,514 | | | | | | — | |
| The International Fixed Income Portfolio | | | | 723 | | | | | 225 | | | | | 531 | | | | | | — | |
| * | DMC, as part of its administrative services, pays operating expenses on behalf of the Portfolios and is reimbursed on a periodic basis. Expenses include items such as printing of shareholder reports, fees for audit, legal and tax services, registration fees, and trustees’ fees. |
2010 Annual report • Delaware Pooled Trust
150
As provided in the investment management agreement, the Portfolios bear the cost of certain legal and tax services, including internal legal and tax services provided to the Portfolios by DMC and/or its affiliates’ employees. For the year ended October 31, 2010, the Portfolios were charged for internal legal and tax services by DMC and/or its affiliates’ employees as follows:
| The Large-Cap Value Equity Portfolio | | $ | 412 |
| The Select 20 Portfolio | | | 368 |
| The Large-Cap Growth Equity Portfolio | | | 8,948 |
| The Focus Smid-Cap Growth Equity Portfolio | | | 140 |
| The Real Estate Investment Trust Portfolio II | | | 118 |
| The Delaware Macquarie Real Estate Portfolio | | | 34 |
| The Core Focus Fixed Income Portfolio | | | 672 |
| The High-Yield Bond Portfolio | | | 923 |
| The Core Plus Fixed Income Portfolio | | | 1,724 |
| The International Equity Portfolio | | | 31,249 |
| The Labor Select International Equity Portfolio | | | 29,499 |
| The Emerging Markets Portfolio | | | 27,215 |
| The Emerging Markets Portfolio II | | | 262 |
| The Global Real Estate Securities Portfolio | | | 2,262 |
| The Global Fixed Income Portfolio | | | 4,778 |
| The International Fixed Income Portfolio | | | 762 |
Trustees’ fees include expenses accrued by each Portfolio for each Trustee’s retainer and meeting fees. Certain officers of DMC, DSC, and DDLP are officers and/or Trustees of the Trust. These officers and Trustees are paid no compensation by the Portfolios.
3. Investments
For the year ended October 31, 2010, each Portfolio made purchases and sales of investment securities other than short-term investments as follows:
| | | Purchases | | | | | | | Sales | | | | | |
| | | other than | | Purchases of | | other than | | Sales of |
| | | U.S. government | | U.S. government | | U.S. government | | U.S. government |
| | | securities | | securities | | securities | | securities |
| The Large-Cap Value Equity Portfolio | | $ | 4,108,254 | | | $ | — | | | $ | 8,234,095 | | | $ | — | |
| The Select 20 Portfolio | | | 7,576,441 | | | | — | | | | 9,100,686 | | | | — | |
| The Large-Cap Growth Equity Portfolio | | | 51,814,030 | | | | — | | | | 104,731,874 | | | | — | |
| The Focus Smid-Cap Growth Equity Portfolio | | | 3,016,068 | | | | — | | | | 3,318,690 | | | | — | |
| The Real Estate Investment Trust Portfolio II | | | 7,009,961 | | | | — | | | | 10,600,845 | | | | — | |
| The Delaware Macquarie Real Estate Portfolio | | | 2,766,367 | | | | — | | | | 802,899 | | | | — | |
| The Core Focus Fixed Income Portfolio | | | 53,566,781 | | | | 29,167,908 | | | | 53,684,596 | | | | 30,910,231 | |
| The High-Yield Bond Portfolio | | | 34,905,999 | | | | — | | | | 31,895,485 | | | | — | |
| The Core Plus Fixed Income Portfolio | | | 98,678,342 | | | | 21,497,950 | | | | 108,023,868 | | | | 20,240,233 | |
| The International Equity Portfolio | | | 148,220,476 | | | | — | | | | 285,217,061 | | | | — | |
| The Labor Select International Equity Portfolio | | | 96,510,322 | | | | — | | | | 181,106,683 | | | | — | |
| The Emerging Markets Portfolio | | | 282,428,479 | | | | — | | | | 245,748,819 | | | | — | |
| The Emerging Markets Portfolio II | | | 10,725,679 | | | | — | | | | 927,721 | | | | — | |
| The Global Real Estate Securities Portfolio | | | 99,221,082 | | | | — | | | | 103,580,800 | | | | — | |
| The Global Fixed Income Portfolio | | | 40,737,323 | | | | 10,065,616 | | | | 55,994,042 | | | | 5,780,078 | |
| The International Fixed Income Portfolio | | | 6,302,982 | | | | — | | | | 5,863,551 | | | | — | |
2010 Annual report • Delaware Pooled Trust
(continues) 151
Notes to financial statements
Delaware Pooled® Trust
3. Investments (continued)
At October 31, 2010, the cost of investments and unrealized appreciation (depreciation) for federal income tax purposes for each Portfolio were as follows:
| | | | | | Aggregate | | Aggregate | | Net unrealized |
| | | Cost of | | unrealized | | unrealized | | appreciation |
| | | investments | | appreciation | | depreciation | | (depreciation) |
| The Large-Cap Value Equity Portfolio | | $ | 6,190,994 | | $ | 720,493 | | $ | (331,274 | ) | | $ | 389,219 | |
| The Select 20 Portfolio | | | 9,707,086 | | | 2,058,161 | | | (295,808 | ) | | | 1,762,353 | |
| The Large-Cap Growth Equity Portfolio | | | 244,378,906 | | | 48,763,189 | | | (9,782,776 | ) | | | 38,980,413 | |
| The Focus Smid-Cap Growth Equity Portfolio | | | 3,910,136 | | | 1,076,775 | | | (363,838 | ) | | | 712,937 | |
| The Real Estate Investment Trust Portfolio II | | | 2,778,974 | | | 323,039 | | | (325,307 | ) | | | (2,268 | ) |
| The Delaware Macquarie Real Estate Portfolio | | | 2,023,155 | | | 281,000 | | | (105 | ) | | | 280,895 | |
| The Core Focus Fixed Income Portfolio | | | 24,260,251 | | | 819,352 | | | (120,524 | ) | | | 698,828 | |
| The High-Yield Bond Portfolio | | | 30,215,486 | | | 2,135,340 | | | (237,445 | ) | | | 1,897,895 | |
| The Core Plus Fixed Income Portfolio | | | 55,706,894 | | | 2,861,323 | | | (598,119 | ) | | | 2,263,204 | |
| The International Equity Portfolio | | | 786,857,639 | | | 178,178,737 | | | (145,413,103 | ) | | | 32,765,634 | |
| The Labor Select International Equity Portfolio | | | 741,122,786 | | | 159,287,814 | | | (143,722,719 | ) | | | 15,565,095 | |
| The Emerging Markets Portfolio | | | 654,069,093 | | | 127,666,994 | | | (8,102,180 | ) | | | 119,564,814 | |
| The Emerging Markets Portfolio II | | | 9,890,094 | | | 1,381,820 | | | (125,853 | ) | | | 1,255,967 | |
| The Global Real Estate Securities Portfolio | | | 70,933,291 | | | 9,087,193 | | | (8,800,989 | ) | | | 286,204 | |
| The Global Fixed Income Portfolio | | | 123,182,454 | | | 17,319,214 | | | (1,862,750 | ) | | | 15,456,464 | |
| The International Fixed Income Portfolio | | | 18,255,713 | | | 3,277,740 | | | (476,566 | ) | | | 2,801,174 | |
U.S. GAAP defines fair value as the price that each Portfolio would receive to sell an asset or pay to transfer a liability in an orderly transaction between market participants at the measurement date under current market conditions. A three level hierarchy for fair value measurements has been established based upon the transparency of inputs to the valuation of an asset or liability. Inputs may be observable or unobservable and refer broadly to the assumptions that market participants would use in pricing the asset or liability. Observable inputs reflect the assumptions market participants would use in pricing the asset or liability based on market data obtained from sources independent of the reporting entity. Unobservable inputs reflect the reporting entity’s own assumptions about the assumptions that market participants would use in pricing the asset or liability developed based on the best information available under the circum stances. Each Portfolio’s investment in its entirety is assigned a level based upon the observability of the inputs, which are significant to the overall valuation. The three level hierarchy of inputs is summarized below.
| Level 1 – | inputs are quoted prices in active markets for identical investments (e.g. equity securities, open-end investment companies, futures contracts, options contracts) |
| | |
| Level 2 – | other observable inputs (including, but not limited to: quoted prices for similar assets or liabilities in markets that are active, quoted prices for identical or similar assets or liabilities in markets that are not active, inputs other than quoted prices that are observable for the assets or liabilities (such as interest rates, yield curves, volatilities, prepayment speeds, loss severities, credit risks and default rates) or other market-corroborated inputs) (e.g. debt securities, government securities, swap contracts, foreign currency exchange contracts, foreign securities utilizing international fair value pricing) |
| | |
| Level 3 – | inputs are significant unobservable inputs (including the Fund’s own assumptions used to determine the fair value of investments) (e.g. broker-quoted securities, fair valued securities) |
The following table summarizes the valuation of The Large-Cap Value Equity Portfolio’s investments by fair value hierarchy levels as of October 31, 2010:
| | | Level 1 | | Level 2 | | Total |
| Common Stock | | $ | 6,508,212 | | $ | — | | $ | 6,508,212 |
| Short-Term | | | — | | | 72,001 | | | 72,001 |
| Total | | $ | 6,508,212 | | $ | 72,001 | | $ | 6,580,213 |
There were no Level 3 securities at the beginning or end of the year.
2010 Annual report • Delaware Pooled Trust
152
The following table summarizes the valuation of The Select 20 Portfolio’s investments by fair value hierarchy levels as of October 31, 2010:
| | | Level 1 | | Level 2 | | Total |
| Common Stock | | $ | 10,631,431 | | $ | — | | $ | 10,631,431 |
| Short-Term | | | — | | | 838,008 | | | 838,008 |
| Total | | $ | 10,631,431 | | $ | 838,008 | | $ | 11,469,439 |
There were no Level 3 securities at the beginning or end of the year.
The following table summarizes the valuation of The Large-Cap Growth Equity Portfolio’s investments by fair value hierarchy levels as of October 31, 2010:
| | | Level 1 | | Level 2 | | Level 3 | | Total |
| Common Stock | | $ | 243,031,657 | | $ | — | | $ | — | | $ | 243,031,657 |
| Short-Term | | | — | | | 1,407,013 | | | — | | | 1,407,013 |
| Securities Lending Collateral | | | — | | | 38,909,044 | | | 11,605 | | | 38,920,649 |
| Total | | $ | 243,031,657 | | $ | 40,316,057 | | $ | 11,605 | | $ | 283,359,319 |
The following is a reconciliation of investments in which significant unobservable inputs (Level 3) were used in determining fair value:
| | The Large-Cap Growth Equity Portfolio |
| | | Securities | |
| | | Lending | |
| | | Collateral | |
| Balance as of 10/31/09 | | | $ | 22 | | |
| Net change in unrealized appreciation/depreciation | | | | 11,583 | | |
| Balance as of 10/31/10 | | | $ | 11,605 | | |
| | | |
| Net change in unrealized appreciation/depreciation | | | | | | |
| from investments still held as of 10/31/10 | | | $ | 11,583 | | |
The following table summarizes the valuation of The Focus Smid-Cap Growth Equity Portfolio’s investments by fair value hierarchy levels as of October 31, 2010:
| | | Level 1 | | Level 2 | | Total |
| Common Stock | | $ | 4,392,071 | | $ | — | | $ | 4,392,071 |
| Short-Term | | | — | | | 231,002 | | | 231,002 |
| Total | | $ | 4,392,071 | | $ | 231,002 | | $ | 4,623,073 |
There were no Level 3 securities at the beginning or end of the year.
The following table summarizes the valuation of The Real Estate Investment Trust Portfolio II’s investments by fair value hierarchy levels as of October 31, 2010:
| | | Level 1 | | Level 2 | | Total |
| Common Stock | | $ | 2,593,817 | | $ | — | | $ | 2,593,817 |
| Investment companies | | | 76,888 | | | — | | | 76,888 |
| Short-Term | | | — | | | 106,001 | | | 106,001 |
| Total | | $ | 2,670,705 | | $ | 106,001 | | $ | 2,776,706 |
There were no Level 3 securities at the beginning or end of the year.
2010 Annual report • Delaware Pooled Trust
(continues) 153
Notes to financial statements
Delaware Pooled® Trust
3. Investments (continued)
The following table summarizes the valuation of The Delaware Macquarie Real Estate Portfolio’s investments by fair value hierarchy levels as of October 31, 2010:
| | | Level 1 |
| Common Stock | | $2,304,050 |
There were no Level 2 or Level 3 securities at the beginning or end of the year.
The following table summarizes the valuation of The Core Focus Fixed Income Portfolio’s investments by fair value hierarchy levels as of October 31, 2010:
| | | Level 2 | | Level 3 | | Total |
| Agency, Asset-Backed and Mortgage-Backed Securities | | $ | 9,833,994 | | $ | 100,500 | | $ | 9,934,494 |
| Corporate Debt | | | 6,050,188 | | | — | | | 6,050,188 |
| Foreign Debt | | | 1,184,603 | | | — | | | 1,184,603 |
| U.S. Treasury Obligations | | | 1,768,493 | | | — | | | 1,768,493 |
| Short-Term | | | 4,856,044 | | | — | | | 4,856,044 |
| Securities Lending Collateral | | | 1,133,345 | | | 2,266 | | | 1,135,611 |
| Preferred Stock | | | 29,646 | | | — | | | 29,646 |
| Total | | $ | 24,856,313 | | $ | 102,766 | | $ | 24,959,079 |
| |
| Swap Contract | | $ | 411 | | $ | — | | $ | 411 |
The following is a reconciliation of investments in which significant unobservable inputs (Level 3) were used in determining fair value:
| | | The Core Focus Fixed Income Portfolio |
| | | Agency, Asset- | | | | | | | | | |
| | | Backed and | | | | | | | | | |
| | | Mortgage- | | Securities | | | | |
| | | Backed | | Lending | | | | |
| | | Securities | | Collateral | | Total |
| Balance as of 10/31/09 | | | $ | 133,316 | | | | | $ | 4 | | | $ | 133,320 | |
| Transfers out of Level 3 | | | | (35,000 | ) | | | | | — | | | | (35,000 | ) |
| Net change in unrealized appreciation/depreciation | | | | 2,184 | | | | | | 2,262 | | | | 4,446 | |
| Balance as of 10/31/10 | | | $ | 100,500 | | | | | $ | 2,266 | | | $ | 102,766 | |
| |
| Net change in unrealized appreciation/depreciation | | | | | | | | | | | | | | | |
| from investments still held as of 10/31/10 | | | $ | 2,184 | | | | | $ | 2,262 | | | $ | 4,446 | |
The following table summarizes the valuation of The High-Yield Bond Portfolio’s investments by fair value hierarchy levels as of October 31, 2010:
| | | Level 1 | | Level 2 | | Level 3 | | Total |
| Common Stock | | $ | 141,697 | | $ | — | | $ | — | | $ | 141,697 |
| Corporate Debt | | | — | | | 28,148,178 | | | 8,501 | | | 28,156,679 |
| Other | | | — | | | 177,750 | | | 1 | | | 177,751 |
| Short-Term | | | — | | | 941,008 | | | — | | | 941,008 |
| Securities Lending Collateral | | | — | | | 2,694,547 | | | 1,699 | | | 2,696,246 |
| Total | | $ | 141,697 | | $ | 31,961,483 | | $ | 10,201 | | $ | 32,113,381 |
2010 Annual report • Delaware Pooled Trust
154
The following is a reconciliation of investments in which significant unobservable inputs (Level 3) were used in determining fair value:
| | | The High Yield Bond Portfolio |
| | | | | | | Securities | | | | | | | |
| | | Corporate | | Lending | | | | | | | |
| | | Debt | | Collateral | | Other | | Total |
| Balance as of 10/31/09 | | $ | 8,501 | | | | $ | 3 | | | $ | — | | $ | 8,504 | |
| Sales | | | (42 | ) | | | | — | | | | — | | | (42 | ) |
| Net change in unrealized appreciation/depreciation | | | 42 | | | | | 1,696 | | | | 1 | | | 1,739 | |
| Balance as of 10/31/10 | | $ | 8,501 | | | | $ | 1,699 | | | $ | 1 | | $ | 10,201 | |
| |
| Net change in unrealized appreciation/depreciation | | | | | | | | | | | | | | | | |
| from investments still held as of 10/31/10 | | $ | — | | | | $ | 1,696 | | | $ | 1 | | $ | 1,697 | |
The following table summarizes the valuation of The Core Plus Fixed Income Portfolio’s investments by fair value hierarchy levels as of October 31, 2010:
| | | Level 1 | | Level 2 | | Level 3 | | Total |
| Agency, Asset-Backed and Mortgage-Backed Securities | | $ | — | | $ | 16,497,913 | | | $ | — | | $ | 16,497,913 | |
| Corporate Debt | | | — | | | 26,338,769 | | | | 107,069 | | | 26,445,838 | |
| Foreign Debt | | | — | | | 3,750,890 | | | | — | | | 3,750,890 | |
| U.S. Treasury Obligations | | | — | | | 1,770,336 | | | | — | | | 1,770,336 | |
| Short-Term | | | — | | | 8,133,073 | | | | — | | | 8,133,073 | |
| Securities Lending Collateral | | | — | | | 1,252,909 | | | | 2,673 | | | 1,255,582 | |
| Preferred Stock | | | — | | | 116,466 | | | | — | | | 116,466 | |
| Total | | $ | — | | $ | 57,860,356 | | | $ | 109,742 | | $ | 57,970,098 | |
| |
| Foreign Currency Exchange Contracts | | $ | — | | $ | (2,190 | ) | | $ | — | | $ | (2,190 | ) |
| Futures Contracts | | | 27,489 | | | — | | | | — | | | 27,489 | |
| Swap Contracts | | | — | | | 28,516 | | | | — | | | 28,516 | |
The following is a reconciliation of investments in which significant unobservable inputs (Level 3) were used in determining fair value:
| | | The Core Plus Fixed Income Portfolio |
| | | Agency, Asset- | | | | | | | | | | | | | | | | | |
| | | Backed and | | | | | | | | | | | | | | | | | |
| | | Mortgage- | | | | | | | | | | Securities | | | | |
| | | Backed | | Corporate | | Foreign | | Lending | | | | |
| | | Securities | | Debt | | Debt | | Collateral | | Total |
| Balance as of 10/31/09 | | | $ | 393,675 | | | | $ | — | | | $ | 378,852 | | | | $ | 5 | | | $ | 772,532 | |
| Purchases | | | | — | | | | | 101,227 | | | | — | | | | | — | | | | 101,227 | |
| Sales | | | | (346,703 | ) | | | | — | | | | (380,591 | ) | | | | — | | | | (727,294 | ) |
| Net realized loss | | | | (376,570 | ) | | | | — | | | | (7,486 | ) | | | | — | | | | (384,056 | ) |
| Transfers into Level 3 | | | | — | | | | | 300,669 | | | | — | | | | | — | | | | 300,669 | |
| Transfers out of Level 3 | | | | (95,000 | ) | | | | — | | | | — | | | | | — | | | | (95,000 | ) |
| Net change in unrealized appreciation/depreciation | | | | 424,598 | | | | | (294,827 | ) | | | 9,225 | | | | | 2,668 | | | | 141,664 | |
| Balance as of 10/31/10 | | | $ | — | | | | $ | 107,069 | | | $ | — | | | | $ | 2,673 | | | $ | 109,742 | |
| |
| Net change in unrealized appreciation/depreciation | | | | | | | | | | | | | | | | | | | | | | | |
| from investments still held as of 10/31/10 | | | $ | — | | | | $ | (294,827 | ) | | $ | — | | | | $ | 2,668 | | | $ | (292,159 | ) |
2010 Annual report • Delaware Pooled Trust
(continues) 155
Notes to financial statements
Delaware Pooled® Trust
3. Investments (continued)
The following table summarizes the valuation of The International Equity Portfolio’s investments by fair value hierarchy levels as of October 31, 2010:
| | | Level 1 | | Level 2 | | Level 3 | | Total |
| Common Stock | | $ | 802,415,520 | | $ | — | | | $ | — | | $ | 802,415,520 | |
| Short-Term | | | — | | | 3,065,028 | | | | — | | | 3,065,028 | |
| Securities Lending Collateral | | | — | | | 14,064,802 | | | | 77,923 | | | 14,142,725 | |
| Total | | $ | 802,415,520 | | $ | 17,129,830 | | | $ | 77,923 | | $ | 819,623,273 | |
| |
| Foreign Currency Exchange Contracts | | $ | — | | $ | (5,279 | ) | | $ | — | | $ | (5,279 | ) |
The following is a reconciliation of investments in which significant unobservable inputs (Level 3) were used in determining fair value:
| | | The International Equity Portfolio |
| | | | Securities | |
| | | | Lending | |
| | | | Collateral | |
| Balance as of 10/31/09 | | | | $ | 151 | | |
| Net change in unrealized appreciation/depreciation | | | | | 77,772 | | |
| Balance as of 10/31/10 | | | | $ | 77,923 | | |
| | | |
| Net change in unrealized appreciation/depreciation | | | | | | | |
| from investments still held as of 10/31/10 | | | | $ | 77,772 | | |
The following table summarizes the valuation of The Labor Select International Equity Portfolio’s investments by fair value hierarchy levels as of October 31, 2010:
| | | Level 1 | | Level 2 | | Level 3 | | Total |
| Common Stock | | $ | 728,239,369 | | $ | — | | | $ | — | | $ | 728,239,369 | |
| Short-Term | | | — | | | 15,024,135 | | | | — | | | 15,024,135 | |
| Securities Lending Collateral | | | — | | | 13,397,423 | | | | 26,954 | | | 13,424,377 | |
| Total | | $ | 728,239,369 | | $ | 28,421,558 | | | $ | 26,954 | | $ | 756,687,881 | |
| |
| Foreign Currency Exchange Contracts | | $ | — | | $ | (11,144 | ) | | $ | — | | $ | (11,144 | ) |
The following is a reconciliation of investments in which significant unobservable inputs (Level 3) were used in determining fair value:
| | | The Labor Select |
| | | International Equity Portfolio |
| | | | Securities | |
| | | | Lending | |
| | | | Collateral | |
| Balance as of 10/31/09 | | | | $ | 52 | | |
| Net change in unrealized appreciation/depreciation | | | | | 26,902 | | |
| Balance as of 10/31/10 | | | | $ | 26,954 | | |
| | | |
| Net change in unrealized appreciation/depreciation | | | | | | | |
| from investments still held as of 10/31/10 | | | | $ | 26,902 | | |
2010 Annual report • Delaware Pooled Trust
156
The following table summarizes the valuation of The Emerging Market Portfolio’s investments by fair value hierarchy levels as of October 31, 2010:
| | | Level 1 | | Level 2 | | Level 3 | | Total |
| Common Stock | | $ | 709,137,373 | | $ | 2,606,068 | | | $ | — | | $ | 711,743,441 | |
| Short-Term | | | — | | | 8,932,080 | | | | — | | | 8,932,080 | |
| Securities Lending Collateral | | | — | | | 22,689,226 | | | | 29,772 | | | 22,718,998 | |
| Preferred Stock | | | 30,239,388 | | | — | | | | — | | | 30,239,388 | |
| Total | | $ | 739,376,761 | | $ | 34,227,374 | | | $ | 29,772 | | $ | 773,633,907 | |
| |
| Foreign Currency Exchange Contracts | | $ | — | | $ | (4,612 | ) | | $ | — | | $ | (4,612 | ) |
The following is a reconciliation of investments in which significant unobservable inputs (Level 3) were used in determining fair value:
| | | The Emerging Markets Portfolio |
| | | | Securities | |
| | | | Lending | |
| | | | Collateral | |
| Balance as of 10/31/09 | | | | $ | 58 | | |
| Net change in unrealized appreciation/depreciation | | | | | 29,714 | | |
| Balance as of 10/31/10 | | | | $ | 29,772 | | |
| | | |
| Net change in unrealized appreciation/depreciation | | | | | | | |
| from investments still held as of 10/31/10 | | | | $ | 29,714 | | |
The following table summarizes the valuation of The Emerging Market Portfolio II’s investments by fair value hierarchy levels as of October 31, 2010:
| | | Level 1 | | Level 2 | | Total |
| Common Stock | | $ | 11,087,945 | | $ | 58,116 | | | $ | 11,146,061 | |
| |
| Foreign Currency Exchange Contracts | | $ | — | | $ | (42 | ) | | $ | (42 | ) |
There were no Level 3 securities at the beginning or end of the year.
The following table summarizes the valuation of The Global Real Estate Securities Portfolio’s investments by fair value hierarchy levels as of October 31, 2010:
| | | Level 1 | | Level 2 | | Level 3 | | Total |
| Common Stock | | $ | 56,465,143 | | $ | — | | | $ | — | | $ | 56,465,143 | |
| Short-Term | | | — | | | 3,040,027 | | | | — | | | 3,040,027 | |
| Securities Lending Collateral | | | — | | | 11,474,382 | | | | 21,486 | | | 11,495,868 | |
| Preferred Stock | | | 218,457 | | | — | | | | — | | | 218,457 | |
| Total | | $ | 56,683,600 | | $ | 14,514,409 | | | $ | 21,486 | | $ | 71,219,495 | |
| |
| Foreign Currency Exchange Contracts | | $ | — | | $ | (7,981 | ) | | $ | — | | $ | (7,981 | ) |
The following is a reconciliation of investments in which significant unobservable inputs (Level 3) were used in determining fair value:
| | | The Global Real Estate Securities Portfolio |
| | | | Securities | |
| | | | Lending | |
| | | | Collateral | |
| Balance as of 10/31/09 | | | | $ | 42 | | |
| Net change in unrealized appreciation/depreciation | | | | | 21,444 | | |
| Balance as of 10/31/10 | | | | $ | 21,486 | | |
| | | |
| Net change in unrealized appreciation/depreciation | | | | | | | |
| from investments still held as of 10/31/10 | | | | $ | 21,444 | | |
2010 Annual report • Delaware Pooled Trust
(continues) 157
Notes to financial statements
Delaware Pooled® Trust
3. Investments (continued)
The following table summarizes the valuation of The Global Fixed Income Portfolio’s investments by fair value hierarchy levels as of October 31, 2010:
| | | Level 2 |
| Foreign Debt | | $ | 114,044,334 |
| Corporate Debt | | | 3,249,584 |
| U.S. Treasury Obligations | | | 20,183,990 |
| Short-Term | | | 1,161,010 |
| Total | | | 138,638,918 |
| |
| Foreign Currency Exchange Contracts | | $ | 75,931 |
There were no Level 3 securities at the beginning or end of the year.
The following table summarizes the valuation of The International Fixed Income Portfolio’s investments by fair value hierarchy levels as of October 31, 2010:
| | | Level 2 |
| Foreign Debt | | $ | 20,816,563 |
| Corporate Debt | | | 114,323 |
| Short-Term | | | 126,001 |
| Total | | $ | 21,056,887 |
| |
| Foreign Currency Exchange Contract | | $ | 16,165 |
The following is a reconciliation of investments in which significant unobservable inputs (Level 3) were used in determining fair value:
| | The International Fixed Income Portfolio |
| | | Foreign | |
| | | Debt | |
| Balance as of 10/31/09 | | | $ | 460,314 | | | |
| Purchases | | | | 390,873 | | | |
| Transfers out of Level 3 | | | | (744,153 | ) | | |
| Net change in unrealized appreciation/depreciation | | | | (107,034 | ) | | |
| Balance as of 10/31/10 | | | $ | — | | | |
In January 2010, the Financial Accounting Standards Board issued an Accounting Standards Update, Improving Disclosures about Fair Value Measurements, which introduced new disclosure requirements and clarified certain existing disclosure requirements around fair value measurements currently presented above. The new disclosures and clarifications of existing disclosures are generally effective for the Portfolios’ year ending October 31, 2011 and interim periods therein.
During the fiscal year ended October 31, 2010, the Portfolios made transfers out of Level 1 investments into Level 2 investments based on management’s decision to classify the BNY Mellon Securities Lending Overnight Fund as a Level 2 investment. Management has classified the BNY Mellon Securities Lending Overnight Fund as a Level 2 investment because the price is not quoted in an active market or listed on a public exchange. The BNY Mellon Securities Lending Overnight Fund is priced daily for investors in the Fund.
| | Transfers from Level 1 investments to |
| | Level 2 investments |
| The Large-Cap Growth Equity Portfolio | | | $ | 38,677,896 | | |
| The Core Focus Fixed Income Portfolio | | | | 1,088,889 | | |
| The High-Yield Bond Portfolio | | | | 2,659,789 | | |
| The Core Plus Fixed Income Portfolio | | | | 1,199,564 | | |
| The International Equity Portfolio | | | | 12,996,043 | | |
| The Labor Select International Equity Portfolio | | | | 12,795,958 | | |
| The Emerging Markets Portfolio | | | | 22,046,929 | | |
| The Global Real Estate Securities Portfolio | | | | 11,278,697 | | |
2010 Annual report • Delaware Pooled Trust
158
Utilizing international fair value pricing for a security could cause transfers from Level 1 investments to Level 2 investments in the hierarchy.
During the year ended October 31, 2010, the following Portfolios made transfers out of Level 3 investments into Level 2 investments. This was due to the Portfolios’ pricing vendor being able to supply a matrix price for an investment that had been utilizing a broker quoted price.
| | Transfers from Level 3 investments to |
| | Level 2 investments |
| The Core Focus Fixed Income Portfolio | | $ | 35,000 | |
| The Core Plus Fixed Income Portfolio | | | 95,000 | |
| The International Fixed Income Portfolio | | | 744,153 | |
Transfers into Level 3 investments from Level 2 investments were made in the amount of $300,669 for The Core Plus Fixed Income Portfolio. This was due to the Portfolio’s pricing vendor dropping coverage of a security.
4. Dividend and Distribution Information
Income and long-term capital gain distributions are determined in accordance with federal income tax regulations, which may differ from U.S. GAAP. Additionally, distributions from net gains on foreign currency transactions and net short-term gains on sales of investment securities are treated as ordinary income for federal income tax purposes. The tax character of dividends and distributions paid during the years ended October 31, 2010 and 2009 was as follows:
| | | Ordinary | | | | | | | | | | | |
| | | income | | | | | | | | | | | |
| Year ended October 31, 2010: | | | | | | | | | | | | | | |
| The Large-Cap Value Equity Portfolio | | $ | 269,213 | | | | | | | | | | | |
| The Large-Cap Growth Equity Portfolio | | | 554,027 | | | | | | | | | | | |
| The Real Estate Investment Trust Portfolio II | | | 148,549 | | | | | | | | | | | |
| The Core Focus Fixed Income Portfolio | | | 946,676 | | | | | | | | | | | |
| The High-Yield Bond Portfolio | | | 2,139,650 | | | | | | | | | | | |
| The Core Plus Fixed Income Portfolio | | | 3,595,170 | | | | | | | | | | | |
| The International Equity Portfolio | | | 28,823,614 | | | | | | | | | | | |
| The Labor Select International Equity Portfolio | | | 22,976,321 | | | | | | | | | | | |
| The Emerging Markets Portfolio | | | 13,508,314 | | | | | | | | | | | |
| The Global Real Estate Securities Portfolio | | | 3,906,141 | | | | | | | | | | | |
| The Global Fixed Income Portfolio | | | 8,038,391 | | | | | | | | | | | |
| The International Fixed Income Portfolio | | | 2,076,030 | | | | | | | | | | | |
| |
| | | Ordinary | | Long-Term | | Return | | | |
| | | income | | capital gain | | of Capital | | Total |
| Year ended October 31, 2009: | | | | | | | | | | | | | | |
| The Large-Cap Value Equity Portfolio | | $ | 237,317 | | $ | — | | | $ | — | | | $ | 237,317 |
| The Select 20 Portfolio | | | 8,262 | | | — | | | | 7,220 | | | | 15,482 |
| The Large-Cap Growth Equity Portfolio | | | 1,012,945 | | | — | | | | — | | | | 1,012,945 |
| The Focus Smid-Cap Growth Equity Portfolio | | | 29,258 | | | — | | | | 7,384 | | | | 36,642 |
| The Real Estate Investment Trust Portfolio II | | | 295,942 | | | — | | | | — | | | | 295,942 |
| The Core Focus Fixed Income Portfolio | | | 1,521,244 | | | — | | | | — | | | | 1,521,244 |
| The High-Yield Bond Portfolio | | | 1,797,338 | | | — | | | | — | | | | 1,797,338 |
| The Core Plus Fixed Income Portfolio | | | 7,498,499 | | | — | | | | — | | | | 7,498,499 |
| The International Equity Portfolio | | | 88,883,940 | | | 115,268,847 | | | | — | | | | 204,152,787 |
| The Labor Select International Equity Portfolio | | | 45,429,859 | | | 21,959,941 | | | | — | | | | 67,389,800 |
| The Emerging Markets Portfolio | | | 18,520,513 | | | 77,714,200 | | | | — | | | | 96,234,713 |
| The Global Real Estate Securities Portfolio | | | 169,854 | | | — | | | | — | | | | 169,854 |
| The Global Fixed Income Portfolio | | | 31,311,090 | | | — | | | | — | | | | 31,311,090 |
| The International Fixed Income Portfolio | | | 2,146,073 | | | — | | | | — | | | | 2,146,073 |
2010 Annual report • Delaware Pooled Trust
(continues) 159
Notes to financial statements
Delaware Pooled® Trust
5. Components of Net Assets on a Tax Basis
As of October 31, 2010, the components of net assets on a tax basis were as follows:
| | | | The | | | | | | The | | The |
| | | Large-Cap | | The | | Large-Cap | | Focus Smid-Cap |
| | | Value Equity | | Select 20 | | Growth Equity | | Growth Equity |
| | | Portfolio | | Portfolio | | Portfolio | | Portfolio |
| Shares of beneficial interest | | | $ | 8,410,122 | | | | $ | 13,110,587 | | | $ | 283,329,494 | | | | $ | 4,917,957 | | |
| Undistributed ordinary income | | | | 187,798 | | | | | — | | | | 164,775 | | | | | — | | |
| Capital loss carryforwards | | | | (2,394,906 | ) | | | | (3,410,171 | ) | | | (78,350,625 | ) | | | | (1,017,618 | ) | |
| Unrealized appreciation of investments | | | | 389,219 | | | | | 1,762,353 | | | | 38,980,413 | | | | | 712,937 | | |
| Net assets | | | $ | 6,592,233 | | | | $ | 11,462,769 | | | $ | 244,124,057 | | | | $ | 4,613,276 | | |
| | |
| | | | | | | | | The | | | | | | | | | | |
| | | The | | Delaware | | The | | The |
| | | Real Estate | | Macquarie | | Core Focus | | High-Yield |
| | | Investment Trust | | Real Estate | | Fixed Income | | Bond |
| | | Portfolio II* | | Portfolio* | | Portfolio | | Portfolio |
| Shares of beneficial interest | | | $ | 5,531,147 | | | | $ | 2,000,017 | | | $ | 18,542,141 | | | | $ | 29,373,701 | | |
| Undistributed ordinary income | | | | 29,791 | | | | | 72,408 | | | | 487,249 | | | | | 1,828,590 | | |
| Capital loss carryforwards | | | | (2,792,517 | ) | | | | — | | | | (520,341 | ) | | | | (3,652,527 | ) | |
| Other temporary differences | | | | — | | | | | — | | | | — | | | | | (10,693 | ) | |
| Unrealized appreciation (depreciation) of investments | | | | | | | | | | | | | | | | | | | | |
| and foreign currencies | | | | (2,268 | ) | | | | 280,892 | | | | 698,828 | | | | | 1,897,895 | | |
| Net assets | | | $ | 2,766,153 | | | | $ | 2,353,317 | | | $ | 19,207,877 | | | | $ | 29,436,966 | | |
| | | | | | | | | | | The | | |
| | | The | | The | | Labor Select | | The |
| | | Core Plus | | International | | International | | Emerging |
| | | Fixed Income | | Equity | | Equity | | Markets |
| | | Portfolio | | Portfolio | | Portfolio | | Portfolio |
| Shares of beneficial interest | | $ | 50,822,246 | | | $ | 934,550,239 | | | $ | 809,063,800 | | | $ | 639,917,417 | |
| Undistributed ordinary income | | | 2,523,944 | | | | 22,831,559 | | | | 19,969,047 | | | | 16,481,716 | |
| Capital loss carryforwards | | | (5,098,436 | ) | | | (181,917,222 | ) | | | (103,831,271 | ) | | | (24,783,996 | ) |
| Other temporary differences | | | (203,581 | ) | | | — | | | | — | | | | — | |
| Unrealized appreciation of investments | | | | | | | | | | | | | | | | |
| and foreign currencies | | | 2,261,286 | | | | 33,546,554 | | | | 15,750,048 | | | | 118,575,315 | |
| Net assets | | $ | 50,305,459 | | | $ | 809,011,130 | | | $ | 740,951,624 | | | $ | 750,190,452 | |
2010 Annual report • Delaware Pooled Trust
160
| | | | | The | | The | | The |
| | The | | Global | | Global | | International |
| | Emerging | | Real Estate | | Fixed | | Fixed |
| | Markets | | Securities | | Income | | Income |
| | Portfolio II | | Portfolio* | | Portfolio | | Portfolio |
| Shares of beneficial interest | $ | 10,000,017 | | $ | 164,489,347 | | | $ | 120,687,453 | | | $ | 18,385,025 | |
| Undistributed ordinary income | | 105,456 | | | 4,757,232 | | | | 4,980,793 | | | | 762,732 | |
| Capital loss carryforwards | | — | | | (109,237,085 | ) | | | (38,911 | ) | | | (351,036 | ) |
| Other temporary differences | | — | | | — | | | | (876,930 | ) | | | (253,093 | ) |
| Unrealized appreciation of investments | | | | | | | | | | | | | | |
| and foreign currencies | | 1,259,004 | | | 305,601 | | | | 15,528,225 | | | | 2,814,592 | |
| Net assets | $ | 11,364,477 | | $ | 60,315,095 | | | $ | 140,280,630 | | | $ | 21,358,220 | |
*The undistributed earnings for The Real Estate Investment Trust Portfolio II, The Delaware Macquarie Real Estate Portfolio and The Global Real Estate Securities Portfolio are estimated pending final notification of the tax character of distributions received from investments in Real Estate Investment Trusts.
The differences between book basis and tax basis components of net assets are primarily attributable to tax deferral of losses on wash sales, mark-to-market on futures contracts, mark-to-market on forward foreign currency contracts, straddle loss deferrals, tax recognition of unrealized gain on passive foreign investment companies, contingent payment debt instruments, the tax treatment of market discount and premium on debt instruments, and CDS contracts.
For financial reporting purposes, capital accounts are adjusted to reflect the tax character of permanent book/tax differences. Reclassifications are primarily due to tax treatment of net operating losses, gain (loss) on foreign currency transactions, dividends and distributions, market discount and premium on certain debt instruments, passive foreign investment companies, CDS and interest rate swaps, tax treatment of Brazilian taxes and paydown gains (losses) on mortgage- and asset-backed securities. Results of operations and net assets were not affected by these reclassifications. For the year ended October 31, 2010, the following Portfolios recorded the following reclassifications:
| | Undistributed | | Accumulated | | | | |
| | (distributions in excess of) | | net realized | | Paid-in |
| | net investment income (loss) | | gain (loss) | | capital |
| The Select 20 Portfolio | | $ | 34,021 | | | | $ | 1,126,726 | | | $ | (1,160,747 | ) |
| The Focus Smid-Cap Growth Equity Portfolio | | | 10,697 | | | | | 1,212 | | | | (11,909 | ) |
| The Delaware Macquarie Real Estate Portfolio | | | 411 | | | | | (411 | ) | | | — | |
| The Core Focus Fixed Income Portfolio | | | (13,812 | ) | | | | 13,812 | | | | — | |
| The High-Yield Bond Portfolio | | | 57,641 | | | | | (57,641 | ) | | | — | |
| The Core Plus Fixed Income Portfolio | | | (191,885 | ) | | | | 191,885 | | | | — | |
| The International Equity Portfolio | | | (50,381 | ) | | | | 3,638,704 | | | | (3,588,323 | ) |
| The Labor Select International Equity Portfolio | | | 171,739 | | | | | (171,739 | ) | | | — | |
| The Emerging Markets Portfolio | | | (722,099 | ) | | | | (2,629,171 | ) | | | 3,351,270 | |
| The Emerging Markets Portfolio II | | | (8,669 | ) | | | | 8,669 | | | | — | |
| The Global Real Estate Securities Portfolio | | | 2,054,407 | | | | | (2,054,407 | ) | | | — | |
| The Global Fixed Income Portfolio | | | 2,055,978 | | | | | (2,055,978 | ) | | | — | |
| The International Fixed Income Portfolio | | | 322,975 | | | | | (322,975 | ) | | | — | |
2010 Annual report • Delaware Pooled Trust
(continues) 161
Notes to financial statements
Delaware Pooled® Trust
5. Components of Net Assets on a Tax Basis (continued)
For federal income tax purposes, capital loss carryforwards may be carried forward and applied against future gains. In 2010, the Portfolios utilized capital loss carryforwards as follows:
| | Capital loss |
| | Carryforwards utilized |
| The Large-Cap Value Equity Portfolio | | $ | 12,526 | |
| The Select 20 Portfolio | | | 885,384 | |
| The Focus Smid-Cap Growth Equity Portfolio | | | 824,101 | |
| The Core Focus Fixed Income Portfolio | | | 640,596 | |
| The High-Yield Bond Portfolio | | | 1,834,840 | |
| The Core Plus Fixed Income Portfolio | | | 2,604,247 | |
| The Emerging Markets Portfolio | | | 22,872,085 | |
| The Global Fixed Income Portfolio | | | 939,114 | |
| The International Fixed Income Portfolio | | | 11,588 | |
In 2010, the following capital loss carryforwards expired:
| | Capital loss |
| | Carryforwards expired |
| The Select 20 Portfolio | $1,122,779 |
Capital loss carryforwards remaining at October 31, 2010 will expire as follows:
| | Year of expiration |
| | 2011 | | 2014 | | 2015 | | 2016 | | 2017 | | 2018 | | Total |
| The Large-Cap Value Equity Portfolio | $ | — | | $ | — | | $ | — | | $ | 1,643,696 | | $ | 751,210 | | $ | — | | $ | 2,394,906 |
| The Select 20 Portfolio | | 596,717 | | | 76,954 | | | — | | | 106,744 | | | 2,629,756 | | | — | | | 3,410,171 |
| The Large-Cap Growth Equity Portfolio | | — | | | — | | | — | | | 16,131,381 | | | 60,026,291 | | | 2,192,953 | | | 78,350,625 |
| The Focus Smid-Cap Growth Equity Portfolio | | — | | | — | | | — | | | — | | | 1,017,618 | | | — | | | 1,017,618 |
| The Real Estate Investment Trust Portfolio II | | — | | | — | | | — | | | 1,246,201 | | | 1,521,902 | | | 24,414 | | | 2,792,517 |
| The Core Focus Fixed Income Portfolio | | — | | | — | | | — | | | — | | | 520,341 | | | — | | | 520,341 |
| The High-Yield Bond Portfolio | | — | | | — | | | — | | | 1,437,186 | | | 2,215,341 | | | — | | | 3,652,527 |
| The Core Plus Fixed Income Portfolio | | — | | | — | | | 1,030,064 | | | 1,786,993 | | | 2,281,379 | | | — | | | 5,098,436 |
| The International Equity Portfolio | | — | | | — | | | — | | | — | | | 168,057,741 | | | 13,859,481 | | | 181,917,222 |
| The Labor Select International Equity Portfolio | | — | | | — | | | — | | | — | | | 85,355,469 | | | 18,475,802 | | | 103,831,271 |
| The Emerging Markets Portfolio | | — | | | — | | | — | | | — | | | 24,783,996 | | | — | | | 24,783,996 |
| The Global Real Estate Securities Portfolio | | — | | | — | | | 1,245,667 | | | 53,802,495 | | | 50,784,384 | | | 3,404,539 | | | 109,237,085 |
| The Global Fixed Income Portfolio | | — | | | — | | | — | | | 38,911 | | | — | | | — | | | 38,911 |
| The International Fixed Income Portfolio | | — | | | 306,422 | | | — | | | 21,289 | | | 23,325 | | | — | | | 351,036 |
2010 Annual report • Delaware Pooled Trust
162
6. Capital Shares
Transactions in capital shares were as follows:
| | | | Shares issued | | | | | | |
| | | | upon reinvestment | | | | | Net |
| | Shares | | of dividends | | Shares | | increase |
| | sold | | and distributions | | repurchased | | (decrease) |
| Year ended October 31, 2010: | | | | | | | | | |
| The Large-Cap Value Equity Portfolio | 175,466 | | 17,372 | | (517,627 | ) | | (324,789 | ) |
| The Select 20 Portfolio | 687,803 | | — | | (837,298 | ) | | (149,495 | ) |
| The Large-Cap Growth Equity Portfolio | 798,974 | | 48,225 | | (7,591,330 | ) | | (6,744,131 | ) |
| The Focus Smid-Cap Growth Equity Portfolio | 181,698 | | — | | (202,377 | ) | | (20,679 | ) |
| The Real Estate Investment Trust Portfolio II | — | | 32,434 | | (782,439 | ) | | (750,005 | ) |
| The Delaware Macquarie Real Estate Portfolio* | 235,296 | | — | | — | | | 235,296 | |
| The Core Focus Fixed Income Portfolio | 47,913 | | 103,164 | | (370,394 | ) | | (219,317 | ) |
| The High-Yield Bond Portfolio | 1,099,387 | | 307,863 | | (988,798 | ) | | 418,452 | |
| The Core Plus Fixed Income Portfolio | 369,239 | | 389,931 | | (1,317,236 | ) | | (558,066 | ) |
| The International Equity Portfolio | 5,047,375 | | 1,149,637 | | (17,437,364 | ) | | (11,240,352 | ) |
| The Labor Select International Equity Portfolio | 2,681,964 | | 1,762,856 | | (11,523,071 | ) | | (7,078,251 | ) |
| The Emerging Markets Portfolio | 9,917,765 | | 1,381,667 | | (9,003,085 | ) | | 2,296,347 | |
| The Emerging Markets Portfolio II** | 1,176,473 | | — | | — | | | 1,176,473 | |
| The Global Real Estate Securities Portfolio — Original Class | 3,376,120 | | 738,547 | | (4,538,708 | ) | | (424,041 | ) |
| The Global Real Estate Securities Portfolio — Class P | — | | 91 | | — | | | 91 | |
| The Global Fixed Income Portfolio | 1,096,047 | | 642,047 | | (2,422,757 | ) | | (684,663 | ) |
| The International Fixed Income Portfolio | — | | 187,706 | | — | | | 187,706 | |
| | | | | | | | | | |
| Year ended October 31, 2009: | | | | | | | | | |
| The Large-Cap Value Equity Portfolio | 10,927 | | 18,672 | | (6,536 | ) | | 23,063 | |
| The Select 20 Portfolio | 3,828 | | — | | (166,897 | ) | | (163,069 | ) |
| The Large-Cap Growth Equity Portfolio | 2,973,390 | | 140,889 | | (10,494,430 | ) | | (7,380,151 | ) |
| The Focus Smid-Cap Growth Equity Portfolio | 66,060 | | 5,376 | | (329,604 | ) | | (258,168 | ) |
| The Real Estate Investment Trust Portfolio II | — | | 85,041 | | — | | | 85,041 | |
| The Core Focus Fixed Income Portfolio | 269,861 | | 100,328 | | (1,808,538 | ) | | (1,438,349 | ) |
| The High-Yield Bond Portfolio | 293,459 | | 391,577 | | (1,025,030 | ) | | (339,994 | ) |
| The Core Plus Fixed Income Portfolio | 245,889 | | 947,977 | | (9,110,977 | ) | | (7,917,111 | ) |
| The International Equity Portfolio | 16,249,143 | | 10,937,486 | | (31,852,141 | ) | | (4,665,512 | ) |
| The Labor Select International Equity Portfolio | 5,040,439 | | 6,309,906 | | (1,217,209 | ) | | 10,133,136 | |
| The Emerging Markets Portfolio | 4,528,942 | | 16,012,486 | | (19,084,860 | ) | | 1,456,568 | |
| The Global Real Estate Securities Portfolio — Original Class | 3,842,799 | | 43,008 | | (12,915,622 | ) | | (9,029,815 | ) |
| The Global Real Estate Securities Portfolio — Class P | — | | — | | — | | | — | |
| The Global Fixed Income Portfolio | 1,197,079 | | 2,646,717 | | (5,750,573 | ) | | (1,906,777 | ) |
| The International Fixed Income Portfolio | — | | 191,956 | | (1,196,911 | ) | | (1,004,955 | ) |
| * | Commenced operations June 30, 2010. |
| ** | Commenced operations June 23, 2010. |
2010 Annual report • Delaware Pooled Trust
(continues) 163
Notes to financial statements
Delaware Pooled® Trust
7. Line of Credit
The Portfolios, along with certain other funds in the Delaware Investments® Family of Funds (Participants), were participants in a $35,000,000 revolving line of credit with BNY Mellon to be used for temporary or emergency purposes as an additional source of liquidity to fund redemptions of investor shares. Under the agreement, the Participants were charged an annual commitment fee, which was allocated across the Participants on the basis of each Participant’s allocation of the entire facility. The Participants were permitted to borrow up to a maximum of one third of their net assets under the agreement. The agreement expired on November 16, 2010. Effective as of November 16, 2010, the Portfolios along with the other Participants entered into an amendment to the agreement with BNY Mellon for a $50,000,000 revolving line of credit. The agreement as amended is to be used as described above and operates in substantially the same manner as the original agreement. The agreement as amended expires on November 15, 2011. The Portfolios had no amounts outstanding as of October 31, 2010 or at any time during the year then ended.
8. Derivatives
U.S. GAAP requires enhanced disclosures that enable investors to understand: 1) how and why an entity uses derivatives; 2) how they are accounted for; and 3) how they affect an entity’s results of operations and financial position.
Foreign Currency Exchange Contracts — The Select 20, The Large-Cap Growth Equity, The Focus Smid-Cap Growth Equity, The Real Estate Investment Trust II, The Delaware Macquarie Real Estate, The Core Focus Fixed Income, The High-Yield Bond, The Core Plus Fixed Income, The International Equity, The Labor Select International Equity, The Emerging Markets, The Emerging Markets II, The Global Real Estate Securities, The Global Fixed Income, and The International Fixed Income Portfolios may enter into foreign currency exchange contracts and foreign cross-currency exchange contracts as a way of managing foreign exchange rate risk. The Portfolios may enter into these contracts to fix the U.S. dollar value of a security that they have agreed to buy or sell for the period between the date the trade was entered into and the date the security is delivered and paid for. The Portfolios may also use these contracts to hedge the U.S. dollar value of securities they already own that are denominated in foreign currencies. The change in market value is recorded as an unrealized gain or loss. When the contract is closed, a realized gain or loss is recorded equal to the difference between the value of the contract at the time it was opened and the value at the time it was closed.
The use of foreign currency exchange contracts and foreign cross-currency exchange contracts does not eliminate fluctuations in the underlying prices of the securities, but does establish a rate of exchange that can be achieved in the future. Although foreign currency exchange contracts limit the risk of loss due to an unfavorable change in the value of the hedged currency, they also limit any potential gain that might result should the value of the currency change favorably. In addition, the Portfolios could be exposed to risks if the counterparties to the contracts are unable to meet the terms of their contracts. The Portfolios’ maximum risk of loss from counterparty credit risk is the value of its currency exchanged with the counterparty. The risk is generally mitigated by having a netting arrangement between a Portfolio and the counterparty and by the posting of collateral by the counterparty to a Portfolio to cover a Portfolio&# 8217;s exposure to the counterparty.
Futures Contracts — A futures contract is an agreement in which the writer (or seller) of the contract agrees to deliver to the buyer an amount of cash or securities equal to a specific dollar amount times the difference between the value of a specific security or index at the close of the last trading day of the contract and the price at which the agreement is made. The Select 20, The Large-Cap Growth Equity, The Focus Smid-Cap Growth Equity, The Real Estate Investment Trust II, The Delaware Macquarie Real Estate, The Core Focus Fixed Income, The Core Plus Fixed Income, The Emerging Markets, The Emerging Markets II, The Global Real Estate Securities, and The International Fixed Income Portfolios may use futures in the normal course of pursuing their investment objectives. Each Portfolio may invest in financial futures c ontracts to hedge their existing portfolio securities against fluctuations in fair value caused by changes in prevailing market interest rates. Upon entering into a futures contract, a Portfolio deposits cash or pledges U.S. government securities to a broker, equal to the minimum “initial margin” requirements of the exchange on which the contract is traded. Subsequent payments are received from the broker or paid to the broker each day, based on the daily fluctuation in the market value of the contract. These receipts or payments are known as “variation margin” and are recorded daily by each Portfolio as unrealized gains or losses until the contracts are closed. When the contracts are closed, the Portfolio records a realized gain or loss equal to the difference between the value of the contract at the time it was opened and the value at the time it was closed. Risks of entering into futures contracts include potential imperfect correlation between the futures contracts and the underly ing securities and the possibility of an illiquid secondary market for these instruments. When investing in futures, there is minimal counterparty credit risk to a Portfolio because futures are exchange traded and the exchange’s clearinghouse, as counterparty to all exchange-traded futures, guarantees against default.
Options Contracts — The Portfolios may buy or write options contracts for any number of reasons, including: to manage a Portfolio’s exposure to changes in securities prices and foreign currencies; as an efficient means of adjusting a Portfolio’s overall exposure to certain markets; to protect the value of portfolio securities; and as a cash management tool. A Portfolio may buy or write call or put options on securities, financial indices, and foreign currencies. When a Portfolio buys an option, a premium is paid and an asset is recorded and adjusted on a daily basis to reflect the current market value of the options purchased. When a Portfolio writes an option, a premium is received and a liability is recorded and adjusted on a daily basis to reflect the current market value of the options written. Premiums r eceived from writing options that expire unexercised are treated by a Portfolio on the expiration date as realized gains. The difference between the premium received and the amount paid on effecting a closing purchase transaction, including brokerage commissions, is treated as realized gain or loss. If a call option is exercised, the premium is added to the proceeds from the sale of the underlying security in determining whether the Portfolio has a realized gain or loss. If a put option is exercised, the premium reduces the cost basis of the securities purchased by the Portfolio. A Portfolio, as writer of an option, bears the market risk of an unfavorable change in the price of the security underlying the written option. When writing options, a Portfolio is subject to minimal counterparty risk because the counterparty is only obligated to pay premiums and does not bear the market risk of an unfavorable market change.
2010 Annual report • Delaware Pooled Trust
164
There were no transactions in written options or purchase options during the year ended October 31, 2010.
Swap Contracts — The Core Focus Fixed Income Portfolio and The Core Plus Fixed Income Portfolio may enter into interest rate swap contracts and index swap contracts in accordance with their investment objectives. These Portfolios and The High-Yield Bond Portfolio may enter into credit default swap (CDS) contracts in accordance with their investment objectives. The Portfolios may use interest rate swaps to adjust the Portfolios’ sensitivity to interest rates or to hedge against changes in interest rates. Index swaps may be used to gain exposure to markets that the Portfolios invest in, such as the corporate bond market. The Portfolios may also use index swaps as a substitute for futures or options contracts if such contracts are not directly available to the Portfolios on favorable terms. The Portfolios may enter in to CDS contracts in order to hedge against a credit event, to enhance total return, or to gain exposure to certain securities or markets.
Interest Rate Swaps. An interest rate swap contract is an exchange of interest rates between counterparties. In one instance, an interest rate swap involves payments received by a Portfolio from another party based on a variable or floating interest rate, in return for making payments based on a fixed interest rate. An interest rate swap can also work in reverse with a Portfolio receiving payments based on a fixed interest rate and making payments based on a variable or floating interest rate. Interest rate swaps may be used to adjust a Portfolio’s sensitivity to interest rates or to hedge against changes in interest rates. Periodic payments on such contracts are accrued daily and recorded as unrealized appreciation/depreciation on swap contracts. Upon periodic payment/receipt or termination of the contract, such amounts are recorded as realized gains or losses on swap contracts. A Portfolio’s maximum risk of loss from counterparty credit risk is the discounted net value of the cash flows to be received from/paid to the counterparty over the interest rate swap contract’s remaining life, to the extent that the amount is positive. This risk is mitigated by having a netting arrangement between a Portfolio and the counterparty and by the posting of collateral by the counterparty to a Portfolio to cover a Portfolio’s exposure to the counterparty.
Index swaps. Index swaps involve commitments to pay interest in exchange for a market-linked return based on a notional amount. To the extent the total return of the security, instrument or basket of instruments underlying the transaction exceeds the offsetting interest obligation, a Portfolio will receive a payment from the counterparty. To the extent the total return of the security, instrument or basket of instruments underlying the transaction falls short of the offsetting interest obligation, a Portfolio will make a payment to the counterparty. The change in value of swap contracts outstanding, if any, is recorded as unrealized appreciation or depreciation daily. A realized gain or loss is recorded on maturity or termination of the swap contract. A Portfolio’s maximum risk of loss from counterparty credit risk is th e discounted net value of the cash flows to be received from/paid to the counterparty over the index swap contract’s remaining life, to the extent that the amount is positive. This risk is mitigated by having a netting arrangement between a Portfolio and the counterparty and by the posting of collateral by the counterparty to a Portfolio to cover a Portfolio’s exposure to the counterparty.
Credit Default Swaps. A CDS contract is a risk-transfer instrument through which one party (purchaser of protection) transfers to another party (seller of protection) the financial risk of a credit event (as defined in the CDS agreement), as it relates to a particular referenced security or basket of securities (such as an index). In exchange for the protection offered by the seller of protection, the purchaser of protection agrees to pay the seller of protection a periodic amount at a stated rate that is applied to the notional amount of the CDS contract. In addition, an upfront payment may be made or received by a Portfolio in connection with an unwinding or assignment of a CDS contract. Upon the occurrence of a credit event, the seller of protection would pay the par (or other agreed-upon) value of the referenced security ( or basket of securities) to the counterparty. Credit events generally include, among others, bankruptcy, failure to pay, and obligation default.
During the year ended October 31, 2010, the Portfolios entered into CDS contracts as purchasers and sellers of protection. Periodic payments (receipts) on such contracts are accrued daily and recorded as unrealized losses (gains) on swap contracts. Upon payment (receipt), such amounts are recorded as realized losses (gains) on swap contracts. Upfront payments made or received in connection with CDS contracts are amortized over the expected life of the CDS contracts as realized losses (gains) on swap contracts. The change in value of CDS contracts is recorded as unrealized appreciation or depreciation daily. A realized gain or loss is recorded upon a credit event (as defined in the CDS agreement) or the maturity or termination of the agreement.
At October 31, 2010, the aggregate unrealized appreciation of credit default swaps for The Core Focus Fixed Income Portfolio was $411. If a credit event had occurred for all swap transactions where collateral posting was required as of October 31, 2010, the swaps’ credit related features would have been triggered and The Core Focus Fixed Income Portfolio would have received $20,000 less the value of the contracts’ related reference obligations.
At October 31, 2010, the aggregate unrealized appreciation of credit default swaps for The Core Plus Fixed Income Portfolio was $28,516. If a credit event had occurred for all swap transactions where collateral posting was required as of October 31, 2010, the swaps’ credit related features would have been triggered and The Core Plus Fixed Income Portfolio would have been required to pay $576,000 less the value of the contracts’ related reference obligations.
As disclosed in the footnotes to the Statement of Net Assets, at October 31, 2010, the notional value of the protection sold for The Core Focus Fixed Income Portfolio was $20,000, which reflects the maximum potential amount the Portfolio could be required to make as a seller of credit protection if a credit event occurs. The quoted market prices and resulting market values for credit default swap agreements on securities and credit indices serve as an indicator of the current status of the payment/performance risk and represent the likelihood of an expected liability (or profit) for the credit derivative if the swap agreement has been closed/sold as of the period end. Increasing market values, in absolute terms when compared to the notional amount of the swap, represent a deterioration of the reference entity’s credit soundness and a greater likelihood of risk of default or other credit event occurring as defined under the terms of t he agreement. At October 31, 2010, the net unrealized appreciation of the protection sold was $411.
2010 Annual report • Delaware Pooled Trust
(continues) 165
Notes to financial statements
Delaware Pooled® Trust
8. Derivatives (continued)
As disclosed in the footnotes to the statement of net assets, at October 31, 2010, the notional value of the protection sold for The Core Plus Fixed Income Portfolio was $595,000, which reflects the maximum potential amount the Portfolio could be required to make as a seller of credit protection if a credit event occurs. The quoted market prices and resulting market values for credit default swap agreements on securities and credit indices serve as an indicator of the current status of the payment/performance risk and represent the likelihood of an expected liability (or profit) for the credit derivative if the swap agreement has been closed/sold as of the period end. Increasing market values, in absolute terms when compared to the notional amount of the swap, represent a deterioration of the reference entity’s credit soundness and a greater likelihood of risk of default or other credit event occurring as defined under the terms of t he agreement. At October 31, 2010, the net unrealized appreciation of the protection sold was $11,798.
Credit default swaps may involve greater risks than if a Portfolio had invested in the referenced obligation directly. Credit default swaps are subject to general market risk, liquidity risk, counterparty risk and credit risk. A Portfolio’s maximum risk of loss from counterparty credit risk, either as the seller of protection or the buyer of protection, is the fair value of the contract. This risk is mitigated by having a netting arrangement between a Portfolio and the counterparty and by the posting of collateral by the counterparty to a Portfolio to cover a Portfolio’s exposure to the counterparty.
Swaps Generally. Because there is no organized market for swap contracts, the value of open swaps may differ from that which would be realized in the event a Portfolio terminated its position in the agreement. Risks of entering into these agreements include the potential inability of the counterparty to meet the terms of the contracts. This type of risk is generally limited to the amount of favorable movements in the value of the underlying security, instrument, or basket of instruments, if any, at the day of default. Risks also arise from potential losses from adverse market movements and such losses could exceed the unrealized amounts shown on the statements of net assets.
Fair values of derivative instruments as of October 31, 2010 were as follows:
| | | The Core Plus Fixed Income Portfolio |
| | | Asset Derivatives | | Liability Derivatives |
| | | Statement of Net Assets Location | | Fair Value | | Statement of Net Assets Location | | Fair Value |
| Foreign exchange contracts | | Receivables and other assets net | | | | | Liabilities net of receivables | | | | |
| (Forward currency contracts) | | of liabilities | | $ | 5,804 | | and other assets | | $ | (7,994 | ) |
| Interest rate contracts | | Receivables and other assets net | | | | | Liabilities net of receivables | | | | |
| (Futures contracts) | | of liabilities | | | 27,489 | | and other assets | | | — | |
| | | Receivables and other assets net | | | | | Liabilities net of receivables | | | | |
| Credit contracts (Swap contracts) | | of liabilities | | | 29,017 | | and other assets | | | (501 | ) |
| Total | | | | $ | 62,310 | | | | $ | (8,495 | ) |
The effect of derivative instruments on the statement of operations for the year ended October 31, 2010 was as follows:
| | | The Core Plus Fixed Income Portfolio |
| | | | | | | | | | Change in Unrealized |
| | | | | | | | | | Appreciation |
| | | | | Realized Gain or | | or Depreciation |
| | | | | Loss on Derivatives | | on Derivatives |
| | | Location of Gain or Loss on Derivatives Recognized in Income | | Recognized in Income | | Recognized in Income |
| Foreign exchange contracts | | Net realized loss on foreign currencies and net | | | | | | | | | | |
| (Forward currency contracts) | | change in unrealized appreciation/depreciation of | | | | | | | | | | |
| | | investments and foreign currencies | | | $ | (275,409 | ) | | | $ | 91,296 | |
| Interest rate contracts | | Net realized gain on futures and net change in | | | | | | | | | | |
| (Futures contracts) | | unrealized appreciation/depreciation of investments | | | | | | | | | | |
| | | and foreign currencies | | | | 148,121 | | | | | 39,114 | |
| Credit contracts | | Net realized loss on swap contracts and net change in | | | | | | | | | | |
| (Swap contracts) | | unrealized appreciation/depreciation of investments | | | | | | | | | | |
| | | and foreign currencies | | | | (54,473 | ) | | | | (49,388 | ) |
| Total | | | | | $ | (181,761 | ) | | | $ | 81,022 | |
2010 Annual report • Delaware Pooled Trust
166
9. Securities Lending
The Portfolios, along with other funds in the Delaware Investments® Family of Funds, may lend their securities pursuant to a security lending agreement (Lending Agreement) with BNY Mellon. With respect to each loan, if on any business day the aggregate market value of securities collateral plus cash collateral held is less than the aggregate market value of the securities which are the subject of such loan, the borrower will be notified to provide additional collateral by the end of the following business day which, together with the collateral already held, will be not less than the applicable collateral requirements for such security loan. If the aggregate market value of securities collateral and cash collateral held with respect to a security loan exceeds the applicable collateral requirement, upon request of the borrower BNY Mellon must return enough collateral to the borrower by the end of the following business day to reduce the value of the remaining collateral to the applicable collateral requirement for such security loan. As a result of the foregoing, the value of the collateral held with respect to a loaned security may be temporarily more or less than the value of security on loan.
Cash collateral received is generally invested in the Delaware Investments Collateral Fund No. 1 (the “Collective Trust”) established by BNY Mellon for the purpose of investment on behalf of funds managed by DMC that participate in BNY Mellon’s securities lending program. The Collective Trust may invest in U.S. government securities and high quality corporate debt, asset-backed and other money market securities and in repurchase agreements collateralized by such securities, provided that the Collective Trust will generally have a dollar-weighted average portfolio maturity of 60 days or less. The Collective Trust seeks to maintain a net asset value per unit of $1.00, but there can be no assurance that it will always be able to do so. The Portfolios may incur investment losses as a result of investing securities lending collateral in the Collective Trust or another collateral investment pool. This could occur if an investme nt in a collateral investment pool defaulted or if it were necessary to liquidate assets in the collateral investment pool to meet returns on outstanding security loans at a time when the collateral investment pool’s net asset value per unit was less than $1.00. Under those circumstances, the Portfolios may not receive an amount from the collateral investment pool that is equal in amount to the collateral the Portfolios would be required to return to the borrower of the securities and the Portfolios would be required to make up for this shortfall. Effective April 20, 2009, BNY Mellon transferred the assets of the Portfolios’ previous collateral investment pool other than cash and assets with a maturity of one business day or less to the BNY Mellon SL DBT II Liquidating Fund (the “Liquidating Fund”), effectively bifurcating the previous collateral investment pool. The Portfolios’ exposure to the Liquidating Fund is expected to decrease as the Liquidating Fund’s assets matur e or are sold. In October 2008, BNY Mellon transferred certain distressed securities from the previous collateral investment pool into the Mellon GSL Reinvestment Trust II. The Portfolios can also accept U.S. government securities and letters of credit (non-cash collateral) in connection with securities loans. In the event of default or bankruptcy by the lending agent, realization and/or retention of the collateral may be subject to legal proceedings. In the event the borrower fails to return loaned securities and the collateral received is insufficient to cover the value of the loaned securities and provided such collateral shortfall is not the result of investment losses, the lending agent has agreed to pay the amount of the shortfall to the Portfolios, or at the discretion of the lending agent, replace the loaned securities. The Portfolios continue to record dividends or interest, as applicable, on the securities loaned and are subject to changes in value of the securities loaned that may occur during the term of the loan. The Portfolios have the right under the Lending Agreement to recover the securities from the borrower on demand. With respect to security loans collateralized by non-cash collateral, the Portfolios receive loan premiums paid by the borrower. With respect to security loans collateralized by cash collateral, the earnings from the collateral investments are shared among the Portfolios, the security lending agent and the borrower. The Portfolios record security lending income net of allocations to the security lending agent and the borrower.
At October 31, 2010, the value of securities on loan and the value of invested collateral are presented below, for wh ich the Portfolios received collateral, comprised of non-cash collateral and cash collateral. Investments purchased with cash collateral are presented on the statements of net assets under the caption “Securities Lending Collateral.”
| | Value | | | | | Cash | | Value of |
| | of securities | | Non-cash | | collateral | | invested |
| | on loan | | collateral | | received | | collateral |
| The Large-Cap Growth Equity Portfolio | $ | 38,486,445 | | $ | — | | $ | 39,140,389 | | $ | 38,920,649 |
| The Core Focus Fixed Income Portfolio | | 1,155,402 | | | — | | | 1,178,495 | | | 1,135,611 |
| The High-Yield Bond Portfolio | | 2,742,216 | | | 139,603 | | | 2,728,440 | | | 2,696,246 |
| The Core Plus Fixed Income Portfolio | | 1,264,622 | | | — | | | 1,306,208 | | | 1,255,582 |
| The International Equity Portfolio | | 14,802,432 | | | — | | | 15,603,826 | | | 14,142,725 |
| The Labor Select International Equity Portfolio | | 13,265,844 | | | — | | | 13,936,680 | | | 13,424,377 |
| The Emerging Markets Portfolio | | 22,062,908 | | | — | | | 23,284,196 | | | 22,718,998 |
| The Global Real Estate Securities Portfolio | | 11,121,416 | | | — | | | 11,895,795 | | | 11,495,868 |
2010 Annual report • Delaware Pooled Trust
(continues) 167
Notes to financial statements
Delaware Pooled® Trust
10. Credit and Market Risk
Some countries in which The International Equity, The Labor Select International Equity, The Emerging Markets, The Emerging Markets II, The Global Real Estate Securities, The Global Fixed Income, and The International Fixed Income Portfolios invest require governmental approval for the repatriation of investment income, capital or the proceeds of sales of securities by foreign investors. In addition, if there is deterioration in a country’s balance of payments or for other reasons, a country may impose temporary restrictions on foreign capital remittances abroad.
The securities exchanges of certain foreign markets are substantially smaller, less liquid and more volatile than the major securities markets in the United States. Consequently, acquisition and disposition of securities by the Portfolios may be inhibited. In addition, a significant portion of the aggregate market value of equity securities listed on the major securities exchanges in emerging markets is held by a smaller number of investors. This may limit the number of shares available for acquisition or disposition by the Portfolios.
The High-Yield Bond Portfolio and The Core Plus Fixed Income Portfolio invest a portion of their assets in high yield fixed income securities, which carry ratings of BB or lower by S&P and/or Ba or lower by Moody’s. Investments in these higher yielding securities are generally accompanied by a greater degree of credit risk than higher rated securities. Additionally, lower rated securities may be more susceptible to adverse economic and competitive industry conditions than investment grade securities.
The Core Focus Fixed Income, The Core Plus Fixed Income, The Global Real Estate Securities, and The Global Fixed Income Portfolios invest in fixed income securities whose value is derived from an underlying pool of mortgages or consumer loans. The value of these securities is sensitive to changes in economic conditions, including delinquencies and/or defaults, and may be adversely affected by shifts in the market’s perception of the issuers and changes in interest rates. Investors receive principal and interest payments as the underlying mortgages and consumer loans are paid back. Some of these securities are collateralized mortgage obligations (CMOs). CMOs are debt securities issued by U.S. government agencies or by financial institutions and other mortgage lenders, which are collateralized by a pool of mortgages held under an indenture. Prepayment of mortgages may shorten the stated maturity of the obligations and can result in a l oss of premium, if any has been paid. Certain of these securities may be stripped (securities which provide only the principal or interest feature of the underlying security). The yield to maturity on an interest-only CMO is extremely sensitive not only to changes in prevailing interest rates, but also to the rate of principal payments (including prepayments) on the related underlying mortgage assets. A rapid rate of principal payments may have a material adverse effect on the Portfolios’ yield to maturity. If the underlying mortgage assets experience greater than anticipated prepayments of principal, the Portfolios may fail to fully recoup their initial investments in these securities even if the securities are rated in the highest rating categories.
The International Equity and The Global Fixed Income Portfolios may invest up to 10% of each Portfolio’s net assets in illiquid securities, which may include securities with contractual restrictions on resale, securities exempt from registration under Rule 144A of the Securities Act of 1933, as amended, and other securities, which may not be readily marketable. The Large-Cap Value Equity, The Select 20, The Large-Cap Growth Equity, The Focus Smid-Cap Growth Equity, The Real Estate Investment Trust II, The Delaware Macquarie Real Estate, The Core Focus Fixed Income, The High-Yield Bond, The Core Plus Fixed Income, The Labor Select International Equity, The Emerging Markets, The Emerging Markets II, The Global Real Estate Securities, and The International Fixed Income Portfolios may invest up to 15% of each Portfolio’s net assets in such securities. The relative illiquidity of these securities may impair each Portfolio from dispo sing of them in a timely manner and at a fair price when it is necessary or desirable to do so. While maintaining oversight, the Portfolios’ Board of Trustees has delegated to DMC the day-to-day functions of determining whether individual securities are liquid for purposes of the Portfolios’ limitation on investments in illiquid assets. Securities eligible for resale pursuant to Rule 144A, which are determined to be liquid, are not subject to the Portfolios’ limit on investments in illiquid securities. Rule 144A and illiquid securities have been identified on the statements of net assets.
The Select 20, The Focus Smid-Cap Growth Equity, and The Global Real Estate Securities Portfolios invest a significant portion of their assets in small- and mid-sized companies and may be subject to certain risks associated with ownership of securities of such companies. Investments in small- or mid-sized companies may be more volatile than investments in larger companies for a number of reasons, which include more limited financial resources or a dependence on narrow product lines.
The Real Estate Investment Trust Portfolio II, The Delaware Macquarie Real Estate and The Global Real Estate Securities Portfolio concentrate their investments in the real estate industry and are subject to the risks associated with that industry. If a Portfolio holds real estate directly as a result of defaults or receives rental income directly from real estate holdings, its tax status as a regulated investment company may be jeopardized. These Portfolios are also affected by interest rate changes, particularly if the real estate investment trusts they hold use floating rate debt to finance their ongoing operations. Each Portfolio’s investments may also tend to fluctuate more in value than a portfolio that invests in a broader range of industries.
2010 Annual report • Delaware Pooled Trust
168
11. Contractual Obligations
The Portfolios enter into contracts in the normal course of business that contain a variety of indemnifications. The Portfolios’ maximum exposure under these arrangements is unknown. However, the Portfolios have not had prior claims or losses pursuant to these contracts. Management has reviewed the Portfolios’ existing contracts and expects the risk of loss to be remote.
12. In-Kind Redemptions
During the year ended October 31, 2010, the following portfolios satisfied withdrawal requests with transfers of securities and cash, resulting in net realized gains (losses).
| | Securities and Cash | | Net realized gain (loss) |
| The International Equity Portfolio | | $ | 18,194,694 | | | | $ | (3,581,435 | ) |
| The Emerging Markets Portfolio | | | 67,497,894 | | | | | 4,933,623 | |
13. Subsequent Events
The Delaware Macquarie Real Estate Portfolio — Termination of Sub-Adviser and Change to Investment Policies
Effective as of November 8, 2010, DMC terminated the Sub-Advisory Agreement dated June 23, 2010 by and between DMC and Macquarie Capital Investment Management LLC and assumed management of The Delaware Macquarie Real Estate Portfolio. In connection with DMC’s assumption of management responsibilities, certain changes were made to the Portfolio’s investment strategies as described in the Portfolio’s current prospectus as supplemented on November 8, 2010.
The International Fixed Income Portfolio — Termination of Sub-Adviser and Proposed Reorganization
On November 18, 2010, the Board of Trustees responsible for The International Fixed Income Portfolio (the “Reorganizing Fund”) approved a proposal to reorganize the Reorganizing Fund with and into a newly organized fund, Delaware International Bond Fund (the “Acquiring Fund”), a series of Delaware Group® Adviser Funds, subject to shareholder approval. The Board of Trustees responsible for the Acquiring Fund also approved the reorganization. It is anticipated that Reorganizing Fund shareholders will be asked to approve the proposed reorganization at a special meeting of shareholders to be held in the first quarter of 2011.
As part of the proposal, Mondrian Investment Partners Limited, the current sub-advisor to the Reorganizing Fund, will be terminated. DMC will serve as investment advisor to the Acquiring Fund.
The investment strategies and policies of the Acquiring Fund differ from those of the Reorganizing Fund in that (1) the Acquiring Fund may invest a larger portion of its assets in below-investment-grade securities, including up to 30% in high yield corporate bonds; (2) the Acquiring Fund may invest a larger portion of its assets in emerging markets securities, which may include below-investment-grade securities; and (3) the Acquiring Fund has no restrictions on maturity or duration.
The expenses of the Acquiring Fund are expected to be consistent with the retail funds within the Delaware Investments® Family of Funds and therefore higher than those of the Reorganizing Fund.
Management has determined no other material events or transactions occurred subsequent to October 31, 2010 that would require recognition or disclosure in the Portfolios’ financial statements.
14. Tax Information (Unaudited)
The information set forth below is for each Portfolio’s fiscal year as required by federal laws. Shareholders, however, must report distributions on a calendar year basis for income tax purposes, which may include distributions for portions of two fiscal years of a fund. Accordingly, the information needed by shareholders for income tax purposes will be sent to them in January of each year. Please consult your tax advisor for proper treatment of this information.
2010 Annual report • Delaware Pooled Trust
(continues) 169
Notes to financial statements
Delaware Pooled® Trust
14. Tax Information (Unaudited) (continued)
For the fiscal year ended October 31, 2010, each Portfolio designates distributions paid during the year as follows:
| | (A) | | | |
| | Ordinary | | | |
| | Income | | (B) |
| | Distributions* | | Qualifying |
| | (Tax Basis) | | Dividends1 |
| The Large-Cap Value Equity Portfolio | 100% | | 100 | % |
| The Large-Cap Growth Equity Portfolio | 100% | | 100 | % |
| The Small-Cap Growth Equity Portfolio | 100% | | — | |
| The Real Estate Investment Trust Portfolio II | 100% | | — | |
| The Core Focus Fixed Income Portfolio | 100% | | — | |
| The High-Yield Bond Portfolio | 100% | | — | |
| The Core Plus Fixed Income Portfolio | 100% | | — | |
| The International Equity Portfolio | 100% | | 8 | % |
| The Labor Select International Equity Portfolio | 100% | | 8 | % |
| The Emerging Markets Portfolio | 100% | | 4 | % |
| The Global Real Estate Securities Portfolio | 100% | | — | |
| The Global Fixed Income Portfolio | 100% | | — | |
| The International Fixed Income Portfolio | 100% | | — | |
| (A) | is based on a percentage of each Portfolio’s total distributions. |
| (B) | is based on a percentage of each Portfolio’s ordinary income distributions. |
| 1 | Qualifying dividends represent dividends which qualify for the corporate dividends received deduction. |
| * | For the fiscal year ended October 31, 2010, certain dividends paid by the Portfolios may be subject to a maximum tax rate of 15%, as provided for by the Jobs and Growth Tax Relief Reconciliation Act of 2003. The Portfolios intend to designate the following amounts to be taxed at a maximum rate of 15%. Complete information will be computed and reported in conjunction with your 2009 or 2010 Form 1099-DIV. |
| | Maximum amount to be |
| | Taxed at a maximum rate of 15% |
| The Large-Cap Value Equity Portfolio | | $ | 269,213 | |
| The Large-Cap Growth Equity Portfolio | | | 554,027 | |
| The Core Focus Fixed Income Portfolio | | | 2,929 | |
| The Core Plus Fixed Income Portfolio | | | 4,537 | |
| The International Equity Portfolio | | | 3,335,283 | |
| The Labor Select International Equity Portfolio | | | 4,751,570 | |
| The Emerging Markets Portfolio | | | 13,508,314 | |
The International Equity Portfolio, The Labor Select International Equity Portfolio, The Emerging Markets Portfolio, The Emerging Markets Portfolio II and The Global Real Estate Securities Portfolio intend to pass through foreign tax credits in the maximum amount of $2,024,170, $1,724,224, $1,691,933, $4,142 and $46,828, respectively. The gross foreign source income earned during the fiscal year 2010 was $30,963,856, $30,399,529, $26,948,917, $80,774 and $1,926,494, respectively. Complete information will be computed and reported in conjunction with your 2010 Form 1099-DIV.
For the fiscal year ended October 31, 2010, certain interest income paid by the Portfolios, determined to be Qualified Interest Income and Short-Term Capital Gains, may be subject to relief from U.S. withholding for foreign shareholders, as provided by the American Jobs Creation Act of 2004. For the fiscal year ended October 31, 2010, each Portfolio has designated maximum distributions of Qualified Interest Income as follows:
| | Maximum Distributions of |
| | Qualified Interest Income |
| The Core Focus Fixed Income Portfolio | | $ | 597,215 | |
| The High-Yield Bond Portfolio | | | 2,139,650 | |
| The International Fixed Income Portfolio | | | 611,842 | |
2010 Annual report • Delaware Pooled Trust
170
Report of independent
registered public accounting firm
To the Board of Trustees of Delaware Pooled® Trust and the Shareholders of The Large-Cap Value Equity Portfolio, The Select 20 Portfolio, The Large-Cap Growth Equity Portfolio, The Focus Smid-Cap Growth Equity Portfolio, The Real Estate Investment Trust Portfolio II, The Delaware Macquarie Real Estate Portfolio, The Core Focus Fixed Income Portfolio, The High-Yield Bond Portfolio, The Core Plus Fixed Income Portfolio, The International Equity Portfolio, The Labor Select International Equity Portfolio, The Emerging Markets Portfolio, The Emerging Markets Portfolio II, The Global Real Estate Securities Portfolio, The Global Fixed Income Portfolio and The International Fixed Income Portfolio:
In our opinion, the accompanying statements of net assets and the related statements of operations and of changes in net assets and the financial highlights present fairly, in all material respects, the financial position of The Large-Cap Value Equity Portfolio, The Select 20 Portfolio, The Large-Cap Growth Equity Portfolio, The Focus Smid-Cap Growth Equity Portfolio, The Real Estate Investment Trust Portfolio II, The Delaware Macquarie Real Estate Portfolio, The Core Focus Fixed Income Portfolio, The High-Yield Bond Portfolio, The Core Plus Fixed Income Portfolio, The International Equity Portfolio, The Labor Select International Equity Portfolio, The Emerging Markets Portfolio, The Emerging Markets Portfolio II, The Global Real Estate Securities Portfolio, The Global Fixed Income Portfolio and The International Fixed Income Portfolio (sixteen of the series constituting Delaware Pooled Trust, hereafter collectively referred to as the R 20;Funds”) at October 31, 2010, and the results of their operations, the changes in each of their net assets and the financial highlights for the periods then ended, in conformity with accounting principles generally accepted in the United States of America. These financial statements and financial highlights (hereafter referred to as “financial statements”) are the responsibility of the Funds’ management; our responsibility is to express an opinion on these financial statements based on our audits. We conducted our audits of these financial statements in accordance with the standards of the Public Company Accounting Oversight Board (United States). Those standards require that we plan and perform the audit to obtain reasonable assurance about whether the financial statements are free of material misstatement. An audit includes examining, on a test basis, evidence supporting the amounts and disclosures in the financial statements, assessing the accounting principles used and significa nt estimates made by management, and evaluating the overall financial statement presentation. We believe that our audits, which included confirmation of securities at October 31, 2010 by correspondence with the custodian and brokers, provide a reasonable basis for our opinion. The statement of changes in net assets for the year ended October 31, 2009 and the financial highlights for the year ended October 31, 2009 and each of the periods prior were audited by other independent accountants whose report dated December 22, 2009 expressed an unqualified opinion on those statements.
PricewaterhouseCoopers LLP
Philadelphia, Pennsylvania
December 21, 2010
2010 Annual report • Delaware Pooled Trust
171
Other Portfolio information
(Unaudited)
Delaware Pooled® Trust
Board Consideration of Investment Advisory Agreements
The Emerging Markets Portfolio II
At a meeting held on February 24-26, 2009 (the “Meeting”), the Board of Trustees of the Delaware Investments® Family of Funds (the “Board”), including the independent Trustees, unanimously approved an investment advisory agreement for The Emerging Markets Portfolio II (the “Fund”). In making its decision, the Board considered information furnished specifically in connection with the approval of the investment advisory agreement with Delaware Management Company (“DMC”).
In considering information relating to the approval of the Fund’s advisory agreement, the independent Trustees received assistance and advice from and met separately with counsel to the independent Trustees. Although the Board gave attention to all information furnished, the following discussion identifies, under separate headings, the primary factors taken into account by the Board during its contract approval considerations.
Nature, Extent and Quality of Service. Consideration was given to the services to be provided by Delaware Investments to the Fund and its shareholders. In reviewing the nature, extent and quality of such services, the Board noted that reports will be furnished to it throughout the year at regular Board meetings covering matters such as compliance of portfolio managers with the investment policies, strategies and restrictions, the compliance of management personnel with the Code of Ethics adopted throughout the Delaware Investments Family of Funds complex and the adherence to fair value pricing procedures as established by the Board. The Board was pleased with the current staffing of the Fund’s investment advisor and the emphasis placed on research in the investment process. The Board noted the investment by DMC in a new computerized platform which is expected to be completed in 2009. The Board also considered the transfer agent and shareholder services to be provided to Fund shareholders by Delaware Investments’ affiliate, Delaware Service Company, Inc. (“DSC”), noting DSC’s commitment to maintain a high level of service as well as Delaware Investments’ expenditures to improve the delivery of shareholder services. The Board once again noted the benefits provided to Fund shareholders for being part of the Delaware Investments Family of Funds, including each shareholder’s ability to exchange investments between Delaware Pooled Trust portfolios or the institutional class shares of other Delaware Investments funds and to reinvest Fund dividends into additional shares of the Fund or into additional shares of other Delaware Investments funds. The Board was satisfied with the nature, extent and quality of the overall services to be provided by Delaware Investments.
Investment Performance. The Board considered the investment performance of the Delaware Investments funds and DMC.
Comparative Expenses. The Board considered management fee and total expense comparison data for the proposed Fund and other comparable funds presented in the Board materials. Management provided the Board with information on pricing levels and fee structures for the Fund. The Board focused on the comparative analysis of the effective management fees and total expense ratios of the Fund versus the effective management fees and expense ratios of a group of similar funds (the “Expense Group”). The Board was satisfied with the proposed management fee and total expenses of the Fund in comparison to other similar emerging markets funds.
Management Profitability. The Board considered the level of profits to be realized by Delaware Investments in connection with the operation of the Fund. In this respect, the Board reviewed the pro forma expense statement for the Fund included in the Board materials which reflected varying projected levels of expense reimbursement at varying asset levels. The Board also considered the extent to which Delaware Investments might derive ancillary benefits from fund operations, including the potential for procuring additional business as a result of the prestige and visibility associated with its role as service provider to the Delaware Investments® Family of Funds and the benefits from allocation of fund brokerage to improve trading efficiencies. The Board found th at the management fees were reasonable in light of the services rendered and the level of profitability of Delaware Investments.
Economies of Scale. The Trustees considered whether economies of scale are realized by Delaware Investments as the Fund’s assets increase and the extent to which any economies of scale are reflected in the level of management fees charged. The Trustees considered the standardized advisory fee pricing and structure, approved by the Board and shareholders. The Board noted that the fee under the Fund’s proposed management contract fell within the standard structure for international equity funds. Management believed, and the Board agreed, that the Fund was priced with a relatively low management fee to reflect potential economies of scale at all asset levels.
The Delaware Macquarie Real Estate Portfolio
At a meeting held on February 16-18, 2010 (the “Meeting”), the Board of Trustees of the Delaware Investments Family of Funds (the “Board”), including the independent Trustees, unanimously approved an investment advisory agreement for The Delaware Macquarie Real Estate Portfolio (the “Fund”). In making its decision, the Board considered information furnished specifically in connection with the approval of the investment advisory agreement with Delaware Management Company (“DMC”).
In considering information relating to the approval of the Fund’s advisory agreement, the independent Trustees received assistance and advice from and met separately with counsel to the independent Trustees. Although the Board gave attention to all information furnished, the following discussion identifies, under separate headings, the primary factors taken into account by the Board during its contract approval considerations.
2010 Annual report • Delaware Pooled Trust
172
Board Consideration of Investment Advisory Agreements (continued)
Nature, Extent and Quality of Service. The Board considered the services to be provided by Delaware Investments to the Fund and its shareholders. In reviewing the nature, extent and quality of services, the Board noted that reports will be furnished to it throughout the year at regular Board Meetings covering matters such as relative performance of the Fund, compliance of portfolio managers with the investment policies, strategies and restrictions for the Fund, compliance by DMC and Delaware Distributors, L.P. (together, “Management”) personnel with the Code of Ethics adopted throughout the Delaware Investments Family of Funds complex and adherence to fair value pricing procedures as established by the Board. The Board was pleased with the current staffing of the Fund’s investment advisor and the emphasis pla ced on research in the investment process. The Board gave favorable consideration to DMC’s efforts to control expenditures while maintaining service levels committed to Delaware Investments fund matters. The Board also considered the transfer agent and shareholder services to be provided to Fund shareholders by DMC’s affiliate, Delaware Service Company, Inc. (“DSC”), noting DSC’s high level of service to shareholders of other Delaware Investments funds. The Board also noted the benefits to be provided to Fund shareholders through each shareholder’s ability to exchange an investment in the Fund for the shares of other Series of DPT. The Board was satisfied with the nature, extent and quality of the overall services proposed to be provided by Delaware Investments.
Investment Performance. The Board considered the investment performance and noted real estate investment expertise of the Delaware Investments funds and DMC.
Comparative Expenses. The Board considered management fee and total expense comparison data for the Fund and other comparable funds presented in the Board materials. Management provided the Board with information on the proposed pricing levels and fee structures for the Fund. The Board focused on the comparative analysis of the effective management fees and total expense ratios of the Fund versus the effective management fees and expense ratios of a group of similar funds (the “Expense Group”). The Board was satisfied with the proposed management fee and total expenses of the Fund in comparison to other similar real estate securities funds.
Management Profitability. The Board considered the level of potential profits to be realized by Delaware Investments in connection with the operation of the Fund. In this respect, the Board reviewed the pro forma expense statement for the Fund included in the Board materials which reflected varying projected levels of expense reimbursement at varying asset levels. The Board also considered the extent to which Delaware Investments might derive ancillary benefits from Delaware Investments fund operations, including the potential for procuring additional business as a result of the prestige and visibility associated with its role as service provider to the Delaware Investments Family of Funds and the benefits from allocation of Delaware Investments fund brokerage to improve trading efficiencies. The Board found that the managemen t fees were reasonable in light of the services proposed to be rendered and the level of profitability of Delaware Investments.
Economies of Scale. The Trustees considered whether economies of scale will be realized by Delaware Investments as the Fund’s assets increase and the extent to which any economies of scale are reflected in the level of management fees charged. The Trustees considered Delaware Investments’ standardized advisory fee pricing and structure. The Board noted that the fee under the Fund’s proposed management contract fell within the standard fee structure for real estate securities funds. Management believed, and the Board agreed, that the Fund was priced with a relatively low management fee to reflect potential economies of scale at all asset levels.
Change in Independent Registered Public Accounting Firm
Due to independence matters under the Securities and Exchange Commission’s auditor independence rules relating to the January 4, 2010 acquisition of Delaware Investments (including DMC, DDLP and DSC) by Macquarie Group, Ernst & Young LLP (“E&Y”) has resigned as the independent registered public accounting firm for Delaware Pooled Trust (the “Trust”) effective May 20, 2010. At a meeting held on May 20, 2010, the Board of Trustees of the Trust, upon recommendation of the Audit Committee, selected PricewaterhouseCoopers LLP (“PwC”) to serve as the independent registered public accounting firm for the Trust for the fiscal year ending October 31, 2010. During the fiscal years ended October 31, 2009 and 2008, E&Y’s audit reports on the financial statements of the Trust did not contain any adverse opinion or disclaimer of opinion, nor were they qualified or modified as to uncertainty, au dit scope, or accounting principles. In addition, there were no disagreements between the Trust and E&Y on accounting principles, financial statements disclosures or audit scope, which, if not resolved to the satisfaction of E&Y, would have caused them to make reference to the disagreement in their reports. Neither the Trust nor anyone on its behalf has consulted with PwC at any time prior to their selection with respect to the application of accounting principles to a specified transaction, either completed or proposed or the type of audit opinion that might be rendered on the Trust’s financial statements.
2010 Annual report • Delaware Pooled Trust
(continues) 173
Other Portfolio information
(Unaudited)
Delaware Pooled® Trust
Fund management
Robert Akester
Senior Portfolio Manager — Mondrian Investment Partners Ltd.
The Emerging Markets Portfolio
Prior to joining Mondrian Investment Partners Ltd. in 1996, Robert Akester was a director of Hill Samuel Investment Management where he had responsibility for significant overseas clients and Far Eastern markets. He has more than 40 years of investment experience, including more than 30 years of involvement in emerging markets. Akester is a graduate of University College, London.
Damon J. Andres, CFA
Vice President, Senior Portfolio Manager
The Delaware Macquarie Real Estate Portfolio
The Global Real Estate Securities Portfolio
The Real Estate Investment Trust Portfolio II
Damon J. Andres, who joined Delaware Investments in 1994 as an analyst, currently serves as a portfolio manager for REIT investments and convertibles. He also serves as a portfolio manager for the firm’s Dividend Income products. From 1991 to 1994, he performed investment-consulting services as a consulting associate with Cambridge Associates. Andres earned a bachelor’s degree in business administration with an emphasis in finance and accounting from the University of Richmond.
Kristen E. Bartholdson
Vice President, Portfolio Manager
The Large-Cap Value Equity Portfolio
Kristen E. Bartholdson is a portfolio manager for the firm’s Large-Cap Value team. Prior to joining the firm in 2006 as an associate portfolio manager, she worked at Susquehanna International Group from 2004 to 2006, where she was an equity research salesperson. From 2000 to 2004 she worked in equity research at Credit Suisse, most recently as an associate analyst in investment strategy. Bartholdson earned her bachelor’s degree in economics from Princeton University.
Fiona A. Barwick
Director of Regional Research — Mondrian Investment Partners Ltd.
The International Equity Portfolio
Fiona A. Barwick joined Mondrian Investment Partners Ltd. in the spring of 1993 to cover the Pacific Basin markets. Prior to this, she spent three years at Touche, Remnant & Co. in London as an assistant portfolio manager and research analyst. Barwick is a graduate of University College, London, and is a member of the CFA Institute and the CFA Society of the U.K.
Joanna Bates
Senior Portfolio Manager — Mondrian Investment Partners Ltd.
The Global Fixed Income Portfolio
The International Fixed Income Portfolio
Joanna Bates joined the Mondrian Investment Partners Ltd. Fixed Income team in 1997, before which she was associate director of Fixed Interest at Hill Samuel Investment Management. She has also worked for Fidelity International and Save & Prosper as a fund manager and analyst for global bond markets. At Mondrian, Bates is a senior portfolio manager with many client relationships including those based in Japan. Her research specialties are emerging market currencies and debt. Bates is a graduate of London University. She holds the ASIP designation and is a member of the CFA Institute and the CFA Society of the U.K.
2010 Annual report • Delaware Pooled Trust
174
Nigel Bliss
Senior Portfolio Manager — Mondrian Investment Partners Ltd.
The Labor Select International Equity Portfolio
Nigel Bliss joined Mondrian Investment Partners Ltd. in July 1995 and is currently a member of the Pacific Equity team where his country research focus lies with Greater China. His sector coverage includes property, utilities, energy, and industrials. He commenced his career at Cazenove & Co. after graduating from the University of Manchester. Bliss holds the ASIP designation and is a member of the CFA Institute and the CFA Society of the U.K.
Christopher J. Bonavico, CFA
Vice President, Senior Portfolio Manager, Equity Analyst
The Select 20 Portfolio
The Focus Smid-Cap Growth Equity Portfolio
The Large-Cap Growth Equity Portfolio
Christopher J. Bonavico joined Delaware Investments in April 2005 as a senior portfolio manager on the firm’s Focus Growth Equity team, which manages large-cap growth, smid-cap growth, all-cap growth, and global growth portfolios. Prior to joining the firm, he was a principal and portfolio manager at Transamerica Investment Management, where he managed sub-advised funds and institutional separate accounts. Before joining Transamerica in 1993, he was a research analyst for Salomon Brothers. Bonavico received his bachelor’s degree in economics from the University of Delaware.
Kenneth F. Broad, CFA
Vice President, Senior Portfolio Manager, Equity Analyst
The Select 20 Portfolio
The Focus Smid-Cap Growth Equity Portfolio
Kenneth F. Broad joined Delaware Investments in April 2005 as a senior portfolio manager on the firm’s Focus Growth Equity team, which manages large-cap growth, smid-cap growth, all-cap growth, and global growth portfolios. Prior to joining the firm, he was a principal and portfolio manager at Transamerica Investment Management, where he also managed sub-advised funds and institutional separate accounts. Before joining Transamerica in 2000, he was a portfolio manager with The Franklin Templeton Group and was a consultant in the business valuation and merger and acquisition group at KPMG Peat Marwick. He received an MBA from the University of California at Los Angeles and his bachelor’s degree in economics from Colgate University.
Liu-Er Chen, CFA
Senior Vice President, Chief Investment Officer — Emerging Markets and Healthcare
The Emerging Markets Portfolio II
Liu-Er Chen heads the firm’s global Emerging Markets team, and he is also the portfolio manager for the Delaware Healthcare Fund, which launched in October 2007. Prior to joining Delaware Investments in September 2006 in his current position, he spent nearly 11 years at Evergreen Investment Management Company, where he most recently served as managing director and senior portfolio manager. He co-managed the Evergreen Emerging Markets Growth Fund from 1999 to 2001, and became the Fund’s sole manager in 2001. He also served as the sole manager of the Evergreen Health Care Fund since its inception in 1999. Chen began his career at Evergreen in 1995 as an analyst covering Asian and global healthcare stocks, before being promoted to portfolio manager in 1998. Prior to his career in asset management, Chen worked for three years in sales, marketing, and business development for major American and European pharmaceutical and medical de vice companies. He is licensed to practice medicine in China and has experience in medical research at both the Chinese Academy of Sciences and Cornell Medical School. He holds an MBA with a concentration in management from Columbia Business School.
2010 Annual report • Delaware Pooled Trust
(continues) 175
Other Portfolio information
(Unaudited)
Delaware Pooled® Trust
Thomas H. Chow, CFA
Senior Vice President, Senior Portfolio Manager
The Core Focus Fixed Income Portfolio
The Core Plus Fixed Income Portfolio
Thomas H. Chow is a member of the firm’s taxable fixed income portfolio management team, with primary responsibility for portfolio construction and strategic asset allocation in investment grade credit exposures. He is the lead portfolio manager for Delaware Corporate Bond Fund and Delaware Extended Duration Bond Fund, as well as several institutional mandates. His experience includes significant exposure to asset liability management strategies and credit risk opportunities. Prior to joining Delaware Investments in 2001 as a portfolio manager working on the Lincoln General Account, he was a trader of high grade and high yield securities, and was involved in the portfolio management of collateralized bond obligations (CBOs) and insurance portfolios at SunAmerica/AIG from 1997 to 2001. Before that, he was an analyst, trader, and portfolio manager at Conseco Capital Management from 1989 to 1997. Chow received a bachelor’s degree in business analysis from Indiana University, and he is a Fellow of Life Management Institute.
Elizabeth A. Desmond
Director and Chief Investment Officer, Developed Equity Markets — Mondrian Investment Partners Ltd.
The International Equity Portfolio
Elizabeth A. Desmond is a graduate of Wellesley College and the Masters Program in East Asian Studies at Stanford University. After working for the Japanese government for two years, she began her investment career as a Pacific Basin investment manager with Shearson Lehman Global Asset Management. Prior to joining Mondrian in the spring of 1991, she was a Pacific Basin equity analyst and senior portfolio manager at Hill Samuel Investment Advisers Ltd. Desmond is a CFA charterholder, and a member of the CFA Institute and the CFA Society of the U.K.
Chuck M. Devereux
Senior Vice President, Director of Credit Research
The Core Focus Fixed Income Portfolio
The High-Yield Bond Portfolio
Chuck M. Devereux is the head of the firm’s taxable credit research department. In addition, he serves as a consultant for the team responsible for portfolio management of some of the firm’s fixed income products. Prior to April 2007, he was a senior vice president and co-head of the firm’s private placements group, which has responsibility for managing a portfolio of approximately $8 billion of privately placed securities. Prior to joining Delaware Investments in 2001, Devereux was employed by Valuemetrics/VM Equity Partners, a financial advisory and investment banking firm, where he participated in financial advisory and capital-raising efforts for privately held, middle-market companies. These efforts included placements of traditional corporate debt and equity as well as mezzanine and venture-capital financings. Prior to Valuemetrics/VM Equity Partners, he was a trust officer in the privately held asset division of th e Northern Trust Corporation for three years. Devereux earned an MBA with a concentration in finance from DePaul University and a bachelor’s degree in economics from St. Joseph’s College.
2010 Annual report • Delaware Pooled Trust
176
Roger A. Early, CPA, CFA, CFP
Senior Vice President, Co-Chief Investment Officer — Total Return Fixed Income Strategy
The Core Focus Fixed Income Portfolio
The Core Plus Fixed Income Portfolio
Roger A. Early rejoined Delaware Investments in March 2007 as a member of the firm’s taxable fixed income portfolio management team, with primary responsibility for portfolio construction and strategic asset allocation. During his previous time at the firm, from 1994 to 2001, he was a senior portfolio manager in the same area, and he left Delaware Investments as head of its U.S. investment grade fixed income group. In recent years, Early was a senior portfolio manager at Chartwell Investment Partners and Rittenhouse Financial and served as the chief investment officer for fixed income at Turner Investments. Prior to joining Delaware Investments in 1994, he worked for more than 10 years at Federated Investors where he managed more than $25 billion in mutual fund and institutional portfolios in the short-term and investment grade markets. He left the firm as head of institutional fixed income management. Earlier in his career, he held management positions with the Federal Reserve Bank, PNC Financial, Touche Ross, and Rockwell International. Early earned his bachelor’s degree in economics from The Wharton School of the University of Pennsylvania and an MBA with concentrations in finance and accounting from the University of Pittsburgh. He is a member of the CFA Society of Philadelphia.
Christopher M. Ericksen, CFA
Vice President, Portfolio Manager, Equity Analyst
The Large-Cap Growth Equity Portfolio
Christopher M. Ericksen joined Delaware Investments in April 2005 as a portfolio manager on the firm’s Focus Growth Equity team, which manages large-cap growth, smid-cap growth, all-cap growth, and global growth portfolios. Prior to joining the firm, he was a portfolio manager at Transamerica Investment Management, where he also managed institutional separate accounts. Before joining Transamerica in 2004, he was a vice president at Goldman Sachs. During his 10 years there, he worked in investment banking as well as investment management. Ericksen received his bachelor’s degree from Carnegie Mellon University, with majors in industrial management, economics, and political science.
Clive A. Gillmore
Chief Executive Officer — Mondrian Investment Partners Ltd.
The International Equity Portfolio
The Labor Select International Equity Portfolio
The Emerging Markets Portfolio
In 1990, Clive A. Gillmore joined Mondrian Investment Partners’ predecessor organization as a founding member, having previously worked as a senior portfolio manager for Hill Samuel Investment Advisers Ltd., and a portfolio manager at Legal and General Investment Management. His research responsibilities are focused today on companies operating in the world’s emerging equity markets. He has more than 20 years of experience analyzing equity markets and securities around the world and has managed client portfolios with a wide range of mandates. Gillmore is a graduate of the University of Warwick and has completed the Investment Management Program at the London Business School. Gillmore is CEO of Mondrian. He is a member of Mondrian’s Equity Strategy Committee (where his research specialization lies) and a member of the company’s Management Steering Committee.
2010 Annual report • Delaware Pooled Trust
(continues) 177
Other Portfolio information
(Unaudited)
Delaware Pooled® Trust
Paul Grillo, CFA
Senior Vice President, Co-Chief Investment Officer — Total Return Fixed Income Strategy
The Core Focus Fixed Income Portfolio
The Core Plus Fixed Income Portfolio
Paul Grillo is a member of the firm’s taxable fixed income portfolio management team with primary responsibility for portfolio construction and strategic asset allocation. He is also a member of the firm’s asset allocation committee, which is responsible for building and managing multi-asset class portfolios. He joined Delaware Investments in 1992 as a mortgage-backed and asset-backed securities analyst, assuming portfolio management responsibilities in the mid-1990s. Grillo serves as co-lead portfolio manager for the firm’s Diversified Income products and has been influential in the growth and distribution of the firm’s multisector strategies. Prior to joining Delaware Investments, Grillo served as a mortgage strategist and trader at Dreyfus Corporation. He also worked as a mortgage strategist and portfolio manager at Chemical Investment Group and as a financial analyst at Chemical Bank. Grillo holds a bachelorR 17;s degree in business management from North Carolina State University and an MBA with a concentration in finance from Pace University.
John Kirk
Director and Senior Portfolio Manager — Mondrian Investment Partners Ltd.
The Global Fixed Income Portfolio
The International Fixed Income Portfolio
Before joining Mondrian in 1998, John Kirk was at Royal Bank of Canada in London, where he was responsible for European and Asian Fixed Income and had global responsibility for credit analysis. He started his career at Ford Motor Company as a member of its operations research group. Kirk leads Mondrian’s credit research and heads the Global Credit Valuation Committee. Kirk is a math graduate from the University of Wales and has an MA in operations research from Lancaster University.
Nikhil G. Lalvani, CFA
Vice President, Portfolio Manager
The Large-Cap Value Equity Portfolio
Nikhil G. Lalvani is a portfolio manager for the firm’s Large-Cap Value team. At Delaware Investments, Lalvani has served as both a fundamental and quantitative analyst. Prior to joining the firm in 1997 as an account analyst, he was a research associate with Bloomberg. Lalvani holds a bachelor’s degree in finance from The Pennsylvania State University. He is a member of the CFA Institute and the CFA Society of Philadelphia.
Emma R. E. Lewis
Senior Portfolio Manager — Mondrian Investment Partners Ltd.
The Labor Select International Equity Portfolio
Emma R. E. Lewis joined Mondrian in 1995, assuming analytical responsibilities in the Pacific Basin Team. Lewis is currently a senior portfolio manager at Mondrian where she manages international portfolios. Prior to joining Mondrian, she began her investment career at the Dutch bank ABN AMRO and later joined Fuji Investment Management. Lewis is a graduate of Pembroke College, Oxford University, where she completed her masters in philosophy and theology. She holds the ASIP designation and is a member of the CFA Institute and the CFA Society of the U.K.
2010 Annual report • Delaware Pooled Trust
178
Anthony A. Lombardi, CFA
Vice President, Senior Portfolio Manager
The Large-Cap Value Equity Portfolio
Anthony A. Lombardi is a senior portfolio manager for the firm’s Large-Cap Value team. Prior to joining the firm in 2004 in his current role, Lombardi was a director at Merrill Lynch Investment Managers. He joined Merrill Lynch Investment Managers’ Capital Management Group in 1998 and last served as a portfolio manager for the U.S. Active Large-Cap Value team, managing mutual funds and separate accounts for institutions and private clients. From 1990 to 1997, he worked at Dean Witter Reynolds as a sell-side equity research analyst. He began his career as an investment analyst with Crossland Savings. Lombardi graduated from Hofstra University, receiving a bachelor’s degree in finance and an MBA with a concentration in finance. He is a member of the New York Society of Security Analysts and the CFA Institute.
Kevin P. Loome, CFA
Senior Vice President, Senior Portfolio Manager, Head of High Yield Investments
The High-Yield Bond Portfolio
The Core Plus Fixed Income Portfolio
Kevin P. Loome is head of the High Yield fixed income team, responsible for portfolio construction and strategic asset allocation of all high yield fixed income assets. Prior to joining Delaware Investments in August 2007 in his current position, Loome spent 11 years at T. Rowe Price, starting as an analyst and leaving the firm as a portfolio manager. He began his career with Morgan Stanley as a corporate finance analyst in the New York and London offices. Loome received his bachelor’s degree in commerce from the University of Virginia and earned an MBA from the Tuck School of Business at Dartmouth.
Nigel G. May
Director and Chief Investment Officer, Developed Equity Markets — Mondrian Investment Partners Ltd.
The International Equity Portfolio
Nigel G. May joined Mondrian in 1991. Having led the European team’s research effort since 1995, he now also has responsibility for the North American and Small Cap teams. May was formerly a senior portfolio manager and analyst with Hill Samuel Investment Advisers Ltd., having joined the Hill Samuel Investment Group in 1986. He is a graduate of Sidney Sussex College, Cambridge University, where he completed his masters in engineering. He holds the ASIP designation and is a member of the CFA Institute and the CFA Society of the U.K.
Christopher A. Moth
Director and Chief Investment Officer, Global Fixed Income & Currency — Mondrian Investment Partners Ltd.
The Global Fixed Income Portfolio
The International Fixed Income Portfolio
Christopher A. Moth joined Mondrian in 1992, after working for the GRE insurance company where he was responsible for quantitative models and projections. He has made key contributions to the development of Mondrian’s fixed income product, and was primarily responsible for the structure of the company’s in-house systems to control and facilitate the investment process. He is an actuarial graduate from The City University in London, and was later awarded the Certificate in Finance & Investment from the London Institute of Actuaries. Moth chairs the Global Fixed Income and Currency Committee meeting.
2010 Annual report • Delaware Pooled Trust
(continues) 179
Other Portfolio information
(Unaudited)
Delaware Pooled® Trust
D. Tysen Nutt Jr.
Senior Vice President, Senior Portfolio Manager, Team Leader — Large-Cap Value Focus Equity
The Large-Cap Value Equity Portfolio
D. Tysen Nutt Jr. is senior portfolio manager and team leader for the firm’s Large-Cap Value team. Before joining Delaware Investments in 2004 as senior vice president and senior portfolio manager, Nutt led the U.S. Active Large-Cap Value team within Merrill Lynch Investment Managers, where he managed mutual funds and separate accounts for institutions and private clients. He departed Merrill Lynch Investment Managers as a managing director. Prior to joining Merrill Lynch Investment Managers in 1994, Nutt was with Van Deventer & Hoch where he managed large-cap value portfolios for institutions and private clients. He began his investment career at Dean Witter Reynolds, where he eventually became vice president, investments. Nutt earned his bachelor’s degree from Dartmouth College, and he is a member of the New York Society of Security Analysts and the CFA Institute.
Daniel J. Prislin, CFA
Vice President, Senior Portfolio Manager, Equity Analyst
The Select 20 Portfolio
The Large-Cap Growth Equity Portfolio
Daniel J. Prislin joined Delaware Investments in April 2005 as a senior portfolio manager on the firm’s Focus Growth Equity team, which manages large-cap growth, smid-cap growth, all-cap growth, and global growth portfolios. Prior to joining the firm, he was a principal and portfolio manager at Transamerica Investment Management, where he also managed sub-advised funds and institutional separate accounts. Prior to joining Transamerica in 1998, he was a portfolio manager with The Franklin Templeton Group. Prislin received an MBA and bachelor’s degree in business administration from the University of California at Berkeley.
David G. Tilles
Executive Chairman of Mondrian Investment Partners Ltd.
The International Equity Portfolio
The Labor Select International Equity Portfolio
The Emerging Markets Portfolio
The Global Fixed Income Portfolio
The International Fixed Income Portfolio
David G. Tilles was educated at the Sorbonne, Warwick University, and Heidelberg University. Prior to joining Mondrian in 1990 as managing director and chief investment officer of Mondrian Investment Partners Limited, he spent 16 years with Hill Samuel in London, serving in a number of investment capacities. His most recent position prior to joining Mondrian was chief investment officer of Hill Samuel Investment Advisers Ltd. He holds the ASIP designation and is a member of the CFA Institute and the CFA Society of the U.K.
Jeffrey S. Van Harte, CFA
Senior Vice President, Chief Investment Officer — Focus Growth Equity
The Select 20 Portfolio
The Large-Cap Growth Equity Portfolio
Jeffrey S. Van Harte is the chief investment officer for the Focus Growth Equity team, which manages large-cap growth, smid-cap growth, all-cap growth, and global growth portfolios. Prior to joining Delaware Investments in April 2005 in his current position, he was a principal and executive vice president at Transamerica Investment Management. Van Harte has been managing portfolios and separate accounts for more than 20 years. Before becoming a portfolio manager, Van Harte was a securities analyst and trader for Transamerica Investment Services, which he joined in 1980. Van Harte received his bachelor’s degree in finance from California State University at Fullerton.
2010 Annual report • Delaware Pooled Trust
180
Robert A. Vogel Jr., CFA
Vice President, Senior Portfolio Manager
The Large-Cap Value Equity Portfolio
Robert A. Vogel Jr. is a senior portfolio manager for the firm’s Large-Cap Value team. Prior to joining Delaware Investments in 2004 as vice president and senior portfolio manager, he worked at Merrill Lynch Investment Managers for more than seven years, where he rose to the position of director and portfolio manager within the U.S. Active Large-Cap Value team. He began his career in 1992 as a financial consultant at Merrill Lynch. Vogel graduated from Loyola College in Maryland, earning both bachelor’s and master’s degrees in finance. He also earned an MBA with a concentration in finance from The Wharton School of the University of Pennsylvania. Vogel is a member of the New York Society of Security Analysts, the CFA Institute, and the CFA Society of Philadelphia.
Babak “Bob” Zenouzi
Senior Vice President, Chief Investment Officer — REIT Equity
The Delaware Macquarie Real Estate Portfolio
The Global Real Estate Securities Portfolio
The Real Estate Investment Trust Portfolio II
Bob Zenouzi is the lead manager for the domestic and global REIT effort at Delaware Investments, which includes the team, its process, and its institutional and retail products, which he created during his prior time with the firm. He also focuses on opportunities in Japan, Singapore, and Malaysia for the firm’s global REIT product. Additionally, he serves as lead portfolio manager for the firm’s Dividend Income products, which he helped to create in the 1990s. He is also a member of the firm’s asset allocation committee, which is responsible for building and managing multi-asset class portfolios. He rejoined Delaware Investments in May 2006 as senior portfolio manager and head of real estate securities. In his first term with the firm, he spent seven years as an analyst and portfolio manager, leaving in 1999 to work at Chartwell Investment Partners, where from 1999 to 2006 he was a partner and senior portfolio manager on Chartwell’s Small-Cap Value portfolio. He began his career with The Boston Company, where he held several positions in accounting and financial analysis. Zenouzi earned a master’s degree in finance from Boston College and a bachelor’s degree from Babson College. He is a member of the National Association of Real Estate Investment Trusts and the Urban Land Institute.
2010 Annual report • Delaware Pooled Trust
181
Board of trustees/directors
and officers addendum
Delaware Investments® Family of Funds
A mutual fund is governed by a Board of Trustees/Directors (“Trustees”), which has oversight responsibility for the management of a fund��s business affairs. Trustees establish procedures and oversee and review the performance of the investment manager, the distributor, and others who perform services for the fund. The independent fund trustees, in particular, are advocates for shareholder interests. Each trustee has served in that capacity since he or she was elected to or appointed to the Board of Trustees, and will continue to serve until his or her retirement or the election of a new trustee in his or her place. The following is a list of the Trustees and Officers with certain background and related information.
| | | | | Number of | |
| | | | | Portfolios in Fund | Other |
| Name, | | | | Complex Overseen | Directorships |
| Address, | Position(s) | Length of | Principal Occupation(s) | by Trustee | Held by |
| and Birth Date | Held with Fund(s) | Time Served | During Past 5 Years | or Officer | Trustee or Officer |
| Interested Trustees | | | | | |
| Patrick P. Coyne1 | Chairman, | Chairman and Trustee | Patrick P. Coyne has served in | 78 | Director — |
| 2005 Market Street | President, | since August 16, 2006 | various executive capacities | | Kaydon Corp. |
| Philadelphia, PA | Chief Executive | | at different times at | | |
| 19103 | Officer, and | President and | Delaware Investments.2 | | Board of Governors |
| | Trustee | Chief Executive Officer | | | Member — Investment |
| April 1963 | | since August 1, 2006 | | | Company Institute (ICI) |
| |
| | | | | | Finance Committee |
| | | | | | Member — St. John |
| | | | | | Vianney Roman |
| | | | | | Catholic Church |
| |
| | | | | | Board of Trustees — |
| | | | | | Agnes Irwin School |
| |
| | | | | | Member of |
| | | | | | Investment Committee — |
| | | | | | Cradle of Liberty Council, |
| | | | | | BSA (2007–2010) |
| Independent Trustees | | | | | |
| Thomas L. Bennett | Trustee | Since | Private Investor — | 78 | Director — |
| 2005 Market Street | | March 2005 | (March 2004–Present) | | Bryn Mawr |
| Philadelphia, PA | | | | | Bank Corp. (BMTC) |
| 19103 | | | Investment Manager — | | |
| | | | Morgan Stanley & Co. | | Chairman of |
| October 1947 | | | (January 1984–March 2004) | | Investment Committee |
| | | | | | — Pennsylvania |
| | | | | | Academy of Fine Arts |
| |
| | | | | | Investment Committee |
| | | | | | and Governance |
| | | | | | Committee Member — |
| | | | | | Pennsylvania |
| | Horticultural Society |
| John A. Fry | Trustee | Since | President | 78 | Director — |
| 2005 Market Street | | January 2001 | Drexel University | | Community Health |
| Philadelphia, PA | | | (August 2010–Present) | | Systems |
| 19103 | | | | | |
| | | | President — | | Director — Ecore |
| May 1960 | | | Franklin & Marshall College | | International |
| | | | (June 2002–July 2010) | | (2009–2010) |
| |
| | | | Executive Vice President — | | Director — Allied |
| | | | University of Pennsylvania | | Barton Securities |
| | | | (April 1995–June 2002) | | Holdings (2005–2008) |
2010 Annual report • Delaware Pooled Trust
182
| | | | | Number of | |
| | | | | Portfolios in Fund | Other |
| Name, | | | | Complex Overseen | Directorships |
| Address, | Position(s) | Length of | Principal Occupation(s) | by Trustee | Held by |
| and Birth Date | Held with Fund(s) | Time Served | During Past 5 Years | or Officer | Trustee or Officer |
| Independent Trustees (continued) | | | | |
| Anthony D. Knerr | Trustee | Since | Founder and Managing Director — | 78 | None |
| 2005 Market Street | | April 1990 | Anthony Knerr & Associates | | |
| Philadelphia, PA | | | (Strategic Consulting) | | |
| 19103 | | | (1990–Present) | | |
| |
| December 1938 | | |
| Lucinda S. Landreth | Trustee | Since | Chief Investment Officer — | 78 | None |
| 2005 Market Street | | March 2005 | Assurant, Inc. | | |
| Philadelphia, PA | | | (Insurance) | | |
| 19103 | | | (2002–2004) | | |
| |
| June 1947 | |
| Ann R. Leven | Trustee | Since | Consultant — | 78 | Director and Audit |
| 2005 Market Street | | October 1989 | ARL Associates | | Committee Chair — |
| Philadelphia, PA | | | (Financial Planning) | | Systemax Inc. |
| 19103 | | | (1983–Present) | | (2001–2009) |
| |
| November 1940 | | | | | Director and Audit |
| | | | | | Committee Chairperson |
| | | | | | — Andy Warhol |
| | Foundation (1999–2007) |
| Thomas F. Madison | Trustee | Since | President and Chief | 78 | Director and Chair of |
| 2005 Market Street | | May 19973 | Executive Officer — | | Compensation |
| Philadelphia, PA | | | MLM Partners, Inc. | | Committee, |
| 19103 | | | (Small Business Investing | | Governance Committee |
| | | | and Consulting) | | Member |
| February 1936 | | | (January 1993–Present) | | — CenterPoint Energy |
| |
| | | | | | Lead Director and Chair |
| | | | | | of Audit |
| | | | | | and Governance |
| | | | | | Committees, |
| | | | | | Member of |
| | | | | | Compensation |
| | | | | | Committee — Digital |
| | | | | | River, Inc. |
| |
| | | | | | Director and Chair of |
| | | | | | Governance |
| | | | | | Committee, Audit |
| | | | | | Committee Member — |
| | | | | | Rimage Corporation |
| |
| | | | | | Director and Chair of |
| | | | | | Compensation |
| | | | | | Committee — Spanlink |
| | | | | | Communications |
| |
| | | | | | Lead Director and |
| | | | | | Member of |
| | | | | | Compensation and |
| | | | | | Governance |
| | | | | | Committees — |
| | | | | | Valmont Industries, Inc. |
| | | | | | (1987–2010) |
| |
| | | | | | Director — Banner |
| | Health (1996–2007) |
| Janet L. Yeomans | Trustee | Since | Vice President and Treasurer | 78 | Director — |
| 2005 Market Street | | April 1999 | (January 2006–Present) | | Okabena Company |
| Philadelphia, PA | | | Vice President — Mergers & Acquisitions | | |
| 19103 | | | (January 2003–January 2006), and | | |
| | | | Vice President | | |
| July 1948 | | | (July 1995–January 2003) | | |
| | 3M Corporation | |
2010 Annual report • Delaware Pooled Trust
(continues) 183
| | | | | Number of | |
| | | | | Portfolios in Fund | Other |
| Name, | | | | Complex Overseen | Directorships |
| Address, | Position(s) | Length of | Principal Occupation(s) | by Trustee | Held by |
| and Birth Date | Held with Fund(s) | Time Served | During Past 5 Years | or Officer | Trustee or Officer |
| Independent Trustees (continued) | | | | |
| J. Richard Zecher | Trustee | Since | Founder — | 78 | Director and Audit |
| 2005 Market Street | | March 2005 | Investor Analytics | | Committee Member — |
| Philadelphia, PA | | | (Risk Management) | | Investor Analytics |
| 19103 | | | (May 1999–Present) | | |
| | | | | | Director — |
| July 1940 | | | Founder — | | Oxigene, Inc. |
| | | | Sutton Asset Management | | (2003–2008) |
| | | | (Hedge Fund) | | |
| | | | (September 1996–Present) | | |
| Officers | | | | | |
| David F. Connor | Vice President, | Vice President since | David F. Connor has served as | 78 | None4 |
| 2005 Market Street | Deputy General | September 2000 | Vice President and Deputy | | |
| Philadelphia, PA | Counsel, and Secretary | and Secretary | General Counsel of | | |
| 19103 | | since | Delaware Investments | | |
| | | October 2005 | since 2000. | | |
| December 1963 | |
| Daniel V. Geatens | Vice President | Treasurer | Daniel V. Geatens has served | 78 | None4 |
| 2005 Market Street | and Treasurer | since | in various capacities at | | |
| Philadelphia, PA | | October 2007 | different times at | | |
| 19103 | | | Delaware Investments. | | |
| |
| October 1972 | |
| David P. O’Connor | Senior Vice | Senior Vice President, | David P. O’Connor has served in | 78 | None4 |
| 2005 Market Street | President, | General Counsel, and | various executive and legal | | |
| Philadelphia, PA | General Counsel, | Chief Legal Officer | capacities at different times | | |
| 19103 | and Chief | since | at Delaware Investments. | | |
| | Legal Officer | October 2005 | | | |
| February 1966 | |
| Richard Salus | Senior | Chief Financial | Richard Salus has served in | 78 | None4 |
| 2005 Market Street | Vice President | Officer since | various executive capacities | | |
| Philadelphia, PA | and | November 2006 | at different times at | | |
| 19103 | Chief Financial | | Delaware Investments. | | |
| | Officer | | | | |
| October 1963 | |
| 1 Patrick P. Coyne is considered to be an “Interested Trustee” because he is an executive officer of the Fund’s(s’) investment advisor. |
| 2 Delaware Investments is the marketing name for Delaware Management Holdings, Inc. and its subsidiaries, including the Fund’s(s’) investment advisor, principal underwriter, and its transfer agent. |
| 3 In 1997, several funds managed by Voyageur Fund Managers, Inc. (the “Voyageur Funds”) were incorporated into the Delaware Investments® Family of Funds. Mr. Madison served as a director of the Voyageur Funds from 1993 until 1997. |
| 4 David F. Connor, Daniel V. Geatens, David P. O’Connor, and Richard Salus serve in similar capacities for the six portfolios of the Optimum Fund Trust, which have the same investment advisor, principal underwriter, and transfer agent as the registrant. |
The Statement of Additional Information for the Fund(s) includes additional information about the Trustees and Officers and is available, without charge, upon request by calling 800 523-1918.
2010 Annual report • Delaware Pooled Trust
184
Fund officers and portfolio managers
| Patrick P. Coyne | Elizabeth A. Desmond | Kevin P. Loome |
| Chairman, President, and | Director and Chief Investment Officer — | Senior Vice President, Senior Portfolio |
| Chief Executive Officer — | Developed Equity Markets | Manager, and Head of High Yield |
| Delaware Investments® Family of Funds | Mondrian Investment Partners Limited | Investments |
| |
| Robert Akester | Chuck M. Devereux | Nigel G. May |
| Senior Portfolio Manager | Senior Vice President and Director of | Director and Chief Investment Officer — |
| Mondrian Investment Partners Limited | Credit Research | Developed Equity Markets |
| | | Mondrian Investment Partners Limited |
| Damon J. Andres | Roger A. Early | |
| Vice President and Senior Portfolio | Senior Vice President and | Christopher A. Moth |
| Manager | Co-Chief Investment Officer — | Director and Chief Investment Officer — |
| | Total Return Fixed Income Strategy | Global Fixed Income and Currency |
| Kristen E. Bartholdson | | Mondrian Investment Partners Limited |
| Vice President and Portfolio Manager | Christopher M. Ericksen | |
| | Vice President, Portfolio Manager, and | D. Tysen Nutt Jr. |
| Fiona A. Barwick | Equity Analyst | Senior Vice President, Senior Portfolio |
| Director of Regional Research | | Manager, and Team Leader — Large-Cap |
| Mondrian Investment Partners Limited | Clive A. Gillmore | Value Focus Equity |
| | Chief Executive Officer | |
| Joanna Bates | Mondrian Investment Partners Limited | Daniel J. Prislin |
| Senior Portfolio Manager | | Vice President, Senior Portfolio Manager, |
| Mondrian Investment Partners Limited | Paul Grillo | and Equity Analyst |
| | Senior Vice President and | |
| Nigel Bliss | Co-Chief Investment Officer — | David G. Tilles |
| Senior Portfolio Manager | Total Return Fixed Income Strategy | Executive Chairman |
| Mondrian Investment Partners Limited | | Mondrian Investment Partners Limited |
| | John Kirk | |
| Christopher J. Bonavico | Director and Senior Portfolio Manager | Jeffrey S. Van Harte |
| Vice President, Senior Portfolio Manager, | Mondrian Investment Partners Limited | Senior Vice President and Chief |
| and Equity Analyst | | Investment Officer — Focus Growth Equity |
| | Nikhil G. Lalvani | |
| Kenneth F. Broad | Vice President and Portfolio Manager | Robert A. Vogel Jr. |
| Vice President, Senior Portfolio Manager, | | Vice President and Senior Portfolio |
| and Equity Analyst | Emma R. E. Lewis | Manager |
| | Senior Portfolio Manager | |
| Liu-Er Chen | Mondrian Investment Partners Limited | Babak (Bob) Zenouzi |
| Senior Vice President, | | Senior Vice President, Chief Investment |
| Chief Investment Officer — Emerging | Anthony A. Lombardi | Officer — REIT Equity |
| Markets and Healthcare | Vice President and Senior Portfolio | |
| | Manager | |
| Thomas H. Chow | | |
| Senior Vice President and Senior Portfolio | | |
| Manager | | |
2010 Annual report • Delaware Pooled Trust
185
| Custodian | |
| The Bank of New York Mellon |
| One Wall Street |
| New York, NY 10286 |
| | |
| Independent registered public accounting firm | |
| PricewaterhouseCoopers LLP | |
| Two Commerce Square, Suite 1700 | |
| 2001 Market Street | |
| Philadelphia, PA 19103-7042 | |
| | |
| Investment advisor | |
| Delaware Management Company, a series of Delaware Management Business Trust | |
| 2005 Market Street | |
| Philadelphia, PA 19103 | |
| | |
| Investment sub-advisor for certain Portfolios | |
| Mondrian Investment Partners Limited | |
| Fifth Floor | |
| 10 Gresham Street | |
| London EC2V 7JD | |
| United Kingdom | |
Investments in the Portfolios are not and will not be deposits with or liabilities of Macquarie Bank Limited ABN 46 008 583 542 and its holding companies, including their subsidiaries or related companies, and are subject to investment risk, including possible delays in repayment and loss of income and capital invested. No Macquarie Group company guarantees or will guarantee the performance of the Portfolios, the repayment of capital from the Portfolios, or any particular rate of return. Delaware Investments, a member of Macquarie Group, refers to DMHI and its subsidiaries. Macquarie Group refers to Macquarie Group Limited and its subsidiaries and affiliates worldwide. The Portfolios are distributed by Delaware Distributors, L.P., an affiliate of DMBT, DMHI, and Macquarie Group Limited. Each Portfolio files its complete schedule of portfolio holdings with the Securities and Exchange Commission for the first and third quarters of each fiscal year on Form N-Q. Each Portfolio’s Forms N-Q, as well as a description of the policies and procedures that each Portfolio uses to determine how to vote proxies (if any) relating to portfolio securities are available without charge (i) upon request, by calling 800 231-8002; (ii) on the Portfolios’ Web site at www.delawareinvestments.com; and (iii) on the Commission’s Web site at www.sec.gov. Each Portfolio’s Forms N-Q may be reviewed and copied at the Commission’s Public Reference Room in Washington, D.C.; information on the operation of the Public Reference Room may be obtained by calling 800 SEC-0330. Information (if any) regarding how each Portfolio voted proxies relating to portfolio securities during the most recently disclosed 12-month period ended June 30 is available without charge (i) through the Portfolios’ Web site at www.delawareinvestments.com; and (ii) on the Commission’s Web site at www.sec.gov. |
This report was prepared for investors in the Delaware Pooled® Trust Portfolios. It may be distributed to others only if preceded or accompanied by a current Delaware Pooled Trust prospectus, which contains details about charges, expenses, investment objectives, and operating policies of the Portfolios. All Delaware Pooled Trust Portfolios are offered by prospectus only. The return and principal value of an investment in a Portfolio will fluctuate so that shares, when redeemed, may be worth more or less than their original cost. Carefully consider the Portfolios’ investment objectives, risk factors, charges, and expenses before investing. This and other information can be found in the Portfolios’ prospectus and, if available, its summary prospectus, which may be obtained by visiting www.delawareinvestments.com or calling 800 231-8002. Investors should read the prospectus carefully before investing. |
 |  | 2005 Market Street
Philadelphia, PA 19103
Telephone 800 231-8002
Fax 215 255-1162 |
| | | |
(6651)
AR-DPT [10/10] DG3 12/10 | | Printed in the USA
PO15952 |

Annual report Delaware REIT Fund October 31, 2010 Value equity mutual fund |
This annual report is for the information of Delaware REIT Fund shareholders, but it may be used with prospective investors when preceded or accompanied by a current prospectus for Delaware REIT Fund. The figures in the annual report for Delaware REIT Fund represent past results, which are not a guarantee of future results. The return and principal value of an investment in the Fund will fluctuate so that shares, when redeemed, may be worth more or less than their original cost. Current performance may be higher or lower than the performance data quoted.
You should consider the investment objectives, risks, charges, and expenses of the Fund carefully before investing. The Delaware REIT Fund prospectus contains this and other important information about the Fund. Prospectuses for all open-end funds in the Delaware Investments® Family of Funds are available from your financial advisor, online at www.delawareinvestments.com, or by phone at 800 523-1918. Please read the prospectus carefully before you invest or send money.
|
You can obtain shareholder reports and prospectuses online instead of in the mail.
Visit www.delawareinvestments.com/edelivery. |
Experience Delaware Investments
Delaware Investments is committed to the pursuit of consistently superior asset management and unparalleled client service. We believe in our investment processes, which seek to deliver consistent results, and in convenient services that help add value for our clients.
If you are interested in learning more about creating an investment plan, contact your financial advisor.
You can learn more about Delaware Investments or obtain a prospectus for Delaware REIT Fund at www.delawareinvestments.com.
| Manage your investments online |
- 24-hour access to your account information
- Obtain share prices
- Check your account balance and recent transactions
- Request statements or literature
- Make purchases and redemptions
|
Delaware Management Holdings, Inc., and its subsidiaries (collectively known by the marketing name of Delaware Investments) are wholly owned subsidiaries of Macquarie Group Limited, a global provider of banking, financial, advisory, investment and funds management services.
Investments in Delaware REIT Fund are not and will not be deposits with or liabilities of Macquarie Bank Limited ABN 46 008 583 542 and its holding companies, including their subsidiaries or related companies (Macquarie Group), and are subject to investment risk, including possible delays in repayment and loss of income and capital invested. No Macquarie Group company guarantees or will guarantee the performance of the Fund, the repayment of capital from the Fund, or any particular rate of return.
| Table of contents | |
| Portfolio management review | 1 |
| Performance summary | 4 |
| Disclosure of Fund expenses | 8 |
| Sector allocation and top 10 holdings | 10 |
| Statement of net assets | 11 |
| Statement of operations | 16 |
| Statements of changes in net assets | 18 |
| Financial highlights | 20 |
| Notes to financial statements | 30 |
| Report of independent registered | |
| public accounting firm | 41 |
| Other Fund information | 42 |
| Board of trustees/directors and | |
| officers addendum | 44 |
| About the organization | 54 |
Unless otherwise noted, views expressed herein are current as of Oct. 31, 2010, and are subject to change.
Funds are not FDIC insured and are not guaranteed. It is possible to lose the principal amount invested.
Mutual fund advisory services provided by Delaware Management Company, a series of Delaware Management Business Trust, which is a registered investment advisor. Delaware Investments, a member of Macquarie Group, refers to Delaware Management Holdings, Inc. and its subsidiaries, including the Fund’s distributor, Delaware Distributors, L.P. Macquarie Group refers to Macquarie Group Limited and its subsidiaries and affiliates worldwide.
© 2010 Delaware Management Holdings, Inc.
All third-party trademarks cited are the property of their respective owners.
| Portfolio management review |
| Delaware REIT Fund | November 9, 2010 |
| Performance preview (for the year ended October 31, 2010) | | | | |
| Delaware REIT Fund (Class A shares) | | 1-year return | | +39.84% |
| FTSE NAREIT Equity REITs Index (benchmark) | | 1-year return | | +42.84% |
Past performance does not guarantee future results.
For complete, annualized performance for Delaware REIT Fund, please see the table on page 4.
The performance of Class A shares excludes the applicable sales charge and reflects the reinvestment of all distributions.
Index performance returns do not reflect any management fees, transaction costs, or expenses. Indices are unmanaged and one cannot invest directly in an index. |
For its fiscal year ended Oct. 31, 2010, Delaware REIT Fund (Class A shares) gained 39.84% at net asset value, and 31.72% at maximum offer price (both returns assume reinvestment of all distributions). In comparison, the Fund’s benchmark, the FTSE NAREIT Equity REITs Index, rose 42.84% during the same time period.
Improving credit environment favored REITs
Investors in U.S. real estate securities enjoyed very strong results during the Fund’s fiscal year ended Oct. 31, 2010, despite a significant downturn between late April and August 2010, when concerns about European government debt levels and the potential for a U.S. economic slowdown were most pronounced. (Market results: Bloomberg.)
One of the leading factors boosting the stock prices of real estate investment trusts (REITs) was the healthy availability of credit. Property companies are capital intensive, which means they rely on credit to finance development projects and real estate acquisitions. Therefore, because they are constantly tapping the debt markets, these types of companies tend to thrive when capital is plentiful and relatively inexpensive. This was the case during the Fund’s fiscal year, and it helped drive REIT share prices upward. Precisely the opposite conditions were present during the credit crisis of late 2007 through early 2009, when REIT performance suffered because lenders were unwilling to finance companies with too much debt.
| REITs also appeared to benefit from: |
- A gradually improving U.S. economy, as property companies typically see increased leasing activity when businesses and consumers are optimistic about their prospects
- Limited construction of new properties, coupled with healthy demand
- Being viewed as an attractive asset class that offers the potential for healthy yields in an environment in which yields across the financial markets remained extremely low (Based on data released by, but not limited to: Bureau of Economic Analysis; Dow Jones; Census Bureau.)
|
Maintaining a slightly defensive positioning
We maintained our basic security selection strategy throughout the period. As such, we continued to invest on a bottom-up basis, meaning that we evaluated potential and current investments based on our view of their growth potential, relative valuation, and the quality of their balance sheets (among other factors). While applying this overall management approach, we also sought ways
1
Portfolio management review
Delaware REIT Fund
to position the Fund to take advantage of promising opportunities, given prevailing market conditions.
| In the early part of the Fund’s fiscal year, for example, REIT values were accelerating along with optimism about economic growth and the availability of credit. We added to the Fund’s investments in a handful of companies that we felt would benefit significantly in such an environment, while de-emphasizing those we felt could not fare as well. These moves included the following: |
- We increased the Fund’s exposure to lodging companies, which are very economically sensitive because they must “re-rent” their rooms on a nightly basis.
- We added to certain mall operators that we thought were well positioned to benefit from growth in consumer spending.
- We invested in companies we believed had increasing potential to improve their balance sheets as credit conditions loosened.
- We reduced our exposure to healthcare and other more defensive REITs, as we felt less economically sensitive real estate companies would lag the REIT market.
|
Beginning in the spring of 2010, as the sovereign debt crisis unfolded in Greece and threatened to distress the global economy, we gradually positioned the Fund’s portfolio more defensively by focusing on stocks with solid balance sheets and attractive performance prospects, as we felt these types of holdings would be less dependent on a recovering economy. Accordingly, we reduced the Fund’s allocation to hotel, mall, and office companies, and preserved an underweight position relative to the benchmark in industrial REITs.
Although this defensive positioning was helpful while market conditions worsened, in retrospect the Fund may have been better served by shifting back into a more aggressive posture in the fiscal year’s final few months. When market conditions turned upward in August 2010, we did not pivot quickly enough to capture the full upside potential.
Performance relative to the FTSE NAREIT Equity REITs Index
Contributors
In general, during the Fund’s fiscal year, economically sensitive sectors including multifamily homes, lodging, and malls tended to do relatively well, while more defensive groups such as healthcare did not perform as favorably as the overall market. Also, certain office REITs lagged behind as job growth remained sluggish. (Data for sector returns: FactSet.)
The multifamily homes sector was a source of positive results for the Fund during the fiscal year. The Fund’s performance was supported by good stock selection as well as an overweight position relative to the benchmark index in this sector, as apartment companies benefited from their relatively short lease durations and therefore were quick to recover when credit conditions improved. The Fund’s top contributor in the multifamily homes sector was Apartment Investment and Management Company, whose shares rose remarkably during the fiscal year, partly due to the Company’s success in improving its balance sheet. Other helpful performers in the Fund’s holdings included Equity Residential, the country’s largest apartment owner and a beneficiary of the broad trends favoring apartment companies. A third
2
notable contributor was Colonial Properties Trust, an apartment company focused on the southeastern U.S. that saw robust growth.
An emphasis on the strong-performing regional malls sector was also helpful, with a number of companies in this group profiting from the gradual improvement in consumer spending. Among the Fund’s leading relative contributors in this sector were Macerich and CBL & Associates Properties. Both of these stocks were hampered by concerns about their debt levels during the credit crisis but succeeded in improving their balance sheets.
The Fund’s underweight position in the troubled industrials group, especially being underexposed to ProLogis, was another positive factor. This stock, which had a fairly meaningful weight within the benchmark index, advanced during the fiscal year though it significantly lagged the benchmark’s impressive results.
(Data for company returns above: FactSet.)
Detractors
In contrast, the biggest source of underperformance was the portfolio’s cash weighting. The Fund held roughly 2% of its assets in cash, on average, during the reporting period — a typical level for the Fund — but even a modest cash balance proved to be a substantial negative influence on performance in such a positive environment for REIT investing.
Holdings within the healthcare sector were also detrimental, as this relatively defensive group failed to keep pace with the benchmark. We opted to limit our exposure to medical-office-property company Health Care REIT in favor of HealthcareRealty Trust, a stock we felt offered better prospects. Unfortunately, this approach did not work out well for the Fund during the fiscal period. As of this writing, we continue to feel that the company’s shares are appropriate investments for the Fund, and we continue to hold them.
The Fund’s relative underweighting in the lodging sector was a modest impediment as the sector outpaced the benchmark overall. A position in Chesapeake Lodging Trust was a noteworthy disappointment, while our holding in Gaylord Entertainment, a hospitality and entertainment company, did relatively well. We bought a stake in Gaylord after its stock price dropped as a result of concerns about the financial effect of flooding in Memphis, home to one of its largest properties. When the damage proved less severe than expected, the stock recovered. As the fiscal year progressed, Cheseapeake and Gay lord became candidates for removal from the Fund, and both positions were completely liquidated by the end of the Fund’s fiscal year.
Outlook
At the end of the fiscal year, the Fund’s positioning was fairly close to that of its benchmark. We maintained a slight relative overweight in apartment and mall companies, while remaining underweight in lodging, office, healthcare, and industrial REITs. In our view, REIT prices have become fairly high, and we feel it is not generally prudent to remain aggressively positioned, in light of a potential shift in the market environment. For example, rising Treasury yields could increase the cost of financing and lead to some headwinds for real estate stocks. We continue to watch market conditions closely and are poised to make the portfolio somewhat more defensive if the market backdrop weakens.
3
| Performance summary |
| Delaware REIT Fund | October 31, 2010 |
The performance data quoted represent past performance; past performance does not guarantee future results. Investment return and principal value will fluctuate so your shares, when redeemed, may be worth more or less than their original cost. Please obtain the performance data current for the most recent month end by calling 800 523-1918 or visiting our Web site at www.delawareinvestments.com/performance. Current performance may be lower or higher than the performance data quoted.
Carefully consider the Fund’s investment objectives, risk factors, charges, and expenses before investing. This and other information can be found in the Fund’s prospectus and, if available, its summary prospectus, which may be obtained by visiting www.delawareinvestments.com or calling 800 523-1918. Investors should read the prospectus and, if available, the summary prospectus carefully before investing.
| Fund performance | | Average annual total returns through Oct. 31, 2010 |
| | | 1 year | | 5 years | | 10 years | | Lifetime |
| Class A (Est. Dec. 6, 1995) | | | | | | | | |
| Excluding sales charge | | +39.84% | | +2.94% | | +9.81% | | n/a |
| Including sales charge | | +31.72% | | +1.73% | | +9.16% | | n/a |
| Class B (Est. Nov. 11, 1997) | | | | | | | | |
| Excluding sales charge | | +38.88% | | +2.19% | | +9.13% | | n/a |
| Including sales charge | | +34.88% | | +1.98% | | +9.13% | | n/a |
| Class C (Est. Nov. 11, 1997) | | | | | | | | |
| Excluding sales charge | | +38.88% | | +2.17% | | +8.99% | | n/a |
| Including sales charge | | +37.88% | | +2.17% | | +8.99% | | n/a |
| Class R (Est. June 2, 2003) | | | | | | | | |
| Excluding sales charge | | +39.50% | | +2.68% | | n/a | | +8.63% |
| Including sales charge | | +39.50% | | +2.68% | | n/a | | +8.63% |
| Institutional Class (Est. Nov. 11, 1997) | | | | | | | | |
| Excluding sales charge | | +40.23% | | +3.19% | | +10.08% | | n/a |
| Including sales charge | | +40.23% | | +3.19% | | +10.08% | | n/a |
Returns reflect the reinvestment of all distributions and any applicable sales charges as noted in the following paragraphs.
Performance for Class B and C shares, excluding sales charges, assumes either that contingent deferred sales charges did not apply or that the investment was not redeemed.
Expense limitations were in effect for all classes during the periods shown in the “Fund performance” chart and in the “Performance of a $10,000 investment” chart. The current expenses for each class are listed on the “Fund expense ratios” chart. (Note that all charts and graphs referred to in the “Performance summary” section of this report are found on pages 4 through 7.) Performance would have been lower had the expense limitations not been in effect.
4
The Fund offers Class A, B, C, R, and Institutional Class shares.
Class A shares are sold with a maximum front-end sales charge of up to 5.75%, and have an annual distribution and service fee of up to 0.30% of average daily net assets. This fee has been contractually limited to 0.25% of average daily net assets from Feb. 28, 2010, through Feb. 28, 2011.
Class B shares may only be purchased through dividend reinvestment and certain permitted exchanges as described in the prospectus. Please see the prospectus for additional information on Class B purchase and sales charges. Class B shares have a contingent deferred sales charge that declines from 4.00% to zero depending on the period of time the shares are held.
Class B shares will automatically convert to Class A shares on a quarterly basis approximately eight years after purchase. They are also subject to an annual distribution and service fee of up to 1.00% of average daily net assets.
Ten-year performance figures for Class B shares reflect conversion to Class A shares after approximately eight years.
Class C shares are sold with a contingent deferred sales charge of 1.00% if redeemed during the first 12 months. They are also subject to an annual distribution and service fee of up to 1.00% of average daily net assets.
Class R shares are available only for certain retirement plan products. They are sold without a sales charge and have an annual distribution and service fee of up to 0.60% of average daily net assets, which has been limited contractually to 0.50% from Feb. 28, 2010, through Feb. 28, 2011.
Institutional Class shares are available without sales or asset-based distribution charges only to certain eligible institutional accounts.
The “Fund performance” table and the “Performance of a $10,000 investment” graph do not reflect the deduction of taxes the shareholder would pay on Fund distributions or redemptions of Fund shares.
Instances of high double-digit returns are unusual, cannot be sustained, and were primarily achieved during favorable market conditions.
Narrowly focused investments may exhibit higher volatility than investments in multiple industry sectors.
REIT investments are subject to many of the risks associated with direct real estate ownership, including changes in economic conditions, credit risk, and interest rate fluctuations.
A REIT fund’s tax status as a regulated investment company could be jeopardized if it holds real estate directly, as a result of defaults, or receives rental income from real estate holdings.
5
Performance summary
Delaware REIT Fund
The Fund’s expense ratios, as described in the most recent prospectus, are disclosed in the following “Fund expense ratios” chart. Delaware Investments has agreed to reimburse certain expenses and/or waive certain fees to prevent total annual fund operating expenses (exclusive of 12b-1 plan and certain other expenses) from exceeding 1.30% of the Fund’s average daily net assets from Feb. 28, 2010, through Feb. 28, 2011. Please see the most recent prospectus and any applicable supplement(s) for additional information on these fee waivers and/or reimbursements.
| Fund expense ratios | Class A | | Class B | | Class C | | Class R | | Institutional Class |
| Total annual operating expenses | 1.88% | | 2.58% | | 2.58% | | 2.18% | | 1.58% |
| (without fee waivers) | | | | | | | | | |
| Net expenses | 1.55% | | 2.30% | | 2.30% | | 1.80% | | 1.30% |
| (including fee waivers, if any) | | | | | | | | | |
| Type of waiver | Contractual | | Contractual | | Contractual | | Contractual | | Contractual |
Performance of a $10,000 investment
Average annual total returns from Oct. 31, 2000, through Oct. 31, 2010
| For period beginning Oct. 31, 2000, through Oct. 31, 2010 | Starting value | Ending value |
| | FTSE NAREIT Equity REITs Index | | $10,000 | | | $29,369 | |
| | Delaware REIT Fund — Class A shares | | $9,425 | | | $24,017 | |
6
The chart assumes $10,000 invested in the Fund on Oct. 31, 2000, and includes the effect of a 5.75% front-end sales charge and the reinvestment of all distributions. Please note additional details on these fees in the “Performance summary” section of this report, which includes pages 4 through 7.
The chart also assumes $10,000 invested in the FTSE NAREIT Equity REITs Index as of Oct. 31, 2000.
The FTSE NAREIT Equity REITs Index measures the performance of all publicly traded equity real estate investment trusts traded on U.S. exchanges.
Index performance returns do not reflect any management fees, transaction costs or expenses. Indices are unmanaged and one cannot invest directly in an index. Past performance is not a guarantee of future results.
Performance of other Fund classes will vary due to different charges and expenses.
The “Fund performance” chart and the “Performance of a $10,000 investment” graph do not reflect the deduction of taxes shareholders would pay on Fund distributions or redemptions of Fund shares.
| | | Nasdaq symbols | | CUSIPs | |
| Class A | | | DPREX | | | 246248868 | |
| Class B | | | DPRBX | | | 246248819 | |
| Class C | | | DPRCX | | | 246248793 | |
| Class R | | | DPRRX | | | 246248561 | |
| Institutional Class | | | DPRSX | | | 246248777 | |
7
Disclosure of Fund expenses
For the six-month period from May 1, 2010 to October 31, 2010
As a shareholder of the Fund, you incur two types of costs: (1) transaction costs, including sales charges (loads) on purchase payments, reinvested dividends, or other distributions; redemption fees; and exchange fees; and (2) ongoing costs, including management fees; distribution and/or service (12b-1) fees; and other Fund expenses. This example is intended to help you understand your ongoing costs (in dollars) of investing in the Fund and to compare these costs with the ongoing costs of investing in other mutual funds.
The example is based on an investment of $1,000 invested at the beginning of the period and held for the entire six-month period from May 1, 2010 to October 31, 2010.
Actual expenses
The first section of the table shown, “Actual Fund return,” provides information about actual account values and actual expenses. You may use the information in this section of the table, together with the amount you invested, to estimate the expenses that you paid over the period. Simply divide your account value by $1,000 (for example, an $8,600 account value divided by $1,000 = 8.6), then multiply the result by the number in the first section under the heading entitled “Expenses Paid During Period” to estimate the expenses you paid on your account during this period.
Hypothetical example for comparison purposes
The second section of the table shown, “Hypothetical 5% return,” provides information about hypothetical account values and hypothetical expenses based on the Fund’s actual expense ratio and an assumed rate of return of 5% per year before expenses, which is not the Fund’s actual return. The hypothetical account values and expenses may not be used to estimate the actual ending account balance or expenses you paid for the period. You may use this information to compare the ongoing costs of investing in the Fund and other funds. To do so, compare this 5% hypothetical example with the 5% hypothetical examples that appear in the shareholder reports of the other funds.
Please note that the expenses shown in the table are meant to highlight your ongoing costs only and do not reflect any transactional costs, such as sales charges (loads), redemption fees, or exchange fees. Therefore, the second section of the table is useful in comparing ongoing costs only, and will not help you determine the relative total costs of owning different funds. In addition, if these transactional costs were included, your costs would have been higher. The Fund’s expenses shown in the table reflect fee waivers in effect. The expenses shown in the table assume reinvestment of all dividends and distributions.
8
Delaware REIT Fund
Expense analysis of an investment of $1,000
| | Beginning | | Ending | | | | Expenses |
| | Account Value | | Account Value | | Annualized | | Paid During Period |
| | 5/1/10 | | 10/31/10 | | Expense Ratio | | 5/1/10 to 10/31/10* |
| Actual Fund Return | | | | | | | | | | | | | | | | |
| Class A | | $ | 1,000.00 | | | | $ | 1,062.60 | | | 1.51% | | | $ | 7.85 | |
| Class B | | | 1,000.00 | | | | | 1,058.70 | | | 2.26% | | | | 11.73 | |
| Class C | | | 1,000.00 | | | | | 1,058.70 | | | 2.26% | | | | 11.73 | |
| Class R | | | 1,000.00 | | | | | 1,061.30 | | | 1.76% | | | | 9.14 | |
| Institutional Class | | | 1,000.00 | | | | | 1,063.70 | | | 1.26% | | | | 6.55 | |
| Hypothetical 5% Return (5% return before expenses) | | | | | | | | |
| Class A | | $ | 1,000.00 | | | | $ | 1,017.59 | | | 1.51% | | | $ | 7.68 | |
| Class B | | | 1,000.00 | | | | | 1,013.81 | | | 2.26% | | | | 11.47 | |
| Class C | | | 1,000.00 | | | | | 1,013.81 | | | 2.26% | | | | 11.47 | |
| Class R | | | 1,000.00 | | | | | 1,016.33 | | | 1.76% | | | | 8.94 | |
| Institutional Class | | | 1,000.00 | | | | | 1,018.85 | | | 1.26% | | | | 6.41 | |
*“Expenses Paid During Period” are equal to the Fund’s annualized expense ratio, multiplied by the average account value over the period, multiplied by 184/365 (to reflect the one-half year period).”
9
| Sector allocation and top 10 holdings | |
| Delaware REIT Fund | As of October 31, 2010 |
Sector designations may be different than the sector designations presented in other Fund materials. The sector designations may represent the investment manager’s internal sector classifications, which may result in the sector designations for one fund being different than another fund’s sector designations.
| Sector | Percentage of net assets |
| Common Stock | 95.99 | % |
| Diversified REITs | 5.46 | % |
| Healthcare REITs | 11.98 | % |
| Hotel REITs | 4.53 | % |
| Industrial REITs | 3.89 | % |
| Mall REITs | 14.37 | % |
| Manufactured Housing REITs | 1.26 | % |
| Multifamily REITs | 16.71 | % |
| Office REITs | 10.48 | % |
| Office/Industrial REITs | 5.27 | % |
| Real Estate Operating Companies | 1.16 | % |
| Self-Storage REITs | 6.42 | % |
| Shopping Center REITs | 9.23 | % |
| Single Tenant REITs | 1.13 | % |
| Specialty REITs | 4.10 | % |
| Exchange-Traded Fund | 2.99 | % |
| Discount Note | 0.88 | % |
| Securities Lending Collateral | 24.18 | % |
| Total Value of Securities | 124.04 | % |
| Obligation to Return Securities Lending Collateral | (24.46 | %) |
| Receivables and Other Assets Net of Liabilities | 0.42 | % |
| Total Net Assets | 100.00 | % |
Holdings are for informational purposes only and are subject to change at any time. They are not a recommendation to buy, sell, or hold any security.
| Top 10 Holdings | | |
| Simon Property Group | 10.24 | % |
| Public Storage | 5.83 | % |
| Vornado Realty Trust | 4.57 | % |
| Boston Properties | 4.18 | % |
| Equity Residential | 4.01 | % |
| Digital Realty Trust | 3.60 | % |
| HCP | 3.51 | % |
| Ventas | 3.26 | % |
| Host Hotels & Resorts | 2.93 | % |
| Macerich | 2.91 | % |
10
| Statement of net assets | |
| Delaware REIT Fund | October 31, 2010 |
| | | Number of shares | | Value |
| Common Stock – 95.99% | | | | |
| Diversified REITs – 5.46% | | | | |
| * | Vornado Realty Trust | 110,192 | | $ | 9,629,678 |
| * | Washington Real Estate Investment Trust | 58,451 | | | 1,872,186 |
| | | | | | 11,501,864 |
| Healthcare REITs – 11.98% | | | | |
| * | Cogdell Spencer | 78,416 | | | 515,193 |
| * | HCP | 205,247 | | | 7,390,945 |
| | Health Care REIT | 19,000 | | | 970,900 |
| * | Healthcare Realty Trust | 72,767 | | | 1,756,595 |
| * | Nationwide Health Properties | 115,058 | | | 4,697,818 |
| * | Omega Healthcare Investors | 132,639 | | | 3,050,697 |
| * | Ventas | 128,036 | | | 6,857,608 |
| | | | | | 25,239,756 |
| Hotel REITs – 4.53% | | | | |
| * | DiamondRock Hospitality | 202,630 | | | 2,143,825 |
| * | Host Hotels & Resorts | 387,823 | | | 6,162,508 |
| | LaSalle Hotel Properties | 40,600 | | | 961,814 |
| † | Strategic Hotel & Resorts | 59,700 | | | 271,635 |
| | | | | | 9,539,782 |
| Industrial REITs – 3.89% | | | | |
| | AMB Property | 135,820 | | | 3,828,766 |
| * | First Potomac Realty Trust | 58,495 | | | 963,998 |
| | ProLogis | 249,445 | | | 3,404,924 |
| | | | | | 8,197,688 |
| Mall REITs – 14.37% | | | | |
| * | CBL & Associates Properties | 116,445 | | | 1,825,858 |
| * | Macerich | 137,551 | | | 6,136,150 |
| | Simon Property Group | 224,662 | | | 21,572,045 |
| * | Taubman Centers | 16,105 | | | 747,594 |
| | | | | | 30,281,647 |
| Manufactured Housing REITs – 1.26% | | | | |
| | Equity Lifestyle Properties | 46,619 | | | 2,653,553 |
| | | | | | 2,653,553 |
11
Statement of net assets
Delaware REIT Fund
| | | Number of shares | | Value |
| Common Stock (continued) | | | | |
| Multifamily REITs – 16.71% | | | | |
| | Apartment Investment & Management | 140,012 | | $ | 3,263,680 |
| | Associated Estates Realty | 62,223 | | | 864,277 |
| * | AvalonBay Communities | 40,651 | | | 4,321,608 |
| * | BRE Properties | 84,929 | | | 3,646,002 |
| * | Camden Property Trust | 100,386 | | | 4,978,142 |
| † | Campus Crest Communities | 45,486 | | | 568,575 |
| * | Colonial Properties Trust | 110,172 | | | 1,975,384 |
| * | Equity Residential | 173,823 | | | 8,453,011 |
| * | Essex Property Trust | 35,927 | | | 4,058,314 |
| | UDR | 136,812 | | | 3,075,534 |
| | | | | | 35,204,527 |
| Office REITs – 10.48% | | | | |
| * | Alexandria Real Estate Equities | 50,769 | | | 3,730,506 |
| * | BioMed Realty Trust | 80,607 | | | 1,479,138 |
| * | Boston Properties | 102,064 | | | 8,796,897 |
| * | Kilroy Realty | 63,690 | | | 2,176,287 |
| | Mack-Cali Realty | 61,700 | | | 2,071,886 |
| | SL Green Realty | 58,187 | | | 3,824,050 |
| | | | | | 22,078,764 |
| Office/Industrial REITs – 5.27% | | | | |
| * | Digital Realty Trust | 127,143 | | | 7,594,251 |
| * | DuPont Fabros Technology | 68,321 | | | 1,714,857 |
| * | PS Business Parks | 30,129 | | | 1,785,445 |
| | | | | | 11,094,553 |
| Real Estate Operating Companies – 1.16% | | | | |
| * | Starwood Hotels & Resorts Worldwide | 45,125 | | | 2,443,068 |
| | | | | | 2,443,068 |
| Self-Storage REITs – 6.42% | | | | |
| * | Extra Space Storage | 77,266 | | | 1,251,709 |
| * | Public Storage | 123,781 | | | 12,281,551 |
| | | | | | 13,533,260 |
| Shopping Center REITs – 9.23% | | | | |
| * | Acadia Realty Trust | 93,840 | | | 1,790,467 |
| * | Federal Realty Investment Trust | 61,176 | | | 5,015,208 |
| * | Kimco Realty | 299,379 | | | 5,158,301 |
12
| | | Number of shares | | Value |
| Common Stock (continued) | | | | | |
| Shopping Center REITs (continued) | | | | | |
| | Ramco-Gershenson Properties Trust | | 57,130 | | $ | 661,565 |
| * | Regency Centers | | 86,325 | | | 3,641,189 |
| * | Weingarten Realty Investors | | 131,200 | | | 3,165,856 |
| | | | | | | 19,432,586 |
| Single Tenant REITs – 1.13% | | | | | |
| * | National Retail Properties | | 88,006 | | | 2,384,963 |
| | | | | | | 2,384,963 |
| Specialty REITs – 4.10% | | | | | |
| * | Entertainment Properties Trust | | 100,571 | | | 4,649,397 |
| * | Plum Creek Timber | | 17,790 | | | 655,384 |
| | Rayonier | | 63,838 | | | 3,332,344 |
| | | | | | | 8,637,125 |
| Total Common Stock (cost $176,046,563) | | | | | 202,223,136 |
| | | | | | |
| Exchange-Traded Fund – 2.99% | | | | | |
| * | iShares Dow Jones U.S. Real Estate Index Fund | | 114,576 | | | 6,292,514 |
| Total Exchange-Traded Fund (cost $5,881,792) | | | | | 6,292,514 |
| | | | | | |
| | | Principal amount | | | |
| ≠ Discount Note – 0.88% | | | | | |
| | Federal Home Loan Bank 0.10% 11/1/10 | | $1,858,017 | | | 1,858,017 |
| Total Discount Note (cost $1,858,017) | | | | | 1,858,017 |
| | | | | | |
| Total Value of Securities Before Securities | | | | | |
| | Lending Collateral – 99.86% (cost $183,786,372) | | | | | 210,373,667 |
| | | | | | |
| | | Number of shares | | | |
| Securities Lending Collateral** – 24.18% | | | | | |
| | Investment Companies | | | | | |
| | Delaware Investments Collateral Fund No. 1 | | 50,576,813 | | | 50,576,813 |
| | BNY Mellon SL DBT II Liquidating Fund | | 351,982 | | | 341,810 |
| | @†Mellon GSL Reinvestment Trust II | | 611,030 | | | 31,590 |
| Total Securities Lending Collateral (cost $51,539,825) | | | | | 50,950,213 |
13
Statement of net assets
Delaware REIT Fund
| | | | |
| Total Value of Securities – 124.04% | | | |
| (cost $235,326,197) | $ | 261,323,880 | © |
| Obligation to Return Securities | | | |
| Lending Collateral** – (24.46%) | | (51,539,825 | ) |
| Receivables and Other Assets | | | |
| Net of Liabilities – 0.42% | | 891,155 | |
| Net Assets Applicable to 20,121,200 | | | |
| Shares Outstanding – 100.00% | $ | 210,675,210 | |
| | | | |
| Net Asset Value – Delaware REIT Fund | | | |
| Class A ($82,646,406 / 7,900,037 Shares) | | | $10.46 | |
| Net Asset Value – Delaware REIT Fund | | | |
| Class B ($7,392,787 / 707,751 Shares) | | | $10.45 | |
| Net Asset Value – Delaware REIT Fund | | | |
| Class C ($18,712,897 / 1,790,705 Shares) | | | $10.45 | |
| Net Asset Value – Delaware REIT Fund | | | |
| Class R ($5,680,165 / 542,985 Shares) | | | $10.46 | |
| Net Asset Value – Delaware REIT Fund | | | |
| Institutional Class ($96,242,955 / 9,179,722 Shares) | | | $10.48 | |
| | | | |
| Components of Net Assets at October 31, 2010: | | | |
| Shares of beneficial interest (unlimited authorization – no par) | $ | 255,219,604 | |
| Accumulated net realized loss on investments | | (70,542,077 | ) |
| Net unrealized appreciation of investments | | 25,997,683 | |
| Total net assets | $ | 210,675,210 | |
14
| * | Fully or partially on loan. |
| † | Non income producing security. |
| ≠ | The rate shown is the effective yield at the time of purchase. |
| ** | See Note 8 in “Notes to financial statements.” |
| @ | Illiquid security. At October 31, 2010, the aggregate amount of illiquid securities was $31,590, which represented 0.02% of the Fund’s net assets. See Note 9 in “Notes to financial statements.” |
| © | Includes $48,958,005 of securities loaned. |
REIT — Real Estate Investment Trust
| Net Asset Value and Offering Price Per Share – | |
| Delaware REIT Fund | |
| Net asset value Class A (A) | $10.46 |
| Sales charge (5.75% of offering price) (B) | 0.64 |
| Offering price | $11.10 |
| (A) | | Net asset value per share, as illustrated, is the amount which would be paid upon redemption or repurchase of shares. |
| (B) | | See the current prospectus for purchase of $50,000 or more. |
See accompanying Notes, which are an integral part of the financial statements.
15
| Statement of operations | |
| Delaware REIT Fund | Year Ended October 31, 2010 |
| Investment Income: | | | | | | |
| Dividends | $ | 6,613,765 | | | | |
| Securities lending income | | 37,476 | | | | |
| Interest | | 4,570 | | $ | 6,655,811 | |
| | | | | | | |
| Expenses: | | | | | | |
| Management fees | | 1,687,502 | | | | |
| Dividend disbursing and transfer agent fees and expenses | | 912,489 | | | | |
| Distribution expenses – Class A | | 222,706 | | | | |
| Distribution expenses – Class B | | 100,986 | | | | |
| Distribution expenses – Class C | | 179,240 | | | | |
| Distribution expenses – Class R | | 27,767 | | | | |
| Reports and statements to shareholders | | 90,830 | | | | |
| Accounting and administration expenses | | 89,327 | | | | |
| Registration fees | | 86,501 | | | | |
| Dues and services | | 26,771 | | | | |
| Legal fees | | 25,128 | | | | |
| Audit and tax | | 23,122 | | | | |
| Trustees’ fees | | 12,929 | | | | |
| Insurance fees | | 8,118 | | | | |
| Custodian fees | | 5,602 | | | | |
| Consulting fees | | 3,296 | | | | |
| Pricing fees | | 2,632 | | | | |
| Trustees’ expenses | | 879 | | | 3,505,825 | |
| Less fees waived | | | | | (83,389 | ) |
| Less waived distribution expenses – Class A | | | | | (37,137 | ) |
| Less waived distribution expenses – Class R | | | | | (4,619 | ) |
| Less expense paid indirectly | | | | | (1,450 | ) |
| Total operating expenses | | | | | 3,379,230 | |
| Net Investment Income | | | | | 3,276,581 | |
16
| Net Realized and Unrealized Gain on Investments: | | |
| Net realized gain on: | | |
| Investments | | 54.066,052 |
| Redemptions in kind* | | 11,297,648 |
| Net realized gain | | 65,363,700 |
| Net change in unrealized appreciation/depreciation of investments | | 4,915,772 |
| Net Realized and Unrealized Gain on Investments | | 70,279,472 |
| |
| Net Increase in Net Assets Resulting from Operations | $ | 73,556,053 |
*See Note 11 in “Notes to financial statements.”
See accompanying Notes, which are an integral part of the financial statements.
17
Statements of changes in net assets
Delaware REIT Fund
| | Ended |
| | 10/31/10 | | 10/31/09 |
| Increase (Decrease) in Net Assets from Operations: | | | | | | | |
| Net investment income | $ | 3,276,581 | | | $ | 5,626,550 | |
| Net realized gain (loss) on investments | | 65,363,700 | | | | (104,064,386 | ) |
| Net change in unrealized | | | | | | | |
| appreciation/depreciation of investments | | 4,915,772 | | | | 94,733,999 | |
| Net increase (decrease) in net assets resulting | | | | | | | |
| from operations | | 73,556,053 | | | | (3,703,837 | ) |
| |
| Dividends and Distributions to shareholders from: | | | | | | | |
| Net investment income: | | | | | | | |
| Class A | | (1,509,601 | ) | | | (1,885,057 | ) |
| Class B | | (122,646 | ) | | | (321,276 | ) |
| Class C | | (231,161 | ) | | | (420,155 | ) |
| Class R | | (82,422 | ) | | | (98,649 | ) |
| Institutional Class | | (2,458,561 | ) | | | (2,839,606 | ) |
| |
| Return of capital | | | | | | | |
| Class A | | — | | | | (484,398 | ) |
| Class B | | — | | | | (82,949 | ) |
| Class C | | — | | | | (123,136 | ) |
| Class R | | — | | | | (27,115 | ) |
| Institutional Class | | — | | | | (747,800 | ) |
| | | (4,404,391 | ) | | | (7,030,141 | ) |
| |
| Capital Share Transactions: | | | | | | | |
| Proceeds from shares sold: | | | | | | | |
| Class A | | 16,852,164 | | | | 14,099,246 | |
| Class B | | 87,749 | | | | 114,096 | |
| Class C | | 1,313,361 | | | | 1,282,972 | |
| Class R | | 2,390,840 | | | | 2,052,540 | |
| Institutional Class | | 52,397,545 | | | | 46,849,175 | |
| |
| Net asset value of shares issued upon reinvestment | | | | | | | |
| of dividends and distributions: | | | | | | | |
| Class A | | 1,374,874 | | | | 2,162,188 | |
| Class B | | 110,571 | | | | 354,139 | |
| Class C | | 210,675 | | | | 492,250 | |
| Class R | | 82,258 | | | | 125,507 | |
| Institutional Class | | 2,375,634 | | | | 3,462,045 | |
| | | 77,195,671 | | | | 70,994,158 | |
18
| | Ended |
| | 10/31/10 | | 10/31/09 |
| Capital Share Transactions (continued): | | | | | | | |
| Cost of shares repurchased: | | | | | | | |
| Class A | $ | (22,632,013 | ) | | $ | (19,539,034 | ) |
| Class B | | (7,213,848 | ) | | | (5,212,173 | ) |
| Class C | | (4,723,235 | ) | | | (5,663,181 | ) |
| Class R | | (1,757,314 | ) | | | (1,887,887 | ) |
| Institutional Class | | (93,812,092 | ) | | | (38,287,466 | ) |
| | | (130,138,502 | ) | | | (70,589,741 | ) |
| Increase (decrease) in net assets derived from capital | | | | | | | |
| share transactions | | (52,942,831 | ) | | | 404,417 | |
| Net Increase (Decrease) in Net Assets | | 16,208,831 | | | | (10,329,561 | ) |
| |
| Net Assets: | | | | | | | |
| Beginning of year | | 194,466,379 | | | | 204,795,940 | |
| End of year (there was no undistributed net | | | | | | | |
| investment income at either year end.) | $ | 210,675,210 | | | $ | 194,466,379 | |
See accompanying Notes, which are an integral part of the financial statements.
19
Financial highlights
Delaware REIT Fund Class A
Selected data for each share of the Fund outstanding throughout each period were as follows:
| Net asset value, beginning of period |
| |
| Income (loss) from investment operations: |
| Net investment income1 |
| Net realized and unrealized gain (loss) on investments |
| Total from investment operations |
| |
| Less dividends and distributions from: |
| Net investment income |
| Net realized gain on investments |
| Return of capital |
| Total dividends and distributions |
| |
| Net asset value, end of period |
| |
| Total return2 |
| |
| Ratios and supplemental data: |
| Net assets, end of period (000 omitted) |
| Ratio of expenses to average net assets |
| Ratio of expenses to average net assets |
| prior to fees waived and expense paid indirectly |
| Ratio of net investment income to average net assets |
| Ratio of net investment income to average net assets |
| prior to fees waived and expense paid indirectly |
| Portfolio turnover |
1 The average shares outstanding method has been applied for per share information. |
2 Total investment return is based on the change in net asset value of a share during the period and assumes reinvestment of dividends and distributions at net asset value and does not reflect the impact of a sales charge. Total investment return during all of the periods shown reflects a waiver by the manager and/or distributor. Performance would have been lower had the waivers not been in effect. |
See accompanying Notes, which are an integral part of the financial statements.
20
| | | Year Ended | | |
| | | 10/31/10 | | 10/31/09 | | 10/31/08 | | 10/31/07 | | 10/31/06 | |
| | | $7.630 | | | $8.200 | | | $17.690 | | | $24.180 | | | $21.390 | | |
| | | | | |
| | | | | |
| | | 0.131 | | | 0.221 | | | 0.225 | | | 0.149 | | | 0.351 | | |
| | | 2.886 | | | (0.509 | ) | | (5.793 | ) | | 0.372 | | | 5.910 | | |
| | | 3.017 | | | (0.288 | ) | | (5.568 | ) | | 0.521 | | | 6.261 | | |
| | | | | |
| | | | | |
| | | (0.187 | ) | | (0.224 | ) | | (0.339 | ) | | (0.380 | ) | | (0.460 | ) | |
| | | — | | | — | | | (3.583 | ) | | (6.631 | ) | | (3.011 | ) | |
| | | — | | | (0.058 | ) | | — | | | — | | | — | | |
| | | (0.187 | ) | | (0.282 | ) | | (3.922 | ) | | (7.011 | ) | | (3.471 | ) | |
| | | | | |
| | | $10.460 | | | $7.630 | | | $8.200 | | | $17.690 | | | $24.180 | | |
| | | | | |
| | | 39.84% | | | (2.97% | ) | | (37.85% | ) | | 2.33% | | | 33.45% | | |
| | | | | |
| | | | | |
| | | $82,646 | | | $64,237 | | | $73,445 | | | $153,051 | | | $231,367 | | |
| | | 1.53% | | | 1.48% | | | 1.48% | | | 1.36% | | | 1.34% | | |
| | | | | |
| | | 1.62% | | | 1.88% | | | 1.59% | | | 1.41% | | | 1.39% | | |
| | | 1.42% | | | 3.38% | | | 1.82% | | | 0.79% | | | 1.65% | | |
| | | | | |
| | | 1.33% | | | 2.98% | | | 1.71% | | | 0.74% | | | 1.60% | | |
| | | 175% | | | 174% | | | 115% | | | 82% | | | 60% | | |
21
Financial highlights
Delaware REIT Fund Class B
Selected data for each share of the Fund outstanding throughout each period were as follows:
| Net asset value, beginning of period |
| |
| Income (loss) from investment operations: |
| Net investment income1 |
| Net realized and unrealized gain (loss) on investments |
| Total from investment operations |
| |
| Less dividends and distributions from: |
| Net investment income |
| Net realized gain on investments |
| Return of capital |
| Total dividends and distributions |
| |
| Net asset value, end of period |
| |
| Total return2 |
| |
| Ratios and supplemental data: |
| Net assets, end of period (000 omitted) |
| Ratio of expenses to average net assets |
| Ratio of expenses to average net assets |
| prior to fees waived and expense paid indirectly |
| Ratio of net investment income to average net assets |
| Ratio of net investment income to average net assets |
| prior to fees waived and expense paid indirectly |
| Portfolio turnover |
1 The average shares outstanding method has been applied for per share information. |
2 Total investment return is based on the change in net asset value of a share during the period and assumes reinvestment of dividends and distributions at net asset value and does not reflect the impact of a sales charge. Total investment return during some of the periods shown reflects a waiver by the manager. Performance would have been lower had the waiver not been in effect. |
See accompanying Notes, which are an integral part of the financial statements.
22
| | | Year Ended | |
| | | 10/31/10 | | 10/31/09 | | 10/31/08 | | 10/31/07 | | 10/31/06 | |
| | | $ 7.620 | | | $ 8.190 | | | $17.680 | | | $24.150 | | | $21.360 | | |
| | | | | |
| | | | | |
| | | 0.061 | | | 0.173 | | | 0.138 | | | 0.006 | | | 0.191 | | |
| | | 2.888 | | | (0.511 | ) | | (5.793 | ) | | 0.373 | | | 5.911 | | |
| | | 2.949 | | | (0.338 | ) | | (5.655 | ) | | 0.379 | | | 6.102 | | |
| | | | | |
| | | | | |
| | | (0.119 | ) | | (0.174 | ) | | (0.252 | ) | | (0.218 | ) | | (0.301 | ) | |
| | | — | | | — | | | (3.583 | ) | | (6.631 | ) | | (3.011 | ) | |
| | | — | | | (0.058 | ) | | — | | | — | | | — | | |
| | | (0.119 | ) | | (0.232 | ) | | (3.835 | ) | | (6.849 | ) | | (3.312 | ) | |
| | | | | |
| | | $10.450 | | | $7.620 | | | $8.190 | | | $17.680 | | | $24.150 | | |
| | | | | |
| | | 38.88% | | | (3.73% | ) | | (38.28% | ) | | 1.52% | | | 32.50% | | |
| | | | | |
| | | | | |
| | | $7,393 | | | $10,985 | | | $17,831 | | | $48,300 | | | $71,206 | | |
| | | 2.28% | | | 2.23% | | | 2.23% | | | 2.11% | | | 2.09% | | |
| | | | | |
| | | 2.32% | | | 2.58% | | | 2.29% | | | 2.11% | | | 2.09% | | |
| | | 0.67% | | | 2.63% | | | 1.07% | | | 0.04% | | | 0.90% | | |
| | | | | |
| | | 0.63% | | | 2.28% | | | 1.01% | | | 0.04% | | | 0.90% | | |
| | | 175% | | | 174% | | | 115% | | | 82% | | | 60% | | |
23
Financial highlights
Delaware REIT Fund Class C
Selected data for each share of the Fund outstanding throughout each period were as follows:
| Net asset value, beginning of period |
| |
| Income (loss) from investment operations: |
| Net investment income1 |
| Net realized and unrealized gain (loss) on investments |
| Total from investment operations |
| |
| Less dividends and distributions from: |
| Net investment income |
| Net realized gain on investments |
| Return of capital |
| Total dividends and distributions |
| |
| Net asset value, end of period |
| |
| Total return2 |
| |
| Ratios and supplemental data: |
| Net assets, end of period (000 omitted) |
| Ratio of expenses to average net assets |
| Ratio of expenses to average net assets |
| prior to fees waived and expense paid indirectly |
| Ratio of net investment income to average net assets |
| Ratio of net investment income to average net assets |
| prior to fees waived and expense paid indirectly |
| Portfolio turnover |
1 The average shares outstanding method has been applied for per share information. |
2 Total investment return is based on the change in net asset value of a share during the period and assumes reinvestment of dividends and distributions at net asset value and does not reflect the impact of a sales charge. Total investment return during some of the periods shown reflects a waiver by the manager. Performance would have been lower had the waiver not been in effect. |
See accompanying Notes, which are an integral part of the financial statements.
24
| | | Year Ended | |
| | | 10/31/10 | | 10/31/09 | | 10/31/08 | | 10/31/07 | | 10/31/06 | |
| | | $7.620 | | | $8.190 | | | $17.680 | | | $24.150 | | | $21.370 | | |
| | | | | |
| | | | | |
| | | 0.062 | | | 0.173 | | | 0.136 | | | 0.006 | | | 0.191 | | |
| | | 2.887 | | | (0.511 | ) | | (5.791 | ) | | 0.373 | | | 5.901 | | |
| | | 2.949 | | | (0.338 | ) | | (5.655 | ) | | 0.379 | | | 6.092 | | |
| | | | | |
| | | | | |
| | | (0.119 | ) | | (0.174 | ) | | (0.252 | ) | | (0.218 | ) | | (0.301 | ) | |
| | | — | | | — | | | (3.583 | ) | | (6.631 | ) | | (3.011 | ) | |
| | | — | | | (0.058 | ) | | — | | | — | | | — | | |
| | | (0.119 | ) | | (0.232 | ) | | (3.835 | ) | | (6.849 | ) | | (3.312 | ) | |
| | | | | |
| | | $10.450 | | | $7.620 | | | $8.190 | | | $17.680 | | | $24.150 | | |
| | | | | |
| | | 38.88% | | | (3.73% | ) | | (38.33% | ) | | 1.58% | | | 32.43% | | |
| | | | | |
| | | | | |
| | | $18,713 | | | $16,314 | | | $22,695 | | | $50,819 | | | $71,614 | | |
| | | 2.28% | | | 2.23% | | | 2.23% | | | 2.11% | | | 2.09% | | |
| | | | | |
| | | 2.32% | | | 2.58% | | | 2.29% | | | 2.11% | | | 2.09% | | |
| | | 0.67% | | | 2.63% | | | 1.07% | | | 0.04% | | | 0.90% | | |
| | | | | |
| | | 0.63% | | | 2.28% | | | 1.01% | | | 0.04% | | | 0.90% | | |
| | | 175% | | | 174% | | | 115% | | | 82% | | | 60% | | |
25
Financial highlights
Delaware REIT Fund Class R
Selected data for each share of the Fund outstanding throughout each period were as follows:
| Net asset value, beginning of period |
| |
| Income (loss) from investment operations: |
| Net investment income1 |
| Net realized and unrealized gain (loss) on investments |
| Total from investment operations |
| |
| Less dividends and distributions from: |
| Net investment income |
| Net realized gain on investments |
| Return of capital |
| Total dividends and distributions |
| |
| Net asset value, end of period |
| |
| Total return2 |
| |
| Ratios and supplemental data: |
| Net assets, end of period (000 omitted) |
| Ratio of expenses to average net assets |
| Ratio of expenses to average net assets |
| prior to fees waived and expense paid indirectly |
| Ratio of net investment income to average net assets |
| Ratio of net investment income to average net assets |
| prior to fees waived and expense paid indirectly |
| Portfolio turnover |
1 The average shares outstanding method has been applied for per share information. |
2 Total investment return is based on the change in net asset value of a share during the period and assumes reinvestment of dividends and distributions at net asset value. Total investment return during all of the periods shown reflects a waiver by the manager and/or distributor. Performance would have been lower had the waivers not been in effect. |
See accompanying Notes, which are an integral part of the financial statements.
26
| | | Year Ended | |
| | | 10/31/10 | | 10/31/09 | | 10/31/08 | | 10/31/07 | | 10/31/06 | |
| | | $7.630 | | | $8.200 | | | $17.690 | | | $24.180 | | | $21.390 | | |
| | | | | | | | | | | | | | | | | |
| | | | | | | | | | | | | | | | | |
| | | 0.109 | | | 0.205 | | | 0.191 | | | 0.102 | | | 0.297 | | |
| | | 2.885 | | | (0.509 | ) | | (5.789 | ) | | 0.363 | | | 5.913 | | |
| | | 2.994 | | | (0.304 | ) | | (5.598 | ) | | 0.465 | | | 6.210 | | |
| | | | | | | | | | | | | | | | | |
| | | | | | | | | | | | | | | | | |
| | | (0.164 | ) | | (0.208 | ) | | (0.309 | ) | | (0.324 | ) | | (0.409 | ) | |
| | | — | | | — | | | (3.583 | ) | | (6.631 | ) | | (3.011 | ) | |
| | | — | | | (0.058 | ) | | — | | | — | | | — | | |
| | | (0.164 | ) | | (0.266 | ) | | (3.892 | ) | | (6.955 | ) | | (3.420 | ) | |
| | | | | | | | | | | | | | | | | |
| | | $10.460 | | | $7.630 | | | $8.200 | | | $17.690 | | | $24.180 | | |
| | | | | | | | | | | | | | | | | |
| | | 39.50% | | | (3.21% | ) | | (38.00% | ) | | 2.03% | | | 33.13% | | |
| | | | | | | | | | | | | | | | | |
| | | | | | | | | | | | | | | | | |
| | | $5,680 | | | $3,596 | | | $3,395 | | | $5,734 | | | $7,107 | | |
| | | 1.78% | | | 1.73% | | | 1.73% | | | 1.61% | | | 1.59% | | |
| | | | | | | | | | | | | | | | | |
| | | 1.92% | | | 2.18% | | | 1.89% | | | 1.71% | | | 1.69% | | |
| | | 1.17% | | | 3.13% | | | 1.57% | | | 0.54% | | | 1.40% | | |
| | | | | | | | | | | | | | | | | |
| | | 1.03% | | | 2.68% | | | 1.41% | | | 0.44% | | | 1.30% | | |
| | | 175% | | | 174% | | | 115% | | | 82% | | | 60% | | |
27
Financial highlights
Delaware REIT Fund Institutional Class
Selected data for each share of the Fund outstanding throughout each period were as follows:
| Net asset value, beginning of period |
| |
| Income (loss) from investment operations: |
| Net investment income1 |
| Net realized and unrealized gain (loss) on investments |
| Total from investment operations |
| |
| Less dividends and distributions from: |
| Net investment income |
| Net realized gain on investments |
| Return of capital |
| Total dividends and distributions |
| |
| Net asset value, end of period |
| |
| Total return2 |
| |
| Ratios and supplemental data: |
| Net assets, end of period (000 omitted) |
| Ratio of expenses to average net assets |
| Ratio of expenses to average net assets |
| prior to fees waived and expense paid indirectly |
| Ratio of net investment income to average net assets |
| Ratio of net investment income to average net assets |
| prior to fees waived and expense paid indirectly |
| Portfolio turnover |
1 The average shares outstanding method has been applied for per share information. |
2 Total investment return is based on the change in net asset value of a share during the period and assumes reinvestment of dividends and distributions at net asset value. Total investment return during some of the periods shown reflects a waiver by the manager. Performance would have been lower had the waivers not been in effect. |
See accompanying Notes, which are an integral part of the financial statements.
28
| | | Year Ended | |
| | | 10/31/10 | | 10/31/09 | | 10/31/08 | | 10/31/07 | | 10/31/06 | |
| | | $7.640 | | | $8.220 | | | $17.710 | | | $24.210 | | | $21.410 | | |
| | | | | | | | | | | | | | | | | |
| | | | | | | | | | | | | | | | | |
| | | 0.155 | | | 0.238 | | | 0.247 | | | 0.196 | | | 0.404 | | |
| | | 2.893 | | | (0.520 | ) | | (5.784 | ) | | 0.366 | | | 5.923 | | |
| | | 3.048 | | | (0.282 | ) | | (5.537 | ) | | 0.562 | | | 6.327 | | |
| | | | | | | | | | | | | | | | | |
| | | | | | | | | | | | | | | | | |
| | | (0.208 | ) | | (0.240 | ) | | (0.370 | ) | | (0.431 | ) | | (0.516 | ) | |
| | | — | | | — | | | (3.583 | ) | | (6.631 | ) | | (3.011 | ) | |
| | | — | | | (0.058 | ) | | — | | | — | | | — | | |
| | | (0.208 | ) | | (0.298 | ) | | (3.953 | ) | | (7.062 | ) | | (3.527 | ) | |
| | | | | | | | | | | | | | | | | |
| | | $10.480 | | | $7.640 | | | $8.220 | | | $17.710 | | | $24.210 | | |
| | | | | | | | | | | | | | | | | |
| | | 40.23% | | | (2.72% | ) | | (37.66% | ) | | 2.56% | | | 33.81% | | |
| | | | | | | | | | | | | | | | | |
| | | | | | | | | | | | | | | | | |
| | | $96,243 | | | $99,334 | | | $87,430 | | | $106,145 | | | $32,166 | | |
| | | 1.28% | | | 1.23% | | | 1.23% | | | 1.11% | | | 1.09% | | |
| | | | | | | | | | | | | | | | | |
| | | 1.32% | | | 1.58% | | | 1.29% | | | 1.11% | | | 1.09% | | |
| | | 1.67% | | | 3.63% | | | 2.07% | | | 1.04% | | | 1.90% | | |
| | | | | | | | | | | | | | | | | |
| | | 1.63% | | | 3.28% | | | 2.01% | | | 1.04% | | | 1.90% | | |
| | | 175% | | | 174% | | | 115% | | | 82% | | | 60% | | |
29
| Notes to financial statements | |
| Delaware REIT Fund | October 31, 2010 |
The Real Estate Investment Trust Portfolio (Delaware REIT Fund or Fund) is a series of Delaware Pooled® Trust (Trust), which is organized as a Delaware statutory trust. The Trust is an open-end investment company. The Fund is considered non-diversified under the Investment Company Act of 1940, as amended, and offers Class A, Class B, Class C, Class R and Institutional Class shares. Class A shares are sold with a maximum front-end sales charge of up to 5.75%. Class A share purchases of $1,000,000 or more will incur a contingent deferred sales charge (CDSC) of 1% if redeemed during the first year and 0.50% during the second year, provided that Delaware Distributors, L.P. (DDLP) paid a financial advisor a commission on the purchase of those shares. Class B shar es may be purchased only through dividend reinvestment and certain permitted exchanges. Prior to June 1, 2007, Class B shares were sold with a CDSC that declined from 4% to zero depending upon the period of time the shares were held. Class B shares will automatically convert to Class A shares on a quarterly basis approximately eight years after purchase. Class C shares are sold with a CDSC of 1%, if redeemed during the first twelve months. Class R and Institutional Class shares are not subject to a sales charge and are offered for sale exclusively to certain eligible investors. This report contains information relating only to the Delaware REIT Fund. All other Delaware Pooled® Trust portfolios are included in a separate report. The investment objectives of the Fund are to seek maximum long-term total return, with capital appre ciation as a secondary objective. It seeks to achieve its objectives by investing primarily in securities of companies principally engaged in the real estate industry.
1. Significant Accounting Policies
The following accounting policies are in accordance with U.S. generally accepted accounting principles (U.S. GAAP) and are consistently followed by the Fund.
Security Valuation — Equity securities, except those traded on the Nasdaq Stock Market, Inc. (Nasdaq), are valued at the last quoted sales price as of the time of the regular close of the New York Stock Exchange (NYSE) on the valuation date. Securities traded on the Nasdaq are valued in accordance with the Nasdaq Official Closing Price, which may not be the last sales price. If on a particular day an equity security does not trade, then the mean between the bid and ask prices will be used. Short-term debt securities are valued at market value. Investment company securities are valued at net asset value per share. Generally, other securities and assets for which market quotations are not readily available are valued at fair value as determined in good faith under the direction of the Fund’s Board of Trustees (Board) . In determining whether market quotations are readily available or fair valuation will be used, various factors will be taken into consideration, such as market closures or suspension of trading in a security. The Fund may use fair value pricing more frequently for securities traded primarily in non-U.S. markets because, among other things, most foreign markets close well before the Fund values its securities generally at 4:00 p.m. Eastern time. The earlier close of these foreign markets gives rise to the possibility that significant events, including broad market moves, government actions or pronouncements, aftermarket trading, or news events may have occurred in the interim. To account for this, the Fund may frequently value foreign securities using fair value prices based on third-party vendor modeling tools (international fair value pricing).
30
Federal Income Taxes — No provision for federal income taxes has been made as the Fund intends to continue to qualify for federal income tax purposes as a regulated investment company under Subchapter M of the Internal Revenue Code of 1986, as amended, and make the requisite distributions to shareholders. The Fund evaluates tax positions taken or expected to be taken in the course of preparing the Fund’s tax returns to determine whether the tax positions are “more-likely-than-not” of being sustained by the applicable tax authority. Tax positions not deemed to meet the more-likely-than-not threshold are recorded as a tax benefit or expense in the current year. Management has analyzed the Fund’s tax positions taken on federal income tax returns for all open tax years (October 31, 2007 – Octobe r 31, 2010), and has concluded that no provision for federal income tax is required in the Fund’s financial statements.
Class Accounting — Investment income, common expenses and realized and unrealized gain (loss) on investments are allocated to the various classes of the Fund on the basis of daily net assets of each class. Distribution expenses relating to a specific class are charged directly to that class.
Use of Estimates — The preparation of financial statements in conformity with U.S. GAAP requires management to make estimates and assumptions that affect the reported amounts of assets and liabilities and disclosure of contingent assets and liabilities at the date of the financial statements and the reported amounts of revenues and expenses during the reporting period. Actual results could differ from those estimates and the differences could be material.
Other — Expenses directly attributable to the Fund are charged directly to the Fund. Other expenses common to various funds within the Delaware Investments® Family of Funds are generally allocated amongst such funds on the basis of average net assets. Management fees and some other expenses are paid monthly. Security transactions are recorded on the date the securities are purchased or sold (trade date) for financial reporting purposes. Costs used in calculating realized gains and losses on the sale of investment securities are those of the specific securities sold. Dividend income is recorded on the ex-dividend date and interest income is recorded on the accrual basis. Distributions received from investments in Real Estate Investment Trusts (REITs) are recorded as dividend income on the ex-dividend date, subject to reclassification upon notice of the character of such distributions by the issuer. The financial statements reflect an estimate of the reclassification of the distribution character. The Fund declares and pays dividends from net investment income quarterly and distributions from net realized gains on investments, if any, annually. The Fund may distribute income dividends and capital gains more frequently, if necessary for tax purposes. Dividends and distributions, if any, are recorded on the ex-dividend date.
Subject to seeking best execution, the Fund may direct certain security trades to brokers who have agreed to rebate a portion of the related brokerage commission to the Fund in cash. Such commission rebates are included in realized gain on investments in the accompanying financial statements and totaled $110 for the year ended October 31, 2010. In general, best execution refers to many factors, including the price paid or received for a security, the commission charged, the promptness and reliability of execution, the confidentiality and placement accorded the order, and other factors affecting the overall benefit obtained by the Fund on the transaction.
31
Notes to financial statements
Delaware REIT Fund
1. Significant Accounting Policies (continued)
The Fund may receive earnings credits from its custodian when positive cash balances are maintained, which are used to offset custody fees. There were no earnings credits for the year ended October 31, 2010.
The Fund may receive earnings credits from its transfer agent when positive cash balances are maintained, which may be used to offset transfer agent fees. The expense paid under this arrangement is included in dividend disbursing and transfer agent fees and expenses on the statement of operations with the corresponding expense offset shown as “expense paid indirectly.” For the year ended October 31, 2010, the Fund earned $1,450 under this agreement.
2. Investment Management, Administration Agreements and Other Transactions with Affiliates
In accordance with the terms of its investment management agreement, the Fund pays Delaware Management Company (DMC), a series of Delaware Management Business Trust and the investment manager, an annual fee which is calculated daily at the rate of 0.75% on the first $500 million of average daily net assets of the Fund, 0.70% on the next $500 million, 0.65% on the next $1.5 billion and 0.60% on average daily net assets in excess of $2.5 billion.
Effective February 28, 2010, DMC has contractually agreed to waive that portion, if any, of its management fee and reimburse the Fund to the extent necessary to ensure that total annual operating expenses (excluding any 12b-1 plan and certain other expenses) do not exceed 1.30% of average daily net assets of the Fund through February 28, 2011. These waivers and reimbursements may only be terminated by agreement of the Manager and the Fund. These fee waivers and expense reimbursements apply only to expenses paid directly by the Fund. Prior to February 28, 2010, DMC had voluntarily agreed to waive that portion, if any, of its management fee and reimburse the Fund to the extent necessary to ensure that total annual operating expenses (excluding any 12b-1 plan and certain other expenses) did not exceed 1.30% of average daily net assets of the Fund.
Delaware Service Company, Inc. (DSC), an affiliate of DMC, provides fund accounting and financial administration oversight services to the Fund. For these services, the Fund pays DSC fees based on the aggregate daily net assets of the Delaware Investments® Family of Funds at the following annual rate: 0.0050% of the first $30 billion; 0.0045% of the next $10 billion; 0.0040% of the next $10 billion; and 0.0025% of aggregate average daily net assets in excess of $50 billion. The fees payable to DSC under the service agreement described above are allocated among all Funds in the Delaware Investments Family of Funds on a relative net asset value basis. For the year ended October 31, 2010, the Fund was charged $11,241 for these services.
DSC also provides dividend disbursing and transfer agency services. The Fund pays DSC a monthly fee based on the number of shareholder accounts for dividend disbursing and transfer agent services.
32
Pursuant to a distribution agreement and distribution plan, the Fund pays DDLP, the distributor and an affiliate of DMC, an annual distribution and service fee not to exceed 0.30% of the average daily net assets of the Class A shares, 1.00% of the average daily net assets of the Class B and C shares and 0.60% of the average daily net assets of the Class R shares. DDLP has contracted to limit Class A and Class R shares’ 12b-1 fees through February 28, 2011 to no more than 0.25% and 0.50%, respectively, of the classes’ average daily net assets. Institutional Class shares pay no distribution and service expenses.
At October 31, 2010, the Fund had liabilities payable to affiliates as follows:
| Investment management fee payable to DMC | $ | 131,683 |
| Dividend disbursing, transfer agent and fund accounting | | |
| oversight fees and other expenses payable to DSC | | 30,495 |
| Distribution fees payable to DDLP | | 42,204 |
| Other expenses payable to DMC and affiliates* | | 12,387 |
*DMC, as part of its administrative services, pays operating expenses on behalf of the Fund and is reimbursed on a periodic basis. These expenses include items such as printing of shareholder reports, fees for audit, legal and tax services, registration fees and trustees’ fees.
As provided in the investment management agreement, the Fund bears the cost of certain legal and tax services, including internal legal and tax services provided to the Fund by DMC and/or its affiliates’ employees. For the year ended October 31, 2010, the Fund was charged $9,865 for internal legal and tax services provided by DMC and/or its affiliates’ employees.
For the year ended October 31, 2010, DDLP earned $10,679 for commissions on sales of the Fund’s Class A shares. For the year ended October 31, 2010, DDLP received gross CDSC commissions of $0, $3,978 and $1,892 on redemptions of the Fund’s Class A, Class B and Class C shares, respectively, and these commissions were entirely used to offset up-front commissions previously paid by DDLP to brokers/dealers on sales of those shares.
Trustees’ fees include expenses accrued by the Fund for each Trustee’s retainer and meeting fees. Certain officers of DMC, DSC and DDLP are officers and/or Trustees of the Trust. These officers and Trustees are paid no compensation by the Fund.
3. Investments
For the year ended October 31, 2010, the Fund made purchases of $377,324,485 and sales of $421,286,673 of investment securities other than short-term investments.
At October 31, 2010, the cost of investments for federal income tax purposes was $255,472,626. At October 31, 2010, net unrealized appreciation was $5,851,254, of which $26,533,433 related to unrealized appreciation of investments and $20,682,179 related to unrealized depreciation of investments.
33
Notes to financial statements
Delaware REIT Fund
3. Investments (continued)
U.S. GAAP defines fair value as the price that the Fund would receive to sell an asset or pay to transfer a liability in an orderly transaction between market participants at the measurement date under current market conditions. A three level hierarchy for fair value measurements has been established based upon the transparency of inputs to the valuation of an asset or liability. Inputs may be observable or unobservable and refer broadly to the assumptions that market participants would use in pricing the asset or liability. Observable inputs reflect the assumptions market participants would use in pricing the asset or liability based on market data obtained from sources independent of the reporting entity. Unobservable inputs reflect the reporting entity’s own assumptions about the assumptions that market participants would use in pricing the asset or liability developed based on the best information available under the circumstance s. The Fund’s investment in its entirety is assigned a level based upon the observability of the inputs which are significant to the overall valuation. The three level hierarchy of inputs is summarized below.
| Level 1 – | inputs are quoted prices in active markets for identical investments (e.g., equity securities, open-end investment companies, futures contracts, options contracts) |
| | |
| Level 2 – | other observable inputs (including, but not limited to: quoted prices for similar assets or liabilities in markets that are active, quoted prices for identical or similar assets or liabilities in markets that are not active, inputs other than quoted prices that are observable for the assets or liabilities (such as interest rates, yield curves, volatilities, prepayment speeds, loss severities, credit risks and default rates) or other market-corroborated inputs) ( e.g., debt securities, government securities, swap contracts, foreign currency exchange contracts, foreign securities utilizing international fair value pricing) |
| | |
| Level 3 – | inputs are significant unobservable inputs (including the Fund’s own assumptions used to determine the fair value of investments) (e.g., broker-quoted securities, fair valued securities) |
The following table summarizes the valuation of the Fund’s investments by fair value hierarchy levels as of October 31, 2010:
| | | Level 1 | | Level 2 | | Level 3 | | Total |
| Common Stock | | $ | 202,223,136 | | $ | — | | $ | — | | $ | 202,223,136 |
| Exchange-Traded Fund | | | 6,292,514 | | | — | | | — | | | 6,292,514 |
| Discount Note | | | — | | | 1,858,017 | | | — | | | 1,858,017 |
| Securities Lending Collateral | | | — | | | 50,918,623 | | | 31,590 | | | 50,950,213 |
| Total | | $ | 208,515,650 | | $ | 52,776,640 | | $ | 31,590 | | $ | 261,323,880 |
34
The following is a reconciliation of investments in which significant unobservable inputs (Level 3) were used in determining fair value:
| | | Security |
| | | Lending |
| | | Collateral |
| Balance as of 10/31/09 | | $ | 61 |
| Net change in unrealized depreciation/depreciation | | | 31,529 |
| Balance as of 10/31/10 | | $ | 31,590 |
| | | | |
| Net change in unrealized appreciation/depreciation | | | |
| from investments still held as of 10/31/10 | | $ | 31,529 |
In January 2010, the Financial Accounting Standards Board issued an Accounting Standards Update, Improving Disclosures about Fair Value Measurements, which introduced new disclosure requirements and clarified certain existing disclosure requirements around fair value measurements currently presented above. The new disclosures and clarifications of existing disclosures are generally effective for the Fund’s year ending October 31, 2011 and interim periods therein. During the year ended October 31, 2010, the Fund made transfers out of Level 1 investments into Level 2 investments in the amount of $ 50,576,813, based on management’s decision to classify the Delaware Investments Collateral Fund No. 1 as a Level 2 investment. Management has classified the Delaware Investments Collateral Fund No. 1 as a Level 2 investment because the price is not quoted in an active market or listed on a public exchange. The Delaware Investments Colla teral Fund No. 1 is priced daily for investors in such Fund. There were no transfers between Level 2 investments and Level 3 investments.
4. Dividends and Distribution Information
Income and long-term capital gain distributions are determined in accordance with federal income tax regulations, which may differ from U.S. GAAP. Additionally, distributions from net short-term gains on sales of investment securities are treated as ordinary income for federal income tax purposes. The tax character of dividends and distributions paid during the years ended October 31, 2010 and 2009 was as follows:
| | | Year Ended |
| | | 10/31/10 | | 10/31/09 |
| Ordinary income | | $ | 4,404,391 | | $ | 5,564,743 |
| Return of capital | | | — | | | 1,465,398 |
| Total | | $ | 4,404,391 | | $ | 7,030,141 |
35
Notes to financial statements
Delaware REIT Fund
5. Components of Net Assets on a Tax Basis
As of October 31, 2010, the components of net assets on a tax basis were as follows:
| Shares of beneficial interest | | $ | 255,219,604 | |
| Capital loss carryforwards | | | (50,395,648 | ) |
| Unrealized appreciation of investments | | | 5,851,254 | |
| Net assets | | $ | 210,675,210 | |
The undistributed earnings for the Delaware REIT Fund are estimated pending final notification of the tax character of distributions received from investments in REITs.
The differences between book basis and tax basis components of net assets are primarily attributable to tax deferral of losses on wash sales.
For financial reporting purposes, capital accounts are adjusted to reflect the tax character of permanent book/tax differences. Reclassifications are primarily due to tax treatment of dividends and distributions and in-kind distributions of shareholder redemptions. Results of operations and net assets were not affected by these reclassifications. For the year ended October 31, 2010, the Fund recorded the following reclassifications:
| Undistributed net investment income | | $ | 1,127,810 | |
| Accumulated net realized loss | | | (2,544,366 | ) |
| Paid-in capital | | | 1,416,556 | |
For federal income tax purposes, capital loss carryforwards may be carried forward and applied against future capital gains, $14,268,327 was utilized in October 31, 2010. Capital loss carryforwards remaining at October 31, 2010 will expire at follows: $ 50,395,648 expires in 2017.
36
6. Capital Shares
Transactions in capital shares were as follows:
| | | Ended |
| | | 10/31/10 | | 10/31/09 |
| Shares sold: | | | | | | |
| Class A | | 1,792,835 | | | 2,175,080 | |
| Class B | | 8,865 | | | 18,567 | |
| Class C | | 142,522 | | | 199,187 | |
| Class R | | 254,887 | | | 330,368 | |
| Institutional Class | | 5,600,897 | | | 7,661,922 | |
| | | | | | | |
| Shares issued upon reinvestment of dividends and distributions: | | | | | | |
| Class A | | 146,361 | | | 360,492 | |
| Class B | | 11,885 | | | 60,103 | |
| Class C | | 22,451 | | | 83,165 | |
| Class R | | 8,730 | | | 20,978 | |
| Institutional Class | | 253,180 | | | 572,391 | |
| | | 8,242,613 | | | 11,482,253 | |
| Shares repurchased: | | | | | | |
| Class A | | (2,459,341 | ) | | (3,067,391 | ) |
| Class B | | (754,876 | ) | | (813,317 | ) |
| Class C | | (514,716 | ) | | (911,408 | ) |
| Class R | | (191,969 | ) | | (293,767 | ) |
| Institutional Class | | (9,673,184 | ) | | (5,874,558 | ) |
| | | (13,594,086 | ) | | (10,960,441 | ) |
| Net increase (decrease) | | (5,351,473 | ) | | 521,812 | |
For the years ended October 31, 2010 and 2009, 470,992 Class B shares were converted to 469,869 Class A shares valued at $4,596,472 and 175,717 Class B shares were converted to 175,412 Class A shares valued at $1,210,467, respectively. The respective amounts are included in Class B redemptions and Class A subscriptions in the table above and in the statements of changes in net assets.
7. Line of Credit
The Fund, along with certain other funds in the Delaware Investments® Family of Funds (Participants), was a participant in a $35,000,000 revolving line of credit with The Bank of New York Mellon (BNY Mellon) to be used for temporary or emergency purposes as an additional source of liquidity to fund redemptions of investor shares. Under the agreement, the Participants were charged an annual commitment fee, which was allocated across the Participants on the basis of each Participant’s allocation of the entire facility. The Participants were permitted to borrow up to a maximum of one third of their net assets under the agreement. The Fund had no amounts outstanding as of October 31, 2010, or at any time during the year then ended. The agreement expired on November 16, 2010.
37
Notes to financial statements
Delaware REIT Fund
7. Line of Credit (continued)
Effective as of November 16, 2010, the Fund along with the other Participants entered into an amendment to the agreement with BNY Mellon for a $50,000,000 revolving line of credit. The agreement as amended is to be used as described above and operates in substantially the same manner as the original agreement. The agreement as amended expires on November 15, 2011.
8. Securities Lending
The Fund, along with other funds in the Delaware Investments® Family of Funds, may lend its securities pursuant to a security lending agreement (Lending Agreement) with BNY Mellon. With respect to each loan, if on any business day the aggregate market value of securities collateral plus cash collateral held is less than the aggregate market value of the securities which are the subject of such loan, the borrower will be notified to provide additional collateral by the end of the following business day which, together with the collateral already held, will be not less than the applicable collateral requirements for such security loan. If the aggregate market value of securities collateral and cash collateral held with respect to a security loan exceeds the applicable collateral requirement, upon the request of the borrower BNY Mellon must return enough collateral to the borr ower by the end of the following business day to reduce the value of the remaining collateral to the applicable collateral requirement for such security loan. As a result of the foregoing, the value of the collateral held with respect to a loaned security may be temporarily more or less than the value of the security on loan.
Cash collateral received is generally invested in the Delaware Investments Collateral Fund No. 1 (the “Collective Trust”) established by BNY Mellon for the purpose of investment on behalf of funds managed by DMC that participate in BNY Mellon’s securities lending program. The Collective Trust may invest in U.S. government securities and high quality corporate debt, asset-backed and other money market securities and in repurchase agreements collateralized by such securities, provided that the Collective Trust will generally have a dollar-weighted average portfolio maturity of 60 days or less. The Collective Trust seeks to maintain a net asset value per unit of $1.00, but there can be no assurance that it will always be able to do so. The Fund may incur investment losses as a result of investing securities lending collateral in the Collective Trust or another collateral investment pool. This could occur if an investment in a collateral investment pool defaulted or if it were necessary to liquidate assets in the collateral investment pool to meet returns on outstanding security loans at a time when the collateral investment pool’s net asset value per unit was less than $1.00. Under those circumstances, the Fund may not receive an amount from the collateral investment pool that is equal in amount to the collateral the Fund would be required to return to the borrower of the securities and the Fund would be required to make up this shortfall. Effective April 20, 2009, BNY Mellon transferred the assets of the Fund’s previous collateral investment pool other than cash and assets with a maturity of one business day or less to the BNY Mellon SL DBT II Liquidating Fund (the “Liquidating Fund”), effectively bifurcating the previous collateral investment pool. The Fund’s exposure to the Liquidating Fund is expected to decrease as the Liquidating Fund’s assets mature or are sold. In October 2008, BNY Me llon transferred certain distressed securities from the previous collateral investment pool into
38
the Mellon GSL Reinvestment Trust II. The Fund can also accept U.S. government securities and letters of credit (non-cash collateral) in connection with securities loans. In the event of default or bankruptcy by the lending agent, realization and/or retention of the collateral may be subject to legal proceedings. In the event the borrower fails to return loaned securities and the collateral received is insufficient to cover the value of the loaned securities and provided such collateral shortfall is not the result of investment losses, the lending agent has agreed to pay the amount of the shortfall to the Fund, or at the discretion of the lending agent, replace the loaned securities. The Fund continues to record dividends or interest, as applicable, on the securities loaned and is subject to change in value of the securities loaned that may occur during the term of the loan. The Fund has the right under the Lending Agreement to recover the securities from the borrower on demand. With respect to security loans collateralized by non-cash collateral, the Fund receives loan premiums paid by the borrower. With respect to security loans collateralized by cash collateral, the earnings from the collateral investments are shared among the Fund, the security lending agent and the borrower. The Fund records security lending income net of allocations to the security lending agent and the borrower.
At October 31, 2010, the value of securities on loan was $48,958,005, for which cash collateral was received and invested in accordance with the Lending Agreement. At October 31, 2010, the value of invested collateral was $50,950,213. Such investments are presented on the statement of net assets under the caption “Securities Lending Collateral.”
9. Credit and Market Risk
The Fund concentrates its investments in the real estate industry and is subject to the risks associated with that industry. If the Fund holds real estate directly as a result of defaults or receives rental income directly from real estate holdings, its tax status as a regulated investment company may be jeopardized. The Fund is also affected by interest rate changes, particularly if the REITs it holds use floating rate debt to finance their ongoing operations. Its investments may also tend to fluctuate more in value than a portfolio that invests in a broader range of industries.
The Fund may invest up to 15% of its net assets in illiquid securities, which may include securities with contractual restrictions on resale, securities exempt from registration under Rule 144A of the Securities Act of 1933, as amended, and other securities which may not be readily marketable. The relative illiquidity of these securities may impair the Fund from disposing of them in a timely manner and at a fair price when it is necessary or desirable to do so. While maintaining oversight, the Fund’s Board has delegated to DMC the day-to-day functions of determining whether individual securities are liquid for purposes of the Fund’s limitation on investments in illiquid assets. Securities eligible for resale pursuant to Rule 144A, which are determined to be liquid, are not subject to the Fund’s 15% limit on investments in illiquid securities. As of October 31, 2010, there were no Rule 144A securities. Illiquid securities have been identified on the statement of net assets.
39
Notes to financial statements
Delaware REIT Fund
10. Contractual Obligations
The Fund enters into contracts in the normal course of business that contain a variety of indemnifications. The Fund’s maximum exposure under these arrangements is unknown. However, the Fund has not had any prior claims or losses pursuant to these contracts. Management has reviewed the Fund’s existing contracts and expects the risk of loss to be remote.
11. In-Kind Redemptions
During the year ended October 31, 2010, the Fund satisfied withdrawal requests with transfers of securities and cash totaling $43,988,012, resulting in a net realized gain of $11,297,648.
12. Subsequent Events
Management has determined no material events or transactions occurred subsequent to October 31, 2010 that would require recognition or disclosure in the Fund’s financial statements.
13. Tax Information (Unaudited)
The information set forth below is for the Fund’s fiscal year as required by federal income tax laws. Shareholders, however, must report distributions on a calendar year basis for income tax purposes, which may include distributions for portions of two fiscal years of a fund. Accordingly, the information needed by shareholders for income tax purposes will be sent to them in January of each year. Please consult your tax advisor for proper treatment of this information.
For the fiscal year ended October 31, 2010, the Fund designates distributions paid during the year as follows:
| (A) | | Ordinary Income Distributions (Tax Basis) | 100% |
| | | Total Distributions (Tax Basis) | 100% |
(A) is based on a percentage of the Fund’s total distributions.
40
Report of independent
registered public accounting firm
To the Board of Trustees of Delaware Pooled Trust
and the Shareholders of The Real Estate Investment Trust Portfolio:
In our opinion, the accompanying statement of net assets and the related statements of operations and of changes in net assets and the financial highlights present fairly, in all material respects, the financial position of The Real Estate Investment Trust Portfolio (one of the series constituting Delaware Pooled Trust, hereafter referred to as the “Fund”) at October 31, 2010, and the results of its operations, the changes in its net assets and the financial highlights for the year then ended, in conformity with accounting principles generally accepted in the United States of America. These financial statements and financial highlights (hereafter referred to as “financial statements”) are the responsibility of the Fund’s management; our responsibility is to express an opinion on these financial statements based on our audit. We conducted our audit of these financial statements in accordance with the standards of the Public Company Accounting Oversight Board (United States). Those standards require that we plan and perform the audit to obtain reasonable assurance about whether the financial statements are free of material misstatement. An audit includes examining, on a test basis, evidence supporting the amounts and disclosures in the financial statements, assessing the accounting principles used and significant estimates made by management, and evaluating the overall financial statement presentation. We believe that our audit, which included confirmation of securities at October 31, 2010 by correspondence with the custodian, provides a reasonable basis for our opinion. The statement of changes in net assets for the year ended October 31, 2009 and the financial highlights for each of the four years in the period ended October 31, 2009 were audited by other independent accountants whose report dated December 22, 2009 expressed an unqualified opinion on those statements.
PricewaterhouseCoopers LLP
Philadelphia, Pennsylvania
December 17, 2010
41
Other Fund information
(Unaudited)
Delaware REIT Fund
Change in Independent Registered Public Accounting Firm
Due to independence matters under the Securities and Exchange Commission’s auditor independence rules relating to the January 4, 2010 acquisition of Delaware Investments (including DMC, DDLP and DSC) by Macquarie Group, Ernst & Young LLP (“E&Y”) has resigned as the independent registered public accounting firm for Delaware Pooled® Trust (the “ Trust”) effective May 20, 2010. At a meeting held on May 20, 2010, the Board of Trustees of the Trust, upon recommendation of the Audit Committee, selected PricewaterhouseCoopers LLP (“PwC”) to serve as the independent registered public accounting firm for the Trust for the fiscal year ending October 31, 2010. During the fiscal years ended October 31, 2009 and 2008, E&Y’s audit reports on the financial statements of the Trust did not contain any adverse opinion or disclaimer of opinion, nor were they qualified or modified as to uncertainty, audit scope, or accounting principles. In addition, there were no disagreements between the Trust and E&Y on accounting principles, financial statements disclosures or audit scope, which, if not resolved to the satisfaction of E&Y, would have caused them to make reference to the disagreement in their reports. Neither the Trust nor anyone on its behalf has consulted with PwC at any time prior to their selection with respect to the application of accounting principles to a specified transaction, either completed or proposed or the type of audit opinion that might be rendered on the Trust’s financial statements.
42
Board of trustees/directors and officers addendum
Delaware Investments® Family of Funds
A mutual fund is governed by a Board of Trustees/Directors (“Trustees”), which has oversight responsibility for the management of a fund’s business affairs. Trustees establish procedures and oversee and review the performance of the investment manager, the distributor, and others who perform services for the fund. The independent fund trustees, in particular, are advocates
| Name, Address, | | Position(s) | | Length of |
| and Birth Date | | Held with Fund(s) | | Time Served |
| Interested Trustees | | | | |
| | | | | |
| Patrick P. Coyne1 | | Chairman, President, | | Chairman and Trustee |
| 2005 Market Street | | Chief Executive Officer, | | since August 16, 2006 |
| Philadelphia, PA 19103 | | and Trustee | | |
| April 1963 | | | | President and |
| | | | | Chief Executive Officer |
| | | | | since August 1, 2006 |
| | | | | |
| | | | | |
| | | | | |
| | | | | |
| | | | | |
| | | | | |
| | | | | |
| | | | | |
| | | | | |
| | | | | |
| | | | | |
| | | | | |
| | | | | |
| | | | | |
| | | | | |
| | | | | |
| | | | | |
| | | | | |
1 Patrick P. Coyne is considered to be an “Interested Trustee” because he is an executive officer of the Fund’s(s’) investment advisor.
44
for shareholder interests. Each trustee has served in that capacity since he or she was elected to or appointed to the Board of Trustees, and will continue to serve until his or her retirement or the election of a new trustee in his or her place. The following is a list of the Trustees and Officers with certain background and related information.
| | | Number of Portfolios in | | |
| Principal Occupation(s) | | Fund Complex Overseen | | Other Directorships |
| During Past 5 Years | | by Trustee or Officer | | Held by Trustee or Officer |
| | | | | |
| | | | | |
| Patrick P. Coyne has served in | | 78 | | Director |
| various executive capacities | | | | Kaydon Corp. |
| at different times at | | | | |
| Delaware Investments.2 | | | | Board of Governors Member |
| | | | | Investment Company |
| | | | | Institute (ICI) |
| | | | | |
| | | | | Finance Committee Member |
| | | | | St. John Vianney Roman |
| | | | | Catholic Church |
| | | | | |
| | | | | Board of Trustees |
| | | | | Agnes Irwin School |
| | | | | |
| | | | | Member of Investment |
| | | | | Committee |
| | | | | Cradle of Liberty Council, |
| | | | | BSA |
| | | | | (2007 – 2010) |
| | | | | |
| | | | | |
| | | | | |
| | | | | |
2 Delaware Investments is the marketing name for Delaware Management Holdings, Inc. and its subsidiaries, including the Fund’s(s’) investment advisor, principal underwriter, and its transfer agent.
45
Board of trustees/directors and officers addendum
Delaware Investments® Family of Funds
| Name, Address, | | Position(s) | | Length of |
| and Birth Date | | Held with Fund(s) | | Time Served |
| Independent Trustees | | | | |
| | | | | |
| Thomas L. Bennett | | Trustee | | Since March 2005 |
| 2005 Market Street | | | | |
| Philadelphia, PA 19103 | | | | |
| October 1947 | | | | |
| | | | | |
| | | | | |
| | | | | |
| | | | | |
| | | | | |
| | | | | |
| | | | | |
| | | | | |
| | | | | |
| | | | | |
| John A. Fry | | Trustee | | Since January 2001 |
| 2005 Market Street | | | | |
| Philadelphia, PA 19103 | | | | |
| May 1960 | | | | |
| | | | | |
| | | | | |
| | | | | |
| | | | | |
| | | | | |
| | | | | |
| | | | | |
| | | | | |
| Anthony D. Knerr | | Trustee | | Since April 1990 |
| 2005 Market Street | | | | |
| Philadelphia, PA 19103 | | | | |
| December 1938 | | | | |
| | | | | |
| | | | | |
| Lucinda S. Landreth | | Trustee | | Since March 2005 |
| 2005 Market Street | | | | |
| Philadelphia, PA 19103 | | | | |
| June 1947 | | | | |
| | | | | |
46
| | | Number of Portfolios in | | |
| Principal Occupation(s) | | Fund Complex Overseen | | Other Directorships |
| During Past 5 Years | | by Trustee or Officer | | Held by Trustee or Officer |
| | | | | |
| | | | | |
| Private Investor | | 78 | | Director |
| (March 2004–Present) | | | | Bryn Mawr Bank Corp. (BMTC) |
| | | | | |
| Investment Manager | | | | Chairman of Investment |
| Morgan Stanley & Co. | | | | Committee |
| (January 1984–March 2004) | | | | Pennsylvania Academy of |
| | | | | Fine Arts |
| | | | | |
| | | | | Investment Committee and |
| | | | | Governance Committee |
| | | | | Member |
| | | | | Pennsylvania Horticultural |
| | | | | Society |
| | | | | |
| President | | 78 | | Director |
| Drexel University | | | | Community Health Systems |
| (August 2010–Present) | | | | |
| | | | | Director — Ecore |
| President | | | | International |
| Franklin & Marshall College | | | | (2009 – 2010) |
| (July 2002–July 2010) | | | | |
| | | | | Director — Allied |
| Executive Vice President | | | | Barton Securities Holdings |
| University of Pennsylvania | | | | (2005 – 2008) |
| (April 1995–June 2002) | | | | |
| | | | | |
| Founder and | | 78 | | None |
| Managing Director | | | | |
| Anthony Knerr & Associates | | | | |
| (Strategic Consulting) | | | | |
| (1990–Present) | | | | |
| | | | | |
| Chief Investment Officer | | 78 | | None |
| Assurant, Inc. (Insurance) | | | | |
| (2002–2004) | | | | |
| | | | | |
| | | | | |
47
Board of trustees/directors and officers addendum
Delaware Investments® Family of Funds
| Name, Address, | | Position(s) | | Length of |
| and Birth Date | | Held with Fund(s) | | Time Served |
| Independent Trustees (continued) | | | | |
| | | | | |
| Ann R. Leven | | Trustee | | Since October 1989 |
| 2005 Market Street | | | | |
| Philadelphia, PA 19103 | | | | |
| November 1940 | | | | |
| | | | | |
| | | | | |
| | | | | |
| | | | | |
| | | | | |
| | | | | |
| Thomas F. Madison | | Trustee | | Since May 19973 |
| 2005 Market Street | | | | |
| Philadelphia, PA 19103 | | | | |
| February 1936 | | | | |
| | | | | |
| | | | | |
| | | | | |
| | | | | |
| | | | | |
| | | | | |
| | | | | |
| | | | | �� |
| | | | | |
| | | | | |
| | | | | |
| | | | | |
| | | | | |
| | | | | |
| | | | | |
| | | | | |
| | | | | |
| | | | | |
| | | | | |
| | | | | |
| | | | | |
| | | | | |
| | | | | |
| | | | | |
3 In 1997, several funds managed by Voyageur Fund Managers, Inc. (the “Voyageur Funds”) were incorporated into the Delaware Investments Family of Funds. Mr. Madison served as a director of the Voyageur Funds from 1993 until 1997.
48
| | | Number of Portfolios in | | |
| Principal Occupation(s) | | Fund Complex Overseen | | Other Directorships |
| During Past 5 Years | | by Trustee or Officer | | Held by Trustee or Officer |
| | | | | |
| | | | | |
| Consultant | | 78 | | Director and Audit |
| ARL Associates | | | | Committee Chair – |
| (Financial Planning) | | | | Systemax Inc. |
| (1983–Present) | | | | (2001 – 2009) |
| | | | | |
| | | | | Director and Audit |
| | | | | Committee Chairperson – |
| | | | | Andy Warhol Foundation |
| | | | | (1999 – 2007) |
| | | | | |
| President and | | 78 | | Director and Chair of |
| Chief Executive Officer | | | | Compensation Committee, |
| MLM Partners, Inc. | | | | Governance Committee |
| (Small Business Investing | | | | Member |
| and Consulting) | | | | CenterPoint Energy |
| (January 1993–Present) | | | | |
| | | | | Lead Director and Chair of |
| | | | | Audit and Governance |
| | | | | Committees, Member of |
| | | | | Compensation Committee |
| | | | | Digital River, Inc. |
| | | | | |
| | | | | Director and Chair of |
| | | | | Governance Committee, |
| | | | | Audit Committee |
| | | | | Member |
| | | | | Rimage Corporation |
| | | | | |
| | | | | Director and Chair of |
| | | | | Compensation Committee |
| | | | | Spanlink Communications |
| | | | | |
| | | | | Lead Director and Member of |
| | | | | Compensation and |
| | | | | Governance Committees |
| | | | | Valmont Industries, Inc. |
| | | | | (1987 – 2010) |
| | | | | |
49
Board of trustees/directors and officers addendum
Delaware Investments® Family of Funds
| Name, Address, | | Position(s) | | Length of |
| and Birth Date | | Held with Fund(s) | | Time Served |
| Independent Trustees (continued) | | | | |
| | | | | |
| Thomas F. Madison | | | | |
| 2005 Market Street | | | | |
| Philadelphia, PA 19103 | | | | |
| February 1936 | | | | |
| | | | | |
| Janet L. Yeomans | | Trustee | | Since April 1999 |
| 2005 Market Street | | | | |
| Philadelphia, PA 19103 | | | | |
| July 1948 | | | | |
| | | | | |
| | | | | |
| | | | | |
| | | | | |
| J. Richard Zecher | | Trustee | | Since March 2005 |
| 2005 Market Street | | | | |
| Philadelphia, PA 19103 | | | | |
| July 1940 | | | | |
| | | | | |
| | | | | |
| | | | | |
| | | | | |
| | | | | |
| | | | | |
| | | | | |
| | | | | |
| | | | | |
| | | | | |
| | | | | |
| | | | | |
| | | | | |
| | | | | |
| | | | | |
| | | | | |
| | | | | |
50
| | | Number of Portfolios in | | |
| Principal Occupation(s) | | Fund Complex Overseen | | Other Directorships |
| During Past 5 Years | | by Trustee or Officer | | Held by Trustee or Officer |
| | | | | |
| | | | | |
| | | | | Director |
| | | | | Banner Health |
| | | | | (1996 – 2007) |
| | | | | |
| | | | | |
| Vice President and Treasurer | | 78 | | Director |
| (January 2006–Present) | | | | Okabena Company |
| Vice President — Mergers & Acquisitions | | | | |
| (January 2003–January 2006), and | | | | |
| Vice President | | | | |
| (July 1995–January 2003) | | | | |
| 3M Corporation | | | | |
| | | | | |
| Founder | | 78 | | Director and Audit |
| Investor Analytics | | | | Committee Member |
| (Risk Management) | | | | Investor Analytics |
| (May 1999–Present) | | | | |
| | | | | |
| Founder | | | | Director |
| Sutton Asset Management | | | | Oxigene, Inc. |
| (Hedge Fund) | | | | (2003 – 2008) |
| (September 1996–Present) | | | | |
| | | | | |
| | | | | |
| | | | | |
| | | | | |
| | | | | |
| | | | | |
| | | | | |
| | | | | |
| | | | | |
| | | | | |
| | | | | |
| | | | | |
51
Board of trustees/directors and officers addendum
Delaware Investments® Family of Funds
| Name, Address, | | Position(s) | | Length of |
| and Birth Date | | Held with Fund(s) | | Time Served |
| Officers | | | | |
| | | | | |
| David F. Connor | | Vice President, | | Vice President since |
| 2005 Market Street | | Deputy General | | September 2000 |
| Philadelphia, PA 19103 | | Counsel, and Secretary | | and Secretary since |
| December 1963 | | | | October 2005 |
| | | | | |
| | | | | |
| Daniel V. Geatens | | Vice President | | Treasurer |
| 2005 Market Street | | and Treasurer | | since October 2007 |
| Philadelphia, PA 19103 | | | | |
| October 1972 | | | | |
| | | | | |
| David P. O’Connor | | Senior Vice President, | | Senior Vice President, |
| 2005 Market Street | | General Counsel, | | General Counsel, and |
| Philadelphia, PA 19103 | | and Chief Legal Officer | | Chief Legal Officer |
| February 1966 | | | | since October 2005 |
| | | | | |
| Richard Salus | | Senior Vice President | | Chief Financial Officer |
| 2005 Market Street | | and Chief Financial Officer | | since November 2006 |
| Philadelphia, PA 19103 | | | | |
| October 1963 | | | | |
| | | | | |
The Statement of Additional Information for the Fund(s) includes additional information about the Trustees and Officers and is available, without charge, upon request by calling 800 523-1918.
52
| | | Number of Portfolios in | | |
| Principal Occupation(s) | | Fund Complex Overseen | | Other Directorships |
| During Past 5 Years | | by Trustee or Officer | | Held by Trustee or Officer |
| | | | | |
| | | | | |
| David F. Connor has served as | | 78 | | None4 |
| Vice President and Deputy | | | | |
| General Counsel of | | | | |
| Delaware Investments | | | | |
| since 2000. | | | | |
| | | | | |
| Daniel V. Geatens has served | | 78 | | None4 |
| in various capacities at | | | | |
| different times at | | | | |
| Delaware Investments. | | | | |
| | | | | |
| David P. O’Connor has served in | | 78 | | None4 |
| various executive and legal | | | | |
| capacities at different times | | | | |
| at Delaware Investments. | | | | |
| | | | | |
| Richard Salus has served in | | 78 | | None4 |
| various executive capacities | | | | |
| at different times at | | | | |
| Delaware Investments. | | | | |
| | | | | |
4 David F. Connor, Daniel V. Geatens, David P. O’Connor, and Richard Salus serve in similar capacities for the six portfolios of the Optimum Fund Trust, which have the same investment advisor, principal underwriter, and transfer agent as the registrant.
53
About the organization
| Board of trustees |
Patrick P. Coyne
Chairman, President, and
Chief Executive Officer
Delaware Investments®
Family of Funds
Philadelphia, PA Thomas L. Bennett
Private Investor
Rosemont, PA John A. Fry
President
Drexel University
Philadelphia, PA | Anthony D. Knerr
Founder and Managing
Director
Anthony Knerr &
Associates
New York, NY Lucinda S. Landreth
Former Chief Investment
Officer
Assurant, Inc.
Philadelphia, PA | Ann R. Leven
Consultant
ARL Associates
New York, NY Thomas F. Madison
President and
Chief Executive Officer
MLM Partners, Inc.
Minneapolis, MN | Janet L. Yeomans
Vice President and
Treasurer
3M Corporation
St. Paul, MN J. Richard Zecher
Founder
Investor Analytics
Scottsdale, AZ |
| | | | |
| Affiliated officers |
David F. Connor
Vice President, Deputy
General Counsel, and
Secretary
Delaware Investments
Family of Funds
Philadelphia, PA | Daniel V. Geatens
Vice President and
Treasurer
Delaware Investments
Family of Funds
Philadelphia, PA | David P. O’Connor
Senior Vice President,
General Counsel,
and Chief Legal Officer
Delaware Investments
Family of Funds
Philadelphia, PA | Richard Salus
Senior Vice President and
Chief Financial Officer
Delaware Investments
Family of Funds
Philadelphia, PA |
This annual report is for the information of Delaware REIT Fund shareholders, but it may be used with prospective investors when preceded or accompanied by a current prospectus for Delaware REIT Fund and the Delaware Investments Fund fact sheet for the most recently completed calendar quarter. These documents are available at www.delawareinvestments.com. The prospectus sets forth details about charges, expenses, investment objectives, and operating policies of the investment company. You should read the prospectus carefully before you invest. The figures in this report represent past results that are not a guarantee of future results. The return and principal value of an investment in the investment company will fluctuate so that shares, when redeemed, may be worth more or less than their original cost. |
Delaware Investments is the marketing name of Delaware Management Holdings, Inc. and its subsidiaries. The Fund files its complete schedule of portfolio holdings with the Securities and Exchange Commission (SEC) for the first and third quarters of each fiscal year on Form N-Q. The Fund’s Forms N-Q, as well as a description of the policies and procedures that the Fund uses to determine how to vote proxies (if any) relating to portfolio securities are available without charge (i) upon request, by calling 800 523-1918; and (ii) on the SEC’s Web site at www.sec.gov. In addition, a description of the policies and procedures that the Fund uses to determine how to vote proxies (if any) relating to portfolio securities and the Fund’s Schedule of Investments are available without charge on the Fund’s Web site at www.delawareinvestments.com. The Fund’s Forms N-Q may be reviewed and copied at the SEC’s Public Reference Room in Washington, D.C.; information on the operation of the Public Reference Room may be obtaine d by calling 800 SEC-0330. Information (if any) regarding how the Fund voted proxies relating to portfolio securities during the most recently disclosed 12-month period ended June 30 is available without charge (i) through the Fund’s Web site at www.delawareinvestments.com; and (ii) on the SEC’s Web site at www.sec.gov. |
54
Item 2. Code of Ethics
The registrant has adopted a code of ethics that applies to the registrant’s principal executive officer, principal financial officer, principal accounting officer or controller, or persons performing similar functions, regardless of whether these individuals are employed by the registrant or a third party. A copy of the registrant’s Code of Business Ethics has been posted on the Delaware Investments Internet Web site at www.delawareinvestments.com. Any amendments to the Code of Business Ethics, and information on any waiver from its provisions granted by the registrant, will also be posted on this Web site within five business days of such amendment or waiver and will remain on the Web site for at least 12 months.
Item 3. Audit Committee Financial Expert
The registrant’s Board of Trustees/Directors has determined that each member of the registrant’s Audit Committee is an audit committee financial expert, as defined below. For purposes of this item, an “audit committee financial expert” is a person who has the following attributes:
a. An understanding of generally accepted accounting principles and financial statements;
b. The ability to assess the general application of such principles in connection with the accounting for estimates, accruals, and reserves;
c. Experience preparing, auditing, analyzing, or evaluating financial statements that present a breadth and level of complexity of accounting issues that are generally comparable to the breadth and complexity of issues that can reasonably be expected to be raised by the registrant’s financial statements, or experience actively supervising one or more persons engaged in such activities;
d. An understanding of internal controls and procedures for financial reporting; and
e. An understanding of audit committee functions.
An “audit committee financial expert” shall have acquired such attributes through:
a. Education and experience as a principal financial officer, principal accounting officer, controller, public accountant, or auditor or experience in one or more positions that involve the performance of similar functions;
b. Experience actively supervising a principal financial officer, principal accounting officer, controller, public accountant, auditor, or person performing similar functions;
c. Experience overseeing or assessing the performance of companies or public accountants with respect to the preparation, auditing, or evaluation of financial statements; or
d. Other relevant experience.
The registrant’s Board of Trustees/Directors has also determined that each member of the registrant’s Audit Committee is independent. In order to be “independent” for purposes of this item, the Audit Committee member may not: (i) other than in his or her capacity as a member of the Board of Trustees/Directors or any committee thereof, accept directly or indirectly any consulting, advisory or other compensatory fee from the issuer; or (ii) be an “interested person” of the registrant as defined in Section 2(a)(19) of the Investment Company Act of 1940.
The names of the audit committee financial experts on the registrant’s Audit Committee are set forth below:
Thomas L. Bennett 1
John A. Fry
Thomas F. Madison
Janet L. Yeomans
J. Richard Zecher
Item 4. Principal Accountant Fees and Services
(a) Audit fees.
The aggregate fees billed for services provided to the registrant by its independent auditors for the audit of the registrant’s annual financial statements and for services normally provided by the independent auditors in connection with statutory and regulatory filings or engagements were $271,800 for the fiscal year ended October 31, 2010.
_______________________
1 The instructions to Form N-CSR require disclosure on the relevant experience of persons who qualify as audit committee financial experts based on “other relevant experience.” The Board of Trustees/Directors has determined that Mr. Bennett qualifies as an audit committee financial expert by virtue of his education, Chartered Financial Analyst designation, and his experience as a credit analyst, portfolio manager and the manager of other credit analysts and portfolio managers.
The aggregate fees billed for services provided to the registrant by its independent auditors for the audit of the registrant’s annual financial statements and for services normally provided by the independent auditors in connection with statutory and regulatory filings or engagements were $270,408 for the fiscal year ended October 31, 2009.
(b) Audit-related fees.
The aggregate fees billed by the registrant’s independent auditors for services relating to the performance of the audit of the registrant’s financial statements and not reported under paragraph (a) of this Item were $0 for the fiscal year ended October 31, 2010.
The aggregate fees billed by the registrant’s independent auditors for services relating to the performance of the audit of the financial statements of the registrant’s investment adviser and other service providers under common control with the adviser and that relate directly to the operations or financial reporting of the registrant were $84,000 for the registrant’s fiscal year ended October 31, 2010. The percentage of these fees relating to services approved by the registrant’s Audit Committee pursuant to the de minimis exceptio n from the pre-approval requirement in Rule 2-01(c)(7)(i)(C) of Regulation S-X was 0%. These audit-related services were as follows: audit procedures performed on Delaware Investments for its consolidation into Macquarie’s financial statements as of March 31, 2010.
The aggregate fees billed by the registrant’s independent auditors for services relating to the performance of the audit of the registrant’s financial statements and not reported under paragraph (a) of this Item were $0 for the fiscal year ended October 31, 2009.
The aggregate fees billed by the registrant’s independent auditors for services relating to the performance of the audit of the financial statements of the registrant’s investment adviser and other service providers under common control with the adviser and that relate directly to the operations or financial reporting of the registrant were $19,074 for the registrant’s fiscal year ended October 31, 2009. The percentage of these fees relating to services approved by the registrant’s Audit Committee pursuant to the de minimis exceptio n from the pre-approval requirement in Rule 2-01(c)(7)(i)(C) of Regulation S-X was 0%. These audit-related services were as follows: issuance of report concerning transfer agent's system of internal accounting control pursuant to Rule 17Ad-13 of the Securities Exchange Act.
(c) Tax fees.
The aggregate fees billed by the registrant’s independent auditors for tax-related services provided to the registrant were $49,350 for the fiscal year ended October 31, 2010. The percentage of these fees relating to services approved by the registrant’s Audit Committee pursuant to the de minimis exception from the pre-approval requirement in Rule 2-01(c)(7)(i)(C) of Regulation S-X was 0%. These tax-related services were as follows: review of income tax returns and review of annual excise distribution calculations.
The aggregate fees billed by the registrant’s independent auditors for tax-related services provided to the registrant’s investment adviser and other service providers under common control with the adviser and that relate directly to the operations or financial reporting of the registrant were $10,000 for the registrant’s fiscal year ended October 31, 2010.
The aggregate fees billed by the registrant’s independent auditors for tax-related services provided to the registrant were $101,919 for the fiscal year ended October 31, 2009. The percentage of these fees relating to services approved by the registrant’s Audit Committee pursuant to the de minimis exception from the pre-approval requirement in Rule 2-01(c)(7)(i)(C) of Regulation S-X was 0%. These tax-related services were as follows: review of income tax returns, review of annual excise distribution calculations, and tax compliance services wit h respect to investments in foreign securities.
The aggregate fees billed by the registrant’s independent auditors for tax-related services provided to the registrant’s investment adviser and other service providers under common control with the adviser and that relate directly to the operations or financial reporting of the registrant were $0 for the registrant’s fiscal year ended October 31, 2009.
(d) All other fees.
The aggregate fees billed for all services provided by the independent auditors to the registrant other than those set forth in paragraphs (a), (b) and (c) of this Item were $0 for the fiscal year ended October 31, 2010.
The aggregate fees billed for all services other than those set forth in paragraphs (b) and (c) of this Item provided by the registrant’s independent auditors to the registrant’s adviser and other service providers under common control with the adviser and that relate directly to the operations or financial reporting of the registrant were $0 for the registrant’s fiscal year ended October 31, 2010.
The aggregate fees billed for all services provided by the independent auditors to the registrant other than those set forth in paragraphs (a), (b) and (c) of this Item were $0 for the fiscal year ended October 31, 2009.
The aggregate fees billed for all services other than those set forth in paragraphs (b) and (c) of this Item provided by the registrant’s independent auditors to the registrant’s adviser and other service providers under common control with the adviser and that relate directly to the operations or financial reporting of the registrant were $0 for the registrant’s fiscal year ended October 31, 2009.
(e) The registrant’s Audit Committee has established pre-approval policies and procedures as permitted by Rule 2-01(c)(7)(i)(B) of Regulation S-X (the “Pre-Approval Policy”) with respect to services provided by the registrant’s independent auditors. Pursuant to the Pre-Approval Policy, the Audit Committee has pre-approved the services set forth in the table below with respect to the registrant up to the specified fee limits. Certain fee limits are based on aggregate fees to the registrant and other registrants within the Delaware Investments Family of Funds.
| Service | Range of Fees |
| Audit Services | |
| Statutory audits or financial audits for new Funds | up to $25,000 per Fund |
| Services associated with SEC registration statements (e.g., Form N-1A, Form N-14, etc.), periodic reports and other documents filed with the SEC or other documents issued in connection with securities offerings (e.g., comfort letters for closed-end Fund offerings, consents), and assistance in responding to SEC comment letters | up to $10,000 per Fund |
| Consultations by Fund management as to the accounting or disclosure treatment of transactions or events and/or the actual or potential impact of final or proposed rules, standards or interpretations by the SEC, FASB, or other regulatory or standard-setting bodies (Note: Under SEC rules, some consultations may be considered “audit-related services” rather than “audit services”) | up to $25,000 in the aggregate |
| Audit-Related Services | |
| Consultations by Fund management as to the accounting or disclosure treatment of transactions or events and /or the actual or potential impact of final or proposed rules, standards or interpretations by the SEC, FASB, or other regulatory or standard-setting bodies (Note: Under SEC rules, some consultations may be considered “audit services” rather than “audit-related services”) | up to $25,000 in the aggregate |
| Tax Services | |
| U.S. federal, state and local and international tax planning and advice (e.g., consulting on statutory, regulatory or administrative developments, evaluation of Funds’ tax compliance function, etc.) | up to $25,000 in the aggregate |
| U.S. federal, state and local tax compliance (e.g., excise distribution reviews, etc.) | up to $5,000 per Fund |
| Review of federal, state, local and international income, franchise and other tax returns | up to $5,000 per Fund |
Under the Pre-Approval Policy, the Audit Committee has also pre-approved the services set forth in the table below with respect to the registrant’s investment adviser and other entities controlling, controlled by or under common control with the investment adviser that provide ongoing services to the registrant (the “Control Affiliates”) up to the specified fee limit. This fee limit is based on aggregate fees to the investment adviser and its Control Affiliates.
| Service | Range of Fees |
| Non-Audit Services | |
| Services associated with periodic reports and other documents filed with the SEC and assistance in responding to SEC comment letters | up to $10,000 in the aggregate |
The Pre-Approval Policy requires the registrant’s independent auditors to report to the Audit Committee at each of its regular meetings regarding all services initiated since the last such report was rendered, including those services authorized by the Pre-Approval Policy.
(f) Not applicable.
(g) The aggregate non-audit fees billed by the registrant’s independent auditors for services rendered to the registrant and to its investment adviser and other service providers under common control with the adviser were $0 and $301,633 for the registrant’s fiscal years ended October 31, 2010 and October 31, 2009, respectively.
(h) In connection with its selection of the independent auditors, the registrant’s Audit Committee has considered the independent auditors’ provision of non-audit services to the registrant’s investment adviser and other service providers under common control with the adviser that were not required to be pre-approved pursuant to Rule 2-01(c)(7)(ii) of Regulation S-X. The Audit Committee has determined that the independent auditors’ provision of these services is compatible with maintaining the auditors’ independence.
Item 5. Audit Committee of Listed Registrants
Not applicable.
Item 6. Investments
(a) Included as part of report to shareholders filed under Item 1 of this Form N-CSR.
(b) Divestment of securities in accordance with Section 13(c) of the Investment Company Act of 1940.
Not applicable.
Item 7. Disclosure of Proxy Voting Policies and Procedures for Closed-End Management Investment Companies
Not applicable.
Item 8. Portfolio Managers of Closed-End Management Investment Companies
Not applicable.
Item 9. Purchases of Equity Securities by Closed-End Management Investment Company and Affiliated Purchasers
Not applicable.
Item 10. Submission of Matters to a Vote of Security Holders
Not applicable.
Item 11. Controls and Procedures
The registrant’s principal executive officer and principal financial officer have evaluated the registrant’s disclosure controls and procedures within 90 days of the filing of this report and have concluded that they are effective in providing reasonable assurance that the information required to be disclosed by the registrant in its reports or statements filed under the Securities Exchange Act of 1934 is recorded, processed, summarized and reported within the time periods specified in the rules and forms of the Securities and Exchange Commission.
There were no significant changes in the registrant’s internal control over financial reporting that occurred during the second fiscal quarter of the period covered by the report to stockholders included herein (i.e., the registrant’s fourth fiscal quarter) that have materially affected, or are reasonably likely to materially affect, the registrant’s internal control over financial reporting.
Item 12. Exhibits
(a) (1) Code of Ethics
Not applicable.
(2) Certifications of Principal Executive Officer and Principal Financial Officer pursuant to Rule 30a-2 under the Investment Company Act of 1940 are attached hereto as Exhibit 99.CERT.
(3) Written solicitations to purchase securities pursuant to Rule 23c-1 under the Securities Exchange Act of 1934.
Not applicable.
(b) Certifications pursuant to Section 906 of the Sarbanes-Oxley Act of 2002 are furnished herewith as Exhibit 99.906CERT.
SIGNATURES
Pursuant to the requirements of the Securities Exchange Act of 1934 and the Investment Company Act of 1940, the registrant has duly caused this report to be signed on its behalf, by the undersigned, thereunto duly authorized.
Name of Registrant: DELAWARE POOLED® TRUST
| /s/ PATRICK P. COYNE |
| By: | Patrick P. Coyne |
| Title: | Chief Executive Officer |
| Date: | January 3, 2011 |
Pursuant to the requirements of the Securities Exchange Act of 1934 and the Investment Company Act of 1940, this report has been signed below by the following persons on behalf of the registrant and in the capacities and on the dates indicated.
| /s/ PATRICK P. COYNE |
| By: | Patrick P. Coyne |
| Title: | Chief Executive Officer |
| Date: | January 3, 2011 |
| /s/ RICHARD SALUS |
| By: | Richard Salus |
| Title: | Chief Financial Officer |
| Date: | January 3, 2011 |